TGF-β activates Akt kinase through a microRNA-dependent amplifying circuit targeting PTEN
20
TGF-β activates Akt kinase via a microRNA-dependent amplifying circuit targeting PTEN Mitsuo Kato 1 , Sumanth Putta 1,2 , Mei Wang 1 , Hang Yuan 1 , Linda Lanting 1 , Indu Nair 1 , Amanda Gunn 2 , Yoshimi Nakagawa 4 , Hitoshi Shimano 4 , Ivan Todorov 1 , John J. Rossi 2,3 , and Rama Natarajan 1,2 1 Gonda Diabetes Center, Beckman Research Institute of the City of Hope, Duarte, California 91010, USA 2 Graduate School of Biological Sciences, Beckman Research Institute of the City of Hope, Duarte, California 91010, USA 3 Division of Molecular Biology, Beckman Research Institute of the City of Hope, Duarte, California 91010, USA 4 Department of Internal Medicine, Metabolism and Endocrinology, Graduate School of Comprehensive Human Sciences, University of Tsukuba, Tsukuba, Ibaraki, Japan, 305-8575 Abstract Akt kinase is activated by transforming growth factor-beta1 (TGF-β) in diabetic kidneys and plays important roles in fibrosis, hypertrophy and cell survival in glomerular mesangial cells (MC)1 – 11. However, the mechanisms of Akt activation by TGF-β are not fully understood. Here we show that TGF-β activates Akt in MC by inducing microRNA-216a (miR-216a) and miR-217, both of which target phosphatase and tensin homologue (PTEN). Both these miRs are located within the second intron of a non-coding RNA (RP23-298H6.1-001). The RP23 promoter was activated by TGF-β and also by miR-192 via E-box-regulated mechanisms as shown previously3. Akt activation by these miRs also led to MC survival and hypertrophy similar to TGF-β. These studies reveal a mechanism of Akt activation via PTEN downregulation by two miRs regulated by upstream miR-192 and TGF-β. Due to the diversity of PTEN function12 , 13, this miR amplifying circuit may play key roles not only in kidney disorders, but also other diseases. Diabetic Nephropathy (DN) is a major complication of diabetes. Key features of DN include glomerular mesangial expansion, hypertrophy and accumulation of extracellular matrix (ECM) proteins such as collagen in the kidney2 , 3 , 7 , 10 , 11. The phosphoinositide 3-kinase (PI3K)-Akt pathway is activated in animal models of DN4 – 7 and Akt1−/− mice are protected from hyperhexosemia-induced mesangial hypertrophy and ECM accumulation7. These results implicate Akt kinase as a key mediator of DN. Increased expression of TGF-β is observed in renal cells during DN progression1 – 3. PI3K-Akt activation by TGF-β4 , 5 , 8 – 10 has been related to increased ECM protein expression9 , 10, hypertrophy5, cell survival and oxidant stress in MC4. However, the mechanism by which TGF-β activates Akt has not been fully elucidated. Address Correspondence to: Rama Natarajan, Ph.D., Tel: 626-256-4673, ext 62289, Fax: 626-301-8136, Email; [email protected] Or Mitsuo Kato, PhD., Tel: 626-256-4673, ext 63996, Fax: 626-301-8136, Email; [email protected], Gonda Diabetes Center, Beckman Research Institute of the City of Hope, 1500 East Duarte Road Duarte, CA 91010. Author contributions M.K. and R.N. designed research; M.K., S.P., M.W., H.Y., L.L., I.N., A.G., and I.T. performed research; M.K., M.W., Y.N,, H.S., and J.J.R. contributed new reagents/analytic tools; M.K., S.P. and I.T analyzed data; and M.K. and R.N. wrote the paper. NIH Public Access Author Manuscript Nat Cell Biol. Author manuscript; available in PMC 2010 January 1. Published in final edited form as: Nat Cell Biol. 2009 July ; 11(7): 881–889. doi:10.1038/ncb1897. NIH-PA Author Manuscript NIH-PA Author Manuscript NIH-PA Author Manuscript
-
Upload
independent -
Category
Documents
-
view
0 -
download
0
Transcript of TGF-β activates Akt kinase through a microRNA-dependent amplifying circuit targeting PTEN
TGF-β activates Akt kinase via a microRNA-dependentamplifying circuit targeting PTEN
Mitsuo Kato1, Sumanth Putta1,2, Mei Wang1, Hang Yuan1, Linda Lanting1, Indu Nair1,Amanda Gunn2, Yoshimi Nakagawa4, Hitoshi Shimano4, Ivan Todorov1, John J. Rossi2,3,and Rama Natarajan1,2
1 Gonda Diabetes Center, Beckman Research Institute of the City of Hope, Duarte, California91010, USA2 Graduate School of Biological Sciences, Beckman Research Institute of the City of Hope,Duarte, California 91010, USA3 Division of Molecular Biology, Beckman Research Institute of the City of Hope, Duarte,California 91010, USA4 Department of Internal Medicine, Metabolism and Endocrinology, Graduate School ofComprehensive Human Sciences, University of Tsukuba, Tsukuba, Ibaraki, Japan, 305-8575
AbstractAkt kinase is activated by transforming growth factor-beta1 (TGF-β) in diabetic kidneys and playsimportant roles in fibrosis, hypertrophy and cell survival in glomerular mesangial cells (MC)1–11.However, the mechanisms of Akt activation by TGF-β are not fully understood. Here we showthat TGF-β activates Akt in MC by inducing microRNA-216a (miR-216a) and miR-217, both ofwhich target phosphatase and tensin homologue (PTEN). Both these miRs are located within thesecond intron of a non-coding RNA (RP23-298H6.1-001). The RP23 promoter was activated byTGF-β and also by miR-192 via E-box-regulated mechanisms as shown previously3. Aktactivation by these miRs also led to MC survival and hypertrophy similar to TGF-β. These studiesreveal a mechanism of Akt activation via PTEN downregulation by two miRs regulated byupstream miR-192 and TGF-β. Due to the diversity of PTEN function12, 13, this miR amplifyingcircuit may play key roles not only in kidney disorders, but also other diseases.
Diabetic Nephropathy (DN) is a major complication of diabetes. Key features of DN includeglomerular mesangial expansion, hypertrophy and accumulation of extracellular matrix(ECM) proteins such as collagen in the kidney2, 3, 7, 10, 11. The phosphoinositide 3-kinase(PI3K)-Akt pathway is activated in animal models of DN4–7 and Akt1−/− mice areprotected from hyperhexosemia-induced mesangial hypertrophy and ECM accumulation7.These results implicate Akt kinase as a key mediator of DN. Increased expression of TGF-βis observed in renal cells during DN progression1–3. PI3K-Akt activation by TGF-β4, 5, 8–
10 has been related to increased ECM protein expression9, 10, hypertrophy5, cell survivaland oxidant stress in MC4. However, the mechanism by which TGF-β activates Akt has notbeen fully elucidated.
Address Correspondence to: Rama Natarajan, Ph.D., Tel: 626-256-4673, ext 62289, Fax: 626-301-8136, Email; [email protected] Mitsuo Kato, PhD., Tel: 626-256-4673, ext 63996, Fax: 626-301-8136, Email; [email protected], Gonda Diabetes Center, BeckmanResearch Institute of the City of Hope, 1500 East Duarte Road Duarte, CA 91010.
Author contributionsM.K. and R.N. designed research; M.K., S.P., M.W., H.Y., L.L., I.N., A.G., and I.T. performed research; M.K., M.W., Y.N,, H.S., andJ.J.R. contributed new reagents/analytic tools; M.K., S.P. and I.T analyzed data; and M.K. and R.N. wrote the paper.
NIH Public AccessAuthor ManuscriptNat Cell Biol. Author manuscript; available in PMC 2010 January 1.
Published in final edited form as:Nat Cell Biol. 2009 July ; 11(7): 881–889. doi:10.1038/ncb1897.
NIH
-PA Author Manuscript
NIH
-PA Author Manuscript
NIH
-PA Author Manuscript
MicroRNAs (miRs) are short non-coding RNAs that induce gene silencing mainly byblocking mRNA translation or promoting mRNA degradation14, 15. A number of miRs arehighly expressed in the kidney16, 17. miR-192 was shown to be upregulated in TGF-β-treated mouse MC (MMC) and in diabetic mouse glomeruli, and to increase collagen type Iα2 chain (Col1a2) expression by downregulating Zeb2 (also called SIP1 or Zfhx1b), an E-box repressor3. Another report showed that miR-377 regulates fibronectin expression inDN18. However, the functional roles and regulation of other renal miRs are unclear. Herewe show that miR-216a is also upregulated by TGF-β in MMC in a dose- and time-dependent manner, similar to miR-1923 (Fig. 1a,b and Supplementary Fig. S1c,k). Col1a2was induced in parallel. miR-216a levels were also increased in renal glomeruli isolatedfrom type1 (streptozotocin [STZ] injected) and type 2 (db/db) diabetic mice relative to theirrespective controls (C57BL/6 and db/+) (Fig. 1c).
miR-216a lies in the second intron of a non-coding RNA (RP23-298H6.1-001, RP23)located in mouse chromosome 11 (miRBase, http://microrna.sanger.ac.uk)19 (Fig. 1d andSupplementary Fig. S2a). RP23 levels were also increased by TGF-β in MMC (Fig. 1a,b andSupplementary Fig. S1b,j). Interestingly, another miR-217 was present in the same intron,6.6 kb-downstream of miR-216a (Fig. 1d). Indeed, miR-217 levels were increased in TGF-β-treated MMC (Fig. 1a, b and Supplementary Fig. S1d,l), and in the glomeruli of diabeticmice (Fig. 1c). Therefore, miR-216a and miR-217 were expressed along with RP23 andinduced by diabetic conditions or TGF-β.
Next, the RP23 promoter region was examined. We focused on CAGA repeats (Smadbinding elements) and E-boxes (CAXXTG), due to their function in TGF-β response3, 20.Multiple CAGAs and E-boxes were found in the RP23 upstream region, especially from −5kb to −2 kb (Fig. 1e). Upstream fragments of the RP23 gene were cloned into pGL4-Lucreporter and transfected into MMC. The longest construct (RP23-4.8k-luc) had the lowestbasal activity, but significant response to TGF-β (Fig. 1f). RP23-3.5k-luc had intermediatebasal activity and also responded to TGF-β. The shortest construct (RP23-2.7kb-luc) hadhighest basal activity, but no TGF-β response. The 4.8-2.7kb region seemed to havenegative elements for basal activity, and positive TGF-β-response elements. To identify theelements, partial fragments of this region were cloned into pGL3P-Luc. WhileRP23-3.5-2.7k-luc responded to TGF-β, neither RP23-4.8-3.5k-luc nor pGL3P alone did(Fig. 1g). Deletion of two or three upstream E-boxes from −3.5–2.7kb did not alter TGF-βeffects (Fig. 1g). However, mutation of the most proximal E-box completely abrogated theTGF-β response, confirming that E-boxes within −3.5-2.7kb are essential for the TGF-βresponse in MMC.
E-boxes are negatively regulated by Zeb1 and Zeb23, 21, 22. miR-192 upregulates Col1a2by targeting Zeb23. In time course experiments, TGF-β induced a significant increase inmiR-192 by 30min, while induction of RP23, miR-216a and miR-217 required 1hr (Fig.1b,Supplementary Fig. S1i-l), suggesting that miR-192 may upregulate RP23, miR216a andmiR-217. Zeb1 and Zeb2 were also reduced at 1hr (Fig. 1b,Supplementary Fig S1m,n).Transfection of MMC with miR-192 mimic or Zeb2 siRNA significantly decreased Zeb2levels and increased the expression of RP23, miR-216a and miR-217 (Fig. 1h,i) as well asRP23-3.5-2.7k-luc activity (Fig. 1j). By inhibiting Zeb2, miR-192 relieves the repression ofRP23 (also miR-216a and miR-217) through its upstream E-boxes, similar to collageninduction by TGF-β3. Initial induction of miR-192 by TGF-β may subsequently increaseRP23 and miR-216a/miR-217.
Transcription factor E3 (TFE3) is a positive regulator of E-boxes20, 23. Ectopic expressionof Tfe3 significantly increased RP23-3.5-2.7k promoter activity (Supplementary Fig. S2b).Conversely, knockdown of Tfe3 by shRNAs23 significantly decreased reporter activity
Kato et al. Page 2
Nat Cell Biol. Author manuscript; available in PMC 2010 January 1.
NIH
-PA Author Manuscript
NIH
-PA Author Manuscript
NIH
-PA Author Manuscript
(Supplementary Fig. S2c). Chromatin immunoprecipitation (ChIP) assays revealed that Tfe3occupancy at the RP23-3.5-2.7kb region was increased by TGF-β while Zeb1 occupancywas decreased (Supplementary Fig. S2d,e). E-box regulators may play key roles in thetranscription of RP23 and miR-216a/217 by TGF-β, collaborating with Smads20(Supplementary Fig. S2i).
Genomic structures of miR216a and miR-217 are conserved from human to mouse, rat andZebrafish19, 24, 25. In the human genome, miR-216a and miR-217 also lie in the secondintron of a non-coding RNA (DA732292, DA73) on chromosome 2. CAGA and E-boxclusters were also found in the human DA73 promoter (7 kb upstream) (Supplementary Fig.S2f). The −7.3–6.5 kb upstream region of DA73 was cloned into pGL3P and transfected intoMMC or human embryonic kidney (HEK-293) cells. Luc activity of this construct wassignificantly enhanced by TGF-β or miR-192 mimics (Supplementary Fig. S2g,h). Theseresults suggest a conserved regulation of miR-216a and miR-217 from mouse to human.
Using miR target predictions (TargetScan, http://www.targetscan.org), we found that PTENis a potential target of both miR-216a and miR-217 (Fig. 2a). PI3K generatesphosphoinositide-3, 4, 5-triphosphate (PIP3) from PIP2, which then activates Akt12, 13.PTEN dephosphorylates PIP3 to inhibit Akt activation. PTEN mutations enhance Aktactivity in certain cancer cells12. Akt activation and decreased PTEN are observed in MCtreated with high glucose (HG) or TGF-β5. Therefore, PTEN might be a link between TGF-β and Akt activation.
Decreased levels of Pten were confirmed in glomeruli of diabetic db/db mice (Fig. 2b–d)and in MMC treated with TGF-β or HG (Fig. 2e). miR-216a or miR-217 mimic decreasedPten levels in MMC (30~40% of negative control)(Fig. 2f,g). Simultaneous transfectionwith these two mimics decreased Pten levels to a greater extent (~10% of negative control),suggesting an additive effect of these two miRs on Pten downregulation. Despite significantdecrease in Pten protein levels in TGF-β-treated MMC, no decrease in Pten mRNA levelswas observed (Fig. 1a,b and Supplementary Fig. S1h,p), suggesting post-transcriptionalreduction of Pten by TGF-β in MMC.
TGF-β activated Akt (Ser-473 phosphorylation) in MMC (Fig. 2h), consistent with previousreports4, 5. A parallel increase in Akt activation in MMC transfected with miR-216a,miR-217 or both (Fig. 2i) further confirmed that miR-216a/217 target Pten in response toTGF-β. A biphasic Akt activation was observed in the time course results (SupplementaryFig. S3a,c). The rapid response (5 min)4 may presumably result from direct interaction ofTGF-β receptor and PI3K8. The second, more robust Akt activation by 6 to 24hr(Supplementary Fig. S3a,c) occurs via induction of RP23 (miR-216a/217) and decrease inPten (Fig. 2e and Supplementary Fig. S3a,b). Interestingly, miR-192 mimic decreased Ptenlevels and promoted Akt activation similar to miR-216a/miR-217 mimics (Fig. 2i,j), againsuggesting that miR-192 acts upstream of miR-216a and miR-217.
To verify whether these miRs target the Pten 3′UTR, Luc reporters containing Pten 3′UTR(full-length and shorter form with miR-216a and miR-217 target sites) were constructed.miR-216a or miR-217 mimics significantly inhibited Pten 3′UTR Luc activity relative tonegative controls, while Pten 3′UTR containing mutations at miR-216a and/or miR-217sites lost this response (Fig. 2k and Supplementary Fig. S4a). Similar inhibition wasobserved with TGF-β, while miR-216a/217 inhibitors could override this TGF-β-induceddecrease in Luc activity (Fig. 2l,m and Supplementary Fig. S4b–g). These results confirmthat Pten 3′UTR is a target of miR-216a and miR-217.
Transgenic mice with the miR-17-92 cluster displayed lymphoproliferative diseases due todecreased Pten and Bim targeted by this cluster26. They also had enlarged kidney glomeruli,
Kato et al. Page 3
Nat Cell Biol. Author manuscript; available in PMC 2010 January 1.
NIH
-PA Author Manuscript
NIH
-PA Author Manuscript
NIH
-PA Author Manuscript

hypercellularity, mesangial expansion, and proteinuria (features similar to DN). Theseobservations further support the physiological significance of our data that Ptendownregulation by miRs is an important step in kidney dysfunction.
Inhibitors of miR-192, miR-216a and miR-217 were next tested to determine functionalrelevance. We first used MMC treated with TGF-β as these cells show features of DN (Aktactivation and ECM accumulation). miR-216a and miR-217 inhibitors reversed the effectsof TGF-β on Pten and P-Akt levels in MMC (Fig. 3a,b), as also the miR-192 inhibitor (Fig.3c,d). Moreover, miR-192 inhibitor reversed the effects of TGF-β on miR-192, RP23,miR-216a, miR-217, Zeb2 and Col1a2 RNA expressions (Fig. 3e), and attenuated TGF-β-induced RP23 promoter activation (Fig. 3f). Therefore, the miR-192 inhibitor blocked keypathological effects of TGF-β in MMC related to DN (including Col1a2 and Akt activation).
We next examined the in vivo consequences of miR-192 inhibition using Locked nucleicacid (LNA)-modified oligonucleotides. LNA antimiRs are potent miR inhibitors even inprimates27. Marked accumulation of LNA-modified miR-192 inhibitor (antimiR-192) wasobserved in mouse kidneys after subcutaneous injections relative to saline (Fig. 3g–j). LNA-antimiR-239b targeting C. elegans miR-239b (similar sequences not found in mammalianRNAs) was injected as a negative control. LNA-antimiR-192, but not LNA-antimiR-239b,significantly inhibited miR-192 levels in renal cortical tissues (Fig. 3k). miR-194 expressionwas unaffected, indicating specificity of LNA-antimiR-192. LNA-antimiR-192 alsoattenuated P-Akt while augmenting Pten levels relative to saline and LNA-antimiR-239bcontrols (Fig. 3l,m). Concomitant decreases in RP23, miR-216a, miR-217 and Col1a2 levels(but not miR-194 or CypA) were observed (Fig. 3n). These in vivo data further supportmiR-192 as a master regulator of other related miRs, and the therapeutic potential ofantimiR-192 for DN. The possible cell-type differential effects of miRs should however beconsidered while designing such therapies.
Next, the biological significance and downstream consequences of Akt activation by thismiR circuit were evaluated. Phosphorylation of Akt targets, FoxO3a, mTOR and GSK3β,associated with cell survival and hypertrophy4–6, 28, was induced by miR-192 andmiR-216a/217 mimics as well as TGF-β (Fig. 4a–d). Interestingly, phosphorylation of theseproteins by TGF-β was blocked or attenuated by inhibitors of these miRs (Fig. 4a–d),suggesting that this miR circuit affects key Akt targets. Since Akt-induced phosphorylationof FoxO3a transcription factor promotes nuclear to cytoplasmic translocation andinactivation, we next tested the effects of the miRs in MMC transfected with a vectorexpressing FoxO3a-GFP4. Serum depletion induced- nuclear localization of FoxO3a, whileTGF-β treatment induced cytoplasmic translocation presumably due to Akt activation andFoxO3a phosphorylation (Fig. 4e), as previously reported4. miR-192 and miR-216a/217mimics induced a similar cytoplasmic translocation of FoxO3a in serum-depleted MMC(Fig. 4e). Conversely, inhibitors of these miRs induced nuclear localization of FoxO3a inTGF-β-treated MMC (Fig. 4e). Fig. 4f showing quantification of the percentage of cells withcytoplasmic FoxO3a confirms that these miRs induced significant nuclear to cytoplasmictranslocation of FoxO3a in serum-depleted MMC similar to TGF-β, while inhibitors of miRsattenuated TGF-β effects. Therefore, these miRs promote FoxO3a phosphorylation andcytoplasmic translocation by inhibiting Pten and activating Akt.
To test whether this miR circuit functionally inhibits FoxO3a transcriptional activity, MMCwere transfected with a luciferase reporter containing Forkhead-response elements (pFRE-luc)4 along with the miRs. miR-192 and miR-216a/217 inhibited Luc activity of thisreporter similar to TGF-β (Fig. 5a). Inhibitors of these miRs could override the reduction inLuc activity by TGF-β (Fig. 5b). By downregulating Pten and activating Akt, this miRcircuit can inhibit FoxO3a function. The expression of the pro-apoptotic gene Bim, a
Kato et al. Page 4
Nat Cell Biol. Author manuscript; available in PMC 2010 January 1.
NIH
-PA Author Manuscript
NIH
-PA Author Manuscript
NIH
-PA Author Manuscript
FoxO3a target, was inhibited by miR-192 and miR-216a/217 as well as TGF-β whileinhibitors of these miRs reversed the effects of TGF-β (Fig. 5c). Moreover, miR-192,miR-216a/217 and TGF-β prevented serum-depletion-induced MMC apoptosis, while theTGF-β effect was reversed by miR inhibitors (Fig. 5d). Therefore, similar to TGF-β, thesemiRs promote MMC survival by downregulating Bim via Akt activation (due to Ptenreduction) and subsequent FoxO3a phosphorylation. The expression of the antioxidant genemanganese superoxide dismutase (MnSOD), another FoxO3a target4, was also inhibited byTGF-β, miR-192 or miR-216a/217 mimics, whereas miR inhibitors restored its expression(Supplementary Fig. S5a), suggesting that this miR circuit may also upregulate oxidantstress in MMC via FoxO3a phosphorylation.
Finally, we evaluated MC hypertrophy, a major feature of DN and downstream consequenceof Akt activation2, 5, 6, 11, 28. TGF-β significantly increased protein levels (Fig. 5e),confirming that it induces MMC hypertrophy. miR-192 or miR-216a/217 mimics similarlyinduced hypertrophy in serum-depleted MC, while inhibitors of these miRs attenuated TGF-β effects (Fig. 5e), suggesting that this miR circuit mediates TGF-β-induced MMChypertrophy. Akt downstream proteins mTOR and GSK3β also regulate protein synthesisand hypertrophy6, 28. Our data with miR mimics and inhibitors on mTOR and GSK3βphosphorylation (Fig. 4a–d), further support a role for these miRs in TGF-β-induced MChypertrophy. Since FoxO3a is implicated in the regulation of autophagy genes29, thesemiRs might also promote hypertrophy via reducing autophagy.
Notably, cyclin-dependent kinase inhibitor p21-mediated cell cycle arrest, but not apoptosis,of cancer cells by miR-192 via the p53 pathway was recently reported30, while miR-192activated the promoter of anti-apoptotic Survivin gene31. Our results show that miR-192also activates Akt and protects cells from apoptosis (Fig. 5d). Therefore, miR-192 likelyinduces only cell cycle arrest but not apoptosis. Since p21-mediated cell cycle arrest isrelated to MC hypertrophy11, miR-192 might also promote glomerular hypertrophy byactivating p21 and p53. Further studies are needed to verify these aspects.
In summary, miR-216a and miR-217 are co-expressed with RP23 and downregulate thesame target (PTEN), illustrating an efficient way to control target genes under certaindisease states (Supplementary Fig. S6). Co-expression of miR-216a and miR-217 in thepancreas (high in acinar but low in islets)24, 32 and opposite expression of PTEN (high inislets but low in acinar)33 support such regulation. Our current results also demonstrate anew mechanism for Akt activation by TGF-β via PTEN downregulation by miR-216a/217,and controlled by upstream miR-192 (Fig. 5f). Akt activation by this miR circuit producedbiological effects in MMC including ECM gene expression, cell survival and hypertrophy,all classic features of DN. Since E-box regulators, PTEN and Akt also play key roles incancer development and insulin signaling12, 13, 23, miR-192, 216a and 217 may alsoregulate not only kidney disorders, but also cancer and metabolic diseases. Inhibitors ofthese miRs, their host non-coding RNAs or promoters, could therefore serve as noveltherapeutic modalities for such diseases.
METHODSCell culture
Primary MMC were isolated and cultured as described3 and used in all experiments.Recombinant human TGF-β1 was from R&D Systems, Inc. (Minneapolis, MN). Cells in 12-well-plate were serum-depleted for 48 hr and then treated with TGF-β for indicated timeperiods.
Kato et al. Page 5
Nat Cell Biol. Author manuscript; available in PMC 2010 January 1.
NIH
-PA Author Manuscript
NIH
-PA Author Manuscript
NIH
-PA Author Manuscript

Animal studiesAll animal studies were approved by Institutional Animal Care and Use Committee.Induction of diabetes with STZ in C57BL/6 mice was carried out as described3. Mice wereused seven weeks after the onset of diabetes. db/db mice and genetic control db/+ mice (10weeks old) were from Jackson Laboratories (Bar Harbor, Maine). Glomeruli were sievedfrom mouse renal cortical tissues as described3.
Real time quantitative PCR (qPCR)Real-time qPCRs were performed using SYBR Green PCR Master Mix and 7300 RealtimePCR System (Applied Biosystems, Foster City, CA USA). Real-time qPCRs were also usedto detect miRs, as reported3. Sequences of miR-specific primers for cDNA synthesis andreverse primers for miR-216a were: 5′-CATGATCAGCTGGGCCAAGACACAGTTGCCAGCTG-3′ and 5′-TAATCTCAGCTGGCAA-3′. Primers for miR-217 were: 5′-CATGATCAGCTGGGCCAAGAATCCAGTCAGTT-3′ (cDNA synthesis) and 5′-TACTGCATCAGGAACT-3′ (reverse primer). miR expression levels were also confirmedby poly-adenylation of mature miR and cDNA synthesis primed by oligo-dT primer taggedwith universal primer sequence (miScript System, Qiagen). cDNA was amplified using miRspecific and universal primers. For miR-192, miR-194, miR-216a and miR-217 PCRs, thesame reverse primers mentioned above and the primers provided by Qiagen were used asmiR-specific primers. 5S RNA or 18S RNA served as internal control (Ambion). PCRprimers for Col1a2, Zeb1, Zeb2 and MnSOD were described previously3, 4. Mouse PtenPCR primers were from SuperArray Bioscience Corporation (Frederick MD). RP23 PCRprimers were: forward (exon 2) 5′-TACTGAACCATCCCCACATCCC -3′ and reverse(exon 3) 5′-TGGCCCAGCTGTAGTTCTGTGA -3′, reverse (exon 3 and 4 junction) 5′-CTTTCTCCAGCCTCAGAGTG -3′ reverse (exon 4) 5′-ATGCAGGCAGTAATCCTTGTG -3′. Bim PCR primers were: forward 5′-cCGGAGATACGGATTGCACAGG-3′ and reverse 5′-cgcttATACCAGACGGAAGATAAAGcG-3′. Cyclophilin A (CypA) primers were: forward5′-ATGGTCAACCCCACCGTGT-3′ and reverse 5′-TTCTTGCTGTCTTTGGAACTTTGTC-3′.
Western blot analysisThese were performed as described previously3, 4. Antibodies against PTEN, P-Foxo3a, P-mTOR, P-GSK3β, Cyclophilin A (Cell Signaling, Beverly, MA) andβ-actin (Sigma-Aldorich, St. Louis, MO) were used.
ImmunohistochmistryImmunostaining of renal cortical sections was performed as reported4 using antibodies toPTEN and quantified with Image-Pro Plus 5.1 software (Media Cybernetics, Inc. Bethesda,MD).
Cloning of the promoter regions of RP23-298H6.1-001The promoter regions of RP23 were cloned by PCR using primers, 5′-AAGGagatctTCACTTCATGAACAAACTGCCTT-3′ and 5′-CTTGaagcttCATCACTGGAATGTTATTAAGTCAAG-3′ for the proximal −0.5 kbfragment, 5′-CTActcgaGGCTACCCTGCATCCTTTTCTAG-3′ and 5′-CTTGaagcttCATCACTGGAATGTTATTAAGTCAAG-3′ for the proximal −2.7 kbfragment, 5′-CCAAGCTAGCCAGATCATAATAGTGAGGTTTGG-3′ and 5′-CTTGaagcttCATCACTGGAATGTTATTAAGTCAAG-3′ for the proximal −3.5 kbfragment, 5′-CCCAGCTAGCCAGATCAAAAGCAGCTTGGG-3′ and 5′-
Kato et al. Page 6
Nat Cell Biol. Author manuscript; available in PMC 2010 January 1.
NIH
-PA Author Manuscript
NIH
-PA Author Manuscript
NIH
-PA Author Manuscript

CTTGaagcttCATCACTGGAATGTTATTAAGTCAAG-3′ for the proximal −4.8 kbfragment, 5′-CCAAGCTAGCCAGATCATAATAGTGAGGTTTGG-3′ and 5′-CACTCGAGTCTGATTGGAGTTACCAGTG-3′ for the −3.5–2.7kb fragment, and 5′-CCCAGCTAGCCAGATCAAAAGCAGCTTGGG-3′ and 5′-GCACTCGAGTCTGTGTGCAGGCTAAGTGC-3′ for the −4.8–3.5 kb fragment. Theentire −4.8 k, −3.5 k, −2.7 k and proximal regions were cloned into pGL4. −3.5–2.7 kb and−4.8–3.5 kb fragments were cloned into the pGL3-promoter (Promega). Reporter with 2x E-boxes was made by digestion of HpaI site. 1xE-box was generated by PCR using a primer,5′-TGGGAGATCTTGGCACGTGCCTTCAATCCCA-3′ (E-box underlined) and −2.7 kreverse primer,and cloned into the pGL3 promoter. Mutant (Mut) E-box construct wasgenerated by PCR using primers, 5′-TGGCTAGCGCCTTCAATCCCA-3′ (mutant E-box isunderlined) and −2.7 k reverse primer, and cloned into the pGL3P.
Plasmids and 3′-UTR reportersFull-length 3′UTR of mouse Pten was amplified using primers, 5′-CATGCTCGAGCTTATCAAGAGGGATAAAATACCATG-3′ and 5′-CATGCGGCCGCCACAGGAAGGTATTTCTAGTCTTATG-3′. The PCR fragment wasdigested with Xho I and Not I and cloned into psiCheck2 (Promega). The shorter 1.4kfragment of Pten 3′UTR (which includes the miR-216a and miR-217 sites) was amplifiedusing primers, 5′-CATGCTCGAGCTTATCAAGAGGGATAAAATACCATG-3′ and 5′-GTTGCGGCCGCTTTACTGCAACTCTAATTTCTTTTTTAAC-3′. miR-216a site mutantin the 1.4k construct was made by Quick Change site directed mutagenesis (Stratagene)using primers, 5′-TTCACAGGAAATTTCAACTCCGAATTCAACAGTAA-3′ and 5′-TTACTGTTGAATTCGGAGTTGAAATTTCCTGTGAA-3′. Bases substituted areunderlined. miR-217 site mutant was amplified using primers, 5′-CATGCTCGAGCTTATCAAGAGGGATAAAATACCATG-3′ and 5′-GTTGCGGCCGCTTGAGATCTACTCTAATTTCTTTTTTAAC-3′. Bases substituted areunderlined. Sequences of all the inserts were confirmed by sequence analysis. For Pten3′UTR minimum target site reporters, NotI site-tagged potential target sequences in the3′UTR of mouse Pten (for miR-216a site, sense, 5′-GGCCTTCACAGGAAATTTCAACTTGAGATTC-3′; antisense, 5′-GGCCGAATCTCAAGTTGAAATTTCCTGTGAA-3′, for miR-217 site, sense, 5′-GGCCAAAAGAAATTAGAGTTGCAGTAA-3′; antisense, 5′-ggccTTACTGCAACTCTAATTTCTTTT-3′) were cloned into NotI site of psiCheck2(Promega). Plasmid containing a sense Pten-3′UTR sequence was used as reporter(psiCheck2mPten-3′UTR-S) while the plasmid containing the 3′UTR sequence in the anti-sense orientation was used as negative control (psiCheck2mPten-3′UTR-AS). The plasmidexpressing FoxO3aGFP and the luciferase reporter plasmid with pFRE-luc were describedpreviously4.
Luciferase assaysMMC were transfected with Luc reporter plasmids and/or small RNAs using XtremeGENE(Roche, Indianapolis, IN USA) in 24-well-plates and treated with TGF-β as reported3. After24hr, Luc activity was measured as described3. For miR and shRNA experiments, cells weretreated for 48hr. MC were also transfected with plasmids and/or small RNAs usingNucleofector (Amaxa Biosystems, Gaithersburg, MD). Basic Nucleofector Kit for PrimarySmooth Muscle Cells (Amaxa) was used. Five programs (A33, D33, P13, P24 and U25)were tested to examine the transfection efficiency of MC with pmaxGFP (Amaxa). ProgramU25 resulted in highest efficiency (~60%) and was used in subsequent experiments(Supplementary Figure S5b).
Kato et al. Page 7
Nat Cell Biol. Author manuscript; available in PMC 2010 January 1.
NIH
-PA Author Manuscript
NIH
-PA Author Manuscript
NIH
-PA Author Manuscript

miR mimic and inhibitor Oligonucleotides (Oligos)miR mimics, negative control #1 (NC) mimics, miR inhibitors, and negative control #1inhibitors were obtained from Dharmacon (Lafayette, CO). Sequences of mimics andinhibitors are based on Sanger miRBase (http://microrna.sanger.ac.uk). LNA-modifiedantimiRs were obtained from Exiqon (Woburn, MA) and IDT (Integrated DNATechnologies, Inc. Coralville, IA). LNA-antimiR-192: 21mer, 5′-gGctGtcAatTcaTagGtcAg-3′ (uppercase: LNA; lowercase: DNA, full phosphorothioate) orcontrol LNA-antimiR-239b; 21mer, 5′-cAgtActTttGtgTagTacAa-3′ were subcutaneouslyinjected (2.5 mg/kg) into normal C57BL/6 mice and renal cortical tissues were harvested 6hrlater.
in situ hybridization to detect LNA-antimiR-192 accumulation in vivoin situ hybridization was performed as described27. Briefly, frozen kidney cortex sectionsfrom LNA-antimiR-192-injected and saline control mice (n=3/group) were fixed inparaformaldehyde (3%, 10 min, room temperature) followed by rinsing in PBS. Slides werepre-hybridized (48°C, 30 min) in hybridization solution (50% formamide, 5× SSC, 500 μg/ml yeast tRNA, 1× Denhardt’s solution), and then hybridized (48°C, 5 min) with Texas Red-labeled LNA-modified oligo probe complementary to LNA-antimiR-192 (21mer, 5′-TexasRed-ctgAccTatGaaTtgAcaGcc-3′ (Exiqon) followed by post-hybridization wash (3 ×10 min, 55°C) in 0.1× SSC. Slides were then stained with DAPI, mounted and analyzed withfluorescence microscope.
Zeb2 knockdown siRNATo knockdown Zeb2 in MMC, ON-TARGETplus SMART pool siRNA (Dharmacon) wastransfected using Amaxa Nucleofector. Target sequences areGAGCAGACAGGCUUACUUA, GUAAAUGGCCGAAUGAGAA,GCGACACGGCCAUUAUUUA and GCAGGUAACCGCAAGUUCA. ON-TARGETplusNon-targeting Pool (Dharmacon) was used as control.
Cell number and cellular protein levelsTo calculate cellular protein content per cell, MMC were trypsinized and counted using aCoulter Counter with 100μm aperture (Beckman Coulter, Fullerton, CA). Cells were lysed,and total protein content determined using Bio-Rad Protein Assays (Bio-Rad, Hercules,CA).
Apoptosis assayApoptosis was evaluated with the ApopTag Fluorecein kit from Chemicon/Millipore. Slideswere counterstained with DAPI (Sigma), washed and embedded in Vectashield (VectorLabs). Quantitative evaluations were performed with laser scanning cytometry34. Briefly,stained slides were scanned through 40x objective at 0.5μm step using iCys laser scanningcytometer (Compucyte, Cambridge, MA. U.S.A.) and iCys 3.3.2 software. Nuclei werecontoured using the 405nm laser based on the DAPI fluorescence. TUNEL positive cellswere recorded using the 488nm laser.
Data AnalysesResults are expressed as means and standard error (s.e.m.) of multiple experiments. PairedStudent′s t-tests (two-tailed) were used to compare two groups. Statistical significance wasdetected at the 0.05 level.
Kato et al. Page 8
Nat Cell Biol. Author manuscript; available in PMC 2010 January 1.
NIH
-PA Author Manuscript
NIH
-PA Author Manuscript
NIH
-PA Author Manuscript

Supplementary MaterialRefer to Web version on PubMed Central for supplementary material.
AcknowledgmentsWe are grateful to on-line data bases, miRBase (http://microrna.sanger.ac.uk), TargetScan (http://www.targetscan.org), microRNA.org (http://www.microrna.org/microrna), NCBI (http://www.ncbi.nlm.nih.gov),Blat (http://genome.ucsc.edu/cgi-bin/hgBlat) and Ensembl (http://www.ensembl.org) for target prediction andanalysis of genomic structure of human and mouse miRs.
This work was supported by grants from the National Institutes of Health (NIH-NIDDK) and the Juvenile DiabetesResearch Foundation (to RN). We are grateful to Dr. Mickey C.-T. Hu for generous gift of plasmids (pFRE-luc andFoxO3aGFP), to Ms. Lin Wang and Ms. Jerlisa Arizala for technical assistance and to Ms. Sylvia DaCosta forediting the manuscript.
References1. Yamamoto T, Nakamura T, Noble NA, Ruoslahti E, Border WA. Expression of transforming
growth factor beta is elevated in human and experimental diabetic nephropathy. Proc Natl Acad SciU S A. 1993; 90:1814–1818. [PubMed: 7680480]
2. Sharma K, Ziyadeh FN. Hyperglycemia and diabetic kidney disease. The case for transforminggrowth factor-beta as a key mediator. Diabetes. 1995; 44:1139–1146. [PubMed: 7556948]
3. Kato M, et al. MicroRNA-192 in diabetic kidney glomeruli and its function in TGF-beta-inducedcollagen expression via inhibition of E-box repressors. Proc Natl Acad Sci U S A. 2007; 104:3432–3437. [PubMed: 17360662]
4. Kato M, et al. Role of the Akt/FoxO3a pathway in TGF-beta1-mediated mesangial cell dysfunction:a novel mechanism related to diabetic kidney disease. J Am Soc Nephrol. 2006; 17:3325–3335.[PubMed: 17082237]
5. Mahimainathan L, Das F, Venkatesan B, Choudhury GG. Mesangial cell hypertrophy by highglucose is mediated by downregulation of the tumor suppressor PTEN. Diabetes. 2006; 55:2115–2125. [PubMed: 16804083]
6. Nagai K, et al. Gas6 induces Akt/mTOR-mediated mesangial hypertrophy in diabetic nephropathy.Kidney Int. 2005; 68:552–561. [PubMed: 16014032]
7. Xin X, Chen S, Khan ZA, Chakrabarti S. Akt activation and augmented fibronectin production inhyperhexosemia. Am J Physiol Endocrinol Metab. 2007; 293:E1036–1044. [PubMed: 17666488]
8. Yi JY, Shin I, Arteaga CL. Type I transforming growth factor beta receptor binds to and activatesphosphatidylinositol 3-kinase. J Biol Chem. 2005; 280:10870–10876. [PubMed: 15657037]
9. Runyan CE, Schnaper HW, Poncelet AC. The phosphatidylinositol 3-kinase/Akt pathway enhancesSmad3-stimulated mesangial cell collagen I expression in response to transforming growth factor-beta1. J Biol Chem. 2004; 279:2632–2639. [PubMed: 14610066]
10. Ghosh Choudhury G, Abboud HE. Tyrosine phosphorylation-dependent PI 3 kinase/Akt signaltransduction regulates TGFbeta-induced fibronectin expression in mesangial cells. Cell Signal.2004; 16:31–41. [PubMed: 14607273]
11. Wolf G, Ziyadeh FN. Molecular mechanisms of diabetic renal hypertrophy. Kidney Int. 1999;56:393–405. [PubMed: 10432377]
12. Cully M, You H, Levine AJ, Mak TW. Beyond PTEN mutations: the PI3K pathway as anintegrator of multiple inputs during tumorigenesis. Nat Rev Cancer. 2006; 6:184–192. [PubMed:16453012]
13. Lazar DF, Saltiel AR. Lipid phosphatases as drug discovery targets for type 2 diabetes. Nat RevDrug Discov. 2006; 5:333–342. [PubMed: 16582877]
14. Stefani G, Slack FJ. Small non-coding RNAs in animal development. Nat Rev Mol Cell Biol.2008; 9:219–230. [PubMed: 18270516]
15. Bartel DP. MicroRNAs: target recognition and regulatory functions. Cell. 2009; 136:215–233.[PubMed: 19167326]
Kato et al. Page 9
Nat Cell Biol. Author manuscript; available in PMC 2010 January 1.
NIH
-PA Author Manuscript
NIH
-PA Author Manuscript
NIH
-PA Author Manuscript
16. Sun Y, et al. Development of a micro-array to detect human and mouse microRNAs andcharacterization of expression in human organs. Nucleic Acids Res. 2004; 32:e188. [PubMed:15616155]
17. Tian Z, Greene AS, Pietrusz JL, Matus IR, Liang M. MicroRNA-target pairs in the rat kidneyidentified by microRNA microarray, proteomic, and bioinformatic analysis. Genome Res. 2008;18:404–411. [PubMed: 18230805]
18. Wang Q, et al. MicroRNA-377 is up-regulated and can lead to increased fibronectin production indiabetic nephropathy. Faseb J. 2008; 22:4126–4135. [PubMed: 18716028]
19. Landgraf P, et al. A mammalian microRNA expression atlas based on small RNA librarysequencing. Cell. 2007; 129:1401–1414. [PubMed: 17604727]
20. Hua X, Liu X, Ansari DO, Lodish HF. Synergistic cooperation of TFE3 and smad proteins in TGF-beta-induced transcription of the plasminogen activator inhibitor-1 gene. Genes Dev. 1998;12:3084–3095. [PubMed: 9765209]
21. Sekido R, et al. The delta-crystallin enhancer-binding protein delta EF1 is a repressor of E2-box-mediated gene activation. Mol Cell Biol. 1994; 14:5692–5700. [PubMed: 8065305]
22. Comijn J, et al. The two-handed E box binding zinc finger protein SIP1 downregulates E-cadherinand induces invasion. Mol Cell. 2001; 7:1267–1278. [PubMed: 11430829]
23. Nakagawa Y, et al. TFE3 transcriptionally activates hepatic IRS-2, participates in insulin signalingand ameliorates diabetes. Nat Med. 2006; 12:107–113. [PubMed: 16327801]
24. Wienholds E, et al. MicroRNA expression in zebrafish embryonic development. Science. 2005;309:310–311. [PubMed: 15919954]
25. Lim LP, Glasner ME, Yekta S, Burge CB, Bartel DP. Vertebrate microRNA genes. Science. 2003;299:1540. [PubMed: 12624257]
26. Xiao C, et al. Lymphoproliferative disease and autoimmunity in mice with increased miR-17-92expression in lymphocytes. Nat Immunol. 2008; 9:405–414. [PubMed: 18327259]
27. Elmen J, et al. LNA-mediated microRNA silencing in non-human primates. Nature. 2008;452:896–899. [PubMed: 18368051]
28. Glass DJ. Signalling pathways that mediate skeletal muscle hypertrophy and atrophy. Nat CellBiol. 2003; 5:87–90. [PubMed: 12563267]
29. Salih DA, Brunet A. FoxO transcription factors in the maintenance of cellular homeostasis duringaging. Curr Opin Cell Biol. 2008; 20:126–136. [PubMed: 18394876]
30. Braun CJ, et al. p53-Responsive MicroRNAs 192 and 215 Are Capable of Inducing Cell CycleArrest. Cancer Res. 2008; 68:10094–10104. [PubMed: 19074875]
31. Gou D, Zhang H, Baviskar PS, Liu L. Primer extension-based method for the generation of asiRNA/miRNA expression vector. Physiol Genomics. 2007; 31:554–562. [PubMed: 17804605]
32. Bravo-Egana V, et al. Quantitative differential expression analysis reveals miR-7 as major isletmicroRNA. Biochem Biophys Res Commun. 2008; 366:922–926. [PubMed: 18086561]
33. Perren A, et al. Mutation and expression analyses reveal differential subcellularcompartmentalization of PTEN in endocrine pancreatic tumors compared to normal islet cells. AmJ Pathol. 2000; 157:1097–1103. [PubMed: 11021813]
34. Omori K, et al. Improvement of human islet cryopreservation by a p38 MAPKinhibitor. Am JTransplant. 2007; 7:1224–1232. [PubMed: 17331110]
Kato et al. Page 10
Nat Cell Biol. Author manuscript; available in PMC 2010 January 1.
NIH
-PA Author Manuscript
NIH
-PA Author Manuscript
NIH
-PA Author Manuscript

Figure 1. Expression and genomic organizations of miR-216a and miR-217a, Dose response of TGF-β (24hr) on miRs and related genes in MMC (qPCR data, *,p<0.05; #, p<0.01 vs control, n=3). See Fig. S1 for details. b, Time course of TGF-β effectsin MMC (qPCRs, *, p<0.05; #, p<0.01, n=3). See Fig. S1 for details. c, Real time qPCRsshowing significant increases in miR-216a and miR-217 levels in glomeruli of STZ-injectedtype 1, and db/db type 2 diabetic mice (n=4). d, Schematic representation of mouse non-coding RNA RP23-298H6.1-001 genomic region showing miR-216a and miR-217 locationsin the second intron, with upstream CAGAs and E-box clusters. e, Genomic structure of theupstream region of the RP23 gene. CAGA repeats (blue triangles) and potential E-boxes(red diamonds) are found in the 2–5kb upstream region. f, Basal activity of RP23 promoter
Kato et al. Page 11
Nat Cell Biol. Author manuscript; available in PMC 2010 January 1.
NIH
-PA Author Manuscript
NIH
-PA Author Manuscript
NIH
-PA Author Manuscript
regions and response to TGF-β −4.8k and −3.5k constructs, but not −2.7k, responded toTGF-β (n=4). g, Response of deletion mutants of the −4.8–2.7k region to TGF-β,( n=4).−4.8–3.5k region includes three E-boxes and ten CAGAs while −3.5–2.7k region has four E-boxes and eight CAGAs. Significant increase in Luc activity of the 3.5–2.7k construct wasobserved but no change with −4.8–3.5k region (n=4). TGF-β had similar effects in theRP23-3.5-2.7k, 2xE-boxes and 1xE-box constructs. One E-box in the most proximal part of−3.5–2.7k was sufficient for TGF-β response. Mutation of this proximal E-box abrogatedthe TGF-β response. h, qPCRs showing that miR-192 mimic (10 nM) decreased theexpression of Zeb2 and reciprocally increased RP23, miR-216a and miR-217 levels (n=3). i,qPCRs showing that, similar to miR-192, ON-TARGETplus SMART pool Zeb2 siRNA (10nM) decreased the expression of Zeb2 but increased RP23, miR-216a and miR-217 levels(n=3). j, miR-192 mimic (10 nM) or SMART pool Zeb2 siRNA(10nM) increased Lucactivity of RP23-3.5-2.7k-luc (n=4). NC, negative control. Bar graph data expressed as meanand s.e.m.
Kato et al. Page 12
Nat Cell Biol. Author manuscript; available in PMC 2010 January 1.
NIH
-PA Author Manuscript
NIH
-PA Author Manuscript
NIH
-PA Author Manuscript
Figure 2. Pten is a direct target of miR-216a and miR-217a, Alignment of human and mouse miR-216a or miR-217 with Pten 3′UTR sequences. Seedregions of these miRs are completely complementary to target sites in the Pten 3′UTR.Target sequences are highly conserved from human and mouse. Numbers next to the PTEN3′UTR sequence are relative to 3′ UTR start sites. b–d, Immunostaining of Pten in mouserenal sections. Pten levels in glomeruli from db/db diabetic mice (c) were significantly lowerthan control db/+ (b) (n=3). Scale bar, 20 μm. e–g,j, Pten protein levels in MMC treated for24 hr with TGF-β or HG (n=3) (e), for 48 hr with miR-216a mimic (10nM)(n=3)(f),miR-217 alone or with miR-216a (n=3) (g), miR-216a, miR-217 or miR-192 mimics (n=4)(j). h,i, Phospho-Akt levels in MMC treated for 24 hr with TGF-β (n=3) (h), for 48 hr with
Kato et al. Page 13
Nat Cell Biol. Author manuscript; available in PMC 2010 January 1.
NIH
-PA Author Manuscript
NIH
-PA Author Manuscript
NIH
-PA Author Manuscript

miR-216a, miR-217 or miR-192 mimics (10nM)(n=4) (i). k, Luc reporters containing full-length (6k) or shorter (1.4k) Pten 3′UTR, and mutants of miR-216a and miR-217 target sites(SVP, SV40 promoter). miR-216a and miR-217 mimics (10nM) significantly inhibited Pten3′UTR Luc (full) activity relative to negative control (NC). The shorter 1.4k construct (WT)which includes the miR-216a and miR-217 target sites showed similar responses as full-length. miR-216a site mutant still responded to miR-217 but not to miR-216a, and viceversa. The double mutant did not respond to either of the miR mimics. Mean and s.e.m.(n=4). See also Fig. S4a for details of Pten 3′UTR constructs. l, Effects of TGF-β andmiR-216a inhibitor on the Pten 3′UTR reporters. Plasmid containing luciferase fused toPten 3′UTR (miR-216a target site) was used as reporter (Pten 3′UTR-S). Significantdecrease in reporter activity was detected with Pten 3′UTR-S by TGF-β (n=4) and this wasreversed by 10 nM miR-216a inhibitor (n=4). m, TGF-β significantly decreased Pten3′UTR-S (miR-217 site) reporter activity (n=4), and this was reversed by 5 nM miR-217inhibitor (n=4). See also Fig. S4. Bar graph data expressed as mean and s.e.m. Full or largerscan blots of e–j are shown in Supplementary Fig. S7.
Kato et al. Page 14
Nat Cell Biol. Author manuscript; available in PMC 2010 January 1.
NIH
-PA Author Manuscript
NIH
-PA Author Manuscript
NIH
-PA Author Manuscript
Figure 3. Effects of miR inhibitors on downstream signaling in vitro and in vivoa,b, Effects of miR-216a and miR-217 inhibitors (10nM) on endogenous Pten, P-Akt levels(Western blots) in MMC treated with or without TGF-β. NC, negative control (n=3). c,d,Effects of miR-192 inhibitor (10nM) on TGF-β induced effects on Pten and P-Akt in MMC.MMC were transfected with inhibitors and then treated with TGF-β, followed by Westernblotting (n=3). e, Effects of miR-192 inhibitor on endogenous RNA levels of miR-192,RP23, miR-216a, miR-217, Zeb1, Zeb2, Col1a2 and Pten in MMC treated with TGF-β(qPCRs, *, p<0.05; #, p<0.01, n=3). #1, p=0.005; #2, p=0.001; #3, p=0.001; *4, p=0.02; #5,p=0.006; #6, p=0.0007; *7, p=0.02; *8, p=0.02; *9, p=0.04; #10, p=0.01; *11, p=0.02; #12,p=0.002; #13, p=0.003. f, Effects of miR-192 inhibitor on TGF-β-induced RP23 promoter(RP23-3.5-2.7k-luc) activity in MMC (n=4). g–j, In vivo delivery of LNA-antimiR-192.
Kato et al. Page 15
Nat Cell Biol. Author manuscript; available in PMC 2010 January 1.
NIH
-PA Author Manuscript
NIH
-PA Author Manuscript
NIH
-PA Author Manuscript
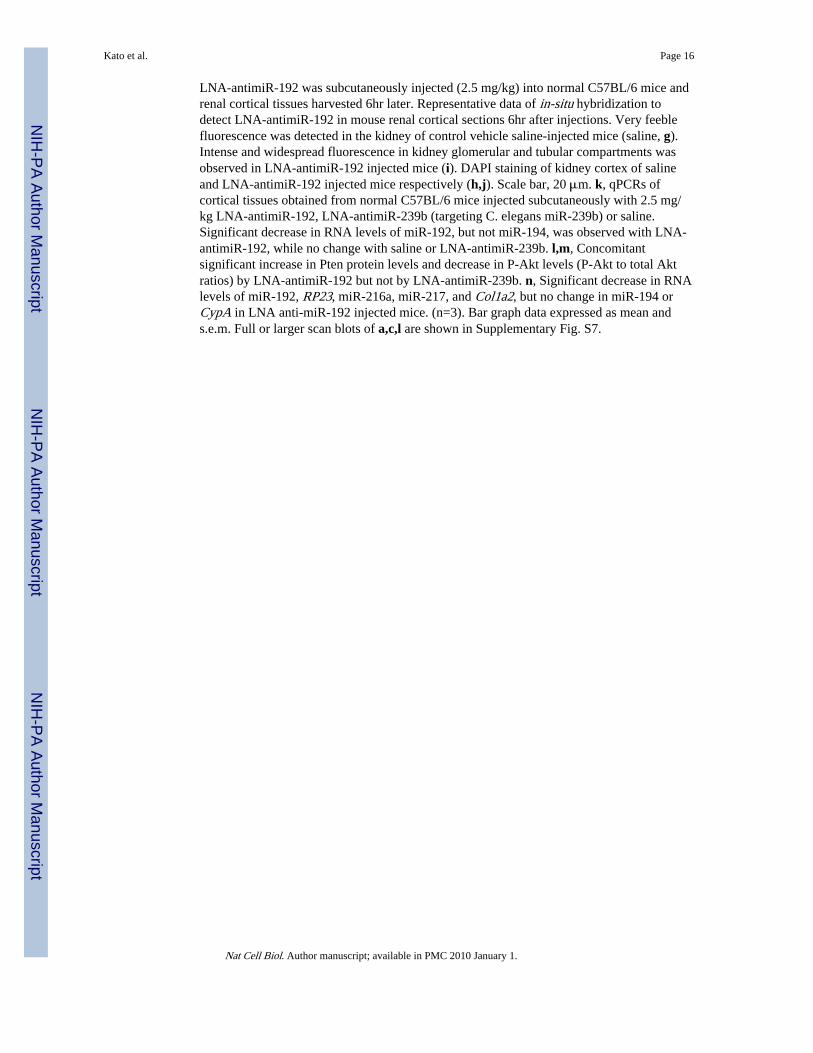
LNA-antimiR-192 was subcutaneously injected (2.5 mg/kg) into normal C57BL/6 mice andrenal cortical tissues harvested 6hr later. Representative data of in-situ hybridization todetect LNA-antimiR-192 in mouse renal cortical sections 6hr after injections. Very feeblefluorescence was detected in the kidney of control vehicle saline-injected mice (saline, g).Intense and widespread fluorescence in kidney glomerular and tubular compartments wasobserved in LNA-antimiR-192 injected mice (i). DAPI staining of kidney cortex of salineand LNA-antimiR-192 injected mice respectively (h,j). Scale bar, 20 μm. k, qPCRs ofcortical tissues obtained from normal C57BL/6 mice injected subcutaneously with 2.5 mg/kg LNA-antimiR-192, LNA-antimiR-239b (targeting C. elegans miR-239b) or saline.Significant decrease in RNA levels of miR-192, but not miR-194, was observed with LNA-antimiR-192, while no change with saline or LNA-antimiR-239b. l,m, Concomitantsignificant increase in Pten protein levels and decrease in P-Akt levels (P-Akt to total Aktratios) by LNA-antimiR-192 but not by LNA-antimiR-239b. n, Significant decrease in RNAlevels of miR-192, RP23, miR-216a, miR-217, and Col1a2, but no change in miR-194 orCypA in LNA anti-miR-192 injected mice. (n=3). Bar graph data expressed as mean ands.e.m. Full or larger scan blots of a,c,l are shown in Supplementary Fig. S7.
Kato et al. Page 16
Nat Cell Biol. Author manuscript; available in PMC 2010 January 1.
NIH
-PA Author Manuscript
NIH
-PA Author Manuscript
NIH
-PA Author Manuscript
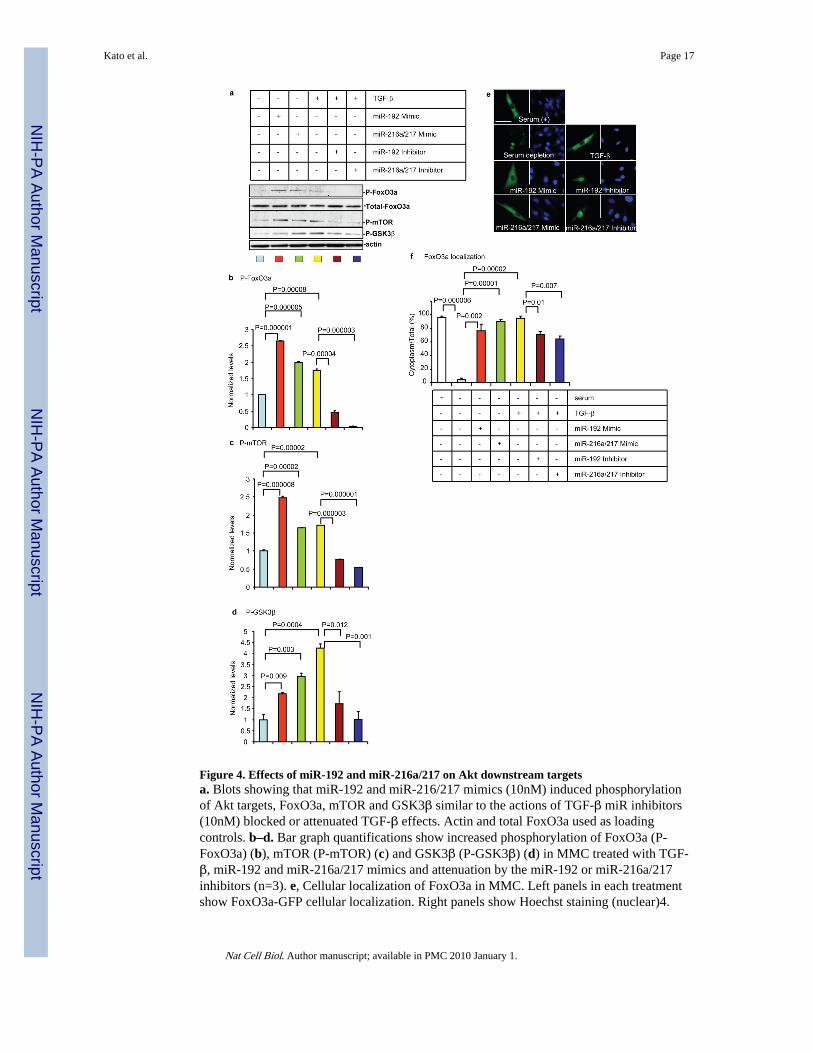
Figure 4. Effects of miR-192 and miR-216a/217 on Akt downstream targetsa. Blots showing that miR-192 and miR-216/217 mimics (10nM) induced phosphorylationof Akt targets, FoxO3a, mTOR and GSK3β similar to the actions of TGF-β miR inhibitors(10nM) blocked or attenuated TGF-β effects. Actin and total FoxO3a used as loadingcontrols. b–d. Bar graph quantifications show increased phosphorylation of FoxO3a (P-FoxO3a) (b), mTOR (P-mTOR) (c) and GSK3β (P-GSK3β) (d) in MMC treated with TGF-β, miR-192 and miR-216a/217 mimics and attenuation by the miR-192 or miR-216a/217inhibitors (n=3). e, Cellular localization of FoxO3a in MMC. Left panels in each treatmentshow FoxO3a-GFP cellular localization. Right panels show Hoechst staining (nuclear)4.
Kato et al. Page 17
Nat Cell Biol. Author manuscript; available in PMC 2010 January 1.
NIH
-PA Author Manuscript
NIH
-PA Author Manuscript
NIH
-PA Author Manuscript
Serum depletion induced nuclear localization of FoxO3a and TGF-β reversed thislocalization to the cytoplasm. miR-192 and miR-216a/217 mimics induced cytoplasmictranslocation of FoxO3a similar to TGF-β. Conversely, inhibitors of these miRs relocatedFoxO3a into the nucleus in TGF-β– treated cells. Scale bar, 20 μm. f, Cells withcytoplasmic or nuclear localization were counted in three fields and the results depicted inthe bar graph as percentage of cells with cytoplasmic fluorescence relative to total (n=3).FoxO3a was localized in the cytoplasm in 96% of cells under normal culture conditions(Serum +). However, after serum depletion (SD), 96% of cells had nuclear FoxO3a (4% incytoplasm). FoxO3a translocated back to the cytoplasm upon treatment with miR-192 (76%)or miR- 216a/217 (90%) mimic, or TGF-β (95%). miR-192 or miR216a/217 inhibitorsignificantly attenuated cytoplasmic FoxO3a to 71% or 64% respectively in TGF-β– treatedcells. Bar graph data expressed as mean and s.e.m. Full or larger scan blots of a are shown inSupplementary Fig. S7.
Kato et al. Page 18
Nat Cell Biol. Author manuscript; available in PMC 2010 January 1.
NIH
-PA Author Manuscript
NIH
-PA Author Manuscript
NIH
-PA Author Manuscript
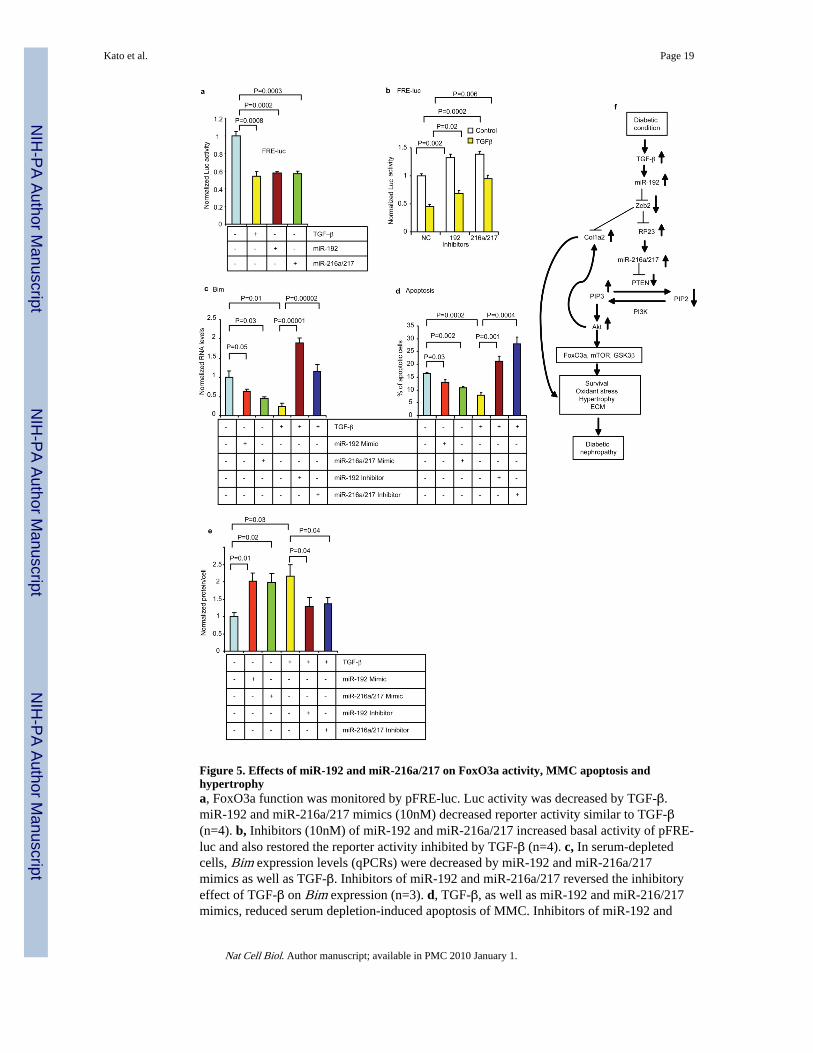
Figure 5. Effects of miR-192 and miR-216a/217 on FoxO3a activity, MMC apoptosis andhypertrophya, FoxO3a function was monitored by pFRE-luc. Luc activity was decreased by TGF-β.miR-192 and miR-216a/217 mimics (10nM) decreased reporter activity similar to TGF-β(n=4). b, Inhibitors (10nM) of miR-192 and miR-216a/217 increased basal activity of pFRE-luc and also restored the reporter activity inhibited by TGF-β (n=4). c, In serum-depletedcells, Bim expression levels (qPCRs) were decreased by miR-192 and miR-216a/217mimics as well as TGF-β. Inhibitors of miR-192 and miR-216a/217 reversed the inhibitoryeffect of TGF-β on Bim expression (n=3). d, TGF-β, as well as miR-192 and miR-216/217mimics, reduced serum depletion-induced apoptosis of MMC. Inhibitors of miR-192 and
Kato et al. Page 19
Nat Cell Biol. Author manuscript; available in PMC 2010 January 1.
NIH
-PA Author Manuscript
NIH
-PA Author Manuscript
NIH
-PA Author Manuscript
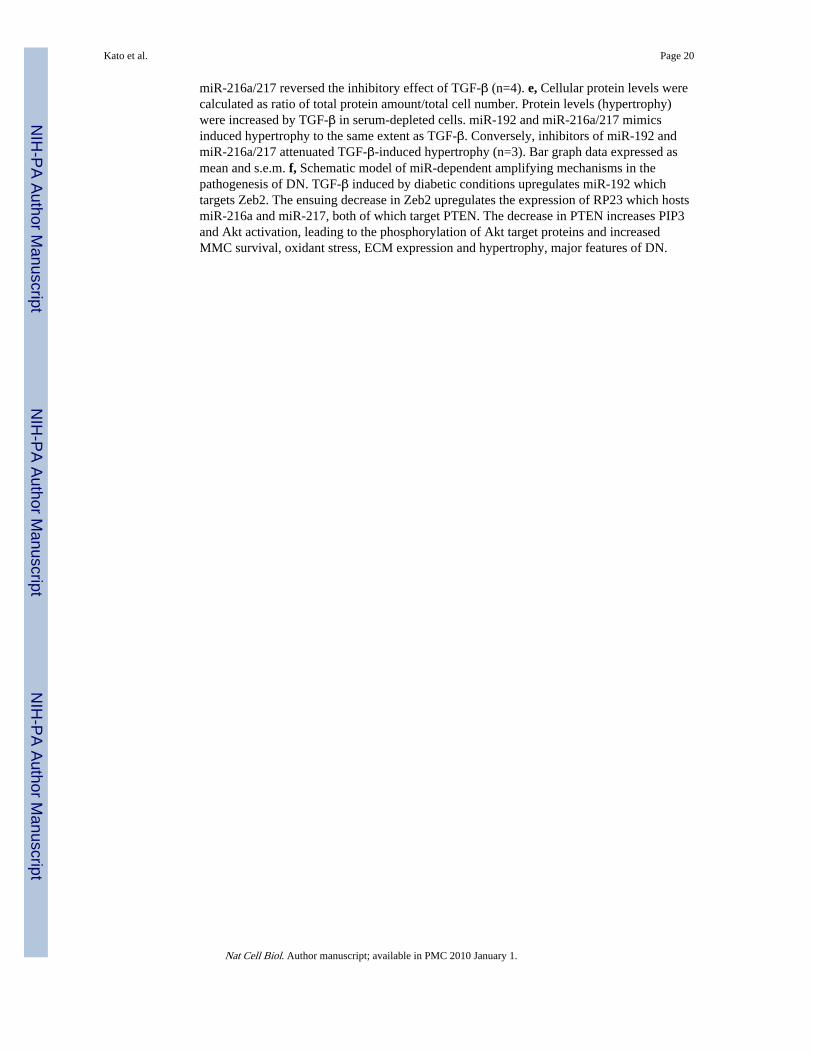
miR-216a/217 reversed the inhibitory effect of TGF-β (n=4). e, Cellular protein levels werecalculated as ratio of total protein amount/total cell number. Protein levels (hypertrophy)were increased by TGF-β in serum-depleted cells. miR-192 and miR-216a/217 mimicsinduced hypertrophy to the same extent as TGF-β. Conversely, inhibitors of miR-192 andmiR-216a/217 attenuated TGF-β-induced hypertrophy (n=3). Bar graph data expressed asmean and s.e.m. f, Schematic model of miR-dependent amplifying mechanisms in thepathogenesis of DN. TGF-β induced by diabetic conditions upregulates miR-192 whichtargets Zeb2. The ensuing decrease in Zeb2 upregulates the expression of RP23 which hostsmiR-216a and miR-217, both of which target PTEN. The decrease in PTEN increases PIP3and Akt activation, leading to the phosphorylation of Akt target proteins and increasedMMC survival, oxidant stress, ECM expression and hypertrophy, major features of DN.
Kato et al. Page 20
Nat Cell Biol. Author manuscript; available in PMC 2010 January 1.
NIH
-PA Author Manuscript
NIH
-PA Author Manuscript
NIH
-PA Author Manuscript