
Testing the impact of predefined and self-defined end anchors on the linearity of the category...
12
Qual Quant (2010) 44:397–408 DOI 10.1007/s11135-008-9209-4 Testing the impact of predefined and self-defined end anchors on the linearity of the category rating scale Joeri Hofmans · Peter Theuns Published online: 14 December 2008 © Springer Science+Business Media B.V. 2008 Abstract In this research the impact of two types of end anchors on the linearity of the category rating scale is studied. Two functional measurement experiments were carried out, each requiring a different kind of judgement, i.e., job satisfaction ratings and attractiveness ratings. One group of participants rated the stimuli using a category rating scale with fixed anchors, while another group was presented with a self-anchoring category rating scale. The results indicate that researchers can be confident in the ability of both category rating scales to provide linear data. This implies that the different end anchors do not impact on the linearity of the category rating scale. Keywords Functional measurement · Category rating scale · Linearity · Self-anchoring scale · End anchors 1 General introduction Although frequently criticized, category rating scales are a common response modality in questionnaires (Poulton 1989; Whitley 2002). The major advantages of category rating scales are their ease of use and their low cost (Breakwell et al. 1974). Despite their widespread use, several opponents have addressed the unsatisfactory measurement level obtained with these scales. Therefore, this study aims at testing the impact of two kinds of end anchors on the linearity of category rating scale data. J. Hofmans · P. Theuns Department of Work and Organisational Psychology, Faculty of Psychology and Educational Science, Vrije Universiteit Brussel, Pleinlaan 2, 1050 Brussels, Belgium Present Address: J. Hofmans (B ) Department of Psychology, Katholieke Universiteit Leuven, Tiensestraat 102, B-3000 Leuven, Belgium e-mail: [email protected] 123
-
Upload
independent -
Category
Documents
-
view
0 -
download
0
Transcript of Testing the impact of predefined and self-defined end anchors on the linearity of the category...

Qual Quant (2010) 44:397–408DOI 10.1007/s11135-008-9209-4
Testing the impact of predefined and self-definedend anchors on the linearity of the category rating scale
Joeri Hofmans · Peter Theuns
Published online: 14 December 2008© Springer Science+Business Media B.V. 2008
Abstract In this research the impact of two types of end anchors on the linearity of thecategory rating scale is studied. Two functional measurement experiments were carried out,each requiring a different kind of judgement, i.e., job satisfaction ratings and attractivenessratings. One group of participants rated the stimuli using a category rating scale with fixedanchors, while another group was presented with a self-anchoring category rating scale. Theresults indicate that researchers can be confident in the ability of both category rating scales toprovide linear data. This implies that the different end anchors do not impact on the linearityof the category rating scale.
Keywords Functional measurement · Category rating scale · Linearity ·Self-anchoring scale · End anchors
1 General introduction
Although frequently criticized, category rating scales are a common response modality inquestionnaires (Poulton 1989; Whitley 2002). The major advantages of category rating scalesare their ease of use and their low cost (Breakwell et al. 1974). Despite their widespread use,several opponents have addressed the unsatisfactory measurement level obtained with thesescales. Therefore, this study aims at testing the impact of two kinds of end anchors on thelinearity of category rating scale data.
J. Hofmans · P. TheunsDepartment of Work and Organisational Psychology,Faculty of Psychology and Educational Science, Vrije Universiteit Brussel,Pleinlaan 2, 1050 Brussels, Belgium
Present Address:J. Hofmans (B)Department of Psychology, Katholieke Universiteit Leuven,Tiensestraat 102, B-3000 Leuven, Belgiume-mail: [email protected]
123
398 J. Hofmans, P. Theuns
Title
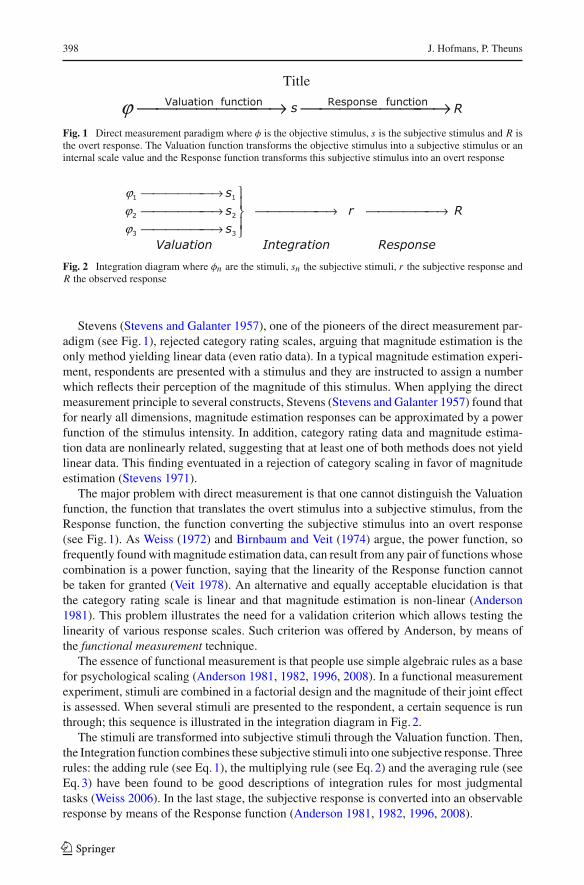
Fig. 1 Direct measurement paradigm where φ is the objective stimulus, s is the subjective stimulus and R isthe overt response. The Valuation function transforms the objective stimulus into a subjective stimulus or aninternal scale value and the Response function transforms this subjective stimulus into an overt response
ϕϕϕ
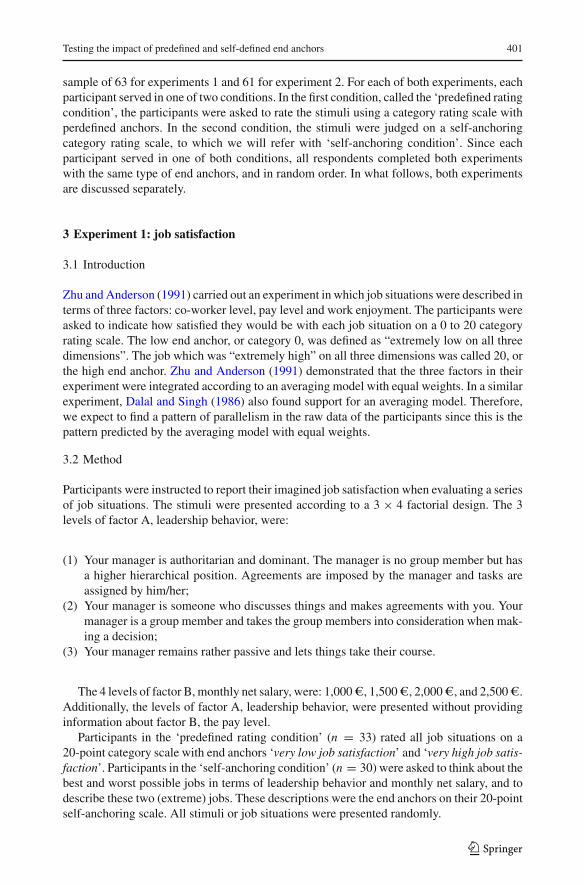
Fig. 2 Integration diagram where φn are the stimuli, sn the subjective stimuli, r the subjective response andR the observed response
Stevens (Stevens and Galanter 1957), one of the pioneers of the direct measurement par-adigm (see Fig. 1), rejected category rating scales, arguing that magnitude estimation is theonly method yielding linear data (even ratio data). In a typical magnitude estimation experi-ment, respondents are presented with a stimulus and they are instructed to assign a numberwhich reflects their perception of the magnitude of this stimulus. When applying the directmeasurement principle to several constructs, Stevens (Stevens and Galanter 1957) found thatfor nearly all dimensions, magnitude estimation responses can be approximated by a powerfunction of the stimulus intensity. In addition, category rating data and magnitude estima-tion data are nonlinearly related, suggesting that at least one of both methods does not yieldlinear data. This finding eventuated in a rejection of category scaling in favor of magnitudeestimation (Stevens 1971).
The major problem with direct measurement is that one cannot distinguish the Valuationfunction, the function that translates the overt stimulus into a subjective stimulus, from theResponse function, the function converting the subjective stimulus into an overt response(see Fig. 1). As Weiss (1972) and Birnbaum and Veit (1974) argue, the power function, sofrequently found with magnitude estimation data, can result from any pair of functions whosecombination is a power function, saying that the linearity of the Response function cannotbe taken for granted (Veit 1978). An alternative and equally acceptable elucidation is thatthe category rating scale is linear and that magnitude estimation is non-linear (Anderson1981). This problem illustrates the need for a validation criterion which allows testing thelinearity of various response scales. Such criterion was offered by Anderson, by means ofthe functional measurement technique.
The essence of functional measurement is that people use simple algebraic rules as a basefor psychological scaling (Anderson 1981, 1982, 1996, 2008). In a functional measurementexperiment, stimuli are combined in a factorial design and the magnitude of their joint effectis assessed. When several stimuli are presented to the respondent, a certain sequence is runthrough; this sequence is illustrated in the integration diagram in Fig. 2.
The stimuli are transformed into subjective stimuli through the Valuation function. Then,the Integration function combines these subjective stimuli into one subjective response. Threerules: the adding rule (see Eq. 1), the multiplying rule (see Eq. 2) and the averaging rule (seeEq. 3) have been found to be good descriptions of integration rules for most judgmentaltasks (Weiss 2006). In the last stage, the subjective response is converted into an observableresponse by means of the Response function (Anderson 1981, 1982, 1996, 2008).
123

Testing the impact of predefined and self-defined end anchors 399
r = ω1s1 + ω2s2 + ω3s3 (1)
r = ω1s1 × ω2s2 × ω3s3 (2)
r = ω1s1 + ω2s2 + ω3s3
ω1 + ω2 + ω3(3)
Two assumptions of the functional measurement paradigm are tested simultaneously. Thefirst assumption being that the participants follow one of the three algebraic rules discussedabove, the second being that the response scale is linear. Both assumptions are validatedsimultaneously if the raw data, presented in a factorial graph, exhibit parallelism for the add-ing rule and averaging rule while the data have to show a linear fan for the multiplication rule(Anderson 1982). Anderson (1981, 1982, 1992) performed several functional measurementexperiments, demonstrating the linearity of category rating scales and thus supporting theresponse generality of category rating scales.
Although the linearity of category rating scales is confirmed in numerous studies, theimpact of the end anchors on the linearity is often disregarded.1 The importance of appro-priate end anchoring may be demonstrated by emphasizing the comparative nature of therating procedure. According to Anderson (1992), the rating procedure depends on similaritycomparisons between the stimulus and each of the end anchors, as shown in Eqs. 4 and 5. LetSL be the lower end stimulus and SU the upper end stimulus, and let RL and RU , respectively,be the corresponding overt responses. Let S be a stimulus and let Sim (S, SL ) and Sim (S, SU )represent the similarity of S to the lower end anchor and the upper end anchor, respectively.As a consequence, the rating of S will be situated between RL and RU in proportion to itssimilarities to the end anchors (Anderson 1992).
(R − RL)Sim(S, SL) = (RU − R)Sim(S, SU ) (4)
When solving for R, Eq. 4 becomes:
R = Sim(S, SL)RL + Sim(S, SU )RU
Sim(S, SL) + Sim(S, SU )(5)
Because of the importance of end anchoring, the category rating scales in Anderson’sexperiments have a characteristic feature. Two stimuli a little more extreme than the exper-imental stimuli are used to define the end anchors, arguing that they define the subjectiverange of the stimuli (Anderson 1982). By using such an anchoring procedure, the anchors areextreme enough, thereby allowing the stimuli to fit into the scale (Poulton 1989). Moreover,the end anchors are not too extreme, as in that case participants may use only part of theresponse scale (Anderson 1982). Despite the importance of the topic, as far as we know,no studies of the effect of different types of end anchors on the linearity of the scale havebeen conducted so far since Anderson reported the lack of studies on this subject, despite itsconsiderable theoretical interest (Anderson 1982).
When designing rating scales for applied research, the anchoring process is not as straight-forward as it is in an experiment, where the stimuli are manipulated by the researcher. Mostly,researchers assume that the end anchors possess the aforementioned properties, but thisremains an assumption. For example, Parducci (1963) proposed to use the end anchors ‘verysmall’ and ‘very large’ when working with six response categories. Although these anchorsmake sense to everyone, it is questionable whether these end anchors are sufficiently extremeand well established for each respondent. In addition, most researchers ignore individual dif-ference in perception of the meaning or intensity of the anchors (Friedman and Amoo 1999).
1 The books of Anderson (1981, 1982, 1992) are a noticeable exception.
123

400 J. Hofmans, P. Theuns
It was demonstrated that, when asked to judge the intensity of several anchors of an agree-ment scale, individual differences in perceived intensity showed up, and this was especiallythe case for the end anchors (Hofmans et al. 2007b). Individual differences in perceptionof the anchors have also been cited by scientists working on sensation and perception, forexample in taste perception (Bartoshuk 2004) and in pain research (Robinson et al. 2003). Asa consequence, the use of vague, predefined anchors like ‘very small’ and ‘very large’ mayimpact on the responses and by inference on the linearity of the rating scale. For example,Pollack, Friedman and Presby (1990, see Friedman and Amoo 1999) found different resultswhen using a rating scale with end anchors ‘superior’ and ‘terrible’ than when using a ratingscale with weaker end anchors like ‘very good’ and ‘very bad’.
A technique proposed by Kilpatrick and Cantril (1960), the self-anchoring striving scale,may offer a solution to several problems and biases present in category rating scales withpredefined anchors. On a self-anchoring striving scale, “a person is asked to define on thebasis of his own assumptions, perceptions, goals, and values the two extremes or anchoringpoints of the spectrum on which some scale measurement is desired ” (Cantril 1965: p. 22).Of course, this method is based on the assumption that the definitions of a specific constructvary between respondents (Lefcowitz and Wallston 1973). When asking a respondent todefine his/her own end anchors, then obviously the extremity of these anchors is guaranteed.Although self-anchoring scales seem very promising and possibly offer a solution to theproblem of the end anchors, this topic has under-addressed in research so far.
Using functional measurement, this study assesses the impact of two types of end anchorson the linearity of the category rating scale. Even though functional measurement allows forthe validation of both the integration rule and the response scale, in previous research thelinearity of the response scale was mainly treated as a testable assumption necessary to findthe relevant integration rule. In this study, functional measurement will be used in a ratherunconventional manner: we are less interested in the exact integration rule but all the more inthe linearity of the response scales. Therefore, we selected stimuli for which the integrationrule is well established. This allows us to make specific predictions about the pattern weshould perceive in the raw data of the participants. If deviations from the predicted patternappear, this is likely due to a nonlinear rating scale. On the other hand, if the hypothesizedpattern is confirmed by the raw data, this implies that the rating scale should be linear. Whilereading the paper, the reader should always bear in mind that our main goal is to asses thelinearity of the rating scales and not to merely replicate previously established integrationrules.
Since category rating scales are being used in quite diverse fields of research, their linearityis tested with two different kinds of stimuli. For this purpose, two experiments were carriedout, each requiring a different kind of judgement. Below, both experiments are discussedseperately, but their common goal is to test the impact of the nature of the end anchors onthe linearity of the category rating scale.
2 General method
2.1 Participants and procedure
Sixty-three undergraduates from the Vrije Universiteit Brussel participated in two exper-iments. In experiment 1, the participants were asked to rate one’s job satisfaction in animaginary situation, while with experiment 2 the task was to rate the attractiveness of photo-graphed people. Two of the 63 participants took part in experiment 1 only, resulting in a total
123
Testing the impact of predefined and self-defined end anchors 401
sample of 63 for experiments 1 and 61 for experiment 2. For each of both experiments, eachparticipant served in one of two conditions. In the first condition, called the ‘predefined ratingcondition’, the participants were asked to rate the stimuli using a category rating scale withperdefined anchors. In the second condition, the stimuli were judged on a self-anchoringcategory rating scale, to which we will refer with ‘self-anchoring condition’. Since eachparticipant served in one of both conditions, all respondents completed both experimentswith the same type of end anchors, and in random order. In what follows, both experimentsare discussed separately.
3 Experiment 1: job satisfaction
3.1 Introduction
Zhu and Anderson (1991) carried out an experiment in which job situations were described interms of three factors: co-worker level, pay level and work enjoyment. The participants wereasked to indicate how satisfied they would be with each job situation on a 0 to 20 categoryrating scale. The low end anchor, or category 0, was defined as “extremely low on all threedimensions”. The job which was “extremely high” on all three dimensions was called 20, orthe high end anchor. Zhu and Anderson (1991) demonstrated that the three factors in theirexperiment were integrated according to an averaging model with equal weights. In a similarexperiment, Dalal and Singh (1986) also found support for an averaging model. Therefore,we expect to find a pattern of parallelism in the raw data of the participants since this is thepattern predicted by the averaging model with equal weights.
3.2 Method
Participants were instructed to report their imagined job satisfaction when evaluating a seriesof job situations. The stimuli were presented according to a 3 × 4 factorial design. The 3levels of factor A, leadership behavior, were:
(1) Your manager is authoritarian and dominant. The manager is no group member but hasa higher hierarchical position. Agreements are imposed by the manager and tasks areassigned by him/her;
(2) Your manager is someone who discusses things and makes agreements with you. Yourmanager is a group member and takes the group members into consideration when mak-ing a decision;
(3) Your manager remains rather passive and lets things take their course.
The 4 levels of factor B, monthly net salary, were: 1,000e, 1,500e, 2,000e, and 2,500e.Additionally, the levels of factor A, leadership behavior, were presented without providinginformation about factor B, the pay level.
Participants in the ‘predefined rating condition’ (n = 33) rated all job situations on a20-point category scale with end anchors ‘very low job satisfaction’ and ‘very high job satis-faction’. Participants in the ‘self-anchoring condition’ (n = 30) were asked to think about thebest and worst possible jobs in terms of leadership behavior and monthly net salary, and todescribe these two (extreme) jobs. These descriptions were the end anchors on their 20-pointself-anchoring scale. All stimuli or job situations were presented randomly.
123
402 J. Hofmans, P. Theuns
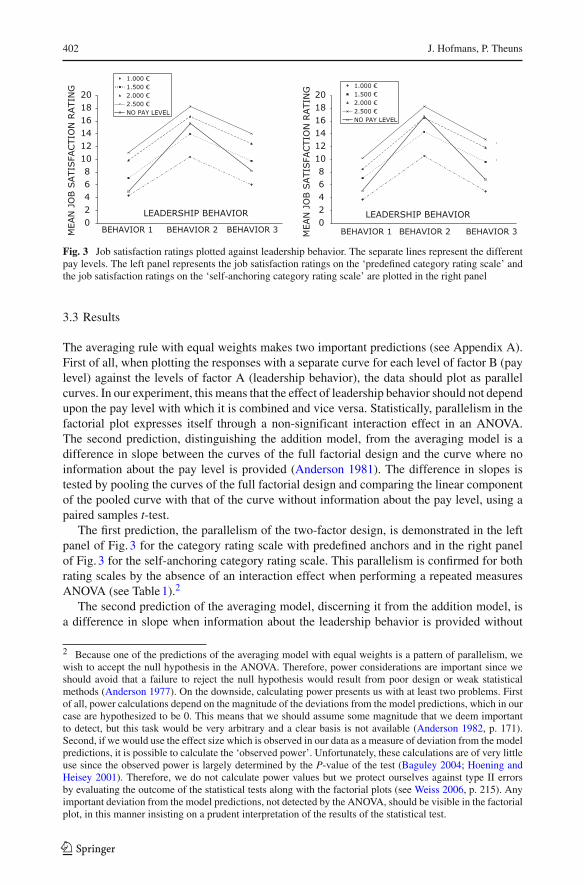
Fig. 3 Job satisfaction ratings plotted against leadership behavior. The separate lines represent the differentpay levels. The left panel represents the job satisfaction ratings on the ‘predefined category rating scale’ andthe job satisfaction ratings on the ‘self-anchoring category rating scale’ are plotted in the right panel
3.3 Results
The averaging rule with equal weights makes two important predictions (see Appendix A).First of all, when plotting the responses with a separate curve for each level of factor B (paylevel) against the levels of factor A (leadership behavior), the data should plot as parallelcurves. In our experiment, this means that the effect of leadership behavior should not dependupon the pay level with which it is combined and vice versa. Statistically, parallelism in thefactorial plot expresses itself through a non-significant interaction effect in an ANOVA.The second prediction, distinguishing the addition model, from the averaging model is adifference in slope between the curves of the full factorial design and the curve where noinformation about the pay level is provided (Anderson 1981). The difference in slopes istested by pooling the curves of the full factorial design and comparing the linear componentof the pooled curve with that of the curve without information about the pay level, using apaired samples t-test.
The first prediction, the parallelism of the two-factor design, is demonstrated in the leftpanel of Fig. 3 for the category rating scale with predefined anchors and in the right panelof Fig. 3 for the self-anchoring category rating scale. This parallelism is confirmed for bothrating scales by the absence of an interaction effect when performing a repeated measuresANOVA (see Table 1).2
The second prediction of the averaging model, discerning it from the addition model, isa difference in slope when information about the leadership behavior is provided without
2 Because one of the predictions of the averaging model with equal weights is a pattern of parallelism, wewish to accept the null hypothesis in the ANOVA. Therefore, power considerations are important since weshould avoid that a failure to reject the null hypothesis would result from poor design or weak statisticalmethods (Anderson 1977). On the downside, calculating power presents us with at least two problems. Firstof all, power calculations depend on the magnitude of the deviations from the model predictions, which in ourcase are hypothesized to be 0. This means that we should assume some magnitude that we deem importantto detect, but this task would be very arbitrary and a clear basis is not available (Anderson 1982, p. 171).Second, if we would use the effect size which is observed in our data as a measure of deviation from the modelpredictions, it is possible to calculate the ‘observed power’. Unfortunately, these calculations are of very littleuse since the observed power is largely determined by the P-value of the test (Baguley 2004; Hoening andHeisey 2001). Therefore, we do not calculate power values but we protect ourselves against type II errorsby evaluating the outcome of the statistical tests along with the factorial plots (see Weiss 2006, p. 215). Anyimportant deviation from the model predictions, not detected by the ANOVA, should be visible in the factorialplot, in this manner insisting on a prudent interpretation of the results of the statistical test.
123
Testing the impact of predefined and self-defined end anchors 403
Table 1 ANOVA results for both experimental conditions
d feffect d ferror F-value sign.
Category rating scale with predefined anchors
Leadership behavior 2 64 86.19 .000
Pay level* 1.67 53.47 92.39 .000
Leadership behavior × pay level 6 192 0.99 .429
Self-anchoring category rating scale
Leadership behavior 2 58 76.67 .000
Pay level* 1.97 57.12 92.43 .000
Leadership behavior × pay level 6 174 1.57 .159
* Since for both experimental groups the sphericity assumption is violated for the factor “Pay level”,a Greenhouse-Geisser correction was applied for this factor
information concerning the pay level. This critical difference is clearly visible in both pan-els of Fig. 3 , thereby providing the necessary support for the averaging model with equalweights. The graphical validation of the averaging rule with equal weights is also statisticallyconfirmed by a significant difference in slopes for the category rating scale with predefinedanchors (t (32) = 5.20, P = .000) as well as for the self-anchoring category rating scale(t (29) = 6.52, P = .000).
3.4 Discussion
We were able to replicate the integration rule found by Zhu and Anderson (1991) and Dalaland Singh (1986). This replication confirms that both response scales pass the required test.In other words, it demonstrates that the ‘category rating scale with predefined anchors’ andthe ‘self-anchoring rating scale’ are linear response measures, which means that the natureof the end anchors has no impact on the linearity of the responses.
4 Experiment 2: attractiveness rating
4.1 Introduction
In an impression formation experiment, where participants were asked to rate how muchthey would like a person described by a set of 2 or 4 personality trait adjectives, Anderson(1965) identified the averaging model with equal weights as the stimulus-combination rule.In this study, we pair adjectives to a face instead of pairing them to other adjectives. Althoughboth experiments are slightly different, we expect to find a pattern in accordance with theaveraging model with equal weights, i.e., a pattern of parallelism in the factorial plot alongwith a difference in slope.
4.2 Method
The respondents were presented with a series of faces, each accompanied by a personalitytrait description. With each face, the respondents were asked to rate the attractiveness ofthe person presented on the computer screen. The stimuli were made according to a 5 × 5
123
404 J. Hofmans, P. Theuns
23456789
101112131415
PERSON
ME
AN
AT
TR
AC
TIV
EN
ES
S R
AT
ING
UNFRIENDLYDISHONESTHONESTINTELLIGENTFRIENDLYNO TRAIT
B AC ED23456789
101112131415
PERSON
ME
AN
AT
TR
AC
TIV
EN
ES
S R
AT
ING UNFRIENDLY
DISHONESTHONESTINTELLIGENTFRIENDLYNO TRAIT
BC AED
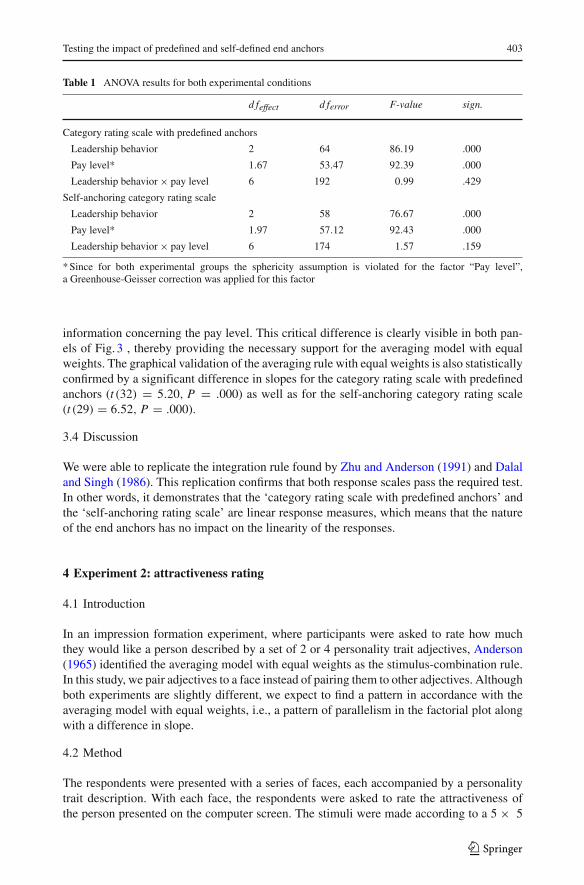
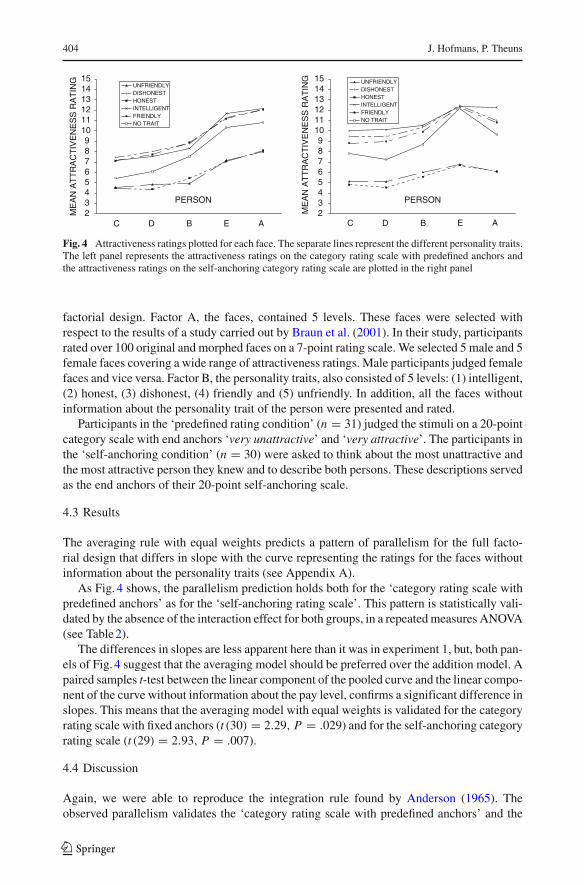
Fig. 4 Attractiveness ratings plotted for each face. The separate lines represent the different personality traits.The left panel represents the attractiveness ratings on the category rating scale with predefined anchors andthe attractiveness ratings on the self-anchoring category rating scale are plotted in the right panel
factorial design. Factor A, the faces, contained 5 levels. These faces were selected withrespect to the results of a study carried out by Braun et al. (2001). In their study, participantsrated over 100 original and morphed faces on a 7-point rating scale. We selected 5 male and 5female faces covering a wide range of attractiveness ratings. Male participants judged femalefaces and vice versa. Factor B, the personality traits, also consisted of 5 levels: (1) intelligent,(2) honest, (3) dishonest, (4) friendly and (5) unfriendly. In addition, all the faces withoutinformation about the personality trait of the person were presented and rated.
Participants in the ‘predefined rating condition’ (n = 31) judged the stimuli on a 20-pointcategory scale with end anchors ‘very unattractive’ and ‘very attractive’. The participants inthe ‘self-anchoring condition’ (n = 30) were asked to think about the most unattractive andthe most attractive person they knew and to describe both persons. These descriptions servedas the end anchors of their 20-point self-anchoring scale.
4.3 Results
The averaging rule with equal weights predicts a pattern of parallelism for the full facto-rial design that differs in slope with the curve representing the ratings for the faces withoutinformation about the personality traits (see Appendix A).
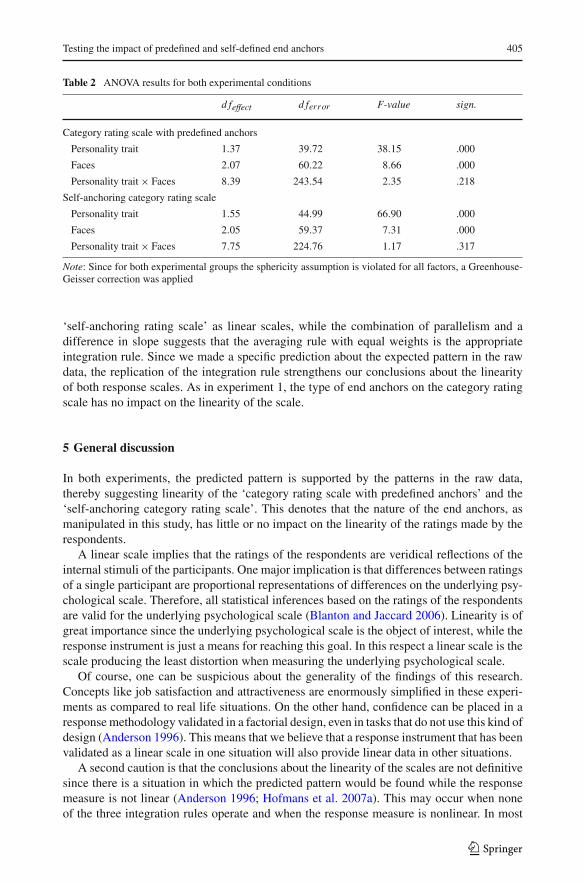
As Fig. 4 shows, the parallelism prediction holds both for the ‘category rating scale withpredefined anchors’ as for the ‘self-anchoring rating scale’. This pattern is statistically vali-dated by the absence of the interaction effect for both groups, in a repeated measures ANOVA(see Table 2).
The differences in slopes are less apparent here than it was in experiment 1, but, both pan-els of Fig. 4 suggest that the averaging model should be preferred over the addition model. Apaired samples t-test between the linear component of the pooled curve and the linear compo-nent of the curve without information about the pay level, confirms a significant difference inslopes. This means that the averaging model with equal weights is validated for the categoryrating scale with fixed anchors (t (30) = 2.29, P = .029) and for the self-anchoring categoryrating scale (t (29) = 2.93, P = .007).
4.4 Discussion
Again, we were able to reproduce the integration rule found by Anderson (1965). Theobserved parallelism validates the ‘category rating scale with predefined anchors’ and the
123
Testing the impact of predefined and self-defined end anchors 405
Table 2 ANOVA results for both experimental conditions
d feffect d ferror F-value sign.
Category rating scale with predefined anchors
Personality trait 1.37 39.72 38.15 .000
Faces 2.07 60.22 8.66 .000
Personality trait × Faces 8.39 243.54 2.35 .218
Self-anchoring category rating scale
Personality trait 1.55 44.99 66.90 .000
Faces 2.05 59.37 7.31 .000
Personality trait × Faces 7.75 224.76 1.17 .317
Note: Since for both experimental groups the sphericity assumption is violated for all factors, a Greenhouse-Geisser correction was applied
‘self-anchoring rating scale’ as linear scales, while the combination of parallelism and adifference in slope suggests that the averaging rule with equal weights is the appropriateintegration rule. Since we made a specific prediction about the expected pattern in the rawdata, the replication of the integration rule strengthens our conclusions about the linearityof both response scales. As in experiment 1, the type of end anchors on the category ratingscale has no impact on the linearity of the scale.
5 General discussion
In both experiments, the predicted pattern is supported by the patterns in the raw data,thereby suggesting linearity of the ‘category rating scale with predefined anchors’ and the‘self-anchoring category rating scale’. This denotes that the nature of the end anchors, asmanipulated in this study, has little or no impact on the linearity of the ratings made by therespondents.
A linear scale implies that the ratings of the respondents are veridical reflections of theinternal stimuli of the participants. One major implication is that differences between ratingsof a single participant are proportional representations of differences on the underlying psy-chological scale. Therefore, all statistical inferences based on the ratings of the respondentsare valid for the underlying psychological scale (Blanton and Jaccard 2006). Linearity is ofgreat importance since the underlying psychological scale is the object of interest, while theresponse instrument is just a means for reaching this goal. In this respect a linear scale is thescale producing the least distortion when measuring the underlying psychological scale.
Of course, one can be suspicious about the generality of the findings of this research.Concepts like job satisfaction and attractiveness are enormously simplified in these experi-ments as compared to real life situations. On the other hand, confidence can be placed in aresponse methodology validated in a factorial design, even in tasks that do not use this kind ofdesign (Anderson 1996). This means that we believe that a response instrument that has beenvalidated as a linear scale in one situation will also provide linear data in other situations.
A second caution is that the conclusions about the linearity of the scales are not definitivesince there is a situation in which the predicted pattern would be found while the responsemeasure is not linear (Anderson 1996; Hofmans et al. 2007a). This may occur when noneof the three integration rules operate and when the response measure is nonlinear. In most
123
406 J. Hofmans, P. Theuns
cases, such combination will lead to non-parallelism, but by accident the one feature cancompensate the other and their combination can yet show a pattern of parallelism (Anderson1996; Hofmans et al. 2007a). Since we were able to replicate the integration rule for jobsatisfaction ratings and for attractiveness ratings, this alternative is very unlikely because itwould imply that in our experiments, as well as in previous studies the Integration functionand the Response function compensate for the other. The alternative explanation is muchmore rigorous, i.e., that the rating scales used in this and previous research are linear scales,thereby (linearly) mirroring the underlying psychological scale. Moreover, the replication ofthe linearity of both rating scales with two different constructs further reduces the probabilitythat the coincidental combination of a nonlinear integration rule and a nonlinear responsescale causes parallelism in our data.
When studying the linearity of response measures, replication of integration rules has anadditional advantage. Theoretically, deviations from parallelism in the raw data can theoret-ically be attributed to the integration rule or to the response scale (or to a combination ofboth). In the case of replication studies, attributing deviations from the predicted pattern tothe Integration function would be unsound since research has already shown the existence ofthe specific integration rule. For example if a pattern of non-parallelism would be perceivedin the experiment about job satisfaction, this non-parallelism could be due to a non-averag-ing integration rule or due to a nonlinear response measure. However, since Dalal and Singh(1986) and Zhu and Anderson (1991) already showed that several factors constituting jobsatisfaction combine according to an averaging model with equal weights, the non-averagingintegration rule can be ruled out. This leaves us with the explanation that the rating scale isnonlinear. Replication studies thus provide us with firm foundation when testing the linearityof the Response function.
On the other hand, replication research is not infallible and we can only agree withBirnbaum and Veit (1974; see also Veit (1978)) who pointed at the need for additionalconstraints, an important topic which deserves further research.
Summarizing, the data in both experiments suggest that manipulating the nature of theend anchors has no impact on the linearity of the responses. The self-anchoring categoryrating scale as well as the category rating scale with fixed anchors is diagnosed as a linearresponse measure.
Appendix A
Equal weighting means that each level has the same weight within each factor (Anderson1982). Accordingly, the rating for a specific stimulus φi j is given by formulae A1:
Ri j = C0 + ω0s0 + ωAsAi + ωBsB j
ω0 + ωA + ωB(A1)
With ωA and ωB being the weights for the row and column factors, while ω0 and s0 areparameterizations of the internal stimuli or the initial state of the respondent, which can alsobe conceptualized as ‘prior beliefs held by the respondent’ (Anderson 1982). C0 representsthe zero of the response scale, and it is automatically captivated into the stimulus values(Anderson 1982).
Since a property of the averaging model with equal weights is that the sum of the weightsin the denominator is the same in each cell of the design, equation A1 can be rewritten:
Ri j = C0 + s̄0 + s̄Ai + s̄B j (A2)
123
Testing the impact of predefined and self-defined end anchors 407
As Eq. A2 shows, it can easily be demonstrated that the averaging rule with equal weightssimplifies to a linear model. The averaging rule with equal weights makes two importantpredictions. First of all, when plotting the responses with a separate curve for each level offactor B (pay level) against the marginal means of factor A (leadership behavior), the datashould plot as parallel curves:
R̄. j =
n∑
i=1(C0 + s̄0 + s̄Ai + s̄B j )
n(A3)
R̄. j = C0 + s̄0 + s̄B j
n+ 1
n
n∑
i=1
s̄Ai (A4)
R̄i. = C0 + s̄0 + s̄B j
n+ s̄A. (A5)
Since C0, s̄0, and s̄A. are constants in equation A5, thus do not depend on i , the marginalmeans of factor B should be a linear function of the scale values of factor B, independent ofthe scale values of factor A (see Veit 1978). In other words, the distance between any twocurves of factor B must be equal for each level of factor A; stated otherwise the curves mustshow a pattern of parallelism.
The second prediction distinguishes the additive model from the averaging model. Thecurve of the ratings for the stimuli without information about one of the factors should show adifference in slope with the curves of the ratings from the two-factor design, where all stimuliprovide information about both factors. When the information about factor B is presentedwithout information about factor A, equation A1 reduces to:
Ri j = C0 + ω0s0 + ωBsB j
ω0 + ωB(A6)
It is obvious that the denominator in equation A6 is smaller than the denominator inequation A1 (Anderson 1996). Hence the slope of Ri j as a function of sB j is greater since:
ωB
ωB + ω0>
ωB
ωA + ωB + ω0(A7)
This will result in a difference in slopes, giving the necessary support for the averagingmodel (Anderson 1981). An important assumption for the decisive test between averagingand adding is that scale values and weights are invariant across sub-designs (Norman 1976).When this critical assumption is satisfied, the difference in slopes can be interpreted mean-ingfully.
Acknowledgements Supported by Grant OZR1041BOF of the Vrije Universiteit Brussel. We are grateful toOlivier Mairesse and Frederik Van Acker for their constructive comments on earlier versions of the manuscript.Correspondence concerning this article should be addressed to Joeri Hofmans, Department of Psychology,Katholieke Universiteit Leuven, Tiensestraat 102, 3000 Leuven, Belgium.
References
Anderson, N.H.: Averaging versus adding as a stimulus-combination rule in impression formation. J. Exp.Psychol. 70, 394–400 (1965)
Anderson, N.H.: Note on functional measurement and data analysis. Percept. Psychophys. 21, 201–215 (1977)Anderson, N.H.: Foundations of information integration theory. Academic Press, London (1981)Anderson, N.H.: Methods of information integration theory. Academic Press, London (1982)
123
408 J. Hofmans, P. Theuns
Anderson, N.H.: Integration psychophysics and cognition. In: Algom, D. (ed.) Psychophysical Approaches toCognition, pp. 13–113. Elsevier Science Publishers, North-Holland (1992)
Anderson, N.H.: A Functional Theory of Cognition. Lawrence Erlbaum Associates, New Jersey (1996)Anderson, N.H.: Unified social cognition. Academic press, London (2008)Baguley, T.: Understanding statistical power in the context of applied research. Appl. Ergon. 35, 73–80 (2004)Bartoshuk, L.M.: Comparing sensory experiences across individuals: recent psychophysical advances illumi-
nate genetic variation in taste perception. Chem. Senses 25, 447–460 (2000)Birnbaum, M.H., Veit, C.T.: Scale convergence as a criterion for rescaling: information integration with dif-
ference, ratio, and averaging tasks. Percept. Psychophys. 15, 7–15 (1974)Blanton, H., Jaccard, J.: Arbitrary metrics in psychology. Am. Psychol. 61, 27–41 (2006)Braun, C., Gruendl, M., Marberger, C., and Scherber, C. In: Beautycheck - Ursachen und Folgen von Attrak-
tivitaet. http://www.beautycheck.de/english/bericht/bericht.htm. Cited 18 April 2006 (2001)Breakwell, G.M., Hammond, S., Fife-Shaw, C.: Research Methods in Psychology. Sage Publica-
tions, London (2000)Cantril, H.: The Pattern of Human Concerns. Rutgers University Press, New Jersey (1965)Friedman, H.H., Amoo, T.: Rating the rating scales. J. Mark. Manag. 9, 114–123 (1999)Dalal, A.K., Singh, R.: An integration theoretical analysis of expected job attractiveness and satisfaction. Int.
J. Psychol. 21, 555–564 (1986)Hoenig, J.M., Heisey, D.M.: The abuse of power; the pervasive fallacy of power calculations for data analy-
sis. Am. Stat. 55, 1–6 (2001)Hofmans, J., Mairesse, O., Theuns, P.: An alternative for prescribed integration rules in testing the linearity
of a response measure. Teor. Model. 12, 259–268 (2007a)Hofmans, J., Theuns, P., Baekelandt, S., Schillewaert, N., Cools, W.: Bias and changes in perceived intensity
of verbal qualifiers effected by scale orientation. Surv. Res. Methods 1,4 97–108 (2007b)Kilpatrick, F.P., Cantril, H.: Self-anchoring scale: a measure of the individual’s unique reality world. J. Individ.
Psychol. 16, 158–170 (1960)Lefcowitz, M.J., Wallston, B.: Self-anchoring scale: does it make a difference?. Sociol. Methods Res. 1,
387–399 (1973)Norman, K.L.: A solution for weights and scale values in functional measurement. Psychol. Rev. 83,
80–84 (1976)Parducci, A.: Range-frequency compromise in judgment. Psychol. Monogr. Gen. Appl. 77, 1–50 (1963)Poulton, E.C.: Bias in Quantifying Judgments. Lawrence Erlbaum Associates Publishers, Hove and
London (1989)Robinson, M.E., Gagnon, C.M., Dannecker, E.A., Brown, J.L., Jump, R.L., Price, D.D.: Sex differences in
common pain events: expectations and anchors. J. Pain 4, 40–45 (2003)Stevens, S.S.: Issues in psychophysical measurement. Psychol. Rev. 78, 426–450 (1971)Stevens, S.S., Galanter, E.H.: Ratio scales and category scales for a dozen perceptual continua. J. Exp.
Psychol. 54, 377–411 (1957)Veit, C.T.: Ratio and subtractive processes in psychophysical judgment. J. Exp. Psychol. Gen. 107,
81–107 (1978)Weiss, D.J.: Averaging: an empirical validity criterion for magnitude estimation. Percept. Psychophys. 12,
385–388 (1972)Weiss, D.J.: Analysis of Variance and Functional Measurement: A Practical Guide. Oxford University
Press, New York (2006)Whitley, B.E. Jr.: Principles of Research in Behavioral Science. McGraww-Hill, New York (2002)Zhu, S., Anderson, N.H.: Self-estimation of weight parameter in multiattribute analysis. Organ. Behav. Hum.
Decis. Process 48, 36–54 (1991)
123