Testing the concept of a modulation filter bank: The audibility of component modulation and...
11
Testing the concept of a modulation filter bank: The audibility of component modulation and detection of phase change in three-component modulators Aleksander Sek Institute of Acoustics, Adam Mickiewicz University, 85 Umultowska, 61-614 Poznan, Poland Brian C. J. Moore a) Department of Experimental Psychology, University of Cambridge, Downing Street, Cambridge CB2 3EB, England ~Received 12 July 2002; revised 24 January 2003; accepted 6 February 2003! Two experiments were performed to test the concept that the auditory system contains a ‘‘modulation filter bank’’ ~MFB!. Experiment 1 examined the ability to ‘‘hear out’’ the modulation frequency of the central component of a three-component modulator applied to a 4-kHz sinusoidal carrier. On each trial, three modulated stimuli were presented. The modulator of the first stimulus contained three components. Within a run the frequencies of the outer two components were fixed and the frequency of the central ~‘‘target’’! component was drawn randomly from one of five values. The modulators of second and third stimuli contained one component. One had a frequency equal to that of the target and the other had a frequency randomly selected from one of the other possible values. Subjects indicated whether the target corresponded to the second or third stimulus. Scores were around 80% correct when the components in the three-component modulator were widely spaced and when the frequencies of the target and comparison differed sufficiently. Experiment 2 examined the ability to hear a change in the relative phase of the components in a three-component modulator with harmonically spaced components, using a 3IFC task. The frequency of the central component, f c , was either 50 or 100 Hz. Scores were 80%–90% correct when the component spacing was <0.5f c , but decreased markedly for greater spacings. Performance was only slightly impaired by randomizing the overall modulation depth from one stimulus to the next. The results of both experiments are broadly consistent with what would be expected from a MFB with a Q value of 1 or slightly less. © 2003 Acoustical Society of America. @DOI: 10.1121/1.1564020# PACS numbers: 43.66.Mk, 43.66.Nm, 43.66.Ba @NFV# I. INTRODUCTION The perception of amplitude modulation ~AM! has often been modeled by a sequence of stages. The first stage is a bank of bandpass filters ~the auditory filters!, although some models assume just a single, broad ‘‘predetection filter’’ ~Vi- emeister, 1979!. Each filter is followed by a nonlinear de- vice, such as a rectifier and compressor, and a ‘‘smoothing’’ device. Usually, this smoothing device is thought to reflect a relatively central process. The output of the smoothing de- vice is fed to a decision device. Models of this general type have been proposed by Viemeister ~1979!, Festen and Plomp ~1981!, Moore et al. ~1988!, Plack and Moore ~1990!, and Oxenham and Moore ~1994!. The smoothing device has been implemented as a low-pass filter ~Viemeister, 1979; Strick- land and Viemeister, 1996! or by a sliding temporal integra- tor ~temporal window! ~Moore et al., 1988; Plack and Moore, 1990; Oxenham and Moore, 1994!. More recently, it has been proposed that modulation per- ception depends on a second stage of filtering in the auditory system ~Dau et al., 1997a, b!. It is assumed that the enve- lopes of the outputs of the auditory filters are fed to a second array of overlapping bandpass filters tuned to different enve- lope modulation rates. This set of filters is usually called a ‘‘modulation filter bank’’ ~MFB!. The concept of the MFB implies that the auditory system performs a limited resolu- tion spectral analysis of the envelope at the output of each auditory filter. Evidence supporting the concept of the MFB has come mainly from experiments on modulation masking ~Bacon and Grantham, 1989; Houtgast, 1989; Dau et al., 1997a, b, 1999; Ewert and Dau, 2000; Ewert et al., 2002!, which ap- pear to show selectivity in the modulation-frequency do- main. However, the interpretation of the results is not en- tirely clear cut, and not all authors accept that a MFB is necessary to explain the results ~Strickland and Viemeister, 1996; Moore et al., 1999a!. It is possible that the results could be explained by the similarity of the temporal patterns of the envelopes of the signal and masker, without analysis using an MFB. Here we describe two experiments not in- volving modulation masking that are aimed at providing fur- ther tests of the concept of the MFB. Both experiments are analogous to experiments that have been performed in the audio-frequency domain, and which are thought to reflect the effects of filtering in the auditory periphery. a! Author to whom correspondence should be addressed. Electronic mail: [email protected] 2801 J. Acoust. Soc. Am. 113 (5), May 2003 0001-4966/2003/113(5)/2801/11/$19.00 © 2003 Acoustical Society of America Downloaded 17 May 2011 to 150.254.100.169. Redistribution subject to ASA license or copyright; see http://asadl.org/journals/doc/ASALIB-home/info/terms.jsp
Transcript of Testing the concept of a modulation filter bank: The audibility of component modulation and...

Downloaded
Testing the concept of a modulation filter bank: The audibilityof component modulation and detection of phase changein three-component modulators
Aleksander SekInstitute of Acoustics, Adam Mickiewicz University, 85 Umultowska, 61-614 Poznan, Poland
Brian C. J. Moorea)
Department of Experimental Psychology, University of Cambridge, Downing Street, Cambridge CB2 3EB,England
~Received 12 July 2002; revised 24 January 2003; accepted 6 February 2003!
Two experiments were performed to test the concept that the auditory system contains a‘‘modulation filter bank’’ ~MFB!. Experiment 1 examined the ability to ‘‘hear out’’ the modulationfrequency of the central component of a three-component modulator applied to a 4-kHz sinusoidalcarrier. On each trial, three modulated stimuli were presented. The modulator of the first stimuluscontained three components. Within a run the frequencies of the outer two components were fixedand the frequency of the central~‘‘target’’ ! component was drawn randomly from one of five values.The modulators of second and third stimuli contained one component. One had a frequency equalto that of the target and the other had a frequency randomly selected from one of the other possiblevalues. Subjects indicated whether the target corresponded to the second or third stimulus. Scoreswere around 80% correct when the components in the three-component modulator were widelyspaced and when the frequencies of the target and comparison differed sufficiently. Experiment 2examined the ability to hear a change in the relative phase of the components in a three-componentmodulator with harmonically spaced components, using a 3IFC task. The frequency of the centralcomponent, fc , was either 50 or 100 Hz. Scores were 80%–90% correct when the componentspacing was<0.5fc , but decreased markedly for greater spacings. Performance was only slightlyimpaired by randomizing the overall modulation depth from one stimulus to the next. The results ofboth experiments are broadly consistent with what would be expected from a MFB with a Q valueof 1 or slightly less. ©2003 Acoustical Society of America.@DOI: 10.1121/1.1564020#
PACS numbers: 43.66.Mk, 43.66.Nm, 43.66.Ba@NFV#
i
-ngtdep
n
-
eto-
ondve-
a
lu-ach
me
o-n-is
,srnssisin-r-
arethe
thema
I. INTRODUCTION
The perception of amplitude modulation~AM ! has oftenbeen modeled by a sequence of stages. The first stagebank of bandpass filters~the auditory filters!, although somemodels assume just a single, broad ‘‘predetection filter’’~Vi-emeister, 1979!. Each filter is followed by a nonlinear device, such as a rectifier and compressor, and a ‘‘smoothidevice. Usually, this smoothing device is thought to reflecrelatively central process. The output of the smoothingvice is fed to a decision device. Models of this general tyhave been proposed by Viemeister~1979!, Festen and Plomp~1981!, Moore et al. ~1988!, Plack and Moore~1990!, andOxenham and Moore~1994!. The smoothing device has beeimplemented as a low-pass filter~Viemeister, 1979; Strick-land and Viemeister, 1996! or by a sliding temporal integrator ~temporal window! ~Moore et al., 1988; Plack andMoore, 1990; Oxenham and Moore, 1994!.
More recently, it has been proposed that modulation pception depends on a second stage of filtering in the audisystem~Dau et al., 1997a, b!. It is assumed that the enve
a!Author to whom correspondence should be addressed. [email protected]
J. Acoust. Soc. Am. 113 (5), May 2003 0001-4966/2003/113(5)/2
17 May 2011 to 150.254.100.169. Redistribution subject to ASA license o
s a
’’a-
e
r-ry
lopes of the outputs of the auditory filters are fed to a secarray of overlapping bandpass filters tuned to different enlope modulation rates. This set of filters is usually called‘‘modulation filter bank’’ ~MFB!. The concept of the MFBimplies that the auditory system performs a limited resotion spectral analysis of the envelope at the output of eauditory filter.
Evidence supporting the concept of the MFB has comainly from experiments on modulation masking~Baconand Grantham, 1989; Houtgast, 1989; Dauet al., 1997a, b,1999; Ewert and Dau, 2000; Ewertet al., 2002!, which ap-pear to show selectivity in the modulation-frequency dmain. However, the interpretation of the results is not etirely clear cut, and not all authors accept that a MFBnecessary to explain the results~Strickland and Viemeister1996; Mooreet al., 1999a!. It is possible that the resultcould be explained by the similarity of the temporal patteof the envelopes of the signal and masker, without analyusing an MFB. Here we describe two experiments notvolving modulation masking that are aimed at providing futher tests of the concept of the MFB. Both experimentsanalogous to experiments that have been performed inaudio-frequency domain, and which are thought to reflecteffects of filtering in the auditory periphery.il:
2801801/11/$19.00 © 2003 Acoustical Society of America
r copyright; see http://asadl.org/journals/doc/ASALIB-home/info/terms.jsp

t-le
isx
raththeo
let’’ome
t i
ale
thr
ia
prs
icomo
la
s-io
d;
,r-eeh
Wa
flund
;
as
ormheal,
ofun,and
0,in
het athe
the
ueset
heentdedal.ting
ense18.holdu-
t 1.pre-
iblenner-
entst fre-y fedonach
Downloaded
II. EXPERIMENT 1—‘‘HEARING OUT’’ COMPONENTMODULATION
In the audio-frequency domain, subjects are able,some extent, to ‘‘hear out’’ individual components in complex tones. This has been shown both for harmonic comptones~Plomp, 1964; Plomp and Mimpen, 1968; Soderqu1970; Fine and Moore, 1993! and for non-harmonic completones ~Plomp, 1964; Moore and Ohgushi, 1993!. For re-views, see Plomp~1976! and Moore~2003!. In a typical taskto demonstrate this ability, subjects hear three sepastimuli: a complex tone and two sinusoidal tones. One ofsinusoidal tones is a component of the complex, andother has a frequency mistuned from that of any componin the complex. The task of the subject is to decide whichthe two sinusoidal tones is contained within the comptone. Usually, the task is performed very well if the ‘‘targecomponent is widely separated in frequency from neighbing components, but it is performed less well when the coponents are closely spaced; on average, a partial can be hout from a complex tone with about 75% accuracy when iseparated from neighboring partials by 1.25ERBN ~Mooreand Ohgushi, 1993; Moore, 2003!, where ERBN denotes theequivalent rectangular bandwidth of the auditory filtermeasured in normal-hearing listeners at moderate soundels ~Glasberg and Moore, 1990; Moore, 2003!. Hence, theability to hear out partials has been ascribed mainly tofrequency analysis that occurs in the auditory peripheHowever, musicians are better at this task than nonmusic~Soderquist, 1970; Fine and Moore, 1993!, even though au-ditory filter bandwidths do not differ between these grou~Fine and Moore, 1993!, which suggests that other factoare involved.
In our first experiment, we assessed the extent to whsubjects can hear out the component modulations in a cplex modulator, as a function of the frequency separationthe components. An ability to hear out component modution would support the concept of the MFB.
A. Rationale and method
The selectivity of the putative MFB is generally asumed to be markedly poorer than selectivity in the audfrequency domain. Q values~center frequency divided bybandwidth! for the modulation filters are typically assumeto be 1–2 ~Dau et al., 1997a, b; Ewert and Dau, 2000Lorenzi et al., 2001b; Ewertet al., 2002; Sek and Moore2002!. To maximize the likelihood that subjects could peform the task, we decided to use a simple three-componmodulator, with relatively wide frequency spacing betwethe components. We assessed whether subjects couldout the central component of this complex modulator.chose to use a 4-kHz sinusoidal carrier rather than a broband noise carrier, as there is evidence that the inherenttuations in a noise carrier can limit the ability to detect adiscriminate imposed modulation~Dau et al., 1997a, b; Ew-ert and Dau, 2000; Verhey, 2002!. To avoid any influence ofresolvable spectral sidebands~Zwicker, 1956; Schorer, 1986Sek and Moore, 1994; Kohlrauschet al., 2000; Moore and
2802 J. Acoust. Soc. Am., Vol. 113, No. 5, May 2003
17 May 2011 to 150.254.100.169. Redistribution subject to ASA license o
o
xt,
teeentfx
r--ards
sv-
ey.ns
s
h-
f-
-
ntneared-c-
Glasberg, 2001!, the highest modulation frequency used w190 Hz, which is less than one-half of ERBN at 4 kHz~Glas-berg and Moore, 1990!.
We designed the task so that subjects could not perfit by judging the mean rate of the complex modulator. Tdesign is illustrated schematically in Fig. 1. On each trithree modulated stimuli were presented. The modulatorthe first stimulus contained three components. Within a rthe frequencies of the outer two components were fixedthe frequency of the central~‘‘target’’ ! component, ftarget,was drawn randomly from one of five possible values: 889.4, 100, 111.8, and 125 Hz. In the example trial shownFig. 1, the target frequency is 111.8 Hz~solid line! and theflanking component frequencies are 10 and 190 Hz. Tmodulators of the second and third stimuli contained jussingle component. In one of these, selected at random,modulation frequency was equal to that of the target. Inother, the~‘‘comparison’’! modulation frequency, fcomp, wasrandomly selected from one of the four other possible valof the target. In the example trial shown in Fig. 1, the targfrequency occurs in the second stimulus~solid line! and thecomparison modulation frequency is 89.4 Hz~solid line inthird row!. Subjects were required to indicate whether tsecond or third stimulus contained a modulation componthat was present in the first stimulus. Feedback was proviby lights on the response box indicating the correct intervSubjects were seated in a double-walled sound-attenuachamber.
The results were analyzed in terms of the ratio betweftarget and fcomp, taking as the numerator whichever of thetwo was the larger. The smallest ratio was equal to 1.1This was chosen as it is somewhat larger than the thresfor detection of a change in modulation frequency of a sinsoidal carrier~Lemanskaet al., 2002! ~although Lemanska
FIG. 1. Schematic illustration of the task and stimuli used in experimenThe top row shows the spectrum of the three-component modulatorsented in the first interval, with~in this example! flanking components at 10and 190 Hz. The inner target component could have one of five possfrequencies, selected at random on each trial, indicated by the five ilines ~four dashed and one solid!. The solid line indicates the target frequency for one specific trial (f4 , equal to 111.8 Hz!. The second and thirdrows show the possible frequencies for the single modulator componpresented in the second and third intervals. In this example, the targequency occurred in the second interval and the comparison frequenc2
~89.4 Hz! occurred in the third interval. On each trial, the target occurrrandomly in interval two or interval three. The frequency of the compariscomponent was selected randomly from the four possible values for etarget frequency.
A. Sek and B. C. J. Moore: Testing the modulation filter bank
r copyright; see http://asadl.org/journals/doc/ASALIB-home/info/terms.jsp

er
nh
s
rog
e.
r-kHtoseenrle
rsdtioso
eha
tra
ded
d
n-hp
oroct
ed
doan
o-em
ndngonnd
terAn;
edz.
elESncyf-
ofe, 80and
o-nentm-ingultsb-An;
of
thesonach
howsd in
Downloaded
et al.used a modulation index of 0.5, while we used an indof 0.33 for each component!. Clearly, if subjects cannot heathe difference between ftarget and fcomp when presented inisolation, they will be unable to perform the task. A rustarted with five trials using the easiest condition, with tlargest ratio of ftarget and fcomp. Scores for these initial fivetrials were discarded. Then each possible value of ftarget waspaired with each possible value of fcomp two times, giving atotal of 40 scored trials per run. Data presented are the reof at least 10 runs per subject~more usually, 13–15 runs!.
B. Stimuli
Stimuli were generated using a Tucker-Davis array pcessor~TDT-AP2! in a host PC, and a 16-bit digital to analoconverter~TDT-DD1! operating at a 50-kHz sampling ratThe stimuli were attenuated~TDT-PA4! and sent through anoutput amplifier ~TDT-HB6! to a Sennheiser HD580 eaphone. Only one ear was tested for each subject. The 4-sinusoidal carrier had a level of 70 dB SPL. Each modulacomponent had a modulation index of 0.33. This was choso as to avoid over-modulation of the three-componmodulator, while ensuring that the modulation was cleaaudible. The starting phase of each modulator componwas chosen randomly for each and every stimulus.
On each trial, the carrier was presented in three buseparated by silent intervals of 400 ms. Each burst ha20-ms raised-cosine rise and fall, and an overall dura~including rise/fall times! of 1000 ms. The modulation waapplied during the whole of the carrier. The flanking compnent frequencies are given in Sec. II D.
C. Subjects
Five subjects were tested in all, although only thrcompleted all conditions. One subject was author AS. Tother subjects were paid for their services. All subjects habsolute thresholds less than 20 dB HL at all audiomefrequencies and had no history of hearing disorders. All hextensive previous experience in tasks similar to thatscribed above; these tasks were variations on the designscribed here that were tried before the final design wascided.
D. Results
In our first condition, the flanking component frequecies were as illustrated in Fig. 1, namely 10 and 190 Hz. Tindividual results for the five subjects are shown in the toleft panel of Fig. 2. For the smallest ratio of ftargetand fcomp,scores are close to the chance level of 50%. However, scincrease as the ratio increases, and for a ratio of 1.56 scrange from about 77% to 90%. A one-way within-subjeanalysis of variance~ANOVA ! was conducted on thearcsine-transformed percent correct scores. This showsignificant effect of frequency ratio;F(3,12)537.28, p,0.001. This suggests an ability to hear out the target molation in the complex modulator when the flanking compnents are widely spaced in frequency from the target,when ftarget and fcomp differ sufficiently.
J. Acoust. Soc. Am., Vol. 113, No. 5, May 2003
17 May 2011 to 150.254.100.169. Redistribution subject to ASA license o
x
e
ult
-
zrnt
ynt
tsan
-
eedicd-e-
e-
e-
esress
a
u--d
We next tried moving the flanking modulator compnents closer to the target component, while keeping thsymmetrically placed~on a linear frequency scale! aroundthe frequency of the central target component~100 Hz!. Theflanking component frequencies were~1! 30 and 170 Hz and~2! 50 and 150 Hz. Results are shown in the top-right abottom-left panels of Fig. 2, respectively. For the flankimodulator frequencies of 30 and 170 Hz, performance,average, is a little worse than for the frequencies of 10 a190 Hz, although subject AS actually showed slightly betperformance for the 30- and 170-Hz frequencies.ANOVA showed a significant effect of frequency ratioF(3,12)516.04, p,0.001. Only three subjects were testusing the flanking modulator frequencies of 50 and 150 HTwo ~AW and AS! performed very close to the chance levof 50%; they were unable to perform the task. Subjectachieved scores of about 65% for the three larger frequeratios. An ANOVA showed that there was no significant efect of frequency ratio;F(3,6)51.2, p50.385. The findingthat performance did not improve with increasing ratioftarget and fcomp may be partly due to the fact that, for thlargest ratio, the lowest and highest target frequenciesand 125 Hz, approached the frequencies of the lowerhigher flanking components, respectively.
In the conditions described so far, the flanking compnents were equally spaced from the central target compoon a linear frequency scale. In the final condition, the coponents were equally spaced on a logarithmic scale; flankcomponent frequencies were 52.6 and 190 Hz. The resare shown in the bottom-right panel of Fig. 2. All three sujects tested showed close to chance performance.ANOVA showed no significant effect of frequency ratioF(3,6)50.24,p50.866.
Comparing across conditions, for the largest ratio
FIG. 2. Results of experiment 1. The percent correct identification oftarget is plotted as a function of the ratio of the target and comparifrequencies, using as numerator whichever of the two was the larger. Esymbol denotes one subject, as indicated in the key. Each panel sresults for a specific pair of flanking component frequencies, as indicatethe key.
2803A. Sek and B. C. J. Moore: Testing the modulation filter bank
r copyright; see http://asadl.org/journals/doc/ASALIB-home/info/terms.jsp
en
frerfomternth
mit
ee
eln
thitthn
el
bithrw
tethbde
ctae,cioinininiacunencye
ie30
tornce
,to
ctslex
atlexly
eex-
dio-for
-ce
asnentio-igh-
tterted
heuld00
ofla-;
velatoridth
po-d,po-the
fthe
desMla-at
he
Downloaded
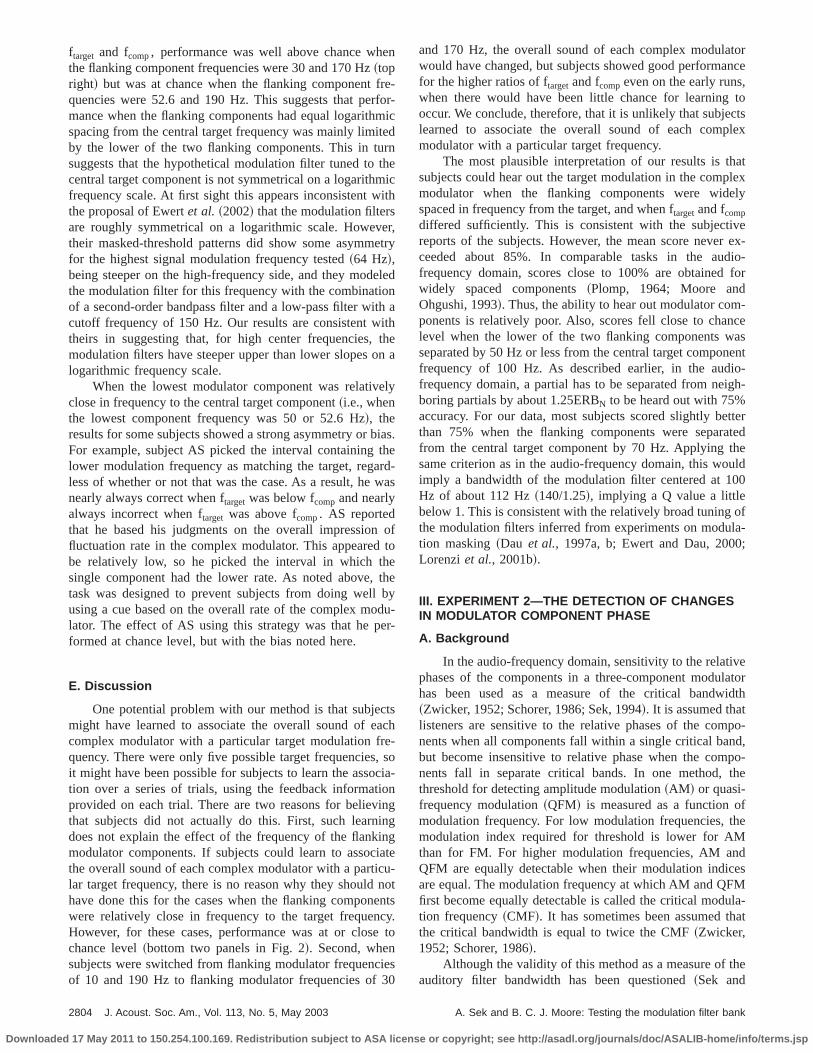
ftarget and fcomp, performance was well above chance whthe flanking component frequencies were 30 and 170 Hz~topright! but was at chance when the flanking componentquencies were 52.6 and 190 Hz. This suggests that pemance when the flanking components had equal logarithspacing from the central target frequency was mainly limiby the lower of the two flanking components. This in tusuggests that the hypothetical modulation filter tuned tocentral target component is not symmetrical on a logarithfrequency scale. At first sight this appears inconsistent wthe proposal of Ewertet al. ~2002! that the modulation filtersare roughly symmetrical on a logarithmic scale. Howevtheir masked-threshold patterns did show some asymmfor the highest signal modulation frequency tested~64 Hz!,being steeper on the high-frequency side, and they modthe modulation filter for this frequency with the combinatioof a second-order bandpass filter and a low-pass filter wicutoff frequency of 150 Hz. Our results are consistent wtheirs in suggesting that, for high center frequencies,modulation filters have steeper upper than lower slopes ologarithmic frequency scale.
When the lowest modulator component was relativclose in frequency to the central target component~i.e., whenthe lowest component frequency was 50 or 52.6 Hz!, theresults for some subjects showed a strong asymmetry orFor example, subject AS picked the interval containinglower modulation frequency as matching the target, regaless of whether or not that was the case. As a result, henearly always correct when ftargetwas below fcomp and nearlyalways incorrect when ftarget was above fcomp. AS reportedthat he based his judgments on the overall impressionfluctuation rate in the complex modulator. This appearedbe relatively low, so he picked the interval in which thsingle component had the lower rate. As noted above,task was designed to prevent subjects from doing wellusing a cue based on the overall rate of the complex molator. The effect of AS using this strategy was that he pformed at chance level, but with the bias noted here.
E. Discussion
One potential problem with our method is that subjemight have learned to associate the overall sound of ecomplex modulator with a particular target modulation frquency. There were only five possible target frequenciesit might have been possible for subjects to learn the assotion over a series of trials, using the feedback informatprovided on each trial. There are two reasons for believthat subjects did not actually do this. First, such learndoes not explain the effect of the frequency of the flankmodulator components. If subjects could learn to assocthe overall sound of each complex modulator with a partilar target frequency, there is no reason why they shouldhave done this for the cases when the flanking componwere relatively close in frequency to the target frequenHowever, for these cases, performance was at or closchance level~bottom two panels in Fig. 2!. Second, whensubjects were switched from flanking modulator frequencof 10 and 190 Hz to flanking modulator frequencies of
2804 J. Acoust. Soc. Am., Vol. 113, No. 5, May 2003
17 May 2011 to 150.254.100.169. Redistribution subject to ASA license o
-r-icd
eich
r,try
ed
ahea
y
as.ed-as
ofo
eyu-r-
sch-soia-ngggte-otts.to
s
and 170 Hz, the overall sound of each complex modulawould have changed, but subjects showed good performafor the higher ratios of ftargetand fcompeven on the early runswhen there would have been little chance for learningoccur. We conclude, therefore, that it is unlikely that subjelearned to associate the overall sound of each compmodulator with a particular target frequency.
The most plausible interpretation of our results is thsubjects could hear out the target modulation in the compmodulator when the flanking components were widespaced in frequency from the target, and when ftargetand fcomp
differed sufficiently. This is consistent with the subjectivreports of the subjects. However, the mean score neverceeded about 85%. In comparable tasks in the aufrequency domain, scores close to 100% are obtainedwidely spaced components~Plomp, 1964; Moore andOhgushi, 1993!. Thus, the ability to hear out modulator components is relatively poor. Also, scores fell close to chanlevel when the lower of the two flanking components wseparated by 50 Hz or less from the central target compofrequency of 100 Hz. As described earlier, in the audfrequency domain, a partial has to be separated from neboring partials by about 1.25ERBN to be heard out with 75%accuracy. For our data, most subjects scored slightly bethan 75% when the flanking components were separafrom the central target component by 70 Hz. Applying tsame criterion as in the audio-frequency domain, this woimply a bandwidth of the modulation filter centered at 1Hz of about 112 Hz~140/1.25!, implying a Q value a littlebelow 1. This is consistent with the relatively broad tuningthe modulation filters inferred from experiments on modution masking~Dau et al., 1997a, b; Ewert and Dau, 2000Lorenzi et al., 2001b!.
III. EXPERIMENT 2—THE DETECTION OF CHANGESIN MODULATOR COMPONENT PHASE
A. Background
In the audio-frequency domain, sensitivity to the relatiphases of the components in a three-component moduhas been used as a measure of the critical bandw~Zwicker, 1952; Schorer, 1986; Sek, 1994!. It is assumed thatlisteners are sensitive to the relative phases of the comnents when all components fall within a single critical banbut become insensitive to relative phase when the comnents fall in separate critical bands. In one method,threshold for detecting amplitude modulation~AM ! or quasi-frequency modulation~QFM! is measured as a function omodulation frequency. For low modulation frequencies,modulation index required for threshold is lower for AMthan for FM. For higher modulation frequencies, AM anQFM are equally detectable when their modulation indicare equal. The modulation frequency at which AM and QFfirst become equally detectable is called the critical modution frequency~CMF!. It has sometimes been assumed ththe critical bandwidth is equal to twice the CMF~Zwicker,1952; Schorer, 1986!.
Although the validity of this method as a measure of tauditory filter bandwidth has been questioned~Sek and
A. Sek and B. C. J. Moore: Testing the modulation filter bank
r copyright; see http://asadl.org/journals/doc/ASALIB-home/info/terms.jsp

ta
nnc
u-d
ong
itMla
ci
antwfluFn
3
-ma
cy
alPe3
etratw
icdenio
retivpathnceiv
ty
ory
ctse
ec-can-esSekrlieref-n ofof
hes,
theted
ofgofjectsthesh-ftheor-. Tof thetheied
ex-pli-orsne
Theu-
left
theby
-ig.ased ao-
nst of
sent
Downloaded
Moore, 1994; Moore, 2003!, it is generally accepted thahuman listeners are more sensitive to within-channel phchanges than to across-channel phase changes~Patterson,1987; Uppenkampet al., 2001; Moore, 2003!. Hence,changes in phase sensitivity with changes in the frequespacing of the components probably do reflect the influeof the frequency selectivity of the auditory system.
In the modulation domain, the effect of relative modlator phase has been assessed in only a few previous stuand these mostly involved ‘‘modulation masking’’~detectionof signal modulation in the presence of masker modulati!rather than a direct measure of the ability to detect chanin relative modulator phase. Bacon and Grantham~1989!measured thresholds for detecting sinusoidal AM of a whnoise carrier in the presence of a second sinusoidal Aacting as a modulation masker. They found no effect of retive phase using masker and signal modulation frequenof 6 and 4 Hz, respectively. Strickland and Viemeister~1996!also examined modulation masking using a noise carriera sinusoidal masker and a sinusoidal signal. When thesinusoids had a frequency ratio of 2:1, thresholds were inenced by the relative phase of the masker and signal.example, when the masker frequency was twice the sigfrequency and the masker frequency was relatively low~32or 8 Hz!, thresholds tended to be lowest~best! when thestarting phase of the signal relative to the masker was 1or 225°.
Lorenziet al. ~1999! studied the effect of relative modulator phase for a two-component modulator when both coponents were clearly detectable. A white noise carrier wmodulated with the sum of two sinusoids with frequenratio 2:1~100, 200 and 150, 300! or 3:1 ~100, 300!. The taskwas to distinguish two stimuli in which the two sinusoidmodulators had either a fixed phase or a drifting phase.formance was good for the 2:1 ratio, but at chance for theratio.
Moore and Sek~2000! explored the effect of relativemodulator phase on the detection of a three-componmodulator applied to a 4-kHz sinusoidal carrier. The cenmodulator component had a frequency of 50 Hz, and theother components had frequencies of 5065, 10, 25, 40, or 45Hz. Thus, the modulator waveform was always periodEach modulator component had the same modulation inm. The relative phases of the components were chosegive a variety of modulation waveforms differing in the ratof maximum to minimum value~max-min! and in crest fac-tor. Modulation detection thresholds were measured by vaing m, using an adaptive two-interval forced-choice procdure. Thresholds were found to be independent of relamodulator phase and of the frequency spacing of the comnents. This experiment is analogous to experiments that hbeen performed in the frequency domain to measureCMF. However, the failure to find an effect of componefrequency spacing cannot be taken as disproof of the conof the MFB, since the listeners were insensitive to relatcomponent phase even for closely spaced components.
Moore and Sek~2000! and other researchers~Mooreet al., 1999a; Lorenziet al., 2001a, b! have suggested thathe internal representation of the envelopes of sounds ma
J. Acoust. Soc. Am., Vol. 113, No. 5, May 2003
17 May 2011 to 150.254.100.169. Redistribution subject to ASA license o
se
cye
ies,
es
e,-
es
do-
oral
5°
-s
r-:1
ntlo
.x,to
y--eo-vee
tpt
e
be
distorted by the presence of nonlinearities in the auditsystem, such as basilar-membrane compression~Rhode andRobles, 1974! and neural saturation and adaptation effe~Shofneret al., 1996!. These nonlinearities can result in thintroduction of components in the effective modulation sptrum that were not present in the stimulus itself, and theyalso result in differences in effective ‘‘internal’’ root-meansquare~rms! value of the modulator when the relative phasof the modulator components are changed. Moore and~2000! suggested that the phase effects found in some eastudies might be partly explained by such differences infective rms value; subjects may have used the impressiothe overall depth of modulation as a cue. The distortionthe modulator waveform produced by nonlinearities in tauditory system would be small for low modulation depthand this could explain the finding of Moore and Sek thatthreshold for detecting complex modulation was unaffecby the relative phases of the modulator components.
The present experiment used stimuli similar to thoseMoore and Sek~2000!. However, rather than measurinthresholds for detecting complex modulation as a functionmodulator component phase, we assessed whether subcould detect changes in relative modulator phase whenmodulation depth of each component was well above threold. As in Moore and Sek~2000!, the frequency spacing othe harmonically related components was varied to testprediction based on the concept of the MFB that perfmance would be better for closely spaced componentsassess whether subjects used the effective rms value omodulator as a cue, we included a condition wheremodulation depth of all components was randomly varfrom one stimulus to the next.
B. Stimuli
The equipment and earphone were the same as forperiment 1. Each modulator component was of equal amtude. Subjects were required to discriminate two modulatdiffering in the relative phases of their components. For omodulator, the starting phase was 0°~sine phase! for allmodulator components. We refer to this as 0-phase.waveforms for this modulator, for each spacing of the modlator components, are shown as the solid lines in thecolumn of Fig. 3~the right column will be explained later!.The waveforms have relatively high peak factors. Forother modulator, the lowest component was phase shifted180° orp radians~the other two components starting at 0°!.We refer to this asp-phase. The waveforms for this modulator are shown as the dotted lines in the left column of F3. They have lower peak factors than for the sine-phmodulator. The center component of the modulator hafrequency, fc , of 50 or 100 Hz. The spacing of the compnents was 5, 15, 25, 35, or 45 Hz, for the 50-Hz fc and 10,30, 50, 70, and 90 Hz for the 100-Hz fc .
On each trial, three stimuli were presented. Duratioand levels were the same as for experiment 1. In one seconditions, the modulation index,m, of each component wafixed at 0.2. In another condition, each modulator componhad the same value ofm, but the value ofm was randomlyvaried from one stimulus to the next, over a range of63 dB
2805A. Sek and B. C. J. Moore: Testing the modulation filter bank
r copyright; see http://asadl.org/journals/doc/ASALIB-home/info/terms.jsp

he
componein
Downloaded
FIG. 3. The left column shows waveforms of the three-component complex modulators used in experiment 2~without DC component! when the centerfrequency was 100 Hz. One modulator had components all with a starting phase of 0°~sine phase!. The waveforms for this modulator, for each spacing of tmodulator components, are shown as the solid lines. The other modulator had the phase of the lowest component shifted by 180° orp radians. The waveformsfor this modulator are shown as the dotted lines. The frequencies of the modulator components are given within each panel. The frequency of thentwhose phase was shifted is in parentheses. The right column shows the venelope~envelope of the envelope! corresponding to each modulation waveformthe left column.
affe
ier-se-the
in terms of 20 logm ~on a uniform scale in terms of logm);the value ofm varied between 0.1416 and 0.2825. This wdone to disrupt a possible cue based on differences in etive rms value of the modulator produced by the changerelative modulator phase.
2806 J. Acoust. Soc. Am., Vol. 113, No. 5, May 2003
17 May 2011 to 150.254.100.169. Redistribution subject to ASA license o
sc-n
C. Procedure
A three-interval forced-choice task was used. Two intvals contained the 0-phase stimulus. The other interval,lected at random from the three intervals, contained
A. Sek and B. C. J. Moore: Testing the modulation filter bank
r copyright; see http://asadl.org/journals/doc/ASALIB-home/info/terms.jsp

tavto
elals,s
vea
g.
thatras
th
th-e
evS
rathmanthherhc
cy
or-tionper-ondu-cat-fec-hecing
is-
ine-lysis
ter
-cy
s
m-za-gs
ela-m-ef-leto
wasissere
c-on-;
e is
r-in
pro-ed
res-putuere
rethntcybth
Downloaded
p-phase stimulus. The task of the subject was to selectinterval that was different from the other two. Feedback wgiven via lights on the response box. A run started with fitrials using the smallest frequency spacing of the modulacomponents; pilot trials indicated that performance was rtively good for this spacing. Then, in successive triastimuli with each frequency spacing were presented onceascending order. This sequence was repeated ten timegive a total of 55 trials per run. Results from the first fitrials of each run were discarded. For each subject, emodulator center frequency, and each condition~fixed or ran-domized modulation depth!, 20 runs were obtained, givin200 judgments for each frequency spacing and condition
D. Subjects
Five subjects were tested. One was author AS. The ofour subjects were paid for their services. All subjects habsolute thresholds less than 20 dB HL at all audiomefrequencies and had no history of hearing disorders. All hprevious experience in psychoacoustic tasks including tasimilar to the present one.
E. Results
The results were very similar across subjects, andmean results are shown in Fig. 4. Error bars show6 onestandard error~SE! across subjects. For the condition wifixed modulation depth~open squares!, performance was reasonably good~80% to 95%! for frequency spacings of thmodulator components up to 0.5fc , but worsened when thefrequency spacing was increased beyond that. However,for the largest spacing used, the means are more than 2above the chance level of 33%. These results are geneconsistent with the pattern that would be expected onbasis of a MFB; subjects may be sensitive to modulator coponent phase when all components fall within the passbof one modulation filter, and become less sensitive whenoverall spacing of the components exceeds the bandwidtthe modulation filter tuned to the central component. Intpreted in this way, the results suggest that the bandwidtthe modulation filters slightly exceeds the center frequen
FIG. 4. Mean results of five subjects for experiment 2. The percent corin the three-alternative forced-choice task is plotted as a function offrequency spacing of the flanking modulator components from the cecomponent. The left and right panels shows results when the frequenthe center modulator component was 50 and 100 Hz, respectively. Errorshow 6 one standard error across subjects. They are omitted whenwould be smaller than the symbol used to represent a point.
J. Acoust. Soc. Am., Vol. 113, No. 5, May 2003
17 May 2011 to 150.254.100.169. Redistribution subject to ASA license o
heser-
,into
ch
erdicdks
e
enEsllye-deof-ofy,
i.e., the Q value is a little less than 1. Such a Q value wasalso suggested by the results of experiment 1.
The randomization of modulation depth~filled squares!produced a small impairment of performance for frequenspacings of the modulator components up to 0.5fc , but hadlittle or no effect for greater spacings. The fact that perfmance remained relatively good even when the moduladepth was randomized suggests that the task could beformed when the effective internal depth of the modulatiwas not a reliable cue. The fact that randomization of molation depth had some effect could be interpreted as indiing that subjects did use a cue related to differences in eftive rms level for the two phase conditions, when tmodulation depth was not randomized and when the spaof the modulator components was<0.5fc . However, itmight also be the case that the randomization simply dtracted subjects to some extent.
To assess the significance of these effects, the arcstransformed data were subjected to a within-subjects anaof variance with factors modulator center frequency~50 or100 Hz!, spacing of the components relative to the cenfrequency ~five values!, and randomization of modulationdepth ~absent or present!. The main effect of center frequency was not significant. The main effect of frequenspacing of the components was significant;F(4,16)591.97, p,0.001. The main effect of randomization waalso significant;F(1,4)510.2, p50.031. Finally, the inter-action of randomization and frequency spacing of the coponents was significant, reflecting the fact that randomition of the modulation depth had an effect for small spacinbut not for large spacings;F(4,16)513.58,p,0.001.
F. Discussion
As noted above, the fact that performance remained rtively good even when the modulation depth was randoized suggests that the task could be performed when thefective internal depth of the modulation was not a reliabcue. However, to be confident of this conclusion we needassess whether the randomization of modulation depthsufficient to effectively prevent the use of such a cue. Itdifficult to give a definite answer to this question, becauthe nature of the nonlinearities involved is uncertain. Mooet al. ~1999a! proposed that the main nonlinearity influening the perception of modulation was the compressive nlinearity on the basilar membrane~Rhode and Robles, 1974Sellick et al., 1982; Robleset al., 1986!, but other nonlin-earities may well be involved~Shofneret al., 1996; Mooreand Sek, 2000! and the data of Verheyet al. ~2002! suggestthat a nonlinearity other than that on the basilar membrandominant.
To get some idea of the likely size of changes in ‘‘intenal’’ rms value of the modulation produced by the changesmodulator component phase, relative to the changesduced by the randomization of modulation depth, we usthe simple model described by Mooreet al. ~1998, 1999b!.The envelopes of the stimuli were passed through a compsive nonlinearity, resembling the compressive input–outfunction of the basilar membrane. We do not want to argthat this is the only nonlinearity involved. We use it he
cteerof
arsey
2807A. Sek and B. C. J. Moore: Testing the modulation filter bank
r copyright; see http://asadl.org/journals/doc/ASALIB-home/info/terms.jsp

bg
thto
thth
intheth
to6o
tcoorrmeget itooed
orh
thopero
zghb
egulpoompr
he
inion
vere-
atorlue
icee-sta-thein
e in.960
hereby
hek-
ingnot
thets:ac-
heeenthe
m-
ltsthe
du-ttheom-
heusec-hycingce ifas
nve-yne-viaeylyti-c-
Downloaded
merely to illustrate the magnitudes of the effects producedthis form of nonlinearity. The nonlinearity had the followinform:
Lout50.9L in16153~12~1/~11exp~20.05~L in250!!!!!,~1!
whereL in is the input level in dB andLout is the output levelin dB; see Fig. 4 in Mooreet al. ~1999b!. This function isbased on an equation suggested by Oxenham~1995!, andused subsequently by Mooreet al. ~1996! and by Oxenhamand Moore~1997!.
For the complex modulators used in our experiment,effect of modulator phase on the rms value of the modulaat the output of the nonlinearity was small. Form50.2, theoutput rms value was between 0.094 34 and 0.094 55 for0-phase stimuli, and between 0.093 54 and 0.093 70 forp-phase stimuli. In comparison, the effects of changmodulation depth were much larger. At the top end ofrange of randomization (m50.2825), the output rms valuwas around 0.1364 for the 0-phase stimuli and 0.1340 forp-phase stimuli. The corresponding numbers at the botend of the range of randomization were 0.0662 and 0.06We conclude that, in terms of output rms value, the rangerandomization was about 106 times as large as the effecthe change in component phase. This means that, in thedition with randomization of modulation depth, any cue fphase discrimination based on a change in effectivevalue of the modulation would have been rendered inefftive. Of course, other nonlinearities might produce a lareffect of component phase on effective rms value. But idifficult to envisage any nonlinearity that would leadchanges in rms value of the modulation comparable to thproduced by the randomization of modulation depth. Givthat the effect of the randomization was small, we concluthat, when randomization was used, subjects did not perfthe task using a cue based on the effective internal deptthe modulation.
Another possible cue introduced by nonlinearities inauditory system is a distortion component at the envelrate of the modulation. Such a distortion component has bproposed as an explanation for modulation masking pduced by two-component ‘‘beating’’ modulators~Mooreet al., 1999a; Verheyet al., 2002! and by ‘‘second-order’’modulation~Lorenziet al., 2001a, b; Ewertet al., 2002; Ver-hey et al., 2002!. For example, for fc550 Hz and a fre-quency spacing of the components of 15 Hz~i.e., compo-nents at 35, 50, and 65 Hz!, a distortion component at 15 Hmight be produced. The strength of this component mivary with the phase of the components, and this couldused as a cue to discriminate the phase changes~possibly,mediated via analysis with an MFB!. However, in several ofthe conditions of our experiment, the use of such a cue seunlikely. For example, for fc550 Hz and a frequency spacinof the components of 25 Hz, the distortion component wohave fallen at 25 Hz, and therefore coincided with a comnent that was already present. Given that the distortion cponent appears to be weak in amplitude relative to themaries ~Shofner et al., 1996; Moore et al., 1999a!, it isunlikely that the change in effective modulation depth of t
2808 J. Acoust. Soc. Am., Vol. 113, No. 5, May 2003
17 May 2011 to 150.254.100.169. Redistribution subject to ASA license o
y
er
ee
ge
em0.fofn-
sc-rs
senemof
ee
en-
te
ms
d--
i-
25-Hz modulator component would provide a useful cuethe phase discrimination task, especially in the conditwhere the modulation depth was randomized.
It is of interest to consider what cue subjects might haused to perform the phase discrimination task. Somesearchers have proposed that the discrimination of modulwaveforms may be based on the ratio of the maximum vato the minimum value of the modulator~max-min! ~Forrestand Green, 1987; Strickland and Viemeister, 1996!, althoughMoore and Sek~2000! found that such a decision statistcould not account for their results on the detection of thrcomponent modulators. To assess whether the max-mintistic could account for the present results, we calculatedmax-min value for each of the modulator waveforms usedour experiment. For the cases where all components wersine phase, the max-min value was between 3.939 and 3for all component spacings except 0.5fc . For this specificcase, the max-min value was only 2.999. For the cases wthe phase of the lowest modulator component was shifted180°, the max-min value varied from 2.565 to 2.615. Tdifferencein max-min value for the two phases was maredly smaller for the spacing of 0.5fc than for all other spac-ings. However, performance was not worse for this spacthan for the smaller spacings. This pattern of results canbe accounted for using the max-min statistic. Use ofmax-min statistic also fails to account for two other effec~1! the worsening of performance when the frequency sping of the components was increased above 0.5fc , and ~2!randomization of modulation depth from one stimulus to tnext had only a small effect. Other statistics that have bsuggested in the literature, such as the crest factor orskewness of the modulator~Lorenziet al., 1999!, also fail toaccount for the effect of the frequency spacing of the coponents.
The most straightforward explanation of our resuseems to be that subjects are sensitive to changes inshape of the modulator waveform at the output of the molation filter centered on~or close to! the central componenof the modulator. This shape would be influenced byrelative phase of the components. When the modulator cponents are widely spaced~spacing greater than 0.5fc), theyinteract less at the output of the modulation filter, so tsensitivity to modulator phase is reduced. However, becaof the broad tuning of the modulation filters, some interation occurs even for wide spacings. This can explain wperformance remained above chance for the largest spaused. It was not possible to use much larger spacings, sinthe spacing exceeds fc , one of the modulator components ha negative frequency.
Ewert et al. ~2002! and Verheyet al. ~2002! have pro-posed that the auditory system somehow derives the elope of the~ac-coupled! envelope of modulated signals. Thereferred to this as the ‘‘venelope.’’ They assumed that velope extraction occurs either in parallel with processingthe MFB or prior to the MFB. For modeling purposes, thcalculated the venelope as the absolute value of the anacal signal derived using the Hilbert transform of the acoupled envelope of the stimulus~Bracewell, 1986!. To
A. Sek and B. C. J. Moore: Testing the modulation filter bank
r copyright; see http://asadl.org/journals/doc/ASALIB-home/info/terms.jsp

acdmo
.6
na
itiv-tor anmni
pr
porlothhhgai
t,thnc
tethta
dulod
th
thla
thi
hiranas
ex
eeda
enth
fre-eret ofese-ter-
at ite-
ilitynt
s inpe,o
buthenthe
m-fre-
-onsthe. Itla-theon-ctsest50,on-
o-te-ourofthe
theitheregesu-or.not
e asnentub-ificas
undralto
gni-
Downloaded
evaluate the venelope concept we used the same approFor our three-component modulators, the venelope
pends on the relative phase with which the modulator coponents are added. This is illustrated in the right columnFig. 3. For all of the 0-phase stimuli~solid lines in the rightcolumn of Fig. 3!, the venelope had a maximum value of 0and a minimum value of 0. For thep-phase stimuli~dottedlines!, the maximum of the venelope was always 0.447 athe minimum was 0.2. Thus, changes in the venelope peto-valley ratio could provide the basis for the phase sensity shown in experiment 2. However, the change in peakvalley ratio produced by the phase shift was the same fospacings of the components, while performance worsewith increasing frequency separation of the modulator coponents. We can conclude either that performance wasbased on the change in venelope peak-to-valley ratio wchanging phase, or that venelope extraction occurs aftercessing via the MFB.
Changing the relative phase of the modulator comnents also changed the time pattern of the venelope. Fospacings of the components, changing the phase of theest component from 0° to 180° resulted in a doubling ofnumber of major peaks per second in the venelope. Tdoubling might have been used to detect the phase sHowever, the doubling occurred for all component spacinbut performance worsened with increasing spacing. Agwe conclude either that performance was not based onchange in venelope fluctuation rate with changing phasethat venelope extraction occurs after processing viaMFB. A possible counter-argument here is that performamay have worsened with component spacing becauseauditory system has difficulty in following rapid venelopfluctuations. However, performance was good whenmodulator components were at 50, 100, and 150 Hz, andvenelope had 50 major peaks per second for the 0-phstimuli and 100 major peaks per second for thep-phasestimuli. In contrast, performance was poor when the molator components were at 15, 50 and 85 Hz and the venehad 35 major peaks per second for the 0-phase stimuli anmajor peaks per second for thep-phase stimuli. Thus therapidity of venelope fluctuations does not seem to becritical factor.
If venelope extraction occurs after processing byMFB, then increasing the frequency spacing of the modutor components would result in a reduced amplitude ofextracted venelope, as the modulator components wouldteract less at the output of any single modulation filter. Tmight make it harder to detect changes in peak-to-valleytio or fluctuation rate of the venelope, which would accoufor the decrease in discrimination performance with increing spacing of the components.
Although our data are not consistent with venelopetraction prior to the MFB, the data of Mooreet al. ~1999a!and Verheyet al. ~2002! cannot be explained in terms of thvenelope concept unless it is assumed that the venelopextracted prior to or in parallel with the MFB. They showethat the detectability of low-frequency probe modulation waffected by higher-frequency ‘‘beating’’ modulators, evwhen the beating modulators were centered well above
J. Acoust. Soc. Am., Vol. 113, No. 5, May 2003
17 May 2011 to 150.254.100.169. Redistribution subject to ASA license o
h.e--f
dk---ll
ed-ot
tho-
-allw-eisift.s,n,heoreehe
ehese
-pe70
e
e-en-s-
t-
-
is
s
e
passband of the modulation filter centered at the probequency. If the venelope is extracted only after the MFB, thseems to be no reason why the venelope at the outpumodulation filters tuned to high modulation frequencishould influence the detectability of modulation at a low frquency, unless there is an across-modulation-channel inference process. Ewertet al. ~2002! discussed the possibilityof such an across-channel process, and suggested thmight provide an alternative way of accounting for their rsults.
It is of interest that Moore and Sek~2000! failed to findan effect of modulator component phase on the detectabof modulation, using stimuli similar to those of the preseexperiment. Possibly, it is much harder to hear differencethe shape of the modulator waveform, or in the venelowhen the modulation is close to threshold. Alternatively, twmodulators may sound different when close to threshold,may nevertheless have the same detection threshold wthe threshold is expressed in terms of the rms value ofmodulator.
For the largest frequency spacing of the modulator coponents, the lowest component of the modulator had aquency of 5 Hz~for a center frequency of 50 Hz! or 10 Hz~for a center frequency of 100 Hz!. For these low modulationrates, the model of Dauet al. ~1997a, 1997b! preserves sensitivity to modulator phase at the output of the modulatifilter. Indeed, Dau~1996! showed that, for modulation rateup to about 10 Hz, subjects could discriminate changes instarting phase of sinusoidal modulation of a 5-kHz carrieris possible that, for large frequency spacings of the modutor components, subjects performed our task by judgingphase of the lowest modulator component relative to theset of the sound. However, it seems unlikely that subjewould have been sensitive to the onset phase of the lowcomponent when the frequency of that component was70, or 90 Hz, yet performance was very good for those cditions ~see the right panel of Fig. 4!.
Finally, we consider whether models of modulation prcessing based on a low-pass filter or sliding temporal ingrator, as described in the Introduction, can account forresults. It appears to us difficult to account for the resultsexperiment 1 using such models. The temporal pattern atoutput of a sliding temporal integrator in response tothree-component modulator would change somewhat wchanges in the frequency of the target component, but thwould be no obvious way for the subject to use such chanto identify which of the comparison single-component modlators was contained within a specific complex modulatRecall that the task was designed so that subjects couldachieve high scores by using the average modulation rata cue. Recall also that the starting phase of each compowas varied randomly from one stimulus to the next, so sjects could not perform the task by learning that a spectime pattern at the output of the temporal integrator wassociated with a specific target frequency.
To assess whether the pattern of phase sensitivity foin experiment 2 could be explained using a sliding tempointegrator, the envelopes of the stimuli were first subjectedcompression, by raising the instantaneous envelope ma
2809A. Sek and B. C. J. Moore: Testing the modulation filter bank
r copyright; see http://asadl.org/journals/doc/ASALIB-home/info/terms.jsp

-ue
lyeth
inte
cy
rf
valadthdorto
ina
th
eeeie
e-frtlwro
on
inefre
rpaa
a-ththwoorera
re-n the
-x
enthe
byaner-nd
’’
ar-
ra-
arri-
-
l
oc.
c-
inu-
.,s
nd
Downloaded
tude to the power 0.5~to simulate basilar-membrane compression!, and then passing the compressed envelope throa sliding temporal integrator with the characteristics dscribed by Oxenham and Moore~1994!. The root-mean-square ~rms! output of the integrator was consistentslightly greater forp-phase stimuli than for the 0-phasstimuli, so a conceivable cue was the ratio of outputs fortwo phases. However, the ratio of rms values for thep-phaseand 0-phase stimuli did not change with frequency spacof the modulator components in a way that was consiswith the data. For both modulation center frequencies~50and 100 Hz!, the ratio was smaller for the middle frequenseparation~25 Hz at 50 Hz and 50 Hz at 100 Hz! than forany other separations, whereas the data showed good pemance at the middle separation and poorer performancegreater separations. Also, the use of a cue based on rmswould have been disrupted by the randomization of modution depth, but little effect of this randomization was founWe conclude that the effect of frequency separation ofcomponents on phase discrimination cannot be explaineterms of the rms output of the sliding temporal integratOther measures of the output of the temporal integra~standard deviation and peak-to-valley ratio! also failed toaccount for the observed effects.
IV. CONCLUSIONS
We have described two experiments aimed at providtests of the concept that the auditory system containsMFB. Both experiments were analogous to experimentsthe audio-frequency domain that are thought to reflectfiltering that occurs in the auditory periphery.
Experiment 1 examined the ability to ‘‘hear out’’ thmodulation frequency of the central component of a thrcomponent modulator applied to a 4-kHz sinusoidal carrSubjects showed some ability to perform the task~scores ofaround 80% correct!, when the components in the threcomponent modulator were widely spaced and when thequencies of the target and comparison differed sufficienScores fell close to chance level when the lower of the tflanking components was separated by 50 Hz or less fthe central target component frequency of 100 Hz. Thisconsistent with the relatively broad tuning of the modulatifilters inferred from experiments on modulation masking
Experiment 2 examined the ability to hear a changethe relative phase of the components in a three-compomodulator with harmonically spaced components. Thequency of the central component, fc , was either 50 or 100Hz. Performance was good~80%–90% correct! when thecomponent spacing was<0.5fc , but worsened markedly fofrequency spacings greater than that. This is broadly thetern of results predicted from the MFB. Performance wonly slightly impaired by randomizing the overall modultion depth from one stimulus to the next. This suggestssubjects did not use the overall effective internal depth ofmodulation as a cue. We argue further that performanceprobably not based on detection/discrimination of a disttion product in the modulation domain. Nor was it basedthe use of statistics such as the max-min value, the cfactor of the modulation, or the output of a sliding tempo
2810 J. Acoust. Soc. Am., Vol. 113, No. 5, May 2003
17 May 2011 to 150.254.100.169. Redistribution subject to ASA license o
gh-
e
gnt
for-orlue-
.ein.r
gn
ine
-r.
e-y.omis
nnt-
t-s
ateasr-nstl
integrator. The most straightforward explanation of oursults seems to be that subjects are sensitive to changes ishape of the modulator waveform or the venelope~envelopeof the envelope! at the output of the modulation filter centered on~or close to! the central component of the complemodulator.
The results of both experiments are broadly consistwith what would be expected from a broadly tuned MFB; tQ value appears to be about 1, or slightly less than 1.
ACKNOWLEDGMENTS
This work was supported by the Wellcome Trust andthe MRC. We thank Hedwig Gockel, Torsten Dau andanonymous reviewer for helpful comments on an earlier vsion of this paper. We also thank Christian Lorenzi aChristian Fu¨llgrabe for helpful discussions.
Bacon, S. P., and Grantham, D. W.~1989!. ‘‘Modulation masking: effects ofmodulation frequency, depth and phase,’’ J. Acoust. Soc. Am.85, 2575–2580.
Bracewell, R. N. ~1986!. The Fourier Transform and its Applications~McGraw–Hill, New York!.
Dau, T. ~1996!. ‘‘Modeling auditory processing of amplitude modulation,Ph.D. thesis, University of Oldenburg, Germany.
Dau, T., Kollmeier, B., and Kohlrausch, A.~1997a!. ‘‘Modeling auditoryprocessing of amplitude modulation: I. Detection and masking with nrowband carriers,’’ J. Acoust. Soc. Am.102, 2892–2905.
Dau, T., Kollmeier, B., and Kohlrausch, A.~1997b!. ‘‘Modeling auditoryprocessing of amplitude modulation: II. Spectral and temporal integtion,’’ J. Acoust. Soc. Am.102, 2906–2919.
Dau, T., Verhey, J. L., and Kohlrausch, A.~1999!. ‘‘Intrinsic envelope fluc-tuations and modulation-detection thresholds for narrow-band noise cers,’’ J. Acoust. Soc. Am.106, 2752–2760.
Ewert, S. D., and Dau, T.~2000!. ‘‘Characterizing frequency selectivity forenvelope fluctuations,’’ J. Acoust. Soc. Am.108, 1181–1196.
Ewert, S. D., Verhey, J. L., and Dau, T.~2002!. ‘‘Spectro-temporal processing in the envelope-frequency domain,’’ J. Acoust. Soc. Am.112, 2921–2931.
Festen, J. M., and Plomp, R.~1981!. ‘‘Relations between auditory functionsin normal hearing,’’ J. Acoust. Soc. Am.70, 356–369.
Fine, P. A., and Moore, B. C. J.~1993!. ‘‘Frequency analysis and musicaability,’’ Music Percept.11, 39–53.
Forrest, T. G., and Green, D. M.~1987!. ‘‘Detection of partially filled gapsin noise and the temporal modulation transfer function,’’ J. Acoust. SAm. 82, 1933–1943.
Glasberg, B. R., and Moore, B. C. J.~1990!. ‘‘Derivation of auditory filtershapes from notched-noise data,’’ Hear. Res.47, 103–138.
Houtgast, T.~1989!. ‘‘Frequency selectivity in amplitude-modulation detetion,’’ J. Acoust. Soc. Am.85, 1676–1680.
Kohlrausch, A., Fassel, R., and Dau, T.~2000!. ‘‘The influence of carrierlevel and frequency on modulation and beat-detection thresholds for ssoidal carriers,’’ J. Acoust. Soc. Am.108, 723–734.
Lemanska, J., Skrodzka, E., and Sek, A.~2002!. ‘‘Discrimination of theamplitude modulation rate,’’ Arch. Acoust.27, 3–22.
Lorenzi, C., Berthommier, F., and Demany, L.~1999!. ‘‘Discrimination ofamplitude-modulation phase spectrum,’’ J. Acoust. Soc. Am.105, 2987–2990.
Lorenzi, C., Soares, C., and Vonner, T.~2001b!. ‘‘Second-order temporalmodulation transfer functions,’’ J. Acoust. Soc. Am.110, 1030–1038.
Lorenzi, C., Simpson, M. I., Millman, R. E., Griffiths, T. D., Woods, W. PRees, A.et al. ~2001a!. ‘‘Second-order modulation detection thresholdfor pure-tone and narrow-band noise carriers,’’ J. Acoust. Soc. Am.110,2470–2478.
Moore, B. C. J.~2003!. An Introduction to the Psychology of Hearing, 5thed. ~Academic, San Diego!.
Moore, B. C. J., and Glasberg, B. R.~2001!. ‘‘Temporal modulation transferfunctions obtained using sinusoidal carriers with normally hearing ahearing-impaired listeners,’’ J. Acoust. Soc. Am.110, 1067–1073.
A. Sek and B. C. J. Moore: Testing the modulation filter bank
r copyright; see http://asadl.org/journals/doc/ASALIB-home/info/terms.jsp

-u
us
pt-.
di
’ in
p-
m.
r
ons,
of
yJpn.
c.
-
w-
-
ps,’’
-
n
n-
Downloaded
Moore, B. C. J., and Ohgushi, K.~1993!. ‘‘Audibility of partials in inhar-monic complex tones,’’ J. Acoust. Soc. Am.93, 452–461.
Moore, B. C. J., and Sek, A.~2000!. ‘‘Effects of relative phase and frequency spacing on the detection of three-component amplitude modtion,’’ J. Acoust. Soc. Am.108, 2337–2344.
Moore, B. C. J., Peters, R. W., and Glasberg, B. R.~1996!. ‘‘Detection ofdecrements and increments in sinusoids at high overall levels,’’ J. AcoSoc. Am.99, 3669–3677.
Moore, B. C. J., Sek, A., and Glasberg, B. R.~1999a!. ‘‘Modulation maskingproduced by beating modulators,’’ J. Acoust. Soc. Am.106, 908–918.
Moore, B. C. J., Glasberg, B. R., Plack, C. J., and Biswas, A. K.~1988!.‘‘The shape of the ear’s temporal window,’’ J. Acoust. Soc. Am.83, 1102–1116.
Moore, B. C. J., Launer, S., Vickers, D., and Baer, T.~1998!. ‘‘Loudness ofmodulated sounds as a function of modulation rate, modulation demodulation waveform and overall level,’’ inPsychophysical and Physiological Advances in Hearing, edited by A. R. Palmer, A. Rees, A. QSummerfield, and R. Meddis~Whurr, London!.
Moore, B. C. J., Vickers, D. A., Baer, T., and Launer, S.~1999b!. ‘‘Factorsaffecting the loudness of modulated sounds,’’ J. Acoust. Soc. Am.105,2757–2772.
Oxenham, A. J.~1995!. ‘‘Psychophysical consequences of peripheral autory nonlinearity,’’ Ph.D. thesis, Cambridge.
Oxenham, A. J., and Moore, B. C. J.~1994!. ‘‘Modeling the additivity ofnonsimultaneous masking,’’ Hear. Res.80, 105–118.
Oxenham, A. J., and Moore, B. C. J.~1997!. ‘‘Modeling the effects ofperipheral nonlinearity in listeners with normal and impaired hearing,’Modeling Sensorineural Hearing Loss, edited by W. Jesteadt~Erlbaum,Mahwah, NJ!.
Patterson, R. D.~1987!. ‘‘A pulse ribbon model of monaural phase percetion,’’ J. Acoust. Soc. Am.82, 1560–1586.
Plack, C. J., and Moore, B. C. J.~1990!. ‘‘Temporal window shape as afunction of frequency and level,’’ J. Acoust. Soc. Am.87, 2178–2187.
Plomp, R.~1964!. ‘‘The ear as a frequency analyzer,’’ J. Acoust. Soc. A36, 1628–1636.
Plomp, R.~1976!. Aspects of Tone Sensation~Academic, London!.Plomp, R., and Mimpen, A. M.~1968!. ‘‘The ear as a frequency analyze
II,’’ J. Acoust. Soc. Am.43, 764–767.Rhode, W. S., and Robles, L.~1974!. ‘‘Evidence from Mossbauer experi-
J. Acoust. Soc. Am., Vol. 113, No. 5, May 2003
17 May 2011 to 150.254.100.169. Redistribution subject to ASA license o
la-
t.
h,
-
ments for non-linear vibration in the cochlea,’’ J. Acoust. Soc. Am.55,588–596.
Robles, L., Ruggero, M. A., and Rich, N. C.~1986!. ‘‘Basilar membranemechanics at the base of the chinchilla cochlea. I. Input-output functituning curves, and response phases,’’ J. Acoust. Soc. Am.80, 1364–1374.
Schorer, E.~1986!. ‘‘Critical modulation frequency based on detectionAM versus FM tones,’’ J. Acoust. Soc. Am.79, 1054–1057.
Sek, A. ~1994!. ‘‘Modulation thresholds and critical modulation frequencbased on random amplitude and frequency changes,’’ J. Acoust. Soc.~E! 15, 67–75.
Sek, A., and Moore, B. C. J.~1994!. ‘‘The critical modulation frequency andits relationship to auditory filtering at low frequencies,’’ J. Acoust. SoAm. 95, 2606–2615.
Sek, A., and Moore, B. C. J.~2002!. ‘‘Mechanisms of modulation gap detection,’’ J. Acoust. Soc. Am.111, 2783–2792.
Sellick, P. M., Patuzzi, R., and Johnstone, B. M.~1982!. ‘‘Measurement ofbasilar membrane motion in the guinea pig using the Mo¨ssbauer tech-nique,’’ J. Acoust. Soc. Am.72, 131–141.
Shofner, S., Sheft, S., and Guzman, S. J.~1996!. ‘‘Responses of ventralcochlear nucleus units in the chinchilla to amplitude modulation by lofrequency, two-tone complexes,’’ J. Acoust. Soc. Am.99, 3592–3605.
Soderquist, D. R.~1970!. ‘‘Frequency analysis and the critical band,’’ Psychon. Sci.21, 117–119.
Strickland, E. A., and Viemeister, N. F.~1996!. ‘‘Cues for discrimination ofenvelopes,’’ J. Acoust. Soc. Am.99, 3638–3646.
Uppenkamp, S., Fobel, S., and Patterson, R. D.~2001!. ‘‘The effects oftemporal asymmetry on the detection and perception of short chirHear. Res.158, 71–83.
Verhey, J. L.~2002!. ‘‘Modeling the influence of inherent envelope fluctuations in simultaneous masking experiments,’’ J. Acoust. Soc. Am.111,1018–1025.
Verhey, J. L., Ewert, S., and Dau, T.~2002!. ‘‘Modulation masking producedby complex tone modulators,’’ J. Acoust. Soc. Am.~submitted!.
Viemeister, N. F.~1979!. ‘‘Temporal modulation transfer functions based omodulation thresholds,’’ J. Acoust. Soc. Am.66, 1364–1380.
Zwicker, E. ~1952!. ‘‘Die Grenzen der Ho¨rbarkeit der Amplitudenmodula-tion und der Frequenzmodulation eines Tones,’’ Acustica2, 125–133.
Zwicker, E. ~1956!. ‘‘Die elementaren Grundlagen zur Bestimmung der Iformationskapazita¨t des Geho¨rs,’’ Acustica6, 356–381.
2811A. Sek and B. C. J. Moore: Testing the modulation filter bank
r copyright; see http://asadl.org/journals/doc/ASALIB-home/info/terms.jsp