Test of a distributed modelling approach to predict flood flows in the karst Suoimuoi catchment in...
10
Introduction Modelling of karst hydrology in a catchment has been less successful for hydrologists due to strong physical and geometrical heterogeneities of the karst aquifer, which cause complex hydraulic conditions and spatial and temporal variability of the model parameters. Generally, two processes, quick flow and slow flow, are apparent and control the characteristics of a karst stormflow hydrograph. After a storm, rapid and turbu- lent groundwater recharge and drainage occur primarily in large conduits through which a large amount of infiltrated water moves rapidly to a karst spring, while slow and predominantly laminar drainage occurs due to gradual emptying of pores, smaller fractures and fissures (Jukic and Jukic 2003). As pointed out by Labat et al. (2000), a karst aquifer can be thought as composed of three interacting systems: the soil forming the upper non-karst impluvium, followed by the infiltration zone to a few metres below the ground surface, which is composed of fine fractures where both unsaturated and saturated flow may occur, and finally, the low perma- nently saturated karst zone composed of a highly orga- nized and hierarchized drainage conduit system in connection with a network of secondary drains. The outlet of the conduit system is a spring. The open con- duit provides low resistance pathways for the subsurface flow, which often has more in common with surface water than with groundwater. Therefore, karst hydrol- ogy requires concepts of both surface water and groundwater hydrology (White 2002). In recent decades, progress has been made in the use of water budgets, tracer studies, hydrograph analysis and chemograph analysis for the characterization of karst aquifers. These have improved the understanding of karst properties, characteristics and evolution substantially. In general, three types of hydrological models can be divided in simulation of karst hydrology: Y. B. Liu O. Batelaan F. De Smedt N. T. Huong V. T. Tam Test of a distributed modelling approach to predict flood flows in the karst Suoimuoi catchment in Vietnam Received: 7 June 2005 Accepted: 15 June 2005 Published online: 20 September 2005 Ó Springer-Verlag 2005 Abstract The major obstacles for modelling flood processes in karst areas are a lack of understanding and model representations of the distinctive features and processes associated with runoff generation and often a paucity of field data. In this study, a distributed flood-mod- elling approach, WetSpa, is modified and applied to simulate the hydro- logical features and processes in the karst Suoimuoi catchment in north- west Vietnam. With input of topog- raphy, land use and soil types in a GIS format, the model is calibrated based on 15 months of hourly meteorological and hydrological data, and is used to simulate both fast surface and conduit flows, and groundwater discharges from karst and non-karst aquifers. Consider- able variability in the simulation accuracy is found among storm events and within the catchment. The simulation results show that the model is able to represent reasonably well the stormflows generated by rainfall events in the study catch- ment. Keywords Flood prediction WetSpa GIS Karst Suoimuoi catchment Vietnam Environ Geol (2005) 48: 931–940 DOI 10.1007/s00254-005-0031-1 ORIGINAL ARTICLE Y. B. Liu (&) O. Batelaan F. De Smedt Department of Hydrology and Hydraulic Engineering, Vrije Universiteit Brussel, Pleinlaan 2, 1050 Brussels, Belgium E-mail: [email protected] Tel.: +32-2-6293335 Fax: +32-2-6293022 N. T. Huong V. T. Tam Research Institute of Geology and Mineral Resources, Thanh Xuan, Hanoi, Vietnam
Transcript of Test of a distributed modelling approach to predict flood flows in the karst Suoimuoi catchment in...

Introduction
Modelling of karst hydrology in a catchment has beenless successful for hydrologists due to strong physicaland geometrical heterogeneities of the karst aquifer,which cause complex hydraulic conditions and spatialand temporal variability of the model parameters.Generally, two processes, quick flow and slow flow, areapparent and control the characteristics of a karststormflow hydrograph. After a storm, rapid and turbu-lent groundwater recharge and drainage occur primarilyin large conduits through which a large amount ofinfiltrated water moves rapidly to a karst spring, whileslow and predominantly laminar drainage occurs due togradual emptying of pores, smaller fractures and fissures(Jukic and Jukic 2003). As pointed out by Labat et al.(2000), a karst aquifer can be thought as composed ofthree interacting systems: the soil forming the uppernon-karst impluvium, followed by the infiltration zone
to a few metres below the ground surface, which iscomposed of fine fractures where both unsaturated andsaturated flow may occur, and finally, the low perma-nently saturated karst zone composed of a highly orga-nized and hierarchized drainage conduit system inconnection with a network of secondary drains. Theoutlet of the conduit system is a spring. The open con-duit provides low resistance pathways for the subsurfaceflow, which often has more in common with surfacewater than with groundwater. Therefore, karst hydrol-ogy requires concepts of both surface water andgroundwater hydrology (White 2002).
In recent decades, progress has been made in the useof water budgets, tracer studies, hydrograph analysisand chemograph analysis for the characterization ofkarst aquifers. These have improved the understandingof karst properties, characteristics and evolutionsubstantially. In general, three types of hydrologicalmodels can be divided in simulation of karst hydrology:
Y. B. Liu
O. Batelaan
F. De Smedt
N. T. Huong
V. T. Tam
Test of a distributed modelling approachto predict flood flows in the karst Suoimuoicatchment in Vietnam
Received: 7 June 2005Accepted: 15 June 2005Published online: 20 September 2005� Springer-Verlag 2005
Abstract The major obstacles formodelling flood processes in karstareas are a lack of understandingand model representations of thedistinctive features and processesassociated with runoff generationand often a paucity of field data. Inthis study, a distributed flood-mod-elling approach, WetSpa, is modifiedand applied to simulate the hydro-logical features and processes in thekarst Suoimuoi catchment in north-west Vietnam. With input of topog-raphy, land use and soil types in aGIS format, the model is calibratedbased on 15 months of hourlymeteorological and hydrological
data, and is used to simulate bothfast surface and conduit flows, andgroundwater discharges from karstand non-karst aquifers. Consider-able variability in the simulationaccuracy is found among stormevents and within the catchment.The simulation results show that themodel is able to represent reasonablywell the stormflows generated byrainfall events in the study catch-ment.
Keywords Flood prediction ÆWetSpa Æ GIS Æ Karst Suoimuoicatchment Æ Vietnam
Environ Geol (2005) 48: 931–940DOI 10.1007/s00254-005-0031-1 ORIGINAL ARTICLE
Y. B. Liu (&) Æ O. BatelaanF. De SmedtDepartment of Hydrologyand Hydraulic Engineering,Vrije Universiteit Brussel, Pleinlaan 2,1050 Brussels, BelgiumE-mail: [email protected].: +32-2-6293335Fax: +32-2-6293022
N. T. Huong Æ V. T. TamResearch Institute of Geologyand Mineral Resources,Thanh Xuan, Hanoi, Vietnam

physical models, conceptual models and empiricalmodels (Jukic and Jukic 2003). Physical models (e.g.Adams and Parkin 2002, Eisenlohr et al. 1997) are basedon principles and formulas valid for turbulent laminarflows in porous media. To provide numerous input dataand model parameters, the distribution and geometry offractures in a karst aquifer need to be investigated,which is very difficult to access by direct observation.This has resulted in a wide use of conceptual models inkarst hydrology, for instance Juberias et al. (1997),Haliban and Wicks (1998) and Cheng and Chen (2005).Conceptual models are based on the conceptualizationof the karst aquifer as a configuration of internal sto-rages and pathways, while physical relationships are notconsidered explicitly but are represented in general termsthrough the conceptualization of the aquifer. Empiricalor black-box models use mathematical relations betweeninput and output time series without applying physicallaws, for which the linear transfer function betweenrainfall and runoff is commonly applied to represent theunit response function of the karst aquifer. However,many models are not clearly defined as belonging toanyone of these categories, but possess a combination ofcomponents from different classes. The choice of simu-lation model thus depends on project objectives, dataavailability, geophysical characteristics of the karstcatchment, etc.
Differing from non-karst catchment, storm runoff isto a large extent provided by water flowing the subsur-face routes to the streams in a karst catchment, eitherthrough the soil matrix or within the fractured bedrock,while surface runoff is very small to negligible (Majoneet al. 2004). Moreover, diverse pathways exist in theshallow subsurface and in the underlying rock formationresulting in a broad distribution of travel times from theland surface to the outlet springs. As a result, inferenceof travel time statistics from spring hydrographs isfraught with difficulties. The most critical are the non-linear effects due to soil moisture dynamics and pre-event water contribution during stormflow (Labet et al.2000). Modelling such a complexity is a quite challeng-ing task, which is typically tackled by means of simpli-fied rainfall-runoff models (Majone et al. 2004). Thisimplies that runoff generation is inherently linear andtime-invariant, and the total hydrograph can bedecomposed into simple elements and can be estimatedby the linear convolution integral between effectiverainfall and a physical transfer function. However, suc-cessful application of this simplified scheme depends onmany other factors, such as the quality of input andoutput time series, data availability of catchment geo-morphology, lithology, channel geometrics, etc.
This paper presents an adapted modelling approachfor simulation of stormflow in the karst Suoimuoicatchment, Vietnam, using a GIS-based spatially dis-tributed hydrological model, WetSpa (Liu et al. 2003,
Liu 2004). The modifications made to WetSpa to simu-late karst aquifers are (1) the addition of a preferential‘‘bypass’’ flow mechanism to represent vertical infiltra-tion through a high-conductivity soil layer, (2) the cou-pling of surface water routing features to the conduitsystem, (3) the coupling of a non-linear reservoir modelto a variably saturated groundwater component. Themodelling processes and parameters are adjusted sepa-rately for the limestone and non-limestone areas basedon 15 months of hourly meteor–hydrological data.Encouraging results have been achieved by comparisonof measured and simulated hydrographs at the catch-ment outlet.
The study catchment and data availability
The Suoimuoi catchment is situated in the mountainousDa River basin in the northwest Vietnam. It covers anarea of 273 km2 with the Suoimuoi sinkhole as thecatchment outlet. The catchment is confined in two re-gional deep fault systems trending in NW–SE direction,the Son La Fault on the east and the Da River Fault onthe west. About 60% of the catchment is covered bykarst features with different limestone formations asshown in Fig. 1. There is almost no surface waterdrainage in the karst area. Instead, closed depressionsexist with cave systems developed in the bottom or in therock walls (Tam et al. 2004). The karst aquifers receivewater, mainly by the regional groundwater flow, withadditional important in-situ recharge by rainfall, surfacewater and exotic water from higher-lying non-karstareas. The movement of karst groundwater is closelycontrolled by these tectonic deformations. The ground-
Fig. 1 Distribution of karst limestone in the Suoimuoi catchment
932

water is mainly stored in fractures, crushed zones andcaves, and circulates in consistence with the hydrody-namic variation. There exist a number of karst springs/resurgences and sinkholes along the river course, whichplay a role in interaction between karst groundwater andsurface runoff (Tam et al. 2001).
The Suoimuoi catchment is characterized by a humidsubtropical climate, and is heavily influenced by themonsoon regime in the northern Vietnam. Two distinctseasons can be observed in the area: the dry winterlasting from November to April, and the rainy summerfrom May to October. The yearly mean temperature is21.1�C with an observed maximum temperature of 41�Cand minimum temperature of 1.1�C. In the study region,the mean annual precipitation is 1,450 mm, about 85%of which falls during the rainy season in summer.
During the period 2000–2003, an extensive hydro-logical and geophysical survey was conducted to studythe mechanisms of hydrogeological processes in theSuoimuoi catchment. Many sophisticated methods, suchas computer modelling, hydrogeological mapping, tracerand pumping test, etc., were performed to analysecomplex groundwater systems. However, it was foundthat more data are needed to make the methods workperfectly in this highly heterogeneous system (Tam et al.2004). The drainage area of the catchment is delineatedby integration of remotely sensed imagery with groundsurveys conducted by Hung et al. (2002). Three digitalmaps, DEM, soil type and land use, available in rasterformat are used to derive spatial model-parameters re-quired in the WetSpa model. The elevation data for theriver basin was digitized from an elevation map andinterpolated to construct a 50·50 m grid size DEM(Fig. 2). The topography of the catchment is character-ized by highlands in the upper part and lowlands in thelower part of the catchment. Elevation ranges from 539to 1815 m with an average catchment slope of 33.2%.The land use consists of close canopy forest (1.7%),open canopy forest (4.2%), shrub (40.4%), grass land(5.6%), upland fields (38.3%), paddy fields (5.2%),residential area (4.5%) and open water (0.01%) (Fig. 3).Major soil types in the catchment are clay (64.3%), clayloam (22.3%), silt loam (11.7%) and sand (1.7%).
A 15-month-observed hydro–meteorological datafrom January 2000 to March 2001 are used to calibratemodel parameters in this study. The hourly stream flowinto the Suoimuoi sinkhole was captured by an auto-mated water-level logger. The recorded hourly series ofwater level was converted to flow hydrograph by a well-calibrated rating curve. The resulting hydrographs areused in the baseflow separation and the model valida-tion. Hourly precipitation was monitored by an auto-mated logger located 4 km upstream of the Suoimuoisinkhole, and was assumed to be uniformly distributedover the catchment. In addition, the data of potentialevapotranspiration and air-temperature were collected
from a nearby gauging station, which are used as inputto the model.
Methodology and application
Description of the WetSpa model
WetSpa is a grid-based distributed hydrologic model forwater and energy transfer between soil, plants andatmosphere (Liu et al. 2003). For each grid cell, fourlayers are divided in the vertical direction as vegetationzone, root zone, transmission zone and saturated zone.
Fig. 2 Topographic map of the Suoimuoi catchment
Fig. 3 Land use map of the Suoimuoi catchment
933

The hydrologic processes considered in the model areprecipitation, interception, depression, surface runoff,infiltration, evapotranspiration, percolation, interflow,groundwater flow and water balance in the root zoneand the saturated zone. The total water balance for araster cell is composed of the water balance for thevegetated, bare-soil, open water and impervious parts ofeach cell. The model predicts peak discharges and hy-drographs, which can be defined for any numbers andlocations in the channel network, and can simulate thespatial distribution of catchment hydrological variables.
Surface runoff is calculated in the model by a modi-fied rational method as:
Rs ¼ CpPnðh=hsÞ ð1Þ
where Rs [LT)1] is the rate of surface runoff, Cp [)] is a
potential runoff coefficient, Pn [LT)1] is the rainfallintensity after canopy interception, h and hs [L
3L)3] areactual and saturated soil moisture content, and a [)] isan empirical exponent. The potential runoff coefficientCp is a measure of rainfall partitioning capacity,depending upon slope, soil type and land use combina-tions. Default potential runoff coefficients for differentslope, soil type and land cover are interpolated fromliterature values, and a lookup table has been builtrelating potential runoff coefficient to different combi-nations of slope, soil type and land use (Liu 2004). Theeffect of rainfall duration is also included in the model,as more runoff is produced during a storm event due toincreasing soil moisture content. In general, the equationaccounts for the effect of slope, soil type, land use, soilmoisture, rainfall intensity and its duration on the pro-duction of surface runoff in a realistic way.
The routing of overland flow and channel flow isconducted by an approximate solution to the diffusivewave equation in the form of a density function of thefirst passage time distribution (Liu et al. 2003), whichrelates the discharge at the end of a flow path to theavailable runoff at the start of the flow path:
UðtÞ ¼ 1ffiffiffiffiffiffiffiffiffiffiffiffiffiffiffiffiffiffiffi
2pr2t3=t30
q exp �ðt � t0Þ2
2r2t=to
" #
ð2Þ
where U(t) [T)1] is the flow path unit response function,t0 [T] is the flow time, and r [T] is the standard deviationof the flow time. The parameters t0 and r are spatiallydistributed, and are obtained by integration along thetopographically determined flow paths as a function offlow celerity and dispersion coefficient (Liu et al. 2003).
Water balance in the root zone is modelled byequating input and output. Water infiltrated into the soilmay stay as soil moisture content, move laterally as in-terflow or percolate as groundwater recharge dependingon the moisture content of the soil. Both percolation andinterflow are assumed to be gravity-driven in the model.
Percolation out of the root zone is equated as thehydraulic conductivity corresponding to the moisturecontent as a function of the soil pore size distributionindex, and is expressed as:
Rg ¼ Ksh� hr
hs � hr
� �ð2þ3BÞ=B
ð3Þ
where Rg [LT)1] is the percolation out of root zone, Ks
[LT)1] is the saturated soil hydraulic conductivity, hs[L3L)3] is the soil porosity, hr [L3L)3] is the residualmoisture content, and B [)] is the soil pore size distri-bution index. Interflow is assumed to occur in the rootzone after percolation and becomes significant onlywhen the soil moisture is higher than field capacity.Darcy’s law and a kinematic approximation are used toestimate the amount of interflow, in the functions ofhydraulic conductivity, the moisture content, the slopeangle and the root depth. The actual evapotranspirationfrom soil and plant is calculated as a function of po-tential evapotranspiration, vegetation and stage ofgrowth and moisture content. A percentage of theremaining potential evapotranspiration is taken outfrom the water content in the groundwater reservoir as afunction of the maximum reservoir storage, giving theeffect of a steeper baseflow recession during dry period.Groundwater flow is modelled using a linear reservoirmethod on small subcatchment scale. The groundwateroutflow is added to any runoff generated at the sub-catchment outlet to produce the total streamflow.Hence, the flow routing consists of tracking runoff alongits topographically determined flow path, and evaluatinggroundwater flow for each small subcatchment. Thetotal discharge at the catchment outlet is obtained bysummation of the overland flow, interflow and ground-water flow.
Model modification for karst areas
Apparently, the schemes of WetSpa model are not validin simulating hydrological processes in a karst catch-ment. Stormwater in karst areas may flow overland fromridge tops, and then enter the ground in upland regionsthrough recharge features and resurgent at springs inlow areas. Diffuse infiltration can also take placethrough the soil and the underlying epikarst. On steepslopes that do not readily develop sinkholes, diffuseinfiltration can occur through the soil or into bedrockfissures. In addition, it is difficult to identify ground-water flow paths and divisions in karst aquifers whicharise from the extreme heterogeneity and anisotropy ofthe karst aquifer, and from changes in groundwaterpatterns with different stages of flow. Taking the abovespecific characteristics into account, some major modi-fications are made to the WetSpa model in order to
934

better represent the predominant hydrological featuresin karst areas in the Suoimuoi catchment.
To reflect the fact that almost no surface flow isapparent in karst areas, the surface runoff coefficient inkarst areas is set to zero in the model, which impliesthat all stormwater after canopy interception infiltratesinto the soil. The water in the root zone remainstemporarily stored in the soil, and is depleted byevapotranspiration, conduit flow through the underly-ing epikarst, and recharge to the groundwater reser-voir. Due to the coarse soil texture and the well-developed fracture systems in the bedrock, vertical flowis considered to be predominant in the soil layer, andthe interflow scale factor is set to zero in the modifiedWetSpa model assuming that no interflow occurs in theroot zone layer.
Evidence has shown that karst drainage and con-duit development are usually aligned along favourablelithostratigraphic horizons and zones of fracture.However, the amount of water that contributes toconduit runoff through fine fractures and pores isstrongly affected by the overlying soil and landscapecharacteristics (Urich 2002). The primary impact is theresulting change of water volume out of the root zone,which eventually affects the fracture development inthe epikarst and karst layers forming pathways totransfer water into the rapid conduit and cave flow.Steep slopes usually mark topography next to riversand are prone to mechanical failure and fracturedevelopment through time (Mullins and Hine 1989).In the Suoimuoi catchment, karst areas are mostlycovered by clay soils, with mixed shrub vegetation insteep slopes and upland field in gentle slopes. Thisimplies that the runoff contributing to fast conduitflow follows the same trend as surface runoff gener-ated in non-karst areas. A similar concept has beenproposed by Kaufmann and Braun (2000) for thestudy of karst aquifer evolution by assuming the re-charge rate proportional to the surface runoff. Tokeep the consistency of WetSpa model, the runoff thatcontributes to fast conduit flow is estimated as a linearfunction of the potential runoff coefficient corre-sponding to the same slope, soil type and land usecharacteristics but for non-karst areas, and is pro-portional to the amount of groundwater recharge, i.e.:
Rc ¼ KcCpRg ð4Þ
where Rc [LT)1] is the amount of water that contributes
to conduit flow, and Kc is a lumped correction factorthat can be optimized during model calibration, orestimated from the observed hydrographs by properflow-separation techniques. In such a way, the fastconduit runoff is directly linked with the characteristicsof site slope, soil type, land use and soil moisture con-tent, and therefore can be simulated using a spatiallydistributed model.
Conduit flow is strongly influenced by structurallycontrolled fractures, which connect surface and sub-surface, and provide for rapid flow through theaquifer to the discharge points. It is similar to the flowin a surface stream in that both are convergentthrough a system of tributaries and both receive dif-fuse flow through the adjacent soils or bedrock (Labatet al. 2000). Routing of conduit flow in a karst systemis difficult due to its non-Darcian flow behaviour andcomplex flow paths. To simplify, the concentrationtime of conduit flow from a site to the stream and thebasin outlet is assumed to be proportional to theconcentration time along its surface flow paths, whileneglecting the complex properties of flow path, slope,hydraulic radius, etc., i.e.:
tc ¼ Ktt0 ð5Þ
where tc is the average travel time of conduit flow [T],and Kt [)] is a lumped correction factor for conduit flowtravel time, which can be determined through the anal-ysis of observed flow hydrographs or through modelcalibration. The standard deviation of the conduit flowtime is then assumed to be in the same order of mag-nitude as the travel time. In such a way, the conduitrunoff can be routed to the basin outlet while keepingthe consistency of flow routing schemes used in theWetSpa model.
To account for the complexities of both karst andepikarst groundwater system, which determines the slowflow response at the basin outlet, a non-linear reservoirmodel is applied for the karst areas on small subcatch-ment scale, i.e.:
Qg ¼ K1Gþ K2G2 ð6Þ
where Qg [L3 T)1] is the groundwater discharge at thesubcatchment outlet, G [L3] is the average activegroundwater storage of the subcatchment, K1 [T
)1] andK2 [L)3T)1] are the first- and second-order baseflowrecession constant. These two parameters can be ob-tained through the analysis of observed flow hydro-graphs, and can also be optimized through modelcalibration.
Through the above major modifications to theWetSpa model, the spatial distribution of runoff andflow responses can be simulated in karst areas. Thoughthe conceptual basis of such modifications cannot fulfilthe requirement of identifying karst hydrological fea-tures in detail, the model provides a reasonable tool forpredicting flood flows by coupling catchment topogra-phy, soil type and land use characteristics in a karstcatchment. The total hydrograph at the catchmentoutlet is then obtained by summation of the direct flow,interflow and groundwater flow from the non-karstareas and the conduit flow and groundwater flow fromthe karst areas.
935

Parameter identification and optimization
Model parameters are identified firstly, using GIS toolsand lookup tables which relate default model parametersto the base maps or the combination of base maps.Starting from the 50 by 50 m pixel resolution digitalelevation map, hydrological features including surfaceslope, flow direction, flow accumulation, flow length,stream network, drainage area and subcatchments aredelineated. The threshold for determining the streamnetwork is set to 50, i.e. the cell is considered to bedrained by streams when the total drained area becomesgreater than 0.125 km2. The threshold for delineatingsubcatchments and main streams is set to 1,000. Maps ofporosity, field capacity, wilting point, residual moisture,saturated hydraulic conductivity and pore size distribu-tion index are obtained from the soil type map. Maps ofroot depth, Manning’s roughness coefficient and inter-ception storage capacity are derived from the land usemap. Maps of default runoff coefficient and depressionstorage capacity are calculated from the slope, soil typeand land use class combinations.
The residential areas are mainly distributed besidesthe Suoimuoi river channel as villages or small towns.Due to the grid size, the residential cell is assumed to be10% covered by impervious materials (roof, road, etc.),and the rest covered by farmland. The average flowdepth is estimated using the power law relationship withan exceeding probability of a 2-year return periodresulting in a minimum overland flow depth of 0.005 mand the channel flow depth of 1.0 m at the catchmentoutlet (Liu et al. 2003). By combining the maps of theaverage flow depth, Manning’s roughness coefficient andsurface slope, the average flow velocity in each cell iscalculated using Manning’s equation, which results in aminimum value of 0.005 m/s for overland flow, and upto 2.5 m/s for some parts of the main river. Next, thecelerity and dispersion coefficient at each cell areproduced, and the values of concentration time and itsstandard deviation for each contributing cell are gener-ated. With the above information, the unit flow pathresponse functions are calculated from each cell to thesub-basin outlet and from the sub-basin outlet to thebasin outlet.
In dealing with the specific problems of karst areas inthe Suoimuoi catchment, the map of potential surfacerunoff coefficient is set to zero on those areas. Otherparameters such as interflow scaling factor, conduit flowfactor, concentration time factor, evapotranspirationfactor, baseflow recession constants, etc., as listed inTable 1, are set or calibrated during model calibration.
Model calibration is implemented by comparing thesimulated and observed hydrographs. Each of thecorrection factors and functions that involved the use ofcoefficients are determined using an independent auto-mated model optimization process (Doherty and
Johnston 2003). The objective function is the sum ofsquares of the difference between observed and predictedflows at the Suoimuoi sinkhole. The correction factor forestimating the volume of conduit flow is found to bearound 0.35, and the concentration time of conduit flowis about 1.8 times of the surface runoff. This results in anaverage quick flow concentration time of 12 h andaverage standard deviation of 8 h for the entire catch-ment. Next, a manual calibration is applied to refinemodel parameters by a trial-and-error method. The trial-and-error procedure can be applied because the numberof calibrated parameters is limited, and the majority ofthe proposed parameters have physical meaning andrelatively short ranges. The two baseflow recessionconstants at the catchment outlet are initially estimatedfrom the recession curves in the observed hydrograph,and refined during calibration. These values are thenadjusted for each subcatchment based on its slope,drainage area and geological features (Liu 2004).
Results and discussion
Flow prediction at the Suoimuoi sinkhole
A graphical comparison between observed and predictedhydrographs for the simulation period at the Suoimuoisinkhole is presented in Fig. 4. One can find a reasonableagreement between simulation results and the observedhydrograph. But for some of the floods, as for instancethe floods in May and August 2000, the peaks are lessaccumulatively estimated. The highest rainfall intensitywas 41 mm/h, observed on 26 April 2000, but this stormdid not produce a high flood, because the antecedent soilmoisture was very low leading to high water storage inthe soil. The largest flood occurred on 6 October 2000,with a maximum rainfall intensity of 31 mm/h and an
Table 1 Lumped model parameters required for optimization
Parameter Description Value
Kc Correction factor for conduit runoff [)] 0.35Kt Correction factor for conduit flow
travel time [)]1.8
Ke Correction factor for plant potentialevapotranspiration [)]
1.13
K1 First order baseflow recessionconstant [d)1]
0.015
K2 Second order baseflow recessionconstant [m)3 d)1]
0.0003
H0 Initial active groundwater storage onsubcatchment scale [mm]
200
Hmax Maximum active groundwater storageon subcatchment scale [mm]
300
S0 Initial relative soil moisturecontent [)]
0.5
936

accumulated rainfall of 146 mm in 22 h. Due to the highantecedent soil moisture condition, this storm caused asevere flood with an observed peak discharge of 37.1 m3/s. The calculated peak discharge is 38.4 m3/s, which is3.5% overestimated. Also, the delay time of peakoccurrence is 3 h, which is well-estimated by the model.
For the 15-month simulation results, about 10% ofthe total rainfall is lost by interception, 54% of the totalrainfall returns to the atmosphere as evapotranspirationfrom the soil and groundwater storage, and 36% be-comes runoff, which is mainly generated during the wetseason. The simulated flow volume is composed of sur-face runoff (7%) from non-karst areas, residential areasand open water surface, fast conduit runoff (10%) fromkarst areas, and groundwater flow (83%) from karst andnon-karst areas. The runoff from non-karst areas con-tributes to about 19% of the total river dischargecalculated at the Suoimuoi sinkhole. This is becausenon-karst areas exhibit more evapotranspiration thankarst areas due to their higher soil-water-holdingcapacity, and part of its groundwater drains intodownstream karst aquifers. However, its dischargecontribution can increase to 32% of the total riverdischarge during storms, due to surface runoff andinterflow generated from steep terrains. This result issimilar to that obtained by Tam et al. (2001) based onriver discharge measurement.
Four statistical evaluation criteria were applied to the15-month simulation results to assess the model per-formance. It is found that the modified WetSpa modelreproduces the observed water volume with )2.4%underestimation. The model Nash efficiency (Nash andSutcliffe 1970) for reproducing the river discharges is72%. The two adapted Nash efficiencies proposed byHoffmann et al. (2004) for reproducing low and highflows are 72% and 76% respectively. Regardless of theacceptable evaluation results, the model contains manyuncertainties, such as deficiencies in model structure,boundary conditions and errors associated with mea-surements used in model calibration. Weaknesses in the
model structure are the simplification in describing thesurface runoff production, conduit flow, soil moisturerelationships with actual evapotranspiration, flow rout-ing procedures, etc. In particular, the model applies alinear convolution integral for fast flow routing in thekarst and non-karst system. This implies that the systemis considered as time-invariant, and the property ofproportionality and superposition law are valid, i.e. thesum of separate hydrographs directly forms the totalhydrograph and vice versa. These two hypotheses in themodel may result in high irregularities in the obtainedtransfer functions and uncertainties in the modellingresults. In addition, data errors associated with mea-surements and an insufficient number of meteorologicalstations in the catchment are also major sources ofmodel uncertainty. Hence, errors in input data used formodel calibration may result from treating rainfall andpotential evapotranspiration as average values of thoseoccurring throughout the catchment.
Fast runoff distribution and water balance
A simulated spatial distribution of fast runoff, i.e. thesurface runoff from non-karst areas and conduit runofffrom karst areas, for the storm-flood on 5–7 October2000, is presented in Fig. 5. Due to the large volume andhigh intensity of the rainfall, storm runoff generatedfrom almost all areas in the catchment. However, fastrunoffs were mainly produced from steep slopes in non-karst areas as overland flow and in karst areas as fastconduit flow, and partly from residential areas and openwater surface in the downstream river valley. The cal-culated average surface runoff in non-karst areas of thecatchment is 14.8 mm (34% of the total fast runoff)forming the flood peak of the hydrograph. The calcu-lated average conduit runoff in karst areas is 16.5 mm(59% of the total fast runoff) consisting the majorrecession part of the hydrograph, since its concentrationtime is longer than that of surface runoff from upstream
Fig. 4 Observed and calculatedhydrographs at Suoimuoisinkhole
937
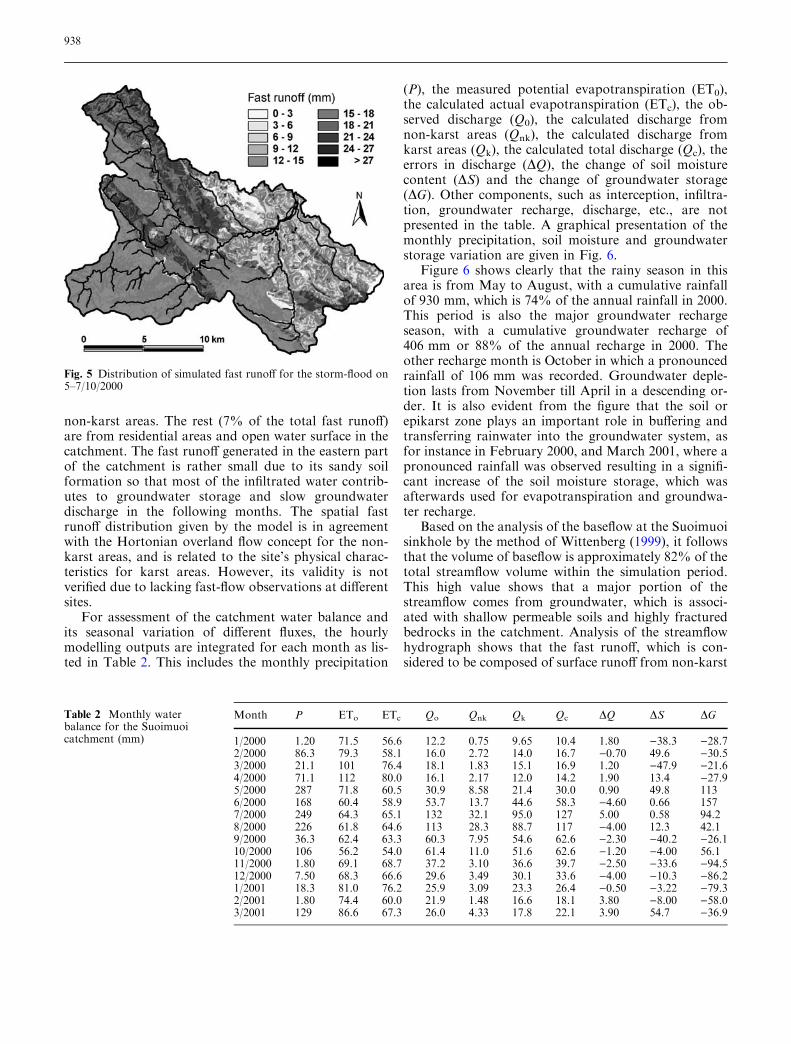
non-karst areas. The rest (7% of the total fast runoff)are from residential areas and open water surface in thecatchment. The fast runoff generated in the eastern partof the catchment is rather small due to its sandy soilformation so that most of the infiltrated water contrib-utes to groundwater storage and slow groundwaterdischarge in the following months. The spatial fastrunoff distribution given by the model is in agreementwith the Hortonian overland flow concept for the non-karst areas, and is related to the site’s physical charac-teristics for karst areas. However, its validity is notverified due to lacking fast-flow observations at differentsites.
For assessment of the catchment water balance andits seasonal variation of different fluxes, the hourlymodelling outputs are integrated for each month as lis-ted in Table 2. This includes the monthly precipitation
(P), the measured potential evapotranspiration (ET0),the calculated actual evapotranspiration (ETc), the ob-served discharge (Q0), the calculated discharge fromnon-karst areas (Qnk), the calculated discharge fromkarst areas (Qk), the calculated total discharge (Qc), theerrors in discharge (DQ), the change of soil moisturecontent (DS) and the change of groundwater storage(DG). Other components, such as interception, infiltra-tion, groundwater recharge, discharge, etc., are notpresented in the table. A graphical presentation of themonthly precipitation, soil moisture and groundwaterstorage variation are given in Fig. 6.
Figure 6 shows clearly that the rainy season in thisarea is from May to August, with a cumulative rainfallof 930 mm, which is 74% of the annual rainfall in 2000.This period is also the major groundwater rechargeseason, with a cumulative groundwater recharge of406 mm or 88% of the annual recharge in 2000. Theother recharge month is October in which a pronouncedrainfall of 106 mm was recorded. Groundwater deple-tion lasts from November till April in a descending or-der. It is also evident from the figure that the soil orepikarst zone plays an important role in buffering andtransferring rainwater into the groundwater system, asfor instance in February 2000, and March 2001, where apronounced rainfall was observed resulting in a signifi-cant increase of the soil moisture storage, which wasafterwards used for evapotranspiration and groundwa-ter recharge.
Based on the analysis of the baseflow at the Suoimuoisinkhole by the method of Wittenberg (1999), it followsthat the volume of baseflow is approximately 82% of thetotal streamflow volume within the simulation period.This high value shows that a major portion of thestreamflow comes from groundwater, which is associ-ated with shallow permeable soils and highly fracturedbedrocks in the catchment. Analysis of the streamflowhydrograph shows that the fast runoff, which is con-sidered to be composed of surface runoff from non-karst
Fig. 5 Distribution of simulated fast runoff for the storm-flood on5–7/10/2000
Table 2 Monthly waterbalance for the Suoimuoicatchment (mm)
Month P ETo ETc Qo Qnk Qk Qc DQ DS DG
1/2000 1.20 71.5 56.6 12.2 0.75 9.65 10.4 1.80 )38.3 )28.72/2000 86.3 79.3 58.1 16.0 2.72 14.0 16.7 )0.70 49.6 )30.53/2000 21.1 101 76.4 18.1 1.83 15.1 16.9 1.20 )47.9 )21.64/2000 71.1 112 80.0 16.1 2.17 12.0 14.2 1.90 13.4 )27.95/2000 287 71.8 60.5 30.9 8.58 21.4 30.0 0.90 49.8 1136/2000 168 60.4 58.9 53.7 13.7 44.6 58.3 )4.60 0.66 1577/2000 249 64.3 65.1 132 32.1 95.0 127 5.00 0.58 94.28/2000 226 61.8 64.6 113 28.3 88.7 117 )4.00 12.3 42.19/2000 36.3 62.4 63.3 60.3 7.95 54.6 62.6 )2.30 )40.2 )26.110/2000 106 56.2 54.0 61.4 11.0 51.6 62.6 )1.20 )4.00 56.111/2000 1.80 69.1 68.7 37.2 3.10 36.6 39.7 )2.50 )33.6 )94.512/2000 7.50 68.3 66.6 29.6 3.49 30.1 33.6 )4.00 )10.3 )86.21/2001 18.3 81.0 76.2 25.9 3.09 23.3 26.4 )0.50 )3.22 )79.32/2001 1.80 74.4 60.0 21.9 1.48 16.6 18.1 3.80 )8.00 )58.03/2001 129 86.6 67.3 26.0 4.33 17.8 22.1 3.90 54.7 )36.9
938

areas and quick conduit flow in karst areas, terminateswithin 32 h after a major rainfall event, while the aver-age peak time occurs around 10 h after the rainfall. Thisshort flow time is due to the steep slopes and extensiveconduit development in the downstream areas. Tamet al. (2004) conducted an analysis for the dailystreamflow and rainfall series in the Suoimuoi catchmentusing auto-correlation and cross-correlation techniquesand concluded that the time response or the mean resi-dence time at the Suoimuoi sinkhole is 1 and 50 days forquick flow and baseflow respectively. The long baseflowresidence time and its high proportion suggest that thekarst groundwater system of the Suoimuoi catchment isgoverned by fractures and fissures. These results arecompatible with present results obtained from the modelsimulation, which indicates that the modified WetSpamodel is able to simulate both streamflow and waterbalance for the karst Suoimuoi catchment.
Summary and conclusion
A test of a GIS-based modelling approach for floodprediction in the karst Suoimuoi catchment is describedin this paper. The model uses a modified rationalmethod to calculate surface runoff in non-karst areasand conduit flow in karst areas based on the spatialcharacteristics of topography, soil type, land use and soilmoisture condition. Flow into the outlet sinkhole isrouted with a linear diffusive wave approximationmethod, while the concentration time of conduit flow isassumed to be proportional to the concentration time ofthe surface runoff. Total discharge at the basin outlet is
calculated by summing predicted fast runoff andgroundwater flow from both non-karst and karst areasin the catchment. The model is calibrated using the 15-month hourly flow data series collected at the Suoimuoisinkhole. The results of model calibration show that, ingeneral, flow hydrographs well-predicted, especially thebaseflow at the catchment outlet. However, predictionsof peak discharge for some of the storms are less accu-rate indicating the need for improved methods of runoffvolume calculation and flow routing in this catchment.
As discussed in the paper, the karst aquifers in theSuoimuoi catchment act as large underground reservoirsof water, but these reservoirs are difficult to exploit be-cause little is known about their hydraulic behaviour. Asimple hydrological model as the modified WetSpamodel used in this study can provide useful informationabout the behaviour of such complex flow system. Themodel with alternative hypothetical structures allows topredict different runoff and flow components, which arefitted to observed hydrographs using an optimizationalgorithm. These results can be used to simulate the flowevolution, but do not allow to determine the internalstructure and spatial disposition of contributions in theaquifer. From point of view of conceptual modelling,this explicitly acknowledges the lack of detailed infor-mation about the location and size of conduits and otherflow paths. However, the model enables to predict theeffects of topography, soil type and land use on runoff,recharge and groundwater discharge, and hence, tocomprehend the hydrological behaviour of the riverbasin. Work continues on incorporating a more physicalapproach in estimation of runoff volume and flowtransport to study the complex hydrological behaviourof the river catchment.
Fig. 6 Monthly soil storage andgroundwater storage deficit
939

References
Adams R, Parkin G (2002) Development ofa coupled surface-groundwater-pipenetwork model for the sustainablemanagement of karstic groundwater.Environ Geol 42:513–517
Cheng JM, Chen CX (2005) An integratedlinear/non-linear flow model for theconduit-fissure-pore media in the karsttriple void aquifer system. Environ Geol47:163–174
Doherty J, Johnston JM (2003) Methodol-ogies for calibration and predictiveanalysis of a watershed model. J AmWater Resour Assoc 39(2):251–265
Eisenlohr L, Bouzelboudjen M, Kiraly L,Rossier Y (1997) Numerical versus sta-tistical modeling of natural response ofa karst hydrogeological system. J Hy-drol 202:244–262
Haliban T, Wicks CM (1998) Modeling ofstorm responses in conduit flow aquiferswith reservoirs. J Hydrol 208:82–91
Hoffmann L, El Idrissi A, Pfister L, Hin-gray B, Guex F, Musy A, Humbert J,Drogue G, Leviandier T (2004) Devel-opment of regionalized hydrologicalmodels in an area with short hydrolog-ical observation series. River Res Appl20(3):243–254
Hung LQ, Dinh NQ, Batelaan O, Tam VT,Lagrou D (2002) Remote sensing andGIS-based analysis of cave developmentin the Suoimuoi Catchment. J CaveKarst Stud 64(1):23–33
Juberias TM, Olazar M, Arandes JM, Za-fra P, Antiguedad I, Basauri F (1997)Application of a solute transport modelunder variable velocity conditions in aconduit flow aquifer: Olalde karst sys-tem, Basque Country, Spain. EnvironGeol 30:143–151
Jukic VD, Jukic D (2003) Compositetransfer functions for karst aquifers.J Hydrol 274:80–94
Kaufmann G, Braun J (2000) Karst aquiferevolution in fractured, porous rocks.Water Resour Res 36(6):1381–1392
Labat D, Mangin A, Ababou R (2000)Rainfall-runoff relations for karsticsprings: Part I: Converlution and spec-tral analysis. J Hydrol 238:123–148
Liu YB (2004) Development and applica-tion of a GIS-based distributed hydro-logical model for flood prediction andwatershed management. Doctoral The-sis, Vrije Universiteit Brussel, Belgium
Liu YB, Gebremeskel S, De Smedt F,Hoffmann L, Pfister L (2003) A diffu-sive transport approach for flow routingin GIS-based flood modelling. J Hydrol283:91–106
Majone B, Bellin A, Borsato A (2004)Runoff generation in karst catchment:multifractal analysis. J Hydrol 294:176–195
Mullins HT, Hine AC (1989) Scallopedbank margins: beginning of the end forcarbonate platforms. Geology 17:30–33
Nash JE, Sutcliffe JV (1970) River flowforecasting through conceptual models,Part 1: A discussion of principles.J Hydrol 10:282–290
Tam VT, Vu TMN, Batelaan O (2001)Hydrological characteristics of a karstmountainous catchment in the North-west of Vietnam. Acta Geologica Sinica75(3):260–268
Tam VT, De Smedt F, Batelaan O, Das-sargues A (2004) Study on the rela-tionship between lineaments andborehole specific capacity in a fracturedand karstified limestone area in Viet-nam. Hydrogeol J 12(6):662–673
Urich PB (2002) Land use in karst terrain:review of impacts of primary activitieson temperate karst ecosystems. SciConserv 198:60p
White WB (2002) Karst hydrology: recentdevelopments and open questions. EngGeol 65:85–105
Wittenberg H (1999) Baseflow recessionand recharge as nonlinear storage pro-cesses. Hydrol Process 13:715–726
940