Revision of Threshold Luminance Levels in Tunnels ... - MDPI
Upload
washingtonCategory
view
4download
0
Vision Research 39 (1999) 1641–1656
Temporal sensitivity of human luminance pattern mechanismsdetermined by masking with temporally modulated stimuli
Geoffrey M. Boynton a,*, John M. Foley b
a SNL-B, The Salk Institute for Biological Studies, PO Box 85800, San Diego, CA 92186-5800, USAb Department of Psychology, Uni6ersity of California, Santa Barbara, CA, USA
Received 12 May 1997; received in revised form 8 April 1998
Abstract
Target contrast thresholds were measured using vertical spatial Gabor targets in the presence of full field maskers of the samespatial frequency and orientation. In the first experiment both target and masker were 2 cpd. The target was modulated at afrequency of 1 or 10 Hz and the maskers varied in temporal frequency from 1 to 30 Hz and in contrast from 0.03 to 0.50. In thesecond experiment both target and masker had a spatial frequency of 1, 5 or 8 cpd. The target was modulated at 7.5 Hz and thesame set of maskers was used as in the first experiment. The results are not consistent with a widely used model that is based onmechanisms in which excitation is summed linearly and the sum is transformed by an S-shaped nonlinear excitation-responsefunction. A new model of human pattern vision mechanisms, which has excitatory and divisive inhibitory inputs, describes theresults well. Parameters from the best fit of the new model to the results of the first experiment show that the 1 Hz and 10 Hztargets were detected by mechanisms with temporal low-pass and band-pass excitatory sensitivity, respectively. Fits to the secondexperiment suggest that at 1 cpd, the excitatory tuning of the detecting mechanism is band-pass. At 5 and 8 cpd, the mechanismsare excited by a broad range of temporal frequencies. Mechanism sensitivity to divisive inhibition depends on temporal frequencyin the same general way as sensitivity to excitation. Mechanisms are more broadly tuned to divisive inhibition than to excitation,except when the target temporal frequency is high. © 1999 Elsevier Science Ltd. All rights reserved.
Keywords: Masking; Spatio-temporal frequency; Inhibition; Contrast
1. Introduction
Current theories of human pattern vision hold thatthe initial stages of visual processing involve an array ofmechanisms, each responsible for detection within asubset of the stimulus domain. The first evidence wasderived from experiments on the detection of spatialpatterns that suggested the existence of mechanismsdifferentially tuned to spatial frequency (Campbell &Robson, 1967). The idea that these mechanisms canalso be characterized by their temporal properties soonfollowed. Early experiments showed that the shape ofthe temporal contrast sensitivity function (TCSF) varieswith spatial frequency (Robson, 1966; van Nes, Koen-derink, Nas & Bouman, 1967; Kelly, 1972; Koenderink& van Doorn, 1979). At low spatial frequencies, the
TCSF has a band-pass temporal characteristic, whilelow-pass characteristics are found at high spatial fre-quencies. As a consequence, if there are mechanismswith different spatial frequency tuning they must alsodiffer in temporal tuning.
A variety of additional psychophysical techniqueshave been used to investigate the temporal properties ofindividual pattern vision mechanisms. These includephenomenological threshold sensation experiments(Keesey, 1972; Kulikowski & Tolhurst, 1973; King-Smith & Kulikowski, 1975; Green, 1981), pattern adap-tation to gratings (Green, 1981), discrimination atthreshold (Watson & Robson, 1981; Thompson, 1983;Hess & Plant, 1985), discrimination above threshold(Mandler, 1984; Mandler & Makous, 1984), metamericmatching of temporal frequencies (Richards, 1979),subthreshold summation (Tolhurst, 1975; Breitmeyer &Ganz, 1977), motion direction discrimination (Ander-son & Burr, 1985), reaction times to the onset of
* Corresponding author. Tel.: +1 619 4534100 x1545; fax: +1619 546 8526; e-mail: [email protected].
0042-6989/99/$ - see front matter © 1999 Elsevier Science Ltd. All rights reserved.
PII: S0042-6989(98)00199-0

G.M. Boynton, J.M. Foley / Vision Research 39 (1999) 1641–16561642
gratings (Breitmeyer, 1975; Tartaglione, Goff, & Ben-ton, 1975; Harwerth & Levi, 1978) and measures ofresponse integration time (Breitmeyer & Ganz, 1977;Legge, 1978). This literature was reviewed by Watson(1986). These experiments show that there are only afew temporal mechanisms operating at a given spatialfrequency. At low spatial frequencies, inferred mecha-nisms generally have band-pass characteristics and low-pass temporal tuning is found at high spatialfrequencies.
The paradigm used in this study is simultaneousmasking. Simultaneous masking occurs when one tran-sient stimulus (the masker) reduces the detectability ofanother stimulus (the target). A common model of thepattern vision mechanism associated with masking ex-periments assumes a spatiotemporal linear filter fol-lowed by an invariant S-shaped contrast responsefunction (Legge & Foley, 1980; Wilson, McFarlane &Phillips, 1983). Masking is predicted with the Fechner-ian notion that the target, at threshold, produces aconstant increment in the mechanism’s response abovethe response to the masker alone. Masking occurs whenthe masker increases the response of the mechanism towhere the slope of the response function begins todecrease, requiring a higher target contrast to producethe increment in response required for detection. Wecall this the nonlinear excitation model (or NE model)of pattern masking.
Two lines of evidence for multiple mechanisms differ-ing in temporal sensitivity come from the application ofthe NE model to masking results. First, the shape ofthe function that relates target contrast at threshold tomasker contrast, or TvC function, varies with spatialand temporal frequency of the target. When target andmasker have low spatial and high temporal frequencies,the rising portion of the TvC function is steeper thanfor high spatial and low temporal frequencies (Burbeck& Kelly, 1980; Pantle, 1983; Lehky, 1985; Hess &Snowden, 1992). According to the NE model, the con-trast response function for low spatial/high temporalfrequency mechanisms shows greater response compres-sion than for high spatial/low temporal frequencymechanisms. Since the shape of the contrast responsefunction is constant for a single mechanism, these re-sults suggest that at least two classes of mechanismsexist.
The second line of evidence comes from maskingfunctions, which relate target threshold to masker tem-poral frequency. Masking functions are obtained byfixing the temporal frequency of the target and varyingthe temporal frequency of the masker at a fixed maskercontrast. According to the NE model, masking func-tions are sufficient to determine the sensitivity of detect-ing mechanisms (up to a scale factor) in a manneranalogous to Stiles (1949) field sensitivity measurementsof chromatic mechanisms. Lehky (1985) and Hess and
Snowden (1992) measured masking functions and esti-mated the temporal sensitivity of the detecting mecha-nism by fitting variations of the NE model topsychophysical results.
Recent work has cast doubt on whether the NEmodel, whether used explicitly or implicitly, is correct(Foley, 1994; Foley & Boynton, 1994). In the presentstudy we test the NE model in the temporal domain bymeasuring the entire TvC function for each of severalmasker temporal frequencies. The experiments in thispaper concern the detectability of Gabor patterns thatare simultaneously masked by gratings of the samespatial frequency and orientation. Both masker andtarget are temporally modulated in counterphase. Byusing five target stimuli we test the model for differentregions of the spatio-temporal domain. We show thatthe NE model is inconsistent with our results for all fivetargets. As an alternative, we describe a new model ofthe human pattern vision mechanism (Foley, 1994;Foley & Boynton, 1994) in which each mechanism hasa divisive inhibitory input in addition to a linear excita-tory input. We call this the divisive inhibition model (orDI model) in this paper. We show that the new modelfits the data well and provides parameter values thatcharacterize the temporal properties of pattern visionmechanisms. Since the past masking experiments havebeen interpreted using the NE model of masking, thestudies reviewed above are re-evaluated in light of thenew model.
The models that we consider are functional models inthe sense that they attempt to describe the relationbetween the stimuli and performance. The models as-sume pattern vision mechanisms that resemble corticalsimple cells in some respects, but we do not identifythem with cells; they are defined solely by their mathe-matical properties. Unlike other models (Teo & Heeger,1994; Watson & Solomon, 1997), our models do notassume specific spatial and temporal sensitivity func-tions for the mechanisms. Instead, they allow mecha-nism sensitivities to be estimated from experimentaldata. If sensitivities are estimated for a set of sinewavegratings that differ along some dimension (e.g. spatialor temporal frequency), we can use these to estimatemechanism sensitivity along the corresponding dimen-sion (space or time). Thus we assume only the mostfundamental properties of the mechanisms and allowother properties, such as sensitivity, to be estimated onthe basis of experimental data. The models are evalu-ated both by their qualitative predictions and theirability to fit data. In spite of their flexibility, if func-tional models of this kind can be found that will fit alarge body of data well, they will provide a concise wayto summarize families of TvC functions and thus showthe constraints that any structural model of these phe-nomena must satisfy.

G.M. Boynton, J.M. Foley / Vision Research 39 (1999) 1641–1656 1643
Fig. 1. The NE model (A) and the DI model (B) of human luminance pattern vision mechanisms. In addition to linear summation of excitationover a receptive field the DI model assumes a mechanism that receives a broadband inhibitory input which is independent of excitation.
The three models that were tested in this study aredescribed in the following section.
2. Models
2.1. Single-mechanism nonlinear excitation model(NE1)
Fig. 1A illustrates the single-mechanism nonlinearexcitation (NE1) model of human pattern vision mecha-nisms. The input stimulus, whether masker or targetplus masker is comprised of pattern components, whichin our case are sinewave gratings and Gabor patterns.The contrast of these patterns is defined as (peakluminance−background luminance)/background lumi-nance. This is equivalent to Michelson contrast forsinewave components. Since our patterns vary in time,the response of the detecting mechanisms very likelyvaries in time. However, we assume that the detectionof our target patterns depends on the response of thedetecting mechanism at one moment in time, which inturn depends on the input to the mechanism at thatmoment.
The excitation of the mechanism produced by anypattern component is given by:
E¦i =Ci SEi (1)
Where Ci is the contrast of that component and SEi isthe excitatory sensitivity of the mechanism to thatcomponent.
Net excitation is the sum of excitation across allpattern components.
E %=%i
E¦i (2)
Net excitation is halfwave rectified:
E=max(E %, 0) (3)
and fed into an S-shaped static nonlinearity R(E):
R(E)=Ep
E2+Z(4)
The parameters p and Z characterize the mechanism,and are constant within a family of TvC functions.
This model was not adequately tested until recently.One testable implication is that if a single mechanismdetects a target, any masker that excites the mechanismcan only shift the TvC function along the maskercontrast axis by a multiplicative constant (Foley, 1994).However, Ross and Speed (1991) and Foley (1994)showed that this horizontal translation rule fails formaskers that are very different from the target in eitherorientation or spatial frequency.

G.M. Boynton, J.M. Foley / Vision Research 39 (1999) 1641–16561644
2.2. Two-mechanism nonlinear excitation model (NE2)
One possible way to reconcile the violation of thehorizontal translation rule is to assume that more thanone mechanism is involved in the detection of thetarget. The NE model can easily be extended to assumemultiple independent mechanisms. If there are twomechanisms, the response of each mechanism is:
R1(E)=E1
p
E12+Z1
R2(E)=E2
p
E22+Z2
The combined response across the two mechanisms is:
R(E)= (R1n+R2
n)1/n (5)
Where n]2. The NE2 model makes similar predictionsto the NE1 model, except that the rising portion of thepredicted TvC functions may show scallops at thetarget contrast threshold where the second mechanismtakes over the role of detecting the target.
The one and two mechanism nonlinear excitationmodels were recently shown to be unable to predictmasking results in which the relative orientation of themasker to target is varied (Foley, 1994; Foley & Boyn-ton, 1994).
2.3. Di6isi6e inhibition model (DI)
This failure led to a new model of human patternvision mechanisms (Foley, 1994; Foley & Boynton,1994). This model was inspired by models of neuro-physiology of cells in visual cortex (Albrecht & Geisler,1991; Heeger, 1992). According to this divisive inhibi-tion (DI) model, pattern masking is a consequence ofdivisive suppression. The model describes masking re-sults for maskers that vary in orientation, contrast andspatial phase as well as for combinations of twomaskers. Fits of the model to these results show thatthe sensitivity to excitatory inputs is more narrowlytuned than sensitivity to divisive inhibitory inputs.
Foley (1994) describes two versions of the DI model.The version described in the present study is his model2 and is illustrated in Fig. 1B. In this model excitationis computed as in Eqs. (1)–(3). The inhibition, pro-duced by the components of the stimulus, is summedlinearly. For temporally modulated stimuli, inhibitionmay vary in time. However, as with excitation weassume that the threshold depends on the inhibition atone moment in time. The inhibition is given by:
I=%i
Ci SIi (6)
The mechanism response is given by:
R(E, I)=Ep
Iq+Z(7)
A comparison of Eq. (4) and Eq. (7) shows that thedivisive inhibition model is formally a more generalversion of the nonlinear excitation model. If I=E andq=2, the two models are mathematically identical.Since I and E are not always equal, it makes sense tointerpret them as a separate inputs to the mechanism.
2.4. Predicting masking results from models
The models described above can predict maskingresults through the assumption that a target is de-tectable only when the response of the mechanism tothe target and masker combined exceeds the responseto the masker alone by a fixed increment. For the DImodel, let Em and Im be the excitatory and inhibitoryinputs to the mechanism produced by the masker, andEmt and Imt be the excitatory and inhibitory inputsproduced by the target and masker combined. Then thetarget is at threshold if:
R(Emt, Imt)−R(Em, Im)=1 (8)
It is of interest to look at the model’s predictions ofthe TvC function for different parameter values. Con-sider the case where SEm=0, and hence Em=0 andR(Em, Im)=0. The target is therefore at thresholdwhen: R(Et, Imt)=1. Where Et is the excitatory re-sponse to the target alone. When the masker and targetare presented together, the denominator of the responsetransform increases monotonically with masker con-trast while the numerator depends only on target con-trast. Thus the contrast of the target must increase withmasker contrast to keep the response of the target plusmasker at threshold. This is pure divisive inhibitorymasking. Fig. 2 shows predicted TvC functions usingtypical parameter values. Note that for pure divisiveinhibitory masking, the TvC function rises monotoni-cally without a dip (facilitation).
Fig. 2 also shows a TvC function for SEm\0, wherethe DI model’s predictions are much like that of thenonlinear excitation model. The familiar dipper-shapedTvC function is predicted.
The DI model predicts that if SEm and SIm are scaledby the same constant, then the TvC function shiftshorizontally on log-log coordinates. Scaling SEt and SIt
together shifts the TvC function vertically on log–logcoordinates, much like the nonlinear excitation model.
However, unlike the NE models, an increase of SEm
with respect to SIm enhances the predicted facilitationand therefore changes the shape of TvC function.
Our goal in this study is to test these three models ofhuman pattern vision mechanisms. The best fittingmodel will be used to estimate mechanism parameters,including sensitivities.

G.M. Boynton, J.M. Foley / Vision Research 39 (1999) 1641–1656 1645
3. Methods
3.1. Equipment
Stimuli were generated using a computer graphicssystem that consisted of an AST 386/20 computer, aTruevision ATVISTA graphics board with 2 MB videomemory, a contrast mixer and attenuator circuit, andtwo video monitors operating at a 60 Hz frame rate.Truevision Stage graphics software was used for imagegeneration and control. The maskers and targets weregenerated on two different monitors and were com-bined by a beam splitter. Images of the fixation field,the masker field and the target field were computed andstored on the graphics board. Each of these images was512×400 pixels and the intensity at each point wasspecified by an 8-bit number. The methods of contrastcontrol are described by Watson, Nielson, Poirson,Fitzhugh, Bilson, Nguyen and Nguyen (1986) and wereadapted to the masking paradigm and to our system.The contrasts of the masker and target were controlledby the green and red channels of the graphics system,respectively. An external analog circuit attenuated oneor both of these signals. A blue channel signal wasadded to these to maintain constant mean luminance.The combined signal was then directed to the greeninput line of a monitor so that all of the stimuli weremonochrome green. The lookup tables had the dualrole of determining contrast and correcting for thenonlinear relation between voltage and screen intensity.As a consequence, the number of possible intensities ineach pattern component was approximately 180. Tworanges of contrast were made possible by the attenuatorcircuit so that low contrast patterns could be presentedwithout loss of wave-form definition.
3.2. Stimuli
Viewing distance was 162 cm and the visual anglesubtended by the stimulus field was 7° horizontal×5°vertical. The mean luminance was 33 cd/m2. The fixa-tion field was uniform except for a small dark fixationpoint at the center. The surround was dark.
Spatially, all maskers were vertical sinewave gratingsthat filled the entire field. Targets were Gaussian win-dowed vertical sinewave gratings (Gabor patterns) withcenter spatial frequencies equal to the spatial frequencyof the masker. Maskers and targets were both in cosinephase with the fixation point. The Gaussian window ofthe target was centered on the fixation point and hadan 1/e space constant of 1.875° in both vertical andhorizontal directions except for the 5 cpd condition ofExperiment 2 where the half-width was 0.375°. Spatiallyrestricted targets were used so that they would stimu-late a region of the retina that is relatively homoge-neous with respect to spatial properties. Contrast forboth patterns was defined as (peak luminance−back-ground luminance)/background luminance. This isequivalent to Michelson contrast for the sinewavemaskers. Contrast is measured in decibels (dB re 1)where 1 dB is one twentieth of a log unit.
Temporal profiles of a typical target and masker areshown in Fig. 3A. Temporally, all maskers were modu-lated in counterphase. Masker duration was 667 ms (40frames) and modulation was in cosine phase with thecenter of the presentation interval. The limited framerate (60 Hz) of the monitors means that the temporalprofile is only approximately sinusoidal even at lowtemporal frequencies. At temporal frequencies above 15Hz the masker temporal waveform was a square-wave.Targets were Gabor patterns in time modulated withina Gaussian window with an 1/e time constant of 105 ms(6.33 frames). Both the cosine phase of the carrierfrequency and the Gaussian window of the Gabortarget were centered in the masker’s presentation inter-val. The target reached peak contrast 333 ms after theonset of the masker, a period long enough that thetransience of the onset should not have influencedtarget detection. The short duration of the target pro-duces a fairly broad band-width in temporal frequencyspectrum. The amplitude spectrum of the three targetstimuli used in this paper are shown Fig. 3B. We referto targets by the temporal frequency of the cosine-wavethat is modulated by the Gaussian envelope.
3.3. Procedure
A two position spatial forced-choice method wasused to determine target contrast thresholds. On eachtrial the target was presented with equal probabilityeither centered 0.8° directly above or below the fixationpoint. A tone was presented during the target interval.
Fig. 2. DI model’s prediction of the TvC function with and withoutexcitatory sensitivity to the masker. Parameter values are: SEm=0and 10, SIm=10, SEt=50, SIt=30, P=2.4, q=2.0, Z=1.0. Targetis detectable when the response to the masker plus target exceeds theresponse to the masker alone by 1.0.

G.M. Boynton, J.M. Foley / Vision Research 39 (1999) 1641–16561646
Fig. 3. (A) Temporal profiles of a target and masker. (B) Amplitude spectra of the three targets used in Experiments 1 and 2. Target contrastsare a Gabor functions in time with a 1/e time constant of 105 ms.
The observer responded by pushing a lever forward orback to indicate target ‘above’ or ‘below’. The responsewas followed by a high or a low tone indicating corrector incorrect. The QUEST procedure (Watson & Pelli,1983) was used to adjust the contrast so as to seek thecontrast corresponding to a probability correct of 0.92.As pointed out by Watson and Pelli (1983), the 0.92probability correct criterion minimizes the ‘sweat fac-tor’ which, for the QUEST procedure, places the inten-sities during the staircase sequence at locations that areoptimal for estimating the position of the psychometricfunction. The sequence was terminated after 40 trials,or 50 trials if there were no errors on the last 20 trials.Each condition was repeated three or four times andconditions were presented in a random order blockedby masker temporal frequency.
3.4. Subjects
One of the authors, GMB, served as a subject. Asecond subject, JYS, was a 20 year old female under-graduate student at the University of California atSanta Barbara. Both subjects had resolution acuity of20/20 without correction and were highly practicedpsychophysical observers. JYS was naive in regard tothe purpose of these experiments.
3.5. Experiment 1
3.5.1. Target and masker spatial frequency 2 cpd; twotarget temporal frequencies of 1 and 10 Hz
Table 1 summarizes the design of the experiment. Allstimuli had a spatial frequency of 2 cpd. Both low and
G.M. Boynton, J.M. Foley / Vision Research 39 (1999) 1641–1656 1647
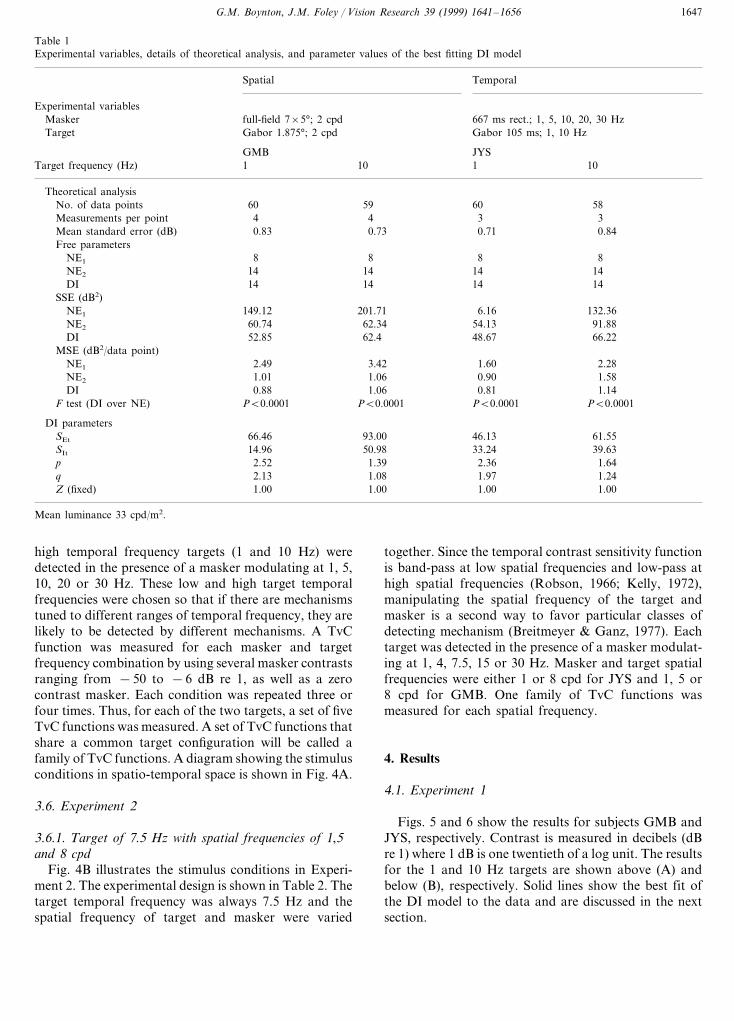
Table 1Experimental variables, details of theoretical analysis, and parameter values of the best fitting DI model
Spatial Temporal
Experimental variables667 ms rect.; 1, 5, 10, 20, 30 HzMasker full-field 7×5°; 2 cpd
Gabor 1.875°; 2 cpd Gabor 105 ms; 1, 10 HzTarget
JYSGMB10 1Target frequency (Hz) 1 10
Theoretical analysis59 60No. of data points 5860
3 3Measurements per point 4 40.73 0.71Mean standard error (dB) 0.83 0.84
Free parameters8 8NE1 8 8
14141414NE2
14 14DI 14 14SSE (dB2)
201.71 6.16NE1 149.12 132.3662.34 91.8854.1360.74NE2
62.4 48.67DI 52.85 66.22MSE (dB2/data point)
3.42 1.60NE1 2.49 2.281.06 0.90 1.581.01NE2
1.06 0.81DI 0.88 1.14PB0.0001PB0.0001 PB0.0001PB0.0001F test (DI over NE)
DI parameters93.00 46.13SEt 66.46 61.55
33.2450.98 39.6314.96SIt
2.36 1.64p 2.52 1.391.241.971.082.13q1.001.00Z (fixed) 1.00 1.00
Mean luminance 33 cpd/m2.
high temporal frequency targets (1 and 10 Hz) weredetected in the presence of a masker modulating at 1, 5,10, 20 or 30 Hz. These low and high target temporalfrequencies were chosen so that if there are mechanismstuned to different ranges of temporal frequency, they arelikely to be detected by different mechanisms. A TvCfunction was measured for each masker and targetfrequency combination by using several masker contrastsranging from −50 to −6 dB re 1, as well as a zerocontrast masker. Each condition was repeated three orfour times. Thus, for each of the two targets, a set of fiveTvC functions was measured. A set of TvC functions thatshare a common target configuration will be called afamily of TvC functions. A diagram showing the stimulusconditions in spatio-temporal space is shown in Fig. 4A.
3.6. Experiment 2
3.6.1. Target of 7.5 Hz with spatial frequencies of 1,5and 8 cpd
Fig. 4B illustrates the stimulus conditions in Experi-ment 2. The experimental design is shown in Table 2. Thetarget temporal frequency was always 7.5 Hz and thespatial frequency of target and masker were varied
together. Since the temporal contrast sensitivity functionis band-pass at low spatial frequencies and low-pass athigh spatial frequencies (Robson, 1966; Kelly, 1972),manipulating the spatial frequency of the target andmasker is a second way to favor particular classes ofdetecting mechanism (Breitmeyer & Ganz, 1977). Eachtarget was detected in the presence of a masker modulat-ing at 1, 4, 7.5, 15 or 30 Hz. Masker and target spatialfrequencies were either 1 or 8 cpd for JYS and 1, 5 or8 cpd for GMB. One family of TvC functions wasmeasured for each spatial frequency.
4. Results
4.1. Experiment 1
Figs. 5 and 6 show the results for subjects GMB andJYS, respectively. Contrast is measured in decibels (dBre 1) where 1 dB is one twentieth of a log unit. The resultsfor the 1 and 10 Hz targets are shown above (A) andbelow (B), respectively. Solid lines show the best fit ofthe DI model to the data and are discussed in the nextsection.

G.M. Boynton, J.M. Foley / Vision Research 39 (1999) 1641–16561648
Fig. 4. Experimental conditions in Experiment 1 (A) and Experiment 2 (B). The spatial and temporal frequencies of maskers and targets aredenoted by open squares and filled circles, respectively. Each target was detected in the presence of all five maskers of the same spatial frequency.An entire TvC function was measured for each masker and target combination.
The thresholds shown are means of three (JYS) orfour (GMB) measurements. The standard errors of themean were roughly equal for all masker temporal fre-quencies and increased by a factor of about 1.2 fromlow to high masker contrasts. Mean standard errors areshown in Table 1.
There is remarkable similarity between the two sub-jects. The shape of the TvC functions varies withmasker temporal frequency in two ways. First, facilita-tion is greatest when masker and target frequencies arethe same for both the 1 and 10 Hz targets. Facilitationdecreases as the difference between target and maskerfrequency increases. Second, the slopes of the risingportion of the TvC functions vary within a family.Table 3 shows the slopes of the best fitting lines(method of least-squares) through the rising portions ofeach TvC function. Data included in the slope analysiswere subjectively defined; points from the highestmasker contrasts were chosen from a region where astraight line appeared to fit the data well. For the 1 Hztarget, slopes are steepest at the intermediate maskingfrequency of 10 Hz. For the 10 Hz target, slopesgenerally increase with masker frequency. The changein slope violates the horizontal displacement rule and isinconsistent with the NE1 model. The decrease in facili-tation is inconsistent with models NE1 and NE2.
Note also that maximum masking does not occur atthe target frequency. The 1 Hz target is masked maxi-mally by a 10 Hz masker and the 10 Hz target ismasked maximally by a 20 Hz masker. Masking isgreater at the masker frequencies above and below the10 Hz target frequency than at the 10 Hz maskerfrequency.
Phenomenological reports from both subjects indi-cate that the percept does not vary systematicallywithin a family of TvC functions. For all masker
frequencies, the 1 Hz target was described as an ori-ented pattern that gradually appeared and then disap-peared. The 10 Hz target produced a flickering orflashing percept in the presence of all masker temporalfrequencies. The spatial configuration of the 10 Hztarget was described as ‘blob-like’. Interestingly, thesereports are similar to the phenomenological ‘flicker’and ‘pattern’ criteria used by Kulikowski and Tolhurstin their investigations of independent temporal channels(Kulikowski & Tolhurst, 1973).
4.2. Experiment 2
Figs. 7 and 8 show the results of Experiment 2 forsubjects GMB and JYS, respectively. Solid lines showthe best fit of the DI model to the data. As in Experi-ment 1, the standard errors of the mean were roughlyequal for all masker temporal frequencies and increasedwith masker contrast by a factor of about 1.3. Meanstandard errors are shown in Table 2.
There is good agreement between the experimentalresults of the two subjects. As in Experiment 1, theresults are inconsistent with the horizontal shift rulepredicted by the NE model. Both the slopes of therising portions of each TvC function and the amount offacilitation vary within a family of TvC functions.Slopes of the regression line through the rising portionof TvC functions are shown in Table 4. Slopes generallyincrease with the temporal frequency of the masker forall spatial frequencies, much like the slopes for the 10Hz target in Experiment 1, but there is very littlechange in slope with spatial frequency. Facilitation ismaximal when the masker frequency equals the targetfrequency of 7.5 Hz. Subjects reported that the 7.5 Hztarget was described to ‘flicker’ or ‘flash’ at all spatialfrequencies and appeared ‘blob-like’ in form.

G.M. Boynton, J.M. Foley / Vision Research 39 (1999) 1641–1656 1649
Table 2Experimental variables, details of theoretical analysis, and parameter values of the best fitting DI model
TemporalSpatialExperimental variables
667 ms; rect 1, 4, 7.5, 15, 30 HzMasker full-field 7×5°; 1, 5, 8 cpdGabor 105 ms; 7.5 HzTarget Gabor 1.875°; 1, 5, 8 cpd
Theoretical analysis JYSGMB
8 1Target frequency (cpd) 1 5 8
63 60 66No. of data points 58683 3Measurements per point 4 48 4
0.81 1.35Mean standard error (dB) 0.79 0.75 0.84Free parameters
8 8NE1 8 8 814141414NE2 14
14 14DI 14 14 14SSE (dB2)
218.24257.482.3163.58NE1 222.99213.38 166.61NE2 127.42 42.39 64.20164.03 109.74DI 66.95 20.14 57.52
MSE (dB2/data point)1.37 3.90 3.671.01NE1 3.281.07 3.23NE2 1.87 0.67 2.87
1.891.900.960.32DI 0.98PB0.0001 PB0.0005F test (DI over NE) PB0.0001 PB0.0001 PB0.0001
DI parameters27.26 22.10107.3214.60SEt 102.43
9.7458.31SIt 7.10 7.24 17.21.351.581.972.44p 2.54
1.80 1.37q 2.38 2.18 1.271.00 1.00Z (fixed) 1.00 1.00 1.00
Again, maximum masking does not occur at thetemporal frequency of 7.5 Hz. As in Experiment 1,masking is greater at the temporal frequencies belowand above the target frequency.
5. Model fitting
Both the NE model (with one and two mechanisms)and the DI model were fitted to the data of Experi-ments 1 and 2. Both of the NE models make qualitativepredictions that are inconsistent with the data. NE1
predicts that any masker that excites the detectingmechanism will produce a TvC function which is alaterally shifted version of the others in our coordi-nates. The results clearly do not agree with that predic-tion. NE2 predicts that the magnitude of facilitationwill be the same for all maskers. The results do notagree with this prediction either. Legge and Foley,(1980) did show in the spatial domain that a NE modelwith multiple mechanisms can predict a decrease in
facilitation as the difference between target and maskerfrequences increases. A similar analysis could apply inthe temporal domain. However, this analysis assumesthat there are multiple approximately equal peaks inthe target waveform. That was not the case for ourGabor temporal waveforms. Nevertheless, we fitted allthree models to our data.
The single-mechanism NE model (NE1) requires fourparameters for each TvC function. The two-mechanismNE model (NE2) contains the same four parameters asNE1 plus three more: additional excitatory sensitivitiesfor the target and masker, and a nonlinear summationparameter, n. The parameter n was fixed to four, so theNE2 model has six free parameters for a single TvCfunction. The DI model requires seven parameters for asingle TvC function, but has only 6 d.f. (Appendix A).The parameter Z is therefore arbitrarily set to one.Table 5 is a description of the parameters for all threemodels.
The NE1 model provides independent estimates ofSEm for each of the five masker frequencies in the

G.M. Boynton, J.M. Foley / Vision Research 39 (1999) 1641–16561650
family. The remaining three parameters, SEt, p, and Z areshared within the family, requiring a total of 5+ 3=8free parameters to predict a family of TvC functions(about 75 data points). The NE2 model has six additionalparameters (the five masker sensitivities and the onetarget sensitivity of the second mechanism). The DImodel has independent estimates of SEm and SIm for eachmasker frequency in the family. The remaining fourparameters, SEt, SIt, p, and q are common to all TvCfunctions in the family, requiring a total of 2×5+4=14free parameters to predict a family of TvC functions.
Fits of all three models to each family of TvC functionswere obtained using an optimization procedure based onPowell’s method (Press, Flannery, Teukolsky & Vetter-ling, 1988) of minimizing the sums of squared error(S.S.E.). For each family of TvC functions, 20 initialconditions were chosen by randomly perturbing theparameters from a set that provided a reasonable fit tothe data. S.S.E. was then minimized using the optimiza-tion procedure for each of the 20 initial conditions. Ofany set of 20 fits, parameter values of the best ten or sowere approximately the same, indicating a global mini-mum of S.S.E. The parameter values from the best fit ofthese 20 optimizations were chosen as our estimate of theglobal minimum of S.S.E.
A statistical test of improvement in goodness of fit(Khuri & Cornell, 1987) was used to compare fits. Thistest takes into account the difference in the number of
Fig. 6. Results of Experiment 1, subject JYS. Targets and maskers at2 cpd. The results for the 1 and 10 Hz targets are shown above (A)and below (B), respectively.
free parameters between one model and a more specificmodel that shares common, but fewer parameters. Thetest is in the form of the F statistic. The following is adescription of the model fits for both experiments.
5.1. Experiment 1
In each of the four families of TvC functions inExperiment 1, the DI model was significantly better ingoodness-of-fit over the NE1 model (PB0.001). It isclear from Figs. 5 and 6 that the DI model fits the datawell. The differing slopes are captured by the model.However, the model does not always capture facilitationwell. The DI model also produced a better fit than theNE2 model in three of the four cases (the fits were equallyas good in the fourth), even though the number ofparameters are the same.
Sums of squared errors (S.S.E.) for all three models areshown in Table 1. Mean standard error of the estimatesand root mean squared error of the fit of the DI modelare roughly similar, which indicates that the model isaccounting for almost all of the effect except for randomerror. The parameter values from the best fits of thedivisive inhibition model to the data, except for thesensitivities to the masker, are shown in Table 1.
Fig. 9 shows the excitatory and divisive inhibitorysensitivities of the detecting mechanism to maskers ofdifferent temporal frequencies. Functions for excitatory
Fig. 5. Results of Experiment 1, subject GMB. Targets and maskersare 2 cpd. The results for the 1 and 10 Hz targets are shown above(A) and below (B), respectively.

G.M. Boynton, J.M. Foley / Vision Research 39 (1999) 1641–1656 1651
Table 3Slopes of regression line through the rising portion of TvC functionsof Experiment 1
GMB JYS
10 Hz 1 Hz1 Hz 10 Hz
0.460.300.52 0.401 Hz0.60 0.675 Hz 0.720.620.93 0.6010 Hz 0.81 0.89
0.611.16 1.150.9220 Hz1.55 0.4330 Hz 0.970.74
0.8260.722 0.5540.908Mean
excitatory sensitivity. Recall that facilitation in the TvCfunctions (the dipper shape) is predicted by the divisiveinhibition model when the excitatory sensitivity to themasker is high. The relatively narrow tuning of theexcitatory sensitivity estimates in Fig. 9, thereforereflects the facilitation effects seen in the TvC functionswhen target and masker are similar in temporal fre-quency (Figs. 5 and 6).
5.2. Experiment 2
A statistical comparison of fits from the three modelsto the data of Experiment 2 shows that the DI modelfits better than the NE1 model for all three families ofTvC functions (PB0.001). It also fits better than theNE2 model in all five cases. Table 2 shows the meansquared errors for all three models and all of theparameter values from the best fits of the DI model tothe data except for the sensitivities to the masker, whichare plotted in Fig. 10. As in Experiment 1, meanstandard error of the estimates and root mean squarederror of the fit of the DI model to the data are roughlysimilar. Although the fit is better than the NE models,the DI model fails to predict the facilitation found withsubject JYS at both 1 and 8 cpd. The model appearsnot to be flexible enough to predict all aspects of theseresults.
Excitatory sensitivity estimates are band-pass at 1and 5 cpd and low pass at 8 cpd. At 5 and 8 cpd,
sensitivity are low-pass for 1 Hz target (Fig. 9A,C) andband-pass for the 10 Hz target (Fig. 9B,D). The in-hibitory sensitivity estimates show broader tuning than
Fig. 7. Results of Experiment 2, subject GMB. All targets were 7.5Hz. The three plots are for target and masker spatial frequencies of 1(A), 5 (B) or 8 (C) cpd.
Fig. 8. Results of Experiment 2, subject JYS. All targets were 7.5 Hz,and target and masker spatial frequencies were 1 (A) or 8 (B) cpd.

G.M. Boynton, J.M. Foley / Vision Research 39 (1999) 1641–16561652
Table 4Slopes of regression line through the rising portion of TvC functionsof Experiment 2
JYSGMB5 cpd 8 cpd1 cpd8 cpd1 cpd
0.64 0.641 Hz 0.84 0.56 0.610.750.840.940.724 Hz 0.86
1.14 0.917.5 Hz 0.81 0.79 0.970.92 1.1015 Hz 0.94 0.67 0.82
1.541.16 1.260.5430 Hz 1.060.8821.006Mean 0.902 0.656 0.960
As in Experiment 1, excitatory and inhibitory sensi-tivity estimates are similar in magnitude when themasker temporal frequency is the same or similar to thetarget frequency (7.5 Hz). For the 1 and 5 cpd condi-tions, excitatory sensitivity drops below inhibitory sen-sitivity for the lowest frequency (1 Hz) masker. Thus at1 and 5 cpd, excitatory tuning is narrower than in-hibitory tuning. However, at 8 cpd excitatory andinhibitory sensitivities are nearly identical for allmasker temporal frequencies.
5.3. Target sensiti6ities
The parameters SEt and SIt (Tables 1 and 2) areexcitatory and inhibitory sensitivity estimates of thedetecting mechanism. In all cases, target excitatorysensitivity is greater than target inhibitory sensitivity.This differs from estimates of sensitivity to the masker,where inhibitory sensitivity is generally broader andgreater than excitatory sensitivity. One possible expla-nation is that the inhibitory component, in addition tobeing broadly tuned to spatial and temporal frequen-cies, might also be sensitive to a greater spatial extentthan the excitatory component. This would predict agreater sensitivity to the full-field masker than therestricted Gabor target. Foley (1994) found that afull-field masker masked more than a Gabor masker.
Excitatory and inhibitory target sensitivities esti-mated from Experiment 1 (2 cpd target) are greaterthan for the 10 Hz target and for the 1 Hz target. Thisis consistent with the masker excitatory and inhibitorysensitivities for all conditions except those with a targetspatial frequency of 8 cpd.
6. Discussion
This study shows that TvC functions for differenttemporal frequency maskers differ greatly both in themagnitude of facilitation and in the slopes of the risingsegments. This is a clear failure of the horizontal trans-lation rule and is qualitatively inconsistent with theNE1 and NE2 models.
The NE models have survived until recently becausethey were not adequately tested. Although they success-fully predict individual TvC functions, the models fail(both qualitatively and in goodness-of-fit) when testedwith threshold measurements for a single target in thepresence of maskers of differing masker temporal fre-quency and contrast. The NE1 model predicts equalslopes of the rising segments of the TvC functions andconstant facilitation. The multiple-mechanism versionallows for different slopes, but also predicts constantfacilitation. We found slopes to vary greatly within afamily of TvC functions that share a single target. Also,
excitatory tuning is very broad. The shape of the in-hibitory tuning functions is broad and varies littleacross all three spatial frequencies. Inhibition is greatestfor the 1 cpd conditions and for the 4–15 Hz temporalfrequency range of the masker.
Table 5Description of the model parameters
Parameter Description
Nonlinear excitation model, onemechanism (NE1)SEm Excitatory sensitivity to the
maskerSEt Excitatory sensitivity to the
targetp Excitatory exponentZ Denominator parameter (fixed
to 1.0)
Nonlinear excitation model,two mechanisms (NE2)SEm1 1st mechanism excitatory
sensitivity to the masker2nd mechanism excitatorySEt1
sensitivity to the target1st mechanism excitatorySEm2
sensitivity to the maskerSEt2 2nd mechanism excitatory
sensitivity to the targetn Nonlinear pooling constant
(fixed to 4)p Excitatory exponentZ Denominator parameter (fixed
to 1.0)
Divisive inhibition model (DI)Excitatory sensitivity to theSEm
maskerSIm Inhibitory sensitivity to the
maskerSEt Excitatory sensitivity to the
targetInhibitory sensitivity to theSI
targetExcitatory exponentp
q Inhibitory exponentZ Denominator parameter (fixed
to 1.0)

G.M. Boynton, J.M. Foley / Vision Research 39 (1999) 1641–1656 1653
Fig. 9. Estimated mechanism sensitivity values from Experiment 1.
facilitation varied within each family of TvC functions,with maximal facilitation when target and masker wereof the same temporal frequency. Such interactions be-tween the contrast of the masker and other propertiesof the masker have been discovered previously for otherclasses of patterns (Georgeson & Georgeson, 1987;Ross & Speed, 1991; Foley & Boynton, 1994; Foley,1994).
We have shown that across a wide variety of stimuliin the spatio-temporal domain that the DI model pro-vides both a good fit and a statistically significantimprovement in fit over the NE1 model (with root meanerror slightly larger than standard error). The DI modelalso fits better than the NE2 model, even though thetwo models have the same number of free parameters.The DI model successfully describes the variation in theshapes of TvC functions across masker temporal fre-quency. It has previously been shown to describe TvCfunctions for different masker orientations relative tothe target (Foley, 1994). Although the new model fitswell, the best fit does not always capture the facilitationthat occurs when target and masker temporal frequen-cies are equal. This failure is not well understood andmerits more study.
The relation between masker temporal frequency andthreshold elevation found here differs in one importantway from results in the literature. Masking functionsfrom Lehky (1985) and Hess and Snowden (1992) are
concave down. In our experiments using 7.5 and 10 Hztargets, we found less masking when masker and targetare of the same temporal frequency than when themasker frequency is just above or below the targetfrequency. This phenomenon was also found usingtarget temporal frequencies of 5, 15 and 30 Hz (Boyn-ton & Foley, 1991). We believe that this discrepancycan be explained by differences in experimentalparadigms; unlike our study, both the Lehky (1985) andHess and Snowden (1992) studies imposed a slightdifference between target and masker. Lehky (1985)offset the orientation of the target, and Hess andSnowden (1992) randomly varied the temporal phase ofthe target with respect to the masker. Since facilitationis maximal when target and masker are similar (Legge& Foley, 1980; Georgeson, 1987), these changes mini-mize differences in facilitation effects across conditions.
Without these differences between the target andmasker, facilitation occurs when target and maskerhave similar temporal frequencies. According to the DImodel, the facilitation effect is the result of excitationby the masker. The facilitation effect lowers the entirerising portion of the TvC function. This explains whythreshold elevation is not always maximal when themasker and target temporal frequencies are equal. Theincreased excitatory sensitivity to the masker shifts theTvC functions (when target and masker frequency aresimilar) downward for all masker contrasts (Fig. 2).

G.M. Boynton, J.M. Foley / Vision Research 39 (1999) 1641–16561654
Fig. 10. Estimated mechanism sensitivity values from Experiment 2.
This study has two important implications for theinterpretation of earlier masking studies. First, the vari-ability in the shape of the TvC functions with maskerfrequency found in our study shows that the bandwidthof traditionally measured masking functions will varywith masker contrast. Thus, the masking functionsmeasured by Hess and Snowden (1992) and Lehky(1985) do not generalize to maskers of all contrasts.Second, even if the variability in the shapes of TvCfunctions within a family are small, masking functionsstill do not directly reflect mechanism sensitivity func-tions, according to the DI model. The DI model pre-dicts that the amount of masking at a single maskercontrast is a consequence of both excitatory and in-hibitory sensitivity to the masker. These two sensitivi-ties are different functions of temporal frequency.
Using the DI model and the masking paradigm witha variety of masker orientations, Foley (1994) hasshown that the detecting pattern vision mechanism hasa narrowly tuned excitatory input and a broadly tuned
inhibitory input in the orientation domain. Similarly, inthis paper we have shown, by masking with a variety oftemporal frequencies, that excitatory sensitivity is morenarrowly tuned to temporal frequency than is in-hibitory sensitivity. Excitatory sensitivity generallypeaks at the temporal frequency of the target. In-hibitory sensitivity is very broadly tuned and varieslittle across the families of TvC functions. Unlike mask-ing across orientation, the difference in tuning betweenexcitation and inhibition is much less dramatic alongthe temporal frequency dimension and disappears at ahigh (8 c/deg) spatial frequency.
It is possible that the excitatory and inhibitory tem-poral sensitivity functions estimated here reflect thetuning of a subset of a finite number of detectingmechanisms in the spatio-temporal domain. However,attempts to fit multiple families of TvC functions withthe same sensitivity parameters failed. This suggeststhat there are that there are at least several spatio-tem-poral mechanisms with different sensitivities. The simi-

G.M. Boynton, J.M. Foley / Vision Research 39 (1999) 1641–1656 1655
ilarity of the inhibitory sensitivities to the masker acrossfamilies of TvC functions is encouraging. It seems likelythat the inhibitory sensitivities reflect the pooled re-sponses of differently tuned mechanisms. These under-lying mechanisms may be the same as those measuredby the excitatory sensitivity estimates.
The DI model was adapted to the temporal domainby assuming that the thresholds depend on the mecha-nism response at one moment in time. Although thismodel accounts for our results well, it does not accountfor the effect of target duration (Legge, 1978; Watson,1979) or for the effect of relative temporal phase inmasking (Breitmeyer & Ganz, 1977).
It seems very likely that a more elaborate model thatspecifies the mechanism response as a function of timeand provides for integration of the response over timewill be necessary to account for these effects.
7. Conclusion
We have shown that when one temporally modulatedpattern is masked by another, the form of the TvCfunction varies greatly with the temporal frequency ofthe patterns. These data are poorly fitted by a one-mechanism nonlinear excitation model. A two-mecha-nism nonlinear excitation model does not fit as well asa divisive inhibition model. Fits of the divisive inhibi-tion model to the data indicate that a different mecha-nism detects each of the five target patterns. Thisindicates that there are several spatio-temporal patternmechanisms in the human visual system that differ intheir response functions as well as their tuning. Thesefits also suggest that excitatory tuning is narrower thandivisive inhibitory tuning except at high spatial frequen-cies where they are approximately the same. Finally,excitatory tuning is low-pass for mechanisms tuned tolow temporal frequencies and high spatial frequencies,and band-pass for mechanisms tuned to high temporalfrequencies and low spatial frequencies.
Appendix A. Degrees of freedom in the divisiveinhibition model
This Appendix discusses the free parameters of theDI model. The seven parameters consist of two excita-tory sensitivities (one for the masker and one for thetarget) two inhibitory sensitivities, two exponents (pand q), and the constant Z. The mechanism response toa stimulus is:
R(E, I)=Ep
Iq+Z(10)
If the parameter Z is changed by a scale factor to kZ,
the values of E and I can be scaled so that the mecha-nism response stays the same because:
R(E, I)=Ep
Iq+Z=
(k1/pE)p
(k1/qI)p+kZ(11)
The equation above shows that scaling Z by a factork can be offset by scaling E by k1/p and scaling I byk1/q. Recall that the quantities E and I are products ofstimulus contrast and mechanism sensitivities. ScalingZ can therefore be offset by scaling the excitatory andinhibitory sensitivities appropriately. Thus the sevenparameters share only 6 d.f. For this reason Z wasarbitrarily set to one for all model fits in this paper.
References
Albrecht, D. G., & Geisler, W. S. (1991). Motion sensitivity and thecontrast-response funtion of simple celIs in the visual cortex.Visual Neuroscience, 7, 531–546.
Anderson, S. J., & Burr, D. C. (1985). Spatial and temporal selectiv-ity of the human motion detection system. Vision Research, 25,1147–1154.
Boynton, G. M., & Foley, J. M. (1991). Adapting to temporallymodulated spatial patterns: effects of temporal frequency andadapter contrast. Association for Research in Vision and Ophthal-mology, 32, 851.
Breitmeyer, B. G. (1975). Simple reaction time as a measure of thetemporal response properties of transient and sustained channels.Vision Research, 15, 1411–1412.
Breitmeyer, B., & Ganz, L. (1977). Temporal studies with flashedgratings: inferences about human transient and sustained chan-nels. Vision Research, 17, 861–865.
Burbeck, C., & Kelly, D. (1980). Spatiotemporal characteristics ofvisual mechanisms: excitatory-inhibitory model. Journal of theOptical Society of America A, 70, 1121–1126.
Campbell, F. W., & Robson, J. G. (1967). Application of Fourieranalysis to the visibility of gratings. Journal of Physiology (Lon-don), 197, 551–556.
Foley, J. M. (1994). Human luminance pattern-vision mechanisms:masking experiments require a new model. Journal of the OpticalSociety of America A, 11, 1710–1719.
Foley, J. M., Boynton, G. M. (1994). A new model of humanluminance pattern vision mechanisms: analysis of the effects ofpattern orientation, spatial phase, and temporal frequency. In: T.A., Lawton, Computational 6ision based on neurobiology, SPIEProceedings, vol. 2054.
Georgeson, M. A. (1987). Temporal properties of spatial contrastvision. Vision Research, 27, 765–780.
Gerogeson, M., & Georgeson, J. (1987). Facilitation and masking ofbriefly presented gratings: time-course and contrast dependence.Vision Research, 27, 369–379.
Green, M. (1981). Psychophysical relationships among mechanismssensitive to pattern, motion and flicker. Vision Research, 21,971–983.
Harwerth, R. S., & Levi, D. M. (1978). Reaction time as a measureof susprathreshold grating detection. Vision Research, 18, 1579–1586.
Heeger, D. J. (1992). Normalization of cell responses in cat striatecortex. Visual Neuroscience, 9, 181–198.
Hess, R., & Plant, G. (1985). Temporal frequency discrimination inhuman vision: evidence for an additional mechanism in the lowspatial and high temporal frequency region. Vision Research, 25,1493–1500.

G.M. Boynton, J.M. Foley / Vision Research 39 (1999) 1641–16561656
Hess, R., & Snowden, R. (1992). Temporal properties of humanvisual filters: number, shapes and spatial covariation. Vision Re-search, 32, 47–59.
Keesey, U. T. (1972). Flicker and pattern detection: a comprison ofthresholds. Journal of the Optical Society of America, 62, 444–448.
Kelly, D. (1972). Flicker. In Hurvich, & Jameson, Handbook ofSensory Physiology. New York: Springer-Verlag.
Khuri, A., & Cornell, J. (1987). Response surfaces : designs andanalysis. New York: Marcel Dekker.
King-Smith, P. E., & Kulikowski, J. J. (1975). Pattern and flickerdetection analysed by subthreshold summation. Journal of Physi-ology, 249, 519–548.
Koenderink, J. J., & van Doorn, A. J. (1979). Spatiotemporal con-trast detection threshold suface is bimodal. Optics Letters, 4,845–849.
Kulikowski, J. J., & Tolhurst, D. J. (1993). Psychophysical evidencefor sustained and transient detectors in human vision. Journal ofPhysiology (London), 232, 149–162.
Legge, G. E. (1978). Sustained and transient mechanisms in humanvision: temporal and spatial properties. Vision Research, 18, 69–81.
Legge, G., & Foley, J. (1980). Contrast masking in human vision.Journal of the Optical Society of America A, 70, 1458–1470.
Lehky, S. (1985). Temporal properties of visual channels measured bymasking. Journal of the Optical Society of America A, 2, 1260–1272.
Mandler, M. (1984). Temporal frequency discriminations abovethreshold. Vision Research, 12, 1873–1880.
Mandler, M., & Makous, W. (1984). A three channel model oftemporal frequency perception. Vision Research, 24, 1881–1887.
Pantle, A. (1983). Temporal determinants of spatial sine-wave mask-ing. Vision Research, 23, 749–757.
Press, W. H., Flannery, B. P., Teulolsky, S. A., & Vetterling, W. T.(1998). Numerical recipes in C. Cambridge: Cambridge UniversityPress.
Richards, W. (1979). Quantifying sensory channels: Generalizingcolorimetry to orientation and texture, touch and tones. SensoryProcesses, 3, 207–229.
Robson, J. G. (1966). Spatial and temporal contrast sensitivity func-
tions of the visual system. Journal of the Optical Society ofAmerica, 56, 1141–1142.
Ross, J., & Speed, H. D. (1991). Contrast adaptaion and contrastmasking in human vision. Proceedings of the Royal Society ofLondon, B, 246, 61–69.
Stiles, W. S. (1949). Increment thresholds and the mechanisms ofcolour vision. Documenta Opthalmologica, 3, 138–163.
Tartaglione, A., Goff, D. P., & Benton, A. L. (1975). Reaction timeto square-wave gratings as a function of spatial frequency, com-plexity and contrast. Brain Research, 100, 111–120.
Teo, P., & Heeger, D.J. (1994). Perceptual image distortion, Proceed-ings of SPIE, vol. 2179, San Jose, CA, pp. 127–141.
Thompson, P. G. (1983). Discrimination of moving gratings at andabove detection threshold. Vision Research, 23, 1533–1538.
Tolhurst, D. J. (1975). Sustained and transient channels in humanvision. Vision Research, 15, 1151–1155.
van Nes, F. L., Koenderink, J. J., Nas, H., & Bouman, M. (1967).Spatio-temporal modulation transfer in the human eye. Journal ofthe Optical Society of America, 57, 1082–1088.
Watson, A. (1979). Probability summation over time. Vision Re-search, 19, 515–522.
Watson, A. B. (1986). Temporal sensitivity. In K. R. Boff, L.Kauffman, & J. P. Thomas, Handbook of perception and humanperformance. In: Sensory processes and perception, Vol. 1. NewYork: Wiley.
Watson, A., & Robson, J. (1981). Discrimiation at threshold: La-belled detectors in human vision. Vision Research, 21, 1115–1122.
Watson, A., & Pelli, D. (1983). Quest: A bayesian adaptive psycho-metric method. Perception and Psychophysics, 33, 113–120.
Watson, A. B., & Soloman, J. A. (1997). Model of visual contrastgain control and pattern masking. Journal of Optical Society ofAmerica A, 14, 2379–2391.
Watson, A. B., Nielson, K. R. K., Poirson, A., Fitzhugh, A., Bilson,A., Nguyen, K., & Nguyen, A. J. A. Jr. (1986). Use of a rasterframebuffer in vision research. Beha6ior Research Methods andInstrumentation Computers, 18, 587–594.
Wilson, H., McFarlane, D., & Phillips, G. (1983). Spatial frequencytuning of orientation sensitive units estimated by oblique mask-ing. Vision Research, 23, 872–882.
.
.
Copyright © 2022 FDOKUMEN