Effect of the luminance signal on adaptation-based time compression
17
Effect of the luminance signal on adaptation-based time compression Cognitive, Perceptual and Brain Sciences Department, University College London, London, UK Inci Ayhan Cognitive, Perceptual and Brain Sciences Department, University College London, London, UK Aurelio Bruno NTT Communication Science Laboratories, Nippon Telegraph & Telephone Corporation, Kanagawa, Japan Shin'ya Nishida Cognitive, Perceptual and Brain Sciences Department, University College London, London, UK,& CoMPLEX, University College London, London, UK Alan Johnston Traditionally, time perception has been considered the product of a central, generic, cognitive mechanism. Recent evidence, however, has shown that high temporal frequency adaptation induces local reductions in the apparent duration of brief intervals suggesting a distributive system with modality-specific sensory components. Here, we examine the effect of the luminance signal on these adaptation-based temporal distortions. Our results show that the luminance signal is crucial to generate duration compression as the effect disappears at isoluminance and that low visibility and task dif ficulty at isoluminance cannot explain the discrepancy. We also demonstrate that the effects of adaptation on perceived duration are dissociable from those on apparent temporal frequency. These results provide further evidence for the involvement of the magnocellular system in the neural encoding and representation of visual time. Keywords: luminance channel, duration perception, magnocellular pathway, temporal, frequency Citation: Ayhan, I., Bruno, A., Nishida, S., & Johnston, A. (2011). Effect of the luminance signal on adaptation-based time compression. Journal of Vision, 11(7):22, 1–17, http://www.journalofvision.org/content/11/7/22, doi:10.1167/11.7.22. Introduction Humans process temporal information over a large scale ranging from microseconds to daily circadian rhythms, perhaps reflecting multiple underlying neural mechanisms (Buonomano, 2007; Buonomano & Karmarkar, 2002; Mauk & Buonomano, 2004). Processing in the sub-second range is often referred as perceptual timing and is essential for a range of specialized perceptual and motor activities including sound localization, speech generation and recog- nition, motor coordination, and motion detection. In this range, duration, encoded explicitly, can also be considered to be part of the perceptual description of an event rather than a cognitive estimate of elapsed time. The underlying mechanisms of time perception in the sub-second range, however, remain obscure. The dominant models of event time have been devised around the idea of an internal clock (Creelman, 1962; Treisman, 1963; Treisman, Faulkner, Naish, & Brogan, 1990), which assumes a single central- ized neural circuit serving all sensory modalities. Percep- tual studies, however, have challenged the notion of a central clock showing that the apparent duration of a short interval depends on stimulus properties (Kanai, Paffen, Hogendoorn, & Verstraten, 2006; Kaneko & Murakami, 2009) and can be affected by adaptation to visual flicker or drifting motion (Ayhan, Bruno, Nishida, & Johnston, 2009; Burr, Tozzi, & Morrone, 2007; Johnston, Arnold, & Nishida, 2006; Johnston et al., 2008). The adaptation studies suggest that peripheral neural systems can be adapted by extended observation of particular stimulus features that play a role in the encoding of the duration of external events. Thus, in this perspective, time is treated as an attribute of a visual stimulus like any other low-level feature such as spatial frequency or contrast (Johnston et al., 2006; Johnston & Nishida, 2001). In the original paradigm, Johnston et al. (2006) presented subjects with a 20-Hz dynamic adaptor in a limited region of visual space and then they sequentially displayed two 10-Hz tests, one in the adapted region and the other in an unadapted region. Subjects had to decide which interval was longer. They observed strong duration compression for the stimulus presented in the adapted position. They also demonstrated that the compression of the apparent duration of 10-Hz dynamic grating is specific to high temporal frequency adaptation and that the magnitude of Journal of Vision (2011) 11(7):22, 1–17 http://www.journalofvision.org/content/11/7/22 1 doi: 10.1167/11.7.22 Received February 8, 2011; published June 29, 2011 ISSN 1534-7362 * ARVO
Transcript of Effect of the luminance signal on adaptation-based time compression

Effect of the luminance signal on adaptation-basedtime compression
Cognitive, Perceptual and Brain Sciences Department,University College London, London, UKInci Ayhan
Cognitive, Perceptual and Brain Sciences Department,University College London, London, UKAurelio Bruno
NTT Communication Science Laboratories,Nippon Telegraph & Telephone Corporation,
Kanagawa, JapanShin'ya Nishida
Cognitive, Perceptual and Brain Sciences Department,University College London, London, UK, &
CoMPLEX, University College London, London, UKAlan Johnston
Traditionally, time perception has been considered the product of a central, generic, cognitive mechanism. Recent evidence,however, has shown that high temporal frequency adaptation induces local reductions in the apparent duration of briefintervals suggesting a distributive system with modality-specific sensory components. Here, we examine the effect of theluminance signal on these adaptation-based temporal distortions. Our results show that the luminance signal is crucial togenerate duration compression as the effect disappears at isoluminance and that low visibility and task difficulty atisoluminance cannot explain the discrepancy. We also demonstrate that the effects of adaptation on perceived duration aredissociable from those on apparent temporal frequency. These results provide further evidence for the involvement of themagnocellular system in the neural encoding and representation of visual time.
Keywords: luminance channel, duration perception, magnocellular pathway, temporal, frequency
Citation: Ayhan, I., Bruno, A., Nishida, S., & Johnston, A. (2011). Effect of the luminance signal on adaptation-based timecompression. Journal of Vision, 11(7):22, 1–17, http://www.journalofvision.org/content/11/7/22, doi:10.1167/11.7.22.
Introduction
Humans process temporal information over a large scaleranging from microseconds to daily circadian rhythms,perhaps reflecting multiple underlying neural mechanisms(Buonomano, 2007; Buonomano & Karmarkar, 2002;Mauk & Buonomano, 2004). Processing in the sub-secondrange is often referred as perceptual timing and is essentialfor a range of specialized perceptual and motor activitiesincluding sound localization, speech generation and recog-nition, motor coordination, and motion detection. In thisrange, duration, encoded explicitly, can also be consideredto be part of the perceptual description of an event ratherthan a cognitive estimate of elapsed time. The underlyingmechanisms of time perception in the sub-second range,however, remain obscure. The dominant models of eventtime have been devised around the idea of an internal clock(Creelman, 1962; Treisman, 1963; Treisman, Faulkner,Naish, & Brogan, 1990), which assumes a single central-ized neural circuit serving all sensory modalities. Percep-tual studies, however, have challenged the notion of acentral clock showing that the apparent duration of a short
interval depends on stimulus properties (Kanai, Paffen,Hogendoorn, & Verstraten, 2006; Kaneko & Murakami,2009) and can be affected by adaptation to visual flicker ordrifting motion (Ayhan, Bruno, Nishida, & Johnston,2009; Burr, Tozzi, & Morrone, 2007; Johnston, Arnold,& Nishida, 2006; Johnston et al., 2008). The adaptationstudies suggest that peripheral neural systems can beadapted by extended observation of particular stimulusfeatures that play a role in the encoding of the duration ofexternal events. Thus, in this perspective, time is treatedas an attribute of a visual stimulus like any other low-levelfeature such as spatial frequency or contrast (Johnstonet al., 2006; Johnston & Nishida, 2001).In the original paradigm, Johnston et al. (2006) presented
subjects with a 20-Hz dynamic adaptor in a limited regionof visual space and then they sequentially displayed two10-Hz tests, one in the adapted region and the other in anunadapted region. Subjects had to decide which intervalwas longer. They observed strong duration compressionfor the stimulus presented in the adapted position. Theyalso demonstrated that the compression of the apparentduration of 10-Hz dynamic grating is specific to hightemporal frequency adaptation and that the magnitude of
Journal of Vision (2011) 11(7):22, 1–17 http://www.journalofvision.org/content/11/7/22 1
doi: 10 .1167 /11 .7 .22 Received February 8, 2011; published June 29, 2011 ISSN 1534-7362 * ARVO

the effect is independent of the relative orientation of theadaptor and test, suggesting an early locus. Recently, theeffect has been shown to have tight spatial tuning (Ayhanet al., 2009) and occur for purely retinotopic stimulation(Bruno, Ayhan, & Johnston, 2010), implying a site in thevisual pathway where the receptive fields of the neuronsremain relatively small and map the visual input inretinotopic coordinates. It is known that the apparentduration of a dynamic stimulus depends to some extentupon its temporal frequency for low to mid-temporalfrequencies (Kanai et al., 2006). Using a procedure designedto eliminate the influence of temporal frequency adaptationon speed judgments, Ayhan et al. (2009) have demon-strated that adaptation-induced duration distortion cannotbe attributed to changes in apparent speed, suggesting thatchanges in apparent duration after temporal frequencyadaptation can be dissociated from changes in apparenttemporal frequency. Temporal frequency shifts are bidirec-tional in that high temporal frequency adaptation reduces,whereas low temporal frequency adaptation increases theperceived temporal frequency of a 10-Hz test. However, fortypical observers, a mid-temporal frequency (10 Hz) testalways appears compressed in duration after low (5 Hz),mid- (10 Hz), and high (20 Hz) temporal frequencyadaptation (Ayhan et al., 2009; Johnston et al., 2006).Thus, separate neural mechanisms are needed to explainthese two effects. We suggest that temporal frequencyshifts result from changes in the relative responses of thetemporal channels following adaptation. For sine functions,temporal frequency can be recovered from the relativeactivity of band-pass and low-pass filters (Smith & Edgar,1994). A stimulus drifting or flickering at 10 Hz stimulatesboth the low-pass and mid-range band-pass filter approx-imately equally. The shift in its apparent temporalfrequency following high temporal frequency adaptationcan be explained by a relative increase in the response ofthe low-pass channel as a result of reduction in sensitivityof the band-pass channel, the pattern representing a lowerfrequency than 10 Hz. The opposite shift arises afteradaptation to a low (e.g., 5 Hz) frequency. This kind ofchange in activity among a pair or population of feature-dependent channels has been used successfully to explainother feature-based aftereffects, such as the tilt aftereffect(Colheart, 1971) and the spatial frequency aftereffect(Wilson & Humanski, 1993). In our duration adaptationparadigm, however, subjects adapt to temporal frequencyrather than duration; thus, adaptation-induced durationcompression cannot be simply explained by a durationchannel population model. We previously linked durationcompression (Ayhan et al., 2009; Johnston et al., 2006) tothe changes in the temporal tuning of band-pass temporalfilters following high temporal frequency adaptation(Ibbotson, Clifford, & Mark, 1998). It has been alsodemonstrated that the phase of signals carried by M cellsare advanced through fast adaptation to high contrast(Benardete & Kaplan, 1999b). The observation that
intermediate high temporal contrast intervals are perceivedas compressed following a 1.5-s dynamic high-contrastinterval but not a low-contrast interval (Bruno & Johnston,2010) provides further evidence for the link betweencontrast gain control in M cells and duration effects. Inaddition, cortically invisible flicker (È60 Hz) producesduration compression in normal subjects but not indyslexics (Johnston et al., 2008) for whom a number ofstudies (for a review, see Stein, 2001) indicated impairmentin the transient (magnocellular) mechanism. That theadaptation effects on temporal tuning of filters are unidirec-tional, i.e., high temporal frequency adaptation causes aphase advance in the signal but low temporal frequencyadaptation does not lead to a phase delay, is consistent withthe observation that both low and high temporal frequencyadaptation induce duration compression.Earlier studies (Ayhan et al., 2009; Burr et al., 2007;
Johnston et al., 2006, 2008) all used achromatic luminance-modulated stimuli, so the effect of a mainly chromaticsignal on the magnitude of the adaptation-induced durationcompression remains unknown. Existing evidence suggeststhat chromatic and achromatic signals are carried inseparate divisions from the retina to the primary visualcortex in the early stages of the visual system (Derrington,Krauskopf, & Lennie, 1984; De Valois, Abramov, &Jacobs, 1966; De Valois, Cottaris, Elfar, Mahon, &Wilson, 2000; Hubel & Wiesel, 1966). The chromaticsignals are thought to be carried by two channels, whichselectively signal the difference of L- and M-coneresponses (red–green) and the difference between short-wave (S)-cone responses and a sum of L- and M-coneresponses (blue–yellow). Though the L–M opponentchannel has also been suggested to contribute to luminancedetection and discrimination at high temporal frequencies(Gouras & Zrenner, 1979) and at high luminance contrasts(Benardete & Kaplan, 1999a), the achromatic signals aretransmitted mainly through a luminance mechanism,which responds to a neural sum of L- and M-cone signalsoriginating in the long-wave (L)- and middle-wave (M)-cones. The lateral geniculate body, where this anatomicaland functional split clearly manifests itself, consists of sixcoaxially arranged layers. The cells in the dorsal, or upper,parvocellular layers receiving opponent signals from L-and M-cones (i.e., L–M) play an important role in colorvision and in the perception of high spatial frequencypatterns. The cells in the ventral, or bottom, magnocel-lular layers receiving additive signals (i.e., L + M) areclearly involved in the perception of motion (Livingstone& Hubel, 1987). There is also a third system, thekoniocellular pathway, which has been proposed tomediate modulation along the S–(L + M) axis (Irvin,Casagrande, & Norton, 1993; Martin, White, Goodchild,Wilder, & Sefton, 1997). However, we will not considerthis pathway further in this study.Here, we test the magnocellular hypothesis of time
compression by examining the effect of the luminance
Journal of Vision (2011) 11(7):22, 1–17 Ayhan, Bruno, Nishida, & Johnston 2
signal on adaptation-based duration compression. As theapparent duration of a dynamic stimulus has been shown tobe affected by its speed (Brown, 1995; Kaneko &Murakami, 2009) or temporal frequency (Kanai et al.,2006), we first minimized the effect of temporal frequencyadaptation on apparent temporal frequency using a para-digm we have recently developed (Ayhan et al., 2009). Wethen measured adaptation-based temporal distortions forstimuli defined by chromatic (L–M) and luminance contrast(L + M). We found that the luminance signal is essential toduration compression. Apparent duration after adaptationwas not significantly different from baseline at isoluminance.We also showed that duration compression is much strongerwith luminance-modulated stimuli even after the perceptualstrength (visibility) of isoluminance and luminance modu-lation conditions are matched, indicating that visibilitycannot explain the discrepancy between the strength ofduration compression in the two conditions. These resultssuggest that the effects of adaptation on perceived durationare mediated by a transient luminance channel.
General methods
Observers
The experiments were performed on 10 adults (5 malesand 5 females), 7 of which were naı̈ve to the purpose ofthe study. All subjects had normal or corrected-to-normalvision with no color vision deficit.
Apparatus
Observers were seated 57 cm from a 19-inch SonyTrinitron Multiscan 500PS monitor that was driven by aVSG 2/5 graphics board (Cambridge Research Systems) ata refresh rate of 100 Hz. At this distance, the monitorsubtended 40 � 30 degrees. The head of the subject wasfixed to prevent head movements using a chin rest.A Gamma Scientific spectroradiometer was used to
measure the spectra of the red, green, and blue phosphorsat their maximum intensity. The primaries of the monitorhad x, y, Y coordinates of 0.61, 0.34, 36.09 (red); 0.28,0.61, 126.5 (green); and 0.15, 0.07, 20.95 (blue). Thewhite point for space calculations was set at CIEchromaticity coordinates (0.28 and 0.31) with a luminanceof 91.6 cd/m2.
Procedure
Prior to all experiments, the point of subjectiveisoluminance was measured individually for each subjectusing a minimum motion technique with the same
configuration and temporal frequency of the stimuli usedin the temporal frequency and duration tasks (Cavanagh,MacLeod, & Anstis, 1987). On a gray background withmean luminance, a chromatic (magenta–cyan) sinewavegrating (0.5 c/deg) was alternated with a luminance-modulated achromatic grating (0.5 c/deg) in a repetitivesequence, each stimulus displaced by one-quarter cyclefrom its predecessor to give the impression of apparentmotion dependent on the relative luminance of magentaand cyan phases of the chromatic grating. Subjects wereasked to adjust the luminance of magenta and cyanphases, respectively, in blocked trials, using a staircaseprocedure, until their perception of motion was replacedby flicker, which indicates the point of subjectiveisoluminance. The means of the two values obtained intwo blocked trials were then used in the subsequentexperiments as individual isoluminance settings.In the temporal frequency and duration experiments,
subjects were initially presented with a central fixationspot and an adaptor. The duration of the adaptation phasewas 32 s with 8-s top-ups between trials. The adaptorgrating reversed the direction of motion every 1 s to avoidthe buildup of a directional motion aftereffect. After500 ms, the adaptor disappeared from the screen, and twodrifting test gratings were presented sequentially on theadapted (standard) and unadapted (comparison) sides of thefixation point. The contrast of the adaptor and tests wasconstant over time; thus, stimuli had an abrupt onset andoffset. Whereas the duration or temporal frequency of thestandard stimulus was fixed across trials, the values ofthe comparison stimulus varied in seven steps. Details ofthe stimuli in each experiment can be found in the methodsof the relevant section. The order of presentation of thestandard and comparison was randomized from trial to trialto control for time order effects (Jamieson & Petrusic,1975). The adaptor location was also interleaved inblocked trials to control for spatial anisotropies in durationjudgments (Vicario et al., 2008). The task of the subjectwas to determine which of the test stimuli drifted faster (inperceived temporal frequency experiments) or for longer(in perceived duration experiments). Responses were usedto generate a psychometric function indicating the percentof trials in which the comparison was judged as faster orlonger than the standard for each subject. The 50% pointon the psychometric function provided an estimate of theeffect of adaptation on the perceived duration of thestandard.
Color space
The sinewave gratings were symmetric modulationsaround a central white point with CIE xyY coordinates(0.28, 0.31, 91.6). The isoluminant gratings were modu-lated around the white point between magenta (CIE xyY:0.319, 0.303, 91.6) and cyan (CIE xyY: 0.245, 0.336, 91.6)
Journal of Vision (2011) 11(7):22, 1–17 Ayhan, Bruno, Nishida, & Johnston 3

so as to isolate the L–M color-opponent mechanism(Derrington et al., 1984). Subjective isoluminance settingswere made by combining the chromatic gratings with low-contrast background color (gray) achromatic gratings, thusintroducing slight modulations of the violet–yellowopponent mechanism. The mean of the individual violet–yellow modulations, however, was only around 2% RMScone contrast for the adaptor and 3% RMS cone contrastfor the test (see Equation 7 for the definition of RMS conecontrast). For both isoluminant and luminance-modulatedstimuli, L- and M-cone excitations generated by themagenta and cyan phases of the gratings were found byintegrating the product of stimulus spectral output (read-ings taken in 1-nm intervals from 390 nm to 780 nm) withthe L- and M-cone fundamentals for 2- stimuli (Stockman& Sharpe, 2000). Having found the L- and M-coneexcitations, L- and M-cone contrasts on the steady graybackground were calculated using the following formulas:
LCCmagenta ¼ ðLCEmagenta j LCEgrayÞ=LCEgray; ð1Þ
MCCmagenta ¼ ðMCEmagenta j MCEgrayÞ=MCEgray; ð2Þ
LCCcyan ¼ ðLCEcyan j LCEgrayÞ=LCEgray; ð3Þ
MCCcyan ¼ ðMCEcyan j MCEgrayÞ=MCEgray; ð4Þ
where LCEmagenta, MCEmagenta, LCEcyan, and MCEcyan referto the cone excitations produced by the magenta and cyanphases of the gratings and LCEgray refer to the coneexcitation produced by the gray background. Each con-trast component indicates the effective stimulus contrast inthat particular class of cones.To compare the effectiveness of luminance-modulated
and isoluminant stimuli, we also computed the root-mean-square cone contrasts (RMSCC) individually for eachcondition separately:
LCC ¼ ðLCEcyan j LCEmagentaÞ=ðLCEcyan þ LCEmagentaÞ; ð5Þ
MCC ¼ ðMCEcyan j MCEmagentaÞ=ðMCEcyan þMCEmagentaÞ;ð6Þ
RMSCC ¼ sqrt½ðM2CC þ L2CCÞ=2�: ð7Þ
For chromatic luminance-modulated stimuli, the root-mean-square contrast corresponds to the sum of the
Michelson contrast [(Lummax j Lummin n)] / [(Lummax +Lummin)] and the RMS cone contrast of the chromaticcomponent. For isoluminant stimuli, the resulting RMScone contrast falls between L- and M-cone contrasts.
Experiment 1: Temporalfrequency shift for equiluminanceand luminance modulation
The apparent duration of a moving stimulus reduceswith temporal frequency at low temporal frequencies(Kanai et al., 2006). We have previously shown thatreductions in perceived durations following 20-Hz adap-tation persist even after matching for perceived temporalfrequency (Johnston et al., 2006), indicating that theeffects of adaptation on temporal frequency and durationcan be dissociated. More recently, we also introduced anew procedure to eliminate any possible influence oftemporal frequency adaptation on speed judgments(Ayhan et al., 2009). Here, we use the same method toexplore temporal frequency shifts following adaptation inisoluminant and luminance modulation conditions. Weinterleave 5- and 10-Hz oscillatory adaptors over time tofind, for each subject, a ratio of durations of these twoadaptor frequencies at which the perceived speed of a 7-Hzdrifting test pattern does not change. We then use thesecritical ratios in our duration experiments to ensure thatany aftereffect we observe cannot be attributed to changesin apparent temporal frequency or speed.
Methods
In Experiment 1, observers were presented with acentral fixation spot and an adapting stimulus (which inhalf of the trials was located 5- above and in half of thetrials 5- below the center of the screen within an 8-diameter circular patch), consisting of a drifting sinusoidalgrating (0.5 c/deg) that alternated direction every 1 s. Inthe adaptation phase, the grating oscillated with a temporalfrequency of 5 and 10 Hz interleaved using one of 3different ratios: 0% (5 Hz)–100% (10 Hz); 50% (5 Hz)–50% (10 Hz); 100% (5 Hz)–0% (10 Hz). The duty cycletypically determined the proportion of time for which thetwo adapting temporal frequencies were displayed. Theduration of the adaptation phase was 32 s. At the beginningof each subsequent trial, subjects were also adapted for ashort period (8-s top-up), in order to maintain a high,constant level of adaptation. Each cycle typically lasted 4 sduring the initial adaptation and 2 s during the top-ups,with the critical duration ratio of the two interleavedadaptor frequencies kept the same. After the adaptationphase, the test stimuli (sinusoidal grating with a spatialfrequency of 0.5 c/deg drifting for 600 ms) were displayed
Journal of Vision (2011) 11(7):22, 1–17 Ayhan, Bruno, Nishida, & Johnston 4

sequentially on the adapted and unadapted sides of thefixation point. The order of display was randomized foreach trial. The temporal frequency of the standardstimulus, which was displayed in the same spatial positionas the adaptor, was fixed across trials (7 Hz). The temporalfrequency of the comparison stimulus, which was dis-played in an unadapted spatial position (centered 5- aboveor below the central fixation point), was varied between 1and 13 Hz in 7 steps. The RMS cone contrasts of thechromatic stimuli were set to 5% for the adaptor and 7%for the test in the isoluminant condition. The luminance-modulated chromatic stimuli were generated by combiningphysically isoluminant magenta–cyan gratings with achro-matic luminance gratings modulated equally around thebackground color between black and white. The bright anddark phases of the achromatic luminance grating wereoverlapped with the cyan and magenta phases of theisoluminant grating, respectively, to yield chromaticluminance-modulated gratings with lighter cyan anddarker magenta phases. The RMS cone contrasts of thechromatic component of the luminance-modulated adaptorand test stimuli were 2% and 2%, with an additionalMichelson luminance contrast of 40% and 52%, respec-tively. The sum of chromatic and luminance contrastsyielded the values of 42% for the adaptor and 54% for thetest. To minimize the effects of axial chromatic aberration,we used low spatial frequency gratings (0.5 c/deg) forwhich the luminance artifact has been shown to be smaller
than 0.5% contrast (Cavanagh & Anstis, 1986). Observersreported which of the tests appeared to drift faster.
Results
Figure 1A shows how the duty cycle of the twointerleaved adaptors (5 and 10 Hz) affected the perceivedtemporal frequency of a subsequently displayed driftingstimulus for each subject. The dashed line indicates thetemporal frequency of the standard grating. Data pointsshow the 50% point on the psychometric function (pointof subjective equality, PSE) plotted as a function of theproportion of the relative time of the 5- and 10-Hzadaptors. The straight lines are the linear fits to these datapoints for each subject. One-sample t-test showed that forthe luminance modulation condition, perceived speed wasreduced when the temporal frequency of the adaptor wasgreater than that of the test, t(5) = j4.99, p G 0.01,indicating a significant difference between the estimatedtemporal frequencies and the physical temporal frequency(7 Hz). Low temporal frequency adaptation, however,induced an increase in the perceived temporal frequencyof test, t(5) = 2.74, p = 0.041. The pattern of theseadaptation effects is consistent with our previous findings(Ayhan et al., 2009). For the isoluminance condition,similar to the luminance modulation condition, hightemporal frequency adaptation induced a significant
Figure 1. Eliminating the influence of temporal frequency adaptation on speed judgments for isoluminant stimuli (with 5% contrast foradaptor and 7% contrast for test) falling close to the L–M axis of the cone contrast space and for luminance-modulated stimuli (with 2%chromatic and 40% Michelson contrast for adaptor and 2% chromatic and 52% Michelson contrast for test) with 65 cd/m2 (adaptor) and85 cd/m2 (test) luminance differences between the cyan and magenta phases. (A) Results of the temporal frequency experiment for7 different subjects (three authors and four naïve subjects). The dashed line indicates the temporal frequency of the standard grating. Datapoints show the PSEs plotted as a function of the relative duration of the 5- and 10-Hz adaptors. The straight lines are the linear fit of thesedata points for each subject. Error bars show T1 SE. Each point is derived from 140 trials. (B) Mean results of the temporal frequencyexperiment for isoluminance (Iso) and luminance modulation (Lum) conditions for 5 different subjects (two authors and four naïvesubjects). The dashed line indicates the temporal frequency of the standard grating. Data points show the mean PSEs plotted as afunction of the relative duration of the 5- and 10-Hz adaptors. The straight lines are the linear fit of these data points. The slope (m) isreported for each condition separately. Error bars show T1 SE of the mean.
Journal of Vision (2011) 11(7):22, 1–17 Ayhan, Bruno, Nishida, & Johnston 5

reduction in the perceived speed of the test, t(5) = j4.16,p G 0.01, and low temporal frequency induced asignificant increase in the perceived speed, t(5) = 2.70,p = 0.043. A paired-samples t-test, however, showed thatthe reduction of perceived speed following high temporalfrequency adaptation in the isoluminance condition wassignificantly smaller than that in the luminance modulationcondition, t(5) = j2.816, p = 0.037, but a similar increasewas observed following low temporal frequency adapta-tion, t(5) = 0.378, p 9 0.1. As can be seen in Figure 1B,the slope in the isoluminance condition is shallower thanin the luminance modulation condition, t(5) = 2.237, p =0.038, confirming the reduction in the temporal frequencyshift. One might think that the difference in the adaptation-induced temporal frequency effects in two conditionsmight be explained by the difference in effective contrastsas the isoluminant gratings had much lower contrast thanthe luminance-modulated stimuli. However, this is notnecessarily the case, as Keck, Palella, and Pantle (1976)found that the duration and initial speed of the motionaftereffect was not greatly affected by increasing theadapting contrast of a 5-Hz adapting grating over 3%contrast. Similarly, Wright and Johnston (1985) foundlittle change in the speed of the MAE for contrasts between10% and 100% for 7-Hz adaptors, although adaptationdeclined with contrast at high temporal frequencies as theadapting stimulus became less visible. Therefore, althoughit is possible that the difference in slope in the temporalfrequency (or speed) function reflects differences ineffective contrast, it may rather reflect real differences inthe adaptability of luminance and chromatic mechanisms.In sum, we have determined the individual ratios of 5-
and 10-Hz adaptation, which had no effect on theperceived temporal frequency of a subsequently presentedtest stimulus. We can use these ratios to design adaptingstimuli for the following duration experiments to ensurethat any aftereffect we observe cannot be attributed tochanges in apparent temporal frequency. Temporal fre-quency adaptation induced perceived temporal frequencyshifts for both luminance and isoluminance conditions,though the shift following high temporal frequencyadaptation in the isoluminance condition was significantlysmaller than that in the luminance condition.
Experiment 2: The role of theluminance signal on durationcompression
In Experiment 2, we investigated the role of theluminance signal on duration compression using stimulidefined in the cone contrast space. We used the individualcritical ratios of 5- and 10-Hz adaptation, which we
obtained from the previous experiment in order to controlfor the changes in perceived temporal frequency on theadapted position. We systematically reduced the lumi-nance contrast over three levels.
Methods
A standard grating (600 ms, 0.5 c/deg) was alwaysdisplayed at the adapted location (in half of the trials 5-above and in the other half 5- below the fixation point)and a comparison (0.5 c/deg), presented at the unadaptedside, had variable duration across trials (300–1200 ms) togenerate a psychometric function. The PSE provided ameasure of perceived duration. Both test and adaptor wereeither isoluminant or luminance modulated across differ-ent conditions. The RMS cone contrasts of the isoluminantstimuli were 5% for the adaptor and 7% for the test. Forthe medium luminance modulation condition, the chro-matic contrast of the adaptor and test was set to 3% and4%, with a Michelson contrast of 27% and 36%. For thelarge luminance modulation condition, the Michelsonluminance contrast was doubled to 54% and 72% for theadaptor and test with a decrease in chromatic contrast to1.5% and 2%. These ratios generated 45 cd/m2 (adaptor)and 60 cd/m2 (test) and 90 cd/m2 (adaptor) and 120 cd/m2
(test) luminance differences between the two phases(magenta being darker) for the medium and largeluminance-modulated stimuli, respectively.Since it is known that the sensitivity to flicker for
chromatic contrast is low at high temporal frequencies (DeLange, 1958; Kelly & Van Norren, 1977; Swanson, Ueno,Smith, & Pokorny, 1987), we used low and mid-temporalfrequencies for the adaptor (5 Hz and 10 Hz interleaved)and test (7 Hz) stimuli. We also used a high-contrastbull’s-eye fixation target to encourage constant accom-modation, which in turn would reduce the luminanceartifact caused by chromatic aberration.
Results
The results for Experiment 2 are shown in Figure 2A.There was a mild apparent temporal compression that wasnot significantly different from zero at isoluminance t(5) =j1.87, p 9 0.1. A paired-samples t-test showed thatduration compression is significantly lower at isolumi-nance as compared to the effect obtained at highluminance modulation, t(5) = 3.136, p = 0.013. We alsoplotted the discrimination threshold, defined as the differ-ence between the 50% and 84% point on the psychometricfunction, obtained in the baseline conditions as a functionof the different luminance conditions (Figure 2B). Thegraph shows that the discrimination thresholds are similarin both isoluminance and luminance modulation condi-tions, implying that a potential increase in task difficulty
Journal of Vision (2011) 11(7):22, 1–17 Ayhan, Bruno, Nishida, & Johnston 6

at isoluminance cannot explain the difference in the twoconditions. These results indicate that duration compres-sion following adaptation is minimized in the isoluminantcondition. That the compression persists even aftercontrolling for the perceived temporal frequency changeson the adapted region suggests that the effects ofadaptation on perceived duration are dissociable fromthose on temporal frequency.
Experiment 3: Visibility
It is known that chromatic stimuli are less visible thanluminance stimuli (Cavanagh & Anstis, 1991). This raisesthe question of whether the decline of the duration effectin the isoluminance condition can be explained by reducedvisibility. The fact that there was no difference in thediscrimination threshold argues against a significantinfluence of visibility. Nevertheless, we decided toinvestigate this issue with an explicit test. We first foundthe direction discrimination thresholds for isoluminant andluminance-modulated stimuli. We then matched percep-tual strength (visibility) for these two conditions in ourduration experiment.
Methods
In Experiment 3, we first found the contrast thresholdfor 75% correct direction discrimination. Subjects judgedthe motion direction (left or right) of a drifting stimulus(isoluminant or luminance-modulated sinusoidal gratingdisplayed within an 8- patch 5- below the central fixationpoint) as a function of different contrast levels assigned bythe QUEST procedure (Watson & Pelli, 1983). We thenused these direction discrimination-based contrast thresh-olds to match the visibility of luminance-modulatedgrating to that of the isoluminant condition for eachsubject separately by the following formula:
ðContrastchrom in Exp: 2=ThresholdisoÞ * Thresholdlum;
ð8Þ
where Contrastchrom in Exp. 2 refers to the chromaticcontrast of the isoluminant stimuli in Experiment 2,Thresholdiso refers to the contrast threshold for theisoluminant stimuli, and Thresholdlum refers to the con-trast threshold for the luminance-modulated stimuli.Finally, we carried out the duration experiment using theobtained contrast values for the luminance-modulatedstimuli.
Figure 2. Effects of temporal frequency adaptation on duration judgments as a function of the luminance signal in the absence of temporalfrequency shifts. The chromatic and luminance contrasts of the stimuli are shown on the bottom of each condition in the two graphs.(A) Effect of luminance signal on duration compression for 6 subjects (1 author and 5 naïve subjects, included in (B)). The meanduration judgments comparative to baseline conditions are plotted as a function of the luminance signal. Error bars show T1 SE of themean. Each point is derived from 140 adaptation trials and 280 control trials. (B) Discrimination thresholds are plotted for the baselinetrials in the conditions shown in Figure 2A. Error bars show T1 SE of the mean. Each point is derived from 280 trials.
Journal of Vision (2011) 11(7):22, 1–17 Ayhan, Bruno, Nishida, & Johnston 7
Results
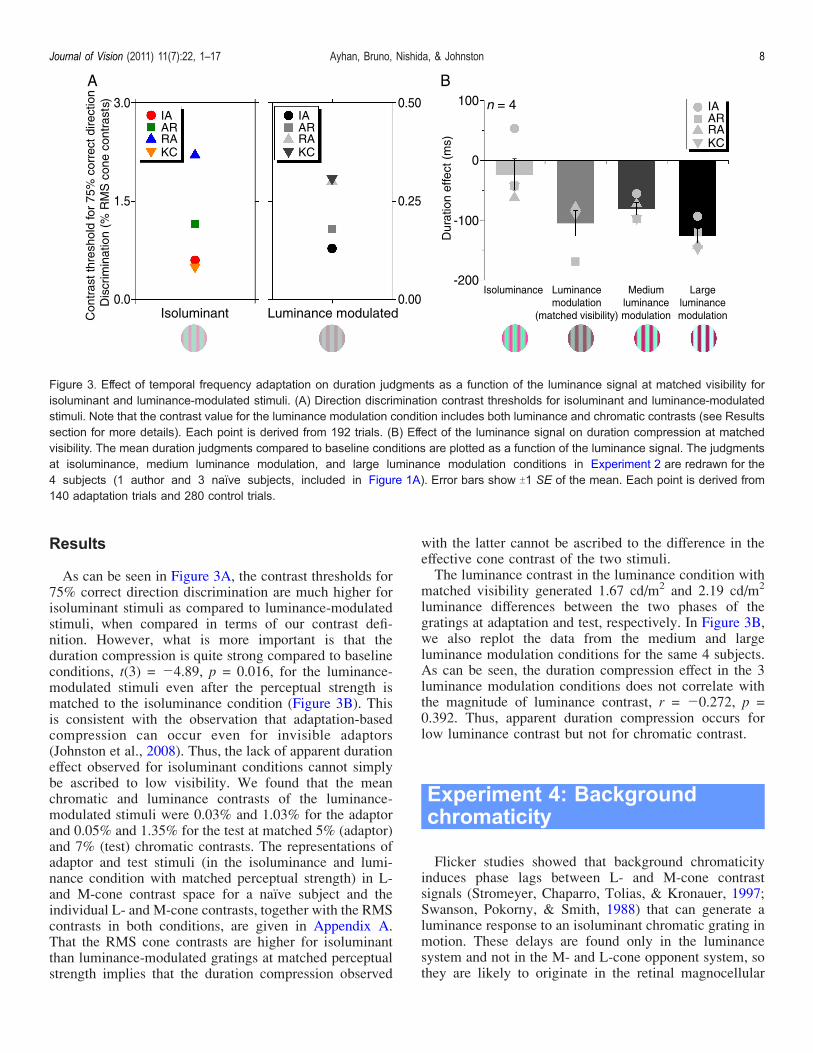
As can be seen in Figure 3A, the contrast thresholds for75% correct direction discrimination are much higher forisoluminant stimuli as compared to luminance-modulatedstimuli, when compared in terms of our contrast defi-nition. However, what is more important is that theduration compression is quite strong compared to baselineconditions, t(3) = j4.89, p = 0.016, for the luminance-modulated stimuli even after the perceptual strength ismatched to the isoluminance condition (Figure 3B). Thisis consistent with the observation that adaptation-basedcompression can occur even for invisible adaptors(Johnston et al., 2008). Thus, the lack of apparent durationeffect observed for isoluminant conditions cannot simplybe ascribed to low visibility. We found that the meanchromatic and luminance contrasts of the luminance-modulated stimuli were 0.03% and 1.03% for the adaptorand 0.05% and 1.35% for the test at matched 5% (adaptor)and 7% (test) chromatic contrasts. The representations ofadaptor and test stimuli (in the isoluminance and lumi-nance condition with matched perceptual strength) in L-and M-cone contrast space for a naı̈ve subject and theindividual L- and M-cone contrasts, together with the RMScontrasts in both conditions, are given in Appendix A.That the RMS cone contrasts are higher for isoluminantthan luminance-modulated gratings at matched perceptualstrength implies that the duration compression observed
with the latter cannot be ascribed to the difference in theeffective cone contrast of the two stimuli.The luminance contrast in the luminance condition with
matched visibility generated 1.67 cd/m2 and 2.19 cd/m2
luminance differences between the two phases of thegratings at adaptation and test, respectively. In Figure 3B,we also replot the data from the medium and largeluminance modulation conditions for the same 4 subjects.As can be seen, the duration compression effect in the 3luminance modulation conditions does not correlate withthe magnitude of luminance contrast, r = j0.272, p =0.392. Thus, apparent duration compression occurs forlow luminance contrast but not for chromatic contrast.
Experiment 4: Backgroundchromaticity
Flicker studies showed that background chromaticityinduces phase lags between L- and M-cone contrastsignals (Stromeyer, Chaparro, Tolias, & Kronauer, 1997;Swanson, Pokorny, & Smith, 1988) that can generate aluminance response to an isoluminant chromatic grating inmotion. These delays are found only in the luminancesystem and not in the M- and L-cone opponent system, sothey are likely to originate in the retinal magnocellular
Figure 3. Effect of temporal frequency adaptation on duration judgments as a function of the luminance signal at matched visibility forisoluminant and luminance-modulated stimuli. (A) Direction discrimination contrast thresholds for isoluminant and luminance-modulatedstimuli. Note that the contrast value for the luminance modulation condition includes both luminance and chromatic contrasts (see Resultssection for more details). Each point is derived from 192 trials. (B) Effect of the luminance signal on duration compression at matchedvisibility. The mean duration judgments compared to baseline conditions are plotted as a function of the luminance signal. The judgmentsat isoluminance, medium luminance modulation, and large luminance modulation conditions in Experiment 2 are redrawn for the4 subjects (1 author and 3 naïve subjects, included in Figure 1A). Error bars show T1 SE of the mean. Each point is derived from140 adaptation trials and 280 control trials.
Journal of Vision (2011) 11(7):22, 1–17 Ayhan, Bruno, Nishida, & Johnston 8

cells (Smith, Lee, Pokorny, Martin, & Valberg, 1992). Toinvestigate the effect of the phase shift on the durationcompression effect, we used two background colors(orange and green) that were shown to produce thegreatest temporal differences between the L- and M-conecontrast signals (Stromeyer et al., 1997). We thencompared the duration compression obtained on thosechromatic backgrounds to the duration compressionobtained on a background with mean chromaticity (gray).
Methods
We carried out the duration experiments on the greenand orange background colors with L/M stimulation ratiosof 1 and 1.33, respectively. The procedure in this experi-ment was similar to the procedure we used in Experiment 3except that there was an initial color adaptation phase inwhich the subjects were asked to look at the backgroundcolor (either orange or green) for 3 min before theexperiment began. We compared the duration compres-sion following adaptation to baseline conditions in whichno adaptor was presented.
Results
The results of Experiment 4 can be seen in Figure 4. Weplot the duration effect as a function of the differentbackground colors (orange, green, and gray) with thesame mean luminance. We found that when the isolu-minant stimuli previously presented on a gray backgroundare displayed on orange and green backgrounds, the
duration compression effect is restored and becomessignificantly different from the baseline conditions (noadaptation), t(4) = j3.84, p = 0.019 and t(4) = j2.95, p =0.042, respectively. We also observed a nonsignificanttrend of stronger duration compression for the orangecompared to the green background, t(4) = 1.50, p 9 0.1.This is consistent with a previous report that shows thatthe phase shifts are bigger on orange adapting back-grounds and weakly reverse on green backgrounds(Swanson et al., 1988).
Discussion
As a test of the magnocellular hypothesis of timecompression (Ayhan et al., 2009; Johnston et al., 2006,2008), we investigated the role of the luminance signaland temporal frequency on adaptation-based temporaldistortions. Our results demonstrate that:
1. The apparent duration compression following tem-poral frequency adaptation is specific to luminance-modulated stimuli and the effect disappears atisoluminance.
2. Visibility and task difficulty cannot explain thediscrepancy between the strength of duration compres-sion in the isoluminant and luminance-modulatedconditions.
3. At isoluminance, duration compression can berecovered on orange and green backgrounds.
4. The effects of adaptation on perceived duration aredissociable from those on temporal frequency,although the speed aftereffect following high tem-poral frequency adaptation is also reduced atisoluminance.
It is well accepted that visual information such as color,motion, depth, or spatial pattern are implicit in thespatiotemporal patterns in the retinas. Time, on the otherhand, has traditionally been treated as dissociated from othersensory attributes. The specificity of the adaptation-basedduration compression to the luminance channel contradicts asupramodal centralized clock model (Creelman, 1962;Treisman, 1963; Treisman et al., 1990), which implies thattime is coded by an abstract high-level cognitive mecha-nism. Rather, we suggest that temporal perception works ina similar way as other sensory attributes and we have low-level adaptable sensory mechanisms that encode therelative time of external events (Johnston & Nishida,2001). There is strong physiological evidence that whilethe magnocellular pathway provides the physiologicalsubstrate of a luminance channel (De Valois et al., 1966;Kaiser, Lee, Martin, & Valberg, 1990; Kremers, Lee, &Kaiser, 1992; Lee, Martin, & Valberg, 1988), the parvo-cellular pathway is responsible for the detection of
Figure 4. Effect of temporal frequency adaptation on durationjudgments at isoluminance as a function of background chroma-ticity. The mean duration judgments comparative to baselineconditions are plotted for 5 subjects (2 authors and 3 naïvesubjects, included in Figure 1A). Error bars show T1 SE of themean. Each point is derived from 140 adaptation trials and 280control trials.
Journal of Vision (2011) 11(7):22, 1–17 Ayhan, Bruno, Nishida, & Johnston 9

chromatic modulation, at least at low temporal frequencies(Lee, Martin, & Valberg, 1989b; Lee, Pokorny, Smith,Martin, & Valberg, 1990). That the duration compressionis specific to luminance-modulated stimuli suggests thatthe adaptation affects the magnocellular layers of the LGN.The idea that the magnocellular pathway might be
involved in time perception has been supported by anincreasing number of observations. Johnston et al. (2006)have demonstrated that the adaptation-induced timecompression is independent of the relative orientation ofthe adaptor and test. The adaptation-induced durationeffect was also shown to exhibit no interocular transfer(Bruno et al., 2010), which together imply an early locus.As well as orientation independence, Johnston et al.(2006) have also shown that the adaptation is limited tohigh temporal frequencies, which preferentially stimulatecells in the magnocellular layers (Derrington & Lennie,1984; Lee, Pokorny, Smith, & Kremers, 1994). Consistentwith these findings, Johnston et al. (2008) have revealedthat the duration compression is still present followingadaptation to invisible flicker (È60 Hz), which is thoughtto stimulate the magnocellular layers of the LGN but notthe primary visual cortex. Moreover, cortically invisibleflicker produces duration compression in normal subjectsbut not in dyslexics for whom a magnocellular-relatedimpairment has been proposed (Stein, 2001; Stein &Walsh, 1997). It is known that M cells are liable to a veryfast adaptation referred to as contrast gain control, inwhich contrast gain at low temporal frequencies isreduced and which, in turn, delivers a more band-passtemporal frequency response. Bruno and Johnston (2010)have demonstrated that the perceived duration of aninterval containing 50% luminance contrast is compressedwhen it follows a high (90%) contrast, implying a linkbetween the contrast gain properties of M cells and theduration perception of brief intervals. There is alsoevidence that the duration of an interval is perceived asbeing compressed before the execution of a saccadic eyemovement (Morrone, Ross, & Burr, 2005), during whichthe magnocellular pathway has been shown to beselectively suppressed (Burr, Morrone, & Ross, 1994).More recently, a similar duration compression effect wasobserved for intervals embedded within a sequence of high-frequency random dynamic luminance flicker, which wasalso considered to suppress the activity in the magnocel-lular pathway (Terao, Watanabe, Yagi, & Nishida, 2008).We observed a recovery of the duration compression at
isoluminance on chromatic backgrounds. Flicker studiesin humans show that adapting to chromatic backgroundscan robustly influence the luminance mechanism. Swansonet al. (1988) revealed that orange (È500 nm) back-grounds induce a large phase lag of the L-cone contrastsignal relative to the M-cone contrast signal and that thephase shift reverses on green (È600 nm) backgrounds.Stromeyer et al. (1997) also showed that orange and greenbackgrounds lead to relative phase shifts between the L-and M-cone contrast signals. Using single-cell recording,
Smith et al. (1992) demonstrated that the phase shifts ariseat a post-receptor level, in the phasic retinal ganglion cellsthat provide input to the magnocellular pathway. On orangebackgrounds, the phase at which M cells give minimalresponse to dynamic chromatic stimuli shifted to the red-leads-green quadrant. The authors explained the effect bya first harmonic response, which was pronounced at lowtemporal frequencies, including the range (5–10 Hz) weused in our chromatic background experiments (Experi-ment 4). The recovery of duration compression on orangeand green backgrounds is possibly linked to this phaseshift, which provides further evidence for the role of themagnocellular pathway in time perception.There is a mild nonsignificant duration compression
even with isoluminant stimuli viewed on a backgroundwith mean chromaticity. Our use of low spatial frequen-cies (0.5 and 1.5 c/deg) and a high-contrast bull’s-eyefixation spot should exclude the possibility that this effectis due to luminance artifacts arising from chromaticaberration (Cavanagh & Anstis, 1991; Flitcroft, 1989;Logothetis, Schiller, Charles, & Hurlbert, 1990). Physio-logical studies have shown that although cells within themagnocellular pathway are generally not color opponent,they are not totally blind to chromatic stimuli. As well asthe first harmonic response we mentioned above, afrequency-doubled signal in response to a grating or auniform field sinusoidally modulated along the isolumi-nant red–green axis has also been reported in the phasiccells of the retina (Lee, Martin, & Valberg, 1989a) and themagnocellular cells of the LGN to which they project(Derrington et al., 1984; Lee & Sun, 2009). It has beensuggested that both the first harmonic and the frequency-doubled response observed within the magnocellularpathway may contribute to psychophysical performance(Dobkins & Albright, 1993; Lee & Sun, 2009; Mullen,Yoshizawa, & Baker, 2003; Yoshizawa, Mullen, & Baker,2003). The frequency-doubled response is present over alarge temporal range (Lee et al., 1989a, 1989b), whichmakes it likely that the small compression effect present inour data at isoluminance might arise from this type ofnonlinearity.There is evidence that P cells might contribute to
luminance detection and discrimination under someconditions (Lennie, Pokorny, & Smith, 1993; Wassle &Boycott, 1991). Gouras and Zrenner (1979) suggested thatthe color-opponent cells in the monkey retina respondbetter to spectral opponency at low temporal frequenciesand better to luminance changes at high temporalfrequencies. They explained this transformation fromchromatic sensitivity by a delay of the color-opponentresponse produced by the surround mechanism such thatthe signal arrives at the site of center–surround combina-tion in the same phase as the signal from the center. Theauthors recorded the flicker responses of color-opponentganglion cells at three different temporal frequencies (low:1.1 Hz, medium: 15–18 Hz, high: 33 Hz) and foundsynergistic responses at medium and high ranges. Our
Journal of Vision (2011) 11(7):22, 1–17 Ayhan, Bruno, Nishida, & Johnston 10

adaptor oscillated at an interleaved frequency of 5 Hz and10 Hz, which falls below the range within which P cellsdisplay such frequency-dependent phase shifts (Lee et al.,1988). The units of the parvocellular pathway have alsobeen shown to respond to achromatic stimuli at highluminance contrast (Benardete & Kaplan, 1999a). InExperiment 3, however, we showed strong durationcompression even at very low luminance contrasts,suggesting that the effect does not depend on theresponses of P cells.Temporal frequency adaptation can have dissociable
effects on apparent temporal frequency and apparentduration. While low temporal frequency adaptationincreases and high temporal frequency adaptationdecreases the perceived speed of a mid-temporal frequencystimulus, distortions in perceived duration are unidirec-tional such that 5-, 10-, and 20-Hz adaptation all inducecompression (Johnston et al., 2006). Changes in apparentduration can also occur in the absence of any change inperceived temporal frequency although the spatial tuningof these effects has been shown to be similar (Ayhan et al.,2009). Moreover, dyslexics show normal temporal fre-quency shifts for intermediate temporal frequencies but donot show any duration compression following adaptationto invisible flicker (Johnston et al., 2008). Here, weinvestigated the effect of the luminance signal onadaptation-induced duration and temporal frequencyshifts. Despite the reduction of both temporal frequency(Experiment 1) and duration shifts (Experiment 2)following high temporal frequency adaptation at isolumi-nance, duration compression was present at luminancemodulation even after the changes in perceived temporalfrequency were eliminated. These results provide furthersupport for separate mechanisms for changes in apparenttemporal frequency and changes in apparent duration.There is evidence that there are at least two, but possibly
three, temporal frequency channels in the human visualsystem (Fredericksen & Hess, 1998; Hess & Snowden,1992; Johnston & Clifford, 1995), each filter having adifferent shape and a different passband. Johnston andClifford (1995) showed that the temporal filters measuredby Hess and Snowden (1992) were well fitted by aGaussian in log time and its first and second derivatives.While the zero-order filter has the low-pass temporalproperty characteristic of P cells, the derivative filters havethe band-pass property associated with M cells. For sinefunctions, temporal frequency can be recovered from therelative activity of band-pass and low-pass filters (Smith &Edgar, 1994). On this model, changes in apparenttemporal frequency are attributed to the changes inrelative sensitivity of the filters. One might assume thatthe sensitivity of the band-pass filter, which is associatedwith M cells, is not affected following adaptation atisoluminance as much as it is following luminancemodulation. This may explain why we observed areduction in the temporal frequency shift following hightemporal frequency adaptation with stimuli defined by
chromatic contrast. The sensitivity of the low-pass filter,however, should be affected by low temporal frequencychromatic adaptation, leading to an increase in theresponse of the band-pass channel. Indeed, no reductionwas observed in temporal frequency shifts for lowtemporal frequency adaptation at isoluminance. Theseresults are consistent with a previous report by Champion,Hammett, and Thompson (2005). In the same context, wealso found that the temporal shifts following low temporalfrequency adaptation with luminance modulation aresmaller (È1 Hz) than the shifts following high temporalfrequency adaptation.Since changes in perceived duration can be dissociated
from changes in perceived temporal frequency, wepropose that the duration effects are linked to a differentmechanism, possibly to the changes in the temporal tuningcurve of M cells (Ayhan et al., 2009; Johnston et al.,2006). There is physiological evidence that high temporalfrequency adaptation induces changes in the temporalfrequency tuning of the band-pass cells of the nucleus ofthe optic tract (NOT) in wallaby, decreasing relativesensitivity to low temporal frequencies and sharpening thetemporal impulse response (Clifford, Ibbotson, & Langley,1997; Ibbotson, 2005; Ibbotson et al., 1998). We use thisadaptation to explain the apparent duration compression ina content-dependent clock model (Johnston, 2010). In thismodel, the band-pass differentiating temporal filters (mag-nocellular units) set a prediction based on the current imagebrightness and the rate of change in image brightness. Thecurrent brightness level registered by a low-pass channel(parvocellular pathway) is then continuously compared tothis forward prediction. When there is a match, the systemcan tell that the preset interval has elapsed so the clock ticksand the duration of an interval is indicated by the cumulatedticks. After adaptation, the phase advance in the magno-cellular neurons shifts the prediction forward in time,delaying the match between the prediction and the currentinput, thereby introducing duration compression. There-fore, we attribute changes in temporal frequency to changesin relative sensitivity of M and P cells and attribute changesin apparent duration to the sharpening of the M celltemporal impulse response (Johnston et al., 2006).In conclusion, the luminance signal is crucial for
adaptation-based temporal compression. Visibility andtask difficulty cannot explain the disappearance of theeffect at isoluminance. Changing background chromaticity(orange and green) can restore the duration effect atisoluminance indicating the involvement of phasic cells inthe retina and the magnocellular layers to which theyproject. High temporal frequencies generate strongerduration compression when the adaptor and test drift atthe same temporal frequency. Finally, temporal frequencyadaptation has dissociable effects on perceived durationand perceived temporal frequency. These results providefurther evidence that temporal channels in human visionmediate duration perception, as well as temporal fre-quency coding and motion perception.
Journal of Vision (2011) 11(7):22, 1–17 Ayhan, Bruno, Nishida, & Johnston 11

Figure A1. Graphical representation of the stimuli in L- and M-cone contrast space. The background field color is drawn in the origin.While the background direction represents the mechanisms and the color of the stimuli, the vector length represents the stimuluscontrast. (A) Representation of the modulations, which isolate different mechanisms. The points on black arrow specify the L- and M-conecontrasts that isolate the luminance mechanism. The red arrow represents the L- and M-cone contrasts that isolate the isoluminance (L–M)mechanism. (B) L- and M-cone contrasts generated by the magenta and cyan phases of the gratings in the isoluminance 5-Hz adaptationphase for a naïve subject (AR). (C) L- and M-cone contrasts generated by the magenta and cyan phases of the gratings in the isoluminant10-Hz adaptation phase for the same subject. (D) L- and M-cone contrasts generated by the magenta and cyan phases of the gratings inthe isoluminant 7-Hz test phase for subject AR. (E) L- and M-cone contrasts generated by the magenta and cyan phases of the gratingsin the low luminance 5- and 10-Hz adaptation phases for subject AR. (F) L- and M-cone contrasts generated by the magenta and cyanphases of the gratings in the low luminance 7-Hz test phase for subject AR.
Journal of Vision (2011) 11(7):22, 1–17 Ayhan, Bruno, Nishida, & Johnston 12

Magenta phase Cyan phaseRoot<mean<square
contrastL<cone contrast M<cone contrast L<cone contrast M<cone contrast
IA Iso 5<Hz adapt 0.015 j0.092 j0.017 0.086 6.4%IA Iso 10<Hz adapt 0.029 j0.078 j0.031 0.072 5.7%IA Iso 7<Hz test j0.001 j0.142 j0.002 0.136 9.8%IA Lum 5< and 10<Hz adapt j0.007 j0.010 0.005 0.004 0.6%IA Lum 7<Hz test j0.008 j0.012 0.006 0.006 0.8%
KC Iso 5<Hz adapt 0.021 j0.085 j0.023 0.080 6.1%KC Iso 10<Hz adapt 0.007 j0.099 j0.009 0.094 6.9%KC Iso 7<Hz test j0.011 j0.152 j0.008 0.146 10.6%KC Lum 5< and 10<Hz adapt j0.036 j0.045 0.034 0.039 3.9%KC Lum 7<Hz test j0.047 j0.059 0.045 0.053 5.1%
RA Iso 5<Hz adapt 0.007 j0.099 j0.009 0.094 6.9%RA Iso 10<Hz adapt 0.075 j0.032 j0.077 0.026 5.7%RA Iso 7<Hz test 0.019 j0.122 j0.022 0.116 8.5%RA Lum 5< and 10<Hz adapt j0.009 j0.015 0.007 0.007 0.9%RA Lum 7<Hz test j0.012 j0.016 0.010 0.010 1.2%
AR Iso 5<Hz adapt 0.015 j0.092 j0.017 0.086 6.4%AR Iso 10<Hz adapt 0.036 j0.071 j0.038 0.065 5.5%AR Iso 7<Hz test 0.019 j0.122 j0.022 0.116 8.5%AR Lum 5< and 10<Hz adapt j0.009 j0.015 0.007 0.007 0.9%AR Lum 7<Hz test j0.012 j0.016 0.010 0.010 1.2%
Table A1. The first four columns of the table show the individual L- and M-cone contrasts generated by the magenta and cyan phases ofthe stimuli in different conditions. The individual RMS cone contrast values are also listed in the final column.
Journal of Vision (2011) 11(7):22, 1–17 Ayhan, Bruno, Nishida, & Johnston 13
Appendix A
Supplementary materials
In Figures A1B–A1F, we drew the representations ofadaptor and test stimuli (in the isoluminance and lumi-nance condition with matched perceptual strength) in L-and M-cone contrast space for a naı̈ve subject (AR). Ascan be seen in Figure A1A, the 45-–225- direction (blackarrow) is the luminance axis along which the amplitudesof L- and M-cone contrasts are equal and in phase. A slightrotation above or below this axis means that the amplitudesof L- and M-cone contrasts are imbalanced; thus, thestimulus is chromatic as well as luminance modulated(Figures A1E and A1F). The vector direction of 133-–313- represents the isoluminant axis (red arrow), whichcorresponds to the direction of tanj1(jx), where x refersto the ratio of L- and M-cone excitations of the adaptingfield. As the point of subjective isoluminance wasmeasured individually for each subject and for differentcontrast and temporal frequencies, individual axes indifferent conditions (Figures A1B–A1D) differed fromthe photometrically isoluminant axis in Figure A1A (seeGeneral methods section for further details).At threshold, we found that sensitivity to discriminate
motion direction of isoluminant stimuli (mean = 90) atmid-temporal frequency (7 Hz) is lower than that ofluminance-modulated stimuli (mean = 443) when boththresholds are expressed in cone contrast consistent withprevious studies (Gegenfurtner & Hawken, 1996a, 1996b).Thus, for all subjects, the RMS cone contrasts of theisoluminant stimuli were higher than the RMS conecontrasts of the luminance-modulated stimuli matched invisibility (Table A1).
Acknowledgments
We would like to thank Prof. Andrew Stockman for hisvaluable comments on a draft of this paper and forallowing access to his spectroradiometer and Dr. CaterinaRipamonti for her help measuring the spectral powerdistributions of the monitor phosphors and her commentson isoluminance. We are also happy to acknowledge thesupport of The Leverhulme Trust, The Nippon Telegraphand Telephone Corporation, The Economic and SocialResearch Council (ESRC), and the Wellcome Trust.
Commercial relationships: none.Corresponding author: Inci Ayhan.Email: [email protected]: Cognitive, Perceptual and Brain SciencesDepartment, University College London, Gower Street,London WC1 6BT, UK.
References
Ayhan, I., Bruno, A., Nishida, S., & Johnston, A. (2009).The spatial tuning of adaptation-based time compres-sion. Journal of Vision, 9(11):2, 1–12, http://www.journalofvision.org/content/9/11/2, doi:10.1167/9.11.2. [PubMed] [Article]
Benardete, E. A., & Kaplan, E. (1999a). The dynamics ofprimate M retinal ganglion cells. Visual Neuro-science, 16, 355–368.
Benardete, E. A., & Kaplan, E. (1999b). Dynamics ofprimate P retinal ganglion cells: Responses tochromatic and achromatic stimuli. The Journal ofPhysiology, 519, 775–790.
Brown, S. W. (1995). Time, change, and motion: Theeffects of stimulus movement on temporal perception.Perception & Psychophysics, 57, 105–116.
Bruno, A., Ayhan, I., & Johnston, A. (2010). Retinotopicadaptation-based visual duration compression. Journalof Vision, 10(10):30, 1–18, http://www.journalofvision.org/content/10/10/30, doi:10.1167/10.10.30. [PubMed][Article]
Bruno, A., & Johnston, A. (2010). Contrast gain shapesvisual time. Frontiers in Psychology, 1, 170.
Buonomano, D. V. (2007). The biology of time acrossdifferent scales. Nature Chemical Biology, 3, 594–597.
Buonomano, D. V., & Karmarkar, U. R. (2002). How dowe tell time? Neuroscientist, 8, 42–51.
Burr, D., Tozzi, A., & Morrone, M. C. (2007). Neuralmechanisms for timing visual events are spatiallyselective in real-world coordinates. Nature Neuro-science, 10, 423–425.
Burr, D. C., Morrone, M. C., & Ross, J. (1994).Selective suppression of the magnocellular visualpathway during saccadic eye movements. Nature,371, 511–513.
Cavanagh, P., & Anstis, S. M. (1991). The contributionof color to motion in normal and color-deficientobservers. Vision Research, 31, 2109–2148.
Cavanagh, P., & Anstis, S. M. (1986). Do opponent-colorchannels contribute to motion? Investigative Opthal-mology & Visual Science, 27, 291.
Cavanagh, P., MacLeod, D. I., & Anstis, S. M. (1987).Isoluminance: Spatial and temporal factors and thecontribution of blue-sensitive cones. Journal of theOptical Society of America A, 4, 1428–1438.
Champion, R. A., Hammett, S. T., & Thompson, P. G.(2005). The effect of isoluminant adaptation upon thevelocity aftereffect. Perception, 34, 231–232.
Journal of Vision (2011) 11(7):22, 1–17 Ayhan, Bruno, Nishida, & Johnston 14

Clifford, C. W. G., Ibbotson, M. R., & Langley, K. (1997).An adaptive Reichardt detector model of motionadaptation in insects and mammals. Visual Neuro-science, 14, 741–749.
Colheart, M. (1971). Visual feature-analyzers and after-effects of tilt and curvature. Psychological Review,78, 114–121.
Creelman, C. D. (1962). Human discrimination of audi-tory duration. Journal of the Acoustical Society ofAmerica, 34, 582–593.
De Lange, H. (1958). Research into the dynamic nature ofthe human foveaVCortex systems with intermittentand modulated light: 2. Phase shift in brightness anddelay in color perception. Journal of the OpticalSociety of America, 48, 784–789.
Derrington, A. M., Krauskopf, J., & Lennie, P. (1984).Chromatic mechanisms in lateral geniculate nucleus ofmacaque. The Journal of Physiology, 357, 241–265.
Derrington, A. M., & Lennie, P. (1984). Spatial andtemporal contrast sensitivities of neurones in lateralgeniculate nucleus of macaque. The Journal ofPhysiology, 357, 219–240.
De Valois, R. L., Abramov, I., & Jacobs, G. H. (1966).Analysis of response patterns of LGN cells. Journalof the Optical Society of America, 56, 966–977.
De Valois, R. L., Cottaris, N. P., Elfar, S. D., Mahon, L. E.,& Wilson, J. A. (2000). Some transformations of colorinformation from lateral geniculate nucleus to striatecortex. Proceedings of the National Academy ofSciences of the United States of America, 97,4997–5002.
Dobkins, K. R., & Albright, T. D. (1993). What happens ifit changes color when it movesVPsychophysicalexperiments on the nature of chromatic input tomotion detectors. Vision Research, 33, 1019–1036.
Flitcroft, D. I. (1989). The interactions between chromaticaberration, defocus and stimulus chromaticity: Impli-cations for visual physiology and colorimetry. VisionResearch, 29, 349–360.
Fredericksen, R. E., & Hess, R. F. (1998). Estimatingmultiple temporal mechanisms in human vision.Vision Research, 38, 1023–1040.
Gegenfurtner, K. R., & Hawken, M. J. (1996a). Interactionof motion and color in the visual pathways. Trends inNeurosciences, 19, 394–401.
Gegenfurtner, K. R., & Hawken, M. J. (1996b). Perceivedvelocity of luminance, chromatic and non-Fourierstimuli: Influence of contrast and temporal frequency.Vision Research, 36, 1281–1290.
Gouras, P., & Zrenner, E. (1979). Enhancement ofluminance flicker by color-opponent mechanisms.Science, 205, 587–589.
Hess, R. F., & Snowden, R. J. (1992). Temporal propertiesof human visual filters: Number, shapes and spatialcovariation. Vision Research, 32, 47–59.
Hubel, D. H., & Wiesel, T. N. (1966). Effects of varyingstimulus size and color on single lateral geniculatecells in Rhesus monkeys. Proceedings of the NationalAcademy of Sciences of the United States of America,55, 1345–1346.
Ibbotson, M. R. (2005). Contrast and temporal frequency-related adaptation in the pretectal nucleus of the optictract. Journal of Neurophysiology, 94, 136–146.
Ibbotson, M. R., Clifford, C. W. G., & Mark, R. F. (1998).Adaptation to visual motion in directional neurons ofthe nucleus of the optic tract. Journal of Neuro-physiology, 79, 1481–1493.
Irvin, G. E., Casagrande, V. A., & Norton, T. T. (1993).Center/surround relationships of magnocellular, par-vocellular, and koniocellular relay cells in primatelateral geniculate nucleus. Visual Neuroscience, 10,363–373.
Jamieson, D. G., & Petrusic, W. M. (1975). Presentationorder effects in duration discrimination. Perception &Psychophysics, 17, 197–202.
Johnston, A. (2010). Modulation of time perception byvisual adaptation. In A. C. Nobre & J. T. Coull (Eds.),Attention and time (chap. 14, pp. 187–200). Oxford,UK: OUP.
Johnston, A., Arnold, D. H., & Nishida, S. (2006).Spatially localized distortions of event time. CurrentBiology, 16, 472–479.
Johnston, A., Bruno, A., Watanabe, J., Quansah, B.,Patel, N., Dakin, S., et al. (2008). Visually-basedtemporal distortion in dyslexia. Vision Research, 48,1852–1858.
Johnston, A., & Clifford, C. W. (1995). A unified accountof three apparent motion illusions. Vision Research,35, 1109–1123.
Johnston, A., & Nishida, S. (2001). Time perception:Brain time or event time? Current Biology, 11,R427–R430.
Kaiser, P. K., Lee, B. B., Martin, P. R., & Valberg, A.(1990). The physiological basis of the minimallydistinct border demonstrated in the ganglion cells ofthe macaque retina. The Journal of Physiology, 422,153–183.
Kanai, R., Paffen, C. L., Hogendoorn, H., & Verstraten,F. A. (2006). Time dilation in dynamic visualdisplay. Journal of Vision, 6(12):8, 1421–1430, http://www.journalofvision.org/content/6/12/8, doi:10.1167/6.12.8. [PubMed] [Article]
Kaneko, S., & Murakami, I. (2009). Perceived duration ofvisual motion increases with speed. Journal of Vision,
Journal of Vision (2011) 11(7):22, 1–17 Ayhan, Bruno, Nishida, & Johnston 15

9(7):14, 1–12, http://www.journalofvision.org/content/9/7/14, doi:10.1167/9.7.14. [PubMed] [Article]
Keck, M. J., Palella, T. D., & Pantle, A. (1976). Motionaftereffects as a function of the contrast of sinusoidalgratings. Vision Research, 16, 187–191.
Kelly, D. H., & Van Norren, D. (1977). 2-band model ofheterochromatic flicker. Journal of the Optical Soci-ety of America, 67, 1081–1091.
Kremers, J., Lee, B. B., & Kaiser, P. K. (1992). Sensitivityof macaque retinal ganglion cells and human observ-ers to combined luminance and chromatic temporalmodulation. Journal of the Optical Society of Amer-ica A, 9, 1477–1485.
Lee, B. B., Martin, P. R., & Valberg, A. (1988). Thephysiological basis of heterochromatic flicker photo-metry demonstrated in the ganglion cells of themacaque retina. The Journal of Physiology, 404,323–347.
Lee, B. B., Martin, P. R., & Valberg, A. (1989a).Nonlinear summation of M- and L-cone inputs tophasic retinal ganglion cells of the macaque. Journalof Neuroscience, 9, 1433–1442.
Lee, B. B., Martin, P. R., & Valberg, A. (1989b).Sensitivity of macaque retinal ganglion cells tochromatic and luminance flicker. The Journal ofPhysiology, 414, 223–243.
Lee, B. B., Pokorny, J., Smith, V. C., & Kremers, J.(1994). Responses to pulses and sinusoids in macaqueganglion cells. Vision Research, 34, 3081–3096.
Lee, B. B., Pokorny, J., Smith, V. C., Martin, P. R., &Valberg, A. (1990). Luminance and chromatic mod-ulation sensitivity of macaque ganglion cells andhuman observers. Journal of the Optical Society ofAmerica A, 7, 2223–2236.
Lee, B. B., & Sun, H. (2009). The chromatic input to cellsof the magnocellular pathway of primates. Journal ofVision, 9(2):15, 1–18, http://www.journalofvision.org/content/9/2/15, doi:10.1167/9.2.15. [PubMed] [Article]
Lennie, P., Pokorny, J., & Smith, V. C. (1993). Lumi-nance. Journal of the Optical Society of America A,10, 1283–1293.
Livingstone, M. S., & Hubel, D. H. (1987). Psychophys-ical evidence for separate channels for the perceptionof form, color, movement, and depth. Journal ofNeuroscience, 7, 3416–3468.
Logothetis, N. K., Schiller, P. H., Charles, E. R., &Hurlbert, A. C. (1990). Perceptual deficits and theactivity of the color-opponent and broad-band path-ways at isoluminance. Science, 247, 214–217.
Martin, P. R., White, A. J., Goodchild, A. K., Wilder,H. D., & Sefton, A. E. (1997). Evidence that blue-oncells are part of the third geniculocortical pathway in
primates. European Journal of Neuroscience, 9,1536–1541.
Mauk, M. D., & Buonomano, D. V. (2004). The neuralbasis of temporal processing. Annual Reviews inNeuroscience, 27, 307–340.
Morrone, M. C., Ross, J., & Burr, D. (2005). Saccadic eyemovements cause compression of time as well asspace. Nature Neuroscience, 8, 950–954.
Mullen, K. T., Yoshizawa, T., & Baker, C. L. (2003).Luminance mechanisms mediate the motion of red–green isoluminant gratings: The role of “temporalchromatic aberration”. Vision Research, 43, 1235–1247.
Smith, A. T., & Edgar, G. K. (1994). Antagonisticcomparison of temporal frequency filter outputs asa basis for speed perception. Vision Research, 34,253–265.
Smith, V. C., Lee, B. B., Pokorny, J., Martin, P. R., &Valberg, A. (1992). Responses of macaque ganglioncells to the relative phase of heterochromaticallymodulated lights. The Journal of Physiology, 458,191–221.
Stein, J. (2001). The magnocellular theory of develop-mental dyslexia. Dyslexia, 7, 12–36.
Stein, J., & Walsh, V. (1997). To see but not to read; themagnocellular theory of dyslexia. Trends in Neuro-sciences, 20, 147–152.
Stockman, A., & Sharpe, L. T. (2000). The spectralsensitivities of the middle- and long-wavelength-sensitive cones derived from measurements inobservers of known genotype. Vision Research, 40,1711–1737.
Stromeyer, C. F., Chaparro, A., Tolias, A. S., & Kronauer,R. E. (1997). Colour adaptation modifies the long-waveversus middle-wave cone weights and temporal phasesin human luminance (but not red–green) mechanism.The Journal of Physiology, 499, 227–254.
Swanson, W. H., Pokorny, J., & Smith, V. C. (1988).Effects of chromatic adaptation on phase-dependentsensitivity to heterochromatic flicker. Journal of theOptical Society of America A, 5, 1976–1982.
Swanson, W. H., Ueno, T., Smith, V. C., & Pokorny, J.(1987). Temporal-modulation sensitivity and pulse-detection thresholds for chromatic and luminanceperturbations. Journal of the Optical Society ofAmerica A, Optics, Image Science, and Vision, 4,1992–2005.
Terao, M., Watanabe, J., Yagi, A., & Nishida, S. (2008).Reduction of stimulus visibility compresses apparenttime intervals. Nature Neuroscience, 11, 541–542.
Treisman, M. (1963). Temporal discrimination and theindifference interval. Implications for a model of
Journal of Vision (2011) 11(7):22, 1–17 Ayhan, Bruno, Nishida, & Johnston 16

the “internal clock.” Psychological Monographs, 77,1–31.
Treisman, M., Faulkner, A., Naish, P. L., & Brogan, D.(1990). The internal clock: Evidence for a temporaloscillator underlying time perception with someestimates of its characteristic frequency. Perception,19, 705–743.
Vicario, C. M., Pecoraro, P., Turriziani, P., Koch, G.,Caltagirone, C., & Oliveri, M. (2008). Relativisticcompression and expansion of experiential time in theleft and right space. PLoS ONE, 3, e1716.
Wassle, H., & Boycott, B. B. (1991). Functional archi-tecture of the mammalian retina. PhysiologicalReviews, 71, 447–480.
Watson, A. B., & Pelli, D. G. (1983). QuestVA Bayesianadaptive psychometric method. Perception & Psy-chophysics, 33, 113–120.
Wilson, H. R., & Humanski, R. (1993). Spatial frequencyadaptation and contrast gain control. Vision Research,33, 1133–1149.
Wright, M. J., & Johnston, A. (1985). Invariant tuning ofmotion aftereffect. Vision Research, 25, 1947–1955.
Yoshizawa, T., Mullen, K. T., & Baker, C. L. (2003).Failure of signed chromatic apparent motion withluminance masking. Vision Research, 43, 751–759.
Journal of Vision (2011) 11(7):22, 1–17 Ayhan, Bruno, Nishida, & Johnston 17