TEMPORAL ANALYSES OF SURFACE AND SUBSURFACE HYDROLOGICAL REGIME IN A URBAN WATERSHED BETWEEN 2000-...
9
Proceedings of HYDRO 2013 INTERNATIONAL, 4-6 Dec 2013, IIT Madras, INDIA 1 TEMPORAL ANALYSES OF SURFACE AND SUBSURFACE HYDROLOGICAL REGIME IN A URBAN WATERSHED BETWEEN 2000- 2010 USING GEOINFORMATICS APPROACH. Tauseef A. Ansari 1 , Y.B. Katpatal 2 1 Ph.D scholar, 2 Professor [email protected], [email protected] Department of Civil engineering Visvesvaraya National Institute of Technology, South Ambazari Road, Nagpur. Maharashtra. Pin 440010 (India) Abstract: Water resources management in the urban watersheds has become crucial in the present due to rapid growth. Nagpur, the second capital of Maharashtra state has secured water availability from Totladoh dam but still the surface and subsurface hydrology is under stress. Recently MIHAN (Multi Model International Hub Airport Nagpur), Power plants and other infrastructure projects are upcoming fast but in turn it has started impacting the water resource regime negatively. The precise and scientific method to record this change is through using the geoinformatics approach. In the present study, the geoinformatics approach has been used to quantify the temporal changes occurred in the land use/land cover and drainage pattern due fast changing urban scenario. The impact of urban change may be recorded on the ground water quality. The spatial impact on the groundwater quality has been analyzed in the present study using high resolution satellite data for the years between 2000 to 2010 in the Nagpur urban area. Change detection shows the transformation of crop land and fallow land into developed area (i.e. High dense, medium dense, low dense area). Simultaneously changes in the ground water quality for the same years (i.e. 2000 to 2010) has been detected and risk prone areas are identified. In this paper weights are assigned for different parameters like land use land cover, type of soil, drainage networks, slope of the area, fluctuation of water levels in the wells, infiltration rate, chemical properties of ground water etc. based on their importance to surface and subsurface hydrological regime in an urban watershed overlay method has been used for analyses. Finally remedial measures are suggested to restore the current scenario for better development of ground water in future. Key words: Geoinformatics; land use/land cover; Temporal analyses; Overly method; surface and sub surface hydrological regimes. 1.Introduction: Urbanization is good in economical development of any country but surface and sub surface hydrological regimes are also very important as far as concern environmental and the impact of urbanization point of view on the water resource management over an urban area. In this study the geoinformatics approach has been used to quantify the temporal changes occurred in the different hydrological parameters over the ten years of span. Temporal analysis is easy to monitor each hydrological regimes, Analysis has been performed by taking high resolution satellite images of two different years. This study has been focused on three major issues i.e. impact of urbanization on drainage patterns of the area, impact of urbanization on land use land cover,
-
Upload
vnitnagpur -
Category
Documents
-
view
2 -
download
0
Transcript of TEMPORAL ANALYSES OF SURFACE AND SUBSURFACE HYDROLOGICAL REGIME IN A URBAN WATERSHED BETWEEN 2000-...

Proceedings of HYDRO 2013 INTERNATIONAL,
4-6 Dec 2013, IIT Madras, INDIA
1
TEMPORAL ANALYSES OF SURFACE AND SUBSURFACE HYDROLOGICAL
REGIME IN A URBAN WATERSHED BETWEEN 2000- 2010 USING
GEOINFORMATICS APPROACH.
Tauseef A. Ansari1, Y.B. Katpatal
2
1Ph.D scholar,
2Professor
[email protected], [email protected]
Department of Civil engineering
Visvesvaraya National Institute of Technology, South Ambazari Road, Nagpur.
Maharashtra. Pin 440010 (India)
Abstract:
Water resources management in the urban watersheds has become crucial in the present
due to rapid growth. Nagpur, the second capital of Maharashtra state has secured water
availability from Totladoh dam but still the surface and subsurface hydrology is under stress.
Recently MIHAN (Multi Model International Hub Airport Nagpur), Power plants and other
infrastructure projects are upcoming fast but in turn it has started impacting the water resource
regime negatively. The precise and scientific method to record this change is through using the
geoinformatics approach. In the present study, the geoinformatics approach has been used to
quantify the temporal changes occurred in the land use/land cover and drainage pattern due fast
changing urban scenario. The impact of urban change may be recorded on the ground water
quality. The spatial impact on the groundwater quality has been analyzed in the present study
using high resolution satellite data for the years between 2000 to 2010 in the Nagpur urban area.
Change detection shows the transformation of crop land and fallow land into developed area (i.e.
High dense, medium dense, low dense area). Simultaneously changes in the ground water quality
for the same years (i.e. 2000 to 2010) has been detected and risk prone areas are identified. In this
paper weights are assigned for different parameters like land use land cover, type of soil,
drainage networks, slope of the area, fluctuation of water levels in the wells, infiltration rate,
chemical properties of ground water etc. based on their importance to surface and subsurface
hydrological regime in an urban watershed overlay method has been used for analyses. Finally
remedial measures are suggested to restore the current scenario for better development of ground
water in future.
Key words: Geoinformatics; land use/land cover; Temporal analyses; Overly method; surface
and sub surface hydrological regimes.
1.Introduction:
Urbanization is good in economical development of any country but surface and sub surface
hydrological regimes are also very important as far as concern environmental and the impact of
urbanization point of view on the water resource management over an urban area. In this study
the geoinformatics approach has been used to quantify the temporal changes occurred in the
different hydrological parameters over the ten years of span. Temporal analysis is easy to monitor
each hydrological regimes, Analysis has been performed by taking high resolution satellite
images of two different years. This study has been focused on three major issues i.e. impact of
urbanization on drainage patterns of the area, impact of urbanization on land use land cover,

Proceedings of HYDRO 2013 INTERNATIONAL,
4-6 Dec 2013, IIT Madras, INDIA
2
impact of urbanization on ground water quality and fluctuations.. The expansion of urban and
suburban areas requires more land and promotes the conversion of rural to urban land use/land
cover (LULC) (Farooq & Ahmad, 2008; Mohan et al., 2011; Xiaoqing & Jianlan, 2007).
The study area has been expanded in the last ten years (i.e.2000 to 2010), Transformation of
different land uses classes has come into scene its impact can be seen at different places
particularly natural drainages totally washed out. It has been replaced by built-up areas. Surface
area of water bodies decreased, at some of the places groundwater qualities crossed physical and
chemical limits. The study assumes different types of built-up , agricultural, barren /waste land,
open spaces, sparse vegetation, water bodies areas. For generating data and its analysis, Arc GIS
10.1 and ERDAS Imagine 9.2 software have been used.
2.Materials and Methods:
2.1. Study area:
Nagpur, the second capital of Maharashtra state, practically at geographical centre of India,
the zero milestone of the India is situated in the city. Total urban area of Nagpur city is 217.17
Sq. Km. and rural area contributing 627.25 Sq. Km. For study purpose, area taken is 627.25
Sq.Km.in an elliptical form. Nagpur has the industrial areas where Buttibori is to be considered
the largest industrial area where Large and small scale industries are there.
Fig 1: Study area Fig 2: LISS III Image of Nagpur District
2.2.Data and Softwares used:
• LISS-III Image of Nagpur District.
• Google image of year 2000 and 2010.
• Observation well data of Nagpur area.
• Arc GIS 10.1 and ERDAS Imagine 9.2
Proceedings of HYDRO 2013 INTERNATIONAL,
4-6 Dec 2013, IIT Madras, INDIA
3
2.3.Methodology:
The methodology of the study is described as in the flow diagram.
Fig3: Flow Diagram of Methodology
2.3.1.Land use /Land cover (LU/LC):
Land use is the hydrological parameter reflects the changes occur due to variation in season
over an earth. Accurate LULC maps can be effective tools in aiding soil erosion control efforts.
Such maps can play an important role in watershed management as a whole and help in deciding
what sort of lands are capable of sustaining agriculture and which are not (Cihlar, 2000;
Renschler and Harbor, 2002). Since land use/cover change is a major factor for global change
because of its interactions with climate, ecosystem processes, biogeochemical cycles,
biodiversity, and, even more important, human activities (ogelmann and Howard, 1998; Xiao et
al., 2006). Temporal changes of the study area have been identified using satellite image. The
different land use classes have been categorized as agricultural, vegetation, barren/wasteland
land, built-up, institutional, vegetation, open space and water body. Built-up area is again
classified into dense built-up, medium dense built-up, sparse built-up where as vegetation is
classified into dense, sparse vegetation area. For the year 2000 and 2010.
Proceedings of HYDRO 2013 INTERNATIONAL,
4-6 Dec 2013, IIT Madras, INDIA
4
2.3.2.Drainage Network :
Drainage network is the most important hydrological parameter for analyzing characteristics
of watershed, particularly drainage density of watershed. Drainage network has been generated
for year 2000 and 2010. Map of the drainage network of respective years can be seen in the
Fig8,Fig9 and Fig10.
2.3.3.Depth to Water Level (DTWL) 2000-2010:
Depth to water level is one of the criteria to visualize subsurface hydrological regimes of an
area and get actual situation of subsurface. In this study, 66 observation wells were taken based
on data, an analyses has been performed Fig14 and Fig15 shows depth to water level changes in
pre monsoon season of a year 2000 and 2010 respectively.
2.3.4.Ground Water Quality From 2000-2010:
Fig16 to Fig19 are showing the changes occurred in the qualities of ground water values
which are parameters of identifying the quality of water for drinking, agriculture, domestic, in
dustrial purposes.
3.Results and Discussion:
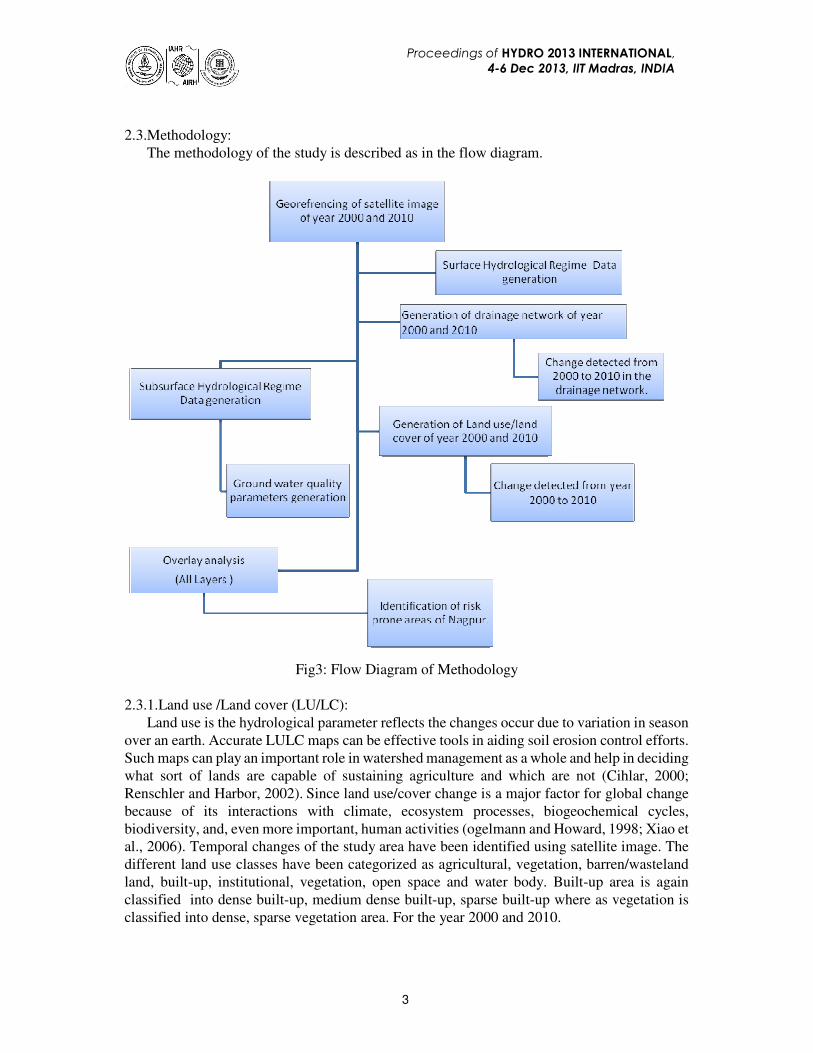
3.1. Chang detected in land use class:
In Fig.4, leaf green colour (code1) is agricultural area, yucca yellow colour (code2) is barren /
waste land, solar yellow colour (code3) is dense built-up area, dark yellow colour (code 4) is
dense vegetation, orange colour (code5) is medium dense built-up, open space (code6), rose dust
colour (code7) is sparse built-up / institutional and pink colour (code8) is showing sparse
vegetation. In Table1 changes occurred in LU/LC can be observed.
Fig 4: LU of year 2000 Fig 5: LU of year 2010. Fig 6: LU changed from 2000 to 2010.

Proceedings of HYDRO 2013 INTERNATIONAL,
4-6 Dec 2013, IIT Madras, INDIA
5
Fig:7 Comparison of land use classes of Nagpur in a year 2000 and 2010.
Table No:1 Land use /Land cover classification of study area.
Code no Land use class Change within 10 years Classes changed
2002 (km2) 2010 (km2)
1 Agricultural 270.4118 264.48631 5.92549
2 Barren/wasteland 173.2642 166.9833 6.2809
3 Dense built-up 27.5761 58.5881 31.012
4 Dense vegetation 19.1768 18.9934 0.1834
5 Medium dense built-up 43.9105 45.9187 2.0082
6 Open space 2.9375 0.8603 2.0772
7 Sparse/institutional 50.89851 61.414297 10.5157
8 Sparse vegetation 33.82803 5.84674 27.9812
9 Water bodies 5.2477 4.16 1.0877
Total 627.24384
627.2438 87.07179
Fig8: Change in Drainage Course within ten years.
Fig9: Texture of Open Spaces
Proceedings of HYDRO 2013 INTERNATIONAL,
4-6 Dec 2013, IIT Madras, INDIA
6
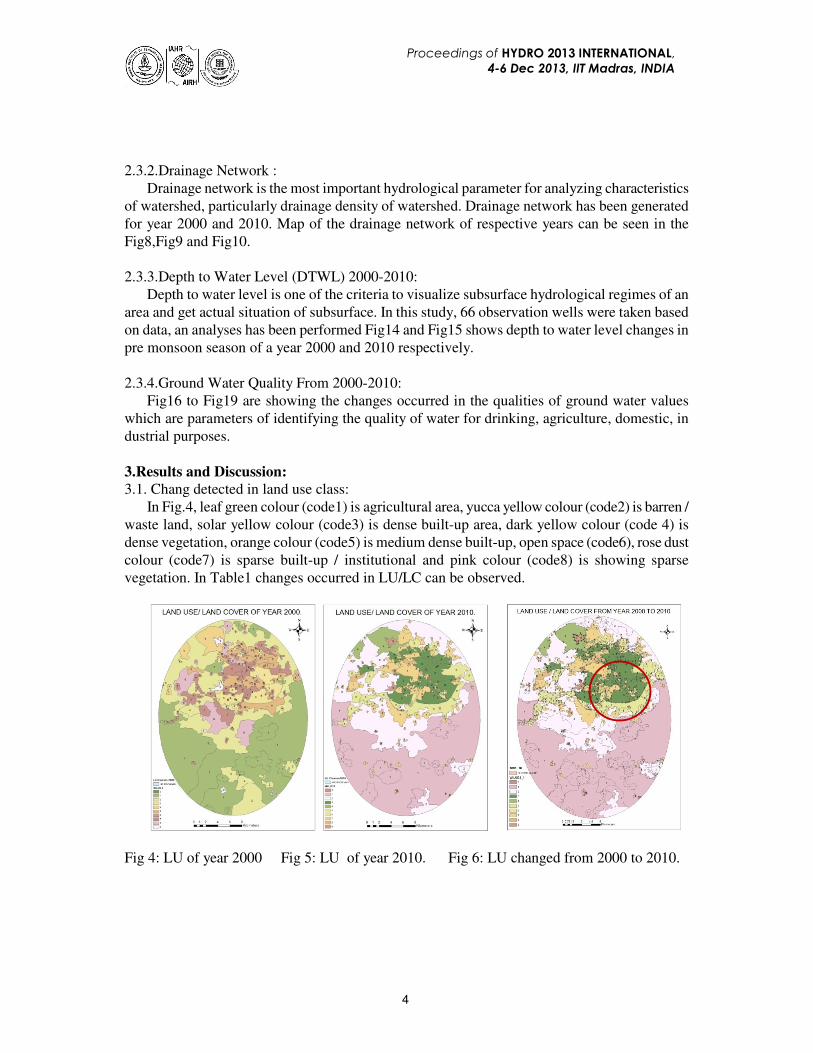
Fig10: Texture of Sparse built-up/ Institutional
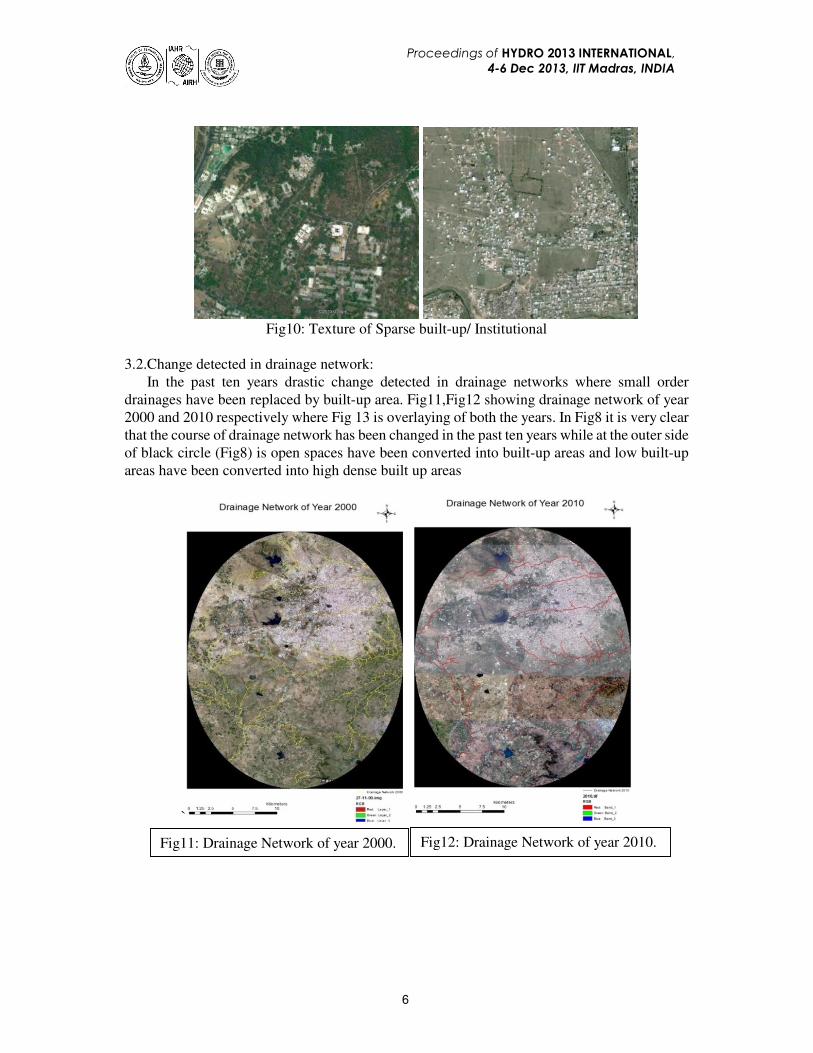
3.2.Change detected in drainage network:
In the past ten years drastic change detected in drainage networks where small order
drainages have been replaced by built-up area. Fig11,Fig12 showing drainage network of year
2000 and 2010 respectively where Fig 13 is overlaying of both the years. In Fig8 it is very clear
that the course of drainage network has been changed in the past ten years while at the outer side
of black circle (Fig8) is open spaces have been converted into built-up areas and low built-up
areas have been converted into high dense built up areas
`
Fig11: Drainage Network of year 2000. Fig12: Drainage Network of year 2010.

Proceedings of HYDRO 2013 INTERNATIONAL,
4-6 Dec 2013, IIT Madras, INDIA
7
3.3.Change detected in depth to water level:
In a year 2000 (Fig14), the value of DTWL in pre monsoon was 0.712m to 11.60m while in
the post monsoon for the same year, DTWL was 0.660m to 13.14m which indicates rise of water
level from 0.052m to 1.54m over the study area. In a year 2010 (Fig15), the value of DTWL in
pre monsoon was 0.503m to 18.47m where as in the post monsoon season it has decreased from
0.0051m to 11.80m. which indicates rise of water level from 0.497m to 6.67m over the whole
study area. Light and dark green colour is showing DTWL is very low which is agood condition,
yellow colour is showing medium while the dark brown colour alarming to bad condition i.e.
draw down condition.
Table No:2 Depth to water level of the study area over ten year span.
Year DTWL (Pre
Monsoon)
highest value
(m)
DTWL(Pre
Monsoon) lowest
value (m)
DTWL(Post
Monsoon)
highest value (m)
DTWL(Post
Monsoon) lowest
value (m)
Rise of water level for
Highest value (m)
2000 11.60 0.712 13.14 0.66 -1.54 (-ve)
2010 18.47 0.503 11.80 0.0051 6.67
Difference -6.87 0.209 1.34 0.6549 -5.53(-ve)
The values in the above table showing the draw down condition of 5.53m since from year 2000
to 2010 in Nagpur urban area.
Fig 13: Drainage Network changed
from year 2000 to 2010

Proceedings of HYDRO 2013 INTERNATIONAL,
4-6 Dec 2013, IIT Madras, INDIA
8
3.4.Change detected in ground water quality:
Table No:3 Quality of ground water in ten year span.
Year Values analyzed in year 2000
Values analyzed in year 2010
Highest value Lowest value
Highest value Lowest value
pH Value 8.298 7.300 8.299 7.500
Total Hardness 978.607 (mg/lit) 95.6 (mg/lit) 644.805 (mg/lit) 100.707 (mg/lit)
Fig 14: Depth to water level
of year 2000 (Pre Monsoon)
Fig 15: Depth to water level
of year 2010 (Pre Monsoon)
Fig16: pH value of year 2000
(Pre Monsoon)
Fig17: pH value of year 2010
(Pre Monsoon)

Proceedings of HYDRO 2013 INTERNATIONAL,
4-6 Dec 2013, IIT Madras, INDIA
9
Urban dense built-up area is a risk prone area as far as concern ground water quality while
rural area has decline of water level in the past ten years. Dark brown colour is reflecting higher
chemical values while yellow colour is of medium and green colour has less values. As per
specification given for drinking purpose to physical and chemical values, pH value is under
control but the total hardness value has been increased.
Conclusion:
Due to the rapid urbanization and economical development of the study area specially land
use/Land cover, drainage network course, fluctuation of water level and quality of ground water
has been badly affected and the reason behind this may be industrial development and solid waste
generation and less use of subsurface sources in the urban areas. Geoinformatics is best
technology to visualize and solving the problems in future.
References:
1. Estoque Ronald C, Murayam Yuji."Spatio-Temporal Urban Land Use/Cover Change
Analysis in a Hill StationThe Case of Baguio City, Philippines". Procedia Social and
Behavioral Sciences 21 (2011) 326–335.
2. Suzanchi Kianoush, Kaur Ravinder."Land use land cover change in National Capital
Region of India: a remote sensing & GIS based two decadal spatial temporal. Procedia
Social and Behavioral Sciences 21 (2011) 212–221.
3. Zhang W.W, Yao L et al."Research on Land Use Change in Beijing Hanshiqiao
Wetland Nature Reserve Using Remote Sensing and GIS. Procedia Environmental
Sciences 10 ( 2011 ) 583 – 588
4. Munthali Kondwani G, Murayama Yuji."Land use/cover change detection and
analysis for Dzalanyama forest reserve, Lilongwe, Malawi" Procedia Social and
Behavioral Sciences 21 (2011) 203–211.
5. Saadat Hossein, Adamowski Jan et al."Land use and land cover classification over a
large area in Iran based on single date analysis of satellite imagery". ISPRS Journal of
Photogrammetry and Remote Sensing 66 (2011) 608–619.
Fig19: Value of Total Dissolved
Solids in a year 2010.
Fig18:Value of Total Dissolved
Solids in a year 2000.