EVALUATING IN SITU WATER AND SOIL CONSERVATION PRACTICES WITH A FULLY COUPLED, SURFACE/SUBSURFACE...
40
This article is protected by copyright. All rights reserved. EVALUATING IN SITU WATER AND SOIL CONSERVATION PRACTICES WITH A FULLY-COUPLED, SURFACE/SUBSURFACE PROCESS-BASED HYDROLOGICAL MODEL IN TIGRAY, ETHIOPIA Emmanuel Opolot 1,2* , Tesfay Araya 3 , Jan Nyssen 4 , Bashar Al-Barri 1 , Koen Verbist 1,5 , Wim M. Cornelis 1 1 Ghent University, Department of Soil Management, Coupure Links 653, B-9000 Gent, Belgium 2 Ghent University, Department of Geology and Soil science, Krijgslaan 281 (S8), B-9000 Gent, Belgium. 3 Mekelle University, Department of Crop and Horticultural Science, POBox 231, Mekelle, Ethiopia 4 Ghent University, Department of Geography, Krijgslaan 281 (S8), B-9000 Gent, Belgium 5 UNESCO Chile *Corresponding author: [email protected] Submitted to: Land Degradation & Development This article has been accepted for publication and undergone full peer review but has not been through the copyediting, typesetting, pagination and proofreading process, which may lead to differences between this version and the Version of Record. Please cite this article as doi: 10.1002/ldr.2335
Transcript of EVALUATING IN SITU WATER AND SOIL CONSERVATION PRACTICES WITH A FULLY COUPLED, SURFACE/SUBSURFACE...
This article is protected by copyright. All rights reserved.
EVALUATING IN SITU WATER AND SOIL CONSERVATION PRACTICES WITH
A FULLY-COUPLED, SURFACE/SUBSURFACE PROCESS-BASED
HYDROLOGICAL MODEL IN TIGRAY, ETHIOPIA
Emmanuel Opolot1,2*
, Tesfay Araya3, Jan Nyssen
4, Bashar Al-Barri
1, Koen Verbist
1,5, Wim
M. Cornelis1
1 Ghent University, Department of Soil Management, Coupure Links 653, B-9000 Gent,
Belgium
2 Ghent University, Department of Geology and Soil science, Krijgslaan 281 (S8), B-9000
Gent, Belgium.
3 Mekelle University, Department of Crop and Horticultural Science, POBox 231, Mekelle,
Ethiopia
4 Ghent University, Department of Geography, Krijgslaan 281 (S8), B-9000 Gent, Belgium
5 UNESCO Chile
*Corresponding author: [email protected]
Submitted to: Land Degradation & Development
This article has been accepted for publication and undergone full peer review but has not been through the copyediting, typesetting, pagination and proofreading process, which may lead to differences between this version and the Version of Record. Please cite this article as doi: 10.1002/ldr.2335
This article is protected by copyright. All rights reserved.
Abstract
In situ water and soil conservation (WSC) practices are a promising intervention to improve
rainwater management particularly in the semi-arid to dry subhumid tropics. This study
applies a fully coupled surface-subsurface process based model (HydroGeoSphere) to
simulate in detail rainwater partitioning as affected by two in situ WSC practices (terwah+,
TER+ and derdero+ (DER+) currently under study on Vertisols in Tigray, Ethiopia and to
evaluate the treatments in terms of rainwater partitioning. In the TER+ practice contour
furrows of 0.2 m wide and 0.1 m deep are created at 1.5 m intervals between permanent
broad beds while in DER+ permanent raised beds of 0.6 m wide with furrows of 0.2 m wide
and 0.1 m deep are created, to minimize runoff and water logging. The model accurately
reproduced measured surface runoff (e.g. in DER+: Nash-Sutcliff model efficiency E = 0.6
for calibration and 0.7 for verification) and soil moisture content (DER+: E = 0.6 for
calibration and 0.8 for verification). Runoff depth was lowest under DER+ (50 mm) followed
by TER+ (67 mm) and significantly higher in conventional tillage, CT (160 mm). Simulated
transpiration, evaporation and drainage out of the root zone were all higher under DER+ and
TER+ compared to CT. The effects of DER+ and TER+ practices on rainwater partitioning
were more pronounced in wet years than in dry years. The model proved to be a promising
and versatile tool to assess the impact of WSC practices on rainwater partitioning at the field
scale.
Key words: surface-subsurface flow model, water and soil conservation, Ethiopia
This article is protected by copyright. All rights reserved.
1. Introduction
Frequent droughts and floods continue to constrain the potential of rain-fed agriculture, yet
this remains a major source of livelihood especially in sub Saharan Africa. In addition, high
runoff losses and unproductive evaporation have been cited as major causes of low yields in
semi-arid areas (Rockström & Falkenmark, 2000). In situ water and soil conservation (WSC)
practices are one of the viable strategies to improve rain-fed agriculture as they increase
vegetative cover, improve soil properties and reduce surface runoff (FAO, 2002). According
to Wallace (2000), principles of runoff reducing techniques are well-known, but there is still
a need to investigate their effects on runoff processes for efficient and appropriate application
of effective measures in the correct circumstances. Evaluation of in situ WSC has been
mainly treated empirically (e.g., Makurira et al., 2007; Tesfay Araya et al., 2011, 2012,
2013a,b) and only few studies (e.g., Boers, 1994; Verbist et al., 2009; 2012) have used a
modeling approach to evaluate the efficiency of water harvesting techniques. Although
empirical studies give valuable insight on the onsite effects of WSC, they remain costly and
time consuming. In addition, results from field experiments cannot be generalized and
applied to other climatic and landscape environments (Verbist et al., 2012).
Continued advances in hydrological models provide an excellent opportunity to assist in
continuous monitoring and evaluation of the effects of in situ WSC practices in different
climatic and landscape environments. According to Soltani & Hoogenboom (2007),
simulation models once validated provide cheaper and faster ways to test the efficiency of
different WSC practices with limited data. However, as mentioned in Verbist et al. (2012)
most modeling studies have used empirical models in which surface runoff is simply
calculated as infiltration excess water and thus unable to describe all complex processes that
influence surface runoff. Studies that have used physically based models to evaluate the
efficiency of water harvesting techniques (Boers, 1994; Verbist et al., 2009) have used
This article is protected by copyright. All rights reserved.
models in which overland and subsurface flow are treated separately, thus unable to
simultaneously describe complex processes of runoff and infiltration. Up to our knowledge,
the only study in which the effects of WSC practices have been investigated with a fully
coupled surface-subsurface model which allows the interaction of soil hydrological surface-
subsurface processes was recently published by Verbist et al. (2012). The advantage of such
models is that they allow detailed insight in the partitioning of rainwater as affected by in situ
WSC practices, and provide a versatile tool for improving their design. Until now, fully
coupled surface-subsurface models have generally been applied at the larger scale of small to
large catchments (e.g., Jones et al., 2008; Sciuto & Diekkrüger, 2010; Qin et al., 2013).
The purpose of this study is to apply a fully coupled surface-subsurface physically based
model (HydroGeoSphere, HGS) (1) to simulate in detail rainwater partitioning as affected by
in situ WSC practices, and (2) to evaluate two in situ WSC practices currently under study in
Tigray, Ethiopia, in terms of rainwater partitioning for crop production.
2. Materials and Methods
2.1 Study site description
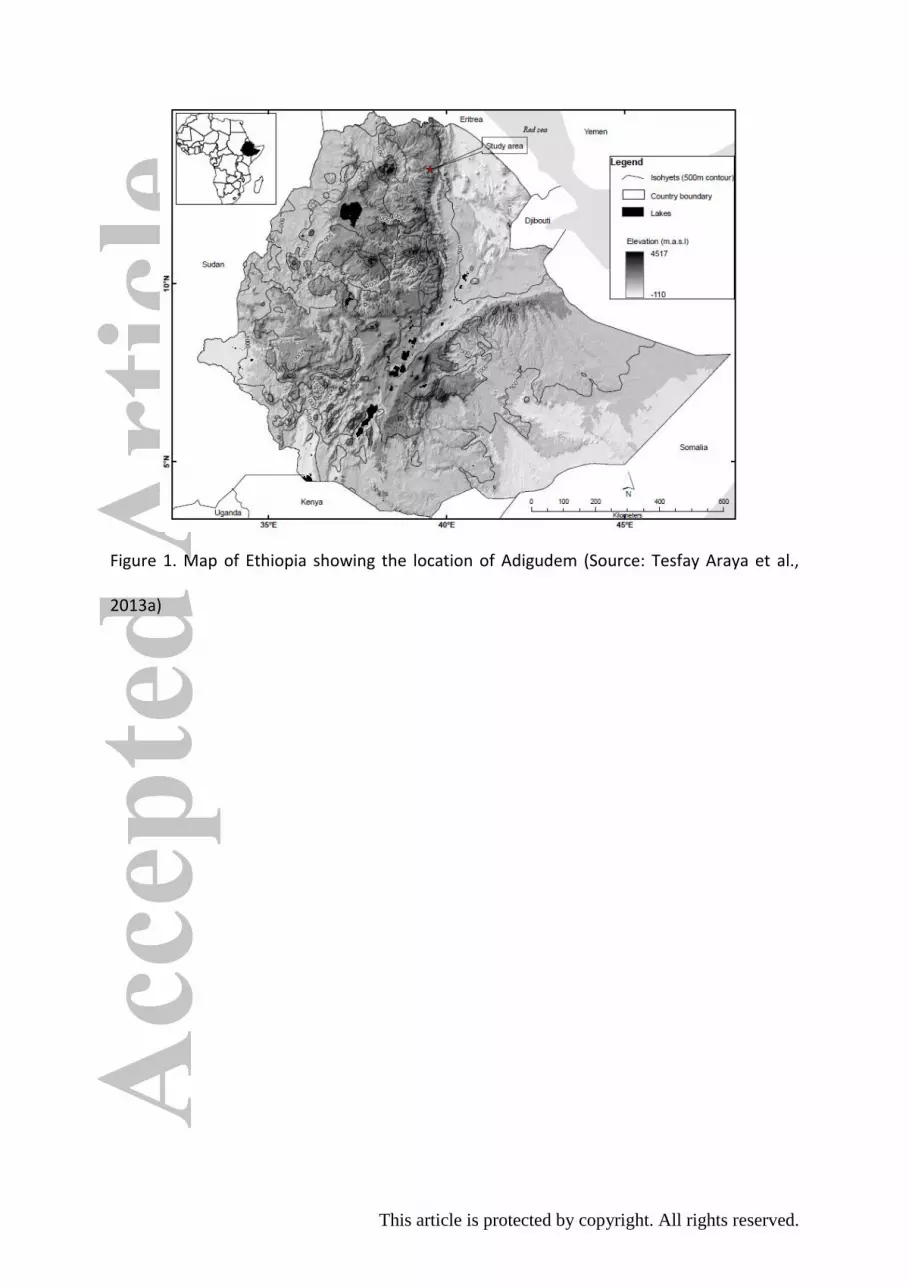
The study area is Adigudem located at 13°14' N and 39°32' E, approximately 740 km from
Addis Ababa at an altitude of 1960 m.a.s.l, in Tigray, northern Ethiopia (Figure 1). The
climate in Adigudem is described as cool tropical semi-arid with recurrent droughts. The area
receives mean annual rainfall of 512 mm, with more than 85% falling during the cropping
season from mid-June to mid-September. The mean, minimum and maximum annual
temperatures of Adigudem are 19 °C, 11 °C and 27 °C respectively, and mean annual
potential evapotranspiration is 1486 mm (Tesfay Araya et al., 2011).
This article is protected by copyright. All rights reserved.
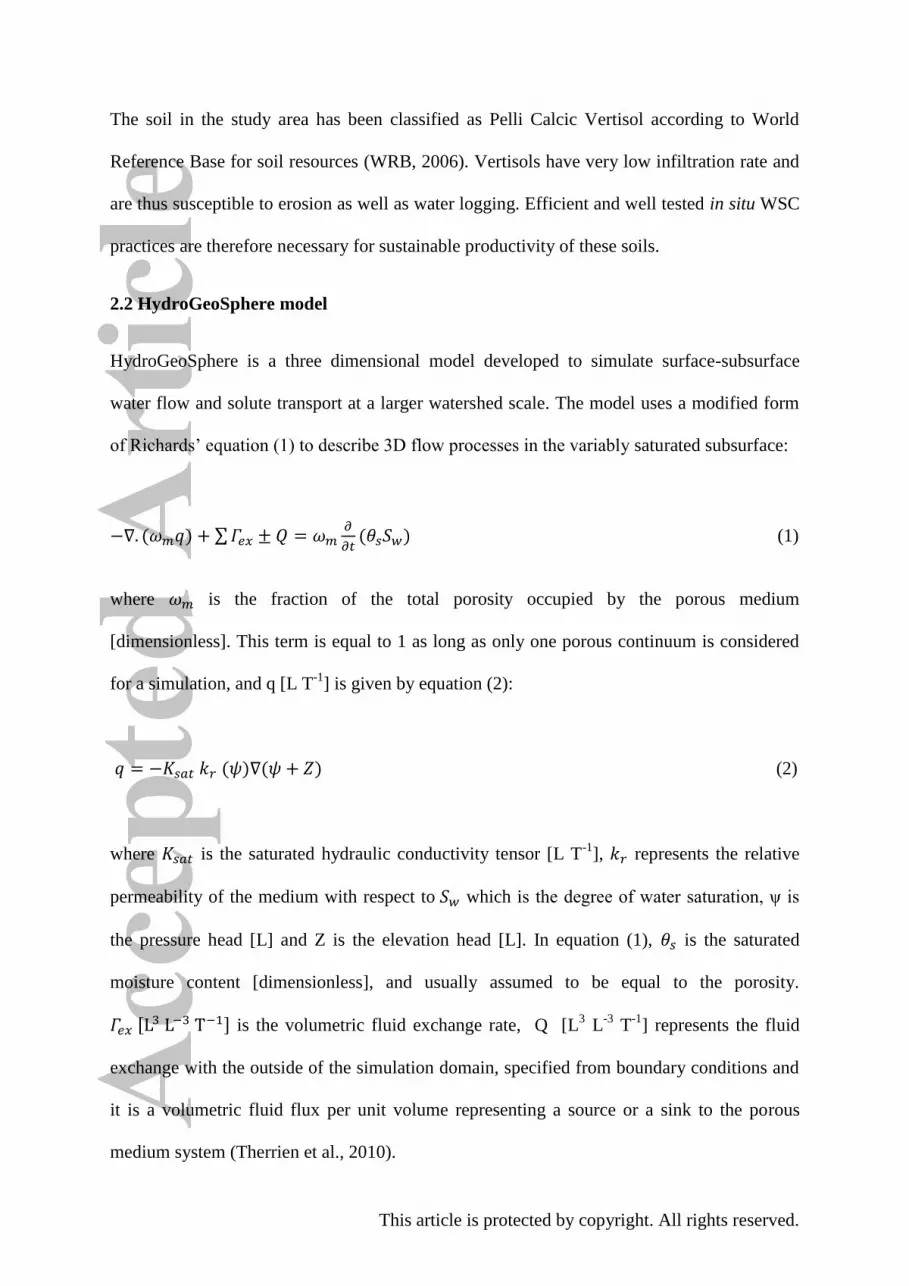
The soil in the study area has been classified as Pelli Calcic Vertisol according to World
Reference Base for soil resources (WRB, 2006). Vertisols have very low infiltration rate and
are thus susceptible to erosion as well as water logging. Efficient and well tested in situ WSC
practices are therefore necessary for sustainable productivity of these soils.
2.2 HydroGeoSphere model
HydroGeoSphere is a three dimensional model developed to simulate surface-subsurface
water flow and solute transport at a larger watershed scale. The model uses a modified form
of Richards’ equation (1) to describe 3D flow processes in the variably saturated subsurface:
(1)
where is the fraction of the total porosity occupied by the porous medium
[dimensionless]. This term is equal to 1 as long as only one porous continuum is considered
for a simulation, and q [L T-1
] is given by equation (2):
(2)
where is the saturated hydraulic conductivity tensor [L T-1
], represents the relative
permeability of the medium with respect to which is the degree of water saturation, ψ is
the pressure head [L] and Z is the elevation head [L]. In equation (1), is the saturated
moisture content [dimensionless], and usually assumed to be equal to the porosity.
is the volumetric fluid exchange rate, Q [L
3 L
-3 T
-1] represents the fluid
exchange with the outside of the simulation domain, specified from boundary conditions and
it is a volumetric fluid flux per unit volume representing a source or a sink to the porous
medium system (Therrien et al., 2010).
This article is protected by copyright. All rights reserved.
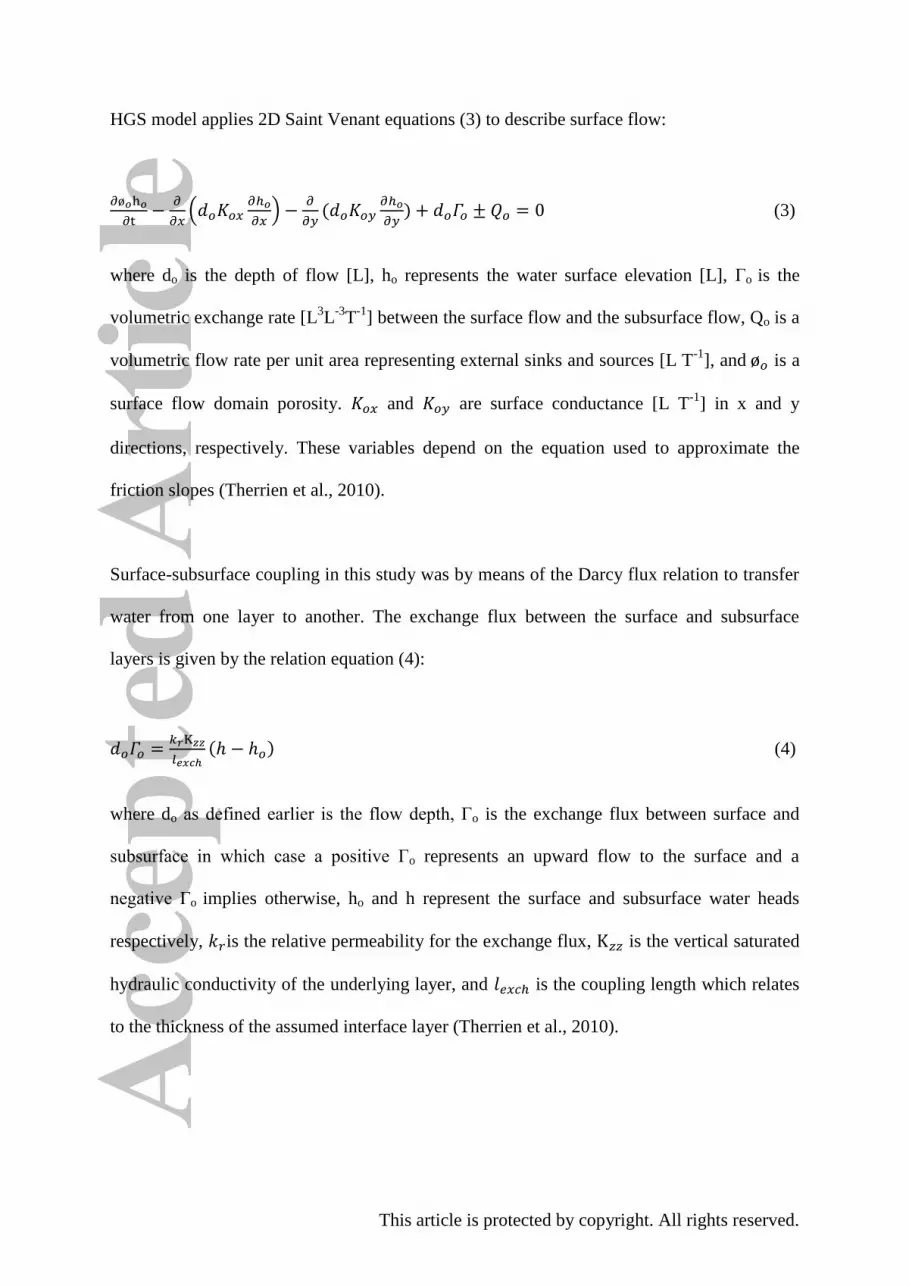
HGS model applies 2D Saint Venant equations (3) to describe surface flow:
(3)
where do is the depth of flow [L], ho represents the water surface elevation [L], Γo is the
volumetric exchange rate [L3L
-3T
-1] between the surface flow and the subsurface flow, Qo is a
volumetric flow rate per unit area representing external sinks and sources [L T-1
], and is a
surface flow domain porosity. and are surface conductance [L T-1
] in x and y
directions, respectively. These variables depend on the equation used to approximate the
friction slopes (Therrien et al., 2010).
Surface-subsurface coupling in this study was by means of the Darcy flux relation to transfer
water from one layer to another. The exchange flux between the surface and subsurface
layers is given by the relation equation (4):
(4)
where do as defined earlier is the flow depth, Γo is the exchange flux between surface and
subsurface in which case a positive Γo represents an upward flow to the surface and a
negative Γo implies otherwise, ho and h represent the surface and subsurface water heads
respectively, is the relative permeability for the exchange flux, is the vertical saturated
hydraulic conductivity of the underlying layer, and is the coupling length which relates
to the thickness of the assumed interface layer (Therrien et al., 2010).
This article is protected by copyright. All rights reserved.
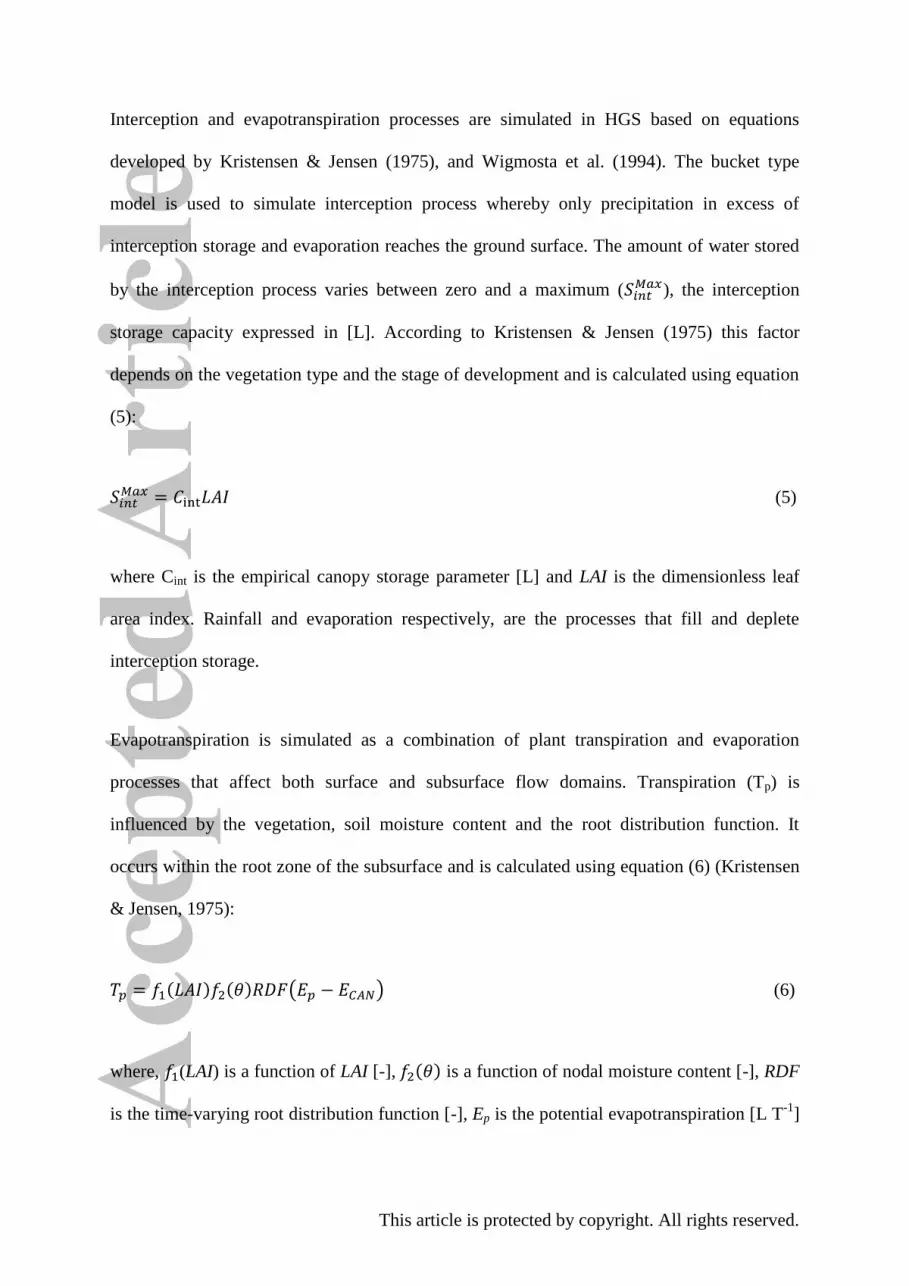
Interception and evapotranspiration processes are simulated in HGS based on equations
developed by Kristensen & Jensen (1975), and Wigmosta et al. (1994). The bucket type
model is used to simulate interception process whereby only precipitation in excess of
interception storage and evaporation reaches the ground surface. The amount of water stored
by the interception process varies between zero and a maximum ( ), the interception
storage capacity expressed in [L]. According to Kristensen & Jensen (1975) this factor
depends on the vegetation type and the stage of development and is calculated using equation
(5):
(5)
where Cint is the empirical canopy storage parameter [L] and LAI is the dimensionless leaf
area index. Rainfall and evaporation respectively, are the processes that fill and deplete
interception storage.
Evapotranspiration is simulated as a combination of plant transpiration and evaporation
processes that affect both surface and subsurface flow domains. Transpiration (Tp) is
influenced by the vegetation, soil moisture content and the root distribution function. It
occurs within the root zone of the subsurface and is calculated using equation (6) (Kristensen
& Jensen, 1975):
(6)
where, (LAI) is a function of LAI [-], is a function of nodal moisture content [-], RDF
is the time-varying root distribution function [-], Ep is the potential evapotranspiration [L T-1
]
This article is protected by copyright. All rights reserved.
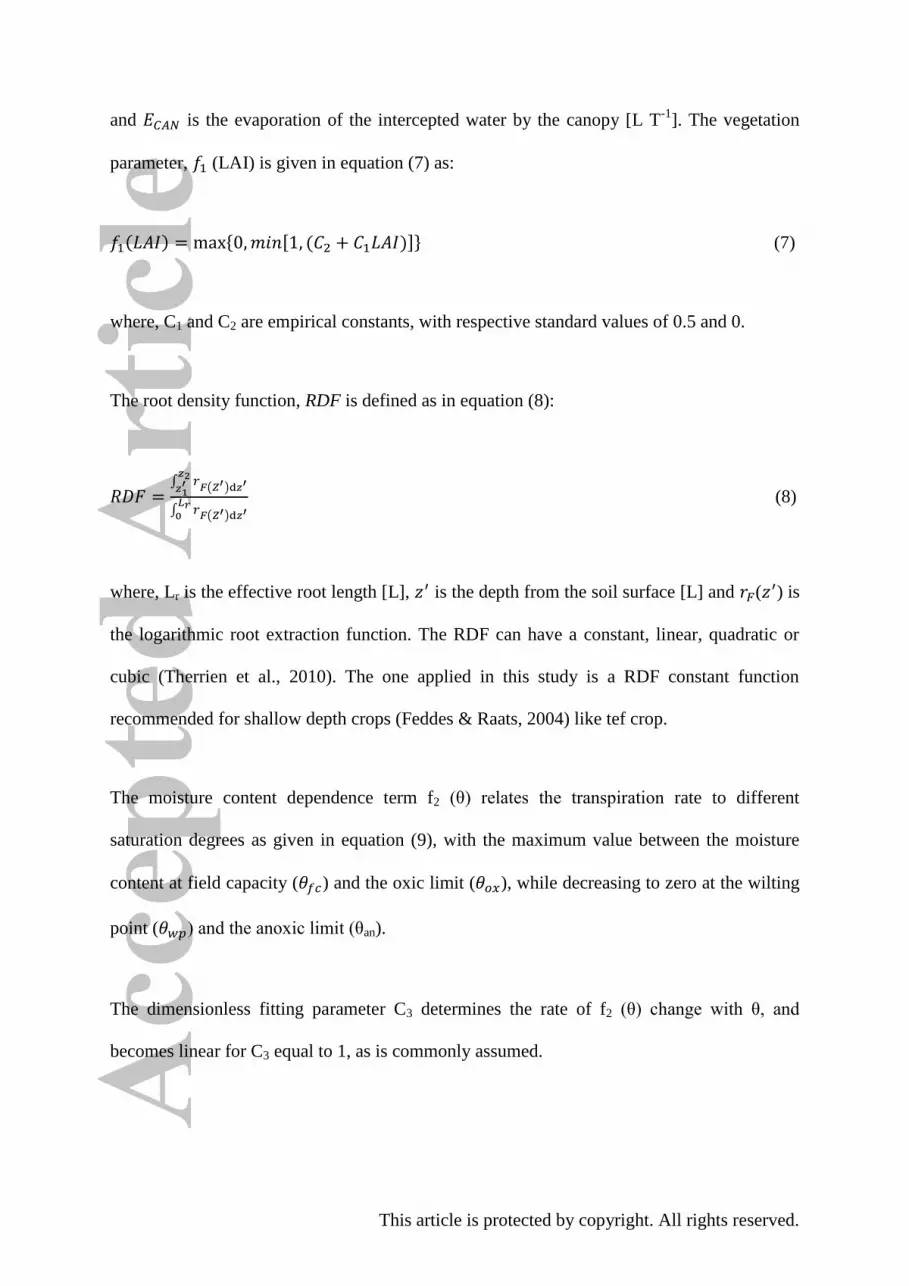
and is the evaporation of the intercepted water by the canopy [L T-1
]. The vegetation
parameter, (LAI) is given in equation (7) as:
(7)
where, C1 and C2 are empirical constants, with respective standard values of 0.5 and 0.
The root density function, RDF is defined as in equation (8):
(8)
where, Lr is the effective root length [L], is the depth from the soil surface [L] and ( ) is
the logarithmic root extraction function. The RDF can have a constant, linear, quadratic or
cubic (Therrien et al., 2010). The one applied in this study is a RDF constant function
recommended for shallow depth crops (Feddes & Raats, 2004) like tef crop.
The moisture content dependence term f2 (θ) relates the transpiration rate to different
saturation degrees as given in equation (9), with the maximum value between the moisture
content at field capacity ( ) and the oxic limit ( ), while decreasing to zero at the wilting
point ( ) and the anoxic limit (θan).
The dimensionless fitting parameter C3 determines the rate of f2 (θ) change with θ, and
becomes linear for C3 equal to 1, as is commonly assumed.
This article is protected by copyright. All rights reserved.
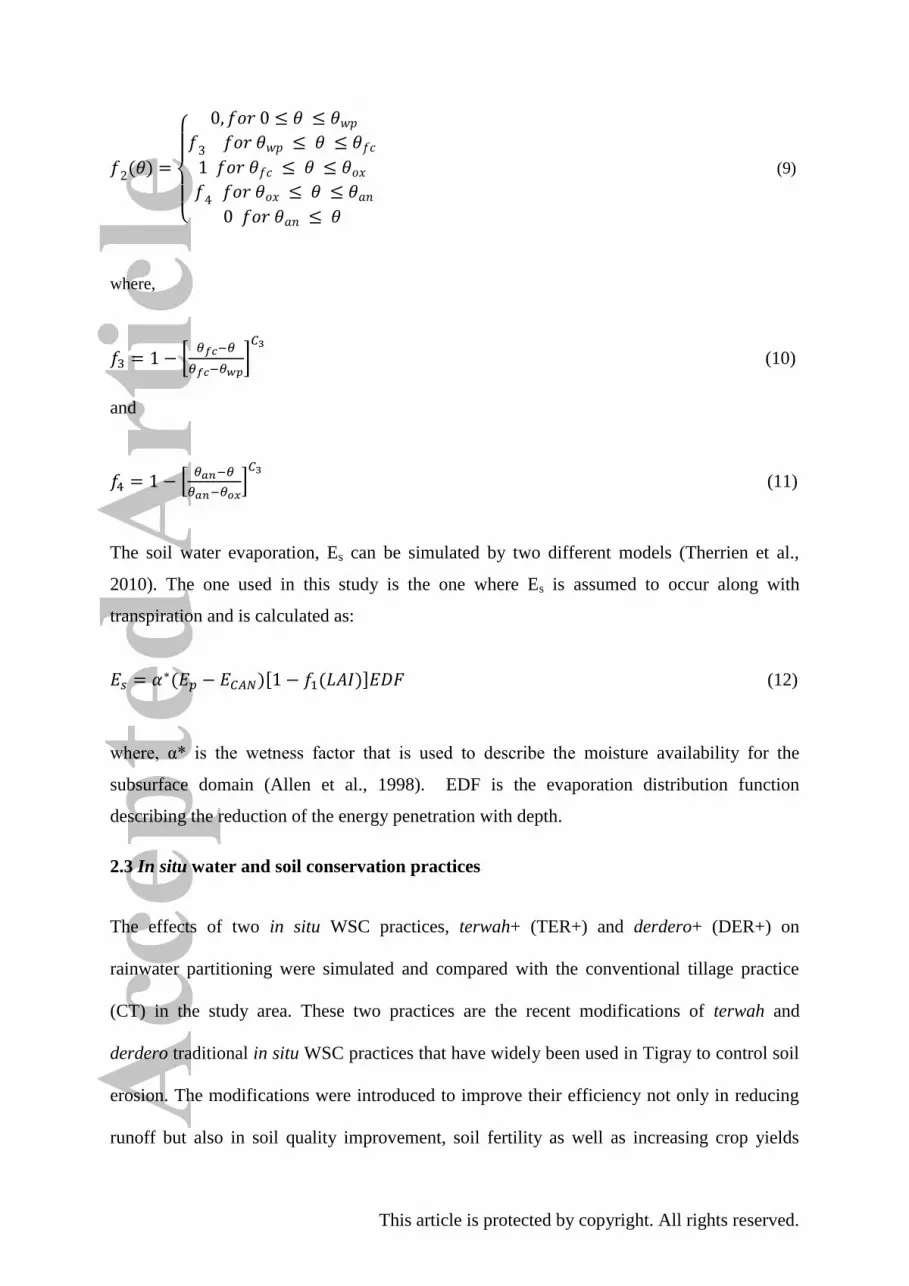
(9)
where,
(10)
and
(11)
The soil water evaporation, Es can be simulated by two different models (Therrien et al.,
2010). The one used in this study is the one where Es is assumed to occur along with
transpiration and is calculated as:
(12)
where, α* is the wetness factor that is used to describe the moisture availability for the
subsurface domain (Allen et al., 1998). EDF is the evaporation distribution function
describing the reduction of the energy penetration with depth.
2.3 In situ water and soil conservation practices
The effects of two in situ WSC practices, terwah+ (TER+) and derdero+ (DER+) on
rainwater partitioning were simulated and compared with the conventional tillage practice
(CT) in the study area. These two practices are the recent modifications of terwah and
derdero traditional in situ WSC practices that have widely been used in Tigray to control soil
erosion. The modifications were introduced to improve their efficiency not only in reducing
runoff but also in soil quality improvement, soil fertility as well as increasing crop yields
This article is protected by copyright. All rights reserved.
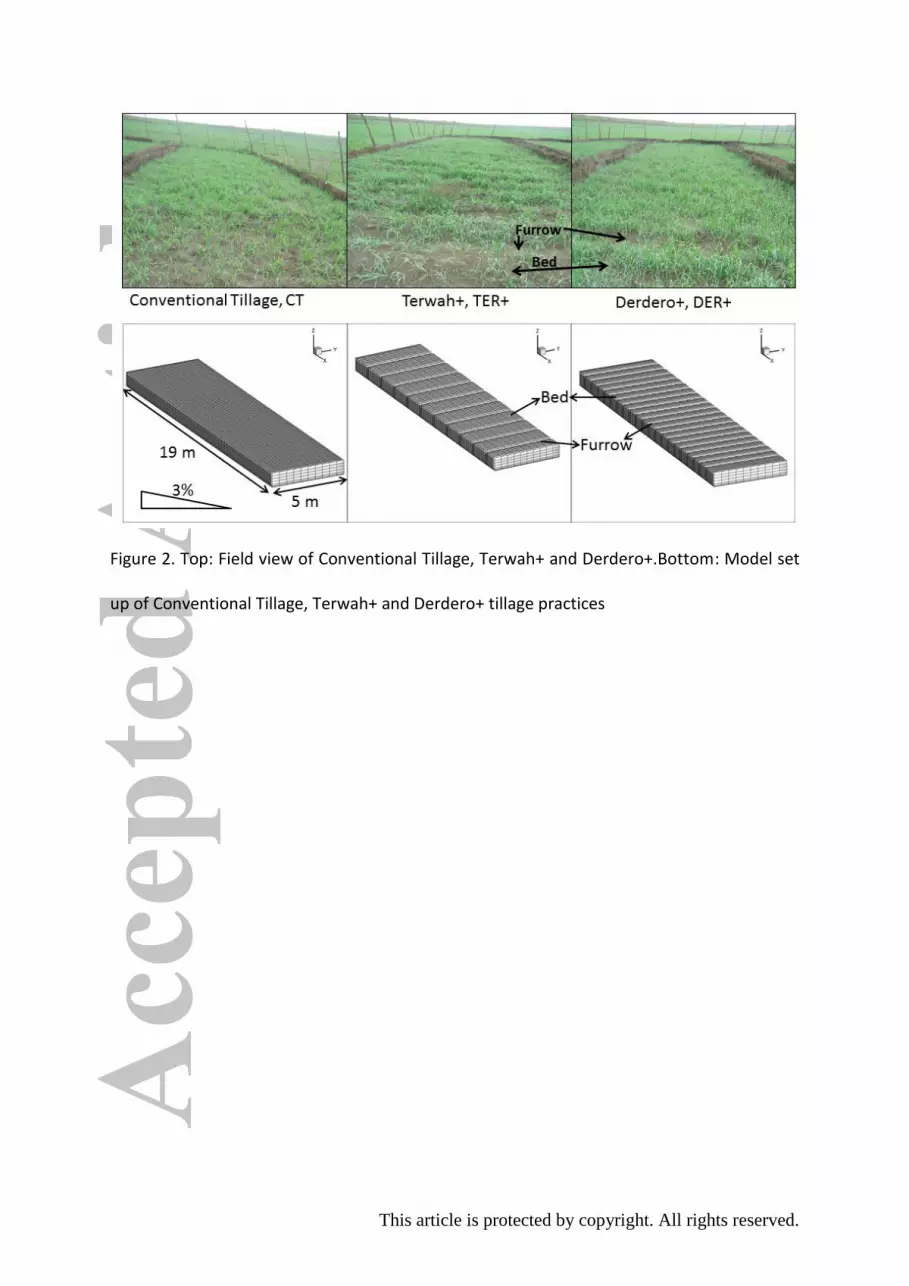
(Nyssen et al., 2011; Tesfay Araya et al., 2011). In TER+ practice, contour furrows of about
0.2 m wide and 0.1 m deep are created at 1.5 m intervals between permanent broad beds
while in DER+ permanent raised beds of 0.6 m width with furrows of about 0.2 m wide and
0.1 m deep are created to prevent water logging and collect excess water that would
otherwise runoff (Figure 2, top). The plus sign (+) in both practices represents retaining at
least 30% of crop residue after a cropping season, minimum tillage of the beds and crop
rotations to comply with the principles of conservation agriculture. In CT (control), no
contour furrows are made and at least three tillage practices are carried out with complete
removal of crop residue. Full descriptions of these in situ WSC practices are given in Nyssen
et al. (2011).
2.3.1 Model setup, initial and boundary conditions
Three grids (Figure 2, bottom) representing CT, TER+ and DER+ in situ WSC practices were
constructed using grid builder program, based on the plot measurements (5 x 19 m) and slope
(3%). Grid builder is a pre-processor software with inbuilt graphical interface and capabilities
to generate 2-dimensional finite element grids. Full description of grid builder can be found
in the manual by McLaren (2007). The choice of grid builder in this study relates to its
compatibility with the HGS model software. Prior to grid generation, text files of elevation
data and grid dimensions (x = 0.1 m and y = 0.1 m) were prepared and exported to grid
builder. For each plot, two layers (base and top) were generated using edit node property
options and were saved as node property files (*nprop). The top layers of TER+ and DER+
were further transformed to include furrows of 0.2 m wide and 0.1 m deep at regular intervals
of 1.5 m and 0.6 m for TER+ and DER+, respectively. Finer grids (0.05 x 0.05 m) were used
at the furrows. All the grid files were copied to the respective grid builder (gb) working
folders of the three practices in HGS. The 2-dimensional grids were extended to a depth of
1m to generate the 3- dimensional grids (Figure 2, bottom). Through the grid builder
This article is protected by copyright. All rights reserved.
evapotranspiration was also introduced into the HGS model by assigning some parts of the
surface layer as evaporating elements and saving such a file with extension (*eprop).
The initial conditions specified included the initial head and initial degree of soil saturation.
With the assumption that, the soil is very dry prior to the start of the rainy season, the water
saturation degree of 0.2 corresponding to initial head of -10000 cm was obtained from the
water retention curve and was taken as initial soil condition. Simulations were started on the
1st of January (5 months before the onset of the rainy season) to ensure that the initial
conditions imposed very little influence on the outcome of the simulations.
Rainfall and evapotranspiration expressed as flux (cm min-1
) were imposed as boundary
conditions at the surface layer while free drainage (also a boundary condition) was imposed
at the bottom faces and the lateral domains of the grid, allowing soil water to freely leave the
soil system. Like in the field, runoff was collected at the bottom of the plots.
2.4 Determination of HydroGeoSphere model input parameters
HydroGeoSphere requires an input of van Genuchten parameters (residual moisture content
θr, saturated moisture content θs, scaling parameter , pore connectivity factor, land shape
parameters n and m) as well as saturated hydraulic conductivity, Ksat, to describe subsurface
flow. Manning coefficients (friction factors in both x and y directions) are required for
simulating surface flow while coupling length is needed to describe surface-subsurface
exchange flow. Crop parameters are also required for simulation of the evapotranspiration
process.
Initial estimates of the van Genuchten parameters were obtained from soil water retention
curves (SWRC) that were established from six undisturbed soil samples taken from each plot
using standard sharpened steel 100 cm3 Kopecky rings at different depths of 0-0.1m, 0.1-0.2
m and 0.3-0.4 m. Full description of the SWRC determination is given in Tesfay Araya et al.
This article is protected by copyright. All rights reserved.
(2013a,b). Field saturated hydraulic conductivity (Kfs) was obtained by Tesfay Araya (2012)
using single ring with constant head method described by Reynolds et al. (2002).
Briefly, this parameter was measured using single ring with constant head method as
described by Reynolds et al. (2002). A total of six measurements per plot were carried out at
the interval of two weeks, each time taking 2 measurements per plot. The metal ring of
diameter 0.22 m and height of 0.25 m was carefully driven into the soil to a depth of 0.03 m.
The ring was carefully filled with water up to the required constant head, H of 0.05 m and
this head was kept constant by using the Mariotte system of a Guelph permeameter®
(Soilmoisture Equipment) (Verbist et al., 2010).
Readings of water height in the reservoir (cm) were taken every minute from the outer
cylinder Guelph for a period of at least one hour. The average value of the last 10 minutes
was taken as the final infiltration rate, q was calculated as:
(13)
where h is water height (cm) in the reservoir, t is time, subscripts 1 and 2 indicate two
successive readings, Aguelph is the inner surface of the reservoir (m2) and Aring is the surface of
the ring (m2).
Field saturated hydraulic conductivity, Kfs was then calculated from infiltration rate
measurements using Reynolds & Elrick (1990) equation (14) relating ponded infiltration and
Kfs.
(14)
where is the quasi steady infiltration rate , a is the ring radius , H is the steady-
state depth of the ponded water in the ring , d is the depth of ring insertion into the soil
, and are dimensionless empirical constants equal to 0.316π and 0.184π respectively
This article is protected by copyright. All rights reserved.
for and , and (value of 0.12 was used) is the macroscopic
capillary length .
Manning coefficients for cultivated field were taken from Manning’s n reference tables.
Sensitivity analysis as described in Verbist et al. (2012) showed that these coefficients were
less sensitive to both surface runoff and soil moisture content. All three practices therefore
received a same value of 0.035 .
The coupling length is based on the virtual surface-subsurface interface, and cannot be
directly measured. Verbist et al. (2012) in the semi-arid environment of Chile demonstrated
that coupling length is the most sensitive parameter in simulating both surface runoff and soil
moisture. In this study, coupling length was determined during model parameter optimisation.
The initial value was set at 0.01m. All input parameters to describe surface-subsurface flow
are summarized in Table 1.
Daily potential evapotranspiration (PET) was calculated from measured daily Epan following
the method given by Allen et al. (1998). The HGS model uses PET to calculate actual
transpiration that also depends on the crop. In this study, teff (Eragrostis Tef) and wheat
(Triticum spp) were crops grown in cropping seasons of 2009 and 2010 and were considered
during model calibration and verification. Transpiration fitting parameters and evaporation
saturation limits required by the model for simulation of evapotranspiration were not
available for teff crop. Because teff crop is similar to grass, this study utilized some
parameters described for grass and found in Therrien et al. (2010). Field capacity ( ) and
permanent wilting point ( ) for both wheat and teff were obtained from SWRC described
in Tesfay Araya et al. (2013a) by curve fitting. Maximum rooting depth of teff was reported
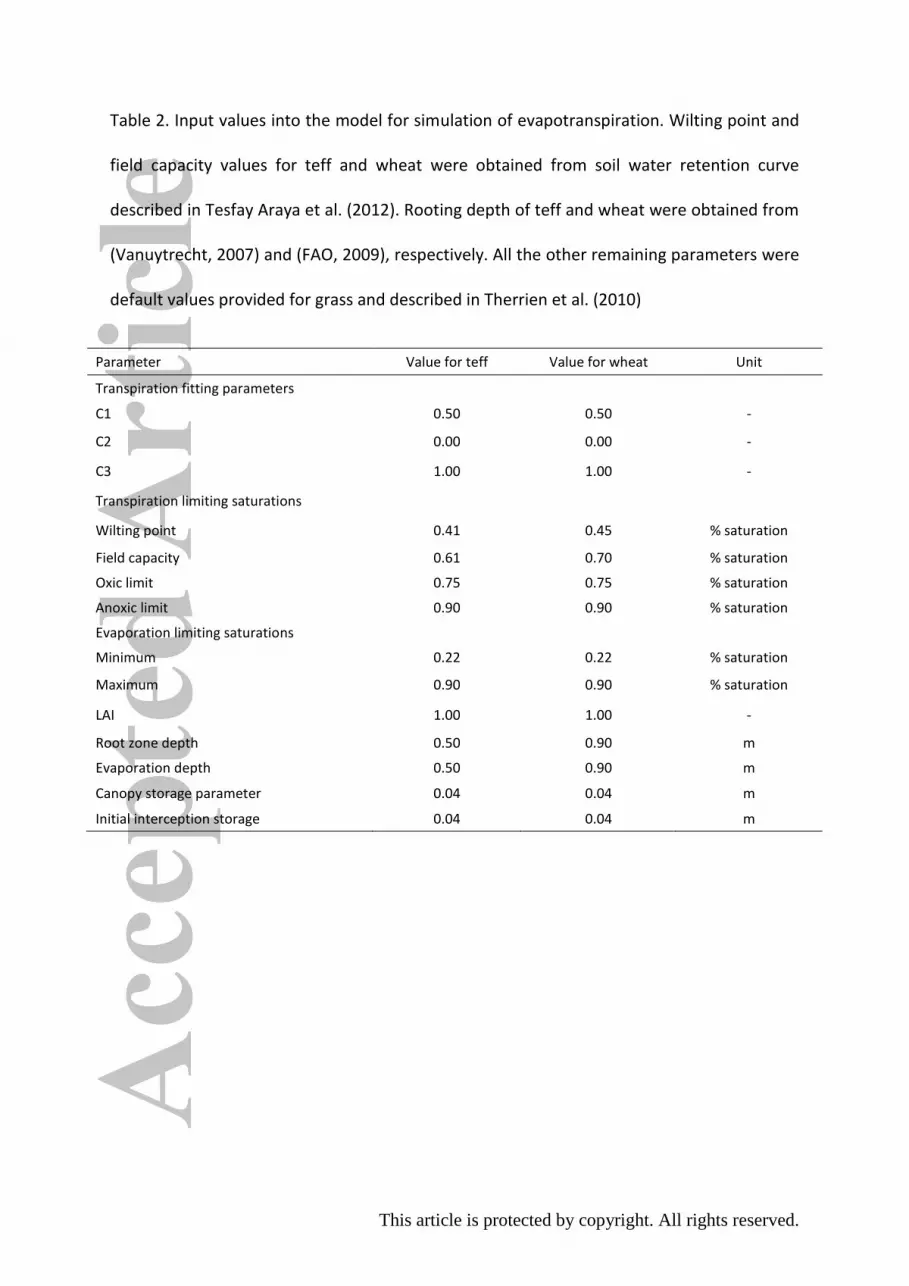
to be 0.5 m (Vanuytrecht, 2007) and 0.9 m for wheat (FAO, 2009). Table 2 gives all
This article is protected by copyright. All rights reserved.
parameters and their values used for simulation of evapotranspiration and interception for
both teff and wheat.
2.5 Model parameter optimisation and calibration
Calibration and validation of the model were performed to match the model simulations to
the measured runoff and soil moisture. Field measured runoff and soil moisture data of 2009
and 2010 growing seasons (described in Tesfay Araya et al., 2012) were used for model
calibration and verification. Briefly, trenches of about 4.5 m long, 1.5 m wide and 1 m deep
were dug at the lower end of each plot and lined with 0.5 mm thick plastic sheets for runoff
and sediment collection. Surface runoff inflow and outflow from the experimental plots was
avoided by placing iron sheets at the surrounding border of each plot except to one side
where the deep collector trenches were located and by separating the plots with a 0.5 m wide
ditches (Tesfay Araya, 2012). The average water height from 3 different positions of each
trench was taken every morning (8.00AM) after the rainfall event that generated runoff. Due
to the swelling and shrinking nature of the Vertisols, the volume of the trenches would vary
with time. Therefore, trenches were calibrated annually in the middle of the growing season
based on known amounts of water and water depth at three sample locations in each trench
following procedures by Gebreegziabher et al. (2009) and Oicha et al. (2010).
The soil moisture content was measured using the gravimetric method. A total of 6 soil
samples per soil depth per treatment were taken at 0.2 m intervals up to a depth of 1 m using
an auger. Fresh weights of these samples were taken in the field before they were transported
to the laboratory. Samples were oven-dried at 105 °C for 24 hours and their dry weights were
measured. Gravimetric soil moisture content ( ) was calculated using equation (15):
(15)
This article is protected by copyright. All rights reserved.
where, and are the mass of water and mass of dry soil, respectively.
Gravimetric moisture content, was converted to volumetric moisture content (θ ) using the
bulk density obtained following procedures described as follows:
The soil shrinkage characteristic curve (SSCC) describing the volume change of Vertisols
with change in moisture content was determined using the equation suggested by Cornelis et
al. (2006):
(16)
where is the moisture ratio, is the void ratio at oven-dryness and , and c are fitting
parameters.
Moisture ratio, (m3 m
-3) was calculated from equation…:
(17)
where is particle density (Mg m-3
) and is density of water, taken at 1 Mg m-3
.
Void ratio, e (m3 m
-3) is calculated as:
(18)
Finally, the bulk density, was obtained by combining equations 16-17 and θ was derived
from equation (19):
θ
(19)
Volumetric moisture content was concurrently recorded using a Trime® water sensor (IMKO
Micromodultechnik GmbH, Ettlingen, Germany) which is dielectric method until 1 m depth.
This article is protected by copyright. All rights reserved.
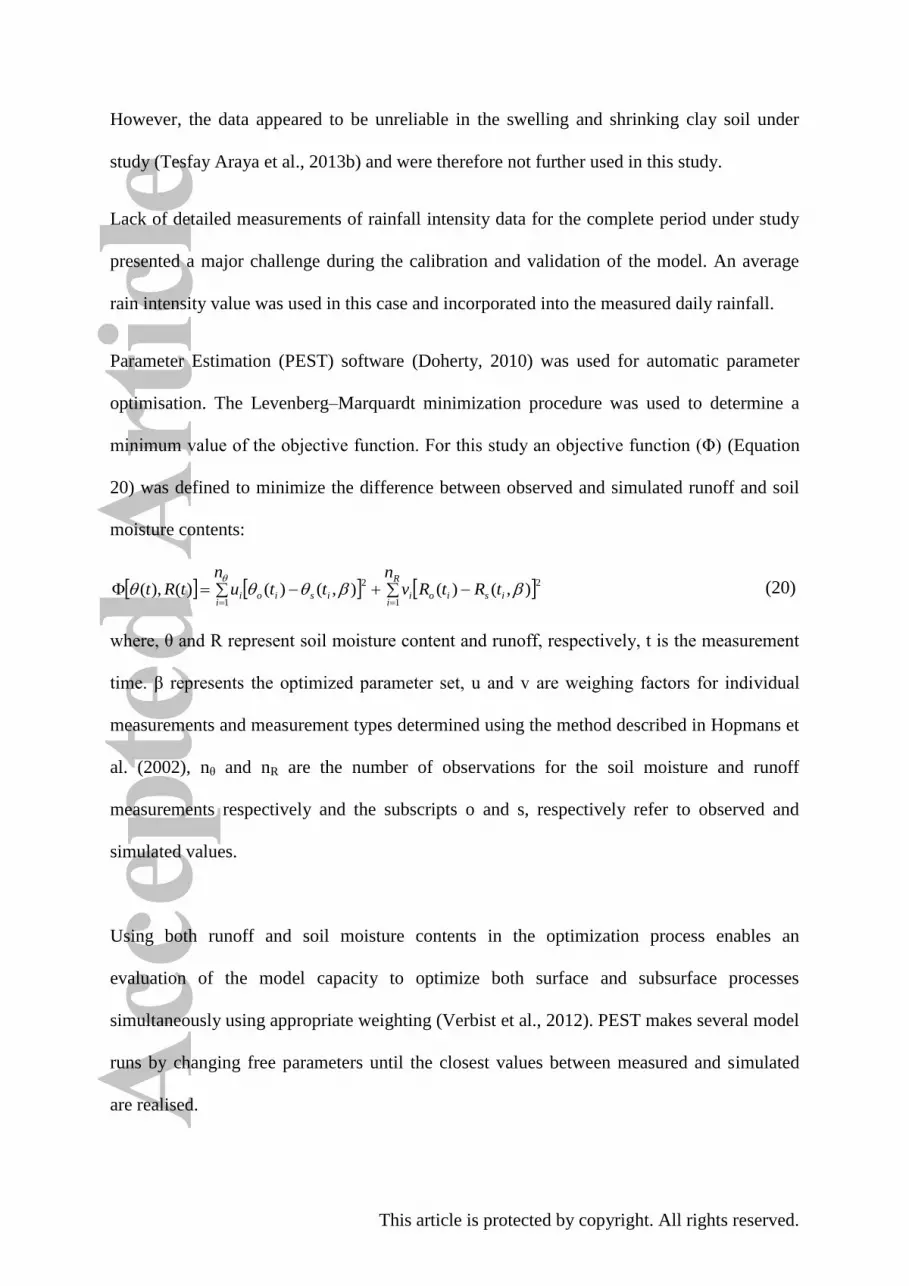
However, the data appeared to be unreliable in the swelling and shrinking clay soil under
study (Tesfay Araya et al., 2013b) and were therefore not further used in this study.
Lack of detailed measurements of rainfall intensity data for the complete period under study
presented a major challenge during the calibration and validation of the model. An average
rain intensity value was used in this case and incorporated into the measured daily rainfall.
Parameter Estimation (PEST) software (Doherty, 2010) was used for automatic parameter
optimisation. The Levenberg–Marquardt minimization procedure was used to determine a
minimum value of the objective function. For this study an objective function (Φ) (Equation
20) was defined to minimize the difference between observed and simulated runoff and soil
moisture contents:
R
iisioi
iisioi
ntRtRv
nttutRt
1
2
1
2),()(),()()(),(
(20)
where, θ and R represent soil moisture content and runoff, respectively, t is the measurement
time. β represents the optimized parameter set, u and v are weighing factors for individual
measurements and measurement types determined using the method described in Hopmans et
al. (2002), nθ and nR are the number of observations for the soil moisture and runoff
measurements respectively and the subscripts o and s, respectively refer to observed and
simulated values.
Using both runoff and soil moisture contents in the optimization process enables an
evaluation of the model capacity to optimize both surface and subsurface processes
simultaneously using appropriate weighting (Verbist et al., 2012). PEST makes several model
runs by changing free parameters until the closest values between measured and simulated
are realised.

This article is protected by copyright. All rights reserved.
Full sensitivity analysis to determine the adjustable model parameters during optimization
was not done. However, an earlier similar study in a semi-arid environment by Verbist et al.
(2012), in which variance-based global sensitivity analysis using Jansens’ estimator (Jansens,
1999) was applied, showed that coupling length and Kfs were the most sensitive parameters to
both surface runoff and soil moisture simulation. Parameters α, n and θs were also shown to
be sensitive with the latter parameter playing an important role in subsurface water
redistribution (Verbist et al., 2012). In this study we kept α and n to their initial values and
only calibrated coupling length, Kfs and θs. Pore connectivity factor (l), θr and x- and y-
friction factors were found to be insensitive to both surface and subsurface processes (Verbist
et al., 2012). A fixed value of 0.5 (Mualem, 1976) was therefore used for l across all the 3
practices. Residual moisture content (θr), x- and y- friction factors were also fixed to their
initial values (Table 1).
Residual mean squared error (RMSE; equation 21), Pearson correlation coefficient ( ;
equation 22) and Nash-Sutcliff model efficiency (E; equation 23) were computed to evaluate
the goodness of fit between measured and HGS simulated runoff and soil moisture contents
across all the three tillage practices:
(21)
(22)
(23)
where, n is the number of measurements, xi and oi are the measured and predicted values,
respectively and, and are the average of the measured and predicted values,
respectively.
This article is protected by copyright. All rights reserved.
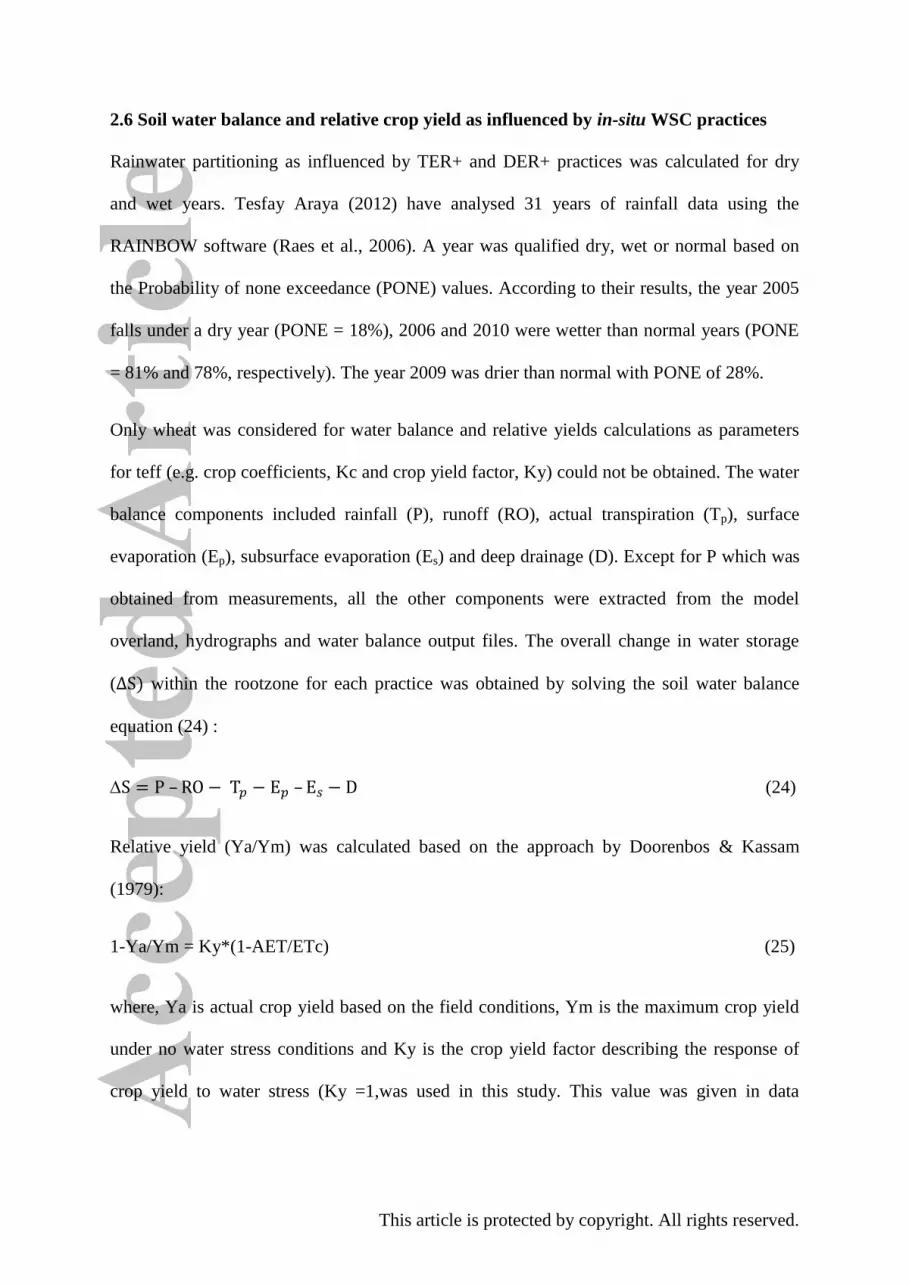
2.6 Soil water balance and relative crop yield as influenced by in-situ WSC practices
Rainwater partitioning as influenced by TER+ and DER+ practices was calculated for dry
and wet years. Tesfay Araya (2012) have analysed 31 years of rainfall data using the
RAINBOW software (Raes et al., 2006). A year was qualified dry, wet or normal based on
the Probability of none exceedance (PONE) values. According to their results, the year 2005
falls under a dry year (PONE = 18%), 2006 and 2010 were wetter than normal years (PONE
= 81% and 78%, respectively). The year 2009 was drier than normal with PONE of 28%.
Only wheat was considered for water balance and relative yields calculations as parameters
for teff (e.g. crop coefficients, Kc and crop yield factor, Ky) could not be obtained. The water
balance components included rainfall (P), runoff (RO), actual transpiration (Tp), surface
evaporation (Ep), subsurface evaporation (Es) and deep drainage (D). Except for P which was
obtained from measurements, all the other components were extracted from the model
overland, hydrographs and water balance output files. The overall change in water storage
( within the rootzone for each practice was obtained by solving the soil water balance
equation (24) :
– – (24)
Relative yield (Ya/Ym) was calculated based on the approach by Doorenbos & Kassam
(1979):
1-Ya/Ym = Ky*(1-AET/ETc) (25)
where, Ya is actual crop yield based on the field conditions, Ym is the maximum crop yield
under no water stress conditions and Ky is the crop yield factor describing the response of
crop yield to water stress (Ky =1,was used in this study. This value was given in data

This article is protected by copyright. All rights reserved.
description-FAST5 (http://www.fao.org/giews/english/shortnews/DataDescriptionFast5.pdf)
for wheat in Ethiopia).
AET is the actual crop evapotranspiration during the growing season, and it was obtained as:
AET= (26)
where, Tp (actual transpiration), Es (subsurface evaporation) and Ep (surface evaporation) are
all outputs from HGS model.
ETc is the maximum crop evapotranspiration under standard conditions calculated as:
ETc=Kc*PET (27)
The growing season of wheat was from (June –September) and 4 different Kc values
(corresponding to initial, development, mid and late season growth stages) for spring wheat
were obtained from FAO website (http://www.fao.org/nr/water/cropinfo_wheat.html). Each
of this value was multiplied by PET for that month to obtain the ETc for the respective
month. The sum of ETc from the 4 months was the value used in equation (25) to calculate
Ya/Ym.
3. Results
3.1 Model performance
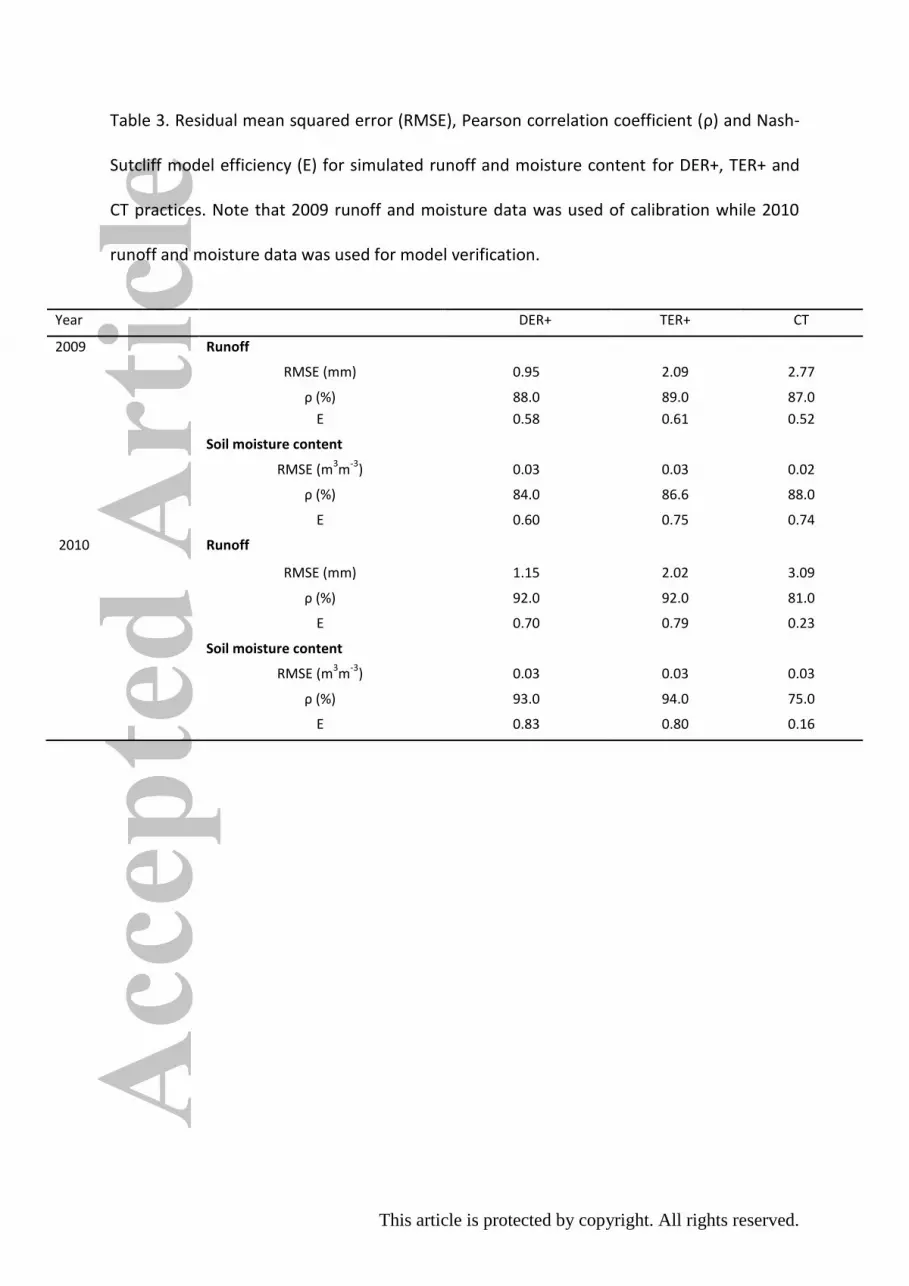
Results of the HGS model performance as reflected by the RMSE, and E values for 2009
(model calibration) and 2010 (model verification) are summarized in Table 3. Generally low
values of RMSE and high values of and E depict good agreement between measured and
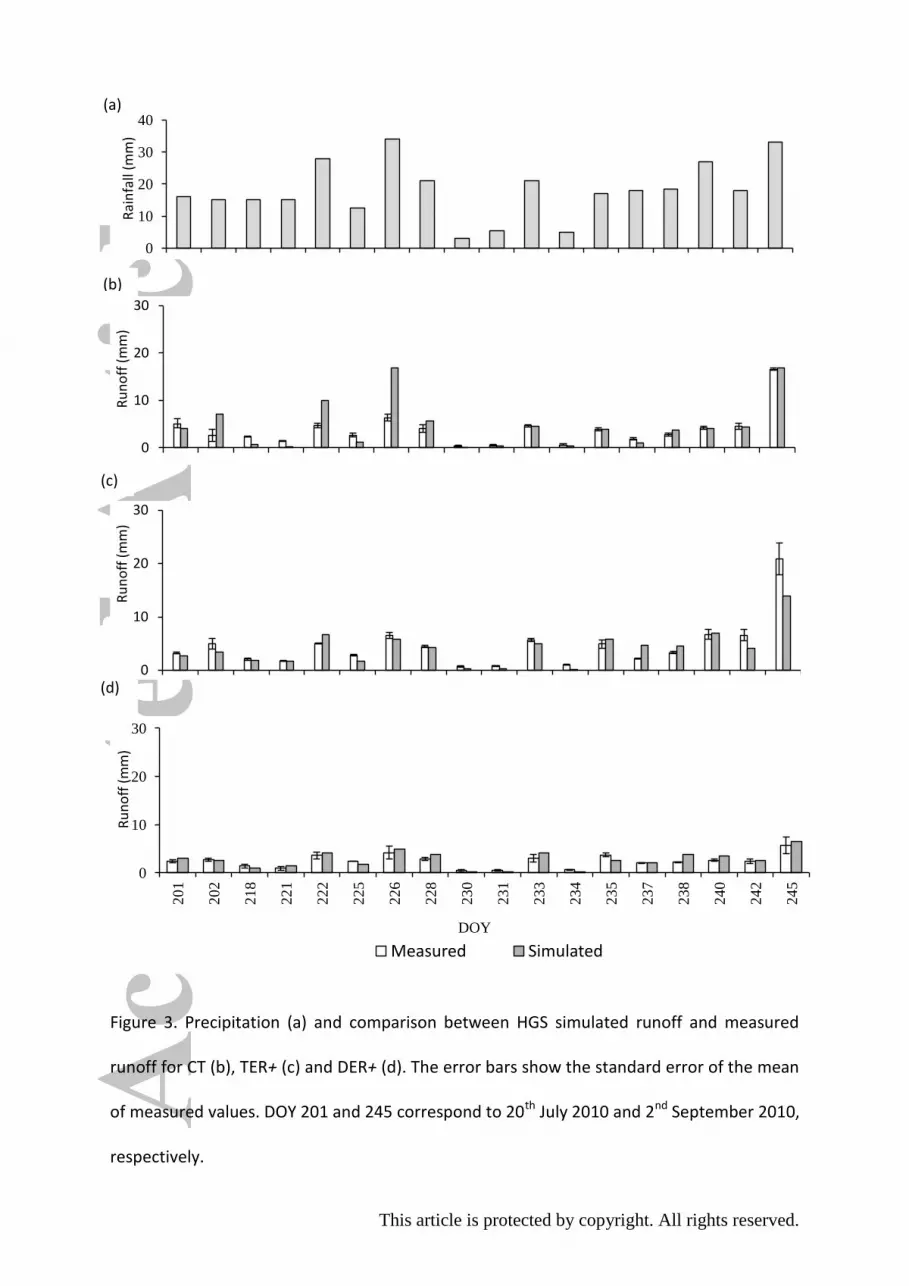
HGS simulated runoff and moisture contents. Additionally, Figure 3 shows good agreement
between simulated and observed runoff values for CT, TER+ and DER+ tillage practices
following rainfall events from 20th
July until 2nd
September 2010. In general HGS simulated
This article is protected by copyright. All rights reserved.
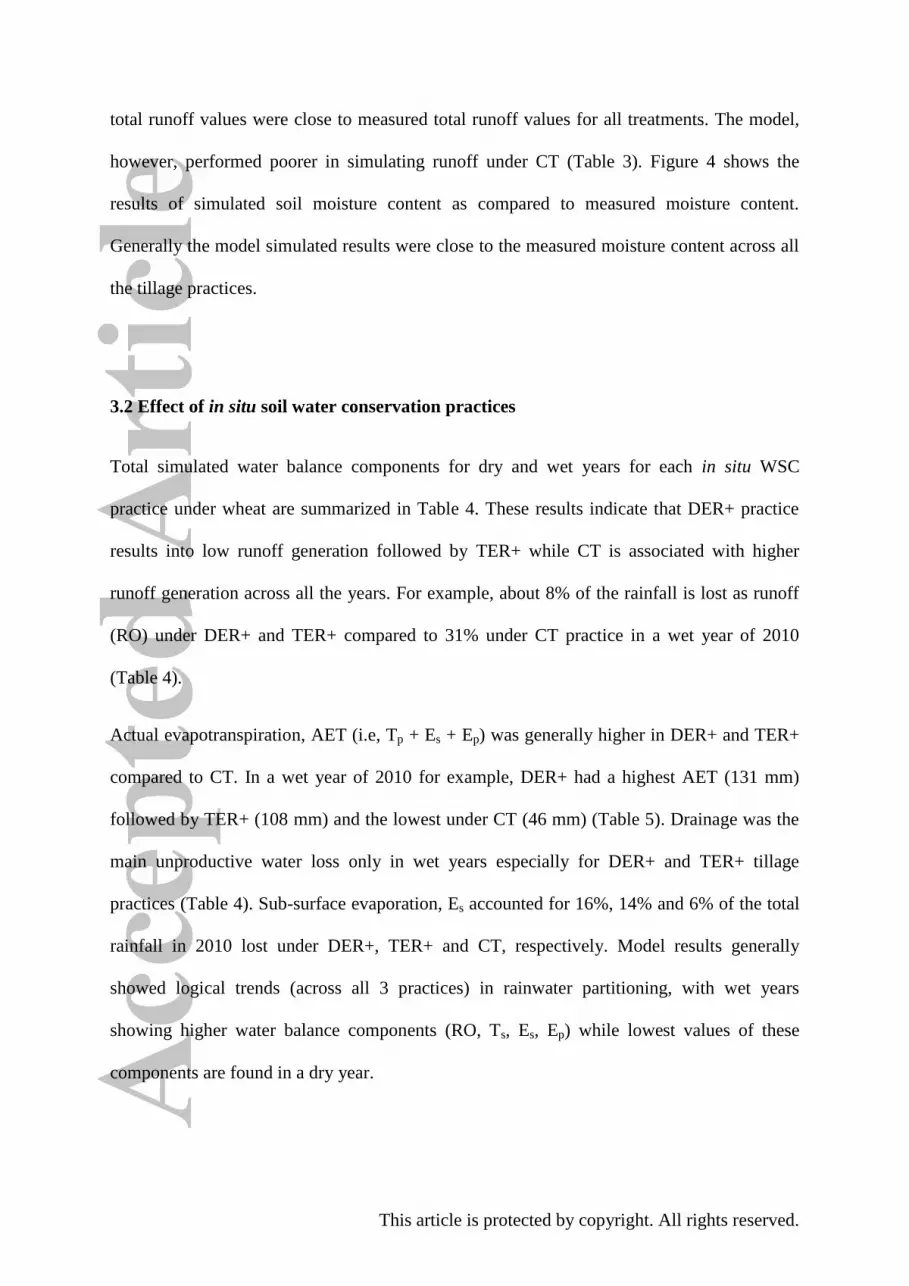
total runoff values were close to measured total runoff values for all treatments. The model,
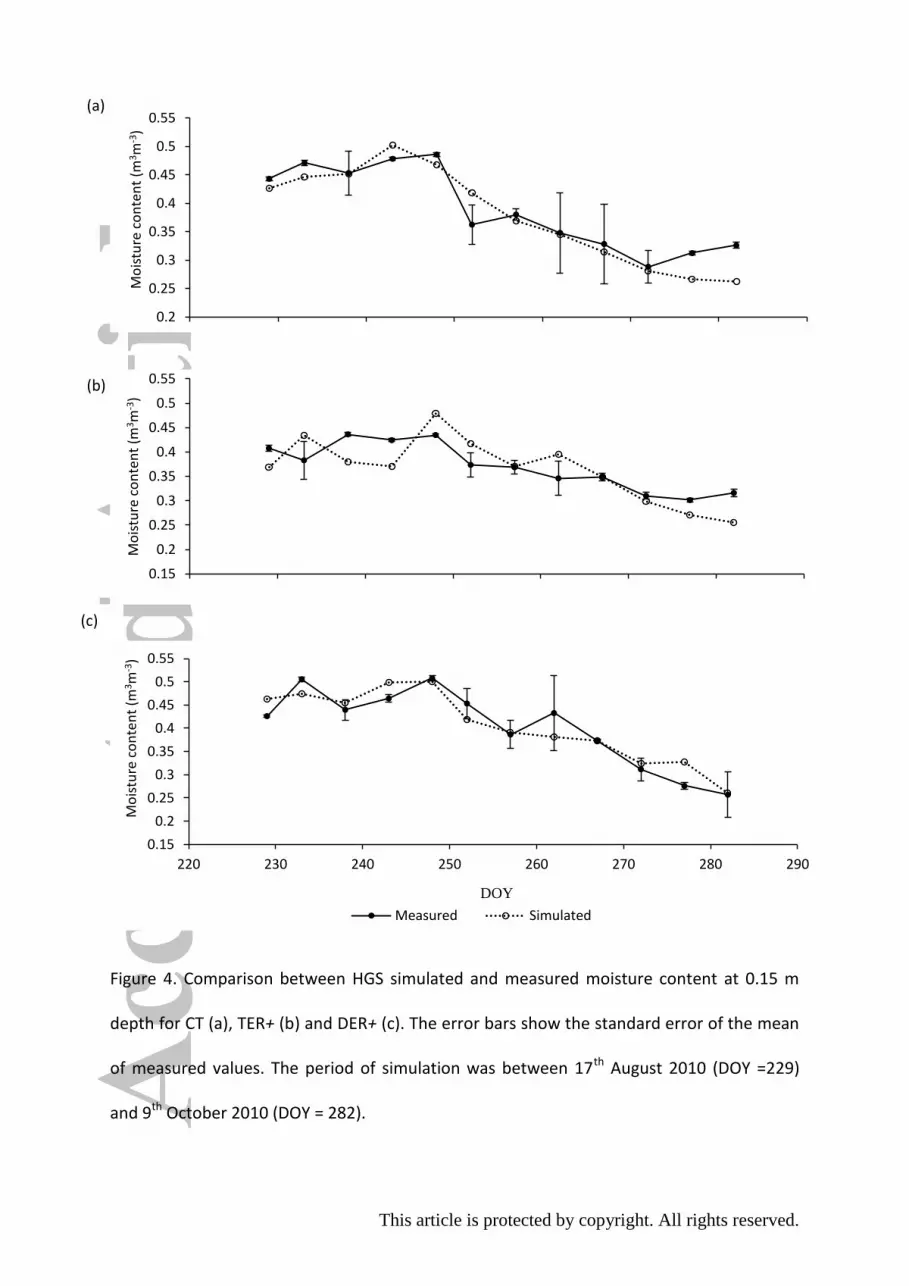
however, performed poorer in simulating runoff under CT (Table 3). Figure 4 shows the
results of simulated soil moisture content as compared to measured moisture content.
Generally the model simulated results were close to the measured moisture content across all
the tillage practices.
3.2 Effect of in situ soil water conservation practices
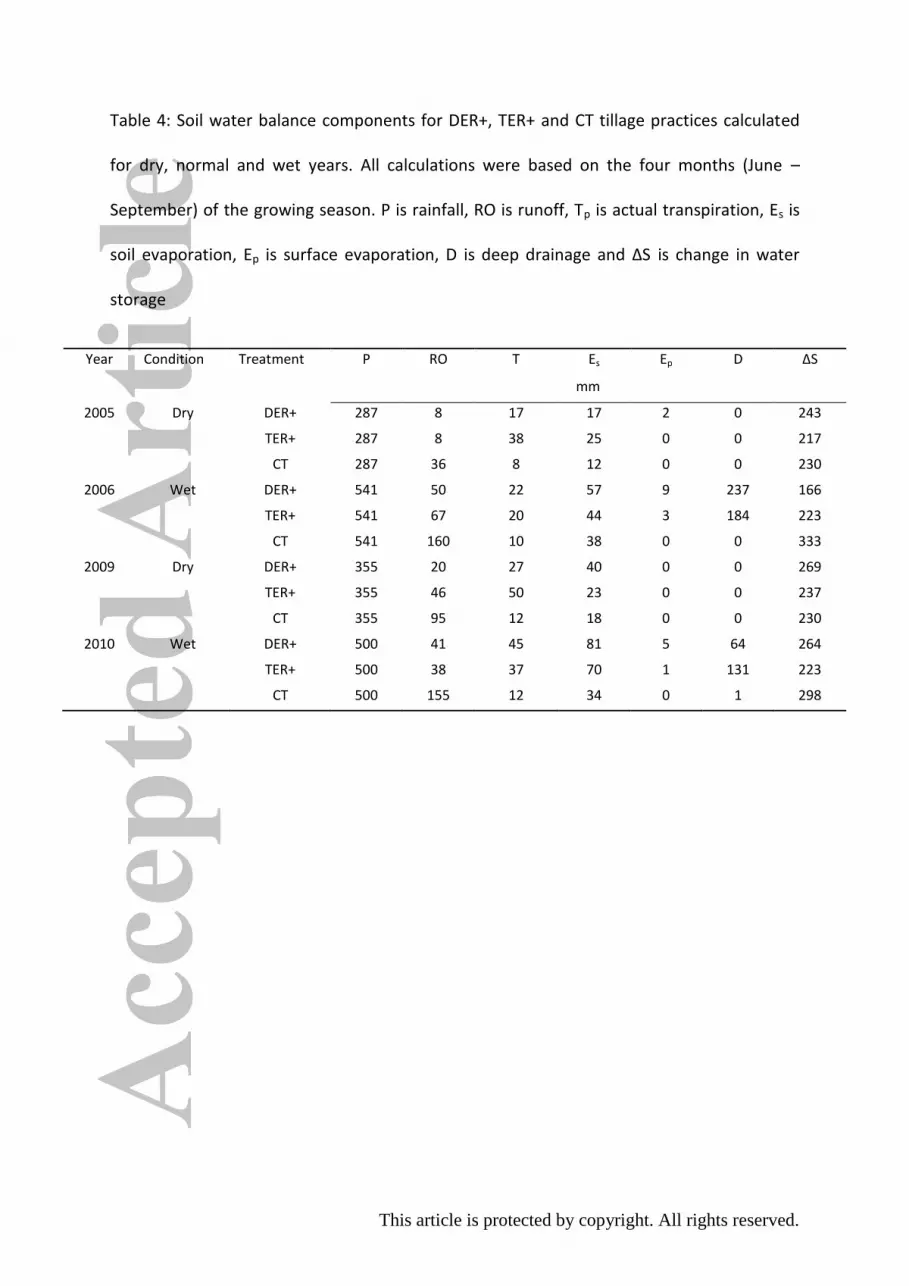
Total simulated water balance components for dry and wet years for each in situ WSC
practice under wheat are summarized in Table 4. These results indicate that DER+ practice
results into low runoff generation followed by TER+ while CT is associated with higher
runoff generation across all the years. For example, about 8% of the rainfall is lost as runoff
(RO) under DER+ and TER+ compared to 31% under CT practice in a wet year of 2010
(Table 4).
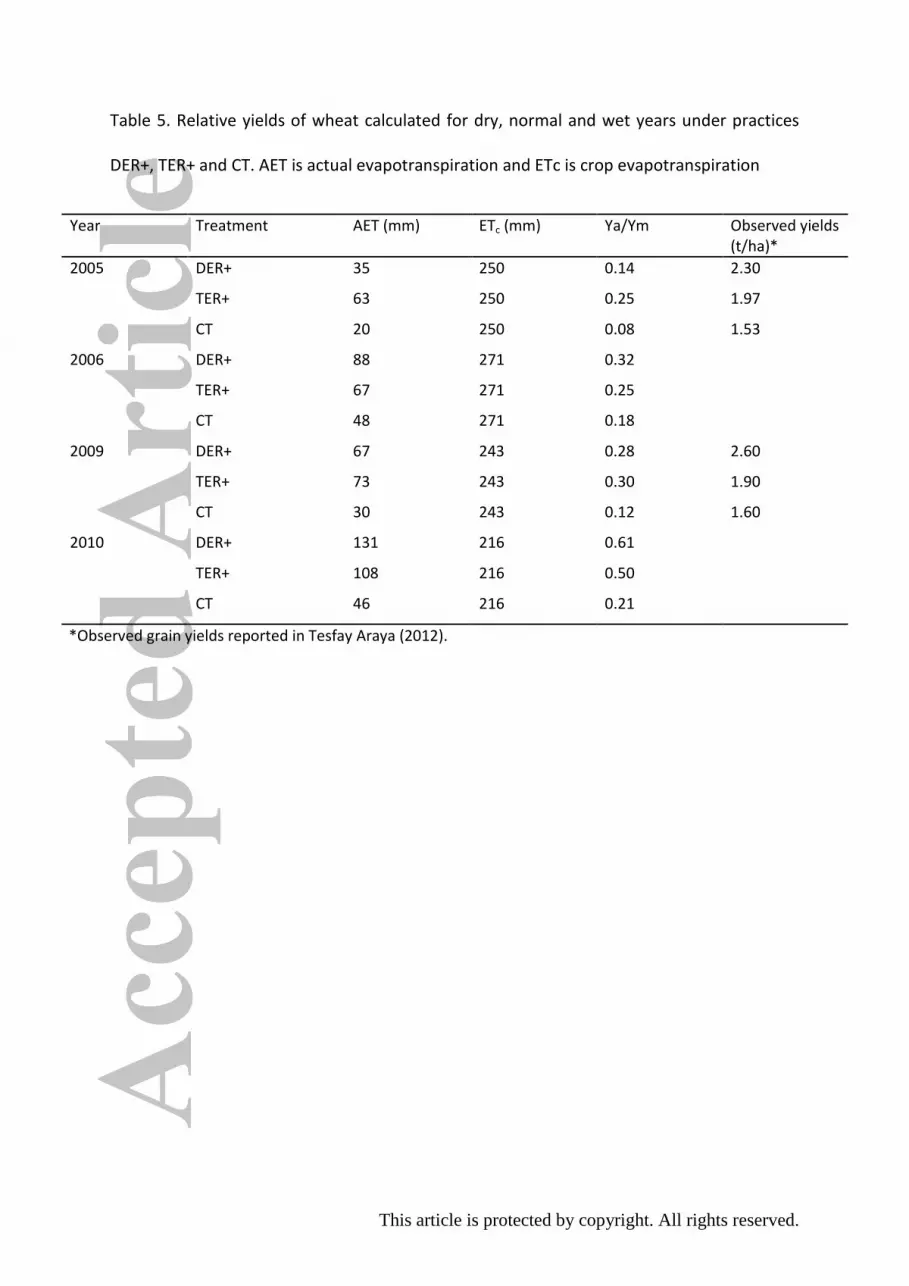
Actual evapotranspiration, AET (i.e, Tp + Es + Ep) was generally higher in DER+ and TER+
compared to CT. In a wet year of 2010 for example, DER+ had a highest AET (131 mm)
followed by TER+ (108 mm) and the lowest under CT (46 mm) (Table 5). Drainage was the
main unproductive water loss only in wet years especially for DER+ and TER+ tillage
practices (Table 4). Sub-surface evaporation, Es accounted for 16%, 14% and 6% of the total
rainfall in 2010 lost under DER+, TER+ and CT, respectively. Model results generally
showed logical trends (across all 3 practices) in rainwater partitioning, with wet years
showing higher water balance components (RO, Ts, Es, Ep) while lowest values of these
components are found in a dry year.

This article is protected by copyright. All rights reserved.
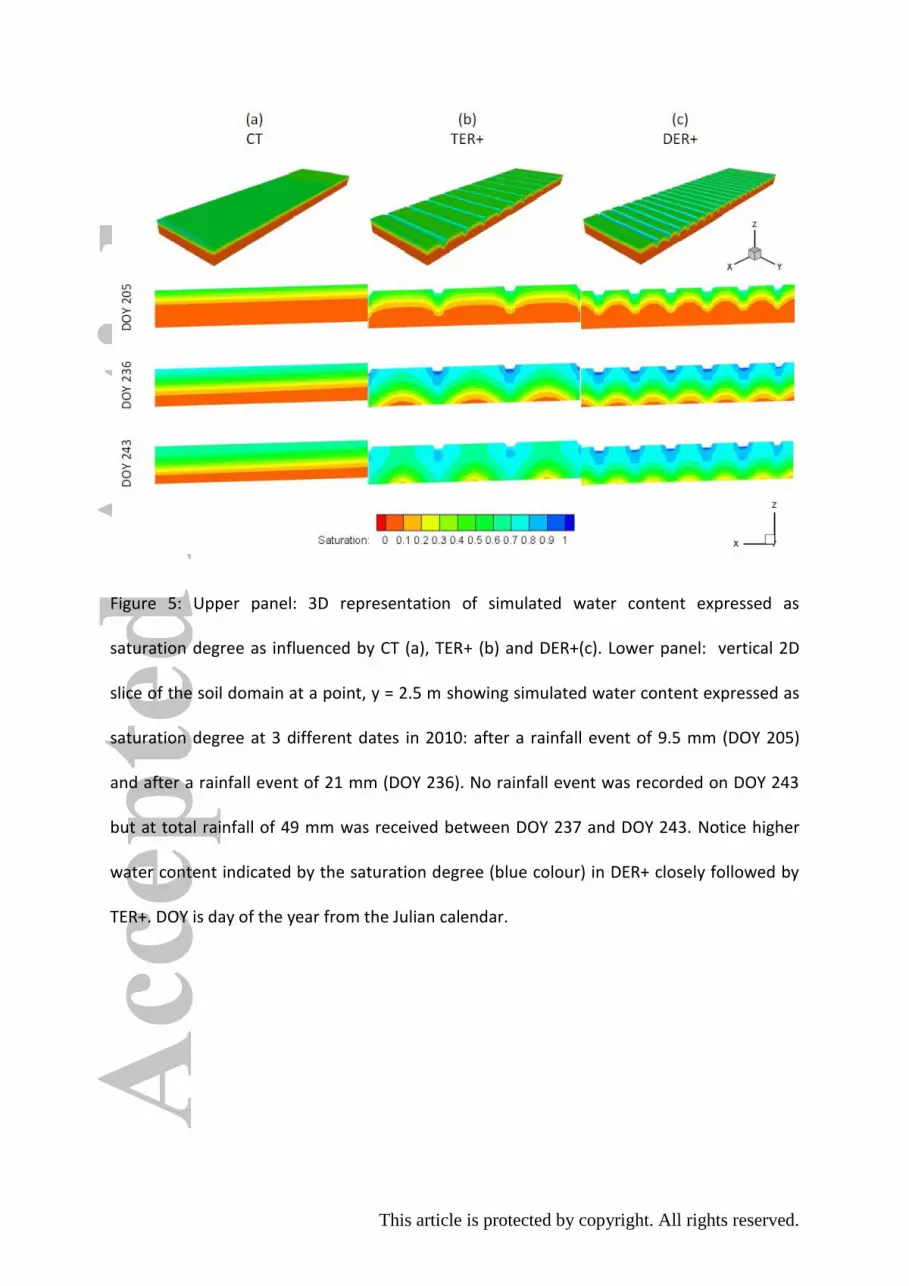
Soil moisture distribution under wheat in 2010 both at the soil surface and subsurface as
influenced by DER+ and TER+ tillage practices can be clearly visualized in Figure 5. It can
be seen that DER+ has more soil moisture distributed throughout the root zone due its closely
spaced furrows. TER+ is as well more effective than CT as the furrows collect water and
slowly distribute it into the lower soil depth.
Relative yields (Ya/Ym) of wheat crop as influenced by in-situ WSC practices are shown in
Table 5. As expected, simulated Ya/Ym values were higher in wet years compared to that of
dry years. In general, relative yields were highest under DER+, followed by TER+ and lowest
under CT.
4. Discussion
4.1 Potential of HydroGeoSphere to simulate the effects of in situ WSC
The measured runoff and soil moisture content across all the three tillage practices were
generally reproduced by the model. However discrepancies between simulated and measured
values were observed. These differences could be explained by the fact that rainfall intensity
used was an average value. Scaling parameter α and shape parameter, n whose values were
fixed to the initial measured values could also have had influence on the runoff output
especially in the beginning of the rainy season (Verbist et al., 2012). The model simulated
results however followed the logical trends as the measured runoff increased with higher
rainfall producing higher surface runoff. These results have demonstrated that HGS model
has a great potential to simulate the effects of in situ WSC practices.
4.2 Effect of TER+ and DER+ in situ soil water conservation practices
Simulated results show that DER+ and TER+ significantly reduced rain water loss through
runoff compared to CT. Runoff coefficients for DER+ and TER+ are lower than (except for
This article is protected by copyright. All rights reserved.
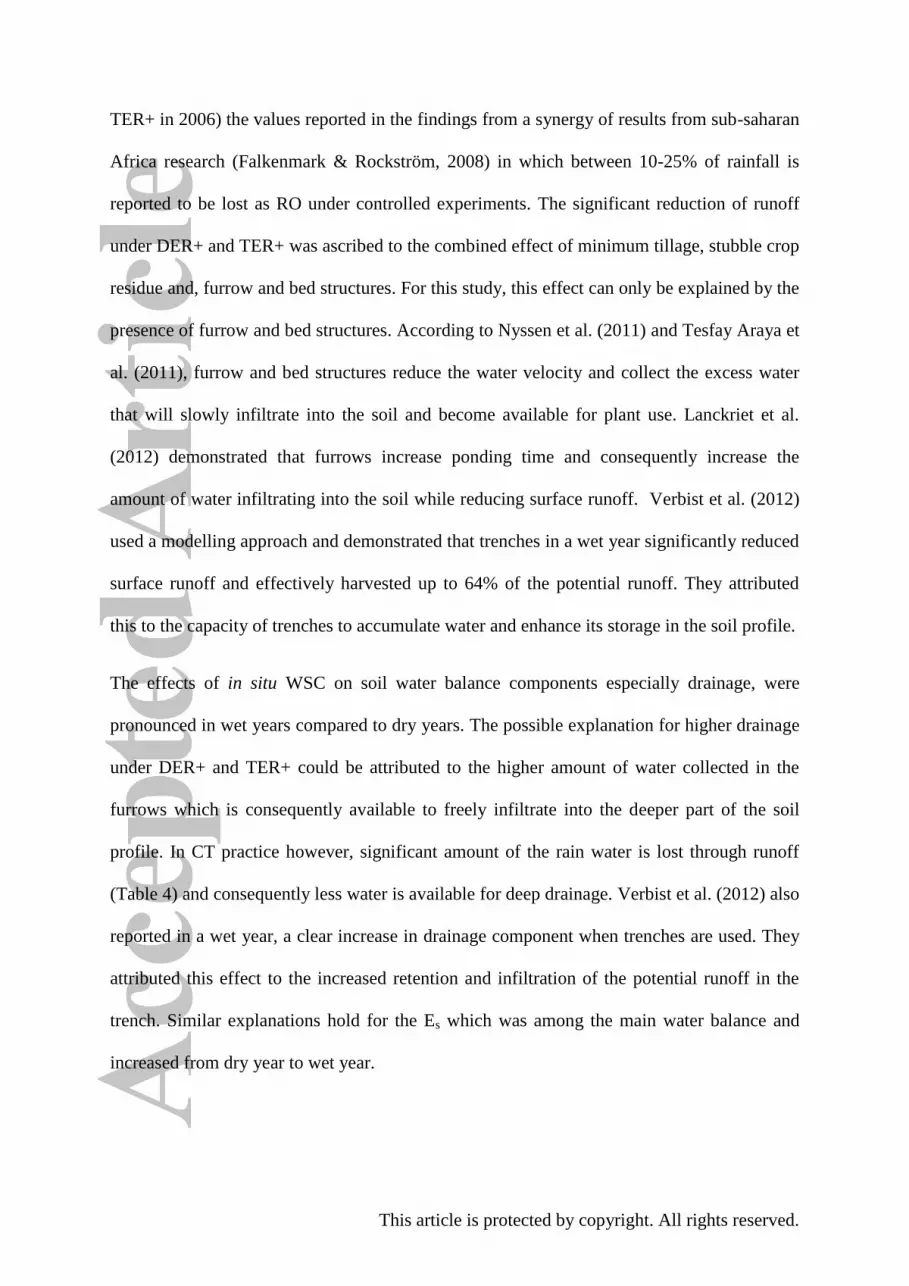
TER+ in 2006) the values reported in the findings from a synergy of results from sub-saharan
Africa research (Falkenmark & Rockström, 2008) in which between 10-25% of rainfall is
reported to be lost as RO under controlled experiments. The significant reduction of runoff
under DER+ and TER+ was ascribed to the combined effect of minimum tillage, stubble crop
residue and, furrow and bed structures. For this study, this effect can only be explained by the
presence of furrow and bed structures. According to Nyssen et al. (2011) and Tesfay Araya et
al. (2011), furrow and bed structures reduce the water velocity and collect the excess water
that will slowly infiltrate into the soil and become available for plant use. Lanckriet et al.
(2012) demonstrated that furrows increase ponding time and consequently increase the
amount of water infiltrating into the soil while reducing surface runoff. Verbist et al. (2012)
used a modelling approach and demonstrated that trenches in a wet year significantly reduced
surface runoff and effectively harvested up to 64% of the potential runoff. They attributed
this to the capacity of trenches to accumulate water and enhance its storage in the soil profile.
The effects of in situ WSC on soil water balance components especially drainage, were
pronounced in wet years compared to dry years. The possible explanation for higher drainage
under DER+ and TER+ could be attributed to the higher amount of water collected in the
furrows which is consequently available to freely infiltrate into the deeper part of the soil
profile. In CT practice however, significant amount of the rain water is lost through runoff
(Table 4) and consequently less water is available for deep drainage. Verbist et al. (2012) also
reported in a wet year, a clear increase in drainage component when trenches are used. They
attributed this effect to the increased retention and infiltration of the potential runoff in the
trench. Similar explanations hold for the Es which was among the main water balance and
increased from dry year to wet year.
This article is protected by copyright. All rights reserved.
Although DER+ and TER+ practices have demonstrated a significant reduction in runoff
losses and increase in AET compared to CT, more of the water in a wet year is lost through
deep drainage. Indeed our 2006 simulations in which around 43% and 37% of the rainfall was
lost through deep drainage under DER+ and TER+, respectively were even outside in the
range of 10-30% reported in (Rockström & Falkenmark, 2000; Falkenmark & Rockström,
2008) from on-farm research on water partitioning in savannah dry land cropping systems in
sub-Saharan Africa. There is therefore need for further improvement in the techniques
(DER+ and TER+) in order to improve the amount of water that goes to transpiration.
Reducing deep drainage losses can be achieved by adding more organic matter to the soil to
increase water holding capacity and intercropping annual crops with perennial species such as
trees that generally have deeper root systems and are more effective in extracting soil water
and reducing drainage. There is however need for research to find tree/crop mixtures which
are feasible and at the same time enable to make better use of the available water resources
(Wallace, 2000).
Introducing furrows at much closer intervals as in DER+ significantly increases the amount
of water that can slowly infiltrate and distribute into the soil. From Figure 5, it can be
visualized that furrows accumulate water first and slowly distribute it into the raised beds.
This implies that presence of these structures can help to minimise the effects of temporal
water logging commonly experienced under Vertisols when rainfall is intense (Nyssen et al.,
2011).
Relative yields reduced towards dry years indicating higher crop water stress as indicated by
lowest values of AET in dry year (2005) compared to wet year (Table 5). These relative
yields however have to be treated with care as a sensitive parameter (Ky) for wheat was
This article is protected by copyright. All rights reserved.
assumed and not calibrated for study area conditions. Differences in relative yields among the
practices reduced in the wet years probably due to less chances of crop water stress at
sensitive growth stages in the wet year compared to dry year. Data on the potential yields
(Ym) of wheat in the study area was not available thus limiting our ability to evaluate the
accuracy of the simulated relative yields. However, actual yields obtained from field
experiments have been reported in Tesfay Araya (2012) and were used for comparison of
trends in relative yields among different practices. Trends in the differences of relative yields
among the WSC practices were comparable with trends of measured yields. However greater
differences in simulated relative yields among DER+, TER+ and CT were recorded across all
the years compared to the differences in actual yields measured for the 3 practices (Table 5).
These differences are due to higher differences in the amounts of simulated AET across the 3
practices with CT recording the lowest values in all the years (see Table 5). These differences
in the yields therefore indicate that AET was either overestimated for DER+ and TER+
practices or underestimated for CT practice. In either case, and referring to equations (6-12)
used for calculating transpiration and evaporation, this would require adjusting the
transpiration and evaporation parameter values (Table 2), especially those relating
transpiration rate to soil moisture saturation (transpiration limiting saturation). However due
to data limitations, no attempt was made to tune these values.
5. Conclusions and recommendations
HydroGeoSphere (HGS) is a fully coupled surface/subsurface process-based model that was
developed to simulate water balances and solute transport on a larger watershed scale. This
study applied HGS model to simulate the effects of in situ WSC at plot scale. In general,
HGS simulated runoff and soil moisture results were close to the measured runoff and
moisture content. It can therefore be concluded that HGS is capable of mimicking water flow
This article is protected by copyright. All rights reserved.
as affected by in situ WSC techniques. The hydrological impact of in situ WSC techniques
above plot scale is one of the knowledge gaps cited in literature (Falkenmark & Rockström,
2008) and HGS could be used to determine the impact of these techniques on the watershed
hydrology.
HGS simulated results indicate that DER+ in situ WSC practice is effective in reducing
surface runoff by up to 68% compared to CT and significantly increases soil moisture
content. It was observed that the furrows have the capability of collect water and slowly
redistribute it to the raised beds. These practices can therefore be used as a strategy to
minimize the impacts of temporal water logging that is commonly experienced under the
Vertisol soils. Furthermore, this study demonstrated that productive water loss through
transpiration was higher under DER+ and TER+ resulting into a higher relative crop yield
compared to CT practice. Most importantly, the model was able to split ET components into
transpiration, soil evaporation as well as surface evaporation. All these water balance
components are important for designing of water soil conservation practices.
7. Acknowledgements
This research was funded by the Institutional University Cooperation (IUC) Project in
Mekelle University through the Flemish Interuniversity Council (VLIR, Belgium). We are
grateful to all staff of Mekelle University- Institutional University Cooperation program
office as well as to the farmers and data collectors for daily activities on the research plot.
Emmanuel Opolot benefited from VLIR-UOS scholarship during his Masters studies.
This article is protected by copyright. All rights reserved.
6. References
Allen RG, Pereira LS, Raes D, Smith M. 1998. Crop evapotranspiration: Guidelines for
computing crop requirements. Irrigation and Drainage Paper No. 56 FAO, Rome, 740
Italy
Carpentier L. 2011. The effect of conservation agriculture on the soil quality of a Vertisol and
the water productivity of tef (Eragrostis tef (Zucc.) Trotter) in Tigray, Ethiopia. Master
Thesis, Ghent University, 77p
Doherty J. 2010. PEST, model-independent parameter estimation user manual: 5th edition 770
Watermak Numerical Computing, Oxley, Australia.
Doorenbos J, Kassam AH. 1979. Yield Response to Water. FAO Irrigation and Drainage
paper No.33.
Falkenmark M, Rockström J. 2008. Building resilience to drought in desertification-prone
savannas in Sub-Saharan Africa: The water perspective. Natural Resources Forum, 32:
93–102
FAO. 2002. Crops and drops. Making the best use of water for agriculture. Rome, Italy.
FAO. 2009. Crop Water Information: Wheat.
http://www.fao.org/nr/water/cropinfo_wheat.html. Accesed on 30/07/2012
Gebreegziabher T, Nyssen J, Govaerts B, Getnet F, Behailu M, Haile M, Deckers J. 2009.
Contour furrows for in situ soil and water conservation, Tigray, northern Ethiopia. Soil
Till. Res. 103, 257–264.
Hopmans JW, Šimŭnek J, Romano N, Durner W. 2002. Inverse Methods. In J. H. Dane and G.
C. Topp, eds. Methods of Soil Analysis. Part 4: Physical Methods. Soil Science Socety of
America ., Madison, USA, 963-808.
Jansen MJW. 1999. Analysis of variance designs for model output. Comput. Phys.Commun.
117:35-43.
This article is protected by copyright. All rights reserved.
Jones JP, Sudicky EA, McLaren RG. 2008. Application of a fully-integrated surface-
subsurface flow model at the watershed-scale: A case study. Water Resour. Res.
44:W03407.
Kristensen, K.J & Jensen, S.E. 1975. A model for estimating actual evapotranspiration 825
from potential evapotranspiration. Nordic Hydrology, 6:170-188.
Lanckriet S, Tesfay Araya, Cornelis WM, Verfaillie E, Poesen J, Govaerts, Bram Bauer H,
Deckers J, Haile M, Nyssen J. 2012. Impact of conservation agriculture on catchment
runoff and soil loss under changing climate conditions in May Zeg-zeg (Ethiopia).
Journal of Hydrology 475: 336–349
Makurira H, Savenije HHG, Uhlenbrook S, Rockström J, Senzanje A. 2007. Towards a better
understanding of water partitioning processes for improved smallholder rainfed
agricultural systems: A case study of Makanya catchment, Tanzania. Physics and
Chemistry of the Earth 32: 1082–1089.
Mannings n values: Accessed on 13/04/2012 on the website:
http://www.fsl.orst.edu/geowater/FX3/help/8_Hydraulic_Reference/Mannings_n_Tables.
htm
Nyssen J, Govaerts B, Tesfay Araya, Cornelis WM, Bauer H, Haile M, Sayre K, Deckers J.
2011. The use of the marasha ard plough for conservation agriculture in Northern
Ethiopia. Agronomy for Sustainable Development 31(2): 287-297.
Oicha T, Cornelis WM, Verplancke H, Nyssen J, Deckers J, Behailu M, Haile M, 2010. Short-
term effects of conservation agriculture on Vertisols under tef (Eragrostis tef (Zucc.)
Trotter) in the northern Ethiopian highlands. Soil Till. Res. 106, 294–302.
Qin H, Cao G, Kristensen M, Refsgaard JC, Rasmussen MO, He X, Liu J, Zheng C. 2013.
Integrated hydrological modeling of the North China Plain and implications for
sustainable water management. Hydrol. Earth Syst. Sci. Discuss., 10:3693–3741
This article is protected by copyright. All rights reserved.
Raes D, Willems P, GBaguidi F. 2006. RAINBOW – a software package for analyzing data
and testing the homogeneity of historical data sets. Proceedings of the 4th International
Workshop on ‘Sustainable management of marginal drylands’. Islamabad, Pakistan, 27-
31 January (in press)
Raes D. 2009. The ETo calculator, evapotranspiration from a reference surface. Reference
manual version 3.1, January. Food and Agricultural Organization of the United Nations,
Land and Water Division.
RETC. 2008. RETC (RETention Curve), RETC model, USDA-ARS U.S. Salinity Laboratory.
Reynolds WD, Elrick DE, Youns E, Amoozegar A. 2002. Field Methods (Vadose and
saturated zone techniques, pg 817-858. SSSA, madison, WI.
Rockström J, Falkenmark M. 2000. Semiarid Crop Production from a Hydrological
Perspective: Gap between Potential and Actual Yields, Critical Reviews in Plant Sciences
19(4): 319-346
Sciuto G, Diekkrüger B. 2010. Influence of soil heterogeneity and spatial discretization on
catchment water balance modeling. Vadose Zone J. 9:955-969.
Soltani A, Hoogenboom G. 2007. Assessing crop management options with crop simulation
models based on generated weather data. Field Crop Res 103: 198– 207.
Tesfay Araya, Cornelis WM, Nyssen J, Govaerts B, Getnet F, Bauer H, Amare K, Raes D,
Haile M, Deckers J. 2012. Medium-term effects of conservation agriculture based
cropping systems for sustainable soil and water management and crop productivity in the
Ethiopian highlands. Field Crops Research 132: 53–62
Tesfay Araya, Nyssen J, Govaerts B, Bauer H, Deckers J, Cornelis WM. 2013b. Impacts of
medium term conservation agriculture-based farming systems on seasonal rainfall
partitioning and productivity on Vertisols in northern Ethiopia.. Submitted to Journal of
Agricultural Water Management.
This article is protected by copyright. All rights reserved.
Tesfay Araya, Nyssen J, Govaerts B, Bauer H, Kindeya Gebrehiwot, Deckers J, Cornelis W.
M .2013a. Improved soil quality after seven years of conservation agriculture-based
resource saving farming systems in Ethiopian drylands. Submitted to Soil Research.
Tesfay Araya. 2012. Conservation Agriculture-based resource saving technology for land
resilience in northern Ethiopia. PhD.thesis, Ghent University.
Tesfay Araya, Cornelis WM, Nyssen J, Govaerts B, Bauer H, Gebreegziabher T, Tigist T,
Raes D, Sayre KD, Haile M, Deckers J. 2011. Effects of conservation agriculture on
runoff, soil loss and crop yield under rain-fed conditions in Tigray, Northern Ethiopia.
Soil Use and Management 27: 404–414
Therrien R, McLaren RG, Sudicky EA, Panday SM. 2010. A Three-dimensional Numerical
Model Describing Fully-integrated Subsurface and Surface Flow and Solute Transport.
Draft, 467p.
Vanuytrecht E. 2007. Crop water productivity of Barley and teff in the Highlands of Tigray
(Northern Ethiopia). PhD Thesis, Katholieke Universititeit Leuven, 144p
Verbist K, Cornelis WM, Gabriels D, Alaerts K, Soto G. 2009. Using an inverse modelling
approach to evaluate the water retention in a simple water harvesting technique.
Hydrological Earth Systems Science, 13:1979–1992
Verbist K, Pierreux S, Cornelis WM, McLaren R, Gabriels D. 2012. Parameterizing a Coupled
Surface-Subsurface Three-Dimensional Soil Hydrological Model to Evaluate the
Efficiency of a Runoff Water Harvesting Technique. Vadose Zone J.
doi:10.2136/vzj2011.0141
Verbist K, Torfs S, Cornelis WM, Oyarzun R, Soto G, Gabriels D. 2010. Comparison of
single- and double-ring infiltrometer methods on stony soils. Vadose Zone J. 9, 462-475

This article is protected by copyright. All rights reserved.
Wallace JS. 2000. Increasing agricultural water use efficiency to meet future food production.
Agriculture, Ecosystems and Environment 82: 105–119.
Wigmosta MS, Vail LW, Lettenmaier DP. 1994. A distributed hydrology vegetation model
for complex terrain. Water Resources Research, 30(6):1665-1679.
WRB (World reference base for soil resources). 2006. A framework for international
classification, correlation and communication. Technical report, FAO.
This article is protected by copyright. All rights reserved.
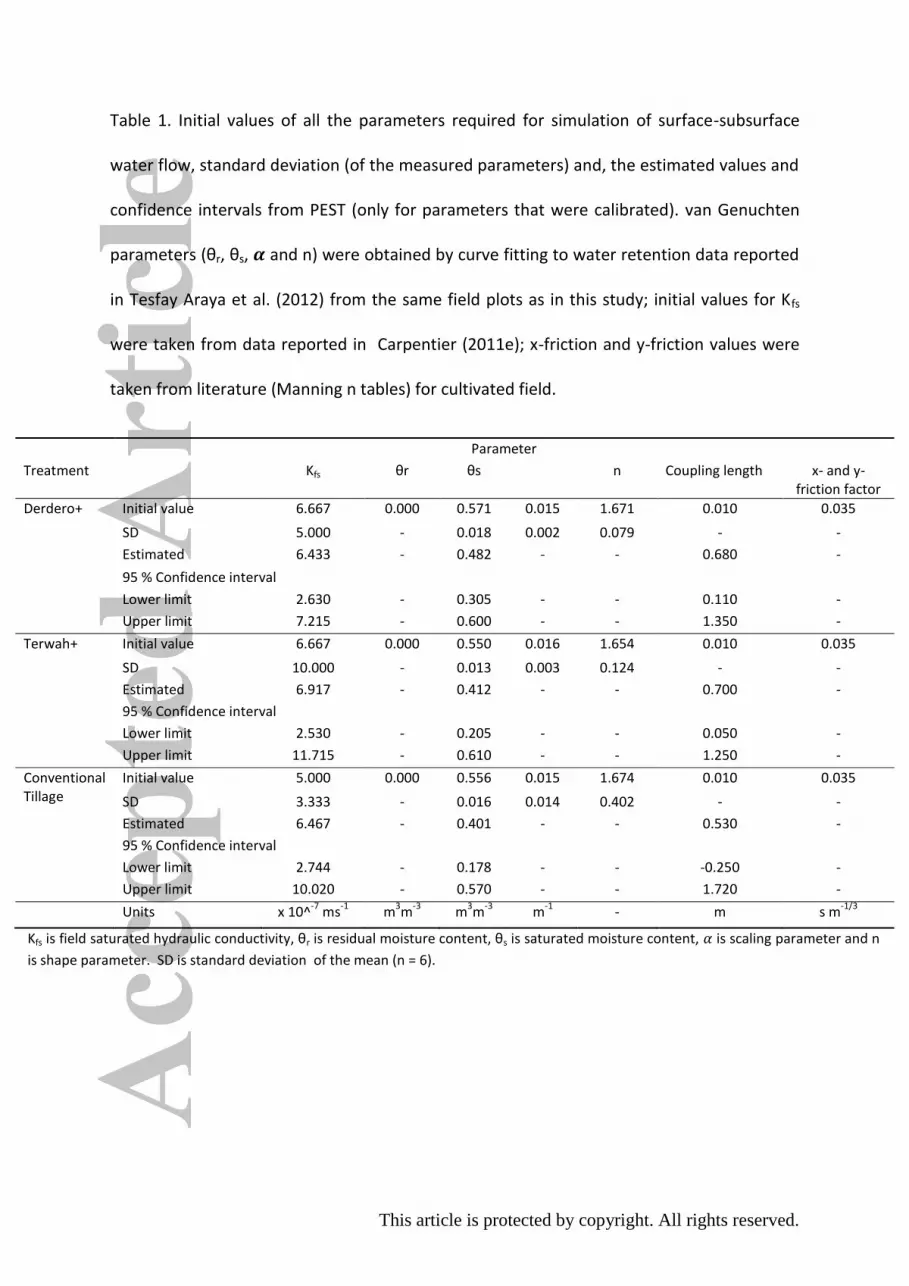
Table 1. Initial values of all the parameters required for simulation of surface-subsurface
water flow, standard deviation (of the measured parameters) and, the estimated values and
confidence intervals from PEST (only for parameters that were calibrated). van Genuchten
parameters (θr, θs, and n) were obtained by curve fitting to water retention data reported
in Tesfay Araya et al. (2012) from the same field plots as in this study; initial values for Kfs
were taken from data reported in Carpentier (2011e); x-friction and y-friction values were
taken from literature (Manning n tables) for cultivated field.
Parameter
Treatment Kfs θr θs n Coupling length x- and y- friction factor
Derdero+ Initial value 6.667 0.000 0.571 0.015 1.671 0.010 0.035
SD 5.000 - 0.018 0.002 0.079 - -
Estimated 6.433 - 0.482 - - 0.680 -
95 % Confidence interval
Lower limit 2.630 - 0.305 - - 0.110 -
Upper limit 7.215 - 0.600 - - 1.350 -
Terwah+ Initial value 6.667 0.000 0.550 0.016 1.654 0.010 0.035
SD 10.000 - 0.013 0.003 0.124 - -
Estimated 6.917 - 0.412 - - 0.700 -
95 % Confidence interval
Lower limit 2.530 - 0.205 - - 0.050 -
Upper limit 11.715 - 0.610 - - 1.250 -
Conventional Tillage
Initial value 5.000 0.000 0.556 0.015 1.674 0.010 0.035
SD 3.333 - 0.016 0.014 0.402 - -
Estimated 6.467 - 0.401 - - 0.530 -
95 % Confidence interval
Lower limit 2.744 - 0.178 - - -0.250 -
Upper limit 10.020 - 0.570 - - 1.720 -
Units x 10^-7
ms-1
m3m
-3 m
3m
-3 m
-1 - m s m
-1/3
Kfs is field saturated hydraulic conductivity, θr is residual moisture content, θs is saturated moisture content, is scaling parameter and n
is shape parameter. SD is standard deviation of the mean (n = 6).
This article is protected by copyright. All rights reserved.
Table 2. Input values into the model for simulation of evapotranspiration. Wilting point and
field capacity values for teff and wheat were obtained from soil water retention curve
described in Tesfay Araya et al. (2012). Rooting depth of teff and wheat were obtained from
(Vanuytrecht, 2007) and (FAO, 2009), respectively. All the other remaining parameters were
default values provided for grass and described in Therrien et al. (2010)
Parameter Value for teff Value for wheat Unit
Transpiration fitting parameters
C1 0.50 0.50 -
C2 0.00 0.00 -
C3 1.00 1.00 -
Transpiration limiting saturations
Wilting point 0.41 0.45 % saturation
Field capacity 0.61 0.70 % saturation
Oxic limit 0.75 0.75 % saturation
Anoxic limit 0.90 0.90 % saturation
Evaporation limiting saturations
Minimum 0.22 0.22 % saturation
Maximum 0.90 0.90 % saturation
LAI 1.00 1.00 -
Root zone depth 0.50 0.90 m
Evaporation depth 0.50 0.90 m
Canopy storage parameter 0.04 0.04 m
Initial interception storage 0.04 0.04 m
This article is protected by copyright. All rights reserved.
Table 3. Residual mean squared error (RMSE), Pearson correlation coefficient (ρ) and Nash-
Sutcliff model efficiency (E) for simulated runoff and moisture content for DER+, TER+ and
CT practices. Note that 2009 runoff and moisture data was used of calibration while 2010
runoff and moisture data was used for model verification.
Year DER+ TER+ CT
2009 Runoff
RMSE (mm) 0.95 2.09 2.77
ρ (%) 88.0 89.0 87.0
E 0.58 0.61 0.52
Soil moisture content
RMSE (m3m
-3) 0.03 0.03 0.02
ρ (%) 84.0 86.6 88.0
E 0.60 0.75 0.74
2010 Runoff
RMSE (mm) 1.15 2.02 3.09
ρ (%) 92.0 92.0 81.0
E 0.70 0.79 0.23
Soil moisture content
RMSE (m3m
-3) 0.03 0.03 0.03
ρ (%) 93.0 94.0 75.0
E 0.83 0.80 0.16
This article is protected by copyright. All rights reserved.
Table 4: Soil water balance components for DER+, TER+ and CT tillage practices calculated
for dry, normal and wet years. All calculations were based on the four months (June –
September) of the growing season. P is rainfall, RO is runoff, Tp is actual transpiration, Es is
soil evaporation, Ep is surface evaporation, D is deep drainage and ∆S is change in water
storage
Year Condition Treatment P RO T Es Ep D ΔS
mm
2005 Dry DER+ 287 8 17 17 2 0 243
TER+ 287 8 38 25 0 0 217
CT 287 36 8 12 0 0 230
2006 Wet DER+ 541 50 22 57 9 237 166
TER+ 541 67 20 44 3 184 223
CT 541 160 10 38 0 0 333
2009 Dry DER+ 355 20 27 40 0 0 269
TER+ 355 46 50 23 0 0 237
CT 355 95 12 18 0 0 230
2010 Wet DER+ 500 41 45 81 5 64 264
TER+ 500 38 37 70 1 131 223
CT 500 155 12 34 0 1 298
This article is protected by copyright. All rights reserved.
Table 5. Relative yields of wheat calculated for dry, normal and wet years under practices
DER+, TER+ and CT. AET is actual evapotranspiration and ETc is crop evapotranspiration
Year Treatment AET (mm) ETc (mm) Ya/Ym Observed yields (t/ha)*
2005 DER+ 35 250 0.14 2.30
TER+ 63 250 0.25 1.97
CT 20 250 0.08 1.53
2006 DER+ 88 271 0.32
TER+ 67 271 0.25
CT 48 271 0.18
2009 DER+ 67 243 0.28 2.60
TER+ 73 243 0.30 1.90
CT 30 243 0.12 1.60
2010 DER+ 131 216 0.61
TER+ 108 216 0.50
CT 46 216 0.21
*Observed grain yields reported in Tesfay Araya (2012).
This article is protected by copyright. All rights reserved.
Figure 1. Map of Ethiopia showing the location of Adigudem (Source: Tesfay Araya et al.,
2013a)
This article is protected by copyright. All rights reserved.
Figure 2. Top: Field view of Conventional Tillage, Terwah+ and Derdero+.Bottom: Model set
up of Conventional Tillage, Terwah+ and Derdero+ tillage practices
This article is protected by copyright. All rights reserved.
Figure 3. Precipitation (a) and comparison between HGS simulated runoff and measured
runoff for CT (b), TER+ (c) and DER+ (d). The error bars show the standard error of the mean
of measured values. DOY 201 and 245 correspond to 20th July 2010 and 2nd September 2010,
respectively.
0
10
20
30
40 R
ain
fall
(mm
)
0
10
20
30
Ru
no
ff (
mm
)
0
10
20
30
Ru
no
ff (
mm
)
0
10
20
30
20
1
20
2
21
8
22
1
22
2
22
5
22
6
22
8
23
0
23
1
23
3
23
4
23
5
23
7
23
8
24
0
24
2
24
5
Ru
no
ff (
mm
)
DOY
Measured Simulated
(b)
(c)
(d)
(a)
This article is protected by copyright. All rights reserved.
Figure 4. Comparison between HGS simulated and measured moisture content at 0.15 m
depth for CT (a), TER+ (b) and DER+ (c). The error bars show the standard error of the mean
of measured values. The period of simulation was between 17th August 2010 (DOY =229)
and 9th October 2010 (DOY = 282).
0.2
0.25
0.3
0.35
0.4
0.45
0.5
0.55 M
ois
ture
co
nte
nt
(m3 m
-3)
0.15
0.2
0.25
0.3
0.35
0.4
0.45
0.5
0.55
Mo
istu
re c
on
ten
t (m
3m
-3)
0.15
0.2
0.25
0.3
0.35
0.4
0.45
0.5
0.55
220 230 240 250 260 270 280 290
Mo
istu
re c
on
ten
t (m
3m
-3)
DOY
Measured Simulated
(a)
(b)
(c)
This article is protected by copyright. All rights reserved.
Figure 5: Upper panel: 3D representation of simulated water content expressed as
saturation degree as influenced by CT (a), TER+ (b) and DER+(c). Lower panel: vertical 2D
slice of the soil domain at a point, y = 2.5 m showing simulated water content expressed as
saturation degree at 3 different dates in 2010: after a rainfall event of 9.5 mm (DOY 205)
and after a rainfall event of 21 mm (DOY 236). No rainfall event was recorded on DOY 243
but at total rainfall of 49 mm was received between DOY 237 and DOY 243. Notice higher
water content indicated by the saturation degree (blue colour) in DER+ closely followed by
TER+. DOY is day of the year from the Julian calendar.