Complex formation between albumin and long-acting insulin ...
Upload
independentCategory
view
3download
0
Temperature Induced Morphological Transitions from Native toUnfolded Aggregated States of Human Serum AlbuminNirmal Kumar Das, Narayani Ghosh, Ajit Prabhakar Kale, Ramakanta Mondal, Uttam Anand,Subhadip Ghosh, Virendra Kumar Tiwari, Manmohan Kapur,* and Saptarshi Mukherjee*
Department of Chemistry, Indian Institute of Science Education and Research Bhopal Indore By-Pass Road, Bhauri, Bhopal 462 066,Madhya Pradesh, India
*S Supporting Information
ABSTRACT: The circulatory protein, human serum albumin (HSA), is known to have twomelting point temperatures, 56 and 62 °C. In this present manuscript, we investigate theinteraction of HSA with a synthesized bioactive molecule 3-pyrazolyl 2-pyrazoline (PZ). Thesole tryptophan amino acid residue (Trp214) of HSA and PZ forms an excellent FRET pairand has been used to monitor the conformational dynamics in HSA as a function oftemperature. Molecular docking studies reveal that the PZ binds to a site which is in theimmediate vicinity of Trp214, and such data are also supported by time-resolved FRETstudies. Steady-state and time-resolved anisotropy of PZ conclusively proved that thestructural and morphological changes in HSA mainly occur beyond its first meltingtemperature. Although the protein undergoes thermal denaturation at elevated temperatures,the Trp214 gets buried inside the protein scaffolds; this fact has been substantiated byacrylamide quenching studies. Finally, we have used atomic force microscopy to establish thatat around 70 °C, HSA undergoes self-assembly to form fibrillar structures. Such anobservation may be attributed to the loss of α-helical content of the protein and a subsequentrise in β-sheet structure.
■ INTRODUCTION
Serum albumins are the most abundant circulatory proteins inblood, constituting nearly 52−60% of plasma and playing amajor role as a transporter of various amino acids, drugmolecules, fatty acids, hemin, and bilirubin to the target sites.1,2
In the circulatory system, human serum albumin (HSA)reduces the activity of toxins, affects the pharmacokinetics ofmany drugs, takes care of the metabolic modifications of someligands, and also sometimes exhibits pseudoenzymaticactivities.2−8 The protein is composed of a single polypeptidechain having 585 amino acid residues, has an average molecularweight of ∼66 kDa, and also is characterized by low tryptophan(Trp) and high cysteine (Cys) content.9 HSA adopts a three-dimensional, heart-shaped structure having three homologousdomains under physiological conditions.9 Each of them is againdivided into two subdomains A and B that consist of 4 and 6 α-helices, respectively.1,9 The secondary structure of HSA consistsof 17 disulfide bridges and about 67% α-helix having six turns.10
He and Carter showed that the two halves of HSA form a 10 Åwide and 12 Å deep crevice.9 A single tryptophan (Trp)residue1,2 at the position 214 of the amino acid sequence(Trp214) makes it very unique and this property enables HSAto be studied extensively making use of the intrinsicfluorescence of this Trp214. HSA is a very efficient proteinfor binding and transporting drugs or bioactive molecules totheir target sites. There are two binding sites of HSA: (i)subdomain IIA (commonly referred to as Sudlow’s site I,warfarin-binding site) and (ii) subdomain IIIA (commonly
referred to as Sudlow’s site II, indole/benzodiazepine site).11
Both hydrophobic and electrostatic interactions play majorroles for bindings of drugs or bioactive molecules to HSA.Bulky heterocyclic molecules having centrally delocalizednegative charges preferably bind to the hydrophobic pocketof domain IIA, i.e., Sudlow’s site I.12,13 Also, theoreticalapproaches using Lamarckian genetic algorithm (LGA) basedmolecular docking studies provide us with an idea of bindingcharacteristics of a small molecule with a biomacromole-cule.14−17
The topic of unfolding/denaturation, i.e., the structuralchanges of serum albumins brought in by chemical denaturantssuch as surfactants, drugs, salts, and also by physicaldenaturants like changes in pH and temperature, has beenwell-documented.18−31 Temperature induced conformationalchanges have also been studied by various methods.32−35 Floraet al. have investigated the thermal denaturation of HSA andshown that it also takes place in a sequential manner.35
According to their opinion, at first domain II starts to denatureat 56 °C followed by domain I at 62 °C. These twotemperatures are commonly referred to as the melting point-1 (Tm1) and melting point-2 (Tm2), respectively of HSA.35
According to G. A. Pico, the thermal denaturation process ofserum albumins occurs via the Eyring and Lumry model: native
Received: March 28, 2014Revised: June 10, 2014
Article
pubs.acs.org/JPCB
© XXXX American Chemical Society A dx.doi.org/10.1021/jp5030944 | J. Phys. Chem. B XXXX, XXX, XXX−XXX
↔ unfolded (reversible) → unfolded (irreversible).36 Hefurther opined that for temperatures less than 74 °C, the rateof the irreversible process is very slow.36 Using differentialscanning calorimetry (DSC), G. A. Pico also concluded that thethermal conformational changes follow a sequential transi-tion.36 Pal and co-workers have exhibited that the hydro-dynamic radius of HSA increases four times at 75 °C usingdynamic light scattering (DLS) experiments.37 They alsostudied the thermal unfolding and refolding of HSA andsuggested that the protein undergoes both reversible andirreversible folding and refolding, depending upon theexperimental conditions.37 Takeda and co-workers proved bycircular dichroism (CD) spectroscopy that with increasingtemperature the helical structures of another homologousprotein, bovine serum albumin (BSA), are destroyed; more β-sheets and random structures are formed.38 They also opinedthat after 65 °C, more β-sheet structures are formed thatcorrelate with the generation of aggregation of protein.38
The bioactive molecule, 3-pyrazolyl 2-pyrazoline (PZ)(Scheme 1), was synthesized by following the protocol as
described by Bhattacharya and co-workers.39 2-Pyrazolinederivatives constitute a class of compound of pharmaceuticalimportance as they have inherent antidiabetic, anesthetic,analgesic, and glutamate transport sensor properties.40
Bhattacharya and co-workers reported earlier that PZ servesas a good fluorescence resonance energy transfer (FRET) pairof Trp214 in HSA and it binds in the close vicinity of thisamino acid residue.41 Hence, this novel bioactive moleculehaving fluorescent properties is of immense importance forinvestigations of physiological activities in living systems. FRETis a phenomenon that describes the energy transfer vianonradiative pathway between a donor fluorescent moleculein the excited state and an acceptor fluorophore in the groundstate.42 According to Forster, the efficiency of energy transferdepends upon the extent of overlap between the emissionspectra of the donor and absorption spectra of the acceptor,quantum yield of donor molecule, relative dipole orientation ofdonor and acceptor fluorophores molecules and molarextinctions coefficient of acceptor fluorophores and alsodistances between donor and acceptor fluorophores. FRET,being a distance dependent phenomenon is sometimes referredto as “biological ruler”.42
Our present study is focused on the generation of differenttemperature dependent unfolded states of HSA and alsoprobing the microenvironment in an around the Trp214residue and the added bioactive fluorescent molecule, PZ.Using steady-state and time-resolved fluorescence techniques,we have concluded that the interactions of PZ with the protein,HSA, are a function of temperature. The conformationalchanges in HSA brought in by increasing temperature were
monitored by FRET studies. We observed that with a rise intemperature, Trp214 gets buried inside the protein matrix andexperiences a more hydrophobic environment which wassupported by our acrylamide quenching data. Also, usingatomic force microscopy (AFM), we have concluded that HSAstarts to form aggregates at elevated temperatures; the processof aggregation gets initiated at 56 °C, and interestingly, at 70°C, it forms aggregated fibrils.
■ EXPERIMENTAL SECTION
(a). Materials. HSA, essentially fatty acid free and globulinfree (A5843, CAS, 70024-90-7) and acrylamide (A9099, CAS,79-06-1) were purchased from Sigma-Aldrich Co., St. Louis,MO. All solutions were prepared in 50 mM Tris-HCl buffer,pH = 7.4. The final protein concentration was adjusted to 10μM using absorption values for steady-state and lifetimemeasurements. The concentration of the protein wasdetermined spectrophotometrically using ε280 = 44 000.21 3-Pyrazolyl-2-pyrazoline derivative, 5-((3aS,7aR)-1-(4-bromo-phenyl)-3a,4,5,6,7,7a-hexahydro-1H-4,7-methano-indazol-3-yl)-3-methyl-1-phenyl-1H-pyrazole-4-carbonitrile (PZ) (Scheme1) was synthesized using the method described earlier.39 Pleasesee Supporting Information SI-1 for the 1H NMR, 13C NMR,and high resolution mass data. For temperature dependentstudies, the samples were incubated for 1 h at a particulartemperature before carrying out the spectroscopic experiments.To confirm whether PZ undergoes any conformationalchange(s) due to an increase in temperature, we had carriedout a variable temperature NMR study. From the spectra(Supporting Information SI-1), it can be concluded that thestructural integrity of PZ remains fully intact as the couplingconstants remain unchanged thereby proving that the probe(PZ) can be monitored by all spectroscopic techniques withinthe temperature window used in this present study.
(b). Steady-State Measurements. Steady-state absorptionmeasurements were carried out in a PerkinElmer UV−visSpectrophotometer, Lambda-25. All the steady-state fluores-cence data were recorded on a HORIBA JOBIN YVON,FLUOROLOG 3-111. The fluorescence spectra were measuredwith a quartz cuvette of 10 mm path length. HSA was excited at295 nm in order to minimize the contribution from tyrosine.The fluorescence emission was collected from 305 to 580 nmwith an integration time of 0.1 s. On the other hand, PZ wasexcited at 395 nm and fluorescence emission was collected from405 to 650 nm with the same integration time. The emissionand the excitation slits were kept at 2 and 1 nm, respectively,for monitoring both Trp214 and PZ. The concentration of PZwas kept very low (∼10 μM) so as to minimize thecontribution from inner filter effects.
(c). Time-Resolved Fluorescence Measurements. Forlifetime measurements, the samples were excited at 295 nm (formonitoring Trp) using a picosecond diode (IBH-NanoLEDsource N-295) and at 375 nm (for monitoring PZ) using apicosecond diode (IBH-NanoLED source N-375). Theemission was collected at magic angle polarization using aHamamatsu MCP Photomultiplier (Model R-3809U-50). Thetime-correlated single photon counting (TCSPC) setupconsists of an Ortec 9327 pico-timing amplifier. The data wascollected with a PCI-6602 interface card as a multichannelanalyzer. The typical full width at half maximum of the systemresponse was about 790 and 805 ps for N-295 and N-375,respectively.
Scheme 1. Structure of PZ
The Journal of Physical Chemistry B Article
dx.doi.org/10.1021/jp5030944 | J. Phys. Chem. B XXXX, XXX, XXX−XXXB

(d). Acrylamide Quenching. Acrylamide was used toquench the Trp214 fluorescence in HSA at various temper-atures. A volume of 2.0 mL of a 10 μM HSA solution wastitrated with varying concentrations (0−10 mM) of acrylamidein the buffer solution. The samples were excited at 295 nm, andthe corresponding emissions were collected from 305 to 500nm with an integration time of 0.1 s. The Stern−Volmerquenching constants in the presence of acrylamide (KSV
A ) werethen calculated.(e). Anisotropy Measurements. Steady-state anisotropy
(r) can be defined by the following equation.
= − +r I GI I GI( )/( 2 )VV VH VV VH (1)
where IVV is the fluorescence intensity when both the excitationand emission polarizers are oriented vertically, and IVH is thefluorescence intensity when the excitation polarizer is verticallyand the emission polarizer is horizontally oriented. The Gfactor is given by
=G I I/HV HH (2)
where IHV is the fluorescence intensity with a horizontalexcitation polarizer and a vertical emission polarizer, whereasIHH is the fluorescence intensity with both the excitation andemission polarizers oriented horizontally.(f). Atomic Force Microscopy. Atomic force microscopy
(AFM) images were obtained from Agilent 5500 instrument.Mica sheets were used to prepare thin film of the samples priorto image scanning in noncontact AFM mode. The proteinsamples were left for about 0.5 h to air-dry and the AFMimaging was performed after the solvent was evaporatedcompletely.
(g). Molecular Docking. The three-dimensional structureof the protein was obtained from Protein Data Bank with PDBcode: 1AO6.43 The PDB file corresponding to the structure ofPZ was obtained from ChemDraw software package and savedin a compatible file format to be read in AutoDock4.214
software program. Blind docking study was performed to obtainthe ligand (PZ)−protein (HSA) energy minimized dockedconformation by AutoDock4.2 software program which usesthe Lamarckian genetic algorithm (LGA).14−17 During thedocking study, all water molecules were removed and hydrogenatoms were added followed by computing Gasteiger charges, asrequired in LGA. The docking parameters used were as follows:grid size 126, 126, and 126 Å along the X, Y, and Z axes having0.403 Å grid spacing. The center of the grid box was fixed atx,y,z = 29.551, 31.855, 23.559. The parameters correspondingto maximum number of energy evaluations, maximum numberof generations, and GA crossover mode were fixed at 250 000,27 000, and two points, respectively. The minimum bindingenergy conformer was searched out of 10 different conformersfor the docking simulation and the resultant one was used forfurther analysis. The presented stereo view of the dockedconformations has been prepared in PyMOL.44
■ RESULTS AND DISCUSSION
(a). Molecular Docking. Molecular docking has beenemployed to understand the interaction of PZ with HSA.Docking study suggests that the most favorable binding site ofthe probe is located inside a hydrophobic cavity of subdomainIIA or Sudlow site-I, near Trp214 amino acid residue of HSA(Figure 1a). The hydrophobic, electrostatic, and hydrogenbonding interactions play a major role for the binding andstabilization of PZ to the hydrophobic cavity of subdomain IIA
Figure 1. (a) Minimum-energy conformation of binding of PZ inside the scaffold of IIA subdomain HSA (PDB ID: 1AO6) as suggested by themolecular docking study. (b) A close view of the amino acid residues in the immediate vicinity of PZ. (c) Distances between Trp214 and PZobtained from molecular docking study.
The Journal of Physical Chemistry B Article
dx.doi.org/10.1021/jp5030944 | J. Phys. Chem. B XXXX, XXX, XXX−XXXC
of HSA. The residues in the immediate vicinity of PZ in itsbinding pocket are Arg218, Lys195, Val343, Tyr452, andAsp451, Glu292, Lys436 and His440 (Figure 1b). Hydrophobicinteractions of the nearby protein residues, Val and Ala, withPZ facilitate the anchoring of the nonpolar probe inside thehydrophobic pocket, while the residues Arg, Glu, Gln, Lys, Tyr,and Asp make polar contacts with the probe PZ in the HSA−PZ complex. It is also noticed that PZ binds in the close vicinityof Trp214 and the average distance between the two residueshas been estimated to vary between 1.53 and 1.74 nm (Figure1c). The binding of this bioactive molecule inside the proteinscaffolds is rather strong and spontaneous and is characterizedby a free energy of binding of −8.48 kcal mol−1.(b). Steady-State Fluorescence Spectroscopy. In
aqueous buffer solution, PZ exhibits an absorption bandpeaked at 395 nm and has an emission peak at around 494nm. These absorption and emission values are in excellentagreement with those reported in literature,39 which corrobo-rate the purity of the synthesized fluorophore. Uponincorporation inside the protein matrix (in the vicinity ofTrp214, Sudlow’s site: I), the absorption profile of PZ stillremains the same (inset of Figure 2), whereas the emission
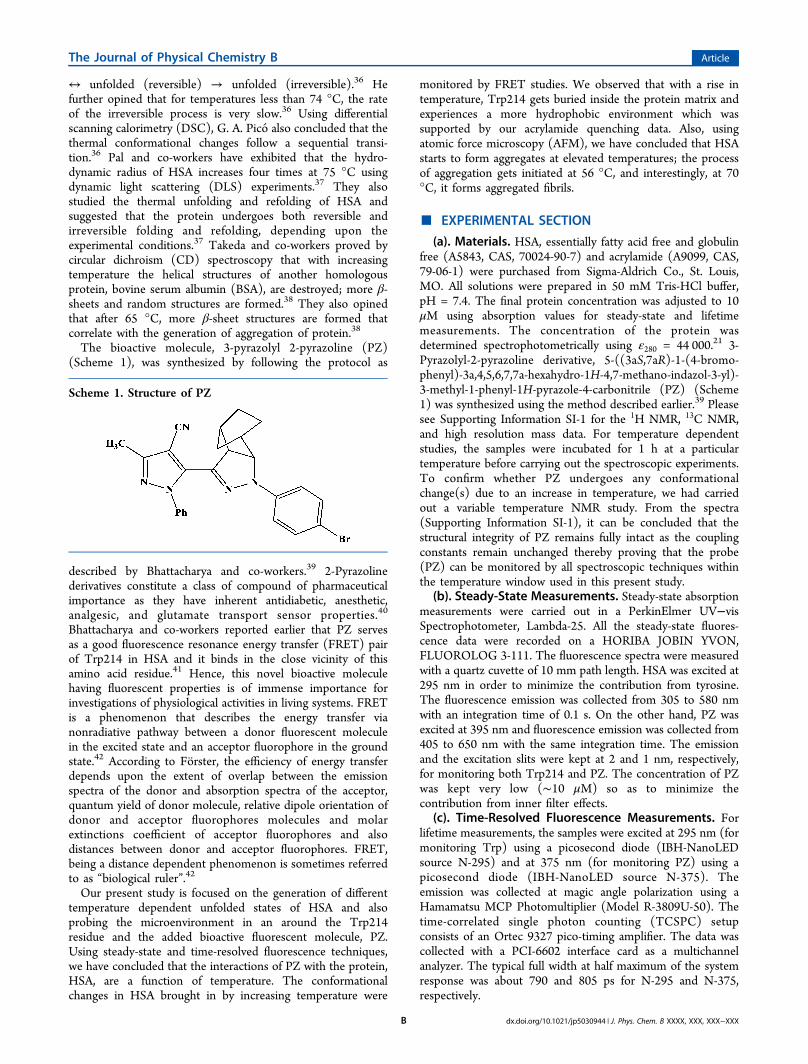
profile undergoes a drastic change. The fluorescence intensityincreases by about 4 times and peaked at 474 nm therebyundergoing a blue-shift of about 20 nm (Figure 2) at 22 °Cwhen excited at 395 nm. This enhancement in fluorescenceintensity along with the 20 nm blue shift is a clear signature thatPZ now experiences a more constrained hydrophobic environ-ment as compared to the bulk. As the main objective of thepresent study was to elucidate the effect of temperature on theconformational dynamics of HSA, we have monitored thesteady-state emission properties of both Trp214 and PZ as afunction of temperature. Figure 3 represents the emissionprofiles of Trp214 and PZ at various temperatures and from thefigure it is evident that the protein undergoes thermaldenaturation and hence both the emission intensities ofTrp214 and PZ decrease with rise in temperature except for70 °C. As stated earlier, HSA has two melting temperatures (56and 62 °C), and it would be very interesting to probe thestructural changes the protein undergoes in the immediatevicinity of these temperatures. From 22 to 56 °C, the emissionmaxima for both Trp214 and PZ remains unchanged, centered
at 346 ± 1 and 480 ± 1 nm, respectively, when excited at 295nm. This proves that the microenvironments of both thefluorophores remain the same within this temperature domain.On further increasing of temperature to 70 °C, contrary to ourexpectations, the Trp214 undergoes a blue shift of 6 nm andthe peak is now centered at 340 nm. This blue shift in emissionmaxima signifies that, although the protein is undergoingthermal denaturation, upon increase of temperature, Trp214gets more buried inside the hydrophobic scaffolds of theprotein. This burial of Trp214 and the associated blue shift hasbeen supported by our acrylamide quenching data (please seesection Acrylamide Quenching for details). In a very seminalwork, Pal and co-workers37 have shown that the protein HSAloses a substantial portion of its helical content with a rise intemperature. Using temperature-dependent CD studies, theyhave observed that the α-helical content of the proteindecreases from 65% at 20 °C to 38% at 70 °C and that thedecrement of helicity is very rapid beyond 55 °C.37 Since CDstudies monitor the global structural changes the proteinundergoes while intrinsic fluorescence experiments probe theimmediate vicinity of the Trp214 amino acid residue, it may notbe possible to draw a direct correlation between these twotechniques. Our emission data of Trp214 is in excellentagreement with these observations; the Trp214 amino acidresidue starts exhibiting a blue shift beyond 56 °C exemplifyingthe fact the microenvironment in and around the amino acidresidue starts getting affected from this particular temperature.It must be mentioned here that the fluorescence intensity ofTrp214 increases as the temperature is increased from 65 to 70°C contrary to what was observed for other temperatures. Thisenhancement in fluorescence intensity can be ascribed to theformation of fibrils at very high temperatures (please seeAtomic Force Microscopy section for details) which make theprotein experience a more constrained environment.The other fluorophore, PZ exhibits almost similar trend in
fluorescence intensity except for the fact that there is a red shiftof around 6 nm when the temperature is increased beyond 56°C. This red shift in emission maxima suggests that the probeexperiences a more hydrophilic environment beyond 56 °C andis most likely due to the loss of secondary structures37,38 of theprotein at elevated temperatures. Here also, there is a rise influorescence intensity beyond 65 °C, signifying that the fibril
Figure 2. Steady-state fluorescence spectra of PZ in buffer and thepresence of HSA. The inset represents the absorption spectra of PZ inbuffer and the presence of HSA.
Figure 3. Steady-state fluorescence spectra of Trp214 in the presenceof PZ at various temperatures as marked in the figure.
The Journal of Physical Chemistry B Article
dx.doi.org/10.1021/jp5030944 | J. Phys. Chem. B XXXX, XXX, XXX−XXXD
formation encompasses a major section of the protein, whichrenders the PZ molecules to experience a more constrainedenvironment. To see the effect of temperature on HSA in theabsence of PZ, we have plotted the various emission profiles ofTrp214 in Supporting Information Figure SI-2. Also, when PZwas exclusively monitored using an excitation wavelength of395 nm (Supporting Information Figure SI-3), the same trendin the variation of emission spectra was obtained asencountered using an excitation wavelength of 295 nm.(c). Time-Resolved Fluorescence Spectroscopy. Tem-
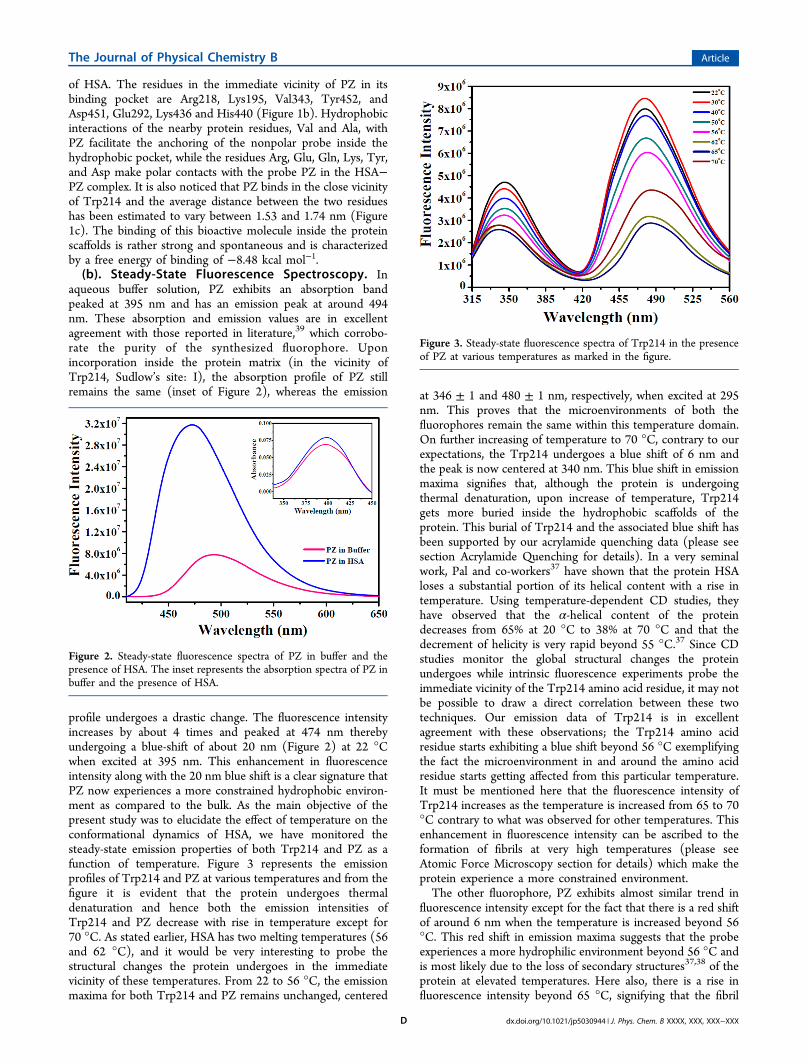
perature induced protein conformational dynamics has beenstudied using time-resolved fluorescence spectroscopy. Forlifetime measurements, samples were excited at 295 and 375nm using a picosecond diode laser for monitoring Trp214 andPZ, respectively, at their respective emission maxima of thesystems. Panels a and b of Figure 4 show the representativedecay profiles of Trp214 and PZ at 22 °C, 56 and 70 °Ctemperatures, respectively. The values of decay parameters aresummarized in Table 1. From Table 1, it is clear that withincreasing temperature, the average lifetimes of both Trp214and PZ decrease, but to different extents. The average lifetimeof Trp214 in HSA (in the presence of PZ) is 5.36 ns at 22 °C.The decrement of lifetime is a manifestation of both quenchingtriggered by internal quencher moieties as well as due totemperature induced conformational transitions. The averagelifetime of Trp214 decreases from 5.36 to 4.40 nscorresponding to a rise in temperature from 22 to 56 °C.The decrement of lifetime with increasing temperature is
attributed to the structural deformation of HSA with marginalchanges of microenvironment in and around Trp214. Beyond56 °C, there is small decrement of lifetime (4.14 ns in at 70°C). As 56 and 62 °C are the two melting temperatures ofHSA, beyond 56 °C, HSA starts to unfold rapidly. But at sametime, from the steady-state measurements, we have seen that a6 nm blue shift of Trp214 occurs which implies that themicroenvironment of Trp214 is more rigid as compared to itsnative state. Beyond 56 °C, there is a competition between (i)protein starting to unfold rapidly, thereby decreasing both thefluorescence intensity and lifetime; and (ii) Trp214 experienc-ing a more rigid environment, thereby increasing thefluorescence intensity. This interplay between the burial ofTrp214 and thermal unfolding results in an overall decrementof the average lifetime of Trp214, but the magnitude of such adecrement is far lesser beyond the first melting temperature, 56°C.PZ binds to a region which is in the close vicinity to Trp214
(please refer to the Molecular Docking section for details);hence, it can be considered that temperature inducedmorphological changes of HSA affects the fluorescence lifetimeof PZ in an manner very similar to that of Trp214. From Table1 it is clear that up to 56 °C, PZ also follows the same trend asTrp214 (the average lifetime of PZ decreases 5.75 to 5.50 ns onincreasing the temperature from 22 to 56 °C). Beyond 56 °C,the average lifetime of PZ further decreases to 4.98 ns at 70 °C.Here also, the thermal denaturation renders PZ to experience amore polar environment as compared to 56 °C (please refer to
Figure 4. Fluorescence lifetime decays of (a) Trp214 and (b) PZ at 22, 56, and 70 °C. The IRF refers to the Instrument Response Function, i.e., thecontribution from the laser diode which was deconvulated during fitting.
Table 1. Fluorescence Lifetime Parameters of Trp214 and PZ in the Presence of PZ
Trp214 PZ
temperature (°C) a1 τ1 (ns) a2 τ2 (ns) ⟨τ⟩ (ns)a χ2b a1 τ1 (ns) a2 τ2 (ns) ⟨τ⟩ (ns)a χ2b
22 17.73 2.01 82.27 6.08 5.36 1.05 4.35 2.64 95.65 5.88 5.75 1.1030 20.88 2.12 79.12 5.93 5.15 1.03 5.8 2.61 94.2 5.95 5.75 1.0940 22.91 2.11 77.09 5.73 4.90 1.05 4.08 1.54 95.92 5.88 5.70 1.0750 25.08 2.08 74.92 5.8 4.72 1.08 8.07 1.09 91.93 5.87 5.48 1.1656 25.37 1.80 74.63 5.29 4.40 1.07 6.28 1.06 93.78 5.80 5.50 1.0662 26.81 1.82 73.11 5.17 4.26 1.0 14.93 3.62 85.07 5.84 5.50 1.1265 26.64 1.75 73.36 5.11 4.21 1.15 30.47 3.68 69.53 5.93 5.24 1.0570 28.64 1.87 71.36 5.20 4.14 1.11 45.68 3.70 54.32 6.06 4.98 1.0
a⟨τ⟩ = (a1τ1 + a2τ2)/100/; ±5%.bThe magnitude of χ2 denotes the goodness of the fit.
The Journal of Physical Chemistry B Article
dx.doi.org/10.1021/jp5030944 | J. Phys. Chem. B XXXX, XXX, XXX−XXXE
the 6 nm red shift in the emission maxima). However, the fibrilformation accounts for a more constrained environment for PZresulting in an overall decrement of the average lifetime beyond56 °C.(d). Binding Interactions of PZ with HSA. As mentioned
earlier, molecular docking experiments revealed that thebinding of PZ to HSA is spontaneous and is characterized bya free energy of binding of −8.48 kcal mol−1. This prompted usto estimate the nature of binding using our steady-state andtime-resolved data. To this effect, we have monitored thechange in fluorescence intensities of Trp214 at roomtemperature (22 °C) with varying concentrations of PZwhich quenches the emission of Trp214. Fluorescencequenching can be best monitored by analyzing the Stern−Volmer equation:21,22,42
τ= + = +F F K k/ 1 [Q] 1 [Q]o SV q 0 (3)
In the above equation, F0 and F are the fluorescenceintensities of the fluorophore (Trp214 in HSA) in the absenceand presence of quencher, respectively. [Q] is the quencher(PZ in the present case) concentration and KSV is the Stern−Volmer quenching constant, kq is the bimolecular quenchingrate constant, and τ0 is the average lifetime of fluorophore inabsence of quencher. Also, from our steady-state results, wefurther estimated the binding constant (K) and the bindingaffinity (n) using a modified version of the Stern−Volmerequation:21,22,42
− = +F F F K nlog[( )/ ] log log[Q]0 (4)
The associated thermodynamics of binding can be estimatedby measuring the free energy of binding (ΔGBinding
0 ) given by
Δ = −G RT K2.303 logBinding0
(5)
The quenching of fluorescence is known to occur by twoprocesses, namely collisional (dynamic) quenching and/orformation of a complex between the quencher and fluorophore(static quenching).42 The linear type of Stern−Volmer plot(figure not shown) reveals that only one type of quenching isoperational.42 As seen from eq 4, a plot of log[(F0 − F)/F]against log[Q] is expected to be linear and from the slope andintercept, n and K can be estimated (Figure SI-4a, SI Table-1).To support the mechanistic pathway of the addition of PZ toHSA, we have used the average lifetime values instead offluorescence intensities in analogy with eq 4 as
τ τ τ− = +K nlog[( )/ ] log log[Q]0 (6)
where, ⟨τ⟩0 and ⟨τ⟩ represent the average lifetime values ofHSA in the absence and presence of PZ. A plot of log[(⟨τ⟩0 −⟨τ⟩)/⟨τ⟩] against log[Q] is shown in Figure SI-4b. The KSVvalues are indicative of the fact that PZ indeed quenches thefluorescence of Trp214 significantly and also the interactionbetween PZ and HSA is pretty strong as evident from themagnitudes of K. As seen from SI Table-1, all the parametersmentioned therein, obtained from steady-state and time-resolved measurements, are almost similar. The high values ofthe bimolecular rate constants (kq ∼1012 s−1, SI Table-1) are aclear signature of the fact that the interaction between PZ andHSA is diffusion controlled.41 If the mechanism of quenchingwas through the formation of a complex, i.e., if static quenchingwas operational, then the lifetimes of the probe molecule wouldnot have been affected by a large extent. Since the magnitudesof both KSV and K obtained from steady-state (which monitors
ground state phenomena) and time-resolved (which monitorsexcited-state phenomena) experiments are in excellent agree-ment with each other, we can rationally conclude that themechanism of quenching is most likely collisional/diffusioncontrolled. Our observations are also in unison with thosereported in the literature.41 Also, the magnitudes of the freeenergy of binding as obtained from our spectroscopic dataagree very well with that reported by our molecular dockingstudies. This further substantiates the correlation between thesetwo methodologies and confirms the rationality of ourcomputational results.
(e). Energy Transfer. Fluorescence resonance energytransfer (FRET) is a spectroscopic phenomenon, where energyis transferred from the excited state donor fluorophore to theground state acceptor fluorophore via nonradiative long-rangedipole−dipole interactions.42 FRET can elucidate morpholog-ical changes or conformational dynamics of a biomacromole-cule and hence can be used to estimate the distance betweendifferent domains where the donor and acceptor molecules arelocated. According to Forster nonradiative energy transfertheory,42 the efficiency of energy transfer (EFRET) dependsupon the distance between the donor and the acceptor (r0) andthe critical energy transfer distance (R0) as
=+
ER
R rFRET06
06
06
(7)
where the Forster distance, R0, is the critical distance at whichthe energy transfer efficiency is 50%. The magnitude of R0 canbe estimated by the following equation:
κ ϕ= × − −R N J8.8 1006 25 2 4
(8)
where κ2 is the spatial orientation factor related to orientationin space of the transition dipoles of the donor and acceptor, Nis the average refractive index of the medium (here buffer), ϕ isthe fluorescence quantum yield of the donor in the absence ofacceptor, and J is the spectral overlap integral between thedonor fluorescence emission spectrum and the acceptorabsorption spectrum. The magnitude of the spectral overlapintegral, J is given by
λ ε λ λ λλ λ
= Σ ΔΣ Δ
JF
F( ) ( )
( )
4
(9)
where F(λ) is the fluorescence intensity of the donor atwavelength λ, and ε(λ) is the molar absorption coefficient ofthe acceptor at that wavelength λ (expressed in M−1 cm−1).Figure SI-5 represents the spectral overlap at 22 °C, betweenthe donor (Trp214 in the present case) emission and theacceptor (PZ in the present case) absorption. From the extentof overlap, it is pretty evident that Trp214 and PZ form a verygood FRET pair and hence can be used to monitor thetemperature dependent conformational dynamics of HSA.From the extent of spectral overlap at various temperaturesand by using eq 9, the J values for the Trp214-PZ FRET pairhas been estimated to be 7.38 × 10⁻¹⁵, 6.4 × 10⁻¹⁵, and 6.45 ×10⁻¹⁵ at 22, 56, and 70 °C, respectively.The efficiency of energy transfer (EFRET) can be best studied
from time-resolved measurements and the magnitude of EFRETis given by24,42,45−47
τ τ= −E 1 /FRET DA D (10)
The Journal of Physical Chemistry B Article
dx.doi.org/10.1021/jp5030944 | J. Phys. Chem. B XXXX, XXX, XXX−XXXF
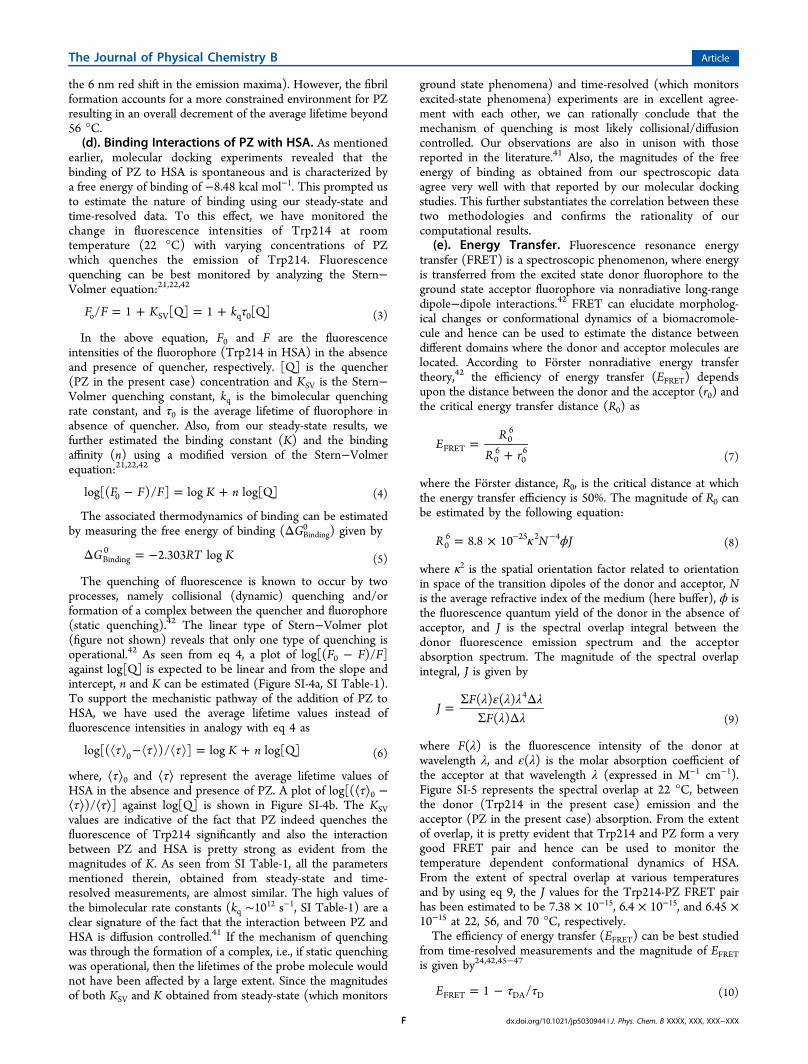
where, τDA and τD are the lifetimes of the donor in the presenceand absence of the acceptor, respectively. Using the values ofaverage lifetimes of Trp214 in the absence (SI Table-2) andpresence (Table 1) of PZ, the values of EFRET have beenestimated at various temperatures (Table 2).Putting the values of κ2 = 2/3, N = 1.36, and ϕ = 0.15, and by
using eqs 7−10, the critical energy transfer distance (R0) andthe distance between the donor and the acceptor (r0) has beencalculated and the results are summarized in Table 3. The
distance between Trp214 and PZ has been estimated to be 3.78nm at 22 °C. With increasing temperature up to 50 °C, EFRETvalues exhibit minor variations with a rise in temperature(Table 2, Figure 5). As stated earlier, the first melting
temperature of HSA is 56 °C and our EFRET data also supportsthis fact. At such a temperature, the magnitude of EFRET shows arapid rise (Table 2); Trp214 which is deep-seated inside theprotein scaffolds becomes labile, and consequently, the distancebetween Trp214 and PZ becomes lesser (Table 3). On furtherincreasing the temperature up to 70 °C, the magnitude of EFRETincreases to 13.2% and the distance between the donor and theacceptor has been estimated to be around 2.98 nm. At suchelevated temperatures, HSA is known to form fibrils,48,49 andhence, in all probabilities, this aggregation behavior results in anenhancement of EFRET and subsequently brings the Trp214 andPZ fluorophores closer to each other. Thus, our temperature-dependent monitoring of EFRET gave us a clearer picture of the
conformational changes that HSA undergoes with the variationof temperature.
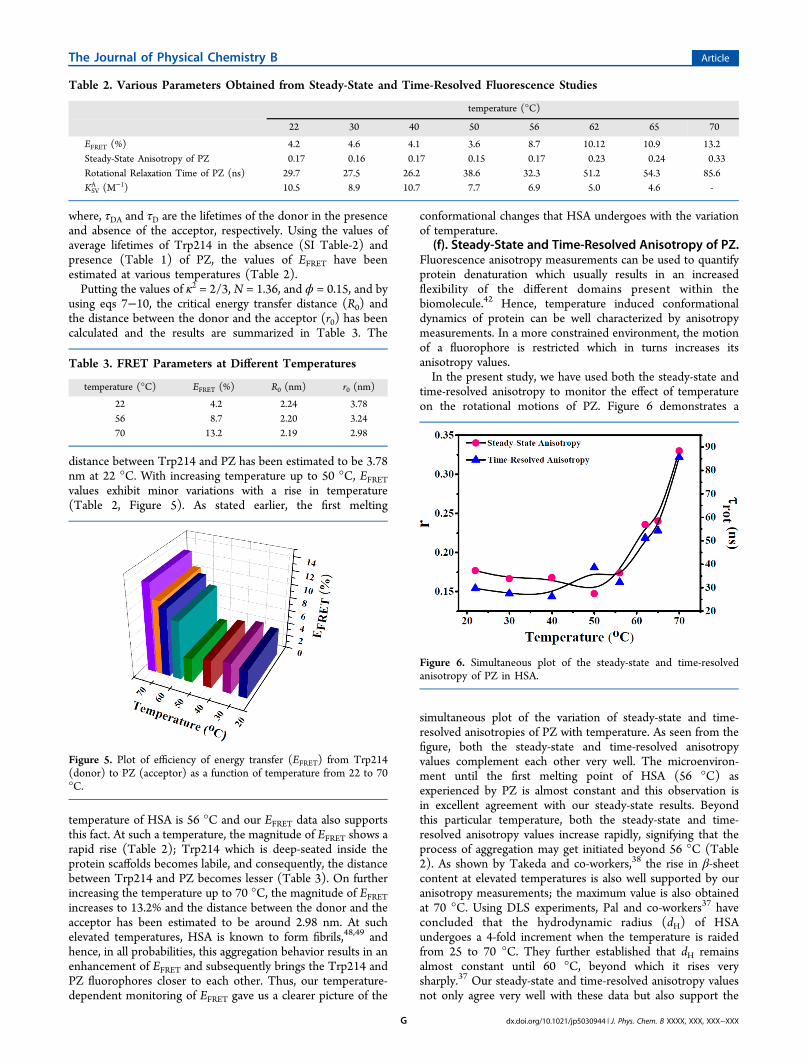
(f). Steady-State and Time-Resolved Anisotropy of PZ.Fluorescence anisotropy measurements can be used to quantifyprotein denaturation which usually results in an increasedflexibility of the different domains present within thebiomolecule.42 Hence, temperature induced conformationaldynamics of protein can be well characterized by anisotropymeasurements. In a more constrained environment, the motionof a fluorophore is restricted which in turns increases itsanisotropy values.In the present study, we have used both the steady-state and
time-resolved anisotropy to monitor the effect of temperatureon the rotational motions of PZ. Figure 6 demonstrates a
simultaneous plot of the variation of steady-state and time-resolved anisotropies of PZ with temperature. As seen from thefigure, both the steady-state and time-resolved anisotropyvalues complement each other very well. The microenviron-ment until the first melting point of HSA (56 °C) asexperienced by PZ is almost constant and this observation isin excellent agreement with our steady-state results. Beyondthis particular temperature, both the steady-state and time-resolved anisotropy values increase rapidly, signifying that theprocess of aggregation may get initiated beyond 56 °C (Table2). As shown by Takeda and co-workers,38 the rise in β-sheetcontent at elevated temperatures is also well supported by ouranisotropy measurements; the maximum value is also obtainedat 70 °C. Using DLS experiments, Pal and co-workers37 haveconcluded that the hydrodynamic radius (dH) of HSAundergoes a 4-fold increment when the temperature is raidedfrom 25 to 70 °C. They further established that dH remainsalmost constant until 60 °C, beyond which it rises verysharply.37 Our steady-state and time-resolved anisotropy valuesnot only agree very well with these data but also support the
Table 2. Various Parameters Obtained from Steady-State and Time-Resolved Fluorescence Studies
temperature (°C)
22 30 40 50 56 62 65 70
EFRET (%) 4.2 4.6 4.1 3.6 8.7 10.12 10.9 13.2Steady-State Anisotropy of PZ 0.17 0.16 0.17 0.15 0.17 0.23 0.24 0.33Rotational Relaxation Time of PZ (ns) 29.7 27.5 26.2 38.6 32.3 51.2 54.3 85.6KSVA (M−1) 10.5 8.9 10.7 7.7 6.9 5.0 4.6 -
Table 3. FRET Parameters at Different Temperatures
temperature (°C) EFRET (%) R0 (nm) r0 (nm)
22 4.2 2.24 3.7856 8.7 2.20 3.2470 13.2 2.19 2.98
Figure 5. Plot of efficiency of energy transfer (EFRET) from Trp214(donor) to PZ (acceptor) as a function of temperature from 22 to 70°C.
Figure 6. Simultaneous plot of the steady-state and time-resolvedanisotropy of PZ in HSA.
The Journal of Physical Chemistry B Article
dx.doi.org/10.1021/jp5030944 | J. Phys. Chem. B XXXX, XXX, XXX−XXXG
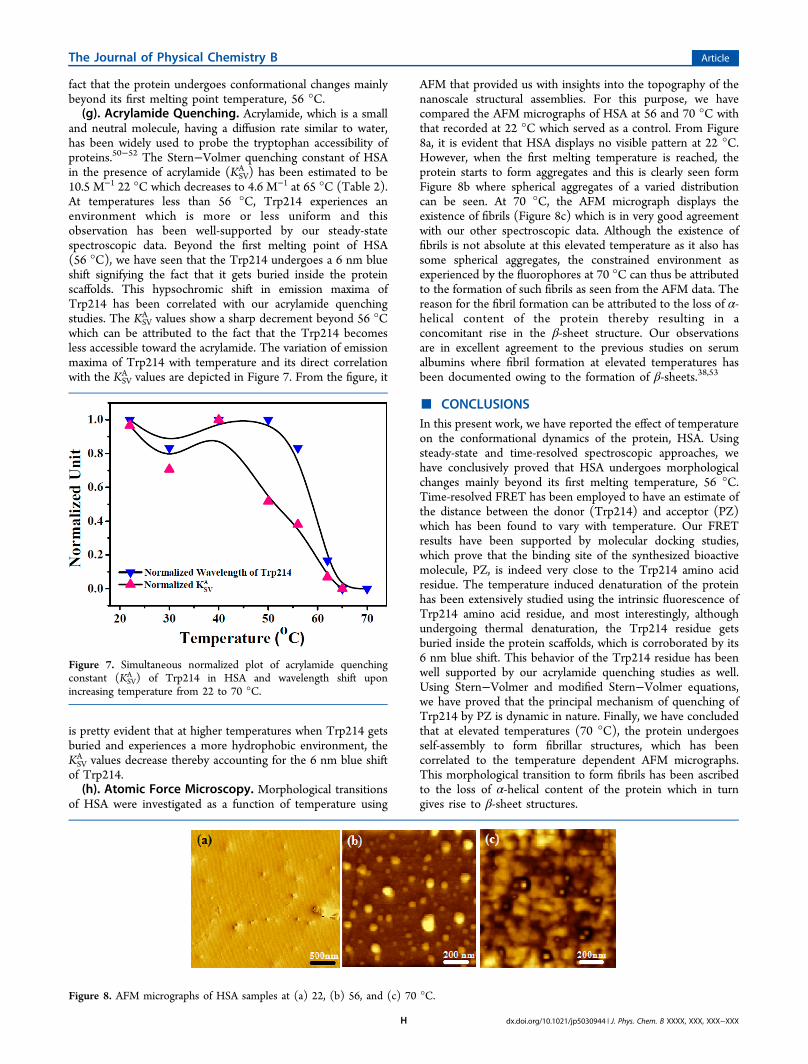
fact that the protein undergoes conformational changes mainlybeyond its first melting point temperature, 56 °C.(g). Acrylamide Quenching. Acrylamide, which is a small
and neutral molecule, having a diffusion rate similar to water,has been widely used to probe the tryptophan accessibility ofproteins.50−52 The Stern−Volmer quenching constant of HSAin the presence of acrylamide (KSV
A ) has been estimated to be10.5 M−1 22 °C which decreases to 4.6 M−1 at 65 °C (Table 2).At temperatures less than 56 °C, Trp214 experiences anenvironment which is more or less uniform and thisobservation has been well-supported by our steady-statespectroscopic data. Beyond the first melting point of HSA(56 °C), we have seen that the Trp214 undergoes a 6 nm blueshift signifying the fact that it gets buried inside the proteinscaffolds. This hypsochromic shift in emission maxima ofTrp214 has been correlated with our acrylamide quenchingstudies. The KSV
A values show a sharp decrement beyond 56 °Cwhich can be attributed to the fact that the Trp214 becomesless accessible toward the acrylamide. The variation of emissionmaxima of Trp214 with temperature and its direct correlationwith the KSV
A values are depicted in Figure 7. From the figure, it
is pretty evident that at higher temperatures when Trp214 getsburied and experiences a more hydrophobic environment, theKSVA values decrease thereby accounting for the 6 nm blue shift
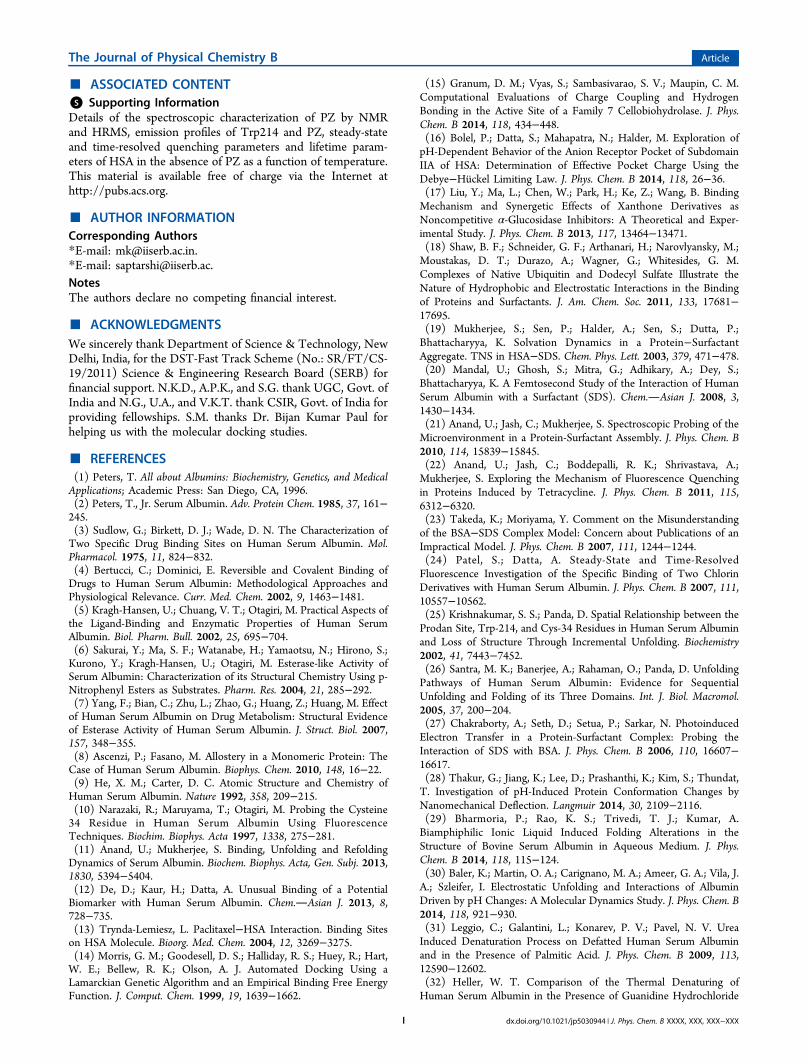
of Trp214.(h). Atomic Force Microscopy. Morphological transitions
of HSA were investigated as a function of temperature using
AFM that provided us with insights into the topography of thenanoscale structural assemblies. For this purpose, we havecompared the AFM micrographs of HSA at 56 and 70 °C withthat recorded at 22 °C which served as a control. From Figure8a, it is evident that HSA displays no visible pattern at 22 °C.However, when the first melting temperature is reached, theprotein starts to form aggregates and this is clearly seen formFigure 8b where spherical aggregates of a varied distributioncan be seen. At 70 °C, the AFM micrograph displays theexistence of fibrils (Figure 8c) which is in very good agreementwith our other spectroscopic data. Although the existence offibrils is not absolute at this elevated temperature as it also hassome spherical aggregates, the constrained environment asexperienced by the fluorophores at 70 °C can thus be attributedto the formation of such fibrils as seen from the AFM data. Thereason for the fibril formation can be attributed to the loss of α-helical content of the protein thereby resulting in aconcomitant rise in the β-sheet structure. Our observationsare in excellent agreement to the previous studies on serumalbumins where fibril formation at elevated temperatures hasbeen documented owing to the formation of β-sheets.38,53
■ CONCLUSIONSIn this present work, we have reported the effect of temperatureon the conformational dynamics of the protein, HSA. Usingsteady-state and time-resolved spectroscopic approaches, wehave conclusively proved that HSA undergoes morphologicalchanges mainly beyond its first melting temperature, 56 °C.Time-resolved FRET has been employed to have an estimate ofthe distance between the donor (Trp214) and acceptor (PZ)which has been found to vary with temperature. Our FRETresults have been supported by molecular docking studies,which prove that the binding site of the synthesized bioactivemolecule, PZ, is indeed very close to the Trp214 amino acidresidue. The temperature induced denaturation of the proteinhas been extensively studied using the intrinsic fluorescence ofTrp214 amino acid residue, and most interestingly, althoughundergoing thermal denaturation, the Trp214 residue getsburied inside the protein scaffolds, which is corroborated by its6 nm blue shift. This behavior of the Trp214 residue has beenwell supported by our acrylamide quenching studies as well.Using Stern−Volmer and modified Stern−Volmer equations,we have proved that the principal mechanism of quenching ofTrp214 by PZ is dynamic in nature. Finally, we have concludedthat at elevated temperatures (70 °C), the protein undergoesself-assembly to form fibrillar structures, which has beencorrelated to the temperature dependent AFM micrographs.This morphological transition to form fibrils has been ascribedto the loss of α-helical content of the protein which in turngives rise to β-sheet structures.
Figure 7. Simultaneous normalized plot of acrylamide quenchingconstant (KSV
A ) of Trp214 in HSA and wavelength shift uponincreasing temperature from 22 to 70 °C.
Figure 8. AFM micrographs of HSA samples at (a) 22, (b) 56, and (c) 70 °C.
The Journal of Physical Chemistry B Article
dx.doi.org/10.1021/jp5030944 | J. Phys. Chem. B XXXX, XXX, XXX−XXXH
■ ASSOCIATED CONTENT*S Supporting InformationDetails of the spectroscopic characterization of PZ by NMRand HRMS, emission profiles of Trp214 and PZ, steady-stateand time-resolved quenching parameters and lifetime param-eters of HSA in the absence of PZ as a function of temperature.This material is available free of charge via the Internet athttp://pubs.acs.org.
■ AUTHOR INFORMATIONCorresponding Authors*E-mail: [email protected].*E-mail: [email protected] authors declare no competing financial interest.
■ ACKNOWLEDGMENTSWe sincerely thank Department of Science & Technology, NewDelhi, India, for the DST-Fast Track Scheme (No.: SR/FT/CS-19/2011) Science & Engineering Research Board (SERB) forfinancial support. N.K.D., A.P.K., and S.G. thank UGC, Govt. ofIndia and N.G., U.A., and V.K.T. thank CSIR, Govt. of India forproviding fellowships. S.M. thanks Dr. Bijan Kumar Paul forhelping us with the molecular docking studies.
■ REFERENCES(1) Peters, T. All about Albumins: Biochemistry, Genetics, and MedicalApplications; Academic Press: San Diego, CA, 1996.(2) Peters, T., Jr. Serum Albumin. Adv. Protein Chem. 1985, 37, 161−245.(3) Sudlow, G.; Birkett, D. J.; Wade, D. N. The Characterization ofTwo Specific Drug Binding Sites on Human Serum Albumin. Mol.Pharmacol. 1975, 11, 824−832.(4) Bertucci, C.; Dominici, E. Reversible and Covalent Binding ofDrugs to Human Serum Albumin: Methodological Approaches andPhysiological Relevance. Curr. Med. Chem. 2002, 9, 1463−1481.(5) Kragh-Hansen, U.; Chuang, V. T.; Otagiri, M. Practical Aspects ofthe Ligand-Binding and Enzymatic Properties of Human SerumAlbumin. Biol. Pharm. Bull. 2002, 25, 695−704.(6) Sakurai, Y.; Ma, S. F.; Watanabe, H.; Yamaotsu, N.; Hirono, S.;Kurono, Y.; Kragh-Hansen, U.; Otagiri, M. Esterase-like Activity ofSerum Albumin: Characterization of its Structural Chemistry Using p-Nitrophenyl Esters as Substrates. Pharm. Res. 2004, 21, 285−292.(7) Yang, F.; Bian, C.; Zhu, L.; Zhao, G.; Huang, Z.; Huang, M. Effectof Human Serum Albumin on Drug Metabolism: Structural Evidenceof Esterase Activity of Human Serum Albumin. J. Struct. Biol. 2007,157, 348−355.(8) Ascenzi, P.; Fasano, M. Allostery in a Monomeric Protein: TheCase of Human Serum Albumin. Biophys. Chem. 2010, 148, 16−22.(9) He, X. M.; Carter, D. C. Atomic Structure and Chemistry ofHuman Serum Albumin. Nature 1992, 358, 209−215.(10) Narazaki, R.; Maruyama, T.; Otagiri, M. Probing the Cysteine34 Residue in Human Serum Albumin Using FluorescenceTechniques. Biochim. Biophys. Acta 1997, 1338, 275−281.(11) Anand, U.; Mukherjee, S. Binding, Unfolding and RefoldingDynamics of Serum Albumin. Biochem. Biophys. Acta, Gen. Subj. 2013,1830, 5394−5404.(12) De, D.; Kaur, H.; Datta, A. Unusual Binding of a PotentialBiomarker with Human Serum Albumin. Chem.Asian J. 2013, 8,728−735.(13) Trynda-Lemiesz, L. Paclitaxel−HSA Interaction. Binding Siteson HSA Molecule. Bioorg. Med. Chem. 2004, 12, 3269−3275.(14) Morris, G. M.; Goodesell, D. S.; Halliday, R. S.; Huey, R.; Hart,W. E.; Bellew, R. K.; Olson, A. J. Automated Docking Using aLamarckian Genetic Algorithm and an Empirical Binding Free EnergyFunction. J. Comput. Chem. 1999, 19, 1639−1662.
(15) Granum, D. M.; Vyas, S.; Sambasivarao, S. V.; Maupin, C. M.Computational Evaluations of Charge Coupling and HydrogenBonding in the Active Site of a Family 7 Cellobiohydrolase. J. Phys.Chem. B 2014, 118, 434−448.(16) Bolel, P.; Datta, S.; Mahapatra, N.; Halder, M. Exploration ofpH-Dependent Behavior of the Anion Receptor Pocket of SubdomainIIA of HSA: Determination of Effective Pocket Charge Using theDebye−Huckel Limiting Law. J. Phys. Chem. B 2014, 118, 26−36.(17) Liu, Y.; Ma, L.; Chen, W.; Park, H.; Ke, Z.; Wang, B. BindingMechanism and Synergetic Effects of Xanthone Derivatives asNoncompetitive α-Glucosidase Inhibitors: A Theoretical and Exper-imental Study. J. Phys. Chem. B 2013, 117, 13464−13471.(18) Shaw, B. F.; Schneider, G. F.; Arthanari, H.; Narovlyansky, M.;Moustakas, D. T.; Durazo, A.; Wagner, G.; Whitesides, G. M.Complexes of Native Ubiquitin and Dodecyl Sulfate Illustrate theNature of Hydrophobic and Electrostatic Interactions in the Bindingof Proteins and Surfactants. J. Am. Chem. Soc. 2011, 133, 17681−17695.(19) Mukherjee, S.; Sen, P.; Halder, A.; Sen, S.; Dutta, P.;Bhattacharyya, K. Solvation Dynamics in a Protein−SurfactantAggregate. TNS in HSA−SDS. Chem. Phys. Lett. 2003, 379, 471−478.(20) Mandal, U.; Ghosh, S.; Mitra, G.; Adhikary, A.; Dey, S.;Bhattacharyya, K. A Femtosecond Study of the Interaction of HumanSerum Albumin with a Surfactant (SDS). Chem.Asian J. 2008, 3,1430−1434.(21) Anand, U.; Jash, C.; Mukherjee, S. Spectroscopic Probing of theMicroenvironment in a Protein-Surfactant Assembly. J. Phys. Chem. B2010, 114, 15839−15845.(22) Anand, U.; Jash, C.; Boddepalli, R. K.; Shrivastava, A.;Mukherjee, S. Exploring the Mechanism of Fluorescence Quenchingin Proteins Induced by Tetracycline. J. Phys. Chem. B 2011, 115,6312−6320.(23) Takeda, K.; Moriyama, Y. Comment on the Misunderstandingof the BSA−SDS Complex Model: Concern about Publications of anImpractical Model. J. Phys. Chem. B 2007, 111, 1244−1244.(24) Patel, S.; Datta, A. Steady-State and Time-ResolvedFluorescence Investigation of the Specific Binding of Two ChlorinDerivatives with Human Serum Albumin. J. Phys. Chem. B 2007, 111,10557−10562.(25) Krishnakumar, S. S.; Panda, D. Spatial Relationship between theProdan Site, Trp-214, and Cys-34 Residues in Human Serum Albuminand Loss of Structure Through Incremental Unfolding. Biochemistry2002, 41, 7443−7452.(26) Santra, M. K.; Banerjee, A.; Rahaman, O.; Panda, D. UnfoldingPathways of Human Serum Albumin: Evidence for SequentialUnfolding and Folding of its Three Domains. Int. J. Biol. Macromol.2005, 37, 200−204.(27) Chakraborty, A.; Seth, D.; Setua, P.; Sarkar, N. PhotoinducedElectron Transfer in a Protein-Surfactant Complex: Probing theInteraction of SDS with BSA. J. Phys. Chem. B 2006, 110, 16607−16617.(28) Thakur, G.; Jiang, K.; Lee, D.; Prashanthi, K.; Kim, S.; Thundat,T. Investigation of pH-Induced Protein Conformation Changes byNanomechanical Deflection. Langmuir 2014, 30, 2109−2116.(29) Bharmoria, P.; Rao, K. S.; Trivedi, T. J.; Kumar, A.Biamphiphilic Ionic Liquid Induced Folding Alterations in theStructure of Bovine Serum Albumin in Aqueous Medium. J. Phys.Chem. B 2014, 118, 115−124.(30) Baler, K.; Martin, O. A.; Carignano, M. A.; Ameer, G. A.; Vila, J.A.; Szleifer, I. Electrostatic Unfolding and Interactions of AlbuminDriven by pH Changes: A Molecular Dynamics Study. J. Phys. Chem. B2014, 118, 921−930.(31) Leggio, C.; Galantini, L.; Konarev, P. V.; Pavel, N. V. UreaInduced Denaturation Process on Defatted Human Serum Albuminand in the Presence of Palmitic Acid. J. Phys. Chem. B 2009, 113,12590−12602.(32) Heller, W. T. Comparison of the Thermal Denaturing ofHuman Serum Albumin in the Presence of Guanidine Hydrochloride
The Journal of Physical Chemistry B Article
dx.doi.org/10.1021/jp5030944 | J. Phys. Chem. B XXXX, XXX, XXX−XXXI
and 1-Butyl-3-Methylimidazolium Ionic Liquids. J. Phys. Chem. B 2013,117, 2378−2383.(33) Fu, L.; Villette, S.; Petoud, S.; Fernandez-Alonso, F.; Saboungi,M. H/D Isotope Effects in Protein Thermal Denaturation: The Caseof Bovine Serum Albumin. J. Phys. Chem. B 2011, 115, 1881−1888.(34) Hedoux, A.; Willart, J.; Paccou, L.; Guinet, Y.; Affouard, F.;Lerbret; Descamps, M. Thermostabilization Mechanism of BovineSerum Albumin by Trehalose. J. Phys. Chem. B 2009, 113, 6119−6126.(35) Flora, K.; Brennan, J. D.; Baker, G. A.; Doody, M. A.; Bright, F.V. Unfolding of Acrylodan-Labeled Human Serum Albumin Probed bySteady-State and Time-Resolved Fluorescence Methods. Biophys. J.1998, 75, 1084−1096.(36) Pico, G. A. Thermodynamic Features of the Thermal Unfoldingof Human Serum Albumin. Int. J. Biol. Macromol. 1997, 20, 63−73.(37) Mitra, R. K.; Sinha, S. S.; Pal, S. K. Hydration in ProteinFolding: Thermal Unfolding/Refolding of Human Serum Albumin.Langmuir 2007, 23, 10224−10229.(38) Takeda, K.; Wada, A.; Yamamoto, K.; Moriyama, Y.; Aoki, K.Conformational Change of Bovine Serum Albumin by HeatTreatment. J. Protein Chem. 1989, 8, 653−659.(39) Chatterjee, S.; Banerjee, P.; Pramanik, S.; Mukherjee, A.;Mahalanabis, K. K.; Bhattacharya, S. C. Role of HomogeneousSolvents on Photophysics of 3-Pyrazolyl-2-Pyrazoline Derivative.Chem. Phys. Lett. 2007, 440, 313−320.(40) Goodell, J. R.; Puig-Basagoiti, F.; Forshey, B. M.; Shi, P. Y.;Ferguson, D. M. Identification of Compounds with Anti-West NileVirus Activity. J. Med. Chem. 2006, 49, 2127−2137.(41) Banerjee, P.; Pramanik, S.; Sarkar, A.; Bhattacharya, S. C.Deciphering the Fluorescence Resonance Energy Transfer Signature of3-Pyrazolyl 2-Pyrazoline in Transport Proteinous Environment. J. Phys.Chem. B 2009, 113, 11429−11436.(42) Lakowicz, J. R. Principles of Fluorescence Spectroscopy; KluwerAcademic: New York, 1999.(43) Sugio, S.; Kashima, A.; Mouchizuki, S.; Noda, M.; Kobayashi, K.Crystal Structure of Human Serum Albumin at 2.5 Å Resolution.Protein Eng. 1999, 12, 439−446.(44) De Lano, W. L. The PyMOL Molecular Graphics System; DeLano Scientific: San Carlos, CA, 2002.(45) Shaw, A. K.; Pal, S. K. Spectroscopic Studies on the Effect ofTemperature on pH-Induced Folded States of Human SerumAlbumin. J. Photochem. Photobiol., B 2008, 90, 69−77.(46) Sahu, K.; Ghosh, S.; Mondal, S. K.; Ghosh, B. K.; Sen, P.; Roy,D.; Bhattacharyya, K. Ultrafast Fluorescence Resonance EnergyTransfer in a Micelle. J. Chem. Phys. 2006, 125, 044714.(47) Huang, F.; Lerner, E.; Sato, S.; Amir, D.; Hass, E.; Fresht, A. R.Time-Resolved Fluorescence Resonance Energy Transfer Study Showsa Compact Denatured State of the B Domain of Protein. Biochemistry2009, 48, 3468−3476.(48) Juarez, J.; Taboada, P.; Mosquera, V. Existence of DifferentStructural Intermediates on the Fibrillation Pathway of Human SerumAlbumin. Biophys. J. 2009, 96, 2353−2370.(49) Pandey, N. K.; Ghosh, S.; Dasgupta, S. Fibrillation in HumanSerum Albumin is Enhanced in the Presence of Copper (II). J. Phys.Chem. B 2010, 114, 10228−10233.(50) Eftink, M. R.; Ghiron, C. A. Exposure of Tryptophanyl Residuesin Proteins. Quantitative Determination by Fluorescence QuenchingStudies. Biochemistry 1976, 15, 672−680.(51) Eftink, M. R.; Ghiron, C. A. Fluorescence Quenching of Indoleand Model Micelle Systems. J. Phys. Chem. 1976, 80, 486−493.(52) Merrill, A. R.; Palmer, L. R.; Szabo, A. G. Acrylamide Quenchingof the Intrinsic Fluorescence of Tryptophan Residues GeneticallyEngineered into the Soluble Colicin E1 Channel Peptide. StructuralCharacterization of the Insertion-Competent State. Biochemistry 1993,32, 6974−6981.(53) Callaghan, P.; Martin, N. H. The Relation of the RotatoryDispersion Behaviour of Human Serum Albumin to its Configuration.Biochem. J. 1962, 83, 144−151.
The Journal of Physical Chemistry B Article
dx.doi.org/10.1021/jp5030944 | J. Phys. Chem. B XXXX, XXX, XXX−XXXJ
Copyright © 2022 FDOKUMEN