Temperature anomalies of hypersound velocity and specific heat ratio in liquid Quinoline
15
Physica A 354 (2005) 34–48 Temperature anomalies of hypersound velocity and specific heat ratio in liquid Quinoline Louis Letamendia a , Miad Belkadi a , Omar Eloutassi a , Jacques Rouch a , Dino Risso b , Patricio Cordero c , Alexander Z. Patashinski d, a Centre de Physique Mole´culaire Optique et Hertzienne, UMR5798 du CNRS Universite´Bordeaux 1, 351 Cours de la Libe´ration 33405 Talence, France b Departamento de Fisica, Universidad del Bio Bio Collao 1202 Concepcion, Chile c Departamento de Fisica Universidad de Chile, Blanco Encalada 2008 Santiago, Chile d Department of Chemistry and Materials Research Center, Northwestern University, Evanston, IL 60208, USA Received 15 October 2004 Available online 21 March 2005 Abstract Results of an extensive study of dynamic polarized (VV) and depolarized (VH) Rayleigh–Brillouin light scattering in Quinoline as a function of temperature are presented. The VV spectrum is analyzed by taking into account the fine structure (shear dip) of the VH spectrum. The hypersound velocity u(T) and the Landau–Placzek ratio gðT Þ have been calculated from the frequency shift of the Brillouin lines and the ratio of the integrated intensities of the non-shifted Rayleigh line to the two Brillouin lines. Under the conditions of high-purity and long equilibration times, the temperature variations of both u(T) and gðT Þ show two reproducible anomalies centered at about 17 and 42 1C. We discuss an interpretation of the anomalies based on local structure changes, and possible relations of these anomalies to liquid–liquid phase transitions in equilibrium liquids. r 2005 Elsevier B.V. All rights reserved. PACS: 68.18.Jk; 61.20.Ne; 61.25.Em Keywords: Complex liquids; Local order; Brillouin scattering; Liquid–liquid phase transitions ARTICLE IN PRESS www.elsevier.com/locate/physa 0378-4371/$ - see front matter r 2005 Elsevier B.V. All rights reserved. doi:10.1016/j.physa.2005.02.027 Corresponding author. Department of Physics and Astronomy, Northwestern University, 2145 Sheridan Road, Evanston, IL 60208-3112, USA. Fax: +1 847 491 9982. E-mail address: [email protected] (A.Z. Patashinski).
-
Upload
independent -
Category
Documents
-
view
0 -
download
0
Transcript of Temperature anomalies of hypersound velocity and specific heat ratio in liquid Quinoline

ARTICLE IN PRESS
Physica A 354 (2005) 34–48
0378-4371/$ -
doi:10.1016/j
�CorrespoSheridan Ro
E-mail ad
www.elsevier.com/locate/physa
Temperature anomalies of hypersound velocityand specific heat ratio in liquid Quinoline
Louis Letamendiaa, Miad Belkadia, Omar Eloutassia,Jacques Roucha, Dino Rissob, Patricio Corderoc,
Alexander Z. Patashinskid,�
aCentre de Physique Moleculaire Optique et Hertzienne, UMR5798 du CNRS Universite Bordeaux 1,
351 Cours de la Liberation 33405 Talence, FrancebDepartamento de Fisica, Universidad del Bio Bio Collao 1202 Concepcion, Chile
cDepartamento de Fisica Universidad de Chile, Blanco Encalada 2008 Santiago, ChiledDepartment of Chemistry and Materials Research Center, Northwestern University, Evanston,
IL 60208, USA
Received 15 October 2004
Available online 21 March 2005
Abstract
Results of an extensive study of dynamic polarized (VV) and depolarized (VH) Rayleigh–Brillouin
light scattering in Quinoline as a function of temperature are presented. The VV spectrum is
analyzed by taking into account the fine structure (shear dip) of the VH spectrum. The hypersound
velocity u(T) and the Landau–Placzek ratio gðTÞ have been calculated from the frequency shift of
the Brillouin lines and the ratio of the integrated intensities of the non-shifted Rayleigh line to the
two Brillouin lines. Under the conditions of high-purity and long equilibration times, the
temperature variations of both u(T) and gðTÞ show two reproducible anomalies centered at about 17
and 42 1C. We discuss an interpretation of the anomalies based on local structure changes, and
possible relations of these anomalies to liquid–liquid phase transitions in equilibrium liquids.
r 2005 Elsevier B.V. All rights reserved.
PACS: 68.18.Jk; 61.20.Ne; 61.25.Em
Keywords: Complex liquids; Local order; Brillouin scattering; Liquid–liquid phase transitions
see front matter r 2005 Elsevier B.V. All rights reserved.
.physa.2005.02.027
nding author. Department of Physics and Astronomy, Northwestern University, 2145
ad, Evanston, IL 60208-3112, USA. Fax: +1847 491 9982.
dress: [email protected] (A.Z. Patashinski).

ARTICLE IN PRESS
L. Letamendia et al. / Physica A 354 (2005) 34–48 35
1. Introduction
Far from the melting line, high-temperature liquids are well described by a modelof a structure-less fluid; at lower temperatures, and especially at supercooling, theproperties of liquids may be explained using the concept of local structure in liquids[1,2]. In these low-temperature liquids, relaxation processes are thermally activated.The activation energy may be found from viscosity dependence on temperature.Most of the effects related to the local structure are found in supercooled liquidsclose to the glass transition, where the activation energy is much larger than thethermal energy kBT. For many systems, this energy substantially increases uponcooling towards the glass transition. It is generally believed that this super-Arrheniusbehavior reflects monotonous and continuous changes in the local structure of theliquid upon cooling.The effects related to the local structure are not limited to the supercooled state of
liquids. Recent studies of equilibrium liquids found discontinuities in thetemperature dependence of electrical conductivity and heat capacity [3–6] in moltensulfur, selenium, iodine, bismuth, and tellurium. These discontinuities wereinterpreted, following the earlier theory [3–10], in terms of changes in the localorder due to a phase transition between liquid states differing in local structure.The continuous and monotonous properties change, and discontinuities at a
liquid–liquid phase transition are two limits of ordering behavior in statisticalmechanics. The liquid–liquid transition between liquid states with different localstructure assumes [7,8] the existence of competing local structure types in thesystem (polyamorphism). Note that, unlike the liquid crystalline ordering, in thecontinuous properties change as well as the discontinuous change in liquid–liquidphase transitions the global symmetry of the liquid is not changed. The liquid–liquid phase transition line terminates at the critical point; crossing of the phasetransition line closer and closer to this point will result in diminishing discontinuities,and increase of fluctuations. In the supercritical range of parameters, onlynon-monotonous properties change remains as an indication of rapid changes inthe statistics of competing local structures upon cooling. One may suggestthat anomalies (non-monotonous behavior upon temperature change) in liquidsmanifesting changes in the local structure are common phenomena for low-temperature liquids with competing local structures. We believe that the unexpectedphysical behaviors found in Benzene, Quinoline, and other complex fluids [11–18],are manifestations of changes in the local structure, and that similar phenomena maybe observed, under special experimental conditions, in many equilibrium andsupercooled liquids. The magnitudes of the observed effects are small, andspecial care has to be given to the purity of the liquids and equilibration time. Inparticular, a very careful de-gassing is a necessary condition for the observation ofthe effect. The anomalies of behavior were so far observed in the hypersound velocityand the ratio of the isobaric and isochoric heat capacities. In Quinoline andBenzene, the orientation relaxation times of molecules were shown to increase withincreasing temperature in small temperature domains located well above the freezingpoint [18].

ARTICLE IN PRESS
L. Letamendia et al. / Physica A 354 (2005) 34–4836
A liquid characterized by a long-living local structure may have new slow modesthat are beyond the framework of the classical theory of liquids. In low-temperatureliquids consisting of rotationally asymmetric molecules, a new hydrodynamicmode of molecular rotation was long ago predicted by Leontovich [19], andexperimentally confirmed by Fabelinskii [20]. In a Leontovich liquid, a changeof molecular orientation beyond the small thermal vibrations is a relaxationprocess characterized by a relaxation time yorbt; where t is the microscopicperiod of molecular vibrations; usually, t�10�12–10�11 s. The orientation relaxa-tion is coupled to the momentum density in the modified set of hydrodynamicequations. More recently, Kawasaki [21] assumed the existence of many new modesneglected in classical theories. Theoretical models based on the slow modeassumption have been proposed by Mountain et al. [22], and Oxtoby et al. [23].Kivelson et al. [24,25] developed a frustrated transition scenario that includes a slowmode.In the current paper, we report new results of a study of light scattering in
Quinoline. In previous experiments, an unusual behavior of the temperaturevariation of the hypersound velocity in Benzene and Hexafluorobenzene [17] wasfound at typically �5GHz from the shift of the Brillouin doublet in polarizedRayleigh–Brillouin spectra. In Quinoline and Benzene, abnormal behavior has alsobeen evidenced [18] in the reorientation correlation time inferred from the width ofthe depolarized Rayleigh spectra. In contrast to the expected monotonic change withtemperature, these quantities have reproducible anomalies at 36 and 46 1C forBenzene, and 38 and 50 1C for Hexafluorobenzene, well above the freezingtemperatures of these liquids.We present the temperature dependence of the hypersound velocity u and of
the specific heats ratio g derived from extensive measurements of the polarizedand depolarized Rayleigh–Brillouin spectra in liquid Quinoline. Both quantitiesshow anomalies at temperatures close to 17 and 42 1C. The reorientation relaxa-tion time and the spin–lattice relaxation time T1 of Quinoline haveanomalies [14,15,18,26] at the same temperatures. A plausible interpretation ofthe observed anomalies in terms of orientation ordering and a possible relationof these anomalies to liquid–liquid phase transitions are discussed in the lastsection. Based on known characteristics of interaction in the systems, we makesuggestions about the ordering in the liquid manifested by the anomalies observed.More work is needed to yield a clear understanding of the details of these orderingprocesses.
2. Experimental
Quinoline from Fluka, contained in a cylindrical sealed glass cell (scattering cell),was first triply distillated under vacuum to eliminate dust, then submitted to freezingcycles in order to remove dissolved gases. The polarized light from a 2020 ArgonSpectra Physics Ion laser delivering a longitudinal single-mode radiation at 514.5 nmis focused on the scattering cell that is imbedded in a circulating bath containing a

ARTICLE IN PRESS
L. Letamendia et al. / Physica A 354 (2005) 34–48 37
liquid of high refractive index to insure index matching. The temperature of the bathis stable at better than70.01K during the duration of the experiment. Mirrors allowus to vary the scattering angle y from 301 up to 1501. The scattering wave-vector
k ¼4pn
lsin
y2
� �
is then changed by a factor of almost 4. Here, n is the refractive index of the sampleand l the wavelength of the laser light. One can measure the VV, VH, HV and HHspectra by using a polarization rotator mounted on the laser head, and polarizerslocated on the scattered beam. Here, V means that the beam is polarizedperpendicular to the scattering plane (vertical direction), and H refers to thepolarization parallel to the scattering plane (horizontal direction). In the currentpaper, we shall focus on the polarized VV and depolarized VH spectra. The scatteredlight is analyzed by using a Tropel double-pass plane Fabry–Perot interferometer(FP). To avoid fluctuations of the refractive index of the air between the coatedplates, the (FP) is located in a temperature-controlled housing. The light issued fromthe FP is focused on a pinhole of convenient diameter and then received via anoptical fiber on an avalanche diode working in Geiger regime with a quantumefficiency of nearly 50%.In order to account for possible frequency drift of the laser frequency during the
experiment, the electronic scanning procedure of the FP is as follows. Theparallelism of the plates of the FP is adjusted by piezoelectric transducers (PZT)connected to a tunable high voltage power supply. This allows us both to adjust thealignment of the plates at the beginning of the experiment and to maximize thefinesse coefficient (typically 50) during all the duration of the experiment via afeedback system. For that task, the FP is alternatively illuminated by the scatteredbeam and by a second beam of very low intensity directly coming from the laser.During each scan corresponding to two interference orders of the FP, the signalcorresponding to the direct beam is maximized by acting on the PZT transducers andrecorded. Then the scattered beam is recorded in his turn. All the data areaccumulated on a 1024 channels multi-channel analyzer driven by a PC computer viaa National Instrument card. For each experiment, we measure both the instrumentalfunction during the total duration of the experiment (typically 1H), and the scatteredspectrum. Then, the scattered spectra are deconvoluted using Zamir et al. [27]procedure. It has to be stressed that, due to polarization selection rules in dynamicallight scattering, the VV spectrum is the sum of the totally polarized Rayleigh–Brillouin triplet (dynamical structure factor Sðk;oÞ; where o is the cyclic frequency)and of a part of the intense depolarized VH spectrum [28,29]. It is easy to show thatthe VV spectrum intensity distribution IVV ðk;oÞ is given by IVV ðk;oÞ ¼ Sðk;oÞ þð3=4ÞIVHðk;oÞ; where IVH ðk;oÞ represents the intensity distribution of the VHdepolarized spectrum. Therefore, in order to have a precise measurement of Sðk;oÞone has to carefully account for the VH spectrum. This spectrum was also recorded.To describe the shape of the VH spectrum, we used the most recent model, proposedby Quentrec [30], that accounts for the coupling between the reorientation motion of

ARTICLE IN PRESS
L. Letamendia et al. / Physica A 354 (2005) 34–4838
molecules and dissipative shear waves:
IVHðk;oÞ ¼ sin2y2
Go2 þ G2
þ cos2y2
G o2 þ Z0Z1k4
r2
� �
o2 � Z0Gk2
r
� �2
þ o2 Gþ Z1k2
r
� �2. (1)
In formula (1), G is the reorientation relaxation frequency of molecules, r is thedensity; Z0 and Z1 ¼ Z0ð1� RÞ are, respectively, the low- and high-frequency valuesof the shear viscosity, R being a coupling constant (0oRo1). In most cases, R isabout 0.4. A typical fit of the VH spectrum to Eq. (1) is shown in Fig. (2). As one cansee, a very good fit of the experimental data using Eq. (1) may be achieved.For non-relaxing liquids, the analytic expression for the dynamical structure
factor Sðk;oÞ has been deduced by many authors in the form
Sðk;oÞ ¼g� 1
g
� �GC
o2 þ G2C
þ1
2gGB
ðo� OBÞ2þ G2
B
þGB
ðoþ OBÞ2þ G2
B
"
�GBðo� OBÞ
ðo� OBÞ2þ G2
C
þGBðoþ OBÞ
ðoþ OBÞ2þ G2
C
#, ð2Þ
Sðk;oÞ is the sum of a non-shifted central Rayleigh line and two symmetricallyshifted Brillouin lines. The Rayleigh line is a Lorentzian line accounting for thermaldissipation in the liquid. The two shifted Brillouin lines are a Lorentzian line and ananti-Lorentzian line. In the formula (2), OB is the Brillouin frequency, GC and GB
are, respectively, the half-widths at half-high of the central Rayleigh line and of theBrillouin lines. These quantities are related to transport coefficients of the liquid, thethermal conductivity and shear and bulk viscosities. The quantity g is the ratio ofspecific heats at the constant pressure and constant volume. This quantity can befound by measuring the ratio RLP of integrated intensities of the central Rayleighline IC to the two Brillouin lines 2IB:
RLP ¼IC
2IB
¼ g� 1 . (3)
The Brillouin frequency shift OB is related to the sound velocity u by OB ¼ ku: Infact, in a Brillouin scattering experiment the wave-vector k is fixed by experimentalconditions. In the case of ultrasonic experiments that give directly u, the frequency isfixed. Therefore, the measured quantity in a Brillouin scattering experiment is notexactly u but u1: These two quantities are linked by
u1 � u 1þG2
B
2O2B
!. (4)
As we shall see below, the correction for the sound velocity is of the order of 2%.Experimental interferograms for polarized VV (triangles) and depolarized VH(squares) Rayleigh–Brillouin spectra, recorded at the same temperature 45 1C andwave-vector, are depicted in Fig. 1. The VH spectrum, clearly showing the so-called

ARTICLE IN PRESS
0.0
0.2
0.4
0.6
0.8
1.00 10
0.0
0.2
0.4
0.6
0.8
1.0
Nor
mal
ized
inte
nsity
Frequency (GHz)
2 4 6 8
0 102 4 6 8
Fig. 1. Polarized spectrum IVV ðq;oÞ (triangles) and depolarized spectrum IVH ðq;oÞ (squares) in Quinolineat 45 1C. Apparatus functions are the same in both measurements.
0.2
0.4
0.6
0.8
1.0
0 4 10
0.2
0.4
0.6
0.8
1.0
VH
Inte
nsity
Frequency (GHz)
2 6 8
0 4 102 6 8
Fig. 2. Depolarized spectrum IVH ðq;oÞ: experimental data (circles) and the fit using formula (1)
(continuous line).
L. Letamendia et al. / Physica A 354 (2005) 34–48 39
shear dip, is so intense that an incorrect evaluation may result in an error in theparameters involved in Sðk;oÞ of more that 20%. A typical fit of the VH spectrum,obtained at 15 1C to Quentrec model [30], is shown in Fig. 2.A good agreement between our experiments and the model is achieved at
temperatures ranging from 10 to 60 1C. Using VH data, one can fit the experimentalVV spectrum; a typical fit is shown in Fig. 3. Here, a very good agreement is alsoobserved between the experimental data and the theoretical model. From the fit, weobtain the dynamic structure factor Sðk;oÞ and the relevant parameters, the soundvelocity u and the Landau–Placzek ratio RLP: The experimental error for the sound

ARTICLE IN PRESS
0.0
0.2
0.4
0.6
0.8
1.0
0 10
0.0
0.2
0.4
0.6
0.8
1.0
Inte
nsity
Frequency (GHz)
2 4 6 8
0 102 4 6 8
Fig. 3. A typical polarized spectrum IVV ðq;oÞ: experimental data (squares) and the fit using formula (5)
(continuous line).
L. Letamendia et al. / Physica A 354 (2005) 34–4840
velocity u is of the order of 70.5%, or �7.5ms�1, whereas the experimental errorfor g ¼ RLP þ 1 is about 75%. The formula for the intensity IVV may be written as
IVV ðk;oÞ ¼g� 1
g2GC
o2 þ G2C
þ1
gGB
ðo� OBÞ2þ G2
B
�ðGB þ ðg� 1ÞGCÞðo� OBÞ
ðo� OBÞ2þ G2
B
"
þGB
ðoþ OBÞ2þ G2
B
þðGB þ ðg� 1ÞGCÞðoþ OBÞ
ðoþ OBÞ2þ G2
B
#. ð5Þ
3. Experimental results
The experimental results critically depend on the degree of liquid purification,especially degassing, and on equilibration time preceding the measurement of thespectrum. We assume that this high sensitivity of the results to preparation factors isan important feature to help in interpretation of the obtained data. Fig. 4 shows thesound velocity as a function of temperature for triply distillated and de-gazedQuinoline samples prepared as described above (full dots). On the same graph, wehave also plotted the sound velocity deduced for Quinoline taken from the pot andonly filtered on Millipore filters to eliminate dust (full line). Whereas in filteredQuinoline we observe the classical monotonic quasi-linear decrease of the soundvelocity upon increasing temperature, a non-monotonic behavior is observed fortriply distillated Quinoline. The sound velocity shows two well-defined local maximaat temperatures about 17 and 42 1C. The maxima are very well reproducible andcannot be attributed to experimental errors. Indeed, the amplitude of the two humpsis of the order of 50m s�1 while the experimental uncertainty is less than 710m s�1.

ARTICLE IN PRESS
10 20 30 40 50 60
1500
1550
1600
1650
1700
10 20 30 40 50 60
1500
1550
1600
1650
1700 D E
u (m
/s)
T (˚C)
Fig. 4. Sound velocity u as a function of temperature: neat Quinoline (black disks), and usual grade (not
neat) Quinoline (continuous line). The black square shows the data of one ultrasound measurement.
10 15 20 25 30 35 40 45 50 55 60 650.20
0.25
0.30
0.35
0.40
0.45
0.50
10 15 20 25 30 35 40 45 50 55 60 65
0.20
0.25
0.30
0.35
0.40
0.45
0.50
RLP
T ( C)
Fig. 5. The Landau–Plazek ratio RLP as a function of temperature in Quinoline. Data for the neat system
(squares) and for the not neat Quinoline (continuous line).
L. Letamendia et al. / Physica A 354 (2005) 34–48 41
On the same graph, we have also plotted the sound velocity found in an ultrasoundexperiment (full square). Acoustic measurements have been performed at only onetemperature, located in the ‘‘normal liquid’’ regime. The observed large dispersion ofthe sound velocity (of the order of 150m s�1) indicates that there are relaxation modesin the frequency range between the ultra- and hypersound. These relaxation modes areexpected to result in the Mountain lines centered at the zero (laser) frequency. In ourmeasurements, we have been unable to measure these lines since they are hidden by theintense non-shifted Rayleigh line and by the depolarized VH line.Fig. 5 shows the ratio RLP ¼ IC=2IB of the integrated intensities of the central
Rayleigh line IC to the two Brillouin lines 2IB: According to the Landau–Placzek
ARTICLE IN PRESS
L. Letamendia et al. / Physica A 354 (2005) 34–4842
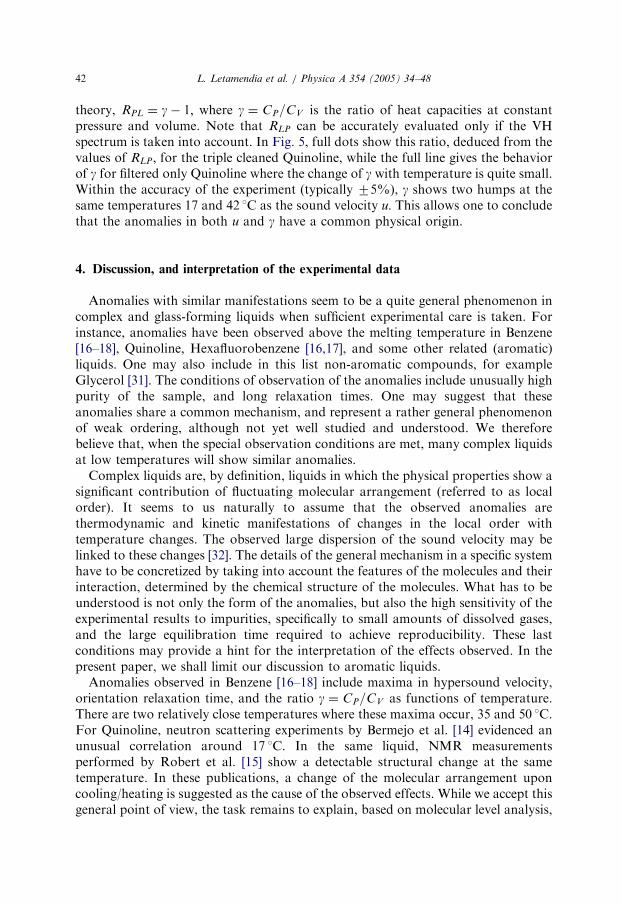
theory, RPL ¼ g� 1; where g ¼ CP=CV is the ratio of heat capacities at constantpressure and volume. Note that RLP can be accurately evaluated only if the VHspectrum is taken into account. In Fig. 5, full dots show this ratio, deduced from thevalues of RLP; for the triple cleaned Quinoline, while the full line gives the behaviorof g for filtered only Quinoline where the change of g with temperature is quite small.Within the accuracy of the experiment (typically 75%), g shows two humps at thesame temperatures 17 and 42 1C as the sound velocity u: This allows one to concludethat the anomalies in both u and g have a common physical origin.
4. Discussion, and interpretation of the experimental data
Anomalies with similar manifestations seem to be a quite general phenomenon incomplex and glass-forming liquids when sufficient experimental care is taken. Forinstance, anomalies have been observed above the melting temperature in Benzene[16–18], Quinoline, Hexafluorobenzene [16,17], and some other related (aromatic)liquids. One may also include in this list non-aromatic compounds, for exampleGlycerol [31]. The conditions of observation of the anomalies include unusually highpurity of the sample, and long relaxation times. One may suggest that theseanomalies share a common mechanism, and represent a rather general phenomenonof weak ordering, although not yet well studied and understood. We thereforebelieve that, when the special observation conditions are met, many complex liquidsat low temperatures will show similar anomalies.Complex liquids are, by definition, liquids in which the physical properties show a
significant contribution of fluctuating molecular arrangement (referred to as localorder). It seems to us naturally to assume that the observed anomalies arethermodynamic and kinetic manifestations of changes in the local order withtemperature changes. The observed large dispersion of the sound velocity may belinked to these changes [32]. The details of the general mechanism in a specific systemhave to be concretized by taking into account the features of the molecules and theirinteraction, determined by the chemical structure of the molecules. What has to beunderstood is not only the form of the anomalies, but also the high sensitivity of theexperimental results to impurities, specifically to small amounts of dissolved gases,and the large equilibration time required to achieve reproducibility. These lastconditions may provide a hint for the interpretation of the effects observed. In thepresent paper, we shall limit our discussion to aromatic liquids.Anomalies observed in Benzene [16–18] include maxima in hypersound velocity,
orientation relaxation time, and the ratio g ¼ CP=CV as functions of temperature.There are two relatively close temperatures where these maxima occur, 35 and 50 1C.For Quinoline, neutron scattering experiments by Bermejo et al. [14] evidenced anunusual correlation around 17 1C. In the same liquid, NMR measurementsperformed by Robert et al. [15] show a detectable structural change at the sametemperature. In these publications, a change of the molecular arrangement uponcooling/heating is suggested as the cause of the observed effects. While we accept thisgeneral point of view, the task remains to explain, based on molecular level analysis,

ARTICLE IN PRESS
L. Letamendia et al. / Physica A 354 (2005) 34–48 43
the nature of this change. Below, we shall suggest a physical picture of low-temperature aromatic liquids that may explain observed anomalies and some otherphysical properties of these systems. This picture is based on assumptions that needto be tested by future experiments.The molecules of Benzene, Quinoline, and Hexafluorobenzene share features
common for aromatic molecules [33]. For considerations related to the structure ofthe liquid, these molecules may be treated as plain and rigid bodies without internaldegrees of freedom. The relatively rigid electronic configurations of the molecules arecharacterized by a significant separation of positive and negative electric charges atthe molecular length scale of few Angstroms. At very short distance betweenmolecules, strong repulsion determines the shapes of the molecules; and at the onlyslightly larger length-scale, attraction become important. At this distance, the electriccharge distribution may be characterized in terms of rigid electrical multipoles.Interactions of these multipoles, together with the very short-range repulsion,determine the set of mutual positions and orientations of two neighboring moleculescorresponding to potential energy minima. Dispersion forces are less sensitive tostructure, and mostly favor higher densities of the liquid.In gas state at temperatures of the anomalies (close to the triple point), the binding
energies DE supporting the dimers, as well as the energy barriers for switchingbetween dimer configurations, are only 3–10 times the thermal energy kBT inBenzene; the energies DE for the most stable dimer configurations increase withincreasing number of aromatic rings in the molecule. The position entropy s that islost when two molecules dimerize is s�kB ln v; where v is the free volume permolecule. This volume is large in the gas state, so that dimers easily break up(evaporate), and the relative concentration of dimers is small. In the low-temperatureliquid state, the density is high and v is small, so that both the positional andorientational parts of the entropy are of the same order, and s�DE=T : Then, theprobability to find two neighboring molecules in relative positions and orientationsnear a minimum of the interaction energy becomes significant. To distinguish thesituation when two neighboring molecules are close to one of the minima of the pairinteraction energy, we will refer to those two molecules as paired. We expect that inthe temperature range of the anomalies, a molecule frequently pairs with more thanone neighbor. This creates an ordered cluster with correlation in positions andorientations of the molecules in this cluster.A description of a liquid in terms of pairs is known in associated liquids, with pairs
(molecule associations) held together by hydrogen bonds. This mechanism of associationmay determine the anomalies in glycerin observed in Ref. [31]. In aromatic liquids, pairsare held together mainly by electrostatic forces. A formal definition of pairing assumespartitioning the two-molecules configuration space into domains corresponding todifferent pairing situations: the domains (energy basins) surrounding the few relativelydeep energy minima represent paired states, and the rest of the configuration spacedescribes unpaired molecules. Details and applications of these ideas are used in thestatistical theory of structure recognition (see Ref. [34] and references therein).For a single dimer at room temperatures, the energy barrier for passing from one
energy minimum configuration to another one is only few time the thermal energy

ARTICLE IN PRESS
L. Letamendia et al. / Physica A 354 (2005) 34–4844
kBT (�3kBT in Benzene, see below). Therefore, the lifetime of a single pairing stateis only about an order of magnitude larger than the molecular vibration period.When molecules in a cluster pair with more than one neighbor each, the clusterbecomes an aggregate of associated molecules. Due to geometrical restrictions, agiven pairing state of two molecules limits their possible pairing states with othermolecules. A lower energy of packing corresponds to a larger number of pairs in acluster, and implies a special local order, with correlated positions and orientationsof molecules in the cluster. The lifetime of those ordered aggregates substantiallyincreases. The multiplicity of dimer pairing states with close energies allows clustersto have different local orders. We assume that the similar anomalies observed inBenzene, Quinoline, and other liquids reflect changes in the size and statistics ofthese ordered clusters. The small magnitude of the effects, and apparently the smallenergies involved, indicate that one deals with a weak association, much weaker thanthat in associated liquids having strong hydrogen bonding as the primary cause ofassociation. It is important that there is more than one type of pairing, and of low-energy local structure in the liquid. One can see some similarity of the above picturewith that of proton disorder in Ice [35].The most studied aromatic molecule is Benzene. The electronic structure of the
Benzene molecule [33] includes a molecular plane with all nuclei and a cloud of s-electrons, and clouds of p-electrons below and above this plane. Interaction energyfor two Benzene molecules favors several mutual positions [16,36,37], labeled as T,L, and S configurations. The T-configuration is found in dimers in the gas phase, andin the crystalline phase. In this T configuration, the carbon atom of one molecule issituated near the center of another molecule, and the C-6 axes of the molecules aremutually orthogonal. Another preferred configuration is the L configuration inwhich a hydrogen atom in one molecule is close to a hydrogen atom and a carbonatom of the other molecule, and the C-6 axes are at right angles. The third knownconfiguration (stacking configuration, S) is when the planes of both molecules areparallel, and there is a small shift of centers along the molecule plane. The calculated[36,37] energy minima for the T, L, and S configurations are �8.5, �6, �4 kJmol�1,respectively. Using different combinations of T, L, and S pairs in Benzene, one mayconstruct differently ordered clusters with a high number of pairs per molecule. Forexample, a planar cluster may be built using the T- and L-pairing to produce a layerof the crystalline lattice. In an ordered cluster, the depth of the potential well for thereorientation of a molecule becomes higher, and the lifetime of the local structure inthe cluster becomes larger than in a dimer with its single pairing. The large line widthof the depolarized Rayleigh lines (�50–70GHz) measured in liquid Benzene isprobably due to reorientation jumps of molecules between equivalent T configura-tions in the less ordered parts of the liquid. This line width is about 20 times smallerin Quinoline, indicating deeper energy basins for pairing of two-ring molecules, andleading to reorientation time of about 3 10�9 s. The electronic structure ofQuinoline allows one to expect a number of preferred configurations, with energyminima about twice as deep as in Benzene. An additional feature is the asymmetry ofthe Quinoline molecule due to the nitrogen atom. This asymmetry results in a frozen-in dipole moment, responsible for the large (�10) dielectric constant of Quinoline.

ARTICLE IN PRESS
L. Letamendia et al. / Physica A 354 (2005) 34–48 45
The electric dipole brings in an additional element of the local order. For pairs ofneighboring molecules, this new element is the dipole moment of the pair.The above description shows that aromatic liquids have a number of pairing states
and thus a large number of possible local arrangements in an ordered small cluster ofthe liquid. The maximum density of pairing (and the minimum of the free energybelow the melting temperature) corresponds to the crystalline state. Note thatcrystalline Benzene is known to have polymorphous transitions. We suggest thatclose to the melting temperature, at any given time there is a significantconcentration of paired molecules and ordered clusters in the liquid having a highnumber of pairs per particle but made of different combinations of possible pairs.Changes, upon cooling, in appearance frequency and in size of these aggregatesdescribe the ordering on the length-scale next to the size of a molecule. As explainedin Refs. [7,8], under certain conditions multiplicity of possible local structures is aprerequisite for a liquid–liquid phase transition. Another possibility is that the phasetransition is avoided but the system comes close to a critical state.One may see similarities and differences between the picture of ordering due to
weak association described above, and that of liquid–crystalline ordering. Aromaticmolecules containing more than 4 aromatic rings are known to form liquid crystals[38]. The aspect ratio for those molecules is high. In the classical theory of liquidcrystals [39], the non-spherical shape of the molecules and high aspect ratio areassumed to cause orientation ordering. We believe that the rich geography of phasesin the thermodynamic (T ;P)-plane, re-entrance transitions and other features ofthose liquids suggest the importance of attraction forces and molecular association,and the physical picture of pairing and clustering apply for those systems. The highaspect ratio of the molecules results in easily detectable elements of the local andglobal order in liquid crystals captured in the order parameter description ofnematic, smectic, and other liquid crystalline states. The higher angular moments ofanisotropy that may play an important role in systems like Benzene are thenneglected because these moments play a secondary role in classical liquid crystals.Theoretically, one may treat the multi-ring aromatic compounds as a system, with
the number of aromatic rings and other details of the chemical structure as newthermodynamic parameters, in addition to the temperature and pressure. Let usdenote the set of these parameters as P; and consider an extended thermodynamic(T ;P;P)-space. The list of known liquid crystals includes liquids with values of Pdifferent but, as one may suggest, not very far from those for Benzene andQuinoline. The singularities in measured properties in known liquid crystals arestronger than those observed in Benzene, Quinoline, and other liquids discussed inour paper, and the liquid–crystalline ordering does not require the rather stringentconditions for observing the anomalies in Benzene and Quinoline. The values thatthe parameter P takes in real molecules belong to a discrete set of values.Theoretically, one may interpolate, and consider a continuous set of values for P:From general considerations one can assume that the free energy landscape in the(T ;P;P)-space does not change abruptly when the coordinate P is changed from theknown liquid crystals towards smaller molecules. Rather, a phase transition surfacein the (T ;P;P)-space terminates in a critical point (Tc;Pc;Pc). The question of

ARTICLE IN PRESS
L. Letamendia et al. / Physica A 354 (2005) 34–4846
anomalies in the liquids consisting of small organic molecules is then: are thesesystems ‘‘above’’ the critical value Pc of P; and by taking even greater precautionsone will arrive at characteristic discontinuities, or these liquids have super-criticalvalues of P; and the observed anomalies indicate the closest proximity to the criticalpoint Tc; Pc; Pc: The answer to this question can be found by future experiments.The anomaly in the heat capacity ratio g suggests that there is a corresponding
anomaly in the thermal expansion coefficient. Local positional and orientationalordering is usually accompanied by volume changes caused by striction (interactionof the order parameters with density). The shape of the anomalies observed inQuinoline is rather typical for near-critical states and other regions of strongfluctuations. The anomaly in hypersound velocity reflects both the fluctuations andthe change in the density and short-range order. In a liquid–crystalline transitionclose to the second order, in addition to direct contributions of fluctuations there arejumps in thermodynamic susceptibilities as predicted by the Landau theory [40], anddiscontinuities due to the weak first-order nature of the transition. The similarity ofthe ordering in aromatic liquids and in liquid crystals allows one to expect similarityof manifestations. An anomaly in hypersound velocity in a phase transition in aliquid–crystalline system was observed, for example, in Ref. [41].One may formally treat an associated low-temperature liquid as a multi-
component solution of pairs. Then, the numbers Na of pairs corresponding topreferred mutual configurations a ¼ 1,2yof molecules become new thermodynamiccharacteristics of the thermal equilibrium state. In the gas state, and at hightemperatures in the liquid, the pair number densities na ¼ Na=V are small. Uponcooling, the fraction of neighboring molecules in preferred mutual configurationsincreases, and the lifetime of these configurations also increases and becomessignificantly larger than the molecular vibration period. When miscibility ofcomponents of a multi-component solution is limited, one arrives at non-miscibility-related phase transitions. There is, however, a difference between thesystems considered in the classical theory of solutions, and the solution of pairs. In anon-reacting solution, particle numbers of components are conserved quantities, andthe chemical potentials for those components depend on temperature, pressure, andparticle numbers. In associated liquids, the pair numbers Na are determined by theconditions of thermodynamic equilibrium, and the formal chemical potentialsfor pairs are equal zero. Note that the particle number conservation is the causefor the appearance of hetero-phase states in solutions at a phase transition line.For a quasistatic change of the state in associate liquid, there is no componentconservation for pairs, and thus no hetero-phase states. However, those states mayappear as temporary states when the condition of complete equilibrium are violatedby a too rapid (non-quasistatic) change of temperature. In this case, at short timesthe system behaves as a system with approximately conserved Na; and may develop atemporary hetero-phase state. This may explain the observation that for insufficientequilibration time, an increased scattering of experimental data is observed ratherthan a reproducible anomaly (see, for example, Ref. [15]).An observation that have to be discussed in the framework of the above physical
picture is that impurities, and especially dissolved gases, have a strong impact on the

ARTICLE IN PRESS
L. Letamendia et al. / Physica A 354 (2005) 34–48 47
experimental results, diminishing or eliminating the anomalies in aromatic liquids.The electric charge distribution in aromatic molecules creates a complex potentialenergy landscape. The details of this landscape determine the special pairconfigurations and corresponding energies. A dissolved Oxygen atom may changethis landscape, and thus the energies of pair configurations. This, in turn, influencesthe parameters determining the phase transition, and thus the shape of theexperimental curves. This influence is especially important near the end of the phasetransition line. Properties of a system change continuously along a supercritical pathin the phase plane, but the rate of changes is substantially increased in the part of thepath close to the critical point. The large influence of impurities may indicate that thesystem is close to a critical point, and impurities shift the critical pressure to highervalues. A study of these systems at higher pressures may then give new and morerevealing insights into the nature of the observed phenomena.
5. Concluding remarks
Ordering phenomena in different condensed systems substantially differ in themagnitude of manifestations. There are strong ordering processes, (for example,crystallization of simple liquids) with large differences between phases in density,entropy, and other properties. In the liquid–liquid phase transitions, as well as inliquid–crystalline ordering, the energy involved and the magnitude of effects aremuch smaller. The anomalies in Benzene and Quinoline indicate the existence of evenweaker ordering phenomena that are close to a critical situation, and maycorrespond, as described above, to a phase transition close to a critical point, withvery small energy effects, and thus relatively weak anomalies and large relaxationtimes, or to a supercritical state close to criticality. A distinct and long-living localstructure is generally expected in supercooled liquids. The anomalies observed inBenzene, Quinoline, and other aromatic liquids, and the liquid–liquid phasetransitions found in molten Bi, Te, and Se, show that at least some liquids have adistinct local structure in equilibrium state above the melting temperature. However,more work is necessary to clarify the intriguing picture of the local ordering in low-temperature complex liquids.
Acknowledgments
AZP acknowledges helpful and insightful discussions with Mark Ratner and YuryBerlin at the Northwestern University.
References
[1] H. Eyring, J. Chem. Phys. 4 (1936) 283.
[2] J. Frenkel, Kinetic Theory of Liquids, Dover, New York, 1955.
[3] V.V. Brazhkin, S.V. Popova, R.N. Voloshin, Physica B 265 (1999) 64.

ARTICLE IN PRESS
L. Letamendia et al. / Physica A 354 (2005) 34–4848
[4] V.V. Brazhkin, S.V. Popova, R.N. Voloshin, High Pressure Res. 15 (1997) 267.
[5] V.V. Brazhkin, R.N. Voloshin, S.V. Popova, A. Lyapin, Usp. Fiz. Nauk. 169 (1999) 1035.
[6] S. Tamaki, Phase Transit. 66 (1998) 167.
[7] A. Patashinski, A.C. Mitus, B.I. Shumilo, Phys. Lett. 113A (1985) 41.
[8] A.C. Mitus, A. Patashinski, Acta Phys. Pol. A 47 (1988) 779.
[9] K.R. Rao, Curr. Science 80 (9) (2001) 1098.
[10] L. Son, G. Rusakov, N. Katkov, Physica A 324 (2003) 633.
[11] E.W. Fischer, Physica A 201 (1993) 183 and references therein.
[12] S.A. Kivelson, X. Zao, D. Kivelson, T.M. Fisher, C. Knobler, J. Chem. Phys. 101 (1994) 2391.
[13] N.B. Rozhdestvenskaya, L.V. Smirnova, JETP Lett. 44 (1986) 1166.
[14] F.J. Bermejo, M. Garcia-Hernandez, W.S. Howells, R. Burriel, F.J. Mompean, D. Martin, Phys.
Rev. E 48 (1993) 2766.
[15] D. Jalabert, J.B. Robert, H. Roux-Buisson, J.P. Kintzinger, J.M. Lehn, R. Zinzius, D. Canet,
P. Tekely, Europhys. Lett. 115 (1991) 435;
J.B. Robert, J.C. Boubel, D. Canet, Mol. Phys. 90 (1997) 399;
L. Gauthier, J.B. Robert, D. Canet, J. Mol. Liq. 85 (2000) 77.
[16] N.B. Rozhdestvenskaya, L.V. Smirnova, J. Chem. Phys. 195 (1991) 1223.
[17] L. Letamendia, M. Belkadi, O. Eloutassi, G. Nouchi, C. Vaucamps, S. Iakovlev, N. Rozhdestvens-
kaya, L.V. Smirnova, M. Runova, Phys. Rev. E 48 (1993) 3572.
[18] L. Letamendia, M. Belkadi, O. Eloutassi, E. Pru-Lestret, G. Nouchi, J. Rouch, D. Blaudez,
F. Mallamace, N. Micali, C. Vasi, Phys. Rev. E 54 (1996) 5327.
[19] M.A. Leontovich, J. Phys. (Moscow) IV (1941) 49.
[20] I.L. Fabelinskii, Molecular Scattering of Light, Plenum Press, New York, 1968.
[21] K. Kawasaki, Physica A 217 (1995) 124.
[22] D. Thirumalai, R.D. Mountain, Phys. Rev. E 47 (1) (1993) 479.
[23] C.K. Bagdassarian, D.W. Oxtoby, J. Chem. Phys. 100 (1994) 2139.
[24] X. Zhao, D. Kivelson, J. Phys. Chem. 99 (1995) 6721.
[25] D. Kivelson, S.A. Kivelson, Xiaolin Zhao, Z. Nussinov, G. Tarjus, Physica A 219 (1995) 27.
[26] W. Ellison, B. Agnus, R. Vicq, G. Delbos, Second Liquid Matter Conference, Firenze Italy,
September 1993
B. Agnus, Ph.D. Thesis, Bordeaux, unpublished, 1994.
[27] E. Zamir, N.D. Gershon, A. Ben-Reuven, J. Chem. Phys. 55 (1971) 3397.
[28] B.J. Berne, R. Pecora, Dynamic Light Scattering, Wiley-Interscience, New York, 1975.
[29] J.P. Boon, S. Yip, Molecular Hydrodynamics, Mc-Graw Hill, New York, 1980.
[30] B. Quentrec, Ann. Phys. (Fr.) 9 (1984) 1.
[31] M. Grimsditch, N. River, Appl. Phys. Lett. 58 (1991) 2345.
[32] A.Z. Patashinski, M.A. Ratner, J. Chem. Phys. 120 (2004) 2814.
[33] R.T. Morrison, R.N. Boyd, Organic Chemistry, Prentice-Hill, Englewood Cliffs, NJ, 1992.
[34] A. Patashinski, A. Mitus, M. Ratner, Phys. Rep. 288 (1997) 409.
[35] D. Eisenberg, W. Kauzman, The Structure and Properties of Water, University Press, New York,
Oxford, 1969.
[36] L.D. Lowden, D. Chandler, J. Chem. Phys. 61 (1974) 5228;
L.D. Lowden, D. Chandler, J. Chem. Phys. 59 (1973) 6587.
[37] P. Linse, J. Am. Chem. Soc. 106 (1984) 5425;
Shi Xiangian, L.S. Bartell, J. Phys. Chem. 92 (1988) 5667.
[38] D. Demus, J. Goodby, G.W. Gray, H.-W. Spiess, V. Vill (Eds.), Handbook of Liquid Crystals, vol. 4,
Wiley-VCH, Weinheim, New York, Chichester, Brisbane, Singapore, Toronto, 1999.
[39] S. Chandrosekhar, Liquid Crystals, Cambridge University Press, Cambridge, 2002.
[40] L.D. Landau, E.M. Lifshitz, Statistical Physics Part I, Pergamon, New York, 1988.
[41] G. Durand, A. Narasimha, Phys. Lett. 27A (7) (1968) 455.