Technology and Institutions: A Critical Appraisal of GIS in the Planning Domain
23
Science, Technology, and Human Values (pre-acceptance author’s copy) Technology and Institutions: A Critical Appraisal of GIS in the Planning Domain Raul P. Lejano Abstract In this article, we take a reflective look at GIS (Geographic Information Systems), which has captured planning practice to an unprecedented degree. In particular, we inquire into the potential and limitations of GIS as a new form of knowledge representation and production. Is GIS a new type of communicative practice within which hitherto unheard narratives can be portrayed, or is it an ideological structuration that is externally imposed? The paper argues how the assumptions and constructs embedded in GIS constrain its capacity for critical and reflective practice. Its power lies in mimesis as a way to map not the real but the formal, which allows it to readily translate real phenomena into forms most amenable to institutional purposes. We make these arguments in three stages: (i) first, we examine the fundamental epistemology of GIS and the particular ways that it structures knowledge; (ii) second, we focus on the internal logic of GIS and how it processes knowledge into analysis; and (iii) lastly, we reflect on the effect of GIS on practice and, in fact, on the planner herself. We use a case study, the Southeast Los Angeles GIS mapping studies, to demonstrate these points. All of these work to separate the planner from real phenomena and processes that should otherwise be the primary focus of practice. There remains, however, an unrealized potential, in GIS, for richer representations of the normative, as well as the liberation of alternative mappings of place and social phenomena. The article calls for a renewed, more grounded approach to the use and construction of GIS. I. Introduction In this article, we comment on some particularly intriguing questions regarding the increasingly dominant influence of GIS (geographical information systems) in urban and regional planning. As great as the utility of GIS is, its widespread use should nevertheless not go unreflected upon. In this paper, we focus on some of the theoretical implications of GIS, vis-à-vis the ways it is utilized in the practice of planning. We will argue how GIS is a particular discourse, in which is embedded often unrecognized assumptions and constructs that can, in many ways, dictate what is recognized as knowledge and, as importantly, constrain the ability of the user to more richly understand place and the social processes in it. Social critiques of GIS began with the first commentaries on GIS's inherent positivism in the 1990's to, more recently, a tempering of resignation to its widespread acceptance with a call for a democratization of its use (Schuuman, 2000). In this article, we will not dwell at length on GIS' positivist framework, nor its technocratic nature, which has been discussed elsewhere (e.g., see Pickles, 1995; Curry, 1998). Rather, we will focus more closely on its epistemology, specifically, the particular logics it fosters and and how this casts its effect on the planner/mapper herself. The question is not whether GIS (and
Transcript of Technology and Institutions: A Critical Appraisal of GIS in the Planning Domain
Science, Technology, and Human Values (pre-acceptance author’s copy)
Technology and Institutions:
A Critical Appraisal of GIS in the Planning Domain
Raul P. Lejano
Abstract In this article, we take a reflective look at GIS (Geographic Information
Systems), which has captured planning practice to an unprecedented degree. In
particular, we inquire into the potential and limitations of GIS as a new form of
knowledge representation and production. Is GIS a new type of communicative practice
within which hitherto unheard narratives can be portrayed, or is it an ideological
structuration that is externally imposed? The paper argues how the assumptions and
constructs embedded in GIS constrain its capacity for critical and reflective practice. Its
power lies in mimesis as a way to map not the real but the formal, which allows it to
readily translate real phenomena into forms most amenable to institutional purposes. We
make these arguments in three stages: (i) first, we examine the fundamental epistemology
of GIS and the particular ways that it structures knowledge; (ii) second, we focus on the
internal logic of GIS and how it processes knowledge into analysis; and (iii) lastly, we
reflect on the effect of GIS on practice and, in fact, on the planner herself. We use a case
study, the Southeast Los Angeles GIS mapping studies, to demonstrate these points. All
of these work to separate the planner from real phenomena and processes that should
otherwise be the primary focus of practice. There remains, however, an unrealized
potential, in GIS, for richer representations of the normative, as well as the liberation of
alternative mappings of place and social phenomena. The article calls for a renewed,
more grounded approach to the use and construction of GIS.
I. Introduction
In this article, we comment on some particularly intriguing questions regarding
the increasingly dominant influence of GIS (geographical information systems)
in urban and regional planning. As great as the utility of GIS is, its widespread
use should nevertheless not go unreflected upon. In this paper, we focus on
some of the theoretical implications of GIS, vis-à-vis the ways it is utilized in
the practice of planning. We will argue how GIS is a particular discourse, in
which is embedded often unrecognized assumptions and constructs that can, in
many ways, dictate what is recognized as knowledge and, as importantly,
constrain the ability of the user to more richly understand place and the social
processes in it.
Social critiques of GIS began with the first commentaries on GIS's inherent
positivism in the 1990's to, more recently, a tempering of resignation to its
widespread acceptance with a call for a democratization of its use (Schuuman,
2000). In this article, we will not dwell at length on GIS' positivist framework,
nor its technocratic nature, which has been discussed elsewhere (e.g., see
Pickles, 1995; Curry, 1998). Rather, we will focus more closely on its
epistemology, specifically, the particular logics it fosters and and how this casts
its effect on the planner/mapper herself. The question is not whether GIS (and
Science, Technology, and Human Values (pre-acceptance author’s
copy)
other) mappings are social constructs or not (as discussed in Taylor, 1991; Lake,
1993; Pickles, 1995; Sheppard, 1995; Harvey and Chrisman, 1998), which they
undeniably are. Rather, what we should ask is what assumptions are embedded
in such constructions and their mappings how these affect the planner's
understanding of place and planning practice. We will probe more deeply into
its aggregative logic, inquiring into what type of claims GIS can be used for.
We will find that, unrecognized in previous critiques of GIS, is perhaps the
technology's most subtle impact, and that is the effect on the planner herself. By
building and basing analysis on the digital representation of a mental and social
construct, the mapper is separated from true integrative knowledge, which we
will call experience. In this discussion, we will specifically refer to the 'planner',
but use this term more broadly to pertain to those users of GIS who link
knowledge to action in the public sphere.
We will structure our argument in three parts:
(i) The Epistemology of GIS
First, we examine the particular ways that it structures knowledge and how this
affects our representation of nature, places, and communities.
(ii) The Analytical Logic of GIS
Second, we focus on the internal logic of GIS, with specific attention to how it
structures analysis. It is in its use for analysis that GIS possesses its greatest
utility, and where the characteristics identified in (i) are most evident. That is,
how does GIS integrate and process knowledge into claims, decisions, and
proposals for action?
(iii) The Construction of the Planner and Planning Practice
Third, we look at implications of the above arguments for the use of GIS. More
importantly, we focus on the effect of GIS practice on the planner herself.
These arguments are made both conceptually and empirically and summarized
in eight formal propositions to be developed below. We will use a case study to
make and illustrate the arguments found herein. As Schuurman has pointed out,
it is important, for both pragmatic and theoretical reasons, to ground a critique
of GIS on actual practice, at least to some extent (Schuurman, 2004). Before we
proceed to the analysis, we first introduce the case study, noting how the author
analyzed the case and linked it to the theoretical propositions.
II. Case Study
Throughout the succeeding discussion, we will refer to a case study of GIS
practice to help make and illustrate the arguments herein. The case study
involves a series of mapping exercises initiated by a community group,
Communities for a Better Environment (CBE), in Southeast Los Angeles
(SELA). The case study is a particularly suitable one inasmuch as GIS mapping
was envisioned, by CBE and its partners, as an avenue to better represent
alternative claims about the justice of land use patterns in the area. As such, this
Science, Technology, and Human Values (pre-acceptance author’s
copy)
was a test of how GIS might be used as a new forum for communication and
knowledge-building, as GIS practitioners have long hoped.
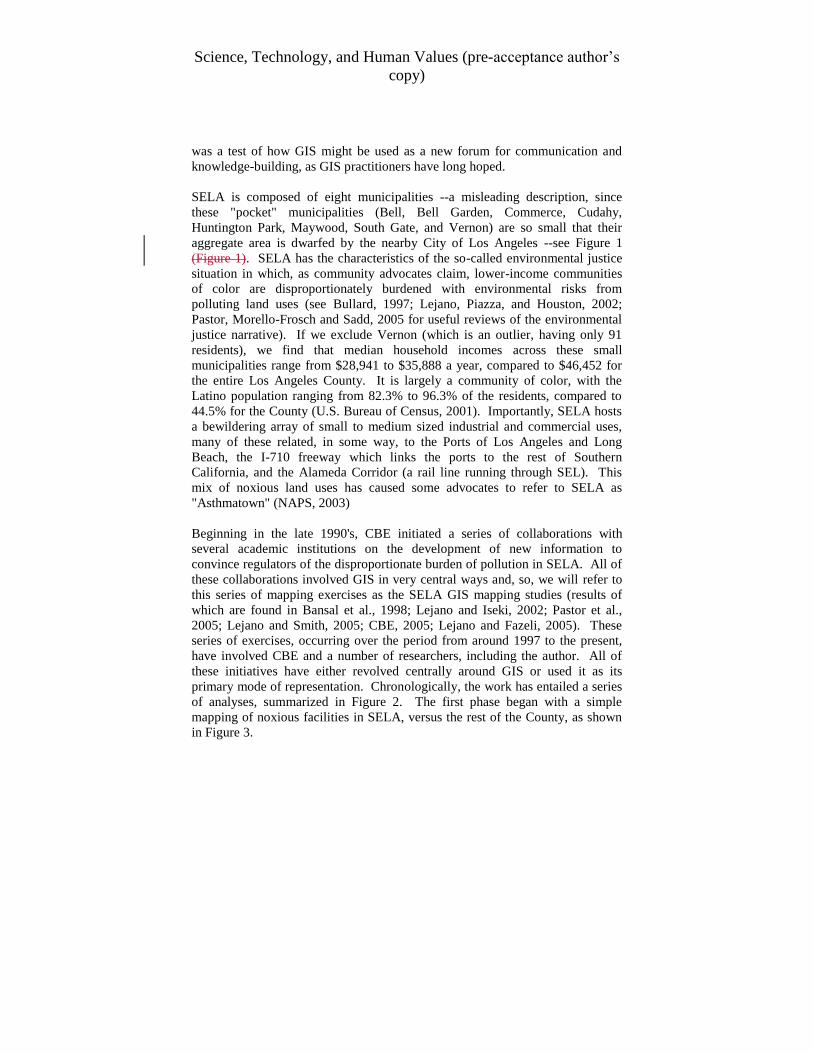
SELA is composed of eight municipalities --a misleading description, since
these "pocket" municipalities (Bell, Bell Garden, Commerce, Cudahy,
Huntington Park, Maywood, South Gate, and Vernon) are so small that their
aggregate area is dwarfed by the nearby City of Los Angeles --see Figure 1
(Figure 1). SELA has the characteristics of the so-called environmental justice
situation in which, as community advocates claim, lower-income communities
of color are disproportionately burdened with environmental risks from
polluting land uses (see Bullard, 1997; Lejano, Piazza, and Houston, 2002;
Pastor, Morello-Frosch and Sadd, 2005 for useful reviews of the environmental
justice narrative). If we exclude Vernon (which is an outlier, having only 91
residents), we find that median household incomes across these small
municipalities range from $28,941 to $35,888 a year, compared to $46,452 for
the entire Los Angeles County. It is largely a community of color, with the
Latino population ranging from 82.3% to 96.3% of the residents, compared to
44.5% for the County (U.S. Bureau of Census, 2001). Importantly, SELA hosts
a bewildering array of small to medium sized industrial and commercial uses,
many of these related, in some way, to the Ports of Los Angeles and Long
Beach, the I-710 freeway which links the ports to the rest of Southern
California, and the Alameda Corridor (a rail line running through SEL). This
mix of noxious land uses has caused some advocates to refer to SELA as
"Asthmatown" (NAPS, 2003)
Beginning in the late 1990's, CBE initiated a series of collaborations with
several academic institutions on the development of new information to
convince regulators of the disproportionate burden of pollution in SELA. All of
these collaborations involved GIS in very central ways and, so, we will refer to
this series of mapping exercises as the SELA GIS mapping studies (results of
which are found in Bansal et al., 1998; Lejano and Iseki, 2002; Pastor et al.,
2005; Lejano and Smith, 2005; CBE, 2005; Lejano and Fazeli, 2005). These
series of exercises, occurring over the period from around 1997 to the present,
have involved CBE and a number of researchers, including the author. All of
these initiatives have either revolved centrally around GIS or used it as its
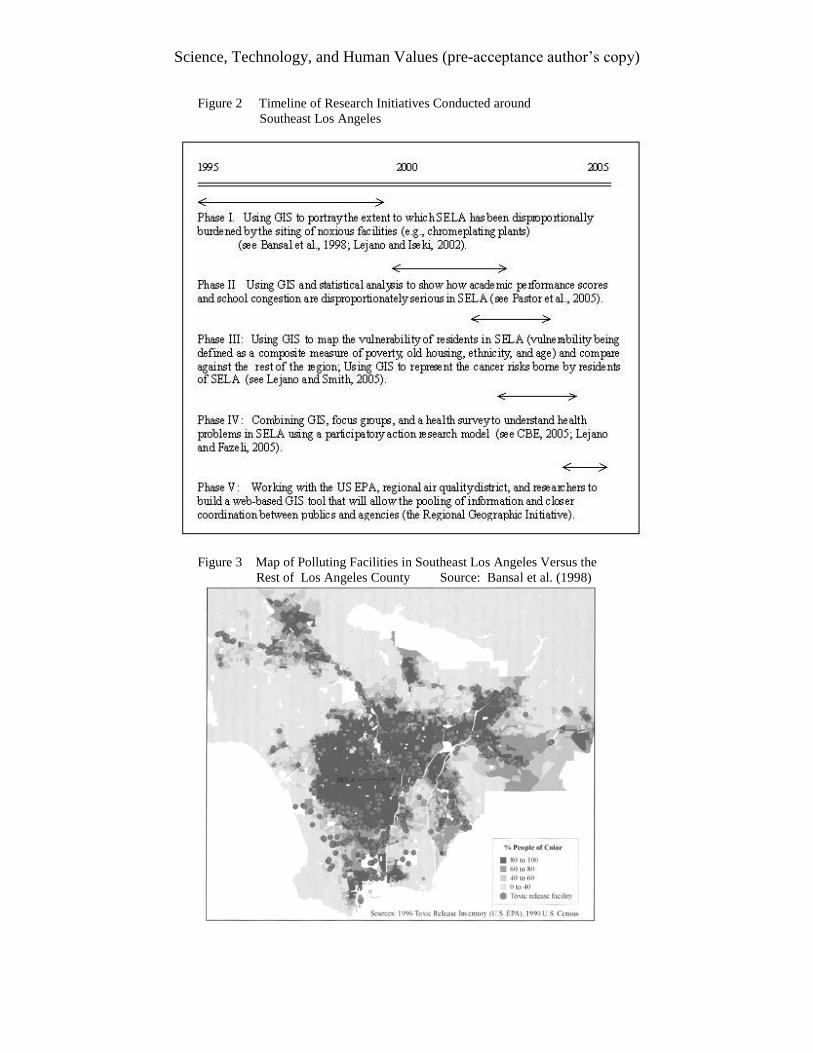
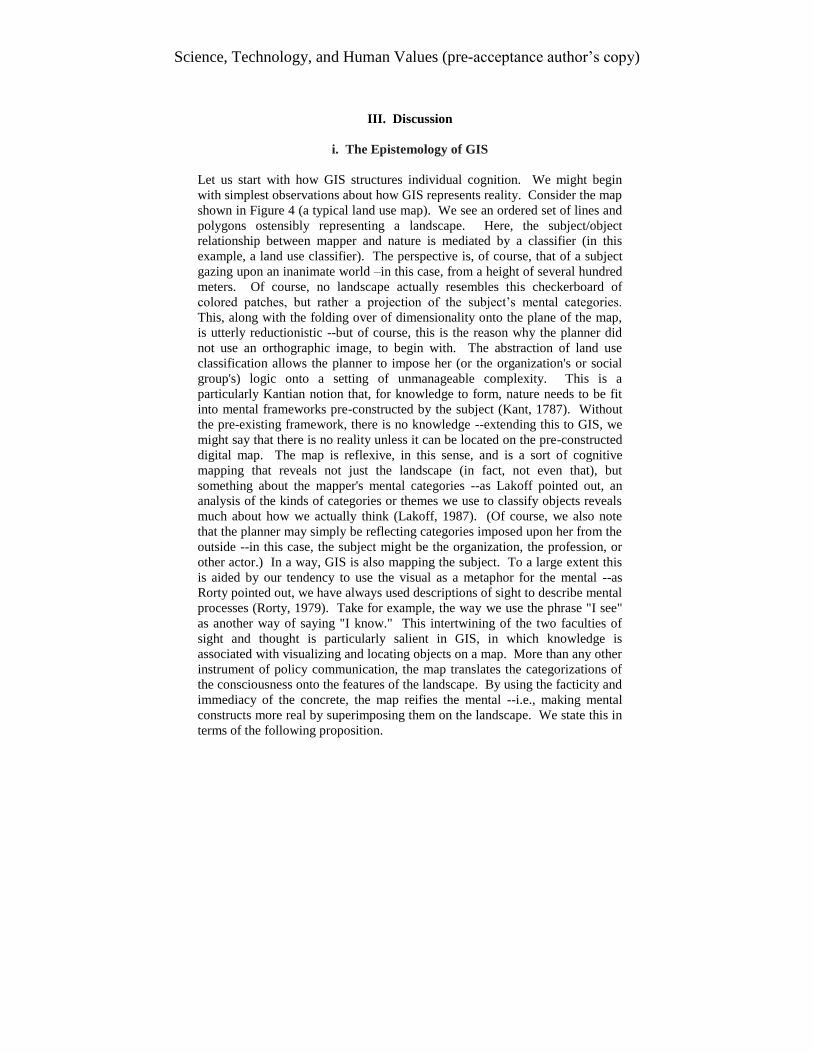
primary mode of representation. Chronologically, the work has entailed a series
of analyses, summarized in Figure 2. The first phase began with a simple
mapping of noxious facilities in SELA, versus the rest of the County, as shown
in Figure 3.
Science, Technology, and Human Values (pre-acceptance author’s
copy)
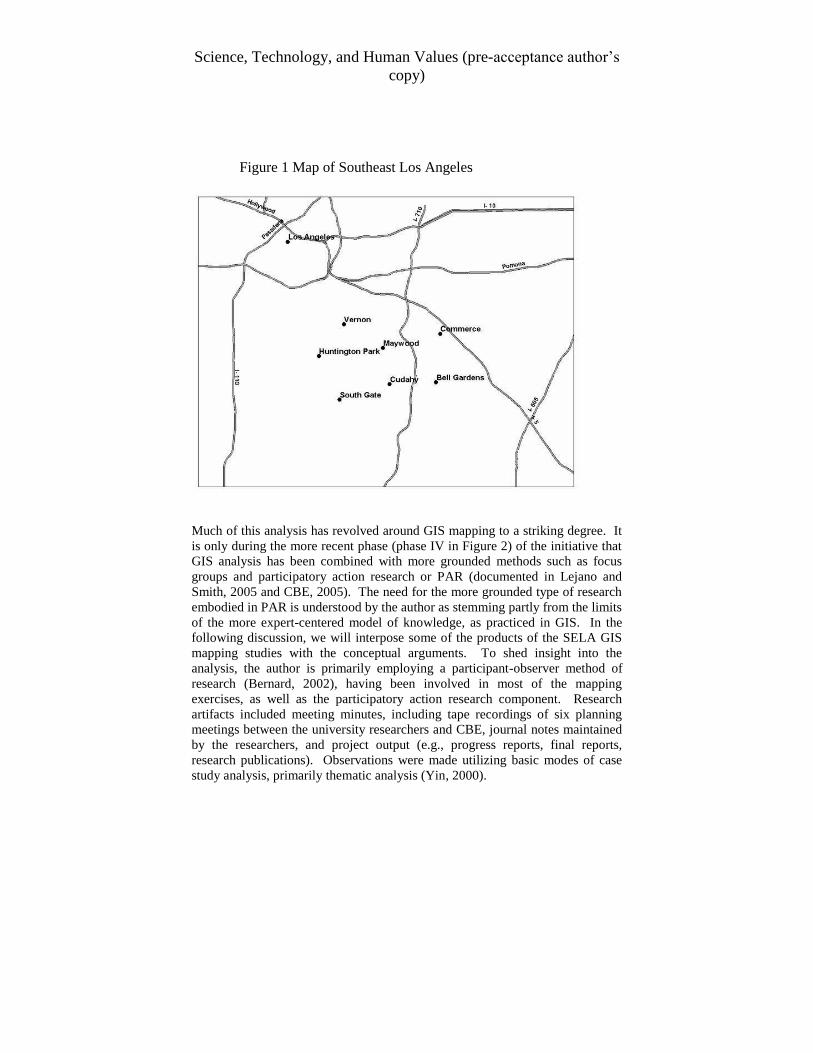
Figure 1 Map of Southeast Los Angeles
Much of this analysis has revolved around GIS mapping to a striking degree. It
is only during the more recent phase (phase IV in Figure 2) of the initiative that
GIS analysis has been combined with more grounded methods such as focus
groups and participatory action research or PAR (documented in Lejano and
Smith, 2005 and CBE, 2005). The need for the more grounded type of research
embodied in PAR is understood by the author as stemming partly from the limits
of the more expert-centered model of knowledge, as practiced in GIS. In the
following discussion, we will interpose some of the products of the SELA GIS
mapping studies with the conceptual arguments. To shed insight into the
analysis, the author is primarily employing a participant-observer method of
research (Bernard, 2002), having been involved in most of the mapping
exercises, as well as the participatory action research component. Research
artifacts included meeting minutes, including tape recordings of six planning
meetings between the university researchers and CBE, journal notes maintained
by the researchers, and project output (e.g., progress reports, final reports,
research publications). Observations were made utilizing basic modes of case
study analysis, primarily thematic analysis (Yin, 2000).
Science, Technology, and Human Values (pre-acceptance author’s copy)
Figure 2 Timeline of Research Initiatives Conducted around
Southeast Los Angeles
Figure 3 Map of Polluting Facilities in Southeast Los Angeles Versus the
Rest of Los Angeles County Source: Bansal et al. (1998)
Science, Technology, and Human Values (pre-acceptance author’s copy)
III. Discussion
i. The Epistemology of GIS
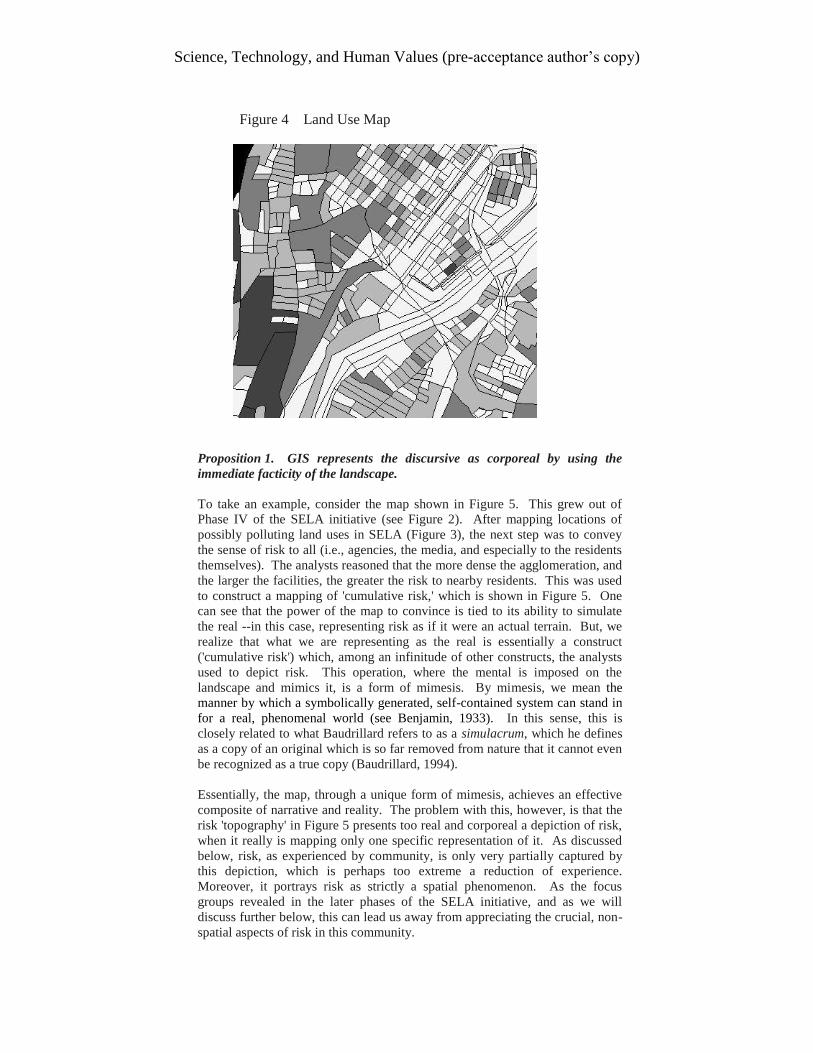
Let us start with how GIS structures individual cognition. We might begin
with simplest observations about how GIS represents reality. Consider the map
shown in Figure 4 (a typical land use map). We see an ordered set of lines and
polygons ostensibly representing a landscape. Here, the subject/object
relationship between mapper and nature is mediated by a classifier (in this
example, a land use classifier). The perspective is, of course, that of a subject
gazing upon an inanimate world –in this case, from a height of several hundred
meters. Of course, no landscape actually resembles this checkerboard of
colored patches, but rather a projection of the subject’s mental categories.
This, along with the folding over of dimensionality onto the plane of the map,
is utterly reductionistic --but of course, this is the reason why the planner did
not use an orthographic image, to begin with. The abstraction of land use
classification allows the planner to impose her (or the organization's or social
group's) logic onto a setting of unmanageable complexity. This is a
particularly Kantian notion that, for knowledge to form, nature needs to be fit
into mental frameworks pre-constructed by the subject (Kant, 1787). Without
the pre-existing framework, there is no knowledge --extending this to GIS, we
might say that there is no reality unless it can be located on the pre-constructed
digital map. The map is reflexive, in this sense, and is a sort of cognitive
mapping that reveals not just the landscape (in fact, not even that), but
something about the mapper's mental categories --as Lakoff pointed out, an
analysis of the kinds of categories or themes we use to classify objects reveals
much about how we actually think (Lakoff, 1987). (Of course, we also note
that the planner may simply be reflecting categories imposed upon her from the
outside --in this case, the subject might be the organization, the profession, or
other actor.) In a way, GIS is also mapping the subject. To a large extent this
is aided by our tendency to use the visual as a metaphor for the mental --as
Rorty pointed out, we have always used descriptions of sight to describe mental
processes (Rorty, 1979). Take for example, the way we use the phrase "I see"
as another way of saying "I know." This intertwining of the two faculties of
sight and thought is particularly salient in GIS, in which knowledge is
associated with visualizing and locating objects on a map. More than any other
instrument of policy communication, the map translates the categorizations of
the consciousness onto the features of the landscape. By using the facticity and
immediacy of the concrete, the map reifies the mental --i.e., making mental
constructs more real by superimposing them on the landscape. We state this in
terms of the following proposition.
Science, Technology, and Human Values (pre-acceptance author’s copy)
Figure 4 Land Use Map
Proposition 1. GIS represents the discursive as corporeal by using the
immediate facticity of the landscape.
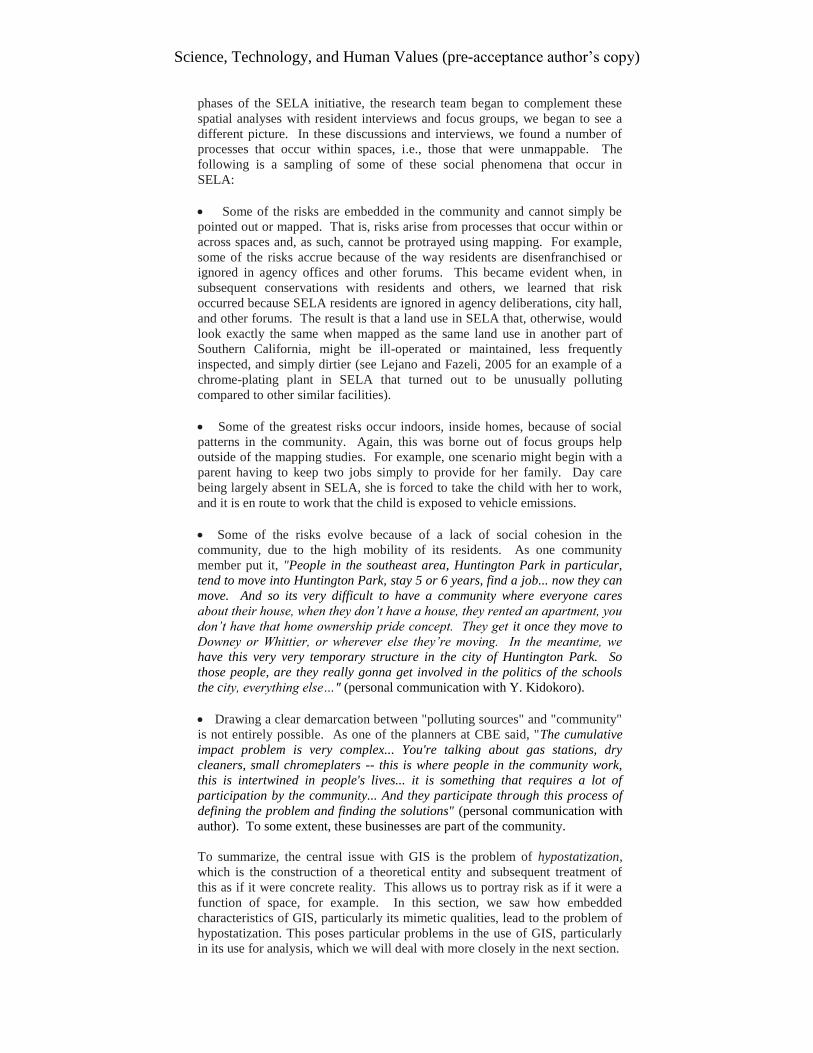
To take an example, consider the map shown in Figure 5. This grew out of
Phase IV of the SELA initiative (see Figure 2). After mapping locations of
possibly polluting land uses in SELA (Figure 3), the next step was to convey
the sense of risk to all (i.e., agencies, the media, and especially to the residents
themselves). The analysts reasoned that the more dense the agglomeration, and
the larger the facilities, the greater the risk to nearby residents. This was used
to construct a mapping of 'cumulative risk,' which is shown in Figure 5. One
can see that the power of the map to convince is tied to its ability to simulate
the real --in this case, representing risk as if it were an actual terrain. But, we
realize that what we are representing as the real is essentially a construct
('cumulative risk') which, among an infinitude of other constructs, the analysts
used to depict risk. This operation, where the mental is imposed on the
landscape and mimics it, is a form of mimesis. By mimesis, we mean the
manner by which a symbolically generated, self-contained system can stand in
for a real, phenomenal world (see Benjamin, 1933). In this sense, this is
closely related to what Baudrillard refers to as a simulacrum, which he defines
as a copy of an original which is so far removed from nature that it cannot even
be recognized as a true copy (Baudrillard, 1994).
Essentially, the map, through a unique form of mimesis, achieves an effective
composite of narrative and reality. The problem with this, however, is that the
risk 'topography' in Figure 5 presents too real and corporeal a depiction of risk,
when it really is mapping only one specific representation of it. As discussed
below, risk, as experienced by community, is only very partially captured by
this depiction, which is perhaps too extreme a reduction of experience.
Moreover, it portrays risk as strictly a spatial phenomenon. As the focus
groups revealed in the later phases of the SELA initiative, and as we will
discuss further below, this can lead us away from appreciating the crucial, non-
spatial aspects of risk in this community.

Science, Technology, and Human Values (pre-acceptance author’s copy)
Figure 5 Cumulative Risk Map (Southeast Los Angeles)
Source: Lejano and Smith (2005)
Let us move on to the institutional aspects of GIS. At this point, we will make
a second claim, and this is the intuition is that the inherent reductionism found
in GIS are constitutive of the planning professions, at as commonly practiced.
First, flattening out society into two-dimensional, homogenous patches of land
use, in conjunction with the elevated perspective of the plan view, provides a
planner the critical distance needed to be able to act in mediation between
society and nature. Somehow, the complexity of real situations needs to be
translated into simpler, policy-actionable forms that planners and community
leaders can implement. Second, such reductionisms reflect the context in
which many planners have traditionally found themselves. These contexts
create organizational requirements that mandate its members to categorize,
inventory, and rationalize its field of action --this is consistent with Weber's
account of bureaucratization (Weber, 1864). Perhaps tracts of land are called
parcels precisely because they can be tallied, bundled, listed, and delivered in
fulfillment of organizational mandates.
GIS reduces place to a flat plane, upon which one can more easily impose the
particular ordering principle (e.g., zoning code) established by one's institution.
More than the inherent universalism, we suggest that it is from this distance
that a planner is allowed to make any claims at all, at least formally. In order
to regulate, e.g., to set an ordinance such as "limiting R1 zones to single-family
homes only," one needs to first reduce the scene to an assemblage of land use
categories. Similarly, for CBE, there is a need to first categorize entities in the
place as "polluting sources" and "community" (later, we will see why this can
be problematic). The formal role of the planner is as one who can take such a
distance and mediate between institutions and nature. Organizationally, the
planner's specific role (but of course, not the only one) as an instrument of

Science, Technology, and Human Values (pre-acceptance author’s copy)
authority gives rise to this function of imposing the dominant groups' meanings
on the world, primarily through classification (Douglas, 1966). This leads us to
state the second proposition.
Proposition 2. GIS allows for the efficient reduction of dimensionality that
is needed, institutionally, to translate reality into policy-actionable form --
partly because the planning professional's traditional institutional task has
been a formal one. GIS maps not the real, but the formal.
By formal, we mean the primacy of "form" or "structure" (as a land-use map
reflects a certain thematic structure). In short, maps translate, by diffraction
and re-assemblage, phenomena and spatial patterns into policy talk. Going
back to Figure 4, we recognize that the land use classification map essentially
translates the complex urban landscape of SELA into policy actionable form.
For the land use agency, policy action may entail revenue collection, which
requires a formal basis upon which to base property taxes --land use
classifications. For the group, CBE, land use designations such as shown in
Figure 4 are used to put the environmental justice narrative in terms close to the
agency's --i.e., a predominance of industrial uses embedded in the residential
zone. In all of these cases, the intent is to translate the landscape into an
institutionally actionable form. The mapping is not of the real, per se, but of
the formal. We agree with others who point out the need for an explicit
sociology of the formal (Berg, 1997) but merely comment that the formal is
clearly a tool with which power is practiced.
Let us go deeper into the way GIS represents reality. Epistemologically, GIS
forces the analyst to consider every phenomenon in spatial terms --i.e., space is
its lingua franca. This poses a number of difficulties --first, that of representing
phenomena that either are not localizable in space or do not occur within space.
The easiest example of this is the absence of the homeless in a density mapping
of residents --they, and other spatially undetermined entities, are, by definition,
unmappable and, by extension, unknowable. Beyond the localizability of
entities, we also find that GIS can overly structure analyses. Consider the ease
by which we can locate racial injustice in terms of residential segregation,
overlooking the fact that some of the most trenchant practices of injustice occur
in areas where there is no visible segregation. By structuring analysis towards
patterns over space, it expressly leaves out consideration of patterns within
space. Moreover, by utilizing space as the primary descriptive, GIS reifies
phenomena and entities as spatial attributes --i.e., characteristics or themes of
space.
The biggest danger lies in GIS' capacity for mimesis. By allowing for analysis
that uses space as the primary descriptive and operator, GIS creates the
possibility for the analyst to mistake space, as geographically constructed, for
place, as experienced. In very real ways, we face the danger of analysts
studying, planning, and designing for places without having ever set foot in
them. This mimetic illusion, along with the unmappability of the institutional,
can create analyses which suffer in relevance. This is expressed in the
following proposition.
Proposition 3 GIS represents reality by extracting space from place but, in
accomplishing this mimesis, removes linkages that might otherwise connect
analyses to institutions.
We see this in real terms if we return to Figure 5. In that map, risk was
represented as being purely a function of space. However, during the later
Science, Technology, and Human Values (pre-acceptance author’s copy)
phases of the SELA initiative, the research team began to complement these
spatial analyses with resident interviews and focus groups, we began to see a
different picture. In these discussions and interviews, we found a number of
processes that occur within spaces, i.e., those that were unmappable. The
following is a sampling of some of these social phenomena that occur in
SELA:
Some of the risks are embedded in the community and cannot simply be
pointed out or mapped. That is, risks arise from processes that occur within or
across spaces and, as such, cannot be protrayed using mapping. For example,
some of the risks accrue because of the way residents are disenfranchised or
ignored in agency offices and other forums. This became evident when, in
subsequent conservations with residents and others, we learned that risk
occurred because SELA residents are ignored in agency deliberations, city hall,
and other forums. The result is that a land use in SELA that, otherwise, would
look exactly the same when mapped as the same land use in another part of
Southern California, might be ill-operated or maintained, less frequently
inspected, and simply dirtier (see Lejano and Fazeli, 2005 for an example of a
chrome-plating plant in SELA that turned out to be unusually polluting
compared to other similar facilities).
Some of the greatest risks occur indoors, inside homes, because of social
patterns in the community. Again, this was borne out of focus groups help
outside of the mapping studies. For example, one scenario might begin with a
parent having to keep two jobs simply to provide for her family. Day care
being largely absent in SELA, she is forced to take the child with her to work,
and it is en route to work that the child is exposed to vehicle emissions.
Some of the risks evolve because of a lack of social cohesion in the
community, due to the high mobility of its residents. As one community
member put it, "People in the southeast area, Huntington Park in particular,
tend to move into Huntington Park, stay 5 or 6 years, find a job... now they can
move. And so its very difficult to have a community where everyone cares
about their house, when they don’t have a house, they rented an apartment, you
don’t have that home ownership pride concept. They get it once they move to
Downey or Whittier, or wherever else they’re moving. In the meantime, we
have this very very temporary structure in the city of Huntington Park. So
those people, are they really gonna get involved in the politics of the schools
the city, everything else…" (personal communication with Y. Kidokoro).
Drawing a clear demarcation between "polluting sources" and "community"
is not entirely possible. As one of the planners at CBE said, "The cumulative
impact problem is very complex... You're talking about gas stations, dry
cleaners, small chromeplaters -- this is where people in the community work,
this is intertwined in people's lives... it is something that requires a lot of
participation by the community... And they participate through this process of
defining the problem and finding the solutions" (personal communication with
author). To some extent, these businesses are part of the community.
To summarize, the central issue with GIS is the problem of hypostatization,
which is the construction of a theoretical entity and subsequent treatment of
this as if it were concrete reality. This allows us to portray risk as if it were a
function of space, for example. In this section, we saw how embedded
characteristics of GIS, particularly its mimetic qualities, lead to the problem of
hypostatization. This poses particular problems in the use of GIS, particularly
in its use for analysis, which we will deal with more closely in the next section.

Science, Technology, and Human Values (pre-acceptance author’s copy)
ii. The Analytical Logic of GIS
In this section, we focus on the use of GIS for analysis. This is appropriate,
since it appears that some of the epistemological difficulties, identified in the
previous section, manifest themselves most clearly in the operations and
products of GIS-based analysis. Analysis, moreover, is the main factor that
distinguishes GIS from simple mapping --with the advent of digital maps, the
planner is able to conduct virtual analysis in real time and, importantly,
associate vast stores of digital data with points or features on a map. With GIS,
one can do an analysis like an optimal routing scheme, for example, that would
not be possible with paper maps.
To repeat, the central problem with GIS is that of hypostatization. To develop
this notion further, we might liken the problematic to that of mythology. A
mythological system involves the construction of theoretical objects and
subsequent treatment as if belonging to nature. One can do analysis, within
this mythological plane, and generate suppositions, relations, and logical
conclusions. However, and this is a central point, such output only pertains to,
and should remain in, the realm of the mythological. That is, once we attempt
to extend, translate, or superimpose this upon nature, the relevance of these
propositions comes into question. As an analogy, we can construct a model of
society as if people were simply atoms, not forming associations, hierarchies,
or social groups. We could derive propositions for the model, e.g., that power
simply comes from the aggregation of the greatest number of atoms around a
certain proposal, but this would, strictly speaking, hold true only within the
confines of the model, and to simply extrapolate this to society is a dangerous
proposition. In fact, taken with the pre-packaged nature of datasets, the
specialized language, its assumption in most circles as a new discipline in
geography and planning, and the user's dependence on graphics technology,
GIS is rather complete as a social construction, what Latour refers to as a
"black box", which is a technology that is so complex and self-contained that
users cease to wonder about the assumptions, programs, and routines embedded
in it (Latour, 1987). When such a technology is so taken for granted, the user
can mistake for basic truth the output which, otherwise, should only be
regarded as suppositions.
As we will see in this section, this problem looms large in GIS. To begin with,
consider how analysis is classically defined, which is the peering into a
phenomenon more closely to discover truths, relationships, or patterns
embedded in it. Analysis involves finding or unearthing truths that are already
hidden in the entity being studied --in GIS, this involves conducting analysis
within and through the use of digital maps. The primacy of the visual, as a
representation of the mental, is again evident here. However, the extent to
which the mapping departs from the visual is important. Consider the change
in resolution as one shifts from near to far and back again. While, visually, one
would only need to zoom in close to achieve a refinement in level of detail, this
does not occur with GIS. Rather, the reduction of nature is irreversible. In
GIS, however, unlike the visual, what one sees has already been determined.
You cannot come down from your elevated perch to see what's there --in GIS,
there is no "there" there. Moreover, you are forced to distance yourself to
recognize any patterns at all --should you zoom in too closely, you see only
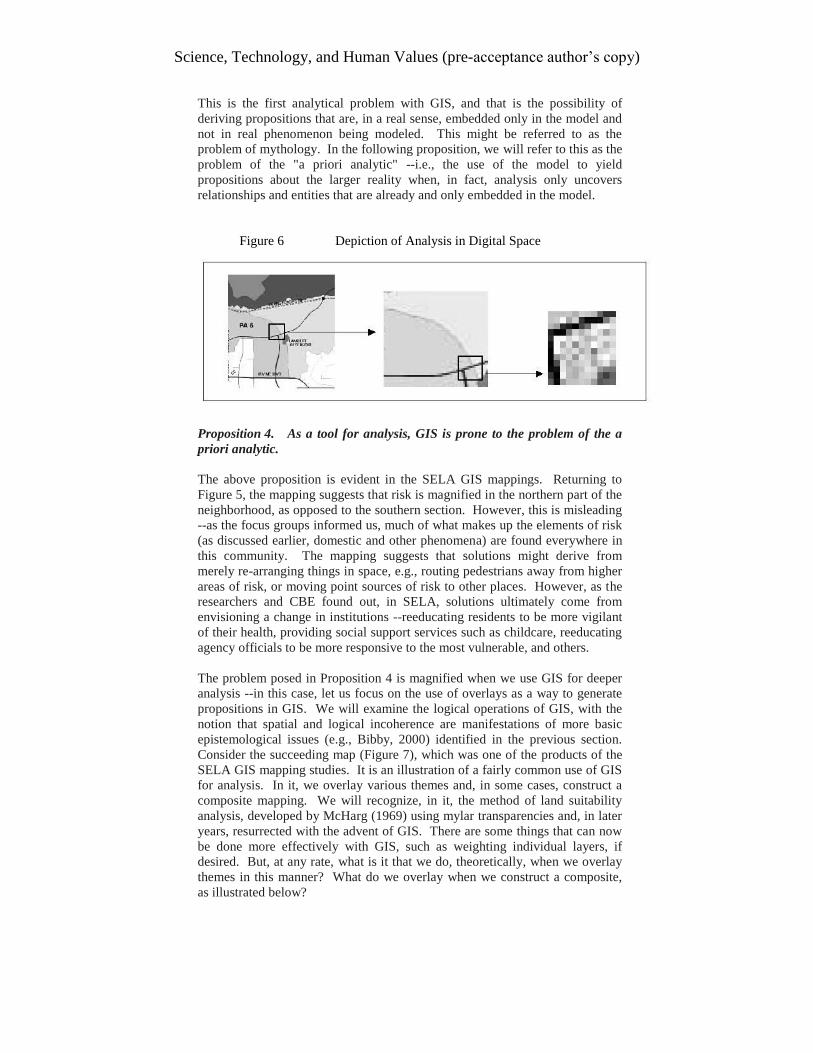
pixels (illustrated in Figure 6). This is a problem for any claim of GIS is
merely a neutral, positivist tool for observation --what we observe has already
been previously been embedded. In this sense, GIS is not a mapping of the
real, but of the formal.
Science, Technology, and Human Values (pre-acceptance author’s copy)
This is the first analytical problem with GIS, and that is the possibility of
deriving propositions that are, in a real sense, embedded only in the model and
not in real phenomenon being modeled. This might be referred to as the
problem of mythology. In the following proposition, we will refer to this as the
problem of the "a priori analytic" --i.e., the use of the model to yield
propositions about the larger reality when, in fact, analysis only uncovers
relationships and entities that are already and only embedded in the model.
Figure 6 Depiction of Analysis in Digital Space
Proposition 4. As a tool for analysis, GIS is prone to the problem of the a
priori analytic.
The above proposition is evident in the SELA GIS mappings. Returning to
Figure 5, the mapping suggests that risk is magnified in the northern part of the
neighborhood, as opposed to the southern section. However, this is misleading
--as the focus groups informed us, much of what makes up the elements of risk
(as discussed earlier, domestic and other phenomena) are found everywhere in
this community. The mapping suggests that solutions might derive from
merely re-arranging things in space, e.g., routing pedestrians away from higher
areas of risk, or moving point sources of risk to other places. However, as the
researchers and CBE found out, in SELA, solutions ultimately come from
envisioning a change in institutions --reeducating residents to be more vigilant
of their health, providing social support services such as childcare, reeducating
agency officials to be more responsive to the most vulnerable, and others.
The problem posed in Proposition 4 is magnified when we use GIS for deeper
analysis --in this case, let us focus on the use of overlays as a way to generate
propositions in GIS. We will examine the logical operations of GIS, with the
notion that spatial and logical incoherence are manifestations of more basic
epistemological issues (e.g., Bibby, 2000) identified in the previous section.
Consider the succeeding map (Figure 7), which was one of the products of the
SELA GIS mapping studies. It is an illustration of a fairly common use of GIS
for analysis. In it, we overlay various themes and, in some cases, construct a
composite mapping. We will recognize, in it, the method of land suitability
analysis, developed by McHarg (1969) using mylar transparencies and, in later
years, resurrected with the advent of GIS. There are some things that can now
be done more effectively with GIS, such as weighting individual layers, if
desired. But, at any rate, what is it that we do, theoretically, when we overlay
themes in this manner? What do we overlay when we construct a composite,
as illustrated below?
Science, Technology, and Human Values (pre-acceptance author’s copy)
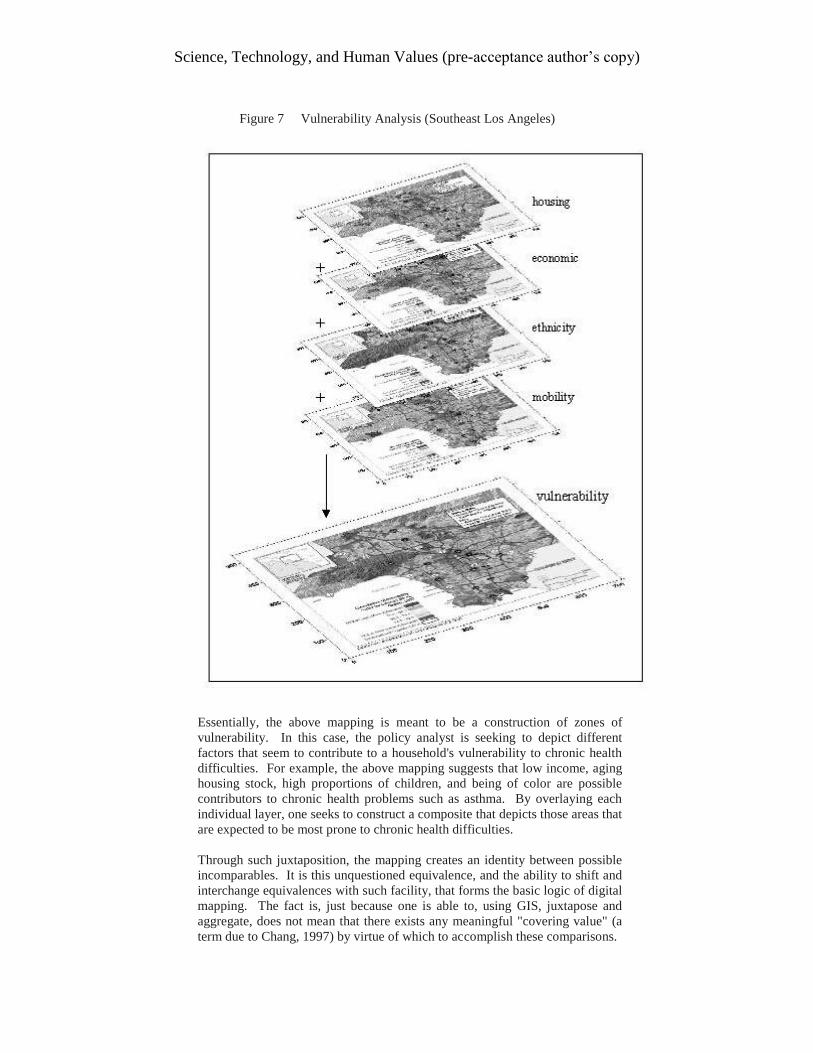
Figure 7 Vulnerability Analysis (Southeast Los Angeles)
Essentially, the above mapping is meant to be a construction of zones of
vulnerability. In this case, the policy analyst is seeking to depict different
factors that seem to contribute to a household's vulnerability to chronic health
difficulties. For example, the above mapping suggests that low income, aging
housing stock, high proportions of children, and being of color are possible
contributors to chronic health problems such as asthma. By overlaying each
individual layer, one seeks to construct a composite that depicts those areas that
are expected to be most prone to chronic health difficulties.
Through such juxtaposition, the mapping creates an identity between possible
incomparables. It is this unquestioned equivalence, and the ability to shift and
interchange equivalences with such facility, that forms the basic logic of digital
mapping. The fact is, just because one is able to, using GIS, juxtapose and
aggregate, does not mean that there exists any meaningful "covering value" (a
term due to Chang, 1997) by virtue of which to accomplish these comparisons.
Science, Technology, and Human Values (pre-acceptance author’s copy)
What do we do when we create a composite picture of overlaying themes? Is
this a representation of probability (in the preceding case, the probability of
injury in those vulnerable zones)? Perhaps, it is even a broader claim about the
probabilistic structure of knowledge (as Hume might suggest). We realize that
frequencies of occurrences over space (as shown in the individual themes) are
not to be confused with frequencies in the temporal/probabilistic sense.
Moreover, layers "add up" categorically, as in a level one shading in one layer
adds up with a level three category in another layer to produce a level four area
in the composite. They do not combine like probabilities (i.e., multiplicatively,
with corrections for covariation). Whether one regards the final composite as a
representation of probability or not, its inherent logic does not support it.
Let us examine the structure of its logic more closely. To begin with, what do
we assume about the nature of the phenomena being portrayed when we so
portray these as overlapping themes? First, we assume a rigid separability of
variables and this, in turn, suggests a strong assumption of variable
independence (Keeney and Raiffa, 1976). But, of course, this cannot strictly
hold --poverty and condition of housing are no more independent than
vegetation and soil moisture are. Regardless of whether one might want to find
functional forms that include interaction terms or not, the interconnectedness of
phenomena are such that they cannot be shown on a map. More than this, we
recognize in this the principle of equivalence (Horkheimer and Adorno, 1947).
Could the composite possibly be a representation of possibility? One construct
for possibility represents possibility as belief functions, and these belief
functions do combine additively (Dempster, 1968; Shafer, 1976).
Correspondingly, each layer represents the strength of one's belief that the
themes in this layer and its patterns do contribute to the phenomenon being
depicted, i.e., vulnerability. Such strength of belief is not associated with
frequencies of occurrence, but rather, occurrences in different alternative
assumption sets that support the thesis. For example, if we study mechanisms
or routes by which ill health in households are created, we ask: which of these
mechanisms incorporate housing quality in its underlying logic? However,
presence of a factor in assumption sets are not to be equated with presence in
space, which is what each thematic layer represents. Whether or not we choose
to interpret the composite as a representation of strength of belief in the
patterns being depicted, the inherent logic of the mapping runs contrary to this.
We inquire whether this perhaps is a mapping of utility. If so, what type of
utility? To investigate this, we begin with one thematic layer and note that
values seemingly need only to be ordinal, in most cases. That is, whatever
classification system is used can be unique up to any order-preserving
transformation. This seems to be consistent with the common tendency to
introduce arbitrary classes within each layer. That is, we might establish a
rating scale from 1 to 4 for the income layer, or equally valid, an alternative
rating scale of 101 to 104.
However, this gives rise to inconsistencies once we add up themes or layers.
For, here, order-preserving transformations do not preserve rankings in the
aggregated, composite layer. For the composite to preserve its properties, we
need to define each theme in terms of a more restrictive notion of cardinal
utility, i.e., values whose magnitudes convey the degree of utility. If so, then,
by constructing a composite of aggregate utility, we import a host of
assumptions for a special, even restrictive notion of utility. This strong form of
utility assumes continuity, cardinality, separability, and transferable utility (von
Science, Technology, and Human Values (pre-acceptance author’s copy)
Neumann and Morgenstern, 1944). The point is that these strong, restrictive
notions of how to interpret the mapping is violated by the manner in which we
construct the individual layers --to begin with, the themes are not categorized
on a cardinal scale. Misinterpretations may arise from the seemingly cardinal
nature of the mapping, by which an observer might associate the shadings on a
map with densities and weight of valuation. It is this strongly aggregative logic
that GIS uses to simulate integrative logic --i.e., the integration of value
spheres that characterizes wertrationalität (Weber, 1921). Instead of
integration, GIS substitutes the ad hoc logic of the overlay. This discussion
leads us to the next principle of GIS.
Proposition 5. GIS affords a system of valuation, but one with inherent
contradictions.
We see how this poses a problem, in the case of the SELA GIS mapping
studies. Going back to Figure 7, it leads us to suppose that there is a physical
trait, called vulnerability. Moreover, vulnerability exists by having various
factors (socio-economic, housing, etc.) act in concert in order to transform
residents and households into 'damaged goods.' To some extent, people are
hurt by these factors, of course. This is not a faithful representation of reality,
however, for several reasons. First, this detracts from these residents' capacity
for agency. Thus, one is led to proposals that involve relocating homes,
neighborhood renewal, and other spatial fixes when much of the solution may
come from residents' own actions (ideally, aided by programs by the state).
Moreover, the overlay can overstress the ecological effect --that is, that there
are vulnerable places when, in reality, injuries occur on a personal and
household level (again, a denial of agency). The overlay can lead us to rely
entirely on place management, to the possible exclusion of case management.
To understand how people suffer poor health, to some extent, it is not enough
to study place, but instead, to follow actual households and individuals --i.e.,
poor health is a phenomenon that may be very individual. There may also be
some error in supposing that these factors act in concert. Again, if poor health
occurs on a highly individual level, for one household, the reason behind poor
health may be poorly maintained apartments; for another, it may be entirely
because of lack of income; for yet another, it may be due to dietary problems.
Moreover, the overlay fixes the answer to the question of what the
determinants of health are. It is possible that housing may really have no
correlation with disease, in a certain neighborhood, yet the overlay accords
housing the same import as age, income, and other determinants. Most of all,
the overlay fixes the notion of vulnerability as empirical. The ease by which
new constructs can be so simply arrived at is magnified with GIS, which allows
the almost limitless aggregation of layers in real-time (versus paper maps).
The danger is that the student of GIS mistake the ad hoc logic of the overlay for
real, grounded analysis.
Part of the critical perspective involves alienation from the alienated and, by
this principle of negation, to distinguish relative truths from false ideologies
(Horkheimer, 1974). However, we see, in the most general applications of
GIS, strong theoretical predispositions that compromise whatever critical
component there might lie in this medium. Consider, first of all, as most
evinced in Figure 7, the use of mapping as a tool for equivalence. GIS, by dint
of its ease of use and its ability to represent phenomena in spatial terms,
literally can bring diverse entities onto the same plane of exchange, even more
efficiently so than the concept of utility or commodity. The extent to which
GIS is compromised is further compounded by the strong assumptions
embedded into it by the strictures of land use planning. For example, at its

Science, Technology, and Human Values (pre-acceptance author’s copy)
very core, GIS commits to a notion of space as location, unlike other, more
existential conceptualizations of space, e.g., as an extension of the temporal
which is the basis of one's capacity for care (Heidegger, 1962). Moreover, the
mapper commits to an association of the social with spatial, e.g., persons
associated with place of residence (sometimes referred to as the ecological
fallacy), thus legitimizing the current social order and property rights system.
In general, we note the following assumptions that are embedded in common
practice of GIS and which ineluctably compromise its critical functions.
i. that space is a medium of exchange;
ii. that space is location;
iii. that space is positive and measurable;
iv that entities are localizable and allocable over space.
In other words, to use another analogy, in the same way that markets function
to reduce everything to monetary terms, GIS functions to reduce everything to
the spatial. The primary goals, whether intended or not, is the same for the
market as for GIS, in some sense --the ability to carry out exchange. In the
market, exchange occurs with the trading of commodities and money. In GIS,
exchange is the ability to bring diverse phenomena onto the same plane --this is
how the vulnerability mapping in Figure 3 worked (although there may not be,
in real terms, any concrete connection between, say, housing and ethnicity).
This allows us to make propositions about a complex reality that we could not
otherwise. In a market economy, we can express the value of anything using
the exchange medium of currency (whether ethically defensible or not). With
GIS, we are tempted to understand all phenomena in spatial terms --whether
this might be the maintenance of pockets of poverty (e.g., the spatial mismatch
hypothesis) or environmental risk (the inequitable siting hypothesis). This
leads us to the following proposition.
Proposition 6. GIS facilitates analysis by using space as its primary medium
of exchange.
We have seen that the overlay suffers from inconsistencies, as far as being a
mode of representing the empirical. However, there is another interpretation of
this kind of mapping operation, which is an attempt to capture a reasoning that
the mapmaker employs that we might refer to as normative reasoning. In the
preceding figure, the mapmaker attempts to represent her understanding of the
right and the good. What is the structure of the normative that might be shown
with a map? Normative arguments are associative, first of all. They speak to
phenomena that coincide in space or time (such as themes on a map) and make
an accounting of such conjunction. Note that the map does not contain or show
all the possible themes, but is directed towards only those relevant to the
mapmaker's values, meaning system, and motivations. The mapmaker than
makes an accounting of these elements coming together by, for example, an
implicit or explicit comparison between the actual and the ideal. Both may be
represented on the same map, and the comparison made implicitly, or be shown
on competing maps and themes turned on and off as a way of logical
juxtaposition. The map portrays, in its way, departures from the ideal. In the
preceding figure, one normative statement that is being represented in the
figure might be stated like this:
"In a morally just society, we would not find such areas where race, poverty,
and environmental insult are systematically intertwined..."
Science, Technology, and Human Values (pre-acceptance author’s copy)
or that, essentially, the dark areas should not be so dark, or should not be
marked out at all. Here is another possible normative statement:
"In a morally just society, processes would move outcomes away from what the
map shows, instead of further entrenching them with each land use decision.
The outcomes we see are indicative of deeply-embedded processes and
oppressions..."
Through the use of the map, the mapmaker is representing the experience of
dissonance (Festinger, 1954), in moral, cognitive, and other terms, using
legends and colors to create a cognitive device to portray such a morally
contingent position and generate the desire, on the part of the viewer, to resolve
it.
Even the admittedly non-quantitative nature of the information or the risk that
is implied can be understood as part of the structuring of the normative, as
illustrated in the following hypothetical claim.
"It is not even a matter of how much these risky facilities impact the
surrounding neighborhood --it is not a numbers game. The fact that we are
exposed to these facilities at all, regardless of quantitation, is, in and of itself,
unjust."
In this light, we see that, in such situations, there is an imperative away from a
utilitarian or other decision-theoretic approach (e.g., probabilistic), since these
other modes of reasoning cannot encompass the normative. Cardinality is
missing from the logic of the map because the underlying normative reasoning
is one that is not captured within the plane of cardinality. This suggests the
following.
Proposition 7. GIS is used, through association and juxtaposition, to
represent the normative.
The normative is also the projection of self onto the world, and is bound up
with how one conceives of one's self. So being, departure of one's immediate
physical and social environment from one's conception of self-dignity and
integrity of self registers such a discrepancy. This is represented, in Figure 3,
as a coincidence of incompatible realities (inequalities in spatial organization
coinciding with my home, which is an extension of my inviolable self). There
is still another aspect of the use of GIS for expression of the normative.
Consider that the preceding map is not only a narrative about injustice, but also
a claim to power or, at least, a shifting of power (in this case, toward the
historically and spatially disenfranchised). Indeed, various authors have
commented at length on the considerable potential of GIS for representing
social relations and reinforcing power structures (Pickles, 1995; Monmonier,
1996). We see, then, in Figure 3, a claim to territoriality or, in other words, a
discourse of power (Foucault, 1977; Lefebvre, 1991). It is the organization
claiming or reclaiming its territory. It is also a statement in an ongoing
struggle to reclaim this space. It is striking how great an extent the initiatives
in SELA have revolved around the use of GIS, but not hard to understand.
There is, in it, the claim to power, as we summarize in the following
proposition.
Proposition 8. GIS is a language of territoriality and a medium by which
territory is negotiated.
Science, Technology, and Human Values (pre-acceptance author’s copy)
In the case of the SELA mapping studies, we can look at Figure 3 and
recognize this as not only a form of community advocacy, but as part of an
organizational strategy. This is evident in the way this same map is used in
CBE's brochures, website, etc. It is also a way for the organization to say,
"when it comes to this neighborhood, we speak with a moral authority with
which agencies and other organizations cannot."
Thus far, we have seen how GIS can introduce errors or inconsistencies in the
understanding of reality, and its representation. In the next section, we further
the analysis and consider how these effects extend to the mapper himself.
iii. The Construction of the Planner and Planning Practice
Epistemologically, GIS can move the planner away from understanding places
and processes in more phenomenological terms, as GIS substitutes the analytic
for experience and presence. GIS puts the planner back in the rarified position
of the analyst, formulating propositions about situations while being removed
from them. It enshrines the planner as expert and affirms her position within
the centralized model of the regulatory state. In this model of the planner,
knowledge is analysis, but it is not experience or participation. Where does
that bring us? At this point, we can only suggest that if there is a way out of
the hegemony of the a priori analytic, it consists in persuading the planner to
enter into the sphere of experience. This means that GIS be considered a step
in a series of integrative steps that includes powering down one's laptop and
venturing out into the streets or fields being studied. It is a framework that we
might describe as postconstructionist (Lejano, 2005) --i.e., the refusal to wholly
contain planning within the a priori analytic and the determination to ground
the analytic in experience.
The effect of GIS on practice is seen in the SELA mapping studies. Initial
analyses make purely spatial arguments, resulting in recommendations that
focused mainly on siting. For example, an earlier set of recommendations dealt
with the creation of new siting criteria (Lejano and Iseki, 2002). As we moved
beyond pure analysis and into the more grounded analysis of the latter phases
of the SELA initiative, which involved participatory action research, our
understanding of the situation changed and, with it, our proposals for action.
For example, the most recent recommendations pertain to strengthening local
institutions and reforming regulatory processes (Lejano and Fazeli, 2005).
GIS affirms the planner's role as a mediator, constructing analyses from a
neutral position (i.e., suspended between the state, on the one hand, and nature
on the other). However, we wonder to what extent GIS compromises the
planner. For example, we should reflect on the extent to which the mapper is
compromised by his dependence on datasets, polygons, census data, surveys,
projections, and boundaries determined by others and the industry at large. The
most immediate manifestation of this is the great extent to which analyses are
determined by assumptions embedded in the datalayers that one imports.
Instead of portraying the planner as architect or engineer, able to formulate
original propositions from her remote position, the mapper is more like a
bricoleur, fashioning and improvising from material that one finds in a place
(Derrida, 1978). The reification of the census tract as an actual, spatially
meaningful entity is an instance of this. Consider the extent to which analyses
of social justice have been driven by census-specified categorizations of race,
ethnicity, income, etc. Most of all, in conflating the social and spatial, GIS
mapping duplicates the reified and opaque nature of society as an object of
observation. In terms of knowledge, the planner is compromised by a pre-
Science, Technology, and Human Values (pre-acceptance author’s copy)
commitment to measurable, pre-packaged, digital data. We cannot help but
end by noting, yet again, the strong theoretical pre-commitment of GIS to the
technological (as also discussed in Obermeyer, 1995; Clark, 1998) to the extent
of discouraging other modes of knowing, such as the narrative (Lyotard, 1974).
IV. Conclusion
We have see how GIS, despite its facility and analytic potential, is constrained
by pre-commitments that are inherently embedded in its structure, function, and
practice. Nonetheless, we suggest that the potential for GIS as a medium
within which to assist processes of communication and understanding is
considerable. Its potential for representation of the normative is, we believe,
still untapped.
There are difficulties with this medium, however, and, perhaps the greatest
danger lies in its facility and power of expression, which may tempt the student
to think that these digital maps are a substitute for deep, grounded analysis.
We have seen how GIS, by representing the discursive as corporeal, achieves
the reification of the formal. In this manner, GIS is able to construct an a priori
analytic in which claims may be largely self-referential. In this manner, GIS is
able to engage in the mythological. But this leads us to our most important
conclusion, and that is the manner that GIS, in fact, reaches back to the
mapper/planner and transforms them. We have seen how, for example, in its
use of overlays as a surrogate for integrative knowledge, GIS isolates the user
from the most legitimate source of integration: experience. GIS constructs an a
priori analytic in which all propositions can posed in circular fashion.
As technology, one cannot dismiss the potential of GIS for use in the
mythological and physical control of nature (Horkheimer and Adorno, 1972),
as an instrument of normalization and surveillance (Foucault,1977), or as
simulacrum (Baudrillard, 1994). It can be a retrogressive tool that, through its
fixative gaze, institutionalizes the status quo. And, yet, its most immediate and
deepest impact is on the mapper himself. GIS imposes itself on the mapper and
cages the latter to the formal, ocular, and cognito-spatial, shutting him out from
the real or phenomenological ecology of place. To be sure, the planner is,
almost by definition, a professional who is grounded in place, but the extreme
degree to which GIS has become a 'black box' that can so completely simulate
place can so easily lead to an analysis completely contained in GIS' self-
referential symbolic universe. It can be the negation of praxis.
Still, we cannot fail to recognize the potential for its use in the freeing up of
alternative discourses. We observe groups in society taking on this technology
--community groups, agencies, churches, and the private sector and realize its
potential as communicative media that provides space and allows voice for the
hitherto unheard. Indeed, ample scholars have written about the potential of
mapping for expression (Pickles, 1995; Cinderby, 1999; Al-Kodmany, 2001;
Elwood, 2002) and even negotiation (Harris and Weiner, 1998; Corner, 1999;
Bunschoten, 2001).
As such, it is only right to end the analysis on a hopeful note. To a great
extent, GIS has been used to broach new narratives, and planners find myriad
ways to go beyond the digital and actually encounter communities and places.
Reflecting on the SELA project over the last few years, it is undeniable that the
GIS products have helped bring a different discourse to the table. The
narratives behind maps such as shown in Figure 5 and 7 are just as important as
the maps themselves --but it is through the maps that their inclusion in the
Science, Technology, and Human Values (pre-acceptance author’s copy)
larger negotiation, with agencies and city governments, was facilitated. Indeed,
this has led to the latest phase in the series of SELA initiatives, and it is a
collaborative with the US EPA, the regional air quality control district, CBE,
and university researchers (including the author) to study how a web-based GIS
mapping might be used to further the environmental justice agenda (phase V in
Figure 2). It is not clear to what extent the group's focus around GIS is an
overly restricting framework (for the various reasons given in this article) or
merely a stage upon which to initiate deeper communication. At this early
date, there are proposals emerging from the SELA collaborative that suggest
avenues for linking the mapping to larger institutions and place, including:
allowing residents and other publics to use the web-based map and include
features and comments of their own;
allowing map users to click on points representing polluting facilities in the
neighborhood, listing pertinent information about it and, importantly, including
an option to contact the district inspector for the facility directly by email;
using the web-based map as a common place for agencies, residents, and
researchers to pool data, observations, and other knowledge. This would be the
first such collaborative involving these agencies and is perhaps akin to what
Rowe and Frewer might refer to as an effective aggregation of diverse
knowledges (Rowe and Frewer, 2005)
We should not simply presume the planner to be helplessly trapped by the "iron
cage" of GIS (as Weber once spoke of the bureaucracy). At the same time as
planners have embraced GIS, there always remains a tradition of reflective
thought which moves the planner to view the tools of the profession critically.
Indeed, the latter phases of the SELA initiative became increasingly grounded
in community focus groups, which inevitably introduced a critical component
or, as Freire referred to it, conscientization (Freire, 1973). Moreover, as the
nature of the profession brings the planner ever more in contact with multiple
publics (e.g., neighborhood groups, public health advocates, service providers),
there are increasing tendencies for her to ground analysis in experience.
On the one hand, we should encourage the present generation of students and
advocates to learn it for its utility and potential for improving our ability to
organize information and inform discussions. At the same time, we must be
cognizant of the dominant modes of reasoning and meaning constructions
embedded in GIS that can dominate a process of claims-making and
deliberation that should otherwise be syncretic and open.
Science, Technology, and Human Values (pre-acceptance author’s copy)
Acknowledgements
The author thanks Bahram Fazeli, Yuki Kidokoro, and Robert Cabrales of
Communities for a Better Environment for participating in the SELA studies
and their insight into the dynamics of the place, and C. Scott Smith for his help
with some of the GIS maps. The author is also grateful for the insightful
suggestions of the anonymous reviewers, whose comments added greatly to the
present paper.
References
Al-Kodmany, K. 2001. Bridging the gap between technical and local: Tools
for promoting community-based planning and design. Journal of Arch. and
Planning Research 18(2) 110-130.
Baudrillard, J. 1994. Simulacra and Simulations (trans. Sheila Glaser). Ann
Arbor: Michigan.
Bansal, S., S. Davis, C. Buntine, and B. Piazza. 1998. Holding Our Breath:
Environmental Injustice Exposed in Southeast Los Angeles. Huntington Park:
Communities for a Better Environment.
Benjamin, W. 1933/ 1999c. On the mimetic faculty. In M. Jennings, H. Eiland
& G. Smith, (Eds.), Walter Benjamin: Selected writings Volume 2, 1927-1934
(pp. 720-727). Cambridge, Massachusetts: Belknap/ Harvard University.
(Original work written April-September 1933)
Berg, M. 1998. Of forms, containers, and the electronic medical record: Some
tools for a sociology of the formal. Science, Technology, & Human Values
22(4):403-433.
Bibby, P. 2000. GIS, Land Use, and Representation. Environment and
Planning B 27(4):583-598.
Bunschoten, R. 2001. Urban Flotsam. Rotterdam: 010 Publishers.
CBE, Communities for a Better Environment, 2005. Children's Health and
Environment in SELA:A Participatory Action Research Project. Huntington
Park: CBE.
Chang, R. 1997. Incommensurability, Incomparability, and Practical Reason.
Cambridge: Harvard University Press.
Cinderby, S. 1999. Geographic Information Systems (GIS) for participation:
the future of environmental GIS? Int. J. Environmental Pollution 11(3) 304-
315.
Clark, M. 1998. GIS –democracy or delusion? Environment and Planning A
30 303-316.
Corner, J. 1999. The agency of mapping. in Cosgrove, D., Mappings. London:
Reaktion.
Curry, M. 1998. Digital Places: Living with Geographic Information
Technologies. New York: Routledge.

Science, Technology, and Human Values (pre-acceptance author’s copy)
Delfino, R., H. Gong, Jr., W. Linn, E. Pelizzari, Y. Hu. 2002. Evaluation of
Health Effects of Toxic Air Pollutants, a Southern California Community: A
Pilot Study. Final Report to the California Air Resources Board, Contract No.
99-302, August 27, 2002.
Dempster, A.P. 1968. A Generalization of Bayesian Inference. Journal of
Royal Statistics Society 30 205-247.
Derrida, Jacques (1978), Writing and Difference (L'écriture et la Différence.
engl. trans. by A. Bass), Chicago: U. Chicago.
Douglas, M. 1966. Purity and Danger. London: Routledge.
Elwood, S. 2002. GIS use in community planning: a multidimensional analysis
of empowerment. Environment and Planning A 34 905-922.
Festinger, L. 1954. A theory of social comparison processes. Human Relations
7 117-140.
Foucault, M. 1977. Discipline and Punish: the Birth of the Prison (trans. Alan
Sheridan). New York: Pantheon.
Freire P. 1973. Pedagogy of the Oppressed. New York: Seabury Press.
Harris, T. and D. Weiner 1998. Empowerment, marginalization, and
community-oriented GIS. Cartography and Geographic Information Systems
25(2) 67-76
Harvey, F. and N. Chrisman 1998. Boundary objects and the social
construction of GIS technology. Environment and Planning A 30 1683-1694.
Heidegger, M. 1962. Being and Time. New Yok: Harper and Row.
Horkheimer, M. 1974. Eclipse of Reason. New York: Seabury.
Horkheimer, M. and T. Adorno 1972. Dialectic of Enlightenment (trans. John
Cumming). New York: Seabury.
Kant, I. 1787. Critique of Pure Reason, (trans. Norman Kemp Smith, 1933)
London: Macmillan.
Keeney, R. and H. Raiffa 1976. Decisions with Multiple Objectives:
Preferences and Value Tradeoffs. New York: Wiley.
Lakoff, G. 1987. Women, Fire, and Dangerous Things: What Categories
Reveal about the Mind. Chicago: University of Chicago Press.
Latour, G. 1987. Science in Action. Cambridge: Harvard University Press.
Lefebvre, H. 1991. The Production of Space. translated by Donald Nicholson-
Smith. Cambridge: Blackwell.
Lejano, R. 2002. Toward a topological concept of rationality. Budhi: A
Journal of Ideas and Culture 6(2,3) 245-255.
Science, Technology, and Human Values (pre-acceptance author’s copy)
Lejano, R. 2005. Policy Frontiers: Merging Text and Context. New York:
Routledge (in press).
Lejano, R. and H. Iseki 2002. “The question of environmental justice: The
spatial distribution of hazardous waste TSDs in Los Angeles,” J.of Urban
Planning and Development 127(2):51.
Lejano, R., B. Piazza, and D. Houston 2002. “Rationality as social justice and
the spatial-distributional analysis of risk,” Environment and Planning C,
20:871-888.
McHarg, I. 1969. Design with Nature. Garden City: Natural History Press.
Monmonier, M. 1991. How to Lie With Maps. Chicago: University of Chicago
Press.
NAPS (National Academy of Public Administration). 2003. Addressing
Community Concerns: How Environmental Justice Relates to Land Use
Planning and Zoning. Washington, D.C.: NAPS.
Obermeyer, N. J. 1995. The hidden GIS technocracy. Cartography and
Geographic Information Systems 22(1) 78-83.
Pickles, J. 1995. Representations in an electronic age: Geography, GIS, and
democracy. in J. Pickles (ed.) Ground Truth: The Social Implications of
Geographic Information Systems. New York: Guilford.
Rorty, R. 1979. Philosophy and the Mirror of Nature. Princeton: Princeton
University Press.
Rowe, G. and L.J. Frewer. 2005. A typology of public engagement
mechanisms. Science, Technology, & Human Values 30(2):251-290.
Schuurman, N. 2000. Trouble in the heartland: GIS and its critics in the 1990s.
Progress in Human Geography 24(4):569-590.
Schuurman, N. 2004. GIS: A Short Introduction. Cambridge: Blackwell.
Shafer, G. 1976 A Mathematical Theory of Evidence (Princeton University
Press, Princeton, NJ)
Sheppard, E. 1995. GIS and society: Toward a research agenda. Cartography
and Geographic Information Systems 22(1): 5-16
Simon, H. 1997. Models of Bounded Rationality vol. 3. Cambridge: MIT
Press.
Von Neumann, J. and O. Morgenstern 1944. The Theory of Games and
Economic Behavior. Princeton U. Press, New Jersey.
Weber, M. 1921. Wirtschaft und Gessellschaft. Cologne and Berlin:
Kiepenhauer und Witsch.
Yin, R. 2003. Case study research: design and methods. Thousand Oaks: Sage
Publications.