Technological Change and Catching-Up in the Indian Banking ...
21
Vol.:(0123456789) Computational Economics (2020) 56:217–237 https://doi.org/10.1007/s10614-020-09993-1 1 3 Technological Change and Catching‑Up in the Indian Banking Sector: A Time‑Dependent Nonparametric Frontier Approach Sushanta Mallick 1 · Aarti Rughoo 2 · Nickolaos G. Tzeremes 3 · Wei Xu 4 Accepted: 4 May 2020 / Published online: 18 May 2020 © The Author(s) 2020 Abstract This paper investigates whether there has been any improvement in efficiency con- vergence of banks in India during the post-reform period considering bank own- ership structures, using a balanced panel for 73 banks over the time period 1996– 2014. Utilizing nonparametric frontier estimators, we compute time-dependent bank efficiency scores, which allow us to examine the dynamics of technological frontier and catch-up levels of Indian banks, and to explore the convergence patterns in the estimated efficiency levels. Our results signify that the state-owned banks, which dominate the banking activity in India, establish themselves as the best perform- ers, ahead of the private, foreign and cooperative banks during post-2005. Even during the recent global financial crisis period, we find that bank efficiency levels increased, except for foreign banks which have had the greatest adverse impact. The convergence results show that heterogeneity is present in bank efficiency conver- gence, which points to the presence of club formation suggesting that Indian banks’ efficiency convergence is partly driven by the ownership structure. Keywords Bank efficiency · Nonparametric frontiers · Conditional efficiency · Convergence · India JEL Classification C14 · G21 · G28 1 Introduction The first significant systemic changes of the Indian banking system can be traced back to the late 1960s when banks were nationalised. It has been argued that these changes were introduced rather chaotically having a weak impact on the reform of Indian banks (Fujii et al. 2014). Subsequently, it was felt that the positive and * Sushanta Mallick [email protected] Extended author information available on the last page of the article
-
Upload
khangminh22 -
Category
Documents
-
view
5 -
download
0
Transcript of Technological Change and Catching-Up in the Indian Banking ...

Vol.:(0123456789)
Computational Economics (2020) 56:217–237https://doi.org/10.1007/s10614-020-09993-1
1 3
Technological Change and Catching‑Up in the Indian Banking Sector: A Time‑Dependent Nonparametric Frontier Approach
Sushanta Mallick1 · Aarti Rughoo2 · Nickolaos G. Tzeremes3 · Wei Xu4
Accepted: 4 May 2020 / Published online: 18 May 2020 © The Author(s) 2020
AbstractThis paper investigates whether there has been any improvement in efficiency con-vergence of banks in India during the post-reform period considering bank own-ership structures, using a balanced panel for 73 banks over the time period 1996–2014. Utilizing nonparametric frontier estimators, we compute time-dependent bank efficiency scores, which allow us to examine the dynamics of technological frontier and catch-up levels of Indian banks, and to explore the convergence patterns in the estimated efficiency levels. Our results signify that the state-owned banks, which dominate the banking activity in India, establish themselves as the best perform-ers, ahead of the private, foreign and cooperative banks during post-2005. Even during the recent global financial crisis period, we find that bank efficiency levels increased, except for foreign banks which have had the greatest adverse impact. The convergence results show that heterogeneity is present in bank efficiency conver-gence, which points to the presence of club formation suggesting that Indian banks’ efficiency convergence is partly driven by the ownership structure.
Keywords Bank efficiency · Nonparametric frontiers · Conditional efficiency · Convergence · India
JEL Classification C14 · G21 · G28
1 Introduction
The first significant systemic changes of the Indian banking system can be traced back to the late 1960s when banks were nationalised. It has been argued that these changes were introduced rather chaotically having a weak impact on the reform of Indian banks (Fujii et al. 2014). Subsequently, it was felt that the positive and
* Sushanta Mallick [email protected]
Extended author information available on the last page of the article

218 S. Mallick et al.
1 3
systematic changes were only introduced in the 1990s in the form of the Narasim-ham Committee reports of 1991 and 1998, which outlined the main trajectory of further improvements. The main aim of the reforms was the promotion of compe-tition and market orientation promoting banks’ efficiency improvements (Kumar 2013). The related literature investigates bank efficiency in India during the last two decades (Kumbhakar and Sarkar 2003; Bhaumik and Dimova 2004; Das and Ghosh 2006; Bhattacharyya and Pal 2013, among others). However, there are limited stud-ies investigating bank performance in India in the more recent years (Fujii et al. 2014; Tzeremes 2015). Additionally, the empirical investigation of convergence patterns among Indian banks’ efficiency levels is largely an unexplored area in the related literature (Kumar and Gulati 2010; Kumar 2013).
In contrast to the related literature on the deregulation and efficiency in Indian banking, this paper makes some important contributions. First, we analyse bank efficiency using a time-dependent non-parametric frontier approach (Bădin et al. 2012; Mastromarco and Simar 2015). This novel approach does not presume that the restrictive “separability” condition among the inputs, the outputs and the time holds (Simar and Wilson 2007, 2011; Daraio et al. 2018). As a result, we assume that time influences banks’ inefficiency levels along with the shape and the level of the bound-ary of the attainable set. These measures enable us to incorporate dynamic effects on the estimated efficiency measures, grasping all the performance changes that are based on different time periods (Mallick et al. 2016; Mastromarco and Simar 2018; Tzeremes 2015, 2019). The applied efficiency estimators are most suited in our case since they enable us to identify the indirect effect of the reforms made over different time periods.
The second part of the paper then tests for convergence in bank efficiency scores using the group and club convergence methods of Phillips and Sul (2007, 2009). This is a robust approach being most suitable for nonparametric efficiency estima-tors, since it does not impose strong assumptions on the trend nor on the stochastic stationarity of the examined efficiency estimates (Chen et al. 2018). Third, we con-duct a comprehensive study by factoring all types of bank ownership structures in our analysis. We thus analyse banks’ efficiency levels on the basis of their ownership structures and test whether bank ownership structure influences the convergence process. Fourth, we are able to draw meaningful conclusions by considering a long dataset (1996–2014) that covers the entire reform period in India while spanning over the global financial crisis period.
The paper is structured in the following manner. Section 2 provides a summary of the related literature, whereas Sect. 3 discusses the methodological framework. In Sect. 4, we describe the data and present the empirical findings. Finally, Sect. 5 concludes the paper.
2 A Brief Snapshot of the Literature
Following the financial reforms during post-1991, considerable research exam-ining efficiency of Indian banks has emerged. The literature follows two main trajectories. First, several studies examine bank efficiency and productivity within

219
1 3
Technological Change and Catching-Up in the Indian Banking…
the context of various bank ownership structures (Sarkar et al. 1998; Bhau-mik and Dimova 2004). Second, a large strand of studies examines the effect of restructuring process on banks’ stability, efficiency and productivity levels (Kumbhakar and Sarkar 2003; Tabak and Tecles 2010; Das and Kumbhakar 2012; Ahamed and Mallick 2017a, b). Most of these studies looking at bank efficiency following the reforms point to low and declining efficiency. For instance, Das and Ghosh (2006) have found low levels of technical efficiency coupled with a declining trend in efficiency. Similarly, the empirical evidence from Battacharyya and Pal (2013) indicates low and declining efficiency for most years, though an improvement was noted towards 2009. In addition, some of the empirical studies revealed varying efficiency levels on the basis of ownership structure. Bhaumik and Dimova (2004) provide evidence of higher performance for domestic private and foreign banks, with the state-owned banks catching-up from mid-1990s.
In their study, Sahoo and Tone (2009) reported that post 2002 all three types of banks experienced an upward trend in efficiency. They attributed the changes to the liberalisation process. Furthermore, they identified weak output and resource allocation performances for nationalised banks. On the other hand, Tabak and Tecles (2010) examined Indian banks’ performance levels over the period 2000–2006 and their results suggest the improvement of state-owned banks’ efficiency levels in relation to domestic private and foreign banks. According to them, the driving force of this performance change was attributed to the liberali-sation policy which in turn enhanced market competition.
In a comparable study, Sanyal and Shankar (2011) over the period 1992–2004 provide evidence that productivity gaps among banks with different ownership have widened after 1998. Fujii et al. (2014) showed that foreign banks perform better than the state-owned and domestic private banks. These results contradict the findings from earlier studies (Sanyal and Shankar 2011; Tabak and Tecles 2010) suggesting that state-owned banks are better performers. In a similar study, Tzeremes (2015) employed a conditional directional distance estimator to esti-mate bank efficiency over the period 2004–2012. The author confirmed previous findings that a bank’s ownership structure has a direct impact on its performance level. The study reported that the overall banking efficiency increased in India during the period 2004–2008, but decreased thereafter.
Stemming from the studies examining the effect of deregulation on the bank-ing industry, Sensarma (2008) found that banks’ efficiency and productivity lev-els have declined as a result of the deregulation policies. In contrast, Das and Kumbhakar (2012) in a different methodological framework provide evidence of a positive impact of deregulation on banks’ efficiency levels. Casu et al. (2013) suggest that banks’ ownership structure influences the way the banks’ responded to the deregulation reforms, suggesting that foreign banks dominate the banking activity in India.
To our knowledge, Kumar and Gulati (2010) and Kumar (2013) are the only stud-ies, so far, that analysed the convergence of Indian banks’ efficiency levels. Specifi-cally, Kumar and Gulati (2010) applied the concept of beta and sigma convergence to a sample of Indian public sector banks (PSBs) providing evidence of increased bank efficiency during the post reform period. Similarly, Kumar (2013) extended the
220 S. Mallick et al.
1 3
study by Kumar and Gulati (2010) providing empirical evidence of a positive effect of deregulation policies on banks’ efficiency levels.
During the post reform period, both studies confirmed the presence of conver-gence among Indian banks’ efficiency levels, which requires re-examination, meas-uring efficiency in a time-dependent non-parametric set-up, while also considering the ownership structures.
3 Data and Methodology
3.1 Data Description
We model Indian banks’ production process utilizing the intermediation approach (Berger and Humphrey 1997). As a result, we argue that banks’ production pro-cess transforms deposits alongside production inputs in order to produce loans and other financial products (Sealey and Lindley 1977). Following the relevant literature (McKillop et al. 1996; Berger and Mester 1997; Drake and Hall 2003; Fukuyama and Matousek 2011; Degl’Innocenti et al. 2017), in our nonparametric efficiency measurement, we need to define banks’ production process. For that reason, we use as inputs: total fixed assets, total deposits and wages and salaries, whereas, as out-put, we use banks’ total loans (see Table 1 for descriptive statistics). Finally, our sample contains a balanced panel of 73 Indian banks with different ownership struc-tures over the period 1996–2014.
3.2 Time‑Dependent Efficiency Measures
By incorporating the developments of the relative literature (Daraio and Simar 2005, 2007; Jeong et al. 2010; Bădin et al. 2012),1 we can define bank’s production func-tion as a set of inputs � ∈ R
p
+ and outputs � ∈ Rq
+ . Then the bank’s production set of � with all technical feasible pairs of inputs and outputs (�, �) can be defined as:
Given a certain input–output level (�0, �0 ∈ �
) the input oriented efficiency score
can be presented as:
In Eq. (2), �0 indicates the input oriented efficiency score and identifies the propor-tionate reduction of bank’s inputs operating at
(�0, �0
) level in order to be technically
efficient. Furthermore, �0 takes values of ≤ 1 with a �0 = 1 suggesting that a bank is
(1)� ={(�, �) ∈ R
p
+ × Rq
+||� can produce �
}
(2)𝜗0 = 𝜗(𝜐0, 𝜅0
)= inf
{𝜗 > 0|
(𝜗𝜐0, 𝜅0
)∈ 𝛺
}.
1 For interesting applications using the probabilistic framework of efficiency measurement see the stud-ies by Gearhart III and Michieka (2018) and Cordero et al. (2018).

221
1 3
Technological Change and Catching-Up in the Indian Banking…
input efficient. Then we utilize the probabilistic approach by Cazals et al. (2002) and define bank’s production set in (1) as:
Table 1 Descriptive statistics
Years Statistics Total fixed assets Total deposits Wages and salaries Total loans and securities
1996 Mean 81,378.595 96,301.381 1603.908 37,451.552Std 187,038.155 206,866.035 4193.022 87,240.205
1997 Mean 91,390.671 106,672.196 1685.832 39,315.477Std 203,710.546 221,257.887 4205.269 86,636.885
1998 Mean 108,056.634 127,152.582 1835.122 46,286.270Std 235,777.206 262,001.699 4517.937 101,528.838
1999 mean 129,111.801 150,510.605 2205.518 53,582.045Std 286,877.755 324,311.000 5617.822 120,561.449
2000 Mean 150,584.001 178,275.385 2453.285 64,423.126Std 332,084.273 378,110.488 5901.275 138,337.393
2001 Mean 174,848.830 210,142.358 3049.271 75,689.201Std 393,857.644 452,193.471 7618.124 157,928.213
2002 Mean 207,690.385 245,812.247 2864.804 91,157.738Std 445,491.963 504,579.781 6590.269 174,697.918
2003 Mean 230,096.737 278,147.078 3125.392 103,025.389Std 481,054.650 562,815.654 7207.918 195,657.430
2004 Mean 265,560.988 320,683.081 3544.674 117,802.533Std 528,755.218 626,236.174 8124.967 221,475.139
2005 Mean 310,459.455 392,311.785 3989.668 153,182.738Std 607,234.692 756,195.591 8936.809 286,164.267
2006 Mean 367,272.164 484,592.290 4407.156 202,950.568Std 690,041.935 900,211.636 10,108.868 379,505.550
2007 Mean 457,535.982 618,286.448 4767.977 265,319.030Std 827,387.362 1,118,209.520 10,070.681 493,880.691
2008 Mean 572,446.727 766,172.292 5290.595 330,984.708Std 1,027,509.681 1,354,028.759 10,120.402 601,368.230
2009 Mean 700,774.714 944,789.000 6505.081 405,645.640Std 1,298,752.825 1,740,176.613 12,615.245 753,260.447
2010 Mean 806,223.566 1,102,669.785 7489.460 472,475.411Std 1,436,563.454 1,967,965.962 15,877.201 866,849.209
2011 Mean 967,551.584 1,337,320.616 9569.534 584,339.033Std 1,697,321.888 2,359,165.301 20,279.363 1,053,892.337
2012 Mean 1,118,001.058 1,554,755.007 10,071.158 690,075.727Std 1,900,736.255 2,698,968.348 21,186.040 1,223,147.129
2013 Mean 1,284,507.821 1,791,613.514 11,344.126 797,568.267Std 2,203,224.114 3,136,658.019 23,135.844 1,437,350.575
2014 Mean 1,468,736.402 2,055,353.169 13,366.877 914,917.373Std 2,542,227.980 3,657,025.292 28,479.543 1,681,956.063
222 S. Mallick et al.
1 3
where Φ�K(�, �) = Prob(� ≤ �, K ≥ �) , implying free disposability of � . Then we can retrieve the following conditional probability Φ� |K = Prob(� ≤ �|K ≥ �) and we consider that:
where �K(�) = Prob(K ≥ �) . Then the banks’ efficiency score at (�0, �0
) level can
be redefined as:
where the empirical version of Φ� |K(�|�) can be obtained from:
As has been introduced by Mastromarco and Simar (2015),2 we can consider time T as a conditional variable and for every time period t (years in our case) we can define �t as the support of the following conditional probability Φt
� |K = Prob(� ≤ �|K ≥ �, T = t) and define �t as:
At a specific time period, let (�0, �0
) denote bank’s input and output levels. Then
the time dependent efficiency score can be obtained from:
As presented by Daouia and Simar (2007), we can retrieve the unconditional and the time dependent robust α-quantile frontiers for any a ∈ (0, 1) from:
We consider the time effect on banks’ input oriented measures (both for the full3 and robust frontiers) by constructing the following ratios from the condi-tional and unconditional measures:
(3)𝛺 =
{(𝜐, 𝜅) ∈ R
p+q
+
|||Φ𝛶K(𝜐, 𝜅) > 0},
(4)Φ�K(�, �) = Φ� |K(�|�)�K(�),
(5)𝜗(𝜐0, 𝜅0
)= inf
{𝜗 > 0|Φ𝛶 |K
(𝜗𝜐0
||𝜅0)> 0
},
(6)Φ̂𝛶 �K(𝜐�𝜅) =∑n
i=1I�𝛶i ≤ 𝜐, Ki ≥ 𝜅
�
∑n
i=1I�Ki ≥ 𝜅
� .
(7)𝛺t =
{(𝜐, 𝜅) ∈ R
p+q
+
|||Φt𝛶K
(𝜐, 𝜅) > 0}.
(8)𝜗t(𝜐0, 𝜅0
)= inf
{𝜗 > 0|
(𝜗𝜐0, 𝜅0
)∈ 𝛺t
}= inf
{𝜗 > 0|Φt
𝛶 |K(𝜗𝜐0
||𝜅0)> 0
}.
(9)𝜗a(𝜐0, 𝜅0
)= inf
{𝜗 > 0|Φ𝛶 |K
(𝜗𝜐0
||𝜅0)> 1 − 𝛼
},
(10)𝜗t,a(𝜐0, 𝜅0
)= inf
{𝜗 > 0|Φt
𝛶 |K(𝜗𝜐0
||𝜅0)> 1 − 𝛼
}.
2 For computational issues on smoothing techniques applied, see Bădin et al. (2010, 2019).3 In order to account for banks’ scale effects, we apply for the estimation of the unconditional and con-ditional frontiers’ data envelopment analysis (DEA) estimators under the variable returns to scale (VRS) (Banker et al. 1984).

223
1 3
Technological Change and Catching-Up in the Indian Banking…
As has been explained in Bădin et al. (2012), by comparing the Q ratios as a func-tion of T we capture the marginal effects of time on banks’ shift of the frontier (i.e. banks’ technological change levels). When we compare Q� (for median α values, i.e.� = 0.5 ), we investigate the effect of time on the distribution of banks’ efficiency levels (i.e. technological catch-up). Given the adopted orientation, a decreasing non-parametric smooth regression line signifies an average positive effect of time (as if time acts as an extra free disposable input). In the opposite case, an increasing non-parametric smooth regression line signifies an average negative effect of time (as if time acts as an extra ‘bad’ output), whereas, a horizontal nonparametric smooth regression line indicates a neutral effect.
3.3 Convergence Methodology: The Phillips and Sul (2007) Approach
As a second step of our analysis, we investigate convergence within the panel of dynamic efficiency scores of 73 Indian banks, for which we utilize the con-vergence methodology of Phillips and Sul (2007). Given the scope of this study investigating the evolution of banks’ time dependent efficiency over a 19-year period, the use of the Phillips and Sul method is perfectly suitable. In addi-tion, this methodology is superior to the classical �-convergence approach (see Matousek et al. 2015 for a discussion). The applied approach accounts for transi-tional heterogeneity utilizing transition coefficients, hit , representing the bank’s efficiency score share yit , in relation to the average efficiency score. Using the relative transition coefficients, the ‘logt’ test can be presented as:
In Eq. (12) � measures the convergence’s magnitude and speed whereas Ht = N−1
∑N
i=1
�hit − 1
�2 . The convergence is indicated when � ≥ 2 , whereas � val-ues 2 > 𝛾 ≥ 0 imply conditional convergence. Using the log t test, we can determine the existence of convergence. In addition, Phillips and Sul (2007, 2009) propose a clustering mechanism tool which identifies the presence of club formation that may be present in the absence of whole panel convergence. The clustering test, as detailed in Phillips and Sul (2007), is a 4-step procedure which consists of repeated logt tests that start with the formation of a core club, and new members are subse-quently added or dropped to identify any convergent or divergent clubs.
(11)Q =�t(�0, �0
)
�(�0, �0
) , Q� =�t,a
(�0, �0
)
�a(�0, �0
)
(12)LogH1
Ht
− 2log(logt) = � + �logt + ut, for t = T0,… , T
224 S. Mallick et al.
1 3
4 Empirical Findings
4.1 Time Dependent Efficiency Scores
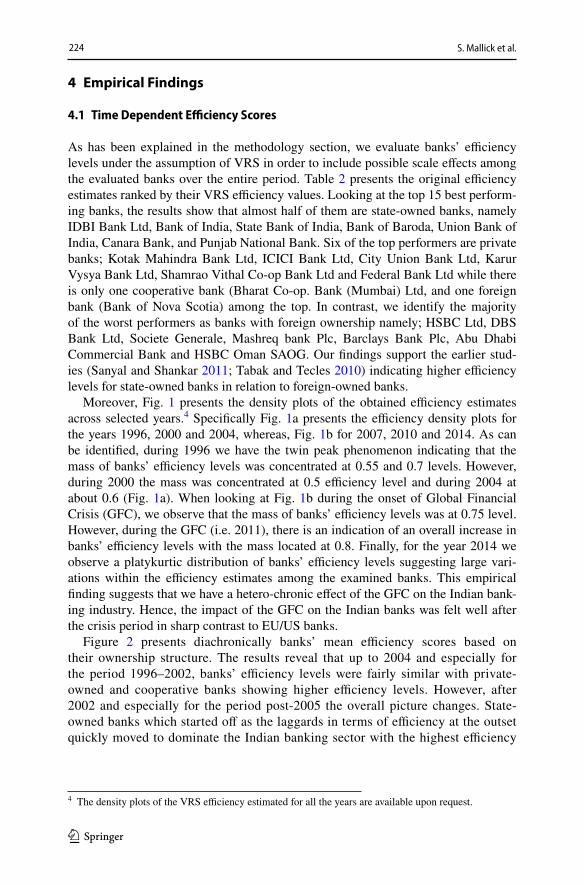
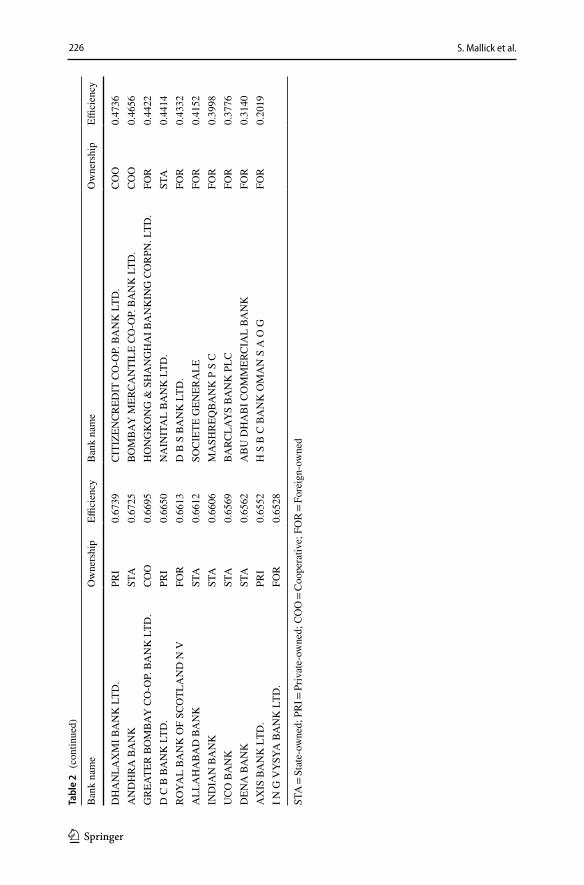
As has been explained in the methodology section, we evaluate banks’ efficiency levels under the assumption of VRS in order to include possible scale effects among the evaluated banks over the entire period. Table 2 presents the original efficiency estimates ranked by their VRS efficiency values. Looking at the top 15 best perform-ing banks, the results show that almost half of them are state-owned banks, namely IDBI Bank Ltd, Bank of India, State Bank of India, Bank of Baroda, Union Bank of India, Canara Bank, and Punjab National Bank. Six of the top performers are private banks; Kotak Mahindra Bank Ltd, ICICI Bank Ltd, City Union Bank Ltd, Karur Vysya Bank Ltd, Shamrao Vithal Co-op Bank Ltd and Federal Bank Ltd while there is only one cooperative bank (Bharat Co-op. Bank (Mumbai) Ltd, and one foreign bank (Bank of Nova Scotia) among the top. In contrast, we identify the majority of the worst performers as banks with foreign ownership namely; HSBC Ltd, DBS Bank Ltd, Societe Generale, Mashreq bank Plc, Barclays Bank Plc, Abu Dhabi Commercial Bank and HSBC Oman SAOG. Our findings support the earlier stud-ies (Sanyal and Shankar 2011; Tabak and Tecles 2010) indicating higher efficiency levels for state-owned banks in relation to foreign-owned banks.
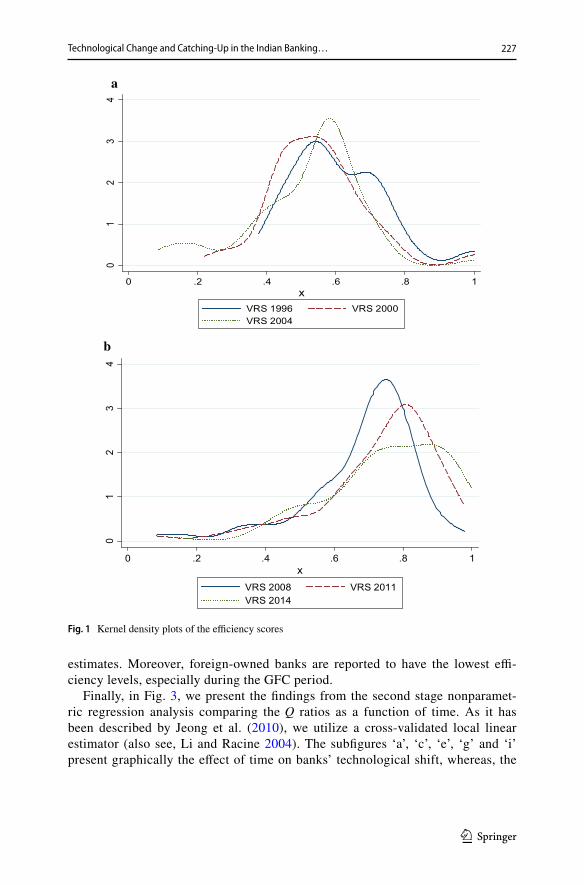
Moreover, Fig. 1 presents the density plots of the obtained efficiency estimates across selected years.4 Specifically Fig. 1a presents the efficiency density plots for the years 1996, 2000 and 2004, whereas, Fig. 1b for 2007, 2010 and 2014. As can be identified, during 1996 we have the twin peak phenomenon indicating that the mass of banks’ efficiency levels was concentrated at 0.55 and 0.7 levels. However, during 2000 the mass was concentrated at 0.5 efficiency level and during 2004 at about 0.6 (Fig. 1a). When looking at Fig. 1b during the onset of Global Financial Crisis (GFC), we observe that the mass of banks’ efficiency levels was at 0.75 level. However, during the GFC (i.e. 2011), there is an indication of an overall increase in banks’ efficiency levels with the mass located at 0.8. Finally, for the year 2014 we observe a platykurtic distribution of banks’ efficiency levels suggesting large vari-ations within the efficiency estimates among the examined banks. This empirical finding suggests that we have a hetero-chronic effect of the GFC on the Indian bank-ing industry. Hence, the impact of the GFC on the Indian banks was felt well after the crisis period in sharp contrast to EU/US banks.
Figure 2 presents diachronically banks’ mean efficiency scores based on their ownership structure. The results reveal that up to 2004 and especially for the period 1996–2002, banks’ efficiency levels were fairly similar with private-owned and cooperative banks showing higher efficiency levels. However, after 2002 and especially for the period post-2005 the overall picture changes. State-owned banks which started off as the laggards in terms of efficiency at the outset quickly moved to dominate the Indian banking sector with the highest efficiency
4 The density plots of the VRS efficiency estimated for all the years are available upon request.

225
1 3
Technological Change and Catching-Up in the Indian Banking…
Tabl
e 2
Ran
king
s of t
he In
dian
ban
ks b
ased
on
thei
r mea
n es
timat
ed e
ffici
ency
scor
es o
ver 1
996–
2014
Ban
k na
me
Ow
ners
hip
Effici
ency
Ban
k na
me
Ow
ners
hip
Effici
ency
I D B
I BA
NK
LTD
.ST
A0.
9523
STA
TE B
AN
K O
F B
IKA
NER
& JA
IPU
RST
A0.
6474
KO
TAK
MA
HIN
DR
A B
AN
K L
TD.
PRI
0.78
99N
K G
S B
CO
-OP.
BA
NK
LTD
.CO
O0.
6448
BAN
K O
F IN
DIA
STA
0.77
90K
AR
NA
TAK
A B
AN
K L
TD.
PRI
0.64
14BA
NK
OF
NO
VA S
COTI
AFO
R0.
7702
CATH
OLI
C S
YR
IAN
BA
NK
LTD
.PR
I0.
6407
I C I
C I
BAN
K L
TD.
PRI
0.75
31TA
MIL
NA
D M
ERCA
NTI
LE B
AN
K L
TD.
PRI
0.63
79B
HA
RA
T CO
-OP.
BA
NK
(MU
MBA
I) L
TD.
COO
0.73
41C
ENTR
AL
BAN
K O
F IN
DIA
STA
0.63
69ST
ATE
BA
NK
OF
IND
IAST
A0.
7206
STA
TE B
AN
K O
F M
AU
RIT
IUS
LTD
.FO
R0.
6361
CIT
Y U
NIO
N B
AN
K L
TD.
PRI
0.72
06ST
ATE
BA
NK
OF
HY
DER
ABA
DST
A0.
6349
KA
RUR
VY
SYA
BA
NK
LTD
.PR
I0.
7198
COSM
OS
COO
BA
NK
LTD
.CO
O0.
6335
BAN
K O
F BA
ROD
AST
A0.
7173
VIJ
AYA
BA
NK
STA
0.61
79U
NIO
N B
AN
K O
F IN
DIA
STA
0.71
52PU
NJA
B &
SIN
D B
AN
KST
A0.
6170
CAN
AR
A B
AN
KST
A0.
7104
BAN
K O
F C
EYLO
NFO
R0.
6120
SHA
MR
AO
VIT
HA
L CO
-OP.
BA
NK
LTD
.PR
I0.
7092
BAN
K O
F M
AH
AR
ASH
TRA
ST
A0.
6095
PUN
JAB
NA
TIO
NA
L BA
NK
STA
0.70
40K
APO
L CO
-OP.
BA
NK
LTD
.CO
O0.
6046
FED
ERA
L BA
NK
LTD
.PR
I0.
7009
BAN
K O
F A
MER
ICA
N A
FOR
0.60
29SY
ND
ICA
TE B
AN
KST
A0.
6991
JAM
MU
& K
ASH
MIR
BA
NK
LTD
.ST
A0.
6017
SAR
ASW
AT
COO
BA
NK
LTD
.CO
O0.
6991
STA
ND
AR
D C
HA
RTER
ED B
AN
K—
IND
IA B
RA
NC
HES
FOR
0.60
11IN
DU
SIN
D B
AN
K L
TD.
PRI
0.69
22H
D F
C B
AN
K L
TD.
PRI
0.60
10ST
ATE
BA
NK
OF
TRAV
AN
COR
EST
A0.
6891
A B
BA
NK
LTD
.FO
R0.
5843
LAK
SHM
I VIL
AS
BAN
K L
TD.
PRI
0.68
72BA
NK
OF
BAH
RA
IN &
KU
WA
IT B
SCFO
R0.
5805
IND
IAN
OV
ERSE
AS
BAN
KST
A0.
6860
CIT
IBA
NK
N A
FOR
0.54
47SO
UTH
IND
IAN
BA
NK
LTD
.PR
I0.
6852
AB
HY
UD
AYA
CO
-OP.
BA
NK
LTD
.CO
O0.
5386
COR
POR
ATI
ON
BA
NK
STA
0.68
18U
NIT
ED B
AN
K O
F IN
DIA
STA
0.53
25ST
ATE
BA
NK
OF
MY
SOR
EST
A0.
6784
DEU
TSC
HE
BAN
K A
GFO
R0.
4990
OR
IEN
TAL
BAN
K O
F CO
MM
ERC
EST
A0.
6762
NEW
IND
IA C
O-O
P. B
AN
K L
TD.
COO
0.49
87BA
NK
OF
TOK
YO
-MIT
SUB
ISH
I U F
J LT
D.
FOR
0.67
61C
RED
IT A
GR
ICO
LE C
OR
POR
ATE
& IN
VST
. BA
NK
FOR
0.49
59
226 S. Mallick et al.
1 3
STA
= S
tate
-ow
ned;
PR
I = P
rivat
e-ow
ned;
CO
O =
Coo
pera
tive;
FO
R =
For
eign
-ow
ned
Tabl
e 2
(con
tinue
d)
Ban
k na
me
Ow
ners
hip
Effici
ency
Ban
k na
me
Ow
ners
hip
Effici
ency
DH
AN
LAX
MI B
AN
K L
TD.
PRI
0.67
39C
ITIZ
ENC
RED
IT C
O-O
P. B
AN
K L
TD.
COO
0.47
36A
ND
HR
A B
AN
KST
A0.
6725
BOM
BAY
MER
CAN
TILE
CO
-OP.
BA
NK
LTD
.CO
O0.
4656
GR
EATE
R B
OM
BAY
CO
-OP.
BA
NK
LTD
.CO
O0.
6695
HO
NG
KO
NG
& S
HA
NG
HA
I BA
NK
ING
CO
RPN
. LTD
.FO
R0.
4422
D C
B B
AN
K L
TD.
PRI
0.66
50N
AIN
ITA
L BA
NK
LTD
.ST
A0.
4414
ROYA
L BA
NK
OF
SCO
TLA
ND
N V
FOR
0.66
13D
B S
BA
NK
LTD
.FO
R0.
4332
ALL
AH
ABA
D B
AN
KST
A0.
6612
SOC
IETE
GEN
ERA
LEFO
R0.
4152
IND
IAN
BA
NK
STA
0.66
06M
ASH
REQ
BAN
K P
S C
FOR
0.39
98U
CO B
AN
KST
A0.
6569
BARC
LAY
S BA
NK
PLC
FOR
0.37
76D
ENA
BA
NK
STA
0.65
62A
BU
DH
AB
I CO
MM
ERC
IAL
BAN
KFO
R0.
3140
AX
IS B
AN
K L
TD.
PRI
0.65
52H
S B
C B
AN
K O
MA
N S
A O
GFO
R0.
2019
I N G
VY
SYA
BA
NK
LTD
.FO
R0.
6528
227
1 3
Technological Change and Catching-Up in the Indian Banking…
estimates. Moreover, foreign-owned banks are reported to have the lowest effi-ciency levels, especially during the GFC period.
Finally, in Fig. 3, we present the findings from the second stage nonparamet-ric regression analysis comparing the Q ratios as a function of time. As it has been described by Jeong et al. (2010), we utilize a cross-validated local linear estimator (also see, Li and Racine 2004). The subfigures ‘a’, ‘c’, ‘e’, ‘g’ and ‘i’ present graphically the effect of time on banks’ technological shift, whereas, the
a
b
01
23
4
0 .2 .4 .6 .8 1x
VRS 1996 VRS 2000VRS 2004
01
23
4
0 .2 .4 .6 .8 1x
VRS 2008 VRS 2011VRS 2014
Fig. 1 Kernel density plots of the efficiency scores

228 S. Mallick et al.
1 3
subfigures ‘b’, ‘d’, ‘f’, ‘h’ and ‘k’ present the effect of time on bank’s technologi-cal catch-up.5
When we examine the entire sample subfigures (a and b) we observe a negative effect of time on change in banks’ technological frontier for the period 1996–2004. This negative effect is illustrated with an increasing nonparametric line. However, after 2004 and for the rest of the examined period the effect becomes positive as demonstrated by a decreasing nonparametric line. In a similar way, a negative effect of time on banks’ catch-up levels is observed for the period 1996–2002, whereas, the effect becomes positive after this point. When we consider foreign-owned banks, we observe a similar phenomenon but with different turning points. For technologi-cal change, the effect is negative just before the start of the GFC. However, the effect of time on foreign owned banks’ technological frontier becomes positive beyond this time point (Fig. 3c). However, for the case of technological catch-up (Fig. 3d) we observe that the negative effect on foreign banks’ technological catch-up levels is more pronounced up to 2011, which, after that time point slightly turns to be posi-tive signifying a recovery time point after GFC. For the private-owned banks, we observe a negative impact of time on their technological change up to early 2000’s (Fig. 3e). After that point and for the period 2001–2010, the effect turns positive and then becomes negative. Moreover, the effect of time on private-owned banks’ tech-nological catch-up levels is reported to be negative (Fig. 3f).
Fig. 2 Diachronical representations of banks’ efficiency scores based on their ownership structure
5 The estimated nonparametric line is presented in those plots alongside 95% estimated bootstrap inter-vals (Hayfield and Racine 2008).

229
1 3
Technological Change and Catching-Up in the Indian Banking…
Fig. 3 Time effects of techno-logical change and technological catch-up
230 S. Mallick et al.
1 3
When we consider the case of cooperative banks’, we can observe a nonlin-ear negative effect for the period 1996–2005 on their technological change levels (Fig. 3g). However, for the rest of the period the effect turns positive. In contrast when we examine the time effects on their technological catch-up, we observe a positive effect over the period 1996–2002, whereas, a negative effect over the period 2002–2014 is noted (Fig. 2h). Finally, for state-owned banks, it is evident that during 1996–2004 the effect of time on banks’ technological change is mixed as reflected in a highly nonlinear nonparametric regression line. However, for the rest of the period the effect is positive with a steeper negative line during the period 2004–2007. This finding suggests that the gains on state-owned banks’ technologi-cal change levels were greater before the GFC period in contrast with the period 2007–2014, in which, again the effects are positive, but, the gains are less as denoted by a less steep negative nonparametric regression line (Fig. 3i). Finally, Fig. 3k sig-nifies nonlinear effects of time on state-owned banks’ technological catch-up levels. It must be noted that for the period 1996–2002, the effect was negative. However, after that year the effect was positive.
4.2 Convergence Results
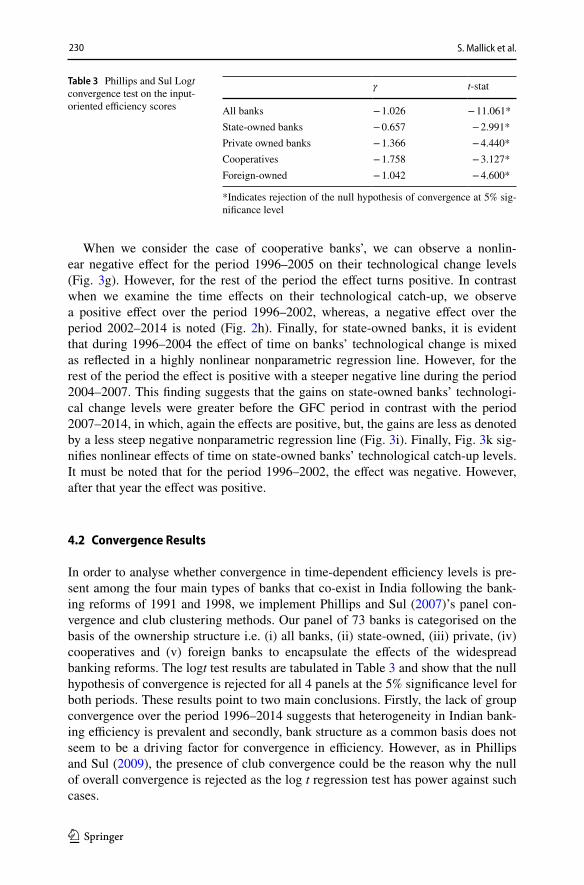
In order to analyse whether convergence in time-dependent efficiency levels is pre-sent among the four main types of banks that co-exist in India following the bank-ing reforms of 1991 and 1998, we implement Phillips and Sul (2007)’s panel con-vergence and club clustering methods. Our panel of 73 banks is categorised on the basis of the ownership structure i.e. (i) all banks, (ii) state-owned, (iii) private, (iv) cooperatives and (v) foreign banks to encapsulate the effects of the widespread banking reforms. The logt test results are tabulated in Table 3 and show that the null hypothesis of convergence is rejected for all 4 panels at the 5% significance level for both periods. These results point to two main conclusions. Firstly, the lack of group convergence over the period 1996–2014 suggests that heterogeneity in Indian bank-ing efficiency is prevalent and secondly, bank structure as a common basis does not seem to be a driving factor for convergence in efficiency. However, as in Phillips and Sul (2009), the presence of club convergence could be the reason why the null of overall convergence is rejected as the log t regression test has power against such cases.
Table 3 Phillips and Sul Logt convergence test on the input-oriented efficiency scores
*Indicates rejection of the null hypothesis of convergence at 5% sig-nificance level
γ t-stat
All banks − 1.026 − 11.061*State-owned banks − 0.657 − 2.991*Private owned banks − 1.366 − 4.440*Cooperatives − 1.758 − 3.127*Foreign-owned − 1.042 − 4.600*

231
1 3
Technological Change and Catching-Up in the Indian Banking…
Tabl
e 4
Clu
b co
nver
genc
e te
st re
sults
Dat
a se
tγ
t-sta
ts
All
73 In
dian
Ban
ks 1
996-
2014
Clu
b 1:
11
Stat
e-ow
ned
bank
s (A
llaha
bad
Ban
k, A
ndhr
a B
ank,
Can
ara
Ban
k, D
ena
Ban
k, In
dian
Ban
k, Ja
mm
u &
Kas
hmir
Ban
k Lt
d, N
aini
tal B
ank
Ltd.
, Pun
jab
& S
ind
Ban
k, P
unja
b N
atio
nal B
ank,
Sta
te B
ank
of B
ikan
er &
Jaip
ur, S
tate
Ban
k of
M
ysor
e), 7
priv
ate
bank
s (C
ity U
nion
Ban
k Lt
d, F
eder
al B
ank
Ltd.
, HD
FC B
ank
Ltd.
, IC
ICI B
ank
Ltd.
, Kot
ak M
ahin
dra
Ban
k Lt
d., T
amiln
ad M
erca
ntile
Ban
k Lt
d., A
xis b
ank
ltd.),
4 C
o-op
erat
ive
bank
s (A
bhyu
daya
Co-
op. B
ank
Ltd.
, Bha
rat
Co-
op. B
ank
(Mum
bai)
Ltd.
, Bom
bay
Mer
cant
ile C
o-op
. Ban
k ltd
., N
ew In
dia
Co-
op. B
ank
ltd.),
6 F
orei
gn b
anks
(Ban
k of
C
eylo
n, B
ank
of T
okyo
-Mits
ubis
hi U
FJ L
td.,
Bar
clay
s Ban
k pl
c, C
itiba
nk N
A, D
euts
che
Ban
k A
G, D
BS
Ban
k Lt
d.)
0.3
0.40
9
Clu
b 2:
3 S
tate
-ow
ned
bank
s (B
ank
of M
ahar
asht
ra, I
ndia
n O
vers
eas B
ank,
Orie
ntal
Ban
k of
Com
mer
ce),
4 Pr
ivat
e ba
nks
(Dha
nlax
mi B
ank
ltd.,
Indu
sind
Ban
k ltd
., K
arna
taka
ban
k ltd
., K
arur
Vys
ya B
ank
Ltd.
) 3 C
o-op
erat
ive
bank
s (C
itize
ncre
dit
Co-
op. b
ank
ltd.,
Cos
mos
co-
oper
ativ
e ba
nk lt
d., K
apol
co-
op. b
ank
ltd.),
2 F
orei
gn b
anks
(AB
ban
k ltd
., H
SBC
Ltd
.)
0.52
50.
681
Clu
b 3:
6 S
tate
-ow
ned
bank
s (B
ank
of In
dia,
Cen
tral b
ank
of In
dia,
Sta
te b
ank
of In
dia,
Syn
dica
te b
ank,
Uni
on b
ank
of In
dia,
U
nite
d ba
nk o
f Ind
ia),
1 co
-ope
rativ
e ba
nk (N
K G
S B
co-
op. B
ank
ltd.)
1 fo
reig
n ba
nks (
Abu
Dha
bi c
omm
erci
al b
ank)
− 1.
173
− 0.
975
Clu
b 4:
4 S
tate
-ow
ned
bank
s (B
ank
of B
arod
a, C
orpo
ratio
n ba
nk, S
tate
ban
k of
Hyd
erab
ad, U
CO b
ank)
, 2 p
rivat
e ba
nks (
Lak-
shm
i Vila
s ban
k ltd
., Sh
amra
o V
ithal
co-
op. b
ank
ltd.),
2 c
o-op
erat
ive
bank
s (G
reat
er B
omba
y co
-op.
ban
k ltd
., Sa
rasw
at
co-o
pera
tive
bank
ltd.
) 1 fo
reig
n ba
nk (B
ank
of B
ahra
in &
Kuw
ait B
SC)
0.61
30.
380
Clu
b 5:
3 S
tate
-ow
ned
bank
s (I D
B I
bank
ltd.
, Sta
te b
ank
of T
rava
ncor
e, V
ijaya
ban
k), 1
priv
ate
bank
(Sou
th In
dian
ban
k ltd
.)−
0.70
4−
0.47
6C
lub
6: 2
priv
ate
bank
s (C
atho
lic S
yria
n ba
nk lt
d, D
CB
b b
ank
ltd.),
2 fo
reig
n ba
nks (
Ban
k of
Am
eric
a N
A, B
ank
of N
ova
Scot
ia)
− 0.
153
− 0.
146
Stat
e-ow
ned
bank
sC
lub
1: A
llaha
bad
Ban
k, A
ndhr
a B
ank,
Can
ara
Ban
k, D
ena
Ban
k, In
dian
Ban
k, In
dian
Ove
rsea
s ban
k, Ja
mm
u &
Kas
hmir
Ban
k Lt
d, N
aini
tal B
ank
Ltd.
, Pun
jab
& S
ind
Ban
k, P
unja
b N
atio
nal B
ank,
Sta
te B
ank
of B
ikan
er &
Jaip
ur, S
tate
Ban
k of
M
ysor
e
0.43
90.
580
Clu
b 2:
Ban
k of
Mah
aras
htra
, Orie
ntal
Ban
k of
Com
mer
ce−
4.21
8−
0.90
9C
lub
3: B
ank
of B
arod
a, B
ank
of In
dia,
Cen
tral b
ank
of In
dia,
Cor
pora
tion
Ban
k, ID
BI b
ank
Ltd.
, Sta
te b
ank
of H
yder
abad
− 0.
630
− 1.
124
Priv
ate-
owne
d ba
nks
Clu
b 1:
City
Uni
on B
ank
Ltd,
Fed
eral
Ban
k Lt
d., H
DFC
Ban
k Lt
d., I
CIC
I Ban
k Lt
d, In
dusi
nd b
ank
ltd.
− 1.
890
− 1.
259
Clu
b 2:
Cat
holic
Syr
ian
bank
ltd,
DC
B b
ank
ltd.,
Dha
nlax
mi b
ank
ltd−
2.04
6−
1.12
0Fo
reig
n ba
nks

232 S. Mallick et al.
1 3
Tabl
e 4
(con
tinue
d)
Dat
a se
tγ
t-sta
ts
Clu
b 1:
Abu
Dha
bi c
omm
erci
al b
ank,
Ban
k of
Nov
a Sc
otia
, Mas
hreq
bank
PSC
, Soc
iete
Gen
eral
e, S
tand
ard
char
tere
d ba
nk -
Indi
a br
anch
es, S
tate
ban
k of
Mau
ritiu
s ltd
., IN
G V
ysya
ban
k ltd
., Ro
yal b
ank
of S
cotla
nd n
v.
0.87
71.
108
Clu
b 2:
A B
ban
k ltd
., B
ank
of A
mer
ica
NA
, Ban
k of
Bah
rain
& K
uwai
t BSC
, Ban
k of
Cey
lon,
Ban
k of
Tok
yo-M
itsub
ishi
U
FJ L
td.,
Bar
clay
s ban
k pl
c, C
itiba
nk N
A, D
euts
che
bank
A G
, HSB
C lt
d., C
redi
t Agr
icol
e co
rpor
ate
& in
vst.
bank
− 0.
723
− 0.
741
Clu
b 3:
D B
S b
ank
ltd.,
HSB
C b
ank
Om
an S
A O
G2.
639
1.91
1C
oope
rativ
e ba
nks
Clu
b 1:
Abh
yuda
ya C
o-op
. Ban
k Lt
d., B
hara
t Co-
op. B
ank
(Mum
bai)
Ltd.
, Bom
bay
Mer
cant
ile C
o-op
. Ban
k ltd
, Kap
ol c
o-op
. ba
nk lt
d., N
ew In
dia
co-o
p. b
ank
ltd.
− 1.
039
− 1.
159
Clu
b 2:
Citi
zenc
redi
t co-
op. b
ank
ltd.,
Cos
mos
co-
oper
ativ
e ba
nk lt
d., G
reat
er B
omba
y co
-op.
ban
k ltd
0.81
40.
407
*Ind
icat
es re
ject
ion
of th
e nu
ll hy
poth
esis
of c
onve
rgen
ce a
t the
5%
sign
ifica
nce
leve
l
233
1 3
Technological Change and Catching-Up in the Indian Banking…
The club convergence results confirm that this is indeed the case as we find the overwhelming presence of several clusters of convergence, as presented in Table 4 across all 4 types of banks. For the whole panel of 73 banks, we identify 6 clusters, with each cluster typically regrouping all 4 types of banks. The first club is the biggest comprising 11 state-owned banks, 7 private banks, 4 co-operative banks and 6 foreign banks. However, the speed of convergence for all 6 clusters is slow with γ ranging between 0.3 and − 1.173. We therefore note that the type of convergence relates to the rate of change in efficiency levels as γ < 2. The other 5 club formations have smaller number of banks and we note weak convergence rates in 2 of the clusters.
When we test for club convergence among each type of bank ownership, we find the presence of up to 3 convergent clusters. The composition of the clusters very closely mirrors those of the clubs obtained when the whole panel is tested so there is consistency in the formation of the clubs. This finding suggests that the type of bank ownership is, partly, a determining factor in efficiency of Indian banks. Other driving factors are likely to be other bank-specific factors such as geographical loca-tion. In addition, two other observations can be made from the club convergence results. Firstly, for the group of private banks, we identify very weak convergence (γ = − 1.890, − 2.046). This would suggest that heterogeneity in efficiency lev-els for private banks is present throughout the period 1996–2014. Secondly, the panel of foreign banks exhibit the highest speed of convergence amongst all panels (γ = 2.639). Again the ownership structure is likely to be a driving force. Overall, our club convergence results, to some extent, tally with those of Kumar and Gulati (2009) and Kumar (2013) who found the presence of �-convergence for the case of Indian public sector banks’ efficiency levels.
5 Conclusions
After having undergone a major transformation since the financial reforms were introduced in the 1990s, the banks in India now comprise of state-run, private, for-eign and cooperative banks. In this study, we analysed the time dependent efficiency scores for a panel of 73 banks over the period 1996–2014. Interestingly we identify several state-owned banks being the most efficient in the panel, while the majority of the worst performers are foreign banks. However, this was not always the case as during the period 1996–2002, as all types of banks’ efficiency levels were fairly sim-ilar with privately-owned and cooperative banks showing higher levels of efficiency. However, after 2002 and especially during the post-2005 period, state-owned banks which started off as the less efficient banks in the panel overtook all other types of banks to assert themselves as the top performers with regard to efficiency.
Our results also indicate an increase in bank efficiency during the global finan-cial crisis, as Indian banks continue to have limited exposure to global markets due to the country’s closed capital account. However, for the year 2014, we find large variations in the efficiency levels for the banks and we attribute the diversity in the estimates to the growth slowdown around that time. The negative impact of the cri-sis was quite significant for the foreign banks. Overall, we note that the banking sector in India is resilient and has weathered the financial crisis differently to their
234 S. Mallick et al.
1 3
counterparts in other emerging and developed economies. Looking at the impact of time on banks’ technological change and catch-up levels, we observe a nega-tive effect of time on banks’ technological change between 1996 and 2004, and on banks’ technological catch-up during 1996–2002. Since 2002 until the end of 2014, we observe a positive effect of time on banks’ technological change and catch-up. This no doubt coincides with massive investment in technology, especially by state-owned banks.
Convergence tests on the efficiency of banks reveal that although overall group con-vergence is absent for the period 1996–2014, club convergence is identified among all four types of banks throughout the sample period. This is evident from the large num-ber of convergent clusters made up of banks from all 4 types of ownership. We find that the composition of the clusters is partly driven by the ownership structure.
With the Indian economy expected to undergo further transformation with poli-cies directed at being more business-conducive and with better targeting of infla-tion reflecting macroeconomic stability, the Indian banking sector finds itself on the brink of further transformation, including the process of consolidation of state-owned banks. Demand for better services, the growing spread of mobile and inter-net banking, the need to invest in technology upgrading and innovation are some of the new and continuing challenges that the banks will face as the economy lurches ahead. Going forward, Indian banks are likely to face further pressure on asset qual-ity and capitalisation as the volume of NPLs in sectors facing difficulties is likely to increase, adding to credit risks. In addition, the implementation of Basel III poses further challenges with capital demand expected to rise. Banks with weak capitalisa-tion will find themselves in more vulnerable position. However, the path ahead for Indian banks will continue to further depend on government’s capital injections and financial support which will undoubtedly have a direct impact on bank performance.
Acknowledgements The authors would like to thank the editor of this journal for two rounds of rewriting on an earlier version of this paper. We are also thankful to Roman Matousek for his useful comments in the early stage of this work. We are solely responsible for any error that might yet remain.
Open Access This article is licensed under a Creative Commons Attribution 4.0 International License, which permits use, sharing, adaptation, distribution and reproduction in any medium or format, as long as you give appropriate credit to the original author(s) and the source, provide a link to the Creative Com-mons licence, and indicate if changes were made. The images or other third party material in this article are included in the article’s Creative Commons licence, unless indicated otherwise in a credit line to the material. If material is not included in the article’s Creative Commons licence and your intended use is not permitted by statutory regulation or exceeds the permitted use, you will need to obtain permission directly from the copyright holder. To view a copy of this licence, visit http://creat iveco mmons .org/licen ses/by/4.0/.
References
Ahamed, M. M., & Mallick, S. K. (2017a). Does regulatory forbearance matter for bank stability? Evi-dence from creditors’ perspective. Journal of Financial Stability, 28, 163–180.
Ahamed, M. M., & Mallick, S. K. (2017b). House of restructured assets: How do they affect bank risk in an emerging market? Journal of International Financial Markets, Institutions and Money, 47, 1–14.
235
1 3
Technological Change and Catching-Up in the Indian Banking…
Bădin, L., Daraio, C., & Simar, L. (2010). Optimal bandwidth selection for conditional efficiency meas-ures: A data-driven approach. European Journal of Operational Research, 201(2), 633–640.
Bădin, L., Daraio, C., & Simar, L. (2012). How to measure the impact of environmental factors in a non-parametric production model? European Journal of Operational Research, 223(3), 818–833.
Bădin, L., Daraio, C., & Simar, L. (2019). A bootstrap approach for bandwidth selection in estimating conditional efficiency measures. European Journal of Operational Research, 277(2), 784–797.
Banker, R. D., Charnes, A., & Cooper, W. W. (1984). Some models for estimating technical and scale inefficiencies in DEA. Management Science, 30(9), 1078–1092.
Berger, A. N., & Humphrey, D. B. (1997). Efficiency of financial institutions: International survey and directions for future research. European Journal of Operational Research, 98, 175–212.
Berger, N. A., & Mester, L. J. (1997). Inside the black box: What explains differences in the efficiencies of financial institutions? Journal of Banking & Finance, 21, 895–947.
Bhattacharyya, A., & Pal, S. (2013). Financial reforms and technical efficiency in Indian commercial banking: A generalized stochastic frontier analysis. Review of Financial Economics, 22, 109–117.
Bhaumik, S., & Dimova, R. (2004). How important is ownership in a market with level playing field? The Indian banking sector revisited. Journal of Comparative Economics, 32, 165–180.
Casu, B., Ferrari, A., & Zhao, T. (2013). Regulatory reform and productivity change in Indian banking. Review of Economics and Statistics, 95, 1066–1077.
Cazals, C., Florens, J. P., & Simar, L. (2002). Nonparametric frontier estimation: A robust approach. Journal of Econometrics, 106(1), 1–25.
Chen, Z., Tzeremes, P., & Tzeremes, N. G. (2018). Convergence in the Chinese airline industry: A Malmquist productivity analysis. Journal of Air Transport Management, 73, 77–86.
Cordero, J. M., Polo, C., Santín, D., & Simancas, R. (2018). Efficiency measurement and cross-country differences among schools: A robust conditional nonparametric analysis. Economic Modelling, 74, 45–60.
Daouia, A., & Simar, L. (2007). Nonparametric efficiency analysis: A multivariate conditional quantile approach. Journal of Econometrics, 140(2), 375–400.
Daraio, C., & Simar, L. (2005). Introducing environmental variables in nonparametric frontier models: A probabilistic approach. Journal of Productivity Analysis, 24(1), 93–121.
Daraio, C., & Simar, L. (2007). Conditional nonparametric frontier models for convex and nonconvex technologies: A unifying approach. Journal of Productivity Analysis, 28(1–2), 13–32.
Daraio, C., Simar, L., & Wilson, P. W. (2018). Central limit theorems for conditional efficiency meas-ures and tests of the ‘separability’ condition in non-parametric, two-stage models of production. The Econometrics Journal, 21(2), 170–191.
Das, A., & Ghosh, S. (2006). Financial deregulation and efficiency: An empirical analysis of Indian banks during the post reform period. Review of Financial Economics, 15, 193–221.
Das, A., & Kumbhakar, S. C. (2012). Productivity and efficiency dynamics in Indian banking: An input distance function approach incorporating quality of inputs and outputs. Journal of Applied Econo-metrics, 27, 205–234.
Degl’Innocenti, M., Kourtzidis, S. A., Sevic, Z., & Tzeremes, N. G. (2017). Investigating bank efficiency in transition economies: A window-based weight assurance region approach. Economic Modelling, 67, 23–33.
Drake, L., & Hall, M. J. B. (2003). Efficiency in Japanese banking: An empirical analysis. Journal of Banking & Finance, 27, 891–917.
Fujii, H., Managi, S., & Matousek, R. (2014). Indian bank efficiency and productivity changes with unde-sirable outputs: A disaggregated approach. Journal of Banking & Finance, 38, 41–50.
Fukuyama, H., & Matousek, R. (2011). Efficiency of Turkish banking: two-stage network system. Vari-able returns to scale model. Journal of International Financial Markets, Institutions and Money, 21, 75–91.
Gearhart, R. S., III, & Michieka, N. M. (2018). A comparison of the robust conditional order-m estima-tion and two stage DEA in measuring healthcare efficiency among California counties. Economic Modelling, 73, 395–406.
Hayfield, T., & Racine, J. S. (2008). Nonparametric econometrics: The np package. Journal of Statistical Software, 27(5), 1–32.
Jeong, S. O., Park, B. U., & Simar, L. (2010). Nonparametric conditional efficiency measures: Asymp-totic properties. Annals of Operations Research, 173, 105–122.
Kumar, S. (2013). Banking reforms and the evolution of cost efficiency in Indian public sector banks. Economic Change and Restructuring, 46, 143–182.
236 S. Mallick et al.
1 3
Kumar, S., & Gulati, R. (2010). Measuring efficiency, effectiveness and performance of Indian public sector banks. International Journal of Productivity and Performance Management, 59, 51–74.
Kumbhakar, S., & Sarkar, S. (2003). Deregulation, ownership, and productivity growth in the banking industry: Evidence from India. Journal of Money, Credit, and Banking, 35, 403–414.
Li, Q., & Racine, J. (2004). Cross-validated local linear nonparametric regression. Statistica Sinica, 14, 485–512.
Mallick, S., Matousek, R., & Tzeremes, N. G. (2016). Financial development and productive inefficiency: A robust conditional directional distance function approach. Economics Letters, 145, 196–201.
Mastromarco, C., & Simar, L. (2015). Effect of FDI and time on catching up: New insights from a condi-tional nonparametric frontier analysis. Journal of Applied Econometrics, 30(5), 826–847.
Mastromarco, C., & Simar, L. (2018). Globalization and productivity: A robust nonparametric world frontier analysis. Economic Modelling, 69, 134–149.
Matousek, R., Rughoo, A., Sarantis, N., & Assaf, A. G. (2015). Bank performance and convergence dur-ing the financial crisis: Evidence from the ‘old’ European Union and Eurozone. Journal of Banking & Finance, 52, 208–216.
McKillop, D. G., Glass, J. C., & Morikawa, Y. (1996). The composite cost function and efficiency in giant Japanese banks. Journal of Banking & Finance, 20, 1651–1671.
Phillips, P. C. B., & Sul, D. (2007). Transition modelling and econometric convergence tests. Economet-rica, 75, 1771–1855.
Phillips, P. C. B., & Sul, D. (2009). Economic transition and growth. Journal of Applied Econometrics, 24, 1153–1185.
Sahoo, B., & Tone, K. (2009). Radial and non-radial decompositions of profit change: With an applica-tion to Indian banking. European Journal of Operational Research, 196, 1130–1146.
Sanyal, P., & Shankar, R. (2011). Ownership, competition, and bank productivity: An analysis of Indian banking in the post-reform period. International Review of Economics and Finance, 20, 225–247.
Sarkar, J., Sarkar, S., & Bhaumik, S. (1998). Does ownership always matter? Evidence from the Indian banking industry. Journal of Comparative Economics, 26, 262–281.
Sealey, C. W., & Lindley, J. T. (1977). Inputs, outputs, and a theory of production and cost at depository financial institutions. Journal of Finance, 32, 1251–1266.
Sensarma, R. (2008). Deregulation, ownership and profit performance of banks: Evidence from India. Applied Financial Economics, 18, 1581–1595.
Simar, L., & Wilson, P. W. (2007). Estimation and inference in two-stage, semiparametric models of pro-duction processes. Journal of Econometrics, 136, 31–64.
Simar, L., & Wilson, P. W. (2011). Two-stage DEA: Caveat emptor. Journal of Productivity Analysis, 36, 205–218.
Tabak, B. M., & Tecles, P. L. (2010). Estimating a Bayesian stochastic frontier for the Indian banking system. International Journal of Production Economics, 125, 96–110.
Tzeremes, N. G. (2015). Efficiency dynamics in Indian banking: A conditional directional distance approach. European Journal of Operational Research, 240(3), 807–818.
Tzeremes, N. G. (2019). Technological change, technological catch-up and export orientation: Evidence from Latin American Countries. Journal of Productivity Analysis, 52(1–3), 85–100.
Publisher’s Note Springer Nature remains neutral with regard to jurisdictional claims in published maps and institutional affiliations.
Affiliations
Sushanta Mallick1 · Aarti Rughoo2 · Nickolaos G. Tzeremes3 · Wei Xu4
Aarti Rughoo [email protected]
Nickolaos G. Tzeremes [email protected]
237
1 3
Technological Change and Catching-Up in the Indian Banking…
Wei Xu [email protected]
1 School of Business and Management, Queen Mary University of London, Mile End Road, London E1 4NS, UK
2 Hertfordshire Business School, University of Hertfordshire, Hatfield AL10 9AB, UK3 Department of Economics, University of Thessaly, 28th October Street, 38333 Volos, Greece4 Department of Mathematics, Ryerson University, Toronto, Canada