Technische Universität München - mediaTUM
202
Technische Universität München Ingenieurfakultät Bau Geo Umwelt Lehrstuhl für Siedlungswasserwirtschaft Development and Evaluation of an Assessment Method for Decentralized Stormwater Treatment Systems for Runoff from Traffic Areas Maximilian Josef Huber Vollständiger Abdruck der von der Ingenieurfakultät für Bau Geo Umwelt der Technischen Universität München zur Erlangung des akademischen Grades eines Doktor‐Ingenieurs (Dr.‐Ing.) genehmigten Dissertation. Vorsitzender: Univ.‐Prof. Dr.‐Ing. Jörg E. Drewes Prüfer der Dissertation: 1. apl. Prof. Dr. rer. nat. habil. Brigitte Helmreich 2. Univ.‐Prof. Dr.‐Ing. habil. Marc Wichern, Ruhr‐Universität Bochum 3. Univ.‐Prof. Dr.‐Ing. Detlef Heinz Die Dissertation wurde am 14.03.2016 bei der Technischen Universität München eingereicht und durch die Ingenieurfakultät Bau Geo Umwelt am 03.06.2016 angenommen.
-
Upload
khangminh22 -
Category
Documents
-
view
0 -
download
0
Transcript of Technische Universität München - mediaTUM

Technische Universität München
Ingenieurfakultät Bau Geo Umwelt
Lehrstuhl für Siedlungswasserwirtschaft
Development and Evaluation of an Assessment Method for
Decentralized Stormwater Treatment Systems for Runoff from Traffic Areas
Maximilian Josef Huber
Vollständiger Abdruck der von der Ingenieurfakultät für Bau Geo Umwelt der Technischen
Universität München zur Erlangung des akademischen Grades eines
Doktor‐Ingenieurs (Dr.‐Ing.)
genehmigten Dissertation.
Vorsitzender: Univ.‐Prof. Dr.‐Ing. Jörg E. Drewes
Prüfer der Dissertation:
1. apl. Prof. Dr. rer. nat. habil. Brigitte Helmreich
2. Univ.‐Prof. Dr.‐Ing. habil. Marc Wichern, Ruhr‐Universität Bochum
3. Univ.‐Prof. Dr.‐Ing. Detlef Heinz
Die Dissertation wurde am 14.03.2016 bei der Technischen Universität München eingereicht
und durch die Ingenieurfakultät Bau Geo Umwelt am 03.06.2016 angenommen.

Abstract
The runoff from traffic areas is polluted by several substances (e.g., heavy metals, hydrocarbons,
compounds of de‐icing salts, and solids) and must often be treated prior to discharge into receiving
waters. In the last few years, many decentralized stormwater treatment systems have been
developed and can be tested in Germany and worldwide by standardized methods. However, no
detailed method is currently available for the determination of the service lives and the influences of
de‐icing salts on the remobilization of pollutants that were previously fixed onto filter materials.
Decentralized stormwater treatment systems, which do not pose any risk for groundwater and
surface water by discharging dissolved pollutants, can only be developed and operated with the
knowledge of a realistic service life and a possible remobilization of previously retained heavy metals
by de‐icing salts. Therefore, the focus of this thesis was set on the development and evaluation of an
assessment method for decentralized stormwater treatment systems for runoff from traffic areas.
In a first step, a literature study was performed to collect data from international monitoring
programs (294 data sets) to determine the heavy metal concentrations of the most relevant heavy
metals cadmium, chromium, copper, lead, nickel, and zinc in runoff from traffic areas. For these
metals, the total and dissolved concentrations (median, average, and distribution) were determined
separately for eight traffic area categories. In addition, the measured runoff concentrations of the
metals antimony, cobalt, manganese, palladium, platinum, rhodium, titanium, and tungsten were
compiled. Moreover, the influences of site‐specific and method‐specific factors on the results of
monitoring programs were evaluated. As one result, the runoff concentrations of zinc were the most
variable compared with the other heavy metals. Furthermore, the method of calculating average
values has a huge impact on the results and the pH value of runoff waters does not correlate with the
dissolved part of heavy metals in the field. In the 80s and 90s, the lead concentrations in runoff from
traffic areas significantly decreased, whereas no trends were detected for copper and zinc.
The determined distributions of the dissolved metal concentrations were used to perform
appropriate experiments for the evaluation of the heavy metal removal by filter materials in lab‐,
pilot‐, and full‐scale experiments. Although the removal mechanisms of filter materials consist of
filtration (e.g., after precipitation), sorption, ion exchange, or biochemical transformation, the term
“filter material” was deliberately chosen because it is commonly used by manufacturers and
operators. At the beginning, a comparison of batch and column experiments was performed.
Capacities and kinetics were determined that describe the removal of copper, nickel, and zinc by six
filter materials. For batch experiments, the influences of two different types of shakers, a variation of
the initial pH value (5 and 7), and the presence of a buffer was tested. For most experiments, the use
of a rotary shaker, a pH buffer simulating ionic strength, and an initial pH value of 7 instead of 5
2

increased the capacities. In contrast to batch experiments, the column experiments were performed
with more realistic boundary conditions. For the results of the column experiments, the differences
between the filter materials were more significant compared with the batch test results. The
capacities determined by column experiments decreased with increasing influent concentrations and
shorter contact times. As a further result, lab‐scale column experiments can be used as an indicator
to determine the service lives of treatment systems. Batch experiments with heavy metals can only
be used under identical and well‐defined conditions to select appropriate filter materials and to
prove the comparability of different production batches. In contrast, the cation exchange capacities,
which were determined in accordance with the Standard Methods DIN EN ISO 11260:2011‐09 and
DIN EN 16070:2014‐06, were not suitable to determine heavy metal removal capacities and to
characterize the performance of filter materials. For the determination of realistic service lives and
removal efficiencies of decentralized stormwater treatment systems for traffic area runoff, pilot‐
scale experiments are necessary. Therefore, a novel and standardized method was developed that
consists of two parts. In Part 1, the filter material is rapidly preloaded in individual models with the
heavy metals copper and zinc. In Part 2, the long‐term performance of the system is assessed by
simulating the last year of the filter material’s service life with three different rain events. All tested
treatment systems had different removal efficiencies, in particular in their long‐term performances.
The average removal efficiencies varied between 48.2% and 99.3% for copper and between 59.7%
and 99.4% for zinc. The smallest values were determined during the rain event with the highest rain
intensity. The applicability of the method was confirmed by a comparison of the novel test method
results with field measurements, which were performed at four sites for two filter channel systems.
Moreover, the remobilization risk of previously retained heavy metals was determined for cadmium,
copper, lead, nickel, and zinc under application of de‐icing salts by lab‐scale column experiments.
Hereby, tests were performed with eight columns for each of the six filter materials to determine the
heavy metal removal. Afterwards, three different experiments were performed with sodium chloride,
a mixture of sodium chloride and calcium chloride, and a mixture of sodium chloride and magnesium
chloride in duplicates. The mixture of sodium chloride and calcium chloride remobilized the most
heavy metals. The remobilization increased with an increasing preloading of the filter and it also
depends on the filter material and the heavy metal. The two preloaded columns without subsequent
salt tests were used for further studies to describe the removal mechanisms.
A monograph was also published that provides an introduction into the topic decentralized
stormwater treatment of runoff from traffic areas and metal roofs. It includes an overview of the
system types, their removal mechanisms, the catchment areas, the discharge criteria, the receiving
compartments, the legal requirements, the approval procedures, and the test methods.
3

Zusammenfassung
Verkehrsflächenabflüsse sind mit einer Vielzahl von Stoffen (z. B. Schwermetalle, Kohlenwasserstoffe,
Auftausalze und Feststoffe) verunreinigt und bedürfen oftmals vor Einleitung in ein Gewässer einer
Behandlung. In den letzten Jahren wurden zahlreiche dezentrale Behandlungsanlagen entwickelt,
welche sowohl in Deutschland als auch weltweit anhand differenzierter Prüfverfahren getestet
werden können. Jedoch ist derzeit keine detaillierte Methodik zur Bestimmung der Standzeit dieser
Anlagen und zur Ermittlung des Einflusses von Auftausalzen auf die Remobilisierung von auf
Filtermaterialien zurückgehaltenen Schadstoffen vorhanden. Nur bei Kenntnis einer realistischen
Standzeit und einer möglichen Remobilisierung bereits zurückgehaltener Schwermetalle durch
Auftausalze können dezentrale Behandlungsanlagen entwickelt und betrieben werden, die kein
Risiko für den Eintrag gelöster Schadstoffe in Grund‐ und Oberflächengewässer bergen. Diese Arbeit
behandelt daher die Entwicklung und Anwendung eines standardisierten Bewertungsverfahrens für
dezentrale Anlagen zur Niederschlagswasserbehandlung von Verkehrsflächenabflüssen.
Als Basis für die Arbeit wurden in einem ersten Schritt 294 Datensätze internationaler Literatur
ausgewertet, um die Schwermetallkonzentrationen der aufkommensrelevanten Stoffe Blei, Cadmium,
Chrom, Kupfer, Nickel und Zink in Verkehrsflächenabflüssen zu bestimmen. Für diese Schwermetalle
wurden die gesamten und gelösten Konzentrationen (Median, Mittelwert und Verteilung) getrennt
für acht Verkehrsflächenkategorien bestimmt. Zusätzlich wurden gemessene Abflusskonzentrationen
der Metalle Antimon, Kobalt, Mangan, Palladium, Platin, Rhodium, Titan und Wolfram
zusammengestellt. Außerdem wurden orts‐ und methodenspezifische Einflüsse auf die Messwerte
von Monitoring‐Programmen evaluiert, wobei das Aufkommen von Zink besonders variabel ist.
Anhand dieser Auswertung konnte u. a. gezeigt werden, dass die Art der Mittelung der
Einzelergebnisse eines Standorts große Einflüsse auf die Charakterisierung der Verkehrsfläche hat
und der pH‐Wert des Abflusses nicht mit den gelösten Anteilen der Schwermetalle im Feld korrelierte.
Während die Bleikonzentrationen der Verkehrsflächenabflüsse in den 80er und 90er Jahren deutlich
zurückgingen, wurden keine Entwicklungen bei den Kupfer‐ und Zinkkonzentrationen festgestellt.
Anhand der ermittelten Konzentrationsverteilungen der gelösten Schadstoffe konnten geeignete
Versuche an Filtermaterialien zur Bestimmung des Schwermetallrückhalts im Labor‐, Pilot‐ und
technischen Maßstab durchgeführt werden. Der Begriff „Filtermaterialien“ wurde bewusst gewählt,
da er unter den Herstellern und Anwendern ein eingeführter Begriff ist. Filtermaterialien beinhalten
jedoch u. a. die Wirkmechanismen Filtration (z. B. nach Fällung), Sorption oder Ionenaustausch.
Zuerst wurden in vergleichenden Schüttel‐ und Säulenversuchen die Kapazitäten und Kinetiken von
sechs Filtermaterialien bzgl. des Rückhalts von Kupfer, Nickel und Zink bestimmt. Dabei wurde der
Einfluss der Schüttlerart, des pH‐Wertes (5 oder 7) und der Verwendung von Puffern auf die
4

Ergebnisse der Schüttelversuche bestimmt. Bei den meisten Versuchen erfolgte eine Zunahme der
Kapazitäten durch die Verwendung eines Vertikalschüttlers, eines pH‐Wertes von 7 statt 5 und von
Puffern. Anhand der Säulenversuche konnten die Unterschiede zwischen einzelnen Materialien im
Vergleich zu den Schüttelversuchen differenzierter und unter realistischeren Bedingungen untersucht
werden. Dabei reduzierten sich die anhand der Säulenversuche ermittelten Kapazitäten mit
steigenden Zulaufkonzentrationen und kürzeren Kontaktzeiten. Die nach DIN EN ISO 11260:2011‐09
und DIN EN 16070:2014‐06 bestimmten Kationenaustauschkapazitäten ergaben, dass diese
Methoden nicht zur Charakterisierung des Schwermetallrückhalts geeignet sind. Dahingegen sind
Schüttelversuche mit Schwermetallen als definierte Methode zur Identifizierung geeigneter
Materialien und zur Überprüfung von Produktionschargen sowie Säulenversuche im Labormaßstab
zur Abschätzung von Standzeiten geeignet. Zur Bestimmung der tatsächlichen Standzeit und
Behandlungsleistung dezentraler Anlagen zur Verkehrsflächenabflussbehandlung sind aber Versuche
im Pilot‐Maßstab notwendig. Die dafür entwickelte und standardisierte Methode besteht aus zwei
Teilen: eine Vorbelastung der Filtermaterialien in geeigneten Modellen mit den Schwermetallen
Kupfer und Zink sowie anschließend die Durchführung dreier Regenspenden zur Bestimmung der
Rückhalteleistung im letzten Betriebsjahr vor dem Materialaustausch. Die untersuchten Anlagen
zeigten besonders im Langzeitverhalten unterschiedliche Leistungen. Der mittlere Rückhalt variierte
zwischen 48,2 % und 99,3 % für Kupfer und zwischen 59,7 % und 99,4 % für Zink. Die niedrigsten
Werte wurden beim Regenereignis mit der höchsten Regenspende gemessen. Die Anwendbarkeit der
Methode wurde durch die Beprobung zweier Rinnensysteme an vier Standorten nachgewiesen.
Anhand von Laborsäulenversuchen wurde anschließend das Remobilisierungsrisiko bereits
gebundener Schwermetalle unter Auftausalzverwendung für Blei, Cadmium, Kupfer, Nickel und Zink
bestimmt. Zuerst wurden für sechs verschiedene Filtermaterialien an je acht Säulen Versuche zum
Schwermetallrückhalt durchgeführt. Je zwei Säulen wurden anschließend mit Natriumchlorid, einer
Mischung aus Natrium‐ und Calciumchlorid sowie einer Mischung aus Natrium‐ und
Magnesiumchlorid beschickt, wobei die Mischung aus Natrium‐ und Calciumchlorid die meisten
Schwermetalle remobilisierte. Die Höhe der Remobilisierung schwankte zudem zwischen den
einzelnen Filtermaterialien und den Schwermetallen und stieg mit zunehmender Beladung der
Materialien an. Die beiden beladenen Säulen ohne anschließende Auftausalzversuche wurden für
weitere Untersuchungen verwendet, um die grundlegenden Wirkmechanismen zu beschreiben.
Ebenfalls wurde eine Einführung in die Thematik der dezentralen Niederschlagswasserbehandlung
für Verkehrsflächen‐ und Metalldachabflüsse erstellt. Diese Buchpublikation gibt einen Überblick zu
den Anlagentypen und deren Wirkmechanismen, den Herkunftsflächen, den Zielkompartimenten,
den rechtlichen Anforderungen sowie zu den Zulassungs‐ und Prüfverfahren.
5
Acknowledgement
This research was financially supported by the following research projects:
Untersuchung von Anlagen zur Behandlung des Niederschlagswassers von Verkehrsflächen
(76e133, Investigations on stormwater treatment plants for road runoff). Funding:
Bayerisches Staatsministerium für Umwelt und Verbraucherschutz (Bavarian State Ministry
for the Environment and Consumer Protection). Scientific support: Bayerische Landesamt für
Umwelt (Bavarian Environment Agency). Cooperation: Frankfurt University of Applied
Sciences and Technical University of Munich.
Reduktion von Kohlenwasserstoffen und anderen organischen Spurenstoffen durch ein
dezentrales Behandlungssystem für Verkehrsflächenabflüsse – Projektphase II
(IV‐7‐042 600 002E, Reduction of hydrocarbons and other trace organic substances by a
decentralized road runoff treatment system – project phase II). Funding: Ministerium für
Klimaschutz, Umwelt, Landwirtschaft, Natur‐ und Verbraucherschutz des Landes Nordrhein‐
Westfalen (Ministry for Climate Protection, Environment, Agriculture, Conservation and
Consumer Protection of the State of North Rhine‐Westphalia). Scientific support: Landesamt
für Natur, Umwelt und Verbraucherschutz Nordrhein‐Westfalen (North Rhine‐Westphalian
Agency for Nature, Environment, and Consumer Protection). Cooperation: Dr. Pecher AG,
Ruhr‐Universität Bochum, and Technical University of Munich.
Einfluss von Auftausalzen auf die Remobilisierung von auf Filtermaterialien zur Behandlung
von Verkehrsflächenabflüssen zurückgehaltenen Schadstoffen (AZ‐1124‐14, Effect of de‐icing
salts on the remobilization of previously retained pollutants on filter materials for treating
traffic area runoff). Funding: Bayerische Forschungsstiftung (Bavarian Research Foundation).
Cooperation: FRÄNKISCHE ROHRWERKE Gebr. Kirchner GmbH & Co. KG and Technical
University of Munich.
6

ListofContents
Abbreviations .......................................................................................................................................... 9
Chapter 1: Introduction ......................................................................................................................... 12
1.1 Substances in Traffic Area Runoff ............................................................................................... 12
1.2 Metal Emissions from Traffic Areas in Germany ......................................................................... 16
1.3 Regulations in Germany .............................................................................................................. 18
1.3.1 Infiltration into the Soil and Groundwater System .............................................................. 18
1.3.2 Discharge into Surface Water ............................................................................................... 20
Chapter 2: Decentralized Treatment Systems for Traffic Area Runoff ................................................. 21
2.1 Application and Functionality of Manufactured Decentralized Stormwater Treatment Systems
........................................................................................................................................................... 21
2.2 Assessment Procedures and Criteria ........................................................................................... 23
2.2.1 Worldwide Overview of Assessment Methods and Criteria Proposed by Authorities ........ 23
2.2.2 Test Methods Used by Manufacturers ................................................................................. 27
2.2.3 Determination of the Remobilization Risk under Application of De‐icing Salts ................... 27
2.3 Importance of this Research Topic .............................................................................................. 28
Chapter 3: Need for Action ................................................................................................................... 31
Chapter 4: Methodology ....................................................................................................................... 33
Chapter 5: Heavy Metal Pollution of Traffic Area Runoff ..................................................................... 35
5.1 Review Paper: “Critical Review of Heavy Metal Pollution of Traffic Area Runoff: Occurrence,
Influencing Factors, and Partitioning” ............................................................................................... 35
5.2 Review Paper: “Heavy Metal Pollution of Traffic Area Runoff – a European Review” ............... 36
5.3 Review Paper: “Stormwater Management: Calculation of Traffic Area Runoff Loads and Traffic
Related Emissions” ............................................................................................................................ 37
Chapter 6: Research Paper: “Evaluation of Factors Influencing Lab‐Scale Studies to Determine Heavy
Metal Removal by Six Sorbents for Stormwater Treatment” ............................................................... 98
Chapter 7: Assessment Method for the Heavy Metal Removal .......................................................... 118
7.1 Research Paper: “Development of a Novel Test Method to Determine Service Lives” ............ 118
7

7.2 Research Paper: “A Novel Test Method to Determine the Filter Material Service Life of
Decentralized Systems Treating Runoff from Traffic Areas” ........................................................... 128
Chapter 8: Research Paper: “De‐icing Salts in Roads Maintenance – Occurrence and Impact on
Decentralized Systems Treating Traffic Area Runoff for Infiltration” ................................................. 139
Chapter 9: Research Paper: “Heavy Metal Removal Mechanisms of Sorptive Filter Materials for Road
Runoff Treatment and Remobilization under De‐icing Salt Applications” .......................................... 155
Chapter 10: Conclusions, Impact, and Novel Research Topics ............................................................ 167
10.1 Highlights of the Research Results .......................................................................................... 167
10.2 Improvement of the State of the Art ...................................................................................... 168
10.3 Impact of the Results on other Projects .................................................................................. 169
10.4 Suggestions for further Research ............................................................................................ 170
References ........................................................................................................................................... 173
Appendix .............................................................................................................................................. 198
Peer Reviewed Journal Articles ....................................................................................................... 198
Monograph ...................................................................................................................................... 199
Conference Talks ............................................................................................................................. 199
Scientific Posters ............................................................................................................................. 200
Research Reports ............................................................................................................................. 201
8

Abbreviations
AADT Annual Average Daily Traffic
As Arsenic
ASTRA Bundesamt für Strassen, Schweiz (Federal Roads Office, Switzerland)
AUS Australia
AUT Austria
B Boron
Ba Barium
BBodSchV Bundes‐Bodenschutz‐ und Altlastenverordnung (German Soil Protection
Ordinance)
BWK Bund der Ingenieure für Wasserwirtschaft, Abfallwirtschaft und Kulturbau
e. V. (German Association of Engineers for Water Management, Waste
Management, and Land Management)
Ca Calcium
Cd Cadmium
CHE Switzerland
Cl Chloride
CN Cyanide
Co Cobalt
Cr Chromium
CrO42− Chromate
CS Channel System
Cu Copper
DCMU 3‐(3,4‐dichlorophenyl)‐1,1‐dimethylurea (trade name: Diuron)
DEHP di(2‐ethylhexyl)‐phthalate
DEU Germany
DIBt Deutsches Institut für Bautechnik (German Centre of Competence for
Construction)
DWA Deutsche Vereinigung für Wasserwirtschaft, Abwasser und Abfall e. V.
(German Association for Water, Wastewater and Waste)
9

ETBE Ethyl‐tert‐butyl ether
F Fluoride
FCS Filter Channel System
FSS Filter Shaft System
GFS Geringfügigkeitsschwellenwerte (de minimis threshold values)
GrwV Grundwasserverordnung (Groundwater Ordinance)
Hg Mercury
LANUV Landesamt für Natur, Umwelt und Verbraucherschutz Nordrhein‐Westfalen
(North Rhine‐Westphalian Agency for Nature, Environment, and Consumer
Protection)
LAWA Bund/Länder‐Arbeitsgemeinschaft Wasser (German Working Group on Water
Issues)
MCPP Methylchlorophenoxypropionic acid (Mecoprop)
Mg Magnesium
Mn Manganese
Mo Molybdenum
MTBE Methyl‐tert‐butyl ether
MUSIC Model for Urban Stormwater Improvement Conceptualization
Na Sodium
NaCl Sodium chloride
NH4+ Ammonium
Ni Nickel
NJ New Jersey
NJDEP New Jersey Department of Environmental Protection
NLD The Netherlands
NO3− Nitrate
NRW Nordrhein‐Westfalen (State of North Rhine‐Westphalia, Germany)
P Phosphor
PAH Polycyclic Aromatic Hydrocarbons
10

Pb Lead
Pd Palladium
PGE Platinum‐Group Elements
PP Permeable Pavements
Pt Platinum
Rh Rhodium
Sb Antimony
Se Selenium
Sn Tin
SO42− Sulfate
SS Shaft System
SWMM Stormwater Management Manual for Western Washington
TAPE Technology Assessment Protocol – Ecology
TARP Technology Acceptance Reciprocity Partnership
Tl Thallium
TN Total Nitrogen
TP Total Phosphor
TPH Total Petroleum Hydrocarbons
TrinkwV Trinkwasserverordnung (Drinking Water Ordinance)
TSS Total Suspended Solids
UBA Umweltbundesamt (Federal Environment Agency)
USA United States of America
V Vanadium
VA Virginia
VTAP Virginia Technology Assessment Protocol
WA Washingtion (state)
WHG Wasserhaushaltsgesetz (Federal Water Act)
Zn Zinc
11

Chapter1:Introduction
1.1SubstancesinTrafficAreaRunoff
The occurrence of substances in traffic area runoff depends on several processes. Dustfalls and dry
deposition during periods without rain entrain contaminants and remove them from the atmosphere
(Hamilton et al., 1987; Ball, 2002). The processes during rain events are wet deposition (removal of
additional substances from the atmosphere) and wash‐off of previously deposited pollutants
(Welker & Dittmer, 2005). Concerning the wash‐off, CH2MHILL (1998) concluded that splashing and
washing of pollutants from vehicles is more important than the wash‐off of pollutants accumulated
on road surfaces. Both the wash‐off and the substances in the atmosphere can be linked to traffic
related sources. The main traffic related sources of pollutants are summarized in Table 1, which
contains seven heavy metals, three noble metals, five de‐icing salt compounds, and four organic
substances. For most heavy metals, the wear of brakes and tires are relevant sources. Moreover,
braking, acceleration, and steering activities lead to increased abrasion of tires, higher use of brake
linings, and increased automotive exhaust gas emissions (Muschak, 1990; Langbein et al., 2006). The
corrosion and subsequent dissolution of zinc (Zn) from the surface of galvanized elements during rain
events is also a relevant source (Gan et al., 2008). Further traffic related sources are the use of
catalytic converters in vehicles (Wei & Morrison, 1994; Geiger‐Kaiser & Jäger, 2005), road
maintenance with de‐icing salts (Novotny et al., 1998; Dai et al., 2012), road wear, and drip losses. All
of these sources lead to a pollution of traffic area runoff.
The concentrations of the substances in the runoff from traffic areas are based on climatic site‐
specific factors and fixed site‐specific factors, which consist of the three categories surrounding land
use characteristics, traffic area site data, and operational characteristics (Shelley et al., 1987). To
specify the land use characteristics, several categories are used: non‐urban, urban, ultra‐urban,
transportation, residential, open, agriculture, commercial, mixed, and industrial (Kayhanian et al.,
2003; Flint and Davis, 2007). Traffic area site data contain information on vegetation, topography
(cut, at grade, or elevated; Driscoll et al., 1990), and road design (e.g., cross‐sections, pavement
surfaces, and drainage areas) (Huber et al., 2016e). The operational characteristics describe
influences concerning traffic volumes (Annual Average Daily Traffic, AADT), percentage of trucks,
driving‐style categories (Horstmeyer et al., 2016), types and speed of vehicles, maintenance (e.g.,
mowing of the roadside shoulders, street sweeping, and winter services; Helmreich et al., 2010), and
institutional regulations (e.g., phase‐out of leaded gasoline). Climatic factors are dry deposition rates,
antecedent dry periods, rain characteristics (volume, intensity, and duration), seasonal effects, and
wind turbulences. These factors, which can have contradicting effects on the concentrations, have an
influence on the real contamination of runoff from traffic areas.
12

Table 1: Substances in traffic area runoff waters and their traffic related sources (Ward, 1990; Wei &
Morrison, 1994; Young et al., 1996; Sansalone & Buchberger, 1997a+b; Ball et al., 1998; Dierkes & Geiger,
1998; Novotny et al., 1998; Hares & Ward, 1999; Legret & Pagotto, 1999; Pahlke et al., 2000; Root, 2000;
Davis et al., 2001; Borden et al., 2002; Denkhaus & Salnikow, 2002; Van Bohemen & Van De Laak, 2003;
Geiger‐Kaiser & Jäger, 2005; Hillenbrand et al., 2005; Mangani et al., 2005; Preciado & Li, 2005; Bleiwas,
2006; Masanao et al., 2006; Wilson, 2006; McKenzie et al., 2009; Kocher et al., 2010a+b; Dai et al., 2012).
Substance Main sources
Antimony (Sb) Brake linings, tires
Cadmium (Cd) Batteries, brake linings, de‐icing salts, fuel, insecticides, tires
Chromium (Cr) Brake linings, metal plating, moving engine parts, tires
Copper (Cu) Brake linings, de‐icing salts, electronic equipment, fungicides,
insecticides, metal plating, moving engine parts, pesticides, tires
Lead (Pb) Brake linings, de‐icing salts, fuel additive, grease, lubricating oil,
tires, paints, vehicle exhaust, weights for tire balance
Manganese (Mn) Brake linings, gasoline additives, moving engine parts, tires,
vehicle exhaust
Nickel (Ni) Asphalt surfaces, batteries, brake linings, diesel fuel, electronic
equipment, lubricating oil, metal plating, stainless steel, vehicle
exhaust
Zinc (Zn) Batteries, brake linings, bridges, de‐icing salts, galvanized car
parts, grease, guardrails, lamp‐posts, motor oil, road signs, safety
fences, sign‐posts, tires
Platinum‐Group Elements
(PGE): palladium (Pd), platinum
(Pt), and rhodium (Rh)
Catalytic converters
Calcium (Ca) Concrete surfaces, de‐icing salts
Chloride (Cl) De‐icing salts
Cyanide (CN) De‐icing salts
Magnesium (Mg) De‐icing salts
Sodium (Na) De‐icing salts
Ethyl‐tert‐butyl ether (ETBE) Fuel additive
Methyl‐tert‐butyl ether (MTBE) Fuel additive
Polycyclic Aromatic
Hydrocarbons (PAH)
Asphalt surfaces, vehicle exhaust
Total Petroleum Hydrocarbons
(TPH)
Anti‐freeze and hydraulic fluids, asphalt surface, drip losses,
motor lubricants
Parameters usually monitored in runoff from traffic areas include solids, oxygen‐consuming
substances, nutrients, heavy metals, compounds of de‐icing salts, and organic substances (e.g.,
Folkeson et al., 2009; Kayhanian et al., 2012). Several of these substances are analyzed as sum
parameters such as solids (e.g., Total Suspended Solids (TSS)), oxygen‐consuming substances (e.g.,
Chemical Oxygen Demand), and hydrocarbons (e.g., Polycyclic Aromatic Hydrocarbons (PAH) and
Total Petroleum Hydrocarbons (TPH)). In addition, individual trace organic substances, pathogens,
13

and toxicities are sometimes measured in runoff waters (e.g., Welker, 2014). The concentrations of
heavy metals and trace organic substances (e.g., PAH) are one to several magnitudes lower than
most of the other substances (e.g., solids, nutrients, and chloride (Cl)). Thus, traffic area runoff is
polluted by substances in varying concentration ranges. At sites with winter services, the highest
concentrations are measured for the parameter Cl with maximum values of 60.3 g/L (Jenewein &
Schinner, 1982).
Summaries of the pollution of runoff from traffic areas are often found in dissertations (e.g.,
Grotehusmann, 1995; Haritopoulou, 1996; Zessner, 1999; Kasting, 2003; Li, 2014), in habilitations
(e.g., Welker, 2004; Helmreich, 2010), and in research reports (e.g., Boller, 2003; Herrera, 2007;
Helmreich et al., 2014) but also in journal papers (e.g., Ellis & Revitt, 1982). However, most authors
had a special focus and subsequently considered only runoff data of one country, one traffic area
category, or selected substances to obtain the data for their individual objectives. Moreover, most
previous literature studies did not distinguish between different traffic area categories (e.g., parking
lots, feeder streets, bridges, or highways) and the influences of site‐specific data and method‐specific
factors on the results had not been evaluated on the basis of a large data set.
Concerning the metal runoff concentrations from traffic areas, most of the previous literature studies
only summarize the runoff concentrations of cadmium (Cd), copper (Cu), lead (Pb), and zinc (Zn) that
were most frequently measured in monitoring programs of the last 40 years. However, several Pb
sources were substituted in the last decades and subsequently Pb runoff concentrations sharply
decreased at the end of the 20th century (Kayhanian, 2012). Although the results of older monitoring
programs are not relevant for current stormwater challenges, these Pb data are still considered in
most literature studies. Further substances that might be relevant for authorities because of
regulations (e.g., chromium (Cr) and nickel (Ni); cf. Section 1.3) have often not been considered in
previous literature studies due to a lack of monitoring data. Further metals that were sometimes
measured in the runoff of traffic areas include aluminum, antimony, arsenic, calcium, cobalt, iron,
manganese, mercury, palladium, platinum, rhodium, sodium, titanium, and tungsten. Rarely
measured metals in the runoff of traffic areas are barium, beryllium, boron, gold, magnesium,
molybdenum, potassium, selenium, silicon, silver, thallium, tin, and vanadium. Furthermore, most
monitoring programs do not distinguish between dissolved and total concentrations and do not
publish annual heavy metal loads normalized per hectare of impervious catchment area, which can
be used to calculate mass balances. Therefore, reliable runoff concentration ranges were missing for
dissolved substances in the past. Nevertheless, the partitioning of heavy metals is often of particular
concern because the dissolved fractions are directly biologically available and are subsequently
relevant for toxic effects (e.g., Paulson & Amy, 1993; Crabtree et al., 2008a).
14

To differentiate the contamination level of the runoff from all types of traffic areas, categories of
pollution are often used in standards and regulations because different traffic areas are influenced by
specific factors. For example, runoff from bridges can be highly affected by the corrosion of
galvanized elements (Wilson, 2006), highway runoff by guardrails and safety fences (Dierkes and
Geiger, 1998), non‐urban road runoff by the use of pesticides for farming (Mangani et al., 2005), road
runoff by the percentage of trucks (Gan et al., 2008), and runoff of parking lots by different
frequencies of use (Göbel et al., 2007) and drip losses (Grotehusmann & Kasting, 2002). Thus, the
pollution sources vary at different traffic area categories. Consequently, the runoff concentrations
can be different for each category. The categorizations of roads are mostly based on the AADT, main
land use categories (urban, non‐urban, or industrial), and the percentage of trucks. Differentiations
are also considered for parking lots and runways of airports. Four different standards and local
regulations are summarized in Table 2.
Less polluted traffic areas are commonly bikeways, footpaths, and roads with an AADT of less than
300 vehicles per day (DWA‐M 153E, 2007; SN 640 347, 2009). In NRW (State of North Rhine‐
Westphalia, Germany), areas with low and medium runoff concentrations are called “category II”.
Feldhaus et al. (2009) proposed a differentiation of “category II” between IIa (< 300 vehicles per day;
low runoff concentrations) and IIb (> 2000 vehicles per day; medium runoff concentrations). Because
the pollution of traffic areas with 300–2000 vehicles per day could not be generally specified, local
authorities must decide individually about the pollution levels of roads within this AADT range. For
traffic areas with expected medium and high runoff concentrations, the differentiation of these
standards and regulations is more heterogeneous. In particular, the influences of industrial zones,
trucks, non‐urban land use, and frequencies of the use of parking lots are assessed differently.
Moreover, the categorization of SWMM (2005) does not clearly distinguish between medium und
high runoff concentrations. Nevertheless, these categories are useful to estimate the pollution of
traffic areas because quantitative measurements at each site are not possible.
In general, most of the classification of traffic areas by these three categories of pollution is only
verified by some research projects (e.g., Grotehusmann & Kasting, 2002; Steiner et al., 2006;
Nadler & Meißner, 2007). Individual site‐specific factors such as corrosion of galvanized elements,
noise barriers, and stop‐and‐go traffic are not considered by these standards and local regulations. A
statistically robust analysis of the pollution at different traffic areas to support these categorizations
is not possible because of the varying site‐specific factors and their large quantity of – sometimes
contradicting – influences. However, a review of literature data can improve the differentiation of
less and highly polluted categories of traffic areas and can also consider further categories (e.g.,
bridges).
15
Table 2: Categories of pollution for different traffic areas.
Reference Low runoff
concentrations
Medium runoff
concentrations
High runoff
concentrations
German Standard
DWA‐M 153E (2007)
Roads with less than
300 vehicles per day;
bikeways; footpaths;
car parking lots
without frequent
change of vehicles in
housing areas
Roads with 300–15,000
vehicles per day;
backyards; car parking
lots without
frequented vehicle
change in mixed areas
and industrial estates
Roads with more than
15,000 vehicles per
day; car parking lots
with frequent vehicle
change; traffic areas
with heavy pollution
(e.g., because of
farming, markets);
truck parking lots
Swiss Standard
SN 640 347 (2009)
Roads*; bikeways;
footpaths; less
frequently used car
parking lots in
residential zones
Roads*; logistics
centers; frequently
used parking lots
Roads (in most cases
with more than 15,000
vehicles per day)*;
highways; frequently
used parking lots
Regulation of the State
of North Rhine‐
Westphalia (NRW),
Germany
MUNLV (2004)
Less frequently used traffic areas (specifications
are proposed by Feldhaus et al. (2009))
Logistics centers;
highly frequented
traffic areas; traffic
areas in industrial
zones; highly polluted
traffic areas (e.g.,
farming, runways,
places with waste or
wastewater disposal)
Stormwater
Management Manual
for Western
Washington, United
States of America
SWMM (2005)
Not defined Urban highways with more than 15,000 vehicles
per day**; other urban roads with more than
7500 vehicles per day**; non‐urban roads with
more than 15,000 vehicles per day**
* depending on AADT, percentage of trucks, urban/non‐urban, grade, de‐icing salt application, and road
sweeping; ** if runoff is discharged to fish‐bearing streams, lakes, or to waters or conveyance systems tributary
to fish‐bearing streams or lakes, enhanced treatment is necessary (cf. Chapter 2)
1.2MetalEmissionsfromTrafficAreasinGermany
For the year 2013, the UBA (Umweltbundesamt; Federal Environment Agency) published total annual
emissions of road transportation of 0.8 t Cd, 25.7 t Cr, 2109 t Cu, 5.0 t Ni, 88.7 t Pb, and 1906 t Zn in
Germany (Umweltbundesamt, 2015). The percentages of the traffic related emissions based on the
total emissions are 11%, 45%, 98%, 5%, 42%, and 95% for Cd, Cr, Cu, Ni, Pb, and Zn, respectively.
Considering these data, road transportation is an important source of total heavy metal emissions in
Germany.
16

A further aspect is the trend of the atmospheric heavy metal emissions since 1990
(Umweltbundesamt, 2015). The trend shows that Cu and Zn emissions of road transportation are
steadily increasing, and the Pb emissions decreased drastically in the last decade of the 20th century
(Figure 1). The total atmospheric emissions of Cd, Cr, and Ni were low compared with the other three
heavy metals and were constantly emitted for the last 15 years. The trend of the Pb emissions also
verifies that a differentiation of Pb runoff concentration measurements between the 20th century
and the 21st century must be considered as it was done in the worldwide and European reviews (cf.
Chapter 5).
Figure 1: Trend of atmospheric heavy metal emissions of road transportation since 1990 (based on data from Umweltbundesamt (2015)).
Hillenbrand et al. (2005) calculated the sinks of traffic related emissions for three different
compartments. Because approximately 73.5% of the traffic emissions originate from non‐urban roads,
most runoff water is infiltrated into the soil and groundwater system (Table 3). In urban catchment
areas, most of the runoff is discharged by sewer systems. Most of this water is treated by a municipal
wastewater treatment plant or pretreated by stormwater reservoirs and some water is discharged
into receiving surface waters without treatment. Because of the dry deposition of heavy metals and
the subsequent street sweeping, several heavy metals were disposed as waste in the past.
Table 3: Traffic related heavy metal sinks in Germany (adapted from Hillenbrand et al., 2005). Sources: Brake lining wear, tire wear, roadway abrasion, weights for tire balance, guardrails, and signs.
Pathway Cu (t/a) Pb (t/a) Zn (t/a)
Soil 797 67.0 1935
Surface water 103 9.7 399
Waste disposal 32 3.4 117
17

The total heavy metal loads of stormwater runoff that are entering receiving waters by separate and
combined sewer systems were calculated by Fuchs et al. (2002) as approximately 187 t/a Cu, 87.4 t/a
Pb, and 1193 t/a Zn. These loads also include stormwater runoff from non‐traffic related surfaces and
are subsequently higher than the values in Table 3 for surface water. A reduction of these loads can
be achieved by appropriate decentralized stormwater treatment systems at the runoff sites (cf.
Chapter 2).
1.3RegulationsinGermany
In Germany, stormwater runoff that is collected and purposefully discharged is defined as
wastewater in accordance with § 54 Wasserhaushaltsgesetz (WHG, 2009; Federal Water Act).
Moreover, surface water and groundwater must be protected from substance emissions that are
likely to cause adverse changes in water quality in a continuous or in a not inconsiderable extent (cf.
§ 9 WHG, 2009).
1.3.1InfiltrationintotheSoilandGroundwaterSystem
For infiltration into the soil and groundwater systems, the threshold values of the Bundes‐
Bodenschutz‐ und Altlastenverordnung (BBodSchV, 1999; German Soil Protection Ordinance) were
previously used in Germany. With the implementation of the Grundwasserverordnung on
09 November 2010 (GrwV, 2010; Groundwater Ordinance), emissions of certain pollutants and
pollutant groups, including Cu and Zn, have to be limited by suitable measures. For the protection of
the groundwater against pollution and deterioration, the Geringfügigkeitsschwellenwerte (GFS; de
minimis threshold values) of the Bund/Länder‐Arbeitsgemeinschaft Wasser (LAWA, 2004; German
Working Group on Water Issues) must be considered by the German authorities. The GFS values are
defined as concentrations at which no significant toxicological effect can occur. Furthermore, the GFS
take into account the requirements of the Trinkwasserverordnung (TrinkwV, 2001; Drinking Water
Ordinance) for both health and aesthetic aspects (LAWA, 2004). The GFS of the year 2004 were
updated in the years 2012/2013 (Moll & Quadflieg, 2014). The thresholds of several parameters were
adjusted because of legal changes in the European Union and new technical findings. A new
ordinance called Mantel‐Verordnung (3rd draft, published on 23 July 2015) is intended to harmonize
the GrwV and the BBodSchV and will further reinforce the binding character of the GFS. Table 4
compares the thresholds of all four regulations for selected inorganic and organic parameters. Thus,
a tightening of the requirements for infiltration was implemented in recent years. In addition, new
parameters such as Cl (250 mg/L), Ethyl‐tert‐butyl ether (ETBE) (2.5 µg/L), and Methyl‐tert‐butyl
ether (MTBE) (5 µg/L) are also considered in the new ordinances.
In many cases, the adjustments of heavy metal thresholds, especially for Cu with 10–14 µg/L, mean
that some thresholds are already exceeded by pure rain (Dauber et al., 1979; Dannecker et al., 1990;
18

Athanasiadis et al., 2007). Therefore, an infiltration of the precipitation into the soil and groundwater
system would not be possible without a pretreatment. Thus, compliance issues regarding the
implementation of the Mantel‐Verordnung must be addressed soon.
Table 4: Selection of thresholds for infiltration into the soil and groundwater systems: thresholds of the
BBodSchV (1999) for the pathway soil‐groundwater, the GFS from 2004 (LAWA, 2004) and 2013 (Moll &
Quadflieg, 2014), and the groundwater thresholds of the 3rd draft of the Mantel‐Verordnung (2015).
Strengthened requirements with respect to the previously valid BBodSchV are marked in bold.
Parameter Unit BBodSchV,
1999
GFS,
2004
GFS,
2013
3rd draft Mantel‐
Verordnung, 2015
Antimony (Sb) µg/L 10 5 5 5
Arsenic (As) µg/L 10 10 2.6 10
Barium (Ba) µg/L ‐ 340 186 340
Boron (B) µg/L ‐ 740 180 740
Cadmium (Cd) µg/L 5 0.5 0.25 0.25
Chromium (Cr)
(total)
µg/L 50 7 3.4 7
Chromate
(CrO42−)
µg/L 8 ‐ ‐ ‐
Cobalt (Co) µg/L 50 8 5.7 8
Copper (Cu) µg/L 50 14 10 14
Lead (Pb) µg/L 25 7 7.2 7
Mercury (Hg) µg/L 1 0.2 0.05 0.05
Molybdenum
(Mo)
µg/L 50 35 35 35
Nickel (Ni) µg/L 50 14 13 20
Selenium (Se) µg/L 10 7 3 7
Thallium (Tl) µg/L ‐ 0.8 0.2 0.8
Tin (Sn) µg/L 40 ‐ ‐ ‐
Vanadium (V) µg/L ‐ 4 4 4
Zinc (Zn) µg/L 500 58 50 58
Ammonium
(NH4+)
mg/L ‐ ‐ ‐ 0.5
Chloride (Cl) mg/L ‐ 250 250 250
Cyanide (CN)
(total)
µg/L 50 50 50 50
Cyanide (CN)
(easily
accessible)
µg/L 10 5 10 5
Fluoride (F) µg/L 750 750 750 750
Nitrate (NO3−) mg/L ‐ ‐ ‐ 50
Sulfate (SO42−) mg/L ‐ 240 250 250
19

1.3.2DischargeintoSurfaceWater
In Germany, no nationwide legally binding rules exist for the discharge of stormwater runoff into
surface water. To guarantee a sufficient treatment of stormwater runoff, the generally accepted
rules of technology must be considered in Germany for planning treatment systems (cf. § 60 WHG,
2009). As relevant rules and standards, DWA‐M 153E (2007), BWK‐M 3 (2007), and BWK‐M 7 (2008)
are applied. The DWA‐M 153 (2007) has implemented an emission‐based method and this standard
will soon be replaced by the DWA‐A 102. In contrast, the two BWK (Bund der Ingenieure für
Wasserwirtschaft, Abfallwirtschaft und Kulturbau e. V.; German Association of Engineers for Water
Management, Waste Management, and Land Management) rules represent immission‐based
approaches. The BWK‐M 3 (2007) will be replaced in the future by a new worksheet (BWK‐A 3).
Furthermore, the list of priority substances in the field of water policy was updated by the European
Union in recent years to prevent a chemical pollution of surface water in the short‐ and long‐term
(DIRECTIVE 2008/105/EC, 2008; DIRECTIVE 2013/39/EC, 2013). Besides other parameters, the list
includes mercury (Hg) and the heavy metals Cd, Ni, and Pb, which are also measured in traffic area
runoff. The annual average values of these substances should not exceed 0.05 µg/L, 0.08–0.25 µg/L
(depending on water hardness classes), 20 µg/L, and 7.2 µg/L in inland surface waters, respectively.
Because all member states of the European Union have to achieve good chemical status of their
surface waters, in which no pollutant may occur at a higher concentration than these environmental
quality standards, it will not be allowed for authorities to discharge stormwater runoff from traffic
areas, which exceed these values, into receiving waters on the long‐term.
20

Chapter2:DecentralizedTreatmentSystemsforTrafficAreaRunoff
2.1 Application and Functionality of Manufactured Decentralized
StormwaterTreatmentSystems
In recent years, various manufactured decentralized treatment systems have been developed to
treat stormwater runoff at the source before it infiltrates into the subsurface or it is discharged to
surface water (Dierkes et al., 2015a). They are particularly used when space is limited (Sample et al.,
2012). Manufactured decentralized systems for treating stormwater runoff are suitable for several
kinds of catchment areas. The drained catchment areas can be roofs, metal roofs, traffic areas, and
combined surfaces, which sometimes also include building facades (Figure 2). The runoff of traffic
areas can be low, medium, or highly polluted (cf. Table 2). In contrast, metal roof runoff (e.g., Zn or
Cu roofs) always contains high concentrations of dissolved heavy metals (Helmreich, 2010) and it is
not polluted with de‐icing salts that are used by winter services on traffic areas. Most roofs (e.g.,
tiled roofs and shingle roofs) and combined surface areas (roofs and low polluted traffic areas such
as sidewalks) are low or medium polluted. Appropriate decentralized systems must be used for the
treatment of stormwater runoff to achieve a specific treatment efficiency. These individual systems
take into account both the type and pollution of the connected catchment area and the receiving
water that are based on legislative requirements and local regulations (Welker & Huber, 2014).
Figure 2: Application of decentralized stormwater treatment systems (adapted from Welker, 2015).
21
Most regulations differentiate between an infiltration of treated runoff into the subsurface or a
discharge into surface water. Thus, different thresholds must be considered. For infiltration into the
soil and groundwater system, distinct legislative requirements exist in Germany (cf. Section 1.3.1).
However, the regulations are ambiguous for discharge into surface water (cf. Section 1.3.2).
The main removal mechanisms of manufactured decentralized stormwater systems are
sedimentation, filtration, sorption, ion exchange, precipitation, and biochemical transformation
(Huber et al., 2015d). In general, the systems consist of one, two, or three treatment steps. In a first
step, sedimentation and/or filtration are the predominant retention mechanisms used to remove
particle‐bound substances. In several treatment systems, dissolved heavy metals are subsequently
retained on filter materials by sorption, ion exchange, and precipitation (Liu et al., 2005). Thus, a
second treatment step with a filter material is necessary to reduce the total concentrations of all
metals (Hilliges et al., 2013; Maniquiz‐Redillas & Kim, 2014). In the following chapters, these
materials are consequently named “filter materials” because it is a commonly used term, although
their removal mechanisms also include filtration after precipitation, sorption, ion exchange, or
biochemical transformation. Nevertheless, the use of a filter material is often not required for basic
treatment (e.g., discharge of runoff from low/medium polluted catchment areas into surface water –
emission based). In addition, oil traps can be used to remove TPH, oil, and grease.
Manufactured decentralized stormwater treatment systems can be categorized into three types:
permeable pavements (PP), filter channel systems (FCS), and filter shaft systems (FSS) (Dierkes et al.,
2015a). These systems are commonly used as conforming products for enhanced stormwater
treatment. For basic treatment (emission based discharge into surface water, cf. Figure 2),
decentralized systems in gully pots, channel systems (CS), and shaft systems (SS) without a filter
material are often used. An overview of all manufactured decentralized treatment systems for runoff
from traffic areas and metal roofs, which are available in Germany and Austria, is presented in
Huber et al. (2015d).
To guarantee a sufficient treatment, different test methods have been developed for manufactured
decentralized systems treating the runoff from traffic areas (cf. Section 2.2). For the metal roofs, the
preliminary test criteria of the Bavarian Environment Agency (Bayerisches Landesamt für Umwelt,
2011) must be applied to guarantee an appropriate runoff treatment in Bavaria, Germany. However,
these criteria cannot be used for systems treating traffic area runoff because this runoff also includes
both solids and de‐icing salt compounds.
22
2.2AssessmentProceduresandCriteria
2.2.1WorldwideOverviewofAssessmentMethodsandCriteriaProposedbyAuthorities
Different assessment procedures were developed to test the performance of decentralized
stormwater treatment systems for runoff from traffic areas. For approvals, further aspects such as
environmental risk assessments, internal/external quality controls, and maintenance issues can also
be mandatory. In addition, criteria for assessing field measurements are sometimes proposed.
Table 5 presents a worldwide overview of test methods and criteria for manufactured stormwater
treatment systems. All test methods are described in the following and the criteria that consider the
removal of heavy metals or the remobilization of pollutants because of de‐icing salt applications are
reported in detail.
In Germany (DEU), the Deutsches Institut für Bautechnik (DIBt; German Centre of Competence for
Construction) can approve decentralized systems for infiltration of runoff from traffic areas into the
soil and groundwater system after passing several tests (e.g., removal of fine particles, TPH, and
heavy metals; remobilization of heavy metals) (DIBt, 2012; DIBt, 2015). One procedure was
developed for PP (DIBt, 2012) and one procedure for FCS and FSS (DIBt, 2015). One part of this
laboratory test investigates the removal of dissolved heavy metals by three different rain events. The
requested elimination is 80% for Cu and 70% for Zn (on average). Afterwards, a test simulating one
rain event is performed under the application of sodium chloride (NaCl) to determine the risk of
remobilization for Cu and Zn. In this part, the difference between the effluent concentrations and the
influent concentrations must be below the threshold values of the BBodSchV (1999) (Cu 50 µg/L and
Zn 500 µg/L). In NRW, a method was developed by the Landesamt für Natur, Umwelt und
Verbraucherschutz Nordrhein‐Westfalen (LANUV, 2012; North Rhine‐Westphalian Agency for Nature,
Environment, and Consumer Protection) for discharge into surface water as an emission‐based
approach. The test procedure consists of lab‐ and field experiments and it is mainly based on
different TSS parameters (LANUV, 2012). The mandatory field measurements last at least twelve
months.
In the Netherlands (NLD), a standard method was developed to approve FCS by laboratory tests
(BRL 2036, 2008). Parts of the method are comparable with the DIBt procedures. However, it also
considers the removal of four heavy metals (Cd, Cu, Pb, and Zn), which is determined by cation
exchange capacities. Capacities of ≥40 cmol+/kg are required for approval.
In Austria (AUT), the draft of the new Standard Method ÖNORM B 2506‐3 Entwurf (2015) was
published, which is based on a research report (Fürhacker et al., 2013). In lab‐scale column tests, the
filter materials of stormwater treatment systems for runoff from metal roofs (Cu and Zn) and traffic
23

areas are evaluated by several tests (e.g., removal of fine particles, TPH, and heavy metals;
remobilization of heavy metals). The requested elimination is 80% for Cu and 50% for Zn (on average).
The Pb effluent concentrations must be below 9 µg/L. Afterwards, a remobilization test is performed
under the application of sodium chloride to determine the risk of remobilization for Cu and Zn. In this
part, the effluent concentration criteria are ≤50 µg/L Cu and ≤500 µg/L Zn.
Table 5: Overview of the test methods and criteria for stormwater treatment systems for traffic area runoff.
Reference Country Type of
systems
Test
procedure
Substances** Receiving
water
ASTRA,
2015a+b*
CHE All Field Cu, TSS, Zn Not specified
BRL 2036,
2008*
NLD FCS Lab Cd, Cu, Pb,
TPH, TSS, Zn
Groundwater
Department
of Ecology,
2011
USA, WA All Lab & field Cu, P, TPH,
TSS, Zn
Groundwater
and surface
water
DIBt, 2012 DEU PP Lab Cu, NaCl, TPH,
TSS, Zn
Groundwater
DIBt, 2015 DEU FCS, FSS Lab Cu, NaCl, TPH,
TSS, Zn
Groundwater
NJDEP, 2009 USA, NJ All Field TSS Not specified
NJDEP, 2013 USA, NJ All Lab TSS Not specified
MUNLV, 2004;
LANUV, 2012*
DEU CS, FCS, FSS,
gully pots, SS
Lab & field TSS Surface water
ÖNORM B
2506‐3
Entwurf,
2015*
AUT All Lab Cu, NaCl, Pb,
TPH, TSS, Zn
Groundwater
Penrith, 2014 AUS All Modeling TPH, TN, TP,
TSS
Groundwater
and surface
water
Sample et al.,
2012*
USA, VA All Lab or field P, TSS Not specified
Schmidt et al.,
2015*
CHE All Lab & field Cu, DCMU,
MCPP, Zn
Not specified
Steiner et al.,
2010
CHE All Field Cu, DOC, PAH,
TSS, Zn
Not specified
Victorian
Stormwater
Committee,
2006
AUS All Not specified Dissolved
substances,
TN, TP, TSS
Not specified
* in development or reassessing; ** TSS, TPH, and P (phosphor) are individually defined by each method
24

In Switzerland (CHE), an assessment procedure will be proposed at the end of 2016 for decentralized
stormwater treatment systems for runoff from traffic areas, roofs, and building facades. The novel
method will consist of lab and field experiments. Among other experiences, it is based on previous
lab‐scale and field experiments with heavy metals (Cu and Zn) and trace organic substances (e.g.,
3‐(3,4‐dichlorophenyl)‐1,1‐dimethylurea (DCMU) and Mecoprop (MCPP)) (Schmidt et al., 2015). The
field experiments will be similar to the monitoring programs proposed by the Swiss Federal Roads
Office (ASTRA) that include the measurement of Cu, TSS, and Zn (ASTRA 2015a; ASTRA 2015b).
Moreover, assessment criteria for the performance of stormwater treatment systems for traffic area
runoff exist that are used to evaluate field‐monitoring results of at least twelve months. The criteria
consist of absolute effluent concentrations discharging into receiving water, removal efficiencies,
specific surface loadings, and hydraulic performances (Steiner et al., 2010). In addition to other
parameters, the total heavy metal concentrations and removal efficiencies of Cu and Zn were
considered as indicators for the performance of stormwater treatment systems. Furthermore,
potential removal efficiencies of treatment systems have been categorized. For the Cu and Zn
removal efficiencies, a range of < 60% to > 90% is postulated by classifying five different levels of
treatment quality. For the total effluent concentrations, five ranges of < 5 µg/L to > 20 µg/L for Cu
and of < 10 µg/L to > 40 µg/L for Zn are defined.
In the United States (USA), some methods have been developed in several federal states to test
decentralized systems. In the State of Washington (WA), the Technology Assessment Protocol‐
Ecology (TAPE) of the Washington State Department of Ecology is used to evaluate and classify
decentralized stormwater treatment systems by lab‐ and field‐scale experiments (e.g., removal of
TSS, Cu, Zn, phosphor (P), and TPH) (Department of Ecology, 2011). Besides requirements for the
basic treatment, which include the removal of TSS, enhanced treatment facilities must exceed a
removal of 30% dissolved Cu and 60% dissolved Zn in a field‐monitoring. In New Jersey (NJ), a
procedure for obtaining verifications of manufactured stormwater treatment systems was
implemented by the New Jersey Department of Environmental Protection (NJDEP) to assess the
removal of TSS and other parameters in the laboratory (NJDEP, 2013). As an amendment to the
Technology Acceptance Reciprocity Partnership (TARP), which was proposed by the states California,
Massachusetts, Maryland, New Jersey, Pennsylvania, and Virginia (VA), a field‐testing for the removal
of TSS can also be performed for final certification (NJDEP, 2009). Thus, TARP focuses primarily on
sediments and compounds that can be removed with sediments, whereas TAPE addresses the
removal of more substances that may also be dissolved (Sample et al., 2012). A new protocol will be
the Virginia Technology Assessment Protocol (VTAP) that will be used to assess the removal of TSS
and P by manufactured treatment systems (Sample et al., 2012). This new protocol is developed
25

because TARP does not consider P, although P is regulated by Virginia’s stormwater management
program.
In Australia (AUS), at least seven regulations of authorities exist, which are usually based on the
removal in percentage of mean annual loads of solids, TPH, and nutrients (i.e., total nitrogen (TN)
and total phosphor (TP)). Schmitt et al. (2011) summarized the criteria of six regulations. Only the
criteria of one further and one updated program, which are similar to the ones reported by
Schmitt et al. (2011), are described in the following: an approach that differentiates between
different systems (primary, secondary, and tertiary treatment) is used in the state of Victoria
(Victorian Stormwater Committee, 2006). For tertiary stormwater treatment systems (e.g., filter
systems), a range of treatment performances has been defined for dissolved pollutants including Cu
and Zn. For a moderate treatment performance, a removal of > 40% is postulated. In the
development control plan of the city of Penrith, issues of the stormwater management are the flood
control and the potential contaminants of stormwater runoff (Penrith, 2014). To safeguard receiving
water by improving the quality of stormwater runoff, the following reductions of the post
development mean annual loads are postulated: 90% of total gross pollutants (greater than 5 mm),
85% of TSS, 60% of TP, 45% of TN, and 90% of TPH. To calculate the annual loads and to prove these
reductions, modeling with MUSIC (Model for Urban Stormwater Improvement Conceptualization)
must be performed.
In summary, many different assessment methods and criteria are available, which sometimes also
consider local requirements (e.g., nutrients). For the heavy metals, the effluent requirements of the
different guidelines vary widely and the risk of remobilization of previously retained substances is
only tested by three methods (DIBt, 2012; DIBt, 2015; ÖNORM B 2506‐3 Entwurf, 2015) and
exclusively for sodium chloride. Furthermore, there is currently no standardized procedure available
by these assessment methods to determine quickly the filter material service lives and long‐term
performances of decentralized stormwater treatment systems.
The service life is defined as the point of time, when the filter material must be changed because of
less efficient treatment. In general, two factors influence the determination of the service life of
decentralized systems treating runoff from traffic areas: The service interval can be limited because
of hydraulic failures of the plant (i.e., clogging of the filter material because of sediment
accumulation and deposition) (Mercado et al., 2015). Otherwise, the service life can be limited
because of the substance removal efficiency (e.g., a reduced retention of heavy metals). Clogging
phenomena of the filter material can be simulated in the laboratory by using a full‐scale system but
realistic particle size distributions and site‐specific factors of the system’s catchment area cannot be
considered. Therefore, this factor needs to be determined by extensive and comparable field
26

measurements that might take several years. In contrast, the terminal service life of the filter
material (e.g., breakthrough of heavy metals) is rarely noticeable by the operator although this has a
crucial effect on the receiving water. Although this effect can be simulated reproducibly at pilot‐scale
for decentralized systems, no assessment method is proposed by the authorities or manufacturers (cf.
Section 2.2.2). The determination of the service life is also essential for a sustainable management of
urban infrastructure because maintenance and the exchange of filter material have an effect on life‐
cycle costs of decentralized treatment systems (O'Sullivan et al., 2015).
2.2.2TestMethodsUsedbyManufacturers
In addition to the procedures and methods proposed by the authorities, each manufacturer of
decentralized stormwater treatment systems has developed different test methods to estimate
maintenance intervals, service lives, and performances of their treatment systems. Moreover,
internal and external quality control has to be conducted for each manufactured product (e.g., to
prove the comparability of different production batches of the filter material). Most of these
experiments are conducted in lab‐scale.
Equilibrium batch experiments with different boundary conditions are used to determine sorption
capacities of heavy metals (Dierkes, 2009) and to prove the comparability of different production
batches (cf. Chapter 6). The service life of the filter material is often calculated by comparing these
determined capacities (retention in g pollutant per kg filter material) and the total amount of filter
material (kg) in the treatment system with the estimated pollutant loads of the connected catchment
area. The determination of cation exchange capacities according to DIN EN ISO 11260:2011‐09 (2011)
is also used for the calculation of service lives and for quality control. However, none of these
methods is suitable to determine realistic service lives and long‐term performances (cf.
Chapters 6 & 7). Several manufacturers also perform lab‐ and pilot‐scale column experiments to
determine removal efficiencies (Dierkes et al., 2013). Furthermore, some manufacturers have field‐
scale monitoring programs to prove the results of the lab‐scale experiments and to determine
maintenance intervals (e.g., Schriefer, 2013; Schriefer, 2014a; Schriefer, 2014b; Grontmij, 2015).
In summary, there are no detailed methods available for the determination of service lives, long‐
term performances, the effects of de‐icing salts, and quality controls that also consider the effects of
different experimental setups. Furthermore, the comparability of the results of different methods
used by the manufacturers was not proven.
2.2.3DeterminationoftheRemobilizationRiskunderApplicationofDe‐icingSalts
Sodium chloride, calcium chloride, and magnesium chloride are widely used as de‐icing salts for road
maintenance (Stotz & Krauth, 1994; Marsalek, 2003; Bäckström et al., 2004; Nelson et al., 2009;
27
Bayerisches Landesamt für Umwelt, 2013). However, there is currently only one assessment method
available that authorities have proposed to test the risk of remobilization for decentralized
stormwater treatment systems and this method only evaluates the effect of sodium chloride on
previously retained Cu and Zn (DIBt, 2012; DIBt, 2015; ÖNORM B 2506‐3 Entwurf, 2015).
The monitoring results of systems treating the runoff from traffic areas highlight the importance to
elucidate the heavy metal removal and remobilization risk under de‐icing salt applications for all
relevant de‐icing salts and heavy metals. For example, during applications of sodium chloride, an
increase in Cd, Cu, Ni, and Zn effluent concentrations was detected at a constructed wetland
(Tromp et al., 2012). Thereby, the Cu effluent concentrations were higher than the maximum influent
concentration. In addition, few studies have examined the remobilization behavior of heavy metals
bound onto soils, which are used to treat runoff from traffic areas (Amrhein & Strong; 1990,
Amrhein et al., 1992; Amrhein et al., 1993; Norrström & Jacks, 1998; Bäckström et al., 2004;
Norrström, 2005). In most cases, a remobilization of heavy metals occurred during the application of
different de‐icing salts in cold seasons and the behavior of each metal differed.
Hence, heavy metal remobilization because of de‐icing salt applications must be considered by
assessment procedures for manufactured decentralized systems treating the runoff from traffic areas.
A novel assessment method to evaluate the risk of remobilization of previously retained heavy
metals must be developed to test these decentralized stormwater treatment systems. It is important
to consider different heavy metals and de‐icing salts because each combination behaves uniquely.
For example, Nelson et al. (2009) tested two soils for the effects of sodium chloride and magnesium
chloride on heavy metal mobility. Both soils showed different behaviors for each de‐icing salt. The
use of sodium chloride resulted in the largest release of Cu and Pb. Magnesium chloride released
higher levels of Cd for both soils. Each soil showed different remobilization effects and all tested
metals were released in different quantities.
2.3ImportanceofthisResearchTopic
The rising importance of manufactured decentralized systems for runoff from traffic areas can be
seen by the increasing number of approved systems in Germany (Figure 3). In each case, only the first
approval is shown. For example, five of the systems were approved by the DIBt in the years 2006,
2009, and 2010. Four of the five systems received new approvals in the years 2011, 2014, and 2015
that are subsequently not shown for the years 2011, 2014, and 2015 in Figure 3. Because of the
increasing number of systems that are available on the German market, the development and
evaluation of an assessment method for decentralized stormwater treatment systems for traffic area
runoff, which determines the service life and the effect of de‐icing salt applications, is currently
important to prevent negative effects on receiving waters.
28

Figure 3: Approved decentralized stormwater treatment systems; data based on the websites DIBt (2016) and LANUV (2016) (01 March 2016). The systems are categorized as Filter Channel Systems (FCS), Filter Shaft Systems (FSS), Permeable Pavements (PP), Channel Systems without a filter (CS), Shaft Systems without a filter (SS), and systems installed in gully pots (Gully).
By using appropriate stormwater treatment systems, large amounts of the traffic and background
emissions can be retained. The traffic emission loads of Hillenbrand et al. (2005) were used for a
theoretical estimation of the reduction of heavy metals by stormwater treatment systems due to a
lack of information concerning the area and pollution of all types of urban roads and parking lots.
Hillenbrand et al. (2005) proposed that 26.5% of the traffic related emissions are produced on urban
traffic areas. As manufactured stormwater treatment systems are mostly used for urban stormwater
runoff, a theoretical heavy metal reduction load was calculated for urban traffic emissions (Figure 4).
It was assumed that the particulate fractions of Cu, Pb, and Zn are 65%, 100%, and 55%, respectively.
The reductions of these pollutants by the treatment systems were estimated to be 92% for all three
particulate fractions, 80% for dissolved Cu, and 70% for dissolved Zn. The percentages of removal
were adapted from the procedures proposed by DIBt (2015) and it is very ambitious to treat all urban
stormwater runoff from traffic areas with these efficiencies. Thus, the loads presented in Figure 4
give only an indication of possible metal reductions and emphasize the use of stormwater treatment
systems.
A reduction of the urban traffic emissions by approximately 10% might also be possible by street
sweeping (Hillenbrand et al., 2005). Because more and more cars, signs, and guardrails exist, the
29

metal loads of Cu and Zn are potentially increasing (cf. Figure 1) and the retained loads will also
increase.
Figure 4: Estimation of heavy metal emissions in Germany and theoretical reduction of heavy metals by urban stormwater treatment systems (traffic related emission loads adapted from Hillenbrand et al. (2005)).
30

Chapter3:NeedforAction
Two aspects are important for the assessment of the relevance of treating individual substances in
stormwater runoff from traffic areas. First, it must be determined, which parameters can have an
eco‐toxicological or human‐toxicological effect. In general, these substances are implemented by the
legislative requirements as thresholds to prevent negative impacts on receiving waters (cf.
Section 1.3). Secondly, these parameters must occur in relevant concentrations in the runoff of
traffic areas (cf. Section 1.1 and Chapter 5). Consequently, a treatment of traffic area runoff waters is
necessary, if the threshold values of the corresponding ordinances are lower or comparable with the
concentrations measured in monitoring programs.
The most relevant inorganic parameters of traffic areas are the four heavy metals Cd, Cu, Pb, and Zn,
as well as the de‐icing salt compound Cl. In addition, the metals Cr and Ni can occur in higher runoff
concentrations compared with the threshold values for infiltration into the soil and groundwater
system (Huber et al., 2015c; Welker, 2014). Thus, a treatment of the runoff from traffic areas is
currently necessary in most cases because of contamination with heavy metals. An appropriate
treatment of the runoff can be achieved with manufactured decentralized stormwater treatment
systems (cf. Section 2.1). Because no procedure was available for the determination of service lives,
long‐term performances, and the remobilization behavior of previously retained substances, the
main objective of this thesis was set on the development and evaluation of an assessment method
for decentralized stormwater treatment systems for traffic area runoff. This method must determine
the removal of relevant dissolved substances (i.e., heavy metals) and their risk to be remobilized by
all relevant de‐icing salts to avoid negative ecological and economic impacts on receiving water. The
focus was set on the decentralized systems with filter materials because they are needed to retain
dissolved metals.
For the development of the assessment method, the occurrence, influencing factors, and partitioning
of all relevant substances must be identified. Thus, a literature study was performed to evaluate the
partitioning and occurrence of heavy metals, alkali metals, and alkaline earth metals in traffic area
runoff for the first time. It also included the site‐specific (both fixed and climatic) and method‐
specific factors influencing runoff concentrations (cf. Chapters 5 & 8). The distributions of the heavy
metals (both runoff concentrations and loads for different traffic area categories) are presented in
three reviews. The two hypotheses of these papers are as follows:
The average metal runoff concentrations and their distributions can be determined by a literature
study of monitoring programs whereupon the mean and median concentrations and the loads of each
site are not comparable (Hypothesis 1).
31

Although the measured heavy metal pollution is influenced by site‐specific and method‐specific
factors, the average total and dissolved metal concentrations vary significantly between different
traffic area categories for a large collection of monitoring sites (Hypothesis 2).
Based on the determination of the dissolved heavy metal concentrations, an assessment method was
developed to evaluate the service lives and long‐term performances of decentralized systems
treating traffic area runoff because such a method was not previously available (cf. Section 2.2).
Subsequently, several tests were performed with filter materials for stormwater treatment in lab‐,
pilot‐, and full‐scale by novel standardized methods that can also be used for further applications
such as quality control (cf. Chapters 6 & 7). The objectives of the three papers presenting the
evaluation of the heavy metal removal performances were related to these hypotheses:
The results of batch experiments and lab‐scale column experiments concerning simultaneous heavy
metal removal differ widely because of varying boundary conditions (Hypothesis 3).
A novel test method for determining the filter material service lives and long‐term performances can
be developed and implemented to evaluate new and already existing decentralized systems
(Hypothesis 4).
A validation of the determined service lives of channel systems by field measurements confirms the
applicability of the developed method (Hypothesis 5).
Concerning the composition of de‐icing salts, in most cases only Cl was monitored and the
corresponding cations were often neglected. Because different de‐icing salt compounds can have a
different effect on the removal efficiencies of decentralized stormwater treatment systems for traffic
area runoff, their use in road maintenance and their occurrence in the runoff from traffic areas must
be subsequently evaluated (cf. Chapter 8). The hypothesis of this part of the thesis is:
Different types and amounts of de‐icing salts are used in road maintenance by German authorities
(Hypothesis 6).
After determining the relevance of three different de‐icing salts in German traffic area runoff, a
further aspect was implemented in the assessment method. Therefore, the heavy metal removal
mechanisms and the risk of remobilization under de‐icing salt applications were evaluated for five
heavy metals to develop a complete assessment method for manufactured decentralized stormwater
treatment systems for runoff from traffic areas (cf. Chapter 9). The corresponding hypothesis is:
The composition of the de‐icing salt solution has a significant effect on the remobilization of heavy
metals and the behavior of each heavy metal differs widely (Hypothesis 7).
32

Chapter4:Methodology
The methods used in this thesis consist of literature studies, computer modeling, lab‐scale, pilot‐
scale, and full‐scale experiments (Figure 5). For each research topic, one or a combination of
different methods was used. The research topics are also listed in Figure 5 with the corresponding
numbers of the chapters of this thesis (left), the hypotheses (right), and the publications (peer
reviewed journal papers, conference proceedings, and the monograph).
Figure 5: Methodology for the evaluation of decentralized treatment systems for traffic area runoff used for this thesis. (*) Number in brackets refers to the publication number of the publications list in the Appendix.
33

The literature studies were used to collect data from other monitoring and research programs that
were published in peer‐reviewed journal papers, reports, books, and non‐reviewed articles (after
validation). The data from the monitoring programs consist of substance concentrations in traffic
area runoff and additional information concerning the monitoring program (e.g., fixed site‐specific
and climatic‐specific influences; objectives, special conditions, and remarks; sample collection,
preparation, analysis, and calculation methods). In addition, the annual heavy metal loads
normalized per hectare of impervious catchment area were summarized and used for mass balances.
In another literature study, information on the application, functionality, removal mechanisms, types
of construction, test procedures, and assessment criteria were collected concerning stormwater
treatment systems for runoff from traffic areas.
The lab‐scale experiments consisted of batch and column experiments. Batch experiments with
heavy metals were performed under identical and well‐defined conditions to prove the comparability
of different production batches and to select filter materials for subsequent column experiments.
Batch equilibrium experiments, batch kinetic experiments, and experiments to determine cation
exchange capacities were also conducted to determine heavy metal removals by filter materials for
stormwater treatment and to evaluate factors influencing lab‐scale studies. Column experiments
were used as an indicator to determine the efficiencies and service lives of decentralized stormwater
treatment systems. Lab‐scale column experiments were also performed to study the remobilization
of heavy metals during the application of three different de‐icing salts.
To determine service lives and characterize long‐term performances, pilot‐scale experiments were
performed on nine different filter systems and the retention of dissolved heavy metals was evaluated.
The novel assessment method, which was developed for these pilot‐scale experiments, consists of
several steps including preloading the filter material in individual models with Cu and Zn by a load of
n‐1 years of the estimated service life (n). Subsequently, three representative rain events were
simulated to evaluate the long‐term performance by dissolved Cu and Zn during the last year of
application. In addition, solid samples were taken at different full‐scale treatment systems.
Furthermore, two full‐scale treatment plants were operated in NRW for monitoring their removal
efficiencies and the pollution of road runoff.
To support the findings of the lab‐scale column experiments concerning the removal and
remobilization of heavy metals, computer modeling was used to simulate the speciation of heavy
metals during removal and under application of different de‐icing salts.
Detailed descriptions of the materials and methods that were used in this thesis are given in the
“Material & Methods” Chapters of the following eight papers.
34

Chapter5:HeavyMetalPollutionofTrafficAreaRunoff
The results of the analysis of monitoring programs were published in three reviews. For the runoff
concentrations, one review presents the results of the complete data set (international review, cf.
Section 5.1) and one review presents the European data (cf. Section 5.2). The metal loads and the
traffic related heavy metal emissions are summarized in the third review (cf. Section 5.3). The first
two reviews deal with the following two hypotheses and the third review only with Hypothesis 1:
The average metal runoff concentrations and their distributions can be determined by a literature
study of monitoring programs whereupon the mean and median concentrations and the loads of each
site are not comparable (Hypothesis 1).
Although the measured heavy metal pollution is influenced by site‐specific and method‐specific
factors, the average total and dissolved metal concentrations vary significantly between different
traffic area categories for a large collection of monitoring sites (Hypothesis 2).
The reviews consider different aspects of the occurrence, influences, and partitioning of heavy
metals. Because of less European data, the second review distinguishes between only five traffic area
categories (instead of eight for the international review) for the metal distributions of Cd, Cr, Cu, Ni,
Pb, and Zn. The mass balances published in the third review consider annual metal runoff loads and
traffic related emission loads.
5.1ReviewPaper:“CriticalReviewofHeavyMetalPollutionofTrafficArea
Runoff:Occurrence,InfluencingFactors,andPartitioning”
The first journal paper deals with the concentrations of relevant heavy metals in the runoff of eight
different types of traffic areas (i.e., parking lots, bridges, roads with an AADT of < 5000, roads with
5000 < AADT < 15,000, roads with an AADT of > 15,000, urban highways with an AADT of > 30,000,
non‐urban highways with an AADT of > 30,000, and highways with an AADT of < 30,000). The data
collected for the first review are based on the international literature study.
This review focuses on the objectives as follows: site‐specific factors (both fixed and climatic) that
influence the occurrence and partitioning of the heavy metals in traffic area runoff from different
sites and that should be documented in monitoring programs were described in detail. The
conditions of the monitoring methods, including sample collection, sample preparation, sample
analysis, and calculation methods, were compiled and evaluated. The concentrations and
fractionation of the heavy metals were summarized to produce a comprehensive data set of
international monitoring programs, to characterize eight types of traffic areas, and to identify
relevant heavy metals.
35

The following heavy metals from 294 sites were considered for the distribution analysis: Cd, Cr, Cu,
Ni, Pb, and Zn. For Pb and Zn, the historical concentration trends were evaluated and only a decrease
in the Pb concentrations was detected. Thus, only Pb data of the 21st century were used for the
characterization of the different traffic areas. It was possible to determine the distributions of the
total and dissolved concentrations of all six heavy metals. Their occurrence differed widely between
the eight traffic area categories. In addition, the mean and median concentrations that were both
available for each site were not comparable. Furthermore, the runoff concentrations of antimony,
cobalt, manganese, platinum‐group elements (PGE), titanium, and tungsten were considered.
Tendencies such as seasonal effects, phase‐out measures, and land use influences, which should be
considered for planning stormwater treatment plants, were identified. In addition, the variability of
Zn in stormwater runoff from traffic areas and continental trends were discussed. No link between
lower pH values and a higher proportion of dissolved metals in the runoff was detected.
The results were published in Science of the Total Environment 541, 895–919. The basis for the
database was set by the habilitation of Welker (2004). Huber collected most of the data, evaluated all
documents, and wrote the review. Both co‐authors contributed to the discussions and conclusions of
the first review.
5.2 Review Paper: “Heavy Metal Pollution of Traffic Area Runoff – a
EuropeanReview”
The second journal paper summarizes the concentrations of relevant heavy metals in the runoff of
five different types of traffic areas (i.e., parking lots, highways, roads with an AADT of < 5000, roads
with 5000 < AADT < 15,000, and roads with an AADT of > 15,000). The data of this review are based
on the database of the international literature study (cf. Section 5.1) and they only include European
runoff concentrations.
This paper focuses on the objectives as follows: site‐specific factors (both fixed and climatic) that
influence the occurrence and partitioning of the heavy metals in traffic area runoff from different
sites were summarized. In addition, the influences of method‐specific factors were compiled. The
concentrations and fractionation of the heavy metals were summarized to produce a comprehensive
data set, to characterize five types of traffic areas, and to identify relevant heavy metals that must be
evaluated in assessment methods for decentralized stormwater treatment systems.
The concentrations and fractionation of Cd, Cr, Cu, Ni, Pb, and Zn were presented in detail. For Cu, Pb,
and Zn, the historical concentration trends were evaluated and a trend was only detected for Pb.
Thus, only Pb data of the 21st century were used for the characterization of the different traffic areas.
The distributions of all six heavy metals differed widely between the five traffic area categories. The
36

average total and dissolved metal concentrations varied significantly because of site‐specific and
method‐specific factors and the concentrations of each site were not comparable. Furthermore, the
maximum runoff concentrations of antimony, barium, cobalt, manganese, palladium, platinum,
titanium, and tungsten were summarized. Continental trends for total Cu and Zn concentrations
were also analyzed. In addition, the highway runoff concentrations were evaluated and discussed for
each European country with available monitoring data. In conclusion, the categories of pollution for
different traffic areas proposed by DWA‐M 153E (2007) (cf. Table 2) were roughly verified and
recommendations for further monitoring programs were summarized.
The second review was published in gwf Wasser/Abwasser 156, 896–909. The basis for the database
was set by the review paper of Section 5.1. Huber collected most of the data, evaluated all
documents, and wrote the paper. Both co‐authors contributed to the discussions and conclusions.
5.3 Review Paper: “StormwaterManagement: Calculation of Traffic Area
RunoffLoadsandTrafficRelatedEmissions”
In this third review, the annual metal runoff loads for different traffic areas (45 sites) were
summarized on the basis of catchment areas (g/ha) for the metals Cd, Cr, Cu, Ni, Sb, Pb, and Zn.
Further objectives were: to identify relevant trends and factors, to update and expand existing mass
balances (heavy metal runoff loads and emissions) for Germany, and to characterize the mass fluxes
of traffic related metals. Of these parameters, the annual traffic area runoff loads per hectare of
catchment area were mostly published by monitoring programs for the three heavy metals Cu, Pb,
and Zn. A historical trend for Pb was detected and the variations of the Zn loads were the highest
compared with the other heavy metals because of site‐specific factors. In addition, the annual loads
were calculated at three monitoring sites for several years and the variations of these loads were
evaluated for each year to determine the correlations of climatic site‐specific factors with the runoff
loads. For the heavy metal runoff loads, a calculation of average values was possible for highways
and for all traffic areas whereupon the average loads of each site and traffic area category differed
widely. The calculated average annual loads were used to perform mass balances for Germany to
identify the total pollution loads of runoff from highways and all traffic areas. In addition, the traffic
related emissions were calculated for Cd, Cu, Pb, and Zn for seven different sources (tire wear, brake
lining wear, roadway abrasion, weights for tire balance, guardrails, lampposts/signs, and de‐icing
salts). However, an evaluation of the mass fluxes by a statistical analysis was not possible for the
metals due to a lack of monitoring data.
This review was published in Water 8 (7), 294:1–21. Maximilian Huber collected the data, evaluated
all documents, and wrote the paper. Brigitte Helmreich contributed to the results and discussions.
37

Science of the Total Environment 541 (2016) 895–919
Contents lists available at ScienceDirect
Science of the Total Environment
j ourna l homepage: www.e lsev ie r .com/ locate /sc i totenv
Review
Critical review of heavymetal pollution of traffic area runoff: Occurrence,influencing factors, and partitioning
Maximilian Huber a, Antje Welker b, Brigitte Helmreich a,⁎a Chair of Urban Water Systems Engineering, Technical University of Munich, Am Coulombwall 8, 85748 Garching, Germanyb Fachgebiet Siedlungswasserwirtschaft und Hydromechanik, Frankfurt University of Applied Sciences, Nibelungenplatz 1, 60318 Frankfurt am Main, Germany
H I G H L I G H T S G R A P H I C A L A B S T R A C T
• Heavy metal runoff concentrations inparking lots, bridges, and roads
• Large dataset of dissolved and total metalconcentrations in traffic area runoff
• Description of site-specific and moni-toring method-specific factors
• Summary of traffic-related and anthro-pogenic heavy metals in road runoff
• Reduction in Pb concentrations over timeis one of the robust chemical results.
Abbreviations: AADT, average annual daily traffic; BR,HU, highwaywith high AADT (N30,000) and urban land uRL, road with low AADT (b5000); RM, road with medium⁎ Corresponding author.
E-mail address: [email protected] (B. Helmreich).
http://dx.doi.org/10.1016/j.scitotenv.2015.09.0330048-9697/© 2015 Elsevier B.V. All rights reserved.
a b s t r a c t
a r t i c l e i n f oArticle history:Received 11 June 2015Received in revised form 7 September 2015Accepted 7 September 2015Available online 6 October 2015
Editor: F.M. Tack
Keywords:BridgeDissolved heavy metalsHighwayParking lotRoadSite-specific factor
A dataset of 294 monitored sites from six continents (Africa, Asia, Australia, Europe, North and South America)was compiled and evaluated to characterize the occurrence and fate of heavy metals in eight traffic area catego-ries (parking lots, bridges, and three types each of both roads and highways). In addition, site-specific (fixed andclimatic) and method-specific (related to sample collection, preparation, and analysis) factors that influence theresults of the studies are summarized. These factors should be considered in site descriptions, conducting mon-itoring programs, and implementing a database for further research. Historical trends for Pb show a sharp de-crease during recent decades, and the median total Pb concentrations of the 21st century for North Americaand Europe are approximately 15 μg/L. No historical trend is detected for Zn. Zn concentrations are very variablein traffic area runoff compared with other heavy metals because of its presence in galvanized structures andcrumbs of car tire rubber. Heavy metal runoff concentrations of parking lots differ widely according to theiruse (e.g., employee, supermarket, rest areas for trucks). Bridge deck runoff can contain high Zn concentrationsfrom safety fences and galvanizing elements. Roads withmore than 5000 vehicles per day are oftenmore pollut-ed than highways because of other site-specific factors such as traffic signals. Four relevant heavymetals (Zn, Cu,
bridge; d, dissolved; HL, highway with low AADT (b30,000); HN, highway with high AADT (N30,000) and non-urban land use;se; HWY, highway; p, particulate; Pb_21, dataset including only Pb concentrationsmeasured in the 21st century; PL, parking lot;AADT (5000 b AADT b 15,000); RU, road with high AADT (N15,000); t, total.
38

896 M. Huber et al. / Science of the Total Environment 541 (2016) 895–919
Ni, and Cd) can occur in the dissolved phase. Knowledge of metal partitioning is important to optimizestormwater treatment strategies and prevent toxic effects to organisms in receiving waters.
© 2015 Elsevier B.V. All rights reserved.
Contents
1. Introduction . . . . . . . . . . . . . . . . . . . . . . . . . . . . . . . . . . . . . . . . . . . . . . . . . . . . . . . . . . . . . . 8962. Material and methods . . . . . . . . . . . . . . . . . . . . . . . . . . . . . . . . . . . . . . . . . . . . . . . . . . . . . . . . . 8973. Occurrence and influencing factors . . . . . . . . . . . . . . . . . . . . . . . . . . . . . . . . . . . . . . . . . . . . . . . . . . . . 897
3.1. Site-specific factors . . . . . . . . . . . . . . . . . . . . . . . . . . . . . . . . . . . . . . . . . . . . . . . . . . . . . . . 8973.1.1. Fixed site . . . . . . . . . . . . . . . . . . . . . . . . . . . . . . . . . . . . . . . . . . . . . . . . . . . . . . . . 8973.1.2. Climate . . . . . . . . . . . . . . . . . . . . . . . . . . . . . . . . . . . . . . . . . . . . . . . . . . . . . . . . . 905
3.2. Monitoring-method-specific factors . . . . . . . . . . . . . . . . . . . . . . . . . . . . . . . . . . . . . . . . . . . . . . . . 9063.2.1. Sample collection . . . . . . . . . . . . . . . . . . . . . . . . . . . . . . . . . . . . . . . . . . . . . . . . . . . . 9063.2.2. Sample preparation and analysis . . . . . . . . . . . . . . . . . . . . . . . . . . . . . . . . . . . . . . . . . . . . . 9093.2.3. Calculation methods . . . . . . . . . . . . . . . . . . . . . . . . . . . . . . . . . . . . . . . . . . . . . . . . . . . 909
4. Occurrence and partitioning . . . . . . . . . . . . . . . . . . . . . . . . . . . . . . . . . . . . . . . . . . . . . . . . . . . . . . . 9104.1. Historical trends . . . . . . . . . . . . . . . . . . . . . . . . . . . . . . . . . . . . . . . . . . . . . . . . . . . . . . . . . 9104.2. Variability of Zn . . . . . . . . . . . . . . . . . . . . . . . . . . . . . . . . . . . . . . . . . . . . . . . . . . . . . . . . . 9104.3. Characteristics of traffic area categories . . . . . . . . . . . . . . . . . . . . . . . . . . . . . . . . . . . . . . . . . . . . . . 9134.4. Runoff concentrations of traffic area categories . . . . . . . . . . . . . . . . . . . . . . . . . . . . . . . . . . . . . . . . . . . 9144.5. Other elements . . . . . . . . . . . . . . . . . . . . . . . . . . . . . . . . . . . . . . . . . . . . . . . . . . . . . . . . . 9154.6. Correlation between pH and type of surface . . . . . . . . . . . . . . . . . . . . . . . . . . . . . . . . . . . . . . . . . . . . 9154.7. Continental trends . . . . . . . . . . . . . . . . . . . . . . . . . . . . . . . . . . . . . . . . . . . . . . . . . . . . . . . . 9154.8. Planning stormwater treatment plants . . . . . . . . . . . . . . . . . . . . . . . . . . . . . . . . . . . . . . . . . . . . . . . 916
5. Conclusions . . . . . . . . . . . . . . . . . . . . . . . . . . . . . . . . . . . . . . . . . . . . . . . . . . . . . . . . . . . . . . 916References . . . . . . . . . . . . . . . . . . . . . . . . . . . . . . . . . . . . . . . . . . . . . . . . . . . . . . . . . . . . . . . . . 916
1. Introduction
Traffic area runoff summarize precipitation- and snowmelt-relateddischarges of mostly impervious surfaces (sidewalks, parking lots (PL),feeder streets, major roads, and highways (HWY)). The main contami-nation sources of traffic area runoff are related to traffic, surroundingland use, atmospheric contamination, and othermeteorological and en-vironmental conditions (Muschack, 1990; Ball, 2002; Crabtree et al.,2009; Valtanen et al., 2014). It is difficult to determine the dominantsources of pollutants because most substances have more than one ori-gin and thewater quality data of runoff fromdifferent sites are extreme-ly heterogeneous because of differing background levels, types of uses(Göbel et al., 2007), and method-specific factors.
The substance spectrum analyzed in traffic area runoff waters in-cludes organic parameters such as polycyclic aromatic hydrocarbons,total petroleum hydrocarbons, chemical oxygen demand, biological ox-ygen demand, and total organic carbon; heavy metals such as Pb, Zn,and Cu; and materials from de-icing salts such as chloride (Smullenet al., 1999; Moy et al., 2003; Eriksson et al., 2007; Kayhanian et al.,2012).
As HWY account for a small percentage of urban land use, they con-tribute only a small portion of pollutant loads comparedwith other roadsurfaces (Shelley et al., 1987). In urban catchments, all road surfacesrepresent approximately 10%–15% of the total area (Bannerman et al.,1993; Ball, 2002), and in commercial and industrial areas, PL can consti-tute up to 46% of the total area (Bannerman et al., 1993). Therefore, it isessential to consider all types of traffic area runoff.
In most cases, runoff waters from PL and road surfaces containhigher levels of the heavy metals than other types of runoff in drain-age systems such as conventional roof runoff (Schueler, 2000; Ball,2002). Metals in roof and road runoff contribute up to 80% of thetotal mass flow in combined sewer systems (Ellis et al., 1987;Boller, 1997). The present review focuses on all heavy metals in traf-fic area runoff that have either traffic or anthropogenic sources.These metals are transported by stormwater runoff either attachedto solids or in dissolved form depending on the prevailing redox
39
and pH conditions (Ball, 2002). However, in most cases, only totalmetal concentrations are analyzed from runoff waters during mea-surement campaigns.
Some of these heavy metals can have acute or chronic impacts asa result of their accumulation in receiving waters in terms of aquatichabitats, drinking water resources, and recreational uses (Ellis andRevitt, 1982; Yousef et al., 1984). For potential toxic effects, thepartitioning between the total and dissolved heavy metals is essen-tial because the dissolved fractions are directly biologically available(Paulson and Amy, 1993; Crabtree et al., 2008). The toxicity of trafficarea runoff has been investigated by various researchers (Gjessinget al., 1984; Pitt et al., 1995; McQueen et al., 2010). A particularlink to the heavy metals was made by Tiefenthaler et al. (2001),who identified trace metals (particularly Zn) as important contribu-tors to toxicity in PL runoff, and by Kayhanian et al. (2008), whoidentified dissolved Cu and Zn as the primary causes of toxicity inHWY runoff. In general, the toxicity of heavy metals is a function ofseveral factors such as metal speciation and physical characteristicsof receiving waters (Revitt and Morrison, 1987). If conditions change,particulate metals transported into receiving waters have the potentialto repartition into the dissolved phase (Sansalone, 2002; Westerlundand Viklander, 2006). Metal partitioning is also important for designingappropriate stormwater treatment strategies (Hilliges et al., 2013;Maniquiz-Redillas and Kim, 2014).
The present review focuses on the objectives as follows:
• To describe site-specific factors (both fixed and climatic conditions)that influence the occurrence and partitioning of the heavy metals intraffic area runoff from different sites and that should be documentedin investigation programs.
• To compile and evaluate the conditions of the monitoring methods,including sample collection, sample preparation, sample analysis,and calculation methods.
• To summarize the concentrations and fractionation of the heavymetals to produce a comprehensive dataset, to characterize differenttypes of traffic areas, and to identify relevant heavy metals.

897M. Huber et al. / Science of the Total Environment 541 (2016) 895–919
• To identify tendencies such as seasonal effects, phase-out measures,and land use influences that should be considered for planningstormwater treatment plants.
2. Material and methods
A dataset based on nearly 300 studies (n = 294) was analyzed. Inaddition to peer-reviewed journal papers, reports, books, and non-reviewed journal articles were considered after validation that present-ed heavy metal concentrations in traffic area runoff, including addition-al data concerning the monitoring program.
Several researchers evaluated street sweeping, the performance ofgrass swales, wetlands, detention ponds, biofiltration systems, porousasphalt surfaces, and artificial treatment plants. Only some character-ized the quantity and quality of traffic area runoff containing heavymetal partitioning and influencing factors as their main objective.Therefore, the details of eachmonitoring programpresented in publica-tions differed and information regarding influencing factors such asthose described in Section 3.1 are often missing.
To analyze historical trends and obtain a wide range of data, it is im-portant to consider publications of the last decades. In North Americaand Europe, a large number of runoff data have been collected sincethe 1970s. Since the 1990s, data from Australia and New Zealand havebeen available, and since the 2000s, the number of publications fromAsia, Africa, and South America has increased.
The date of themonitoring programwas used instead of the publica-tion date. If the date of the monitoring program was not available, thedate of paper submission was used. All data are subdivided into eightcategories: PL; bridges (BR); roads with an average annual daily traffic(AADT) of b5000 (RL), 5000 b AADT b 15,000 (RM), and N15,000(RU); urban HWY with an AADT of N30,000 (HU); non-urban HWYwith an AADT of N30,000 (HN); and HWY with an AADT of b30,000(HL). If the AADT was not mentioned, the classification was performedfrom the description of themonitoring site, e.g., a feeder streetwas clas-sified as category RL. Each site was linked to one category. The identifi-cation (ID) of each site consists of two capital letters according to thecategory and two consecutive numbers, e.g., PL01. These IDs are usedin Tables 1, 2, and 3 and in Sections 4.3 and 4.4.
One important stepwas to ensure that each dataset from one site wasonly considered once, although it might have been published twice ormore in different forms. All data of one site was recalculated to obtainone dataset per site, except where the investigation period was notcontinuous (e.g., a new monitoring program after several years) or site-specific factors varied because of construction work (e.g., new road sur-face). In these cases, one site provides two or three datasets (highlightedin Tables 1, 2, and 3 by adding a letter a, b, or c at the end of an ID).
At data collection, total (t), dissolved (d), and particulate(p) concentrations were distinguished, as were mean and medianconcentrations. If authors presented both mean and median values,both values were used in this review. For sites including all single-event concentrations, both mean and median concentrations werecalculated. Some extreme measured concentrations were deletedfor plotting the figures but all these concentrations are mentionedin Section 4.
For statistical analysis and plotting histograms and box plots, thesoftware package SPSS 22 (IBM) was used. For box and whisker plots,the bottom and top of each box are the first and third quartiles andthe band inside the box is the median. The whiskers represent 1.5times the interquartile range (IQR). Outliers (N1.5 times IQR) aremarked as small circles and extreme values (N3.0 times IQR) as stars.
3. Occurrence and influencing factors
Literature datasets have a wide variation due to site-specific andmonitoring-method-specific factors (Fig. 1). Site-specific factors canbe divided into fixed site-specific factors (spatial variance) and climatic
40
site-specific factors (temporal variance); both affect the real pollution ofsurface runoff. Method-specific influences on the results, which shouldrepresent the real situation, are caused by the boundary conditions of ameasurement program and occur during sample collection, samplepreparation, sample analysis, and calculation.
3.1. Site-specific factors
3.1.1. Fixed siteFixed site-specific factors can be divided into three categories: sur-
rounding land use characteristics, traffic area site data, and operationalcharacteristics (Shelley et al., 1987).
For the first factor, i.e., surrounding land use characteristics, severalcategories are used: non-urban, urban, ultra-urban, transportation, res-idential, open, agriculture, commercial, mixed, and industrial categories(Kayhanian et al., 2003; Flint and Davis, 2007). Driscoll et al. (1990)specified urban (undefined, commercial/residential, residential, andsuburban) and non-urban (undefined rural, forest, undeveloped, agri-cultural, and desert) land use categories. Because the term residentialland use could include a mixture of streets, driveways, rooftops, andlawns (Schueler, 2000), its use for analysis is restrictive and only com-parisons of land use categories analyzed in one research program canprovide an indication of their influence. E.g., the results of Danneckeret al. (1990) showed similar runoff pollution levels of an industrialroad and a main street of an inner urban city.
The second factor, i.e., the traffic area site data, contains informationabout vegetation, topography, and road design. Only some data areavailable for surrounding vegetation, street surface covered with trees,and topography, which describes the slope and the configuration ofthe traffic area (cut, at grade, or elevated (Driscoll et al., 1990)).Jenewein and Schinner (1982) did not find a correlation of the slopewith runoff concentrations. Most fixed site-specific data are availableabout road design, including information about cross-sections, pave-ment surfaces, and drainage areas. The cross-section describes the num-ber of lanes per direction and the existence of curbs,median strips, hardshoulders, drainage systems, crash/noise barriers, and safety fences. Theabsence of curbs has a positive effect on reducing runoff concentrations(Driscoll et al., 1990), and further influences are described by Irish et al.(1998) and Li et al. (2008). Hard shoulders have an influence on waterquality because they act as a sink for suspended solids and particle-associated metals (Berbee et al., 1999). Detailed information about thetypes of surfaces drained and sampled in monitoring programs is avail-able in literature (62.9% of the datasets). Most surfaces are conventionalasphalt surfaces (n= 122), followed by concrete (n= 33), asphalt andconcrete (n = 15; mostly HWY with new lanes), porous asphalt (n =9), asphalt and paver (n = 3; PL), paver (n = 2; PL), and crushedstone (n=1; feeder street). Drapper et al. (2000) concluded that a con-crete surface does not have a significant impact on pollutant runoff con-centrations compared with asphalt surfaces. The surface condition hasan effect on concentrations by either increasing runoff loads from de-composition products or reducing them during filtration into cracksand pot-holes (Driscoll et al., 1990). The size of the drainage area inthe dataset of this study varies widely (3–429,000m2) and has an effecton the first flush (Lau et al., 2009) and metal concentration, when theratio of the drainage area to traffic volume is considered (CH2MHILL,1998). The same applies to the imperviousness of the surface. Noise bar-riers lead to an increase in runoff concentrations (Dierkes, 1999; Kocheret al., 2010a,b), and concrete barriers can retainmore solids on road sur-faces (Barrett et al., 1998). Speed limits and traffic signals have an influ-ence on runoff concentrations because braking and accelerationactivities lead to increased abrasion of tires, higher use of brake linings,and increased automotive exhaust gas emissions (Muschak, 1990;Langbein et al., 2006). Drapper et al. (2000) measured higher concen-trations of Cu and Zn at locations with exit lanes due to sharp brakingby exiting vehicles and road signs release metals as a result of rain andsplashing water (Van Bohemen and Van de Laak, 2003).

Table1
Register
ofstud
iesinve
stigatingpa
rkinglotr
unoff.
IDLiterature
Location
Samplingpe
riod
Special
cond
itions
aDisch
arge
area
[m2]
Type
andch
aracteristics
ofpa
rkinglots
Num
berof
even
tssampled
Type
ofsample
colle
ction
Sampling
strategy
Pore
diam
eter
forfiltration
Partitionb
Metalsde
tected
c
PL01
Grotehu
sman
nan
dKasting
(200
2)DEU
2001
-01–
2001
-12
D,M
,S10
,000
Tank
farm
andrest
area
for41
truc
ksan
dfour
busses
40Active-au
tomatic
Flow
-prop.
0.45
d,t
Cd,C
r,Cu
,Hg,
Pb,P
d,Pt,Z
n
PL02
Grotehu
sman
nan
dKasting
(200
2)DEU
2001
-01–
2001
-12
D,M
,S50
00Ta
nkfarm
andrest
area
for12
2cars
43Active-au
tomatic
Flow
-prop.
0.45
d,t
Cd,C
r,Cu
,Hg,
Pb,P
d,Pt,Z
n
PL03
Grotehu
sman
nan
dKasting
(200
2)DEU
2001
-01–
2001
-12
D,M
,S17
,700
Tank
farm
andrest
area
for18
truc
ks,1
6bu
sses
and78
cars
42Active-au
tomatic
Flow
-prop.
0.45
d,t
Cd,C
r,Cu
,Hg,
Pb,P
d,Pt,Z
n
PL04
Pick
etal.(20
02)
DEU
1999
-03–
2000
-11
–30
0Ca
mpu
spa
rkinglot
–Active-au
tomatic
Mixed
–t
Cd(b
1.0),C
r,Cu
,Ni,Pb
,Zn
PL05
Enge
lhardet
al.(20
12)
AUT
2010
-04-02
–201
1-02
-21
D–
Supe
rmarke
t–
Passive-au
tomatic
Mixed
–t
Cd,C
r,Cu
,Ni,Pb
,Zn
PL06
Gromaire-M
ertz
etal.
(199
9)FR
A19
96-07–
1997
-05
––
Courtyard,
oldreside
ntial
district
withsm
all
busine
sses
7Active-au
tomatic
Flow
-prop.
0.45
d,t
Cd,C
u,Pb
,Zn
PL07
Gne
ccoet
al.(20
05)
ITA
2002
-01-23
–200
3-09
-28
–10
00Ca
mpu
spa
rkinglot,
typicalu
rban
reside
ntial
area
9Active-au
tomatic
Time-prop
.(equ
ally
timed
)–
dCu
,Pb,
Zn
PL08
Gne
ccoet
al.(20
08)
ITA
2005
-11-15
–200
6-07
-12
–14
,000
Airpo
rtpa
rkingarea
with
100ve
hicles
perho
ur4
Active-au
tomatic
Time-prop
.(equ
ally
timed
)0.45
d,p
Al,Cu
,Fe,
Mn,
Pb,Z
n
PL09
Now
akow
ska-Blaszczy
kan
dZa
krze
wski(
1996
)PO
L–
S–
––
––
–t
Pb
PL10
Hog
land
etal.(19
87)
SWE
1985
–47
0Re
search
center
2Active-au
tomatic
Time-prop
.(equ
ally
timed
)–
tAl,Cd
,Cr,Cu
,Pb,
Zn
PL11
Wei
andMorrison
(199
4)SW
E19
92-05-26
––
Park
andride
1–
–0.45
d,t
Pt
PL12
Pittet
al.(19
95)
USA
––
–Pa
rkan
dride
1Man
ual
Rand
om0.45
d,t
Al,Cd
,Cr,Cu
,Ni,Pb
,Zn
PL13
Caltrans
(200
3)USA
2002
-11-07
–200
3-04
-24
––
Park
andride
,co
mmercial
site
within
thefoothills
8Active-au
tomatic
Flow
-prop.
–d,
tAs,Cd
(b0.2),C
r,Cu
,Ni,Pb
,Zn
PL14
Caltrans
(200
3)USA
2002
-12-09
–200
3-02
-12
––
Park
andride
8Active-au
tomatic
Flow
-prop.
–d,
tAs,Cd
,Cr,Cu
,Hg,
Ni,Pb
,Zn
PL15
Caltrans
(200
3)USA
2002
-11-07
–200
3-02
-15
––
Park
andride
8Active-au
tomatic
Flow
-prop.
–d,
tAs,Cd
,Cr,Cu
,Hg,
Ni,Pb
,Zn
PL16
aCa
ltrans
(200
3)USA
2002
-11-29
–200
3-05
-02
––
Park
andride
,cam
pus
parkinglot
8Active-au
tomatic
Flow
-prop.
–d,
tAs,Cd
,Cr,Cu
,Ni,Pb
,Zn
PL16
bTiefen
thaler
etal.
(200
1)USA
2000
-07-15
–200
0-10
-07
S60
8Pa
rkan
dride
,cam
pus
parkinglot
5Active-au
tomatic
Time-prop
.(equ
ally
timed
)0.45
d,t
Al,Cd
,Cr,Cu
,Fe,
Ni,Pb
,Zn
PL17
Caltrans
(200
3)USA
2002
-11-07
–200
3-04
-14
––
Park
andride
8Active-au
tomatic
Flow
-prop.
–d,
tAs,Cd
,Cr,Cu
,Ni,Pb
,Zn
PL18
Caltrans
(200
3)USA
2002
-12-20
–200
3-04
-14
––
Park
andride
,rural
area
near
foothills
4Active-au
tomatic
Flow
-prop.
–d,
tCd
,Cr,Cu
,Ni,Pb
,Zn
PL19
Caltrans
(200
3)USA
2002
-11-07
–200
3-04
-12
––
Park
andride
,flat
busine
ss/retaila
rea
8Active-au
tomatic
Flow
-prop.
–d,
tAs,Cr,C
u,Ni,Pb
,Zn
898 M. Huber et al. / Science of the Total Environment 541 (2016) 895–919
41

PL20
Caltrans
(200
3)USA
2002
-11-08
–200
3-04
-14
––
Park
andride
8Active-au
tomatic
Flow
-prop.
–d,
tAs,Cd
,Cr,Cu
,Ni,Pb
,Zn
PL21
Caltrans
(200
3)USA
2002
-12-12
–200
3-03
-14
––
Rest
area
withplan
ter
boxe
san
drestroom
s8
Active-au
tomatic
Flow
-prop.
–d,
tAs,Cd
,Cr,Cu
,Ni,Pb
,Zn
PL22
Caltrans
(200
3)USA
2003
-02-12
–200
3-04
-12
––
Rest
area
,rollin
ggrassy
hills
3Active-au
tomatic
Flow
-prop.
–d,
tAs,Cd
,Cr,Cu
,Ni,Pb
,Zn
PL23
Caltrans
(200
3)USA
2002
-12-16
–200
3-04
-17
––
Rest
area
,flat
agricu
ltural
land
3Active-au
tomatic
Flow
-prop.
–d,
tAs,Cd
,Cr,Cu
,Ni,Pb
,Zn
PL24
Rush
ton(2
001)
USA
1998
-11–
1999
-11
–10
50FloridaAqu
arium
30Active-au
tomatic
Flow
-prop.
–t
Cu,Fe,
Mn,
Pb,Z
nPL
25Ru
shton(2
001)
USA
1998
-11–
1999
-11
–10
50FloridaAqu
arium
30Active-au
tomatic
Flow
-prop.
–t
Cu,Fe,
Mn,
Pb,Z
nPL
26Steu
eret
al.(19
97)
USA
1993
-10,
1994
-05–
1994
-08
–54
,000
Commercial
12Pa
ssive-au
tomatic
Flow
-prop.
0.45
d,t
Cu,C
d,Pb
,Zn
PL27
McQ
ueen
etal.,20
10USA
2006
-10-16
–200
7-07
-17
nD,M
1254
Campu
spa
rkinglotfor
23of
231cars,
reside
ntial/co
mmuter
19Active-au
tomatic
Firstflu
sh(2
.54mm)
–t
Al,Cd
,Cr,Cu
,Fe,
Mn,
Ni,Pb
,Zn
PL28
McQ
ueen
etal.,20
10USA
2007
-01-05
–200
7-07
-30
nD,M
6398
Campu
spa
rkinglotfor
189of
1089
cars,
reside
ntial/co
mmuter
12Active-au
tomatic
Firstflu
sh(2
.54mm)
–t
Al,Cd
,Cr,Cu
,Fe,
Mn,
Ni,Pb
,Zn
PL29
Line
etal.(19
97)
USA
1993
-11-05
–16
,000
Veh
icle
mainten
ance
1Active-au
tomatic
Firstflu
sh(5
min)
–t
As(b
10),Cd
(b2)
,Cr(b
5),
Cu,H
g(b
0.2)
,Ni(b10
),Pb
(b5)
,Sb(b
50),Zn
PL30
Line
etal.(19
97)
USA
1993
-11-27
–24
,000
Veh
icle
mainten
ance
1Active-au
tomatic
Firstflu
sh(5
min)
–t
As(b
10),Cd
(b2)
,Cr,Cu
,Hg
(b0.2)
,Ni(b10
),Pb
,Sb
(b50
),Zn
PL31
aBo
othan
dLe
avitt
(199
9)USA
1996
-11–
1996
-12-25
–18
Employ
eepa
rkinglot
withon
ce-in,
once-out
daily
usag
e
3Pa
ssive-au
tomatic
Flow
-prop.
–d,
tBa
,Cu,
Fe,M
n,Pb
,Zn
PL31
bBrattebo
andBo
oth
(200
3)USA
2001
-11–
2002
-03
–18
Employ
eepa
rkinglot
withon
ce-in,
once-out
daily
usag
e
9Pa
ssive-au
tomatic
Flow
-prop.
–d,
tCu
,Pb(b
1),Z
n
PL32
Bann
erman
etal.
(199
3)USA
1991
-05-05
–199
1-07
-07
––
Commercial
5Pa
ssive-au
tomatic
Flow
-prop.
0.7;
0.45
d,t
Cd,C
r,Cu
,Pb,
Zn
PL33
Bann
erman
etal.
(199
3)USA
1991
-05-05
–199
1-07
-07
––
Indu
strial
9Pa
ssive-au
tomatic
Flow
-prop.
0.7;
0.45
d,t
Cd,C
r,Cu
,Pb,
Zn
PL34
Hattet
al.(20
09)
AUS
2007
-01–
2007
-11
–45
00Ca
mpu
spa
rkinglot,top
leve
lofa
multi-lev
elcarpark
17Active-au
tomatic
Flow
-prop.
–t
Cu,M
n,Pb
,Zn
PL35
Man
iquizet
al.(20
10)
KOR
2006
-06–
2008
-10
–10
,700
Veh
icle
registration
offic
e,co
mmercial
and
light
indu
strial
45Man
ual
Time-prop
.(fi
rst
flush
-enh
anced)
–t
Pb,Z
n
aD=
De-icingsaltap
plication,
nD=
node
-icing
saltap
plication,
M=
Mainten
ance,S
=Sw
eeping
.b
d=
dissolve
d,p=
particulate,t=
total.
cMetalsmeasu
redbe
low
stud
y-sp
ecificde
tectionlim
itsarehigh
lighted
inthistablewithitalicsan
dthede
tectionlim
itsarepresen
tedin
bracke
tsbe
hind
theseelem
ents.
899M. Huber et al. / Science of the Total Environment 541 (2016) 895–919
42

Table2
Register
ofstud
iesinve
stigatingroad
runo
ff.
IDLiterature
Location
Samplingpe
riod
Special
cond
itions
aDisch
arge
area
[m2]
AADT
[Veh
iclespe
rda
y]
Num
berof
even
tssampled
Type
ofsample
colle
ction
Sampling
strategy
Pore
diam
eter
forfiltration
Partitionb
Metalsde
tected
c
RL01
Xan
thop
oulosan
dHah
n(1
995)
DEU
––
–32
0087
––
–t
Cd,C
u,Ni,Pb
,Zn
RL02
Dan
neck
eret
al.(19
90)
DEU
1987
–21
050
017
Active-au
tomatic
Mixed
250,
0.45
tAl,As,Ba
,Be(b
0.2)
,Cd,
Co,C
r,Cu
,Fe,
Mn,
Ni,Pb
,Sb,
Se,V
,Zn
RL03
aDan
neck
eret
al.(19
90)
DEU
1986
–29
023
0016
Active-au
tomatic
Mixed
250,
0.45
p,t
Al,As,Be
(b0.2),C
d,Co
,Cr,Cu
,Fe
,Mn,
Ni,Pb
,Sb,
Se,V
,Zn
RL03
bDan
neck
eret
al.(19
90)
DEU
1987
–29
023
0016
Active-au
tomatic
Mixed
250,
0.45
p,t
Al,As,Ba
,Be(b
0.2)
,Cd,
Co,C
r,Cu
,Fe,
Mn,
Ni,Pb
,Sb,
Se,V
,Zn
RL04
Dau
ban
dStrieb
el(1
995)
DEU
1994
––
b10
003
Active-au
tomatic
–0.45
,0.1
d,p
Cu,P
bRL
05Le
gret
etal.(19
96)
FRA
1991
–199
4M
2800
2000
39Pa
ssive-au
tomatic
Firstflu
sh0.45
d,t
Cd,C
u,Pb
,Zn
RL06
Van
Dam
etal.(19
86)
NDL
1982
-07–
1985
-12
M,S
176
3200
11–
––
tCd
,Cr,Cu
,Pb,
ZnRL
07MacKay
etal.(20
11)
USA
2006
-08-29
M54
930
001
Active-au
tomatic
Time-prop
.(equ
ally
timed
)0.45
d,t
Cu,P
b,Zn
RL08
MacKay
etal.(20
11)
USA
2006
-08-29
M11
6130
001
Active-au
tomatic
Time-prop
.(equ
ally
timed
)0.45
d,t
Cu,P
b,Zn
RL09
MacKay
etal.(20
11)
USA
2008
-08-15
M13
0240
001
Active-au
tomatic
Time-prop
.(equ
ally
timed
)0.45
d,t
Cu,P
b(b
5),Z
n
RL10
MacKay
etal.(20
11)
USA
2008
-09-06
M27
920
001
Active-au
tomatic
Time-prop
.(equ
ally
timed
)0.45
d,t
Cu,P
b,Zn
RL11
Gilb
ertan
dClau
sen
(200
6)USA
2002
-06–
2003
-05
–19
9–
12Pa
ssive-au
tomatic
Mixed
–t
Cu,P
b,Zn
RL12
Gilb
ertan
dClau
sen
(200
6)USA
2002
-06–
2003
-05
–40
5–
12Pa
ssive-au
tomatic
Mixed
–t
Cu,P
b,Zn
RL13
Gilb
ertan
dClau
sen
(200
6)USA
2002
-06–
2003
-05
–22
5–
12Pa
ssive-au
tomatic
Mixed
–t
Cu,P
b,Zn
RL14
Steu
eret
al.(19
97)
USA
1993
-10,
1994
-05–
1994
-08
S10
4,00
0b31
0012
Passive-au
tomatic
Flow
-prop.
0.45
d,t
Cd,C
u,Pb
,Zn
RL15
Driscolle
tal.(19
90)
USA
1970
san
dea
rly19
80s
–50
5920
00–
––
–t
Cu,P
b,Zn
RL16
Driscolle
tal.(19
90)
USA
1970
san
dea
rly19
80s
–10
1225
00–
––
–t
Cu,P
b,Zn
RL17
Bann
erman
etal.(19
93)
USA
1991
-05-05
–199
1-07
-07
S–
100–
400
10Pa
ssive-au
tomatic
Flow
-prop.
0.7,
0.45
d,t
Cd,C
r,Cu
,Pb,
ZnRL
18Ba
nnerman
etal.(19
93)
USA
1991
-05-05
–199
1-07
-07
S–
500–
2150
9Pa
ssive-au
tomatic
Flow
-prop.
0.7,
0.45
d,t
Cd,C
r,Cu
,Pb,
ZnRL
19W
asch
busch(1
996)
USA
1994
–199
5–
–37
8–
––
–d,
tCd
,Cu,
Pb,Z
nRL
20Dav
isan
dBirch(2
010)
AUS
2007
-08-19
–200
8-04
-06
–86
020
004
Active-au
tomatic
Time-prop
.(fir
stflu
sh-enh
anced)
250,
0.45
d,p
Cu,P
b,Zn
RL21
Man
iquiz-Re
dilla
san
dKim
(201
4)KOR
2010
-05–
2012
-11
–52
0–
24Man
ual
Time-prop
.(fir
stflu
sh-enh
anced)
0.45
d,t
Cd,C
r,Cu
,Fe,
Ni,Pb
,Zn
RM01
Robien
etal.(19
97)
DEU
1990
–199
1D,S
600
6000
4Active-au
tomatic
–0.45
,0.1
d,p
Cd,C
u,Fe
,Ni,Pb
,Zn
RM02
Nad
leran
dMeißne
r(2
007)
DEU
1996
-10-01
–200
5-09
-08
D17
.368
0036
Passive-au
tomatic
Mixed
–t
Cd,C
r,Cu
,Fe,
Mo,
Ni,Pb
,Pt,Sb
,V,Z
nRM
02x
Nad
leran
dMeißne
r(1
999)
DEU
1997
-10-01
–199
7-12
-31
D17
.361
001
Passive-au
tomatic
Mixed
0.45
d,t
Cd,C
u,Pb
,Zn
RM03
Mus
chack(1
990)
DEU
1984
-09–
1985
-08
––
14,200
31–
––
tCd
,Cr,Cu
,Fe,
Hg,
Ni,Pb
,Zn
RM04
Holthuiset
al.(20
12)
DEU
2008
-09–
2010
-07
D41
,200
15,000
8–
––
tCu
,Fe,
ZnRM
05SE
H(2
010)
DEU
2008
-08-20
–201
0-02
-08
D25
055
0018
Passive-au
tomatic
Flow
-prop.
–t
Cd(b
50),Cu
(b10
0),P
b(b
100)
,Zn
RM06
SEH(2
010)
DEU
2008
-08-20
–201
0-02
-08
D25
055
0017
Passive-au
tomatic
Flow
-prop.
–t
Cd(b
50),Cu
(b10
0),P
b(b
100)
,Zn
RM07
SEH(2
010)
DEU
2008
-08-20
–201
0-02
-08
D40
012
,800
17Pa
ssive-au
tomatic
Flow
-prop.
–t
Cd(b
50),Cu
(b10
0),P
b(b
100)
,Zn
RM08
Krauthan
dStotz(1
993)
DEU
1991
-12-17
–199
3-04
-30
D15
,300
9870
111
––
–t
Cd,C
r,Cu
,Fe,
Ni,Pb
,Zn
RM09
Jene
weinan
dSchinn
er(1
982)
AUT
––
––
––
Firstflu
sh–
tCu
,Pb,
Zn
RM10
Rutz
(200
9)CH
E20
08-01-16
,20
08-04-14
,200
8-07
-03
–23
,000
12,000
3Man
ual
Rand
om–
d,t
Cd,C
r,Cu
,Pb,
Zn
900 M. Huber et al. / Science of the Total Environment 541 (2016) 895–919
43
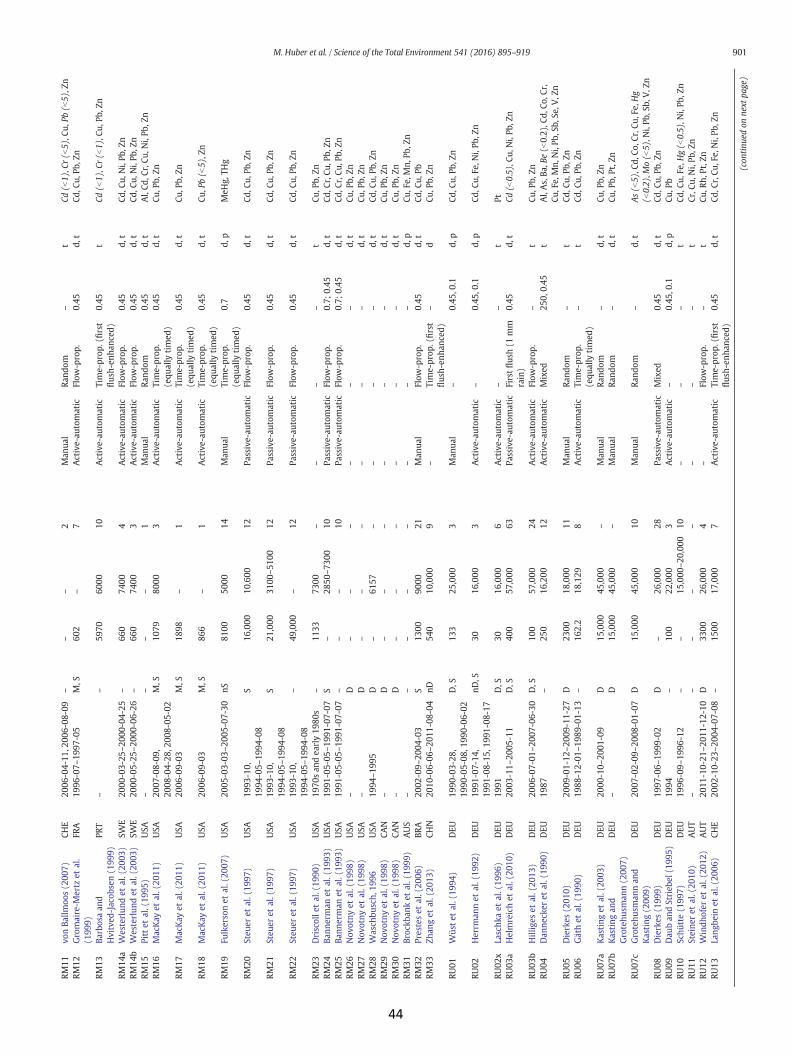
RM11
vonBa
llmoo
s(2
007)
CHE
2006
-04-11
,200
6-08
-09
––
–2
Man
ual
Rand
om–
tCd
(b1),C
r(b
5),C
u,Pb
(b5)
,Zn
RM12
Gromaire-M
ertz
etal.
(199
9)FR
A19
96-07–
1997
-05
M,S
602
–7
Active-au
tomatic
Flow
-prop.
0.45
d,t
Cd,C
u,Pb
,Zn
RM13
Barbosaan
dHvitved
-Jacob
sen(1
999)
PRT
––
5970
6000
10Active-au
tomatic
Time-prop
.(fir
stflu
sh-enh
anced)
0.45
tCd
(b1),C
r(b
1),C
u,Pb
,Zn
RM14
aW
esterlun
det
al.(20
03)
SWE
2000
-03-25
–200
0-04
-25
–66
074
004
Active-au
tomatic
Flow
-prop.
0.45
d,t
Cd,C
u,Ni,Pb
,Zn
RM14
bW
esterlun
det
al.(20
03)
SWE
2000
-05-25
–200
0-06
-26
–66
074
003
Active-au
tomatic
Flow
-prop.
0.45
d,t
Cd,C
u,Ni,Pb
,Zn
RM15
Pittet
al.(19
95)
USA
––
––
1Man
ual
Rand
om0.45
d,t
Al,Cd
,Cr,Cu
,Ni,Pb
,Zn
RM16
MacKay
etal.(20
11)
USA
2007
-08-09
,20
08-04-28
,200
8-05
-02
M,S
1079
8000
3Active-au
tomatic
Time-prop
.(equ
ally
timed
)0.45
d,t
Cu,P
b,Zn
RM17
MacKay
etal.(20
11)
USA
2006
-09-03
M,S
1898
–1
Active-au
tomatic
Time-prop
.(equ
ally
timed
)0.45
d,t
Cu,P
b,Zn
RM18
MacKay
etal.(20
11)
USA
2006
-09-03
M,S
866
–1
Active-au
tomatic
Time-prop
.(equ
ally
timed
)0.45
d,t
Cu,P
b(b
5),Z
n
RM19
Fulkersonet
al.(20
07)
USA
2005
-03-03
–200
5-07
-30
nS81
0050
0014
Man
ual
Time-prop
.(equ
ally
timed
)0.7
d,p
MeH
g,TH
g
RM20
Steu
eret
al.(19
97)
USA
1993
-10,
1994
-05–
1994
-08
S16
,000
10,600
12Pa
ssive-au
tomatic
Flow
-prop.
0.45
d,t
Cd,C
u,Pb
,Zn
RM21
Steu
eret
al.(19
97)
USA
1993
-10,
1994
-05–
1994
-08
S21
,000
3100
–510
012
Passive-au
tomatic
Flow
-prop.
0.45
d,t
Cd,C
u,Pb
,Zn
RM22
Steu
eret
al.(19
97)
USA
1993
-10,
1994
-05–
1994
-08
–49
,000
–12
Passive-au
tomatic
Flow
-prop.
0.45
d,t
Cd,C
u,Pb
,Zn
RM23
Driscolle
tal.(19
90)
USA
1970
san
dea
rly19
80s
–11
3373
00–
––
–t
Cu,P
b,Zn
RM24
Bann
erman
etal.(19
93)
USA
1991
-05-05
–199
1-07
-07
S–
2850
–730
010
Passive-au
tomatic
Flow
-prop.
0.7;
0.45
d,t
Cd,C
r,Cu
,Pb,
ZnRM
25Ba
nnerman
etal.(19
93)
USA
1991
-05-05
–199
1-07
-07
––
–10
Passive-au
tomatic
Flow
-prop.
0.7;
0.45
d,t
Cd,C
r,Cu
,Pb,
ZnRM
26Nov
otny
etal.(19
98)
USA
–D
––
––
––
d,t
Cu,P
b,Zn
RM27
Nov
otny
etal.(19
98)
USA
–D
––
––
––
d,t
Cu,P
b,Zn
RM28
Wasch
busch,
1996
USA
1994
–199
5D
–61
57–
––
–d,
tCd
,Cu,
Pb,Z
nRM
29Nov
otny
etal.(19
98)
CAN
–D
––
––
––
d,t
Cu,P
b,Zn
RM30
Nov
otny
etal.(19
98)
CAN
–D
––
––
––
d,t
Cu,P
b,Zn
RM31
Broc
kban
ket
al.(19
99)
AUS
––
––
––
––
d,p
Cu,Fe,
Mn,
Pb,Z
nRM
32Presteset
al.(20
06)
BRA
2002
-09–
2004
-03
S13
0090
0021
Man
ual
Flow
-prop.
0.45
d,t
Cd,C
u,Pb
RM33
Zhan
get
al.(20
13)
CHN
2010
-06-06
–201
1-08
-04
nD54
010
,000
9–
Time-prop
.(fir
stflu
sh-enh
anced)
–d
Cu,P
b,Zn
RU01
Wüs
tet
al.(19
94)
DEU
1990
-03-28
,19
90-05-08
,199
0-06
-02
D,S
133
25,000
3Man
ual
–0.45
,0.1
d,p
Cd,C
u,Pb
,Zn
RU02
Herrm
annet
al.(19
92)
DEU
1991
-07-14
,19
91-08-15
,199
1-08
-17
nD,S
3016
,000
3Active-au
tomatic
–0.45
,0.1
d,p
Cd,C
u,Fe
,Ni,Pb
,Zn
RU02
xLaschk
aet
al.(19
96)
DEU
1991
D,S
3016
,000
6Active-au
tomatic
––
tPt
RU03
aHelmreichet
al.(20
10)
DEU
2003
-11–
2005
-11
D,S
400
57,000
63Pa
ssive-au
tomatic
Firstflu
sh(1
mm
rain)
0.45
d,t
Cd(b
0.5),C
u,Ni,Pb
,Zn
RU03
bHilliges
etal.(20
13)
DEU
2006
-07-01
–200
7-06
-30
D,S
100
57,000
24Active-au
tomatic
Flow
-prop.
–t
Cu,P
b,Zn
RU04
Dan
neck
eret
al.(19
90)
DEU
1987
–25
016
,200
12Active-au
tomatic
Mixed
250,
0.45
tAl,As,Ba
,Be(b
0.2)
,Cd,
Co,C
r,Cu
,Fe,
Mn,
Ni,Pb
,Sb,
Se,V
,Zn
RU05
Dierkes
(201
0)DEU
2009
-01-12
–200
9-11
-27
D23
0018
,000
11Man
ual
Rand
om–
tCd
,Cu,
Pb,Z
nRU
06Gäthet
al.(19
90)
DEU
1988
-12-01
–198
9-01
-13
–16
2.2
18,129
8Active-au
tomatic
Time-prop
.(equ
ally
timed
)–
tCd
,Cu,
Pb,Z
n
RU07
aKasting
etal.(20
03)
DEU
2000
-10–
2001
-09
D15
,000
45,000
–Man
ual
Rand
om–
d,t
Cu,P
b,Zn
RU07
bKasting
and
Grotehu
sman
n(2
007)
DEU
–D
15,000
45,000
–Man
ual
Rand
om–
d,t
Cu,P
b,Pt,Z
n
RU07
cGrotehu
sman
nan
dKasting
(200
9)DEU
2007
-02-09
–200
8-01
-07
D15
,000
45,000
10Man
ual
Rand
om–
d,t
As(b
5),C
d,Co
,Cr,Cu
,Fe,
Hg
(b0.2),M
o(b
5), N
i,Pb
,Sb,
V,Z
nRU
08Dierkes
(199
9)DEU
1997
-06–
1999
-02
D–
26,000
28Pa
ssive-au
tomatic
Mixed
0.45
d,t
Cd,C
u,Pb
,Zn
RU09
Dau
ban
dStrieb
el(1
995)
DEU
1994
–10
022
,000
3Active-au
tomatic
–0.45
,0.1
d,p
Cu,P
bRU
10Schü
tte(1
997)
DEU
1996
-09–
1996
-12
––
15,000
–20,00
010
––
–t
Cd,C
u,Fe
,Hg(b
0.5),N
i,Pb
,Zn
RU11
Steine
ret
al.(20
10)
AUT
––
––
––
––
tCr,C
u,Ni,Pb
,Zn
RU12
Windh
ofer
etal.(20
12)
AUT
2011
-10-21
–201
1-12
-10
D33
0026
,000
4–
Flow
-prop.
–t
Cu,R
h,Pt,Z
nRU
13Lang
bein
etal.(20
06)
CHE
2002
-10-23
–200
4-07
-08
–15
0017
,000
7Active-au
tomatic
Time-prop
.(fir
stflu
sh-enh
anced)
0.45
d,t
Cd,C
r,Cu
,Fe,
Ni,Pb
,Zn
(con
tinu
edon
next
page)
901M. Huber et al. / Science of the Total Environment 541 (2016) 895–919
44

Table2(con
tinu
ed)
IDLiterature
Location
Samplingpe
riod
Special
cond
itions
aDisch
arge
area
[m2]
AADT
[Veh
iclespe
rda
y]
Num
berof
even
tssampled
Type
ofsample
colle
ction
Sampling
strategy
Pore
diam
eter
forfiltration
Partitionb
Metalsde
tected
c
RU14
Steine
ret
al.(20
06)
CHE
2002
–200
4–
14.1
17,000
–Pa
ssive-au
tomatic
Mixed
–t
Cd,C
r,Cu
,Fe,
Pb,S
n,Zn
RU15
Klim
asze
wskaet
al.
(200
7)PO
L20
03-01–
2003
-05
S–
59,000
13Pa
ssive-au
tomatic
Flow
-prop.
–t
Cd,P
b,Zn
RU16
Klim
asze
wskaet
al.
(200
7)PO
L20
03-01–
2003
-05
S–
39,400
8Pa
ssive-au
tomatic
Flow
-prop.
–t
Cd,P
b,Zn
RU17
Now
akow
ska-Blaszczy
kan
dZa
krze
wski(
1996
)PO
L–
S–
––
––
–t
Pb
RU18
Wei
andMorrison
(199
4)SW
E19
92-05-26
––
–1
––
0.45
d,t
Pt
RU19
aBa
nnerman
etal.(19
93)
USA
1991
-05-05
–199
1-07
-07
S–
20,000
10Pa
ssive-au
tomatic
Flow
-prop.
0.7,
0.45
d,t
Cd,C
r,Cu
,Pb,
ZnRU
19b
Wasch
busch(1
996)
USA
1994
–199
5–
–18
,600
––
––
d,t
Cd,C
u,Pb
,Zn
RU20
Bann
erman
etal.(19
93)
USA
1991
-05-05
–199
1-07
-07
S–
19,800
9Pa
ssive-au
tomatic
Flow
-prop.
0.7,
0.45
d,t
Cd,C
r,Cu
,Pb,
ZnRU
21Dav
isan
dBirch(2
010)
AUS
2007
-08-19
–200
8-04
-06
–10
9584
,500
6Active-au
tomatic
Time-prop
.(fir
stflu
sh-enh
anced)
250,
0.45
d,p
Cu,P
b,Zn
RU22
Lloy
dan
dW
ong(1
999)
AUS
1999
-01-22
,199
9-01
-29
nS15
0032
,000
2Man
ual
Time-prop
.(equ
ally
timed
)–
tCd
,Cu,
Pb,Z
n
RU23
Timpe
rley
etal.(20
05)
NZL
2002
-08-24
–200
2-09
-18
––
17,000
4Active-au
tomatic
Flow
-prop.
–d,
pCu
,Pb,
ZnRU
24Ch
anget
al.(20
09)
CHN
2005
-06-28
,200
5-09
-21
––
–2
–Time-prop
.(equ
ally
timed
)0.45
d,t
Cd,C
r,Cu
,Ni,Pb
,Zn
RU25
Hua
nget
al.(20
07)
CHN
2005
-06–
2006
-09
–38
7530
,000
5Active-au
tomatic
Time-prop
.(fir
stflu
sh-enh
anced)
–t
Cu,P
b,Zn
RU26
Man
iquizet
al.(20
10)
KOR
2006
-06–
2008
-10
–50
00–
45Man
ual
Time-prop
.(fir
stflu
sh-enh
anced)
–t
Pb,Z
n
aD=
De-icingsaltap
plication,
nD=
node
-icing
saltap
plication,
M=
Mainten
ance,S
=Sw
eeping
,nS=
nosw
eeping
.b
d=
dissolve
d,p=
particulate,t=
total.
cMetalsmeasu
redbe
low
stud
y-specificde
tectionlim
itsarehigh
lighted
inthistablewithitalicsan
dthede
tectionlim
itsarepresen
tedin
bracke
tsbe
hind
theseelem
ents.
902 M. Huber et al. / Science of the Total Environment 541 (2016) 895–919
45

Table3
Register
ofstud
iesinve
stigatingbridge
runo
ff.
IDLiterature
Location
Samplingpe
riod
Special
cond
itions
aDisch
arge
area
[m2]
AADT[veh
icles
perda
y]Num
berof
even
tssampled
Type
ofsample
colle
ction
Samplingstrategy
Pore
diam
eter
forfiltration
Partitionb
Metalsde
tected
c
BR01
aLe
gret
andPa
gotto(1
999)
FRA
1995
-03-28
–199
6-02
-26
D,S
3200
12,000
49Active-au
tomatic
Flow
-prop.
0.45
d,t
Cd,C
u,Pb
,Zn
BR01
bPa
gottoet
al.(20
00)
FRA
1997
-06-09
–199
7-11
-09
D32
0012
,000
25Active-au
tomatic
Flow
-prop.
0.45
d,t
Cd,C
u,Pb
,Zn
BR02
aHallberget
al.(20
07)
SWE
2005
-05-03
–200
5-08
-26
D13
,700
108,30
04
Active-au
tomatic
Flow
-prop.
0.45
d,t
Al,Cd
,Co,
Cr,C
u,Fe
,Mn,
Ni,
Pb,Z
nBR
02b
Hallberget
al.(20
07)
SWE
2005
-12-14
–200
6-02
-14
D13
,700
108,30
05
Active-au
tomatic
Flow
-prop.
0.45
d,t
Al,Cd
,Co,
Cr,C
u,Fe
,Mn,
Ni,
Pb,Z
nBR
03Driscolle
tal.(19
90)
USA
1970
san
dea
rly19
80s
–60
7042
,000
––
––
tCu
,Fe,
Pb,Z
nBR
04Yo
usef
etal.(19
84)
USA
––
6825
55,000
11–
––
d,t
Cd,C
r,Cu
,Fe,
Ni,Pb
,Zn
BR05
Yous
efet
al.(19
84)
USA
1982
-08–
1983
-05
–19
,800
11,500
15–
––
d,t
Cd,C
r,Cu
,Fe,
Ni,Pb
,Zn
BR06
Driscolle
tal.(19
90)
USA
1970
san
dea
rly19
80s
–57
8770
,000
––
––
tCd
,Cr,Cu
,Pb,
ZnBR
07Dea
net
al.(20
05)
USA
2002
-04-11
–200
2-06
-16
–54
4–
4Man
ual
Time-prop
.(eq
ually
timed
)0.45
d,p
Cd,C
u,Pb
,Zn
BR08
Wuet
al.(19
98)
USA
1995
-09-22
–199
6-07
-01
D,M
1497
25,000
10Active-au
tomatic
Time-prop
.(pre-set
time)
–t
Cd(b
0.5)
,Cr,Cu
,Ni,Pb
BR09
Barrettet
al.(19
98)
USA
1994
-04-29
–199
5-05
-18
–52
687
8026
Active-au
tomatic
Flow
-prop.
–t
Cu,Fe,
Pb,Z
nBR
10Ba
rrettet
al.(19
98)
USA
1994
-10-17
–199
5-05
-08
–10
6047
,000
8Active-au
tomatic
Flow
-prop.
–t
Cu,Fe,
Pb,Z
nBR
11Bo
urcier
andHindin(1
979)
;Bo
urcier
etal.(19
80)
USA
1976
-10-14
–197
7-03
-23
M,S
2323
–3
––
dd,
tCr,Fe,
Pb,T
i,W
,Zn
BR12
Driscolle
tal.(19
90)
USA
1970
san
dea
rly19
80s
–40
142
,000
––
––
tCu
,Pb,
ZnBR
13Driscolle
tal.(19
90)
USA
1970
san
dea
rly19
80s
–89
017
,000
––
––
tCu
,Pb,
ZnBR
14W
ilson
(200
6)USA
2003
-04-08
,20
03-10-06
,200
4-01
-14
–25
010
0,00
0–18
0,00
03
Active-au
tomatic
Flow
-prop.
–d,
tAs,Ba
,Cd,
Co,C
r,Cu
,Hg,
Mo,
Ni,Pb
,Sb,
V,Z
nBR
15Driscolle
tal.(19
90)
USA
late
1970
san
dea
rly
1980
–84
9853
,000
35–
––
tCd
,Cr,Cu
,Fe,
Hg,
Pb,Z
n
BR16
aFrazer,1
990
CAN
––
––
29–
––
tCd
,Cu,
Ni,Pb
,Zn
BR16
bMarsaleket
al.(19
97)
CAN
16mon
ths
––
83,700
–102
,100
53Pa
ssive-au
tomatic
Flow
-prop.
0.45
d,t
Cd,C
u,Ni,Pb
,Zn
BR17
Drapp
eret
al.(20
00)
AUS
1997
-07–
1999
-01
––
5200
12Pa
ssive-au
tomatic
Firstflu
sh(2
0l)
–t
Cu,P
b,Zn
BR18
Drapp
eret
al.(20
00)
AUS
1997
-07–
1999
-01
––
3548
12Pa
ssive-au
tomatic
Firstflu
sh(2
0l)
–t
Cu,P
b,Zn
BR19
Drapp
eret
al.(20
00)
AUS
1997
-07–
1999
-01
––
15,524
12Pa
ssive-au
tomatic
Firstflu
sh(2
0l)
–t
Cu,P
b,Zn
RB20
Drapp
eret
al.(20
00)
AUS
1997
-07–
1999
-01
––
23,672
12Pa
ssive-au
tomatic
Firstflu
sh(2
0l)
–t
Cu,P
b,Zn
BR21
Drapp
eret
al.(20
00)
AUS
1997
-07–
1999
-01
––
15,766
12Pa
ssive-au
tomatic
Firstflu
sh(2
0l)
–t
Cu,P
b,Zn
BR22
Drapp
eret
al.(20
00)
AUS
1997
-07–
1999
-01
––
27,000
12Pa
ssive-au
tomatic
Firstflu
sh(2
0l)
–t
Cu,P
b,Zn
BR23
Drapp
eret
al.(20
00)
AUS
1997
-07–
1999
-01
––
12,156
12Pa
ssive-au
tomatic
Firstflu
sh(2
0l)
–t
Cu,P
b,Zn
BR24
Drapp
eret
al.(20
00)
AUS
1997
-07–
1999
-01
––
13,302
12Pa
ssive-au
tomatic
Firstflu
sh(2
0l)
–t
Cu,P
b,Zn
BR25
Drapp
eret
al.(20
00)
AUS
1997
-07–
1999
-01
––
14,312
12Pa
ssive-au
tomatic
Firstflu
sh(2
0l)
–t
Cu,P
b,Zn
BR26
Drapp
eret
al.(20
00)
AUS
1997
-07–
1999
-01
––
33,000
12Pa
ssive-au
tomatic
Firstflu
sh(2
0l)
–t
Cu,P
b,Zn
BR27
Drapp
eret
al.(20
00)
AUS
1997
-07–
1999
-01
––
33,000
12Pa
ssive-au
tomatic
Firstflu
sh(2
0l)
–t
Cu,P
b,Zn
BR28
Drapp
eret
al.(20
00)
AUS
1997
-07–
1999
-01
––
35,248
12Pa
ssive-au
tomatic
Firstflu
sh(2
0l)
–t
Cu,P
b,Zn
BR29
Drapp
eret
al.(20
00)
AUS
1997
-07–
1999
-01
––
33,191
12Pa
ssive-au
tomatic
Firstflu
sh(2
0l)
–t
Cu,P
b,Zn
BR30
Drapp
eret
al.(20
00)
AUS
1997
-07–
1999
-01
––
26,950
12Pa
ssive-au
tomatic
Firstflu
sh(2
0l)
–t
Cu,P
b,Zn
BR31
Drapp
eret
al.(20
00)
AUS
1997
-07–
1999
-01
––
26,826
12Pa
ssive-au
tomatic
Firstflu
sh(2
0l)
–t
Cu,P
b,Zn
BR32
Drapp
eret
al.(20
00)
AUS
1997
-07–
1999
-01
––
50,304
12Pa
ssive-au
tomatic
Firstflu
sh(2
0l)
–t
Cu,P
b,Zn
BR33
Drapp
eret
al.(20
00)
AUS
1997
-07–
1999
-01
––
46,235
12Pa
ssive-au
tomatic
Firstflu
sh(2
0l)
–t
Cu,P
b,Zn
BR34
Drapp
eret
al.(20
00)
AUS
1997
-07–
1999
-01
––
32,000
12Pa
ssive-au
tomatic
Firstflu
sh(2
0l)
–t
Cu,P
b,Zn
BR35
Drapp
eret
al.(20
00)
AUS
1997
-07–
1999
-01
––
32,000
12Pa
ssive-au
tomatic
Firstflu
sh(2
0l)
–t
Cu,P
b,Zn
BR36
Drapp
eret
al.(20
00)
AUS
1997
-07–
1999
-01
––
45,000
12Pa
ssive-au
tomatic
Firstflu
sh(2
0l)
–t
Cu,P
b,Zn
BR37
Drapp
eret
al.(20
00)
AUS
1997
-07–
1999
-01
––
5900
12Pa
ssive-au
tomatic
Firstflu
sh(2
0l)
–t
Cu,P
b,Zn
BR38
Gan
etal.(20
08)
CHN
2006
-04-06
–200
6-06
-12
M11
031
,000
7Active-au
tomatic
Time-prop
.(fir
stflu
sh-enh
anced)
–t
Cd,C
r,Cu
,Ni,Pb
,Zn
BR39
Yuan
dZh
ao(2
012)
CHN
2007
-04-22
–200
7-09
-01
––
–3
–Time-prop
.(eq
ually
timed
)–
tCd
,Cr,Ni,Pb
,Zn
aD=
De-icingsaltap
plication,
M=
Mainten
ance,S
=Sw
eeping
.b
d=
dissolve
d,p=
particulate,t=
total.
cMetalsmeasu
redbe
low
stud
y-specificde
tectionlim
itsarehigh
lighted
inthistablewithitalicsan
dthede
tectionlim
itsarepresen
tedin
bracke
tsbe
hind
theseelem
ents.
dCe
ntrifuging
50mlo
fsam
plefor5min
at68
1g.
903M. Huber et al. / Science of the Total Environment 541 (2016) 895–919
46

Fig. 1. Factors influencing monitoring programs and general flow schema for analysis of runoff characteristics and concentrations.
904 M. Huber et al. / Science of the Total Environment 541 (2016) 895–919
The final part of site-specific factors describes operational character-istics concerning traffic, types of vehicles,maintenance, and institutionalregulations. Traffic volume is mostly characterized by AADT and variesin this review between 100 and 328,000 vehicles per day. Althoughsome authors have concluded that AADT has the greatest influence onrunoff concentrations of metals (Mangani et al., 2005; Crabtree et al.,2008), it might not be the best indicator for traffic area runoff concen-trations and should not be used as a sole predictor because it only ex-plains approximately 30% of the variation in these concentrations(Driscoll et al., 1990; Drapper et al., 2000; Kayhanian et al., 2003). Spe-cial cases of AADT are the traffic flow volume during sampling and be-tween two sampling periods (Shinya et al., 2003; Hallberg et al., 2007;Li and Barret, 2008). CH2MHILL (1998) concluded that splashing andwashing of pollutants from vehicles is more important than the wash-off of pollutants accumulated on road surface during dry periods andsplashing corresponds with average vehicle speed during storms(Hallberg et al., 2007). It has not been specified whether the stated
47
AADT is only valid for the monitored lanes or for all lanes in both di-rections; this makes it difficult to compare different studies, e.g., thesite described by Aryal and Lee (2009), and to evaluate the impact ofAADT on runoff concentrations. Another traffic-related aspect is thatthe percentage of trucks can be very high in industrial zones (approx-imately 37%) (Dannecker et al., 1990) and can be as much as 60% ofthe AADT (Gan et al., 2008). Further factors influencing runoff qual-ity are construction works, car accidents, firefighting foams, andleakages (Hogland et al., 1987; Barrett et al., 1998; Holthuis et al.,2012). Maintenance factors, which differ widely among countries(Gan et al., 2008), are mowing of the roadside shoulders (Barrett,2008), street sweeping (Gromaire-Mertz et al., 1999; Waschbusch,2003; Horwatich and Bannerman, 2009; Helmreich et al., 2010),and winter services (Sansalone and Glenn, 2002; Bäckström et al.,2003; Crabtree et al., 2006; Hallberg et al., 2007; Klimaszewskaet al., 2007; Tromp et al., 2012). The most important institutional reg-ulation was the phase-out of Pb (cf. Section 4.1).

Fig. 2.Differences betweenmean andmedian values (d and t) for Cu, Zn (both left), Ni and Pb (both right) for highway runoff data (n=41). Datawere obtained frommonitoringprogramswith more than two observed rain events, and both mean and median data were calculated for each site.
905M. Huber et al. / Science of the Total Environment 541 (2016) 895–919
3.1.2. ClimateClimatic site-specific factors are dry deposition rates, antecedent dry
periods (ADP), rain characteristics (volume, intensity, and duration),seasonal effects, and wind turbulence. Significant non-traffic-relatedsources are dustfalls and dry deposition during periods without rain,which entrains contaminants and removes them from the atmosphere(Hamilton et al., 1987; Ball, 2002). ADP were found to be a statisticallysignificant factor for runoff concentrations due to the accumulation ofsubstances on the traffic area surface (Harrison and Wilson, 1985;Hewitt and Rashed, 1992; Pitt et al., 1995; Irish et al., 1998; Drapperet al., 2000; Shinya et al., 2003; Westerlund et al., 2003; Manganiet al., 2005; Han et al., 2006a; Prestes et al., 2006; Wilson, 2006; Aloet al., 2007; Gan et al., 2008; Li and Barrett, 2008; Moores et al., 2010;Lee et al., 2011). However, Moy and Crabtree (2003), Shinya et al.(2003), Langbein et al. (2006), andNason et al. (2012) foundno relationbetween ADP and metal concentrations. This is most probably becauseof street sweeping,wind turbulence, and air turbulence caused by traffic
Fig. 3. Historical trends of Pb (n = 194 for mean; n = 146 for median) and Zn (n =
48
(Bourcier et al., 1980; Helmreich et al., 2010). However, not all stormevents completely clean the road surface and this effect prolongs the ac-tual ADP (Cristina and Sansalone, 2003). A special case in (semi)arid re-gions is the first storm of each season characterized by higher runoffconcentrations (Stenstrom and Kayhanian, 2005; Terzakis et al., 2008).
For rain characteristics, mostly poor correlationswere obtained (Moyet al., 2003; Han et al., 2006a; Desta et al., 2007; MacKay et al., 2011;Nason et al., 2012; Zhang et al., 2013) and only rain history appears tohave an effect on the washed-off substances (Steiner and Goosse,2007). In contrast, some researchers found a correlation between runoffconcentrations and storm intensities (Pitt et al., 1995; Tiefenthaler et al.,2001; Crabtree et al., 2006).
Moy et al. (2003) have observed an influence of seasonal effects onrunoff concentrations; however, the conclusions are heterogeneous.Several studies have indicated that metal concentrations are higher insnowmelt runoff than in rainfall runoff because of the snow accumula-tion period, and the following melting period appears to be a critical
206 for mean; n = 148 for median) in traffic area runoff from the 1970s to date.

Table4
Statistics
ofFig.
3—
historical
tren
dsof
lead
(n=
194formean;
n=
146formed
ian)
andzinc
(n=
206formean;
n=
148formed
ian)
intraffic
area
runo
fffrom
the19
70sto
date.
Elem
ent
Decad
eCa
lculationforallm
eanva
lues
from
theliterature
Calculationforallm
edianva
lues
from
theliterature
Min
Med
ian
Geo
metricmea
nMea
n75
th90
th95
thMax
SD95
%a
Min
Med
ian
Geo
metricmea
nMea
n75
th90
th95
thMax
SD95
%a
Pb19
70s
90,0
293
346
558
923
bb
1860
662
694
610
610
610
610
bb
b61
0b
b
Pb19
80s
20,0
200
162
277
328
617
b15
5834
616
711
,025
223
039
368
599
512
8114
5737
714
6Pb
1990
s4,0
41,0
40,7
79,6
71,5
227
339
670
119
28,8
7,0
100
73,3
133
200
350
450
575
133
38,2
Pb20
00s
1,4
19,2
20,7
42,2
56,0
118
152
380
59,9
12,0
2,3
18,0
17,2
26,1
34,2
59,0
92,3
171
28,2
7,0
Pb20
10s
24,0
27,5
27,3
27,5
bb
b31
,04,9
44,5
15,0
31,0
37,3
52,7
bb
b11
252
,012
9Zn
1970
s25
045
577
635
4052
40b
b19
,100
7624
8000
410
410
410
410
bb
b41
0b
b
Zn19
80s
166
292
366
535
467
1994
b22
1061
431
640
,026
421
736
636
465
523
3628
9256
523
8Zn
1990
s43
,822
023
032
945
062
094
022
3434
289
,144
,033
333
244
556
484
614
8618
5037
211
6Zn
2000
s21
,021
520
129
537
565
285
717
6028
752
,425
,016
217
026
430
466
789
117
8029
668
,0Zn
2010
s88
,017
318
821
335
3b
b36
111
512
135
,015
418
954
586
1b
b25
6099
110
40
a95
%confi
denc
eerrors
onthemea
ns.
bNova
lues
becauseof
smallu
nive
rse.
906 M. Huber et al. / Science of the Total Environment 541 (2016) 895–919
49
one for metal runoff concentrations (Lygren et al., 1984; Sansalone andBuchberger, 1996;Westerlund et al., 2003). A general increase ofmetalsin traffic area runoff in winter was detected due to higher wear and tearas well as to an increased corrosion enhanced by de-icing salts andlower rain intensities (Legret and Pagotto, 1999; Hallberg et al., 2007;Helmreich et al., 2010). In contrast, Mungur et al. (1995) and Brezonikand Stadelmann (2002) detected the highest runoff loads in springand summer, and Langbein et al. (2006) did not observe any seasonaldependency.
Thefinal climatic factor, i.e.,wind and car-induced turbulence, leads to adecrease in atmospheric deposition and reduces metal runoff concentra-tions (Stotz, 1987; Ball et al., 1998; Barbosa and Hvitved-Jacobsen, 1999;Preciado and Li, 2005).Wind turbulence increaseswith increasing vehiclespeeds and decreases with the existence of hard shoulders and road bar-riers (Scheiwiller, 2008). In special cases such as in Auckland, NewZealand, frequent rain does not allow contaminants to be blown off theroad surface (Timperley et al., 2005).
Further description of several site-specific factors for HWY can befound in Opher and Friedler (2010).
3.2. Monitoring-method-specific factors
In most studies, mean or median metal concentrations from run-off of a particular surface type are analyzed; other studies usedpollutographs of single events. Further differences occur in samplepreparation and analysis. The largest possible deviations arise duringsampling and sample preparation, while the actual sample analysiscauses less variation, if appropriate analytical methods are used.
3.2.1. Sample collectionThe type of sampling (automatic ormanual) depends on the research
objective. For short-term sampling,manual (grab) samples are regularlyused because they are a sampling requirement for stormwater permitapplications (Line et al., 1997) and are easily manageable for an evalua-tion of the effectiveness of decentralized stormwater treatment plants(van Ballmoos, 2007; Dierkes, 2010; Rutz, 2012). Automatic compositesamplers are used for a convenient collection of representative sampleswith up to several hundred subsamples of entire stormevents (Ma et al.,2009; Steiner and Goosse, 2011b). Within the literature study, 13% ofthe datasets containing information about the sampling type werebased on manual sampling, whereas 38% conducted passive-automaticsampling and 49% conducted active-automatic sampling. Active-automatic sampling can lead to the loss of particulate metals (Pagottoet al., 2000). This depends on the runoff composition, the mixture ofthe flowingwater, the sampler intake orientation, and the tube and suc-tion pump used. To minimize the fractionation effect during sampling,highest flow rates and shortest sampling tubes possible should beused; the loss of metals by adsorption can be avoided usingpolytetrafluoroethylene sampling tubes (Hewitt and Rashed, 1992).For the determination of pH and temperature, automatic samplersshould not be used and manual sampling is recommended (Minervini,2008). This recommendation is applicable to all rapidly degradablecompounds and to substances that can adhere on container surfaces.To avoid cross-contamination of runoff samples, bottles must bechanged for each rain event to prevent the mixing of samples fromtwo events. Therefore, criteria for detecting a runoff are essential, aswell as the event definition, which is directly linked to the samplingstrategy and considers both the beginning and endof each event, to pre-vent a sampling of overlapping events. An appropriate cleaning of tubes,bottles, and the parts of the sampling device in contactwith the runoff isnecessary. For manual sampling, only bottle cleaning must be consid-ered. Detailed examples of passive-automatic sampling devices havebeen given by Bannerman et al. (1993) and Li et al. (2008); an active-automatic sampling device has been described by Striebel et al.(1994). A comparison of grab and composite sampling techniques byMa et al. (2009) concluded that a large number of grab samples (N30)

Fig. 4. Frequencies of Zn-to-Cu-ratios for all datasets containing median values (n = 141; mean = 8.1, SD = 10.9).
907M. Huber et al. / Science of the Total Environment 541 (2016) 895–919
is required to approach the precision and accuracy of flow-proportionalautomatic sampling and for detecting a first flush effect, evenmore grabsamples must be obtained. For manual sampling, the best strategy is tocollect grab samples flow-proportionally (Stenstrom and Kayhanian,2005). A storing of samples at 3 °C–6 °C is preferred (Hallberg et al.,2007; Hilliges et al., 2013; Scheiwiller, 2014).
The sampling strategy differs between flow-proportional (38% ofdatasets with information about the sampling strategy), time-proportional (24%), first flush (21%), mixed (12%), and random(5%) sampling.
In flow-proportional sampling, combined samples are mostly collect-ed but discrete sampling is used for producing pollutographs (Legretand Pagotto, 1999) and a second device is required to trigger the sam-pling device. The second device can be, e.g., a magnetic inductive flowmeter (Hilliges et al., 2013), a V-shaped overflowwith an immersed ul-trasonic flowmeter (Legret and Pagotto, 1999; Hatt et al., 2009), a weirwith a pressure probe (Hallberg et al., 2007), or a bubbler flow meter(Barrett et al., 1998; Nason et al., 2012). Criteria for sampling are verysite-specific and can be 20 mL of sample for every 100 L of a runoff(Tromp et al., 2012). This strategy is limited by the detection limit ofthe second device sensor (Lau et al., 2009).
Time-proportional sampling can be subdivided into first flush-enhanced and equally timed sample collection. Han et al. (2006b) per-formed first flush-enhanced sampling, in which five grab samples werecollected every 15min in the first hour after the start of a detectable run-off. Subsequently, one sample was obtained every hour for the following7 h and one or two additional grab sampleswere collected for events last-ing longer than 8 h. Equally timed samples were obtained at specific timeintervals by considering the sampling type and site-specific factors suchas rain intensity, the slope of the catchment area and the season (Stotz,1987). In most cases, the time interval is 5 min but it varies between afew minutes (2 min (Tiefenthaler et al., 2001) or 3 min (Chang et al.,2009)) up to 45 min (Golwer and Schneider, 1983) and 60 min (Gäthet al., 1990). Discrete time-proportional samples can be handled similarto mixed/combined flow-proportional samples by considering the datafor simultaneous and continuous flowmeasurements.
50
For first flush sampling, which is a special case of time-proportionalsampling, three types of triggering signals are used: time, volume, orrain depth. Line et al. (1997) sampled water of the first 5 min per rainevent, Mangani et al. (2005) collected the first 10 L, Drapper et al.(2000) collected the first 20 L, Helmreich et al. (2010) collected the first400 L (equaling a rain depth of 1 mm for this monitored site), andMcQueen (2008) collected the first 2.5 mm runoff of a storm event. Foran evaluation of the first flush effect, which might occur in the first 30to 60 min, a sampling of the entire rain event is necessary (Han et al.,2006a). Definitions of the first flush effect are given by Wanielista andYousef (1993), Saget et al. (1996), and Bertrand-Krajewski et al. (1998).
Mixed sampling by collecting the complete runoff volume of oneevent is an ideal method to obtain representative concentrations of astormevent. However, this strategy is only practical for small catchmentareas (b20 m2) and a settling of particles in a storage tank must beavoided (Kasting et al., 2003). Some mixed samples are taken over atime period containing several rain events (Nadler and Meißner,2007; Engelhard et al., 2012).
All randomly collected samples were taken manually during stormevents to evaluate the effectiveness of best management practices.
The type and strategy of sampling have an influence on metalconcentration, as does the location, from which runoff samples aretaken. E.g., sediments can be retained by the overflow of a measure-ment channel and are not sampled by the suction pump of an auto-matic sampler (Legret and Pagotto, 1999). Further aspects arerelated to the characteristics of the channel. A concrete channel hasan influence on pH and long distances between the runoff edge,and the sampling device might allow the settling of solids in thechannel during rain events with low intensities. Coatings and tubematerials (e.g., stainless steel) can increase Ni concentrations in thesamples (Nadler and Meißner, 1999).
Overall, as a result of rain events without runoff, equipment failure,and operational reasons such as holidays, not all rain events can be sam-pled: Grotehusmann and Kasting (2009) sampled and analyzed abouthalf of all events during a one-year investigation period, Lee et al.(2011) monitored 50 out of more than 100 storm events during a

Fig. 5. Mean metal concentrations (d and t) in parking lot (PL) and road (RL, RM, and RU) runoff.
908 M. Huber et al. / Science of the Total Environment 541 (2016) 895–919
51

909M. Huber et al. / Science of the Total Environment 541 (2016) 895–919
three-year period, and Terzakis et al. (2008) sampled 41 out of 58 rainevents during a one-year period.
In conclusion, sampling programs had different objectives and con-straints, and the sampling types and strategies used varied widely. Fur-ther influencing factors arise from equipment and operators.
3.2.2. Sample preparation and analysisPrior to analysis, samples must be prepared according to the objec-
tives. Only 36% of the datasets contain information about preparationmethods (e.g., homogenization, subsampling, and filtration) and only55 sets describe the holding time. For all metal analyses except thosefor total concentrations, the holding time is essential by having a criticaleffect on pH and on the fractionation of metals. Runoff samples wereheld for less than 1 h (Dean et al., 2005; Fulkerson et al., 2007), for 2–3 h (Barbosa and Hvitved-Jacobsen, 1999), for 7 h (Lau et al., 2009) orfor a maximum of 24 h (Stotz, 1987; Stotz and Krauth, 1994; Boothand Leavitt, 1999; Brattebo and Booth, 2003; Flint and Davis, 2007;Moores et al., 2010; Lee et al., 2011; Nason et al., 2012; Borne et al.,2013) before delivery to a laboratory and beginning of preparation.Other studies stated the holding time as “immediately” or did not spec-ify it properly. As Minervini (2008) discussed, the description of thesample collection and analysis often does not state how the pH analysiswas performed, especially considering the maximum recommendedholding time of 15 min (APHA, 2005). Only pH measurements in thefield can comply with this requirement (Sansalone et al., 2005). As on-site filtration is risky owing to possible contamination of aqueous sam-ples, samples should be fractionized as soon as practically possiblewith-in hours after collection in a laboratory to preserve the partitioning atthe time of interest (Gnecco et al., 2008). For the fractionation process,a 0.45-μm-pore-diameter membrane filter is used (APHA, 2005) andthe metals passing through the filter are the dissolved part. Filters withsmaller pores (0.1 μm (Herrmann et al., 1992), 0.2 μm (Kluge et al.,2014), and 0.22 μm (Mangani et al., 2005)) and larger pores of up to0.8 μm (Golwer and Schneider, 1983; Fulkerson et al., 2007) have alsobeen applied. In addition, centrifuging (Bourcier and Hindin, 1979)and decanting before filtration (Bäckström et al., 2003) have been con-ducted. After filtration, the samples are mostly conserved with nitricacid to a pH of less than 2. The soluble part is determined as the dissolvedpart but from an acid preserved solution. Further factors associatedwiththefiltration process are the diameter of thefilter, themanufacturer, thevolume of sample processed, and the amount of suspended solids in thesample, from which an inclusion/exclusion of colloidally-associatedtrace metals can occur (Horowitz et al., 1996). Measurements byLangbein et al. (2006) detected that the filtrate might contain fine col-loids and particulate material in the nanometer range. An example ofcontamination during preparation and analysis of aqueous samplesthat was detected using blanks is described by Bannerman et al.(1993), in which the samples were contaminated with Zn during filter-ing procedure.
Preciado and Li (2005) described a procedure of using a chelex resinin a glass column to obtain the resin-exchangeable part of heavy metals,which is highly bioavailable.
To determine the potentially bioavailable part of a sample that canbe mobile in different environmental conditions (i.e., for most metalsat a lower pH), one part of a sample can be decanted and acidifiedfollowed by filtration after 24 h (Bäckström et al., 2003).
The acid-exchangeable part of metals is also called the total recover-able or pseudo-total concentration and is determined by adding astrong acid to the sample. Depending on the oxidizing potential of theacid and other equipment used (i.e., autoclave, microwave), a differentpart of all metals (i.e., all dissolved/soluble and a varying part of the par-ticulate bound metals) is analyzed.
For the determination of total concentration of metals, aqua regia di-gestion (Nadler andMeißner, 1999;Hilliges et al., 2013), aqua regia diges-tionwith amicrowave (Shinya et al., 2000; Shinya et al., 2003), or lithiummetaborate digestion must be used to destruct any particulate matter.
52
The difference between the results of total and acid-exchangeable con-centrations depends on the element, fixed site-specific factors, and cli-matic factors.
The particulate content is measured by separating and weighing theparticulates gravimetrically. The metal concentration in particulates,i.e., the particulate bound metals, is usually taken as the difference oftotal or acid-exchangeable and dissolved or soluble concentrations butcan also bedetermined in thefilter residue by acid digestion, autoclaves,microwave digestion, or a combination of these digestion methods.
After sample preparation, the concentrations were determined inmost cases using atomic absorption spectroscopy (AAS, 62 times), induc-tively coupled plasma optical emission spectrometry/inductively coupledplasma mass spectrometry (ICP-OES/ICP-MS, 108 times), or both tech-niques consecutively to reduce the detection limits of several elements(25 times), and to improve the differentiation of solid and liquid phases(Sansalone and Buchberger, 1997b).
To obtain precise and accurate data, it is essential to conduct severalquality assurance/quality control (QA/QC) procedures. First, field repli-cate samples should be collected and analyzed. Second, field and meth-od blanks, certified referencematerials, matrix spikes, and duplicates ortriplicates must be considered and analyzed to prevent failures duringsample preparation/analysis (Line et al., 1997; Wilson, 2006). Lineet al. (1997) used standard and spiked samples for a minimum of 10%of their field samples. A further QA/QC procedure is the use of materialsfrom twomanufacturers for every elemental standard used in the anal-ysis (Westerlund and Viklander, 2006).
3.2.3. Calculation methodsThomson et al. (1997) and Drapper et al. (2000) concluded that a
minimum of 17 runoff events provides a statistically representativesample database. In the dataset of this review, the number of eventssampled varied between 1 and 211 (Moxness, 1986), with amean of 18.
The most influential factor for the calculation of mean or medianvalues concerns the analyzed concentrations of samples below the de-tection limits. There are several methods of dealing with this type of re-sult: they could be discarded and only observed concentrations could beused for the calculation (Pitt et al., 1995), or they could be set as the de-tection values (Barrett et al., 1998; Dierkes, 1999; Lange et al., 2003;Borne et al., 2013), or as numerical values of one-half the detectionlevel (Herrmann et al., 1992; Bannerman et al., 1993; Laschka et al.,1996; CH2MHILL, 1998; Brattebo and Booth, 2003; Flint and Davis,2007; Grotehusmann and Kasting, 2009; Lau et al., 2009). None of thestudies included in the dataset specified, when a mean or median valueis stated as “not detected” or when it is calculated using either the fullor one-half the detection values and it is often not specified, how manyof the analyses were below the detection limit. This has a crucial effecton the concentrations of elements near the detection limit such as Cdor dissolved Cr concentrations and might lead to an overestimation ofthe dissolved fraction. A comparison of themean andmedian concentra-tions of a HWY runoff shows that the median Cd concentration was ashigh as the detection limit (1.0 μg/L) and only the mean concentrationwas slightly higher (1.6 μg/L) (Lange et al., 2003).
Some researchers selected the storm events used for analysis. Themain criterion for the selection is associated with ADP to distinguish be-tween different events or to discard several rain events. In the firstcase, different lengths of time between 30 min (Steiner et al., 2008)and 10 h (Barett et al., 1998) of dry weather are used to separate twoevents and the concentration of each event is used for the calculationof mean/median values. In the second case, an ADP between 24 h(Moy et al., 2003;Wilson, 2006) and up to five dayswasmaintained be-fore stormwater sampling was deployed (Hares and Ward, 1999). Thisapproach, together with the influence of the ADP on runoff concentra-tions (longer ADP leads to higher concentrations, cf. Section 3.1),might lead to higher metal concentrations in a runoff in comparisonwith measurements obtained without a selection. A minimum raindepth, which varied between 1.5 mm (Steiner et al., 2008), 3.8 mm

910 M. Huber et al. / Science of the Total Environment 541 (2016) 895–919
(Nason et al., 2012), 5.1 mm (Horwatich and Bannerman, 2009),6.4 mm (Wilson, 2006), and 13 mm (Brattebo and Booth, 2003), is con-sidered to ensure that sufficient and representative sample volumescould be collected. Nason et al. (2012) considered a minimum rain du-ration of 1 h.
Further influencing factors involve data processing and plausibilitytests for all relevant data such as flowmeasurements, clock time adjust-ments, and communication among sampling devices.
The most important criterion for representative datasets must be asampling of a full range of seasonal conditions for a complete range ofrainfall intensities, depths, and durations (Thomson et al., 1997; Moyet al., 2003; Stagge et al., 2012; Tromp et al., 2012) and all sources of crit-ical pollutants should be considered (Sansalone and Buchberger,1997b). However, most studies have been performed within a singleyear or a part of a year and their conclusions often do not reflect the sea-sonality and environmental variability of the site (Uhl and Kasting,2002; Steiner and Goosse, 2011a).
Overall mean and median values presented in previous studies,which were calculated using different methods and should describethe real water quality (Fig. 1), are not assumed to be comparable. Toprove the correctness of this hypothesis, mean and median concentra-tions that are both available for each HWY site and contain a minimumof three events are presented in Fig. 2. For the mean datasets, more ex-treme values and outliers are computed (for all four elements and forthe dissolved and total fractions) in comparisonwith themedian values.Therefore, for this review, mean and median datasets are not combinedand are used separately to characterize the central tendency and vari-ability of runoff concentrations among sites or site categories.
4. Occurrence and partitioning
4.1. Historical trends
Historical trends of Pb and Zn in traffic area runoff published in liter-ature were analyzed from the 1970s to date. As described by Kayhanian(2012), for HWY runoff, Pb concentrations have been decreasing con-tinuously in the last few decades. The decrease of Pb use as an anti-knocking agent started in the USA in themid-1980s andwas completedin 1996 (FHWA, 1999). In Europe, the situationwas not as homogenousas in the USA. In Germany, the beginning of the phase-out of leaded gas-oline began in 1976,when the permitted concentration of Pb in gasolinedecreased sharply to 150 mg/L (Golwer and Schneider, 1983). Thephase-out in other countries of Western Europe started at the latest in1986 (Berbee et al., 1999) and endedwith the elimination of leaded gas-oline in Italy in January 2002 (Mangani et al., 2005). At the same time,leaded gasoline was banned in China (Gan et al., 2008). Further reduc-tions in Pb runoff concentrations are related to the substitution of Pbin other sources such as tires and brake linings (Sansalone et al., 1996;Legret and Pagotto, 1999; Davis et al., 2001), lubricating oil and grease(Ball et al., 1998), weights added to vehicles for tire balance (Root,2000; Bleiwas, 2006), and Pb-based paints on roads and HWY (Mosleyand Peake, 2001; Preciado and Li, 2005;Masanao et al., 2006). However,tires still contain Pb (Shinya et al., 2006; McKenzie et al., 2009).
A decline in Pb concentrations can be observed in the dataset of thisreview. Because of different numbers of measurements per year, thecollected data were aggregated into decades to ensure that there weresufficient data for statistical analysis. Less data is available for the1970s and 2010s compared to the other three decades (Fig. 3). The de-cline of Pb starting in the 1980s correlates with the statements men-tioned above and is comparable to the one presented by Kayhanian(2012) for HWY runoff. Overall median concentrations of Pb in the1980s are 252 μg/L (for all median values) and 200 μg/L (for all meanvalues). In the 2000s, overall median concentrations are one order ofmagnitude lower at 18.0 μg/L (for all median values) and 19.2 μg/L(for allmean values). All data is summarized in Table 4. The highest con-centrations in the 21st century illustrated in Fig. 3 were measured in
53
Poland by Klimaszewska et al. (2007), South Korea by Maniquiz-Redillas and Kim (2014), and China by Zhao et al. (2001). To increasethe benefit of all other data analysis, only Pb data for the 21st centurywere used. These Pb concentration datasets shown in Figs. 5 and 6 arehighlighted by the use of the index “21”. However, in this selecteddataset, artifacts caused by the wash-off of Pb deposited on the upperpart of road soils cannot be excluded completely.
For Zn, the trend is different. Neither a significant decline nor an in-crease in measured concentrations can be identified for the last few de-cades (Fig. 3). For themedians, overall concentrations of Zn in the 1980sare 264 μg/L (for all median values) and 292 μg/L (for all mean values).In the 2000s, overall median concentrations are 162 μg/L (for all medianvalues) and 215 μg/L (for all mean values). All data is summarized inTable 4. Kayhanian et al. (2007) compared different Zn datasets obtain-ed in California and concluded that there was a decrease in measuredconcentrations. In contrast, an increase in runoff concentrations is pro-posed as a result of an increasing use of Zn for safety fences (Dierkesand Geiger, 1998) and of galvanized car parts containing a Zn platingthat should prevent corrosion (Sansalone and Buchberger, 1997a). Inaddition to these increasingly common applications, Zn has been usedfor decades in several structural elements, batteries (Davis et al.,2001), tires (Van Bohemen and Van de Laak, 2003; McKenzie et al.,2009), brake linings (Legret and Pagotto, 1999), motor oils and grease(Ball et al., 1998). Consequently, Legret and Pagotto (1999) indicatedthat Zn concentrations remain highly variable depending on the use ofsafety barriers made from galvanized steel and site-specific factorsthat have an influence on tire and brake wear. This is confirmed bythe occurrence of several outliers and extreme values shown in Fig. 3.The highest values in the 21st century are affected by the corrosion ofgalvanized elements (Wilson, 2006; Gan et al., 2008) or by highly traf-ficked and congested roads (Helmreich et al., 2010; Moores et al.,2010) and HWY (Lau et al., 2009; Kluge et al., 2014). Preciado and Li(2005) identified Zn as a metal of future potential concern because itwas second in concentration to Fe in most dust, air, and water samples.
4.2. Variability of Zn
Zn concentrations are very variable in traffic area runoff comparedwith other heavy metals as shown in Section 4.1. In recent years, mostmonitoring programs measured Zn and Cu, and frequencies of Zn-to-Cu-ratios are calculated for all datasets containing median values(n = 141, Fig. 4) to show the variability of Zn compared to Cu.
Calculation of Zn-to-Cu-ratios was first performed by Moores et al.(2010) for total median concentrations of HWY runoff in NewZealand. The calculated ratios in untreated runoff waters were withinthe range of 4–5 at all four sites (6–8 rain events per site; active-automatic and flow-proportional sampling) except at one site with po-rous asphalt that had a lower median concentration ratio of 2.4.
The most frequent ratios of Fig. 4 are between 3 and 5 with a largerdeviation (mean=8.1, SD=10.9). For the highest ratios, either samplecontamination or special site conditions are responsible. The highestvalue of 76.5 was calculated for a PL runoff that received water from aslate roof with Zn gutters (Gnecco et al., 2005). The ratio of 70.5 couldbe explained by the presence of a nearby Zn smelter (Driscoll et al.,1990), the ratio of 30.8 by vehicle maintenance (Line et al., 1997), andthe ratio of 24.5 by the surrounding old residential district (Gromaire-Mertz et al., 1999). The ratio of 23.4 is correlated with a failure of galva-nizing material of a BR (Wilson, 2006). Mangani et al. (2005) describedthe presence of safety fences at a construction site with a nearby agricul-tural land use, where metal-containing pesticides are used, that mighthave led to the high Zn-to-Cu-ratio of 22.7. Further ratios might be influ-enced by the presence of guardrails (ratios 14.0 and 16.5) (Gäth et al.,1990; Nadler and Meißner, 1999), and the erosion of galvanized utilitiesand noise barrier walls (ratio 14.8) (Gan et al., 2008). The Zn-to-Cu-ratios of 24.9, 34.2, 38.0, and 61.0 are caused by a temporal contaminationof samples by a Zn-containing anti-corrosive paint have (Dierkes, 1999).

Table5
Statistics
ofFigs.5
and6—
meanmetal
conc
entrations
(dissolved
andtotal)in
parkinglot(PL),roa
d(R
L,RM
,and
RU),bridge
(BR)
,and
high
way
(HL,HN,and
HU)runo
ff.
Elem
ent
Traffic
area
catego
ryDissolved
conc
entrations
Totalc
oncentration
s
Min
Med
ian
Geo
metricMea
nMea
n75
th90
th95
thMax
SD95
%a
Min
Med
ian
Geo
metricMea
nMea
n75
th90
th95
thMax
SD95
%a
Pb_2
1PL
1,0
1,7
2,5
4,3
8,0
12,0
b15
,94,6
2,6
2,5
16,3
15,5
23,1
36,3
59,8
65,8
66,0
19,5
9,1
Pb_2
1RL
––
––
––
––
––
2,0
27,0
21,5
61,5
123
bb
152
66,2
61,3
Pb_2
1RM
0,13
0,4
0,4
0,9
2,3
bb
2,8
1,3
2,0
3,7
20,3
18,3
32,3
30,5
bb
136
43,1
36,0
Pb_2
1RU
0,5
4,0
2,7
3,9
6,5
bb
7,0
2,8
4,4
6,0
44,5
38,8
79,3
71,0
331
b38
011
267
,4Pb
_21
BR0,13
0,14
0,4
1,4
bb
b3,8
2,1
5,3
24,0
41,7
42,5
49,9
83,7
bb
92,3
32,3
51,4
Pb_2
1HL
0,01
1,0
0,3
1,3
2,6
bb
3,1
1,3
1,3
2,5
25,0
32,1
64,4
118
212
b23
073
,149
,1Pb
_21
HN
12,8
12,8
12,8
12,8
bb
b12
,8b
b4,4
16,0
18,7
31,7
64,5
bb
90,0
34,1
35,8
Pb_2
1HU
0,8
2,1
2,3
3,0
4,9
bb
7,4
2,4
2,6
1,4
12,6
16,8
33,1
39,7
81,7
155
220
44,9
16,5
ZnPL
12,0
60,4
56,1
77,2
113
157
293
317
69,1
30,6
39,0
178
155
201
295
397
586
620
147
53,7
ZnRL
15,0
24,0
42,6
76,2
119
bb
314
98,8
76,0
25,0
149
141
212
272
525
b94
021
910
9Zn
RM7,9
31,0
41,4
68,0
73,0
226
b25
877
,242
,823
,027
420
328
538
453
388
610
0021
789
,6Zn
RU51
,078
,397
,711
315
9b
b26
271
,655
,112
035
137
947
455
698
218
0519
4039
717
6Zn
BR50
,014
819
135
464
6b
b12
2643
233
277
,049
861
122
3170
015
,572
b19
,100
5607
3766
ZnHL
5,0
66,5
54,3
76,9
108
177
b19
153
,030
,632
,321
720
730
637
164
215
4017
6035
915
5Zn
HN
8,6
66,8
9020
445
3b
b57
723
117
752
,521
624
838
538
812
0218
7522
1047
719
3Zn
HU
11,0
50,0
77,1
217
166
595
1838
2118
449
194
21,0
213
237
338
414
682
986
2234
358
103
Ni
PL1,8
3,0
3,2
3,8
4,4
10,2
b12
,43,0
1,9
2,1
7,1
10,5
23,7
35,0
86,9
b14
537
,019
,7Ni
RL3,1
4,7
4,5
4,7
bb
b6,3
2,2
20,2
8,4
13,9
12,5
13,1
bb
b16
,94,3
10,7
Ni
RM0,5
1,0
0,9
0,9
bb
b1,3
0,4
1,0
3,8
17,0
12,7
16,3
23,0
bb
35,0
11,2
11,3
Ni
RU9,5
10,5
10,5
10,5
bb
b11
,51,4
12,7
4,1
9,8
13,8
20,5
40,4
bb
55,0
20,2
21,2
Ni
BR3,0
4,8
8,3
15,9
35,5
bb
49,0
19,5
20,5
6,0
26,7
28,0
82,0
65,0
bb
458
154
129
Ni
HL
––
––
––
––
––
6,0
12,0
15,6
22,6
35,2
bb
73,0
25,3
26,5
Ni
HN
4,0
11,0
10,6
14,0
bb
b27
,011
,829
,34,0
20,0
16,1
29,3
57,0
bb
83,0
30,8
23,7
Ni
HU
1,9
9,6
9,9
14,9
28,3
bb
28,8
12,5
15,6
2,0
8,7
9,5
19,2
31,5
68,8
b93
,025
,112
,1Cu
PL2,7
9,0
9,4
11,8
13,5
28,5
34,3
35,0
8,7
3,7
5,0
19,6
23,4
40,7
56,0
116
165
220
49,2
15,4
CuRL
3,3
11,0
14,5
20,3
37,8
53,2
b56
,017
,911
,46,0
48,0
37,5
53,7
77,4
104
b18
043
,921
,2Cu
RM2,7
11,2
11,2
16,0
23,0
35,0
b65
,014
,97,2
7,0
30,5
38,6
64,6
100
175
264
280
71,3
31,6
CuRU
6,8
23,0
22,2
26,4
39,0
55,0
b56
,815
,99,6
26,0
86,9
86,9
105
149
197
275
288
66,6
29,5
CuBR
16,0
23,5
24,7
26,1
31,1
bb
47,0
9,9
8,3
20,0
54,0
54,9
63,9
93,2
133
b13
636
,125
,8Cu
HL
5,7
18,0
18,9
23,3
31,1
56,9
b64
,016
,49,9
13,3
48,0
49,4
60,7
91,7
124
138
140
38,8
17,2
CuHN
4,0
28,7
25,8
34,6
51,5
88,0
b10
026
,917
,123
,053
,061
,884
,497
,020
539
443
090
,439
,1Cu
HU
4,1
15,4
18,8
35,5
49,1
122
144
151
42,0
17,3
13,0
56,4
51,4
63,5
74,7
118
145
274
45,5
13,2
CdPL
0,05
0,3
0,3
0,4
0,6
1,6
b2,0
0,5
0,3
0,2
0,8
0,9
3,0
2,0
5,6
36,6
40,0
8,6
3,9
CdRL
0,14
0,4
0,5
0,7
1,2
bb
1,8
0,6
0,6
0,3
1,6
1,5
2,7
2,8
12,0
b13
,03,8
2,7
CdRM
0,01
0,2
0,1
0,2
0,3
0,4
b0,5
0,1
0,1
0,06
0,6
0,7
3,2
1,3
14,1
b37
,09,1
4,8
CdRU
0,25
0,6
0,5
0,6
0,7
bb
0,9
0,2
0,2
0,67
2,0
2,7
5,6
6,5
22,0
b25
,07,8
4,5
CdBR
0,04
0,5
0,3
0,5
1,0
1,0
1,0
1,0
0,4
0,4
0,28
3,5
3,9
10,3
15,0
43,8
b47
,014
,410
,3Cd
HL
0,02
0,1
0,1
0,5
0,8
bb
2,6
1,0
1,1
0,05
0,9
0,7
1,8
1,9
7,6
b9,0
2,6
1,6
CdHN
0,50
1,1
1,2
1,4
1,8
bb
3,0
0,8
0,8
0,14
1,3
1,2
2,6
4,6
6,2
11,6
11,9
3,0
1,4
CdHU
0,10
0,9
0,8
1,3
1,7
bb
3,8
1,2
1,1
0,06
1,7
1,6
4,1
2,4
12,5
31,3
35,0
7,9
2,9
CrPL
1,0
1,5
1,6
1,7
2,2
2,7
b2,7
0,6
0,4
1,5
8,6
8,6
13,1
21,0
26,4
50,4
56,0
12,5
5,4
CrRL
1,4
1,8
1,7
1,8
bb
b2,2
0,6
5,3
5,0
11,5
10,4
11,2
15,3
bb
16,0
4,3
4,5
CrRM
0,6
1,2
1,0
1,2
bb
b1,8
0,8
7,6
2,0
9,9
9,0
12,0
24,2
bb
24,2
8,9
8,3
CrRU
3,0
3,0
3,0
3,0
bb
b3,0
bb
3,6
12,9
11,6
13,2
17,8
bb
23,0
6,4
6,7
CrBR
1,3
3,2
3,3
4,0
7,1
bb
7,5
2,6
2,7
7,5
11,0
26,7
83,5
140
bb
381
140
129
CrHL
––
––
––
––
––
4,9
12,5
14,4
18,6
38,0
bb
40,4
14,4
13,3
CrHN
0,5
11,3
3,3
11,3
bb
b22
,115
,313
72,7
9,3
12,7
25,0
36,8
88,7
b89
,033
,423
,9Cr
HU
1,5
3,2
3,3
4,5
8,0
bb
11,9
4,3
5,3
1,0
7,3
8,6
17,9
13,8
69,3
103
105
26,8
12,5
a95
%co
nfide
nceerrors
onthemeans
.b
Nova
lues
becaus
eof
smallu
nive
rse.
911M. Huber et al. / Science of the Total Environment 541 (2016) 895–919
54

Fig. 6. Mean metal concentrations (d and t) in bridge (BR) and highway (HL, HN, and HU) runoff.
912 M. Huber et al. / Science of the Total Environment 541 (2016) 895–919
55

Table6
Elem
ents
that
arede
tected
insamplingprog
ramsan
dthat
arerelatedto
traffic
ormight
beus
edas
atracer
foran
thropo
genicsources.
Elem
ent
Literature
(partition
)
CoDan
neck
eret
al.(19
90)(p
,t);
Hares
andW
ard(1
999)
(t);
Bäck
ström
etal.(20
03)(d
,t);
Wils
on(2
006)
(d,t);
Hallberget
al.(20
07)(d
);Herrera
(200
7)(a;d
,t);
Steine
ran
dGoo
sse(2
007)
(t);
vonBa
llmoo
s(2
007)
(t);
Grotehu
sman
nan
dKasting
(200
9)(t)
Mn
Ellis
andRe
vitt(1
982)
(a;d
,t);
Golwer
andSchn
eide
r(1
983)
(t);
Harrisonan
dW
ilson
(198
5)(d
,t);
Dan
neck
eret
al.(19
90)(p
,t);
Sans
alon
ean
dBu
chbe
rger
(199
7a)(d
,t);
Boothan
dLe
avitt(1
999)
(d);
Broc
kban
ket
al.
(199
9)(d
,t);
Hares
andW
ard(1
999)
(t);
Shinya
etal.(20
00)(t);
Rush
ton(2
001)
(t);
Bäck
ström
etal.(20
03)(p
);Sh
inya
etal.(20
03)(t);
Preciado
andLi
(200
5)(d
,t);
Hallberget
al.(20
07)(d
);Gne
ccoet
al.(20
08)(t);
Hattet
al.(20
09)(t);
McQ
ueen
(201
0)(t)
PGE
Wei
andMorrison(1
994)
(Pt;d,
t);L
asch
kaet
al.(19
96)(P
t;t);G
rotehu
sman
nan
dKasting
(200
2)(P
d;d,
t;Pt;d
,t);
Moy
etal.(20
03)(P
d;t);M
oyan
dCrab
tree
(200
3)(P
t;t);H
illiges
(200
7)(R
h;t);K
asting
and
Grotehu
sman
n(2
007)
(Pt;d,
t);N
adleran
dMeißne
r(2
007)
(Pt;t);W
indh
ofer
etal.(20
12)(P
t,Rh
;t)
SbDan
neck
eret
al.(19
90)(p
,t);
CH2M
HILL(1
998)
(t);
Hares
andW
ard(1
999)
(t);
Wils
on(2
006)
(d,t);
Herrera
(200
7)(a;t,d
);Nad
leran
dMeißne
r(2
007)
(t);
Stache
letal.(20
07)(a;t);
Sche
iwiller
(200
8)(t);
Grotehu
sman
nan
dKasting
(200
9)(t);
Steine
ran
dGoo
sse(2
009)
(t)
TiBo
urcier
etal.(19
80)(t);
Golwer
andSchn
eide
r(1
983)
(d,t);
Fürh
acke
ret
al.(20
13)(t)
WBo
urcier
etal.(19
80)(t);
Bäck
ström
etal.(20
03)(d
,t)
aLiterature
stud
y.
913M. Huber et al. / Science of the Total Environment 541 (2016) 895–919
56
The explanation for low Zn-to-Cu-ratios related to porous asphalt couldonly be confirmed by one Zn-to-Cu-ratio with a value of 1.2 (Berbeeet al., 1999). For comparison, mean ratios of porous asphalt vary between1.0 and 3.9 with one exception of a ratio of 8.5 (Stotz and Krauth, 1994),which strengthens the conclusion of Moores et al. (2010). Examples oflow median ratios resulting from higher Cu concentrations could not beidentified.
In conclusion, the calculation of median Zn-to-Cu-ratios can be usedto evaluate datasets to detect possible sample contamination and to em-phasize the importance of detailed site descriptions.
4.3. Characteristics of traffic area categories
The data for all traffic areas are subdivided into eight categories, asdescribed in Section 2. The data for five categories, including PL, differ-ent roads without HWY, and BR, which are presented for the firsttime, are shown in detail in Tables 1, 2, and 3.
In Table 1, 35 PL are included, of which twowere investigated in twomonitoring programs (PL16a + b and PL31a + b). Most PL sampleswere collected in the USA; some samples were obtained in Europe(Germany, Austria, France, Italy, Poland, and Sweden). Only one PL run-off was collected in each of Australia and South Korea.
Generally, PL have low traffic densities. Thus, even in high-useparking areas such as at supermarkets, vehicle changes only occur upto four times per hour and might not exceed 50 vehicles per day perparking slot (Göbel et al., 2007). However, drip losses, tire and brakewear due to braking and steering activities, and exhaust gas emissionsbecause of acceleration are higher compared with non-congestedroads. Therefore, most of the Cu loads in runoff waters from industrialland uses originate from PL (Bannerman et al., 1993; Steuer et al.,1997) and PL runoff are a dominant contributor of total Zn and Cdloads in urban runoff (Steuer et al., 1997). Another factor is the contam-ination of parked vehicles (Pick et al., 2002). PL maintenance includesregular sweeping and cleaning of drains about three times a year(Grotehusmann and Kasting, 2002).
All types of road categories with an AADT of b5000 (RL, 21 sites),5000 b AADT b 15,000 (RM, 33 sites), and N15,000 (RU, 26 sites) arepresented in Table 2.
For RL, most published data are for US sites, with four sites inGermany and one site each in France, the Netherlands, Australia, andSouth Korea. The land uses are mostly urban and residential but alsorural (RL07–RL10), industrial (RL03 + RL18), non-urban desert(RL15), and non-urban agricultural (RL16). RL mostly includes residen-tial, feeder, and smaller collector streets, often with sidewalks andsometimes with side parking zones and curbs. Urban sites have single-family houses and two- to six-story buildings nearby. For RM, 14datasets have been published for US sites, eight for German sites, anda total of twelve for sites in eight other countries. The land uses aremostly urban and residential but also include rural (RM11, RM13,RM16–18) and non-urban agricultural (RM23) uses. RM include collec-tor roads, residential driveways, and other medium-traffic major roadswith mostly two lanes, curbs, and limited on-street parking. RL andRM can be maintained by daily sweeping of street gutters and pressur-ized washing of sidewalks and gutters several times a week (Gromaire-Mertz et al., 1999). For porous asphalts pressurized water spraying andsuction to prevent clogging is used (Legret et al., 1996; Dierkes et al.,1999). For RU, ten sites are located in Germany, three in Poland, threein the USA, and a total of ten sites in six other countries. All sites arehighly trafficked arterial roadswith almost no hard shoulders. The num-ber of lanes varies between two and five for urban sites, which some-times have medians, and only RU08 is a two-lane rural road with hardshoulders.
All BR are summarized in Table 3. 21 of the 39 sites are from a hugeAustralian study by Drapper et al. (2000), and 13 sites are located in theUSA. One site in Francewasmonitoredwith original asphalt surface andafter renovation with porous asphalt (BR01a + b), one site in Sweden

914 M. Huber et al. / Science of the Total Environment 541 (2016) 895–919
was selected to evaluate seasonal variations (summer/winter;BR02a+ b), one site in Canada was monitored in two different decades(BR16a + b), and two sites are located in China. BR are monitored be-cause contaminant sources are assumed to be exclusively traffic-related (Wilson, 2006), minimal infrastructure modifications are re-quired for sampling (Drapper et al., 2000), and sites are better protectedagainst vandalism (Marsalek et al., 1997). BR decks are intensivelymaintained (Wu et al., 1998).
All HWY sites are classified depending on the AADT according toStrecker et al. (1990). For HWY with an AADT of N30,000, all sites aredistinguished between urban (HU, 64 sites) and non-urban (HN, 33sites) land uses, which have been proposed to be the only factor havinga statistically significant influence on pollutant concentrations for USdatasets (Strecker et al., 1990; Kayhanian et al., 2007; Nason et al.,2012). The dataset also includes 35 HL sites. Data are available for fiveof six continents (no data for South America); 47 of the 132 sites are lo-cated in the USA, 24 in Germany, and eleven in each of Switzerland andthe United Kingdom. The main difference between RU and HWY inEuropean countries is that the latter mostly have hard shoulders androads may have traffic signals in contrast to HWY.
4.4. Runoff concentrations of traffic area categories
All publishedmeanmetal concentrations (d and t) in PL, RL, RM, andRU runoff for Pb (n= 74), Zn (n= 154), Ni (n= 55), Cu (n= 164), Cd(n=103), and Cr (n=64) are plotted in Fig. 5 (Table 5). As datasets arenot plotted because of fewer available data (n = 24 with 18 for PL). Inmost cases, the overall median concentrations for PL are lower thanthose for roads. Differences in pollution are related to the type of PLuse: Employee PL (mostly once-in and once-out per day usage, PL31)are less polluted than highly frequented car PL (supermarket, PL05)and PL for trucks are higher loaded for almost all parameters in compar-ison to car PL (Grotehusmann andKasting, 2002). RU is the road catego-rywith the highest runoff concentrations for allmetals except Ni. Zn hasthe highest total runoff concentration, followed by Cu, Pb, Ni, Cr, and Cd.The highest dissolved concentrations have Zn and Cu, followed by Ni,Pb, Cr, and Cd. Thus, Pb and Cr are mostly in the particulate phase,whereas Ni and Cd are almost dissolved. For PL, median values for As(2.1 μg/L t; 1.1 μg/L d) are higher than those for Cd (0.8 μg/L t;0.3 μg/L d). The total concentrations of PL08 (only one event analyzedin contrast to the dissolved values) and the very high values of RL21are not plotted in Fig. 5.
In Fig. 6, all publishedmeanmetal concentrations (d and t) in BR, HL,HN, and HU runoff are plotted separately (Table 5). For BR, the numberof datasets varies between seven for Pb and 20 for Zn. For HWY runoff,much more data are available for Pb (n = 61), Zn (n = 144), Ni (n =42), Cu (n = 142), Cd (n = 83), and Cr (n = 44). For BR, the order oftotal and dissolved concentrations is equal to the ones presented inFig. 5 but the Zn concentrations of BR runoff are higher comparedwith all other categories (cf. Sections 3.1, 4.2, and 4.3). Median valuesof total Cr concentrations (n = 13) are very high compared with allother datasets. This might be related to the generally very high totalconcentrations of BR11 (19,100 μg/L Zn, 1860 μg/L Pb, 140 μg/L Cr)and to specific conditions in China (BR38, BR39; 26.8–381 μg/L Cr).From a comparison of twomonitoring programs of a French BRwith as-phalt and after renovation using porous asphalt (BR01a + b), it can beconcluded that heavy metal runoff concentrations of porous asphaltare markedly lower and the type of BR deck surface does not affectheavy metal partitioning. A comparison of the effects of winter andsummer on the runoff concentrations of a BR in Sweden (BR02a + b)showed higher mean concentrations during winter, and a comparisonof two Canadian BR runoff (BR16a + b) indicated a sharp historical de-crease in Zn and Pb concentrations and an increase in Cu and Ni concen-trations during the 1990s.
For HWY, no significant difference among the three categories HL,HN, and HU could be detected. This contrasts with the conclusions
57
obtained using US datasets that HL and HN have lower runoff concen-trations compared with HU (Strecker et al., 1990). For comparisonwith this dataset, note that in this evaluation, all HN of US sites are incategory HL. Thus, in HN, only European and two New Zealand sitesare included. According to Strecker et al. (1990), the concentrations ofHL should be lower than those of HN and HU. However, by consideringworldwide data, the correlation among HWY runoff concentrations,AADT, and land use could not be verified. Thus, other site-specific as-pects such as hard shoulders, median strips, noise barriers, and gradeof congestion might be better indicators to characterize HWY runoffconcentrations. This is confirmed by a comparison of RU data withHWY datasets. For RU, nearly all overall heavymetalmedian concentra-tions are higher in comparison to each of the three HWY categories. Forspecial site conditions such as for RM03, the runoff concentrations of anurban road can be higher than most measurements of HWY because ofbraking and acceleration activities at traffic signals. The results of anevaluation of runoff concentrations of a HWY construction site not yetin use with two other sites on the same HWY showed that Zn runoffconcentrations of the construction site are sometimes higher comparedwith the other two sites and that Cu and Pb concentrations of the con-struction site are lower (Mangani et al., 2005). This demonstrates theimportance of site-specific factors for HWY runoff.
An analysis was performed to examine the hypothesis that alower pH of the runoff corresponds to a higher proportion of dis-solved metals (Mikkelsen et al., 1994; Sansalone and Buchberger,1997b; Genç-Fuhrman et al., 2007). The dissolved concentrations inrunoff samples are influenced by the capacity for rainwater and pH-modified runoff (cf. Section 4.6) to dissolve metals from a surface,which is influenced by kinetic factors, and by the rate of dissolution,which increases as pH decreases. An acidic pH of one entire event con-firms the ionic form for Cu asmost relevant (Gnecco et al., 2008). How-ever, an evaluation of datasets for the percentages of Cu and Zndissolved at the prevailing runoff pH could not confirm the speciationproposed by Genç-Fuhrman et al. (2007). The dissolved fraction of Cuin runoff from different sites was analyzed as 52% at a pH of 6.2(Caltrans, 2003), 81% at a pH of 6.7 (Lau et al., 2009), and 72% at a pHof 8.0 (Mangani et al., 2005). The dissolved Cu fraction varies between1% at a pH of 7.6 (Pitt et al., 1995) and 93% at a pH of 7.2 (Golwer andSchneider, 1983). For Zn, the dissolved fraction varies between 2% at apH of 8.1 (Mangani et al., 2005), 11% at a pH of 7.1 (Lange et al.,2003), and 91% at a pH of 6.7 (Lau et al., 2009). Thus, nearly no decreaseof the dissolved fraction of Zn and Cu can be found in the pH range be-tween 6.2 and 8.1, and the hypothesis could not be confirmed. Potentialreasons include the likelihood that dissolution is kinetically limited, therelative independence of dissolved and particulate sources, or differ-ences in the sample preparation and analysis.
The results from all datasets show that Cu and Zn mostly exhibitedintermediate behavior (Harrison and Wilson, 1985; Dean et al., 2005;Herrera, 2007; Kayhanian et al., 2007) but sometimes, they were moredissolved (Timperley et al., 2005; Wilson, 2006; Hilliges et al., 2013).The concentrations of Pb and Cr are mostly in the particulate phase;this was confirmed in several individual monitoring programs(Harrison and Wilson, 1985; Shinya et al., 2000; Timperley et al.,2005; Herrera, 2007; Kayhanian et al., 2007; Kayhanian, 2012; Hilligeset al., 2013). Ni (Shinya et al., 2000) and Cd (Wilson, 2006) are mainlyin the dissolved form, although they are sometimes equally partitionedbetween the two phases (Harrison andWilson, 1985; Dean et al., 2005;Kayhanian et al., 2007). The particulate fraction of heavy metals mightbe higher for snowmelt events than rain events (Westerlund et al.,2003). Bäckström et al. (2003) confirmed this for Pb and Zn, althoughother metals remained at a constant fraction during winter, andHallberg et al. (2007) determined higher dissolved fractions of Cd, Cr,and Ni in winter compared to summer, whereas no significant differ-ences occurred for Cu, Pb, and Zn. Helmreich et al. (2010) concludedthat the fractionation of the heavy metals was not affected by seasonalvariations but remarkable fluctuations were observed between

915M. Huber et al. / Science of the Total Environment 541 (2016) 895–919
different rain events with dissolved fractions greater than 90%. Similarresults were confirmed by Dauber et al. (1979). However, Dean et al.(2005) stated that the partitioning of Pb was unaffected by flow rate.
4.5. Other elements
Other elements that are detected in sampling programs and that arerelated to traffic or might be used as a tracer for anthropogenic sourcesare listed in Table 6. As tracers, Co and W are potentially suitable forroads and traffic because of their low natural concentrations in environ-mentalwaters (Bäckström et al., 2003). Nadler andMeißner (1999) andHuang et al. (1994) suggest that Sb should be used as a marker, too.
Co is mainly used in steel and paints (Makepeace et al., 1995) and indiesel (Roeva et al., 1996). Steiner et al. (2006) concluded that traffic isnot the main source for Co in soils, whereas Ward (1990) observed in-creased levels of Co in soils because of traffic activities. Bäckström et al.(2003) clearly demonstrated that roads act as a source for Co. Totalmean concentration of Co varies between 1.5 μg/L (Grotehusmann andKasting, 2009) and 13.3 μg/L (Bäckström et al., 2003) and dissolvedmean concentrations are between 0.1 μg/L (Dannecker et al., 1990) and15.1 μg/L (Hallberg et al., 2007); dissolved fractions vary between 4.1%(Dannecker et al., 1990) and 67% (Bäckström et al., 2003). The highestmass of Co (around 94%) in runoff was transported during winter atone site in Sweden (Bäckström et al., 2003).
Bourcier et al. (1980) measured W, which is used in tire studs, inconcentrations between non-detectable (2.5 mg/L) and 25 mg/L inroad runoff (completely in the particulate phase) and did not detect itin precipitation and dust samples. Bäckström et al. (2003) measuredW at two sites in summer and winter and found that the particulatefraction is low and the concentrations increased by a factor of ten duringwinter (5.8–9.2 μg/L).
Sb is a very toxic element, and the main traffic-related sources arebrake pads (Von Uexküll et al., 2005). Concentrations of Sb have beenpresented in ten publications (cf. Table 6). Totalmean Sb concentrationsare between 0.8 μg/L (Dannecker et al., 1990) and 10.7 μg/L (CH2MHILL,1998). Dissolved concentrations were analyzed at three sites and varybetween 1.2 μg/L (Dannecker et al., 1990) and 5.05 μg/L (Wilson, 2006).
Anthropogenic sources of Mn are moving engine parts (Ballet al., 1998; Drapper et al., 2000), gasoline additives such asmethylcyclopentadienyl manganese tricarbonyl (MMT) (Younget al., 1996; Preciado and Li, 2005), brake wear (Ward, 1990;Sansalone et al., 1996), and tire wear (Hares and Ward, 1999). Valuesof Mn concentrations in runoff from different sites have been presentedin 17 publications (cf. Table 6). Shinya et al. (2000) reported that Mn ismainly particle-bound,whereas Sansalone andBuchberger (1997a) andHarrison and Wilson (1985) reported that it is mainly dissolved. Totalmean concentrations of Mn vary between 11.1 μg/L (Rushton, 2001)and 659 μg/L (Gnecco et al., 2008) (both PL), and dissolved mean con-centrations are between 9 μg/L (Booth and Leavitt, 1999) and 255 μg/L(Sansalone and Buchberger, 1997a). Ward (1990) measured elevatedlevels of Mn in soils with increased traffic density.
Of the PGE only Rh, Pd, and Pt are related to traffic sources. Since theend of the 1980s, these three elements have been primarily used as cat-alytic converters and the number of automobiles equipped with theseconverters has increased sharply (Wei and Morrison, 1994). A three-way catalytic converter contains a total of 2–3 g of Rh, Pd, and Pt(Geiger-Kaiser and Jäger, 2005). Fritsche and Meisel (2004) determinedthe distribution of PGE in soils alongmajor Austrian HWY and concludedthat Rh, Pd, and Pt significantly exceeded natural background values. Inroad runoff, Rh was only detected by Hilliges (2007) at a concentrationof 1.14 μg/L and by Windhofer et al. (2012) at a concentration of0.08 μg/L. Pt concentrations vary between 0.0065 μg/L (Wei andMorrison, 1994) and24 μg/L (MoyandCrabtree, 2003), and Pd concentra-tions are between 0.34 μg/L (Moy et al., 2003) and 8 μg/L (Grotehusmannand Kasting, 2002). The dissolved phases of Pd and Pt are high (65%–81%,
58
Grotehusmann and Kasting, 2002). According to Laschka et al. (1996), Ptrunoff concentrations depend on ADP, rain intensity, and rain duration.
Ti was only measured in three studies, and its main source is thewear of white road marking paint containing titanium dioxide as pig-ment (Makepeace et al., 1995), which is often renewed once a year(Golwer and Schneider, 1983). Another source is tire studs (Bourcieret al., 1980). Ti was not measured in precipitation samples by Bourcieret al. (1980) but was measured in road runoff with a mean concentra-tion of 12.7 mg/L. Golwer and Schneider (1983) detected that Ti wasmostly particulate and only 26 μg/L was dissolved. Fürhacker et al.(2013) measured Ti in one HU runoff sample with a total concentrationof 630 μg/L.
4.6. Correlation between pH and type of surface
The partitioning of metals in runoff is strongly influenced by the pHof the rainfall, the solids present, the solubility of all substances, thepavement residence time, and the type of surface (Prestes et al.,2006). For asphalt, no significant level of alkalinity is provided to neu-tralize the pH of rainfall (Sansalone and Buchberger, 1997a), whereasa concrete pavement provides alkalinity to raise the runoff pH morethan that of an asphalt pavement (Dierkes, 1999). Therefore, concretesurfaces should have a stronger influence on metal partitioning to theparticulate phase than asphalt surfaces.
The evaluation of pH for 63 asphalt, 13 asphalt and concrete, 21 con-crete, and four porous asphalt surfaces cannot provide significant differ-ences. The median pH of asphalt surfaces was the lowest (6.8) andvaried between 5.4 (Driscoll et al., 1990) and 8.2 (Zhang et al., 2013).A combination of asphalt and concrete surfaces had a median pH of6.9 and varied between 6.4 (Lau et al., 2009) and 7.5 (GrotehusmannandKasting, 2009). For concrete surfaces, amean value of 7.2was calcu-lated, which is 0.4 units higher than the value for asphalt. The valuesvaried between 5.6 (Driscoll et al., 1990) and 7.9 (Geiger-Kaiser andJäger, 2005). For porous asphalts, the median value is 7.5.
The non-significant evaluation results of all datasets can be ex-plained by two factors. First, the pavement residence times vary be-tween each monitored site and samples were sometimes collectedfrom a concrete channel that would have had an influence on the pH(Dierkes, 1999). Second, the pH of the rain itself can be different. Two-thirds of the measurements with concrete surfaces were conducted inthe 1980s, when rain was more acidic. Conversely, the pH of the runoffof a concrete BR deck increased slightlywith increasingflow rates (Deanet al., 2005). Drapper et al. (2000) compared asphalt and concrete BRdecks and did not observe any variance in the pH or runoff concentra-tions. Aspects that might have an effect on porous asphalts have beendescribed by Muschack (1990), and a literature review was providedby Barrett et al. (2006).
4.7. Continental trends
The runoff concentrations of Pb, Zn, and Cu that occur in the highestconcentrations compared with other heavy metals were evaluated sep-arately for each continent for whichmore than five datasets were avail-able (i.e., Asia, Australia, Europe, and North America). For Pb, the recentconcentrations are very low and the older, higher concentrations corre-late well with the phase-out of leaded gasoline for all continents (cf.Section 4.1). The overall median Pb values for Europe and NorthAmerica are approximately 30 μg/L and 15 μg/L for the 21st century.For Asia, both Pb values are approximately 50 μg/L, which correlateswith the later Pb-phase out in Asia compared with Europe and NorthAmerica (cf. Section 4.1). The Australian overall median Pb concentra-tion is approximately five times higher than those of Europe andNorth America for the complete dataset and approximately threetimes for the dataset of the 21st century. The same results were obtain-ed by Kayhanian et al. (2012) for HWY runoff, whereas the Asian HWYvalues consist out of one extreme value (Maniquiz et al., 2010). For Cu,

916 M. Huber et al. / Science of the Total Environment 541 (2016) 895–919
the overall median concentrations are approximately 30 μg/L for NorthAmerica and approximately twice as much for Asia, Australia, andEurope. For Zn, the overall median concentrations are approximately170 μg/L for North America, 250 μg/L for Europe, 300 μg/L forAustralia, and 620 μg/L for Asia. For Asia, it must be considered thatfewer data are available compared with the other three continentsand the data are mostly for heavily loaded traffic areas. In conclusion,the median values in North America are the lowest for Pb, Zn, and Cu,and the variance of Pb and Zn runoff concentrations among the conti-nents is higher than the variance of Cu.
4.8. Planning stormwater treatment plants
Several factors concerning the occurrence and partitioning of heavymetals must be considered when planning stormwater treatment plantsbecause the differentiation between the dissolved and particulate phasesis of great concern for a successful treatment of stormwater to preventnegative effects on groundwater and surface water. As not all metals arepresent predominantly in the particulate phase (Cd, Ni, Zn, and Cu; cf.Section 4.4), an additional priority should be set for the reduction of dis-solved metal concentrations in runoff treatment programs (Tiefenthaleret al., 2001). Because dissolved metals cannot be removed mechanicallywith solids (e.g., by sedimentation and filtration), a second treatmentstep (e.g., filtermedia) is necessary to reduce highermetal runoff concen-trations (Hilliges et al., 2007; Steiner and Goosse, 2008; Minervini, 2010;Kayhanian et al., 2012). Maniquiz-Redillas and Kim (2014) investigatedthe partitioning of heavy metals in runoff and in the effluent of astormwater treatment plant (manufactured eco-biofilter) and concludedthat the fractionation of heavymetals plays an important role on the per-formance of the systemand a reduction of dissolvedmetal concentrationsis necessary. It is recommended that not only the initial runoff or the first25% of the total runoff should be treated but the entire water volume(Flint and Davis, 2007; Maniquiz-Redillas and Kim, 2014). In addition,the individual site and climatic influencing factors (cf. Section 3.1) are rel-evant for the construction and operation of treatment plants to preventnegative toxic effects on ecosystems (Schueler, 2000; Nason et al., 2012;Dierkes et al., 2015). As discussed in Section 4.3, the treatment of runofffrom large PL should be considered for an effective control of heavymetal loads. Furthermore, a proper control of BR runoff, runoff ofcongested streets, and arterial roads with traffic signals becomes a con-cern. A better knowledge of the historical trends (cf. Section 4.1) and sea-sonal variations of heavymetal runoff concentrations (cf. Section 4.4) canbe used for optimization of treatment processes (Hallberg et al., 2007).
5. Conclusions
The conclusions of this review are summarized as follows:
• Trace element pollutant loads determined at a given site depend onthe unique subset of site-specific (surrounding land use characteris-tics, traffic area site data, operational characteristics, and climatic fac-tors) and method-specific factors (sample collection, preparation,analysis, and calculation). In literature, inconsistent conclusions havebeen obtained regarding how specific variables affect traffic area run-off. Thus, a combination of several interacting factors results in heavymetal runoff pollution, and these factors should be described in detailfor each monitoring site. These factors should also be implemented indatabases to allow further specifications in future.
• The calculation ofmedian Zn-to-Cu-ratios can be used to detect possi-ble sample contamination and relevant site-specific factors.
• Historical trends for Pb show a sharp decrease during the last decades,consistent with the phase-out of leaded gasoline; no historical trendswere detected for Zn.
• The heavymetal runoff concentrations of PL differwidely according totheir use (e.g., employee, supermarket, rest areas for trucks). BR deckrunoff can contain high Zn concentrations from safety fences and
59
galvanizing elements. Roads with more than 5000 vehicles per dayare often more polluted than HWY because of other site-specific fac-tors such as braking and acceleration at traffic signals. WorldwideHWY runoff concentrations are not significantly influenced by AADTand urban/non-urban land uses.
• Pb and Cr are mostly particle-bound, while Zn, Cu, Ni, and Cd occur at ahigher fraction in the dissolved phase. Therefore, the treatment of run-off waters containing dissolved heavy metal pollutants by stormwatertreatment strategies is important.
• Further traffic-related elements areMn, Rh, Pd, Pt, and Ti. As tracers, Co,W, and Sb, which have anthropogenic sources, are potentially suitablefor traffic areas.
References
Alo, B.I., Abayomi, A.A., Osuntogun, B.A., Olayinka, K.O., 2007. Urban highway runoff inNigeria 1: heavymetals in sheet flow from themain expressway in Lagos metropolis.J. Appl. Sci. 7, 2800–2805.
APHA, 2005. Standard Methods for the Examination of Water and Wastewater. 21st ed.American Public Health Association, Washington, D.C.
Aryal, R.K., Lee, B.K., 2009. Characteristics of suspended solids andmicropollutants in first-flush highway runoff. Water Air Soil Pollut. Focus 9, 339–346.
Bäckström, M., Nilsson, U., Håkansson, K., Allard, B., Karlsson, S., 2003. Speciation of heavymetals in road runoff and roadside total deposition. Water Air Soil Pollut. 147,343–366.
Ball, J.E., 2002. Stormwater Quality at Centennial Park. University of New South Wales,School of Civil and Environmental Engineering, Water Research Laboratory, Sydney,Australia.
Ball, J.E., Jenks, R., Aubourg, D., 1998. An assessment of the availability of pollutant constit-uents on road surfaces. Sci. Total Environ. 209, 243–254.
Bannerman, R.T., Owens, D.W., Dodds, R.B., Hornewer, N.J., 1993. Sources of pollutants inWisconsin stormwater. Water Sci. Technol. 28, 241–259.
Barbosa, A.E., Hvitved-Jacobsen, T., 1999. Highway runoff and potential for removal ofheavy metals in an infiltration pond in Portugal. Sci. Total Environ. 235, 151–159.
Barrett, M., 2008. Effects of a permeable friction course on highway runoff. J. Irrig. Drain.Eng. 134, 646–651.
Barrett, M.E., Irish, L.B., Malina, J.F., Charbeneau, R.J., 1998. Characterization of highwayrunoff in Austin, Texas, area. J. Environ. Eng. 124, 131–137.
Barrett, M.E., Kearfott, P., Malina, J.F., 2006. Stormwater quality benefits of a porous fric-tion course and its effect on pollutant removal by roadside shoulders. Water Environ.Res. 78, 2177–2185.
Berbee, R., Rijs, G., de Brouwer, R., Van Velzen, I., 1999. Characterization and treatment ofrunoff from highways in the Netherlands paved with impervious and pervious as-phalt. Water Environ. Res. 71, 183–190.
Bertrand-Krajewski, J.-L., Chebbo, G., Saget, A., 1998. Distribution of pollutant mass vs vol-ume in stormwater discharges and the first flush phenomenon. Water Res. 32,2341–2356.
Bleiwas, D.I., 2006. Stocks and flows of lead-basedwheel weights in the United States. U.S.Geological Survey Open File Report 1111. U.S. Department of the Interior, U.S. Geo-logical Survey, pp. 1–6.
Boller, M., 1997. Tracking heavy metals reveals sustainability deficits of urban drainagesystems. Water Sci. Technol. 35, 77–87.
Booth, D.B., Leavitt, J., 1999. Field evaluation of permeable pavement systems for im-proved stormwater management. J. Am. Plan. Assoc. 65, 314–325.
Borne, K.E., Fassman, E.A., Tanner, C.C., 2013. Floating treatment wetland retrofit to im-prove stormwater pond performance for suspended solids, copper and zinc. Ecol.Eng. 54, 173–182.
Bourcier, D.R., Hindin, E., 1979. Lead, iron, chromium and zinc in road runoff at Pullman,Washington. Sci. Total Environ. 12, 205–215.
Bourcier, D.R., Hindin, E., Cook, J.C., 1980. Titanium and tungsten in highway runoff atPullman, Washington. Int. J. Environ. Stud. 15, 145–149.
Brattebo, B.O., Booth, D.B., 2003. Long-term stormwater quantity and quality performanceof permeable pavement systems. Water Res. 37, 4369–4376.
Brezonik, P.L., Stadelmann, T.H., 2002. Analysis and predictive models of stormwater run-off volumes, loads, and pollutant concentrations from watersheds in the Twin Citiesmetropolitan area, Minnesota, USA. Water Res. 36, 1743–1757.
Brockbank, C.I., Batley, G.E., Ball, J.E., Tilley, J.H., 1999. Metals and hydrocarbons instormwater runoff from urban roads. Investigation Report ET/IR98. Division of EnergyTechnology, Center for Advanced Analytical Chemistry, CSIRO.
Caltrans, 2003. Storm water monitoring and data management 2002–2003. CaltransAnnual Data Summary Report. California Department of Transportation,pp. 1–74.
CH2MHILL, 1998. Highway Stormwater Runoff Study. TheMichigan Department of Trans-portation, pp. 1–48.
Chang, J., Liu, M., Li X-h, Yu.J., Lin, X., Wang, L.-l., et al., 2009. Dissolved-particulatepartitioning of heavy metals in urban road runoff of Shanghai. China Acad. J. 20,714–720.
Crabtree, B., Moy, F., Whitehead, M., Roe, A., 2006. Monitoring pollutants in highway run-off. Water Environ. J. 20, 287–294.

917M. Huber et al. / Science of the Total Environment 541 (2016) 895–919
Crabtree, B., Dempsey, P., Johnson, I., Whitehead, M., 2008. The development of a risk-based approach to managing the ecological impact of pollutants in highway runoff.Water Sci. Technol. 57, 1595–1600.
Crabtree, B., Dempsey, P., Johnson, I., Whitehead,M., 2009. The development of an ecolog-ical approach to manage the pollution risk from highway runoff. Water Sci. Technol.59, 549–555.
Cristina, C.M., Sansalone, J.J., 2003. “First flush,” power law and particle separationdiagrams for urban storm-water suspended particulates. J. Environ. Eng. 129,298–307.
Dannecker, W., Au, M., Stechmann, H., 1990. Substance load in rainwater runoff from dif-ferent streets in Hamburg. Sci. Total Environ. 93, 385–392.
Daub, J., Striebel, T., 1995. Schadstofffrachten von Dachflächen und Straßen undBeobachtungen zu Quellen und zur Mobilität von Schadstoffen. In: Hahn, H.H.,Xanthopoulos, C. (Eds.), Schadstoffe im Regenabfluss III — 3. Präsentation desBMBF — Verbundprojektes: Niederschlagsbedingte Schmutzbelastung der Gewässeraus städtischen befestigten Flächen (Phase II). Band 73. Schriftenreihe des Institutsfür Siedlungswasserwirtschaft, Universität Karlsruhe (TH), Oldenbourg Verlag,München, pp. 221–245 (in German).
Dauber, L., Novak, B., Zobrist, J., Zürcher, F., 1979. Schmutzstoffe im Regenwasserkanaleiner Autobahn. Stuttgarter Berichte zur Siedlungswasserwirtschaft. Beeinflussungder Gewässergüte durch Regenabflüsse von Straßen. Band 64. Oldenbourg Verlag,München, pp. 41–57 (in German).
Davis, B., Birch, G., 2010. Comparison of heavy metal loads in stormwater runoff frommajor and minor urban roads using pollutant yield rating curves. Environ. Pollut.158, 2541–2545.
Davis, A.P., Shokouhian, M., Ni, S., 2001. Loading estimates of lead, copper, cadmium, andzinc in urban runoff from specific sources. Chemosphere 44, 997–1009.
Dean, C.M., Sansalone, J.J., Cartledge, F.K., Pardue, J.H., 2005. Influence of hydrology onrainfall-runoff metal element speciation. J. Environ. Eng. 131, 632–642.
Desta, M.B., Bruen, M., Higgins, N., Johnston, P., 2007. Highway runoff quality in Ireland.J. Environ. Monit. 9, 366–371.
Dierkes, C., 1999. Wirkung von Schwermetallen im Regenabfluß von Verkehrsflächen beider Versickerung über poröse Deckbeläge. Forum Siedlungswasserwirtschaft undAbfallwirtschaft. Heft 14. Universität Essen, pp. 1–216 (in German).
Dierkes, C., 2010. Untersuchungen einer Behandlungsanlage für Straßenabflüsse an derBremer Straße in Hamburg-Harburg über einen Zeitraum von drei Jahren. 3P TechnikFiltersysteme GmbH, pp. 89–99 (in German).
Dierkes, C., Geiger, F., 1998. Decontaminating Effect of Greened Highway Embankments.NOVATECH, Lyon/France, pp. 497–504.
Dierkes, C., Holte, A., Geiger, W.F., 1999. Heavymetal retention within a porous pavementstructure. 8th International Conference on Urban Storm Drainage, Sydney/Australia,pp. 1955–1962.
Dierkes, C., Lucke, T., Helmreich, B., 2015. General technical approvals for decentralisedsustainable urban drainage systems (SUDS)—the current situation in Germany. Sus-tainability 7, 3031–3051.
Drapper, D., Tomlinson, R., Williams, P., 2000. Pollutant concentrations in road runoff:Southeast Queensland Case Study. J. Environ. Eng. 126, 313–320.
Driscoll, E., Shelly, P.E., Strecker, E.W., 1990. Pollutant loadings and impacts from highwaystormwater runoff. Volume III: Analytical Investigation and Research Report. US De-partment of Transportation, pp. 1–162.
Ellis, J.B., Revitt, D.M., 1982. Incidence of heavy metals in street surface sediments: solu-bility and grain size studies. Water Air Soil Pollut. 17, 87–100.
Ellis, J.B., Revitt, D.J., Harrop, D.O., Beckwith, P.R., 1987. The contribution of highway surfacesto urban stormwater sediments and metal loadings. Sci. Total Environ. 59, 339–349.
Engelhard, C., Fach, S., Rauch, W., 2012. Langzeitverhalten der hydraulischen undstofflichen Leistungsfähigkeit von Muldenversickerungen im Sommer- undWinterbetrieb. Arbeitsbereich Umwelttechnik, Institut für Infrastruktur, BaufakultätUniversität Innsbruck, pp. 1–76 (in German).
Eriksson, E., Baun, A., Scholes, L., Ledin, A., Ahlman, S., Revitt, M., et al., 2007. Selectedstormwater priority pollutants — a European perspective. Sci. Total Environ. 383,41–51.
FHWA, 1999. Is Highway Runoff a Serious Problem? Office of Infrastructure R&D, Turner-Faribank Highway Research Center, McLean, VA
Flint, K., Davis, A., 2007. Pollutant mass flushing characterization of highway stormwaterrunoff from an ultra-urban area. J. Environ. Eng. 133, 616–626.
Frazer, G., 1990. Event mean concentrations of trace metals and PAHs in Burlington Sky-way runoff (data appendix). Unpublished contract report to the National Water Re-search Institute. Burlington, Ont.
Fritsche, J., Meisel, T., 2004. Determination of anthropogenic input of Ru, Rh, Pd, Re, Os, Irand Pt in soils along Austrian motorways by isotope dilution ICP-MS. Sci. Total Envi-ron. 325, 145–154.
Fulkerson, M., Nnadi, F., Chasar, L., 2007. Characterizing dry deposition of mercury inurban runoff. Water Air Soil Pollut. 185, 21–32.
Fürhacker, M., Haile, T.M., Schärfinger, B., Kammerer, G., Allabashi, R., Magnat, S., et al.,2013. Entwicklung von Methoden zur Prüfung der Eignung von Substraten für dieOberflächenwasserbehandlung von Dach- und Verkehrsflächen, Fördervertrag GZB100121, Wien, Österreich. pp. 1–240 (in German).
Gan, H., Zhuo, M., Li, D., Zhou, Y., 2008. Quality characterization and impact assessment ofhighway runoff in urban and rural area of Guangzhou, China. Environ. Monit. Assess.140, 147–159.
Gäth, S., Sternheim, M., Frede, H.-G., 1990. Einfluss des Kraftfahrzeugverkehrs auf denSchwermetallgehalt von Straßenabflußwasser. Forum Städte — Hygiene 41,pp. 235–238 (in German).
Geiger-Kaiser, M., Jäger, P., 2005. Reinigung von Straßenabwässern, Wirksamkeit vonRetentionsfilterbecken zur Reinigung von Straßenoberflächenwässern. Gewässerschutz11, 1–54 (in German).
60
Genç-Fuhrman, H., Mikkelsen, P.S., Ledin, A., 2007. Simultaneous removal of As, Cd, Cr, Cu,Ni and Zn from stormwater: experimental comparison of 11 different sorbents.Water Res. 41, 591–602.
Gilbert, J.K., Clausen, J.C., 2006. Stormwater runoff quality and quantity from asphalt,paver, and crushed stone driveways in Connecticut. Water Res. 40, 826–832.
Gjessing, E., Lygren, E., Andersen, S., Berglind, L., Carlberg, G., Efraimsen, H., et al., 1984.Acute toxicity and chemical characteristics of moderately polluted runoff from high-ways. Sci. Total Environ. 33, 225–232.
Gnecco, I., Berretta, C., Lanza, L.G., La Barbera, P., 2005. Storm water pollution in the urbanenvironment of Genoa, Italy. Atmos. Res. 77, 60–73.
Gnecco, I., Sansalone, J.J., Lanza, L.G., 2008. Speciation of zinc and copper in stormwaterpavement runoff from airside and landside aviation land uses. Water Air Soil Pollut.192, 321–336.
Göbel, P., Dierkes, C., Coldewey, W.G., 2007. Storm water runoff concentration matrix forurban areas. J. Contam. Hydrol. 91, 26–42.
Golwer, A., Schneider, W., 1983. Untersuchungen über die Belastung des unterirdischenWassers mit anorganischen toxischen Spurenstoffen im Gebiet von Straßen.Untersuchungen über die Belastung des Grundwassers mit organischen Stoffen imBereich von Straßen, p. 391 (in German).
Gromaire-Mertz, M.C., Garnaud, S., Gonzalez, G., Chebbo, G., 1999. Characterisation ofurban runoff pollution in Paris. Water Sci. Technol. 39, 1–8.
Grotehusmann, D., Kasting, U., 2002. Schlussbericht: Untersuchung über dieBeschaffenheit der Oberflächenabflüsse von Parkflächen bei Tank- undRastanlagen. Ingenieurgesellschaft für Stadthydrologie mbH, Hannover,Bundesanstalt für Straßenwesen, Bergisch Gladbach, pp. 1–62 (in German).
Grotehusmann, D., Kasting, U., 2009. Vergleich der Reinigungsleistung vonRetentionsbodenfiltern und Versickerungsanlagen an Bundesfernstraßen.p. 1024 (in German).
Hallberg, M., Renman, G., Lundbom, T., 2007. Seasonal variations of tenmetals in highwayrunoff and their partition between dissolved and particulate matter. Water Air SoilPollut. 181, 183–191.
Hamilton, R.S., Revitt, D.M., Warren, R.S., Duggan, M.J., 1987. Metal mass balance studieswithin a small highway dominated catchment. Sci. Total Environ. 59, 365–368.
Han, Y., Lau, S.-L., Kayhanian, M., Stenstrom, M.K., 2006a. Characteristics of highwaystormwater runoff. Water Environ. Res. 78, 2377–2388.
Han, Y.H., Lau, S.-L., Kayhanian, M., Stenstrom, M.K., 2006b. Correlation analysisamong highway stormwater pollutants and characteristics. Water Sci. Technol.53, 235–243.
Hares, R.J., Ward, N.I., 1999. Comparison of the heavy metal content of motorwaystormwater following discharge into wet biofiltration and dry detention pondsalong the London Orbital (M25) motorway. Sci. Total Environ. 235, 169–178.
Harrison, R.M., Wilson, S.J., 1985. The chemical composition of highway drainage waters,I. Major ions and selected trace metals. Sci. Total Environ. 43, 63–77.
Hatt, B.E., Fletcher, T.D., Deletic, A., 2009. Pollutant removal performance of field-scalestormwater biofiltration systems. Water Sci. Technol. 59, 1567–1576.
Helmreich, B., Hilliges, R., Schriewer, A., Horn, H., 2010. Runoff pollutants of a highly traffickedurban road — correlation analysis and seasonal influences. Chemosphere 80, 991–997.
Herrera, 2007. Untreated Highway Runoff in Western Washington. pp. 1–43.Herrmann, R., Daub, J., Striebel, T., 1992. Charakterisierung und Analyse der
Verschmutzung des Niederschlages und des Niederschlagabflusses.Abschlußbericht: Niederschlagsbedingte Schmutzbelastung der Gewässeraus städtischen befestigten Flächen, Phase 1,— Teilprojekt 1. Eigenverlag des Institutsfür Siedlungswasserwirtschaft, Universität Karlsruhe (in German).
Hewitt, C.N., Rashed, M.B., 1992. Removal rates of selected pollutants in the runoff watersfrom a major rural highway. Water Res. 26, 311–319.
Hilliges, R., 2007. Entwicklung eines mehrstufigen Behandlungssystems für hochbelasteteVerkehrsflächenabflüsse imurbanen Raum. Berichte aus der Siedlungswasserwirtschaft.Band 193. TU München, pp. 1–208 (in German).
Hilliges, R., Helmreich, B., Horn, H., Bischof, F., Dierkes, C., 2007. Entwicklung undOptimierung eines mehrstufigen Reinigungssystems für Straßen- und Parkplatzabläufein urbanen Gebieten zur Abflussdämpfung (Hochwasserschutz). Technische UniversitätMünchen, Lehrstuhl für Siedlungswasserwirtschaft, pp. 1–65 (in German).
Hilliges, R., Schriewer, A., Helmreich, B., 2013. A three-stage treatment system for highlypolluted urban road runoff. J. Environ. Manag. 128, 306–312.
Hogland, W., Niemczynowicz, J., Wajlman, T., 1987. The unit superstructure during theconstruction period. Sci. Total Environ. 59, 411–424.
Holthuis, J.-U., Dobner, I., Tegge, K.-T., Warrelmann, J., Mahro, B., 2012. Praxistest einesneuartigen, bepflanzten Bodenfilters zur Behandlung von Straßenabflüssen. Teil 1:Wasseruntersuchungen. KA Abwasser, Abfall 59, pp. 1030–1039 (in German).
Horowitz, A.J., Lum, K.R., Garbarino, J.R., Hall, G.E.M., Lemieux, C., Demas, C.R., 1996. Prob-lems associatedwith using filtration to define dissolved trace element concentrationsin natural water samples. Environ. Sci. Technol. 30, 954–963.
Horwatich, J.A., Bannerman, R.T., 2009. Pollutant Loading to Stormwater Runoff fromHighways: Impact of a Highway Sweeping Program: Phase II, Madison, Wisconsin.pp. 1–136.
Huang, X., Olmez, I., Aras, N.K., Gordon, G.E., 1994. Emissions of trace elements frommotor vehicles: potential marker elements and source composition profile. Atmos.Environ. 28, 1385–1391.
Huang, J., Du, P., Ao, C., Ho, M., Lei, M., Zhao, D., et al., 2007. Multivariate analysis forstormwater quality characteristics identification from different urban surface typesin Macau. Bull. Environ. Contam. Toxicol. 79, 650–654.
Irish, L.B., Barrett, M.E., Malina, J.F., Charbeneau, R.J., 1998. Use of regression models foranalyzing highway storm-water loads. J. Environ. Eng. 124, 987–993.
Jenewein, I., Schinner, M., 1982. Zur Frage der Zusammensetzung und möglicheBeeinflussung des Grundwassers von Regenabflüssen aus Hochleistungsstraßen amBeispiel der Brenner-Autobahn. Forum Städte— Hygiene 33, pp. 113–116 (in German).

918 M. Huber et al. / Science of the Total Environment 541 (2016) 895–919
Kasting, U., Grotehusmann, D., 2007. Entwässerungssysteme, Bodenfilteranlagen zurBehandlung von Straßenabflüssen, Halbtechnische Bodenfilterversuche — Teil 2:Versuche zur Salzbelastbarkeit. KA Abwasser, Abfall 54, pp. 789–797 (in German).
Kasting, U., Janiczek, M., Grotehusmann, D., 2003. Entwässerungssysteme,Bodenfilteranlagen zur Reinigung von Abflüssen stark verschmutzter Verkehrsflächen,Halbtechnische Bodenfilterversuche. KA Abwasser, Abfall 50, pp. 1428–1433 (inGerman).
Kayhanian, M., 2012. Trend and concentrations of legacy lead (Pb) in highway runoff. En-viron. Pollut. 160, 169–177.
Kayhanian,M., Singh, A., Suverkropp, C., Borroum, S., 2003. Impact of annual average dailytraffic on highway runoff pollutant concentrations. J. Environ. Eng. 129, 975–990.
Kayhanian, M., Suverkropp, C., Ruby, A., Tsay, K., 2007. Characterization and prediction ofhighway runoff constituent event mean concentration. J. Environ. Manag. 85,279–295.
Kayhanian, M., Stransky, C., Bay, S., Lau, S.L., Stenstrom,M.K., 2008. Toxicity of urban high-way runoff with respect to storm duration. Sci. Total Environ. 389, 386–406.
Kayhanian, M., Fruchtman, B.D., Gulliver, J.S., Montanaro, C., Ranieri, E., Wuertz, S., 2012.Review of highway runoff characteristics: comparative analysis and universal impli-cations. Water Res. 46, 6609–6624.
Klimaszewska, K., Polkowska, Z., Namieśnik, J., 2007. Influence of mobile sources on pol-lution of runoff waters from roads with high traffic intensity. Pol. J. Environ. Stud. 16,889–897.
Kluge, B., Werkenthin, M., Wessolek, G., 2014. Metal leaching in a highway embankmenton field and laboratory scale. Sci. Total Environ. 493, 495–504.
Kocher, B., Brose, S., Chlubek, A., Görg, C., Klein, N., Siebertz, I., 2010a. Stoffeintrag inStraßenrandböden: Messzeitraum 2006/2007. Berichte der Bundesanstalt fürStraßenwesen. Verkehrstechnik, Bergisch Gladbach, pp. 1–38 (in German).
Kocher, B., Brose, S., Chlubek, A., Karagüzel, N., Klein, N., Siebertz, I., 2010b. Stoffeintrag inStraßenrandböden: Messzeitraum 2005/2006. Berichte der Bundesanstalt fürStraßenwesen, Bergisch Gladbach, pp. 1–45 (in German).
Krauth, K., Stotz, G., 1993. Gewässerbelastung durch Straßenoberflächenwasser vonlärmmindernden Straßenbelägen durch längere Kontaktzeiten des Regenwassersmit den Verunreinigungen und den veränderten Salzkonzentrationen. UBA-Schlussbericht 102 04 381 (in German).
Langbein, S., Steiner, M., Boller, M., 2006. Schadstoffe im Straßenabwasser einer starkbefahrenen Straße und deren Retention mit neuartigen Filterpaketen ausgeotextil und Adsorbermaterial. Schlussbericht des Forschungsprojekts,pp. 1–77 (in German).
Lange, G., Grotehusmann, D., Kasting, U., Schütte, M., Dietrich, M., Sondermann, W., 2003.Wirksamkeit von Entwässerungsbecken im Bereich von Bundesfernstraßen. p. 861(in German).
Laschka, D., Striebel, T., Daub, J., Nachtwey, M., 1996. Platin im Regenabfluss einer Straße.Umweltwiss. Schadst. Forsch. 8, 124–129 (in German).
Lau, S.-L., Han, Y., Kang, J.-H., Kayhanian, M., Stenstrom, M.K., 2009. Characteristics ofhighway stormwater runoff in Los Angeles: metals and polycyclic aromatic hydrocar-bons. Water Environ. Res. 81, 308–318.
Lee, J.Y., Kim, H., Kim, Y., Han, M.Y., 2011. Characteristics of the event mean concentration(EMC) from rainfall runoff on an urban highway. Environ. Pollut. 159, 884–888.
Legret, M., Pagotto, C., 1999. Evaluation of pollutant loadings in the runoff waters from amajor rural highway. Sci. Total Environ. 235, 143–150.
Legret, M., Colandini, V., Le Marc, C., 1996. Effects of a porous pavement with reser-voir structure on the quality of runoff water and soil. Sci. Total Environ. 189–190,335–340.
Li, M.-H., Barrett, M.E., 2008. Relationship between antecedent dry period and highwaypollutant: conceptual models of buildup and removal processes. Water Environ.Res. 80, 740–747.
Li, M., Barrett, M., Rammohan, P., Olivera, F., Landphair, H., 2008. Documentingstormwater quality on Texas highways and adjacent vegetated roadsides.J. Environ. Eng. 134, 48–59.
Line, D.E., Wu, J., Arnold, J.A., Jennings, G.D., Rubin, A.R., 1997. Water quality of first flushrunoff from 20 industrial sites. Water Environ. Res. 69, 305–310.
Lloyd, S.D., Wong, T.H.F., 1999. Particulates, associated pollutants and urban stormwatertreatment. 8th International Conference on Urban Storm Drainage, Sydney/Australia, pp. 1833–1840.
Lygren, E., Gjessing, E., Berglind, L., 1984. Pollution transport from a highway. Sci. TotalEnviron. 33, 147–159.
Ma, J., Kang, J., Kayhanian, M., Stenstrom, M., 2009. Sampling issues in urban runoff mon-itoring programs: composite versus grab. J. Environ. Eng. 135, 118–127.
MacKay, A., Zinke, S., Mahoney, J., Bushey, J., 2011. Roadway runoff water quality frommilled and unaltered surfaces during convective storms. J. Environ. Eng. 137,1165–1175.
Makepeace, D.K., Smith, D.W., Stanley, S.J., 1995. Urban stormwater quality: summary ofcontaminant data. Crit. Rev. Environ. Sci. Technol. 25, 93–139.
Mangani, G., Berloni, A., Bellucci, F., Tatàno, F., Maione, M., 2005. Evaluation of the pollut-ant content in road runoff first flush waters. Water Air Soil Pollut. 160, 213–228.
Maniquiz, M.C., Lee, S., Kim, L.-H., 2010. Multiple linear regression models of urban runoffpollutant load and event mean concentration considering rainfall variables.J. Environ. Sci. 22, 946–952.
Maniquiz-Redillas, M., Kim, L.-H., 2014. Fractionation of heavy metals in runoff and dis-charge of a stormwater management system and its implications for treatment.J. Environ. Sci. 26, 1214–1222.
Marsalek, J., Brownlee, B., Mayer, T., Lawal, S., Larkin, G.A., 1997. Heavy metals and PAHsin stormwater runoff the Skyway Bridge, Burlington, Ontario. Water Qual. Res. J. Can.32, 815–827.
Masanao, S., Kunihiro, F., Kenshi, K., Saburo, M., 2006. Determination of lead sources inurban runoff due to automative traffic. J. Jpn. Soc. Water Environ. 29, 693–698.
61
McKenzie, E.R., Money, J.E., Green, P.G., Young, T.M., 2009. Metals associated withstormwater-relevant brake and tire samples. Sci. Total Environ. 407, 5855–5860.
McQueen, A., 2008. Characterization of Campus Parking Lot Stormwater and Remediationof Risks Using Constructed Wetland Treatment Systems. pp. 1–87.
McQueen, A.D., Johnson, B.M., Rodgers Jr., J.H., English, W.R., 2010. Campus parking lotstormwater runoff: physicochemical analyses and toxicity tests using Ceriodaphniadubia and Pimephales promelas. Chemosphere 79, 561–569.
Mikkelsen, P.S., Weyer, G., Berry, C., Waldent, Y., Colandini, V., Poulsen, S., et al., 1994. Pol-lution from urban stormwater infiltration. Water Sci. Technol. 29, 293–302.
Minervini, W.P., 2008. Discussion of: characteristics of highway stormwater runoff. WaterEnviron. Res. 80, 766–768.
Minervini, W.P., 2010. Discussion of: characteristics of highway stormwater runoff in LosAngeles: metals and polycylic aromatic hydrocarbons. Water Environ. Res. 82, 861–862.
Moores, J., Pattinson, P., Hyde, C., 2010. Enhancing the Control of Contaminants from NewZealand's Roads: Results of a Road Runoff Sampling Programme. National Institute ofWater and Atmospheric Research Ltd., Auckland, pp. 1–161.
Mosley, L.M., Peake, B.M., 2001. Partitioning of metals (Fe, Pb, Cu, Zn) in urban run‐offfrom the Kaikorai Valley, Dunedin, New Zealand. N. Z. J. Mar. Freshw. Res. 35,615–624.
Moxness, K.L., 1986. Characteristics of urban freeway runoff— Interstate 94, Minneapolis,Minnesota. Report #FHWA/MN-86/02. Minnesota Department of Transportation,Federal Highway Administration.
Moy, F., Crabtree, R.W., 2003. The long termmonitoring of pollution from highway runoff.Final Report, M4/Brinkworth Brook — Site Report, pp. 1–142.
Moy, F., Crabtree, R.W., Simms, T., 2003. The long termmonitoring of pollution from high-way runoff. Final report, pp. 1–183.
Mungur, A.S., Shutes, R.B.E., Revitt, D.M., House, M.A., 1995. An assessment of metalremoval from highway runoff by a natural wetland. Water Sci. Technol. 32,169–175.
Muschack, W., 1990. Pollution of street run-off by traffic and local conditions. Sci. TotalEnviron. 93, 419–431.
Nadler, A., Meißner, E., 1999. Zwischenbericht Entwicklungsvorhaben: Versickerungdes Niederschlagswassers von befestigten Verkehrsflächen. Bericht über dieBetriebsjahre Oktober 1996 bis Oktober 1998. Bayerisches Landesamt fürWasserwirtschaft, pp. 1–46 (in German).
Nadler, A., Meißner, E., 2007. Versickerung des Niederschlagswassers von befestigtenVerkehrsflächen, Abschlussbericht, Entwicklungsvorhaben, Oktober 1996–Oktober2005. Bayerisches Landesamt für Umwelt, pp. 1–72 (in German).
Nason, J., Bloomquist, D., Sprick, M., 2012. Factors influencing dissolved copper concentra-tions in Oregon highway storm water runoff. J. Environ. Eng. 138, 734–742.
Novotny, V., Muehring, D., Zitomer, D.H., Smith, D.W., Facey, R., 1998. Cyanide and metalpollution by urban snowmelt: impact of deicing compounds. Water Sci. Technol. 38,223–230.
Nowakowska-Blaszczyk, A., Zakrzewski, J., 1996. The sources and phases of increase ofpollution in runoff waters in route to receiving waters. 7th International Conferenceon Urban Storm Drainage, Hannover/Germany, pp. 49–53.
Opher, T., Friedler, E., 2010. Factors affecting highway runoff quality. Urban Water J. 7,155–172.
Pagotto, C., Legret, M., Le Cloirec, P., 2000. Comparison of the hydraulic behaviour and thequality of highway runoff water according to the type of pavement. Water Res. 34,4446–4454.
Paulson, C., Amy, G., 1993. Regulating metal toxicity in stormwater. Water Environ.Technol. 44–49.
Pick, V., Fettig, J., Miethe, M., Strüber, K., 2002. Dezentrale Behandlung desNiederschlagsabflusses von Verkehrsflächen in einer mehrstufigen Schachtanlage.KA Abwasser, Abfall 49, pp. 312–320 (in German).
Pitt, R., Field, R., Lalor, M., Brown, M., 1995. Urban stormwater toxic pollutants: assess-ment, sources, and treatability. Water Environ. Res. 67, 260–275.
Preciado, H.F., Li, L.Y., 2005. Evaluation of metal loadings and bioavailability in air, waterand soil along two highways of British Columbia, Canada. Water Air Soil Pollut. 172,81–108.
Prestes, E.C., dos Anjos, V.E., Sodré, F.F., Grassi, M.T., 2006. Copper, lead and cadmiumloads and behavior in urban stormwater runoff in Curitiba, Brazil. J. Braz. Chem.Soc. 17, 53–60.
Revitt, D.M., Morrison, G.M., 1987. Metal speciation variations within separatestormwater systems. Environ. Technol. Lett. 8, 373–380.
Robien, A., Striebel, T., Herrmann, R., 1997. Modeling of dissolved and particle-bound pol-lutants in urban street runoff. Water Sci. Technol. 36, 77–82.
Roeva, N.N., Rovinskii, F.Y., Kononov, E.Y., 1996. Special features of the behavior of heavymetals in various natural environments. J. Anal. Chem. 51, 384–397.
Root, R.A., 2000. Lead loading of urban streets by motor vehicle wheel weights. Environ.Health Perspect. 108, 937–940.
Rushton, B., 2001. Low impact parking lot design reduces runoff and pollutant loads.WRPMD'99pp. 172–179.
Rutz, F., 2009. Waldeggstrasse, Strassenabwasserbehandlungsanlage SABA Ristet.Gesamtbericht über Erfolgskontrollenpp. 1–23 (in German).
Rutz, F., 2012. Strassenabwasserbehandlung, Funktionskontrollen bei denRetentionsfilterbecken für die A1. pp. 1–22 (in German).
Saget, A., Chebbo, G., Bertrand-Krajewski, J.-L., 1996. The first flush in sewer systems.Water Sci. Technol. 33, 101–108.
Sansalone, J.J., 2002. Physical and chemical nature of urban storm water runoff. In: Fileds,R., Sullivan, D. (Eds.), Management of Wet-weather Flows in the Watershed. CRCPress, Bca Raton, Fla, pp. 43–66.
Sansalone, J.J., Buchberger, S.G., 1996. Characterization of solid and metal element distri-butions in urban highway stormwater. 7th International Conference on Urban StormDrainage, Hannover/Germany, pp. 253–368.

919M. Huber et al. / Science of the Total Environment 541 (2016) 895–919
Sansalone, J.J., Buchberger, S.G., 1997a. Characterization of solid and metal element distri-butions in urban highway stormwater. Water Sci. Technol. 36, 155–160.
Sansalone, J.J., Buchberger, S.G., 1997b. Partitioning and first flush of metals in urban road-way storm water. J. Environ. Eng. 123, 134–143.
Sansalone, J.J., Glenn, D.W., 2002. Accretion of pollutants in snow exposed to urban trafficand winter storm maintenance activities. I. J. Environ. Eng. 128, 151–166.
Sansalone, J.J., Buchberger, S.G., Al-Abed, S.R., 1996. Fractionation of heavymetals in pave-ment runoff. Sci. Total Environ. 189–190, 371–378.
Sansalone, J.J., Hird, J.P., Cartledge, F.K., Tittlebaum, M.E., 2005. Event-based stormwaterquality and quantity loadings from elevated urban infrastructure affected by trans-portation. Water Environ. Res. 77, 348–365.
Scheiwiller, E., 2008. Schadstoffabschwemmungen: Am Beispiel von Hochleistungsstraßen.gwa. pp. 539–546 (in German).
Scheiwiller, E., 2014. SABA Pfaffensteig (Bümpliz), Probebetrieb und Leistungsprüfungder SABA mit technischem Filter im Jahr 2012/13. pp. 1–14 (in German).
Schueler, T., 2000. Stormwater pollution source areas isolated in Marquette, Michigan.Watershed Prot. Tech. 3, 609–612.
Schütte, M., 1997. Messungen der Regenwasserverschmutzung im Einzugsgebiet desBiesdorfer Baggersees. Ingenieurgesellschaft für Stadthydrologie, Hannover (inGerman).
SEH, 2010. Untersuchungen Straßenablauffilter INNOLET, Juli 2008–Februar 2010.pp. 1–29 (in German).
Shelley, P.E., Driscoll, E.D., Sartor, J.D., 1987. Probabilistic characterization of pollutant dis-charges from highway stormwater runoff. Sci. Total Environ. 59, 401–410.
Shinya, M., Tsuchinaga, T., Kitano, M., Yamada, Y., Ishikawa, M., 2000. Characterization ofheavy metals and polycyclic aromatic hydrocarbons in urban highway runoff. WaterSci. Technol. 42, 201–208.
Shinya, M., Tsuruho, K., Konishi, T., Ishikawa, M., 2003. Evaluation of factors influencingdiffusion of pollutant loads in urban highway runoff. Water Sci. Technol. 47, 227–232.
Shinya, M., Funasaka, K., Katahira, K., Ishikawa, M., Matsui, S., 2006. Lead isotope ratios inurban road runoff. Water Sci. Technol. 53, 185–191.
Smullen, J.T., Shallcross, A.L., Cave, K.A., 1999. Updating the U.S. nationwide urban runoffquality data base. Water Sci. Technol. 39, 9–16.
Stachel, B., Tegge, K.-T., Jantzen, E., 2007. Schadstoffe in Hamburger Autobahnabwässernund ihre Einschätzung unter Berücksichtigung der EG-Wasserrahmenrichtlinie (EG-WRRL). Straße und Autobahn 58, pp. 326–333 (in German).
Stagge, J.H., Davis, A.P., Jamil, E., Kim, H., 2012. Performance of grass swales for improvingwater quality from highway runoff. Water Res. 46, 6731–6742.
Steiner, M., Goosse, P., 2007. Monitoring SABA Attinghausen, 1. Zwischenbericht. pp. 1–25(in German).
Steiner, M., Goosse, P., 2008. Monitoring SABA Attinghausen, 3. Zwischenbericht. pp. 1–14(in German).
Steiner, M., Goosse, P., 2009. Monitoring SABA Attinghausen, Schlussbericht. pp. 1–47 (inGerman).
Steiner, M., Goosse, P., 2011a. Leistungsüberwachung der SABA Hagnau, 3. Zwischenbericht.pp. 1–7 (in German).
Steiner, M., Goosse, P., 2011b. Leistungsüberwachung, SABA Chlosterschür, SABANeuwiesen. pp. 1–15 (in German).
Steiner, M., Langbein, S., Boller, M., 2006. Bankette bestehender Straßen, Untersuchungder Versickerung von Straßenabwasser über Straßenrandstreifen an einerbestehenden Straße. pp. 1–51 (in German).
Steiner, M., Goosse, P., Hermann, E., Boller, M., 2008. Leistungsbeurteilung der SABAAttinghausen, Halbzeit des Monitorings. gwa. pp. 531–538 (in German).
Steiner, M., Goosse, P., Rutz, F., Brodmann, R., Pazeller, A., 2010.Straßenabwasserbehandlungsverfahren, Stand der Technik. Bundesamt für StraßenASTRA. Bundesamt für Umwelt BAFU, Bern, pp. 1–130 (in German).
Stenstrom, M.K., Kayhanian, M., 2005. First Flush Phenomenon Characterization. Univer-sity of California, pp. 1–69.
Steuer, J., Selbig, W., Hornewer, N.J., Prey, J., 1997. Sources of contamination in an urbanbasin in Marquette, Michigan and an analysis of concentrations, loads, and data qual-ity. USGS Water-Resources Investigations Report 97-4242, pp. 1–25.
Stotz, G., 1987. Investigations of the properties of the surface water run-off from federalhighways in the FRG. Sci. Total Environ. 59, 329–337.
Stotz, G., Krauth, K., 1994. The pollution of effluents from pervious pavements of an ex-perimental highway section: first results. Sci. Total Environ. 146–147, 465–470.
Strecker, E.W., Driscoll, E.D., Shelley, P.E., Gaboury, D.R., Sartor, J.D., 1990. The U.S. federalhighway administrations receiving water impact methodology. Sci. Total Environ. 93,489–498.
Striebel, T., Daub, J., Herrmann, R., 1994. A sampling device for measuring physical andchemical characteristics of urban street runoff. Sci. Total Environ. 146–147, 515–523.
62
Terzakis, S., Fountoulakis, M.S., Georgaki, I., Albantakis, D., Sabathianakis, I., Karathanasis,A.D., et al., 2008. Constructed wetlands treating highway runoff in the central Medi-terranean region. Chemosphere 72, 141–149.
Thomson, N.R., McBean, E.A., Snodgrass, W., Monstrenko, I.B., 1997. Highway stormwaterrunoff quality: development of surrogate parameter relationships. Water Air SoilPollut. 94, 307–347.
Tiefenthaler, L.L., Schiff, K.C., Bay, S.M., 2001. Characteristics of parking lot runoff pro-duced by simulated rainfall. Technical Report 343, pp. 1–67.
Timperley, M., Williamson, B., Mills, G., Horne, B., Hasan, M.Q., 2005. Sources and Loads ofMetals in Urban Stormwater. National Institute of Water & Atmospheric ResearchLtd., pp. 1–80.
Tromp, K., Lima, A.T., Barendregt, A., Verhoeven, J.T.A., 2012. Retention of heavy metalsand poly-aromatic hydrocarbons from road water in a constructed wetland and theeffect of de-icing. J. Hazard. Mater. 203–204, 290–298.
Uhl, M., Kasting, U., 2002. Verschmutzung des Niederschlagabflusses in Misch- undTrennsystemen und von Straßen. Wasser und Abfall 3, pp. 14–22 (in German).
Valtanen, M., Sillanpää, N., Setälä, H., 2014. The effects of urbanization on runoff pollutantconcentrations, loadings and their seasonal patterns under cold climate. Water AirSoil Pollut. 225, 1–16.
Van Bohemen, H.D., Van De Laak, W.H.J., 2003. The influence of road infrastructure andtraffic on soil, water, and air quality. Environ. Manag. 31, 0050–0068.
Van Dam, C.H., Scholten, M., de Ven FH, Van, 1986. Urban water quality in Lelystad: rain-fall and runoff from selected surfaces. Urban Storm Water Quality and Ecological Ef-fects Upon Receiving Waters, Wageningenpp. 25–37.
von Ballmoos, M., 2007. A28a — Umfahrung Klosters, WirkungskontrolleStraßenabwasserbehandlungsanlage (SABA). Concepta AG, Tiefbauamt des KantonsGraubündenpp. 1–17 (in German).
von Uexküll, O., Skerfving, S., Doyle, R., Braungart, M., 2005. Antimony in brake pads—acarcinogenic component? J. Clean. Prod. 13, 19–31.
Wanielista, M.P., Yousef, Y.A., 1993. Stormwater Management. John Wiley and Sons, Inc.,New York, USA.
Ward, N.I., 1990. Multielement contamination of British motorway environments. Sci.Total Environ. 93, 393–401.
Waschbusch, R.J., 1996. U.S. Geological Survey written commun., cited in Steuer et al.,1997.
Waschbusch, R.J., 2003. Data and Methods of a 1999–2000 Street Sweeping Study on anUrban Freeway in Milwaukee County. U.S. Department of the Interior, U.S. GeologicalSurvey, Wisconsin, pp. 1–13.
Wei, C., Morrison, G.M., 1994. Platinum analysis and speciation in urban gullypots. Anal.Chim. Acta 284, 587–592.
Westerlund, C., Viklander, M., 2006. Particles and associated metals in road runoff duringsnowmelt and rainfall. Sci. Total Environ. 362, 143–156.
Westerlund, C., Viklander, M., Bäckström, M., 2003. Seasonal variations in road runoffquality in Luleå, Sweden. Water Sci. Technol. 48, 93–101.
Wilson, D., 2006. Highway 520 Bridge StormWater Runoff Study. King County Water andLand Resources Division, Department of Natural Resources and Parks, pp. 1–66.
Windhofer, G., Clara, M., Scheffknecht, C., 2012. Emissionen anthropogener Spurenstoffevon Verkehrsflächen. Gewässerschutzanlagen für Verkehrsflächen, Wienpp. 1–24(in German).
Wu, J., Allan, C., Saunders, W., Evett, J., 1998. Characterization and pollutant loading esti-mation for highway runoff. J. Environ. Eng. 124, 584–592.
Wüst, W., Kern, U., Herrmann, R., 1994. Street wash-off behaviour of heavy metals,polyaromatic hydrocarbons and nitrophenols. Sci. Total Environ. 146–147, 457–463.
Xanthopoulos, C., Hahn, H.H., 1995. Neuere Untersuchungen zur Verschmutzung desRegen- und Mischwasserabflusses. WasserAbwasserPraxis 4, pp. 40–44 (in German).
Young, G.K., Stein, S., Cole, P., Kammer, T., Graziano, F., Bank, F., 1996. Evaluation andMan-agement of Highway Runoff Water Quality. Office of Environment and Planning,FHWA, Washington, D.C.
Yousef, Y.A., Wanielista, M.P., Hvitved-Jacobsen, T., Harper, H.H., 1984. Fate of heavymetals in stormwater runoff from highway bridges. Sci. Total Environ. 33, 233–244.
Yu, A.H., Zhao, C., 2012. Evaluation on the highway asphalt pavement runoff with the graycorrelation model. Procedia Environ. Sci. 13, 1827–1835.
Zhang, Q., Wang, X., Hou, P., Wan,W., Ren, Y., Ouyang, Z., et al., 2013. The temporal chang-es in road stormwater runoff quality and the implications to first flush control inChongqing, China. Environ. Monit. Assess. 185, 9763–9775.
Zhao, J., Liu, S., Qiu, L., Ying, C., 2001. The characteristics of expressway runoff quality andpollutants discharge rule. China Environ. Sci. 21, 445–448.
896 gwf-Wasser | Abwasser 9/2015
Belastung von Verkehrsflächenabflüssen mit Schwermetallen – ein europäischer VergleichMaximilian Huber, Antje Welker und Brigitte Helmreich
Regenwasserbewirtschaftung, Autobahnen, Einflussfaktoren, gelöste Schwermetalle, Parkplätze, Straßen
Verkehrsflächenabflüsse können mit einer Reihe von organischen und anorganischen Stoffen belastet sein. Zu den anorganischen Stoffen zählen insbesondere die Schwermetalle Zink, Kupfer, Blei, Nickel, Chrom und Cadmium. Die Höhe der Belastung hängt von ortsspezifischen Faktoren, die sich aus den kontinuierlichen Eigenschaften des Einzugsgebiets und den klimatischen Bedingungen zusammensetzen, und methodikspezifischen Einflussfaktoren ab. Diese bestimmen auch die ermittelte Verteilung der Schwermetalle zwischen der gelösten und der partikulären Phase. Diese Unterscheidung ist besonders für die Beurteilung der Toxizität des Niederschlagsabflusses sowie für dessen Behandlung in weitergehenden Behandlungsanlagen entscheidend. Im vorliegenden Beitrag werden historische Trends sowie das Aufkommen und die Verteilung von Schwermetallen in Verkehrsflächenabflüssen der Kategorien Parkplätze, Straßen und Autobahnen in Europa zusammengestellt.
Heavy Metal Pollution of Traffic Area Runoff – a European Review
Traffic area runoff waters are polluted by several organic and inorganic substances. The most concerning inorganic substances are the heavy metals zinc, copper, lead, nickel, chromium and cadmium. The discharge concentration in traffic area runoff waters depends on sitespecific factors, which are composed of fixedsite conditions of the drainage area and climatic conditions, and methodspecific influencing factors. These factors also determine the partitioning of heavy metals between the dissolved and the particulate phase. This distinction is relevant for the evaluation of the runoff toxicity and for its management in twostage treatment plants. Historical trends and the impact of the traffic area categories parking lots, roads and highways on European runoff concentrations are described and evaluated.
1. EinleitungUnter dem Begriff Verkehrsflächenabflüsse werden niederschlagsbedingte Abflüsse von Flächen zusammengefasst, die höchst unterschiedliche Nutzungen aufweisen. Diese reichen vom Gehweg, über Parkplätze und Anliegerstraßen bis hin zu Autobahnen [1]. Die meisten Mess programme befassen sich mit den Abflüssen von Autobahnen, wobei auch die Abflüsse anderer Verkehrsflächenkategorien aufgrund ihrer deutlich höheren Flächenanteile in urbanen Gebieten für die Niederschlagswasserbewirtschaftung relevant sind. So können Parkplätze in Gewerbe sowie Industriegebieten einen Anteil von bis zu 46 % an den urbanen Einzugsgebieten haben und der
Anteil der Straßen kann 10–15 % der gesamten Stadtfläche betragen [2].
Eine Primärbelastung der Verkehrsflächenabflüsse sind die Inhaltsstoffe der Niederschläge, die aus der Atmosphäre ausgewaschen werden. Beim Auftreffen auf Oberflächen (befestigt und unbefestigt) und während des Abfließens von diesen Oberflächen nimmt der Niederschlag eine Vielzahl weiterer Stoffe in unterschiedlicher Konzentration auf. Diese Verschmutzung wird als Sekundärbelastung bezeichnet. Entsprechend der räumlichen und zeitlichen Variabilität ist das Spektrum der möglichen stofflichen Verunreinigungen der Verkehrsflächenabflüsse sowohl hinsichtlich der Art der auftretenden Stoffe als auch bezogen auf das Ausmaß
FACHBERICHTE Regenwasserbewirtschaftung
63

897gwf-Wasser | Abwasser 9/2015
Regenwasserbewirtschaftung FACHBERICHTE
der Belastung breit. Da viele der aufkommensrelevanten Stoffe mehr als eine Quelle aufweisen, sind die Hauptquellen der Verunreinigungen nur schwer bestimmbar. Dennoch ist eine Beschreibung der kontinuierlichen Eigenschaften des Einzugsgebietes (z. B. Querschnitt und Unterhalt der Straße) und der klimatischen Bedingungen (z. B. Dauer und Höhe des Regens) zur Quantifizierung der ortsspezifischen Einflüsse wichtig [3].
Neben den ortsspezifischen Einflüssen unterliegen die Ergebnisse auch methodikspezifischen Faktoren. Diese umfassen die Probennahme, die Probenaufbereitung bzw. Analytik sowie die Ergebnisauswertung, welche je nach Randbedingung des Messprogramms die Abbildung der realen Verhältnisse ermöglichen [4].
Die wichtigsten Stoffe in Verkehrsflächenabflüssen sind neben den Schwermetallen (z. B. Blei, Kupfer und Zink) die Bestandteile aus Auftausalzen (z. B. Chlorid) sowie orga nische Verbindungen (z. B. Mineralölkohlenwasserstoffe, polyzyklische aromatische Kohlenwasserstoffe und Methyl tertbutylether) [5, 6]. Anhand von Messprogrammen kann die Aufkommensrelevanz dieser Stoffe in Verkehrsflächenabflüssen belegt werden.
Aus der Vielzahl an Stoffen werden im Folgenden aufgrund ihrer Aufkommens und Wirkungsrelevanz nur die Schwermetalle behandelt. Neben der Höhe der Gesamtschwermetallkonzentrationen ist auch eine Betrachtung der Fraktionierung der Schwermetalle wichtig, da diese sowohl für die Bestimmung der Toxizität des Abflusses [7, 8, 9] als auch für dessen Behandelbarkeit in technischen Anlagen, welche sowohl die gelösten als auch partikulären Schwermetalle entfernen sollten [10], entscheidend ist.
Die Hypothese dieses Beitrags ist, dass mithilfe der Auswertung der Ergebnisse einer Vielzahl von Messprogrammen anhand von Verkehrsflächenkategorien Rückschlüsse auf die Zusammensetzung der Abflüsse trotz verschiedener Randbedingungen (orts und methodikspezifische Faktoren) gezogen werden können. Ziel dieses Beitrags ist es daher, die orts und methodikspezifischen Faktoren zu benennen, welche einen Einfluss auf die Höhe und Art der Belastung der Verkehrsflächenabflüsse haben, sowie das Auftreten und die Fraktionierung der Schwermetalle für verschiedene Verkehrsflächenkategorien zu beschreiben. Ferner werden historische Trends für die wichtigsten Schwermetalle aufgezeigt und es wird eine Einordnung der Verschmutzung europäischer Verkehrsflächenabflüsse im Vergleich zu anderen Kontinenten vorgenommen.
2. MethodikFür diesen Beitrag wurde der Fokus auf die Erfassung und Auswertung europäischer Daten zu Verkehrsflächenabflusskonzentrationen gelegt. Diese entstammen einer von den Autoren dieses Beitrags erstellten Datenbank mit
nationalen und internationalen Studien, die 294 einzelne Datensätze umfasst. Diese enthält neben den Schwermetallkonzentrationen weitere Stoffe sowie Informationen über die Probennahmeorte, die Analysen und Auswertungen. Dabei wird jeder Probennahmeort, auch wenn er mehrmals publiziert wurde, als ein Datensatz betrachtet. Ausnahmen sind die Orte, an denen zwischen den Messprogrammen viele Jahre (meist verbunden mit einer Änderung der durchschnittlichen täglichen Verkehrsstärke (DTV), des Straßenunterhalts, etc.), liegen bzw. konstruktive Änderungen am Straßenquerschnitt vorgenommen wurden, welche einen Einfluss auf die Ergebnisse haben (z. B. Erneuerung der konventionellen Deckschicht mit einem offenporigen Asphalt). Insgesamt konnten so 131 Studien ausgewertet werden. Bei der Datensammlung wurde immer zwischen gesamten, partikulären und gelösten Konzentrationen unter schieden. Ferner wurde zwischen der Angabe des arithmetischen Mittelwerts (im Folgenden als Mittelwert bezeichnet) und des Medians differenziert. Bei fehlenden Mittelungen wurden diese nach Möglichkeit aus allen Einzelergebnissen berechnet, sodass für viele Datensätze sowohl die Mittelwerte als auch Mediane erzeugt wurden.
Die Datenbank umfasst Messprogramme seit den 1970erJahren. Um aus diesen Daten auch historische Trends aufzeigen zu können, wurden die Konzentrationen zusammen mit den entsprechenden Untersuchungszeiträumen der Messprogramme abgespeichert und verwendet. Falls der Untersuchungszeitraum in einer Studie nicht angegeben war, wurde das Jahr, an dem der Zeitschriftenbeitrag eingereicht wurde, in der Datenbank hinterlegt.
Aus der Vielzahl der Stoffe, die in der Datenbank enthalten sind, werden in diesem Beitrag folgende Elemente ausgewählt, welche in den Tabellen 1 und 2 mit ihrem Symbol abgekürzt werden: Aluminium (Al), Arsen (As), Barium (Ba), Cadmium (Cd), Kobalt (Co), Chrom (Cr), Kupfer (Cu), Eisen (Fe), Quecksilber (Hg), Mangan (Mn), Molybdän (Mo), Nickel (Ni), Blei (Pb), PlatinumGruppenElemente (PGE; bestehen aus Palladium (Pd), Platin (Pt) und Rhodium (Rh)), Antimon (Sb), Selen (Se), Silicium (Si), Zinn (Sn), Titan (Ti), Vanadium (V), Wolfram (W) und Zink (Zn).
Da verschiedene Kategorien von Verkehrsflächenabflüssen untersucht wurden, wurden sämtliche Daten für die Auswertung in fünf Kategorien eingeteilt: Parkplätze, Straßen der Kategorie 1 (DTV ≤ 5000), Straßen der Kate gorie 2 (5000 < DTV ≤ 15 000), Straßen der Kategorie 3 (DTV > 15 000) sowie Autobahnen. Wenn keine Angabe der DTV verfügbar war, wurde die Kategorisierung anhand der Beschreibung des Probennahmeortes vorgenommen, z. B. wurden Anliegerstraßen in die Kategorie 1 eingruppiert.
Für die statistische Auswertung und das Erstellen der Bilder wurde das Programmpaket SPSS 22 von IBM verwendet. Als Darstellung wurden BoxWhiskerPlots gewählt, bei denen das obere bzw. untere Ende der Box dem oberen bzw. unteren Quartil entspricht und der Strich in der Box
64

898 gwf-Wasser | Abwasser 9/2015
FACHBERICHTE Regenwasserbewirtschaftung
Tabelle 1: Übersicht der europäischen Messprogramme zur Charakterisierung von Autobahnabflüssen mit einer DTV ≤ 30 000; Fraktionen: t = gesamt, d = gelöst, p = partikulär; Elemente in kursiv unterhalb der Bestimmungsgrenze – diese ist, sofern veröffentlicht, in Klammern in µg/L angegeben
Land OrtUntersuchungszeit-
raumDTV
Ereignis-anzahl
Fraktion Elemente Literatur
CHE Uri, Attinghausen, N2 08.03.2007–06.12.2008 21 000 17 t Cd, Co, Cr, Cu, Fe, Mo, Ni, Pb, Sb, Zn [65, 66, 67]
DEU Saarland, Illingen, A1 – 25 470 – t Al, Cd, Cr, Cu, Fe, Hg, Ni, Pb, Zn [68]
DEU Saarland, Nonnweiler, A1 – 15 360 – t Al, Cd, Cr, Cu, Fe, Hg, Ni, Pb, Zn [68]
FRALoireAtlantique, Nantes, A11,
Brücke28.03.1995–26.02.1996;09.06.1997–09.11.1997
12 000 74 d, t Cd, Cu, Pb, Zn [43, 69]
GBR Cowley, A417 06.1998–07.1999 23 650 10 d, t Al, Cd, Cr, Cu, Ni, Pb, Pd, Pt (< 0,15), Zn [5]
GBR Cumbria, BurtoninKendal, M6 01.12.1980–28.02.1982 30 000 10 d, p Cd, Cu, Fe, Mn, Pb [70]
IRL Dublin, M4, Maynooth 12.2003–08.2005 29 140 42 d, t Cd, Cu (< 30), Pb (< 100), Zn [71]
IRL Dublin, M4, Maynooth 12.2003–08.2005 29 140 42 d, t Cd, Cu, Pb (< 100), Zn [71]
IRL Dublin, M7, Kildare 12.2003–08.2005 25 760 42 d, t Cd, Cu, Pb, Zn [71]
IRL Dublin, M7, Monasterevin 12.2003–08.2005 18 430 42 d, t Cd, Cu, Pb (< 100), Zn [71]
ITA SS73/bis, km 78 23.08.2002+24.10.2002 18 440 2 d, p Al, Cu, Fe, Pb, Zn [26]
ITA SS73/bis, km 107 23.08.2002+24.10.2002 18 440 2 d, p Al, Cu, Fe, Pb, Zn [26]
NOR Jessheim, E6 17.09.1980–13.05.1982 8000 26 t Cd, Cr, Cu, Fe, Hg, Ni, Pb, Zn [72]
PRT Vila Real, IP4 – 6000 10 t Cd (< 1), Cr (< 1), Cu, Pb, Zn [35]
SWE Göteborg, E20 26.05.1992 – 1 d, t Pt [73]
SWE Norsholm, E4 06.1998–06.1999 15 600 12 d, t Al, Cd, Co, Cu, Fe, Mn, Pb, Si, W, Zn [61]
SWE Svaneberg, E20 06.1998–06.1999 7400 14 d, t Al, Cd, Co, Cu, Fe, Mn, Pb, Si, W, Zn [61]
Tabelle 2: Übersicht der europäischen Messprogramme zur Charakterisierung von Autobahnabflüssen mit einer DTV > 30 000; Fraktionen: t = gesamt, d = gelöst, p = partikulär; Elemente in kursiv unterhalb der Bestimmungsgrenze – diese ist, sofern veröffentlicht, in Klammern in µg/L angegeben
Land OrtUntersuchungszeit-
raumDTV
Ereignis-anzahl
Fraktion Elemente Literatur
AUTNiederösterreich, Hinterbrühl, A21
04.11.2011–08.12.2011 42 000 4 tCd, Cr, Cu, Fe, Mn, Mo, Ni, Pb, Pd, Pt,
Rh, Sb, V, Zn[74]
AUTSalzburger Land, A1,
Schwarzenbergkaserne12.2001–04.2003 > 60 000 29 t
Al, Cd (< 1), Co (< 2), Cr, Cu, Fe, Ni, Pb, Zn
[58]
AUT Salzburger Land, A1, Baulos West 12.2001–04.2003 > 60 000 29 t Al, Cd, Co (< 2), Cr, Cu, Fe, Ni, Pb, Zn [58]
AUT Salzburger Land, A1, Messe 12.2001–04.2003 > 60 000 29 t Al, Cd (< 1), Co (< 2), Cr, Cu, Fe, Ni, Pb, Zn [58]
AUT Tirol, A13 – – – t Cu, Pb, Zn [52]
AUT Tirol, A13, Mautstelle – – – t Cu, Pb, Zn [52]
AUT Wien, Kaisermühlen, A23 12.2012 > 240 000 1 t Ba, Cd, Cr, Cu, Ni, Pb, Ti, V, Zn [51]
AUT – – – 45 t Cd (< 5), Cr (< 10), Cu, Ni (< 1), Pb (< 10), Zn [75]
CHEAargau, Wettingen, N1, Chlosterschür
24.08.2010–10.04.2012109 000–120 000
7 t Cu, Zn [76, 77]
CHEAargau, Würenlos,
N1, Neuwiesen15.06.2011–02.06.2012
106 000–120 000
3 t Cu, Zn [77]
CHEBaselLandschaft,
Birsfelden, N2, Hagnau01.02.2008–31.12.2010 > 120 000 43 t Cu, Zn [78, 79]
CHE Bern, Allmendingen, N6 2006–2007 59 000 – d, t Cd (< 0,5), Cr, Cu, Pb, Zn [16]
CHE Bern, Bümpliz, N12, Pfaffensteig 06.03.2012–17.04.2013 38 985 – t Cu, Zn [80]
CHE Bern, Mattstetten, N1 2006–2009 74 000 – d, t Cd (< 0,5), Cr, Cu, Pb, Sb, Zn [16]
CHE Zürich, Rossberg, N1 01.05.1976–30.04.1977 72 000 – t Cd, Cu, Pb, Zn [81]
CHEZürich, Winterthur, N1,
Chrebsbachknie12.08.1996–14.11.2000 60 000 > 10 d, t Cd, Cr, Cu, Ni, Pb, Zn
[82, 83, 84, 85]
DEUBadenWürttemberg,
HeilbronnObereisesheim, A602.1979–07.1979 47 000 48 t Cd, Cr, Cu, Fe, Pb, Zn [36]
▶ ▶
65

899gwf-Wasser | Abwasser 9/2015
Regenwasserbewirtschaftung FACHBERICHTE
Land OrtUntersuchungszeit-
raumDTV
Ereignis-anzahl
Fraktion Elemente Literatur
DEUBadenWürttemberg,
Pleidesheim, A8102.1978–09.1978 41 000 53 t Cd, Cr, Cu, Fe, Pb, Zn [36]
DEUBadenWürttemberg,
Ulm/West, A8/B1005.1980–03.1981 52 100 44 t Cd, Cr, Cu, Fe, Pb, Zn [36]
DEUBadenWürttemberg,
Weinsberg, A604.1990–04.1991 34 675 t Cd, Cr, Cu, Fe, Pb, Zn [37]
DEU Berlin, A113 05.11.2006–16.08.2007 140 000 20 d, tAs, Cd, Co, Cr, Cu, Fe, Hg (< 0,1),
Mo, Ni, Pb, Sb, V, Zn[86]
DEU Berlin, A115 02.2008–03.2008 91 000 3 d, p Cd, Cr, Cu, Ni, Pb, Zn [53]
DEUHessen,
Frankfurt/Main, A309.1975–10.1977; 08.1978–08.1980
62 78590 000
> 6 d, tAs, Ba, Cd, Co (< 10), Cr, Cu, Fe, Hg (< 0,1), Mn, Mo (< 0,1), Ni, Pb,
Sb (< 0,2), Se (< 2), Sn, Ti, V, Zn[38]
DEUNordrheinWestfalen,
Bensberg, A42005–2007 71 220 82 t
Cd, Co (< 10), Cr (< 5), Cu, Fe, Mo (< 25), Ni (< 10), Pb (< 25), V (< 5), Zn
[18, 87]
DEUNordrheinWestfalen,
Gelsenkirchen, A206.1997–02.1999 61 061 20 d, t Cd, Cu, Pb, Zn [17]
DEUNordrheinWestfalen,
Gladbeck, A3106.1997–02.1999 39 021 25 d, t Cd, Cu, Pb, Zn [17]
DEUNordrheinWestfalen,
Haltern, A4306.1997–02.1999 – – d, t Cd, Cu, Pb, Zn [17]
DEUNordrheinWestfalen,
KölnOst, A311.08.2006–24.08.2007 156 000 20 d, t
As (< 10), Cd, Co (< 20), Cr, Cu, Fe, Hg (< 2), Mo (< 20), Ni, Pb, Sb (< 10), V, Zn
[86]
DEUNordrheinWestfalen,
KölnPoll, A412.07.1998–22.01.2000 > 50 000 33 d, t Cd, Cr (< 5), Cu, Hg, Ni (< 10), Pb, Zn [88]
DEUNordrheinWestfalen,
KölnPorz, A5912.07.1998–05.07.2000 > 50 000 29 d, t Cd, Cr, Cu, Hg, Ni (< 10), Pb, Zn [88]
DEUNordrheinWestfalen,
Meckenheim, A612005–2007 73 310 88 t
Cd, Co (< 10), Cr (< 5), Cu, Fe, Mo (< 25), Ni (< 10), Pb (< 25), V (< 5), Zn
[18, 87]
DEUNordrheinWestfalen,
Mülheim, A306.1997–02.1999 89 498 13 d, t Cd, Cu, Pb, Zn [17]
DEUNordrheinWestfalen,
Oberhausen, A4206.1997–02.1999 74 991 19 d, t Cd, Cu, Pb, Zn [17]
DEUNordrheinWestfalen,
Widdig, A5552005–2007 69 368 88 t
Cd, Co (< 10), Cr (< 5), Cu, Fe, Mo (< 25), Ni (< 10), Pb (< 25), V (< 5), Zn
[18, 87]
GBR Cumbria, BurtoninKendal, M6 12.04.1986–11.04.1987 37 600 7 d, p Cd, Cu, Pb [89]
GBR London, A406 03.1993–02.1994 – – t Cd, Cu, Pb, Zn [90]
GBRLondon, M25,
junctions 5 and 601.1997–02.1998 120 000 10 t
Cd, Co, Cr, Cu, Mn, Mo, Ni, Pb, Sb, V, Zn
[57]
GBRLondon, M25,
junction 901.1997–02.1998 140 000 10 t
Cd, Co, Cr, Cu, Mn, Mo, Ni, Pb, Sb, V, Zn
[57]
GBR Newbury, A34 05.2001–06.2002 37 192 10 d, t Al, Cd, Cr, Cu, Ni, Pb, Pd, Pt (< 0,15), Zn [5]
GBR Souldern Brook, M40 08.1999–10.2000 83 579 10 d, t Al, Cd, Cr, Cu, Ni, Pb, Pd, Pt (< 0,15), Zn [5]
GBR Weston on the Green, A34 09.2000–03.2002 64 953 10 d, t Al, Cd, Cr, Cu, Ni, Pb, Pd, Pt (< 0,15), Zn [5]
GBRWiltshire,
Brinkworth Brook, M417.12.1997–17.12.1998 70 830 10 d, t
Al, Cd (< 4), Cr (< 10), Cu, Ni (< 10), Pb (< 50), Pd (< 0,5), Pt, Zn
[63]
GBR Wiltshire, Swindon, M4 12.1998–03.2000 36 107 10 d, t Al, Cd, Cr, Cu, Ni, Pb, Pd, Pt (< 0,15), Zn [5]
GRC Crete, Hersonissos, E75 09.2006–08.2007 – 41 t Cu, Ni, Pb, Zn [91]
NLD Amsterdam, A7 07.1994–09.1995 53 000 6 d, t Cd, Cr, Cu, Ni, Pb, Zn [39]
NLD Amsterdam, A9 07.1994–09.1995 83 000 6 d, t Cd, Cr, Cu, Ni, Pb, Zn [39]
NLD Laren, A1 27.01.2003–05.09.2004 80 d, t Cd, Cr, Cu, Ni, Pb, Zn [92]
SWE Stockholm, E4, Brücke03.05.2005–26.08.2005; 14.12.2005–14.02.2006
108 300 9 d, t Al, Cd, Co, Cr, Cu, Fe, Mn, Ni, Pb, Zn [93]
66

900 gwf-Wasser | Abwasser 9/2015
FACHBERICHTE Regenwasserbewirtschaftung
dem Median. Die Länge der Whisker gibt das 1,5Fache des Interquartilsabstands (IQR) wieder. Ausreißer (>1,5Fache des IQR) werden mit kleinen Kreisen und Extremwerte (>3,0Fache des IQR) mit Sternen gekennzeichnet.
3. EinflussfaktorenDie Ergebnisse von Messprogrammen zur Qualität von Verkehrsflächenabflüssen hängen von einer Vielzahl von Einflussfaktoren ab, weshalb die in der Literatur dokumentierten Qualitätsdaten aus verschiedenen Messprogrammen eine extrem weite Streuung aufweisen [4]. Grundsätzlich lassen sich ortsspezifische und methodikspezifische Faktoren unterscheiden. Die ortsspezifischen Faktoren variieren nicht nur örtlich, sondern auch über die Zeit und beeinflussen somit die reale Verschmutzung des Oberflächenabflusses. Folglich lassen sich diese Faktoren in Eigenschaften des jeweiligen Einzugsgebietes (örtliche Varianz) sowie Witterungs und Klimaeinflüsse (zeitliche Varianz) unterscheiden. Dabei können die konstanten Eigenschaften des Einzugsgebietes in die drei Unterkategorien umgebende Landnutzung, Verkehrsflächeneigenschaften sowie Verkehrsgeschehen unterteilt werden.
Die erste Unterkategorie, Landnutzung, kann die Abflusskonzentrationen beeinflussen. Dies wurde beispielsweise für die beiden Kategorien städtisch und ländlich für amerikanische Autobahnabflüsse gezeigt [11, 12]. Eine weitere Kategorisierung (z. B. gewerblich, industriell, städtisch, ultrastädtisch und gemischt) ist nicht eindeutig, da deren Auslegung zwischen den einzelnen Messprogrammen variiert, und somit kann ein eindeutiger Zusammenhang zwischen diesen Kategorien und den Abflusskonzentrationen nicht gefunden werden.
Zu den Verkehrsflächeneigenschaften gehören neben Informationen zur Vegetation und Topographie Angaben
zum Straßenquerschnitt und den eingesetzten Materialien. Derzeit sind wenige Informationen zur Topographie (Einschnitt, Dammlage etc.), zur straßennahen Vegetation, zur Steigung/Neigung der Straße sowie dem Vorhandensein von Bordsteinkanten, Lärmschutzwänden und Leitplanken in den Studien wiedergegeben, obwohl diese einen Einfluss auf die Konzentrationen im Abfluss haben [13, 14, 15, 16]. Beispielsweise führen Lärmschutzwände zu einem Anstieg der Konzentrationen [17, 18] und auch durch Betonbarrieren können mehr Feststoffe während der Trockenperioden zurückgehalten werden, welche während eines anschließenden Regens mobilisiert werden können [19]. Ferner haben Geschwindigkeitsbeschränkungen, Ampelanlagen sowie Ein und Ausfahrten einen Einfluss auf die Abflusskonzentrationen, da durch das Bremsen und Beschleunigen ein höherer Reifen und Bremsabrieb sowie ein erhöhter Ausstoß an Abgasen induziert wird [20, 21, 22]. Dahingegen beschreiben die meisten Studien die Anzahl der Fahrstreifen, die Materialoberfläche der Verkehrsfläche und die Größe des Einzugsgebietes. Die Anzahl der Fahrstreifen in Verbindung mit der DTV hat Auswirkungen auf die Staugefahr, welche einen Einfluss auf die Abflusskonzentrationen hat [23, 24]. Als Material für die Deckschicht wurde in Europa meist Asphalt (n=44), aber auch Asphalt und Beton (n=9), Beton (n=7) und offenporiger Asphalt (n=6) untersucht. Dabei führt nur die Betondecke zu einer signifikanten Erhöhung des pHWerts in Verkehrsflächenabflüssen [25].
Das Verkehrsgeschehen umfasst die DTV, den Fahrzeugtyp, den Unterhalt der Straße sowie institutionelle Vorgaben. Obwohl einige Autoren die DTV als wichtigsten Einflussfaktor auf die Abflusskonzentrationen identifiziert haben [26, 27], ist die DTV oftmals nicht als bester Indikator für die Verschmutzung von Abflüssen geeignet, da sie als einzelne Variable nur teilweise die Abweichungen in den Konzentrationen zwischen verschiedenen Messorten beschreiben
Bild 1: Beispiele zweier Standorte in Deutschland zur Bestimmung der Verkehrsflächenabflusskonzentrationen urbaner Straßen (links: Wuppertal, rechts: München)
67

901gwf-Wasser | Abwasser 9/2015
Regenwasserbewirtschaftung FACHBERICHTE
kann [28]. Ferner ist bei der Angabe der DTV darauf zu achten, dass sich die Werte oft auf beide Fahrtrichtungen beziehen, obwohl nur eine beprobt wurde und eine Beeinflussung durch die andere Richtung ausgeschlossen werden kann. Zu den Fahrzeugtypen zählen zum einen die Anteile des Schwerlastverkehrs an der DTV und zum anderen das Alter und der Unterhalt der Fahrzeuge, welche zwischen einzelnen Ländern stark variieren können [14]. Der Unterhalt der Straßen umfasst unter anderem den Winterdienst und die Straßenreinigung, welche beide einen erheblichen Einfluss auf das Stoffspektrum haben können [23, 29]. Als institutionelle Vorgabe kann beispielsweise das Verbot bleihaltigen Benzins angesehen werden. Diese wird in Abschnitt 4.1 genauer beschrieben.
Zu den klimatischen Einflussfaktoren zählen die Trockendeposition, die vorhergehende Trockenperiode, die Regencharakteristik (Volumen, Intensität und Dauer), saisonale Effekte sowie Windturbulenzen. Der wichtigste dieser Faktoren, der die Abflusskonzentrationen beeinflusst, ist die vorhergehende Trockenperiode [13], während der Feststoffe auf der Straße und im Straßenrandbereich akkumulieren können. Reduziert wird die Akkumulation unter anderem durch die Straßenreinigung sowie durch Windverfrachtungen (z. B. Verwehungen aufgrund vorbeifahrender Fahrzeuge) [23]. Weiterhin ist ein allgemeiner Anstieg der Schwermetallkonzentrationen in den Wintermonaten aufgrund der durch Auftausalze bedingten Korrosion in Verbindung mit geringeren Regenintensitäten festzustellen [23].
Beispiele für die Unterschiede zwischen zwei urbanen Einzugsgebieten, deren Abflüsse regelmäßig beprobt wurden, sind in Bild 1 dargestellt. Während in Wuppertal die Straße anhand ihrer Steigung, der Vegetation, der Leitplanken aus Zink und der Nähe zu einem Kreuzungsbereich mit Blitzer gekennzeichnet ist, ist die Stelle in München deutlich stärker befahren (57 000 Kfz/d), hat eine erhöhte Staugefahr und mehr Fahrstreifen mit einer zusätzlichen Standspur. Gemeinsamkeiten der beiden Standorte stellen die Straßenlaternen sowie die teilerneuerten alten Fahrbahndecken aus Asphalt dar. Ferner ist Wuppertal mit die regenreichste Großstadt Deutschlands (jährliche Niederschlagshöhe: 1183 mm/a), wodurch sich die Niederschlagsmengen von denen in München (967 mm/a) unterscheiden. Folglich führen viele überlagernde Quellen und Einflussfaktoren, die die Belastung teils verstärken und teils reduzieren, zu einem unterschiedlichen Stoffaufkommen.
Als methodikspezifische Einflüsse gelten jene Randbedingungen des Messprogramms, die die Abbildung der realen Verhältnisse betreffen. Wichtige Teilschritte bei der Untersuchungsmethodik sind die Probennahme, die Probenaufbereitung bzw. Analytik sowie die Ergebnisauswertung. Bei der Probennahme gibt es zwei Arten (automatisch oder manuell), welche je nach Untersuchungsziel eingesetzt werden. Manuelle Probennahmen mit der
Hand werden besonders bei kurzen Beprobungen genutzt, wie sie zum Nachweis der Funktionsfähigkeit dezentraler Anlagen [30] oder im Rahmen der Voraussetzungen zur behandlungsfreien Einleitung verwendet werden [31], da sie einfach umsetzbar sind. Dahingegen eignen sich automatische Probennehmer (sowohl aktive als auch passive) besonders zur Erzeugung repräsentativer Mischproben, wobei diese aus mehreren Hundert Teilproben bestehen können [32]. Entscheidend dabei ist auch die Probennahmestrategie, wobei zwischen volumenproportional (n=36 − alle Daten zur Anzahl der Probennahmestrategie für Europa), zeitproportional (n=22), First Flush (n=12), Mischprobe (n=25) und Zufallsprobe (n=9) unterschieden wird. Dabei werden zeitproportionale Probennahmen sowohl zu festen Zeitintervallen als auch zu variablen Zeiten genommen. Bei letzterer erfolgen zu Beginn des Regenereignisses mehr Probennahmen in kürzeren Intervallen als im weiteren Verlauf des Ereignisses. Neben der Art und Strategie haben weitere Aspekte wie der Ort der Probennahme (Straßenrand vs. Ablaufrinne, mögliche Vorsedimentation), der Probennehmerschlauch (Klassierungseffekte, Verunreinigungen etc.), die Kühlung der Proben sowie die Schulung des Personals Einflüsse auf die Messergebnisse. Auch hat die Anzahl der beprobten Regenereignisse einen Einfluss auf die Ergebnisse. So werden bei der Beprobung ausgewählter Regenereignisse meist nur größere Ereignisse mit höheren Schadstoffbelastungen untersucht, sodass dies im Jahresvergleich zu einem überhöhten Mittelwert/Median führen kann.
Bei der Probenvorbereitung für die Bestimmung der Schwermetallkonzentrationen ist immer die Art des Probenaufschlusses entscheidend (z. B. Säureaufschluss, Königswasseraufschluss), da nicht jeder Aufschluss sämtliche Schwermetalle für die anschließende Analytik detektierbar macht. Ferner ist bei der Bestimmung der gelösten Anteile die Dauer zwischen Probennahme und Filtration entscheidend. Als Zeitspanne zwischen Probennahme und Filtration wird in der Literatur 1 h [33, 34], 2–3 h [35] sowie maximal 24 h genannt [24, 36, 37]. Ähnlich verhält es sich auch mit der Messung des pHWerts, welcher am besten binnen 15 Min nach Probennahme vor Ort gemessen werden sollte, da er sich aufgrund einer Gleichgewichtseinstellung der Stoffe in der Probe zügig ändern kann und damit auch den Anteil an gelösten und ungelösten Stoffen ändert.
Die größten möglichen Abweichungen zwischen Realität und Messwert treten somit bei der Probennahme und Probenvorbereitung auf, während die eigentliche Probenanalytik (z. B. Messung der Schwermetalle mittels Atomabsorptionspektrometrie) in der Regel geringere Schwankungen verursacht.
Bei der Ergebnisauswertung ist vor allem der Umgang mit Proben unterhalb der Bestimmungsgrenze ausschlaggebend. Diese werden je nach Autor gar nicht, mit der Hälfte der Bestimmungsgrenze sowie mit der ganzen Bestimmungsgrenze angesetzt. Auch unterscheidet sich
68

902 gwf-Wasser | Abwasser 9/2015
FACHBERICHTE Regenwasserbewirtschaftung
das Vorgehen dahingehend, ab welchem Anteil an nichtbestimmbaren Konzentrationen eine mittlere Konzentration angegeben wird. Aufgrund der verschiedenen Herangehensweisen können beispielsweise Fehler bei der Bestimmung des gelösten Anteils auftreten, wenn die gelösten Anteile sehr gering sind und nahe an der Bestimmungsgrenze liegen. Dies kann auch einen großen Einfluss auf berechnete Mediane und Mittelwerte haben. Außerdem werden häufig die Ergebnisse der Messprogramme nicht frach tgemittelt angegeben, für deren Berechnung eine verlässliche Messung des Abflussvolumens notwendig ist. Dabei ist zu beachten, dass frachtgewogene Mittelwerte nicht direkt mit arithmetischen Mittelwerten zu vergleichen sind.
4. Ergebnisse und Diskussion4.1 Historische EntwicklungenDie historischen Entwicklungen für die drei aufkommensrelevanten Schwermetalle Zink, Kupfer und Blei wurden seit den 1970erJahren bis heute anhand der Literaturdaten ausgewertet und sind in Bild 2 dargestellt. Dabei ist nur für Blei ein deutlicher Rückgang der Konzentrationen erkennbar, welcher mit institutionellen Vorgaben zusammenhängt.
Die Reduzierung der BleiKonzentrationen im Benzin begann beispielsweise in Deutschland im Jahr 1976, als die zulässige Konzentration im Benzin von 850 mg/L auf 150 mg/L reduziert wurde [38]. Nachdem in den 80erJahren aufgrund des Einsatzes von Katalysatoren vermehrt zusätzlich bleifreies Benzin an den Tankstellen angeboten wurde, begann auch in allen anderen Staaten Westeuropas bis spätestens 1986 die Reduzierung der zulässigen Blei Konzentrationen [39], sodass eine erhebliche Minimierung der Bleiquellen bis in die 90erJahre erzielt wurde. In fast allen Ländern der Europäischen Union sowie in der Schweiz
darf seit Anfang 2000 kein verbleites Motorenbenzin mehr verkauft werden. Als letztes dieser Länder verbot Italien im Januar 2002 den Verkauf bleihaltigen Benzins [26]. Weitere Quellen für Blei, wie Auswuchtgewichte in Felgen [40], wurden ebenfalls substituiert, sodass einhergehend mit dem Verbot zum Verkauf bleihaltigen Benzins dessen Konzentrationen in Verkehrsflächenabflüssen weiterhin abgenommen haben. So nahm der Median der mittleren BleiKonzentrationen in Europa von 163 µg/L in den 1980erJahren über 51 µg/L in den 1990erJahren auf 17 µg/L in den 2000erJahren ab. Für die Zeit nach 2009 sind bisher nur zwei Datensätze verfügbar, sodass ein hoher Einzelwert von 112 µg/L die bestehende Reduzierung der Bleiabflusskonzentrationen überprägt. Der Trend für Blei in Europa ist vergleichbar mit den Ergebnissen einer Untersuchung aus den USA [41].
Für Zink ist kein einheitlicher Trend feststellbar, obwohl einige Autoren annehmen, dass erhöhte ZinkKonzentrationen in Verkehrsflächenabflüssen aufgrund des zunehmenden Gebrauchs von Zink durch die steigende Anzahl an Leitplanken [42] und die Verwendung als Korrosionsschutz im Automobilbau [25] wahrscheinlich sind. Da Zink zusätzlich seit Jahrzehnten in weiteren Autoteilen, wie z. B. Reifen und Bremsen [43], verwendet wird und deren Abrieb je nach örtlichen Bedingungen schwankt, kann kein Trend für Zink gefunden werden. Ferner ist Zink aufgrund der Verwendung in Leitplanken, Straßenschildern und Brückenkonstruktionen an spezifischen Orten besonders aufkommensrelevant, weshalb stark erhöhte ZinkKonzentrationen oftmals mit diesen ortsspezifischen Einflüssen korrelieren. Ebenfalls ist für Kupfer kein Trend ermittelbar. Kupfer wird wie Zink in Autoteilen, z. B. Bremsen [43], verwendet und kommt daher fortwährend in den Verkehrsflächenabflüssen, insbesondere an Stellen mit starken Bremsvorgängen [21], vor.
Bild 2: Historischer Trend der Blei, Zink und KupferKonzentrationen (gesamt) in europäischen Verkehrsflächenabflüssen (BoxWhiskerPlots: oberes bzw. unteres Ende der Box entspricht dem oberen bzw. unteren Quartil und der Strich in der Box dem Median; kleine Kreise stellen Ausreißer und Sterne Extremwerte dar)
69

903gwf-Wasser | Abwasser 9/2015
Regenwasserbewirtschaftung FACHBERICHTE
4.2 Parkplätze und StraßenDie Datensätze zu den europäischen Verkehrsflächenabflüssen wurden – wie in Kapitel 2 beschrieben – in fünf Kategorien eingeteilt. Die mittleren Konzentrationen für die Parkplätze und die drei Straßenkategorien sind in Bild 3 vergleichend für die sechs Schwermetalle Zink, Kupfer, Blei, Nickel, Cadmium und Chrom, sowohl für die gelösten als auch die gesamten Konzentrationen, dargestellt. Dabei gibt es in der Datenbank für die Straßen der Kategorie 3 die meisten Datensätze (n=20), für die Kategorie 2 (n=16) und die Parkplätze (n=11) weniger Daten und für die Straßen der Kategorie 1 in Europa sind den Autoren dieser Studie nur sieben Datensätze bekannt. Da in jedem Messprogramm nicht immer alle sechs dargestellten Schwermetalle gemessen wurden, kann die Anzahl für jeden Balken geringer sein. Dies trifft insbesondere auf die gelösten Konzentrationen zu und dabei vor allem auf Nickel, Cadmium und Chrom.
Die Ergebnisse dieser Auswertung für die europäischen Parkplatzabflüsse ergaben, dass die Konzentrationen für die Schwermetalle Kupfer, Zink, Blei und Cadmium vergleichbar
mit den Konzentrationen für die Straßen sind. Bei den BleiKonzentrationen ist zu beachten, dass die beiden höchsten Konzentrationen (350 µg/L und 107 µg/L) 1996 bzw. 1995 gemessen wurden. Auffällig sind die im Vergleich zu den Straßen hohen ChromKonzentrationen zwischen 8 µg/L und 28 µg/L (n=6). Für Nickel liegen nur zwei Gesamtkonzentrationen sowie eine gelöste Konzentration vor. Die gelösten Anteile der Schwermetalle Blei und Chrom sind sehr gering, wohingegen Kupfer, Zink und Cadmium deutlich stärker gelöst vorliegen.
In Deutschland werden Parkplätze nach DWAM 153 je nach Nutzung in verschiedene Kategorien eingeteilt und die zugehörigen Flächenverschmutzungen werden entsprechend als gering, mittel oder stark eingestuft [44]. Ein Vergleich der Abflüsse dreier Tank und Rastanlagen an deutschen Autobahnen ergab, dass die LkwStellplätze, welche nach DWAM 153 als stark verschmutzt eingruppiert sind, bei fast allen Parametern deutlich höher belastet waren als die Abflüsse der PkwStellplätze [45]. Ferner sind laut der Eingruppierung nach DWAM 153 stark frequentierte PkwParkplätze (z. B. von Supermärkten) im
Bild 3: Schwermetallkonzentrationen an Zink, Kupfer, Blei, Nickel, Cadmium und Chrom (gelöst und gesamt) in Abflüssen von Parkplätzen und drei Straßenkategorien (Kategorie 1: DTV ≤ 5000; Kategorie 2: 5000 < DTV ≤ 15 000; Kategorie 3: DTV > 15 000) in Europa (BoxWhiskerPlots: oberes bzw. unteres Ende der Box entspricht dem oberen bzw. unteren Quartil und der Strich in der Box dem Median; kleine Kreise stellen Ausreißer und Sterne Extremwerte dar)
70

904 gwf-Wasser | Abwasser 9/2015
FACHBERICHTE Regenwasserbewirtschaftung
Gegensatz zu Hof und Parkflächen mit geringer Frequentierung stark belastet. Dies konnte jedoch aus den wenigen in der Datenbank verfügbaren Konzentrationen für diese Verkehrsflächenkategorie nur bedingt abgeleitet werden. So weisen beispielsweise die Parkplatzabflüsse dreier Universitäten [46, 47, 48], bei denen von einer geringen täglichen Belegung ausgegangen werden kann, die geringsten Zink, Kupfer und BleiKonzentrationen bezogen auf alle Parkplatzkategorien auf. Für den einzigen verfügbaren Supermarktplatz liegen die mittleren Abflusskonzentrationen bei 361 µg/L Zink, 77 µg/L Kupfer, 24 µg/L Blei und 40 µg/L Nickel (alles Gesamtkonzentrationen) [49] und somit oberhalb der UniversitätsParkplatzabflusskonzentrationen und im Bereich der PkwStellplätze der AutobahnRastanlagen. Etwas höhere Abflusskonzentrationen sind aus der Beprobung eines FlughafenParkplatzes bekannt [50]. Folglich kann davon ausgegangen werden, dass Parkplätze je nach Frequentierung, Fahrzeugkategorie und Fahrzeugverschmutzung stark belastet sind. Dies ist damit zu erklären, dass die Tropfverluste, die Abgasemissionen (auch kalter Motor) sowie die Brems und Reifenabriebe auf dieser Verkehrsflächenkategorie besonders hoch sind, auch wenn die Belegung stark frequentierter Parkplätze maximal 50 Kfz/d pro Stellplatz zulässt [1].
Da in Deutschland die Höhe der stofflichen Belastung im Abfluss einer Straße im DWAM 153 anhand der DTV festgelegt ist [44], wurden die drei Straßenkategorien entsprechend des Merkblattes gewählt. Die Kategorie 1 umfasst somit Wohn, Anlieger, Erschließungs und Kreisstraßen und die Kategorie 2 Hauptverkehrsstraßen. Nach diesem Merkblatt werden die Hauptverkehrsstraßen mit überregionaler Bedeutung (Kategorie 3) mit über
15 000 Kfz/d als stark belastet bzw. nicht tolerierbar bezeichnet. Die Auswertung der Datensätze ergibt nur für die ZinkKonzentrationen mit steigender StraßenKategorie durchgehend eine Zunahme sowohl der MedianWerte (von 229 µg/L über 342 µg/L auf 349 µg/L) als auch der Maxima (von 940 µg/L auf 1940 µg/L). Bei den KupferKonzentrationen sind lediglich die Konzentrationen der Kategorie 3 am höchsten. Bei den anderen Elementen als auch bei den weltweiten Daten sind die Tendenzen ähnlich. Besonders für Cadmium und Chrom ergeben sich Abflusskonzentrationen, die unabhängig von der DTV sind. Bei den BleiKonzentrationen ist zu beachten, dass für die Kategorie 1 nur Werte vorliegen, die zwischen 1982 und 1994 gemessen wurden. Bei den Kategorien 2 und 3 wurden die Konzentrationen zwischen 1990 und 2009 gemessen, weshalb diese geringer als bei der ersten Kategorie sind, wobei die beiden Ausreißer der Kategorie 2 zu den ältesten Datensätzen zählen. Folglich sind die Straßenabflüsse unterschiedlich stark mit Schwermetallen belastet und die Höhe der Konzentrationen ist besonders durch örtliche Randbedingungen gekennzeichnet. Beispielsweise waren die Konzentrationen an einer Straße der Kategorie 2 (14 200 Kfz/d) in Hildesheim, Deutschland, aufgrund der Brems und Beschleunigungsvorgänge an einer Ampel stark erhöht (Zink 436 µg/L und Kupfer 136 µg/L, Gesamtkonzentrationen) und lagen oberhalb der Konzentrationen, die üblicherweise an Autobahnen gemessen werden [20].
Insgesamt gesehen sind die Konzentrationen an Zink heutzutage am aufkommensrelevantesten, gefolgt von Kupfer und Blei. Je nach Ort folgen Nickel, Chrom und Cadmium. Die gelösten Anteile von Zink und Kupfer sind ebenfalls am höchsten, wobei Nickel aufgrund des höheren
Bild 4: Belastung von Autobahnabflüssen europäischer Länder mit den Schwermetallen Zink und Kupfer (gelöst und gesamt) (BoxWhiskerPlots: oberes bzw. unteres Ende der Box entspricht dem oberen bzw. unteren Quartil und der Strich in der Box dem Median; kleine Kreise stellen Ausreißer und Sterne Extremwerte dar)
71

905gwf-Wasser | Abwasser 9/2015
Regenwasserbewirtschaftung FACHBERICHTE
gelösten Anteils in höheren gelösten Konzentrationen als Blei und Chrom vorkommt. Die gelösten Konzentrationen an Blei und Chrom sind vergleichbar mit den gelösten Konzentrationen an Cadmium.
4.3 AutobahnenDie meisten Messprogramme zu Verkehrsflächenabflusskonzentrationen in Europa haben sich mit der Charakteristik von Autobahnabflüssen beschäftigt (n=73), wobei die am häufigsten untersuchten Orte in Deutschland (DEU, n=24 an 20 Orten), in Großbritannien (GBR, n=11 an zehn Orten), in der Schweiz (CHE, n=11 an neun Orten), in Österreich (AUT, n=8) und in Schweden (SWE, n=6 an vier Orten) lagen. Weitere Länder mit mehr als einem Datensatz sind Irland (IRL, n=4), Italien (ITA, n=4 an zwei Orten), die Niederlande (NLD, n=3) und Frankreich (FRA, n=2 an einem Ort). Für Norwegen (NOR) und Portugal (PRT) liegt jeweils ein Datensatz vor. Auffällig bei den Ländern mit zahlreichen Messprogrammen ist, dass für Österreich keine gelösten Anteile vorliegen und in der Schweiz nur bei wenigen Messungen gelöste Konzentrationen bestimmt wurden. Die DTV der in Bild 4 dargestellten Messergebnisse (Mittelwerte) variiert sehr stark und liegt zwischen 6000 Kfz/d in Portugal [35] und 240 000 Kfz/d in Österreich [51]. Eine Abhängigkeit der Belastung von der Landnutzung konnte nicht ermittelt werden, weshalb neben der Aufgliederung der Messergebnisse nach Ländern auf weitere Darstellungen verzichtet wurde. Alle Messprogramme zu Autobahnabflüssen sind in den Tabellen 1 und 2 aufgeführt.
Die höchsten gesamten ZinkKonzentrationen in Autobahnabflüssen wurden in absteigender Reihenfolge an der A23 in Wien, Österreich [51], an der A13 an einer Maut stelle in Tirol, Österreich [52], an der A43 in Haltern, Deutschland [17], und an der A115 in Berlin, Deutschland [53], gemessen. Die höchsten gesamten KupferKonzentrationen in Autobahnabflüssen wurden an der A23 in Wien, Österreich [51], und an der A115 in Berlin, Deutschland [53], gemessen. Ein Vergleich der MedianKonzentrationen ergibt, dass die höchsten Werte sowohl für Zink (gesamt 366 µg/L, gelöst 170 µg/L) als auch für Kupfer (gesamt 78 µg/L, gelöst 38 µg/L) in Deutschland gemessen wurden. Somit liegen die gelösten Anteile dieser beiden Schwermetalle bei jeweils knapp 50 %.
Insgesamt liegen die ZinkKonzentrationen an Autobahnabflüssen über alle Länder gemittelt bei 230 µg/L (gesamt) und 76 µg/L (gelöst) und die KupferKonzentrationen bei 52 µg/L (gesamt) und 22 µg/L (gelöst), wobei die gelösten Anteile für Europa geringer sind als die in Deutschland ermittelten Anteile. Außerdem sind die Konzentrationen der beiden Schwermetalle in Autobahnabflüssen mit denen der Straßen aus Bild 3 vergleichbar, wobei die Straßen der Kategorie 3 im Mittel höher als die Autobahnen belastet sind. Zum einen sind diese Hauptverkehrsstraßen mit überregionaler Bedeutung oftmals
aufgrund spezifischer Randbedingungen (z. B. dichte Bebauung und Ampeln) höher belastet und zum anderen verursachen die hohen Fahrgeschwindigkeiten und der Wind auf den großen Straßenflächen der Autobahnen mit Standspuren mehr Verwehungen, als dies auf den Hauptverkehrsstraßen der Kategorie 3 der Fall ist, welche zu einer Reduzierung der Ablaufkonzentrationen beitragen. Im Gegensatz können Schallschutzwände diesen Effekt vermindern. Ferner können die Schwermetallkonzentrationen in Abflüssen von Autobahnen im Vergleich zu Außerortsstraßen geringer sein, da bei Autobahnen eine Standspur vorhanden ist, die zu einer Verdünnung der gemessenen Konzentrationen führen kann.
4.4 Kontinentale TrendsDie Verkehrsflächenabflusskonzentrationen für die beiden derzeit aufkommensrelevantesten Schwermetalle Zink und Kupfer wurden ebenfalls getrennt nach Kontinenten ausgewertet und sind in Bild 5 als Gesamtkonzentrationen dargestellt. Bei der Auswertung wurden nur die vier Kontinente Asien, Europa, Nordamerika und Ozeanien berücksichtigt, da aus Südamerika und Afrika jeweils weniger als fünf Datensätze zur Verfügung standen. Dabei liegen für Europa mit 131 Datensätzen etwas mehr Daten als für Nordamerika (n=117) vor.
Als Ergebnis der Auswertung geht hervor, dass die gesamte gemittelte MedianKonzentration für Kupfer rund 30 µg/L für Nordamerika und ungefähr das Doppelte für Asien, Europa und Ozeanien beträgt. Die maximale KupferKonzentration in Europa ist mit 430 µg/L ebenfalls höher als die in Nordamerika gemessene Konzentration von
Bild 5: Vergleich der Zink und KupferKonzentrationen (gesamt) in Verkehrsflächenabflüssen verschiedener Kontinente (BoxWhiskerPlots: oberes bzw. unteres Ende der Box entspricht dem oberen bzw. unteren Quartil und der Strich in der Box dem Median; kleine Kreise stellen Ausreißer und Sterne Extremwerte dar)
72

906 gwf-Wasser | Abwasser 9/2015
FACHBERICHTE Regenwasserbewirtschaftung
280 µg/L. Die gesamte gemittelte MedianKonzentration für Zink liegt bei ungefähr 170 µg/L für Nordamerika, 250 µg/L für Europa, 300 µg/L für Ozeanien und 620 µg/L für Asien. Die höchsten Konzentrationen an Zink sind mit 1940 µg/L und 2210 µg/L für Europa und 2234 µg/L und 19 100 µg/L für Nordamerika nicht vergleichbar. Bei den Werten für Asien muss berücksichtigt werden, dass für Asien im Vergleich zu den anderen Kontinenten weniger Datensätze (n=13) verfügbar sind und die Probennahmen vornehmlich an hochbelasteten Verkehrsflächenkategorien erfolgten.
Zusammengefasst kann gesagt werden, dass die MedianKonzentrationen in Nordamerika für die beiden Schwermetalle am geringsten sind und die Unterschiede für Zink zwischen allen Kontinenten deutlich größer ausgeprägt sind als für Kupfer. Vergleichbare Ergebnisse wurden bereits in einer Übersicht von Autobahnabflüssen dargestellt [54].
4.5 Weitere MetalleZu den weiteren Metallen, die in Messprogrammen bestimmt werden und verkehrsbedingt erhöhte Konzentrationen aufweisen, gehören Kobalt (Diesel [55]), Mangan (Motoren [21], Bremsen [56], Reifen [57]), die PlatinGruppenElemente (Palladium, Platin und Rhodium in Katalysatoren [58]), Antimon (Bremsen [59]), Titan (Fahrbahnmarkierungen [38]) und Wolfram (Spikes [60]).
Die höchsten in Einzeluntersuchungen gemittelten Konzentrationen in Europa reichen von unter 8 µg/L für Palladium [45] über bis zu 9,2 µg/L für Wolfram [61] bis zu 13,3 µg/L für Kobalt [61], bis zu 24 µg/L für Platin [62], bis zu 35 µg/L für Antimon [16], bis zu 86,6 µg/L für Barium [63], bis zu 329 µg/L für Mangan [57] und bis zu 630 µg/L für Titan [51]. Aus diesen Stoffen eignen sich Antimon, Kobalt und Wolfram aufgrund ihres geringen Vorkommens in der Umwelt als TracerElemente zur Bestimmung des Einflusses des Verkehrs auf Umweltkompartimente [61, 64].
5. Zusammenfassung und FazitZusammenfassend lässt sich sagen, dass die Einzelergebnisse eines Messprogramms für den untersuchten Ort charakteristisch sind und von dessen kontinuierlichen (umgebende Landnutzung, Verkehrsflächeneigenschaften sowie Verkehrsgeschehen) und klimatischen (Regen und Trockenperioden) Randbedingungen beeinflusst sind, wobei die Repräsentativität der über den gewählten Untersuchungszeitraum beprobten Ereignisse bezüglich der klimatischen Bedingungen (z. B. Verteilung der Regenintensitäten) nachzuweisen ist. Zusätzlich haben methodikspezifische Faktoren einen Einfluss auf die Abbildung der realen Verhältnisse. Dabei ist eine statistische Auswertung des Einflusses für jeden aufgeführten Faktor auf die jeweiligen Verkehrsflächenabflusskonzentrationen wegen der geringen Grundgesamtheit der entsprechenden Daten nicht möglich gewesen.
Aufgrund der breiten Datenbasis konnten für Europa viele Messprogramme mit verschiedenen Randbedingungen nach Verkehrsflächenkategorien (Parkplätze, drei Straßenkategorien und Autobahnen) ausgewertet werden. Als Ergebnis lässt sich für jede Kategorie eine Aussage zur Zusammensetzung und Belastung mit Schwermetallen treffen. Ein wichtiges Ergebnis ist, dass die Abflüsse an Hauptverkehrsstraßen mit überregionaler Bedeutung aufgrund der Randbedingungen meist stärker belastet sind als die Abflüsse von Autobahnen. Für eine fundierte Beschreibung der Belastung verschiedener Parkplatztypen (z. B. Mitarbeiterparkplätze, Supermarktparkplätze und LkwStellplätze) fehlt derzeit eine breite Datenbasis, jedoch ist die Einteilung nach DWAM 153 nachvollziehbar.
Neben den fehlenden Messprogrammen für Parkplätze sollten zusätzlich hochbelastete Innerortstraßen, vor allem mit besonderer Fahrweise wie Stopandgo, untersucht werden, damit die Einflüsse des Fahrverhaltens auf die Abfluss konzentrationen besser bekannt sind, diese zukünftig statistisch ausgewertet und die Abflüsse entsprechend behandelt werden können.
Bei allen Messprogrammen sollten vermehrt die ortsspezifischen Randbedingungen, die Anzahl der beprobten Regenereignisse sowie die Art und Strategie der Probennahme vermerkt werden und auch der pHWert sowie die gelösten Konzentrationen der Schwermetalle bestimmt werden. Anhand dieser zusätzlichen Daten wird es möglich sein, sowohl an Parkplätzen, an denen derzeit viele dezentrale Behandlungsanlagen gebaut werden, als auch an Hauptverkehrsstraßen mit besonderen Gegebenheiten eine zukunftsorientierte Niederschlagswasserbewirtschaftung zu ermöglichen. Dabei ist für die weitergehende Behandlung von Verkehrsflächenabflüssen mit Filtermaterialien die Kenntnis der gelösten Anteile für eine ausreichende Reduzierung der Schwermetallkonzentrationen entscheidend, weshalb weitere Daten dazu benötigt werden.
DanksagungDiese Publikation wurde durch die Bereitstellung von Berichten und Analysendaten durch die Bundesanstalt für Straßenwesen, Bergisch Gladbach, Deutschland, und durch das Bundesamt für Strassen ASTRA, Bern, Schweiz, unterstützt. Die Auswertung der Datensätze erfolgte unter Mitwirkung von Magdalena Knysak und Julia Scharrer.
Literatur[1] Göbel, P., Dierkes, C. and Coldewey, W. G.: Storm water runoff
concentration matrix for urban areas. Journal of Contaminant Hydrology 91 (2007) No. 1−2, p. 26−42.
[2] Bannerman, R. T., Owens, D. W., Dodds, R. B. and Hornewer, N. J.: Sources of Pollutants in Wisconsin Stormwater. Water Science and Technology 28 (1993) No. 3−5, p. 241−259.
[3] Opher, T. and Friedler, E.: Factors affecting highway runoff quality. Urban Water Journal 7 (2010) No. 3, p. 155−172.
73

907gwf-Wasser | Abwasser 9/2015
Regenwasserbewirtschaftung FACHBERICHTE
[4] Welker, A. und Dittmer, U.: Belastung von Verkehrsflächenabflüssen mit Schwermetallen und PAK. gwfWasser | Abwasser 146 (2005) Nr. 4, S. 320−332.
[5] Moy, F., Crabtree, R. W. and Simms, T.: The Long Term Monitoring of Pollution from Highway Runoff: Final Report. 2003, p. 1−183.
[6] Eriksson, E., Baun, A., Scholes, L., Ledin, A., Ahlman, S., Revitt, M., Noutsopoulos, C. and Mikkelsen, P. S.: Selected stormwater priority pollutants − a European perspective. Science of the Total Environment 383 (2007) No. 1−3, p. 41−51.
[7] Tiefenthaler, L. L., Schiff, K. C. and Bay, S. M.: Characteristics of Parking Lot Runoff Produced by Simulated Rainfall. Technical Report 343 (2001), p. 1−67.
[8] Kayhanian, M., Stransky, C., Bay, S., Lau, S. L. and Stenstrom, M. K.: Toxicity of urban highway runoff with respect to storm duration. Science of the Total Environment 389 (2008) No. 2−3, p. 386−406.
[9] McQueen, A. D., Johnson, B. M., Rodgers, J. H. and English, W. R.: Campus parking lot stormwater runoff: Physicochemical analyses and toxicity tests using Ceriodaphnia dubia and Pimephales promelas. Chemosphere 79 (2010) No. 5, p. 561−569.
[10] Maniquiz-Redillas, M. and Kim, L.-H.: Fractionation of heavy metals in runoff and discharge of a stormwater management system and its implications for treatment. Journal of Environmental Sciences 26 (2014) No. 6, p. 1214−1222.
[11] Strecker, E. W., Driscoll, E. D., Shelley, P. E., Gaboury, D. R. and Sartor, J. D.: The U.S. federal highway administrations receiving water impact methodology. Science of the Total Environment 93 (1990), p. 489−498.
[12] Kayhanian, M., Suverkropp, C., Ruby, A. and Tsay, K.: Characterization and prediction of highway runoff constituent event mean concentration. Journal of Environmental Management 85 (2007) No. 2, p. 279−295.
[13] Irish, L. B., Barrett, M. E., Malina, J. F. and Charbeneau, R. J.: Use of Regression Models for Analyzing Highway StormWater Loads. Journal of Environmental Engineering 124 (1998) No. 10, p. 987−993.
[14] Gan, H., Zhuo, M., Li, D. and Zhou, Y.: Quality characterization and impact assessment of highway runoff in urban and rural area of Guangzhou, China. Environmental Monitoring and Assessment 140 (2008) No. 1−3, p. 147−159.
[15] Li, M., Barrett, M., Rammohan, P., Olivera, F. and Landphair, H.: Documenting Stormwater Quality on Texas Highways and Adjacent Vegetated Roadsides. Journal of Environmental Engineering 134 (2008) No. 1, p. 48−59.
[16] Scheiwiller, E.: Schadstoffabschwemmungen: Am Beispiel von Hochleistungsstraßen. gwa (2008) Nr. 7, S. 539−546.
[17] Dierkes, C.: Wirkung von Schwermetallen im Regenabfluß von Verkehrsflächen bei der Versickerung über poröse Deckbeläge. Forum Siedlungswasserwirtschaft und Abfallwirtschaft Universität Essen 14 (1999).
[18] Kocher, B., Brose, S., Chlubek, A., Karagüzel, N., Klein, N. und Siebertz, I.: Stoffeintrag in Straßenrandböden: Messzeitraum 2005/2006. Berichte der Bundesanstalt für Straßenwesen, Bergisch Gladbach 198 (2010), S. 1−45.
[19] Barrett, M. E., Irish, L. B., Malina, J. F. and Charbeneau, R. J.: Characterization of Highway Runoff in Austin, Texas, Area. Journal of Environmental Engineering 124 (1998) No. 2, p. 131−137.
[20] Muschack, W.: Pollution of street runoff by traffic and local conditions. Science of the Total Environment 93 (1990), p. 419−431.
[21] Drapper, D., Tomlinson, R. and Williams, P.: Pollutant Concentrations in Road Runoff: Southeast Queensland Case Study. Journal of Environmental Engineering 126 (2000) No. 4, p. 313−320.
[22] Langbein, S., Steiner, M. und Boller, M.: Schadstoffe im Straßenabwasser einer stark befahrenen Straße und deren Retention mit neuartigen Filterpaketen aus Geotextil und Adsorbermaterial. Schlussbericht des Forschungsprojekts (2006), S. 1−77.
[23] Helmreich, B., Hilliges, R., Schriewer, A. and Horn, H.: Runoff pollutants of a highly trafficked urban road – Correlation analysis and seasonal influences. Chemosphere 80 (2010) No. 9, p. 991−997.
[24] Moores, J., Pattinson, P. and Hyde, C.: Enhancing the control of contaminants from New Zealand’s roads: results of a road runoff sampling programme. National Institute of Water and Atmospheric Research Ltd, Auckland, 2010, p. 1−161.
[25] Sansalone, J. J. and Buchberger, S. G.: Characterization of solid and metal element distributions in urban highway stormwater. Water Science and Technology 36 (1997) No. 8–9, p. 155−160.
[26] Mangani, G., Berloni, A., Bellucci, F., Tatàno, F. and Maione, M.: Evaluation of the Pollutant Content in Road Runoff First Flush Waters. Water, Air, & Soil Pollution 160 (2005) No. 1−4, p. 213−228.
[27] Crabtree, B., Dempsey, P., Johnson, I. and Whitehead, M.: The development of a riskbased approach to managing the ecological impact of pollutants in highway runoff. Water Science and Technology 57 (2008) No. 10, p. 1595−1600.
[28] Kayhanian, M., Singh, A., Suverkropp, C. and Borroum, S.: Impact of Annual Average Daily Traffic on Highway Runoff Pollutant Concentrations. Journal of Environmental Engineering 129 (2003) No. 11, p. 975−990.
[29] Hilliges, R., Schriewer, A. and Helmreich, B.: A threestage treatment system for highly polluted urban road runoff. Journal of Environmental Management 128 (2013), p. 306−312.
[30] Dierkes, C.: Untersuchungen einer Behandlungsanlage für Straßenabflüsse an der Bremer Straße in HamburgHarburg über einen Zeitraum von drei Jahren. 3P Technik Filtersysteme GmbH (2010), S. 89−99.
[31] Line, D. E., Wu, J., Arnold, J. A., Jennings, G. D. and Rubin, A. R.: Water quality of first flush runoff from 20 industrial sites. Water Environment Research 69 (1997), No. 3, p. 305−310.
[32] Ma, J., Kang, J., Kayhanian, M. and Stenstrom, M.: Sampling Issues in Urban Runoff Monitoring Programs: Composite versus Grab. Journal of Environmental Engineering 135 (2009), No. 3, p. 118−127.
[33] Dean, C. M., Sansalone, J. J., Cartledge, F. K. and Pardue, J. H.: Influence of Hydrology on RainfallRunoff Metal Element Speciation. Journal of Environmental Engineering 131 (2005) No. 4, p. 632−642.
[34] Fulkerson, M., Nnadi, F. and Chasar, L.: Characterizing Dry Deposition of Mercury in Urban Runoff. Water, Air, & Soil Pollution 185 (2007) No. 1−4, p. 21−32.
[35] Barbosa, A. E. and Hvitved-Jacobsen, T.: Highway runoff and potential for removal of heavy metals in an infiltration pond in Portugal. Science of the Total Environment 235 (1999) No. 1−3, p. 151−159.
[36] Stotz, G.: Investigations of the properties of the surface water runoff from federal highways in the FRG. Science of the Total Environment 59 (1987), p. 329−337.
[37] Stotz, G. and Krauth, K.: The pollution of effluents from pervious pavements of an experimental highway section: first results. Science of the Total Environment 146−147 (1994), p. 465−470.
[38] Golwer, A. und Schneider, W.: Untersuchungen über die Belastung des unterirdischen Wassers mit anorganischen toxischen Spurenstoffen im Gebiet von Straßen. Untersuchungen über die Belastung des Grundwassers mit organischen Stoffen im Bereich von Straßen. Forschungsberichte aus dem Forschungsprogramm des Bundesministers für Verkehr und der Forschungsgesellschaft für Straßen und Verkehrswesen e. V., Heft 391 (1983).
74

908 gwf-Wasser | Abwasser 9/2015
FACHBERICHTE Regenwasserbewirtschaftung
[39] Berbee, R., Rijs, G., de Brouwer, R. and Van Velzen, l.: Characterization and Treatment of Runoff from Highways in the Netherlands Paved with Impervious and Pervious Asphalt. Water Environment Research 71 (1999) No. 2, p. 183−190.
[40] Root, R. A.: Lead loading of urban streets by motor vehicle wheel weights. Environmental Health Perspective 108 (2000) No. 10, p. 937−940.
[41] Kayhanian, M.: Trend and concentrations of legacy lead (Pb) in highway runoff. Environmental Pollution 160 (2012), p. 169−177.
[42] Dierkes, C. and Geiger, F.: Decontaminating effect of greened highway embankments. Proceedings of the NOVATECHConference in Lyon, 1998, p. 497−504.
[43] Legret, M. and Pagotto, C.: Evaluation of pollutant loadings in the runoff waters from a major rural highway. Science of the Total Environment 235 (1999) No. 1−3, p. 143−150.
[44] DWAM 153: Handlungsempfehlungen zum Umgang mit Regenwasser, 2007. DWA Deutsche Vereinigung für Wasserwirtschaft, Abwasser und Abfall e. V., Hennef, 2013, ISBN 13: 9783942964500.
[45] Grotehusmann, D. und Kasting, U.: Untersuchung über die Beschaffenheit der Oberflächenabflüsse von Parkflächen bei Tank und Rastanlagen. Ingenieurgesellschaft für Stadthydrologie mbH, Hannover. Bericht der Bundesanstalt für Straßenwesen FE 05.123/2000/GGB, Bergisch Gladbach (2002), S. 1−62.
[46] Hogland, W., Niemczynowicz, J. and Wajlman, T.: The unit superstructure during the construction period. Science of the Total Environment 59 (1987), p. 411−424.
[47] Pick, V., Fettig, J., Miethe, M. und Strüber, K.: Dezentrale Behandlung des Niederschlagsabflusses von Verkehrsflächen in einer mehrstufigen Schachtanlage. KA Abwasser, Abfall 49 (2002) Nr. 3, S. 312−320.
[48] Gnecco, I., Berretta, C., Lanza, L. G. and La Barbera, P.: Storm water pollution in the urban environment of Genoa, Italy. Atmospheric Research 77 (2005) No. 1−4, p. 60−73.
[49] Engelhard, C., Fach, S. und Rauch, W.: Langzeitverhalten der hydrau lischen und stofflichen Leistungsfähigkeit von Muldenversickerungen im Sommer und Winterbetrieb. Arbeitsbereich Umwelttechnik, Institut für Infrastruktur, Baufakultät Universität Innsbruck (2012), S. 1−76.
[50] Gnecco, I., Sansalone, J. J. and Lanza, L. G.: Speciation of Zinc and Copper in Stormwater Pavement Runoff from Airside and Landside Aviation Land Uses. Water, Air, & Soil Pollution 192. (2008) No. 1−4, p. 321−336.
[51] Fürhacker, M., Haile, T. M., Schärfinger, B., Kammerer, G., Allabashi, R., Magnat, S. und Lins, A.: Entwicklung von Methoden zur Prüfung der Eignung von Substraten für die Oberflächenwasserbehandlung von Dach und Verkehrsflächen, Fördervertrag GZ B100121, Wien, Österreich (2013), S. 1−240.
[52] Jenewein, I. und Schinner, M.: Zur Frage der Zusammensetzung und mögliche Beeinflussung des Grundwassers von Regenabflüssen aus Hochleistungsstraßen am Beispiel der BrennerAutobahn. Forum StädteHygiene 33 (1982), S. 113−116.
[53] Kluge, B., Werkenthin, M. and Wessolek, G.: Metal leaching in a highway embankment on field and laboratory scale. Science of the Total Environment 493 (2014), p. 495−504.
[54] Kayhanian, M., Fruchtman, B. D., Gulliver, J. S., Montanaro, C., Rani-eri, E. and Wuertz, S.: Review of highway runoff characteristics: Comparative analysis and universal implications. Water Research 46 (2012) No. 20, p. 6609−6624.
[55] Roeva, N. N., Rovinskii, F. Y. and Kononov, E. Y.: Special features of the behavior of heavy metals in various natural environments. Journal of Analytical Chemistry 51 (1996) No. 4, p. 384−397.
[56] Ward, N. I.: Multielement contamination of British motorway environments. Science of the Total Environment 93 (1990), p. 393−401.
[57] Hares, R. J. and Ward, N. I.: Comparison of the heavy metal content of motorway stormwater following discharge into wet biofiltration and dry detention ponds along the London Orbital (M25) motorway. Science of the Total Environment 235 (1999) No. 1−3, p. 169−178.
[58] Geiger-Kaiser, M. und Jäger, P.: Reinigung von Straßenabwässern, Wirksamkeit von Retentionsfilterbecken zur Reinigung von Straßenoberflächenwässern. Reihe Gewässerschutz, Band 11 (2005), S. 1−54.
[59] von Uexküll, O., Skerfving, S., Doyle, R. and Braungart, M.: Antimony in brake padsa carcinogenic component? Journal of Cleaner Production 13 (2005) No. 1, p. 19−31.
[60] Bourcier, D. R., Hindin, E. and Cook, J. C.: Titanium and tungsten in highway runoff at Pullman, Washington. International Journal of Environmental Studies 15 (1980) No. 2, p. 145−149.
[61] Bäckström, M., Nilsson, U., Håkansson, K., Allard, B. and Karlsson, S.: Speciation of Heavy Metals in Road Runoff and Roadside Total Deposition. Water, Air, & Soil Pollution 147 (2003) No. 1−4, p. 343−366.
[62] Moy, F. and Crabtree, R. W.: The Long Term Monitoring of Pollution from Highway Runoff: Final Report, M4/Brinkworth Brook – Site Report. 2003, p. 1−142.
[63] Dannecker, W., Au, M. and Stechmann, H.: Substance load in rainwater runoff from different streets in Hamburg. Science of the Total Environment 93 (1990), p. 385−392.
[64] Nadler, A. und Meißner, E.: Zwischenbericht Entwicklungsvorhaben: Versickerung des Niederschlagswassers von befestigten Verkehrsflächen. Bericht über die Betriebsjahre Oktober 1996 bis Oktober 1998. Bayerisches Landesamt für Wasserwirtschaft. 1999, S. 1−46.
[65] Steiner, M. und Goosse, P.: Monitoring SABA Attinghausen. 1. Zwischenbericht (2007), S. 1−25.
[66] Steiner, M. und Goosse, P.: Monitoring SABA Attinghausen. 3. Zwischenbericht (2008), S. 1−14.
[67] Steiner, M. und Goosse, P.: Monitoring SABA Attinghausen. Schlussbericht (2009), S. 1−47.
[68] Krauth, K. und Stotz, G.: Gewässerbelastung durch Straßenoberflächenwasser von lärmmindernden Straßenbelägen durch längere Kontaktzeiten des Regenwassers mit den Verunreinigungen und den veränderten Salzkonzentrationen. UBASchlussbericht 102 04 381, 1993.
[69] Pagotto, C., Legret, M. and Le Cloirec, P.: Comparison of the hydraulic behaviour and the quality of highway runoff water according to the type of pavement. Water Research 34 (2000) No. 18, p. 4446−4454.
[70] Harrison, R. M. and Wilson, S. J.: The chemical composition of highway drainage waters, I. Major ions and selected trace metals. Science of the Total Environment 43 (1985) No. 1−2, p. 63−77.
[71] Desta, M. B., Bruen, M., Higgins, N. and Johnston, P.: Highway runoff quality in Ireland. Journal of Environmental Monitoring 9 (2007), p. 366−371.
75

909gwf-Wasser | Abwasser 9/2015
Regenwasserbewirtschaftung FACHBERICHTE
[72] Lygren, E., Gjessing, E. and Berglind, L.: Pollution transport from a highway. Science of the Total Environment 33 (1984) No. 1−4, p. 147−159.
[73] Wei, C. and Morrison, G. M.: Platinum analysis and speciation in urban gullypots. Analytica Chimica Acta 284 (1994) No. 3, p. 587−592.
[74] Windhofer, G., Clara, M. und Scheffknecht, C.: Emissionen anthropogener Spurenstoffe von Verkehrsflächen. Proceedings „Gewässerschutzanlagen für Verkehrsflächen“. Seminar der Universität für Bodenkultur, Wien (2012).
[75] Scholler (2010) zitiert in Measho, T. und Fürhacker, M.: Forschungsergebnisse zur Reinigung von Straßenabwässern. Proceedings „Gewässerschutzanlagen für Verkehrsflächen“. Seminar der Universität für Bodenkultur, Wien, 2012.
[76] Steiner, M. und Goosse, P.: Leistungsüberwachung, SABA Chlosterschür, SABA Neuwiesen. 2011, S. 1−15.
[77] Rutz, F.: SABA Chlosterschür und Neuwiesen. Funktionskontrollen, Gesamtbericht. 2013, S. 1−150.
[78] Steiner, M. und Goosse, P.: Leistungsüberprüfung SABA Hagnau, 2. Zwischenbericht. 2009, S. 1−16.
[79] Steiner, M. und Goosse, P.: Leistungsüberwachung der SABA Hagnau, 3. Zwischenbericht. 2011, S. 1−7.
[80] Scheiwiller, E.: SABA Pfaffensteig (Bümpliz), Probebetrieb und Leistungsprüfung der SABA mit technischem Filter im Jahr 2012/13. 2014, S. 1−14.
[81] Dauber, L., Novak, B., Zobrist, J. und Zürcher, F.: Schmutzstoffe im Regenwasserkanal einer Autobahn. Stuttgarter Berichte zur Siedlungswasserwirtschaft. Beeinflussung der Gewässergüte durch Regenabflüsse von Straßen. Band 64. Oldenbourg Verlag, München, 1979, S. 41−57.
[82] Rutz, F., Frank, S., Schurter, M., Jost, B. und Bieber, P.: Biologische Straßenabwasserreinigung. Auswertung der Messkampagnen an der Anlage Chrebsbachknie bei Winterthur. gwa (1999) Nr. 4, S. 1−11.
[83] Furumai, H., Balmer, H. and Boller, M.: Dynamic behavior of suspended pollutants and particle size distribution in highway runoff. Water Science and Technology 46 (2002) No. 11−12, p. 413−418.
[84] Rutz, F., Pazeller, A. und Schurter, M. F.: StraßenabwasserBehandlungsanlagen – Betriebserfahrungen und Erfolgskontrollen. gwa (2007) Nr. 2, S. 123−131.
[85] Aryal, K. and Lee, B. K.: Characteristics of Suspended Solids and Micropollutants in FirstFlush Highway Runoff. Water, Air, & Soil Pollution: Focus 9 (2009) No. 5−6, p. 339−346.
[86] Grotehusmann, D. und Kasting, U.: Vergleich der Reinigungsleistung von Retentionsbodenfiltern und Versickerungsanlagen an Bundesfernstraßen. Forschungsberichte aus dem Forschungsprogramm des Bundesministeriums für Verkehr, Bau und Wohnungswesen und der Forschungsgesellschaft für Straßen und Verkehrswesen e. V., Heft 1024 (2009).
[87] Kocher, B., Brose, S., Chlubek, A., Görg, C., Klein, N. und Siebertz, I.: Stoffeintrag in Straßenrandböden: Messzeitraum 2006/2007. Berichte der Bundesanstalt für Straßenwesen, Bergisch Gladbach 199 (2010), S. 1−38.
[88] Lange, G., Grotehusmann, D., Kasting, U., Schütte, M., Dietrich, M. und Sondermann, W.: Wirksamkeit von Entwässerungsbecken im Bereich von Bundesfernstraßen. Forschungsberichte aus dem Forschungsprogramm des Bundesministers für Verkehr, Bau und Wohnungswesen und der Forschungsgesellschaft für Straßen und Verkehrswesen e. V., Heft 861 (2003).
[89] Hewitt, C. N. and Rashed, M. B.: Removal rates of selected pollutants in the runoff waters from a major rural highway. Water Research 26 (1992) No. 3, p. 311−319.
[90] Mungur, A. S., Shutes, R. B. E., Revitt, D. M. and House, M. A.: An assessment of metal removal from highway runoff by a natural wetland. Water Science and Technology 32 (1995) No. 3, p. 169−175.
[91] Terzakis, S., Fountoulakis, M. S., Georgaki, I., Albantakis, D., Sabathianakis, I., Karathanasis, A. D., Kalogerakis, N. and Manios, T.: Constructed wetlands treating highway runoff in the central Mediterranean region. Chemosphere 72 (2008) No. 2, p. 141−149.
[92] Tromp, K., Lima, A. T., Barendregt, A. and Verhoeven, J. T. A.: Retention of heavy metals and polyaromatic hydrocarbons from road water in a constructed wetland and the effect of deicing. Journal of Hazardous Materials 203−204 (2012), p. 290−298.
[93] Hallberg, M., Renman, G. and Lundbom, T.: Seasonal Variations of Ten Metals in Highway Runoff and their Partition between Dissolved and Particulate Matter. Water, Air, & Soil Pollution 181 (2007) No. 1−4, p. 183−191.
Autoren
Maximilian Huber, M.Sc.Lehrstuhl für Siedlungswasserwirtschaft |Technische Universität München |
Prof. Dr. rer. nat. habil. Brigitte [email protected] |Lehrstuhl für Siedlungswasserwirtschaft |Technische Universität München |Am Coulombwall 8 |D85748 Garching
Prof. Dr.Ing. habil. Antje WelkerFachgebiet Siedlungswasserwirtschaft und Hydromechanik |Frankfurt University of Applied Sciences |Nibelungenplatz 1 |D60318 Frankfurt am Main
Im Peer-Review-Verfahren begutachtet
Eingereicht: 27.04.2015
Korrektur: 13.06.2015
76

water
Review
Stormwater Management: Calculation of Traffic AreaRunoff Loads and Traffic Related EmissionsMaximilian Huber and Brigitte Helmreich *
Chair of Urban Water Systems Engineering, Technical University of Munich, Am Coulombwall 3,85748 Garching, Germany; [email protected]* Correspondence: [email protected]; Tel.: +49-892-891-3719
Academic Editor: Marco FranchiniReceived: 18 May 2016; Accepted: 12 July 2016; Published: 15 July 2016
Abstract: Metals such as antimony, cadmium, chromium, copper, lead, nickel, and zinc can behighly relevant pollutants in stormwater runoff from traffic areas because of their occurrence, toxicity,and non-degradability. Long-term measurements of their concentrations, the corresponding watervolumes, the catchment areas, and the traffic volumes can be used to calculate specific emission loadsand annual runoff loads that are necessary for mass balances. In the literature, the annual runoffloads are often specified by a distinct catchment area (e.g., g/ha). These loads were summarized anddiscussed in this paper for all seven metals and three types of traffic areas (highways, parking lots,and roads; 45 sites). For example, the calculated median annual runoff loads of all sites are 355 g/hafor copper, 110 g/ha for lead (only data of the 21st century), and 1960 g/ha for zinc. In addition,historical trends, annual variations, and site-specific factors were evaluated for the runoff loads.For Germany, mass balances of traffic related emissions and annual heavy metal runoff loads fromhighways and total traffic areas were calculated. The influences on the mass fluxes of the heavy metalemissions and the runoff pollution were discussed. However, a statistical analysis of the annualtraffic related metal fluxes, in particular for different traffic area categories and land uses, is currentlynot possible because of a lack of monitoring data.
Keywords: de-icing salt; Germany; heavy metal source; highway; mass balance; parking lot; pollution;road; site-specific factors; urban
1. Introduction
In most cases, four types of traffic related loads are used for calculating mass balances andfluxes [1]. Specific substance emission loads are presented in the literature for each vehicle perkilometer traveled (mg/(vehicle¨ km)) or for all vehicle kilometers traveled in a distinct catchment areaduring a specific period (mg/(ha¨ km)). Annual loads can be specified by the road length (g/km) or bythe traffic area (g/ha). For the description of the pollution of a traffic area, a differentiation is necessarybetween total traffic related emission loads, atmospheric deposition loads (wet and/or dry), andrunoff loads from traffic areas. For the calculation of runoff loads, long-term measurements of runoffconcentrations and water volumes of a monitoring site with a distinct catchment area must be recorded,analyzed, and published. Although several researchers have evaluated the runoff concentrations ofdifferent traffic areas [2,3], only a part of these monitoring programs included the calculation of annualloads. This is based on the fact that during most monitoring programs, only a limited number ofsamples is collected and most objectives do not require the calculation of loads (e.g., manual (grab)samples for stormwater permit applications). Nevertheless, annual heavy metal loads normalizedper hectare of impervious catchment area are necessary for mass balances and their determination issubsequently important for several purposes (e.g., modeling of stormwater quality and transportationinto receiving water, calculation of metal masses removed by treatment systems, determination of
Water 2016, 8, 294; doi:10.3390/w8070294 www.mdpi.com/journal/water
77

Water 2016, 8, 294 2 of 21
pollution loads for laboratory test methods, calculation of regional or national mass balances, or theassessment of the environmental impact and benefit of different techniques to remove toxic substancesin relation to their costs).
For stormwater management, determining traffic area runoff loads for different traffic areacategories is necessary to design effective stormwater management practices [4]. Therefore, detailedinformation on differentiated traffic related sources (emissions because of leaded gasoline, tire wear,brake lining wear, roadway abrasion, weights for tire balance, guardrails, lampposts/signs, andde-icing salts) and areas (traffic area categories) is needed to determine their contributions to thetotal pollution of environmental compartments and to develop cost efficient mitigation strategies.Previously, urban area pollutant categories were often confined to broader land use categories suchas commercial, industrial, or residential [4]. By this approach, the different pollution loads of trafficareas cannot be considered although all road surfaces represent approximately 10%–15% of the totalurban area [5,6] and in commercial and industrial areas, parking lots can constitute up to 46% of thetotal area [5]. Thus, it is essential to consider the runoff loads more differentiated because of the largepercentages of different traffic areas to the total urban area. However, most values for specific trafficarea categories were available and summarized for highways and less were published for parking lotsand other roads [7–9]. Because most values and ranges of pollutant loads published in books, reports,regulations, and standards are only based on a few studies, no reliable values are currently availablefor the main traffic area categories and a relation of the loads to climatic factors was also not evaluatedpreviously. In addition, most published data summaries of runoff loads are based on the last centuryand they do subsequently not represent the latest trends.
In traffic area runoff, the occurrence of substances depends on several processes. Dustfallsand dry deposition during periods without rain entrain contaminants and remove them from theatmosphere [6,10]. These mechanisms are especially relevant for urban areas [11]. The processesduring rain events are wet deposition (removal of additional substances from the atmosphere) andwash-off of previously deposited pollutants. Concerning the wash-off, Racin et al. [12] concluded thatsplashing and washing of pollutants from vehicles is more important than the wash-off of pollutantsaccumulated on road surfaces. Both the wash-off and the substances in the atmosphere can be linkedto traffic related sources. For most heavy metals, the wear of brakes and tires are relevant sources.Moreover, braking, acceleration, and steering activities lead to increased abrasion of tires, higher use ofbrake linings, and increased automotive exhaust gas emissions [13,14]. The corrosion and subsequentdissolution of zinc (Zn) from the surface of galvanized elements during rain events is also a relevantsource [15]. Further traffic related sources are the use of catalytic converters in vehicles [16], roadmaintenance with de-icing salts [17], road wear, and drip losses. All of these traffic related sourcesemit heavy metals, hydrocarbons, and further substances and subsequently lead to a pollution ofrunoff from traffic areas. Thus, the substances analyzed in traffic area runoff waters include solids,organic parameters, heavy metals, and compounds of de-icing salts [18,19]. Metals such as cadmium(Cd), chromium (Cr), copper (Cu), nickel (Ni), lead (Pb), antimony (Sb), and Zn are crucial pollutantsbecause of their toxicity, non-degradability, and their increase in all environmental compartments inconsequence of their widespread industrial use [20,21]. Among these parameters, the three heavymetals Cu, Pb, and Zn were mostly measured in the highest concentrations in runoff from trafficareas [2]. Because of the relevant heavy metal concentrations, a treatment of the runoff water isoften necessary to prevent negative effects on surface water, groundwater, and aquatic biota [22–24].These stormwater treatment systems can be designed as a part of existing urban infrastructure forstormwater management [25].
The focus of this paper was set on the metals in traffic area runoff and their traffic related emissions.The hypothesis of this study was that a distinct calculation of mass balances for traffic related metals(emissions and runoff loads) of all types of traffic areas (i.e., highways, roads, and parking lots) ispossible as a result of a literature study. The objectives of this paper were as follows: to summarize thedistributions of annual metal loads of runoff from different types of traffic areas, to identify relevant
78
Water 2016, 8, 294 3 of 21
trends and factors, to update and expand existing mass balances (heavy metal runoff loads andemissions) for Germany, and to determine the mass fluxes of traffic related metals.
2. Materials and Methods
The annual loads summarized in this paper were selected from a database of German andinternational studies with descriptions of the runoff from traffic areas. The database includesinformation on the monitored traffic area (categories: bridges, highways, parking lots, and roads),the substance concentrations and loads, and all influencing factors reported by the authors(e.g., land use characteristics, vegetation, topography, road design, operational characteristics, climaticfactors, type of sampling, sampling strategy, sample preparation, sample analysis, and calculationmethods). In addition to peer-reviewed journal papers, reports, books, and non-reviewed journalarticles that presented data of metals in traffic area runoff were considered after validating thepublished results (i.e., to fulfill requirements such as a detailed description of the applied methods,the performance of quality control measures, and the reliability of the monitoring setup). The metalrunoff concentrations and site-specific and method-specific (i.e., sample collection, preparation, andanalysis) factors influencing the results were presented in another review [2]. From this databasewith more than 300 monitoring sites, this review includes all studies that presented traffic area runoffloads for the metals Cd, Cr, Cu, Ni, Pb, Sb, and Zn. The values were always reported as total(recoverable) metals that were measured after an appropriate digestion (i.e., strong acid or aquaregia digestion; sometimes combined with an autoclave or microwave). The sample preparationand analysis conducted by the selected studies had a low influence on the results because of qualityassurance/quality control procedures [2]. All studies used automatic composite samplers to obtaina large number of samples for each rain event (active sampling) or a mixed sample of a part ofthe complete runoff (passive sampling). The highest uncertainties regarding all selected long-termmonitoring programs are related to the handling of the raw data (e.g., time interval of the data loggingand the link between flow-/rainfall-measurements and measured runoff concentrations) and thecalculation methods for the annual loads (e.g., values below the detection limit or missing valuesbecause of a malfunction of a device). All monitored traffic areas were categorized in one of the threecategories highway (H), parking lot (P), and road (R). Sites with reported runoff loads that are notcompletely linked to impervious traffic areas were categorized as special (S). Each monitoring site gotan identification number (ID) that consists of one capital letter according to the category (H, P, R, or S)and two consecutive numbers, e.g., H01. These IDs were used in the Tables and Section 3.
The characteristics of the sites used for this review are summarized in Table 1. Table 1 includesdata about the location (country), the period of sampling, the land use, special fixed site-specificfactors, the road maintenance (i.e., winter services and sweeping), the average annual daily traffic(AADT), the discharge area of the monitoring site (i.e., the catchment area connected to the sampler),and the annual rainfall depth. The runoff loads of the metals are presented in Table 2. This novelevaluation of different types of traffic areas (H, R, and P) only used annual metal loads per hectareof catchment area (g/ha) that were calculated by the respective authors of the selected studies fromrunoff concentrations of impervious surfaces without a subsequent (pre-)treatment (i.e., some sitespresented in [26–30] are summarized in the category S). Therefore, a conversion of units was sometimesperformed (lb/acre, mg/m2, or kg/ha in g/ha). In addition, if all required information was available,annual metal loads presented as g/km were recalculated to g/ha. A calculation of loads fromrunoff concentrations and the corresponding water volumes was not performed because of climaticsite-specific factors (i.e., variable at each site) and several uncertainties (e.g., missing data about thepercentage of analyzed runoff volumes to total volumes, the percentage of collected rain events to totalrain events, the representativeness of the analyzed rain events in terms of intensities and durations,and the ambiguity between rainfall and runoff volumes).
The software package SPSS 22 (IBM) was used for statistical analysis and plotting. For boxand whisker plots, the bottom and top of each box are the first and third quartiles and the band
79

Water 2016, 8, 294 4 of 21
inside the box is the median. The whiskers represent 1.5 times the interquartile range (IQR). Outliers(>1.5 times IQR) are marked as small circles and extreme values (>3.0 times IQR) as stars. To analyzehistorical trends, the period of the monitoring program was used instead of the publication date.Because of the non-normal distribution of most parameters, the non-parametric Spearmen rank-ordercorrelation was subsequently used for the correlation analysis following the example of Mosley andPeake [31]. For the correlation analysis, the sites H27, H28, and R02 were split up into two, four, andnine independent data sets, respectively, to consider the heavy metal loads and annual rainfall depthsfor each year. For H05, H06, and H08–H13, no values for the annual rainfall depths were used for thestatistical analysis because of missing mean values.
Table 1. Characteristics of traffic area sites with heavy metal loads reported in the literature.
ID Literature Location * Period ofSampling
Study SiteCharacteristics **
AADT(veh./d)
DischargeArea (m2)
Rainfall(mm/yr)
H01 [32] GBR 1973–1974 urban, B, D, S 57,600 36,000 533H02 [1] CHE 1976–1977 non-urban, D 72,000 54,300 1132H03 [33] FRA 1978–1979 – 13,600 – –H04 [26,27] DEU 1978 non-urban, D, nS 41,000 13,000 792H05 [34] USA 1978–1981 urban 53,000 4937 810–1140H06 [34] USA 1978–1981 urban 42,000 401 810–1140H07 [26,27] DEU 1979 non-urban, D, nS 47,000 25,200 737H08 [34] USA 1979–1981 non-urban 8600 1133 1020–2290H09 [34] USA 1979–1981 non-urban 7700 728 1520–2540H10 [34] USA 1979–1981 non-urban 7300 1133 1780–2540H11 [34] USA 1979–1981 non-urban 2000 5059 178–381H12 [34] USA 1979–1981 urban, B, Zn smelter 17,300 890 432–711H13 [34] USA 1979–1981 non-urban 2500 1012 254–483H14 [35] FRA 1980–1982 non-urban 5500 1470 801H15 [35] FRA 1980–1982 non-urban 7000 – 620H16 [36] FRA 1993–1994 non-urban 30,000 13,000 –H17 [30] USA 1993–1995 urban, B 58,150 5341 1160H18 [30] USA 1994–1995 urban, B 8780 526 1670H19 [37] USA 1995–1996 urban 41,000 1670 945H20 [37] USA 1995–1996 urban 51,000 4940 945H21 [28] USA 1995–1996 urban, B, D 25,000 1497 –H22 [38] FRA 1995–1996 urban, B, D, S 12,000 3200 656H23 [37] USA 1995–1997 urban 120,000 1880 945H24 [39] DEU 1998–2000 urban, D >50,000 75,800 774H25 [39] DEU 1998–2000 urban, D >50,000 51,300 774H26 [40] CHE 1999–2000 non-urban 60,000 75,000 1050H27 [41] CHE 2006–2007 urban, D, S 59,000 25,000 876–1184H28 [41] CHE 2006–2009 non-urban, D, S 74,000 20,000 477–726H29 [42] DEU 2011–2012 non-urban, D 85,600 27.5 538H30 [42] DEU 2011–2012 urban, D 66,200 28.0 471H31 [42] DEU 2011–2012 non-urban, D 45,000 27.3 454H32 [43] CHE 2012–2013 urban, D, S 39,000 42,000 1147R01 [44] DEU 1988–1989 urban 18,129 162.2 609R02 [45] DEU 1996–2005 urban, D 6800 17.3 334–863R03 [14] CHE 2002–2004 non-urban 17,000 1500 1000R04 [14] CHE 2002–2004 urban 17,000 14.1 1000R05 [46] BRA 2002–2004 urban 9000 1300 –R06 [47] DEU 2006–2007 urban, D, S 57,000 100 739R07 [48] DEU 2014–2015 non-urban, D 20,600 9870 1200R08 [48] DEU 2015 urban, nD 9500 1600 800P01 [29] USA 1998–1999 urban – 1050 1000P02 [29] USA 1998–1999 urban – 1050 1000P03 [49] DEU 2001 non-urban, D, S – 10,000 635P04 [49] DEU 2001 non-urban, D, S – 5000 635P05 [49] DEU 2001 non-urban, D, S – 17,700 769
Notes: * BRA (Brazil), CHE (Switzerland), DEU (Germany), FRA (France), GBR (Great Britain), and USA(United States of America); ** B = Bridge, D = De-icing salt application, nD = no De-icing salt application,nS = no Sweeping, S = Sweeping reported in the literature.
80

Water 2016, 8, 294 5 of 21
Table 2. Annual total heavy metal loads in runoff from traffic areas. The characteristics of all trafficarea sites are described in Table 1.
ID Literature Cd Load(g/ha)
Cr Load(g/ha)
Cu Load(g/ha)
Ni Load(g/ha)
Pb Load(g/ha)
Zn Load(g/ha)
H01 [32] – 972 3780 1000 12,900 19,000H02 [1] 25 – 350 – 2500 1900H03 [33] – – – – 1200 2300H04 [26,27] 37 62 621 – 1330 2330H05 [34] – – 223 – 4420 2320H06 [34] – – 732 – 15,920 4210H07 [26,27] 29 100 544 – 1160 2890H08 [34] – – 34 – 130 220H09 [34] – – 361 – 1670 2010H10 [34] – – 565 – 5480 2560H11 [34] – – 30 – 80 470H12 [34] – – 118 – 690 10,400H13 [34] – – 65 – 320 390H14 [35] – – – – 410 1170H15 [35] – – – – 820 1410H16 [36] – – – – 140 1390H17 [30] – – 230 – 470 1300H18 [30] – – 80 – 200 450H19 [37] 5.6 50.4 235 – 112 1300H20 [37] 4.5 40.4 269 – 112 874H21 [28] 30 90 220 90 200 –H22 [38] 8.1 – 249 – 567 2080H23 [37] 19.1 381 628 – 425 3230H24 [39] – – 440 – 217 1960H25 [39] – – 480 – 250 2120H26 [40] 30 – 1070 – 560 1990H27 [41] – – 440 – 80 1190H28 [41] – – 359 – 55 1270H29 [42] 1.4 – 805 – 88 2440H30 [42] 0.6 – 241 – 44 878H31 [42] 0.8 – 350 – 72 834H32 [43] – – 750 – – 3930R01 [44] – – 500 – 1800 10,600R02 [45] 1.7 41 225 41 83 2510R03 [14] 4.0 119 471 – 179 3230R04 [14] 3.2 75.4 398 – 170 2100R05 [46] 8.0 – 310 – 500 –R06 [47] – – 970 – 210 4820R07 [48] – – 600 – – 1300R08 [48] – – 184 – – 1060P01 [29] – – 42 – 18 174P02 [29] – – 33 – 17 147P03 [49] – – 400 – 150 2400P04 [49] – – 250 – 110 1000P05 [49] – – 500 – 200 2000
For the calculations of median values, mean values, and standard deviations (SD) in Section 3.3,some data were excluded because of special site-specific factors (cf. Section 3.2.1). To avoid a biasbecause of the historical trends of the Pb data (cf. Section 3.2.2), the values of the 20th centurywere excluded for the discussion of recent loads. All of these exceptions are directly specified at thepresentation and discussion of the particular results.
3. Results and Discussion
3.1. Annual Metal Runoff Loads for Different Traffic Areas
A summary of annual total metal loads of 45 sites is presented in Table 2 for all three traffic areacategories (H, R, and P) and the six most relevant heavy metals (Cd, Cr, Cu, Ni, Pb, and Zn). Most of
81

Water 2016, 8, 294 6 of 21
the values were published for highway sites (H, n = 32) with fewer values for other roads (R, n = 8)and parking lots (P, n = 5). The traffic area runoff loads of Cu, Pb, and Zn were mostly measured andpublished by other researchers. Less data are available for Cd, Cr, Ni, and Sb. For Sb, the annualaverage runoff load was only published for one urban road (16.8 g/ha at R02; [45]) and three highwaysites (11.2 g/ha at H19, 5.6 g/ha at H20, and 17.9 g/ha at H23; [37]).
The most concentrated metal was Zn, followed by Pb, Cu, Ni, Cr, Cd, and Sb. The SDs betweenall monitoring results are quite high for all heavy metals summarized in Table 2: 12.9 g/ha Cd,291 g/ha Cr, 587 g/ha Cu, 540 g/ha Ni, 3180 g/ha Pb, and 3330 g/ha Zn. In addition, the runoffloads of one to four sites are calculated as extreme values for most metals (Figure 1). Compared withthe other heavy metals, the variations of the Pb and Zn data (e.g., cf. the SDs above and the IQRspresented in Figure 1) are the highest. For Pb, it is linked to the historical trends (cf. Section 3.2.2).In contrast, the contributions of different Zn sources to the runoff loads are highly variable betweeneach site (e.g., brake linings, galvanized bridge parts, galvanized car parts, guardrails, lamp-posts,motor oil, tires, safety fences, and signs; [38,50,51]). Thus, these high loads are based on different fixedsite-specific factors (cf. Section 3.2.1), operational characteristics (cf. Section 3.2.2) but can also belinked to climatic (cf. Section 3.2.3) and method-specific influences [2].
Water 2016, 8, 294 6 of 21
The most concentrated metal was Zn, followed by Pb, Cu, Ni, Cr, Cd, and Sb. The SDs between
all monitoring results are quite high for all heavy metals summarized in Table 2: 12.9 g/ha Cd, 291
g/ha Cr, 587 g/ha Cu, 540 g/ha Ni, 3180 g/ha Pb, and 3330 g/ha Zn. In addition, the runoff loads of
one to four sites are calculated as extreme values for most metals (Figure 1). Compared with the other
heavy metals, the variations of the Pb and Zn data (e.g., cf. the SDs above and the IQRs presented in
Figure 1) are the highest. For Pb, it is linked to the historical trends (cf. Section 3.2.2). In contrast, the
contributions of different Zn sources to the runoff loads are highly variable between each site (e.g.,
brake linings, galvanized bridge parts, galvanized car parts, guardrails, lamp‐posts, motor oil, tires,
safety fences, and signs; [38,50,51]). Thus, these high loads are based on different fixed site‐specific
factors (cf. Section 3.2.1), operational characteristics (cf. Section 3.2.2) but can also be linked to climatic
(cf. Section 3.2.3) and method‐specific influences [2].
For most values, the loads published for runoff from parking lots were lower than the loads of
highway and road runoff (Table 2 and Figure 1). One further trend between the traffic area categories
was found for the runoff loads from parking lots. The two parking lots P01 and P02 at the Florida
Aquarium (USA) were less polluted compared with the three frequently used German highway
parking lots for trucks (P03), cars (P04), and all types of vehicles (P05). Thus, the frequently used
highway parking lots with high percentages of trucks have increased runoff loads and these values
are comparable with the annual metal loads of the runoff from roads.
Figure 1. Annual total heavy metal loads of Cr (n = 10), Cu (n = 41), Pb (n = 42), and Zn (n = 43) in
runoff from traffic areas for each of the three categories highways (H), roads (R), and parking lots (P).
Strong and statistical significant correlations were determined for Cr with Pb, Cu, and Zn (Table
3) that represent the particulate fraction of these metals because Cr and Pb are mostly particulate in
the runoff from traffic areas and Cu and Zn are also particulate but more dissolved [2]. Some
significant correlations between the catchment area and the metal runoff loads were also calculated
(Table 3). However, only an effect of the area on the first flush was previously reported [52].
3.2. Influences on the Metal Runoff Loads
3.2.1. Fixed Site‐Specific Influences
One often‐discussed factor is the impact of the AADT on the runoff pollution of traffic areas.
However, AADT can only explain approximately 30% of the variations between different sites [53].
In this review, the AADT varies between 2000 vehicles per day and 120,000 vehicles per day for the
highway and road sites (Table 1). Significant correlations between AADT and the heavy metals were
found for Cd, Cr, and Cu (Table 3). Cr was the only metal with a strong correlation (δ = 0.66). Thus,
Figure 1. Annual total heavy metal loads of Cr (n = 10), Cu (n = 41), Pb (n = 42), and Zn (n = 43) inrunoff from traffic areas for each of the three categories highways (H), roads (R), and parking lots (P).
For most values, the loads published for runoff from parking lots were lower than the loads ofhighway and road runoff (Table 2 and Figure 1). One further trend between the traffic area categorieswas found for the runoff loads from parking lots. The two parking lots P01 and P02 at the FloridaAquarium (USA) were less polluted compared with the three frequently used German highwayparking lots for trucks (P03), cars (P04), and all types of vehicles (P05). Thus, the frequently usedhighway parking lots with high percentages of trucks have increased runoff loads and these values arecomparable with the annual metal loads of the runoff from roads.
Strong and statistical significant correlations were determined for Cr with Pb, Cu, and Zn (Table 3)that represent the particulate fraction of these metals because Cr and Pb are mostly particulate in therunoff from traffic areas and Cu and Zn are also particulate but more dissolved [2]. Some significantcorrelations between the catchment area and the metal runoff loads were also calculated (Table 3).However, only an effect of the area on the first flush was previously reported [52].
82

Water 2016, 8, 294 7 of 21
Table 3. Spearman correlation coefficients of average annual daily traffic (AADT), catchment area,annual rainfall depths, and heavy metal runoff loads: correlation coefficient ď0.39 = weak correlation,0.40–0.59 = medium correlation, and ě0.60 = strong correlation. Strong correlations are in bold typeand no values are presented for Ni because of the small n (5 or 6 for all correlations).
Variable Cd Cr Cu Pb Sb Zn AADT Area Rainfall
Cd – – – – – – – – –– – – – – – – –
Cr0.76 ** – – – – – – – –n = 17 – – – – – – –
Cu0.49 * 0.77 ** – – – – – – –n = 24 n = 18 – – – – – –
Pb0.94 ** 0.90 ** 0.43 ** – – – – – –n = 24 n = 18 n = 50 – – – – –
Sb´0.22 0.08 0.41 ´0.10 – – – – –n = 12 n = 12 n = 12 n = 12 – – – –
Zn0.21 0.69 ** 0.56 ** 0.50 ** 0.63 * – – – –
n = 22 n = 17 n = 51 n = 52 n = 12 – – –
AADT0.44 * 0.66 ** 0.47 ** ´0.01 ´0.32 ´0.03 – – –n = 24 n = 18 n = 48 n = 49 n = 12 n = 50 – –
Area0.74 ** 0.54 * 0.41 ** 0.25 ´0.39 ´0.14 0.43 ** – –n = 24 n = 18 n = 53 n = 52 n = 12 n = 53 n = 50 –
Rainfall0.64 ** 0.29 0.04 0.22 0.07 ´0.11 0.02 0.22 -n = 22 n = 17 n = 43 n = 42 n = 12 n = 45 n = 40 n = 44
Notes: * p < 0.05, statistical significance of the correlations; ** p < 0.01, statistical significance of the correlations.
3.2. Influences on the Metal Runoff Loads
3.2.1. Fixed Site-Specific Influences
One often-discussed factor is the impact of the AADT on the runoff pollution of traffic areas.However, AADT can only explain approximately 30% of the variations between different sites [53].In this review, the AADT varies between 2000 vehicles per day and 120,000 vehicles per day for thehighway and road sites (Table 1). Significant correlations between AADT and the heavy metals werefound for Cd, Cr, and Cu (Table 3). Cr was the only metal with a strong correlation (δ = 0.66). Thus,further site-specific factors have an influence on the annual loads. A general description of thesesite-specific factors that influence the metal runoff concentrations and loads from traffic areas is givenin [2]. In the following, only the fixed site-specific factors that were responsible for the extreme valuescalculated for all 45 sites were discussed with the exception of Pb (cf. Section 3.2.2).
Most of the largest annual loads were measured for the urban site H01, which has a high AADTof 57600 vehicles per day. Further factors that might have led to the high runoff concentrations werethe extreme use of de-icing salts, which had increased levels of metal contents (cf. Section 3.4.2), by thewinter services (ca. 2100 g/(m2¨yr)), the grade of congestion during rush hours, and the road design(e.g., a section of the monitoring site was a bridge with concrete pillars) [32]. In addition to these highconcentrations, uncertainties regarding the discharge area because of the steep slope at the ends of thedrainage area causing additional water flowing into the monitored area might have led to the increasedcalculated annual runoff loads [32]. At H12, the presence of a nearby Zn smelter was responsible forthe high Zn runoff loads [34]. The road design of R01 resulted in increased runoff loads because of thecomplete drainage of the catchment area by curbs and gutters (runoff volumes were calculated fromthe rainfall depths and an assumed runoff coefficient of 0.9), the presence of guardrails (at the medianand at both sites of the road), and the stop-and-go traffic.
For the special sites (S, n = 10), grass swales were often used instead of conventional curbsand gutters to drain the catchment areas and the samples were often taken at the drainage pipes.
83

Water 2016, 8, 294 8 of 21
The category S consists of the highway sites S01–S04 and the parking lot sites S05–S10. Most metalrunoff loads of category S (Table 4) are much lower than the ones reported for non-pre-treated runoffloads for comparable sites (Table 2). At S01, the surface was only sealed by 39.6% with asphalt andthe rest of the drainage area were adjacent areas with surfaces vegetated by grass [26]. At S02, thecatchment area consisted of 61% asphalt, which was drained to a catch basin, and the grassy shoulderthat were both monitored [28]. A similar situation was present at S03 with 45% impervious asphaltand a grassy shoulder [28]. At S04, 37.6% of the drainage area was paved with asphalt and thehighway runoff drained into a large grassy median that were both simultaneously monitored in mixedsamples [30]. For the parking lots, several loads for pre-treated runoff were reported [29]: asphaltsurfaces with subsequent vegetated swales (S05,S06), cement surfaces with subsequent vegetatedswales (S07,S08), and pervious surfaces with subsequent vegetated swales (S09,S10). A comparisonof the sites S05–S10 with the sites P01 and P02 shows that small alterations to parking lot designscan dramatically decrease runoff metal loads. The reduction of pollutants by grass swales was alsomeasured for the adjacent sites H21/S02 and the data presented for S04 in [30]. These results concerningthe runoff load reductions by pervious surfaces and vegetated swales can be used for designingstormwater management practices. For the design of vegetated swales, further site-specific factorssuch as the road design (e.g., crossings and roundabouts) and the grade of congestion (i.e., sites withfrequent stop-and-go traffic) must be considered [54].
Table 4. Annual total heavy metal loads in pre-treated runoff from traffic areas.
Site Literature Cd Load(g/ha)
Cr Load(g/ha)
Cu Load(g/ha)
Ni Load(g/ha)
Pb Load(g/ha)
Zn Load(g/ha)
S01 [26,27] 7.2 12 130 – 360 715S02 [28] 10 20 70 20 70 –S03 [28] 50 50 100 50 130 –S04 [30] – – 15 – 10 60S05 [29] – – 8 – 2 37S06 [29] – – 25 – 7 79S07 [29] – – 8 – 3 42S08 [29] – – 9 – 4 56S09 [29] – – 3 – 1 20S10 [29] – – 6 – 3 36
3.2.2. Historical Trends
The historical trends of traffic area runoff loads published in literature were analyzed for Cu, Pb,and Zn from the 1970s to date. The loads were aggregated into five decades and plotted as box andwhisker plots in Figure 2.
For the Pb data, a significant decrease of the loads was detected as a function of time because ofthe phase-out and substitution of leaded gasoline. The decrease of Pb use as an anti-knocking agentstarted in the USA in the mid-1980s and was completed in 1996 [55]. In Europe, the situation wasnot as homogenous as in the USA. For example, Pb was almost completely phased-out in gasolinein Germany and several other countries of Western Europe since 1986 [56,57]. The phase-out in theEuropean Union ended in January 2002, with the elimination of leaded gasoline in Italy [58]. At thesame time, leaded gasoline was banned in China [15]. Further reductions of Pb usage are related tothe substitution of Pb in tires and brake linings [38,59,60], lubricating oil and grease [50], and weightsadded to vehicles for tire balance [61,62]. These developments are responsible for the high Pb loadsreported in older publications (cf. Table 2). However, tires still contain Pb [63,64] (cf. Section 3.4.2)and Pb is added to the gasoline used in classic cars. As a consequence, Pb is still found in runoffsamples of the 21st century in low concentrations [2] and in younger vegetated infiltration swales inlow contents [54]. Thus, only Pb data of the 21st century should be used for current mass balances(cf. Sections 3.3 and 3.4). For Cu and Zn, no historical trends were detected. The median values of the
84

Water 2016, 8, 294 9 of 21
decades varied because of different characteristics of the sites monitored per decade. The evaluationof the Cu and Zn loads confirms the higher variability of Zn (e.g., cf. the IQRs presented in Figure 2)compared with Cu that is based on the different sources (e.g., presence of Zn in galvanized structuresand crumbs of car tire rubber; cf. Section 3.4.2). In addition, Cu and Zn are simultaneously present insome sources such as brake linings [38,65] and, therefore, their runoff loads have a medium correlation(Table 3).
Water 2016, 8, 294 8 of 21
decrease runoff metal loads. The reduction of pollutants by grass swales was also measured for the
adjacent sites H21/S02 and the data presented for S04 in [30]. These results concerning the runoff load
reductions by pervious surfaces and vegetated swales can be used for designing stormwater
management practices. For the design of vegetated swales, further site‐specific factors such as the
road design (e.g., crossings and roundabouts) and the grade of congestion (i.e., sites with frequent
stop‐and‐go traffic) must be considered [54].
Table 4. Annual total heavy metal loads in pre‐treated runoff from traffic areas.
Site Literature Cd Load
(g/ha)
Cr Load
(g/ha)
Cu Load
(g/ha)
Ni Load
(g/ha)
Pb Load
(g/ha)
Zn Load
(g/ha)
S01 [26,27] 7.2 12 130 – 360 715
S02 [28] 10 20 70 20 70 –
S03 [28] 50 50 100 50 130 –
S04 [30] – – 15 – 10 60
S05 [29] – – 8 – 2 37
S06 [29] – – 25 – 7 79
S07 [29] – – 8 – 3 42
S08 [29] – – 9 – 4 56
S09 [29] – – 3 – 1 20
S10 [29] – – 6 – 3 36
3.2.2. Historical Trends
The historical trends of traffic area runoff loads published in literature were analyzed for Cu,
Pb, and Zn from the 1970s to date. The loads were aggregated into five decades and plotted as box
and whisker plots in Figure 2.
Figure 2. Historical trends of Cu (n = 41), Pb (n = 42), and Zn (n = 43) in traffic area runoff loads from
the 1970s to date.
For the Pb data, a significant decrease of the loads was detected as a function of time because of
the phase‐out and substitution of leaded gasoline. The decrease of Pb use as an anti‐knocking agent
started in the USA in the mid‐1980s and was completed in 1996 [55]. In Europe, the situation was not
as homogenous as in the USA. For example, Pb was almost completely phased‐out in gasoline in
Germany and several other countries of Western Europe since 1986 [56,57]. The phase‐out in the
European Union ended in January 2002, with the elimination of leaded gasoline in Italy [58]. At the
Figure 2. Historical trends of Cu (n = 41), Pb (n = 42), and Zn (n = 43) in traffic area runoff loads fromthe 1970s to date.
3.2.3. Annual Variations and Climatic Site-Specific Influences
Since most of the other sampling periods were only 1 to 2 years long (cf. Table 1), valuesof the annual runoff loads and annual rainfall depths are only available for each monitored yearfor the three traffic area sites R02, H27, and H28. Variations of the annual runoff loads (n = 9)were calculated for a nine-year monitoring program (R02) from the data presented by Nadler andMeißner [45]. The minima and maxima of the annual runoff loads calculated for each twelve monthsare 0.5–3.1 g/ha Cd, 17–76 g/ha Cr, 116–324 g/ha Cu, 20–60 g/ha Ni, 28–143 g/ha Pb, 10–23 g/ha Sb,and 1530–3550 g/ha Zn. The coefficients of variation (n = 9) for the annual runoff loads of R02 are 56%for Cd, 51% for Cr, 33% for Cu, 43% for Ni, 44% for Pb, 27% for Sb, and 30% for Zn. The catchmentarea, the sampling procedure, and most fixed site-specific factors (e.g., presence of a guardrail) werethe same for the complete monitoring campaign. Only a small increase of the AADT was measured(6100 vehicles per day at the beginning and approximately 6800 vehicles per day in the second half ofthe monitoring program) and a different agricultural land use occurred in the east of the monitoringsite. Since most annual metal loads of the second half of the monitoring program are lower thanthe loads of the first half, the influence of the AADT on the loads is not significant. Therefore, thevariation of the heavy metals might be correlated with climatic factors such as the annual rainfalldepth that varied largely between 334 mm and 863 mm (mean 667 mm; coefficient of variation 26%).However, a strong correlation (δ ě 0.60) between the seven metals and the annual rainfall depth wasonly calculated for Sb (δ = 0.68, p < 0.05). Thus, the annual rainfall depths also had no significantinfluence on the variability of the annual heavy metal runoff loads for this site although most of thelowest loads were calculated for the year with low rainfall depths and long dry weather periods in thespring and summer.
Smaller annual variations of the heavy metal runoff loads were published for H28 (n = 4) for eachof the four years that were monitored [41]: 340–381 g/ha for Cu, 47–63 g/ha for Pb, and 1200–1370 g/hafor Zn. The coefficients of variation (n = 4) are 5% for Cu, 13% for Pb, and 6% for Zn. The annualrainfall depths varied between 477 mm and 726 mm (mean 591 mm; coefficient of variation 22%) at
85

Water 2016, 8, 294 10 of 21
this highway site. The small variations can be partially explained by varying street sweeping intervalsof the hard shoulders [41]. Because of the small n, no correlation analyses were performed.
The variations of the annual rainfall depths at both sites were comparable (coefficients of variationare 26% and 22%). However, the variations between the metal runoff loads were much higher for R02than for H28. These differences between the monitored years and sites can depend on a multitudeof climatic boundary conditions (not only the rainfall depths), which can generally induce differentdeposition and wash-off processes, and on fixed site-specific factors (i.e., different median pollutionloads of both sites). These influences on the median loads can be related to the different AADT andspeed limits (50 km/h at R02 and 120 km/h at H28) and the presence of noise barriers, a forest, andhard shoulders at H28, which can also reduce the influences of climatic factors (e.g., wind turbulences)on the runoff loads [41]. Thus, the fixed site-specific factors also affected the influences of the climaticfactors on the annual variations of the runoff loads.
At H27, with a speed limit of 120 km/h, the published annual heavy metal runoff loads were470/410 g/ha for Cu, 71/88 g/ha for Pb, and 1010/1370 g/ha for Zn for the years 2006/2007 [41].The annual rainfall depths were 876 mm and 1184 mm for the years 2006 and 2007, respectively. Thus,the rainfall depth was higher for 2007 and the runoff loads increased for Pb and Zn but not for Cu.Consequently, median runoff concentrations from the literature multiplied by different annual rainfalldepths of a specific site cannot be used to describe the variance of the annual runoff loads because ofclimatic variations.
For all monitoring sites, the annual rainfall depth varied between 254 mm and 2540 mm(median 792 mm; 90th percentile 1200 mm). A strong correlation between the annual rainfall depthsand the heavy metals was only calculated for Cd (δ = 0.64, p < 0.01) for all monitoring sites (Table 3).The influence of the seasons on the pollution of traffic area runoff was evaluated by Helmreich et al. [66]with a considerable seasonal increase of pollutants in the runoff during the cold season. A correlationof the seasons could not be performed in this study because all published annual loads did notdistinguish between different seasons. Therefore, only the results of single events can be used for thispurpose. For example, the first storm of each season in (semi)arid regions is a special case for theclimatic influences that is characterized by higher runoff loads [67,68].
In addition, the atmospheric deposition (wet and dry) must be considered as a climatic factor thataffects the runoff loads. The deposition fluxes on traffic areas are strongly influenced by site-specificfactors [69]. For example, the absence of curbs, hard shoulders, and noise barriers are site-specificinfluences that have a positive effect on reducing runoff concentrations by decreasing the depositionrates and the subsequent wash-off [41,70]. The deposition is also influenced by the traffic volumeand the surrounding land use. Less data are available for urban traffic area sites (in particular roadsand parking lots) at which higher fractions of metal emissions can be deposited and washed-offcompared with non-urban traffic areas [11]. These rates are also influenced by the antecedentdry period [71]. However, Racin et al. [12] concluded that splashing and washing of pollutantsfrom vehicles is more important than the wash-off of pollutants accumulated on road surfaces byprecipitation (wet deposition). An increased importance of precipitation for runoff pollution of trafficareas in industrial zones is proposed by Dannecker et al. [72] and it is highly variable for each metal.Dry deposition at industrial sites also has an important effect, whereas the influences of traffic relatedemissions become more important at non-industrial urban sites [72]. For the non-urban sites H04,H07, and S01, the influence of the wet and dry deposition rates on the corresponding annual runoffloads was determined. The ratios of deposition loads to runoff loads for the sites H05/H07/S01 were35%/31%/42% for Cd, 65%/2%/125% for Cr, 36%/23%/46% for Cu, 24%/27%/50% for Pb, and54%/31%/80% for Zn [27]. Thus, the deposition affects the runoff loads at these non-urban highwaysites and the influences depend on both the site and the metal.
In summary, the deposition is highly variable for each site because of site-specific factors anda robust data set is currently not available to determine the deposition loads for all types of trafficareas and the most relevant land use categories. For a rough estimation, the average deposition
86

Water 2016, 8, 294 11 of 21
loads summarized by Zessner [73] can be used, which consist of traffic related and non-traffic relatedmetals. He determined annual deposition loads of 1.4 g/ha Cd, 50 g/ha Cu, and 300 g/ha Zn for ruralareas and annual deposition loads of 6.0 g/ha Cd, 250 g/ha Cu, and 1000 g/ha Zn for urban areas.Ilyin et al. [74] modeled annual deposition loads of 0.25–0.65 g/ha Cd and 8–20 g/ha Pb for Germanyon a large scale. However, these data might underestimate the real values of metals deposited ontraffic areas because of the large-scale model. For comparison, Kocher et al. [75] determined annualdeposition loads for three different German highways and the rates varied strongly between eachyear, season, metal, and monitoring point (at ground level or 1.5 m height and with distance fromthe highways). Thus, method-specific factors also have an influence on the results. At 1.5 m height,the deposition rates determined by Kocher et al. [75] are in the range of the ones summarized byZessner [73]. However, the values at ground level can be higher by a factor of up to approximatelyfive for the measurements directly at the highway site. Thus, traffic related emissions highly affect thedeposition rates on traffic areas.
A general description of the influences of climatic factors such as deposition rates, the antecedentdry periods, rain characteristics (volume, intensity, and duration), seasonal effects, and wind turbulenceon the runoff from traffic areas is given in [2]. For rain characteristics, mostly poor correlations wereobtained for the metal runoff concentrations. This is in accordance with the findings of this review(low correlation between annual rainfall depths and runoff loads). Thus, the differences of the runoffloads cannot be based on the uncertainties of the measured values and the high variability of the metalrunoff loads between different years must be based on the variability of climatic factors and somefixed-site specific factors such as road maintenance (e.g., the variability of the use of de-icing saltsby winter services; cf. Section 3.4.2). However, further data are needed to calculate the correlationsbetween runoff loads and rainfall intensities or antecedent dry periods.
3.3. Average Runoff Loads for Different Traffic Area Categories
The values of the runoff loads presented in Table 2 were used to calculate median values, meanvalues, and SDs that could be used for mass balances (no values from H01 and Zn from H12).The calculated median annual runoff loads for all traffic areas are presented in Table 5.
Table 5. Median annual runoff loads (g/ha) for all traffic areas. For Pb, only data measured in the21st century was used.
Parameter n Median Mean SD
Cd 16 6.8 13.0 12.9Cr 9 75 107 106Cu 40 355 384 254Ni 2 66 66 35Pb 13 110 149 119Sb 4 14.0 12.9 5.7Zn 41 1960 2018 1751
For the highway data, the calculated median runoff loads are presented in Table 6.
Table 6. Median annual runoff loads (g/ha) for all highway sites. For Pb, only data measured in the21st century was used.
Parameter n Median Mean SD
Cd 12 14 16 14Cr 6 76 121 130Cu 27 355 388 260Ni 1 90 90 –Pb 5 72 68 18Sb 3 11 12 6Zn 29 1900 1773 1004
87

Water 2016, 8, 294 12 of 21
In a literature study, Hullmann and Kraft [76] presented annual average Cu and Zn loads forrunoff from traffic areas that were summarized from several studies as approximately 800 g/ha for Cuand 2700 g/ha for Zn. These values are higher than the ones calculated in this study. For comparison,Driscoll et al. [7] reported the following ranges of annual heavy metal runoff loads measured in the USA(n = 24): 7.2–37 g/ha for Cd, 12–120 g/ha for Cr, 30–4670 g/ha for Cu, 70 g/ha for Ni, 80–21,200 g/hafor Pb, and 220–10,400 g/ha for Zn. The surrounding land use characteristics comprised nineteen urbansites (commercial, residential, and suburban) and five non-urban sites (forest, agricultural, and desert).Burton and Pitt [8] also summarized the runoff loads for parking lots, highways, and different landuse categories that were published in five reports of the 1970s and 1980s. For parking lots, the reportedvalues of the annual runoff loads are 10 g/ha Cd, 60 g/ha Cu, 800 g/ha Pb, and 800 g/ha Zn [8].The published annual runoff loads are higher for highway sites: 20 g/ha Cd, 90 g/ha Cr, 370 g/ha Cu,4500 g/ha Pb, and 2100 g/ha Zn [8]. With the exception of Pb, these annual highway runoff loads areonly slightly higher than the median values calculated for highways in this review. In contrast, thesesummarized parking lot runoff loads are highly different compared with the parking lot values ofTable 2 because the use of parking lots differ widely. Subsequently, the runoff loads of parking lotsshould not be summed up but considered in accordance to their type of use (cf. Section 3.1). Anotherrelevant factor for parking lots is the contamination of parked vehicles with dirt, rust, and furthersubstances [77] that must be considered for planning stormwater management strategies.
3.4. Heavy Metal Load Balances for Germany
3.4.1. Mass Balances of Heavy Metal Traffic Area Runoff Loads
In Germany, there are approximately 281.3 km2 of highways and 339.5 km2 of state roads [78].The total amount of all types of traffic areas, which also include the areas for railroads, airports,and waterways, is 18,070 km2 in Germany and the fraction of roads, places (e.g., parking lots andmarketplaces), and sidewalks is 15,750 km2 [79].
Since median values are preferred for the analyses of such field data [80], the median annualloads for highway runoff and the area of highways in Germany (281.3 km2) were used to calculatethe total amount of metal loads in runoff from German highways.. These total loads are presented ast/yr (1 t/yr = 1000 kg/yr) and were calculated as approximately 0.38 t/yr Cd, 2.1 t/yr Cr, 9.8 t/yr Cu,2.5 t/yr Ni, 2.0 t/yr Pb, 0.31 t/yr Sb, and 53.4 t/yr Zn.
The calculated median annual heavy metal loads for all traffic areas, which are similar to theones for the highway sites, and the total amount of all transportation areas (15,750 km2) were used toestimate the total traffic area runoff loads for Germany. Thus, approximately 10.7 t/yr Cd, 119 t/yr Cr,558 t/yr Cu, 103 t/yr Ni, 173 t/yr Pb, 22.1 t/yr Sb, and 3087 t/yr Zn are transported by runoff fromtraffic areas in Germany. Since less polluted traffic areas are also summarized in the total amount oftransportation areas and no data are available for these categories regarding runoff loads, the calculatedvalues tend to exaggerate the total runoff loads for Germany.
3.4.2. Mass Balances of Traffic Related Heavy Metal Emissions
Hillenbrand et al. [81] published heavy metal emission loads of different sources in a literaturestudy for Germany. For the traffic related heavy metal emissions, they calculated the average loadsfor Cu, Pb, and Zn for the following sources: brake lining wear, tire wear, roadway abrasion, andPb weights for tire balance. These data were adapted, updated, and extended by Cd and furthersources (Zn weights for tire balance guardrails, lampposts/signs, and de-icing salts) for this review.The emission of Pb by leaded gasoline used by classic cars was not considered (only 0.6% of thecars in Germany are classic cars and their kilometric performances are low). A summary of thefollowing results for the four metals Cd, Cu, Pb, and Zn is presented in Table 7. Both the metalcontents of different sources (mg/kg) and the emission rates (mg/(vehicle¨km)) are highly variable
88

Water 2016, 8, 294 13 of 21
and only average values for each source are published to indicate their importance in relation to otheremission sources.
Table 7. Traffic related heavy metal emissions in Germany (summary of mean values of the calculationspresented in Section 3.4.2 that are based on different literature data).
Source Cd (t/yr) Cu (t/yr) Pb (t/yr) Zn (t/yr)
Tire wear 0.19 0.79 2.0 1255Brake lining wear 0.03 928 61.5 309Roadway abrasion – 4.3 7.1 149
Weights for tire balance – – 2.2 6.6Guardrails – – – 313
Lampposts and signs – – – 60De-icing salts 0.70 1.75 11.6 1.75
Sum of all seven sources 0.92 935 84.4 2094
The first four sources are directly related to vehicles and the loads are determined by multiplyingthe metal contents of the material by their total abrasion masses. The tire wear was determinedby Kocher et al. [82] based on 62 different tire samples for 13 metals and further substances.Kocher et al. [82] measured the metal contents of each tire (n = 62) and the coefficients of variation forthe metal contents are 70% for Cd, 38% for Cr, 56% for Cu, 74% for Ni, 95% for Pb, 330% for Sb, and35% for Zn. This is based on the different ages, manufacturers, and types of tires. The complete mass oftire wear is based on the emission factors reported in seven studies, which determined the tire wear as(mg/(vehicle¨ km)) for four vehicle categories (summarized in [81]), and the kilometric performancesof the vehicles in Germany. By using the mean metal contents published by Kocher et al. [82] andan annual mass of tire wear of 111,420 t (coefficient of variation 29%) for Germany, the mean totalemission loads for tire wear in Germany were calculated as 0.19 t/yr Cd, 0.51 t/yr Cr, 0.79 t/yr Cu,0.97 t/yr Ni, 2.03 t/yr Pb, 0.42 t/yr Sb, and 1255 t/yr Zn. In contrast, Hillenbrand et al. [81] proposedannual emission loads of 2.7 t/yr Pb and 1620 t/yr Zn for tire wear. Thus, the calculated Pb andZn loads of tire wear differ by approximately 20%–25% between these two studies. A summary ofmeasured metal contents in tires and brakes was also presented by McKenzie et al. [64]. The contentsalso have a high variation for each metal (mostly one order of magnitude) and are in the order of thevalues summarized and measured by the German researchers [81,82]. The Cd emission load caused bybrake wear was calculated with the metal content of 2.7 mg/kg presented by Legret and Pagotto [38],which is the median value of the contents summarized by McKenzie et al. [64] (coefficient of variation120%), and the total brake lining abrasion mass of 12,500 t/yr published by Hillenbrand et al. [81].The loads of brake lining wear for Cu, Pb, and Zn are taken from [81], which are based on the heavymetal contents of brake linings and their emissions published in eight studies separately for cars andtrucks. In Germany, the brake linings of cars were responsible for 83%, 94%, and 80% of the total brakelining emission loads for Cu, Pb, and Zn, respectively. The emissions by weights for tire balances(Pb emissions reduced by 75% because of its substitution, mainly by Zn) and roadway abrasion wereadapted from [81]. The roadway abrasion loads are based on the mean values of 18 road samples.The metal contents of the road surfaces varied between 0.0 and 31.5 mg/kg Cu, 0.9–29.0 mg/kg Pb,and 4–614 mg/kg Zn. Since only few data were available about the wear emission rates, in particularfor different types of vehicles (e.g., cars, trucks, and buses), the uncertainties of the emission loads arehigh. Consequently, more data are needed to calculate reliable tire and break wear loads.
Guardrails, lampposts, and signs are parts of the road design and their heavy metal emissionsmust also be linked to road transportation [81]. The Zn emissions of lampposts and signs can onlybe a rough estimation because the number and surface area of traffic signs and further posts attraffic areas cannot be determined exactly. Most values are based on the assumptions proposed byHillenbrand et al. [81].
89

Water 2016, 8, 294 14 of 21
The traffic related heavy metal emissions by de-icing salts for road maintenance were notpreviously evaluated for Germany. The novel calculated mean de-icing salt emissions (0.70 t/yr Cd,1.75 t/yr Cu, 11.6 t/yr Pb, and 1.75 t/yr Zn) are based on an annual consumption of 3.5 million tons inGermany [78] and heavy metal contents of 0.2 mg/kg for Cd, 0.5 mg/kg for Cu and Zn, and 3.3 mg/kgfor Pb in the de-icing salts [38]. However, these annual de-icing salt emissions are highly variablebecause of the different metal contents of the salts and the different annual consumptions that stronglydepend on climatic factors. According to German regulation, the maximum permitted values for thesoluble fraction of de-icing salts in Germany (sodium chloride, calcium chloride, and magnesiumchloride) are 2 mg/kg Cd, 5 mg/kg Cu, 5 mg/kg Cr, 5 mg/kg Ni, 5 mg/kg Pb, and 20 mg/kg Zn [83].In Great Britain, higher values were measured for a sodium chloride de-icing salt with 4.7 mg/kg Cr,12 mg/kg Ni, 8.7 mg/kg Pb, and 6.0 mg/kg Zn [32]. Values of 1.2 mg/kg Cu and 1.6 mg/kg Pbwere reported in [84] for sodium chloride (Cd and Zn not detected). For another sodium chloridede-icing salt, metal contents of 0.94 mg/kg Cd, 1.02 mg/kg Cr, 3.15 mg/kg Cu, 6.29 mg/kg Ni,6.29 mg/kg Pb, and 1.57 mg/kg Zn were reported by Kobriger and Geinopolos [85]. Variations of themetal contents for highway de-icing salts were also published by Gupta et al. [86]: 0.003–0.01 mg/kgfor Cr, 0–0.0004 mg/kg for Cu, 0.002–0.003 mg/kg for Ni, and 0.08–0.09 mg/kg for Pb. A comparisonof the metal contents in de-icing salts with the ones measured in cooking salts [87] confirms that thesesmall impurities can occur in all salts used in large quantities. Nevertheless, the total emission loadscan be high because of the large amounts of salts used in Germany per year.
The total emissions are influenced by the highly variable annual consumption in Germany(0.46–5.26 million tons per year for the years 1990–2013). The metal contents of Cd, Cu, Pb, and Znpublished in five references were multiplied by the annual consumption values in Germany for theyears 1990–2013 (Table 8 and Figure 3). Each box and whisker represents the annual variation of theheavy metal emissions by de-icing salts for one element and the metal content of the correspondingreference. Thus, the mean de-icing salt emissions presented in Table 7 can only be a very roughestimation. In contrast to the other traffic related emission sources, the variability of these emissionsmainly depends on climatic factors.
Water 2016, 8, 294 15 of 21
Table 8. Variations of the traffic related heavy metal emissions (t/yr) by de‐icing salts with different contents (cf. [38,83–86]) in Germany (1990–2013).
Parameter Min Median Mean Max
[38] [83] [84] [85] [86] [38] [83] [84] [85] [86] [38] [83] [84] [85] [86] [38] [83] [84] [85] [86]
Cd 0.09 0.92 – 0.43 – 0.36 3.61 – 1.70 – 0.41 4.07 – 1.91 – 1.05 10.5 – 4.95 –
Cu 0.23 2.30 0.55 1.45 0.00 0.90 9.02 2.17 5.68 0.00 1.02 10.2 2.44 6.41 0.00 2.63 26.3 6.31 16.6 0.00
Pb 1.52 2.30 0.74 2.89 0.04 5.95 9.02 2.89 11.4 0.16 6.71 10.2 3.25 12.8 0.18 17.4 26.3 8.42 33.1 0.47
Zn 0.23 9.20 – 0.72 – 0.90 36.1 – 2.83 – 1.02 40.7 – 3.19 – 2.63 105 – 8.26 –
Figure 3. Variations of the traffic related heavy metal emissions by de‐icing salts in Germany (1990–2013). Heavy metal contents of the de‐icing salts differ largely within
each reference.
Figure 3. Variations of the traffic related heavy metal emissions by de-icing salts in Germany(1990–2013). Heavy metal contents of the de-icing salts differ largely within each reference.
90

Water 2016, 8, 294 15 of 21
Table 8. Variations of the traffic related heavy metal emissions (t/yr) by de-icing salts with differentcontents (cf. [38,83–86]) in Germany (1990–2013).
ParameterMin Median Mean Max
[38] [83] [84] [85] [86] [38] [83] [84] [85] [86] [38] [83] [84] [85] [86] [38] [83] [84] [85] [86]
Cd 0.09 0.92 – 0.43 – 0.36 3.61 – 1.70 – 0.41 4.07 – 1.91 – 1.05 10.5 – 4.95 –Cu 0.23 2.30 0.55 1.45 0.00 0.90 9.02 2.17 5.68 0.00 1.02 10.2 2.44 6.41 0.00 2.63 26.3 6.31 16.6 0.00Pb 1.52 2.30 0.74 2.89 0.04 5.95 9.02 2.89 11.4 0.16 6.71 10.2 3.25 12.8 0.18 17.4 26.3 8.42 33.1 0.47Zn 0.23 9.20 – 0.72 – 0.90 36.1 – 2.83 – 1.02 40.7 – 3.19 – 2.63 105 – 8.26 –
For the year 2013 (year 2000 in brackets), the German Federal Environment Agency publishednational total annual emissions for road transportation as 0.78 (0.82) t Cd, 25.7 (25.1) t Cr, 2109 (1986)t Cu, 5.0 (4.7) t Ni, 88.7 (80.8) t Pb, and 1906 (1805) t Zn [88]. There is a slight increase of the emissionsfor five of the six heavy metals in the 21st century. In 2013, the percentages of the traffic relatedemissions based on the total emissions are 11% for Cd, 45% for Cr, 98% for Cu, 5% for Ni, 42% for Pb,and 95% for Zn. Considering these data, road transportation is an important source of total heavymetal emissions in Germany. With the exception of the data for Cu, these values are comparable withthe ones presented in Table 7. Denier van der Gon et al. [89] presented annual road transportationemissions for Germany for the year 2000 of 0.88 t Cd, 4.0 t Cr, 102.9 t Cu, 5.0 t Ni, 0.40 t Pb, and209.8 t Zn. Most of these emission values are lower than the ones proposed by Hillenbrand et al. [81],calculated in this study, and published by Umweltbundesamt [88]. These differences are quite highand this is not only related to the variability of the data but also to the fact that each study considersdifferent traffic related sources, which can also vary because of substitutions.
3.4.3. Transportation of Traffic Related Heavy Metals
A sustainable stormwater management combines the stormwater source control and the treatmentof traffic area runoff loads to reduce the impact of heavy metals on receiving waters. Therefore,the influence of the traffic related heavy metal emissions on the runoff loads because of leaded gasoline,tire wear, brake lining wear, roadway abrasion, weights for tire balance, guardrails, lampposts/signs,and de-icing salts must also be considered to identify cost efficient mitigation strategies. This processwas successfully implemented by the phase-out of Pb in recent decades (cf. Section 3.2.2). Nevertheless,not all traffic related emissions are found in the runoff because of wind turbulences, vehicles(traffic volume and vehicle speed), antecedent dry periods, and other site-specific factors (e.g., particlesize distribution, land use, road surface roughness, or elevated configuration of the traffic area; [69]).For example, Hallberg et al. [90] found out that splashing corresponds with the average vehiclespeed during storms. In Great Britain, Harrison et al. [91] measured that 90% of Pb emissionsfrom fast-moving vehicles are deposited away from the immediate vicinity of a non-urban highway(up to several hundred meters). Consequently, most of the emitted Pb was not measured in the runoff.In contrast to Pb, Harrison and Johnston [92] showed that the Cd and Cu deposition fluxes wereelevated close to the investigated highway section and decreased to background levels within 20–40 m.Langbein et al. [14] and Steiner et al. [93] measured the different fluxes of Cd, Cr, Cu, Pb, and Znemissions at a non-urban road with approximately 17,000 vehicles per day in Switzerland (averagevehicle speed between 60 km/h and 80 km/h). They evaluated that 17%–25% of the heavy metalswere found in the runoff, 21%–38% in the splash water, 19%–45% were blown away and deposited ina distance of up to 25 m away from the road, and 17%–37% were deposited far away (>25 m). Thus,only some heavy metals were found in the runoff of a non-urban road and the fluxes of the emittedheavy metals varied between each element. Legret and Pagotto [38] calculated emission fluxes andestimated the percentages of Cd, Cu, Pb, and Zn that were removed by runoff waters. The followingwere considered as emission sources: tire and brake wear, gasoline, safety fences, de-icing salts, andatmospheric deposition (wet and dry). At the investigated rural highway bridge, 313% of the emittedCd, 2% of Cu, 5% of Pb, and 37% of Zn were found in the runoff water and the rest was dispersed
91

Water 2016, 8, 294 16 of 21
into the atmosphere as dust. For Cd, the authors assumed that some sources might be unrealized orunderestimated. Hewitt and Rashed [94] also measured that the largest part of Pb (approximately86%) was dispersed in the atmosphere. Most of these mass fluxes are proposed for non-urban sitesand bridges. In contrast, a higher percentage of the traffic related emissions (e.g., 50%) might be foundin urban runoff from traffic areas [14]. Thus, the heavy metal emissions in the urban areas influencethe runoff concentrations and loads more directly [11]. Moreover, all traffic related emissions that werenot found in the runoff (i.e., approximately 50%–98% according to the above data) would be depositedon non-traffic areas and consequently have an effect on the environment.
The influence of traffic related emissions on the runoff loads can be determined for de-icingsalt applications on highways. Granato [95] calculated mean annual runoff loads as 4100 g/ha Cl,1.8 g/ha Cr, 6.6 g/ha Cu, 2.0 g/ha Ni, and 3.6 g/ha Pb for the application of sodium chloride onhighway runoff. Compared with the median runoff loads for highways calculated in this review(76 g/ha Cr, 355 g/ha Cu, 90 g/ha Ni, and 72 g/ha Pb), the de-icing salt emissions contribute to about2.4%, 1.9%, 2.2%, and 5.0% of the total annual runoff loads for Cr, Cu, Ni, and Pb, respectively. Higherratios were calculated for H01 with 38% for Cr, 56% for Ni, 2.2% for Pb, and 1.5% for Zn [32]. Thus,the use of de-icing salts with lower metal impurities can directly reduce the runoff loads by somepercentages although de-icing salts are only used for several months per year.
In summary, the identification and subsequent reduction or substitution of relevant traffic relatedheavy metal sources (cf. Section 3.4.2) can help to fulfill the requirements of a sustainable stormwatermanagement. Since the runoff loads are also influenced by special site-specific factors (e.g., nearbyindustries like Zn smelters) and non-traffic related emissions, a runoff treatment of distinct traffic areacategories (e.g., highways, roads, and frequently used parking lots) is also necessary. This can be doneby permeable pavements, grass swales, and technical stormwater treatment systems [96,97].
4. Conclusions
For stormwater management, an improved knowledge about the runoff loads of different trafficarea categories is necessary. These loads were summarized for highways, roads, and parking lots.The highest loads were determined for highways, roads, and frequently used parking lots (in particularby trucks). In contrast to highways and roads, parking lots must be considered individually because ofsite-specific factors. The traffic related emissions in Germany were estimated for seven different sources(tire wear, brake lining wear, roadway abrasion, weights for tire balance, guardrails, lampposts/signs,and de-icing salts). Zn is mostly emitted by galvanized elements and tires, Cu and Pb by brakes, andCd by de-icing salts. The calculated loads are comparable with the ones presented in other studies formost metals. However, a statistical analysis of traffic related metal mass fluxes (e.g., the contributionof metal emissions on the runoff loads, in particular for different traffic area categories and land uses)is not currently possible because of a lack of monitoring data (e.g., metal contents of different sources,emission factors, deposition rates for different traffic area categories and land use characteristics,and size characterizations of distinct catchment areas for different traffic area categories).
Nevertheless, the estimation of the runoff loads and the emission loads for Germany stated that thevehicles, the road design, and the winter services emit heavy metals in large quantities (0.93 t/yr Cd,935 t/yr Cu, 84.4 t/yr Pb, and 2094 t/yr Zn) and the runoff also contains high amounts of metalloads per year. Currently, the most relevant metals are Cu and Zn because the annual Pb loads havedecreased significantly in the last few decades and traffic related Cd and Ni contribute only 5% and11% of the total emissions in Germany, respectively. However, the loads of the other metals can also bedetrimental for receiving waters and aquatic biota. In particular, for the highly toxic metals Cd andSb. Thus, efforts should be intensified to reduce traffic related loads (both emissions and runoff) andsubsequently to minimize their input into receiving waters and soils.
For the future, more long-term data, which include a large variety of substances and a detaileddescription of climatic factors, must be measured and published to improve the determination of metal
92

Water 2016, 8, 294 17 of 21
loads, mass balances, and fluxes and to reduce the large uncertainties of several values used in thisreview for the calculations.
Acknowledgments: Special thanks to Alicia Dery and Antje Welker for their contributions, support, and valuablecomments. This work was supported by the German Research Foundation (DFG) and the Technical University ofMunich (TUM) in the framework of the Open Access Publishing Program.
Author Contributions: Maximilian Huber collected the data, evaluated all documents, and wrote the paper.Brigitte Helmreich contributed to the results and discussions.
Conflicts of Interest: The authors declare no conflict of interest.
References
1. Dauber, L.; Novak, B.; Zobrist, J.; Zürcher, F. Schmutzstoffe im Regenwasserkanal einer Autobahn. StuttgarterBerichte zur Siedlungswasserwirtschaft. In Beeinflussung der Gewässergüte durch Regenabflüsse von Straßen;Oldenbourg Verlag: München, Germany, 1979; Volume 64, pp. 41–57. (In German)
2. Huber, M.; Welker, A.; Helmreich, B. Critical review of heavy metal pollution of traffic area runoff:Occurrence, influencing factors, and partitioning. Sci. Total Environ. 2016, 541, 895–919. [CrossRef] [PubMed]
3. Opher, T.; Friedler, E. Factors affecting highway runoff quality. Urban Water J. 2010, 7, 155–172. [CrossRef]4. Schueler, T. Stormwater pollution source areas isolated in Marquette, Michigan. Watershed Prot. Tech. 2000,
3, 609–612.5. Bannerman, R.T.; Owens, D.W.; Dodds, R.B.; Hornewer, N.J. Sources of pollutants in Wisconsin stormwater.
Water Sci. Technol. 1993, 28, 241–259.6. Ball, J.E. Stormwater Quality at Centennial Park, Sydney, Australia; University of New South Wales,
School of Civil and Environmental Engineering, Water Research Laboratory: Sydney, New South Wales,Australia, 2002; pp. 1–62.
7. Driscoll, E.; Shelley, P.E.; Strecker, E.W. Pollutant Loadings and impacts from Highway Stormwater Runoff, VolumeIV: Design Procedure; Report no. FHWA-RD-88-009; US Department of Transportation: Washington, DC,USA, 1990; pp. 1–143.
8. Burton, G.A.; Pitt, R.E. Stormwater Effects Handbook: A Toolbox for Watershed Managers, Scientists, and Engineers;CRC Press: Boca Raton, FL, USA, 2001.
9. SN640347. Strassenentwässerung. Belastung von Strassenabwasser (gültig ab 1. Februar 2009); SchweizerischerVerband der Strassen- und Verkehrsfachleute, Schweizerische Normen-Vereinigung SNV: Zürich,Switzerland, 2009; pp. 1–20. (In German)
10. Hamilton, R.S.; Revitt, D.M.; Warren, R.S.; Duggan, M.J. Metal mass balance studies within a small highwaydominated catchment. Sci. Total Environ. 1987, 59, 365–368. [CrossRef]
11. Barrett, M.; Zuber, R.D.; Collins, E.R.; Malina, J.F.; Charbeneau, R.; Ward, G.H. A Review and Evaluationof Literature Pertaining to the Quantity and Control of Pollution from Highway Runoff and Construction;CRWR Online Report 95-5; University of Texas at Austin: Austin, TX, USA, 1995; pp. 1–180.
12. Racin, J.A.; Howell, R.B.; Winters, G.R.; Shirley, E.C. Estimating Highway Runoff Quality; Report No.FHWA-CA/TL-82/11; California Department of Transportation: Sacramento, CA, USA, 1982; pp. 1–97.
13. Muschack, W. Pollution of street run-off by traffic and local conditions. Sci. Total Environ. 1990, 93, 419–431.[CrossRef]
14. Langbein, S.; Steiner, M.; Boller, M. Schadstoffe im Straßenabwasser einer stark befahrenen Straße und derenRetention mit neuartigen Filterpaketen aus Geotextil und Adsorbermaterial, Schlussbericht des Forschungsprojekts;Eawag: Dübendorf, Switzerland, 2006; pp. 1–77. (In German)
15. Gan, H.; Zhuo, M.; Li, D.; Zhou, Y. Quality characterization and impact assessment of highway runoff inurban and rural area of Guangzhou, China. Environ. Monit. Assess. 2008, 140, 147–159. [CrossRef] [PubMed]
16. Wiseman, C.L.S.; Zereini, F. Airborne particulate matter, platinum group elements and human health:A review of recent evidence. Sci. Total Environ. 2009, 407, 2493–2500. [CrossRef] [PubMed]
17. Dai, H.L.; Zhang, K.L.; Xu, X.L.; Yu, H.Y. Evaluation on the effects of deicing chemicals on soil and waterenvironment. Procedia Environ. Sci. 2012, 13, 2122–2130. [CrossRef]
18. Eriksson, E.; Baun, A.; Scholes, L.; Ledin, A.; Ahlman, S.; Revitt, M.; Noutsopoulos, C.; Mikkelsen, P.S.Selected stormwater priority pollutants—A European perspective. Sci. Total Environ. 2007, 383, 41–51.[CrossRef] [PubMed]
93

Water 2016, 8, 294 18 of 21
19. Folkeson, L.; Bækken, T.; Brencic, M.; Dawson, A.; Francois, D.; Kurímská, P.; Leitão, T.; Licbinský, R.;Vojtešek, M. Sources and fate of water contaminants in roads. In Water in Road Structures—Movement, Drainageand Effects, 1st ed.; Dawson, A., Ed.; Springer Science+Business Media B.V.: Dordrecht, The Netherlands,2009; pp. 107–146.
20. Roeva, N.N.; Rovinskii, F.Y.; Kononov, E.Y. Special features of the behavior of heavy metals in various naturalenvironments. J. Anal. Chem. 1996, 51, 352–364.
21. Kayhanian, M.; Stransky, C.; Bay, S.; Lau, S.L.; Stenstrom, M.K. Toxicity of urban highway runoff with respectto storm duration. Sci. Total Environ. 2008, 389, 386–406. [CrossRef] [PubMed]
22. Barbosa, A.E.; Hvitved-Jacobsen, T. Highway runoff and potential for removal of heavy metals in aninfiltration pond in Portugal. Sci. Total Environ. 1999, 235, 151–159. [CrossRef]
23. Spromberg, J.A.; Baldwin, D.H.; Damm, S.E.; McIntyre, J.K.; Huff, M.; Sloan, C.A.; Anulacion, B.F.; Davis, J.W.;Scholz, N.L. Coho salmon spawner mortality in western us urban watersheds: Bioinfiltration prevents lethalstorm water impacts. J. Appl. Ecol. 2016, 53, 398–407. [CrossRef]
24. McIntyre, J.K.; Davis, J.W.; Hinman, C.; Macneale, K.H.; Anulacion, B.F.; Scholz, N.L.; Stark, J.D.Soil bioretention protects juvenile salmon and their prey from the toxic impacts of urban stormwaterrunoff. Chemosphere 2015, 132, 213–219. [CrossRef] [PubMed]
25. Scholz, M. Sustainable drainage systems. Water 2015, 7, 2272–2274. [CrossRef]26. Klein, H. Die Beschaffenheit der Niederschlagsabflüsse von Autobahnen. Wasserwirtschaft 1982, 72, 37–43.
(In German)27. Stotz, G. Investigations of the properties of the surface water run-off from federal highways in the FRG.
Sci. Total Environ. 1987, 59, 329–337. [CrossRef]28. Wu, J.; Allan, C.; Saunders, W.; Evett, J. Characterization and pollutant loading estimation for highway
runoff. J. Environ. Eng. 1998, 124, 584–592. [CrossRef]29. Rushton, B.T. Low-impact parking lot design reduces runoff and pollutant loads. J. Water Resour. Plan. Manag.
2001, 127, 172–179. [CrossRef]30. Barrett, M.E.; Malina, J.F.; Charbeneau, R.J.; Ward, G.H. Characterization of highway runoff in Austin, Texas,
area. J. Environ. Eng. 1998, 124, 131–137. [CrossRef]31. Mosley, L.M.; Peake, B.M. Partitioning of metals (Fe, Pb, Cu, Zn) in urban run-off from the Kaikorai Valley,
Dunedin, New Zealand. N. Z. J. Mar. Freshw. Res. 2001, 35, 615–624. [CrossRef]32. Hedley, G.; Lockley, J.C. Quality of water discharged from an urban motorway. Water Pollut. Control 1975,
74, 659–674.33. Cathelain, M.; Friant, G.; Olie, J.L. Les eaux de ruissellement de chaussees autoroutieres: Evaluation des
charges de pollution. Paris Bull. Liaison Lab. Ponts Chaussees 1981, 116, 9–24. (In French)34. Chui, T.W.D.; Mar, B.W.; Horner, R.R. Highway Runoff in Washington State: Model Validation and Statistical
Analysis; Report No. WA-RD-39.12; Washington State Department of Transportation: Olympia, WA,USA, 1982.
35. Balades, J.D.; Cathelain, M.; Marchandise, P.; Peybernard, J.; Pilloy, J.C. Chronic pollution of intercitymotorway runoff waters. Water Sci. Technol. 1984, 17, 1165–1174.
36. Montrejaud-Vignoles, M.; Roger, S.; Herremans, L. Runoff water pollution of motorway pavement inMediterranean area. In Proceedings of the 7th International Conference on Urban Storm Drainage, Hannover,Germany, 9–13 September 1996; pp. 247–252.
37. CH2MHILL. Highway Stormwater Runoff Study; The Michigan Department of Transportation: Lansing, MI,USA, 1998; pp. 1–48.
38. Legret, M.; Pagotto, C. Evaluation of pollutant loadings in the runoff waters from a major rural highway.Sci. Total Environ. 1999, 235, 143–150. [CrossRef]
39. Lange, G.; Grotehusmann, D.; Kasting, U.; Schütte, M.; Dietrich, M.; Sondermann, W. Wirksamkeit vonEntwässerungsbecken im Bereich von Bundesfernstraßen. Forschungsberichte aus dem Forschungsprogrammdes Bundesministers für Verkehr, Bau- und Wohnungswesen und der Forschungsgesellschaft für Straßen- undVerkehrswesen e.V; Bundesministerium für Verkehr, Bau- und Wohnungswesen, Abteilung Straßenbau,Straßenverkehr: Bonn, Germany, 2003; Volume 861. (In German)
40. Suter, J. Schwermetallbilanz eines Autobahnabschnittes und die Behandlung des Strassenabwassers.Diploma Thesis, ETHZ/Eawag, Zürich/Dübendorf, Switzerland, 2000. (In German)
94

Water 2016, 8, 294 19 of 21
41. Scheiwiller, E. Schadstoffabschwemmungen: Am Beispiel von Hochleistungsstraßen. GWA 2008, 88, 539–546.(In German)
42. Grotehusmann, D.; Lambert, B.; Fuchs, S.; Graf, J. Schlussbericht zum BASt Forschungsvorhaben FE-Nr.05.152/2008/GRB “Konzentrationen und Frachten organischer Schadstoffe im Straßenabfluss”; Ingenieurgesellschaftfür Stadthydrologie mbH, Hannover: Bundesanstalt für Straßenwesen, Bergisch Gladbach, Germany, 2014;pp. 1–89. (In German)
43. Scheiwiller, E.; (Amt für Wasser und Abfall des Kantons Bern, Bern, Switzerland). Personalcommunication, 2014.
44. Gäth, S.; Sternheim, M.; Frede, H.-G. Einfluss des Kraftfahrzeugverkehrs auf den Schwermetallgehalt vonStraßenabflußwasser. Forum Städte—Hyg. 1990, 41, 235–238. (In German)
45. Nadler, A.; Meißner, E. Versickerung des Niederschlagswassers von befestigten Verkehrsflächen, Abschlussbericht,Entwicklungsvorhaben, Oktober 1996—Oktober 2005; Bayerisches Landesamt für Umwelt: Augsburg, Germany,2007; pp. 1–72. (In German)
46. Prestes, E.C.; dos Anjos, V.E.; Sodré, F.F.; Grassi, M.T. Copper, lead and cadmium loads and behavior inurban stormwater runoff in Curitiba, Brazil. J. Braz. Chem. Soc. 2006, 17, 53–60. [CrossRef]
47. Hilliges, R.; Schriewer, A.; Helmreich, B. A three-stage treatment system for highly polluted urban roadrunoff. J. Environ. Manag. 2013, 128, 306–312. [CrossRef] [PubMed]
48. Wichern, M.; Vesting, A.; Pecher, K.H.; Giga, A.; Wolke, M.; Helmreich, B.; Huber, M.; Li, Y. Untersuchungs-und Entwicklungsvorhaben im Bereich Abwasser zum Themenschwerpunkt Niederschlagswasserbeseitigung:Vergabe-Nr. 08/058.2. Reduktion von Kohlenwasserstoffen und anderen organischen Spurenstoffen durch eindezentrales Behandlungssystem für Verkehrsflächenabflüsse, gefördert durch das Ministerium für Klimaschutz,Umwelt, Landwirtschaft, Natur- und Verbraucherschutz des Landes Nordrhein-Westfalen, wissenschaftlich begleitetdurch das Landesamt für Natur, Umwelt und Verbraucherschutz Nordrhein-Westfalen (IV-7–042 600 002E).Abschlussbericht Projektphase II; Ruhr-Universität Bochum: Bochum, Germany, 2015; pp. 1–260. (In German)
49. Grotehusmann, D.; Kasting, U. Schlussbericht: Untersuchung über die Beschaffenheit der Oberflächenabflüssevon Parkflächen bei Tank- und Rastanlagen; Ingenieurgesellschaft für Stadthydrologie mbH, Hannover:Bundesanstalt für Straßenwesen: Bergisch Gladbach, Germany, 2002; pp. 1–62. (In German)
50. Ball, J.E.; Jenks, R.; Aubourg, D. An assessment of the availability of pollutant constituents on road surfaces.Sci. Total Environ. 1998, 209, 243–254. [CrossRef]
51. Wilson, D. Highway 520 Bridge Storm Water Runoff Study; King County Water and Land Resources Division,Department of Natural Resources and Parks: Seattle, WA, USA, 2006; pp. 1–66.
52. Lau, S.-L.; Han, Y.; Kang, J.-H.; Kayhanian, M.; Stenstrom, M.K. Characteristics of highway stormwaterrunoff in Los Angeles: Metals and polycyclic aromatic hydrocarbons. Water Environ. Res. 2009, 81, 308–318.[CrossRef] [PubMed]
53. Kayhanian, M.; Singh, A.; Suverkropp, C.; Borroum, S. Impact of annual average daily traffic on highwayrunoff pollutant concentrations. J. Environ. Eng. 2003, 129, 975–990. [CrossRef]
54. Horstmeyer, N.; Huber, M.; Drewes, J.E.; Helmreich, B. Evaluation of site-specific factors influencing heavymetal contents in the topsoil of vegetated infiltration swales. Sci. Total Environ. 2016, 560–561, 19–28.[CrossRef] [PubMed]
55. FHWA. Is Highway Runoff a Serious Problem?; Office of Infrastructure R&D, Turner-Faribank HighwayResearch Center: McLean, VA, USA, 1999.
56. Berbee, R.; Rijs, G.; de Brouwer, R.; Van Velzen, l. Characterization and treatment of runoff from highwaysin the Netherlands paved with impervious and pervious asphalt. Water Environ. Res. 1999, 71, 183–190.[CrossRef]
57. Hagner, C. European regulations to reduce lead emissions from automobiles—Did they have an economicimpact on the German gasoline and automobile markets? Reg. Environ. Chang. 2000, 1, 135–151. [CrossRef]
58. Mangani, G.; Berloni, A.; Bellucci, F.; Tatàno, F.; Maione, M. Evaluation of the pollutant content in roadrunoff first flush waters. Water Air Soil Pollut. 2005, 160, 213–228. [CrossRef]
59. Sansalone, J.J.; Buchberger, S.G.; Al-Abed, S.R. Fractionation of heavy metals in pavement runoff.Sci. Total Environ. 1996, 189–190, 371–378. [CrossRef]
60. Davis, A.P.; Shokouhian, M.; Ni, S. Loading estimates of lead, copper, cadmium, and zinc in urban runofffrom specific sources. Chemosphere 2001, 44, 997–1009. [CrossRef]
95

Water 2016, 8, 294 20 of 21
61. Root, R.A. Lead loading of urban streets by motor vehicle wheel weights. Environ. Health Perspect. 2000,108, 937–940. [CrossRef] [PubMed]
62. Bleiwas, D.I. Stocks and Flows of Lead-Based Wheel Weights in the United States, U.S. Geological Survey Open FileReport 1111; U.S. Department of the Interior, U.S. Geological Survey: Reston, VA, USA, 2006; pp. 1–6.
63. Shinya, M.; Funasaka, K.; Katahira, K.; Ishikawa, M.; Matsui, S. Lead isotope ratios in urban road runoff.Water Sci. Technol. 2006, 53, 185–191. [CrossRef] [PubMed]
64. McKenzie, E.R.; Money, J.E.; Green, P.G.; Young, T.M. Metals associated with stormwater-relevant brake andtire samples. Sci. Total Environ. 2009, 407, 5855–5860. [CrossRef] [PubMed]
65. Thorpe, A.; Harrison, R.M. Sources and properties of non-exhaust particulate matter from road traffic:A review. Sci. Total Environ. 2008, 400, 270–282. [CrossRef] [PubMed]
66. Helmreich, B.; Hilliges, R.; Schriewer, A.; Horn, H. Runoff pollutants of a highly trafficked urbanroad—Correlation analysis and seasonal influences. Chemosphere 2010, 80, 991–997. [CrossRef] [PubMed]
67. Stenstrom, M.K.; Kayhanian, M. First Flush Phenomenon Characterization; University of California: Berkeley,CA, USA, 2005; pp. 1–69.
68. Terzakis, S.; Fountoulakis, M.S.; Georgaki, I.; Albantakis, D.; Sabathianakis, I.; Karathanasis, A.D.;Kalogerakis, N.; Manios, T. Constructed wetlands treating highway runoff in the central Mediterraneanregion. Chemosphere 2008, 72, 141–149. [CrossRef] [PubMed]
69. Liu, A.; Gunawardana, C.; Gunawardena, J.; Egodawatta, P.; Ayoko, G.A.; Goonetilleke, A. Taxonomy offactors which influence heavy metal build-up on urban road surfaces. J. Hazard. Mater. 2016, 310, 20–29.[CrossRef] [PubMed]
70. Driscoll, E.; Shelley, P.E.; Strecker, E.W. Pollutant Loadings and Impacts from Highway Stormwater Runoff,Volume III: Analytical Investigation and Research Report; Report No. FHWA-RD-88-008; U.S. Department ofTransportation: Washington, DC, USA, 1990; pp. 1–162.
71. Li, M.; Barrett, M.; Rammohan, P.; Olivera, F.; Landphair, H. Documenting stormwater quality on Texashighways and adjacent vegetated roadsides. J. Environ. Eng. 2008, 134, 48–59. [CrossRef]
72. Dannecker, W.; Au, M.; Stechmann, H. Substance load in rainwater runoff from different streets in Hamburg.Sci. Total Environ. 1990, 93, 385–392. [CrossRef]
73. Zessner, M. Bedeutung und Steuerung von Nährstoff- und Schwermetallflüssen des Abwassers; Wiener Mitteilungen:Wien, Austria, 1999; Volume 157. (In German)
74. Ilyin, I.; Gusev, A.; Rozovskaya, O.; Strijkina, I. Transboundary Pollution of Germany by Heavy Metals andPersistent Organic Pollutants in 2010; EMEP/MSC-E technical Report 5/2012; EMEP/MSC-E: Moscow, Russia,2012; pp. 1–23.
75. Kocher, B.; Brose, S.; Chlubek, A.; Görg, C.; Klein, N.; Siebertz, I. Stoffeintrag in Straßenrandböden: Messzeitraum2006/2007; Berichte der Bundesanstalt für Straßenwesen: Bergisch Gladbach, Germany, 2010; Volume 199,pp. 1–38. (In German)
76. Hullmann, H.; Kraft, U. Kupfer und Zink—Die Bedeutung der Abschwemmungen von Metalldächern.gwf Wasser/Abwasser 2003, 144, 127–133. (In German)
77. Pick, V.; Fettig, J.; Miethe, M.; Strüber, K. Dezentrale Behandlung des Niederschlagsabflusses vonVerkehrsflächen in einer mehrstufigen Schachtanlage. KA Abwasser Abfall 2002, 49, 312–320. (In German)
78. Lippold, C. Der Elsner 2015: Handbuch für Straßen- und Verkehrswesen (Planung, Bau, Erhaltung, Verkehr, Betrieb),69 ed.; Otto Elsner Verlagsgesellschaft: Berlin, Germany, 2014. (In German)
79. DESTATIS. Land-und Forstwirtschaft, Fischerei. Bodenfläche nach Art der tatsächlichen Nutzung. Fachserie 3 Reihe5.1; Statistisches Bundesamt: Wiesbaden, Germany, 2015. (In German)
80. Horwatich, J.A.; Bannerman, R.T. Pollutant Loading to Stormwater Runoff from Highways Impact of a HighwaySweeping Program: Phase II, Madison, Wisconsin; Wisconsin Department of Transportation: Madison, WI, USA,2009; pp. 1–121.
81. Hillenbrand, T.; Toussaint, D.; Böhm, E.; Fuchs, S.; Scherer, U.; Rudolphi, A.; Hoffmann, M.; Kereißig, J.;Kotz, C. Einträge von Kupfer, Zink und Blei in Gewässer und Böden—Analyse der Emissionspfade und möglicherEmissionsminderungsmaßnahmen; Forschungsbericht 202 242 20/02, UBA-Texte 19/05; Umweltbundesamt:Dessau, Germany, 2005; pp. 1–329. (In German)
82. Kocher, B.; Brose, S.; Feix, J.; Görg, C.; Peters, A.; Schenker, K. Stoffeinträge in den Straßenseitenraum—Reifenabrieb; Berichte der Bundesanstalt für Straßenwesen: Bergisch Gladbach, Germany, 2010; Volume 188,pp. 1–33. (In German)
96

Water 2016, 8, 294 21 of 21
83. FGSV379/1. Hinweise und Empfehlungen für die Beschaffung von Streustoffen—Kommentar zur TL-Streu;FGSV Forschungsgesellschaft für Straßen- und Verkehrswesen e. V.: Köln, Germany, 2004. (In German)
84. Harned, D.A. Effects of Highway Runoff on Streamflow and Water Quality in the Sevenmile Creek Basin, a RuralArea in the Piedmont Province of North Carolina, July 1981 to July 1982; U.S. Geological Survey Water-SupplyPaper 2329; U.S. Geological Survey: Denver, CO, USA, 1988; pp. 1–44.
85. Kobriger, N.P.; Geinopolos, A. Sources and migration of highway runoff pollutants. Volume III: Research Report;Report No. FHWA-RD-84/059; US Department of Transportation: Washington, DC, USA, 1984; pp. 1–368.
86. Gupta, M.K.; Agnew, R.W.; Kobriger, N.P. Constituents of Highway Runoff. Volume I: State-of-the-Art Report;Report No. FHWA-RD-81/042; US Department of Transportation: Washington, DC, USA, 1981; pp. 1–124.
87. Heshmati, A.; Vahidinia, A.; Salehi, I. Determination of heavy metal levels in edible salt. Avicenna J.Med. Biochem. 2014, 2, e19836. [CrossRef]
88. Umweltbundesamt. National Trend Tables for the German Atmospheric Emission Reporting (Heavy Metals)1990–2013; Final Version: 3 February 2015; Umweltbundesamt: Berlin, Germany, 2015.
89. Denier van der Gon, H.A.C.; van het Bolscher, M.; Visschedijk, A.J.H.; Zandveld, P.Y.J. Study to the Effectivenessof the UNECE Heavy Metals Protocol and Costs of Possible Additional Measures. Phase I: Estimation of EmissionReduction Resulting from the Implementation of the HM Protocol; TNO-Report B&O-A R 2005/193; TNO:Apeldoorn, The Netherlands, 2005; pp. 1–134.
90. Hallberg, M.; Renman, G.; Lundbom, T. Seasonal variations of ten metals in highway runoff and theirpartition between dissolved and particulate matter. Water Air Soil Pollut. 2007, 181, 183–191. [CrossRef]
91. Harrison, R.M.; Johnston, W.R.; Ralph, J.C.; Wilson, S.J. The budget of lead, copper and cadmium for a majorhighway. Sci. Total Environ. 1985, 46, 137–145. [CrossRef]
92. Harrison, R.M.; Johnston, W.R. Deposition fluxes of lead, cadmium, copper and polynuclear aromatichydrocarbons (PAH) on the verges of a major highway. Sci. Total Environ. 1985, 46, 121–135. [CrossRef]
93. Steiner, M.; Boller, M.; Schulz, T.; Pronk, W. Modelling heavy metal fluxes from traffic into the environment.J. Environ. Monit. 2007, 9, 847–854. [CrossRef] [PubMed]
94. Hewitt, C.N.; Rashed, M.B. An integrated budget for selected pollutants for a major rural highway.Sci. Total Environ. 1990, 93, 375–384. [CrossRef]
95. Granato, G.E. Deicing chemicals as source of constituents of highway runoff. Transp. Res. Rec. J. Transp.Res. Board 1996, 1533, 50–58. [CrossRef]
96. Dierkes, C.; Lucke, T.; Helmreich, B. General Technical Approvals for Decentralised Sustainable UrbanDrainage Systems (SUDS)—The Current Situation in Germany. Sustainability 2015, 7, 3031–3051. [CrossRef]
97. Huber, M.; Welker, A.; Dierschke, M.; Drewes, J.E.; Helmreich, B. A novel test method to determine thefilter material service life of decentralized systems treating runoff from traffic areas. J. Environ. Manag. 2016,179, 66–75. [CrossRef] [PubMed]
© 2016 by the authors; licensee MDPI, Basel, Switzerland. This article is an open accessarticle distributed under the terms and conditions of the Creative Commons Attribution(CC-BY) license (http://creativecommons.org/licenses/by/4.0/).
97

Chapter 6: Research Paper: “Evaluation of Factors Influencing Lab‐
ScaleStudies toDetermineHeavyMetalRemovalbySixSorbents for
StormwaterTreatment”
Based on the results of Chapter 5, the heavy metals Cu, Ni, and Zn are relevant pollutants in the
runoff from traffic areas. Thus, these metals must be retained by decentralized stormwater
treatment systems. To remove dissolved and particulate heavy metals, the use of filter materials is
necessary. For testing filter materials for urban stormwater treatment systems, it is important to
assure that reproducible and reliable results are obtained. Therefore, the research objectives of this
study were to identify relevant experimental boundary conditions concerning the simultaneous
removal of Cu, Ni, and Zn and to evaluate important influencing factors by testing six filter materials
with different removal mechanisms. Thus, this journal paper deals with the evaluation of different
materials by batch and lab‐scale column experiments. The hypothesis of the research article was:
The results of batch experiments and lab‐scale column experiments concerning simultaneous heavy
metal removal differ widely because of varying boundary conditions (Hypothesis 3).
The results of batch and small‐scale column experiments concerning simultaneous heavy metal
removal differed widely for each filter material. Hence, the following boundary conditions and
factors should be considered to determine heavy metal removal capacities: batch experiments with
the dissolved heavy metals of interest using synthetic water at pH 5 are suggested and the influence
of the type and speed of the shaker must be considered. Adjustments of ionic strength and pH > 5
are more sensitive and should be avoided because they mostly lead to an overestimation of the
removal capacities of filter materials. The filtration step at the end of the batch experiments has an
effect on the results and does not simulate real situations. Batch experiments with other cations (e.g.,
magnesium and ammonium) should not be used as surrogates. Thus, the following applications are
recommended: batch experiments with heavy metals can only be used under identical and
well‐defined conditions to prove the comparability of different production batches and to select filter
materials for subsequent column experiments. In contrast, small‐scale column experiments can be
used as an indicator to determine roughly the efficiencies and service lives of treatment systems.
The following paper was published in Water 8 (2), 62:1–19. Huber, Badenberg, Wulff, and Helmreich
conceived the experiments. Huber, Badenberg, and Wulff designed, performed, and evaluated the
experiments. Huber also wrote the manuscript. Badenberg, Drewes, and Helmreich contributed to
the results, discussions, and conclusions.
98

water
Article
Evaluation of Factors Influencing Lab-Scale Studies toDetermine Heavy Metal Removal by Six Sorbents forStormwater TreatmentMaximilian Huber, Sophia C. Badenberg, Moritz Wulff, Jörg E. Drewes and Brigitte Helmreich *
Chair of Urban Water Systems Engineering, Technical University of Munich, Am Coulombwall 8,85748 Garching, Germany; [email protected] (M.H.); [email protected] (S.C.B.);[email protected] (M.W.); [email protected] (J.E.D.)* Correspondence: [email protected]; Tel.: +49-892-891-3719
Academic Editor: Andreas AngelakisReceived: 21 December 2015; Accepted: 15 February 2016; Published: 17 February 2016
Abstract: For the development of decentralized treatment systems for road runoff, the determinationof pollutant removal capacities is essential. The aim of this study was to evaluate the impact ofboundary conditions on the simultaneous removal of copper, nickel, and zinc by six sorbents used forurban stormwater treatment (i.e., granular activated alumina, anthracite, granular reactivated carbon,granular ferric hydroxide, calcium carbonate, and granular activated lignite). For batch experiments,capacities were determined at initial concentrations within the range of 2.5–180 mg/L with a rotaryshaker. Further influences were investigated: the use of a horizontal shaker for concentrations of upto 1080 mg/L, a variation of the initial pH value (5 and 7), and the presence of a buffer. Furthermore,the influences of the filtration process on the capacities were studied. Kinetic experiments wereconducted for contact times between 5 min and 120 min. Lab-scale column experiments with inflowconcentrations of 2.5 mg/L (copper and nickel) and 5.0 mg/L (zinc) at an initial pH of 5 and acontact time of 11 min were performed for comparison. Selected experiments were subsequentlycarried out with changes in initial concentrations and contact time. One result is that it is essentialto conduct batch experiments with the metals of interest. The capacities determined by columnexperiments deviated from batch experiments. Batch experiments under well-defined conditions canbe used to evaluate different production batches. Column experiments give a more faithful capacityby considering realistic boundary conditions and should be preferred to determine efficiencies andservice lives.
Keywords: batch experiments; column experiments; filter material; filtration; ion exchange; ionicstrength; kinetics; pH value; sorption; urban stormwater management
1. Introduction
Metals such as arsenic (As), cadmium (Cd), chromium (Cr), cobalt (Co), copper (Cu), lead (Pb),nickel (Ni), and zinc (Zn) are crucial pollutants because of their toxicity, lack of degradability, and theirubiquitous presence in the environment as a consequence of their industrial use [1–3]. Among thesemetals, the last four elements occur in highest concentrations in highway runoff [4,5]. Pb concentrationshave decreased significantly in all traffic area runoff waters in the last few decades because of thephase-out of leaded gasoline and the substitution of Pb in other traffic-related sources. Thus, Cu, Ni,and Zn are, nowadays, measured in the highest runoff concentrations (maxima of mean concentrationsper monitored site for the 21st century: 682 µg/L Cu, 458 µg/L Ni, and 2560 µg/L Zn—calculatedfrom the worldwide data presented in [5]). These three heavy metals tend to be less particle-bound
Water 2016, 8, 62; doi:10.3390/w8020062 www.mdpi.com/journal/water
99

Water 2016, 8, 62 2 of 19
than other heavy metals such as Pb [6,7]. Sources of Cu in runoff water are brake linings [3,8], metalplatings, moving engine parts [9], and pesticides applied to road medians [10]. Ni is present in dieselfuel [1], Ni-Cd batteries, stainless steel, and other electronic equipment [11]. The following are productscontaining Zn: batteries [12], brake linings [13], galvanized car parts [14], motor oils and grease [9],safety fences [15], and tires [16,17]. Furthermore, Cu and Zn show high accumulation potentials,biochemical activities, lifetimes, and solubility; Ni also has a high biochemical activity and lifetime [1].
To retain these heavy metals from traffic area runoff, decentralized stormwater treatment systemsare used, which can be designed as an integral part of existing urban infrastructure [18]. Sedimentationand filtration are the retention mechanisms used to remove particle-bound metals. Dissolvedheavy metals were retained on filter materials by sorption, ion exchange, and precipitation. Toreduce particulate loadings for the filter materials, pretreatment ahead of the filter is required [19].Both mechanical and chemical steps are necessary to sufficiently reduce dissolved and total metalconcentrations [20,21]. Laboratory studies of the filter materials are necessary to develop new treatmentsystems, to control and optimize existing ones, and to determine application areas and service lives.
In the past, several types of laboratory studies have been conducted to evaluate different filtermaterials for stormwater treatment. Concerning the determination of cation exchange capacities, metalssuch as barium and magnesium are sometimes used as surrogates for the removal of heavy metalsin time-efficient one-step methods [22]. In equilibrium batch experiments (48 h), the simultaneousremoval of As, Cd, Cr, Cu, Ni, and Zn from stormwater was investigated by Genç-Fuhrman et al. [23]for eleven different sorbents with eight different initial metal concentrations. An equilibrium batchsetup was also used by Wu and Zhou [24] to determine the simultaneous removal of the same sixmetals with eleven different initial concentrations on granular ferric hydroxide and its mixtures withzeolite and crystal gravel. Liu et al. [25] used manganese oxide coated polymeric media to evaluate theremoval of Cd, Cu, Pb, and Zn in a recirculating flow-through reactor. In contrast to the static natureof batch experiments and their tendency to reach equilibrium, column experiments can help to assessthe behavior of large-scale treatment systems with continuous influent concentrations, specific emptybed contact time (EBCT), and individual influent flow-rates [26]. Therefore, lab-scale column tests,which are less time-consuming and need smaller volumes of stock solution compared with pilot-scaleexperiments, can be used as an approach to evaluate the performance of sorbents at a small scale [27].To evaluate filter materials for the removal of heavy metals, Li and Helmreich [28] conducted lab-scalecolumn experiments with granular activated carbon and lignite to determine the removal of Zn.Liu et al. [19] used conventional and engineered media to evaluate the removal of Cd, Cu, Pb, and Zn(i.e., silica sand, granular activated carbon, cementitious media, manganese oxide coated media, andother coated media).
However, a standardized protocol to compare filter materials for stormwater treatment systemsfor both batch and column experiments is missing. Therefore, the hypothesis of this study is that theresults of batch- and lab-scale column experiments concerning simultaneous heavy metal removaldiffer widely because of varying boundary conditions.
The research objectives of this study were to identify relevant boundary conditions concerning thesimultaneous removal of Cu, Ni, and Zn and the evaluation of important influencing factors by testingsix sorbents with different removal mechanisms. By adjusting and standardizing these boundaryconditions, an optimal use of the lab experiments can be achieved for their practical application in thefield of stormwater treatment (e.g., type and amount of sorbent, removal efficiencies, ratio of drainagearea to filter area, or service life). All of the materials used for this study were relatively coarse (mainparticle size 1.0–2.0 mm) to secure high permeability during service life and to prevent clogging ofthe filter. Furthermore, different production batches were evaluated to determine the use of batchexperiments with well-defined methods for internal and external quality control.
100

Water 2016, 8, 62 3 of 19
2. Materials and Methods
2.1. Sorbents and Chemicals
The sorbents used were: granular activated alumina (alumina, Albemarle Corporation, BatonRouge, LA, USA), anthracite (anthracite, EVERS GmbH & Co. KG, Hopsten, Germany), granularreactivated carbon (GAC, Chemviron Carbon GmbH, Beverungen, Germany), granular ferrichydroxide (GFH, HeGo Biotec GmbH, Berlin, Germany), calcium carbonate (calcium carbonate, AdolfSteinbach Steinindustrie-Schotterwerke GmbH & Co. KG, Bad Neustadt an der Saale, Germany), andgranular activated lignite (lignite, Rheinbraun Brennstoff GmbH, Frechen, Germany). The physicalcharacteristics of the sorbents, which were all commercially supplied, are provided in Table 1. Filtermaterials that retain heavy metals only by ion exchange and that can be improved or regeneratedby sodium chloride (e.g., zeolites) [29,30] were not used in this study because they do not fulfill therequirements of a reliable heavy metal removal from traffic area runoff waters containing de-icing salts.All sorbents were sieved to a similar size fraction of 0.5–2.0 mm to avoid the influence of differentsize fractions of each sorbent on the retention of heavy metals [25,31]. The chosen size fraction (mainparticle size 1.0–2.0 mm) also fulfills the requirements of technical decentralized treatment systems (i.e.,permeability and filtration of particles). The sieved materials were subsequently dried at 105 ˘ 2 ˝C toachieve a constant weight, and finally stored in desiccators without additional treatment until usage.
Table 1. Physical characteristics of sorbents (based on dry mass).
FilterMaterial
SurfaceArea m²/g TC % TS % Al
mg/kgCa
mg/kgFe
mg/kgMn
mg/kgCu
mg/kgNi
mg/kgZn
mg/kg
Alumina 263 - - 462000 87.6 1270 7.43 18.6 1.98 9.11Anthracite 1.4 88.2 0.91 931 1010 2260 20.5 16.0 2.57 1.56Calciumcarbonate 3.1 - - 3520 318500 4370 78.7 3.50 2.91 5.04
GAC 896 91.6 0.83 6300 3050 3260 61.8 458 28.4 7.92GFH 224 - - 753 56300 431000 9090 2.00 41.3 87.6
Lignite 262 89.2 0.46 1090 18800 2330 83.1 0.17 1.69 0.37
The heavy metals used were: copper(II) nitrate trihydrate pure (AppliChem GmbH, Darmstadt,Germany), nickel(II) nitrate hexahydrate p.a. (Merck KGaA, Darmstadt, Germany), and zinc nitratehexahydrate pure (AppliChem GmbH, Darmstadt, Germany). To determine the cation exchangecapacities, barium chloride dehydrate p.a. (Merck KGaA, Darmstadt, Germany), magnesium sulfateheptahydrate p.a. (Merck KGaA, Darmstadt, Germany), sodium chloride 99.9% (AppliChem GmbH,Darmstadt, Germany), and ammonium chloride pure (Merck KGaA, Darmstadt, Germany) were used.pH adjustments and conservation of samples were performed with nitric acid 65% p.a. (Merck KGaA,Darmstadt, Germany). A combination of potassium dihydrogen phosphate p.a. (Th. Geyer GmbH& Co. KG, Renningen, Germany) and disodium hydrogen phosphate dihydrate p.a. (Merck KGaA,Darmstadt, Germany) was used as a buffer.
2.2. Experimental Setup
For all of the experiments with heavy metals, the concentration of Zn was always twice as highas the concentration of Cu and Ni, respectively. This represents the higher concentrations of Zn intraffic area runoff waters [5]. Equal concentrations of Cu and Ni made it easier to detect a possiblecompetition between the removals of each metal.
2.2.1. Batch Experiments with Heavy Metals
For the equilibrium batch tests, sorption experiments were carried out in 250 mL low-densitypolyethylene (LDPE) bottles, at pH 5, and with initial metal concentrations from 2.5 mg/L to 90 mg/L
101

Water 2016, 8, 62 4 of 19
for Cu and Ni, and from 5.0 mg/L to 180 mg/L for Zn. Deionized water (electric conductivity of<1 µS/cm) was used for preparing all stock solutions and the initial pH value was adjusted withnitric acid. At pH 5, all three heavy metals are present in dissolved form [23]. This initial pH valuewas chosen because filter materials in stormwater treatment systems are mainly designed to retaindissolved substances. The filter material dosage was always 8.0 g of filter material in 200 mL stocksolution. No delay occurred between the addition of the solution to the sorbent in the bottles andthe beginning of the shaking. Shaking was performed on a rotary shaker at a speed of 16 rpm for24 ˘ 0.5 h. Subsequently, samples were filtrated with a cellulose nitrate membrane filter (0.45 µm poresize, Sartorius, Göttingen, Germany) to separate the dissolved and solid phases. All experiments werecarried out in duplicate at room temperature (21 ˘ 2 ˝C).
Control experiments were conducted with all six sorbents without adding heavy metals. Theyfollowed the same experimental procedure as described previously to observe a possible release ofheavy metals from the sorbents. In addition, further blank and spike samples were included intothe experimental setup to detect possible sample contaminations during the filtration process andsubsequent sample preparations and analyses. Samples with the same heavy metal concentrations,but without sorbents, were used to evaluate any possible heavy metal losses because of adsorption tothe flasks and bottles. No significant losses of heavy metals were detected for any materials.
Differences between the rotary shaker (16 rpm) and a horizontal shaker (125 rpm) were examinedfor concentrations of up to 540 mg/L (Cu and Ni) and 1080 mg/L (Zn). In addition, the presence ofa buffer was tested at pH 5 and pH 7 with the rotary shaker. A pH value of 7 represents commonlyobserved values for traffic area runoff [5]. Since the runoff water from traffic areas consists of severalcompounds that constitute a buffer capacity, other studies used sodium hydrogen carbonate buffers inthe stock solution [23,24]. Since carbonate leads to a precipitation of heavy metals similar to the sorbentcalcium carbonate and its addition influences the removal mechanisms, a phosphate buffer was usedto minimize pH changes in this evaluation. Furthermore, the influence of the filtration process on themeasured concentrations was studied by using further samples without sorbents, and by followingthe same experimental procedure.
Batch kinetic experiments were conducted with two concentration ranges (10 mg/L and 90 mg/Lfor Cu and Ni, respectively; 20 mg/L and 180 mg/L for Zn). The contact times were 5 min, 10 min,20 min, 30 min, 60 min, and 120 min, respectively.
For the evaluation of different production batches, only Cu with an initial concentration of63.5 mg/L was used. In contrast to the other experiments, the dosages were 0.4 ˘ 0.05 g material and0.3 ˘ 0.05 g material in 250 mL solution.
2.2.2. Column Experiments
Lab-scale column experiments were conducted with inflow concentrations of 2.5 mg/L (Cu andNi) and 5.0 mg/L (Zn) at an initial pH of 5 and at ambient temperature (21 ˘ 2 ˝C). Deionized water(electric conductivity of <1 µS/cm) was used for influent preparation. pH adjustments were performedwith nitric acid. The experimental apparatus was constructed of glass and all pipes were of polyvinylchloride. The glass column had an inner diameter of 2.0 cm and a length of 40 cm, providing asorbent bed height of 23 cm. A glass screen was placed at the bottom of the column to support thefilter materials. The feed water percolated through the glass columns in down-flow mode (from topto bottom) and the flow-rate was adjusted to about 6.5 mL/min by a peristaltic pump (ECOLINEVC-MS/CA8-6, Ismatec SA, Glattbrugg, Switzerland). As a result, the EBCT was maintained at 11 min.The experiments were performed in duplicate from Monday to Friday. During weekends, the filtermaterials were kept saturated without flow. Operation of all columns was terminated when theremoval efficiencies of all metals were less than 20%. However, for the two tests representing thebest performing removal efficiencies, this operational criterion was not achieved during a four-weektesting period.
102

Water 2016, 8, 62 5 of 19
One influent sample per stock solution and several effluent samples at designated times werecollected in 250 mL LDPE bottles. Filtration of samples was not conducted. Selected experiments weredone with changes in initial concentrations and contact time.
2.2.3. Batch Experiments According to Standard Methods
Further batch experiments were performed according to two standard protocols [32,33]. Bothprocedures were often used in the field of stormwater treatment to determine sorption capacities ofheavy metals although they do not use heavy metals as adsorbates, but other cations as substitutes.
The cation exchange capacity of the first method (CEC 1) is determined by shaking 2.50 g offilter material with 30 mL of barium chloride solution three times each for 60 min to extract sodium,potassium, calcium, and magnesium [32]. After each step, the solution is separated from the filtermaterial by centrifugation and subsequently rejected. The filter material is then shaken again witha fresh barium chloride solution to preload the material with barium for 17 h. After centrifugation,30 mL of magnesium sulfate solution is added to the filter material to exchange the sorbed bariumions with magnesium under the precipitation of barium sulfate. After 24 h of shaking, the decrease ofdissolved magnesium is determined in filtrated samples of the last step. The result of the magnesiumsorption is given in cmol+/kg and this value is often proposed to be valid for other metal cations. Thisstandard protocol was developed for soils but is also used for technical filter materials. All experimentswere done in quadruplicate.
The cation exchange capacity of the second method (CEC 2) is determined by preparing a sampleof the filter material (10 g) with sodium chloride and then adding the sorbent to a 300 mL solution ofammonium chloride [33]. This cation exchange capacity is calculated by the decrease of ammonium ina filtrated sample after 2 h of shaking. It is assumed that the exchange capacity related to ammoniumis comparable to the total cation exchange capacity. This standard was developed for natural zeolites.All experiments were carried out in triplicate.
2.3. Analytical Procedures
The same analytical procedures and equipment were used during all experiments to minimizethe influences of sample preparation and analysis on the results.
The concentrations of heavy metals were measured by flame atomic absorption spectrometry(AAS, Varian Spectrometer AA-240FS, Palo Alto, CA, USA) according to Standard Method 3111 [34]with detection limits of 50 µg/L (Cu), 50 µg/L (Ni), 20 µg/L (Zn), 2500 µg/L (aluminum), 100 µg/L(calcium), 100 µg/L (iron), 50 µg/L (manganese), and 50 µg/L (magnesium). Some samples werealso measured with a graphite furnace AAS (Varian Spectrometer AA-240Z with GTA 120, Palo Alto,CA, USA) according to Standard Method 3113 [34] with detection limits of 5 µg/L (Cu) and 5 µg/L(Ni). Total metal concentrations were measured with AAS in an aqua regia digestion of the samples toquantify their contents in the filter materials. Quality control was maintained by using control andblank samples, and taking standard solution quantity checks of every five samples.
Ammonium was measured using cuvette tests (Hach Lange GmbH, Düsseldorf, Germany). Totalcarbon (TC) and total sulfur (TS) were determined with a multi EA 4000 element analyzer (AnalytikJena AG, Jena, Germany). The solid samples were directly decomposed and oxidized at 1350 ˝C andthe resulting oxides were quantified simultaneously with a non-dispersive infrared (NDIR) detector.Specific surface areas of the sorbents were determined according to ISO standard 9277 [35] using a SA3100 plus (Beckman Coulter, Brea, CA, USA) with nitrogen as adsorption gas (BET method).
For all samples, the pH value and electric conductivity were measured immediately after samplecollection. Measurements of the pH value were performed with a glass electrode (WTW Sentix 60,Weilheim, Germany) according to Standard Method 4500-H+ and electric conductivity (detectionlimit: 0.1 µS/cm) was determined by using a WTW ProfiLine Cond 1970i (WTW, Weilheim, Germany)according to Standard Method 2520 B [34]. Subsequently, all samples were conserved with nitric acid
103

Water 2016, 8, 62 6 of 19
at pH < 2. Sorbent samples were weighed using an analytical balance (Sartorius MC1 Research RC210D, Göttingen, Germany) with an accuracy of ˘0.1 mg.
2.4. Data Evaluation
Heavy metal capacities, representing their contents on the sorbent, were calculated for eachexperiment and each sorbent. This was done by using the analyses of the corresponding metalconcentrations before and after the experiments with Equation (1):
qe “ pc0´ cq{X, (1)
where qe (mg/g) is the sorbed amount of adsorbate on the filter material, c0 (mg/L) is the initial metalconcentration, c (mg/L) is the equilibrium or averaged effluent metal concentration of adsorbate insolution, and X is the filter material dosage (g/L).
The Langmuir isotherm model (a non-linear isotherm with two-fitting parameters) was used forthe calculation of qm (2):
qe “ qm Kl c{p1 ` Kl cq, (2)
where qm (mg/g) is the saturated amount of adsorbate on the filter material, and Kl (L/mg) is theLangmuir parameter representing the consumed energy in the sorption process.
For the column experiments, breakthroughs in this study were defined at c/c0 = 0.1 andc/c0 = 0.5. The corresponding capacities were q10% and q50%, respectively.
3. Results and Discussion
3.1. Batch Experiments
Comparing the removal of heavy metals by all investigated materials, anthracite had the lowestcapacities because it was not pretreated and it had the smallest specific surface area (1.4 m²/g).Anthracite was the only sorbent with metal leaching in the control batches without any heavy metalsbeing present in the stock solution. The leached concentrations observed after shaking were 13.5 µg/LCu, 41.4 µg/L Ni, and 30.3 µg/L Zn.
For all other equilibrium experiments, Cu showed the highest affinity for all sorbents. For thehighest concentrations, smaller quantities of Ni and Zn were retained. Almost no removal of Ni wasobserved at initial concentrations of 540 mg/L Ni (pH 5, no buffer) for alumina or calcium carbonate.Zn was not removed by GAC or calcium carbonate at an initial concentration of 1080 mg/L Zn undercompetitive conditions (i.e., in the presence of other metals). At the same concentrations and pH values,the removal mechanisms including sorption, ion exchange, and precipitation preferentially removedCu from the solutions. With increasing metal concentrations, the equilibrium pH value decreased forall sorbents. This trend was also reported by Wu and Zhou [24] for GFH. During the shaking, the shiftof the pH value of the solution is linked to the presence of the filter material, the removal of metalsfrom the solution, and the exposure to limited amount of atmosphere in the bottle. In the case of poorremoval (e.g., by anthracite in this study), the difference between the concentration measurementsof the stock solution and after shaking is very small, which might lead to small calculated capacitiesbecause of the analytical accuracy (Figure 1).
104

Water 2016, 8, 62 7 of 19
Water 2016, 8, 62 7 of 19
Figure 1. Influences of a rotary shaker (16 rpm) and a horizontal shaker (125 rpm) on sorption capacities at pH 5 without a buffer.
The effect of different types of shakers on the removal capacities was determined for the equilibrium experiments. The speed of each shaker was adapted in order to ensure that the sorbents were in suspension. The same substrate dosage and stock solutions (i.e., initial heavy metal concentrations, pH 5, and no buffer) were used. The capacities determined in the experiments with the rotary shaker were often higher (Figure 1). These differences are likely because of material abrasion and dispersion during shaking [36], which subsequently led to larger surface areas. This effect depends on the type of material and, as a consequence, different behaviors between the sorbents occurred. The absolute differences were low for anthracite and high for alumina. For Cu, the capacities of all of the substrates, determined using the rotary shaker, were between 98% and 268% of the ones determined using the horizontal shaker. At the lowest concentrations, when nearly all of the Cu ions were removed, the difference was very small for all sorbents (factor 1.05) but increased for the highest concentration (factor 1.37). The higher capacities of Ni determined using the horizontal shaker at increasing concentrations can be explained by minor retention of Cu and Zn compared with the rotary shaker on the material surface. Therefore, the competition was lower and Ni ions had more opportunities to sorb onto the material.
Quevauviller et al. [37] investigated the influence of shaking types and speed on the determination of extractable trace metals in sediments. They reported that lower amounts of metals were extracted by experiments with horizontal shakers at a speed of less than 40 rpm compared with speeds of up to 150 rpm. In experiments with rotary shakers operated at 30 rpm, 20% more Cu was
Figure 1. Influences of a rotary shaker (16 rpm) and a horizontal shaker (125 rpm) on sorption capacitiesat pH 5 without a buffer.
The effect of different types of shakers on the removal capacities was determined for theequilibrium experiments. The speed of each shaker was adapted in order to ensure that thesorbents were in suspension. The same substrate dosage and stock solutions (i.e., initial heavymetal concentrations, pH 5, and no buffer) were used. The capacities determined in the experimentswith the rotary shaker were often higher (Figure 1). These differences are likely because of materialabrasion and dispersion during shaking [36], which subsequently led to larger surface areas. Thiseffect depends on the type of material and, as a consequence, different behaviors between the sorbentsoccurred. The absolute differences were low for anthracite and high for alumina. For Cu, the capacitiesof all of the substrates, determined using the rotary shaker, were between 98% and 268% of the onesdetermined using the horizontal shaker. At the lowest concentrations, when nearly all of the Cuions were removed, the difference was very small for all sorbents (factor 1.05) but increased for thehighest concentration (factor 1.37). The higher capacities of Ni determined using the horizontal shakerat increasing concentrations can be explained by minor retention of Cu and Zn compared with therotary shaker on the material surface. Therefore, the competition was lower and Ni ions had moreopportunities to sorb onto the material.
Quevauviller et al. [37] investigated the influence of shaking types and speed on the determinationof extractable trace metals in sediments. They reported that lower amounts of metals were extractedby experiments with horizontal shakers at a speed of less than 40 rpm compared with speeds of up
105

Water 2016, 8, 62 8 of 19
to 150 rpm. In experiments with rotary shakers operated at 30 rpm, 20% more Cu was extracted,compared with experiments using a horizontal shaker at 130 rpm. This effect was less pronounced forNi than for Cu [37].
Due to the small amount of materials used in batch experiments (8.0 g) an extensive disintegrationof the material was possible during rotary shaking intervals of 24 h. This was observed duringthe experiments with calcium carbonate. Abrasion led to significant experimental difficulty andrepresentative analyses were hardly possible, which was also observed by Liu et al. [25] for manganeseoxide-coated polymeric media. Therefore, it is essential to record the type of shaker and its speed toassure reproducible and reliable results.
The initial pH value has an influence on the sorption capacities. For example, Smith [31]investigated the Cd removal by a recycled iron sorbent and determined a capacity increase as the pHincreased within the range of 4–7. Liu et al. [25] calculated the equilibrium capacities for Pb removalthat was observed at pH 5, 6, and 7. Between pH 5 and 6 the capacity increased slightly, whereas it wasseveral times higher for pH 7 compared with pH 6. Reed et al. [38] also reported higher Pb removal byGAC for elevated pH values. Athanasiadis et al. [30] measured higher Zn uptakes of a zeolite with anincreasing initial pH value. For example, at higher pH values more metals are precipitated [24], thepH value is at or above the point of zero charge that leads to negatively charged sorbent surfaces andhigher retention of cations [23], and sorption also increases because metal ions exchange hydrogenions of the sorbent surfaces more likely [39]. Thus, higher capacities for all six sorbents were expectedfor an initial pH value of 7 instead of 5.
The results of the experiments with the variation of the initial pH value are presented in Figure 2.A buffer was used for all curves and the results without a buffer are shown as single points forcomparison. For the best materials (alumina and GFH), nearly no differences in the removal of heavymetals occurred with and without buffer. Anthracite, which showed nearly no removal for experimentswithout a buffer, had removal capacities for all heavy metals for the experiments with a pH buffer atpH 5 and all capacities increased for the experiments at pH 7. The behavior of calcium carbonate wassimilar. For GAC, differences occurred only for the removal of Ni that was better removed at pH 7instead of pH 5. However, the use of a buffer had a negative effect on the Ni capacities compared withexperiments without buffer addition. Lignite that has larger amounts of primarily oxygen-containingfunctional groups (e.g., carboxylic, phenolic, and carbonyl groups) than GAC [40–42] also showeddifferences in the Ni capacities. At pH 5 without a buffer, Ni was completely removed. For theexperiments with a buffer, Ni was not completely removed and the removal increased with increasingpH value. This might be related to the functional groups and to a preferred removal of the cationspresent in the buffer (i.e., potassium and sodium) compared with Ni. In consequence, an increaseof the initial pH value led to higher removal capacities whereas the addition of a buffer showeddifferent results.
The difference of the removal capacities for the used buffer and the pH values correlated withthe filtration step at the end of the equilibrium experiments. Some heavy metals can be associatedwith colloidal sorbent compounds and can pass through the 0.45 µm-filter and are subsequentlyanalyzed [31]. In contrast, larger colloids and particulate heavy metals are retained by the filter. Thegreatest difference between total and filtrated heavy metal concentrations was observed for a stocksolution with a buffer at an initial pH of 7. This difference in initial and equilibrium concentrationscould be related to a capacity that is equal for all experiments at pH 7 (Figure 3). A comparison of thiscapacity (equilibrium experiment with no sorbent) with the total capacities of alumina and anthracite(equilibrium experiments with sorbents) illustrated that all heavy metals were partially removed bythe filtration process. Thus, the capacities of anthracite at pH 7 and in the presence of a pH buffer(Figure 2) were not related to the sorbent but mainly to the experimental setup. Similar results wereobtained by Liu et al. [25]. They investigated the removal of Pb during equilibrium batch experimentsfor pH values between 5 and 11. At pH values > 6, Pb was not only adsorbed onto the sorbent surfacebut also precipitated. Thus, 89% of Pb was removed at pH 7 by precipitation in the presence of the
106

Water 2016, 8, 62 9 of 19
sorbent, and 62% of Pb was precipitated in the solution without sorbent (same experimental setup)and, therefore, retained during the filtration process. Results consistent with this study were alsoreported by Genç-Fuhrman et al. [23] and Wu and Zhou [24] at an initial pH of 6.5.
Water 2016, 8, 62 9 of 19
this study were also reported by Genç-Fuhrman et al. [23] and Wu and Zhou [24] at an initial pH of 6.5.
Figure 2. Influences of a buffer at pH 5 and pH 7 for the rotary shaker. For comparison, pH 5 without a buffer (metal pH 5 no) is also presented.
The addition of a buffer and other chemicals to adjust the ionic strength, led to an oversaturation of the heavy metal minerals and salts in the synthetic solutions. Thus, higher metal concentrations tended to precipitate with compounds of the added chemicals and not with the constituents of the sorbents. They were also retained during the filtration process and contributed to the overall removal. Consequently, the removal of dissolved heavy metals by sorbents for stormwater treatment systems should be determined at pH 5 without the addition of a buffer.
Figure 2. Influences of a buffer at pH 5 and pH 7 for the rotary shaker. For comparison, pH 5 without abuffer (metal pH 5 no) is also presented.
Water 2016, 8, 62 9 of 19
this study were also reported by Genç-Fuhrman et al. [23] and Wu and Zhou [24] at an initial pH of 6.5.
Figure 2. Influences of a buffer at pH 5 and pH 7 for the rotary shaker. For comparison, pH 5 without a buffer (metal pH 5 no) is also presented.
The addition of a buffer and other chemicals to adjust the ionic strength, led to an oversaturation of the heavy metal minerals and salts in the synthetic solutions. Thus, higher metal concentrations tended to precipitate with compounds of the added chemicals and not with the constituents of the sorbents. They were also retained during the filtration process and contributed to the overall removal. Consequently, the removal of dissolved heavy metals by sorbents for stormwater treatment systems should be determined at pH 5 without the addition of a buffer.
Figure 3. Influence of the filtration process at pH 7 for experiments using a buffer and a rotary shaker:heavy metal removal for different initial concentrations for two sorbents and for the same initialconcentrations without any sorbent (metal no sorbent).
107

Water 2016, 8, 62 10 of 19
The addition of a buffer and other chemicals to adjust the ionic strength, led to an oversaturationof the heavy metal minerals and salts in the synthetic solutions. Thus, higher metal concentrationstended to precipitate with compounds of the added chemicals and not with the constituents of thesorbents. They were also retained during the filtration process and contributed to the overall removal.Consequently, the removal of dissolved heavy metals by sorbents for stormwater treatment systemsshould be determined at pH 5 without the addition of a buffer.
Batch kinetic experiments can be used to evaluate capacities for the design of treatment systems.In stormwater treatment systems, the contact time between the influent and the filter material is inthe order of several minutes and varies widely because rain intensities can be very heterogeneousand the retention volumes are very small in decentralized systems. These short EBCTs can lead toan incomplete reaction of the heavy metals with the sorbents. Therefore, the kinetics of the heavymetal removal is very important to characterize the suitability of a material for this application.Since the removal mechanisms in porous media are controlled by physical-chemical processes or bychemical-dominant surface reactions (i.e., adsorption, desorption, surface complexation, ion exchange,and precipitation), the capacities after several minutes or hours depend on the filter material and thesubstances of interest as some processes are rate limited (e.g., intraparticle transport and dissolution ofcarbonates) [31,43,44].
For all kinetic experiments, a higher initial concentration correlated with less heavy metal removalefficiencies at the same time, and the pH values increased with time for all sorbents except anthracitebecause of the sorbent specific removal mechanisms (e.g., dissolution of the sorbent minerals or releaseof phenols) [23]. Following an initial fast reaction stage, a slower stage continued for the four sorbentshaving the best removal capacities (Figure 4).
Water 2016, 8, 62 10 of 19
Figure 3. Influence of the filtration process at pH 7 for experiments using a buffer and a rotary shaker: heavy metal removal for different initial concentrations for two sorbents and for the same initial concentrations without any sorbent (metal no sorbent).
Batch kinetic experiments can be used to evaluate capacities for the design of treatment systems. In stormwater treatment systems, the contact time between the influent and the filter material is in the order of several minutes and varies widely because rain intensities can be very heterogeneous and the retention volumes are very small in decentralized systems. These short EBCTs can lead to an incomplete reaction of the heavy metals with the sorbents. Therefore, the kinetics of the heavy metal removal is very important to characterize the suitability of a material for this application. Since the removal mechanisms in porous media are controlled by physical-chemical processes or by chemical-dominant surface reactions (i.e., adsorption, desorption, surface complexation, ion exchange, and precipitation), the capacities after several minutes or hours depend on the filter material and the substances of interest as some processes are rate limited (e.g., intraparticle transport and dissolution of carbonates) [31,43,44].
For all kinetic experiments, a higher initial concentration correlated with less heavy metal removal efficiencies at the same time, and the pH values increased with time for all sorbents except anthracite because of the sorbent specific removal mechanisms (e.g., dissolution of the sorbent minerals or release of phenols) [23]. Following an initial fast reaction stage, a slower stage continued for the four sorbents having the best removal capacities (Figure 4).
Figure 4. Results of the kinetic experiments with two initial concentrations (rotary shaker, pH 5, and no buffer). Figure 4. Results of the kinetic experiments with two initial concentrations (rotary shaker, pH 5, and
no buffer).
108

Water 2016, 8, 62 11 of 19
Sorption rates were fast for GAC with nearly 100% of the equilibrium capacities within 5 minfor all metals at lower concentrations and Cu at higher concentrations, where the removal of Znwas slower and the removal capacity of Ni was only 71% after 2 h compared with the result ofthe equilibrium experiment (Zn 89%, respectively). Lignite had a similar behavior but had slowerefficiencies compared with GAC for the higher concentrations until 20–30 min. The initial fast rates canbe explained by the large surface areas (cf. Table 1) and the following reactions were rate-limited bydiffusion through the micropores of the sorbent because easily available surface areas were occupiedby previously-sorbed metals [39]. Similar results were calculated for GFH with slower rates in thefirst 5 min for the lower concentrations and a subsequent faster increase in removal efficiencies. Forhigher concentrations, GFH had the highest removal rates compared with all other sorbents. Foralumina, the capacities increased slowly, especially for Ni. Calcium carbonate exhibited slow increasesin the removal capacities over time (rate-limited dissolution) with varying results likely because ofthe abrasion of the material. Therefore, in the range of 5–20 min, which is relevant for stormwatertreatment systems, differences occurred between all sorbents for all heavy metals. However, batchkinetic experiments are not suitable to evaluate contact times shorter than 5 min. Thus, these conditionsrepresentative of high rain intensities should be simulated using column experiments.
The effect of different temperatures was not evaluated as lab-experiments were always performedat ambient temperatures. Changes in the behavior of heavy metals because of temperature effects inlabs were not considered significant according to Quevauviller et al. [37] and Pehlivan and Arslan [39].
3.2. Column Experiments
Column studies were carried out with appropriate solid-to-solution-ratios [36] and filtration wasnot conducted when preparing the samples. The differing behavior of the sorbents during the batchkinetic experiments were reflected in the performance of the filter materials in the lab-scale columntests. One of the aims of these column studies was to achieve maximum capacities of a sorbent underspecific boundary conditions. These capacities are needed to design full-scale systems for stormwatertreatment (e.g., amount of sorbent and service life) [45]. The design of a full-scale system requires theprediction of the concentration-time profile or the breakthrough curve using lab-scale experiments.The breakthrough curves had a very high coincidence with the pH drift curve for all sorbents (Figure 5).In general, the pH drop correlated with decreasing heavy metal removal for the experiments with anEBCT of 11 min. This pH effect can be used in monitoring the removal process.
The best material (GFH) had a breakthrough of 10% at ca. > 2200, 1300, and 1470 bed volumes forCu, Ni, and Zn, respectively. The capacities of the column experiments were also comparable to theones of the batch experiments (Table 2). No differences occurred between alumina and GFH in theequilibrium batch experiments for concentrations <100 mg/L and there were only small differences inthe kinetic studies for lower concentrations. For the column experiments, the differences were moreevident. A 10%(50%)-breakthrough of Ni, Zn, and Cu was observed after treatment of approximately70(240), 190(310), and 380(950) bed volumes by alumina, respectively. The high efficiency of GFHcompared with alumina cannot be linked exclusively to the specific surface area [24] and the mediumpore diameter because they are both similar. However, GFH has a 4.5 times larger pore volume(0.717 cm³/g) that supports heavy metal pore diffusion, surface interaction, surface complexation withhydroxide groups, and precipitation with calcium carbonate (cf. Table 1). Furthermore, a regenerationof the filter material during weekends was observed (Figure 5).
Although GAC had the largest specific surface area (896 m²/g), it had very low capacities in thecolumn experiments and the steepest gradient from breakthrough to exhaustion. The simultaneoussteep decrease of the pH value can be linked to the formation of hydroxide complexes of Zn and Niafter the breakthrough point, when the surface area is limited for sorption of metal ions. These lowcapacities of GAC limits its applicability for stormwater treatment systems as it was also reportedby Liu et al. [19] and Li and Helmreich [28]. Both GAC and lignite had Zn and Ni values above 1.0for c/c0 as a result of competition because Cu is preferentially retained. As sorption is one of the key
109

Water 2016, 8, 62 12 of 19
removal mechanisms, a partial displacement of previously sorbed Ni and Zn occurred as the remainingcapacity decreased and led to effluent concentrations that were higher than the influent concentrations.A higher selectivity of lignite for Cu removal (followed by Zn and Ni) was also measured byJochová et al. [44].
Water 2016, 8, 62 12 of 19
Liu et al. [19] and Li and Helmreich [28]. Both GAC and lignite had Zn and Ni values above 1.0 for c/c0 as a result of competition because Cu is preferentially retained. As sorption is one of the key removal mechanisms, a partial displacement of previously sorbed Ni and Zn occurred as the remaining capacity decreased and led to effluent concentrations that were higher than the influent concentrations. A higher selectivity of lignite for Cu removal (followed by Zn and Ni) was also measured by Jochová et al. [44].
Figure 5. Heavy metal removal and pH drift curves of all column experiments conducted with influent concentrations of 2.5 mg/L Cu, 2.5 mg/L Ni, and 5.0 mg/L Zn at a flow-rate of 6.5 mL/min (exceptions: two calcium carbonate experiments with variations; GFH has a different scale).
Anthracite had an exhaustion of the capacity before the first sampling (Figure 5).
Figure 5. Heavy metal removal and pH drift curves of all column experiments conducted with influentconcentrations of 2.5 mg/L Cu, 2.5 mg/L Ni, and 5.0 mg/L Zn at a flow-rate of 6.5 mL/min (exceptions:two calcium carbonate experiments with variations; GFH has a different scale).
Anthracite had an exhaustion of the capacity before the first sampling (Figure 5).
110

Water 2016, 8, 62 13 of 19
In contrast to the batch experiments, calcium carbonate had higher capacities in columnexperiments (Table 2). Therefore, the batch experiment setup had a negative effect while determiningsorption capacities because of the abrasion and disintegration of the material. Despite its medium Niand Zn removal efficiencies, calcium carbonate showed a high Cu removal because Cu is predominantlyprecipitated as copper carbonate at the prevailing pH values (cf. Figure 5) [23].
Table 2. Comparison of different sorption capacities; batch experiments: highest values measured (qe)for two initial concentrations (mg/L) at pH 5 with the rotary shaker without a buffer and calculatedusing the Langmuir isotherm model (qm); column experiments: at 10% breakthrough point (q10%) andat 50% breakthrough point (q50%)—all values in mg/g.
FilterMaterial
Cu Ni Zn
qe,2.5 qe,540 qm q10% q50% qe,2.5 qe,540 qm q10% q50% qe,2.5 qe,540 qm q10% q50%
Alumina 0.06 12.7 13.5 1.46 3.07 0.06 1.75 1.77 0.25 0.71 0.12 6.45 6.47 1.35 2.01Anthracite 0 0.09 - - - 0 0.06 - - - 0 0.36 - - -Calciumcarbonate 0.06 1.45 1.45 1.60 >2.27 0.06 0.30 0.31 0.13 0.42 0.12 0.53 0.53 1.06 2.25GAC 0.06 11.9 12.0 1.40 1.81 0.06 1.51 1.52 0.28 0.41 0.12 4.11 4.44 0.71 1.22GFH 0.06 14.4 21.8 >8.92 >8.92 0.06 6.73 6.82 4.90 >7.57 0.12 24.0 23.5 11.1 >11.3Lignite 0.06 14.6 16.6 1.27 2.00 0.06 2.73 2.73 0.44 0.60 0.12 10.9 11.2 1.26 1.62
Selected experiments were performed with calcium carbonate because of its rate-limiting removalmechanism to evaluate the influence of changes in initial concentrations and contact time. These arethe main factors varying between different rain events treated in decentralized systems. For decreasingEBCT, capacities and efficiently treated bed volumes decreased (Figure 5). The q50%-capacity decreasedfor Zn from 2.25 mg/g to 0.42 mg/g (double influent concentration) and to 0.14 mg/g (doubleinfluent concentration and double flow-rate). These results indicated that the impact of the EBCT forcalcium carbonate was comparable to the ones for GAC and manganese oxide-coated media [19,38].Inglezakis et al. [43] also determined for a zeolite that the breakthrough point (set at c/c0 = 10%)could be observed after a smaller amount of treated bed volumes as the flow-rate increased andthe EBCT decreased. This effect also occurred in the experiments of this study (Figure 5) and itinfluenced the capacities negatively because the steepness of the breakthrough curve also increased. Incontrast to the manganese oxide-coated media tested by Liu et al. [19], the breakthrough capacities ofcalcium carbonate decreased with increasing concentrations for the same EBCT. For the same removalefficiencies, a longer EBCT must be maintained for higher influent concentrations [38]. Therefore,for the same EBCT and higher influent concentrations, the removal efficiencies decreased and thesteepness of the breakthrough curve increased (Figure 5). All breakthrough curves can be used toevaluate service lives for specific removal efficiencies under defined boundary conditions of the columnexperiments. These individual breakthroughs can be linked to meeting regulatory requirements.
3.3. Comparison of Batch and Column Experiment Capacities
A comparison of the capacities determined for the three heavy metals is summarized in Table 2.These removal capacities are important because they are needed to design full-scale systems forstormwater treatment (e.g., type and amount of sorbent, ratio of drainage area to filter area, or servicelife) [45]. For realistic stormwater runoff concentrations (2.5 mg/L and 5.0 mg/L) in batch experiments,all filter materials exhibited approximately 100% removal (with the exception of anthracite) and,therefore, achieved the same capacities (0.06 mg/g for Cu and Ni, 0.12 mg/g for Zn). For thehighest initial concentrations of the batch experiments (540 mg/L and 1080 mg/L) the sorbents canbe differentiated by the capacities. However, aspects such as a decrease in the equilibrium pH valuebecause of the high metal concentrations make it difficult to evaluate the results as some metalswere not removed. These capacities are comparable with the ones calculated using the Langmuirisotherm model.
111

Water 2016, 8, 62 14 of 19
In column experiments, the sorbents were evaluated by realistic concentrations under an EBCT of11 min, which represents lower rain intensities. The capacities were much lower than the maximalsorption capacities calculated from the batch experiments, with the exception of GFH and calciumcarbonate. GFH was the best material in the lab-scale column tests and calcium carbonate wasdisintegrated during the batch experiments. These differences were observed because of the reactionkinetics and the experimental setup. For a calcareous soil, a comparison of the retention of heavy metalsin batch and column experiments showed similar results [46]. A comparison of the batch (qe,2.5 orqe,5.0) and column capacities (q10% and q50%) using the same stock solution concentrations showed thatlarger amounts are sorbed on the column materials because of the higher solid-to-solution-ratios [36].
Lab-scale column experiments are more representative than batch experiments because of aconstant flow, higher solid-to-solution-ratios, and the missing of the filtration step, which makes itpossible to compare the efficiencies of filter materials and the effluent water quality [47]. A variationof the flow-rate to evaluate varying rain intensities can be achieved without high efforts during oneexperimental run by considering the site-specific hydrology and the flow-rate that is relevant for thefilter system. Column experiments are applicable to simulate the behavior of stormwater filter materialsfor high rain intensities (contact times < 5 min) and, therefore, kinetic effects are better consideredcompared with batch kinetic experiments. In addition, there is no abrasion of filter materials thatcould influence the results. Thus, column experiments give a more realistic capacity by consideringreal boundary conditions and should be preferred to determine efficiencies and service lives. Thedetermined service life is only valid for the dissolved substances and further field experiments areneeded to verify the performance in the presence of particulate matter that can cause clogging. Batchexperiments can be used to exclude sorbents that are not appropriate for the removal of a specificmetal from subsequent and more expensive column experiments and to evaluate different productionbatches (cf. Section 3.6). To date, a lack of standardized methods does not allow a comparison ofvarious results of one sorbent used in different research programs [37].
3.4. Comparison of Different Batch Experiment Capacities
In addition to the batch experiments with heavy metals, further batch experiments were conductedwith surrogates according to standard methods to evaluate their ability to determine the capacitiesof different sorbents. Both methods use other cations (magnesium and ammonium) that replacepreviously exchanged cations (barium and sodium, respectively). Due to the exchange of cations beinga selective process, the use of surrogates assumes that their affinity for being removed is comparablewith the cations of interest. This is especially critical for the method CEC 2 because it was developedfor natural zeolites and not for filter materials in general. It must be noted that the method CEC 1 isnot suitable for materials containing significant amounts of calcite or gypsum [32]. This applies to thesorbent calcium carbonate.
The results of both methods that are described in Section 2.2.3 are shown in comparison withsorption capacities of Cu, Ni, and Zn in Table 3. All capacities are presented in the unit cmol+/kgto enable a comparison as it is suggested by the two standard methods. By comparing the absolutenumbers of the sorption capacities with the results of CEC 1, differences between each sorbent areapparent. GFH and lignite have comparable results regarding the sorption capacities for all threeheavy metals, although they have different CEC 1 values. Therefore, different removal mechanismsare responsible for the retention of heavy metals. For alumina, CEC 1 values and the sum of the heavymetal sorption capacities are comparable. However, the individual heavy metal capacities indicatethat Cu is completely retained, Zn less, and Ni only up to 67%. Thus, the method CEC 1 does notconsider the diverse behavior of the heavy metals and overestimates the capacity for more mobilemetals such as Ni. By using the method CEC 2, a capacity was calculated for anthracite that does notretain any heavy metals (cf. Figure 1). Furthermore, a ranking of the capacities according to CEC 2 isnot comparable with the results of the batch experiments with heavy metals. The use of the methodCEC 2 for natural zeolites is also limited because sodium chloride is used to enhance the sorption
112

Water 2016, 8, 62 15 of 19
behavior of natural zeolites by pretreatment [30]. The use of sodium chloride during application ofCEC 2 would, therefore, falsify the capacity results for pretreated and untreated zeolites.
Table 3. Comparison of different capacities determined by batch experiments at pH 5 with the rotaryshaker and without a buffer, CEC 1, and CEC 2—all values in cmol+/kg.
FilterMaterial
Four Sorption Capacities CEC 1 CEC 2
120 mg/L Cu 120 mg/L Ni 240 mg/L Zn 480 mg/Lř
(Cu+Ni+Zn)480 mg/L
Mg180 mg/L
NH4+
Alumina 8.42 5.93 15.0 29.4 28.5 7.33Anthracite 0 0 0 0 0 5.37Calcium
carbonate 3.00 1.34 0 4.34 7.94 3.45
GAC 8.38 3.39 12.4 24.2 3.99 3.63GFH 8.44 8.96 17.0 34.4 40.2 10.7
Lignite 8.44 8.93 17.0 34.4 9.39 2.98
3.5. Implementation of Ionic Strength and the pH value of Stormwater Runoff
In lab-scale experiments with sorbents for stormwater treatment systems, chemicals such asNaCl [23,24], NaClO4 [31], and NaNO3 [19,25,39] are used to adjust ionic strength, which shallrepresent the one measured in traffic area runoff. These chemicals contain further cations and chloridethat might have an effect on sorption efficiencies (e.g., the presence of other cations can diminish theavailable number of sorption sites and chloride can form complexes that enhance the mobility of heavymetals [48]).
The parameter of field measurements that is often quantified and mostly related to ionic strengthis the electric conductivity because hardness is only sometimes measured. However, the values varybetween 11.3 µS/cm and 52000 µS/cm in the dataset presented in [5] with a median value of 160 µS/cm.Thus, the ionic strength relates to site-specific factors that are mainly influenced by the road surface androad maintenance. It should at least be distinguished between warm and cold climates and betweenasphalt and concrete surface runoff waters. Hence, a median ionic strength is not representative forseveral sites or seasons. Winter maintenance practices, such as de-icing salt applications, generatechlorides and associated cations, in particular sodium and calcium, that can have an effect on theremoval of heavy metals [49,50]. Thus, the ionic strength previously used in lab experiments does notreflect the amount and composition of the cations and anions of real stormwater runoff. Since eachelement has a unique effect on the removal, additional compounds to simulate ionic strength shouldbe used carefully.
In summary, the consideration of ionic strength in lab-scale experiments is ambiguous as it variesin reality because of de-icing salt maintenance and other site-specific factors that lead to differentcompositions of the stormwater runoff, which cannot be reproduced in the lab. Therefore, the use ofno buffer or ionic strength might be a worst case scenario for the determination of dissolved heavymetal removal to prevent oversaturated systems. However, for treatment systems in cold climates,de-icing salts must be considered. Additional experiments might be a better solution to observe theirmobility and remobilization behavior.
The initial pH value has an effect on the measured capacities (cf. Figure 2). The pH values of6.0, 6.5, and 7.0 [23–25,31] are often used in lab experiments that represent the median value of 6.9for traffic area runoff waters [5]. A higher initial pH value results in more metals being precipitatedbecause of the experimental setup [25]. This leads to an overestimation of the capacities of sorbents(especially for higher metal concentrations), which are predominantly increased by the filtration stepat the end of all batch experiments by which larger colloids and particulate heavy metals are retained(cf. Figure 3). This effect does not occur in real stormwater treatment systems because the wire mesh orgeotextile that is used to restrain the sorbents has larger pore diameters and these fine heavy metalscan pass through them. Therefore, the enhanced precipitation has a great influence on the results, and
113

Water 2016, 8, 62 16 of 19
the comparability between the real situation and the lab experiments is limited. Using realistic influentpH values is not suitable to test the performance of filters for stormwater treatment systems that haveto remove dissolved heavy metals. Therefore, to determine the sorbent performance and to investigatethe removal mechanisms of decentralized stormwater treatment systems, it is preferred to performbatch experiments with the dissolved heavy metals of interest using synthetic water at pH 5.
3.6. Evaluation of Different Production Batches
A well-defined method for batch experiments can also be used to evaluate different productionbatches in a fast and inexpensive way. This method must contain information on the initial pH value,the concentrations of the metals of interest, the substrate dosage, the type and speed of the shaker,the shaking time, the temperature, and the sample preparation. The addition of a buffer or ionicstrength should be avoided. All experiments should be performed in triplicate and blank samplesare recommended.
The evaluation of different production batches of GFH for the removal of Cu is plotted in Figure 6.All samples were filtrated (0.45 µm) after 24 h of shaking and before analysis. The first two batchexperiments marked with * contained 0.4 ˘ 0.05 g material instead of 0.3 ˘ 0.05 g material in 250 mLsolution. A lower filter material dosage had an effect on the results that is comparable to the one ofincreasing concentrations for the same dosages. A decreased dosage led to fewer variations of theresults (Figure 6). Comparing the four batches with the same experimental setup, it can be seen thatthe results are reproducible for each production batch and there is only a slight variation betweendifferent production batches.
Water 2016, 8, 62 16 of 19
wire mesh or geotextile that is used to restrain the sorbents has larger pore diameters and these fine heavy metals can pass through them. Therefore, the enhanced precipitation has a great influence on the results, and the comparability between the real situation and the lab experiments is limited. Using realistic influent pH values is not suitable to test the performance of filters for stormwater treatment systems that have to remove dissolved heavy metals. Therefore, to determine the sorbent performance and to investigate the removal mechanisms of decentralized stormwater treatment systems, it is preferred to perform batch experiments with the dissolved heavy metals of interest using synthetic water at pH 5.
3.6. Evaluation of Different Production Batches
A well-defined method for batch experiments can also be used to evaluate different production batches in a fast and inexpensive way. This method must contain information on the initial pH value, the concentrations of the metals of interest, the substrate dosage, the type and speed of the shaker, the shaking time, the temperature, and the sample preparation. The addition of a buffer or ionic strength should be avoided. All experiments should be performed in triplicate and blank samples are recommended.
The evaluation of different production batches of GFH for the removal of Cu is plotted in Figure 6. All samples were filtrated (0.45 µm) after 24 h of shaking and before analysis. The first two batch experiments marked with * contained 0.4 ± 0.05 g material instead of 0.3 ± 0.05 g material in 250 mL solution. A lower filter material dosage had an effect on the results that is comparable to the one of increasing concentrations for the same dosages. A decreased dosage led to fewer variations of the results (Figure 6). Comparing the four batches with the same experimental setup, it can be seen that the results are reproducible for each production batch and there is only a slight variation between different production batches.
Figure 6. Evaluation of different production batches of GFH by sorption capacities for Cu: batch experiments marked with * contained 0.4 ± 0.05 g sorbent instead of 0.3 ± 0.05 g sorbent in 250 mL solution.
This method can be used to evaluate the performance of the sorbent in comparison with different production batches under identical experimental conditions. Such an evaluation is needed for internal and external quality control, which is conducted several times per year by the manufactures of technical decentralized stormwater treatment systems. This quality control proves
Figure 6. Evaluation of different production batches of GFH by sorption capacities for Cu: batchexperiments marked with * contained 0.4 ˘ 0.05 g sorbent instead of 0.3 ˘ 0.05 g sorbent in250 mL solution.
This method can be used to evaluate the performance of the sorbent in comparison with differentproduction batches under identical experimental conditions. Such an evaluation is needed for internaland external quality control, which is conducted several times per year by the manufactures of technicaldecentralized stormwater treatment systems. This quality control proves that the filter materials of onetreatment system always have the same characteristics. Therefore, the performance of different plants
114

Water 2016, 8, 62 17 of 19
should be comparable. However, this method is not suitable to design full-scale treatment systems orto predict the service life because it overestimates the sorbent capacity.
4. Conclusions
For testing sorbents for urban stormwater treatment systems, it is important to assure thatreproducible and reliable results were obtained. Hence, the following influencing factors must beconsidered for the determination of capacities:
‚ Experiments with the dissolved heavy metals of interest using synthetic water at pH 5 is suggestedand the influence of the type and speed of the shaker must be considered.
‚ Adjustments of ionic strength and pH > 5 are more sensitive and should be avoided because theymostly lead to an overestimation of the removal capacities of sorbents.
‚ The filtration step at the end of the batch experiments has an effect on the results and does notsimulate real situations.
‚ Batch experiments with other cations (e.g., magnesium and ammonium) should not be usedas surrogates.
The results of batch and lab-scale column experiments concerning simultaneous heavy metalremoval differed widely for each sorbent. Thus, the following applications are recommended:
‚ Batch experiments with heavy metals can only be used under identical and well-defined conditionsto prove the comparability of different production batches and to select sorbents for subsequentcolumn experiments.
‚ Column experiments can be used as an indicator to determine the efficiencies and service lives oftreatment systems.
Acknowledgments: Special thanks to Alicia Dery, Julius Fassnacht, and Antje Welker for their contributions,support, and valuable comments.
Author Contributions: Maximilian Huber, Sophia C. Badenberg, Moritz Wulff, and Brigitte Helmreich conceivedthe experiments. Maximilian Huber, Sophia C. Badenberg, and Moritz Wulff designed, performed, andevaluated the experiments. Maximilian Huber wrote the manuscript. Sophia C. Badenberg, Jörg E. Drewes, andBrigitte Helmreich contributed to the Sections 3 and 4.
Conflicts of Interest: The authors declare no conflict of interest.
References
1. Roeva, N.N.; Rovinskii, F.Y.; Kononov, E.Y. Special features of the behavior of heavy metals in various naturalenvironments. J. Anal. Chem. 1996, 51, 352–364.
2. von Uexküll, O.; Skerfving, S.; Doyle, R.; Braungart, M. Antimony in brake pads-a carcinogenic component?J. Clean. Prod. 2005, 13, 19–31. [CrossRef]
3. Thorpe, A.; Harrison, R.M. Sources and properties of non-exhaust particulate matter from road traffic: Areview. Sci. Total Environ. 2008, 400, 270–282. [CrossRef] [PubMed]
4. Kayhanian, M.; Fruchtman, B.D.; Gulliver, J.S.; Montanaro, C.; Ranieri, E.; Wuertz, S. Review of highwayrunoff characteristics: Comparative analysis and universal implications. Water Res. 2012, 46, 6609–6624.[CrossRef] [PubMed]
5. Huber, M.; Welker, A.; Helmreich, B. Critical review of heavy metal pollution of traffic area runoff:Occurrence, influencing factors, and partitioning. Sci. Total Environ. 2016, 541, 895–919. [CrossRef] [PubMed]
6. Sansalone, J.; Glenn, D.W. Temporal variations in heavy metal partitioning and loading in urban highwaypavement sheet flow: Implications for in situ treatment design. Transp. Res. Rec. 2000, 1720, 100–111.[CrossRef]
7. Helmreich, B.; Hilliges, R.; Schriewer, A.; Horn, H. Runoff pollutants of a highly trafficked urbanroad—Correlation analysis and seasonal influences. Chemosphere 2010, 80, 991–997. [CrossRef] [PubMed]
8. Roubicek, V.; Raclavska, H.; Juchelkova, D.; Filip, P. Wear and environmental aspects of composite materialsfor automotive braking industry. Wear 2008, 265, 167–175. [CrossRef]
115

Water 2016, 8, 62 18 of 19
9. Ball, J.E.; Jenks, R.; Aubourg, D. An assessment of the availability of pollutant constituents on road surfaces.Sci. Total Environ. 1998, 209, 243–254. [CrossRef]
10. Mangani, G.; Berloni, A.; Bellucci, F.; Tatàno, F.; Maione, M. Evaluation of the pollutant content in roadrunoff first flush waters. Water Air Soil Pollut. 2005, 160, 213–228. [CrossRef]
11. Denkhaus, E.; Salnikow, K. Nickel essentiality, toxicity, and carcinogenicity. Critical Rev. Oncol. Hematol.2002, 42, 35–56. [CrossRef]
12. Davis, A.P.; Shokouhian, M.; Ni, S. Loading estimates of lead, copper, cadmium, and zinc in urban runofffrom specific sources. Chemosphere 2001, 44, 997–1009. [CrossRef]
13. Legret, M.; Pagotto, C. Evaluation of pollutant loadings in the runoff waters from a major rural highway. Sci.Total Environ. 1999, 235, 143–150. [CrossRef]
14. Sansalone, J.J.; Buchberger, S.G. Partitioning and first flush of metals in urban roadway storm water.J. Environ. Eng. 1997, 123, 134–143. [CrossRef]
15. Dierkes, C.; Geiger, W.F. Decontaminating effect of greened highway embankments. In Proceedings of theNOVATECH-Conference, Lyon, France, 4–6 May 1998; pp. 497–504.
16. Van Bohemen, H.D.; Van De Laak, W.H.J. The influence of road infrastructure and traffic on soil, water, andair quality. Environ. Manage. 2003, 31, 50–68. [CrossRef] [PubMed]
17. McKenzie, E.R.; Money, J.E.; Green, P.G.; Young, T.M. Metals associated with stormwater-relevant brake andtire samples. Sci. Total Environ. 2009, 407, 5855–5860. [CrossRef] [PubMed]
18. Dierkes, C.; Lucke, T.; Helmreich, B. General technical approvals for decentralised sustainable urban drainagesystems (SUDS)—The current situation in Germany. Sustainability 2015, 7, 3031–3051. [CrossRef]
19. Liu, D.; Sansalone, J.J.; Cartledge, F.K. Comparison of sorptive filter media for treatment of metals in runoff.J. Environ. Eng. 2005, 131, 1178–1186. [CrossRef]
20. Hilliges, R.; Schriewer, A.; Helmreich, B. A three-stage treatment system for highly polluted urban roadrunoff. J. Environ. Manage. 2013, 128, 306–312. [CrossRef] [PubMed]
21. Maniquiz-Redillas, M.; Kim, L.-H. Fractionation of heavy metals in runoff and discharge of a stormwatermanagement system and its implications for treatment. J. Environ. Sci. 2014, 26, 1214–1222. [CrossRef]
22. Hendershot, W.H.; Duquette, M. A simple barium chloride method for determining cation exchange capacityand exchangeable cations. Soil Sci. Soc. Am. J. 1986, 50, 605–608. [CrossRef]
23. Genç-Fuhrman, H.; Mikkelsen, P.S.; Ledin, A. Simultaneous removal of As, Cd, Cr, Cu, Ni and Zn fromstormwater: Experimental comparison of 11 different sorbents. Water Res. 2007, 41, 591–602. [CrossRef][PubMed]
24. Wu, P.; Zhou, Y.S. Simultaneous removal of coexistent heavy metals from simulated urban stormwater usingfour sorbents: A porous iron sorbent and its mixtures with zeolite and crystal gravel. J.Hazard. Mater. 2009,168, 674–680. [CrossRef]
25. Liu, D.; Sansalone, J.J.; Cartledge, F.K. Adsorption characteristics of oxide coated buoyant media (ρs < 1.0)for storm water treatment. I: Batch equilibria and kinetics. J. Environ. Eng. 2004, 130, 374–382.
26. Summers, S.R. Standardized Protocol for the Evaluation of GAC; AWWA Research Foundation and AmericanWater Works Association: Denver, CO, USA, 1992.
27. Crittenden, J.C.; Berrigan, J.K.; Hand, D.W. Design of rapid small-scale adsorption tests for a constantdiffusivity. Water Pollut. Control Fed. 1986, 58, 312–319.
28. Li, Y.; Helmreich, B. Simultaneous removal of organic and inorganic pollutants from synthetic road runoffusing a combination of activated carbon and activated lignite. Sep. Purif. Technol. 2014, 122, 6–11. [CrossRef]
29. Doula, M.; Ioannou, A.; Dimirkou, A. Copper adsorption and Si, Al, Ca, Mg, and Na release fromclinoptilolite. J. Colloid Interface Sci. 2002, 245, 237–250. [CrossRef] [PubMed]
30. Athanasiadis, K.; Helmreich, B. Influence of chemical conditioning on the ion exchange capacity and onkinetic of zinc uptake by clinoptilolite. Water Res. 2005, 39, 1527–1532. [CrossRef] [PubMed]
31. Smith, E.H. Modeling batch kinetics of cadmium removal: By a recycled iron adsorbent. Sep. Sci. Technol.1998, 33, 149–168. [CrossRef]
32. Soil Quality—Determination of Effective Cation Exchange Capacity and Base Saturation Level Using BariumChloride Solution (ISO 11260:1994+Cor. 1:1996), Normenausschuss Wasserwesen (NAW) im DIN; DIN EN ISO11260:2011-09; DIN Deutsches Institut für Normung e. V.: Berlin, Germany, 2011; pp. 1–16.
116

Water 2016, 8, 62 19 of 19
33. Products Used for Treatment of Water Intended for Human Consumption—Natural Zeolite, NormenausschussWasserwesen (NAW) im DIN; DIN EN 16070:2014-06; DIN Deutsches Institut für Normung e. V.: Berlin,Germany, 2014; pp. 1–20.
34. American Public Health Association (APHA). Standard Methods for the Examination of Water and Wastewater,21st ed.; APHA: Washington, DC, USA, 2005; pp. 1–184.
35. Determination of the Specific Surface Area of Solids by Gas Adsorption—BET Method; Normenausschuss Bauwesen(NABau) im DIN; ISO 9277:2010-09; DIN Deutsches Institut für Normung e. V.: Berlin, Germany, 2014;pp. 1–30.
36. Bürgisser, C.S.; Cernik, M.; Borkovec, M.; Sticher, H. Determination of nonlinear adsorption isotherms fromcolumn experiments: An alternative to batch studies. Environ.Sci. Technol. 1993, 27, 943–948. [CrossRef]
37. Quevauviller, P.; Rauret, G.; Muntau, H.; Ure, A.M.; Rubio, R.; López-Sánchez, J.F.; Fiedler, H.D.; Griepink, B.Evaluation of a sequential extraction procedure for the determination of extractable trace metal contents insediments. Fresenius J. Anal. Chem. 1994, 349, 808–814. [CrossRef]
38. Reed, B.E.; Jamil, M.; Thomas, B. Effect of pH, empty bed contact time and hydraulic loading rate on leadremoval by granular activated carbon columns. Water Environ. Res. 1996, 68, 877–882. [CrossRef]
39. Pehlivan, E.; Arslan, G. Removal of metal ions using lignite in aqueous solution—low cost biosorbents. FuelProcess. Technol. 2007, 88, 99–106. [CrossRef]
40. Mohan, D.; Chander, S. Single, binary, and multicomponent sorption of iron and manganese on lignite.J. Colloid Interface Sci. 2006, 299, 76–87. [CrossRef] [PubMed]
41. Mohan, D.; Chander, S. Removal and recovery of metal ions from acid mine drainage using lignite—a lowcost sorbent. J. Hazard. Mater. 2006, 137, 1545–1553. [CrossRef] [PubMed]
42. Qi, Y.; Hoadley, A.F.A.; Chaffee, A.L.; Garnier, G. Characterisation of lignite as an industrial adsorbent. Fuel2011, 90, 1567–1574. [CrossRef]
43. Inglezakis, V.J.; Loizidou, M.D.; Grigoropoulou, H.P. Equilibrium and kinetic ion exchange studies of Pb2+,Cr3+, Fe3+ and Cu2+ on natural clinoptilolite. Water Res. 2002, 36, 2784–2792. [CrossRef]
44. Jochová, M.; Puncochár, M.; Horácek, J.; Štamberg, K.; Vopálka, D. Removal of heavy metals from water bylignite-based sorbents. Fuel 2004, 83, 1197–1203. [CrossRef]
45. Yan, G.; Viraraghavan, T.; Chen, M. A new model for heavy metal removal in a biosorption column.Adsorption Sci. Technol. 2001, 19, 25–43. [CrossRef]
46. Plassard, F.; Winiarski, T.; Petit-Ramel, M. Retention and distribution of three heavy metals in a carbonatedsoil: Comparison between batch and unsaturated column studies. J. Contam. Hydrol. 2000, 42, 99–111.[CrossRef]
47. Poddar, M.; Nair, A.N.B.; Mahindrakar, A.B. A review on the use of rapid small scale column test (RSSCT)on predicting adsorption of various contaminants. J. Environ. Sci., Toxicol. Food Technol. 2013, 3, 77–85.[CrossRef]
48. Boekhold, A.E.; Temminghoff, E.J.M.; Van der Zee, S.E.A.T.M. Influence of electrolyte composition and pHon cadmium sorption by an acid sandy soil. J. Soil Sci. 1993, 44, 85–96. [CrossRef]
49. Bäckström, M.; Karlsson, S.; Bäckman, L.; Folkeson, L.; Lind, B. Mobilisation of heavy metals by deicing saltsin a roadside environment. Water Res. 2004, 38, 720–732. [CrossRef] [PubMed]
50. Nelson, S.; Yonge, D.; Barber, M. Effects of road salts on heavy metal mobility in two eastern Washingtonsoils. J. Environ. Eng. 2009, 135, 505–510. [CrossRef]
© 2016 by the authors; licensee MDPI, Basel, Switzerland. This article is an open accessarticle distributed under the terms and conditions of the Creative Commons by Attribution(CC-BY) license (http://creativecommons.org/licenses/by/4.0/).
117

Chapter7:AssessmentMethodfortheHeavyMetalRemoval
7.1 Research Paper: “Development of a Novel TestMethod toDetermine
ServiceLives”
Because batch and small‐scale column experiments are not suitable to determine service lives and
long‐term performances of filter materials (cf. Chapter 6), a novel test method was developed during
this thesis, which can be used to assess manufactured decentralized stormwater treatment systems
for runoff from traffic areas in the laboratory. The corresponding hypothesis was: A novel test
method for determining the filter material service lives and long‐term performances can be developed
and implemented to evaluate new and already existing decentralized systems (Hypothesis 4).
This novel test method was developed to determine – within a few days – the service lives and long‐
term removal efficiencies for dissolved substances in stormwater treatment systems. It consists of
two parts: in Part 1, the filter system is rapidly preloaded with heavy metal loads of n‐1 years. The
variable n represents the estimated service life of the filter material in years that has been
determined in previous batch or small‐scale column experiments (cf. Chapter 6). In Part 2, the
long‐term performance of the system is assessed by simulating the last year of the filter material
service life. For all experiments, Cu and Zn are used and the filter systems are represented in
individual pilot‐scale models. To calculate the amount of Cu and Zn for each test, the connected
catchment area and a filter model factor are considered. The experimental results of one FCS are
presented. In addition, the heavy metal contents of Cu and Zn as a function of depth (0–10 cm) were
measured for this system. These contents were compared with the field measurements of a full‐scale
treatment plant, which were available for the metals Cd, Cr, Cu, Ni, Pb, and Zn after 2 years, 5 years,
and 9 years of operation (service life: 10 years). However, further pilot‐scale experiments in the
laboratory and field measurements were required to show the applicability of the novel method (cf.
Section 7.2). In addition, the influence of sodium chloride and calcium chloride on the remobilization
of Cu and Zn was evaluated at the end of the service life for the FCS. More results concerning the
heavy metal remobilization were presented in Huber et al. (2014a) for five filter systems. In some
cases, both heavy metals were released and in other cases, only Zn showed higher mobility. The pH
of the effluent was often reduced by the de‐icing salts. For a few materials, Cu and Zn showed nearly
no increased mobility during all de‐icing salt experiments. Thus, a more standardized method must
be developed to assess the remobilization of five heavy metals by three de‐icing salts (cf. Chapter 9).
This paper was published in gwf Wasser/Abwasser 155, 630–638. Huber, Welker, Dierschke, and
Helmreich conceived and designed the experiments. Huber performed the tests, evaluated the
experiments, and wrote the manuscript. All authors contributed to the discussions and conclusions.
118

Mai 2014 630 gwf-Wasser Abwasser
Abwasserbehandlung| | FACHBERICHTE
Ein neues Laborverfahren zur Ermittlung von Standzeiten dezentraler Anlagen zur Behandlung von Verkehrsflächen-abflüssenAbwasserbehandlung, Verkehrsflächenabfluss, Niederschlagswasserbehandlungsanlage, dezentral, Standzeit, Schwermetalle, Substrat
Maximilian Huber, Antje Welker, Martina Dierschke, Jörg E. Drewes und Brigitte Helmreich
Im Rahmen eines vom Bayerischen Landesamt für Umwelt (LfU) beauftragten Forschungsvorhabens wurde ein auf Grundlage der Prüfverfahren des Deutschen Instituts für Bautechnik (DIBt) für de-zentrale Niederschlagswasserbehandlungsanlagen basierendes Laborverfahren entwickelt, um realis-tische Standzeiten und Reinigungsleistungen so-wie deren zeitliche Veränderungen in Bezug auf gelöste Schwermetalle zu ermitteln. Die Evaluie-rung dieses neuen Verfahrens erfolgte anhand von Laboruntersuchungen an kommerziellen Behand-lungssystemen für Verkehrsflächenabflüsse, die be-reits durch das DIBt zugelassen wurden, und das Ergebnis wird anhand eines Rinnensystems erläutert. Anhand dieses Verfahrens können realistische Standzeiten mit einer einheitlichen Methodik er-mittelt werden, wodurch Behörden, Planern und Betreibern ein objektiverer Vergleich der Anlagen ermöglicht wird.
A Novel Laboratory-Scale Test Method to Determine the Service Time of Decentralized Plants Treating Street Surface RunoffIn a project initiated by the Bavarian Environment Agency (Bayerisches Landesamt für Umwelt, LfU) a laboratory-scale test method was developed to deter-mine the service time and efficiencies to remove dis-solved heavy metals in decentralized water treatment systems based on standard procedures proposed by the Deutsches Institut für Bautechnik (DIBt). This method was evaluated in the laboratory using commercial treatment systems, which have already national approvals by the DIBt for treating street surface runoff, and the results are presented for one channel system. The novel method developed during this study enables a standardised and more accurate estimation of service intervals of decentralized treatment systems and therefore provides regulatory authorities, designers and operators with a more objective basis for performance assessment.
1. EinleitungIn den letzten Jahren wurden zahlreiche dezentrale Behandlungsanlagen für Verkehrsflächenabflüsse ent-wickelt, welche eine allgemeine bauaufsichtliche Zu-lassung nach einer Prüfung durch das Deutsche Institut für Bautechnik (DIBt) erhalten können. Das Kernstück der DIBt-Zulassungsgrundsätze für Filteranlagen ist die Wirksamkeitsprüfung [1]. Dabei werden die Rückhalte-vermögen für Abfiltrierbare Stoffe (AFS) sowie für Mineral-ölkohlenwasserstoffe (MKW) an der jeweiligen Original-anlage geprüft. Der Rückhalt von Schwermetallen und die mögliche Remobilisierung der Schwermetalle durch das Auftausalz Natriumchlorid (NaCl) werden an einem verkleinerten, repräsentativen Filtermodell durchgeführt, um so wenig wie möglich schwermetallhaltiges Abwasser zu produzieren. In den Zulassungsgrundsätzen werden
die Prüfanordnung, die Zusammensetzung des Beschi-ckungswassers, die Höhe und Dauer der Regenspenden sowie die Art der Probenahme, der Analytik und der Ergebnisauswertung ausführlich beschrieben. Jedoch ist bei diesem Prüfverfahren keine detaillierte Methodik zur Ermittlung einer realistischen Standzeit der Anlagen vorgesehen. Derzeit werden diese von den Herstellern mittels unterschiedlicher Verfahren (z. B. Bestimmung der Kationenaustauschkapazität oder der Adsorptions-kapazität bzw. Säulenversuche) ermittelten und im Zu-lassungsverfahren vorgeschlagenen Standzeiten der Subs-trate vom DIBt, ggf. nach einer Korrektur, übernommen.
Daher hat das Bayerische Landesamt für Umwelt (LfU) ein Projekt in Auftrag gegeben, welches von der Technischen Universität München in Kooperation mit der FH Frankfurt am Main bearbeitet wurde. Das Ziel
119

Mai 2014 gwf-Wasser Abwasser 631
Abwasserbehandlung | FACHBERICHTE |
dieses Vorhabens war, die Reinigungsleistungen und realistische Standzeiten sowie deren zeitliche Verände-rungen für dezentrale Niederschlagswasserbehandlungs-anlagen für Verkehrsflächenabflüsse durch eine repro-duzierbare Testmethode zu ermitteln.
Grundsätzlich können bei der Bestimmung der Standzeit zwei Effekte zum Tragen kommen, welche bei der Entwicklung einer Methodik für die Standzeitermitt-lung bei Verkehrsflächenabflüssen untersucht werden müssen:a) Die Standzeit ist limitiert durch das hydraulische Be-
triebsversagen der Anlagen. Häufig wird hierbei eine Kolmation beobachtet, welche meist durch erhöhte Feststoffbelastung in Kombination mit kolmations-fördernden Randbedingungen der Örtlichkeit (z. B. mineralische Streustoffe, Baustaub oder organische Belastung aus Pollenflug, Blüten sowie Laub) ausge-löst wird.
b) Die Standzeit ist limitiert durch das stoffliche Betriebs-versagen der Anlagen bzw. eine signifikante Reduk-tion der stofflichen Rückhalteleistung. Hierbei ist im Regelfall die Rückhaltekapazität des Filtersubstrats hinsichtlich der Schwermetalle erreicht.
Da eine Kolmation (Fall a) wesentlich und nicht vorher-sehbar durch die Randbedingungen am Einbauort der Anlagen bestimmt wird (z. B. kurzzeitige und massive Fahrbahnverschmutzungen durch Baustellenverkehr), kann die Kolmation nur in umfassenden und verglei-chenden Feldversuchen an verschiedenen Standorten festgestellt werden. Sollte es in der Realität zu einer Kolmation an einem vom DIBt zugelassenen System kommen, wird dem Betreiber der Handlungsbedarf sichtbar aufgezeigt. Da diese Anlagen keinen Notüber-lauf besitzen dürfen, erfolgt ein Rückstau des Nieder-schlagswassers im Falle einer Kolmation auf die Straße, wodurch Handlungszwang besteht.
Beim Überschreiten der Standzeit des Filtersubstrats (Fall b) hingegen (z. B. Filterdurchbruch oder reduzierte Fällwirkung) können unzulässig hohe Schadstoff-konzentrationen, z. B. Schwermetalle, unbemerkt in den Ablauf der Anlage und somit in das Boden-Grundwasser-System gelangen. Dieser Effekt lässt sich unter Labor-bedingungen nachstellen und wurde im Rahmen dieses Vorhabens untersucht.
Die am häufigsten bei diesen Behandlungsanlagen auftretenden Wirkungsweisen der Filtersubstrate in Bezug auf den Schadstoffrückhalt werden nachfolgend beschrieben, wobei die ersten beiden Mechanismen abhängig vom pH-Wert sind:1. Sorption: Der wichtigste Prozess zur Entfernung von
gelösten Stoffen ist die Adsorption an festen Ober-flächen (Bsp. Aktivkohle). Dabei unterscheidet man zwischen Physisorption und Chemisorption. Bei der Physisorption werden die Stoffe aufgrund von schwachen Van-der-Waals-Kräften an der Material-
oberfläche zurückgehalten. Dahingegen resultiert die Chemisorption aus elektrostatischen und kovalenten Wechselwirkungen. Das Prinzip dieser Bindung besteht in der Ausbildung sehr stabiler Einheiten der ober-flächennahen, funktionellen Gruppen (z. B. Carboxyl-, Hydroxy- bzw. Phenolgruppen) des Filtersubstrats mit zahlreichen Stoffen im Niederschlagswasser. Ein Bei-spiel ist der Ionenaustauschprozess, für den auf den Ionenaustauschermaterialoberflächen (Bsp. Zeolith) geladene Ionen wie Natriumionen (Na+) oder Calcium-ionen (Ca2+) durch elektrostatische Kräfte an ent-gegengesetzt geladenen Oberflächenladungen ge-bunden sein müssen. Die so gebundenen Ionen sind leicht durch andere Ionen gleicher Ladung aus-tauschbar. Beispielsweise werden die auf den Ober-flächen befindlichen Na+ und Ca2+ während des Anlagenbetriebs durch Schwermetallkationen wie Zn2+ (Zinkionen) oder Cu2+ (Kupferionen) unter Be-rücksichtigung äquivalenter Ladungen unspezifisch ausgetauscht.
2. Fällung: Durch eine Erhöhung des pH-Wertes kann es bei gelösten Schwermetallionen zu einer Aus-fällung als entsprechende Hydroxid- oder Carbonat-verbindung kommen; die Schwermetallionen werden somit in eine wasserunlösliche Form überführt (Bsp. Carbonatgestein).
3. Filtration: Dabei handelt es sich um ein mechanisch-physikalisches Verfahren, bei dem partikuläre Schad-stoffe zurückgehalten werden, indem sie entweder größer als der Porenraum des Filtersubstrats oder kleiner als dieser sind und durch Partikelträgheit, Adhäsion oder Sperreffekte zurückgehalten werden.
Im Folgenden wird das in diesem Vorhaben entwickelte Verfahren zur Bestimmung der Standzeiten und Rei-nigungsleistungen in Bezug auf gelöste Schwermetalle dargestellt und anhand der Untersuchung eines Subs-trats aus einer bereits durch das DIBt zugelassenen Anlage erläutert. Die Ergebnisse dieser standardisierten Testmethode können zukünftig Behörden, Planern und Betreibern einen objektiven Vergleich der auf dem Markt verfügbaren Anlagen ermöglichen, da derzeit z. B. der amtliche Sachverständige bei der wasserwirtschaft-lichen Beurteilung dieser technischen Behandlungsan-lagen im Hinblick auf Reinigungsleistungen und Stand-zeiten zumeist auf Herstellerangaben angewiesen ist.
2. Auswahl der UntersuchungsparameterAls Vorgaben zur Bewertung der Leistungen von dezen-tralen Behandlungsanlagen werden derzeit die Prüfwerte der Bundes-Bodenschutz- und Altlastenverordnung (BBodSchV) vom 12.07.1999 für den Wirkungspfad Boden-Grundwasser zugrunde gelegt [2]. Demnach sind im Ablauf der Behandlungsanlage bspw. Konzentrationen von 50 µg/L Kupfer (Cu) und 500 µg/L Zink (Zn) zu errei-chen bzw. zu unterschreiten. Mit der Mantelverordnung
120

Mai 2014 632 gwf-Wasser Abwasser
Abwasserbehandlung| | FACHBERICHTE
(Mantel-V, derzeit Entwurf vom 31.10.2012) [3] sollen unter anderem die Verordnung zum Schutz des Grundwassers vom 09.11.2010 und die derzeit gültige BBodSchV geän-dert werden. Tabelle 1 stellt ausgewählte Prüfwerte der BBodSchV und des Entwurfs der Mantel-V gegenüber. Eine Verschärfung der Prüfwerte durch die Einführung der Mantel-V ist derzeit möglich. Dies würde sich direkt auf zukünftige Anforderungen an alle Behandlungs-techniken für die anschließende Versickerung aus wirken.
Bei der Auswahl der Stoffe für eine Standzeituntersu-chung von Behandlungsanlagen von Straßenabflüssen ist neben der Aufkommensrelevanz die praktische Unter-suchbarkeit der einzelnen Stoffe wichtig. Zunächst wurde anhand einer Literaturstudie geklärt, welche Stoffpara-meter in Verkehrsflächenabflüssen aufkommensrelevant und somit in signifikanten Mengen im Straßenabfluss vorhanden sind. Anschließend haben versuchspraktische Erwägungen (z. B. toxische Effekte einzelner Stoffe) die Untersuchung der aufkommens- und wirkungsrelevanten Stoffparameter eingeschränkt.
Die wesentlichen Ergebnisse der Literaturstudie zur Festlegung des Beschickungswassers für die Unter-suchungen zum Standzeitverhalten sind im Folgenden dargestellt.
Ausgewählte Verkehrsflächenabflusskonzentrations-bereiche sind in Tabelle 2 dargestellt.
2.1 SchwermetalleDie in vielen Behandlungsanlagen eingesetzten Filter-substrate dienen vornehmlich dem Rückhalt gelöster Stoffe. Für diese Untersuchung sind daher nur in gelöster Form vorliegende Schwermetalle relevant, da davon ausgegangen wird, dass partikuläre Anteile in der je-weiligen mechanischen Behandlungsstufe der Anlagen (z. B. Hydrozyklon oder Sedimentationseinheit) aus dem Niederschlagswasser entfernt werden und somit die Entfernung der ungelösten Anteile beispielsweise mit einer Prüfung auf den Feststoffrückhalt nachgewiesen werden kann. In diesem Zusammenhang wurden häufig vorkommende Schwermetalle auf ihre Relevanz (Auf-kommen, Schadwirkung und gelöster Anteil) überprüft.
Chrom (Cr) gilt neben Blei (Pb) als eines der immo-bilsten Schwermetalle und liegt in der Regel überwiegend partikulär gebunden vor [4, 5]. Außerdem kommt Chrom in Verkehrsflächenabflüssen nur in niedrigen Konzentra-tionen vor. So wurden beispielsweise in einer LfU-Studie in Augsburg im Mittel 6 µg/L Cr [6] und in einer Schweizer Untersuchung in Burgdorf ca. 10 µg/L Cr [7] gemessen.
Für Nickel (Ni) wurden ebenfalls nur geringe Kon-zentrationen in Verkehrsflächenabflüssen nachgewiesen. Beispielsweise wurden in einer LfU-Studie im Mittel 5 µg/L Ni [6], bei Untersuchungen in Bayreuth ca. 9,9 µg/L Ni und etwa 36 µg/L Ni [8] sowie von der TU München in München im Mittel 35 µg/L Ni [9] gemessen.
Die Aufkommensrelevanz von Chrom und Nickel ist somit gering.
Blei liegt in Verkehrsflächenabflüssen fast vollstän-dig partikulär vor und dessen Konzentrationen nehmen seit Jahren kontinuierlich in den betrachteten Verkehrs-abflüssen ab [6, 10, 11, 12]. Aufgrund der Umstellung auf bleifreies Benzin und des Ersatzes der Bleigewichte an Autofelgen wird Blei immer weniger aufkommens-relevant. Blei gilt zudem im Boden als immobilstes Schwermetall [4, 13].
Die Untersuchung des Rückhalts von Cadmium (Cd) ist aufgrund der guten Stofflöslichkeit, der Wirkungs-relevanz und der möglichen Wechselwirkung mit anderen Kationen erstrebenswert, kann aber in Laborversuchen aufgrund seiner Toxizität und der Entsorgungspro-blematik nicht mit vertretbarem Aufwand abgebildet werden. Zudem liegen die Cadmiumkonzentrationen in Verkehrsflächenabflüssen in neueren Studien bei unter 1 µg/L [6, 11, 14].
Als Bestandteile des Beschickungswassers für diese Versuche zur Standzeituntersuchung werden somit die beiden aufkommensrelevanten Schwermetalle Kupfer und Zink verwendet. Die in der durchgeführten Lite-raturstudie bestimmten Schwerpunktkonzentrationen (Gesamtgehalt, Tabelle 2), welche die partikulären und gelösten Stoffanteile beinhalten, betragen ca. 85 µg/L Cu
Tabelle 1. Prüfwerte der BBodSchV für den Wirkungs-pfad Boden-Grundwasser und die Prüfwerte Grund-wasser des Entwurfs der Mantel-V vom 31.10.2012 für ausgewählte anorganische Parameter [2, 3].
Einheit BBodSchV Mantel-V
Pb µg/L 25 7
Cd µg/L 5 0,25
Cr µg/L 50 7
Cu µg/L 50 14
Ni µg/L 50 20
Zn µg/L 500 58
Cl mg/L - 250
Tabelle 2. Schwerpunktwerte sowie oberer und unterer Wertebereich für ausgewählte Stoffe in Verkehrsflächenabflusskonzentrationen.
Einheit Schwerpunktwert Wertebereich
Pb µg/L 160 10–300
Cd µg/L 3,0 0,2–6
Cr µg/L 10 1–25
Cu µg/L 85 30–280
Ni µg/L 20 2–60
Zn µg/L 450 200–620
Cl mg/L 7 500*
* Spitzenwert
121

Mai 2014 gwf-Wasser Abwasser 633
Abwasserbehandlung | FACHBERICHTE |
und etwa 450 µg/L Zn. Die gelösten Anteile liegen jeweils deutlich darunter. Für diese beiden Stoffe ist zudem im Entwurf der Mantel-V im Vergleich zur BBodSchV eine deutliche Verschärfung der Prüf- bzw. Grenzwerte an-gesetzt (siehe Tabelle 1), die möglicherweise bei zu-künftigen Versuchen berücksichtigt werden muss.
2.2 Eisen, Natrium und CalciumWeitere aufkommensrelevante Kationen im Straßen-abfluss sind Eisen, Natrium (Na) und Calcium (Ca). Dabei liegt frisch korrodiertes Eisen partikulär vor und kann somit durch Sedimentation entfernt werden [6, 15]. Da einige der vom DIBt zugelassenen und auf dem Markt erhältlichen Substrate eisenhaltig sind und das Eisen bei diesen Anlagen für die stoffliche Rückhalteleistung entscheidend ist, würde die Berücksichtigung von Eisen bei diesen Untersuchungen zu ungleichen Versuchs-bedingungen führen, weshalb aus versuchspraktischen Erwägungen darauf verzichtet wurde.
Die Einflüsse von Natrium und Calcium auf das Standzeitverhalten werden durch die Berücksichtigung von chloridischen Auftausalzen (Straßenwinterdienst) untersucht, wodurch auch der in Tabelle 2 aufgeführte Spitzenwert von Chlorid (Cl) berücksichtigt wird. NaCl ist das in Deutschland am häufigsten verwendete Auf-tausalz [16]. Außerdem wird in diesem Vorhaben zusätz-lich das zweiwertige Calcium neben dem einwertigen Natrium abgebildet. Die Berücksichtigung von Calcium bildet nicht nur einen möglichen Anteil im auf den Straßen ausgebrachten Feuchtsalz (Calciumchlorid (CaCl2)) ab, sondern auch den Abrieb der Fahrbahnoberfläche, welcher zusammen mit den örtlichen Gegebenheiten den Calciumeintrag in situ darstellt.
3. Darstellung des neu entwickelten Laborverfahrens3.1 VersuchsaufbauBei den Standzeitversuchen werden die zu untersuchen-den Rinnensysteme mit Originalbreite und einer Baulänge von 0,50 m bzw. 1,00 m im Versuchsmodell verwendet. Die Einfüllhöhen, die Substratmengen sowie die Einbringver-fahren entsprechen den Angaben der Einbauanleitungen der Hersteller. Die Rinnen selbst werden mithilfe einer Be-regnungsanlage über 625 Edelstahlkanülen (Durchmesser 0,90 mm) beschickt, die an einer quadratischen, geschlos-senen Acrylwanne mit einer Kantenlänge von 1 m oberhalb der Hersteller systeme befestigt sind. In der Wanne befindet sich ein unter Druck stehendes Wasserreservoir, welches mittels einer Pumpe über den Vorlagebehälter gespeist wird. Die Beregnungsintensität wird über den Durchfluss der Pumpe sowie den Wasserdruck im Wasserreservoir gesteuert, über das Schwebekörper-Durchflussmess-gerät bestimmt und über die Waage kontrolliert (Bild 1). Bei diesem Versuchsaufbau werden die Rinnen sowohl direkt von oben als auch über Edelstahlbleche seitlich mit dem Beschickungswasser beaufschlagt (Bild 2).
Das bei diesen Versuchen verwendete Beschickungs-wasser besteht aus deionisiertem Wasser, welches künstlich mit den aufkommensrelevanten Schwerme-tallen Zink und Kupfer angereichert wird. Die beiden Schwermetalle werden in Kombination als gut lösliche Nitrat-Salze zugegeben, damit die Wechselwirkungen zwischen beiden Schwermetallen und den jeweiligen Substraten zeitgleich untersucht werden können, wobei die in den Chemikalien enthaltenen Anionen keinen Einfluss auf die Funktionsweise der Substrate haben. Die elektrische Leitfähigkeit (LF) des deionisierten Wassers ohne Zusätze beträgt ca. 1 µS/cm. Der pH-Wert der Lö-sung wird mit Salpetersäure auf pH 4,8 bis pH 5,1 einge-stellt, damit die beiden Schwermetalle vollständig gelöst vorliegen. Es wird kein Puffer hinzugegeben, damit sich der pH-Wert des Wassers in der Anlage entsprechend den darin vorherrschenden Bedingungen zügig ver ändern kann. Somit können die substratspezifischen Wirkungs-mechanismen zum Rückhalt von Kupfer und Zink, zu denen die Adsorption, der Ionenaustausch sowie die Fällung mit Filtration gehören, realitätsnah abgebildet werden.
Die auf den Anschluss befestigter Verkehrsflächen bezogenen, gelösten Jahresfrachten von 135 mg/m² Zn und 15,5 mg/m² Cu werden entsprechend der Modell-
Bild 1. Versuchsaufbau für Rinnensysteme – Fließbild.
Bild 2. Versuchsaufbau für Rinnensysteme – Ansicht der Beregnungs-anlage, der beiden Edelstahlbleche sowie in der Mitte unten die beiden hintereinander angeordneten Rinnenkörper (Doppelbestimmung).
122

Mai 2014 634 gwf-Wasser Abwasser
Abwasserbehandlung| | FACHBERICHTE
dimensionierung als gelöste Gesamtfrachten auf die zu untersuchenden Anlagen aufgebracht und beruhen auf folgenden Annahmen: Für die Berechnung der gelösten Frachten für Zink und Kupfer wurden die im DIBt-Ver-fahren verwendeten Schwerpunktkonzentrationen her-angezogen, welche aus einer umfangreichen Literatur-studie festgelegt wurden und mit den eigenen Literatur-recherchen (siehe Tabelle 2) sehr gut überein stimmen [18]. Die für die Versuche verwendeten gelösten Anteile der Schwerpunktkonzentrationen liegen bei ca. 200 μg/L Zn und bei etwa 23 μg/L Cu. Diese spiegeln somit die Kon-zentrationen typischer Verkehrsflächenabflüsse wider, lassen jedoch keine Unterscheidung nach durchschnitt-licher täglicher Verkehrsstärke (DTV), Nutzung der Fläche sowie weiteren Faktoren zu. Die Abflussannahme be-ruht auf Auswertungen der Niederschlagsstation Mühl-dorf am Inn in Bayern durch das LfU [19]. An dieser Station betrug die langjährige mittlere Niederschlagshöhe 888 mm und der Jahresabflussbeiwert lag bei 0,76. Das Ergebnis wird in Zulassungsverfahren für Niederschlags-wasserbehandlungsanlagen als Worst-Case-Szenario fachlich anerkannt.
Für die Berechnung der gelösten Gesamtfrachten werden die maximale Anschlussfläche und die vom Her-steller angegebene Standzeit der Anlage verwendet. Au-ßerdem erfolgt die Skalierung der Gesamtfrachten auf das im Modell anteilig verwendete Substratvolumen linear.
3.2 VersuchsdurchführungDas entwickelte Verfahren gliedert sich in drei Teile, wel-che in Bild 3 dargestellt sind und in diesem Kapitel er-läutert werden.
Im Teil 1 der Versuchsdurchführung wird eine Vor-belastung mit einer Fracht von (n-1) Jahren aufgebracht, wobei n für die vom Hersteller angegebene Standzeit
der Anlage in Jahren steht. Abhängig von den aufzu-bringenden Zink- und Kupferfrachten werden für die-sen Versuchsteil Wassermengen zwischen 35 L und 120 L verwendet, wodurch sich für jedes Versuchs-modell spezifische Schwermetallkonzentrationen im Vorlagebehälter ergeben. Bei den auf diese Weise ge-wählten Wassermengen liegen die Konzentrationen bei allen Vorbelastungsversuchen in vergleichbarer Größen-ordnung vor. Aus jeder Vorlage wird eine Probe ent-nommen und analysiert, um die Soll-Konzentrationen zu überprüfen. Die Durchführung von Teil 1 erfolgt für alle Systeme gleich. Dabei werden (n-1) Jahre als Vor-belastung mit einer Regenspende von 10 L/(s·ha) auf-gebracht. Der Ablauf wird bei allen Versuchen komplett in einem entsprechend großen Behälter aufgefangen. Nach einem Durchgang der Vorlage werden die darin enthaltenen Ablaufmischkonzentrationen an Zink und Kupfer mit einem photometrischen Küvetten-Schnell-test bestimmt, dessen Genauigkeit und Bestimmungs-grenzen in diesem Fall ausreichend sind. Gegebenen-falls wird der Ablauf weitere Male unter gleichen Be-dingungen durch das Versuchsmodell gepumpt, bis mindestens 90 % von jeder der beiden Schwermetall-frachten in der Anlage zurückgehalten wurden. Ab-schließend werden zwei Ablaufmischproben entnommen und mittels AAS analysiert.
Beim Teil 2 werden die Schwermetallfrachten des n-ten Jahres aufgebracht, welche somit die Frachten eines Jahres darstellen. Die Durchführung erfolgt analog zu den Wirksamkeitsprüfungen im DIBt-Verfahren unter Verwendung des mit (n-1) Jahren vorbelasteten Modells. Die berechnete n-te Jahresfracht wird in drei gleich große Frachtportionen aufgeteilt, die in jeweils einer Teilregen-spende auf das Versuchsmodell aufgebracht werden. Die drei Teilregenspenden betragen 2,5 L/(s·ha), 6,0 L/(s·ha)
Bild 3. Ver-suchsdurch-
führung – Darstellung
der einzelnen Teile.
123

Mai 2014 gwf-Wasser Abwasser 635
Abwasserbehandlung | FACHBERICHTE |
und 25 L/(s·ha) mit den entsprechenden Dauern von 480 min, 200 min und 48 min. Somit ergibt sich bei jeder Teilregenspende eines Modells im Zulauf das gleiche Wasservolumen. Die im Zulaufwasser gleichzeitig vor-handenen Schwermetallkonzentrationen sind gegen-über der Realität erhöht und betragen unabhängig von der zu untersuchenden Anlage immer 6250 µg/L Zn und 718 µg/L Cu [1]. Daher wird in Anlehnung an das DIBt-Prüfverfahren ein definierter Stoffrückhalt, welcher 70 % für Zink und 80 % für Kupfer beträgt [1], gefordert, der in Abhängigkeit von den derzeit gültigen gesetz-lichen Anforderungen berechnet wurde. Vor jedem Versuchsbeginn wird eine Zulaufprobe entnommen und analysiert, um die Soll-Konzentrationen zu über-prüfen. Im Ablauf erfolgen pro Teilregenspende vier Probenahmen mit je zwei Probeflaschen nach jeweils einem Viertel der Versuchsdauer, in denen jeweils die beiden Schwermetalle Zink und Kupfer bestimmt werden.
Nach dem Aufbringen der drei Teilregenspenden wird der Versuchsaufbau mit Trinkwasser gespült, um das mit Schwermetallen belastete Beschickungswasser aus dem Versuchsmodell vollständig zu entfernen. Die Menge an verwendetem Trinkwasser entspricht der einer Teilregenspende aus Teil 2. Es werden ebenfalls eine Zulaufprobe zur Analyse der Trinkwasserzusammenset-zung sowie nach jeweils der Hälfte der Spüldauer je zwei Proben im Ablauf zur Bestimmung der Schwermetall-konzentrationen entnommen.
Frühestens 16 Stunden nach der Spülung beginnt Teil 3 der Untersuchung, welcher sich mit dem Rückhalt der Schwermetalle unter Salzeinfluss befasst. Es wird das gleiche, belastete Modell verwendet, welches auch bei den Versuchsteilen 1 und 2 verwendet wurde. Bei diesem Versuch wird eine Auftausalzmischung mit Zulaufkonzentrationen von 10 g NaCl/L [20] und 2,5 g CaCl2/L verwendet. Das Wasservolumen entspricht im-mer der in Teil 2 pro Teilregenspende verwendeten Was-sermenge und die Chloridzulaufkonzentration liegt bei 7660 mg/L. Als Regenspende wird in Teil 3 abweichend vom DIBt 6,0 L/(s·ha) bei einer Dauer von 200 Minuten verwendet, da in der Realität im Winter niedrigere Re-genspenden deutlich häufiger auftreten als im Sommer. Eine Messung der Chlorid-, Zink- und Kupferkonzentra-tionen in der Auftausalzlösung wird durchgeführt, um zum einen die richtige Dosierung der Auftausalze und zum anderen eventuelle Verunreinigungen der verwen-deten Salze mit Schwermetallen feststellen zu können. Im Ablauf werden vier Proben mit je drei Probeflaschen nach jeweils einem Viertel der Versuchsdauer genom-men. Jeweils eine Probe wird auf Chlorid untersucht und die anderen Proben werden auf Zink und Kupfer analysiert. Analog zum DIBt-Verfahren beträgt bei diesem Versuchsteil die zulässige Zink-Ablaufkonzen-tration (500 + Messwert Auftausalzlösung) µg/L und die zulässige Kupfer-Ablaufkonzentration (50 + Messwert
Auftausalzlösung) µg/L. Anhand dieses Versuchs ist eine Aussage über eine mögliche Schwermetallremobili-sierung im Filtersubstrat möglich. Diese potenziell mögliche Rücklösung von zuvor zurückgehaltenen Schwermetallionen durch Auftausalze in der Behand-lungsanlage wird durch erhöhte Ablaufkonzentrationen im vorgeschlagenen Verfahren detektiert. Somit wird durch den Versuchsteil 3 sichergestellt, dass die ge-forderten Ablaufkonzentrationen auch am Ende der un-tersuchten Standzeit während der simulierten Winter-dienstsaison eingehalten werden. Die einzuhaltenden Schwermetallablaufkonzentrationen orientieren sich an den Werten der BBodSchV und müssen eventuell bei einer Umsetzung der Mantel-V angepasst werden. Gleiches gilt für einen möglichen Chlorid-Prüfwert in der Mantel-V.
3.3 Materialien und AnalysenmethodenDie für die Schwermetalle verwendeten Chemikalien waren Zinknitrat-Hexahydrat reinst (AppliChem GmbH) und Kupfer(II)-nitrat-Trihydrat reinst (AppliChem GmbH). Für die pH-Wert-Einstellung wurde Salpetersäure 65 % zur Analyse (Merck KGaA) verwendet.
Bei den Untersuchungen zum Einfluss von Auftau-salz auf eine mögliche Rücklösung der Schwermetalle wurde Trinkwasser vom Forschungsgelände der TU München in Garching als Beschickungswasser mit einer LF von ca. 580 µS/cm verwendet, dem gleichzeitig die Salze NaCl und CaCl2 zugegeben wurden. Als NaCl wurde ein handelsübliches Auftausalz (esco Steinsalz, 25-kg-PE-Sack) nach TL-Streu verwendet [21], welches laut Hersteller eine Löslichkeit von fast 100 % sowie einen hohen NaCl-Gehalt von rund 99 % aufweist. Als CaCl2 reinst wurde eine getrocknete und gepulverte Chemikalie (AppliChem GmbH) verwendet.
Zur Probenahme wurden 250 mL PE-LD-Flaschen (VWR Collection) verwendet. Bei jeder entnommenen Wasserprobe wurden neben den Zink- und Kupfer-Konzentrationen mittels Atomabsorptionsspektro-metrie (AAS) nach DIN 38406-E8 bzw. DIN 38406-E7 auch der pH-Wert nach EN ISO 10523:2012, die LF nach DIN EN 27888-C8 sowie die Temperatur nach DIN 38404-C4 bestimmt [22]. Bei den Ablaufmisch-proben aus Teil 1 wurden zur Bestimmung photomet-rische Küvetten-Schnelltests der Firma HACH LANGE GmbH verwendet (LCK 329 für Cu und LCK 360 für Zn). Bei den Versuchen mit Auftausalz wurde Cl mittels Ionenchromatographie nach EN ISO 10304-1:2009-D19 analysiert [22]. Alle Proben wurden mit Salpetersäure 65 % zur Analyse (Merck KGaA) konserviert. Bei zusätzlichen Analysen wurden Na, Ca und Magnesium mittels AAS nach DIN 38406-E14 (Na) bzw. DIN 38406-E3-1 (Ca und Magnesium) bestimmt. Der Königswasseraufschluss bei der schichtweisen Beprobung zur Ermittlung der Zn- und Cu-Konzentra-tionen erfolgte nach DIN 38414-S7.
124

Mai 2014 636 gwf-Wasser Abwasser
Abwasserbehandlung| | FACHBERICHTE
4. Ergebnisse und Diskussion4.1 LaborverfahrenDie Durchführbarkeit des in diesem Vorhaben entwi-ckelten Verfahrens wird im Folgenden beispielhaft an-hand der Untersuchung eines kommerziellen Rinnen-systems, welches bereits durch das DIBt zur Behandlung von Verkehrsflächenabflüssen zugelassen ist und eine Standzeit von zehn Jahren hat, aufgezeigt.
Die Schwermetallvorbelastung, welche im Teil 1 neun Jahren entspricht und auf zwei Rinnenelemente desselben Herstellers mit einer Baulänge von je 0,50 m aufgebracht wurde, wurde in je 60 L deionisiertem Wasser gelöst. Somit ergaben sich Zulaufkonzentrationen von 114 000 mg/L Zn und 12 900 mg/L Cu. Die Vorbe-lastung konnte während der Untersuchung auf das Rinnensubstrat beim ersten Durchgang durch das System mit einer Vorbelastungsregenspende von 10 L/(s·ha) aufgebracht werden. Aus den gemessenen Ablauf-mischkonzentrationen (849 mg/L Zn und 80 mg/L Cu) ergaben sich im Mittel ein Zinkrückhalt von 99,3 % und ein Kupferrückhalt von 99,4 %, welche beide deutlich über den jeweils geforderten 90 % an Zink- und Kupfer-rückhaltewerten lagen.
Beim Teil 2 des Verfahrens wurden pro Teilregen-spende 86,4 L Wasser benötigt. Die maximal gemessene Zinkkonzentration im Ablauf betrug 75,1 µg/L und die maximal gemessene Kupferkonzentration lag bei 7,5 µg/L. Somit lagen alle Ablaufkonzentrationen unter-halb der Prüfwerte der BBodSchV für den Wirkungspfad Boden-Grundwasser und die geforderten Rückhalte von mindestens 70 % Zink und 80 % Kupfer wurden erreicht. Bei allen drei Regenspenden ergaben sich Kupfer-rückhaltewerte von jeweils 99,2 %. Bei Zink betrug der Rückhalt 99,5 % bei der mittleren Regenspende mit 6,0 L/(s·ha) und 99,4 % bei den anderen beiden Regen-spenden.
Beim Teil 3 lagen die Kupferkonzentration in der Auf-tausalzlösung bei 16,9 µg/L und die Zinkkonzentration bei 702 µg/L. Alle gemessenen Ablaufkonzentrationen waren bei beiden Rinnen unterhalb der Prüfwerte der BBodSchV für den Wirkungspfad Boden-Grundwasser, wobei die Kupferwerte sogar durchwegs unterhalb der Bestimmungsgrenze von 5 µg/L lagen. Die höchste gemessene Zinkablaufkonzentration betrug 36,2 µg/L. Die nach diesem Laborverfahren im Ablauf zulässigen Konzentrationen, getrennt nach BBodSchV und
Mantel-V, sind in Tabelle 3 aufgeführt. Daraus ergibt sich, dass die an die Anlage gestellten Anforderungs-kriterien selbst bei einer möglichen Verschärfung durch die Mantel-V (zulässige Kupferkonzentration 30,9 µg/L und zulässige Zinkkonzentration 760 µg/L) eingehalten wurden. Die während dieses Versuchsteils gemessenen Chloridablaufkonzentrationen betrugen 6840 mg/L im Mittel und lagen damit nur geringfügig unterhalb der Zulaufkonzentration von 8290 mg/L, welche etwa den in der Realität gemessenen Spitzenwerten in Verkehrs-flächenabflüssen entspricht.
Aus diesen Ergebnissen folgt, dass eine Einführung eines Prüf- oder Grenzwertes für Chlorid zu Problemen führen würde. So sieht der Entwurf der Mantel-V [3] einen Prüfwert von 250 mg/L Cl vor (siehe Tabelle 1). Alle derzeit vom DIBt zugelassenen Behandlungsanlagen sowie Oberboden können Chlorid aus chemisch-physi-kalischen Gründen nicht zurückhalten und würden so-mit den nach Mantel-V geforderten Wert während der Streusalzphase im Winter nicht einhalten können. Dieses gilt in gleichem Maße für Flächenversickerungsanlagen und Mulden- bzw. Mulden-Rigolen-Systeme nach DWA-A 138 [23]. Dies würde auch bereits eingebaute Systeme für die anschließende Versickerung betreffen.
Hier ergibt sich weiterer Forschungsbedarf. So muss z. B. geklärt werden, wie sich die zeitlich begrenzte Chloridspitzenkonzentration auf den Boden-Grund-wasserkörper auswirkt und ob die Betrachtung einer mittleren Jahreskonzentration in diesem speziellen Fall legitim ist. Eine Einschränkung der Auftausalzaus-bringung hat in jedem Fall weitreichende Folgen für die Verkehrssicherheit, insbesondere auf Autobahnen. Somit kann diese Thematik an dieser Stelle nicht ab-schließend beurteilt werden.
Mit dem in diesem Vorhaben entwickelten Verfahren war es möglich, im Labor Aussagen zur Standzeit und zu Veränderungen im Rückhalt der beiden Leitparameter Zink und Kupfer zu treffen. So konnte an dem als Bei-spiel dargestellten Rinnensystem die Herstellerangabe zur Standzeit bestätigt werden. Im zweiten Versuchsteil konnte keine Verschlechterung der Ablaufwerte im Ver-lauf der drei Regenspenden festgestellt werden, sodass von einem Puffer bei der Standzeit zum Schwermetall-rückhalt für diese Anlage ausgegangen werden kann. Außerdem wurden während der Untersuchung bei diesem Rinnensystem keine Schwermetalle durch Na+ und Ca2+ remobilisiert. Somit kann durch dieses Vorge-hen eine weitreichendere Aussage zu einer möglichen Schwermetallremobilisierung getroffen werden, als dies mit der derzeitigen Salzprüfung der DIBt-Zulassungs-grundsätze möglich ist.
4.2 Vergleich der Substratschwermetallgehalte im Labor mit FeldmessungenDas in der dargestellten Untersuchung verwendete Substrat hatte vor Versuchsbeginn einen Zinkgehalt von
Tabelle 3. Zulässige Ablaufkonzentrationen für das dargestellte Rinnensystem auf Grundlage der Prüfwerte zur Beurteilung des Wirkungspfads Boden-Grund-wasser gemäß BBodSchV (zul. AKB) und Mantel-V (zul. AKM) [2, 3].
Einheit Auftau-salzlösung
Prüfwert BBodSchV
zul. AKB
Prüfwert Mantel-V
zul. AKM
Cu µg/L 16,9 50 66,9 14 30,9
Zn µg/L 702 500 1 200 58 760
125

Mai 2014 gwf-Wasser Abwasser 637
Abwasserbehandlung | FACHBERICHTE |
51 mg/kgTR und einen Kupfergehalt von 23 mg/kgTR (TR: Trockenrückstand). Nach der Versuchsdurchführung im Labor wurden die obersten 10 cm des verwendeten Filtersubstrats beprobt und bezüglich des Zink- und Kupfergehaltes analysiert. Die bestimmten Schwer-metallgehalte lagen nach dem Aufbringen von zehn Jahresfrachten im Mittel bei 468 mg/kgTR für Zink und bei 70 mg/kgTR für Kupfer. Ein Vergleich der im Labor ermittelten Ergebnisse mit regelmäßigen Feldbepro-bungen einer seit neun Jahren im Betrieb befindlichen Rinne desselben Herstellers zeigt, dass die beiden Stoffe Zink und Kupfer auch am untersuchten Standort aufgrund ihrer Aufkommensrelevanz im Vergleich zu anderen Schwermetallen den größten Anteil der zu-rückgehaltenen Mengen ausmachen (siehe Bild 4). Dadurch wird die Auswahl, nur die beiden auf-kommensrelevanten Stoffe Zink und Kupfer im Labor zu betrachten, nochmals bestätigt.
Bei der Feldmessung lagen die Ausgangsgehalte bei 23 mg/kgTR Zn und 11 mg/kgTR Cu, welche geo-gen als Bestandteile der Mineralien im Substrat ent-halten waren und nicht eluiert werden konnten. Sie lagen damit unterhalb der Werte der Laborrinne vor Versuchsbeginn. Ein Vergleich der Anreicherungen aus neun Jahren in situ gemessener Schwermetallgehalte (186 mg/kgTR Zn und 39 mg/kgTR Cu) mit denen im Labor ergibt in der Tendenz eine gute Übereinstim-mung. Es zeigte sich, dass die getroffenen Annahmen für die Schwermetallkonzentrationen zur Versuchs-durchführung im Vergleich zu den tatsächlichen Belas-tungen einer Rinne in situ höher waren. Damit wird sichergestellt, dass an anderen Einbauorten mit hö heren Belastungen die sich daraus ergebenden hö-heren Frachten in der gleichen Zeit zurückgehalten werden können. Somit erscheint diese Methode für die Standzeitbestimmung anhand der durchgeführten Evaluierung des Laborverfahrens an einer Feldbe-probung geeignet zu sein.
5. FazitDie Ermittlung von Standzeiten dezentraler Behand-lungsanlagen ist nach wie vor ein schwieriges und teil-weise offenes Thema. Dies liegt vor allem daran, dass sehr viele Einflussfaktoren das Auftreten eines Versa-gensfalls an sich und dessen Ausmaß stark beeinflussen. In vielen Fällen wird die Kolmation als limitierender Prozess für die Standzeit identifiziert. Gerade für diesen Prozess ist keine Labormethode verfügbar und auch kaum zu entwickeln.
Zur Ableitung einer Methodik zur standardisierten Standzeitermittlung bei Niederschlagswasserbehand-lungsanlagen für Verkehrsflächenabflüsse ist es un-abdingbar, verfügbare Betriebsdaten auszuwerten. Weiterhin sind Betriebsbegehungen inklusive Messun-gen der hydraulischen Kennwerte wünschenswert. Hieraus könnte eine Verknüpfung der hydraulischen
Leistungsfähigkeit mit der Charakteristik der Anlagen und der jeweiligen Örtlichkeit vollzogen werden. Damit ließen sich Belastungsklassen definieren und die Vorhersage von Kolmationseffekten verbessern.
Insgesamt ist festzuhalten, dass realistische Stand-zeiten mit Bezug auf den gelösten Schwermetall-rückhalt für Rinnensysteme nach dem beschriebenen Verfahren, welches in drei Teile gegliedert ist und die die Standzeit limitierenden Schwermetalle Zink und Kupfer berücksichtigt, erfolgreich bestimmt werden können.
Auch für Schachtsysteme konnten mit dem be-schriebenen Verfahren wertvolle Erkenntnisse zum Standzeitverhalten gewonnen werden. Da sich bei den Standzeitversuchen der Schachtsysteme durch den spezifischen Modellaufbau Unterschiede ergeben, er-scheinen hierzu weitere Untersuchungen wünschens-wert. Dazu gehören ein Vergleich verschiedener Modell-faktoren bei der Abbildung der Schachtfiltereinheiten als Säulenmodelle sowie eine Beurteilung der Be-deutung von Ruhephasen sowohl während als auch zwischen den einzelnen Versuchsteilen, da innerhalb der Untersuchung Niederschläge ohne die in der Rea-lität vorhandenen Trockenzeiten aufgebracht werden. Diese haben bei den Schachtsystemen aufgrund der Funktionsweise der Substrate und des größeren Ver-hältnisses aus befestigter Verkehrsanschlussfläche zu Filteroberfläche eine höhere Bedeutung als bei den Rinnensystemen.
DanksagungDie Ergebnisse dieser Arbeit sind Teil des Forschungsvorhabens „Untersuchung von Anlagen zur Behandlung des Niederschlags-wassers von Verkehrsflächen - 76e133“, welches vom LfU be-auftragt wurde. Die Beregnungsanlage wurde vom TÜV Rheinland LGA Products GmbH, Würzburg, als Leihgabe zur Verfügung gestellt.
Bild 4. Zeitlicher Verlauf der Schwermetallgehalte eines in situ beprobten Rinnensubstrats [5].
126

Mai 2014 638 gwf-Wasser Abwasser
Abwasserbehandlung| | FACHBERICHTE
Literatur[1] Deutsches Institut für Bautechnik: Zulassungsgrundsätze für
Niederschlagswasserbehandlungsanlagen. Teil 1: Anlagen zum Anschluss von Kfz-Verkehrsflächen bis 2000 m² und Be-handlung des Abwassers zur anschließenden Ver sickerung in Boden und Grundwasser. Deutsches Institut für Bautech-nik, Berlin, Februar 2011.
[2] BBodSchV: Bundes-Bodenschutz- und Altlastenverordnung vom 12. Juli 1999. BGBI. Nr. 36, 1999, S. 1554.
[3] Mantel-V: Verordnung zur Festlegung von Anforderungen für das Einbringen oder das Einleiten von Stoffen in das Grundwasser, an den Einbau von Ersatzstoffen und für die Verwendung von Boden und bodenähnlichem Material. Bundesministerium für Umwelt, Naturschutz und Reaktor-sicherheit. Entwurf 31.10.2012.
[4] Abwassertechnische Vereinigung: Schwermetalle in der aquatischen und terrestrischen Umwelt. ATV-Arbeitsbericht. GFA Verlag, Hennef, 1999.
[5] Schriefer, T.: Projekt Berliner Stadtreinigung, Recyclinghof „Spindlersfeld“. Niederschlagswasserbehandlung in vorge-fertigten Sickermulden mit Substrat. Bericht vom 29.05.2009.
[6] Bayerisches Landesamt für Umwelt: Versickerung von Niederschlagswasser von befestigten Flächen. Abschluss-bericht, Bayerisches Landesamt für Umwelt, Augsburg, 2007, ISBN: 978-3-940009-85-2.
[7] EAWAG: Untersuchung der Versickerung von Straßenwasser über Straßenrandstreifen an einer bestehenden Strasse. Dübendorf, Schlussbericht, 2006.
[8] Herrmann, R., Daub, J. und Striebel, T.: Charakterisierung und Analyse der Verschmutzung des Niederschlagsabflusses. Bericht: Niederschlagsbedingte Schmutzbelastung der Gewässer aus städtischen befestigten Flächen. Phase I, Teil-projekt 1. Eigenverlag des Instituts für Siedlungswasserwirt-schaft, Universität Karlsruhe, 1992.
[9] Helmreich, B.: Stoffliche Betrachtungen der dezentralen Niederschlagswasserbehandlung. Berichte aus der Sied-lungswasserwirtschaft, TU München, Band 199, 2010, ISSN 0942–914X.
[10] Mangani, G., Berloni, A., Bellucci, F., Tatano, F. and Maione, M.: Evaluation of the pollutant content in road runoff first flush waters. Wat. Air Soil Poll. 160 (1–4), 2005, p. 213–228.
[11] Helmreich, B., Hilliges, R., Schriewer, A. and Horn, H.: Runoff pollutants of a highly trafficked urban road – Correlation analysis and seasonal influences. Chemosphere, 80 (9), 2010, p. 991–997.
[12] Kayhanian, M., Fruchtman, B.D., Gulliver, J.S., Montanaro, C. Ranieri, E. and Wuertz, S.: Review of highway runoff characte-ristics: Comparative analysis and universal implications. Wat. Res. 46 (20), 2012, p. 6609–6624.
[13] Scheffer, F. und Schachtschabel, P.: Lehrbuch der Bodenökolo-gie, Spektrum Akademischer Verlag GmbH. Heidelberg, Ber-lin. 15. Auflage, 2002, ISBN 3-8274-1324-9.
[14] Bayerisches Landesamt für Wasserwirtschaft: Zwischen-bericht Entwicklungsvorhaben: Versickerung des Nieder-schlagswassers von befestigten Verkehrsflächen. Bericht über die Betriebsjahre Oktober 1996 bis Oktober 1998, Bayerisches Landesamt für Wasserwirtschaft, München, 1999.
[15] BIOPLAN: Bodenkundliche Untersuchungen im Rahmen des LfU-Entwicklungsvorhabens „Versickerung des Nieder-schlagswassers von befestigten Flächen“, 2007.
[16] Bayerisches Landesamt für Umwelt: UmweltWissen – Praxis. Streusalz und Splitt im differenzierten Winterdienst, 2013.
[17] Dauber, L., Novak, B., Zobrist, J. und Zürcher, F.: Schmutzstoffe im Regenwasserkanal einer Autobahn. Stuttgarter Berichte zur Siedlungswasserwirtschaft, Band 64, S. 41–57 „Beeinflus-sung der Gewässergüte durch Regenabflüsse von Straßen“, Oldenbourg Verlag, München, 1979.
[18] Welker, A.: Schadstoffströme im urbanen Wasserkreislauf – Aufkommen und Verteilung, insbesondere in den Abwasser-entsorgungssystemen. Habilitationsschrift. Schriftenreihe der TU Kaiserslautern, FG Siedlungswasserwirtschaft, Band 20. Aktualisierter Anhangband, 2005/2013.
[19] Bayerisches Landesamt für Umwelt: Prüfkriterien zur Beur-teilung von Anlagen zum Rückhalt von Metallionen aus Niederschlagsabflüssen von Metalldächern – Festlegung von Regenspenden und Prüfdauern. Augsburg, 06.05.2008.
[20] Bundesanstalt für Straßenwesen: Risiko-Abschätzung für den Einsatz von Tausalzen. Folgen für die Umweltmedien unter Berücksichtigung neuester Tendenzen. Berichte der Bundesanstalt für Straßenwesen, Verkehrstechnik Heft V 21, Bergisch Gladbach, 1995.
[21] Forschungsgesellschaft für Straßen- und Verkehrswesen: TL-Streu – Technische Lieferbedingungen für Streustoffe des Straßenwinterdienstes, 2003.
[22] DEV: Deutsche Einheitsverfahren zur Wasser-, Abwasser- und Schlammuntersuchung, Wasserchemische Gesellschaft, Fachgruppe in der Gesellschaft Deutscher Chemiker. Wiley VCH, Weinheim, 2013, ISBN 13: 978-3-527-19010-2.
[23] DWA-A 138: Planung, Bau und Betrieb von Anlagen zur Versickerung von Niederschlagswasser. DWA Deutsche Vereinigung für Wasserwirtschaft, Abwasser und Abfall e. V., Hennef, 2005, ISBN: 3-937758-66-6.
Autoren
Maximilian Huber, M.Sc.Wissenschaftlicher MitarbeiterProf. Dr.-Ing. Jörg E. DrewesPD Dr. rer. nat. habil. Brigitte Helmreich(Korrespondenzautorin) |E-Mail: [email protected] |Technische Universität München |Lehrstuhl für Siedlungswasserwirtschaft |Am Coulombwall 8 |D-85748 Garching
Prof. Dr.-Ing. habil. Antje WelkerDipl.-Ing. Martina DierschkeFH Frankfurt |Fachgebiet Siedlungswasserwirtschaft und Hydromechanik |Nibelungenplatz 1 |D-60318 Frankfurt am Main
Im Peer-Review-Verfahren begutachtet Eingereicht: 23.01.2014
Korrektur: 14.04.2014
Deutscher Industrieverlag GmbH | Arnulfstr. 124 | 80636 München
WISSEN FÜR DIE
ZUKUNFT
Quellfassungsanlagen zur TrinkwasserversorgungDas neue, umfangreiche Fachbuch beschäftigt sich mit Quellen zur Trink-wasser gewinnung und klammert die Mineralwasser-, Thermalwasser- und Heilwasserquellen bewusst aus, da hier andere Bewertungsmaßstä-be und Nutzungskonzepte gelten. Mit dieser Neuerscheinung über den Bau und Betrieb von Quellfassungen für die Trinkwasserversorgung wird die Reihe der Standardwerke zur Wassergewinnung im Deutschen Indus-trieverlag fortgeführt. Das Buch wendet sich gleichermaßen an Betreiber wie Planer und Genehmigungsbehörden, die mit der Wasserversorgung beschäftigt sind.
Christoph Treskatis, Horst Tauchmann 1. Auflage 2013 692 Seiten, vierfarbig, 170 x 240 mm, Hardcover Erhältlich in 2 Varianten
Bestellung per Fax: +49 201 / 820 02-34 oder abtrennen und im Fensterumschlag einsenden
AntwortVulkan-Verlag GmbH Versandbuchhandlung Postfach 10 39 62 45039 Essen
Widerrufsrecht: Sie können Ihre Vertragserklärung innerhalb von zwei Wochen ohne Angabe von Gründen in Textform (z.B. Brief, Fax, E-Mail) oder durch Rücksendung der Sache widerrufen. Die Frist beginnt nach Erhalt dieser Belehrung in Textform. Zur Wahrung der Widerrufsfrist genügt die rechtzeitige Absendung des Widerrufs oder der Sache an die Vulkan-Verlag GmbH, Versandbuchhandlung, Postfach 10 39 62, 45039 Essen.
Bevorzugte Zahlungsweise Bankabbuchung Rechnung
PAQZT2013
Vorname, Name des Empfängers
Straße / Postfach, Nr.
Land, PLZ, Ort
Telefon Telefax
Branche / Wirtschaftszweig
Bank, Ort
Bankleitzahl Kontonummer
Ort, Datum, Unterschrift
Firma/Institution
Standardwerk zur Errichtung und Sanierung von Quellfassungen
Nutzung personenbezogener Daten: Für die Auftragsabwicklung und zur Pflege der laufenden Kommunikation werden personenbezogene Daten erfasst und gespeichert. Mit dieser Anforderung erkläre ich mich damit einverstanden, dass ich vom DIV Deutscher Industrieverlag oder vom Vulkan-Verlag per Post, per Telefon, per Telefax, per E-Mail, nicht über interessante, fachspezifische Medien und Informationsangebote informiert und beworben werde. Diese Erklärung kann ich mit Wirkung für die Zukunft jederzeit widerrufen.
DIV
Deu
tsch
er In
dust
rieve
rlag
Gm
bH, A
rnul
fstr.
124
, 806
36 M
ünch
en
Ja, ich bestelle gegen Rechnung 3 Wochen zur Ansicht
___Ex. Quellfassungsanlagen zur Trinkwasserversorgung 1. Auflage 2013 – ISBN: 978-3-8356-7125-6
für € 128,- (zzgl. Versand)
___Ex. Quellfassungsanlagen zur Trinkwasserversorgung mit interaktivem eBook (Online-Lesezugriff im MediaCenter) 1. Auflage 2013 – ISBN: 978-3-8356-7127-X für € 148,- (zzgl. Versand)
Edition
Jetzt bestellen!
www.di-verlag.de
127

7.2ResearchPaper:“ANovelTestMethodtoDeterminetheFilterMaterial
ServiceLifeofDecentralizedSystemsTreatingRunofffromTrafficAreas”
The selection of the two authoritative parameters (Cu and Zn), the boundary conditions, and the
original procedure of the novel method were presented in Section 7.1. After completing the
assessment of eight more systems, the final experimental setup was described in this journal article
that does not contain an application of de‐icing salts (cf. Chapter 9). The assessment method can be
used to determine service lives and long‐term performances of all types of decentralized stormwater
treatment systems with filter materials in pilot‐scale models. Furthermore, additional field samples
were collected to show the applicability of the novel procedure. The corresponding hypothesis was:
A validation of the determined service lives of channel systems by field measurements confirms the
applicability of the developed method (Hypothesis 5).
The validation of the results of two channel systems at four field‐monitoring sites confirmed the
applicability of the novel test method despite different site‐specific characteristics. Moreover, the
long‐term performances of the nine decentralized filter systems varied significantly for the two
authoritative parameters Cu and Zn between the different rain events, which have an impact on
management strategies to prevent the transport of pollutants into the environment. Furthermore,
the type and amount of the filter material influenced the retention of Cu and Zn significantly for all
systems. The results of the novel test method provide regulatory authorities, designers, and
operators with a more objective basis for performance assessment. In addition, further substances
such as nutrients can have a crucial impact on the receiving water (Sample et al., 2012). An
application of these substances in the novel test method is possible after a calculation of the annual
loads. Thus, this method was successfully expanded to evaluate the simultaneous removal of Cu, Zn,
and P. Both the service life (Part 1) and the long‐term performance (Part 2) were determined for all
three substances for one FSS. The relevance of P was also proposed by Welker et al. (2015). In lab‐
scale experiments, the removal of Cu, Zn, P, and trace organic substances (i.e., ETBE and MTBE) was
tested. The results showed that ETBE and MTBE were more easily removed than P. Furthermore, a
relevance of ETBE and MTBE in traffic area runoff could not be confirmed by current monitoring
programs presented by Grotehusmann et al. (2014) and Vesting et al. (2015). Moreover, MTBE can
be easily removed by activated carbon (Li, 2012; Wichern et al., 2012).
The following paper was published in the Journal of Environmental Management 179, 66–75. Huber,
Welker, Dierschke, and Helmreich conceived and designed the experiments. Huber performed the
tests, evaluated the experiments, and wrote the manuscript. All authors contributed to the
discussions and conclusions.
128

lable at ScienceDirect
Journal of Environmental Management 179 (2016) 66e75
Contents lists avai
Journal of Environmental Management
journal homepage: www.elsevier .com/locate/ jenvman
Research article
A novel test method to determine the filter material service life ofdecentralized systems treating runoff from traffic areas
Maximilian Huber a, Antje Welker b, Martina Dierschke b, J€org E. Drewes a,Brigitte Helmreich a, *
a Chair of Urban Water Systems Engineering, Technical University of Munich, Am Coulombwall 3, 85748 Garching, Germanyb Fachgebiet Siedlungswasserwirtschaft und Hydromechanik, Frankfurt University of Applied Sciences, Nibelungenplatz 1, 60318 Frankfurt am Main,Germany
a r t i c l e i n f o
Article history:Received 25 January 2016Received in revised form24 April 2016Accepted 2 May 2016
Keywords:Channel systemCopperHeavy metalShaft systemDistributed stormwater treatmentZinc
* Corresponding author.E-mail address: [email protected] (B. Helmreic
http://dx.doi.org/10.1016/j.jenvman.2016.05.0030301-4797/© 2016 Elsevier Ltd. All rights reserved.
a b s t r a c t
In recent years, there has been a significant increase in the development and application of technicaldecentralized filter systems for the treatment of runoff from traffic areas. However, there are still manyuncertainties regarding the service life and the performance of filter materials that are employed indecentralized treatment systems. These filter media are designed to prevent the transport of pollutantsinto the environment. A novel pilot-scale test method was developed to determine e within a few dayse the service lives and long-term removal efficiencies for dissolved heavy metals in stormwater treat-ment systems. The proposed method consists of several steps including preloading the filter media in apilot-scale model with copper and zinc by a load of n-1 years of the estimated service life (n). Subse-quently, three representative rain events are simulated to evaluate the long-term performance by dis-solved copper and zinc during the last year of application. The presented results, which verified theapplicability of this method, were obtained for three filter channel systems and six filter shaft systems.The performance of the evaluated systems varied largely for both tested heavy metals and during allthree simulated rain events. A validation of the pilot-scale assessment method with field measurementswas also performed for two systems. Findings of this study suggest that this novel method does provide astandardized and accurate estimation of service intervals of decentralized treatment systems employingvarious filter materials. The method also provides regulatory authorities, designers, and operators withan objective basis for performance assessment and supports stormwater managers to make decisions forthe installation of such decentralized treatment systems.
© 2016 Elsevier Ltd. All rights reserved.
1. Introduction
Parameters commonly monitored in runoff from traffic areasinclude organic substances, heavy metals, and compounds of de-icing salts (Eriksson et al., 2007; Folkeson et al., 2009; Fraga et al.,2016). Heavy metals such as cadmium (Cd), chromium (Cr), cop-per (Cu), lead (Pb), nickel (Ni), and zinc (Zn) are highly relevantpollutants because of their toxicity, non-degradability, and theirincreasing presence in the environment as a consequence of theirwidespread industrial use (Roeva et al., 1996; Tiefenthaler et al.,2001). Among these heavy metals, Cu, Pb, and Zn commonlyoccur in highest concentrations in runoff from highways and other
h).
12
traffic areas (Kayhanian et al., 2012; Revitt et al., 2014; Huber et al.,2016a). However, Pb concentrations have decreased significantly intraffic area runoff in the last few decades because of the phase-outof leaded gasoline and the substitution of Pb in other traffic-relatedsources (Kayhanian, 2012; Huber et al., 2016a). In addition, Pb oc-curs mostly particle-bound, while Cu and Zn are usually morepresent in the dissolved phase (Timperley et al., 2005; Wilson,2006; Kayhanian et al., 2007). Helmreich et al. (2010) concludedthat the fractionation of these heavy metals is not affected byseasonal variations but remarkable fluctuations can occur betweendifferent rain events with dissolved fractions higher than 90%.Therefore, Cu and Zn are relevant dissolved substances in runofffrom traffic areas during all seasons because of their total concen-trations, fractionation behavior, and toxicity.
To retain these heavy metals from traffic area runoff, decen-tralized stormwater treatment systems are used, which can be
9

M. Huber et al. / Journal of Environmental Management 179 (2016) 66e75 67
designed as an integral part of existing urban infrastructure forstormwater management and rainwater harvesting (Scholeset al., 2008; Inamdar et al., 2013; Scholz, 2015). In a first stepof these treatment systems, sedimentation and filtration are thepredominant retention mechanisms used to remove particle-bound substances. Subsequently, dissolved heavy metals areretained on filter materials by sorption, ion exchange, or pre-cipitation (Liu et al., 2005). Thus, a second treatment step with afilter material is necessary to reduce the total concentrations ofall metals (Hilliges et al., 2013; Maniquiz-Redillas and Kim, 2014).In recent years, various technical decentralized stormwatertreatment systems have been developed to treat the runoff oftraffic areas when space is limited (Sample et al., 2012; Dierkeset al., 2015a). Three categories of these urban drainage systemsare: permeable pavement, filter channel system (FCS), and filtershaft system (FSS). These systems are commonly used as con-forming products in order to treat stormwater runoff at thesource before it infiltrates into the subsurface or is discharged tosurface water. Permeable pavements are similar to those oftraditional concrete block pavements. They are specificallydesigned for infiltration of stormwater through the pores of thepavers and/or the joints between the pavers, which are filledwith filter media to retain pollutants, into the various pavementlayers and subsequently into the soil (Dierkes et al., 2015a). A FCSconsists of a typical drainage channel (concrete or poly-propylene) that is filled by filter materials (mixture, layers, oronly one material). Each FCS has a specific retention volumebetween the grate and the filter media and the stormwater runoffpercolates (down-flow mode) through the filter media and thetreated water is subsequently drained by holes in the bottom ofthe channel or by a pipe. The pollutants are retained by sedi-mentation on top of the filter and within the filter media byfiltration and (bio-)chemical processes. Some FCS have a sedi-mentation box/trap (polypropylene or steel) ahead of the filter.FSS usually consist of a sedimentation unit and a subsequentfilter, which is integrated either into the system or in anothershaft (concrete or polypropylene). The stormwater can be treatedby the filter vertically in both up-flow and down-flow mode, or ina radial direction. Some FSS are permanently submerged andothers run dry after each rainfall event (Dierkes et al., 2015a). InGermany, the Deutsches Institut für Bautechnik (DIBt, GermanCenter of Competence for Construction) can approve thesedecentralized systems for the infiltration of runoff from trafficareas after performing several tests (e.g., removal of fine parti-cles, total petroleum hydrocarbons, and heavy metals; remobi-lization of Cu and Zn under application of sodium chloride) (DIBt,2012; DIBt, 2015). In the United States, several methods havebeen developed to test decentralized systems. In the State ofWashington, the Technology Assessment Protocol-Ecology (TAPE)of the Washington State Department of Ecology is used to eval-uate and classify decentralized stormwater treatment systems bylab- and field-scale experiments (e.g., removal of total suspendedsolids, Cu, Zn, phosphor, and petroleum hydrocarbons)(Department of Ecology (2011)). In New Jersey, a procedure forobtaining verifications of stormwater treatment systems wasimplemented by the New Jersey Department of EnvironmentalProtection to assess the removal of total suspended solids in thelaboratory (NJDEP, 2013). As an amendment to the TARP (Tech-nology Acceptance Reciprocity Partnership) Protocol, a fieldtesting for the removal of total suspended solids can also beperformed for final certification (NJDEP, 2009). However, there isno standardized method available to quickly determine the filtermaterial service life of decentralized stormwater treatmentsystems.
In general, two factors influence the determination of the
130
service life of decentralized systems treating runoff from trafficareas:
� The service interval is limited because of a hydraulic failure ofthe plant (i.e., clogging of the filter material because of sedimentaccumulation and deposition) (Mercado et al., 2015). This isoften related to an increased solids load in combination withsite-specific factors that enhance clogging (e.g., mineral sub-stances such as grit and construction site dust, or organic loadsof pollen and leaf litter) (CH2MHILL, 1998).
� The service life is limited because of the substance removal ef-ficiency (i.e., a reduced retention of substances). In most cases,the capacity of the filter material for heavy metal removal isexhausted.
Clogging phenomena of the filter material can be simulated inthe laboratory by using a full-scale system but realistic particle sizedistributions and site-specific factors of the system's catchmentarea cannot be considered. Therefore, this factor needs to bedetermined by extensive and comparable field measurements thatmight take several years. The terminal service life of the filtermaterial (e.g., breakthrough of heavy metals) is rarely noticeable bythe operator although this has a crucial effect on the receivingwater. However, this effect can be simulated reproducibly at pilot-scale for decentralized systems. Nevertheless, a standardized testmethod for the determination of the service life and long-termperformance of different types of filter systems is currently notpublished by other researchers. This lack regards the completeprocedure (e.g., input parameters such as estimated service livesand metal loads, rainfall events, breaks, and effluent requirements)and the performing of an experimental study.
Since the treatment of traffic area runoff is a serious issue, theevaluation of decentralized filter systems for the removal of heavymetals is very important. An appropriate experimental setup isnecessary to evaluate the removal of dissolved substances as theuse of filter systems for stormwater treatment is increasingworldwide and keeping track of the filter usability and perfor-mance is currently a difficult task because of the multitude ofmanufacturers of filter systems. Such a method is also neededbecause, depending on the type of the system, field experience of5e20 years is often missing for existing systems. Because of themissing experience and information concerning their long-termperformance and service lives, it is currently difficult to guaranteea sustainable and cost efficient stormwater management bydecentralized systems. The determination of the service life is alsoessential for a sustainable management of urban infrastructurebecause maintenance and the exchange of filter material have aneffect on life-cycle costs of decentralized treatment systems(O'Sullivan et al., 2015). In addition, the benefit of using a novelmethod, which must consist of several well defined steps thatrepresent the real conditions realistically, for testing new productdevelopments and existing decentralized systems must also bebased on a rapid performance assessment within a few days fortoxic dissolved substances.
The hypothesis of this study is that a novel test method can bedeveloped and implemented to evaluate the long-term perfor-mance of new and already operational decentralized systems. Thisnovel assessment method can provide a simulation of the servicelives of the filter materials and their long-term performanceswithin a few days prior to field applications. The objectives of thisstudy are the development of a pilot-scale test method, the eval-uation of nine channel and shaft systems to determine their servicelives and efficiencies to remove dissolved heavy metals, validationof results, and the delivery of stormwater treatment guidelines ofauthorities for the assessment of heavy metal retention

M. Huber et al. / Journal of Environmental Management 179 (2016) 66e7568
performances by standardized procedures for decentralizedstormwater treatment systems.
2. Material and methods
2.1. Method
2.1.1. Scheme and requirementsThe novel assessment method consists of two parts (Fig. 1). In
Part 1, the filter system is rapidly preloaded with heavy metal loadsof n-1 years. The variable n represents the estimated service life ofthe filter material in years that has been determined in previousbatch or small-scale column experiments. By these lab-experiments, the capacities of the filter media, which is used inthe full-scale system in the same composition, are determined forall substances of interest. Appropriate procedures for the deter-mination of capacities are proposed by Huber et al. (2016b) withinformation on the initial pH value, the concentrations of themetals of interest, the substrate dosage, the type and speed of theshaker, the contact time, the influence of the ionic strength (e.g.,buffer), and the sample preparation. The determined capacities(mg/kg) are multiplied for each substance (e.g., Cu and Zn), whichhas to be retained, by the total amount of filter material (kg) that isused in the full-scale system. This maximum amount of retainedsubstances (mg) in the filter system without an exchange of thefilter media (i.e., the service life) is subsequently divided by thecorresponding typical annual loads (mg/a) (described in thefollowing; values must be multiplied by the connected catchmentarea of the full-scale system) to roughly determine service lives foreach substance. The estimated service life of the filter system isequal the rounded down value of the smallest value calculated forall substances. For the estimated service lives calculated from batchexperiment results, a reduction of the measured capacities by afactor between four and eight is recommended.
For the calculation of the annual loads, which are specified perm2 catchment area, total runoff concentrations of 443 mg/L Zn and76.3 mg/L Cu are used in accordance with concentrations measuredin field studies for road runoff (Welker, 2005). Assuming an averagedissolved fraction of 45% for the total Zn concentrations and of 30%for the total Cu concentrations (Huber et al., 2016a), mean dissolvedconcentrations of 199 mg/L Zn and 22.9 mg/L Cu are calculated.
Fig. 1. Scheme of both parts of the filter material service life experiments (n equals the estcolumn experiments).
13
Particulate heavy metals are not considered in this method becausetheir removal mechanisms are not sorption, ion exchange, or pre-cipitation but filtration. Therefore, metals that are bound ontoparticles in the influent of a system do not limit the service life ofthe filter material concerning the substance removal efficiency.Particulate fractions of pollutants are considered by other tests thatare designed to evaluate the removal of fine particles (<200 mm)because most particulate heavy metals in highway runoff wereoccurring in this size fraction (Sansalone and Buchberger, 1997;Roger et al., 1998). Runoff is calculated as 677 mm (annual pre-cipitation height 888 mm, mean annual runoff coefficient 0.76;Mühldorf am Inn, Germany) (Bayerisches Landesamt für Umwelt,2008). Thus, the annual loads for traffic areas are 135 mg/m2 Znand 15.5 mg/m2 Cu (DIBt, 2015). Values for other heavy metals canbe calculated in the same manner after determination of the con-centrations and the dissolved fractions (cf. Huber et al., 2016a). InPart 2, the long-term performance of the system is assessed bysimulating the last year of the filter material service life. For allexperiments, Cu and Zn are used and the filter systems are repre-sented in individual pilot-scale models (cf. Section 2.2). To calculatethe amount of Cu and Zn for each test, the connected catchmentarea of the full-scale system and a filter model factor to scale downthe catchment area are considered.
2.1.2. Experimental setupIn Part 1, the preloading of the filter system with a load of n-1
years is performed. The total loads of Part 1 are calculated bymultiplying the annual loads (135mg/m2 Zn and 15.5 mg/m2 Cu) byn-1 years and the catchment area of the filter model. The heavymetals are dissolved in 35e200 L of water to obtain heavy metalconcentrations in one order of magnitude for all systems (theamount of water also depends on the model of the filter system).Deionized water without a buffer is used as feed water and the pHvalue is adjusted to 4.9 ± 0.3. Thus, all heavy metals are present inthe dissolved form (Genç-Fuhrman et al., 2007). The feed watercirculates through the filter model with a rain intensity (RI) of 10 L/(s$ha), representing a precipitation of 3.6 mm/h, until 90% of eachCu and Zn are retained. One influent sample and several effluentsamples (one sample after each complete circulation of the feedwater) are taken. Afterwards, the filter materials are either sub-merged in the feed water or dried at room temperature (20 ± 2 �C)
imated service life in years that has been determined in previous batch or small-scale
1

M. Huber et al. / Journal of Environmental Management 179 (2016) 66e75 69
for several hours in accordance with the full-scale systems.In Part 2, the filter system's performance during the last year is
evaluated. The annual loads of Cu and Zn are the same as in Part 1.Part 2 is performed using three different RIs with the same amountof water to simulate the long-term performance for defined rainevents: 2.5 L/(s$ha) for 480 min, 6.0 L/(s$ha) for 200 min, and 25 L/(s$ha) for 48 min (DIBt, 2015). They equal precipitations of 0.9 mm/h, 2.2 mm/h, and 9.0 mm/h, respectively. These rainfall intensitiesare selected after completing a comprehensive statistical analysis oftypical rainfall intensities across Germany (longtime average)(Dierkes et al., 2015a). The water volume of each experiment de-pends on the connected catchment area of the filter model and iscalculated from the RI and its duration (i.e., 7.2 L/m2 per RI). Theheavy metal loads of the last year are divided equally within thethree RIs (45 mg/m2 Zn and 5.17 mg/m2 Cu per RI). Thus, the con-centrations of each RI are always 0.72 mg/L Cu and 6.25 mg/L Zn,which are higher than most values of real runoff waters (Kayhanianet al., 2012; Huber et al., 2016a). Deionized water without a buffer isused as feed water and the pH value is adjusted to 4.9 ± 0.3. A breakof 15 h is maintained between RI 2.5 L/(s$ha) and RI 6.0 L/(s$ha).This represents only a small antecedent dry period and is linked tothe experimental setup (RI 2.5 L/(s$ha) takes one day and the othertwo RI one further day). Afterwards, RI 6.0 L/(s$ha) and RI 25 L/(s$ha) are performed in one run with changing flow rates. Theretention of Cu and Zn is determined by measuring the influentconcentrations and eight effluent concentrations per RI. Twoeffluent samples are taken per RI at the end of each quarter (e.g.,after 12 min, 24 min, 36 min, and 48 min for RI 25 L/(s$ha)). Theremoval efficiencies are calculated as the ratio of the difference ofthe influent concentration and the arithmetic average of all eighteffluent concentrations and the corresponding influent concen-tration. The efficiencies can directly be compared with effluentrequirements or local regulations (cf. Section 4.2).
All experiments are performed in duplicate. The influent con-centrations are adjusted with an accuracy of ±10% and the flow ratewith an accuracy of ±5%. The experimental setup consists of a feedwater tank with a scale, a pump, a flow meter and the model of thefilter system (Fig. 2). The scale is used for preparing the feed waterand to control the flow meter. The pump is adjusted by the flowmeter to simulate different RIs. The model of the filter system de-pends on the type of the system and each system has an individualmodel. The different models are based on the fact that the func-tionality of each system varies because of specific design features(e.g., up/down/radial-flow, submerged/run dry after rainfall, andwith/without pre-treatment), filter materials (e.g., type, grainsize,amount, filter bed height, and retention mechanisms), catchmentareas, and estimated service lives (1e10 years). All filter modelsmust consider the real flow conditions, the flow paths, and thecontact times of the full-scale systems (DIBt, 2015). To simulate the
Fig. 2. Scheme of the e
132
service lives of FSS, adapted pilot-scale models are used to reducethe amount of water for each experiment (Dierkes et al., 2015b).However, at least 35 L of feed water should be used in Part 2 per RI(DIBt, 2015). Segments of the full-scale systems are used to test allFCS and some FSS. The model must be in accordance with the in-formation of the manufacturer's instructions for full-scale systemsfor the filter materials, the heights, the amounts, and the pro-cedures of filling.
2.2. Filter systems
An evaluation of three different FCS and six FSS, which arecommonly used in urban stormwater management, was per-formed. The systems were selected to represent a wide range ofcommercial decentralized treatment systems, which were devel-oped in Germany and are distributed worldwide, with filter ma-terials designed to treat runoff from traffic areas (Huber et al.,2015a). The functionalities and maintenance of several systemsselected for the following experiments are described by Dierkeset al. (2015a). The values n and catchment area were set in accor-dance with the specifications of the manufacturers and batchexperiment results. A linear downscaling of the total loads of eachfilter system on the filter model was performed. The modellingfactor, which was used to scale down the catchment areas, was 1:1for all FCS and varied between 1:4 and 1:8000 for the FSS (Table 1).
All full-scale FSS are available in different sizes (i.e., differentshaft diameter or different amounts of segments with filter mate-rial) and can subsequently be adopted for several catchment areasizes. Since the systems and the filter media are completely scaledup for different catchment areas (e.g., same ratio of catchment areato filter media surface area and same flow paths), the filter modelfactors and, therefore, the removal efficiencies are the same.Because of the different shaft designs, individual filter models thatconsisted of a representative segment or column were used for allFSS. For example, a column (inner diameter 8.0 cm) representing asection of the filter segments (e.g., two full segments for 1500 m2
catchment area and four segments for 3000 m2) was used to testthe performance of FSS3 with a filter model factor of 1:82 (Fig. 3,left). For FSS1, a quarter of the filter unit was used for the pilot-scaleexperiments. Columns representing cross-sections of the filters areused for the other FSS. For the FCS, a section of each channel wasused with full width and 0.5 m length (Fig. 3, right) or 1.0 m length.The rain-simulating-device for the FCS consisted of 625 hollowstainless steel needles (inner diameter 0.90 mm) that were fixedonto a square plate (1 m2). The feed water was delivered withdifferent RIs from the pressurized water reservoir installed on topof the FCS. All experiments were performed in duplicate.
xperimental setup.

Table 1Results of the evaluation of all treatment systems for Cu and Zn in Part 2 (means of duplicates).
Description Type of system Channel system (FCS) Shaft system (FSS)
Connectedcatchment area
12e20 m2/rma 500e3000 m2 10,000 m2
Estimated service life 10 years 3e4 years 1 year 3 years
System ID FCS1 FCS2 FCS3 FSS1 FSS2 FSS3 FSS4 FSS5 FSS6
Filter model factor 1:1 1:1 1:1 1:4 1:100 1:82 1:82 1:8000 1:430
Main filter mediacomponent
Naturalminerals
Calciumcarbonate
Activatedcarbon
Zeolite Zeolite Granular ferrichydroxide
Granular ferrichydroxide
Activatedcarbon
Calciumsilicate
Cu-Retention RI 2.5 L/(s$ha) 99.2% 99.3% 72.7% 57.6% 55.4% 99.3% 98.8% 87.6% 95.8%RI 6.0 L/(s$ha) 99.2% 99.3% 66.6% 47.1% 54.4% 99.1% 97.9% 97.5% 89.0%RI 25 L/(s$ha) 99.2% 99.3% 56.0% 39.9% 51.2% 85.3% 79.5% 83.3% 79.7%Average 99.2% 99.3% 65.1% 48.2% 53.7% 94.6% 92.1% 89.5% 88.2%
Zn-Retention RI 2.5 L/(s$ha) 99.4% 98.5% 68.3% 73.2% 65.3% 99.7% 98.6% 89.7% 98.4%RI 6.0 L/(s$ha) 99.5% 99.5% 66.9% 66.5% 58.9% 98.2% 94.4% 94.5% 89.5%RI 25 L/(s$ha) 99.4% 99.7% 55.3% 60.5% 55.0% 70.4% 49.7% 24.8% 74.6%Average 99.4% 99.2% 63.5% 66.7% 59.7% 89.4% 80.9% 69.6% 87.5%
a rm: running meter.
Fig. 3. Experimental setups: FSS model as a column with flow meters (left) and FCS model as two channels (full width) with rain-simulating-device (right).
M. Huber et al. / Journal of Environmental Management 179 (2016) 66e7570
2.3. Chemicals, and materials
For the heavy metals, copper(II) nitrate trihydrate pure (Appli-Chem GmbH, Germany) and zinc nitrate hexahydrate pure (Appli-Chem GmbH, Germany) were used. Deionized water (electricconductivity of <1 mS/cm) was used for preparing the feed water.Feed water pH adjustments and preservation of all samples wereperformed with nitric acid 65% p.a. (Merck KGaA, Germany). Allsamples were collected in 250 mL low-density polyethylene bottles(VWR Collection, Germany).
2.4. Analytical procedures
The pH value and electric conductivity were measured imme-diately after each sample collection using a glass electrode (WTWSentix 60) according to Standard Method 4500-Hþ and a WTWProfiLine Cond 1970i (detection limit: 0.1 mS/cm) according toStandard Method 2520 B (APHA, 2005), respectively. Subsequently,all samples were preserved with nitric acid at pH < 2.
For Part 1, Cu and Zn concentrations were first measured usingcuvette tests (Hach Lange GmbH, Germany) to reduce the durationof the test method. Subsequently, the total concentrations of bothheavy metals were measured in all samples by flame atomic ab-sorption spectrometry (AAS, Varian Spectrometer AA-240FS) ac-cording to Standard Method 3111 (APHA, 2005) with detectionlimits of 50 mg/L (Cu) and 20 mg/L (Zn). Cu samples with concen-trations below 50 mg/L were repeatedly measured with a graphitefurnace AAS (Varian Spectrometer AA-240Z with GTA 120) ac-cording to Standard Method 3113 (APHA, 2005) with a detection
13
limit of 5 mg/L. Total metal concentrations were measured with AASin an aqua regia digestion of selected samples to determine thedifferences of metal concentrations between acidified (pH < 2) anddigested effluent samples, and to quantify the metal contents indried filter material samples in an aqua regia digestion. No differ-ences were determined by both methods for the effluent samples.Quality control was maintained by using control and blank sam-ples, and taking standard solution quantity checks every fivesamples.
3. Results
3.1. Part 1: preloading
The preloading of each filter system was achieved within 24 h.For FSS5, no preloading was conducted because the estimatedservice life was 1 year. For most systems, the retention of Cu washigher than the Zn retention. For two FCS, a circulation of the feedwater (14.0 mg/L Cu and 121.5 mg/L Zn in 120 L) was not necessarybecause the mixed effluent concentrations after the first perco-lating of the feed water (120 L) through the filter media wereapproximately 0.1e0.6% for Cu and 0.7e3.7% for Zn of the influentconcentrations for all experiments (retention >90%, cf. the termi-nating criteria in Section 2.1.2).
3.2. Part 2: removal efficiencies and long-term performance
The results of Part 2 for the FCS and the FSS, which describe thelong-term performances of the filter systems and their heavy metal
3

M. Huber et al. / Journal of Environmental Management 179 (2016) 66e75 71
retention efficiencies in the last year, were more heterogeneous(Table 1). Differences occurred between both heavy metals, the RIs,the system types, and each filter system. The two FCS with only onepreloading run had the highest removal efficiencies for both metalsand all RI (99.2e99.4%). All other filter elements showed largerdifferences for all RI between each other and eachmetal. In general,most of the FSS and FCS showed high performances for removingthe dissolved heavy metals. The lower retention of FSS1 and FSS2might be related to the higher ratio of the connected catchmentarea to the surface area of the filter but it can also be linked to theirunique design (e.g., type of filter media).
Besides the determination of the retention capacities and theremoval efficiencies of decentralized systems, removal processesmust also be considered. For most systems, the retention of Cu washigher than the retention of Zn. This observation is consistent withtheir speciation because Cu is less dissolved in the percolatingwater at pH values higher than 6.5 and Zn at pH values higher than8.5 (Genç-Fuhrman et al., 2007). The pH of the effluent samplesvaried between minimum values of 7.1 for FSS3 and 8.2 for FCS2,and maximum values of 11.1 for FCS1 and of 11.4 for FSS2. In gen-eral, a high removal efficiency (cf. Table 1) can be achieved at lowerpH values with granular ferric hydroxide (adsorption and precipi-tation) and calcium carbonate (precipitation) and at higher pHvalues with natural minerals (adsorption, ion exchange, and pre-cipitation). Less removal efficiencies were measured for filters withactivated carbons and zeolites.
An increase of the RI led to a decrease of the contact time be-tween the feed water and the filter material. For most of the sys-tems evaluated, this decrease of contact time correlated with adecrease in performance. In addition, the absolute contact timesvaried between the different systems and for some systems, veryshort contact times for RI 25 L/(s$ha) (<1 min) led to a significantdecrease of their heavy metal removal (e.g., FSS5). Consequently,the performance of the systems correlated with the hydraulicloading rate.
The differences between the performances were also linked tomore exhausted capacities of the filter materials because of thepreloading and the subsequent loading. These trends of theremoval efficiencies during Part 2 led to an increase of the ratio c/c0(effluent concentration/influent concentration) for most filter sys-tems (Fig. 4, which does not represent typical breakthrough curvesbecause of the preloading (Part 1) and the varying RIs of Part 2).However, this trend was not detected for the two FCS (Fig. 4a andb). Both heavy metals were continuously retained by these FCS andno significant variations of the pH values were measured. Both FCStreated low amounts of bed volumes (Fig. 4a and b), i.e., the ratio offilter material to water volume treated was the highest. Therefore,the capacities of these filter materials (cf. Section 4.1) were lowerthan the ones of all other filter materials. FCS2 treated 27% morebed volumes than FCS1, although the removal efficiencies and theamount of treated water were comparable (the amount of waterper RI was the same because of the same connected catchmentareas of these systems although the volume of the filter media isdifferent in the pilot-scale and the corresponding full-scale FCSbecause of the design features). Concerning Part 2, all other systemshad significantly higher amounts of bed volumes treated. For FSS3(Fig. 4c) and FSS6 (Fig. 4d), the trend of increasing effluent con-centrations was observed for RI 6.0 L/(s$ha) and RI 25 L/(s$ha)because of decreasing contact times and increasing loadings of thefilter materials within one RI. The removal efficiencies decreasedfor FSS3 continuously during RI 25 L/(s$ha), whereas in the ex-periments with FSS6, the efficiencies and the pH value decreasedstepwise for all three RIs. This is also linked to the different ca-pacities and removal mechanisms of the filter materials of FSS3(sorption and precipitation) and FSS6 (sorption and ion exchange).
134
In addition, the performances of the filter materials were correlatedwith the pH value of the effluent samples. The pH value decreasedwith increasing effluent concentrations for all filter systems (Fig. 4cand d). Consequently, the type of the filter material and the amountof the treated bed volumes influenced the retention of Cu and Znsignificantly for all systems (heavy metal loading rates).
4. Discussion
4.1. Validation of the test method
The results of the novel test method were compared with fieldmeasurements to confirm the applicability of the pilot-scale ex-periments. The only field measurements available were the heavymetal contents of the filter materials in the full-scale systems FCS1and FCS2 as a function of depth. The total heavy metal contents ofthe loaded pilot-scale filter material samples were sometimeslower than the contents of the field samples. This is because of thefact that the systems FCS1 and FCS2 do not have a separate treat-ment step to retain particulate matter. Thus, the total runoff con-centrations were removed by the filter material and weresubsequently measured in the field samples. However, the testmethod only considers dissolved metal concentrations. Conse-quently, the field measurements have much higher metal contentsin the top layer of the filter material because herein most of thesolids were retained.
A long-term monitoring was available for the system FCS1 atthree different locations after several years of operation (Schriefer,2013, 2014a, 2014b). One system was built in 2004 in a parking lotof a buyback center in Berlin, Germany (four sample collectionsafter 1 year, 2 years, 5 years, and 9 years). The system was alsoinstalled and monitored at two frequently used parking lots ofbuilding supplies stores in Bristol, Great Britain (built in 2006; onesample collection after 8 years), and Würzburg, Germany (built in2005; three sample collections after 2 years, 4 years, and 9 years).Themain results of all pilot-scale and field samples are summarizedin Table 2. The heavy metal contents of the blank samples (i.e., newand unloaded material) were much lower than the loaded contentsof Zn and slightly lower for Cu. Concerning the blank samples, bothmetals could not be eluted by water within 24 h (<5 mg/L Cu and<10 mg/L Zn) (Schriefer, 2014b). For all samples, the contents of Znwere higher compared with the contents of Cu, and all contentsdecreased from top to bottom of the three filter layers (i.e., in theflow direction). The contents at the Bristol location were higherthan the contents at all other sites because of different site-specificfactors that had a significant influence on the total contents(Horstmeyer et al., 2016). At the Bristol site, the contents of thefield-samples were recalculated for comparisonwith the pilot-scalesamples (45% for Zn and 30% for Cu, cf. Section 2.1). The fictiveaverage “dissolved” contents, extrapolated for 10 years, areapproximately 317mg/kg Zn and 54mg/kg Cu (also considering thedifferent blank contents). Therefore, the results of the test methodsamples (320 mg/kg Zn and 52 mg/kg Cu) were comparable withthe field samples at a highly polluted catchment area (Huber et al.,2016a) for the same service life. The contents of both heavy metalsat the other two field sampling sites were lower and the compar-ison of the contents in Würzburg after 4 years and 9 years provedthe increase of the heavy metals in the top layer after several years.
The field samples of FCS2 were collected at a monitoring site inAugsburg, Germany, where the system was installed and operatedfor four years. The ratio of the filter surface area (AF) to the con-nected catchment area (AU) of each test channel varied (Table 3).The catchment area consisted of a road with medium averageannual daily traffic of approximately 7000 vehicles per day. The sitewas characterized by a high annual load of solids (up to 4500 kg/ha)

Fig. 4. Effluent concentration trends of both heavy metals (averages and standard deviations of four samples) and the pH value curves of two channel systems (left) and two shaftsystems (right) of Part 2.
Table 2Comparison of the test results of FCS1 (own pilot-scale samples) with field samples from Schriefer (2013; 2014a; 2014b). Heavy metal contents (mg/kg) based on dry matter asa function of depth (three layers).
Type of sample Pilot-scale samples Field samples
Blank Loaded Blank Berlin Bristol Würzburg Würzburg
Service life 0 years 10 years 0 years 9 years 8 years 4 years 9 years
Element Cu Zn Cu Zn Cua Zn Cu Zn Cu Zn Cu Zn Cu Zn0e10 cm 23 51 70 468 5e11 23 39 186 206 1130 19 434 165 61010e20 cm 23 51 51 332 5e11 23 13 52 44 230 8 51 e e
20e30 cm 23 51 36 160 5e11 23 12 44 29 129 6 55 e e
Average 23 51 52 320 5e11 23 21 94 93 496 11 180 e e
a Range of contents.
Table 3Comparison of the test results of FCS2with field samples. Heavymetal contents (mg/kg) based on dry matter as a function of depth (six layers).
Type of sample Pilot-scale samples Field samples
Blank Loaded Blank Augsburg Augsburg
Service life 0 years 10 years 0 years 4 years 4 years
AF: AU e 2.1% e 4.8% 2.4%
Element Cu Zn Cu Zn Cu Zn Cu Zn Cu Zn0e3 cm 3.5 5.0 e e 3.1 6.4 351 1080 379 12703e6 cm 3.5 5.0 e e 3.1 6.4 204 533 453 10606e9 cm 3.5 5.0 e e 3.1 6.4 24.6 149 370 8499e12 cm 3.5 5.0 e e 3.1 6.4 26.7 109 229 44212e15 cm 3.5 5.0 e e 3.1 6.4 9.8 36.6 41.4 94.113e18 cm 3.5 5.0 e e 3.1 6.4 11.3 52.9 13.9 55.5Average 3.5 5.0 57 458 3.1 6.4 105 327 248 628
M. Huber et al. / Journal of Environmental Management 179 (2016) 66e7572
13
and the presence of a guardrail. All samples had a similar behaviorto the samples of FCS1: the contents of Zn were higher than thecontents of Cu, the contents decreased in flow direction, and themetal contents of the field samples were higher compared with thepilot-scale samples for comparable ratios of AF:AU. This is alsolinked to the missing mechanical pre-treatment step. Nevertheless,a comparison of the field and pilot-scale results proves the appli-cability of the test method for this highly polluted site.
In summary, the field sample contents of Cu and Zn variedwidely at different locations because of individual site-specificfactors. Furthermore, the time of operation and the ratio of AF toAU (i.e., the same channel with different catchment areas) differedbetween several samples. However, as a result of these compari-sons, the applicability of the novel test method was verifiedbecause the heavy metal contents of the pilot-scale samples werein a realistic range and showed mostly conservative results.Therefore, the test results can be used by stakeholders to managestormwater treatment challenges.
5

M. Huber et al. / Journal of Environmental Management 179 (2016) 66e75 73
4.2. Criteria for assessing performance data of treatment systems
Themain objective of this paper was the development of a pilot-scale method to determine the service life and the long-term per-formance of decentralized treatment systems. This method hasbeen tested for nine systems (cf. Table 1). The assessment of thedifferent system performances under these pilot-scale conditionsdepends on specific boundary conditions of the operation site andis varying because of different requirements in several countries. Asa guideline to assess the removal efficiencies determined in Part 2,different criteria concerning heavy metal removal are summarizedin the following.
In Germany, the DIBt can approve decentralized systems forgroundwater infiltration of runoff from traffic areas after passingseveral tests. One part of this laboratory test investigates theremoval of dissolved heavy metals. The requested elimination is80% for Cu and 70% for Zn (on average) (DIBt, 2015).
In the State of Washington (USA), the performance goals ofstormwater treatment systems have been summarized in theTechnical Guidance Manual for Evaluating Emerging StormwaterTreatment Technologies of TAPE (Department of Ecology (2011);Sample et al., 2012). Besides requirements for the “basic treat-ment”, which include the removal of total suspended solids,“enhanced treatment” facilities must exceed a removal of 30%dissolved Cu and 60% dissolved Zn in a field monitoring.
In Switzerland, requirements are evaluated on the basis of ab-solute effluent concentrations discharging into receiving water,removal efficiencies, specific surface loadings, and hydraulic per-formances (Steiner et al., 2010). In addition to other parameters, thetotal heavymetal concentrations and removal efficiencies of Cu andZn were considered as indicators for the performance of storm-water treatment systems. Furthermore, potential removal effi-ciencies of technical treatment systems have been categorized. Forthe Cu and Zn removal efficiencies, a range of <60% to >90% ispostulated by classifying five different levels of treatment quality(Steiner et al., 2010). These categories are used to compare differenttypes of systems after a field monitoring of at least twelve months.
A similar approach is used in Australia (Victorian StormwaterCommittee, 2006). For tertiary treatment systems (e.g., filter sys-tems), a range of treatment performances has been defined fordissolved pollutants including Cu and Zn. For a moderate treatmentperformance, a removal of >40% is postulated.
In summary, the effluent requirements of the different guide-lines vary widely and can be directly linked to the results of Part 2 ofthis pilot-scale test method (cf. Table 1). The requirements repre-sent local regulations, which depend on the receiving water(groundwater or surface water), site-specific factors, and types ofconnected catchment areas/systems. The guidelines can be used bystormwater managers to classify different decentralized systems.
4.3. Impact of the novel method
Although stormwater runoff waters consist of many differentpollutants, the use of the most common dissolved heavy metalsensured that the testing procedure remained relatively straightforward and can be easily performed (Dierkes et al., 2015a). Becausefield measurements are expensive and take several years, a pilot-scale method can be used to evaluate filter systems within daysand should be used before their application.
The results of the novel test method provide regulatory au-thorities, designers, and operators with a more objective basis forperformance assessment. With this method, the estimated servicelives of the filter materials of decentralized stormwater treatmentsystems can be verified or discarded. This is in contrast to theo-retical approaches that can only be used to rank different systems
136
without determining removal efficiencies (Scholes et al., 2008). Thenovel standardized protocol also verifies the long-term perfor-mances of the systems, although the runoff water quality and thetreatment technologies of decentralized systems are variable(Sample et al., 2012). The efficiencies of the treatment plants, whichare measured in Part 2 (cf. Table 1), can be linked to differentguidelines/regulations (cf. Section 4.2) and the measured effluentconcentrations are also relevant to allow infiltration or discharge tosurface water. The results enable stakeholders to identify realisticservice intervals of the decentralized stormwater treatment sys-tems independently from the manufacturer's statements. Thus, thecosts for maintenance can be better calculated and a reliablecomparison of different systems is achieved by these tests. A real-istic service life also enables a sustainable use of the filter materials.
In contrast to the novel method, which is based on pilot-scalemodels of the decentralized stormwater treatment systems, lab-scale models are only suitable to roughly estimate the servicelives of these systems. For example, the maximum contents of Cuand Zn for FSS3 determined by batch experiments were 14,400 mg/kg and 24,000 mg/kg, respectively. These contents were severaltimes higher than the ones measured in this study (1100 mg/kg forCu and 9560 mg/kg for Zn). The results concerning the granularferric hydroxide of FSS3 are comparable with other filter materials(Huber et al., 2016b). In addition, batch experiments are not suit-able to assess the removal efficiencies under flow conditions withappropriate solid-to-solution-ratios (Bürgisser et al., 1993; Poddaret al., 2013). As a benefit, the pilot-scale experiments of this studydescribe the reality better than lab-scale column experiments (e.g.,inner diameter of approximately 20 mm) because the real flowpaths and contact times of the full-scale systems can be imple-mented in the pilot-scale models by using the original grain sizes ofthe filter media. Furthermore, individual models for each systemcan also be implemented by pilot-scale models (cf. FCS).
In other studies, permeable pavements were tested with thesame rain-simulating-device that was used for the FCS in this study(Fach et al., 2001; DIBt, 2012). Thus, it is theoretically possible toperform tests with this method to determine the service lives ofFCS, FSS, and permeable pavements that are used to retain pollut-ants such as dissolved heavy metals. In addition, further substancessuch as nutrients can have a crucial impact on the receiving water(Sample et al., 2012). An application of nutrients and further metalsis possible after a calculation of the annual loads. For example, thismethod was successfully expanded to evaluate the simultaneousremoval of Cu, Zn, and phosphor by the FSS6 (annual load ofphosphor: 101 mg/m2). Both the service life and the long-termperformance of the system were determined for all threesubstances.
4.4. Restrictions of the novel method
This novel method does not consider all boundary conditionsthat have an influence on the service life. Service lives that arelimited because of a hydraulic failure of the plant (cf. Section 1)cannot be determined by this assessment method. To determinethis factor, decentralized systems must be monitored at severalsites over periods of some years. In addition, the presence of otherdissolved contaminants in stormwater runoff (both further metalsand other non-metals), which are currently not implemented intothe novel assessment method, may influence the performance andthe service life of the filter.
In this study, the effect of de-icing salts on the remobilization ofheavy metals was not considered. De-icing salts such as sodiumchloride, calcium chloride, and magnesium chloride are mostlyused on traffic areas (B€ackstr€om et al., 2004; Nelson et al., 2009;Huber et al., 2015b). For example, sodium chloride can lead to an

M. Huber et al. / Journal of Environmental Management 179 (2016) 66e7574
increase of heavy metal concentrations in the effluent of technicaldecentralized systems such as constructed wetlands (Tromp et al.,2012). The effect of all three de-icing salts on filter systems willbe published elsewhere.
5. Conclusions
Decentralized filter systems are an integral part for the man-agement of urban stormwater runoff. By implementing theassessment method developed in this study, it was possible tocharacterize the performance of nine different filter systems. Thus,the developed method can be used to determine the filter materialservice lives and the changes in the long-term performance of theremoval efficiencies by the two authoritative parameters Cu and Zn.The estimated service lives were confirmed for all systems. How-ever, the retention efficiencies varied significantly between thenine filter systems because of different filter materials and filtersystem designs. The removal efficiencies decreased with an in-crease of the flow rate, the exhaustion of the capacities, the ratio ofdrainage area to filter material surface area, and the dissolved partof the heavy metals (i.e., a decrease of the pH value). To assess theefficiencies, different guidelines of authorities were summarized tocorrelate local regulations with the test criteria of this study. Lowerperformances can be suitable for distinct receiving waters whereasthe same efficiencies might not be appropriate for other treatmentgoals because of local requirements. The validation of the results fortwo channel systems confirmed the applicability of the novel testmethod despite different site-specific characteristics. In summary,the method provides regulatory authorities, designers, and opera-tors with a more standardized basis for performance assessment.
Acknowledgement
This research was supported by the Bavarian EnvironmentAgency (Bayerisches Landesamt für Umwelt, 76e133). The rain-simulating-device for the channel systems was provided as a loanby TÜV Rheinland LGA Products GmbH, Würzburg, Germany. Thetesting of two decentralized shaft systems was supported by theMinistry for Climate Protection, Environment, Agriculture, Con-servation and Consumer Protection of the State of North Rhine-Westphalia (MKUNLV, IV-7-042 600 002E), and the Hessen StateMinistry of Higher Education, Research and the Arts (LOEWE, HA-Projekt-Nr.: 173/12).
References
APHA, 2005. Standard Methods for the Examination of Water and Wastewater,twenty-first ed. American Public Health Association, Washington, D.C,pp. 1e184.
B€ackstr€om, M., Karlsson, S., B€ackman, L., Folkeson, L., Lind, B., 2004. Mobilisation ofheavy metals by deicing salts in a roadside environment. Water Res. 38,720e732.
Bayerisches Landesamt für Umwelt, 2008. Prüfkriterien zur Beurteilung vonAnlagen zum Rückhalt von Metallionen aus Niederschlagsabflüssen von Met-alld€achern e Festlegung von Regenspenden und Prüfdauern (Criteria for theassessment of systems for the retention of metal ions from metal roof runoff edetermination of rain intensities and test durations). Augsburg. (In German).
Bürgisser, C.S., Cernik, M., Borkovec, M., Sticher, H., 1993. Determination ofnonlinear adsorption isotherms from column experiments: an alternative tobatch studies. Environ. Sci. Technol. 27, 943e948.
CH2MHILL, 1998. Highway Stormwater Runoff Study. The Michigan Department ofTransportation, pp. 1e48.
Department of Ecology, 2011. Guidance for Evaluating Emerging StormwaterTreatment Technologies: Technology Assessment Protocol e Ecology (TAPE).Washington State Department of Ecology, Olympia, WA, pp. 1e59 publicationnumber 02-10-037.
DIBt, 2012. Zulassungsgrunds€atze für Niederschlagswasserbehandlungsanlagen.Teil 2: Wasserdurchl€assige Bel€age für Kfz-Verkehrsfl€achen für die Behandlungdes Abwassers zur anschließenden Versickerung in Boden und Grundwasser(Abwasserbehandelnde Fl€achenbel€age) (Approval guidelines for stormwater
13
treatment systems. Part 2: Permeable pavements for vehicle traffic areas for thetreatment of wastewater for subsequent discharge into soil and groundwater(wastewater treating permeable pavements)). Deutsches Institut für Bau-technik, Berlin (In German).
DIBt, 2015. Zulassungsgrunds€atze für Niederschlagswasserbehandlungsanlagen.Teil 1: Anlagen zur dezentralen Behandlung des Abwassers von Kfz-Ver-kehrsfl€achen zur anschließenden Versickerung in Boden und Grundwasser(Approval guidelines for stormwater treatment systems. Part 1: systems for thedecentralized treatment of wastewater from vehicle traffic areas for subsequentdischarge into soil and groundwater). Deutsches Institut für Bautechnik, Berlin(In German).
Dierkes, C., Lucke, T., Helmreich, B., 2015a. General technical approvals for decen-tralised sustainable urban drainage systems (SUDS)dThe current situation inGermany. Sustainability 7, 3031e3051.
Dierkes, C., Welker, A., Dierschke, M., 2015b. Approval of technical SUDS in Ger-many. In: E-Proceedings of the 36th IAHR Word-Congress. 28. June - 3. July,2015. The Hague, the Netherlands.
Eriksson, E., Baun, A., Scholes, L., Ledin, A., Ahlman, S., Revitt, M., Noutsopoulos, C.,Mikkelsen, P.S., 2007. Selected stormwater priority pollutants d a Europeanperspective. Sci. Total Environ. 383, 41e51.
Fach, S., Dierkes, C., Geiger, W.F., 2001. Entwicklung eines Prüfverfahrens für was-serdurchl€assige Fl€achenbel€age (Development of an assessment procedure forpermeable pavements). Agriculture and Consumer protection of North Rhine-Westphalia, file: IV-9-042 235, University of Essen. Final report for theBavarian State Agency of Water Management and for the Ministry of Environ-ment and Nature conservation, (In German).
Folkeson, L., Bækken, T., Bren�ci�c, M., Dawson, A., Fran�cois, D., Ku�rímsk�a, P., Leit~ao, T.,Li�cbinský, R., Vojt�e�sek, M., 2009. Sources and fate of water contaminants inroads. In: Dawson, A. (Ed.), Water in Road Structures e Movement, Drainageand Effects. Springer, Netherlands, pp. 107e146.
Fraga, I., Charters, F.J., O'Sullivan, A.D., Cochrane, T.A., 2016. A novel modellingframework to prioritize estimation of non-point source pollution parametersfor quantifying pollutant origin and discharge in urban catchments. J. Environ.Manag. 167, 75e84.
Genç-Fuhrman, H., Mikkelsen, P.S., Ledin, A., 2007. Simultaneous removal of As, Cd,Cr, Cu, Ni and Zn from stormwater: experimental comparison of 11 differentsorbents. Water Res. 41, 591e602.
Helmreich, B., Hilliges, R., Schriewer, A., Horn, H., 2010. Runoff pollutants of a highlytrafficked urban road e Correlation analysis and seasonal influences. Chemo-sphere 80, 991e997.
Hilliges, R., Schriewer, A., Helmreich, B., 2013. A three-stage treatment system forhighly polluted urban road runoff. J. Environ. Manag. 128, 306e312.
Horstmeyer, N., Huber, M., Drewes, J.E., Helmreich, B., 2016. Evaluation of site-specific factors influencing heavy metal contents in the topsoil of vegetatedinfiltration swales. Sci. Total Environ. 560e561, 19e28.
Huber, M., Welker, A., Helmreich, B., 2015a. Einführung in die dezentrale Nieders-chlagswasserbehandlung für Verkehrsfl€achen- und Metalldachabflüsse:Schacht-/Kompaktsysteme, Rinnensysteme, Straßeneinl€aufe und Fl€achenbel€age(Introduction into the topic decentralized stormwater treatment of runoff fromtraffic areas and metal roofs: shaft systems, channel systems, gully pots, andpermeable pavements) In: Berichte aus der Siedlungswasserwirtschaft, first ed.,Band 213. Technische Universit€at München, Garching (In German).
Huber, M., Welker, A., Drewes, J.E., Helmreich, B., 2015b. Auftausalze im Stra-ßenwinterdienst e Aufkommen und Bedeutung für dezentrale Behand-lungsanlagen von Verkehrsfl€achenabflüssen zur Versickerung (De-icing Salts inRoads Maintenance e Occurrence and Impact on Decentralized SystemsTreating Traffic Area Runoff for Infiltration). gwf Wasser/Abwasser 156,1138e1152 (In German).
Huber, M., Welker, A., Helmreich, B., 2016a. Critical review of heavy metal pollutionof traffic area runoff: occurrence, influencing factors, and partitioning. Sci. TotalEnviron. 541, 895e919.
Huber, M., Badenberg, S.C., Wulff, M., Drewes, J.E., Helmreich, B., 2016b. Evaluationof factors influencing lab-scale studies to determine heavy metal removal by sixsorbents for stormwater treatment. Water 8 (62), 1e19.
Inamdar, P.M., Cook, S., Sharma, A.K., Corby, N., O'Connor, J., Perera, B.J.C., 2013.A GIS based screening tool for locating and ranking of suitable stormwaterharvesting sites in urban areas. J. Environ. Manag. 128, 363e370.
Kayhanian, M., 2012. Trend and concentrations of legacy lead (Pb) in highwayrunoff. Environ. Pollut. 160, 169e177.
Kayhanian, M., Fruchtman, B.D., Gulliver, J.S., Montanaro, C., Ranieri, E., Wuertz, S.,2012. Review of highway runoff characteristics: comparative analysis anduniversal implications. Water Res. 46, 6609e6624.
Kayhanian, M., Suverkropp, C., Ruby, A., Tsay, K., 2007. Characterization and pre-diction of highway runoff constituent event mean concentration. J. Environ.Manag. 85, 279e295.
Liu, D., Sansalone, J.J., Cartledge, F.K., 2005. Comparison of sorptive filter media fortreatment of metals in runoff. J. Environ. Eng. 131, 1178e1186.
Maniquiz-Redillas, M., Kim, L.-H., 2014. Fractionation of heavy metals in runoff anddischarge of a stormwater management system and its implications for treat-ment. J. Environ. Sci. 26, 1214e1222.
Mercado, J.M.R., Maniquiz-Redillas, M.C., Kim, L.-H., 2015. Laboratory study on theclogging potential of a hybrid best management practice. Desalin. Water Treat.53, 3126e3133.
Nelson, S., Yonge, D., Barber, M., 2009. Effects of road salts on heavy metal mobilityin two eastern Washington soils. J. Environ. Eng. 135, 505e510.
7

M. Huber et al. / Journal of Environmental Management 179 (2016) 66e75 75
NJDEP, 2009. Protocol for Total Suspended Solids Removal Based on Field Testing.In: Amendments to TARP Protocol. August 5, 2009. Department of Environ-mental Protection, State of New Jersey, pp. 1e8.
NJDEP, 2013. Procedure for Obtaining Verification of a Stormwater ManufacturedTreatment Device from New Jersey Corporation for Advanced Technology.Department of Environmental Protection, State of New Jersey, pp. 1e11.
O'Sullivan, A.D., Wicke, D., Hengen, T.J., Sieverding, H.L., Stone, J.J., 2015. Life CycleAssessment modelling of stormwater treatment systems. J. Environ. Manag.149, 236e244.
Poddar, M., Nair, A.N.B., Mahindrakar, A.B., 2013. A review on the use of rapid smallscale column test (RSSCT) on predicting adsorption of various contaminants.J. Of Environ. Sci. Toxicol. And Food Technol. 3, 77e85.
Revitt, D.M., Lundy, L., Coulon, F., Fairley, M., 2014. The sources, impact and man-agement of car park runoff pollution: a review. J. Environ. Manag. 146, 552e567.
Roeva, N.N., Rovinskii, F.Y., Kononov, E.Y., 1996. Special features of the behavior ofheavy metals in various natural environments. J. Anal. Chem. 51, 352e364.
Roger, S., Montrejaud-Vignoles, M., Andral, M.C., Herremans, L., Fortune, J.P., 1998.Mineral, physical and chemical analysis of the solid matter carried by motorwayrunoff water. Water Res. 32, 1119e1125.
Sample, D.J., Grizzard, T.J., Sansalone, J., Davis, A.P., Roseen, R.M., Walker, J., 2012.Assessing performance of manufactured treatment devices for the removal ofphosphorus from urban stormwater. J. Environ. Manag. 113, 279e291.
Sansalone, J.J., Buchberger, S.G., 1997. Characterization of solid and metal elementdistributions in urban highway stormwater. Water Sci. Technol. 36, 155e160.
Scholes, L., Revitt, D.M., Ellis, J.B., 2008. A systematic approach for the comparativeassessment of stormwater pollutant removal potentials. J. Environ. Manag. 88,467e478.
Scholz, M., 2015. Sustainable drainage systems. Water 7, 2272e2274.Schriefer, T., 2013. Projekt Berliner Stadtreinigung, Recyclinghof “Spindlersfeld”.
Niederschlagswasserbehandlung in vorgefertigten Sickermulden mit Substrat(Project Berliner Stadtreinigung, buyback center “Spindlersfeld”. Stormwatertreatment in channel systems with filter media). Lemwerder, August 2013. (InGerman).
138
Schriefer, T., 2014a. Projekt: Hornbach e Würzburg. Nieders-chlagswasserbehandlung in vorgefertigten Sickermulden mit Substrat (Project:Hornbach e Würzburg. Stormwater treatment in channel systems with filtermedia). Lemwerder, Juni 2014. (In German).
Schriefer, T., 2014b. Projekt: B & Q Car Park Cribbs Causeway Bristol 10 7TX. Nie-derschlagswasserbehandlung in vorgefertigten Sickermulden mit Substrat(Project: B & Q Car Park Cribbs Causeway Bristol 10 7TX. Stormwater treatmentin channel systems with filter media). Lemwerder, November 2014. (InGerman).
Steiner, M., Goosse, P., Rutz, F., Brodmann, R., Pazeller, A., 2010. Stra-ßenabwasserbehandlungsverfahren, Stand der Technik (Road runoff treatmentsystems, state of art analysis). Bundesamt für Straßen ASTRA. Bundesamt fürUmwelt BAFU, Bern, pp. 1e130 (In German).
Tiefenthaler, L.L., Schiff, K.C., Bay, S.M., 2001. Characteristics of Parking Lot RunoffProduced by Simulated Rainfall. Technical Report 343, pp. 1e67.
Timperley, M., Williamson, B., Mills, G., Horne, B., Hasan, M.Q., 2005. Sources andLoads of Metals in Urban Stormwater. National Institute of Water & Atmo-spheric Research Ltd, pp. 1e80.
Tromp, K., Lima, A.T., Barendregt, A., Verhoeven, J.T.A., 2012. Retention of heavymetals and poly-aromatic hydrocarbons from road water in a constructedwetland and the effect of de-icing. J. Hazard. Mater. 203e204, 290e298.
Victorian Stormwater Committee, 2006. Urban Stormwater: Best Practice Envi-ronmental Management Guidelines. Commonwealth Scientific and IndustrialResearch Organisation, pp. 1e268.
Welker, A., 2005. Schadstoffstr€ome im urbanen Wasserkreislauf e Aufkommen undVerteilung, insbesondere in den Abwasserentsorgungssystemen (Pollutants inthe urban water cycle e occurrence and fate, particularly in the sanitationsystems). In: Habilitationsschrift, Band 20. Schriftenreihe der TU Kaiserslautern,FG Siedlungswasserwirtschaft aktualisierter Anhangband, 2005/2013. (InGerman).
Wilson, D., 2006. Highway 520 Bridge Storm Water Runoff Study. King CountyWater and Land Resources Division, Department of Natural Resources andParks, pp. 1e66.

Chapter 8: Research Paper: “De‐icing Salts in RoadsMaintenance –
Occurrence and Impact on Decentralized Systems Treating Traffic
AreaRunoffforInfiltration”
The use of de‐icing salts in road maintenance and their occurrence in runoff from traffic areas must
be determined for the implementation of a more standardized method to test the influence of
de‐icing salts on the remobilization of previously retained heavy metals (cf. Chapter 9). A detailed
survey was conducted to collect data about the application of de‐icing salts from German authorities
that use de‐icing salts for winter services on roads, parking lots, and bikeways. Thereby, the used
loads of de‐icing salts were evaluated for selected German roads and highways. In addition, the total
consumptions were summarized for three federal states, also for different categories of traffic areas.
In addition, the database of the reviews (cf. Chapter 5) was used to summarize runoff data from
Germany, Austria, and Switzerland. The presented runoff concentrations included the de‐icing salt
compounds Ca, Cl, CN, K, Mg, and Na. The corresponding hypothesis was:
Different types and amounts of de‐icing salts are used in road maintenance by German authorities
(Hypothesis 6).
The evaluation of the de‐icing salt use showed that the amount of salts used per year has increased
in the last decades although new and more efficient techniques were implemented. Furthermore,
the annual loads of salt per m² highway surface were higher compared with the values for state
roads. Moreover, each authority and municipality uses different types of de‐icing salts. Sodium
chloride is the most commonly used de‐icing salt. Mixtures of sodium chloride with calcium chloride
or magnesium chloride are also used. In some cases, pure brines of calcium chloride or magnesium
chloride are used in Germany. In addition, the runoff concentrations from traffic areas confirmed
that the de‐icing salts occur in high concentrations (several g/L). Thus, de‐icing salts are relevant
constituents of runoff from traffic areas in moderate and cold climates with winter services. They can
have an effect on decentralized stormwater treatment systems because of their high concentrations,
e.g., 50.3 g/L Na (Jenewein & Schinner, 1982), and their behavior (Nelson et al., 2009).
In addition, three different methods (cf. Section 2.2.1, Section 7.1, and Chapter 9) were compared
that can be used to evaluate the impact of de‐icing salts on decentralized treatment systems for
infiltration into the soil and groundwater system.
The following paper was published in gwf Wasser/Abwasser 156, 1138–1152. Most of the runoff data
were based on the database, which was created for the reviews (cf. Chapter 5). Huber collected
further research data, performed a survey to get more data from German authorities, evaluated all
documents, and wrote the manuscript. All authors contributed to the discussions and conclusions.
139

1138 gwf-Wasser | Abwasser 11/2015
Auftausalze im Straßenwinter-dienst – Aufkommen und Bedeu-tung für dezentrale Behandlungs-anlagen von Verkehrsflächen-abflüssen zur VersickerungMaximilian Huber, Antje Welker, Jörg E. Drewes und Brigitte Helmreich
Regenwasserbewirtschaftung, Auftausalzverbrauch, Labormethoden, Niederschlagswasserbehand-lungsanlagen, Verkehrsflächenabflusskonzentrationen
In Deutschland werden Natrium-, Calcium- und Magnesiumchlorid sowie deren Mischungen als Auftausalze im Straßen-winterdienst verwendet. Diese Auftausalze werden mit Ausnahme kleinerer Kommunen als Feuchtsalz ausgebracht und werden meist in den Monaten November bis April in den Verkehrsflächenabflüssen wiedergefunden. Dabei werden vereinzelt mehr als 10 g/L Salz in Verkehrsflächenabflüssen gemessen. Diese im Vergleich zu anderen Schadstoffen deutlich höheren Konzentrationen können die Behandlungsprinzipien dezentraler Anlagen zur Verkehrsflächenabfluss-behandlung negativ beeinflussen. Eine Remobilisierung bereits zurückgehaltener Schadstoffe durch die verwendeten Auftausalze ist möglich. Zur Quantifizierung des Remobilisierungsrisikos wurden zwei Labormethoden entwickelt. Anhand dieser Methoden kann die Einhaltung der rechtlichen Anforderungen auch während des Einsatzes von Auftau-salzen untersucht werden.
De-icing Salts in Roads Maintenance – Occurrence and Impact on Decentralized Systems Treating Traffic Area Runoff for Infiltration
In Germany, sodium, calcium and magnesium chloride and their mixtures are used as de-icing salts in winter roads maintenance. With the exception of small municipalities, pre-wetting technologies are used for spreading the salt on the roadway and de-icing salts are usually found in the months of November to April in traffic area runoff waters. Salt concentrations higher than 10 g/L are sometimes measured in traffic area runoff. These concentrations are significantly higher compared with other pollutants and may negatively affect the treatment steps of decentralized stormwater treatment systems for traffic area runoff. A remobilization of pollutants by the use of each de-icing salt is possible. To quantify the risk of remobilization, two laboratory-scale test methods were developed. By these methods, the comp-liance with legal requirements can be examined during the use of de-icing salts.
1. EinleitungVerkehrsflächenabflüsse können mit einer Vielzahl von Stoffen, wie Schwermetallen, Mineralölkohlenwasserstoffen (MKW), Polycyclischen Aromatischen Kohlenwasserstoffen (PAK), Ethyl-tert-butylether (ETBE), Methyl-tert-butylether
(MTBE) sowie Auftausalzen, verunreinigt sein und bedürfen oftmals vor der Einleitung in ein Gewässer einer Behand-lung. Unter diesen Verunreinigungen weisen besonders die Bestandteile der Auftausalze starke saisonale Schwan-kungen auf. Diese sind aufgrund der in den Wintermonaten
FACHBERICHTE Regenwasserbewirtschaftung
140
1139gwf-Wasser | Abwasser 11/2015
Regenwasserbewirtschaftung FACHBERICHTE
(Ende Oktober bis April) deutlich erhöhten Abflusskonzen-trationen aufkommensrelevant. Der Verbrauch an Auftau-salzen unterliegt dabei örtlichen und jährlichen Schwan-kungen.
Zur Behandlung von Verkehrsflächenabflüssen wurden in den letzten Jahren zahlreiche dezentrale Anlagen als Alternativen zu zentralen Anlagen, wie Regenklärbecken bzw. Retentionsbodenfiltern, entwickelt, um die Abflüsse von versiegelten Flächen vor Ort zu bewirtschaften. Dabei müssen die dezentralen Anlagen für die anschließende Versickerung weitergehende Anforderungen an den Schad-stoffrückhalt berücksichtigen, welche meist durch eine Kombination aus einer mechanisch-physikalischen Behand-lung und einem oder mehreren (bio-)chemischen Verfah-ren erfüllt werden. Die Verfahrenskombinationen der de-zentralen Anlagen zur Versickerung müssen dabei die rechtlichen Rahmenbedingungen beachten, welche sich derzeit aus den Prüfwerten der Bundes-Bodenschutz- und Altlastenverordnung (BBodSchV) für den Wirkungspfad Boden-Grundwasser [1] und der Einführung der Verord-nung zum Schutz des Grundwassers (GrwV) [2] ergeben. Diese Prüfwerte sind so definiert, dass bei deren Einhaltung trotz einer möglichen Erhöhung der Konzentration im Grundwasser keine relevanten toxikologischen Wirkungen auftreten können. Beispielsweise sind als Parameter nicht nur Schwermetalle aufgeführt, sondern auch Chlorid und Cyanide, welche Bestandteile von Auftausalzen und der darin verwendeten Antibackmittel sind [3].
Dezentrale Anlagen zur Behandlung von Verkehrsflä-chenabflüssen für die anschließende Versickerung können bundesweit durch das Deutsche Institut für Bautechnik (DIBt) geprüft und zugelassen werden [4]. Wichtigster Punkt der Zulassungsgrundsätze ist die Wirksamkeitsprüfung der Behandlungsanlage unter Laborbedingungen, anhand derer der Rückhalt an Abfiltrierbaren Stoffen (AFS), MKW und Schwermetallen ermittelt wird. Anschließend wird in der Teilprüfung zum Salzeinfluss auf den Zink- und Kup-ferrückhalt die Beständigkeit der eingesetzten Filtermate-rialien gegenüber Natriumchlorid (NaCl) als repräsenta-tivem Auftausalz untersucht. Jedoch ist bei diesem Prüf-verfahren derzeit keine detaillierte Methodik zur Ermittlung des Einflusses weiterer Auftausalze auf die Remobilisierung von auf Filtermaterialien zurückgehaltenen Schadstoffen vorhanden. Folglich gibt es aktuell keine dezentrale Be-handlungsanlage für Verkehrsflächenabflüsse in Deutsch-land, bei der die Filterstabilität aller aufkommensrelevanten Auftausalze, welche seit Jahren im differenzierten Winter-dienst (Unterscheidung der Wahl des Streustoffes und der ausgebrachten Menge nach Straßenkategorien, deren Trassierung und dem Einsatzfall) verwendet werden [5], nachgewiesen wurde. Daher ist die Entwicklung einer Me-thodik zur Durchführung weitergehender Untersuchungen für die Bestimmung einer möglichen Remobilisierung von bereits auf Filtermaterialien zurückgehaltenen Schwerme-
tallen durch die auf deutschen Straßen verwendeten Auf-tausalze notwendig.
In diesem Beitrag wird ausgehend von der Darstellung des Verbrauchs der Auftausalze im Straßenwinterdienst und der in Messprogrammen bestimmten Abflusskonzen-trationen der fünf wichtigsten Auftausalzbestandteile (Cal-cium (Ca), Chlorid (Cl), Kalium (K), Magnesium (Mg) und Natrium (Na)) erläutert, welche Einflüsse Auftausalze auf die Behandlung von Verkehrsflächenabflüssen in dezent-ralen Anlagen zur anschließenden Versickerung haben. Abschließend werden zwei Methoden zur Bestimmung der Salzstabilität dezentraler Anlagen unter aufkommens-relevanten Auftausalzen im Labor vorgestellt, anhand de-rer die Wirksamkeit der Filtermaterialien – auch während des Einsatzes von Auftausalzen – nachgewiesen werden kann. Die Verknüpfung dieser Aspekte ermöglicht es, die Einflüsse der Auftausalzverwendung auf die dezentrale Verkehrsflächenabflussbehandlung unter Berücksichtigung rechtlicher Vorgaben zu erfassen.
2. Auftausalze im StraßenwinterdienstDas in Deutschland auf Straßen am häufigsten verwen dete Auftausalz ist NaCl, wobei Auftausalze wie Calciumchlorid (CaCl2) und Magnesiumchlorid (MgCl2) sowie deren Mischungen im Feuchtsalz (FS) seit Jahren zusätzlich im Straßenwinterdienst verwendet werden. Dabei wird zwi-schen Feuchtsalz, das 30 % Sole (Salzlösung) und 70 % Trockensalz enthält (FS30) und solches, das 100 % Sole (FS100, Flüssigstreuung) enthält, unterschieden [6]. Als Aus-gangskonzentrationen der Lösungen werden meist 21–23 Massen (M.)-% NaCl, 20–21 M.-% CaCl2 bzw. 17,5 M.-% MgCl2 verwendet. Diese drei Stoffe werden auch in der aktuell geltenden TL-Streu (Technische Lieferbedingungen für Streustoffe des Straßenwinterdienstes) als Einzige neben den abstumpfenden Streustoffen (Sand, Splitt) aufgeführt [3]. Bei der Wahl der verwendeten Auftausalze spielt sowohl der Preis, die regionale Verfügbarkeit, die Tauwirksamkeit, als auch die Taugeschwindigkeit eine wesentliche Rolle [7]. Dabei werden die CaCl2- und MgCl2-Solen besonders bei Meistereien eingesetzt, die einen hohen Anteil an Stei-gungsstrecken und gegebenenfalls weitere lokale Beson-derheiten, wie Engstellen und Brücken, unterhalten [8]. Weitere Stoffe, wie Formiate, Acetate, Harnstoffe, Alkohole und Glykole, werden derzeit für den Einsatz auf Straßen in Deutschland nicht empfohlen [6, 9], werden aber beispiels-weise auf Flughäfen zur Enteisung verwendet.
2.1 Auftausalzverbrauch in DeutschlandIn den letzten Jahrzehnten ist trotz der flächendeckenden Einführung des differenzierten Winterdienstes [8] und der zunehmenden Umstellung auf Feuchtsalztechnik FS30 sowie neuerdings auf Flüssigstreuung FS100 [10] der gesamte Auf-tausalzverbrauch in Deutschland gestiegen. Als repräsen-
141
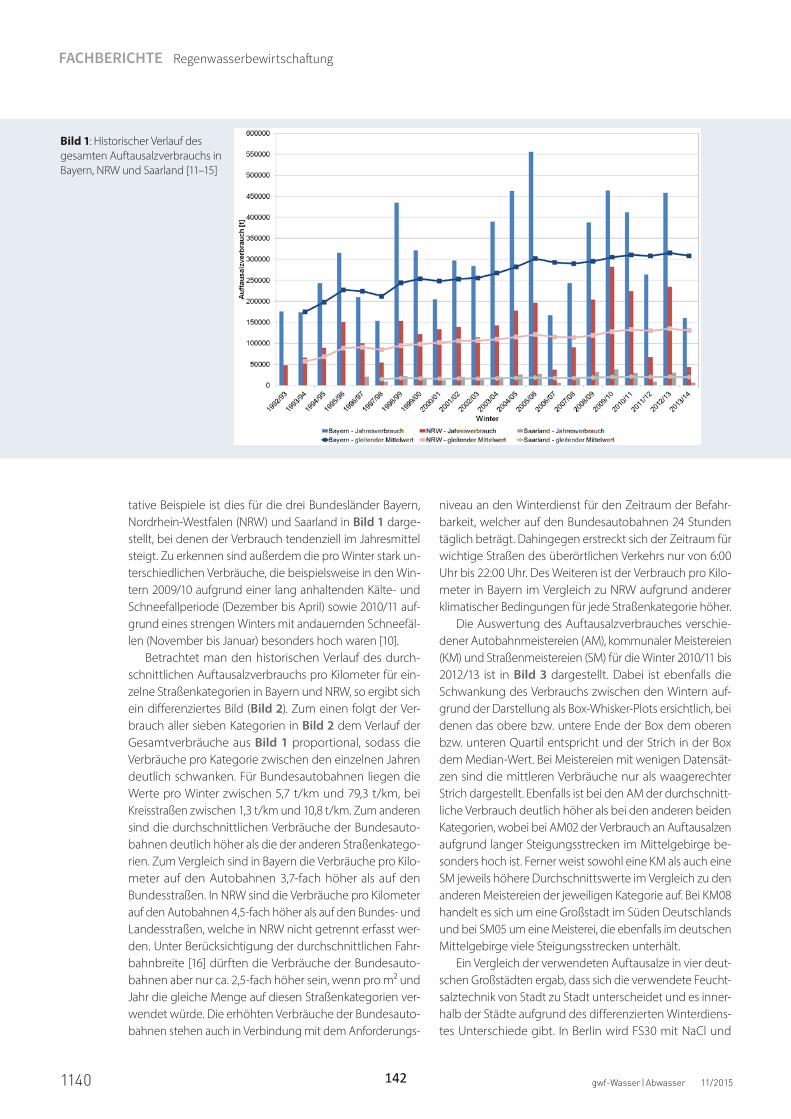
1140 gwf-Wasser | Abwasser 11/2015
FACHBERICHTE Regenwasserbewirtschaftung
tative Beispiele ist dies für die drei Bundesländer Bayern, Nordrhein-Westfalen (NRW) und Saarland in Bild 1 darge-stellt, bei denen der Verbrauch tendenziell im Jahresmittel steigt. Zu erkennen sind außerdem die pro Winter stark un-terschiedlichen Verbräuche, die beispielsweise in den Win-tern 2009/10 aufgrund einer lang anhaltenden Kälte- und Schneefallperiode (Dezember bis April) sowie 2010/11 auf-grund eines strengen Winters mit andauernden Schneefäl-len (November bis Januar) besonders hoch waren [10].
Betrachtet man den historischen Verlauf des durch-schnittlichen Auftausalzverbrauchs pro Kilometer für ein-zelne Straßenkategorien in Bayern und NRW, so ergibt sich ein differenziertes Bild (Bild 2). Zum einen folgt der Ver-brauch aller sieben Kategorien in Bild 2 dem Verlauf der Gesamtverbräuche aus Bild 1 proportional, sodass die Verbräuche pro Kategorie zwischen den einzelnen Jahren deutlich schwanken. Für Bundesautobahnen liegen die Werte pro Winter zwischen 5,7 t/km und 79,3 t/km, bei Kreisstraßen zwischen 1,3 t/km und 10,8 t/km. Zum anderen sind die durchschnittlichen Verbräuche der Bundesauto-bahnen deutlich höher als die der anderen Straßenkatego-rien. Zum Vergleich sind in Bayern die Verbräuche pro Kilo-meter auf den Autobahnen 3,7-fach höher als auf den Bundesstraßen. In NRW sind die Verbräuche pro Kilometer auf den Autobahnen 4,5-fach höher als auf den Bundes- und Landesstraßen, welche in NRW nicht getrennt erfasst wer-den. Unter Berücksichtigung der durchschnittlichen Fahr-bahnbreite [16] dürften die Verbräuche der Bundesauto-bahnen aber nur ca. 2,5-fach höher sein, wenn pro m² und Jahr die gleiche Menge auf diesen Straßenkategorien ver-wendet würde. Die erhöhten Verbräuche der Bundesauto-bahnen stehen auch in Verbindung mit dem Anforderungs-
niveau an den Winterdienst für den Zeitraum der Befahr-barkeit, welcher auf den Bundesautobahnen 24 Stunden täglich beträgt. Dahingegen erstreckt sich der Zeitraum für wichtige Straßen des überörtlichen Verkehrs nur von 6:00 Uhr bis 22:00 Uhr. Des Weiteren ist der Verbrauch pro Kilo-meter in Bayern im Vergleich zu NRW aufgrund anderer klimatischer Bedingungen für jede Straßenkategorie höher.
Die Auswertung des Auftausalzverbrauches verschie-dener Autobahnmeistereien (AM), kommunaler Meistereien (KM) und Straßenmeistereien (SM) für die Winter 2010/11 bis 2012/13 ist in Bild 3 dargestellt. Dabei ist ebenfalls die Schwankung des Verbrauchs zwischen den Wintern auf-grund der Darstellung als Box-Whisker-Plots ersichtlich, bei denen das obere bzw. untere Ende der Box dem oberen bzw. unteren Quartil entspricht und der Strich in der Box dem Median-Wert. Bei Meistereien mit wenigen Datensät-zen sind die mittleren Verbräuche nur als waagerechter Strich dargestellt. Ebenfalls ist bei den AM der durchschnitt-liche Verbrauch deutlich höher als bei den anderen beiden Kategorien, wobei bei AM02 der Verbrauch an Auftausalzen aufgrund langer Steigungsstrecken im Mittelgebirge be-sonders hoch ist. Ferner weist sowohl eine KM als auch eine SM jeweils höhere Durchschnittswerte im Vergleich zu den anderen Meistereien der jeweiligen Kategorie auf. Bei KM08 handelt es sich um eine Großstadt im Süden Deutschlands und bei SM05 um eine Meisterei, die ebenfalls im deutschen Mittelgebirge viele Steigungsstrecken unterhält.
Ein Vergleich der verwendeten Auftausalze in vier deut-schen Großstädten ergab, dass sich die verwendete Feucht-salztechnik von Stadt zu Stadt unterscheidet und es inner-halb der Städte aufgrund des differenzierten Winterdiens-tes Unterschiede gibt. In Berlin wird FS30 mit NaCl und
Bild 1: Historischer Verlauf des gesamten Auftausalzverbrauchs in Bayern, NRW und Saarland [11–15]
142

1141gwf-Wasser | Abwasser 11/2015
Regenwasserbewirtschaftung FACHBERICHTE
CaCl2 als Sole verwendet [17]. Dabei werden Auftausalze im Regelfall nur in der Einsatzstufe E1 (Straßen mit beson-derer Verkehrsbedeutung oder öffentlichen Personennah-verkehr) sowie auf den Bundesfernstraßen verwendet [18]. In Frankfurt/Main wird vorwiegend NaCl als Feuchtsalz auf den Hauptverkehrs- und Durchgangsstraßen (Kategorie A) sowie auf Zubringer- und Erschließungsstraßen (Katego-rie B) eingesetzt, wobei zusätzlich wenige Tonnen pro Jahr CaCl2 auf sensiblen Belägen/Fußgängerbrücken sowie mehrere Hundert Tonnen pro Jahr Splitt auf den restlichen Wohnstraßen der Kategorie C verwendet werden [19, 20]. In Hannover wird auf den Straßen (ca. 420 km) sowie den Rad- und Gehwegen der Stufe 1 FS30 mit NaCl und MgCl2 als Sole verwendet, auf Radwegen testweise auch FS100
mit MgCl2 sowie auf Straßen der Kategorie 2 Splitt [21, 22]. Auf den ca. 2300 Straßenkilometern in München wird auf den ca. 805 km Salzrouten FS30 mit NaCl sowie eine Splitt-Streuung in Sonderfällen im Nebenstraßennetz auf einer Länge von ca. 560 km angewandt [23]. Folglich werden aktuell alle drei Auftausalze in deutschen Großstädten in unterschiedlichen Kombinationen verwendet.
2.2 Konzentrationen an auftausalzbedingten Stoffen in VerkehrsflächenabflüssenAufgrund der Unterschiede zwischen den Wintern, den Straßenkategorien sowie den Meistereien sind die Ergeb-nisse der Messprogramme aus Deutschland, Österreich und der Schweiz sehr unterschiedlich (vgl. Tabelle 1). Dabei
Bild 2: Historischer Verlauf des Auf-tausalzverbrauchs in Bayern und NRW getrennt nach Straßenkatego-rien – die Staatsstraßen in Bayern entsprechen den Landesstraßen in NRW [12–14]
Bild 3: Auftausalzverbrauch in Deutschland von verschiedenen Autobahnmeistereien (AM), kommu-nalen Meistereien (KM) und Straßen-meistereien (SM) für die Winter 2010/11 bis 2012/13 (Box-Whisker-Plots: oberes bzw. unteres Ende der Box entspricht dem oberen bzw. unteren Quartil und der Strich in der Box dem Median)
143

1142 gwf-Wasser | Abwasser 11/2015
FACHBERICHTE Regenwasserbewirtschaftung
Tabelle 1: Übersicht der Messprogramme in Deutschland, Österreich und der Schweiz zur Charakterisierung von Auftausalzbestandteilen in Verkehrs-flächenabflüssen; die gesamten Konzentrationen sind in [mg/L] angegeben und in Klammern sind die Mittelwerte (MW), sofern verfügbar, aufgeführt
Land Ort Untersuchungszeitraum DTVEreignis-anzahl
Winter-dienst
Elemente und Konzentrationen Literatur
AUTSalzburger Land, A1,
Schwarzenbergkaserne12.2001–04.2003 > 60 000 29 Ja
5,4–160 Ca (37,0 MW)1,4–5200 Cl (646 MW)
0,7–15 K (3,7 MW)< 0,1–8,3 Mg (2,4 MW)2,4–3400 Na (440 MW)
[44]
AUTSalzburger Land, A1,
Baulos West12.2001–04.2003 > 60 000 29 Ja
15–240 Ca (71,5 MW)1,7–2600 Cl (582 MW)
1,6–13 K (5,6 MW)< 0,1–14 Mg (4,6 MW)5,9–1500 Na (410 MW)
[44]
AUTSalzburger Land, A1,
Messe12.2001–04.2003 > 60 000 29 Ja
13–350 Ca (55,0 MW)1,3–7900 Cl (1255 MW)
0,1–29 K (8,1 MW)< 0,1–10 Mg (2,5 MW)5,4–5700 Na (984 MW)
[44]
AUTTirol, A13,
Steigungsabschnitt– – – –
1–60300 Cl (7537 MW)0,3–193 K (26,6 MW)
1,1–50250 Na (5467 MW)[45]
AUTTirol, A13,
Mautstelle– – – –
1–7816 Cl (1378 MW)0,9–18,0 K (6,3 MW)
2,4–6064 Na (1016 MW)[45]
AUTTirol,
Stadtstraße– – – –
1–485 Cl (86,0 MW)0,8–50,5 K (7,5 MW)
1,5–348 Na (82,1 MW)[45]
CHEBern, Burgdorf,
Kirchbergstrasse23.10.2002–08.07.2004 17 000 7 –
Ca (34,9 MW)Ca (21,5 MW – gelöst)
[46]
CHEGraubünden, Klosters- Serneus, N28a, Klosters
11.04.2006–09.08.2006 – 2 – 15,0–746 Cl [47]
CHEZürich, Birmensdorf,
Waldeggstrasse, Ristet16.01.2008–03.07.2008 12 000 3 – 15,3–2350 Cl (815 MW) [48]
CHE Zürich, Rossberg, N1 01.05.1976–30.04.1977 72 000 – Ja Cl (159 MW) [42]
DEUBaden-Württemberg, Heil-bronn-Obereisesheim, A6
02.1979–07.1979 47 000 48 Ja Cl (152 MW) [49]
DEUBaden-Württemberg,
Pleidesheim, A8102.1978–09.1978 41 000 53 Ja Cl (108 MW) [49]
DEUBaden-Württemberg,
Ulm/West, A8/B1005.1980–03.1981 52 100 44 Ja Cl (357 MW) [49]
DEUBaden-Württemberg,
Weinsberg, A604.1990–04.1991 34 680 – Ja
Ca (115 MW)Ca Sommer (17 MW)Ca Winter (205 MW)
Cl (2061 MW)Cl Sommer (36 MW)Cl Winter (3921 MW)
Mg (3,5 MW)Mg Sommer (2,1 MW)Mg Winter (4,8 MW)
[50]
DEUBayern, Augsburg, Derchinger Straße
01.10.1996–08.09.2005 6800 36 Ja14–123 Ca (44 MW)
1,0–4100 Cl (584 MW)1,8–2840 Na (380 MW)
[51]
DEUBayern, Bayreuth, B22,
Königsallee14.07.1991–17.08.1991 16 000 3 – 1–56 Cl [52]
DEUBayern, Bayreuth,
Meranierring13.06.1990–06.08.1990 6000 3 – 0,2–4,5 Cl [52]
DEUBayern, München, Landshuter Allee
11.2003–11.2005 57 000 63 Ja 17,6–10 400 Na [53]
DEUBayern, München, Landshuter Allee
01.07.2006–30.06.2007 57 000 24 Ja < 25–2480 Na [54]▶ ▶
144

1143gwf-Wasser | Abwasser 11/2015
Regenwasserbewirtschaftung FACHBERICHTE
Land Ort Untersuchungszeitraum DTVEreignis-anzahl
Winter-dienst
Elemente und Konzentrationen Literatur
DEU Berlin, A113 05.11.2006–16.08.2007 140 000 20 –14–175 Ca (34 MW)3–1110 Cl (117 MW)5–568 Na (62 MW)
[55]
DEUHamburg, Hamburg-Billbrock,
Pinkertweg1986 2300 16 –
Ca (15,1 MW)Cl (10,7 MW)K (1,7 MW)
Mg (1,4 MW)Na (5,0 MW)
[43]
DEUHamburg, Hamburg-Billbrock,
Pinkertweg1987 2300 16 –
Ca (13,7 MW)Cl (4,1 MW)K (1,7 MW)
Mg (1,0 MW)Na (21,3 MW)
[43]
DEU Hamburg, Jungiusstraße 1987 16 200 12 –
Ca (14,5 MW)Cl (3,9 MW)K (1,9 MW)
Mg (1,0 MW)Na (3,0 MW)
[43]
DEU Hamburg, Redder 1987 500 17 –
Ca (11,7 MW)Cl (4,5 MW)K (2,6 MW)
Mg (1,3 MW)Na (2,6 MW)
[43]
DEU Hamburg, Halenreie 09.2008–07.2010 15 000 8 Ja 9,7–1270 Cl (25,2 MW) [56]
DEUHessen, Frankfurt/Main,
A309.1975–10.1977; 08.1978–08.1980
62 790– 90 000
> 6 Ja
Ca (40 MW)Cl (74 MW)K (4,6 MW)
Mg (1,8 MW)Na (64 MW)
[57]
DEU Hessen, Gießen, A485 26.08.2014–27.08.2014 ca. 40 000 1 Nein
5,8–8,7 Ca1,1–2,6 K
1,4–2,1 Mg11,5–42,2 Na
*
DEUNiedersachsen, Allertal West, A7
01.2001–12.2001 Parkplatz 42 Ja 1–2471 Cl (120 MW) [58]
DEU Niedersachsen, Brake, L875 27.04.2013–31.08.20136000– 7000
2 –23,0–35,4 Ca26,7–55,8 Na
*
DEUNiedersachsen, Garbsen Nord
Z1, A201.2001–12.2001 Parkplatz 40 Ja 2–2449 Cl (157 MW) [58]
DEUNiedersachsen, Garbsen Nord
Z2, A201.2001–12.2001 Parkplatz 43 Ja 2–7580 Cl (604 MW) [58]
DEU Niedersachsen, Hannover, B3 10.2000–09.2001 45 000 – Ja Cl (168 MW) [59]
DEU Niedersachsen, Hannover, B3 09.02.2007–07.01.2008 45 000 10 –31–88 Ca
10–1320 Cl (186 MW)12–850 Na
[55]
DEUNiedersachsen, Hildesheim,
Marienburger Str., P509.1984–08.1985 14 200 31 - Cl (80,2 MW) [60]
DEUNordrhein-Westfalen,
Bensberg, A42005–2006 71 220 76 Ja
1,6–185 Ca (45,9 MW)0,5–4760 Na (258 MW)
[61]
DEUNordrhein-Westfalen,
Bensberg, A42006–2007 71 220 6 Ja
15,5–113 Ca (67,4 MW)0,5–365 Na (154 MW)
[62]
DEUNordrhein-Westfalen,
Köln-Ost, A311.08.2006–24.08.2007 156 000 20 –
8–46 Ca (20 MW)3–829 Cl (93 MW)7–456 Na (59 MW)
[55]
DEUNordrhein-Westfalen,
Köln-Poll, A412.07.1998–22.01.2000 > 50 000 33 –
1–6600 Cl (501 MW)1–170 Cl Sommer (22,0 MW)
13–6600 Cl Winter (1372 MW)[63]
▶ ▶
145

1144 gwf-Wasser | Abwasser 11/2015
FACHBERICHTE Regenwasserbewirtschaftung
decken einige Messergebnisse nur Teile der Jahreszeiten ab und die Konzentrationen werden je nach Studie als Bereiche, Mittelwerte oder Mediane angegeben. Wegen fehlender Angaben, ob Straßenwinterdienst mit Auf-tausalzen erfolgte bzw. welche Auftausalzkombination verwendet wurde, sowie der oftmals fehlenden Unter-scheidung zwischen Sommer- und Wintermonaten ist eine statistische Auswertung der Daten nicht möglich. Die in den drei Ländern maximal gemessenen Konzentrationen betragen 603 mg/L Ca, 60 300 mg/L Cl, 193 mg/L K, 14 mg/L Mg und 50 250 mg/L Na. Somit wurden Salzkon-zentrationen größer 10 000 mg/L in den Abflüssen gemes-sen. Es ist zu beachten, dass für Kalium (n = 14) und Mag-nesium (n = 12) den Autoren nur wenige Datensätze zur Verfügung stehen.
Für die Messungen, die Werte für den Sommerzeitraum angegeben haben bzw. die außerhalb des Einsatzes von Auftausalzen durchgeführt wurden, wurden maximale Konzentrationen von 33,3 mg/L Ca, 170 mg/L Cl, 2,6 mg/L K, 6,3 mg/L Mg und 42,2 mg/L Na ermittelt.
Eine beispielhafte Berechnung der Salzabflusskonzen-trationen aus den aufgebrachten Salzmengen ist in [24] angegeben. Ausgehend von einer Autobahn mit einer befestigten Fahrbahnbreite von 20 m und der Ausbringung von insgesamt 2000 kg/km NaCl innerhalb eines ab-flussunwirksamen Zeitraums (z. B. vier Streueinsätze mit je 25 g/m²) und einer anschließenden Schmelzwasserabfluss-höhe von 10 mm sind im Mittel ca. 10 g/L NaCl, also ca. 4000 mg/L Na und ca. 6000 mg/L Cl, im Verkehrsflächen-abfluss rechnerisch zu finden. Durch Variation der Aus-gangsdaten in Kombination mit den Daten der Bilder 2 und 3 können weitere Konzentrationen für Strecken be-
rechnet werden, für die keine Abflussmessungen vorliegen. Mit diesem Ansatz können auch reale Abflussereignisse nachgerechnet werden. Als grobe Näherungen können für die Straßenbreiten die Regelquerschnitte RQ 29,5 (Auto-bahnen, Breite der befestigten Fläche beträgt 2 x 11,5 m) bzw. RQ 10,5 (Bundesstraßen, Breite der befestigten Fläche beträgt 7,5 m) zugrunde gelegt werden. Für eine Bundes-straße mit einem Auftausalzverbrauch von 113 kg/km NaCl (z. B. ein Streueinsatz mit 15 g/m² oder ca. 1/65 der im Durchschnitt bei den ausgewerteten SM im Jahr aus-gebrachten Mengen) und einer anschließenden Schmelz-wasserabflusshöhe von 30 mm, sind im Mittel ca. 0,5 g/L NaCl, also ca. 200 mg/L Na und ca. 300 mg/L Cl, im Ver-kehrsflächenabfluss zu finden. Eine Berücksichtigung von Verwehungen und Spritzwasserverlusten (sowohl des Feuchtsalzes als auch des Niederschlags/Schmelzwassers, vgl. auch [16]) kann im Einzelfall in Betracht gezogen werden.
3. Prinzipien dezentraler Anlagen zur Behandlung von VerkehrsflächenabflüssenDerzeit ist eine Vielzahl dezentraler Behandlungsanlagen für Verkehrsflächenabflüsse auf dem deutschen Markt ver-fügbar, die für unterschiedliche Einsatzorte und angeschlos-sene Flächen konzipiert sind sowie variierende Reinigungs-ziele verfolgen. Eine Einteilung der Systeme sowie deren technischer Ausführungen und Behandlungsprinzipien ist schwierig, da sich die Produkte in vielen Aspekten erheb-lich unterscheiden. Jedoch können die Anlagen grob nach der Einbauweise (oberflächennah, z. B. Rinnen, versus ober-flächenfern, z. B. Schächte) und dem Reinigungsprinzip
Land Ort Untersuchungszeitraum DTVEreignis-anzahl
Winter-dienst
Elemente und Konzentrationen Literatur
DEUNordrhein-Westfalen,
Köln-Porz, A5912.07.1998–05.07.2000 > 50 000 29 Ja
1,0–9300 Cl (402 MW)1,0–5,0 Cl Sommer (2,5 MW)3,0–9300 Cl Winter (748 MW)
[63]
DEUNordrhein-Westfalen,
Meckenheim, A612005–2006 73 310 63 Ja
1,8–603 Ca (79,4 MW)0,7–5574 Na (812 MW)
[61]
DEUNordrhein-Westfalen,
Meckenheim, A612006–2007 73 310 25 Ja
4,7–53,8 Ca (12,9 MW)1,0–66 Na (13 MW)
[62]
DEUNordrhein-Westfalen,
Widdig, A5552005–2006 69 370 65 Ja
4,3–83,4 Ca (25,1 MW)1,5–5160 Na (691 MW)
[61]
DEUNordrhein-Westfalen,
Widdig, A5552006–2007 69 370 23 Ja
3,4–31,0 Ca (12,5 MW)0,5–189 Na (58 MW)
[62]
DEUNordrhein-Westfalen,
Wuppertal, L41714.10.2014–07.11.2014 20 670 4 Nein
16,3–33,3 Ca1,3–2,1 K
4,0–6,3 Mg 3,6–12,0 Na
[26]
DEUNordrhein-Westfalen,
Wuppertal, L41710.12.2014–11.12.2014 20 670 2 Ja (NaCl)
18,6–34,2 Ca0,9–1,6 K
3,2–4,5 Mg63,0–387 Na
[26]
* eigene unveröffentlichte Untersuchungen
146

1145gwf-Wasser | Abwasser 11/2015
Regenwasserbewirtschaftung FACHBERICHTE
(z. B. Siebung, Leichtstoffabscheidung, Sedimentation und Ionenaustausch) unterschieden bzw. klassifiziert wer-den [25].
In den dezentralen Anlagen werden die Behandlungs-prinzipien der Dichtetrennung, der Filtration, der Sorption, der (bio-)chemischen Umsetzung, der Fällung und des Ionenaustausches entweder alleine oder in Kombination verwendet, wobei jedes Prinzip nicht zum Rückhalt aller Schadstoffe geeignet ist. Bei den einstufigen Anlagen wer-den die Schadstoffe meist rein mechanisch-physikalisch (z. B. durch Sedimentation) zurückgehalten, wohingegen bei den Anlagen, die aus einer Kombination mehrerer Behandlungsprinzipien bestehen, vorwiegend nach der mechanisch-physikalischen Behandlung eine oder mehrere (bio-)chemische Verfahren nachgeschaltet sind (z. B. Ionenaustausch und Fällung im Filter).
Beim Einsatz von Auftausalzen verändert sich die Zusammensetzung und Dichte des zu behandelnden Niederschlagswassers von Verkehrsflächen. Die Erhöhung der Dichte durch das Auftausalz hat zur Folge, dass u. a. die Sedimentation der (Fein-)Partikel erschwert wird [26] und dadurch der mechanisch-physikalische Rückhalt in dezen-tralen Anlagen reduziert werden kann. Dabei wird nicht nur der Rückhalt an AFS, sondern damit verbunden auch der von partikulär gebundenen Schwermetallen verringert. Zusätzlich haben in diesen Fällen die Kationen der Auftau-salze (Natrium, Calcium und Magnesium), welche in deutlich höheren Konzentrationen als die Schwermetalle vorkommen (Faktor ca. 1:1000), einen Einfluss auf die chemischen Verfahren zum Schadstoffrückhalt. Zum einen können bei Filtermaterialien aus Ionenaustauschern, bei denen durch elektrostatische Kräfte Kationen an negativ geladenen Oberflächen zurückgehalten werden, bereits aus vorhergehenden Regenereignissen zurückgehaltene Schwermetalle durch die Auftausalzbestandteile ausge-tauscht und somit wieder in Lösung gebracht werden [27]. Bei der Remobilisierung ist eine Rücklösung von Schwer-metallen, die bereits seit Monaten oder Jahren gebunden wurden, möglich, wodurch die Ablaufkonzentrationen der dezentralen Anlagen für einzelne Schwermetalle höher als die Zulaufkonzentrationen sein können [28]. Zum anderen können auch aufgrund schwacher Van-der-Waals-Kräfte (Physisorption) an der Materialoberfläche zurückgehaltene Stoffe remobilisiert werden. Ferner können freie Plätze durch Auftausalzkationen belegt werden, welche somit nicht mehr bzw. erschwert dem Schadstoffrückhalt zur Verfügung stehen. Durch Reaktionen der Auftausalz-bestandteile mit den Filtermaterialien und anderen Schad-stoffen können sowohl während des Regenereignisses als auch während der Trockenperioden bei dauereingestauten Systemen weitere Rücklösungen erfolgen [29]. Durch Aus-bildung eines chemischen Gleichgewichts kann sich der pH-Wert des zu behandelnden Wassers verringern [30], sodass einzelne, bereits gefällte Schwermetalle wieder in
Lösung gehen und somit aus dem System ausgetragen werden können. Folglich ist es unerlässlich, dass die ein-gesetzten dezentralen Anlagen ihre Leistungsfähigkeit auch während der Wintermonate mit Auftausalzeinsatz sicherstellen und dabei die Anforderungen, u. a. zum Rück-halt von Schwermetallen, einhalten.
Derzeit ist noch nicht geklärt, wie sich die unterschied-lich hohen Konzentrationen an Calcium, Kalium, Magnesium und Natrium an verschiedenen Orten – auch ohne den Einsatz von Auftausalzen – auf den Schadstoffrückhalt eines Behandlungssystems auswirken.
Ein Rückhalt von Chlorid ist bei keiner dezentralen Anlage vorgesehen, sodass die in den Verkehrsflächen-abflüssen gemessenen Chlorid-Konzentrationen von bis zu 60 300 mg/L ebenfalls im Ablauf der Behandlungsanlagen zu finden sind.
4. Rechtliche Rahmenbedingungen für dezentrale Anlagen zur VersickerungAls Vorgaben zur Bewertung der Leistungsfähigkeit dezen-traler Behandlungsanlagen wurden bislang die Prüfwerte der BBodSchV vom 12.07.1999 für den Wirkungspfad Boden-Grundwasser zugrunde gelegt [1]. Mit Einführung der GrwV vom 09.11.2010 [2] sind Einträge bestimmter Schadstoffe und Schadstoffgruppen, darunter Kupfer und Zink, durch geeignete Maßnahmen(-programme) zu begrenzen. Bei der Festlegung der Maßnahmen(-program-me) sind, so die Aussage vom Umweltbundesamt und der Länderarbeitsgemeinschaft Wasser (LAWA), die Länder zum Schutz des Grundwassers vor Verschmutzung und Verschlechterung an die Geringfügigkeitsschwellenwerte der LAWA von 2004 gebunden. Geringfügigkeitsschwellen-werte sind als Konzentrationen definiert, bei denen trotz einer Erhöhung der Konzentration im Grundwasser keine relevanten toxikologischen Wirkungen auftreten können. Zusätzlich werden die Anforderungen der Trinkwasser-verordnung, wie z. B. für die Parameter Chlorid und Sulfat, berücksichtigt, welche sowohl gesundheitliche als auch ästhetische Aspekte berücksichtigen [31]. Eine Aktuali-sierung der Ableitung von Geringfügigkeitsschwellen-werten für das Grundwasser von 2004 erfolgte in den Jahren 2012/2013 aufgrund rechtlicher Änderungen in der Europäischen Union und neuen fachlichen Erkennt-nissen [32].
Die Mantel-Verordnung („Verordnung zur Festlegung von Anforderungen für das Einbringen oder das Einleiten von Stoffen in das Grundwasser, an den Einbau von Ersatz-stoffen und für die Verwendung von Boden und boden-ähnlichem Material“, derzeit Entwurf vom 31.10.2012) [33] soll die GrwV und die BBodSchV harmonisieren und die Verbindlichkeit der Geringfügigkeitsschwellenwerte weiter untermauern. Tabelle 2 stellt die Anforderungen für aus-gewählte Parameter gegenüber. Eine Verschärfung der
147

1146 gwf-Wasser | Abwasser 11/2015
FACHBERICHTE Regenwasserbewirtschaftung
Anforderungen für sämtliche Behandlungstechniken von Verkehrsflächenabflüssen zur anschließenden Versickerung ist somit bereits formaljuristisch gegeben (betroffene Pa-rameter sind in Tabelle 2 fett markiert).
Weiterhin ist für die Anforderungen an dezentrale Be-handlungstechniken zu diskutieren, inwiefern das Hinzu-kommen neuer Parameter (z. B. Chlorid, ETBE und MTBE) aufgrund der Relevanz in Verkehrsflächenabflüssen be-rücksichtigt werden muss.
Zu den für Verkehrsflächenabflüsse aufkommensrele-vanten Parametern aus Tabelle 2 gehören die drei Schwer-metalle Blei, Kupfer und Zink sowie die Auftausalzbestand-teile Chlorid und Cyanid [34, 35]. Ferner können in Verkehrs-flächenabflüssen die anorganischen Parameter Cadmium,
Chrom, Nickel und Quecksilber in Konzentrationen ober-halb des Entwurfs der Mantel-Verordnung vorkommen [35].
Bei der aktuellen Verschärfung der Anforderungen sind besonders die Werte für Cadmium, Kupfer, Zink und Chlo-rid für die bestehenden Behandlungstechniken relevant. Dabei ist Cadmium ein sehr mobiles Element, welches sich in den Behandlungsanlagen durch die Filtermaterialien verlagern kann. Ein Durchsickern aus den Verkehrsflächen-abflüssen in das Grundwasser ist somit möglich. Außerdem ist zu beachten, dass viele der derzeitigen Messprogramme eine Bestimmungsgrenze von 0,5 µg/L für Cadmium haben [36] und damit eine gesicherte Aussage zur ausreichenden Behandlungsfähigkeit von Cadmium in dezentralen Be-handlungsanlagen, aber auch in zentralen Anlagen und
Tabelle 2: Auswahl der Prüfwerte der BBodSchV für den Wirkungspfad Boden-Grundwasser, der Prüfwerte Grundwasser des Entwurfs der Mantel-Verord-nung vom 31.10.2012 und der Geringfügigkeitsschwellenwerte der LAWA aus den Jahren 2004 und 2013. Verschärfungen der Anforderungen gegenüber der bisher gültigen BBodSchV sind fett markiert
Parameter Einheit BBodSchV, 1999Geringfügigkeits-
schwellenwerte, 2004Entwurf Mantel-
Verordnung, 2012Geringfügigkeits-
schwellenwerte, 2013
Antimon µg/L 10 5 5 –
Arsen µg/L 10 10 10 2,6
Barium µg/L – 340 340 186
Blei µg/L 25 7 7 7,2
Bor µg/L – 740 740 180
Cadmium µg/L 5 0,5 0,25 0,25
Chrom, gesamt µg/L 50 7 7 3,4
Chromat µg/L 8 – – –
Kobalt µg/L 50 8 8 5,7
Kupfer µg/L 50 14 14 10
Molybdän µg/L 50 35 35 –
Nickel µg/L 50 14 20 13
Quecksilber µg/L 1 0,2 0,05 0,05
Selen µg/L 10 7 7 3
Thallium µg/L – 0,8 0,8 0,2
Vanadium µg/L – 4 4 –
Zink µg/L 500 58 58 50
Zinn µg/L 40 – – –
Ammonium mg/L – – 0,5 –
Chlorid mg/L – 250 250 –
Cyanid, gesamt µg/L 50 – – –
Cyanid, leicht freisetzbar µg/L 10 5* 5* 10*
Fluorid µg/L 750 750 750 –
Nitrat mg/L – – 50 –
Sulfat mg/L – 240 250 –
ΣPAK µg/L 0,2 0,2 0,2 –
ETBE µg/L – – – 5
MTBE µg/L – 15 15 2,5
* 50, wenn kein leicht freisetzbares Cyanid vorliegt
148

1147gwf-Wasser | Abwasser 11/2015
Regenwasserbewirtschaftung FACHBERICHTE
Oberböden, fehlt. Ferner führen die Verschärfungen der Prüfwerte für Kupfer und Zink dazu, dass an hochbelaste-ten Stellen (z. B. Stop+Go-Bereiche) ein zu hoher Austrag der Schwermetalle in das Grundwasser erfolgen kann. Die Aufnahme von Chlorid mit einer Konzentration von 250 mg/L führt dazu, dass nun neben Cyanid, welches in Verkehrsflächenabflüssen in Gesamt-Konzentrationen von bis zu 190 µg/L vorkommt [37], der Hauptbestandteil der aufkommensrelevanten Auftausalze bei der Versickerung direkt beachtet werden muss. Gleichzeitig müssen die Kat-ionen der Auftausalze in Verbindung mit den strengeren Anforderungen an den Schwermetallrückhalt sowie den möglichen Schwermetallremobilisierungen aufgrund der verwendeten Behandlungsprinzipien stärker bei der Filter-materialwahl berücksichtigt werden.
5. Methoden zur Bestimmung der Salzstabilität dezentraler AnlagenZur Sicherstellung der Einhaltung der Anforderungen (siehe Kapitel 4) durch dezentrale Anlagen sind aufgrund der Behandlungsprinzipen und den damit verbundenen Risiken einer Schwermetallremobilisierung (siehe Kapitel 3) Me-thoden zur Bestimmung der Salzstabilität der verwendeten Filtermaterialien unerlässlich.
Die ersten Prüfverfahren zur Salzstabilität in Deutsch-land wurden mit NaCl konzipiert. Dies fand auch Eingang in die Zulassungsgrundsätze des DIBt (siehe Kapitel 5.1). Durch den Einsatz von alternativen Verbindungen wurden zwei Methoden entwickelt, um auch die Auswirkungen von weiteren Auftausalzen (CaCl2 und MgCl2) zu untersu-chen (siehe Kapitel 5.2 und 5.3). Die Versuche werden i. d. R. an verkleinerten Filterelementen (Modelle) im Labormaß-stab durchgeführt.
Als Grundlage für die in den Versuchen verwendeten Konzentrationen an Auftausalzen dienten sowohl die Emp-fehlungen und Merkblätter zum Winterdienst [3, 6, 9, 10], welche durch eine Umfrage bei zahlreichen Meistereien eruiert wurden, als auch die gemessenen Verkehrsflächen-abflusskonzentrationen sowie die aus den Auftausalzver-bräuchen rechnerisch ermittelten Konzentrationen. Davon ausgehend wurde der Fokus auf das in Deutschland auf Straßen am häufigsten verwendete Auftausalz NaCl sowie auf die beiden FS30-Kombinationen aus NaCl mit MgCl2 bzw. NaCl mit CaCl2, welche z. B. in Hannover und Berlin verwendet werden (siehe Kapitel 2.1), gelegt. Die Konzen-tration an NaCl wurde aus Auftausalzverbräuchen rechne-risch zu 10 g/L ermittelt (siehe Kapitel 2.2) und anhand gemessener Konzentrationen plausibilisiert (siehe Tabelle 1). Da für Magnesium wenige Messergebnisse vorliegen und kein Monitoringstandort bekannt ist, an dem MgCl2 als Auftausalz ausgebracht wurde, konnten dessen Konzent-rationen nur theoretisch berechnet werden. Unter der Annahme, dass die Verhältnisse aus NaCl und MgCl2 im
FS30 gleich dem im Verkehrsflächenabfluss sind, werden ausgehend von den 10 g/L an NaCl (70 %) bei einer MgCl2-Sole (30 %), die mit 26,3 M.-% MgCl2 einen um 50 % höher als optimal empfohlenen Salzanteil enthält (Worst-Case-Betrachtung, z. B. generell höherer Anteil (21 % statt 17,5 %) und Fehler bei der Herstellung der Sole), ca. 1,1 g/L MgCl2 abflusswirksam. Für Calcium ist die Abschätzung einer effektiven Verkehrsflächenabfluss- und somit Anlagenzu-laufkonzentration schwieriger, da Calcium, welches für die Remobilisierungsbetrachtung im Gegensatz zum Chlorid relevant ist (siehe Kapitel 3), sowohl aus dem Auftausalz als auch aus erhöhtem Fahrbahnabrieb stammen kann. Da die Umstellung von Trockensalz auf FS30 schrittweise erfolgte und in kleineren Meistereien immer noch nicht abgeschlos-sen ist sowie aufgrund fehlender Beschreibungen der Randbedingungen in Messprogrammen, können auch für Calcium die gemessenen Abflusskonzentrationen nicht direkt mit verschiedenen Feuchtsalztechniken und dem Straßenabrieb korreliert werden. Daher wurde in einem Worst-Case-Szenario die höchste im Mittel eines Regener-eignisses gemessene Konzentration von 603 mg/L Ca he-rangezogen und ebenfalls um 50 % erhöht (905 mg/L Ca bzw. 2,5 g/L CaCl2). Damit soll sichergestellt werden, dass sowohl der Anteil des Calciums aus dem Auftausalz (analog zur Herangehensweise beim MgCl2 wären dies ca. 1,4 g/L CaCl2) als auch der erhöhte Fahrbahnabrieb berücksichtigt werden.
5.1 Salzprüfung beim DIBtDie bundesweite Zulassung von dezentralen Niederschlag-wasserbehandlungsanlagen deckt den Anwendungsfall „Einleitung Verkehrsflächenabflüsse in das Boden-Grund-wasser-System“ ab [4]. Durch die Anforderungen an den Rückhalt gelöster Schadstoffe (z. B. Kupfer und Zink) werden beim DIBt vorwiegend Anlagen mit einer Filterstufe zuge-lassen. Das Ausmaß einer möglichen Rücklösung bereits zurückgehaltener Schwermetalle wird unter den Randbe-dingungen der Salzprüfung getestet. Ein weiterer Effekt, der im Winterbetrieb auftreten kann, ist die mögliche Ver-änderung der Filterstabilität. Unter hohem Salzeinfluss können in Filterstufen Kolmationseffekte auftreten [38]. Auch dieser Einfluss wird beim Prüfverfahren des DIBt bei der Vorlage von kolmationsfördernden Randbedingungen (z. B. Ton/Schluff-Anteil > 5 %) berücksichtigt.
In der Salzprüfung des DIBt wird NaCl verwendet. Die Prüfung wird an einem verkleinerten Filterelement (z. B. Säule) oder an der Originalanlage durchgeführt. Die Rand-bedingungen des Maßstabs der Prüfanlage orientieren sich dabei an der Vorgabe, möglichst geringe Mengen an be-lastetem Prüfwasser zu erzeugen. Dazu legt der Hersteller einen zusammen mit der benannten Prüfstelle konzipierten Versuchsplan vor, der vom DIBt geprüft wird. Die Salzprü-fung erfolgt im Anschluss an die Prüfung auf den Rückhalt an gelösten Kupfer- und Zinkverbindungen (Schwermetall-
149

1148 gwf-Wasser | Abwasser 11/2015
FACHBERICHTE Regenwasserbewirtschaftung
prüfung). In der Schwermetallprüfung wird eine Stoff-jahresfracht auf das Filterelement in drei charakteristischen Prüfregenspenden aufgebracht. Kupfer und Zink werden in gelöster Form in entionisiertem Wasser (pH 4,5–5,2) ap-pliziert. Die Prüfung gilt als bestanden, wenn mindestens 80 % (Kupfer) bzw. 70 % (Zink) der Schwermetallfracht von der Anlage zurückgehalten wurde. Frühestens 16 h und spätestens 72 h nach Beendigung der Prüfung des Zink- und Kupferrückhalts wird dasselbe Filterelement auf eine mögliche Rücklösung der Schwermetalle durch Auftausalze geprüft. Hierzu wird eine mit Auftausalzen (NaCl gemäß TL-Streu 10 g/L, siehe Kapitel 2.2) versetzte Lösung aus entionisiertem Wasser verwendet. Das Filterelement wird mit dieser Lösung 200 Min. lang mit einer Intensität von 6 L/(s·ha) beaufschlagt. Vor Beginn der Versuche werden die Säulen zunächst mit 6 L/(s·ha) entionisiertem Wasser gespült, bis die Leitfähigkeit im Ablauf stabil ist. Die Probennahme im Ablauf erfolgt nach einem genau fest-gelegten Programm [4].
Die Salzprüfung nach DIBt ist bestanden, wenn die gemittelte Gesamtkonzentration aller Einzelproben die zulässigen Ablaufkonzentrationen gemäß Tabelle 3 nicht überschreitet. Diese Werte entsprechen den Prüfwerten der BBodSchV für Kupfer (50 µg/L) und Zink (500 µg/L). In der Berechnung werden die möglichen Kupfer- und Zinkbelastungen der Tausalzlösung berücksichtigt. Des Weiteren wird verlangt, dass auch die Konzentration in den Einzelproben bestimmte Gehalte nicht übersteigt.
5.2 Methode 1: Untersuchungen zur Salz stabilität im Rahmen eines Projekts zur StandzeitermittlungIn dem Forschungs- und Entwicklungs-Projekt „Unter-suchung von Anlagen zur Behandlung des Niederschlags-wassers von Verkehrsflächen“, welches vom Bayerischen Landesamt für Umwelt (LfU) beauftragt wurde, wurde ein Laborverfahren zur Standzeitermittlung dezentraler Be-handlungsanlagen entwickelt [39], da während der Prüfung beim DIBt keine detaillierte Methodik zur Ermittlung einer realistischen Standzeit der Anlagen vorgesehen ist. Dieses Verfahren besteht aus drei Teilen. Während des ersten Teils wird eine Vorbelastung mit Zink und Kupfer in Abhängig-keit der Anlagenstandzeit (bis zu zehn Jahre) auf das Filter-
material im Labormodell aufgebracht (Bild 4, links). Im zweiten Teil wird analog zu den Prüfgrundsätzen des DIBt eine Stoffjahresfracht an Zink und Kupfer auf das vorbela-dene Filterelement in drei charakteristischen Regenspen-den aufgebracht (siehe Kapitel 5.1). Die Randbedingungen (mit Zink und Kupfer beladenes Filterelement, Dauer der Wartezeit, Spülung vor Auftausalzuntersuchung, Regen-spende, Regendauer und Probennahme) im dritten Teil sind analog zu den aktuellen DIBt-Prüfgrundsätzen, welche aufgrund der Erkenntnisse aus diesem Projekt teilweise modifiziert wurden. Im Unterschied zum DIBt-Verfahren wird bei der neu entwickelten Untersuchungsmethode eine Auftausalzmischung aus Trinkwasser mit Zulaufkon-zentrationen von 10 g NaCl/L und 2,5 g CaCl2/L verwendet. Somit liegt die Chlorid-Zulaufkonzentration bei 7660 mg/L und ist mit den in Tabelle 1 angegebenen Konzentrationen realer Verkehrsflächenabflüsse vergleichbar.
Anhand dieser Laboruntersuchungen wurde festge-stellt, dass bei einigen Filtermaterialien, die mit den beiden Schwermetallen Kupfer und Zink beladen sind, beim Einsatz eines Feuchtsalzgemisches aus NaCl und CaCl2 eine Rück-lösung von Kupfer und Zink stattfinden kann, obwohl bei reinem NaCl keine Remobilisierungen auftraten [40]. Au-ßerdem kam es bei wenigen der beladenen Filtermateria-lien während der Feuchtsalzuntersuchung zur selektiven Remobilisierung von Zink. Es wurde bei einem Teil der Filtermaterialien festgestellt, dass die Feuchtsalzaufbrin-gung zu einer Veränderung des pH-Wertes im Anlagen-ablauf führte. Besonders kritisch ist zu sehen, dass weder die untersuchten dezentralen Behandlungsanlagen noch der zu Vergleichszwecken verwendete Oberboden, der in Versickerungsmulden und Banketten eingesetzt wird, Chlo-rid zurückhalten können und sie somit nach GrwV in Ver-bindung mit den Geringfügigkeitsschwellenwerten schon heute nicht mehr zur Behandlung von Verkehrsflächenab-flüssen bei anschließender Versickerung geeignet wären.
5.3 Methode 2: Weitergehende Untersuchungen im Rahmen des Projekts „Schadstoff-remobilisierung durch Auftausalze“Die grundlegende wissenschaftliche Beschreibung und Erklärung des Remobilisierungsverhaltens von verschiede-nen, gleichzeitig auf Filtermaterialien zurückgehaltenen Schwermetallen bei der dezentralen Behandlung von Ver-kehrsflächenabflüssen unter Verwendung unterschiedlicher Auftausalze ist das Ziel des Forschungsvorhabens „Schad-stoffremobilisierung durch Auftausalze“, welches von der Bayerischen Forschungsstiftung und der Firma FRÄNKISCHE ROHRWERKE gefördert wird. Als Schwermetalle werden dabei Zink, Kupfer, Nickel, Blei und Cadmium verwendet, um weitreichendere Aussagen zum Rückhalt unterschied-lich mobiler Schwermetalle treffen zu können. Daneben werden die Wirkmechanismen zum Schwermetallrückhalt der einzelnen Filtermaterialien beschrieben. Abschließend
Tabelle 3: Festgesetzte Prüfwerte für Zink und Kupfer im Ablauf (zulässige Ablaufkonzentration nach [3])
Schwer-metall
Zulaufkonzentration Schwermetall in der
Auftausalzlösung [µg/L]
Zulässige Ablauf- konzentration [µg/L]
Zink Messwert Auftausalzlösung≤ 500 + Messwert Auftausalzlösung
Kupfer Messwert Auftausalzlösung≤ 50 + Messwert Auftausalzlösung
150

1149gwf-Wasser | Abwasser 11/2015
Regenwasserbewirtschaftung FACHBERICHTE
wird eine mögliche Schwermetallremobilisierung anhand des Einsatzes dreier verschiedener Auftausalze in getrenn-ten Versuchen untersucht.
Bei den Säulenversuchen (Bild 4, rechts) erfolgt zuerst eine Beladung der Materialien mit Zink, Kupfer, Nickel, Blei und Cadmium (Zink: 5000 µg/L, Kupfer, Nickel und Blei: je 2500 µg/L und Cadmium: 625 µg/L) bis zum Schwermetall-durchbruch. Der Durchbruch wurde als Zeitpunkt, an dem die Ablaufkonzentration an Kupfer oder Zink als Leitparameter mindestens 50 % der Zulaufkonzentration beträgt, definiert. Sollte in den nachfolgenden Auftau salz-Untersuchungen eine Schwermetallremobilisierung auftreten, werden weitere Säulen mit demselben Filterma-terial befüllt und mit einer mittleren Belastung von ca. einer Jahresfracht beladen. Dabei wird jedes Material in acht Säu-len vergleichbar beladen, sodass in den folgenden vier Un-tersuchungen (drei verschiedene Auftausalzkombinationen sowie weitergehende Analysen) jeweils zwei Säulen (Dop-pelbestimmung) zur Verfügung stehen, um differenzierte Aussagen zum Remobilisierungsrisiko treffen zu können.
Nach der Beladung werden unterschiedliche Feucht-salzversuche mit reinem NaCl (10 g/L), mit einer definierten Mischung aus NaCl und CaCl2 (10 g/L bzw. 2,5 g/L) und mit einer definierten Mischung aus NaCl und MgCl2-Hexa-hydrat (10 g/L bzw. 2,5 g/L) mit einer Regenspende von 6 L/(s·ha) für je 200 Minuten unter Verwendung von ent-ionisiertem Wasser an getrennten Säulen durchgeführt.
Weitergehende Analysen, wie Korngrößenverteilung, Porenvolumen, Porengrößenverteilung, Schwermetallge-halte, spezifische Oberfläche sowie Beschaffenheit der Oberfläche, dienen dazu, unterschiedliche Wirkmechanis-men zu identifizieren, um die in Kapitel 3 erläuterten Wech-selwirkungen zu untersuchen und das Verhalten der Filter-materialien bei Auftausalzeinwirkung unter realen Bedin-gungen zu dokumentieren [41].
Aufgrund der differenzierten Herangehensweise bei den Säulenversuchen ist es für fünf Schwermetalle möglich, Aussagen zum Remobilisierungsrisiko anhand zweier un-terschiedlicher Beladungszustände der Filtermaterialien zu
treffen. Als Ergebnis kann festgehalten werden, dass die sechs untersuchten Materialien die Schwermetalle unter-schiedlich gut zurückhalten. Dabei unterscheidet sich so-wohl der Zeitpunkt, an dem der Durchbruch zu 50 % erfolgt, als auch bei der Beladung mit nur einer Jahresfracht der prozentuale Schwermetallrückhalt deutlich. Ferner werden Kupfer und Blei meist besser als die anderen Schwermetal-le gebunden, sodass die Durchbrüche zu 50 % anhand des Parameters Zink bestimmt wurden. Im Anschluss an die Beladung wurde das mögliche Auftreten einer Schwerme-tallremobilisierung durch drei verschiedene Auftausalz-mischungen getrennt erfasst. Die ersten Ergebnisse zur Remobilisierung bestätigen die Erkenntnisse der ersten Methode (Kapitel 5.2), jedoch sollen in Kombination mit den noch auszuführenden, weitergehenden Analysen de-taillierte Aussagen ermöglicht werden. Diese Ergebnisse werden Gegenstand einer weiteren Publikation sein.
5.4 Vergleich und Anwendungsbereich der Methoden 1 und 2Die erste Methode hat im Gegensatz zur zweiten Methode den Vorteil, dass innerhalb einer Versuchswoche im Labor Aussagen zur Standzeit als auch zur Schwermetallremobi-lisierung getroffen werden können. So wird die zu unter-suchende Anlage innerhalb eines Tages gealtert, an zwei Tagen auf den Schwermetallrückhalt im letzten Betriebsjahr getestet sowie in den beiden darauffolgenden Tagen an-hand von Salzversuchen auf die Rücklösung von Schwer-metallen untersucht. Dabei werden für eine Doppelbe-stimmung nur zwei Labormodelle benötigt. Aufgrund der größeren Modelle im Vergleich zu Methode 2 (siehe Bild 4) können lediglich die beiden aufkommensrelevantesten Schwermetalle Kupfer und Zink untersucht werden (Toxi-zität sowie Entsorgungsproblematik). Sobald bei einer Salzuntersuchung eine Remobilisierung ermittelt wurde, kann die Höhe einer möglichen Remobilisierung bei den nachfolgenden Salzuntersuchungen am gleichen Material aufgrund der bereits zurückgelösten Schwermetalle nicht mehr bestimmt werden.
Bild 4: Beispiele für Versuchs-aufbauten: Methode 1 (links) und Methode 2 (rechts)
151

1150 gwf-Wasser | Abwasser 11/2015
FACHBERICHTE Regenwasserbewirtschaftung
Im Gegensatz dazu ist der Aufwand für die zweite Me-thode deutlich höher. Es werden anstelle zweier Modelle acht parallel zu beschickende Säulen pro Material benötigt. Dabei werden diese je nach Rückhaltekapazität des Mate-rials zwischen drei und dreißig Tage lang mit den fünf rele-vantesten Schwermetallen beaufschlagt, wobei während der Beladung die Simulation von Trockenperioden möglich ist. Zwei Säulen dienen den weitergehenden Analysen und je zwei der anderen sechs Säulen der getrennten Untersu-chung der drei relevanten Auftausalz(-kombinationen). Diese Untersuchungen eignen sich zur quantitativen Be-stimmung des Einflusses jedes Auftausalzes auf an Filter-materialien zurückgehaltenen Schwermetallen sowie zur Beschreibung der Rückhaltemechanismen. Aufgrund der Verwendung von fünf Schwermetallen kann zusätzlich nach-gewiesen werden, welche davon besonders gut zurück-gehalten werden und ob bzw. bei welchen Auftausalzen diese remobilisiert werden können. Jedoch ist bei dieser Methode eine genaue Erfassung der Standzeit aufgrund der kleinen Säulendurchmesser nicht möglich (Randeffekte).
6. Fazit und AusblickZu den in Deutschland aufkommensrelevanten Auftausal-zen zählen neben dem am weitesten verbreiteten NaCl, ebenfalls CaCl2, MgCl2 und deren Mischungen. Bei der Verwendung des Auftausalzes spielt sowohl der Preis, die regionale Verfügbarkeit, die Tauwirksamkeit als auch die Taugeschwindigkeit eine Rolle. Somit können CaCl2 und MgCl2 regional begrenzt in einer Kommune, nur an be-stimmten Orten, wie sensible Beläge und Fußgängerbrü-cken, innerhalb einer Kommune oder temporär bei tiefen Temperaturen eingesetzt werden. Die eingesetzten Men-gen orientieren sich an den Empfehlungen der FGSV und die über ein Jahr pro m² Straßenfläche eingesetzten Men-gen sind auf Autobahnen im Vergleich zu anderen Stra-ßenkategorien am höchsten. Dabei hat sich die Feucht-salztechnik im staatlichen Straßenwinterdienst überall mit Ausnahme kleinerer Kommunen durchgesetzt. Ausgehend von den aufgebrachten Mengen an Auftausalzen, können die Chlorid-Abflusskonzentrationen abgeschätzt werden, auch wenn keine Abflusskonzentrationen gemessen wur-den. Diese rechnerisch ermittelten Chlorid-Konzentrationen liegen dabei meist über dem Geringfügigkeitsschwellen-wert von 250 mg/L, was durch zahlreiche im Winter ge-messene Konzentrationen bestätigt wird.
Die Verwendung von Auftausalzen hat für dezentrale Behandlungsanlagen für Verkehrsflächenabflüsse zur Folge, dass ein Teil der Prozesse zum Schadstoffrückhalt an Filter-materialien durch die erhöhten Salzkonzentrationen negativ beeinflusst werden kann. Somit müssen Filter-materialien vor dem Einsatz in der Realität an Verkehrs-flächen mit Auftausalzeinsatz bei Untersuchungen im Labor zeigen, dass deren Rückhaltemechanismen durch den
saisonalen Einsatz von Auftausalzen nicht bzw. nur gering-fügig beeinträchtigt sind und somit filterstabil sind. Anhand der vorgestellten Methodik mit weitergehenden Unter-suchungen (siehe Kapitel 5.3) ist es erstmalig möglich, die Einflüsse der aufkommensrelevanten Auftausalze im Labor getrennt für fünf Schwermetalle zu erfassen und die Wirk-mechanismen der Filtermaterialien zu beschreiben. Sollte sich bei solchen Untersuchungen zeigen, dass eine Anlage nicht für alle Auftausalze einen sicheren Schadstoffrückhalt bietet, dürfen diese dezentralen Anlagen nur an Stand orten eingesetzt werden, an denen entsprechende Auftausalze verwendet werden, welche zu keiner Schadstoffremobili-sierung führen. Ziel muss es immer sein, durch die Einhal-tung der rechtlichen Anforderungen die in Verkehrsflächen aufkommensrelevanten Stoffe in dezentralen Anlagen ausreichend zurückzuhalten und somit negative Auswir-kungen auf das Grundwasser zu verhindern.
In Zukunft kann die Umsetzung der Verschärfung der Geringfügigkeitsschwellenwerte aus den Jahren 2012/2013 zu erhöhten Anforderungen an die dezentralen Anlagen führen, sodass auch geringe Remobilisierungen durch Auf-tausalze nicht mehr erlaubt sein werden. Denn eine wei-tere Verschärfung der Schwermetallkonzentrationen, be-sonders für Cadmium, Kupfer und Zink, würde bedeuten, dass deren Zielwerte in vielen Fällen bereits durch den reinen Niederschlag überschritten werden [42, 43]. Eine Versickerung des Straßenabflusses wäre somit oft nicht möglich, da der Zielwert für Kupfer von 10 µg/L im Anla-genablauf durch derzeitige Behandlungstechniken nur schwer eingehalten wird.
DanksagungDie Auswertung des Auftausalzverbrauchs erfolgte dank der Bereit-stellung von Unterlagen und weitergehenden Informationen durch Meistereien und Behörden. Weitere Teilergebnisse dieser Arbeit sind Teil des vom LfU beauftragten Forschungsvorhabens „Untersuchung von Anlagen zur Behandlung des Niederschlagswassers von Verkehrs-flächen – 76e133“. Das aktuelle Forschungsprojekt „Schadstoffremo-bilisierung durch Auftausalze – AZ-1124-14“ wird von der Bayerischen Forschungsstiftung und der Firma FRÄNKISCHE ROHRWERKE gefördert.
Literatur[1] BBodSchV: Bundes-Bodenschutz- und Altlastenverordnung vom
12. Juli 1999. BGBI. Nr. 36, S. 1554.
[2] GrwV: Grundwasserverordnung vom 09. November 2010. BGBl. I, S. 1513.
[3] FGSV (Forschungsgesellschaft für Straßen- und Verkehrswesen) 379: TL-Streu – Technische Lieferbedingungen für Streustoffe des Straßenwinterdienstes (2003).
[4] DIBt (Deutsches Institut für Bautechnik): Zulassungsgrundsätze für Niederschlagswasserbehandlungsanlagen. Teil 1: Anlagen zur dezentralen Behandlung des Abwassers von Kfz-Verkehrs-flächen zur anschließenden Versickerung in Boden und Grund-wasser. Deutsches Institut für Bautechnik, Berlin, Januar 2015.
[5] LfU (Bayerisches Landesamt für Umwelt): UmweltWissen – Pra-xis. Streusalz und Splitt im differenzierten Winterdienst (2013).
152

1151gwf-Wasser | Abwasser 11/2015
Regenwasserbewirtschaftung FACHBERICHTE
[6] FGSV (Forschungsgesellschaft für Straßen- und Verkehrswesen) R 2: Merkblatt für den Winterdienst auf Straßen (2010).
[7] Hanke, H.: Einsatz von Salzlösungen im Winterdienst. Straße und Autobahn (2015) Nr. 1, S. 34–38.
[8] VKU (Verband kommunaler Unternehmen e. V.): VKS-Information 52. Differenzierter Winterdienst im kommunalen Bereich (2003).
[9] FGSV (Forschungsgesellschaft für Straßen- und Verkehrswesen) 379/1: Hinweise und Empfehlungen für die Beschaffung von Streustoffen – Kommentar zur TL-Streu (2004).
[10] VKU (Verband kommunaler Unternehmen e. V.): VKS-Information 79. Effektiver Straßenwinterdienst im kommunalen Bereich. Empfeh-lungen zur Durchführung (2013).
[11] Oberste Baubehörde im Bayerischen Staatsministerium des Innern: Salzmanagement und Winterdienstorganisation der Bayerischen Straßenbauverwaltung. Dezember 2011 (2011) S. 1–18.
[12] Landesbetrieb Straßen NRW: Persönliche Mitteilung vom 05.07.2013.
[13] Bayerischer Landtag: Antwort des Staatsministeriums des Innern, für Bau und Verkehr vom 06.10.2014 auf die schriftliche Anfrage des Abgeordneten Markus Ganserer BÜNDNIS 90/DIE GRÜNEN vom 28.08.2014 in 17/3289 vom 10.11.2014 (2014).
[14] Landesbetrieb Straßen NRW: Persönliche Mitteilung vom 02.06.2015.
[15] Landesbetrieb für Straßenbau – Saarland: Informationen zur Durchführung des Winterdienstes im Saarland (2014), S. 1–8.
[16] Lippold, C.: Der Elsner 2015: Handbuch für Straßen- und Verkehrs-wesen (Planung, Bau, Erhaltung, Verkehr, Betrieb). 69. Aufl. Otto Elsner Verlagsgesellschaft Berlin, 2014.
[17] Meyer, T.: Schnee(t)räumen mit der BSR. Tagesspiegel vom 17.12.2010.
[18] Berliner Stadtreinigungsbetriebe (BSR): Staatliche Leistung. Mit vollem Einsatz für ein sauberes Berlin. Broschüre vom 12.03.2015.
[19] Frankfurter Entsorgungs- und Service GmbH: Pressemitteilung vom 28.03.2013: Bilanz FES-Winterdienst 2012/2013 (2013).
[20] Frankfurter Entsorgungs- und Service GmbH: Pressemitteilung vom 01.04.2015: Bilanz FES-Winterdienst 2014/2015 (2015).
[21] Klein, M.: Winterdienst ist gegen Glatteis gewappnet. Hannover-sche Allgemeine vom 04.12.2012.
[22] Zweckverband Abfallwirtschaft Region Hannover (aha): Weg-weiser Winterdienst in der Stadt Hannover. Was Sie bei Schnee und Eis beachten sollten. Broschüre vom 18.10.2013.
[23] Landeshauptstadt München – Baureferat: Winterdienst. Unsere Leistungen – Ihre Pflichten. Broschüre vom September 2011.
[24] Brod, H.-G.: Risiko-Abschätzung für den Einsatz von Tausalzen. Folgen für die Umweltmedien unter Berücksichtigung neuester Tendenzen. Berichte der Bundesanstalt für Straßenwesen, Ver-kehrstechnik Heft V 21 (1995).
[25] Welker, A. und Huber, M.: Dezentrale Behandlungsanlagen für Verkehrsflächenabflüsse – Stand der Technik. 42. Abwassertech-nisches Seminar: Zukunftsfähige Bewirtschaftungskonzepte für Niederschlagswasser, Garching, 10.07.2014. Berichte aus der Siedlungswasserwirtschaft der TU München, Band 211 (2014).
[26] Wichern, M., Vesting, A., Pecher, K. H., Giga, A., Wolke, M., Helmreich, B., Huber, M. und Li, Y.: Reduktion von Kohlenwasserstoffen und anderen organischen Spurenstoffen durch ein dezentrales Be-handlungssystem für Verkehrsflächenabflüsse. Abschlussbericht Projektphase II (2015).
[27] Athanasiadis, K. and Helmreich, B.: Influence of chemical conditioning on the ion exchange capacity and on kinetic of zinc uptake by clinoptilolite. Water Research 39 (2005) No. 8, p. 1527–1532.
[28] Tromp, K., Lima, A. T., Barendregt, A. and Verhoeven, J. T. A.: Reten-tion of heavy metals and poly-aromatic hydrocarbons from road water in a constructed wetland and the effect of de-icing. Jour-nal of Hazardous Materials 203–204 (2012), p. 290–298.
[29] Amoakwah, E., Van Slycken, S., Tack, F. M. G. and Essumang, D.: Assessing the Extraction Efficiency of CaCl2 and Rhizon Extrac-tion Methods after the Application of Organic Matter and CaCl2 as Soil Amendments to Enhance the Mobility of Cd and Zn. Journal of Environmental & Analytical Toxicology 3 (2013) No. 2, p. 167–173.
[30] Bäckström, M., Karlsson, S., Bäckman, L., Folkeson, L. and Lind, B.: Mobilisation of heavy metals by deicing salts in a roadside en-vironment. Water Research 38 (2004) No. 3, p. 720–732.
[31] LAWA (Länderarbeitsgemeinschaft Wasser): Ableitung von Ge-ringfügigkeitsschwellenwerten für das Grundwasser, Düsseldorf (2004).
[32] Moll, B. und Quadflieg, A.: Aktualisierung der Ableitung von Ge-ringfügigkeitsschwellenwerten für das Grundwasser. Wasser und Abfall (2014) Nr. 3, S. 10–14.
[33] Mantel-V: Verordnung zur Festlegung von Anforderungen für das Einbringen oder das Einleiten von Stoffen in das Grundwas-ser, an den Einbau von Ersatzstoffen und für die Verwendung von Boden und bodenähnlichem Material. Bundesministerium für Umwelt, Naturschutz und Reaktorsicherheit. Entwurf 31.10.2012.
[34] Paschka, M. G., Ghosh, R. S. and Dzombak, D. A.: Potential Water-Quality Effects from Iron Cyanide Anticaking Agents in Road Salt. Water Environment Research 71 (1999) No. 6, p. 1235–1239.
[35] Welker, A.: Schadstoffströme im urbanen Wasserkreislauf – Auf-kommen und Verteilung, insbesondere in den Abwasserentsor-gungssystemen. Habilitationsschrift. Schriftenreihe der TU Kaiserslautern, FG Siedlungswasserwirtschaft, Band 20. Aktua-lisierter Anhangband (2005/2014).
[36] Huber, M., Welker, A. und Helmreich, B.: Belastung von Verkehrs-flächenabflüssen mit Schwermetallen – ein europäischer Ver-gleich. gwf-Wasser|Abwasser 156 (2015) Nr. 9, S. 896–909.
[37] Novotny, V., Muehring, D., Zitomer, D. H., Smith, D. W. and Facey, R.: Cyanide and metal pollution by urban snowmelt: Impact of deicing compounds. Water Science and Technology 38 (1998) No. 10, p. 223–230.
[38] Ifs-Forschungsbericht: Naturnahe Verfahren zur Behandlung von Regenabflüssen, 2. Untersuchungszeitraum. Bericht der Ingenieurgesellschaft für Stadthydrologie mbH, März 2006.
[39] Huber, M., Welker, A., Dierschke, M., Drewes, J. E. und Helmreich, B.: Ein neues Laborverfahren zur Ermittlung von Standzeiten de-zentraler Anlagen zur Behandlung von Verkehrsflächenabflüs-sen. gwf-Wasser|Abwasser 155 (2014) Nr. 5, S. 630–638.
[40] Huber, M., Dierschke, M., Welker, A. and Helmreich, B.: Laborverfah-ren zur Ermittlung von Standzeiten von Anlagen zur Behandlung des Niederschlagswassers von Verkehrsflächen. Aqua Urbanica 2014, Innsbruck, 23.–24.10.2014. ISBN 978-3-902978-28-8.
[41] Huber, M., Hilbig, H., Drewes, J. E. und Helmreich, B.: Einfluss von Auftausalzen auf die Remobilisierung von auf Filtermaterialien zur Behandlung von Verkehrsflächenabflüssen zurückge-haltenen Schwermetallen. Aqua Urbanica 2015, Stuttgart, 07.–08.10.2015.
[42] Dauber, L., Novak, B., Zobrist, J. und Zürcher, F.: Schmutzstoffe im Regenwasserkanal einer Autobahn. Stuttgarter Berichte zur Siedlungswasserwirtschaft. Beeinflussung der Gewässergüte durch Regenabflüsse von Straßen. Band 64, Oldenbourg Verlag, München (1979), S. 41–57.
[43] Dannecker, W., Au, M. and Stechmann, H.: Substance load in rain-water runoff from different streets in Hamburg. Science of the Total Environment 93 (1990), p. 385–392.
153

1152 gwf-Wasser | Abwasser 11/2015
FACHBERICHTE Regenwasserbewirtschaftung
[44] Geiger-Kaiser, M. und Jäger, P.: Reinigung von Straßenabwässern, Wirksamkeit von Retentionsfilterbecken zur Reinigung von Straßenoberflächenwässern. Reihe Gewässerschutz Band 11 (2005), S. 1–54.
[45] Jenewein, I. und Schinner, M.: Zur Frage der Zusammensetzung und mögliche Beeinflussung des Grundwassers von Regenab-flüssen aus Hochleistungsstraßen am Beispiel der Brenner-Au-tobahn. Forum Städte-Hygiene 33 (1982), S. 113–116.
[46] Langbein, S., Steiner, M. und Boller, M.: Schadstoffe im Straßenab-wasser einer stark befahrenen Straße und deren Retention mit neuartigen Filterpaketen aus Geotextil und Adsorbermaterial. Schlussbericht des Forschungsprojekts (2006), S. 1–77.
[47] von Ballmoos, M.: A28a – Umfahrung Klosters, Wirkungskontrol-le Straßenabwasserbehandlungsanlage (SABA). Concepta AG, Tiefbauamt des Kantons Graubünden (2007), S. 1–17.
[48] Rutz, F.: Waldeggstrasse, Strassenabwasserbehandlungsanlage SABA Ristet. Gesamtbericht über Erfolgskontrollen (2009), S. 1–23.
[49] Stotz, G.: Investigations of the properties of the surface water run-off from federal highways in the FRG. Science of the Total Environment 59 (1987), p. 329–337.
[50] Stotz, G. and Krauth, K.: The pollution of effluents from pervious pavements of an experimental highway section: first results. Science of the Total Environment 146–147 (1994), p. 465–470.
[51] Nadler, A. und Meißner, E.: Versickerung des Niederschlagswassers von befestigten Verkehrsflächen, Abschlussbericht, Entwick-lungsvorhaben, Oktober 1996 – Oktober 2005. Bayerisches Landesamt für Umwelt (2007), S. 1–72.
[52] Herrmann, R., Daub, J. und Striebel, T.: Charakterisierung und Ana-lyse der Verschmutzung des Niederschlages und des Nieder-schlagabflusses, Abschlussbericht: Niederschlagsbedingte Schmutzbelastung der Gewässer aus städtischen befestigten Flächen, Phase 1, Teilprojekt 1. Eigenverlag des Instituts für Sied-lungswasserwirtschaft, Universität Karlsruhe (1992).
[53] Helmreich, B., Hilliges, R., Schriewer, A. and Horn, H.: Runoff pollu-tants of a highly trafficked urban road – Correlation analysis and seasonal influences. Chemosphere 80 (2010) No 9, p. 991–997.
[54] Hilliges, R., Schriewer, A. and Helmreich, B.: A three-stage treatment system for highly polluted urban road runoff. Journal of Envi-ronmental Management 128 (2013), p. 306–312.
[55] Grotehusmann, D. und Kasting, U.: Vergleich der Reinigungsleis-tung von Retentionsbodenfiltern und Versickerungsanlagen an Bundesfernstraßen. Forschungsberichte aus dem Forschungs-programm des Bundesministeriums für Verkehr, Bau- und Woh-nungswesen und der Forschungsgesellschaft für Straßen- und Verkehrswesen e. V. Heft 1024 (2009).
[56] Holthuis, J.-U., Dobner, I., Tegge, K.-T., Warrelmann, J. und Mahro, B.: Praxistest eines neuartigen, bepflanzten Bodenfilters zur Be-handlung von Straßenabflüssen, Teil 1: Wasseruntersuchungen. KA Abwasser, Abfall 59 (2012) Nr. 11, S. 1030–1039.
[57] Golwer, A. und Schneider, W.: Untersuchungen über die Belastung des unterirdischen Wassers mit anorganischen toxischen Spu-renstoffen im Gebiet von Straßen. Untersuchungen über die Belastung des Grundwassers mit organischen Stoffen im Bereich von Straßen. Forschungsberichte aus dem Forschungspro-gramm des Bundesministers für Verkehr und der Forschungs-gesellschaft für Straßen- und Verkehrswesen e. V. Heft 391 (1983).
[58] Grotehusmann, D. und Kasting, U.: Untersuchung über die Be-schaffenheit der Oberflächenabflüsse von Parkflächen bei Tank- und Rastanlagen. Ingenieurgesellschaft für Stadthydrologie mbH, Hannover. Bericht der Bundesanstalt für Straßenwesen FE 05.123/2000/GGB, Bergisch Gladbach (2002), S. 1–62.
[59] Kasting, U., Janiczek, M. und Grotehusmann, D.: Entwässerungs-systeme, Bodenfilteranlagen zur Reinigung von Abflüssen stark verschmutzter Verkehrsflächen, Halbtechnische Bodenfilterver-suche. KA Abwasser, Abfall 50 (2003) Nr. 11, S. 1428–1433.
[60] Muschack, W.: Pollution of street run-off by traffic and local conditions. Science of the Total Environment 93 (1990), p. 419–431.
[61] Kocher, B., Brose, S., Chlubek, A., Karagüzel, N., Klein, N. und Siebertz, I.: Stoffeintrag in Straßenrandböden: Messzeitraum 2005/2006. Berichte der Bundesanstalt für Straßenwesen, Bergisch Gladbach 198 (2010), S. 1–45.
[62] Kocher, B., Brose, S., Chlubek, A., Görg, C., Klein, N. und Siebertz, I.: Stoffeintrag in Straßenrandböden: Messzeitraum 2006/2007. Berichte der Bundesanstalt für Straßenwesen, Bergisch Gladbach 199 (2010), S. 1–38.
[63] Lange, G., Grotehusmann, D., Kasting, U., Schütte, M., Dietrich, M. und Sondermann, W.: Wirksamkeit von Entwässerungsbecken im Bereich von Bundesfernstraßen. Forschungsberichte aus dem Forschungsprogramm des Bundesministers für Verkehr, Bau- und Wohnungswesen und der Forschungsgesellschaft für Straßen- und Verkehrswesen e. V. Heft 861 (2003).
Im Peer-Review-Verfahren begutachtet
Eingereicht: 27.04.2015
Korrektur: 07.08.2015
Autoren
Maximilian Huber, M.Sc.Lehrstuhl für Siedlungswasserwirtschaft |Technische Universität München |
Prof. Dr.-Ing. Jörg E. DrewesLehrstuhl für Siedlungswasserwirtschaft |Technische Universität München |
Prof. Dr. rer. nat. habil. Brigitte [email protected] |Lehrstuhl für Siedlungswasserwirtschaft |Technische Universität München |Am Coulombwall 8 |D-85748 Garching
Prof. Dr.-Ing. habil. Antje WelkerFachgebiet Siedlungswasserwirtschaft und Hydromechanik |Frankfurt University of Applied Sciences |Nibelungenplatz 1 |D-60318 Frankfurt am Main
154

Chapter 9: Research Paper: “Heavy Metal Removal Mechanisms of
Sorptive Filter Materials for Road Runoff Treatment and
RemobilizationunderDe‐icingSaltApplications”
First results showed that Cu and Zn were not (or less) released with pure sodium chloride but with a
mixture of sodium chloride and calcium chloride (cf. Section 7.1). However, only the effect of sodium
chloride on previously retained Cu and Zn is currently considered in test procedures of authorities
(DIBt, 2012; DIBt, 2015; ÖNORM B 2506‐3 Entwurf, 2015). Thus, the objective of the following paper
was to elucidate the heavy metal removal and remobilization under de‐icing salt applications for five
heavy metals and three de‐icing salts (sodium chloride, a mixture of sodium chloride with calcium
chloride, and a mixture of sodium chloride with magnesium chloride) using lab‐scale column
experiments. Because more and more manufactured decentralized treatment systems are used (cf.
Section 2.3), the focus was set on six commercially supplied filter materials. The hypothesis was:
The composition of the de‐icing salt solution has a significant effect on the remobilization of heavy
metals and the behavior of each heavy metal differs widely (Hypothesis 7).
The risk of remobilization was determined after preloading the filter material with Cd, Cu, Ni, Pb, and
Zn. The removal efficiencies of each heavy metal varied for all filter materials. In most cases, Cu and
Pb were best retained. The best material removed about six times more Zn compared with all other
materials. Concerning the subsequent de‐icing salt experiments, the results were more
heterogeneous. The behavior of each filter material, each heavy metal, and each de‐icing salt was
different. In general, Cu was released the least from most of the selected filter materials by the three
de‐icing salts. In most cases, the mixture of sodium chloride and calcium chloride resulted in the
strongest effect on remobilization compared with the other two de‐icing salts. Pure sodium chloride
had a minor effect on the remobilization for most heavy metals and filter materials. The results can
be helpful for the development and improvement of filter materials used in decentralized systems.
Advanced analyses were used to specify the removal mechanisms. For example, the metal
distribution in a particle was evaluated by energy‐dispersive X‐ray spectroscopy and laser ablation
tests. Computer modeling was used to support the findings of the lab‐scale column experiments by
simulating the speciation of heavy metals, also under the application of different de‐icing salts. Data
and figures of the modeling are presented in the conference proceeding Huber et al. (2016b).
The following research paper was published in Water Research 102, 453–463. Huber, Hilbig,
Badenberg, Fassnacht, and Helmreich conceived the experiments. Huber, Hilbig, Badenberg, and
Fassnacht designed, performed, and evaluated the experiments. Fassnacht and Huber did the
computer modeling. Huber also wrote the manuscript. All authors contributed to the discussions.
155

lable at ScienceDirect
Water Research 102 (2016) 453e463
Contents lists avai
Water Research
journal homepage: www.elsevier .com/locate/watres
Heavy metal removal mechanisms of sorptive filter materials for roadrunoff treatment and remobilization under de-icing salt applications
Maximilian Huber a, Harald Hilbig b, Sophia C. Badenberg a, Julius Fassnacht a,J€org E. Drewes a, Brigitte Helmreich a, *
a Chair of Urban Water Systems Engineering, Technical University of Munich, Am Coulombwall 3, 85748 Garching, Germanyb cbmeCentre for Building Materials, Technical University of Munich, Baumbachstraße 7, 81245 Munich, Germany
a r t i c l e i n f o
Article history:Received 11 April 2016Received in revised form20 June 2016Accepted 29 June 2016Available online 1 July 2016
Keywords:De-icing saltsDecentralized systemFilter materialRoad maintenanceStormwater treatmentWinter service
* Corresponding author.E-mail address: [email protected] (B. Helmreic
http://dx.doi.org/10.1016/j.watres.2016.06.0630043-1354/© 2016 Elsevier Ltd. All rights reserved.
a b s t r a c t
The objective of this research study was to elucidate the removal and remobilization behaviors of fiveheavy metals (i.e., Cd, Cu, Ni, Pb, and Zn) that had been fixed onto sorptive filter materials used indecentralized stormwater treatment systems receiving traffic area runoff. Six filter materials (i.e.,granular activated carbon, a mixture of granular activated alumina and porous concrete, granular acti-vated lignite, half-burnt dolomite, and two granular ferric hydroxides) were evaluated in column ex-periments. First, a simultaneous preloading with the heavy metals was performed for each filter material.Subsequently, the remobilization effect was tested by three de-icing salt experiments in duplicate usingpure NaCl, a mixture of NaCl and CaCl2, and a mixture of NaCl and MgCl2. Three layers of each columnwere separated to specify the attenuation of heavy metals as a function of depth. Cu and Pb were retainedbest by most of the selected filter materials, and Cu was often released the least of all metals by the threede-icing salts. The mixture of NaCl and CaCl2 resulted in a stronger effect upon remobilization than theother two de-icing salts. For the material with the highest retention, the effect of the preloading levelupon remobilization was measured. The removal mechanisms of all filter materials were determined byadvanced laboratory methods. For example, the different intrusions of heavy metals into the particleswere determined. Findings of this study can result in improved filter materials used in decentralizedstormwater treatment systems.
© 2016 Elsevier Ltd. All rights reserved.
1. Introduction
Parameters commonly monitored in runoff from traffic areasinclude solids, organic substances, heavymetals, and compounds ofde-icing salts (Folkeson et al., 2009). Heavy metals such as Cd, Cu,Ni, Pb, and Zn are often measured because of their environmentalrelevance and can occur in notable runoff concentrations (Huberet al., 2016c). Chloride is also determined in high runoff concen-trations from traffic areas with winter services because NaCl, CaCl2,and MgCl2 are widely used as de-icing salts (Bauske and Goetz,1993; Nelson et al., 2009).
In recent years, dozens of manufactured decentralized storm-water treatment systems have been developed to treat traffic arearunoff prior to discharge into surface water or local groundwater(Dierkes et al., 2015). To retain dissolved and particulate substances,
h).
156
commonly a mechanical step (e.g., sedimentation or filtration)followed by a subsequent treatment step with a filter material isnecessary (Hilliges et al., 2013). The term “filter material” wasdeliberately chosen because it is commonly used by manufacturersand operators, although the removal mechanisms of filter materialsconsist not just of filtration (e.g., after precipitation), but also ofsorption or ion exchange. These decentralized treatment systemsfor traffic area runoff can be approved for use after passing severaltests (e.g., remobilization of Cu and Zn by NaCl; DIBt, 2015). How-ever, no standardized testing method is provided among theseapproval processes to determine the impact of all relevant de-icingsalts upon the remobilization of heavy metals that were previouslyretained by filter materials. Consequently, there is currently nomanufactured decentralized treatment system for road runoffavailable in Germanywith proven filter stability against NaCl, CaCl2,andMgCl2, although Cl� and the corresponding cations can have aneffect upon retained heavy metals. For example, during applica-tions of NaCl in road maintenance, increases in Cd, Cu, Ni, and Zn

M. Huber et al. / Water Research 102 (2016) 453e463454
concentrations were detected in the effluent of a constructedwetland (Tromp et al., 2012). Thereby, the Cu effluent concentra-tions were higher than the maximum influent concentration andthe system itself became a source of contamination during the coldseason. Hence, the consideration of heavy metal releases triggeredby de-icing salts is relevant for systems treating traffic area runoffin moderate and cold climates.
A few studies have examined the remobilization behavior ofheavy metals bound to roadside soils (e.g., Amrhein et al., 1992;Bauske and Goetz, 1993; B€ackstr€om et al., 2004). Nelson et al.(2009) tested two soils for the effects of NaCl and MgCl2 on heavymetal mobility (Cd, Cu, and Pb). Both soils exhibited different be-haviors for each de-icing salt and heavy metal, in particular for Cu.The use of NaCl resulted in the largest remobilization of Cu and Pb.MgCl2 released higher levels of Cd for both soils. Huber et al. (2014)published results concerning the remobilization of Cu and Zn byNaCl and CaCl2 for two soils and five filter materials used forstormwater treatment. In some cases, both heavy metals werereleased and in other cases, only Zn showed higher mobility. Theseeffects depended upon the material and the de-icing salt, e.g., someheavymetals were not released with NaCl alone but by amixture ofNaCl and CaCl2. In addition, the pH of the effluent was oftenreduced by the use of de-icing salts in this study. However, neitherof these studies experimented with all of the relevant five heavymetals and three de-icing salts. Thus, the focus of further researchshould be on the identification of the impact of relevant de-icingsalts upon previously retained metals. Moreover, as more andmore manufactured decentralized treatment systems are used,commercially supplied filter materials must be tested as thesematerials are much higher loaded than roadside soils because oftheir high ratio of drainage area to filter material surface area(Huber et al., 2014).
The objectives of this study were to elucidate the removal andremobilization behaviors of five heavymetals under the applicationof three de-icing salts using lab-scale column experiments. Inaddition, the removal mechanisms were specified for all sixcommercially supplied filter materials, and the influence of twopreloading levels upon the remobilization was determined for thematerial with the highest removal capacity.
2. Material and methods
2.1. Filter materials and chemicals
The following filter materials were used in this study: granularactivated carbon (GAC, Donau Carbon GmbH, Germany), a mixture(called alumina) of granular activated alumina (55%; AlbemarleCorporation, USA) and porous concrete (45%; Xella DeutschlandGmbH, Germany), granular activated lignite (lignite, RheinbraunBrennstoff GmbH, Germany), half-burnt dolomite (dolomite,Rheinkalk Akdolit GmbH & Co. KG, Germany), and two granularferric hydroxides with different calcium contents (FerroSorp, HeGoBiotec GmbH, Germany; GFH, Wasserchemie GmbH & Co. KG,Germany). Prior to conducting any experiments, lignite and dolo-mite were sieved to the size fraction of the other materials(0.5e2.0 mm) to minimize the influence of different size fractionsof each filter material upon the heavy metal retention (Smith,1998). Subsequently, all materials were dried at 105 ± 2 �C toachieve a constant weight, and finally stored in desiccators withoutadditional treatment until use. The chemical and physical charac-teristics of all blank materials are presented in Tables 1 and 2.
The heavy metal salts used were CdSO4$8/3H2O (AppliChem
GmbH, Germany), Cu(NO3)2$3H2O (AppliChem GmbH, Germany),Ni(NO3)2$6H2O (Merck KGaA, Germany), Pb(NO3)2 (AppliChemGmbH, Germany), and Zn(NO3)2$6H2O (AppliChem GmbH,
15
Germany). Adjustments of pH values and preservation of all liquidsamples were performed with nitric acid 65% p.a. (Merck KGaA,Germany). As de-icing salts, NaCl (AppliChem GmbH, Germany),dried, powdered CaCl2 (AppliChem GmbH, Germany), andMgCl2$6H2O (AppliChem GmbH, Germany) were used.
2.2. Experimental setup
The experimental apparatus was constructed of glass and allpipes were made of polyvinyl chloride. The glass column had aninner diameter of 2.0 cm and a length of 40 cm, providing a filtermaterial bed height of 14.4 cm. Thus, the ratio of the inner diameterto the largest particle was at least 10:1 to obtain appropriate lab-scale design parameters (Fanfan et al., 2005). A glass screen wasplaced at the bottom of the column to support the filter materials.The influent was directed through the glass columns in up-flowmode (from bottom to top) at ambient temperature (21 ± 2 �C).All sorbent samples wereweighed using an analytical balance (MC1Research RC 210D, Sartorius AG, Germany) with an accuracy of±0.1 mg.
For heavy metal removal, lab-scale column experiments wereconducted with influent concentrations of 0.625 mg/L (Cd), 2.5 mg/L (Cu, Ni, and Pb), and 5.0 mg/L (Zn). These concentrations arehigher than most values measured in runoff from traffic areas (toshorten the duration of the experiments), and the different valueswere chosen to simulate realistic proportions (Huber et al., 2016c).The initial pH was 4.9 ± 0.3 to obtain dissolved metals. Deionizedwater (electrical conductivity <1 mS/cm) was used for influentpreparation and no buffer was used to simulate a worst-case sce-nario for the determination of dissolved heavy metal removal (e.g.,to avoid oversaturated conditions) (Huber et al., 2016a). The flowrate was adjusted to about 6.5 mL/min by a peristaltic pump(ECOLINE VC-MS/CA8-6, Ismatec SA, Switzerland). Thereby, theempty bed contact time was maintained at about 7 min. The ex-periments were performed in eight columns per material fromMonday to Friday. During weekends, the filter materials were keptsaturated without flow (representing dry-weather periods). Thepreloading part was terminated when the breakthrough of Zn wasat least 50% in the effluent. This removal efficiency corresponds tothe elimination criteria often requested by international regula-tions for stormwater treatment systems (Huber et al., 2016b).Consequently, a breakthrough of 50% correlates with the end of theservice life (i.e., the maximum preloading of a real filter). In addi-tion, one shorter preloading run was performed with the filtermaterial that had the highest removal capacity to test the effects ofdifferent preloading levels on remobilization. At the end of thepreloading, each column was flushed with deionized water for60min to remove the dissolved heavymetals, which were not fixedonto the filter material. The flushing process was controlled bymeasuring the heavy metal concentrations in effluent samples forall tests. Thus, the effluent concentrations measured in the subse-quent de-icing salt experiments were only related to remobilizationand no remobilization occurred during the previous deionizedwater flushes.
Six of the eight columns containing filter materials with pre-loaded heavy metals were used for the de-icing salt experiments.Two columns were operated with pure NaCl solution (10 g/L), twowith a mixture of NaCl (10 g/L) and CaCl2 (2.5 g/L), and two with amixture of NaCl (10 g/L) and MgCl2 hexahydrate (2.5 g/L). All de-icing salt concentrations were taken from the literature (Huberet al., 2015) and the experiments simulated a typical runoff event(6.0 L/(s$ha), which corresponds to 2.2 mm/h, for 200 min). Theratio of the filter surface area to the drainage area of the decen-tralized treatment system that was selected for the de-icing salttests was 1:1820. Therefore, the corresponding flow rate was
7

Table 1Chemical characteristics of all blank filter materials based on dry matter. For alumina, the characteristics of the two components are specified.
Parameter Main elements Heavy metals
Al TC Ca Fe K Mg Mn Na TS Si Cd Cu Cr Ni Pb Zn
Unit wt% wt% wt% wt% wt% wt% wt% wt% wt% wt% mg/kg mg/kg mg/kg mg/kg mg/kg mg/kg
Dolomite <0.02 8.74 28.7 0.04 <0.02 17.1 <0.02 0.02 <0.02 0.09 <0.3 3.0 52.2 1.4 <5 4.9FerroSorp 0.12 2.18 6.16 41.5 <0.02 0.46 0.92 0.02 0.06 5.56 0.3 <1 50.3 50.7 14.9 90.0GAC 0.07 96.3 0.21 0.07 0.96 0.09 <0.02 0.07 0.06 0.39 <0.3 4.5 53.9 5.5 <5 13.2GFH 0.05 0.09 0.28 60.0 0.02 0.03 0.14 <0.02 0.53 0.18 <0.3 <1 31.3 44.1 22.6 11.9Granular activated alumina 46.2 0.08 <0.02 0.13 <0.02 <0.02 <0.02 0.19 0.04 0.05 <0.3 18.6 161 2.0 <5 9.1Lignite 0.10 89.2 2.27 0.70 0.06 0.88 <0.02 0.25 0.46 0.04 <0.3 <1 21.6 2.0 <5 <1Porous Concrete 0.56 1.82 15.9 0.46 0.13 0.20 <0.02 0.03 0.62 30.6 0.5 16.7 165 9.1 5.4 57.8
M. Huber et al. / Water Research 102 (2016) 453e463 455
20.5 mL/min. The influent pH value was not adjusted for the de-icing salt tests. After the de-icing salt experiments, each columnwas flushed with deionized water for 15 min to remove most of thesalts that were not fixed onto the filter material and to obtaincomparable solid samples.
For all preloading experiments, one influent sample per stocksolution and several effluent samples at designated times werecollected in 50mL polypropylene bottles. For each de-icing salt test,one influent sample and four effluent samples (each representing a50 min period) were collected. This sampling strategy was inaccordance with the DIBt procedure (DIBt, 2015). Selected samplesof all tests were additionally filtrated to determine the dissolvedconcentrations of the heavy metals (0.45 mm pore size, VWR In-ternational GmbH, Germany).
Finally, three layers of each column were separated to specifythe attenuation of heavy metals as a function of depth. All sampleswere subsequently dried at 40 ± 2 �C in a vacuum for 24 h andstored separately in glass vessels pending analysis.
2.3. Analyses
For all water samples, measurements of the pH value wereimmediately performed after sample collection with a glasselectrode Sentix 60 (WTW GmbH, Germany) according to DIN ENISO 10523:2012-04. Subsequently, all samples were preservedwith nitric acid at pH < 2. The concentrations of heavy metalswere measured by flame atomic absorption spectrometry (AAS,Varian Spectrometer AA-240FS, Palo Alto, USA) according to theAPHA Standard Method 3111 with limits of quantification (LOQ) of1.0 mg/L (Ca), 20 mg/L (Cd), 50 mg/L (Cu), 0.1 mg/L (Fe), 0.5 mg/L(Mg), 1.0 mg/L (Na), 50 mg/L (Ni), 200 mg/L (Pb), and 20 mg/L (Zn).Graphite furnace AAS (Varian Spectrometer AA-240Z with GTA120, Palo Alto, USA) was used to reduce the LOQ for Cu, Ni, and Pb(5 mg/L) in accordance with the APHA Standard Method 3113.Quality control was maintained by using control and blank
Table 2Physical characteristics of all blank and dried filter materials. For alumina, the characteri
Parameter Dry residue(105 �C)
Loss on ignition(550 �C)
Loss on ignition(1000 �C)
Bd
Unit % % % g
Dolomite 99.9 0.3 31.1 1FerroSorp 90.0 10.9 16.5 5GAC 97.0 12.4 96.3 4GFH 55.0 8.8 11.9 1Granular activated
alumina99.8 7.6 8.7 9
Lignite 99.2 8.8 89.2 4Porous Concrete 99.4 5.2 11.6 3
158
samples and by performing standard solution quantity checksevery five samples.
The loaded solid and blank samples of all filter materials werefused at 1000 �C for 15 minwith three times their mass of LiBO2 (orat 500 �C for 10 min with ten times their mass of NaOH). Subse-quently, the melt pellets were digested and quantitative chemicalanalyses of the solutions were performed using inductively coupledplasma optical emission spectroscopy (ICP-OES, Ultima 2 ICP-OES,HORIBA Jobin Yvon, France) for Al, Ca, Cr, Fe, K, Mg, Mn, Na, S,and Si (LOQ for all elements was 0.02 wt%). Heavy metals (Cd, Cu,Cr, Ni, Pb, and Zn) were determined with ICP-OES after an inverseaqua regia digestion in a pressure vessel (300 mg sample in 6 mLHNO3 and 2 mL HCl for 20 min at 180 �C and ca. 20 bar; LOQ: Cd:0.3 mg/kg, Pb: 5 mg/kg, all others: 1 mg/kg).
For all blank and selected loaded samples, the physical charac-teristics dry residue (105 �C), loss on ignition (550 �C and 1000 �C),and bulk density were determined according to DIN EN12880:2001-02, DIN 18128:2002-12, and DIN EN 1097-3:1998-06,respectively. The characteristics of the pore system (pore volumesand porosity) were determined by Hg intrusion in a pressure rangefrom 0.004 MPa to 400 MPa (AutoPore III, Micromeritics GmbH,Germany) to detect the pore diameter in the range from 345 mm to3.2 nm. Specific surface areas of the filter materials were deter-mined according to Standard Method ISO 9277:2010-09 using a SA3100 plus (Beckman Coulter, Brea, USA) with N2 as an adsorptiongas (BET method). In addition, the total carbon (TC) and total sulfur(TS) were determined with a multi EA 4000 element analyzer at1350 �C (Analytik Jena AG, Germany).
To characterize selected blank and loaded samples, thefollowing advanced methods were used: X-ray diffraction datawere collected using an XRD 3003 TT (GE Sensing & InspectionTechnologies GmbH, Germany) with q-q configuration and Cu Karadiation (l ¼ 1.54 Å). Intensities were recorded over scatteringangles between 5� and 70� at steps of 0.02� and ZnO was used asan internal standard. The electroacoustic principle was used for
stics of the two components are specified.
ulkensity
Pore volume (5e345,000 nm)
Pore volume (5e50 nm)
Porosity Surface area(BET)
/L cm3/g cm3/g % m2/g
130 0.132 0.031 28.2 5.490 0.717 0.636 72.2 22430 0.354 0.026 27.5 986120 0.154 0.000 8.9 23770 0.159 0.103 27.4 263
70 0.450 0.014 38.2 26250 1.239 0.397 85.4 29.8
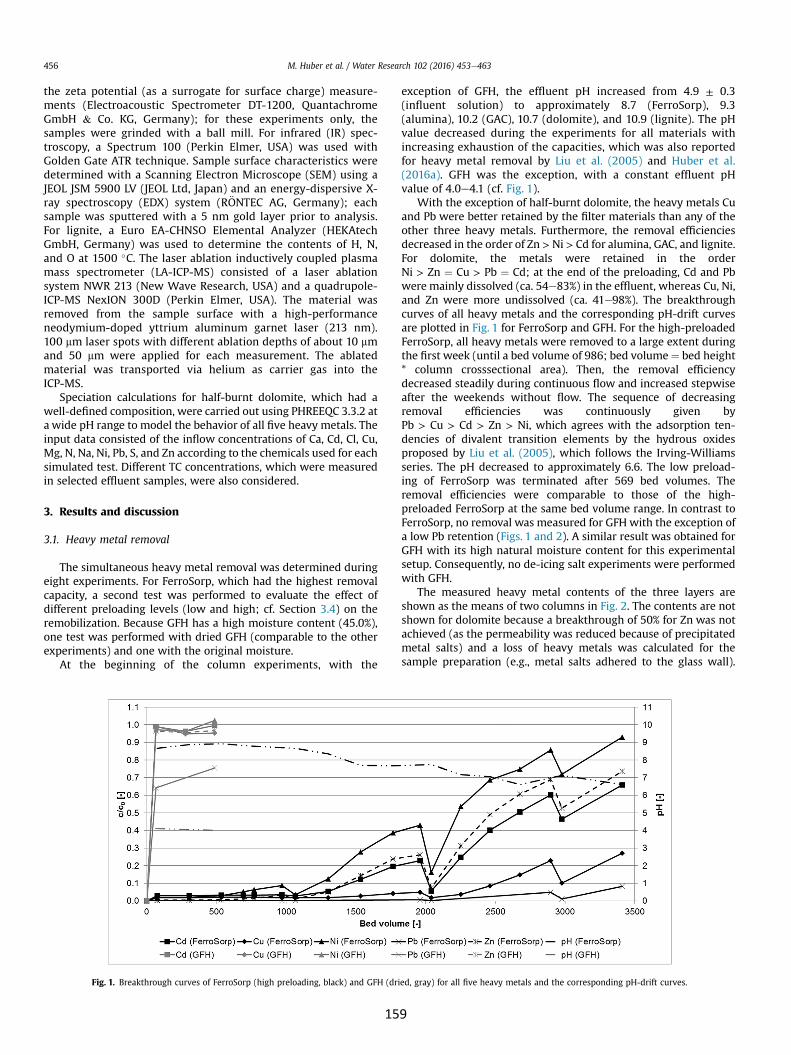
M. Huber et al. / Water Research 102 (2016) 453e463456
the zeta potential (as a surrogate for surface charge) measure-ments (Electroacoustic Spectrometer DT-1200, QuantachromeGmbH & Co. KG, Germany); for these experiments only, thesamples were grinded with a ball mill. For infrared (IR) spec-troscopy, a Spectrum 100 (Perkin Elmer, USA) was used withGolden Gate ATR technique. Sample surface characteristics weredetermined with a Scanning Electron Microscope (SEM) using aJEOL JSM 5900 LV (JEOL Ltd, Japan) and an energy-dispersive X-ray spectroscopy (EDX) system (R€ONTEC AG, Germany); eachsample was sputtered with a 5 nm gold layer prior to analysis.For lignite, a Euro EA-CHNSO Elemental Analyzer (HEKAtechGmbH, Germany) was used to determine the contents of H, N,and O at 1500 �C. The laser ablation inductively coupled plasmamass spectrometer (LA-ICP-MS) consisted of a laser ablationsystem NWR 213 (New Wave Research, USA) and a quadrupole-ICP-MS NexION 300D (Perkin Elmer, USA). The material wasremoved from the sample surface with a high-performanceneodymium-doped yttrium aluminum garnet laser (213 nm).100 mm laser spots with different ablation depths of about 10 mmand 50 mm were applied for each measurement. The ablatedmaterial was transported via helium as carrier gas into theICP-MS.
Speciation calculations for half-burnt dolomite, which had awell-defined composition, were carried out using PHREEQC 3.3.2 ata wide pH range to model the behavior of all five heavy metals. Theinput data consisted of the inflow concentrations of Ca, Cd, Cl, Cu,Mg, N, Na, Ni, Pb, S, and Zn according to the chemicals used for eachsimulated test. Different TC concentrations, which were measuredin selected effluent samples, were also considered.
3. Results and discussion
3.1. Heavy metal removal
The simultaneous heavy metal removal was determined duringeight experiments. For FerroSorp, which had the highest removalcapacity, a second test was performed to evaluate the effect ofdifferent preloading levels (low and high; cf. Section 3.4) on theremobilization. Because GFH has a high moisture content (45.0%),one test was performed with dried GFH (comparable to the otherexperiments) and one with the original moisture.
At the beginning of the column experiments, with the
Fig. 1. Breakthrough curves of FerroSorp (high preloading, black) and GFH (dri
15
exception of GFH, the effluent pH increased from 4.9 ± 0.3(influent solution) to approximately 8.7 (FerroSorp), 9.3(alumina), 10.2 (GAC), 10.7 (dolomite), and 10.9 (lignite). The pHvalue decreased during the experiments for all materials withincreasing exhaustion of the capacities, which was also reportedfor heavy metal removal by Liu et al. (2005) and Huber et al.(2016a). GFH was the exception, with a constant effluent pHvalue of 4.0e4.1 (cf. Fig. 1).
With the exception of half-burnt dolomite, the heavy metals Cuand Pb were better retained by the filter materials than any of theother three heavy metals. Furthermore, the removal efficienciesdecreased in the order of Zn > Ni > Cd for alumina, GAC, and lignite.For dolomite, the metals were retained in the orderNi > Zn ¼ Cu > Pb ¼ Cd; at the end of the preloading, Cd and Pbwere mainly dissolved (ca. 54e83%) in the effluent, whereas Cu, Ni,and Zn were more undissolved (ca. 41e98%). The breakthroughcurves of all heavy metals and the corresponding pH-drift curvesare plotted in Fig. 1 for FerroSorp and GFH. For the high-preloadedFerroSorp, all heavy metals were removed to a large extent duringthe first week (until a bed volume of 986; bed volume ¼ bed height* column crosssectional area). Then, the removal efficiencydecreased steadily during continuous flow and increased stepwiseafter the weekends without flow. The sequence of decreasingremoval efficiencies was continuously given byPb > Cu > Cd > Zn > Ni, which agrees with the adsorption ten-dencies of divalent transition elements by the hydrous oxidesproposed by Liu et al. (2005), which follows the Irving-Williamsseries. The pH decreased to approximately 6.6. The low preload-ing of FerroSorp was terminated after 569 bed volumes. Theremoval efficiencies were comparable to those of the high-preloaded FerroSorp at the same bed volume range. In contrast toFerroSorp, no removal was measured for GFH with the exception ofa low Pb retention (Figs. 1 and 2). A similar result was obtained forGFH with its high natural moisture content for this experimentalsetup. Consequently, no de-icing salt experiments were performedwith GFH.
The measured heavy metal contents of the three layers areshown as the means of two columns in Fig. 2. The contents are notshown for dolomite because a breakthrough of 50% for Zn was notachieved (as the permeability was reduced because of precipitatedmetal salts) and a loss of heavy metals was calculated for thesample preparation (e.g., metal salts adhered to the glass wall).
ed, gray) for all five heavy metals and the corresponding pH-drift curves.
9

Fig. 2. Heavy metal contents of five filter materials as functions of depth after the preloading in the up-flow mode (values are the means of duplicates). For FerroSorp, bothpreloading levels are presented.
M. Huber et al. / Water Research 102 (2016) 453e463 457
Therefore, the average metal contents of dolomite were calculatedfrom the differences of influent and effluent concentrations to beapproximately 379 mg/kg Cd, 1680 mg/kg Cu, 1720 mg/kg Ni,1350 mg/kg Pb, and 3420 mg/kg Zn. For all filter materials, the totalamount of each heavymetal retainedwas always much higher thanthe corresponding solid contents of the blankmaterials (cf. Table 1).The highest capacities were measured for FerroSorp (high pre-loading), followed by comparable results for alumina, FerroSorp(low preloading), and lignite. GAC had lower sorption capacities,and GFH showed only a slight Pb removal in these experiments.More mobile elements (i.e., Cd, Ni, and Zn) had an earlier break-through and the highest contents in the top layer, whereas Cu andPb mostly had the highest contents in the bottom layer. For GAC, allheavy metals had a fast breakthrough of at least 50% and a
160
competition between the metals was observed (Cu and Pb replacedother metals). Consequently, the heavy metal attenuation of GACwas different from that of the other filter materials.
The removal of metals by filter materials for stormwater treat-ment has also been determined by other researchers. For the sameGFH, Genç-Fuhrman et al. (2007) measured the third-best removalin a batch experiment comparison of eleven materials. It retainedCr most effectively, but also Cd, Cu, Ni, and Zn. The arsenic removalwas moderate in contrast to the results of Sperlich et al. (2005).However, Genç-Fuhrman et al. (2007) used an initial pH value of 6.5and NaCl/NaHCO3 to simulate the ionic strength that led to theprecipitation of some metals. Sperlich et al. (2005) performedcolumn experiments at a pH of 7 with ionic strength simulated byNaCl. These differences in the experimental setup can explain the

M. Huber et al. / Water Research 102 (2016) 453e463458
large variances in the removal efficiencies for GFH (Huber et al.,2016a).
3.2. Removal mechanisms
3.2.1. AluminaThe mixture consisted of a granular activated alumina (87.3%
Al2O3; 0.19% Na) and a porous concrete with low impurities(Table 1). The pH value of the effluent decreased during the heavymetal removal test from 9.3 to 6.6. The removal mechanisms arebased on the high surface area and the interactions of metals withthe surface, but also on the high porosity of the porous concrete(Table 2). The zeta potential decreased from �41 mV (unloadedsample at original pH value) to�10mV at the end of the preloading,confirming that alumina had a high removal capacity for metalcations because of outer-sphere complexation. In addition, thenegatively charged surface enables sorption by ligand exchange.They could also precipitate at the prevailing pH values, mainly ashydroxides, although themetal concentrations in solutionmight beless than the solubility limits. Considering literature data, somecations might be removed by sorption after pore diffusion or ionexchange (Genç-Fuhrman et al., 2007), the latter being proposed bythe measurements of a decreasing Na content in the filter materialduring the experiment.
3.2.2. DolomiteHalf-burnt dolomite is obtained from the thermic dissociation of
dolomite at 650e750 �C. The main components were determinedto be CaCO3 (approximately 71.6%), MgCO3 (0.9%), andMgO (26.8%).The pH increased by the reaction of H2OwithMgO to formMg(OH)2and the dissolution of carbonates and their subsequent reactions.High effluent concentrations of Ca (3.1e13.2 mg/L) and Mg(5.9e7.9 mg/L) and a low reduction of the materials’ C content weremeasured. The heavy metals were mainly retained at pH 10 byprecipitation as hydroxides and carbonates as identified by thePHREEQC calculations at a pH of 9.7e10.7 and a TC of 3.5 mmol/L.The main metal species were: free cations (Cd), hydroxides (Cd, Cu,and Zn), and carbonates (Cd, Ni, Pb, and Zn). In addition, simula-tions showed that Ni had the highest affinity for carbonate pre-cipitation. This effect increased with decreasing TC. Thus, Cd, Pb,and Znwere precipitated less as carbonates because of the presenceof Ni. This speciation can explain the low removal of Cd and Pb andthe high removal of Ni. The calculations were confirmed by theanalyses of preloaded dolomite by SEM/EDX (Fig. 3). By evaluatingthe backscattered electrons (lighter places indicate heavier ele-ments), clusters of retained heavymetals were found on the surface(site B). At these sites, C and O were also measured, indicating theprecipitation of the metals. Acosta et al. (2011) also determined theremoval of Pb and Zn by carbonate precipitation on the surface ofdolomite.
3.2.3. FerroSorpThis porous ferric hydroxide has a large surface area and pore
volume. It mainly consists of Fe, Si, Ca, TC, and Mn compounds.During the removal experiment, almost no Fe (<0.1 mg/L), someMg(<0.5e3.3 mg/L), and large amounts of Ca (3.0e13.4 mg/L) weremeasured in the effluent. The TC content of the filter material,which was mostly present as CaCO3, decreased to 1.22% (Ca to1.73%). Thus, the Ca content decreased by approximately 72% andthe TC content by approximately 44%. Consequently, heavy metalsmust be precipitated as carbonates and might also be retained byion exchange. Further pH-dependent removal mechanisms, such assorption (cf. Section 3.1) and surface complexation (hydroxidegroups), were proposed by Wu and Zhou (2009) and supported byzeta potential measurements. Moreover, the porous structure of
16
FerroSorp enhances the diffusion of heavy metals into the particle.On the surface, only high amounts of Pbweremeasured by SEM/
EDX (Fig. 4). To determine the intrusion of all metals into the par-ticle, LA-ICP-MS tests were performed with particles of the bottomlayer; at and near the surface (0e60 mm), a high retention of Pbwasmeasured. Cu was also found near the surface and mainly within aparticle depth of up to 100 mm. The more mobile elements, Cd, Ni,and Zn, were mostly found in the depth range of 40e300 mm. Inparticular, Ni diffused into the whole particle (40e1000 mm) inlarge amounts compared with the other heavy metals. The distri-bution of the heavy metals was displayed for a high resolution ofthe first 130 mm in Fig. 4. Therefore, most heavymetals diffused intothe pores, where they were retained at internal sites. The higherdecrease of Ca andMg at and near the surface indicates surficial andsome internal precipitation and ion exchange. The evaluationmethod for the LA-ICP-MS tests, as well as the complete results, willbe published elsewhere.
During the preloading experiment, adsorption and precipitationlikely took place first in the outer porous system because of the lowdiffusion coefficients (Sperlich et al., 2005). With more and moreheavy metals retained, these metals diffused into the particle. Atemporary desorption of a heavy metal and its intra-particletransport to an adjacent site was also possible. Since intra-particle pore and surface diffusion are rate-limited (Badruzzamanet al., 2004), the removal of FerroSorp decreased although the in-ner porous system was not saturated. The rate-limitation of someprocesses and the differences between the metals were alsodetected by the increased removal efficiencies after the weekendswithout flow (Fig. 1). The generally high removal efficiencies mightbe related to the large macropores and mesopores of the material,which are beneficial for high adsorption kinetics (Badruzzamanet al., 2004).
3.2.4. GACThis material is based on coconut shells and is activated by
steam and an alkaline reaction to obtain a large surface area(986 m2/g). It mainly consists of TC, K, Si, and Ca. This used GAC haslarge contents of micropores (0.483 cm3/g) and mesopores(0.071 cm3/g) (Kaya et al., 2008) and these physical characteristicssupport the adsorption of substances, which primarily takes placein these small pores. Nevertheless, its chemical structure affects itsinteraction with inorganic compounds. During the heavy metalremoval experiment, the Ca content decreased to 0.04%, which canbe linked to ion exchange and/or precipitation. Largitte et al. (2014)tested a similar GAC for the removal of Pb, and the precipitation ascarbonates, oxalates, oxides, and/or hydroxides was determined. Inaddition, metals can be adsorbed to GAC by weak intermolecular(van der Waals forces) and electrostatic interactions (ionic metalsand surface oxide groups). No heavy metals were detected by SEM/EDX on the surface, indicating removal of the metals in the pores bya film diffusion-controlled adsorption mechanism as proposed byKaya et al. (2008) for this GAC. However, a distinct determination ofthe removal mechanisms is not possible because of the heteroge-neity and small amounts of functional groups in combination withother cations on the surface.
3.2.5. GFHFor this poorly crystallized b-FeOOH, the point of zero charge
(pHpzc) was determined to be 7.5e8.0 (Sperlich et al., 2005). Thus,at pH values of 4.0e4.1, the surface of the GFH was positivelycharged, which does not promote metal cation removal by elec-trostatic interactions (all metals were measured to be free ions inthe influent at pH 5). In addition, no significant precipitation couldoccur at the measured pH values and only a slight removal of Pbwas determined, probably by sorption. The low pH might be linked
1

Fig. 3. Analyses of preloaded dolomite (SEM/EDX): detection of secondary electrons (top left), of backscattered electrons (top right), and elements (below).
M. Huber et al. / Water Research 102 (2016) 453e463 459
to the absence of CaCO3, which is often added to GFH. However, thisGFH was selected to determine the influence of CaCO3 in ferrichydroxides on the removal and subsequent remobilization of heavymetals.
3.2.6. LigniteThis lignite was activated by a rotary-hearth furnace process
that increased the carbon content, surface area, and mesoporevolume and decreased the number of functional groups (Murakamiet al., 1995). The used lignite mainly consisted of 89.2% TC, 5.15% O,2.27% Ca, 0.88% Mg, 0.46% TS, 0.26% N, 0.25% Na, and 0.22% H. ByXRD analysis, the presence of CaCO3 was determined and Ca wasdetected on the surface in agglomerates using SEM/EDX. No func-tional groups were detected via IR spectroscopy. Qi et al. (2011) alsodescribed IR spectroscopy curves showing no specific absorptionbands for a steam-activated coconut shell with an O content of 3.8%.Only a large variation between the blank and the preloaded sam-ples was measured for the Ca and Na contents (preloaded sample:1.66% Ca and 0.06% Na). The effluent concentrations were approx-imately 41 mg/L Ca and 9.7 mg/L Na at the beginning of the pre-loading test and <1.0 mg/L Ca and <1.0 mg/L Na at the end. Thus,the exhaustion of the heavy metal removal correlated with thedecrease of Ca and Na. Therefore, the retention mechanisms weremainly precipitation (e.g., as carbonates or sulfur compounds) and
162
ion exchange. The physical characteristics (cf. Table 2) also enablethe removal of heavy metals by adsorption.
3.3. Remobilization
Remobilization of a heavy metal is defined as a direct or indirectmetal release during de-icing salt application. The main processesduring these experiments were the complexation of heavy metalswith Cl�, ion exchange, competition of de-icing salt cations withpositively charged metal species for sorption sites on the filtermaterial, and change of metal species due to decrease of the pHvalue (B€ackstr€om et al., 2004; Norrstr€om, 2005; Acosta et al., 2011).Consequently, the important factors are the pH value and theretention sites (Nelson et al., 2009).
Each remobilization test represented one realistic traffic arearunoff event on a short-term basis (91 bed volumes). The objectivewas to differentiate between heavy metals, de-icing salts, and filtermaterials, rather than to determine the total amount of metals thatcould be remobilized. The results for the amounts of heavy metalsmeasured in the effluent per test are presented in Fig. 5. The pre-sented amounts are based on the individual filter material massesof each column.
Alumina had low remobilized amounts with no significant dif-ferences between the heavy metals. The highest measured effluent

Fig. 4. Analyses of high-preloaded FerroSorp (SEM, EDX, and LA-ICP-MS): detection of secondary electrons (top), detection of elements on the surface (bottom left), and the resultsof the LA-ICP-MS for the qualitative heavy metal retention as a function of intra-particle attenuation (bottom right; normalized by Fe, which was evenly distributed; verified by Si).
M. Huber et al. / Water Research 102 (2016) 453e463460
concentrations (the average of each sampling for the two columns)were 119 mg/L Cd (NaCl þ CaCl2), 87 mg/L Cu (NaCl þ CaCl2), 71 mg/LNi (NaCl þ MgCl2), 96 mg/L Pb (NaCl þ CaCl2), and 220 mg/L Zn(NaCl þ CaCl2). All values originated from the first sampling. Theaverage effluent pH values were 9.0 (NaCl), 8.5 (NaCl þMgCl2), and8.1 (NaCl þ CaCl2). The lowering of the pH could be a response toion exchange (B€ackstr€om et al., 2004). For all tests, Ni, Cd, and Pbwere mainly dissolved (>95%). By contrast, Cu and Zn were moreparticulate (0e44%).
Dolomite had moderate remobilized amounts with the excep-tion of a high Pb release. The highest measured effluent concen-trations (averages of each sampling) were 372 mg/L Cd(NaCl þ MgCl2), 292 mg/L Cu (NaCl þ CaCl2), 141 mg/L Ni(NaCl þ CaCl2), 791 mg/L Pb (NaCl þ CaCl2), and 375 mg/L Zn(NaCl þ CaCl2). All values originated from the first two samplings.The average effluent pH values were 10.3 (NaCl), 9.9(NaCl þ MgCl2), and 10.3 (NaCl þ CaCl2). For most samples, Cd andPb were mainly dissolved (>90%) and all other metals were moreparticle-bound with high variations, in particular Cu with a par-ticulate fraction of up to 99%. Modeling with PHREEQC determinedthat Cd was mostly complexed with Cl�, with less than 10% existingas free ion. Acosta et al. (2011) also found that Cd and Pb were verymobile in the presence of CaCl2 because they were more efficiently
16
replaced by Ca and more readily complexed with Cl� than Cu or Zn.These effects were similarly measured for NaCl with lower releasedmetal concentrations. A generally higher remobilization of Pb,which was previously precipitated on the surface, was also deter-mined for soils with increasing carbonate contents (Acosta et al.,2011).
FerroSorp (high preloading) showed a high remobilization, inparticular for Ni. The highest measured effluent concentrations(average of each sampling) were 1720 mg/L Cd,157 mg/L Cu, 4010 mg/L Ni, 91 mg/L Pb, and 1990 mg/L Zn. The values originated from thefirst and last samplings for the NaCl þ CaCl2 test, which also indi-cated different mechanisms or rate-limitation processes (e.g.,diffusion). Nevertheless, Ni was mostly remobilized at the begin-ning, although it was mainly bound within the particle (cf. Fig. 4).The difference between the Cd remobilization by NaCl þ CaCl2 andthe other de-icing salts was highest for FerroSorp, indicating that acation exchange by Ca (both having similar ionic radii) was likely(Amrhein et al., 1992). The average effluent pH values were 7.4(NaCl), 7.2 (NaCl þ MgCl2), and 6.9 (NaCl þ CaCl2). For all tests, allfive heavy metals were mainly dissolved (>95%). For the tests withNaCl þ MgCl2 and NaCl þ CaCl2, higher particulate fractions of Cu(7e23%), Pb (19e47%), and Zn (5e8%) were measured at the lastsampling (200 min) with no differences in the effluent pH values
3

Fig. 5. De-icing salt experiments: amounts of heavy metals measured in the effluent, calculated as the average of both columns for de-icing salt tests and based on the filter materialmass of each column (i.e., eight water samples per salt test that are represented for each metal in one bar). For FerroSorp, both preloading levels were evaluated.
M. Huber et al. / Water Research 102 (2016) 453e463 461
compared with earlier samplings.GAC, which had previously retained low amounts of heavy
metals (Fig. 2), showed mostly moderate remobilized amounts. Thehighest measured effluent concentrations (average of each sam-pling) were 143 mg/L Cd, 116 mg/L Cu, 150 mg/L Ni, 163 mg/L Pb, and418 mg/L Zn. All values originated from the first sampling for theNaCl þ CaCl2 test. The average effluent pH values were 7.6 (NaCl),7.5 (NaCl þ MgCl2), and 7.6 (NaCl þ CaCl2). For all tests, Cd wasmainly dissolved (>93%), followed by Zn, Ni, Pb, and Cu (52e91%).
Lignite also had moderate remobilized amounts. The highestmeasured effluent concentrations (averages of each sampling) were107 mg/L Cd, 197 mg/L Cu, 97 mg/L Ni, 210 mg/L Pb, and 229 mg/L Zn.All values originated from the first sampling for the NaCl þ CaCl2test. The average effluent pH values were 9.5 (NaCl), 9.1(NaCl þ MgCl2), and 9.2 (NaCl þ CaCl2). For all tests, Cd was mainly
164
dissolved (>95%) and all other metals were more particle-boundwith high variations.
In summary, each filter material behaved differently during thede-icing salt experiments because of their differing chemicalcompositions. Concerning the heavy metals, Cu was mostlyreleased the least by the three de-icing salts, followed by Pb. Themost mobile metal was Cd, which had the highest dissolved frac-tion and total remobilized amounts of previously retainedmetals of3.0% (alumina), 4.7% (dolomite), 6.3% (FerroSorp, high preloading),21.7% (GAC), and 5.8% (lignite) during the NaCl þ CaCl2 tests. Fordolomite, this percentage was also very high for Pb (4.5%) duringthe NaCl þ CaCl2 experiment. The Cd values were higher for theNaCl þ MgCl2 experiments for dolomite (6.1%) and lignite (5.9%).The high affinity of Cd for forming highly soluble complexes withCl� has been reported in previous studies (e.g., Norrstr€om, 2005;

M. Huber et al. / Water Research 102 (2016) 453e463462
Nelson et al., 2009), and this resulted in the measured Cd remo-bilization. Because of the relatively small amounts of releasedmetals, the differences of metal attenuation as functions of depthbefore and after the de-icing salt tests could not be experimentallydetermined. The pH values were always the highest for the NaCltests and often the lowest during the NaCl þ CaCl2 experiments,indicating a correlation between remobilization and pH decrease.However, the absolute pH values were different between the ma-terials. For a comparison between the filter materials, no correla-tion of the pH values and the remobilized amounts was determinedfor each de-icing salt. A correlation between remobilization and theremoval mechanism was also not found because of the large di-versity of mechanisms and their different combinations for eachfilter material. In most cases, NaCl þ CaCl2 application resulted inthe highest remobilization and pure NaCl application resulted inthe lowest. The difference between the remobilizations by Ca andMg was likely because of their differences in size and atomic mass;Ca is larger and heavier than Mg and probably replaces heavymetals faster and more easily (Acosta et al., 2011). In addition, CaandMg can competemore effectively for cation exchange sites thanthe monovalent Na (Amrhein et al., 1992). Consequently, all de-icing salts had an impact on the high-preloaded filter materialsand the effluent concentrations could be very high.
3.4. Effect of the preloading level on the remobilization
The effect of the preloading level was investigated for FerroSorpbecause it had the highest removal capacity. The heavy metal ca-pacities of the low-preloaded FerroSorp were lower by a factor ofapproximately 5 than those of the high-preloaded filter material(Fig. 2). For all remobilization tests, the effluent concentrations ofthe high-preloaded material were much higher than those of thelow-preloaded filter material. For high/low-preloading experi-ments, the maxima of the average concentrations per test were1240/123 mg/L for Cd, 128/6.8 mg/L for Cu, 2960/163 mg/L for Ni,63.0/20.1 mg/L for Pb, and 1620/87.5 mg/L for Zn. All maxima wereobtained for the tests with NaCl þ CaCl2, with the exceptions of Cuand Pb for the low-preloading experiment (i.e., the remobilizationby NaCl þ MgCl2). Thus, high-preloaded filter materials releasedhigher heavy metal concentrations under the same simulated de-icing salt runoff event than low-preloaded materials, and theseconcentrations can be relevant for the evaluation of toxicity effects.The average pH values of the effluent samples for the high/low-preloading experiments were 7.4/9.1, 7.2/8.7, and 6.9/8.1 for thetests with NaCl, NaCl þ MgCl2, and NaCl þ CaCl2 (with comparableinfluent pH values of 7.0, 6.9, and 8.2), respectively. The highestratios of remobilized heavy metals (Fig. 5) to previously retainedmetals (Fig. 2) were 6.3%/4.2% Cd, 0.1%/0.1% Cu, 4.6%/1.2% Ni, 0.1%/0.2% Pb, and 1.1%/0.4% Zn for the high/low-preloading experiments.Therefore, significantly higher fractions of previously retainedmetals were remobilized from the higher preloadedmaterial for Cd,Ni, and Zn.
The heavy metal contents of these manufactured filter materialswere much higher than the contents of roadside soils that havebeen evaluated by other researchers for heavy metal remobiliza-tion. For example, Acosta et al. (2011) tested nine soils with heavymetal contents of 1.07e14.1 mg/kg Cd, 15e89 mg/kg Cu,31e2764 mg/kg Pb, and 34e401 mg/kg Zn. For CaCl2, a total releaseof Cd of up to 4.1% was measured. It decreased for MgCl2 (3.0%) andNaCl (1.8%) for the high ionic strength of each de-icing salt (0.3 M).The releases of Pb and Cu were smaller and very low for Zn(0.0e0.2%). Thus, Cd was previously retained less and had thehighest remobilization ratios, whereas Cu was highly retained andsubsequently less remobilized (Acosta et al., 2011). Bauske andGoetz (1993) reported similar results with a release of 15.7% Cd
16
and 1.9% Zn by NaClþ CaCl2 from soil containing 2.99mg/kg Cd and658 mg/kg Zn. Norrstr€om (2005) evaluated the remobilization ofCd, Cu, Pb, and Zn from two soils from infiltration trenches forhighway runoff (1.5e2.7 mg/kg Cd, 155e194 mg/kg Cu,171e324 mg/kg Pb, and 607e781 mg/kg Zn). In total, 37e45% of Cd,0.1e0.2% of Pb, and 4.7e5.0% of Zn were leached by NaCl. Thus,higher fractions of the more mobile elements were remobilized.Despite the influences of the test conditions (e.g., ionic strength,durations, batch or column experiments), similar trends weredetected.
To exclude the effects of different preloading levels, a compar-ison of FerroSorp (low preloading) with alumina and lignite, whichwere similarly preloaded (Fig. 2), was performed. The lowest/highest releases of heavy metals from these three materials weremeasured as 0.7%/6.3% of Cd, 0.0%/1.2% of Cu, 0.4%/1.3% of Ni, 0.1%/2.4% of Pb, and 0.1%/1.3% of Zn for all de-icing salt tests. The lowestpercentages were all determined for the experiment with Ferro-Sorp/NaCl and the highest rates for lignite/NaCl þ CaCl2. However,for some combinations of heavy metal and de-icing salt, the leastremobilization was determined for alumina.
4. Conclusions
� The differentiated approach of this study made it possible toelucidate the removal and remobilization of five heavy metalsand six filter materials in lab-scale column experiments, bothagainst three different de-icing salts.
� The removal efficiencies of each heavy metal and their retentionmechanisms varied for all filter materials. Cu and Pb wereretained best except in the case of half-burnt dolomite.
� Concerning the de-icing salt experiments, the results weremoreheterogeneous. The behavior of each filter material, each heavymetal, and each de-icing salt was different. In general, Cu wasreleased the least by the three de-icing salts. The NaCl þ CaCl2mixture resulted in a stronger effect on remobilization than theother two de-icing salts. Pure NaCl had a minor effect on theremobilization for most heavy metals and filter materials. Acorrelation between the heavy metal solid content and theremobilization level was found.
� The use of a mixture of different filter materials might bebeneficial for reducing remobilization under all three differentde-icing salts.
� Findings of this research can be utilized in the development andimprovement of decentralized stormwater treatment systemsusing filter materials. By using these improvedmaterials, a moreenvironmentally friendly operation of these systems for trafficarea runoff can be ensured.
Acknowledgement
This research was financially supported by the BavarianResearch Foundation (AZ-1124-14) and the company FR€ANKISCHEROHRWERKE Gebr. Kirchner GmbH & Co. KG.
References
Acosta, J.A., Jansen, B., Kalbitz, K., Faz, A., Martínez-Martínez, S., 2011. Salinity in-creases mobility of heavy metals in soils. Chemosphere 85, 1318e1324.
Amrhein, C., Strong, J.E., Mosher, P.A., 1992. Effect of deicing salts on metal andorganic matter mobilization in roadside soils. Environ. Sci. Technol. 26,703e709.
B€ackstr€om, M., Karlsson, S., B€ackman, L., Folkeson, L., Lind, B., 2004. Mobilisation ofheavy metals by deicing salts in a roadside environment. Water Res. 38,720e732.
Badruzzaman, M., Westerhoff, P., Knappe, D.R.U., 2004. Intraparticle diffusion andadsorption of arsenate onto granular ferric hydroxide (GFH). Water Res. 38,4002e4012.
5

M. Huber et al. / Water Research 102 (2016) 453e463 463
Bauske, B., Goetz, D., 1993. Effects of deicing-salts on heavy metal mobility. ActaHydrochim. Hydrobiol. 21, 38e42.
DIBt, 2015. Zulassungsgrunds€atze für Niederschlagswasserbehandlungsanlagen.Teil 1: Anlagen zur dezentralen Behandlung des Abwassers von Kfz-Ver-kehrsfl€achen zur anschließenden Versickerung in Boden und Grundwasser.Deutsches Institut für Bautechnik, Berlin. January 2015, (in German).
Dierkes, C., Lucke, T., Helmreich, B., 2015. General technical approvals for decen-tralised sustainable urban drainage systems (SUDS)dthe current situation inGermany. Sustainability 7, 3031e3051.
Fanfan, P.N., Mabon, N., Carletti, I., Claustriaux, J.J., Thonart, P., Lognay, G., Copin, A.,Barth�elemy, J.P., 2005. New model for performance prediction in fixed-bedreactors based on the approach of the unused bed zone. Water Res. 39,4004e4010.
Folkeson, L., Bækken, T., Bren�ci�c, M., Dawson, A., Fran�cois, D., Ku�rímsk�a, P., Leit~ao, T.,Li�cbinský, R., Vojt�e�sek, M., 2009. Sources and fate of water contaminants inroads. In: Dawson, A. (Ed.), Water in Road StructureseMovement, Drainage andEffects, first ed. Springer, Netherlands, pp. 107e146.
Genç-Fuhrman, H., Mikkelsen, P.S., Ledin, A., 2007. Simultaneous removal of As, Cd,Cr, Cu, Ni and Zn from stormwater: experimental comparison of 11 differentsorbents. Water Res. 41, 591e602.
Hilliges, R., Schriewer, A., Helmreich, B., 2013. A three-stage treatment system forhighly polluted urban road runoff. J. Environ. Manag. 128, 306e312.
Huber, M., Dierschke, M., Welker, A., Helmreich, B., 2014. Laborverfahren zurErmittlung von Standzeiten von Anlagen zur Behandlung des Nieders-chlagswassers von Verkehrsfl€achen. Aqua Urbanica 2014, Innsbruck (Austria),23e24 October 2014. ISBN 13: 978-3-902978-28-8. (in German).
Huber, M., Welker, A., Drewes, J.E., Helmreich, B., 2015. Auftausalze im Stra-ßenwinterdiensteAufkommen und Bedeutung für dezentrale Behand-lungsanlagen von Verkehrsfl€achenabflüssen zur Versickerung. gwf Wasser/Abwasser 156, 1138e1152 (in German).
Huber, M., Badenberg, S.C., Wulff, M., Drewes, J.E., Helmreich, B., 2016a. Evaluationof factors influencing lab-scale studies to determine heavy metal removal by sixsorbents for stormwater treatment. Water 8 (62), 1e19.
Huber, M., Welker, A., Dierschke, M., Drewes, J.E., Helmreich, B., 2016b. A novel test
166
method to determine the filter material service life of decentralized systemstreating runoff from traffic areas. J. Environ. Manag. 179, 66e75.
Huber, M., Welker, A., Helmreich, B., 2016c. Critical review of heavy metal pollutionof traffic area runoff: occurrence, influencing factors, and partitioning. Sci. TotalEnviron. 541, 895e919.
Kaya, Y., G€oner, Z.B., Vergili, I., Barlas, H., 2008. Removal of cetyl-trimethylammonium bromide and sodium dodecylether sulfate by granularactivated carbon. J. Sci. Ind. Res. 67, 249e253.
Largitte, L., Gervelas, S., Tant, R., Couespel Dumesnil, P., Hightower, A., Yasami, R.,Bercion, Y., Lodewyckx, P., 2014. Removal of lead from aqueous solutions byadsorption with surface precipitation. Adsorption 20, 689e700.
Liu, D., Sansalone, J.J., Cartledge, F.K., 2005. Comparison of sorptive filter media fortreatment of metals in runoff. J. Environ. Eng. 131, 1178e1186.
Murakami, K., Ozaki, J.-i., Nishiyama, Y., 1995. Effects of surface treatment on cationexchange properties of Australian brown coals. Fuel Process. Technol. 43,95e110.
Nelson, S., Yonge, D., Barber, M., 2009. Effects of road salts on heavy metal mobilityin two eastern Washington soils. J. Environ. Eng. 135, 505e510.
Norrstr€om, A.C., 2005. Metal mobility by de-icing salt from an infiltration trench forhighway runoff. Appl. Geochem. 20, 1907e1919.
Qi, Y., Hoadley, A.F.A., Chaffee, A.L., Garnier, G., 2011. Characterisation of lignite as anindustrial adsorbent. Fuel 90, 1567e1574.
Smith, E.H., 1998. Modeling batch kinetics of cadmium removal: by a recycled ironadsorbent. Sep. Sci. Technol. 33, 149e168.
Sperlich, A., Werner, A., Genz, A., Amy, G., Worch, E., Jekel, M., 2005. Breakthroughbehavior of granular ferric hydroxide (GFH) fixed-bed adsorption filters:modeling and experimental approaches. Water Res. 39, 1190e1198.
Tromp, K., Lima, A.T., Barendregt, A., Verhoeven, J.T.A., 2012. Retention of heavymetals and poly-aromatic hydrocarbons from road water in a constructedwetland and the effect of de-icing. J. Hazard. Mater. 203e204, 290e298.
Wu, P., Zhou, Y.-S., 2009. Simultaneous removal of coexistent heavy metals fromsimulated urban stormwater using four sorbents: a porous iron sorbent and itsmixtures with zeolite and crystal gravel. J. Hazard. Mater. 168, 674e680.

Chapter10:Conclusions,Impact,andNovelResearchTopics
10.1HighlightsoftheResearchResults
For the first time, the pollution of different traffic area runoff categories (i.e., parking lots, bridges,
and three types of both highways and roads) was summarized in an extensive literature study for
total and dissolved heavy metal runoff concentrations. Therefore, a large data set (n = 294) of
validated dissolved and total metal concentrations in traffic area runoff was created and analyzed.
The calculated fractionation of heavy metals helped to obtain dissolved parts of the most relevant
metals Cd, Cr, Cu, Ni, Pb, and Zn, which can be used to evaluate toxic effects and the performance of
stormwater treatment systems. In addition, runoff concentrations of further traffic related metals,
anthropogenic metals, and de‐icing salt compounds were summarized. A description of site‐specific
and method‐specific factors was presented to evaluate their influences on the monitoring results.
Analyses of historical and continental trends were performed and the reduction in Pb concentrations
over time was one of the robust chemical results. Moreover, the annual heavy metal loads
normalized per hectare of impervious catchment area were summarized and used to calculate mass
balances.
The second research topic addressed the removal of heavy metals from traffic area runoff. The heavy
metal retention of different filter materials was determined by lab‐scale, pilot‐scale, and full‐scale
experiments. At the beginning, method‐specific differences of heavy metal capacities were
determined by an analysis of the influences of various experimental setups. After the comparison of
the results of four different lab‐scale methods for metal removal (Cu, Ni, and Zn), the suitability of
different methods was evaluated by testing six filter materials for stormwater treatment with diverse
properties. As a result, the following recommendations were given: a guideline for manufacturers
was proposed with a well‐defined description of batch experiments for internal and external quality
control that could be used for testing different production batches but also for selecting appropriate
filter materials for subsequent column experiments. Further recommendations included testing the
removal efficiencies and service life by using small‐scale column experiments. In addition, a
pilot‐scale performance assessment method was developed to determine the service life of various
filter materials for dissolved substances. The novel method is applicable to a wide range of filter
systems (i.e., channel systems, shaft systems, and permeable pavements) and allows a rapid
evaluation (within a few days) of long‐term performances and service lives of all of these
manufactured decentralized systems. The determined removal efficiencies can be compared with the
presented assessment criteria based on stormwater treatment guidelines. Furthermore, the novel
method was validated by field measurements of two different filter channel systems at four sites and
it can be extended for further dissolved substances (e.g., nutrients).
167

The third topic of the development of an assessment method for decentralized stormwater
treatment systems for runoff from traffic areas included the evaluation of the heavy metal
remobilization by various de‐icing salts. At the beginning, the composition of the de‐icing salts used
by winter services was evaluated in order to identify realistic compositions for further tests. In
Germany, the de‐icing salts consist of different types of compounds (e.g., sodium chloride, a mixture
of sodium chloride with calcium chloride, and a mixture of sodium chloride with magnesium chloride).
An assessment method was developed that considered all three de‐icing salts and five heavy metals
(Cd, Cu, Ni, Pb, and Zn). As a result, the behavior was different for each of the six filter materials
tested, each heavy metal, and each de‐icing salt. In general, Cu was released the least from most of
the selected filter materials by the three de‐icing salts. Compared with the other two de‐icing salts,
the mixture of sodium chloride and calcium chloride resulted in the strongest effect on
remobilization. Pure sodium chloride had a minor effect on the remobilization for most heavy metals
and filter materials. In addition, higher preloaded filter materials released more heavy metals than
less preloaded filter materials. After completing the lab‐scale column experiments, advanced
analyses were conducted with the unloaded and loaded filter materials to specify the attenuation of
heavy metals as a function of depth and to describe the removal mechanisms. In addition, computer
modeling was used to support the findings of the lab‐scale column experiments by simulating the
speciation of heavy metals.
The results of this research can be implemented into the development and improvement of
manufactured stormwater treatment systems using filter materials. Both novel assessment methods
can be used to evaluate new and already existing decentralized systems for stormwater treatment.
By these findings, a more environmentally friendly operation of these systems for traffic areas can be
ensured and a longer service life is possible.
10.2ImprovementoftheStateoftheArt
The pollution classification of traffic areas by three categories was only verified by some research
projects (e.g., Grotehusmann & Kasting, 2002; Steiner et al., 2006; Nadler & Meißner, 2007). As novel
contributions, the reviews differentiated the pollution of various traffic area categories for both
European and worldwide data. The results can be used to update existing rules and standards and to
emphasize the monitoring of runoff from highly polluted sites (e.g., sites with stop‐and‐go traffic,
crossings, and entries/exits of parking lots at supermarkets). In addition, the better estimation of the
pollution of different traffic areas supports the use of appropriate treatment systems that are neither
oversized nor have an insufficient treatment. Thus, the initial costs and the maintenance are reduced.
The critical review can also be used to identify all relevant site‐specific and method‐specific factors of
monitoring programs concerning stormwater runoff. Because these factors have an influence on the
168

results, it is important for research reports to record and present site‐specific and method‐specific
data in an appendix. As a result of the analysis of different monitoring programs, it is also helpful to
present the complete runoff data sets together with the rain characteristics because they are
required for data evaluation as the authors often have a different objective compared with other
researchers. In addition, the method‐specific factors that were summarized and discussed in the
reviews can be used to develop novel monitoring schemes.
Previously, the experimental results of manufacturers were not comparable because the influences
of different lab‐scale boundary conditions on the heavy metal removal were not summarized or
evaluated (cf. Section 2.2.2). Based on the new results regarding stormwater treatment systems with
filter materials, standardized methods for quality control, selection of filter materials, and
performance evaluation are available.
For the determination of service lives and long‐term performances, no assessment method or criteria
had been proposed by authorities (cf. Section 2.2). By developing the novel test method, a
standardized and more accurate estimation of service intervals of decentralized treatment systems
was implemented. The method also provides regulatory authorities, designers, and operators with a
more objective basis for the performance assessment and supports stormwater managers to make
decisions for the installation of manufactured decentralized treatment systems.
In recent years, the composition of de‐icing salts used in experiments was mainly based on
information provided by German state authorities, which use sodium chloride in most cases.
Consequently, only the effect of sodium chloride on previously retained Cu and Zn is currently
considered in authorities’ test procedures (DIBt, 2012; DIBt, 2015; ÖNORM B 2506‐3 Entwurf, 2015).
However, as a result of the survey, municipalities use different types of de‐icing salts on urban traffic
areas. This is important for manufactured decentralized stormwater treatment systems because they
are mainly installed at these sites. The differentiated approach of the second assessment method
enabled an evaluation of the effect of different de‐icing salts on all relevant heavy metals for six
commercially used filter materials. The results established an understanding of the different
mechanisms and will lead to the development of filter materials that are less affected by a
remobilization of pollutants due to the three tested de‐icing salts.
10.3ImpactoftheResultsonotherProjects
Several results of the research project presented in Section 7.1 were implemented in an update of
the DIBt procedure (DIBt, 2011; DIBt, 2015). For example, the rain duration and its intensity for the
test with de‐icing salts was changed to more realistic values (200 min with 6.0 L/(s∙ha) instead of
48 min with 25 L/(s∙ha)). In addition, the current procedure of the DIBt (2015) only allows the use of
169

deionized water for all experiments instead of drinking water to avoid the possibility of different
results from various institutes. The novel method for the determination of service lives and
long‐term performances was successfully applied by manufacturers of decentralized stormwater
treatment systems and is currently under consideration for implementation into the approval
process of the DIBt.
The method developed in this thesis for the evaluation of the service lives and long‐term
performances of decentralized systems was also applied in another research project to test the
removal of dissolved substances (i.e., Cu, TP, and Zn) by a semi‐decentralized treatment plant. The
results will be used to compare the pilot‐scale performances determined in the laboratory with field
measurements. Such a testing procedure, which also includes TP and/or TN, might be beneficial to
support the export of manufactured decentralized treatment systems into other countries (e.g.,
Australia and USA).
The evaluation of the use of different de‐icing salts by German authorities affected the experimental
setup of other research projects. For example, Barjenbruch et al. (2016) determined the influence of
a mixture of sodium chloride and calcium chloride on previously retained Cu and Zn for two different
decentralized treatment systems in the laboratory according to the new findings presented in Huber
et al. (2015b).
The summary of the influences of method‐specific factors on the measurements (cf. Chapter 5) was
used to improve the setup of a monitoring campaign at two sites in NRW, Germany, which consisted
of the measurement of the road runoff and the effluent water quality of a decentralized stormwater
treatment system (parameters: Cu, ETBE, MTBE, PAH, TPH, TSS, and Zn). The summary of site‐specific
factors was used to describe the influences of both catchment areas on the pollution. The results of
this monitoring are presented in Wichern et al. (2015).
10.4SuggestionsforfurtherResearch
The composition of the feed water has a strong effect on the results of all types of experiments (e.g.,
batch experiments, lab‐scale column experiments, and pilot‐scale experiments) as the results of
Huber et al. (2014a), Welker et al. (2014), and Wichern et al. (2015) indicate. An effect of ionic
strength on the heavy metal removal was mainly measured for decentralized systems with filter
materials using ion exchange as the main removal mechanism and for filter materials with limited
capacities. For example, the effect of using drinking water (approximately 300–500 µS/cm) instead of
deionized water (< 1 µS/cm) was tested by two different experimental setups. For the determination
of the breakthrough curves of Cu and Zn, drinking water had a strong effect on the removal
capacities (Wichern et al., 2015). Thus, the capacities decreased significantly for the experiments
170

with drinking water compared with deionized water. Moreover, a higher remobilization of Cu and Zn
was measured for several de‐icing salt tests with drinking water instead of deionized water
(Huber et al., 2014a). To exclude this influence, deionized water was used in the experiments
presented in this thesis. However, the effect of ionic strength should be considered in a further study
because institutes for internal and external quality control often have “deionized” water with an
electric conductivity of > 1 µS/cm that can have an effect on the results. In addition, not only the
electric conductivity has an influence on the results but also the composition of the feed water. For
example, two feed waters with an electric conductivity of approximately 200 µS/cm were compared
for the removal of Cu and Zn by the same filter material (Welker et al., 2014). One of the feed waters
consisted of deionized water with a defined amount of calcium and the other of deionized water with
a defined amount of magnesium. The filter material evaluated with the calcium containing feed
water showed a decreased retention of Cu and Zn. This effect is also important for the novel
assessment method (Huber et al., 2016d) if more dissolved substances are tested simultaneously
(e.g., heavy metals with TN, TP, or trace organic substances). For example, in the presence of P, the
retention of Cu and Zn increased and the remobilization of both metals decreased. In addition, the
influences of pretreatment before the first experimental run (e.g., flushing of the filter model) and of
the breaks between different experimental runs should be addressed in a further research project.
The relevant dissolved heavy metals (Cu and Zn) are considered in the novel method to determine
the service lives and long‐term performances (cf. Chapter 7). Moreover, the experimental setup of
the assessment method allows for testing of further dissolved substances, also simultaneously,
because different requirements are proposed by the authorities (cf. Table 5). In the future, further
parameters such as trace organic substances (e.g., MTBE and ETBE) might be added because of new
legislative requirements (cf. Section 1.3). Thus, an implementation of further substances into the
novel methods should be carried out in the future in accordance with legal requirements and new
monitoring results.
The novel method for the determination of service lives should also be applied to permeable
pavements to assess their performances. This evaluation can be used to compare the long‐term
performances of all three types of decentralized treatment systems with filter materials. In addition,
modified permeable pavements might also be beneficial in terms of water balances (Dierkes & Lucke,
2015).
As mentioned in Section 2.2.1, this novel method cannot consider all boundary conditions that have
an influence on the service life, such as a limitation due to a hydraulic failure of the plant. To
determine this factor, decentralized systems must be monitored at several sites over periods of at
least two years. Thus, a full‐scale monitoring of tested treatment systems should be performed with
171

a special focus on the service life of permanently submerged systems, the maintenance, and the
measurement of further substances. It should monitor additional substances such as de‐icing salt
compounds, fine particles, and new priority pollutants, which might be higher than the values of the
updated GFS of 2013 (groundwater) (Moll & Quadflieg, 2014) or of the environmental quality
standards (surface water) (DIRECTIVE 2013/39/EC, 2013). These substances should be monitored
because the necessity for treating these trace organic substances in runoff from traffic areas cannot
be evaluated currently due to a lack of monitoring data. These parameters are antimony,
benzo(a)pyrene, benzo(g,h,i)‐perylene, cyanide, cobalt, di(2‐ethylhexyl)‐phthalate (DEHP), diuron,
fluoranthene, mercury, and vanadium. In urban runoff, brominated diphenylethers, nonylphenols,
and octylphenols might also occur in relevant concentrations (Stachel et al., 2007; Grotehusmann et
al., 2014). By using a well‐known location (e.g., “Landshuter Allee” in Munich), a long‐term
monitoring of this site can be used to characterize the less reported annual pollution loads (kg/ha)
for heavy metals (cf. Section 5.3). In addition, the monitoring‐site can also be used to verify the
influences of different site‐specific factors (e.g., road maintenance and climatic factors) because this
site was used in three earlier research programs (Hilliges et al., 2007; Helmreich & Horn, 2009;
Helmreich et al., 2010; Hilliges et al., 2013). Furthermore, the results of Chapter 5 might be beneficial
for developing the monitoring setup.
172

References
Acosta, J.A., Jansen, B., Kalbitz, K., Faz, A., Martínez‐Martínez, S., 2011. Salinity increases mobility of heavy
metals in soils. Chemosphere 85, 1318–1324
Alo, B.I., Abayomi, A.A., Osuntogun, B.A., Olayinka, K.O., 2007. Urban Highway Runoff in Nigeria 1: Heavy
Metals in Sheet Flow from the Main Expressway in Lagos Metropolis. Journal of Applied Sciences 7, 2800–2805.
Amoakwah, E., Van Slycken, S., Tack, F.M.G., Essumang, D., 2013. Assessing the Extraction Efficiency of CaCl2
and Rhizon Extraction Methods after the Application of Organic Matter and CaCl2 as Soil Amendments to
Enhance the Mobility of Cd and Zn. Environmental & Analytical Toxicology 3, 1–7.
Amrhein, C., Mosher, P.A., Strong, J.E., 1993. Colloid‐Assisted Transport of Trace Metals in Roadside Soils
Receiving Deicing Salts. Soil Science Society of America Journal 57, 1212–1217.
Amrhein, C., Strong, J.E., 1990. The Effect of Deicing Salts on Trace Metal Mobility in Roadside Soils. Journal of
Environmental Quality 19, 765–772.
Amrhein, C., Strong, J.E., Mosher, P.A., 1992. Effect of deicing salts on metal and organic matter mobilization in
roadside soils. Environmental Science & Technology 26, 703–709.
APHA, 2005. Standard Methods for the Examination of Water and Wastewater. 21st ed., American Public
Health Association, Washington, D.C., pp. 1–184.
Aryal, R.K., Lee, B.K., 2009. Characteristics of Suspended Solids and Micropollutants in First‐Flush Highway
Runoff. Water, Air, & Soil Pollution: Focus 9, 339–346.
ASTRA, 2015a. Fachhandbuch T/U (Trassee/Umwelt), Technisches Merkblatt Bauteil, Entwässerung und
Strassenabwasserbehandlung, 21 001‐10468: Leistungsprüfung neuer Verfahren. Abteilung
Strasseninfrastruktur I, Bundesamt für Strassen ASTRA, pp. 1–8 (in German).
ASTRA, 2015b. Fachhandbuch T/U (Trassee/Umwelt), Technisches Merkblatt Bauteil, Entwässerung und
Strassenabwasserbehandlung, 21 001‐10469: Funktionsprüfung bei der Abnahme und bei der periodischen
Kontrolle. Abteilung Strasseninfrastruktur I, Bundesamt für Strassen ASTRA, pp. 1–9 (in German).
Athanasiadis, K., Helmreich, B., 2005. Influence of chemical conditioning on the ion exchange capacity and on
kinetic of zinc uptake by clinoptilolite. Water Research 39, 1527–1532.
Athanasiadis, K., Helmreich, B., Horn, H., 2007. On‐site infiltration of a copper roof runoff: Role of clinoptilolite
as an artificial barrier material. Water Research 41, 3251–3258.
ATV (Abwassertechnische Vereinigung), 1999. Schwermetalle in der aquatischen und terrestrischen Umwelt.
ATV‐Arbeitsbericht. GFA Verlag, Hennef (in German).
Bäckström, M., Karlsson, S., Bäckman, L., Folkeson, L., Lind, B., 2004. Mobilisation of heavy metals by deicing
salts in a roadside environment. Water Research 38, 720–732.
Bäckström, M., Nilsson, U., Håkansson, K., Allard, B., Karlsson, S., 2003. Speciation of Heavy Metals in Road
Runoff and Roadside Total Deposition. Water, Air and Soil Pollution 147, 343–366.
Badruzzaman, M., Westerhoff, P., Knappe, D.R.U., 2004. Intraparticle diffusion and adsorption of arsenate onto
granular ferric hydroxide (GFH). Water Research 38, 4002–4012.
Balades, J.D., Cathelain, M., Marchandise, P., Peybernard, J., Pilloy, J.C., 1984. Chronic pollution of intercity
motorway runoff waters. Water Science and Technology 17, 1165–1174.
Ball, J.E., 2002. Stormwater Quality at Centennial Park, Sydney, Australia. University of New South Wales,
School of Civil and Environmental Engineering, Water Research Laboratory, pp. 1–67.
173

Ball, J.E., Jenks, R., Aubourg, D., 1998. An assessment of the availability of pollutant constituents on road
surfaces. Science of The Total Environment 209, 243–254.
Bannerman, R.T., Owens, D.W., Dodds, R.B., Hornewer, N.J., 1993. Sources of Pollutants in Wisconsin
Stormwater. Water Science and Technology 28, 241–259.
Barbosa, A.E., Hvitved‐Jacobsen, T., 1999. Highway runoff and potential for removal of heavy metals in an
infiltration pond in Portugal. Science of The Total Environment 235, 151–159.
Barjenbruch, M., Heinzmann, B., Kober, P., Post, M., Remy, C., Rouault, P., Sommer, H., Sonnenberg, H., Weiß,
B., 2016. Dezentrale Reinigung von Straßenabflüssen, Abschlussbericht, Projekt im Berliner
Umweltentlastungsprogramm UEPII/2, Projekt‐Nr.: 11315 UEPII/2, Berlin, Stand: Januar 2016. Kofinanzierung:
Land Berlin und Europäische Union, pp. 1–205.
Barrett, M., 2008. Effects of a Permeable Friction Course on Highway Runoff. Journal of Irrigation and Drainage
Engineering 134, 646–651.
Barrett, M.E., Irish, L.B., Malina, J.F., Charbeneau, R.J., 1998. Characterization of Highway Runoff in Austin,
Texas, Area. Journal of Environmental Engineering 124, 131–137.
Barrett, M.E., Kearfott, P., Malina, J.F., 2006. Stormwater Quality Benefits of a Porous Friction Course and Its
Effect on Pollutant Removal by Roadside Shoulders. Water Environment Research 78, 2177–2185.
Barrett, M., Zuber, R.D., Collins, E.R., Malina, J.F., Charbeneau, R., Ward, G.H., 1995. A Review and Evaluation of
Literature Pertaining to the Quantity and Control of Pollution from Highway Runoff and Construction. CRWR
Online Report 95‐5. University of Texas at Austin, pp. 1–180.
Bauske, B., Goetz, D., 1993. Effects of Deicing‐Salts on Heavy Metal Mobility. Acta hydrochimica et
hydrobiologica 21, 38–42.
Bayerischer Landtag, 2014. Antwort des Staatsministeriums des Innern, für Bau und Verkehr vom 06.10.2014
auf die schriftliche Anfrage des Abgeordneten Markus Ganserer BÜNDNIS 90/DIE GRÜNEN vom 28.08.2014 in
17/3289 vom 10.11.2014 (in German).
Bayerisches Landesamt für Umwelt, 2008. Prüfkriterien zur Beurteilung von Anlagen zum Rückhalt von
Metallionen aus Niederschlagsabflüssen von Metalldächern – Festlegung von Regenspenden und Prüfdauern,
Augsburg (in German).
Bayerisches Landesamt für Umwelt, 2011. Prüfkriterien zur vorläufigen Beurteilung von Behandlungsanlagen
zum Rückhalt von Metallionen aus Niederschlagsabflüssen von Metalldächern, Stand 03.01.2011, pp. 1–5 (in
German).
http://www.lfu.bayern.de/wasser/niederschlagswasser_umgang/versickerung/doc/pruefkriterien_behandlung
sanlagen.pdf
Bayerisches Landesamt für Umwelt, 2013. UmweltWissen – Praxis. Streusalz und Splitt im differenzierten
Winterdienst, pp. 1–6 (in German).
BBodSchV, 1999. Bundes‐Bodenschutz‐ und Altlastenverordnung of 12 July 1999 (BGBI. Nr. 36 p. 1554), last
amended on 31 August 2015, BGBl. I, p. 1474, 1491 (in German).
Berbee, R., Rijs, G., de Brouwer, R., Van Velzen, l., 1999. Characterization and Treatment of Runoff from
Highways in the Netherlands Paved with Impervious and Pervious Asphalt. Water Environment Research 71,
183–190.
Berliner Stadtreinigungsbetriebe (BSR), 2015. Staatliche Leistung. Mit vollem Einsatz für ein sauberes Berlin.
Brochure, 12 March 2015 (in German).
174

Bertrand‐Krajewski, J.‐L., Chebbo, G., Saget, A., 1998. Distribution of pollutant mass vs volume in stormwater
discharges and the first flush phenomenon. Water Research 32, 2341–2356.
BIOPLAN, 2007. Bodenkundliche Untersuchungen im Rahmen des LfU‐Entwicklungsvorhabens „Versickerung
des Niederschlagswassers von befestigten Flächen“ (in German).
Bleiwas, D.I., 2006. Stocks and Flows of Lead‐Based Wheel Weights in the United States, U.S. Geological Survey
open file report 1111. U.S. Department of the Interior, U.S. Geological Survey, pp. 1–6.
Boekhold, A.E., Temminghoff, E.J.M., Van der Zee, S.E.A.T.M., 1993. Influence of electrolyte composition and
pH on cadmium sorption by an acid sandy soil. Journal of Soil Science 44, 85–96.
Boller, M., 1997. Tracking heavy metals reveals sustainability deficits of urban drainage systems. Water Science
and Technology 35, 77–87.
Boller, M., 2002. Charakterisierung von Straßenabwasser – Emissionen und Immissionen. VSA‐Fortbildungskurs
2002 – Straßenentwässerung der Zukunft, pp. 1–26 (in German).
Boller, M., 2003. Nachhaltige Regenwasserentsorgung auf dem Weg in die Praxis. EAWAG news 57, 25–28 (in
German).
Booth, D.B., Leavitt, J., 1999. Field Evaluation of Permeable Pavement Systems for Improved Stormwater
Management. Journal of the American Planning Association 65, 314–325.
Borden, R.C., Black, D.C., McBlief, K.V., 2002. MTBE and aromatic hydrocarbons in North Carolina stormwater
runoff. Environmental Pollution 118, 141–152.
Borne, K.E., Fassman, E.A., Tanner, C.C., 2013. Floating treatment wetland retrofit to improve stormwater pond
performance for suspended solids, copper and zinc. Ecological Engineering 54, 173–182.
Bourcier, D.R., Hindin, E., 1979. Lead, iron, chromium and zinc in road runoff at Pullman, Washington. Science
of The Total Environment 12, 205–215.
Bourcier, D.R., Hindin, E., Cook, J.C., 1980. Titanium and Tungsten in Highway Runoff at Pullman, Washington.
International Journal of Environmental Studies 15, 145–149.
Brattebo, B.O., Booth, D.B., 2003. Long‐term stormwater quantity and quality performance of permeable
pavement systems. Water Research 37, 4369–4376.
Brezonik, P.L., Stadelmann, T.H., 2002. Analysis and predictive models of stormwater runoff volumes, loads,
and pollutant concentrations from watersheds in the Twin Cities metropolitan area, Minnesota, USA. Water
Research 36, 1743–1757.
BRL 2036, 2008. Nationale Beoordelingsrichtlijn voor het KOMO® attest‐met‐productcertificaat voor Kunststof
gootsystemen voor de reiniging van hemelwater. Kiwa N.V., pp. 1–34 (in Dutch).
Brockbank, C.I., Batley, G.E., Ball, J.E., Tilley, J.H., 1999. Metals and hydrocarbons in stormwater runoff from
urban roads, Investigation Report ET/IR98. Division of Energy Technology, Center for Advanced Analytical
Chemistry, CSIRO.
Brod, H.‐G., 1995. Risiko‐Abschätzung für den Einsatz von Tausalzen. Folgen für die Umweltmedien unter
Berücksichtigung neuester Tendenzen. Berichte der Bundesanstalt für Straßenwesen, Verkehrstechnik Vol. 21,
Bergisch Gladbach, pp. 1–64. ISBN: 3‐89429‐645‐3 (in German).
Bürgisser, C.S., Cernik, M., Borkovec, M., Sticher, H., 1993. Determination of nonlinear adsorption isotherms
from column experiments: an alternative to batch studies. Environmental Science & Technology 27, 943–948.
Burton, G.A., Pitt, R.E., 2001. Stormwater Effects Handbook: A Toolbox for Watershed Managers, Scientists, and
Engineers. CRC Press.
175

BWK‐M 3, 2007. Ableitung von immissionsorientierten Anforderungen an Misch‐ und
Niederschlagswassereinleitungen unter Berücksichtigung örtlicher Verhältnisse. Bund der Ingenieure für
Wasserwirtschaft, Abfallwirtschaft und Kulturbau e. V., Sindelfingen, November 2007 (in German).
BWK‐M 7, 2008. Detaillierte Nachweisführung immissionsorientierter Anforderungen an Misch‐ und
Niederschlagswassereinleitungen gemäß BWK‐Merkblatt 3. Bund der Ingenieure für Wasserwirtschaft,
Abfallwirtschaft und Kulturbau e. V., Sindelfingen, November 2008 (in German).
Caltrans, 2003. Storm Water Monitoring and Data Management 2002–2003, Caltrans Annual Data Summary
Report. California Department of Transportation, pp. 1–74.
Cathelain, M., Friant, G., Olie, J.L., 1981. Les eaux de ruissellement de chaussees autoroutieres: evaluation des
charges de pollution. Paris, Bulletin de Liaison des Laboratoires des Ponts et Chaussees 116, 9–24 (in French).
CH2MHILL, 1998. Highway Stormwater Runoff Study. The Michigan Department of Transportation, pp. 1–48.
Chang, J., Liu, M., Li, X.‐h., Yu, J., Lin, X., Wang, L.‐l., Gao, L., 2009. Dissolved‐particulate partitioning of heavy
metals in urban road runoff of Shanghai. China Academic Journal 20, 714–720 (in Chinese).
Chui, T.‐W., Mar, B.W., Horner, R.R., 1982. Pollutant loading model for highway runoff. Journal of
Environmental Engineering 129, 1193–1210.
Chui, T.W.D., Mar, B.W., Horner, R.R., 1982. Highway Runoff in Washington State: Model Validation and
Statistical Analysis. Report No. WA‐RD‐39.12. Washington State Department of Transportation.
Crabtree, B., Dempsey, P., Johnson, I., Whitehead, M., 2008a. The development of a risk‐based approach to
managing the ecological impact of pollutants in highway runoff. Water Science and Technology 57, 1595–1600.
Crabtree, B., Dempsey, P., Moy, F., Brown, C., Song, M., 2008b. Improved Determination of Pollutants in
Highway Runoff – Phase 2: Final Report. Highways Agency Contract Reference 3/376, pp. 1–102.
Crabtree, B., Dempsey, P., Johnson, I., Whitehead, M., 2009. The development of an ecological approach to
manage the pollution risk from highway runoff. Water Science and Technology 59, 549–555.
Crabtree, B., Moy, F., Whitehead, M., Roe, A., 2006. Monitoring pollutants in highway runoff. Water and
Environment Journal 20, 287–294.
Cristina, C.M., Sansalone, J.J., 2003. “First Flush,” Power Law and Particle Separation Diagrams for Urban
Storm‐Water Suspended Particulates. Journal of Environmental Engineering 129, 298–307.
Crittenden, J.C., Berrigan, J.K., Hand, D.W., 1986. Design of Rapid Small‐Scale Adsorption Tests for a Constant
Diffusivity. Water Pollution Control Federation 58, 312–319.
Dai, H.L., Zhang, K.L., Xu, X.L., Yu, H.Y., 2012. Evaluation on the Effects of Deicing Chemicals on Soil and Water
Environment. Procedia Environmental Sciences 13, 2122–2130.
Dannecker, W., Au, M., Stechmann, H., 1990. Substance load in rainwater runoff from different streets in
Hamburg. Science of The Total Environment 93, 385–392.
Daub, J., Striebel, T., 1995. Schadstofffrachten von Dachflächen und Straßen und Beobachtungen zu Quellen
und zur Mobilität von Schadstoffen, in: Hahn, H.H., Xanthopoulos, C. (Eds.), Schadstoffe im Regenabfluss III – 3.
Präsentation des BMBF‐Verbundprojektes: Niederschlagsbedingte Schmutzbelastung der Gewässer aus
städtischen befestigten Flächen (Phase II). Schriftenreihe des Instituts für Siedlungswasserwirtschaft,
Universität Karlsruhe (TH), Vol. 73, Oldenbourg Verlag, München, pp. 221–245 (in German).
Dauber, L., Novak, B., Zobrist, J., Zürcher, F., 1979. Schmutzstoffe im Regenwasserkanal einer Autobahn.
Stuttgarter Berichte zur Siedlungswasserwirtschaft, Beeinflussung der Gewässergüte durch Regenabflüsse von
Straßen, Vol. 64, Oldenbourg Verlag, München, pp. 41–57 (in German).
176

Davis, A.P., Shokouhian, M., Ni, S., 2001. Loading estimates of lead, copper, cadmium, and zinc in urban runoff
from specific sources. Chemosphere 44, 997–1009.
Davis, B., Birch, G., 2010. Comparison of heavy metal loads in stormwater runoff from major and minor urban
roads using pollutant yield rating curves. Environmental Pollution 158, 2541–2545.
Dean, C.M., Sansalone, J.J., Cartledge, F.K., Pardue, J.H., 2005. Influence of Hydrology on Rainfall‐Runoff Metal
Element Speciation. Journal of Environmental Engineering 131, 632–642.
Denier van der Gon, H.A.C., van het Bolscher, M., Visschedijk, A.J.H., Zandveld, P.Y.J., 2005. Study to the
effectiveness of the UNECE Heavy Metals Protocol and costs of possible additional measures. Phase I:
estimation of emission reduction resulting from the implementation of the HM Protocol. TNO‐Report B&O‐A R
2005/193, pp. 1–134.
Denkhaus, E., Salnikow, K., 2002. Nickel essentiality, toxicity, and carcinogenicity. Critical Reviews in
Oncology/Hematology 42, 35–56.
Department of Ecology, 2011. Guidance for Evaluating Emerging Stormwater Treatment Technologies:
Technology Assessment Protocol – Ecology (TAPE), publication number 02‐10‐037. Washington State
Department of Ecology, Olympia, WA, pp. 1–59.
Desta, M.B., Bruen, M., Higgins, N., Johnston, P., 2007. Highway runoff quality in Ireland. Journal of
Environmental Monitoring 9, 366–371.
DESTATIS, 2015. Land‐ und Forstwirtschaft, Fischerei. Bodenfläche nach Art der tatsächlichen Nutzung.
Fachserie 3 Reihe 5.1, Statistisches Bundesamt, Wiesbaden, 25.11.2015 (in German).
DEV, 2013. Deutsche Einheitsverfahren zur Wasser‐, Abwasser‐ und Schlammuntersuchung, Wasserchemische
Gesellschaft, Fachgruppe in der Gesellschaft Deutscher Chemiker. Wiley VCH, Weinheim. ISBN 13: 978‐3‐527‐
19010‐2 (in German).
DIBt, 2011. Zulassungsgrundsätze für Niederschlagswasserbehandlungsanlagen. Teil 1: Anlagen zum Anschluss
von Kfz‐Verkehrsflächen bis 2.000 m² und Behandlung des Abwassers zur anschließenden Versickerung in
Boden und Grundwasser. Deutsches Institut für Bautechnik, Berlin, Februar 2011 (in German).
DIBt, 2012. Zulassungsgrundsätze für Niederschlagswasserbehandlungsanlagen. Teil 2: Wasserdurchlässige
Beläge für Kfz‐Verkehrsflächen für die Behandlung des Abwassers zur anschließenden Versickerung in Boden
und Grundwasser (Abwasserbehandelnde Flächenbeläge). Deutsches Institut für Bautechnik, Berlin, April 2012
(in German).
DIBt, 2015. Zulassungsgrundsätze für Niederschlagswasserbehandlungsanlagen. Teil 1: Anlagen zur dezentralen
Behandlung des Abwassers von Kfz‐Verkehrsflächen zur anschließenden Versickerung in Boden und
Grundwasser. Deutsches Institut für Bautechnik, Berlin, Januar 2015 (in German).
DIBt, 2016. Search Approvals – national. Deutsches Institut für Bautechnik. http://www.dibt.de/
Dierkes, C., 1999. Wirkung von Schwermetallen im Regenabfluß von Verkehrsflächen bei der Versickerung über
poröse Deckbeläge. Forum Siedlungswasserwirtschaft und Abfallwirtschaft, Universität Essen, Vol. 14, pp. 1–
216 (in German).
Dierkes, C., 2009. Prüfverfahren für Regenwasserbehandlungsanlagen: Ermittlung der Sorptionskapazität für
Kupfer und Zink, pp. 1–3 (in German).
Dierkes, C., 2010. Untersuchungen einer Behandlungsanlage für Straßenabflüsse an der Bremer Straße in
Hamburg‐Harburg über einen Zeitraum von drei Jahren. 3P Technik Filtersysteme GmbH, pp. 89–99 (in
German).
177
Dierkes, C., Geiger, W.F., 1998. Decontaminating effect of greened highway embankments. In Proceedings of
the NOVATECH‐Conference, Lyon, France, pp. 497–504.
Dierkes, C., Holte, A., Geiger, W.F., 1999. Heavy metal retention within a porous pavement structure 8th
International Conference on Urban Storm Drainage, Sydney/Australia, 1955–1962.
Dierkes, C., Lucke, T., 2015. Development and Approval of an Innovative Permeable Pavement With High
Design Demands. E‐Proceedings of the 36th IAHR Word‐Congress. 28 June–03 July 2015, The Hague, the
Netherlands.
Dierkes, C., Lucke, T., Helmreich, B., 2015a. General Technical Approvals for Decentralised Sustainable Urban
Drainage Systems (SUDS)—The Current Situation in Germany. Sustainability 7, 3031–3051.
Dierkes, C., Welker A., Dierschke, M., 2013. Development of testing procedures for the certification of
decentralized stormwater treatment facilities – results of laboratory tests. In Proceedings of the NOVATECH‐
Conference, Lyon, France.
Dierkes, C., Welker, A., Dierschke, M., 2015b. Approval of technical SUDS in Germany. E‐Proceedings of the
36th IAHR Word‐Congress. 28 June–03 July 2015, The Hague, the Netherlands.
DIN EN 16070:2014‐06, 2014. Products used for treatment of water intended for human consumption – natural
zeolite. Normenausschuss Wasserwesen (NAW) im DIN, pp. 1–20 (in German).
DIN EN ISO 11260:2011‐09, 2011. Soil quality – determination of effective cation exchange capacity and base
saturation level using barium chloride solution (ISO 11260:1994+Cor. 1:1996). Normenausschuss Wasserwesen
(NAW) im DIN, pp. 1–16 (in German).
DIRECTIVE 2008/105/EC, 2008. Directive on environmental quality standards in the field of water policy,
amending and subsequently repealing Council Directives 82/176/EEC, 83/513/EEC, 84/156/EEC, 84/491/EEC,
86/280/EEC and amending Directive 2000/60/EC of the European Parliament and of the Council. European
Parliament and of the Council, 16 December 2008.
DIRECTIVE 2013/39/EC, 2013. Directive amending Directives 2000/60/EC and 2008/105/EC as regards priority
substances in the field of water policy. European Parliament and of the Council, 12 August 2013.
Doula, M., Ioannou, A., Dimirkou, A., 2002. Copper Adsorption and Si, Al, Ca, Mg, and Na Release from
Clinoptilolite. Journal of Colloid and Interface Science 245, 237–250.
Drapper, D., Tomlinson, R., Williams, P., 2000. Pollutant Concentrations in Road Runoff: Southeast Queensland
Case Study. Journal of Environmental Engineering 126, 313–320.
Driscoll, E., Shelley, P.E., Strecker, E.W., 1990a. Pollutant Loadings and Impacts from Highway Stormwater
Runoff, Volume III: Analytical Investigation and Research Report. US Department of Transportation, Report No.
FHWA‐RD‐88‐008, pp. 1–162.
Driscoll, E., Shelley, P.E., Strecker, E.W., 1990b. Pollutant Loadings and Impacts from Highway Stormwater
Runoff, Volume IV: Research Report Data Appendix. US Department of Transportation, Report No. FHWA‐RD‐
88‐009, pp. 1–143.
DWA‐A 138, 2005. Planung, Bau und Betrieb von Anlagen zur Versickerung von Niederschlagswasser. Deutsche
Vereinigung für Wasserwirtschaft, Abwasser und Abfall e. V., Hennef, 2005. ISBN: 3‐937758‐66‐6 (in German).
DWA‐M 153, 2007. Handlungsempfehlungen zum Umgang mit Regenwasser. Deutsche Vereinigung für
Wasserwirtschaft, Abwasser und Abfall e. V., Hennef, 2012. ISBN 13: 978‐3‐939057‐98‐7 (in German).
DWA‐M 153E, 2007. Recommended Actions for Dealing with Stormwater. German Association for Water,
Wastewater and Waste, Hennef, 2007. ISBN 13: 978‐3‐941089‐97‐6.
178

Ellis, J.B., Revitt, D.J., Harrop, D.O., Beckwith, P.R., 1987. The contribution of highway surfaces to urban
stormwater sediments and metal loadings. Science of The Total Environment 59, 339–349.
Ellis, J.B., Revitt, D.M., 1982. Incidence of heavy metals in street surface sediments: solubility and grain size
studies. Water, Air and Soil Pollution 17, 87–100.
Engelhard, C., Fach, S., Rauch, W., 2012. Langzeitverhalten der hydraulischen und stofflichen Leistungsfähigkeit
von Muldenversickerungen im Sommer‐ und Winterbetrieb. Endbericht einer Studie am Arbeitsbereich
Umwelttechnik, Institut für Infrastruktur, Baufakultät Universität Innsbruck, 18 January 2012, pp. 1–76 (in
German).
Eriksson, E., Baun, A., Scholes, L., Ledin, A., Ahlman, S., Revitt, M., Noutsopoulos, C., Mikkelsen, P.S., 2007.
Selected stormwater priority pollutants — a European perspective. Science of The Total Environment 383, 41–
51.
Fach, S., Dierkes, C., Geiger, W.F., 2001. Entwicklung eines Prüfverfahrens für wasserdurchlässige
Flächenbeläge (Development of an assessment procedure for permeable pavements). Final report for the
Bavarian State Agency of Water Management and for the Ministry of Environment and Nature conservation,
Agriculture and Consumer protection of North Rhine‐Westphalia, file: IV‐9‐042 235, University of Essen (in
German).
Fanfan, P.N., Mabon, N., Carletti, I., Claustriaux, J.J., Thonart, P., Lognay, G., Copin, A., Barthélemy, J.P., 2005.
New model for performance prediction in fixed‐bed reactors based on the approach of the unused bed zone.
Water Research 39, 4004–4010.
Feldhaus, R., Klein, N., Röhrig, J., Meier, G., 2009. Maßnahmen zur Niederschlagswasserbehandlung in
kommunalen Trennsystemen am Beispiel des Regierungsbezirkes Köln, Abschlussbericht, Fachhochschule Köln.
Auftraggeber: Bezirksregierung Köln, pp. 1–106 (in German).
FGSV 379, 2003. Technische Lieferbedingungen für Streustoffe des Straßenwinterdienstes – TL‐Streu. FGSV
Forschungsgesellschaft für Straßen‐ und Verkehrswesen e. V., Köln, 2003. ISBN: 3‐937356‐02‐9 (in German).
FGSV 379/1, 2004. Hinweise und Empfehlungen für die Beschaffung von Streustoffen – Kommentar zur TL‐
Streu. FGSV Forschungsgesellschaft für Straßen‐ und Verkehrswesen e. V., Köln, 2004. ISBN: 3‐937356‐41‐X (in
German).
FGSV 416 R 2, 2010. Merkblatt für den Winterdienst auf Straßen. FGSV Forschungsgesellschaft für Straßen‐ und
Verkehrswesen e. V., Köln, 2010. ISBN 13: 978‐3‐941790‐52‐0 (in German).
FHWA, 1999. Is highway runoff a serious problem? Office of Infrastructure R&D, Turner‐Faribank Highway
Research Center, McLean, VA.
Flint, K., Davis, A., 2007. Pollutant Mass Flushing Characterization of Highway Stormwater Runoff from an Ultra‐
Urban Area. Journal of Environmental Engineering 133, 616–626.
Folkeson, L., Bækken, T., Brenčič, M., Dawson, A., Frančois, D., Kuřímská, P., Leitão, T., Ličbinský, R., Vojtěšek,
M., 2009. Sources and Fate of Water Contaminants in Roads, in: Dawson, A. (Ed.), Water in Road Structures –
Movement, Drainage and Effects. Springer, Netherlands, pp. 107–146.
Fraga, I., Charters, F.J., O'Sullivan, A.D., Cochrane, T.A., 2016. A novel modelling framework to prioritize
estimation of non‐point source pollution parameters for quantifying pollutant origin and discharge in urban
catchments. Journal of Environmental Management 167, 75–84.
Frankfurter Entsorgungs‐ und Service GmbH, 2013. Press release of 28 March 2013: Bilanz FES‐Winterdienst
2012/2013 (in German).
Frankfurter Entsorgungs‐ und Service GmbH, 2015. Press release of 01 April 2015: Bilanz FES‐Winterdienst
2014/2015 (in German).
179

Frazer, G., 1990. Event mean concentrations of trace metals and PAHs in Burlington Skyway runoff (data
appendix). Unpublished contract report to the National Water Research Institute. Burlington, Ont.
Fritsche, J., Meisel, T., 2004. Determination of anthropogenic input of Ru, Rh, Pd, Re, Os, Ir and Pt in soils along
Austrian motorways by isotope dilution ICP‐MS. Science of The Total Environment 325, 145–154.
Fuchs, S., Scherer, U., Hillenbrand, T., Marscheider‐Weidemann, F., Behrendt, H., Opitz, D., 2002.
Schwermetalleinträge in die Oberflächengewässer Deutschlands. UBA‐Texte 54/02, Umweltbundesamt, Berlin
(in German).
Fulkerson, M., Nnadi, F., Chasar, L., 2007. Characterizing Dry Deposition of Mercury in Urban Runoff. Water, Air
and Soil Pollution 185, 21–32.
Fürhacker, M., Haile, T.M., Schärfinger, B., Kammerer, G., Allabashi, R., Magnat, S., Lins, A., 2013. Entwicklung
von Methoden zur Prüfung der Eignung von Substraten für die Oberflächenwasserbehandlung von Dach‐ und
Verkehrsflächen. Fördervertrag GZ B100121, Bundesministerium für Land‐ und Forstwirtschaft, Umwelt und
Wasserwirtschaft, Wien, Österreich, pp. 1–240 (in German).
Furumai, H., Balmer, H., Boller, M., 2002. Dynamic behavior of suspended pollutants and particle size
distribution in highway runoff. Water Science and Technology 46, 413–418.
Gan, H., Zhuo, M., Li, D., Zhou, Y., 2008. Quality characterization and impact assessment of highway runoff in
urban and rural area of Guangzhou, China. Environmental Monitoring and Assessment 140, 147–159.
Gäth, S., Sternheim, M., Frede, H.‐G., 1990. Einfluss des Kraftfahrzeugverkehrs auf den Schwermetallgehalt von
Straßenabflußwasser. Forum Städte‐Hygiene 41, 235–238 (in German).
Geiger‐Kaiser, M., Jäger, P., 2005. Reinigung von Straßenabwässern, Wirksamkeit von Retentionsfilterbecken
zur Reinigung von Straßenoberflächenwässern. Gewässerschutz 11, 1–54 (in German).
Genç‐Fuhrman, H., Mikkelsen, P.S., Ledin, A., 2007. Simultaneous removal of As, Cd, Cr, Cu, Ni and Zn from
stormwater: Experimental comparison of 11 different sorbents. Water Research 41, 591–602.
Gilbert, J.K., Clausen, J.C., 2006. Stormwater runoff quality and quantity from asphalt, paver, and crushed stone
driveways in Connecticut. Water Research 40, 826–832.
Gjessing, E., Lygren, E., Andersen, S., Berglind, L., Carlberg, G., Efraimsen, H., Kallqvist, T., Martinsen, K., 1984.
Acute toxicity and chemical characteristics of moderately polluted runoff from highways. Science of The Total
Environment 33, 225–232.
Gnecco, I., Berretta, C., Lanza, L.G., La Barbera, P., 2005. Storm water pollution in the urban environment of
Genoa, Italy. Atmospheric Research 77, 60–73.
Gnecco, I., Sansalone, J.J., Lanza, L.G., 2008. Speciation of Zinc and Copper in Stormwater Pavement Runoff
from Airside and Landside Aviation Land Uses. Water, Air and Soil Pollution 192, 321–336.
Göbel, P., Dierkes, C., Coldewey, W.G., 2007. Storm water runoff concentration matrix for urban areas. Journal
of Contaminant Hydrology 91, 26–42.
Golwer, A., Schneider, W., 1983. Untersuchungen über die Belastung des unterirdischen Wassers mit
anorganischen toxischen Spurenstoffen im Gebiet von Straßen. Untersuchungen über die Belastung des
Grundwassers mit organischen Stoffen im Bereich von Straßen. Forschungsberichte aus dem
Forschungsprogramm des Bundesministers für Verkehr und der Forschungsgesellschaft für Straßen‐ und
Verkehrswesen e. V., Heft 391 (in German).
Granato, G.E., 1996. Deicing Chemicals as Source of Constituents of Highway Runoff. Transportation Research
Record: Journal of the Transportation Research Board 1533, 50–58.
180

Gromaire‐Mertz, M.C., Garnaud, S., Gonzalez, G., Chebbo, G., 1999. Characterisation of urban runoff pollution
in Paris. Water Science and Technology 39, 1–8.
Grontmij, 2015. Betriebsprüfung: Niederschlagswasserbehandlungsanlage DRAINFIX CLEAN®,
Teilstrombehandlung, Hauraton GmbH & Co KG. Grontmij GmbH, Düsseldorf, pp. 1–69 (in German).
Grotehusmann, D., 1995. Versickerung von Niederschlagsabflüssen unter Berücksichtigung des
Grundwasserschutzes. Schriftenreihe Stadtentwässerung und Gewässerschutz, Institut für Wasserwirtschaft,
Universität Hannover, Vol. 12 (in German).
Grotehusmann, D., Kasting, U., 2002. Schlussbericht zum BASt Forschungsvorhaben FE‐Nr. 05.123/2000/GGB:
Untersuchung über die Beschaffenheit der Oberflächenabflüsse von Parkflächen bei Tank‐ und Rastanlagen.
Ingenieurgesellschaft für Stadthydrologie mbH, Hannover. Auftraggeber: Bundesanstalt für Straßenwesen,
Bergisch Gladbach, pp. 1–62 (in German).
Grotehusmann, D., Kasting, U., 2009. Vergleich der Reinigungsleistung von Retentionsbodenfiltern und
Versickerungsanlagen an Bundesfernstraßen. Forschungsberichte aus dem Forschungsprogramm des
Bundesministeriums für Verkehr, Bau‐ und Wohnungswesen und der Forschungsgesellschaft für Straßen‐ und
Verkehrswesen e. V., Heft 1024 (in German).
Grotehusmann, D., Lambert, B., Fuchs, S., Graf, J., 2014. Schlussbericht zum BASt Forschungsvorhaben FE‐Nr.
05.152/2008/GRB „Konzentrationen und Frachten organischer Schadstoffe im Straßenabfluss“.
Ingenieurgesellschaft für Stadthydrologie mbH, Hannover. Auftraggeber: Bundesanstalt für Straßenwesen,
Bergisch Gladbach, pp. 1–89 (in German, unpublished).
GrwV, 2010. Grundwasserverordnung of 09 November 2010. BGBl. I, p. 1513 (in German).
Gupta, M.K., Agnew, R.W., Kobriger, N.P., 1981. Constituents of Highway Runoff: Volume I, State‐of‐the‐Art
Report. Report No. FHWA/RD‐81/042. US Department of Transportation, pp. 1–124.
Hagner C., 2000. European regulations to reduce lead emissions from automobiles – did they have an economic
impact on the German gasoline and automobile markets? Regional Environmental Change 1, 135–151.
Hallberg, M., Renman, G., Lundbom, T., 2007. Seasonal Variations of Ten Metals in Highway Runoff and their
Partition between Dissolved and Particulate Matter. Water, Air and Soil Pollution 181, 183–191.
Hamilton, R.S., Revitt, D.M., Warren, R.S., Duggan, M.J., 1987. Metal mass balance studies within a small
highway dominated catchment. Science of The Total Environment 59, 365–368.
Han, Y., Lau, S.‐L., Kayhanian, M., Stenstrom, M.K., 2006a. Characteristics of Highway Stormwater Runoff.
Water Environment Research 78, 2377–2388.
Han, Y.H., Lau, S.‐L., Kayhanian, M., Stenstrom, M.K., 2006b. Correlation analysis among highway stormwater
pollutants and characteristics. Water Science and Technology 53, 235–243.
Hanke, H., 2015. Einsatz von Salzlösungen im Winterdienst. Straße und Autobahn 1, 35–38 (in German).
Hares, R.J., Ward, N.I., 1999. Comparison of the heavy metal content of motorway stormwater following
discharge into wet biofiltration and dry detention ponds along the London Orbital (M25) motorway. Science of
The Total Environment 235, 169–178.
Haritopoulou, T., 1996. Polycyclische Aromatische Kohlenwasserstoffe und Schwermetalle in urbanen
Entwässerungssystemen – Aufkommen, Transport und Verbleib. Schriftenreihe des Instituts für
Siedlungswasserwirtschaft, Universität Karlsruhe (TH), Vol. 77, Oldenbourg Verlag, München (in German).
Harned, D.A., 1988. Effects of Highway Runoff on Streamflow and Water Quality in the Sevenmile Creek Basin,
a Rural Area in the Piedmont Province of North Carolina, July 1981 to July 1982. U.S. Geological Survey Water‐
Supply Paper 2329, pp. 1–44.
181

Harrison, R.M., Johnston, W.R., 1985. Deposition fluxes of lead, cadmium, copper and polynuclear aromatic
hydrocarbons (PAH) on the verges of a major highway. Science of The Total Environment 46, 121–135.
Harrison, R.M., Johnston, W.R., Ralph, J.C., Wilson, S.J., 1985. The budget of lead, copper and cadmium for a
major highway. Science of The Total Environment 46, 137–145.
Harrison, R.M., Wilson, S.J., 1985. The chemical composition of highway drainage waters, I. Major ions and
selected trace metals. Science of The Total Environment 43, 63–77.
Hatt, B.E., Fletcher, T.D., Deletic, A., 2009. Pollutant removal performance of field‐scale stormwater
biofiltration systems. Water Science and Technology 59, 1567–1576.
Hedley, G., Lockley, J.C., 1975. Quality of water discharged from an urban motorway. Water Pollution Control
74, 659–674.
Helmreich, B., 2010. Stoffliche Betrachtungen der dezentralen Niederschlagswasserbehandlung. Berichte aus
der Siedlungswasserwirtschaft, Technische Universität München, Vol. 199, ISSN 0942‐914X, pp. 1–184 (in
German).
Helmreich, B., Hilliges, R., Schriewer, A., Horn, H., 2010. Runoff pollutants of a highly trafficked urban road –
Correlation analysis and seasonal influences. Chemosphere 80, 991–997.
Helmreich, B., Horn, H., 2009. Bericht zur Beprobung der Behandlungsanlage für stofflich belastete
Straßenabflüsse an der Landshuter Allee in München, Datum: 30. Juni 2009. Auftraggeber: Landeshauptstadt
München, Baureferat, Tiefbau BAU BauT22/O, pp. 1–32 (in German).
Helmreich, B., Huber, M., Welker, A., Dierschke, M., 2014. Abschlussbericht zum F + E ‐Vorhaben
„Untersuchung von Anlagen zur Behandlung des Niederschlagswassers von Verkehrsflächen“ (76e133), 29 July
2014. Auftraggeber: Bayerisches Landesamt für Umwelt, pp. 1–216 (in German).
Hendershot, W.H., Duquette, M., 1986. A Simple Barium Chloride Method for Determining Cation Exchange
Capacity and Exchangeable Cations. Soil Science Society of America Journal 50, 605–608.
Herrera, 2007. Untreated Highway Runoff in Western Washington. White Paper prepared for Washington State
Department of Transportation, 16 May 2007, pp. 1–66.
Herrmann, R., Daub, J., Striebel, T., 1992. Charakterisierung und Analyse der Verschmutzung des
Niederschlages und des Niederschlagabflusses, Abschlußbericht: Niederschlagsbedingte Schmutzbelastung der
Gewässer aus städtischen befestigten Flächen, Phase 1, – Teilprojekt 1 –. Eigenverlag des Instituts für
Siedlungswasserwirtschaft, Universität Karlsruhe (in German).
Heshmati, A., Vahidinia, A., Salehi, I., 2014. Determination of Heavy Metal Levels in Edible Salt. Avicenna
Journal of Medical Biochemistry 2, e19836.
Hewitt, C.N., Rashed, M.B., 1990. An integrated budget for selected pollutants for a major rural highway.
Science of The Total Environment 93, 375–384.
Hewitt, C.N., Rashed, M.B., 1992. Removal rates of selected pollutants in the runoff waters from a major rural
highway. Water Research 26, 311–319.
Hillenbrand, T., Toussaint, D., Böhm, E., Fuchs, S., Scherer, U., Rudolphi, A., Hoffmann, M., Kereißig, J., Kotz, C.,
2005. Einträge von Kupfer, Zink und Blei in Gewässer und Böden – Analyse der Emissionspfade und möglicher
Emissionsminderungsmaßnahmen. Forschungsbericht 202 242 20/02, UBA‐Texte 19/05, Umweltbundesamt,
Dessau, pp. 1–329 (in German).
Hilliges, R., 2007. Entwicklung eines mehrstufigen Behandlungssystems für hochbelastete
Verkehrsflächenabflüsse im urbanen Raum. Berichte aus der Siedlungswasserwirtschaft, Technische Universität
München, Vol. 193, ISSN 0942‐914X, pp. 1–208 (in German).
182

Hilliges, R., Helmreich, B., Horn, H., Bischof, F., Dierkes, C., 2007. Entwicklung und Optimierung eines
mehrstufigen Reinigungssystems für Straßen‐ und Parkplatzabläufe in urbanen Gebieten zur Abflussdämpfung
(Hochwasserschutz), finanziert von der Deutschen Bundesstiftung Umwelt. Technische Universität München,
Lehrstuhl für Siedlungswasserwirtschaft, pp. 1–65 (in German).
Hilliges, R., Schriewer, A., Helmreich, B., 2013. A three‐stage treatment system for highly polluted urban road
runoff. Journal of Environmental Management 128, 306–312.
Hogland, W., Niemczynowicz, J., Wajlman, T., 1987. The unit superstructure during the construction period.
Science of The Total Environment 59, 411–424.
Holthuis, J.‐U., Dobner, I., Tegge, K.‐T., Warrelmann, J., Mahro, B., 2012. Praxistest eines neuartigen,
bepflanzten Bodenfilters zur Behandlung von Straßenabflüssen, Teil 1: Wasseruntersuchungen. KA Abwasser,
Abfall 59, 1030–1039 (in German).
Horowitz, A.J., Lum, K.R., Garbarino, J.R., Hall, G.E.M., Lemieux, C., Demas, C.R., 1996. Problems associated with
using filtration to define dissolved trace element concentrations in natural water samples. Environmental
Science & Technology 30, 954–963.
Horstmeyer, N., Huber, M., Drewes, J.E., Helmreich, B., 2016. Evaluation of site‐specific factors influencing
heavy metal contents in the topsoil of vegetated infiltration swales. Science of the Total Environment 560–561,
19–28.
Horwatich, J.A., Bannerman, R.T., 2009. Pollutant Loading to Stormwater Runoff from Highways: Impact of a
Highway Sweeping Program. Phase II, Madison, Wisconsin, pp. 1–136.
Huang, J., Du, P., Ao, C., Ho, M., Lei, M., Zhao, D., Wang, Z., 2007. Multivariate Analysis for Stormwater Quality
Characteristics Identification from Different Urban Surface Types in Macau. Bulletin of Environmental
Contamination and Toxicology 79, 650–654.
Huang, X., Olmez, I., Aras, N.K., Gordon, G.E., 1994. Emissions of trace elements from motor vehicles: Potential
marker elements and source composition profile. Atmospheric Environment 28, 1385–1391.
Huber, M., Badenberg, S.C., Wulff, M., Drewes, J.E., Helmreich, B., 2016a. Evaluation of Factors Influencing Lab‐
Scale Studies to Determine Heavy Metal Removal by Six Sorbents for Stormwater Treatment. Water 8 (2), 62:1–
19.
Huber, M., Dierschke, M., Welker, A., Helmreich, B., 2014a. Laborverfahren zur Ermittlung von Standzeiten von
Anlagen zur Behandlung des Niederschlagswassers von Verkehrsflächen. Aqua Urbanica 2014, Innsbruck
(Austria), 23–24 October 2014. ISBN 13: 978‐3‐902978‐28‐8 (in German).
Huber, M., Fassnacht, J., Hilbig, H., Drewes, J.E., Helmreich, B., 2016b. Auftausalzeinfluss auf die
Remobilisierung von auf Filtermaterialien zur Behandlung von Verkehrsflächenabflüssen zurückgehaltenen
Schwermetallen. Wasser 2016, Bamberg, 02–04 May 2016 (in German).
Huber, M., Helmreich, B., 2016. Stormwater Management: Calculation of Traffic Area Runoff Loads and Traffic
Related Emissions. Water 8 (7), 294:1–21.
Huber, M., Hilbig, H., Badenberg, S.C., Fassnacht, J., Drewes, J.E., Helmreich, B., 2016c. Heavy metal removal
mechanisms of sorptive filter materials for road runoff treatment and remobilization under de‐icing salt
applications. Water Research 102, 453–463.
Huber, M., Hilbig, H., Drewes, J.E., Helmreich, B., 2015a. Einfluss von Auftausalzen auf die Remobilisierung von
auf Filtermaterialien zur Behandlung von Verkehrsflächenabflüssen zurückgehaltenen Schwermetallen. Aqua
Urbanica 2015, Stuttgart, 07–08 October 2015. Stuttgarter Berichte zur Siedlungswasserwirtschaft, Vol. 225.
ISBN 13: 978‐3‐8356‐7292‐5, pp. 123–130 (in German).
183

Huber, M., Welker, A., Dierschke, M., Drewes, J.E., Helmreich, B., 2014b. Ein neues Laborverfahren zur
Ermittlung von Standzeiten dezentraler Anlagen zur Behandlung von Verkehrsflächenabflüssen. gwf
Wasser/Abwasser 155, 630–638 (in German).
Huber, M., Welker, A., Dierschke, M., Drewes, J.E., Helmreich, B., 2016d. A novel test method to determine the
filter material service life of decentralized systems treating runoff from traffic areas. Journal of Environmental
Management 179, 66–75.
Huber, M., Welker, A., Drewes J.E., Helmreich, B., 2015b. Auftausalze im Straßenwinterdienst – Aufkommen
und Bedeutung für dezentrale Behandlungsanlagen von Verkehrsflächenabflüssen zur Versickerung. gwf
Wasser/Abwasser 156, 1138–1152 (in German).
Huber, M., Welker, A., Helmreich, B., 2015c. Belastung von Verkehrsflächenabflüssen mit Schwermetallen – ein
europäischer Vergleich. gwf Wasser/Abwasser 156, 896–909 (in German).
Huber, M., Welker, A., Helmreich, B., 2015d. Einführung in die dezentrale Niederschlagswasserbehandlung für
Verkehrsflächen‐ und Metalldachabflüsse: Schacht‐/ Kompaktsysteme, Rinnensysteme, Straßeneinläufe und
Flächenbeläge. Berichte aus der Siedlungswasserwirtschaft, Technische Universität München, Vol. 213, 1st ed.,
ISSN 0942‐914X, pp. 1–98 (in German).
Huber, M., Welker, A., Helmreich, B., 2016e. Critical review of heavy metal pollution of traffic area runoff:
Occurrence, influencing factors, and partitioning. Science of The Total Environment 541, 895–919.
Hullmann, H., Kraft, U., 2003. Kupfer und Zink – Die Bedeutung der Abschwemmungen von Metalldächern. gwf
Wasser/Abwasser 144, 127–133 (in German).
Ifs‐Forschungsbericht, 2006. Naturnahe Verfahren zur Behandlung von Regenabflüssen, 2.
Untersuchungszeitraum. Bericht der Ingenieurgesellschaft für Stadthydrologie mbH, March 2006, pp. 1–118 (in
German).
Ilyin, I., Gusev, A., Rozovskaya, O., Strijkina, I., 2012. Transboundary Pollution of Germany by Heavy Metals and
Persistent Organic Pollutants in 2010. EMEP/MSC‐E Technical Report 5/2012, pp. 1–23.
Inamdar, P.M., Cook, S., Sharma, A.K., Corby, N., O'Connor, J., Perera, B.J.C., 2013. A GIS based screening tool
for locating and ranking of suitable stormwater harvesting sites in urban areas. Journal of Environmental
Management 128, 363–370.
Inglezakis, V.J., Loizidou, M.D., Grigoropoulou, H.P., 2002. Equilibrium and kinetic ion exchange studies of Pb2+,
Cr3+, Fe3+ and Cu2+ on natural clinoptilolite. Water Research 36, 2784–2792.
Irish, L.B., Barrett, M.E., Malina, J.F., Charbeneau, R.J., 1998. Use of Regression Models for Analyzing Highway
Storm‐Water Loads. Journal of Environmental Engineering 124, 987–993.
ISO 9277:2010‐09, 2014. Determination of the specific surface area of solids by gas adsorption – BET method.
Normenausschuss Bauwesen (NABau) im DIN, pp. 1–30.
Jenewein, I., Schinner, M., 1982. Zur Frage der Zusammensetzung und mögliche Beeinflussung des
Grundwassers von Regenabflüssen aus Hochleistungsstraßen am Beispiel der Brenner‐Autobahn. Forum
Städte‐Hygiene 33, 113–116 (in German).
Jochová, M., Punčochář, M., Horáček, J., Štamberg, K., Vopálka, D., 2004. Removal of heavy metals from water
by lignite‐based sorbents. Fuel 83, 1197–1203.
Kasting, U., 2003. Reinigungsleistung von zentralen Anlagen zur Behandlung von Abflüssen stark befahrener
Straßen. Schriftenreihe des Fachgebietes Siedlungswasserwirtschaft, Universität Kaiserslautern, Vol. 17 (in
German).
184

Kasting, U., Grotehusmann, D., 2007. Entwässerungssysteme, Bodenfilteranlagen zur Behandlung von
Straßenabflüssen, Halbtechnische Bodenfilterversuche – Teil 2: Versuche zur Salzbelastbarkeit. KA Abwasser,
Abfall 54, 789–797 (in German).
Kasting, U., Janiczek, M., Grotehusmann, D., 2003. Bodenfilteranlagen zur Reinigung von Abflüssen stark
verschmutzter Verkehrsflächen – Halbtechnische Bodenfilterversuche. KA Abwasser, Abfall 50, 1428–1433 (in
German).
Kaya, Y., Göner, Z.B., Vergili, I., Barlas, H., 2008. Removal of cetyltrimethylammonium bromide and sodium
dodecylether sulfate by granular activated carbon. Journal of Scientific & Industrial Research 67, 249–253.
Kayhanian, M., 2012. Trend and concentrations of legacy lead (Pb) in highway runoff. Environmental Pollution
160, 169–177.
Kayhanian, M., Fruchtman, B.D., Gulliver, J.S., Montanaro, C., Ranieri, E., Wuertz, S., 2012. Review of highway
runoff characteristics: Comparative analysis and universal implications. Water Research 46, 6609–6624.
Kayhanian, M., Singh, A., Suverkropp, C., Borroum, S., 2003. Impact of Annual Average Daily Traffic on Highway
Runoff Pollutant Concentrations. Journal of Environmental Engineering 129, 975–990.
Kayhanian, M., Stransky, C., Bay, S., Lau, S.L., Stenstrom, M.K., 2008. Toxicity of urban highway runoff with
respect to storm duration. Science of The Total Environment 389, 386–406.
Kayhanian, M., Suverkropp, C., Ruby, A., Tsay, K., 2007. Characterization and prediction of highway runoff
constituent event mean concentration. Journal of Environmental Management 85, 279–295.
Klein, H., 1982. Die Beschaffenheit der Niederschlagsabflüsse von Autobahnen. Wasserwirtschaft 72, 37–43 (in
German).
Klein, M., 2012. Winterdienst ist gegen Glatteis gewappnet. Hannoversche Allgemeine, 04 December 2012 (in
German).
Klimaszewska, K., Polkowska, Z., Namieśnik, J., 2007. Influence of Mobile Sources on Pollution of Runoff Waters
from Roads with High Traffic Intensity. Polish Journal of Environmental Studies 16, 889–897.
Kluge, B., Werkenthin, M., Wessolek, G., 2014. Metal leaching in a highway embankment on field and
laboratory scale. Science of The Total Environment 493, 495–504.
Kobriger, N.P., Geinopolos, A., 1984. Volume III. Sources and migration of highway runoff pollutants ‐ research
report. Report No. FHWA/RD‐84/059. US Department of Transportation, pp. 1–368.
Kocher, B., Brose, S., Chlubek, A., Görg, C., Klein, N., Siebertz, I., 2010a. Stoffeintrag in Straßenrandböden:
Messzeitraum 2006/2007, Berichte der Bundesanstalt für Straßenwesen, Verkehrstechnik Vol. 199, Bergisch
Gladbach, pp. 1–38 (in German).
Kocher, B., Brose, S., Chlubek, A., Karagüzel, N., Klein, N., Siebertz, I., 2010b. Stoffeintrag in Straßenrandböden:
Messzeitraum 2005/2006, Berichte der Bundesanstalt für Straßenwesen, Verkehrstechnik Vol. 198, Bergisch
Gladbach, pp. 1–45 (in German).
Kocher, B., Brose, S., Feix, J., Görg, C., Peters, A., Schenker, K., 2010c. Stoffeinträge in den Straßenseitenraum –
Reifenabrieb, Berichte der Bundesanstalt für Straßenwesen, Verkehrstechnik Vol. 188, Bergisch Gladbach, pp.
1–33 (in German).
Krauth, K., Stotz, G., 1993. Gewässerbelastung durch Straßenoberflächenwasser von lärmmindernden
Straßenbelägen durch längere Kontaktzeiten des Regenwassers mit den Verunreinigungen und den
veränderten Salzkonzentrationen (in German).
Landesbetrieb für Straßenbau – Saarland, 2014. Informationen zur Durchführung des Winterdienstes im
Saarland, pp. 1–8 (in German).
185

Landesbetrieb Straßen NRW, 2013. Written communication (in German).
Landesbetrieb Straßen NRW, 2015. Written communication (in German).
Landeshauptstadt München – Baureferat, 2011. Winterdienst. Unsere Leistungen – Ihre Pflichten. Brochure,
September 2011 (in German).
Langbein, S., Steiner, M., Boller, M., 2006. Schadstoffe im Straßenabwasser einer stark befahrenen Straße und
deren Retention mit neuartigen Filterpaketen aus Geotextil und Adsorbermaterial, Schlussbericht des
Forschungsprojekts, pp. 1–77 (in German).
Lange, G., Grotehusmann, D., Kasting, U., Schütte, M., Dietrich, M., Sondermann, W., 2003. Wirksamkeit von
Entwässerungsbecken im Bereich von Bundesfernstraßen. Forschungsberichte aus dem Forschungsprogramm
des Bundesministeriums für Verkehr, Bau‐ und Wohnungswesen und der Forschungsgesellschaft für Straßen‐
und Verkehrswesen e. V., Heft 861 (in German).
LANUV, 2012. Nachweis der Vergleichbarkeit von dezentralen Behandlungsanlagen. Landesamt für Natur,
Umwelt und Verbraucherschutz Nordrhein‐Westfalen (in German).
http://www.lanuv.nrw.de/fileadmin/lanuv/wasser/abwasser/2012_09_25_NWdezentral_pruefung.pdf
LANUV, 2016. Dezentrale Niederschlagswasserbehandlung. Landesamt für Natur, Umwelt und
Verbraucherschutz Nordrhein‐Westfalen (in German). http://www.lanuv.nrw.de/wasser/abwasser/ds/
Largitte, L., Gervelas, S., Tant, R., Couespel Dumesnil, P., Hightower, A., Yasami, R., Bercion, Y., Lodewyckx, P.,
2014. Removal of lead from aqueous solutions by adsorption with surface precipitation. Adsorption 20, 689–
700.
Laschka, D., Striebel, T., Daub, J., Nachtwey, M., 1996. Platin im Regenabfluss einer Straße. UWSF – Zeitschrift
für Umweltchemie und Ökotoxikologie 8, 124–129 (in German).
Lau, S.‐L., Han, Y., Kang, J.‐H., Kayhanian, M., Stenstrom, M.K., 2009. Characteristics of Highway Stormwater
Runoff in Los Angeles: Metals and Polycyclic Aromatic Hydrocarbons. Water Environment Research 81, 308–
318.
LAWA, 2004. Ableitung von Geringfügigkeitsschwellenwerten für das Grundwasser. Länderarbeitsgemeinschaft
Wasser, Düsseldorf (in German).
Lee, J.Y., Kim, H., Kim, Y., Han, M.Y., 2011. Characteristics of the event mean concentration (EMC) from rainfall
runoff on an urban highway. Environmental Pollution 159, 884–888.
Legret, M., Colandini, V., Le Marc, C., 1996. Effects of a porous pavement with reservoir structure on the quality
of runoff water and soil. Science of The Total Environment 189–190, 335–340.
Legret, M., Pagotto, C., 1999. Evaluation of pollutant loadings in the runoff waters from a major rural highway.
Science of The Total Environment 235, 143–150.
Li, M., Barrett, M., Rammohan, P., Olivera, F., Landphair, H., 2008. Documenting Stormwater Quality on Texas
Highways and Adjacent Vegetated Roadsides. Journal of Environmental Engineering 134, 48–59.
Li, M.‐H., Barrett, M.E., 2008. Relationship Between Antecedent Dry Period and Highway Pollutant: Conceptual
Models of Buildup and Removal Processes. Water Environment Research 80, 740–747.
Li, Y., 2012. Evaluation of adsorbents for road runoff treatment.
http://nbn‐resolving.de/urn/resolver.pl?urn:nbn:de:bvb:91‐diss‐20121221‐1116337‐0‐2
Li, Y., Helmreich, B., 2014. Simultaneous removal of organic and inorganic pollutants from synthetic road runoff
using a combination of activated carbon and activated lignite. Separation and Purification Technology 122, 6–
11.
186

Line, D.E., Wu, J., Arnold, J.A., Jennings, G.D., Rubin, A.R., 1997. Water quality of first flush runoff from 20
industrial sites. Water Environment Research 69, 305–310.
Lippold, C., 2014. Der Elsner 2015: Handbuch für Straßen‐ und Verkehrswesen (Planung, Bau, Erhaltung,
Verkehr, Betrieb), 69th ed., Otto Elsner Verlagsgesellschaft, Berlin. ISBN 13: 978‐3‐871992‐13‐1 (in German).
Liu, A., Gunawardana, C., Gunawardena, J., Egodawatta, P., Ayoko, G.A., Goonetilleke, A., 2016. Taxonomy of
factors which influence heavy metal build‐up on urban road surfaces. Journal of Hazardous Materials 310, 20–
29.
Liu, D., Sansalone, J.J., Cartledge, F.K., 2004. Adsorption Characteristics of Oxide Coated Buoyant Media
(ρs<1.0) for Storm Water Treatment. I: Batch Equilibria and Kinetics. Journal of Environmental Engineering 130,
374–382.
Liu, D., Sansalone, J.J., Cartledge, F.K., 2005. Comparison of Sorptive Filter Media for Treatment of Metals in
Runoff. Journal of Environmental Engineering 131, 1178–1186.
Lloyd, S.D., Wong, T.H.F., 1999. Particulates, associated pollutants and urban stormwater treatment. 8th
International Conference on Urban Storm Drainage, Sydney/Australia, 1833–1840.
Lygren, E., Gjessing, E., Berglind, L., 1984. Pollution transport from a highway. Science of The Total Environment
33, 147–159.
Ma, J., Kang, J., Kayhanian, M., Stenstrom, M., 2009. Sampling Issues in Urban Runoff Monitoring Programs:
Composite versus Grab. Journal of Environmental Engineering 135, 118–127.
MacKay, A., Zinke, S., Mahoney, J., Bushey, J., 2011. Roadway Runoff Water Quality from Milled and Unaltered
Surfaces during Convective Storms. Journal of Environmental Engineering 137, 1165–1175.
Makepeace, D.K., Smith, D.W., Stanley, S.J., 1995. Urban stormwater quality: Summary of contaminant data.
Critical Reviews in Environmental Science and Technology 25, 93–139.
Mangani, G., Berloni, A., Bellucci, F., Tatàno, F., Maione, M., 2005. Evaluation of the Pollutant Content in Road
Runoff First Flush Waters. Water, Air and Soil Pollution 160, 213–228.
Maniquiz, M.C., Lee, S., Kim, L.‐H., 2010. Multiple linear regression models of urban runoff pollutant load and
event mean concentration considering rainfall variables. Journal of Environmental Sciences 22, 946–952.
Maniquiz‐Redillas, M., Kim, L.‐H., 2014. Fractionation of heavy metals in runoff and discharge of a stormwater
management system and its implications for treatment. Journal of Environmental Sciences 26, 1214–1222.
Mantel‐Verordnung, 2012. Verordnung zur Festlegung von Anforderungen für das Einbringen oder das
Einleiten von Stoffen in das Grundwasser, an den Einbau von Ersatzstoffen und für die Verwendung von Boden
und bodenähnlichem Material. Bundesministerium für Umwelt, Naturschutz und Reaktorsicherheit. Entwurf,
Stand: 31.10.2012 (in German).
Mantel‐Verordnung, 2015. Verordnung zur Festlegung von Anforderungen für das Einbringen oder das
Einleiten von Stoffen in das Grundwasser, an den Einbau von Ersatzstoffen und für die Verwendung von Boden
und bodenähnlichem Material. Bundesministerium für Umwelt, Naturschutz, Bau und Reaktorsicherheit. 3.
Arbeitsentwurf, 23.07.2015 (in German).
Marsalek, J., 2003. Road salts in urban stormwater: an emerging issue in stormwater management in cold
climates. Water Science and Technology 48, 61–70.
Marsalek, J., Brownlee, B., Mayer, T., Lawal, S., Larkin, G.A., 1997. Heavy Metals and PAHs in Stormwater
Runoff the Skyway Bridge, Burlington, Ontario. Water Quality Research Journal of Canada 32, 815–827.
Masanao, S., Kunihiro, F., Kenshi, K., Saburo, M., 2006. Determination of lead sources in urban runoff due to
automative traffic. Journal of Japan Society on Water Environment 29, 693–698.
187

McIntyre, J.K., Davis, J.W., Hinman, C., Macneale, K.H., Anulacion, B.F., Scholz, N.L., Stark, J.D., 2015. Soil
bioretention protects juvenile salmon and their prey from the toxic impacts of urban stormwater runoff.
Chemosphere 132, 213–219.
McKenzie, E.R., Money, J.E., Green, P.G., Young, T.M., 2009. Metals associated with stormwater‐relevant brake
and tire samples. Science of The Total Environment 407, 5855–5860.
McQueen, A., 2008. Characterization of Campus Parking Lot Stormwater and Remediation of Risks using
Constructed Wetland Treatment Systems, pp. 1–87.
McQueen, A.D., Johnson, B.M., Rodgers Jr, J.H., English, W.R., 2010. Campus parking lot stormwater runoff:
Physicochemical analyses and toxicity tests using Ceriodaphnia dubia and Pimephales promelas. Chemosphere
79, 561–569.
Measho, T., Fürhacker, M., 2012. Forschungsergebnisse zur Reinigung von Straßenabwässern. Proceedings
„Gewässerschutzanlagen für Verkehrsflächen“. Seminar der Universität für Bodenkultur, Wien, pp. 1–30 (in
German).
Mercado, J.M.R., Maniquiz‐Redillas, M.C., Kim, L.‐H., 2015. Laboratory study on the clogging potential of a
hybrid best management practice. Desalination and Water Treatment 53, 3126–3133.
Meyer, T., 2010. Schnee(t)räumen mit der BSR. Tagesspiegel, 17 December 2010 (in German).
Mikkelsen, P.S., Weyer, G., Berry, C., Waldent, Y., Colandini, V., Poulsen, S., Grotehusmann, D., Rohlfing, R.,
1994. Pollution from urban stormwater infiltration. Water Science and Technology 29, 293–302.
Minervini, W.P., 2008. Discussion Of: Characteristics of Highway Stormwater Runoff. Water Environment
Research 80, 766–768.
Minervini, W.P., 2010. Discussion Of: Characteristics of Highway Stormwater Runoff in Los Angeles: Metals and
Polycylic Aromatic Hydrocarbons. Water Environment Research 82, 861–862.
Mohan, D., Chander, S., 2006a. Removal and recovery of metal ions from acid mine drainage using lignite—A
low cost sorbent. Journal of Hazardous Materials 137, 1545–1553.
Mohan, D., Chander, S., 2006b. Single, binary, and multicomponent sorption of iron and manganese on lignite.
Journal of Colloid and Interface Science 299, 76–87.
Moll, B., Quadflieg, A., 2014. Aktualisierung der Ableitung von Geringfügigkeitsschwellenwerten für das
Grundwasser. Wasser und Abfall 3, 10–14 (in German).
Montrejaud‐Vignoles, M., Roger, S., Herremans, L., 1996. Runoff water pollution of motorway pavement in
mediterranean area. 7th International Conference on Urban Storm Drainage, Hannover/Germany, 247–252.
Moores, J., Pattinson, P., Hyde, C., 2010. Enhancing the control of contaminants from New Zealand’s roads:
results of a road runoff sampling programme. National Institute of Water and Atmospheric Research Ltd,
Auckland, pp. 1–161.
Mosley, L.M., Peake, B.M., 2001. Partitioning of metals (Fe, Pb, Cu, Zn) in urban run‐off from the Kaikorai Valley,
Dunedin, New Zealand. New Zealand Journal of Marine and Freshwater Research 35, 615–624.
Moxness, K.L., 1986. Characteristics of Urban Freeway Runoff – Interstate 94, Minneapolis, Minnesota.
Minnesota Department of Transportation, Federal Highway Administration.
Moy, F., Crabtree, R.W., 2003. The Long Term Monitoring of Pollution from Highway Runoff: Final Report,
M4/Brinkworth Brook – Site Report, pp. 1–142.
Moy, F., Crabtree, R.W., Simms, T., 2003. The Long Term Monitoring of Pollution from Highway Runoff: Final
Report, pp. 1–183.
188

Mungur, A.S., Shutes, R.B.E., Revitt, D.M., House, M.A., 1995. An assessment of metal removal from highway
runoff by a natural wetland. Water Science and Technology 32, 169–175.
MUNLV, 2004. Anforderungen an die Niederschlagsentwässerung im Trennverfahren. Ministerium für Umwelt
und Naturschutz, Landwirtschaft und Verbraucherschutz vom 26.05.2004 („Trenn‐Erlass“) (in German).
Murakami, K., Ozaki, J.‐i., Nishiyama, Y., 1995. Effects of surface treatment on cation exchange properties of
Australian brown coals. Fuel Processing Technology 43, 95–110.
Muschack, W., 1990. Pollution of street run‐off by traffic and local conditions. Science of The Total
Environment 93, 419–431.
Nadler, A., Meißner, E., 1999. Zwischenbericht Entwicklungsvorhaben: Versickerung des Niederschlagswassers
von befestigten Verkehrsflächen. Bericht über die Betriebsjahre Oktober 1996 bis Oktober 1998. Bayerisches
Landesamt für Wasserwirtschaft, pp. 1–46 (in German).
Nadler, A., Meißner, E., 2007. Versickerung des Niederschlagswassers von befestigten Verkehrsflächen,
Abschlussbericht, Entwicklungsvorhaben, Oktober 1996 – Oktober 2005. Bayerisches Landesamt für Umwelt,
pp. 1–72 (in German).
Nason, J., Bloomquist, D., Sprick, M., 2012. Factors Influencing Dissolved Copper Concentrations in Oregon
Highway Storm Water Runoff. Journal of Environmental Engineering 138, 734–742.
Nelson, S., Yonge, D., Barber, M., 2009. Effects of Road Salts on Heavy Metal Mobility in Two Eastern
Washington Soils. Journal of Environmental Engineering 135, 505–510.
NJDEP, 2009. Protocol for Total Suspended Solids Removal Based on Field Testing. Amendments to TARP
Protocol. August 5, 2009, Department of Environmental Protection, State of New Jersey, pp. 1–8.
NJDEP, 2013. Procedure for Obtaining Verification of a Stormwater Manufactured Treatment Device from New
Jersey Corporation for Advanced Technology. Department of Environmental Protection, State of New Jersey, pp.
1–11.
Norrström, A.C., 2005. Metal mobility by de‐icing salt from an infiltration trench for highway runoff. Applied
Geochemistry 20, 1907–1919.
Norrström, A.C., Jacks, G., 1998. Concentration and fractionation of heavy metals in roadside soils receiving de‐
icing salts. Science of The Total Environment 218, 161–174.
Novotny, V., Muehring, D., Zitomer, D.H., Smith, D.W., Facey, R., 1998. Cyanide and metal pollution by urban
snowmelt: Impact of deicing compounds. Water Science and Technology 38, 223–230.
Nowakowska‐Blaszczyk, A., Zakrzewski, J., 1996. The sources and phases of increase of pollution in runoff
waters in route to receiving waters. 7th International Conference on Urban Storm Drainage,
Hannover/Germany, pp. 49–53.
Oberste Baubehörde im Bayerischen Staatsministerium des Innern, 2011. Salzmanagement und
Winterdienstorganisation der Bayerischen Straßenbauverwaltung, Dezember 2011, pp. 1–18 (in German).
ÖNORM B 2506‐3 Entwurf, 2015. Soakaways for rain water from roof gutters and reinforce surfaces – Part 3:
Filter materials – Requirements and tests (Ausgabe: 2015‐08‐01). Komitee 120 Abwassertechnik, Austrian
Standards Institute, pp. 1–28 (in German).
Opher, T., Friedler, E., 2010. Factors affecting highway runoff quality. Urban Water Journal 7, 155–172.
O'Sullivan, A.D., Wicke, D., Hengen, T.J., Sieverding, H.L., Stone, J.J., 2015. Life Cycle Assessment modelling of
stormwater treatment systems. Journal of Environmental Management 149, 236–244.
189

Pagotto, C., Legret, M., Le Cloirec, P., 2000. Comparison of the hydraulic behaviour and the quality of highway
runoff water according to the type of pavement. Water Research 34, 4446–4454.
Pahlke, G., Leonhardt, H., Tappe, M., 2000. Mögliche Umweltbelastungen durch die Nutzung von MTBE
(Methyl‐tertiär‐Butylether) als Kraftstoffzusatz in Deutschland und Westeuropa. Erdöl Erdgas Kohle 116, 498–
504 (in German).
Paschka, M.G., Ghosh, R.S., Dzombak, D.A., 1999. Potential Water‐Quality Effects from Iron Cyanide Anticaking
Agents in Road Salt. Water Environment Research 71, 1235–1239.
Paulson, C., Amy, G., 1993. Regulating Metal Toxicity in Stormwater. Water Environment & Technology, 44–49.
Pehlivan, E., Arslan, G., 2007. Removal of metal ions using lignite in aqueous solution—Low cost biosorbents.
Fuel Processing Technology 88, 99–106.
Penrith, 2014. Penrith Development Control Plan 2014, C3 Water Management. Penrith City Council, Australia,
pp. C3‐1–C3‐33.
Pick, V., Fettig, J., Miethe, M., Strüber, K., 2002. Dezentrale Behandlung des Niederschlagsabflusses von
Verkehrsflächen in einer mehrstufigen Schachtanlage. KA Abwasser, Abfall 49, 312–320 (in German).
Pitt, R., Field, R., Lalor, M., Brown, M., 1995. Urban Stormwater Toxic Pollutants: Assessment, Sources, and
Treatability. Water Environment Research 67, 260–275.
Plassard, F., Winiarski, T., Petit‐Ramel, M., 2000. Retention and distribution of three heavy metals in a
carbonated soil: comparison between batch and unsaturated column studies. Journal of Contaminant
Hydrology 42, 99–111.
Poddar, M., Nair, A.N.B., Mahindrakar, A.B., 2013. A Review on the Use of Rapid Small Scale Column Test
(RSSCT) on Predicting Adsorption of Various Contaminants. Journal Of Environmental Science, Toxicology And
Food Technology 3, 77–85.
Preciado, H.F., Li, L.Y., 2005. Evaluation of Metal Loadings and Bioavailability in Air, Water and Soil Along Two
Highways of British Columbia, Canada. Water, Air and Soil Pollution 172, 81–108.
Prestes, E.C., E. dos Anjos, V., Sodré, F.F., Grassi, M.T., 2006. Copper, lead and cadmium loads and behavior in
urban stormwater runoff in Curitiba, Brazil. Journal of the Brazilian Chemical Society 17, 53–60.
Qi, Y., Hoadley, A.F.A., Chaffee, A.L., Garnier, G., 2011. Characterisation of lignite as an industrial adsorbent.
Fuel 90, 1567–1574.
Queensland Government, 2009. South East Queensland Regional Plan 2009–2031, Implementation Guideline
No. 7, Water Sensitive Urban Design: Design objectives for urban stormwater management, November 2009.
The State of Queensland, Queensland Department of Infrastructure and Planning, Australia, 2009, pp. 1–18.
Quevauviller, P., Rauret, G., Muntau, H., Ure, A.M., Rubio, R., López‐Sánchez, J.F., Fiedler, H.D., Griepink, B.,
1994. Evaluation of a sequential extraction procedure for the determination of extractable trace metal
contents in sediments. Fresenius' Journal of Analytical Chemistry 349, 808–814.
Racin, J.A., Howell, R.B., Winters, G.R., Shirley, E.C., 1982. Estimating Highway Runoff Quality. Report No.
FHWA‐CA/TL‐82/11. California Department of Transportation, Sacramento, CA, pp. 1–97.
Reed, B.E., Jamil, M., Thomas, B., 1996. Effect of pH, Empty Bed Contact Time and Hydraulic Loading Rate on
Lead Removal by Granular Activated Carbon Columns. Water Environment Research 68, 877–882.
Revitt, D.M., Lundy, L., Coulon, F., Fairley, M., 2014. The sources, impact and management of car park runoff
pollution: A review. Journal of Environmental Management 146, 552–567.
190

Revitt, D.M., Morrison, G.M., 1987. Metal speciation variations within separate stormwater systems.
Environmental Technology Letters 8, 373–380.
Robien, A., Striebel, T., Herrmann, R., 1997. Modeling of dissolved and particle‐bound pollutants in urban street
runoff. Water Science and Technology 36, 77–82.
Roeva, N.N., Rovinskii, F.Y., Kononov, E.Y., 1996. Special features of the behavior of heavy metals in various
natural environments. Journal of Analytical Chemistry 51, 352–364.
Roger, S., Montrejaud‐Vignoles, M., Andral, M.C., Herremans, L., Fortune, J.P., 1998. Mineral, physical and
chemical analysis of the solid matter carried by motorway runoff water. Water Research 32, 1119–1125.
Root, R.A., 2000. Lead loading of urban streets by motor vehicle wheel weights. Environmental Health
Perspective 108, 937–940.
Roubicek, V., Raclavska, H., Juchelkova, D., Filip, P., 2008. Wear and environmental aspects of composite
materials for automotive braking industry. Wear 265, 167–175.
Rushton, B., 2001. Low Impact Parking Lot Design Reduces Runoff and Pollutant Loads, WRPMD'99, pp. 172–
179.
Rutz, F., 2009. Waldeggstrasse, Strassenabwasserbehandlungsanlage SABA Ristet, Gesamtbericht über
Erfolgskontrollen, pp. 1–23 (in German).
Rutz, F., 2012. Strassenabwasserbehandlung, Funktionskontrollen bei den Retentionsfilterbecken für die A1, pp.
1–22 (in German).
Rutz, F., 2013. SABA Chlosterschür und Neuwiesen, Funktionskontrollen, Gesamtbericht, pp. 1–150 (in German).
Rutz, F., Frank, S., Schurter, M., Jost, B., Bieber, P., 1999. Biologische Straßenabwasserreinigung. Auswertung
der Messkampagnen an der Anlage Chrebsbachknie bei Winterthur. gwa, 1–11 (in German).
Rutz, F., Pazeller, A., Schurter, M.F., 2007. Straßenabwasser‐Behandlungsanlagen – Betriebserfahrungen und
Erfolgskontrollen. gwa 123–131 (in German).
Saget, A., Chebbo, G., Bertrand‐Krajewski, J.‐L., 1996. The first flush in sewer systems. Water Science and
Technology 33, 101–108.
Sample, D.J., Grizzard, T.J., Sansalone, J., Davis, A., P., Roseen, R.M., Walker, J., 2012. Assessing performance of
manufactured treatment devices for the removal of phosphorus from urban stormwater. Journal of
Environmental Management 113, 279–291.
Sansalone, J., Glenn, D.W., 2000. Temporal Variations in Heavy Metal Partitioning and Loading in Urban
Highway Pavement Sheet Flow: Implications for In Situ Treatment Design. Transportation Research Record
1720, 100–111.
Sansalone, J.J., 2002. Physical and chemical nature of urban storm water runoff, in: Fileds, R., Sullivan, D. (Eds.),
Management of wet‐weather flows in the watershed, CRC Press, Bca Raton, Fla., pp. 43–66.
Sansalone, J.J., Buchberger, S.G., 1996. Characterization of solid and metal element distributions in urban
highway stormwater. 7th International Conference on Urban Storm Drainage, Hannover/Germany, pp. 253–
368.
Sansalone, J.J., Buchberger, S.G., 1997a. Characterization of solid and metal element distributions in urban
highway stormwater. Water Science and Technology 36, 155–160.
Sansalone, J.J., Buchberger, S.G., 1997b. Partitioning and First Flush of Metals in Urban Roadway Storm Water.
Journal of Environmental Engineering 123, 134–143.
191

Sansalone, J.J., Buchberger, S.G., Al‐Abed, S.R., 1996. Fractionation of heavy metals in pavement runoff. Science
of The Total Environment 189–190, 371–378.
Sansalone, J.J., Glenn, D.W., 2002. Accretion of Pollutants in Snow Exposed to Urban Traffic and Winter Storm
Maintenance Activities. I. Journal of Environmental Engineering 128, 151–166.
Sansalone, J.J., Hird, J.P., Cartledge, F.K., Tittlebaum, M.E., 2005. Event‐Based Stormwater Quality and Quantity
Loadings from Elevated Urban Infrastructure Affected by Transportation. Water Environment Research 77,
348–365.
Scheffer, F., Schachtschabel, P., 2002. Lehrbuch der Bodenökologie, 15th ed., Spektrum Akademischer Verlag
GmbH, Heidelberg, Berlin. ISBN: 3‐8274‐1324‐9 (in German).
Scheiwiller, E., 2008. Schadstoffabschwemmungen: Am Beispiel von Hochleistungsstraßen. gwa, 539–546 (in
German).
Scheiwiller, E., 2014. SABA Pfaffensteig (Bümpliz), Probebetrieb und Leistungsprüfung der SABA mit
technischem Filter im Jahr 2012/13, pp. 1–14 (in German).
Schmidt, S., Burkhardt, M., Gohl, M., Boller, M., 2015. Neue Konzepte zur dezentralen Behandlung von
Regenwasserabflüssen. Aqua Urbanica 2015, Stuttgart, 07–08 October 2015. Stuttgarter Berichte zur
Siedlungswasserwirtschaft, Vol. 225. ISBN 13: 978‐3‐8356‐7292‐5, pp. 85–90 (in German).
Schmitt, T.G., Welker, A., Dierschke, M., Uhl, M., Maus, C., Remmler, F., 2010. Entwicklung von Prüfverfahren
für Anlagen zur dezentralen Niederschlagswasserbehandlung im Trennverfahren. Schlussbericht Az: 26840‐23
der Deutschen Bundesstiftung Umwelt, pp. 1–236 (in German).
Schmitt, T.G., Welker, A., Dierschke, M., Uhl, M., Maus, C., 2011. Entwicklung von Prüfverfahren für Anlagen zur
dezentralen Niederschlagswasserbehandlung im Trennverfahren. Schlussbericht Ergänzungsauftrag –
15.08.2011. Im Auftrag der Deutschen Bundesstiftung Umwelt, Osnabrück, pp. 1–63 (in German).
Scholes, L., Revitt, D.M., Ellis, J.B., 2008. A systematic approach for the comparative assessment of stormwater
pollutant removal potentials. Journal of Environmental Management 88, 467–478.
Scholler, 2010. Cited in Measho & Fürhacker, 2012 (in German).
Scholz, M., 2015. Sustainable Drainage Systems. Water 7, 2272–2274.
Schriefer, T., 2013. Projekt Berliner Stadtreinigung, Recyclinghof „Spindlersfeld“.
Niederschlagswasserbehandlung in vorgefertigten Sickermulden mit Substrat. Lemwerder, August 2013, pp. 1–
11 (in German).
Schriefer, T., 2014a. Projekt: Hornbach – Würzburg. Niederschlagswasserbehandlung in vorgefertigten
Sickermulden mit Substrat. Lemwerder, June 2014, pp. 1–8 (in German).
Schriefer, T., 2014b. Projekt: B & Q Car Park Cribbs Causeway Bristol 10 7TX. Niederschlagswasserbehandlung
in vorgefertigten Sickermulden mit Substrat. Lemwerder, November 2014, pp. 1–19 (in German).
Schueler, T., 2000. Stormwater Pollution Source Areas Isolated in Marquette, Michigan. Watershed Protection
Techniques 3, 609–612.
Schütte, M., 1997. Messungen der Regenwasserverschmutzung im Einzugsgebiet des Biesdorfer Baggersees.
Ingenieurgesellschaft für Stadthydrologie, Hannover (in German).
SEH, 2010. Untersuchungen Straßenablauffilter INNOLET, Juli 2008–Februar 2010. Stadtentwässerung Hagen,
pp. 1–29 (in German).
Shelley, P.E., Driscoll, E.D., Sartor, J.D., 1987. Probabilistic characterization of pollutant discharges from
highway stormwater runoff. Science of The Total Environment 59, 401–410.
192

Shinya, M., Funasaka, K., Katahira, K., Ishikawa, M., Matsui, S., 2006. Lead isotope ratios in urban road runoff.
Water Science and Technology 53, 185–191.
Shinya, M., Tsuchinaga, T., Kitano, M., Yamada, Y., Ishikawa, M., 2000. Characterization of heavy metals and
polycyclic aromatic hydrocarbons in urban highway runoff Water Science and Technology 42, 201–208.
Shinya, M., Tsuruho, K., Konishi, T., Ishikawa, M., 2003. Evaluation of factors influencing diffusion of pollutant
loads in urban highway runoff. Water Science and Technology 47, 227–232.
Smith, E.H., 1998. Modeling Batch Kinetics of Cadmium Removal: by a Recycled Iron Adsorbent. Separation
Science and Technology 33, 149–168.
Smullen, J.T., Shallcross, A.L., Cave, K.A., 1999. Updating the U.S. Nationwide Urban runoff quality data base.
Water Science and Technology 39, 9–16.
SN 640 347, 2009. Strassenentwässerung. Belastung von Strassenabwasser (Gültig ab 1. Februar 2009).
Schweizerischer Verband der Strassen‐ und Verkehrsfachleute, Schweizerische Normen‐Vereinigung SNV, pp.
1–20 (in German).
Sperlich, A., Werner, A., Genz, A., Amy, G., Worch, E., Jekel, M., 2005. Breakthrough behavior of granular ferric
hydroxide (GFH) fixed‐bed adsorption filters: modeling and experimental approaches. Water Research 39,
1190–1198.
Spromberg, J.A., Baldwin, D.H., Damm, S.E., McIntyre, J.K., Huff, M., Sloan, C.A., Anulacion, B.F., Davis, J.W.,
Scholz, N.L., 2016. Coho salmon spawner mortality in western US urban watersheds: bioinfiltration prevents
lethal storm water impacts. Journal of Applied Ecology 53, 398–407.
Stachel, B., Tegge, K.‐T., Jantzen, E., 2007. Schadstoffe in Hamburger Autobahnabwässern und ihre
Einschätzung unter Berücksichtigung der EG‐Wasserrahmenrichtlinie (EG‐WRRL). Straße und Autobahn 58,
326–333 (in German).
Stagge, J.H., Davis, A.P., Jamil, E., Kim, H., 2012. Performance of grass swales for improving water quality from
highway runoff. Water Research 46, 6731–6742.
Steiner, M., Boller, M., Schulz, T., Pronk, W., 2007. Modelling heavy metal fluxes from traffic into the
environment. Journal of Environmental Monitoring 9, 847–854.
Steiner, M., Goosse, P., 2007. Monitoring SABA Attinghausen, 1. Zwischenbericht, pp. 1–25 (in German).
Steiner, M., Goosse, P., 2008. Monitoring SABA Attinghausen, 3. Zwischenbericht, pp. 1–14 (in German).
Steiner, M., Goosse, P., 2009a. Leistungsüberprüfung SABA Hagnau, 2. Zwischenbericht, pp. 1–16 (in German).
Steiner, M., Goosse, P., 2009b. Monitoring SABA Attinghausen, Schlussbericht, pp. 1–47 (in German).
Steiner, M., Goosse, P., 2011a. Leistungsüberwachung der SABA Hagnau, 3. Zwischenbericht, pp. 1–7 (in
German).
Steiner, M., Goosse, P., 2011b. Leistungsüberwachung, SABA Chlosterschür, SABA Neuwiesen, pp. 1–15 (in
German).
Steiner, M., Goosse, P., Hermann, E., Boller, M., 2008. Leistungsbeurteilung der SABA Attinghausen, Halbzeit
des Monitorings. gwa, 531–538 (in German).
Steiner, M., Goosse, P., Rutz, F., Brodmann, R., Pazeller, A., 2010. Straßenabwasserbehandlungsverfahren,
Stand der Technik. Bundesamt für Straßen ASTRA. Bundesamt für Umwelt BAFU, Bern, pp. 1–130 (in German).
Steiner, M., Langbein, S., Boller, M., 2006. Bankette bestehender Straßen, Untersuchung der Versickerung von
Straßenabwasser über Straßenrandstreifen an einer bestehenden Straße, pp. 1–51 (in German).
193

Stenstrom, M.K., Kayhanian, M., 2005. First Flush Phenomenon Characterization. University of California, pp. 1–
69.
Steuer, J., Selbig, W., Hornewer, N.J., Prey, J., 1997. Sources of contamination in an urban basin in Marquette,
Michigan and an analysis of concentrations, loads, and data quality. USGS Water‐Resources Investigations
Report 97‐4242, pp. 1–25.
Stotz, G., 1987. Investigations of the properties of the surface water run‐off from federal highways in the FRG.
Science of The Total Environment 59, 329–337.
Stotz, G., Krauth, K., 1994. The pollution of effluents from pervious pavements of an experimental highway
section: first results. Science of The Total Environment 146–147, 465–470.
Strecker, E.W., Driscoll, E.D., Shelley, P.E., Gaboury, D.R., Sartor, J.D., 1990. The U.S. federal highway
administrations receiving water impact methodology. Science of The Total Environment 93, 489–498.
Striebel, T., Daub, J., Herrmann, R., 1994. A sampling device for measuring physical and chemical characteristics
of urban street runoff. Science of The Total Environment 146–147, 515–523.
Summers, S.R., 1992. Standardized protocol for the evaluation of GAC. American Water Works Association
Research Foundation and American Water Works Association, ISBN: 0‐89867‐626‐6.
Suter, J., 2000. Schwermetallbilanz eines Autobahnabschnittes und die Behandlung des Strassenabwassers,
Diplomarbeit, ETHZ/Eawag (in German).
SWMM, 2005. Stormwater Management Manual for Western Washington, Volume 5. September 22, 2008
Edition. Washington State Department of Ecology, Olympia, WA, pp. 1–143.
Terzakis, S., Fountoulakis, M.S., Georgaki, I., Albantakis, D., Sabathianakis, I., Karathanasis, A.D., Kalogerakis, N.,
Manios, T., 2008. Constructed wetlands treating highway runoff in the central Mediterranean region.
Chemosphere 72, 141–149.
Thomson, N.R., McBean, E.A., Snodgrass, W., Monstrenko, I.B., 1997. Highway stormwater runoff quality:
Development of surrogate parameter relationships. Water, Air and Soil Pollution 94, 307–347.
Thorpe, A., Harrison, R.M., 2008. Sources and properties of non‐exhaust particulate matter from road traffic: A
review. Science of The Total Environment 400, 270–282.
Tiefenthaler, L.L., Schiff, K.C., Bay, S.M., 2001. Characteristics of Parking Lot Runoff Produced by Simulated
Rainfall. Technical Report 343, pp. 1–67.
Timperley, M., Williamson, B., Mills, G., Horne, B., Hasan, M.Q., 2005. Sources and loads of metals in urban
stormwater. National Institute of Water & Atmospheric Research Ltd, pp. 1–80.
TrinkwV, 2001. Verordnung über die Qualität von Wasser für den menschlichen Gebrauch of 21 May 2001
(BGBI. I, p. 2977), last amended on 18 November 2015, BGBl. I, p. 2076 (in German).
Tromp, K., Lima, A.T., Barendregt, A., Verhoeven, J.T.A., 2012. Retention of heavy metals and poly‐aromatic
hydrocarbons from road water in a constructed wetland and the effect of de‐icing. Journal of Hazardous
Materials 203–204, 290–298.
Uhl, M., Kasting, U., 2002. Verschmutzung des Niederschlagabflusses in Misch‐ und Trennsystemen und von
Straßen. Wasser und Abfall 3, 14–22 (in German).
Umweltbundesamt, 2015. National Trend Tables for the German Atmospheric Emission Reporting (Heavy
Metals) 1990–2013. Final version: 03 February 2015.
Valtanen, M., Sillanpää, N., Setälä, H., 2014. The Effects of Urbanization on Runoff Pollutant Concentrations,
Loadings and Their Seasonal Patterns Under Cold Climate. Water, Air and Soil Pollution 225, 1–16.
194

Van Bohemen, H.D., Van De Laak, W.H.J., 2003. The Influence of Road Infrastructure and Traffic on Soil, Water,
and Air Quality. Environmental Management 31, 50–68.
Van Dam, C.H., Scholten, M., Van de Ven, F.H., 1986. Urban Water Quality in Lelystad, Rainfall and Runoff from
selected surfaces. Urban Storm Water Quality and Ecological Effects upon Receiving Waters, 25–37.
Vesting, A., Huber, M., Giga, A., Helmreich, B., Wichern, M., 2015. Erfahrungen aus Praxisuntersuchungen eines
dezentralen Behandlungssystems zur Reduktion von Kohlenwasserstoffen und organischen Spurenstoffen aus
Verkehrsflächenabflüssen. Aqua Urbanica 2015, Stuttgart, 07–08 October 2015. Stuttgarter Berichte zur
Siedlungswasserwirtschaft, Vol. 225. ISBN 13: 978‐3‐8356‐7292‐5, pp. 131–141 (in German).
Victorian Stormwater Committee, 2006. Urban Stormwater: Best Practice Environmental Management
Guidelines. Commonwealth Scientific and Industrial Research Organisation, pp. 1–268.
VKU, 2003. VKS‐Information 52. Differenzierter Winterdienst im kommunalen Bereich. Verband kommunaler
Unternehmen e. V., Berlin, pp. 1–20 (in German).
VKU, 2013. VKS‐Information 79. Effektiver Straßenwinterdienst im kommunalen Bereich. Empfehlungen zur
Durchführung. Verband kommunaler Unternehmen e. V., Berlin, pp. 1–36 (in German).
von Ballmoos, M., 2007. A28a – Umfahrung Klosters, Wirkungskontrolle Straßenabwasserbehandlungsanlage
(SABA). Concepta AG, Tiefbauamt des Kantons Graubünden, pp. 1–17 (in German).
von Uexküll, O., Skerfving, S., Doyle, R., Braungart, M., 2005. Antimony in brake pads‐a carcinogenic
component? Journal of Cleaner Production 13, 19–31.
Wanielista, M.P., Yousef, Y.A., 1993. Stormwater Management, John Wiley and Sons, Inc., New York, USA.
Ward, N.I., 1990. Multielement contamination of British motorway environments. Science of The Total
Environment 93, 393–401.
Waschbusch, R.J., 1996. U.S. Geological Survey, written communication. Cited in Steuer et al., 1997.
Waschbusch, R.J., 2003. Data and Methods of a 1999–2000 Street Sweeping Study on an Urban Freeway in
Milwaukee County, Wisconsin. U.S. Department of the Interior, U.S. Geological Survey, pp. 1–13.
Wei, C., Morrison, G.M., 1994. Platinum analysis and speciation in urban gullypots. Analytica Chimica Acta 284,
587–592.
Welker, A., 2004. Schadstoffströme im urbanen Wasserkreislauf – Aufkommen und Verteilung, insbesondere in
den Abwasserentsorgungssystemen. Schriftenreihe des Fachgebietes Siedlungswasserwirtschaft, Universität
Kaiserslautern, Vol. 20 (in German).
Welker, A., 2014. Schadstoffströme im urbanen Wasserkreislauf – Aufkommen und Verteilung, insbesondere in
den Abwasserentsorgungssystemen. Schriftenreihe des Fachgebietes Siedlungswasserwirtschaft, Universität
Kaiserslautern, Vol. 20, updated appendix (in German).
Welker, A., 2015. Behandlung von Straßenabflüssen in dezentralen Anlagen: Belastungsgrößen, Wirksamkeit.
48. ESSENER TAGUNG für Wasser‐ und Abfallwirtschaft „Forschung trifft Praxis“, Aachen, 15–17 April 2015. Ges.
z. Förderung d. Siedlungswasserwirtschaft, Vol. 236, pp. 24/1‐24/11.
Welker, A., Dierschke, M., Dierkes, C., 2014. Untersuchungen zur Verifizierung der DIBt‐Zulassungsgrundsätze.
Kurzbericht. Im Auftrag des Deutschen Instituts für Bautechnik (DIBt) Berlin, März 2014, pp. 1–10 (in German,
unpublished).
Welker, A., Dittmer, U., 2005. Belastung von Verkehrsflächenabflüssen mit Schwermetallen und PAK. gwf
Wasser/Abwasser 146, 320–332 (in German).
195

Welker, A., Huber, M., 2014. Dezentrale Behandlungsanlagen für Verkehrsflächenabflüsse – Stand der Technik.
42. Abwassertechnisches Seminar: Zukunftsfähige Bewirtschaftungskonzepte für Niederschlagswasser,
Garching, 10 July 2014. Berichte aus der Siedlungswasserwirtschaft, Technische Universität München, Vol. 211,
ISSN 0942‐914X, pp. 89–106 (in German).
Welker, A., Huber, M., Dierschke, M., Drewes, J.E., Helmreich, B., 2015. Weitergehende Anforderungen an
dezentrale Behandlungsanlagen für Verkehrsflächenabflüsse: organische Schadstoffe und Phosphor. Aqua
Urbanica 2015, Stuttgart, 07–08 October 2015. Stuttgarter Berichte zur Siedlungswasserwirtschaft, Vol. 225.
ISBN 13: 978‐3‐8356‐7292‐5, pp. 91–107 (in German).
Westerlund, C., Viklander, M., 2006. Particles and associated metals in road runoff during snowmelt and rainfall.
Science of The Total Environment 362, 143–156.
Westerlund, C., Viklander, M., Bäckström, M., 2003. Seasonal variations in road runoff quality in Luleå, Sweden.
Water Science and Technology 48, 93–101.
WHG, 2009. Wasserhaushaltsgesetz of 31 July 2009 (BGBl. I, p. 2585), last amended on 31 August 2015, BGBl. I,
p. 1724, 1520 (in German).
Wichern, M., Grüning, H., Helmreich, B., Pahl, A., Maile, E., Sosinka, K., Giga, A., Li, Y., 2012. Untersuchungs‐
und Entwicklungsvorhaben im Bereich Abwasser zum Themenschwerpunkt Niederschlagswasserbeseitigung:
Vergabe‐Nr. 08/058.2. Reduktion von Kohlenwasserstoffen und anderen organischen Spurenstoffen durch ein
dezentrales Behandlungssystem für Verkehrsflächenabflüsse, gefördert durch das Ministerium für Klimaschutz,
Umwelt, Landwirtschaft, Natur‐ und Verbraucherschutz des Landes Nordrhein‐Westfalen, wissenschaftlich
begleitet durch das Landesamt für Natur, Umwelt und Verbraucherschutz Nordrhein‐Westfalen.
Abschlussbericht Projektphase I, pp. 1–145 (in German).
Wichern, M., Vesting, A., Pecher, K.H., Giga, A., Wolke, M., Helmreich, B., Huber, M., Li, Y., 2015.
Untersuchungs‐ und Entwicklungsvorhaben im Bereich Abwasser zum Themenschwerpunkt
Niederschlagswasserbeseitigung: Vergabe‐Nr. 08/058.2. Reduktion von Kohlenwasserstoffen und anderen
organischen Spurenstoffen durch ein dezentrales Behandlungssystem für Verkehrsflächenabflüsse, gefördert
durch das Ministerium für Klimaschutz, Umwelt, Landwirtschaft, Natur‐ und Verbraucherschutz des Landes
Nordrhein‐Westfalen, wissenschaftlich begleitet durch das Landesamt für Natur, Umwelt und
Verbraucherschutz Nordrhein‐Westfalen (IV‐7‐042 600 002E). Abschlussbericht Projektphase II, pp. 1–260 (in
German).
Wilson, D., 2006. Highway 520 Bridge Storm Water Runoff Study. King County Water and Land Resources
Division, Department of Natural Resources and Parks, pp. 1–66.
Windhofer, G., Clara, M., Scheffknecht, C., 2012. Emissionen anthropogener Spurenstoffe von Verkehrsflächen.
Gewässerschutzanlagen für Verkehrsflächen, pp. 1–24 (in German).
Wiseman, C.L.S., Zereini, F., 2009. Airborne particulate matter, platinum group elements and human health: A
review of recent evidence. Science of The Total Environment 407, 2493–2500.
Wu, J., Allan, C., Saunders, W., Evett, J., 1998. Characterization and Pollutant Loading Estimation for Highway
Runoff. Journal of Environmental Engineering 124, 584–592.
Wu, P., Zhou, Y.‐S., 2009. Simultaneous removal of coexistent heavy metals from simulated urban stormwater
using four sorbents: A porous iron sorbent and its mixtures with zeolite and crystal gravel. Journal of Hazardous
Materials 168, 674–680.
Wüst, W., Kern, U., Herrmann, R., 1994. Street wash‐off behaviour of heavy metals, polyaromatic hydrocarbons
and nitrophenols. Science of The Total Environment 146–147, 457–463.
Xanthopoulos, C., Hahn, H.H., 1995. Neuere Untersuchungen zur Verschmutzung des Regen‐ und
Mischwasserabflusses. WasserAbwasserPraxis 4, 40–44 (in German).
196

Yan, G., Viraraghavan, T., Chen, M., 2001. A New Model for Heavy Metal Removal in a Biosorption Column.
Adsorption Science & Technology 19, 25–43.
Young, G.K., Stein, S., Cole, P., Kammer, T., Graziano, F., Bank, F., 1996. Evaluation and Management of
Highway Runoff Water Quality. Office of Environment and Planning, FHWA, Washington, D.C., pp. 1–480.
Yousef, Y.A., Wanielista, M.P., Hvitved‐Jacobsen, T., Harper, H.H., 1984. Fate of heavy metals in stormwater
runoff from highway bridges. Science of The Total Environment 33, 233–244.
Yu, A.H., Zhao, C., 2012. Evaluation on the highway asphalt pavement runoff with the gray correlation model.
Procedia Environmental Sciences 13, 1827–1835.
Zessner, M., 1999. Bedeutung und Steuerung von Nährstoff‐ und Schwermetallflüssen des Abwassers. Wiener
Mitteilungen, Vol. 157, Wien (in German).
Zhang, Q., Wang, X., Hou, P., Wan, W., Ren, Y., Ouyang, Z., Yang, L., 2013. The temporal changes in road
stormwater runoff quality and the implications to first flush control in Chongqing, China. Environmental
Monitoring and Assessment 185, 9763–9775.
Zhao, J., Liu, S., Qiu, L., Ying, C., 2001. The characteristics of expressway runoff quality and pollutants discharge
rule. China Environmental Science 21, 445–448 (in Chinese).
Zweckverband Abfallwirtschaft Region Hannover (aha), 2013. Wegweiser Winterdienst in der Stadt Hannover.
Was Sie bei Schnee und Eis beachten sollten. Brochure, 18 October 2013 (in German).
197

Appendix
PeerReviewedJournalArticles
1. Huber, M., Welker, A., Dierschke, M., Drewes, J.E., Helmreich, B., 2014. Ein neues
Laborverfahren zur Ermittlung von Standzeiten dezentraler Anlagen zur Behandlung von
Verkehrsflächenabflüssen. gwf Wasser/Abwasser 155 (5), 630–638.
2. Hinken, L., Huber, M., Weichgrebe, D., Rosenwinkel, K.‐H., 2014. Modified ADM1 for
modelling an UASB reactor laboratory plant treating starch wastewater and synthetic
substrate load tests. Water Research 64, 82–93.
3. Huber, M., Welker, A., Helmreich, B., 2015. Belastung von Verkehrsflächenabflüssen mit
Schwermetallen – ein europäischer Vergleich. gwf Wasser/Abwasser 156 (9), 896–909.
4. Huber, M., Welker, A., Drewes, J.E., Helmreich, B., 2015. Auftausalze im Straßenwinterdienst
– Aufkommen und Bedeutung für dezentrale Behandlungsanlagen von
Verkehrsflächenabflüssen zur Versickerung. gwf Wasser/Abwasser 156 (11), 1138–1152.
5. Helmreich, B., Huber, M., Drewes, J.E., 2015. Schwermetalle in Metalldachabflüssen und
Möglichkeiten zur dezentralen Behandlung. gwf Wasser/Abwasser 156 (12), 1238–1245.
6. Huber, M., Welker, A., Helmreich, B., 2016. Critical review of heavy metal pollution of traffic
area runoff: Occurrence, influencing factors, and partitioning. Science of the Total
Environment 541, 895–919.
7. Huber, M., Badenberg, S.C., Wulff, M., Drewes, J.E., Helmreich, B., 2016. Evaluation of
Factors Influencing Lab‐Scale Studies to Determine Heavy Metal Removal by Six Sorbents for
Stormwater Treatment. Water 8 (2), 62:1–19.
8. Horstmeyer, N., Huber, M., Drewes, J.E., Helmreich, B., 2016. Evaluation of site‐specific
factors influencing heavy metal contents in the topsoil of vegetated infiltration swales.
Science of the Total Environment 560–561, 19–28.
9. Huber, M., Helmreich, B., 2016. Stormwater Management: Calculation of Traffic Area Runoff
Loads and Traffic Related Emissions. Water 8 (7), 294:1–21.
10. Huber, M., Welker, A., Dierschke, M., Drewes, J.E., Helmreich, B., 2016. A novel test method
to determine the filter material service life of decentralized systems treating runoff from
traffic areas. Journal of Environmental Management 179, 66–75.
11. Huber, M., Hilbig, H., Badenberg, S.C., Fassnacht, J., Drewes, J.E., Helmreich, B., 2016. Heavy
metal removal mechanisms of sorptive filter materials for road runoff treatment and
remobilization under de‐icing salt applications. Water Research 102, 453–463.
198

12. Horstmeyer, N., Huber, M., Drewes, J.E., Helmreich, B., 2016. Räumliche Verteilung der
Schwermetallgehalte in den Oberböden von 35 Versickerungsmulden für
Verkehrsflächenabflüsse. gwf Wasser/Abwasser. Under Review.
Monograph
Huber, M., Welker, A., Helmreich, B., 2015. Einführung in die dezentrale
Niederschlagswasserbehandlung für Verkehrsflächen‐ und Metalldachabflüsse: Schacht‐/
Kompaktsysteme, Rinnensysteme, Straßeneinläufe und Flächenbeläge. Berichte aus der
Siedlungswasserwirtschaft, Technische Universität München, Vol. 213, 1st ed., ISSN 0942‐
914X, pp. 1–98.
ConferenceTalks
1. Huber, M., 2014. Durchführung von Laborversuchen zur anaeroben
Industrieabwasserbehandlung und Modellierung der Ergebnisse mit dem ADM1. Forum
„Young Scientists“. 47. Essener Tagung, Essen, 19–21 March 2014.
2. Welker, A., Huber, M., 2014. Dezentrale Behandlungsanlagen für Verkehrsflächenabflüsse –
Stand der Technik. 42. Abwassertechnisches Seminar: Zukunftsfähige
Bewirtschaftungskonzepte für Niederschlagswasser, Garching, 10 July 2014. Berichte aus der
Siedlungswasserwirtschaft, Technische Universität München, Vol. 211, ISSN 0942‐914X, pp.
89–106.
3. Huber, M., Dierschke, M., Welker, A., Helmreich, B., 2014. Laborverfahren zur Ermittlung von
Standzeiten von Anlagen zur Behandlung des Niederschlagswassers von Verkehrsflächen.
Aqua Urbanica 2014, Innsbruck (Austria), 23–24 October 2014. ISBN 13: 978‐3‐902978‐28‐8.
4. Huber, M., Welker, A., Drewes, J.E., Helmreich, B., 2015. Anforderungen an dezentrale
Anlagen zur Behandlung von Verkehrsflächenabflüssen. FGSV/BASt‐Tagung Straßenbauwerk
– Umweltschutz – Kreislaufwirtschaft (StrUK), Bergisch Gladbach, 22–23 June 2015. ISBN 13:
978‐3‐86446‐143‐9, pp. 101–113.
5. Huber, M., Horstmeyer, N., Drewes, J.E., Helmreich, B., 2015. Bewachsener Oberboden nach
DWA‐A 138 und DWA‐M 153 im Kontext des Entwurfs der Mantel‐Verordnung und der
Aktualisierung der Geringfügigkeitsschwellenwerte. FGSV/BASt‐Tagung Straßenbauwerk –
Umweltschutz – Kreislaufwirtschaft (StrUK), Bergisch Gladbach, 22–23 June 2015. ISBN 13:
978‐3‐86446‐143‐9, pp. 114–123.
6. Welker, A., Huber, M., Dierschke, M., Drewes, J.E., Helmreich, B., 2015. Weitergehende
Anforderungen an dezentrale Behandlungsanlagen für Verkehrsflächenabflüsse: organische
Schadstoffe und Phosphor. Aqua Urbanica 2015, Stuttgart, 07–08 October 2015. Stuttgarter
Berichte zur Siedlungswasserwirtschaft, Vol. 225. ISBN 13: 978‐3‐8356‐7292‐5, pp. 91–107.
199
7. Huber, M., Hilbig, H., Drewes, J.E., Helmreich, B., 2015. Einfluss von Auftausalzen auf die
Remobilisierung von auf Filtermaterialien zur Behandlung von Verkehrsflächenabflüssen
zurückgehaltenen Schwermetallen. Aqua Urbanica 2015, Stuttgart, 07–08 October 2015.
Stuttgarter Berichte zur Siedlungswasserwirtschaft, Vol. 225. ISBN 13: 978‐3‐8356‐7292‐5, pp.
123–130.
8. Vesting, A., Huber, M., Giga, A., Helmreich, B., Wichern, M., 2015. Erfahrungen aus
Praxisuntersuchungen eines dezentralen Behandlungssystems zur Reduktion von
Kohlenwasserstoffen und organischen Spurenstoffen aus Verkehrsflächenabflüssen. Aqua
Urbanica 2015, Stuttgart, 07–08 October 2015. Stuttgarter Berichte zur
Siedlungswasserwirtschaft, Vol. 225. ISBN 13: 978‐3‐8356‐7292‐5, pp. 131–141.
9. Huber, M., 2015. Übersicht über die Behandlung von Verkehrsflächenabflüssen in
Deutschland. 1. Erfahrungsaustausch SABA ASTRA, Ittigen (Switzerland), 05 November 2015.
10. Huber, M., 2015. Dezentrale Anlagen zur Behandlung von Verkehrsflächenabflüssen. 1.
Erfahrungsaustausch SABA ASTRA, Ittigen (Switzerland), 05 November 2015.
11. Huber, M., Fassnacht, J., Hilbig, H., Drewes, J.E., Helmreich, B., 2016. Auftausalzeinfluss auf
die Remobilisierung von auf Filtermaterialien zur Behandlung von Verkehrsflächenabflüssen
zurückgehaltenen Schwermetallen. Wasser 2016, Jahrestagung der Wasserchemischen
Gesellschaft, Bamberg, 02–04 May 2016. ISBN 13: 978‐3‐936028‐94‐2, pp. 421–426.
12. Huber, M., Hilbig, H., Drewes, J.E., Helmreich, B., 2016. Heavy Metal Removal and
Remobilization under De‐icing Salt Applications using Lab‐scale Column Experiments.
NOVATECH‐Conference, Lyon (France), 28 June – 01 July 2016, pp. 1–7.
13. Helmreich, B., Huber, M., Vesting, A., Giga, A., Wichern, M., 2016. Erfahrungen mit einem
dezentralen Behandlungssystem für Verkehrsflächenabflüsse – Vom Labormaßstab in die
technische Umsetzung. 15. Regenwassertage der DWA, Darmstadt, 05–06 July 2016.
14. Huber, M., Welker, A., Scharrer, J., Helmreich, B., 2016. Schwermetalle und weitere Metalle
in Verkehrsflächenabflüssen: methodenspezifische Einflüsse von Monitoring‐Programmen
auf Datenqualität und Untersuchungsergebnisse. Aqua Urbanica 2016, Rigi Kaltbad
(Switzerland), 26–27 September 2016, pp. 1–5.
ScientificPosters
1. Huber, M., 2014. Durchführung von Laborversuchen zur anaeroben
Industrieabwasserbehandlung und Modellierung der Ergebnisse mit dem ADM1. 47. Essener
Tagung, Essen, 19–21 March 2014.
2. Huber, M., Helmreich, B., 2014. Untersuchungen von Anlagen zur
Niederschlagswasserbehandlung. IFAT, Munich, 05–09 June 2014.
200

3. Huber, M., 2015. Evaluation Method for Decentralized Storm Water Treatment Systems –
Development and application for traffic area runoff. Doctoral Candidates’ Day 2015 of FGC
BGU, Munich, 08 January 2015.
4. Huber, M., Welker, A., Drewes, J.E., Helmreich, B., 2015. Anforderungen an dezentrale
Anlagen zur Behandlung von Verkehrsflächenabflüssen. FGSV/BASt‐Tagung Straßenbauwerk
– Umweltschutz – Kreislaufwirtschaft (StrUK), Bergisch Gladbach, 22–23 June 2015.
5. Huber, M., Horstmeyer, N., Drewes, J.E., Helmreich, B., 2015. Bewachsener Oberboden nach
DWA‐A 138 und DWA‐M 153 im Kontext des Entwurfs der Mantel‐Verordnung und der
Aktualisierung der Geringfügigkeitsschwellenwerte. FGSV/BASt‐Tagung Straßenbauwerk –
Umweltschutz – Kreislaufwirtschaft (StrUK), Bergisch Gladbach, 22–23 June 2015.
6. Huber, M., Fassnacht, J., Hilbig, H., Drewes, J.E., Helmreich, B., 2016.
Schwermetallremobilisierung durch Auftausalze. Wasser 2016, Bamberg, 02–04 May 2016.
7. Hilbig, H., Huber, M., Gmell, A., Heinz, D., 2016. Determination of Heavy Metals in Highly
Porous Sorptive Filter Material with LA‐ICP‐MS. EWLA 2016, Ljubljana (Slovenia), 12–15 July
2016.
8. Huber, M., Welker, A., Scharrer, J., Helmreich, B., 2016. Methodenspezifische Einflüsse auf
Feldmessungen. Aqua Urbanica 2016, Rigi Kaltbad (Switzerland), 26–27 September 2016.
ResearchReports
1. Helmreich, B., Huber, M., Welker, A., Dierschke, M., 2013. 2. Zwischenbericht zum F + E‐
Vorhaben „Untersuchung von Anlagen zur Behandlung des Niederschlagswassers von
Verkehrsflächen“ (76e133), 16 April 2013. Authority: Bayerisches Landesamt für Umwelt, pp.
1–55.
2. Helmreich, B., Huber, M., Welker, A., Dierschke, M., 2013. 3. Zwischenbericht zum F + E ‐
Vorhaben „Untersuchung von Anlagen zur Behandlung des Niederschlagswassers von
Verkehrsflächen“ (76e133), 30 August 2013. Authority: Bayerisches Landesamt für Umwelt,
pp. 1–75.
3. Helmreich, B., Huber, M., Welker, A., Dierschke, M., 2013. 4. Zwischenbericht zum F + E ‐
Vorhaben „Untersuchung von Anlagen zur Behandlung des Niederschlagswassers von
Verkehrsflächen“ (76e133), 27 September 2013. Authority: Bayerisches Landesamt für
Umwelt, pp. 1–160.
4. Helmreich, B., Huber, M., Welker, A., Dierschke, M., 2014. Abschlussbericht zum F + E ‐
Vorhaben „Untersuchung von Anlagen zur Behandlung des Niederschlagswassers von
Verkehrsflächen“ (76e133), 29 July 2014. Authority: Bayerisches Landesamt für Umwelt, pp.
1–216.
201
5. Huber, M., Helmreich, B., Kießling, F., Schütz, M., 2015. Abschlussbericht (AZ‐1124‐14)
„Einfluss von Auftausalzen auf die Remobilisierung von auf Filtermaterialien zur Behandlung
von Verkehrsflächenabflüssen zurückgehaltenen Schadstoffen“, sponsored by the Bayerische
Forschungsstiftung. Lemma „Schadstoffremobilisierung durch Auftausalze“, 15 December
2015, pp. 1–32.
6. Wichern, M., Vesting, A., Pecher, K.H., Giga, A., Wolke, M., Helmreich, B., Huber, M., Li, Y.,
2015. Untersuchungs‐ und Entwicklungsvorhaben im Bereich Abwasser zum
Themenschwerpunkt Niederschlagswasserbeseitigung: Vergabe‐Nr. 08/058.2. Reduktion von
Kohlenwasserstoffen und anderen organischen Spurenstoffen durch ein dezentrales
Behandlungssystem für Verkehrsflächenabflüsse, gefördert durch das Ministerium für
Klimaschutz, Umwelt, Landwirtschaft, Natur‐ und Verbraucherschutz des Landes Nordrhein‐
Westfalen, wissenschaftlich begleitet durch das Landesamt für Natur, Umwelt und
Verbraucherschutz Nordrhein‐Westfalen (IV‐7‐042 600 002E). Abschlussbericht Projektphase
II, pp. 1–260.
202