Technical Report #5 DRAFT - City of Hattiesburg
127
2045 Metropolitan Transportation Plan - Technical Report #5 Hattiesburg-Petal-Forrest-Lamar Metropolitan Planning Organization 1 Technical Report #5 Plan Development DRAFT October 2020 2045 Metropolitan Transportation Plan
-
Upload
khangminh22 -
Category
Documents
-
view
3 -
download
0
Transcript of Technical Report #5 DRAFT - City of Hattiesburg
2045 Metropolitan Transportation Plan - Technical Report #5 Hattiesburg-Petal-Forrest-Lamar Metropolitan Planning Organization
1
Technical Report #5 Plan Development
DRAFT October 2020
2045 Metropolitan Transportation Plan

2045 Metropolitan Transportation Plan - Technical Report #5 Hattiesburg-Petal-Forrest-Lamar Metropolitan Planning Organization
i
Table of Contents
1.0 Introduction ............................................................................................................................................ 1
2.0 Public and Stakeholder Involvement Phase 1 ........................................................................................ 2
2.1 How We Engaged ................................................................................................................................ 2
2.2 Stakeholder Input................................................................................................................................ 3
2.3 Public Input ......................................................................................................................................... 9
3.0 Public and Stakeholder Involvement Phase 2 ...................................................................................... 22
3.1 How We Engaged .............................................................................................................................. 22
3.2 Stakeholder Input.............................................................................................................................. 22
3.3 Public Input ....................................................................................................................................... 22
4.0 Visioning and Strategies ....................................................................................................................... 23
4.1 Vision and Strategic Framework ....................................................................................................... 23
4.2 Goals and Objectives ......................................................................................................................... 24
4.3 Relationship with Planning Factors ................................................................................................... 27
4.4 National Goals and Performance Measures ..................................................................................... 28
4.5 Strategies .......................................................................................................................................... 33
5.0 Project Development ............................................................................................................................ 35
5.1 Project Identification ........................................................................................................................ 35
5.2 Estimating Project Costs ................................................................................................................... 36
6.0 Environmental Analysis and Mitigation................................................................................................ 38
6.1 The Environment and MTP ............................................................................................................... 38
6.2 Air Quality and Change in Climate .................................................................................................... 39
6.3 Environmental Regulations ............................................................................................................... 44
6.4 The Natural Environment .................................................................................................................. 45
6.5 The Human Environment .................................................................................................................. 57
7.0 Project Prioritization ............................................................................................................................. 71
7.1 Roadway Capacity Project Prioritization ........................................................................................... 71
7.2 Bicycle and Pedestrian Corridor Prioritization .................................................................................. 77
8.0 Financial Plan ........................................................................................................................................ 81
2045 Metropolitan Transportation Plan - Technical Report #5 Hattiesburg-Petal-Forrest-Lamar Metropolitan Planning Organization
ii
8.1 Roadway Funding .............................................................................................................................. 81
8.2 Bicycle and Pedestrian Funding ........................................................................................................ 85
8.3 Public Transit Funding ....................................................................................................................... 86
9.0 Implementation Plan ............................................................................................................................ 90
9.1 Fiscally Constrained Plan ................................................................................................................... 90
9.2 Visionary (Unfunded) Projects ........................................................................................................ 102
Appendix: Public/Stakeholder Outreach Documentation ........................................................................ 108
Round 1 Documentation ....................................................................................................................... 109
Round 2 Documentation ....................................................................................................................... 120
2045 Metropolitan Transportation Plan - Technical Report #5 Hattiesburg-Petal-Forrest-Lamar Metropolitan Planning Organization
iii
List of Tables
Table 2.1: Phase 1 Public and Stakeholder Activity ........................................................................... 3
Table 2.2: Intersections or Corridor Most In Need of Safety Improvements .................................... 6
Table 2.3: Most Congested Intersections or Corridors ....................................................................... 6
Table 2.4: Public Survey Respondent Self-Identification by Group ................................................... 9
Table 2.5: Public Survey Respondent Self-Identification by ZIP Code ............................................... 9
Table 2.6: Votes per Transportation Priority .................................................................................... 10
Table 2.7: Budget Allocation Responses ........................................................................................... 12
Table 2.8: Most Congested Intersections ........................................................................................ 13
Table 2.9: Most Congested Corridors .............................................................................................. 13
Table 2.10: Intersections Most In Need of Safety Improvements ................................................... 13
Table 2.11: Corridors Most In Need of Safety Improvements .......................................................... 14
Table 2.12: Public Input Ideas for Pedestrians.................................................................................. 15
Table 2.13: Public Input Ideas for Roadways .................................................................................... 16
Table 2.14: Public Input Ideas for Transit ......................................................................................... 17
Table 2.15: Public Input Ideas for Bicycling ...................................................................................... 18
Table 2.16: Other Public Input Ideas ................................................................................................. 18
Table 4.1: Relationship between Goals, Objectives, Performance Measures, and Federal Planning
Factors ........................................................................................................................... 30
Table 5.1: Typical Roadway Costs by Improvement Type................................................................. 36
Table 6.1: Typical Environmental Resources Evaluated ................................................................... 38
Table 6.2: National Ambient Air Quality Standards (NAAQS) as of 2020 ......................................... 40
Table 6.3 Species Identified under Endangered Species Act in Hattiesburg, MS ............................. 49
Table 6.4: Test Projects Impacting Wetlands or Floodplains ............................................................ 50
Table 6.5: Test Projects Impacting Low Income or Minority Populations ........................................ 60
Table 7.1: Project Prioritization Methodology for Roadway Capacity Projects ................................ 72
Table 7.2: Project Prioritization Results for Roadway Capacity Projects .......................................... 73
Table 7.3: Project Prioritization Methodology for Bicycle and Pedestrian Projects ......................... 78
Table 7.4: High-Priority Bicycle and Pedestrian Project Corridors .................................................... 79
2045 Metropolitan Transportation Plan - Technical Report #5 Hattiesburg-Petal-Forrest-Lamar Metropolitan Planning Organization
iv
Table 9.1: Travel Impacts of Fiscally Constrained Roadway Capacity Projects................................. 91
Table 9.2: Fiscally Constrained Roadway Capacity Projects ............................................................. 93
Table 9.3: Fiscally Constrained Roadway Non-Capacity Projects ..................................................... 95
Table 9.4: Fiscally Constrained List of Bicycle and Pedestrian Projects ............................................ 98
Table 9.5: Fiscally Constrained List of Transit Projects ................................................................... 100
Table 9.6: Visionary Roadway Capacity Projects ............................................................................ 103
Table 9.7: Visionary Bicycle and Pedestrian Project Corridors ....................................................... 106
2045 Metropolitan Transportation Plan - Technical Report #5 Hattiesburg-Petal-Forrest-Lamar Metropolitan Planning Organization
v
List of Figures
Figure 1.1: Metropolitan Transportation Planning Process ................................................................ 1
Figure 2.1: Transportation Priorities Ranked in Order of Importance ............................................... 4
Figure 2.2: Biggest Challenges to Implementing Projects .................................................................. 4
Figure 2.3: Biggest Causes of Congestion in the Region .................................................................... 5
Figure 2.4: Rank These Potential New Funding Sources ..................................................................... 5
Figure 2.5: Anticipated Growth Areas, According to Stakeholders .................................................... 7
Figure 2.6: Big Ideas for Transportation Improvement from Stakeholders ........................................ 8
Figure 2.7: Average Priority Ranking ................................................................................................. 10
Figure 2.8: Budget Allocation Results ............................................................................................... 11
Figure 2.9: Most Congested Roadways During Rush Hour, According to Public Survey .................. 19
Figure 2.10: Roadways Most in Need of Safety Improvements, According to Public Survey ........... 20
Figure 2.11: Big Ideas from Public Meeting Map .............................................................................. 21
Figure 4.1: Vision and Strategic Framework ..................................................................................... 23
Figure 4.2: Current Transportation Performance Overview ............................................................. 29
Figure 6.1: Wetlands and Waterways ............................................................................................... 54
Figure 6.2: Flood Zones ..................................................................................................................... 55
Figure 6.3: Critical Habitats ............................................................................................................... 56
Figure 6.4: Historic and Recreational Resources .............................................................................. 64
Figure 6.5: Potentially Hazardous Sites............................................................................................. 65
Figure 6.6: Block Group Demographics: People in Poverty .............................................................. 66
Figure 6.7: Block Group Demographics: Minority Populations ........................................................ 67
Figure 6.8: Concentration of Housing Built Pre-1960 ....................................................................... 68
Figure 6.9: Land Cover Classification ................................................................................................ 69
Figure 6.10: Land Cover Classification Breakdown ........................................................................... 70
Figure 7.1: Project Prioritization Results for Roadway Capacity Projects ......................................... 76
Figure 7.2: High-Priority Bicycle and Pedestrian Project Corridors .................................................. 80
Figure 9.1: Fiscally Constrained Roadway Projects (Federal Funding Only) ..................................... 90
Figure 9.2: Fiscally Constrained Bicycle/Pedestrian Projects (Federal Funding Only) ...................... 91
2045 Metropolitan Transportation Plan - Technical Report #5 Hattiesburg-Petal-Forrest-Lamar Metropolitan Planning Organization
vi
Figure 9.3: Fiscally Constrained Transit Projects (Federal Funding Only) ......................................... 92
Figure 9.4: Fiscally Constrained Roadway Capacity Projects ............................................................ 94
Figure 9.5: Fiscally Constrained Roadway Non-Capacity Projects .................................................... 97
Figure 9.6 Fiscally Constrained Bicycle and Pedestrian Projects ...................................................... 99
Figure 9.7: Visionary Roadway Capacity Projects ........................................................................... 105
Figure 9.8: High-Priority Bicycle and Pedestrian Project Corridors ................................................ 107
2045 Metropolitan Transportation Plan - Technical Report #5 Hattiesburg-Petal-Forrest-Lamar Metropolitan Planning Organization
1
Introduction
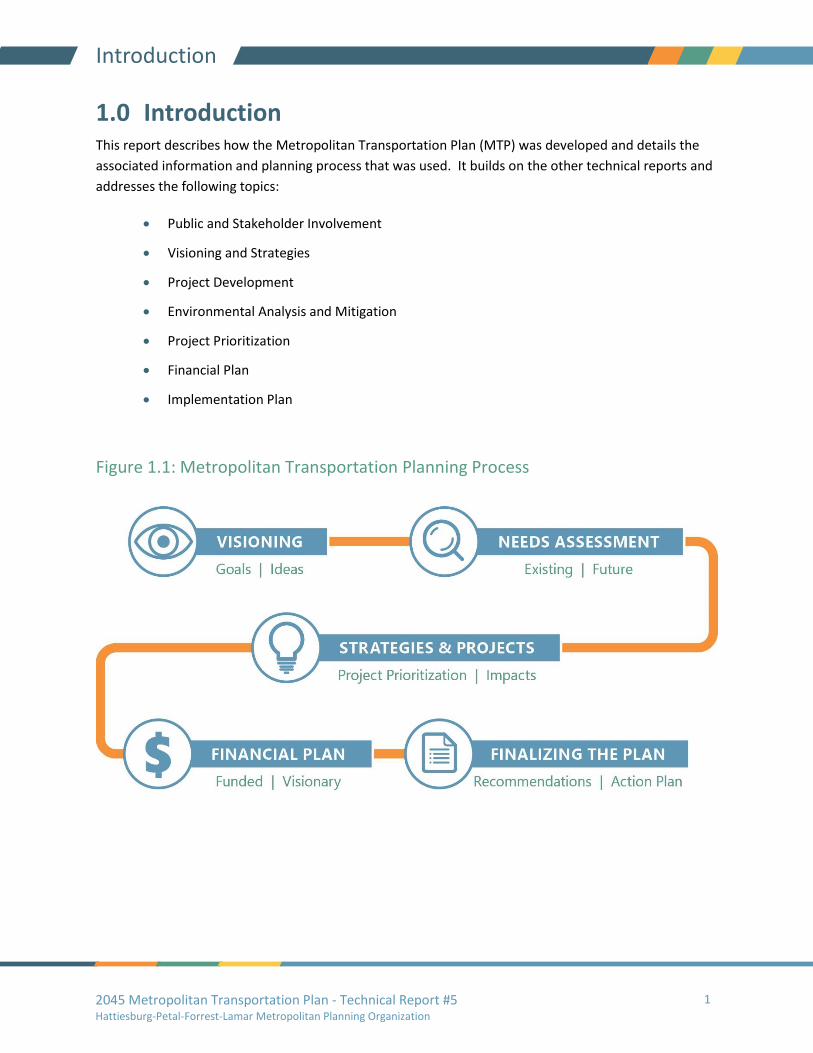
1.0 Introduction This report describes how the Metropolitan Transportation Plan (MTP) was developed and details the
associated information and planning process that was used. It builds on the other technical reports and
addresses the following topics:
• Public and Stakeholder Involvement
• Visioning and Strategies
• Project Development
• Environmental Analysis and Mitigation
• Project Prioritization
• Financial Plan
• Implementation Plan
Figure 1.1: Metropolitan Transportation Planning Process

2045 Metropolitan Transportation Plan - Technical Report #5 Hattiesburg-Petal-Forrest-Lamar Metropolitan Planning Organization
2
Public and Stakeholder Involvement Phase 1
2.0 Public and Stakeholder Involvement Phase 1 The first phase of the planning process – Listening and Learning – was designed to learn about people’s
values regarding transportation in the region and hear their big ideas for the future. It also provided an
opportunity to meet with key stakeholders in the region and learn about upcoming plans and the
region’s long-term trends.
Input was gathered from over 200 people which Informed the plan's goals and priority projects.
Stakeholders also provided Input on areas of future growth with assisted in forecasting future
socioeconomic data for the regional travel demand model.
2.1 How We Engaged
Stakeholder Meeting
A stakeholder meeting was held in both counties to hear input from stakeholders who came from a
variety of fields, such as local government, industries, or community organizations.
• The first meeting, in Lamar County, was held on Tuesday, March 26, 2019 from 1 P.M. to 3
P.M. at the Lamar Park Community Center in Hattiesburg, MS.
o Three (3) stakeholders attended.
• The second meeting, in Forrest County, was held on Thursday, March 28 from 1 P.M. to 3
P.M. at the Hattiesburg Historic Train Station in Hattiesburg, MS.
o Seventeen (17) stakeholders attended.
The purpose of these meetings was to learn about priorities, brainstorm Ideas for improving
transportation, and identify major growth areas.
Public Meeting and Online Survey
A public meeting was held in both counties to gather input from the community.
• 16 people attended the meeting held in Lamar County on March 26, 2019 from 4 P.M. to 6
P.M. at the Lamar Park Community Center in Hattiesburg, MS.
• 23 people attended the second meeting held in Forrest County on March 28, 2019 from 4
P.M. to 6 P.M. at the Hattiesburg Historic Train Station in Hattiesburg, M.S.
Attendees at each meeting participated in three (3) activities in which they learned about the plan and
shared their priorities and big Ideas.
A pop-up event accompanied the Hattie Hundred Bike Ride on Saturday, April 27, 2019. 15 people
stopped by the engagement table. Eight (8) people completed the budget allocation exercise and several
people completed surveys.

2045 Metropolitan Transportation Plan - Technical Report #5 Hattiesburg-Petal-Forrest-Lamar Metropolitan Planning Organization
3
Public and Stakeholder Involvement Phase 1
From March 21, 2019 through May 2, 2019, an online survey was available that replicated the surveys at
public meetings and pop up event. During that period, 134 people answered the online survey and 14
people answered paper surveys at the public meetings and the pop-up event.
Table 2.1: Phase 1 Public and Stakeholder Activity Activity People Engaged
Stakeholder Meetings 20
Public Meetings 39
Pop Up Event 15
Online Survey 134
Total 208
2.2 Stakeholder Input
The attendees of the two stakeholder meetings participated in three (3) exercises.
The first exercise was an interactive polling exercise that asked about transportation priorities,
challenges, and concerns. Figures 2.1 through 2.4 and Tables 2.2 and 2.3 show the results from these
polls. Key takeaways include:
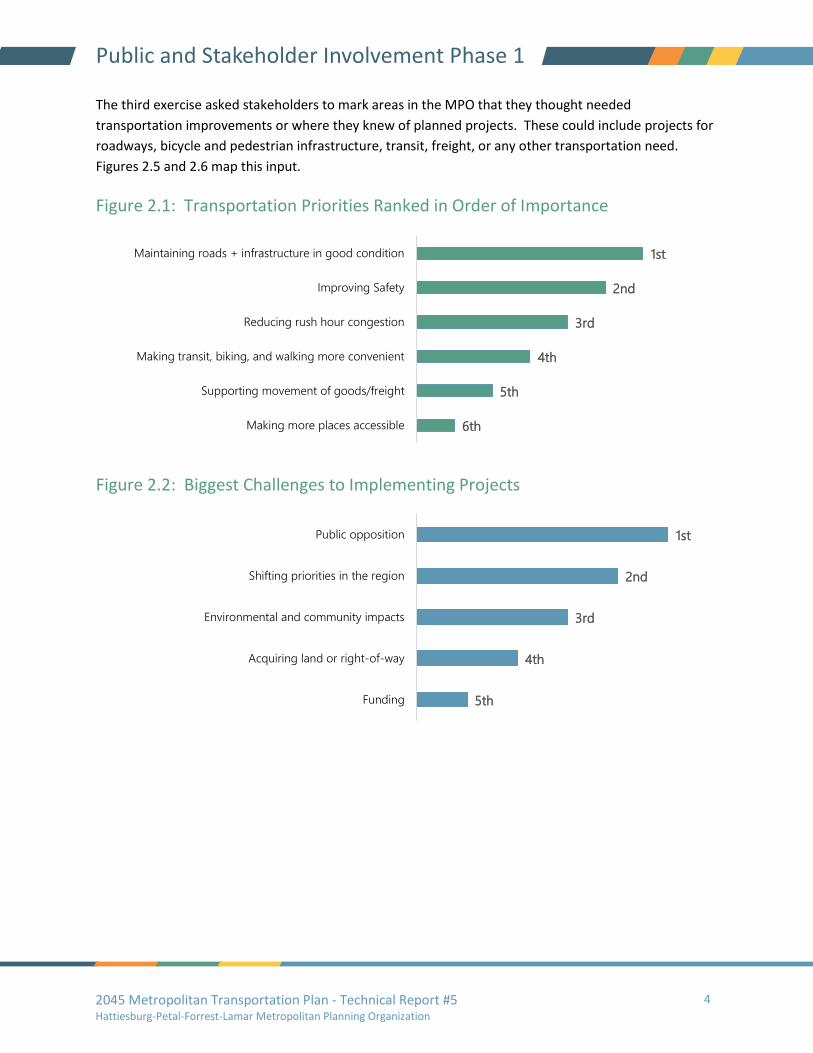
• Maintaining roads and infrastructure was voted the top priority, followed by reducing rush
hour congestion and improving safety.
• Public opposition was voted as the biggest challenge to implementing projects, followed by
shifting priorities in the region and environmental and community impacts.
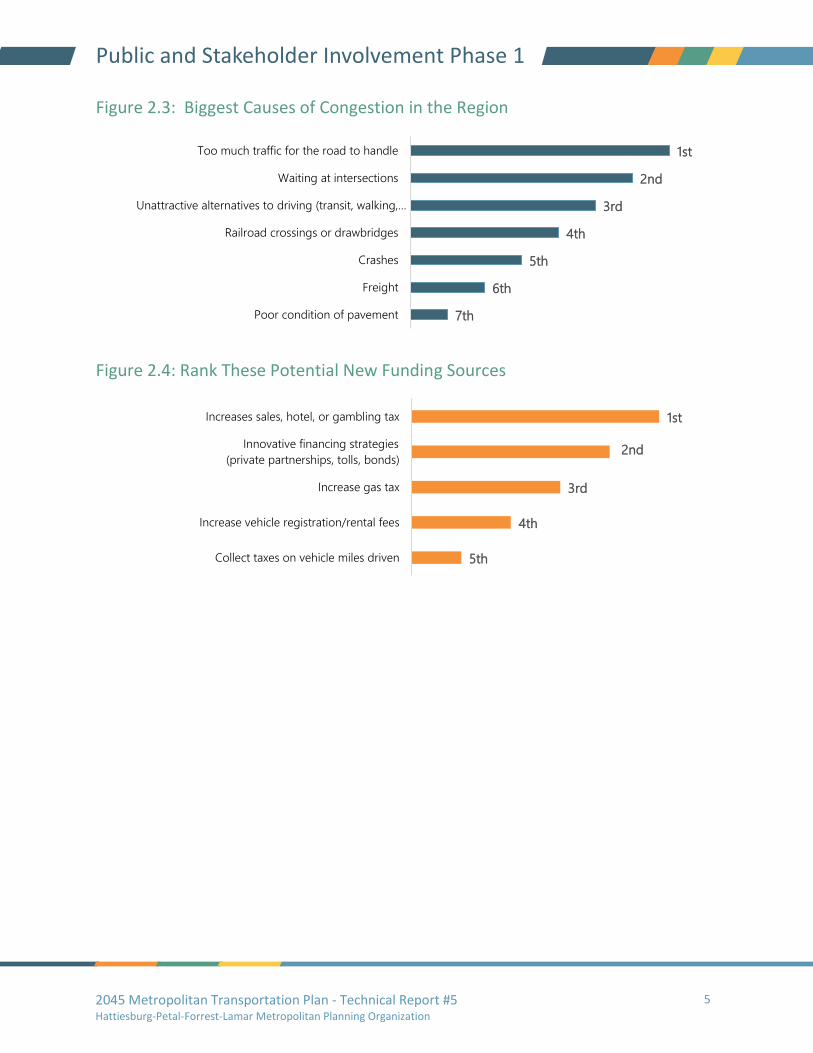
• “Too much traffic for the road to handle” was voted as the number one cause of congestion.
o “Waiting at intersections" and "unattractive alternatives to driving" were voted the
next top causes of congestion.
• The intersection of US-98 and Westover Drive was most frequently named as needing safety
improvements.
o Other participants named intersections along Hardy St or US-49 as needing safety
improvements.
• Hardy St/US-98 was voted the most congested corridor by half of the participants, followed
by the intersection of Hardy St/US-98 and Westover Drive.
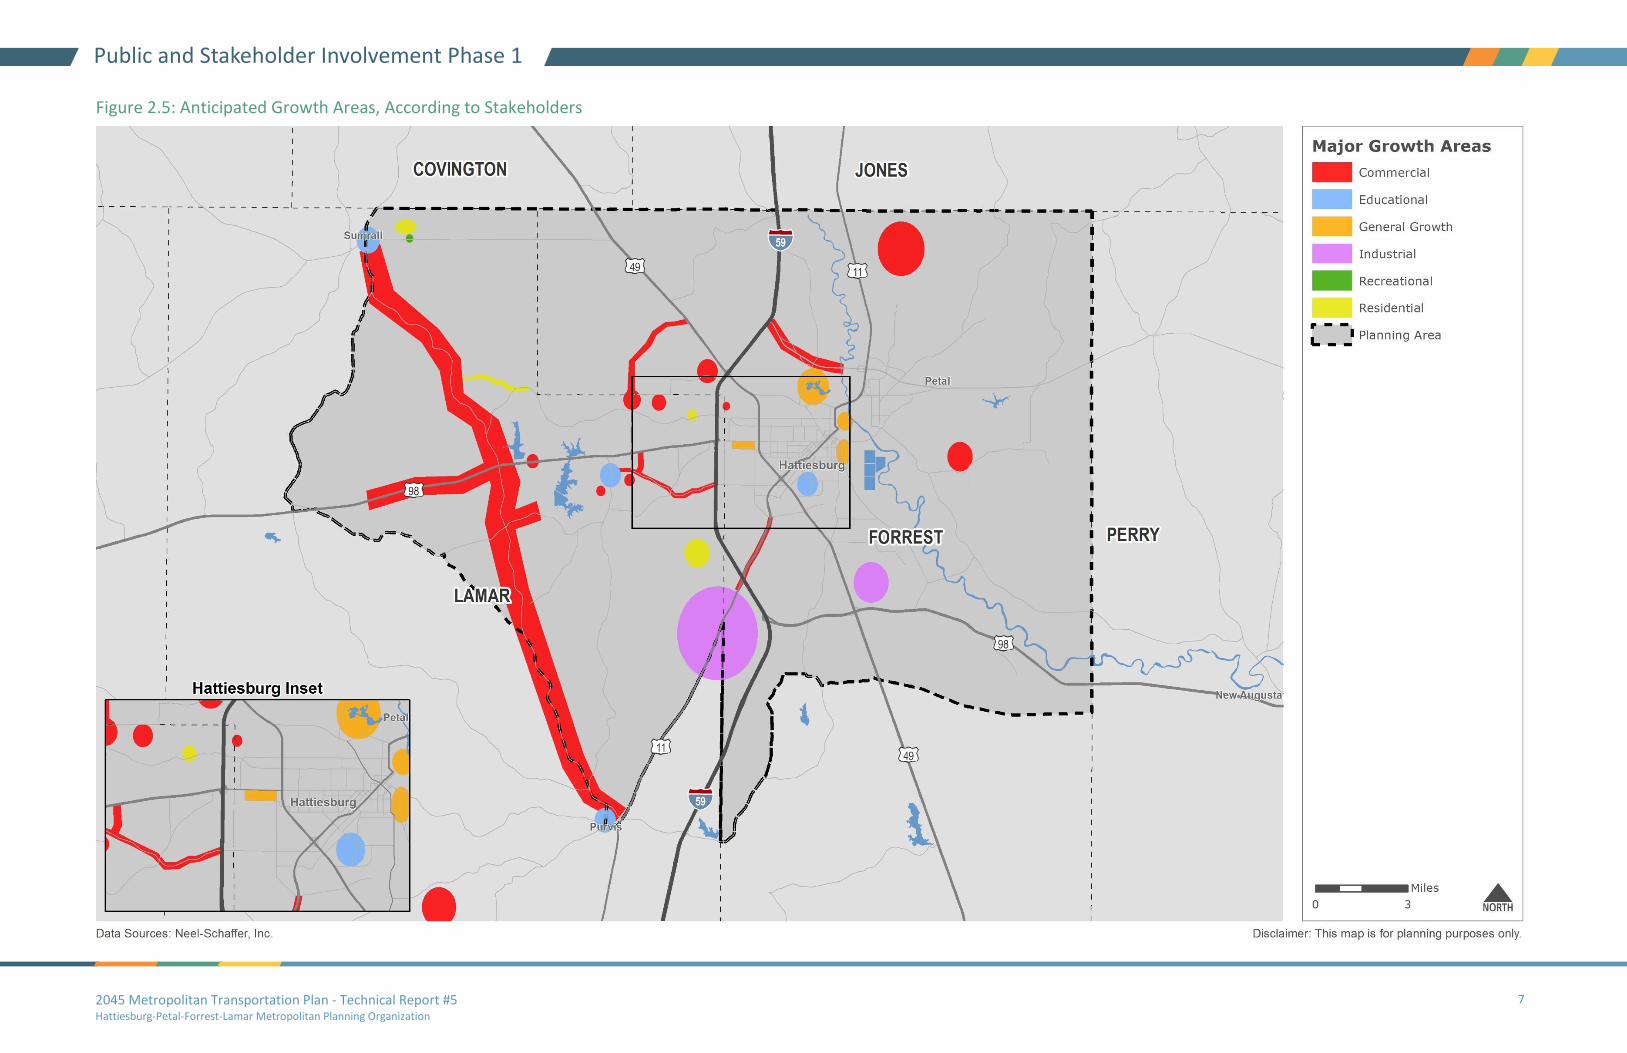
In a second exercise stakeholders were asked to mark areas where they expected future development
and to indicate what kind of development this would be (residential, commercial, industrial,
recreational, or educational/medical). Figure 2.5 shows these areas of anticipated development.
2045 Metropolitan Transportation Plan - Technical Report #5 Hattiesburg-Petal-Forrest-Lamar Metropolitan Planning Organization
4
Public and Stakeholder Involvement Phase 1
The third exercise asked stakeholders to mark areas in the MPO that they thought needed
transportation improvements or where they knew of planned projects. These could include projects for
roadways, bicycle and pedestrian infrastructure, transit, freight, or any other transportation need.
Figures 2.5 and 2.6 map this input.
Figure 2.1: Transportation Priorities Ranked in Order of Importance
Figure 2.2: Biggest Challenges to Implementing Projects
6th
5th
4th
3rd
2nd
1st
Making more places accessible
Supporting movement of goods/freight
Making transit, biking, and walking more convenient
Reducing rush hour congestion
Improving Safety
Maintaining roads + infrastructure in good condition
5th
4th
3rd
2nd
1st
Funding
Acquiring land or right-of-way
Environmental and community impacts
Shifting priorities in the region
Public opposition
2045 Metropolitan Transportation Plan - Technical Report #5 Hattiesburg-Petal-Forrest-Lamar Metropolitan Planning Organization
5
Public and Stakeholder Involvement Phase 1
Figure 2.3: Biggest Causes of Congestion in the Region
Figure 2.4: Rank These Potential New Funding Sources
7th
6th
5th
4th
3rd
2nd
1st
Poor condition of pavement
Freight
Crashes
Railroad crossings or drawbridges
Unattractive alternatives to driving (transit, walking,…
Waiting at intersections
Too much traffic for the road to handle
5th
4th
3rd
2nd
1st
Collect taxes on vehicle miles driven
Increase vehicle registration/rental fees
Increase gas tax
Innovative financing strategies
(private partnerships, tolls, bonds)
Increases sales, hotel, or gambling tax

2045 Metropolitan Transportation Plan - Technical Report #5 Hattiesburg-Petal-Forrest-Lamar Metropolitan Planning Organization
6
Public and Stakeholder Involvement Phase 1
Table 2.2: Intersections or Corridor Most In Need of Safety Improvements Intersection Times Mentioned
US-98 at Westover Dr 4
Hwy-49 at I-59 3
Hwy-49 at Hardy St 3
E Gandy Pkwy (Corridor) 3
Hardy St at I-59 3
US-11 (Veterans Memorial Dr) at Sullivan Kilrain Rd 2
Hardy St at 40th St 1
Table 2.3: Most Congested Intersections or Corridors Intersection Times Mentioned
Hardy St/US-98 (Corridor) 10
Hardy St/US-98 at Westover Dr 3
Oak Grove Rd (Corridor) 1
Oak Grove Rd at Westover Dr 1
US-49 at Hardy St 1
4th St at Hardy St 1
4th St at Westover Dr 1
2045 Metropolitan Transportation Plan - Technical Report #5 Hattiesburg-Petal-Forrest-Lamar Metropolitan Planning Organization
7
Public and Stakeholder Involvement Phase 1
Figure 2.5: Anticipated Growth Areas, According to Stakeholders

2045 Metropolitan Transportation Plan - Technical Report #5 Hattiesburg-Petal-Forrest-Lamar Metropolitan Planning Organization
8
Public and Stakeholder Involvement Phase 1
Figure 2.6: Big Ideas for Transportation Improvement from Stakeholders

2045 Metropolitan Transportation Plan - Technical Report #5 Hattiesburg-Petal-Forrest-Lamar Metropolitan Planning Organization
9
Public and Stakeholder Involvement Phase 1
2.3 Public Input
The public meeting, online survey, and pop-up event sought resident input to better understand
regional priorities and needs by asking about the following topics:
• General transportation priorities
• Budget allocation priorities
• Perceived safety issues
• Perceived high levels of congestion
• Ideas for improving transportation in the region
The exercises at the public meeting and survey questions were identical. A total of 144 surveys were
completed from the public meeting and online survey. Survey participants were not required to answer
all questions. Table 2.4 shows how respondents self-Identified and Table 2.5 shows how participation
varied by zip code.
Table 2.4: Public Survey Respondent Self-Identification by Group Type of Respondent Count
General Public 97
Government/Public Agency 26
Elected Official 9
Major Employer 5
Other 5
Advocacy Group 2
Total 144
Table 2.5: Public Survey Respondent Self-Identification by ZIP Code ZIP Code Area Count
39402 West Hattiesburg 64
39401 Hattiesburg 45
39429 Columbia 8
39465 Petal 7
39406 Hattiesburg: USM 5
39482 Sumrall 4
Total All 133
2045 Metropolitan Transportation Plan - Technical Report #5 Hattiesburg-Petal-Forrest-Lamar Metropolitan Planning Organization
10
Public and Stakeholder Involvement Phase 1
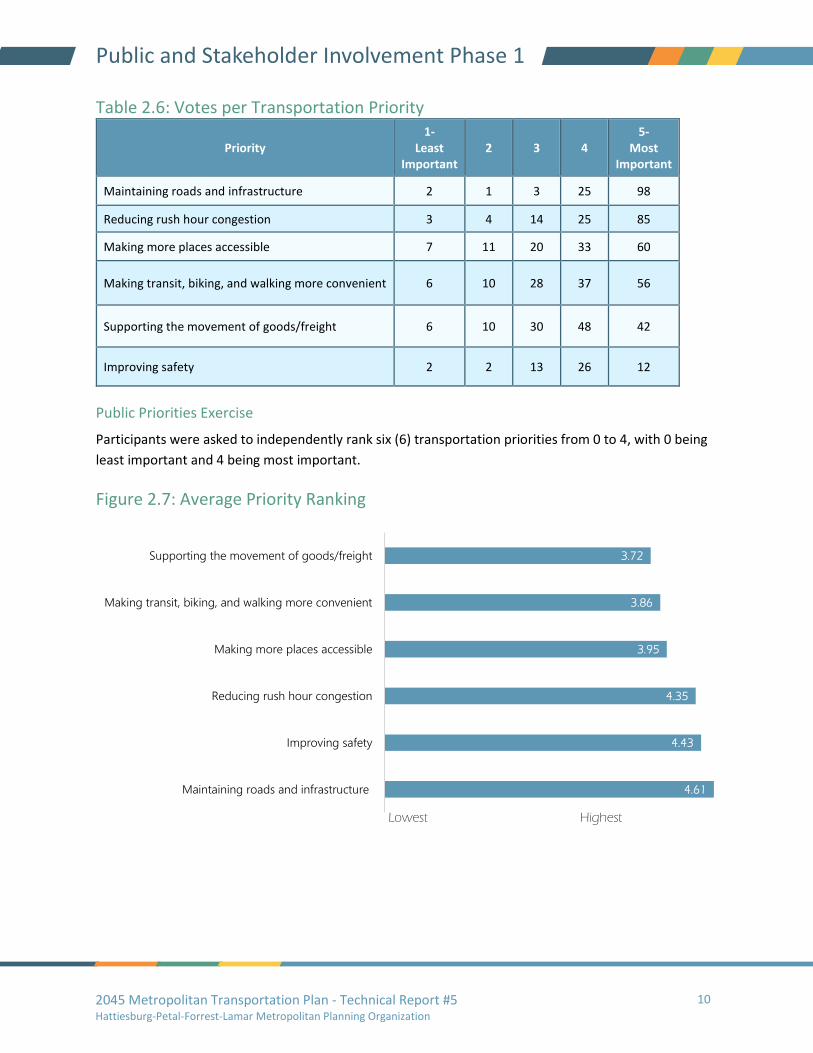
Table 2.6: Votes per Transportation Priority
Priority 1-
Least Important
2 3 4 5-
Most Important
Maintaining roads and infrastructure 2 1 3 25 98
Reducing rush hour congestion 3 4 14 25 85
Making more places accessible 7 11 20 33 60
Making transit, biking, and walking more convenient 6 10 28 37 56
Supporting the movement of goods/freight 6 10 30 48 42
Improving safety 2 2 13 26 12
Public Priorities Exercise
Participants were asked to independently rank six (6) transportation priorities from 0 to 4, with 0 being
least important and 4 being most important.
Figure 2.7: Average Priority Ranking
4.61
4.43
4.35
3.95
3.86
3.72
Maintaining roads and infrastructure
Improving safety
Reducing rush hour congestion
Making more places accessible
Making transit, biking, and walking more convenient
Supporting the movement of goods/freight
Lowest Highest
2045 Metropolitan Transportation Plan - Technical Report #5 Hattiesburg-Petal-Forrest-Lamar Metropolitan Planning Organization
11
Public and Stakeholder Involvement Phase 1
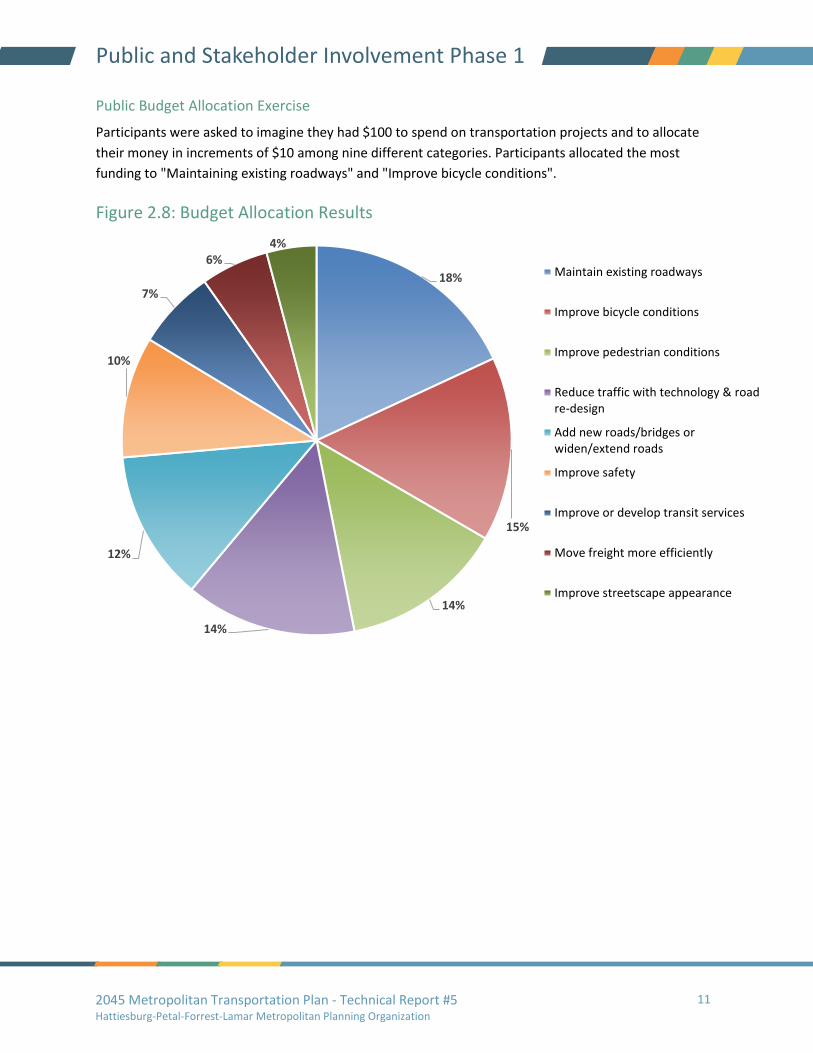
Public Budget Allocation Exercise
Participants were asked to imagine they had $100 to spend on transportation projects and to allocate
their money in increments of $10 among nine different categories. Participants allocated the most
funding to "Maintaining existing roadways" and "Improve bicycle conditions".
Figure 2.8: Budget Allocation Results
18%
15%
14%
14%
12%
10%
7%
6%4%
Maintain existing roadways
Improve bicycle conditions
Improve pedestrian conditions
Reduce traffic with technology & roadre-design
Add new roads/bridges orwiden/extend roads
Improve safety
Improve or develop transit services
Move freight more efficiently
Improve streetscape appearance
2045 Metropolitan Transportation Plan - Technical Report #5 Hattiesburg-Petal-Forrest-Lamar Metropolitan Planning Organization
12
Public and Stakeholder Involvement Phase 1
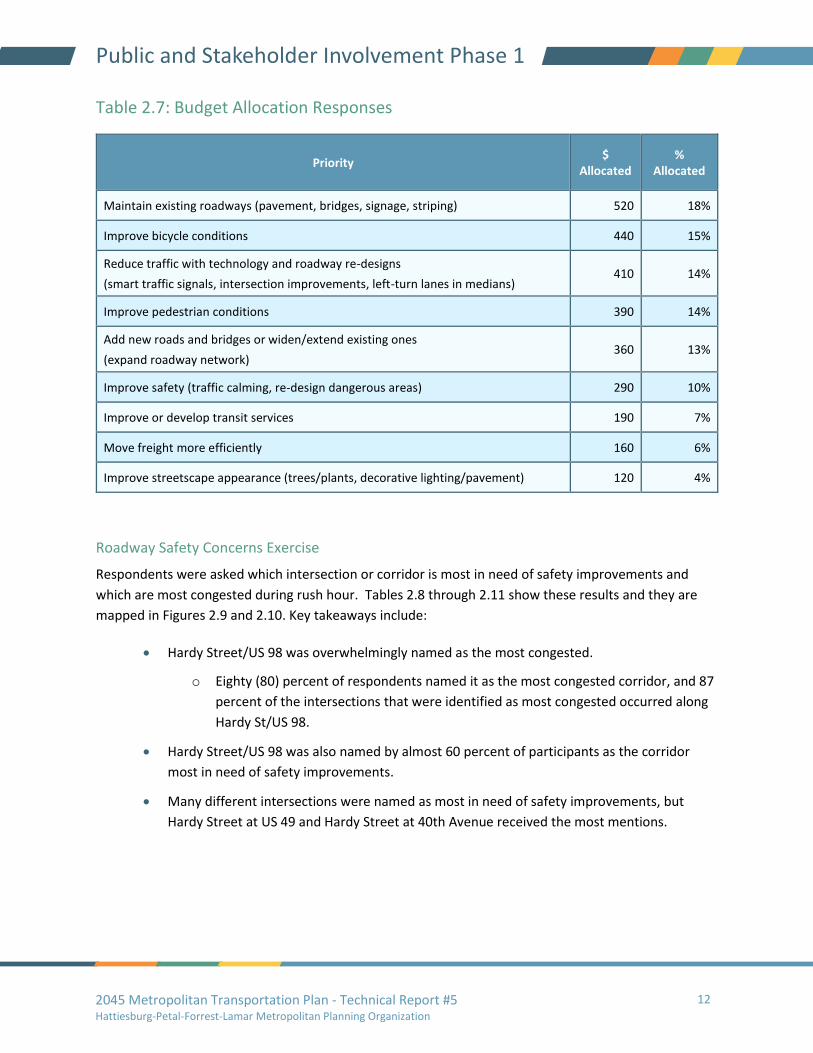
Table 2.7: Budget Allocation Responses
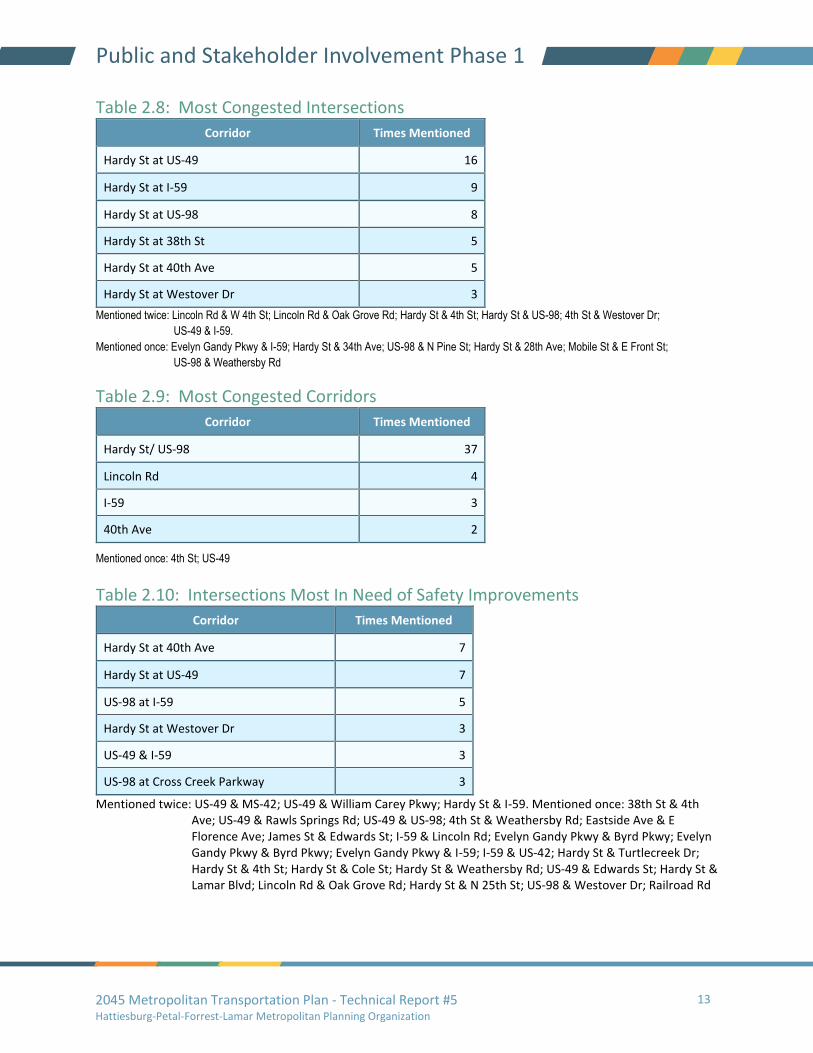
Roadway Safety Concerns Exercise
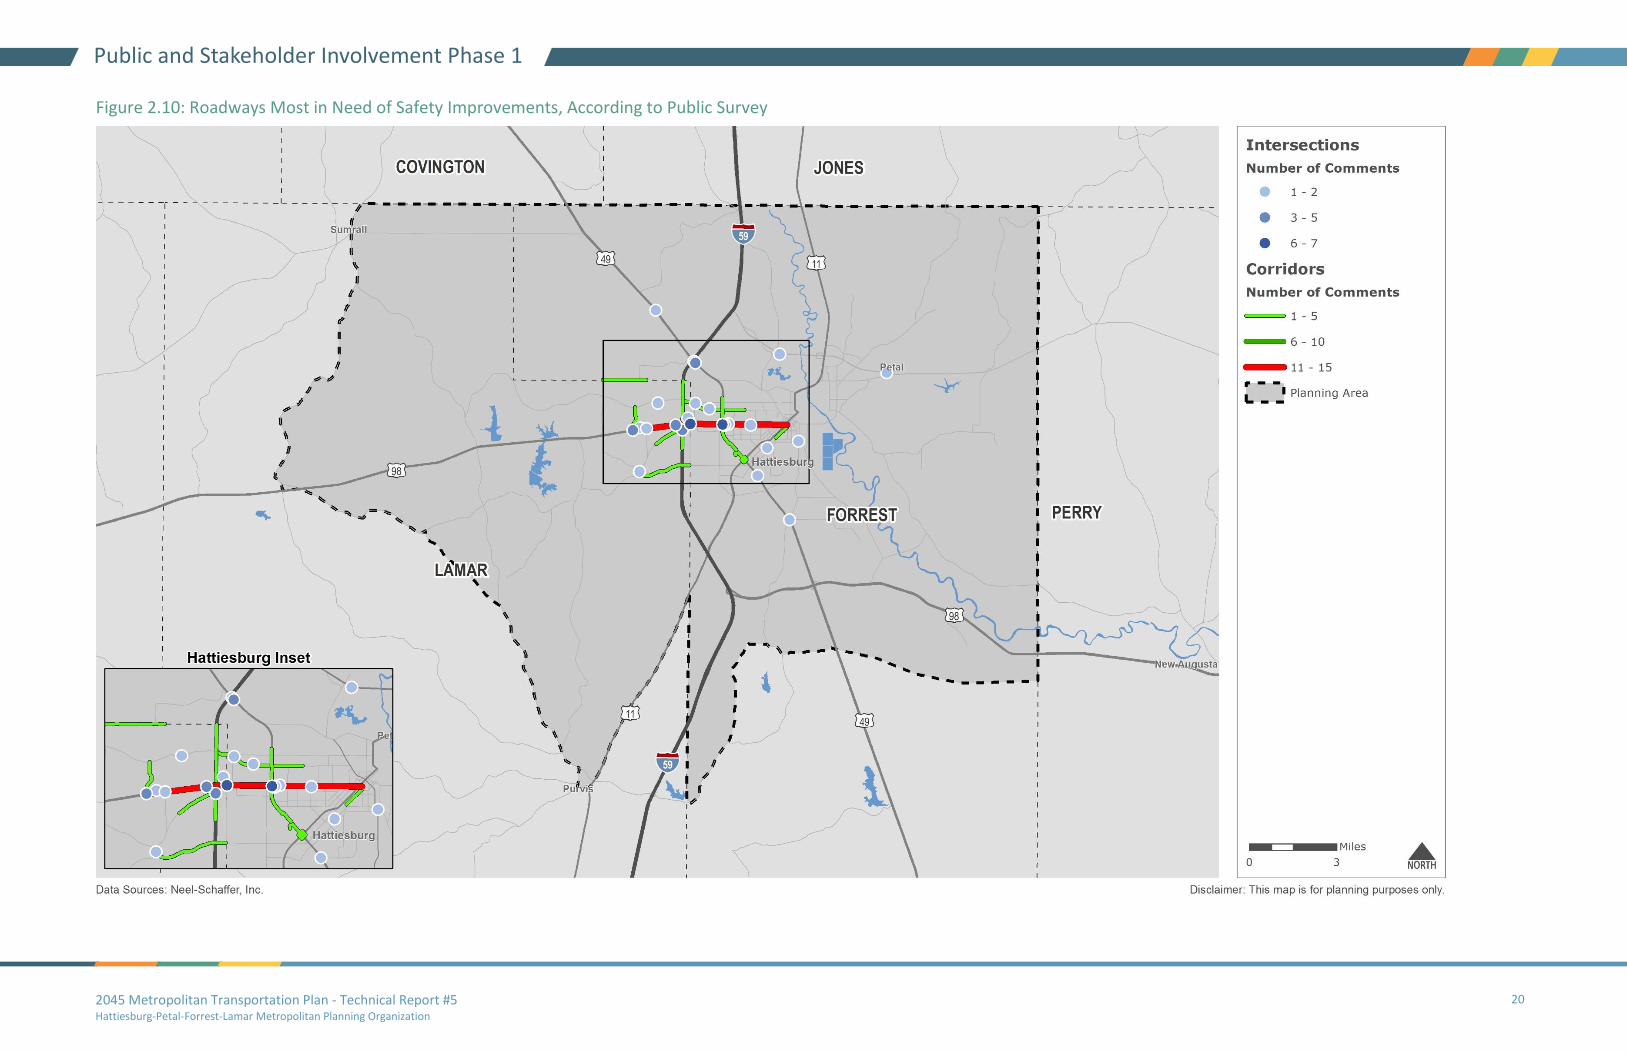
Respondents were asked which intersection or corridor is most in need of safety improvements and
which are most congested during rush hour. Tables 2.8 through 2.11 show these results and they are
mapped in Figures 2.9 and 2.10. Key takeaways include:
• Hardy Street/US 98 was overwhelmingly named as the most congested.
o Eighty (80) percent of respondents named it as the most congested corridor, and 87
percent of the intersections that were identified as most congested occurred along
Hardy St/US 98.
• Hardy Street/US 98 was also named by almost 60 percent of participants as the corridor
most in need of safety improvements.
• Many different intersections were named as most in need of safety improvements, but
Hardy Street at US 49 and Hardy Street at 40th Avenue received the most mentions.
Priority $
Allocated %
Allocated
Maintain existing roadways (pavement, bridges, signage, striping) 520 18%
Improve bicycle conditions 440 15%
Reduce traffic with technology and roadway re-designs
(smart traffic signals, intersection improvements, left-turn lanes in medians) 410 14%
Improve pedestrian conditions 390 14%
Add new roads and bridges or widen/extend existing ones
(expand roadway network) 360 13%
Improve safety (traffic calming, re-design dangerous areas) 290 10%
Improve or develop transit services 190 7%
Move freight more efficiently 160 6%
Improve streetscape appearance (trees/plants, decorative lighting/pavement) 120 4%
2045 Metropolitan Transportation Plan - Technical Report #5 Hattiesburg-Petal-Forrest-Lamar Metropolitan Planning Organization
13
Public and Stakeholder Involvement Phase 1
Table 2.8: Most Congested Intersections
Corridor Times Mentioned
Hardy St at US-49 16
Hardy St at I-59 9
Hardy St at US-98 8
Hardy St at 38th St 5
Hardy St at 40th Ave 5
Hardy St at Westover Dr 3
Mentioned twice: Lincoln Rd & W 4th St; Lincoln Rd & Oak Grove Rd; Hardy St & 4th St; Hardy St & US-98; 4th St & Westover Dr;
US-49 & I-59.
Mentioned once: Evelyn Gandy Pkwy & I-59; Hardy St & 34th Ave; US-98 & N Pine St; Hardy St & 28th Ave; Mobile St & E Front St;
US-98 & Weathersby Rd
Table 2.9: Most Congested Corridors
Corridor Times Mentioned
Hardy St/ US-98 37
Lincoln Rd 4
I-59 3
40th Ave 2
Mentioned once: 4th St; US-49
Table 2.10: Intersections Most In Need of Safety Improvements
Corridor Times Mentioned
Hardy St at 40th Ave 7
Hardy St at US-49 7
US-98 at I-59 5
Hardy St at Westover Dr 3
US-49 & I-59 3
US-98 at Cross Creek Parkway 3
Mentioned twice: US-49 & MS-42; US-49 & William Carey Pkwy; Hardy St & I-59. Mentioned once: 38th St & 4th Ave; US-49 & Rawls Springs Rd; US-49 & US-98; 4th St & Weathersby Rd; Eastside Ave & E Florence Ave; James St & Edwards St; I-59 & Lincoln Rd; Evelyn Gandy Pkwy & Byrd Pkwy; Evelyn Gandy Pkwy & Byrd Pkwy; Evelyn Gandy Pkwy & I-59; I-59 & US-42; Hardy St & Turtlecreek Dr; Hardy St & 4th St; Hardy St & Cole St; Hardy St & Weathersby Rd; US-49 & Edwards St; Hardy St & Lamar Blvd; Lincoln Rd & Oak Grove Rd; Hardy St & N 25th St; US-98 & Westover Dr; Railroad Rd
2045 Metropolitan Transportation Plan - Technical Report #5 Hattiesburg-Petal-Forrest-Lamar Metropolitan Planning Organization
14
Public and Stakeholder Involvement Phase 1
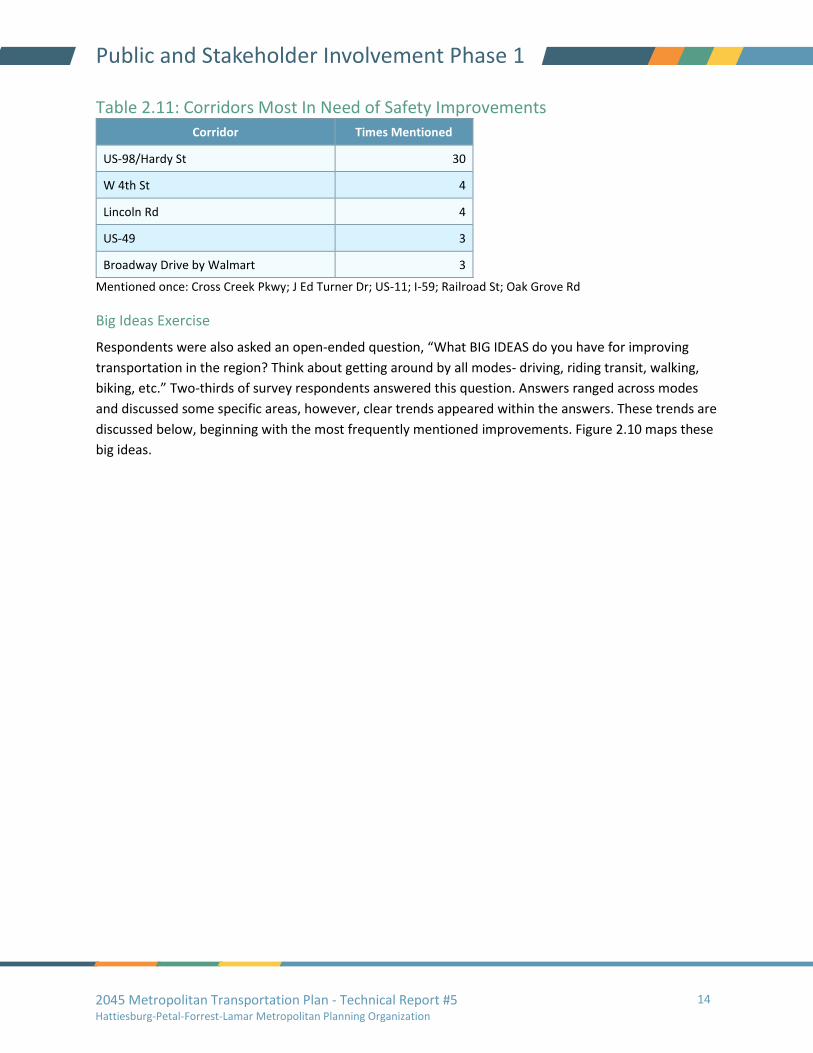
Table 2.11: Corridors Most In Need of Safety Improvements Corridor Times Mentioned
US-98/Hardy St 30
W 4th St 4
Lincoln Rd 4
US-49 3
Broadway Drive by Walmart 3
Mentioned once: Cross Creek Pkwy; J Ed Turner Dr; US-11; I-59; Railroad St; Oak Grove Rd
Big Ideas Exercise
Respondents were also asked an open-ended question, “What BIG IDEAS do you have for improving
transportation in the region? Think about getting around by all modes- driving, riding transit, walking,
biking, etc.” Two-thirds of survey respondents answered this question. Answers ranged across modes
and discussed some specific areas, however, clear trends appeared within the answers. These trends are
discussed below, beginning with the most frequently mentioned improvements. Figure 2.10 maps these
big ideas.
2045 Metropolitan Transportation Plan - Technical Report #5 Hattiesburg-Petal-Forrest-Lamar Metropolitan Planning Organization
15
Public and Stakeholder Involvement Phase 1
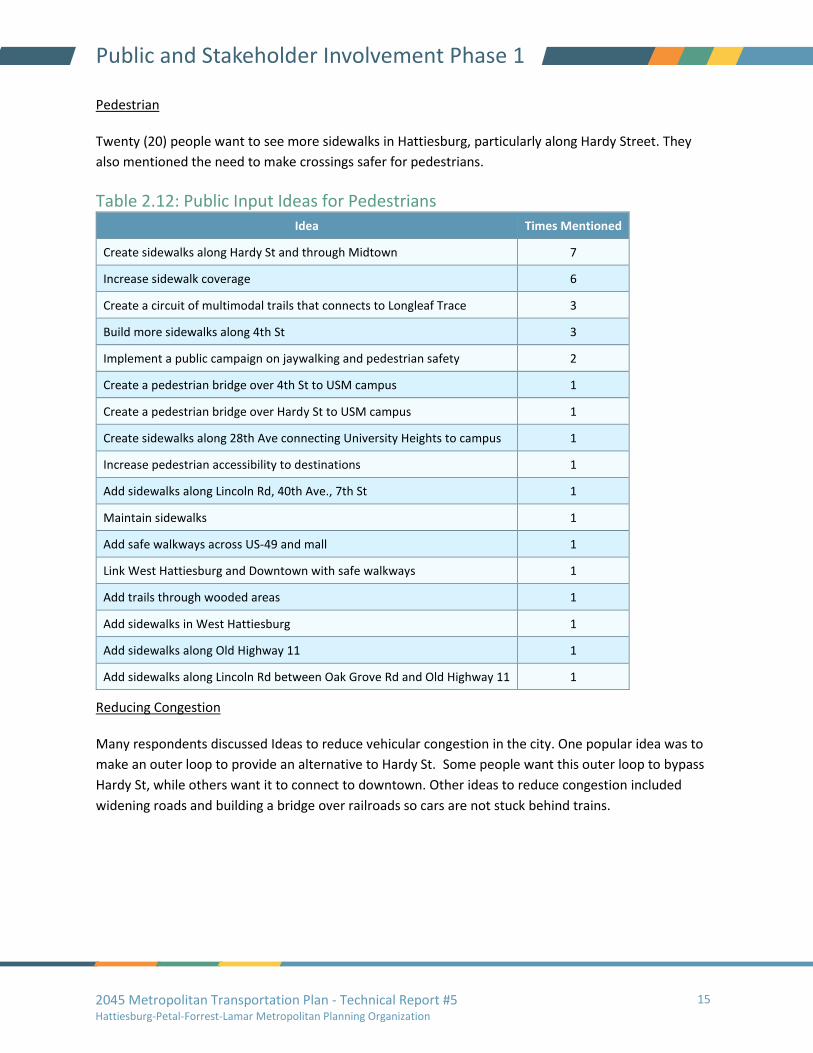
Pedestrian
Twenty (20) people want to see more sidewalks in Hattiesburg, particularly along Hardy Street. They
also mentioned the need to make crossings safer for pedestrians.
Table 2.12: Public Input Ideas for Pedestrians Idea Times Mentioned
Create sidewalks along Hardy St and through Midtown 7
Increase sidewalk coverage 6
Create a circuit of multimodal trails that connects to Longleaf Trace 3
Build more sidewalks along 4th St 3
Implement a public campaign on jaywalking and pedestrian safety 2
Create a pedestrian bridge over 4th St to USM campus 1
Create a pedestrian bridge over Hardy St to USM campus 1
Create sidewalks along 28th Ave connecting University Heights to campus 1
Increase pedestrian accessibility to destinations 1
Add sidewalks along Lincoln Rd, 40th Ave., 7th St 1
Maintain sidewalks 1
Add safe walkways across US-49 and mall 1
Link West Hattiesburg and Downtown with safe walkways 1
Add trails through wooded areas 1
Add sidewalks in West Hattiesburg 1
Add sidewalks along Old Highway 11 1
Add sidewalks along Lincoln Rd between Oak Grove Rd and Old Highway 11 1
Reducing Congestion
Many respondents discussed Ideas to reduce vehicular congestion in the city. One popular idea was to
make an outer loop to provide an alternative to Hardy St. Some people want this outer loop to bypass
Hardy St, while others want it to connect to downtown. Other ideas to reduce congestion included
widening roads and building a bridge over railroads so cars are not stuck behind trains.

2045 Metropolitan Transportation Plan - Technical Report #5 Hattiesburg-Petal-Forrest-Lamar Metropolitan Planning Organization
16
Public and Stakeholder Involvement Phase 1
Table 2.13: Public Input Ideas for Roadways Idea Times Mentioned
Create a "ring road" around downtown 10
Use smart signals along US-98 5
Create a ramp off I-59 and Lincoln Rd 4
Widen Lincoln Rd 4
Create a bypass in Bellevue connecting US-98 W and US-98 E 3
Increase police enforcement of running red lights 3
Widen US-49 3
Increase police enforcement of poor driving behavior 2
Expand 4th St 2
Add cross street over I-59 2
Widen I-59 2
Widen roads 2
Fix potholes 1
Widen Hwy-42 from US-49 to Epley Rd 1
Straighten/Widen Epley Rd 1
Widen Hwy-589 1
Create North-South route across Hattiesburg 1
Create carpool roads 1
Reroute 4th St to end east of USM campus 1
Reroute W 7th Ave to be an East-West corridor 1
Redesign Cross Creek Pkwy to reduce crashes 1
Create a roundabout at Weathersby Rd and Oak Grove Rd 1
Widen Old US-11 from US-98 to Richburg Rd 1
Widen Oak Grove Rd to three lanes from Westover Dr to Old Highway 11. 1
Add back entrance to Chick-Fil-A to reduce backlog along US-98 1
Improve road and intersection marking 1
Remove 3 lane roads 1
Add a roundabout at US-11 and Sullivan Kilrain Rd 1
Remove speed bumps 1
Extend Lincoln Rd 1
2045 Metropolitan Transportation Plan - Technical Report #5 Hattiesburg-Petal-Forrest-Lamar Metropolitan Planning Organization
17
Public and Stakeholder Involvement Phase 1
Idea Times Mentioned
Extend Hwy 42 to US-49 1
Improve safety at I-59 S Gandy exit 1
Connect I-59 to Oak Grove Rd 1
Extend Gandy Rd to US-49 and Rawls Spring 1
Add access to I-59 between Lincoln and Hardy Rd 1
Transit
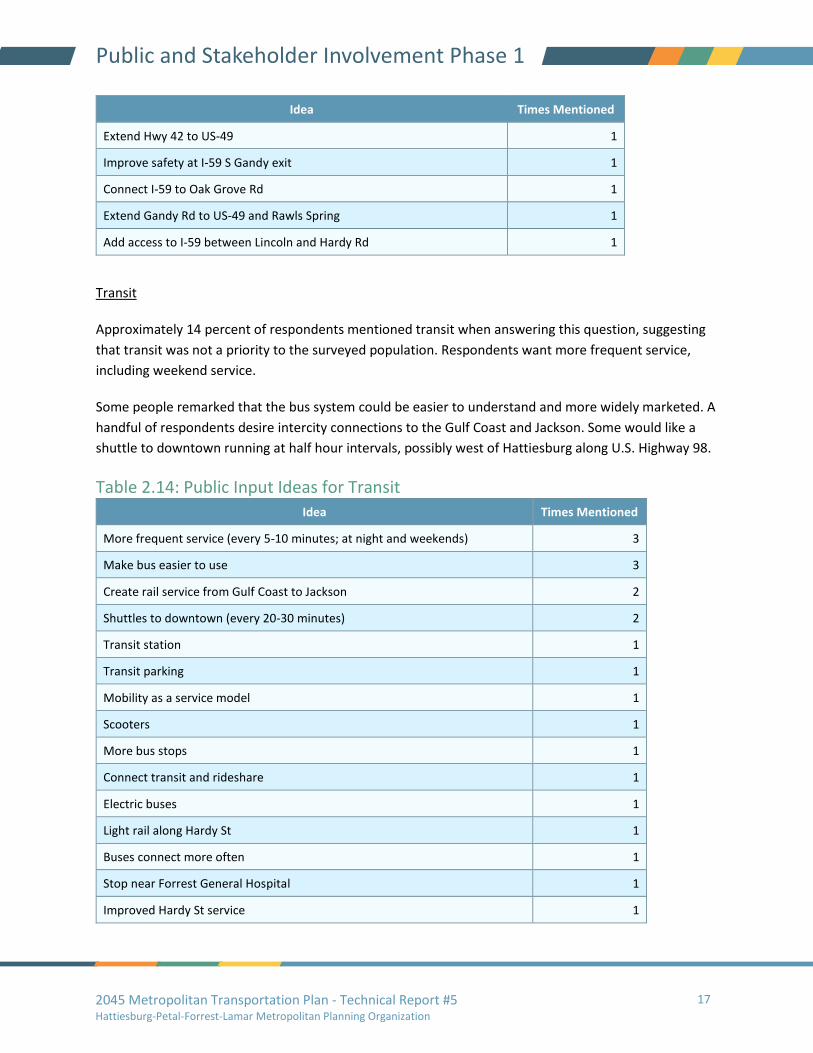
Approximately 14 percent of respondents mentioned transit when answering this question, suggesting
that transit was not a priority to the surveyed population. Respondents want more frequent service,
including weekend service.
Some people remarked that the bus system could be easier to understand and more widely marketed. A
handful of respondents desire intercity connections to the Gulf Coast and Jackson. Some would like a
shuttle to downtown running at half hour intervals, possibly west of Hattiesburg along U.S. Highway 98.
Table 2.14: Public Input Ideas for Transit Idea Times Mentioned
More frequent service (every 5-10 minutes; at night and weekends) 3
Make bus easier to use 3
Create rail service from Gulf Coast to Jackson 2
Shuttles to downtown (every 20-30 minutes) 2
Transit station 1
Transit parking 1
Mobility as a service model 1
Scooters 1
More bus stops 1
Connect transit and rideshare 1
Electric buses 1
Light rail along Hardy St 1
Buses connect more often 1
Stop near Forrest General Hospital 1
Improved Hardy St service 1
2045 Metropolitan Transportation Plan - Technical Report #5 Hattiesburg-Petal-Forrest-Lamar Metropolitan Planning Organization
18
Public and Stakeholder Involvement Phase 1
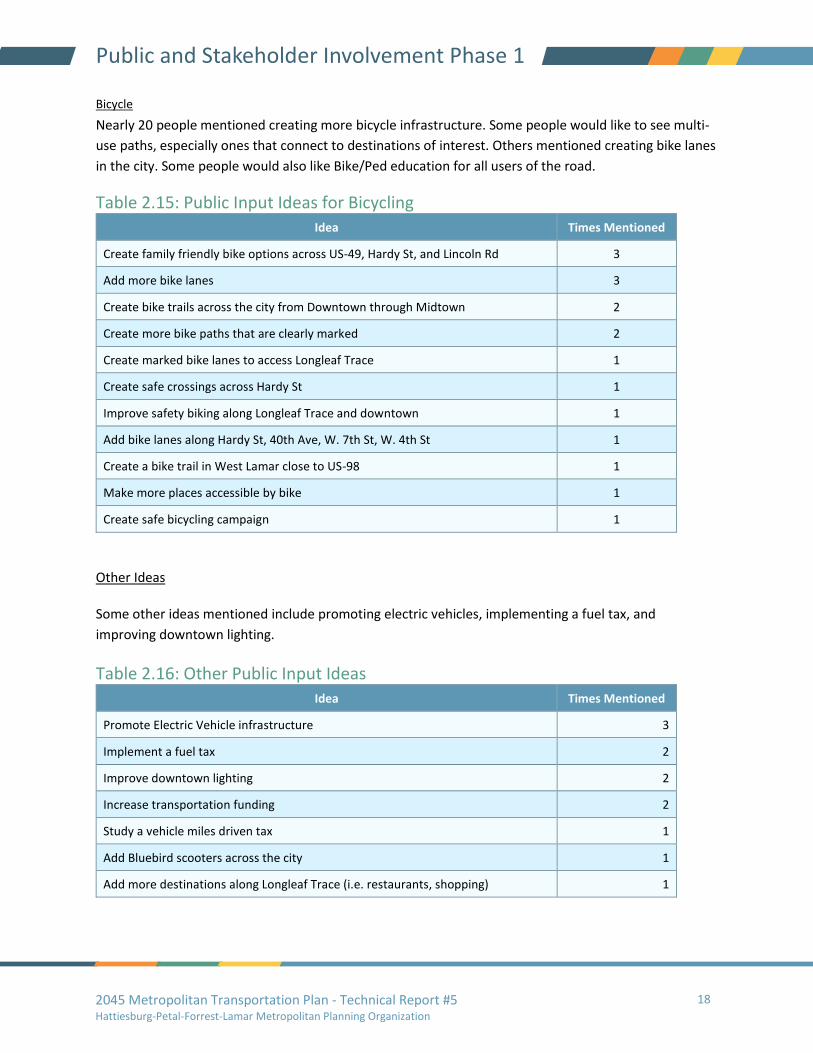
Bicycle
Nearly 20 people mentioned creating more bicycle infrastructure. Some people would like to see multi-
use paths, especially ones that connect to destinations of interest. Others mentioned creating bike lanes
in the city. Some people would also like Bike/Ped education for all users of the road.
Table 2.15: Public Input Ideas for Bicycling Idea Times Mentioned
Create family friendly bike options across US-49, Hardy St, and Lincoln Rd 3
Add more bike lanes 3
Create bike trails across the city from Downtown through Midtown 2
Create more bike paths that are clearly marked 2
Create marked bike lanes to access Longleaf Trace 1
Create safe crossings across Hardy St 1
Improve safety biking along Longleaf Trace and downtown 1
Add bike lanes along Hardy St, 40th Ave, W. 7th St, W. 4th St 1
Create a bike trail in West Lamar close to US-98 1
Make more places accessible by bike 1
Create safe bicycling campaign 1
Other Ideas
Some other ideas mentioned include promoting electric vehicles, implementing a fuel tax, and
improving downtown lighting.
Table 2.16: Other Public Input Ideas Idea Times Mentioned
Promote Electric Vehicle infrastructure 3
Implement a fuel tax 2
Improve downtown lighting 2
Increase transportation funding 2
Study a vehicle miles driven tax 1
Add Bluebird scooters across the city 1
Add more destinations along Longleaf Trace (i.e. restaurants, shopping) 1

2045 Metropolitan Transportation Plan - Technical Report #5 Hattiesburg-Petal-Forrest-Lamar Metropolitan Planning Organization
19
Public and Stakeholder Involvement Phase 1
Figure 2.9: Most Congested Roadways During Rush Hour, According to Public Survey
2045 Metropolitan Transportation Plan - Technical Report #5 Hattiesburg-Petal-Forrest-Lamar Metropolitan Planning Organization
20
Public and Stakeholder Involvement Phase 1
Figure 2.10: Roadways Most in Need of Safety Improvements, According to Public Survey

2045 Metropolitan Transportation Plan - Technical Report #5 Hattiesburg-Petal-Forrest-Lamar Metropolitan Planning Organization
21
Public and Stakeholder Involvement Phase 1
Figure 2.11: Big Ideas from Public Meeting Map
2045 Metropolitan Transportation Plan - Technical Report #5 Hattiesburg-Petal-Forrest-Lamar Metropolitan Planning Organization
22
Public and Stakeholder Involvement Phase 2
3.0 Public and Stakeholder Involvement Phase 2 During this phase, the public and stakeholders reviewed the draft plan and provided input to refine and
finalize the plan.
3.1 How We Engaged
Public Meeting
Virtual Public Meeting is scheduled for October 27 at 6 P.M. Additional information will be added once
Phase 2 is completed.
3.2 Stakeholder Input
[WILL BE ADDED ONCE PHASE 2 IS COMPLETE]
3.3 Public Input
[WILL BE ADDED ONCE PHASE 2 IS COMPLETE]
2045 Metropolitan Transportation Plan - Technical Report #5 Hattiesburg-Petal-Forrest-Lamar Metropolitan Planning Organization
23
Visioning and Strategies
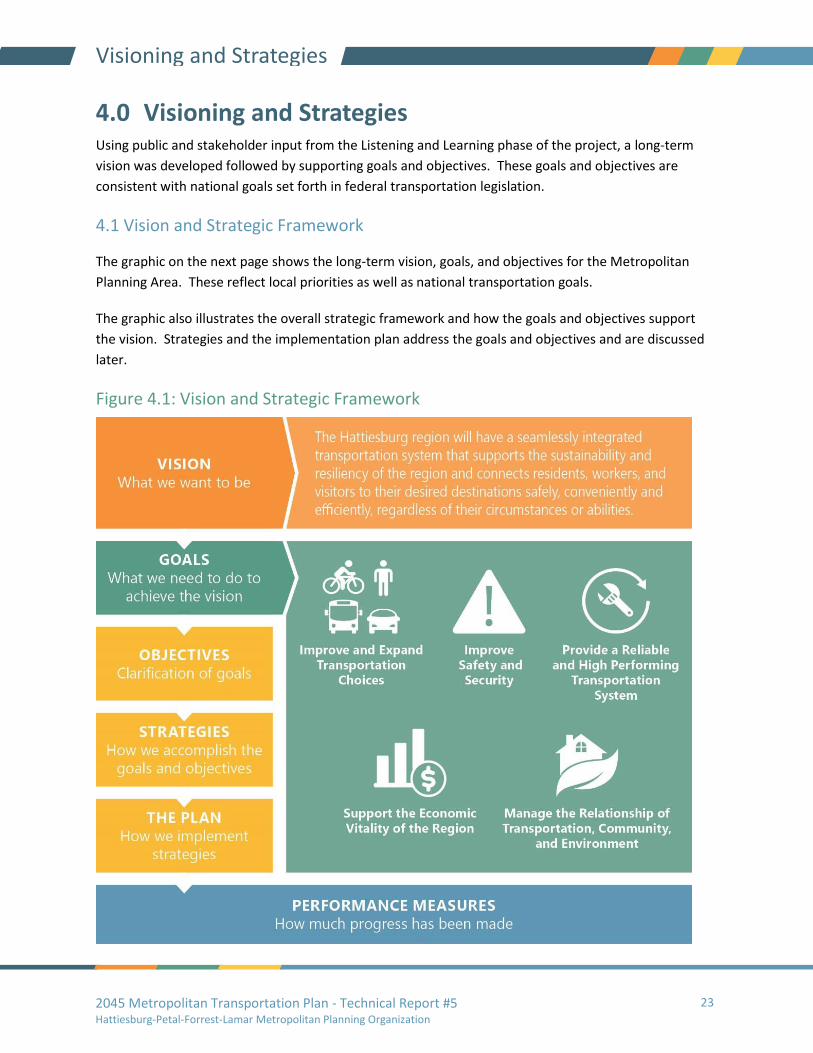
4.0 Visioning and Strategies Using public and stakeholder input from the Listening and Learning phase of the project, a long-term
vision was developed followed by supporting goals and objectives. These goals and objectives are
consistent with national goals set forth in federal transportation legislation.
4.1 Vision and Strategic Framework
The graphic on the next page shows the long-term vision, goals, and objectives for the Metropolitan
Planning Area. These reflect local priorities as well as national transportation goals.
The graphic also illustrates the overall strategic framework and how the goals and objectives support
the vision. Strategies and the implementation plan address the goals and objectives and are discussed
later.
Figure 4.1: Vision and Strategic Framework
2045 Metropolitan Transportation Plan - Technical Report #5 Hattiesburg-Petal-Forrest-Lamar Metropolitan Planning Organization
24
Visioning and Strategies
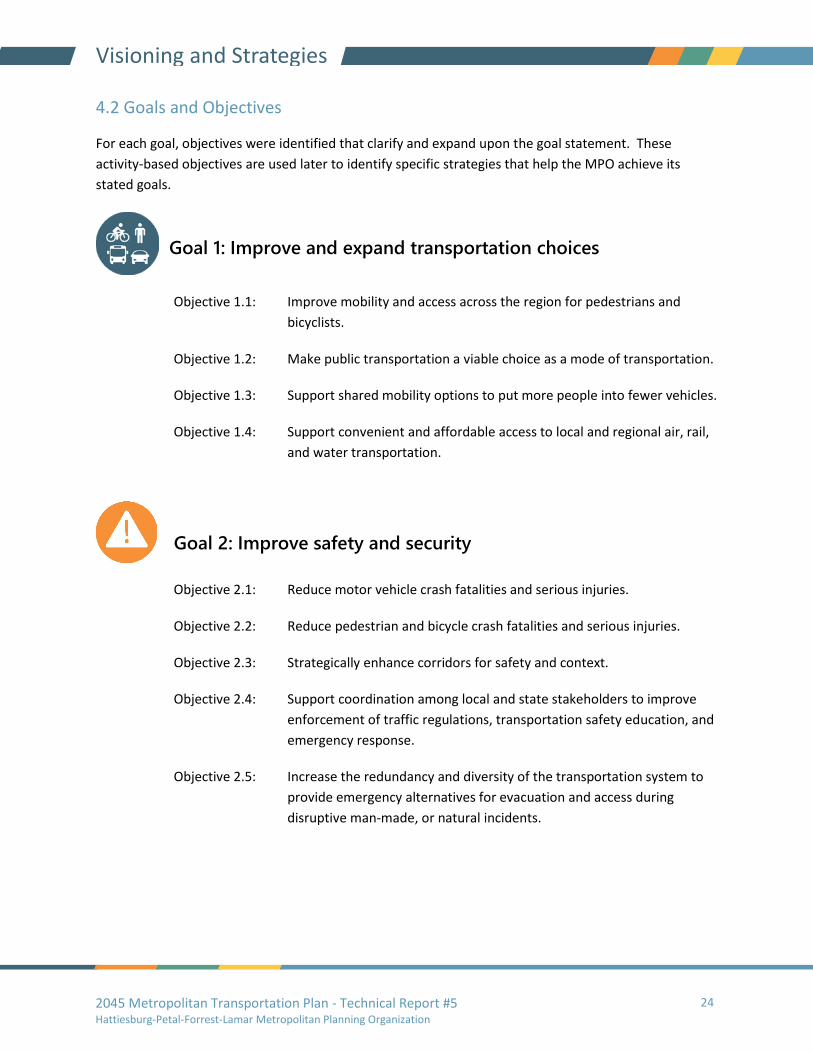
4.2 Goals and Objectives
For each goal, objectives were identified that clarify and expand upon the goal statement. These
activity-based objectives are used later to identify specific strategies that help the MPO achieve its
stated goals.
Objective 1.1: Improve mobility and access across the region for pedestrians and
bicyclists.
Objective 1.2: Make public transportation a viable choice as a mode of transportation.
Objective 1.3: Support shared mobility options to put more people into fewer vehicles.
Objective 1.4: Support convenient and affordable access to local and regional air, rail,
and water transportation.
Objective 2.1: Reduce motor vehicle crash fatalities and serious injuries.
Objective 2.2: Reduce pedestrian and bicycle crash fatalities and serious injuries.
Objective 2.3: Strategically enhance corridors for safety and context.
Objective 2.4: Support coordination among local and state stakeholders to improve
enforcement of traffic regulations, transportation safety education, and
emergency response.
Objective 2.5: Increase the redundancy and diversity of the transportation system to
provide emergency alternatives for evacuation and access during
disruptive man-made, or natural incidents.
Goal 1: Improve and expand transportation choices
Goal 2: Improve safety and security

2045 Metropolitan Transportation Plan - Technical Report #5 Hattiesburg-Petal-Forrest-Lamar Metropolitan Planning Organization
25
Visioning and Strategies
Objective 3.1: Enhance regional connectivity.
Objective 3.2: Maintain the transportation infrastructure and assets in a good state of
repair.
Objective 3.3: Improve mobility by reducing traffic congestion and delay.
Objective 3.4: Prepare for technological advances that will efficiently and dynamically
manage roadway demand, capacity, and overall systems operations.
Objective 4.1: Improve the transportation system to enhance economic
competitiveness and provide access to national and global markets.
Objective 4.2: Use transportation improvements to provide equitable benefits across
the region.
Objective 4.3: Use transportation improvements to support vibrant activity centers
that are consistent with local plans for growth and economic
development.
Objective 4.4: Improve the mobility of freight by truck, rail, and other modes.
Objective 4.5: Support a fiscally constrained 25-year Metropolitan Transportation Plan
that addresses existing and future needs while maximizing projected
revenues.
Goal 3: Provide a reliable and high performing transportation
system
Goal 4: Support the economic vitality of the region

2045 Metropolitan Transportation Plan - Technical Report #5 Hattiesburg-Petal-Forrest-Lamar Metropolitan Planning Organization
26
Visioning and Strategies
Objective 5.1: Make the transportation system resilient, especially to effectively
manage and mitigate stormwater runoff.
Objective 5.2: Minimize or avoid adverse impacts from transportation improvements
to the natural environment and the human environment (historic sites,
recreational areas, environmental justice populations).
Objective 5.3: Improve mobility for underserved communities.
Objective 5.4: Provide an inclusive setting for regional transportation decision-making.
Objective 5.5: Support the reduction of transportation-related greenhouse gas
emissions and the improvement of air quality through fleet fuel
management and the reduction of congestion.
Objective 5.6 Provide access to active transportation options, healthcare facilities,
and healthy foods.
Goal 5: Manage the relationship of transportation,
community, and environment

2045 Metropolitan Transportation Plan - Technical Report #5 Hattiesburg-Petal-Forrest-Lamar Metropolitan Planning Organization
27
Visioning and Strategies
4.3 Relationship with Planning Factors
Federal legislation requires the Metropolitan Transportation Plan to consider the following ten planning
factors:
1) Support the economic vitality of the metropolitan area, especially by enabling global
competitiveness, productivity, and efficiency;
2) Increase the safety of the transportation system for motorized and non-motorized users
3) Increase the security of the transportation system for motorized and non-motorized users;
4) Increase accessibility and mobility of people and freight;
5) Protect and enhance the environment, promote energy conservation, improve the quality of
life, and promote consistency between transportation improvements and State and local
planned growth and economic development patterns;
6) Enhance the integration and connectivity of the transportation system, across and between
modes, for people and freight;
7) Promote efficient system management and operation;
8) Emphasize the preservation of the existing transportation system;
9) Improve the resiliency and reliability of the transportation system and reduce or mitigate
stormwater impacts of surface transportation; and
10) Enhance travel and tourism.
Table 4.1 shows how these planning factors are addressed by each goal area.
2045 Metropolitan Transportation Plan - Technical Report #5 Hattiesburg-Petal-Forrest-Lamar Metropolitan Planning Organization
28
Visioning and Strategies
4.4 National Goals and Performance Measures
Following federal legislation and rulemaking, the Federal Highway Administration and Federal Transit
Administration have moved to performance-based planning and have established national goals and
performance measures. These national goals and performance measures are summarized below.
The MTP goals and objectives are consistent with these national goals and federal performance
measures, as indicated in Table 4.1.
• Safety - To achieve a significant reduction in traffic fatalities and serious injuries on all public
roads.
o Number of fatalities
o Rate of fatalities per 100 million VMT
o Number of serious injuries
o Rate of serious injuries per 100 million VMT
o Number of non-motorized fatalities and serious injuries
• Infrastructure Condition - To maintain the highway infrastructure asset system in a state of
good repair
o Percentage of Interstate pavements in Good condition
o Percentage of Interstate pavements in Poor condition
o Percentage of non-Interstate NHS pavements in Good condition
o Percentage of non-Interstate NHS pavements in Poor condition
o Percentage of NHS bridges by deck area in Good condition
o Percentage of NHS bridges by deck area in Poor condition
• Congestion Reduction - To achieve a significant reduction in congestion on the National
Highway System
o Annual hours of peak-hour excessive delay per capita*
o Percent of non-single-occupant vehicle travel
• System Reliability - To improve the efficiency of the surface transportation system
o Percent of the person-miles traveled on the Interstate that are reliable
o Percent of the person-miles traveled on the non-Interstate NHS that are reliable
2045 Metropolitan Transportation Plan - Technical Report #5 Hattiesburg-Petal-Forrest-Lamar Metropolitan Planning Organization
29
Visioning and Strategies
• Freight Movement and Economic Vitality - To improve the national freight network,
strengthen the ability of rural communities to access national and international trade
markets, and support regional economic development.
o Truck Travel Time Reliability (TTTR) Index
• Environmental Sustainability - To enhance the performance of the transportation system
while protecting and enhancing the natural environment.
o Total emissions reduction*
• Transit Asset Management - To maintain transit assets in a state of good repair.
o Percentage of track segments that have performance restrictions
o Percentage of revenue vehicles that exceed useful life benchmark
o Percentage of non-revenue vehicles that exceed useful life benchmark
o Percentage of facilities rated less than 3.0 on TERM Scale
*only required for areas designated as nonattainment or maintenance for certain pollutants
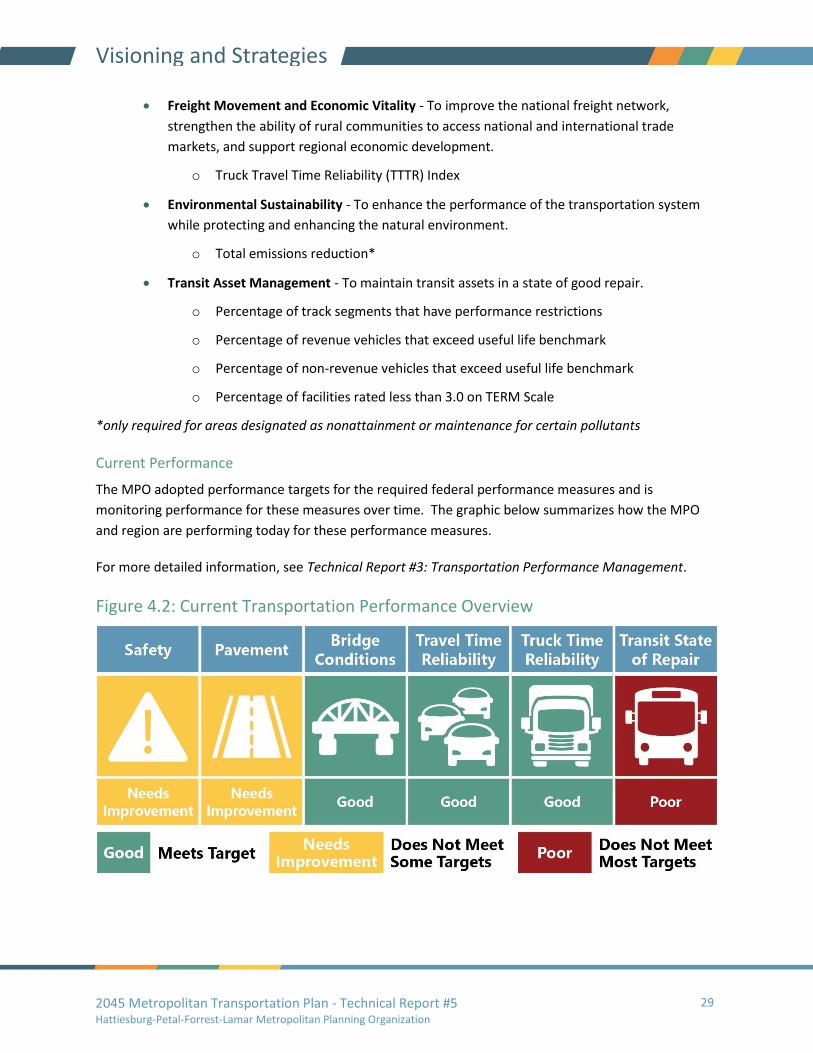
Current Performance
The MPO adopted performance targets for the required federal performance measures and is
monitoring performance for these measures over time. The graphic below summarizes how the MPO
and region are performing today for these performance measures.
For more detailed information, see Technical Report #3: Transportation Performance Management.
Figure 4.2: Current Transportation Performance Overview

2045 Metropolitan Transportation Plan - Technical Report #5 Hattiesburg-Petal-Forrest-Lamar Metropolitan Planning Organization
30
Visioning and Strategies
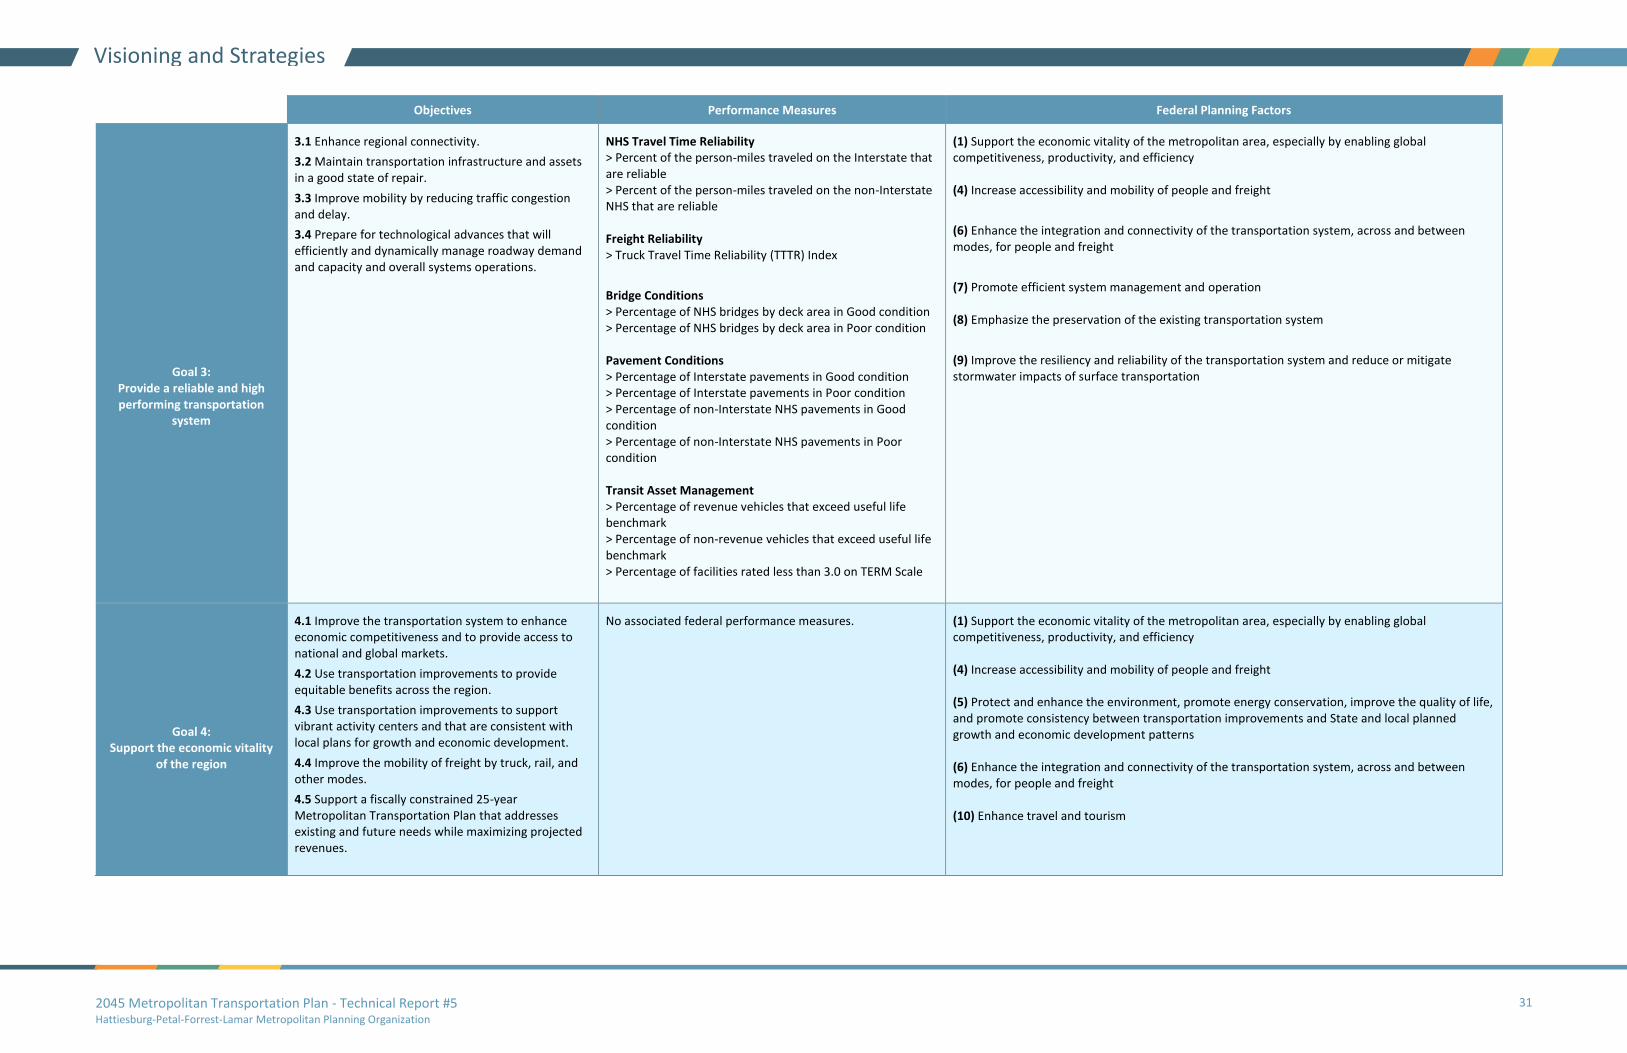
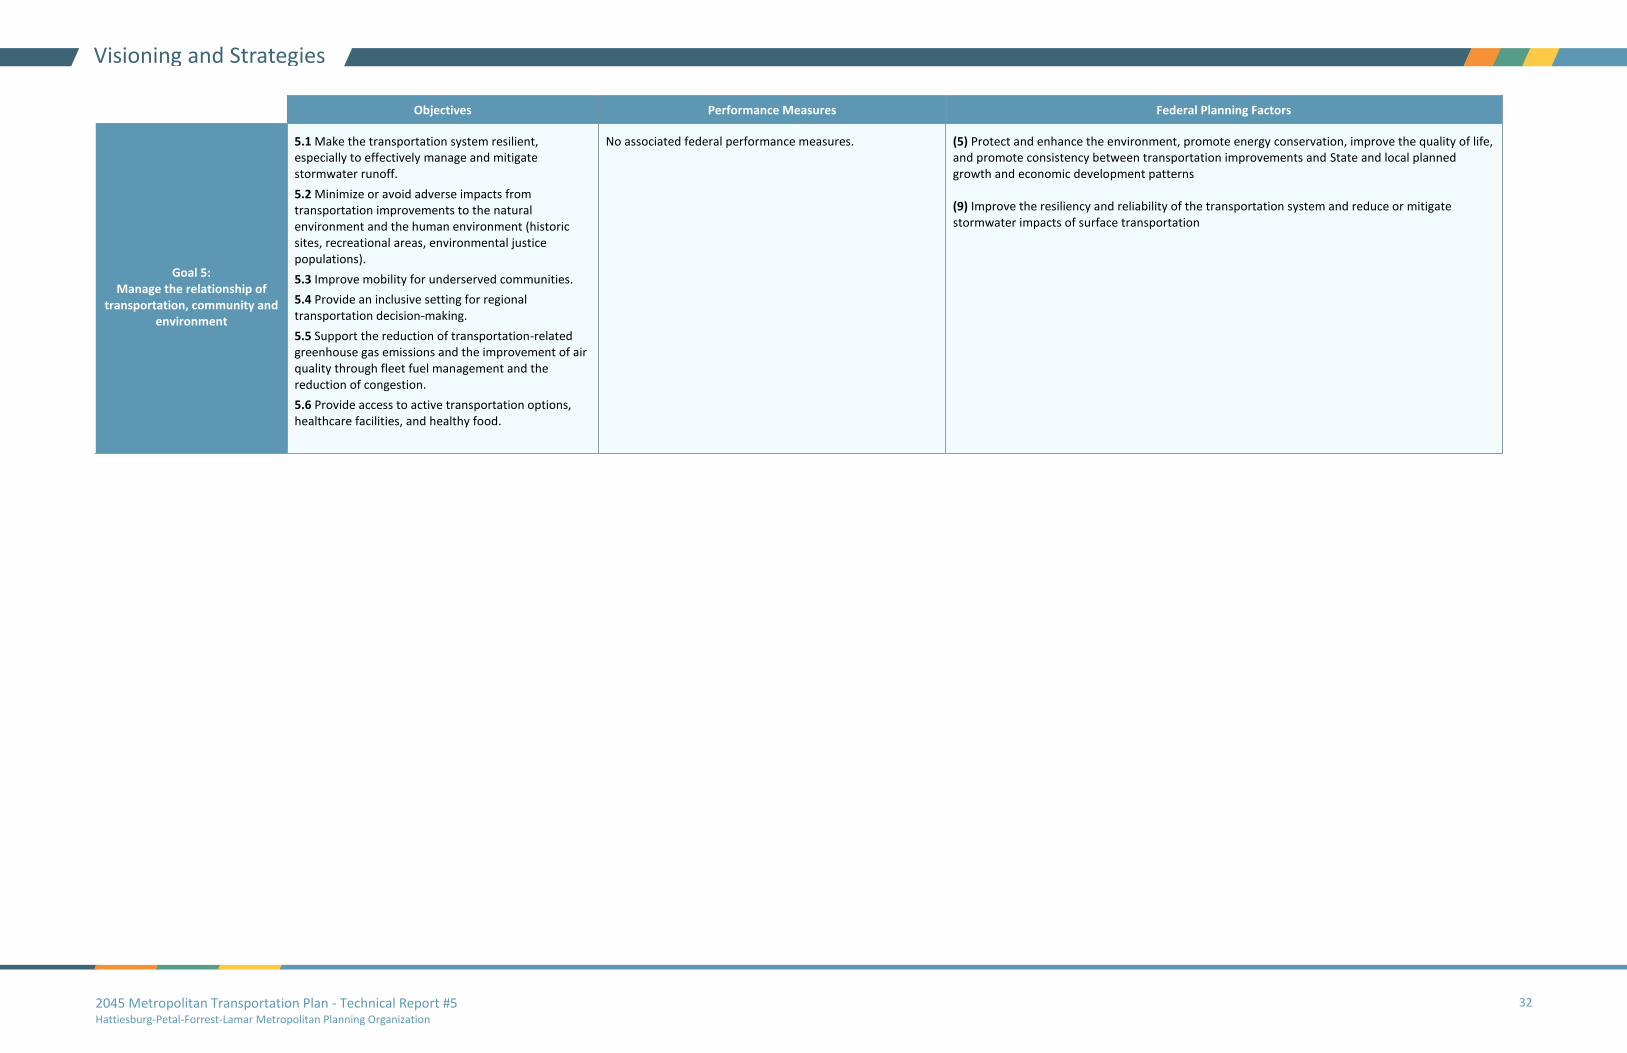
Table 4.1: Relationship between Goals, Objectives, Performance Measures, and Federal Planning Factors
Objectives Performance Measures Federal Planning Factors
Goal 1:
Improve and expand transportation choices
1.1 Improve mobility and access across the region for pedestrians and bicyclists.
1.2 Make public transportation a viable choice mode of transportation.
1.3 Support shared mobility options to put more people into fewer vehicles.
1.4 Support convenient and affordable access to local and regional air, rail, and water transportation.
No associated federal performance measures.
(4) Increase accessibility and mobility of people and freight (6) Enhance the integration and connectivity of the transportation system, across and between modes, for people and freight
Goal 2:
Improve Safety and Security
2.1 Reduce motor vehicle crash fatalities and serious injuries.
2.2 Reduce pedestrian and bicycle crash fatalities and serious injuries.
2.3 Strategically enhance corridors for safety and context.
2.4 Support coordination among local and state stakeholders to improve enforcement of traffic regulations, transportation safety education, and emergency response.
2.5 Increase the redundancy and diversity of the transportation system to provide emergency alternatives for evacuation and access during disruptive man-made or natural incidents.
Safety > Number of fatalities > Rate of fatalities per 100 million VMT > Number of serious injuries > Rate of serious injuries per 100 million VMT > Number of non-motorized fatalities and serious injuries
Transit Safety
> Transit-related fatalities, injuries, and safety events by mode
> Rate of transit-related fatalities, injuries, and safety events by mode
> Mean distance between major mechanical failures by mode
(2) Increase the safety of the transportation system for motorized and non-motorized users (3) Increase the security of the transportation system for motorized and non-motorized users
2045 Metropolitan Transportation Plan - Technical Report #5 Hattiesburg-Petal-Forrest-Lamar Metropolitan Planning Organization
31
Visioning and Strategies
Objectives Performance Measures Federal Planning Factors
Goal 3: Provide a reliable and high performing transportation
system
3.1 Enhance regional connectivity.
3.2 Maintain transportation infrastructure and assets in a good state of repair.
3.3 Improve mobility by reducing traffic congestion and delay.
3.4 Prepare for technological advances that will efficiently and dynamically manage roadway demand and capacity and overall systems operations.
NHS Travel Time Reliability > Percent of the person-miles traveled on the Interstate that are reliable > Percent of the person-miles traveled on the non-Interstate NHS that are reliable Freight Reliability > Truck Travel Time Reliability (TTTR) Index
Bridge Conditions > Percentage of NHS bridges by deck area in Good condition > Percentage of NHS bridges by deck area in Poor condition Pavement Conditions > Percentage of Interstate pavements in Good condition > Percentage of Interstate pavements in Poor condition > Percentage of non-Interstate NHS pavements in Good condition > Percentage of non-Interstate NHS pavements in Poor condition Transit Asset Management > Percentage of revenue vehicles that exceed useful life benchmark > Percentage of non-revenue vehicles that exceed useful life benchmark > Percentage of facilities rated less than 3.0 on TERM Scale
(1) Support the economic vitality of the metropolitan area, especially by enabling global competitiveness, productivity, and efficiency (4) Increase accessibility and mobility of people and freight
(6) Enhance the integration and connectivity of the transportation system, across and between modes, for people and freight
(7) Promote efficient system management and operation (8) Emphasize the preservation of the existing transportation system
(9) Improve the resiliency and reliability of the transportation system and reduce or mitigate stormwater impacts of surface transportation
Goal 4:
Support the economic vitality of the region
4.1 Improve the transportation system to enhance economic competitiveness and to provide access to national and global markets.
4.2 Use transportation improvements to provide equitable benefits across the region.
4.3 Use transportation improvements to support vibrant activity centers and that are consistent with local plans for growth and economic development.
4.4 Improve the mobility of freight by truck, rail, and other modes.
4.5 Support a fiscally constrained 25-year Metropolitan Transportation Plan that addresses existing and future needs while maximizing projected revenues.
No associated federal performance measures.
(1) Support the economic vitality of the metropolitan area, especially by enabling global competitiveness, productivity, and efficiency (4) Increase accessibility and mobility of people and freight (5) Protect and enhance the environment, promote energy conservation, improve the quality of life, and promote consistency between transportation improvements and State and local planned growth and economic development patterns (6) Enhance the integration and connectivity of the transportation system, across and between modes, for people and freight (10) Enhance travel and tourism
2045 Metropolitan Transportation Plan - Technical Report #5 Hattiesburg-Petal-Forrest-Lamar Metropolitan Planning Organization
32
Visioning and Strategies
Objectives Performance Measures Federal Planning Factors
Goal 5:
Manage the relationship of transportation, community and
environment
5.1 Make the transportation system resilient, especially to effectively manage and mitigate stormwater runoff.
5.2 Minimize or avoid adverse impacts from transportation improvements to the natural environment and the human environment (historic sites, recreational areas, environmental justice populations).
5.3 Improve mobility for underserved communities.
5.4 Provide an inclusive setting for regional transportation decision-making.
5.5 Support the reduction of transportation-related greenhouse gas emissions and the improvement of air quality through fleet fuel management and the reduction of congestion.
5.6 Provide access to active transportation options, healthcare facilities, and healthy food.
No associated federal performance measures.
(5) Protect and enhance the environment, promote energy conservation, improve the quality of life, and promote consistency between transportation improvements and State and local planned growth and economic development patterns (9) Improve the resiliency and reliability of the transportation system and reduce or mitigate stormwater impacts of surface transportation
2045 Metropolitan Transportation Plan - Technical Report #5 Hattiesburg-Petal-Forrest-Lamar Metropolitan Planning Organization
33
Visioning and Strategies
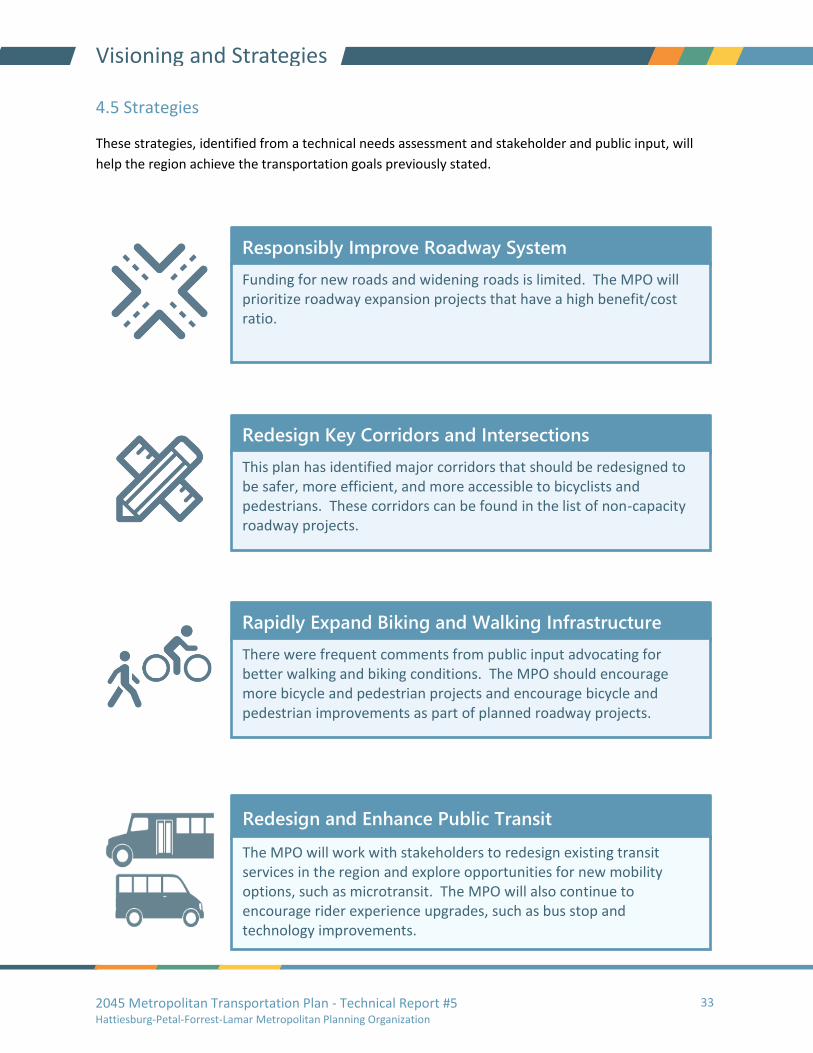
4.5 Strategies
These strategies, identified from a technical needs assessment and stakeholder and public input, will
help the region achieve the transportation goals previously stated.
Responsibly Improve Roadway System
Funding for new roads and widening roads is limited. The MPO will prioritize roadway expansion projects that have a high benefit/cost ratio.
Redesign Key Corridors and Intersections
This plan has identified major corridors that should be redesigned to be safer, more efficient, and more accessible to bicyclists and pedestrians. These corridors can be found in the list of non-capacity roadway projects.
Rapidly Expand Biking and Walking Infrastructure
There were frequent comments from public input advocating for better walking and biking conditions. The MPO should encourage more bicycle and pedestrian projects and encourage bicycle and pedestrian improvements as part of planned roadway projects.
Redesign and Enhance Public Transit
The MPO will work with stakeholders to redesign existing transit services in the region and explore opportunities for new mobility options, such as microtransit. The MPO will also continue to encourage rider experience upgrades, such as bus stop and technology improvements.
2045 Metropolitan Transportation Plan - Technical Report #5 Hattiesburg-Petal-Forrest-Lamar Metropolitan Planning Organization
34
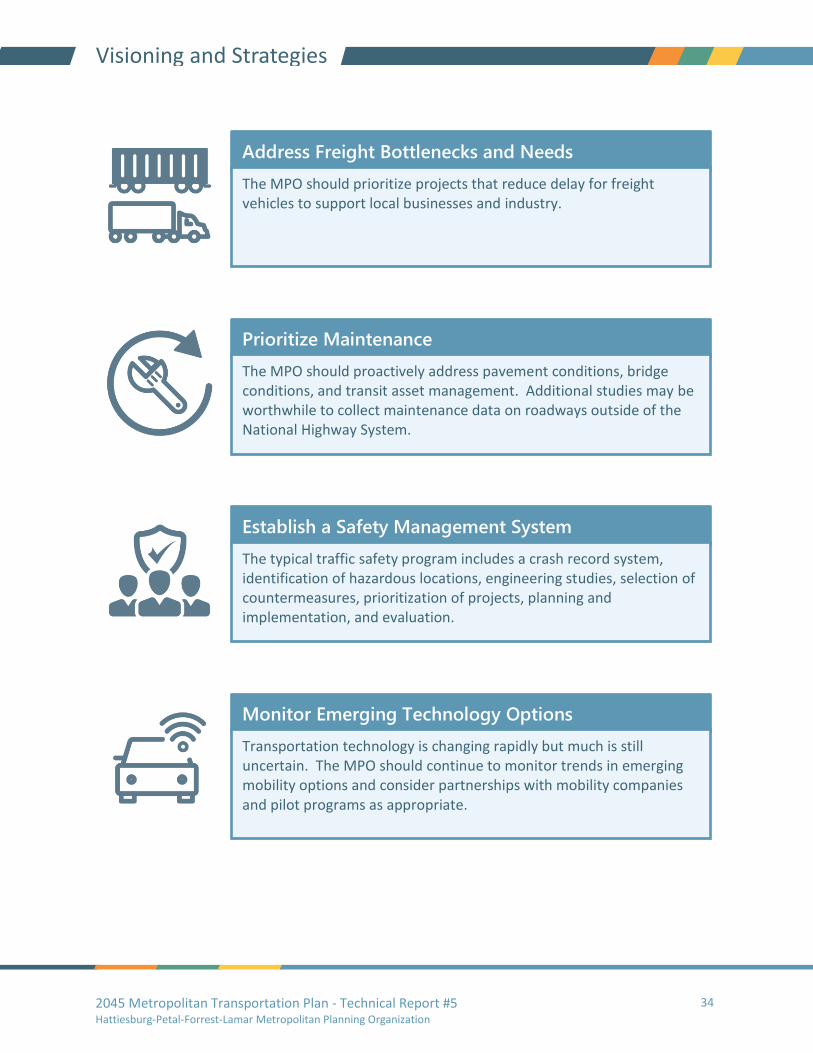
Visioning and Strategies
Address Freight Bottlenecks and Needs
The MPO should prioritize projects that reduce delay for freight vehicles to support local businesses and industry.
Prioritize Maintenance
The MPO should proactively address pavement conditions, bridge conditions, and transit asset management. Additional studies may be worthwhile to collect maintenance data on roadways outside of the National Highway System.
Establish a Safety Management System
The typical traffic safety program includes a crash record system, identification of hazardous locations, engineering studies, selection of countermeasures, prioritization of projects, planning and implementation, and evaluation.
Monitor Emerging Technology Options
Transportation technology is changing rapidly but much is still uncertain. The MPO should continue to monitor trends in emerging mobility options and consider partnerships with mobility companies and pilot programs as appropriate.
2045 Metropolitan Transportation Plan - Technical Report #5 Hattiesburg-Petal-Forrest-Lamar Metropolitan Planning Organization
35
Project Development
5.0 Project Development This chapter summarizes how committed and potential transportation projects were identified and how
cost estimates were developed for these projects.
5.1 Project Identification
Roadway Projects
A preliminary list of roadway projects was developed for both capacity and non-capacity roadway
projects. Each list included the following:
• All projects included in the current Transportation Improvement Program (TIP)
• Projects from the 2040 MTP
• Projects addressing needs frequently cited in public input
• Projects identified in stakeholder consultation and in existing plans
• Projects that addressed any remaining needs identified in the Needs Assessment
The list of projects was refined with stakeholders and some projects were removed or modified in
scale/scope based on feasibility assessments.
Bicycle and Pedestrian Projects
Bicycle and pedestrian projects included in the current TIP were incorporated into the MTP. Outside of
these projects, no other stand-alone bicycle and pedestrian projects were identified.
Instead, the MPO will continue to work with its local agencies to identify and prioritize bicycle and
pedestrian projects along high priority bicycle and pedestrian corridors. These corridors were identified
based on existing plans like the MPO Pathways Master Plan (2015) and the Needs Assessment.
Furthermore, bicycle and pedestrian improvements must be part of the overall design phase of all
projects and included unless restrictions apply, consistent with FHWA guidance.
Transit Projects
At a minimum, the MTP assumes that existing transit services will continue to operate at current levels
and that vehicles will be kept in a good state of repair.

2045 Metropolitan Transportation Plan - Technical Report #5 Hattiesburg-Petal-Forrest-Lamar Metropolitan Planning Organization
36
Project Development
5.2 Estimating Project Costs
Roadway Project Cost Estimates
Cost estimates for some projects were available from existing studies or preliminary engineering work
from local governments or MDOT. For the remaining projects, order-of-magnitude cost estimates were
developed using MDOT’s Chart for Preliminary Cost Estimates. These typical construction cost estimates
for various types of improvements are shown in Table 5.1.
Cost estimates for studies were based on similar projects. No cost estimates were made for
maintenance projects such as bridge and pavement projects.
Table 5.1: Typical Roadway Costs by Improvement Type
Improvement Type Average Cost (2019 dollars) Unit
New 4 Lane Freeway $17,500,000 Mile
New 2 Lane Roadway $5,900,000 Mile
New 4 Lane Arterial $12,000,000 Mile
Interstate Widening $9,900,000 Mile
Interstate Rehab - 2 Lane $2,000,000 Mile
Interstate Rehab - 4 Lane $2,600,000 Mile
Arterial Widening $3,500,000 Mile
Center Turn Lane $3,250,000 Mile
Overlay $700,000 Mile
ITS $425,000 Mile
New Bridge - 2 Lane $2,400,000 Each
New Bridge - 4 Lane $4,100,000 Each
Traffic Signal $1,250,000 Each
RR Crossing $200,000 Each
Intersection Improvement $900,000 Each
Interchange Improvement $6,250,000 Each
New Interchange $24,000,000 Each
Underpass $12,000,000 Each
Overpass $6,750,000 Each
Note: Total Costs include Construction, Engineering, Right-of-Way & Utilities

2045 Metropolitan Transportation Plan - Technical Report #5 Hattiesburg-Petal-Forrest-Lamar Metropolitan Planning Organization
37
Project Development
Bicycle and Pedestrian Project Cost Estimates
Bicycle and pedestrian project costs included in the TIP were incorporated into the MTP. Outside of
these projects, no other stand-alone bicycle and pedestrian projects were identified. Instead, the MPO
will continue to work with its local agencies to identify bicycle and pedestrian projects. High priority
bicycle and pedestrian corridors are identified later and the MPO should encourage local agencies to
implement projects along these corridors. Furthermore, incidental bicycle and pedestrian
improvements may be implemented alongside planned roadway projects.
Transit Project Cost Estimates
The annual cost of operating public transit in the MPO was taken from the current levels of expenditures
shown in the TIP. Future operating costs forecasted the annual cost shown in the TIP by an inflation
factor of one (1) percent per year.
Capital transit projects for FY 2020-2024 were provided in the TIP and these were used as provided.
Future capital costs were estimated by analyzing the ratio of average annual capital costs to average
Vehicle Revenue Miles (VRM) since 2011. Annual capital costs and VRM data came from the National
Transit Database. This ratio was then applied to current VRM to estimate current capital costs and
forecast into the future at an annual inflation rate of one (1) percent.
2045 Metropolitan Transportation Plan - Technical Report #5 Hattiesburg-Petal-Forrest-Lamar Metropolitan Planning Organization
38
Environmental Analysis and Mitigation
6.0 Environmental Analysis and Mitigation 6.1 The Environment and MTP
The MTP must consider the impacts of transportation on both the natural and human environment. By
providing appropriate consideration of environmental impacts early in the planning process, the plan
increases opportunities for inter-agency coordination, enables expedited project delivery, and promotes
outcomes that are more environmentally sustainable.
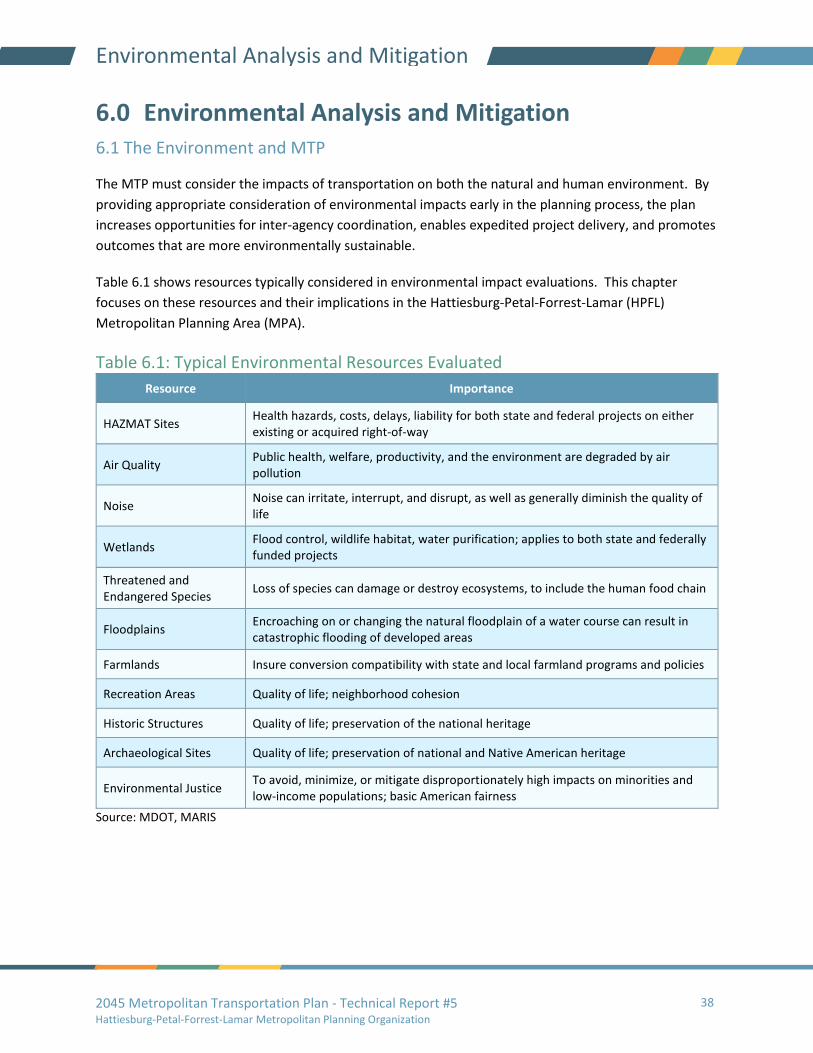
Table 6.1 shows resources typically considered in environmental impact evaluations. This chapter
focuses on these resources and their implications in the Hattiesburg-Petal-Forrest-Lamar (HPFL)
Metropolitan Planning Area (MPA).
Table 6.1: Typical Environmental Resources Evaluated
Resource Importance
HAZMAT Sites Health hazards, costs, delays, liability for both state and federal projects on either existing or acquired right-of-way
Air Quality Public health, welfare, productivity, and the environment are degraded by air pollution
Noise Noise can irritate, interrupt, and disrupt, as well as generally diminish the quality of life
Wetlands Flood control, wildlife habitat, water purification; applies to both state and federally funded projects
Threatened and Endangered Species
Loss of species can damage or destroy ecosystems, to include the human food chain
Floodplains Encroaching on or changing the natural floodplain of a water course can result in catastrophic flooding of developed areas
Farmlands Insure conversion compatibility with state and local farmland programs and policies
Recreation Areas Quality of life; neighborhood cohesion
Historic Structures Quality of life; preservation of the national heritage
Archaeological Sites Quality of life; preservation of national and Native American heritage
Environmental Justice To avoid, minimize, or mitigate disproportionately high impacts on minorities and low-income populations; basic American fairness
Source: MDOT, MARIS

2045 Metropolitan Transportation Plan - Technical Report #5 Hattiesburg-Petal-Forrest-Lamar Metropolitan Planning Organization
39
Environmental Analysis and Mitigation
6.2 Air Quality and Change in Climate
Air Quality and Transportation
Highway vehicles and non-road equipment are mobile sources of air pollutants, some of which are
known or suspected by the Environmental Protection Agency (EPA) to cause cancer or other serious
health and environmental effects. Mobile sources, via the combustion of fossil fuels, release nitrogen
dioxide and Volatile Organic Compounds (VOC), which chemically react in the presence of heat and
sunlight to form ground-level ozone. Ground-level ozone can trigger a variety of health problems such as
asthma and can also have harmful effects on sensitive vegetation and ecosystems. Mobile sources also
contribute to climate change when combustion of fossil fuels release nitrous oxide and carbon dioxide.
The EPA regulates vehicle emissions and fuel efficiency through its vehicle Greenhouse Gas Emissions
and Corporate Average Fuel Economy (CAFE) standards. It also regulates and monitors pollutants
considered harmful to public health and the environment through the National Ambient Air Quality
Standards (NAAQS) authorized by the Clean Air Act (1970). The EPA has set NAAQS for six (6) principal
“criteria” pollutants. These are listed in Table 6.2 along with the current standards.
All counties within the MPA are currently in attainment of the NAAQS.
In 2015, the EPA revised the primary and secondary ozone standards to 70 parts per billion (ppb), down
from the current 75 ppb, and retained their indicators (O3), forms [fourth-highest daily maximum,
averaged across three (3) consecutive years] and averaging times (eight hours). The HPFL MPA is not
anticipated to immediately be affected by the 70 ppb standard. Therefore, it was recommended that
Forrest and Lamar Counties be designated as attainment/unclassifiable for the 2015 NAAQS.
The CAAA requires that transportation plans, programs, and projects in nonattainment or maintenance
areas that are funded or approved by the FHWA be in conformity with the State Implementation Plan
(SIP), which represents the state’s plan, to either achieve or maintain the NAAQS for a particular
pollutant.
Should either of the counties within the MPA ever exceed NAAQS and are designated as a
nonattainment or maintenance area, the MTP will be subject to a conformity analysis. If this were to
occur in the future, the transportation model, which forms the basis of transportation decision-making,
provides numeric outputs that may be utilized in regional air quality modeling.
Transportation conformity is a process required of MPOs
pursuant to the Clean Air Act Amendments of 1990 (CAAA of
1990) to ensure that Federal funding and approval are given to
those transportation activities that are consistent with air quality
goals.

2045 Metropolitan Transportation Plan - Technical Report #5 Hattiesburg-Petal-Forrest-Lamar Metropolitan Planning Organization
40
Environmental Analysis and Mitigation
Table 6.2: National Ambient Air Quality Standards (NAAQS) as of 2020 Pollutant Primary/Secondary Averaging Time Level Form
Carbon Monoxide primary 8-hours 9 ppm Not to be exceeded
more than once per year 1-hour 35 ppm
Lead primary and secondary Rolling 3 month average 0.15 μg/m3 Not to be exceeded
Nitrogen Dioxide
primary 1-hour 100 ppb 98th percentile of 1-hour daily maximum concentrations, averaged over 3 years
primary and secondary Annual 53 ppb
Ozone primary and secondary 8-hours 0.070 ppm
Annual fourth-highest daily maximum 8-hr concentration, averaged over 3 years
Particle Pollution
primary Annual 12.0 μg/m3 annual mean, averaged over 3 years
secondary Annual 15.0 μg/m3 annual mean, averaged over 3 years
primary and secondary 24-hours 35 μg/m3 98th percentile, averaged over 3 years
primary and secondary 24-hours 150 μg/m3 Not to be exceeded more than once per year on average over 3 years
Sulfur Dioxide
primary 1-hour 75 ppb
99th percentile of 1-hour daily maximum concentrations, averaged over 3 years
secondary 3-hours 0.5 ppm Not to be exceeded more than once per year
Source: EPA Note: ppm - parts per million ppb - parts per billion μg/m3 - micograms per cubic meter

2045 Metropolitan Transportation Plan - Technical Report #5 Hattiesburg-Petal-Forrest-Lamar Metropolitan Planning Organization
41
Environmental Analysis and Mitigation
Change in Climate
The current scientific belief
holds that the planet is going
through a period of
warming. This changing
trend in climate is believed
to be caused by the increase in Greenhouse Gases (GHGs), which has only been increased through human
behavior through the use of fossil fuels. According to the EPA, the transportation sector generated the
largest share of GHG emissions in the United States in 2018, responsible for over 28 percent. The MPO
understands the need for air quality within the area and is taking several steps to address this new
challenge.
Effects of Climate Change
Geographically, the Hattiesburg MPA is inland and away from the coast, but inland flooding, tornadoes
and hurricanes are still considered a direct threat to the area. These events can impact the area over
time. The most obvious and immediate effect of climate change has been the increased global
temperature, which has a large impact on the transportation system. The increased heat warps the steel
of railroad tracks, stresses bridge joints, and affects pavement conditions. Pavement that has been
softened by heat to which it was never designed can buckle and rut under high truck volumes. This in
turn creates a need for further maintenance and the use of more material, which itself is carbon-based.
The rising temperatures are not the only
major impact that has been observed with
the recent climate change. Storms have
been rising in intensity with the shift in the
climate and “Superstorms” such as Katrina,
Sandy, and Harvey are becoming a more
regular occurrence. Mississippi has seen
direct impacts of weather extreme
amplification recently in the historic Pearl
River Flood in February of 2020 as well as
three (3) EF4 tornadoes that passed near
Hattiesburg within one week of each other;
one passing less than ten (10) miles south of downtown Hattiesburg. Fifty-eight (58) hurricanes have been
recorded in or near Hattiesburg since 1930. The largest was Hilda in 1964; with the most recent being Lee
in 2011.
Recent storms with a high intensity over a short period of time are becoming common and can result in
flash floods. These flash floods trap motorists and deposit large amounts of water on the impervious
surfaces of the roadways. This water eventually becomes surface runoff, which can pool and damage a
roadway’s substructure. This impact is worse near major rivers, leading to potential disasters that can
affect roadways and other infrastructure.
2045 Metropolitan Transportation Plan - Technical Report #5 Hattiesburg-Petal-Forrest-Lamar Metropolitan Planning Organization
42
Environmental Analysis and Mitigation
A strategy that the MPO can employ to deal with this need is the increased inspection of bridges and
roadways. This will ensure that the infrastructure is structurally sound and that erosion from storms has
not degraded it. Drainage for the infrastructure is also important and should be inspected to ensure that
roadways will not contribute to runoff.
Climate Change Strategies
The transportation system is the largest contributor to GHGs, contributing over one-quarter of the total
amount. These gases come from vehicle emissions and air conditioning. Vehicle emissions are increased
when a vehicle is idling and less efficient. This contribution to GHGs makes the transportation sector a
priority to address climate change. There are several strategies that may be employed in order to reduce
the impact of transportation on climate change.
Introducing Low-Carbon Fuels
This strategy explores the use of fuels from alternative sources which produce less carbon and are more
efficient. These fuels include ethanol, biodiesel, natural gas, and more. Additional low-carbon fuels
include alternatives such as hybrids, electric vehicles, and hydrogen fuel. In an effort to reduce emissions,
the local transit systems have been making the switch to hybrid buses.
Reduction of High-Carbon Activities
Single occupancy vehicles and motorcycles are comparatively inefficient modes of transportation that
produce GHGs. Strategies can be implemented that encourage transportation users to choose alternative
transportation modes which reduce the emissions on the transportation system. These include the use
of carpooling, increased transit ridership, and the reduction of unnecessary trips.
The construction and maintenance of transportation systems can also contribute to GHGs, as many of the
products used in these processes are carbon-based. The use of lower-carbon materials during
construction and maintenance would aid with this strategy.
Improving System Efficiency
The transportation network is the system by which people, goods, and services are moved through the
area. This strategy encourages the use of an efficient transportation system to reduce travel time, reduce
idling vehicles, and increase quality of traffic operations. This can be achieved through the use of:
• ITS,
• Traffic signal retiming and coordination,
• TDM, and
• Other means to reduce congestion and idling vehicles.

2045 Metropolitan Transportation Plan - Technical Report #5 Hattiesburg-Petal-Forrest-Lamar Metropolitan Planning Organization
43
Environmental Analysis and Mitigation
Additional Strategies
The strategies listed on the previous page cover the key methods that can be used to reduce the effect of
GHGs from transportation sources. The following strategies may also be deployed:
• Reducing the amount of travel necessary for transportation users
• Increasing vehicle occupancies for all modes
• Establishing transportation pricing
• Encouraging non-vehicular travel
• Promoting trip-chaining
• Improved freight logistics
• Using LED lights in traffic signals

2045 Metropolitan Transportation Plan - Technical Report #5 Hattiesburg-Petal-Forrest-Lamar Metropolitan Planning Organization
44
Environmental Analysis and Mitigation
6.3 Environmental Regulations
Planning Requirements
Federal regulations (23 C.F.R. §450) require the MTP to address environmental concerns by consulting
with relevant stakeholder agencies and discussing potential environmental mitigation activities.
The plan should involve consultation with state and local agencies responsible for land use
management, natural resources, environmental protection, conservation, and historic preservation.
This should include a comparison of the plan with State conservation plans or maps and inventories of
natural or historic resources, if this information is available.
The plan must discuss types of potential environmental mitigation activities related to the
implementation of the plan. This includes potential areas for these activities to occur and activities
which may have the greatest potential to mitigate the effects of the plan projects and strategies.
Mitigation activities do not have to be project-specific and can instead focus on broader policies,
programs, and strategies. The discussion must involve consultation with federal, state, and tribal land
management, wildlife, and regulatory agencies.
Defining Mitigation
The National Environmental Policy Act (1970), or NEPA, established the basic framework for integrating
environmental considerations into federal decision-making. Federal regulations relating to NEPA (40
C.F.R. 1508) define mitigation as:
• Avoiding the impact altogether by not taking a certain action or parts of an action.
• Minimizing impacts by limiting the degree or magnitude of the action and its
implementation.
• Rectifying the impact by repairing, rehabilitating, or restoring the affected environment.
• Reducing or eliminating the impact over time by preservation and maintenance operations
during the life of the action.
• Compensating for the impact by replacing or providing substitute resources or
environments.
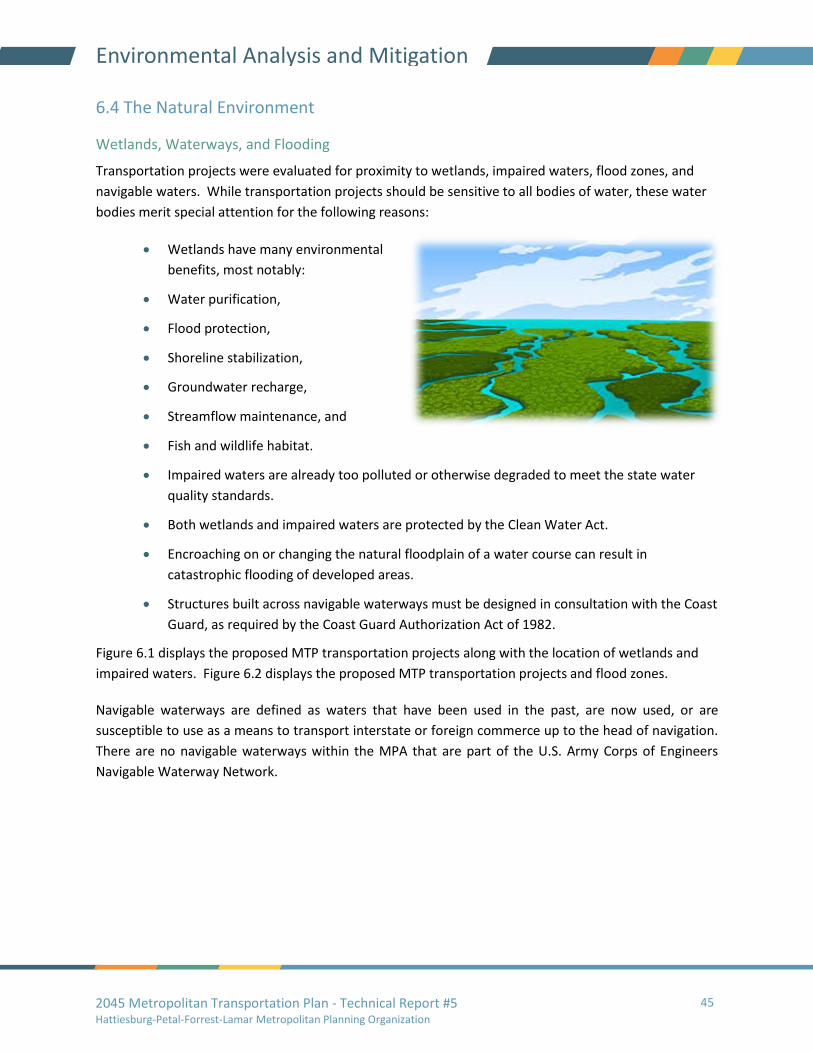
2045 Metropolitan Transportation Plan - Technical Report #5 Hattiesburg-Petal-Forrest-Lamar Metropolitan Planning Organization
45
Environmental Analysis and Mitigation
6.4 The Natural Environment
Wetlands, Waterways, and Flooding
Transportation projects were evaluated for proximity to wetlands, impaired waters, flood zones, and
navigable waters. While transportation projects should be sensitive to all bodies of water, these water
bodies merit special attention for the following reasons:
• Wetlands have many environmental
benefits, most notably:
• Water purification,
• Flood protection,
• Shoreline stabilization,
• Groundwater recharge,
• Streamflow maintenance, and
• Fish and wildlife habitat.
• Impaired waters are already too polluted or otherwise degraded to meet the state water
quality standards.
• Both wetlands and impaired waters are protected by the Clean Water Act.
• Encroaching on or changing the natural floodplain of a water course can result in
catastrophic flooding of developed areas.
• Structures built across navigable waterways must be designed in consultation with the Coast
Guard, as required by the Coast Guard Authorization Act of 1982.
Figure 6.1 displays the proposed MTP transportation projects along with the location of wetlands and
impaired waters. Figure 6.2 displays the proposed MTP transportation projects and flood zones.
Navigable waterways are defined as waters that have been used in the past, are now used, or are
susceptible to use as a means to transport interstate or foreign commerce up to the head of navigation.
There are no navigable waterways within the MPA that are part of the U.S. Army Corps of Engineers
Navigable Waterway Network.

2045 Metropolitan Transportation Plan - Technical Report #5 Hattiesburg-Petal-Forrest-Lamar Metropolitan Planning Organization
46
Environmental Analysis and Mitigation
Mitigation
This early in the planning stage, there are not enough resources available to assess project level impacts
to specific wetlands. As individual projects proceed through the MDOT project delivery process and
NEPA process, it is anticipated that project sponsors will:
• Ensure that transportation facilities constructed in floodways will not increase flood heights
• Take steps to avoid wetland and flood zone impacts where feasible
• Consider strategies which minimize potential impacts to wetlands and flood zones
• Provide compensation for any remaining unavoidable impacts through activities to restore
or create wetlands
• Projects near impaired waters should consider measures to improve the quality of these
waters.
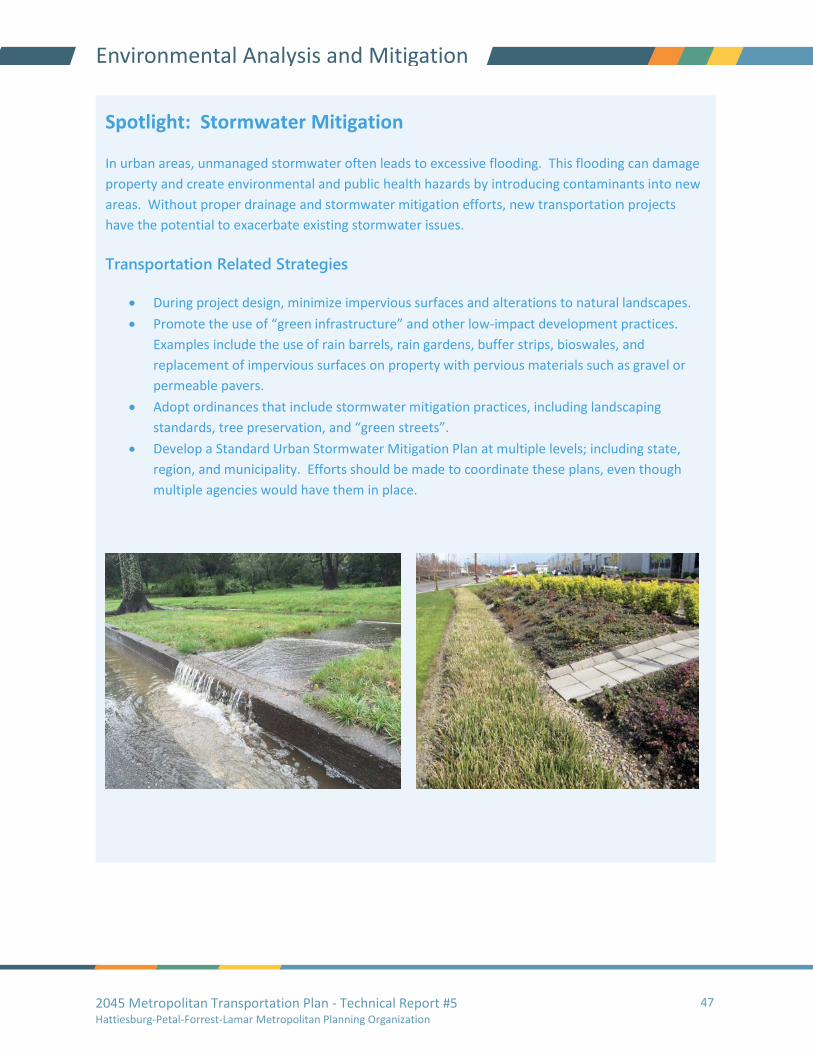
2045 Metropolitan Transportation Plan - Technical Report #5 Hattiesburg-Petal-Forrest-Lamar Metropolitan Planning Organization
47
Environmental Analysis and Mitigation
Spotlight: Stormwater Mitigation
In urban areas, unmanaged stormwater often leads to excessive flooding. This flooding can damage
property and create environmental and public health hazards by introducing contaminants into new
areas. Without proper drainage and stormwater mitigation efforts, new transportation projects
have the potential to exacerbate existing stormwater issues.
Transportation Related Strategies
• During project design, minimize impervious surfaces and alterations to natural landscapes.
• Promote the use of “green infrastructure” and other low-impact development practices.
Examples include the use of rain barrels, rain gardens, buffer strips, bioswales, and
replacement of impervious surfaces on property with pervious materials such as gravel or
permeable pavers.
• Adopt ordinances that include stormwater mitigation practices, including landscaping
standards, tree preservation, and “green streets”.
• Develop a Standard Urban Stormwater Mitigation Plan at multiple levels; including state,
region, and municipality. Efforts should be made to coordinate these plans, even though
multiple agencies would have them in place.
2045 Metropolitan Transportation Plan - Technical Report #5 Hattiesburg-Petal-Forrest-Lamar Metropolitan Planning Organization
48
Environmental Analysis and Mitigation
Wildlife
The test projects were evaluated for proximity to identified critical habitat areas for threatened and
endangered species and wildlife refuges. The Endangered Species Act of 1973, as amended, was
enacted to provide a program for the preservation of endangered and threatened species. The Act
provides protection for the ecosystems upon which these species depend for their survival. All federal
agencies or projects utilizing federal funding are required to implement protection programs for
designated species and to apply them in facilitating their survival.
Additionally, Section 4(f) of the Department of Transportation (DOT) Act of 1966 affords protection to
wildlife or waterfowl refuges when USDOT funds are invested in a project.
An endangered species is a species in danger of extinction throughout all or a significant portion of its
range. A threatened species is a species likely to become endangered within the foreseeable future
throughout all or a significant portion of its range. Proposed species are those which have been formally
submitted to Congress for official listing as threatened or endangered.
Species may be considered endangered or threatened when any of the five (5) following criteria occur:
• The current/imminent destruction, modification, or curtailment of their habitat or range
• Overuse of the species for commercial, recreational, scientific, or educational purposes
• Disease or predation
• The inadequacy of existing regulatory mechanisms
• Other natural or human-induced factors affect continued existence.
Table 6.3 lists species classified as endangered, threatened, or recovered within the MPA. Figure 6.3
displays the proposed MTP transportation projects along with the location of identified critical habitat
areas. There are no wildlife or waterfowl refuges in the MPA.
Mitigation
Preliminary planning undertaken within the context of development of the MTP does not include
resources sufficient to assess project specific impacts to species habitats. As projects are carried
forward through the MDOT project delivery process, the NEPA process, design, and construction,
projects will be developed in consultation with U.S. Fish and Wildlife Service and Mississippi Department
of Wildlife, Fisheries, and Parks. Where practicable, actions which impact critical habitats will be
avoided.

2045 Metropolitan Transportation Plan - Technical Report #5 Hattiesburg-Petal-Forrest-Lamar Metropolitan Planning Organization
49
Environmental Analysis and Mitigation
Table 6.3 Species Identified under Endangered Species Act in Hattiesburg, MS
Group Common Name Scientific Name Status
Amphibians Dusky Gopher Frog Rana sevosa Endangered
Birds Red-cockaded woodpecker Picoides borealis Endangered
Wood stork Mycteria americana Threatened
Clams Tan riffleshell Epioblasma florentina walkeri (=E. walkeri)
Endangered
Ferns and Allies Louisiana quillwort Isoetes louisianensis Endangered
Fish Atlantic sturgeon (Gulf subspecies)
Acipenser oxyrinchus (=oxyrhynchus) desotoi
Threatened
Pearl darter Percina aurora Threatened
Mammals Louisiana black bear Ursus americanus luteolus Recovery
Reptiles
Yellow-blotched map turtle Graptemys flavimaculata Threatened
Black pine snake Pituophis melanoleucus lodingi Threatened
Gopher tortoise Gopherus polyphemus Threatened
Source: U.S. Fish and Wildlife Service, Environmental Conservation Online System; National Marine Fisheries Service (NOAA Fisheries)
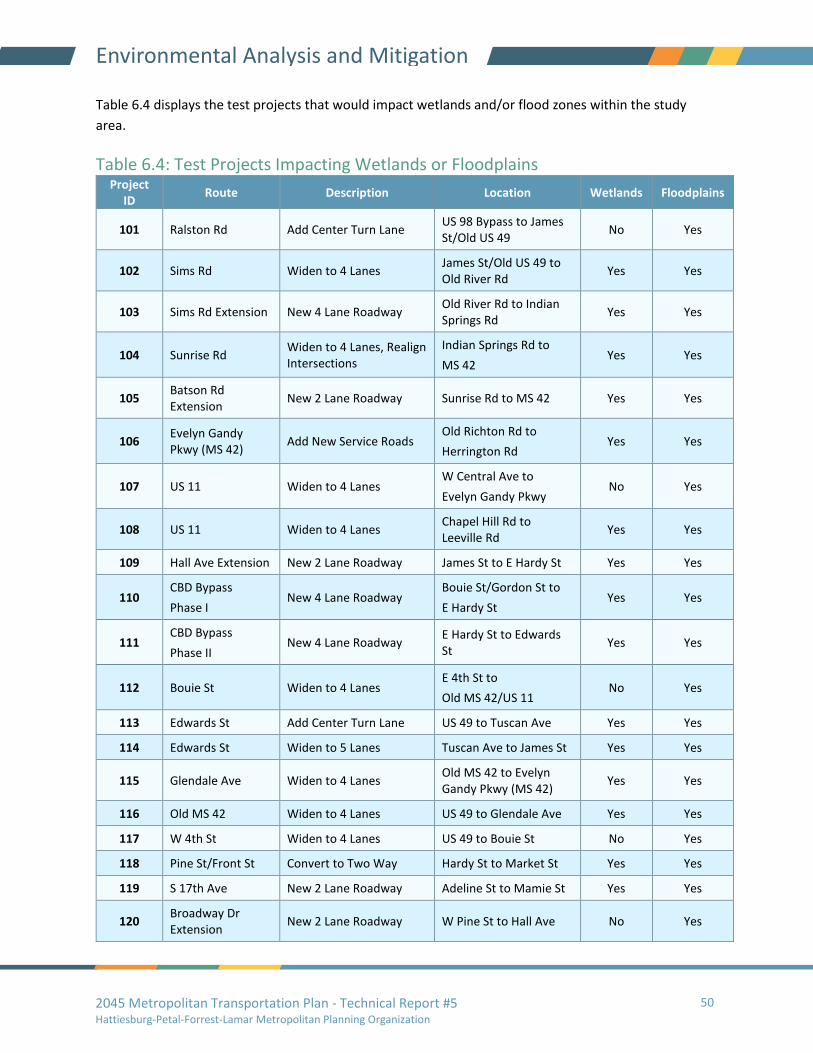
2045 Metropolitan Transportation Plan - Technical Report #5 Hattiesburg-Petal-Forrest-Lamar Metropolitan Planning Organization
50
Environmental Analysis and Mitigation
Table 6.4 displays the test projects that would impact wetlands and/or flood zones within the study
area.
Table 6.4: Test Projects Impacting Wetlands or Floodplains Project
ID Route Description Location Wetlands Floodplains
101 Ralston Rd Add Center Turn Lane US 98 Bypass to James St/Old US 49
No Yes
102 Sims Rd Widen to 4 Lanes James St/Old US 49 to Old River Rd
Yes Yes
103 Sims Rd Extension New 4 Lane Roadway Old River Rd to Indian Springs Rd
Yes Yes
104 Sunrise Rd Widen to 4 Lanes, Realign Intersections
Indian Springs Rd to
MS 42 Yes Yes
105 Batson Rd Extension
New 2 Lane Roadway Sunrise Rd to MS 42 Yes Yes
106 Evelyn Gandy Pkwy (MS 42)
Add New Service Roads Old Richton Rd to
Herrington Rd Yes Yes
107 US 11 Widen to 4 Lanes W Central Ave to
Evelyn Gandy Pkwy No Yes
108 US 11 Widen to 4 Lanes Chapel Hill Rd to Leeville Rd
Yes Yes
109 Hall Ave Extension New 2 Lane Roadway James St to E Hardy St Yes Yes
110 CBD Bypass
Phase I New 4 Lane Roadway
Bouie St/Gordon St to
E Hardy St Yes Yes
111 CBD Bypass
Phase II New 4 Lane Roadway
E Hardy St to Edwards St
Yes Yes
112 Bouie St Widen to 4 Lanes E 4th St to
Old MS 42/US 11 No Yes
113 Edwards St Add Center Turn Lane US 49 to Tuscan Ave Yes Yes
114 Edwards St Widen to 5 Lanes Tuscan Ave to James St Yes Yes
115 Glendale Ave Widen to 4 Lanes Old MS 42 to Evelyn Gandy Pkwy (MS 42)
Yes Yes
116 Old MS 42 Widen to 4 Lanes US 49 to Glendale Ave Yes Yes
117 W 4th St Widen to 4 Lanes US 49 to Bouie St No Yes
118 Pine St/Front St Convert to Two Way Hardy St to Market St Yes Yes
119 S 17th Ave New 2 Lane Roadway Adeline St to Mamie St Yes Yes
120 Broadway Dr Extension
New 2 Lane Roadway W Pine St to Hall Ave No Yes
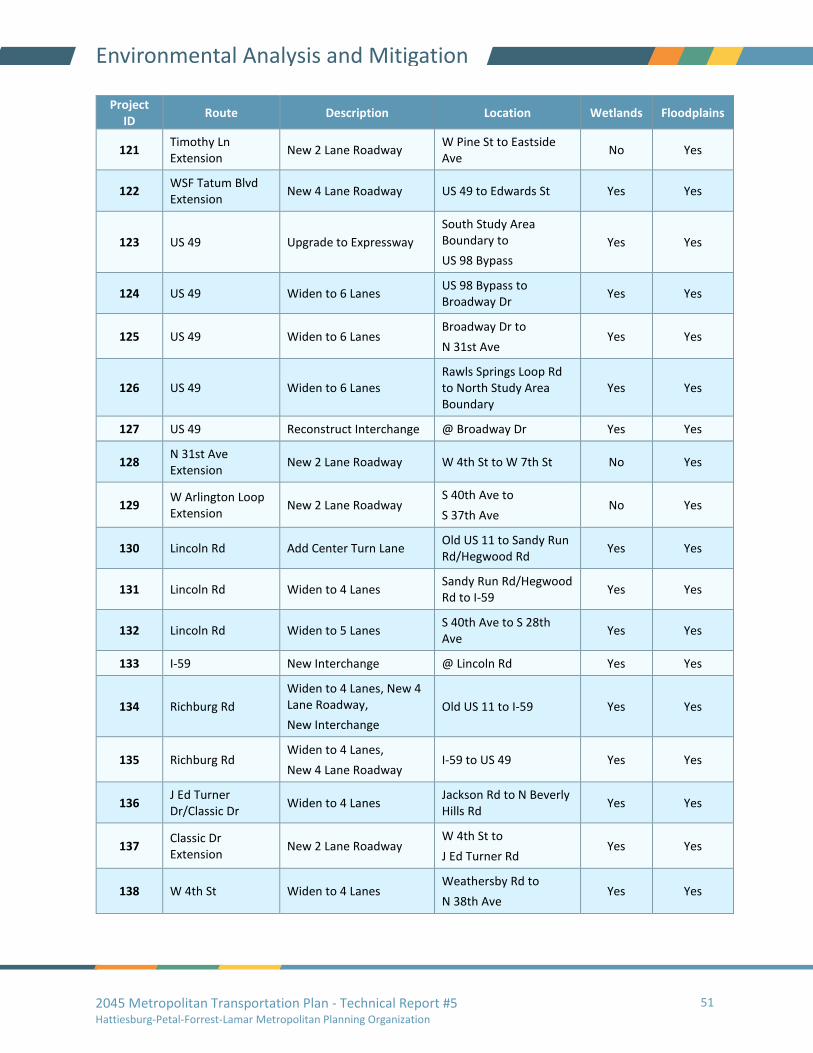
2045 Metropolitan Transportation Plan - Technical Report #5 Hattiesburg-Petal-Forrest-Lamar Metropolitan Planning Organization
51
Environmental Analysis and Mitigation
Project ID
Route Description Location Wetlands Floodplains
121 Timothy Ln Extension
New 2 Lane Roadway W Pine St to Eastside Ave
No Yes
122 WSF Tatum Blvd Extension
New 4 Lane Roadway US 49 to Edwards St Yes Yes
123 US 49 Upgrade to Expressway
South Study Area Boundary to
US 98 Bypass
Yes Yes
124 US 49 Widen to 6 Lanes US 98 Bypass to Broadway Dr
Yes Yes
125 US 49 Widen to 6 Lanes Broadway Dr to
N 31st Ave Yes Yes
126 US 49 Widen to 6 Lanes Rawls Springs Loop Rd to North Study Area Boundary
Yes Yes
127 US 49 Reconstruct Interchange @ Broadway Dr Yes Yes
128 N 31st Ave Extension
New 2 Lane Roadway W 4th St to W 7th St No Yes
129 W Arlington Loop Extension
New 2 Lane Roadway S 40th Ave to
S 37th Ave No Yes
130 Lincoln Rd Add Center Turn Lane Old US 11 to Sandy Run Rd/Hegwood Rd
Yes Yes
131 Lincoln Rd Widen to 4 Lanes Sandy Run Rd/Hegwood Rd to I-59
Yes Yes
132 Lincoln Rd Widen to 5 Lanes S 40th Ave to S 28th Ave
Yes Yes
133 I-59 New Interchange @ Lincoln Rd Yes Yes
134 Richburg Rd
Widen to 4 Lanes, New 4 Lane Roadway,
New Interchange
Old US 11 to I-59 Yes Yes
135 Richburg Rd Widen to 4 Lanes,
New 4 Lane Roadway I-59 to US 49 Yes Yes
136 J Ed Turner Dr/Classic Dr
Widen to 4 Lanes Jackson Rd to N Beverly Hills Rd
Yes Yes
137 Classic Dr Extension
New 2 Lane Roadway W 4th St to
J Ed Turner Rd Yes Yes
138 W 4th St Widen to 4 Lanes Weathersby Rd to
N 38th Ave Yes Yes
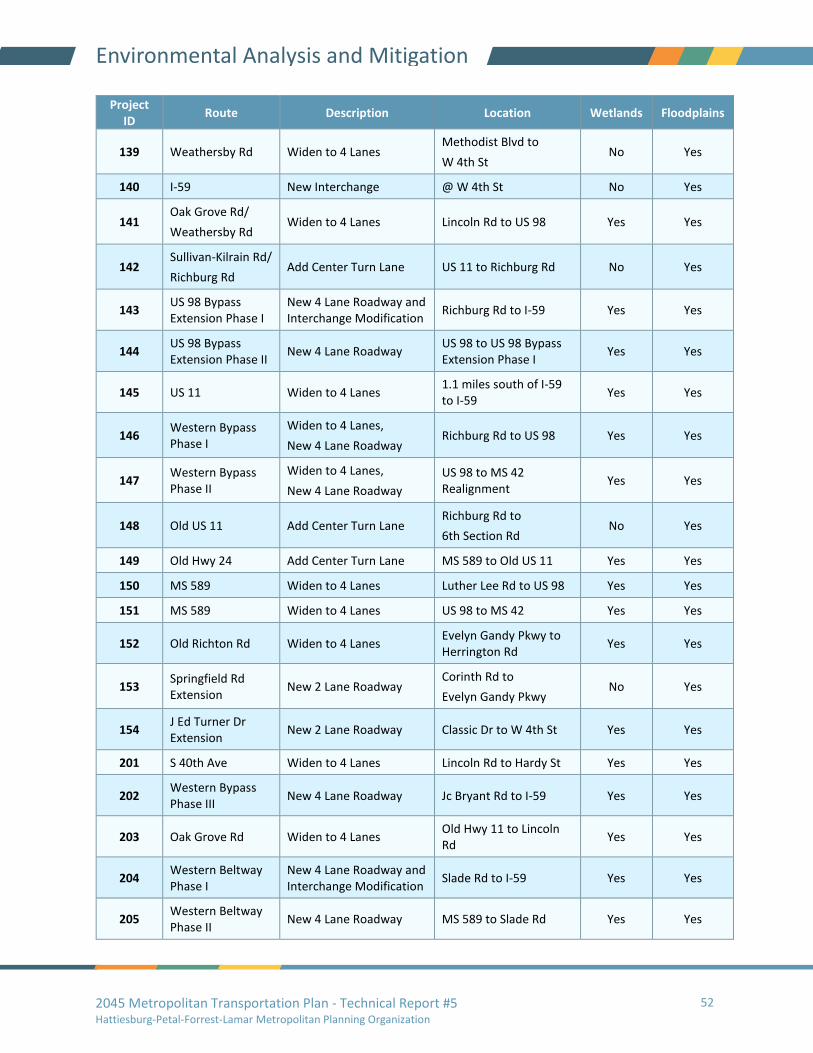
2045 Metropolitan Transportation Plan - Technical Report #5 Hattiesburg-Petal-Forrest-Lamar Metropolitan Planning Organization
52
Environmental Analysis and Mitigation
Project ID
Route Description Location Wetlands Floodplains
139 Weathersby Rd Widen to 4 Lanes Methodist Blvd to
W 4th St No Yes
140 I-59 New Interchange @ W 4th St No Yes
141 Oak Grove Rd/
Weathersby Rd Widen to 4 Lanes Lincoln Rd to US 98 Yes Yes
142 Sullivan-Kilrain Rd/
Richburg Rd Add Center Turn Lane US 11 to Richburg Rd No Yes
143 US 98 Bypass Extension Phase I
New 4 Lane Roadway and Interchange Modification
Richburg Rd to I-59 Yes Yes
144 US 98 Bypass Extension Phase II
New 4 Lane Roadway US 98 to US 98 Bypass Extension Phase I
Yes Yes
145 US 11 Widen to 4 Lanes 1.1 miles south of I-59 to I-59
Yes Yes
146 Western Bypass Phase I
Widen to 4 Lanes,
New 4 Lane Roadway Richburg Rd to US 98 Yes Yes
147 Western Bypass Phase II
Widen to 4 Lanes,
New 4 Lane Roadway
US 98 to MS 42 Realignment
Yes Yes
148 Old US 11 Add Center Turn Lane Richburg Rd to
6th Section Rd No Yes
149 Old Hwy 24 Add Center Turn Lane MS 589 to Old US 11 Yes Yes
150 MS 589 Widen to 4 Lanes Luther Lee Rd to US 98 Yes Yes
151 MS 589 Widen to 4 Lanes US 98 to MS 42 Yes Yes
152 Old Richton Rd Widen to 4 Lanes Evelyn Gandy Pkwy to Herrington Rd
Yes Yes
153 Springfield Rd Extension
New 2 Lane Roadway Corinth Rd to
Evelyn Gandy Pkwy No Yes
154 J Ed Turner Dr Extension
New 2 Lane Roadway Classic Dr to W 4th St Yes Yes
201 S 40th Ave Widen to 4 Lanes Lincoln Rd to Hardy St Yes Yes
202 Western Bypass Phase III
New 4 Lane Roadway Jc Bryant Rd to I-59 Yes Yes
203 Oak Grove Rd Widen to 4 Lanes Old Hwy 11 to Lincoln Rd
Yes Yes
204 Western Beltway Phase I
New 4 Lane Roadway and Interchange Modification
Slade Rd to I-59 Yes Yes
205 Western Beltway Phase II
New 4 Lane Roadway MS 589 to Slade Rd Yes Yes

2045 Metropolitan Transportation Plan - Technical Report #5 Hattiesburg-Petal-Forrest-Lamar Metropolitan Planning Organization
53
Environmental Analysis and Mitigation
Project ID
Route Description Location Wetlands Floodplains
206 Western Beltway Phase III
New 4 Lane Roadway US 98 to MS 589 Yes Yes
207 Outer Western Bypass
Widen to 4 Lanes, New 4 Lane Roadway
US 98 to MS 42 Yes Yes
Source: MDOT, NSI
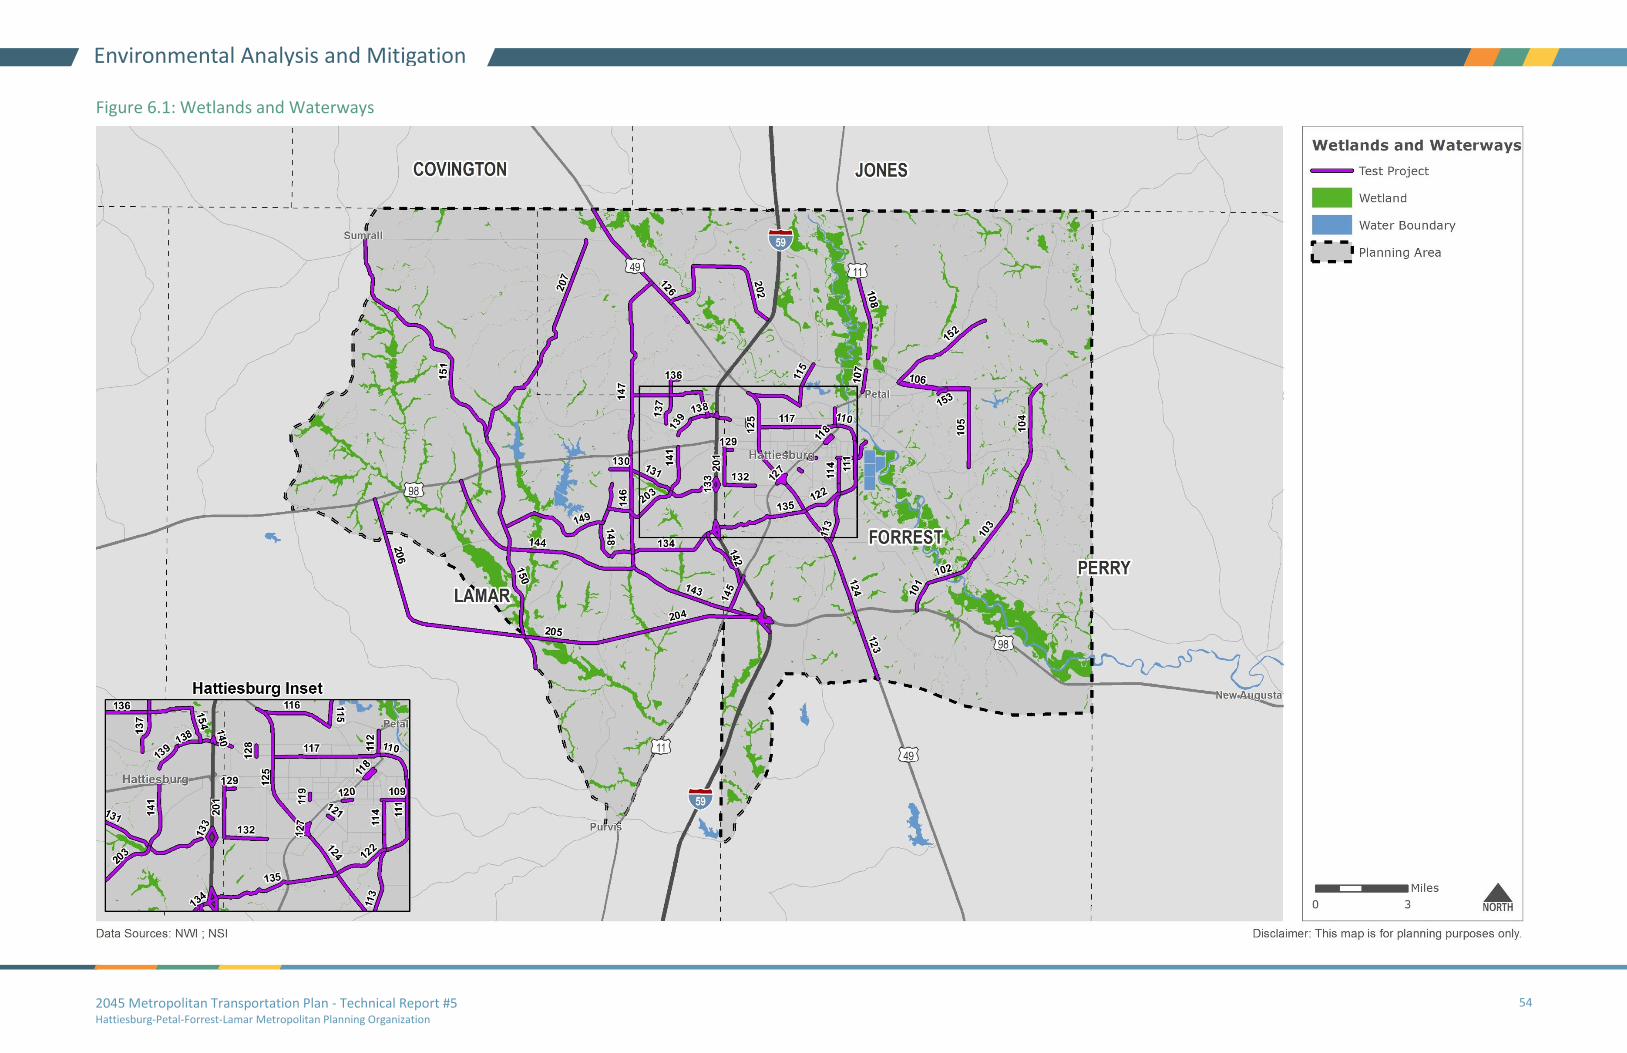
2045 Metropolitan Transportation Plan - Technical Report #5 Hattiesburg-Petal-Forrest-Lamar Metropolitan Planning Organization
54
Environmental Analysis and Mitigation
Figure 6.1: Wetlands and Waterways
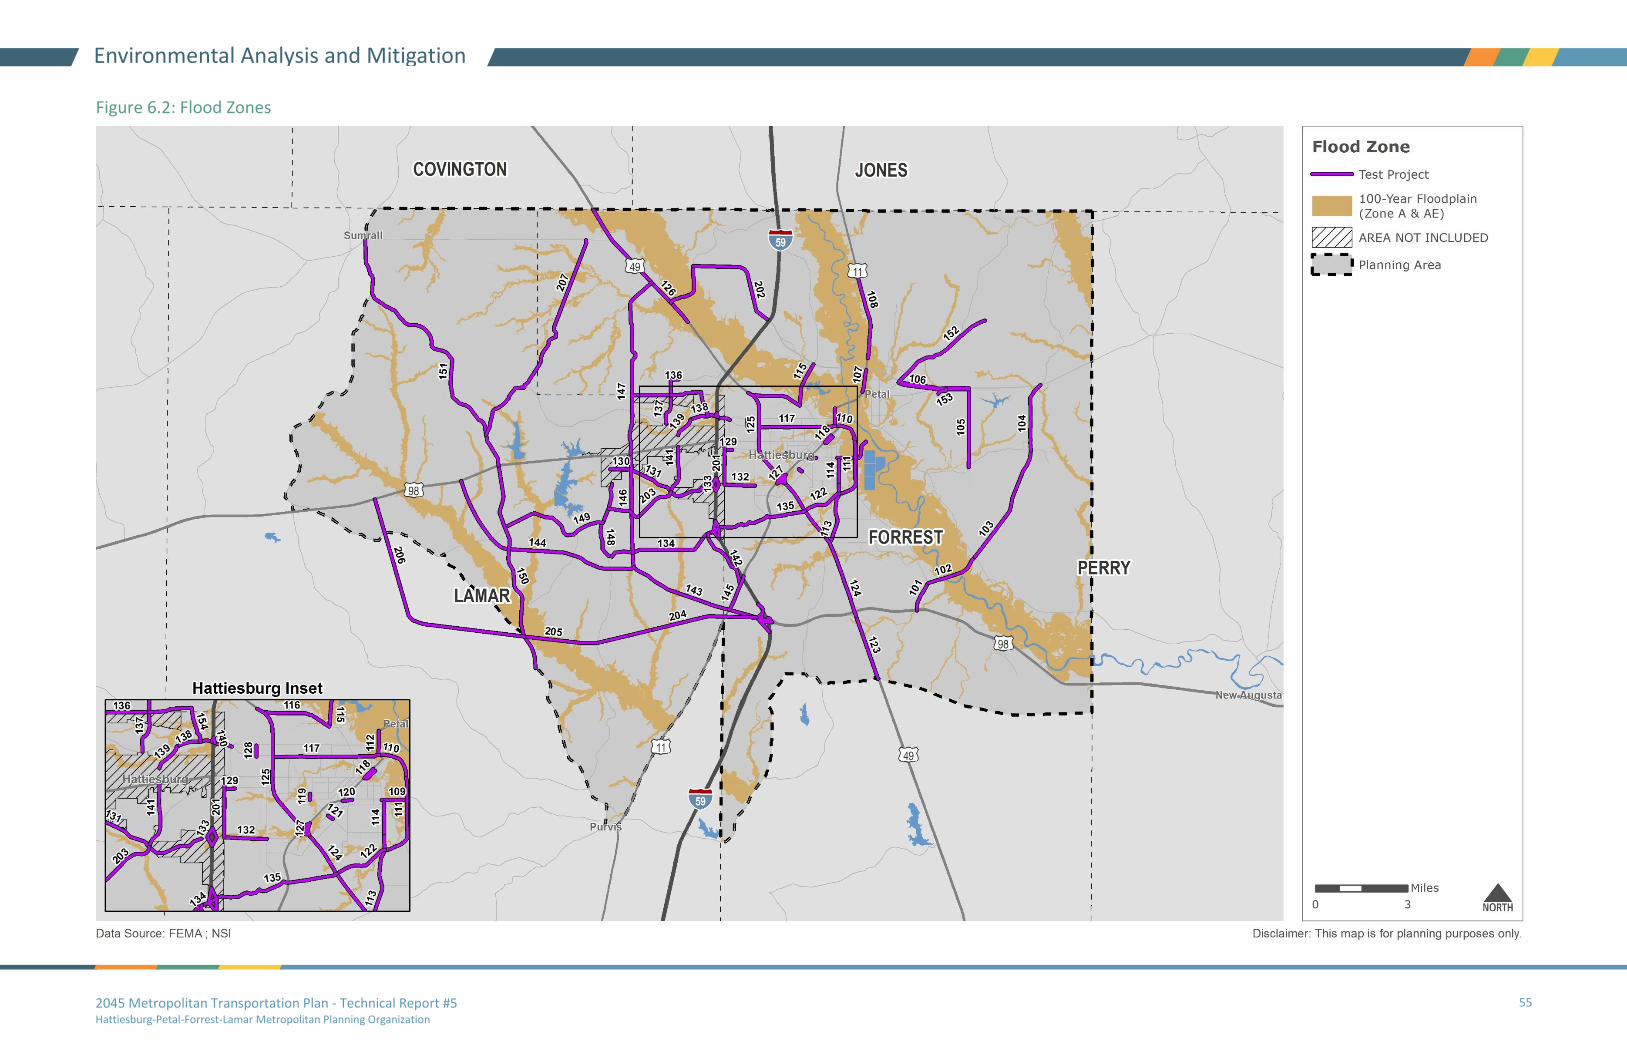
2045 Metropolitan Transportation Plan - Technical Report #5 Hattiesburg-Petal-Forrest-Lamar Metropolitan Planning Organization
55
Environmental Analysis and Mitigation
Figure 6.2: Flood Zones
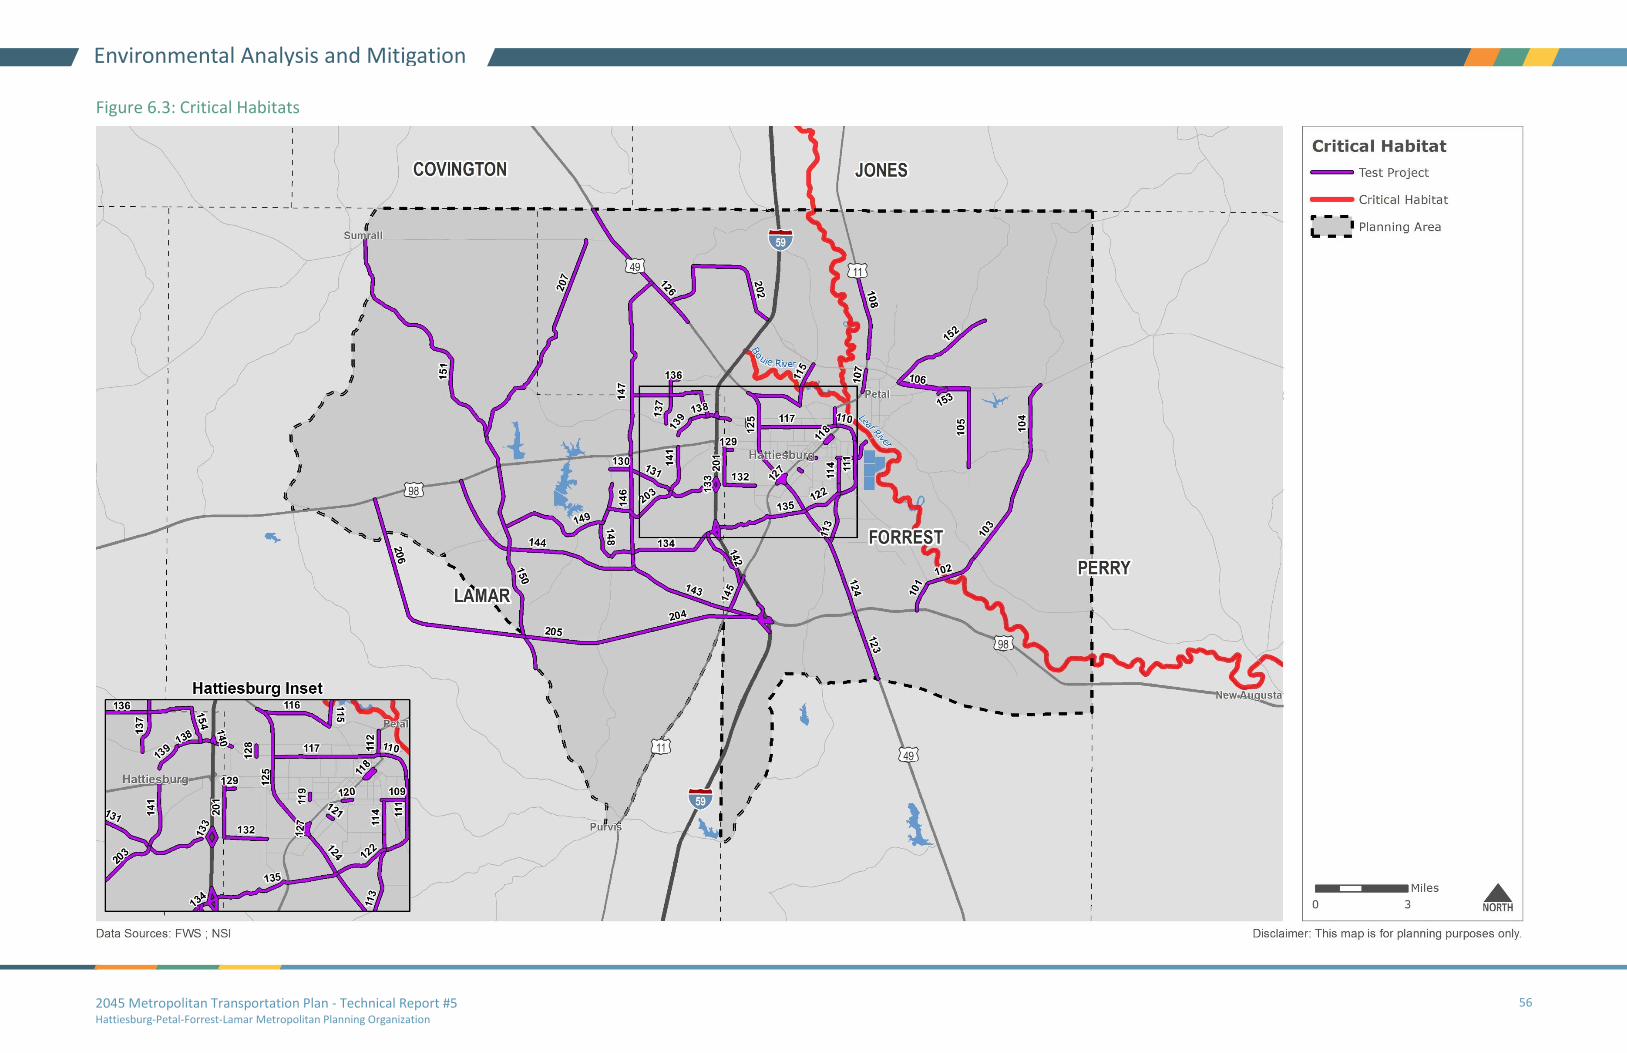
2045 Metropolitan Transportation Plan - Technical Report #5 Hattiesburg-Petal-Forrest-Lamar Metropolitan Planning Organization
56
Environmental Analysis and Mitigation
Figure 6.3: Critical Habitats
2045 Metropolitan Transportation Plan - Technical Report #5 Hattiesburg-Petal-Forrest-Lamar Metropolitan Planning Organization
57
Environmental Analysis and Mitigation
6.5 The Human Environment
Historic and Recreational Resources
The test projects were evaluated for proximity to historic sites and publicly-owned recreational facilities.
Section 4(f) of the Department of Transportation (DOT) Act of 1966 affords protection to publicly-owned
parks and recreation areas and all historic sites listed or eligible for listing on the National Register of
Historic Places (NRHP) when USDOT funds are invested in a project.
In order to be eligible for the NRHP, a district, site, building, structure, or object must possess:
• Integrity of location
• Design
• Setting
• Materials
• Workmanship
• Feeling
• Association
• Generally must be at least 50 years
old.
It will also be evaluated by the following criteria:
• Association with events that have made a significant contribution to the broad patterns of
our history; or
• Association with the lives of significant persons in our past; or
• Embodiment of the distinctive characteristics of a type, period, or method of construction,
or representative of the work of a master, or possession of high artistic values, or
representative of a significant and distinguishable entity whose components may lack
individual distinction; or
• Provision or likelihood to provide information important in history or prehistory.
Figure 6.4 displays all historic sites listed on the National Register and State Register. It is important to
note the State Register properties are not necessarily protected by Section 4(f) regulations unless they
meet NRHP eligibility. Furthermore, there may be additional properties not listed on either register
which are eligible for the NRHP. Note that Figure 6.4 excludes all historic features deemed 'restricted' or
'sensitive', such as sensitive archaeological sites.
Figure 6.4 also displays all publicly-owned parks and recreation areas deemed significant by a review of
public agency websites.
Mitigation
Projects will be developed in consultation with the State Historic Preservation Office (SHPO) and to the
extent practicable, actions which adversely impact NRHP properties and publicly-owned recreation
2045 Metropolitan Transportation Plan - Technical Report #5 Hattiesburg-Petal-Forrest-Lamar Metropolitan Planning Organization
58
Environmental Analysis and Mitigation
areas will be avoided. When historic properties are adversely affected, mitigation will include data
recovery as appropriate to document the essential qualities of the historic resources. When publicly-
owned recreation areas are adversely affected, appropriate compensation will be provided.
Potentially Hazardous Materials
Accidents, spills, leaks, and past improper disposal and handling of hazardous materials and wastes have
resulted in contamination of many sites across the country.
The Comprehensive Environmental Response, Compensations, and Liability Act (CERCLA), commonly
known as Superfund, was enacted in 1980 and:
• Established prohibitions and requirements concerning closed and abandoned hazardous
waste sites
• Provided for liability of persons responsible for releases of hazardous waste at these sites
• Established a trust fund to provide for cleanup when no responsible party could be
identified
CERCLA also enabled the revision of the National Contingency Plan, which established the National
Priorities List (NPL).The NPL is the list of national priorities among the known releases or threatened
releases of hazardous substances, pollutants, or contaminants throughout the United States and its
territories. It is intended primarily to guide the EPA in determining which sites warrant further
investigation.
There is only one (1) site in the MPA listed on the NPL, the Davis Timber Company in Lamar County. A
Five Year Review was conducted in 2016 which found the remedy to be protective of human health and
the environment. This site was identified using the EPA’s Cleanups in My Community database, which
includes cleanup sites, facilities and properties for which EPA collects information by law, or voluntarily
via grants. This site, and other sites evaluated for inclusion in the NPL within the MPA, are illustrated in
Figure 6.5.
Mitigation
At this stage in project development, not enough information is available to determine impacts and
mitigation. However, transportation projects affected by or affecting potentially hazardous properties
will be evaluated during the MDOT project delivery process, the NEPA process, design, and construction.
Environmental Justice Populations
Executive Order 12898: Federal Actions to Address Environmental Justice in Minority Populations and
Low Income Populations, was signed in 1994. It reaffirms the intent of Title VI of the Civil Rights Act of
1964, NEPA, and other federal laws, regulations, and policies by establishing the following
Environmental Justice (EJ) principles for all federal agencies and agencies receiving federal funds, such
as MPOs:
2045 Metropolitan Transportation Plan - Technical Report #5 Hattiesburg-Petal-Forrest-Lamar Metropolitan Planning Organization
59
Environmental Analysis and Mitigation
• To avoid, minimize, or mitigate disproportionately high and adverse human health and
environmental effects, including social and economic effects, on minority populations and
low-income populations.
• To ensure the full and fair participation by all potentially affected communities in the
transportation decision-making process.
• To prevent the denial of, reduction in, or significant delay in the receipt of benefits by
minority and low-income populations.
Figure 6.6 shows areas in the MPA where low-income households make up a greater share of the overall
population.
Similarly, Figure 6.7 shows areas in the MPA where minority populations make up a greater share of the
overall population.
Mitigation
In an attempt to prevent disproportionately high and adverse effects on minority or low-income
populations early in the planning process, the MPO should encourage high community and stakeholder
engagement in the design phase of projects. This is especially important for projects that are located in
areas with a disproportionately high minority and/or low-income population. Figures 6.6 and 6.7
illustrate transportation projects in relation to disproportionately high minority or low-income
populations, but in-depth discussions need to be held to further explore the potential negative impacts
in these communities.
Historical Urban Development
The historical urban development of the MPA breaks down the likely distribution of historic and other
cultural resources. Figure 6.8 shows that the areas with the greatest concentrations of historical housing
structures, or those at least 50 years old, are in the center of the City of Jackson and the City of Canton.
There are likely smaller concentrations not revealed by historic centers of many of the smaller
municipalities within the MPA. This information is merely intended to illustrate general patterns.
Land Cover
The land cover of the MPA is illustrated in Figure 6.9 and summarized in Figure 6.10. Forested, pasture,
and herbaceous lands make up the majority of the land area in the MPA at over 57 percent. Developed
areas still only account for around 16 percent of the land area.
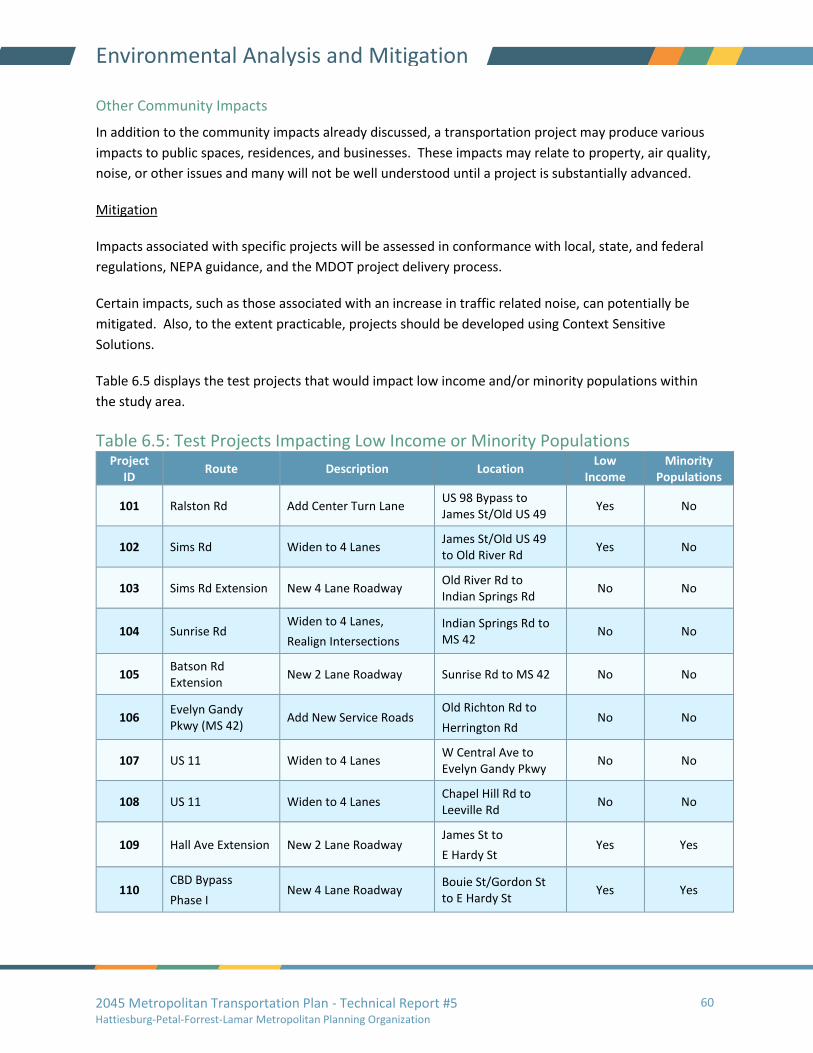
2045 Metropolitan Transportation Plan - Technical Report #5 Hattiesburg-Petal-Forrest-Lamar Metropolitan Planning Organization
60
Environmental Analysis and Mitigation
Other Community Impacts
In addition to the community impacts already discussed, a transportation project may produce various
impacts to public spaces, residences, and businesses. These impacts may relate to property, air quality,
noise, or other issues and many will not be well understood until a project is substantially advanced.
Mitigation
Impacts associated with specific projects will be assessed in conformance with local, state, and federal
regulations, NEPA guidance, and the MDOT project delivery process.
Certain impacts, such as those associated with an increase in traffic related noise, can potentially be
mitigated. Also, to the extent practicable, projects should be developed using Context Sensitive
Solutions.
Table 6.5 displays the test projects that would impact low income and/or minority populations within
the study area.
Table 6.5: Test Projects Impacting Low Income or Minority Populations Project
ID Route Description Location
Low Income
Minority Populations
101 Ralston Rd Add Center Turn Lane US 98 Bypass to James St/Old US 49
Yes No
102 Sims Rd Widen to 4 Lanes James St/Old US 49 to Old River Rd
Yes No
103 Sims Rd Extension New 4 Lane Roadway Old River Rd to Indian Springs Rd
No No
104 Sunrise Rd Widen to 4 Lanes,
Realign Intersections
Indian Springs Rd to MS 42
No No
105 Batson Rd Extension
New 2 Lane Roadway Sunrise Rd to MS 42 No No
106 Evelyn Gandy Pkwy (MS 42)
Add New Service Roads Old Richton Rd to
Herrington Rd No No
107 US 11 Widen to 4 Lanes W Central Ave to Evelyn Gandy Pkwy
No No
108 US 11 Widen to 4 Lanes Chapel Hill Rd to Leeville Rd
No No
109 Hall Ave Extension New 2 Lane Roadway James St to
E Hardy St Yes Yes
110 CBD Bypass
Phase I New 4 Lane Roadway
Bouie St/Gordon St to E Hardy St
Yes Yes

2045 Metropolitan Transportation Plan - Technical Report #5 Hattiesburg-Petal-Forrest-Lamar Metropolitan Planning Organization
61
Environmental Analysis and Mitigation
Project ID
Route Description Location Low
Income Minority
Populations
111 CBD Bypass
Phase II New 4 Lane Roadway
E Hardy St to Edwards St
Yes Yes
112 Bouie St Widen to 4 Lanes E 4th St to
Old MS 42/US 11 Yes Yes
113 Edwards St Add Center Turn Lane US 49 to Tuscan Ave Yes Yes
114 Edwards St Widen to 5 Lanes Tuscan Ave to
James St Yes Yes
115 Glendale Ave Widen to 4 Lanes Old MS 42 to Evelyn Gandy Pkwy (MS 42)
Yes Yes
116 Old MS 42 Widen to 4 Lanes US 49 to
Glendale Ave Yes Yes
117 W 4th St Widen to 4 Lanes US 49 to Bouie St Yes Yes
118 Pine St/Front St Convert to Two Way Hardy St to Market St Yes Yes
119 S 17th Ave New 2 Lane Roadway Adeline St to
Mamie St No No
120 Broadway Dr Extension
New 2 Lane Roadway W Pine St to Hall Ave Yes Yes
121 Timothy Ln Extension
New 2 Lane Roadway W Pine St to
Eastside Ave Yes Yes
122 WSF Tatum Blvd Extension
New 4 Lane Roadway US 49 to Edwards St Yes Yes
123 US 49 Upgrade to Expressway
South Study Area Boundary to
US 98 Bypass
Yes No
124 US 49 Widen to 6 Lanes US 98 Bypass to Broadway Dr
Yes Yes
125 US 49 Widen to 6 Lanes Broadway Dr to
N 31st Ave Yes Yes
126 US 49 Widen to 6 Lanes Rawls Springs Loop Rd to North Study Area Boundary
No No
127 US 49 Reconstruct Interchange @ Broadway Dr Yes Yes
128 N 31st Ave Extension
New 2 Lane Roadway W 4th St to W 7th St Yes Yes
129 W Arlington Loop Extension
New 2 Lane Roadway S 40th Ave to
S 37th Ave No No
130 Lincoln Rd Add Center Turn Lane Old US 11 to Sandy Run Rd/Hegwood Rd
No Yes

2045 Metropolitan Transportation Plan - Technical Report #5 Hattiesburg-Petal-Forrest-Lamar Metropolitan Planning Organization
62
Environmental Analysis and Mitigation
Project ID
Route Description Location Low
Income Minority
Populations
131 Lincoln Rd Widen to 4 Lanes Sandy Run Rd/ Hegwood Rd to I-59
No Yes
132 Lincoln Rd Widen to 5 Lanes S 40th Ave to
S 28th Ave No No
133 I-59 New Interchange @ Lincoln Rd No Yes
134 Richburg Rd
Widen to 4 Lanes,
New 4 Lane Roadway,
New Interchange
Old US 11 to I-59 No Yes
135 Richburg Rd Widen to 4 Lanes,
New 4 Lane Roadway I-59 to US 49 Yes Yes
136 J Ed Turner Dr/ Classic Dr
Widen to 4 Lanes Jackson Rd to N Beverly Hills Rd
No Yes
137 Classic Dr Extension
New 2 Lane Roadway W 4th St to J Ed Turner Rd
No Yes
138 W 4th St Widen to 4 Lanes Weathersby Rd to
N 38th Ave Yes Yes
139 Weathersby Rd Widen to 4 Lanes Methodist Blvd to
W 4th St No Yes
140 I-59 New Interchange @ W 4th St Yes Yes
141 Oak Grove Rd/
Weathersby Rd Widen to 4 Lanes Lincoln Rd to US 98 No Yes
142 Sullivan-Kilrain Rd/
Richburg Rd Add Center Turn Lane US 11 to Richburg Rd Yes Yes
143 US 98 Bypass Extension Phase I
New 4 Lane Roadway and Interchange Modification
Richburg Rd to I-59 Yes No
144 US 98 Bypass Extension Phase II
New 4 Lane Roadway US 98 to US 98 Bypass Extension Phase I
No No
145 US 11 Widen to 4 Lanes 1.1 miles south of I-59 to I-59
Yes No
146 Western Bypass Phase I
Widen to 4 Lanes,
New 4 Lane Roadway Richburg Rd to US 98 No Yes
147 Western Bypass Phase II
Widen to 4 Lanes,
New 4 Lane Roadway
US 98 to MS 42 Realignment
No Yes
148 Old US 11 Add Center Turn Lane Richburg Rd to
6th Section Rd No No
149 Old Hwy 24 Add Center Turn Lane MS 589 to Old US 11 No No
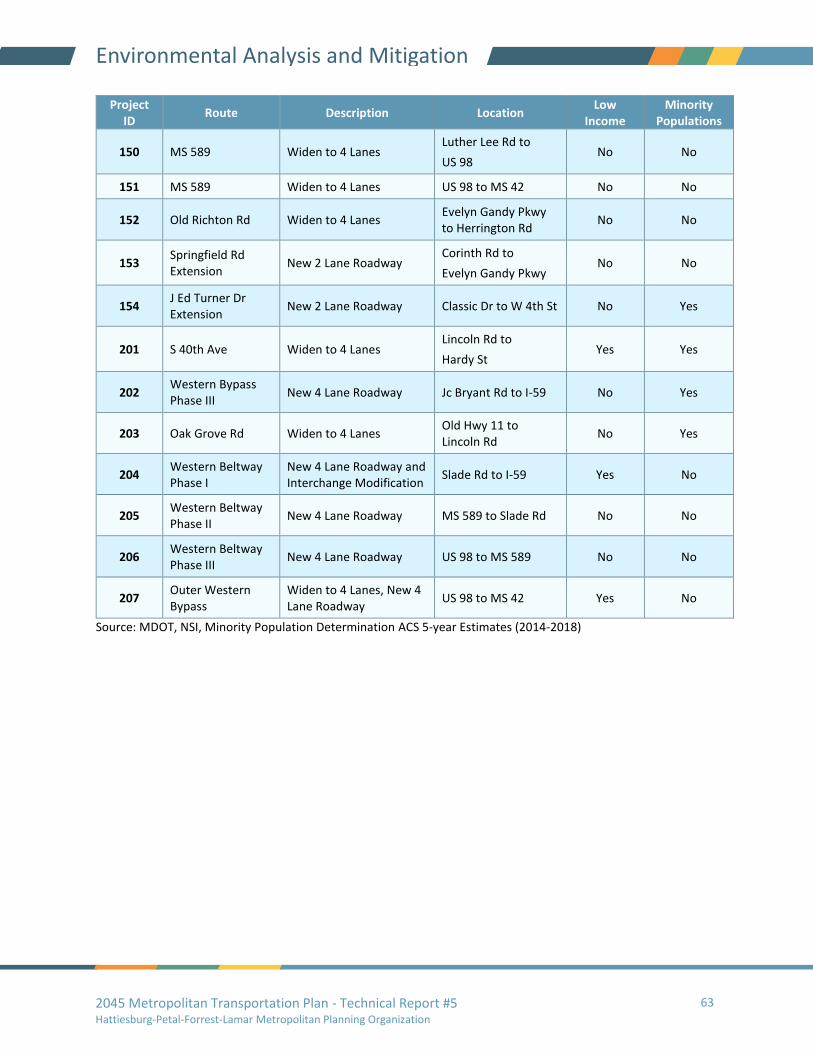
2045 Metropolitan Transportation Plan - Technical Report #5 Hattiesburg-Petal-Forrest-Lamar Metropolitan Planning Organization
63
Environmental Analysis and Mitigation
Project ID
Route Description Location Low
Income Minority
Populations
150 MS 589 Widen to 4 Lanes Luther Lee Rd to
US 98 No No
151 MS 589 Widen to 4 Lanes US 98 to MS 42 No No
152 Old Richton Rd Widen to 4 Lanes Evelyn Gandy Pkwy to Herrington Rd
No No
153 Springfield Rd Extension
New 2 Lane Roadway Corinth Rd to
Evelyn Gandy Pkwy No No
154 J Ed Turner Dr Extension
New 2 Lane Roadway Classic Dr to W 4th St No Yes
201 S 40th Ave Widen to 4 Lanes Lincoln Rd to
Hardy St Yes Yes
202 Western Bypass Phase III
New 4 Lane Roadway Jc Bryant Rd to I-59 No Yes
203 Oak Grove Rd Widen to 4 Lanes Old Hwy 11 to Lincoln Rd
No Yes
204 Western Beltway Phase I
New 4 Lane Roadway and Interchange Modification
Slade Rd to I-59 Yes No
205 Western Beltway Phase II
New 4 Lane Roadway MS 589 to Slade Rd No No
206 Western Beltway Phase III
New 4 Lane Roadway US 98 to MS 589 No No
207 Outer Western Bypass
Widen to 4 Lanes, New 4 Lane Roadway
US 98 to MS 42 Yes No
Source: MDOT, NSI, Minority Population Determination ACS 5-year Estimates (2014-2018)
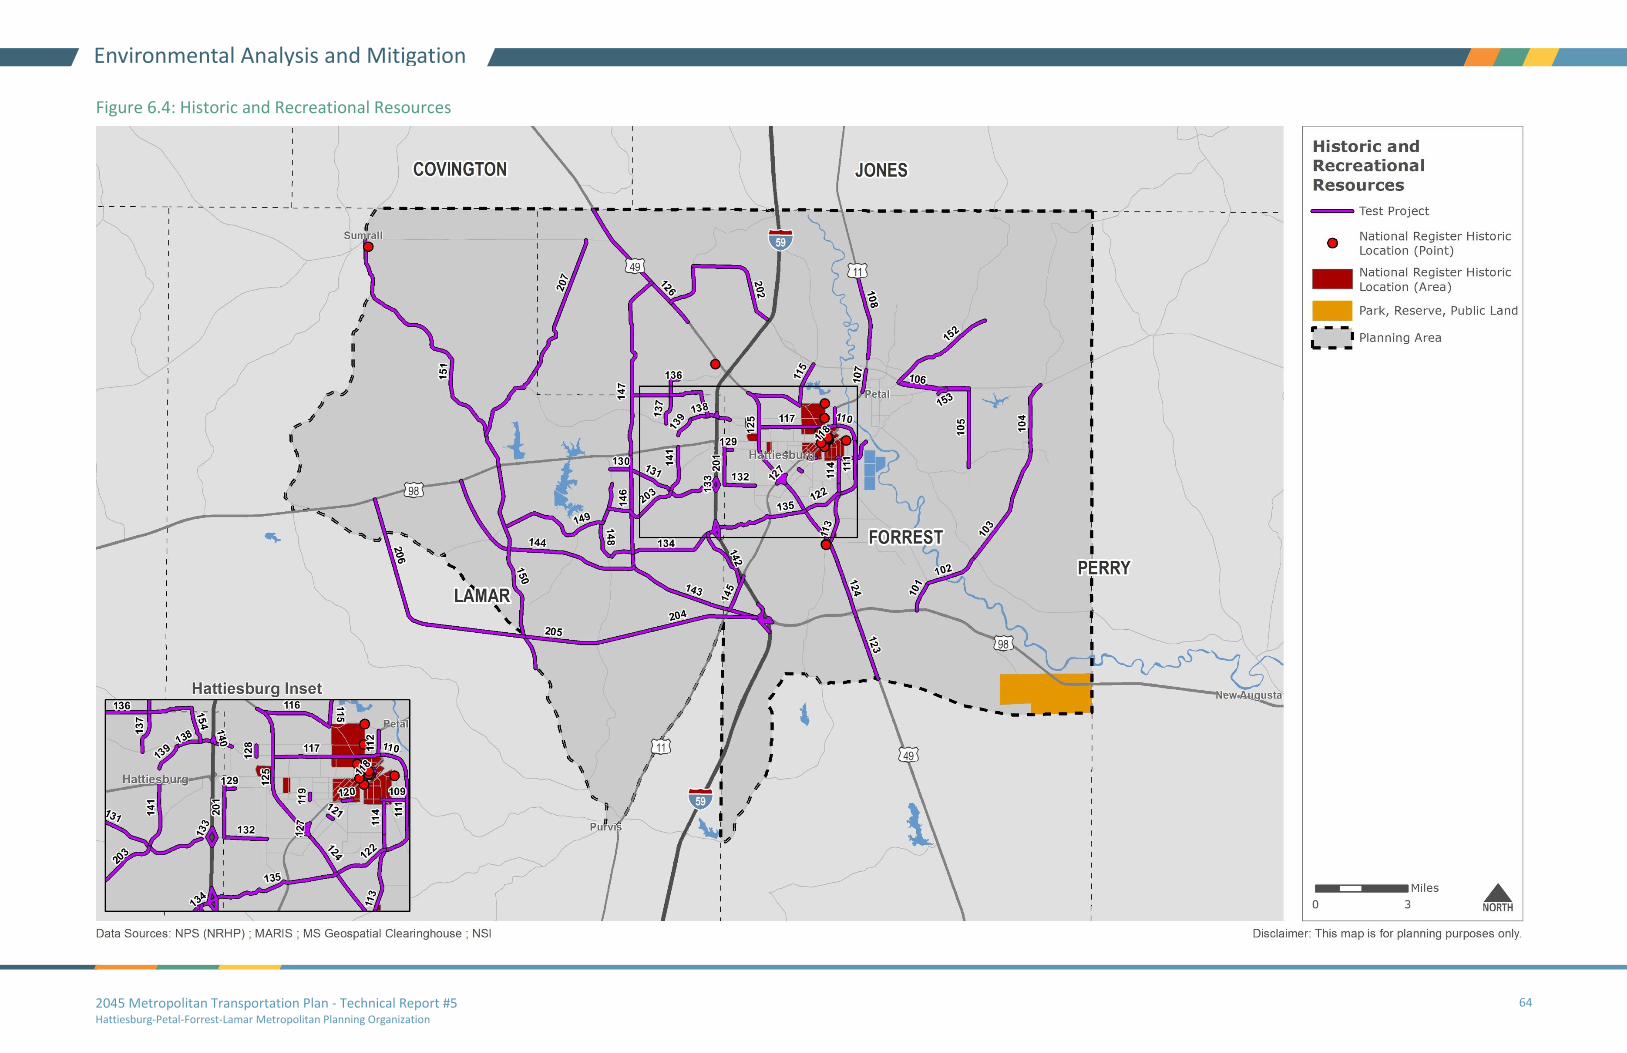
2045 Metropolitan Transportation Plan - Technical Report #5 Hattiesburg-Petal-Forrest-Lamar Metropolitan Planning Organization
64
Environmental Analysis and Mitigation
Figure 6.4: Historic and Recreational Resources
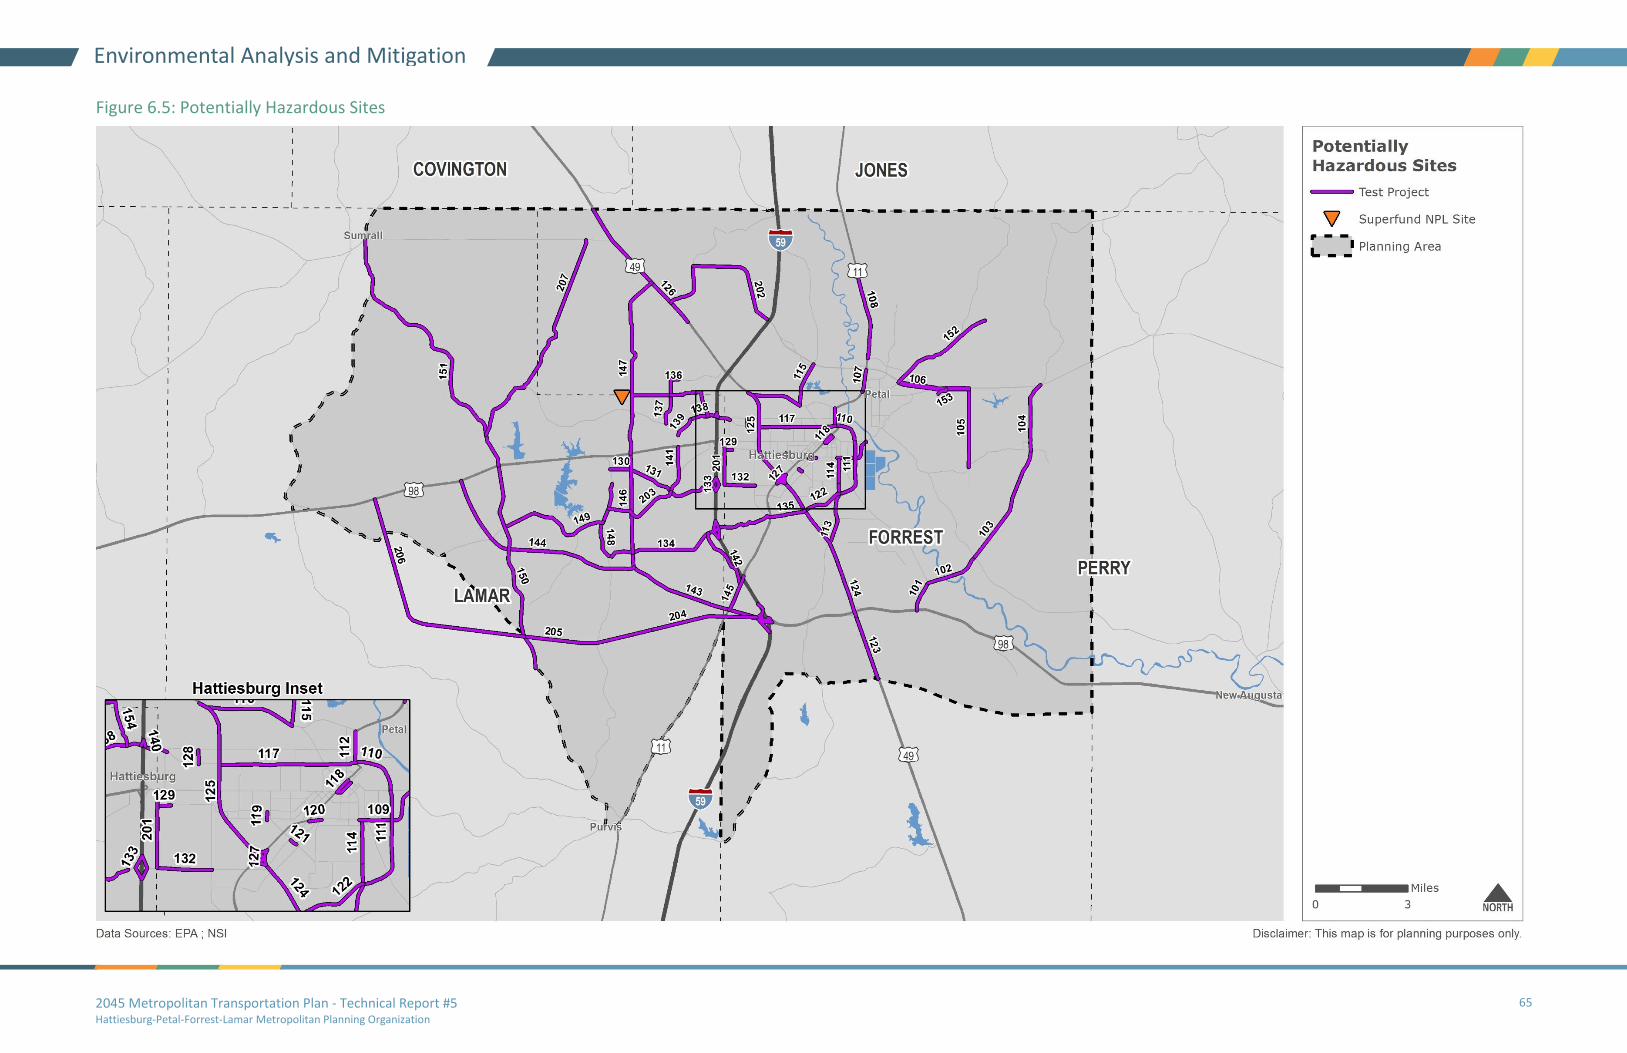
2045 Metropolitan Transportation Plan - Technical Report #5 Hattiesburg-Petal-Forrest-Lamar Metropolitan Planning Organization
65
Environmental Analysis and Mitigation
Figure 6.5: Potentially Hazardous Sites
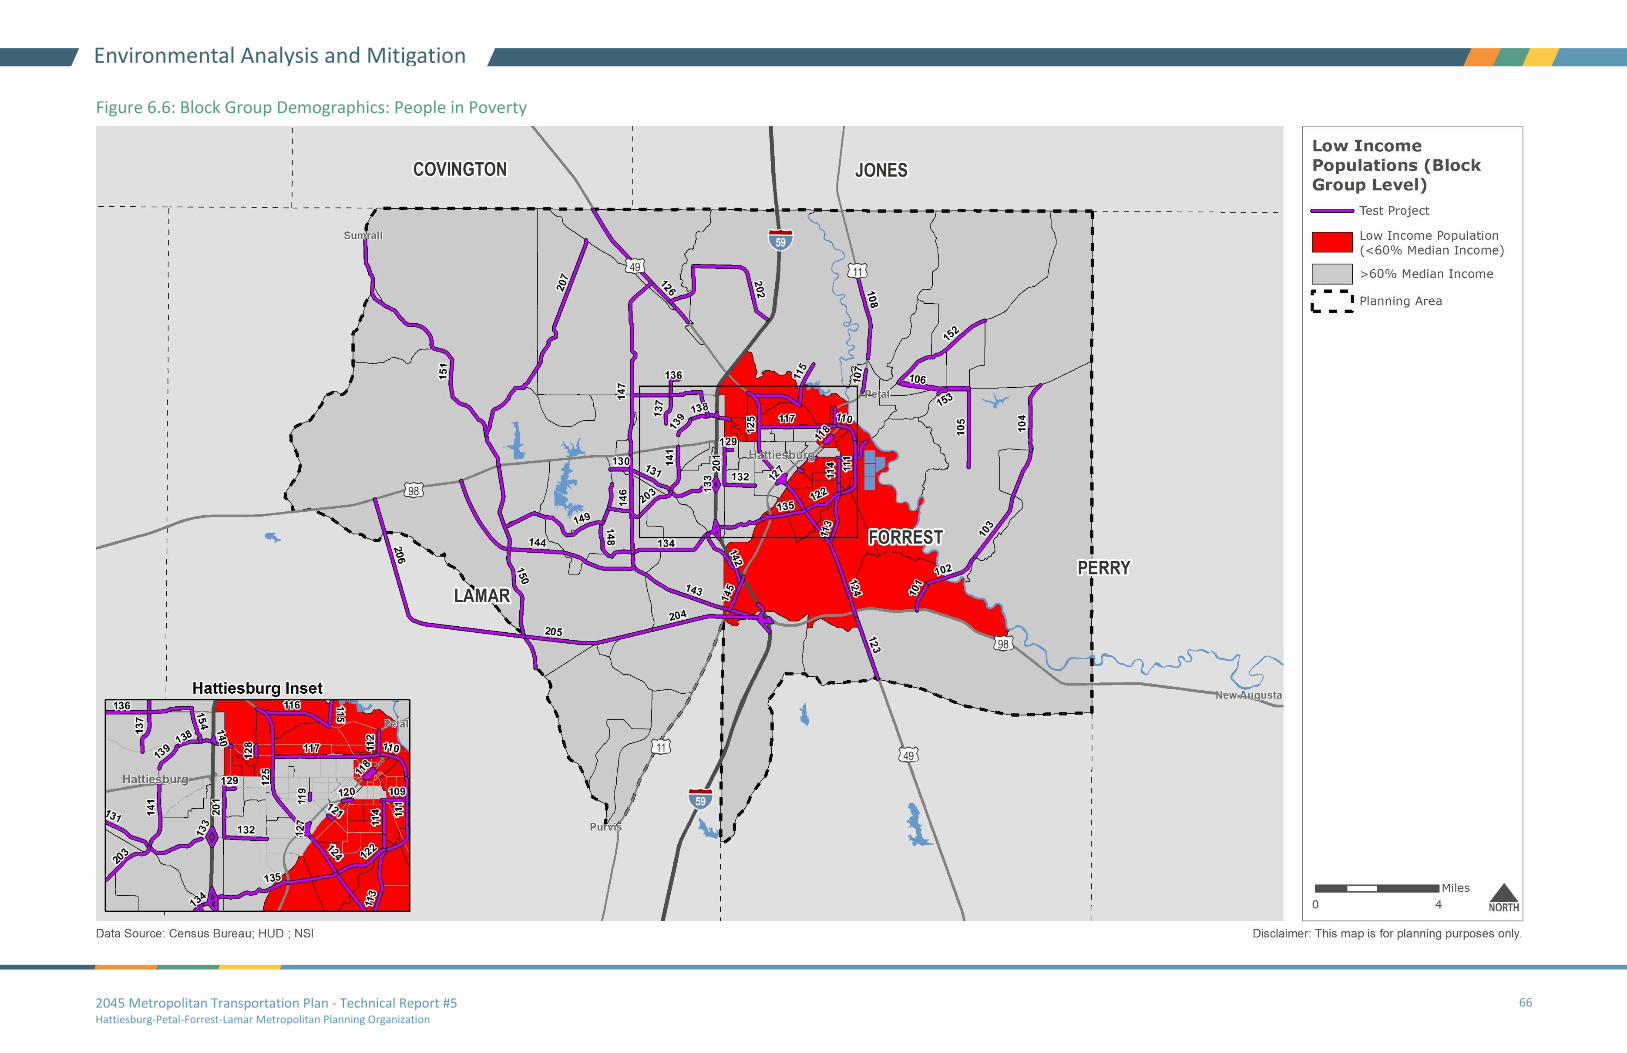
2045 Metropolitan Transportation Plan - Technical Report #5 Hattiesburg-Petal-Forrest-Lamar Metropolitan Planning Organization
66
Environmental Analysis and Mitigation
Figure 6.6: Block Group Demographics: People in Poverty
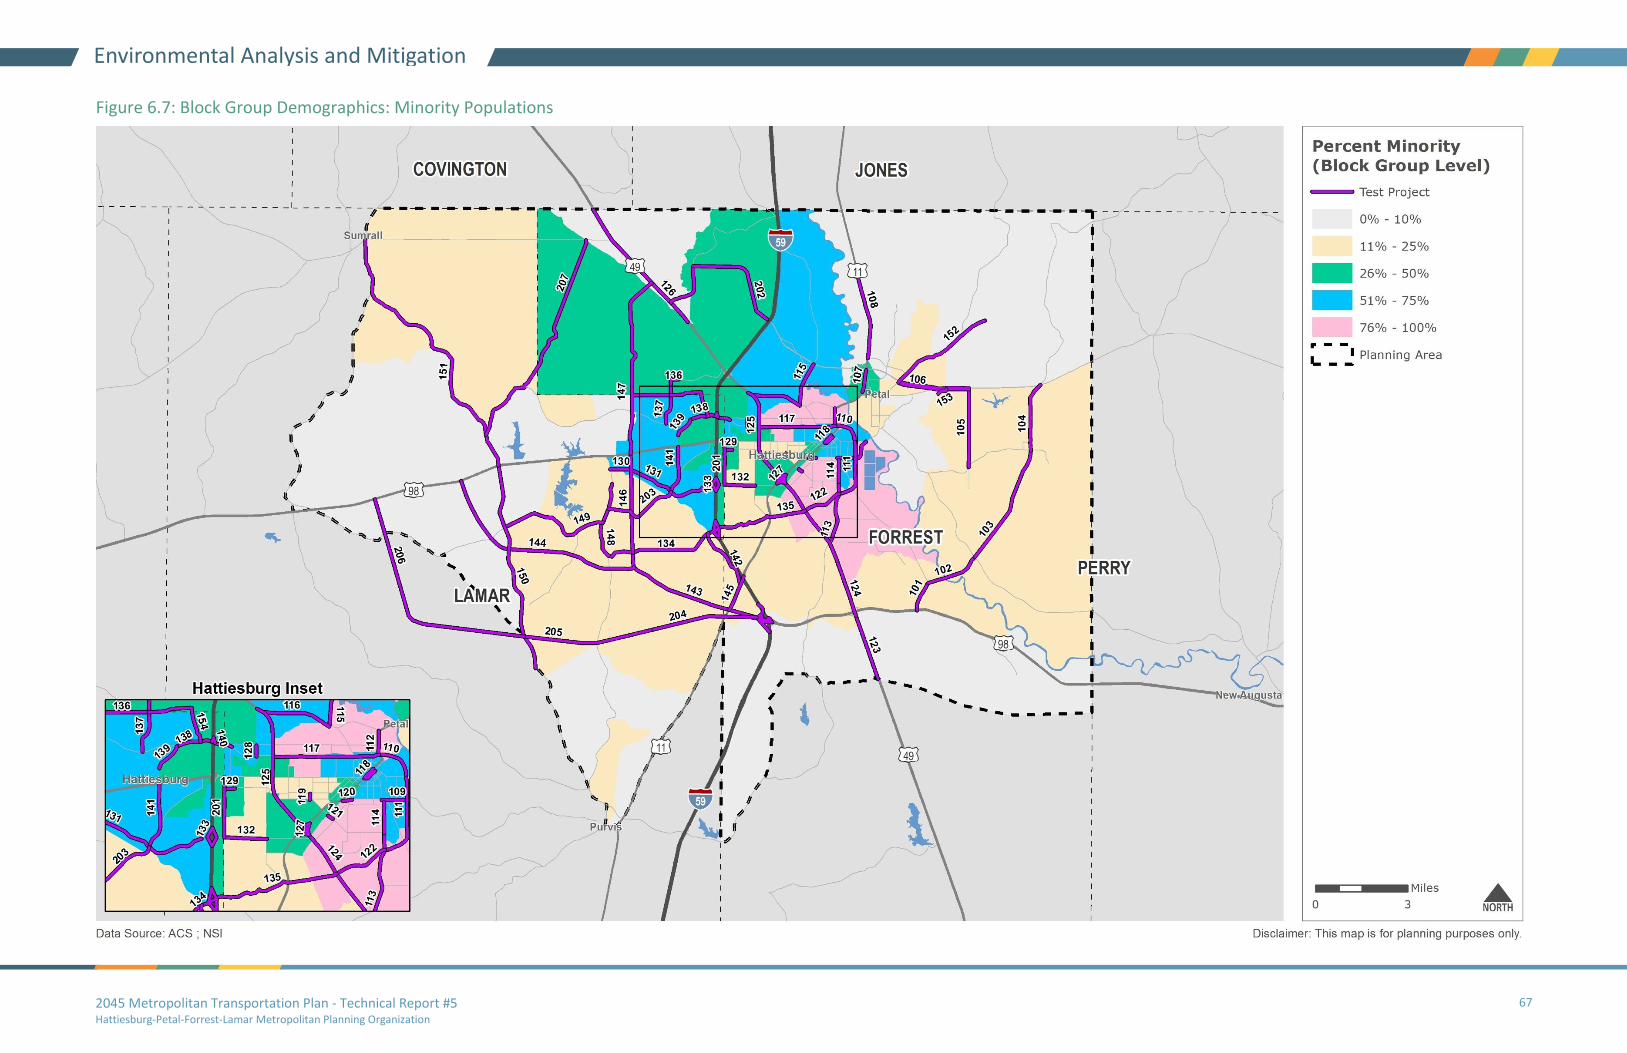
2045 Metropolitan Transportation Plan - Technical Report #5 Hattiesburg-Petal-Forrest-Lamar Metropolitan Planning Organization
67
Environmental Analysis and Mitigation
Figure 6.7: Block Group Demographics: Minority Populations
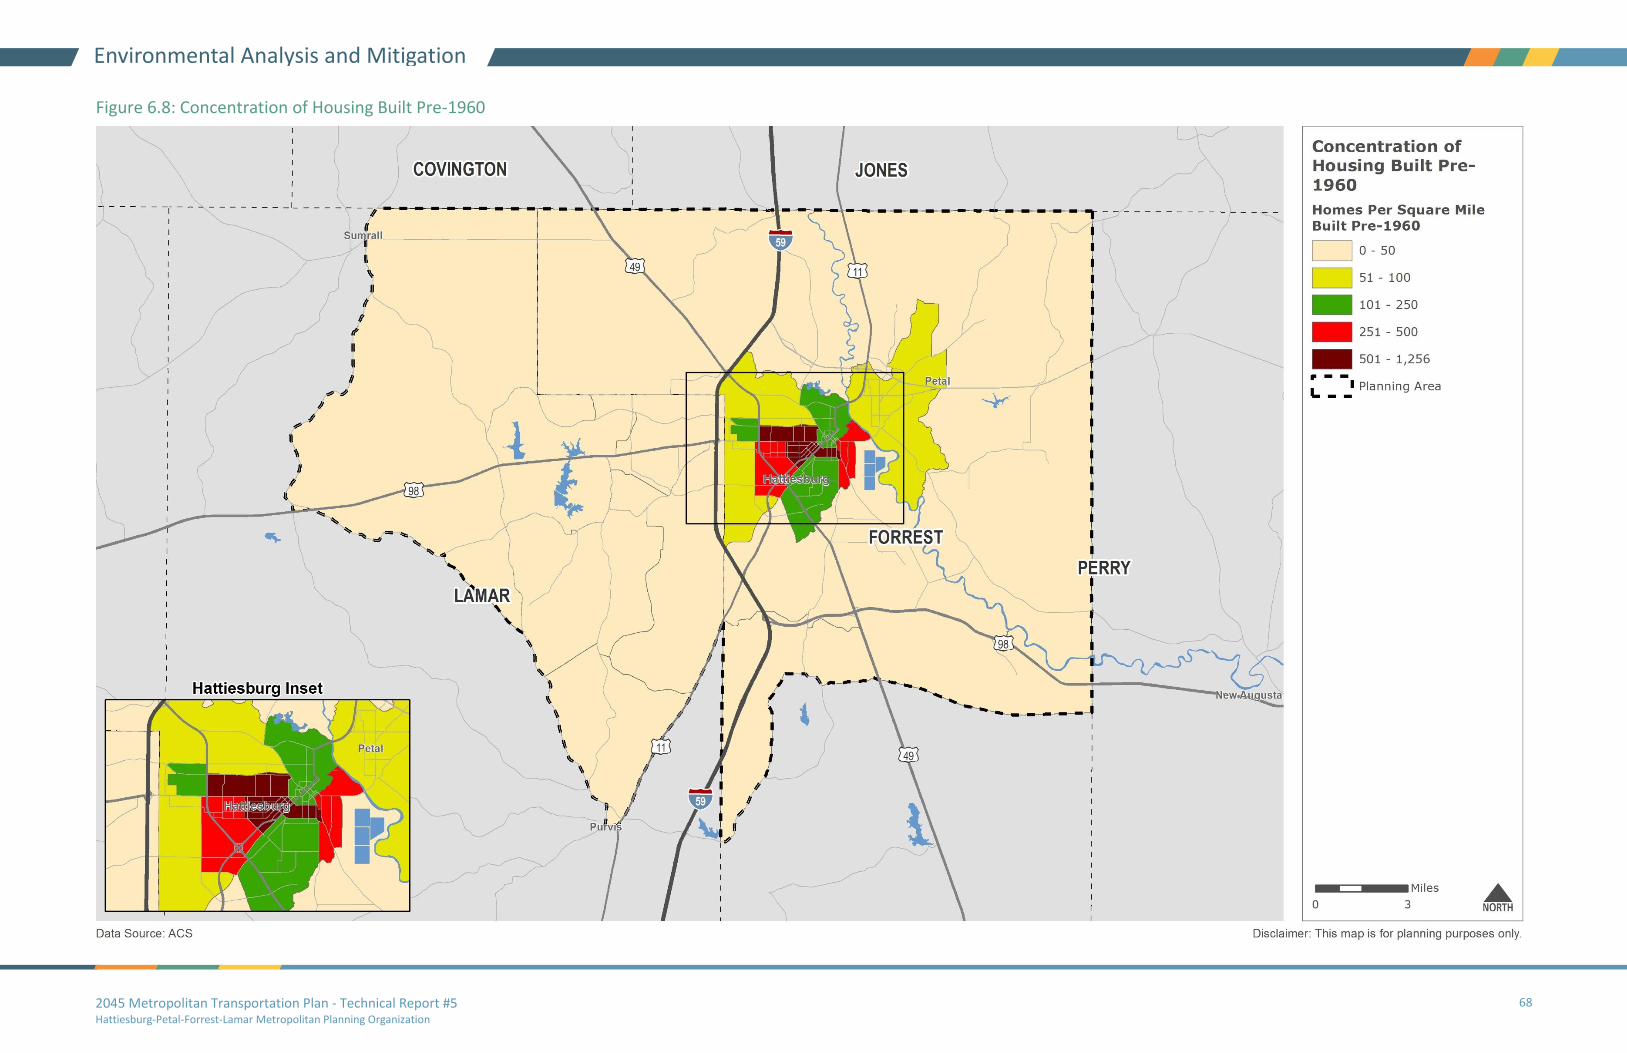
2045 Metropolitan Transportation Plan - Technical Report #5 Hattiesburg-Petal-Forrest-Lamar Metropolitan Planning Organization
68
Environmental Analysis and Mitigation
Figure 6.8: Concentration of Housing Built Pre-1960
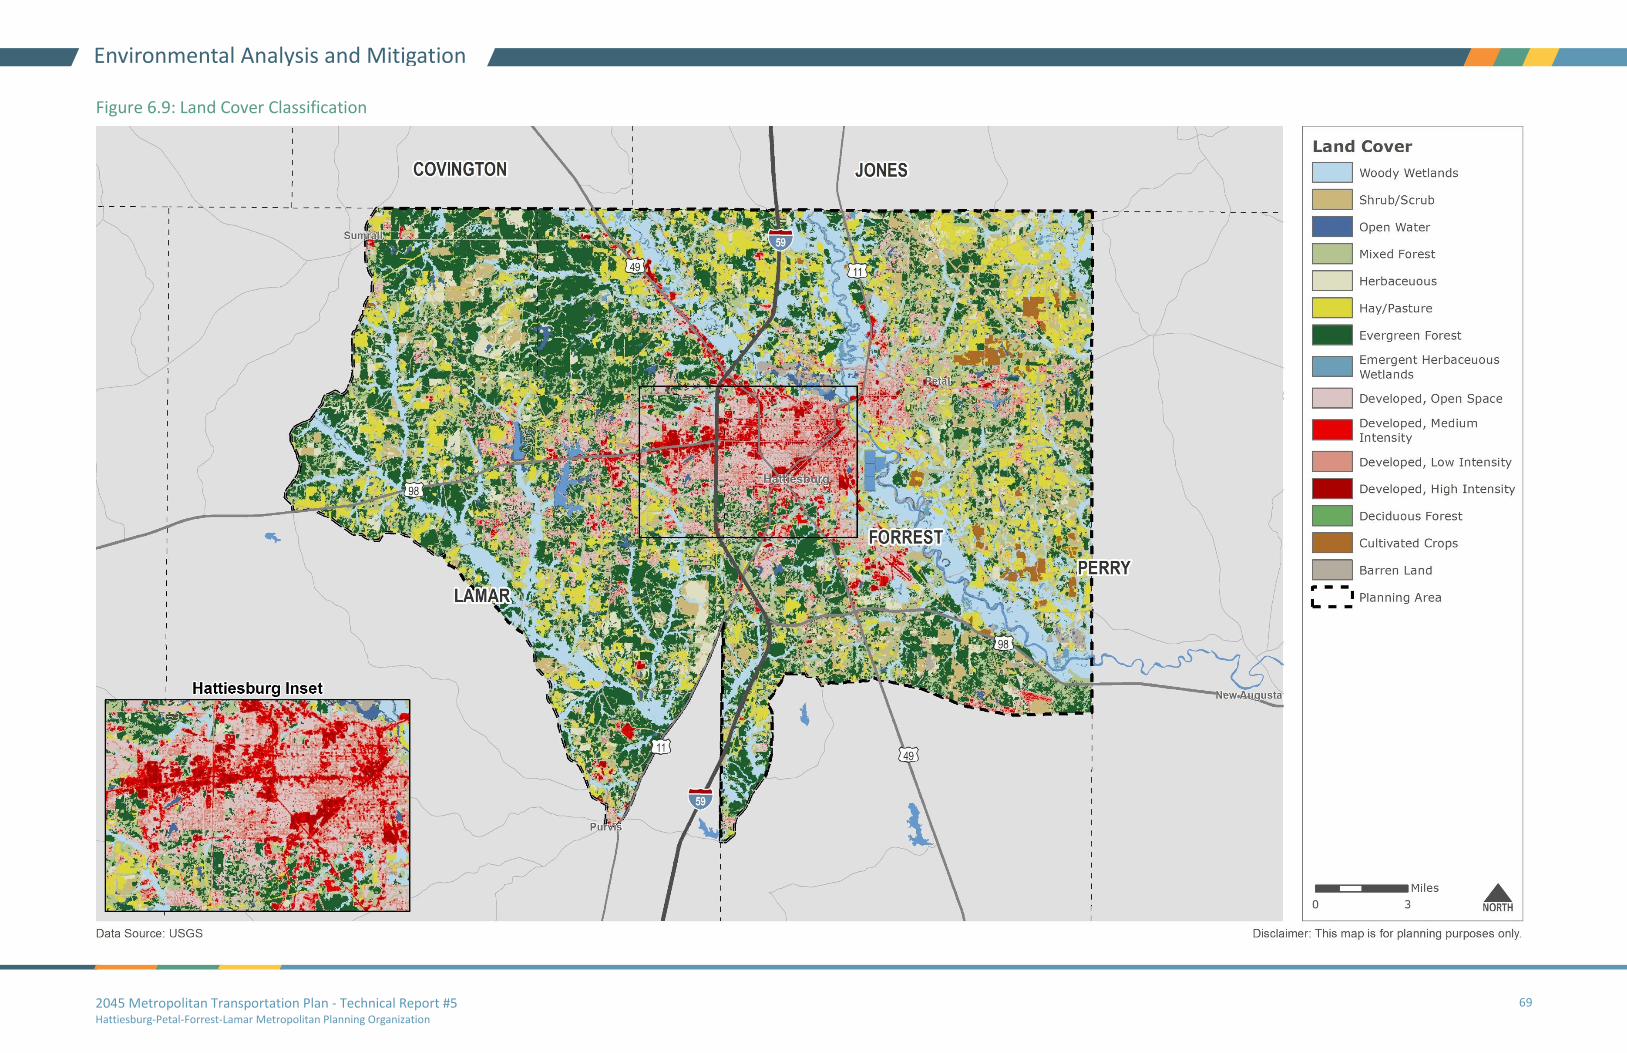
2045 Metropolitan Transportation Plan - Technical Report #5 Hattiesburg-Petal-Forrest-Lamar Metropolitan Planning Organization
69
Environmental Analysis and Mitigation
Figure 6.9: Land Cover Classification
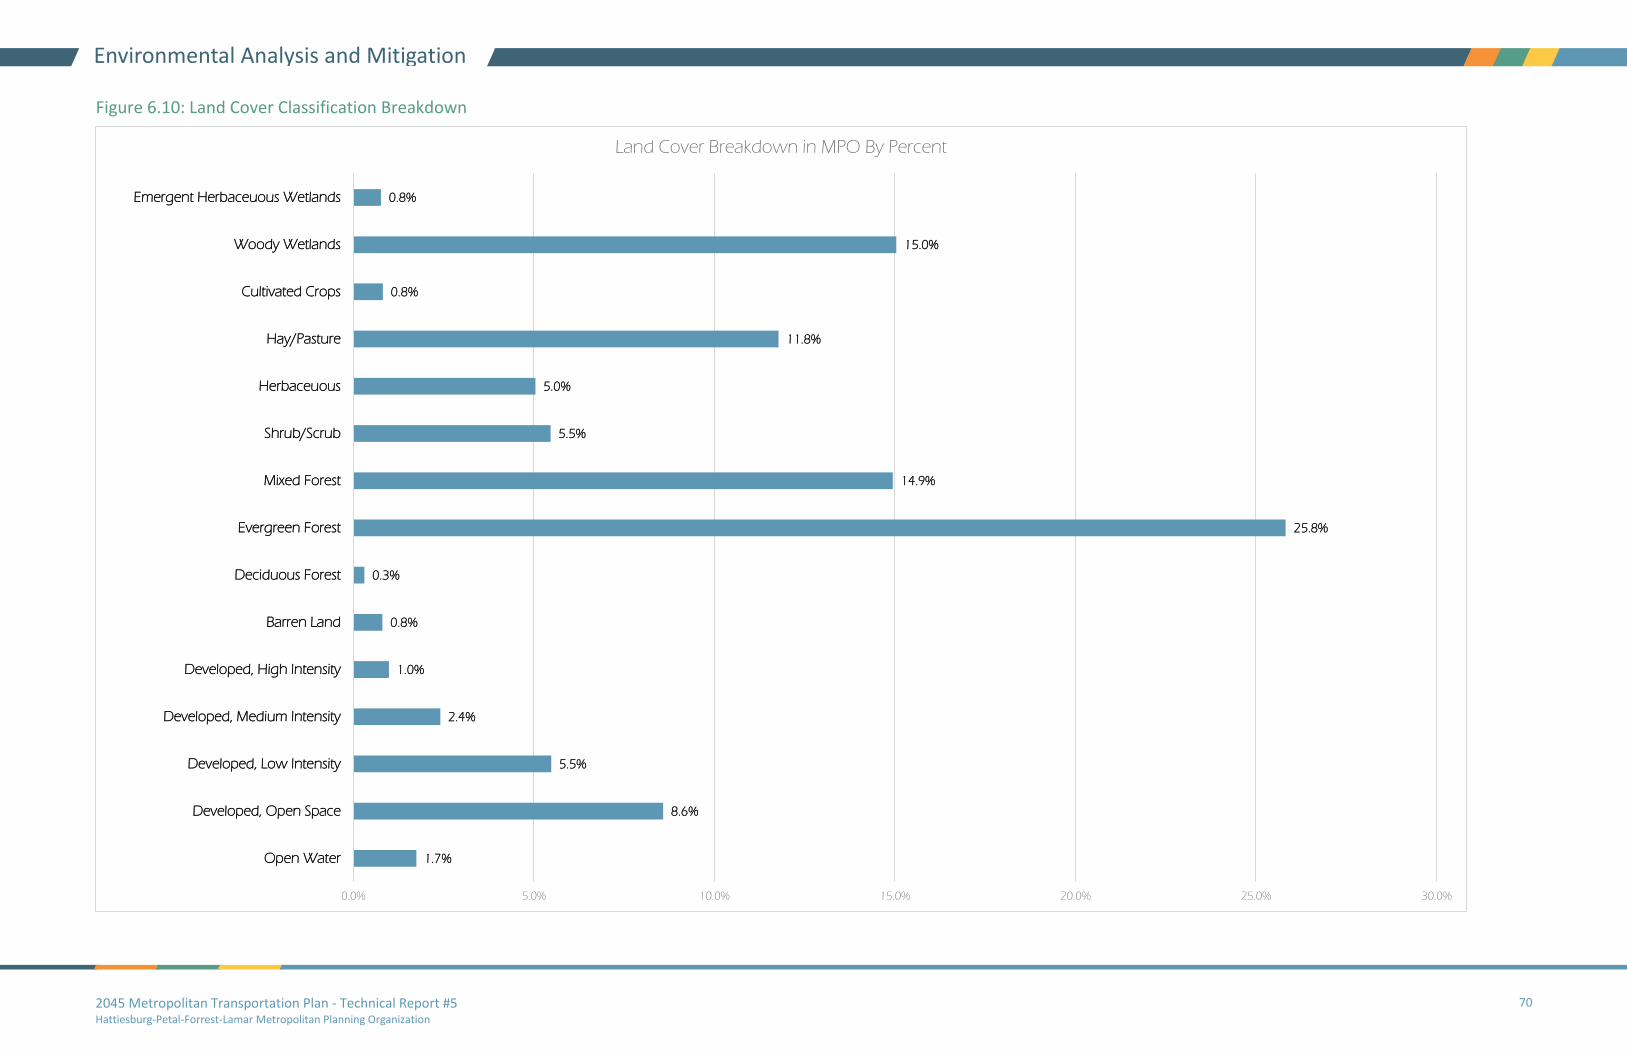
2045 Metropolitan Transportation Plan - Technical Report #5 Hattiesburg-Petal-Forrest-Lamar Metropolitan Planning Organization
70
Environmental Analysis and Mitigation
Figure 6.10: Land Cover Classification Breakdown
1.7%
8.6%
5.5%
2.4%
1.0%
0.8%
0.3%
25.8%
14.9%
5.5%
5.0%
11.8%
0.8%
15.0%
0.8%
Open Water
Developed, Open Space
Developed, Low Intensity
Developed, Medium Intensity
Developed, High Intensity
Barren Land
Deciduous Forest
Evergreen Forest
Mixed Forest
Shrub/Scrub
Herbaceuous
Hay/Pasture
Cultivated Crops
Woody Wetlands
Emergent Herbaceuous Wetlands
0.0% 5.0% 10.0% 15.0% 20.0% 25.0% 30.0%
Land Cover Breakdown in MPO By Percent
2045 Metropolitan Transportation Plan - Technical Report #5 Hattiesburg-Petal-Forrest-Lamar Metropolitan Planning Organization
71
Project Prioritization
7.0 Project Prioritization Roadway capacity projects were prioritized based on the goals and objectives stated earlier in this MTP.
Non-capacity roadway projects, such as safety and maintenance projects, were not prioritized. Instead,
the MPO will continue to identify and prioritize non-capacity projects on a regular basis with local
governments.
7.1 Roadway Capacity Project Prioritization
To maximize the amount of limited funding available within the MPA, roadway capacity projects were
prioritized. Table 7.1 shows the criteria and weights that were utilized to prioritize the identified
roadway capacity projects. This methodology is intended to support the previously stated goals and
objectives. Additionally, projects could receive up to an additional 10 points in project scoring based on
environmental mitigation and environmental justice analysis.
During the project scoring process, the MPO and the local jurisdictions were asked to provide local
priority ratings for each project, ranging from A (highest priority) to D (lowest priority). These were used
to further refine project selection for the Staged Improvement Program.
The results of this prioritization exercise are shown in Table 7.2 and illustrated in Figure 7.1.
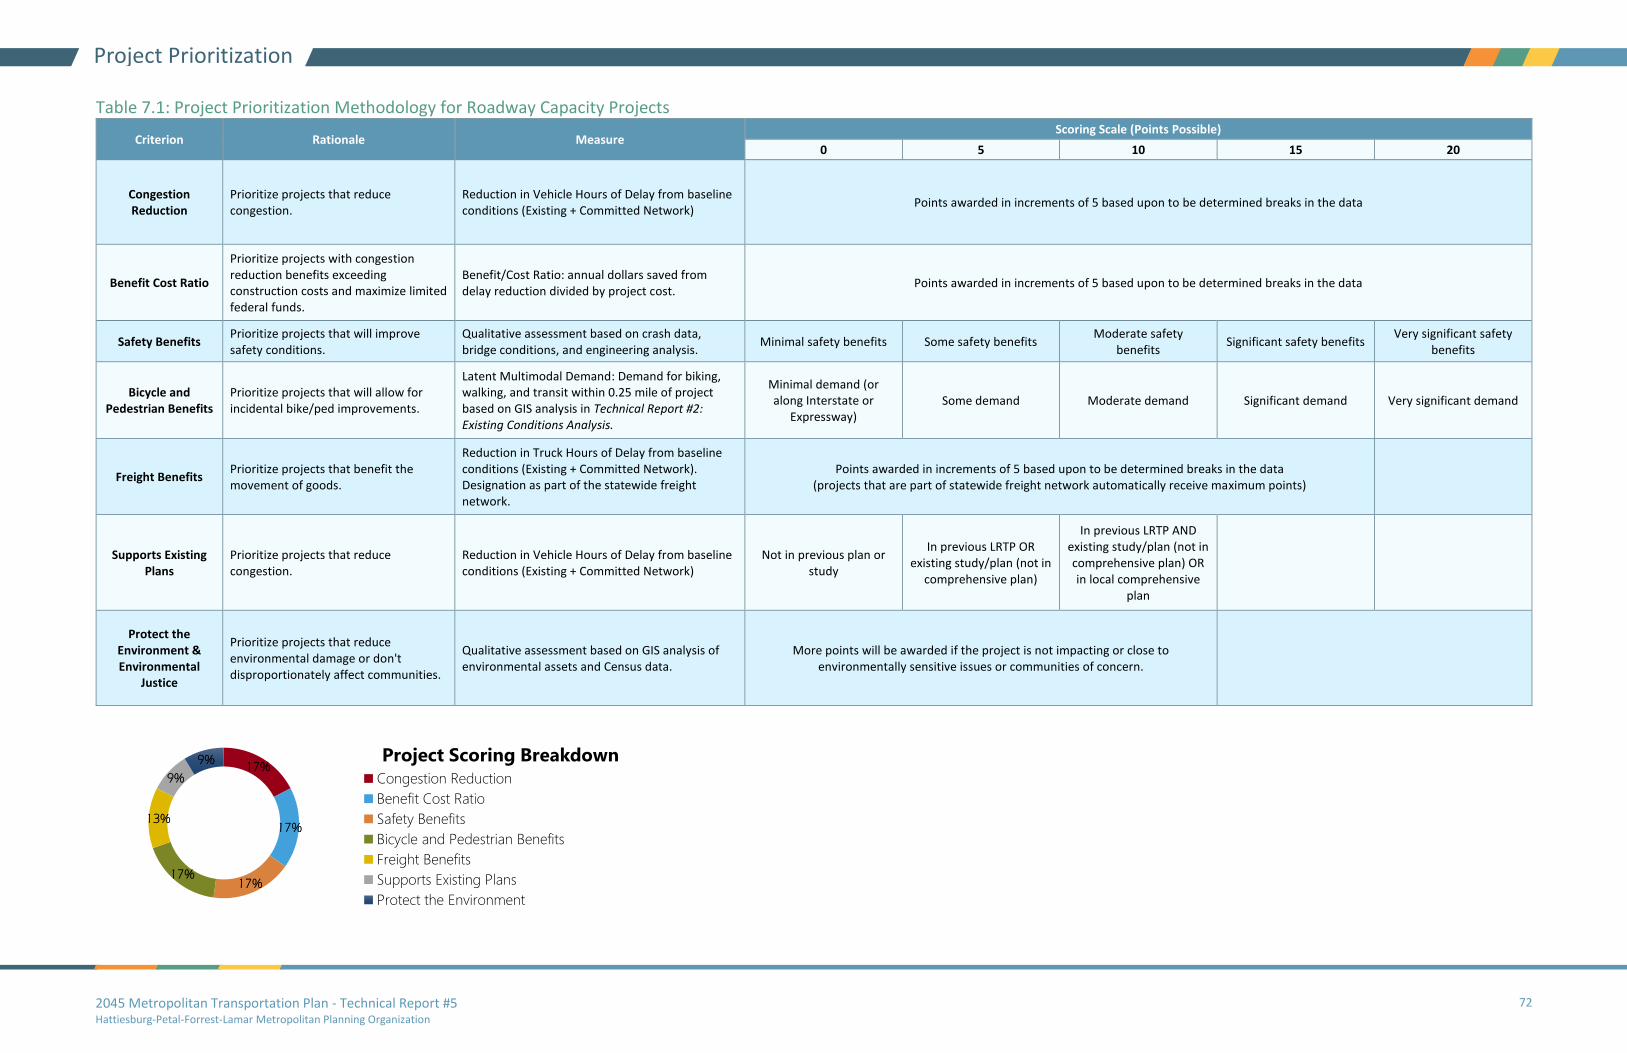
2045 Metropolitan Transportation Plan - Technical Report #5 Hattiesburg-Petal-Forrest-Lamar Metropolitan Planning Organization
72
Project Prioritization
Table 7.1: Project Prioritization Methodology for Roadway Capacity Projects
Criterion Rationale Measure Scoring Scale (Points Possible)
0 5 10 15 20
Congestion Reduction
Prioritize projects that reduce congestion.
Reduction in Vehicle Hours of Delay from baseline conditions (Existing + Committed Network)
Points awarded in increments of 5 based upon to be determined breaks in the data
Benefit Cost Ratio
Prioritize projects with congestion reduction benefits exceeding construction costs and maximize limited federal funds.
Benefit/Cost Ratio: annual dollars saved from delay reduction divided by project cost.
Points awarded in increments of 5 based upon to be determined breaks in the data
Safety Benefits Prioritize projects that will improve safety conditions.
Qualitative assessment based on crash data, bridge conditions, and engineering analysis.
Minimal safety benefits Some safety benefits Moderate safety
benefits Significant safety benefits
Very significant safety benefits
Bicycle and Pedestrian Benefits
Prioritize projects that will allow for incidental bike/ped improvements.
Latent Multimodal Demand: Demand for biking, walking, and transit within 0.25 mile of project based on GIS analysis in Technical Report #2: Existing Conditions Analysis.
Minimal demand (or along Interstate or
Expressway) Some demand Moderate demand Significant demand Very significant demand
Freight Benefits Prioritize projects that benefit the movement of goods.
Reduction in Truck Hours of Delay from baseline conditions (Existing + Committed Network). Designation as part of the statewide freight network.
Points awarded in increments of 5 based upon to be determined breaks in the data (projects that are part of statewide freight network automatically receive maximum points)
Supports Existing Plans
Prioritize projects that reduce congestion.
Reduction in Vehicle Hours of Delay from baseline conditions (Existing + Committed Network)
Not in previous plan or study
In previous LRTP OR existing study/plan (not in
comprehensive plan)
In previous LRTP AND existing study/plan (not in comprehensive plan) OR in local comprehensive
plan
Protect the Environment & Environmental
Justice
Prioritize projects that reduce environmental damage or don't disproportionately affect communities.
Qualitative assessment based on GIS analysis of environmental assets and Census data.
More points will be awarded if the project is not impacting or close to environmentally sensitive issues or communities of concern.
17%
17%
17%17%
13%
9%
9% Project Scoring Breakdown
Congestion Reduction
Benefit Cost Ratio
Safety Benefits
Bicycle and Pedestrian Benefits
Freight Benefits
Supports Existing Plans
Protect the Environment
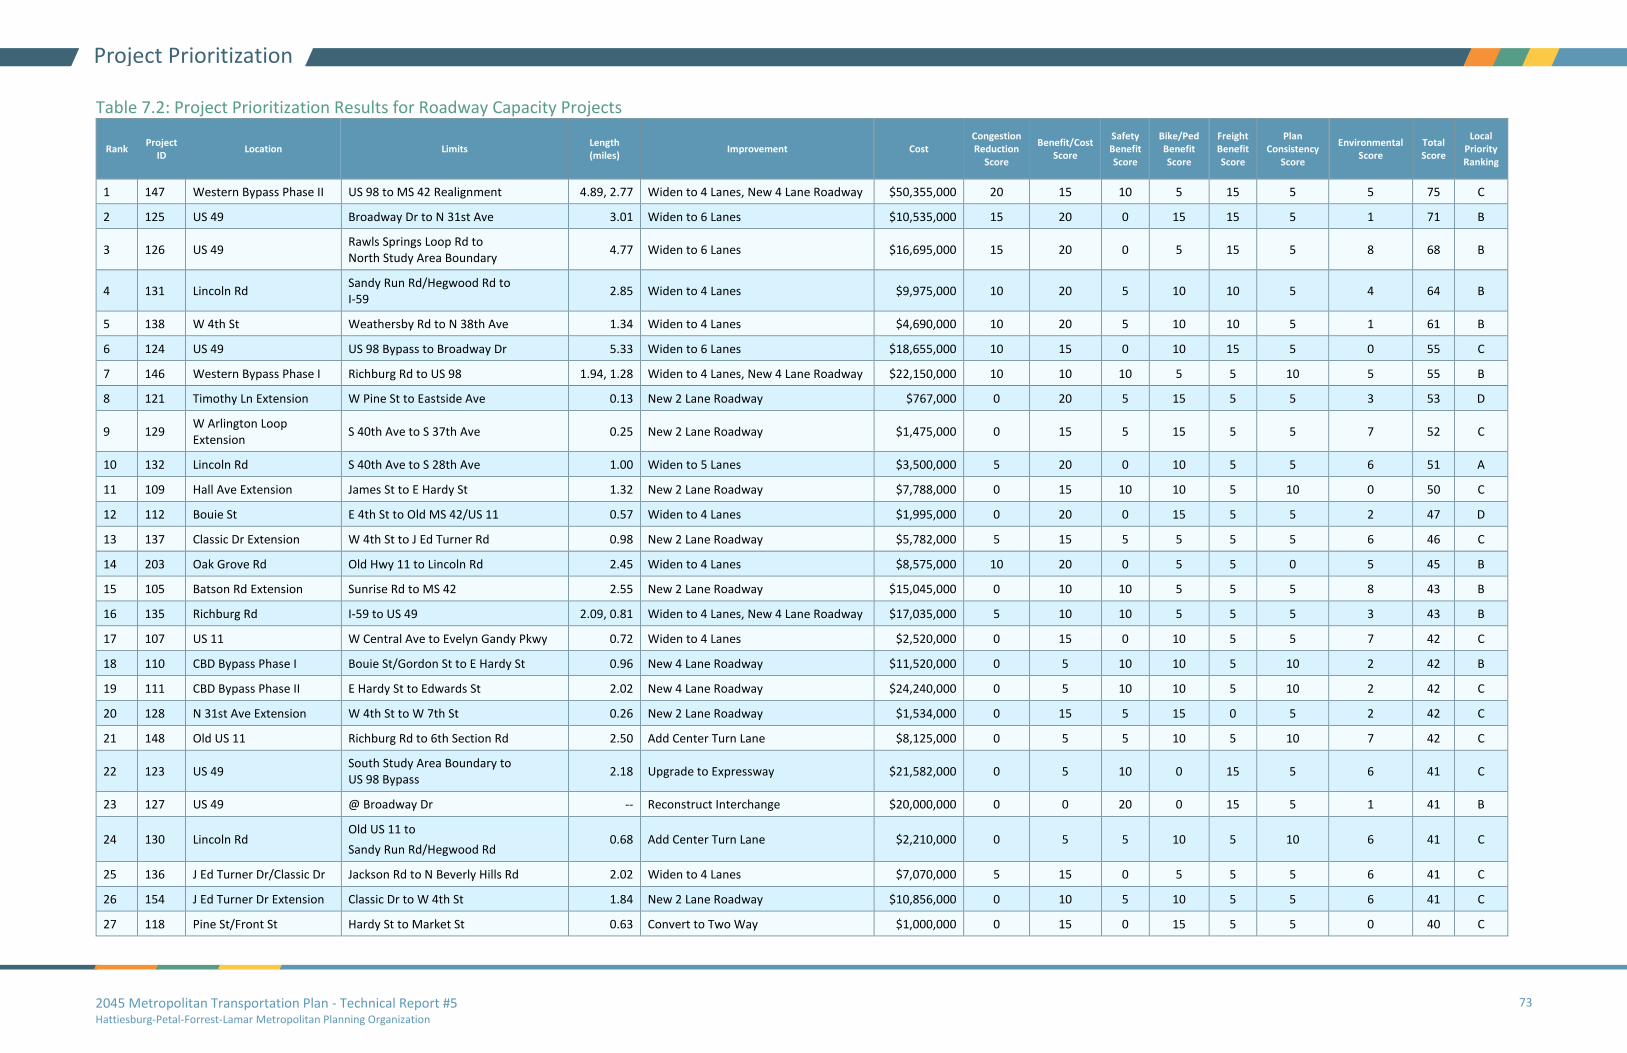
2045 Metropolitan Transportation Plan - Technical Report #5 Hattiesburg-Petal-Forrest-Lamar Metropolitan Planning Organization
73
Project Prioritization
Table 7.2: Project Prioritization Results for Roadway Capacity Projects
Rank Project
ID Location Limits
Length (miles)
Improvement Cost Congestion Reduction
Score
Benefit/Cost Score
Safety Benefit Score
Bike/Ped Benefit Score
Freight Benefit Score
Plan Consistency
Score
Environmental Score
Total Score
Local Priority Ranking
1 147 Western Bypass Phase II US 98 to MS 42 Realignment 4.89, 2.77 Widen to 4 Lanes, New 4 Lane Roadway $50,355,000 20 15 10 5 15 5 5 75 C
2 125 US 49 Broadway Dr to N 31st Ave 3.01 Widen to 6 Lanes $10,535,000 15 20 0 15 15 5 1 71 B
3 126 US 49 Rawls Springs Loop Rd to North Study Area Boundary
4.77 Widen to 6 Lanes $16,695,000 15 20 0 5 15 5 8 68 B
4 131 Lincoln Rd Sandy Run Rd/Hegwood Rd to I-59
2.85 Widen to 4 Lanes $9,975,000 10 20 5 10 10 5 4 64 B
5 138 W 4th St Weathersby Rd to N 38th Ave 1.34 Widen to 4 Lanes $4,690,000 10 20 5 10 10 5 1 61 B
6 124 US 49 US 98 Bypass to Broadway Dr 5.33 Widen to 6 Lanes $18,655,000 10 15 0 10 15 5 0 55 C
7 146 Western Bypass Phase I Richburg Rd to US 98 1.94, 1.28 Widen to 4 Lanes, New 4 Lane Roadway $22,150,000 10 10 10 5 5 10 5 55 B
8 121 Timothy Ln Extension W Pine St to Eastside Ave 0.13 New 2 Lane Roadway $767,000 0 20 5 15 5 5 3 53 D
9 129 W Arlington Loop Extension
S 40th Ave to S 37th Ave 0.25 New 2 Lane Roadway $1,475,000 0 15 5 15 5 5 7 52 C
10 132 Lincoln Rd S 40th Ave to S 28th Ave 1.00 Widen to 5 Lanes $3,500,000 5 20 0 10 5 5 6 51 A
11 109 Hall Ave Extension James St to E Hardy St 1.32 New 2 Lane Roadway $7,788,000 0 15 10 10 5 10 0 50 C
12 112 Bouie St E 4th St to Old MS 42/US 11 0.57 Widen to 4 Lanes $1,995,000 0 20 0 15 5 5 2 47 D
13 137 Classic Dr Extension W 4th St to J Ed Turner Rd 0.98 New 2 Lane Roadway $5,782,000 5 15 5 5 5 5 6 46 C
14 203 Oak Grove Rd Old Hwy 11 to Lincoln Rd 2.45 Widen to 4 Lanes $8,575,000 10 20 0 5 5 0 5 45 B
15 105 Batson Rd Extension Sunrise Rd to MS 42 2.55 New 2 Lane Roadway $15,045,000 0 10 10 5 5 5 8 43 B
16 135 Richburg Rd I-59 to US 49 2.09, 0.81 Widen to 4 Lanes, New 4 Lane Roadway $17,035,000 5 10 10 5 5 5 3 43 B
17 107 US 11 W Central Ave to Evelyn Gandy Pkwy 0.72 Widen to 4 Lanes $2,520,000 0 15 0 10 5 5 7 42 C
18 110 CBD Bypass Phase I Bouie St/Gordon St to E Hardy St 0.96 New 4 Lane Roadway $11,520,000 0 5 10 10 5 10 2 42 B
19 111 CBD Bypass Phase II E Hardy St to Edwards St 2.02 New 4 Lane Roadway $24,240,000 0 5 10 10 5 10 2 42 C
20 128 N 31st Ave Extension W 4th St to W 7th St 0.26 New 2 Lane Roadway $1,534,000 0 15 5 15 0 5 2 42 C
21 148 Old US 11 Richburg Rd to 6th Section Rd 2.50 Add Center Turn Lane $8,125,000 0 5 5 10 5 10 7 42 C
22 123 US 49 South Study Area Boundary to US 98 Bypass
2.18 Upgrade to Expressway $21,582,000 0 5 10 0 15 5 6 41 C
23 127 US 49 @ Broadway Dr -- Reconstruct Interchange $20,000,000 0 0 20 0 15 5 1 41 B
24 130 Lincoln Rd Old US 11 to
Sandy Run Rd/Hegwood Rd 0.68 Add Center Turn Lane $2,210,000 0 5 5 10 5 10 6 41 C
25 136 J Ed Turner Dr/Classic Dr Jackson Rd to N Beverly Hills Rd 2.02 Widen to 4 Lanes $7,070,000 5 15 0 5 5 5 6 41 C
26 154 J Ed Turner Dr Extension Classic Dr to W 4th St 1.84 New 2 Lane Roadway $10,856,000 0 10 5 10 5 5 6 41 C
27 118 Pine St/Front St Hardy St to Market St 0.63 Convert to Two Way $1,000,000 0 15 0 15 5 5 0 40 C
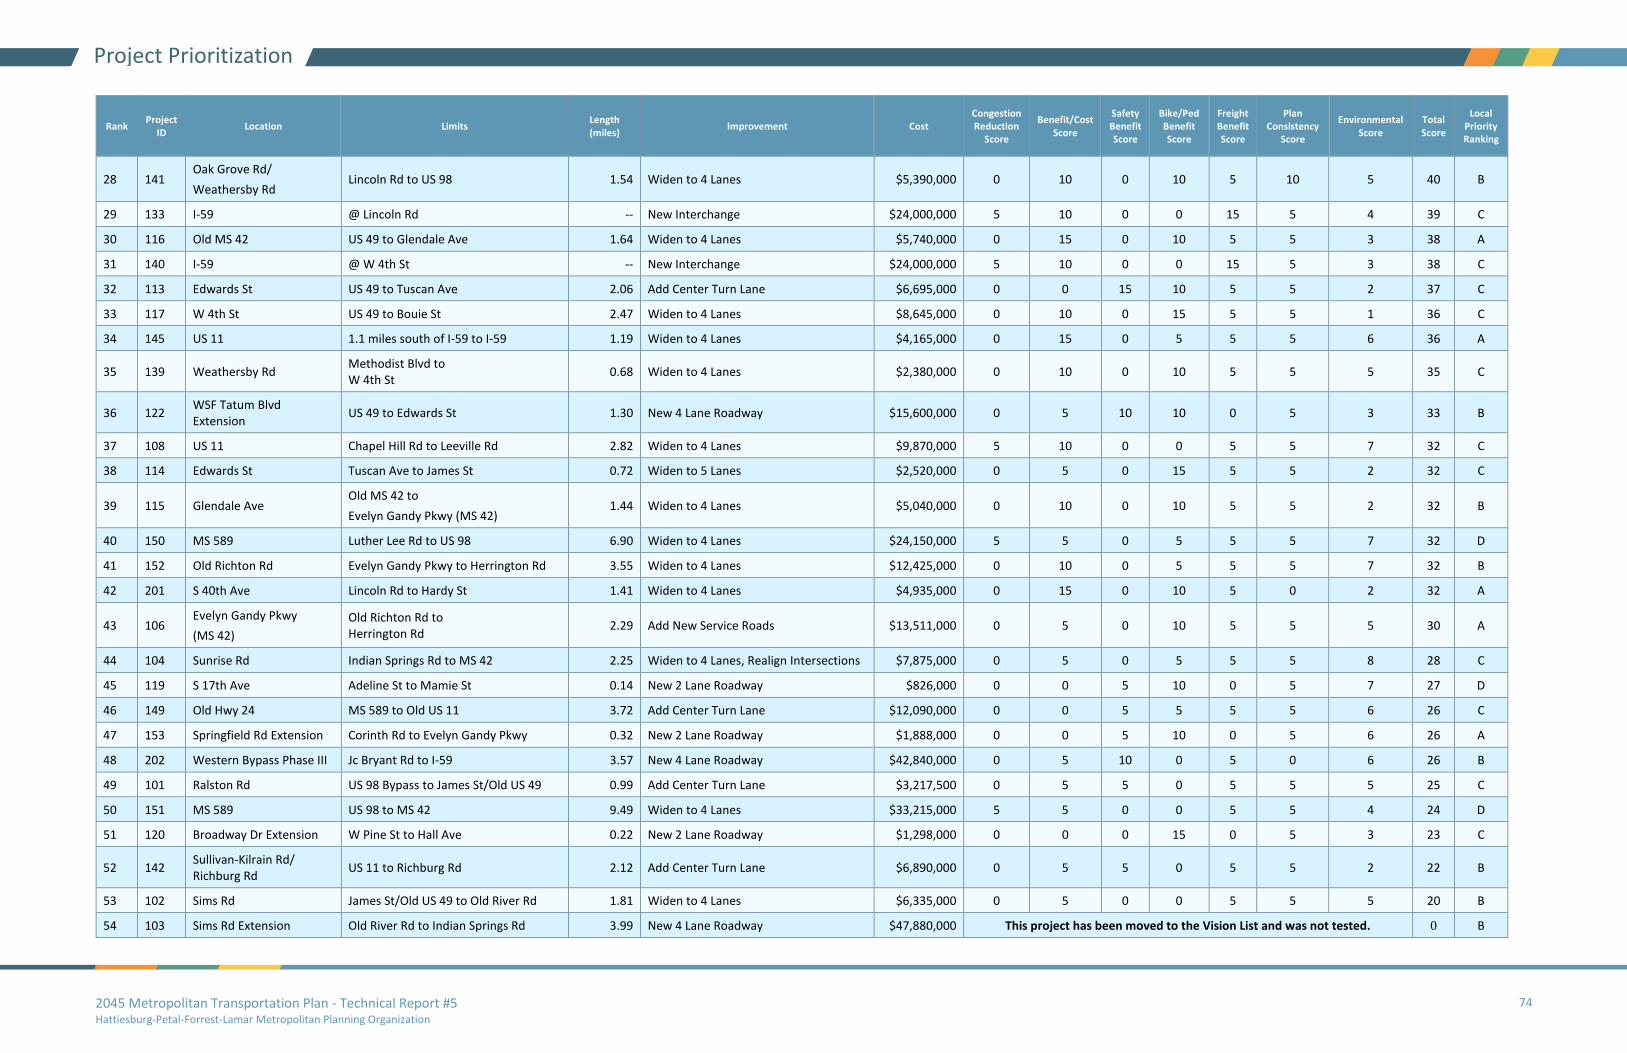
2045 Metropolitan Transportation Plan - Technical Report #5 Hattiesburg-Petal-Forrest-Lamar Metropolitan Planning Organization
74
Project Prioritization
Rank Project
ID Location Limits
Length (miles)
Improvement Cost Congestion Reduction
Score
Benefit/Cost Score
Safety Benefit Score
Bike/Ped Benefit Score
Freight Benefit Score
Plan Consistency
Score
Environmental Score
Total Score
Local Priority Ranking
28 141 Oak Grove Rd/
Weathersby Rd Lincoln Rd to US 98 1.54 Widen to 4 Lanes $5,390,000 0 10 0 10 5 10 5 40 B
29 133 I-59 @ Lincoln Rd -- New Interchange $24,000,000 5 10 0 0 15 5 4 39 C
30 116 Old MS 42 US 49 to Glendale Ave 1.64 Widen to 4 Lanes $5,740,000 0 15 0 10 5 5 3 38 A
31 140 I-59 @ W 4th St -- New Interchange $24,000,000 5 10 0 0 15 5 3 38 C
32 113 Edwards St US 49 to Tuscan Ave 2.06 Add Center Turn Lane $6,695,000 0 0 15 10 5 5 2 37 C
33 117 W 4th St US 49 to Bouie St 2.47 Widen to 4 Lanes $8,645,000 0 10 0 15 5 5 1 36 C
34 145 US 11 1.1 miles south of I-59 to I-59 1.19 Widen to 4 Lanes $4,165,000 0 15 0 5 5 5 6 36 A
35 139 Weathersby Rd Methodist Blvd to W 4th St
0.68 Widen to 4 Lanes $2,380,000 0 10 0 10 5 5 5 35 C
36 122 WSF Tatum Blvd Extension
US 49 to Edwards St 1.30 New 4 Lane Roadway $15,600,000 0 5 10 10 0 5 3 33 B
37 108 US 11 Chapel Hill Rd to Leeville Rd 2.82 Widen to 4 Lanes $9,870,000 5 10 0 0 5 5 7 32 C
38 114 Edwards St Tuscan Ave to James St 0.72 Widen to 5 Lanes $2,520,000 0 5 0 15 5 5 2 32 C
39 115 Glendale Ave Old MS 42 to
Evelyn Gandy Pkwy (MS 42) 1.44 Widen to 4 Lanes $5,040,000 0 10 0 10 5 5 2 32 B
40 150 MS 589 Luther Lee Rd to US 98 6.90 Widen to 4 Lanes $24,150,000 5 5 0 5 5 5 7 32 D
41 152 Old Richton Rd Evelyn Gandy Pkwy to Herrington Rd 3.55 Widen to 4 Lanes $12,425,000 0 10 0 5 5 5 7 32 B
42 201 S 40th Ave Lincoln Rd to Hardy St 1.41 Widen to 4 Lanes $4,935,000 0 15 0 10 5 0 2 32 A
43 106 Evelyn Gandy Pkwy
(MS 42)
Old Richton Rd to Herrington Rd
2.29 Add New Service Roads $13,511,000 0 5 0 10 5 5 5 30 A
44 104 Sunrise Rd Indian Springs Rd to MS 42 2.25 Widen to 4 Lanes, Realign Intersections $7,875,000 0 5 0 5 5 5 8 28 C
45 119 S 17th Ave Adeline St to Mamie St 0.14 New 2 Lane Roadway $826,000 0 0 5 10 0 5 7 27 D
46 149 Old Hwy 24 MS 589 to Old US 11 3.72 Add Center Turn Lane $12,090,000 0 0 5 5 5 5 6 26 C
47 153 Springfield Rd Extension Corinth Rd to Evelyn Gandy Pkwy 0.32 New 2 Lane Roadway $1,888,000 0 0 5 10 0 5 6 26 A
48 202 Western Bypass Phase III Jc Bryant Rd to I-59 3.57 New 4 Lane Roadway $42,840,000 0 5 10 0 5 0 6 26 B
49 101 Ralston Rd US 98 Bypass to James St/Old US 49 0.99 Add Center Turn Lane $3,217,500 0 5 5 0 5 5 5 25 C
50 151 MS 589 US 98 to MS 42 9.49 Widen to 4 Lanes $33,215,000 5 5 0 0 5 5 4 24 D
51 120 Broadway Dr Extension W Pine St to Hall Ave 0.22 New 2 Lane Roadway $1,298,000 0 0 0 15 0 5 3 23 C
52 142 Sullivan-Kilrain Rd/ Richburg Rd
US 11 to Richburg Rd 2.12 Add Center Turn Lane $6,890,000 0 5 5 0 5 5 2 22 B
53 102 Sims Rd James St/Old US 49 to Old River Rd 1.81 Widen to 4 Lanes $6,335,000 0 5 0 0 5 5 5 20 B
54 103 Sims Rd Extension Old River Rd to Indian Springs Rd 3.99 New 4 Lane Roadway $47,880,000 This project has been moved to the Vision List and was not tested. 0 B
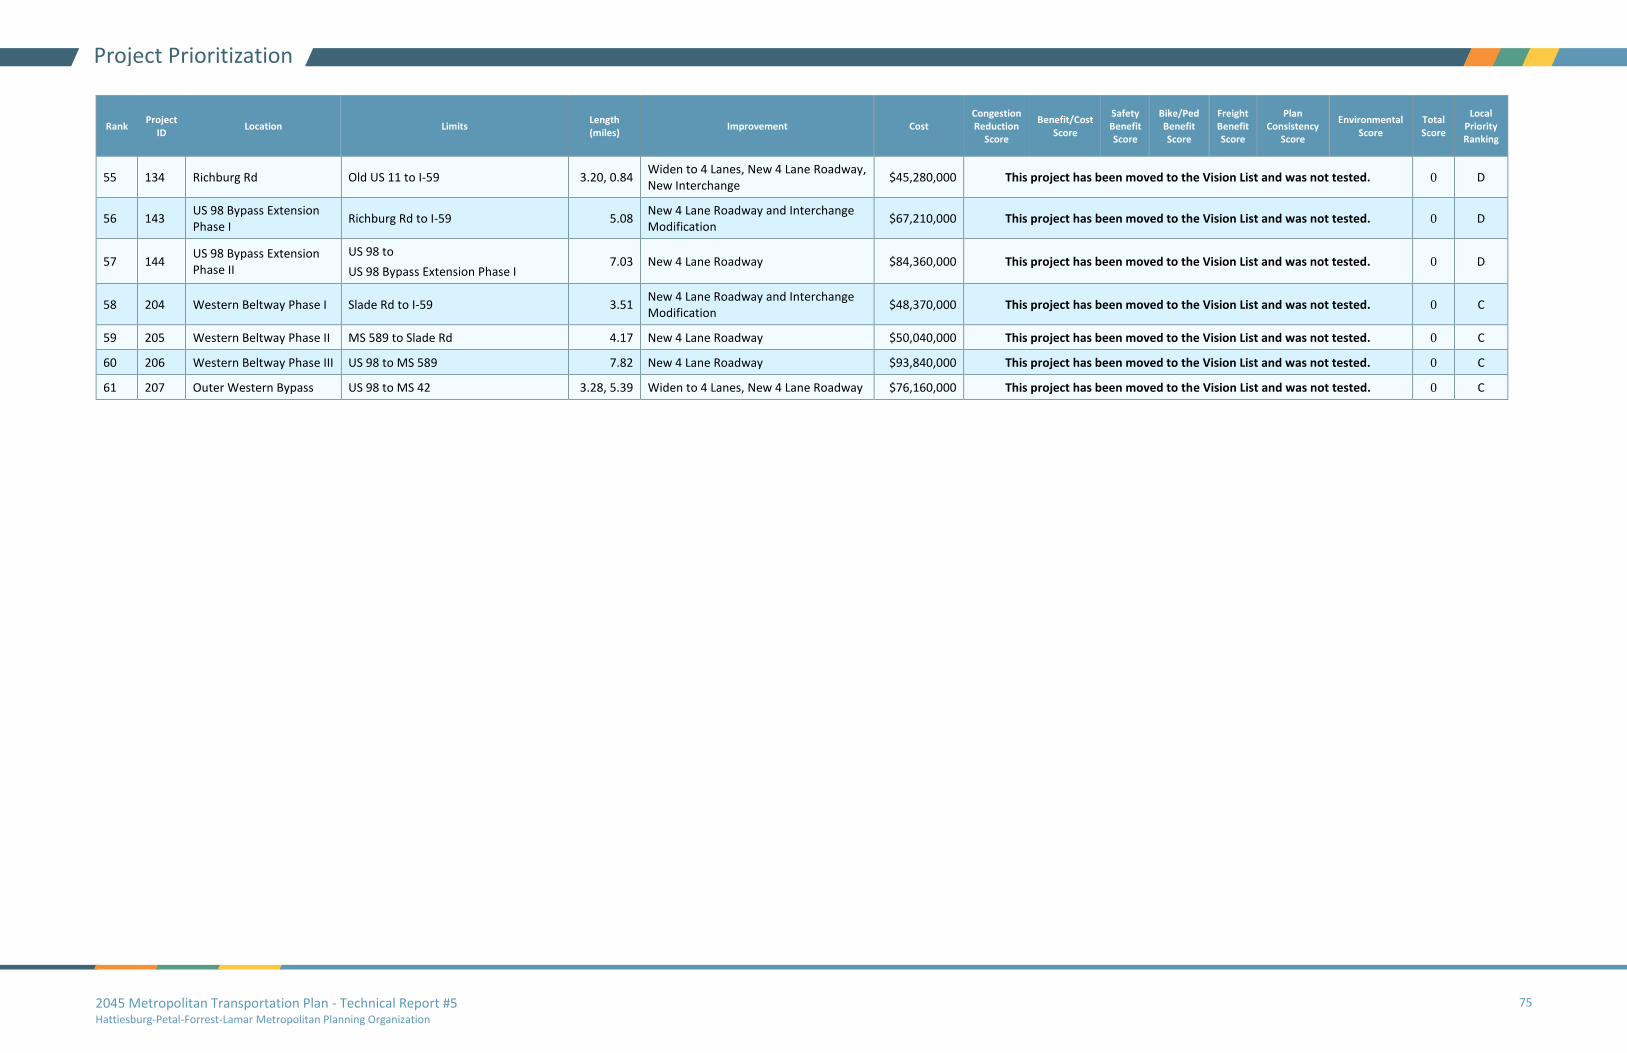
2045 Metropolitan Transportation Plan - Technical Report #5 Hattiesburg-Petal-Forrest-Lamar Metropolitan Planning Organization
75
Project Prioritization
Rank Project
ID Location Limits
Length (miles)
Improvement Cost Congestion Reduction
Score
Benefit/Cost Score
Safety Benefit Score
Bike/Ped Benefit Score
Freight Benefit Score
Plan Consistency
Score
Environmental Score
Total Score
Local Priority Ranking
55 134 Richburg Rd Old US 11 to I-59 3.20, 0.84 Widen to 4 Lanes, New 4 Lane Roadway, New Interchange
$45,280,000 This project has been moved to the Vision List and was not tested. 0 D
56 143 US 98 Bypass Extension Phase I
Richburg Rd to I-59 5.08 New 4 Lane Roadway and Interchange Modification
$67,210,000 This project has been moved to the Vision List and was not tested. 0 D
57 144 US 98 Bypass Extension Phase II
US 98 to
US 98 Bypass Extension Phase I 7.03 New 4 Lane Roadway $84,360,000 This project has been moved to the Vision List and was not tested. 0 D
58 204 Western Beltway Phase I Slade Rd to I-59 3.51 New 4 Lane Roadway and Interchange Modification
$48,370,000 This project has been moved to the Vision List and was not tested. 0 C
59 205 Western Beltway Phase II MS 589 to Slade Rd 4.17 New 4 Lane Roadway $50,040,000 This project has been moved to the Vision List and was not tested. 0 C
60 206 Western Beltway Phase III US 98 to MS 589 7.82 New 4 Lane Roadway $93,840,000 This project has been moved to the Vision List and was not tested. 0 C
61 207 Outer Western Bypass US 98 to MS 42 3.28, 5.39 Widen to 4 Lanes, New 4 Lane Roadway $76,160,000 This project has been moved to the Vision List and was not tested. 0 C
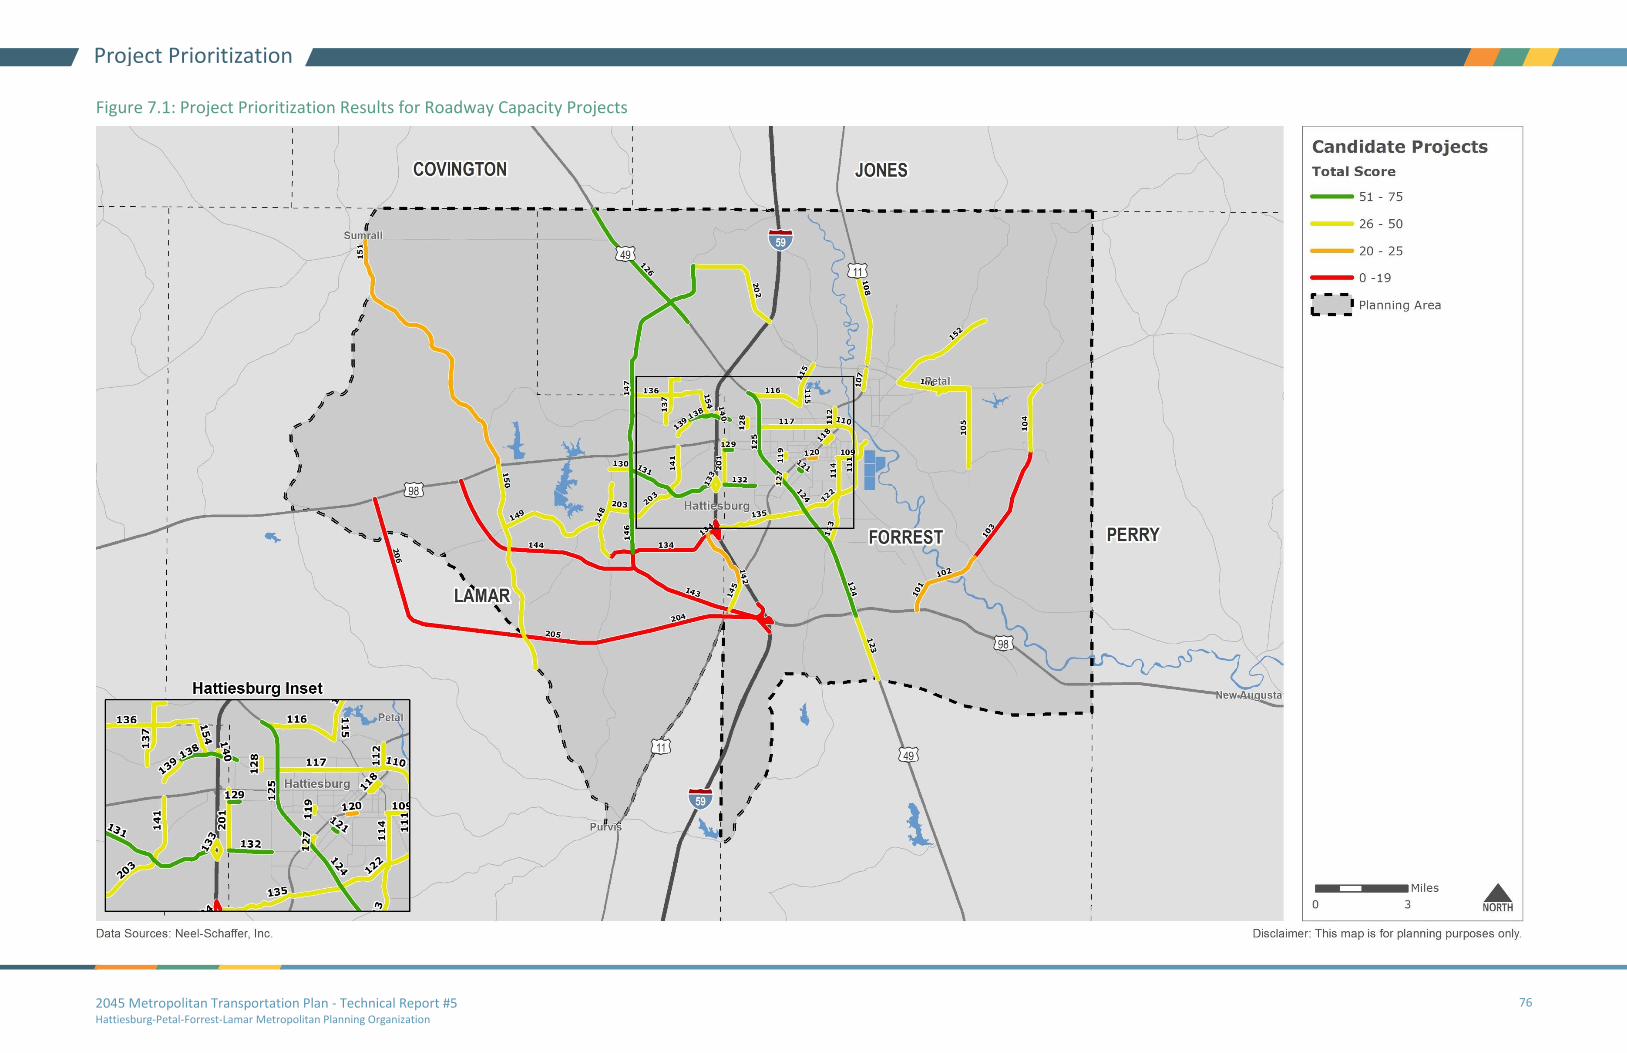
2045 Metropolitan Transportation Plan - Technical Report #5 Hattiesburg-Petal-Forrest-Lamar Metropolitan Planning Organization
76
Project Prioritization
Figure 7.1: Project Prioritization Results for Roadway Capacity Projects

2045 Metropolitan Transportation Plan - Technical Report #5 Hattiesburg-Petal-Forrest-Lamar Metropolitan Planning Organization
Project Prioritization
7.2 Bicycle and Pedestrian Corridor Prioritization
Bicycle and pedestrian projects were identified based on existing plans, especially the MPO Pathways
Master Plan (2015), and the Needs Assessment. These projects were then prioritized based on the
criteria and weights shown in Table 7.3. This methodology is intended to support the previously stated
goals and objectives. These high-priority projects are shown in Table 7.4 and illustrated in Figure 7.2.
The MTP does not recommend specific bicycle and pedestrian projects.
Individual sidewalk projects were not included in this prioritization. Instead, local municipalities should
begin setting aside annual funding to bring existing sidewalks into ADA compliance and to build new
infrastructure that prioritizes pedestrian access to medical services, retail centers, and public facilities.
Furthermore, bicycle and pedestrian improvements should be part of the overall design phase of all
projects and included unless restrictions apply, consistent with FHWA guidance.

2045 Metropolitan Transportation Plan - Technical Report #5 Hattiesburg-Petal-Forrest-Lamar Metropolitan Planning Organization
78
Project Prioritization
Table 7.3: Project Prioritization Methodology for Bicycle and Pedestrian Projects
Criterion Measure Scoring Scale (Points Possible)
0 5 10 18.5 37.5 56.25 75
Land Use and Demographics
Multimodal Demand Analysis Tier (Methodology found in Technical Report 2: Existing Conditions in Table 4.2). This considers the following: population, employment, and student density; popular destinations1; households without vehicles; and street connectivity.
Lowest Demand (Tier 1)
Low Demand
(Tier 2)
Medium Demand
(Tier 3)
High Demand
(Tier 4)
Highest Demand
(Tier 5)
System Connectivity Number of existing bicycle connections per project mile Less than 1 bike connection per
mile
1 to 2 bike connection per
mile
More than 2 bike connections per
mile
Safety Ratio of unsafe roadway miles to project miles (unsafe roadway = posted speed above 25 MPH)2
< 0.5 0.5-1.00 >1.00 OR Shared-
Use Path
Public Input Number of times the location was mentioned in public surveys and meetings
0 Comments 1-5 Comments
1Popular desinations are parks, major recreation centers, schools, libraries, hospitals, grocery stores, pharmacies, convenience stores, eating and drinking places, and hotels/motels. Universities were weighted 10x, other schools and hospitals
were weighed 5x and hotels/motels, grocery stores, pharmacies, and convenience stores and parks/rec centers were weighted 2x.
2Posted speeds came from the Travel Demand Model Network of major roads in the MPO. Roads not included in this model were considered to be local roads with a speed limit of 25 mph or less.
75%
10%
10%5%
Project Scoring Breakdown
Land Use and Demographics
System Connectivity
Safety
Public Input
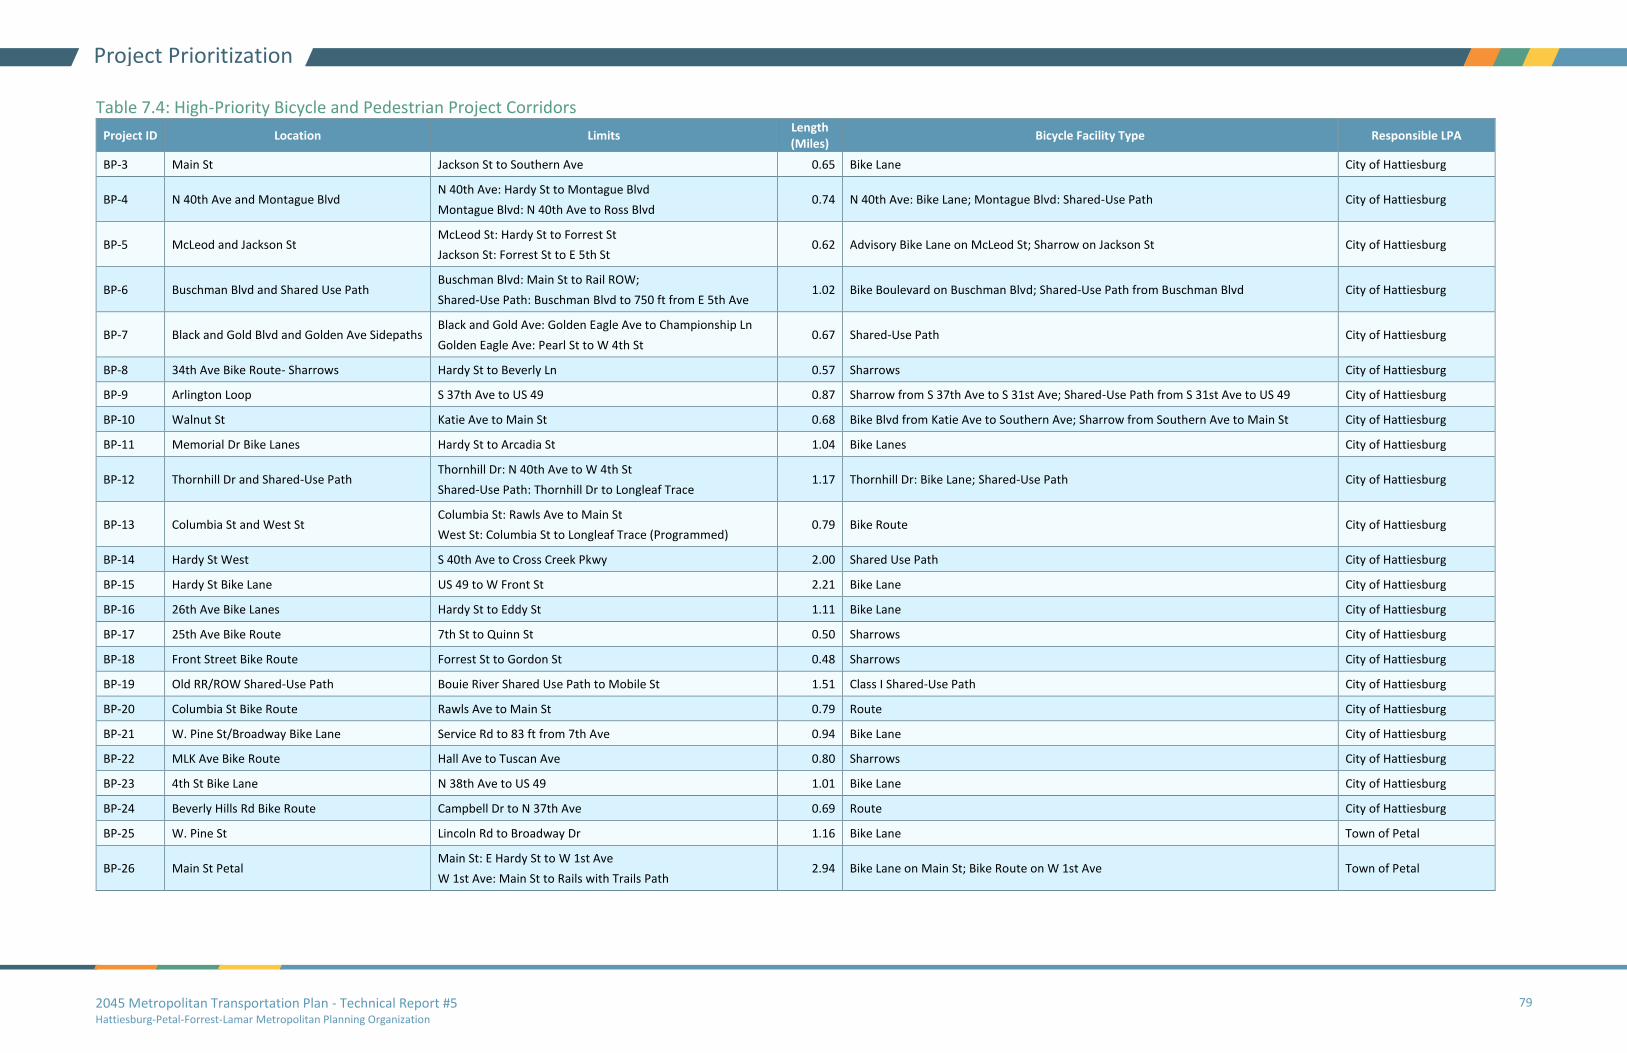
2045 Metropolitan Transportation Plan - Technical Report #5 Hattiesburg-Petal-Forrest-Lamar Metropolitan Planning Organization
79
Project Prioritization
Table 7.4: High-Priority Bicycle and Pedestrian Project Corridors
Project ID Location Limits Length (Miles)
Bicycle Facility Type Responsible LPA
BP-3 Main St Jackson St to Southern Ave 0.65 Bike Lane City of Hattiesburg
BP-4 N 40th Ave and Montague Blvd N 40th Ave: Hardy St to Montague Blvd
Montague Blvd: N 40th Ave to Ross Blvd 0.74 N 40th Ave: Bike Lane; Montague Blvd: Shared-Use Path City of Hattiesburg
BP-5 McLeod and Jackson St McLeod St: Hardy St to Forrest St
Jackson St: Forrest St to E 5th St 0.62 Advisory Bike Lane on McLeod St; Sharrow on Jackson St City of Hattiesburg
BP-6 Buschman Blvd and Shared Use Path Buschman Blvd: Main St to Rail ROW;
Shared-Use Path: Buschman Blvd to 750 ft from E 5th Ave 1.02 Bike Boulevard on Buschman Blvd; Shared-Use Path from Buschman Blvd City of Hattiesburg
BP-7 Black and Gold Blvd and Golden Ave Sidepaths Black and Gold Ave: Golden Eagle Ave to Championship Ln
Golden Eagle Ave: Pearl St to W 4th St 0.67 Shared-Use Path City of Hattiesburg
BP-8 34th Ave Bike Route- Sharrows Hardy St to Beverly Ln 0.57 Sharrows City of Hattiesburg
BP-9 Arlington Loop S 37th Ave to US 49 0.87 Sharrow from S 37th Ave to S 31st Ave; Shared-Use Path from S 31st Ave to US 49 City of Hattiesburg
BP-10 Walnut St Katie Ave to Main St 0.68 Bike Blvd from Katie Ave to Southern Ave; Sharrow from Southern Ave to Main St City of Hattiesburg
BP-11 Memorial Dr Bike Lanes Hardy St to Arcadia St 1.04 Bike Lanes City of Hattiesburg
BP-12 Thornhill Dr and Shared-Use Path Thornhill Dr: N 40th Ave to W 4th St
Shared-Use Path: Thornhill Dr to Longleaf Trace 1.17 Thornhill Dr: Bike Lane; Shared-Use Path City of Hattiesburg
BP-13 Columbia St and West St Columbia St: Rawls Ave to Main St
West St: Columbia St to Longleaf Trace (Programmed) 0.79 Bike Route City of Hattiesburg
BP-14 Hardy St West S 40th Ave to Cross Creek Pkwy 2.00 Shared Use Path City of Hattiesburg
BP-15 Hardy St Bike Lane US 49 to W Front St 2.21 Bike Lane City of Hattiesburg
BP-16 26th Ave Bike Lanes Hardy St to Eddy St 1.11 Bike Lane City of Hattiesburg
BP-17 25th Ave Bike Route 7th St to Quinn St 0.50 Sharrows City of Hattiesburg
BP-18 Front Street Bike Route Forrest St to Gordon St 0.48 Sharrows City of Hattiesburg
BP-19 Old RR/ROW Shared-Use Path Bouie River Shared Use Path to Mobile St 1.51 Class I Shared-Use Path City of Hattiesburg
BP-20 Columbia St Bike Route Rawls Ave to Main St 0.79 Route City of Hattiesburg
BP-21 W. Pine St/Broadway Bike Lane Service Rd to 83 ft from 7th Ave 0.94 Bike Lane City of Hattiesburg
BP-22 MLK Ave Bike Route Hall Ave to Tuscan Ave 0.80 Sharrows City of Hattiesburg
BP-23 4th St Bike Lane N 38th Ave to US 49 1.01 Bike Lane City of Hattiesburg
BP-24 Beverly Hills Rd Bike Route Campbell Dr to N 37th Ave 0.69 Route City of Hattiesburg
BP-25 W. Pine St Lincoln Rd to Broadway Dr 1.16 Bike Lane Town of Petal
BP-26 Main St Petal Main St: E Hardy St to W 1st Ave
W 1st Ave: Main St to Rails with Trails Path 2.94 Bike Lane on Main St; Bike Route on W 1st Ave Town of Petal

2045 Metropolitan Transportation Plan - Technical Report #5 Hattiesburg-Petal-Forrest-Lamar Metropolitan Planning Organization
80
Project Prioritization
Figure 7.2: High-Priority Bicycle and Pedestrian Project Corridors

2045 Metropolitan Transportation Plan - Technical Report #5 Hattiesburg-Petal-Forrest-Lamar Metropolitan Planning Organization
81
Financial Plan
8.0 Financial Plan Metropolitan Transportation Plans are required by federal legislation to be fiscally constrained. In order
to demonstrate fiscal constraint, the costs of programmed projects must not exceed the amount of
funding that is reasonably expected to be available.
This chapter reviews available funding sources and forecasts the amount of funding that can reasonably
be anticipated to be available for transportation projects and programs in the MPA through 2045.
Forecasts used in this chapter are for planning purposes only and do not commit any jurisdiction or
agency to provide a specific level of funding.
8.1 Roadway Funding
Federal Funding Sources
Federal funding for transportation is authorized through the current transportation bill (The FAST Act)
and includes several major “formula” programs and discretionary programs. While “formula” programs
may change somewhat in future transportation bills, they have been relatively stable over time.
National Highway Performance Program (NHPP)
Overview: The NHPP provides support for the condition and performance of the National Highway
System (NHS), for the construction of new facilities on the NHS, and to ensure that investments of
Federal-aid funds in highway construction are directed to support progress toward the achievement of
performance targets established in a State's asset management plan.
Eligible Activities: Projects or programs supporting progress toward the achievement of national
performance goals for improving infrastructure condition, safety, congestion reduction, system
reliability, or freight movement on the NHS.
Federal Share: 90 percent for most projects on the Interstate System and 80 percent elsewhere.
Surface Transportation Block Grant Program (STBG)
Overview: The STBG Program provides flexible funding that may be used for just about any type of
transportation-related project. The FAST Act continues the regulation that 50 percent of a state’s STBG
apportionment is sub-allocated to areas based on their relative share of the total state population, with
the other 50 percent available for use in any area of the state. These sub-allocations to the urban areas
are called attributable funds.

2045 Metropolitan Transportation Plan - Technical Report #5 Hattiesburg-Petal-Forrest-Lamar Metropolitan Planning Organization
82
Financial Plan
Eligible Activities: Most transportation projects are eligible for STBG funding. See 23 U.S.C. 133(b)(15)
for details.
Federal Share: 90 percent for most projects on the Interstate System and 80 percent elsewhere.
Highway Safety Improvement Program (HSIP)
Overview: The HSIP seeks to achieve a significant reduction in traffic fatalities and serious injuries on all
public roads, including non-State-owned public roads and roads on tribal lands. The HSIP requires a
data-driven, strategic approach to improving highway safety on all public roads that focuses on
performance.
Eligible Activities: Safety projects that are consistent with the State’s Strategic Highway Safety Plan
(SHSP) and that correct or improve a hazardous road location or feature or address a highway safety
problem.
Federal Share: 90 percent except as provided in 23 U.S.C. 120 and 130.
Congestion Mitigation and Air Quality Improvement Program (CMAQ)
Overview: The CMAQ program provides a flexible funding source to State and local governments for
transportation projects and programs to help meet the requirements of the Clean Air Act. Funding is
available to reduce congestion and improve air quality for areas that do not meet the National Ambient
Air Quality Standards for ozone, carbon monoxide, or particulate matter (nonattainment areas) and for
former nonattainment areas that are now in compliance (maintenance areas).
Note: The HPFL MPO currently does not qualify for CMAQ funds because it is in attainment of air quality
standards. However, should that change in the future, the MPO would become eligible for CMAQ
funding.
Eligible Activities: Projects or programs that are likely to contribute to the attainment or maintenance of
a national ambient air quality standard, with a high level of effectiveness in reducing air pollution.
Federal Share: 90 percent for most projects on the Interstate System and 80 percent elsewhere.

2045 Metropolitan Transportation Plan - Technical Report #5 Hattiesburg-Petal-Forrest-Lamar Metropolitan Planning Organization
83
Financial Plan
National Highway Freight Program (NHFP)
Overview: The NHFP seeks to improve the efficient movement of freight on the National Highway
Freight Network (NHFN) and support national freight related goals.
Eligible Activities: Generally, NHFP funds must contribute to the efficient movement of freight on the
NHFN and be identified in a freight investment plan included in the State’s freight plan.
Federal Share: 90 percent for most projects on the Interstate System and 80 percent elsewhere.
State and Local Funding Sources
State Funding
State transportation revenues come from motor fuel taxes and fees and vehicles taxes and fees. The
gasoline excise tax in particular is the state’s largest funding source for roadway projects.
Property, Sales, and Income Taxes
Taxation contributes the most revenue to local governments in the United States. Property taxes, sales
taxes, and income taxes are the most common and biggest sources of local government tax revenue.
Taxes may be levied by states, counties, municipalities, or other authorities.
User Fees
User fees are fees collected from those who utilize a service or facility. The fees are collected to pay for
the cost of a facility, finance the cost of operations, and/or generate revenue for other uses. User fees
are commonly charged for public parks, water and sewer services, transit systems, and solid waste
facilities. The theory behind the user fee is that those who directly benefit from these public services
pay for the costs.
Special Assessments
Special assessment is a method of generating funds for public improvements, whereby the cost of a
public improvement is collected from those who directly benefit from the improvement. In some
instances, new streets are financed by special assessment. The owners of property located adjacent to
the new streets are assessed a portion of the cost of the new streets, based on the amount of frontage
they own along the new streets.
Special assessments have also been used to generate funds for general improvements within special
districts, such as central business districts. These assessments may be paid over a period of time rather
than as a lump sum payment.

2045 Metropolitan Transportation Plan - Technical Report #5 Hattiesburg-Petal-Forrest-Lamar Metropolitan Planning Organization
84
Financial Plan
Impact Fees
New developments create increased traffic volumes on the streets around them. Development impact
fees are a way of attempting to place a portion of the burden of funding improvements on developers
who are creating or adding to the need for improvements.
Bond Issues
Property tax and sales tax funds can be used on a pay-as-you-go basis, or the revenues from them can
be used to pay off general obligation or revenue bonds. These bonds are issued by local governments
upon approval of the voting public.
Forecasting Available Funds
Using analysis of historical funding within the MPA, the forecasted amount of federal funding that the
MPO can reasonably expect to be available for roadway projects over the next 25 years was developed.
These forecasts account for inflation and were provided for seven categories:
• Capacity projects
• Reconstruction
• Overlay
• Bridges
• Enhancement
• Safety
• Maintenance
Using the assumptions above, the amount of federal funding reasonably expected to be available for
roadway projects in the MPO through 2045 is as follows:
• Capacity Projects
o Stage 1 (2020-2025) - $69,210,169
o Stage 2 (2026-2035) - $124,940,806
o Stage 3 (2036-2045) - $138,012,379
• Non-capacity Funding
o Stage 1 (2020-2025) - $84,590,207
o Stage 2 (2026-2035) - $152,705,430
o Stage 3 (2036-2045) - $168,681,796
The values above reflect the total funding expected within the MPA. Of this, the following are funds
that can be used at the MPO's discretion and are expected to be available for capacity improvements:
• MPO Discretionary Funds - Stage 1 (2020-2025) - $4,303,131
• MPO Discretionary Funds - Stage 2 (2026-2035) - $8,411,794
• MPO Discretionary Funds - Stage 3 (2036-2045) - $10,253,930
2045 Metropolitan Transportation Plan - Technical Report #5 Hattiesburg-Petal-Forrest-Lamar Metropolitan Planning Organization
85
Financial Plan
8.2 Bicycle and Pedestrian Funding
This section addresses funding for independent, or stand-alone bicycle and pedestrian projects. Funding
for bicycle and pedestrian improvements that are part of other projects are addressed in other sections.
Federal Funding Sources
Transportation Alternatives (TA) Set-Aside
Overview: This set-aside program within the Surface Transportation Block Grant (STBG) program
includes all projects and activities previously eligible under the Transportation Alternatives Program
(TAP).
Eligible Activities: Pedestrian and bicycle facilities, recreational trails, safe routes to school projects,
community improvements such as historic preservation and vegetation management, and
environmental mitigation related to stormwater and habitat connectivity.
Federal Share: 90 percent for most projects on the Interstate System and 80 percent elsewhere.
“Flex” Funding
Other federal roadway and public transit funding sources are also flexible enough to fund construction
of bicycle and pedestrian facilities. Still, most funding from these sources do not go to bicycle and
pedestrian projects.
State and Local Funding Sources
State and local funding sources for bicycle and pedestrian projects are the same as those listed for
roadways.
Forecasting Available Funds
Funding forecasts for independent bicycle and pedestrian projects are based on the Transportation
Alternatives (TA) set-aside. TA funding for the MPO was forecast based on the following assumptions:
• Future State allocations will generally correlate with population. At a minimum, 50 percent
of a state's TA apportionment (after deducting the set-aside for the Recreational Trails
Program) must be sub-allocated to urban and rural areas based on their relative share of the
total state population.
• The MPO will receive an amount of funding from the State that is proportionate to its
Metropolitan Planning Area’s share of the state population (4.6 percent). In 2020, that will
amount to $566,314.
• TA revenue will increase 1.0 percent annually.
2045 Metropolitan Transportation Plan - Technical Report #5 Hattiesburg-Petal-Forrest-Lamar Metropolitan Planning Organization
86
Financial Plan
Using the assumptions above, the amount of federal TA funding reasonably expected to be available for
bicycle and pedestrian projects in the MPO through 2045 is as follows:
• Stage 1 (2021-2025) - $3,483,974
• Stage 2 (2026-2035) - $6,289,401
• Stage 3 (2036-2045) - $6,947,412
8.3 Public Transit Funding
Federal Funding Sources
There are many federal funding sources for public transit. Most of these sources are programs funded
by the Federal Transit Administration (FTA) and administered by the State.
Urbanized Area Formula Grants (Section 5307)
Overview: This formula-based funding program provides funds for capital and operating assistance for
transit service in urbanized areas with populations greater than 50,000 and for transportation-related
planning.
As part of the Coronavirus Aid, Relief, and Economic Security (CARES) Act, FTA allocated $22.7 billion to
recipients of urbanized area formula funds. Funding is provided at a 100-percent federal share, with no
local match required, and will be available to support capital, operating, and other expenses generally
eligible under those programs to prevent, prepare for, and respond to COVID-19.
Eligible Activities: Funds can be used for planning, engineering, design and evaluation of transit projects
and other technical transportation-related studies; capital investments in bus and bus-related activities
such as replacement of buses, overhaul of buses, rebuilding of buses, crime prevention and security
equipment and construction of maintenance and passenger facilities; computer hardware/software; and
operating assistance in urbanized areas under 200,000 in population or with 100 or fewer fixed-route
buses operating in peak hours. Activities eligible under the former Job Access and Reverse Commute
(JARC) program, which provided services to low-income individuals to access jobs, are now eligible
under the Urbanized Area Formula program.
Federal Share: 80 percent for capital projects, 50 percent for operating assistance, and 80 percent for
ADA non-fixed route paratransit service.
Enhanced Mobility of Seniors and Individuals with Disabilities (Section 5310)
Overview: Grants are made by the State to private non-profit organizations (and certain public bodies)
to increase the mobility of seniors and persons with disabilities. The former New Freedom program
(Section 5317) is folded into this program.

2045 Metropolitan Transportation Plan - Technical Report #5 Hattiesburg-Petal-Forrest-Lamar Metropolitan Planning Organization
87
Financial Plan
Eligible Activities: Projects must be included in a coordinated human service transportation plan. Funds
can be used for buses and vans; wheelchair lifts, ramps, and securement devices; transit-related
information technology systems; mobility management programs; acquisition of transportation services
under a contract, lease, or other arrangement; travel training; volunteer driver programs; building an
accessible path to a bus stop; and incremental cost of providing same day service or door-to-door
service.
Federal Share: 80 percent for capital projects, 50 percent for operating assistance.
Rural Area Formula Grants (Section 5311)
Overview: This formula-based funding program provides administration, capital, planning, and operating
assistance to support public transportation in rural areas, defined as areas with fewer than 50,000
residents.
Eligible Activities: Planning, capital, operating, job access and reverse commute projects, and the
acquisition of public transportation services. Activities eligible under the former JARC program, which
provided services to low-income individuals to access jobs, are now eligible under the Rural Area
Formula program.
Federal Share: 80 percent for capital projects, 50 percent for operating assistance, and 80 percent for
ADA non-fixed route paratransit service.
Bus and Bus Facilities Formula Grants (Section 5339a)
Overview: This program provides funds to replace, rehabilitate, and purchase buses and related
equipment and to construct bus-related facilities.
Eligible Activities: Capital projects to replace, rehabilitate and purchase buses, vans, and related
equipment, and to construct bus-related facilities, including technological changes or innovations to
modify low or no emission vehicles or facilities.
Federal Share: 80 percent for capital projects.
Other FTA Grant Programs
The FTA has several other funding sources that each address specific issues. Most of these are more
limited in funding and are competitive programs, meaning that applicants must compete for funding
based on the merits of their project.
More details can be found at https://www.transit.dot.gov/grants
2045 Metropolitan Transportation Plan - Technical Report #5 Hattiesburg-Petal-Forrest-Lamar Metropolitan Planning Organization
88
Financial Plan
Flexible, Non-FTA Funds
Surface Transportation Block Grant Program (STBG): Provides funding that may be used by states and
localities for a wide range of projects to preserve and improve the conditions and performance of
surface transportation, including highway, transit, intercity bus, bicycle and pedestrian projects.
National Highway Performance Program (NHPP): Funds may only be used for the construction of a
public transportation project that supports progress toward the achievement of national performance
goals for improving infrastructure condition, safety, mobility, or freight movement on the NHS and
which is eligible for assistance under chapter 53 of title 49, if: the project is in the same corridor as, and
in proximity to, a fully access-controlled NHS route; the construction is more cost-effective (as
determined by a benefit-cost analysis) than a NHS improvement; and the project will reduce delays or
produce travel time savings on the NHS, as well as improve regional traffic flow. Local match
requirement varies.
Congestion Mitigation and Air Quality Program (CMAQ): Provides funding to areas in nonattainment or
maintenance for ozone, carbon monoxide, and/or particulate matter. States that have no
nonattainment or maintenance areas still receive a minimum apportionment of CMAQ funding for
either air quality projects or other elements of flexible spending. Funds may be used for any transit
capital expenditures otherwise eligible for FTA funding as long as they have an air quality benefit.
State and Local Funding Sources
State and local funding sources include the same potential sources as those outlined for roadways. Fare
revenue and advertising revenue are also important local funding sources but are relatively small.
Forecasting Available Funds
Forecasts were developed for federal transit programs Section 5307 and 5339 that are utilized by transit
providers in the region, using the following assumptions:
• The region will receive 100 percent of annual Section 5307 funding allocated to the
Hattiesburg, MS Urbanized Area.
• The region will receive 100 percent of the annual Section 5339 apportionment for
Mississippi small urbanized areas.
• The region will receive 100 percent of the one-time 2020 CARES Act funding allocated to the
Hattiesburg, MS Urbanized Area.
• Federal funding for these programs is inflated 1 percent annually. This is consistent with
long-term annual increases in FTA program funding.
2045 Metropolitan Transportation Plan - Technical Report #5 Hattiesburg-Petal-Forrest-Lamar Metropolitan Planning Organization
89
Financial Plan
Based on these assumptions, the following levels of federal funding for public transit in the MPO can be
expected through 2045:
• Stage 1 (2020-2025) - $10,272,637 for operating and capital projects (This includes the one-
time CARES Act funds but does not include any carry over funds.)
• Stage 2 (2026-2035) - $12,757,095 for operating and capital projects
• Stage 3 (2036-2045) - $14,091,770 for operating and capital projects
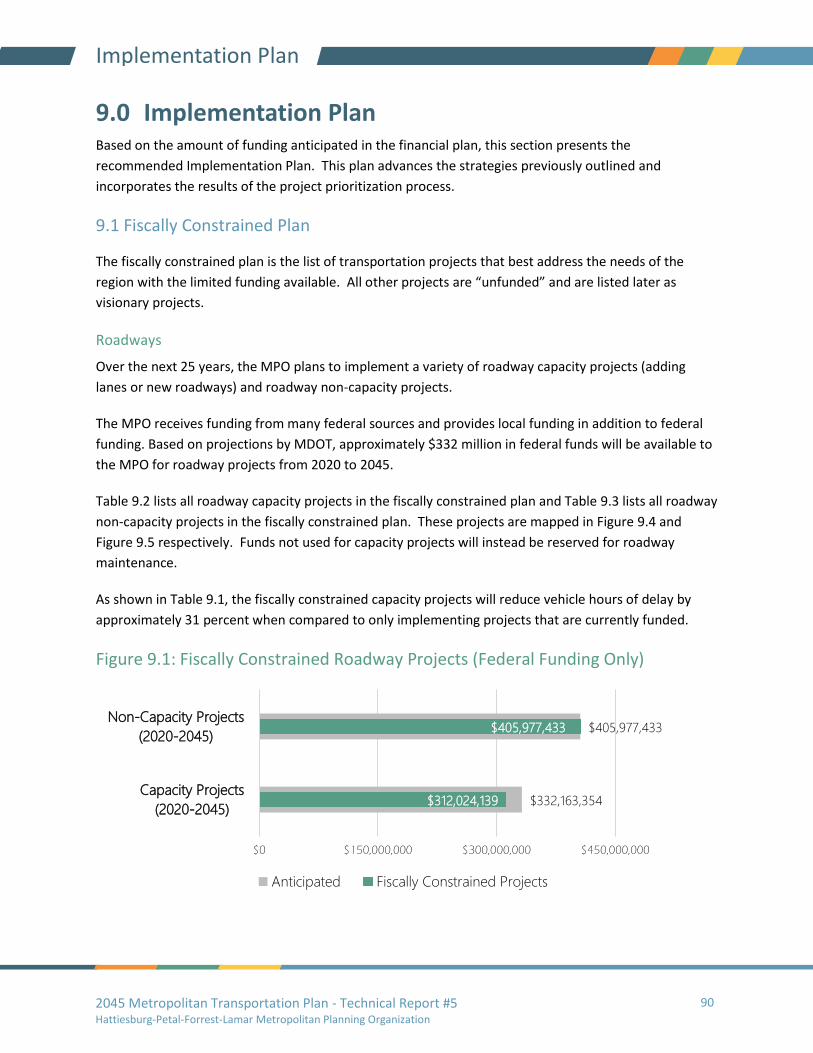
2045 Metropolitan Transportation Plan - Technical Report #5 Hattiesburg-Petal-Forrest-Lamar Metropolitan Planning Organization
90
Implementation Plan
9.0 Implementation Plan Based on the amount of funding anticipated in the financial plan, this section presents the
recommended Implementation Plan. This plan advances the strategies previously outlined and
incorporates the results of the project prioritization process.
9.1 Fiscally Constrained Plan
The fiscally constrained plan is the list of transportation projects that best address the needs of the
region with the limited funding available. All other projects are “unfunded” and are listed later as
visionary projects.
Roadways
Over the next 25 years, the MPO plans to implement a variety of roadway capacity projects (adding
lanes or new roadways) and roadway non-capacity projects.
The MPO receives funding from many federal sources and provides local funding in addition to federal
funding. Based on projections by MDOT, approximately $332 million in federal funds will be available to
the MPO for roadway projects from 2020 to 2045.
Table 9.2 lists all roadway capacity projects in the fiscally constrained plan and Table 9.3 lists all roadway
non-capacity projects in the fiscally constrained plan. These projects are mapped in Figure 9.4 and
Figure 9.5 respectively. Funds not used for capacity projects will instead be reserved for roadway
maintenance.
As shown in Table 9.1, the fiscally constrained capacity projects will reduce vehicle hours of delay by
approximately 31 percent when compared to only implementing projects that are currently funded.
Figure 9.1: Fiscally Constrained Roadway Projects (Federal Funding Only)
$332,163,354
$405,977,433
$312,024,139
$405,977,433
$0 $150,000,000 $300,000,000 $450,000,000
Capacity Projects
(2020-2045)
Non-Capacity Projects
(2020-2045)
Anticipated Fiscally Constrained Projects
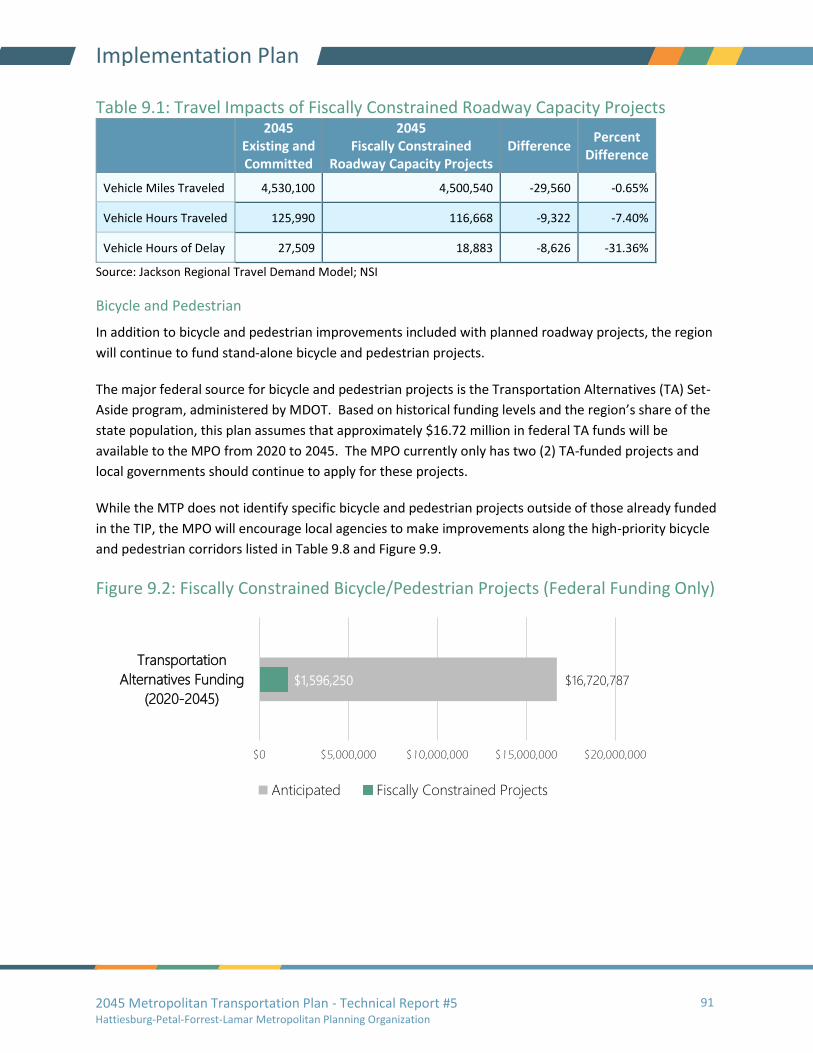
2045 Metropolitan Transportation Plan - Technical Report #5 Hattiesburg-Petal-Forrest-Lamar Metropolitan Planning Organization
91
Implementation Plan
Table 9.1: Travel Impacts of Fiscally Constrained Roadway Capacity Projects 2045
Existing and Committed
2045 Fiscally Constrained
Roadway Capacity Projects Difference
Percent Difference
Vehicle Miles Traveled 4,530,100 4,500,540 -29,560 -0.65%
Vehicle Hours Traveled 125,990 116,668 -9,322 -7.40%
Vehicle Hours of Delay 27,509 18,883 -8,626 -31.36%
Source: Jackson Regional Travel Demand Model; NSI
Bicycle and Pedestrian
In addition to bicycle and pedestrian improvements included with planned roadway projects, the region
will continue to fund stand-alone bicycle and pedestrian projects.
The major federal source for bicycle and pedestrian projects is the Transportation Alternatives (TA) Set-
Aside program, administered by MDOT. Based on historical funding levels and the region’s share of the
state population, this plan assumes that approximately $16.72 million in federal TA funds will be
available to the MPO from 2020 to 2045. The MPO currently only has two (2) TA-funded projects and
local governments should continue to apply for these projects.
While the MTP does not identify specific bicycle and pedestrian projects outside of those already funded
in the TIP, the MPO will encourage local agencies to make improvements along the high-priority bicycle
and pedestrian corridors listed in Table 9.8 and Figure 9.9.
Figure 9.2: Fiscally Constrained Bicycle/Pedestrian Projects (Federal Funding Only)
$16,720,787$1,596,250
$0 $5,000,000 $10,000,000 $15,000,000 $20,000,000
Transportation
Alternatives Funding
(2020-2045)
Anticipated Fiscally Constrained Projects

2045 Metropolitan Transportation Plan - Technical Report #5 Hattiesburg-Petal-Forrest-Lamar Metropolitan Planning Organization
92
Implementation Plan
Public Transit
Over the next 25 years, Hub City Transit will continue to provide its fixed and demand route services. At
a minimum, the MTP assumes that existing transit services will continue to operate at current levels and
that vehicles will be kept in a state of good repair.
Figure 9.3: Fiscally Constrained Transit Projects (Federal Funding Only)
$37,121,502 $29,812,884
$0 $10,000,000 $20,000,000 $30,000,000 $40,000,000
Federal Transit Funding
(2020-2045)
Anticipated Fiscally Constrained Projects
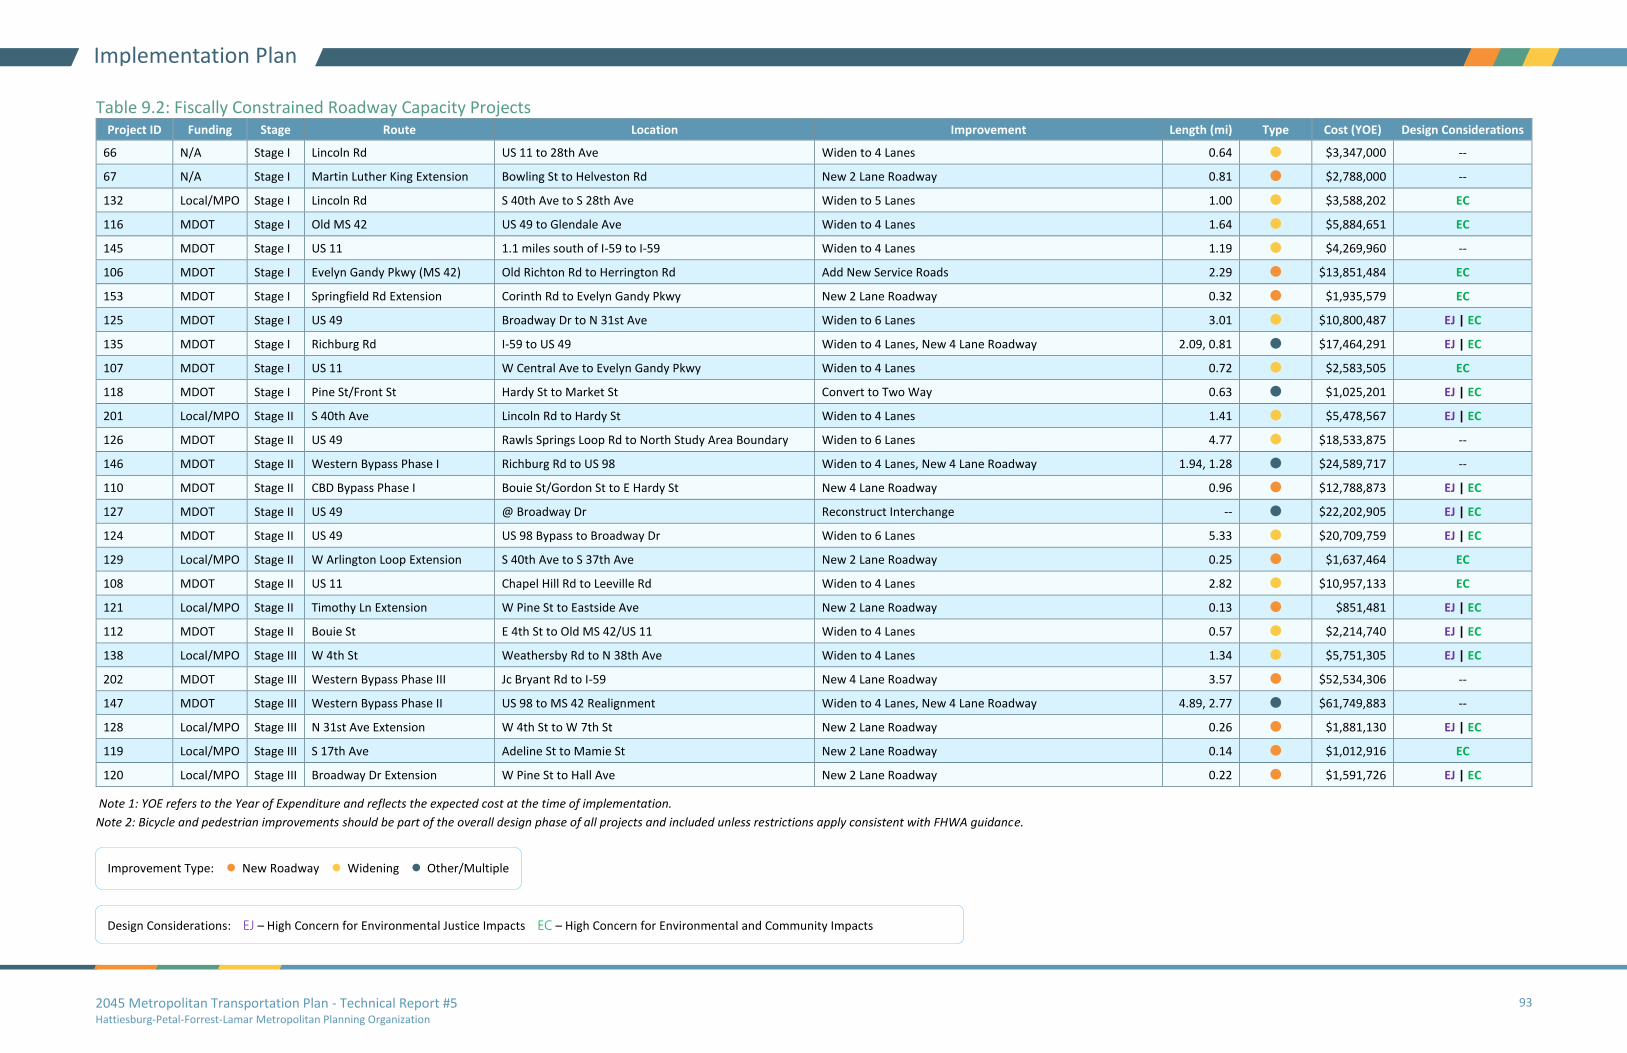
2045 Metropolitan Transportation Plan - Technical Report #5 Hattiesburg-Petal-Forrest-Lamar Metropolitan Planning Organization
93
Implementation Plan
Table 9.2: Fiscally Constrained Roadway Capacity Projects Project ID Funding Stage Route Location Improvement Length (mi) Type Cost (YOE) Design Considerations
66 N/A Stage I Lincoln Rd US 11 to 28th Ave Widen to 4 Lanes 0.64 ⚫ $3,347,000 --
67 N/A Stage I Martin Luther King Extension Bowling St to Helveston Rd New 2 Lane Roadway 0.81 ⚫ $2,788,000 --
132 Local/MPO Stage I Lincoln Rd S 40th Ave to S 28th Ave Widen to 5 Lanes 1.00 ⚫ $3,588,202 EC
116 MDOT Stage I Old MS 42 US 49 to Glendale Ave Widen to 4 Lanes 1.64 ⚫ $5,884,651 EC
145 MDOT Stage I US 11 1.1 miles south of I-59 to I-59 Widen to 4 Lanes 1.19 ⚫ $4,269,960 --
106 MDOT Stage I Evelyn Gandy Pkwy (MS 42) Old Richton Rd to Herrington Rd Add New Service Roads 2.29 ⚫ $13,851,484 EC
153 MDOT Stage I Springfield Rd Extension Corinth Rd to Evelyn Gandy Pkwy New 2 Lane Roadway 0.32 ⚫ $1,935,579 EC
125 MDOT Stage I US 49 Broadway Dr to N 31st Ave Widen to 6 Lanes 3.01 ⚫ $10,800,487 EJ | EC
135 MDOT Stage I Richburg Rd I-59 to US 49 Widen to 4 Lanes, New 4 Lane Roadway 2.09, 0.81 ⚫ $17,464,291 EJ | EC
107 MDOT Stage I US 11 W Central Ave to Evelyn Gandy Pkwy Widen to 4 Lanes 0.72 ⚫ $2,583,505 EC
118 MDOT Stage I Pine St/Front St Hardy St to Market St Convert to Two Way 0.63 ⚫ $1,025,201 EJ | EC
201 Local/MPO Stage II S 40th Ave Lincoln Rd to Hardy St Widen to 4 Lanes 1.41 ⚫ $5,478,567 EJ | EC
126 MDOT Stage II US 49 Rawls Springs Loop Rd to North Study Area Boundary Widen to 6 Lanes 4.77 ⚫ $18,533,875 --
146 MDOT Stage II Western Bypass Phase I Richburg Rd to US 98 Widen to 4 Lanes, New 4 Lane Roadway 1.94, 1.28 ⚫ $24,589,717 --
110 MDOT Stage II CBD Bypass Phase I Bouie St/Gordon St to E Hardy St New 4 Lane Roadway 0.96 ⚫ $12,788,873 EJ | EC
127 MDOT Stage II US 49 @ Broadway Dr Reconstruct Interchange -- ⚫ $22,202,905 EJ | EC
124 MDOT Stage II US 49 US 98 Bypass to Broadway Dr Widen to 6 Lanes 5.33 ⚫ $20,709,759 EJ | EC
129 Local/MPO Stage II W Arlington Loop Extension S 40th Ave to S 37th Ave New 2 Lane Roadway 0.25 ⚫ $1,637,464 EC
108 MDOT Stage II US 11 Chapel Hill Rd to Leeville Rd Widen to 4 Lanes 2.82 ⚫ $10,957,133 EC
121 Local/MPO Stage II Timothy Ln Extension W Pine St to Eastside Ave New 2 Lane Roadway 0.13 ⚫ $851,481 EJ | EC
112 MDOT Stage II Bouie St E 4th St to Old MS 42/US 11 Widen to 4 Lanes 0.57 ⚫ $2,214,740 EJ | EC
138 Local/MPO Stage III W 4th St Weathersby Rd to N 38th Ave Widen to 4 Lanes 1.34 ⚫ $5,751,305 EJ | EC
202 MDOT Stage III Western Bypass Phase III Jc Bryant Rd to I-59 New 4 Lane Roadway 3.57 ⚫ $52,534,306 --
147 MDOT Stage III Western Bypass Phase II US 98 to MS 42 Realignment Widen to 4 Lanes, New 4 Lane Roadway 4.89, 2.77 ⚫ $61,749,883 --
128 Local/MPO Stage III N 31st Ave Extension W 4th St to W 7th St New 2 Lane Roadway 0.26 ⚫ $1,881,130 EJ | EC
119 Local/MPO Stage III S 17th Ave Adeline St to Mamie St New 2 Lane Roadway 0.14 ⚫ $1,012,916 EC
120 Local/MPO Stage III Broadway Dr Extension W Pine St to Hall Ave New 2 Lane Roadway 0.22 ⚫ $1,591,726 EJ | EC
Note 1: YOE refers to the Year of Expenditure and reflects the expected cost at the time of implementation.
Note 2: Bicycle and pedestrian improvements should be part of the overall design phase of all projects and included unless restrictions apply consistent with FHWA guidance.
Design Considerations: EJ – High Concern for Environmental Justice Impacts EC – High Concern for Environmental and Community Impacts
Improvement Type: ⚫ New Roadway ⚫ Widening ⚫ Other/Multiple
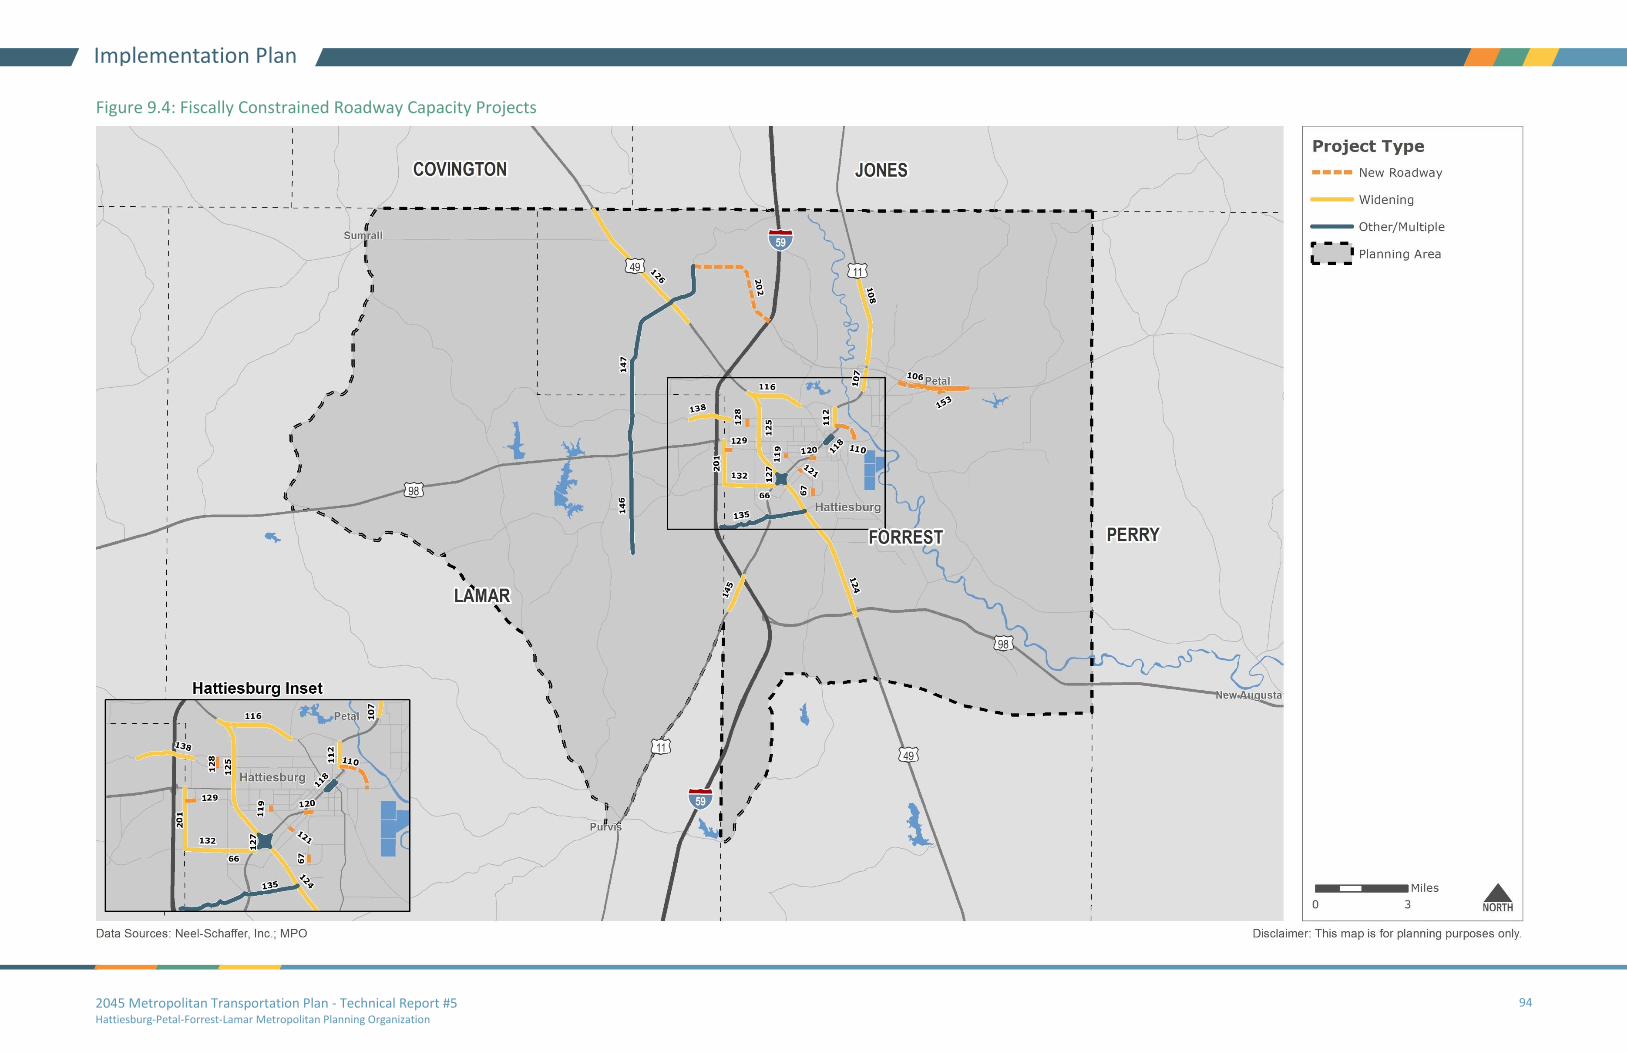
2045 Metropolitan Transportation Plan - Technical Report #5 Hattiesburg-Petal-Forrest-Lamar Metropolitan Planning Organization
94
Implementation Plan
Figure 9.4: Fiscally Constrained Roadway Capacity Projects
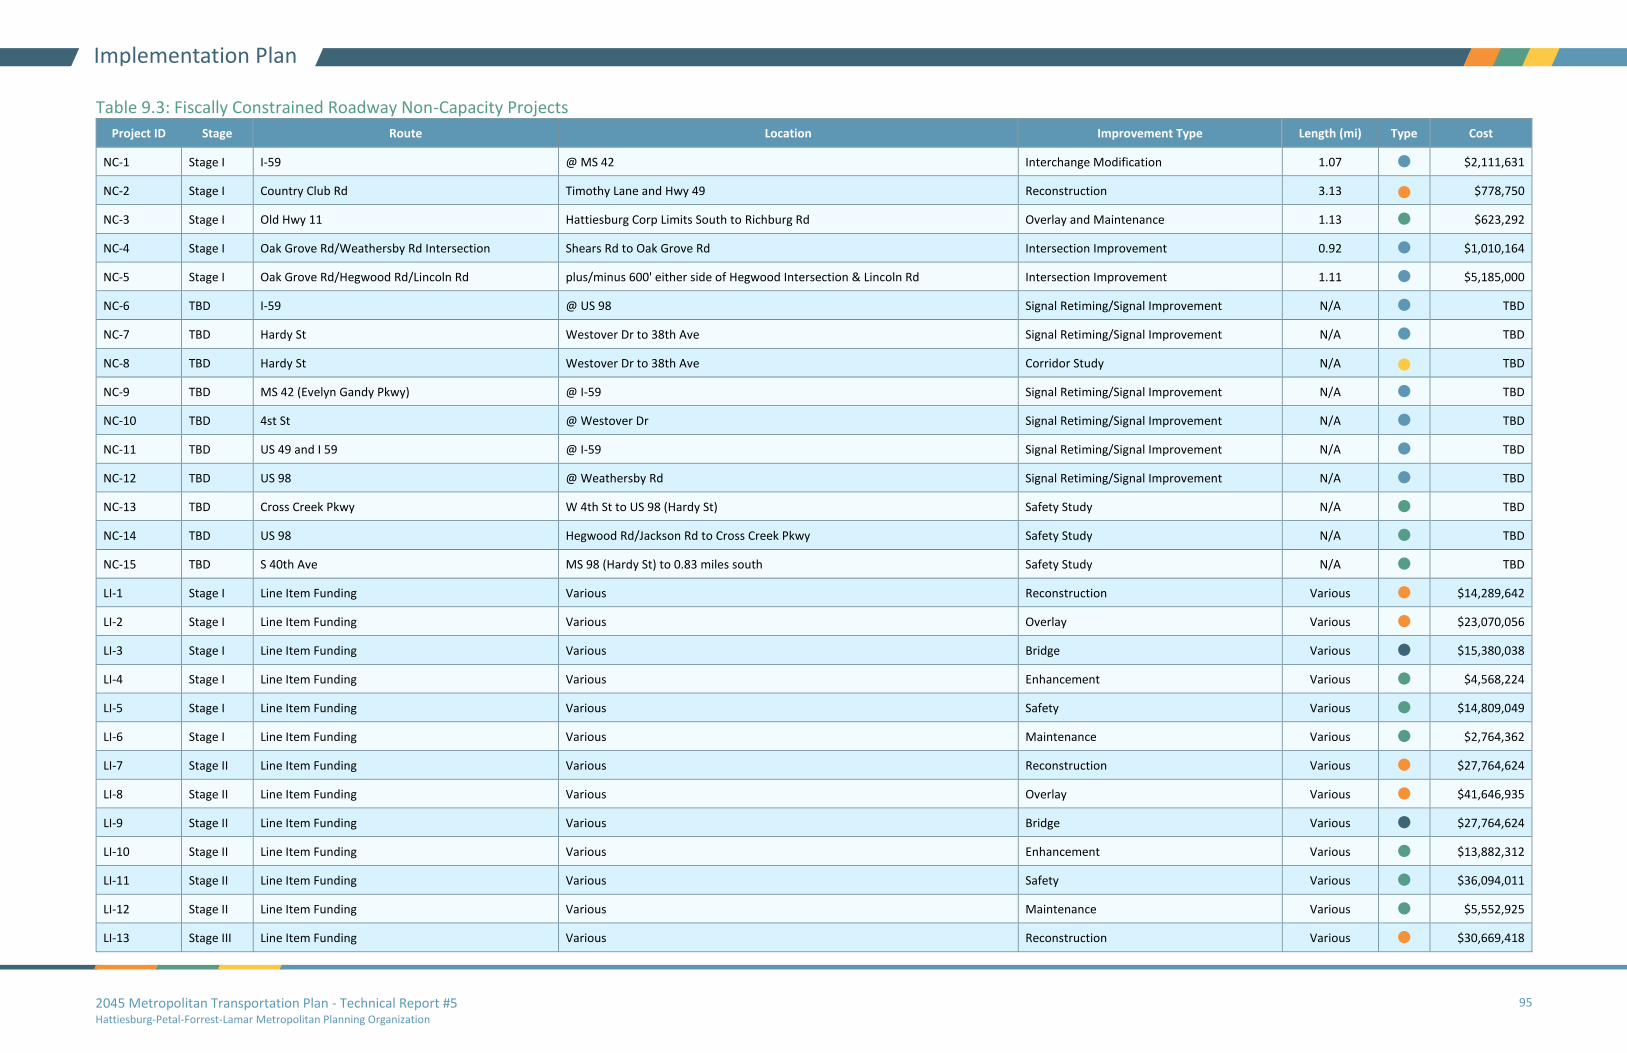
2045 Metropolitan Transportation Plan - Technical Report #5 Hattiesburg-Petal-Forrest-Lamar Metropolitan Planning Organization
95
Implementation Plan
Table 9.3: Fiscally Constrained Roadway Non-Capacity Projects
Project ID Stage Route Location Improvement Type Length (mi) Type Cost
NC-1 Stage I I-59 @ MS 42 Interchange Modification 1.07 ⚫ $2,111,631
NC-2 Stage I Country Club Rd Timothy Lane and Hwy 49 Reconstruction 3.13 ⚫ $778,750
NC-3 Stage I Old Hwy 11 Hattiesburg Corp Limits South to Richburg Rd Overlay and Maintenance 1.13 ⚫ $623,292
NC-4 Stage I Oak Grove Rd/Weathersby Rd Intersection Shears Rd to Oak Grove Rd Intersection Improvement 0.92 ⚫ $1,010,164
NC-5 Stage I Oak Grove Rd/Hegwood Rd/Lincoln Rd plus/minus 600' either side of Hegwood Intersection & Lincoln Rd Intersection Improvement 1.11 ⚫ $5,185,000
NC-6 TBD I-59 @ US 98 Signal Retiming/Signal Improvement N/A ⚫ TBD
NC-7 TBD Hardy St Westover Dr to 38th Ave Signal Retiming/Signal Improvement N/A ⚫ TBD
NC-8 TBD Hardy St Westover Dr to 38th Ave Corridor Study N/A ⚫ TBD
NC-9 TBD MS 42 (Evelyn Gandy Pkwy) @ I-59 Signal Retiming/Signal Improvement N/A ⚫ TBD
NC-10 TBD 4st St @ Westover Dr Signal Retiming/Signal Improvement N/A ⚫ TBD
NC-11 TBD US 49 and I 59 @ I-59 Signal Retiming/Signal Improvement N/A ⚫ TBD
NC-12 TBD US 98 @ Weathersby Rd Signal Retiming/Signal Improvement N/A ⚫ TBD
NC-13 TBD Cross Creek Pkwy W 4th St to US 98 (Hardy St) Safety Study N/A ⚫ TBD
NC-14 TBD US 98 Hegwood Rd/Jackson Rd to Cross Creek Pkwy Safety Study N/A ⚫ TBD
NC-15 TBD S 40th Ave MS 98 (Hardy St) to 0.83 miles south Safety Study N/A ⚫ TBD
LI-1 Stage I Line Item Funding Various Reconstruction Various ⚫ $14,289,642
LI-2 Stage I Line Item Funding Various Overlay Various ⚫ $23,070,056
LI-3 Stage I Line Item Funding Various Bridge Various ⚫ $15,380,038
LI-4 Stage I Line Item Funding Various Enhancement Various ⚫ $4,568,224
LI-5 Stage I Line Item Funding Various Safety Various ⚫ $14,809,049
LI-6 Stage I Line Item Funding Various Maintenance Various ⚫ $2,764,362
LI-7 Stage II Line Item Funding Various Reconstruction Various ⚫ $27,764,624
LI-8 Stage II Line Item Funding Various Overlay Various ⚫ $41,646,935
LI-9 Stage II Line Item Funding Various Bridge Various ⚫ $27,764,624
LI-10 Stage II Line Item Funding Various Enhancement Various ⚫ $13,882,312
LI-11 Stage II Line Item Funding Various Safety Various ⚫ $36,094,011
LI-12 Stage II Line Item Funding Various Maintenance Various ⚫ $5,552,925
LI-13 Stage III Line Item Funding Various Reconstruction Various ⚫ $30,669,418

2045 Metropolitan Transportation Plan - Technical Report #5 Hattiesburg-Petal-Forrest-Lamar Metropolitan Planning Organization
96
Implementation Plan
Project ID Stage Route Location Improvement Type Length (mi) Type Cost
LI-14 Stage III Line Item Funding Various Overlay Various ⚫ $46,004,126
LI-15 Stage III Line Item Funding Various Bridge Various ⚫ $30,669,418
LI-16 Stage III Line Item Funding Various Enhancement Various ⚫ $15,334,709
LI-17 Stage III Line Item Funding Various Safety Various ⚫ $39,870,243
LI-18 Stage III Line Item Funding Various Maintenance Various ⚫ $6,133,884
Note: YOE refers to the Year of Expenditure and reflects the expected cost at the time of implementation.
Improvement Type: ⚫ Bridge ⚫ Pavement ⚫ Intersection/Interchange ⚫ Corridor Redesign ⚫ Other/Multiple
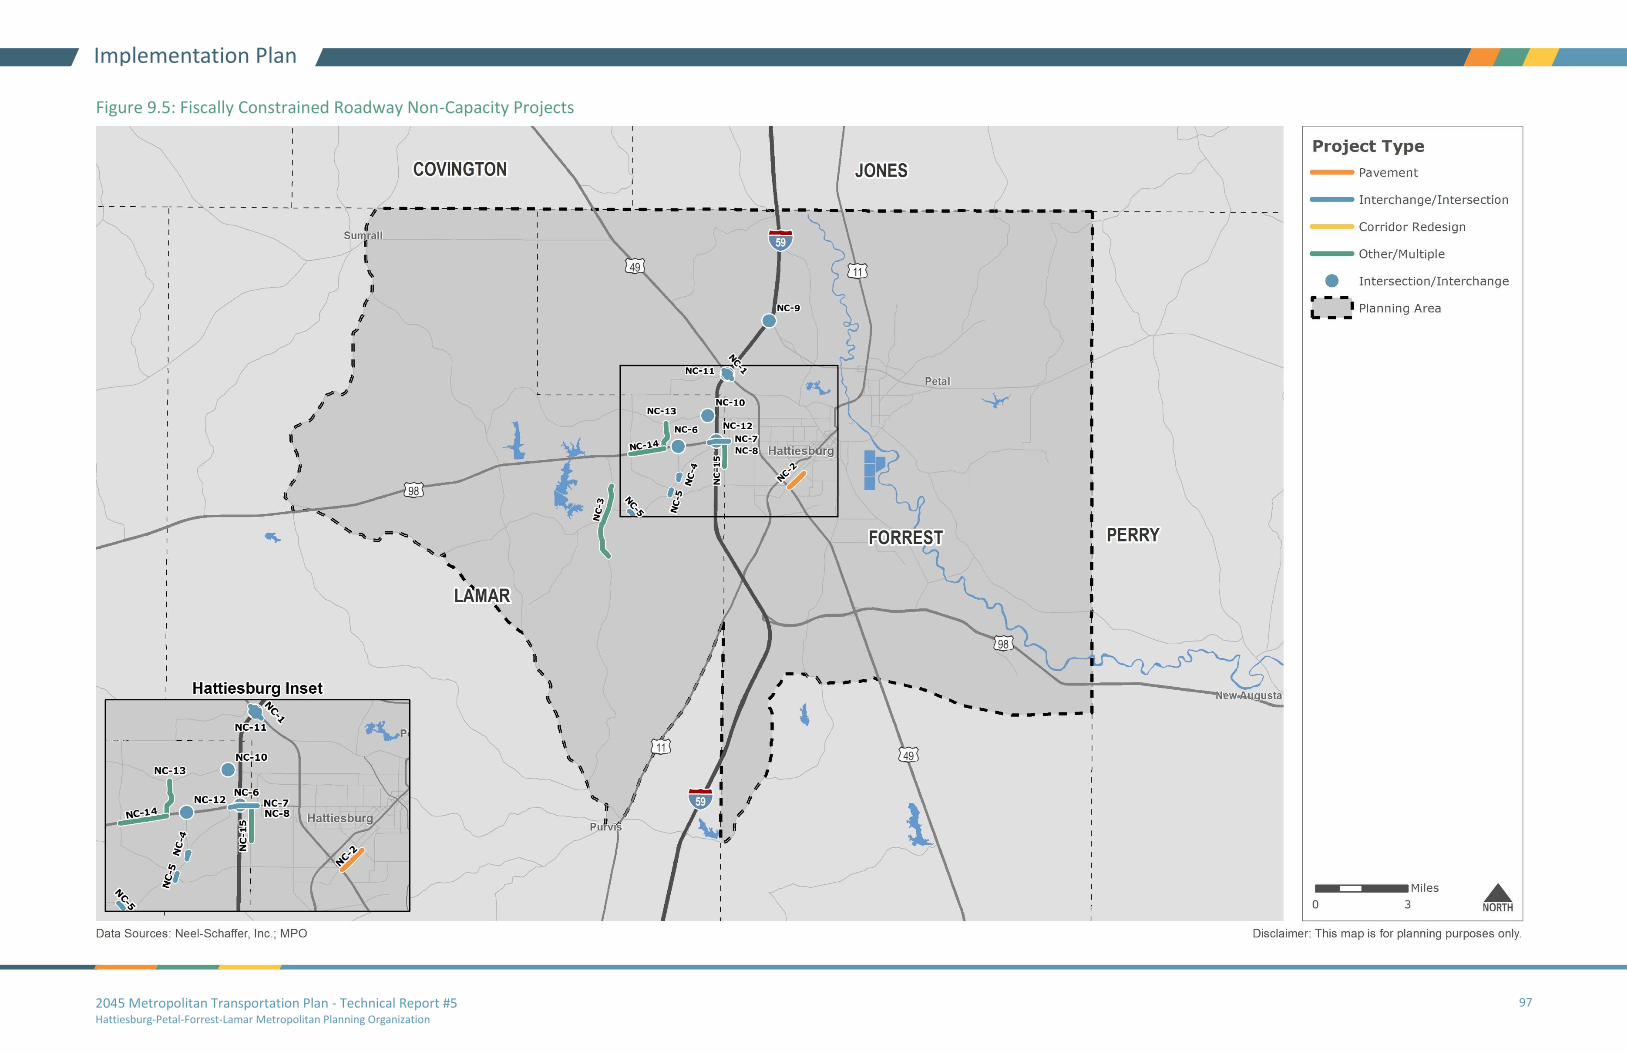
2045 Metropolitan Transportation Plan - Technical Report #5 Hattiesburg-Petal-Forrest-Lamar Metropolitan Planning Organization
97
Implementation Plan
Figure 9.5: Fiscally Constrained Roadway Non-Capacity Projects

2045 Metropolitan Transportation Plan - Technical Report #5 Hattiesburg-Petal-Forrest-Lamar Metropolitan Planning Organization
98
Implementation Plan
Table 9.4: Fiscally Constrained List of Bicycle and Pedestrian Projects
Project ID TIP ID Stage Route Location Improvement
Type Length (mi) Responsible LPA Fiscal Year Total Cost (YOE) Federal Cost (YOE)
BP-1 502 Stage I Classic Drive Pine Tree Drive to US Hwy 49 ⚫ 1.8 Forrest County 2022 $296,250 $237,000
BP-2 505 Stage I Country Club Rd Country Club Rd across Us Hwy 49 ⚫ 0.1 Forrest County 2022 $1,300,000 $1,040,000
1Funds for this project were committed through the Mississippi Department of Transportation (MDOT) and were not included in Figure 9.2.
Facility Type: ⚫ Pedestrian ⚫ Bicycle and Pedestrian

2045 Metropolitan Transportation Plan - Technical Report #5 Hattiesburg-Petal-Forrest-Lamar Metropolitan Planning Organization
99
Implementation Plan
Figure 9.6 Fiscally Constrained Bicycle and Pedestrian Projects
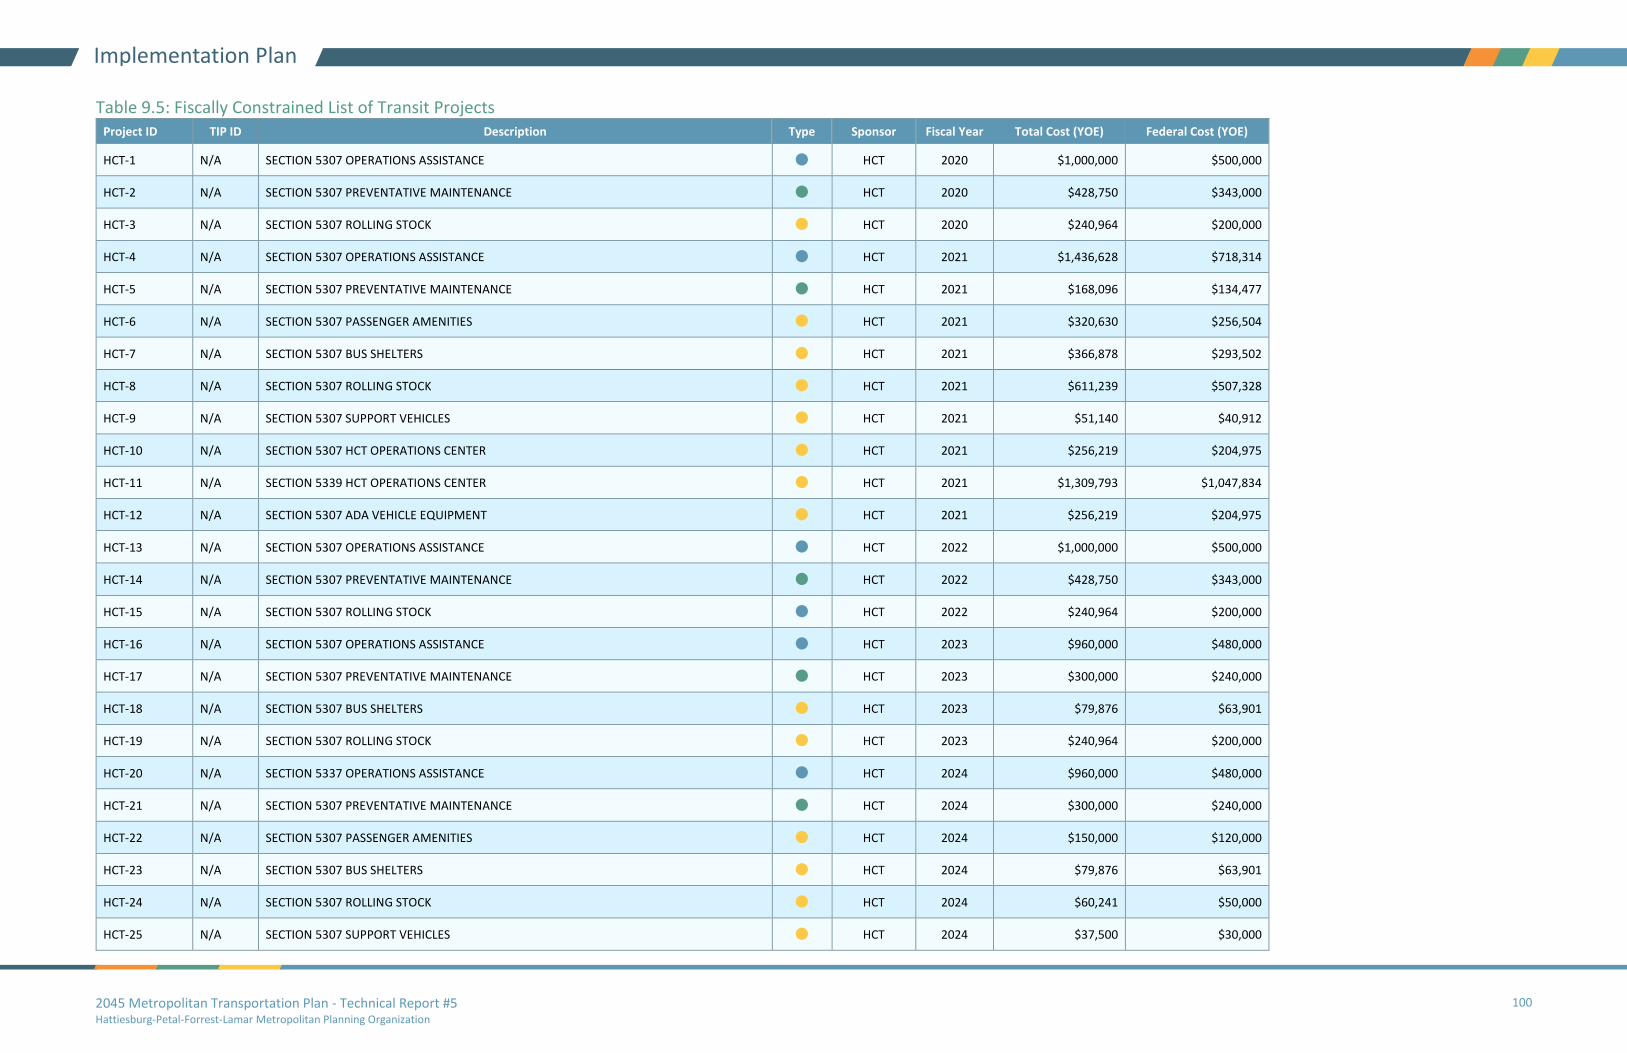
2045 Metropolitan Transportation Plan - Technical Report #5 Hattiesburg-Petal-Forrest-Lamar Metropolitan Planning Organization
100
Implementation Plan
Table 9.5: Fiscally Constrained List of Transit Projects Project ID TIP ID Description Type Sponsor Fiscal Year Total Cost (YOE) Federal Cost (YOE)
HCT-1 N/A SECTION 5307 OPERATIONS ASSISTANCE ⚫ HCT 2020 $1,000,000 $500,000
HCT-2 N/A SECTION 5307 PREVENTATIVE MAINTENANCE ⚫ HCT 2020 $428,750 $343,000
HCT-3 N/A SECTION 5307 ROLLING STOCK ⚫ HCT 2020 $240,964 $200,000
HCT-4 N/A SECTION 5307 OPERATIONS ASSISTANCE ⚫ HCT 2021 $1,436,628 $718,314
HCT-5 N/A SECTION 5307 PREVENTATIVE MAINTENANCE ⚫ HCT 2021 $168,096 $134,477
HCT-6 N/A SECTION 5307 PASSENGER AMENITIES ⚫ HCT 2021 $320,630 $256,504
HCT-7 N/A SECTION 5307 BUS SHELTERS ⚫ HCT 2021 $366,878 $293,502
HCT-8 N/A SECTION 5307 ROLLING STOCK ⚫ HCT 2021 $611,239 $507,328
HCT-9 N/A SECTION 5307 SUPPORT VEHICLES ⚫ HCT 2021 $51,140 $40,912
HCT-10 N/A SECTION 5307 HCT OPERATIONS CENTER ⚫ HCT 2021 $256,219 $204,975
HCT-11 N/A SECTION 5339 HCT OPERATIONS CENTER ⚫ HCT 2021 $1,309,793 $1,047,834
HCT-12 N/A SECTION 5307 ADA VEHICLE EQUIPMENT ⚫ HCT 2021 $256,219 $204,975
HCT-13 N/A SECTION 5307 OPERATIONS ASSISTANCE ⚫ HCT 2022 $1,000,000 $500,000
HCT-14 N/A SECTION 5307 PREVENTATIVE MAINTENANCE ⚫ HCT 2022 $428,750 $343,000
HCT-15 N/A SECTION 5307 ROLLING STOCK ⚫ HCT 2022 $240,964 $200,000
HCT-16 N/A SECTION 5307 OPERATIONS ASSISTANCE ⚫ HCT 2023 $960,000 $480,000
HCT-17 N/A SECTION 5307 PREVENTATIVE MAINTENANCE ⚫ HCT 2023 $300,000 $240,000
HCT-18 N/A SECTION 5307 BUS SHELTERS ⚫ HCT 2023 $79,876 $63,901
HCT-19 N/A SECTION 5307 ROLLING STOCK ⚫ HCT 2023 $240,964 $200,000
HCT-20 N/A SECTION 5337 OPERATIONS ASSISTANCE ⚫ HCT 2024 $960,000 $480,000
HCT-21 N/A SECTION 5307 PREVENTATIVE MAINTENANCE ⚫ HCT 2024 $300,000 $240,000
HCT-22 N/A SECTION 5307 PASSENGER AMENITIES ⚫ HCT 2024 $150,000 $120,000
HCT-23 N/A SECTION 5307 BUS SHELTERS ⚫ HCT 2024 $79,876 $63,901
HCT-24 N/A SECTION 5307 ROLLING STOCK ⚫ HCT 2024 $60,241 $50,000
HCT-25 N/A SECTION 5307 SUPPORT VEHICLES ⚫ HCT 2024 $37,500 $30,000

2045 Metropolitan Transportation Plan - Technical Report #5 Hattiesburg-Petal-Forrest-Lamar Metropolitan Planning Organization
101
Implementation Plan
Project ID TIP ID Description Type Sponsor Fiscal Year Total Cost (YOE) Federal Cost (YOE)
HCT-26 N/A SECTIONS 5307 AND 5339 CAPITAL ⚫ HCT 2025 $293,186 $234,549
HCT-27 N/A SECTION 5337 OPERATIONS ASSISTANCE ⚫ HCT 2025 $10,245,602 $5,122,801
HCT-28 N/A SECTION 5307 PREVENTATIVE MAINTENANCE ⚫ HCT 2025 $3,201,751 $2,561,401
HCT-29 N/A SECTIONS 5307 AND 5339 CAPITAL ⚫ HCT 2026-2035 $3,098,045 $2,478,436
HCT-30 N/A SECTION 5337 OPERATIONS ASSISTANCE ⚫ HCT 2026-2035 $10,245,602 $5,122,801
HCT-31 N/A SECTION 5307 PREVENTATIVE MAINTENANCE ⚫ HCT 2026-2035 $3,201,751 $2,561,401
HCT-32 N/A SECTIONS 5307 AND 5339 CAPITAL ⚫ HCT 2036-2045 $3,422,169 $2,737,735
HCT-33 N/A SECTION 5337 OPERATIONS ASSISTANCE ⚫ HCT 2036-2045 $11,317,520 $5,658,760
HCT-34 N/A SECTION 5307 PREVENTATIVE MAINTENANCE ⚫ HCT 2036-2045 $3,536,725 $2,829,380
Note: YOE (Year of Expenditure) costs assume a 1% annual inflation rate for transit projects.
Improvement Type: ⚫ Operating ⚫ Capital ⚫ Preventative Maintenance
2045 Metropolitan Transportation Plan - Technical Report #5 Hattiesburg-Petal-Forrest-Lamar Metropolitan Planning Organization
102
Implementation Plan
9.2 Visionary (Unfunded) Projects
Visionary projects are identified projects that are unfunded or unprogrammed in the fiscally constrained
list of projects.
Visionary Roadway Capacity Projects
Unfunded roadway capacity projects are not necessarily less important or effective; they just cannot be
accommodated within the fiscally constrained budget. This may be due to project costs or overall
feasibility.
Table 9.6 shows the list of visionary roadway capacity projects and Figure 9.7 maps these projects.
Visionary Bicycle and Pedestrian Corridors
The fiscally constrained plan has a line-item for TA projects. Local agencies should consider the visionary
bicycle and pedestrian corridors when MDOT releases a call for TA project grant applications.
Table 9.8 shows the list of visionary bicycle and pedestrian corridors and Figure 9.9 maps these projects.
Visionary Transit Expansion
The Needs Assessment revealed regional demand for increased and improved transit service. To address
these needs, the MTP recommends performing a Regional Transit Study. The Regional Transit Study
should consider the following questions:
• How could existing routes and services be redesigned to provide more effective service?
• Which areas not currently served by fixed routes would most benefit from new or expanded
routes?
• Are there any new modes or trends in the transit industry that could serve the area (i.e.
microtransit)?
Answers to these questions should inform the study's strategies for Hub City Transit in the short, mid,
and long-term horizons.
Unfunded projects that could become funded with additional
funding or if the fiscally constrained plan is changed.
Projects that can be programmed within the line-item budget
for Transportation Alternatives projects.
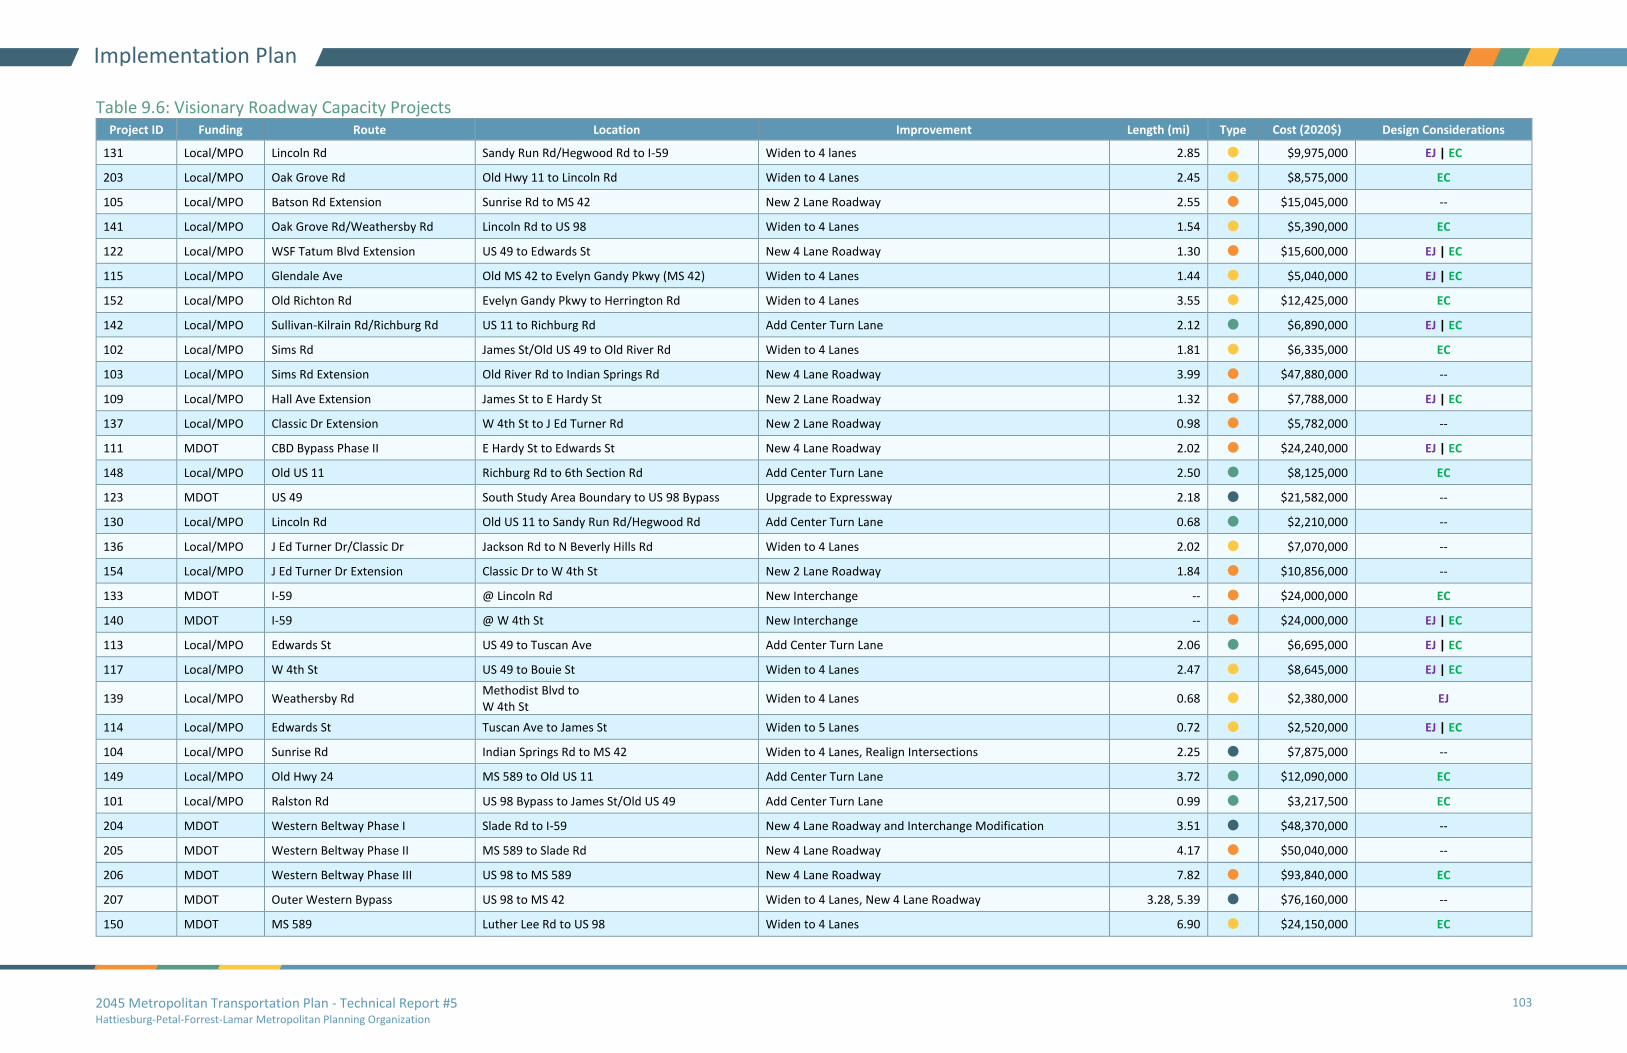
2045 Metropolitan Transportation Plan - Technical Report #5 Hattiesburg-Petal-Forrest-Lamar Metropolitan Planning Organization
103
Implementation Plan
Table 9.6: Visionary Roadway Capacity Projects Project ID Funding Route Location Improvement Length (mi) Type Cost (2020$) Design Considerations
131 Local/MPO Lincoln Rd Sandy Run Rd/Hegwood Rd to I-59 Widen to 4 lanes 2.85 ⚫ $9,975,000 EJ | EC
203 Local/MPO Oak Grove Rd Old Hwy 11 to Lincoln Rd Widen to 4 Lanes 2.45 ⚫ $8,575,000 EC
105 Local/MPO Batson Rd Extension Sunrise Rd to MS 42 New 2 Lane Roadway 2.55 ⚫ $15,045,000 --
141 Local/MPO Oak Grove Rd/Weathersby Rd Lincoln Rd to US 98 Widen to 4 Lanes 1.54 ⚫ $5,390,000 EC
122 Local/MPO WSF Tatum Blvd Extension US 49 to Edwards St New 4 Lane Roadway 1.30 ⚫ $15,600,000 EJ | EC
115 Local/MPO Glendale Ave Old MS 42 to Evelyn Gandy Pkwy (MS 42) Widen to 4 Lanes 1.44 ⚫ $5,040,000 EJ | EC
152 Local/MPO Old Richton Rd Evelyn Gandy Pkwy to Herrington Rd Widen to 4 Lanes 3.55 ⚫ $12,425,000 EC
142 Local/MPO Sullivan-Kilrain Rd/Richburg Rd US 11 to Richburg Rd Add Center Turn Lane 2.12 ⚫ $6,890,000 EJ | EC
102 Local/MPO Sims Rd James St/Old US 49 to Old River Rd Widen to 4 Lanes 1.81 ⚫ $6,335,000 EC
103 Local/MPO Sims Rd Extension Old River Rd to Indian Springs Rd New 4 Lane Roadway 3.99 ⚫ $47,880,000 --
109 Local/MPO Hall Ave Extension James St to E Hardy St New 2 Lane Roadway 1.32 ⚫ $7,788,000 EJ | EC
137 Local/MPO Classic Dr Extension W 4th St to J Ed Turner Rd New 2 Lane Roadway 0.98 ⚫ $5,782,000 --
111 MDOT CBD Bypass Phase II E Hardy St to Edwards St New 4 Lane Roadway 2.02 ⚫ $24,240,000 EJ | EC
148 Local/MPO Old US 11 Richburg Rd to 6th Section Rd Add Center Turn Lane 2.50 ⚫ $8,125,000 EC
123 MDOT US 49 South Study Area Boundary to US 98 Bypass Upgrade to Expressway 2.18 ⚫ $21,582,000 --
130 Local/MPO Lincoln Rd Old US 11 to Sandy Run Rd/Hegwood Rd Add Center Turn Lane 0.68 ⚫ $2,210,000 --
136 Local/MPO J Ed Turner Dr/Classic Dr Jackson Rd to N Beverly Hills Rd Widen to 4 Lanes 2.02 ⚫ $7,070,000 --
154 Local/MPO J Ed Turner Dr Extension Classic Dr to W 4th St New 2 Lane Roadway 1.84 ⚫ $10,856,000 --
133 MDOT I-59 @ Lincoln Rd New Interchange -- ⚫ $24,000,000 EC
140 MDOT I-59 @ W 4th St New Interchange -- ⚫ $24,000,000 EJ | EC
113 Local/MPO Edwards St US 49 to Tuscan Ave Add Center Turn Lane 2.06 ⚫ $6,695,000 EJ | EC
117 Local/MPO W 4th St US 49 to Bouie St Widen to 4 Lanes 2.47 ⚫ $8,645,000 EJ | EC
139 Local/MPO Weathersby Rd Methodist Blvd to W 4th St
Widen to 4 Lanes 0.68 ⚫ $2,380,000 EJ
114 Local/MPO Edwards St Tuscan Ave to James St Widen to 5 Lanes 0.72 ⚫ $2,520,000 EJ | EC
104 Local/MPO Sunrise Rd Indian Springs Rd to MS 42 Widen to 4 Lanes, Realign Intersections 2.25 ⚫ $7,875,000 --
149 Local/MPO Old Hwy 24 MS 589 to Old US 11 Add Center Turn Lane 3.72 ⚫ $12,090,000 EC
101 Local/MPO Ralston Rd US 98 Bypass to James St/Old US 49 Add Center Turn Lane 0.99 ⚫ $3,217,500 EC
204 MDOT Western Beltway Phase I Slade Rd to I-59 New 4 Lane Roadway and Interchange Modification 3.51 ⚫ $48,370,000 --
205 MDOT Western Beltway Phase II MS 589 to Slade Rd New 4 Lane Roadway 4.17 ⚫ $50,040,000 --
206 MDOT Western Beltway Phase III US 98 to MS 589 New 4 Lane Roadway 7.82 ⚫ $93,840,000 EC
207 MDOT Outer Western Bypass US 98 to MS 42 Widen to 4 Lanes, New 4 Lane Roadway 3.28, 5.39 ⚫ $76,160,000 --
150 MDOT MS 589 Luther Lee Rd to US 98 Widen to 4 Lanes 6.90 ⚫ $24,150,000 EC
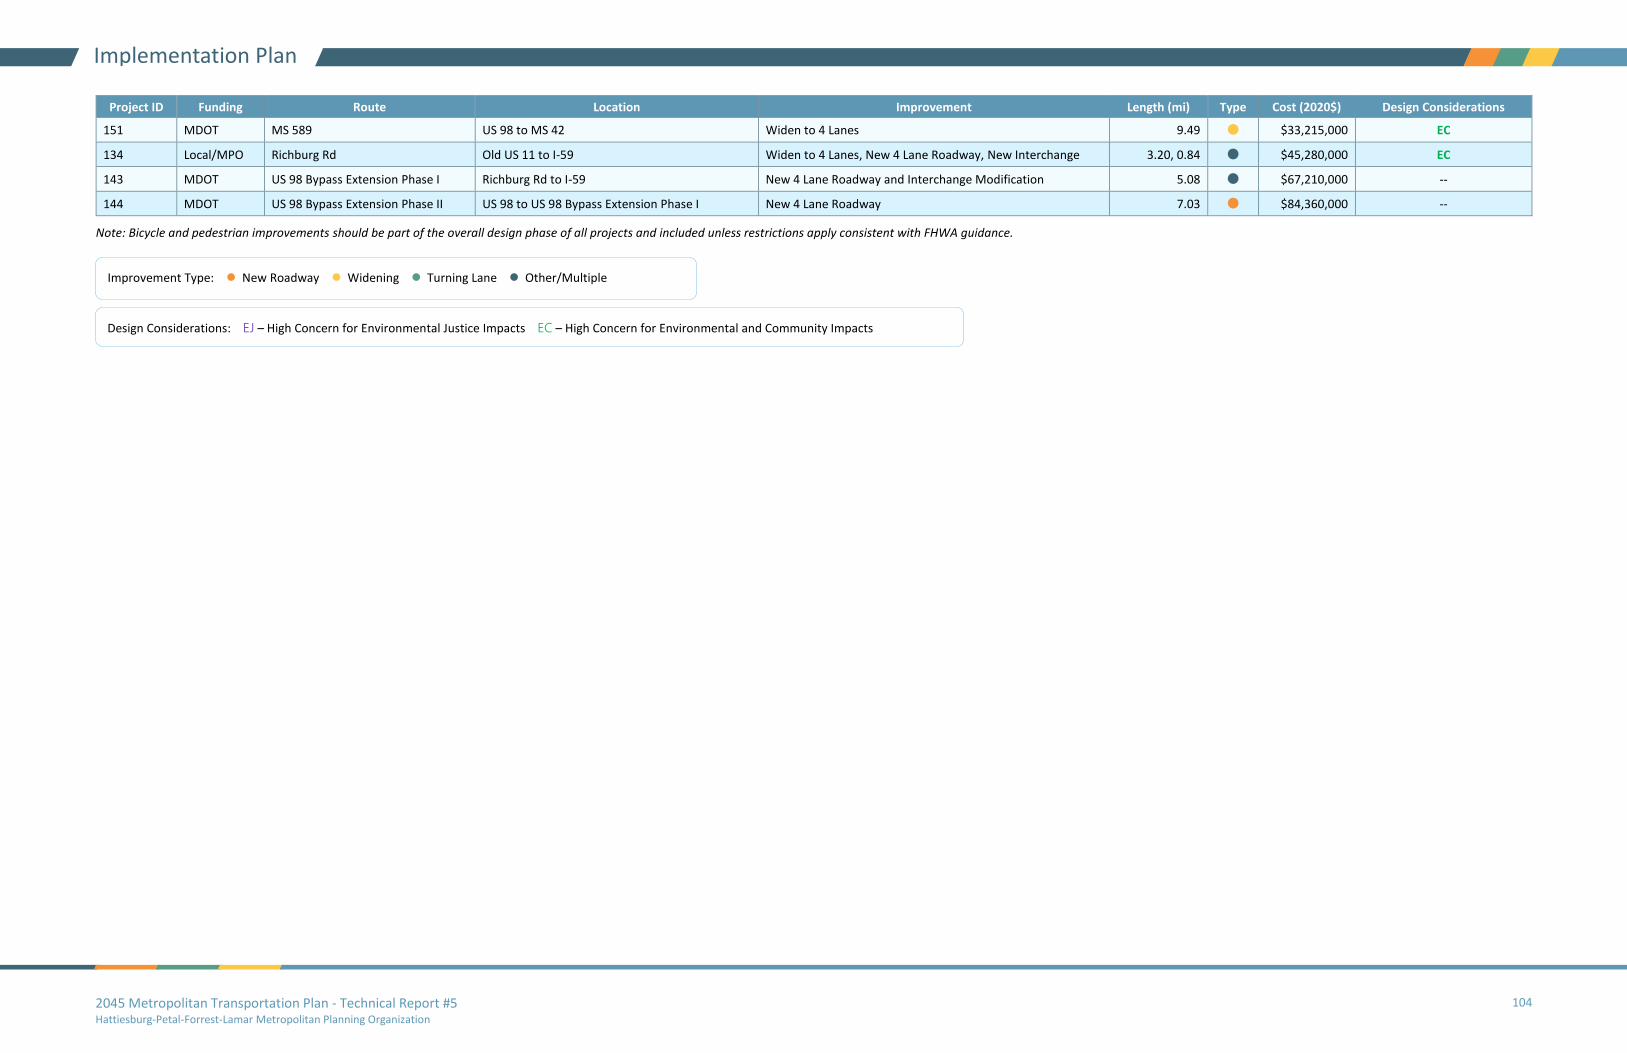
2045 Metropolitan Transportation Plan - Technical Report #5 Hattiesburg-Petal-Forrest-Lamar Metropolitan Planning Organization
104
Implementation Plan
Project ID Funding Route Location Improvement Length (mi) Type Cost (2020$) Design Considerations
151 MDOT MS 589 US 98 to MS 42 Widen to 4 Lanes 9.49 ⚫ $33,215,000 EC
134 Local/MPO Richburg Rd Old US 11 to I-59 Widen to 4 Lanes, New 4 Lane Roadway, New Interchange 3.20, 0.84 ⚫ $45,280,000 EC
143 MDOT US 98 Bypass Extension Phase I Richburg Rd to I-59 New 4 Lane Roadway and Interchange Modification 5.08 ⚫ $67,210,000 --
144 MDOT US 98 Bypass Extension Phase II US 98 to US 98 Bypass Extension Phase I New 4 Lane Roadway 7.03 ⚫ $84,360,000 --
Note: Bicycle and pedestrian improvements should be part of the overall design phase of all projects and included unless restrictions apply consistent with FHWA guidance.
Design Considerations: EJ – High Concern for Environmental Justice Impacts EC – High Concern for Environmental and Community Impacts
Improvement Type: ⚫ New Roadway ⚫ Widening ⚫ Turning Lane ⚫ Other/Multiple
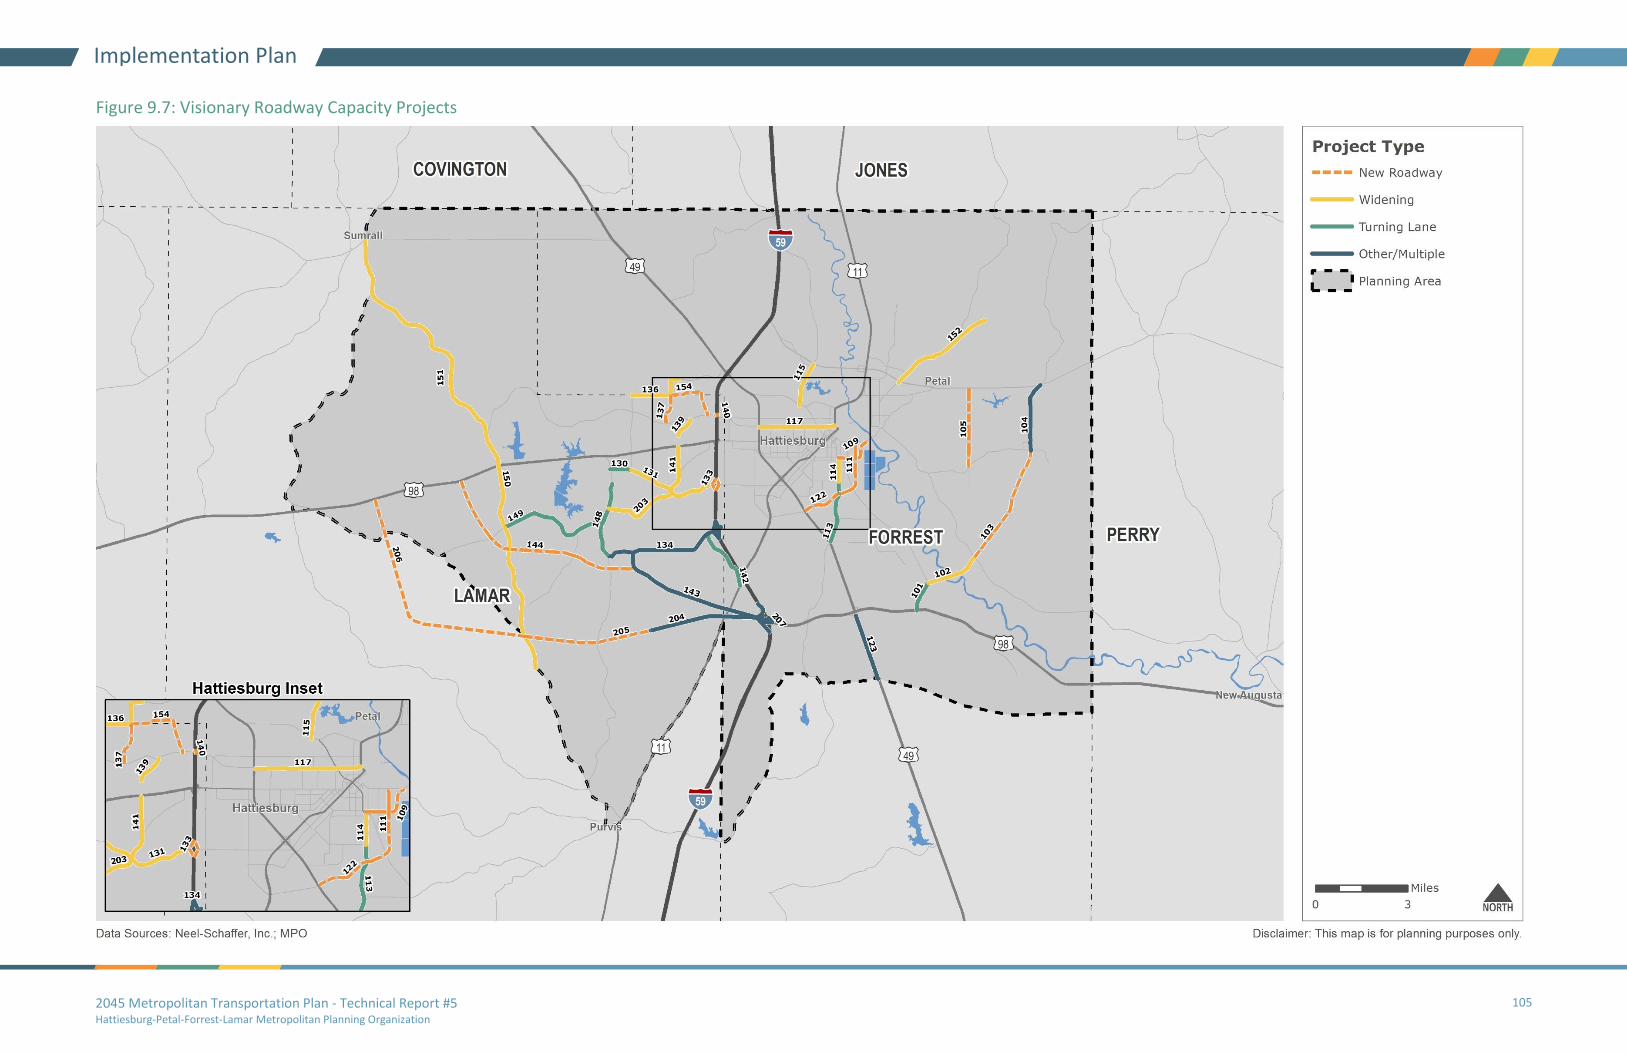
2045 Metropolitan Transportation Plan - Technical Report #5 Hattiesburg-Petal-Forrest-Lamar Metropolitan Planning Organization
105
Implementation Plan
Figure 9.7: Visionary Roadway Capacity Projects

2045 Metropolitan Transportation Plan - Technical Report #5 Hattiesburg-Petal-Forrest-Lamar Metropolitan Planning Organization
106
Implementation Plan
Table 9.7: Visionary Bicycle and Pedestrian Project Corridors Project ID Responsible LPA Stage Route Location Length (mi) Type Cost (2020$)
BP-3 City of Hattiesburg Vision Main St Jackson St to Southern Ave 0.65 ⚫ TBD
BP-4 City of Hattiesburg Vision N 40th Ave and Montague Blvd N 40th Ave: Hardy St to Montague Blvd; Montague Blvd: N 40th Ave to Ross Blvd 0.74 ⚫⚫ TBD
BP-5 City of Hattiesburg Vision McLeod and Jackson St McLeod St: Hardy St to Forrest St; Jackson St: Forrest St to E 5th St 0.62 ⚫⚫ TBD
BP-6 City of Hattiesburg Vision Buschman Blvd and Shared Use Path Buschman Blvd: Main St to Rail ROW; Shared-Use Path: Buschman Blvd to 750 ft from E 5th Ave 1.02 ⚫⚫ TBD
BP-7 City of Hattiesburg Vision Black and Gold Blvd and Golden Ave Sidepaths Black and Gold Ave: Golden Eagle Ave to Championship Ln; Golden Eagle Ave: Pearl St to W 4th St 0.67 ⚫ TBD
BP-8 City of Hattiesburg Vision 34th Ave Bike Route- Sharrows Hardy St to Beverly Ln 0.57 ⚫ TBD
BP-9 City of Hattiesburg Vision Arlington Loop S 37th Ave to US 49 0.87 ⚫⚫ TBD
BP-10 City of Hattiesburg Vision Walnut St Katie Ave to Main St 0.68 ⚫ TBD
BP-11 City of Hattiesburg Vision Memorial Dr Bike Lanes Hardy St to Arcadia St 1.04 ⚫ TBD
BP-12 City of Hattiesburg Vision Thornhill Dr and Shared-Use Path Thornhill Dr: N 40th Ave to W 4th St; Shared-Use Path: Thornhill Dr to Longleaf Trace 1.17 ⚫⚫ TBD
BP-13 City of Hattiesburg Vision Columbia St and West St Columbia St: Rawls Ave to Main St; West St: Columbia St to Longleaf Trace (Programmed) 0.79 ⚫ TBD
BP-14 City of Hattiesburg Vision Hardy St West S 40th Ave to Cross Creek Pkwy 2.00 ⚫ TBD
BP-15 City of Hattiesburg Vision Hardy St Bike Lane US 49 to W Front St 2.21 ⚫ TBD
BP-16 City of Hattiesburg Vision 26th Ave Bike Lanes Hardy St to Eddy St 1.11 ⚫ TBD
BP-17 City of Hattiesburg Vision 25th Ave Bike Route 7th St to Quinn St 0.50 ⚫ TBD
BP-18 City of Hattiesburg Vision Front Street Bike Route Forrest St to Gordon St 0.48 ⚫ TBD
BP-19 City of Hattiesburg Vision Old RR/ROW Shared-Use Path Bouie River Shared Use Path to Mobile St 1.51 ⚫ TBD
BP-20 City of Hattiesburg Vision Columbia St Bike Route Rawls Ave to Main St 0.79 ⚫ TBD
BP-21 City of Hattiesburg Vision W. Pine St/Broadway Bike Lane Service Rd to 83 ft from 7th Ave 0.94 ⚫ TBD
BP-22 City of Hattiesburg Vision MLK Ave Bike Route Hall Ave to Tuscan Ave 0.80 ⚫ TBD
BP-23 City of Hattiesburg Vision 4th St Bike Lane N 38th Ave to US 49 1.01 ⚫ TBD
BP-24 City of Hattiesburg Vision Beverly Hills Rd Bike Route Campbell Dr to N 37th Ave 0.69 ⚫ TBD
BP-25 Town of Petal Vision W. Pine St Lincoln Rd to Broadway Dr 1.16 ⚫ TBD
BP-26 Town of Petal Vision Main St Petal Main St: E Hardy St to W 1st Ave; W 1st Ave: Main St to Rails with Trails Path 2.94 ⚫⚫ TBD
Improvement Type: ⚫ Bike Lane ⚫ Bike Route ⚫ Shared-Use Path
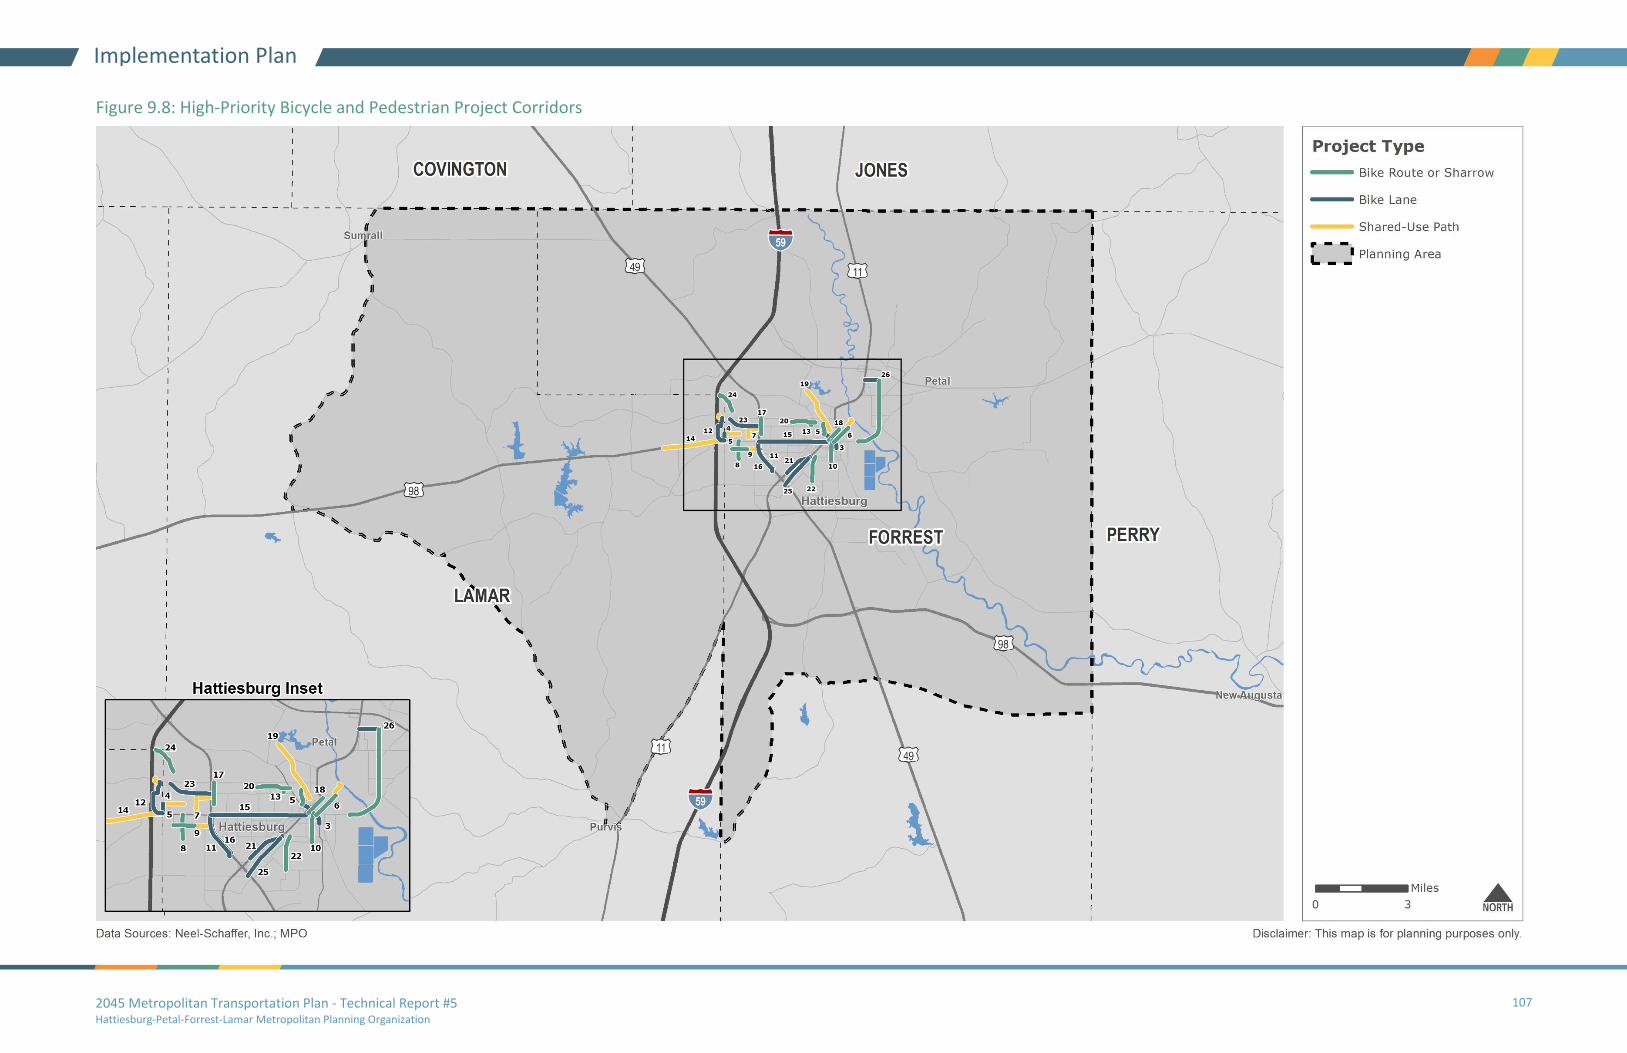
2045 Metropolitan Transportation Plan - Technical Report #5 Hattiesburg-Petal-Forrest-Lamar Metropolitan Planning Organization
107
Implementation Plan
Figure 9.8: High-Priority Bicycle and Pedestrian Project Corridors

2045 Metropolitan Transportation Plan - Technical Report #5 Hattiesburg-Petal-Forrest-Lamar Metropolitan Planning Organization
108
Public/Stakeholder Outreach Record
Appendix: Public/Stakeholder Outreach Documentation
2045 Metropolitan Transportation Plan - Technical Report #5 Hattiesburg-Petal-Forrest-Lamar Metropolitan Planning Organization
109
Public/Stakeholder Outreach Record
Round 1 Documentation
Summary of outreach efforts will be provided at end of engagement process.
Multiplan Website
Summary of outreach efforts will be provided at end of engagement process.
Quarterly Newsbytes
Summary of outreach efforts will be provided at end of engagement process.
2045 Metropolitan Transportation Plan - Technical Report #5 Hattiesburg-Petal-Forrest-Lamar Metropolitan Planning Organization
110
Public/Stakeholder Outreach Record
Social Media
2045 Metropolitan Transportation Plan - Technical Report #5 Hattiesburg-Petal-Forrest-Lamar Metropolitan Planning Organization
111
Public/Stakeholder Outreach Record
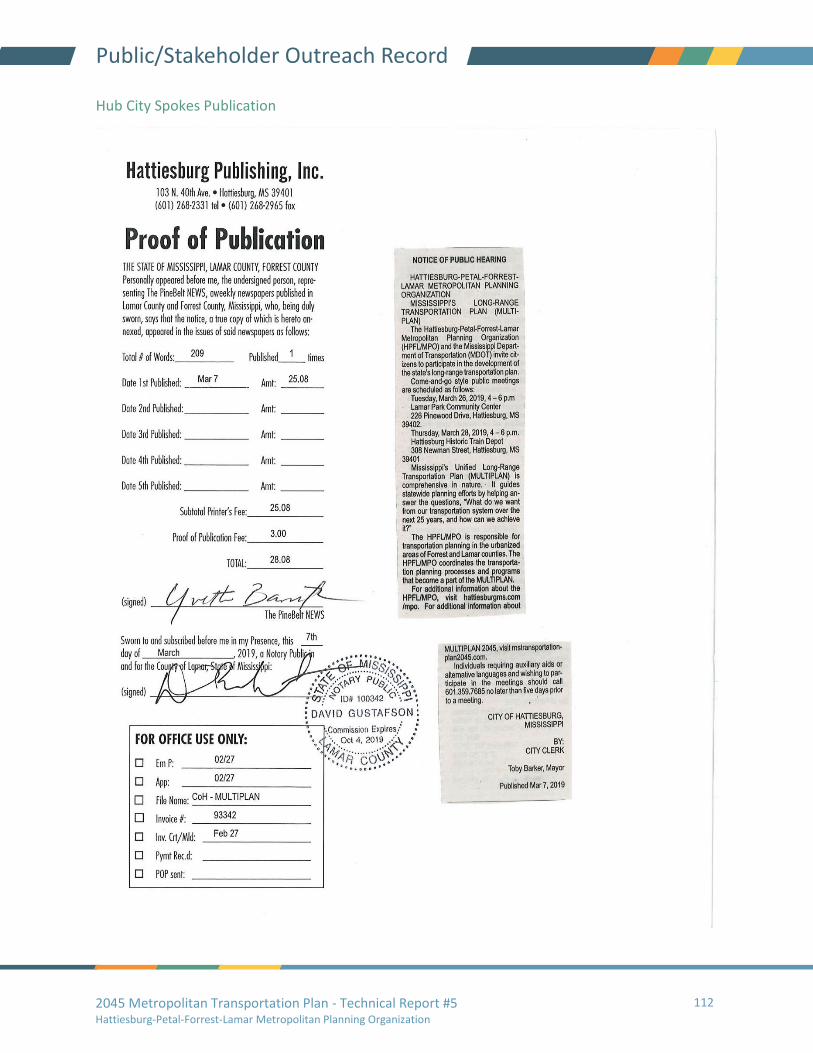
2045 Metropolitan Transportation Plan - Technical Report #5 Hattiesburg-Petal-Forrest-Lamar Metropolitan Planning Organization
112
Public/Stakeholder Outreach Record
Hub City Spokes Publication
2045 Metropolitan Transportation Plan - Technical Report #5 Hattiesburg-Petal-Forrest-Lamar Metropolitan Planning Organization
113
Public/Stakeholder Outreach Record
Outreach to Underserved Communities
Summary of outreach efforts will be provided at end of engagement process.
Online Survey
Summary of outreach efforts will be provided at end of engagement process.
Public Meetings
Complete summary of outreach efforts will be provided at end of engagement process.
Stakeholder Meetings
Complete summary of outreach efforts will be provided at end of engagement process.

2045 Metropolitan Transportation Plan - Technical Report #5 Hattiesburg-Petal-Forrest-Lamar Metropolitan Planning Organization
114
Public/Stakeholder Outreach Record
Public Meeting Sign-in Sheet – Round 1
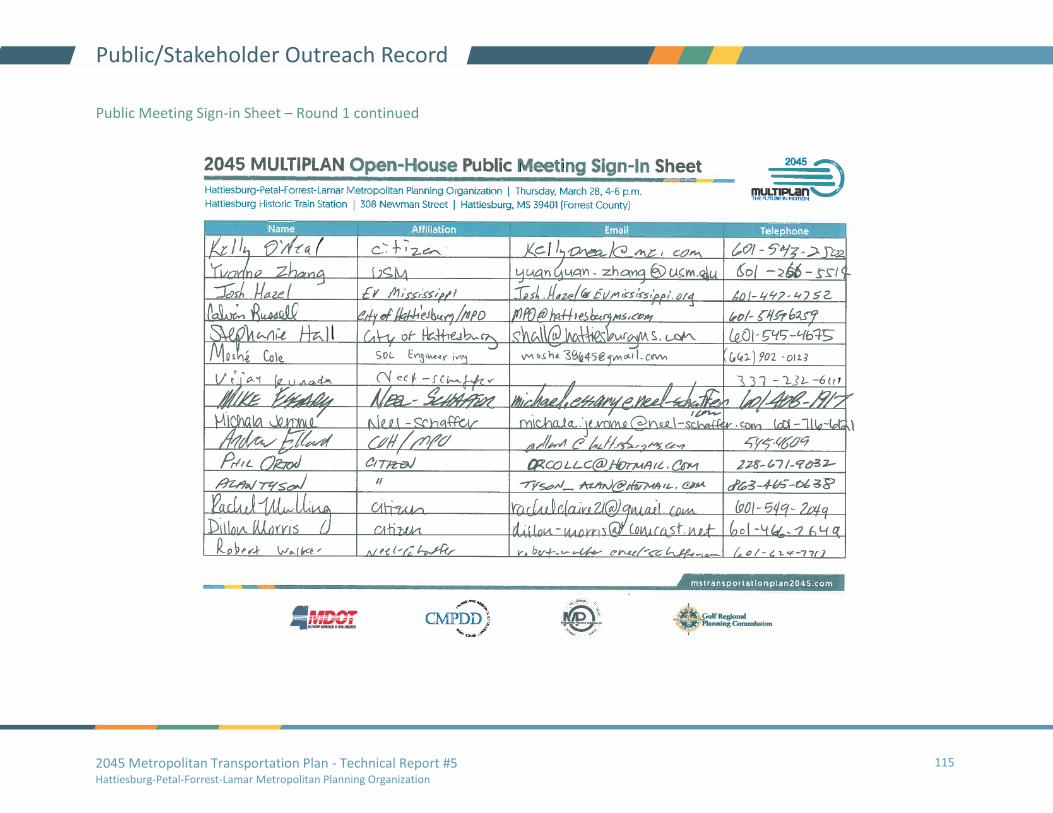
2045 Metropolitan Transportation Plan - Technical Report #5 Hattiesburg-Petal-Forrest-Lamar Metropolitan Planning Organization
115
Public/Stakeholder Outreach Record
Public Meeting Sign-in Sheet – Round 1 continued

2045 Metropolitan Transportation Plan - Technical Report #5 Hattiesburg-Petal-Forrest-Lamar Metropolitan Planning Organization
116
Public/Stakeholder Outreach Record
Public Meeting Sign-in Sheet – Round 1 continued
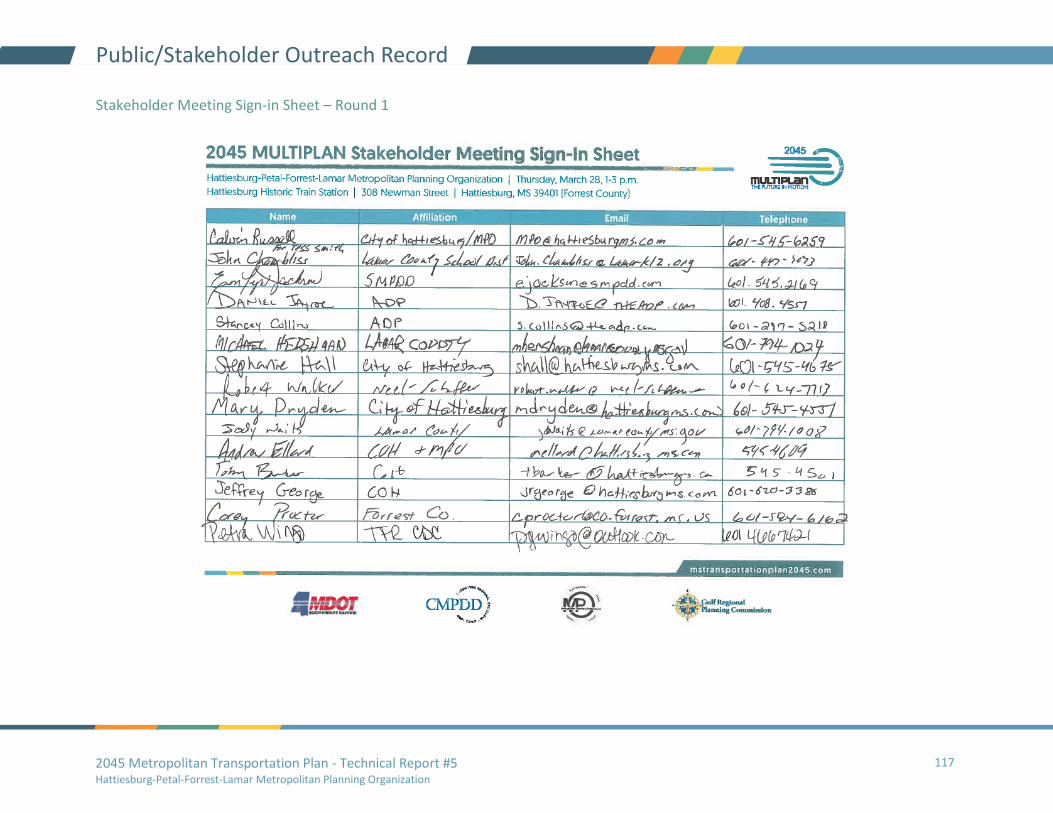
2045 Metropolitan Transportation Plan - Technical Report #5 Hattiesburg-Petal-Forrest-Lamar Metropolitan Planning Organization
117
Public/Stakeholder Outreach Record
Stakeholder Meeting Sign-in Sheet – Round 1
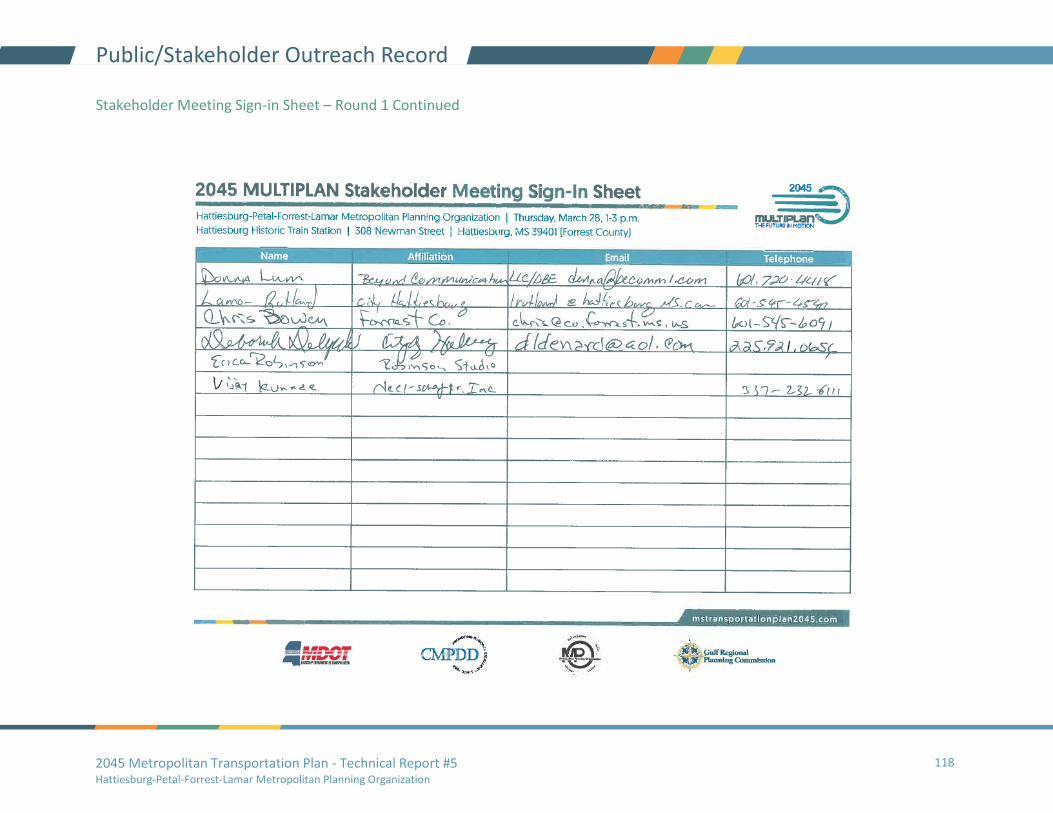
2045 Metropolitan Transportation Plan - Technical Report #5 Hattiesburg-Petal-Forrest-Lamar Metropolitan Planning Organization
118
Public/Stakeholder Outreach Record
Stakeholder Meeting Sign-in Sheet – Round 1 Continued

2045 Metropolitan Transportation Plan - Technical Report #5 Hattiesburg-Petal-Forrest-Lamar Metropolitan Planning Organization
119
Public/Stakeholder Outreach Record
Stakeholder Meeting Sign-in Sheet – Round 1 Continued
2045 Metropolitan Transportation Plan - Technical Report #5 120 Hattiesburg-Petal-Forrest-Lamar Metropolitan Planning Organization
Public/Stakeholder Outreach Record
Round 2 Documentation
Summary of outreach efforts will be provided at end of engagement process.
Multiplan Website
Summary of outreach efforts will be provided at end of engagement process.
Quarterly Newsbytes
Summary of outreach efforts will be provided at end of engagement process.
Social Media
Summary of outreach efforts will be provided at end of engagement process.
Outreach to Underserved Communities
Summary of outreach efforts will be provided at end of engagement process.
Online Survey
Summary of outreach efforts will be provided at end of engagement process.
Public Meetings
Summary of outreach efforts will be provided at end of engagement process.
Stakeholder Meetings
Summary of outreach efforts will be provided at end of engagement process.