Retail Market Technical Report - City of Chicago
22
South Shore Corridor Study Retail Market Technical Report
-
Upload
khangminh22 -
Category
Documents
-
view
0 -
download
0
Transcript of Retail Market Technical Report - City of Chicago
South Shore Corridor Study
Retail Market Technical Report
South Shore Corridor Retail Context
1 South Shore Corridor Retail Context
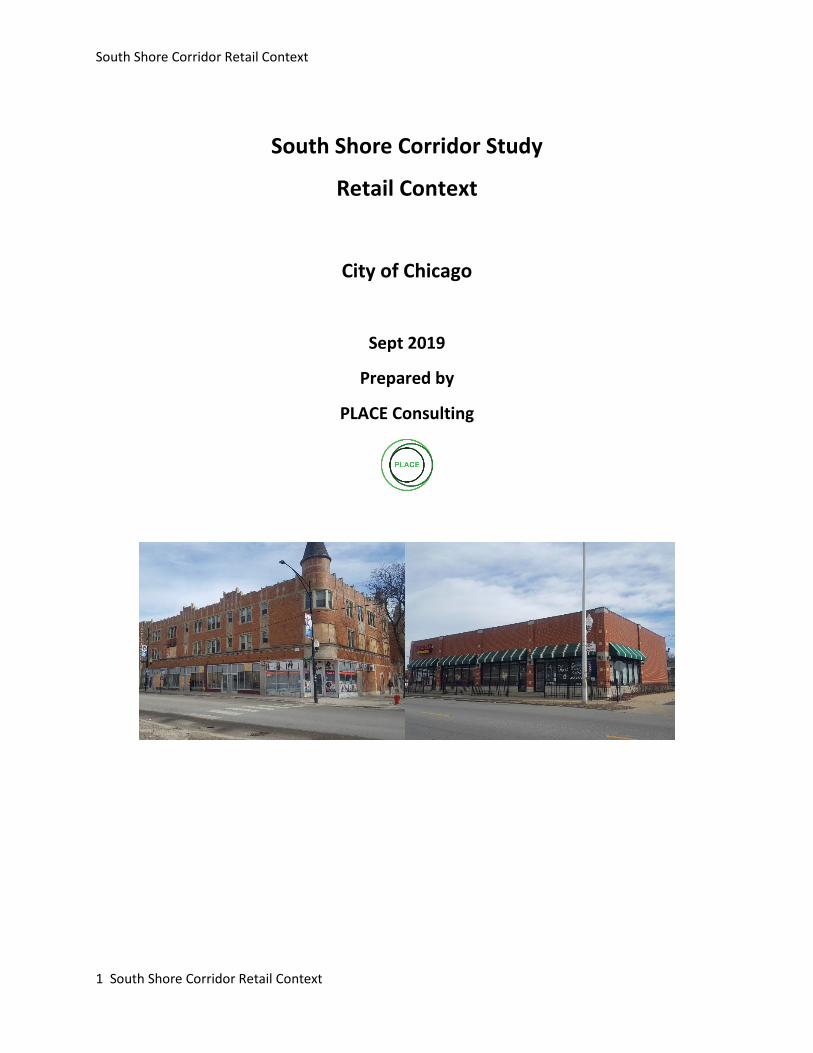
South Shore Corridor Study
Retail Context
City of Chicago
Sept 2019
Prepared by
PLACE Consulting

South Shore Corridor Retail Context
2 South Shore Corridor Retail Context
Table of Contents
1.0 Introduction 3 2.0 Existing Retail Conditions 4
2.1 Demographic Analysis 5 2.2 Retail Market Analysis 8 2.3 Business Inventory 11 2.4 Building Conditions 12 2.5 Vacancies 13
3.0 Recommendations 16 3.1 Site Specific Recommendations 16 3.2 District-Wide Recommendations 17
4.0 Implementation Resources 18 4.1 Special Service Area (SSA) #49 18 4.2 Businesses of Color Partnerships Fund 19 4.3 Neighborhood Opportunity Fund 20 4.4 Retail Thrive Zone 20 4.5 Word Business Chicago 21 4.6 The Community Law project 21
South Shore Corridor Retail Context
3 South Shore Corridor Retail Context
1.0 Introduction The purpose of this Retail Context report, commissioned by the City of Chicago as part of the South Shore Corridor Study, is to evaluate the existing retail conditions in the South Shore corridor and develop recommendation to strengthen the retail environment along 79th Street, 75th Street, and Stony Island Avenue.
It is important to evaluate the local retail market and identify areas of strength and areas that need improvement in the South Shore Study Area. Strong retail corridors and transportation improvements can have a symbiotic relationship, where strong retail increases transit ridership and transportation improvement can increase customer traffic into retail storefronts.
The existing retail market context is evaluated to identify areas of retail spending surplus and leakage. This is a measure of how well local retail competes for spending among people from both outside and within the community. A surplus indicates people from outside the area are spending within in it. Spending leakage indicates that residents are spending more on retail outside of the area than expected. This can suggest retail types that could be attracted to the area.
This information is evaluated, along with the existing business mix in the South Shore Study area, to identify retail categories that need to be strengthened in the study area.
Informed by the data analysis and community feedback, a set of recommendation to strengthen retail in South Shore is discussed. Recommendation are also accompanied by implementation guidelines that will identify potential funding sourced and partners to help implement the recommendations.

South Shore Corridor Retail Context
4 South Shore Corridor Retail Context
2.0 Existing Retail Conditions The diagram below shows the Retail Market area, which includes the South Shore, Hyde Park, Greater Grand Crossing, Woodlawn, Chatham, Avalon Park, Calumet Heights, and South Chicago Community Areas. This provides a wider market context for the South Shore retail market, as people cross boundaries to access different types of retail and services, and a point of comparison for retail performance. The Project Area indicated, covers the South Shore Corridor Study area.
ESRI Business Analyst demographic reports for the Retail Market Area, Project Area, and various sub-markets were reviewed to obtain a greater understanding of how the South Shore Project Area compares to the wider Retail Market area and its various sub-districts.
Retail Context Map

South Shore Corridor Retail Context
5 South Shore Corridor Retail Context
2.1 Demographic Analysis
Retail Market Area Demographics
The wider Retail Market Area, including South Shore, Hyde Park, Greater Grand Crossing, Woodlawn, Chatham, Avalon Park, Calumet Heights, and South Chicago Community has the following key characteristics.
• 2018 Population: 224,586 • 2023 Projected Population: 225,324 • Projected Growth Rate: 0.07% • Median Household Income: $34,313
Sub-Market Demographics Table
South Shore Chatham Woodlawn Hyde Park 2018 Population 52,965 30,354 25,613 27,504 2023 Proj. Population 53,253 30,010 26,355 28,548 Projected Growth Rate 0.11% -0.23% 0.57% 0.75% Median HH Income $29,533 $35,704 $25,638 $53,011
Overall South Shore has a projected growth rate that is very similar to the Retail Market Area, but almost half a percent lower than the growth rate for Woodlawn and three quarters of a percent lower than the growth rate for Hyde Park. However, the overall population in South Shore has at least 20,000 more people than every other sub-market.
The Median Household Income of South Shore is lower than every sub-market except Woodlawn. Hyde Park’s Median Household Income is almost double that of South Shore.
These numbers suggests that while the overall population of South Shore is strong, efforts to attract new residents will be needed to boost population growth rates. Lower income numbers compared to other sub-markets may suggest that incentives will be required to attract new retail tenants.
South Shore Project Area Demographics
Detailed demographics related to Population, Race/Ethnicity, Household Income, Age, Households, and Education Attainment are reviewed below.
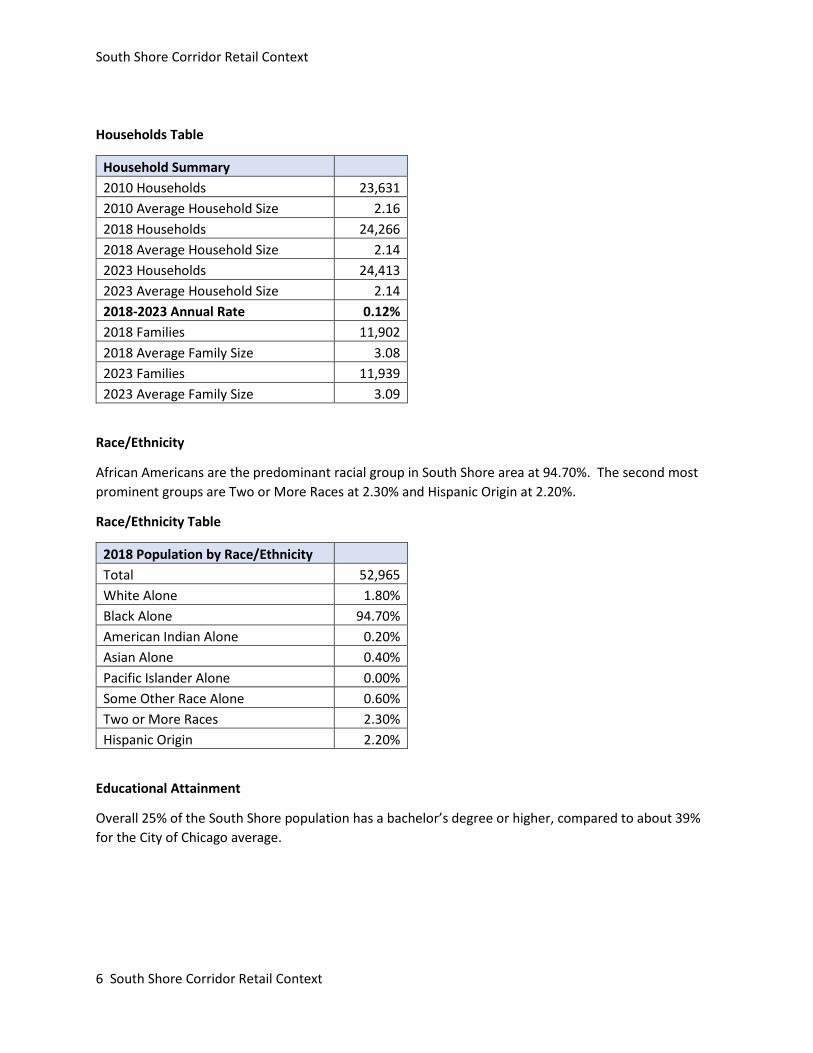
Households
The overall average household size and average family size is expected to hold steady in South Shore compared to 2010 numbers. The average family size of 3.09 suggests that families in the South Shore area have small families without large numbers of children, which suggests child focused retail is unlikely to be a need in the area.
South Shore Corridor Retail Context
6 South Shore Corridor Retail Context
Households Table
Household Summary 2010 Households 23,631 2010 Average Household Size 2.16 2018 Households 24,266 2018 Average Household Size 2.14 2023 Households 24,413 2023 Average Household Size 2.14 2018-2023 Annual Rate 0.12% 2018 Families 11,902 2018 Average Family Size 3.08 2023 Families 11,939 2023 Average Family Size 3.09
Race/Ethnicity
African Americans are the predominant racial group in South Shore area at 94.70%. The second most prominent groups are Two or More Races at 2.30% and Hispanic Origin at 2.20%.
Race/Ethnicity Table
2018 Population by Race/Ethnicity Total 52,965 White Alone 1.80% Black Alone 94.70% American Indian Alone 0.20% Asian Alone 0.40% Pacific Islander Alone 0.00% Some Other Race Alone 0.60% Two or More Races 2.30% Hispanic Origin 2.20%
Educational Attainment
Overall 25% of the South Shore population has a bachelor’s degree or higher, compared to about 39% for the City of Chicago average.

South Shore Corridor Retail Context
7 South Shore Corridor Retail Context
Educational Attainment Table
2018 Population 25+ by Educational Attainment Less than 9th Grade 2.60% 9th - 12th Grade, No Diploma 9.00% High School Graduate 19.10% GED/Alternative Credential 4.00% Some College, No Degree 30.90% Associate Degree 8.40% Bachelor's Degree 15.40% Graduate/Professional Degree 10.50%
Median Age
The Median Age in South Shore is 39, and projected to be 40.1 by 2023. This is five years higher than the Chicago average. The data suggests that the South Shore area is an aging community that is not experiencing an influx of younger resident of working age. An older neighborhood population also has a significant impact on the local retail market, as many seniors live on fixed incomes.
Median Age Table
Median Age 2010 37.5 2018 39.0 2023 40.1
Psychographic Profiles
The most prevalent psychographic profiles present are City Strivers, City Commons, and Family Foundations. The groups have household incomes below the national average, and employment rates well above the national rate. Detailed profiles are included as an appendix.

South Shore Corridor Retail Context
8 South Shore Corridor Retail Context
2.2 Retail Market Analysis
The following analysis addresses the South Shore Community Area and the South Shore Study Area. The Community Area is from S. Stony Island Avenue on the west to Lake Michigan on the east, and from 67th Street on the north and 79th Street on the south. The smaller study area covers an area from S. Woodward on the west to Lake Michigan on the east, and from 73rd Street on the north and 81st Street on the south.
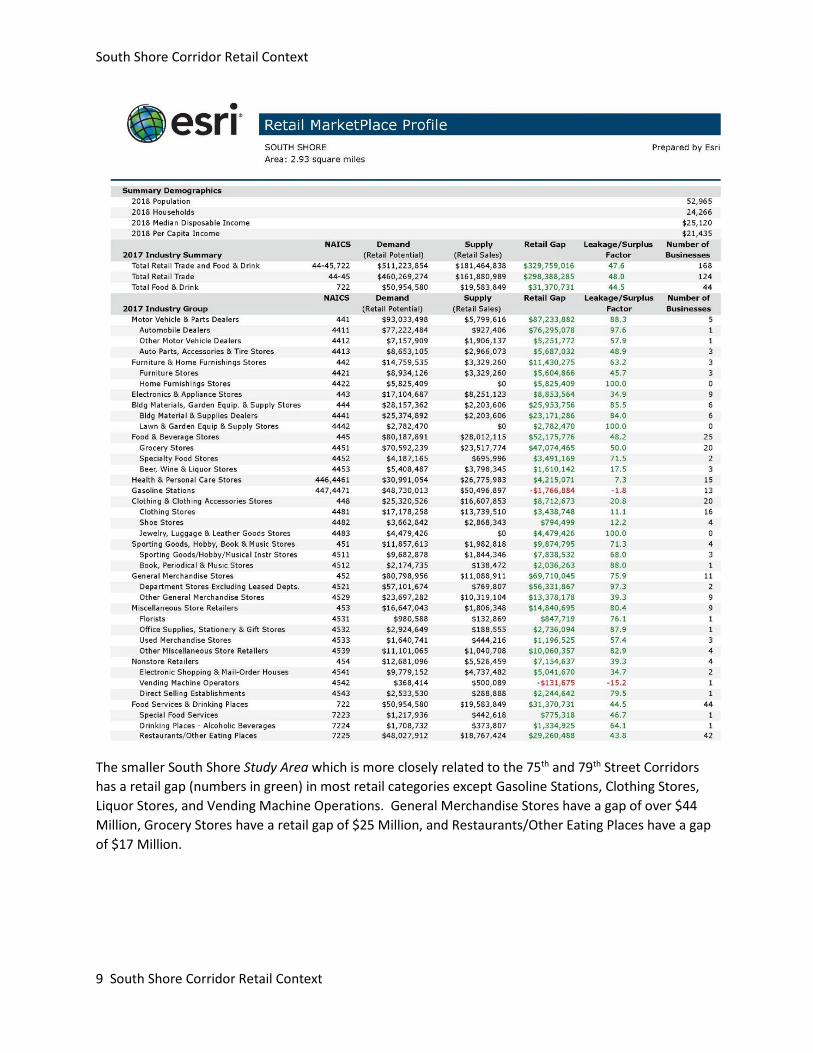
The South Shore Community Area has a retail gap (numbers in green below) for all retail categories except Gasoline Stations and Vending Machine Operations. This indicates that residents are leaving the South Shore Community Area to a significant amount of their retail dollars.
General Merchandise Stores have a gap of over $69 Million dollars, Grocery Stores have a retail gap of $47 Million, and Restaurants/Other Eating Places have a gap of $29 Million Dollars.
These retail gap numbers show that South Shore residents are leaving the neighborhood for most of their everyday retail needs. Increased local provision could recapture some of this. Recruiting business in these categories would help fill the retail gaps mentioned previously. However, it is likely that financial assistance would be required to recruit these businesses.
South Shore Corridor Retail Context
9 South Shore Corridor Retail Context
The smaller South Shore Study Area which is more closely related to the 75th and 79th Street Corridors has a retail gap (numbers in green) in most retail categories except Gasoline Stations, Clothing Stores, Liquor Stores, and Vending Machine Operations. General Merchandise Stores have a gap of over $44 Million, Grocery Stores have a retail gap of $25 Million, and Restaurants/Other Eating Places have a gap of $17 Million.

South Shore Corridor Retail Context
10 South Shore Corridor Retail Context

South Shore Corridor Retail Context
11 South Shore Corridor Retail Context
2.3 Business Inventory
A field inventory of the South Shore Study Area corridor was conducted to obtain a detailed inventory of the existing businesses in the area.
South Shore’s most prevalent business types are Other Services (legal, insurance, etc.) and Personal Services (hair/nail salons). Sit Down Dining and Entertainment combined make up less than 2% of the businesses in the South Shore Study Area. It is likely that residents go to other neighborhoods such as Hyde Park for entertainment or social activities. Another business type that is lacking in the area is Grocery Stores, with only 1.51% in this category. The business inventory reinforces retail data conclusions that South Shore residents are leaving the area for most of their everyday purchases.
The lack of sit-down dining options or retail makes it difficult to attract a critical mass of shoppers to visit storefronts in the shopping district. Most of the retail in the South Shore Study Area corridors are fast casual dining establishments or businesses that do not encourage shoppers to make multiple stops while they are in South Shore.
Business Inventory Table: Distribution by Type
Business Type Percentage Automobile Care 5.42% Cellular Retail 1.81%
Child Care Services 3.61%
Church 7.23%
Convenience Retail 5.12%
Entertainment 0.60%
Independently Owned Fast Casual Dining 4.52% National Fast Food Chain 3.92%
Financial/Real Estate Services 4.82%
Gas Station 2.11%
Grocery Store 1.51%
Home-Based 3.61%
Laundromat/Dry Cleaning 1.81% Liquor Store 2.11%
Medical/Senior Care 4.52%
Professional Services 25.00%
Personal Services (Hair/Nail Salon) 12.05%
Retail 9.04%
Sit-Down Dining 1.20% Grand Total 100.00%

South Shore Corridor Retail Context
12 South Shore Corridor Retail Context
2.4 Building Conditions
Another component of the inventory visually assessed the condition of commercial building in the South Shore Study Area corridor. Commercial properties in the area were evaluated on the following scale:
• A: Little to no renovations needed • B: Building needs minor cosmetic façade work • C: Building needs significant cosmetic façade work • D: Building likely has code violations, will need major renovations
Building Conditions Tables
Overall Grade Percentage of Buildings A 10.94% B 37.89% C 46.88% D 4.30% Total 100.00%
75TH Street Row Labels Percentage of Buildings A 3.70% B 32.10% C 56.79% D 7.41% Grand Total 100.00%
Overall Stony Island buildings are in much better condition than 79th and 75th, with almost 70% of buildings having a score of B or better.
Buildings with score of A or B tended to be those that had an established retail chain as a commercial tenant.
Approximately 35% of buildings on 75th Street had a score of B or better, while almost 50% of buildings on 79th Street are in these categories.
Generally, there are more retail buildings in poorer condition on 75th Streets than on other streets. Buildings in poor condition will generally have a difficult time attracting new retail tenants.
In addition, many buildings in the study area did not have hours or signage posted, which makes it more difficult for potential shoppers to tell if a store is open.
Stony Island Row Labels Percentage of Buildings A 35.71% B 33.33% C 23.81% D 7.14% Grand Total 100.00%
79TH Street Row Labels Percentage of Buildings A 7.41% B 42.22% C 47.41% D 2.96% Grand Total 100.00%

South Shore Corridor Retail Context
13 South Shore Corridor Retail Context
Building Conditions Map
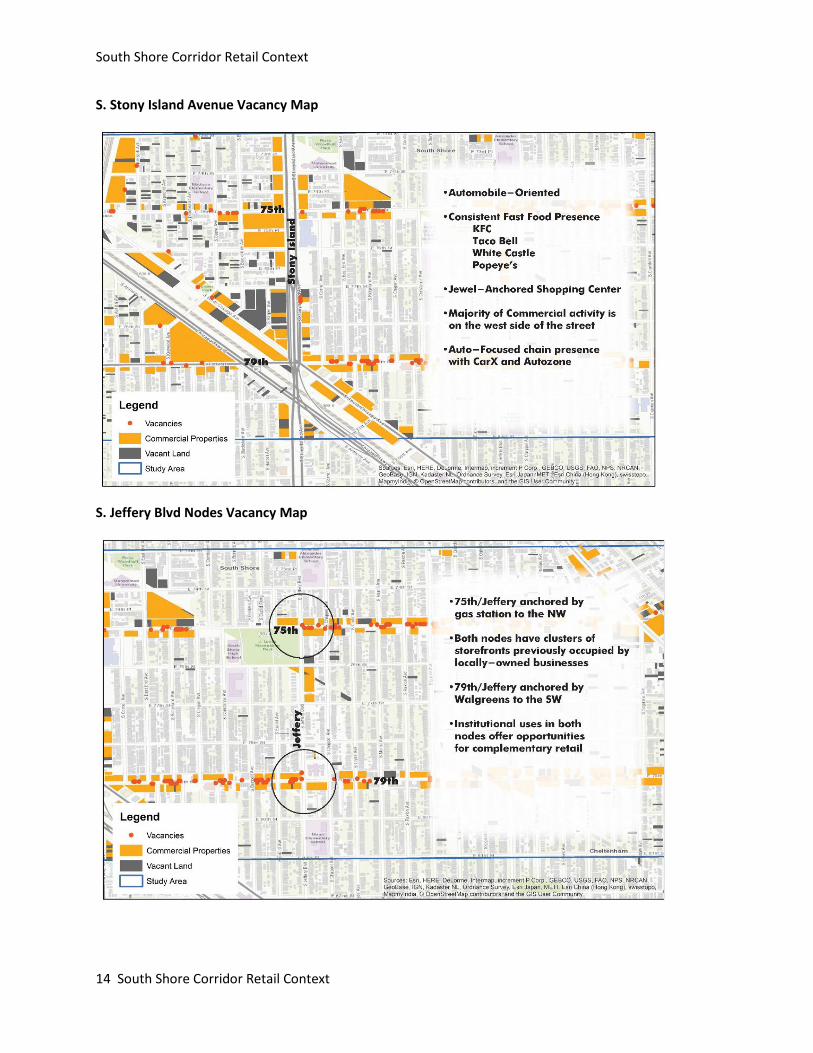
2.5 Vacancies
Field data collection also included vacancy rates by storefront. The Overall vacancy rate for the study area is 46%. The vacancy rate for 79th is 48% and the vacancy rate for 75th is 59%. These rates are dramatically higher than the 11.5% retail vacancy rates for the Chicago area according to CBRE. To help narrow the vacancy rate, business attraction efforts should be focused on filling vacant storefronts near transit nodes.
South Shore Corridor Retail Context
14 South Shore Corridor Retail Context
S. Stony Island Avenue Vacancy Map
S. Jeffery Blvd Nodes Vacancy Map

South Shore Corridor Retail Context
15 South Shore Corridor Retail Context
S. Yates Nodes Vacancy Map
S. Exchange Avenue Nodes Vacancy Map

South Shore Corridor Retail Context
3.0 Recommendations The recommendations were developed using standard industry data sources, data collected in the field and community feedback gathered via stakeholder meetings, public meetings, and working sessions with the project team. These recommendations are centered around attracting businesses and strengthening the retail environment in South Shore, especially around transit stations and interchanges.
3.1 Business OpportunitiesPursue a Small Footprint Produce Market
The South Shore retail gap in groceries, and community feedback both support the recruitment of a small footprint produce market in South Shore. The business would ideally be locally owned and would help fill a critical everyday shopping need in South Shore. To leverage commuter traffic, it would ideally be located near a transit stop. It should also be located to avoid direct competition with grocery provision on 71st Street and at 75th Street and Stony Island Avenue. This suggests the south east of the study area.
Attract Fast-Casual and Sit-Down Restaurants
Attracting fast-casual and sit-down restaurants to the area can help strengthen the retail environment by creating a critical mass of dining options for users to come to the retail corridor on a more regular basis rather that visiting on occasion for 1-2 specific establishments. Recruiting locally owned and independent existing businesses present in other neighborhoods to open a second location in South Shore is an effective strategy since the business already has a successful operation. Some examples of these types of businesses include Sweet Maple Café, 5 Loaves Eatery, and Roy’s. Such businesses could be located at Metra station transit nodes, other bus intersections on S. Jeffery and associated with a cultural and entertainment hub at 79th and S. Stony Island.
Attract Additional Cultural/Entertainment Uses Near the Regal Avalon Theatre
The redevelopment of the Regal Avalon theatre presents the opportunity to create a cultural attraction to bring visitors from outside South Shore into the area. Developing additional cultural or entertainment uses near the theatre on 79th will help create an arts district that activates the area on a more consistent basis outside of when there are events at the Regal Avalon theatre.
16 South Shore Corridor Retail Context

South Shore Corridor Retail Context
17 South Shore Corridor Retail Context
One example use is an arts center, and an example is Fabrica de Arte Cubano in Cuba. It is a combination gallery, live performance, and dining venue. Its former use was a cooking oil factory, but a group of local artists and musician reimagined the space as a cultural venue. This type of adaptive reuse can leverage the momentum created by the Regal Avalon redevelopment and attract artists from around the south side to showcase their work and act as a creative hub for the area. The increased activity on the area would also help increase transit ridership in South Shore. Additional uses to help create an art district would be arts education uses.
3.2 District-wide Recommendations
Focus Retail Development on 79th Street
South Shore has an established retail corridor on 71st Street to the north of the 75th and 79th Street corridors addressed by the study.
It is recommended that 79th Street is the focus of retail development initiatives. This will avoid placing competing retail to close together, and fragmenting and diluting the market. 79th Street is further away from 71st Street, while still serving a large part of the South Shore community. Placing retail on 79th Street also avoids competition with the Jewel supermarket on 75th Street. 79th Street also benefits from higher bus ridership and higher traffic counts than 75th Street. 79th Street could target convenience uses, such as coffee/café, dry cleaning, pharmacy, newspapers/magazines, bakery, floral, and pet care, near the Metra and Jeffery Jump stations.
This is not intended to be exclusive, and opportunities for infill retail on 75th Street close to the Metra Station and at S. Yates and S. Jeffrey can still meet the needs of residents on nearby blocks and serve passing commuters.
Lift Liquor Moratorium to Enable Entertainment Uses
Strategies to encourage cultural and entertainment uses will be supported by a review and potential lifting of Liquor Moratoria, in whole or in part. Successful cultural and entertainment districts offer a range of performance, dining and drinking establishments that make the district and attraction for multiple audiences.

South Shore Corridor Retail Context
18 South Shore Corridor Retail Context
4.0 Implementation Resources
4.1 Special Service Area (SSA) #49
There is currently a Special Service Area in the study area. The following description of Special Service Areas is from the City of Chicago’s website:
https://www.chicago.gov/city/en/depts/dcd/supp_info/special_service_areassaprogram.html.
Special Service Areas, known as Business Improvement Districts or BIDs in other cities, are local tax districts that fund expanded services and programs through a localized property tax levy within contiguous areas. The enhanced services and programs are in addition to those currently provided through the City. SSA-funded projects typically include but are not limited to public way maintenance and beautification; district marketing and advertising; business retention/attraction, special events and promotional activities; auto and bike transit; security; façade improvements; and other commercial and economic development initiatives. The City contracts with local non-profits, called Service Providers, to manage SSAs. Mayorally-appointed SSA Commissioners for each SSA district oversee and recommend the annual services, budget and Service Provider Agency to the City. There are currently 53 active SSAs in Chicago.
A map of SSA #49 can be found here: https://www.chicago.gov/content/dam/city/depts/dcd/ssa/maps/SSA49SouthShoreExchange.pdf
SSA#49’s 2019 annual levy is approximately $450,000. The funds area budgeted to be spent in the following categories:
Category and Description 2018 Levy Customer Attraction (decorative banners, holiday decorations, print materials)
$31,182
Public Way Aesthetics (planting of bushes and trees, façade grants for storefront improvements, streetscape elements, sidewalk cleaning, permits for streetscape elements, sidewalk snow removal, new waste receptacles)
$202,623
Economic/Business Development (SSA reconstitution consultant)
$25,000
Safety Programs (installation of ADT security cameras for small businesses in district)
$39,600
SSA Management (audit, bookkeeping, office rent, utilities, office equipment, postage, commission meetings and trainings, bank account fees, loan interest, storage space fees, liability/property insurance, conferences and trainings)
$21,720
Personnel (SSA wages and fringe for some or all of the following staff: executive director, director of finance, director of marketing and communications, director SSA #49)
$116,535
South Shore Corridor Retail Context
19 South Shore Corridor Retail Context
The Illinois State Statute limits SSA administrative expenses at 30% of the levy budget. In 2019, SSA#49’s percentage of levy used for administrative expenses is 29.657%.
The SSA is a vital capacity-building tool for neighborhood redevelopment. Beyond its funding capability to help finance the programs mentioned above, it fosters an increased level of community involvement from the local business and property owner community to implement change in the district. It is also a vital tool to help recruit new businesses and retain contributing businesses.
If the SSA were renewed (reconstituted) for a new ten- to fifteen-year term, it could provide critical funding for the following activities that are recommended in this plan:
• Façade Improvements • Sign Removal • Banners • Holiday Decorations • Tenant Attraction and Retention • Window Merchandising • Public Art • District Activation and Special Events • Gateway Identifiers • Safety Programs
The personnel funding in SSA #49 is substantial at $116,535 per year and would make a very large positive impact on the capacity of the South Shore Chamber, should they become the new SSA #49 Service Provider upon its renewal (reconstitution).
4.2 Businesses of Color Partnerships Fund
The Chicago Community Trust, The Coleman Foundation, JPMorgan Chase Foundation and Robert R. McCormick Foundation are funding collaborations committed to better serving entrepreneurs of color to support a growing and thriving community of businesses of color in Chicago and Cook County.
Program priorities:
• Sustainable partnership and collaboration • Improved businesses readiness for and paths to capital services and procurement • Specialized services and mentorship by industry, business life-cycle, and professional business
services • Access to new business networks and right-fit and culturally competent mentorship • New ways to deliver holistic services and supports • Stronger capacity of BSOs • Partnerships to advance a stronger and more connected small business field of practice
One-year grant awards $50,000 to $175,000, with possibility for renewal. The lead applicant must be a 501(c)(3) or government organization.

South Shore Corridor Retail Context
20 South Shore Corridor Retail Context
4.3 City of Chicago Neighborhood Opportunity Fund
For all Neighborhood Opportunity Fund projects, costs that can be funded by grants must generally be related to new construction or the rehabilitation of existing buildings.
This includes:
• Land acquisition and assembly • Building acquisition, demolition and environmental remediation • Security measures • Roofing, façade repair and mechanical system repairs • Architectural and engineering fees • Financing fees (related to securing a loan or other capital) • Minor site improvements, such as fencing or planters, when a part of an eligible project • Other soft costs associated with eligible hard costs
Applications will be prioritized using four key factors, all with the goal of providing catalytic impact to a community or commercial corridor:
• The gap the project fills—what services or goods are provided that are lacking, how it makes a difference in building a stronger neighborhood.
• How the project builds community wealth, how communities benefit from the project, and the extent to which local entrepreneurs, property owners, and residents are included.
• How the project defines and measures success. • Whether the project is feasible and has a clear and ready path to implementation.
4.4 Retail Thrive Zone
South Shore is a Retail Thrive Zone, a program initiated by former Mayor Rahm Emanuel. The program uses the city’s Small Business Improvement Fund to support small businesses that are located in eight neighborhood commercial corridors on the City’s South, Southwest, and West sides. Small business owners and property owners that lease to businesses in the Retail Thrive Zones can receive reimbursement grants of up to $250,000 for commercial projects and to cover the costs of eligible remodeling work. The goals of the program are threefold: to spark development by providing greater access to capital and financial incentives; rebuild and strengthen commercial corridors by activating underutilized real estate and making infrastructure improvements; and create community-based wealth and local jobs by supporting existing small business owners and new entrepreneurs.
4.5 World Business Chicago
World Business Chicago (WBC) is a public-private, non-profit partnership that drives inclusive economic growth and job creation, supports business, and promotes Chicago as a leading global city. WBC engages with partners across the public, private, and civic sectors to drive economic growth and job creation across the region. WBC’s staff can help navigate the site selection process for companies by providing economic and industry data, state and local incentive information, and bringing together key parties to spur economic growth.

South Shore Corridor Retail Context
21 South Shore Corridor Retail Context
4.6 The Community Law Project
Low-cost or free legal services can amplify local CDC capacity by assisting with governance issues, such as bylaws, negotiating vendor and project contracts, applying for IRS tax-exemptions and/or sales tax exemptions, revising personnel policies, and other issues or topics that the South Shore Chamber of Commerce and other local nonprofits may encounter or desire to pursue.
The Community Law Project helps to build, strengthen, and support community-based organizations that are focused on economic development in Chicago’s low-income neighborhoods and that offer the delivery of social services to residents of these areas. They improve impoverished neighborhoods by supporting small businesses and home ownership. Working with volunteers from Chicago’s top law firms, the Community Law Project's expert legal staff provides nonprofit leaders and small businesses owners the knowledge to sustain the quality of their programs, improve outcomes, and spur economic development.
Specifically, The Community Law Project:
• Provides transactional legal assistance to create, build the capacity of, stabilize, and foster growth of nonprofit organizations focused on economic development and social services in low-income communities.
• Provides legal assistance to help low and moderate-income entrepreneurs grow and strengthen their small businesses, which in turn strengthens low-income communities, improves their financial stability, and brings in much-needed goods and services.
• Represents first-time low-income home buyers, to help them avoid unscrupulous lenders and realtors, understand mortgage documents and homeowner responsibilities, and obtain long-term financial stability.
• Provides legal support to coalitions of non-profit organizations in negotiations with developers to secure benefits for surrounding communities. Community benefits agreements (CBAs) may include commitments to build affordable housing, hire local residents and pay livable wages, among other investments important to Chicago neighborhoods and their residents.
• Implements community lawyering through all its programs—that is, working with clients and communities at the grassroots level, attending community meetings, providing strategic feedback and advice to coalitions, helping to coordinate community input, and to negotiate or mediate constructively among multiple community stakeholders, when development threatens to displace residents.