A Spectral Theory of Rainfall Intensity at the Meso-beta Scale
A b s t r a c t. The objective of this paper is to present a method
for determining diurnal distribution of the intensity of effective
non rainfall water flux. It was found that the application of TDR
technique for the determination of diurnal dynamics of effective
non rainfall water flux requires temperature correction of sensed
volumetric moisture contents. Without temperature correction the
error of estimated non rainfall water flux can be as much as 26%. In
addition, the effect of temperature changes on the soil surface was
determined in 0.5, 1, 2, 3, 4, and 5 hours periods. It was found that
the intensity of effective non rainfall water flux was determined to
the greatest extent by the rate of temperature drop during the period
of 3 h preceding the non rainfall water flux determination. The
agreement of non rainfall water flux calculated with the method
proposed and that obtained by the collector was better for dew than
for hoarfrost periods.
K e y w o r d s: TDR technique, effective non rainfall water
flux, impermeable barrier
INTRODUCTION
Knowledge of the physical processes that affect the ef-
ficiency of water infiltration into the surface horizon of soil
is important in the formulation of input data for mathe-
matical models describing the movement of water (Jacobs et
al., 2002; Reinhard and Reinhard, 2005). Knowledge of the
run of processes of that type is important, as water is a source
of nutrients for animals and plants (Kidron, 2005; Kolev et
al., 2012). In such considerations one should take into
account the role of dew, hoarfrost, condenzation of water
vapour contained in the soil air, and adsorption of water
from the atmosphere. In regions with arid climate the effect
of those processes on the water balance of the top horizon of
soil may be greater than that of atmospheric precipitation
(Agam and Berliner, 2006). As an example, the contribution
of dew and hoarfrost in the annual water balance of the sur-
face horizon of soil in a semi-desert area situated in Nevada,
USA, amounts to 31 mm year-1
(Malek et al., 1999). With
regard to the phenomena considered here, the contemporary
methods for the determination of the diurnal dynamics of the
intensity of water infiltration can be classified in four groups:
methods consisting in measurements with the use of dew
and hoarfrost collectors, lysimetric methods, models em-
ploying empirical mathematical formulae, and phenomeno-
logical models.
The first group includes eg the Duvdevani dew gauge,
the Cloth Plate Method and the Hiltner Dew Balance. The
Duvdevani dew gauge is one of the first devices for the
measurement of the dew balance (Duvdevani, 1947). The
measured volume of dew deposit should be treated as an
estimate and it cannot be compared with absolute values.
The Cloth Plate Method is also a method in which the mea-
surement is taken manually. The apparatus is equipped with
a glass plate with dimensions of 10 x 10 x 0.2 cm, to the
centre of which highly absorbing synthetic fabrics are at-
tached, with dimensions of 6 x 6 cm (Kidron, 1998). In their
study, Zangvil and Druian (1980) applied the Hiltner Dew
Balance for dew measurement. In this case, the measure-
ment consists in weighing an artificial condenzation plate
Int. Agrophys., 2014, 28, 23-37
doi: 10.2478/intag-2013-0024
TDR technique for estimating the intensity of effective non rainfall
Grzegorz Janik1, Wojciech Skierucha2, Marek B³aœ3, Mieczys³aw Sobik3, Ma³gorzata Albert1,
Micha³ Dubicki1, and Anna Zawada1
1Institute of Environmental Protection and Development, Wroc³aw University of Environmental and Life Sciences,
Pl. Grunwaldzki 24, 50-363 Wroc³aw, Poland2Institute of Agrophysics, Polish Academy of Sciences, Doœwiadczalna 4, 20-290 Lublin, Poland
3Department of Earth and Environmental Sciences, University of Wroc³aw, Kosiby 8, 51-621 Wroc³aw, Poland
Received March 19, 2013; accepted November 26, 2013
© 2014 Institute of Agrophysics, Polish Academy of Sciences*Corresponding author e-mail: [email protected]
IIINNNTTTEEERRRNNNAAATTTIIIOOONNNAAALLL
AAAgggrrroooppphhhyyysssiiicccsss
www.international-agrophysics.org

suspended on a beam 2 cm above the ground. The short-
coming of that simple and easy to use device is the fact that
the energy balance of the condenzation plate is different
from the balance of the soil surface. This is due to the
difference between the specific heat of the material of the
plate and the specific heat of the soil material. Therefore the
values measured can also be treated as a certain indicator
(Agam and Berliner, 2006). The second group of methods
comprises measurements made with the use of lysimeters of
very high accuracy. They were applied eg in a study con-
ducted in Greece, under semi-arid conditions, for quantita-
tive determination of water vapour adsorption by soil
(Kosmas et al., 1998). The results obtained indicate that the
diurnal changes in volumetric moisture are the greatest in
the top horizon of the soil (0-5 cm) and are subject to
variation in an analogous manner to the diurnal variation of
the relative humidity of the air. A similar experiment was
conducted in 1997, also in Greece, in the locality of Spata
(Kosmas et al., 2001). In that case, due to significant diurnal
variations of temperature (the amplitude was as much as
24.3°C), a temperature correction was applied to the rea-
dings taken by means of a TDR apparatus (as in the study by
Yamanaka et al., 2007). In studies conducted in the Negev
Desert (Jacobs et al., 1999; 2002) it was demonstrated that
the diurnal dew balance was from 0.1 to 0.2 mm, and its
effect was limited only to 2, 3 cm layers of soil. In another
study conducted also in the Negev Desert it was demon-
strated that for dew measurement the minimum depth of
micro-lysimeters should exceed the depth at which the
diurnal temperature of the soil is constant (Bryœ and Bryœ,
2010; Ninari and Berliner, 2002). The micro-lysimeters
designed by Heusinkveld et al. (2005) and applied by
Kaseke et al. (2011) are fully automated (LCM) and sup-
plied with solar energy. Studies conducted in the winter
period in Stellenbosch, South Africa, involved the use of an
aluminium Tedea-Huntleigh 1004 loadcell. It was demon-
strated that the diurnal adsorption of water vapour (average
of 2.369 mm) had a three-fold larger contribution to the
supply of the surface horizon of soil than the dew yield
(mean of 0.785 mm).
The third group of methods comprises mathematical
formulae, in which the difficulty of finding effective solutions
results from the necessity of determining a large number of
input data (Agam and Berliner, 2006; Li, 2002; Richards,
2002). A study by Kosmas et al. (1998) presented an empiri-
cal formula in which the input data included the adsorption
of water vapour (mm), soil moisture tension (kPa), mini-
mum daily relative humidity (%), and the daily amplitude of
relative humidity.
The fourth group includes phenomenological models ie
such in which the phenomenon of non-rainfall is described
by means of mathematical relations between physical va-
lues. Due to the complexity of the phenomenon of the forma-
tion of dew and water vapour condenzation, the use of such
models is difficult. As in the case of the empirical models, it
is necessary to introduce a lot of input data characterising the
soil medium, information on the changing atmospheric
conditions, and to determine the status of the soil water. As
an example, in a comprehensive mathematical model described
in a paper by Katata et al. (2007), the input data include the
soil temperature (K), the thermal conductivity (W m-1
K-1
),
the latent heat of vaporization (J kg-1
),the phase changes of soil
water (kg m-2
s-1
), the volumetric soil water content (m3
m-3
),
the soil water diffusivity (m2
s-1
), the unsaturated hydraulic
conductivity (m s-1
), the density of liquid water (kg m-3
), the
diffusion coefficient of water vapour (m2
s-1
), and the den-
sity of water vapour (kg m-3
). At present, both of those ap-
proaches – the empirical and the phenomenological – are
criticized (Agam and Berliner, 2006).
Summing up the review of the four groups of methods
used so far for the determination of effective non rainfall
water flux (ER) it should be concluded that each of them is
burdened with shortcomings. In the methods involving the
use of collectors the energy balance of the condenzation pla-
tes differs from the balance of the soil surface. In lysimetric
tests the structure of the soil is disturbed, and there appear
interferences caused by the boundary effect. There is also
a risk of appearance of interference between phenomena
(water from an overgrown monolith can be transmitted by
the plants to the atmosphere and at the same time dew can be
deposited on the soil surface, supplying its top horizon with
moisture). Also, we do not know the answer to the question
what part of the water remains on the surface of the soil or
plants and what part actually supplies the surface horizon of
the soil (Ermich, 1958). In lysimetric experiments it is
difficult to ascertain whether the surface horizon of the soil
has been supplied with water from dew deposition on the
soil surface or as a result of water vapour condenzation.
Methods employing empirical mathematical formulae, and
phenomenological models, require numerous input data.
The objective of the present study was to propose a me-
thod which is free of the above shortcomings and permits the
determination of the diurnal distribution of the intensity of
effective non rainfall water flux. Effective non rainfall water
flux is understood as the volume of water which actually
supplies the surface horizon of soil, in the form of dew, hoar-
frost, deposition of fog, condenzation of water vapour from
the soil air, and adsorption of water from the atmosphere.
The only input parameters required for the proposed method
will be the moisture content and temperature of the soil
surface horizon.
MATERIALS AND METHODS
Let us consider changes in volumetric moisture content,
determined by the TDR technique ( ), ,
��i j kTDR , in a soil space
denoted in Fig. 1 asVi j, ,1, in the surface horizon k = 1. The
change of ��i jTDR, ,1
may be an actual change in the volumetric
24 G. JANIK et al.

moisture content of ��
�i j
Vi j, ,
, ,1
1and a temperature change of
the measured medium (Skierucha, 2009). This can be
written as:
��i jTDR, ,1
= � �� �
� �i j
Vi ji j
i j, ,
, ,, ,
, ,1
11
1� , (1)
where: ��i jTDR, ,1
– change of the reading from the TDR gauge,
��
�i j
Vi j, ,
, ,1
1– actual change of volumetric moisture, �
��
i ji j, ,
, ,1
1–
change of reading caused by temperature change (��i j, ,1 ).
Changes of ��
�i j
Vi j, ,
, ,1
1are caused by water flow through
the side walls of space V V Vi j i j
X
i j
Y, , , , , ,
( ; )1 1 1� � and also
through the upper and lower surfaces ( ; ), , , ,
� �V Vi j
ZB
i j
ZT
1 1.
A change of ��
�i j
Vi j, ,
, ,1
1can be caused also by draining water
from plant roots ( ), ,
�Vi j
E
1. In addition, due to the cooling of
the soil air, water vapour condenzation may appear on the
surface of soil pores, which can also cause an increase in the
volume of soil water content (�Vi j
C
, ,1). Change of �
��
i j
Vi j, ,
, ,1
1
results from an error introduced by the instrument itself ie its
short- or long-term thermal drift, non-linearity of the delay
system, inaccuracy of determination in time of the extremes
on the reflectogram. Ultimately we can write, in confor-
mance with Fig. 1, that changes of ��i jTDR, ,1
are the function of
the following values:
� � � � ��i jTDR
i jX
i jY
i jZB
i jZTf V V V V
, , , , , , , , , ,( ; ; ;
1 1 1 1 1� ; ;
, ,�V
i jE
1
� �Vi jC
i ji j
, , , ,, ,
; )1 1
1�
T, (2)
where: symbols as in Fig. 1.
Let us assume � �V Vi j
X
i j
Y
, , , ,,
1 1, and �V
i j
ZB
, ,1to be zero.
This can be achieved with the application of an impermeable
barrier on the side walls and on the lower surface. If in space
Vi j, ,1 there are no plant roots and no irrigation system,
�Vi j
E
, ,1= 0. Let us assume additionally that there is a known
function describing the effect of the temperature of the me-
dium and of the environment on TDR readings. Such a func-
tion can be developed on the basis of a field experiment.
After introducing a temperature correction, we obtain the
corrected volumetric moisture content (�i jTDR S, ,
,1
), and that –
in relation with the assumptions introduced earlier –
depends only on �Vi j
Z T
, ,
,
1and �V
i j
C
, ,1. Therefore we can
finally write that:
� � ��i jTDR S
i jZT
i jCf V V
, ,,
, , , ,( ; )
1 1 1� , (3)
where: symbols as in Eq. (2).
Change of �Vi j
ZT
, ,1can be caused by atmospheric pre-
cipitation, evaporation or infiltration of water from the soil
surface that originated from dew or hoarfrost deposition on
the soil surface. It can be written that:
� � � �V V N V P V Ei j
ZT
i j
ZT
i j
ZT
i j
ZT r
, , , , , , , ,( ) ( ) ( )
1 1 1 1� � � , (4)
where: �V Ni j
ZT
, ,( )
1– volume change of water inVi j, ,1 space
resulting from atmospheric precipitation, �V Pi j
ZT
, ,( )
1–
change in the volume of water in space Vi j, ,1 due to
evaporation, �V Ei j
ZT r
, ,( )
1– change in the volume of water
in space Vi j, ,1 due to the infiltration of water from the soil
TDR TECHNIQUE FOR ESTIMATING THE INTENSITY OF EFFECTIVE NON RAINFALL 25
Fig. 1. Causes of changes in readings of TDR gauge during measu-
rements of volumetric moisture of soil, � �V Vi j
X
i j
Y
, , , ,,
1 1– change
of water volume in space Vi j, ,1 caused by flow in the direction of
axis 0X (0Y), �Vi j
ZB
, ,1(�V
i j
ZT
, ,1) – change of water volume in space
Vi j, ,1 caused by flow in the direction of axis 0Z, through the lower
(upper) surface, �Vi j
E
, ,1– change of water volume caused by
irrigation or by water uptake by plant roots, �Vi j
C
, ,1– change of
water volume caused by condenzation of water vapour contained in
the soil air, ��
� i ji j
, ,, ,1
1– change of TDR reading caused by changes of
the temperature of the skeleton, water, air in space Vi j, ,1 and the
environment.

surface that originated from the deposition of dew or
hoarfrost. Taking into account the adopted assumptions, on
the basis of Eqs (3) and (4) we can write that:
� � ��i jTDR S
i jZT
i jZTf V N V P
, ,,
, , , ,( ( ); ( );
1 1 1�
� �V E Vi jZT r
i jC
, , , ,( ); )
1 1, (5)
where: symbols as in Eqs (3) and (4).
In Eq. (5), for a period with no rain, when � � �Vi jC, ,1
and �V Ei jZT r, ,
( )1
0� (when air moisture content is high),
then �V Pi jZT, ,
( )1
0 . Therefore we can finally write that:
� � ��i jTDR S
i jC
i jZT rf V V E
, ,,
, , , ,( ; ( ))
1 1 1� . (6)
The sum of components �Vi jC, ,1
and �V Ei jZT r, ,
( )1
consti-
tutes the volume of water that will actually supply the
surface horizon of the soil. That water is formed through the
deposition of dew or hoarfrost, and also through the
condenzation of water vapour from soil and atmospheric air.
The sum of those components will be denoted with the
symbol �Vi jR, ,1
and the intensity of that supply referenced to
area, expressed in mm h-1
, will be denoted with the symbol
ER. Further on the value E
Rwill be referred to as the intensity
of effective non rainfall water flux. It can be calculated from
Eq. (7):
EV
P t
Ri jTDR S tk
i jTDR S t p i j
� (( ) ( ) ), ,
,, ,
, , ,� �
1 1
1
�, (7)
where: ER
– intensity of effective non rainfall water flux;
��i jTDR S, ,
,)
1– corrected reading from the TDR gauge at the
initial moment (tp), (at the final moment (t
k)); P – upper
surface of volumeVi j k, , , P x y� � � (Fig. 1), �t t tk p� .
To demonstrate the applicability of the TDR technique
for the determination of the intensity of effective non rainfall
water flux (ER) a field experiment was conducted in
Wroc³aw, Lower Silesia, in the area of the meteorological
observatory of the Department of Climatology and
Atmosphere Protection, University of Wroc³aw, during
the period from 20th October to 16th December, 2011.
A schematic presentation of the experiment is given in
Fig. 2. The particle size distribution of the mineral parts of
the soil material forming the surface horizon corresponded,
acc. to PTG classification of 2008, to sandy loam (gp). It was
assayed with the method of laser diffraction at the Labora-
tory of Applied Optical Measurement Techniques, Bohdan
Dobrzañski Institute of Agrophysics PAS, Lublin, Poland.
The measurements were made using a Mastersizer 2000
apparatus with Hydro G attachment (Sochan et al., 2012).
The parameters recorded included the intensity of
atmospheric precipitation and the temperature at the soil
surface. The deposited dew/hoarfrost was collected by
means of insulated plain radiative condensers (B³aœ et al.,
2002; Nilsson, 1996; Muselli et al., 2002; Beysens et al.,
2003). The condensing surface of 1 m2
was covered with
polyethylene film and 5 cm thick insulating layer made of
styrofoam. It was placed at the height of about 1 m above the
ground. The inclination angle of the surface was 15-20. The
condenser was inclined towards the west in order to mini-
mize the warming effect of direct solar radiation after sun-
rise. The condenser was cleaned up with deionized water,
around sunset, just before the potential start of a new dew
formation episode. In the profile of the surface horizon of
the soil also the volumetric moisture was recorded (sensors
FP/mts and LP/ms) and the temperature (sensors LP/T). The
sensors were made at the Institute of Agrophysics PAS,
Lublin (Poland) (online: Soil water status measurement
devices, 2008).
26 G. JANIK et al.
Fig. 2. Schematic presentation of experiment.
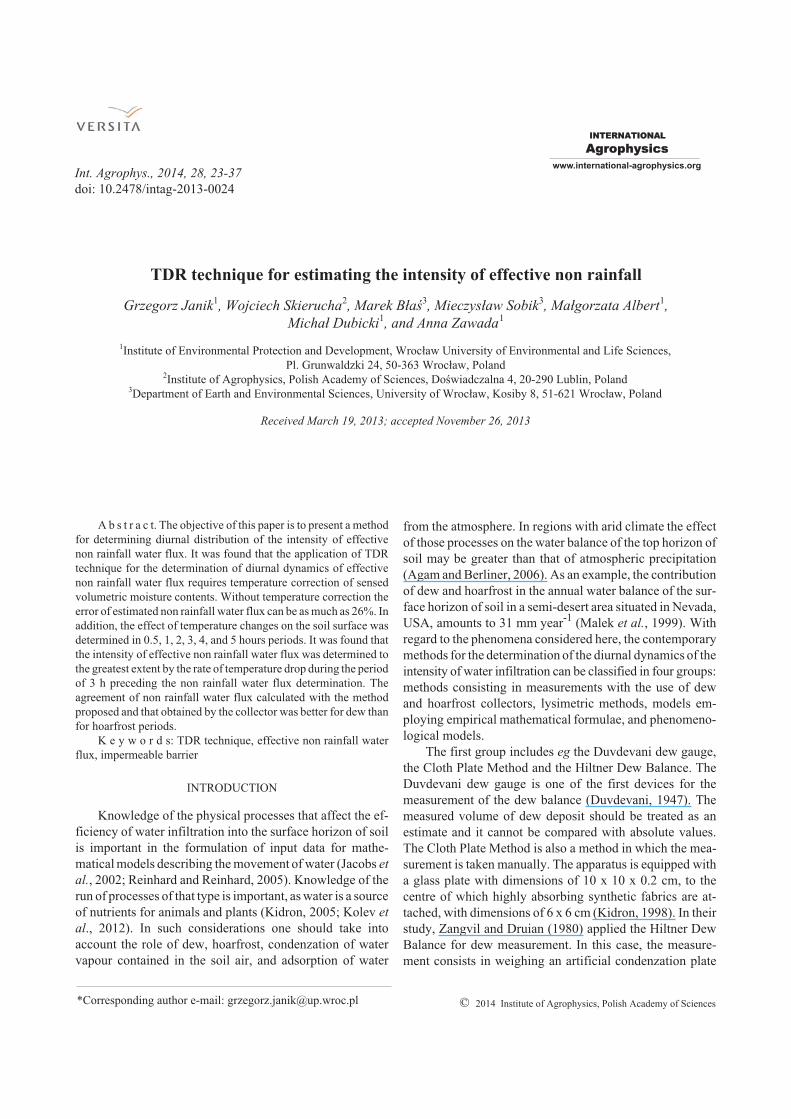
The particular test sites in the experiment were denoted
with symbols A, B, C and D (Fig. 3). At site A, beneath the
surface of the ground, moisture and temperature sensors
were installed at intervals from 1 to 10 cm down to the depth
of 40 cm. At sites B, C and D measurements were made only
in the top 1 centimetre layers which were separated from the
underlying soil profile be means of an aluminium barrier.
The length of the LP/ms sensor needle is 5.3 cm and the
distance between the metal rods is 0.6 cm. It was found
(Janik et al., 2011) that for soils of low water content the
LP/ms sensor sphere of influence is an elliptic cylinder with
the radiuses of 0.3 cm and 0.4 cm and the height of 11.2 cm.
In the experiment presented in the paper, the height of the
soil layer was 1 cm. Consequently, the distance between the sen-
sor axis and the border of the soil-aluminium barrier is bigger
and it is equal to 0.5 cm. As a result, the LP/ms sensor sphere
of influence is enclosed completely in the tested soil volume.
The preparation of the measurement site was as follows.
The vertical surface was exposed, which enabled to push the
aluminium barrier without destroying the soil profile in the
middle of the barrier. Then, the needles of the sensor were
pressed in so as not to destroy the soil structure. Finally, the
vertical barriers were installed and covered with the soil.
Site C was insulated additionally with a top barrier.
Sites A, B and C were situated on a fallow, and D on a grass-
covered area. The purpose of the measurements at site B was
the determination of the intensity of effective non rainfall
water flux on a fallow, and at site D – on a lawn. The results
obtained at that site were burdened with an error resulting
from the fact that �Vi jE, ,1
0� . The measurements at site C
were aimed at the determination of the temperature cor-
rection for object No. 1 to permit the determination of the
corrected value of volumetric moisture ( ), ,
��
i jTDR S
1. The re-
sults of measurements at site A were compared with the
results of measurements at site B to determine the effect of
the use of the barrier. At the final stage of analysis of data
from that object, tests of the goodness of fit were performed
for the values of ER
obtained from the measurements at sites
A, B and D with the data measured with a dew collector. The
following measures were applied: maximum absolute dif-
ference (R|max|) (Eq. (8)), mean values of absolute diffe-
rences (SWB ) (Eq. (9)) and the root mean square of the
differences (R.M.S) (Eq. (10)). Additionally, the maximum
difference Pmax (Eq. (11)) and the minimum difference Pmin(Eq. (12)) were applied. Definitions of selected measures for
a constant number of days (H = const) are as follows:
R E Eh
hR
K hR
max , ,max{ }� �
A,B,D, (8)
SH
E EWB A B D hR
K hR
h
� ���
1
1, , , ,
H
, (9)
R M SH
E Eh
RK hR
h
. ., ,
� ���
1 2
1A,B,D
H
, (10)
P E Eh
hR
K hR
max , ,max{ }� �
A,B,D, (11)
P E Eh
hR
K hR
min , ,min{ }� �
A,B,D, (12)
where: E RA,B,D
– intensity of effective non rainfall water flux
calculated on the basis of measurements at test sites A, B, D;
EKR – intensity of effective non rainfall water flux calculated
on the basis of measurements made with a dew collector;
R max – maximum absolute difference; R.M.S – root mean
square; Pmax – maximum difference; Pmin – minimum
difference; H – number of days; h – index of day.
TDR TECHNIQUE FOR ESTIMATING THE INTENSITY OF EFFECTIVE NON RAINFALL 27
Fig. 3. Detailed plan of distribution of moisture and temperature sensors in experimental object.

RESULTS
The intensity of atmospheric precipitation, the dyna-
mics of temperature and moisture in the top 1 centimetre
layer of soil at test sites A, B and D is presented in Fig. 4. The
initial values of volumetric moisture content on 21.10.2011
at 000
were varied. At test sites A and D they were �A21.10 =
28.8% and �D21.10 =28.5%, respectively, while at site B
�B21.10 = 21.5%. Their range is 7.3%. At the final moment, on
15.12.2011 at 2400
, it was even stronger R15.12
=12.3%. The
moisture increments from rainfall also varied. For example,
in the case of 0.1 and 4.3 mm day-1
precipitation that oc-
curred on the 25th and 26th October, 2011, respectively, the
following moisture increments were recorded: at test site A:
��A25.10 =31.7-26.4=5.3%, at site B: ��
B25.10 =23.2-16.7= 6.5%,
at site D: ��D25.10 =38.2-23.6=14.7%. Amplitudes caused by
a more intensive rainfall, with a maximum of 14 mm day-1
,
that occurred on 5th December, 2011, were as follows:
��A5.12 = 39.8-20.5=19.3%, ��
B5.12 = 32.4-13=19.4% and
��D5.12 =32.3-10.3=22%, respectively. These moisture incre-
ments were calculated on the basis of moisture contents
28 G. JANIK et al.
Fig. 4. Intensity of rainfall in object and dynamics of volumetric moisture and temperature in 1 cm layer of soil and at test sites A, B and D,
in the period from 21.10 to 15.11.2011, �A21.10; �B
21.10; �D21.10; �A
15.12; �B15.12; �D
15.12 – values of moisture on 21.10 and 15.12 ��A26.10;
��B26.10; ��D
26.10– moisture increments caused by rainfall on 25 and 26.10.2011, ��A,B – difference between moisture values observed
at test sites A and B.
measured at each test site simultaneously. Variations in the
soil moisture contents and amplitudes due to the rainfall are
justified and result from spatial variation of the soil physical
properties. This applies to points situated at small distance
from each other. This should always be kept in mind when
conducting studies using TDR gauges (Janik, 2008; Obalum
at al., 2013). At the sites on the fallow (A and B) moisture
content changes were similar. The moisture content at test
site A was higher than that at site B, throughout the study
period (��A,B 9%). Different course of moisture content
changes was observed at the grass covered site (D). In this
site a transpiration effect was observable (assumption of
relation 7 is not fulfilled). The observed moisture changes
were influenced by, among other things, atmospheric
precipitation that occurred on 25th and 26th October, 2011,
and from 2nd to 14th December, 2011, as well as the drop of
temperature below 0�C in the top 1 centimetre of soil, ie out
of the normal operation range of the TDR gauge. Such
periods appeared from 12th to 14th November, 24th to 25th
November, 29th November to 1st December, and 10th to
13th December, 2011. In those periods effective non rainfall
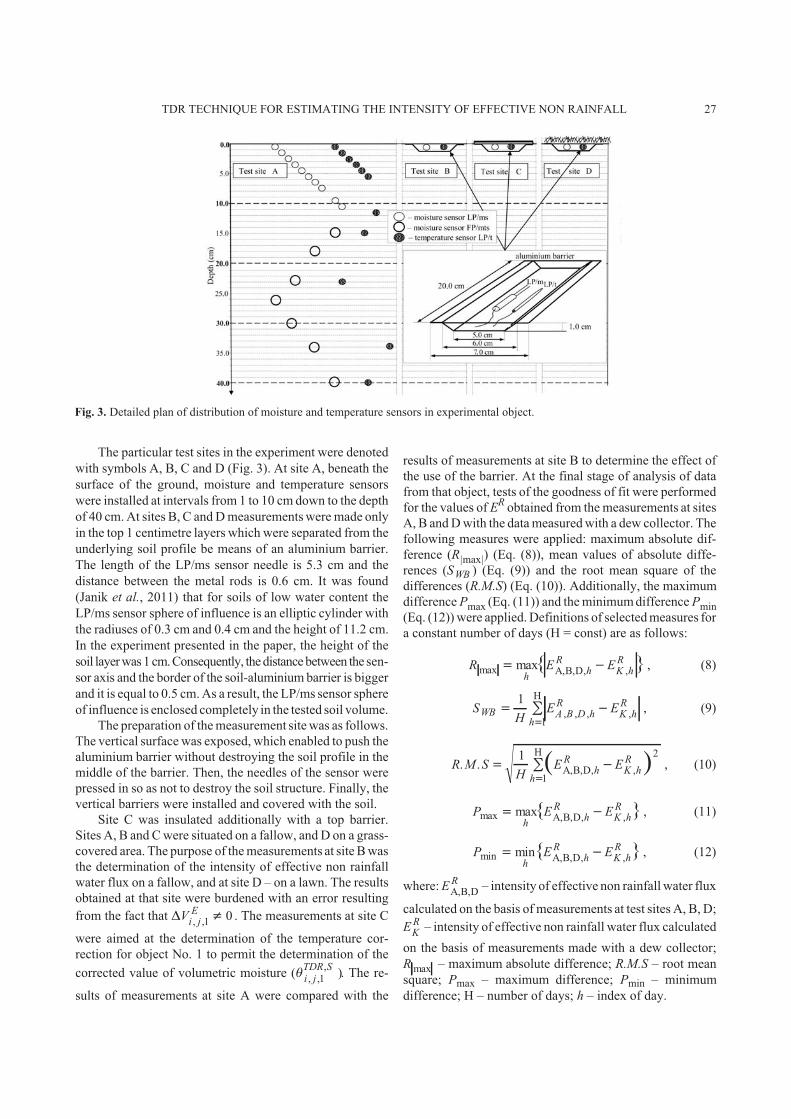
water flux was not determined. Figure 5 presents the tem-
perature and moisture content dynamics at site A at selected
soil depths. Diurnal variations in temperature were observed
even at the depth of 40 cm, though their value was only
0.6�C. However, diurnal variations in moisture contents
were observed only to 5mm soil depth.
TDR TECHNIQUE FOR ESTIMATING THE INTENSITY OF EFFECTIVE NON RAINFALL 29
Fig. 5. Dynamics of soil temperature and dynamics of volumetric moisture at depths of 0.5, 5.5, 15, 23 and 40 cm.
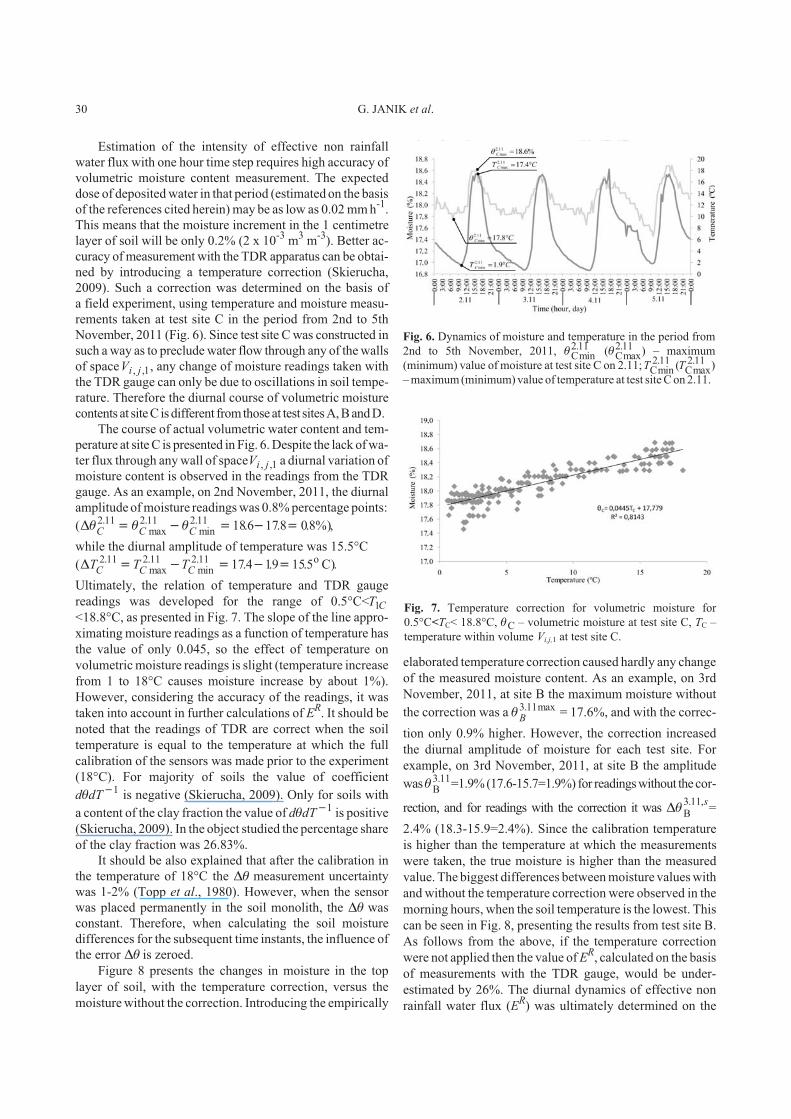
Estimation of the intensity of effective non rainfall
water flux with one hour time step requires high accuracy of
volumetric moisture content measurement. The expected
dose of deposited water in that period (estimated on the basis
of the references cited herein) may be as low as 0.02 mm h-1
.
This means that the moisture increment in the 1 centimetre
layer of soil will be only 0.2% (2 x 10⁻³
m3
m-3
). Better ac-
curacy of measurement with the TDR apparatus can be obtai-
ned by introducing a temperature correction (Skierucha,
2009). Such a correction was determined on the basis of
a field experiment, using temperature and moisture measu-
rements taken at test site C in the period from 2nd to 5th
November, 2011 (Fig. 6). Since test site C was constructed in
such a way as to preclude water flow through any of the walls
of spaceVi j, ,1, any change of moisture readings taken with
the TDR gauge can only be due to oscillations in soil tempe-
rature. Therefore the diurnal course of volumetric moisture
contents at site C is different fromthose at test sites A, B and D.
The course of actual volumetric water content and tem-
perature at site C is presented in Fig. 6. Despite the lack of wa-
ter flux through any wall of spaceVi j, ,1 a diurnal variation of
moisture content is observed in the readings from the TDR
gauge. As an example, on 2nd November, 2011, the diurnal
amplitude of moisture readings was 0.8% percentage points:
( . . . %).max
.min
.�� � �C C C2 11 2 11 2 11 186 178 08� � � ,
while the diurnal amplitude of temperature was 15.5°C
( . . . ).max.
min.�T T T
C C C2 11 2 11 2 11 174 19 155� � � o C .
Ultimately, the relation of temperature and TDR gauge
readings was developed for the range of 0.5°C<T C1
<18.8°C, as presented in Fig. 7. The slope of the line appro-
ximating moisture readings as a function of temperature has
the value of only 0.045, so the effect of temperature on
volumetric moisture readings is slight (temperature increase
from 1 to 18°C causes moisture increase by about 1%).
However, considering the accuracy of the readings, it was
taken into account in further calculations of ER. It should be
noted that the readings of TDR are correct when the soil
temperature is equal to the temperature at which the full
calibration of the sensors was made prior to the experiment
(18°C). For majority of soils the value of coefficient
d dT� 1 is negative (Skierucha, 2009). Only for soils with
a content of the clay fraction the value of d dT� 1 is positive
(Skierucha, 2009). In the object studied the percentage share
of the clay fraction was 26.83%.
It should be also explained that after the calibration in
the temperature of 18°C the �� measurement uncertainty
was 1-2% (Topp et al., 1980). However, when the sensor
was placed permanently in the soil monolith, the �� was
constant. Therefore, when calculating the soil moisture
differences for the subsequent time instants, the influence of
the error �� is zeroed.
Figure 8 presents the changes in moisture in the top
layer of soil, with the temperature correction, versus the
moisture without the correction. Introducing the empirically
elaborated temperature correction caused hardly any change
of the measured moisture content. As an example, on 3rd
November, 2011, at site B the maximum moisture without
the correction was a �B3 11. max = 17.6%, and with the correc-
tion only 0.9% higher. However, the correction increased
the diurnal amplitude of moisture for each test site. For
example, on 3rd November, 2011, at site B the amplitude
was �B3 11. =1.9% (17.6-15.7=1.9%) for readings without the cor-
rection, and for readings with the correction it was ��B3 11. ,s
=
2.4% (18.3-15.9=2.4%). Since the calibration temperature
is higher than the temperature at which the measurements
were taken, the true moisture is higher than the measured
value. The biggest differences between moisture values with
and without the temperature correction were observed in the
morning hours, when the soil temperature is the lowest. This
can be seen in Fig. 8, presenting the results from test site B.
As follows from the above, if the temperature correction
were not applied then the value of ER, calculated on the basis
of measurements with the TDR gauge, would be under-
estimated by 26%. The diurnal dynamics of effective non
rainfall water flux (ER) was ultimately determined on the
30 G. JANIK et al.
Fig. 6. Dynamics of moisture and temperature in the period from
2nd to 5th November, 2011, �Cmin.2 11 (�Cmax
.2 11 ) – maximum
(minimum) value of moisture at test site C on 2.11;TCmin.2 11 (TCmax
.2 11 )
– maximum (minimum) value of temperature at test site C on 2.11.
Fig. 7. Temperature correction for volumetric moisture for
0.5°C<TC< 18.8°C, �C – volumetric moisture at test site C, TC –
temperature within volume Vi,j,1 at test site C.

basis of the corrected values of moisture. For the calcula-
tions (Eq. (7)), the minimum moisture from the preceding
day was adopted as the initial moisture ( ), ,
,�
i jTDR S t p
1, while
the final moisture ( ), ,
,�
i jTDR S tk
1was the maximum moisture
value on the current day. The results of calculations of the
value of ER
for periods in which no rainfalls were observed
and soil temperatures were higher than 0.5�C are presented
in Fig. 9. The values calculated for the particular test sites
and for the dew collector have different runs. The lines
marked with symbols ERA
and ERB
represent calculations for
data from sites with no vegetation. The lines are parallel,
which indicates similar temporal variation of the intensity of
effective non rainfall water flux. The values of the intensity
at the site isolated from the soil monolith (test site B) are
higher than those at site A. This should be attributed to the
fact that the water from effective non rainfall, that penetrated
through the surface into the top layer of the soil, did not
supply the lower horizons. It should be kept in mind that the
lack of the barrier at test site A results in
� � �V V Vi jZB
i jX
i jY
, , , , , ,1 1 10� � �0; 0; , thus the adopted as-
sumptions (see ‘Material and Methods’) are not fulfilled.
Analysing the shape of line EKR formed as a result of the
observations obtained from the dew collector one can
conclude that variations on the consecutive days are greater
than in lines ERA
and ERB
. The difference in the shape of line
TDR TECHNIQUE FOR ESTIMATING THE INTENSITY OF EFFECTIVE NON RAINFALL 31
Fig. 8. Dynamics of volumetric moisture in objects A, B and D after the temperature correction, versus the moisture without the
correction.

EKR in relation to lines E
RA
and ERB
should be attributed to the
different atmospheric conditions in the vicinity of the dew
collector and on the soil surface. However, the courses of
lines ER1A
and ER1B
are predominantly similar to the course of
line EKR . The intensity of effective non rainfall water flux for
the grass cover test site (E RD
) is approximately constant: 0
mm day-1
. This means that when the soil is covered with
grass the water from effective non rainfall does not supply
the top layer of the soil or that supply is balanced by
evapotranspiration.
Figure 9 presents also periods in which dew or hoarfrost
were observed on the collector. The first to be analysed were
those time intervals in which dew was observed, then the
periods when hoarfrost was observed on the collector. The
estimation of the goodness of fit of the data obtained on the
basis of measurements taken at test sites A, B and D with the
data from the dew collector was performed with two me-
thods. The first consisted in the analysis of values calculated
on the basis of relations 7 to 11, and the second in the
analysis of the regression lines. Table 1 presents the values
of the fit of the data for the period when dew was observed
on the collector, and separately for the periods with hoar-
frost. On the days with dew the values of SWB and R.M.S. are
the lowest for test site B, and the highest for site D. This
indicates that when the intensity of effective non rainfall
water flux is estimated only on the basis of TDR measure-
ments, with simultaneous isolation of the top layer of the
bare soil, the results of the value ER
are the closest to the
values of ER
measured on the collector. Analysis of data
Pmax and Pmin shows that the maximumdifferences between
the values calculated on the basis of TDR measurements in
relation to the values calculated from the collector data are
significant – even for test site B (Pmax at site B for dew is
0.081 mm day-1
). Analysing the values of the measures of
goodness of fit for the periods when hoarfrost appeared on
the collector we can find that, as in the case of periods with
32 G. JANIK et al.
Fig. 9. Diurnal intensity of effective non rainfall water flux calculated on the basis of TDR measurements and data from dew collector,
ERA; ER
B ; ERD– diurnal intensity of effective non rainfall water flux at test sites A, B and D; EK
R – diurnal amount of deposit recorded on the
collector.
Test site
Rmax R.M.S Pmax Pmin SWB
(mm day-1)
for a period with dew on the collector
A 0.149 0.065 0.031 -0.149 0.044
B 0.082 0.044 0.081 -0.055 0.037
D 0.234 0.096 0.005 -0.234 0.065
for a period with hoarfrost on the collector
A 0.194 0.088 0.029 -0.194 0.081
B 0.102 0.054 0.100 -0.102 0.050
D 0.272 0.129 0.026 -0.272 0.119
T a b l e 1. Measures of the goodness of fit between data obtained on the basis of measurements with the TDR apparatus and the data from
the collector
dew, the values of SWB and R.M.S. are the lowest for test site
B and the highest for site D. The only difference is that 13
out of the 15 measures calculated assume higher values in
the case of hoarfrost. This indicates that for periods with
hoarfrost the goodness of fit of calculated values of ER
obtained on the basis of TDR measurements with values
obtained on the basis of data from the collector is lower.
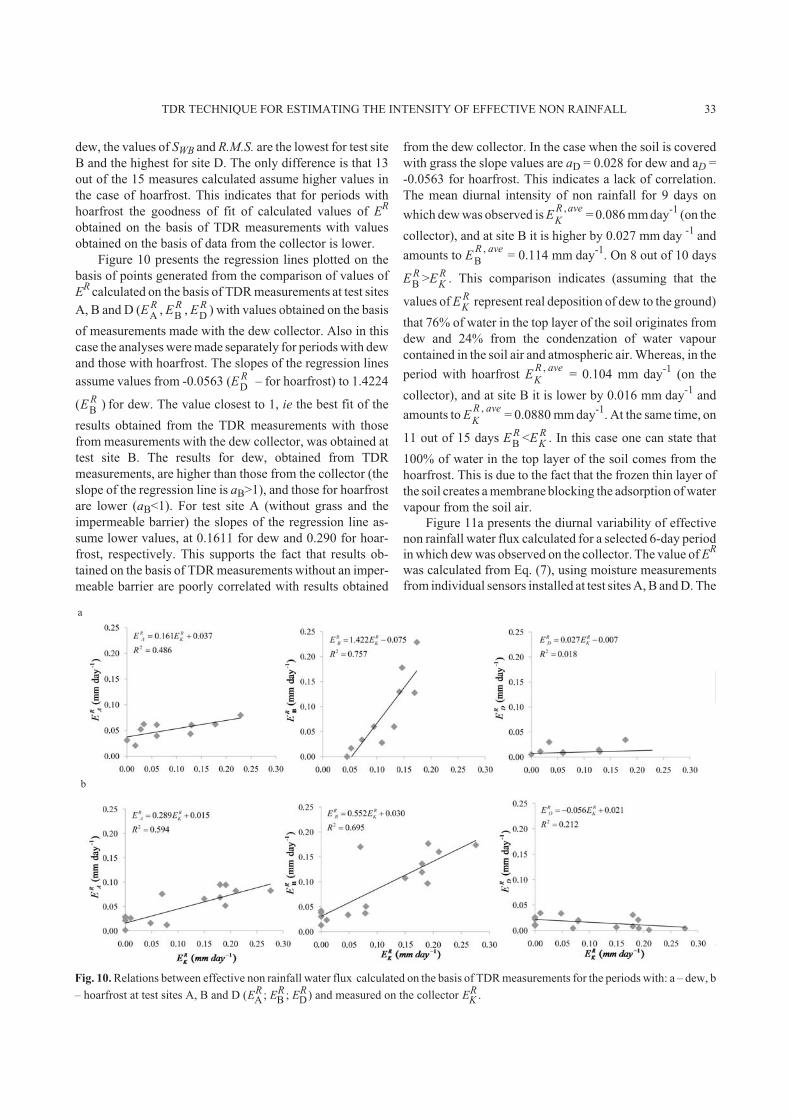
Figure 10 presents the regression lines plotted on the
basis of points generated from the comparison of values of
ER
calculated on the basis of TDR measurements at test sites
A, B and D (E RA
, E RB
, E RD
) with values obtained on the basis
of measurements made with the dew collector. Also in this
case the analyses were made separately for periods with dew
and those with hoarfrost. The slopes of the regression lines
assume values from -0.0563 (E RD
– for hoarfrost) to 1.4224
( )E RB
for dew. The value closest to 1, ie the best fit of the
results obtained from the TDR measurements with those
from measurements with the dew collector, was obtained at
test site B. The results for dew, obtained from TDR
measurements, are higher than those from the collector (the
slope of the regression line is aB>1), and those for hoarfrost
are lower (aB<1). For test site A (without grass and the
impermeable barrier) the slopes of the regression line as-
sume lower values, at 0.1611 for dew and 0.290 for hoar-
frost, respectively. This supports the fact that results ob-
tained on the basis of TDR measurements without an imper-
meable barrier are poorly correlated with results obtained
from the dew collector. In the case when the soil is covered
with grass the slope values are aD = 0.028 for dew and aD =
-0.0563 for hoarfrost. This indicates a lack of correlation.
The mean diurnal intensity of non rainfall for 9 days on
which dew was observed is EK
R ave,= 0.086 mm day
-1(on the
collector), and at site B it is higher by 0.027 mm day-1
and
amounts to ER ave
B
,= 0.114 mm day
-1. On 8 out of 10 days
E RB
>EKR . This comparison indicates (assuming that the
values of EKR represent real deposition of dew to the ground)
that 76% of water in the top layer of the soil originates from
dew and 24% from the condenzation of water vapour
contained in the soil air and atmospheric air. Whereas, in the
period with hoarfrost EK
R ave,= 0.104 mm day
-1(on the
collector), and at site B it is lower by 0.016 mm day-1
and
amounts to EK
R ave,= 0.0880 mm day
-1. At the same time, on
11 out of 15 days E RB
<EKR . In this case one can state that
100% of water in the top layer of the soil comes from the
hoarfrost. This is due to the fact that the frozen thin layer of
the soil creates a membrane blocking the adsorption of water
vapour from the soil air.
Figure 11a presents the diurnal variability of effective
non rainfall water flux calculated for a selected 6-day period
in which dew was observed on the collector. The value of ER
was calculated from Eq. (7), using moisture measurements
from individual sensors installed at test sites A, B and D. The
TDR TECHNIQUE FOR ESTIMATING THE INTENSITY OF EFFECTIVE NON RAINFALL 33
Fig. 10. Relations between effective non rainfall water flux calculated on the basis of TDR measurements for the periods with: a – dew, b
– hoarfrost at test sites A, B and D (ERA; ER
B ; ERD) and measured on the collector EK
R .
a
b

calculations were made with a time step of �t = 0.5 h. The
values obtained were expressed in mm h-1
. The maximum
values of E RA
and E RB
appear in the period between 1500
and
1800
hours. On each of the days analyzed there appear
periods in which the values of E RB
are considerably higher
than those of E RA
. This supports the fact that changes in the
volume of water at site B are caused solely by effective non
rainfall water flux (the water does not supply the lower
layers of soil). Values of E RD
– at the test site covered with
grass – assume negative values throughout the period of the
experiment. This means that at site D the phenomenon of top
layer of soil being supplied by effective non rainfall water
flux does not appear, in spite of dew deposit being observed
on the collector. Non rainfall is deposited on grass blades
and then evaporates to the atmosphere, or water uptake by
grass roots balances or exceeds the supply from the non
rainfall. In the study presented here this problem has not
been solved. The irregularities of lines E RA
, E RB
and E RD
result from the fact that a change in moisture reading by
0.1% causes a change in the value of ER
by 0.01 mm h-1
. The
shapes of lines E RA
, E RB
and E RD
plotted for a period with
hoarfrost observed on the collector are similar to those of the
lines presented in Fig. 11b. The only difference is that the
values of ERmax are lower than those calculated for the
period with dew (the membrane effect).
Figure 12a presents the changes in the values of ER
calculated separately for each test site, and averaged for the
period with dew. It can be seen from the Figure that the
process of supply of the top layer of the soil at test site B
starts already at 1400
. Then its intensity increases, reaching
its maximum Eave
R
Bmax,
= 0.027 mm h-1
at 1630
. In the
subsequent period a decrease is observed in the value of
Eave
RB,
. However, it is not as dynamic as the initial growth.
The value of Eave
R1B,
gets zeroed at 2330
. The shape of line
EaveR
,Ais similar. However, the process of supply of the top
layer of soil starts later that at site B – ie at 1500
. The
maximum, Eave
R
A,max = 0.011 mm h
-1, is over two-fold lower
than Eave
R
B,max and it is attained 0.5 h later, ie at 17
00. From
1700
there is a slow decrease, and the value of 0 mm day-1
is
reached at 2330
. At test site D the values of EA ave
R
,max are nega-
tive throughout the day. Figure 12b presents the course of
the values of ER
calculated separately for each test site and
averaged for the period with hoarfrost. The character of the
runs of values for the periods with dew and with hoarfrost is
similar, the difference consisting in that the averaged values
of ER
for hoarfrost are lower than the corresponding ave-
rages calculated for the periods with dew.
34 G. JANIK et al.
Fig. 11. Diurnal variation of the intensity of effective non rainfall water flux calculated on the basis of TDR measurements, for the
periods with: a – dew, b – hoarfrost, ERA; ER
B ; ERD – diurnal intensity of effective non rainfall water flux calculated on the basis of
measurements from individual sensors separately for each test site.
a
b
TDR TECHNIQUE FOR ESTIMATING THE INTENSITY OF EFFECTIVE NON RAINFALL 35
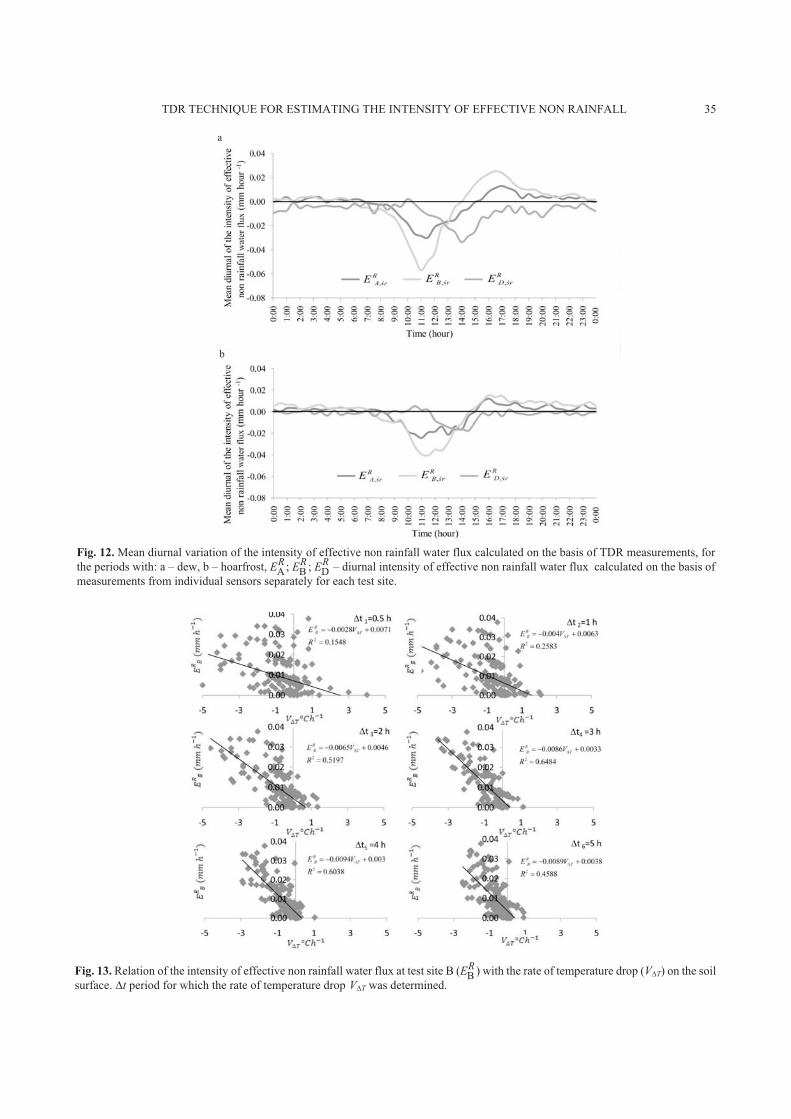
Fig. 12. Mean diurnal variation of the intensity of effective non rainfall water flux calculated on the basis of TDR measurements, for
the periods with: a – dew, b – hoarfrost, ERA; ER
B ; ERD – diurnal intensity of effective non rainfall water flux calculated on the basis of
measurements from individual sensors separately for each test site.
a
b
Fig. 13. Relation of the intensity of effective non rainfall water flux at test site B (ERB ) with the rate of temperature drop (V�T) on the soil
surface. �t period for which the rate of temperature drop V�T was determined.

Figure 13 presents the relation between the intensity of
effective non rainfall water flux and the rate of changes of
temperature on the soil surface. That rate is denoted as V�T
and it was determined for different intervals �ti(�ti = 0.5, 1,
2, 3, 4, 5 h). If V�T� 0�C h
-1there is a drop of temperature.
The intensity of effective non rainfall water flux (E RB
) was
determined within hourly intervals. Linear relations E RB
=
V�T + b were developed from the periods �ti. The highest
value of the coefficient of correlation was obtained when �ti= 3h (R
A2 = 0.6484). This means that the rate of temperature
drop on the soil surface during the period of 3 h preceding
the determination of the value of ER
has the strongest effect
on the intensity of effective non rainfall water flux.
CONCLUSIONS
1. The advantage of the presented method for the deter-
mination of the diurnal distribution of effective non rainfall
water flux is that the only input parameters required for the
application of the method, and ones easy to measure, are the
moisture of the top layer of the soil and its temperature. The
measurements were conducted on samples with undisturbed
structure, under thermal conditions equivalent to the natural
conditions.
2. The application of the TDR technique for the determi-
nation of the diurnal dynamics of the intensity of effective
non rainfall water flux requires the application of a tem-
perature correction during the determination of volumetric
moisture. The lack of such a correction may cause that the
value of the intensity of effective non rainfall water flux will
be estimated with an error of up to 26%.
3. The method, applied in conjunction with measure-
ments on a dew and hoarfrost collector, permits to determine
what part of effective non rainfall water flux is due to the
condenzation of water vapour from the soil air and atmos-
pheric air, and what part originates from dew or hoarfrost.
4. The agreement between the values of the intensity of
effective non rainfall water flux calculated with the method
proposed and the values obtained from the collector is better
for periods with dew than for periods with hoarfrost. The
relevant root mean square values equal 0.044 and 0.054 mm
day-1
, respectively.
5. It was found that when hoarfrost appears on the soil
surface a membrane forms, rendering the adsorption of
water vapour from the soil air impossible.
REFERENCES
Agam N. and Berliner P.R., 2006. Dew formation and water va-
por adsorption in semi-arid environments. A review. J. Arid
Environ., 65, 572-590.
Beysens D., Milimouk I., Nikolayev V., Muselli M., and Marcillat J.,
2003. Using radiative cooling to condense atmospheric
vapor: a study to improve water yield. J. Hydrol., 276, 1-11.
B³aœ M., Sobik M., Quiel F., and Netzel P., 2002. Temporal and
spatial variations of fog in the Western Sudety Mts. Poland.
Atmospheric Res., 64, 19-28.
Bryœ K. and Bryœ T., 2010. Reconstruction of the 217-year
(1791-2007) Wroc³aw air temperature and precipitation
series. Bulletin of Geography (Physical Geography Series).
Wyd. Nauk. UMK Toruñ, 3, 121-171.
Duvdevani S., 1947. An optical method of dew estimation.
Quarterly J. Royal Meteorol. Soc., 73, 282-296.
Ermich K., 1958. An attempt at determination of the share of so-
called horizontal precipitation in water cycle in nature (in Polish).
Wiadomoœci Botaniczne, II(IV), 219-236.
Heusinkveld B.G., Berkowicz S.M., Jacobs A.F.G., Holtslag A.A.M.,
and Hillen W.C.A.M., 2005. An automated microlysimeter
to study dew formation and evaporation in arid and semiarid
regions. J. Hydrometeorol., 7, 825-832.
Jacobs A.F.G., Heusinkveld B.G., and Berkowicz S.M., 1999.
Dew deposition and drying in a desert system: a simple
simulation model. J. Arid Environ., 42, 211-222.
Jacobs A.F.G., Heusinkveld B.G., and Berkowicz S.M., 2002.
A simple model for potential dewfall in an arid region.
Atmospheric Res., 64, 285-295.
Janik G., 2008. Spatial variability of soil moisture as information
on variability of selected physical properties of soil. Int.
Agrophysics, 22, 35-43.
Janik G., Szpila M., S³owiñska J., Brej G., Turkiewicz M.,
Skierucha W., and Pastuszka T., 2011. Method for the
determination of the sensitivity zone of TDR probe. Acta
Agrophysica, 183, 269-286.
Kaseke F.K., Mills A.J., Brown R., Esler K.J., Henschel R., and
Seely M.K., 2011. A method for direct assessment of the
‘non rainfall’ atmospheric water cycle: input and evapora-
tion from the soil. Pure Appl. Geophys., 169(5-6), 847-857.
Katata G., Nagai H., Ueda H., Agam N., and Berliner P.R., 2007.
Development of a land surface model including evaporation
and adsorption processes in the soil for the land-air exchange
in arid regions. J. Hydrometeor., 8, 1307-1324.
Kidron G.J., 1998. A simple weighing method for dew and fog
measurements. Weather, 53, 428-433.
Kidron G.J., 2005. Angle and aspect dependent dew and fog
precipitation in the Negev desert. J. Hydrol., 301, 66-74.
Kolev N., Levi A., Milenova L., Nenov M., Haarbrink R., and
Shutko A., 2012. Energy budget elements estimation of the
agricultural field by aircraft remote sensing and land surface
observations. Comptesrendusde l'Acade'miebulgare des
Sci., 65(7), 991-996.
Kosmas C., Danalatos N.G., Poesen J., and van Wesemael B.,
1998. The effect of water vapour adsorption on soil moisture
content under Mediterranean climatic conditions. Agric.
Water Manag., 36, 157-168.
Kosmas C., Marathianou M., Gerontidis St., Detsi V., Tsara M.,
and Poesen J., 2001. Parameters affecting water vapor
adsorption by the soil under semi-arid climatic conditions.
Agric. Water Manag., 48, 61-78.
Li X.J., 2002. Effects of gravel and sand mulches on dew
deposition in the semiarid region of China. J. Hydrol., 260,
151-160.
Malek E., McCurdyb G., and Giles B., 1999. Dew contribution
to the annual water balances in semi-arid desert valleys.
J. Arid Environ., 42, 71-80.
36 G. JANIK et al.

Muselli M., Beysens D., Marcillat J., Milimouk I., Nilsson T.,
and Louche A., 2002. Dew water collector for potable water
in Ajaccio (Corsica Island, France). Atmospheric Res., 64,
297-312.
Nilsson T., 1996. Initial experiments on dew collection in Sweden
and Tanzania. Solar Energy Materials Solar Cells, 40, 23-32.
Ninari N. and Berliner P.R., 2002. The role of dew in the water
and heat balance of bare loess soil in the NegevDesert:
quantifying the actual dew deposition on the soil surface.
Atmospheric Res., 64, 323-334.
Obalum S., Oppong J., Igwe C., Watanabe J., and Obi M., 2013.
Spatial variability of uncultivated soils in derived savanna.
Int. Agrophys., 27, 57-67.
Reinhard T. and Reinhard A., 2005. Choice of time step in
calculation of water moisture by means of a mathematical
model simulating drip irrigation (in Polish). Zesz. Nauk.,
Univ. Agric. Wroc³aw, 520, 95-105.
Richards K., 2002. Hardware scale modelling of summertime
patterns of urban dew and surface moisture in Vancouver,
BC, Canada. Atmospheric Res., 64, 313-321.
Skierucha W., 2009. Temperature dependence of time domain
reflectometry - measured soil dielectric permittivity. J. Plant
Nutrition Soil Sci., 172, 186-193.
Sochan A., Bieganowski A., Ry¿ak M., Dobrowolski R., and
Bartmiñski P., 2012. Comparison of soil texture determi-
ned by two dispersion units of Mastersizer 2000. Int.
Agrophys., 26, 99-102.
Soil water status measurement devices, IA PAS, Lublin, 2008.
http://www.easytest.pl/downloads/ET_Brochure%202008.pdf
Topp G.C., Davis J.L., and Annan A.P., 1980. Electromagnetic
determination of soil-water content – measurements in
coaxial transmission-lines. Water Resour. Res., 16(3),
574-582.
Yamanaka T., Kaihotsu I., Oyunbaatar D., and Ganbold T., 2007.
Summertime soil hydrological cycle and surface energy ba-
lance on the Mongolian steppe. J. Arid Environ., 69, 65-79.
Zangvil A. and Druian P., 1980. Measurements of dew at a desert
site in southern Israel. Geographical Res. Forum, 2, 26-34.
TDR TECHNIQUE FOR ESTIMATING THE INTENSITY OF EFFECTIVE NON RAINFALL 37
Copyright © 2022 FDOKUMEN