Tamara Modebadze thesis 2014 FOR BINDING
250
Some pages of this thesis may have been removed for copyright restrictions. If you have discovered material in Aston Research Explorer which is unlawful e.g. breaches copyright, (either yours or that of a third party) or any other law, including but not limited to those relating to patent, trademark, confidentiality, data protection, obscenity, defamation, libel, then please read our Takedown policy and contact the service immediately ([email protected])
-
Upload
khangminh22 -
Category
Documents
-
view
3 -
download
0
Transcript of Tamara Modebadze thesis 2014 FOR BINDING

Some pages of this thesis may have been removed for copyright restrictions.
If you have discovered material in Aston Research Explorer which is unlawful e.g. breaches copyright, (either yours or that of a third party) or any other law, including but not limited to those relating to patent, trademark, confidentiality, data protection, obscenity, defamation, libel, then please read our Takedown policy and contact the service immediately ([email protected])

1""
NEURONAL NETWORK DYNAMICS DURING
EPILEPTOGENESIS IN THE MEDIAL TEMPORAL LOBE
Tamara Modebadze Doctor of Philosophy
Aston University
September 2014
©Tamara Modebadze, 2014
Tamara Modebadze asserts her moral right to be identified as the author of this thesis
This copy of the thesis has been supplied on condition that anyone who consults it is understood to recognise that its copyright rests with its author and that no quotation from the thesis and no information derived from it may be published without proper
acknowledgement.

2""
Aston University Neuronal network dynamics during epileptogenesis in the medial temporal lobe
Tamara Modebadze
Doctor of Philosophy
2014
Epilepsy is one of the most common neurological disorders, a large fraction of which is resistant to pharmacotherapy. In this light, understanding the mechanisms of epilepsy and its intractable forms in particular could create new targets for pharmacotherapeutic intervention. The current project explores the dynamic changes in neuronal network function in the chronic temporal lobe epilepsy (TLE) in rat and human brain in vitro. I focused on the process of establishment of epilepsy (epileptogenesis) in the temporal lobe.
Rhythmic behaviour of the hippocampal neuronal networks in healthy animals was explored using spontaneous oscillations in the gamma frequency band (SγO). The use of an improved brain slice preparation technique resulted in the natural occurence (in the absence of pharmacological stimulation) of rhythmic activity, which was then pharmacologically characterised and compared to other models of gamma oscillations (KA- and CCh-induced oscillations) using local field potential recording technique. The results showed that SγO differed from pharmacologically driven models, suggesting higher physiological relevance of SγO. Network activity was also explored in the medial entorhinal cortex (mEC), where spontaneous slow wave oscillations (SWO) were detected.
To investigate the course of chronic TLE establishment, a refined Li-pilocarpine-based model of epilepsy (RISE) was developed. The model significantly reduced animal mortality and demonstrated reduced intensity, yet high morbidy with almost 70% mean success rate of developing spontaneous recurrent seizures. We used SγO to characterize changes in the hippocampal neuronal networks throughout the epileptogenesis. The results showed that the network remained largely intact, demonstrating the subtle nature of the RISE model. Despite this, a reduction in network activity was detected during the so-called latent (no seizure) period, which was hypothesized to occur due to network fragmentation and an abnormal function of kainate receptors (KAr). We therefore explored the function of KAr by challenging SγO with kainic acid (KA). The results demonstrated a remarkable decrease in KAr response during the latent period, suggesting KAr dysfunction or altered expression, which will be further investigated using a variety of electrophysiological and immunocytochemical methods. The entorhinal cortex, together with the hippocampus, is known to play an important role in the TLE. Considering this, we investigated neuronal network function of the mEC during epileptogenesis using SWO. The results demonstrated a striking difference in AMPAr function, with possible receptor upregulation or abnormal composition in the early development of epilepsy. Alterations in receptor function inevitably lead to changes in the network function, which may play an important role in the development of epilepsy. Preliminary investigations were made using slices of human brain tissue taken following surgery for intratctable epilepsy. Initial results showed that oscillogenesis could be induced in human brain slices and that such network activity was pharmacologically similar to that observed in rodent brain. Overall, our findings suggest that excitatory glutamatergic transmission is heavily involved in the process of epileptogenesis. Together with other types of receptors, KAr and AMPAr contribute to epilepsy establishment and may be the key to uncovering its mechanism.

3""
Acknowledgements I would like to express my biggest gratitude to my supervisor, Prof. Gavin Woodhall,
for being the best supervisor one could dream of having. His guidance, support and
great sense of humor have made my PhD so enjoyable. I admire his passion for
science, and this is something for me to look up to. A big thank you goes to my
associate supervisor, Prof. Ian Stanford, for giving advice and support whenever I
needed it, and for his always honest opinions.
I would like to thank everyone who taught me so many things when I started. Most of
all, Emma (Dr. Prokic!), thank you so much for all the lab and not-so-lab times and for
always taking time to answer my million questions! I want to thank Craig (Dr.
McAllister), Dr. Stephen Hall, Kim (Dr. Ronnqvist), Drs. Rhein Parri and Rob Sims.
Many thanks to the guys from the biomed facilities, Wayne, Jeffrey, Kathryn and
Brian, for always being ready to help. A special thank you goes to Gerard for the
analysis of my data and his endless patience!
Big thanks to my friends and current lab mates Emma (again), Nick, Jane, Darshna
(especially, for helping me finish some of the experiments!), Swetha and Serena!
Those long long hours in the lab (and outside of it) were so much more fun with you
guys! I would also like to thank my dear friends Korjik, Belka and Vova, who were
miles away but were still supporting me in my good and bad times.
A very big thank you goes to my dear Andreas, who always encouraged me to move
forward, who was always there for me. Thank you so much for your patience and all
the tea and food that you made for me while I was writing up!
Finally, the most important thank you goes to my parents and my family, for always
believing in me, for encouraging me, for loving and supporting me, most importantly
for making me the person I am today. For that I am endlessly grateful.

4""
Table of Contents
Acknowledgements ...................................................................................................... 3
Table of Contents .......................................................................................................... 4
List of Figures ................................................................................................................. 9
List of Tables ................................................................................................................. 12
Abbreviations ................................................................................................................ 13
1. Chapter 1 Introduction ....................................................................................... 17
1.1. Neuronal network oscillations ......................................................................................... 18
1.1.1. What are brain rhythms? ...................................................................................... 18
1.1.2. Gamma rhythm (30 – 100 Hz) ............................................................................. 19
1.1.2.1. ING model ..................................................................................................... 20
1.1.2.2. PING model ................................................................................................... 21
1.1.2.3. Gamma oscillations in brain physiology ........................................................ 23
1.1.2.4. Gamma oscillations in brain pathology ......................................................... 24
1.1.3. Slow rhythm (0.1 – 0.5 Hz) .................................................................................. 25
1.1.3.1. Mechanism of SWO generation .................................................................... 26
1.1.3.2. Pharmacology of SWO .................................................................................. 27
1.1.3.3. SWO in brain physiology ............................................................................... 29
1.1.3.4. SWO in brain pathology ................................................................................ 29
1.2. Kainate receptors and oscillogenesis ............................................................................. 30
1.2.1. KAr in the hippocampus ....................................................................................... 30
1.2.2. KAr in the EC ....................................................................................................... 32
1.2.3. KAr pharmacology ............................................................................................... 33
1.2.4. KAr in gamma oscillations .................................................................................... 34
1.2.5. KAr in epilepsy ..................................................................................................... 36
1.3. Aims and objectives ........................................................................................................ 38
2. Chapter 2 Methods ............................................................................................... 39
2.1. Brain slice preparation .................................................................................................... 40
2.2. Reduced intensity model of chronic epilepsy .................................................................. 41
2.2.1. Model protocol ..................................................................................................... 41
2.2.2. Experimental timeline ........................................................................................... 42
2.2.3. SRS development ................................................................................................ 43
2.3. Human brain tissue electrophysiology ............................................................................ 43
2.4. Electrophysiological Recordings ..................................................................................... 44

5""
2.4.1. Extracellular recording ......................................................................................... 44
2.4.2. Evoked field potential recording ........................................................................... 45
2.4.3. Patch-clamp recording ......................................................................................... 46
2.5. Data Collection and Analysis .......................................................................................... 46
2.5.1. Spontaneous gamma oscillations ........................................................................ 46
2.5.2. Phase analysis ..................................................................................................... 47
2.5.3. SWO analysis ...................................................................................................... 50
2.5.4. Evoked field potential and patch-clamp analysis ................................................. 51
2.6. Drugs .............................................................................................................................. 51
3. Chapter 3 Spontaneous gamma oscillations in CA3 hippocampus ................................................................................................................. 52
3.1. Introduction ..................................................................................................................... 53
3.1.1. In vitro models of induced gamma oscillations and pharmacology ...................... 53
3.1.2. Spontaneous gamma oscillations ........................................................................ 55
3.1.3. Improved brain slice preparation technique ......................................................... 56
3.2. Results ............................................................................................................................ 57
3.2.1. Traditional vs. improved brain slice preparation .................................................. 57
3.2.2. Basic profile of SγO, KA- and CCh-induced gamma oscillations ......................... 58
3.2.3. Characterisation of SγO ....................................................................................... 62
3.2.4. Pharmacological profile of SγO, KγO and CChγO ............................................... 62
3.2.4.1. GABAergic pharmacology ............................................................................. 63
3.2.4.2. Glutamatergic pharmacology ........................................................................ 65
3.2.4.3. Cholinergic pharmacology ............................................................................. 69
3.2.4.4. Gap junctions ................................................................................................ 69
3.2.5. Phase profile of SγO, KγO and CChγO ............................................................... 71
3.2.5.1. Phase characterisation .................................................................................. 71
3.2.5.2. Volume conduction problem .......................................................................... 74
3.2.5.3. Dose-dependent phase effects of KA and CCh on SγO ............................... 74
3.2.6. Laminar profile of SγO and KγO .......................................................................... 78
3.3. Discussion ....................................................................................................................... 78
3.3.1. SγO in improved brain slice preparation .............................................................. 78
3.3.2. Basic profile of SγO, KγO and CChγO ................................................................. 80
3.3.3. Characterisation of SγO ....................................................................................... 82
3.3.4. Comparative Pharmacology ................................................................................. 83
3.3.4. Phase analysis of SγO ......................................................................................... 87
3.3.5. Laminar characterisation of SγO and KγO ........................................................... 87
3.3.7. SγO as a physiologically relevant model of gamma oscillations .......................... 88
6""
3.4. Conclusion ...................................................................................................................... 88
4. Chapter 4 The Reduced Intensity Status Epilepticus (RISE) model of chronic epilepsy ...................................................................................... 90
4.1. Introduction ..................................................................................................................... 91
4.1.1. Epilepsy models in animals .................................................................................. 92
4.1.1.1. In vitro models of seizures ............................................................................ 93
4.1.1.2. Models of acute seizures .............................................................................. 94
4.1.1.3. Kindling model of epilepsy ............................................................................ 94
4.1.1.4. Post SE epilepsy models .............................................................................. 94
4.1.1.4.1. KA-induced SE model of epilepsy .......................................................... 96
4.1.1.4.2. Pilocarpine/Li-pilocarpine model of epilepsy .......................................... 96
4.1.2. Epilepsy in human brain slices in vitro ............................................................... 100
4.1.3. Necessity for improvement and refinement ....................................................... 101
4.2. Results .......................................................................................................................... 102
4.2.1. Model refinement ............................................................................................... 102
4.2.1.1. Low mortality and high morbidity ................................................................. 103
4.2.2. Behavioural studies ............................................................................................ 105
4.2.3. In vitro studies in the hippocampus .................................................................... 107
4.2.3.1. Morphology and staining ............................................................................. 107
4.2.3.2. SγO in healthy and epileptic rats ................................................................. 110
4.2.3.2.1. 24h post-SE ......................................................................................... 110
4.2.3.2.2. 7d post-SE ........................................................................................... 112
4.2.3.2.3. 6-8 wks post-SE ................................................................................... 114
4.2.3.2.4. 90+d post-SE ....................................................................................... 116
4.2.3.3. VFO as a biomarker of epilepsy .................................................................. 118
4.2.3.4. Ictal and interictal activity in CA3 ................................................................ 119
4.2.3.5. Spontaneous ictal activity in the mEC in PSE 7d ........................................ 121
4.3. Discussion ..................................................................................................................... 122
4.3.1. Model refinement ............................................................................................... 122
4.3.2. Reduced mortality in RISE ................................................................................. 123
4.3.3. Behavioural studies ............................................................................................ 123
4.3.4. In vitro studies of neuronal networks ................................................................. 124
4.3.4.1. Early post-insult alterations in network function .......................................... 124
4.3.4.2. Neuronal network function during the latent period .................................... 126
4.3.4.3. Neuronal network function during SRS period ............................................ 127
4.3.4.4. Ictal activity in the mEC ............................................................................... 128
4.4. Conclusion .................................................................................................................... 128

7""
5. Chapter 5 KAr studies in RISE ..................................................................... 130
5.1. Introduction ................................................................................................................... 131
5.1.1. KAr expression in human epilepsy ..................................................................... 132
5.1.2. KAr expression in animal models of epilepsy .................................................... 134
5.2. Results .......................................................................................................................... 135
5.2.1. Extracellular recordings ..................................................................................... 135
5.2.2. KAr function in evoked field potential recording ................................................. 145
5.2.3. KAr function in whole-cell patch-clamp recordings ............................................ 148
5.2.3.1. Attempts to increase CA3 viability ............................................................... 148
5.2.3.2. KAr effects on GABA release ...................................................................... 149
5.3 Discussion .............................................................................................................. 153
5.4. Conclusion .................................................................................................................... 156
6. Chapter 6 Spontaneous rhythmic activity in layer II mEC ............ 157
6.1. Introduction ................................................................................................................... 158
6.1.1. The EC and epilepsy .......................................................................................... 158
6.1.2. The EC and SWO .............................................................................................. 158
6.2. Results .......................................................................................................................... 160
6.2.1. Basic profile in control slices .............................................................................. 160
6.2.2. Pharmacological characterisation ...................................................................... 165
6.2.3. Spontaneous SWO in RISE ............................................................................... 171
6.2.4. Pharmacology of SWO in epileptic slices .......................................................... 172
6.3. Discussion ..................................................................................................................... 173
6.3.1. Basic profile of SWO in control vs. epileptic slices ............................................ 173
6.3.2. Pharmacology of SWO in control vs. epileptic slices ......................................... 175
6.3.3. Functional significance and relation to in vivo studies ....................................... 179
6.4. Conclusions .................................................................................................................. 181
7. Chapter 7 Electrophysiology of paediatric brain tissue resected from patients with intractable epilepsy ......................................................... 182
7.1. Introduction ................................................................................................................... 183
7.2. Results .......................................................................................................................... 184
7.2.1. Basic profile of neuronal network oscillations .................................................... 184
7.2.2. Pharmacological characterisation ...................................................................... 188
7.2.3. VFO and ictal activity ......................................................................................... 192
7.2.4. IPSC kinetics in human cortical slices ............................................................... 194
7.3. Discussion ..................................................................................................................... 195
7.3.1. Basic profile of human tissue oscillations .......................................................... 195

8""
7.3.2. Pharmacology of human tissue oscillations ....................................................... 200
7.3.3. VFO and ictal activity ......................................................................................... 200
7.4. Conclusion .................................................................................................................... 201
Chapter 8 General discussion and future work .................................................................... 202
References ........................................................................................................................... 207
A. Appendix ................................................................................................................. 244
Appendix 1 ........................................................................................................................... 245
Appendix 2 ........................................................................................................................... 248

9""
List of Figures Figure 1.1. Schematic representation of ING and PING models of gamma oscillations. ...... 21
Figure 1.2. Schematic diagram of interconnected pyramidal cell and different types of
interneurons in hippocampal CA3 region ....................................................................... 22
Figure 1.3. KAr localisation in the hippocampus. ................................................................... 31
Figure 1.4. KAr localisation in the EC .................................................................................... 33
Figure 2.1. Experimental timeline. ......................................................................................... 42
Figure 2.2. Schematic diagram of combined hippocampal-EC brain slice. ........................... 44
Figure 2.3. Electrophysiology rig setup. ................................................................................. 45
Figure 2.4. PLV for random and unimodal distribution of phase angle difference. ................ 48
Figure 2.5. Method limitation: bimodal phase angle difference distribution. .......................... 49
Figure 3.1. Impoved brain slice preparation increases slice viability and exposes natural SγO.
....................................................................................................................................... 58
Figure 3.2. Basic profile of SγO, KγO and CChγO. ............................................................... 59
Figure 3.3. Time-frequency analysis of SγO, KγO and CChγO. ............................................ 59
Figure 3.4. Mean power-frequency characterisation of SγO, KγO and CChγO. .................... 60
Figure 3.5. SγO survive prolonged storage. .......................................................................... 61
Figure 3.6. Weight-dependent profile of SγO. ....................................................................... 62
Figure 3.7. Abolition of SγO, KγO and CChγO by 20 µM PTX. ............................................. 63
Figure 3.8. The effects of GABA-Ar modulators on SγO, KγO and CChγO. ......................... 64
Figure 3.9. Differential effects of GluK1,3 KAr antagonist UBP310 (3 µM) on SγO, KγO and
CChγO. .......................................................................................................................... 65
Figure 3.10. Differential effects of NMDAr antagonist on SγO, KγO and CChγO. ................. 67
Figure 3.11. The effects of glutamatergic antagonists on SγO, KγO and CChγO. ................ 68
Figure 3.12. Differential effects of mAChr antagonist on SγO, KγO and CChγO. ................. 69
Figure 3.13. The effects of mGluR and mAChr antagonists and gap junction blocker SγO,
KγO and CChγO. ........................................................................................................... 70
Figure 3.14. Phase coupling of SγO, KγO and CChγO across CA3. ..................................... 72
Figure 3.15. Short- and long-range connectivity in SγO. ....................................................... 73
Figure 3.16. Volume conduction issue. .................................................................................. 74
Figure 3.17. Phase synchrony-power relationship for increasing concentrations of KA and
CCh. ............................................................................................................................... 76
Figure 3.18. Phase synchrony-power-concentration relationship for KγO. ............................ 77
Figure 3.19. Laminar profile of SγO and KγO. ....................................................................... 78
Figure 4.2. The mechanism of pilocarpine model of chronic TLE. ......................................... 94
Figure 4.2. SRS frequency is variable and follows a weekly cycle. ..................................... 104
Figure 4.3. Behavioural measurements of epilepsy following induction. ............................. 106

10""
Figure 4.4. Morphology of epileptic brains. .......................................................................... 109
Figure 4.5. At PSE 24h LFP recordings show SγO and fast bursts in CA3. ........................ 111
Figure 4.6. SγO in CA3 at PSE 7d. ...................................................................................... 113
Figure 4.7. SγO in CA3 during PSE 6wks. .......................................................................... 115
Figure 4.8. SγO in CA3 during PSE 90d. ............................................................................. 117
Figure 4.9. VFO as a biomarker of increased excitability in PSE 24h and PSE 90d. .......... 118
Figure 4.10. Spontaneous ictal activity in the hippocampal CA3 region in PSE 24h. .......... 120
Figure 4.11. Interictal activity in the hippocampal CA3 region in PSE 24h. ......................... 121
Figure 4.12. Spontaneous ictal events in layers II/III mEC in PSE 7d slices. ...................... 121
Figure 5.2. Basic profile of SγO and KγO in AMC and PSE 24h. ........................................ 136
Figure 5.3. Basic profile of SγO and KγO in AMC and PSE 7d. .......................................... 137
Figure 5.4. Basic profile of SγO and KγO in AMC and PSE 6wks shows compromised KA-
induced activity. ........................................................................................................... 140
Figure 5.5. Basic profile of SγO and KγO in AMC and PSE 90d. ........................................ 141
Figure 5.5. Pooled peak frequency and peak power plots for SγO and KγO in control and
epileptic conditions. ...................................................................................................... 144
Figure 5.6. KAr response is compromised during PSE 6wks. ............................................. 145
Figure 5.7. Evoked field potential in the hippocampal CA3 region. ..................................... 147
Figure 5.8. Poor survival of the hippocampal CA3 in control adult slices. ........................... 148
Figure 5.9. KAr effects on GABA release in CA3 of control slices. ...................................... 151
Figure 5.10. KAr effects on GABA release in CA3 of epileptic slices. ................................. 152
Figure 6.1. Basic profile of SWO in layers II/III of the mEC. ................................................ 161
Figure 6.2. Variety of electrographic patterns of SWO in control and PSE 24h/7d slices. .. 162
Figure 6.3. SWO in deep and superficial layers of the mEC. .............................................. 163
Figure 6.4. Differences in the developmental profile of SWO in control and epileptic slices.
..................................................................................................................................... 164
Figure 6.5. Reducing [Mg2+]o promotes SWO in control adult slices. ................................... 164
Figure 6.6. Differential effects of GABA-Ar blockade on SWO in control and PSE 24h/7d
slices. ........................................................................................................................... 165
Figure 6.7. The effects of GABA-Br blockade on SWO in control and PSE 24h/7d slices. . 166
Figure 6.8. NMDAr blockade reduces the interburst frequency but increases burst amplitude
in control and PSE 24h/7d. .......................................................................................... 167
Figure 6.9. AMPAr/KAr blockade abolishes SWO in control and PSE 24h/7d slices. ......... 167
Figure 6.10. GluK1,3 KAr blockade abolishes SWO in control and PSE 24h/7d slices ....... 168
Figure 6.11. The effect of KAr activation on SWO in PSE 24h/7d. ...................................... 168
Figure 6.12. AMPAr blockade abolishes SWO in PSE 24h/7d but not control slices .......... 169
Figure 6.13. mGluR5 blockade promotes intraburst synchrony in control and PSE 24h/7d. 170

11""
Figure 6.14. mGluR gpoups II/III blockade promotes intraburst synchrony in control and PSE
24h/7d. ......................................................................................................................... 170
Figure 6.15. Gap junction blockade abolishes SWO in control and PSE 24h/7d. ............... 171
Figure 7.1. Human brain tissue slice morphology and KA-induced rhythmic activity .......... 186
Figure 7.2. KA- and CCh-induced rhythmic activity in human cortical brain tissue. ............ 187
Figure 7.3. Rhythmic activity in the human cortex is mediated by GABA-Ar. ...................... 188
Figure 7.7.4. Pharmacological profile of pharmacologically-induced rhythmic activity in the
human cortical tissue. .................................................................................................. 190
Figure 7.5. VFOs are not mediated via gap junctions. ......................................................... 191
Figure 7.6. Similarities between VFO in PSE 24h slices and epileptic human tissue .......... 192
Figure 7.7. Ictal event in epileptic cortical tissue from a human brain. ................................ 193
Figure 7.8. GABA sIPSC kinetic properties of the individual cells in normal and dysplastic
human tissues. ............................................................................................................. 194
Figure 7.9. KAr modulated GABA release. .......................................................................... 195
Figure A.1. ........................................................................................................................... 245

12""
List of Tables Table 1.1. KAr ligands. ........................................................................................................... 34
Table 2.1. Racine scale of seizures. ...................................................................................... 42
Table 2.2. Patient data. .......................................................................................................... 43
Table 4.1 PSBB tasks. ......................................................................................................... 105
Table A.1. Choline chloride-based cutting solution recipe. .................................................. 248
Table A.2. NMDG-based cutting solution recipe. ................................................................. 248
Table A.3. Modified HEPES holding aCSF recipe. .............................................................. 249
Table A.4 Recording aCSF recipe. ...................................................................................... 249

13""
Abbreviations ACh - Acetylcholine
aCSF – Artificial Cerebrospinal Fluid
ADP – Adenosine Tiphosphate
AMC – Age-Matched Control
AMPAr - 2-amino-3-(5-methyl-3-oxo-1, 2- oxazol-4-yl) propanoic acid receptor
AP-5 - D-(-)-2-Amino-5-phosphonopentanoic acid
Arb. Unit – Arbitrary Unit
ATP – Adenosine Triphosphate
Av. - Average
Ca2+ - Calcium Ion
CaCl2 – Calcium Chloride
CBX - Carbenoxolone
CCh – Carbachol
CChγO – CCh-induced Gamma Oscillations
CHPG - (RS)-2-Chloro-5-hydroxyphenylglycine
Cl- - Chloride Ion
CNQX - 6-Cyano-7-nitroquinoxaline-2,3-dione
D - Day
DG – Dentate Gyrus
DHPG- (S)-3,5-Dihydroxyphenylglycine
e.g. – Exempli Gratia
EC – Entorhinal Cortex
EEG- Electroencephalogram
EPSCs – Excitatory Postsynaptic Currents
eEPSCs – Evoked excitatory Postsynaptic Currents
FFT – Fast Fourier Transform
FIR – Finite Impulse Response
GABA - Gamma (γ)-Aminobutyric Acid
GABA-Ar - Gamma (γ)-Aminobutyric Acid - A receptor
GABA-Br Gamma (γ)-Aminobutyric Acid – B receptor
GBZ - Gabazine
h - Hour

14""
HCO3- - Bicarbonate Ion
HEPES - 4-(2-Hydroxyethyl)piperazine-1-ethanesulfonic acid
i.e. – Id est
ICAN - Calcium-sensitive Non-selective Cation Current
IEI –Interevent Interval
IEM 1460 - N, N, H,-Trimethyl-5-[(tricyclo [3.3.1.13, 7] dec-1-ylmethyl) amino]-1-
entanaminiumbromide hydrobromide
iGluR – Ionotropic Glutamate Receptor
ILAE – International League Against Epilepsy
i/m - Intramuscular
INa(p) – Persistent Sodium Channel
ING - Interneuron Network Gamma
IP3 – Inositol 1,4,5-trisphosphate
IPSCs – Inhibitory Postsynaptic Currents
IPSPs- Inhibitory Postsynaptic Potentials
IR-DIC – Infrared light/Differential Interference Contrast
K+ - Potassium Ion
KA – Kainic Acid
KAr – Kainate Receptor
KCl – Potassium Chloride
Kg - Kilogram
KγO – KA-induced Gamma Oscillations
KO – Knock Out
LFP – Local Field Potential
Li – Lithium
LiCl – Lithium Chloride
mAChRs – Muscarinic Acetylcholine Receptors
MEG - Magnetoencephalography
Mg2+ - Magnesium Ion
mGluR – Metabotropic Glutamate Receptor
MgSO4 – Magnesium Sulphate
mEC – Medial Entorhinal Cortex
mEPSPs – Miniature Excitatory Postsynaptic Potentials
MEST - Maximal Electroshock Seizure Threshold

15""
Min - Minute
mIPSC - Miniature Inhibitory Postsynaptic Current
ml - Millilitre
mM - Millimolar
µM - Micromolar
MΩ - Megaohm 12
Ms - Millisecond
NA - Noradrenaline
Na+ - Sodium Ion
NaCl – Sodium Chloride
NaH2PO4 – Sodium Phosphate
NaHCO3 – Sodium Hydrogen Carbonate
nM - Nanomolar
NMDAr - N-Methyl-D-aspartic acid receptor
NMDG - N-methyl d-glucamine chloride
P – Postnatal Day
PING – Pyramidal Interneuron Network Gamma
PLV – Phase-Locking Value
PPS – Proportionate Phase Synchrony
PSBB – Post-seizure Behavioural Battery
PSE 24h – 24 Hours Post Status Epilepticus
PSE 7d – 7 Days Post Status Epilepticus
PSE 6wks – 6 weeks Post Status Epilepticus
PSE 90d – 90 Days Post Status Epilepticus PSd – Phase-Locking Value for KA- or CCh- induced gamma oscillations
PSs – Phase-Locking Value for Spontaneous gamma oscillations
PTX - Picrotoxin
PTZ - Pentylenetetrazol
PV - Parvalbumin
RISE – Reduced Intensity Status Epilepticus
RMS – Root Mean Square
s – Second
s. - Stratum
s/c - Subcutaneous

16""
SE – Status Epilepticus
S.E.M. – Standard Error of the Mean
SγO – Spontaneous Gamma Oscillations
sIPSC – Spontaneous Inhibitory Postsynaptic Current
sPSC – Spontaneous Postsynaptic Currents
SRS – Spontaneous Recurrent Seizures
SWO – Slow Wave Oscillations
TTX - Tetrodotoxin
TLE – Temporal Lobe Epilepsy
uIPSC – Unitary Inhibitory Postsynaptic Current
VFO – Very Fast Oscillations
vs. - Versus
wks - Weeks

17""
1. Chapter 1 Introduction ""

18""
1.1. Neuronal network oscillations
As early as 1875, the first electrical signals were recorded from the exposed brains of
animals by Richard Canton, a Liverpool physician. However, it was not until 50 years
later that such signals were recorded from a human brain. An Austrian psychiatrist,
Hans Berger, was one of the pioneers in electroencephalography (EEG), having
invented the EEG device, which allowed recording rhythmic activity of the brain.
Since then much effort has been put into exploring various brain rhythms, their
functions and mechanisms, roles in physiological and pathological states, as well as
ways of altering rhythmic activity, using pharmacotherapy, deep brain stimulation and
transcranial magnetic stimulation.
In the past 20 years, the field of neuronal network oscillations has become very
popular, it has been able to attract neuroscientists from different areas by providing
the opportunity to study brain function at multiple organisational levels: from
understanding cellular and synaptic mechanisms underlying neuronal network
behaviour, through interactions between networks at regional and interregional
levels, to how network oscillations correlate with higher brain functions and
pathological conditions. The development of in vitro electrophysiology has broadened
the horizons of neuroscientific research. Using a combination of in vivo and in vitro
approaches provides an opportunity to bring insights from different techniques
together, working towards a larger picture of neuronal network function.
1.1.1. What are brain rhythms?
Brain rhythms represent extracellular voltage changes, which originate from the
summation of electrical activity of neuronal assemblies, and are shaped by the
geometry and alignment of those neurons (Buzsaki, 2006). The complexity of
human/animal behaviour and cognitive functions requires neuronal networks in
different areas of the brain to work together, which in turn requires populations of
neurons engaged in a task to fire synchronously and repeatedly. This neuronal
network activity is synchronized into particular rhythms. These rhythms can be
detected and measured in vivo e.g. through EEG and magnetoencephalography
(MEG), and in vitro e.g. local field potential recording (LFP). The mechanisms

19""
underlying the generation of specific brain rhythms and the role(s) they play in the
brain remain key questions in neuroscience.
Neuronal network oscillations are known to occur at characteristic frequencies
ranging from 0.05 to ~600 Hz (Buzsaki and Draguhn, 2004). The EEG classification
of brain rhythms divides them into frequency bands:
delta (1 – 4 Hz)
theta (4 – 7 Hz)
alpha (8 – 13 Hz)
beta (13 – 30 Hz)
gamma (30 – 100 Hz)
Frequencies beyond this classification such as slow-wave (<1 Hz) oscillations (SWO)
and very fast (>100 Hz) oscillations (VFOs) have also been observed (Steriade et al.,
1993c,d; Curio et al., 1994). Each of the frequency bands correlates with specific
brain functions, and various physiological and pathological states. For instance, delta
rhythm can be observed during the deepest stages of sleep, whereas alpha wave
represents a wakeful relaxation with closed eyes (Kandel et al., 2000). Faster
rhythms are thought to be involved in the process of memory formation and
cognition, feature binding and, more globally, in a large-scale integration (Thallon-
Baudry and Bertrand, 1999; Singer, 1999). Furthermore, some neurological disorders
like epilepsy, Alzheimer’s disease, schizophrenia and Parkinson’s disease, are
associated with abnormalities in synchronised brain activity (for review see Herrmann
and Demiralp, 2005; Ulhaas and Singer, 2006). There is clear evidence that neuronal
network oscillations play one of the key roles in the operation of the brain; exploring
these network oscillations will lead to a better understanding of mechanisms
underlying higher brain functions. Below, I will briefly review neuronal network
oscillations of high (gamma) and very low (SWO) frequencies in terms of their
mechanisms and biological functions.
1.1.2. Gamma rhythm (30 – 100 Hz)
Probably the most extensively studied rhythm in the brain in vitro is the gamma
rhythm. It is commonly observed in various regions of the brain during wakefulness

20""
and is most often associated with cognitive function (for reviews see Singer and
Gray, 1995; Engel et al., 2001). In terms of in vitro gamma rhythmogenesis, the most
explored oscillations have been those occurring in the hippocampus. This is due to
its accessibility, its clearly defined laminar organisation and its densely packed
pyramidal cells, which give rise to large-amplitude oscillations. In vivo, hippocampal
gamma oscillations are known to arise during specific behavioural states like
exploration, when they usually co-occur with theta oscillations; therefore, there is an
opportunity to study the relationship between oscillations and behaviour (Bragin et
al., 1995). Due to a large amount of work done on gamma activity in hippocampus,
many underlying mechanisms have been already uncovered.
From the results of in vivo studies, two independent generators of gamma oscillations
in the hippocampus have been identified, the first one being in the dentate gyrus
(DG) receiving inputs from the entorhinal cortex (EC) and another one being in CA3
region propagating to CA1 (Csicsvari et al., 2003). Over the years, ways of artificially
inducing gamma oscillations in brain slices have been discovered: kainic acid (KA),
carbachol (CCh) or (RS)-2-Chloro-5-hydroxyphenylglycine (CHPG, metabotropic
glutamate receptor agonist), hypertonic potassium (K+) solution, as well as by tetanic
stimulation (Whittington et al., 1995; Fisahn et al., 1998; Fisahn et al., 2004; Hajos
and Paulsen, 2009). Overall, the general mechanism has been established and it is
known that gamma oscillations arise from the interaction of the inhibitory
interneuronal network and pyramidal cells. One of the crucial conditions for gamma
rhythm generation in hippocampus is the presence of γ-Aminobutyric acid (GABA)-
mediated inhibition by interneurons. Two models of gamma oscillations include
interneuron network gamma (ING) and pyramidal-interneuron network gamma
(PING) and have been reviewed by Whittington et al. (2000).
1.1.2.1. ING model
Gamma oscillations can be generated by a group of inhibitory interneurons (Fig.
1.1A). The prerequisites for the emergence of gamma oscillations are: 1.
interconnected inhibitory interneurons, 2. GABA-A receptor (GABA-Ar) mediated
inhibitory postsynaptic potentials (IPSPs) with an exponential decay time constant
and 3. an excitatory drive to elicit spiking in the interneurons (Wang and Rinzel,

21""
"Figure 1.1. Schematic representation of ING and PING models of gamma oscillations. ING (A), PING (B). Adapted from Mann et al., 2005a.
1992; Whittington et al., 1995; Traub et al., 1996a). When the interneurons receive
either a tonic or stochastic excitatory input, they start firing spikes. The synchrony
comes about when a group of interneurons starts discharging together and thus
generate IPSPs in the coupled interneurons, which respond with a rebound spiking
after the decay of GABA-Ar-mediated hyperpolarisation, and the process is repeated
(Buzsaki and Wang, 2012). Single interneurons spike with the frequency of
approximately 40 Hz (Wang and Buzsaki, 1996). Such mutual inhibition takes all the
interneurons to zero-phase synchrony, when the activity is synchronous without any
temporal delays. The frequency of oscillations essentially depends on the kinetics of
IPSPs. Experiments with increased decay time constant have demonstrated a
decrease in the frequency of oscillations whilst manipulations, which speed up the
decay time constant, have the opposite effect (Traub et al., 1996a).
1.1.2.2. PING model
Compared to a simple ING model, a more complex PING model (Fig. 1.1B), which
adds to the system pyramidal cells reciprocally connected to the interneurons,
demonstrates how the whole network can be phase-locked to gamma frequency. It is
believed that with certain strength of the fast excitation coupled with delayed
inhibition, activity in the two populations of cells can alternate in a cyclic manner
(Buzsaki and Wang, 2012). In the PING model, three different types of interneurons
are distinguished: targeting either other interneurons, perisomatic regions of
pyramidal cells, or pyramidal cell dendrites (Fig. 1.2) (Buhl et al., 1994; Halasy et al.,
1996; Acsady et al., 1996; Cobb et al., 1997). After numerous studies on the possible
mechanism of PING model, it was identified that of all the different types of

22""
Figure 1.2. Schematic diagram of interconnected pyramidal cell and different types of interneurons in hippocampal CA3 region (adapted from Hajos et al., 2004). PC, pyramidal cell; BC, basket cell, IS, interneuron-selective cell; OLM, oriens-lacunosum-moleculare cell; RC, radiatum cell.
interneurons, the fast spiking parvalbumin-containing (PV) basket cells projecting to
the pyramidal cell soma have the putative role of generating gamma rhythm (Lytton
and Sejnowski, 1991; Penttonen et al., 1998; Csicsvari et al., 2003; Gloveli et al.,
2005; Mann et al., 2005b). The basket cells impose rhythmic IPSPs on the pyramidal
cells, thus making their firing become binned into narrow time windows (Penttonen et
al., 1998; Gloveli et al., 2005, Hasenstaub et al., 2005, Mann et al., 2005a). Among
different types of interneurons, basket cells stand out because of their low spike
threshold, ability to fire quickly, and their resonance in gamma frequency band in
response to stochastic excitation (Gulyas et al., 1993; Buzsaki et al., 1983;
McCormick et al., 1985; Pike et al., 2000). The role of other interneuron types in
generating gamma oscillations is less understood. Miles and colleagues (1996)
compared the roles of somatic and dendritic targeting interneurons and concluded
that while somatic interneurons control pyramidal cell output, the dendritic
interneurons regulate the efficacy of dendritic inputs.
"Receiving the excitatory drive from pyramidal cells, individual interneurons become
synchronised. With the coordinated involvement of interneuron-selective interneurons
and basket cell coupling with each other via synapses and gap junctions, the
interneuronal network activity becomes synchronised with gamma frequency (Cobb

23""
et al., 1997; Fukuda and Kosaka, 2000; Meyer et al., 2002). Electrical coupling
between the interneurons does not seem to be a prerequisite for the generation of
gamma oscillations. However, knocking out (KO) gap junction protein connexin 36,
which is expressed between interneurons (Galarreta and Hestrin, 1999, 2002),
greatly reduced the amplitude of oscillations (Hormuzdi et al., 2001; Buhl et al.,
2003). Similarly, pharmacological blockade of gap junctions reduced oscillatory
power as well (Traub et al., 2000, 2001a)."
Interestingly, the intracellular recordings from the basket and pyramidal cells during
gamma oscillations revealed that pyramidal cells phase-locked to the oscillation fired
at a very low frequency (approximately 3 Hz), while the phase-coupled interneurons
fire with a delay at higher frequencies (Fisahn et al., 1998; Hajos et al., 2004).
Interneurons terminating in the perisomatic region exhibited firing at high frequencies
and were strongly phase-coupled, whereas interneurons projecting to the dendrites
displayed firing at lower frequency and weaker phase coupling (Hajos et al., 2004).
To investigate whether the pyramidal cells firing at low frequencies are able to
support gamma oscillations, Mann and colleagues (2005a) designed a network
model of 400 pyramidal cell and 40 interneurons. They concluded that with the
phasic excitation of interneurons provided by pyramidal cells, the recurrent feedback
inhibition appeared to be a plausible mechanism for network activity synchronisation
and that pyramidal cells were not required to fire on every cycle of an oscillation.
1.1.2.3. Gamma oscillations in brain physiology
The role of gamma oscillations in the brain is still being uncovered, however, they are
most often observed during attentive states such as focused wakefulness, sensory
perception, object recognition, and language perception (Bouyer et al., 1981; Sheer
et al., 1989; Murthy and Fetz, 1992; Pfurtscheller and Neuper, 1992). Gamma
frequency oscillations have been implicated in fast coordination of neurons required
in such hippocampal processes as input selection, arranging cells into functional
groups, memory storage and retrieval (Colgin and Moser, 2010). These operations
require activation of certain neuronal populations, as well as selective elimination of
unnecessary inputs. Hence, hippocampal pyramidal cells are known not to fire on
every cycle of the gamma rhythm (Senior et al., 2008; Colgin et al., 2009; de Almeida
et al., 2009). It is believed that gamma is involved in temporal encoding and sensory

24""
binding of features, as well as learning and memory processes (Hopfield et al., 1995;
Buzsaki and Chrobak, 1995; Lisman and Idiart, 1995; Lisman, 1999). On a global
scale, gamma frequency oscillations are thought to indicate integration mechanisms
in the brain (Herrmann et al., 2004). It is clear that gamma oscillations play a
substantial role in cognitive brain functions, however this area requires further
exploration.
1.1.2.4. Gamma oscillations in brain pathology
Apart from the physiological role of gamma oscillations, gamma rhythm alterations
are also observed during various pathological states. For example, synchronous
activity of neuronal networks is a key player in epilepsy, as it has long been thought
that hypersynchronisation was the main feature underlying this condition (Penfield
and Jasper, 1954). In this context, high frequency oscillations in the gamma range
have been observed both before and at the onset of ictal events (Fisher et al., 1992;
Allen et al., 1992). A special place in epilepsy disorder is taken by VFOs observed
both in vivo and in vitro in humans and animals at the onset of seizures and have
been proposed to play a role of biomarkers of epilepsy (Fisher et al., 1992; Bragin et
al., 1999a,b; Traub et al., 2001b; Grenier et al., 2003; Worrell et al., 2008). Several
studies explored changes in synchrony associated with epilepsy and showed
enhanced local phase synchrony (van Putten, 2003; Garcia Dominguez et al., 2005).
In contrast to hypersynchrony in epilepsy, schizophrenia is one of the disorders
closely associated with the impairment of neuronal network beta and gamma
frequency range oscillation and their synchronisation over long distances, leading to
disturbed cognitive functions (Kwon et al., 1999; Krishnan et al., 2005; Ulhaas et al.,
2006). Abnormalities of GABA-ergic transmission, as well as NMDAr dysfunction
have been proposed to play a role in the mechanism of disrupted synchronisation in
schizophrenia (Lewis et al., 2005; Moghaddam et al., 2003). Herrmann and Demiralp
(2005), as well as Ulhaas and Singer (2006), have published extensive reviews of
abnormal gamma rhythms in the context of neuropsychiatric disorders. Several
studies also suggested that impaired long-range synchronisation was implicated in
Alzheimer’s disease, and this, together with neuronal loss, was leading to cognitive
dysfunctions (Babiloni et al., 2004; Koenig et al., 2005; Stam et al., 2006). Gamma
rhythm activity has also been shown to play a role in such disorders as autism (Brock
et al., 2002) and attention deficit hyperactivity disorder (Yordanova et al., 2001).

25""
1.1.3. Slow rhythm (0.1 – 0.5 Hz)
Studies in behaving animals have investigated oscillatory neuronal network activity in
the two fundamental brain states: sleep and arousal. The state of arousal in animals
is represented by attentiveness and alertness and appears on EEG as low-voltage
high-frequency activity (Moruzzi and Magoun, 1949). Quiescent states, on the other
hand, are observed during sleep or anaesthesia and are accompanied by high-
voltage low-frequency oscillatory activity. During deep sleep and anaesthesia, the
cortex does not simply remain in an idle state, but rather engages in a characteristic
pattern of activity consisting of periods of silence (DOWN state) and intensive cell
firing (UP state) alternating at 0.1–0.5 Hz. In humans the frequency range may be
slightly broader (Achermann and Borbely, 1997; Iber et al., 2007). Steriade (2006)
suggested that SWO in vivo played a role in grouping other rhythms creating
complex, nested waveforms. Human studies demonstrated that UP states of SWO
were accompanied by elevated activity in almost all frequency bands (Csercsa et al.,
2010). Cortical activity of such low frequency has been reported both in vivo in
anaesthesised and sleeping animals and in vitro in cortical slices of various species
(Steriade et al., 1993a-d; Timofeev et al., 1996; Sanchez-Vives and McCormick,
2000; Shu et al., 2003; Dickson et al., 2003; Cunningham et al., 2006; Sheroziya et
al., 2009). Due to the occurrence of SWO in various cortical regions (in neo- and
allocortex), different functional properties have been assigned to observed cortical
activity (from implications in development and metabolism to information processing
and memory consolidation). Nevertheless, SWO show striking similarities regardless
of the brain area, and it is commonly agreed that the more recently described SWO
recorded in vitro resemble those recorded by Steriade et al. (1993c,d) during sleep
and anaesthesia.
SWO are generated within the cortex. Experiments with lesioned thalamocortical
connections revealed that SWO persisted in the cortex in the absence of reciprocal
connections and does not appear in the thalamus of decorticated animals (Timofeev
and Steriade, 1996). Different views exist regarding the layer-specific origin of this
activity. Several reports from in vitro and in vivo studies suggest that activity is
generated in the deep cortical layers (in particular layer V of the neocortex),
spreading to layer VI and later to the superficial layers (Sanchez-Vives and
McCormick, 2000, Chauvette et al., 2010). On the other hand, the current-source

26""
density analysis of human recordings from prefrontal and parietal cortices revealed a
large sink in supragranular layers, indicating superficial origin of UP state generation
(Csercsa et al., 2010). Furthermore, studies in the entorhinal cortex demonstrate that
SWO activity is generated by interaction of superficial neurons and interneurons
(Dickson et al., 2003; Gnatkovsky et al., 2007). The discrepancies, however, could
arise from the differences in species, the cytoarchitectonics of recorded cortical
areas, as well as recording conditions.
Nir and colleagues (2011) investigated whether the human cortical SWO activity was
a global or localised phenomenon. Their results demonstrated a localised nature of
this activity, favouring the theory of sleep being controlled by local circuits (Krueger et
al., 2008). Nir et al. (2011) also showed that slow waves could propagate along
different anatomic pathways. At the cellular level, the following questions arise: what
causes peristent firing during UP states of SWO? Does it occur due to intinsic
membrane properties or barrages of synaptic activity? Some experimental results
demonstrated that intracellular injection of hyperpolarising or depolarising currents
did not alter the parameters of SWO, indicating that network mechanisms may
underly this rhythm (Sanchez-Vives and McCormick, 2000).
1.1.3.1. Mechanism of SWO generation
Numerous studies dedicated to unraveling how SWO activity is generated yielded
two plausible cellular mechanisms. UP states are initiated by spontaneous firing of
layer V neurons (in conditions of increased excitability) and sustained through
recurrent excitatory connections (Sanchez-Vives and McCormick, 2000; Compte et
al., 2003). Being the largest cortical cells, layer V neurons have the largest number of
inputs, which increases the probability of UP state generation. Another proposed
mechanism involves occasional summation of miniature excitatory postsynaptic
potentials (mEPSPs), which activates persistent sodium (Na+) current (INa(p)) leading
to the depolarisation of cortical pyramidal cells, activation of calcium (Ca2+)-sensitive
non-selective cation current (ICAN) (Sheroziya et al., 2009) and subsequent spike
generation. This process triggers an UP state of prolonged bursts maintained by
INa(p), ICAN and synaptic activity (Timofeev et al., 2000; Bazhenov et al., 2002;
Sheroziya et al., 2009; Chauvette et al., 2010). INa(p) is a small but long-lasting Na+
current, which is activated by subthreshold voltages and persists for hundreds of
27""
milliseconds (ms), thus enhancing excitability of other depolarising currents and
maintaining repetitive firing (Stafstrom et al., 1985; Beck and Yaari, 2008).
DOWN states are known to be refractory periods of hyperpolarisation occurring due
to Na+- and Ca2+-activated K+ currents and synaptic fatigue (possibly due to depletion
of extracellular Ca2+ after a prolonged UP state) (Steriade et al., 1993d; Sanchez-
Vives and McCormick, 2000; Bazhenov et al., 2002; Compte et al., 2003; Sheroziya
et al., 2009). Cunningham and colleagues (2006) suggested that the initiation of
DOWN states occurred due to a K+ current activated by metabolic demands
[ATP]/[ADP] (adenosine triphosphase/adenosine diphosphate) during UP states.
Overall, activation of K+ currents leads to cell hyperpolarisation. It has been reported
that the switch to silent (DOWN) state was highly synchronous, which implied
involvement of widespread inhibition mediated by interneurons (Volgushev et al.,
2006). A later study demonstrated that almost half of the fast-spiking cell population
started firing at a higher rate towards the end of UP states (Puig et al., 2008).
1.1.3.2. Pharmacology of SWO
In a combined in vitro and in vivo study, Sanchez-Vives and McCormick (2000)
suggested that UP states of SWO were generated by both excitatory and inhibitory
postsynaptic potentials. A detailed pharmacological analysis of SWO helped tease
apart various components of synaptic transmission involved in their generation and
maintenance. Several studies suggested that spontaneous SWO in the cortex
depended heavily on N-Methyl-D-aspartic acid receptors (NMDAr), being blocked by
NMDAr antagonist AP-5 (Sanchez-Vives and McCormick, 2000; Shu et al., 2003;
Allene et al., 2008; Sheroziya et al., 2009). Conversely, Cunningham and colleagues
(2006) demonstrated that neither NMDAr nor 2-Amino-3-(5-methyl-3-oxo-1,2-oxazol-
4-yl) propanoic acid receptors (AMPAr) were involved in SWO. CNQX, a non-
selective AMPAr/KAr antagonist, reliably abolished SWO activity in most studies,
indicating a crucial role of KAr-mediated excitation (Sanchez-Vives and McCormick,
2000; Shu et al., 2003; Cunningham et al., 2006; Sheroziya et al., 2009).
Cunningham and colleagues (2006) further investigated KAr role by applying
UBP302 (a selective GluK1 antagonist), which readily blocked spontaneous SWO.

28""
Together with excitatory components, the role of GABA-ergic inhibition was
investigated in several studies. It is generally accepted that GABA-Ar blockade
enhances SWO activity before transforming it into interictal (epileptiform) discharges
(Sanchez-Vives and McCormick, 2000; Shu et al., 2003; Allene et al., 2008;
Sheroziya et al., 2009). Similar results were demonstrated with a decrease in
magnesium (Mg2+) concentration in artificial cerebro-spinal fluid (aCSF) causing a
gradual rise in the frequency of rhythmic activity and a rapid switch to prolonged
epileptiform bursts (Sanchez-Vives and McCormick, et al., 2000). Recently, Allene et
al. (2008) reported two distinct types of SWO occuring at different stages of
development (cortical early network oscillations and cortical giant depolarising
potentials). Interestingly, while the early network oscillations were considered to be
glutamate-driven (abolished by NMDAr blockade, but enhanced by GABA-Ar
blockade), the giant depolarising potentials were less sensistive to NMDAr block and
were abolished by GABA-Ar antagonists (Allene et al., 2008).
Resemblance of SWO in vitro with those observed during sleep and anaesthesia
encouraged researchers to explore potential cholinergic and noradrenergic
modulation of this activity. It is known that these two systems are at least partially
involved in cortical arousal, since slow rhythmic patterns of activity can be disrupted
by brainstem stimulation of cholinergic and noradrenergic nuclei (Moruzzi and
Magoun 1949; Steriade et al. 1993a; Steriade and Contreras 1995). Several studies
demonstrated that the same results could be reproduced in vitro by application of
either CCh or noradrenaline (NA) (Shu et al., 2003; Favero et al., 2012). These
results indicated that cortical SWO recorded in brain slices related in some way to
slow wave sleep oscillations, and possibly represented the same phenomenon at the
mechanistic level.
Together with obvious similarities between various reported slow oscillations, there
are certain discrepancies in their properties. Hence, it is not clear whether the
disparities arise from exploring different brain regions in different species under
different conditions or because investigators are actually observing different types of
cortical activity.

29""
1.1.3.3. SWO in brain physiology
Several research groups study rather similar patterns of SWO, but diverge in their
views on the nature and the functional significance of this activity. For instance, the
laboratories of Yehezkel Ben-Ari, Rosa Cossart and others suggest a developmental
role of SWO during the maturation of the cortex. Furthermore, Sheroziya et al. (2009)
also suggest an important role played by bursting neurons (in the EC) in cortical and
hippocampal development. Although Allene and colleagues (2008) draw a parallel
between cENO and in vivo rhythms observed during sleep, they do not make any
definite conclusions. Steriade, Timofeev, McCormick and others, on the other hand,
focus on the SWO occurring during sleep and anaesthesia and suggest implications
in information processing and memory consolidation (Sanchez-Vives and
McCormick, 2000; Tononi and Cirelli, 2006; Stickgold and Walker, 2007). These
sleep-related SWO may exhibit an age-dependent pattern of their own. For example,
Massimini and colleagues (2004) demonstrated that in humans this activity originated
mostly from frontal cortical areas. Supporting these findings, Kurth et al. (2010)
showed how the SWO propagation changed with age, starting from occipital regions
in toddlers and gradually switching from posterior to anterior cortical brain regions
until late adolescence. These results suggested changing levels of cortical excitability
throughout development, which could potentially explain recording spontaneous
SWO in the EC only in young animals (Sheroziya et al., 2009) or in adult animals
under the conditions of increased excitability (Cunningham et al., 2006).
1.1.3.4. SWO in brain pathology
A potential link between SWO and epilepsy has been investigated in several studies
in humans and animals. Vanhatalo and colleagues (2004) used EEG recording to
detect slow activity (0.02 – 0.2 Hz) in the brains of epileptic patients during sleep.
The study demonstrated that interictal activity was synchronised with SWO in cortical
regions, preferentially appearing on the negative peak of SWO. The authors
suggested that these results might help develop new diagnostic and therapeutic
approaches to epilepsy. In animals, for instance, Steriade and Contreras (1995)
showed that normal sleep-like synchronous activity in the cortex could develop into
ictal activity, represented by typical 2 – 4 Hz spike-and-wave complexes. This type of
pathological activity is normally observed on the EEG during absence seizures.
Assuming SWO are a developmental phenomenon, it is possible to explore this

30""
rhythmic activity in epileptic animals to determine any developmental changes
occurring in pathological conditions.
1.2. Kainate receptors and oscillogenesis
Glutamate is a major excitatory neurotransmitter in the mammalian brain.
Metabotropic and ionotropic glutamate receptors (mGluR and iGluR) are two classes
of receptors mediating excitatory transmission through G-proteins and ion channels,
respectively. KAr, together with AMPAr and NMDAr, constitute a class of ligand-
gated iGluRs, which are mostly permeable to Na+, K+ and Ca2+. KAr are homo- and
heteromeric tetramers, comprised of the combinations of 5 receptor subunits GluK1-
5, formerly known as GluR5-7 and KA1-2 (Bettler and Mulle, 1995). KAr have been
shown to give rise to excitatory postsynaptic currents (EPSCs) with kinetics much
slower compared to AMPAr (Castillo et al., 1997; Vignes and Collingridge, 1997).
While AMPAr and NMDAr, located postsynaptically, mostly mediate basal excitatory
synaptic transmission, KAr produce a variety of regulatory effects in neuronal
communication. This type of receptors is found both pre- and postsynaptically.
Postsynaptic KAr, due to their slow kinetics, have a role of regulating neuronal
excitability and information processing by integrating excitatory synaptic inputs
(Frerking and Nicoll, 2000; Frerking and Oligher-Frerking, 2002, Goldin et al., 2007,
Pinheiro et al., 2013). Presynaptic KAr, on the other hand, bidirectionally regulate
neurotransmitter release at both inhibitory and excitatory synapses (Schmitz et al.,
2000; Lauri et al., 2001; Rodriguez-Moreno et al., 1998; Frerking et al., 1999; Cossart
et al., 2001). For extensive updated reviews on KAr in the brain see Perrais et al.
(2010), Contractor et al. (2011), Lerma and Marques (2013).
1.2.1. KAr in the hippocampus
Despite the abundance of KAr across diverse brain regions, possibly the most
studied area remains the hippocampus (for review see Carta et al., 2014). Early
studies demonstrated high densities of KAr, with all 5 subunit types expressed in rat
hippocampus (Monaghan and Cotman, 1982; Wisden and Seeburg, 1993). Studies
reported expression of GluK1 KAr subunits on the hippocampal interneurons, GluK2
were found in pyramidal cell layers and interneurons, GluK3 were expressed mostly
in the DG, GluK4 on pyramidal cells, while GluK5 were widely found throughout the
31""
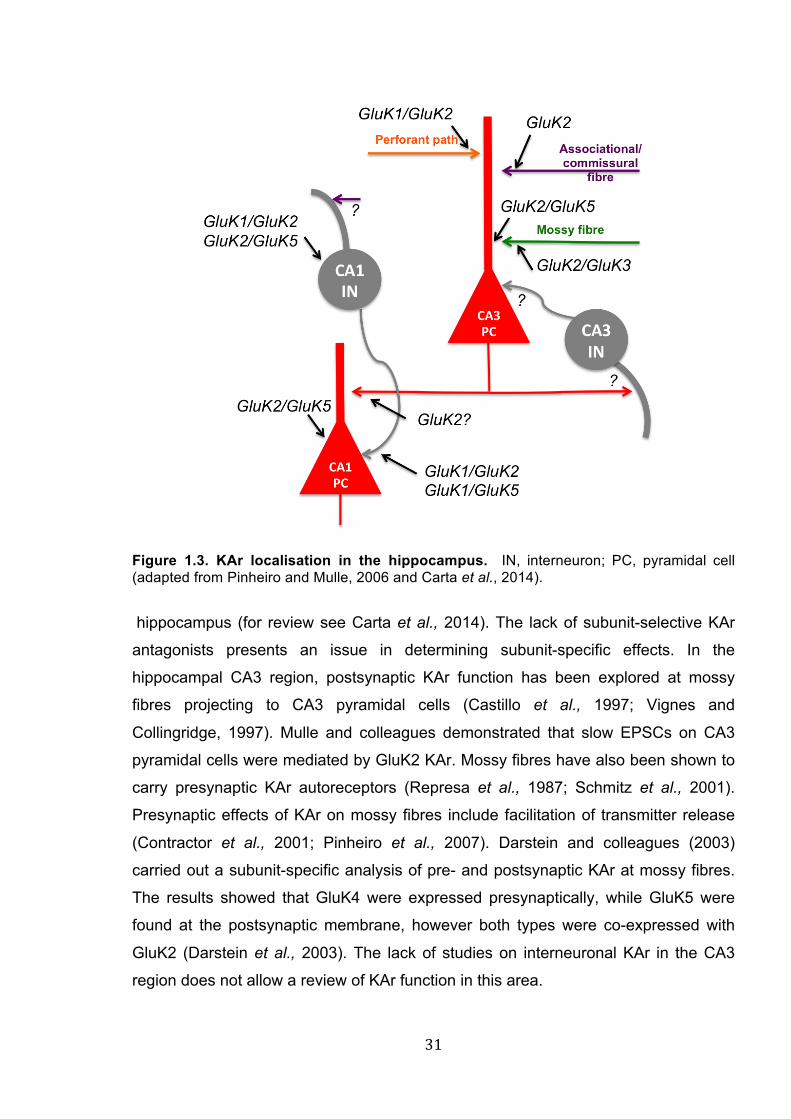
Figure 1.3. KAr localisation in the hippocampus. IN, interneuron; PC, pyramidal cell (adapted from Pinheiro and Mulle, 2006 and Carta et al., 2014).
hippocampus (for review see Carta et al., 2014). The lack of subunit-selective KAr
antagonists presents an issue in determining subunit-specific effects. In the
hippocampal CA3 region, postsynaptic KAr function has been explored at mossy
fibres projecting to CA3 pyramidal cells (Castillo et al., 1997; Vignes and
Collingridge, 1997). Mulle and colleagues demonstrated that slow EPSCs on CA3
pyramidal cells were mediated by GluK2 KAr. Mossy fibres have also been shown to
carry presynaptic KAr autoreceptors (Represa et al., 1987; Schmitz et al., 2001).
Presynaptic effects of KAr on mossy fibres include facilitation of transmitter release
(Contractor et al., 2001; Pinheiro et al., 2007). Darstein and colleagues (2003)
carried out a subunit-specific analysis of pre- and postsynaptic KAr at mossy fibres.
The results showed that GluK4 were expressed presynaptically, while GluK5 were
found at the postsynaptic membrane, however both types were co-expressed with
GluK2 (Darstein et al., 2003). The lack of studies on interneuronal KAr in the CA3
region does not allow a review of KAr function in this area.

32""
Together with the CA3 region, KAr localisation and function were explored in CA1.
Early reports demonstrated presynaptic inhibition of glutamate release at Schaffer
collateral – CA1 pyramidal cell synapses (Chittajallu et al., 1996; Kamiya and Ozawa,
1998). Later studies proposed that presynaptic modulation was conducted by
metabotropic KAr (Rodriguez-Moreno and Lerma, 1998; Frerking et al., 2001).
Interestingly, postsynaptic KAr responses (KAr EPSCs) could not be evoked at CA1
pyramidal cells, indicating the absence of KAr on the postsynaptic membrane
(Cossart et al., 1998; Frerking et al., 1998; Cossart et al., 2002). Early studies
reported that micromolar (µM) concentration of KA presynaptically reduced inhibitory
transmission of CA1 interneurons onto the pyramidal cells (Fisher and Alger, 1984;
Kehl et al., 1984; Rodriguez-Moreno et al., 1997). Later studies using submicromolar
concentrations reported an increase of inhibition (Cossart et al., 2001; Jiang et al.,
2001). Rodriguez-Moreno and colleagues (1997) suggested metabotropic nature of
presynaptic KAr. Somato-dendritic KAr have been found on CA1 interneurons,
contributing to the postsynaptic excitatory inputs to interneurons. Semyanov and
Kullmann (2001), however, suggest axonal localisation of KAr on CA1 interneurons.
KAr localisation and function in the hippocampus is summarised in Fig. 1.3, adapted
from Vincent and Mulle (2009) and Carta et al. (2014).
1.2.2. KAr in the EC
KAr function in the EC has been described only by a small number of studies (West
et al., 2007; Beed et al., 2009 and Chamberlain et al., 2012). The most extensive
characterisation of pre- and postsynaptic KAr in layer III of the EC was presented by
Chamberlain and colleagues (2012). Authors reported that glutamate terminals
carried presynaptic KAr, which facilitated glutamate release and were likely to be
assembled of GluK1 and possibly GluK2 subunits, similarly to mossy fibre
autoreceptor reports. The authors did not exclude the possibility of non-GluK1 KAr
inhibiting glutamate release. It was also suggested that GluK1 KAr were unlikely to
participate in postsynaptic transmission. KAr were shown to mediate slow EPSCs in
layer III neurons via GluK2, but not GluK1-containing KAr (Beed et al., 2009;
Chamberlain et al., 2012). It was suggested that postsynaptic KAr in the EC could be
located peri- or extrasynaptically (Chamberlain et al., 2012). The role of KAr in
GABA-ergic transmission was also investigated in layer III EC. The results

33""
Figure 1.4. KAr localisation in the EC LIII IN, mEC layer III interneuron; EC LIII PC, mEC layer III pyramidal cell; GLU input, glutamatergic input (adapted from Chamberlain et al., 2012).
demonstrated that KAr stimulation increased GABA release, as a result of increased
firing of interneurons due to activation of somato-dendritic GluK1-containing KAr on
interneurons (Chamberlain et al., 2012). Same study suggested the existence of
presynaptic non-GluK1 KAr heteroreceptors inducing GABA release. The effects of
KAr in the EC are summarized in Fig. 1.4, adapted from Chamberlain et al. (2012).
1.2.3. KAr pharmacology
Uncovering the functions of KAr has always been restricted by the lack of selective
pharmacological agents that could first distinguish between AMPAr and KAr and then
between the different subunits within KAr. With the development of selective AMPAr
antagonists like GYKI 53655 (Paternain et al., 1995) and SYM 2206 (Pelletier et al.,
1996), it was possible to extract KAr-mediated currents and their slow kinetics
(Castillo et al., 1997). Pharmacological advancement resulted in the development of
subunit-selective KAr agonists and antagonists, which are summarised in Table 1.1,

34""
adapted from Jane et al. (2009). Certain KAr subunits like GluK2 or GluK5 remain
without selective antagonists, which complicates KAr characterisation.
Table 1.1. KAr ligands. Adapted from Jane et al., (2009).
Compound Activity Selectivity References
KA Agonist KAr (EC50<10µM) Watkins, 1981; Alt et al., 2004
AMPA Agonist AMPAr
(EC50>100µM)
Hansen et al., 1983;
Alt et la., 2004
ATPA Agonist GluK1 Clarke te al., 1997; Alt et al.,
2004
ACET Antagonist GluK1, GluK1/5 Dolman et al., 2007;
Perrais et al., 2009
UBP310 Antagonist GluK1, GluK3 Dolman et al., 2007;
Perrais et al., 2009
UBP304 Antagonist GluK1 Dolman et al., 2006
UBP296 Antagonist GluK1, GluK1/2,
GluK1/5
More et al., 2004;
Dolman et al., 2006
LY382884 Antagonist GluK1, GluK1/2,
GluK1/5 Alt et al., 2004
1.2.4. KAr in gamma oscillations
The fast excitation provided for interneurons by the pyramidal cells is mediated via
glutamatergic synapses. There are contradicting reports on the role of glutamatergic
AMPAr in generation and maintenance of gamma oscillations in the brain. Some
reports demonstrated that gamma oscillations were greatly decreased in power with
genetically reduced AMPA currents and were greatly diminished or blocked by AMPA
receptor antagonists (Fuchs et al., 2007; Cunningham et al., 2003, 2004; Palhalmi et
al., 2004). By contrast, Fisahn et al. (2004) reported that AMPAr antagonist did not
produce any effect, implying that AMPAr were not involved in gamma oscillations.
The discrepancies, however, could be species- (rats vs. mice), area- (hippocampus
vs. EC), AMPAr antagonism- (GYKI 53655 vs. SYM2206 vs. AMPAr KO) and gamma
type-specific (KA- vs. CCh- vs. DHPG-induced).

35""
Another mediator of glutamatergic transmission is KAr, abundantly expressed both in
the hippocampus and EC and playing an important role in neuronal communication.
KAr also appear to be crucial for neuronal network synchronisation in the gamma
frequency band. Application of nanomolar doses of KA produces persistent gamma
oscillation in brain slices, which has been observed in the cortex (Buhl et al., 1998;
Cunningham et al., 2003), hippocampus (Hajos et al., 2000; Hormuzdi et al., 2001;
Fisahn et al., 2004) and other areas. Several studies were dedicated to uncovering
the roles of each receptor subunit. Fisahn and colleagues (2004) studied the
hippocampus of GluK1 and GluK2 KO mice and discovered that in the absence of
GluK2, KA was not able to induce oscillations. It was suggested that GluK2 subunit-
containing KAr were located in the somato-dendritic region of interneurons and
pyramidal cells and, when activated by KA, increased action potential firing and
consequent GABA and glutamate release. KAr containing GluK1, on the other hand,
were located on the axons of interneurons and did not seem to be critical for
induction of oscillatory activity, but instead set the inhibition level, preventing
epileptiform activity. A slightly different picture was presented by Brown et al. (2006)
in the hippocampus and Stanger et al. (2008) in the medial EC (mEC). In those
studies, KAr GluK1 subunit function was pharmacologically tested using selective
GluK1 antagonists and it was revealed that while it might not be sufficient to generate
oscillatory activity, it played an important role in maintaining gamma oscillations in
the temporal lobe.
It was demonstrated that KAr played a crucial role not only in gamma frequency
oscillations but also in the generation of SWO in the EC. SWO are known to be
shaped by the balance between excitation and inhibition. Contributing to this balance
may be KAr, since SWO was abolished by CNQX, as well as by GluK1-selective KAr
antagonist UBP302 (Cunningham et al., 2006; Sheroziya et al., 2009). Taking into
account the work of Chamberlain and colleagues (2012), it appears that it is either
tonically active presynaptic KAr autoreceptors or somato-dendritic KAr receptors on
layer III interneurons that are involved in SWO generation. Further studies would be
required to determine the exact role of KAr in this type of rhythmic activity.

36""
1.2.5. KAr in epilepsy
Interestingly, application of KA can produce not only oscillatory, but also epileptiform
activity. For many years local and systemic administration of KA has been used as a
model of seizures/epilepsy, which resemble those observed in temporal lobe epilepsy
(TLE) patients (Ben-Ari et al., 1985). The role of KAr in epilepsy and its link to
oscillogenesis have been explored. The variety of pre- and postsynaptic effects
exerted by KAr on different cells populations in the temporal lobe introduces
possibilities of KAr involvement in regulating the excitation and inhibition balance
(Ben-Ari and Cossart, 2000). Several studies indicated a dual nature of KA effects,
depending on the subunit composition. GluK1 subunit KAr are located mostly on
interneurons and act to decrease excitability of pyramidal neurons by increasing tonic
and phasic inhibition (Khalilov et al., 2002; Fisahn et al., 2004). The GluK1 subunit
specific agonist ATPA was shown to augment the firing of interneurons and
subsequent GABA release, which inhibited pyramidal cells. Authors also reported
that ATPA was able to stop propagation of paroxysmal discharges in hippocampal
regions. There are, however, studies showing that GluK1 antagonist prevented
pilocarpine- and 6 Hz stimulation-induced seizures (Smolders et al., 2002; Barton et
al., 2003). GluK2-containing KAr, on the other hand, are found in mossy fibre
synapses and are considered to be involved in seizure generation, since KO studies
show a significant increase in seizure threshold and a reduced sensitivity to KA
(Cossart et al., 1998; Mulle et al., 1998; Fisahn et al., 2004). Telfeian and colleagues
(2000) reported that overexpression of GluK2 receptors in the hippocampus
produced limbic seizures in vivo.
A study by Behr et al. (2002) demonstrated inhibitory presynaptic KAr effects on
GABA release in DG. As the results suggest, this effect was augmented in kindled
animals, indicating elevated KAr sensitivity or expression. Epsztein et al. (2010)
discovered KAr-related differences between dentate granule cells in TLE and healthy
animals. It was reported that in TLE, unlike controls, recurrent mossy fibre synapses
relied on KA transmission, which changed the firing of dentate granule cells from
sparse to sustained rhythmic pattern. Since the DG gates information flow from EC to
hippocampus, its altered activity in TLE may disrupt normal neuronal processing and
coding (Artinian et al., 2011).

37""
Much effort has been put into exploring the effects of KAr agents in both healthy and
epileptic animals, providing new possibilities for drug discovery process. A large part
of research focused on the roles of GluK1 and GluK2 subunits. For instance, it was
demonstrated that the anticonvulsant, topiramate, was able to block both
electrophysiological and clinical GluK1-mediated effects (Gryder and Rogawski,
2003; Kaminski et al., 2004). It also reduced KA-induced seizures (Kaminski et al.,
2004). The role of GluK1 was also explored by Smolders and colleagues (2002) both
in vivo and in vitro. GluK1 antagonists were found to reduce and prevent population
spikes elicited by KA or pilocarpine in hippocampal regions. Similar anticonvulsant
effects were achieved by GluK1 antagonists in vivo, when tested against pilocarpine-
and 6 Hz stimulation-induced seizures. Both electrical stimulation- and picrotoxin-
induced epileptiform events in CA3 were reduced by GluK1 antagonists, although the
compounds were found to be ineffective against seizures caused by intravenous
injection of picrotoxin (PTX). Barton and colleagues (2003) demonstrated that one of
those GluK1 antagonists, although ineffective against generalised MES seizures,
produced a decrease in seizures induced by 6 Hz stimulation. Furthermore, studies
on soman-induced seizure model revealed that GluK1 antagonists could block
pathological rhythmic activity both in vitro and in vivo (Apland et al., 2009; Apland et
al., 2013; Figueiredo et al., 2011).
Apart from GluK1 and GluK2, the role of GluK3 was investigated by Loscher et al.
(1999). It was reported that a relatively selective GluK3 antagonist reduced seizures
elicited by kindling in rats, however, did not produce any significant effect in MES
model.
Altogether, studies in the literature demonstrate that KAr are tightly involved in an
essential brain function, such as rhythmogenesis, by exerting a variety of their
regulatory effects due to differential subunit composition and receptor localisation on
different types of neurons. Moreover, growing evidence shows a complex role of KAr
in the processes of icto- and epileptogeneses and the potential for unravelling the
mechanism of epilepsy and developing new therapeutic approaches.

38""
1.3. Aims and objectives
1. To develop a physiologically-relevant model of neuronal network activity in the
hippocampus in vitro and compare it to existing models.
2. To develop a model reflecting natural activity of neuronal networks in the EC
in vitro.
3. To develop a refined model of chronic TLE in the rat.
4. To characterise changes in the temporal lobe network function in the refined
model of epilepsy using models 1 and 2.
5. To investigate the role of excitatory neurotransmission in epileptogenesis.
6. To characterise neuronal network activity in human epileptic brain in vitro and
compare it to the refined animal model of epilepsy.

39""
2. Chapter 2 Methods ""

40""
2.1. Brain slice preparation
Combined hippocampal-EC slices were obtained from male Wistar rats (50 – 500 g).
Each rat was anaesthetized firstly with 2% isoflurane in N2/O2 and then with injection
of pentobarbital (~600 mg/kg) and ketamine (~100 mg/kg) + xylazine (10 mg/kg) until
the paw pinch, tail pinch and corneal reflexes disappeared. Then the rat was
transcardially perfused with ice-cold sucrose aCSF, which contained (mM): 180
sucrose, 2.5 KCl, 10 MgSO4, 25 NaHCO3, 1.25 NaH2PO4, 0.5 CaCl2, 10 glucose, 1 L-
ascorbic acid, 2 N-acetyl-L-cysteine, 1 taurine, 20 ethyl pyruvate, 0.04 indomethacin,
0.4 uric acid, 0.01 aminoguanidine, 0.19 ketamine and saturated with carbogen (95%
O2, 5% CO2). To obtain brain tissue free of spontaneous activity, basic sucrose
solution composition was used for perfusion and cutting (mM): 206 sucrose, 2 KCl,
1.6 MgSO4, 26 NaHCO3, 1.25 NaH2PO4, 2.25 CaCl2, 10 glucose, and 5 sodium
pyruvate. After the perfusion, the brain was rapidly and carefully extracted and
placed in the same solution. Horizontal slices 450 µm (for extracellular recording) and
400 µm (for patch-clamp recording) thick were cut in chilled (5 – 10°C) sucrose aCSF
using Vibroslice (Campden Instruments, UK). Following the cutting, slices were
placed into an interface (for extracellular recording) or submersion (for patch-clamp
recording) chambers, which were constantly bubbled with carbogen and were filled
with room-temperature sodium chloride based aCSF of the following composition
(mM): 126 NaCl, 3 KCl, 1.6 MgSO4, 26 NaHCO3, 1.25 NaH2PO4, 2 CaCl2, 10
glucose. 0.04 mM indomethacin and 0.4 mM uric acid were also added to the storage
solution. Slices for patch-clamp recording were kept in the submerged storing
chamber for one hour (h) prior to being placed in the recording chamber. Slices for
extracellular recordings were placed into the recording chamber immediately after
slicing (Scientific System Design Inc., Canada), where they were perfused with
sodium chloride aCSF for one hour at 33 – 34 °C, which was maintained by PTC03
proportional temperature controller (Scientific System Design Inc., Canada).

41""
2.2. Reduced intensity model of chronic epilepsy
2.2.1. Model protocol
The current epilepsy model is based on a modified version of the lithium(Li)/low-dose
pilocarpine model originally described in rats by Glien et al. (2001). The described
model involved a pre-dose of lithium chloride (LiCl) 24 h prior to repeated (30
minutes) low-doses of pilocarpine. The model employs a similar protocol but
combined this with administration of the sedative and muscle relaxant drug, xylazine,
during the acute seizure phase and rapid termination of the acute seizure phase with
an anticonvulsant/antiepileptic cocktail.
Rats (male Wistar, 45–80g) were housed in temperature and humidity controlled
conditions with a 12/12 light/dark cycle and were allowed to feed and drink ad libitum.
On day 1, rats were treated with 127 mg/kg LiCl via subcutaneous (s/c) injection.
Twenty-four hours following the LiCl injection, α-methyl scopolamine 1mg/kg (s/c)
was administered to reduce peripheral effects of muscarinic cholinergic (mAChr)
receptor activation. Thirty minutes later, a low dose of pilocarpine (15–25 mg/kg, s/c)
was given. Animals were then closely observed for signs of seizure activity, which
was ranked using Racine’s scale (Table 2.1, Racine, 1972). Animals failing to reach
Racine Stage 4 were dosed again with pilocarpine, up to a maximum of 3 doses
given at 30–45 minute intervals. When a seizure severity rating of >3 on Racine’s
scale was reached (bilateral forelimb clonus with rearing), xylazine (2.5 mg/kg
intramuscularly – i/m) was immediately administered. To reduce seizure severity, rats
were allowed to remain in xylazine-modified status epilepticus (SE) for no more than
one hour, at which point seizure activity was arrested using a ‘stop’ solution, given
s/c at 1 ml/Kg, and containing MK-801 (0.1 mg/kg; R&D systems, UK), diazepam (2.5
mg/kg; ethanolic solution; Bayer, De) and MPEP (20 mg/kg Abcam Biochemicals,
UK). SE ceased within 30 min and animals were then closely monitored during
subsequent recovery. During the recovery period, rats were kept on a heat pad to
maintain body temperate and visually monitored until ambulatory and able to
consume water and moistened, powdered food. Where necessary, 0.9% w/v saline
was given s/c to rehydrate animals. In most cases recovery was near complete at 4 h
and all rats were fully recovered within 12 h. Regular checks were made to ensure
animals were recovering well, and animals were weighed at 24 h and 48 h to monitor

42""
recovery. The end-point for weight loss was 20% of weight at induction, and this was
not reached at any point. The low severity of the protocol precluded the requirement
for eye drops to prevent ocular keratitis. At approximately 48–72 h after recovery,
rats were housed in groups of 2–5 and allowed to feed and drink ad libitum.
Table 2.1. Racine scale of seizures. Adapted from Racine et al., 1972) Stage 1. Mouth and facial movements
Stage 2. Head nodding
Stage 3. Forelimb clonus
Stage 4. Rearing
Stage 5. Rearing and falling
2.2.2. Experimental timeline
For experimental purposes, comparison of network activity was conducted between
epileptic rats and age-matched control rats (often litter mates) that received no
pharmacological treatments. Animals were taken for experiments 24 h, 5–7 days, 6–
8 weeks and 90+ d post-SE (PSE 24h, PSE 7d, PSE 6wks, PSE 90d), which roughly
fell into the following phases of epileptogenesis: SE and some breakthrough
seizures, latent period and spontaneous recurrent seizures (SRS) period (Fig. 2.1).
For brain slice preparation see Section 2.1.
"Figure 2.1. Experimental timeline. Red box represents SE period, blue boxes indicate periods (PSE 24h, PSE 7d, PSE 6wks, PSE 90d), during which animals were sacrificed for experiments

43""
2.2.3. SRS development
In the absence of post-seizure behavioural battery (PSBB), the development of the
SRS stage was determined by exposing an animal to either new environment (a box)
or a strong stimulus (e.g. a loud clap) to evoke a seizure episode of stage 2–3
Racine scale. Animals that exhibited seizures were considered to have entered the
SRS stage. The tests were carried out one day prior to sacrificing the animal for
experiments.
2.3. Human brain tissue electrophysiology
Human brain tissue was obtained from paediatric patients undergoing surgical brain
resection due to intractable epilepsy. The tissue was obtained via collaboration with
Birmingham Children's Hospital and with the approval of, and according to the terms
specified by, both the Black Country LREC (protocol 'Cellular studies in epilepsy'
10/H1202/23), and the Birmingham Children's Hospital NHS Trust (RECREF
10/H1202/23) (see Appendix 1). The work was undertaken with Aston University’s
ethical permission Project number 328. Briefly, surgically removed tissue from
locations predetermined using intraoperative and/or implanted electrocorticography
was placed in cooled in aCSF and slices prepared as described in Section 2.1.
Patient data are presented in Table 2.2.
Table 2.2. Patient data.
Patient Diagnosis/pathological substrate Nature of resected brain tissue
1 Heterotopia Control tissue above the lesion
2 Cortical dysplasia Dysplastic tissue
3 Cortical dysplasia Control tissue
4 Cortical dysplasia Control and dysplastic cortex
5 Cortical dysplasia Dysplastic cortex

44""
"Figure 2.2. Schematic diagram of combined hippocampal-EC brain slice. Two recording electrodes placed in CA3 and layer II regions. Red line shows a cut made to disconnect the two areas in some experiments.
2.4. Electrophysiological Recordings
2.4.1. Extracellular recording
LFP of neuronal networks were measured using an extracellular recording technique.
Borosilicate microelectrodes filled with aCSF were used to record LFPs from brain
slices. Microelectrodes with an open tip resistance of 1–3 MΩ were fabricated using
a Flaming/Brown micropipette puller (P-97, Sutter instruments Co, USA). A silver
wire electroplated with silver chloride was inserted into the microelectrode and then
placed on a manually operated micro-manipulator (Narishige MM-3, Japan).
Synchronised activity of neuronal networks could be detected within the 250 µm
radius from the electrode tip (Katzner et al., 2009; Xing et al., 2009). LFPs were simultaneously recorded from 4 slices using 4 microelectrodes placed
under the Olympus SZ51 microscope (Olympus, Japan) into either CA3 s.
pyramidale of the hippocampus to record spontaneous gamma oscillations (SγO) or
layers II/III of the mEC to record SWO (Fig. 2.2). The signal was amplified by 100
times and low-pass filtered at 1 KHz through EXT-02F amplifier (NPI, Germany). It
was further amplified by 10 times and low-pass filtered at 700 Hz through LHBF-48X
amplifier/filter (NPI, Germany). Environmental noise was reduced by Hum Bug 50/60
Hz noise eliminators (Quest Scientific Instruments Inc, Canada). Signals were
digitised to a PC at 10 KHz using an Axon Digidata 1400A (Axon Instruments, USA)
or Micro-1401 (Cambridge Electronic Device, UK) analog to digital converter and

45""
recorded by Clampex 10.2 or Spike2 7.0 software, respectively (Fig. 2.3.). The data
were analysed using Clampfit 10.2, Spike2 7.0, Mini Analysis (Synaptosoft Inc, USA)
and GraphPad Prism 5, MatLab software.
To explore phase properties of SγO, KA- and CCh-induced gamma oscillations (KγO
and CChγO), the same equipment was used for data acquisition. However, the
experimental setup was different: 4 evenly separated microelectrodes were placed
into the hippocampal CA3 s. pyramidale of a single slice. When SγO were stable,
either a single dose or increasing doses of KA or CCh were bath-applied. Epochs of
data for analysis were taken when the oscillations were stable.
2.4.2. Evoked field potential recording
Evoked field potentials were recorded from CA3 hippocampus in order to study KAr-
mediated response induced by electrical stimulation. Stimulation was delivered by
ISO STIM01D (NPI, Germany) through a bipolar electrode made from 80/20
nichrome wire, which was placed in granule cell layer to stimulate mossy fibres.
Different stimulation protocols were employed (see section 5.2.2.). Evoked field
potentials were recorded by Clampex 10.2 software and analysed in Clampfit 10.2.
"Figure 2.3. Electrophysiology rig setup. Electrophysiology rig for LFP and evoked field potential recordings.

46""
2.4.3. Patch-clamp recording
Borosilicate glass microelectrodes pulled with a P-2000 laser puller (Sutter
Instruments, USA) were used for the current technique. Microelectrodes with tip
resistance of 5–7 MΩ were filled with internal solution of the following composition (in
nM): 100 CsCl, 40 HEPES, 1.0 QX-314, 0.6 EGTA, 5.0 MgCl2, 10 TEA-Cl, 80 ATP-
Na, 6 GTP-Na, 1 IEM1460. The microelectrode was connected to an Axon CV-2
headstage, which was in turn connected to an Axopatch 200B amplifier (Molecular
Devices, USA). Recording was made in the submerged chamber continuously
perfused with sodium chloride aCSF at 5-7 ml/min, 32 °C. Prior to the recording, the
neurons of hippocampal CA3 region, layer II/III of the mEC or human cortex in the
slice were visualized using differential interference contrast optics and infrared
camera (IR-DIC). The internal solution composition allowed the observation of
inhibitory postsynaptic currents (IPSCs) at a holding potential of -65 mV.
2.5. Data Collection and Analysis
2.5.1. Spontaneous gamma oscillations
All data from extracellular experiments were converted to a digital waveform and
recorded in Clampex 10.2 and Spike 2 (version 7.0). The data were analysed in
Clampfit 10.2 and Spike 2 using the Fast Fourier Transform (FFT) algorithm, which
created power spectrum where the waveform was split into frequency components.
30 seconds (s) epochs of sampled data were analysed. Pooled data were analysed
in GraphPad Prism 5 and presented as mean normalized peak power change (with
control value taken for 100%) and mean peak frequency change. Statistical
significance was determined using paired non-parametric Wilcoxon matched-pairs
signed rank test. All data are expressed as mean ± standard error of the mean
(S.E.M.). For RISE model and KAr LFP studies, statistical significance was
determined using Mann-Whitney test between the epileptic and AMC groups.
MatLab software was used to conduct a time-frequency analysis. For analysis of
SγO, KγO and CChγO, Morlet wavelet spectrograms were created using a script
written by Dr. Stephen Hall (Aston University, Plymouth University).

47""
2.5.2. Phase analysis
Frequency-specific synchronisation is a part of brain coding and is important in both
physiological and pathological conditions (e.g. epilepsy). The idea was to use phase
synchrony to characterise SγO in CA3. The main question was asked: are SγO
different from KγO and CChγO? We are planning to further use this analysis to
characterise epilepsy development, as we hypothesise that during a seizure-free
period network synchrony is disrupted and recovers during the SRS stage.
The method called phase-locking statistics, which allows measuring phase synchrony
between two signals, was developed by Lachaux et al. (1999) and has advantages
over the traditional method of spectral coherence by separating phase and amplitude
components. It is important because coherence increases with amplitude covariance,
which does not allow an independent phase component estimation.
The phase analysis of SγO, KγO and CChγO was carried out by our collaborator
Gerard Gooding-Williams (Aston University). Epochs of 60 s of data were processed
using Matlab software. Down-sampled to 1 kHz, the data were filtered to the
frequency of interest (±2.5 Hz) using a zero phase finite impulse response (FIR) filter
function. Instantaneous phase values were estimated using Hilbert transform. Phase
angle difference and phase synchronisation as measured by phase-locking value
(PLV) were calculated using the following formulas (Lachaux et al., 1999):
€
Δθ =θ1(t) −θ2(t),
where ∆θ(t) is instantaneous phase angle difference between the 2 signals, θ2(t)
instantaneous phase angle of signal 2, θ1(t) instantaneous phase angle of signal 1.
€
Δθ =θ1(t) −θ2(t)
€
PLV =1N
eiΔθnn=1
N∑
€
PLV =1N
eiΔθnn=1
N∑ ,
where PLV is phase-locking value (phase synchronisation), ∆θ is phase angle
difference.

48""
PLVs were normalised to a scale of 0 to 1, with a score of 0 meaning no phase-
locking between the two signals measured, a score of 1 implying a perfect phase-
locking between the signals. Fig. 2.4. presents two examples of phase angle
difference distributions (3000 points) and resulting PLVs: a random sample (no
phase synchrony) and an example of phase synchrony centred around 90 degrees
(unimodal distribution). Fig. 2.5. demonstrates an example of method limitation,
where it is not able to resolve a bimodal distribution and therefore produces a false
result.
"Figure 2.4. PLV for random and unimodal distribution of phase angle difference. A. Random phase angle difference distribution histogram (top), histogram plotted onto circular plot (middle), generated PLV (bottom). B. Unimodal phase angle difference distribution histogram (top), histogram plotted onto circular plot (middle), generated PLV (bottom).
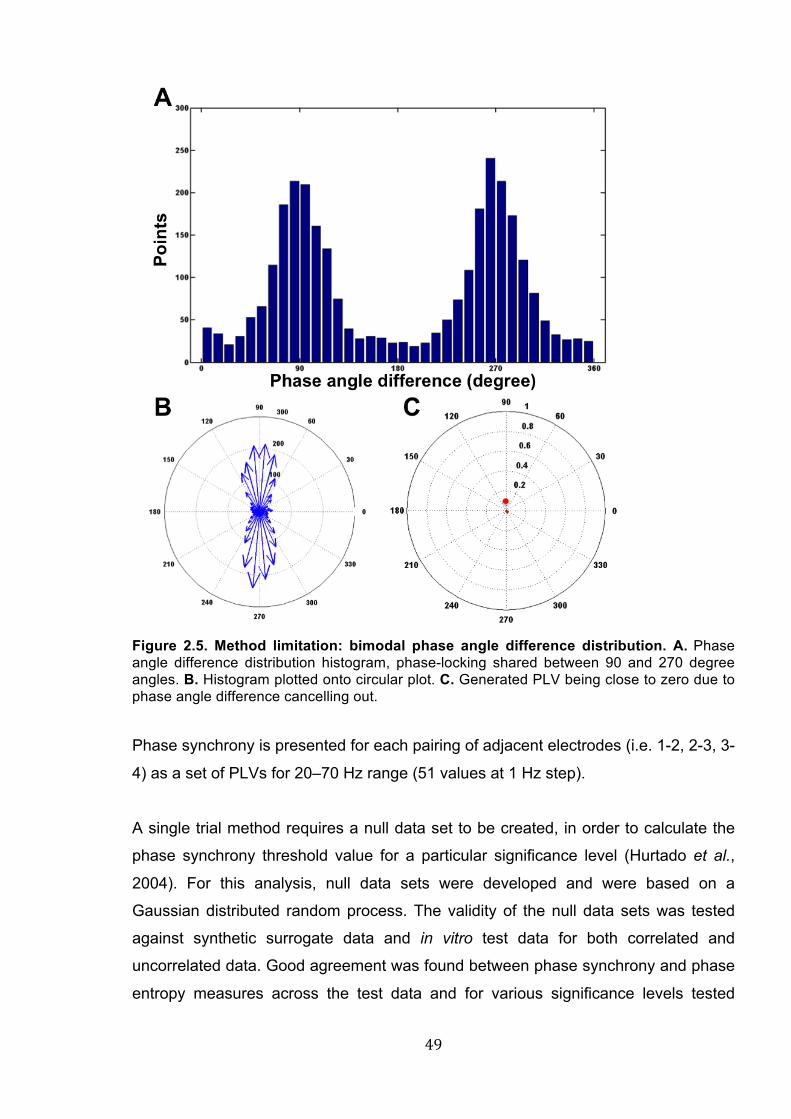
49""
Figure 2.5. Method limitation: bimodal phase angle difference distribution. A. Phase angle difference distribution histogram, phase-locking shared between 90 and 270 degree angles. B. Histogram plotted onto circular plot. C. Generated PLV being close to zero due to phase angle difference cancelling out.
Phase synchrony is presented for each pairing of adjacent electrodes (i.e. 1-2, 2-3, 3-
4) as a set of PLVs for 20–70 Hz range (51 values at 1 Hz step).
A single trial method requires a null data set to be created, in order to calculate the
phase synchrony threshold value for a particular significance level (Hurtado et al.,
2004). For this analysis, null data sets were developed and were based on a
Gaussian distributed random process. The validity of the null data sets was tested
against synthetic surrogate data and in vitro test data for both correlated and
uncorrelated data. Good agreement was found between phase synchrony and phase
entropy measures across the test data and for various significance levels tested

50""
(although only PLV data are presented here). A multiple comparison correction was
applied to the phase coherence significance threshold for the plots presented.
Both linear and non-linear measurements of phase analysis, such as phase
synchrony and phase entropy, were employed in the analysis. Different approaches
produced equivalent results at the same significance level, as the phase difference
data were unimodal. Presented data are the result of phase synchrony analysis.
To account for the variability of phase synchrony between the tissue samples, a new
value 'proportional phase synchrony' (PPS) was adopted. For each frequency and
electrode pair there is a phase synchrony PLV for spontaneous (PSs) and
corresponding KA- or CCh- driven (PSd) oscillations.
For PLV increase from spontaneous to driven, PPS = (PSd-PSs)/(1-PSs) For PLV decrease from spontaneous to driven, PPS = (PSd-PSs)/PSs
Using the same filter parameters as in the calculation of phase synchrony, the root
mean square (RMS) power was calculated at each frequency (20 – 70 Hz) for
spontaneous and driven (KA or CCh) conditions. A measure is produced by the
following ratio:
(driven RMS power)/(spontaneous RMS power)
To derive an aggregated value across electrodes, the PPS and RMS power values
were averaged. Graphs were produced by plotting RMS power against PPS
measured at 1 Hz intervals across 20 – 70 Hz for different concentrations of KA and
CCh.
2.5.3. SWO analysis
For SWO, a burst analysis was carried out in Mini-Analysis software. It allowed to
determine burst duration, peak amplitude, interburst interval, interevent interval
(intraburst interval), and the number of events in a burst. The data were compared
between control and drug conditions within both healthy and epileptic groups, as well
as healthy versus (vs.) epileptic. Statistical significance was determined using

51""
Wilcoxon matched pairs signed rank test within the group and Mann-Whitney test
between the groups. The data are presented as percentage of change from control to
drug (with control value taken for 100%) ± S.E.M. for each measured parameter in
both groups (healthy and epileptic).
2.5.4. Evoked field potential and patch-clamp analysis
Recorded evoked field potentials were low-pass filtered at 10 Hz in Clampfit 10.2 to
eliminate stimulation artefacts. The amplitude of evoked response was measured in
the same software.
For patch-clamp recording IPSCs were recorded using Clampex 10.2 and later
analysed in Mini Analysis software. A minimum of 200 events were taken from the
recordings in order to calculate the amplitude, the decay time and the interevent
interval (IEI) of the IPSCs. The cumulative probability distributions were plotted for
each of the variables in control and drug. The two-sample Kolmogorov-Smirnov (KS)
test was used to determine whether the difference between two distributions was
significant.
2.6. Drugs
The drugs were purchased from Tocris Bioscience, Bristol, UK. Stock solutions of
each drug were prepared at a certain concentration and stored at – 20 °C prior to
being used. The drugs were directly applied to the perfusing aCSF, for approximately
50 – 60 min or depending on the experiment design.

52""
3. Chapter 3 Spontaneous gamma oscillations in CA3 hippocampus

53""
3.1. Introduction
3.1.1. In vitro models of induced gamma oscillations and pharmacology
Knowledge accumulated over the last 20 years demonstrates that rhythmic electrical
activity of gamma frequency arises from the interaction of inhibitory interneuronal
network and pyramidal cells. Critical conditions for gamma rhythm generation are the
presence of GABA-Ar-mediated inhibition by interneurons and the excitatory
glutamatergic drive (Wang and Rinzel, 1992; Whittington et al., 1995; Traub et al.,
1996a). In addition to that, other mechanisms were found to be involved leading to
various ways of eliciting different forms of gamma oscillations in vitro: using CCh
(Fisahn et al., 1998), KA (Buhl et al., 1998; Hajos et al., 2000; Fisahn et al., 2004),
mGluR activation (Whittington et al., 1995; Whittington et al., 1997; Palhalmi et al.,
2004) and hypertonic K+ solution (LeBeau et al., 2002).
One of the first discovered ways of inducing gamma oscillations in vitro in the
hippocampus was by activation of mGluRs either by an agonist (Whittington et al.,
1995) or by tetanic stimulation (Whittington et al., 1995; Whittington et al., 1997). This
type of gamma oscillations is of transient nature, because of time-limited nature of
the stimulus and subsequent glutamate reuptake and/or mGluR desensitisation.
However, despite the transience of this rhythm, it was established that the
oscillations were phase-locked over the distance of 1–2 mm and dependent on the
inhibition mediated by GABA-Ar. Oscillations remained in the presence of GABA-B
receptor (GABA-Br) and iGluR antagonists, further supporting this point. Whittington
et al. (1995) suggested a crucial role of tonic activation (mGluRs) projecting
excitatory effects on inhibitory interneurons. The role of gap junctions was studied
and it was concluded that while electrical cell coupling was not essential, it
significantly enhanced the network synchrony. Several years later, persistent dose-
dependent gamma oscillations in the hippocampus could be elicited by activation of
mGluRs with DHPG (group I mGluR agonist). Palhalmi et al. (2004)
pharmacologically characterised this rhythmic activity and drew a conclusion that
DHPG-induced gamma depended both on excitation and inhibition, as it was blocked
by a broad-spectrum mGluR antagonist, LY341495, and an AMPAr antagonist,
GYKI53655, as well as by a GABA-Ar antagonist, bicuculline (Palhalmi et al., 2004).

54""
Shortly after the discovery of mGluR role in inducing gamma oscillations, a different
way of providing excitatory input in the hippocampus was suggested by Buhl and
colleagues (1998) – pharmacological stimulation with the combination of CCh and KA
(in somatosensory cortex), or with either CCh (Fisahn et al., 1998) or KA (Hajos et
al., 2000; Fisahn et al., 2004) independently. Application of micromolar
concentrations of mAChr agonist CCh consistently elicited persistent 40 Hz gamma
oscillations in the hippocampus (Fisahn et al., 1998). CChγO were abolished by a
non-selective mAChr antagonist, atropine, and an M1 mAChr antagonist,
pirenzepine. Once again indicating the crucial role of inhibition and excitation, GABA-
Ar, AMPAr and KAr antagonists blocked CChγO. NMDAr and mGluR, on the other
hand, did not produce any effect, the latter suggesting the differences in models of
oscillations in vitro. This work was yet another milestone in in vitro network activity
research.
Following the work of Buhl et al. (1998), Hajos et al. (2000) explored persistent
hippocampal gamma oscillations induced by nanomolar application of KA. They
described the modulation of KγO by the cannabinoid system. This model was further
characterized in connexin-36 KO studies performed by Hormuzdi et al. (2001). It was
discovered that oscillations in the wild-type mice were sensitive to GABA-Ar and gap
junction blockers. KO mice, however, demonstrated reduced amplitude oscillations
with preserved frequency and synchrony within the area. Several years later, Fisahn
and colleagues (2004) further characterised the pharmacology of KγO and explored
the role of different KAr subunits in generation and maintenance of oscillations. KγO
persisted in the presence of GYKI53655, AP-5 and MCPG, which suggests AMPAr,
NMDAr and group I mGluR respectively, are not involved in this model of network
oscillations. DNQX, a non-selective AMPAr/KAr antagonist, and bicuculline, GABA-Ar
antagonist, abolished the activity, indicating the prerequisite components common to
all models. Studies with M1 mAChr knockout mice demonstrated that CCh could not
generate oscillations, while induction with KA remained intact, proving these two
models have an independent generation mechanism (Fisahn et al., 2004).

55""
3.1.2. Spontaneous gamma oscillations
The diversity of in vitro models brings up such questions as which model represents
best the in vivo gamma oscillations or whether all of them contribute to the actual
gamma rhythm mechanism, reflecting the difference in regions and states. Apart from
the absence of proper network connectivity and a higher degree of spatial coherence
compared to the intact brain, in vitro gamma oscillations are induced through artificial
stimulation. In this light, the latest model described in literature – SγO occurring in the
hippocampus in vitro (Trevino et al., 2007; Pietersen et al., 2009; Case and
Broberger, 2012) – seems to be a better physiological model, free of any external
intervention. SγO are observed in the healthiest slices, therefore improving brain
slice preparation techniques and increasing viability of the slices results in
uncovering a persistent gamma rhythm in the hippocampal CA3 region. Hajos and
Mody (2009) suggested possible modifications of aCSF composition in order to
create physiological environment resembling that of neurons in an intact brain.
Inclusion of such neuroprotective agents as NMDAr antagonists, antioxidants and
anti-inflammatory drugs reduces the processes of excitotoxicity, oxidative stress and
neuroinflammation taking place in the slice (Farooqui, 2008). Improved aCSF
composition combined with transcardial perfusion of the animal appear to be the key
factors in obtaining brain slices with increased viability and longevity, which allows
neuronal populations to exhibit their natural spontaneous activity.
One of the most extensive reports on SγO was done by Pietersen et al. (2009),
where SγO were compared to KγO in murine hippocampus. The analysis revealed
common features of the basic mechanism in both models, demonstrating once again
that oscillations arise from the interplay of excitation and inhibition. Gap junction
blockers demonstrate that both models rely on electrical coupling between the cells.
AMPAr antagonist SYM2206 was reported to block SγO, while it only partially
decreased KγO. Furthermore, NMDAr antagonist also did not produce similar effects
in the two models, causing a decrease in SγO and an increase in KγO. A broad-
spectrum mGluR antagonist did not produce any significant effect in either of the
models, demonstrating that mGluR activation was not required for maintenance of
gamma oscillations. Partial block of SγO was observed in atropine, suggesting the
involvement of mAChr. Based on the current-source density analysis, Pietersen and
colleagues (2009) reported that SγO relied on the perisomatic inhibition less in

56""
comparison to KγO. Moreover, cross-correlation and phase studies revealed that
KγO were coherent across the CA3 region, whereas phase changed between the
regions in SγO. Overall, they concluded that both oscillation models arise from the
same local network mechanism; however, they show differences in the
pharmacological properties. In this light, it was suggested that SγO is used as a new
physiologically relevant model of gamma oscillations in vitro. Unfortunately, this
report has major discrepancies between tabulated effects and results/discussion in
the main text, and this makes interpretation of these data difficult.
3.1.3. Improved brain slice preparation technique
The acute brain slice technique (Yamamoto and McIlwain, 1966; Andersen et al.,
1972; Alger et al., 1984) has contributed substantially to the investigation of the
electrical and morphological properties of neurons and synapses. More recently, the
in vitro slice approach has provided insights into neuronal network oscillations
(Whittington et al.; 1995; Traub et al., 1996a; Buhl et al., 1998; Cunningham et al.,
2003), allowing the understanding of fundamental mechanisms underlying network
function and the EEG.
A brain slice is a preparation containing local neuronal networks, yet in such
preparation a great number of input and output connections with other brain regions
are either cut off due to the size of a brain slice or severed as a result of performed
manipulations (e.g. brain extraction, cutting procedures). These manipulations are
stressful for brain tissue, as they trigger a cascade of excitotoxic and
neuroinflammatory reactions, which alters electrical properties of the cells and
eventually leads to cell death. In order for in vitro brain slice research to be
translational, it is crucial to obtain healthy and viable brain slices with well-preserved
brain cells and networks, so that the networks resemble those found in vivo.
Traditionally, rhythmic activity in a brain slice has been induced by either
pharmacological or electrical stimulation to mimic excitatory inputs or by alteration of
ionic concentrations to set the right level of neuronal excitability. However, I noticed
that upon improvement of preparation techniques, brain slices started exhibiting
spontaneous rhythmic activity (free of any pharmacological or electrical stimulation),
suggesting a sufficient presence of network elements required for the generation of
oscillations by the system itself.

57""
Having obtained these spontaneous oscillations, it was of interest to investigate their
nature more thoroughly and compare them to the most commonly used models in the
literature (KγO and CChγO). Naturally occurring gamma activity in the slices
presented an opportunity to investigate a physiologically relevant in vitro model of
hippocampal oscillations that can be correlated with in vivo observations in animals
and EEG recordings in humans. To determine the differences between the three
models of oscillations, we examined their pharmacology using standard LFP
recording techniques. Time-series analysis was used to investigate the phase
relationships between neighbouring local networks in the models of gamma
oscillations.
3.2. Results
3.2.1. Traditional vs. improved brain slice preparation
Spontaneous activity in the gamma frequency range (SγO) was observed in CA3
hippocampus in brain slices obtained using improved methods described in Prokic
(2012). The method included transcardial perfusion and alteration of aCSF recipe to
include various neuroprotectants, including taurine, aminoguanidine and ethyl
pyruvate, which significantly improved the viability of Betz cells in M1 brain slices. We
compared horizontal hippocampal-entorhinal slices obtained with traditional method
to the ones obtained using the modified method. In young adult rats, the hippocampal
CA3 region (usually the most vulnerable area) generally survived better in modified
preparation, compared to the traditional one (Fig. 3.1A,B). We then explored whether
SγO were present in CA3 hippocampus s.pyramidale in slices made using standard
methods, and it appeared that the activity was still present in some slices. However,
it did not appear reliably and, when present, was low in power and variable in
frequency (Fig. 3.1C,D). SγO were observed in 22.9% (11/48) of traditional method
slices, whereas this increased to 87.7% (142/162) slices obtained with the modified
technique.

58""
"Figure 3.1. Impoved brain slice preparation increases slice viability and exposes natural SγO. A. and B. Images of the hippocampal CA3 region in traditional and improved brain slice preparation, respectively. C. and D. FFT power spectra of spontaneous rhythmic activity in slices from traditional and improved preparations.
3.2.2. Basic profile of SγO, KA- and CCh-induced gamma oscillations
SγO were studied and compared to KγO (50 nM KA) and their CChγO (1µM CCh).
Oscillations were recorded from s.pyramidale of CA3 hippocampus of 80 – 120 g
Wistar rats (Fig. 3.2). Time-frequency relationship of all gamma oscillation models
was explored using Morlet wavelet analysis. The results demonstrated that the peak
frequency was stable over time and oscillation amplitude showed low-frequency
modulation (Fig. 3.3). The average peak frequency of SγO was 31.8 ± 0.4 Hz and
average peak power 55.2 ± 6.1 µV (n=121), compared to the frequency and
amplitude range of oscillations induced by 50 nM KA (37.4±0.8 Hz and 596.3±167.2
µV [n=58]) or 1 µM CCh (38.1±0.5 Hz and 151.9±23.7 µV [n=69]) (Fig. 3.4).

59""
"Figure 3.2. Basic profile of SγO, KγO and CChγO. . Ai., Bi. and Ci. Unfiltered raw traces of SγO, KγO (75 nM KA) and CChγO (1µM CCh), respectively. Aii., Bii. and Cii. Representative FFT power spectra of SγO, KγO and CChγO, respectively.
Figure 3.3. Time-frequency analysis of SγO, KγO and CChγO. A., B. and C. Morlet wavelet time-frequency plots for SγO, KγO and CChγO, respectively.

60""
"Figure 3.4. Mean power-frequency characterisation of SγO, KγO and CChγO. Mean peak frequency (A.) and power (B.) of SγO (teal), KγO (red) and CChγO (blue). **** represent p<0.0001, * represents p<0.05. SγO appeared from the start of the recording (1 h after slicing), peaked in power after
1–1.5 h and persisted in this stable state for several hours, with the longest recording
of stable SγO being >7 hrs. KγO and CChγO emerged approximately 10 minutes
after bath application of either KA or CCh, reached stable state 1.5–2 h later and
again persisted for several hours.
Observation of SγO over time demonstrated a gradual increase in power until
reaching a stable state. Addition of KA or CCh to pre-existing SγO in majority of
slices resulted in initial acceleration of oscillations and rapid power escalation. As the
power was reaching its peak, the frequency decreased slightly, before settling,
usually at a point above the pre-drug level. Shifts in frequency upon transition could
probably be explained by elevated level of excitation produced by KA and CCh in the
slice (Wang and Buzsaki, 1996). Exploratory KA and CCh dose-response curve
experiments demonstrated that the power of gamma oscillation induced by 25 nM KA
corresponded approximately to the power induced by 1 µM CCh, however, CCh
induced a different input-output curve, inducing rhythmic activity of different
frequencies, depending on the dose.

61""
"Figure 3.5. SγO survive prolonged storage. Ai. and Aii. Unfiltered raw trace and FFT power spectrum of SγO recorded from a slice stored for 1 h. Bi. and Bii. Unfiltered raw trace and FFT power spectrum of SγO preserved in a slice stored for 7 h.
SγO appeared in almost all hippocampal slices immediately after 1 h of recovery
period, as well as after a prolonged (even up to >6h) storage (Fig. 3.5). The
oscillations in stored slices varied in peak power and frequency, but were generally
smaller and slower compared to freshly-cut slices. In stored slices, gamma
oscillations could also be induced with as little as 25 nM KA and 500 nM CCh,
indicating higher sensitivity of CA3 to KA. Generally there was a positive correlation
between the size and frequency of SγO and chemically induced gamma oscillations
in the same slice.

62""
"
"Figure 3.6. Weight-dependent profile of SγO. Ai. and Aii. Bar charts showing mean peak frequency and peak power of SγO in slices from 50 g, 100 g, 250 g and 450 g animals. *** indicate p<0.001, ** indicate p<0.01, * indicates p<0.05.
3.2.3. Characterisation of SγO
SγO were more readily observed towards the dorsal side of the hippocampus. To
determine the origin of SγO, LFP recordings were obtained from slices with the cut
made through the perforant path/mossy fibres and Schaffer collateral to disconnect
CA3 region from the EC, DG and CA1, respectively. Persistent SγO could still be
observed in CA3 region, suggesting that spontaneous activity was intrinsic to this
area.
SγO were studied across different weight groups (50g, 100g, 250g, 450g). These
studies showed that the average peak frequency significantly increased with weight
from 26.6±0.8 Hz (n=13) in 50g animals to 31.8±0.4 Hz (n=26) in 100g, 34.7±0.8 Hz
(n=17) in 250g and 36.3±0.8 Hz (n=14) in 450g animals (Fig. 3.6). Generally the FFT
peaks appeared sharper in older rats. The average peak power, though quite
variable, did not exhibit statistically significant differences across all age groups.
3.2.4. Pharmacological profile of SγO, KγO and CChγO
Pharmacological properties of three gamma oscillation models were characterized
and compared. We explored the roles of inhibitory and excitatory systems in
generation and maintenance of SγO, KγO and CChγO.

63""
"Figure 3.7. Abolition of SγO, KγO and CChγO by 20 µM PTX. A., B. and C. Unfiltered raw traces of SγO (teal), KγO (red) and CChγO (blue) under control and 20 µM PTX.
3.2.4.1. GABAergic pharmacology
It is known that GABA-mediated inhibition is critical for induced gamma oscillation
generation and maintenance in vitro (Whittington et al., 1995; Fisahn et al., 1998;
Pietersen et al., 2009). We explored the role of GABA-Ar in SγO observed in our
slices and compared it to chemically induced gamma oscillations. In all experiments,
the GABA-Ar antagonist bicuculline (20 µM) and GABA-Ar blocker PTX (20 µM)
reliably abolished gamma oscillations, demonstrating the crucial role of the
GABAergic system (Fig. 3.7). Hence, in the majority of slices, gamma rhythm was
replaced by slow interictal-like activity, appearing once the effect of GABA-Ar
blockade had stabilised. Benzodiazepine site agonist zolpidem (100 nM) significantly
augmented the peak power of SγO, KγO and CChγO by 44.5±25.2% (n=10, p<0.01),
21.0±18.6% (n=9, p<0.05), 46.8±25.4% (n=8, p<0.05), respectively (Fig. 3.8A). A
decrease in the peak frequency was also observed in all three models: ∆Hz -
1.95±1.6, p<0.01 in SγO, -1.2±0.9, p<0.05 in KγO and -1.4±0.8, p<0.05 in CChγO.
We then investigated the effects of GABA-Ar modulator pentobarbital (10 µM), which
produced a significant change in peak power only in CChγO (increase by 21±14.6%

64""
p<0.01, n=10), although a characteristic significant decrease in the peak frequency
was observed in all three models (∆Hz -3.5±1.9Hz, n=9, p<0.01 in SγO, -4.8±1.8Hz,
n=9, p<0.01 in KγO and -2.3±1.1Hz, n=10, p<0.01 in CChγO) [Fig. 3.8B].
"Figure 3.8. The effects of GABA-Ar modulators on SγO, KγO and CChγO. A. Bar charts illustrating a significant reduction of peak frequency and an increase in the peak power of SγO (teal), KγO (red) and CChγO (blue) upon the application of 100 nM zolpidem. B. Bar charts showing a significant reduction of SγO (teal), KγO (red) and CChγO (blue) peak frequency upon the application of 10 µM pentobarbital. A significant increase in peak power observed only in CChγO. ** indicate p<0.01, * indicates p<0.05.

65""
"Figure 3.9. Differential effects of GluK1,3 KAr antagonist UBP310 (3 µM) on SγO, KγO and CChγO. Ai., Bi. and Ci. Unfiltered raw traces of SγO, KγO and CChγO under control conditions. Aii., Bii. and Cii. Unfiltered raw traces of SγO, KγO and CChγO after 3 µM UBP310 application. Aiii., Biii. and Ciii. FFT power spectra for control and UBP310 conditions in SγO, KγO and CChγO, respectively. The figure demonstrates a marked reduction of KγO power in UBP310, while an increase in SγO and CChγO.
3.2.4.2. Glutamatergic pharmacology
The role of phasic excitatory inputs in oscillogenesis was established in the works of
Buhl et al. (1998) and Fisahn et al. (1998). To explore the involvement of excitatory
glutamatergic system in the generation of spontaneous and other types of gamma
oscillations, a KAr/AMPAr antagonist, CNQX (20 µM), was bath applied. CNQX
caused a significant reduction of gamma band power in all three models, however, a
broad peak in theta/beta bands was introduced instead with mean peak frequencies
13.22±2.1 Hz for SγO (n=12), 11.39±2.9 Hz for KγO (n=3) and 17.5±1.5 Hz for
CChγO (n=12). The mean peak power of the theta oscillation was significantly lower
compared to initial gamma peak in both KγO (by 69.3±10.6 %, p<0.05) and CChγO
(by 68.24±10.6 %, p<0.001), but did not change significantly in SγO (p<0.05), as
illustrated by Fig. 3.11A. The role of GluK1 and/or GluK3-containing KAr in the
generation of gamma oscillations by the administration of a selective antagonist,
UBP310 (3µM). The effects produced by UBP310 application differed significantly

66""
between the models. The antagonist produced an increase in mean peak power of
SγO by 68±21.4 % (n=12, p<0.05) and a decrease in the mean peak frequency by
4.5±2.4 Hz (n=12, p<0.01), as illustrated by Figs. 3.9A and 3.11C. In contrast,
application of UBP310 dramatically reduced the peak power of KγO (by 78.9±6.25 %,
n=11, p=0.001) and insignificantly increased the peak frequency (Figs. 3.9B and
3.11C). CChγO did not change significantly upon the blockade of GluK1,3 KAr (Figs.
3.9C and 3.14C).
In addition to KA type glutamate receptors, mammalian neurones express AMPAr,
which mediate fast synaptic transmission. We examined the role of AMPAr by
applying AMPAr antagonist, SYM2206 (Pelletier et al., 1996). Application of
SYM2206 (20 µM) did not demonstrate consistent results. Initially, SYM2206
produced a significant increase in all types of gamma oscillations, however, when
experiments were repeated, it showed abolition of gamma rhythm in all models.
Therefore it was decided to block AMPAr with the combination of 20 µM SYM2206
and 2.5 µM NBQX. At such a low concentration NBQX is known to be selective for
AMPAr, although higher doses also act on KAr. SYM2206+NBQX reliably abolished
gamma oscillations in SγO (n=9), KγO (n=8) and CChγO (n=10) but introduced a low
amplitude theta peak (10 – 15 Hz) afterwards (Fig. 3.11B). The mean peak
frequencies after AMPAr blockade were 10.26±0.7 (p<0.01) Hz in SγO, 11.32±0.9
(p<0.01) in KγO and 13.94±2.6 (p<0.01) in CChγO. We also investigated whether
another type of ionotropic glutamate receptors, NMDAr, were involved in the
mechanism of gamma oscillations. DL-AP-5 (25 µM), an NMDAr antagonist,
increased the peak power of only CChγO by 56.2±20.8% (n=11, p<0.01), and caused
no significant effect in other models (Figs. 3.10 and 3.11D). Despite no changes in
power, DL-AP-5 significantly reduced the peak frequency of SγO and KγO (by
3.78±1.1 Hz [n=10, p<0.01] and 1.0±0.6 Hz [n=9, p<0.05], respectively). Apart from
ionotropic glutamate receptors, mammalian neurones express a variety of
metabotropic glutamate receptors, which exert their effects on excitability and
synaptic function through G-proteins. The main mGluRs can be divided into 3 groups,

67""
Figure 3.10. Differential effects of NMDAr antagonist on SγO, KγO and CChγO. Ai., Bi. and Ci. Unfiltered raw traces of SγO, KγO and CChγO under control conditions. Aii., Bii. and Cii. Unfiltered raw traces of SγO, KγO and CChγO after 25 µM AP-5 application. Aiii., Biii. and Ciii. FFT power spectra for control and AP-5 conditions in SγO, KγO and CChγO, respectively. The figure demonstrates a marked increase of CChγO power in AP-5, while no significant change in SγO and KγO.
groups I contains mGluRs 1 and 5, group II is comprised of mGluRs 2 and 3, while
group III contains mGluR4, mGluR6-8. The role of metabotropic receptors, mediating
slow excitation and presynaptic inhibition of transmitter release, was explored using a
selective antagonist, MPEP (mGlu5 antagonist), and a group II/III mGluR antagonist,
LY341495. MPEP (20 µM) increased γ oscillation peak power in SγO, KγO and
CChγO by 60.3±27.6% (n=9, p<0.01), 48.9±27.5% (n=10, p=0.01) and 31.9±21.9%
(n=11, p<0.05), respectively (Fig. 3.13A). Furthermore, results demonstrated that
MPEP reduced the peak frequency of SγO and KγO by 3.8±0.7 Hz (p<0.01) and
2.3±1.7 Hz (p<0.05), respectively (Fig 3.13A). Application of LY341495 (5 µM) did
not result in a significant effect in any of the three models, yet it significantly
decreased the peak frequency of gamma oscillations by 2.17±1.4 Hz (n=9, p<0.05) in
SγO and 1.6±0.9 Hz (p<0.05) in KγO (Fig. 3.13B).

68""
"Figure 3.11. The effects of glutamatergic antagonists on SγO, KγO and CChγO. A. Bar charts illustrating a significant reduction of peak frequency in SγO (teal), KγO (red) and CChγO (blue) and peak power of KγO and CChγO, but not SγO upon the application of AMPAr/KAr antagonist CNQX (20µM). B. Bar charts illustrating a similar reduction in the peak frequency of all three models, while a reduction in power only in SγO and KγO, but not CChγO upon administration of AMPAr antagonists SYM2206+NBQX (20µM and 2.5µM, respectively). C. Bar charts showing significant decrease in peak frequency and an increase of peak power of SγO upon administration of 3 µM UBP310 (GluK1,3 Kar antagonist). UBP3010 nearly abolished KγO. D. Bar charts showing the effects of NMDAr antagonist AP-5 (25 µM), which reduced the peak frequency of SγO and KγO and increased the peak power of CChγO. *** indicate p<0.001, ** p<0.01, * p<0.05.

69""
"Figure 3.12. Differential effects of mAChr antagonist on SγO, KγO and CChγO. Ai., Bi. and Ci. Unfiltered raw traces of SγO, KγO and CChγO under control conditions. Aii., Bii. and Cii. Unfiltered raw traces of SγO, KγO and CChγO after 5 µM atropine application. Aiii., Biii. and Ciii. FFT power spectra for control and atropine conditions in SγO, KγO and CChγO, respectively. The figure demonstrates abolition of CChγO by atropine, while no significant change in SγO and KγO.
3.2.4.3. Cholinergic pharmacology
According to Fisahn and colleagues (1998), atropine blocked CChγO, suggesting this
model of oscillations heavily depends on cholinergic system. We investigated,
whether this was the case for SγO or KγO. We first established that atropine (5 µM)
abolished CChγO, confirming previous reports in literature (Fig. 3.13C). The
muscarinic receptor antagonist, however, produced no significant effect on the power
of SγO and KγO (Fig. 3.12). Despite that, it still significantly reduced the frequency of
SγO by 2.77±0.9 Hz (n=11, p<0.01).
3.2.4.4. Gap junctions
Early work on in vitro gamma oscillations demonstrated that electrical coupling
between neurons is an important part of neuronal network oscillations (Traub et al.,
2000; Hormuzdi et al., 2001). We bath applied 200 µM carbenoxolone (CBX), a gap
junction blocker, and it significantly decreased SγO, KγO and CChγO by 83.3±7.21%
(n=15, p<0.0001), 61.2±21.4% (n=10, p<0.01) and 60.4±20.5% (n=8, p>0.05),
respectively (Fig. 3.13D).

70""
"Figure 3.13. The effects of mGluR and mAChr antagonists and gap junction blocker SγO, KγO and CChγO. A. Bar charts showing a significant reduction of peak frequency in SγO and KγO and an increase in peak power of all three models produced by an mGluR5 antagonist, MPEP (20µM). B. Bar charts showing a significant reduction in the peak frequency of SγO and KγO upon the application of mGluR group II and III antagonist LY341495. C. Bar charts demonstrating a decrease of SγO peak frequency produced by mAChr antagonist atropine (5µM). D. Bar charts showing a reduction of peak frequency in SγO and KγO produced by a gap junction blocker CBX (200 µM). CBX caused a dramatic decreased in the peak power of all three models. *** indicate p<0.001, ** p<0.01, * p<0.05.

71""
3.2.5. Phase profile of SγO, KγO and CChγO
3.2.5.1. Phase characterisation
Phase analysis of SγO, KγO and CChγO was carried out to determine the difference
between the three models of gamma oscillations. Phase synchrony differences were
explored by adding various doses of KA or CCh to existing SγO, thus investigating
SγO->KγO and SγO->CChγO transitions. As a first stage of analysis, three
parameters were considered: phase synchrony (PLV), dominant frequency and
phase angle difference. Phase synchrony and phase angle difference plots for
adjacent electrodes recording SγO, KγO and CChγO are presented in Fig. 3.14. The
results showed that SγO had high degree of phase synchronisation between all
electrodes within a single slice. Between adjacent electrodes (e.g. 1-2) the phase
coupling generally occurred across the 20 – 70 Hz range, with a dominant frequency
of approximately 5 Hz bandwidth between 30 Hz and 40 Hz. As for the long-range
phase relations (electrodes 1-4), phase coupling was reduced, yet the dominant
frequency was still preserved (Fig. 3.15). Phase angle difference between adjacent
pairs of electrodes was consistent across the frequency range.
Addition of either 50 nM KA or 1 µM CCh increased the intrinsic phase coupling
across the measured frequency band. The effect of phase angle difference, however,
was not consistent, either increasing or remaining unchanged. At this stage of
analysis, no differences were detected between KA and CCh in their effect on SγO in
the CA3 hippocampus.

72""
"
Figure 3.14. Phase coupling of SγO, KγO and CChγO across CA3. Ai., Bi. and Ci. Strong phase coupling at gamma frequency between the neighbouring local CA3 networks in SγO, KγO and CChγO, respectively. The plots show strong phase coupling in all models of gamma oscillations. Aii., Bii. and Cii. Small phase angle difference between the two signals in SγO, KγO and CChγO, respectively.

73""
Figure 3.15. Short- and long-range connectivity in SγO. A. A schematic representation of 4 recording electrodes in the hippocampal CA3 region. Bi. and Bii. Phase synchrony between the adjacent (1-2) and distal (1-4) electrodes in SγO, demonstrating stronger phase coupling between the adjacent electrodes. Ci. and Cii. Phase synchrony between the adjacent and distal electrodes in KγO demonstrating stronger phase coupling between the adjacent electrodes. Di. and Dii. Phase synchrony between the adjacent and distal electrodes in CChγO, demonstrating stronger phase coupling between the adjacent electrodes.

74""
"Figure 3.16. Volume conduction issue. A. A schematic representation of 4 recording electrodes in the hippocampal CA3 region with an incision made between electrodes 2 and 3. Bi., Bii. and Biii. PLV plots demonstrating preservation of SγO phase coupling between electrodes 1 and 2, 3 and 4, while a disruption of phase coupling between electrodes 2 and 3, demonstrating no volume conduction effect.
3.2.5.2. Volume conduction problem
High values of phase synchrony, as mentioned above, raise the possibility that the
data were compromised by volume conduction phenomenon and might not represent
the real network activity recorded by the electrodes. To test this possibility, a cut was
made in the slice through CA3b region, thus separating electrodes 2 and 3. The
hypothesis was that the incision would sever neuronal connection disrupting neuronal
communication between electrodes 2 and 3; however, the touching sides of the
lesioned tissue would allow volume conduction phenomenon to occur, if present. The
results demonstrated that the phase synchrony between electrodes 2 and 3 was
below significance level, whereas electrode pairs on either side of the cut presented
high degree of phase coupling, which suggested a disrupted link between the two
middle electrodes (Fig. 3.16). Results demonstrated that volume conduction played
little or no role in generating the phase-locking data observed.
3.2.5.3. Dose-dependent phase effects of KA and CCh on SγO
Phase synchrony and oscillatory power relationship was explored using increasing
concentrations of KA (0.5 – 125 nM) and CCh (0.5 – 50 µM) applied to SγO. Scatter

75""
plots were built for each agent concentration (each dot representing PPS-RMS power
relationship for every frequency value between 20 Hz and 70 Hz). The plots for KA
and CCh are presented in Fig. 3.17. Results suggested that the relationship between
power and phase were linear across frequencies at a particular drug concentration,
hence could be decribed by the parameters of a linear equation y=mx+c for each
dose of a driving agent, where m determines the slope of the line (i.e. the relationship
between phase synchrony and power), while c determines the y-intercept (i.e. the
gain in power at each concentration). Plotting gradients (m) and constants (c) for
different concentrations of driving agents (in this case KA) produces the following
graph presented in Fig. 3.18. The plot shows the behaviour of CA3 network
oscillations under different concentrations of KA. By the created definition of phase-
power relationship, at 0 nM KA (essentially, SγO) no phase-power relationship (m=0)
and no gain in power (c=1) would be expected. This was confirmed experimentally
(within the measurement error), as at near zero concentration c is close to 1,
whereas m is approaching 0 (Fig. 3.18). While the power (c line) appears to increase
linearly with added doses of KA, the phase-power relationship (m curve)
demonstrates dose-dependent differences, suggesting different modes of oscillations
at low concentrations compared a higher (>20 nM) KA drive. Nevertheless, at
concentrations above 20 nM KA, which are commonly used for KγO induction, m
seems to change in a linear fashion. To test the hypothesis that SγO are
mechanistically the same as KγO, only smaller, we extrapolated from the linear
region (20 – 100 nM KA) back to 0 nM KA (i.e. SγO). Fig. 3.18 shows that
extrapolation does not produce c=1, m=0 for SγO, which would be the case, if SγO
were the same as KγO. Although the results are preliminary, they suggest that SγO
are different from KγO elicited by 20-100 nM KA. Although pharmacologically they
appeared similar to KγO, the effects of UBP310 confirmed our interpretation of
fundamental differences between induced and spontaneous gamma activity.

76""
"Figure 3.17. Phase synchrony-power relationship for increasing concentrations of KA and CCh. A. Scatter plot showing phase synchrony (PPS) and KγO oscillation power relationship at different concentrations of KA. B. Scatter plot showing phase synchrony (PPS) and CChγO oscillation power relationship at different concentrations of CCh.

77""
Figure 3.18. Phase synchrony-power-concentration relationship for KγO. A. c (red) values representing the power change of KA and m (blue) values showing phasepower relationship change with increasing concentrations for KA. The graph demonstrates linear increase in power, while a curvilinear phase-power relationship change. Extrapolation (blue dotted line) from the linear part of m (20–100 nM KA) to zero concentration gives m=0.8841 instead of predicted m=0 if SγO were the same as KγO (induced by 20–100 nM KA).

78""
"Figure 3.19. Laminar profile of SγO and KγO. A. Band-pass filtered (20–60 Hz) raw traces of SγO (teal) and KγO (red) recorded from the hippocampal CA3 layers (single recording). The peak frequency of SγO remains the same throughout the layers, whereas KγO in s. oriens showed lower frequency compared to other layers. Largest peak power for both SγO and KγO was observed in s. lacunosum-moleculare. Scale bars 20µV✕25ms for SγO (left) and 100µV✕25ms for KγO (right).
3.2.6. Laminar profile of SγO and KγO
The laminar profile of SγO and KγO was studied in the same slice by placing
recording electrodes in s. oriens, s. pyramidale, s. radiatum and s. lacunosum-
moleculare (distal s. radiatum) of the CA3 region. The largest power of both SγO and
KγO was observed in s. lacunosum-moleculare and declined further away from the
layer (Fig. 3.19). The frequency remained the same throughout the layers, although
s. oriens showed lower frequency in KγO. Phase analysis demonstrated phase
reversal between s.pyramidale and s. radiatum in both SγO and KγO (data not
shown).
3.3. Discussion !
3.3.1. SγO in improved brain slice preparation
In vitro brain slice research in rodents has always been criticised by researchers
occupying “higher” levels of research pyramid, working on whole-brain preparations,
on larger mammals, on in vivo preparations and finally on humans. Obvious
limitations of brain slices include reduced size of the preparation, isolated neuronal

79""
networks, absence of long-range connectivity, artificial conditions, not to mention the
differences in species. Despite all these factors, so much information that we
possess today has been acquired through in vitro research, and many mechanisms
were uncovered because of the work that otherwise would not be possible due to
ethical and practical considerations. Yet discrepancies still exist between the in vitro
and in vivo sides of research, and it is our responsibility to make research more
translational. One of the first steps towards this process should be increasing the
quality of in vitro research by maximising the quality of brain preparations.
Increasing the viability and longevity of brain slices by improving slice preparation
and storage techniques resulted in uncovering a natural gamma frequency rhythm in
the hippocampal CA3 region. During the traumatic brain injury like brain extraction
and cutting, brain cells undergo a stressful insult, which triggers a cascade of
excitotoxic reactions aggravated by neuroinflammation and oxidative stress. These
factors compromise cell well-being and result in cell death. In our lab, much effort is
put into creating conditions for brain slices resembling the conditions found in more
intact ‘physiological’ systems. Our goal is obtaining healthy slices and, hence good
quality recordings. In their review Hajos and Mody (2009) proposed several
modifications to the aCSF that would significantly improve tissue preservation.
Altering aCSF composition was one of the first steps: using different aCSF solutions
for cutting and recording (sucrose- and NaCl-based, respectively). Replacing NaCl
with sucrose prevents cell swelling and lysis during the damaging procedure of
cutting slices (Aghajanian and Rassmussen, 1989). Furthermore, inclusion into the
aCSF of various neuroprotectants, neuromodulators and antioxidants, like
indomethacin, uric acid, aminoguanidine, L-ascorbic acid, ketamine, N-acetylcysteine
and taurine substantially improved cell viability and longevity (Pakhotin et al., 1997;
Tutak et al., 2005; Proctor, 2008; Griffiths et al., 1993; Rice, 2000; Green and Cote,
2009; Tian et al., 2003; Kreisman and Olson, 2003). Changing the dissection
technique, employing transcardial perfusion with ice-cold cutting aCSF caused
remarkable changes in slice visualisation and endurance. These modified
techniques, combined and utilised by Prokic (2012) allowed us to minimize
excitotoxicity and neuronal death in the slice, which resulted in the observed
spontaneous activity in the CA3. Pietersen et al. (2009) also reported that using

80""
transcardial perfusion with sucrose-based aCSF substantially increased the
occurrence of SγO in the hippocampal slices.
Spontaneous activity observed in brain slices in the absence of any pharmacological
intervention allows us to study the natural “preferred” rhythm of a particular network.
This way we are able to exclude from the process a biased step of artificial promotion
of activity, a forceful drive of a network, which might not necessarily be the case in
vivo. SγO present an opportunity to study a more physiologically relevant model of
gamma oscillations and broaden our understanding of this phenomenon. Another
potential application of this model is in the drug discovery/development process for
increasing cognitive functions, as gamma waves in hippocampus are know to be
involved in learning and memory.
3.3.2. Basic profile of SγO, KγO and CChγO
Due to the fact that SγO were persistently observed in the majority of slices, in order
to independently measure and compare KγO and CChγO models, we had to go back
to the basic aCSF composition for slice preparation, in order to create a clear
baseline prior to induction of oscillatory activity. In the absence of additional
neuroprotectants and neuromodulators, spontaneous activity was mostly absent or
significantly reduced, suggesting that slice viability was a key factor in observations
of spontaneous oscillatory activity. SγO have been reported previously in a
preparation of murine hippocampus, however, they appeared only in 32.9% of slices
and persisted for only 20 – 40 min, which makes pharmacological characterisation of
this activity difficult (Pietersen et al., 2009). In contrast to this, SγO described in this
report readily appeared in the majority (>85%) of slices and lasted for several (up to
7) h, which could be explained by using improved brain slice preparation techniques.
The basic profiles of explored gamma models appear to be very similar, although
SγO frequency is significantly lower than induced oscillations. The mean peak
frequencies of gamma rhythm models observed by Pietersen and colleagues (2009)
were comparable to SγO and KγO recorded from our slices, suggesting to some
extent a similar nature of SγO studied in both laboratories. There are several
possible reasons that could account for frequency difference between spontaneous
and induced activity. On the one hand, the oscillations could involve same core
mechanisms, but different levels of excitatory drive. Hence, increasing the tonic

81""
excitatory drive by addition of KA or CCh and recruiting larger networks makes
chemically-induced gamma oscillations faster and more powerful compared to SγO
(Buzsaki and Wang, 1996). On the other hand, the studied models could involve
different microcircuits and interneuron types in the generation of gamma oscillations
(Middleton et al., 2008; Pietersen et al., 2009). In this scenario, different
interneurones would have different connectivity, IPSP decay kinetics or excitability,
which might alter the rhythm created upon their activation. The contrast in the
frequency of rhythmic activity is observed not only during the independent
comparison, but also when KA/CCh are added to pre-existing SγO. The frequency
shift marks the transition from one type of oscillation to another for the possible
reasons decribed above. It is worth mentioning the positive correlation between the
quality of SγO and induced gamma in the same slice, indirectly implying involvement
of similar basic mechanism (Pietersen et al., 2009), although it can also reflect good
general survival of different network elements.
The differences in the peak power of oscillations between the three models arise due
to uneven strength of excitatory drives provided by 50 nM KA and 1 µM CCh. As
identified from the input-output curves, application of 25 nM KA produces gamma
frequency oscillations of a comparable power to the ones produced by 1 µM CCh.
Concentrations of driving agents used to elicit gamma oscillations in our experiments
were considerably lower than the ones reported in original studies, indicating higher
sensitivity for KA and CCh (Fisahn et al., 1998; Hajos et al., 2000; Hormuzdi et al.,
2001). Possibly due to enhanced slice viability and network preservation, minimal
excitation was sufficient to generate network oscillations. Despite seemingly
increased excitability, the hippocampal network appeared to be relatively stable, as it
was impossible to induce any epileptiform activity, even at high concentrations of KA
and CCh. Increasing driving force usually reached a point when oscillations gradually
ceased, which was in line with early studies on hippocampal oscillations (Traub et al.,
1996a). A project carried out by Darshna Shah, another member of the laboratory, in
collaboration with Newcastle University has revealed that the modified brain slice
preparation contained more PV-positive interneurons (usually vulnerable to injury)
and was less susceptible to epileptiform activity compared to traditional slice
preparations.

82""
Early studies on brain slice preparation techniques (methodology) revealed that
immediately after cutting brain, slices required a minimum of 1 h rest prior to
recording, during which a structural recovery of the slice took place (Garthwaite et al.,
1980; Hajos et al., 1989; Kirov et al., 1999). This technique is also used in our
laboratory, and we found that when the LFP was recorded after the recovery period,
SγO were already present in the hippocampal CA3 region. By contrast, when
recorded straight after slicing, no activity was observed in the slices, however, it still
emerged after approximately 1 h, upon the completion of “synaptically silent” period
of recovery (Kirov et al., 1999). In all three models, gamma oscillations became
stable within 1.5–2 h of recording and usually lasted for several hours. Even though
we conducted no direct studies measuring the maximum life span of oscillations in
our slices, it was obvious from dose-response/sham experiments that SγO persisted
for up to 7 h, while oscillations sustained by pharmacological stimulation could persist
for 10 h and possibly longer. These observations once again point out high level of
brain cell preservation. Even slices exposed to prolonged storage (>6h) exhibited
SγO, further supporting this interpretation.
It is interesting how hippocampal rhythmic activity undergoes changes in frequency,
depending on applied KA/CCh dose. Dose-response experiments demonstrated that
at higher concentrations of KA and CCh, together with gamma oscillations, slow
rhythms were introduced (either theta or delta). It has been reported previously in
experimental and modeling conditions that different concentrations of CCh (4–60 µM)
were able to elicit transient delta, theta and gamma rhythm oscillations (Fellous and
Sejnowski, 2000; Tiesinga et al., 2001). Theta oscillations have been widely
observed in the hippocampus of rodents during active behaviour. Of a particular
interest is co-occurrence of gamma and theta rhythms, the so-called nesting of
rhythms (Soltesz and Deschenes, 1993; Bragin et al., 1995; Colgin et al., 2009;
Belluscio et al., 2012). It is believed that such dual oscillation is involved in coding
information, memory and sensory processes (Lisman and Jensen, 2013).
3.3.3. Characterisation of SγO
Apart from the CA3 region, spontaneous oscillatory activity has not been detected in
any other hippocampal regions in our slices. It is known that spontaneous oscillations
emerge from the areas with a substantial system of recurrent excitatory collaterals, a

83""
characteristic feature of the hippocampal CA3 region. Our results from experiments
with cut slices (to isolate CA3) support the idea of intrinsically generated SγO.
Exploring SγO occurrence across different age groups has revealed that
spontaneous activity is present throughout the life of an animal, although reports
exist in the literature about gamma rhythm decline in aged animals (Vreugdenhil and
Toescu, 2005; Lu et al., 2009). In contrast to this, our experiments show that SγO
become stronger and increase in frequency, as the rats get older. It is probably
important to establish whether it is the development or the aging of the system, as by
P20 (50g rat) the most fundamental developmental processes are already
completed. Pharmacological analysis showed that SγO peak frequencies were
altered significantly in response to any modulation, even when the power of
oscillations remained unchanged. This might indicate that oscillation frequency is
sensitive to even slight changes in the network balance, which provides
generation/maintenance of gamma oscillations. It is possible that some network
elements undergo fine age-dependent alterations, which modulate the frequency of
rhythmic neuronal activity. One of the potential contributors is the change in kinetic
properties of GABA-Ar, as the frequency of gamma oscillations is determined by the
decay time constant of GABAr-mediated IPSCs (Whittington et al., 1995; Buzsaki et
al., 1996). Some of our data show that spontaneous IPSCs recorded from CA3
pyramidal cells of 50g rats have a longer decay time compared to 100g animals,
hence slower gamma frequency oscillations (see Section 5.2.3.2.). This difference
could potentially be traced in older animals, however more experiments are required.
Other studies have demonstrated faster IPSC kinetics in mature animals compared
to young ones, which was associated with an increase in α1 subunit content of
postsynaptic GABA-Ar (Doischer et al., 2008; Lazarus and Huang, 2011). The
frequency of SγO could also depend on the overall level of interneuron excitation
mediated by AMPAr (Wallenstein and Hasselmo, 1997), which could change
throughout development/aging.
3.3.4. Comparative Pharmacology
Together with basic characterisation of in vitro gamma oscillations models, we
carried out a pharmacological analysis of SγO, KγO and CChγO, which revealed that
the three models were pharmacologically different. The results showed that

84""
GABAergic system was essential for gamma oscillations generation and
maintenance in all studied models, as GABA-Ar antagonists PTX and bicuculline
readily abolished all oscillatory activity. These findings were in line with the original
studies on SγO, KγO and CChγO in the hippocampus and cortical regions (Fisahn et
al., 1998; Fisahn et al., 2004; Palhalmi et al., 2004; Cunningham et al., 2003;
Yamawaki et al., 2008; Pietersen et al., 2009). Increased power of gamma
oscillations caused by the positive allosteric modulator of GABA-Ar zolpidem (100
nM) further supported the importance of GABA involvement. Similar effect was
observed by Heistek et al. (2010) in the hippocampus and Yamawaki et al. (2008),
Prokic (2012) and Ronnqvist et al. (2013) in M1 motor cortex. Palhalmi et al., 2004,
on the other hand, reported an opposite effect in CA3 area, which may be due to a
100-fold difference in zolpidem concentration. In accordance with previous
pharmacological studies (Fisahn et al., 1998; Cunningham et al., 2003; Yamawaki et
al., 2008; Pietersen et al., 2009), GABA-Ar modulator pentobarbital produced a
characteristic decrease in frequency of all three types of gamma oscillations due to
its ability to prolong the decay time of GABAergic IPSCs (Segal and Barker, 1984). A
significant shift in power was observed only in CChγO, which could indicate that this
model might be more dependent on GABAergic IPSCs. Together these findings
demonstrate that in SγO, like other gamma oscillations models, GABA-mediated
inhibition is a prerequisite for neuronal network synchronisation.
We also explored the role of excitatory glutamatergic system in the generation of
SγO and compared it to traditional KγO and CChγO models. Our findings show that
fast excitation mediated by ionotropic AMPAr was necessary for gamma oscillations
generation in all studied models. In all models, a non-selective AMPAr and KAr
antagonist, CNQX, abolished gamma rhythm, and replaced it with theta oscillations
6-15 Hz and ripples (150-200 Hz). This effect was similar to the one observed with
the combination of selective AMPAr blockers NBQX+SYM2206, although the theta
rhythm seemed to be more pronounced, whereas ripples were less prominent. Theta
oscillations occurring under the conditions of suppressed AMPAr activity were
reported by Gillies et al. (2002) and have been suggested to be generated by intrinsic
theta-frequency spiking subset of hippocampal interneurons. A remarkable difference
between the models appeared when GluK1,3-containing KAr were blocked by
UBP310 and the expected reduction in KγO power was contrasted with an increase

85""
in SγO power. The lack of literature on KAr in CA3 means we may only speculate on
the possible mechanism of UBP310 action on SγO. It seems likely that the effect
occurs on a local CA3 interneuron/pyramidal cell level. Based on the studies of KAr
in the hippocampus (for reviews see Pinheiro and Mulle, 2006 and Carta et al.,
2014), pyramidal cells mostly express GluK2-containing KAr, while GluK1 KAr are
found on the interneurons. An increase in SγO peak power could arise from blocking
the suppressive effect of presynaptic GluK1,3 on GABA release. For example,
Rodríguez-Moreno and colleagues" (1997) showed that presynaptic KA-
heteroreceptors decreased GABA release by 90% in hippocamnpus in vitro and in
and in vivo. Jiang et al. (2001) further demonstrated that high levels of KAr activity
depressed GABA inhibition in CA1, whilst low levels of activity facilitated inhibition in
the form of increased success rate of unitary IPSCs (uIPSCs). Hence, during SγO,
low levels of KAr activity may favour inhibition of pyramidal cell activity and this would
be relieved by KAr blockade with UBP310, leading to increased principal cell
excitability and enhanced oscillatory power, whilst during KA-driven activity, inhibition
would already be suppressed to some extent and the effects of UBP310 would be
dominated by depressant effects on network excitation – leading to a reduction in
KγO power. This mechanism is necessarily speculative, since the work cited above
was performed in CA1, however, we might predict that CChγO activity, which also
lacks direct KAr activation, might resemble SγO in its response to UBP310. This was
indeed observed in some experiments (see Fig. 3.9C) but not in others and the
mixed effects may indicate that CCh drive places the network at the threshold for
significant indirect KAr activation, placing this model somewhere between SγO and
KγO in this regard.
Due to the lack of selective GluK2 KAr antagonists, it is difficult to evaluate the role of
GluK2 subunit in the generation of gamma oscillations. However, Fisahn and
colleagues (2004) showed that in GluK2 KO mice, KA application failed to elicit
gamma oscillations. Most studies suggest that KAr and AMPAr-mediated excitation
was required for the generation of various types of gamma oscillations (Fisahn et al.,
1998; Whittington et al., 2000; Cunningham et al., 2003; Khazipov and Holmes,
2003; Fisahn et al., 2004; Brown et al., 2006; Pietersen et al., 2009). Fisahn and
colleagues (2004), however, argued that AMPAr activation was not necessary for

86""
KγO, although discrepancies could possibly occur due to different AMPAr
antagonists used.
Our results demonstrated that NMDAr did not significantly contribute to SγO or KγO,
the latter being supported by the original pharmacological study (Fisahn et al., 2004).
On the contrary, Pietersen et al. (2009) showed SγO suppression and
KγO enhancement with NMDAr antagonist AP-5. Interestingly, our CChγO increased
significantly after NMDAr were blocked.
The involvement of metabotropic glutamate receptors was explored using MPEP and
LY341495 to block mGlu1, mGlu5 and groups II and III, respectively. Our findings
showed that groups II and III did not actively contribute to gamma oscillations in
either of explored models. Blockade of mGlu5, on the other hand, resulted in a
substantial increase in oscillation power in all three models, possibly due to indirect
effects leading to increased synaptic inhibition, which boosted the oscillations (Desai
et al.,1994).
Apart from the synaptic mechanism, all three models of gamma oscillations heavily
relied on the non-synaptic component, as the gap junction blocker either greatly
decreased or abolished gamma oscillations in all experiments. These observations
were in line with previous reports (Traub et al., 2000, 2003; Hormuzdi et al., 2001;
Buhl et al., 2003; Pietersen et al., 2009). Generally, previous reports demonstrated
that electrical coupling dramatically increased the power of gamma frequency
oscillations, however were not required for the generation of rhythmic activity.
Atropine, as an mACh antagonist, was used to determine whether these receptors
were required for maintaining gamma rhythm oscillations. The results demonstrated
that while activation of cholinergic system was able to induce oscillatory activity, its
presence was not required for the naturally occurring rhythm in the slices (SγO). The
fact that atropine blocked CChγO (Fisahn et al., 1998), but not SγO and KγO (Fisahn
et al., 2004) indicated that SγO were more comparable to KγO than CChγO. Our
observations led us to an assumption that KγO represented a more physiologically
relevant in vitro model of gamma oscillations in comparison to CChγO, however as

87""
the system is capable of generating different types of gamma activity, we cannot
exclude the possibility of KγO or CChγO occurrence in an intact brain.
Overall, pharmacological characterisation shows fundamental differences in the
mechanism of the three models. SγO, KγO, CChγO seem to share some basic
elements taking part in rhythmogenesis, such as dependence on GABAergic
inhibition. However, the independence of SγO from GluK1 KAr and mAChr, which are
essential for KγO and CChγO maintenance, respectively, suggests that SγO
constitute a distinct class of rhythmic activity.
3.3.4. Phase analysis of SγO
Phase synchrony analysis provided some insights into the nature of SγO and their
spatial profile. Similarly to driven oscillation, SγO were strongly phase coupled
throughout the CA3 region. Although it decreased in the long range, the coupling was
still rather strong. The fact that upon addition of pharmacological agents the phase
synchrony became slightly stronger suggested either the recruitment of more cells or
a more synchronised cell firing. To address the issue of volume conductance, we
carried out experiments with the cut between adjacent electrodes, which showed that
strong coupling was produced by the network activity recorded by the electrodes.
The analysis of short- and long-range connectivity is in progress, and should provide
more knowledge on the spatial properties of SγO, in comparison to KγO and CChγO.
Based on the KA dose-dependent phase synchrony-power relationship, it appeared
that SγO were different from KγO, as SγO behaviour did not fit into the predicted 0
nM KA KγO. More experiments are required to investigate whether SγO are a 'small
version' of CChγO.
3.3.5. Laminar characterisation of SγO and KγO
The laminar profile of SγO suggested that the change in polarity from s. pyramidale
to s. radiatum reflected the flow of currents in somato-dendritic regions of CA3
pyramidal cells. Original studies demonstrated phase reversal from body to apical
dendrites of hippocampal pyramidal cells in KγO and CChγO (Csicsvari et al., 2003;
Buzsaki et al., 2003; Hajos et al., 2004; Mann et al., 2005a; Vreugdenhil and Toescu,
2005). Current-source density (CSD) studies revealed that gamma oscillations were

88""
associated with alternating current sink and source pairs in s. pyramidale and s.
radiatum (Csicsvari et al., 2003; Hajos et al., 2004; Mann et al., 2005a). The
investigation carried out by Vreugdenhil and Toescu (2005) on KγO and CChγO
revealed certain differences in characteristics of these two models. Although some
observation from the study did not fit with other literature (in particular regarding
CChγO), the authors concluded that despite similar mechanisms between
KγO and CChγO, they involved different networks (Vreughdenhil and Toescu, 2005).
The same research group investigated laminar CSD profile of SγO in comparison to
KγO, their results showed less pronounced sinks and sources in SγO and authors
suggested that KγO additionally recruited perisomatic IPSCs (Pietersen et al., 2009).
3.3.7. SγO as a physiologically relevant model of gamma oscillations
Electrophysiological and pharmacological comparison of three types of gamma
oscillations (SγO, KγO and CChγO), combined with previous reports, suggest that,
compared to KγO and CChγO, SγO more closely resemble the gamma oscillations
observed in vivo (Csicsvari et al., 2003; Buzsaki et al., 2003; Vreugdenhil and
Toescu, 2005; Pietersen et al., 2009). We demonstrate that SγO are
pharmacologically different, and thus could be used for exploring rhythmic activity in
the hippocampus in vitro. Although SγO have been observed previously, it had a
transient nature and did not appear regularly. For these reasons, characterisation of
such SγO and interpretation of results appear to be difficult. Despite this limitation,
Pietersen and colleagues (2009) suggest that SγO and KγO arise from the same
basic network, but are different in the types of involved interneurons and
pharmacological properties, although it is difficult to make conclusions. Nevertheless,
the main idea taken from spontaneous activity observation is that SγO represent a
physiologically-relevant model of oscillations, as it is naturally produced by the local
neuronal networks preserved in a brain slice. Due to the existance of only two
characterisational studies on SγO, much information about this rhythm is still
unknown.
3.4. Conclusion
In this report we explore a model of persistent spontaneous gamma oscillations in
CA3 area of the hippocampus. We suggest that improving slice viability by altering

89""
methodology (techniques) uncovers this natural rhythm. We compare its
electrophysiological and pharmacological properties to traditional KγO and CChγO
models of gamma oscillations. We conclude that SγO in CA3 hippocampus appear to
employ the same basic inhibition-based mechanism as KγO, however, significant
difference in KAr dependence is observed. Similarly, SγO differs from CchγO in their
independence from cholinergic system. Based on the pharmacological and phase
analyses, we conclude that SγO are a distinct type of gamma rhythmic activity, and
hence, due to their natural occurrence, are more physiologically relevant. These
findings present an opportunity to work on a reliable physiological model of neuronal
network oscillations, partially solving the problem of large discrepancies between in
vitro and in vivo research.

90""
4. Chapter 4 The Reduced Intensity Status Epilepticus (RISE) model of chronic epilepsy

91""
4.1. Introduction
Epilepsy is a pathological condition, characterized by the occurrence of SRS, which
appear as a result of abnormal neuronal excitability and synchrony. Electrographic
seizures are associated with large amplitude oscillatory activity, suggesting
hypersynchrony, at least on a local level (Timofeev et al., 2012). Due to a large
variety of seizure and epilepsy types in humans, as well as a large variety of studied
brain regions, different types of rhythmic activity have been associated with seizures
(either preceding or superimposed upon them): spike-wave complexes (2 – 3 Hz)
and fast runs at 10 – 20 Hz (Steriade et al., 1998; Neckelmann et al., 1998), 50 – 80
Hz rhythmic activity (Allen et al., 1992); 80 – 200 Hz ripples (Fisher et al., 1992;
Traub et al., 2001b; Grenier et al., 2003) and 200 – 500 Hz fast ripples (Bragin et al.,
1999b). Overall, much information has been accumulated from both human and
animal studies over the years; however, more research exploring the role of different
oscillatory patterns in epilepsy is yet to come. It is becoming clear that high-
frequency oscillations are tightly associated with seizure activity and might indicate
epileptogenic properties of the tissue and identify the focus of seizure generation.
From a clinical point of view, as defined by the International League Against Epilepsy
(ILAE), epilepsy is “a condition characterized by two or more recurrent epileptic
seizures over a period longer than 24 h, unprovoked by any immediate identified
cause” (Sander, 1997). Various classifications of epilepsy exist in the literature and
clinics, including the localisation of the focus, aetiology, as well as the seizure types.
According to seizure manifestation, seizures can be motor, sensory (auditory, visual,
olfactory), autonomic (sweating, piloerection, epigastric sensation), psychic
(cognitive, illusions, hallucinations). There are two types of seizures: partial,
occurring in a specific area of the brain (focal), and generalised, when the
pathological activity spreads across the brain regions. Partial seizures are further
divided into simple (maintained consciousness) and complex (loss of
consciousness). Generalised seizures actively involve motor system, hence are
accompanied by convulsive state with tonic /clonic phases. Based on the aetiology,
epilepsy is classified into idiopathic (e.g. absence epilepsy), provoked, cryptogenic
and the largest group symptomatic, which includes genetic/developmental and

92""
acquired (e.g. head trauma, infection, brain tumors) (Shorvon, 2011). Depending on
the brain area producing the seizures, epilepsies are classified into temporal, frontal,
parietal and occipital lobe epilepsies. TLE is the most commont type among
localisation-related epilepsies, occuring in 66% cases (Semah et al., 1998).
Furthermore, TLE is known to be the most common type of intractable epilepsy,
occuring in 50 – 70% of the cases (Wass et al., 1985; Guldvog et al., 1994; Keene et
al., 1997). As suggested by its name, TLE involves temporal lobe brain structures
like the hippocampus and amygdala, its symptoms usually inlcude motionless staring
(freezing) and oroalimentary automatisms (Engel, 1996). TLE is usually accompanied
by characteristic neuropathological alterations like hippocampal sclerosis with
excessive gliosis and cell death, neuronal circuit reorganisation with axonal sprouting
and synaptogenesis (Sutula et al., 1988, 1989; Mikkonen et al., 1998).
4.1.1. Epilepsy models in animals
A number of questions have been formulated in the epilepsy research over the years.
What leads to cell hyperexcitability, what causes abnormal synchronous neuronal
discharges, what underlies the transition from interictal to ictal activity, why do
seizures propagate, how do they stop, how is intractable epilepsy different from other
types, and, of course, developing new antiepileptic drugs (AEDs) – these are the
main questions the research has been trying to answer (Mody and Schwartzkroin,
1997).
One might understand that human studies are not suitable for extensive epilepsy
research, due to obvious ethical issues. These limitations have led to the
development of a wide variety of epilepsy and seizure models in animals. The search
for new effective AEDs and the necessity to unravel the mechanism of
epileptogenesis have been the main factors pushing forward the development of
different epilepsy models up to this date. One of the critical moments of epilepsy
animal research is to distinguish between seizure and epilepsy models. Both types
are widely used nowadays, however they serve different purposes. Seizure models
are mainly utilised for new AED screening in the pharmaceutical industry, when
certain model properties like cost- and time-effectiveness are essential. Epilepsy
models, on the other hand, are mostly used by research groups exploring the

93""
mechanisms of epileptogenesis in search for new targets for pharmacotherapeutic
intervention.
One of the main challenges in the field has been the questionable validity of epilepsy
models. As summarised by Sarkisian (2001), some people reasonably argue that
many investigations are carried out on healthy rather than epileptic brains, some of
the seizure manifestations, both behavioural and at the level of brain recording, do
not resemble those observed in humans, and finally, it may be asked: how
translational is animal research in epilepsy? So what are the criteria for a good
epilepsy model? Again, as pointed out by Sarkisian (2001), an epilepsy model should
exhibit the same or at least similar behavioural and EEG patterns of seizures, as in
human epilepsy. Furthermore, a valid epilepsy model should mimic the aetiology of
the corresponding human condition. The model should have a similar age of epilepsy
onset and exhibit the same pathological changes characteristic for a certain type of
human epilepsy. Logically, a valid epilepsy model should respond to the same AEDs
as the human epilepsy.
A brief description of the most commonly used models of seizures and epilepsy will
be given now.
4.1.1.1. In vitro models of seizures
In vitro brain slice preparations allow modelling and studying epileptiform discharges
at the cellular and network levels, which can be a solid support for epilepsy model
findings and the mechanism(s) of action of AEDs. In vitro models of seizures are a
good basis for exploring seizure intiation, propagation and cessation within a
localised area. These models clearly lack the most important features of in vivo
models, such as long-range connectivity of the brain, as well as behavioural and
motor components, and therefore can produce only limited aspects of seizures.
These seizure equivalents are achieved by altering electrical activity and ionic
concentrations in slices. In brain slices, acute seizure-like activity can be elicited with
low Ca2+ (Jefferys and Haas, 1982), low Mg2+ (Stanton et al., 1987) or elevated K+
(Jensen and Yaari, 1988) medium, as well as 4-aminopyridine (4-AP) (Avoli et al.,
1996) and/or electrical stimulation (Rafiq et al., 1995). It is peculiar that seizures are
induced in slices from healthy tissues, yet it is often very difficult to elicit seizures in

94""
the same way in human tissue from epileptic brain (Gabriel et al., 2004; Huberfeld et
al., 2011). When using brain slice preparations to study seizure-like events, one
should always keep in mind the disadvantages of this model, such as the tissue
undergoing acute lesioning/ischemia, disturbed networks, severed connections,
reduced oxygen and nutrients diffusion in slices, differences in brain
physiology/anatomy between species (Heinemann et al., 2006).
4.1.1.2. Models of acute seizures
Different models of seizures and epilepsy are used based on the aims of conducted
research. For the purpose of screening a large number of compounds for
anticonvulsant properties, a new class of models termed models of acute seizures
was developed. These models include induction of seizures with chemical agents like
pentylenetetrazol (PTZ), antibiotics, metals and toxins or with electrical stimulation,
such as maximal electroshock seizure threshold (MEST) and 6-Hz seizure test (for
review see Velisek, 2006; Mares and Kubova, 2006).
4.1.1.3. Kindling model of epilepsy
The kindling phenomenon was discovered by Graham Goddard in 1967, and it has
been widely used in epilepsy research as a model of chronic TLE, since the most
significant changes appear in the temporal lobe regions like the amygdala and
piriform, perirhinal, entorhinal, and insular cortices (Goddard et al., 1969; McIntyre et
al., 1999). The kindling phenomenon occurs when a repeated induction of focal
seizures results in a gradually increasing response to the stimulating agent,
producing electrographic and behavioural changes and leading to the kindled state.
Eventually, after a long period of time, epileptic seizures start appearing
spontaneously, as the brain region becomes 'overkindled' and truly epileptic. For an
extensive review of kindling models see Morimoto et al. (2004).
4.1.1.4. Post SE epilepsy models
TLEs exhibit several features that have been incorporated into different animal
models. These hallmarks include seizure foci in the temporal lobe (Bartolomei et al.,
2005), an intial insult (so-called 'initial precipitating injury') [Mathern et al., 2002]
followed by a seizure-free period and certain histopathological changes (Mathern et

95""
al., 1997). SE models of epilepsy constitute a large field of animal epilepsy research,
due to the common properties they share with TLE. They allow exploration of truly
epileptic animals exhibiting SRS some time after systemic administration of
convulsant agents like KA or pilocarpine. These models, although employing different
mechanisms, progress through the same stages: an initial hours-long SE
characterised by continuous recurrent seizures, followed by a quiescent period of a
few weeks or months with no seziures (the so-called latent period), and finally SRS,
when an animal becomes epileptic. During the SRS phase, researchers can observe
seizures lasting 1 – 3 min and resembling complex partial seizures with secondary
generalisation, which increase in frequency with epilepsy progression. The most
explored stages are either SRS period or the transition from latent period to SRS. It is
believed that all neuropathological changes take place during the latent period. The
duration of latent period can not be precisely calculated, however, its mean duration
is around 40 d (Glien et al., 2001) and it can be manipulated through the dose of
inducing agent, lasting from several days at high doses to months after SE induction
at lower doses (Hamani and Mello, 2002). Moreover, Navarro Mora et al. (2009)
suggest that in pilocarpine model a prolonged SE is not required for an animal to
become epileptic. They demonstrate that even after not having experienced SE still,
lesioned animals develop SRS after latent periods of up to a year.
SE models are widely used to study TLE, as they closely mimic the changes occuring
in human mesial TLE, even though animal models may produce extensive brain
damage. Indeed, severe brain damage and animal mortality during the induction are
serious disadvantages and problems of these models. Klitgaard and colleagues
(2002) report that in pilocarpine model minimum 30 min SE is necessary for SRS
development later on, however, the longer the SE period is, the more extensive
cellular death is observed (Inoue et al., 1992). It is known that SE might be difficult to
control, and it is further exacerbated by the variability in sensitivity towards
convulsant agents among animals. These factors often result in high animal mortality.
On the other hand, reducing the dose of an agent most of the times leads to a low
success rate, therefore, when working with these models, it is essential to find the
right balance.

96""
4.1.1.4.1. KA-induced SE model of epilepsy
In 1978 Nadler and colleagues discovered that focal injection of KA induced seizure
and neuropathological changes in the hippocampus. This model became a powerful
tool in the epilepsy field. KA-induced epilepsy in animals closely resemble acquired
human epilepsy and TLE condition, sharing the same morphological alterations such
as significant neuronal death, hippocampal gliosis, and axonal sprouting (Wieser et
al., 2004). Furthermore, a similar etiology was documented in humans, when an
outbreak of amnesic shellfish poisoning took place in Canada in 1987. Acute domoic
acid (a KA analogue) poisoning resulted in affected people exhibiting various seizure
manifestations from chewing and grimacing to a prolonged SE (Teitelbaum et al.,
1990; Cendes et al., 1995). The patients who had undergone SE had a seizure-free
period of about a year before developing TLE (Cendes et al., 1995). The postmortem
examinations of patients with fatal outcome revealed specific neuropathological
changes in the hippocampus and amygdala, similar to KA-induced damage in
animals (Teitelbaum et al., 1990).
4.1.1.4.2. Pilocarpine/Li-pilocarpine model of epilepsy
The pilocarpine model of chronic epilepsy was first described by Turski and
colleagues in 1983, and since then has been used extensively as a model of human
TLE. The fact that pilocarpine-induced epilepsies demonstrate circuit reorganisation
in limbic structures (e.g. the loss of interneurons, mossy fibre sprouting and reactive
gliosis) and are poorly controlled by AEDs further supports the use of this model for
exploring TLE (Wieser, 2004; Glien et al., 2002; Chakir et al., 2006). Studies show
that pilocarpine produces its epileptogenic effects via M1 mAChr, since seizures can
not be induced with pilocarpine in M1 receptor KO mice (Hamilton et al., 1997).
Furthermore, administration of atropine prior to SE induction is able to prevent the
development of seizures (Clifford et al., 1987). Interestingly, atropine loses its
effectiveness once the seizures are initiated, suggesting that their maintenance relies
on mechanisms other than muscarinic receptor activation (Clifford et al., 1987).
Extensive research on the mechanism of pilocarpine effects has been conducted for
years now, and it has been summerised by Cavalheiro et al. (2006) and presented in
Fig. 4.1. When examining the whole picture, it becomes clear that pilocarpine triggers
a massive cascade of reactions in neurons and glial cells. These reactions affect
signal transduction pathways, ionic concentrations, receptor and neurotrasmitter

97""
Figu
re 4
.1. T
he m
echa
nism
of
pilo
carp
ine
mod
el o
f ch
roni
c TL
E. T
he c
hart
show
s a
casc
ade
of n
euro
infla
mm
ator
y re
actio
ns tr
igge
red
by p
iloca
rpin
e ad
min
istra
tion
(ada
pted
from
Cav
alhe
iro e
t al.,
200
6).

98""
activity, and inflamation, which lead to increased excitability, development of SE,
cellular death and neuronal reorganisation.
Many epilepsy models, including the pilocarpine model, initially induce SE, which
progresses through the Racine stages, culminates in generalised tonic-clonic
seizures and persists for hours before spontaneously subsiding. Before and during
SE, EEG recordings initially demonstrate theta rhythm in the hippocampus, which
turns into large amplitude and high frequency activity, as the seizures worsen. Later
on, high voltage spiking appears prior to seizures, hence both ictal and interictal
activity can be observed on the EEG. Once SE remits, the EEG goes back to normal.
Studies suggest that the epileptiform activity originates in hippocampus and spreads
to the amygdala and the cortex (Turski et al., 1983).
The SRS phase is characterised by the occurrence of spontaneous seizures, which
begin with partial seizures such as staring, oroalimentary auromatism, forelimb
clonus and later turn into generalized seizures, incuding bilateral forelimb clonus,
rearing, falling and tonic-clonic seizures (Veliskova, 2006; Goffin et al., 2007). It has
been noted that SRS appear in a cyclic manner every 5–8 days (Goffin et al., 2007).
EEG manifestations include bursts of spikes originating in the hippocampus and
propagating to the cortex; ictal activity is followed by interictal activity with
suppressed background activity with spikes (Cavalheiro et al., 1991). "
Since the pilocarpine model of epilepsy has been in use for decades now, it has
inevitably undergone modification and improvement. Different research groups add
their own components and change the protocol according to desired outcomes. One
of the most popular modifications of the model is administration of Li 24 h prior to
pilocarpine induction (Honchar et al., 1983). It was suggested that Li and pilocarpine
exert synergistic effects, increasing inositol 1,4,5-trisphosphate (IP3) production and
subsequent acetylcholine (ACh) release and mAChr signalling (Honchar et al., 1983;
Jope et al., 1986). Administration of Li allows reducing the dose of pilocarpine from
300–400 mg/kg to only 30 mg/kg. The models seem to be indistinguishable in all their
parameters, apart from increased sensitivity to pilocarpine and increased success
rate (Clifford et al., 1987; Goffin et al., 2007). Despite all its advantages, the Li-
pilocarpine still caused very high (>90%) mortality among the animals (Jope et al.,

99""
1986; Morissett et al., 1987). To reduce mortality, different methods have been
suggested, such as repeated injections of low doses of pilocarpine over time and
shortening SE by termination with drugs (diazepam, pentobarbital and phenytoin).
Neuropathological alterations occurring under the influence of pilocarpine induction of
epilepsy are similar to those observed in KA-induced model and human TLE.
Following SE, the changes appear in many areas of the brain, including olfactory
cortex, the amygdala, hippocampus, thalamus, and neocortex (Turski et al.,
1983a,b). Cell death has been reported in different limbic structures like amygdala,
subiculum and entorhinal cortex, particular loss of interneurons was found in the
hippocampus (Turski et al., 1983a,b; Du et al., 1995; Mello and Covolan, 1996;
Knopp et al., 2005). Neocortex has been reported to undergo significant
neuropathological changes like sprouting, reorganisation, abnormal morphology,
reactive gliosis, disruption of cortical organisation, and reduction in the cortical
thickness (Sanabria et al., 2002; Silva et al., 2002). It is still not clear what role those
changes play in the reorganisation and seizure development, since sprouting can
occur without extensive cell loss, and epileptogenesis itself has been suggested to
occur without neuronal damage (Zhang et al., 2002). This observation can be true,
since there is a minority of TLE patients without gross histopathological changes
(Margerison and Corsellis, 1966; Lehericy et al., 1997; Liu et al., 2002; Jackson et
al., 2004; and other).
Much effort has been put into trying to unravel the mechanism(s) of epileptogenesis.
Different theories have been proposed and explored, including reduction in synaptic
inhibition, increase of excitation, and changes in receptors and ion channels (for
review see Dudek et al., 2006). Researchers have employed a variety of in vitro and
in vivo electrophysiological and histological methods in their attempts to disentangle
mechanisms, however, there is a daunting level of complexity. For example, some
research groups have been focusing on exploring axonal sprouting and development
of new recurrent excitatory circuits during epileptogesis (Dudek et al., 2002; Dudek
and Shao, 2003; Nadler, 2003). Other laboratories have pursued a different path,
focusing on the possible selective loss of interneurons, leading to subsequent
disinhibition of pyramidal cells (Best et al., 1994; Morin et al., 1998; Buckmaster and
Jongen-Relo, 1999). In their review, Bernard and colleagues (2000) reasonably point
100""
out that alterations observed in the brain are area-, pathway-, time- and model-
specific, which adds an incredible number of variables that have to be taken into
account when researching in this field. On the one hand, it would be extremely
helpful to have a unified model of epilepsy. On the other hand, so much variability
exists among the human epilepsy itself, that it may justify the existance and usage of
different animal models. Finally, identifying the mechanisms/findings that are
common across models could potentially be the most fruitful approach.
4.1.2. Epilepsy in human brain slices in vitro
A handful of laboratories around the world explore mechanisms underlying epilepsy
in a preparation of human brain slices. The tissue is usually obtained from surgical
resections of epileptogenic brain foci in patients with pharmacoresistant epilepsies,
most commonly mesial TLEs. Significant amount of information on the human brain
tissue physiology has been accumulated thanks to the works of Köhling,
Schwartzkroin, Avoli, Miles, Cunningham and others. A variety of electrophysiological
techniques, including intracellular and field potential recordings (commonly utilising
multielectrode arrays), have been used to study ionic concentrations, voltage-gated
currents, cellular, synaptic, and network properties of epileptic human brain tissue
(Köhling et al., 2006). Apart from electrophysiological techniques, a wide range of
histochemical and immonochemical, optical imaging and pharmacological methods
have been implemented as well. Despite best efforts, human brain slices do not
exhibit spontaneous epileptiform activity, however, electrical and pharmacological
stimulation, as well as changes of ionic concentration were found to elicit epileptiform
activity (Masukawa et al., 1989, Avoli et al., 1991; Hwa et al., 1991, Avoli et al.,
1994).
One of the greatest advantages of this specimen compared to the models discussed
previously is the true nature of human epilepsy. The findings derived from the
epileptic human tissue would never be under the attack of animal model criticism or
skepticism regarding the actual relation to human disease. However, together with
strengths, certain limitations of this prepration exist. Firstly, it is extemely difficult to
obtain non-epileptic human brain tissue to use as a negative control. Researchers
have, however, sometimes used tumour resections or healthy tissue taken to gain
access to deep epileptic areas. Secondly, resected tissues are always minimised in

101""
size and often do not contain preserved networks, which might be crucial in the
context of epilepsy. Possibly due to these reasons, little or no spontaneous ictal
activity has ever been observed in epileptic human brain slices. Thirdly, access to
this kind of material is usually limited and only a small number of laboratories have
the opportunity conduct human tissue research.
4.1.3. Necessity for improvement and refinement
“The sheer mass of data now available on the subject of temporal lobe
epilepsy is emblematic of the modern problem of having so much information
on any given subject that it is significant conceptual challenge to separate
facts from notions, associations from causes, and to discriminate between the
possibly important and the probably unimportant. The enormous information
now available to us, taken together with the natural desire we have to get clear
and unambiguous answers to all of the questions we ask, makes simple
answers appealing, and may explain, in part, the general hesitancy we have to
admit that we may know far less than we actually do”. (Sloviter 2005)
After decades of researching epilepsy, it appears that we are still in the very
beginning of our understanding. Numerous discrepancies and inconsistencies arising
from epilepsy animal research prevent it from moving forward. The use of a wide
array of different seizure and epilepsy models, which are time- and cost-effective, but
which often fail to reflect the natural history of epilepsy only further exacerbates the
problem. All models of seizures and epilepsy undoubtedly demonstrate both
advantages and disadvantages. For instance, kindling and focal lesioning are known
to be less severe, compared to systemic injections of proconvulsants. Systemic
injections, on the other hand, allow a “self-selection” of brain regions most vulnerable
to seizures. Despite this advantage, some systemic protocols may involve a very
intense and/or prolonged seizure activity resulting in a severe neuronal damage all
over the brain, which is not found in the majority of epilepsy patients, hence, is not a
prerequisite for idiopathic epilepsy. Sloviter (2005) has questioned the validity of
epilepsy models that rely upon prolonged SE for the induction of the disease. The
amount of research conducted and infomation accumulated over the past years
compared to the overall progress made suggests the necessity of employing a
multidisciplinary approach, with active integration of existing models with the only

102""
truly epileptic material i.e. human brain tissue. The adoption of 3Rs (Reduction,
Refinement and Replacement of animals) principles into the research ethics
framework of many EU and non-EU nations has provided an encouragement to seek
more refined animal models that not only reduce animal usage and suffering but also
aim to improve the scientific basis for models through, for example, closer homology
to the natural history of a disease (Russell and Burch, 1959).
The disadvantages of existing epilepsy models encouraged us to attempt to improve
the Li-pilocarpine model to mimic the human condition more closely. The severity of
existing models and the extent of neuropathological brain damage were the key
factors that required refining, as pointed out by Sloviter (2005, 2008). As mentioned
earlier, high animal mortality also remains an important issue, as it undermines both
ethical priciples, as well as physiological relevance of the model. Therefore, we
developed a model of acquired TLE with a better control of induced SE and, thus,
minimised brain damage and mortality. We characterised it in behavioural and in vitro
studies, demonstrating that the refined model is of low severity, yet high morbidity,
which makes it a good tool to explore the mechanisms of epileptogenesis.
4.2. Results
4.2.1. Model refinement
The current Li/low-dose pilocarpine epilepsy model is based on a modified version of
the model originally described in rats by Glien et al. (2001). The original model
involved a pre-dose of Li 24 h prior to repeated (30 min intervals) low doses of
pilocarpine. The reduced-intensity status epilepticus (RISE) model described and
utilised here employs a similar protocol but combines this with administration of the
sedative and muscle relaxant drug, xylazine, during the acute seizure phase and
rapid termination of the acute seizure phase with an anticonvulsant/antiepileptic
cocktail.
The original studies used high-dose pilocarpine (300–400 mg/kg) model, which was
very common and was associated with the development of a full syndrome, yet with a
very high mortality (Turski et al., 1983b, 1989; Cavalheiro et al., 1991; Liu et al.,

103""
1994). Honchar and colleagues (1983) discovered that administration of relatively low
doses of pilocarpine to Li-treated rats produced sustained limbic seizures. Li was
found to have a potentiating effect on pilocarpine-produced seizures, when pre-
administered 24 h before pilocarpine (Honchar et al., 1983; Jope et al., 1986; Clifford
et al., 1987). Studies have reported that Li-pilocarpine model produces similar
behavioural and electrographic seizures, as well as neuropathological changes, as
those seen in animals treated only with high doses of pilocarpine, but appears to be
more consistent in seizure onset latency and success rate (Jope et al., 1986; Clifford
et al., 1987). Hence, the Li-pilocarpine model of chronic epilepsy was used as a
foundation for the current model. After predosing with Li (127 mg/kg), we used 30
mg/kg pilocarpine (s/c) to induce SE. Α-methylscopolamine was administered (s/c)
prior pilocarpine to block peripheral cholinergic effects like piloerection, salivation,
tremor and diarrhoea. Once the animals experienced two periods of stage 4–5
Racine scale seizures, behavioural seizure manifestations and clonic muscle
contractions were attenuated by administration of a low dose (2.5 mk/kg) of the
central muscle relaxant xylazine (Yang et al., 2006; Thompson et al., 2007).
Administration of xylazine helped minimise animal suffering and the severity of the
model. Glien and colleagues (2001) conducted a study showing that the majority of
animals exhibit SRS even after 1h of SE, which is significantly shorter than used by
some laboratories (Lemos and Cavalheiro, 1995). Therefore, to reduce
neuropathological damage and animal suffering, after 1h of xylazine-modified SE, a
STOP cocktail containing diazepam (allosteric modulator at GABA-Ar
benzodiazepine site), MPEP (mGluR5 antagonist), MK-801 (selective and non-
competitive NMDAr antagonist) and ethanol was administered s/c to terminate SE, as
diazepam and MK-801 are known to produce anticonvulsant effects (Walton and
Treiman, 1988, 1991; Ormandy et al., 1989). The rats were recovering during the
next 6 h and were back to normal within 24 h. Close monitoring of animals during the
recovery period was a critical condition for high survival of animals after lesioning.
4.2.1.1. Low mortality and high morbidity
The current model of chronic epilepsy has been tested on a total of 396 rats, which
resulted in 12 losses during initial SE and 39 animals were sacrificed for health and
welfare reasons. Once the model protocol was fully established from a total of 196
rats only 2 losses were recorded, showing a very low mortality rate (~1%) across the

104""
Figure 4.2. SRS frequency is variable and follows a weekly cycle. A. Distribution of weekly seizure frequency as observed during video monitoring (n=10). B. Mean daily seizure frequency of animals during the recording period, data are expressed as mean ± S.E.M. (n=10).
two laboratories in which it has been used. Overall, using a combination of Li-
pilocarpine and decreasing the duration of SE to only 1 h, resulted in a lower
mortality rate during and after SE, when compared to previous reports: 40–50%
(Glien et al., 2001; Turski et al., 1989) and 50–80% (Jope et al., 1986). In order to
determine the fraction of animals undergoing SRS, our collaborators from Reading
University used behavioural assessment discussed below) and demonstrated that
40–100% of surviving animals in any cohort (mean 69% overall) successfully
developed SRS. After it was confirmed by PSBB (see below) and video monitoring
that animals exhibited SRS, the group in Reading explored the course of SRS
development in behaviourally monitored animals (n=10). The results showed a large
variability of seizure occurrence among the animals (range: 1–37; mean: 8.1 ± 3.5
seizures per week), however the frequency of seizures also varied in a characteristic
periodic way peaking every 5–7 days (Fig. 4.2). It should be noted that the observed
animals were from different batches and exhibited SRS at different times. Hence the
rats were video monitored on different schedules, which made it impossible for any
external factors to interfere with these results.
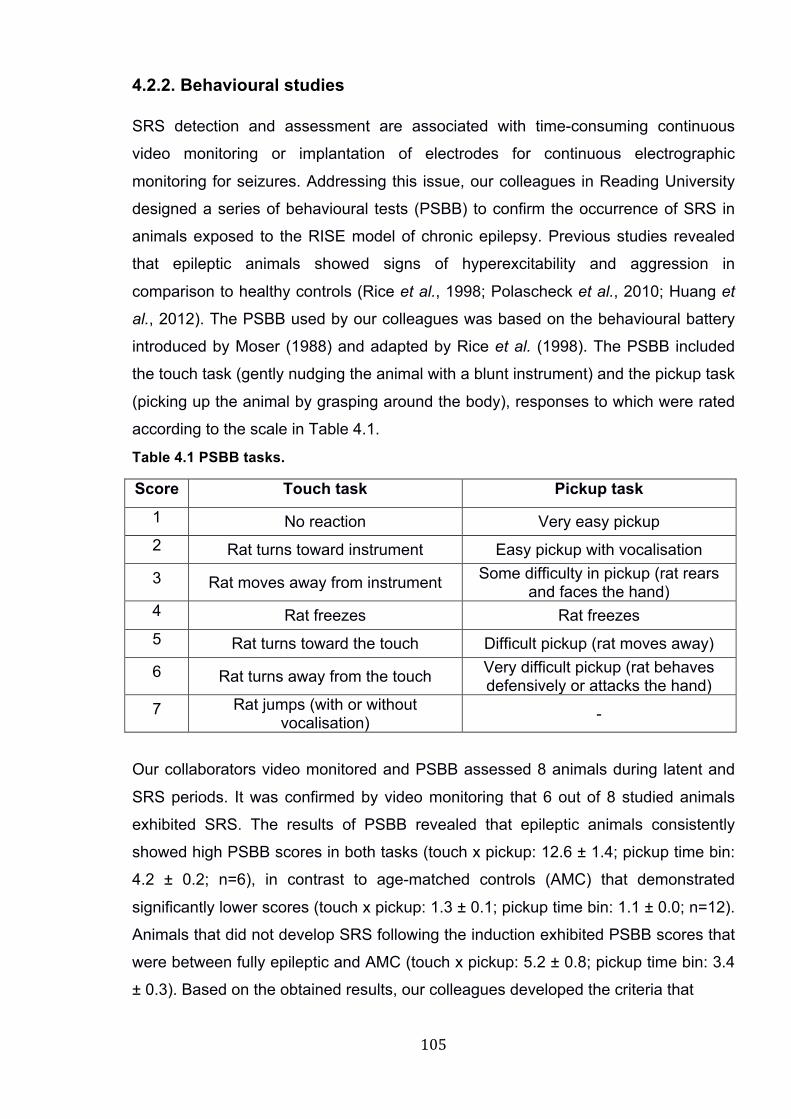
105""
4.2.2. Behavioural studies
SRS detection and assessment are associated with time-consuming continuous
video monitoring or implantation of electrodes for continuous electrographic
monitoring for seizures. Addressing this issue, our colleagues in Reading University
designed a series of behavioural tests (PSBB) to confirm the occurrence of SRS in
animals exposed to the RISE model of chronic epilepsy. Previous studies revealed
that epileptic animals showed signs of hyperexcitability and aggression in
comparison to healthy controls (Rice et al., 1998; Polascheck et al., 2010; Huang et
al., 2012). The PSBB used by our colleagues was based on the behavioural battery
introduced by Moser (1988) and adapted by Rice et al. (1998). The PSBB included
the touch task (gently nudging the animal with a blunt instrument) and the pickup task
(picking up the animal by grasping around the body), responses to which were rated
according to the scale in Table 4.1.
Table 4.1 PSBB tasks.
Score Touch task Pickup task
1 No reaction Very easy pickup 2 Rat turns toward instrument Easy pickup with vocalisation
3 Rat moves away from instrument Some difficulty in pickup (rat rears and faces the hand)
4 Rat freezes Rat freezes 5 Rat turns toward the touch Difficult pickup (rat moves away)
6 Rat turns away from the touch Very difficult pickup (rat behaves defensively or attacks the hand)
7 Rat jumps (with or without vocalisation) -
Our collaborators video monitored and PSBB assessed 8 animals during latent and
SRS periods. It was confirmed by video monitoring that 6 out of 8 studied animals
exhibited SRS. The results of PSBB revealed that epileptic animals consistently
showed high PSBB scores in both tasks (touch x pickup: 12.6 ± 1.4; pickup time bin:
4.2 ± 0.2; n=6), in contrast to age-matched controls (AMC) that demonstrated
significantly lower scores (touch x pickup: 1.3 ± 0.1; pickup time bin: 1.1 ± 0.0; n=12).
Animals that did not develop SRS following the induction exhibited PSBB scores that
were between fully epileptic and AMC (touch x pickup: 5.2 ± 0.8; pickup time bin: 3.4
± 0.3). Based on the obtained results, our colleagues developed the criteria that

106""
Figure 4.3. Behavioural measurements of epilepsy following induction. A. The percentage of animals meeting PSBB criteria at various weeks post-induction (n=31). B. Touch x pickup and C. time bin pickup PSBB scores of animals having undergone status epilepticus induction (n=37) and age-matched controls (criteria met/seizure observed, n=13; criteria met/no seizure observed, n=18; criteria not met/no seizure observed, n=6; control, n=12). D. Correlation between pilocarpine dose administered during SE dose and the week animals met PSBB criteria. A Spearman’s rank analysis was conducted showing no statistical correlation (p>0.05; n=31).
would help easily identify animals in the SRS stage: touch x pickup score is >10 or
time-bin pickup score is ≥4 for 4 consecutive trials. According to this scale, 83% of
animals with confirmed SRS fulfilled these criteria and none of the non-epileptic
animals did so. These findings indicate the possibility of false negative, however not
false positive, results.
Using PSBB criteria assessment, the Reading group determined the duration of the
seizure-free latent period. The results showed that, following a successful SE
induction (n=37), 84% of the animals fulfilled the SRS criteria by 12 weeks post-SE. It
was revealed that a large number of animals developed SRS within 4 and 5 weeks
post-induction (48% and 23%, respectively) [Fig. 4.3]. When compared to AMC
(n=12), all the animals that fulfilled the SRS criteria showed a significantly higher
PSBB score (p<0.001). It is worth mentioning that even though no significant
difference was observed between non-epileptic rats (not meeting the SRS criteria)
and AMC (p>0.05), non-epileptic ones showed greater variability in scores. This
could indicate individual differences in the speed of SRS development in those

107""
animals (e.g. >12 week). The findings described here validate the use of PSBB
independently of visual monitoring for identification of SRS. It was also investigated
whether the dose of injected pilocarpine during the induction could influence the
duration of the latent period, however, no significant correlation was observed
(p>0.05).
4.2.3. In vitro studies in the hippocampus
Following a period of RISE not exceeding 60 minutes, we sacrificed animals and
made recordings at specific time points PSE 24h, PSE 7d, PSE 6wks, PSE 90d. We
made horizontal brain slices containing both hippocampus and EC (Jones and
Heinemann, 1988), cut such that connections around the extended circuitry remained
intact. These two regions are known to be heavily involved in and affected by TLE.
Recordings were made in the hippocampal area CA3 at the indicated time-points in
order to track the progress of epileptogenesis and to monitor the functional state of
neuronal networks in CA3. During the post-insult development of SRS, we noted
clear differences between the activities of neuronal networks relevant to TLE.
4.2.3.1. Morphology and staining
High doses of inducing agents and prolonged SE in traditional unrefined models of
epileptogenesis are known to induce gross neuropathological damage, which do not
necessarily reflect changes occurring in human epilepsy (Sloviter, 2005). We
compared horizontal brain slices taken from animals that underwent epilepsy
induction (PSE 24h, PSE 7d, PSE 90d) to those from AMC. When viewed with IR-
DIC optics, both healthy and lesioned hippocampal slices showed no severe cell loss
in hippocampal CA3 region. Slices from animals that, for the reasons of individual
hypersensitivity, exhibited severe and difficult to control SE exhibited clear
microhemorrhages, which appeared in the piriform, perirhinal, entorhinal cortices and
the hippocampus (Fig. 4.4E,F). The hemorrhages were visible to the naked eye and
were not removed by transcardial perfusion, indicating that those areas could be
ischemic in the live animal. The slices taken from severe cases of SE and studied
under the microscope did not present viable tissue either; it appeared inflamed,
rough and had no cells. When rats received higher doses of pilocarpine (37.5 mg/kg
compared to 25 mg/kg), it has a pronounced effect on the temporal lobe, when

108""
explored PSE 24h. The ventral part of the temporal lobe exhibited significant tissue
sclerosis (Fig. 4.4C,D).
Generally, no significant differences were observed in the morphology of CA3
pyramidal cells between PSE 24h and AMC animals (Fig. 4.4A,B). It was a challenge
to preserve CA3 area in adult slices from both epileptic and control animals, as the
region becomes very sensitive to any external intervention, especially mechanical
damage. Our collaborators from Newcastle University performed a histological
analysis of the brains of epileptic rats and demonstrated that there was no gross cell
loss in the CA3 region in PSE 90d (data not shown). Overall, we showed that our
model demonstrated reduced severity due to high survival rate and low
neuropathological damage, yet high morbidity due to the good success rate of
animals developing SRS.

109""
Figure 4.4. Morphology of epileptic brains. A. and B. Images of control and PSE 24h hippocampal CA3 region. C. and D. PSE 24h brain of an animal that had undergone severe SE (signs of sclerosis). E. and F. Sections of PSE 24h brain after a severe SE (visible microhemorrhages) and a healthy brain, respectively.

110""
4.2.3.2. SγO in healthy and epileptic rats
4.2.3.2.1. 24h post-SE
Earlier in this report I described SγO occurring in the hippocampal CA3 region in the
absence of any pharmacological stimulation (see Chapter 3). We investigated
whether SγO was altered in the slices of animals that had undergone epilepsy
induction or whether spontaneous activity was present. We tested the functional
capability of hippocampal network at PSE 24h in rats that were recovering from the
initial insult and exhibited breakthrough seizures. In healthy AMC brain slices SγO
were routinely recorded from CA3 region and had mean peak frequency 28.0 ± 0.9
Hz and mean peak power 46.1 ± 10.46 µV2 (n=17). When recordings were made
from PSE 24h slices, SγO were also routinely observed and has mean frequency
30.5 ± 1.1 Hz and mean peak power 36.6 ± 10 µV2 (n=18). Typical SγO data from
PSE 24h and AMC are shown in Fig. 4.5A,B. The time-frequency characteristics
were assessed by constructing Morlet-wavelet spectrograms and comparing them for
PSE 24h and AMC (Fig. 4.5C,D). The results showed a similar profile of gamma
oscillatory activity in both conditions, however, in PSE 24h a richer mix of low and
high frequency rhythmic activity was observed in CA3 region. When pooled data from
17 AMC and 18 PSE 24h recordings were compared (Fig. 4.5G,H), no significant
differences were found in mean peak power or mean peak frequency values (p>0.05,
Mann-Whitney test). In order to determine the stability of periodic spontaneous
network activity over time, we computed the autocorrelation function for short (1.6 s)
epochs of gamma activity in CA3. Under control conditions, the mean peak
autocorrelation function was 0.23 ± 0.04, and this was significantly higher than that
determined at PSE 24h (0.15 ± 0.04; p< 0.05, unpaired t-test, n=20).

111""
Figure 4.5. At PSE 24h LFP recordings show SγO and fast bursts in CA3. A. and B. Examples of unfiltered raw traces from AMC and PSE 24h, respectively. C. and D. Example Morlet wavelet spectra and power spectral density plots of the same traces, white dotted lines on spectra indicate 20-60 Hz pseudofrequency band. E. and F. Representative power spectra for AMC and PSE 24h, respectively. G. and H. Pooled peak frequency (G) and peak power (H) for AMC and PSE 24.

112""
4.2.3.2.2. 7d post-SE
Together with early post-induction period studies, we performed similar investigations
at PSE 7d slices, which corresponded to the early seizure-free latent period. At this
stage, SγO could be recorded in slices from both PSE 7d and AMC animals. The
power of SγO was similar between groups (mean peak power 44.61 ± 10.12 µV2
[n=12] in AMC vs. 44.39 ± 7.94 µV2 [n=10] in PSE 7d, p>0.05), as was the mean
peak frequency (30.40 ± 1.19 Hz [n=12] in control vs. 29.81 ± 0.80 µV2 [n=10] in PSE
7d, p>0.05), which is illustrated in Fig. 4.6. Despite the similarities in the static power-
frequency parameters, more dynamic data representations involving the time
component (raw traces and Morlet-wavelet spectrograms) still demonstrated a
tendency towards less stable network oscillatory activity (Fig. 4.6C,D), although
comparison of the mean peak autocorrelation function did not quite reach
significance (AMC 0.19 ± 0.02 [n=12] vs. PSE 7d 0.13 ± 0.02 [n=10]; p>0.05).
Analysis of SγO in PSE 7d slices showed partial recovery of the hippocampal
network from the altered state seen at PSE 24h. These results again indicated that
CA3 remained functional at this point of epileptogenesis.

113""
Figure 4.6. SγO in CA3 at PSE 7d. A. and B. Examples of unfiltered raw traces from AMC and PSE 7d, respectively. C. and D. Example Morlet wavelet spectra and power spectral density plots of the same traces, white dotted lines on spectra indicate 20–60 Hz pseudofrequency band. E. and F. Representative power spectra for AMC and PSE 7d, respectively. G. and H. Pooled peak frequency (G) and peak power (H) for AMC and PSE 7d.

114""
4.2.3.2.3. 6-8 wks post-SE
As mentioned before, the length of the latent period varies significantly between
animals, and this was also observed between laboratories using the same protocol.
Thus, rats in Reading were mostly epileptic by 4-5 weeks, whereas it took around 6-8
weeks for the rats to develop SRS in Birmingham. In both cases, however, the
majority of rats exhibited SRS at PSE 90d, as assessed by PSBB and/or behavioural
monitoring. Following the plan of comparing epileptic animals at various points of
epileptogenesis to AMC, we examined CA3 activity in vitro during the 6-8 weeks
post-induction (PSE 6wks), which corresponded to the latent period. Our results
showed that SγO could be routinely observed in hippocampal CA3 in both PSE 6wks
and AMC animals, demonstrating that oscillatory activity remained intact at this stage
of epileptogenesis. Fig. 4.7A,B shows typical recordings from PSE 6 wks and AMC
slices. SγO recorded under these conditions had a mean peak power of 25.2 ± 9.9
µV2 (n=14) in control slices, as compared to 12.5 ± 6.2 µV2 (n=13) in PSE 6wks
slices. Statistical analysis revealed significant differences in the mean peak power of
SγO between the two conditions (p<0.05), demonstrated in Fig. 4.7G,H. The mean
peak frequency values were very similar in both conditions (34.7 ± 0.9 Hz [n=14] in
control vs. 34.7 ± 1.8 Hz [n=13] in PSE 6wks, p>0.05). Interestingly, when the peak
autocorrelation function was analysed, the mean value for SγO autocorrelation at
PSE 6wks appeared to be significantly higher than control values, despite its low
oscillatory power (0.19 ± 0.02 [n=14] vs. 0.10 ± 0.02 [n=13], respectively; p<0.01). No
spontaneous epileptiform activity was found in recordings during this period,
indicating that CA3 remained functionally intact and further suggesting that the model
did not grossly damage circuits in this region.
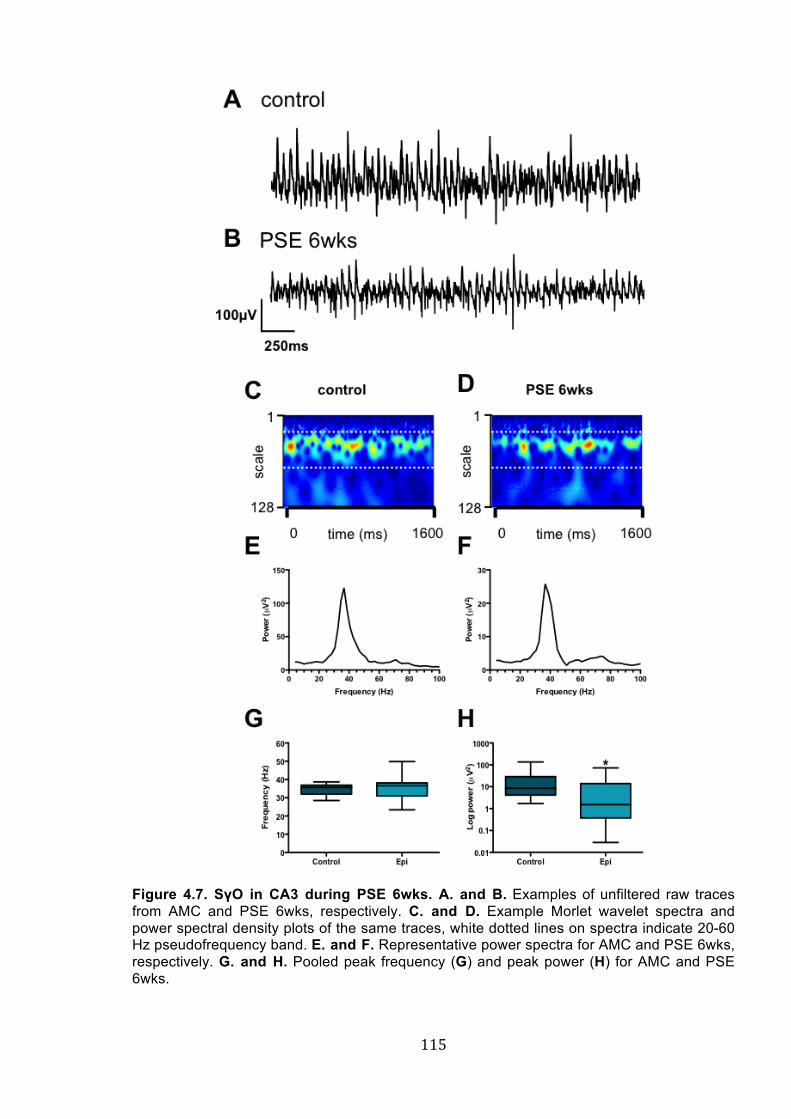
115""
Figure 4.7. SγO in CA3 during PSE 6wks. A. and B. Examples of unfiltered raw traces from AMC and PSE 6wks, respectively. C. and D. Example Morlet wavelet spectra and power spectral density plots of the same traces, white dotted lines on spectra indicate 20-60 Hz pseudofrequency band. E. and F. Representative power spectra for AMC and PSE 6wks, respectively. G. and H. Pooled peak frequency (G) and peak power (H) for AMC and PSE 6wks.

116""
4.2.3.2.4. 90+d post-SE
We further investigated the properties of hippocampal networks in epileptic rats by
comparing recorded SγO from hippocampal CA3 of PSE 90d and AMC. At this point,
the rats exhibited SRS and were considered fully epileptic. In rats now weighing 400-
500g, CA3 was again spontaneously active generating similar SγO (mean peak
power 65.7 ± 11 µV2 at 36.7 ± 0.9 Hz, n=18) to those observed in controls (mean
peak power 84.3 ± 23.8 µV2 at 36.3 ± 0.9 Hz, n=14). The differences in frequency
and power between PSE 90d and AMC were statistically non-significant. The results
suggested that in epileptic rats CA3 again remained functionally intact. Fig. 4.8
shows typical spontaneous gamma activity in CA3 recorded in PSE 90d and AMC
slices. The time-frequency analysis also revealed strong similarity between activity
recorded in control and epileptic animals (Fig. 4.8C,D). Neither of the recordings from
epileptic rats demonstrated spontaneous ictal activity. Many slices, however, showed
SγO with superimposed high frequency activity (Fig. 4.8B).

117""
Figure 4.8. SγO in CA3 during PSE 90d. A. and B. Examples of unfiltered raw traces from AMC and PSE 90d, respectively. C. and D. Example Morlet wavelet spectra and power spectral density plots of the same traces, white dotted lines on spectra indicate 20-60 Hz pseudofrequency band. E. and F. Representative power spectra for AMC and PSE 90d, respectively. G. and H. Show pooled peak frequency (G) and peak power (H) for AMC and PSE 90d.

118""
Figure 4.9. VFO as a biomarker of increased excitability in PSE 24h and PSE 90d.
A. Unfiltered raw trace from PSE 24h with an episode of VFO of 120 Hz and the power spectrum of VFO. B. Unfiltered raw trace from PSE 90d with an episode of VFO.
4.2.3.3. VFO as a biomarker of epilepsy
VFOs have been implicated in epilepsy, as they have been found to appear at the
onset of seizures and during the interictal period (Fisher et al., 1992; Bragin et al.,
1999a,b; Traub et al., 2001b; Grenier et al., 2003). In our experiments, when PSE
24h slices were studied for spontaneous hippocampal activity, together with SγO
episodes of transient VFO were recorded. The bursts of fast oscillations (range 136–
670 Hz, n=13) were notable at intervals ranging from 0.6–8.8 seconds. An example
of VFO superimposed on SγO is shown in Fig. 4.9. Occasionally, VFO could be
observed on top of gamma frequency oscillations (both spontaneous and
pharmacologically-induced gamma) in control animals, however this feature was

119""
more prominent in slices from animals that had undergone epilepsy induction. VFO
were also observed along with SγO in slices from epileptic rats (PSE 90d),
suggesting a correlation between VFO occurrence and seizure manifestations.
Example traces from PSE 90d are presented in Fig. 4.9.
4.2.3.4. Ictal and interictal activity in CA3
During the observation of rhythmic activity in the hippocampus throughout different
stages of epileptogenesis, ictal activity has been infrequently recoded from both CA3
and EC, although at different time points post-SE. Hippocampal seizures were
observed spontaneously during PSE 24h, while PSE 90d exhibited large interictal
events in the presence of 100 nM KA. The early period seizure occurred in one slice
during a simultaneous recording of SγO with 4 electrodes (Fig. 4.10). An ictal
episode consisted of high amplitude sharp rhythmic activity in the high gamma
frequency range superimposed on a slow wave, followed by a transient abolition of
synaptic activity followed by afterdischarges, after which the normal, pre-ictal gamma
returned. Despite the poor quality of the recording, the lag between the 4 sites was
obvious. The results suggest that seizure activity was initiated in one site and then
propagated further across the area (4->1).
The duration of the episode was around 70 s, it started with a high-amplitude high
frequency (~50 Hz) discharge with a large slow wave followed by a period of
quiescence for approximately 30 s, after which large-amplitde afterdischarges
appeared (Fig. 4.10). A type of interictal events emerged in the CA3 of PSE 90d
slice, however, it occurred in the presence of 100 nM KA (Fig. 4.11). The events
consisted of a slow wave with superimposed highly-synchronous discharges (100
Hz). Although the occurrence of epileptiform activity during PSE 24h and PSE 90d
was in line with the stages of epileptogenesis, their scarcity did not allow us to make
any valid conclusions on this matter.

120""
"Figure 4.10. Spontaneous ictal activity in the hippocampal CA3 region in PSE 24h.
A. Raw traces from 4 recording electrodes positioned in CA3 (CA3c->CA3a top to bottom trace) of one PSE 24h slice. Clear seizure propagation through CA3 is demonstrated. Enlarged traces show slow high-amplitude afterdischarges at the end of an ictal event and an episode of high-amplitude high-frequency rhythmic discharge at the onset of a seizure (representative power spectrum presented in B).

121""
Figure 4.11. Interictal activity in the hippocampal CA3 region in PSE 24h. A. Raw trace from PSE 90d slice in the presence of 100 nM KA and a high-amplitude high-frequency gamma discharge (representative power spectrum presented in B).
4.2.3.5. Spontaneous ictal activity in the mEC in PSE 7d
PSE 7d slices spontaneously exhibited episodes of ictal activity, suggesting the
involvement of mEC in the process of epileptogenesis. Seizures consisted of a high
gamma frequency (multiple 70–100 Hz) sharp discharge superimposed on a slow
wave followed by large amplitude afterdischarges, as illustrated in Fig. 6.16. SWO
reappeared 10 mins after the seizure.
"Figure 4.12. Spontaneous ictal events in layers II/III mEC in PSE 7d slices. A. and B. Raw traces showing spontaneous ictal events in PSE 7d slices. Below high-pass filtered (>5 Hz) raw traces showing high-frequency rhythmic activity.

122""
4.3. Discussion
4.3.1. Model refinement
The current model of chronic epilepsy is a modified version of low-dose Li-pilocarpine
model described by Glien et al. (2001). Model refinement reduced mortality from
uncontrollable seizures during the initial insult and minimised the exhausting effects
of prolonged seizures, which further reduced mortality during the recovery period.
Together with low mortality, the model maintained high morbidity, as the majority of
rats undergoing epilepsy induction developed SRS within 3 months.
One of the main refinements employed in RISE was the use of central muscle
relaxant xylazine, which has been reported previously by Yang et al. (2006),
Thompson et al. (2007). The effects of xylazine were most likely associated with its
action at the central alpha-adrenergic receptors. Joy and colleagues (1983)
described the effects of xylazine in seizures as dose-dependent pro- and
anticonvulsant (0.3 mg/kg and 3–20 mg/kg, respectively). In addition to any direct
effects of xylazine on seizure threshold or ongoing activity in vulnerable neuronal
networks, xylazine also exerted sedative and muscle relaxant effects, which seemed
to work effectively in reducing the intensity. At the dose used during RISE, xylazine
produced sedation, locomotor hypoactivity and ataxia, successfully curtailing
behavioural manifestations of SE. In humans, non-convulsive SE has been
associated with lower mortality, in comparison to clinically manifested SE (Tatum et
al., 2001). Eliminating the convulsive component with xylazine injection may be an
important factor in reducing mortality by preventing running/bouncing seizures and
decreasing the chance of secondary generalisation involving subcortical structures
such as the brainstem (Samoriski and Applegate, 1997).
Another refinement introduced into RISE was administration of the anticonvulsant
cocktail in order to terminate SE 1 h after induction. The cocktail contained an
mGluR5 antagonist, MPEP, a non-competitive NMDAr antagonist, MK-801 and
diazepam, a benzodiazepine. This combination of drugs has previously been used in
high-dose pilocarpine studies by Tang and colleagues (2007). The authors
demonstrated that MPEP, MK801 and diazepam caused an effective cessation of SE
and subsequent neuronal loss in the hippocampus. We used the same combination

123""
of drugs, although a smaller dose of MPEP and a higher dose of diazepam, and
observed the same effects in low-dose Li-pilocarpine model. The cocktail
successfully terminated RISE, and, furthermore, little damage was observed in the
temporal lobe. Together, the reduction of convulsive effects induced by xylazine, and
the rapid termination of SE radically reduced mortality associated with
epileptogenesis using the pilocarpine model.
4.3.2. Reduced mortality in RISE
High animal mortality of SE epilepsy models is an issue in modern epilepsy research,
not only due to the ethical element of the problem, but also the aspect of translational
animal research. Mortality rates are often omitted in the scientific literature, and when
reported, vary greatly and are usually high (sometimes >90%), even in low dose
pilocarpine protocols (see Curia et al., 2008). High mortality in traditional models of
acquired epilepsy has to some extent been associated with prolonged period of SE.
Sloviter (2005) argued that continuous SE resulted in gross neuropathological
changes in cortical regions, inflammatory and cerebrovascular lesions, and therefore
aggressive models failed to mimic the natural history of epilepsy in humans. In the
RISE model mortality was reduced to a minimum (~1%), yet it did not affect the
development of epilepsy in lesioned animals (although the progress was relatively
slow). Moreover, as mentioned before, administration of xylazine decreased seizure
intensity due to reducing highly metabolically demanding continuous convulsive
activity during SE. Regarding the animal project licensing and animal welfare,
previous models of acquired chronic epilepsy have always been categorized by the
Home Office (UK) as being of ‘substantial’ severity due to the stressful effects of the
acute induction and the associated mortality. The RISE model has now been
classified as ‘moderate’ severity. An important point of model improvement is the fact
that low mortality rate resulted in fewer animals being used overall, thus the RISE
model clearly fulfilled at least two (refinement and reduction) of the 3Rs.
4.3.3. Behavioural studies
Introduction of behavioural assessment methods into the model is a great
advancement, as it allows determining the progression of epileptogenesis in a quick
and effective manner, avoiding the laborious long-term video or electrophysiological
monitoring for seizure onset. Studies carried out by our collaborators in Reading

124""
University showed that PSBB scoring system was sufficient in identifying animals that
had developed SRS. With a large variability in the latent period duration, behavioural
assessment presents a valuable tool for epilepsy model research and makes the
study of SRS in this model more feasible and approachable.
4.3.4. In vitro studies of neuronal networks
For in vitro investigations, animals were sacrificed for experimental purposes at
different time points following SE induction, such that we could study the dynamic
changes of neuronal network function throughout the different stages of
epileptogenesis. Together with functional studies (LFP), we looked at a general
survival of cells in epileptic vs. AMC slices. Our findings indicated that the current
RISE model produced more subtle effects, devoid of neuronal damage, in the
temporal lobe regions throughout the whole process of epileptogenesis, implying that
cell loss and damage were not prerequisite for epilepsy development. The results of
haemotoxylin and eosin staining showed that even at later stages of epilepsy
development the hippocampus was still a viable healthy-looking structure, which
again demonstrated that hippocampal lesion was not necessarily a characteristic
feature of epilepsy. These findings were in line with the study conducted in humans,
where postmortem histological analysis showed normal looking hippocampus in 48%
of patients with epilepsy (Margerison and Corsellis, 1966). Other reports also
revealed that the majority of newly diagnosed epilepsy patients only had minimal
brain abnormalities and did not show signs of hippocampal sclerosis (Lehericy et al.,
1997; Liu et al., 2002 Jackson et al., 2004 and other). It seems plausible that the
RISE model in animals is better in reflecting the natural course of human epilepsy. As
we have observed, slight increase in pilocarpine dose or individual cases with severe
SE stage caused a remarkable damage to the brain. The severe tissue sclerosis and
vascular pathologies that we observed showed that the unrefined models were too
intense/severe to mimic human condition, supporting the views previously expressed
by Sloviter (2005, 2008).
4.3.4.1. Early post-insult alterations in network function
Together with morphological/histological examination, we also measured the
functional state of the neuronal networks using LFP recording and found that the
vulnerable CA3 region of hippocampus remained spontaneously active in vitro

125""
throughout the development of chronic epilepsy, suggesting strongly that our model
did not result in wholesale excitotoxic damage to this region. During the early post-
insult stage, although the basic characteristics of SγO were similar in both groups,
the activity appeared altered compared to AMC, with periodic bursts of VFOs and
less stable gamma activity. Despite that, the inhibition required to generate coherent,
SγO activity remained generally intact. VFOs, on the other hand, are known to be
involved in abnormal epileptogenic mechanisms, as they have been observed during
the interictal EEG spikes and are thought to be associated with regions
spontaneously generating seizures (Bragin et al., 1999b; Jacobs et al., 2008).
Although VFO also appear in healthy controls and relate to normal function of the
brain, it is believed that high frequency activity is strongly enhanced in epileptic
brains (Buzsaki et al., 1992; Ylien et al., 1995; Draguhn et al., 1998; Bragin et al.,
1999b; Engel et al., 2009). In our experiments VFO were sometimes observed
together with gamma oscillations in control rats (both spontaneously and in the
presence of KA), however, it was more prominent in lesioned rats during early post-
insult stages. The findings could indicate that the hippocampal network was still
under the effects of SE or breakthrough seizures, suggesting a link between VFO
and epileptic/ictal activity.
Throughout the process of epileptogenesis it was extremely difficult to induce any
epileptiform activity in vitro, let alone to observe it spontaneously. One of the few
occasions the ictal activity was detected, was in a PSE 24h slice when 4 electrodes
simultaneously recorded a seizure in CA3 region. Different electrographic seizure
patterns have been reported in literature, from LFP population spike with associated
slow wave to low voltage high-frequency activity (Bragin et al., 2005; Kobayashi et
al., 2005; Bragin et al., 2007). Together with a general examination of an ictal
episode, these data allowed us a glimpse of seizure propagation phenomenon within
the CA3. It appeared that hippocampal cells did not discharge synchronously across
the whole area, but a clear order of firing was present instead. Seizure activity
propagated from CA3b to CA3a region and was possibly driven by EC/DG inputs or
originated independently in the CA3 region (Ben-Ari, 1981; Rafiq et al., 1993;
Barbarosie and Avoli, 1997, Bragin et al., 1997, 1999a; Dzhala and Staley, 2003).
Although the propagation was clear, we can only hypothesize where the
epileptogenic focus was and how the activity spread outside the area covered by our
4 electrodes. It is possible that ictal activity originated in CA3c region and propagated

126""
to CA3a, as demonstrated by several seizure models (Colom and Saggau, 1994;
Dzhala and Staley, 2003). Shi and colleagues (2014) showed the following
propagation sequence using a multi-electrode array (MEA): EC->DG->CA3c-a->CA1.
Another study suggested that sharp-wave seizure type emerged in CA3a-b regions
and spread to CA3c before propagating to CA1 (Csicsvari et al., 2000). Only more
experiments would shed light on spatiotemporal properties of ictal activity; however, it
is extremely challenging to record spontaneous seizures in an SE model in vitro in
the absence of necessary equipment such as MEA. Possibly, like the VFO observed
in PSE 24h slices, the occurrence of a seizure during the same period could
characterize enhanced hyperexcitability of the hippocampal network and its
susceptibility to seizures, as residual effects of the SE experienced by the animal.
The variability in sensitivity towards seizures among animals could also explain why
ictal activity was observed only in the minority of slices. Contributing to this might be
a different way of brain slice preparation, which preserves more cells, in particular the
PV-positive interneurons, which might reflect the situation in an intact brain. As
mentioned above, it is difficult to detect spontaneous epileptiform activity even in the
truly epileptic material, such as human tissue (Gabriel et al., 2004; Huberfeld et al.,
2011). Reduced network connectivity in a brain slice and an increased endogenous
anticonvulsant effects have been proposed (Heinemann and Staley, 2014).
4.3.4.2. Neuronal network function during the latent period
Whilst abnormal neuronal activity can be demonstrated in CA3 as early as 24 hours
after the initial insult, this activity appears to resolve during the latent period, with the
area showing relatively normal spontaneous activity. Indeed, SγO recorded from PSE
7d slices has very similar power-frequency characteristics compared to control slices,
which shows that the network remains intact and fully functional. One week after SE
would correspond to the early latent period, when seizures subside, animals are fully
recovered from initial insult and their behaviour appears normal, which is reflected by
electrophysiological recordings. As the hippocampus returns to its normal state,
some undefined changes seem to take place in the EC during this period. Two ictal
events have been recorded in PSE 7d layers II/III of the mEC in the absence of any
pharmacological agents, suggesting imbalance between inhibition and excitation
allowing for a simultaneous discharge of cortical neurons.

127""
Further investigation of hippocampal neuronal network function during later stages of
latent period revealed robust SγO, suggesting the presence of sufficient inhibitory
and excitatory components to generate spontaneous activity. Of particular interest is
a significantly lower power of SγO in PSE 6 wks, yet a higher stability of gamma
oscillation cycle length compared to control slices. A plausible mechanism could be a
large CA3 network breaking up into small internally synchronised local networks of
neurons, which could explain a decrease in power and a high degree of oscillation
stability. Rhythmic hippocampal activity appears normal in the latent period; however,
this possible fragmentation into smaller networks could play a role in reorganisational
changes that take place during this period. In the absence of robust global
connectivity, it is possible that initiated seizures remain focal. Or the fragmentation of
the network could prevent seizure initiation, as, according to Kramer and colleagues
(2010), the network shows highest synchronisation at the onset and before the
termination of a seizure. Therefore, network compartmentalisation could disrupt
seizure initiation or propagation mechanisms, preventing it from generalisation.
Determining role of latent period changes in epilepsy development and how they link
to the absence of seizure activity in this period is yet to be elucidated. Some of the
further work would include exploring the spatial distribution and phase coupling of
SγO during the latent period, as a way of evaluating network integrity.
4.3.4.3. Neuronal network function during SRS period
Following the development of SRS three months after initial insult, we compared
spontaneous hippocampal activity to AMC. Strong SγO were again present in both
groups, demonstrating that even during this period the network remains functional.
The rhythmic activity regained its power, in comparison to the late latent period.
Interestingly, concurrent bursts of high frequency activity and gamma rhythm were
again observed in CA3, resembling the ones observed in PSE 24h slices. These
findings indicate some similarities between the two periods. Furthermore, ictal-like
events were observed in CA3 in the presence of KA, suggesting higher seizure
susceptibility of the tissue. It is debatable whether the observed activity can be
considered ictal or interictal preceding a seizure, as it consist of a ripple with a slow
wave and has an element of post-ictal synaptic depression. Previous literature
described an abruptly occurring population burst as a typical feature of interictal
epileptiform discharges (Dzhala and Staley, 2003; Dzhala and Staley, 2004). Another

128""
study reported this type of activity as a seizure-like event (Gong et al., 2010).
Recently, the mechanistic differences in the generation of interictal spikes and sharp-
wave ripples have been explored (Karlocai et al., 2014; Gulyas and Freund, 2014). In
the context of current project, whether the events were ictal or interictal, was not of
great importance, since they reflected alterations in the network operation and
excitability regardless of their nature. The change of oscillatory power and the
occurrence of VFO, as well as ictal-interictal activity, indicate increase in network
excitability and possibly connectivity that was undermined during the latent period.
These changes coincide with the appearance of behavioural SRS in animals,
whether these are linked will have to be determined in the future. Overall, these data
strongly suggest that processes underlying epileptogenesis can be readily explored
within the model, and hint that a stepwise process involving multiple neuronal regions
in the temporal lobe (and beyond) may be involved in the development of SRS.
4.3.4.4. Ictal activity in the mEC
Investigation of neuronal network activity in the mEC has revealed two episodes of
spontaneous ictal activity in PSE 7d slices, demonstrating that EC is implicated in the
development of chronic TLE, which has been shown in literature (Du et al., 1993;
Spencer and Spencer, 1994; Du et al., 1995; Schwarcz et al., 2000). The occurrence
of spontaneous seizures coinciding with the possible upregulation of AMPAr in the
mEC could indicate that the two are related (see Chapter 6). Of a particular interest is
the relationship between the EC and the hippocampus in epilepsy and during
epileptogenesis, as these regions are highly interconnected. Spencer and Spencer
(1994) showed that the EC and hippocampus interact to produce and propagate
seizures. Several paths can be explored in this regard. What is the link between
AMPAr and KAr function alterations? Why receptor changes occur at different points
of epileptogenesis? Do brain regions undergo epileptogenesis independently or
differently?
4.4. Conclusion
Together, the use of the low-dose lithium protocol, minimisation of time spent in SE,
administration of xylazine and the use of the multi-drug cocktail provide a highly
reliable and repeatable method for induction of epilepsy which reduces mortality

129""
whilst maintaining a high degree of epileptogenicity. A criticism often leveled at
animal models of chronic epilepsy by clinical colleagues is that patients almost never
present with epilepsy that has resulted following an episode of SE, and, as such,
models employing SE during induction are fundamentally unable to mimic human
epilepsy (and see Sloviter, 2005). The current model, whilst retaining and element of
short-duration, modified SE, goes some way to mitigating this criticism, and shows
that prolonged SE is not necessary for the reliable induction of a condition with
significant similarities to human epilepsy. In this context, a recent report (Navarro
Mora et al., 2009) of slow development of SRS in animals treated with pilocarpine but
who did not enter SE suggest it may not be the critical factor in pilocarpine
epileptogenesis, and indicates that further development of the current model may be
possible. In this regard, refinement of the protocol for administration of lithium, which
is an irritant, is both desirable and necessary.

130""
5. Chapter 5 KAr studies in RISE "

131""
5.1. Introduction
Uncovering the mechanisms underlying ictogenesis and epileptogenesis has been
one of the main directions pursued by neuroscientists with an interest in epilepsy. It is
now clear that epilepsy has a complex, multicomponent mechanism(s). A long-
standing opinion among the neuroscience community is the imbalance between
inhibition and excitation that underlies this disorder. Researchers have been trying for
decades to identify whether it is the excess of excitation or the lack of inhibition or
both that is causing seizures to appear. Given the complexity of the problem and the
diversity of obtained results so far, it is probably safe to say that changes in both
excitation and inhibition may be sufficient, but not necessary to cause epilepsy, and
other mechanisms including inflammation and glia-induced hyperexcitability may play
important roles (Devisnky et al., 2013). At a more sophisticated level, the 'dormant
basket cell' hypothesis was proposed by Sloviter (1983, 1987, 1991), suggesting that
hippocampal hyperexcitability emerged due to a selective loss of neurons specifically
activating inhibitory basket cells. However, this later proved to be inadequate to
explain TLE, with other investigators recording active basket cells in epilepsy and
questioning the interpretation of the original papers (Bernard et al., 1998). Indeed,
abnormalities in ionic concentrations, receptors, transmitter release/uptake and other
factors have all been reported and identified as potentially causal. However, the
results so far have been inconsistent, since, for virtually every finding there is a study
reporting opposing results. Finally, at the network level, two popular theories have
been explored: selective loss of interneurons and axonal sprouting creating recurrent
excitatory connections. These mechanisms are not mutually exclusive and can co-
exist in an epileptic brain, and some evidence in their support has been evinced (for
review see Ben-Ari and Dudek, 2010).
Our previous findings suggested that changes in network excitability occurred
throughout the process of epilepsy establishment in RISE model of epilepsy. We
intended to investigate what could underlie network excitability decline during the
latent period and its return during the SRS stage. We hypothesized that KAr, being
one of the major mediators of excitatory glutamatergic transmission and
oscillogenesis, could play a key role in the appearance of epileptic activity. Although

132""
KAr studies in epilepsy appear to be rather controversial, a number of reports exist
demonstrating abnormal expression of these receptors and, hence, their involvement
in epilepsy mechanism. For instance, Graebenitz et al. (2011) and Palomero-
Gallagher et al. (2012) demonstrated an increase in KAr in human epileptic brain
tissue, compared to healthy brains. KAr subunit KO studies in animals revealed that
GluK2 subunits were associated with low seizure threshold and high KA sensitivity
(Fisahn et al., 2004). An overview of KAr expression in epilepsy is presented below,
for functional studies see section 1.2.5.
5.1.1. KAr expression in human epilepsy
One of the advantages of obtaining resected epileptic tissue following surgical
intervention in refractory epilepsy, is the possibility to perform a variety of techniques
to determine changes occurring in epileptic tissue. A number of studies were
dedicated to exploring changes in receptor (including KAr) expression in pathological
tissue. The findings are often inconsistent, which could be the result of studying
different brain regions, progress of epilepsy, types of epilepsy and diversity among
patients (adults vs. children). In 1990, Geddes and colleagues reported a decrease
in KAr expression in various sclerotic regions of the hippocampus (CA1, CA3 and
hilus) in patients with intractable epilepsies. This decrease coincided with an increase
in parahippocampal regions, perhaps representing aberrant excitatory connections in
these regions. In line with these findings, Brines et al. (1997) reported a uniform
decrease in KAr expression throughout the whole hippocampal region. Another study
was conducted by Zilles and colleagues (1999) on adult temporal cortex from
patients with focal epilepsy. They reported no overall change in KAr binding in
epileptic tissue compared to control, however it was noticed that KAr density was
higher in deeper cortical layers, compared to superficial layers (Zilles et al., 1999;
Palomero-Gallagher et al., 2012). In contrast to previously mentioned studies,
Graebenitz et al. (2011) demonstrated a change in receptor densities and functions,
including a significant increase in KAr binding in lateral amygdala nucleus of epilepsy
patients. An extensive study charactrerising receptor alterations was carried out by
Palomero-Gallagher and colleagues (2012). The study is an admirable attempt to
correlate receptor alterations with different epilepsy subgroups according to clinical
and electrophysiological criteria. The results show significant changes in KA, AMPA,
M2 and 5HT1A receptors across all subgroups, suggesting these receptors to be the

133""
key players in epilepsy. Focusing on KAr, a positive correlation was found between
KAr upregulation and the frequency of seizures in patients with associated brain
tumors.
A number of studies have approached KAr function/expression in epilepsy from a
subunit-specific point of view, which further complicated already relatively
inconsistent findings. On the other hand, considering differential effects of KAr in the
brain, systematising according to subunits may be a step forward in understanding
the role of KAr in epilepsy. DeFelipe et al. (1994) reported patches of reduced GluK1-
3 KAr staining in adult epileptic tissue resected from the temporal cortex. They
suggested that these foci could be involved in seizure generation and propagation.
Another study using the same technique reported an increase in KAr in superficial
layers of temporal cortex, yet a decrease in layer VI, which contradicted the results of
previously mentioned reports (Gonzalez-Albo et al., 2001). A study focusing on
different KAr subunits was conducted by Grigorenko and colleagues (1997), where
significant changes were observed in the hippocampal area of epileptic tissue (GluK2
was increased, while GluK4 was decreased). GluK1 KAr were found neither in
control nor in epileptic tissue. Using in situ hybridisation, Mathern et al. (1998)
investigated the levels of GluK1-5 in epileptic tissue with and without hippocampal
sclerosis and control postmortem tissue. The results demonstrated a decrease in
GluK1-2 in different regions of the hippocampus in both groups of epileptic patients.
GluK3-5 were also decreased, but only in sclerotic hippocampus (Mathern et al.,
1998). Contrary to this report, no change in hippocampal GluK1 and GluK2 was
reported by Kortenbruck and colleagues (2001), however, elevated KAr expression
was found in the temporal cortex, which was suggested to be a compensatory
phenomenon for prevention of excess Ca2+ influx during ictal activity. Another study
on resected cortical tissue from paediatric patients with epilepsy suggested a
reduction in GluK1 while an increase in GluK2 mRNA (Baybis et al., 2004). In line
with Mathern et al. (1998), Li and colleagues reported a decrease in GluK1 in the
hippocampus of patients with complex partial TLE. However, opposite to Mathern
report, an increase of GluK4 and GluK5 was found in the hippocampus of epileptic
tissue (Das et al., 2012).

134""
5.1.2. KAr expression in animal models of epilepsy
Undoubtedly, animal model studies dedicated to KAr function yield even more
diverse results than human data, especially due to such wide variety of models in
use. Several studies using kindling by electrical stimulation reported contradictory
results, including both increase and decrease in KAr binding in hippocampal CA3 and
the dentate gyrus (Savage et al., 1984; Represa et al., 1989). In the model of
chemical kindling with PTZ, KAr binding measured 24 h after a seizure revealed
reduced binding in limbic structures including EC, hippocampus and amygdala
(Cremer et al., 2009). Other kindling studies demonstrated increased GluK4 mRNA in
hippocampal CA3 region (Hikiji et al., 1993). Kamphuis et al. (1995) reported minor
increase in GluK2 and GluK5 in CA1, CA3 and DG, whereas a small reduction in
GluK3 in DG, all during early stages of epileptogenesis.
KAr levels were also explored in animals at various timepoints after KA- or
pilocarpine-induced SE. Ullal et al. (2005) invetigated hippocampal protein
expression for KAr 72 h, 90 and 180 d post KA-induced SE. Results demonstrated
GluK1 expression increase throughout the period of observation, while GluK3
appeared to be decreased only at 90 days, returning to normal levels at 180 days.
GluK2 remained unaltered throughout. Porter and colleagues (2006) carried out a
study on rats exposed to Li-pilocarpine epilepsy induction and sacrificed 14 days
post-induction. Authors report a reduction in GluK2 mRNA and an increase in GluK5,
while no change in GluK3 and GluK4 in DG neurons. Although not specified directly,
it appears that the study was carried out during the latent period of epileptogenesis.
The diversity of reported results in literature does not allow making any conclusions
on the precise role of KAr in epilepsy, although it is clear that they have some part in
it.
Understanding what changes KAr undergo throughout epileptogenesis may provide
an insight into the further role of this class of receptors. The transition from the latent
phase to the period of behavioural SRS is a critical point of epileptogenesis when
KAr changes may take place. Abnormal KAr function may potentially underlie both
hypoexcitability and reduced connectivity of the hippocampal network in seizure-free
period and may be responsible for the appearance of epileptic SRS activity later on.
To test this, we used the RISE model and attempted an investigation of KAr function

135""
change throughout the epileptogenesis. Both extra- and intracellular techniques were
utilised to study KAr on the network and cellular level. Results showed a dramatic
redutcion in gamma oscillation power during the late stage. Although LFP studies do
not provide direct answers in abnormal KAr contribution to epilepsy establishment,
experiments with selective KAr agents on SγO, intracellular and immunocytochemical
methods could lead to a better understanding of KAr role in this pathological
condition.
5.2. Results
5.2.1. Extracellular recordings
Our previous findings suggested that hippocampal neuronal network exhibited
functional changes throughout the process of epileptogenesis in RISE model of
epilepsy. The properties of network oscillations were investigated in epileptic vs.
AMC rats as various timepoints during epileptogenesis (PSE 24h, PSE 7d, PSE 6wks
and PSE 90d). We compared how spontaneous hippocampal activity responded to a
challenge with KA in epileptic vs. healthy control brain slices. KA is known to elicit
gamma oscillations in hippocampal slices (Hajos et al., 2000; Hormuzdi et al., 2001;
Fisahn et al., 2004). Earlier in this report we have demonstrated that hippocampal
slices exhibited SγO (see Chapter 3). In this project we first compared the baseline
activity (SγO) present in AMC vs. epileptic slices, as well as the activity produced by
KA application (KγO) in the same slices. Representative raw traces and power
spectra of both oscillation types in PSE 24h and AMC slices are shown in Fig. 5.1. As
mentioned previously, SγO in PSE 24h exhibited concurrent high-frequency bursts
and gamma rhythm activity, explaining a less defined peak on the FFT, compared to
AMC slices where oscillations were more stable and synchronised and appeared to
stay within a narrow frequency band (Fig. 5.1). A mix of slow and fast oscillations in
PSE 24h came out clearly from Morlet-wavelet spectrogram (Fig. 5.1Aiii,Biii).
Although SγO seemed abnormal in PSE 24h, the network was still responsive to 100
nM KA stimulation, causing a large increase in power and producing more coherent
synchronised oscillations, comparable to the ones observed in control slices in the
presence of KA (Fig 5.1Aii,Bii). Administration of KA suppressed high-frequency
activity in epileptic slices. Pooled data demonstrated that SγO PSE 24h had a mean
peak power of 36.57±10.1 µV2 (n=18) at a mean peak frequency of 30.47±1.1 Hz

136""
(n=18), while in SγO AMC showed a mean peak power 33.74±6.8 µV2 (n=13, ns) at a
mean peak frequency 26.7±0.8 Hz (n=13, p<0.05) [Fig. 5.5A]. In the presence of 100
nM KA, SγO PSE 24h reached 3235±1333 µV2 (n=18) at 36.23±1.4 Hz (n=18), while
SγO AMC reached 4024±2191 µV2 (n=13, ns) at 29.5±1.4 Hz (n=13, p<0.01).
The analysis of neuronal network oscillations in PSE 7d slices revealed moderate
SγO activity in CA3 hippocampus, similar to that observed in AMC slices (Fig. 5.2).
SγO in epileptic slices still showed a residual high frequency component, although,
compared to PSE 24h, it was less prominent, but the gamma rhythm itself appeared
more pronounced (Fig. 5.2Aiii,Biii). When 100 nM KA was bath applied to pre-
existing SγO, the activity increased in power dramatically, both in PSE 7d and AMC
slices. Representative traces and power spectra are shown in Fig. 5.2A,B. Despite
the fact that KγO demonstrated good oscillatory power, as well as sharp and well-
defined FFT peaks in both groups, the time-frequency analysis suggested that PSE
7d oscillations were less stable, with patches of low gamma power. Overall, SγO in
AMC slices reached the mean peak power of 28.34±11.38 µV2 at 32.3±0.9 Hz
(n=12), which was comparable to the peak power but not the peak frequency of
oscillations observed in PSE 7d (44.39±7.9 µV2 at 29.8±0.8 Hz, n=10, p>0.05 and
p<0.05, respectively) [Fig. 5.5B]. Application of 100 nM KA increased SγO to
1666±554.0 µV2 at 29.8±1.0 Hz (n=12) in AMC slices and 2039±585.3 µV2 at
31.37±2 Hz (n=10) in PSE 7d (both p>0.05).

137""
Figu
re 5
.1. B
asic
pro
file
of SγO
and
KγO
in A
MC
and
PSE
24h
. A
. and
B. SγO
and
KγO
in A
MC
and
PS
E 2
4h, r
espe
ctiv
ely.
Ai.
and
Bi.
Unf
ilter
ed ra
w tr
aces
of SγO
and
KγO
(100
nM
KA
) rec
orde
d fro
m A
MC
l and
PS
E 2
4h, r
espe
ctiv
ely.
Aii.
and
Bii.
Rep
rese
ntat
ive
pow
er s
pect
ra fo
r th
e sa
me
trace
s. A
iii. a
nd B
iii. M
orle
t wav
elet
sp
ectra
and
pow
er s
pect
ral d
ensi
ty p
lots
of t
he s
ame
trace
s, w
hite
dot
ted
lines
on
spec
tra in
dica
te 2
0-60
Hz
pseu
dofre
quen
cy b
and.
S
cale
bar
s fo
r raw
trac
es 2
00 m
s ✕
100
µV
.

138""
Figu
re 5
.2. B
asic
pro
file
of SγO
and
KγO
in A
MC
and
PSE
7d.
A
. an
d B
. SγO
and
KγO
in A
MC
and
PS
E 7
d, r
espe
ctiv
ely.
Ai.
and
Bi.
Unf
ilter
ed r
aw tr
aces
of SγO
and
KγO
(10
0 nM
KA
) re
cord
ed
from
AM
C a
nd P
SE
7d,
res
pect
ivel
y. A
ii. a
nd B
ii. R
epre
sent
ativ
e po
wer
spe
ctra
for
the
sam
e tra
ces.
Aiii
. an
d B
iii.
Mor
let
wav
elet
sp
ectra
and
pow
er s
pect
ral d
ensi
ty p
lots
of
the
sam
e tra
ces,
whi
te d
otte
d lin
es o
n sp
ectra
indi
cate
20-
60 H
z ps
eudo
frequ
ency
ban
d.
Sca
le b
ars
for r
aw tr
aces
200
ms ✕
100
µV
.

139""
According to our previous findings, SγO exhibited changes during the late latent
period (Chapter 4). In this project, we compared both SγO and KγO between PSE
6wks and AMC slices. The results in PSE 6wks demonstrated SγO, which was not
observed consistently, indicating underlying abnormalities of the network function
(Fig. 5.3). Spontaneous activity was surprisingly small in power, yet highly coherent
with a sharp gamma peak on the power spectrum, which is not very characteristic of
low-power SγO. These findings may reflect possible involvement of small but
synchronous networks (Fig. 5.3Aii,Bii). AMC slices consistently exhibited strong SγO
in CA3 region, demonstrating normal operation of the hippocampal neuronal network
(Fig. 5.3). 100 nM KA administered to control slices with SγO produced a dramatic
increase in the power of oscillations, similar to other AMC slices. In PSE 6wks,
application of 100 nM KA, on the contrary, produced only a small change, indicating
poor sensitivity to the agent or KAr receptor dysfunction. Stimulation with a double
dose of KA (200 nM) resulted in a small increase of oscillatory power, which still was
not comparable to control slices (Fig. 5.3Aii,Bii). These findings demonstrated a
decrease in network excitability and a disruption of network oscillation mechanism,
although the exact involvement of KAr in this case was not clear. Fig. 5.3 presents a
recording from an AMC slice challenged with 200 nM KA. Overall, SγO AMC slices
was significantly higher in power compared to PSE 6 wks (41±11.5 µV2, n=18 vs.
20.59±6.6 µV2, n=20, p<0.05), although similar in mean peak frequency (35.4±0.9
Hz, n=18 vs. 34.87±1.2 Hz, n=20, p>0.05). These results showed that network
changes/reorganisation in the latent period were already visible from the natural
hippocampal activity of the slices. Application of KA revealed further exacerbated the
differences between the two groups. The contrast in KγO mean peak power between
AMC and PSE 6 wks slices was evident (1968±756.8 µV2, n=18 vs. 322.5±156.7 µV2,
n=20, p<0.01), even though no significant difference was observed in mean peak
frequency (34.6±0.8 Hz, n=18 vs. 36.4±1.3 Hz, n=20, p>0.05). Pooled data results
are presented in Fig. 5.5C.
To determine whether rhythmic activity in the hippocampus underwent changes
during epileptogenesis, we explored SγO and KγO in the slices from fully epileptic
rats (PSE 90d) and compared them to AMC. SγO demonstrated strong power in both
control and epileptic slices, although concurrently with gamma frequency PSE 90d
slices exhibited transient high-frequency activity (Fig. 5.4). Traces demonstrating

140""
multiple frequency components in PSE 90d are shown in Fig. 5.4Bi. These bursts of
high-frequency activity may represent increased excitability of the tissue and its
susceptibility to seizures. When 100 nM KA was applied to pre-existing SγO,
rhythmic activity dramatically increased in power and became regular in both groups
(Fig. 5.4Ai,Bi). Moreover, in epileptic slices administration of KA abolished fast
activity and introduced a pure gamma frequency rhythm (Fig. 5.4Bi,Bii). The main
parameters of SγO were comparable in AMC vs. PSE 90d (84.29±23.9 µV2 at
36.3±0.9 Hz [n=14] vs. 62.65±9.6 µV2 at 35.9±0.9 Hz [n=22], p>0.05), as shown in
Fig. 5.5D. KγO, on the other hand, were significantly stronger in power in PSE 90d
compared to AMC (3401±757.4 µV2 [n=22] vs. 1798±612.7 µV2 [n=14], p<0.05). The
frequency of KγO did not demonstrate significant differences (29.9±0.8 Hz [n=22] in
PSE 90d vs. 31.4±0.4 Hz [n=14] in AMC, p>0.05). Interestigly, it appears that
adminstration of 100 nM KA produced a larger effect in epileptic slices, which is
illustrated by Fig. 5.5D. These results could reflect elevated excitability of the tissue,
which may be the link to the appearance of behavioural seizures during this period.
In addition, ictal/interictal episodes described earlier further support the idea of
increased seizure susceptibility of the epileptic tissue/brain.

141""
Figu
re 5
.3. B
asic
pro
file
of SγO
and
KγO
in A
MC
and
PSE
6w
ks s
how
s co
mpr
omis
ed K
A-in
duce
d ac
tivity
. A
. an
d B
. SγO
and
KγO
in A
MC
and
PS
E 6
wks
, re
spec
tivel
y. A
i. an
d B
i. U
nfilt
ered
raw
tra
ces
of SγO
and
KγO
(20
0 nM
KA
) re
cord
ed f
rom
AM
C a
nd P
SE
6w
ks,
resp
ectiv
ely.
Aii.
and
Bii.
Rep
rese
ntat
ive
pow
er s
pect
ra f
or t
he s
ame
trace
s. A
iii.
and
Biii
. M
orle
t w
avel
et s
pect
ra a
nd p
ower
spe
ctra
l de
nsity
plo
ts o
f th
e sa
me
trace
s, w
hite
dot
ted
lines
on
spec
tra i
ndic
ate
20-6
0 H
z ps
eudo
frequ
ency
ban
d. S
cale
bar
s fo
r raw
trac
es 2
00 m
s ✕
50 µV
.

142""
Figu
re 5
.4. B
asic
pro
file
of SγO
and
KγO
in A
MC
and
PSE
90d
. A
. and
B. SγO
and
KγO
in A
MC
and
PS
E 9
0d, r
espe
ctiv
ely.
Ai.
and
Bi.
Unf
ilter
ed ra
w tr
aces
of SγO
and
KγO
(100
nM
KA
) rec
orde
d fro
m A
MC
and
PS
E 9
0d, r
espe
ctiv
ely.
Aii.
and
Bii.
Rep
rese
ntat
ive
pow
er s
pect
ra fo
r th
e sa
me
trace
s. A
iii. a
nd B
iii. M
orle
t wav
elet
sp
ectra
and
pow
er s
pect
ral d
ensi
ty p
lots
of t
he s
ame
trace
s, w
hite
dot
ted
lines
on
spec
tra in
dica
te 2
0-60
Hz
pseu
dofre
quen
cy b
and.
S
cale
bar
s fo
r raw
trac
es 2
00 m
s ✕
100
µV
.

143""
In this project we used potentiation of baseline oscillatory activity (SγO) upon
administration of 100–200 nM KA, as a measure of KAr activity during different
stages of epileptogenesis. We compared the changes in power produced by KA
application (KγO – SγO) in epileptic and control conditions, as well as between
different stages of epileptogenesis. Direct pharmacological stimulation of PSE 24h
slices with KA produced similar effects to the ones recorded in AMC (3198.4±1333
µV2, n=18 in PSE 24h vs. 3990±2191 µV2, n=13 in AMC, p>0.05). Similar picture was
observed in PSE 7d slices, where KA-induced change was comparable to control
slices (1994.6±585.3 µV2, n=10 in PSE 7d vs. 1647.3±606.8 µV2, n=11, p>0.05). The
most dramatic deviation from control values appeared in the late latent period (PSE
6wks). At this time SγO seemed to lose its oscillatory power and even a double
concentration of KA failed to produce a response comparable to AMC level
(301.91±156.8 µV2, n=20 in PSE 6 wks vs. 1926.17±756.9 µV2, n=18 in AMC,
p<0.05). Later stages were characterized by robust SγO and KγO in both epileptic
and control slices. Development of behavioural seizures seemed to coincide with
regained power of SγO and KγO in PSE 90d slices. Although the change in power produced by KA in PSE 90d did not reach statistical significance (3338.35±757.5 µV2
in PSE 90d vs. 1713±613 µV2, n=14, p>0.05), it appeared that epileptic slices were
more responsive to KA (as the raw power of KγO was high), indicating possible
increased excitability.
When compared within healthy and lesioned groups, the results demonstrated a
similar/consistent level of power change from SγO to KγO throughout all control
slices, whereas in epileptic slices the level of power change did not appear stable
throughout the epileptogenesis, which indicated underlying network alterations (Fig.
5.6). The figure demonstrates that after the initial insult, KA effect on SγO was
gradually declining until reaching the lowest point during the late latent period, when
application of KA produced the smallest effect compared to AMC and other stages.
Contrary to the latent period, SRS stage was characterized by a rebound of the
hippocampal rhythmic activity to the early post, indicating restored mechanisms for
synchronisation.

144""
"Figure 5.5. Pooled peak frequency and peak power plots for SγO and KγO in control and epileptic conditions. A. Pooled peak frequency and peak power plots for PSE 24h and AMC slices. SγO and KγO peak frequency is significantly lower in AMC slices compared to PSE 24h. B. Pooled peak frequency and peak power plots for PSE 7d and AMC slices. C. Pooled peak frequency and peak power plots for PSE 6wks and AMC slices. A significant reduction in the peak power is observed in SγO and KγO in PSE 6wks compared to AMC. D. Pooled peak frequency and peak power plots for PSE 90d and AMC. A significantly higher KγO peak power is demonstrated in PSE 90d compared to AMC slices. ** indicate p<0.01, * indicates p<0.05.

145""
"Figure 5.6. KAr response is compromised during PSE 6wks. A. Changes in the peak power of gamma oscillations produced by the application of KA in AMC and epileptic slices at different stages of epileptogenesis.
5.2.2. KAr function in evoked field potential recording
We sought to explore KAr function during the process of epileptogenesis, latent
period in particular, using a more direct method. We first attempted to induce and
then pharmacologically isolate KAr-mediated effects in CA3 region brain slices from
healthy adult rats (~300g, age-matched to PSE 6 wks). The experiments were based
on the work of Castillo and colleagues (1997), who used electrical stimulation of
mossy fibres to evoke field postsynaptic potentials in CA3 s. lucidum of a brain slice.
According to experiments described by the authors, application of a single stimulus
produced a response that was blocked by selective AMPAr antagonist GYKI 53655.
The response, however, was restored by a train of 6 stimuli at 30 Hz in the presence
of GYKI 53655, indicating non-involvement of AMPAr. This evoked synaptic potential
was blocked by a non-selective KAr/AMPAr antagonist CNQX demonstrating that the
response was mediated by KAr.
The experiments we repeated in adult rat slices, however, the results were not
consistent. A successful experiment is demonstrated in Fig. 5.7A. A response was
evoked with a single stimulus (the recording is an average of 10 runs) and was
146""
blocked with 30 µM GYKI 53655. A train of 6 stimuli at 30 Hz every 5 seconds was
then applied to initiate glutamate release and hopefully expose KAr-mediated
reponses. The amplitude of evoked synaptic potential was 1300 µV, which reduced
by 60% when 40 µM CNQX was bath-applied. CNQX application produced a
significantly smaller effect in comparison to original studies by Castillo et al. (1997),
which suggested involvement of other receptor types. In other experiments that were
conducted, bath application of GYKI 53655 produced either an increase or no
change in single stimulus evoked potential amplitude. Administration of another
AMPAr antagonist NBQX (2.5 µM) could not block the response either, indicating
contribution of other receptors or possible technical issues during the experiment. We
also tried co-application of 40 µM MK-801, 20 µM PTX, 5 µM CGP 55845 with 30 µM
GYKI 53655. This combination of drugs was administered to pharmacologically
isolate KAr-mediated responses. Despite these efforts, synaptic potential evoked by
a single stimulus could not be blocked by this cocktail. Application of 40 µM CNQX
did not abolish the train-induced potential either (Fig. 5.7B), hence 1 µM tetrodotoxin
(TTX) was tested to determine whether the recorded responses were real. TTX
produced a small reduction, however could not abolish the activity, suggesting that
the signal might reflect volume conduction or directly driven synaptic currents.
Overall, the inconsistency of obtained results suggested that this method was not
appropriate to characterise KAr function in our brain slices, possibly due to technical
limitations.
We also investigated the role of KAr using a different protocol, which at first yielded
more consistent results, however, this too eventually proved ineffective. Mossy fibres
were stimulated to produce synaptic responses in CA3 hippocampus. A test
recording was obtained first, in order to confirm that a single stimulus induced a
postsynaptic potential. When this was established, the stimulation protocol was
changed to a train of 40 stimuli at 200 Hz, which produced a slow postsynaptic
potential, which we believed was mediated by KAr. When a combination of 20 µM
PTX, 5 µM CGP 55845, 2.5 µM NBQX, 20 µM SYM2206 and 20 µM MK-801 was
bath-applied, the response changed in amplitude and duration, abolishing fast events
and retaining the slow component. Application of 40 µM CNQX reduced the slow
event (Fig. 5.7C). Pooled data from control slices suggest that mean suppression of

147""
synaptic potential amplitude 46.7±8.5% (n=12), however the results were not
consistent. Therefore, we found this protocol inaproppriate for investigation of KAr.
"Figure 5.7. Evoked field potential in the hippocampal CA3 region. A. Raw trace showing a successfully reproduced experiment by Castillo et al. (1997), where AMPAr blockade (teal) exposed a slow postsynaptic potential, which was reduced by CNQX application (red) and was therefore KAr-mediated. B. Raw traces showing no change in field postsynaptic potential after blocking all major receptor types. A small effect produced by TTX application (black) raises concerns about the biological nature of observed signals. C. Raw traces showing an example of successful experiment, where application of CNQX reduced the amplitude and duration of the evoked field potential. All traces low-pass filtered at 10 Hz.

148""
"Figure 5.8. Poor survival of the hippocampal CA3 in control adult slices. A., B. and C. Iimages of CA3, CA1 and layer II EC, respectively. Brain slices obtained from 300+g rats.
5.2.3. KAr function in whole-cell patch-clamp recordings
5.2.3.1. Attempts to increase CA3 viability
The whole cell patch-clamp technique was used to determine the change in pre- and
post-synaptic contribution of KAr in CA3 throughout epileptogenesis. My initial plan
included characterising presynaptic KAr by exploring spontaneous postsynaptic
currents (sPSCs) and postsynaptic KAr by exploring evoked EPSCs (eEPSCs).
Conclusions drawn from extracellular results suggested close investigation of the
latent and SRS stages of epilepsy development. This, however, has proved to be
rather challenging, as the survival of CA3 cells decreased dramatically in slices from
>300g animals. Despite our best efforts, the hippocampal CA3 region seemed to be
extremely vulnerable to manipulations required to make brain slices. In contrast to
CA3, CA1 and mEC, for instance, appeared healthy looking (Fig. 5.8). We employed
a variety of methods to increase the viability of neurons in the CA3 region. The
improved-composition cutting solution routinely used in the lab was not very effective
in protecting CA3 neurons, hence we tried using basic cutting solution (see Section
2.1.), which further decreased the quality of slices. Replacing sucrose with an
equivalent amount of glycerol resulted in relatively healthy slices, however the cells
were very difficult to patch. We then tried different variations of the 'protective
recovery method' used by Peca and colleagues (2011), which included preincubation
of brain slices in NMDG or choline chloride solution at 32–34°C (for recipes see
Appendix 2). Together with protective recovery method, addition of high doses of

149""
NAC to cutting solutions was used to prevent glutathione depletion for better slice
preservation. These modifications produced apparent enhanced preservation of CA3
regions, however, cells appeared swollen and when patched were depolarised,
suggesting poor viability. We also tried using H2S donors as an additional component
of sucrose cutting solution, in order to suppress oxidative damage through promotion
of reductive environment. This did not improve CA3, however. In our attempts to
increase morphological presevation of CA3 cells, we tried different cutting blades
(ceramic vs. steel), different slicers (Vibroslice HA752 by Campden Instruments vs.
HM650V by Microm), different speed (slow vs. fast) and temperature (4–10°C vs.
room temperature) of slicing, different brain orientation (slicing back to front vs. side
to side) and finally different storing conditions (submerged vs. interface). None of the
used method modifications could consistently produce healthy-looking well-preserved
CA3 region in slices from 300g and above rats.
5.2.3.2. KAr effects on GABA release
Due to the issues described above, the study of KAr function using intracellular
recordings could not be completed, yet some results are still presented in this report.
We started investigating KAr activity by recording sIPSCs on CA3 pyramidal cells.
Application of 100 nM KA produced a significant decrease in sIPSC inter-event
interval (IEI) in 50g control rats (142.6±9.1 ms to 66.9±2.6 ms, n=3, KS p<0.0001), as
illustrated in Fig. 5.9A,B. In these recordings the frequency of events increased by
53.1%. The amplitude of sIPSCs increased slightly from 40.65±2.4 pA to 46.3±2.8 pA
(n=3, paired t-test p>0.05), however did not reach significance. In slices from 90-
100g animals (AMC to PSE 7d) administration of KA caused a significant reduction in
IEI (from 121.0±4.4 ms to 83.4±1.9 ms, n=5, KS p<0.0001), thus increasing the
frequency by 31.1% (Fig. 5.9C,D). KA also produced a significant increase in sIPSC
amplitude (41.7±1.5 pA to 48.5±1.9, n=5, paired t-test, p<0.01). In contrast to control
slices, sIPSCs recorded from PSE 7d significantly decreased in amplitude (from
210.6±13.9 pA to 161.3±13 pA, n=1, paired t-test, p<0.0001) but exhibited no change
in frequency (IEI 105.4±4.5 ms to 114.7±5.1, n=1, p>0.05) [Fig. 5.10A,B]. In adult
animals, one recording was obtained from a PSE 6wks slice. Application of KA
demonstrated a significant increase in sIPSC amplitude (10.7±0.4 pA to 14.9±0.8 pA,
n=1, paired t-test, p<0.0001), yet the effect on IEI was not significant (158±8.9 ms to
131.9±7.2 ms, n=1, p>0.05) (Fig. 5.10C,D). It appears that pharmacological

150""
stimulation with KA produced presynaptically regulated increase in GABA release. It
is yet to determine with more experiments whether the fact that KAr activation in
epileptic slices indeed causes no change in sIPSC frequency and, hence GABA
release, implying a disrupted function of KAr in epilepsy development. Overall, at this
stage it is impossible to draw any conclusions about the changes of either pre- or
postsynaptic KAr activity throughout epileptogenesis, as further investigation is
required, specifically during latent and SRS stages. These data, however, could
contribute to further experiments.

151""
Figure 5.9. KAr effects on GABA release in CA3 of control slices. Ai. and Ci. Cumulative probability plots showing sIPSC amplitude change upon application of 100 nM KA in 50g and 90g control slices, repsectively. Aii. and Cii. Cumulative probability plots showing sIPSC IEI change upon application of 100 nM KA in 50g and 90g control slices, repsectively. B. and D. Example traces showing control and 100 nM KA condition in 50g and 90g control slices, respectively.

152""
Figure 5.10. KAr effects on GABA release in CA3 of epileptic slices. Ai. and Ci. Cumulative probability plots showing sIPSC amplitude change upon application of 100 nM KA in PSE 7d and PSE 6wks slices, repsectively. Aii. and Cii. Cumulative probability plots showing sIPSC IEI change upon application of 100 nM KA in PSE 7d and PSE 6wks slices, repsectively. B. and D. Example traces showing control and 100 nM KA condition in PSE7d and PSE 6wks slices, respectively.

153""
5.3 Discussion
There is evidence that KAr play a role in epilepsy and we hypothesise that this class
of receptors is involved in crucial network changes underlying the transition from
seizure-free latent period to behavioural SRS period. Neuronal network oscillations
are a reflection of network activity, therefore we measured the effect produced by
KAr stimulation at various stages of epilepsy development. Through results obtained
we estimated the contribution of KAr to the network function and how it changed
throughout epileptogenesis. During the early post-insult period, although SγO
appeared altered, KAr-mediated responses remained intact. A similar picture
emerged in PSE 7d slices, as KA application produced comparable effects on
gamma oscillations, indicating similar activity of KAr in both PSE 7d and AMC. With
the progression of the latent period, epileptic slices exhibited significantly lower SγO
and KγO power compared to AMC. Even stronger KA stimulation was not able to
produce a response similar to AMC. These results indicated abnormal function of
hippocampal network, and although the basic mechanism for rhythmic activity
generation was not disrupted, it appeared suppressed. As mentioned in the previous
section of this report, changes in the oscillatory activity may reflect fragmentation of
entire CA3 network into smaller localised networks due to the loss of interneurons
and/or disturbed or limited activity of KAr, which are involved in network
synchonisation (Fisahn et al., 2004; Fisahn et al., 2005; Kramer et al., 2010). It is
possible that these networks lost means of communication with each other, hence
such dramatic change in power was observed. Development of behavioural seizures
in animals coincided with a rebound of oscillatory power in both SγO and KγO,
indicating restoration and possibly hyperfunction of KAr. The findings suggest that in
PSE 90d the network possibly regained synchronisation mechanism and established
stronger synaptic connections. The results demonstrated that network/KAr changes
do not take place until further into the latent period. Another time point aroung PSE
3wks might be necessary for future experiments to determine how soon the changes
develop.
Results obtained from extracellular recordings let us suggest that KAr underwent
certain changes during epileptogenesis, which were reflected by abnormal
rhythmogenesis in the epileptic hippocampal slices. KAr are known to mediate a

154""
variety of regulatory effects in neuronal communication and are the key players of
glutamatergic transmission in the hippocampus (Cossart et al., 2002). Postsynaptic
KAr, due to their slow kinetics, have a role of regulating neuronal excitability and
information processing by integrating excitatory synaptic inputs (Frerking and Nicoll,
2000; Frerking and Oligher-Frerking, 2002, Goldin et al., 2007, Pinheiro et al., 2013).
Presynaptic KAr, on the other hand, bidirectionally regulate neurotransmitter release
at both inhibitory and excitatory synapses (Schmitz et al., 2000; Lauri et al., 2001;
Rodriguez-Moreno et al., 1997; Frerking et al., 1999; Cossart et al., 2001).
Suppressed oscillatory activity observed during the latent period in response to KA
gives an indirect indication of underlying network alterations, however does not
identify a clear source of abnormality, considering that rhythmic activity has a
complex multi-component network mechanism. Since KAr are heavily involved in
synaptic transmission and have means of regulating other network components,
without direct intracellular studies exploring the function of KAr during
epileptogenesis, it is impossible to make conclusions on the cause of observed
changes. KAr may be affected in various ways, which could explain a drop in gamma
oscillations during the seizure-free period and its later recovery during the SRS
stage. For instance, KAr subunit composition, protein expression, channel gating and
other factors influencing KAr kinetics, as well as receptor desensitisation, synaptic
plasticity and changes in presynaptic regulation of other neurotransmitters (e.g.
GABA) could contribute to or be responsible for an abnormal function of KAr in
epilepsy.
To evaluate KAr activity more directly, yet in the network context, we recorded
evoked field potentials in CA3 hippocampus. Mimicking glutamate release at mossy
fibre terminals by electrical stimulation and subsequent pharmacological
decomposition of postsynaptic potentials in an attempt to isolate KAr-mediated
responses. Postsynaptic potentials appeared in various shapes and amplitudes, and
were neither stable nor consistent. Application of AMPAr, NMDAr, GABA-Ar, GABA-
Br, and AMPAr/KAr antagonists did not demonstrate reproducible effects, indicating
possible technical faults like artefacts or factors like volume conductance and
disruption of electrical activity of cells. Isolation of one neurotransmission element in
a population of cells might not be as straightforward as in an individual cells.
Replication of the original experimental protocol by Castillo and colleagues (1997)

155""
could not produce reliable results, as GYKI 53655 failed to block AMPAr-mediated
component, as did CNQX.
The next step in investigating the functional state of KAr involved intracellular
evaluation of pre- and postsynaptic KAr activity at various timepoints of
epileptogenesis. The idea of this investigation was to focus on the late latent period
of 6-8 wks and the SRS stage when animals exhibit behavioural seizures, as the
dramatic changes in network function were observed then. It is known that
preservation of neurons in slices from adult/old animals can be challenging, therefore
most of the research has been conducted on young animals. We have encountered
this problem in the hippocampal brain slices of 300+g animals, where CA3 region
exhibited low viability in both epileptic and AMC slices. Interestingly, poor
preservation was highly distinctive for CA3, whereas other areas of the slice
appeared healthy, which demonstrated a higher age-dependent vulnerability of CA3
cells to mechanical damage. Various brain slice preparation techniques were tested
in order to preserve this area (see Appendix 2). Unfortunately, it was not possible to
increase survival of CA3 cells and at the same time maintain the morphological and
electrophysiological properties of the cells. Due to technical issues and limited time,
we gathered little information on KAr properties in AMC and epileptic slices. The
results that were obtained were in line with previous reports in literature (Fisahn et
al., 2004; Christensen et al., 2004; Chamberlain, 2009). In our experiments
application of KA increased the frequency of sIPSCs in CA3 pyramidal cells,
indicating positive modulation of GABA release mediated by presynaptic KAr.
Conducted experiments are only a first step in characterising KAr function, as more
experimental work is needed to investigate both pre- and postsynaptic components.
However, the problem of poor CA3 viability in adult brain slices is a serious obstacle,
which has to be overcome prior to carrying out intracellular studies.
Having conducted a number of electrophysiological studies exploring functional
changes in KAr in epilepsy, we chose to support the findings with
immunocytochemical methods to investigate the presence rather than the functional
state of KAr during the latent period and the SRS stage (in collaboration with Prof.
Elek Molnar, Bristol University. Alterations in KAr subunit expression during the
process of epilepsy establishment in the temporal lobe may explain the progression

156""
of epileptogenesis and occurrence of behavioural seizures. Nevertheless, protein
expression does not provide a full receptor profile, as a receptor might be expressed
but not functionally active, which could be misleading. Therefore it seems reasonable
to utilise various characterisation methods to obtain a more detailed picture.
Looking back, it would be beneficial to characterise the role of KAr in SγO during
epileptogenesis. Using a variety of subunit-selective KAr antagonists and agonists
(e.g. UBP310 and ATPA) would provide insight into the direct contribution of GluK1-
containing KAr to the drop of gamma activity during the latent period and gamma
power rebound in the SRS stage. Our previous pharmacological findings in control
animals demonstrate a difference in GluK1 KAr role in SγO and KγO. Measuring the
degree of SγO potentiation upon addition of GluK1 KAr antagonist in epileptic vs.
AMC slices would reveal any abnormal function of GluK1 KAr without having to
artificially stimulate the receptors with KA.
5.4. Conclusion
Overall, it is clear that the hippocampal CA3 network undergoes certain changes
during the latent period of RISE model, when the activity temporarily shrinks and
becomes less responsive to KA, as demonstrated by our results. The activity
recuperates coincidentally with the appearance of SRS, suggesting a possible
restored and augmented function of KAr in epilepsy. One of the limitations in
interpreting extracellular data is the fact that the rhythmic activity of a network is a
complex process involving multiple interrelated components including KAr. It is
known that KAr play a crucial role in the generation and maintenance of the gamma
rhythm, but KγO can not be used as a direct measure of KAr activity.
Immunocytochemical methods might provide support for our hypothesis. A potentially
fruitful approach would also be to test the effects of subunit-selective KAr agents on
SγO in epileptic vs. control animals.

157""
6. Chapter 6 Spontaneous rhythmic activity in layer II mEC

158""
6.1. Introduction
6.1.1. The EC and epilepsy
In the previous chapters we investigated the establishment of epilepsy in the CA3
hippocampus, however, TLE is not restricted to the hippocampal area, but involves
other regions like the entorhinal and perirhinal cortices, as well as the amygdala.
Some of the work on epilepsy has been dedicated to the role of the EC in the TLE, as
various studies have shown that ictal activity can arise independently in this region, in
humans (Rutecki et al., 1989; Spencer and Spencer, 1994; Assaf and Ebersole, 1997
and others) and animal models (Ben-Ari et al., 1981; Collins et al., 1983; Stringer et
al., 1994). A reduction of the EC volume has been demonstrated in the patients with
TLE, suggesting a destructive effect of epilepsy on this area (Bernasconi et al., 1999,
2001; Jutila et al., 2001; Bonilha et al., 2003). Several reports showed a correlation
between the size of EC resection and the success rate of the surgery for intractable
TLE (Siegel et al., 1990; Fried et al., 1993). EC resections often presented with
atrophy and gliosis, while a particular vulnerability was demonstrated for the layer III
neurons (Du et al., 1993; Yilmazer-Hanke et al., 2000). Animal studies are in line with
human observations, showing neuronal damage in layer III of the EC (Du et al., 1995;
Wozny et al., 2005). Opposite views exist on the localisation of seizure focus in the
EC. Jones and Lambert (1990) showed that epileptiform activity emerged from the
deep layers, while Tolner and colleagues (2005) demonstrated a superficial origin.
Based on the previous knowledge, we set out to investigate the role of EC in the
epileptogenesis, using the RISE model. We explored the possibility of differential
time scales for epilepsy development in the hippocampus and the EC, as well as a
possible migration of a seizure focus. SWO were taken as a measure of network
activity in the EC, which were recorded from layers II/III in both AMC and epileptic
slices.
6.1.2. The EC and SWO
Slow brain rhythms constitute an important part of neurophysiology, as they appear
during sleep and anaesthesia (Steriade et al., 1993a-d). Slow rhythms have been

159""
shown to group and modulate rhythmic activity of higher frequencies, reflecting active
processes taking part in the brain during sleep (Steriade and Amzica, 1998). Studies
report the occurence of <1 Hz rhythms in the cortical regions of animals, both in vivo
and in vitro (Steriade et al., 1993a-d; Timofeev and Steriade, 1996; Sanchez-Vives
and McCormick, 2000; Shu et al., 2003; Dickson et al., 2003; Cunningham et al.,
2006; Sheroziya et al., 2009). The cortex has been shown to exhibit alternating 0.1-
0.5 Hz periods of UP (intensive cell firing) and DOWN (periods of quiescence) states.
This type of activity has been detected in prefrontal, somatosensory, visual and
entorhinal cortices and implications in development, metabolism, as well as
information processing have been proposed (Sheroziya et al., 2009; Cunningham et
al., 2006; Steriade et al.,1993c; Sanchez-Vives and McCormick, 2000).
A commonly accepted mechanism of slow rhythm generation in the cortex is a
combined action of intrinsic and synaptic mechanisms, when activation of INa(p) and
ICAN generate spiking of neurons and together with synaptic mechanisms sustain
prolonged bursting, thus forming an UP state (Timofeev et al., 2000; Bazhenov et al.,
2002; Sheroziya et al., 2009; Chauvette et al., 2010). DOWN states, on the other
hand, reflect periods of hyperpolarisation mediated by K+ currents and synaptic
fatigue (Steriade et al., 1993d; Sanchez-Vives and McCormick, 2000; Bazhenov et
al., 2002; Compte et al., 2003; Sheroziya et al., 2009). Moreover, interneurons
supposedly govern the synchronised switch from to the DOWN state (Volgushev et
al., 2006; Puig et al., 2008).
Of a particular interest to us was spontaneous rhythmic activity of <1 Hz in the EC
reported by Dickson et al. (2003), Cunningham et al. (2006), Gnatkovsky et al. (2007)
and Sheroziya et al. (2009). In these reports, SWO was generated by reducing Mg2+
and Ca2+ concentrations and/or electrical stimulation of the lateral olfactory tract, by
setting the right level of excitation in the slice. While Sheroziya and colleagues (2009)
detected slow rhythmic activity only in neonatal rats (P5–P13), others recorded from
young adult guinea pig and adult rat brains, which raises a question whether this
activity was a truly developmental phenomenon or a result of adjusted experimental
conditions. SWO were recorded from layers II/III of the mEC in all studies, and
findings from Marco de Curtis' laboratory (Dickson et al., 2003; Gnatkovsky et al.,
2007) demonstrated that SWO were generated by the interaction of superficial layer

160""
pyramidal cells and interneurons, although activity could still be recorded layer V
mEC.
Although the <1 Hz cortical activity is widely associated with sleep and anaesthesia,
the functional relevance might differ between the cortical areas. So far, a common
theory has been involvement of SWO in information processing and memory
consolidation. For example, Cunningham and colleagues (2006) demonstrated that
the activity was driven by the interaction between neuronal network mechanism and
metabolism-related mechanism. Sheroziya et al. (2009), on the other hand, showed
that SWO activity reflected developmental processes and could be important in the
maturation of EC and the hippocampus. Future in vitro studies combined with in vivo
research will help uncover the role of alternating states of activity and quiescence.
Searching for network activity in the EC, the presence of spontaneous SWO in
control and epileptic slices from young animals was observed. Much like in CA3
hippocampus, these spontaneous oscillations presented an opportunity to explore
the differences between slices from healthy animals and from animals that had
undergone RISE induction. SWO were a good reflection of the natural network state,
therefore any changes in epileptic slices could suggest the effects of epileptogenesis.
We, therefore, compared the basic electrophysiological and pharmacological profiles
profile pharmacology/mechanism of SWO in both groups of slices.
6.2. Results
6.2.1. Basic profile in control slices
Using the same improved brain slice preparation technique, combined hippocampal-
EC brain slices were prepared from healthy 50–100 g rats (n=47 number of animals
12). SWO was recorded from layers II/III of mEC in a traditional aCSF recipe in the
absence of driving pharmacological agents. The frequency of SWO varied from 0.1 to
1.8 Hz, with the mean interburst frequency being 0.72±0.1 Hz (n=27). Layers II/III
demonstrated a range of electrographic patterns of oscillatory activity, consisting of
rhythmic bursts and/or slow waves in various combinations (Fig. 6.1). The bursts
lasted for 1.2±0.1 s, while the burst amplitude was 106.9±13.8 µV2 with the mean

161""
"Figure 6.1. Basic profile of SWO in layers II/III of the mEC. A. Example unfiltered raw trace showing SWO, low-pass filtered (<1Hz) raw trace showing the slow component of SWO, band-pass filtered (5 – 60 Hz) traces revealing bursts of higher (>5 Hz) frequency activity. B. Representative power spectrum of unfiltered data showing a large peak at 0.15 Hz. C. Morlet wavelet time-frequency plot of unfiltered SWO data showing very low frequency activity with bursts of 5–40 Hz activity occurring approximately every 5s.
intraburst frequency of 28.97±2.0 Hz (n=27). The patterns could be divided into
following groups: synchronised bursts/single units with slow wave, synchronised
bursts/single units with no slow wave, slow wave no bursts, as well as complex
patterns with alternating bursts of higher and lower amplitude (Fig. 6.2). A number of
slices exhibited occasional bursts and/or slow waves but no rhythmicity; such
recordings were excluded from general characterisation but were included into some
pharmacology experiments. The variability of observed oscillatory patterns did not
appear to depend on animal age, experimental conditions or layer-specific position of
the electrode. The differences in burst/spike patterns could depend on electrode
position in relation to individual cells and cell populations. Once established, SWO

162""
"Figure 6.2. Variety of electrographic patterns of SWO in control and PSE 24h/7d slices. A. Unfiltered raw traces of SWO recorded from layers II/III mEC of AMC slices. B. Unfiltered raw traces of SWO recorded from layers II/III mEC of PSE 24h/7d slices.
persisted for several hours, however, in some cases the frequency and the pattern
were unstable over time. Apart from layers II/III, SWO could also be recorded from
layer V of mEC (Fig. 6.3). Experiments with severed connections between mEC and
the hippocampus, as well as between mEC and lateral EC showed that spontaneous
SWO were still present in the mEC indicating an intrinsic nature of this activity.
One of the characteristic features of SWO in the mEC in healthy rats was the
disappearance of activity in animals older than 100 g when recordings were made in
normal aCSF with standard [Mg2+] and using a 30 minute period in which to test for
the appearance of SWO activity. A cutoff at 100 g suggested some developmental

163""
Figure 6.3. SWO in deep and superficial layers of the mEC. A. Unfiltered raw trace of SWO (left) recorded from layers II/III mEC of control slices. Band-pass filtered (10 – 60 Hz) raw trace (right) showing a burst of high-frequency component. B. Unfiltered raw trace of SWO (left) recorded from layer V mEC of control slices. Band-pass filtered (10 – 60 Hz) raw trace (right) showing a burst of high-frequency component.
changes taking place in the EC at this stage, however, by this age the development
should be completed. Fig. 6.4 shows a plot of the percentage of slices exhibiting
SWO within 30 minutes of commencing recording. It is clear that slices from
chronically epileptic rats show an enhanced tendency towards generation of SWO. A
number of brain slices from adult rats exhibited either irregular elements of slow
activity (occasional bursts and/or slow waves) or episodes of rhythmic activity,
however, these required several hours to develop. A possible explanation for this
phenomenon could be a reduction of slice thickness over time and possibly better
penetration/diffusion of the perfusate. To determine whether enhanced excitability in
the slice would promote spontaneous SWO in slices from adult rats similar to
Cunningham et al. (2006), we changed traditional aCSF to 'in vivo-like' aCSF.
Increasing the level of excitation in the slice promoted bursting and rhythmic activity,
indicating insufficient excitation in adult slices to generate spontaneous rhythmic
activity (Fig. 6.5).
"

164""
Figure 6.4. Differences in the developmental profile of SWO in control and epileptic slices. The graph shows an earlier decline of SWO occurrence in control compared to epileptic slices.
"Figure 6.5. Reducing [Mg2+]o promotes SWO in control adult slices. A. Unfiltered raw trace recorded from layers II/III mEC of a control slice in traditional aCSF composition. B. Unfiltered raw trace recorded from layers II/III mEC of a control slice in low Mg2+ aCSF composition.

165""
Figure 6.6. Differential effects of GABA-Ar blockade on SWO in control and PSE 24h/7d slices. A. Unfiltered raw traces in control (left) and 20 µM PTX (right) conditions in a control slice. PTX enhances SWO. B. Unfiltered raw trace in control (left) and 20 µM PTX (right) in a PSE 7d slice. PTX transforms SWO into interictal discharges. "
6.2.2. Pharmacological characterisation
We explored the contribution of synaptic component into generation and
maintenance of spontaneous SWO activity in the mEC. We started the
pharmacological characterisation by looking at GABA-ergic inhibition, as it is known
to be involved in network synchronisation. Application of GABA-Ar blocker PTX (20
µM) enhanced slow rhythmic activity, increased burst amplitude by 46±18% (p< 0.05,
n=4) and the intraburst frequency by 44.73±12% (p<0.05, n=4; Fig. 6.6A). Although
blocking GABA-Ar increased the amplitude of bursts, it did not promote
synchronisation of cell firing. It should be noted that blocking the inhibition was able
to generate SWO in slices with no initial activity. The results suggest that GABA-ergic
inhibition does not have the same function in the generation of spontaneous SWO,
as compared to gamma rhythm synchronisation. The function of slow GABA-Br-
mediated inhibition was explored by administration of receptor antagonist CGP
55845 (5 µM). GABA-Br blockade seemed prolong burst duration in some slices (Fig.
6.7A), however, this was not significant (p>0.05, n=5). CGP 55845 promoted SWO in
some slices without pre-existing spontaneous activity.

166""
"Figure 6.7. The effects of GABA-Br blockade on SWO in control and PSE 24h/7d slices. A. Unfiltered raw traces in control (left) and 5 µM CGP55845 (right) conditions in a control slice. B. Unfiltered raw trace in control (left) and 5 µM CGP55845 (right) in a PSE 7d slice.
We next investigated the role of ionotropic glutamatergic transmission by blocking
NMDAr, AMPAr/KAr, AMPAr, KAr and with 20 µM MK-801, 20 µM CNQX, 2.5 µM
NBQX, and 3 µM UBP310, respectively. The contribution of NMDAr was
inconclusive, since changes in none of the measured burst parameters reached
significance (p>0.05, n=4 for both amplitude and duration); Fig. 6.8A, however,
shows there was a tendency for NMDAr antagonist to increase burst amplitude and
reduce the frequency of SWO. Application of CNQX abolished all spontaneous
activity in layers II/III of the mEC in 10/10 slices, as illustrated in Fig. 6.9A.
Administration of UBP310, a selective GluK1 and GluK3-contaning KAr antagonist,
readily abolished all spontaneous activity in the mEC in 7/7 slices, indicating that
KAr-mediated transmission was a crucial part of the generation mechanism (Fig.
6.10A). When 200 nM KA was applied, a cessation of SWO was observed prior to
the emergence of persistent gamma oscillations in the mEC (Fig. 6.11). Selective
blockade of AMPAr with low concentration NBQX (2.5 µM)"produced mixed effects,
as it terminated all activity in 2 out of 7 slices, while abolished or reduced only the
burst component but kept the rhythmic slow wave in 4 out of 7 slices (Fig. 6.12A). In
one slice with a complex oscillatory pattern, NBQX selectively abolished low
amplitude bursts, yet retained large bursts and a slow wave. Overall, NBQX reduced
SWO power by 14.4 ± 17.0 %, however, this was not significant (p>0.05, n=7).

167""
"Figure 6.8. NMDAr blockade reduces the interburst frequency but increases burst amplitude in control and PSE 24h/7d. A. Unfiltered raw traces in control (left) and 20 µM MK801 (right) conditions in a control slice. B. Unfiltered raw trace in control (left) and 20 µM MK801 (right) in a PSE 7d slice.
Figure 6.9. AMPAr/KAr blockade abolishes SWO in control and PSE 24h/7d slices. A. Unfiltered raw traces in control (left) and 20 µM CNQX (right) conditions in a control slice. CNQX abolishes all activity. B. Unfiltered raw trace in control (left) and 20 µM CNQX (right) in a PSE 7d slice. CNQX abolishes all activity.

168""
Figure 6.10. GluK1,3 KAr blockade abolishes SWO in control and PSE 24h/7d slices . A. Unfiltered raw traces in control (left) and 3 µM UBP310 (right) conditions in a control slice. UBP310 abolishes all activity. B. Unfiltered raw trace in control (left) and 3 µM UBP310 (right) in a PSE 7d slice. UBP310 abolishes all activity.
Figure 6.11. The effect of KAr activation on SWO in PSE 24h/7d. Figure shows an unfiltered raw trace of SWO at the onset of KA effect, demonstrating a gradual transformation of SWO into a persistent gamma rhythm. An increase in the frequency of the fast component is observed, while the low-frequency modulation of amplitude (burstiness) disappears.

169""
"Figure 6.12. AMPAr blockade abolishes SWO in PSE 24h/7d but not control slices . A. Unfiltered raw traces in control (left) and 2.5 µM NBQX (right) conditions in a control slice. NBQX abolishes bursts of high frequency activity but retains the slow wave. B. Unfiltered raw trace in control (left) and 2.5 µM NBQX (right) in a PSE 7d slice. NBQX abolishes all activity. C. Power spectra showing the effect of AMPAr blockade on SWO in control slices. D. Pooled data showing the effect of NBQX on the peak power of SWO in control and PSE 7d slices. * indicates p<0.05. The contribution of slow glutamatergic transmission mediated by mGluRs was
explored using selective antagonists for groups I and II/III (MTEP and LY 341495).
The results showed apparent potentiation of spontaneous slow rhythmic activity
produced by both antagonists. The effect of MTEP on SWO parameters did not reach
significance (p>0.05, n=6). Group II and III antagonist LY 341495 increased the
number or events in the bursts by 54.2±13.2%, p<0.01, and the intraburst frequency
by 23.4±6.4%, p<0.05 (n=8). Blocking mGluRs appeared to enhance the synchrony
of bursting cells, which is visible from the Morlet wavelet time-frequency
spectrograms (Figs. 6.13A and 6.14A). These findings might indicate an indirect
modulation of GABA release taking part in the network synchronisation.
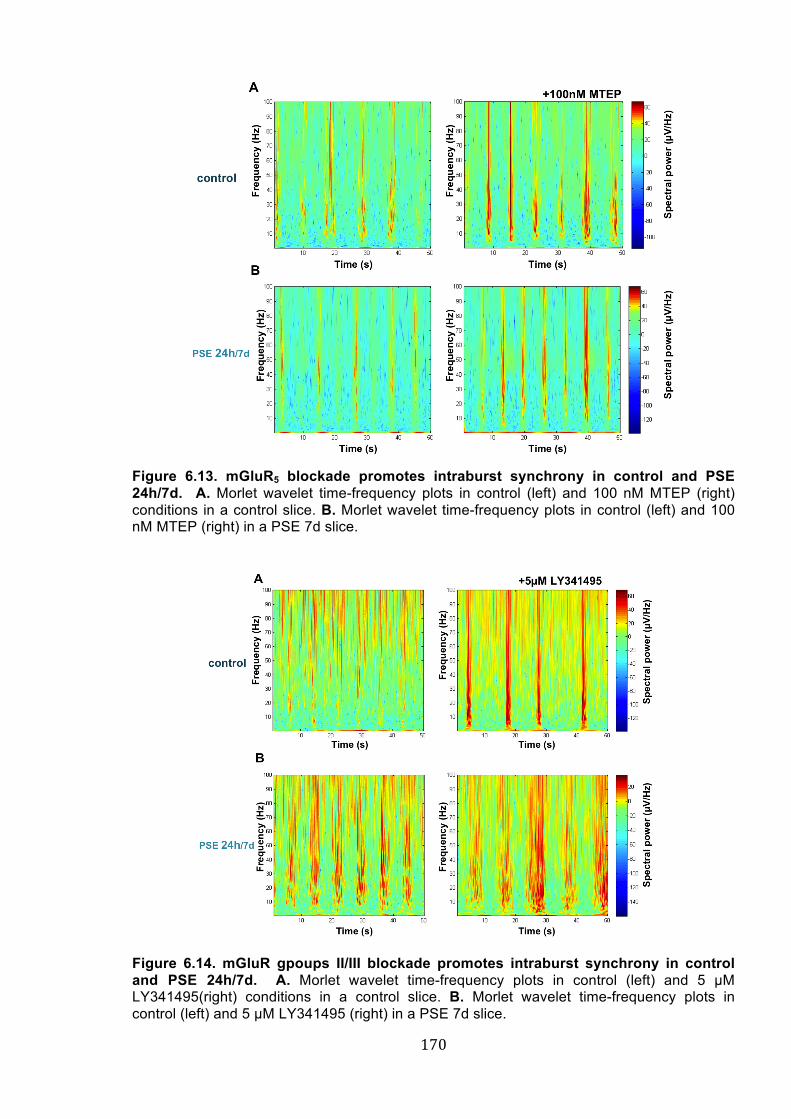
170""
Figure 6.13. mGluR5 blockade promotes intraburst synchrony in control and PSE 24h/7d. A. Morlet wavelet time-frequency plots in control (left) and 100 nM MTEP (right) conditions in a control slice. B. Morlet wavelet time-frequency plots in control (left) and 100 nM MTEP (right) in a PSE 7d slice.
Figure 6.14. mGluR gpoups II/III blockade promotes intraburst synchrony in control and PSE 24h/7d. A. Morlet wavelet time-frequency plots in control (left) and 5 µM LY341495(right) conditions in a control slice. B. Morlet wavelet time-frequency plots in control (left) and 5 µM LY341495 (right) in a PSE 7d slice.

171""
Figure 6.15. Gap junction blockade abolishes SWO in control and PSE 24h/7d. A. Unfiltered raw traces in control (left) and 200 µM CBX (right) conditions in a control slice. B. Unfiltered raw trace in control (left) and 200 µM CBX (right) in a PSE 7d slice.
Previous studies have shown that gap junctions play an important role in network
synchronisation at high and very high frequencies (Hormuzdi et al., 2001; Buhl et al.,
2003; Draguhn et al., 1998). Application of gap junction blocker, CBX, at 200 µM
abolished all activity in 3 out of 8 slices. In the rest of the slices (5/8), CBX caused a
decrease in SWO power (Fig. 6.15A). Overall, CBX application reduced SWO by
50.41±20.5% (p<0.05, n=8). These findings confirm that SWO share the same
mechanisms with the persistent high frequency activity such as gamma rhythm
oscillations.
6.2.3. Spontaneous SWO in RISE
SWO were observed in combined hippocampal-EC slices from animals that had
undergone epilepsy induction (RISE). The activity was most prominent in layers II/III
of the mEC in PSE 24h and PSE 7d animals, corresponding to 50-140 g. Overall,
spontaneous SWO in epileptic rats were similar in their basic characteristics to the
ones observed in control animal with mean burst duration 1.3±0.2 s, inter- and
intraburst frequencies being 0.21±0.05 Hz and 27.9±2.2 Hz (n=31). The mean peak
amplitude, however, was significantly lower compared to control slices (61.14±7.2

172""
µV2 vs. 106.9±13.8 µV2, p<0.01). Epileptic slices also resembled AMC slices in a
variety of produced oscillatory patterns of low frequency (Fig. 6.2).
Interestingly, in AMC slices spontaneous SWO disappeared, with rare exceptions,
after the animals reached 100g. On the other hand, in animals that had previously
undergone SE spontaneous SWO were still prominent between 100-140 g,
suggesting underlying differences in brain development or network excitability in
epileptic animals. The percentage of spontaneously active slices from the 100 – 140
g weight category was 21.2% (7/33) in control vs. 65% (26/40) in epileptic slices, as
illustrated by Fig. 6.4. No evident spontaneous activity was observed in the mEC of
adult animals further into epilepsy development, perhaps indicating that similarly to
healthy animals, SWO activity undergoes some form of developmental regulation in
the epileptic brain.
6.2.4. Pharmacology of SWO in epileptic slices
Taking into account the differences in developmental profile of SWO in control and
epileptic slices, we investigated whether SWO in epileptic animals were driven by the
same mechanisms. The results demonstrated in Fig. 6.6B showed that GABA-Ar
blockade produced similar effects as in AMC by enhancing SWO, however, unlike
control slices, PTX quickly transformed SWO into interictal type activity (n=4).
Blocking GABA-Br-mediated slow inhibition seemed to decrease the frequency of
bursts, however the results again did not reach significance (p>0.05, n=5). GABA-Br
blockade effects are demonstrated in Fig. 6.7B. Overall, it appeared that GABA-ergic
inhibition remained in balance with excitation, which allowed generation of SWO in
the mEC in both control and epileptic slices. "
NMDAr antagonist seemed to increase the amplitude of bursts, which was similar to
control slices, however, the results did not reach significance (p>0.05, n=4) Fig.
6.8B). We then explored the role of excitation by blocking AMPAr and KAr with 20 µM
CNQX, which abolished all rhythmic activity in 5/5 slices (Fig. 6.9B), suggesting a
crucial role of these receptors in SWO generation. In order to separate KAr and
AMPAr contributions to SWO mechanism, selective antagonists (3 µM UBP 310 and
2.5µM NBQX, respectively) were administered. UBP 310 had a similar effect as in
AMC, terminating SWO in 5 out of 6 slices (Fig. 6.10B). KA application demonstrated

173""
the same action on SWO, as in AMC, transforming slow activity into a persistent
gamma rhythm (Fig. 6.11). The most interesting effect, however, was produced by
low dose (i.e. AMPAr selective) NBQX (2.5 µM), which nearly abolished rhythmic
activity in all slices (reduction of SWO power by 80.38±9.5%, n=7, p<0.05), indicating
that, unlike control slices, both slow and fast components of SWO were AMPAr-
dependent in epileptic slices (Fig. 6.12). These findings might be the key element
underlying the difference between healthy and pathological networks in the EC.
Investigation of mGluR contribution to SWO generation in PSE 24h – PSE 7d slices
yielded similar results as in AMC. Although the parameters did not reach statistical
significance, blocking mGluR groups I (n=8) and II/III (n=5) had a positive effect on
spontaneous activity, enhancing SWO and promoting synchronisation of the UP
states (Figs. 6.13, 6.14). And finally a gap junction blocker, CBX, abolished all activity
in 4/7 epileptic slices, overall decreasing SWO power by 73.12±14.2% (p<0.01, n=7).
CBX effects showed a substantial contribution of electrical coupling in the generation
of SWO in both control and epileptic slices (Fig. 6.15).
6.3. Discussion
6.3.1. Basic profile of SWO in control vs. epileptic slices
Improving brain slice preparation technique has resulted in an increased viability of
slices and a better preservation of local neuronal networks. This has allowed for the
slices to exhibit their natural activity not only in the hippocampus, but also in the EC.
Spontaneous SWO observed in the brain slices from young rats were similar to those
reported in vitro by Dickson et al. (2003), Cunningham et al. (2006) and Sheroziya et
al. (2009). SWO in the mEC were detected in control animals younger than 100 g,
suggesting late developmental/age-dependent changes such as reduction in cellular
excitability, which prevent the activity from appearing spontaneously under normal
experimental conditions. It seems plausible that ambient glutamate levels play an
important role in spontaneous generation of SWO, hence the developmental
upregulation of glutamate transporters (Danbolt, 2001) and an increase of
extracellular space could lead to the disappearance of rhythmic activity in slices from
older animals (Sykova et al., 2000). Based on the previous studies of spontaneous
oscillations in EC, it appears that by adjusting the level of excitability, either by

174""
changing aCSF composition or by electrical stimulation, it is possible to manipulate
the appearance of rhythmic activity. Therefore, in our experiments, 'in vivo-like' aCSF
was able to generate slow oscillations in the mEC of the adult animal slices.
Chamberlain (2009) investigated the changes produced by lowering Mg2+
concentration, which allowed for the generation of SWO in adult slices. Reducing
[Mg2+] was shown to increase glutamate release, which strongly activated GluK1
KAr, which, in turn, increased GABA release (Chamberlain, 2009).
In contrast to AMC slices, epileptic slices (PSE 24h and PSE 7d) produced evident
SWO in animals up to 140 g, suggesting two possible mechanisms: delayed
development or increased excitability of epileptic slices. Hence, the stressful insult of
SE and associated damage to sensitive neural circuits may result in a delayed
neurodevelopment. Another possibility for a prolonged appearence of spontaneous
SWO in epileptic slices is tissue hyperexcitability due to such factors as increased
levels of ambient glutamate, enhanced sensitivity of receptors and others. These
effects may occur as a result of epilepsy establishment in the EC and, indeed, may
reflect the early stages of altered balance between excitation and inhibition.
A variety of oscillatory patterns generated by local cortical networks might suggest a
multicomponent mechanism of SWO. The patterns clearly showed interchanging
periods of high (UP state) and low (DOWN state) activity at ~0.7 Hz, resembling that
reported by Steriade et al. (1993c,d) during sleep and anaesthesia. In both AMC and
epileptic slices, UP states were represented by bursts of single-unit spikes, epochs of
synchronised 10-40 Hz activity and/or ascending part of the slow wave. Intracellular
studies in the literature suggested that UP states were generated by intensive
neuronal firing, represented by unit activity or local network oscillations, while DOWN
states reflected periods of hyperpolarisation (Dickson et al., 2003; Cunningham et al.,
2006; Gnatkovsky et al., 2007; Sheroziya et al., 2009). The complex structure of
SWO contains a low frequency component, which reflects the termporally broad
cellular excitability, and a fast component, which determines the exact timing when
an AP is generated (Hasenstaub et al., 2005). A large number of our slices (both
AMC and epileptic) exhibited SWO with superimposed periods of fast (theta/gamma)
oscillations, which resembled the ones described by Le Van Quyen et al. (2010) in
human EC during sleep. Indeed, the authors showed that gamma frequency

175""
episodes appeared at the UP states of slow oscillations during slow-wave sleep and
were coherent over a single cortical region. Similar patterns of activity have been
reported in animals in vivo by Steriade et al. (1996), Isomura et al. (2006) and in vitro
by Dickson et al. (2003) and Compte et al. (2008), indicating a common cortical
phenomenon. Cellular studies did not identify rhythmicity in the firing pattern;
however, the firing was phase-locked to the gamma rhythm, reflecting sparse
neuronal participation in the rhythmogenesis (Compte et al., 2008; Le Van Quyen et
al., 2010).
Much research has been conducted on the origin of SWO and its laminar cortical
profile. It has been established by several studies that SWO emerged intracortically,
which was also confirmed in our experiments with preserved spontaneous rhythmic
activity in isolated mEC slices (Steriade et al., 1993e; Timofeev and Steriade, 1996).
Previous reports demonstrated that the activity was generated in the superficial
layers of the EC, although deep layer origin has also been reported in other areas
(Cunningham et al., 2006; Gnatkovsky et al., 2007, Sheroziya et al., 2009; Sanchez-
Vives and McCormick, 2000; Chauvette et al., 2010). Contrary to the observations of
Cunningham and colleagues (2006), spontaneous SWO recorded by our group
persisted in layers II/III and V of the mEC, suggesting the propagation of activity from
superficial to deep layers.
6.3.2. Pharmacology of SWO in control vs. epileptic slices
The presence of spontaneous SWO in the EC can be used as a measure of neuronal
network activity, which is important in the context of TLE. We, therefore, explored
pharmacological properties of SWO in both epileptic and AMC slices to determine the
nature of spontaneously occurring activity, as well as to compare it between healthy
and pathological conditions. Pharmacological characterisation revealed that SWO in
the EC shared similar elements of generation mechanism with higher frequency
rhythmic acivity, such as earlier described SγO. Related to this point is the fact that
gamma oscillations appeared as a part of slow activity. According to previous
studies, SWO in the cortex emerged from the balance between recurrent excitation
and inhibition with contributing intrinsic mechanisms (Shu et al., 2003; Compte et al.,
2003, 2008; Haider et al., 2006). We investigated the role of synaptic component by

176""
application of selective agonists and antagonists for the main types of receptors
known to be involved in rhythmogenesis. The findings showed that glutamatergic
transmission, especially mediated by KAr and AMPAr, was the key player in the
generation of SWO in the mEC. It appeared that ambient levels of glutamate were
sufficient to spontaneously produce SWO, which were readily blocked by CNQX both
in our experiments and in literature (Cunningham et al., 2006 in EC; Sanchez-Vives
and McCormick, 2000; Shu et al., 2003 in other regions). Reliable abolition of SWO
with GluK1,3-containing KAr antagonist (in line with Cunningham et al., 2006) and
high doses of agonist (KA) suggested a window of receptor activation allowing for the
generation of rhythmic activity in both control and epileptic slices.
Interestingly, the role of AMPAr and its change in epileptic animals was
fundamentally different to controls. As might be expected, blockade of AMPAr
reduced the general level of excitation and decreased SWO bursts in control slices,
however, the slow component of SWO often remained and abolition of all activity was
only ever achieved in the presence of KAr blockade. These findings indicate that both
fast excitation through AMPAr and slower excitation via KAr is required for full
expression of SWO activity under control conditions. Interestingly, observations by
the Cunningham group (Cunningham et al., 2006) showed increased cell firing
produced by an AMPAr antagonist, which might seem to be at odds with our data,
although we did not conduct any intracellular recordings with which to make direct
comparisons. Taking into account the fact that KAr blocker abolished all activity,
while AMPAr blockers only reduced it, control SWO appear to rely more on KAr-
mediated excitation. A different picture was observed in PSE 24h and PSE 7d slices,
where all rhythmic activity (both fast and slow) was abolished by AMPAr blockade,
suggesting greater participation of these receptors in SWO. These results suggest an
increase in the function of AMPAr in the early stages of epileptogenesis, which might
reflect neuronal network alterations due to either an initial insult (SE) or a progressing
establishment of epilepsy. Several factors could account for that, including altered
expression with insertion of AMPAr caused by the SE and abnormal receptor function
due to delayed development. Previous reports in literature have demonstrated
AMPAr plasticity taking place after SE. Rajasekaran and colleagues (2012) showed a
loss of GluA2 and an increase in GluA1 subunits of AMPAr following the SE, which
resulted in another source of Ca2+ entry into the neurons (as GluA2-lacking AMPAr

177""
flux Ca2+), thus increasing excitability and possibly susceptibility to seizures, which
we have observed spontaneously in PSE 7d slices in the EC. Ca2+-permeable
AMPAr are not only a pathological, but also a developmental feature, as GluA2-
lacking AMPAr are replaced by Na+ and K+-permeable GluA2-containing AMPAr
during development, which has been shown in CA1 (Stubblefield and Benke, 2010).
Therefore, taking into account delayed development in our PSE 24h/7d slices, it is
plausible that AMPAr remained in their developmental state. Furthermore, Abegg et
al. (2004) have shown that in the hippocampus epileptiform activity strengthens
excitatory synapses by increasing the number of functional AMPAr. By contrast, Hu
and colleagues (2012) demonstrated a reduction of AMPAr following the SE,
however they also observed changes in the subunit composition of the receptors,
which might suggest that in our model it is not the quantity, but the “quality” (perhaps
efficacy) of AMPAr that may alter network activity and play a role in epileptogenesis.
In agreement with Cunningham et al. (2006), but contrary to other reports (Sanchez-
Vives and McCormick, 2000; Shu et al., 2003; Sheroziya et al., 2009), NMDAr did not
appear to play a crucial role in the mechanism of SWO neither in AMC nor in
epileptic slices. By contrast, recorded rhythmic activity, especially its burst
component, was significantly affected by mGluR groups I-III antagonists, which
enhanced theta/gamma oscillations nested on the slow wave by modulating the
levels of glutamate and GABA via different mechanisms. Errington and colleagues
(2011) demonstrated an increase in tonic inhibition by activation of the group I
mGluR. Activation of mGluR group II is known to presynaptically reduce glutamate
release in the EC (Bandrowski et al., 2003; Wang et al., 2012). Woodhall et al. (2001)
demonstrated that mGluR group III were not tonically activated in the EC, hence are
probably not involved in the generation of SWO. Overall, the findings suggested that
tonically activated mGluR contributed to the balance of excitation and inhibition,
which gave rise to SWO. Sheroziya and colleagues (2009) also demonstrated that
application of a group I/II antagonist E4CPG did not abolish intrinsic bursting of layer
III neurons.
The disinhibition of control and epileptic slices with a GABA-Ar blocker produced
differential effects on spontaneous SWO. Previous studies have demonstrated that
blocking GABA-Ar transformed SWO into epileptiform activity (Sanchez-Vives and

178""
McCormick, 2000; Shu et al., 2003; Sheroziya et al., 2009). Our experiments, on the
other hand, showed interictal-type activity in PSE 24h and PSE 7d, but not in control
slices, where merely a potentiation of SWO was observed. In control slices, PTX
appeared to create favourable conditions for the SWO development. However, the
disinhibition of epileptic slices revealed a somewhat augmented excitatory
component, which could be associated with the change in AMPAr function. Blocking
slow GABA-Br resulted in what seemed like an enhancement of rhythmic activity,
suggesting GABA-Br acted to suppress slow activity and kept it at a slow pace,
although the effect was not consistent. The role of inhibition in control over UP and
DOWN states has previously been explored in the EC by Mann and colleagues
(2009). They demonstrated that increasing concentrations of gabazine (GBZ)
shortened the duration of the UP state and increased the spiking frequency,
eventually transforming it into epileptiform activity. GABA-Br, on the other hand, were
involved in the UP state termination, as GABA-Br blockade resulted in a prolongation
of UP states, which is generally in line with some of our findings. It has been
demonstrated that DOWN states appeared synchronously (Volgushev et al., 2006),
hence Mann and colleagues (2009) suggested that it was GABA-Br that determined
the transition from active to silent state, together with GABA-Ar controlling spike rate
and synchrony.
Application of a gap junction blocker produced a marked overall reduction of SWO
power, suggesting the involvement of gap junctions in the both slow and fast network
synchronisation, which has been previously established in gamma oscillations
(Hormuzdi et al., 2001; Buhl et al., 2003). By contrast, Sheroziya et al. (2009)
showed that SWO were not affected by a gap junction blocker.
Despite a substantial body of literature on slow sleep oscillations observed in various
cortical regions, pharmacological studies are limited to the effects of GABA and
iGluR antagonists. Considering the importance of synaptic transmission in the
generation of SWO, it is necessary to carry out a more in depth analysis to determine
more contributing elements. We, therefore, investigated the roles of mGluRs and gap
junctions, together with the basic pharmacology, which we compared to previous
literature. It would also be interesting to explore cholinergic and histaminergic effects

179""
on SWO, as these systems are known to be involved in sleep/wakefulness
processes.
6.3.3. Functional significance and relation to in vivo studies
To understand the functional relevance of in vitro findings, the results need to be
considered in the context of in vivo animal and human research. Spontaneous SWO
have been initially observed in animals in vivo during sleep and anaesthesia by the
group of M. Steriade (Steriade et al., 1993a-e). Since then SWO have been recorded
and explored in different cortical areas in both animals and humans (e.g. Timofeev et
al., 2000; Hasenstaub et al., 2005; Isomura et al., 2006; Volgushev et al., 2006;
Luczak et al., 2007; Csercsa et al., 2010; Le Van Quyen et al., 2010 and other).
Different functions of slow rhythmic activity have been proposed, some of the most
popular being memory consolidation, information processing, homeostatic and
developmental (Steriade and Timofeev, 2003; Huber et al., 2004; Luczak et al., 2007;
Tononi and Cirelli, 2006; Cunningham et al., 2006; Sheroziya et al., 2009).
Interestingly, Le Van Quyen et al. (2010) reported episodes of gamma oscillations
appearing on the UP states of SWO in the EC of sleeping humans during slow-wave
sleep (non-REM). This activity closely resembled our observations in the rat EC. Le
Van Quyen and colleagues suggested that, since fast rhythmic activity was similar to
that appearing in wakefulness, these ‘microwakes’ reflected or ‘replayed’ previously
experienced events in a form of synchronisations incorporated into slow wave sleep
activity (Ji and Wilson, 2006). Authors also pointed out that synchronised gamma
activity might represent means of local cortical communication (Le Van Quyen et al.,
2010).
Another aspect of spontaneous SWO is their disappearance in adult brain slices,
whether this phenomenon is limited to brain slices and experimental set up or
whether the activity in mEC is indeed age-dependent. Previous in vitro studies in this
brain region suggested that experimental conditions greatly affected spontaneous
activity in mEC (Dickson et al., 2003; Cunningham et al., 2006; Sheroziya et al.,
2009). On the other hand, human sleep studies demonstrated that throughout
childhood and adolescence SWO shifted from posterior to anterior regions of the
brain, which followed the same time course as cortical maturation (Shaw et al., 2008;

180""
Kurth et al., 2010). These authors suggested that, apart from regional development
of the cortex, SWO alterations reflected changes in synaptic density (synaptic
pruning), which affected network synchronisation (Sowell et al., 2004; Vyazovskiy et
al., 2009). It has been shown that slow activity strongly correlated with grey matter
thickness, both decreasing with age (Buchman et al., 2011). These findings indicated
a clear developmental component in the operation of slow rhythmic activity
associated with sleep in the human brain, however, in vivo studies might help
determine the role of development in animals.
The possible involvement of slow rhythmic activity in memory consolidation raises an
interesting question regarding cortico-hippocampal interactions during sleep and
whether cortical SWO are correlated with hippocampal activity. Several studies have
explored these relationships in vivo, including Isomura et al. (2006), Ji and Wilson
(2006), Le Van Quyen et al. (2010). In a study carried out by Isomura and colleagues
(2006) in vivo recordings were taken from the hippocampus, neo- and paleocortices.
The results showed that while EC neurons dwelled in a bimodal (UP-DOWN) state
associated with slow oscillations, hippocampal neurons exhibited independent firing
patterns. Nevertheless, these authors showed that excitatory component of SWO did
spread from the neocortex to the hippocampus via EC, although hippocampal
neurons still remained active during cortical DOWN states. Overall, it was concluded
that hippocampal neurons operated via both neo-/paleocortex-dependent and
independent mechanisms, suggesting some degree of cortico-hippocampal
interaction during sleep. It would be interesting to explore the relationship between
the EC and hippocampus in both healthy and epileptic animals, as we have an
opportunity to simultaneously observe SWO and SγO in a slice.
Finally, as is clear from the results above, from a methodological point of view these
studies were difficult to analyse and interpret and, in particular, statistical validation of
observations was problematic. This was due in no small part to the variability
between recordings of SWO, which are difficult to quantify in a manner that is both
rigorous and repeatable. Further work in this area is ongoing in the laboratory, and
we hope to develop more reliable indices of SWO ‘power’, perhaps by including both
slow-wave amplitude and and intraburst power in a combined metric.
181""
6.4. Conclusions
Our investigations into how the EC network operation changed during epilepsy
development revealed that spontaneous SWO employed a different mechanism of
oscillogenesis, which relied more on AMPAr activation, as compared to control slices.
It is yet to determine the exact role that AMPAr take over and its significance in the
context of epilepogenesis. We can also conclude that epilepsy development or the
initial insult (SE) acted to delay network maturation in animals that had experienced
RISE.

182""
7. Chapter 7 Electrophysiology of paediatric brain tissue resected from patients with intractable epilepsy

183""
7.1. Introduction
Despite the existance of a large variety of AEDs, 30–40% of patients with epilepsy
exhibit seizures that are poorly controlled by medication (Kwan and Brodie, 2000).
TLE is generally one of the most common types of epilepsy, however, it also
constitutes 50–70% of intractable epilepsy cases (Semah et al., 1998; Wass et al.,
1985; Guldvog et al., 1994; Keene et al., 1997). Characteristic changes such as
hippocampal sclerosis with excessive gliosis and cell death, neuronal circuit
reorganisation with axonal sprouting and synaptogenesis are normally associated
with TLE (Sutula et al., 1988, 1989; Mikkonen et al., 1998). Studies suggest that 50%
of epilepsy cases begin before the age of 5 (Hauser, 1992). Although TLE is not the
most common type of epilepsy in paediatric patients, it forms a large part of drug-
resistant cases requiring surgical intervention. Manifestations of temporal lobe
seizures include the onset of aura (e.g. olfactory, gustatory, auditory) indicating a
simple partial seizure, followed by a complex partial seizure (automatisms,
psychomotor seizures) with impaired consciousness and possibly culminating in
generalised tonic-clonic seizures (Adelson, 2008). The most common pathological
substrates in paediatric drug-resistant epilepsy are cortical dysplasia, tumors, mesial
temporal lobe sclerosis and vascular lesions (review by Cataltepe and Cosgrove,
2011). Nowadays, advanced surgical expertise allows good outcomes with low
morbidity and mortality (Benifla et al., 2006; Kan et al., 2008). Reviews published by
Engel et al. (2003) and Schmidt and Stavem (2009) point out that surgical resection
produces a seizure-free outcome in 40–60% of cases, which is 4–5 times higher
compared to prolonged medication. A more recent report by Muhlebner et al. (2014)
demonstrated that 80% of the patients were seizure-free (56.7% stopped receiving
AEDs). It appears that similar surgical outcomes were observed in children
regardless of age (Chugani et al., 1993; Wyllie et al., 1998; Maton et al., 2008).
Epileptic brain tissues surgically resected from patients with pharmacoresistant
epilepsies present extremely valuable material for studying cellular and network
changes. A direct relation to human pathology is one of the obvious advantages that
human tissue possesses compared to animal research. A limited number of
laboratories around the world use various techniques to characterise human brain

184""
tissue. Over the years, information has been accumulated on electrophysiological
properties of human cortical neurons (Avoli and Olivier, 1989; McCormick, 1989;
Foehring et al., 1991; de la Prida, 2002; Molnar et al., 2008; Florez et al., 2013) and
the role and mechanism of VFOs in epileptic human tissue (Roopun et al., 2010;
Cunningham et al., 2012; Simon et al., 2014). However, only one report described
physiological network function has recently appeared in literature (Florez et al.,
2013). The lack of studies characterising neuronal network synchronisation in human
brain tissue indicates a clear gap in our knowledge. Abnormal network function
constitutes the basis of epileptic disorder, therefore investigation and establishment
of physiological/baseline human network profile seems of major importance. One of
the main limitations is the paucity of control human brain tissue. However certain
surgeries require resection of healthy tissue to gain access to remote epileptic
regions. In addition, brain resections of non-epileptic pathologies such as brain
tumors could also be utilised as a control tissue. Despite the fact that extensive
animal research characterising healthy and epileptic networks has been conducted
for decades, similar investigations in the human brain are required to establish
differences and similarities. Therefore, we started a pharmacological characterisation
of neuronal network oscillations recorded from resected cortical brain tissue from
paediatric patients with drug-resistant epilepsy.
7.2. Results
7.2.1. Basic profile of neuronal network oscillations
Human brain tissue was resected from the brains of paediatric patients suffering from
intractable epilepsy. We received brain tissue samples of 5 patients with cortical
dysplasia, the specimens were mostly taken from the temporal cortex and were
either normal or dysplastic (see Section 2.3.).
As a collective effort from all members of the lab (Jane Pennifold, Darshna Shah,
Swetha Kalyanapu, Dr. Emma Prokic, and Nicholas Johnson), brain slices were
prepared the same way as described for animal slices (see Section 2.1.). LFP
recordings were made from human cortical tissue under control drug-free conditions,
as well as during pharmacological stimulation with various doses of KA and CCh.
Electrodes were placed in both deep and superficial cortical layers, although in some

185""
cases it was impossible to distinguish between them. Slices did not exhibit any
spontaneous activity, apart from occasional single-unit spikes. When a human
cortical slice was washed with 'in vivo-like' aCSF, which enhanced tissue excitability,
slow baseline fluctuations (~0.1 Hz) appeared, but no stable rhythmicity or
ictal/interictal events were detected.
Different concentrations of KA (150 nM, 300-400 nM, 800 nM and 1-1.2 µM) were
bath-applied in orded to elicit rhythmic activity in the slices. Induced oscillations
emerged 10-15 mins after drug application and were persistent for several hours.
Lower doses of KA generated low power low frequency oscillations as demonstrated
by raw traces and power spectra in Fig. 7.1B-D. Application of 150 nM KA produced
oscillations with the mean peak frequency 5.6±0.5 Hz and mean peak power
1.95±0.6 µV2 (n=2). In a different set of slices administration of 300 – 400 nM KA
resulted in rhythmic activity with higher mean peak frequency 10.17±2.2 Hz and
similar mean peak power of 1.85±0.5 µV2 (n=6). A higher concentration of 800 nM
KA produced beta frequency rhythmic activity (mean peak frequency 21.57±1.1 Hz)
with higher mean peak power of 11.49±9.7 (n=3). Gamma frequency oscillations
were observed upon application of 1-1.2 µM KA. An increased dose produced faster
but not larger oscillations (mean peak frequency 27.47±6.2 Hz and meak peak power
7.37±2.7 µV2, n=4). We also tested the effects of KA and CCh co-application in 7
cortical slices, which resulted in generation of beta frequency activity (mean peak
frequency 17.38±2.3 Hz) with consistently higher power compared to KA-induced
oscillations (mean peak power 20.97±7.2 µV2). Frequency-power characteristics of
recorded neuronal network oscillations are summarised in Fig. 7.2C, where a positive
correlation could be observed between KA dose and the frequency of induced
oscillations. Using Morlet wavelet method, the time-frequency characteristics were
analysed for different types of induced oscillations and showed stable oscillatory
activity over time (Fig. 7.2A,B).
Simultaneous recording of field potential from deep and superficial layers of the
human cortex revealed a more prominent rhythmic activity in superficial layers upon
application of 400-800 nM KA. Increasing the dose of KA from 400 nM to 800 nM
resulted in the oscillation frequency shift from 15 Hz to 35 Hz in the superficial layers,
while no network synchronisation was observed in the deep cortical layers (n=1).

186""
These findings could indicate disruption of laminar connectivity, independent rhythm
generators within the cortex or poor survival of deep layer neurons. Florez and
colleagues (2013) have previously pointed out the differences in the laminar profile of
network oscillations in the human cortex. In that study, superficial layers generated
higher power rhythmic activity compared to deep layers in response to cholinergic
activation, which was explained by histological differences and a higher density of
muscarinic receptors in superficial layers (Florez et al., 2013).
"Figure 7.1. Human brain tissue slice morphology and KA-induced rhythmic activity. Ai. and Aii. Images of normal and dysplastic human cortical brain tissue, respectively. B., C. and D. Band-pass filtered (2 – 50 Hz) raw traces and representative power spectra for oscillations induced by 300 nM, 800 nM and 1.2 µM KA, respectively.

187""
Figure 7.2. KA- and CCh-induced rhythmic activity in human cortical brain tissue. A. Unfiltered raw trace of KA-induced oscillations and representative Morlet wavelet time-frequency plot. B. Unfiltered raw trace of KA+CCh-induced oscillations and representative Morlet wavelet time-frequency plot. C. Bar charts showing peak frequency and peak power of rhythmic activity induced by different concentrations of driving agents (recordings not paired). A positive correlation is observed between the dose of KA and the peak frequency of induced oscillations.

188""
"Figure 7.3. Rhythmic activity in the human cortex is mediated by GABA-Ar. A. Power spectra showing a reduction in the peak power of oscillations produced by low concentration GBZ (250 nM) and a desynchronisation produced by 2 µM GBZ. B. Unfiltered raw traces showing large delta-type oscillations produced by 2 µM GBZ. C. and D. Power spectra showing differential dose-dependent effects of 100 nM and 10 nM zolpidem, respectively.
7.2.2. Pharmacological characterisation
Together with basic characterisation, we started pharmacological analysis of the
rhythmic activity to determine whether it shared the same mechanism with
oscillations in animal brain slices. Original studies established that synchronous
activity in animal slices crucially depended on GABA-mediated inhibition (Whittington
et al., 1995; Buhl et al., 1998), hence the effect of GABA-Ar antagonist GBZ was
tested on pharmacologically-induced oscillations in human cortical slices. At 250 nM
GBZ produced a decrease in the peak power of oscillations by 32.04±11.1% and a
small reduction in the peak frequency from 22.5±6.8 Hz to 18.8±0.5 Hz, n=2 (Fig.
7.3A). As illustrated by Fig. 7.3B, high concentration (2 µM) of the antagonist
abolished oscillations and introduced a low-frequency high-power rhythmic activity of
delta frequency range, which was possibly mediated by excitatory transmission. The

189""
mean peak frequency decreased from 22.5±6.8 Hz to 5.03±1.7 Hz (n=4), whereas
power increased >10000-fold (%). These results indicate that beta-gamma
synchronous activity generated by human tissue networks is dependent on GABA
inhibition. These findings were further supported by the effect of a GABA-Ar blocker,
PTX (20 µM), which also abolished network oscillations. The activity was also
affected by a benzodiazepine site agonist, zolpidem, which produced differential
effects at 10 nM and 100 nM concentrations. High concentration of zolpidem
produced an increase in the peak power of beta band rhythmic activity by 24.2 %,
while a reduction in the peak frequency from 18.3 Hz to 15.9 Hz (n=1), as
demonstrated by Fig. 7.3C. Low dose of zolpidem, on the other hand, resulted in a
slight reduction of beta oscillation power by 21.3 % and a minor decrease in the peak
frequency from 22.0 Hz to 20.8 Hz, n=1 (Fig. 7.3D). It is not possible to make
conclusions about the effects of zolpidem, however, the results already suggest a
certain level of modulation.
The second main component of rhythm generation in animals is AMPAr-mediated
excitation (Whittington et al., 1995). We, therefore, explored the effects of an AMPAr
antagonist, NBQX (2.5 µM), on KA+CCh-induced oscillations in the human cortical
slices. Blockade AMPAr resulted in the abolition of gamma activity and appearance
of a slow rhythm with a lower peak power instead (the peak shifted from 30.5 Hz to
6.1 Hz and decreased in power by 52%, n=1), indicating involvement of
glutamatergic transmission in the generation and maintenance of rhythmic activity in
human neuronal networks (Fig. 7.4A). The role of NMDAr in the generation and
maintenance of rhythmic activity was explored by application of 50µM DL-AP-5.
NMDAr blocked reduced gamma peak by 54.4% (n=1), while retained the slow
rhythm (Fig. 7.4B). To investigate the contribution of KAr, a selective GluK1,3 subunit
agonist UBP310 (3 µM) was bath-applied to KA- and KA+CCh-induced oscillations.
The results demonstrated similar effects to non-selective AMPAr/KAr blockade, as
UBP310 caused a significant reducion in beta band power, yet an increase in lower
frequencies (Fi. 7.4C,D). The peak frequency shifted from 15.9 Hz to 7.3 Hz,
whereas the peak power decreased by 47.2% (n=1). These findings suggest a role of
KAr in beta/gamma frequency network synchronisation, similarly to findings in animal
slices.

190""
Cholinergic involvement in the generation of rhythmic activity was explored by
addition of 5 µM atropine, an mAChr antagonist. Cholinergic blockade produced
different effects in KA- and KA+CCh-induced oscillations, similar to our previous
findings in rodent hippocampus (Chapter 3). KA-induced oscillations persisted in the
Figure 7.7.4. Pharmacological profile of pharmacologically-induced rhythmic activity in the human cortical tissue. A. Power spectra showing a dramatic reduction in the peak frequency and peak power of oscillations produced by 2.5 µM NBQX. B. Power spectra showing the NMDAr blockade with 25 µM AP-5 causes a marked desynchronisation in the gamma frequency band, yet maintains the low-frequency peak. C. and D. Power spectra showing a reduction in the peak frequency and peak power of KA+CCh- (C.) and KA- (D.) induced oscillations produced by 3 µM UBP310. E. Power spectra showing a reduction in the peak power of KA-induced oscillations produced by 5 µM atropine. F. Power spectra showing gamma frequency desynchronisation produced by a gap junction blocker, CBX (200 µM).

191""
"Figure 7.5. VFOs are not mediated via gap junctions.A. High-pass filtered (at 100 Hz) raw trace in control conditions showing high-frequency episodes. B. High-pass filtered (at 100 Hz) raw trace showing that application of a gap junction blocker did not abolish VFOs. presence of atropine with the peak power reduction by 34.9% (n=1), whereas
KA+CCh-induced activity was rapidly abolished (n=1), indicating that cholinergic
activation is not essential for oscillation generation and maintenance and that the two
oscillation models rely on different mechanisms (Fig. 7.4E). Similar results were
reported by Florez and colleagues (2013), where KA+CCh-induced oscillations were
abolished by atropine application in the human tissue.
Electrical coupling between neurons is a potent facilitatory mechanism of rhythmic
network activity in rodent brain (Traub et al., 2000, 2003; Hormuzdi et al., 2001; Buhl
et al., 2003; Pietersen et al., 2009). Gap junctions have been linked to VFOs in
human epileptic brain (Cunningham et al., 2012). Taking these findings into
consideration, 200 µM CBX was bath-applied to existing beta frequency oscillations.
The gap junction blocker readily curtailed rhythmic activity in the beta range, however
augmented the power level in the delta frequency band (peak frequency changed
from 20.8 Hz to 6.1 Hz, while delta-peak power was 63.6% lower than beta peak,
n=1), as illustrated by Fig. 7.4F. Several human tissue recordings presented with
episodes of high frequency activity (Fig. 7.5). We, therefore, applied 200 µM CBX to
determine whether the observed fast component was mediated via gap junctions. In
a single recording, gap junction blocker did not appear to produce any effect on fast
oscillations (Fig. 7.5). In an attempt to promote high frequency ocillations, a gap
junction opener, 10mM trimethylamine, was bath applied. Stimulation of gap junction
conductance reduced beta oscillation power, which was counterintuitive, considering
similar effects produced by a gap junction blocker, and did not enhance high
frequency activity.

192""
Figure 7.6. Similarities between VFO in PSE 24h slices and epileptic human tissue. A. Unfiltered raw traces showing episodes of VFO recorded from PSE 24h slices. Power spectum of the VFO showing a peak at 150 Hz. A. Unfiltered raw traces showing episodes of VFO recorded from epileptic human brain slices. Power spectum of the VFO showing a peak at around 150 Hz. Scale bars 200ms✕50µV.
7.2.3. VFO and ictal activity
As mentioned earlier, human cortical slices occasionally exhibited bursts of high
frequency activity, similar to the ones observed in brain slices from epileptic rats (Fig.
7.6). The epochs of fast activity were of 200 – 600 Hz frequency range. Since
enhanced VFOs have been associated with epilepsy, it would reasonable to assume
that high frequency oscillations observed in our human and rat slices are a
characteristic feature of epileptogenicity. An episode of ictal activity was also
recorded from the human cortical tissue. The seizure consisted of a high-amplitude
relatively slow wave followed by a period of rhythmic activity with multiple frequency
components (Fig. 7.7A). The episode exhibited a changing frequency pattern, which
is illustrated by the Morlet-wavelet spectrogram (Fig. 7.7B).

193""
"Figure 7.7. Ictal event in epileptic cortical tissue from a human brain. A. Unfiltered raw trace recorded from the epileptic human tissue. B. Representative Morlet wavelet time-frequency spectrogram.

194""
"Figure 7.8. GABA sIPSC kinetic properties of the individual cells in normal and dysplastic human tissues. A. Bar chart showing sIPSC amplitude across 7 cells. B. Bar chart showing sIPSC rise time across 7 cells. C. Bar chart showing sIPSC decay time across 7 cells. D. Bar chart showing sIPSC IEI across 7 cells.
7.2.4. IPSC kinetics in human cortical slices
Intracellular patch-clamp recordings were taken from the human cortical neurons. We
recorded sIPSCs in 7 pyramidal-looking cells from control and dysplastic tissues and
summarised their kinetic properties under control (drug-free) conditions. The events
had the mean amplitude of 12.8±0.4 pA, a mean rise time of 4.75±0.1 ms and mean
decay time 11.75±0.3 ms, while the IEI was 445.3±29.1 ms (n=7). The parameters
across individual cells are presented in Fig. 7.8. The amplitude and the rise time
appeared to be more consistent from cell to cell in comparison to the decay time and
IEI. Cells from supposedly dysplastic regions did not appear to show significant
differences, as some of the kinetic parameters were rather variable. At this stage of
investigations it is too early to draw conclusions.
To investigate the effects of KAr on GABA release in human brain slices, 100 nM KA
was bath-applied. In one cell recording in control tissue, KA administration caused a
significant decrease in the frequency of sIPSCs, indicating negative modulation by

195""
Figure 7.9. KAr modulated GABA release. Ai. and Aii. Raw traces of sIPSCs in control and 100 nM KA conditions. Bi. And Bii. Cumulative probability plots showing changes in sIPSCs amplitude and IEI upon the application of 100 nM KA.
presynaptic KAr (p<0.05), as illustrated by Fig. 7.9Bii. No significant changes in
amplitude, rise and decay times were observed upon addition of KA. It is obvious that
more experiments are required to make conclusions on the modulatory presynaptic
functions of KAr in human cortical neurons.
7.3. Discussion
7.3.1. Basic profile of human tissue oscillations
The ultimate goal of animal research is understanding neurophysiological and
neuropathological processes taking part in the human brain and finding ways of
altering these conditions. Although animal research has yielded a substantial part of
our knowledge of human physiology, the question of species differences is always
open for discussion. Therefore exploring electrophysiological properties of neurons
and neuronal networks in human brain tissue constitutes a valuable section of brain
research. Brain tissue resection is common for surgical treatment of intractable
epilepsy in humans, and this fact presents an opportunity to study pathological

196""
changes occurring in epilepsy. We explored neuronal network properties in human
brain slices by eliciting rhythmic activity in the temporal cortex. Previous human
tissue studies mostly focused on the electrophysiology of individual cells, however
several reports demonstrated the existence of transient oscillations of mostly theta
and high gamma frequencies (Cunningham et al., 2012; Florez et al., 2013). Here,
we report persistent neuronal network oscillations of different frequencies induced in
the human cortical tissue, which, to our knowledge, has not been reported in the
literature to date. Similar to animal models of brain rhythms, oscillations in the human
cortex could be generated by application of KA or KA+CCh (Buhl et al., 1998;
Cunningham et al., 2003; Roopun et al., 2006; Yamawaki et al., 2008). Florez and
colleagues (2013) used a combination of KA and CCh to induce theta oscillations
that lasted for approximately three minutes. The differences between oscillations
could be determined by different experimental conditions (Mg2+ concentration in
aCSF, submerged recording and temperature) and doses of driving agents.
The aim of initial experiments was to establish an induction protocol, which would
reliably generate rhythmic activity in human brain slices. The starting concentrations
of KA and CCh were chosen based on the protocol of gamma oscillation induction in
cortical rat brain slices (entorhinal, motor and piriform cortices). Established doses in
human slices roughly corresponded to those used in rodent slices. Despite this fact,
human rhythmic activity was much lower in power compared to that induced in
animals. Several factors could account for that: higher cell survival rate and
preservation of local circuits in animal slices. Interestingly, in rodents application of a
driving agent resulted in a dose-dependent increase in oscillatory power, yet in little
change in the frequency of oscillations. In human brain slices, on the other hand, a
positive correlation was observed between the dose KA and produced frequency of
oscillations, while the power did not seem to consistently depend on the strength of
the drive. The power of oscillations, however, could be limited by the size of the
network (the number of survived neurons) or a more sparse location of cells in the
human brain. It appeared that cortical neurons in the human brain were more
sensitive to a gain in the input drive, increasing the firing rate or changing the kinetics
of GABA IPSCs, as it is known to determine the frequency of oscillations.

197""
Application of KA in the human cortex was able to produce network oscillations of
various frequency bands (5 – 30 Hz), which means that the level of excitatory drive
could be matched to induce rhythmic activity observed in the intact human brain.
However, the fact that the same area could generate multiple oscillation frequencies
depending on the excitation suggests similar underlying mechanism, which does not
seem to be the case in rodent slices. Another question is whether the induction
method is important, as we know application of KA alone and KA+CCh are able to
induce various types of rhythmic activity, whereas pure cholinergic activation was
insufficient to generate oscillations (Florez et al., 2013). In our human tissue
experiments, co-administration of CCh and KA consistently produced higher power of
oscillations, compared to KA alone, however, had a less pronounced effect on the
frequency. These results together with pharmacological data suggest that cholinergic
input indeed modulates the generation of rhythmic activity, but is not a prerequisite.
Hence, it is not clear whether the cholinergic activation participates in the generation
of neuronal network oscillations in an intact human brain. Our previous findings
demonstrated that in the rodent hippocampus the naturally occurring spontaneous
rhythmic activity is different from both KA- and CCh-induced oscillations (Chapter 3).
However, in the absence of spontaneous cortical activity in human slices, which
model of oscillations is more physiologically relevant? Given the existence of different
oscillation induction mechanisms, it is an important question, whether cholinergic
activation is involved in rhythm generation in vivo. Previous reports suggest that KA-
induced oscillations persist in the absence of cholinergic input, whereas CCh-induced
activity is abolished with blocked glutamatergic transmission. In a complex system
such as intact brain, it is plausible that both systems act separately or together to
generate different rhythms in various parts of the brain. However, when working with
a simpler model like a brain slice, unless spontaneous rhythmic activity presents
itself, researchers have to choose among several ways of induction. Personal
preferences for a particular model and the diversity of available models may
complicate the generalisation of accumulated knowledge.
Stimulation of cortical network with different doses of KA elicited oscillations ranging
from 4 to 45 Hz. Generation of different oscillation frequencies could either indicate a
similar underlying mechanism with altered neuronal firing or employment of different
network mechanisms depending on the level of excitatory drive. A substantial amount

198""
of intra- and extracellular studies are required to determine the origin of observed
frequency change. It can still be speculated that KA application is able to induce
rhythmic activity with different mechanims and properties. For instance, a relatively
low concentration of KA produced slow theta frequency rhythm. Although theta
oscillations have been widely reported in the hippocampus of rodents, in humans
theta frequencies have been observed in cortical structures, but several studies
suggest that these rhythms are not coherent with theta in the hippocampus and
represent different states in each region (Kahana, 1999; Raghavachari et al., 2001).
Theta rhythm has been linked to various behavioural states, in particular associated
with voluntary movement (Vanderwolf, 1969; Whishaw and Vanderwolf, 1973; Bland
and Oddie, 2001). However, theta waves were also observed in animals during
immobility associated with fear conditioning and attention to predators (Whishaw,
1972; Sainsbury et al., 1987a,b). Some findings also suggest that theta rhythm is
involved in the processes of memory and learning (Berry and Thompson, 1978;
Winson, 1978; Givens and Olton, 1990; Vertes and Kocsis, 1997; Berry and Seager,
2001).
Increased KA concentration caused a significant shift in oscillation frequency
producing a 10 Hz oscillation, which corresponded to alpha frequency band in the
human brain. In literature alpha oscillations are categorised into three types. The first
type is the “occipital alpha”, which prevails during quiet wakefulness and is
decreases by eye opening. Occipital alpha is a major contributor to the alpha band
magnitude during this behavioural state. Another type of alpha frequency rhythm is
known as the mu rhythm, these waves are present in the central cortical areas and
can be observed only in a small number of individuals (< 15%) during relaxed
wakefulness (Jasper and Andrews, 1938; Maddochs et al., 1951; Schutz and Muller,
1951). Studies demonstrate the attenuation of this rhythm by motor movements or
somatosensory stimuli (Pfurtscheller et al., 1998). The third type of alpha rhythm is
the “third rhythm” (independent temporal alphoid rhythm) observed in the temporal
region and described by Niedermeyer (1990; 1991). However, these waves are
visible on the EEG only in subjects with skull defects (Niedermeyer, 1997). A
distinctive feature of the third rhythm is the absence of a specific blocking process or
stimulus, unlike with occipital alpha or mu rhythm (Niedermeyer, 1997). It seems
plausible that the third rhythm analogue could be generated in the temporal cortex

199""
slices, although it should be noted that a brain slice is a reduced system with limited
connectivity.
A further increase in the glutamatergic drive resulted in alpha oscillations developing
into a beta frequency (~15-20 Hz) rhythm. In humans beta rhythm is associated with
sensorimotor functions and cognitive processing related to stimulus assessment and
decision-making. Beta activity is prominent during steady contractions and holding
periods following movements, and is blocked by voluntary movement (Sanes and
Donoghue, 1993; Baker et al., 1997; Kilner et al., 1999; Klostermann et al., 2007).
Apart from sensory-motor area, beta frequencies have been recorded from more
frontal, as well as posterior and temporal regions (for review see Niedemeyer and
Lopes da Silva, 2005). There is a possibility that beta oscillations represent
pathological states and are enhanced in such conditions as Parkinson’s and
epilepsy. In vitro experiments might support this idea. It is yet to determine whether
beta oscillations recorded from the epileptic human brain slices are physiological or
emerge as a consequence of a pathological condition. Another possibility is that what
appears to be a beta type activity could in fact be a slow gamma rhythm, indicating
the same underlying mechanism. Therefore, more studies will help identify the nature
of recorded activity.
Acceleration of rhythmic activity at high doses of KA in human slices demonstrated
capability of the human cortex to generate gamma oscillations in vitro. The gamma
rhythm in human slices was similar to that recorded from rodents, although in an
intact human brain gamma oscillations tend to be of a higher frequency. This,
however, could be explained by reduced connectivity in a slice, as well as artificial
experimental conditions. It is believed that the functional role of gamma oscillations is
involvement in temporal encoding, sensory binding of features, learning and memory
processes (Hopfield et al., 1995; Buzsaki and Chrobak, 1995; Lisman and Idiart,
1995; Lisman, 1999, Jensen et al., 2007). Gamma oscillations are observed during
attentive state, focused wakefulness, sensory perception, object recognition, and
language perception (Bouyer et al., 1981; Sheer et al., 1989; Murthy and Fetz, 1992;
Pfurtscheller and Neuper, 1992, Bragin et al., 1995; Jensen et al., 2007). On a global
scale, gamma frequency oscillations are thought to reflect integration mechanisms in
the brain (Herrmann et al., 2004).

200""
7.3.2. Pharmacology of human tissue oscillations
Pharmacological investigation of synchronous activity in the human cortical tissue
revealed similar findings to rodent pharmacology, implying similar underlying
mechanism. Crucial role of GABA-ergic inhibition and glutamatergic excitation in the
generation of beta/gamma oscillations suggests that the species share basic
mechanisms of neuronal communication and information processing/transmission
(Buhl et al., 1998; Cunningham et al., 2003; Yamawaki et al., 2008). Initial results
demonstrated that a benzodiazepine site agonist, zolpidem, produced a dual dose-
dependent modulation of rhythmic activity, which again supported the role of GABA-
Ar and was in line with the effects reported in rat M1 (Yamawaki et al., 2008; Prokic,
2012). KAr are known to take part in the generation and maintenance of neuronal
network activity (Stanger et al., 2008), and our results showed that GluK1 subunit-
containing KAr were also involved in the network synchronisation in the human
tissue. Our findings demonstrated that human oscillations relied heavily on gap
junction transmission, similar to animal findings in vitro. Together with the similarities,
several differences occurred when human pharmacology was compared to rodent
oscillations. It appeared that NMDAr and mAChr were more involved in the
generation and maintenance of gamma activity in the human cortex, compared to
KA-induced oscillations in rodents. At the moment, our dataset is limited; therefore it
is too early to make conclusions on the mechanism of human oscillations in vitro.
7.3.3. VFO and ictal activity
Several experiments revealed episodes of high frequency activity recorded from
human brain slices taken from paediatric patients suffering from intractable epilepsy.
The burst of fast oscillations resembled those recorded from PSE 24h and PSE 90d
slices, indicating that RISE model bears at least a superficial similarity to the human
condition. As mentioned earlier, fast oscillations are significantly enhanced in
epilepsy and are known to precede and superimpose upon seizure activity. High
frequency oscillations have been observed both in vivo and in vitro, in humans and
animals (for review see Traub et al., 2012). Studies suggest that high frequency
activity can be generated in the absence of chemical neurotransmission by non-
synaptic mechanisms relying on axonal gap junctions. In our experiments, however,
gap junction blocker did not produce the expected effect suggesting a different

201""
physiological mechanism or a non-biological nature of the events. Gap junction
activation with TMA could not promote high frequency activity in human slices,
although more experiments are needed to draw conclusions on the origins of fast
oscillations.
An ictal episode observed in one of the human brain slices confirmed the
epileptogenic nature of the tissue. As previously mentioned, human tissue in vitro
appears to be relatively seizure-resistant, making epilepsy research in vitro rather
difficult (Heinemann and Staley, 2014). Various methods have been used to promote
ictogenesis in the brain slice, including 4-AP, bicuculline, elevated K+ and reduced
Mg2+, however whether these models are physiologically relevant is still a question
open for discussion (Avoli et al., 2003; Gabriel et al., 2004; Huberfeld et al., 2011).
Recent advances in the clinical field demonstrate the use of a single pulse electrical
stimulation as a new diagnostic tool for epileptogenic focus detection (Valentin et al.,
2008). It has been shown that a single pulse of electrical stimulation produces a
different response in the regions of spontaneous seizure occurrence, compared to
normal brain regions. This method could be implemented in vitro to facilitate epilepsy
research and is now being piloted in the laboratory.
7.4. Conclusion
Overall, we are starting to uncover electrophysiological properties and neuronal
network dynamics of the human brain tissue. We are still in the early stages of
understanding cellular and network mechanisms of synchronised activity in the
human brain. Nevertheless, the findings we have so far show a striking similarity
between the human and animal brain tissue. We have demonstrated the possibility of
recording oscillations of various frequencies in reduced cortical networks of the
human brain, much like in rat brain slices. The mechanism of human oscillations is
also similar in its dependence on both synaptic inhibition and excitation, as well as
non-synaptic mechanisms. Completing pharmacological and electrophysiological
characterisation of rhythmic activity and supporting LFP findings with intracellular
data would set a solid foundation for in vitro human brain research, which could be
built on and compared to in pathological conditions. Once the electrophysiological
properties of human brain tissue are established, it would present an opportunity to
explore KAr and AMPAr changes, as well as other alterations in the human epilepsy.

202""
Chapter 8 General discussion and future work

203""
The ultimate goal of this project was to explore the process of epileptogenesis in the
temporal lobe, since TLE, intractable forms in particular, constitute a large clinical
problem. As the hippocampus and the EC are known to be implicated in the
development of TLE, these were the areas of our focus.
To understand the course of epileptogenesis, it is important to approach it at the right
organisational level, as epilepsy is a network disorder. Dynamic changes in the
network operation could well reflect the progression of epileptogenesis. We therefore
chose spontaneous rhythmic activity of neuronal populations to characterize the state
of hippocampal and EC networks throughout the development of epilepsy.
Spontaneous oscillations seem to represent well the natural (free of external
intervention) state of the network and do not raise questions about the validity of
induction models of rhythmic activity in vitro.
Having this in mind, we established a model of SγO in the hippocampal CA3 region.
SγO had been previously observed by Pietersen et al. (2009), however, on a less
regular and reliable basis than our own observations. We determined the nature of
this activity and carried out a phamacological comparison to other gamma oscillation
models existing in literature (KγO and CChγO). The results showed that SγO
represented a separate class of rhythmic activity, as they were pharmacologically
different from previously described KγO and CChγO. These findings were further
confirmed by phase analysis of the models. Nevertheless, having routinely observed
stable SγO in the hippocampus was a reliable way of assessing network function in
healthy and pathological conditions. Despite the fact that spontaneous activity in the
hippocampus has been reported by a number of studies, the transient nature and
sporadic occurrence of spontaneous oscillations present serious limitations for the
utilisation of this model in hippocampal studies. By contrast, our slices routinely
exhibited a persistent activity of high frequency and power, which was stable for
hours, thus allowing the use of this activity to characterise network function in various
physiological and pathological states, epilepsy in particular. Together with the
hippocampus, we explored the EC and detected spontaneous rhythmic activity of low
frequency in layers II/III (SWO). SWO were pharmacologically characterised to
establish basic synaptic mechanism of these oscillations, which were used to study
epilepsy development in the EC. Overall, established and characterised spontaneous

204""
activity in the major regions of the temporal lobe set a solid foundation for exploring
network changes occurring during epileptogenesis and leading to the development of
behavioural seizures.
To study chronic TLE, we developed Li-pilocarpine-based RISE model, which proved
to have reduced severity, yet high morbidity. The use of the Li-low-dose pilocarpine
protocol, reduction of SE duration, administration of xylazine and the use of the multi-
drug cocktail altogether provide a highly reliable and repeatable method for induction
of epilepsy which reduces mortality whilst maintaining a high degree of
epileptogenicity. Unlike other, more aggressive models, the subtle nature of this
model does not allow gross neuropathological changes, thus mimicking the natural
course of epilepsy. We assessed the progression of epileptogenesis in this model
based on the changes in hippocampal SγO and EC SWO. Recordings were
conducted at 4 timepoints following the initial insult (SE): PSE 24h (recovery from
SE), PSE 7d and PSE 6wks (early and late latent period, respectively), PSE 90d
(occurrence of SRS). Observations, supposedly, covered the main stages of
epileptogenesis, such as SE, followed by a seizure-free latent period, culminating in
the appearance of behavioural seizures (SRS). The hippocampal network
demonstrated signs of hyperactivity with elements of high frequency oscillations
shortly after the SE and during the SRS stage, when ictal and interictal activities were
also detected. The late latent period (seizure-free stage), on the other hand, showed
reduced network activity, which was reflected by reduced power of SγO in CA3.
These findings suggested that certain changes occurred in the network during
epileptogenesis, in particular during latent and SRS stages, when a period of
quiescence was asssociated with reduced neuronal synchronisation, while the
appearance of behavioural seizure coincided with the network activity bouncing back.
We hypothesised that network fragmentation during the latent period (possibly due to
the loss of interneurons) and its reconnection during the SRS stage might underlie
the transition from no-seizure to seizure period. A substantial body of literature is still
focused on the role of GABA inhibition in epilepsy, while changes in the excitatory
component are sometimes overlooked. Nevertheless, several studies have pointed
out the role of KAr in the epileptic condition (Mulle et al., 1998; Mathern et al., 1998;
Smolders et al., 2002; Fisahn et al., 2004). We, therefore, explored KAr function and
their possible role in the network alterations throughout epileptogenesis, including

205""
network fragmentation. SγO, in this light, presented a useful tool for exploring
network properties.
We set out to test this hypothesis by challenging hippocampal SγO with KA, to
evaluate the response/network excitability at different stages of epileptogenesis. The
results showed a striking difference in the latent period, when KAr stimulation
produced a minimal effect. By contrast, the response was restored when epilepsy
was established and behavioural seizures occurred, which guided us to further
investigate KAr function directly via intracellular recordings. Unfortunately, due to
poor survival of CA3 region in older animals, this has proved to be rather challenging.
Therefore, at this point it is not clear whether the effect was mediated by direct
activation of KAr or presynaptic modulation via KAr. Nevetherless, it is clear that the
latent period deserves attention, as the occurring changes might play a key role in
the establishment of epilepsy in the hippocampus. We also investigated neuronal
network changes appearing in the EC and used spontaneous SWO for their
evaluation. It should be noted that SWO were present in the slices only up to a
certain animal age, therefore EC network function was explored during the early
stages post-SE. Generally, spontaneous activity was fairly similar between epileptic
and AMC slices. However, shortly after the SE, the system showed a greater
dependence on AMPAr activation compared to control slices. Possible mechanisms
could include upregulation or abnormal function/subunit composition of AMPAr
following the SE. Overall, alterations in the function of KAr and AMPAr might be a
part of the complex changes associated with epileptogenesis.
The role of excitatory glutamatergic transmission in epilepsy has been in the shadow
of GABA research. However, both AMPAr and KAr appear to be involved in the
complex mechanism of epileptogenesis and might contribute to/be responsible for
the development of behavioural seizures. As our findings demonstrated, both the
hippocampus and the EC neuronal networks undergo changes associated with
glutamatergic receptors. Considering the complexity of epilepsy mechanism, it is
worth exploring multiple receptor types, as has been done by Graebenitz and
colleagues (2011) and Palomero-Gallagher et al. (2012) who have shown altered
expression of glutamatergic, cholinergic and adrenergic receptors in human epilepsy.
It is worth asking: what are the differences in epileptogenesis between the

206""
hippocampus and the EC, does it develop on a different time scale in these regions,
what are the roles of KAr and AMPAr, as well as what happens in the EC later into
the epileptogenesis. Hence, there is plenty of room for further research:
∴ Explore the role of KAr in the hippocampus during epileptogenesis
using intracellular techniques. Investigate possible involvement of
AMPAr in the hippocampus.
∴ Explore the role of AMPAr and KAr in the EC during all stages of
epileptogenesis.
∴ Correlate findings from RISE model in animals with the epileptic
human tissue data.

207""
References

208""
Abegg, M H., Savic, N., Ehrengruber, M.U., McKinney, R.A. and Gähwiler, B.H. (2004). Epileptiform activity in rat hippocampus strengthens excitatory synapses. J Physiol, 554(2), p.439-448.
Achermann, P. and Borbely, A. A. (1997). Low-frequency (< 1 Hz) oscillations in the human sleep electroencephalogram. Neuroscience, 81, p.213-222.
Acsady, L., Gorcs, T.J. and Freund, T.F. (1996). Different populations of vasoactive intestinal olypeptide-immunoreactive interneurons are specialized to control pyramidal cells or interneurons in the hippocampus. Neuroscience, 73, p.317-334.
Adelson, P.D. (2008). The surgical treatment of temporal lobe epilepsy in children. Progress in Clinical Neurosciences, 23, p.201.
Aghajanian, G. K. and Rasmussen, K. (1989). Intracellular studies in the facial nucleus illustrating a simple new method for obtaining viable motoneurons in adult rat brain slices. Synapse, 3(4), p.331-338.
Alger, B. E. (1984). Characteristics of A Slow Hyperpolarizing Synaptic Potential in Rat Hippocampal Pyramidal Cells-Invitro. J. Neurophysiol., 52(5), p.892-910.
Allene, C., Cattani, A., Ackman, J.B., Bonifazi, P., Aniksztejn, L., Ben-Ari, Y. and Cossart, R. (2008). Sequential generation of two distinct synapse-driven network patterns in developing neocortex. J. Neurosci., 28, p.12851-12863.
Allen, P.J., Fish, D.R. and Smith, S.J. (1992). Very high-frequency rhythmic activity during SEEG suppression in frontal lobe epilepsy. Electroen. Clin. Neuro., 82, p.155-159.
Alt, A., Weiss, B., Ogden, A.M., Knauss, J.L., Oler, J., Ho, K., Large, T.H. and Bleakman, D. (2004). Pharmacological characterization of glutamatergic agonists and antagonists at recombinant human homomeric and heteromeric kainate receptors in vitro. Neuropharmacol., 46, p.793-806.
Amzica, F. and Steriade, M. (1998). Electrophysiological correlates of sleep delta waves. Electroen. Clin. Neuro., 107(2), p.69-83.
Andersen, P., Bland, B., Skrede, K., Sveen, O. and Westgaard. R. (1972). Single unit discharge in brain slices maintained in vitro. Acta Physiol Scand, 84, p.1-2.
André, V., Dubé, C., François, J., Leroy, C., Rigoulot, M.A. and Roch, C. (2007). Pathogenesis and pharmacology of epilepsy in the lithium–pilocarpine model. Epilepsia, 48(Suppl 5), p.41-47.
Apland, J.P., Aroniadou-Anderjaska, V. and Braga, M.F. (2009). Soman induces ictogenesis in the amygdala and interictal activity in the hippocampus that are blocked by a GluR5 kainate receptor antagonist in vitro. Neuroscience, 159, p.380-389.
Apland, J.P., Aroniadou-Anderjaska, V., Figueiredo, T.H., et al. (2013). Efficacy of the GluK1/AMPA receptor antagonist LY293558 against seizures and

209""
neuropathology in a soman-exposure model without pretreatment and its pharmacokinetics after intramuscular administration. J Pharmacol Exp Ther, 344, p.133-140."
Assaf, B.A. and Ebersole, J.S. (1997). Continuous source imaging of scalp ictal rhythms in temporal lobe epilepsy. Epilepsia, 38(10), p.1114-1123."
Avoli, M. and Olivier, A. (1989). Electrophysiological properties and synaptic responses in the deep layers of the human epileptogenic neocortex in vitro.J. Neurophysiol., 61(3), p.589-606.
Avoli, M., Drapeau, C., Louvel, J., Pumain, R., Olivier, A. and Villemure, J.G. (1991). Epileptiform activity induced by low extracellular magnesium in the human cortex maintained in vitro. Ann. Neurol., 30, p.589-596.
Avoli, M., Mattia, D., Siniscalchi, A., Perreault, P. and Tomaiuolo, F. (1994). Pharmacology and electrophysiology of a synchronous GABAmediated potential in the human neocortex. Neuroscience, 62, p.655-666.
Avoli, M., Louvel, J., Kurcewicz, I., Pumain, R. and Barbarosie, M. (1996). Extracellular free potassium and calcium during synchronous activity induced by 4-aminopyridine in the juvenile rat hippocampus. J. Physiol (Lond.), 493, p.707-717.
Babiloni, C., Ferri, R., Moretti, D.V., Strambi, A., Binetti, G., Dal Forno, G., Ferreri, F., Lanuzza, B., Bonato, C., Nobili, F., et al. (2004). Abnormal fronto-parietal coupling of brain rhythms in mild Alzheimer’s disease: a multicentric EEG study. Eur. J. Neurosci., 19, p.2583-2590.
Baker, S.N., Olivier, E. and Lemon, R.N. (1997). Coherent oscillations in monkey motor cortex and hand muscle EMG show task-dependent modulation. J. Physiol., 501(Pt 1), p.225-241.
Bandrowski, A.E., Huguenard, J.R. and Prince, D.A. (2003). Baseline glutamate levels affect group I and II mGluRs in layer V pyramidal neurons of rat sensorimotor cortex. J. Neurophysiol., 89(3), p.1308-1316.
Barbarosie, M. and Avoli, M. (1997). CA3-driven hippocampal-entorhinal loop controls rather than sustains in vitro limbic seizures. J. Neurosci., 17, p.9308-9314.
Bartolomei, F., Khalil, M., Wendling, F., Sontheimer, A., Regis, J. and Ranjeva, J.P. (2005). Entorhinal cortex involvement in human mesial temporal lobe epilepsy: an electrophysiologic and volumetric study. Epilepsia, 46, p.677-687.
Barton, M.E., Klein, B.D., Wolf, H.H. and White, H.S. (2001). Pharmacological characterization of the 6 Hz psychomotor seizure model of partial epilepsy. Epilepsy Res., 47, p.217-227.
Baybis, M., Lynch, D., Lee, A., Patel, A., McKhann, G., Chugani, D., . and Crino, P. B. (2004). Altered Expression of Neurotransmitter!receptor Subunit and Uptake Site mRNAs in Hemimegalencephaly. Epilepsia, 45(12), p.1517-1524.

210""
Bazhenov, M., Timofeev, I., Steriade, M. and Sejnowski, T.J. (2002). Model of thalamocortical slow-wave sleep oscillations and transitions to activated states. J. Neurosci., 22( 8), p.691-704
Beck, H., & Yaari, Y. (2008). Plasticity of intrinsic neuronal properties in CNS disorders. Nat. Rev. Neurosci., 9(5), 357-369.
Beed, P.S., Salmen, B. and Schmitz, D. (2009). GluK2-mediated excitability within the superficial layers of the entorhinal cortex. PLoS One 4, e5576.
Behr, J., Gebhardt, C., Heinemann, U. and Mody, I. (2002). Kindling enhances kainate receptor-mediated depression of GABAergic inhibition in rat granule cells. Eur. J. Neurosci., 16, p.861-867.
Belluscio, M.A., Mizuseki, K., Schmidt, R., Kempter, R. and Buzsaki, G. (2012). Cross-frequency phase-phase coupling between theta and gamma oscillations in the hippocampus. J. Neurosci., 32(2), p.423-35.
Ben-Ari, Y. (1985). Limbic seizure and brain damage produced by kainic acid: mechanisms and relevance to human temporal lobe epilepsy. Neuroscience, 14(2), p.375-403.
Ben-Ari, Y. and Cossart, R. (2000). Kainate, a double agent that generates seizures: two decades of progress. Trends Neurosci., 23, p.580-587.
Ben-Ari, Y. (2004). History of Neuroscience: Kainic Acid and Temporal Lobe Epilepsy. IBRO History of Neuroscience.
Benifla, M., Otsubo, H., Ochi, A., Weiss, S.K., Donner, E.J., Shroff, M. and Rutka, J.T. (2006). Temporal Lobe Surgery for Intractable Epilepsy in Children: An Analysis Ofoutcomes in 126 Children. Neurosurgery, 59(6), p.1203-1214.
Bernard, C., Esclapez, M., Hirsch, J. C. and Ben-Ari, Y. (1998). Interneurones are not so dormant in temporal lobe epilepsy: a critical reappraisal of the dormant basket cell hypothesis. Epilepsy Res., 32(1), p.93-103.
Bernard, C., Cossart, R., Hirsch, J.C., Esclapez, M. and Ben-Ari, Y. (2000). What is GABAergic inhibition? How is it modified in epilepsy? Epilepsia, 41, p.90-95.
Bernasconi, N., Bernasconi, A. andermann, F., Dubeau, F., Feindel, W. and Reutens, D.C. (1999). Entorhinal cortex in temporal lobe epilepsy A quantitative MRI study. Neurology, 52(9), p.1870-1870.
Berry, S.D. and Thompson, R.F. (1978). Prediction of learning rate from the hippocampal electroencephalogram. Science, 200, p.1298-1300.
Berry, S.D. and Seager, M.A. (2001). Hippocampal theta oscillations and classical conditioning. Neurobiol Learn Mem, 76, p.298-313.
Best, N., Mitchell, J. and Wheal, H.V. (1994). Ultrastructure of parvalbumin-immunoreactive neurons in the CA1 area of the rat hippocampus following a kainic acid injection. Acta neuropathologica, 87(2), p.187-195.

211""
Bettler, B. and Mulle, C. (1995). Review: neurotransmitter receptors. II. AMPA and kainate receptors. Neuropharmacol., 34, p.123-139.
Bialer, M., Johannessen, S.I., Levy, R.H., Perucca, E., Tomson, T. and White, H.S. (2009). Progress report on new antiepileptic drugs: a summary of the Ninth Eilat Conference (EILAT IX). Epilepsy Res., 83, p.1-43.
Bland, B.H. and Oddie, S.D. (2001). Theta band oscillation and synchrony in the hippocampal formation and associated structures: the case for its role in sensorimotor integration. Behav. Brain. Res., 127(1), p.119-136.
Boddeke, H.W., Best, R. and Boeijinga, P.H. (1997). Synchronous 20 Hz rhythmic activity in hippocampal networks induced by activation of metabotropic glutamate receptors in vitro. Neuroscience, 76, p.653-658.
Bonilha, L., Kobayashi, E., Rorden, C., Cendes, F. and Li, L.M. (2003). Medial temporal lobe atrophy in patients with refractory temporal lobe epilepsy. J Neurol Neurosurg Psychiatry, 74(12), p.1627-1630.
Bouyer, J.J., Montaron, M.F. and Rougeul, A. (1981). Fast fronto-parietal rhythms during combined focused attentive behavior and immobility in cat: cortical and thalamic localizations. Electroencephal Clin Neurophsysiol, 51, p.244-252.
Bragin, A., Jando, G., Nadasdy, Z., Hetke, J., Wise, K. and Buzsaki, G. (1995). Gamma frequency (40-100 Hz) patterns in the hippocampus of the behaving rat. J. Neurosci., 15, p.47-60.
Bragin, A., Csicsvari, J., Penttonen, M. and Buzsaki, G. (1997). Epileptic afterdischarge in the hippocampal–entorhinal system: current source density and unit studies. Neuroscience, 76, p.1187-1203.
Bragin, A., Engel, J. Jr, Wilson, C.L., et al. (1999a). Hippocampal and entorhinal cortex high-frequency oscillations (100–500 Hz) in human epileptic brain and in kainic acid-treated rats with chronic seizures. Epilepsia, 40, p.127-37.
Bragin, A., Engel, J. Jr, Wilson, C.L., Fried, I. and Buzski, G. (1999b). High-frequency oscillations in the human brain. Hippocampus, 9, p.137-142.
Bragin, A., Azizyan, A., Almajano, J., Wilson, C. L. and Engel, J. (2005). Analysis of chronic seizure onsets after intrahippocampal kainic acid injection in freely moving rats. Epilepsia, 46(10), p.1592-1598.
BrainSliceMethods, accessed on 01 August 2014, http://www.brainslicemethods.com/#!recipes/czv4.
Brines, M.L., Sundaresan, S., Spencer, D.D. and Lanerolle, N. C. (1997). Quantitative Autoradiographic Analysis of lonotropic Glutamate Receptor Subtypes in Human Temporal Lobe Epilepsy: Up!regulation in Reorganized Epileptogenic Hippocampus. Eur. J. Neurosci., 9(10), p.2035-2044.
Brock, J., Brown, C.C., Boucher, J. and Rippon, G. (2002). The temporal binding deficit hypothesis of autism. Dev. Psychopathol., 14, p.209-224.
212""
Brown, J.T., Teriakidis, A. and Randall, AD. (2006). A pharmacological investigation of the role of GLUK5-containing receptors in kainate-driven hippocampal gamma band oscillations. Neuropharmacol., 50. P.47-56.
Bruckner, C. and Heinemann, U. (2000). Effects of standard anticonvulsant drugs on different patterns of epileptiform discharges induced by 4-aminopyridine in combined entorhinal cortex-hippocampal slices. Brain Res., 859, p.15-20.
Buchheim, K., Schuchmann, S., Siegmund, H., Weissinger, F., Heinemann, U. And Meierkord, H. (2000). Comparison of intrinsic optical signals associated with low Mg2+-4-aminopyridine-induced seizure-like events reveals characteristic features in adult rat limbic system. Epilepsia, 41, p.635-641.
Buchmann, A., Kurth, S., Ringli, M., Geiger, A., Jenni, O.G. and Huber, R. (2011). Anatomical markers of sleep slow wave activity derived from structural magnetic resonance images. J. Sleep Res., 20(4), p.506-513.
Buckmaster, P.S. and Jongen-Relo, A.L. (1999). Highly specific neuron loss preserves lateral inhibitory circuits in the dentate gyrus of kainate-induced epileptic rats. J. Neurosci. 19, p.9519-9529.
Buhl, E.H., Halasy, K. and Somogyi. P. (1994). Diverse sources of hippocampal unitary inhibitory postsynaptic potentials and the number of synaptic release sites. Nature, 368, p.823-828.
Buhl, E.H., Tamas, G. and Fisahn, A. (1998). Cholinergic activation and tonic excitation induce persistent gamma oscillations in mouse somatosensory cortex in vitro. J Physiol (Lond), 513, p.117-126.
Buhl, D.L., Harris, K.D., Hormuzdi, S.G., Monyer, H. and Buzsaki, G. (2003). Selective impairment of hippocampal gamma oscillations in connexin-36 knock-out mouse in vivo. J. Neurosci., 23, p.1013-1018.
Buzsaki, G., Leung, L. and Vanderwolf, C.H. (1983). Cellular bases of hippocampal EEG in the behaving rat. Brain Res. Rev, 6, p.139-171.
Buzsaki, G., Horvath, Z., Urioste, R., Hetke, J. and Wise, K. (1992). High-frequency network oscillation in the hippocampus. Science, 256, p.1025-1027.
Buzsáki, G. and Chrobak, J.J. (1995). Temporal structure in spatially organized neuronal ensembles: a role for interneuron networks. Curr Opin Neurobiol, 5, p.504-510.
Buzsáki, G., Buhl, D.L., Harris, K.D., Csicsvari, J., Czeh, B. and Morozov, A. (2003). Hippocampal network patterns of activity in the mouse. Neuroscience, 116, p.201-211.
Buzsaki, G. and Draguhn, A. (2004) Neuronal oscillations in cortical networks. Science, 304 (00:00), p.1926 -1929.
Buzsaki, G. (2006). Rhythms of the Brain. Oxford University Press.

213""
Buzsáki, G. and Wang, X.J. (2012). Mechanisms of gamma oscillations. Annu. Rev. Neurosci., 35, p.203–225.
Castillo, P.E., Malenka, R.C. and Nicoll, R.A. (1997). Kainate receptors mediate a slow postsynaptic current in hippocampal CA3 neurons. Nature, 388, p.182-186.
Case, L. and Broberger, C. (2013). A method for visually guided whole-cell recordings in brain slices exhibiting spontaneous rhythmic activity. J. Neurosci. Methods, 212(1), p.64-71.!
Cataltepe, O. and Cosgrove, G.R. (2011). Surgical Management of Lesional Temporal Lobe Epilepsy. In: Cataltepe, O. and Jallo, G.I. (eds.) Pediatric Epilepsy Surgery: Preoperative Assessment and Surgical Treatment. p.161-174.
Cavalheiro, E.A., Leite, J.P., Bortolotto, Z.A., Turski, W.A., Ikonomidou, C. and Turski, L. (1991). Long-term effects of pilocarpine in rats: structural damage of the brain triggers kindling and spontaneous recurrent seizures. Epilepsia,32, p.778-782.
Cavalheiro, E.A., Naffah-Mazzacoratti, M.G., Mello, L.E. and Leite, J.P. (2006). The Pilocarpine Model of Seizures. In: Pitkänen, A., Schwartzkroin, P.A. and Moshé, S.L. (eds.) Models of Seizures and Epilepsy. Burlington, MA: Elsevier Academic, p.433-449.
Cendes, F. andermann, F., Carpenter, S., Zatorre, R.J. and Cashman, N.R. (1995). Temporal lobe epilepsy caused by domoic acid intoxication: evidence for glutamate receptor-mediated excitotoxicity in humans. Ann. Neurol., 37, p.123-126.
Chakir, A., Fabene, P.F., Ouazzani, R. and Bentivoglio, M. (2006). Drug resistance and hippocampal damage after delayed treatment of pilocarpine-induced epilepsy in the rat. Brain Res Bull., 71, p.127-138.
Chamberlain, S. (2009). Functional role of kainate receptors in the rat entorhinal cortex (Doctoral dissertation, University of Bath).
Chamberlain, S.E., Jane, D.E. and Jones, R.S. (2012). Pre- and post-synaptic functions of kainate receptors at glutamate and GABA synapses in the rat entorhinal cortex. Hippocampus 22, p.555-576.
Chauvette, S., Volgushev, M. and Timofeev, I. (2010). Origin of active states in local neocortical networks during slow sleep oscillation. Cereb Cortex, 20, p.2660-2674.
Chittajallu, R., Vignes, M., Dev, K.K., Barnes, J.M., Collingridge, G.L. and Henley, J.M. (1996). Regulation of glutamate release by presynaptic kainite receptors in the hippocampus. Nature, 379, p.78-81.
Christensen, J.K., Paternain, A.V., Selak, S., Ahring, P.K. and Lerma, J. (2004). A mosaic of functional kainate receptors in hippocampal interneurons. J. Neurosci., 24(41), p.8986-8993.
Chugani, H.T., Shewmon, D.A., Shields, W.D., Sankar, R., Comair, Y., Vinters, H.V. and Peacock, W.J. (1993). Surgery for intractable infantile spasms: neuroimaging perspectives. Epilepsia, 34(4), p.764-771.

214""
Clarke, V.R.J., Ballyk, B.A., Hoo, K.H., Mandelzys, A., Pellizzari, A., Bath, C.P., Thomas, J., Sharpe, E.F., Davies, C.H., Ornstein, P.L., Schoepp, D.D., Kamboj, R.K., Collingridge, G.L., Lodge, D. and Bleakman, D. (1997). A hippocampal GluR5 kainate receptor regulating inhibitory synaptic transmission. Nature, 389, p.599-603.
Clifford, D.B., Olney, J.W., Maniotis, A., Collins, R.C. and Zorumski, C.F. (1987). The functional anatomy and pathology of lithium-pilocarpine and high-dose pilocarpine seizures. Neuroscience, 23, p.953-968.
Cobb, S.R., Halasy, K., Vida, I., Nyiri, G., Tamas, G., Buhl, E.H. and Somogyi, P. (1997). Synaptic effects of identified interneurons innervating both interneurons and pyramidal cells in the rat hippocampus. Neuroscience, 79, p.629-648.
Colgin, L.L., Denninger, T., Fyhn, M., Hafting, T., Bonnevie, T., Jensen, O., Moser, M.B. and Moser, E.I. (2009). Frequency of gamma oscillations routes flow of information in the hippocampus. Nature, 462(7271), p.353-357.
Colgin, L.L. and Moser, EI. (2010). Gamma oscillations in the hippocampus. Physiol (Bethesda), 25, p.319-329.
Collins, R.C., Tearse, R.G. and Lothman, E.W. (1983). Functional anatomy of limbic seizures: focal discharges from medial entorhinal cortex in rat. Brain Res., 280(1), p.25-40.
Colom, L.V. and Saggau, P. (1994). Spontaneous interictal-like activity originates in multiple areas of the CA2-CA3 region of hippocampal slices. J Neurophysiol, 71, p.1574-1585.
Compte, A., Sanchez-Vives, M.V., McCormick, D.A. and Wang, X.J. (2003). Cellular and network mechanisms of slow oscillatory activity (<1 hz) and wave propagations in a cortical network model. J Neurophysiol, 89, p.2707-2725.
Compte, A., Reig, R., Descalzo, V.F., Harvey, M.A., Puccini, G.D. and Sanchez-Vives, M.V. (2008). Spontaneous high-frequency (10–80 Hz). oscillations during up states in the cerebral cortex in vitro. J. Neurosci., 28(51), p.13828-13844.
Contractor, A., Swanson, G. & Heinemann, S.F. (2001). Kainate receptors are involved in short- and long-term plasticity at mossy fiber synapses in the hippocampus. Neuron, 29, p.209-216.
Contractor, A., Mulle, C. and Swanson, G.T. (2011). Kainate receptors coming of age: milestones of two decades of research. Trends Neurosci., 34, p.154-163.
Cossart, R., Esclapez, M., Hirsch, J.C., Bernard, C. and Ben-Ari, Y. (1998). GluR5 kainate receptor activation in interneurons increases tonic inhibition of pyramidal cells 41. Nat. Neurosci., 1, p.470-478.
Cossart, R., Tyzio, R., Dinocourt, C., Esclapez, M., Hirsch, J.C., Ben-Ari, Y. and Bernard, C. (2001). Presynaptic kainate receptors that enhance the release of GABA on CA1 hippocampal interneurons. Neuron, 29, p.497-508.

215""
Cossart, R., Epsztein, J., Tyzio, R., Becq, H., Hirsch, J., Ben-Ari, Y. and Cr_epel, V. (2002). Quantal release of glutamate generates pure kainate and mixed AMPA/kainate EPSCs in hippocampal neurons. Neuron, 35, p.147-159.
Cremer, C. M., Palomero-Gallagher, N., Bidmon, H. J., Schleicher, A., Speckmann, E. J., and Zilles, K. (2009). Pentylenetetrazole-induced seizures affect binding site densities for GABA, glutamate and adenosine receptors in the rat brain. Neuroscience, 163(1), p.490-499.
Csicsvari, J., Hirase, H., Mamiya, A. and Buzsáki, G. (2000). Ensemble patterns of hippocampal CA3-CA1 neurons during sharp wave–associated population events. Neuron, 28(2), p.585-594.
Csicsvari, J., Jamieson, B., Wise, K.D. and Buzsaki, G. (2003). Mechanisms of gamma oscillations in the hippocampus of the behaving rat. Neuron, 37, p.311-322.
Csercsa, R., Dombovari, B., Fabo, D., Wittner, L., Eross, L., Entz, L., Solyom, A., Rasonyi, G., Szucs, A., Kelemen, A., et al. (2010). Laminar analysis of slow wave activity in humans. Brain, 133, p.2814-2829.
Cunningham, M.O., Davies, C.H., Buhl, E.H. and Whittington, M.A. (2003). Gamma oscillations induced by kainate receptor activation in the entorhinal cortex in vitro. J. Neurosci. 23(30), p.9761-9769.
Cunningham, M.O., Halliday, D.M., Davies, C.H., Traub, R.D., Buhl, E.H. and Whittington, M.A. (2004). Coexistence of gamma and high frequency oscillations in rat medial entorhinal cortex in vitro. J Physiol., 559(2), p.347-353.
Cunningham, M.O., Pervouchine, D.D., Racca, C., Kopell, N.J., Davies, C.H., Jones, R.S., Traub, R.D. and Whittington, M.A. (2006). Neuronal metabolism governs cortical network response state. Proc Natl Acad Sci USA, 103, p.5597-5601.
Cunningham, M.O., Roopun, A., Schofield, I.S., Whittaker, R.G., Duncan, R., Russell, A. and Traub, R.D. (2012). Glissandi: transient fast electrocorticographic oscillations of steadily increasing frequency, explained by temporally increasing gap junction conductance. Epilepsia, 53(7), p.1205-1214.
Curia, G.L., Biagini, G., Jones, R.S.G. and Avoli, M. (2008). The pilocarpine model of temporal lobe epilepsy. J. Neurosci. Meth., 172, p.143-157.
Curio, G., Mackert, B.M., Burghoff, M., Koetitz, R., Abraham-Fuchs, K. and Harer, W. (1994). Localization of evoked neuromagnetic 600 Hz activity in the cerebral somatosensory system. Electroen. Clin. Neuro., 91, p.483- 487.
Danbolt, N.C. (2001). Glutamate uptake. Progress in neurobiology, 65(1), p.1-105.
Darstein, M., Petralia, R.S., Swanson, G.T., Wenthold, R.J. and Heinemann, S.F. (2003). Distribution of kainate receptor subunits at hippocampal mossy fiber synapses. J. Neurosci., 23, p.8013-8019.
Das, A., Wallace Iv, G. C., Holmes, C., McDowell, M. L., Smith, J. A., Marshall, J. D. and Banik, N. L. (2012). Hippocampal tissue of patients with refractory temporal lobe

216""
epilepsy is associated with astrocyte activation, inflammation, and altered expression of channels and receptors. Neuroscience, 220, p.237-246.
de Almeida, L., Idiart, M. and Lisman, J.E. (2009). A second function of gamma frequency oscillations: an E%-max winner-take-all mechanism selects which cells fire. J. Neurosci., 29, p.7497-7503.
DeFelipe, J., Huntley, G. W., del Río, M. R., Sola, R. G. and Morrison, J. H. (1994). Microzonal decreases in the immunostaining for non-NMDA ionotropic excitatory amino acid receptor subunits GluR 2/3 and GluR 5/6/7 in the human epileptogenic neocortex. Brain Res., 657(1), p.150-158.
de la Prida, L.M., Benavides-Piccione, R., Sola, R. and Pozo, M.A. (2002). Electrophysiological properties of interneurons from intraoperative spiking areas of epileptic human temporal neocortex. Neuroreport, 13(11), p.1421-1425.
Desai, M.A., McBain, C.J., Kauer, J.A. and Conn, P.J. (1994). Metabotropic glutamate receptor-induced disinhibition is mediated by reduced transmission at excitatory synapses onto interneurons and inhibitory synapses onto pyramidal cells. Neurosci Lett, 181, p.78-82.!
Devinsky, O., Vezzan, A., Najjar, S., De Lanerolle, N.C. and Rogawski, M.A. (2013). Glia and epilepsy: excitability and inflammation. Trends Neurosci., 36(3), p.178-184.
Dickson, C.T., Biella, G., de Curtis, M. (2003). Slow periodic events and their transition to gamma oscillations in the entorhinal cortex of the isolated guinea pig brain. J Neurophysiol, 90, 39-46.
Doischer, D., Hosp, J.A., Yanagawa, Y., Obata, K., Jonas, P., Vida, I. and Bartos, M. (2008). Postnatal differentiation of basket cells from slow to fast signaling devices. J. Neurosci., 28(48), p.12956-12968.
Dolman, N.P., More, J.C.A., Alt, A., Ogden, A.M., Troop, H.M., Bleakman, D., Collingridge, G.L. and Jane, D.E. (2006). Structure–activity relationship studies on N3 -substituted willardiine derivatives acting as AMPA or kainate receptor antagonists. J. Med. Chem., 49, p.2579-2592.
Dolman, N.P., More, J.C.A., Alt, A., Knauss, J.L., Pentika¨inen, O.T., Glasser, C.R., Bleakman, D., Mayer, M.L., Collingridge, G.L. and Jane, D.E. (2007). Synthesis and pharmacological characterization of N 3-substituted willardiine derivatives: role of the substituent at the 5-position of the uracil ring in the development of highly potent and selective GLUK5 kainate receptor antagonists. J. Med. Chem., 50, p.1558-1570.
Draguhn, A., Traub, R.D., Schmitz, D., Jefferys, J.G.R. (1998). Electrical coupling underlies high-frequency oscillations in the hippocampus in vitro. Nature, 394, p.189-192.
Dudek, F.E., Hellier, J.L., Williams, P.A., Ferraro, D.J. and Staley, K.J. (2002). The course of cellular alterations associated with the development of spontaneous seizures after status epilepticus In: Sutula, T. and Pitkanen, A. (eds.) Do seizures damage the brain? (Elsevier, Amsterdam), p.53-65.

217""
Dudek, F. and Shao, L. (2004). Mossy fiber sprouting and recurrent excitation: Direct electrophysiological evidence and potential implications. Epilepsy Currents, 4, p.184-187.
Dudek, F.E., Clark, S., Williams, P.A. and Grabenstatter, H.L. (2006). Kainate-Induced Status Epilepticus: a Chronic Model of Acquired Epilepsy. In: Pitkänen, A., Schwartzkroin, P.A., Moshé, S.L. (eds.) Models of Seizures and Epilepsy. Burlington, MA: Elsevier Academic, p.415-433.
Du, F., Whetsell, W.O. Jr, Abou-Khalil, B., Blumenkopf, B., Lothman, E.W. and Schwarcz, R. (1993). Preferential neuronal loss in layer III of the entorhinal cortex in patients with temporal lobe epilepsy. Epilepsy Res,16, p.223-233.
Du, F., Eid, T., Lothman, E.W., Köhler, C. and Schwarcz, R. (1995). Preferential neuronal loss in layer III of the medial entorhinal cortex in rat models of temporal lobe epilepsy. J. Neurosci., 15, p.6301-6313.
Dzhala, V.I. and Staley, K.J. (2003). Transition from interictal to ictal activity in limbic networks in vitro. J. Neurosci., 23, p.7873-7880.
Dzhala, V. I. and Staley, K. J. (2004). Mechanisms of fast ripples in the hippocampus. J. Neurosci., 24(40), p.8896-8906.
Engel Jr, J. (1996). Introduction to temporal lobe epilepsy. Epilepsy Res, 26, p.141-150.
Engel, A., Fries, P. and Singer, W. (2001). Dynamic predictions: oscillations and synchrony in top-down processing. Nat. Rev. Neurosci., 2, p.704-716.
Engel Jr, J. (2006). ILAE classification of epilepsy syndromes. Epilepsy Res., 70, p.5-10.
Engel Jr, J., Bragin, A., Staba, R. and Mody, I. (2009). High-frequency oscillations: what is normal and what is not? Epilepsia, 50, p.598-604.
Epsztein, J., Repressa, A., Jorquera, I., Ben-Ari, Y. and Crépel, V. (2005). Recurrent mossy fibers establish aberrant kainate receptor-operated synapses on granule cells from epileptic rats. J. Neurosci., 25(36), p.8229-8239.
Epsztein, J., Sola, E., Represa, A., Ben-Ari, Y. and Crepel, V.A. (2010). Selective interplay between aberrant EPSPKA and INaP reduces spike timing precision in dentate granule cells of epileptic rats. Cereb Cortex, 20, p.898-911.
Favero, M., Varghese, G. and Castro-Alamancos, M.A. (2012). The state of somatosensory cortex during neuromodulation. J Neurophysiol, 108, p.1010-1024.
Fellous, J-M., Sejnowski, T. (2000). Cholinergic induction of oscillations in the hippocampal slice in the slow (0.5–2 Hz), theta (5–12 Hz), and gamma (35–70 Hz). bands. Hippocampus, 10, p.187-197.
Figueiredo, T.H., Qashu, F., Apland, J.P., Aroniadou-Anderjaska, V., Souza, A.P. and Braga, M.F. (2011). The GluK1 (GluR5). Kainate/{alpha}-amino-3-hydroxy-5-

218""
methyl-4-isoxazolepropionic acid receptor antagonist LY293558 reduces soman-induced seizures and neuropathology. J Pharmacol Exp Ther., 336, p,303-312.
Fisahn, A., Pike, F.G., Buhl, E.H. and Paulsen, O. (1998). Cholinergic induction of network oscillations at 40 Hz in the hippocampus in vitro. Nature, 394, p.186-189.
Fisahn, A., Contractor, A., Traub, R.D., Buhl, E.H., Heinemann, S.F. and McBain, C.J. (2004). Distinct roles for the kainate receptor subunits GluR5 and GluR6 in kainate-induced hippocampal gamma oscillations. J. Neurosci., 24, p.9658-9668.
Fisahn, A. (2005). Kainate receptors and rhythmic activity in neuronal networks: hippocampal gamma oscillations as a tool. J. Physiol., 562(1), p.65-72.
Fisher, R.S., Alger, B.E. (1984). Electrophysiological mechanisms of kainic acidinduced epileptiform activity in the rat hippocampal slice. J. Neurosci., 4(5), p.1312-1323.
Fisher, R.S., Webber, W.R., Lesser, R.P., Arroyo, S. and Uematsu, S. (1992). High-frequency EEG activity at the start of seizures. J Clin Neurophysiol, 9, p.441-448.
Florez, C.M., McGinn, R.J., Lukankin, V., Marwa, I., Sugumar, S., Dian, J., and Valiante, T.A. (2013). In vitro recordings of human neocortical oscillations. Cereb. Cortex, bht235.
Foehring, R.C., Lorenzon, N.M., Herron, P.A. U. L. and Wilson, C.J. (1991). Correlation of physiologically and morphologically identified neuronal types in human association cortex in vitro. J neurophysiol, 66(6), p.1825-1837.
Frerking, M., Petersen, C.C. and Nicoll, R.A. (1999). Mechanisms underlying kainate receptor-mediated disinhibition in the hippocampus. Proc. Natl. Acad. Sci. USA, 96, p.12917-12922.
Frerking, M. and Nicoll, R.A. (2000). Synaptic kainate receptors. Curr Opin Neurobiol., 10(3), p.342-351
Frerking, M. and Ohliger-Frerking, P. (2002). AMPA receptors and kainite receptors encode different features of afferent activity. J. Neurosci., 22, p.7434-7443.
Fried I. (1993). Anatomic temporal lobe resections for temporal lobe epilepsy. Neurosurg Clin N Am., 4(2), p.233-42.
Fuchs, E.C., Zivkovic, A.R., Cunningham, M.O., Middleton, S. and Lebeau, F.E. (2007). Recruitment of parvalbumin-positive interneurons determines hippocampal function and associated behavior. Neuron, 53, p.591-604.
Fukuda, T. and Kosaka, T. (2000). Gap junctions linking the dendritic network of GABAergic interneurons in the hippocampus. J. Neurosci., 20, p.1519-1528.
Gabriel, S., Njunting, M., Pomper, J.K., Merschhemke, M., Sanabria, E.R.G., Eilers, A., Kivi, A., Zeller, M., Meencke, H.J., Cavalheiro, E.A., Heinemann, U. and Lehmann, T.N. (2004). Stimulus and potassium-induced epileptiform activity in the human dentate gyrus from patients with and without hippocampal sclerosis. J. Neurosci., 24, p.10416-10430.

219""
Galarreta, M. and Hestrin, S. (1999). A network of fast-spiking cells in the neocortex connected by electrical synapses. Nature, 402, p.72-75.
Galarreta, M. and Hestrin, S. (2002). Electrical and chemical synapses among parvalbumin fast-spiking GABAergic interneurons in adult mouse neocortex. Proc. Natl Acad. Sci. USA, 99, p.12438-12443.
Garcia Dominguez, L., Wennberg, R.A., Gaetz, W., Cheyne, D., Snead, O.C., III, and Perez Velazquez, J.L. (2005). Enhanced synchrony in epileptiform activity? Local versus distant phase synchronization in generalized seizures. J. Neurosci., 25, p.8077-8084.
Garthwaite, J., Woodhams, P.L., Collins, M.J. and Balazs, R. (1980). A morphological study of incubated slices of rat cerebellum in relation to postnatal age. Dev Neurosci., 3, p.90-99.
Geddes, J.W., Gahan, L.D., Cooper, S.M., Kim, R.C., Choi, B.H. and Cotman, C.W. (1990). Altered distribution of excitatory amino acid receptors in temporal lobe epilepsy. Exp. Neurol., 108(3), p.214-220.
Gillies, M.J., Traub, R.D., LeBeasu, F.E., Davies, C.H., Gloveli, T., Buhl, E.H. and Whittington, M.A. (2002). A model of atropine-resistant theta oscillations in the rat hippocampal area CA1. J Physiol (Lond), 543, p.779-793.
Givens, B.S. and Olton, D.S. (1990). Cholinergic and GABAergic modulation of the medial septal area: effect on working memory. Behav Neurosci, 104,p.849-855.
Glien, M., Brandt, C., Potschka, H., Voigt, H., Ebert, U. and Löscher, W. (2001). Repeated low-dose treatment of rats with pilocarpine: low mortality but high proportion of rats developed epilepsy. Epilepsy Res, 46, p.111-119."
Gloveli, T., Dugladze, T., Saha, S., Monyer, H. and Heinemann, U. (2005) Differential involvement of oriens/pyramidale interneurones in hippocampal network oscillations in vitro. J. Physiol. 562(1), p.131-147.
Gnatkovsky, V., Wendling, F. and de Curtis, M. (2007). Cellular correlates of spontaneous periodic events in the medial entorhinal cortex of the in vitro isolated guinea pig brain. Eur J. Neurosci., 26, p.302-311.
Goddard, G.V., McIntyre, D.C. and Leech, C.K. (1969). A permanent change in brain function resulting from daily electrical stimulation. Exp. Neurol., 25, p.295-330."
Goffin, K., Nissinen, J., Van Laere, K. and Pitkänen, A. (2007). Cyclicity of spontaneous recurrent seizures in pilocarpine model of temporal lobe epilepsy in rat. Exp Neurol, 205, p.501-505."
Goldin, M., Epsztein, J., Jorquera, I., Represa, A., Ben-Ari, Y., Crepel, V. & Cossart, R. (2007). Synaptic kainate receptors tune oriens-lacunosum moleculare interneurons to operate at theta frequency. J. Neurosci., 27, p.9560-9572.
Gong, X.W., Yang, F., Liu, J.S., Lu, Q.C., Gong, H.Q., Liang, P.J. and Zhang, P.M. (2010). Investigation of The Initiation Site and Propagation of Epileptiform Discharges

220""
in Hippocampal Slices Using Microelectrode Array. Progress Biochem Biophys, 37, p.1240-1247.
González-Albo, M. C., Gómez-Utrero, E., Sánchez, A., Sola, R. G. and DeFelipe, J. (2001). Changes in the colocalization of glutamate ionotropic receptor subunits in the human epileptic temporal lobe cortex. Exp. Brain Res., 138(3), p.398-402.
Graebenitz, S., Kedo, O., Speckmann, E. J., Gorji, A., Panneck, H., Hans, V. and Pape, H.C. (2011). Interictal-like network activity and receptor expression in the epileptic human lateral amygdala. Brain, 134(10), p.2929-2947."
Gray, C.M. and Singer, W. (1989). Stimulus-specific oscillations in orientation columns of cat visual cortex. Proc Natl Acad Sci USA, 86, p.1698-1702.
Grenier, F, Timofeev, I. and Steriade, M. (2003). Neocortical very fast oscillations (ripples, 80–200 hz) during seizures: Intracellular correlates. J Neurophysiol, 89, p.841-852.
Griffiths, M. J., Messent, M., MacAllister, R. J. and Evans, T. W. (1993). Aminoguanidine selectively inhibits inducible nitric oxide synthase. Br.J.Pharmacol., 110(3), p.963-968.
Grigorenko, E., Glazier, S., Bell, W., Tytell, M., Nosel, E., Pons, T. and Deadwyler, S. A. (1997). Changes in glutamate receptor subunit composition in hippocampus and cortex in patients with refractory epilepsy. J. Neurol. Sci., 153(1), p.35-45.
Gryder, D.S. and Rogawski, M.A., (2003). Selective antagonism of GluR5 kainate-receptormediated synaptic currents by topiramate in rat basolateral amygdala neurons. J. Neurosci., 23(18), p.7069-7074.
Guldvog, B., Loyning, Y., Hauglie-Hanssen, E., Flood, S. and Bjornaes, H. (1994). Surgical treatment for partial epilepsy among Norwegian children and adolescents. Epilepsia, 35(3), p.554-565.
Gulyas, A.I., Miles, R., Sık, A., Toth, K., Tamamaki, N. and Freund, T.F. (1993). Hippocampal pyramidal cells excite inhibitory neurons through a single release site. Nature, 366(6456), p.683-687.
Gulyás, A. I., & Freund, T. T. (2015). Generation of physiological and pathological high frequency oscillations: the role of perisomatic inhibition in sharp-wave ripple and interictal spike generation. Curr. Opin. Neurobiol., 31, 26-32.
Haider, B., Duque, A., Hasenstaub, A.R. and McCormick, D.A. (2006). Neocortical network activity in vivo is generated through a dynamic balance of excitation and inhibition. J. Neurosci., 26(17), p.4535-4545.
Hajos, F., Garthwaite, J., Garthwaite, G. and Csillag, A. (1989). Morphology of supravital brain slices pre-incubated in a physiological solution prior to fixation. Acta Morphol Hung, 37, p.181-199.
Hájos, N., Katona, I., Naiem, S.S., Mackie, K., Ledent, C., Mody, I. and Freund, T.F. (2000).Cannabinoids inhibit hippocampal GABAergic transmission and network oscillations. Eur J. Neurosci., 12, p.3239-3249.

221""
Hajos, N., Palhalmi, J., Mann, E.O., Nemeth, B., Paulsen, O. and Freund, T.F. (2004). Spike timing of distinct types of GABAergic interneuron during hippocampal gamma oscillations in vitro. J. Neurosci., 24, p.9127-9137.
Hájos, N. and Paulsen, O. (2009). Network mechanisms of gamma oscillations in the CA3 region of the hippocampus, Neural Networks, 22 (8), p.1113-1119.
Halasy, K., Buhl, E.H., Lorinczi, Z., Tamas G. and Somogyi, P. (1996). Synaptic target selectivity and input of GABAergic basket and bistratified interneurons in the CA1 area of the rat hippocampus. Hippocampus, 6, p.306-329.
Hamani, C. and Mello, L.E. (2002). Spontaneous recurrent seizures and neurophatology in the chronic phase of the pilocarpine and PTX model epilepsy. Neurol Res., 24, p.199-209.
Hamilton, S.E., Loose, M.D., Qi, M., Levey, A.I., Hille, B. and McKnight, G.S. (1997). Disruption of the m1 receptor gene ablates muscarinic receptor-dependent M current regulation and seizure activity in mice. Proc Natl Acad Sci USA, 94, p.13311–13316.
Hansen, J.J., Nielsen, B., Krogsgaard-Larsen, P., Brehm, L., Nielsen, E.Ø. and Curtis, D.R. (1989). Excitatory amino acid agonists. Enzymic resolution, X-ray structure, and enantioselective activities of (R)- and (S)-bromohomoibotenic acid. J Med Chem, 32, p.2254-2260.
Hasenstaub, A., Shu, Y., Haider, B., Kraushaar, U., Duque, A. and McCormick, D.A. (2005). Inhibitory postsynaptic potentials carry synchronized frequency information in active cortical networks. Neuron, 47(3), p.423-435.
Hauser, W.A. (1992). Seizure disorders: the changes with age. Epilepsia, 33(s4), p.6-14.
Heinemann, U., Kann, O. and Schuchmann, S. (2006). An overveiw of in vitro seizure models in acute and organotypic slices. In: Pitkänen A, Schwartzkroin PA, Moshé SL (eds.), Models of Seizures and Epilepsy, Burlington, MA: Elsevier Academic, p.35–44.
Heinemann, U. and Staley, K. J. (2014). What is the clinical relevance of in vitro epileptiform activity?. In: Issues in Clinical Epileptology: A View from the Bench. Springer Netherlands. p.25-41.
Heistek, T.S., Timmerman, A.J., Spijker, S., Brussaard, A.B. and Mansvelder, H.D. (2010). GABAergic synapse properties may explain genetic variation in hippocampal network oscillations in mice. Front Cell Neurosci, 4, p.18.
Herrmann, C.S., Munk, M.H. and Engel, A.K. (2004). Cognitive functions of gamma-band activity: memory match and utilization. Trends Cogn. Sci., 8, p.347-355.
Herrmann, C.S. and Demiralp, T. (2005). Human EEG gamma oscillations in neuropsychiatric disorders. Clin Neurophysiol, 116(12), p.2719–2733.
Higashima, M., Ohno, K., Kinoshita, H. and Koshino, Y. (2000). Involvement of GABAA and GABAB receptors in after discharge generation in rat hippocampal slices. Brain Res., 865, p.186-193.

222""
Hikiji, M., Tomita, H., Ono, M., Fujiwara, Y. and Akiyama, K. (1993). Increase of kainate receptor mRNA in the hippocampal CA3 of amygdala-kindled rats detected by in situ hybridization. Life sciences, 53(10), p.857-864.
Honchar, M.P., Olney, J.W. and Sherman, W.R. (1983). Systemic cholinergic agents induce seizures and brain damage in lithium-treated rats. Science, 220, p.323-325.
Hopfield J.J. (1995). Pattern recognition computation using action potential timing for stimulus representation. Nature, 376, p.33-36.
Hormuzdi, S.G, Pais, I., LeBeau, F.E., Towers, S.K., Rozov, A., Buhl, E.H., Whittington, M.A. and Monyer, H. (2001). Impaired electrical signaling disrupts gamma frequency oscillations in connexin 36-deficient mice. Neuron, 31, p.487-495.
Huang, X., McMahon, J. and Huang, Y. (2012). Rapamycin attenuates aggressive behavior in a rat model of pilocarpine-induced epilepsy. Neuroscience, 215, p.90-97.
Huberfeld, G., Menendez, d.P., Pallud, J., Cohen, I., Le Van Quyen, M., Adam, C., Clemenceau, S., Baulac, M. and Miles, R. (2011). Glutamatergic pre-ictal discharges emerge at the transition to seizure in human epilepsy. Nat Neurosci, 14, p.627-634.
Huber, R., Ghilardi, M.F., Massimini, M. and Tononi, G. (2004). Local sleep and learning. Nature, 430(6995), p.78-81.
Hurtado, J.M., Rubchinsky, L.L. and Sigvardt, K.A. (2004). Statistical method for detection of phaselocking episodes in neural oscillations. J. Neurophysiol., 91, p.1883-1898.
Hu, Y., Jiang, L., Chen, H. and Zhang, X. (2012). Expression of AMPA receptor subunits in hippocampus after status convulsion. Child's Nervous System, 28(6), p.911-918.
Hwa, G.G.C., Avoli, M., Olivier, A. and Villemure, J.G. (1991). Bicuculline-induced epileptogenesis in the human neocortex maintained in vitro. Exp. Brain Res., 83, p.329-339.
Iber, C., Ancoli-Israel, S., Chesson, A. and Quan, S.F. (2007). The AASM Manual for the Scoring of Sleep and Associated Events: Rules, Terminology and Technical Specifications. Westchester: American Academy of Sleep Medicine.
Inoue, K., Morimoto, K., Sato, K., Yamada, N. and Otsuki, S. (1992). Mechanisms in the development of limbic status epilepticus and hippocampal neuron loss: an experimental study in a model of status epilepticus induced by kindling-like electrical stimulation of the deep prepyriform cortex in rats. Acta Med. Okayama, 46, p.129-139.
Isomura, Y., Sirota, A., Özen, S., Montgomery, S., Mizuseki, K., Henze, D.A. and Buzsáki, G. (2006). Integration and segregation of activity in entorhinal-hippocampal subregions by neocortical slow oscillations. Neuron, 52(5), p.871-882.
Jackson, G.D., Briellmann, R.S. and Kuzniecky, R.I. (2004). Temporal lobe epilepsy. In: Kuzniecky, R.I. and Jackson, G.D. (eds.) Magnetic resonance in epilepsy; neuroimaging techniques. Elsevier, Amsterdam, p.99-176.

223""
Jacobs, J., LeVan, P., Chander, R., Hall, J., Dubeau, F. and Gotman, J. (2008). Interictal high-frequency oscillations (80–500 Hz). are an indicator of seizure onset areas independent of spikes in the human epileptic brain. Epilepsia, 49, p.1893-1907.
Jane, D.E., Lodge, D. and Collingridge, G.L. (2009). Kainate receptors: pharmacology, function and therapeutic potential. Neuropharmacol., 56, p.90-113.
Jasper, H.H. and Andrews H.L. (1938). Electroencephalography. III. Normal differentiation of occipital and precentral regions in man. Arch Neurol Psychiatry, 39, p.96-115.
Jefferys, J.G.R. and Haas, H.L. (1982). Synchronized bursting of CA1 pyramidal cells in the absence of synaptic transmission. Nature, 300, p.448-450.
Jensen, M.S. and Yaari, Y. (1988). The relationship between interictal and ictal paroxysms in an in vitro model of focal hippocampal epilepsy. Ann Neurol, 24, p.591-598.
Jensen, O., Kaiser, J. and Lachaux, J.P. (2007). Human gamma-frequency oscillations associated with attention and memory. Trends Neurosci.s, 30(7), p.317-324.
Ji, D. and Wilson, M.A. (2006). Coordinated memory replay in the visual cortex and hippocampus during sleep. Nat. Neurosci., 10(1), p.100-107.
Jones, R.S.G. and Heinemann, U. (1988). Synaptic and intrinsic responses of medical entorhinal cortical cells in normal and magnesium-free medium in vitro. J Neurophysiol., 59(5), p.1476-1496.
Jones, R.S.G. and Lambert, J.D.C. (1990). Synchronous discharges in the rat entorhinal cortex in vitro: Site of initiation and the role of excitatory amino acid receptors. Neurosci., 34(3), p.657-670
Jope, R.S., Morrisett, R.A. and Snead O.C. (1986). III Characterization of lithium potentiation of pilocarpine-induced status epilepticus in rats. Exp Neurol., 91, p.471-480.
Jutila, L., Ylinen, A., Partanen, K., Alafuzoff, I., Mervaala, E., Partanen, J., and Pitkänen, A. (2001). MR volumetry of the entorhinal, perirhinal, and temporopolar cortices in drug-refractory temporal lobe epilepsy. Am. J. Neuroradiol., 22(8), p.1490-1501.
Kahana, M.J., Sekuler, R., Caplan, J.B., Kirschen, M. and Madsen, J R. (1999). Human theta oscillations exhibit task dependence during virtual maze navigation. Nature, 399(6738), p.781-784.
Kaminski, R.M., Banerjee, M. and Rogawski, M.A. (2004). Topiramate selectively protects against seizures induced by ATPA, a GluR5 kainate receptor agonist. Neuropharmacol., 46(8), p.1097-1104.
Kamiya, H. and Ozawa, S. (1998). Kainate receptor-mediated inhibition of presynaptic Ca2+ influx and EPSP in area CA1 of the rat hippocampus. J. Physiol., 509(Pt. 3), p.833-845.

224""
Kamphuis, W., Hendriksen, H., Diegenbach, P.C. and Da Silva, F.H. (1995). N-methyl-d-aspartate and kainate receptor gene expression in hippocampal pyramidal and granular neurons in the kindling model of epileptogenesis. Neuroscience, 67(3), p.551-559.
Kan, P., Van Orman, C. and Kestle, J.R. (2008). Outcomes after surgery for focal epilepsy in children. Child's Nervous System, 24(5), p.587-591.
Karlócai, M. R., Kohus, Z., Káli, S., Ulbert, I., Szabó, G., Máté, Z., ... & Gulyás, A. I. (2014). Physiological sharp wave-ripples and interictal events in vitro: what’s the difference?. Brain, 137(2), 463-485.
Katzner, S., Nauhaus, I., Benucci, A., Bonin, V., Ringach, D.L. and Carandini, M. (2009). Local origin of field potentials in visual cortex. Neuron, 61, p.35-41.
Keene, D. L., Higgins, M. J. and Ventureyra, E.C.G. (1997). Outcome and life prospects after surgical management of medically intractable epilepsy in patients under 18 years of age. Child's Nervous System, 13(10), p.530-535.
Kehl, S.J., McLennan, H., Collingridge, G.L. (1984). Effects of folic and kainic acids on synaptic responses of hippocampal neurones. Neurosci., 11(1), p.111-124.
Khalilov, I., Hirsch, J., Cossart, R., Ben-Ari, Y. (2002). Paradoxical anti-epileptic effects of a GluR5 agonist of kainate receptors. J Neurophysiol., 88, p.523–527
Khazipov, R. and Holmes, G.L. (2003). Synchronization of kainate-induced epileptic activity via GABAergic inhibition in the superfused rat hippocampus in vivo. J. Neurosci., 23, p.5337-5341.!
Kilner, J.M., Baker, S.N., Salenius, S., Jousmaki, V., Hari, R. and Lemon, R.N. (1999). Taskdependent modulation of 15-30 Hz coherence between rectified EMGs from human hand and forearm muscles. J Physiol, 516(Pt 2), p.559-570.!
Kirov, S.A., Sorra, K.E. and Harris, K.M. (1999). Slices have more synapses than perfusion-fixed hippocampus from both young and mature rats. J. Neurosci., 19, p.2876-2886.
Klitgaard, H., Matagne, A., Vanneste-Goemaere, J. and Margineanu, D.G. (2002). Pilocarpine-induced epileptogenesis in the rat: impact of initial duration of status epilepticus on electrophysiological and neuropathological alterations. Epilepsy Res., 51, p.93-107.
Klostermann, F., Nikulin, V.V., Kuhn, A.A., Marzinzik, F., Wahl, M., Pogosyan, A., Kupsch, A., Schneider, G.H., Brown, P. and Curio, G. (2007). Task- related differential dynamics of EEG alpha- and beta-band synchronization in cortico-basal motor structures. Eur J. Neurosci., 25, p.1604-1615.
Knopp, A., Kivi, A., Wozny, C., Heinemann, U. and Behr, J. (2005). Cellular and network properties of the subiculum in the pilocarpine model of temporal lobe epilepsy. J Comp Neurol., 483, p.476-488.

225""
Kobayashi, K., Oka, M., Inoue, T., Ogino, T., Yoshinaga, H. and Ohtsuka, Y. (2005). Characteristics of slow waves on EEG associated with epileptic spasms. Epilepsia, 46(7), p.1098-1105.
Koenig, T., Prichep, L., Dierks, T., Hubl, D., Wahlund, L.O., John, E.R. and Jelic, V. (2005). Decreased EEG synchronization in Alzheimer’s disease and mild cognitive impairment. Neurobiol. Aging, 26, p.165-171.
Kohling, R., Schwartzkroin, P.A. and Avoli, M. (2006). Studying Epilepsy in the Human Brain In vitro. In: Pitkänen, A., Schwartzkroin, P.A. and Moshé, S.L. (eds.) Models of Seizures and Epilepsy. Burlington, MA: Elsevier Academic, p.89-103.
Konnerth, A., Heinemann, U. and Yaari, Y. (1984). Slow transmission of neural activity in hippocampal area CA1 in absence of active chemical synapses. Nature, 307, p.69-71.
Kortenbruck, G., Berger, E., Speckmann, E. J. and Musshoff, U. (2001). RNA editing at the Q/R site for the glutamate receptor subunits GLUR2, GLUR5, and GLUR6 in hippocampus and temporal cortex from epileptic patients. Neurobiol. Dis., 8(3), p.459-468.
Kramer, M. A., Eden, U. T., Kolaczyk, E. D., Zepeda, R., Eskandar, E. N. and Cash, S. S. (2010). Coalescence and fragmentation of cortical networks during focal seizures. J. Neurosci., 30(30), p.10076-10085.
Kreisman, N. R. and Olson, J. E. (2003). Taurine enhances volume regulation in hippocampal slices swollen osmotically. Neuroscience, 120(3), p.635-642.
Krishnan, G.P., Vohs, J.L., Hetrick, W.P., Carroll, C.A., Shekhar, A., Bockbrader, M.A. and O’Donnell, B.F. (2005). Steady state visual evoked potential abnormalities in schizophrenia. Clin. Neurophysiol, 116, p.614-624.
Krueger, J.M., Rector, D.M., Roy, S., Van Dongen, H.P., Belenky, G. and Panksepp, J. (2008). Sleep as a fundamental property of neuronal assemblies. Nat. Rev. Neurosci. 9, p.910-919.
Kurth, S., Ringli, M., Geiger, A., LeBourgeois, M., Jenni, O.G. and Huber, R. (2010). Mapping of cortical activity in the first two decades of life: A high-density sleep electroencephalogram study. J Neurosci., 30, p.13211-13219.
Kwan, P. and Brodie, M.J. (2000). Early identification of refractory epilepsy.New Engl. J. Med., 342(5), p.314-319.
Kwon, J.S., O’Donnell, B.F., Wallenstein, G.V., Greene, R.W., Hirayasu, Y., Nestor, P.G., Hasselmo, M.E., Potts, G.F., Shenton, M.E. and McCarley, R.W. (1999). Gamma frequency-range abnormalities to auditory stimulation in schizophrenia. Arch. Gen. Psychiatry, 56, p.1001-1005.
Lachaux, J. P., Rodriguez, E., Martinerie, J. and Varela, F. J. (1999). Measuring phase synchrony in brain signals. Hum. Brain Mapp., 8, p.194-208.

226""
Lauri, S.E., Bortolotto, Z.A., Bleakman, D., Ornstein, P.L., Lodge, D., Isaac, J.T. and Collingridge, G.L. (2001). A critical role of a facilitatory presynaptic kainate receptor in mossy fiber LTP. Neuron, 32, p.697-709.
Lazarus, M.S. and Huang, Z.J. (2011). Distinct maturation profiles of perisomatic and dendritic targeting GABAergic interneurons in the mouse primary visual cortex during the critical period of ocular dominance plasticity. J. Neurophysiol., 106(2), p.775-787.
LeBeau, F. E. N., Towers, S. K., Traub, R. D., Whittington, M. A. and Buhl, E. H. (2002). Fast network oscillations induced by potassium transients in the rat hippocampus in vitro. J. Physiol. (Lond.), 542, p.167-179.
Lehericy, S., Semah, F., Hasboun, D., Dormont, D., Clemenceau, S., Granat, O., Marsault, C. and Baulac, M. (1997). Temporal lobe epilepsy with varying severity: MRI study of 222 patients. Neuroradiology, 39, p.788-796.
Lemos, T. and Cavalheiro, E.A. (1995). Suppression of pilocarpine-induced status epilepticus and the late development of epilepsy in rats. Exp Brain Res., 102, p.423-428.
Lerma, J. and Marques, J.M. (2013). Kainate receptors in health and disease. Neuron, 80, p.292-311.
Le Van Quyen, M., Staba, R., Bragin, A., Dickson, C., Valderrama, M., Fried, I. and Engel, J. (2010). Large-scale microelectrode recordings of high-frequency gamma oscillations in human cortex during sleep. J. Neurosci., 30(23), p.7770-7782.
Lewis, D.A., Hashimoto, T. and Volk, D.W. (2005). Cortical inhibitory neurons and schizophrenia. Nat. Rev. Neurosci., 6, p.312-324.
Lisman, J.E. and Idiart, M.A.P. (1995). Storage of 7 6 2 short-term memories in oscillatory subcycles. Science, 267, p.15120-1514.
Lisman, J. E. (1999). Relating hippocampal circuitry to function: recall of memory sequences by reciprocal dentate-CA3 interactions. Neuron, 22, p.233-242.
Lisman, J.E. and Jensen, O. (2013). The theta–gamma neural code. Neuron., 77, p.1002-1016.
Liu, R.S., Lemieux, L., Bell, G.S., Sisodiya, S.M., Bartlett, P.A., Shorvon, S.D., Sander, J.W. and Duncan, J.S. (2002). The structural consequences of newly diagnosed seizures. Ann Neurol, 52, p.573-580.
Liu, Z., Nagao, T., Desjardins, G.C., Gloor, P. And Avoli, M. (1994). Quantitative evaluation of neuronal loss in the dorsal hippocampus in rats with long-term pilocarpine seizures. Epilepsy Res., 17, p.237-247.
Löscher, W. and Schmidt, D. (1988). Which animal models should be used in the search for new antiepileptic drugs? A proposal based on experimental and clinical findings. Epilepsy Res., 2, p.145-181.
Loscher, W., Lehmann, H., Behl, B., Seemann, D., Teschendorf, H.J., Hofmann, H.P., Lubisch, W., Hoger, T., Lemaire, H.G. and Gross, G. (1999). A new pyrrolyl-

227""
quinoxalinedione series of non-NMDA glutamate receptor antagonists: pharmacological characterization and comparison with NBQX and valproate in the kindling model of epilepsy. Eur J. Neurosci., 11, p.250-262.
Lu, C. B., Hamilton, J. B., Powell, A. D., Toescu, E. C. and Vreugdenhil, M. (2009). Effect of ageing on CA3 interneuron sAHP and gamma oscillations is activity-dependent. Neurobiol. Aging., 32(5), p.956-965.
Luczak, A., Barthó, P., Marguet, S.L., Buzsáki, G. and Harris, K.D. (2007). Sequential structure of neocortical spontaneous activity in vivo. Pro. Natl. Acad. Sci., 104(1), p.347-352.
Lytton, W. and Sejnowski, T. (1991). Simulations of cortical pyramidal neurons synchronized by inhibitory interneurons. J. Neurophysiol, 66, p.1059-1079.
Maddochs, J.A., Hodge, R.S. and Rex, J. (1951). Observations on the occurrence of precentral activities in the lower brainstem. Electroencephalogr Clin Neurophysiol, 3, p.370.
Mann, E.O., Radcliffe, C.A. and Paulsen, O. (2005a). Hippocampal gamma frequency oscillations: from interneurones to pyramidal cells, and back. J. Physiol. (Lond.), 562, p.55-63.
Mann, E.O., Suckling, J.M., Hajos, N., Greenfield, S.A. and Paulsen, O. (2005b). Perisomatic feedback inhibition underlies cholinergically induced fast network oscillations in the rat hippocampus in vitro. Neuron, 45, p.105-117.
Mann, E. O., Kohl, M. M. and Paulsen, O. (2009). Distinct roles of GABAA and GABAB receptors in balancing and terminating persistent cortical activity. J. Neurosci., 29(23), p.7513-7518.
Mann, E. O. and Mody, I. (2010). Control of hippocampal gamma oscillation frequency by tonic inhibition and excitation of interneurons. Nat. Neurosci., 13(2), p.205-212.
Mares, P. and Kubova, H. (2006). Electrical Stimulation-Induced Models of Seizures. In: edited by Pitkänen, A., Schwartzkroin, P.A. and Moshé, S.L. (eds.) Models of Seizures and Epilepsy. Burlington, MA: Elsevier Academic, 2006, p.153-161.
Margerison, J.H. and Corsellis, J.A. (1966). Epilepsy and the temporal lobes. A clinical, electroencephalographic and neuropathological study of the brain in epilepsy, with particular reference to the temporal lobes. Brain, 89, p.499-530.
Massimini, M., Huber, R., Ferrarelli, F., Hill, S. and Tononi, G. (2004). The sleep slow oscillation as a traveling wave. J. Neurosci., 24, p.6862-6870.
Masukawa, L.M., Higashima, M., Kim, J.H. and Spencer, D.D. (1989). Epileptiform discharges evoked in hippocampal brain slices from epileptic patients. Brain Res, 493, p.168-174.
Mathern, G.W., Babb, T.L. and Armstrong, D.L. (1997). Hippocampal sclerosis. In: Engel J., Pedley T.A. (eds.). Epilepsy: a comprehensive textbook. Lippincott-Raven; Philadelphia: 1997. p.133-155.

228""
Mathern, G. W., Pretorius, J. K., Kornblum, H. I., Mendoza, D., Lozada, A., Leite, J. P., and Adelson, P. D. (1998). Altered hippocampal kainate-receptor mRNA levels in temporal lobe epilepsy patients. Neurobiol. Dis., 5(3), p.151-176.
Mathern, G.W., Adelson, P.D., Cahan, L.D. and Leite, J.P. (2002). Hippocampal neuron damage in human epilepsy: Meyer's hypothesis revisited. Prog Brain Res., 135, p.237-251.
Maton, B., Jayakar, P., Resnick, T., Morrison, G., Ragheb, J. and Duchowny, M. (2008). Surgery for medically intractable temporal lobe epilepsy during early life. Epilepsia, 49(1), p.80-87.
McCormick, D.A., Connors, B.W., Lighthall, J.W. and Prince, D.A. (1985). Comparative electrophysiology of pyramidal and sparsely spiny stellate neurons of the neocortex. J. Neurophysiol. 54(4), p.782-806.
McCormick, D.A. (1989). GABA as an inhibitory neurotransmitter in human cerebral cortex. J Neurophysiol, 62(5), p.1018-1027.
McIntyre, D.C., Kelly, M.E. and Dufresne, C. (1999). FAST and SLOW amygdala kindling rat strains: comparison of amygdala, hippocampal, piriform and perirhinal cortex kindling. Epilepsy Res., 35, p.197-209.
Mello, L.E., Covolan, L. (1996). Spontaneous seizures preferentially injure interneurons in the pilocarpine model of chronic spontaneous seizures. Epilepsy Res., 26, p.123-129.
Meyer, A.H., Katona, I., Blatow, M., Rozov, A. and Monyer, H. (2002). In vivo labeling of parvalbumin-positive interneurons and analysis of electrical coupling in identified neurons. J. Neurosci., 22, p.7055-7064.
Middleton, S., Jalics, J., Kispersky, T., LeBeau, F.E.N., Roopun, A.K., Kopell, N.J., Whittington, M.A. and Cunningham, M.O. (2008). NMDA receptordependent switching between different gamma rhythm-generating microcircuits in entorhinal cortex. Proc. Natl. Acad. Sci. U.S.A, 105, p.18572-18577.
Mikkonen, M., Soininen, H., Kalvianen, R., Tapiola, T., Ylinen, A., Vapalahti, M., Paljarvi, L. and Pitkanen, A. (1998). Remodeling of neuronal circuitries in human temporal lobe epilepsy: increased expression of highly polysialylated neural cell adhesion molecule in the hippocampus and the entorhinal cortex. Ann. Neurol., 44, p.923-934.
Miles, R., Toth, K., Gulyas, A. I., Hajos, N. and Freund, T. F. (1996). Differences between somatic and dendritic inhibition in the hippocampus. Neuron, 16, p.815-823.
Mody, I., Schwartzkroin, P.A. (1997). Acute seizure models (intact animals). In: Epilepsy: a Comprehensive Textbook. Eds. Engel J, Pedley TA, Philadelphia, Lippincott-Raven, p.397-404.
Moghaddam, B. (2003). Bringing order to the glutamate chaos in schizophrenia. Neuron, 40, p.881–884.

229""
Molnár, G., Oláh, S., Komlósi, G., Füle, M., Szabadics, J., Varga, C. and Tamás, G. (2008). Complex events initiated by individual spikes in the human cerebral cortex. PLoS biology, 6(9), p.222.
Monaghan, D.T. and Cotman, C.W. (1982). The distribution of [3H]kainic acid binding sites in rat CNS as determined by autoradiography. Brain Res., 252, p.91-100.
Montgomery, S.M., Sirota, A. and Buzsaki, G. (2008). Theta and gamma coordination of hippocampal networks during waking and rapid eye movement sleep. J. Neurosci., 28, p.6731-6741.
More, J.C.A., Nitisco, R., Dolman, N.P., Clarke, V.R.J., Alt, A.J., Ogden, A.M., Buelens, F.P., Troop, H.M., Kelland, E.E., Pilato, F., Bleakman, D., Bortolotto, Z.A., Collingridge, G.L. and Jane, D.E. (2004). Characterisation of UBP296: a novel, potent and selective kainate receptor antagonist. Neuropharmacol., 47, p.46-64.
Morimoto, K., Fahnestock, M. and Racine, R.J. (2004). Kindling and status epilepticus models of epilepsy: rewiring the brain. Prog Neurobiol.,73, p.1-60.
Morin, F., Beaulieu, C. and Lacaille, J.C. (1998). Selective loss of GABA neurons in area CA1 of the rat hippocampus after intraventricular ‘entate’. Epilepsy Res., 32, p.363-369.
Morrisett, R.A., Jope, R.S. and Snead, O.C., (1987). III Effects of drugs on the initiation and maintenance of status epilepticus induced by administration of pilocarpine to lithium-pretreated rats. Exp Neurol., 97, p.193-200.
Moruzzi, G. and Magoun, H.W. (1949) Brainstem reticular formation and activation of the EEG. Electroencephalogr Clin Neurophysiol, 1, p.455-473.
Moser, V., (1988). Comparison of chlordimeform and carbaryl using a functional observational battery. Fund. Appl. Toxicol., 11, p.189-206.
Moyer, J.R. Jr. and Brown, T.H. (1998). Methods for whole-cell recording from visually preselected neurons of perirhinal cortex in brain slices from young and aging rats. J. Neurosci. Meth., 86, p.35-54.
Mühlebner, A., Gröppel, G., Dressler, A., Reiter-Fink, E., Kasprian, G., Prayer, D. and Feucht, M. (2014). Epilepsy surgery in children and adolescents with malformations of cortical development–outcome and impact of the new ILAE classification on Focal Cortical Dysplasia. Epilepsy Res.
Mulle, C., Sailer, A., Perez-Otano, I., Dickinson-Anson, H., Castillo, P.E., Bureau, I., Maron, C., Gage, F.H., Mann, J.R., Bettler, B., et al. (1998). Altered synaptic physiology and reduced susceptibility to kainate-induced seizures in GluR6-deficient mice. Nature, 392, p.601-605.
Murthy, V.N. and Fetz, E.E. (1992). Coherent 25- to 35-Hz oscillations in the sensorimotor cortex of awake behaving monkeys. Proc Natl Acad Sci USA, p. 5670-5674.
Nadler, J.V., Perry, B. W. and Cotman, C.W. (1978). Intraventricular kainic acid preferentially destroys hippocampal pyramidal cells. Nature (Land.), 271, p.676-677.
230""
Nadler, J.V. (1981). Minireview. Kainic acid as a tool for the study of temporal lobe epilepsy. Life Sci., 29, p.2031-2042.
Nadler, J.V. (2003). The recurrent mossy fiber pathway of the epileptic brain. Neurochem. Res., 28, p.1649-1658.
Navarro Mora, G., Bramanti, P., Osculati, F., Chakir, A., Nicolato, E., Marzola, P., Sbarbati, A. and Fabene, P.F. (2009). Does pilocarpine-induced epilepsy in adult rats require status epilepticus? PLoS One, 4, p.5759.
Neckelmann, D., Amzica, F. and Steriade, M. (1998). Spike-wave complexes and fast components of cortically generated seizures. III. Synchronizing mechanisms. J Neurophysiol, 80, p.1480-1494.
Niedermeyer, E. (1990). Alpha-like rhythmical activity of the temporal lobe. Clin Electroencephalogr, 21(4), p.210-24.
Niedermeyer, E. (1991). The “third rhythm”: further observations. Clin Electroencephalogr, 22(2), p.83-96.
Niedermeyer, E. (1997). Alpha rhythms as physiological and abnormal phenomena. Int J Psychophysiol, 26(1-3), p.31-49.
Niedermeyer, E. and da Silva, F. L. (Eds.). (2005). Electroencephalography: basic principles, clinical applications, and related fields. Lippincott Williams and Wilkins.
Nir, Y., Staba, R.J. andrillon, T., Vyazovskiy, V.V., Cirelli, C., Fried, I. and Tononi, G. (2011). Regional slow waves and spindles in human sleep. Neuron, 70, p.153-169.
Olsen, R.W., Bergman, M.O., Van Ness, P.C., Lummis, S.C., Watkins, A.E., Napias, C. and Greenlee, D.V. (1981). Gamma-Aminobutyric acid receptor binding in mammalian brain. Heterogeneity of binding sites. Mol Pharmacol, 19(2), p.217-27.
Ormandy, G.C., Jope, R.S. and Snead, O.C. III. (1989). Anticonvulsant actions of MK-801 on the lithium-pilocarpine model of status epilepticus in rats. Exp Neurol, 106, p.172-180.
Pakhotin, P. I., Pakhotina, I. D. and Andreev, A. A. (1997). Functional stability of hippocampal slices after treatment with cyclooxygenase inhibitors. Neuroreport, 8(7), p.1755-1759.
Palhalmi, J., Paulsen, O., Freund, T.F. and Hajos, N. (2004). Distinct properties of carbachol- and DHPG-induced network oscillations in hippocampal slices. Neuropharmacol., 47, p.381-389.
Palomero-Gallagher, N., Schleicher, A., Bidmon, H.-J., Pannek, H.-W., Hans, V., Gorji, A., Speckmann, E.J. and Zilles, K. (2012). Multireceptor analysis in human neocortex reveals complex alterations of receptor ligand binding in focal epilepsies. Epilepsia, 53(11), p.1987-1997.
Paternain, A.V., Morales, M, and Lerma, J. (1995). Selective antagonism of AMPA receptors unmasks kainate receptor mediated responses in hippocampal neurons. Neuron, 14(1), p.185-189.

231""
Peça, J., Feliciano, C., Ting, J. T., Wang, W., Wells, M. F., Venkatraman, T. N., ... & Feng, G. (2011). Shank3 mutant mice display autistic-like behaviours and striatal dysfunction. Nature, 472(7344), p. 437-442.
Pelletier et al. (1996). Substituted 1,2-dihydrophthalazines: potent, selective and non-competitive inhibitors of the AMPA receptor. J.Med.Chem., 39, p.343.
Penfield, W., & Jasper, H. Epilepsy and the functional anatomy of the human brain, 1954. Little, Brown, Boston, 896.
Perrais, D., Pinheiro, P.S., Jane, D.E. and Mulle, C. (2009). Antagonism of recombinant and native GluR7-containing kainate receptors. Neuropharmacol., 56, 131-140.
Perrais, D., Veran, J. and Mulle, C. (2010). Gating and permeation of kainite receptors: differences unveiled. Trends Pharmacol. Sci., 31, p.516-522.
Pfurtscheller, G. and Neuper, C. (1992). Simultaneous EEG 10 Hz desynchronization and 40 Hz synchronization during finger movements. Neuroreport, p. 1057-1060.
Pfurtscheller, G., Zalaudek, K. and Neuper, C. (1998). Event-related beta synchronization after wrist, finger and thumb movement. Electroen. Clin. Neuro./Electromyography and Motor Control, 109(2), p.154-160.
Penttonen, M., Kamondi, A., Acsady, L. and Buzsaki, G. (1998). Gamma frequency oscillation in the hippocampus of the rat: intracellular analysis in vivo. Eur. J. Neurosci., 10, p.718-728.
Pietersen, A.N., Lancaster, D.M., Patel, N., Hamilton, J.B. and Vreugdenhil, M. (2009). Modulation of gamma oscillations by endogenous adenosine through A1 and A2A receptors in the mouse hippocampus. Neuropharmacol., 56, p.481-492.
Pietersen, A. N.J., Patel, N., Jefferys, J. G.R. and Vreugdenhil, M. (2009). Comparison between spontaneous and kainate-induced gamma oscillations in the mouse hippocampus in vitro. Eur. J. Neurosci., 29, p.2145-2156.
Pike, F.G., Goddard, R.S., Suckling, J.M., Ganter, P., Kasthuri, N. and Paulsen, O. (2000). Distinct frequency preferences of different types of rat hippocampal neurones in response to oscillatory input currents. J. Physiol, 529, p.205-213.
Pineau, N., Charriaut-Marlangue, C., Motte, J. and Nehlig, A. (1999). Pentylenetetrazol seizures induce cell suffering but not death in the immature rat brain. Brain Res Dev Brain Res., 112, p.139-144.
Pinheiro, P.S., Perrais, D., Coussen, F., Barhanin, J., Bettler, B., Mann, J.R., Malva, J.O., Heinemann, S.F. and Mulle, C. (2007). GluR7 is an essential subunit of presynaptic kainate autoreceptors at hippocampal mossy fiber synapses. Proc. Natl. Acad. Sci. USA, 104, p.12181-12186.
Pinheiro, P.S., Lanore, F., Veran, J., Artinian, J., Blanchet, C., Crepel, V., Perrais, D. and Mulle, C. (2013). Selective block of postsynaptic kainite receptors reveals their function at hippocampal mossy fiber synapses. Cereb. Cortex, 23, p.323-331.

232""
Pitkänen, A., Schwartzkroin, P.A. and Moshé, S.M. (2006). Models of seizures and epilepsy. Elsevier Academic Press Burlington, p. 712.
Polascheck, N., Bankstahl, M. and Löscher, W. (2010). The COX-2 inhibitor parecoxib is neuroprotective but not antiepileptogenic in the pilocarpine model of temporal lobe epilepsy. Exp. Neurol., 224, p.219-233.
Porter, B.E., Cui, X.N. and Brooks!Kayal, A.R. (2006). Status epilepticus differentially alters AMPA and kainate receptor subunit expression in mature and immature dentate granule neurons. Eur. J. Neurosci., 23(11), p.2857-2863.
Proctor, P. H. (2008). Uric acid and neuroprotection, Stroke, 39(8), p. E126.
Prokic, E. (2012). Modulation of neuronal network activity in the primary motor cortex (Doctoral dissertation, Aston University).
Puig, M.V., Ushimaru, M. and Kawaguchi, Y. (2008). Two distinct activity patterns of fast-spiking interneurons during neocortical up states. Proc Natl Acad Sci USA, 2008, 105(24), p.8428-8433.
Racine, R.J. (1972). Modification of seizure activity by electrical stimulation. II. Motor seizure. Electroenceph Clin Neurophysiol., 32, p.281-294.
Rafiq, A., Zhang, Y.F., DeLorenzo, R.J. and Coulter, D.A. (1995). Long duration self-sustained epileptiform activity in the hippocampal-parahippocampal slice: a model of status epilepticus. J. Neurophysiol., 74, p.2028-2042.
Rafiq, A., DeLorenzo R. and Coulter, D. A. (1993). Generation and propagation of epileptiform discharges in a combined entorhinal cortex/hippocampal slice. J. Neurophysiol., 70, p.1962-1974.
Raghavachari, S., Kahana, M.J., Rizzuto, D.S., Caplan, J.B., Kirschen, M.P., Bourgeois, B. and Lisman, J.E. (2001). Gating of human theta oscillations by a working memory task. J. Neurosci., 21(9), p.3175-3183.
Rajasekaran, K., Todorovic, M. and Kapur, J. (2012). Calcium!permeable AMPA receptors are expressed in a rodent model of status epilepticus. Ann. Neurol., 72(1), p.91-102.
Represa, A., Tremblay, E. and Ben-Ari, Y. (1987). Kainate binding sites in the hippocampal mossy fibers: localization and plasticity. Neuroscience, 20, p.739-748.
Represa, A., Le Gall La Salle, G. and Ben-Ari, Y. (1989). Hippocampal plasticity in the kindling model of epilepsy in rats. Neuroscience lett., 99(3), p.345-350.
Ribary, U., et al. (1991). Magnetic field tomography of coherent thalamocortical 40-Hz oscillations in humans. Proc. Natl Acad. Sci. USA, 88, p.11037-11041.
Rice, A.C., Floyd, C.L., Lyeth, B.G., Hamm, R.J.and Delorenzo, R.J. (1998). Status Epilepticus Causes Long-Term NMDA Receptor-Dependent Behavioural Changes and Cognitive Deficits. Epilepsia, 39, p.1148-1157.

233""
Rice, M. E., Perezpinzon, M. A. and Lee, E. J. K. (1994). Ascorbic-Acid, But Not Glutathione, Is Taken Up by Brain-Slices and Preserves Cell Morphology. J. Neurophysiol., 71(4), p.1591-1596.
Rice, M.E. (2000). Ascorbate regulation and its neuroprotective role in the brain, Trends Neurosci., 23(5), p.209-216.
Rodriguez-Moreno A, Herreras O and Lerma J. (1997). Kainate receptors presynaptically downregulate GABAergic inhibition in the rat hippocampus. Neuron, 19(4), p.893-901.
Rodriguez-Moreno, A. and Lerma, J. (1998). Kainate receptor modulation of GABA release involves a metabotropic function. Neuron, 20, p.1211-1218.
Ronnqvist, K. C., McAllister, C. J., Woodhall, G. L., Stanford, I. M. and Hall, S. D. (2013). A multimodal perspective on the composition of cortical oscillations. Front. Hum. Neurosci., 7, p.132.
Roopun, A.K., Middleton, S.J., Cunningham, M.O., LeBeau, F.E., Bibbig, A., Whittington, M.A. and Traub, R.D. (2006). A beta2-frequency (20–30 Hz). oscillation in nonsynaptic networks of somatosensory cortex. Pro. Natl. Acad. Sci., 103(42), p.15646-15650.
Roopun, A.K., Simonotto, J.D., Pierce, M.L., Jenkins, A., Nicholson, C., Schofield, I.S. and Cunningham, M.O. (2010). A nonsynaptic mechanism underlying interictal discharges in human epileptic neocortex. Pro. Natl. Acad. Sci., 107(1), p.338-343.
Rothman, S. M. (1985). The neurotoxicity of excitatory amino acids is produced by passive chloride influx. J.Neurosci., 5(6), p.1483-1489.
Russell, W. M. S., Burch, R. L., & Hume, C. W. (1959). The principles of humane experimental technique.
Rutecki, P.A., Grossman, R.G., Armstrong, D. and Irish-Loewen, S. (1989). Electrophysiological connections between the hippocampus and entorhinal cortex in patients with complex partial seizures. J. Neurosurg., 70(5), p.667-675.
Sainsbury, R.S., Harris, J.L. and Rowland, G.L. (1987a). Sensitization and hippocampal type 2 theta in the rat. Physiol Behav, 41, p.489-493.
Sainsbury, R.S., Heynen, A. and Montoya, C.P. (1987b). Behavioral correlates of hippocampal type 2 theta in the rat. Physiol Behav, 39, p.513- 519.
Samoriski, G.M. and Applegate, C.D. (1997). Repeated generalized seizures induce time-dependent changes in the behavioral seizure response independent of continued seizure induction. J. Neurosci., 17, p.5581-5590.
Sanabria, E.R.G., da Silva, A.V., Spreafico, R. and Cavalheiro, E.A. (2002). Damage, reorganization, and abnormal neocortical hyperexcitability in the pilocarpine model of temporal lobe epilepsy. Epilepsia., 43(Suppl 5), p.6-106.
Sanchez-Vives, M.V. and McCormick, D.A. (2000). Cellular and network mechanisms of rhythmic recurrent activity in neocortex. Nat Neurosci., 3, p.1027-1034.

234""
Sander, J.W.A.S. (1997). The epidemiology of the epilepsies: future directions. Epilepsia, 38(5), p.614-618.
Sanes, J. N. and Donoghue, J. P. (1993). Oscillations in local field potentials of the primate motor cortex during voluntary movement. Pro. Natl. Acad. Sci., 90(10), p.4470-4474.
Sarkisian, M.R. (2001). Overview of the current animal models for human seizure and epileptic disorders. Epilepsy Behav, 2, p. 201-216.
Savage, D.D., Nadler, J.V. and McNamara, J. O. (1984). Reduced kainic acid binding in rat hippocampal formation after limbic kindling. Brain Res., 323(1), p.128-131.
Schwartzkroin, P. A. (1997). Origins of the Epileptic State. Epilepsia, 38, p.853-858.
Schmidt, D. and Stavem, K. (2009). Long!term seizure outcome of surgery versus no surgery for drug!resistant partial epilepsy: A review of controlled studies. Epilepsia, 50(6), p.1301-1309.
Schmitz, D., Frerking, M. and Nicoll, R.A. (2000). Synaptic activation of presynaptic kainate receptors on hippocampal mossy fiber synapses. Neuron, 27(2), p.327-338.
Schmitz, D., Mellor, J. and Nicoll, R.A. (2001). Presynaptic kainate receptor mediation of frequency facilitation at hippocampal mossy fiber synapses. Science, 291, p1972-1976.
Schutz, E. and Muller, H.W. (1951). Uber ein neues Zeichen zentral nervoser Erregbarkeitssteigerung im Elektroenzephalogramm. Klin Wochenschr, 29(22-23).
Segal, M. and Barker, J. L. (1984). Rat hippocampal neurons in culture: voltage-clamp analysis of inhibitory synaptic connections. J. Neurophysiol., 52, p.469-487.
Semah, F., Picot, M.C., Adam, C., Broglin, D., Arzimanoglou, A., Bazin, B., et al. (1998). Is the underlying cause of epilepsy a major prognostic factor for recurrence? Neurology, 51, p.1256-1262.
Semyanov, A and Kullmann, D.M. (2001). Kainate receptor-dependent axonal depolarization and action potential initiation in interneurons. Nat Neurosci, 4, p.718-723.
Senior, T.J., Huxter, J.R., Allen, K., O'Neill, J. and Csicsvari, J. (2008). Gamma oscillatory firing reveals distinct populations of pyramidal cells in the CA1 region of the hippocampus. J. Neurosci., 28, p.2274-2286.
Shaw, P., Kabani, N.J., Lerch, J.P., Eckstrand, K., Lenroot, R., Gogtay, N. and Wise, S.P. (2008). Neurodevelopmental trajectories of the human cerebral cortex. J. Neurosci., 28(14), p.3586-3594.
Sheer, D.E. (1989). Focused arousal and the cognitive 40-Hz event-related potentials: differential diagnosis of Alzheimer's disease. Prog Clin Biol Res, p.79-94.

235""
Sheroziya, M.G., von Bohlen Und Halbach, O., Unsicker, K., Egorov, A.V. (2009). Spontaneous bursting activity in the developing entorhinal cortex. J. Neurosci., 29, p.12131–12144.
Shimono, K., Brucher, F., Granger, R., Lynch, G. and Taketani, M. (2000). Origins and distribution of cholinergically induced beta rhythms in hippocampal slices. J. Neurosci., 20, p.8462-8473.
Shi, Y.J., Gong, X.W., Gong, H.Q., Liang, P.J., Zhang, P.M. and Lu, Q.C. (2014). Effect of the entorhinal cortex on ictal discharges in low-Mg2+-induced epileptic hippocampal slice models. Neural Plasticity 2014.
Shorvon, S. D. (2011). The etiologic classification of epilepsy. Epilepsia, 52, p1052-1057.
Shuai, J., Bikson, M., Hahn, P.J., Lian, J. and Durand, D.M. (2003). Ionic mechanisms underlying spontaneous CA1 neuronal firing in Ca2+-free solution. Biophys J., 84(3), p.2099-2111.
Shu, Y., Hasenstaub, A. and McCormick, D.A. (2003). Turning on and off recurrent balanced cortical activity. Nature, 423, p.288-293.
Siegel, A.M., Wieser, H.G., Wichman, W. and Yasargil, G.M. (1990). Relationships between MR-imaged total amount of tissue removed, resection scores of specific mediobasal limbic subcompartments and clinical outcome following selective amygdalohippocampectomy. Epilepsy Res, 6(1), p.56-65.
Silva, A.V., Sanabria, E.R.G., Cavalheiro, E.A. and Spreafico, R. (2002). Alterations of the neocortical GABAergic system in the pilocarpine model of temporal lobe epilepsy: neuronal damage and immunocytochemical changes in chronic epileptic rats. Brain Res Bull., 58, p.417-421.
Simon, A., Traub, R.D., Vladimirov, N., Jenkins, A., Nicholson, C., Whittaker, R.G. and Whittington, M.A. (2014). Gap junction networks can generate both ripple!like and fast ripple!like oscillations. Eur. J. Neurosci., 39(1), p.46-60.
Singer, W. and Gray, C. (1995). Visual feature integration and the temporal correlation hypothesis. Annu. Rev. Neurosci., 18, p.555–586.
Singer, W. (1999) Neuronal synchrony: a versatile code for the definition of relations? Neuron, 24, p.49-65.
Smolders, I., Bortolotto, Z.A., Clarke, V.R., Warre, R., Khan, G.M., O’Neill, M.J., Ornstein, P.L., Bleakman, D., Ogden, A., Weiss, B., Stables, J.P., Ho, K.H., Ebinger, G., Collingridge, G.L., Lodge, D. and Michotte, Y. (2002). Antagonists of GLU(K5)-containing kainate receptors prevent pilocarpine-induced limbic seizures. Nat Neurosci., 5, p.796-804.
Sloviter, R. S. (1983). “Epileptic” brain damage in rats induced by sustained electrical stimulation of the perforant path. I. Acute electrophysiological and light microscopic studies. Brain Res. bulletin, 10(5), p.675-697.

236""
Sloviter, R. S. (1987). Decreased hippocampal inhibition and a selective loss of interneurons in experimental epilepsy. Science, 235(4784), p.73-76.
Sloviter, R. S. (1991). Permanently altered hippocampal structure, excitability, and inhibition after experimental status epilepticus in the rat: the “dormant basket cell” hypothesis and its possible relevance to temporal lobe epilepsy.Hippocampus, 1(1), p.41-66.
Sloviter, R.S., Zappone, C.A., Bumanglag, A.V., Norwood, B. and Kudrimoti, H. (2007). On the relevance of prolonged convulsive status epilepticus in animals to the etiology and neurobiology of human temporal lobe epilepsy. Epilepsia,48(8), p.6-10.
Sloviter, R.S. (2005). The neurobiology of temporal lobe epilepsy: too much information, not enough knowledge. C R Biol., 328, p.143-153.
Sloviter, R.S. (2008). Hippocampal epileptogenesis in animal models of mesial temporal lobe epilepsy with hippocampal sclerosis: the importance of the "latent period" and other concepts. Epilepsia, 49(Suppl. 9), p.85-92.
Soltesz, I. and Deschênes, M. (1993). Low- and high-frequency membrane potential oscillations during theta activity in CA1 and CA3 pyramidal neurons of the rat hippocampus under ketamine-xylazine anaesthesia. J. Neurophysiol., 70, p.97-116.
Sowell, E.R., Thompson, P.M. and Toga, A.W. (2004). Mapping changes in the human cortex throughout the span of life. The Neuroscientist, 10(4), p.372-392.
Spencer, S.S. and Spencer, D.D. (1994). Entorhinal!Hippocampal Interactions in Medial Temporal Lobe Epilepsy. Epilepsia, 35(4), 721-727.
Stafstrom, C. E., Schwindt, P. C., Chubb, M. C., & Crill, W. E. (1985). Properties of persistent sodium conductance and calcium conductance of layer V neurons from cat sensorimotor cortex in vitro. J. Neurophysiol.,53(1), p. 153-170.
Stam, C. J., Jones, B. F., Nolte, G., Breakspear, M., & Scheltens, P. (2007). Small-world networks and functional connectivity in Alzheimer's disease. Cereb. cortex, 17(1), 92-99.
Stanger, H.L., Alford, R., Jane, D.E., Cunningham, M.O. (2008). The role of GLU K5-containing kainate receptors in entorhinal cortex gamma frequency oscillations. Neural Plast., 401645.
Stanton, P.K, Jones, R.S., Mody, I. and Heinemann, U. (1987). Epileptiform activity induced by lowering extracellular [Mg2+] in combined hippocampal-entorhinal cortex slices: modulation by receptors for norepinephrine and N-methyl-D-aspartate. Epilepsy Res, 1, p.53-62.
Stelzer, A., Slater, N. and Bruggencate, G. (1987). Activation of NMDA receptors blocks GABAergic inhibition in an in vitro model of epilepsy. Nature, 326, p.698-701.
Steriade, M., Amzica, F. and Nunez, A. (1993a). Cholinergic and noradrenergic modulation of the slow (0.3 Hz) oscillation in neocortical cells. J Neurophysiol, 70, p.1385-1400.

237""
Steriade, M., Contreras, D., Curró Dossi, R., Nuñez, A. (1993b). The slow (<1 Hz) oscillation in reticular thalamic and thalamocortical neurons: scenario of sleep rhythm generation in interacting thalamic and neocortical networks. J. Neurosci., 13, p.3284-3299.
Steriade, M., McCormick, D.A. and Sejnowski, T.J. (1993c). Thalamocortical oscillations in the sleeping and aroused brain. Science, 262, p.679-685.
Steriade, M., Nunez, A. and Amzica, F. (1993d). A novel slow (< 1 Hz) oscillation of neocortical neurons in vivo: depolarizing and hyperpolarizing components. J. Neurosci., 13, p.3252-3265.
Steriade, M., Nuñez, A., & Amzica, F. (1993e). Intracellular analysis of relations between the slow (< 1 Hz) neocortical oscillation and other sleep rhythms of the electroencephalogram. J. Neurosci., 13(8), 3266-3283.
Steriade, M. and Contreras, D. (1995). Relations between cortical and thalamic cellular events during transition from sleep patterns to paroxysmal activity. J. Neurosci., 15, p.623-42.
Steriade, M., Timofeev, I. and Grenier, F. (2001). Natural waking and sleep states: A view from inside neocortical neurons. J Neurophysiol.
Steriade, M. and Timofeev, I. (2003). Neuronal plasticity in thalamocortical networks during sleep and waking oscillations. Neuron, 37(4), p.563-576.
Steriade, M. (2006). Grouping of brain rhythms in corticothalamic systems. Neuroscience, 137, p. 1087–1106.
Stelzer, A., Slater, N. and Bruggencate, G. (1987). Activation of NMDA receptors blocks GABAergic inhibition in an in vitro model of epilepsy. Nature, 326, p.698-701.
Stickgold, R. and Walker, M.P. (2007). Sleep-dependent memory consolidation and reconsolidation. Sleep Med., 8, p.331-343.
Stringer, J.L. (1994). Pentylenetetrazol elicits epileptiform activity in the dentate gyrus of the urethane anesthetized rat by activation of the entorhinal cortex. Brain Res., 636(2), p.221-226.
Stubblefield, E.A. and Benke, T.A. (2010). Distinct AMPA-type glutamatergic synapses in developing rat CA1 hippocampus. J. Neurophysiol., 104(4), p.1899-1912.
Sutula, T., He, X.X., Cavazos, J. and Scott, G. (1988). Synaptic reorganization in the hippocampus induced by abnormal functional activity. Science, 239, p.1147-1150.
Sutula, T., Cascino, G., Cavazos, J., Parada, I. and Ramirez, L. (1989). Mossy fiber synaptic reorganization in the epileptic human temporal lobe. Ann. Neurol., 26, p.321-330.

238""
Syková, E., Mazel, T., Vargová, L., Voříšek, I. and Prokopová-Kubinová, Š. (2000). Extracellular space diffusion and pathological states. Prog. Brain Res., 125, p.155-178.
Tallon-Baudry, C. and Bertrand, O. (1999). Oscillatory gamma activity in humans and its role in object representation. Trend Cogn Sci, 3, p.151-162.
Tanaka, Y., Tanaka, Y., Furuta, T., Yanagawa, Y. and Kaneko, T. (2008). The effects of cutting solutions on the viability of GABAergic interneurons in cerebral cortical slices of adult mice. J. Neurosci. Meth., 171(1), p.118-125.
Tang, F.R., Chen, P.M., Tang, Y.C., Tsai, M.C. and Lee, W.L. (2007). Two-methyl-6-phenylethynyl-pyridine (MPEP), a metabotropic glutamate receptor 5 antagonist, with low doses of MK801 and diazepam: a novel approach for controlling status epilepticus. Neuropharmacol., 53(7), p.821-831.
Tatum, W.O., French, J.A., Benbadis, S.R. and Kaplan, P.W. (2001). The etiology and diagnosis of status epilepticus. Epilepsy Behav, 2, p.311-317.
Teitelbaum, J.S., Zatorre, R.J., Carpenter, S., Gendron, D., Evans, A.C., Gjedde, A. and Cashman, N.R. (1990). Neurologica sequelae of domoic acid intoxication due to the ingestion of contaminated mussels. N Engl J Med, 322, p.1781–1787.
Telfeian, A.E., Federoff, H.J., Leone, P., During, M.J. and Williamson, A. (2000). Overexpression of GluR6 in rat hippocampus produces seizures and spontaneous nonsynaptic bursting in vitro. Neurobiol Dis., 7, p.362-374.
Tian, H., Zhang, G. Y., Li, H. C. and Zhang, Q. G. (2003). Antioxidant NAC and AMPA/KA receptor antagonist DNQX inhibited JNK3 activation following global ischemia in rat hippocampus. Neurosci. Res., 46(2), p.191-197.
Tiesinga, P. H.E., Fellous, J.-M., José, J. V. and Sejnowski, T. J. (2001). Computational model of carbachol-induced delta, theta, and gamma oscillations in the hippocampus. Hippocampus, 11, p.251-274.
Timofeev, I. and Steriade, M. (1996). Low-frequency rhythms in the thalamus of intact-cortex and decorticated cats. J Neurophysiol, 76, p.4152-4168.
Timofeev, I., Grenier, F., Bazhenov, M., Sejnowski, T.J. and Steriade, M. (2000). Origin of slow cortical oscillations in deafferented cortical slabs. Cereb Cortex, 10, p.1185-1199.
Timofeev, I., Bazhenov, M., Seigneur, J., & Sejnowski, T. (2012). Neuronal synchronization and thalamocortical rythms in sleep, wake and epilepsy. Jasper's basic mechanisms of the epilepsies. JL Noebels, M. Avoli, MA Rogawski, RW Olsen and AV Delgado-Escueta. Bethesda (MD). National Center for Biotechnology Information. Thompson, S.E., Woodhall, G.L. and Jones R.S.G. (2007). Depression of glutamate and GABA release by presynaptic GABAB receptors in the entorhinal cortex in normal and chronically epileptic rats. Neurosignals., 15, p.202-216.

239""
Tolner, E.A., Kloosterman, F., Kalitzin, S.N., Da Silva, F.H.L. and Gorter, J.A. (2005). Physiological changes in chronic epileptic rats are prominent in superficial layers of the medial entorhinal area. Epilepsia, 46(s5), p.72-81.
Tononi, G. and Cirelli, C. (2006). Sleep function and synaptic homeostasis. Sleep Med. Rev., 10, p.49-62.
Traub, R.D., Whittington, M.A, Collins, S.B., Buzsaki, G. and Jefferys, J.G.R. (1996a). Analysis of gamma rhythms in the rat hippocampus in vitro and in vivo. J. Physiol., 493, p.471-484.
Traub, R.D., Whittington, M.A., Stanford, I.M. and Jefferys, J.G. (1996b). A mechanism for generation of long-range synchronous fast oscillations in the cortex. Nature, 383(6601), p.621-624.
Traub, R.D., Bibbig, A., Fisahn, A., LeBeau, F.E.N., Whittington, M.A. and Buhl, E.H. (2000). A model of gamma-frequency network oscillations induced in the rat CA3 region by carbachol in vitro. Eur. J. Neurosci., 12, p.4093-4106.
Traub, R. D., Kopell, N., Bibbig, A., Buhl, E. H., LeBeau, F. E., & Whittington, M. A. (2001a). Gap junctions between interneuron dendrites can enhance synchrony of gamma oscillations in distributed networks. J. Neurosci., 21(23), 9478-9486.
Traub, R.D., Whittington, M.A., Buhl, E.H., LeBeau, F.E., Bibbig, A., Boyd, S., Cross, H. and Baldeweg, T. (2001b). A possible role for gap junctions in generation of very fast EEG oscillations preceding the onset of, and perhaps initiating, seizures. Epilepsia, 42, p.153-170.
Traub, R.D., Whittington, M.A. and Cunningham, M.O. (2012). Fast Oscillations and Synchronization Examined with In vitro Models. Jasper's Basic Mechanisms of the Epilepsies, 80, p.286.
Trevino, M., Vivar, C. and Gutierrez, R. (2007). Beta ⁄ gamma oscillatory activity in the CA3 hippocampal area is depressed by aberrant GABAergic transmission from the dentate gyrus after seizures. J. Neurosci., 27, p.251-259.
Turski, W.A., Czuczwar, S.J., Kleinrok, Z. and Turski L. (1983a). Cholinomimetics produce seizures and brain damage in rats. Experientia., 39, p.1408-1411.
Turski, W.A., Cavalheiro, E.A., Schwarz, M., Czuczwar, S.L.J., Kleinrok, Z. and Turski, L. (1983b). Limbic seizures produced by pilocarpine I rats: behavioral, electroencephalographic and neuropathological study. Behav Brain Res., 9, p.315-335.
Turski, W.A., Cavalheiro, E.A., Bortolotto, Z.A., Mello, L.M., Schwarz, M. and Turski, L. (1984). Seizures produced by pilocarpine in mice: a behavioral, electroencephalographic and morphological analysis. Brain Res., 32, p.237-253.
Turski, L., Ikonomidou, C., Turski, W.A., Bortolotto, Z.A. and Cavalheiro, E.A. (1989). Review: cholinergic mechanisms and epileptogenesis. The seizures induced by pilocarpine: a novel experimental model of intractable epilepsy. Synapse, 3, p.154-171.
240""
Tutak, E., Satar, M., Zorludemir, S., Erdogan, S., Yapicioglu, H. and Narli, N. (2005). Neuroprotective effects of indomethacin and aminoguanidine in the newborn rats with hypoxic-ischemic cerebral injury. Neurochem. Res., 30(8), p.937-942
Uhlhaas, P.J. and Silverstein, S.M. (2005). Perceptual organization in schizophrenia spectrum disorders: empirical research and theoretical implications. Psychol. Bull, 131, p.618-632.
Uhlhaas, P.J. and Singer, W. (2006). Neural synchrony in brain disorders: Relevance for cognitive dysfunctions and pathophysiology. Neuron, 52, p.155-168.
Ullal, G., Fahnestock, M. and Racine, R. (2005). Time!dependent Effect of Kainate!induced Seizures on Glutamate Receptor GluR5, GluR6, and GluR7 mRNA and Protein Expression in Rat Hippocampus. Epilepsia, 46(5), p.616-623.
Valentin, A., Arunachalam, R., Mesquita-Rodrigues, A., Garcia Seoane, J. J., Richardson, M. P., Mills, K. R., & Alarcon, G. (2008). Late EEG responses triggered by transcranial magnetic stimulation (TMS) in the evaluation of focal epilepsy. Epilepsia, 49(3), p. 470-480.
Vanderwolf, C. H. (1969). Hippocampal electrical activity and voluntary movement in the rat. Electroen. Clin. Neuro., 26(4), p.407-418.
Vanhatalo, S., Palva, J.M., Holmes, M.D., Miller, J.W., Voipio, J. and Kaila, K. (2004). Infraslow oscillations modulate excitability and interictal epileptic activity in the human cortex during sleep. Proc Natl Acad Sci USA, 101, p.5053-5057.
van Putten, M.J. (2003). Nearest neighbor phase synchronization as a measure to detect seizure activity from scalp EEG recordings. J. Clin. Neurophysiol, 20, p.320-325.
Velisek, L. (2006). Models of Chemically-induced Acute Seizures. In: Pitkänen, A., Schwartzkroin PA, Moshé, S.L. (eds) Models of Seizures and Epilepsy, Burlington, MA: Elsevier Academic, 2006, p.127-153.
Veliskova, J., Pitkänen, A., Schwartzkroin, P.A. and Moshé, S.L. (2006). Behavioral characterization of seizures in rats. Models of seizures and epilepsy. Elsevier Academic Press, Burlington. p.601-611.
Vertes, R.P. and Kocsis, B. (1997). Brainstem-diencephalo-septohippocampal systems controlling the theta rhythm of the hippocampus. Neuroscience, 81, p.893-926.
Vignes, M. and Collingridge, G.L. (1997). The synaptic activation of kainite receptors. Nature, 388, p.179-182.
Volgushev, M., Chauvette, S., Mukovski, M. and Timofeev, I. (2006). Precise long-range synchronization of activity and silence in neocortical neurons during slow-wave sleep. J. Neurosci., 26, p.5665-5672.
Vreugdenhil, M. and Toescu, E.C., (2005). Age-dependent reduction of gamma oscillations in the mouse hippocampus in vitro. Neuroscience, 132, p.1151-1157.
241""
Vyazovskiy, V.V., Olcese, U., Lazimy, Y.M., Faraguna, U., Esser, S.K., Williams, J.C. and Tononi, G. (2009). Cortical firing and sleep homeostasis.Neuron, 63(6), p.865-878.
Wallenstein, G.V. and Hasselmo, M.E. (1997). GABAergic modulation of hippocampal activity: Sequence learning, place field development, and the phase precession effect. J. Neurophysiol., 78, p.393-408.
Walton, N.Y. and Treiman, D.M. (1988). Response of status epilepticus induced by lithium and pilocarpine to treatment with diazepam. Exp Neurol, 101, p.267-275.
Walton, N.Y. and Treiman, D.M. (1991). Motor and electroencephalographic response of refractory experimental status epilepticus in rats to treatment with MK-801, diazepam, or MK-801 plus diazepam. Brain Res, 553, p.97-104.
Wang, S., Chen, X., Kurada, L., Huang, Z. and Lei, S. (2012). Activation of group II metabotropic glutamate receptors inhibits glutamatergic transmission in the rat entorhinal cortex via reduction of glutamate release probability. Cereb. Cortex, 22(3), p.584-594.
Wang, X.J. and Rinzel, J. (1992). Alternating and synchronous rhythms in reciprocally inhibitory model neurons. Neural Comput., 4, p.84-97
Wang, X.J. and Buzsaki, G. (1996). Gamma oscillation by synaptic inhibition in a hippocampal interneuronal network model. J. Neurosci., 16, p.6402-6413.
Wass, C. T., Rajala, M. M., Hughes, J. M. and Sharbrough, F. W. (1996). Long-term follow-up of patients treated surgically for medically intractable epilepsy: results in 291 patients treated at mayo clinic rochester between july 1972 and march 1985. Mayo Clinic Proceedings, 71(11), p.1105-1113.
Watkins, J.C. and Evans, R.H., (1981). Excitatory amino acid transmitters. Annu. Rev. Pharmacol., 21, p.165-204.
West, P.J., Dalpe´-Charron, A., Wilcox, KS. (2007). Differential contribution of kainate receptors to excitatory post-synaptic currents in the superficial layer neurons of the rat medial entorhinal cortex. Neuroscience, 146, p.1000–1012.
Whishaw, I.Q. (1972). Hippocampal electroencephalographic activity in the Mongolian gerbil during natural behaviours and wheel running and in the rat during wheel running and conditioned immobility. Can J Psychol, 26, p.219-239.
Whishaw, I.Q. and Vanderwolf, C.H. (1973). Hippocampal EEG and behavior: change in amplitude and frequency of RSA (theta rhythm). associated with spontaneous and learned movement patterns in rats and cats. Behavioral biology, 8(4), p.461-484.
Whittington, M.A., Traub, R.D. and Jefferys, J.G.R. (1995). Synchronized oscillations in interneuron networks driven by metabotropic glutamate receptor activation. Nature, 373, p.612-615.

242""
Whittington, M. A., Stanford, I. M., Colling, S. B., Jefferys, J. G. R. and Traub, R. D. (1997). Spatiotemporal patterns of gamma frequency oscillations tetanically induced in the rat hippocampal slice. Journal of Physiology-London, 502(3), p.591-607.
Whittington, M. A., Traub, R. D., Kopell, N., Ermentrout, B. and Buhl, E. H. (2000). Inhibition-based rhythms: experimental and mathematical observations on network dynamics. Int. J. Psychophysiol. 38, p.315–336.
Wieser, H.G. (2004). ILAE Commission on Neurosurgery of Epilepsy. ILAE Commission Report. Mesial temporal lobe epilepsy with hippocampal sclerosis. Epilepsia, 45, p.695-714.
Winson, J. (1978). Loss of hippocampal theta rhythm results in spatial memory deficit in the rat. Science, 201, p.160-163.
Wisden, W. and Seeburg, P.H. (1993). A complex mosaic of high-affinity kainite receptors in rat brain. J. Neurosci., 13, p.3582-3598.
Woodhall, G., Evans, D.I.P. and Jones, R.S.G. (2001). Activation of presynaptic group III metabotropic glutamate receptors depresses spontaneous inhibition in layer V of the rat entorhinal cortex. Neuroscience, 105(1), p.71-78.
Worrell, G.A., Gardner, A.B., Stead, S.M., Hu, S., Goerss, S., Cascino, G.J., Meyer, F.B., Marsh, R. and Litt, B. (2008). High-frequency oscillations in human temporal lobe: Simultaneous microwire and clinical macroelectrode recordings. Brain, 131, p.928-937.
Wozny, C., Gabriel, S., Jandova, K., Schulze, K., Heinemann, U. and Behr, J. (2005). Entorhinal cortex entrains epileptiform activity in CA1 in pilocarpine-treated rats. Neurobiol. Dis., 19(3), p.451-460.
Wyllie, E., Comair, Y. G., Kotagal, P., Bulacio, J., Bingaman, W. and Ruggieri, P. (1998). Seizure outcome after epilepsy surgery in children and adolescents. Annals of neurology, 44(5), p.740-748.
Xing, D., Yeh, C.I. and Shapley, R.M. (2009). Spatial spread of the local field potential and its laminar variation in visual cortex. J. Neurosci., 29, p.11540-11549.
Yamamoto, C. and McIlwain, H. (1996). Electrical activities in thin sections from the mammalian brain maintained in chemically-defined media in vitro. J Neurochemistry, 13, p.1333-1343.
Yamawaki, N., Stanford, I.M., Hall, S.D. and Woodhall, G.L. (2008). Pharmacological induced and stimulus evoked rhythmic neuronal oscillatory activity in the primary motor cortex (M1). in vitro. Neuroscience, 151, p.386-395.
Yang J., Woodhall G.L. and Jones R.S.G. (2006). Tonic facilitation of glutamate release by presynaptic NR2B-containing NMDA receptors is increased in the entorhinal cortex of chronically epileptic rats. J. Neurosci., 26, p.406-410.
Ye, J. H., Zhang, J., Xiao, C. and Kong, J. Q. (2006). Patch-clamp studies in the CNS illustrate a simple new method for obtaining viable neurons in rat brain slices:

243""
glycerol replacement of NaCl protects CNS neurons. J. Neurosci. Meth., 158(2), p.251-259.
Yilmazer-Hanke, D. M., Wolf, H. K., Schramm, J., Elger, C. E., Wiestler, O. D. and Blümcke, I. (2000). Subregional pathology of the amygdala complex and entorhinal region in surgical specimens from patients with pharmacoresistant temporal lobe epilepsy. Journal of Neuropathology and Exp. Neurol., 59(10), p.907-920.
Ylinen, A., Sik, A., Bragin, A., Nadasdy, Z., Jando, G., Szabo, I. and Buzsaki, G. (1995). Sharp wave-associated high-frequency oscillation (200 Hz). in the intact hippocampus: network and intracellular mechanisms. J. Neurosci., 15, p.30-46.
Yordanova, J, Banaschewski, T., Kolev, V., Woerner, W., Rothenberger, A. (2001). Abnormal early stages of task stimulus processing in children with attention-deficit hyperactivity disorder evidence from eventrelated gamma oscillations. Clin Neurophysiol, 112, p.1096 -1108.
Zhang, C.L., Dreier, J.P., Heinemann, U. (1995). Paroxysmal epileptiform discharges in temporal lobe slices after prolonged exposure to low magnesium are resistant to clinically used anticonvulsants. Epilepsy Res., 20, p.105-111.
Zhang, X., Cui, S.S., Wallace, A.E., Hannesson, D.K., Schmued, L.C. and Saucier, D.M. (2002). Relations between brain pathology and temporal lobe epilepsy. J. Neurosci., 22, p.6052-6061.

244""
A. Appendix
245""
Appendix 1
"Figure A.1. Copy of ethical approval for cellular studies in human epilepsy.

246""
"Figure A.1. Copy of ethical approval for cellular studies in human epilepsy (cont.).

247""
"""
"Figure A.1. Copy of ethical approval for cellular studies in human epilepsy (cont.).

248""
Appendix 2
Table A.1. Choline chloride-based cutting solution recipe. Adapted from BrainSliceMethods n.d. Choline Chloride Recovery Solution (JT) Recovery period <12 min at 32-34*C (use the shortest possible) Excellent for very old mice or for difficult/compact brain areas (CA1, CA3) (NOTE: extended exposure can permanently disrupt physiology) (NOTE: recommended only if NMDG-HEPES aCSF is not sufficient)
mM MW g/L g/500 mL
Choline chloride 92 139.6 12.85 6.42 KCl 2.5 74.6 0.19 0.09 NaH2PO4 1.2 138.0 0.17 0.08 NaHCO3 30 84.0 2.52 1.26 HEPES 20 238.3 4.77 2.38 Glucose 25 180.2 4.51 2.25 Sodium ascorbate 5 198.0 0.99 0.50 Thiourea 2 76.1 0.15 0.08 Sodium pyruvate 3 110.0 0.33 0.17
MgSO4.7H2O 10 246.4
8 5 mL 2.5 mL (2M stock)
CaCl2.2H2O 0.5 147.0
1 250 µL 125 µL
(2M stock)
Table A.2. NMDG-based cutting solution recipe. Adapted from BrainSliceMethods n.d.
NMDG-HEPES Recovery Solution (JT) Recovery period <15 min at 32-34*C Excellent for mouse ages 5 weeks to 1 year old or older
mM MW g/L g/500 mL
NMDG 93 195.2 18.16 9.08 HCl (see note) 93 (10N stock) KCl 2.5 74.6 0.19 0.09 NaH2PO4 1.2 138.0 0.17 0.08 NaHCO3 30 84.0 2.52 1.26 HEPES 20 238.3 4.77 2.38 Glucose 25 180.2 4.51 2.25 Sodium ascorbate 5 198.0 0.99 0.50 Thiourea 2 76.1 0.15 0.08 Sodium pyruvate 3 110.0 0.33 0.17
MgSO4.7H2O 10 246.5 5 mL 2.5 mL (2M stock)
CaCl2.2H2O 0.5 147.0 250 125 µL (2M

249""
µL stock) Table A.3. Modified HEPES holding aCSF recipe. Adapted from BrainSliceMethods n.d.
Modified HEPES Holding aCSF (JT)
mM MW g/L g/500 mL
NaCl 92 58.4 5.38 2.69 KCl 2.5 74.6 0.19 0.09 NaH2PO4 1.2 138.0 0.17 0.08 NaHCO3 30 84.0 2.52 1.26 HEPES 20 238.3 4.77 2.38 Glucose 25 180.2 4.51 2.25 Sodium ascorbate 5 198.0 0.99 0.50 Thiourea 2 76.1 0.15 0.08 Sodium pyruvate 3 110.0 0.33 0.17
MgSO4.7H2O 2 246.5 1
mL 0.5 mL
(2M stock)
CaCl2.2H2O 2 147.0 1
mL 0.5 mL
(2M stock)
Table A.4 Recording aCSF recipe. Adapted from BrainSliceMethods n.d. Standard recording aCSF (JT) mM MW g/L g/500mL NaCl 124 58.4 7.25 3.62 KCl 2.5 74.6 0.19 0.09 NaH2PO4 1.2 138.0 0.17 0.08 NaHCO3 24 84.0 2.02 1.01 HEPES 5 238.3 1.19 0.60 Glucose 12.5 180.2 2.25 1.13
MgSO4.7H2O 2 246.5 1
mL 0.5 mL
(2M stock)
CaCl2.2H2O 2 147.0 1
mL 0.5 mL
(2M stock)