Tailoring width of microfabricated nanochannels to solute size can be used to control diffusion...
11
Tailoring width of microfabricated nanochannels to solute size can be used to control diffusion kinetics Frank Martin a, * , Robbie Walczak a , Anthony Boiarski a , Michael Cohen a , Teri West a , Carlo Cosentino b , Mauro Ferrari c a iMEDD Inc., Columbus, OH, USA b Department of Experimental and Clinical Medicine, University of Catanzaro bMagna Gr&ciaQ, Catanzaro, Italy c Department of Internal Medicine, Ohio State University, Columbus, OH, USA Received 17 June 2004; accepted 28 September 2004 Abstract Top–down microfabrication techniques were used to create silicon-based membranes consisting of arrays of uniform channels having a width as small as 7 nm. The measurement of diffusion kinetics of solutes across these membranes under sink conditions reveals non-Fickian behavior as the nanopore width approaches the hydrodynamic diameter of the solute. Zero-order diffusion of interferon is observed at channel width of 20 nm, and the same phenomenon occurs with albumin and 13-nm-wide channels, whereas Fickian diffusion kinetics is seen at 26 nm and larger pore sizes. A prototypical drug delivery device is described that is fitted with a 13-nm nanopore membrane and loaded with radio-labeled BSA. Following subcutaneous implantation in rats, diffusion from the device provided prolonged levels of BSA in the blood. Such a nonmechanical device offers important advantages in drug delivery applications, including zero-order release and high loading capacity. D 2004 Elsevier B.V. All rights reserved. Keywords: Nanochannels; Nanopore membranes; Silicon membranes; Microfabrication 1. Introduction Fick’s laws of diffusion are usually adequate to describe the kinetics of solutes from a region of higher concentration to a region of lower concentration through a thin, semipermeable membrane. As the size of the membrane pores approaches that of the solute, however, unexpected effects can occur, which cause substantial deviations from the kinetics predicted by Fick’s laws. The diffusion of molecules in micro- porous media such as zeolites has led to experimental evidence of such unusual phenomena as molecular traffic control and single file diffusion (SFD; [1–6]). Theoretical treatments and simulations suggest that, in 0168-3659/$ - see front matter D 2004 Elsevier B.V. All rights reserved. doi:10.1016/j.jconrel.2004.09.024 * Corresponding author. E-mail address: [email protected] (F. Martin). Journal of Controlled Release 102 (2005) 123 – 133 www.elsevier.com/locate/jconrel
-
Upload
independent -
Category
Documents
-
view
2 -
download
0
Transcript of Tailoring width of microfabricated nanochannels to solute size can be used to control diffusion...

www.elsevier.com/locate/jconrel
Journal of Controlled Releas
Tailoring width of microfabricated nanochannels to solute size can
be used to control diffusion kinetics
Frank Martina,*, Robbie Walczaka, Anthony Boiarskia, Michael Cohena, Teri Westa,
Carlo Cosentinob, Mauro Ferraric
aiMEDD Inc., Columbus, OH, USAbDepartment of Experimental and Clinical Medicine, University of Catanzaro bMagna Gr&ciaQ, Catanzaro, Italy
cDepartment of Internal Medicine, Ohio State University, Columbus, OH, USA
Received 17 June 2004; accepted 28 September 2004
Abstract
Top–down microfabrication techniques were used to create silicon-based membranes consisting of arrays of uniform
channels having a width as small as 7 nm. The measurement of diffusion kinetics of solutes across these membranes under sink
conditions reveals non-Fickian behavior as the nanopore width approaches the hydrodynamic diameter of the solute. Zero-order
diffusion of interferon is observed at channel width of 20 nm, and the same phenomenon occurs with albumin and 13-nm-wide
channels, whereas Fickian diffusion kinetics is seen at 26 nm and larger pore sizes. A prototypical drug delivery device is
described that is fitted with a 13-nm nanopore membrane and loaded with radio-labeled BSA. Following subcutaneous
implantation in rats, diffusion from the device provided prolonged levels of BSA in the blood. Such a nonmechanical device
offers important advantages in drug delivery applications, including zero-order release and high loading capacity.
D 2004 Elsevier B.V. All rights reserved.
Keywords: Nanochannels; Nanopore membranes; Silicon membranes; Microfabrication
1. Introduction
Fick’s laws of diffusion are usually adequate to
describe the kinetics of solutes from a region of higher
concentration to a region of lower concentration
0168-3659/$ - see front matter D 2004 Elsevier B.V. All rights reserved.
doi:10.1016/j.jconrel.2004.09.024
* Corresponding author.
E-mail address: [email protected] (F. Martin).
through a thin, semipermeable membrane. As the size
of the membrane pores approaches that of the solute,
however, unexpected effects can occur, which cause
substantial deviations from the kinetics predicted by
Fick’s laws. The diffusion of molecules in micro-
porous media such as zeolites has led to experimental
evidence of such unusual phenomena as molecular
traffic control and single file diffusion (SFD; [1–6]).
Theoretical treatments and simulations suggest that, in
e 102 (2005) 123–133

F. Martin et al. / Journal of Controlled Release 102 (2005) 123–133124
the case of SFD, solute molecules of equal size cannot
pass each other in pores that approximate the
dimensions of the molecule itself, regardless of the
influence of concentration gradient, and thus, their
initial rate of movement (or flux) is overestimated by
Fick’s law [7–12].
Top–down microfabrication methods have been
used to create nanopore membranes consisting of
arrays of parallel rectangular channels, which, in their
smallest aspect, range from 7 to 50 nm (Fig. 1). The
original method pioneered by Chu et al. [14] consists
of two basic steps: (1) surface micromachining of
nanochannels in a thin film on the top of a silicon
wafer, and (2) forming the nanopore membrane by
etching away the bulk of the silicon wafer underneath
the thin-film structure. The overall fabrication process
is shown schematically in Fig. 2.
Fig. 1. Photographic images of nanopore membranes. (A) Appearance of
dies before being cut into individual units. (B) SEM cross-sectional view
material. (C) SEM top view of membrane with pores at 1000� magnifi
regions. (D) Top SEM view of membrane, 6000�, showing details of po
Several factors hinder controlled diffusion for
current commercial membrane fabrication techniques.
Solvent-casting process, which is the most common,
typically exhibits large variations in the pore size; ion-
track etching yields better results concerning the pore
size distribution, but low porosities, while the pore
configurations and arrangements in porous alumina
membranes, which exhibit an high uniformity, are
difficult to control. On the other hand, Desai et al. [13]
showed that, by the same silicon microfabrication
technique exploited in this work, it is possible to
create nanoporous silicon membranes exhibiting con-
trolled diffusion and rejection performance compara-
ble with current commercially available ones, such as
those by Whatman and Millipore.
Given the absolute pore sizes in the 7- to 50-nm
range possible with silicon microfabrication technol-
4 inches silicon wafer showing 120 small and 100 large membranes
of membrane with 50-nm pores separated by silicon and polysilicon
cation showing 45-Am-long pores separated by 10-Am-long anchor
re and anchor structures.

Fig. 2. Schematic of key steps in silicon nanopore membrane fabrication process. Details are given in Materials and methods.
F. Martin et al. / Journal of Controlled Release 102 (2005) 123–133 125
ogy, nanopore membranes were first applied to create
capsules for the immunoisolation of transplanted islet
cells [15]. In this setting, the nanopore membrane is
designed to serve as the only connection between the
reservoir containing the cells and the external
medium. The membrane size is selected to allow the
passage of insulin, glucose, oxygen, and carbon
dioxide, molecules required for the proper function
of the cell feedback system, while blocking elements
of the immune system which might attack the graft.
Although it is relatively easy to prevent the passage of
cytotoxic cells, macrophages, and other cellular
immune molecules through the biocapsule, it is more
challenging to block humoral immune components
such as antibodies and cytokines, as well as cell-
secreted antigens. Previous studies have indicated that
a membrane with maximum pore diameter of 30 nm
can retain immunoglobulin and complement mole-
cules [16]. Microfabricated nanopore membranes with
pores of about 15 nm appear well suited for this
purpose [17,18].
During the development of the immunoisolating
biocapsule, it was noted that diffusion through nano-
pore membranes was slower than predicted from
Fick’s law when using smaller pore sizes. To explore
this phenomenon, the relationship between diffusion
rates of various solutes and the width of nanopore
membranes was investigated in more detail and is
presented in this paper.
2. Materials and methods
2.1. Materials
All laboratory reagents and chemicals were
obtained from Sigma (St. Louis, MO) or Fisher
Biochemicals (Pittsburgh, PA), unless otherwise noted.
2.2. Nanopore membrane fabrication
The first major process step involves etching
channels in the silicon substrate over its entire surface
to define the overall shape of the pores (Fig. 2A). The
etched channels are 2 Am wide, separated by 2 Am,
and they are 5 Am deep. These channels are formed
using a plasma-etch procedure with a thermally grown
oxide layer as an etch-mask.
F. Martin et al. / Journal of Controlled Release 102 (2005) 123–133126
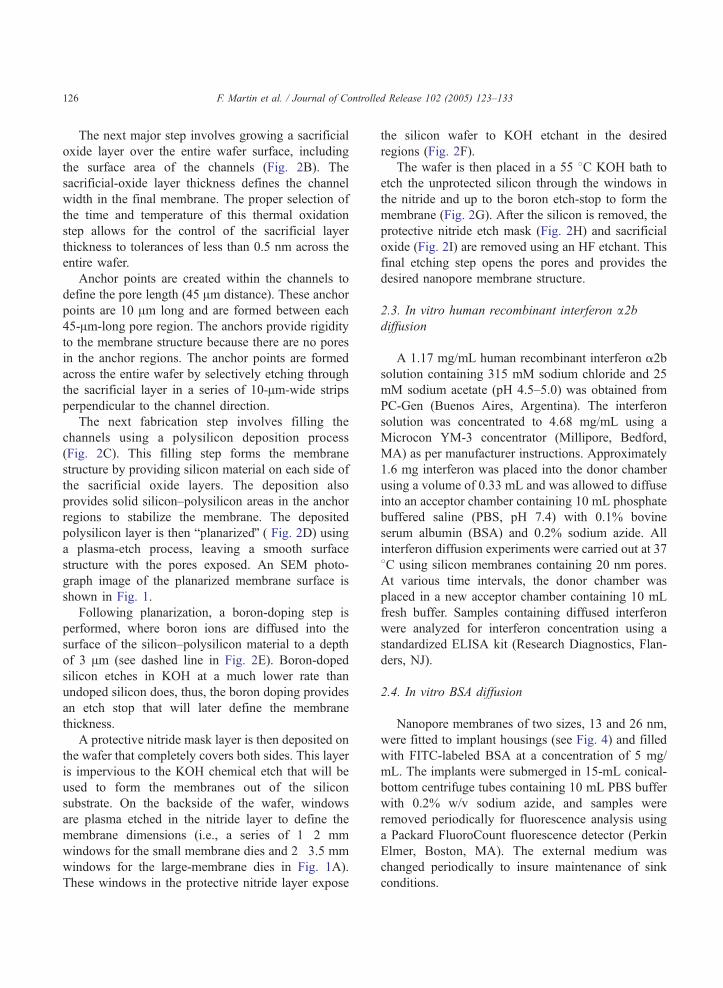
The next major step involves growing a sacrificial
oxide layer over the entire wafer surface, including
the surface area of the channels (Fig. 2B). The
sacrificial-oxide layer thickness defines the channel
width in the final membrane. The proper selection of
the time and temperature of this thermal oxidation
step allows for the control of the sacrificial layer
thickness to tolerances of less than 0.5 nm across the
entire wafer.
Anchor points are created within the channels to
define the pore length (45 Am distance). These anchor
points are 10 Am long and are formed between each
45-Am-long pore region. The anchors provide rigidity
to the membrane structure because there are no pores
in the anchor regions. The anchor points are formed
across the entire wafer by selectively etching through
the sacrificial layer in a series of 10-Am-wide strips
perpendicular to the channel direction.
The next fabrication step involves filling the
channels using a polysilicon deposition process
(Fig. 2C). This filling step forms the membrane
structure by providing silicon material on each side of
the sacrificial oxide layers. The deposition also
provides solid silicon–polysilicon areas in the anchor
regions to stabilize the membrane. The deposited
polysilicon layer is then bplanarizedQ ( Fig. 2D) usinga plasma-etch process, leaving a smooth surface
structure with the pores exposed. An SEM photo-
graph image of the planarized membrane surface is
shown in Fig. 1.
Following planarization, a boron-doping step is
performed, where boron ions are diffused into the
surface of the silicon–polysilicon material to a depth
of 3 Am (see dashed line in Fig. 2E). Boron-doped
silicon etches in KOH at a much lower rate than
undoped silicon does, thus, the boron doping provides
an etch stop that will later define the membrane
thickness.
A protective nitride mask layer is then deposited on
the wafer that completely covers both sides. This layer
is impervious to the KOH chemical etch that will be
used to form the membranes out of the silicon
substrate. On the backside of the wafer, windows
are plasma etched in the nitride layer to define the
membrane dimensions (i.e., a series of 1�2 mm
windows for the small membrane dies and 2�3.5 mm
windows for the large-membrane dies in Fig. 1A).
These windows in the protective nitride layer expose
the silicon wafer to KOH etchant in the desired
regions (Fig. 2F).
The wafer is then placed in a 55 8C KOH bath to
etch the unprotected silicon through the windows in
the nitride and up to the boron etch-stop to form the
membrane (Fig. 2G). After the silicon is removed, the
protective nitride etch mask (Fig. 2H) and sacrificial
oxide (Fig. 2I) are removed using an HF etchant. This
final etching step opens the pores and provides the
desired nanopore membrane structure.
2.3. In vitro human recombinant interferon a2bdiffusion
A 1.17 mg/mL human recombinant interferon a2b
solution containing 315 mM sodium chloride and 25
mM sodium acetate (pH 4.5–5.0) was obtained from
PC-Gen (Buenos Aires, Argentina). The interferon
solution was concentrated to 4.68 mg/mL using a
Microcon YM-3 concentrator (Millipore, Bedford,
MA) as per manufacturer instructions. Approximately
1.6 mg interferon was placed into the donor chamber
using a volume of 0.33 mL and was allowed to diffuse
into an acceptor chamber containing 10 mL phosphate
buffered saline (PBS, pH 7.4) with 0.1% bovine
serum albumin (BSA) and 0.2% sodium azide. All
interferon diffusion experiments were carried out at 37
8C using silicon membranes containing 20 nm pores.
At various time intervals, the donor chamber was
placed in a new acceptor chamber containing 10 mL
fresh buffer. Samples containing diffused interferon
were analyzed for interferon concentration using a
standardized ELISA kit (Research Diagnostics, Flan-
ders, NJ).
2.4. In vitro BSA diffusion
Nanopore membranes of two sizes, 13 and 26 nm,
were fitted to implant housings (see Fig. 4) and filled
with FITC-labeled BSA at a concentration of 5 mg/
mL. The implants were submerged in 15-mL conical-
bottom centrifuge tubes containing 10 mL PBS buffer
with 0.2% w/v sodium azide, and samples were
removed periodically for fluorescence analysis using
a Packard FluoroCount fluorescence detector (Perkin
Elmer, Boston, MA). The external medium was
changed periodically to insure maintenance of sink
conditions.
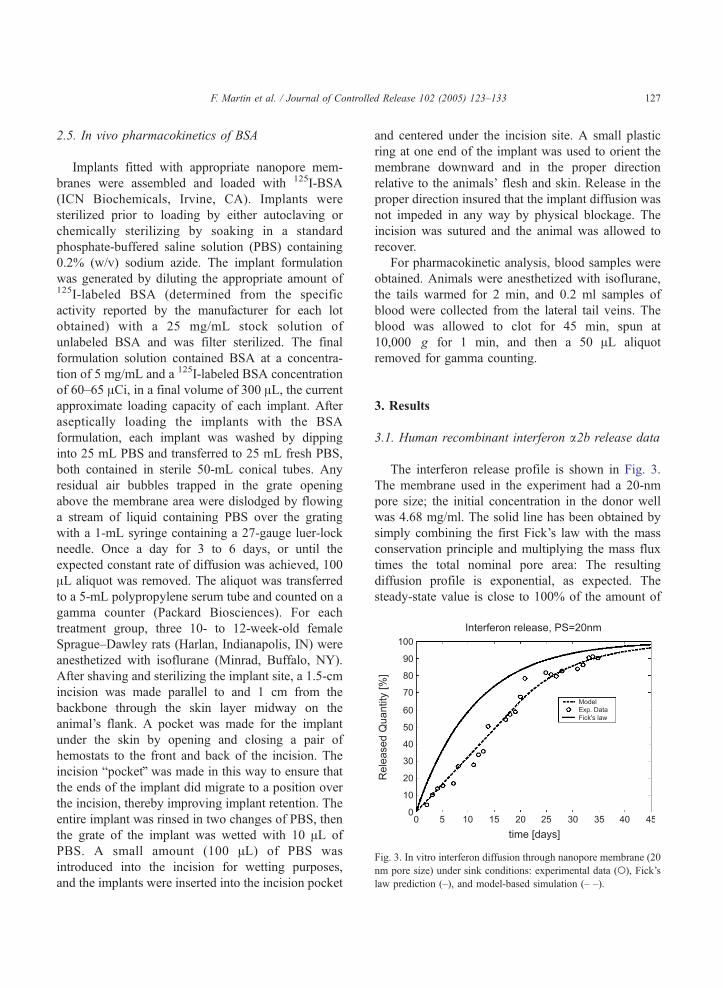
Fig. 3. In vitro interferon diffusion through nanopore membrane (20
nm pore size) under sink conditions: experimental data (o), Fick’s
law prediction (–), and model-based simulation (– –).
F. Martin et al. / Journal of Controlled Release 102 (2005) 123–133 127
2.5. In vivo pharmacokinetics of BSA
Implants fitted with appropriate nanopore mem-
branes were assembled and loaded with 125I-BSA
(ICN Biochemicals, Irvine, CA). Implants were
sterilized prior to loading by either autoclaving or
chemically sterilizing by soaking in a standard
phosphate-buffered saline solution (PBS) containing
0.2% (w/v) sodium azide. The implant formulation
was generated by diluting the appropriate amount of125I-labeled BSA (determined from the specific
activity reported by the manufacturer for each lot
obtained) with a 25 mg/mL stock solution of
unlabeled BSA and was filter sterilized. The final
formulation solution contained BSA at a concentra-
tion of 5 mg/mL and a 125I-labeled BSA concentration
of 60–65 ACi, in a final volume of 300 AL, the currentapproximate loading capacity of each implant. After
aseptically loading the implants with the BSA
formulation, each implant was washed by dipping
into 25 mL PBS and transferred to 25 mL fresh PBS,
both contained in sterile 50-mL conical tubes. Any
residual air bubbles trapped in the grate opening
above the membrane area were dislodged by flowing
a stream of liquid containing PBS over the grating
with a 1-mL syringe containing a 27-gauge luer-lock
needle. Once a day for 3 to 6 days, or until the
expected constant rate of diffusion was achieved, 100
AL aliquot was removed. The aliquot was transferred
to a 5-mL polypropylene serum tube and counted on a
gamma counter (Packard Biosciences). For each
treatment group, three 10- to 12-week-old female
Sprague–Dawley rats (Harlan, Indianapolis, IN) were
anesthetized with isoflurane (Minrad, Buffalo, NY).
After shaving and sterilizing the implant site, a 1.5-cm
incision was made parallel to and 1 cm from the
backbone through the skin layer midway on the
animal’s flank. A pocket was made for the implant
under the skin by opening and closing a pair of
hemostats to the front and back of the incision. The
incision bpocketQ was made in this way to ensure that
the ends of the implant did migrate to a position over
the incision, thereby improving implant retention. The
entire implant was rinsed in two changes of PBS, then
the grate of the implant was wetted with 10 AL of
PBS. A small amount (100 AL) of PBS was
introduced into the incision for wetting purposes,
and the implants were inserted into the incision pocket
and centered under the incision site. A small plastic
ring at one end of the implant was used to orient the
membrane downward and in the proper direction
relative to the animals’ flesh and skin. Release in the
proper direction insured that the implant diffusion was
not impeded in any way by physical blockage. The
incision was sutured and the animal was allowed to
recover.
For pharmacokinetic analysis, blood samples were
obtained. Animals were anesthetized with isoflurane,
the tails warmed for 2 min, and 0.2 ml samples of
blood were collected from the lateral tail veins. The
blood was allowed to clot for 45 min, spun at
10,000�g for 1 min, and then a 50 AL aliquot
removed for gamma counting.
3. Results
3.1. Human recombinant interferon a2b release data
The interferon release profile is shown in Fig. 3.
The membrane used in the experiment had a 20-nm
pore size; the initial concentration in the donor well
was 4.68 mg/ml. The solid line has been obtained by
simply combining the first Fick’s law with the mass
conservation principle and multiplying the mass flux
times the total nominal pore area: The resulting
diffusion profile is exponential, as expected. The
steady-state value is close to 100% of the amount of

F. Martin et al. / Journal of Controlled Release 102 (2005) 123–133128
drug loaded into the donor well because the acceptor
well volume is much larger than that of the donor
well. Therefore, to make the concentration homoge-
neous on both sides of the membrane, only a small
amount of drug has to be retained in the donor well.
Looking at the experimental measurements (circle
markers), it is fairly clear that, even if the nominal
experimental parameter values are varied, Fick’s law
could not explain the nonexponential measured
diffusion profile. On the contrary, the release rate
remains constant (zero-order kinetics) for a long
period (about 25 days), until 75% of the total amount
has been released. Later on, a possible interpretation
for this result will be provided, and a suitable
theoretical diffusion model fitting the data (dashed
line) will be devised.
Fig. 4. Implant device fitted with nanopore membrane. (Top) Drawing ill
possible diffusion path of a drug molecule held within the device reservoir.
in relation to a U.S. 1 cent piece. All implant housing components were
cylindrical methacrylate inset carrier is fitted with two rubber O-rings. A 2�within the insert carrier using general-purpose silicone adhesive and allow
titanium encasement until the nanopore membrane region is fully aligned u
rubber septa are sealed at each end of the titanium encasement using si
vertically, and a 27-gauge luer-lock needle is inserted into the upper septa f
implant via the lower septa until all the air within the implant is removed, a
The needles are removed under gentle liquid injection pressure to avoid an
by immersion in appropriate buffer prior to either placement into a testing
3.2. In vitro BSA release data
Experiments like the one described in the previous
section indicate that nanopore membranes can be
engineered to control diffusion rates and kinetic order
by bfine tuningQ the channel width in relation to the
size of the solutes. Moreover, when the proper balance
is struck, zero-order diffusion kinetics is possible.
Implantable zero-order output devices are useful to
deliver drugs that are not orally bioavailable, partic-
ularly in clinical settings where the maintenance of a
steady-state level in the blood stream for long periods
is desirable [19]. The nanopore membrane offers a
nonmechanical means to achieve such release
kinetics. These considerations encouraged the devel-
opment of a prototypical drug delivery device (Fig. 4).
ustrating key features of the device. The dashed arrow represents a
(Bottom) Photograph of prototype implant device illustrating its size
obtained from Manufacturing Technical Solutions (Carroll, OH). A
3 mm nanopore membrane die is affixed over a small-bore opening
ed to cure 3 h at 55 8C. The completed carrier is inserted into the
nder the grate opening. Methacrylate end caps containing resealable
licone adhesive and were allowed to cure. The implant is oriented
or use as an air vent. The liquid suspension is slowly injected into the
s indicated by the presence of liquid exuding from the upper needle.
y concomitant influx of air upon withdrawal. The implants are rinsed
vessel or surgical implantation.

Fig. 6. In vitro diffusion kinetics of fluorescein isothiocyanate
(FITC)-labeled BSA through 26-nm pore size membrane under sink
conditions: experimental data (o), Fick’s law prediction (–), and
model-based simulation (– –).
F. Martin et al. / Journal of Controlled Release 102 (2005) 123–133 129
The device consists of a reservoir formed from a
cylindrical titanium alloy enclosure (45�5 mm)
capped at both ends with molded polymer plugs.
The device is fitted with a nanopore membrane as the
only connection between the internal reservoir and the
external medium. The nanopore membrane serves to
control the release rates of drugs loaded into the
reservoir. It was reckoned that the device would be
useful for delivering small-molecular-weight organic
drugs, as well as larger peptide- and protein-based
biopharmaceuticals.
As a point of reference, the hydrodynamic diameter
of a typical biopharmaceutical ranges between about 4
and 15 nm, and a typical small organic drug may be 3
to 5 nm in size [20]. Thus, the widths of these
nanopore channels can be made to approximate
molecular dimensions. To test the system, bovine
serum albumin (BSA) MW 66,000 Da) has been
selected as a surrogate of a fairly large protein
biopharmaceutical. Virtually no BSA diffusion is seen
through nanopore membranes of 7 nm (data not
shown), which would be expected because the hydro-
dynamic diameter of BSA is about 8 nm. The in vitro
release of fluorescent-labeled BSA loaded into
implants fitted with nanopore membranes of two
sizes, 13 and 26 nm, under sink conditions is shown in
Figs. 5 and 6, respectively.
Fig. 5. In vitro diffusion kinetics of fluorescein isothiocyanate
(FITC)-labeled BSA through 13-nm pore size membrane under sink
conditions: experimental data (o), Fick’s law prediction (–), and
model-based simulation (– –).
The expected diffusion behavior predicted by
Fick’s law is depicted in the figures and compared
with an interpolation, obtained from a dynamic
diffusion model, which will be discussed later on.
The mass flux is constant in the 13-nm case (Fig.
5), and zero-order kinetics is maintained for the entire
duration of the experiment, while the 26-nm test data
(Fig. 6) show an approximate exponential release
profile. Note that, in the latter case, there is a second-
order effect, which creates a kind of inertia in the
initial days: The release rate starts from a very low
value, then increases until the curve assumes a slope
close to that predicted by Fick’s law. This phenom-
enon occurs in some experiments and is likely caused
by an unsuccessful prewetting of the pores. Thus, it
has to be neglected and classified as experimental
error.
As one would intuitively expect, even with pore
sizes greater than 26 nm, BSA diffusion remains
Fickian (data not shown). These data indicate that flux
can be controlled by porosity, and the diffusion
kinetics controlled by channel width.
3.3. In vivo tests
To capitalize on the constrained diffusion feature
offered by these nanopore membranes, some tests
were conducted to assess their utility as a means of

Fig. 7. Pharmacokinetics of 125I-BSA in rats given as a single bolus
subcutaneous injection (n) or following implantation of nanopore
devices with an in vitro output rate of 15 Ag/day (E). Mean values
for three implants and standard deviation are plotted.
Table 1
BSA release of different kinds of membranes
Whatman Millipore iMEDD
Nominal pore size (nm) 20 25 13
Membrane thickness (Am) 1 105 4
Effective area (mm2) 4 5.6 0.0111
Release rate (mg/day) 17.1 13.7 0.9
Release rate/Effective area
(mg/day/mm2)
4.28 2.45 81.1
F. Martin et al. / Journal of Controlled Release 102 (2005) 123–133130
controlling the bioavailability of a protein in vivo.
Devices fitted with 13-nm membranes and filled with
300 AL of a solution containing 0.15 mg of 125I-BSA
were implanted dorsally and subcutaneously in three
rats. The devices were adjusted to have an in vitro
output rate of 15 Ag/day and, thus, were designed to
release the albumin for about 100 days. The pharma-
cokinetics of the labeled BSA in blood was measured
and compared with a dose of BSA delivered by a
standard subcutaneous bolus injection. Fig. 7 shows
the mean values for blood levels over a period of 45
days after implantation. In the case of the nanopore
implant group, following an initial period of rapid
decline (during the first 9 days), the rate of clearance
of BSA from the central compartment slowed,
maintaining measurable levels for the ensuing 4
weeks. The initial decline is attributed to the
equilibration of the radiolabeled BSA appearing in
the blood with the albumin pool in the interstitial fluid
volume. This equilibration has been reported to have a
half-life of about 3–7 days, which is in line with the
results obtained [23]. In comparison with the standard
subcutaneous injection, BSA delivered in the nano-
pore device was detectable for a substantially longer
period. As expected, when the devices were recovered
from experimental animals, they were encapsulated in
a fibrous capsule, but upon visual inspection, the
nanopore membrane itself was free of any tissue
intrusion. The encapsulation response did not appear
to retard the bioavailability of the albumin released
from the device; about half the labeled albumin was
recovered from the nanopore device, which conforms
to the expectation that half the drug was released
during the 7-week implantation period.
4. Discussion
4.1. Performance analysis
The performance of iMEDD membranes, in terms
of drug release, can be compared with that of other
commercially available membranes, based on differ-
ent fabrication processes. To this aim, data reported in
Ref. [13] can be exploited, where Desai et al.
compared a silicon microfabricated membrane with
two commercially available filter membranes by
Whatman (made from porous alumina) and Millipore
(fabricated by ion-track etching). They analyzed the
diffusive transport of BSA between two vessels across
the membranes; to assess the rejection performances
of the membranes, they used a diffusion chamber with
two compartments, A and B, containing 2 ml of
solutions at different concentrations, divided by the
membrane. The initial concentrations in the two
compartments were 4 and 0 g/dL, respectively. The
BSA concentration in the sink was measured after 7 h.
These results have been translated in a daily release
rate and compared with the measurements from the
release test on 13-nm pore size membranes (Table 1).
From Table 1, it can be noted that nanoporous silicon
membranes exhibit a much larger release rate per unit
effective area with respect to other membranes based
on different technologies.
A particular attention must be paid to the issue of
protein fouling/sticking on the membrane surface. In
Ref. [13], for example, microscopy imaging of

F. Martin et al. / Journal of Controlled Release 102 (2005) 123–133 131
membranes before and after the diffusion experiments
revealed that Whatman and Millipore membranes had
undergone significant changes in morphology, while
micromachined silicon membranes did not exhibit any
change and the pores were free from biofouling and
any agglomeration of protein. This results suggest that
silicon membranes suffer much less from biofouling
than other kind of membranes do.
Zhang et al. [21] devised a method to significantly
reduce nonspecific protein (such as albumin, fibrino-
gen, and IgG) adsorption and cell adhesion, modify-
ing silicon surfaces by the covalent attachment of a
self-assembled polyethylene glycol (PEG) film. How-
ever, the need for this surface treatment in the drug-
delivery applications explored in this paper was not
encountered. Biofouling by nonspecific molecular
adsorption is, indeed, a great concern in the context
of convective mass transport, as is the case in delivery
systems activated by osmotic pressure-driven or
mechanical pumps. It is, however, of lesser impor-
tance in diffusive nanoscale systems, where the
reversible and dynamic nature of noncovalent adsorp-
tion appears to interfere, to a lesser extent, with the
desired transport and release phenomena.
4.2. Results interpretation
The situation presented here differs from the SFD
observed for adsorbate molecules, such as methane or
CF4, in crystalline zeolites. The microfabricated
nanopore channels used here are of molecular size
in only one dimension, and the solutes themselves do
not tend to adsorb to the silicon surface. The
observations reported in this paper are consistent with
the diffusion reported for colloidal particles confined
in closed one-dimensional channels of micrometer
scale, where particle self-diffusion is non-Fickian for
long time periods and the distribution of particle
displacements is a Gaussian function [3]. In the case
presented here, zero-order flux is observed when a
chamber filled with a solute is separated from a
solute-free external medium by channels that are only
several times wider than the hydrodynamic diameter
of the individual molecules. The basic principle of
diffusion as a mixing process with solutes free to
undergo Brownian motion in three dimensions does
not apply because, in at least one dimension, solute
movement within the nanopore is physically con-
strained by the channel walls. Experimental observa-
tions of colloidal particles in a density matched fluid
confined between two flat plates reveal that particle
diffusion becomes anisotropic near the interface, in
this case, leading to hindered diffusion as a conse-
quence of constrained Brownian motion and hydro-
dynamic drag effects at distances close to the walls
[22]. In the case of iMEDD membranes, it is not
entirely certain that the ordering of solutes imposed by
the nanopore geometry will be as strict as true
cylindrical pores, nor that the sequence of particles
passing through the nanopores under the influence of
the concentration gradient will remain unchanged
over the time required to travel the 4 Am length of the
channel; particles could conceivably pass each other
laterally. Whether a consequence of a SFD-like
phenomenon or drag effects (or a combination of
both), the nanopore membrane used here is rate
limiting and, if properly tuned, restricts solute
diffusion to a point that flux rates across the
membrane are entirely independent of concentration
gradient.
4.3. Modeling and data fitting
To achieve a further insight in the mechanisms
involved in nanochannel diffusion, the experimental
phenomena have been described in mathematical
terms, thus yielding a dynamic model. The model
allows to simulate the diffusion experiments and fit
the related data.
A detailed description of such a model is beyond
the scope of this work, thus, the description will be
limited to the main concepts. Basically, the core of the
model is constituted by combining Fick’s first law
with the mass conservation principle. The model relies
upon the basic hypothesis that the membrane effect
can be mathematically described by means of a
saturation value for the mass flux, where the threshold
is intuitively dependent on the nanochannel width and
the molecular dimensions.
This hypothesis can be better understood if one
looks at the results from the interferon diffusion test.
Referring to Fig. 3, the release profile depicted by the
dashed line can be obtained by simply simulating the
experiment with the nominal parameters values and
optimizing the mass flux saturation level (which is
therefore the only free parameter) on the basis of the

Fig. 8. Interferon mass flux through a 20-nm pore size membrane:
Fick’s law prediction (–) and model-based simulation (– –).
F. Martin et al. / Journal of Controlled Release 102 (2005) 123–133132
available data. The simulated mass flux is depicted in
Fig. 8, along with the same quantity obtained from a
simulation of the free (Fickian) diffusion case, with
the same parameters values. Clearly, the flux at the
beginning achieves the highest value because the
concentration gradient is maximum. Assuming a
saturation level below this maximum value results in
a constant flux for a certain time interval, in this case,
about 20 days. The switch from constant to exponen-
tially decreasing profile occurs when the concentra-
tion gradient becomes so low that the flux value is less
or equal than the fixed threshold.
In light of the good fit that the model provides to
diffusion data, it can be argued that the hypothesis
about the flux saturation effect is reasonable, although
deeper understanding must be achieved, concerning
the basic molecular mechanisms causing it. Besides
the theoretical value, this interpretation of the phe-
nomenon, along with the computational model,
proves very useful as a tool for the tuning of the
release device, allowing to substitute long and
expensive experimental tests by simulation with
different parameters values.
5. Conclusion
The experimental and mathematical results pre-
sented in this work lead to believe that the devices
outfitted with silicon nanopore membranes can regu-
late the delivery kinetics of a wide range of drugs.
Moreover, because the mechanism of release is
attributable to a novel constrained diffusion mecha-
nism provided by the precise geometry of the nanopore
membrane itself, and no moving parts, such as pistons,
are required, the drugs can likely be loaded into the
device reservoir in a range of physical states, including
solutions and crystalline or micronized suspensions.
Flexibility with respect to the physical form of
encapsulated drugs provides options to substantially
increase the loaded dose and duration of therapy, as
well as approaches to increase the stability of proteins,
which are intrinsically unstable in an aqueous solution
at body temperature.
References
[1] L.A. Clark, G.T. Ye, R.Q. Snurr, Molecular traffic control in a
nanoscale system, Physical Review Letters 84 (2000) 2893–2896.
[2] T. Meersmann, et al., Exploring single-file diffusion in one-
dimensional nanochannels by laser-polarized 129Xe NMR
spectroscopy, Journal of Physical Chemistry A 104 (2000)
11665–11670.
[3] Q. Wei, C. Bechinger, P. Leiderer, Single-file diffusion of
colloids in one-dimensional channels, Science 287 (2000)
625–627.
[4] V. Kukla, et al., NMR studies of single-file diffusion in
unidimensional channel zeolites, Science 272 (1996 (May 3))
702–704.
[5] V. Gupta, S.S. Nivarthi, D. Keffer, A.V. McCormick, D. H.T.,
Evidence of single-file diffusion in zeolites, Science 274
(1996) 164.
[6] K. Hahn, J. Karger, V.V. Kukla, Single file-diffusion observa-
tion, Physical Review Letters 76 (1996) 2762–2765.
[7] S.M. Auerbach, Theory and simulation of jump dynamics,
diffusion and phase equilibrium in nanopores, International
Reviews in Physical Chemistry 19 (2000) 155–198.
[8] Z. Mao, S.B. Sinnott, A computational study of molecular
diffusion and dynamic flow through carbon nanotubes, Journal
of Physical Chemistry B 104 (2000) 4618–4624.
[9] P. Nelson, S. Auerbach, Self-diffusion in single-file zeolite
membranes is Fickian at long times, Journal of Chemical
Physics 110 (1999) 9235–9244.
[10] J.M.D. MacElroy, S.H. Suh, Self-diffusion in single-file pores
of finite length, Journal of Chemical Physics 106 (1997)
8595–8597.
[11] S.K. Aityan, V.I. Portnov, General Physiology and Biophysics
5 (1986 (Aug)) 351–364.
[12] D.G. Levitt, Dynamics of a single-file pore: non-Fickian
behavior, Physical Review. A, General Physics 8 (1973)
3050–3054.

F. Martin et al. / Journal of Controlled Release 102 (2005) 123–133 133
[13] T.A. Desai, D.J. Hansford, L. Leoni, M. Essenpreis, M.
Ferrari, Nanoporous anti-fouling silicon membranes for bio-
sensors applications, Biosensors and Bioelectronics 15 (2000)
453–462.
[14] W.H. Chu, R. Chin, T. Huen, M. Ferrari, Silicon membrane
nanofilters from sacrificial oxide removal, Journal of Micro-
electromechanical Systems 8 (1999) 34–42.
[15] T.A. Desai, Microfabrication technology for pancreatic cell
encapsulation, Expert Opinion in Biological Therapeutics 2
(2002 (Aug)) 633–646.
[16] R.P. Lanza, et al., Transplantation of encapsulated canine islets
into spontaneously diabetic BB/W or rats without immuno-
suppression, Endocrinology 131 (1992) 637–642.
[17] T.A. Desai, et al., Microfabricated immunoisolating bio-
capsules, Biotechnology and Bioengineering 57 (1998)
118–120.
[18] T.A. Desai, D. Hansford, M. Ferrari, Characterization of
micromachined silicon membranes for immunoisolation and
bioseparation applications, Journal of Membrane Science 159
(1999) 221–231.
[19] J.C. Wright, et al., An in vivo/in vitro comparison with a
leuprolide osmotic implant for the treatment of prostate cancer,
Journal of Controlled Release 75 (2001) 1–10.
[20] E.M. Johnson, D.A. Berk, R.K. Jain, W.M. Deen, Hindered
diffusion in agarose gels: test of effective medium model,
Journal of Biophysics 70 (1996) 1017–1023.
[21] M. Zhang, T.A. Desai, M. Ferrari, Proteins and cells on
peg immobilized silicon surfaces, Biomaterials 19 (1998)
953–960.
[22] B. Lin, J. Yu, S. Rice, Direct measurements of constrained
Brownian motion of an isolated sphere between two walls,
Physical Review E 62 (2000) 3909–3919.
[23] A. Spiess, V. Mikalunas, S. Carlson, M. Zimmer, R.M. Craig,
Albumin kinetics in hypoalbuminemic patients receiving total
parenteral nutrition, Journal of Parenteral and Enteral Nutrition
20 (1996 (Nov–Dec)) 424–428.