A Review on Tailoring Stiffness in Compliant Systems, via ...
Upload
khangminh22Category
view
1download
0
�����������������
Citation: Torrado-Salmeron, C.;
Laguna, A.; Guillén, A.; Saro, M.G.;
Matji, A.; Torrado, J.J.; Serrano, D.R.
Tailoring Rational Manufacturing of
Extemporaneous Compounding Oral
Dosage Formulations with a Low
Dose of Minoxidil. Pharmaceutics
2022, 14, 658. https://doi.org/
10.3390/pharmaceutics14030658
Academic Editors: Jaehwi Lee and
Arvind K. Bansal
Received: 28 December 2021
Accepted: 14 March 2022
Published: 17 March 2022
Publisher’s Note: MDPI stays neutral
with regard to jurisdictional claims in
published maps and institutional affil-
iations.
Copyright: © 2022 by the authors.
Licensee MDPI, Basel, Switzerland.
This article is an open access article
distributed under the terms and
conditions of the Creative Commons
Attribution (CC BY) license (https://
creativecommons.org/licenses/by/
4.0/).
pharmaceutics
Article
Tailoring Rational Manufacturing of ExtemporaneousCompounding Oral Dosage Formulations with a Low Doseof MinoxidilCarlos Torrado-Salmeron 1 , Almudena Laguna 1, Alicia Guillén 1, Miguel G. Saro 1, Antonio Matji 1,Juan J. Torrado 1,2,* and Dolores R. Serrano 1,*
1 Department of Pharmaceutics and Food Technology, Complutense University of Madrid,28240 Madrid, Spain; [email protected] (C.T.-S.); [email protected] (A.L.); [email protected] (A.G.);[email protected] (M.G.S.); [email protected] (A.M.)
2 Galenical and Industrial Pharmaceutical Institute, Complutense University of Madrid, 28240 Madrid, Spain* Correspondence: [email protected] (J.J.T.); [email protected] (D.R.S.); Tel.: +34-91-394-1620 (J.J.T.)
Abstract: Low amounts of minoxidil in oral dosage forms are commonly prescribed as anti-alopecicpharmacological treatments. Side effects are usually related to individual susceptibility. However,poor drug content and mass uniformity can lead to a potential risk of overdosing, and higher chancesto experience side effects. The impacts of four formulation variables on drug content and masspharmaceutical quality attributes were studied with an experimental design at two levels. The firstvariable (A) was the particle size of the direct compression microcrystalline cellulose (MCC) used asa diluent (Avicel® PH 101 vs. LP 200). The second variable (B) was the type of production process(direct filling vs. wet granulation). The third variable (C) was the particle size of riboflavin added as acolor mixture indicator agent (granular vs. milled). The fourth variable (D) was the type of oral soliddosage form (capsule vs. tablet). In half of the formulations, the mean minoxidil content and minoxidiluniformity were out of the specification limits of the Pharmacopoeia, demonstrating the importance ofcarefully selecting the excipients as well as the utilized process when manufacturing low oral dosageminoxidil formulations. The best minoxidil content uniformity was achieved when using MCC LP200, wet granulation, granular riboflavin, and capsules. However, tablets are the recommendeddosage form when utilizing Avicel® PH 101 or direct filling. Meeting these criteria, the content andmass uniformity are more likely to meet the specification limits of the Pharmacopeia. Techniques suchas NIR spectroscopy should be implemented to control the quality of extemporaneous compoundingformulations with a low dose of active ingredient.
Keywords: minoxidil; content; uniformity; tablet; capsule; particle size; compounding
1. Introduction
Minoxidil was first introduced as an antihypertensive treatment in the 1970s. However,the discovery of its common adverse event, hypertrichosis, led to the manufacturing ofa topical formulation for promoting hair growth [1]. Although topical minoxidil is aneffective treatment for alopecia, there is poor patient compliance due to the need forapplication twice a day, undesirable hair texture, and scalp irritation [2]. Recently, oralminoxidil, at a low dose between 0.25 and 5 mg, has been proposed as a well-toleratedtreatment for hair loss, presenting a lower standard adverse effect rate than standard doses.The most common adverse effects after low oral doses for minoxidil are pedal edema(2%), lightheadedness (1.7%), insomnia (0.2%), postural hypotension (1.1%), and heart ratealterations (1.3%), which force patients to discontinue the treatment [3,4].
Although those side effects are usually related to individual susceptibility, poor contentand mass uniformity can lead to a potential risk of overdosing and higher chances to expe-rience side effects. In Spain, most of these prescriptions are formulated as extemporaneous
Pharmaceutics 2022, 14, 658. https://doi.org/10.3390/pharmaceutics14030658 https://www.mdpi.com/journal/pharmaceutics

Pharmaceutics 2022, 14, 658 2 of 12
compounding formulations in community pharmacies in small batches of approximately30 units in the form of capsules of size numbers 3 or 4. Even though the elaboration ofthis oral formulation must be performed to assure the quality of the finished product, thelow dose of minoxidil within the capsules, along with lack of time and poor analyticalresources in most community pharmacies, can result in poor drug content uniformity. Toovercome this challenge, riboflavin, an orange powder, is commonly incorporated in thepowder mixture before capsule filling as a visual color agent indicator to ensure correctmixture homogeneity. However, it has not been demonstrated that just the visual control ofthe colored riboflavin homogeneity assures an adequate content uniformity for minoxidil,bearing in mind the difference in particle size between both powder substances.
The hypothesis underpinning this work is that the overall manufacturing processof low oral dose minoxidil formulations can have a significant impact on drug content,mass uniformity and, hence, treatment efficacy and toxicity. The selection of the soliddosage form (capsules versus tablets), the production process (direct powder filling versuswet granulation), the particle size of the diluents used, such as microcrystalline cellulose(Avicel® PH 101 vs. LP200 type), and the particle size of the riboflavin added as a colormixture indicator agent (granular vs. milled) may play major roles in the overall minoxidilcontent uniformity. This work aimed to study the effect of the four different formulationvariables mentioned above on the minoxidil content uniformity containing riboflavin asa homogeneity color indicator. The mean minoxidil content and content uniformity maybe affected by differences in the particle size of the powders, the mixing conditions, thepossibility of wet granulation, and even the selection of the type of oral solid dosage form(capsule or tablet). An experimental factorial design of these four variables at two levels wasdeveloped to study the uniformity of minoxidil and riboflavin contents and the mass uni-formity with the ultimate goal of tailoring the rational manufacturing of extemporaneouslow oral doses of minoxidil formulations. The studied variables were: (A) the particle sizeof the microcrystalline cellulose employed as a diluent (Avicel® PH 101 vs. LP 200), (B) theelaboration process (direct filling vs. wet granulation), (C) the particle size of the riboflavinadded to the powder mixture as a visual indicator of homogeneity (granular vs. milledriboflavin) and (D) the type of dosage form (capsule vs. tablet). A carefully structureddesign of experiments was implemented to investigate the effect of the four previouslydescribed variables as a tool recommended on pharmaceutical development to ensure thequality of drug products [5]. Additionally, chemometric models were developed using NIRspectroscopic data with the aim of determining if this technique could be implemented incompounding to ensure the quality of minoxidil low oral dose formulations.
2. Materials and Methods
All chemicals applied in formulations were of European pharmacopeial grade. Twominoxidil suppliers, EP Metapharmaceutical (Barcelona, Spain) and Roig Pharma, (Terrasa,Barcelona, Spain) were used. Two riboflavin suppliers, Fagron (Barcelona, Spain) andAcofarma (Madrid, Spain) were also used. Microcrystalline cellulose was obtained fromtwo different suppliers; Avicel® PH 101 from Fagron (Barcelona, Spain) and Emcocel®
LP 200, which was a gift from JRS Pharma (Rosenberg, Germany), were used. Colloidalsilicon dioxide (Aerosil® 200) was purchased from Evonik (Darmstadt, Germany). All otherchemicals for this study were of analytical grade and were used without further purification.
2.1. Experimental Design (DoE) of Oral Minoxidil Formulations
The quality by design approach was used to find the optimal manufacturing conditionsof a low-dose minoxidil oral formulation. A 24 simple factorial design was performed usingthe sign criterion [6] or Minitab® 20.3 (Coventry, UK). The impacts of the four differentvariables described above were investigated on five responses: the percentage of minoxidilcontent (compared to the theoretical 100%), mass content, dosage uniformity of minoxidiland riboflavin (%), and mass variation (Table 1). Polynomial regression models werecalculated targeting a minimization of the minoxidil content variability when preparing

Pharmaceutics 2022, 14, 658 3 of 12
extemporaneous compounding minoxidil oral formulations to reduce undesirable adverseeffects [7].
Table 1. Experimental conditions of the different tested formulations in the DOE. Responses are:the minoxidil content, mass content, dosage uniformity of minoxidil and riboflavin (%), and massvariation (responses 1–5). Sign criteria and key codes: 1 Two different particle sizes of microcrystallinecellulose (MCC) were used fine (Avicel® PH 101) (−) vs. coarse (LP 200) (+); 2 Two different mixtureprocesses were tested, direct filling (−) vs. wet granulation (+); 3 Two different riboflavin particlesizes were tested: granular (−) vs. milled (+); 4 two different dosage forms, capsules (−) vs. tablets(+), were tested; 5 Mass content was evaluated as tablet weight or capsule content estimated as thedifference between the filled and empty capsules.
Factor A Factor B Factor C Factor D Response 1 Response 2 Response 3 Response 4 Response 5
Run MCC 1 Process 2 Riboflavin 3 Dosage Form 4Content (%
Difference ofTheorical)
Content(mg/form)
ContentUniformity
(CV)
ContentUniformity
(CV)
MassVariation
(CV)
Minoxidil Mean Mass 5 Minoxidil Riboflavin Powder
1 * 101 Direct filling Granular Capsules 78.8 * 96.0 11.09 * 29.05 3.332 * 101 Direct filling Milled Capsules 87.0 * 94.7 9.87 * 20.24 3.483 * LP200 Direct filling Granular Tablets 94.2 102.2 15.39 * 12.78 1.964 101 Wet granulation Milled Capsules 100.4 97.4 8.62 14.78 2.55
5 * LP200 Direct filling Milled Tablets 90.6 * 105.1 9.41 * 8.91 1.646 101 Wet granulation Granular Capsules 101.6 94.7 6.62 24.06 3.197 101 Direct filling Milled Tablets 89.4 99.8 7.08 15.17 2.48 101 Direct filling Granular Tablets 95.8 97.7 8.0 23.17 1.8
9 * 101 Wet granulation Granular Tablets 106.4 * 101.2 6.45 19.87 1.1910 * LP200 Direct filling Milled Capsules 93.8 * 98.1 9.36 * 8.25 1.5311 LP200 Wet granulation Milled Tablets 104.4 98.3 6.16 15.71 1.93
12 * 101 Wet granulation Milled Tablets 100.6 107.8 * 8.77 10.52 1.3413 * LP200 Wet granulation Granular Tablets 106.0 * 98.4 5.92 9.45 1.5914 LP200 Wet granulation Granular Capsules 98.4 91.4 3.84 7.86 1.97
15 * LP200 Direct filling Granular Capsules 93.4 * 97.8 10.23 * 14.79 1.2716 LP200 Wet granulation Milled Capsules 102.0 97.7 5.07 8.52 1.88
* Out of Pharmacopoeia specifications: Minoxidil content (90–110% content, minoxidil tablets USP), mean anduniformity mass (±7.5% in tablets and ±10% in capsules Eur. Pharm 10th), minoxidil content uniformity (85–115%or less than 75–125%, Pharm. Eur. 10th).
Oral formulations containing minoxidil (0.5 mg), riboflavin (0.5 mg), and a mixture ofexcipients up to 100 mg were developed according to an experimental design describedin Table 1. The mixture of excipients is described by the Spanish National Formulary asexcipient number 1 for capsules (Spanish National Formulary, 2020) and contains micro-crystalline cellulose (98.05%) and colloidal silicon dioxide (1.95%). Both capsule and tabletformulations had 100 mg theoretical mass content. A mixture of powders was achievedby two processes, either direct powder mixture or wet granulation. The direct mixturewas obtained following the process of geometric dilution. The granulation process wasperformed using a mixture of deionized water: ethanol 96◦ at 50:50 (v:v). Riboflavin wasdissolved in the water fraction while minoxidil was dissolved in the ethanol phase. Oncethe liquid fraction was added slowly to the powder mixture, the wet mass was passedthrough a 1.6 mm sieve and dried at room temperature in a dark closed room for 24 h.Finally, the dried mass was passed through a 1.0 mm sieve. The direct powder mixture orgranules were used to manufacture either size 3 capsules or tablets according to the DoEmatrix. Gelatin red capsules of size number 3 were provided by Guinama (Valencia, Spain)and were manually filled by a manual capsule filler machine (Capsunorm, Microcaya,Bilbao, Spain). Tablets were obtained with an eccentric tablet press machine (Korsch EK0, Berlin, Germany) with two 7 mm circular concave manually operated punches. Themeans ± standard deviations of tablet height and hardness were 2.68 ± 0.17 mm and51.09 ± 16.2 N, respectively. Batches for both capsules and tablets were of 20 g of powdermixture, although only 30 units of each dosage form were elaborated.
2.2. Particle Size
The sizes of the different raw material particles were measured by laser light diffrac-tion according to the monograph 2.9.31 European Pharmacopoeia (10th ed, 2020). Solid
Pharmaceutics 2022, 14, 658 4 of 12
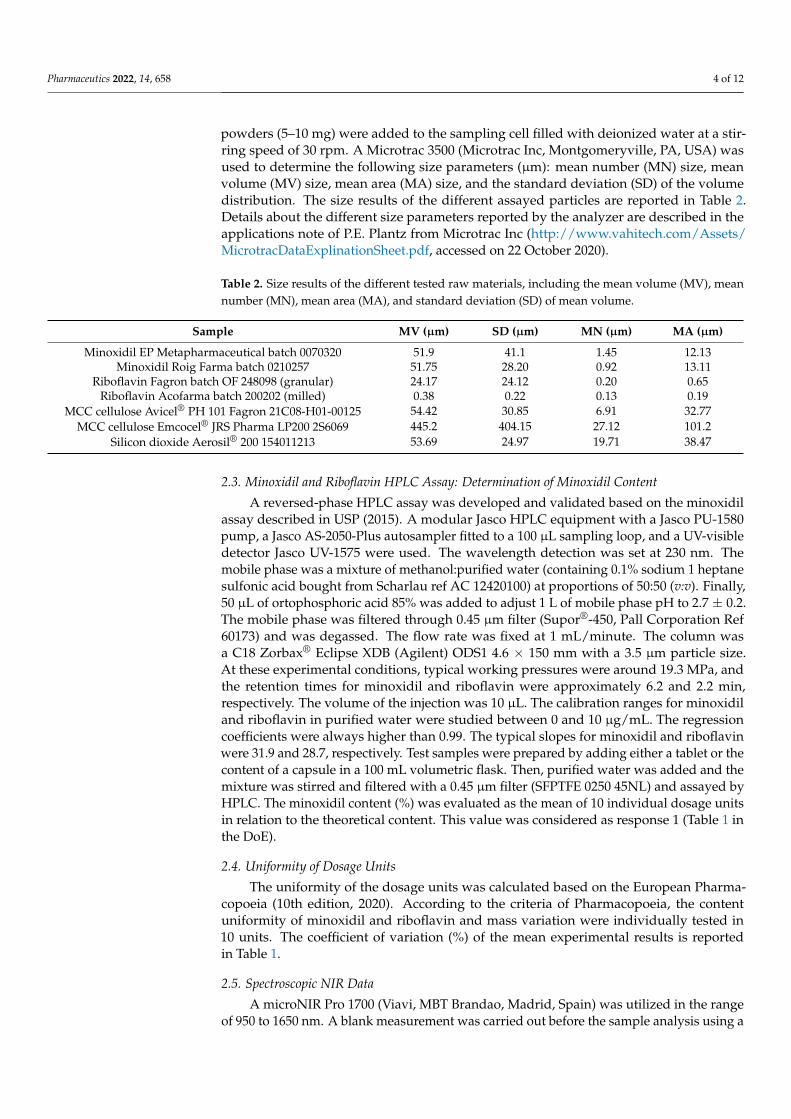
powders (5–10 mg) were added to the sampling cell filled with deionized water at a stir-ring speed of 30 rpm. A Microtrac 3500 (Microtrac Inc, Montgomeryville, PA, USA) wasused to determine the following size parameters (µm): mean number (MN) size, meanvolume (MV) size, mean area (MA) size, and the standard deviation (SD) of the volumedistribution. The size results of the different assayed particles are reported in Table 2.Details about the different size parameters reported by the analyzer are described in theapplications note of P.E. Plantz from Microtrac Inc (http://www.vahitech.com/Assets/MicrotracDataExplinationSheet.pdf, accessed on 22 October 2020).
Table 2. Size results of the different tested raw materials, including the mean volume (MV), meannumber (MN), mean area (MA), and standard deviation (SD) of mean volume.
Sample MV (µm) SD (µm) MN (µm) MA (µm)
Minoxidil EP Metapharmaceutical batch 0070320 51.9 41.1 1.45 12.13Minoxidil Roig Farma batch 0210257 51.75 28.20 0.92 13.11
Riboflavin Fagron batch OF 248098 (granular) 24.17 24.12 0.20 0.65Riboflavin Acofarma batch 200202 (milled) 0.38 0.22 0.13 0.19
MCC cellulose Avicel® PH 101 Fagron 21C08-H01-00125 54.42 30.85 6.91 32.77MCC cellulose Emcocel® JRS Pharma LP200 2S6069 445.2 404.15 27.12 101.2
Silicon dioxide Aerosil® 200 154011213 53.69 24.97 19.71 38.47
2.3. Minoxidil and Riboflavin HPLC Assay: Determination of Minoxidil Content
A reversed-phase HPLC assay was developed and validated based on the minoxidilassay described in USP (2015). A modular Jasco HPLC equipment with a Jasco PU-1580pump, a Jasco AS-2050-Plus autosampler fitted to a 100 µL sampling loop, and a UV-visibledetector Jasco UV-1575 were used. The wavelength detection was set at 230 nm. Themobile phase was a mixture of methanol:purified water (containing 0.1% sodium 1 heptanesulfonic acid bought from Scharlau ref AC 12420100) at proportions of 50:50 (v:v). Finally,50 µL of ortophosphoric acid 85% was added to adjust 1 L of mobile phase pH to 2.7 ± 0.2.The mobile phase was filtered through 0.45 µm filter (Supor®-450, Pall Corporation Ref60173) and was degassed. The flow rate was fixed at 1 mL/minute. The column wasa C18 Zorbax® Eclipse XDB (Agilent) ODS1 4.6 × 150 mm with a 3.5 µm particle size.At these experimental conditions, typical working pressures were around 19.3 MPa, andthe retention times for minoxidil and riboflavin were approximately 6.2 and 2.2 min,respectively. The volume of the injection was 10 µL. The calibration ranges for minoxidiland riboflavin in purified water were studied between 0 and 10 µg/mL. The regressioncoefficients were always higher than 0.99. The typical slopes for minoxidil and riboflavinwere 31.9 and 28.7, respectively. Test samples were prepared by adding either a tablet or thecontent of a capsule in a 100 mL volumetric flask. Then, purified water was added and themixture was stirred and filtered with a 0.45 µm filter (SFPTFE 0250 45NL) and assayed byHPLC. The minoxidil content (%) was evaluated as the mean of 10 individual dosage unitsin relation to the theoretical content. This value was considered as response 1 (Table 1 inthe DoE).
2.4. Uniformity of Dosage Units
The uniformity of the dosage units was calculated based on the European Pharma-copoeia (10th edition, 2020). According to the criteria of Pharmacopoeia, the contentuniformity of minoxidil and riboflavin and mass variation were individually tested in10 units. The coefficient of variation (%) of the mean experimental results is reportedin Table 1.
2.5. Spectroscopic NIR Data
A microNIR Pro 1700 (Viavi, MBT Brandao, Madrid, Spain) was utilized in the rangeof 950 to 1650 nm. A blank measurement was carried out before the sample analysis using a
Pharmaceutics 2022, 14, 658 5 of 12
99% 1.25” diffuse reflectance standard. The NIR sample measurements were performed intriplicate by placing the probe directly on the surface of the tablets or the powder previouslywithdrawn from the capsule. Data acquisition was performed with MicroNIR Pro ES 1700software (VIAVI Solutions Inc, San Jose, CA, USA). The time required to perform eachmeasurement was less than one minute.
2.6. Statistical Data Assay
The results of the experimental design were evaluated according to a sign criterion [6].Student’s two-tailed paired t-test was performed with Excel (Office 365, Microsoft). The DoEwas performed using Minitab® 20.3 (Coventry, UK). The multivariate data analysis of theNIR spectroscopic data was performed using Unscrambler® X software (CAMO Software,Oslo, Norway). A pre-processing transformation (data normalization and second derivativeSavitzky–Golay with seven points) was used. A support vector machine regression (SVR)and a partial least squares regression (PLSR) were used to correlate the amount of minoxidildetermined by HPLC from the samples and the NIR spectra. The Kernel and NIPALSalgorithms were used to compute the estimated regression coefficients for the PLSR. Theperformances of the models were evaluated using the correlation coefficient (R2) andthe root mean-square error (RMSE) to estimate the fit of the validation and calibrationsamples [8,9].
3. Results and Discussion3.1. Design of Experiments
According to USP, the content of minoxidil tablets should fall within the range of90–110%, while the content uniformity should be, for most of the solid units, in the range85–115%, with none outside of the 75–125% range (Eur. Ph. 10th, 2020). Table 1 showshow in our experimental conditions for mean minoxidil content (response 1) and minoxi-dil content uniformity (response 3) less than half of the formulations complied with thePharmacopoeia specifications. Although the differences observed for the minoxidil con-tent (response 1) and content uniformity (response 3) should have low clinical relevance,these differences support the practice of medical supervision of patients following thesepharmacological treatments. These data illustrate the difficulty of achieving accuracy whenpreparing minoxidil extemporaneous low-dose oral formulations in clinical practice. In-teresting, there is no significant (p > 0.1) relationship between the drug (response 1) andmass content (response 2). This lack of a significant correlation between responses 1 and2 suggests that other factors different from tablet or capsule content weights are relatedto the differences in drug content. This lack of significance also questions the commonpractice of simply checking the mass as an indirect control to study drug content uniformity.In the Pharmacopoeias, it is a clear fact that when drug content is low the mass weightis not enough to ensure an adequate drug quality control, and hence, quantitative drugassay is required. However, for all the other responses there were significant (p < 0.001)relationships. Higher minoxidil mean content (response 1) was significantly (p < 0.001)related with better minoxidil (response 3), riboflavin (response 4) and mass (response 5)uniformities. Mean mass powder (response 2) was significantly (p < 0.001) related withpoorer minoxidil content uniformity (response 3) but better riboflavin (response 4) andmass (response 5) uniformities. More importantly, the relationships among the differentcontent (responses 3 and 4) and mass (response 5) uniformities were always significant(p < 0.001) and directly related. If minoxidil content uniformity (response 3) improved,riboflavin and mass uniformities (responses 4 and 5, respectively) also improved. The gooddirect correlation between riboflavin (response 4) and minoxidil (response 3) uniformitiessupports the practice of using a color agent as an indicator of uniformity.
Particle size is a key factor in the uniformity of powder mixtures. Table 2 shows theparticle size of the different tested raw materials. The particle size of the two different rawmaterials suppliers for minoxidil was very similar, at around 50 µm of mean volume size.The supplier Metapharmaceutical was selected for the elaboration of the 16 formulations.

Pharmaceutics 2022, 14, 658 6 of 12
In contrast, the riboflavin and microcrystalline cellulose materials were very different de-pending on the type of material and supplier. For this reason, these different raw materials(MCC and riboflavin) were included as variables 1 and 3 in the experimental design.
The experimental design allowed the study of the comparative relevance of the dif-ferent variables in the responses and the possible interactions. Table 3 shows the signalcriteria of the experiment and the relevance of the different variables and their interactionson the studied responses. According to its effect on the responses, the variables and theirpossible interactions on the studied responses are ordered from the highest effect:
• Response 1 (minoxidil mean content): B (+96.8) > D (+32.0) > Rest;• Response 2 (mean mass dosage form): D (+42.7) > AB (−30.3) > C (+19.5) > Rest;• Response 3 (minoxidil content uniformity): B (−29) > AB (−17.8) > Rest;• Response 4 (riboflavin content uniformity): A (−70.6) > C (−38.9) > Rest;• Response 5 (mass uniformity): AD (+6.3) > A (−5.5) > D (−5.3) > Rest.
Table 3. Signal criteria of the experimental design and the relevance of the different variables and theirinteractions on the studied responses. Sign criteria and key codes: Variable A 1 Two different particlesizes of microcrystalline cellulose (MCC) were used, fine (Avicel® PH 101) (−) vs. coarse (LP200) (+);Variable B 2 Two different mixture processes were tested, direct filling (−) vs. wet granulation (+);Variable C 3 Two different riboflavin particle sizes were tested, granular (−) vs. Milled (+); Variable D4 two different dosage forms, capsules (−) vs. tablets (+), were tested. Response 1: mean minoxidilcontent (% of theorical value), response 2: mean mass content (% of theorical value), responses 3 and4: minoxidil and riboflavin dosage uniformities (%), and response 5: mass variation uniformity (%).
8 A 1 B 2 C 3 D 4 AB AC AD BC BD CD ABC ABD BCD ABCD
1 − − − − + + + + + + − − − +
2 − − + − + − + − + − + − + −
3 + − − + − − + + − − + − + +
4 − + + − − − + + − − − + − +
5 + − + + − + + − − + − − − −
6 − + − − − + + − − + + + + −
7 − − + + + − − − − + + + − +
8 − − − + + + − + − − − + + −
9 − + − + − + − − + − + − − +
10 + − + − − + − − + − − + + +
11 + + + + + + + + + + + + + +
12 − + + + − − − + + + − − + −
13 + + − + + − + − + − − + − −
14 + + − − + − − − − + − − + +
15 + − − − − − − + + + + + − −
16 + + + − + + − + − − + − − −
Response 1 22.80 96.80 −6.40 32.00 −19.20 4.00 −16.80 −3.60 −2.00 −28.40 14.00 14.80 8.80 −11.20
Response 2 −0.30 −4.50 19.50 42.70 −30.30 −0.70 −4.70 11.50 6.30 3.50 −5.50 −0.90 −8.50 −9.50
Response 3 −1.12 −28.98 −3.20 2.48 −17.82 −7.56 14.28 14.78 3.82 −5.48 1.86 −12.30 4.14 4.10
Response 4 −70.59 −21.59 −38.93 −11.97 15.21 31.95 26.83 15.51 12.63 9.01 19.15 −2.61 2.05 3.81
Response 5 −5.51 −1.77 0.45 −5.35 3.71 −0.07 6.29 −0.93 −1.73 1.09 1.55 −3.55 1.35 0.67
The mean and standard deviation values of the different runs for minoxidil contentelaborated by direct filling and wet granulation were 0.45 ± 003 and 0.51 ± 0.01 mg/dosageform unit, respectively. The elaboration process (variable B) was the most relevant variableaffecting mean minoxidil content. The wet granulation process was significantly (p < 0.001)related with a higher mean content of minoxidil. The dosage form (variable D) was alsorelated to a higher mean minoxidil content with mean and standard deviation values of

Pharmaceutics 2022, 14, 658 7 of 12
0.43 ± 0.03 and 0.45 ± 0.03, for capsules and tablets (NS, p = 0.11), respectively. The sameresults were obtained using Minitab® (Figure 1).
Pharmaceutics 2022, 14, x 11 of 12
Response 2 −0.30 −4.50 19.50 42.70 −30.30 −0.70 −4.70 11.50 6.30 3.50 −5.50 −0.90 −8.50 −9.50 Response 3 −1.12 −28.98 −3.20 2.48 −17.82 −7.56 14.28 14.78 3.82 −5.48 1.86 −12.30 4.14 4.10 Response 4 −70.59 −21.59 −38.93 −11.97 15.21 31.95 26.83 15.51 12.63 9.01 19.15 −2.61 2.05 3.81 Response 5 −5.51 −1.77 0.45 −5.35 3.71 −0.07 6.29 −0.93 −1.73 1.09 1.55 −3.55 1.35 0.67
The mean and standard deviation values of the different runs for minoxidil content elaborated by direct filling and wet granulation were 0.45 ± 003 and 0.51 ± 0.01 mg/dosage form unit, respectively. The elaboration process (variable B) was the most relevant varia-ble affecting mean minoxidil content. The wet granulation process was significantly (p < 0.001) related with a higher mean content of minoxidil. The dosage form (variable D) was also related to a higher mean minoxidil content with mean and standard deviation values of 0.43 ± 0.03 and 0.45 ± 0.03, for capsules and tablets (NS, p = 0.11), respectively. The same results were obtained using Minitab® (Figure 1).
Figure 1. Factorial plots for mean minoxidil content and mass content (%) obtained from Minitab®.
Related to the mean mass content (response 2), the most relevant variable was the type of formulation (variable D). The mean contents of tablet weight and mass content of capsule were 96.0 ± 2.3 and 101.3 ± 3.6, for capsule and tablets (p = 0.002), respectively. So, in our experimental conditions, capsules exhibited a significantly (p < 0.01) lower mean mass than tablets (Figure 1).
Responses 3, 4, and 5 can be compared together because all of them are expressed as coefficient variations in the same units (%). The mean and standard deviations for the minoxidil content (response 3), riboflavin content (response 4), and mass (response 5) uni-formities were 8.2 ± 2.8, 15.1 ± 6.5, and 2.1 ± 0.7%, respectively. The worst variations were observed in response 4. The lowest variation was observed for the mass uniformity pa-rameter, while minoxidil and riboflavin content uniformities were approximately four and seven times the mass variation uniformity. Interestingly, there were significant (p < 0.001) and direct relationships between these three responses. A higher the mass uni-formity (response 5) was significantly related (p < 0.001) with both lower minoxidil content (response 3) and lower riboflavin content (response 4) uniformities. These significant and direct relationships among responses 3–5 are indicative of minoxidil and riboflavin uni-formity of the mass in the 16 runs.
Figure 1. Factorial plots for mean minoxidil content and mass content (%) obtained from Minitab®.
Related to the mean mass content (response 2), the most relevant variable was thetype of formulation (variable D). The mean contents of tablet weight and mass content ofcapsule were 96.0 ± 2.3 and 101.3 ± 3.6, for capsule and tablets (p = 0.002), respectively. So,in our experimental conditions, capsules exhibited a significantly (p < 0.01) lower meanmass than tablets (Figure 1).
Responses 3, 4, and 5 can be compared together because all of them are expressedas coefficient variations in the same units (%). The mean and standard deviations for theminoxidil content (response 3), riboflavin content (response 4), and mass (response 5) uni-formities were 8.2 ± 2.8, 15.1 ± 6.5, and 2.1 ± 0.7%, respectively. The worst variations wereobserved in response 4. The lowest variation was observed for the mass uniformity parame-ter, while minoxidil and riboflavin content uniformities were approximately four and seventimes the mass variation uniformity. Interestingly, there were significant (p < 0.001) and di-rect relationships between these three responses. A higher the mass uniformity (response 5)was significantly related (p < 0.001) with both lower minoxidil content (response 3) andlower riboflavin content (response 4) uniformities. These significant and direct relationshipsamong responses 3–5 are indicative of minoxidil and riboflavin uniformity of the mass inthe 16 runs.
Minoxidil content uniformity (response 3) is a key quality parameter. Table 1 showshow six of the sixteen formulations are outside of the Pharmacopoeia specifications fordrug content uniformity. The most efficient way to improve minoxidil content uniformityis by wet granulation (factor B) (Figure 2). The mean and standard deviation values of thedifferent runs for minoxidil content uniformity by direct filling and wet granulation were10.05 ± 2.49 and 6.43 ± 1.65%, respectively (p = 0.005). For the direct filling, the selectionof microcrystalline cellulose 101 significantly improves (p = 0.08) the minoxidil contentuniformity (as an interaction exists between the AB factors in response 3).
Pharmaceutics 2022, 14, 658 8 of 12
Pharmaceutics 2022, 14, x 11 of 12
Minoxidil content uniformity (response 3) is a key quality parameter. Table 1 shows how six of the sixteen formulations are outside of the Pharmacopoeia specifications for drug content uniformity. The most efficient way to improve minoxidil content uniformity is by wet granulation (factor B) (Figure 2). The mean and standard deviation values of the different runs for minoxidil content uniformity by direct filling and wet granulation were 10.05 ± 2.49 and 6.43 ± 1.65%, respectively (p = 0.005). For the direct filling, the selection of microcrystalline cellulose 101 significantly improves (p = 0.08) the minoxidil content uni-formity (as an interaction exists between the AB factors in response 3).
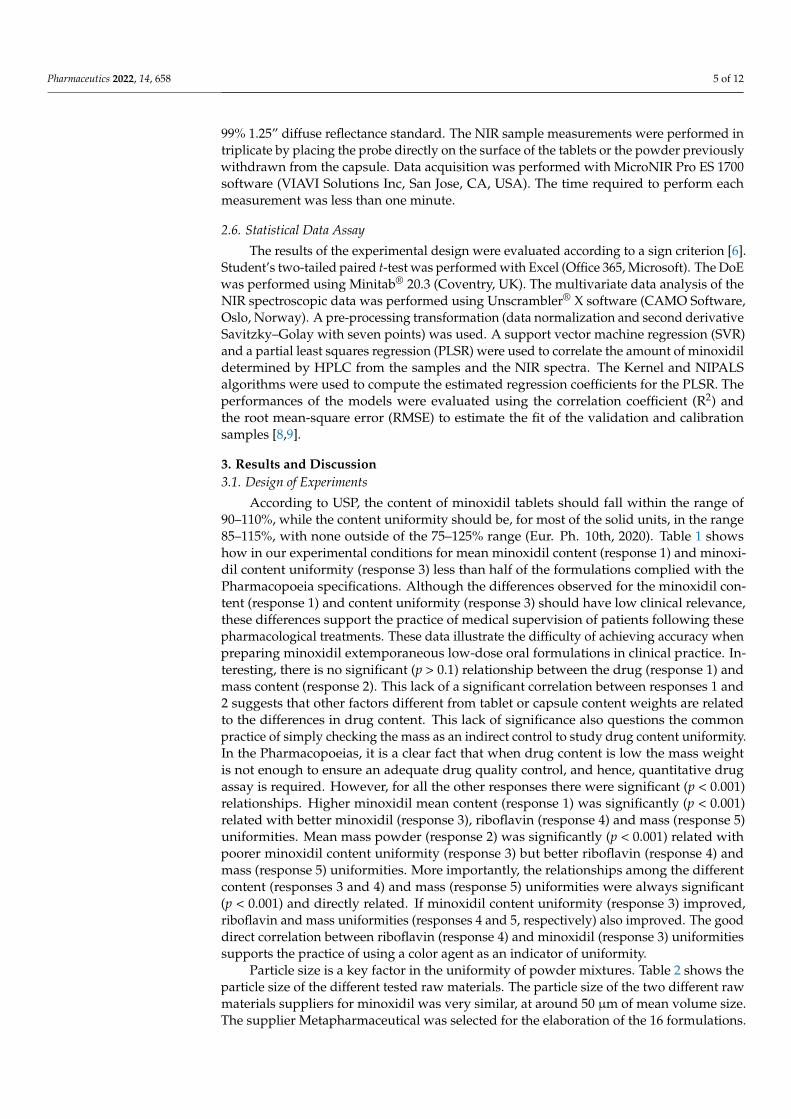
Figure 2. Factorial plots for the mean content uniformity for the minoxidil and riboflavin expressed coefficients of variation (%) obtained from Minitab®.
Riboflavin content uniformity (response 4) was studied for two reasons: (i) to confirm if riboflavin content is directly related to minoxidil content and (ii) to study the effect of raw material particle size on content uniformity (variable C). Response 4 is directly and significantly (p < 0.001) related to minoxidil (response 3) and mass (response 5) uniformi-ties. Therefore, it can be confirmed that the addition of a coloring agent, such as riboflavin, is indicative of the uniformity of the mixture. The importance of particle size on the uni-formity of mixture is shown by the crucial effects of diluent particle size (factor A) and riboflavin particle size (factor C) on the riboflavin content uniformity (response 4) (Figure 2). The most efficient way to improve the riboflavin content uniformity was by using the microcrystalline cellulose of a bigger size (factor A). The mean and standard deviation values of the different runs for riboflavin content uniformity with MCC Avicel® PH 101 and MCC LP 200 were 19.61 ± 5.95 and 10.78 ± 3.15%, respectively (p < 0.01). The second way to improve the riboflavin content uniformity was by using the riboflavin raw material of a smaller size (milled riboflavin) (factor C). The mean and standard deviation values of the different runs for riboflavin content uniformity with granular and milled riboflavin particles were 17.14 ± 8.03 and 12.76 ± 4.35%, respectively. However, Factor C was not significantly different (p = 0.2).
The most efficient way to improve mass uniformity (response 5) was by the combi-nation of the factors of diluent particle size (factor A) and type of formulation (factor D). Clearly, the worst combination for mass uniformity was capsules prepared with MCC Avicel® PH 101 (interaction AD) (Figure 3). The effect of particle size of diluent was sig-nificant (p = 0.07). The mean and standard deviation values of the different runs for mass
Figure 2. Factorial plots for the mean content uniformity for the minoxidil and riboflavin expressedcoefficients of variation (%) obtained from Minitab®.
Riboflavin content uniformity (response 4) was studied for two reasons: (i) to confirmif riboflavin content is directly related to minoxidil content and (ii) to study the effect ofraw material particle size on content uniformity (variable C). Response 4 is directly andsignificantly (p < 0.001) related to minoxidil (response 3) and mass (response 5) uniformities.Therefore, it can be confirmed that the addition of a coloring agent, such as riboflavin,is indicative of the uniformity of the mixture. The importance of particle size on theuniformity of mixture is shown by the crucial effects of diluent particle size (factor A)and riboflavin particle size (factor C) on the riboflavin content uniformity (response 4)(Figure 2). The most efficient way to improve the riboflavin content uniformity was byusing the microcrystalline cellulose of a bigger size (factor A). The mean and standarddeviation values of the different runs for riboflavin content uniformity with MCC Avicel®
PH 101 and MCC LP 200 were 19.61 ± 5.95 and 10.78 ± 3.15%, respectively (p < 0.01). Thesecond way to improve the riboflavin content uniformity was by using the riboflavin rawmaterial of a smaller size (milled riboflavin) (factor C). The mean and standard deviationvalues of the different runs for riboflavin content uniformity with granular and milledriboflavin particles were 17.14 ± 8.03 and 12.76 ± 4.35%, respectively. However, Factor Cwas not significantly different (p = 0.2).
The most efficient way to improve mass uniformity (response 5) was by the combi-nation of the factors of diluent particle size (factor A) and type of formulation (factor D).Clearly, the worst combination for mass uniformity was capsules prepared with MCCAvicel® PH 101 (interaction AD) (Figure 3). The effect of particle size of diluent was sig-nificant (p = 0.07). The mean and standard deviation values of the different runs for massuniformity with MCC Avicel® PH 101 and MCC LP 200 were 2.41 ± 0.89 and 1.72 ± 0.255%,respectively. The type of dosage form (factor D) was also relevant. The mean and standarddeviation values of the different runs for mass uniformity with capsules and tablets were2.40 ± 0.86 and 1.73 ± 0.38%, respectively, and were significantly different (p = 0.07).

Pharmaceutics 2022, 14, 658 9 of 12
Pharmaceutics 2022, 14, x 11 of 12
uniformity with MCC Avicel® PH 101 and MCC LP 200 were 2.41 ± 0.89 and 1.72 ± 0.255%, respectively. The type of dosage form (factor D) was also relevant. The mean and standard deviation values of the different runs for mass uniformity with capsules and tablets were 2.40 ± 0.86 and 1.73 ± 0.38%, respectively, and were significantly different (p = 0.07).
Figure 3. Factorial plots for the mean mass content uniformity expressed coefficients of variation (%) obtained from Minitab®.
3.2. Formulation Optimization For optimization purposes, the best minoxidil content uniformity (indicated by the
lower coefficient of variation) targeting a 100% drug content was achieved when using MCC LP200, wet granulation, granular riboflavin, and capsules. However, tablets are the recommended dosage form when utilizing MCC Avicel® PH 101 or direct filling. Meeting these criteria, the minoxidil content and coefficients of variation are more likely to meet the specification limits of the Pharmacopeia.
It is worthwhile to note that the use of MCC LP200 is preferable over the MCC Avi-cel® PH 101 when manufacturing capsules but the opposite is true for the fabrication of tablets. MCC Avicel® PH 101 has a mean particle size close to the raw minoxidil material. The use of excipients of similar particle size is key in achieving a homogenous blend and reducing the potential for de-mixing after the homogenous blend is obtained, especially when a direct filling takes place. However, MCC LP200 demonstrated superior perfor-mance in the wet granulation processes. This excipient has excellent flow properties, ena-bling a homogenous blend to be easily achieved. However, the high potential for the blend to de-mix is not removed, but the wet granulation of this type of blend helps in reducing the de-mixing potential [10,11].
3.3. NIR Measurements and Chemometric Models In Figure 4, the NIR spectra for the 16 minoxidil batches are illustrated. Differences
in three regions, 1416, 1465, and 1614 nm, were detected between capsules and tablets. Chemometric models (SVR and PLSR) were constructed using the signal attributed to these three wavelengths. The content of minoxidil (expressed as the percentage of the the-oretical content) was the predicted response.
Figure 3. Factorial plots for the mean mass content uniformity expressed coefficients of variation (%)obtained from Minitab®.
3.2. Formulation Optimization
For optimization purposes, the best minoxidil content uniformity (indicated by thelower coefficient of variation) targeting a 100% drug content was achieved when usingMCC LP200, wet granulation, granular riboflavin, and capsules. However, tablets are therecommended dosage form when utilizing MCC Avicel® PH 101 or direct filling. Meetingthese criteria, the minoxidil content and coefficients of variation are more likely to meet thespecification limits of the Pharmacopeia.
It is worthwhile to note that the use of MCC LP200 is preferable over the MCC Avicel®
PH 101 when manufacturing capsules but the opposite is true for the fabrication of tablets.MCC Avicel® PH 101 has a mean particle size close to the raw minoxidil material. The useof excipients of similar particle size is key in achieving a homogenous blend and reducingthe potential for de-mixing after the homogenous blend is obtained, especially when adirect filling takes place. However, MCC LP200 demonstrated superior performance inthe wet granulation processes. This excipient has excellent flow properties, enabling ahomogenous blend to be easily achieved. However, the high potential for the blend tode-mix is not removed, but the wet granulation of this type of blend helps in reducing thede-mixing potential [10,11].
3.3. NIR Measurements and Chemometric Models
In Figure 4, the NIR spectra for the 16 minoxidil batches are illustrated. Differencesin three regions, 1416, 1465, and 1614 nm, were detected between capsules and tablets.Chemometric models (SVR and PLSR) were constructed using the signal attributed to thesethree wavelengths. The content of minoxidil (expressed as the percentage of the theoreticalcontent) was the predicted response.
Pharmaceutics 2022, 14, x 11 of 12
Figure 4. NIR accumulated spectra after data normalization and a second derivative.
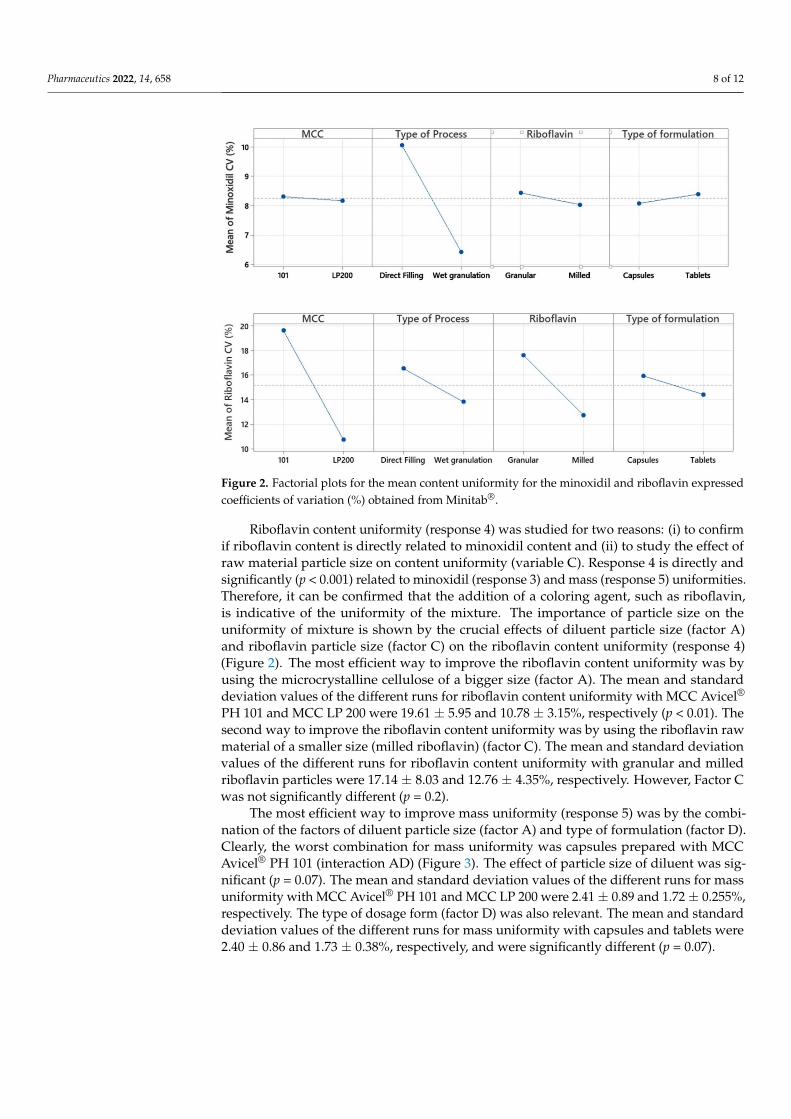
The PLSR showed a better predictive capability of minoxidil content compared to the SVR (Figure 5). To enhance the resolution of the chemometric model, capsules and tablets were plotted separately. A better correlation was observed in the capsules than in the tab-lets (R2 of 0.833 vs. 0.618, respectively). Moreover, the RMSE was 25% smaller for the cap-sules (3.07 vs. 4.02, respectively). Even though the differences in drug content were small, NIR was demonstrated to have a good sensibility in detecting small differences amongst the 16 prepared batches.
Figure 4. NIR accumulated spectra after data normalization and a second derivative.
Pharmaceutics 2022, 14, 658 10 of 12
The PLSR showed a better predictive capability of minoxidil content compared tothe SVR (Figure 5). To enhance the resolution of the chemometric model, capsules andtablets were plotted separately. A better correlation was observed in the capsules thanin the tablets (R2 of 0.833 vs. 0.618, respectively). Moreover, the RMSE was 25% smallerfor the capsules (3.07 vs. 4.02, respectively). Even though the differences in drug contentwere small, NIR was demonstrated to have a good sensibility in detecting small differencesamongst the 16 prepared batches.
Pharmaceutics 2022, 14, x 11 of 12
Figure 4. NIR accumulated spectra after data normalization and a second derivative.
The PLSR showed a better predictive capability of minoxidil content compared to the SVR (Figure 5). To enhance the resolution of the chemometric model, capsules and tablets were plotted separately. A better correlation was observed in the capsules than in the tab-lets (R2 of 0.833 vs. 0.618, respectively). Moreover, the RMSE was 25% smaller for the cap-sules (3.07 vs. 4.02, respectively). Even though the differences in drug content were small, NIR was demonstrated to have a good sensibility in detecting small differences amongst the 16 prepared batches.
Pharmaceutics 2022, 14, x 11 of 12
Figure 5. PLSR models for capsules (a) and tablets (b). Key: mx, minoxidil. Calibration data is rep-resented in blue and validation data in red.
This work highlighted the importance of following a specific protocol to manufacture solid dosage forms with a low amount of drug in order to meet Pharmacopeia specifica-tions. Clinical settings, such as hospitals or community pharmacies, do not possess suffi-cient analytic techniques to quantify drug content before dispensing the extemporaneous medicines they prepare. Hence, it is essential to ensure that the manufacturing procedure is correct, resulting in a high content uniformity.
In this work, we have analyzed the importance of selecting adequate excipients along with the most suitable manufacturing method to keep an optimal content and mass uni-formity of minoxidil low oral dose formulations. Wet granulation showed a superior per-formance compared to direct mixing and filling of powders when preparing solid dosage forms of minoxidil. However, wet granulation is not a common procedure implemented in local pharmacies, and this is one of the reasons behind the high content variability and, thereafter, side effects. This is the first time that the impact of using wet granulation versus direct filling on the final quality of the solid dosage forms of minoxidil to treat hair loss has been demonstrated. Due to the importance of this issue, it has been addressed before in several patents [12,13]. As an alternative, other authors have investigated the capability of automated powder dispensing systems to fill very low doses of drug directly into cap-sules (100 µg–5 mg). These systems are designed to dispense pure active pharmaceutical ingredients into the capsules which can be an alternative to the use of wet granulation [14]. However, these systems can be costly, and, hence, a manufacturing technique as de-scribed for wet granulation in this manuscript can be an alternative to fabricating extem-poraneous low oral dose solid dosage formulations with a high guarantee of meeting the Pharmacopeia specifications. Moreover, the implementation of novel analytical tech-niques for drug quantification, such as NIR, can be of great use in clinical settings, bearing in mind that they are clean, non-destructive, and 100% of the solid dosage forms can be analyzed in a matter of minutes before dispensing.
Figure 5. PLSR models for capsules (a) and tablets (b). Key: mx, minoxidil. Calibration data isrepresented in blue and validation data in red.

Pharmaceutics 2022, 14, 658 11 of 12
This work highlighted the importance of following a specific protocol to manufacturesolid dosage forms with a low amount of drug in order to meet Pharmacopeia specifications.Clinical settings, such as hospitals or community pharmacies, do not possess sufficient ana-lytic techniques to quantify drug content before dispensing the extemporaneous medicinesthey prepare. Hence, it is essential to ensure that the manufacturing procedure is correct,resulting in a high content uniformity.
In this work, we have analyzed the importance of selecting adequate excipientsalong with the most suitable manufacturing method to keep an optimal content andmass uniformity of minoxidil low oral dose formulations. Wet granulation showed asuperior performance compared to direct mixing and filling of powders when preparingsolid dosage forms of minoxidil. However, wet granulation is not a common procedureimplemented in local pharmacies, and this is one of the reasons behind the high contentvariability and, thereafter, side effects. This is the first time that the impact of using wetgranulation versus direct filling on the final quality of the solid dosage forms of minoxidilto treat hair loss has been demonstrated. Due to the importance of this issue, it hasbeen addressed before in several patents [12,13]. As an alternative, other authors haveinvestigated the capability of automated powder dispensing systems to fill very low dosesof drug directly into capsules (100 µg–5 mg). These systems are designed to dispensepure active pharmaceutical ingredients into the capsules which can be an alternative tothe use of wet granulation [14]. However, these systems can be costly, and, hence, amanufacturing technique as described for wet granulation in this manuscript can be analternative to fabricating extemporaneous low oral dose solid dosage formulations with ahigh guarantee of meeting the Pharmacopeia specifications. Moreover, the implementationof novel analytical techniques for drug quantification, such as NIR, can be of great use inclinical settings, bearing in mind that they are clean, non-destructive, and 100% of the soliddosage forms can be analyzed in a matter of minutes before dispensing.
4. Conclusions
There is a high variability when manufacturing a low oral dose of minoxidil extempo-raneous formulation in clinical practice. To minimize this variability, it is recommended touse wet granulation rather than the direct filling of powders. The fabrication of tablets in-stead of capsules reduces the variability encountered in the mass of the solid dosage forms.The use of MCC LP200 with a larger particle size aids in improving content uniformity.The implementation of NIR tools in compounding could aid in minimizing the risk of highcontent variability when manufacturing low oral dose solid dosage formulations.
Author Contributions: Conceptualization, A.M. and J.J.T.; methodology, C.T.-S., J.J.T. and D.R.S.;software, C.T.-S., J.J.T. and D.R.S.; formal analysis, A.L., A.G. and M.G.S.; resources, A.M. and J.J.T.;data curation, C.T.-S. and J.J.T.; writing—original draft preparation, J.J.T. and D.R.S.; writing—reviewand editing, J.J.T. and D.R.S.; supervision, J.J.T.; project administration, J.J.T.; funding acquisition, J.J.T.All authors have read and agreed to the published version of the manuscript.
Funding: This research was funded by Universidad Complutense de Madrid, grant number 910939.
Institutional Review Board Statement: Not applicable.
Informed Consent Statement: Not applicable.
Acknowledgments: This work was partially funded by the University Complutense of Madrid(Research group: 910939). The authors thank the support of MTB Brandao (Madrid, Spain) for givingus their support in performing the NIR measurements.
Conflicts of Interest: The authors declare no conflict of interest.

Pharmaceutics 2022, 14, 658 12 of 12
References1. Suchonwanit, P.; Thammarucha, S.; Leerunyakul, K. Minoxidil and its use in hair disorders: A review. Drug Des. Devel. Ther. 2019,
13, 2777–2786. [CrossRef] [PubMed]2. Randolph, M.; Tosti, A. Oral minoxidil treatment for hair loss: A review of efficacy and safety. J. Am. Acad. Dermatol. 2021, 84,
737–746. [CrossRef] [PubMed]3. Jimenez-Cauhe, J.; Saceda-Corralo, D.; Rodrigues-Barata, R.; Moreno-Arrones, O.M.; Ortega-Quijano, D.; Fernandez-Nieto, D.;
Jaen-Olasolo, P.; Vaño-Galvan, S. Safety of low-dose oral minoxidil treatment for hair loss. A systematic review and pooled-analysis of individual patient data. Dermatol. Ther. 2020, 33, e14106. [CrossRef] [PubMed]
4. Vañó-Galván, S.; Pirmez, R.; Hermosa-Gelbard, A.; Moreno-Arrones, Ó.M.; Saceda-Corralo, D.; Rodrigues-Barata, R.;Jimenez-Cauhe, J.; Koh, W.L.; Poa, J.E.; Jerjen, R.; et al. Safety of low-dose oral minoxidil for hair loss: A multicenter study of1404 patients. J. Am. Acad. Dermatol. 2021, 84, 1644–1651. [CrossRef]
5. EMA. Design of Experiments. ICH Guideline Q8 (R2); Document EMA/CHMP/ICH/167068/2004; EMA: London, UK, 2004.6. Torrado, J.; Illum, L.; Davis, S. Particle size and size distribution of albumin microspheres produced by heat and chemical
stabilization. Int. J. Pharm. 1989, 51, 85–93. [CrossRef]7. Sánchez-Guirales, S.A.; Jurado, N.; Kara, A.; Lalatsa, A.; Serrano, D.R. Understanding Direct Powder Extrusion for Fabrication of
3D Printed Personalised Medicines: A Case Study for Nifedipine Minitablets. Pharmaceutics 2021, 13, 1583. [CrossRef] [PubMed]8. Matji, A.; Donato, N.; Gagol, A.; Morales, E.; Carvajal, L.; Serrano, D.R.; Worku, Z.A.; Healy, A.M.; Torrado, J.J. Predicting the
critical quality attributes of ibuprofen tablets via modelling of process parameters for roller compaction and tabletting. Int. J.Pharm. 2019, 565, 209–218. [CrossRef] [PubMed]
9. Alonso, T.R.; Gagol, A.; Scherer, M.; Matji, A.; Torrado-Santiago, S.; Serrano, D.R.; Garcia-Arieta, A.; Torrado, J.J. A multivariateinvestigation into the relationship between pharmaceutical characteristics and patient preferences of bioequivalent ibuprofentablets. Patient Prefer. Adherence 2018, 12, 1927–1935. [CrossRef]
10. Schmidt, J.; Burchard, W.; Richtering, W. Shear-Induced Mixing and Demixing in Aqueous Methyl Hydroxypropyl CelluloseSolutions. Biomacromolecules 2003, 4, 453–460. [CrossRef] [PubMed]
11. Saharan, V.A.; Choudhury, P.K. Dissolution rate enhancement of piroxicam by ordered mixing. Pak. J. Pharm. Sci. 2012, 25,521–533. [PubMed]
12. Mortimer, N.; Napper, J.A.; Loudon, J.M.; Manek, S.J.; Kumar, R.; Sidney, M.; Clark, G.; O’brien, K.T. Process for Preparing SolidDosage Forms of Very Low-Dose Drugs. W.O. Patent 9,704,750, 13 February 1997.
13. Yalkowsky, S.H. Process for Preparing Solid Unit Dosage Forms of Ultra-Low Dose Drugs. U.S. Patent 4,489,026, 18 December 1984.14. Bi, M.; Sun, C.C.; Alvarez, F.; Alvarez-Nunez, F. The manufacture of low-dose oral solid dosage form to support early clinical
studies using an automated micro-filing system. AAPS PharmSciTech 2011, 12, 88–95. [CrossRef] [PubMed]
Copyright © 2022 FDOKUMEN