T Cell Receptor structure and cytokine responses in lung ...
357
T Cell Receptor structure and cytokine responses in lung targeted inflammatory models A thesis submitted for the degree of Doctor of Philosophy University of London Catherine Jane Reynolds Lung Immunology Group National Heart and Lung Institute Sir Alexander Fleming Building Imperial College London SW7 2AZ Supervised by: Dr Rosemary Boyton Professor Daniel Altmann 2008
-
Upload
khangminh22 -
Category
Documents
-
view
3 -
download
0
Transcript of T Cell Receptor structure and cytokine responses in lung ...

T Cell Receptor structure and cytokine
responses in lung targeted inflammatory
models
A thesis submitted for the degree of Doctor of Philosophy
University of London
Catherine Jane Reynolds
Lung Immunology Group
National Heart and Lung Institute
Sir Alexander Fleming Building
Imperial College
London
SW7 2AZ
Supervised by: Dr Rosemary Boyton Professor Daniel Altmann
2008

Acknowledgements
Over the course of my PhD there have been many people without whom I would never
have been able to get to this point. Whether it was the kind donation of reagents,
training and advice in lab techniques, scientific input or simply morale support, all
help has been invaluable and very much appreciated.
I would particularly like to thank my supervisors, Rosemary Boyton and Danny
Altmann. There is definitely no way that this thesis would exist without your
unrelenting support, vision and enthusiasm. Your unwavering belief that I would get
there in the end, even through the darker times of transgenic founder screening, and
the enormous commitment, both in terms of your time and your energy, made my PhD
an extremely rewarding and enjoyable experience.
Many people contributed reagents, training and advice to me throughout my PhD and
I've tried to list all of these people, to whom I am extremely grateful, below. There
have also been lots of people who have contributed less specifically, but no less
importantly, particularly in terms of moral support and maintaining my mental well-
being, during the course of this thesis. I'd particularly like to thank all members past
and present of the Boyton, Altmann and Dallman labs, especially Tracey and
Xiaoming who were important extra pairs of hands in many big experiments!
Finally I'd like to thank my partner, Matt. A massive thank you for your never ending
support and patience including all the meals cooked, washing done and pep talks
delivered! I couldn't have done it without you.
2

Reagents, help and support
Transgenesis
Helen Bodmer — HEL expression cassette
Brian Sauer — floxed stop cassette
Jeffrey Whitsett — CC10 promoter
Diane Mathis and Christophe Benoist — TCR cassette vectors
Maggie Dallman f3m70 Cre transgenic line
Laurence Bugeon
Colin Hetherington
Robert Sumner
Karla Watson
Pronuclear injections at Nuffield Department of Medicine (University of Oxford)
Zoe Webster — pronuclear injections at MRC Clinical Sciences Centre (Imperial
College)
Keith Murray
Daniel Wells
Darren Bilton
Amy Wathen
South Kensington campus animal facility technicians
Technical help and support
Kate Choy Lung function studies
Sara Mathie
Lorraine Lawrence — Lung histology
Julia Llewellyn-Hughes — DNA sequencing
Katlin Takacs — DNA preparation for pronuclear injection
Yogesh Singh — Spectratyping
Alan Ahern Molecular biology techniques
Jennifer Rowland
Gurman Kaur — Real time PCR
3

Abstract
Thl or Th2 type immune responses are an important feature of many human diseases,
including several lung pathologies. Multiple factors are involved in determining
whether a naïve CD4+ T cell differentiates into a Thl or Th2 effector cell and several
lines of evidence point towards an important role for the interaction between the T cell
receptor (TCR) and its peptide ligand. A previous study showed that highly polarised
Th2 CD4+ T cells selected under Th2 polarising conditions favour a structurally
distinct TCR with an elongated TCR a chain complimentarity determining region 3
(CDR3), while those selected under Thl polarising conditions favour a shorter TCR
CDR3 a chain. Molecular modelling predicted that this elongated TCR a chain
results in a less optimal (lower avidity) interaction between the TCR and peptide/MHC
complex. In this thesis, clonotypic analysis was used to identify dominant TCR
chains from established Thl and Th2 polarised T cell lines. Dominant TCR a chains
were cloned into TCR transgenic expression vectors and lines of mice with transgenic
expression of these chains were identified. In vitro and in vivo studies were used to
investigate T cell responses in these transgenic lines and the data suggests that
expression of the Th2 derived TCR a chain can cause an inherent bias in CD4+ T cell
phenotype. A long term aim of this work is to use the Thl and Th2 TCR transgenic
animals to develop novel mouse models of lung disease and this thesis also describes
the generation of transgenic mice that express the Thl and Th2 TCR cognate epitope,
PLP 56-70, inducibly and specifically in the lung. Also implicated in the pathogenesis
of many lung diseases is the CXC chemokine, interleukin 8. The final chapter of this
thesis describes the generation of transgenic mice overexpressing this human protein
constitutively in the lung and reports initial characterisation of protein expression and
consequent lung inflammation in these animals.
4

Table of contents page number
Title page 1
Acknowledgements 2
Abstract 4
Table of contents 5
List of figures 10
List of tables 15
List of appendices 16
List of abbreviations 18
Chapter 1. Introduction
1.1 The ar3 T cell receptor 24
1.2 T cell receptor gene rearrangement 25
1.3 T cell receptor sequence diversity 28
1.4 T cell receptor assembly 29
1.5 Thymic selection 34
1.6 Dual TCR expression 36
1.7 TCR editing and revision 37
1.8 Structure of the TCR/CD3 signalling complex 38
1.9 pMHC binding by TCR 44
1.10 TCR binding affinity and conformational change 46
1.11 TCR triggering 49
1.12 CD4+ T cell phenotype 53
1.13 Thl and Th2 cell differentiation 56
1.14 The TCR and CD4+ T cell differentiation 61
1.15 Thl and Th2 responses in human lung disease 64
1.16 Mouse models of human lung disease 70
1.17 Approaches to transgenesis 74
1.18 Interleukin 8 80
1.19 Neutrophil function 83
5

1.20 Interleukin 8 and human lung disease 86
1.21 Aims of this thesis 90
Chapter 2. Materials and methods
2.1 Genomic DNA extraction 94
2.2 RNA extraction 94
2.3 DNase treatment of RNA samples 95
2.4 cDNA synthesis 95
2.5 Polymerase Chain Reaction (PCR) 96
2.6 Restriction enzyme digest 96
2.7 Preparation of XL-Gold competent cells 96
2.8 E-coli transformation 97
2.9 Standard cloning and ligation protocol 97
2.10 Blunt end generation 98
2.11 Oligonucleotide annealing 99
2.12 TA cloning of PCR products 99
2.13 Preparation and screening of plasmid DNA 99
2.14 T cell receptor PCR analysis 100
2.15 Sequencing and T cell receptor sequence analysis 100
2.16 TCR CDR3 spectratyping 101
2.17 Real-time PCR 101
2.18 Preparation of DNA for oocytes pronuclear injection 102
2.19 Genotyping 102
2.20 Southern blotting 103
2.21 Southern blot Digoxigenin (DIG) probe labelling, hybridisation 103
and detection
2.22 Tamoxifen induction 105
2.23 Footpad/flank peptide immunisation 105
2.24 Immediately ex vivo T cell proliferation assay 105
2.25 Culture of T cell lines 106
2.26 Measurement of bronchial hyperreactivity (BHR) 106
6

2.27 Measurement of Resistance (R) and Compliance (Cdyn) 107
2.28 Collection of Bronchoalveolar lavage (BAL) and serum 107
2.29 Cell extraction from whole lung lobe 108
2.30 Differential cell counting 108
2.31 Lung homogenate 108
2.32 Lung histology — tissue preparation 109
2.33 Haematoxylin and Eosin (H+E) staining 109
2.34 Periodic Acid Schiff (PAS) staining and scoring 109
2.35 Immunohistochemistry — tissue fixation 110
2.36 Peroxidase based immunohistochemistry 110
2.37 Immunofluorescence tissue staining 111
2.38 Inflammatory cell scoring 112
2.39 Induction of allergic airway disease using ovalbumin (OVA) 112
2.40 Enzyme Linked ImmunoSorbant Assay (ELISA) 112
2.41 Flow cytometric analysis 113
Chapter 3. Generation of Thl and Th2 TCR a chain transgenic lines
Results
3.1 Determination of a and p TCR gene usage in Thl and Th2 lines 114
specific for PLP 56-70
3.2 Construction of Thl and Th2 TCR a chain transgenes 124
3.3 Identification of Thl and Th2 TCR a chain transgenic founder 132
animals
3.4 Determination of TCR a chain transgene expression 136
Discussion 146
Chapter 4. TCR 13 chain selection and cytokine phenotype in Thl and
Th2 a chain transgenics
Results
4.1 Analysis of TCR p chain usage in unprimed Th2 TCR a chain 153
transgenics
7

4.2 Analysis of TCR 13 chain usage in Th2 TCR a chain transgenic 157
in the context of antigen specificity
4.3 Analysis of PLP (56-70) specific Th2 TCR a chain transgenic 160
T cell lines
4.4 Construction of a Th2 TCR (3 chain transgene 171
4.5 Identification of a Th2 TCR p chain transgenic founder animal 174
4.6 Analysis of a PLP (56-70) specific Thl TCR a chain transgenic 176
T cell line
4.7 Altered cytokine phenotype of an in vivo memory response to antigen 178
in Th2 TCR a chain transgenic animals
Discussion 182
Chapter 5. Generation of transgenic lines for inducible, lung targeted,
antigen expression
Results
5.1 Design and construction of transgenes for inducible, lung targeted, 192
expression of the antigen PLP 56-70
5.2 Identification of MIPLP transgenic founder animal 203
5.3 Determination of stop sequence excision and MIPLP transgene 205
expression
5.4 Re-design of the SIPLP transgene 209
5.5 Identification of SIPLP transgenic founder animals 212
Discussion 216
Chapter 6. Generation and initial characterisation of transgenic lines
with lung targeted expression of human interleukin 8
Results
6.1 Design and construction of a transgene for lung targeted expression 222
of human interleukin 8
6.2 Identification of lung targeted hIL-8 transgenic founder animals 226
6.3 Determination of lung specific hIL-8 transgene expression 228
8

6.4 Lung function and lung cell infiltrate in lung targeted hIL-8 233
transgenics
6.5 Investigation of the impact of IL-8 expression in the murine lung 239
during ovalbumin induced lung inflammation
Discussion 246
Overview 256
Bibliography 260
Appendices 307
9

List of Figures
Page number
Chapter 1. Introduction
1.1 TCR a and p loci gene arrangement and recombination 26
1.2 Timing of TCR gene rearrangement and T cell selection during 30
normal thymocyte development
1.3 Signalling pathways downstream of the T cell receptor 40
1.4 Cytokine environment and CD4+ T cell differentiation 58
1.5 The mechanistic basis of reverse tetracycline-controlled 77
transcriptional activator (rtTA) and Cre/Lox systems of inducible
gene targeting
1.6 Transgenic strategies of this thesis 93
Chapter 3. Generation of Thl and Th2 TCR a chain transgenic lines
3.1 The PCR strategy used to determine a and (3 TCR gene usage in Thl 115
and Th2 line cDNA
3.2 A comparison of TCR a and 13 gene usage in Thl and Th2 T cell lines 122
in order to select chains for transgenic expression
3.3 Presence or absence of the dominant Thl and Th2 CDR3 a motifs in 123
Thl and Th2 lines
3.4 The different states of arrangement of TCR a genes 125
3.5 A schematic diagram showing the cloning strategy used to create the 127
Thl a chain construct
3.6 A schematic diagram showing the cloning strategy used to create the 128
Th2 a chain construct
3.7 Assembly of Thl and Th2 TCR a chain constructs 130
3.8 Complete Thl and Th2 TCR a chain constructs 131
3.9 Identification of Th2 TCR a chain transgenic founder animals 134
3.10 Identification of the Thl TCR a chain transgenic founder animal 135
10

3.11 Demonstration of correct Th2 TCR a chain transgene processing 139
and expression by PCR
3.12 Demonstration of correct Thl TCR a chain transgene processing and 140
expression by PCR
3.13 An increased percentage of double negative thymocytes and a 143
decreased CD4:CD8 ratio suggests expression of the TCR a chain
transgene at the cell surface early in thymocyte development
3.14 An increased percentage of double negative thymocytes suggests 144
expression of the Thl a chain transgene at the cell surface early in
thymocyte development
3.15 Transgenic expression of Thl or Th2 T cell receptor a chains does 145
not affect the levels of TCR at the cell surface
Chapter 4. TCR 13 chain selection and cytokine phenotype in Thl and
Th2 a chain transgenics
4.1 TCR 13 chain sequences from splenocytes of unprimed Th2 TCR a 155
chain transgenic and littermate control animals
4.2 Spectratype analysis of TCR 13 chain gene usage in splenocytes of 156
unprimed Th2 TCR a chain transgenic and littermate control animals
4.3 TCR p chain sequences from primed draining lymph node of Th2 158
TCR a chain transgenic and littermate control animals
4.4 Spectratype analysis of TCR 13 chain gene usage in primed draining 159
lymph node T cells of Th2 TCR a chain transgenic and littermate
control animals
4.5 Rapid clonal expansion of TCR over successive restimulations of a 161
Th2 TCR a chain transgenic T cell line
4.6 Spectratype analysis of Th2 a chain transgenic and littermate derived 162
T cell lines through successive restimulations
4.7 Cytokine phenotype of Th2 TCR a chain transgenic and littermate T 165
11

cell lines over successive restimulations
4.8 Real time PCR analysis of GATA3 and Tbet transcripts in Th2 TCR a 166
chain transgenic and littermate T cell lines over successive
restimulations
4.9 Cytokine phenotype of Th2 TCR a chain transgenic and littermate T 167
cell lines after 15 restimulations
4.10 Clonal expansion of a TCR over successive restimulations of a Th2 169
TCR a chain transgenic T cell line
4.11 Cytokine phenotype of a line 34 Th2 TCR a chain transgenic T cell 170
line
4.12 A schematic diagram showing the cloning strategy used to create the 172
Th2 (3 chain construct
4.13 Cloning of the rearranged Th2 TCR p chain into the TCR (3 expression 173
cassette
4.14 Identification of the Th2 TCR p chain transgenic founder animal 175
4.15 Analysis of a Thl TCR a transgenic derived T cell line 177
4.16 An in vivo memory response to peptide demonstrates a difference in 180
cytokine profile between Th2 TCR a chain transgenic and littermate
animals
4.17 TCR analysis of splenocytes from Th2 TCR a transgenic and 181
littermate animals at day 32 after priming
Chapter 5. Generation of transgenic lines for inducible, lung targeted,
antigen expression
5.1 The strategy for inducible, lung specific, expression of antigen 195
PLP (56-70)
5.2 The localisation of Cre and CC10 proteins in uninduced and tamoxifen 197
induced lung sections from (3m70 MerCreMer mice
5.3 Co-localisation of Cre and CC10 in the lung of a tamoxifen induced 198
r3m70 MerCreMer mouse
12

5.4 A schematic diagram of the cloning strategy used to create the 200
inducible, lung specific PLP (56-70) transgenes
5.5 Assembly of the inducible, lung specific, membrane bound and secreted 201
PLP (56-70) transgenes
5.6 Complete inducible, lung specific, PLP constructs (membrane [MIPLP] 202
and secreted [SIPLP])
5.7 Identification of an MIPLP transgenic founder animal 204
5.8 Removal of the floxed stop sequence and expression of MIPLP in lung 207
tissue following induction with tamoxifen
5.9 Complete removal of the floxed stop sequence occurs over many days 208
and persists for many weeks following induction with tamoxifen
5.10 A schematic diagram to demonstrate the potential importance of loxP 210
site orientation
5.11 A schematic diagram of the cloning strategy used to invert the floxed 211
stop sequence of the SIPLP construct
5.12 Identification of SIPLP transgenic founder animals 214
5.13 Removal of the floxed stop sequence and expression of SIPLP in lung 215
tissue following induction with tamoxifen
Chapter 6. Generation and initial characterisation of transgenic lines
with lung targeted expression of human interleukin 8
6.1 A schematic diagram of the cloning strategy used to create the lung 224
targeted hIL-8 transgene
6.2 Cloning of human IL-8 cDNA into a lung targeted expression 225
construct
6.3 Identification of lung targeted hIL-8 transgenic founder animals 227
6.4 Tissue specific expression of hIL-8 in both transgenic lines 230
6.5 Levels of hIL-8 cDNA transcripts and hIL-8 protein in the lung of both 231
lines of hIL-8 transgenic mice
6.6 hIL-8 expresion is confined to bronchial epithelial cells of the lung in 232
both lines of transgenic mice
13

6.7 Baseline cell infiltrates in the lungs of IL-8 transgenics and littermate 235
animals
6.8 Neutrophil staining by immunohistochemistry of lung sections from 236
IL-8 transgenic and littermate animals
6.9 Mild inflammation in line 19 transgenic compared to line 33 and 237
littermate animals
6.10 Lung function of IL-8 transgenic and littermate animals 238
6.11 Lung function measurements in IL-8 transgenic and littermate animals 242
following ovalbumin sensitisation and challenge
6.12 Differential BAL and lung cell counts from IL-8 transgenic and 243
littermate animals following ovalbumin sensitisation and challenge
6.13 Lung inflammation in OVA sensitised and challenged IL-8 transgenic 244
and littermate animals
6.14 Prevalence of mucus secreting goblet cells in inflated lung sections 245
from OVA sensitised and challenged IL-8 transgenic and littermate animals
14
List of Tables
Page number
Chapter 3. Generation of Thl and Th2 TCR a chain transgenic lines
3.1 TCR a sequences from a Thl polarised NOD.E T cell line against 118
PLP (56-70)
3.2 TCR a sequences from a Th2 polarised NOD.E T cell line against 119
PLP (56-70)
3.3 TCR p sequences from a Thl polarised NOD.E T cell line against 120
PLP (56-70)
3.4 TCR l sequences from a Th2 polarised NOD.E T cell line against 121
PLP (56-70)
3.5 TCR a chain sequences from splenocytes of Th2 TCR a chain 141
transgenic and littermate control animals
3.6 TCR a chain sequences from 2 Thl a chain transgenic animals 142
15
List of Appendices
Page number
1. Stock solutions and buffers 307
2. Antibodies and recombinant proteins 310
3. Restriction enzymes and buffers 311
4. PCR primers for analysis of TCR a and p gene usage 312
5. TCR CDR3r3 spectratyping primers 313
6. Thl and Th2 TCR a chain primers 314
7. MIPLP and SIPLP transgene primers and oligonucleotides 315
8. PCR primers 316
9. Wright-Giemsa stain — cell morphology 317
10. Thl TCR a chain construct - plasmid map 318
11. Th2 TCR a chain construct — plasmid map 319
12. Th2 TCR I chain construct — plasmid map 320
13. MIPLP construct — plasmid map 321
14. SIPLP construct — plasmic! map 322
15. Inverted stop sequence SIPLP construct — plasmid map 323
16. Lung targeted hIL-8 construct — plasmid map 324
17. Thl TCR a complete V-J insert nucleotide sequence 325
18. Thl TCR a rearranged V-J insert nucleotide/protein sequence 326
19. Th2 TCR a complete V-J insert nucleotide sequence 327
20. Th2 TCR a rearranged V-J insert nucleotide/protein sequence 328
21. Th2 TCR 13 complete V-J insert nucleotide sequence 329
22. Th2 TCR 3 rearranged V-J insert nucleotide/protein sequence 330
23. MIPLP construct — complete nucleotide sequence 331
24. Transmembrane HEL/PLP (56-70) nucleotide/protein sequence 337
25. SIPLP construct — complete nucleotide sequence 339
26. Secreted HEL/PLP (56-70) nucleotide/protein sequence 345
27. Inverted stop sequence SIPLP construct — complete nucleotide 346
16

sequence
28. Lung targeted hIL-8 construct — complete nucleotide sequence 352
29. hIL-8 nucleotide/protein sequence 356
30. Inflammatory cell scoring system 357
17

List of abbreviations
AHR
AIRE
AP
APC
APECED
APL
ARDS
ATP
BAL
Bax
BCG
Bcl
BHR
Blys
bp
BSA
C
°C
CC10
CD
cDNA
CDR
Cdyn
CF
CFA
CFTR
Airway hyperresponsiveness
Autoimmune regulator
Activating protein
Antigen presenting cell
Autoimmune polyendocrinopathy candidiasis ectodermal dystrophy
Altered peptide ligand
Acute respiratory distress syndrome
Adenosine triphosphate
Bronchoalveolar lavage
Bc12 associated X protein
Bacille Calmette-Guerin (strain of Mycobacterium bovis)
B cell leukaemia protein
Bronchial hyperreactivity
B lymphocyte stimulator
base pair
Bovine serum albumin
Constant
Centigrade
Clara cell protein 10
Cluster of differentiation
Complimentary DNA
Complimentarity determining region
Compliance
Cystic fibrosis
Complete Freund's adjuvant
Cystic fibrosis transmembrane conductance regulator
18

CIAP Calf intestinal alkaline phosphatase
CMA Cytomegalovirus
COPD Chronic obstructive pulmonary disease
cTEC Cortical thymic epithelial cells
CTLA Cytotoxic T lymphocyte associated antigen
CTP Cytidine triphosphate
D Diversity
DAG Diacylglycerol
DC Dendritic cell
DC-SIGN Dendritic cell-specific ICAM3-grabbing nonintegrin
DIG Digoxigenin
DLN Draining lymph node
DN Double negative
DNA Deoxyribonucleic acid
DP Double positive
DPB Diffuse panbronchiolitis
DTT Dithiothreitol
E Enhancer
EAE Experimental autoimmune encephalomyelitis
EBV Epstein barr virus
ELISA Enzyme linked immunosorbant assay
ER Endoplasmic reticulum
ERK Extracellular signal-regulated kinase
F Forward
FCS Foetal calf serum
FITC Fluorescein Isothiocyanate
g gram
g gravitational acceleration
19

GATA Gene activator of TCR a
GTP Guanosine triphosphate
H+E Haematoxylin and Eosin
HCMV Human cytomegalovirus
HEL Hen egg lysozyme
hIL-8 human Interleukin 8
HPRT Hypoxanthine Phosphoribosyltransferase
Hsp Heat shock protein
i.m intra-muscular
i.p intra-peritoneal
ICAM Intracellular adhesion molecule
IFA Incomplete Freund's adjuvant
IFN Interferon
Ig Immunoglobulin
IL Interleukin
IMGT International immunogenetics
IP3 Inositol- 1 ,4,5-triphosphate
IPF Idiopathic pulmonary fibrosis
IPTG Isopropyl-P-d-thiogalactopyranoside
ITAM Immunoreceptor tyrosine based activation motif
IU International unit
J Joining
KB Kilobase
kD Kilodalton
1 litre
LAT Linker for activation of T cells
20

LB
Luria-Bertani
Lck
Lymphocyte-specific-protein-tyrosine kinase
LFA
Lymphocyte function associated antigen
M Molar
m meter
m milli
mAb monoclonal antibody
MAPK Mitogen activated protein kinase
MBP Myelin basic protein
MDNCF Monocyte derived neutrophil chemotactic factor
Mer Mutated oestrogen receptor
MHC Major histocompatibility complex
MIPLP Membrane bound, inducible, proteolipoprotein
MONAP Monocyte derived neutrophil activating peptide
MPO Myeloperoxidase
mRNA messenger ribonucleic acid
MS Multiple sclerosis
mTEC medullary thymic epithelial cell
n nano
N random nucleotide
NAF Neutrophil activating factor
NFAT Nuclear factor of activated T cells
NF-KB Nuclear factor K B
NK Natural killer
NOD Non-obese diabetic
NTP Nucleotide triphosphate
OVA Ovalbumin
21

P Promoter
PAS Periodic acid Schiff
PBMC Peripheral blood mononuclear cell
PBS Phosphate buffered saline
PCC Pigeon cytochrome c
PCD Pulmonary ciliary dyskinesia
PCR Polymerase chain reaction
PE Phycoerythrin
phox phagocyte oxidase
PI3K Phosphatidylinositol 3 kinase
PIP2 Phosphatidylinositol 3,4-bisphosphate
PLC Phospholipase C
PLP Proteolipoprotein
pMHC peptide/MHC complex
pTa pre-TCR a chain
R Resistance
R Reverse
r recombinant
RAG Recombination activating gene
reg regulatory
RNA Ribonucleic acid
RNAi RNA interference
RS S Recombination signal sequence
rTS reverse transcriptional silencer
rtTA reverse tetracycline transcriptional activator
s.c sub-cutaneous
SCID Severe combined immunodeficiency disease
SD Standard deviation
SE Standard error
22

SH Src homology
SIPLP Secreted, inducible, proteolipoprotein
SLP SH2 domain containing leukocyte protein
SLPI Secretory leukocyte protease inhibitor
SOCS Suppressor of cytokine signalling
SP Single positive
SP Surfactant protein
STAT Signal transducer and activator of transcription
tetO Tetracycline operator
TGF Transforming growth factor
Th T helper cell
TLR Toll like receptor
TNF Tumor necrosis factor
TRITC Tetramethyl rhodamine iso-thiocyanate
TTP Thymidine triphosphate
V
Variable
V
Volt
ZAP z-chain associated protein kinase
23

Chapter 1
Introduction
1.1 The afi T cell receptor
The af3 T cell receptor (TCR) is a transmembrane heterodimer expressed on the
surface of CD4+ and CD8 + T lymphocytes. TCRs on CD4+ and CD8+ T cells
recognise peptides bound to class I or class II major histocompatibility complex
(MHC) molecules respectively and engagement of the TCR with peptide and MHC
can result in activation of the T cell and initiation of an adaptive immune response.
The TCR protein was first identified in the early 1980's using antibodies raised against
lymphomas or T cell clones (Allison et al., 1982 and Haskins et al., 1983). It was
noted that these antibodies, specific for a component of the T cell, could block antigen
recognition and that this blocking or binding did not occur when the antibodies were
used against T cells of different antigen specificities. Precipitation of the proteins
bound by these antibodies revealed a dimer of approximately 80 kilodaltons (kD),
which, on reduction of disulphide bonds, could be separated into two monomers of 39
and 41 kD. Tryptic peptide analysis of the two TCR monomers, now known as the
alpha chain and the beta chain, began to reveal the basis of TCR clonality and
peptide/MHC specificity (Kappler et al., 1983), with comparisons of peptides derived
from TCRs of different specificities suggesting the presence of constant and variable
regions in both chains. Understanding of the genetic basis for these constant and
variable regions of the TCR became possible following the isolation of alpha and beta
chain cDNA (Chien et al., 1984 and Hedrick et al., 1984) which showed the TCR
chains to be composed of rearranged variable (V), diversity (D), joining (J) and
constant (C) region sequences, a concept previously encountered in studies of the B
cell antigen receptor immunoglobulin genes (Hozumi and Tonegawa, 1976).
24

Following the discovery of the a13 TCR, another TCR molecule, known as the y8
TCR, was also described (Brenner et al., 1986).
1.2 T cell receptor gene rearrangement
There are three distinct TCR loci in the genome of both humans and mice, Tcrb,
Tcra/Tcrd and Tcrg, containing the V, D, J and C genes necessary for assembly of af3
and y8 T cell receptors. An outline of the murine germline configuration of genes
within the Tcrb and Tcra/Tcrd loci is shown in figure 1.1. The process of gene
rearrangement and the joining of V, D, J and C genes to form a functional TCR chain
occurs in the thymus during lymphocyte development and utilises highly conserved
recombination signal sequences (RSS) that flank each gene segment (Akira et al.,
1987). The recombination signals consist of conserved heptamer and nonamer
sequences that flank relatively non-conserved 12 bp (12RSS) or 23 bp (23RSS)
spacers. Point mutations in the conserved sequences, or changes in the length of the
spacers, drastically reduce recombination efficiency (Akira et al., 1987) and, although
non-conserved, changes in the sequence of the spacer regions have also been shown to
have an impact (Montalbano et al., 2003). Recombination between gene segments
occurs via a mechanism of double strand breaks (Roth et al., 1992) and is mediated by
the recombination activating genes, RAG1 and RAG2 (McBlane et al., 1995). Mice
deficient in either RAG1 or RAG2 fail to develop mature T cells, due to an inability to
initiate V(D)J recombination (Mombaerts et al., 1992a and Shinkai et al., 1992), and
as such, transgenic expression of rearranged TCR alpha and beta chain genes can
restore T cell development in these animals (Shinkai et al., 1993). The RAG proteins
control the specificity of cleavage events during recombination by binding to the
conserved RSS motifs, but also control the configuration in which gene segments can
be joined together, by dictating that a gene with a 5' 23RSS can only be joined to a
gene with a 3' 12RSS and vice versa (van Gent et al., 1996). This is known as the
12/23 rule of recombination (Akira et al., 1987). However, this seemingly simple
mechanism of control over the configuration of TCR genes cannot account for the
25

Va and VS (a) genes
DS Jo ES CS VS Ja Ca Ea
__ I
Vf3 genes PD(31 DP1 Jf31
ti
Cf31 Dp2 J132
CP2 E(3 V(3 r) C) I
[
(b)
RAG mediated cleavage
Random nucleotide (N) addition by TdT
(c) NN
—11111111E11— Va Ja
N N 4
Vf3 Df3 Jr3 Vf3 DP JP
Figure 1.1 TCR a and 13 loci gene arrangement and recombination. (a) Schematic diagrams of the arrangement of V, D, J and C genes and enhancer elements at the murine Tcra/d and Tcrb loci are shown. (b) Gene segments are combined by a mechanism of double strand breaks, mediated by the RAG recombinase protein complex. Junctional diversity during the joining together of gene segments is brought about by random nucleotide (N) addition by the Terminal deoxynucleotidyl transferase (TdT) enzyme. (c) The order in which gene segments are combined is strictly controlled with DP-J(3 recombination occurring before VP-DP joining. Points at which N nucleotide addition creates junctional diversity in the a and [3 TCR chains are marked (N).
26
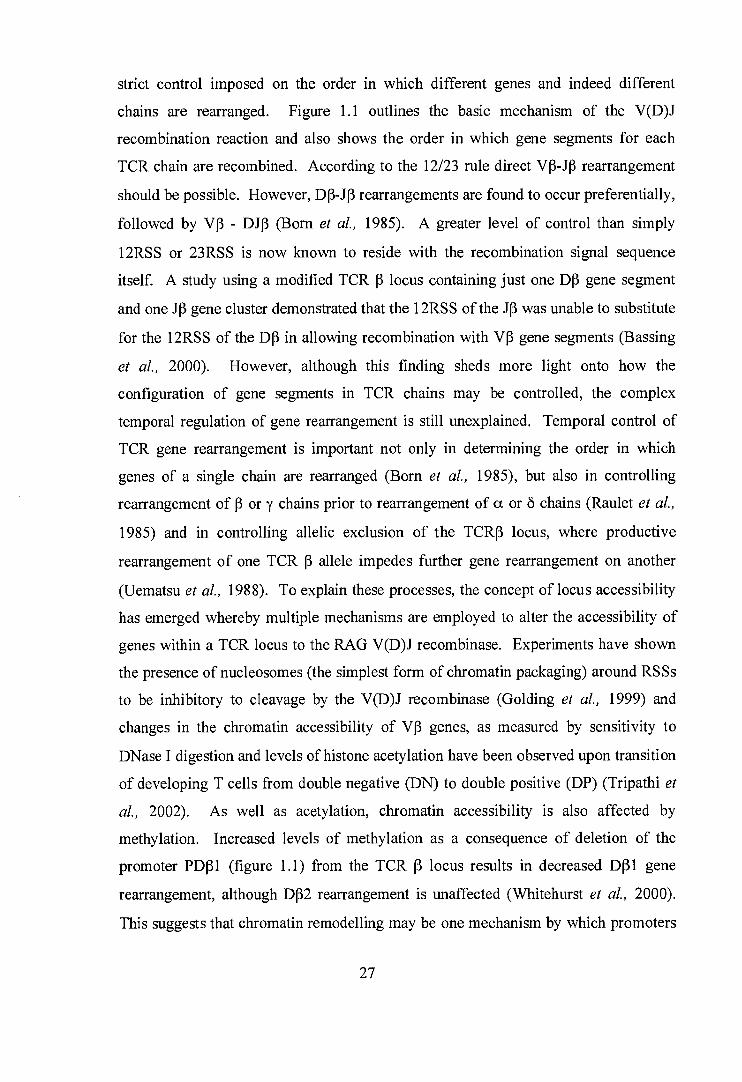
strict control imposed on the order in which different genes and indeed different
chains are rearranged. Figure 1.1 outlines the basic mechanism of the V(D)J
recombination reaction and also shows the order in which gene segments for each
TCR chain are recombined. According to the 12/23 rule direct VP-J13 rearrangement
should be possible. However, DP-JP rearrangements are found to occur preferentially,
followed by VP - D.43 (Born et al., 1985). A greater level of control than simply
12RSS or 23RSS is now known to reside with the recombination signal sequence
itself. A study using a modified TCR (3 locus containing just one DP gene segment
and one JP gene cluster demonstrated that the 12RSS of the JP was unable to substitute
for the 12RSS of the DP in allowing recombination with VP gene segments (Bassing
et al., 2000). However, although this finding sheds more light onto how the
configuration of gene segments in TCR chains may be controlled, the complex
temporal regulation of gene rearrangement is still unexplained. Temporal control of
TCR gene rearrangement is important not only in determining the order in which
genes of a single chain are rearranged (Born et al., 1985), but also in controlling
rearrangement of (3 or y chains prior to rearrangement of a or 8 chains (Raulet et al.,
1985) and in controlling allelic exclusion of the TCRP locus, where productive
rearrangement of one TCR (3 allele impedes further gene rearrangement on another
(Uematsu et al., 1988). To explain these processes, the concept of locus accessibility
has emerged whereby multiple mechanisms are employed to alter the accessibility of
genes within a TCR locus to the RAG V(D)J recombinase. Experiments have shown
the presence of nucleosomes (the simplest form of chromatin packaging) around RSSs
to be inhibitory to cleavage by the V(D)J recombinase (Golding et al., 1999) and
changes in the chromatin accessibility of VP genes, as measured by sensitivity to
DNase I digestion and levels of histone acetylation have been observed upon transition
of developing T cells from double negative (DN) to double positive (DP) (Tripathi et
al., 2002). As well as acetylation, chromatin accessibility is also affected by
methylation. Increased levels of methylation as a consequence of deletion of the
promoter PD(31 (figure 1.1) from the TCR (3 locus results in decreased D131 gene
rearrangement, although D(32 rearrangement is unaffected (Whitehurst et al., 2000).
This suggests that chromatin remodelling may be one mechanism by which promoters
27

within TCR loci exert control over local rearrangements. Longer range control over
chromatin structure has been observed for the enhancer sequence (EP) of the TCR P
locus (figure 1.1), deletion of which significantly reduces chromatin accessibility
throughout the DpJP region (Oestreich et al., 2006). This study also reported direct
physical contact between EP and PD131, implying that different control elements
within a TCR locus can interact to exert control over TCR gene rearrangement during
T cell development.
1.3 T cell receptor sequence diversity
Mathematical estimates of the number of different TCR sequences that can potentially
exist are in the range of 1012-1015 (Davis and Chien, 1999). However, through the
need for self tolerance, and the processes of negative and positive selection in the
thymus, estimates of the number of different aP T cell receptor sequences present in
the periphery range from 2 x 10⁶ for a naive mouse (Casrouge et al., 2000) to 2 x 10⁷
in human peripheral blood (Arstila et al., 1999). Diversity of TCRs is achieved in one
of three ways. As already discussed, the genomic locus of each TCR chain contains
many different V, D and J gene segments which recombine to generate a functional
TCR chain. There are therefore many possible combinations of gene sequences that
can exist following recombination. Secondly, each TCR is composed of an a and a P
chain. Diversity is therefore amplified by receptor heterodimerisation where, for
example, a particular p chain sequence is able to form a functional receptor with
multiple TCR a chain partners (Listman et al., 1996). The third mechanism by which
TCR sequence diversity is achieved is by imprecise joining of gene segments during
the recombination process itself. Following cleavage of the TCR locus, coding ends
of gene segments, brought into close proximity by the RAG V(D)J recombinase
complex, must be joined together to create a functional TCR chain. During the joining
phase of rearrangement reactions, random nucleotides (N) are added in a template
independent fashion onto the 3' OH ends of the combining gene segments by the
terminal deoxynucloetidyl transferase (TdT) enzyme. Regions of N nucleotides at the
junctions of gene segments are absent in the TCRs of T lymphocytes that lack this
28

enzyme (Komori T et al., 1993) and the size of the a(3 TCR repertoire in TdT null
mice has been estimated to be just 10% of the size of a normal wild-type animal
(Cabaniols et al., 2001). However, immune responses appear relatively unimpaired in
these animals, which remain able to mount robust responses against a range of
different antigens (Gilfillan et al., 1995). Regions of each TCR chain sequence that
are subject to N region addition are marked on figure 1.1 and lie in a region termed the
CDR3a or CDR313 of the TCR a and 13 chains respectively. The CDR3, along with
the germline encoded CDR1 and CDR2 regions of the TCR, plays an important role in
peptide specificity and in binding of the TCR to peptide/MHC and will be discussed in
more detail in a later section.
1.4 T cell receptor assembly
The assembly of a functional a(3 TCR on the surface of a mature T cell is an ordered
process that is subject to strict control measures at multiple stages during T cell
development. A schematic diagram of the different stages of T cell development in
the thymus and the timing of al3 TCR assembly is shown in figure 1.2. The main
requirements of a TCR on the surface of a T cell, exiting the thymus to join the
peripheral immune system, are that it should be able to recognise peptides bound to
self-MHC molecules but that it should not be reactive to peptides derived from self-
proteins. The nature of TCR gene rearrangement in promoting extensive TCR
sequence diversity, as discussed in the previous section, means that there is estimated
to be potential for the generation of 1012 — 1015 different TCRs. However many of
these will not satisfy the self MHC / self peptide requirements mentioned above and so
processes of positive and negative selection are employed in the thymus to reduce and
restrict the peripheral TCR repertoire to those molecules which will be functional, but
not self reactive.
During T cell development, the TCR (3 chain is rearranged before the a chain (Raulet
et al., 1985) and indeed use of a TCR p chain transgene in scid mice (Bosma et al.,
1983), which carry a mutation in a DNA repair enzyme and so cannot carry out VDJ
29
DN4
DP a chain
SP SP
f
TCR a gene rearrangement
13 chain selection
Positive and negative selection
DN1
DN2
DN3 }
TCR p gene rearrangement
+
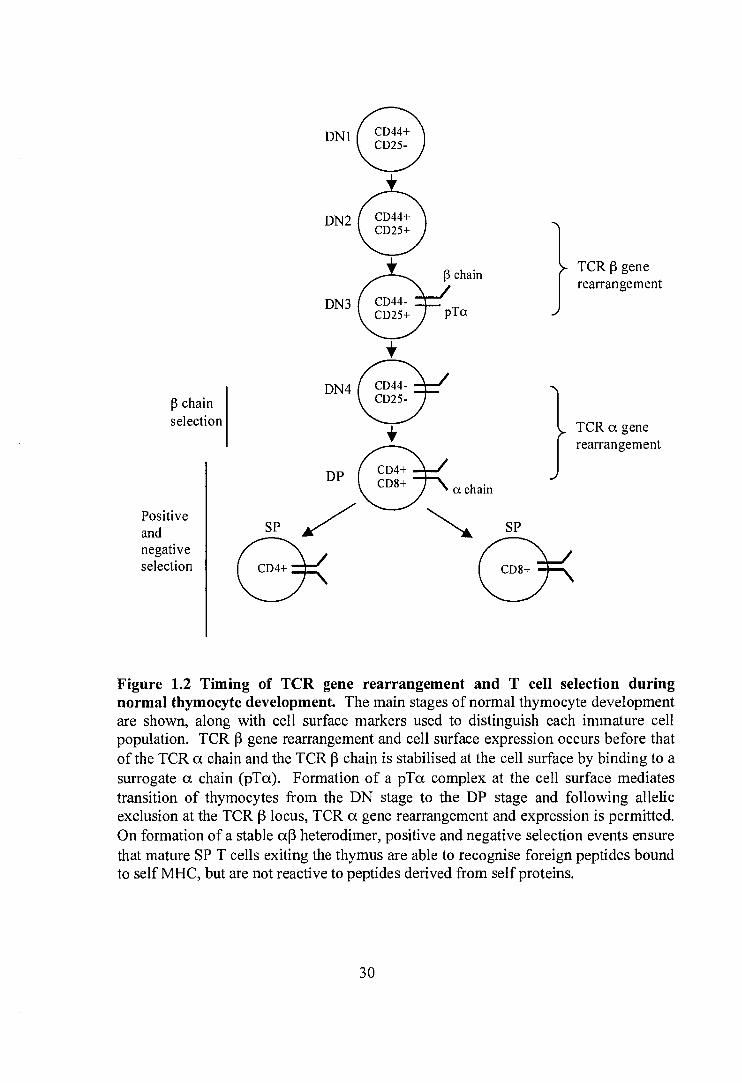
Figure 1.2 Timing of TCR gene rearrangement and T cell selection during normal thymocyte development. The main stages of normal thymocyte development are shown, along with cell surface markers used to distinguish each immature cell population. TCR (3 gene rearrangement and cell surface expression occurs before that of the TCR a chain and the TCR (3 chain is stabilised at the cell surface by binding to a surrogate a chain (pTa). Formation of a pTa complex at the cell surface mediates transition of thymocytes from the DN stage to the DP stage and following allelic exclusion at the TCR (3 locus, TCR a gene rearrangement and expression is permitted. On formation of a stable a13 heterodimer, positive and negative selection events ensure that mature SP T cells exiting the thymus are able to recognise foreign peptides bound to self MHC, but are not reactive to peptides derived from self proteins.
30

recombination, demonstrated expression of the TCR (3 chain on the cell surface of DN
thymocytes in the absence of the a chain (Hiroyki et al., 1991). Stable cell surface
expression of the 13 chain is permitted by the formation of a heterodimer with a 33 kDa
glycoprotein known as the pre-TCR a chain (Groettrup et al., 1993). af3 T cell
development is found to be severely impaired in animals that lack the pre-TCR a gene
(Fehling et al., 1995), with T cell development blocked at the transition between DN
and DP thymocytes (figure 1.2), although the block is incomplete compared to that
seen in the absence of the 13 chain (Mombaerts et al., 1992b). This finding implies that
proteins other than the pre-TCR a (pTa) are able to facilitate transition of thymocytes
from DN to DP and indeed in pTa deficient mice, a13 TCR complexes can rescue T
cell development and promote maturation and expansion of T cells expressing a
productively rearranged (3 chain (Buer et al., 1997). However, the a chain cannot act
as a direct substitute for pTa, as T cells manipulated to express a TCR a chain at the
point of normal pTa gene expression, but lacking endogenous pTa, demonstrate
impaired development, proliferation and differentiation (Borowski et al., 2004). In
this study, inefficiencies in T cell development and survival were partly overcome by
expression of a hybrid TCR a chain, containing the cytoplasmic domain of pTa, and
multiple lines of evidence now point to an important role for pTa in mediating
signalling events that promote T cell development and allelic exclusion at the TCR p
locus. pTa is a type 1 transmembrane protein (Saint-Ruf et al., 1994) which pairs
with the TCR p chain via a disulphide bond. The extracellular portion of the protein is
an immunoglobulin (Ig) like domain and the intracellular cytoplasmic tail contains
several potential phosphorylation sites and a Src homology 3 (SH3) domain binding
sequence. Mutation studies of this cytoplasmic tail have demonstrated an important
role in T cell development (Aifantis et al., 2002) and in intracellular Ca2+ mobilisation,
an important mediator of intracellular signalling events which has been shown to
increase, alongside activation of the transcription factors NF-KB and NFAT, during
constitutive signalling through the pre-TCR complex (Aifantis et al., 2001). The
process by which a developing lymphocyte expressing a pre-TCR (TCR (3 / pTa)
complex is permitted to move from the DN to DP compartment of the thymus, thereby
31

undergoing proliferation and escape from apoptosis, is known as p selection and is
accompanied by allelic exclusion at the TCR (3 locus, ensuring that each developing T
cell expresses a single TCR (3 chain. Signalling through the pre-TCR is known to be
important in this allelic exclusion as thymocytes from mice lacking pTa show an
increased number of cells with two rearranged TCR (3 alleles (Aifantis et al., 1997), a
finding also observed in mice lacking the signalling pathway adapter, SH2 Domain-
containing Leukocyte Protein (SLP)-76 (Aifantis et al., 1999). These SLP-76
knockout mice also show a block at the DN stage of thymocyte development, which
cannot be overcome by expression of TCR a and p chain transgenes. However,
signalling through the pre-TCR during (3 selection does not occur in isolation and other
signalling pathways, such as those initiated by the Notch receptor and its ligands have
also been shown to play a role (Ciofani et aL, 2004).
One of the functional outcomes of pre-TCR signalling, leading to allelic exclusion at
the TCR (3 locus, is the down regulation of the RAG genes responsible for gene
rearrangement (Wilson et al., 1994). Expression levels of RAG-1 and RAG-2 are high
at two stages during lymphocyte development. The first is early in DN thymocytes,
prior to (3 chain selection, and the second later in DP thymocytes, permitting
rearrangement at the TCR a locus (figure 1.2). Unlike the TCR (3 locus, both alleles
of the TCR a locus are permitted to undergo rearrangement simultaneously and this
rearrangement is not inhibited by expression of an aP TCR at the cell surface
(Borgulya et al., 1992). As such, rearrangement at the TCR a locus continues until an
a(3 pair on the surface of the T cell successfully engages with a major
histocompatibility complex molecule and results in positive selection and
downregulation of RAG gene expression (Brandle et al., 1992). A single TCR a allele
is able to make multiple rearrangements, so that if the first rearrangement does not
result in a functional TCR when paired with the TCR (3 chain expressed by that T cell,
the TCR a locus can excise the first rearrangement and recombine different V and J
genes upstream and downstream of the original rearrangement respectively in a
process termed TCR a chain revision (Marolleau et al., 1988). Mice engineered to
32

express a modified TCR a locus containing a very limited number of V and J genes,
which cannot undergo effective TCR cc chain revision, show a reduced number of a(3
T cells in the periphery (Huang et al., 2005), highlighting the importance of this
process in normal T cell development. At the point of TCR a chain rearrangement
and expression, the pre-TCR complex is downregulated from the cell surface via a
mechanism of competitive displacement (Trop et al., 2000). Immature double positive
thymocytes (TCRI') often express two cell surface TCR a chains, derived from each
TCR a, allele, both forming pairs with the same TCR 13 chain (Alam et al., 1995).
However, most mature thymocytes and peripheral T cells express just one cc(3 TCR
and this process of selection of one TCR cc chain over another is known as allelic
exclusion, although the functional rearrangement of both TCR cc chain alleles that can
precede exclusion makes it a functionally different process from that previously
described for allelic exclusion at the TCR (3 locus. Several different hypotheses have
been proposed to explain allelic exclusion of TCR a chains. The first proposes that
competition between the chains for pairing with a limited number of TCR (3 chain
molecules dictates which pair becomes dominant. This is supported by experiments
demonstrating good expression of both chains intracellularly, despite the presence of
just one on the cell surface, arguing against a mechanism of downregulation of one
chain (Alam and Gascoigne, 1998). However, T cells engineered to express two
independent TCRs, i.e. with different cc and (3 chains, still preferentially express just
one receptor at the cell surface, although both TCR proteins can be detected
intracellularly and the receptor which dominates is not fixed between T cell clones
(Sant'Angelo et al., 2001). This finding makes the competition hypothesis harder to
rationalise, but does point to a post-translational mechanism of control. A second
hypothesis proposes an active mechanism of exclusion whereby signalling events are
required to select one a(3 pair over another. In a study using immature thymocytes
expressing two TCR cc chains with different peptide specificities, allelic exclusion was
achieved upon ligand recognition with subsequent loss of the non-ligated receptor in
mature T cells (Boyd et al., 1998). This receptor specific signal for allelic exclusion
was also found to be CD45 dependent, implicating a mechanism of signalling through
33

the TCR, a finding subsequently supported by studies involving other mediators of the
TCR signalling pathway (Niederberger et al., 2003).
1.5 Thymic selection
The process of positive selection, whereby an ocr3 TCR demonstrates binding and
recognition of self-MHC, occurs in the thymic cortex. Interactions between T cells
and cortical thymic epithelial cells (cTECs) have been shown to be dependent upon
MHC (Bousso et al., 2002) and lead to the migration of thymocytes towards the
thymic medulla, a process mediated by the upregulation of chemokine receptors, such
as CCR7, and their ligands (Kwan and Killeen, 2004). In the thymic medulla T cells
interact with other cell types, such as dendritic cells (DCs) and medullary thymic
epithelial cells (mTECs), which present a diverse array of peptide/MHC complexes
with peptides derived from ubiquitously expressed, but also tissue specific proteins
(Sospedra et al., 1998). A high affinity interaction between an a(3 TCR and a self
peptide/MHC complex results in negative selection and deletion of the thymocyte
bearing the autoreactive TCR (Kappler et al., 1987) thus establishing tolerance to self
proteins. A recent study highlighting the importance of negative selection in
establishing tolerance used mice able to express an MHC molecule (IA") bound to just
a single peptide, permitting positive selection of thymocytes but severely impairing the
process of negative selection. The authors demonstrated that mature T cells specific
for this MHC molecule were highly cross reactive, not only recognising other peptides
bound to IA", but also binding other MHC alleles (Huseby et al., 2005).
Expression of peripheral antigens in the thymus was found to be a function of mTECs
(Derbrinksi et al., 2001) and in this study, expression of a peripheral protein in these
cells was found to be sufficient for the generation of peripheral tolerance. However,
although expression of the tissue specific antigen is a function of mTECs, they are not
necessarily the cell type that ultimately presents the antigen to the developing
lymphocyte. A study of antigen presentation in the thymus, using mice in which
mTECs could express ovalbumin (OVA) but not MHC class I, demonstrated that DCs
34

in the thymus could generate tolerance to this protein via a mechanism of indirect
antigen presentation (Gallegos and Bevan, 2004). Expression of tissue specific
antigens in mTECs is now known to be primarily mediated by the transcription factor
AIRE (Anderson et al., 2002), although some genes can still be upregulated in the
absence of this protein (Derbinski et al., 2005). Humans with mutations in the AIRE
gene suffer from systemic autoimmunity (Finnish-German APECED Consortium,
1997), as do AIRE deficient mice (Anderson et al., 2002). More recently, variations
between individuals in thymic expression levels of autoantigens controlled by the
AIRE protein, such as insulin, have been correlated with susceptibility to disease
(Taubert et al., 2007). However, thymic expression of a protein does not necessarily
result in efficient negative selection and tolerance. A study investigating tolerance
versus autoimmunity to the membrane protein H+/K+ ATPase, the main autoantigen of
autoimmune gastritis, found that although one subunit of the protein (H/Ka) is
expressed in the thymus, T cells specific for this molecule are not deleted (Allen et al.,
2005). The reason for this failure of negative selection was found to be the absence of
the (3 subunit (H/K(3), which is required to stabilise the H/Ka subunit in the
membrane. Many proteins are also expressed differentially between tissues as
different splice variants of the same gene. This can mean that, despite induction of
gene expression in the thymus during T cell development, the epitope associated with
disease is not encountered by autoreactive T cells until they reach the periphery (Klein
et al., 2000). Therefore, although the expression of tissue specific antigens in the
thymus is critical for the generation of self-tolerance, tolerance may be harder to
achieve for more complicated proteins with multiple subunits or complex genetic
expression mechanisms.
The main mechanism of central tolerance induction in the thymus is negative selection
by apoptosis. T cells deficient in two key pro-apoptotic proteins, Bak and Bax
demonstrate impaired thymocyte development, including an impaired ability to
undergo negative selection (Rathmell et al., 2002), and NOD mice, which display a
general susceptibility to autoimmunity, have been shown to have reduced expression
of another mediator of apoptosis, the bim protein (Liston et al., 2004). However, an
35

alternative mechanism of central tolerance, where T cells bearing autoreactive TCRs
are induced to acquire a regulatory T cell (CD4+CD25±) phenotype has also been
described (Jordan et al., 2001). T cells proceeding along this pathway of selection
have been shown to require a high affinity interaction with their peptide/MHC
complex. That a high affinity interaction between a TCR and self/peptide MHC in the
thymus can result in development of a regulatory T cell phenotype in some cases, but
apoptosis and negative selection in other cases, and that a low affinity interaction
spares the T cell from deletion resulting in positive selection (Alam et al., 1996),
raises important, but yet broadly unanswered questions about how the T cell interprets
a signal through the TCR to generate different functional outcomes. This issue will be
explored further in later sections discussing TCR structure, TCR signalling and T cell
differentiation.
1.6 Dual TCR expression
Although most mature CD4+ and CD8+ T cells express just a single type of al3 TCR at
the cell surface, allelic exclusion, particularly at the TCR a locus, is not always
complete. This results in the expression of two TCR a chains, each pairing with the
same TCR p chain to form two independent receptors (Padovan et al., 1993). It is
estimated that as many as 30% of peripheral human T cells (Padovan et al., 1993) and
10-30% of peripheral mouse T cells (Elliott and Altmann, 1995 and Sarukhan et al.,
1998) may carry dual a chains and although dual TCRs are most commonly associated
with incomplete allelic exclusion at the a locus, very low frequencies of T cells
expressing two p chains have also been reported (Padovan et al., 1995). Since the
demonstration of dual TCR expression on the surface of a single T cell in the
periphery, much attention has focussed on the potential implication of this finding in
terms of antigen specificity and autoimmunity. It has been postulated that autoreactive
TCRs may escape negative selection in the thymus by being expressed at low levels on
the surface of a T cell which is then subsequently positively selected based on low
affinity self peptide/MHC recognition by a second, more highly expressed, TCR. This
idea was supported by a study using dual TCR transgenic mice where one receptor,
36

specific for the natural self-antigen C5, was rescued from negative selection in the
thymi of C5+ mice by expression of a second unrelated TCR. Both TCRs were
present on the surface of mature T cells in the periphery, but levels of the autoreactive
TCR were very low and these CD8+ T cells were only able to mediate killing of a C5
carrying target cell when activated via the second TCR (Zal et al., 1996). That this
phenomenon may then lead to increased susceptibility to autoimmunity also has some
experimental support (Sarukhan et al., 1998). In this study a TCR transgenic model of
autoimmune diabetes was used to demonstrate that, in the context of an active central
tolerance mechanism, T cells expressing low levels of autoantigen specific TCR could
still be found in the periphery and that these cells also expressed a second TCR
molecule and were capable of causing disease. However, other studies in different
disease systems using mice hemizygous for the TCR a locus and therefore unable to
express dual TCRs have not always supported this link (Elliott and Altmann, 1996 and
Corthay et al., 2001). Another proposed implication of dual TCR expressing cells is
that they may serve to increase the repertoire of TCRs in the periphery which are
capable of binding to foreign peptides by rescuing from deletion those TCRs which do
not bind self peptide/MHC with high enough affinity to be positively selected in the
thymus (He et al., 2002).
1. 7 TCR editing and revision
Although discussions of negative selection in the thymus usually refer to deletion of a
T cell bearing an autoreactive TCR, there is some evidence that T cell apoptosis is not
always the default pathway for removing these receptors from the repertoire. As an
alternative, a mechanism of receptor editing has been proposed to occur whereby
autoreactive TCRs are internalised and further rearrangement at the TCR a locus is
permitted (McGargill et al., 2000). This was demonstrated using a transgenic TCR
specific for a peptide of OVA in a mouse expressing this peptide specifically in the
thymus. Why the binding of some autoreactive TCRs may activate this receptor
editing pathway of negative selection compared to the apoptotic pathway initiated by
others is not currently understood, but does seem to be an outcome intrinsic to the
37

TCR and antigen being recognised. When a different TCR (2C) and ligand (HY) were
used in the system described above, deletion was the main outcome (Mayerova and
Hogquist, 2004) and the choice between receptor editing and deletion was found to be
unaffected by the cell type involved in presentation of the antigen within the thymus.
When a T cell exits the thymus and enters the peripheral immune system, the TCR(s)
it bears on the cell surface are generally considered to be fixed, i.e. no further changes
in TCR sequence occur. However, a study using a TCR Vp5 transgenic mouse
demonstrated that the RAG genes could be re-expressed in peripheral CD4+ T
lymphocytes, and that active V(D)J recombination was detectable in these cells
(McMahan and Fink, 1998). In this study, this process of receptor revision was seen
to occur over time, with numbers of V135+ cells in the periphery decreasing as mice
aged, but it has also been reported to occur in response to stimulation with
superantigen (Huang et al., 2002) and the notion that receptor revision is restricted to
recent thymic emigrants still undergoing secondary rearrangement events has also
been challenged (Cooper et al., 2003). Any changes in the TCR of a T cell once in the
periphery and out of reach of thymic selection could be potentially dangerous to self
as, although receptor revision may serve as a mechanism of peripheral tolerance and
deletion, the generation of autoreactive TCR is also a possibility. In one study using
non-obese diabetic (NOD) mice, which are susceptible to autoimmune diabetes, a
population of peripheral, autoagressive, CD40+ T cells were seen to express RAG
genes and alter their surface expression of Va (Vaitaitis et al., 2003). However, a
good understanding of the importance of TCR revision in relation to disease
mechanisms, peripheral tolerance or TCR repertoire expansion is still lacking.
1.8 Structure of the TCR/CD3 signalling complex
As previously discussed, the ar3 and y8 TCRs are both transmembrane heterodimers
whose individual subunits are composed of rearranged V, D, J and C region
sequences. Many crystal structures for both al3 TCRs and yo TCRs have now been
solved (e.g. Garcia et al., 1996 and Allison et al., 2001). Each TCR chain is revealed
38

to form 2 immunoglobulin (Ig) like domains on the extracellular side of the cell
membrane, one composed of rearranged V, D and J sequences and the other formed
from part of the C region, although the Ig fold formed by the Ca region is atypical due
to the absence of a top (3 sheet. A connecting peptide, the transmembrane domain and
a short cytoplasmic tail are also encoded by the C regions and the two chains of each
TCR are joined together by disulphide bonds. Cell surface expression of the TCR
heterodimer is stabilised by, and is indeed dependent upon, association with another 3
protein dimers (CD3ye, CD38E and CD3t) and a TCR molecule at the cell surface in
association with these additional polypeptides is known as the TCR/CD3complex
(Samelson et al., 1985, Sussman et al., 1988 and Geisler, 1992). The extracellular
domains of the y,E, and 8 chains also form Ig folds (Arnett et al., 2004 and Kjer-
Nielsen et al., 2004) while the extracellular domains of the chains are only 9 amino
acids in length and are of unknown structure. A schematic diagram of the 4 protein
dimers that make up the TCR/CD3 complex is shown in figure 1.3. However,
although the identity of the components of the complex are now fairly well
established, the lack of a crystal structure for the complex in its entirety means that our
understanding of the three dimensional organization of the complex is still incomplete.
Although precise interactions between subunits, particularly the extracellular portions
are ill defined, acidic and basic charged residues in the transmembrane helices of TCR
and CD3 subunits, which are highly conserved, are known to play an important role in
complex assembly (Call et al., 2002). In this study, isolation of radiolabelled
assembly intermediates from the cell endoplasmic reticulum (ER), and a mutagenesis
approach, allowed the exact transmembrane residue requirements of each intermediate
to be determined. It was found that the intermediates of (TCRa - CD38E), (TCR(i -
CD3yE) and (TCRa - CD3) all required one basic and two acid residues for
assembly with the basic residues provided by transmembrane regions of the TCR
chains and acidic residues by transmembrane regions of the CD3 chains. This study
also provided evidence that each TCR/CD3 complex contained just a single TCR aP
heterodimer, a concept that has been controversial, with other groups reporting
evidence of multiple aP molecules per complex (Fernandez-Miguel et al., 1999). To
date, the exact stoichiometry of the TCR/CD3 complex is still debated, but more
39

H
(Raf--1)
CSIlfjneurin
Transcriptional activation
TCR
8 6
CD4
Figure 1.3 Signalling pathways downstream of the T cell receptor. This schematic diagram shows the major components of the intracellular signalling pathways of T cell activation but does not cover all known proteins and interactions. Phosphorylation of ITAM motifs in the intracellular domains of the CD3 proteins by Lck results in recruitment and activation of ZAP-70. ZAP-70 phosphorylates the adaptor molecule LAT, which is then able to recruit a multitude of other adapter proteins and enzymes ultimately leading to activation of the transcriptional activation by the transcription factors AP-1, NF-xl3 and NFAT
40

recent evidence points towards the existence of both monovalent and multivalent
complexes on the cell surface (Schamel et al., 2005) a finding that may have important
implications for current models of TCR signalling.
Much is now known about the nature of the intracellular signalling events that occur
following ligation of the TCR with a peptide/MHC complex (pMHC). A review of all
of the different kinases, phosphatases and adapter molecules currently known to be
involved in the propagation of a productive TCR signal will not be attempted here, but
the main components of the signalling cascade are shown in figure 1.3. The earliest
signalling events following TCR ligation are phosphorylation of immunoreceptor-
tyrosine-based activation motif (ITAM) tyrosines in the intracellular domains of CD3
chains by the Src family kinases Lck and Fyn, although the contribution of Fyn under
normal physiological conditions is thought to be minimal as it is largely unable to
compensate for the loss of a functional Lck molecule (Straus and Weiss, 1992). The
CD3 y, 8 and 6 chains each contain 1 ITAM while the CD3 chain contains 3 and
phosphorylation of these motifs creates docking sites for the Src homology 2 (SH2)
domains of the Syk family kinase ZAP-70 (Chan et al., 1991). Expression of the
ITAM containing region of the CD3 chain as a chimeric transmembrane protein that
is oligomerized by an extracellular stimulus such as a monoclonal antibody (Irving and
Weiss, 1991) or the aggregation of chimeric proteins bearing ZAP-20 and Fyn as their
intracellular components (Kolanus et al., 1993) are both able to transduce normal
activation signals by themselves, independently of the rest of the TCR complex.
Recruitment of ZAP-70 to the TCR/CD3 signalling complex results in
phosphorylation of ZAP-70 by Lck at position Tyr-493 (Chan et al., 1995) and the
critical importance of this molecule in normal T cell function is clear from the severe
immunodeficiencies in both CD8÷ and CD4+ responses in patients which lack a
functional ZAP-70 protein (Elder et al., 1994). Activated ZAP-70 then itself
phosphorylates the adapter protein LAT (linker for activation of T cells) (Zhang et al.,
1998), the multiple phosphotyrosine residues of which act to recruit the many other
enzymes and linker proteins involved in the main Ras and Ca2+ mediated pathways of
cell signalling (Zhang et al., 1999). Activation of these signalling pathways ultimately
41

lead to the activation of transcription factors such as AP-1 and NFAT (figure 1.3)
which then act, often cooperatively (Jain et al., 1992) to direct the expression of the
many different genes known to be upregulated during T cell activation. Binding sites
for these transcription factors were originally identified in regulatory regions upstream
of the interleukin-2 (IL-2) gene (Serfling et al., 1989 and Shaw et al., 1988) but a role
in regulation of expression of many other proteins, particularly cytokine genes, is now
known. Mice with T cells that lack the main lymphocyte NFAT proteins, NFAT1 and
NFAT2, show deficiencies in many of the main effector outcomes of T cell activation
(Peng et al., 2001) such as cytotoxicity, due to failure to upregulate effector molecules
such as CD40 ligand and Fas ligand, and cytokine production, with production of
cytokines such as IL-2, interferon-y (IFN-y), IL-4, IL-10, IL-5, and tumor necrosis
factor-a (TNF-a) all severely impaired in these animals. The question of whether
these generic T cell activation transcription factors can influence the effector
phenotype of an activated T cell, for example in determining whether a T cell
differentiates to become a Thl cell, producing predominantly IL-2 and IFN-y, or a Th2
cell, producing cytokines such as IL-4, IL-5 and IL-13, has been much debated. The
processes governing Thl and Th2 T cell differentiation will be discussed in more
detail in a later section, but important studies addressing this issue include those
utilising mice deficient in one or other of the NFAT1 and NFAT2 proteins. Mice
lacking NFAT1 show impaired IFN-y production by activated T cells (Kiani et al.,
2001), are more susceptible to infections that rely on the development of a Thl
effector cell response (Kiani et al., 1997) and show exacerbated Th2 type responses
(Ranger et al., 1998a). Conversely, NFAT2 deficient T cells show impaired IL-4
production (Yoshida et al., 1998) and reduced titres of the IL-4 dependent antibody
isotypes IgG1 and IgE (Ranger et al., 1998b). However, from more recent data, the
simplistic explanation of these knockout studies, that NFAT1 positively regulates Thl
cell differentiation but negatively regulates Th2 cell differentiation and that NFAT2 is
required for Th2 cell differentiation, has not held true. Expression of constitutively
active forms of NFAT1 and NFAT2 are both able to induce transcription of Thl
(Porter and Clipstone, 2002) and Th2 cytokines (Monticelli and Rao, 2002) and
cooperative binding of NFAT1 with Thl and Th2 lineage specific transcription factors
42

has been demonstrated in vivo at the promoter regions of both the IFN-y and IL-4
genes (Avni et al., 2002).
Although the TCR signalling cascade discussed in brief above was described as being
mediated by a series of phosphorylation events, effective control over TCR signalling
also requires the coordinated action of tyrosine phosphatases. Upon TCR engagement,
increased protein tyrosine phosphorylation within the cell is detectable within a matter
of just a few seconds (June et al., 1990). However, to be a well controlled signalling
mechanism, the tyrosine residues in question must be kept in an unphosphorylated
state prior to TCR ligation. In keeping with this, treatment of T cells with
pervanadate, a protein tyrosine phosphatase inhibitor, results in activation of some of
the tyrosine kinase mediated signalling events normally associated with ligation of the
TCR, such as activation of Lck, and the induction of some effector outcomes of TCR
signalling, such as production of IL-2 (Secrist et al., 1993). In relation to T cell
signalling, the most well studied tyrosine phosphatase protein to date is CD45 (Tonks
et al., 1988). CD45 is a membrane bound protein expressed on the surface of all
nucleated hematopoietic cells, a deficiency in which results in profound defects in T
cell development and function (Mee et al., 1999 and Weaver et al., 1991). Perhaps
counter intuitively to the findings of the pervanadate experiment described above,
CD45-/- T cells show an increase in the strength of the TCR stimulus that is required
for TCR signalling (Mee et al., 1999). This can be explained by the action of CD45
phosphatase activity on the protein tyrosine kinase, Lck. CD45 activity was found to
keep Lck in an easily activated form by removal of a tyrosine phosphate that
negatively regulates the kinase activity of this protein (Mustelin et al., 1989). The
balance between phosphorylation and dephosphorylation of proteins that make up and
surround the TCR/CD3 signalling complex is therefore of paramount importance in
dictating whether or not a TCR mediated signalling event is propagated into the T cell.
How ligation of the TCR leads to the triggering of these signalling events and how the
nature of ligand binding to TCR is interpreted by the signalling machinery to lead to
different T cell effector outcomes is still very poorly understood and multiple different
models of TCR triggering have been proposed.
43

1.9 pMHC binding by TCR
Although the way in which the TCR activation signal is propagated from TCR ligation
to initiation of intracellular signalling events is poorly defined, better understood is the
nature of the physical interaction between the TCR and its pMHC, studies of which
have helped to shed some light on possible mechanisms of TCR triggering. Despite
the technical difficulties involved in crystallising complexes of multiple, multimeric,
transmembrane proteins, the crystal structures of at least 24 TCRs bound to either
class I or class II pMHC complexes have been solved (Garcia et al., 1996 and
Reinherz et al., 1999). In terms of the pMHC structure being recognised by the TCR,
the general architecture of class I and class II MHC molecule peptide binding grooves
are quite similar, with the floor of the groove formed by a seven stranded (3 sheet and
sides of the groove by two long a helices. However, differences in the pMHC surface
which must be bound by TCR are brought about by the different lengths of peptide
bound preferentially by each class of MHC, with class I molecules tending to bind
shorter peptides than those bound by class II molecules (Stern and Wiley, 1994).
Class I MHC molecules generally bind peptides of 8-10 residues in length, the termini
of which are anchored into the peptide binding groove by conserved, MHC allele
specific, pockets (Colbert et al., 1993). These conserved pockets mean that allele
specific motifs in peptides binding to a particular MHC molecule have also been
identified (Falk et al., 1991). The anchoring of peptide termini in MHC class I
complexes results in longer peptides being forced to bulge out of the binding groove
(Speir et al., 2001) and, along with generally shallower binding of peptide in the
groove, means that peptide residues in MHC class I complexes are generally more
accessible to the TCR. However, as the termini of peptides bound to MHC class II
molecules are not fixed, and class II molecules are able to bind peptides of
significantly longer length, peptide termini extending from the ends of MHC class II
peptide binding grooves can also play a major role in interacting with the TCR
(Carson et al., 1997). Despite recognition of different MHC molecules bound to
peptides of different lengths and conformations, the general orientation of the TCR,
with respect to pMHC, upon binding is seen to be relatively similar between
44
complexes. Generally the TCR molecule binds such that its orientation is diagonal
with respect to the MHC peptide-binding groove. The Va and VP domains of the
TCR lie over the N and C terminal portions of the peptide respectively and the
majority of peptide contacts are made via the hypervariable CDR3a and CDR.3(3
loops. Contacts with the MHC a helices that form the walls of the peptide binding
groove are made predominantly by the less variable and germline encoded CDR1 and
CDR2 regions, although peptide contacts with these loops have also been noted
(Garcia et al., 1996). Although, from the structural data obtained to date for different
TCR/pMHC complexes, this diagonal mode of binding is by far the most commonly
observed, there are notable exceptions. For example, recently solved structures of two
autoimmune TCRs binding to their pMHC ligands revealed that compared to other
conventional TCR binding positions, these MBP specific autoimmune TCRs were not
centred over the pMHC surface, but were shifted towards the N terminus of the
peptide (Hahn et al., 2005 and Li et al., 2005). Determining whether an unusual
binding pattern is a general feature of autoreactive TCRs requires the resolution of
many more structures, not least because the features of a TCR or pMHC that define
conventional binding are still not clear. Although at the level of each individual
TCR/pMHC whose structure has been solved, the precise residues involved in binding
of the TCR in this orientation can be identified, there are as yet no general rules to
describe the location and identity of residues involved in this docking and resultant
MHC restriction of TCR. Indeed, different TCRs recognising the same pMHC
complex have been shown to use assume the same orientation, yet use completely
different TCR amino acids for binding (Ding et al., 1998) and in a recent study, the
same TCR was shown to utilise different binding residues and adopt an altered
orientation when binding to a self versus a foreign MHC molecule (Colf et al., 2007).
This data argues against the presence of conserved residues in TCR molecules that
dictate binding orientation, although some amino acid positions are suggested to make
more frequent contacts than others and analysis of TCR reactivity to MHC from T
cells which had not undergone negative or positive selection suggested that MHC
reactivity is indeed an inherent feature of TCR germline sequences (Zerrahn et al.,
1997). More convincing data to explain MHC restriction comes from study of
45

residues in the MHC molecule itself. When all known structures are compared,
several MHC residues are consistently observed to make important contacts, for
example residues a65 and a155 of MHC class I molecules. These residues were also
recently shown to be 2 of only 3 residues involved in binding to TCR in a complex
with a highly bulged peptide which severely restricted possible TCR/MHC
interactions (Tynan et al., 2005). The authors of this study proposed binding via these
residues to comprise the minimal "generic footprint" of MHC restriction, but in the
absence of many more conserved TCR and MHC contacts other mechanisms that drive
the docking of the TCR with a pMHC complex have been proposed. To reconcile the
need for a TCR to scan many different pMHC complexes on the surface of an APC but
then to initiate signalling and T cell activation only when specific binding is achieved,
a two step mechanism of TCR binding to pMHC has been put forward (Wu et al.,
2002). This study, using a mutagenesis approach and measurement of TCR/pMHC
binding interactions using surface plasmon resonance, demonstrated that mutation of
MHC contact residues had a profound effect on initial association of the TCR with
pMHC but that these residues contributed very little to the overall stability of the
interaction. Conversely, mutations of peptide contacts profoundly influenced the
stability of the complex, affecting off rates of binding, but made only a minor
contribution to complex association. The model therefore proposes that initial
interactions between the TCR and MHC guide and position the receptor over the
peptide ligand and that the TCR, most likely using the CDR3 loops, then forms a more
stable interaction with its ligand which, if of sufficiently high affinity, will allow
transmission of a positive signal and activation of the T cell.
1.10 TCR binding affinity and conformational change
Interactions between TCRs and pMHC are usually characterised as being of relatively
low affinity with slow association rates and faster dissociation rates (Matsui et al.,
1994). That the low affinity of this interaction may be due to insufficient contacts
between the TCR and the pMHC is not supported by extensive interactions revealed
by structural studies. Instead, the demonstration that the kinetics of binding becomes
46

faster with increased temperature (Boniface et al., 1999) led to an induced fit model of
TCR binding where productive binding required the TCR to overcome a large energy
barrier. Calculation of binding energies showed that binding was associated with
unfavourable changes in entropy (Willcox et al., 1999), which suggests an increase in
molecule ordering. This could be brought about by conformational changes, and as a
consequence reduced flexibility, of a part of the TCR/pMHC complex itself, or by the
incorporation of ordered water molecules at the binding interface. As water molecules
are excluded from the TCR/pMHC interface upon binding this does not seem a likely
explanation for unfavourable entropy. Instead, structural studies support a model in
which parts of the TCR, particularly the CDR3 loops, undergo a conformational
change on binding, such that a greater number of contacts are made with the peptide
and stability of the complex is increased (Garcia et al., 1998 and Reiser et al., 2002).
However, a more recent analysis of the well studied LC13 TCR, specific for an
Epstein-Barr virus (EBV) peptide, showed that not all TCR/pMHC interactions
conform to this thermodynamic model of binding (Ely et al., 2006). In this study,
CDR loops were found to be well ordered in the unliganded state suggesting that in
this case, although a conformational change did occur on binding, binding was
entropically favoured rather than disfavoured. Another study with the same TCR
molecule used mutagenesis and surface plasmon resonance to examine the
contribution of binding energy from the CDR1, CDR2 and CDR3 loops of this
receptor. Contrary to the two-step mechanism of binding described above, the CDR1
and CDR2 loops were found to contribute only minimally to ligand binding with
stabilization of the complex mediated mainly by the CDR3 loops (Borg et al., 2005).
Despite increasingly apparent differences in the binding mechanisms employed by
different TCR/pMHC complexes, the important contribution made by the CDR3 loops
to binding affinity and specificity, but also degeneracy, is clear. That the flexibility of
the CDR3 loops, and therefore their ability to undergo conformational change on
ligand binding, could explain how a single receptor is able cross react with multiple
peptides, has been demonstrated using structural studies where the structure of a single
TCR was solved in complex with different peptides bound to the same MHC molecule
(Reiser et al., 2003). CDR3 loops were found to adopt very different conformations
47

depending on the ligand bound, although changes in other parts of the molecule were
also observed. Indeed, specificity of binding has recently been shown to be influenced
by residues of the pMHC molecule that do not make any direct contacts with the TCR
molecule at all (Huseby et al., 2006).
Despite the ability of many TCRs to bind multiple ligands, the affinity of this binding
is invariably not the same. That this is because the TCR molecule is flexible only up
to a point was addressed in a recent study using a single TCR recognising 3
structurally distinct peptides (Mazza et al., 2007). Although overall binding
orientations in the 3 structures were comparable, different peptide structures forced
some adaptation of the TCR molecule which, when combined with the retention of
many TCR/MHCa helix contacts, resulted in suboptimal and lower affinity binding
interactions with some peptides compared to others. Suboptimal binding was
associated with impaired effector outcomes of T cell activation, such as reduced
proliferation and IL-2 production. The observation that TCR/pMHC interactions of
different affinity can result in different functional outcomes for the T cell is a well
documented one (Sykulev et al., 1994, Matsui et al., 1994). Studies linking TCR
binding affinity to effector outcome have been used to investigate processes such as
thymocyte positive selection (Alam et al., 1996) and many different groups have
reported the ability to generate receptors with increased affinity for pMHC by
mutating residues of the TCR, most commonly in the CDR1, CDR2 or CDR3 regions
(Chlewicki et al., 2005 and Manning et al., 1999). However, as mentioned previously,
the way in which information about the affinity of the TCR binding interaction is
transmitted into the cell to initiate the TCR signalling machinery, and how different
biological outcomes might arise from the transmission of this information is still
poorly understood. Some of the different mechanisms that have been proposed to
explain the process of TCR triggering are discussed below.
48

1.11 TCR triggering
The two earliest models of TCR triggering were based on the concepts of
multimerization and conformational change. The multimerization model proposed
that specific pMHC binding by TCRs would result in clustering of pMHC/TCR
complexes at the cell surface, bringing intracellular signalling molecules into close
proximity with one another and allowing signalling to be initiated. Evidence was
provided by the demonstration that, in solution, TCR/pMHC complexes could
oligomerise upon ligand binding (Reich et al., 1997). However, these results were
subsequently disputed (Baker and Wiley, 2001) and, as this model requires the
simultaneous ligation of multiple TCR molecules, the observation that a T cell could
be activated by just a single pMHC could not be explained (Sykulev et al., 1996 and
Irvine et al., 2002). To resolve this problem variants of the multimerization model
have been proposed (Trautrnann and Randriamampita, 2003), such as the
heterodimerization model, where triggering is initiated by simultaneous pMHC
binding of the TCR and its CD4 or CD8 co-receptor (Delon et al., 1998), and the
pseudo-dimerisation model, where TCR oligomers form by engagement of both
specific peptide and self peptide MHC (Irvine et al., 2002). As for the
multimerization model however, some data remains unexplained by these
mechanisms. Mice that lack co-receptors are still able to mount effector T cell
responses (Schilham et al., 1993) and the same is true for T cells with greatly reduced
expression of self-peptide MHC (Sporri and e Sousa, 2002). Conformational change
has been another mechanism proposed to explain TCR triggering. Small scale
conformational changes that occur in the TCR molecule, particularly the CDR loops,
upon ligand binding have now been noted from comparisons of non-ligated and ligated
structures of several TCRs (Garcia et al., 1998 and Reiser et al., 2002). However,
with the exception of one study, where upon ligand binding a conformational change
in the TCRa constant domain was observed (Kjer-Nielsen et al., 2003), large
conformational changes in the extracellular domains or constant regions of the TCR
have not been seen and so argue against a mechanism of signal transduction by
conformational changes through the TCRaf3 heterodimer itself. In support of a
49
conformational change mechanism though, thermodynamic data of TCR binding does
find a relationship between flexibility at the TCR/pMHC interface and T cell
activation (Krogsgaard et al., 2003) and more recently attention has focused on the
idea that binding induces changes in the structural relationship between the TCRar3
heterodimer and CD3 components of the signalling complex. A study using a yeast
two-hybrid approach, to identify molecules that bind to the CD3 subunits of the
signalling complex during T cell activation, showed that an adaptor protein, Nck,
binds to a proline-rich sequence present in the cytoplasmic tail of CDR. This
sequence was only available for Nck binding following ligation of the TCR and was
proposed to be exposed as a consequence of a conformational change induced by
ligand binding (Gil et al., 2002). Studies subsequently showed that this
conformational change occurred in thymocytes upon presentation by MHC of both
positively and negatively selecting peptides (Gil et al., 2005) although more recently
conformational change was found to be more associated with thymocytes undergoing
negative selection than positive selection (Risueno et al., 2006) suggesting that rather
than being an all or nothing event, conformational change could be a mechanism by
which the T cell could transmit information about the strength of TCR/pMHC
interactions. It remains to be seen whether the cytoplasmic tails of other CD3 proteins
may show similar rearrangements upon TCR ligation, and the normal T cell
development observed in mice that lack this proline rich sequence of CDR has called
into question the real importance of this conformational change in the mechanism of
TCR triggering (Szymczak et al., 2005).
A third model of TCR triggering also gaining experimental support is the kinetic
segregation model (van der Merwe et al., 2000). This model hypothesises that, in a
resting cell, phosphorylation of signalling molecules is maintained at a low level by
tyrosine phosphatases such as CD45 and CD148 and signalling is therefore not
initiated. Upon ligation of the TCR, proteins at the cell surface passively segregate
according to size, with larger molecules such as CD45, CD148 and LFA-1 becoming
separated from the smaller proteins that comprise the TCR signalling complex. The
exclusion of bulky phosphatases from around TCR signalling molecules means that,
50

once phosphorylated, they are more likely to remain that way and, as TCR/pMHC
binding would be likely to prohibit the diffusion of signalling complexes away from
these small contact zones, a TCR signal can be potentiated. The advantage of this
model over those already discussed is that it is able to explain observations of ligand-
independent triggering, for example where CTLA-4 is able to inhibit T cell activation
in the absence of its ligand, B7 (Chikuma et al., 2005), as the presence or absence of
phosphatases around the signalling machinery is mediated by passive diffusion rather
than a specific ligation signal. In support of this kinetic segregation model both CD45
and CD148 are found to be excluded from sites of TCR triggering (Bunnell et al.,
2002 and Lin and Weiss, 2003). In the study involving CD148 (Lin and Weiss, 2003),
chimeric proteins were used to demonstrate that exclusion was mediated, in large part,
by presence of the bulky extracellular domain of the protein and that if the intracellular
phosphatase domain was targeted to the immune synapse by creating a fusion protein
with the adapter molecule LAT, signalling through the TCR could be inhibited.
Further evidence that the segregation of molecules is dependent upon the sizes of their
extracellular domains and that this process is important in TCR triggering was also
provided by a study in which the size of an MHC class I extracellular domain was
increased using immunoglobulin spacers. A larger MHC molecule was associated
with reduced TCR triggering with very little depletion of CD45 at the site of cell
contact, but no effect on ligation of the TCR with pMHC was observed (Choudhuri et
al., 2005). That protein segregation alone is sufficient to mediate TCR triggering has
yet to be demonstrated and it is possible that several of the proposed mechanisms
discussed here may act together in controlling this process. Indeed a recent study
examining the requirement of the CDR conformational change for activation has
reported that the conformational change induced in this subunit must be accompanied
by TCR/pMHC clustering in order to be productive (Minguet et al., 2007).
Whatever the answer to the question of how TCR triggering is initiated, a slightly
separate issue is one of how the TCR signalling complex interprets the variable
binding properties of different pMHC ligands in order to generate different effector
outcomes, whether that be positive versus negative thymic selection (Alam et al.,
51

1996) or other effector decisions such as CD4+ T cell differentiation (Lezzi et al.,
1999). Differences in phosphorylation states of TCR signalling molecules in response
to different ligands have been well documented (Sloan-Lancaster et al., 1994 and
Madrenas et al., 1995) but several hypotheses exist for how these different signalling
patterns may be achieved. The idea that conformational changes may occur in the
signalling complex to different extents depending on the nature of the TCR/pMHC
binding interaction has been mentioned above, but currently there is very little data to
support this idea. More widely accepted is the view that information about binding is
transmitted into the cell via serial triggering events (Lanzavecchia et al., 1999) and
that signalling is therefore dependent upon the half-life or "dwell time" of the
TCR/pMHC complex. This model proposes that a threshold number of TCRs must be
engaged for T cell activation and that each pMHC can serially engage multiple TCRs.
The shorter the half-life of a pMHC, the less efficient the triggering will be and the
longer it will take to reach the required threshold. Equally however, if the half-life of
a complex exceeds the time required to trigger the TCR, efficiency of signalling will
also be decreased as less serial engagements will occur within a given time period.
Consistent with this theory were the findings of a mutagenesis study where mutations
in the antigen binding site of a TCR were used to increase or decrease the half-life of
the TCR/pMHC complex (Kalergis et al., 2001). Mutations that resulted in decreased
and increased half-lives of TCR/pMHC complexes, as measured by binding to pMHC
tetramers, both resulted in impaired T cell activation. Additional evidence that
TCR/pMHC complexes with a short half-life have been associated with incomplete
phosphorylation of the CD3 chain also supports this hypothesis (Kersh et al., 1998)
highlighting the importance of binding kinetics and serial phosphorylation events in
TCR signalling. Some data however remains unexplained by this model, such as the
observation that the binding of TCR/pMHC complexes with very similar half-lives can
result in very different functional outcomes (Baker et al., 2000).
Although the preceding discussion has addressed the central role of the TCR and its
associated signalling molecules in T cell activation, in a normal biological setting, the
complex does not act alone and many other molecules and mechanisms interact to
52

elicit the final effector outcome for the T cell. T cell contact with an antigen
presenting cell (APC) can last for many hours (Stoll et al., 2002). During this time
TCR/pMHC complexes, but also other receptor/ligand pairs including co-stimulatory
molecules (e.g. CD28-B7) and adhesion molecules (e.g. LFA-1-ICAM-1) accumulate
and adopt a defined arrangement at the T cell-APC interface which is now referred to
as the "immune synapse" (Monks et al., 1998). Although formation of the immune
synapse is dependent upon signalling through the TCR, the myriad of other molecules
present at this interface serves to highlight the many other mechanisms that must be
considered when deciphering the pathway to a functional outcome of T cell activation.
This thesis will attempt to define the role that cq3 TCR structure has in influencing the
outcome of CD4+ T cell differentiation into T cells of different effector phenotypes.
The nature of the signal that a T cell receives through its TCR is known to have some
influence over this process, but many other factors and signalling pathways have also
been implicated. The process of CD4÷ T cell differentiation and the mechanisms that
may be involved in its control are discussed below.
1.12 CD4+ T cell phenotype
The two major lineages of cq3 TCR bearing T cells that emerge from the thymus are
classified according to their expression of co-receptors. Cells bearing the co-receptor
CD8 are termed CD8+, but when activated are also referred to as cytotoxic T cells due
to their primary function in killing infected target cells (Blanchard et al., 1987). CD8+
T cells will not be discussed further here, but instead attention focussed on cells
bearing the co-receptor CD4, termed CD4+ T cells. CD4+ T cells are also known as T
helper (Th) cells and have been shown to play a role in many different types of
immune response, mainly through their ability to co-ordinate the actions of other cell
types into a response appropriate to the initial insult or infection. This functional
diversity of CD4+ T cells was partly explained by the findings of Mosmann et al. that
mouse CD4+ T cell clones could be classified into distinct populations (named Thl
and Th2) on the basis of their patterns of cytokine production. It was subsequently
53

found that these different cytokine patterns could be linked to the different functional
properties of these cells (Mosmann and Coffman, 1989). Thl cells produce mainly
IL-2 and IFN-y, are involved in cell mediated inflammatory reactions such as those in
response to bacterial infections (Andersen et al., 1995) and have been implicated in a
variety of autoimmune diseases (Trembleau et al., 1995). Th2 cells can produce IL-4,
IL-5, IL-9, IL-10 and IL-13 and are involved in expulsion of extracellular parasites
(Bancroft et al., 1994) as well as strong antibody reactions and allergy (Robinson et
al., 1992). This fundamental role of Thl and Th2 cells in adaptive immunity, and the
finding that populations of these highly polarised cells can be identified in a variety of
disease states means that there is much interest in understanding the mechanisms
involved in their generation. The many factors now known to be involved in Thl
versus Th2 differentiation, including the hypothesis that the structure of the ap TCR
may be important, are discussed in the section below. However, since the original
classification of CD4+ T cells into one or other of these subsets, other populations of
CD4+ T cells that are distinct from Thl or Th2 have also been identified.
Aside from Thl and Th2 effector cells, the CD4+ T cell subset on which the most
attention has been focused in recent years is the regulatory CD4+ T cell (Treg). Most
commonly, Tregs are now defined by the expression of CD4 and CD25 at the cell
surface and by their ability to downregulate the immune responses mediated by other
T cell subsets. Depletion of lymph node cells and splenocytes of CD4+CD25+ T cells,
and then transfer of the remaining cells into nude BALB/c mice, results in the
development of spontaneous autoimmune pathologies (Sakaguichi et al., 1995).
However, the mode of action of T„g cells remains ill defined. Cytokines that have
been implicated in the suppressive mechanisms of CD4+CD25+ T cells include IL-10
and transforming growth factor p (TGF(3). CD4+CD25+ T cells have been shown to
produce IL-10 in vivo (Annacker et al., 2001) and IL-10 production by these cells
mediates suppression of some forms of autoimmunity, although others are IL-10
independent (Surf-Payer and Cantor, 2001). For TGFP there is little evidence to
suggest that CD4+CD25+ T cells mediate suppression of CD4+ T cells via this
cytokine, but TGFP mediated suppression of CD8+ T cells has been documented
54

(Chen M et al., 2005). Other proposed modes of action are based on mechanisms of
direct cell-cell contact as T cells deficient in the co-stimulatory molecules CD80 and
CD86 are resistant to suppression (Paust et al., 2004). That regulatory T cells may
develop during the process of thymic selection has already been mentioned and central
to this process is TCR signalling. Mice deficient in two downstream molecules of
TCR signalling, Bc1-10 and PKC-O have reduced numbers of Treg cells (Schmidt-
Supprian et al., 2004) and understanding the signalling mechanisms and genetics of
Treg lineage commitment was greatly advanced by the identification of the supposed
CD4+CD25+ T cell specific transcription factor, Foxp3 (Hori et al., 2003 and Fontenot
et al., 2005). A recent study in which the Cre recombinase system of gene targeting
(discussed later) was used to ablate Foxp3 expression specifically in Treg cells resulted
in an altered cytokine expression profile towards Thl cytokines such as IL-2 and IFN-
y, an altered pattern of gene expression where genes known to be controlled by Foxp3
such as Socs2 and Ctla-4 were downregulated, and a loss of suppressor function
(Williams and Rudensky, 2007). Many gene targets of the Foxp3 transcription factor
are now being identified and the recent identification of other transcription factors that
cooperate with Foxp3 (Wu et al., 2006 and Ono et al., 2007) should enable rapid
identification of the patterns and sequences of gene expression that are required to
bestow regulatory cell phenotype and function.
Another CD4+ T cell lineage specific transcription factor recently identified is RORyt,
reported to be expressed by the newly described Th17 subset of CD4+ T cells (Ivanov
et al., 2006) that have been associated with inflammatory responses such as those seen
in autoimmunity (Langrish et al., 2005). Th17 cells were identified as a subset of T
cells whose differentiation could be induced by the cytokine IL-23 (Aggarwal et al.,
2003) and it is known that mice deficient in IL-23 are resistant to several autoimmune
diseases, such as experimental autoimmune encephalomyelitis (EAE) (Cua et al.,
2003). This link with IL-17 producing cells and the demonstration that
proteolipoprotein (PLP) specific, IL-17 producing T cells could induce EAE when
transferred into naive mice while classical Thl cells could not (Langrish et al., 2005)
helped to explain why previous data regarding the pathogenicity of Thl responses was
55

confusing. Data showing that ablation of Thl responses can in fact worsen
autoimmune disease (Ferber et al., 1996) can now be reconciled with data showing a
reciprocal relationship between Thl, Th2, Th17 and indeed Treg cells where cytokines
promoting the development of one subset act to prevent the development of others
(Park et al., 2005 and Bettelli et al., 2006). This concept of antagonistic development
of one subset by another will be discussed further in the section below in relation to
Thl and Th2 cell differentiation, but it is becoming ever clearer that the original
classification of CD4+ T cells into either Thl or Th2 is no longer by any means the
whole picture and it is likely that in the future, important roles of other subsets of
CD4+ T cells, in addition to the ones discussed here, will be elucidated.
1.13 Thl and Th2 cell differentiation
One of the most important and well described factors influencing CD4+ T cell
differentiation is local cytokine environment. Among the most well characterised Thl
promoting cytokines is IL-12. IL-12 is a heterodimer composed of p40 and p35
subunits, and is produced primarily by antigen presenting cells, including
macrophages, monocytes and dendritic cells (Macatonia et al., 1995). Mice deficient
in IL-12 are impaired, although not completely lacking, in their ability to produce
IFN-y and mount an effective Thl response (Magram et al., 1996) and exogenous
addition of this cytokine is now used extensively in vitro as a means to generate a Thl
phenotype in primary T cells. IL-12 acts via the signal transducer and activator of
transcription 4 (STAT4), following binding to the IL-12 receptor on the surface of the
T cell and, primarily, activation of this signalling pathway leads to the upregulation of
IFN-y expression (Thierfelder et al., 1996). The residual IFN-y production in IL-12
deficient mice also points towards the importance of other cytokines in the
development of Thl responses and IFN-y itself, as well as other cytokines such as IL-
18, IL-27 and IFN-a have all been implicated (Schmitt et al., 1994, Kohno et al.,
1997 and Hibbert et al., 2003). Important in the understanding of Thl phenotype
development was the discovery of the Thl lineage specific transcription factor, Tbet.
T-bet is a member of the T-box family of transcription factors and the antagonistic
56

nature of Thl versus Th2 differentiation is exemplified by the demonstration that IFN-
y production can be induced, and IL-4 and IL-5 production repressed, by the
introduction of Tbet into T cells that were defined as having a Th2 phenotype (Szabo
et al., 2000). In addition, mice lacking Tbet spontaneously develop a phenotype
similar to that seen in human asthma, a predominantly Th2 mediated disease (Finotto
et al., 2002). Lineage specific transcription factors identified in Th2 cells include
GATA-3 and c-maf (Zheng and Flavell, 1997 and Ho et al., 1996) and as observed for
T-bet, ectopic expression of GATA-3 can induce Th2 cytokine production in
committed Thl cells (Lee et al., 2000). GATA-3 expression is induced in Th2
differentiating cells by the transcription factor STAT6, which is activated by T cell
binding of the main Th2 promoting cytokine, IL-4. Additionally very recent data
suggests that GATA-3 expression is additionally regulated by Notch signals (Fang et
al., 2007). T cells from IL-4, STAT6 and GATA-3 knockout mice are all greatly
impaired in their ability to undergo differentiation into Th2 cells (Kopf et al., 1993,
Shimoda et al., 1996 and Pai et al., 2004). Less is known about the regulation of the
c-maf transcription factor, but more recently signalling via IL-6 and the TCR were
both implicated (Yang et al., 2005). A schematic diagram of the main cytokines and
transcription factors involved in the differentiation of Thl and Th2 cells is shown in
figure 1.4. As well as the action of Thl and Th2 associated transcription factors in
directly promoting the expression of some cytokines and repression of others,
epigenetic mechanisms involving chromatin remodelling and locus accessibility have
been proposed to explain the fixed phenotype of fully differentiated T cells and the
heritability of phenotype as cells proliferate and clonally expand during the course of
an immune response. In support of this, additional DNase I hypersensitivity sites
(HS), indicators of increased locus accessibility, appear at the 114 locus and Ifng locus
in Th2 and Thl differentiating cells respectively (Agarwal and Rao, 1998) and
changes in acetylation and methylation, other markers of chromatin remodelling, have
also been observed (Avni et al., 2002 and Lee et al., 2002). There is evidence that
lineage specific transcription factors are involved in mediating these epigenetic
changes, with ectopic expression of GATA-3 able to mediate chromatin remodelling at
the 114 locus, even in Thl cells (Lee et al., 2000). However, a direct role for T-bet in
57

Naïve CD4f T cell
Thl CD4+ T cell Th2 CD4+ T cell
Figure 1.4 Cytokine environment and CD4+ T cell differentiation. Cytokines IL-12 and IL-4 promote Thl and Th2 cell differentiation respectively. Intracellular signalling pathways activated by TCR and cytokine receptor ligation result in activation of the Stat protein and lineage specific transcription factors Tbet, GATA3 and cMaf. These transcription factors drive the expression of genes for Thl and Th2 CD4+ T cell differentiation, including the cytokines IFN-y and IL-4 which act to potentiate the development of Thl and Th2 cell lineages respectively.
58

modifications at the Ifng locus has recently been questioned with evidence suggesting
that previously observed remodelling events at this locus maybe an indirect
consequence of GATA-3 downregulation by the Thl transcription factor (Usui et al.,
2006).
With the clear importance of cytokines in the process of CD4+ T cell differentiation, it
follows that APCs, as the primary source of these cytokines during the initiation phase
of an immune response, should also have an important role to play. The types of
cytokines that an APC produces are greatly dependent upon the type of pathogen or
stimulus that it meets. For example, dendritic cells mature into Th2 promoting
effectors (DC2s) in the presence of protein extract from the parasite Schistosoma
mansoni, but Thl promoting effectors (DC1s) result from exposure to toxins from
intracellular bacteria (de Jong et al., 2002). Differential activation of Toll like
receptors (TLRs) is proposed as one mechanism by which these different APC
phenotypes arise. In one study, using an OVA based disease induction protocol, TLR2
ligation was associated with promotion of a Th2 type immune response, but TLR9
ligation with a more Thl type response (Redecke et al., 2004) and dendritic cells
isolated from BALB/c mice infected with Chlarnydia show increased expression of
TLR9 and can inhibit in vivo allergic responses to OVA when adoptively transferred
(Han et al., 2004). However, understanding the possible effects of TLR ligation on
differentiation are complicated by the presence of TLRs on T cells as well as APCs
and a recent study has linked direct ligation of TLR2 on T cells to activation of Thl
effector functions in already differentiated T cells (Imanishi et al., 2007). Also to be
considered is the timing, cytokine environment and location of APC activation.
Highlighting the temporal and historic importance of APC activation, one study
showed that mice infected with Influenza virus 30 days before exposure to allergen
developed more severe allergic disease than control animals (Dahl et al., 2004). The
cytokine environment of the APC itself at the time of activation was also shown to
have an influence on T cell differentiation in a murine model of Leishmania infection.
BALB/c mice are normally susceptible to this pathogen as a result of a dominant Th2
immune response. When IL-4 was present in vivo during initial activation of DCs,
59

rather than during T cell priming, mice developed a Thl response and were resistant to
disease (Biedermann et al., 2001). Other evidence suggests that the site at which the
APC encounters antigen is also important and several studies have shown that antigen
encountered by APC at mucosal sites, such as the lung and the intestine, preferentially
induce Th2 cell differentiation, even in mouse strains that are strongly biased towards
the development of Thl CD4 T cells (Constant et al., 2000 and Iwasaki and Kelsall,
1999). That some mouse strains, such as C57BL/6 and BALB/c are biased towards
developing Thl and Th2 responses respectively suggests an important genetic
component. Studies in this area have mainly focussed on MHC genotype (Murray et
al., 1992), although a locus on murine chromosome 11 has also been implicated
(Gorham et al., 1996).
As previously mentioned, the immune synapse that develops at the site of T cell-APC
contact during activation contains many more proteins than just those of the
TCR/pMHC complex. Co-stimulation is an important component of T cell activation
and acts not only to deliver a second signal to the T cell on top of the signal received
through the TCR, but also to increase the avidity (strength) of the T cell-APC
interaction. The two main co-stimulatory molecules upregulated on APCs following
encounter with antigen are B7-1 (CD80) and B7-2 (CD86) (Reiser et al., 1992 and
Freeman et al., 1993). CD86 has been shown to preferentially induce IL-4 production
(Freeman et al., 1995) and distinct regions in the cytoplasmic domain of CD28, the
receptor for CD80 and CD86 on the surface of the T cell, that are required for Th2
differentiation have now been identified (Andres et al., 2004). There is also evidence
that the co-stimulatory molecule OX40 as well as the CD4 molecule itself can play a
supportive role in Th2 development (Ohshima et al., 1998 and Fowell et al., 1997).
With the large array of other proteins on the surface of, and secreted by, both T cells
and APCs, other molecules proposed to influence CD4+ T cell differentiation are
continually being identified (Oosterwijk et al., 2007 and Lund et al., 2007 and Fang et
al., 2007), but the challenge will be how to fit these into an already complex picture of
decision making at the time of T cell priming.
60

1.14 The TCR and CD4+ T cell differentiation
Despite the importance of co-stimulation, key to the overall avidity of a T cell-APC
interaction is the binding of TCR to its pMHC ligand, and there are now multiple lines
of evidence pointing towards a role for both avidity and affinity of TCR/pMHC
interactions in influencing CD4+ T cell differentiation. Indeed, some recent data
tentatively suggests that for some TCR/pMHC interactions, TCR mediated signals
alone, in the absence of co-stimulation, or Thl promoting cytokines and even T-bet,
are sufficient to drive development of Thl cells (Ariga et al., 2007). That the strength
of the signal received through the TCR can influence T cell effector outcome was
supported by data on the duration of TCR signalling, where prolonged stimulation of
naïve CD4+ T cells in vitro with pMHC and an anti-CD28 antibody was required to
induce a Th2 phenotype (Lezzi et al., 1999). It can be imagined that the most simple
way in which TCR/pMHC interactions could influence avidity of T cell-APC binding
would be the number of binding interactions occurring at any given time, with a
greater number of binding events increasing binding avidity. In support of this, both
peptide dose and the density of MHC molecules on the surface of an APC have been
shown to be important (DiMolfetto et al., 1998). Data on antigen dose are slightly
conflicting and depend upon the antigen used in the study but, in general, very high
and low doses of antigen elicit Th2 responses, while moderate and high antigen doses
favour Thl responses (Constant et al., 1995 and Hosken et al., 1995). Alternatively,
strength of TCR signalling could be influenced by the kinetics of binding and affinity
for pMHC of each individual TCR molecule, i.e. at the level of structural interactions
between the TCR and its pMHC ligand. Early evidence that this may be true came
from studies using altered (mutated) peptide ligands (APLs). It was observed that
amino acid substitutions in peptide ligands, usually by as little as just a single residue,
could shift the effector cell phenotype of CD4+ T cells responding to this antigen from
Thl to Th2 (Pfeiffer et al., 1995 and Tao et al., 1997). That these switches in T cell
phenotype can alter disease outcome has also been seen in several studies involving
the Thl mediated murine autoimmune disease, EAE (Brocke et al., 1996 and
Nicholson et al., 1995). In the study by Nicholson et al. SJL mice, normally
61

susceptible to EAE induction using a peptide of PLP (PLP 139-151), were prevented
from developing, or displayed greatly reduced severity of disease when immunised
with an altered peptide ligand (Q144). Disease could be prevented by immunising
with APL alone or in combination with the wild-type peptide and the adoptive transfer
of T cell lines specific for APL Q144 could also confer protection. T cells isolated
from mice immunised with Q144 were found to secrete the Th2 type cytokines IL-4
and IL-10 and were able to proliferate in response to both Q144 and the native peptide.
This suggested that T cells were able generate productive TCR signals in response to
the mutated peptide and that Q144 was not simply acting as a competitive MHC
blocker inhibiting productive TCR/pMHC interactions. The mutated residue of this
APL was known to be the primary contact residue in TCR binding and a subsequent
study revealed that the primary contact points of APL Q144 had shifted to residues
141 and 142, towards the N terminal end of the peptide (Das et al., 1997). Others had
demonstrated APLs, described as antagonistic in these studies, to have reduced affinity
for TCR (Lyons et al., 1996) and the generation of altered affinity TCR/pMHC
interactions by mutating residues in the TCR itself has already been discussed. A link
between mutations in TCR structure and CD4+ T cell differentiation came with the
demonstration that a change in a single amino acid in the CDR2 region of a TCR could
shift the immune response from Thl to Th2 (Blander et al., 2000). Taken together, all
of this data leads to a hypothesis which suggests that the structure of a TCR and, as a
consequence, the binding interaction between TCR and pMHC can bias CD4+ T cell
differentiation, with high affinity interactions promoting Thl development and lower
affinity interactions favouring a Th2 response.
However, despite this data, all of which involves manipulation of TCR interactions
artificially in vitro, what is the relevance in vivo to any role that TCR structure may
have in determining the CD4+ T cell phenotype of populations of T cells with a normal
and diverse repertoire of TCRs? The finding that TCRs with relatively high affinity
can be selected and come to dominate the repertoire during the course of an immune
response has been observed both in vivo and in vitro. In an in vitro study, PCR
mutagenesis was used to mutate the CDR3a regions of TCRs and through successive
62

rounds of in vitro selection using a yeast expression system, high affinity mutants were
found to become dominant (Holler et al., 2000). In vivo, pMHC multimers have been
used to demonstrate expansion of both MHC class I and MHC class II restricted, high
affinity TCRs, during development of an immune response to pathogen in mouse
models of infection (Busch and Pamer, 1999 and Malherbe et al., 2000) and high
affinity TCRs, sequences of which are conserved between patients, have also been
seen in studies assessing T cell clonal dominance to human cytomegalovirus (HCMV)
(Trautmann et al., 2005). In the study by Malherbe et al. looking at expansion of
MHC class II restricted CD4+ T cells in mice during the course of infection with the
Leishmania major parasite, T cell populations expanding in a resistant strain of mice
(D10.D2), which develop a Thl type immune response to the pathogen, were found to
bind pMHC with higher affinity and have a different pattern of Va and CDR3a usage
to T cell populations expanding in the susceptible BALB/c strain of mouse, which
develop a predominantly Th2 type response. Other studies have also observed
selection of preferred CDR3 motifs during immune responses (McHeyzer-Williams et
al., 1999). In this study, CDR3 sequences from T cells present at time points
throughout the course of an immune response to whole pigeon cytochrome c (PCC)
protein were analysed. By day 3, 40% of cells analysed were using CDR3 sequences
containing at least 6 of 8 conserved features identified, for example a CDR3a length
of 8 amino acids or a serine residue at position a95, and this rose to more than 80%
after 2 weeks. In a subsequent memory response to PCC, 96% of T cells were using a
restricted TCR. As, unlike B cells, T cells do not undergo affinity maturation
(mutation of CDR amino acids to generate higher affinity ligand binding), the
dominant sequences must have been selected from the original starting repertoire of
pMHC specific TCRs. Combined, this data led to the idea that not only could
preferred structural motifs be selected for during an immune response, but that the
structural features selected may bear some relation to the phenotype of the cells
responding, i.e. structural features of TCR selected during a Thl immune response
may be different from those selected during a Th2 immune response. This question
was addressed by a study in our laboratory, published in 2002, which determined the
TCR gene usage, CDR3a and CDR313 sequences from T cell clones and lines selected
63

under Thl versus Th2 polarising conditions in vitro (Boyton et al., 2002). This study
found that CD4+ T cell clones selected under Th2 polarising conditions favoured an
elongated TCR CDR3a chain and from modelling studies predicted that these
elongated TCR a chains may result in less optimal (lower affinity) interactions
between the pMHC complex, which in this case was a PLP peptide (PLP 56-70)
complexed to the MHC class II molecule I-Ag7, and CDR loops of the TCR. No clear
V gene bias between Thl and Th2 cell derived TCRs was observed and there were no
differences in the lengths of CDR3(3 regions. In short term Thl and Th2 polarised T
cell lines, dominant Thl and Th2 TCR CDR3a sequences could be identified, and
when oligonucleotides of these CDR3a sequences were radiolabelled and used to
probe cDNA libraries of CDR3a sequences, it was found that the longer Th2 derived
CDR3a motif was present only in Th2 lines while the shorter Thl CDR3a motif
seemed to be permissible in both, although was more dominant in the Thl lines.
The hypothesis that emerged from this study was that, if structurally distinct TCRs
arising from Thl and Th2 polarised T cells, i.e. a TCR bearing an elongated CDR3a
region from a Th2 cell and a shorter CDR3a region from a Thl cell, are expressed
transgenically, an inherent bias towards Thl or Th2 will be observed in CD4+ T cell
responses from these animals. Chapters 3 and 4 of this thesis describe the generation
and characterisation of such transgenic animals. Further to this hypothesis is a second
question of whether these Thl and Th2 transgenic animals could be used to create new
models of Thl and Th2 mediated disease. The lung is one organ in which
understanding Thl and Th2 type responses is of much interest. The roles played by
Thl and Th2 CD4+ T cells in human lung diseases are discussed below, and chapter 5
of this thesis describes the generation of a new transgenic model that could be of use
in the modelling of these diseases in the mouse.
1.15 Thl and Th2 responses in human lung disease
CD4+ T cells in the lung are an area of major interest, as a number of lung diseases are
believed to be associated with a bias for either Thl or Th2 type responses. Pulmonary
64

sarcoidosis is an example of a chronic lung disease that has been associated with a
predominantly Thl type immune response (Moller et al., 1996) while asthma,
bronchopulmonary aspergillosis and cryptogenic fibrosing alveolitis are among other
diseases thought to be predominantly Th2 mediated (Robinson et al., 1992, Kurup et
al., 1994 and Wallace et al., 1995). In most cases the underlying cause, or nature of
the initiating insult to the lung, is not well understood and other major challenges still
remaining include a good understanding of the regulation of lung inflammation, and
the long term processes of repair and lung remodelling that occur in the context of
prolonged, chronic, inflammatory responses.
Allergic asthma is probably the best studied lung disease thought to be associated with
Th2 type responses. Many different allergens have been associated with asthma, but
among the most common and well studied include proteins from the house dust mite,
grass pollen and cat dander. Allergic asthma is characterised by airway
hyperreactivity, which for the most part is reversible, high levels of IgE antibodies and
airway inflammation. The main cell types found in the asthmatic lung are CD4+ T
cells, eosinophils, mast cells, basophils and neutrophils, and cytokines found to be
elevated in the lungs of asthmatics are predominantly of the Th2 type (Robinson et al.,
1992). Since the discovery of a role for CD4+ T cells and Th2 cytokine production in
allergy, much effort has gone into understanding the mechanisms by which they act to
cause disease. A major function of IL-4 and IL-13 is to mediate IgE antibody class
switching by B cells (Lebman and Coffman, 1988 and Punnonen et al., 1993). These
cytokines function though activation of the transcription factor STAT6, which can
synergise with the transcription factor NF-KB to promote germline transcription of
IgE. The process of IgE transcription is also mediated by signalling through CD40
(Kawabe et al., 1994), the ligand for which is transiently expressed on T cells
following antigen stimulation, and polymorphisms in the IL-4, IL-13 and CD40 genes
have all been associated with high IgE levels in patients with asthma (Suzuki et al.,
2000, Hunninghake et al., 2007, Park et al., 2007). IgE class switching is a process
mediated by a germline recombination event, similar to those described above for
TCR gene rearrangement, although it is RAG independent (Lansford et al., 1998). It
65

is proposed to occur predominantly in lymphoid tissue (Muramatsu et al., 1999)
although active class switching in the bronchial mucosa of asthmatics has also been
demonstrated (Takhar et al., 2007). IgE acts by binding to high affinity receptors
(FCERI) on the surface of mast cells and basophils, and crosslinking of this IgE by
specific antigens leads to the release of inflammatory mediators such as histamine,
leukotrienes, enzymes and cytokines (Segal et al., 1977). Mast cell and basophil
degranulation, and the release of these inflammatory mediators by specific IgE
crosslinking in the lungs of asthmatics upon exposure to allergen, is proposed to be the
initiating sequence of events in an asthmatic response. Consequences include mucus
secretion, smooth muscle contraction and the recruitment of other effector cells to the
lung, some of which contribute to the observed increase in airway
hyperresponsiveness (AHR) that is synonymous with asthma. In keeping with an
essential role for IgE in the early phase of an asthmatic response, administration of an
anti-IgE antibody to asthmatic patients has been shown to inhibit allergen induced
AHR (Fahy et al., 1997), although mouse models of asthma have demonstrated
development of AHR and eosinophilia in the absence of IgE (Mehlhop et al., 1997).
As such, the exact nature of the mechanisms behind the development of AHR are not
yet fully understood and the roles played by inflammatory cells, such as the
eosinophil, are still controversial. Recruitment of eosinophils to the lung is mediated
by chemokines such as eotaxin (Ganzalo et al., 1996), and cytokines such as IL-5.
Mice deficient in IL-5 fail to develop lung eosinophilia and AHR (Foster et al., 1996),
and although this may be interpreted as evidence for a role for IL-5 and eosinophils in
AHR development this has been complicated by the subsequent demonstration that
this effect was dependent upon the genetic background of the IL-5-/- mice (Hogan et
al., 1998). The key roles of the prototypic Th2 cytokines, IL-4, IL-5, and IL-13
discussed so far in the context of asthma serves to highlight the important role of Th2
type, allergen specific, CD4+ T cells in the pathogenesis of this disease, and with
evidence that Thl cytokines are antagonistic towards the development of T cells with
a Th2 phenotype (Wynn et al., 1995), the prospect that promotion of a Thl type
environment may ameliorate Th2 mediated disease in the lung has provoked much
interest. However, results have been conflicting and while some groups have
66

demonstrated reduced airway inflammation and AHR upon transfer of antigen specific
Thl T cells in established mouse models of asthma (Huang et al., 2001), others have
not, but have instead seen enhanced inflammatory cell recruitment to the lung (Hansen
et al., 1999). In a recent study where IFN-y was overexpressed in the mouse lung,
levels of IL-5 and IL-13 were found to be increased upon induction of allergic airway
inflammation (Koch et al., 2006). Some studies have reported increased number of T
cells expressing IFN-y in the lungs of patients with asthma (Krug et al., 1996) and
viral infections, immune responses to which are predominantly Thl mediated, have
been associated with an increased risk of developing this disease (Sigurs et al., 2005).
In the Thl associated lung disease of pulmonary sarcoidosis, although the pathology
of the disease is well characterised in terms of the presence of granulomas,
accumulation of activated CD4+ T lymphocytes and macrophages and production of
Thl type cytokines (Moller et al., 1996), the antigen(s) to which the immune system is
responding is not yet known. The presence of activated CD4+ T cells at the sites of
disease has led to much research to try to identify the antigens for which these T cells
are specific but, although some studies have reported some V gene bias in the TCRs of
these lymphocytes, with bias being linked to MHC class II genotype (Grunewald et
al., 2002), the activating peptides remain elusive. Some studies have pointed towards
mycobacterial antigens as possible targets of T cell responses in sarcoidosis (Song et
al., 2005 and Hajizadeh et al., 2007), although attempts to identify mycobacterium
tuberculosis in sarcoid biopsies have been unsuccessful (Marcoval et al., 2005) and the
possibility that Thl T cells in sarcoidosis may be responding to endogenous rather
than bacterial antigens still remains. Additionally, the finding that patients with
sarcoidosis are deficient in, or have greatly reduced numbers of, a recently described
subset of CD 1 d-restricted NKT cells, which have immunoregulatory functions, has
also led to the suggestion that defects in immune regulation may play a role in the
development of this disease (Ho et al., 2005).
Despite the Thl type nature of immune responses during development of sarcoidosis,
severe fibrosis is a common end point (Moller, 2003). Fibrosis is more commonly
67

associated with Th2 type responses, with cytokines IL-4, IL-5 and IL-13 all implicated
in pathogenesis and in a common mouse model of fibrosis, promotion of Thl type
immunity using IL-12 was seen to markedly reduce fibrotic disease development
(Wynn et al., 1995). How the Thl environment of sarcoidosis may then lead to
fibrosis is therefore unclear, although other pro-fibrotic mediators such as TGF-p are
found to be expressed in the sarcoidosis lung (Zissel et al., 1996) and more recently
polymorphisms in the gene for TGF-133 have been implicated in progression to fibrosis
in sarcoid patients (Kruit et al., 2006). Fibrosis is a mechanism of tissue repair and
occurs when connective tissue grows in place of normal parenchymal tissue. If limited
to small areas of an organ, fibrosis is beneficial, as it can reverse tissue damage.
However, if the process of fibrosis becomes continuous and progressive, organ
function, particularly of those such as the lung, where tissue architecture is delicate,
can become severely compromised and can ultimately cause organ failure.
A common fibrotic lung disease in humans is cryptogenic fibrosing alveolitis, one of a
group of interstitial lung diseases that are characterised by lung inflammation and
fibrosis. Lung infiltrates include activated T cells, macrophages, B cells and, in
keeping with the Th2 nature of the disease, eosinophils and a Th2 like pattern of
cytokines (Haslam et al., 1980 and Wallace et al., 1995). Similar to sarcoidosis, the
exact nature of the lung antigens that initiate the disease process is unknown, however,
the inflammatory pathways that lead to fibrosis are becoming better defined. Key
roles for the cytokines IL-13 and TGF-P have been proposed. Overexpression of both
of these cytokines in transgenic animals leads to severe fibrosis (Sime et al., 1997 and
Zhu et al., 1999), while neutralisation can attenuate disease (Belperio et al., 2002).
That this is not just a feature of all Th2 type cytokines was demonstrated by the lack of
airway fibrosis seen in transgenic mice that overexpressed IL-4 (Rankin et al., 1996).
Signalling pathways that mediate fibrosis and are initiated by these cytokines are still
being elucidated, but IL-13 has been proposed to act in both a TGF-p dependent (Lee
et al., 2001) and independent manner (Kaviratne et al., 2004). Signalling molecules
shown recently to be upregulated by IL-13 include the chemokine receptor CCR5 and
IL-11Ra and blocking the functions of both of these receptors ameliorated IL-13
68

induced inflammation and fibrosis (Ma et al., 2006 and Chen Q et al., 2005). The
Smad3 signalling pathway has been implicated in TGF-13 mediated pulmonary fibrosis,
with Smad3 mice shown to be resistant to the severe fibrosis induced by
overexpression of TGF-13 in the lung (Bonniaud et al., 2004) and more recently,
importance of the mitochondrial mediated pathway of apoptosis, involving the
apoptosis proteins Bax and Bid has also been suggested (Kang et al., 2007). This
demonstration of a link between TGF-I3 signalling and pathways of apoptosis provide
an explanation for the dependence on epithelial cell apoptosis previously observed for
TGF-13 induced fibrosis (Lee et al., 2004). Although fibrosis is the main pathology
observed in lung diseases such as cryptogenic fibrosing alveolitis, that it is observed as
a chronic component of other lung diseases, such as sarcoidosis, COPD and asthma,
serves to highlight the interrelated nature of the many inflammatory and repair
processes that can be initiated in the lung in response to a wide range of insults.
There is therefore still much to be learnt about the consequences of Thl and Th2 type
immune responses in the lung and it is becoming increasingly clear that, far from
being exclusively one type or the other, the pathogenesis of many lung diseases,
particularly those that are chronic in nature, probably involves interplay between many
different Thl and Th2 cytokine mediated mechanisms. A further level of complexity
now arises from the description of Treg cells and more recently Th17 cells, a subset of
CD4÷ T cells whose development can be antagonised by both Thl and Th2 type
cytokines, and there will undoubtedly be many examples in the coming months of how
these other T cell subsets may play a role in lung inflammation. IL-17 mRNA has
been reported to be elevated in the sputum of asthmatic patients (Bullens et al., 2006)
and in a study using Tbet /- mice discussed previously as having a spontaneous asthma
like phenotype, increased neutrophilia in the airways of these mice has now been
linked to a greater propensity of T cells from these mice to develop into IL-17
producing cells (Fujiwara et al., 2007). As a result, effective treatments for many of
these diseases are unlikely to be achieved by blocking a single pathway. However,
much of what is currently known about lung inflammation, and the apparent
dependence of some pathologies on single mediators, has come from mouse models
69

using manipulation of single entities using transgenesis or monoclonal antibodies, and
the induction of disease through conditions that may be far from physiologically
normal. Some of the mouse models commonly used in the study of human lung
disease are discussed below.
1.16 Mouse models of human lung disease
Many different mouse models now exist for the study of human lung disease. Some
mimic specific disease pathologies such as granuloma formation, while others have
achieved modelling of multiple disease outcomes, such as the AHR, lung
inflammation and the high IgE levels that result from antigen challenge in several
mouse models of asthma. The disease outcomes associated with the chronic Thl type
and IFN-y mediated lung inflammation of diseases such as sarcoidosis and
bronchiectasis have proved the hardest to model. Bronchiectasis is characterised by
irreversible airway dilation and is found in association with chronic bronchial
infection and inflammation. There are currently no good animal models of
bronchiectasis, and while bacterial lung infection can be easily induced in the mouse
(Cole et al., 2005), the irreversible changes in lung structure that occur in humans over
long periods of time have proved harder to mimic. No spontaneous models have been
described and our lack of understanding surrounding the processes involved in chronic
airway structural change makes it difficult to arrive at a starting point in trying to
establish an in vivo model. Likewise, there are currently no good models of
sarcoidosis, although some protocols to induce granuloma formation in the mouse
have been described. Early models investigated the use of human sarcoid tissue itself
as an inducing agent, with granuloma formation in mice observed following
inoculation with sarcoid tissue homogenate (Mitchell et al., 1976). However, results
were not consistent, with others reporting similar granulomas when control tissue
homogenates were used (Belcher and Reid, 1975) and this model as since fallen out of
favour. Other approaches include the intravenous injection of complete Freund' s
adjuvant in rats (Bergeron et al., 2001) and Schistosome mansoni or
Propionibacterium acnes infection in mice (Wynn et al., 1993 and Nishiwaki et al.,
70

2004). However, the mechanisms of granuloma formation in these models remain
poorly defined and indeed elucidation of mechanisms that are occurring in response to
antigens irrelevant to the human disease of sarcoidosis may be misleading. This may
be particularly true of Schistosome mansoni infection, where formation of granulomas
is seen to be accompanied by a Th2 type pattern of cytokine expression (Wynn et al.,
1993). However, in keeping with the Th2 nature of this disease model, S. mansoni
infection is also used as a model of fibrosis (Wynn et al., 1995). In the S.mansoni
model, fibrosis and granuloma formation occur in the liver. To model fibrosis in the
lung, the most common protocols involve the infliction of lung injury using toxins or
drugs. The antibiotic bleomycin is used most commonly (Adamson and Bowden,
1974) but the acute nature of the fibrotic disease caused by these agents raises doubts
over whether they are faithful mimics of the slower but progressive tissue remodelling
observed in diseases such as idiopathic pulmonary fibrosis. Another infection model
that has been used to cause fibrosis in the lung uses Aspergillus fumigatus (Blease et
al., 2002). Models using this pathogen are of particular interest as this fungus is
known to be the cause of allergic bronchopulmonary aspergillosis and is associated
with asthma. As such, many features of human asthma, such as AHR, eosinophilia
and high levels of IgE, can be modelled in mice by exposure to this pathogen (Kurup
et al., 1992).
Aside from the aspergillosis model, several different and well characterised murine
systems now exist for the study of the more acute phases of allergic lung immune
responses. The most commonly cited of these is the ovalbumin (OVA) model of
murine asthma (Kung et al., 1994). Protocols for disease induction using the OVA
model vary slightly, but the overall scheme of sensitisation to OVA by intraperitoneal
(i.p) injection followed by exposure of the airways to the allergen, either as an aerosol
or by intranasal administration, 2 or 3 weeks after the initial priming, is similar across
most studies. Strains of mouse commonly used are BALB/c and C57BL/6 and mice
sensitised and challenged with antigen demonstrate airway hyperresponsiveness, lung
infiltrates dominated by allergen specific CD4+ T cells and eosinophils, Th2 type
cytokines in the BAL and lung such as IL-4, IL-5 and IL-13, and high levels of
71

allergen specific serum IgE. The existence of transgenic mice that express a TCR
(D011.10), specific for a peptide of OVA (OVA323-339) (Murphy et al., 1990) has
made the use of this model even more widespread. These TCR transgenic mice have
facilitated the development of adoptive transfer models of lung inflammation where
lymphocytes from immunised TCR transgenic mice are cultured in vitro, often in Thi
or Th2 polarising conditions, before being transferred by intravenous injection to naïve
mice that are subsequently challenged with OVA (Randolph et al., 1999). In this way,
allergen specific T cells can be tracked in vivo and this approach has allowed for a
better understanding of the role of both Thl and Th2 CD4+ T cells in the development
of allergy. In the context of human asthma, and indeed murine allergy, as no natural
mouse allergens have been described, OVA is an irrelevant protein. The success of
the model in generating a Th2 type disease profile is mediated in part by the inclusion
of the Th2 promoting adjuvant, alum, in the priming stages of disease induction (Grun
and Maurer, 1989). In this way, the OVA model of asthma is non-ideal as it
predisposes the immune response towards a Th2 phenotype in a way that is
independent of allergen, which in the case of OVA is also physiologically irrelevant to
the human disease. The non-physiological nature of the immune response is also
highlighted by the large doses of protein, administered over a period of many days,
that are required to induce significant disease, compared to the relatively small doses
of antigen that human asthmatics are proposed to be exposed to (Arshad et al., 1998).
In order to more closely mimic human disease, other models that use human allergens
have been developed, for example, the house dust mite allergen, DerP1 (Lee et al.,
1999). However, disease induction protocols with DerP1 also require priming with
alum and high antigen doses. More complicated attempts to create humanised mouse
models of asthma have also used house dust mite allergy as their basis, with SCID
mice reconstituted with peripheral blood mononuclear cells (PBMCs) from house dust
mite allergic patients showing evidence of human cell inflammatory infiltrates and
specific human IgE responses following challenge with antigen (Duez et al., 1996).
Another drawback of original OVA and DerP1 disease induction protocols is that they
fail to mimic the progressive fibrotic and remodelling processes that are seen to occur
over the long term in the lungs of patients with more severe asthma. To try to model
72

these changes, existing protocols have been modified to include extended periods of
allergen challenge. Signs of airway remodelling, such as goblet cell hyperplasia and
collagen deposition, have been observed (McMillan and Lloyd, 2004) although similar
to criticisms of acute airway inflammation, in these models, the doses of antigen
required to elicit these pathologies in the murine lung are extremely high and unlikely
to be physiologically similar to the human disease.
In addition to the use of exogenous agents, such as pathogens, drugs or proteins,
transgenic mice have been used extensively, both in combination with the models so
far described, and alone, to decipher more specifically the roles of individual
molecules or pathways in the mechanisms and potential treatments of disease. For
example, most of the cytokines associated with CD4+ T cell immune responses have
now been overexpressed in the lung. Overexpression of IL-4, IL-5, IL-13, and IL-9 all
result in spontaneous recruitment of inflammatory cells, particularly eosinophils and
lymphocytes, to the airways and are also associated with other pathologies such as
mucus hypersecretion, airway hyperresponsiveness, collagen deposition and fibrosis to
varying degrees (Rankin et al., 1996, Lee et al., 1997, Zhu et al., 1999, and Temann et
al., 1998). Overexpression of IFNI leads to infiltrates of macrophages and
neutrophils, and alveolar enlargement, characteristic of emphysema, is also observed
(Wang et al., 2000). The opposite approach has been to knockout proteins of interest.
The spontaneous asthma like phenotype of Tbefi" mice has already been discussed
(Finotto et al., 2002), as has the lack of eosinophilia and AHR in IL-5-/- animals
(Foster et al., 1996), and a great many molecules have now been manipulated in these
ways. However, results should be interpreted with caution, bearing in mind potential
genetic background effects and also the presence or absence of these proteins from
birth, which could result in abnormal lung or lymphoid tissue development. To
circumvent the problems of abnormal lung development and enable genetic
intervention purely at the point of disease induction, inducible transgenic animals are
now being increasingly employed (Cheng et al., 2007). However, having stated this
caveat to the timing of gene overexpression, the phenotypes observed when IL-13 is
73

inducibly targeted to the lung are found to be very similar to those that result in mice
that express this cytokine constitutively (Zheng et al., 2000).
Chapter 5 of this thesis describes the generation of an inducible transgenic model of
lung disease, where induction results not in the overexpression or ablation of
endogenous protein but in the expression of a peptide antigen for CD4+ T cells. The
peptide in question is the cognate antigen for the T cell receptors used in the
generation of the TCR transgenic animals described in chapters 3 and 4 of this thesis.
Commonly employed strategies in the generation of transgenic animals, along with the
transgenic approaches that have been used in the generation of the mouse models in
this thesis are discussed in the section below.
1.17 Approaches to transgenesis
Transfer of foreign DNA into the mouse genome by injection of a plasmid into the
pronuclei of fertilised mouse oocytes, a technology now known as transgenesis, was
first achieved in 1980 (Gordon et al., 1980). That this transfer of genetic material
could lead to an altered phenotype in genetically modified animals was demonstrated a
couple of years later (Palmiter et al., 1982) and since this time, the use of transgenic
mice in research has become widespread and routine. Improvements in transgene
design have led to better and more predictable expression levels of the proteins of
interest, but pronuclear injection of oocytes remains the most common technique by
which genetic modification of the mouse is achieved, and it has now been employed in
many other species of animal including rats, rabbits, sheep, pigs and cows. Other
approaches to DNA integration that have been tried and which are becoming more
widely used include the use of transposons (DNA sequences that trigger integration)
(Dupuy et al., 2002) and the use of retroviral vectors (Lois et al., 2002). Of these
approaches, retroviral vectors probably hold the most promise, and very high
efficiencies from low titre preparations of virus are now being reported (Ritchie et al.,
2007). Although random recombination events are the most straightforward way to
introduce new genetic material into the genome, modification of endogenous gene
74

function by gene knockout or mutation cannot be achieved in this way. This approach
requires a homologous recombination event at the endogenous loci of the gene of
interest and is achieved using embryonic stem (ES) cells as, in these cells, for
unknown reasons, homologous recombination is the most efficient. Although more
efficient in ES cells, homologous recombination is still a rare event and cells in which
this has occurred must be selected and further used to generate a living embryo. Only
two mouse lines have proven useful in the development of chimeric embryos, which
then transmit the recombined gene to their progeny, and most chimeric mice have been
generated using 129/SV ES cells. The difficulty of this technique is additionally
highlighted by the failure to date to achieve transgenesis by homologous
recombination in any species other than the mouse.
One of the benefits of homologous recombination over random integration of a
transgene is that factors influencing transgene expression are better understood. If the
position of the transgene in the genome is known and controlled, then so are the
corresponding promoter and enhancer elements surrounding the integrated DNA.
When a transgene is integrated randomly into the genome, control over expression
may be mediated not only by the promoter that has been engineered into the transgene
itself, but also by promoter, enhancer and silencer elements that now surround it
(Cranston et al., 2001). Approaches to minimise the influence of surrounding genetic
elements have included the use of so called insulator sequences (Taboit-Dameron et
al., 1999) and the inclusion of long genomic DNA fragments in the transgene itself
(Giraldo and Montoliu, 2001), but removing bacterial sequences prior to pro-nuclear
injection and the inclusion of intronic sequences immediately before coding sequences
are among some straight forward rules now employed in the design of transgenes to
aid correct expression. Aside from the coding sequence of the gene of interest, crucial
to the function of the transgene is the choice of promoter. The promoter used will
determine the timing and tissue specificity of transgene expression and the use of a
wide variety of different promoters have been reported in transgenic mice, from
ubiquitous and constitutive, such as the chicken (3 actin promoter (Wiekowski et al.,
2001a) to the tissue specific and developmentally controlled, such as the CD4
75
promoter (Salmon et aL, 1996). There is also a growing interest in inducible gene
expression technology, where tissue specific or ubiquitous gene expression/ablation
can be exogenously controlled at the most appropriate time point for the scientific
question being addressed. For gene knockout studies this approach was demanded by
the embryo lethal phenotype of many constitutive knockouts and in overexpression
studies it has become important to separate abnormal developmental processes from
those really involved in the biological pathway of interest. Several systems for
inducible gene targeting have now been described with the tetracycline and Cre
systems being the most commonly employed and schematic diagrams that outline the
mechanistic basis behind these two approaches are shown in figure 1.5
In the tetracycline system of inducible gene targeting a ubiquitous or tissue specific
promoter directs expression of a reverse tetracycline transcriptional activator (rtTA).
Temporal control is achieved because this molecule can only initiate transcription of
the target gene by binding an upstream tetracycline operator (tetO) sequence in the
presence of doxycycline (Zhu Z et al., 2002). The main drawback to this approach has
been the low baseline levels of target gene expression found in the absence of
induction, as rtTA can exhibit a degree of residual affinity to tetO in the absence of the
drug. To minimise this problem, some groups have used another transgene coding for
a transcriptional silencer (rTS). rTS binds to tetO only in the absence of doxycyline
and so transcriptional repression is lifted on administration of the drug (Zhu et al.,
2001). An additional problem with this system was highlighted more recently in a
study of rtTA transgene use in the lung (Sisson et al., 2006). This study found that
expression of simply the rtTA protein alone in the lung, in the absence of any target
gene, could cause pulmonary pathology consistent with an emphysema like phenotype
in these mice. This study highlights one of the many dangers of interpreting data
derived from transgenic animals and makes a strong case for the need to control for all
aspects of a particular genetic manipulation.
The Cre/lox system involves a mechanism of site-specific recombination that derives
from bacteriophage P 1. Cre recombinase recognises, and catalyses recombination
76

Promoter rtTA
(et° Promoter
No expression of target gene
• • Addition of • Doxycycline No Doxycycline
Filo- target gene Q•
DO
target gene
Complex retained in the cytoplasm
Hsp90 Addition of Tamoxifen
Nuclear translocation
target gene Promoter STOP p • • .. E. • • • •
U
(a) Tetracycline system
Expression of target gene
(b) Cre/Lox system
I*Mer Cre Mer V A Promoter
)c* target gene Promoter p STOP 1........"..."••••••1
loxP loxP
No expression of target gene Recombination between lox? sites
target gene Promoter Ip
Expression of target gene 4'e El
Figure 1.5 The mechanistic basis of reverse tetracycline-controlled transcriptional activator (rtTA) and Cre/Lox systems of inducible gene targeting. In both systems, spacial control is achieved with the use of one or more tissue specific promoters. (a) In the tetracycline system a transcriptional activator (rtTA) is only active in the presence of the tetracycline derivative, doxycycline. Upon binding to doxycycline, rtTA can bind an operator sequence (tet0) and activate target gene expression. (b) In the Cre/Lox system, the Cre recombinase mutated oestrogen receptor complex must bind tamoxifen and translocate to the cell nucleus in order to activate target gene expression. Gene expression is permitted by the excision of a translational stop sequence. Alternatively, engineering of loxP sites to flank the gene of interest itself can result in temporal control over gene ablation. Cre mediated recombination is prevented in the absence of tamoxifen by Hsp90 retention of the MerCreMer complex in the cytoplasm.
77

between, 34 base pair sequences known as loxP sites. Excision of a stretch of DNA
located between two loxP sites can either knockout a gene or permit expression of an
adjacent gene (figure 1.5) and the system becomes inducible when two mutated
hormone-binding domains of the murine oestrogen receptor are engineered to flank the
Cre protein (MerCreMer) (Metzger et al., 1995). These hormone binding domains
complex with Hsp90 to retain the Cre recombinase in the cell cytoplasm until
administration of the drug tamoxifen. On binding tamoxifen the MerCreMer complex
is able to move to the cell nucleus and mediate recombination. Spatial control over
this system can be achieved by tissue specific expression of Cre and/or the gene of
interest and it has been suggested that further control over specificity may be possible
by expressing the Cre protein as two halves, under the control of two different
promoters (Casanova et al., 2003). Cre toxicity is the most widely reported problem
of this system (Loonstra et al., 2001). It occurs because mammalian genomes contain
pseudo loxP sites whose sequence can deviate considerably from the consensus loxP
sites present in the transgene, but which can still act as functional recognition sites for
the Cre protein. The inducible MerCreMer system does minimise this problem by
reducing the amount of time for which cells are exposed to the Cre protein, but the
possibility of phenotypes arising from cell toxicity means that proper experimental
controls, where animals carry the Cre transgene but not the target gene, should always
be included.
An emerging area in the field of gene targeting is the use of RNA interference (RNAi)
and a recent study has combined RNAi technology with the inducible tetracycline
system of gene expression to achieve inducible, tissue specific and reversible gene
knockdown in transgenic mice (Dickins et al., 2007). In this study, a short hairpin
RNA (shRNA) targeting the mouse Trp53 gene was expressed transgenically under
the control of a tetracycline responsive CMV promoter with rtTA under the control of
a liver specific promoter. Efficient, tissue specific and reversible knockdown of Trp53
was observed upon administration of doxycycline that could be demonstrated to have
functional consequences in an established model of tumoregenesis, where knockdown
of Trp53 led to more rapid disease progression. The Cre system of gene targeting does
not led itself so well to this approach as induction is not reversible, but the use of the
78

tetracycline system and RNAi in this way represents a promising new approach to
controlling endogenous gene expression in vivo.
Chapter 5 of this thesis describes the use of the MerCreMer system of inducible gene
targeting to create a transgenic system in which a T cell epitope (PLP 56-70) is
expressed inducibly and specifically in the lung. There are currently no reports in the
literature of other peptides being targeted for expression in the lung in this way, but
the inducible targeting of proteins to cardiac tissue (Xiong et al., 2007) and tumor cells
(Spiotto et al., 2003) are examples of other studies that have successfully employed
the MerCreMer system of gene expression.
The peptide (PLP56-70), used in the inducible mouse model described in chapter 5, is
the cognate epitope for the T cell receptors used for the generation of the TCR
transgenic animals described in chapters 3 and 4. TCR transgenic animals were first
described in 1988, when mice bearing transgenes encoding the a and (3 chains of a
TCR specific for the male H-Y antigen were generated (Kisielow et al., 1988).
Studies with these animals served to answer important questions about T cell tolerance
and thymic selection. The authors observed that, while in female mice peripheral
CD8+ T cells bearing the transgenic TCR were capable of lysing male target cells,
fewer transgenic TCR bearing cells were present in the periphery of male mice, and
those that were present were unable to react to antigen. Since the publication of these
first TCR transgenic animals, a great many more TCR transgenic models have been
described, serving to answer many more questions about T cell development and
function as well as providing valuable new disease models. The integral role that TCR
transgenic animals have played in the understanding of T cell development has been
discussed earlier in this thesis. Expression of a and (3 chain transgenes, both
independently and together, was pivotal to understanding the way in which TCR
molecules are assembled (Uematsu et al., 1988) and these models have also played an
important role in our understanding the role of the TCR in, and the timing of, negative
selection in the thymus (Douek et al., 1996). In this study by Douek et al., the timing
of negative selection in several different TCR transgenic lines were compared. The
79

site at which negative selection occurred in the thymus, i.e. thymic cortex or thymic
medulla, was found to be influenced by the nature of the antigen recognised by the
TCR. Negative selection as a consequence of superantigen recognition was found to
occur in the medulla, while presentation of cognate self-peptide could induce deletion
in either compartment. TCR transgenics have also been used to answer important
questions about T cell function in the periphery and there are now numerous examples
in the literature of the use of TCR transgenics to investigate T cell function in the
context of a disease. The use of mice bearing a transgenic TCR (D011.10) specific for
an epitope of the ovalbumin protein, in combination with the commonly used
ovalbumin model of allergic airways disease, has already been described in the context
of mouse models of lung disease. Other examples of the use of TCR transgenesis in
disease models include mouse models of multiple sclerosis (MS) (Ellmerich et al.,
2005) and autoimmune gastritis (Candon et al., 2004). In the study by Ellmerich et
al., the TCR in question was a human sequence derived from myelin basic protein
specific T cells of MS patients and was used in conjunction with a human HLA class
II transgenic mouse. Mice expressing both the human TCR and human HLA class II
were shown to develop spontaneous MS like pathologies. The TCR transgenic mice
described in chapters 3 and 4 of this thesis have been used to try to answer basic
biological questions about the role of the TCR in determining CD4+ T cell phenotype,
but are also linked to the inducible transgenic model described in chapter 5, which
uses the MerCreMer inducible system of gene expression. A long-term aim of the
work in this thesis is to combine the TCR transgenic models (chapters 3 and 4) with
the inducible lung gene expression system (chapter 5) to create a new mouse model of
lung inflammation.
1.18 Interleukin 8
Previous discussion surrounding lung diseases and attempts to understand the
processes of lung inflammation has included the mention of many proteins that have
been both ablated and overexpressed in the lung. One cytokine not normally directly
associated with Thl or Th2 type immune responses per se, but nevertheless implicated
80

in the pathogenesis of several human lung diseases, is IL-8. To date there are no
reports in the literature of IL-8 having been overexpressed in the mouse lung and
chapter 6 of this thesis, along with discussion in the following sections, describes
current understanding of this cytokine in the context of lung inflammation and the
generation of transgenic mouse lines with lung targeted, but constitutive, expression of
IL-8.
Interleukin-8 (IL-8) was first identified in 1987 through its role as a neutrophil
activating cytokine. Identification of this protein by several different groups at around
the same time meant that it was assigned different names, being referred to as
monocyte derived neutrophil chemotactic factor (MDNCF) (Yoshimura et al., 1987),
monocyte derived neutrophil activating peptide (MONAP) (Schroder et al., 1987) and
neutrophil activating factor (NAP) (Walz et al., 1987). The name IL-8 was
subsequently proposed and adopted but since that time a whole family of structurally
related cytokines, known also as chemokines, have been identified, and in much of the
current literature IL-8 is referred to as CXCL8. Chemokines are so called because of
the leukocyte chemotactic properties displayed by most. Members of this family are
low molecular weight proteins with cysteine residues at well conserved positions and
it is these cysteine residues that define their nomenclature (Zlotnik and Yoshie, 2000).
IL-8 belongs to the CXC subgroup of chemokines, which are so called because the
first two cysteine residues at the N terminus of the functional protein are separated by
a single amino acid. This is compared to 3 amino acids or adjacent cysteine residues
in the CX3C and CC subgroups respectively. CXC chemokines can be further
classified into ELR+ or ELR- based on the presence or absence of a tripeptide motif
(Glu-Leu-Arg) directly before the first cysteine residue at the N terminus of the
protein. IL-8 is an ELR+ chemokine (appendix 29) that correlates with a potent
chemotactic effect, particularly on neutrophils, (Yoshimura et al., 1987), angiogenic
activity (Strieter et al., 1995) and high affinity binding to the chemokine receptors
CXCR1 and CXCR2 (Holmes et al., 1991 and Murphy and Tiffany, 1991).
81

The cDNA of IL-8 encodes a 99 amino acid precursor protein (appendix 29), the N
terminal signal sequence of which is cleaved extracellularly to yield predominantly 77
or 72 amino acid versions of the protein (Matsushima et al., 1988). Processing is
carried out by extracellular proteases and the form that dominates depends upon the
cellular environment. In vitro cultures of fibroblasts and endothelial cells produce
mainly the 77 amino acid form, while the 72 amino acid form is produced by
leukocytes (Padrines et al., 1994, Hebert et al., 1990 and Nakagawa et al., 1991).
Different forms of the protein exhibit different neutrophil chemoattraction activities
with the 72 amino acid form more potent than the 77 amino acid protein and it is the
72 amino acid protein that is identified at sites of inflammation in vivo (Ko et al.,
1993). Crystallographic studies revealed that at high concentrations IL-8 exists as a
homodimer (Baldwin et al., 1991), however at nanomolar concentrations, which most
likely reflects conditions in vivo, this cytokine is predominantly monomeric (Burrows
et al., 1994) and indeed mutation of the protein to prevent dimerization does not
prevent receptor binding or neutrophil activation (Rajarathnam et al., 1994).
IL-8 can be produced by leukocytes such as T cells, monocytes, neutrophils and
natural killer (NK) cells but also by somatic cells such as endothelial cells, fibroblasts
and epithelial cells. However, expression is not generally constitutive and production
is induced by inflammatory cytokines such as IL-1 and TNF-a (Matsushima et al.,
1988). Bacterial proteins and viruses can cause upregulation of IL-8 expression
(Martich et al., 1991 and Johnston et al., 1997), as well as environmental conditions
such as hypoxia (Xu et al., 1999), and the transcription factors NF-K13 and AP-1 have
been shown to bind the IL-8 gene, implicating these proteins in the control of IL-8
gene transcription (Murayama et al., 1997 and Thompson et al., 2006). The biological
activities of IL-8 are mediated through binding to the G protein coupled receptors,
CXCR1 and CXCR2. These receptors are more than 80% homologous at the amino
acid sequence level and differ only in their NH2 terminal portions, giving rise to
slightly different binding specifies of other chemokines. Binding of IL-8 induces
receptor internalisation, although receptors are subsequently recycled to the cell
surface (Samanta et al., 1990) and signalling is mediated by the receptor coupled G
82
proteins which activate pathways such as those mediated by PI3K-y and MAPK
(Hirsch et al., 2000 and Km11 et al., 1996). CXCR1 and CXCR2 receptors have been
identified on the surface of several different cell types such as neutrophils, monocytes
and NK cells (Morohashi et al., 1995), and while the role of IL-8 in NK cell migration
remains slightly controversial, with some studies reporting IL-8 to be chemotactic to
NK cells and others not (Campbell et al., 2001 and Loetscher et al., 1996), neutrophil
chemotaxis in response to IL-8 is better defined. In order for IL-8 produced by a
tissue, for example in response to a bacterial infection, to attract neutrophils, the
cytokine is first internalised by vascular endothelial cells, transcytosed and then
presented to neutrophils at the luminal surface of the vessel (Middleton et al., 1997).
This transcytosis and presentation on the luminal surface is mediated by the C terminal
end of the protein, and cleavage of this C terminal region by a Streptococcus pyogenes
bacterial proteinase has been proposed as a mechanism of immune evasion by this
pathogen (Edwards et al., 2005). On binding to the CXCR1 and CXCR2 receptors on
the surface of passing neutrophils, IL-8 induces the shedding of adhesion molecule L-
selectin and alters the expression levels and avidity of integrins such as CD11 b and
CD1 1 c, stimulating migration across endothelial and epithelial cell layers (Detmers et
al., 1990, Huber et al., 1991 and Mul et al., 2000). Additionally, IL-8 can activate
some of the effector mechanisms employed by neutrophils, such as degranulation and
the respiratory burst (Walz et al., 1987) and migration of other cell types such as
basophils, eosinophils and T cells, both directly and indirectly, has also been reported
(Geiser et al., 1993, Bruijnzeel et al., 1993, Larsen et al., 1989 and Chertov et al.,
1996).
1.19 Neutrophil function
High levels of IL-8 protein are found to be associated with several different diseases
(discussed later), often in conjunction with large neutrophil infiltrates. With the potent
chemotactic and neutrophil activating properties of IL-8, and the important role that
neutrophils are known to play in innate defence mechanisms and in direction of the
adaptive immune response, there is much interest in the relevance of the high levels of
83

IL-8 protein and neutrophils in these disease pathologies. Neutrophils are most
commonly thought of as phagocytes that accumulate at, and are rapidly recruited to,
sites of bacterial infection where they ingest and kill invading microbes. Neutrophils
produce a wide variety of antimicrobial compounds which are stored within the cell to
kill ingested pathogens, but which are also secreted during the processes of
degranulation and the respiratory burst, which occur as a result of neutrophil
activation. Neutrophil granules contain many antimicrobial molecules, such as
lactoferrin, lysozyme and matrix metalloproteinases (Faurschou and Borregaard, 2003)
and products of the respiratory burst, such as hydrogen peroxide, hypochlorous acid
and reactive oxygen intermediates are also toxic to invading pathogens. First to be
discharged upon activation of the neutrophil are the peroxidase-negative secondary
and tertiary granules. As well as the matrix metalloproteinases MMP8, MMP9 and
MMP25, which are thought to have an important role in facilitating neutrophil
recruitment and tissue breakdown (Faurschou and Borregaard, 2003), these granules
contain the antimicrobial proteins lactoferrin, lipocalin, lysozyme and LL37, which act
to kill microorganisms. Lactoferrin, for example, is an iron binding protein that acts to
sequester iron thereby removing an essential microbial growth factor from the
extracellular environment, and transgenic mice that overexpress the human form of
lactoferrin are found to have enhanced immune responses to bacterial infection
(Guillen et al., 2002). Following the release of secondary and tertiary granules, next
to be released by the neutrophil are the peroxidase-positive primary granules. These
contain additional antibiotic proteins, such as cathepsin G, neutrophil elastase,
protease 3, and Azurocidin (Campanelli et al., 1990) as well as myeloperoxidase.
Myeloperoxidase is an iron containing enzyme that converts hydrogen peroxide into
the much more powerful antiseptics, hypochlorous acid, hypobromous acid and
hypoiodous acid. The hydrogen peroxide that serves as a substrate for
myeloperoxidase derives from production of reactive oxygen intermediates by the
neutrophil, the primary mediator of which is a phagocyte oxidase (phox). A
deficiency of this enzyme is fatal as patients are unable to control bacterial infection
(Good et al., 1968). Neutrophils are therefore an essential and powerful first line of
defence against invading pathogens, but the chemicals that they release are also
84

damaging to host cells and if uncontrolled can cause enormous damage to the local
tissue. A small level of tissue damage around a site of infection is probably beneficial
to the host as it may help to isolate microbes and prevent spread of infection, however,
in the longer term neutrophils also generate signals to suppress their own activation,
promote apoptosis and initiate repair processes. Anti-inflammatory compounds
secreted by neutrophils include lipoxins, and both neutrophils and macrophages
secrete the anti-inflammatory factor, secretory leukocyte protease inhibitor (SLPI) (Jin
et al., 1997) that acts to neutralise some of the antimicrobial proteases secreted during
the process of neutrophil degranulation. This protease inhibitor also acts to protect the
epithelial-cell-growth-promoting cytokine, proepithelin, from neutrophil elastase
thereby enabling repair processes to be initiated. If proepithelin is instead degraded by
neutrophil elastase, products of this degradation act to promote IL-8 release by
epithelial cells and the recruitment of activated neutrophils to the site of injury
continues (Zhu J et al., 2002).
Neutrophils are produced continuously by the bone marrow and traffic though the
peripheral blood stream until recruited to sites of infection by chemokines such as IL-
8. As such, they are one of the first cell types to be found at the site of a wound and
there is growing interest in the role that neutrophils may have in directing later stages
of the immune response. That activated neutrophils themselves can be a source of IL-8
has already been mentioned, but other examples include TNF-a, B lymphocyte
stimulator (BLys) and IFN-y. TNF-a drives DC and macrophage differentiation and
activation (Bennouna et al., 2003) and neutrophils can additionally mediate DC
activation by cell-cell contact through engagement of the CD11 b integrin on
neutrophils by the DC specific adhesion molecule, DC-SIGN (van Gisbergen et al.,
2005). BLys secretion by neutrophils promotes the activation of B cells and in a
recent study, levels of BLys secreted by neutrophils from patients with rheumatoid
arthritis were found to be greater than those from healthy control subjects (Scapini et
al., 2005). Incidentally, rheumatoid arthritis is an example of a human disease that has
been associated with elevated levels of IL-8 at the site of disease (Troughton et al.,
1996). A further link between neutrophils and the adaptive immune system comes
85

from the demonstration that in the presence of IL-12, neutrophils can produce IFN-y
(Ethuin et al., 2004) and as well as through the secretion of inflammatory mediators,
another way in which neutrophils may act to initiate adaptive immune responses was
reported in a recent study using a Mycobacterium bovis strain Bacille Calmette-Guerin
(BCG) model of infection (Abadie et al., 2005). In this study by Abadie et al. they
used transgenic BCG expressing enhanced green fluorescent protein to show that
neutrophils rather than dendritic cells carried BCG from a site of infection in the skin
into the draining lymph node. However, there are also examples in the literature of
neutrophils functioning to suppress rather than activate the adaptive immune response
(Schmielau and Finn, 2001) and so a picture is emerging of a role for neutrophils in
both the positive and negative regulation of many aspects of the immune response to a
pathogen, some aspects of which are likely to be intimately linked to the presence or
absence of IL-8 at the site of inflammation.
1.20 Interleukin-8 and human lung disease
High levels of IL-8 are found in association with several human lung diseases. One
well studied example is bronchiectasis (Richman-Eisenstat et al., 1993).
Bronchiectasis is characterised by irreversible airway dilation and is found in
association with chronic bronchial infection and inflammation. As the respiratory
organ of the body, the lung is constantly exposed to airborne microbes and as such has
had to develop a multitude of innate and adaptive defence mechanisms to deal with
these pathogens. To allow for sufficient and efficient gas exchange, the epithelial
surface of the lung is vast and, in humans, much of this epithelial surface is covered by
a layer of mucus. Mucus acts to trap incoming bacteria, and these can then be cleared
from the lung by the action of motile cilia which line the surface of airway epithelial
cells. It therefore follows that an impairment in mucus production, or the function of
cilia, will result in susceptibility to infection, and in the diseases of cystic fibrosis (CF)
and primary ciliary dyskinesia (PCD), which are both known causes of bronchiectasis,
this is indeed the case (Matsui et al., 2006 and Bush et al., 1998). In this recent study
by Matsui et al. the concentrated airway mucus that results from the deficiencies in ion
86

transport seen in CF was found to not only impede clearance of mucus from the
airways, but also provide a favourable environment for bacterial growth and biofilm
formation. In some cases of bronchiectasis, such as those caused by CF and PCD, the
cause of persistent infection is understood. In many cases however, the disease is
idiopathic (of unknown cause). Failure to clear bacteria from the airways in the first
instance by ciliary movement results in bacterial contact with, and activation of, the
lungs innate defence system of which neutrophils are an important component. The
main mechanisms by which neutrophils clear invading microbes has been discussed in
the previous section and the importance of the multitude of antimicrobial peptides
secreted by these cells during a bacterial infection are highlighted by various disease
models such as the disease protection conferred on mice manipulated to express
lysozyme constitutively in the lung (Akinbi et al., 2000), and more recently by the
impaired bacterial clearance observed in mice deficient in this protein (Cole et al.,
2005). It is the persistent nature of infection that lies behind the pathophysiology of
bronchiectasis, as sustained inflammatory responses inevitably lead to tissue damage,
impairing the ability of the lung to fight infection, and creating a vicious cycle of IFN-
y mediated immunity.
As previously mentioned, CF patients suffer from chronic bacterial infections and
elevated levels of IL-8 protein have been found in BAL, sputum and in the bronchial
epithelial cells of these patients (Muhlebach et al., 1999, Sloane et al., 2005 and
Muhlebach et al., 2004), along with pronounced neutrophilic infiltrates (Konstan et
al., 1994). Whether the observed high levels of IL-8 are purely a function of chronic
inflammatory reactions occurring in the lung, increasing IL-8 expression as a
consequence of high levels of inflammatory cytokines and bacterial proteins, or
whether the reason for high IL-8 expression is intrinsic to CF itself is not quite clear.
However, two recent studies have suggested that the mutation in CF transmembrane
conductance regulator (CFTR) gene alone, proposed to be the genetic basis for
disease, is sufficient to cause elevated IL-8 gene expression in the airways (Perez et
al., 2007 and Chan et al., 2006).
87

Another lung disease characterised by large neutrophil infiltrates and high levels of IL-
8 is acute respiratory distress syndrome (ARDS). Caused by a variety of direct or
indirect insults to the lung such as pneumonia, smoke inhalation or surgery, several
groups have reported a correlation between neutrophilia and levels of IL-8 in patients
with ARDS (Aggarwal et al., 2000) and indeed an association between high levels of
IL-8 and an increased risk of subsequently developing this condition has also been
reported (Donnelly et al., 1993). A role for IL-8 in mediating the pathogenesis of this
acute disease, aside from simply recruiting and activating the neutrophils which
amplify lung inflammation and cause tissue damage, has been suggested to be
mediated by anti-interleukin-8 autoantibodies (Kurdowska et al., 2001). This group
reported a significant correlation between concentrations of IL-8:anti-IL-8 antibody
complexes in the lung and the onset of ARDS. More recently, they have also
demonstrated that these IL-8:anti-IL-8 antibody complexes are indeed attached to
FcyRIIa receptors and are therefore likely to be mediating pro-inflammatory signals in
the lung (Allen et al., 2007).
Other diseases for which IL-8 has been found to be a marker of disease severity
include idiopathic pulmonary fibrosis (IPF), COPD and diffuse panbronchiolitis
(DPB) (Cane et al., 1991, Yamamoto et al., 1997 and Koga, 1993). Indeed, anti-IL-8
therapy has been suggested as a possible therapeutic approach for the treatment of
COPD (Mahler et al., 2004). Aside from neutrophil recruitment, additional roles for
IL-8 in the pathogenesis of each of these diseases is currently unclear, but
polymorphisms in the IL-8 gene have been reported in association with DPB (Emi et
al., 1999) and in the COPD study by Yamamoto et al. IL-8 levels were closely
correlated with lung function measurements. A more recent study has attempted to
elucidate a role for IL-8 in directly affecting airway structure and function
(Govindaraju et al., 2006). In this study, smooth muscle cells from human airways
were analysed for expression of the IL-8 receptors, CXCR1 and CXCR2. Both
receptors were found to be present on the surface of these cells and blocking of the
receptors using neutralising antibodies could prevent changes in intracellular Ca2+
observed upon IL-8 stimulation. IL-8 was also found to cause contraction of the
88

muscle cells as well as stimulating cell migration. This data suggests that the lung
function changes observed in many of the lung diseases discussed here could, in part,
be mediated by the high levels of IL-8 found within the lung.
Although asthma is normally considered to be associated with eosinophilic lung
infiltrates, neutrophil influx is found to be a common feature of persistent asthma and
this neutrophilia has also been associated with elevated levels of IL-8 (Gibson et al.,
2001). Increased levels of IL-8 have also been found in sputum samples directly
before late phase exacerbations in acute asthma (Kurashima et al., 1996) and in
keeping with the more recent results of the airway smooth muscle study by
Govindaraju et al., IL-8 inhalation has been shown to directly provoke
bronchoconstriction in guinea pigs, which was observed in the absence of any
leukocyte recruitment into the airways (Fujimura et al., 1999). A positive role for IL-
8 in the regulation of asthma has been proposed following the finding that IL-8 can
selectively inhibit IL-4 induced IgE production (Kimata et al., 1992) and the treatment
of human lungs with IgE results in the release of IL-8 (Erger and Casale, 1998).
However, there must then be a trade off between IgE downregulation and the
neutrophil and eosinophil chemoattractant properties of this cytokine. Aside from IgE,
the reason for elevated IL-8 levels in the airways of asthmatic is not yet clear, but that
the initial source of this cytokine maybe the airway epithelium in response to allergen
is supported by the finding that pulmonary epithelial cells can produce high levels of
IL-8 in the presence of diesel exhaust particles (Takizawa et al., 1999). However the
wide range of toxic chemicals present in diesel exhaust fumes means that this finding
is not necessarily applicable to other more classical allergens.
The neutrophilia observed in many human lung diseases, the central role of IL-8 in
neutrophil recruitment and also emerging roles for IL-8 in disease pathogenesis that
are separate from neutrophil recruitment and activation, all make IL-8 an attractive
target for manipulation in animal models of lung disease. There are currently no
reports in the literature of IL-8 having been overexpressed in the airways of mice,
although this may not be an intuitive experiment as in the mouse genome, the IL-8
89

gene and the gene for its receptor, CXCR1, have been deleted. However, the CXCR2
receptor is expressed, and this receptor is able to mediate neutrophil chemotaxis in
response to the two proposed murine homologues of IL-8, KC and MIP-2 as well as in
response to human IL-8 itself (Bozic et al., 1994). The chemoattractant properties of
human IL-8 have been demonstrated using neutrophils for a variety of different
species, including monkeys, rabbits, dogs and mice (Rot, 1991). Although the potency
of human IL-8 varied between species and was lower than that observed for human
neutrophils, these findings nevertheless suggest that interleukin-8, if expressed in the
murine lung, should be biologically active. Various studies have manipulated the
mouse CXCR2 receptor and its ligands in vivo and in keeping with the role of IL-8 and
its receptors in human studies, mice overexpressing KC in a variety of tissues,
including the lung, do show evidence of neutrophil infiltrates (Lira, 1996). Mice
overexpressing KC in the lung also demonstrate increased resistance to infection (Tsai
et al., 1998), while neutralising the CXCR2 receptor results in increased disease
susceptibility (Tsai et al., 2000). These studies suggest that, as in humans, ELR+ CXC
chemokines are critical mediators of neutrophil mediated host defence mechanisms.
However, as has been discussed in this section, there is increasing evidence that IL-8
mediates lung pathology in ways other than those involving neutrophil recruitment and
additionally, to study potential therapeutic approaches to IL-8 mediated lung
pathology in the mouse, using the human IL-8 protein rather than the mouse
homologues, which are similar but not equivalent, would be preferable. There is
therefore merit in the approach to overexpress human IL-8 in the murine lung and the
generation and initial characterisation of such transgenic animals is described in
chapter 6 of this thesis.
1.21 Aims of this thesis
Much of the discussion in this chapter has centred around the T cell receptor molecule
and around the Thl and Th2 type immune responses that are an important feature of
many human diseases, including several lung pathologies. Multiple factors are
involved in determining whether a naive CD4+ T cell differentiates into a Thl or Th2
90

effector cell and several lines of evidence point towards an important role for the
interaction between the T cell receptor (TCR) and its peptide ligand. A previous study
by Boyton et al. (Boyton et al., 2002) showed that highly polarised Th2 CD4+ T cells
selected under Th2 polarising conditions favour a structurally distinct TCR with an
elongated TCR a chain complimentarity determining region 3 (CDR3), while those
selected under Thl polarising conditions favour a shorter TCR CDR3 a chain.
Molecular modelling predicted that this elongated TCR a chain results in a less
optimal (lower avidity) interaction between the TCR and peptide/MHC complex and
gave rise to the hypothesis that, if structurally distinct TCRs arising from Thl and Th2
polarised T cells, i.e. a TCR bearing an elongated CDR3a region from a Th2 cell and
a shorter CDR3a region from a Thl cell, are expressed transgenically, an inherent bias
towards Thl or Th2 will be observed in CD4+ T cell responses from these animals.
Much of the data in this study by Boyton et al. was derived from T cell responses of
H2-E transgenic NOD (NOD.E) mice to the peptide epitope PLP 56-70. PLP 56-70 is
an epitope used to induce EAE in NOD and NOD.E mice. A deletion in the promoter
region of the I-E a chain gene means that NOD mice only express the MHC class II
molecule I-A and are known to spontaneously develop type 1 diabetes. However,
expression of an I-E a chain transgene protects NOD.E mice from diabetes (Lund et
al., 1990), but makes them more susceptible to EAE (Tackas et al., 1995). In this
study by Tackas et al. I-E expression in NOD.E animals was associated with a shift
away from IL-4 production and towards greater IFN-y production in T cell responses
to PLP 56-70, suggesting an association between Thl responses and disease in this
model, whilst describing Th2 responses in association with protection. In the study by
Boyton et al., multiple NOD.E T cell lines and clones specific for the peptide PLP 56-
70 were grown and polarised in vitro towards a Thl or Th2 phenotype. In all cases,
the peptide response was found to be I-Ag7 rather than I-E restricted. It is Thl and Th2
T cell lines grown during the course of this study, which are specific for the peptide
epitope PLP 56-70, that serve as the starting point for the work described in chapters 3
and 4 of this thesis, where the aim is to express dominant TCRs from Thl and Th2
polarised T cell lines transgenically to determine whether a structurally distinct TCR
can cause an innate bias in CD4+ T cell phenotype (figure 1.6)
91

Further to this hypothesis is a second question of whether these Thl and Th2 TCR
transgenic animals could be used to create new models of Thl and Th2 mediated
disease. The lung is one organ in which understanding Thl and Th2 type responses is
of much interest and a second aim of this thesis is to establish a mouse model whereby
the peptide epitope for these Thl and Th2 TCRs (PLP 56-70) can be expressed
inducibly and specifically in the lung. Chapter 5 of this thesis describes the generation
of this model using a lung specific promoter and the MerCreMer system of inducible
gene expression and a schematic diagram detailing the way in which these mice would
be used to generate novel lung disease models is shown in figure 1.6.
The final aim of this thesis is to generate another mouse model of lung disease, where
lung pathology is as a consequence of overexpression of the human cytokine IL-8
(figure 1.6). Elevated levels of IL-8 protein are found associated with several different
human lung diseases, but the precise role that IL-8 plays in the pathologies of these
diseases has yet to be elucidated. Chapter 6 of this thesis describes the generation of
mice overexpressing the human IL-8 protein in the lung and initial characterisation of
lung pathology in these animals.
92

(b) Lung targeted
Antigen
• Inducible and lung targeted
Antigen
1
(c) (a)
Antigen specific CD4+ T cell lines
Lung targeted
IL-8 f
Lung pathology? CD4+ T cell phenotype?
Thi or Th2 derived TCR
Thl or Th2 type lung inflammation?
Figure 1.6 Transgenic strategies of this thesis. A schematic diagram of the transgenic strategies proposed for the three main aims of this thesis. (a) The use of TCR transgenics to answer questions about a possible role for the TCR in determining CD4+ T cell phenotype. (b) The targeting of antigen inducibly and specifically to the lung to generate, in combination with the TCR transgenics, models of Thi and th2 type lung inflammation. (c) Targeting of human interleukin 8 to the lung to elucidate the role of this cytokine in lung inflammation and pathology.

Chapter 2
Materials and methods
2.1 Genomic DNA extraction
400 µ1 of digestion buffer (appendix 1) and 10 [,t1 of 20 mg/ml proteinase K (Sigma-P-
6556) were added to each tissue sample and samples incubated at 56°C overnight.
After complete digestion, 200 µ1 of 6M (saturated) NaC1 were added and the sample
mixed well by vigorous shaking before centrifuging at 16000 x g for 15 minutes. The
supernatant was removed to a fresh tube and DNA precipitated by the addition of 600
µI of isopropanol. The sample was mixed well by inversion and spun at 16000 x g for
10 minutes to pellet the DNA. The DNA pellet washed once in 70 % EtOH before
being briefly air-dried and dissolved in 50-80 1_11 of TE buffer (appendix 1). Samples
were incubated briefly at 56°C for 15 minutes to ensure the DNA pellet was fully in
solution and samples were then stored at 4°C for up to one week or -20°C for more
long term storage.
2.2 RNA extraction
For tissue samples or samples of greater than 5 x 10⁶ cells, RNA was extracted using
Trizol (Invitrogen-15596-018) a phenol and guanidine thiocyanate based extraction
reagent. Prior to addition of Trizol reagent, tissue samples were homogenized using a
manual glass-glass homogenizer. Samples were lysed by repeated pipetting with 1 ml
of Trizol reagent. If not processed to RNA immediately, samples were stored at 4°C
overnight or at -20°C for up to 1 month. Following cell lysis, 2000 of chloroform
was added, the sample mixed by vigorous shaking for 30 seconds and then incubated
on ice for 5 minutes. Samples were centrifuged at 12,000 x g for 15 minutes at 4°C
and the upper aqueous layer removed to a new tube. RNA was precipitated by
addition of 500 Ill of isopropanol. Samples were mixed by inversion and incubated at
room temperature for 10 minutes before centrifugation at 12,000 x g to pellet the
RNA. RNA pellets were washed once with 75% EtOH, air-dried briefly and dissolved
94

in 20-30 t1,1 of RNase free water (Sigma-W4502). RNA samples were stored at -20°C
in the presence of 20 U RNase OUT (Invitrogen-10777-019).
RNA from cell line samples of less than 5 x 10⁶ cells was extracted using an RNA
binding spin column (Stratagene-400805).
2.3 DNase treatment of RNA samples
To remove contaminating DNA from some RNA preparations prior to cDNA
synthesis, samples were treated with an RNase free DNase (Promega-M610A). 3-51.1g
of RNA in a reaction volume of 20 tx1 containing 2 Ill 10X reaction buffer (400 mM
Tris-HC1 pH 8.0, 100 mM MgSO4 and 10 mM CaC12) and 1 U of DNase per Rg of
RNA were incubated at 37°C for 30 minutes. The DNase was then removed from the
sample by phenol:chloroform (Sigma-P1944) extraction. All traces of phenol were
removed by an additional chloroform:isoamylalcohol (24:1) extraction and RNA
precipitated using 2.5 volumes of 100% EtOH. RNA pellets were washed once with
70% EtOH before being briefly air-dried and dissolved in 10 µ1 of RNase free water.
cDNA synthesis reactions were then set up both with and without the reverse
transcriptase enzyme to ensure that subsequent PCR results obtained were not due to
contaminating DNA.
2.4 cDNA synthesis
RNA was quantitated by spectrophotometer and 10Ong - ltA,g used per cDNA reaction.
The RNA in a volume of 13 1A.1 of sterile water containing 50 ng random hexamers
(Invitrogen-48190-011) and 1 IA of 10 mM dNTPs (Invitrogen-18427-013) was heated
to 65°C for 5 minutes and then placed on ice. 4 iil of 5X cDNA synthesis buffer
(Invitrogen-18080-044), 1 !Al of 0.1M DTT (Invitrogen-18080-044), 40 U of RNase
OUT and 200 U of Superscript III (Invitrogen-18080-044) were added. The mixture
was heated at 25°C for 5 minutes, followed by 50°C for 60 minutes and 70°C for 15
minutes. 1 [11 of completed cDNA reaction mixture was used as a template for each
subsequent PCR reaction. cDNA was stored at -20°C.
95

2.5 Polymerase Chain Reaction (PCR)
A general PCR protocol is described below. All oligonucleotide primer sequences,
reaction product sizes and any reaction conditions that varied from those described in
this section are listed in appendices 6, 7 and 8.
PCR reactions were carried out in a reaction volume of 25 µI containing 50-100 ng of
template DNA, 16 mM (NH4)2SO4, 67 mM Tris-HC1 (pH 8.8), 0.01% Tween-20, 1.5
mM MgC12, 200 µM dATP, dCTP, dGTP, and dTTP (Bioline-BIO-39025), 0.5 ILIM of
each oligonucleotide primer (Sigma Genosys) and 0.6 units of Taq polymerase. The
reaction mixture was incubated at 95°C for 5 minutes, 30 cycles of 95°C for 1 minute,
55°C for 1 minute, and 72°C for 1 minute, and a final cycle at 72°C for 8 minutes. The
result of each PCR was then determined by running the reaction on a 1% agarose TAE
(appendix 1) gel stained with EtBr (Sigma-E1510).
2.6 Restriction enzyme digest Restriction enzyme digests were carried out in a volume of 20 µI containing 0.5-2 µg
of plasmid DNA, 1 U of appropriate restriction enzyme(s), and 2µl of 10X buffer
(appendix 3). Reactions were incubated at 37°C or 50°C (appendix 3) for at least 1
hour. Digests were run alongside a DNA ladder with markers of known molecular
weight (Promega-G5711) on 1% agarose TAE gels at 90V.
2.7 Preparation ofXL-Gold competent cells
XL-Gold cells from a previous preparation were streaked onto a Luria-Bertani (LB)
agar (Sigma-L2897) plate containing 50 µg/m1 tetracycline (Sigma-T8032) and
incubated at 37°C overnight. The following day a single XL-Gold colony was
inoculated into 10 ml of LB broth (Sigma-L3022) containing 50 lag/m1 tetracycline
and incubated at 37°C overnight on a shaker (225 rpm). The 10 ml overnight culture
was inoculated into 200 ml of LB broth containing 0.015M MgC12 and grown until the
optical density Q = 600 nm) of the culture reached 0.6. The culture flask was then
placed on ice for 10 minutes before spinning 100 ml of the culture in a pre-cooled
96

centrifuge (4°C) at 1600 x g for 10 minutes. The supernatant was discarded and the
remaining culture volume spun down in the same tubes. The cell pellets were
resuspended by swirling and gentle pipetting in a total volume of 60 ml of ice cold
solution A (appendix 1) and incubated on ice for 20 minutes. Samples were then
centrifuged again, the supernatant discarded, and the pellets resuspended in a total
volume of 12 ml of ice cold solution B (appendix 1). Competent cells were stored at -
80°C in 200 µ1 aliquots.
2.8 E-coli transformation
All transformations were performed using XL-Gold (see above) or INVaF' competent
cells (Invitrogen-C2020-03). The same transformation protocol was used for both
strains. 2111 of a ligation reaction or 1µl of a plasmid preparation were added to 50 [al
of competent cells. The mixture was incubated on ice for 30 minutes before heat
shock at 42°C for 30 seconds. 250 pi of SOC medium (supplied with INVaF'
competent cells) or LB broth warmed to room temperature were added and the cells
were then incubated with shaking (225 rpm) at 37°C for 1 hour. Bacteria were spread
onto LB agar plates containing 50 µg/ml of ampicillin (Sigma-A9518). Plates were
inverted and incubated at 37°C overnight. For TA cloning ligations, plates were also
spread with 40 ial of a 40 mg/ml stock solution of 5-bromo-4-chloro-3-indolyl-b-D-
galactopyranoside (X-Gal) (Bioline-Bio37035) and 8R1 of a 100 mM stock solution of
Isopropyl 13-D-1-thiogalactopyranoside (IPTG) (Sigma-16758) 30 minutes before
plating of the bacteria. This allowed successfully ligated plasmids to be identified by
blue/white screening of the bacterial colonies. Colonies containing a plasmid with a
PCR product correctly ligated appear white.
2.9 Standard cloning and ligation protocol
With the exception of one step, which used a synthetic oligonucleotide insert, the
fragments for all other cloning steps were obtained by single or double restriction
enzyme digests of the appropriate plasmids. These restriction digests were carried out
overnight in a volume of 40 111. For single enzyme digests it was necessary to
dephosphorylate the ends of the vector fragment after digestion to prevent re-ligation.
97

This was achieved by adding 0.01 U of Calf Intestinal Alkaline Phosphatase (CIAP)
(Promega-M1821) per pmol of DNA ends in the reaction (where 1 !is of 1000 bp
DNA = 3.03 pmol of DNA ends) and incubating at 37°C for 1 hour. All DNA
fragments used for cloning were purified by separation on a 1% agarose (Sigma-
A9539) TAE gel followed by gel extraction using silica beads (Qbiogene-1001-600).
The amount of each purified fragment recovered was quantitated by running 1 [xl of
each sample on an agarose gel alongside a quantitative DNA ladder (Bioline-
BI033025). As optimal ligation conditions for each cloning step were unknown, a
number of reactions using different ratios of vector to insert were set up each time.
The amount of each fragment required to achieve each ratio was calculated using the
equation below.
amount of vector (ng) x size of insert (bp) x molar ratio of insert = amount of insert (ng) size of vector (bp) vector
Standard ratios of vector to insert used were 1:1, 1:3, 1:6 and 1:12. Control reactions
of 1:0 and 1:0 with no ligase added were also set up to assess levels of re-ligated and
uncut vector respectively. Ligation reactions were set up in a volume of 10 [AI
containing 5 U of T4 DNA ligase (Promega-M1801) and 2 [11 of 5 x reaction buffer
(250 mM Tris-HC1 pH 7.6, 50 mM MgC12, 5 mM ATP, 5 mM DTT and 25% w/v
polyethylene glycol-8000). Reactions were incubated at 16°C overnight before
transformation into XL-Gold E-coli (see above).
2.10 Blunt end generation
A restriction digest (see above) of the appropriate plasmid and restriction enzyme was
inactivated by heating to 65°C for 15 minutes. Blunt ends were generated using T4
DNA polymerase (Promega-M4211). The reaction volume of the original restriction
digest was increased to 50 1,t1 using sterile water, and contained 6 U of T4 DNA
polymerase, 100 mM of each dNTP and 3 ill of promega 10X multi-core buffer (250
mM Tris acetate, pH 7.8, 1 M potassium acetate, 100 mM Magnesium acetate and 10
mM DTT). Reactions were incubated at 37°C for 5 minutes before inactivation at
98

75°C for 10 minutes. The plasmid was then purified by agarose gel extraction and
blunt ends ligated using T4 DNA ligase.
2.11 Oligonucleotide annealing
Each oligonucleotide was made up to a concentration of 1 mg/ml in sterile water. 1 121
of each oligonucleotide was then added to 18 itil of TE buffer and the mixture heated at
70°C for 5 minutes. The tube was placed into a beaker of water at 65°C and left to
cool to room temperature before placing on ice. No further purification of this
annealed product was required before ligation.
2.12 TA cloning of PCR products
PCR products amplified using Taq polymerase (Bioline-BIO-21040) were cloned into
the plasmid pCle2.1 by TA cloning (Invitrogen-K2000-01). Vector DNA did not
require any purification before ligation, but PCR products were separated by agarose
gel electrophoresis and gel purified using a silica matrix protocol to preserve the A
overhangs. 10-20 ng of PCR product were ligated into 25 ng of pCle2.1 vector in a
reaction volume of 10 pi containing 4 U of T4 DNA ligase (Invitrogen-15224-041)
and 1 1,t1 of 10 x reaction buffer (60 mM Tris-HC1 pH 7.5, 60 mM MgC12, 50 mM
NaCl, 1 mg/ml BSA, 70mM (3-mercaptoethanol, 1 mM ATP, 10 mM spermidine and
20 mM DTT). Ligation reactions were incubated at 16°C overnight.
2.13 Preparation and screening of plasmid DNA
Successfully transformed bacterial colonies were picked from agar plates using sterile
pipette tips and grown up in 8 ml of LB broth containing ampicillin (50 p.g/m1) at
37°C overnight. Bacteria were pelleted by spinning at 1500 x g for 4 minutes and
plasmid DNA extracted and purified by alkaline lysis (Qiagen-27106 or Sigma
PLN350). Successfully ligated plasmids were identified by restriction enzyme digest
and PCR.
99
2.14 T cell receptor PCR analysis T cell receptor (TCR) a and (3 chain cDNA transcripts were amplified using sets of
primers previously described by Candeias et al. (Candeias et al., 1991). Three rounds
of PCR are required to obtain a chain products while two rounds are required for (3.
The 5' primers for both a and 13 are degenerate and designed to bind all TCR families.
5' primers for a and (3 chain amplification are NW36, NW37, NW38 and NK121,
NK122, NK123 respectively. They were used as an equimolar mixture for all rounds
of amplification. 3' primers are derived from a and (3 constant regions. For the a
chain, 3' primer NJ108 was used in the first round of amplification, followed by
NJ109 and NJ110. For the (3 chain, MQ284 was the first 3' primer used, followed by
MS175. Primer sequences are listed in appendix 4. All PCR rounds were set up as
described in the section above using an annealing temperature of 53°C for 2 minutes
and amplifying for 28 cycles. Products obtained were 300-400 bp in size and were TA
cloned as described. Successfully ligated PCR products were identified by EcoR1
digestion of plasmid DNA and sequenced using the M13 primer (appendix 4).
2.15 Sequencing and T cell receptor sequence analysis
All sequencing reactions were performed at the Natural History Museum sequencing
facility. Plasmid DNA containing the sequence of interest was sequenced using a
sequence specific primer and the Big Dye Terminator v1.1 Cycle Sequencing Kit
(Applied Biosystems). Sequencing reaction products were analysed on an Applied
Biosystems 3130x1 DNA analyser and sequence data obtained was manipulated using
GeneJockeyll software. Raw sequence data files were read by EditView (Perkin
Elmer).
T cell receptor sequences and CDR3 region lengths were identified based on the
classifications of the International Immunogenetics (IMGT) information system
database (http://imgt.cines.fr) (Ruiz et al., 2000). CDR3 length was taken as the
number of amino acids between, and not including, the conserved cysteine residue (C)
at the 3' end of the V gene segment and the conserved phenylalanine residue (F) at the
5' end of the J segment.
100

2.16 TCR CDR3 Spectratyping
The sequences of the specific Vf3 gene primers and the constant Cr3 primer conjugated
to the fluorescent dye 6-carboxyflurorescein-amino-hexy (6-FAM) are shown in
appendix 5. PCR reactions were set up as described above with a final MgCl2
concentration of 3.5 mM. For a given cDNA template, each V13 primer was set up as a
separate PCR reaction with the constant C13-6FAM primer. PCR reaction mixtures
were incubated at 95°C for 10 minutes followed by 36 cycles of 94°C for 20 seconds,
55°C for 40 seconds, 72°C for 40 seconds and a final extension step of 72°C for 5
minutes. 10 til of each PCR reaction was run on a 1% agarose TAE gel to confirm
that the reaction had been successful before proceeding. PCR products were then run
on an ABI Prism 3100 Genetic Analyzer in ABI Prism 96 well optical reaction plates
(Applied Biosystems-403012) where each well of the plate contained 5 IA of PCR
product, 1011,1 of Hi-Di Formamide (Applied Biosystems-4311320) and 0.50 of a
Genescan 500 ROX standard (Applied Biosystems-401734). Data was collected and
analysed by Gene Mapper ID Software version 3.2 (Applied Biosystems).
2.17 Real- time PCR RNA and cDNA were prepared as described. 500 ng of DNase treated RNA was used
as a template in each cDNA reaction. PCR reactions were carried out in a volume of
20 Ill containing 1 !al of cDNA, 8 [Al of RNase free water, 1µ1 of 20x gene specific
primer mix (Applied Biosystems — Assays-on-DemandTM Gene Expression Assay)
(appendix 8) and 10 ttl of 2x TaqMan® Universal PCR Master Mix (Applied
Biosystems - 4304437). Reactions were incubated at 50°C for 2 minutes, 95°C for 10
minutes and then 40 cycles of 95°C for 15 seconds and 60°C for 1 minute. PCR
reactions were set up in triplicate for each set of primers used, and CT values (the PCR
cycle number at which the fluorescence passes a fixed threshold) were obtained using
a Stratagene MX3000P real-time PCR machine and software. Variability in the
amount of RNA used for each cDNA reaction was controlled for by running a PCR for
18s RNA for each sample. PCR of a dilution series of a single sample showed the 18s
and all other primer sets to have different amplification efficiencies. It was therefore
101

not possible to use the 2-mc` mathematical expression for fold change. CT values for
PCR reactions were instead converted to numerical values, using the equation for the
appropriate efficiency curve before normalising each gene of interest value with
respect to the 18s value for the same sample. The sample with the lowest level of gene
expression was assigned a value of 1. Levels of gene expression in all other samples
were expressed as a value relative to 1.
2.18 Preparation of DNA for oocyte pronuclear injection
Plasmid DNA purified using a commercial alkaline lysis based purification kit
(Qiagen-12162) was digested overnight with the appropriate restriction enzyme.
Restriction digests were performed in a volume of 60 Ill containing 15 [t.g of plasmid
DNA and at least 30 U of restriction enzyme. The required band was separated by
running the sample on a 0.8% low melting point agarose (Promega-V2831) TAE gel at
70 V for 6 hours. The fragment for injection was excised and gel purified using a
DNA binding column (Qiagen-28704). An additional wash step of 5 minutes was
added to the recommended protocol. DNA was eluted from the column in embryo
grade water (Sigma—W1503) and the DNA solution sterilised by passing though a
0.22um Costar spin filter (Fisher Scientific —MPA150010C). Purified DNA fragments
were quantitated using a spectrophotometer (Nanodrop® ND-1000) and by running
of the preparation on a 1% agarose TAE gel alongside a quantitative DNA ladder.
Purified DNA fragments were stored at 4°C until the day of injection when they were
diluted to a concentration of 2-4 ng/p,1 in embryo grade water in a final volume of 50
pl. Oocyte pronuclear injections were performed at the Nuffield Department of
Medicine (University of Oxford) or the MRC Clinical Sciences Centre (Hammersmith
campus of Imperial College London)
2.19 Genotyping
Genomic DNA from a small sample of tail tissue was extracted using a high salt DNA
extraction method (see above). Mice were assigned a number for identification based
on cage number and ear marking at the time of tail biopsy. Mice carrying the
transgene of interest were identified by PCR. The genotypes of transgenic founder
102

animals and of animals used for subsequent breeding were also confirmed by Southern
blot (see below).
2.20 Southern blotting
Restriction digests of genomic DNA were carried out in a reaction volume of 50 0
containing 10-15 [tg of genomic DNA, 50 U of appropriate restriction enzyme, 5 !al of
10X buffer supplied with enzyme (appendix 3), 1 mM Spermidine (Sigma-S2501),
100 µg/ml Ribonuclease A (Sigma-R4875) and 100 µg/ml BSA (Promega-R396D).
Reactions were incubated at 37°C overnight. Digests were run alongside a standard
ladder on a large 1% agarose TAE gel for 18 hours at 45V. Prior to blotting, the gel
was photographed alongside a ruler to allow determination of band size on the final
blot. Size markers and excess gel were trimmed away and the remaining gel incubated
in depurination solution (appendix 1) for 10 minutes at room temperature. Following
a brief wash in distilled water the gel was incubated in denaturing buffer (appendix 1)
for 45 minutes at room temperature and then in neutralising buffer (appendix 1) for a
further 45 minutes. The DNA was blotted overnight onto Hybond N+ (Amersham
Biosciences RPN203B), a positively charged nylon transfer membrane, using 20X
SSC (appendix 1) as the transfer buffer. DNA was irreversibly bound to the
membrane by exposure to UV light for 2 minutes. The membrane could then be
washed briefly in distilled water to remove any excess agarose, air-dried and stored at
4°C.
2.21 Southern blot Digoxigenin (DIG) probe labelling, hybridisation and detection
DNA fragments to be DIG labelled and used as Southern probes were generated by
PCR from plasmid DNA using primers specific to each transgene. PCR products were
purified by gel extraction and quantitated by running on a 1% agarose TAE gel
alongside a quantitative DNA ladder. 1-3 pg of DNA template was made up to a
volume of 16 0 with sterile water and boiled for 10 minutes to separate strands before
placing immediately on ice. 4 1A1 of DIG high prime mix (Roche-1 585 606)
containing digoxygenin labelled dUTP was added and the reaction incubated at 37°C
for 20 hours. The mixture was cleaned using a spin column (Bioline-BIO-28030) after
103

labelling to remove any unincorporated labelled nucleotides that could cause high
background. The amount of probe successfully labelled was quantitated by dot
blotting a dilution series of the probe, along with a dilution series of control labelled
DNA (Roche-1 585 738) onto a nylon membrane, cross linking with UV and then
carrying out the detection procedure described below.
The Southern blotted genomic DNA membrane was incubated with 10 ml of pre-
warmed DIG Easy Hyb hybridisation solution (Roche-1 796 895) with gentle rotation
at 42°C for 30 minutes. This solution was then discarded and the membrane incubated
at 42°C overnight with 8 ml of pre-warmed hybridisation solution containing 20 ng/ml
of denatured probe. The probe was denatured by boiling in 20 iil of water for 5
minutes and then placing immediately on ice. This hybridisation solution could be re-
used by storing at -20°C and heating to 68°C for 10 minutes immediately before use.
Following hybridisation the membrane was washed twice for 5 minutes in 2X SSC
containing 0.1% SDS at room temperature and then twice for 20 minutes in 0.5X SSC
containing 0.1% SDS at 65°C with gentle agitation.
For detection of the labelled probe, the membrane was rinsed briefly in maleic acid
wash buffer (appendix 1) before incubation in blocking solution (Roche-1 096 176) for
30 minutes with gentle agitation at 37°C. This blocking solution was discarded and
the membrane incubated for a further 30 minutes in blocking solution containing a
1:10,000 dilution of an anti-digoxigenin alkaline phosphatase conjugated antibody
(Roche-1 093 274). The membrane was washed twice for 15 minutes in maleic acid
wash buffer and then the membrane adjusted to the correct pH by equilibration for 5
minutes in detection buffer (appendixl). The membrane was then placed between two
sheets of soft plastic and 1 ml of the alkaline phosphatase chemiluminescent substrate,
CSPD, (Roche- 1 755 633) applied drop wise to the surface of the membrane. The
membrane was covered with the plastic sheet to distribute the substrate evenly over
the surface and then incubated for 5 minutes at room temperature before removing all
air bubbles and sealing the edges of the plastic by heat. The membrane was exposed
104

to light sensitive film (Sigma-Z37351650EA) for 15-120 minutes to achieve the
desired signal strength.
2.22 Tamoxifen induction
Cre nuclear localisation in MerCreMer (Bm70) transgenic animals was induced using
Tamoxifen (Sigma-T5648). Tamoxifen was administered at a dose of 1
mg/mouse//day for 5 consecutive days and was prepared by combining 10 mg
tamoxifen with 100 d EtOH and 2 ml of sunflower oil (Tesco pure sunflower oil).
The mixture was incubated in a sonic water bath at room temperature for 30 minutes.
200 [1,1 per mouse of the sonicated mixture was administered by i.p injection each day.
2.23 Footpad /flank peptide immunisation
The peptide PLP 56-70 (DYEYLINVIHAFQYV) was used for immunisation and in
vivo priming of T cell responses in NOD.E mice (Lund et al., 1990 and Takacs et al.,
1995). 50 IA.g of peptide, as an emulsion with either Complete Freund's Adjuvant
(CFA) (Sigma-F5881) or Incomplete Freund's Adjuvant (IFA) (Sigma-F5506), was
administered per immunisation in the footpad or the flank. 50 µ.1 or 100 pi of peptide
emulsion were injected into the footpad or flank respectively. Emulsions were a 1:1
mixture of peptide solution and CFA or IFA and were prepared by vortexing for 30
minutes, followed by incubation in an iced sonic water bath for 1 -2 hours.
2.24 Immediately ex vivo T cell proliferation assay
10 days (unless otherwise stated) after immunisation with peptide, the draining lymph
node (s) (DLN) and spleen were harvested. The popliteal lymph node drains from the
footpad and the inguinal lymph node drains from the flank. Single cell suspensions
were prepared in HL-1 medium (Cambrex-BE344017) supplemented with 2 mM L-
glutamine (Gibco-25030024), 25 Wm' Penicillin G (Gibco-15070063) and 25 µg/m1
Streptomycin sulfate (Gibco-15070063). Cells were counted using a haemocytometer
and were cultured in triplicate in 96- well plates (SLS-161093) with 3 x 10⁵ cells per
well in the presence of different concentrations of peptide PLP 56-70
(DKEKLINVIHAFQYV). A substituted (Y-'K) version of the peptide PLP 56-70
105

was used for in vitro assays as the un-substituted peptide is very insoluble. After 2
days of culture, 100 Ill of supernatant was removed from each well. Supernatants
from triplicates were pooled and stored at —20 °C for subsequent cytokine analysis by
ELISA. 100 µ1 of fresh HL-1 culture medium was added to each well along with 5
[Xi of [3H] Thymidine (MP-2405905). Cells were cultured for an additional 18 hours
before plates were harvested (MACH III M Harvester 96) for beta scintillation
counting (Wallac 1450 microbeta TRILUX).
2.25 Culture of T cell lines
T cell lines from immunised footpad draining lymph nodes were set up with 3 x 10⁶
DLN cells / ml in the presence of 25 [tg/ ml of PLP 56-70 (substituted). After 48
hours, IL-2 (10 IU/ml) (R&D systems-402-ML-020) was added to the culture medium
and the cultures incubated for an additional 8 days. Cells were then resuspended in
RPMI 1640 medium containing 10% Foetal Calf Serum (FCS) (Globepharm-batch
F30610), 50 I_LM beta mercaptoethanol (Sigma-M7522), 2 mM L-Glutamine 50 U/ml
Penicillin G and 50 µg/ml Streptomycin sulfate, and restimulated with 25 µg/ml of
peptide in the presence of 3 x 10⁶ /ml of irradiated NOD.E splenocytes. The ratio of T
cells to irradiated APC in restimulation cultures was 1:25. Splenocytes were irradiated
by exposure to 3000 RADs of gamma radiation (Gammacell® 3000 Elan, Nordion
International Inc.). All T cell lines were repeatedly restimulated every 9-11 days and
maintained in 10 IU/ml IL-2. Proliferation assays were set up for each line at each
restimulation to check peptide specificity and cytokine production. Proliferation
assays were performed as described above with 3 x 10⁵ irradiated splenocytes and 2 x
104 T cells in RPMI 1640 medium per well. RNA was also isolated from each cell
line at each restimulation.
2.26 Measurement of bronchial hyperreactivity (BHR)
Measurement of BHR was performed by recording respiratory pressure curves by
whole body plethysmography, calculated as Penh (Enhanced Pause, Buxco, USA).
Mice were placed, fully conscious, into individual plethysmograph chambers and
changes in air pressure between these chambers and a control chamber measured by a
106

differential pressure transducer to give a lung function measurement for each
individual mouse. Penh is a calculated value, which correlates with measurement of
airway resistance, impedance, and intrapleural pressure in the same mouse
(Hamelmann et al., 1997). Penh = ((Te-Tr)/Tr x PEP/PIP (Te = expiration time, Tr =
relaxation time, PEP = peak expiratory pressure, PIP= peak inspiratory pressure).
Following a baseline measurement, Penh measurements were taken for each mouse in
response to increasing doses (3, 10, 30 and 100 mg/ml) of methacholine (Sigma-
A2251).
2.27 Measurement of Resistance (R) and Compliance (Cdyn)
Mice were anaesthetised by sub-cutaneous (s.c) injection of 100 ILL1 of a 1:0.55:0.42
mix of PBS, Medetomidine hydrochloride (Pfizer-Domitor®) and ketamine (Fort
Dodge Animal Health Ltd-Ketaset®). After 15 minutes, a further 150 RI of anaesthetic
was administered by intra-muscular (i.m) injection before cannulation of the trachea.
Mice were placed onto an artificial ventilator and, following a baseline reading,
resistance and compliance measurements taken (Buxco, USA lung function
equipment) in response to PBS and increasing doses (3, 10, 30 and 100 mg/ml) of
methacholine.
2.28 Collection of Bronchoalveolar lavage (BAL) and serum
Unless mice had already undergone resistance and compliance lung function
measurement, in which case they were already unconscious, mice were anaesthetised
by intra-peritoneal (i.p) injection of 80 pi of a 2:1 mix of ketamine (Fort Dodge
Animal Health Ltd-Ketaset®) and xylazine (Bayer-Rompune). Mice were
exsanguinated by cardiac puncture followed by cannulation of the trachea. Lungs
were lavaged 3 times with 0.4 ml Phosphate Buffered Saline (PBS) (Invitrogen-10010-
015) using a 1 ml syringe and all BAL fluid for each mouse was pooled. BAL fluid
was centrifuged at 260 x g for 8 minutes. The supernatant was removed to a new tube
and stored at —80 °C for subsequent cytokine analysis by ELISA (see below). Blood
collected from cardiac puncture was left to coagulate at room temperature overnight
107

before centrifugation at 12,000 x g and collection of the serum fraction. Serum was
stored at -80 °C for subsequent analysis by ELISA.
2.29 Cell extraction from whole lung lobe
One lung lobe was finely chopped and placed into 5 ml of RPMI 1640 medium
(Gibco-31870-025) containing 0.15 mg/ml Collagenase D (Roche-11088858001) and
25 lig/m1DNase I (Roche-11284932001). The lung tissue was incubated with shaking
for 1 hour at 37°C and the mixture passed through a 70 pan cell strainer. Cells were
washed twice in RPMI 1640 medium before differential cell counting (see below).
2.30 Differential cell counting
Following centrifugation of BAL fluid or lung cells, cells were re-suspended in 250 .d
of RPMI culture medium. A small aliquot of this cell suspension was diluted 1:2 in
Turks stain (appendix 1) to lyse red blood cells, and white blood cells were counted on
a haemocytometer. Samples were adjusted to 5 x 10⁵ cells / ml and 100 1A,1 (5 x 10⁴
cells) spun onto a polysine glass microscope slide (VWR-6310107). Cytospins were
performed by centrifugation (Shandon-Cytospin 3) at 400 rpm for 4 minutes. Slides
were allowed to air dry for 5 minutes before fixing in methanol for 3 minutes. Wright
Giemsa staining of BAL cytospins allowed different cell types to be distinguished on
the basis of morphology (appendix 9). Slides were stained by immersing in Wright
Giemsa stain (Sigma-WG16) for 1 minute, followed by distilled water for 6 minutes
without agitation. Slides were rinsed briefly in running distilled water to stop stain
development and then allowed to air dry before addition of a cover slip and cell
counting. A total of 300 cells were counted on each slide and the total number of each
cell type recovered calculated by multiplying the percentage of each cell type by the
total number of cells isolated in each sample.
2.31 Lung homogenate
One lung lobe was weighed and placed into Hank's Balanced Salt Solution (HBSS)
without MgC12 or CaC12 (Invitrogen-14175-046), containing a mixture of protease
inhibitors (Roche-11836153001), at a concentration of 100 mg of lung per 1 ml of
108

HBSS solution. The lung was homogenised using an electric homogeniser before
centrifugation (1500 x g) and collection of the supernatant for analysis by ELISA. If
it was not possible to process the lung tissue immediately after harvesting, lung lobes
were snap frozen using liquid nitrogen and stored at -80 °C.
2.32 Lung histology - Tissue preparation
Lungs and heart were removed from the chest cavity en bloc prior to lung inflation or
harvesting of lung for RNA / cell extraction. If lung tissue was required for RNA or
cell extraction it was necessary isolate and prevent inflation of several lobes by tying
main bronchi with sewing cotton. Remaining lobes were inflated by intra-tracheal
infusion of a 1:1 mixture of PBS and Optimal Cutting Temperature (OCT) embedding
medium (Cell Path-KMA010000A). Inflated lung tissue was snap frozen in OCT
using a dry ice/isopentane (BDH-103614T) slurry and stored at -80°C. Sections were
cut on a cryostat (Bright) at a thickness of 5 IAM and mounted onto polysine glass
microscope slides. Sections were allowed to air dry for 15 minutes before staining or
storage at -20°C.
2.33 Haematoxylin and Eosin (H+E) staining
Slides were immersed in Harris Haematoxylin (VWR-351945S) for 20 seconds and
then held in running tap water until the sections were visibly blue. Slides were then
immersed in 1% Eosin (VWR-341973R) for 5 seconds before dehydration and cover
slip mounting. Sections were dehydrated by immersing, consecutively, for 30 seconds
with gentle agitation, in 70%, 90%, 100% and 100% Industrial Methylated Spirit
(IMS) (Fisher Scientific-M/4400/17) followed by 3 x 5 minute incubations in
Histoclear (National Diagnostics-HS200). Cover slips were applied with DPX
mountant (BDH-360294H).
2.34 Periodic Acid Schiff (PAS) staining and scoring
Immediately after sectioning, lung tissue was fixed by incubating slides in ice-cold
acetone for 15 minutes. Slides were allowed to air dry at room temperature before
oxidising for 5 minutes in 1% periodic acid (MP Biomedicals-102595). Slides were
109

rinsed briefly in distilled water and then immersed in Schiff's reagent (Fisher
Scientific-J/7300/PB08), in a fume hood, for 15 minutes. Slides were rinsed again in
distilled water and then held under running tap water for 5 minutes to terminate the
reaction. Nuclei were counterstained with Haematoxylin before dehydration and cover
slip mounting (see above). To score PAS stained sections, the percentage of cells
surrounding the lumen of each airway that were positively staining with PAS was
calculated. Each airway was assigned a score from 0 to 4 where:
0 = less than 5% of cells are positively stained
1 = 5-25% of cells are positively stained
2 = 26-50% of cells are positively stained
3 = 51-75% of cells are positively stained
4 = greater than 75% of cells are positively stained
The average airway score in each section was then calculated.
2.35 Immunohistochemistry - tissue fixation
A hydrophobic barrier (Vector-H4000) was drawn around each tissue section to allow
incubation of the section in small volumes (100-150 µl per section) of staining
solutions. Tissue sections were fixed using 4% paraformaldehyde (Sigma-P6148)
made up in PBS (Sigma-P4417). Sections were incubated with this fixative for 10
minutes before washing twice for 10 minutes in PBS. Peroxidase based or
fluorescence antibody staining was then performed.
2.36 Peroxidase based immunohistochemistry
Following fixation with paraformaldehyde, sections were incubated in 0.5% H202
(BDH laboratory supplies-101284N), made up in PBS, for 10 minutes. Sections were
washed twice for 10 minutes with PBS and then incubated in blocking solution
(appendix 1) for 30 minutes before rinsing in PBS. Sections were incubated for 15
minutes in Avidin block (Vector—SP2001) and 15 minutes in Biotin block (Vector-
SP2001), rinsing with PBS in between, before application of the primary antibody.
The primary and biotinylated secondary antibodies used for the detection of Cre,
CC10, IL-8 and myeloperoxidase proteins are shown in appendix 2. Antibodies were
110

diluted in block solution and sections incubated at room temperature overnight.
Sections were washed twice for 10 minutes in PBS and the secondary antibody applied
for 40 minutes at room temperature. Sections were washed twice for 10 minutes in
PBS, followed by application of an avidin/biotinylated peroxidase enzyme complex,
solution ABC (Vector-SP2001) for 30 minutes, and two further PBS washes. To
visualise antibody staining, solution AEC (Vector-SP2001) containing a peroxidase
enzyme substrate was applied and colour development monitored under a light
microscope. When the desired staining intensity was achieved, AEC solution was
removed and slides washed several times in distilled water to terminate the reaction.
Sections were then counterstained with hematoxylin to allow visualisation of tissue
morphology and cover slips mounted using a glycerol based mounting medium
(DAKO-00563). Images of tissue sections were captured using a light microscope
and digital camera (Leica MPS 60 with IM1000 software).
2.37 Immunofluorescence tissue staining
Following fixation in paraformaldehyde, sections were incubated in block solution for
30 minutes. Sections were washed twice for 10 minutes in PBS before application of
the primary antibody overnight at room temperature. Primary antibodies used for
fluorescence staining were as described for peroxidase staining. Sections were washed
twice for 10 minutes in PBS and then incubated with secondary antibody for 1 hour at
room temperature. For Cre staining, a TRITC conjugated donkey anti-rabbit antibody
(SantaCruz-SC2095) was used at a dilution of 1:400. For CC10 staining, a FITC
conjugated donkey anti-goat antibody (Jackson-705-095-147) was used at a dilution of
1:50. When double staining the same section for both Cre and CC10, the CC10
primary antibody was applied for 4 hours before incubation with the Cre primary
antibody overnight. Secondary antibodies were also applied sequentially for 1 hour
each, with the CC10 secondary antibody being applied first. Sections were washed
twice for 10 minutes in PBS and cover slips mounted using Vectashield (Vector-
H1200) to preserve the fluorescence lifetime. Images of fluorescence staining were
captured using a fluorescence microscope and digital camera (Leica MPS 60 with
IM1000 software).
111

2.38 Inflammatory cell scoring
The same inflammatory scoring system was used to assess levels of inflammation
around bronchi and blood vessels in both H+E and MPO stained lung sections. Each
airway and blood vessel in a section was assigned a score from 0 to 3 where:
0 = Bronchi or blood vessel is not surrounded by any inflammatory cells
1 = Bronchi or blood vessels is surrounded by the occasional inflammatory cell
2 = Inflammation completely surrounds and is 1-4 cells in diameter from the edge of
the bronchi or vessel
3 = Inflammation completely surrounds and is 5 or more cells in diameter from the
edge of the bronchi or vessel
Examples of bronchi and blood vessels assigned each score are shown in appendix 30.
The average score for all bronchi and the average score for all blood vessels in a
section was then calculated.
2.39 Induction of allergic airway disease using ovalbumin (OVA)
Groups of hIL-8 transgenic and littermate control mice were sensitised by i.p injection
of OVA (Sigma -A5503) (0.01 mg / mouse) in 0.3 ml of alum (Au-Gel-S, Serva
Electrophoresis, Heidelberg, Germany) (AMS Biotechnology-12261.01) on days 0 and
12. Control mice received the same volume of PBS in alum. All mice were
challenged on days 19, 20, 21, 22 and 23 with a 5% solution of OVA in PBS,
administered as a 20 minute aerosol (PART Medical Ltd — TurboBoyN compressor).
BHR was measured on day 24. Resistance and compliance measurements were taken
on day 25 and lung tissue and peripheral blood were harvested for analysis.
2.40 Enzyme Linked ImmunoSorbant Assay (ELISA)
Levels of cytokine production in cell culture supernatants and BAL were determined
by ELISA, measuring against linear standard curves. 100 1A,1 of capture antibody
(appendix 2) were added to wells of an ELISA plate (SLS-442404), the plate sealed
and incubated overnight at room temperature. The next day, wells were washed 3
times with 400 [11 of wash buffer (appendix 1) and plates blotted against paper towel to
112

remove all liquid. 300 11,1 of block solution (appendix 1) were added to each well and
plates incubated at room temperature for 1 hour. Wells were washed again and 50 pi
of the appropriate dilution of standard (appendix 2) or sample added. Plates were
covered and incubated at room temperature for 2 hours. Wells were washed again and
100 µ1 of the appropriate biotinylated detection antibody (appendix 2) added to each
well. Plates were covered and incubated at room temperature for another 2 hours
before another wash and addition of 100 !al of a 1/200 dilution of streptavidin Horse
Radish Peroxidase (HRP) (R&D systems-DY998). Plates were incubated with
streptavidin HRP for 20 minutes at room temperature before another wash step and
addition of 100m1 of substrate solution (R&D systems-DY999). Plates were incubated
at room temperature in the dark for 20-25 minutes before terminating the reaction with
of 50 µl of stop solution (1M H2SO4). The optical density of each well at 450nm was
determined using an ELISA plate reader (TECAN Sunrise) with wavelength correction
set to 570 nm.
2.41 Flow cytometric analysis
Fluorescence activated cell sorting (FACS) was performed on a BD Biosciences
FACSCalibur, with CellQuest software (Becton Dickinson UK LTD) and
fluorochrome-labelled antibodies. Single cell suspensions of thymocytes and
splenocytes were prepared and washed once with PBS containing 10% FCS. Red
blood cells in splenocyte preparations were lysed by resuspending briefly in distilled
water followed by an additional PBS wash. Cells were stained with Phycoerythrin
(PE) conjugated anti-mouse CD4 (eBioscience-12004183) and Fluorescein
isothiocyanate (FITC) conjugated anti-mouse CD8 (eBioscience-11008182) or with
FITC conjugated anti-mouse TCR (eBioscience-115961-81). Isotype matched
controls, FITC Rat IgG2a (eBioscience 11-4321-81) and PE Rat IgG (eBioscience 12-
4301-81) were also used. Cells were stained for 45 minutes in the dark at 4 °C and
washed twice with PBS containing 10% FCS before analysis.
113

Chapter 3
Generation of Thl and Th2 TCR a chain transgenic lines
Results
3.1 Determination of a and /3 TCR gene usage in Thl and Th2 lines specific for PLP
56-70
Short term Thl and Th2 polarised T cell lines derived from NOD.E mice and specific
for the peptide epitope PLP 56-70 had been previously generated in our laboratory.
The Thl line was maintained in IL-2 (330 IU/ml), IL-12 (100 IU/ml) and anti-IL-4 (10
µg/ml). The Th2 line was maintained in IL-2 (330 IU/ml), IL-4 (100 IU/ml) and anti-
IFN-y (10 µgimp. The lines were strongly polarised and highly peptide specific and
both had undergone three restimulations with NOD.E splenocytes and PLP 56-70.
cDNA from both lines was available for analysis.
TCR gene usage in the Thl and Th2 cell lines described above was determined using a
PCR strategy first described by Candeias et al. (Candeias et al., 1991). This strategy
uses sets of degenerate primers, designed to bind all known TCR a and TCR p sequences, in combination with primers specific for the TCR constant regions. The
strategy allows all TCR a or TCR 13 genes expressed by a population of T cells to be
identified from a single nested PCR experiment. The PCR strategy and PCR products
obtained from the Thl and Th2 T cell line cDNA are shown in figure 3.1.
114

z Z'
z 1--i
H bp
750 —III. 500 --110 250-0-
(b)
bp Z Q o
0 0
1000—* 750-10- 500-0-
250
(c)
Rearranged TCR a chain cDNA Rearranged TCR 13 chain cDNA
(a)
NW36 NK121 NW37 NK122 NW38 NK123 —IP- --110- --IP- -110. ___00. —110-
V J C V D J C
111111W/7 A I
4— 4— 4—NJ110 NJ109 NJ108
if-- Al—MS175 MQ284
(adapted from Candeias et al., 1991)
Figure 3.1 The PCR strategy used to determine a and p TCR gene usage in Thl and Th2 line cDNA. (a) A nested PCR strategy was used, involving 3 rounds of amplification for the TCR a chain and 2 for the TCR 13 chain. V region primers for both TCR a and TCR (3 chains are degenerate oligonucleotides designed to bind all known V genes. These primers were used in all PCR rounds. For the (3 chain, the C region primer MQ284 was used in the 1st round of amplification, followed by MS175. For the a chain, C region primers NJ108, NJ109 and NJ110 were used successively. The gel photos in (b) and (c) show the PCR products obtained from Thl and Th2 line cDNA using the TCR a chain and TCR p chain PCRs respectively. These PCR products are approximately 300bp in length and were TA cloned and sequenced in order to determine TCR gene usage for each T cell line.
115

TCR gene sequences amplified by PCR were identified by TA cloning and
sequencing. 29 TCR a clones were sequenced for both the Thl and Th2 T cell lines.
30 and 31 TCR p clones were sequenced for the Thl and Th2 lines respectively.
Dominant TCR a sequences were found in both cell lines. 48% of a clones sequenced
from the Thl line were identified as using the a chain variable region gene TRAV1OD
with the a chain joining region gene TRAJ58 (table 3.1). The CDR3 region of this
TCR a chain was 12 amino acids in length (CAASREGTGSKLSF). 31% of a clones
sequenced from the Th2 line were identified as using the a chain variable region gene
TRAV17 with the a chain joining region gene TRAJ50 (table 3.2). The CDR3 region
of this TCR a chain was 14 amino acids in length (CALEGIASSSFSKLVF). These
dominant Thl and Th2 TCR a chains were selected for transgenic expression.
Although both lines had a dominant TCR a chain sequence, the gene usage and CDR3
region sequences were more heterogeneous in the Th2 line. 6 different combinations
of variable and joining a chain genes and 6 different CDR3 a sequences were
identified in the Thl line compared with 9 different gene combinations and 12
different CDR3 a sequences in the Th2 line (figure 3.2). In keeping with the data
previously published by our laboratory (Boyton et al., 2002), there was a statistically
significant difference in CDR3 a length between Thl and Th2 derived sequences. The
Thl line had a mean CDR3 a length of 11.4 + 0.2 compared to 12.5 + 0.2 for the Th2
line. Comparison of these two mean values gives a P value of <0.0005.
There was no statistical difference in CDR3 p length between Thl and Th2 derived
sequences, which had mean values of 12.3 + 0.2 and 12.4 + 0.3 respectively (P =
0.974). No TCR p chain appeared dominant in either line (tables 3.3 and 3.4),
although as seen for the a chain genes, p gene usage and CDR3 region sequences were
more heterogeneous in the Th2 line (figure 3.2). The lack of a dominant TCR p chain
in either line made it impossible, at this stage, to determine which 13 chain was pairing
with the dominant Thl and Th2 TCR a chains. Indeed the heterogeneity of the 13
chains, particularly in the Th2 line, suggests that the dominant a chains are able to pair
with more than one (3.
116

Previously published data (Boyton et al., 2002) suggested that the dominant 14 amino
acid CDR3 a motif identified in the Th2 line would not be present in the Thl line, but
that the shorter, Thl derived, 12 amino acid CDR3 a motif would be permissible in
both Thl and Th2 cells. PCR primers specific to these CDR3 regions were used to
confirm this finding in these cell lines (figure 3.3). This data confirmed the selection
of these Thl and Th2 derived dominant TCR a chains as good candidates for
transgenic expression. No beta chain pair for either TCR a chain had been
determined. Therefore, only transgenes for expression of TCR a chains were
constructed. The intent was to identify beta chain pairs for each a chain in vivo and
also to use these animals to answer questions about the impact of the structurally
different Thl and Th2 a chains alone on T cell responses and beta chain selection.
117

Table 3.1 TCR a sequences from a Thl polarised NOD.E T cell line against PLP (56-70)
TA clone TRAV CDR3a amino acid sequence TRAJ CDR3 length
Th1 A1.5 10D CAASREGTGSKLSF 58 12 A1.10 A1.11 A1.16 A1.19 A1.20 A1.33 A1.42 A1.43 A1.44 A1.47 A1.48 A1.61 A1.62 A1.23 CAASKPNNRIFF 31 10 A1.4 17 CALEGRGGRALIF 15 11 A1.15 A1.18 A1.34 A1.45 A1.46 A1.49 A1.51 A1.9 4D-3 CAALPGTGSNRLTF 28 12 A1.17 A1.55 A1.8 CAAETNSAGNKLTF 17 A1.27 CAADSNYQLIW 33 9 A1.60
Mean Thl CDR3a length = 11.4 + 0.2 (SE)
118

Table 3.2 TCR a sequences from a Th2 polarised NOD.E T cell line against PLP (56-70)
TA clone TRAY CDR3a amino acid sequence TRAJ CDR3 length Th2
A2.13 17 CALEGIASSSFSKLVF 50 14 A2.15 A2.16 A2.20 A2.21 A2.33 A2.39 A2.41 A2.54 A2.10 12-2 CALSDANNYAQGLTF 112-2 13 A2.31 A2.38 A2.42 A2.32 13-4 CAMERQDNYAQGLTF A2.3 6-6 CALGEDTNAYKVIF 30 12
A2.17 CALVRDTGYQNFYF 49 A2.49 A2.53 CALGFQGGRALIF 15 11 A2.48 CALGSQGGRALIF A2.22 10 CAASRGNMGYKLTF 9 12 A2.25 A2.58 A2.14 3-3 CAVRGTNAYKVIF 30 11 A2.40 A2.55 A2.34 CAAGDTNTGKLTF 27 A2.35 A2.36 CAALNTNTGELTF A2.43 CAALNTNTGKLTF
Mean Th2 CDR3a length = 12.5 + 0.2 (SE)
119

Table 3.3 TCR 3 sequences from a Thl polarised NOD.E T cell line against PLP (56-70)
TA clone TRBV CDR3P amino acid sequence TRBJ CDR3 length
Thl B1.14 2 CASSQGPLSNERLFF 1.4 13 B1.36 B1.41 B1.81 B1.82 B1.83 B1.98 B1.57 CASSKAGTGEDTQYF B1.1 CASSQEMQGQDTQYF B1.94 B1.95 B1.37 CASSQQGDQDTQYF 12 B1.60 CASSQEGTGVQDTQYF 14 B1.3 , CASSRDWGDTQYF 11 B1.21 B1.85 B1.90 B1.70 CASSPWGVQDTQYF 2.5 12 B1.93 B1.10 : CASSQAGTDTQYF 11 B1.18 19 CASSRSGDQDTQYF 12 B1.58 B1.88 B1.92 B1.96 B1.97 B1.77 16 CASSNQNYAEQFF 2.1 11 B1.84 CASSLAGQGARSQNTLY] 2.4 16 B1.89 CASSSRDWGDEQYF 2.7 12 B1.8 15 CASSLVGAEQFF 2.4 10
Mean Thl CDR3p length = 12.3 + 0.2 (SE)
120

Table 3.4 TCR 13 sequences from a Th2 polarised NOD.E T cell line against PLP (56-70)
TA clone TRBV CDR3[3 amino acid sequence TRBJ CDR3 length
Th2 B2.2 16 CASSFQTGGAETLYF 2.3 13 B2.7 B2.5 CASSVRDWGDTQYF 2.5 12 B2.84 CASSLRGHTEVFF 1.1 11 B2.53 CASSLRNTEVFF 10 B2.4 : CASSQEAGGVDTQYF 13 B2.8 B2.56 CASSQEGWGPYEQYF 2.7 B2.61 CASSQGLGNYAEQFF 2.1 B2.66 CASSQEGTGGYAEQFF 14 B2.82 CASSQDGTGGYAEQFF B2.78 CASSLGTGDAEQFF 12 B2.30 CASSPANSDYTF 1.2 10 B2.46 CASSQGIYEQYF 2.7 B2.74 CASSLRDNGDTQYF 2.5 12 B2.13 19 CASSPRTTSGNTLYF 1.3 13 B2.71 B2.31 CASSSPTGGWNAWQFF 2.1 14 B2.50 CASSSPTGGWNAEQFF B2.86 B2.76 CASSPPTGSPNERLFF 1.4 B2.79 B2.85 CASSIEDSGTEVFF 1.1 12 B2.26 4 CASSPRGLYAEQFF B2.43 CASSNYAEQFF 9 B2.68 13-3 CASSGRTTANTEVFF 13 B2.75 20 CGARDLWGGKNTLYF 2.4 B2.83 B2.80 1 CTCSADGSYEQYF 2.7 11 B2.24 17 CASSSGGFAETLYF 2.3 12 B2.63 CASRDWGETLYF 10
Mean Th2 CDR3(3 length = 12.4 + 0.3 (SE)
121

(a) Thl line TCR a gene usage TCR 13 gene usage
VlOD - 358 V17 - 315 V4D3 - 328 V4D3 - 333 V4D3 - 317 V10 - 358
V2 - 31.4 V19 - 32.1 V4 - 31.4 V4 - 32.5 V5 - 32.5
_ V16 - 32.1 • V16 - 32.4 E V16 - 32.7 • V15 - 32.4
(b) Th2 line
TCR a gene usage
TCR 13, gene usage
E V17 - 350 'V12-2 - 3112-2 V10 - 39 V3-3 - 330 V6-6 - 349 V3-3 - 327
• V6-6 - 315 V6-6 - J30
E V13-4 - 3112-2
EV16 - 32.3 riV2 - 31.1
V19-31.3 :7,V19 - 32.1 EV19 -31.4 ,V20 - 32.4 E V2 -32.1 EV16 - 31.1 E V2 - 32.7 55V17 - 32.3 E V4 - 31.1
V2 - 31.2 EIV2 - 32.5
V16 - 32.5 EIV19 - 32.1 E V19 - 31.1
V13-3-31.1 E V1 - 32.7
Figure 3.2 A comparison of TCR a and gene usage in Thl and Th2 T cell lines in order to select chains for transgenic expression. TCR gene usage in a Thl and Th2 T cell line are shown in (a) and (b) respectively. Each segment of a pie chart represents an individual CDR3 sequence, while V-J gene combinations are differentiated by colour. The percentage of each a repertoire made up by the most dominant TCR chain is also shown. The dominant a chains for both the Thl and Th2 lines were selected to be expressed transgenically, but diverse gene usage and CDR3 regions in TCR 13 chain repertoires meant that (3 chain pairs could not be identified.
122

bp
Thl CDR3a motif Th2 CDR3a motif
a.) .0 .0 .0 .0 —
H H. 4 0 4 z
500
250-'10.
Figure 3.3 Presence or absence of the dominant Thl and Th2 CDR3 a motifs in Thl and Th2 lines. Primers specific for the dominant Thl 12 amino acid CDR3 motif and Th2 14 amino acid CDR3 a motif were used with C region primer NJ108 to determine presence of these motifs in Thl and Th2 line cDNA. The shorter Thl motif is present in both Thl and Th2 lines, while the longer Th2 motif is only present in the Th2 line.
123

3.2 Construction of Thl and Th2 TCR a chain transgenes.
Several different cassette vectors have been used to achieve transgenic expression of
TCR genes. Promoter sequences that have been used in these vectors to drive TCR
expression include CD2 (McHugh et al., 2001) and MHC class I (Kb) (Mendel et al.,
2004). However, as expression of TCR genes is not an endogenous function of these
promoters, TCRs under the control of these vectors can be subject to abnormal timing
and regulation of expression. The vector used in this study (pTa) was designed by
Kouskoff et al. (Kouskoff et al., 1995) and utilises endogenous mouse TCR
promoter and enhancer elements. As such, the vector contains many kilobases of non-
coding sequence cloned from regions upstream and downstream of the mouse TCR
locus. The aim is to ensure that TCR expression is, as far as possible, under the control
of its natural regulatory elements. The vector also contains the mouse TCR Ca gene
and associated regulatory sequences. To express a TCR a chain transgenically it is
necessary to clone into the vector the rearranged V-J coding sequence of interest.
Many TCR transgenics have been created using TCR a or I chain cDNA. However,
although in the genome of a T cell, TCR genes have been rearranged and spliced
together, some intronic sequences remain. Intronic sequence is present at the 5' and 3'
ends of the rearranged V-J segment, but also separates a coding leader sequence from
the remainder of the V gene (figure 3.4). To express a TCR a chain using the pTa
cassette vector it is essential to include a short section of intronic sequence 3' to the
rearranged J gene. This allows splicing of the V-J coding segment to the Ca gene also
present in the vector. It is unknown exactly what role the other intronic sequences
may play in the regulation and processing of the TCR, but it is thought advisable to
include them in the construct. Therefore, the T cell genomic configuration of the V-J
segment, rather than that found in cDNA should be used to create the TCR transgene.
124

fa) Non-T cell genome
Intron LP1 V J C // //
(b) T cell genome
Intron LP1 V C
umoma:zzzmu---// CDR3
(c) T cell mRNA
LP1
V
C
CDR3
(d) Required TCR gene arrangement in transgenic expression vector
Intron LP1 V
il= r af i I- '—r--)
CDR3
Figure 3.4 The different states of arrangement of TCR a genes. (a) No rearrangement of TCR a genes occurs in non-T cells. Germ-line configuration is maintained. (b) In the thymus, rearrangement of TCR a genes occurs in T cells such that a V gene is spliced to a J gene at the level of genomic DNA, to create a variable CDR3 a region. Intronic sequence remains between the V leader region (LP1) and the rest of the V gene and also between the J and C regions. (c) These intronic sequences are removed by splicing at the level of mRNA prior to expression of a functional TCR a chain on the surface of the T cell. (d) To express a TCR a chain transgenically, the arrangement of TCR a genes should resemble that found in the T cell genome, as intronic sequences present in this configuration facilitate correct processing and expression of the TCR.
125

For the T cell lines and T cell receptor sequences being used in this study, only cDNA
samples were available. It was therefore not possible to obtain the correct T cell
genomic configuration of the Thl and Th2 TCR V-J segments by a single PCR
strategy.
The only region of each required TCR a V-J segment not present in non-T cell
genomic DNA was the junction between the rearranged V and J gene (CDR3 region).
The CDR3 region is present in cDNA and so it was possible to create the required
configuration of each V-J segment by cloning together fragments derived from non-T
cell NOD.E genomic DNA and Thl or Th2 line cDNA. The cloning strategies,
including PCR primers and restriction enzyme sites, used for both the Thl and Th2
TCR a chain constructs are shown in figures 3.5 and 3.6.
Three PCR fragments were used to create each TCR a V-J segment. The 2 intron
containing fragments were derived from non-T cell NOD.E genomic DNA and
fragments containing the rearranged 12 amino acid and 14 amino acid CDR3 regions
were derived from Thl and Th2 cDNA respectively. The sequences of all PCR
primers used for these cloning strategies, along with the PCR conditions and product
sizes are shown in appendix 6. The PCR products cloned, and the joining together of
these PCR fragments to create the Thl and Th2 TCR a transgenes, are shown in figure
3.7. For both the Thl and Th2 strategies it was necessary to create a Hind III
restriction site in the J region in order to join the PCR fragments. In both cases the
change was a single base pair mutation from G to T, introduced using the PCR primers
used to obtain the PCR fragments. Mutations were silent and resulted in the creation
of an alternative codon for the amino acid leucine. All fragments generated by PCR
were verified by sequencing prior to proceeding with subsequent stages of the cloning
strategy. The nucleotide and amino acid sequences of the Thl and Th2 TCR a V-J
segments are shown in appendices 17 and 18 and appendices 19 and 20 respectively.
126

Xma I 11..2MAI
V Nco I Hind III
VIO J58 LP1
(b)
Fragments joined using Hind III
(ii) (iii)
NOD.E genomic DNA Thl line cDNA NOD.E genomic DNA
TRA V10
Xma 1
Nco I
ThlintronF
Nco- I Hind III
HindIIITh IF
Hind - III
Sac II
LP1 V10 V10 J58 J58
Th1LP1/2IntronR
ThlHindIIIR TRAJ58
Fragments joined using Nco I
(c) Xma I Nco I
Iimmi Hind III Sac II
LP1 V10 J58
Complete Thl VI 0/J58 fragment cloned into the pTa expression vector using Xma I and Sac II
(d) Sal I
Xma I
Sac II
pTa Sal I cassette vector --......,
Thl a construct is linearised for injection using Sal I Figure 3.5 A schematic diagram showing the cloning strategy used to create the Thl a chain construct. It was only possible to obtain the correct CDR3 a region from Thl line cDNA. However, cDNA derived TCR sequence does not contain the required intronic regions (figure 3.4). (a) The TCR a chain was therefore created using 2 intron containing fragments (i) and (iii) derived from NOD.E genomic DNA and one CDR3 a containing fragment (ii) obtained by PCR from Thl line cDNA. (b) The 5' intronic fragment and that containing the CDR3 region were cloned together using a unique and endogenous NcoI site. (c) It was necessary to introduce a unique HindIII site into the sequence of J58 by PCR in order to join the 3' intronic fragment. The G-*T mutation introduced does not alter the amino acid sequence of the final protein. (d) XmaI and SacII sites were introduced by PCR at the 5' and 3' ends of the a chain respectively to allow directional cloning into the pTa cassette vector. Bacterial sequences were removed from the vector, by digestion with Sall, prior to pronuclear injection. All PCR primers and conditions are shown in appendix 6.
127

Sac II Sac I
V17
Hind III
J50
Fragments joined using Sac I
Xma I
LP1 Complete Th2 V17/J50 fragment is cloned into the pTa expression vector using Xma I and Sac II
(c)
Sac II
Xma I I 11011=.11 1
V17 J50 Fragments joined using Hind III
(b) V Sac I Hind III
LP1
Xma I
(ii) (iii)
NOD.E genomic DNA Th2 line cDNA NOD.E genomic DNA TRAV 17
Th2intronF
Sac I Hind III
Adomr2=1]
Th2HindIIIF
Hind III
Xma I
Sac I
Sac II
LP1 V17 V17 J50 J50
Th2LP 1 /2IntronR Th2HindIIIR TRAJ50
Th2 a construct is linearised for injection using Sal I Figure 3.6 A schematic diagram showing the cloning strategy used to create the Th2 a chain construct. It was only possible to obtain the correct CDR3 a region from Th2 line cDNA. However, cDNA derived TCR sequence does not contain the required intronic regions (figure 3.4). (a) The TCR a chain was therefore created using 2 intron containing fragments (i) and (iii) derived from NOD.E genomic DNA and one CDR3 a containing fragment (ii) obtained by PCR from Th2 line cDNA. (b) The 5' intronic fragment and that containing the CDR3 region were cloned together using a unique and endogenous Sad site. (c) It was necessary to introduce a unique HindIII site into the sequence of J50 by PCR in order to join the 3' intronic fragment. The G---*T mutation introduced does not alter the amino acid sequence of the final protein. (d) XmaI and SacII sites were introduced by PCR at the 5' and 3' ends of the a chain respectively to allow directional cloning into the pTa cassette vector. Bacterial sequences were removed from the vector, by digestion with Sall, prior to pronuclear injection. All PCR primers and conditions are shown in appendix 6.
128

To enable each complete V-J segment to be inserted into the pTa cassette vector,
XmaI and SacII restriction sites were introduced by PCR at the 5' and 3' ends
respectively (figure 3.7). Screening for successfully ligated clones by restriction
enzyme digest was possible due to the difference in size between the V-J a segment
being removed and that being introduced (figure 3.8). The large size of the pTa
cassette vector, and the tendency of this plasmid to undergo rearrangements and
deletions during manipulation, meant that it was also necessary to check patterns of
digest with other restriction enzymes, such as EcoRl (figure 3.8). Observation of the
same patterns of digest before and after manipulation meant that the cassette vector
was intact. That the Thl and Th2 TCR a V-J segments were correct within the final
constructs was also confirmed by sequencing. Plasmid maps of the Thl and Th2 TCR
a constructs are shown in appendices 10 and 11 respectively.
Introducing bacterial sequences from the cloning vector into the mouse genome during
transgenesis is not recommended and can result in greatly reduced levels of transgene
expression or even no expression of the transgene at all. (Kjer-Nielsen et al., 1992).
Bacterial sequences of the pTa cassette vector were therefore removed from both the
Thl and Th2 TCR a constructs, by digestion with Sal I, prior to pronuclear injection.
The 15,000 bp fragment of each construct purified for injection is shown in figure 3.8.
129

Th2
< < < 0 z z .z :. . 0 .... . :. ....
z
750 —10 500-0.
250
(a)
750 —* 500 —0.
250 —*
bp
(b)
bp
Thl
z z z
z z z
(c) (d)
(EcoR1) (EcoR1)
bp c (X
maI
/ Sa
cII)
1000-0' 1000-0 750-10 750 500 500
Figure 3.7 Assembly of Thl and Th2 TCR a chain constructs. All gel lane labels refer to fragments described in figures 3.5 and 3.6 for Thl and Th2 constructs respectively. (a) and (b) show the 3 PCR fragments required for assembly of the Thl and Th2 TCR a chains respectively. (c) and (d) show the joining of these fragments and the successful introduction of XmaI and SacII sites at either end of these constructs. All construct fragments shown in (c) and (d) are in the cloning vector pCRe2.1, and within this vector are flanked by EcoR1 sites.
130

cd bp
Thl
tu
10000 6000
3000
2000
Original pTa Thl
cd o cn v) $... --- --.. N T' ' r4 bp "0 X"0 c.71
E o X
10000 6000 3000
1000 750
500
Th2
Th2
o o 8 a
(a)
(b)
Figure 3.8 Complete Thl and Th2 TCR a constructs. Thl and Th2 VJ fragments were inserted into the pTa cassette vector by directional cloning using XmaI and SacII. (a) XmaI/SacII digests of the final Thl and Th2 constructs show the presence of the respective VJ regions (661 and 622 bp) replacing a larger VJ fragment (approx. 950 bp) used previously in this vector. The pTa vector is very large (20,000 bp) and so can be prone to rearrangements during manipulation. EcoRI digests of the Thl and Th2 constructs, and of the original vector, demonstrate that no rearrangements or deletions have occurred. (b) It was necessary to remove the 5000 bp bacterial sequence from the Thl and Th2 vectors prior to pronuclear injection. This was achieved for both constructs by digestion with Sall and purification of the upper 15,000 bp band.
131

3.3 Identification of Thl and Th2 TCR a chain transgenic founder animals.
The inbred mouse strains used most frequently for pronuclear injection are FVB/N and
C57BL/6. These strains respond well to super-ovulation and pronuclear embryos are
generally larger and less fragile than those of other mouse strains, making them
technically easier to inject and giving better rates of embryo survival and transgene
integration (Brinster et al., 1985). However, the Thl and Th2 cell lines, from which
the transgenic TCR a chains were identified, were originally derived from NOD.E
mice. In NOD and NOD.E mouse strains, the peptide epitope for which the TCR a
chains are specific, PLP 56-70, is presented in the context of the MEIC class II
molecule I-Age. Transgenic mice carrying either TCR a chain transgene must
therefore also express I-Age in order for T cell responses to PLP 56-70 to be studied,
and TCR I chain pairs to be identified in these animals. To circumvent the need to
cross the transgenic founder animals onto a NOD.E background, the Thl and Th2
TCR a chain transgenes were initially injected into NOD oocytes. Despite their
fragility, NOD oocytes have successfully been used to generate transgenic lines
(O'Shea et al., 2006 and Birk et al., 1996). However, multiple attempts to inject the
TCR constructs into these pronuclear embryos failed to generate any litters.
Therefore, to achieve transgenesis, it was necessary to use C57BL/6 or FVBN oocytes.
48 potential founder animals obtained from pro-nuclear injection of FVB/N oocytes at
the Nuffield department of Medicine in Oxford were screened for the presence of the
Th2 TCR a chain transgene. An initial PCR screen, using genomic DNA extracted
from a tail biopsy, identified 2 founder animals (figure 3.9). These founder animals
are subsequently referred to as Th2 a line 20 and Th2 a line 34, based on numbers
assigned to each animal at the point of tail biopsy. The transgenic status of these two
founder animals was confirmed by Southern blotting. The entire rearranged V-J
segment present in the construct was used to probe genomic DNA that had been
digested using the restriction enzyme EcoRI (figure 3.9). EcoRl does cut within the
construct itself, but sites are only 3' to the V-J segment with the most 5' site 3013 bp
from the 5' end of the construct. Integration of a transgene into the genome can occur
132

at one or multiple sites and at each site, multiple copies of the transgene are often
found as head to tail concatamers. On the Th2 TCR a line Southern blot, bands
present in transgenic and littermate samples are due to binding of the probe to
endogenous, unrearranged, TRAV17 and TRAJ50 sequences. Bands that are
differential between the two transgenic lines represent different sites of integration
into the genome, while the most intense band, which is 6 kilobases in size, is due to
the head to tail concatamers present at one or more of the integration sites.
23 potential founder animals obtained from pronuclear injection of C57BL/6 oocytes
at the MRC Clinical Sciences Centre, Imperial college, were screened for the presence
of the Thl TCR a chain transgene. An initial PCR screen identified 1 founder animal,
Thl a line 30 (figure 3.10). The transgenic status of this animal was confirmed by
Southern blot using the same strategy as that described for the Th2 TCR a chain, but
using the Thl rearranged V-J segment as a probe (figure 3.10).
The sequence and product sizes of all PCR and Southern primers used for screening of
Thl and Th2 TCR a chain transgenic founder animals are shown in appendix 6.
NOD.E mice were used as breeding partners for subsequent breeding of all TCR a
chain transgenic founder animals. New generations of each line were also backcrossed
onto NOD.E. As NOD.E mice are homozygous for the MHC class II molecule I-M7,
all TCR a chain transgenic animals subsequent to the founder will express the
transgene and I-Ag7.
133

LP I V17
Sac II (a)
TRA,150
J50
Th2HindIIIR
TRAV 17 Th2lntronF
Xma I
1000 500 250
(c)
35-48 Potential founders 1-19 bp
rn
21-28 29-33 •2
r-A---•
(b) z . 8 0 a, 3
kb
10 8 —0. 6 —+ 5-4 4-4
3 2.5—+
2--+
E E
V
DIG labelled probe
unde
r
Line
34 fo
unde
r
Figure 3.9 Identification of Th2 TCR a chain transgenic founder animals. Transgenic founders were identified by PCR and by Southern blot. The location of primers used for PCR screening (Th2lntronF and Th2HindIIIR) and for generation of the Southern probe (TRAV17 and TRAJ50) are shown in (a). Two transgenic animals were identified from an initial PCR screen of 48 potential founders (b). The transgenic status of these two animals (numbers 20 and 34) was then confirmed by Southern blot (c). The restriction enzyme used to digest genomic DNA for Southern blotting was EcoRI (E). This enzyme only cuts the integrated construct on the 3' side of the V-J region being used as a probe (c), giving information about construct integration sites and copy number.
134

1000 500 250
(c) kb
Lin
e 30 fo
unde
r
12-11. 8 —IP. 6—O. 5 4 —111
3 —110.
C J
EEE E
V
DIG labelled probe
(a)
TRAV 1 0 ThllntronF
Xma I
Sac II
LP1 TRAVIO TRAJ58
ThlHindIIIR
TRA,158
4::, M <
Z cli .,18 Z q Potential founders 16-29 1 31-39 2 r.._____—•1/4—._._Th 1 r______—A_____‘
Figure 3.10 Identification of the Thl TCR a chain transgenic founder animal. The transgenic founder was identified by PCR and by Southern blot. The location of primers used for PCR screening (ThllntronF and Thl HindIIIR) and for generation of the Southern probe (TRAV10 and TRAJ58) are shown in (a). One transgenic animal was identified from an initial PCR screen of 23 potential founders (b). The transgenic status of this animal (number 30) was then confirmed by Southern blot (c). The restriction enzyme used to digest genomic DNA for Southern blotting was EcoRI (E). This enzyme only cuts the integrated construct on the 3' side of the V-J region being used as a probe (c), giving information about construct integration sites and copy number.
135
(b)
bp

3.4 Determination of TCR a chain transgene expression.
The TCR a chain transgenes contain multiple regions of intronic sequence as well as
coding regions for the Thl and Th2 rearranged V-J segments and the mouse Ca gene.
For correct expression, all intronic regions should be removed and the V-J coding
segment spliced to the Ca gene.
A PCR strategy was used to demonstrate that correct processing of the transgenic TCR
a chain, by removal of intronic sequence, and expression of the TCR a chain coding
sequence, at the level of mRNA, was occurring in T cells from both of the Th2 TCR a
chain transgenic lines (figure 3.11) and the Thl TCR a chain transgenic line (figure
3.12). Removal of the intronic sequence at the 5' end of the V gene results in a shorter
V-J segment and therefore a smaller PCR product when cDNA is used as a template
compared to genomic DNA.
Correct splicing of the TCR a V-J segments to the Ca gene present in the transgene
was demonstrated by using the nested PCR strategy described in figure 3.1 to look at
TCR a chain usage in these animals. The strategy uses primers specific for mouse V
genes in combination with a primer specific for the mouse Ca gene. In the transgene,
the J region and C region are separated by many kilobases of intronic sequence. A
PCR product of the correct size will only be obtained if splicing has occurred.
Splenocyte cDNA was used as a template for PCR and the sequences obtained from
each line are shown in tables 3.5 and 3.6. From Th2 a line 20, all a sequences
obtained were transgenic. From Th2 a line 34, most sequences were transgenic but a
small number of endogenous TCR a sequences were also seen. From Thl a line 30
the percentage of the repertoire made up by the transgenic TCR alpha chain was more
variable. In one animal 16% of the sequences obtained were transgenic compared to
54% for another. This data suggest that in the Th2 a chain transgenic lines levels of
expression of the transgenic TCR are high, but are not completely exclusive of
endogenous TCR. In the Thl a chain transgenic line expression levels may be more
136

variable and a significant number of T cells bear endogenous T cell receptors in these
animals.
Although data presented thus far confirms correct processing and high levels of
expression of the TCR a chain transgenes at the level of mRNA, they do not provide
evidence for expression of the TCR chains at the surface of the T cell. Direct evidence
for this is difficult to obtain as no antibodies exist against either TRAV10 or TRAV17.
Other single TCR a chain transgenic models do exist and studies with these mice have
demonstrated that mice expressing a TCR a chain transgene have an increased
percentage of double negative (DN) thymocytes compared to wild-type mice (Huang
and Kanagawa, 2004). During normal thymocyte development, the TCR p locus is the
first to rearrange (Mombaerts et al., 1992b). Successfully rearranged p chains then
pair with a surrogate a chain known as the pre-TCR a. This pre-TCRa/r3 complex
mediates the differentiation of the thymocyte from CD4-CD8- (double negative) to
CD4+CD8÷ (double positive) (Fehling et al., 1995). Studies of TCR a chain
transgenic mice suggest that premature expression of a rearranged a chain at the DN
stage of thymocyte development precludes the formation of pre-TCRa/f3 complexes.
This results in less efficient transition of thymocytes from DN to DP and an increased
percentage of DN thymocytes. Staining of thymocytes with antibodies against CD4
and CD8 showed this to be true for both lines of Th2 TCR a chain transgenic mice
(figure 3.13). Additional evidence for altered TCR expression at the cell surface also
comes from the observation that Th2 TCR a chain transgenic animals have a reduced
CD4+: CD8+ ratio in the thymus. However, this difference in ratio was not observed in
splenocytes (P = 0.9977 and P = 0.1999 for lines 34 and 20 compared to littermates
respectively) and so the CD4+: CD8+ ratio of T cells in the periphery seems to be
unaffected by Th2 TCR a chain transgene expression. An increased percentage of
double negative thymocytes was also observed in Thl TCR a chain transgenic mice
(figure 3.14). However, there was no change in the CD4+: CD8+ ratio in the thymi or
splenocytes of these animals.
137

Despite high levels of transgene expression in Th2 TCR a chain transgenic animals,
and significant levels of expression in some Thl TCR a chain transgenics, staining of
splenocytes with an antibody directed against the constant region of the TCR
demonstrated normal levels of a/13 TCR at the cell surface (figure 3.15).
138

(b) Transgenic T cell cDNA Th2lntronF —1
LP1
Th2HindIIIR
V17 J50
(c)
,-c) -,:, by ,-,.:, ct _..1
1000 750 500 250
-i-R 71-
< 0 N cn :4 4 '1) a) a) *., CI =
..-. a.'+
(d)
N c.) - 1- cn
,- ,4.
bp
1000 750 500
250
527bp
(a) Transgenic genome Th2lntronF Th2HindIIIR
—.111111-1111 LP1 V17 J50
391bp
Figure 3.11 Demonstration of correct Th2 TCR a chain transgene processing and expression by PCR. Splicing out of intronic sequence should occur during correct processing and expression of the TCR a chain transgene. PCR using primers shown in (a) and (b) should demonstrate a size difference in PCR product between the genomic configuration of the construct (a) and that obtained from transgenic T cells where intronic sequence has been removed (b). An HPRT control PCR demonstrates successful reverse transcription from transgenic and littermate control splenocyte RNA (c). Expression of the transgene and correct splicing of intronic sequence has been demonstrated by PCR from splenocyte cDNA in both Th2 TCR a chain transgenic lines (d).
139

(b) Transgenic T cell cDNA
LP1 V10
372bp
V10
J58
► ThlHindIHR
J58
4111 ThlIntronF
LP1
-rt bp -cf ccs
1000 750
500
250
Tra
nsge
nic
gDN
A
0 •
0
Cyd
538bp
(a) Transgenic genome ThlIntronF ThlHindIIIR
-111=-- 77/7/7/A
(c)
Figure 3.12 Demonstration of correct Thl TCR a chain transgene processing and expression by PCR. Splicing out of intronic sequence should occur during correct processing and expression of the TCR a chain transgene. PCR using primers shown in (a) and (b) should demonstrate a size difference in PCR product between the genomic configuration of the construct (a) and that obtained from transgenic T cells where intronic sequence has been removed (b). (c) Expression of the transgene, and correct splicing of intronic sequence, has been demonstrated by PCR in the Thl TCR a chain transgenic line using splenocyte cDNA. A low level of expression of this V10/J58 TCR sequence was also detected in the littermate cDNA sample.
140

Table 3.5 TCR a chain sequences from splenocytes of Th2 TCR a chain transgenic and littermate control animals.
TA clone TRAV CDR3a amino acid sequence TRAJ CDR3 length
Th2 a line 20 20-2 Al 17 CALEGIASSSFSKLVF 50 14 20-2 A3 20-2 A4 20-2 A8 20-2 A9 20-2 A10 20-2 All 20-2 Al2 20-2 A13 20-2 A14
Th2 a line 34 34-20 AI 17 CALEGIASSSFSKLVF 50 14 34-20 A2 34-20 A4 34-20 A5 34-20 A7 34-20 A10 34-20 All 34-20 A6 4D-3 CAAVNYGGSGNKLIF 32 13 34-20 A9 CASSGSWQLIF 22 9
Littermate 34-21A15 4D-3 CAAETNTDKVVF 34 10 34-21A16 CAAPDSNYQLIW 33 34-21A17 CAAYIASSSFSKLVF 50 13 34-21 A3 CAADNTNTGKLTF 27 11 34-21 A2 4D-4 CAAGLPNYNVLYF 21 34-21Al2 CAARNSGYNKLTF 11 34-21 A5 4-4 CAAENTGNYKYVF 40 34-21 A9 CAAEITGNTRKLIF 37 12
141

Table 3.6 TCR a chain sequences from 2 Thl TCR a chain transgenic animals.
TA clone TRAY CDR3a amino acid sequence TRAJ CDR3 length
Thl a line 30 Th1-56 Al4 10D CAASREGTGSKLSF 58 12 Th1-56 A8 Th1-56 A5 CAALGAGNTRKLIF 37 Thl-56 A6 Thl-56A4 4D-3 CAAPPNYGNEKITF 48 Th1-56 Al6 CAAETGTGGYKVVF 12 Th1-56 Al7 CAAEATRGNNKLTF 56 Th1-56 A3 4-3 CAAEIMGTYQRF 13 10 Th1-56 Al5 CAAEGVNTGNYKYVF 40 13 Th1-56 Al 4D-4 CAAVNTGNYKYVF 11 Th1-56 A7 4-4 CAAEAKNTGYQNF 49 13 Thl-56A10 4-2 CAAEDANNRIFF 31 10
Th1-63 A2 10D CAASREGTGSKLSF 58 12 Thl-63 A3 Thl-63 A8 Thl-63 All Thl-63 Al2 Thl-63 A13 Thl-63 A16 Th1-63 Al 4-4 CAAEAGGADRLTF 45 11 Th1-63 A20 Th1-63 Al9 CAAEKDSGTYQRF 13 Th1-63 A4 4D-3 Th1-63 Al8 CAAEEDMGYKLTF 9 Th1-63 Al0 CVAEDYGGSGNKLIF 32 13
142

Littermate Line 20 Tg Line 34 Tg
16.4% 71.7% O
O
TV
• • •
•• • •
LL
:i•N .... a. 4:1.,f .,:•• .....'..5;.,
N.--4- • • •••••.. • ...n” o .0 10o 101 102 3 1 0 10 10 —.10 103 101 ^100 101 102 10 104 101 102 3
FL 1-H -
O
O
Ct".0 LL
0
FL1-H FL I-H
CD8
40
46 10
0
(b)
• •
* *
littermates line 34 line 20
(c) (d) 5 •
•
CD4
/CD
8 ra
tio
littermates line line 34 line 20
4 • •
3 • • • ■
2- • •
1 • •• • ■
0 littermates line 34 line 20
0 TS2 3 co O 0 2 -4-
0
0
Figure 3.13 An increased percentage of double negative thymocytes and a decreased CD4:CD8 ratio suggests expression of the Th2 a chain transgene at the cell surface early in thymocyte development. (a) Thymocytes from both lines of Th2 TCR a chain transgenic animals and littermate control animals were stained with CD4-PE and CD8-FITC antibodies. FACS analysis showed an increased percentage of double negative thymocytes in transgenic animals compared to controls (b). The CD4:CD8 ratio was also decreased in thymocytes from transgenic animals (c) but no change in CD4:CD8 ratio was observed in splenocytes (d). Data points for individual animals are shown and mean values + SD are also marked. The statistical significance of differences between transgenic and littermate groups were tested using a non-paired t test, ***P < 0.001, **** P < 0.0001, and data shown is representative of two independent experiments.
143

30-o
.c 20-z 46 10-
3
2
•
•
CD
4/CD
8 ra
tio
3
CD4J
CD
8 ra
tio
2-
1-
litterinates Th1 he 30 0 0
littermates Thl line 30
4 4-
1-
(a) Littermate Thl 30 Tg
A
o
6.66% . . .'72.76%
f: •
.. .. ..
)5.90% 3.68%
7.94% ... 65.92% • :./
•sA. .. , ''' '
• e: .
'' ...
: . 3.396/0 - . 2.76%
FL1-H 161
2 3
10 10 FL1-1-1
104
CD8
(b) 40 **
0
(c)
litterrnates Th1 line 30
(d)
Figure 3.14 An increased percentage of double negative thymocytes suggests expression of the Thl a chain transgene at the cell surface early in thymocyte development. (a) Thymocytes from Thl TCR a chain transgenic and litter mate control animals were stained with anti CD4 PE and anti CD8 FITC antibodies. FACS analysis showed an increased percentage of double negative thymocytes in transgenic animals compared to controls (b). There was no difference in the CD4:CD8 ratio observed between the two groups in either thymocytes (c) or splenocytes (d). Data points for individual animals are shown and mean values + SD are also marked. The statistical significance of differences between transgenic and littermate groups were tested using a non-paired t test, **P < 0.01, and data shown is representative of a single experiment.
144

102 FL1.H
0
Isotype control Littermate
Th2 line 20 Th2 line 34
10 10
Isotype control Littermate
Thl line 30
(a) Th2
(b) Thl
...... 100 10 10 2 '103 -104
FL I -H
Figure 3.15 Transgenic expression of Thl or Th2 T cell receptor a chains does not affect the levels of TCR at the cell surface. Splenocytes from TCR oc chain transgenic and littermate control animals were stained with an anti TCR [3 chain FITC conjugated antibody. No differences in levels of TCR at the cell surface were observed in either Th2 TCR a chain transgenic line (a) or the Thl TCR a chain transgenic line (b) when compared to littermate control animals.
U
145

Discussion
Many factors are known to influence CD4+ T lymphocyte differentiation and there is a
growing body of evidence to suggest that the avidity and affinity of the TCR/pMHC
interaction is important. Most studies suggest that a low affinity interaction between
the TCR and pMHC complex will favour a Th2 response, while a high affinity
interaction promotes Thl development (Malherbe et al., 2000). A study from our
laboratory in 2002 observed that CD4+ T cells selected under Th2 polarising
conditions favoured an elongated TCR CDR3a chain and predicted that these
elongated TCR a chains may result in less optimal (lower affinity) interactions
between the class II pMHC complex and CDR loops of the TCR (Boyton et al., 2002).
As a continuation of this work, the aim of this study was to express these elongated
Th2 and shorter Thl TCR a chains transgenically to determine if TCR structure can
cause an inherent Thl or Th2 bias in CD4+ effector cell phenotype. This chapter has
described identification of TCR a chains derived from polarised T cell lines and the
generation of Thl and Th2 TCR a chain transgenic mice.
A PCR strategy was used to determine the profile of TCR a and TCR r3 gene usage in
the cDNA of short term polarised NOD.E Thl and Th2 cell lines, both of which were
specific for an antigen (PLP 56-70) used in the previous study. Dominant TCR a
chains were present in both cell lines and there was a statistically significant difference
in CDR3a length between Th 1 and Th2, with the CDR3a regions of the Th2 line
being longer than those of the Thl. This data is in keeping with the findings of the
original study from which these lines derive, as was the observation that there was no
significant difference in CDR3 (3 length and that the Th2 CDR3 motif could not be
identified in the Thl line by PCR. No clonal expansion of a dominant TCR p chain
was observed in either line, suggesting that the dominant TCR a chains were able to
form peptide specific heterodimers with more than one p chain. However, as the
dominant TCR a chains identified made up a significant proportion, but the not the
entirety, of each line no single TCR (3 chain partner for either a chain could be
146

confidently identified. Selective expansion of TCR sequences, which then become
dominant during the course of an immune response has been well documented in
studies of both mice and humans and for both CD4 and CD8 responses (Wedderburn
et al., 1993, Fasso et al., 2000 and Zhong and Reinherz, 2004). However, these
studies mostly report the presence of dominant TCR a and p chain pairs or have
observed narrowing of the TCR (3 chain repertoire. That a TCR a chain, using a
conserved CDR3 a region, i.e. not just a V gene bias, should come to dominate a TCR
repertoire in the absence of any simultaneous TCR p sequence expansion is perhaps
unexpected. During normal T cell development in the thymus, TCR p chain
rearrangement and cell surface expression occurs before that of the a chain (Kishi et
al., 1991). Transition of thymocytes from double negative to double positive denotes
successful (3 chain rearrangement and selection and is accompanied by cell
proliferation (Hoffman et al., 1996). Many T cells bearing the same TCR p chain with
an identical CDR3 (3 region will therefore be present in the thymus, and populations of
mature T cells exiting the thymus with the same TCR (3 chain, but pairing with
different TCR a chains are likely. However, that exactly the same TCR a chain will
be generated by different T cells as they undergo TCR a chain rearrangement is a
random event and therefore T cells exiting the thymus carrying the same TCR a chain
but different TCR p chains are likely to occur at a much lower frequency. The TCR a
chain bias observed in the lines used for this study may therefore be of great
significance, in terms of providing peptide specific structural features to the TCR
heterodimer that are selected for under Thl or Th2 polarising conditions, and lends
further weight to the argument that an inherent bias may be observed upon transgenic
expression of these TCR a chains. However, transgenic expression of the TCR a
chain alone is unlikely to yield an inherent peripheral repertoire of T cells with the
correct antigen specificity. One approach to finding TCR (3 chain partners that formed
antigen specific receptors with the expanded a chains would have been to use a T cell
transfection technique. In vitro expression and analysis of TCRs has been described
by many other groups (Sugiyama et al., 2004) and transfecting T cells lacking
endogenous TCR with the Thl and Th2 TCR a chains, along with TCR (3 chains
147

identified from the diverse repertoire of each line, would have allowed identification
of [3 chain partners which were able to form stable heterodimers with the required
specificity for the antigen PLP 56-70. However, given the unexpected, but striking,
TCR a chain bias observed in both Thl and Th2 cell lines, further questions arise
about whether indeed the dominant TCR a chains alone could be responsible for any
observed phenotype bias. As such it was decided that the Thl and Th2 TCR a chains
should be expressed transgenically in the absence of an identified antigen specific
TCR 13 chain pair, and that pairing would be subsequently established from in vitro
and in vivo studies of these TCR a chain transgenic mice.
Following construction of transgenes for both Thl and Th2 TCR a chains, mice
transgenic for each chain were identified by both PCR and Southern blot. 2 lines of
mice for the Th2 TCR a chain were established, and one line of mice carried the Thl
TCR a chain. Founder animals were crossed, and then each subsequent generation
backcrossed, onto the NOD.E strain of mice as this strain expresses the MHC class II
molecule, I-Ag7, to which the peptide specificity of the original Thl and Th2 cell lines
was restricted. At each generation, mice for subsequent breeding were identified by
both PCR and Southern blot, as germline transmission of transgenes can sometimes
result in loss of transgene copies (Kim et al., 2004). As it was not practical to examine
levels of transgene expression in each line at each new generation, transgene copy
number by southern blot was taken as a surrogate marker that the new generation was
the same as the previous.
The most straightforward way to determine expression of a TCR transgene would be
to use a V region specific antibody. However, although many antibodies exist against
V(3 sequences, very few Va antibodies are available. Cell surface staining of T cells
from transgenic animals was therefore not possible as a means of determining
transgene expression in these mice. Direct observation of transgene expression at the
level of cDNA was possible however, and a PCR strategy demonstrated transgene
expression, and indeed correct splicing out of intronic sequences present in the V
region of each transgene, for each line of transgenic mice. Transgenes for both Thl
148

and Th2 TCR a chains were derived from endogenous mouse TCR a promoter and
enhancer elements contained within the transgenic cassette vectors designed by
Kouskoff et al. (Kouskoff et al., 1995), NOD.E genomic DNA and Thl or Th2 cell
line cDNA. In using these endogenous elements from the TCR a locus, as far as
possible, expression patterns of the transgenic TCR chains should be normal.
However, it is well documented that mice expressing a TCR a chain transgene have an
increased percentage of DN thymocytes compared to wild-type mice (Huang and
Kanagawa, 2004). This is a consequence of the necessity to include pre-rearranged V
and J gene segments in the transgenic construct and altered percentages of thymocyte
populations result from early expression of the transgenic TCR a chain compared to
endogenous a chains. This consequence of TCR a chain transgenesis was alluded to
in the original paper by Kouskoff et al. where the transgenic vectors used in this study
were first described. In this study, high expression levels of transgenes were
documented in double negative thymocytes. The impact of this premature TCR
expression on T cell development and selection was addressed in a recent study by
Baldwin et al. In this study, correct timing of TCR a chain expression was achieved
using the Cre/lox system of conditional gene targeting where Cre was expressed under
the control of the CD4 promoter/enhancer and a TCR a chain transgene was under the
control of a constitutively active promoter, but preceded by a foxed stop sequence
(Baldwin et al., 2005). TCR a chain expression was therefore restricted to DP and SP
thymocytes. The authors report that, when the TCR a chain was expressed in DP
thymocytes, no perturbations of thymocyte DN and DP populations were observed
and, by using a well characterised HY TCR transgenic line, they demonstrated that in
male mice negative selection of HY specific thymocytes occurred at the single positive
(SP) stage of thymocyte development rather than at the DP stage reported in
conventional HY transgenic animals. Thus, the unphysiological expression pattern of
TCR a chains observed in studies using conventional TCR expression vectors are non-
ideal and potential consequences for normal T cell development and selection should
be born in mind. However, in this study, the expected block in thymocyte
development observed serves to answer an important question regarding transgene
expression. Increased percentages of double negative thymocytes were observed in all
149

3 lines of TCR a chain transgenic animals and because thymocyte development is
perturbed by early expression of the TCR a chain at the cell surface, that the Thl and
Th2 TCR a chain transgenes are indeed being expressed at the cell surface can be
surmised.
As both the Thl and Th2 TCR a chains were derived from CD4+ T cells, which are
restricted to antigen recognition in the context of MHC class II molecules, a shift
towards the dominance of CD4+ T cells in the periphery may have been predicted.
Other studies using a13 transgenic mice have seen a large shift in ratio towards CD4+
or CD8+ T cells both in the thymus and the periphery depending on whether the TCR
in question was MHC class II or MHC class I restricted respectively (Lobito et al.,
2002). This was observed in the study by Lobito et al. using an MHC class II
restricted TCR, although they reported a small increase in CD8+ T cells when the TCR
a chain of the receptor was expressed alone. In our study, no statistically significant
shift in CD4/CD8 ratio was observed in the periphery of either Th 1 or Th2 TCR a
chain transgenic animals, although a small apparent shift towards CD8+ T cells in the
Th2 TCR a transgenics, particularly line 20, may have become more apparent if more
mice were included in the analysis. There is however, a significant shift towards
CD8+ T cells in the thymi of these mice. That the same shift is not observed in the
Thl TCR a chain transgenic line suggests that this difference is inherent to the
different TCR a chains being expressed rather than a consequence of transgene
expression per se, but the lack of CD4+ T cell bias in either line suggests that MHC
class restriction is not mediated by either TCR a chain alone and that the transgenic
TCR a chains are likely to be present on the surface of both CD4+ and CD8+ T cells.
In the absence of an antibody and despite some evidence that both TCR a chain
transgenes were being expressed at the cell surface, levels of transgene expression in
the periphery could only be assessed by TCR sequence analysis. However, for all 3
transgenic lines, normal levels of TCR expression on peripheral T cells, whether
endogenous or transgenic, were demonstrated using an antibody specific for the
constant region of the TCR. This finding is particularly important in light of findings
150

about T cell phenotype and is discussed in chapter 4. Sequence analysis of TCRs
expressed by peripheral T cells from splenocytes of both Th2 TCR a chain transgenic
lines and the Thl TCR a chain transgenic line revealed the presence of transgenic
sequences in all samples. However, the percentage of the repertoire comprising the
transgenic sequence was very different between Thl and Th2 animals. From Th2
TCR a chain transgenic animals, almost all sequences obtained derived from the
transgene, with only the occasional endogenous sequence identified. In contrast, no
more than 50% of sequences from Thl TCR a chain transgenic animals were
transgenic and percentages between animals were highly variable. There are several
possible reasons for these variations. Expression levels of transgenes are known to be
highly variable depending on the site of transgene integration (Robertson et al., 1995)
and so the Thl TCR a chain transgene may be integrated into a locus of the genome
permitting weaker expression of the transgene than those in which the Th2 a chain
transgene has integrated. However, if the block at the DN stage of thymocyte
development is any indication of the level of transgene expression, then the
thymocytes of Thl and Th2 transgenic animals appear to be very similar. Another
possibility is that many T cells bearing the transgenic Thl TCR a chain are negatively
selected in the thymus and therefore do not proceed to become part of the peripheral T
cell repertoire. The Thl a chain was originally identified from a highly specific, but
also highly polarized T cell line, whose TCRs were predicted to display a high affinity
for pMHC. T cells with a high affinity for self pMHC are known to be negatively
selected in the thymus (Alam et al., 1996) and it may be that T cells bearing this
shorter CDR3 a region of the Thl TCR a chain are more likely to make high affinity
interactions with self pMHC compared to those bearing the longer CDR3 a region of
the Th2 TCR a chain. This hypothesis would be most easily tested by sorting
different populations of T cells as they proceed through the different stages of T cell
development, i.e. DN, DP, SP and mature T cells and analysing the repertoire of TCR
a chains at each stage, although the picture will be complicated by the appearance of
endogenous TCR a at a different time point to that of the transgene. Perhaps a cleaner
system in which to analyse thymic selection of this TCR a chain would be to use mice
151

in which the endogenous TCR a locus is disrupted. Also a possibility is transgene
deletion as there is some evidence that TCR transgenes can become deleted in
peripheral T cells (Komori S et al., 1993). This issue could be resolved by single cell
sorting of peripheral T cells and using PCR to detect the presence or absence of the
transgene at the level of genomic DNA and cDNA. A final explanation for apparent
low levels of expression in the Thl TCR a chain transgenic line is that many T cells
are expressing the transgenic a chain as well as endogenous a chains, i.e. that there
are many dual a expressing cells in these animals. This may equally apply to
endogenous TCR a sequences detected in samples from Th2 TCR a chain transgenics.
Again, single cell sorting could determine whether some T cells from these animals
were expressing two TCR a chains. These latter two possibilities would also help to
explain the variability observed between animals of the same line.
Data in this chapter has described the identification of dominant Th 1 and Th2 cell
derived TCR a chains and the strategy used to express these TCR chains
transgenically. In vitro and in vivo studies using these animals to try to determine
antigen specific TCR 13 chain pairing, and to determine whether T cells expressing
these chains display any inherent effector phenotype bias are described in the next
chapter.
152

Chapter 4
TCR 6 chain selection and cytokine phenotype in Thl and Th2 TCR
a chain transgenics
Results
4.1 Analysis of TCR /3 chain usage in unprimed Th2 TCR a chain transgenics.
Previous analysis of TCR a chain usage in the Th2 TCR a chain transgenic animals
had shown that, in both transgenic lines, most T cells in the periphery bear the
transgenic TCR a chain (table 3.5). Using the PCR strategy described previously
(figure 3.1) splenocytes from unprimed mice were used to examine TCR 13 chain usage
in these animals (figure 4.1). The aim was to determine whether dominance of this
transgenic TCR a chain generates any innate bias in the TCR (3 chain repertoire of
these animals in the absence of exogenous priming with the antigen (PLP 56-70) for
which the TCR, from which the a chain derives, was specific. However, no
preference for a particular TCR (3 chain was observed in either line, and the pattern of
TCR (3 chain genes used was very similar between transgenic and littermate samples.
There were also no differences in the length of CDR3 regions seen in the TCR (3
chains. From this sequence data it seems that the peripheral TCR (3 chain repertoire is
unaffected by the dominant expression of the transgenic Th2 TCR a chain. However,
as the number of sequences obtained for any one sample represent just a tiny fraction
of TCR (3 chains present in the periphery, any subtle impact of the Th2 TCR a chain
on the 13 chain repertoire may be hard to detect using this approach. CDR3 spectratype
analysis was therefore used in order to build a more global picture of TCR (3 chain
usage in the periphery of these animals. CDR3 spectratype analysis was originally
developed and described by Pannetier et al. (Pannetier et al., 1993). It uses TRBV
gene specific primers in combination with either a fluorescently labelled constant
153
region primer or fluorescently labelled TRBJ gene specific primers to amplify all TCR
p chain sequences in a given sample. Products from each PCR reaction are then
analysed according to size. A typical profile of product sizes for any given primer
combination usually consists of 4 or more discrete peaks, spaced 3 nucleotides apart,
that follow a Gaussian (normal) distribution. Clonal expansion or bias towards a
particular TCR p chain is observed as a dominant peak or skewing of the peak profile
away from a normal Gaussian distribution. To analyse TCR p chain usage in the
periphery of the Th2 TCR a chain transgenic animals, TRBV gene specific primers
were used in combination with a fluorescently labelled constant region primer.
Profiles obtained for each TRBV gene were then compared between transgenic and
littermate animals (figure 4.2). No major differences were observed between the
spectra of transgenic and littermate animals. There was also no evidence of clonal
expansion for any TRBV gene, with all spectra displaying a normal distribution of
product sizes. Good spectra were not obtained for all TRBV genes. These genes (e.g.
TRBV 23, TRBV 21, TRBV 30 and TRBV 24) were also never observed from
sequence analysis of transgenic or littermate splenocytes samples and so as a
consequence of genetic background are probably poorly represented in the periphery
of these animals. It is not possible from this spectratyping data to determine the CDR3
lengths represented by individual peaks as they represent combinations of each TRBV
gene with many different TRBJ genes, but the similarity in spectra between transgenic
and littermate samples suggests that there are no differences in average TCR I CDR3
length or TRBV gene usage as a consequence of transgenic Th2 TCR a chain
expression.
154

TA clone TRBV CDR3(3 amino acid sequence TRBJ CDR3 length
Th2 a line 20 20-2 B1 20-2 B7 20-2 B9 20-2 B2 20-2 B5 20-2 B4 20-2 B6 20-2 B8
20-2 B10 Mean CDR3 length
2 CASSQDSQNILYF 2-4 11 CASSPDRGRNTLYF 12 CASSQGQGSYEQYF 2-7
20 CGARLGLNQDTQYF 2-5 13-2 CASGDAGFNQDTQYF
13
CASGDWGSGNTLYF 1-3
12 16 CASSFRDRGF 2-7
8
17 CASSPDNYEQYF
10 19 CATLGQNYAEQF F 2-1
11 11.2
Th2 a line 34 34-23 B1 34-23 B9 34-23 B3
34-23 B10 34-23 B8 34-23 B5 34-23 B6 34-23 B2 34-23 B11 34-23 B7
Mean CDR3 length
17 CASSRTGGQDTQYF 2-5 12 CASSRLGTGDTQYF
2 CASSQERRINQDTQYF 14 13-2 CASGDARWGGSQDTQl 15 19 CASSILTGSNQDTQYF 14
CASSILSQNTLYF 2-4 11 15 CASSSGQQNTLYF 29 CASGTNTEVFF 1-1
9
CASSPPTGRSAETLYF 2-3
14 4 CASSSGQGDNQAPLF 1-5
13 12.5
Littermate 20-31 B1
20-31 B12 20-31 B6 20-31 B2 20-31 B3
20-31 B11 20-31 B4 20-31 B8 20-31 B9
20-31 B10 Mean CDR3 length
29 CASSSRQGMDSPLYF 1-6 CASRDQGANTGQLYF 2-2 CASSRTGYEQYF 2-7
15 CASSLDRDEQYF 13-1 CASSLWGNQDTQYF 2-5
CASSDWGASYEQYF 2-7 2 CASSQDRDYEQYF
13-3 CASGVLGGGAETLYF 2-3 16 CASSLGTGGYEQYF 2-7
13
10
12
11 13 12 11.8
Figure 4.1 TCR 13 chain sequences from splenocytes of unprimed Th2 TCR a chain transgenic and littermate control animals. A PCR strategy (figure 3.1) was used to determine TCR (3 chain usage in Th2 TCR a chain transgenic and littermate splenocytes.
155

10 170 150 147 160 170 200 271
Th2 TCR transgenic
, A
ft 1'11
Littermate
IAA ))
I\A
ft\
TRBV 1
TRBV 2 TRBV 4
TRBV 5 TRBV 12-1 TRBV 13-1 TRBV 13-2 TRBV 13-3
Th2 TCR a transgenic
Littermate
TRBV 14 TRBV 15 TRBV 16 TRBV 17 TRBV 19 TRBV 20 TRBV 29 TRBV 31
Figure 4.2 Spectratype analysis of TCR 13 chain gene usage in splenocytes of unprimed Th2 TCR a chain transgenic and littermate control animals. TRBV gene specific primers were used with a fluorescently labelled constant region primer to amplify TCR (3 chain sequences from splenocyte cDNA. Analysis of product sizes obtained from each PCR reaction showed no major differences in spectra obtained for transgenic compared to littermate control animals and no evidence of clonal expansion for any TCR (3 chain in the presence of a dominant Th2 TCR a chain. Numbers at the top of each spectra indicate the size of PCR product in base pairs. Data shown is representative of 2 animals per group.

4.2. Analysis of TCR fi chain usage in Th2 TCR a chain transgenics in the context of
antigen specificity.
The data from unprimed animals suggests no bias in TCR 13 chain repertoire in the
context of a dominant transgenic Th2 TCR a chain and that the transgenic a chain is
able to form a functional TCR with many different TCR 13 chains with different
lengths of CDR3. However, the TCRs present in the periphery of the animals used to
generate this data have an enormous range of antigen specificities. Structural
constraints on which TCR 13 chains may be able to pair with the transgenic Th2 TCR a
chain may be more apparent in the context of an antigen specific response. PLP (56-
70) is the antigen for which the original TCR, from which the transgenic Th2 TCR a
chain was derived, was specific. Th2 TCR a chain transgenic and littermate animals
were immunised in the footpad with PLP 56-70. The peptide was administered as an
emulsion with Complete Freund's Adjuvant (CFA) in order to generate an immune
response and 10 days after immunisation, popliteal draining lymph nodes from these
animals were harvested and peptide specificity and TCR [3 chain usage determined.
Good proliferation in response to antigen was seen from both transgenic and littermate
lymph node T cells, but neither sequence analysis (figure 4.3) nor CDR3 spectratype
analysis (figure 4.4) showed any evidence of clonal expansion, TRBV gene bias or
differences in TRBV gene usage and CDR3 length between Th2 TCR a chain
transgenic and littermate animals.
157

20-131311 13-2 CASGSGGPNQDTQYF 2-5 13 20-13B13 CASGDAGGRDTQYF 12 20-13 B5 CASGGLGDEQYF 2-7 10 20-13 B9 CASGDALGASAETLYF 2-3 14 20-13 B1 19 CASSPDSAETLYF 11 20-13 B4 CASRQTGGDQDTQYF 2-5 13 20-13 B7 13-1 CASSDGGGPEVFF 1-1 11
20-13 BIO CASSPGENTLYF 2-4 10 20-13 B6 31 CAWTTGGTTGWLYF 2-2 12 20-13 B8 4 CASSWDWEQDTQYF 2-5
Mean CDR3 11.8
Th2 a line 34 34-3 BIO 16 CASSPRQGENTGQLYF 2-2 14 34-3 B11 CASSLVDAANSDYTF 1-2 13 34-3 B7 CASSLTGGVQDTQYF 2-5 34-3 B8 15 CASSLAPGLGKDTQYF 14 34-3 B9 CASSRQGNTEVFF 1-1 11 34-3B12 13-1 CA SSDAYRGGTEVFF 13 34-3 B1 CASSDEGYTLYF 2-4 10 34-3 B3 5 CASSQQGEQYF 2-7 9 34-3 B5 19 CASSIEDQGARTERLFF 1-4 15
Mean CDR3 12.4
Littermate 34-1 B7 13-2 CASGGRDRASERLFF 1-4 13 34-1B11 1-4 34-1 B2 13-1 CASSDVWDWGYEQYF 2-7
34-1 B15 CASSDGQGDNQAPLF 1-5 34-1 B8 CASSDSRLGGAETLYF 2-3 14
34-1 B13 CASSDQGANTEVFF 1-1 12 34-1 B3 2 CASSQDLSNQAPLF 1-5 34-1 B5 CASSQQNSDYTF 1-2 10 34-1 B6 20 CGARDWGGAYAEQFF 2-1 13
34-1 B14 19 CASSILGGEETLYF 2-3 12 Mean CDR3 12.5
M 70000—g 80000-. 50000-
40000.
30000. 2 20000.
10000-g. 0
10 20 30 40 50 peptide concentration (p.almli
8000 700 800 5000 4000o
E 3000 E zoos
1000
10 20 30 40 50 peptide concentration (p0/m1)
5000
S 4000
3000
2000
a 1000
10 20 30 40 50 peptide concentration (µ0/m1)
TA clone TRBV CDR3p amino acid sequence TRBJ CDR3 length
Th2 a line 20
Figure 4.3 TCR I chain sequences from primed draining lymph node of Th2 TCR a chain transgenic and littermate control animals. Mice were primed with the peptide PLP 56-70 by footpad immunisation. The draining popliteal lymph node was harvested at day 10 and peptide specificity of T cells determined by proliferation assay. TCR (I chain usage was determined by PCR. The proliferation data shown corresponds to the draining lymph node from which each set of sequence data is derived.
158

_A m
170 80 130 140
A A V
TRBV 4 TRBV 5 TRBV 12-1 TRBV 13-1 TRBV 13-2 TRBV 13-3 1.
TRBV 1 160
TRBV 2 00 000 210 220
I I)
180 130 ISO
110
TRBV 14 TRBV 15 TRBV 16 TRBV 17 TRBV 19 TRBV 20 TRBV 29 TRBV 31 14) 150 170 100 150 160 160 200 510
A )
Th2 TCR a transgenic
Littermate
Th2 TCR transgenic
Littermate
Figure 4.4 Spectratype analysis of TCR 13 chain gene usage in primed draining lymph node T cells of Th2 TCR a chain transgenic and littermate control animals. TRBV gene specific primers were used with a fluorescently labelled constant region primer to amplify TCR 13 chain sequences from draining lymph node cell cDNA. Analysis of product sizes obtained from each PCR reaction showed no major differences in spectra obtained for transgenic compared to littermate control animals and no evidence of clonal expansion for any TCR [3 chain in the context of a dominant Th2 TCR a chain and PLP peptide specificity. Numbers at the top of each spectra indicate the size of PCR product in base pairs. Data shown is representative of 2 animals per group.

4.3. Analysis of PLP (56-70) specific Th2 TCR a chain transgenic T cell lines.
The lack of a dominant TCR (3 chain in the draining lymph nodes of PLP 56-70
immunised transgenic animals suggests that a single priming with antigen and 10 days
between priming and harvesting of the lymph node was not sufficient for a clonal
expansion to occur. Antigen specific T cell lines were therefore established from Th2
TCR a chain transgenic and littermate draining lymph nodes and grown in vitro over
many weeks with repeated exposure to antigen and APC in growth medium containing
10U/m1 IL-2. T cell lines were restimulated with antigen (PLP 56-70) every 9-11 days
and splenocytes from NOD.E mice were used to present the peptide at each
restimulation, as APCs from this mouse strain carry the MHC class II molecule I-Ag7,
against which the original Th2 TCR was restricted. TCR p chain usage in these PLP
56-70 specific cell lines was analysed over successive restimulations. Figure 4.5
shows TCR p chain sequence data for Th2 TCR a chain transgenic (derived from
transgenic line 20) and littermate T cell lines grown over 6 restimulations. A clonal
expansion of a TCR (3 chain was apparent at the 4th restimulation of the transgenic T
cell line and this 13 chain (TRBV 31 / TRBJ 2-3) with a CDR3 p length of 12 amino
acids, comprised 100 % of all sequences obtained at the 6th restimulation. In contrast,
the littermate derived line showed no evidence of clonal expansion at the 4th
restimulation and the most significant expansion at the 6th restimulation comprised just
21% of the sequenced repertoire. However, despite the major differences in TRBV
gene usage between the two lines, CDR3 (3 lengths remained similar throughout.
The rapid narrowing of the TCR p chain repertoire in the transgenic line compared to
the littermate line was also seen from CDR3 spectratyping data (figure 4.6). For each
of the TRBV genes shown, even at the 2nd restimulation, the number of peaks in each
spectra was greater in the littermate line than in the transgenic line where all spectra
rapidly narrow or disappear completely. Narrowing of the repertoire was also evident
in the littermate line by the 6th restimulation but for this line the kinetics of this change
in (3 chain usage was much slower.
160

2°d restimulation 4th restimulation 6th restimulation
TA clone TRBV CDR3IO amino acid sequence TRBJ CDR3 length TA clone TRBV CDR30 amino acid sequence TRBJ CDR3 length TA clone TRBV CDR313 amino acid sequence TRIM CDR3 length
Th2 a transgenic 2°20814 2° 20 1316 2° 20 135
2°20 B13 2°20818 2° 20 B8
2° 20021 2° 20 B4
2°20 B23 2°20 B17 2° 20 Ell
2° 20 1312 2° 20 B20 2° 2082
2° 20 B22 2° 20 B7
2
13-2
13.1
4 31 29
CAS SQRL VNQDTQYF
CA S S LGT ANTGQLYF
CAS S LGT ANTGQP YF CASSQEERTNSDYTE CAS SQDGQFLNERLFF CASGDPD W TETLY F
CASGDRDRGNNSPLYF CAS SAGTNSNERLFF CAS S DAGD 1NNQAPLF CASSDAWGQGNTEVFF CAS SGTGGNTLYF CALGHRINERLFF CA S SPGTGVDTQYF
2-5
2-2
1-2 1-4 2-3
1-6 1-4 1-5 1-1 2-4 1-4 2-5
13
14 12
14 13 14
12
Th2 a transgenic 4° 20 131 4°2003 4° 20 136 4° 20 B8 4120E19 4° 20 1310 4° 20811 4°20013 020B14 4° 20E16 4° 20 B21 4°20137 4° 20 1317 020 1318 4°20E123 4°20 B2 4°2004
(201320
31
13-1
13-3
5
CAWS LGGGAETLYF
CASSDAWGQGNTEVFF
CAS SG PPGQSSGNTLYF CAS RRDNQAPLF
CASSQTFLNSDYTF
2-3
1.1
1-3 1-5
1-2
12
14
15 10
12
Th2 a transgenic 6°20131 e20B2 6°20 B3 6°2084 6° 20 B5 6° 20 B6 e 20 87 6'2088 6° 20 B9 (201310 6°20611 (20 B12 e 20 513 6°20814 6°20E115 e 20 1316 6°201317 6°20 BIS 6°201320 6'20521
31 CAWSLGGGAETLYF 2.3 12
Mean CDR3 12.8 Mean CDR3 12.6
Littermate 2° WT B3 2° WT1320 2°WTB1 2° WT B2 2° WT B13 2° WT B17 2° WT B4 2° WTB11 2° WT B14 2° WT B6 2° WT B12 21 WT 139 2° WT B21 2° WT B20" 2° WT B24 2° WT 137 2° WT B18 rwr 819
16
13-1
2
19 24 31
CASSTTSYEQYF
CASS LDGT TNSDY TF CAS S LQGA 1 S NEGLEF CAS SLVGSNERLF F CASSSDWGSTLYF CAS S DEWGETDTQYF CAS S DAGTGSYEQY F CASSALGGRSYEQYF CAS RPDWG GAGAEQFF CASSDAGGARDAETLYF CASSQDRDFYAEQFF CAS SQEGGVG AEQFF CAS S PRDNQ NTLY F CA S S QDM GGAHQDTQYF CASTPGQGNSPLYF CA SSPSGTGGNTL YF CAWSPGGGAETLYF
2-7
1-2 1-4
2-4 2-5 2-7
2-1 2-3 2-I
2-4 2-5 1-6 2-4 2-3
10
13 14 12 11 13 13 13 14 15 13 13 12 15 12 13 12
Littermate e wrm
WT B12 4° WT131 4° WT 86
WT Bit 4° WT 820
WT BIO 4° WT BI6 4° WT B2 4°WT 114 4° WT 135
WT B21 4° 337 813 4° W1"1314 4°WT 87
WT 89 4° WT 1317 4° s/17 B15 (WT1119
WT BR
13-1
15
17
16
12-2 2 14 31 20
13-2
CASSDAGGARDAETLYF 2-3 15
CAS SPRTTSQNTLYF 2-4 13 CAS R PDWGGAGAEQ IF 2-1 14 CASSLGGSGNTLYF 1-3 12
CASSSRDNQDTQYF 2-5 12
CAS SLELGQSNQDTQYF 15 CAS RDWGSNTGQLYF 2-2 13 CASSLGGVTEVFF 1-1 1 CASSLDDANTEVFF 12 CASSRDWGDEQYF 2-7 II CASSLVIFSNE RIFF 1-4 13
2 CASSLDNNQDTQYF 2-5 CASSQEGLGETQYF CASSSREDTQYF 10 CAWSSRDWGDKQYF 2-7 12 CGARDRDWGDEQYF CASGGDWGLALYF 2-4 II
Mean CDR3 12
Littermate (IVT134 6° WT 136 6° Wr 07 ewTBI9 6°Avr 85 6° WT 03 6" WT139 6° WT BIO 6° 18T1315 6° WT 1318 6" WT1320 eurrI311 6° WT 82
6° WT 822 6° 1118817
WT 131 ex7521 61%71316 6° WT138
16
2
13-1
13-2
29
CASSRDWGDEQYF
C AS SLE WG DEQ VF CASSRDWGDTQYF CASSLDDANTEVFF C AS S FQG YNE RL FF CASSLv1FSNF.RLFF CASSQEGTGGAGAEQFF
CASSDAGGARDAETLYF
CAS SD VG KDTE VFF CASGESANTEVFF CAS CPT ANTE VFF C AS GDAGG AET L CF CASSFSGTGENERLFF
2.7
2.5 1-1 1-4
2.1
2-3
1-1
2-3 1-4
12
13 15
1121
12 14
Mean CDR3 12.8 Me. CDR3 12.4 Mean CDR3 123
Figure 4.5 Rapid clonal expansion of TCR over successive restimulations of a Th2 TCR a chain transgenic T cell line. T cell lines were established from PLP 56-70 primed draining lymph nodes of transgenic and littermate control animals. T cells were restimulated with peptide in the presence of NOD.E splenocytes every 9-11 days. RNA was extracted from cell lines at each restimulation and TCR beta usage determined by PCR. A clonal expansion in the transgenic T cell line is apparent from the 4th restimulation and this TCR comprises 100% of the repertoire by the 6th restimulation. No significant expansion was observed in the littermate line.

IAA % \.-
U:
Transgenic
Littermate
kr'
TRBV 31
TRBV 16
TRBV 13-1
TRBV 2
restimulation 4th restimulation 6th restimulation
Figure 4.6 Spectratype analysis of Th2 a chain transgenic and littermate derived T cell lines through successive restimulations. T cell lines were restimulated every 9-11 days with peptide (PLP 56-70) and NOD.E splenocytes. RNA was extracted from cell lines at each restimulation. TRBV gene specific primers were used with a fluorescently labelled constant region primer to amplify TCR 13 chain sequences from T cell line cDNA. Analysis of product sizes obtained from each PCR reaction showed narrowing of the TCR 13 chain repertoire in both T cell lines over successive restimulations. Narrowing of the repertoire was more rapid in the Th2 a chain transgenic line with complete disappearance of some TRBV genes by the 6th restimulation.
162

Given the enormous differences observed in TCR usage, proliferation in response to
antigen and cytokine phenotype of the two lines were examined. Proliferation assays
with multiple doses of peptide at each restimulation showed that both cell lines were
highly peptide specific and that rates of proliferation in response to antigen were
roughly equivalent between the two lines (figure 4.7). However, cytokine profiles
revealed marked differences. In the Th2 TCR a chain transgenic line levels of the Thl
cytokine IFN-y were decreased between the 2❑d and the 6th restimualtion while levels
of the Th2 cytokines IL-4 and particularly IL-5 were increased. In the littermate
control line IFN-y production remained high and IL-4 and IL-5 remain low throughout
the timecourse. This apparent phenotype difference between the two lines was also
seen at the level of Thl and Th2 transcription factors by real time PCR for Tbet (Thl)
and GATA3 (Th2) transcripts (figure 4.8). At all time points, levels of Tbet
transcripts were higher in the littermate line than in the transgenic line and, from the
4th restimulation, levels of GATA3 transcripts show the opposite trend. Taken
together, the sequence, cytokine, and real time PCR data suggest that, by the 6th
restimulation, the Th2 TCR a chain transgenic T cell line has undergone a rapid clonal
expansion such that the line now comprises a dominant TCR and that the line has a
Th2 type phenotype compared to the more heterogeneous TCR repertoire of the
littermate line which has a predominantly Thl type phenotype.
The original hypothesis of this study asked whether the structure of the TCR could
cause an inherent Thl or Th2 bias in T cell phenotype. As it was not possible to
identify a TCR (3 chain pair for the Th2 TCR a chain used to make the transgenics in
this study, it would be necessary to use the a chain only transgenic lines to identify a 13
chain that pairs with this alpha chain in the context of peptide specificity and a Th2
phenotype. The data for the transgenic cell line described here suggested that the
clonally expanded TRBV 31/TRBJ 2-3 TCR (3 chain may be a suitable P chain pair for
transgenic expression. The picture of TCR usage and cytokine profile over 6
restimulations of this transgenic T cell lines is a rapidly changing one. However, if
cytokine phenotype here is linked to the clonal expansion of the TCR you would
expect that once a single TCR is present, the cytokine phenotype should remain stable.
163

The cell lines were therefore grown over many more restimulations. Figure 4.9 shows
the cytokine phenotype and relative abundance of Tbet and GATA3 transcripts for the
transgenic and littermate T cell lines after 15 restimulations with antigen. The
transgenic T cell line was still producing high levels of Th2 cytokines IL-4 and IL-5,
but low levels of IFN-y while the littermate line produced only IFN-y. Levels of Tbet
transcripts were still higher in the littermate line while GATA3 transcripts were more
abundant in the transgenic line. The Th2 type phenotype of this Th2 TCR a chain cell
line therefore appears to be stable.
164

7 00
q xp 10 20 10 40 50
1.13.0 DOnc0114011011 0.111D
10 /0 30 40 00001. .002.11.
10 20 00 40 50 000000.110n (..11
0 10 20 30 40 0.00010 a c.ntr tb. (.5.1)
2nd restimulation 4th restimulation 6th restimulation
(a)
3
20110
proliferation
IFN-y
IL-4
0 10 20 10 40 50 pop1101..c.o00o• h/p/m1) 1.011115 Danc•ntratIon 0.101m1)
0 20 10 000112. moo...1110n 0..1)
500
400
300
100
IL-5
10 10 30 40 50 0.1101. c.t.ntrtbn 1,400,09
20 50 40 50 p0011011100Kontra11011 (11020)
(b)
10 20 31 40 50 .21. Conan.. W.)
0 10 20 30 40 1.10110•100nCentr1000n 100121101)
0 10 21 30 40 pe0010 C00.101111011 2021110
SO
proliferation
IFN-y
IL-4 1
IL-5
200
1 100
10 10 10 40 (p09.)
200
/D 10 40 11•010111Coneentr.n (01/1101)
20 . 40s0 10 10 40 00 gollde.n0entrzt100 200029 got. 00nc«wtlon (1.1119
Op 2. S
100
1D 20 JO 40 50 0000. concontrotlen 419.1)
Figure 4.7 Cytokine phenotype of Th2 TCR a chain transgenic and littermate T cell lines over successive restimulations. Th2 TCR a chain transgenic (a) and littermate (b) T cell lines were restimulated every 9-11 days with peptide (PLP 56-70) and NOD.E splenocytes. At each restimulation, proliferation assays were performed with multiple doses of antigen. After 48 hours of culture, supernatants were harvested and wells pulsed with [3H] thymidine to determine proliferation. Cytokines in cell culture supernatants were quantitated by ELISA.
165

(a) (b)
2nd restimulation
c
• 4 ;3<• 2
u • 3
re re 2 E 1 D
1 c
22 0 0
4th restimulation
e 0
a - 2 - z z cc E -
d o
0 I ; • 4 a. o 3 z cc 2
> ̀
o n
6th restimulation
Figure 4.8 Real time PCR analysis of GATA3 and Tbet transcripts in Th2 TCR a chain transgenic and littermate T cell lines over successive restimulations. T cell lines were restimulated every 9-11 days with peptide (PLP 56-70) and NOD.E splenocytes. RNA was extracted from cell lines at each restimulation. Real time PCR analysis was used to compare levels of GATA3 (a) and Tbet (b) transcripts between the Th2 TCR a transgenic line (grey bars) and the littermate line (black bars) at each restimulation. RNA levels in each sample were normalised to 18s. At each time point, and for each gene of interest, the sample with the lowest level of gene expression was assigned a value of 1 and gene expression levels in other samples expressed as a value relative to 1.
166

10 ID ID so 10 le 30 40 a. pe....entrellen(.1.1) peptide conceninition
0 10 20 30 40 60 p.600 conoentration (p2/m11
310
10 30 20 dO pisptide Doncentralion(i./211)
IFN-y
IL-4
10 20 30 40 60 peptide concentration 1.1.0)
10 20 . 10 50 pepIcit concentration (pyng)
IL-5
proliferation 1.00
(a)
(b)
10 20 30 60 10 20 40 50 acnoentration pap.. concentration (µ0/01)
(c)
(d)
c 14-0 7n 1 2- .42 o. 10-
rt 6 4- 2-
e
rela
tive
mRN
A ex
pres
sion
Figure 4.9 Cytokine phenotype of Th2 TCR a chain transgenic and littermate T cell lines after 15 restimulations. T cell lines were restimulated every 9-11 days with peptide (PLP 56-70) and NOD.E splenocytes. At the 15th restimulation RNA was extracted from each line and proliferation assays were performed with multiple doses of antien. After 48 hours of culture, supernatants were harvested and wells pulsed with [ thymidine to determine proliferation. Cytokines in the cell culture supernatants of the Th2 TCR a chain transgenic line (a) and the littermate line (b) were quantitated by ELISA. Relative abundance of GATA3 (c) and Tbet (d) transcripts in the Th2 TCR a chain transgenic line (grey bars) compared to the littermate line (black bars) were determined by real time PCR. RNA levels in each sample were normalised to 18s. For each gene of interest the sample with the lowest level of gene expression was assigned a value of 1 and gene expression levels in other samples expressed as a value relative to 1.
167

The transgenic T cell line described above was derived from the primed draining
lymph nodes of Th2 TCR a chain line 20 transgenic animals. Another example of a
Th2 TCR a chain transgenic T cell line with a rapid TCR (3 chain clonal expansion
and a Th2 type cytokine phenotype was derived from line 34 transgenic animals. TCR
(3 chain sequence data in figure 4.10 shows that, over 9 restimulations, a single TCR (3
chain expanded to comprise the majority of the T cell line, with this TCR already
making up 50% of the repertoire by the 5th restimulation. The TCR 13 chain expanded
in this line (TRBV 13-1/TRBJ 2-7) had a long CDR3 (3 of 15 amino acids. This T cell
line produced no IFN-y (figure 4.11) but made high levels of Th2 cytokines IL-4 and
IL-5. A switch in cytokine phenotype towards a Th2 type profile between the 1St and
5th restimulation was also apparent from Tbet and GATA3 real time PCR data with
Tbet transcripts more abundant at the 1st restimulation and low levels of Tbet
transcripts but high levels of GATA3 transcripts at the 5th and 9th restimulations.
Cytokine phenotype data from this line 34 derived T cell line therefore confirmed
previous findings from the line 20 derived T cell line discussed earlier.
Although in the line 34 derived transgenic T cell line the kinetics of TCR (3 chain
expansion are slightly slower, in both examples one TCR ultimately dominates the
line, which displays a predominantly Th2 type phenotype with low levels of the Thl
type cytokine IFN-y and high levels of the Th2 type cytokines IL-4 and IL-5. Both
expanded TCR (3 chains would therefore be good candidates for transgenic expression.
Transgenic constructs for both Th2 TCR 13 chains were created, but technical
difficulties verifying the final line 34 derived TRBV 13-1/TRBJ 2-7 construct meant
that only the line 20 derived TRBV 31/TRBJ 2-3 (3 chain was subsequently used for
transgenesis. The generation of transgenic animals carrying this Th2 TCR (3 chain are
described below.
168

TA clone TRBV CDA3p amino acid sequence TRBJ CDR3 length
1° 34132 1° 34 B3 1° 34 135 I° 34 B7
16 CASSPDWGETLYF
CASSLDWGSDYT F
2-3
1-2 1° 34 1316 1° 34 BI CASSEGKGTNTEVFF I-1 13
1° 34 BIS CASSLDPAGGYEQY F 2-7 I ° 34 B21 CASSGDWGDEQYF 11 1° 34 1317 13-1 CASSGDSTEVFF 1-1 10 1° 34 BI9 I ° 34 B4 CASSDAGGTEVF F 11 I° 34 B6 CASSDAGTGRDTEVFF 14
I ° 34 BI2 CASSDAGTSANTEVFF I ° 34 013 CASTQGPTNERLFF 1-4 12 I' 34 BI5 CASSQTNNYAEQFF 2-1 I° 34 B20 CASSDVGRGNAF.TLYF 2-3 14 1° 34 B8 12-2 CASSLEGWGGAGDTQYF 2-5 15
I ° 34 1111 19 CASSPPGTTYSGNTLYF 1-3 Mean CDR3 12.6
TA clone
5° 34 132 5° 34 B3 5' 34 B4 r 34 135 5" 34 06 r 34 B14 5° 34 1315 r 34 B16 5° 34 1318 5° 34 1321 r 34 BI9 5° 34 B9 5° 34 B20 5° 14 B1 r 34 1310 5° 34 013 r 34 BI2 r 34 Bl7 5° 34 BI8
Mean CDR3
10t restimulation 5th restimulation 9th restimulation
TRBV CDR33 amino acid sequence TRBJ CDR3 length TA clone TRBV CDR3tI amino acid sequence TRBJ CDR3 length
13-I CASSDTGGAQSSYEQYF 2-7 15 9°34 131 9° 34 B2 9° 34 133 9° 34 B7 r 34 I38 9° 34 119
9° 34 1310 r 34 B12 r 34 BI3 9° 34 B25
I3-1 CASSDTGGAQSSYEQYF 2-7 15
2 CASSQDGLGGLDTQYF 2-5 14 9° 34 B26 r 34 B27
CASSQPPTI1NQDTQYF 9° 34 13213 r 34 B29 r 34 B30 r 34 B31
16 CASSLDGLVDSNSDYTF 1-2 15 9° 34 B32 CASSLEW GAEQF F 2-I II 9° 34 1333 ON
5 CASSRHRADTEVFF I-I 12 r 34 B34 .f:3 13.5 9° 34 BI4 13-2 CASGDAGGEQDTQY F 2-5 13 i--1
Mean CDR3 14
Figure 4.10 Clonal expansion of a TCR over successive restimulations of a Th2 TCR a chain transgenic T cell line. The T cell line was established from PLP 56-70 primed draining lymph nodes from line 34 Th2 TCR a chain transgenic animals. The line was restimulated with peptide and NOD.E splenocytes every 9-11 days. RNA was extracted at each restimulation and TCR beta chain usage determined by PCR. A clonal expansion was apparent at the 5th restimulation of this line and this TCR comprises the majority of the TCR beta chain repertoire by the 9th restimulation.

1000
.0 A 30 40 A p•ptitle 509290.19n (..9
IL-4
3000
HOD I
1000 I 31
111 20 30 40 sp 10 30 30 40 50
990105 conemlnklon (I00 90511510 9999050011On 929/2110
15009 15004 13400 12500
.1 10,000.
5000 .rj 4000 2500 3504
0 10 20 30 40 0
MOO
1/1
0 10 20 30 40 GO 0. 11 A A MI 10
IL-5
.2 50- ra ct)
0.2 40- x 0
< 30-z
E 20-
9111
c 90-
•N • 80- (5 a) 70-
cx̀ 60-
< • 50-
Z re
40•
E
> 20. ri co 10-a.)
0 r.) • 0 ""T""
1st 5th 1;t 5th 9th
(a)
proliferation
IFN-y
15t restimulation 5th restimulation 9th restimulation
#14000..
6000.
1 2SOOD.
Slr ID 0 39 40 SO
ccccc .410on
10 20 30 40 40 110910.11 000000.900 1102009
0 10 39 30 40 10 peptide concenbattOn (WM
10 20 31 40 SO 20121151 ConCantratIon ( 2001)
ppIldeconcomtrstlan 002/02) peptide concrnien "Okla concsalretIon 950/0111
(b) (c)
Figure 4.11 Cytokine phenotype of a line 34 Th2 TCR a chain transgenic T cell line. The T cell line was restimulated with peptide (PLP 56-70) and NOD.E splenocytes every 9-11 days. At each restimulation a proliferation assay was performed with multiple doses of antigen. After 48 hours of culture, supernatants were harvested and plates pulsed with [3H] thymidine to determine proliferation (a). Cytokines in cell culture supernatants were quantitated by ELISA (a). Relative abundance of GATA3 (b) and Tbet (c) transcripts in cDNA samples from successive restimulations were determined by real time PCR. RNA levels in each sample were normalised to 18s. For each gene of interest the sample with the lowest level of gene expression was assigned a value of 1. Gene expression levels in all other samples are expressed as a value relative to 1.
170

4.4. Construction of a Th2 TCR p chain transgene.
The cassette vector used in the construction of the Thl and Th2 TCR a chain
transgenes has already been described. The TCR p chain vector (pT(3) was also
designed by Kouskoff et al. (Kouskoff et al., 1995) and is based upon the same
principle of using endogenous mouse TCR [3 promoter and enhancer elements to drive
gene expression. To express a TCR (3 chain transgenically it is necessary to insert into
the vector the rearranged TCR p V-J coding region of interest. Also described in the
previous chapter was the importance of using the genomic DNA configuration rather
than the cDNA configuration of the rearranged TCR chain. However, unlike the
situation described for the generation of the TCR a chain constructs, genomic DNA
was available from the T cell line from which the TCR p chain of interest was
identified. It was therefore possible to obtain the full sequence of the required TCR (3
chain V-J segment by a single PCR strategy, whereby PCR was used to generate
restriction sites at either end of the V-J segment which could then be inserted directly
into the cassette vector (figure 4.12). The nucleotide and amino acid sequence of the
Th2 TCR p chain used to make the transgene are shown in appendices 21 and 22
respectively. PCR primers used to clone the V-J segment from cell line genomic DNA
are listed in appendix 8.
The PCR product that was cloned into the pT(3 cassette vector and verification of the
final construct by restriction digest are shown in figure 4.13. The sequence of the
TCR (3 chain V-J segment in the final construct was also verified by sequencing prior
to preparation for pronuclear injection. Bacterial sequences were removed from the
vector prior to pronuclear injection by digestion of the construct with Kpnl and
purification of the upper 17,700 bp band (figure 4.13). A plasmid map of the complete
Th2 TCR (3 chain construct is shown in appendix 12.
171

VB31F
Xhol L_. ME
LP1 -
LP1 VB3I JB2-3 \-1 SacII JB2-3R
Xho I I NMI
7.777,77 Sac II
LP1 VB31 JB2-3
(c) Xho I
(a)
(b)
Kpn I
Kpn I
Th2 (3 construct is linearised for injection using Kpn I
Figure 4.12 A schematic diagram showing the cloning strategy used to create the Th2 13 chain construct. (a) Genomic DNA from the Th2 a transgenic cell line was used to isolate the required VB31/JB2-3 fragment containing the appropriate intronic regions for correct transcript processing. PCR primers (VB31F and VJ2-3R) were used to introduce Xho I and Sac II restriction sites to the 5' and 3' ends of the VJ fragment respectively. (b) The Th2 p VJ fragment was then inserted into the pTp cassette vector by directional cloning using Xho I and Sac II. (c) Bacterial sequences were removed from the vector, by digestion with Kpn I, prior to pronuclear injection.
172

Z rearranged TRBV31-TRBJ2-3 bp
1000 750 500 —111"
bp
10000
,—, 0 at
—••, $.4 a) V)
^c1 0 0 ,—] 0 W Ca at >,.. 0 ad = U bp
(b) o.
(c)
10000 5000 3000 2000
1000 --Po-
500 —110.
(a)
Figure 4.13 Cloning of the rearranged Th2 TCR f chain into the TCR 13 expression cassette. (a) The rearranged configuration of the Th2 TCR p chain was cloned from T cell line genomic DNA by PCR. The cloned VJ fragment was sequenced and then inserted into the TCR (3 expression cassette using restriction enzymes XhoI and SacII. (b) Prior to digestion and purification for pronuclear injection, the complete construct was checked by restriction digest to ensure that no rearrangement of the plasmid had occurred during cloning. (c) Bacterial sequences were removed from the construct before injection by digestion with KpnI and purification of the upper 17,000 bp band.
173

4.5. Identification of a Th2 TCR fl chain transgenic founder animal
The Th2 TCR (3 chain transgene was injected into C57BL/6 oocytes at the MRC
Clinical Sciences Centre of Imperial College, London. 20 potential founder animals
were screened for the presence of the Th2 TCR (3 chain transgene. An initial PCR
screen, using genomic DNA extracted from a tail biopsy, identified 1 founder animal
(figure 4.14). This founder was subsequently referred to as Th2 TCR [3 line 4 based
on the number assigned to the animal at the point of tail biopsy. Technical difficulties
with the technique have meant that, so far, the transgenic status of this animal has not
been confirmed by Southern blot.
The founder animal (Th2 TCR [3 line 4) was male. Th2 TCR a chain line 20
transgenic females were therefore used as breeding partners to obtain the next
generation of this line, which may be transgenic for both a and p chains of the Th2
TCR. Normal rates of germline transmission of the Th2 TCR a chain were observed
in the progeny of this mating. However, transmission of the Th2 TCR p chain
transgene was very poor. Of 54 progeny screened by PCR for the Th2 TCR a and p chain transgenes, 27 animals carried the a chain compared to just 3 carrying the p
chain. 2 mice carrying both transgenes have now been set up as the next generation
breeding pair for this transgenic line, but the small number of Th2 TCR (3 chain
positive animals identified means that experiments to characterise these animals are
not reported here as they are not within the timecourse of this thesis.
174
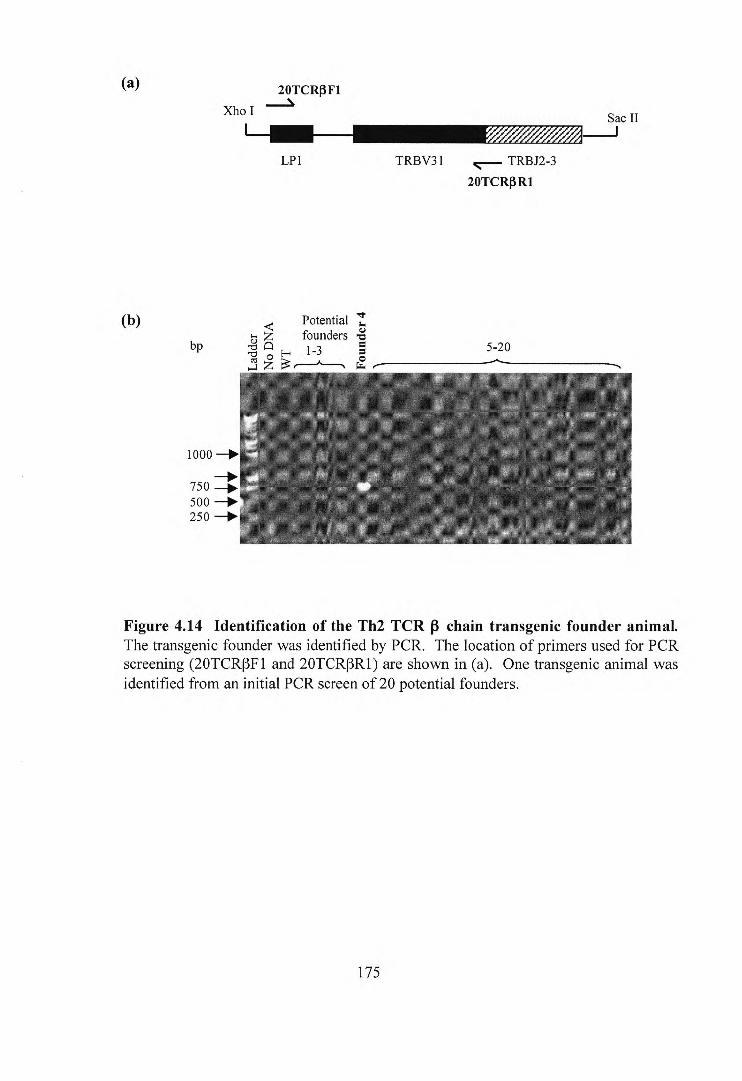
(a) 20TCRI3F1 Xho I Sac II
LP1 TRBV31 TRBJ2-3 20TCRPR1
(b) < 6 Potential .1. O.) I- 4 founders -0
bp '-i) -t , E-, 1-3 = 0 ,fi r—A---, PZ
5-20
1000 —111,'
750 —0. 500 —11. 250 —IP.
Figure 4.14 Identification of the Th2 TCR 13 chain transgenic founder animal. The transgenic founder was identified by PCR. The location of primers used for PCR screening (20TCR13F1 and 20TCR(3R1) are shown in (a). One transgenic animal was identified from an initial PCR screen of 20 potential founders.
175

4.6 Analysis of a PLP (56-70) specific Thl TCR a chain transgenic T cell line.
To determine whether rapid clonal expansion of a TCR p chain would also occur in T
cell lines derived from Thl TCR a chain animals, T cell lines were established from
PLP 56-70 primed draining lymph nodes of these mice. As described for the Th2 TCR
a chain transgenic lines, T cells were grown in vitro in growth medium containing
10U/m1 IL-2 by restimulation with peptide and NOD.E splenocytes every 9-11 days.
Proliferation in response to antigen, and cytokine phenotype, were determined at
successive restimulations. Figure 4.15 shows that over 6 restimulations the Thl TCR
a chain transgenic line was highly antigen specific and displayed a predominantly Thl
type phenotype, producing high levels of IFN-y. Sequence analysis of TCR (3 chain
usage at the 6th restimulation showed a small clonal expansion, comprising 26% of the
repertoire. However, sequence analysis of TCR a usage by this line failed to identify
the transgenic Thl TCR a chain (figure 4.15). A PCR for the rearranged Thl TCR a
chain in cDNA from the line at the 6th restimulation suggested that the transgenic a
chain was being expressed by this line. However, sequence data suggests that T cells
bearing this transgenic a chain are not present at any significant level and are not
likely to be pairing with the expanding TCR p chain. This finding is consistent with
the low level of expression of the Thl TCR a chain transgene found in unprimed
splenocytes of this TCR transgenic line (table 3.6). Further T cell lines derived from
Thl TCR a chain transgenic animals are currently being characterised.
176

proliferation
IFN-y
IL-4
IL-5
(a)
40000—
o
1:0
10000. 1000
10 20 34 40 10 0,35154 conoentr•tion 100/m1)
10 20 30 4 0 peptide concentration inonnI)
4000
10 20 30 10 SO peptide COnCentratiOn 04/010
15000 1500
12500 1250
tl "1;00 I 7° 50
3 5050 1 500
2500 260
pryal100 001.0ntrallon 04003) 0 10 30 30 40 60
peptide concentration (WM 3•0010a concanIntlan 101111.0 To 2.0 30 411 60 10 20 30 40 05
2300
100e
30001
io A io io 50 concontra000 (1410110 0.110000ncentratIon 040001)
1
,.,.:000
20 30
2' restimulation 4th restimulation 6th restimulation
(b) (c) TA clone TRBVCDR313 amino acid sequence TRBJ CDR3 length
6°Thl 6°Thl
1311 1311
13-1 CASSDAPGQGAGNTLYF 1-3 15 TA clone TRAY CDR3a amino acid sequence TRAJ CDR3length 6°Thl B2( 6°Thl B24
6thThl Al 3-3 CAVTNTNAYKVIF 30 11 6"Thl 1321 6thThl Al( 6°Thl B1( CASSDLGTAGNTLYF 13 6thThl A21 6°Thl 131. 6thTh1A22 6°Thl B2 CASSEPGTGRSGNTLYF 15 6thThlA2 4D-3 CAAPSGSFNKLTF 4 6°Thl 134 2 CASSQEGWGAWEQYF 2-7 13 6thThIA6 6°Thl Blf CASSQDGGGAYEQYF 13 6thThIA17 6°Thl B3 CASSQVDRPYEQYF 12 6thThlAl9 CAAMNYNQGKLIF 23 6°Thl B8 CASSQEGTGGYAEQFF 2-I 14 6thTh1 A20 6°Thl B21 19 CASSILGGHTGQLYF 2-2 13 6thThlA3 CAAGARNNNNRIFF 31 12 6°Thl B21 CASSLGNTGQLYF 11 6thThIA4 CAAEKHNNRIFF 10 6"ThI B5 4 CASSLRDWGDEQYF 2-7 12 6thThlA5 4D-4 CAAEGENNNAPRF 43 11 6°Thl B7 1 CTCSGRDWGDEQYF
6°Thl B9 31 CAWSLGGGAETLYF 2-3 12 6°Thl 1311 16 CASSFGTDYEQYF 2-7 11 6°Thl 1323 17 CASS RAGDSNERLFF 1-4 13
Figure 4.15 Analysis of a Thl TCR a transgenic derived T cell line. A T cell line was established from PLP 56-70 primed draining lymph nodes of Thl TCR a transgenic animals. The T cell line was restimulated every 9-11 days with peptide (PLP 56-70) and NOD.E splenocytes. At each restimulation a proliferation assay was performed with multiple doses of antigen and supernatants harvested for cytokine analysis by ELISA (a). RNA was also extracted at each restimulation and TCR alpha chain (b) and beta chain (c) usage at the 6th restimulation determined by PCR.
177

4.7. Altered cytokine phenotype of an in vivo memory response to antigen in Th2 TCR
a chain transgenic animals.
The Th2 TCR a chain transgenic T cell lines described in this chapter were grown in
vitro in growth medium containing 10 U/ml IL-2. This growth medium should be
non-polarising (i.e. should not promote a Thl or Th2 phenotype bias). Not all Th2
TCR a chain transgenic cell lines grown in vitro during the course of this study
developed a Th2 type phenotype, or indeed demonstrated a rapid TCR clonal
expansion. However, the expansions and Th2 type phenotype of the 2 lines described
here, which were derived from different transgenic lines, are quite striking and quite
surprising given the lack of any exogenous polarising cytokines in the growth
medium. The implication is that expression of the Th2 TCR a chain can, in the
context of specificity to antigen (PLP 56-70) predispose to selection of a TCR 1 chain
pair, which can then bias the T cell response towards a Th2 phenotype. A peptide
priming experiment was therefore designed to test whether the same bias, observed so
far in an in vitro system, could also be observed in vivo. Figure 4.16 outlines the
experimental protocol. Mice were primed with 50 [ig of peptide (PLP 56-70), which
was administered in the footpad as an emulsion with CFA. Mice were then re-primed
in the flank with the same dose on day 28. Splenocytes were harvested from groups of
animals (4 transgenics and 4 littermates) at each time point shown in figure 4.16. At
each time point, proliferation in response to antigen and cytokine phenotype were
determined. The proliferative response of splenocytes to peptide (PLP 56-70) at each
time point was similar between transgenic and littermate groups and demonstrated a
good memory response to antigen (figure 4.16). At day 10 there was no major
difference in IFN-y production between transgenics and littermates. However at days
28 and 32 animals in the transgenic group produced very little, or no IFN-y in response
to antigen. At day 28 the difference in IFN-y production between the transgenic and
littermate groups was statistically significant. This was not the case at day 32, but
animal numbers in groups were small and the difference is still apparent. Neither
group produced IFN-y in any significant amount at day 38. No splenocytes produced
IL-4 or IL-5 at any time point of this experiment. From this data it appears that the in
178

vivo memory response to antigen in Th2 TCR a chain transgenic animals is shifted to
a less Thl type profile than for littermate animals, but that this shift does not extend to
appearance of a Th2 type profile.
CDR3 spectratype analysis of TCR l chain usage in splenocyte samples from days 28
and 32 of this experiment was used to try to determine whether any clonal expansions
had occurred. Figure 4.17 shows that for a few TRBV genes there was some evidence
of possible clonal expansions in Th2 TCR a chain transgenic compared to littermate
samples. These clonal expansions are suggested by the presence of a dominant peak
in the spectra for these TRBV genes, where the dominant peak comprises greater than
35% of the total area. However, sequence analysis of TCR 13 chains in these
splenocytes samples failed to find any evidence of these expansions (figure 4.17).
Although the spectra for some TRBV genes show the emergence of a dominant peak,
this does not mean that this expansion within a particular TRBV gene family equates
to an expansion in the context of all TRBV genes being used in that splenocytes
sample. To detect these expansions it may be necessary to just sequence TCR 1
chains using the TRBV gene in question. A further complication is the problem of
using a whole splenocyte cDNA sample to detect a peptide specific clonal expansion.
The memory T cells in the spleens of these animals will have many different
specificities, and although the proliferation and cytokine data can be attributed to PLP
56-70 specific T cells, the splenocyte sequence and CDR3 spectratype data cannot.
179

(a) 50 ug of PLP 56-70 given as a flank immunisation with CFA
50 ug of PLP 56-70 given as a footpad immunisation with CFA
40000
:_-... 30000 E 1M a 20000 t- z l'-`- 10000
*
Day 10 Day 28 Day 32 Day 38
(b)
day 6
I10
1 r I 28 32 38
+ + + + Splenocyte Splenocyte Splenocyte Splenocyte
assay assay assay assay
-I.
I i I 1 1 1 1 Day 10 Day 28 Day 32 Day 38
3 H t hym
idin
e in
corp
ora
tion
(Acp
m)
10000
7500
5000
2500
0
(c)
Figure 4.16 An in vivo memory response to peptide demonstrates a difference in cytokine profile between Th2 TCR a chain transgenic and littermate animals. (a) Mice were primed with a peptide (PLP 56-70) / CFA emulsion on day 0 and day 28. Splenocytes were harvested at days 10, 28, 32 and 38 and proliferation assays performed with multiple doses of antigen. After 48 hours of culture, supernatants were harvested and wells pulsed with [3H] thymidine to determine proliferation. (b) Proliferation of splenocytes to 50 µg/m1 of peptide from Th2 TCR a chain transgenic (grey bars) and littermate (black bars) animals at each time point are shown. Data shown are mean values (minus background) for the 4 animals in each group + SE (c) Levels of IFN-y in supernatants from cells cultured with 50 µg/m1 of peptide were quantitated by ELISA. Data shown are mean values for the 4 animals in each group ± SE. The statistical significance of differences between transgenic (grey bars) and littermate (black bars) groups were tested using a Mann-Whitney U test. *P <0.05.
180

TRBV 3 TRBV 17
0 180
150
Th2 TCR a chain transgenic
\ • P-• A, A, ik-fl •V kA,r‘
(a)
Littermate
(b)
TA clone TRBV CDR3I3 amino acid sequence TRBJ CDR3 length
34-196B2 13-2 CASGEQGGTGQLYF 2-2 12 34-196 B4 34-196 B5 CASGDTDWGDPNTGQLYF 16
34-196B13 CASGDATGVYEQYF 2-7 12 34-196B6 2 CASSQGLDYEQYF 11 34-196 B8 CASSQELGPSAETLYF 2-3 14 34-196B10 CASSQERRADTQYF 2-5 12 34-196B15 CASSPQISNERLFF 1-4 34-196B21 CASSQVRGRRGNTLYF 2-4 14 34-196B3 13-1 CASRDSSNERLFF 1-4 11 34-196B14 CASSDDRTGQLYF 2-2 34-196B17 CASSPGETLYF 2-3 9 34-196B19 CASSGNWEQDTQYF 2-5 12 34-196B11 5 CASSRDWGYAEQFF 2-1 34-196B18 CASSRRDWGYEQYF 2-7 34-196 B7 17 CASSPGTGGDTQYF 2-5 34-196B12 20 CGARDRKNTGQLYF 2-2
Figure 4.17 TCR analysis of splenocytes from Th2 TCR a transgenic and littermate animals at day 32 after priming. (a) Spectratype analysis using splenocyte cDNA obtained from animals at day 32 of the in vivo priming protocol (figure 4.16) showed some evidence of possible clonal expansions for some TRBV genes in Th2 TCR a chain transgenic compared to littermate samples. However, these expansions were not apparent when TCR (3 chains were sequenced from these samples (b).
181

Discussion
A previous study demonstrated that CD4+ T cells selected under Th2 polarising
conditions favoured an elongated CDR3a region and that this longer CDR loop may
result in less optimal (lower affinity) interactions with the pMHC complex (Boyton et
al., 2002). This finding led to the hypothesis that, under Th 1 or Th2 polarising
conditions, different TCR structural motifs are preferred, and that if TCRs bearing
these motifs were to be expressed transgenically, an inherent Thl or Th2 bias in T cell
phenotype would be observed. The previous chapter of this thesis described the
identification of TCR a chains for transgenic expression, and the generation of
animals expressing these chains on peripheral T cells. Data presented in this chapter
has described analysis of the TCR p chain repertoire of these animals and experiments
to try to determine an antigen specific TCR (3 chain partner, as well as any phenotype
bias that may result from expression of structurally distinct Thl and Th2 derived TCR
a chains.
As antigen specific TCR (3 chain partners for the dominant a chains had not been
identified, TCR transgenic animals, described in chapter 3, were expressing the Thl or
Th2 TCR a chain only. To exit the thymus as a mature T cell, positive selection
events dictate that the cell must be expressing an a13 heterodimer at the cell surface
(Mombaerts et al., 1992b). Cells expressing the transgenic TCR a chain in the
periphery must, therefore, be pairing with endogenous TCR p chains. To determine
whether expression of the Th2 TCR a chain during T cell development had any impact
on the peripheral repertoire of TCR (3 chains, in the absence of peptide specificity,
sequence analysis and spectratype analysis were employed to look at TCR usage in
splenocytes. TCR a chain transgenics made by other groups have previously been
reported to show normal V(3 usage in the periphery (Huang and Kanagawa, 2004)
implying that these transgenic a chains are capable of pairing with a broad spectrum
of endogenous 13 chains. In addition, other studies have implied that it is the CDR3a
region rather than the CDR3(3 region that dictates TCR repertoire diversity in the
182

recognition of foreign antigens and the formation of the preimmune TCR repertoire
(Yokosuka et al., 2002). In the study by Yokosuka et al, an in vitro transfection
system was used to analyse hundreds of potential ap heterodimers for their ability to
recognise foreign antigen. It was found that for a given antigen, very few a chains
were permissible, but that any one particular a chain could use a wide variety of TCR
13 chains to achieve peptide specificity. Consistent with these findings, no particular
bias in VP repertoire, either in terms of the V[3 genes used, or the CDR3f3 region
lengths observed, were seen in either Th2 TCR a chain transgenic line by sequence
analysis or by spectratyping. The VP gene families identified by sequencing were
similar between littermate animals and transgenics and the CDR313 lengths were also
comparable. No obvious bias in the amino acids used in the CDR3P regions were seen
and spectra obtained for each VP family showed a normal Gaussian distribution,
suggesting that no significant expansions of any one sequence were present. This
analysis suggests that the transgenic Th2 TCR a chain is able to form stable a(3
heterodimers with a wide variety of different endogenous P chains that bind self-
pMHC with sufficient affinity to be positively selected, although this data does not
provide evidence that the diverse receptors are able to respond normally to a diverse
array of foreign antigens.
The concept of repertoire diversity, however, is not a straightforward one and is highly
dependent upon the peptide antigen in question. For some peptide antigens, the TCR
a chain has been seen to be highly restrictive in determining which TCR 13 chains are
permissible (Turner et al., 1996). Therefore, although in the peripheral T cell
repertoire of the Th2 TCR a chain transgenic mice a diverse array of TCR
sequences are observed, this is in the context of many self pMHC having been
presented in the thymus and the situation may be different in the context of specificity
to single antigen. The antigen of interest in this study is the proteolipoprotein peptide
PLP 56-70. The T cells from which the transgenic TCR a chains derive were highly
specific for this peptide. In order to generate a peptide specific immune response,
mice were primed with an emulsion of PLP 56-70 and CFA. However, sequence and
183

spectratype analysis of T cells in draining lymph nodes of these animals revealed a
similar picture to that seen in unprimed mice, where many different TCR (3 chains
from different gene families were identified and symmetrical spectratype profiles
revealed no obvious clonal expansions within each V(3 gene family. V(3 gene usage
and spectratype profiles were comparable between transgenic and littermate animals
and it is also worth noting that proliferative responses of DLN cells to antigen in vitro
were also similar between transgenics and non transgenics, indicating that T cells
bearing the transgenic TCR a chain are able to form PLP peptide specific
heterodimers with endogenous TCR (3 chains and mount an effective response to this
antigen.
Although no obvious TCR 13 chain bias was observed in DLN T cells of primed mice,
it should be born in mind that in order to provoke an immune response to antigen,
mice are primed with CFA. The ability of CFA to provoke an immune response is
mediated by the mycobacterial components it contains and as such, although many T
cells in the DLN will be specific for the peptide, others are also likely to be specific
for these bacterial antigens. To look at TCR (3 chain usage in a population of truly
peptide specific T cells, T cell lines derived from the DLN cells of PLP 56-70 primed
mice were grown in vitro. This approach also allowed selection and change in the V13
repertoire to be examined over successive restimulations with antigen. The data from
two Th2 TCR a chain transgenic T cell lines were presented in this chapter. One line
was derived from mouse line 20 and the other from mouse line 34. Both T cell lines
demonstrated a clonal expansion of a dominant TCR (3 chain through successive
peptide restimulations. The expansion was particularly rapid in the T cells derived
from mouse line 20 where, by the 6th restimulation, 100% of TCR (3 sequences
obtained were identical. Both transgenic T cell line expansions were in contrast to the
absent or very limited expansions observed in a littermate derived T cell line. The
marked rate of clonal expansion in the TCR a chain transgenic T cell lines could also
be observed from spectratype profiles of selected V13 families. Small quantities of
cDNA available from each line at each restimulation meant that a full spectratype
analysis across all V(3 gene families was not possible. However, using V(3 families
184

known from sequence analysis to be present in the repertoire at very early
restimulations, spectra reveal that even as early as the 2nd restimulation, the diversity
of the V13 repertoire in the littermate derived T cell line is far greater than that seen for
the TCR a chain transgenic line. This data suggests that, in the context of specificity
to the cognate antigen PLP 56-70, the diversity of the TCR p chain repertoire is
limited by the expression of the transgenic Th2 TCR a chain.
The dominant TCR (3 chain sequences selected in the two transgenic lines presented
here are not the same. They use different V[3 genes, have different CDR3(3 regions
and indeed have different CDR3 (3 region lengths. Therefore, although influencing
TCR (3 chain diversity, the transgenic TCR a chain appears not to mediate selection of
a common, or "public" TCR (3 sequence. A "public" TCR sequence is one that is
identified as common between different individuals and is probably the least common
type of TCR bias. One of the most well studied public TCRs is LC13, a human TCR
specific for an antigen of the Epstein-Barr virus (EBV) (Argaet et al., 1994). In many
individuals, CD8+ T cells recognising this antigen use the same TRAV26-2/TRBV 7-6
TCR with identical CDR3 regions. The sequence of this TCR is not the only one able
to recognise antigen, as individuals expressing the MHC class I molecule HLA-
B*4402 are found to use other receptors different from LC13 (Burrows et al., 1995),
but structural studies of this TCR have revealed exquisite complimentarity between
the antigen and peptide binding pockets formed by CDR loops of the TCR (Kjer-
Nielsen et al., 2003). However, aside from complete sequence homology, other forms
of public TCR bias have also been documented. Some studies document preference of
particular V(3 genes, for example, the use of V(38 and V(37 genes in murine responses
to different antigens of the influenza virus (Belz et al., 2000). Others have reported
the selection of conserved amino acid sequences within CDR3 regions (Trautmann et
al., 2005). When reviewing the large numbers of TCR (3 sequences obtained during
the course of this thesis, it is of note that one amino acid motif in the CDR3 region is
particularly common in the context of antigen specific T cells. Sequences containing
the amino acid motif, SRDWG, in the CDR3(3 region were observed in both of the
original Thl and Th2 T cell lines from which the transgenic TCR a chains were
185

cloned. This motif was then also sequenced in peptide specific lines from littermate
animals and indeed is part of the CDR3I3 region most dominant in this line following 6
restimulations with peptide. The motif becomes even more common if seen as
SXDWG although this motif was also isolated from T cells of unprimed mice. The
SRDWG motif in the CDR3(3 region of a TCR may therefore be predicted to make
some important contribution towards pMHC recognition to account for this bias,
although it was not observed in either of the TCR p chains seen to rapidly clonally
expand in the Th2 TCR a chain transgenic lines. The contributions that the CDR3a
and CDR3p regions of a TCR make to peptide recognition are known to be dependent
upon the peptide being recognised and to involve different residues of the peptide. In
a study by Jorgensen et al. (Jorgensen et al., 1992) mice transgenic for either an a or a
p chain were immunised to peptide variants in order to determine the relative
contribution of each chain to the binding of specific residues. This study found that
the a and p chains contact independent parts of the peptide and so that preferred
motifs are observed in one chain in conjunction with more heterogeneity in the other is
not an unexpected finding.
One of the main aims of this study was to explore the possibility that the transgenic
expression of structurally distinct Thl and Th2 TCRs results in an inherent Thl or Th2
bias in T cell phenotype. Transgenic expression of peptide specific Thl and Th2 TCR
heterodimers has not yet been achieved to permit the ultimate test of this hypothesis,
but, as discussed in chapter 3, the dominance of the Thl and Th2 TCR a chains in the
original T cell lines, in the absence concomitant TCR (3 expansion, raises interesting
questions about the role of the TCR a chain alone. Cytokine production by the
antigen specific Th2 TCR a chain transgenic and littermate T cell lines was therefore
determined. As expected, particularly from T cells originally primed using CFA, the
dominant cytokine produced by the littermate derived T cell line was IFN-y. This was
in stark contrast to the cytokine profile of both Th2 TCR a chain transgenic lines,
where high levels of the Th2 cytokines, IL-4 and IL-5 were observed. Production of
these cytokines was seen to increase through progressive restimulations with cytokine
186

and indeed this phenotype was stable, with the line 20 derived T cells producing
significant amounts of IL-4 and IL-5, although also a small amount of IFN-y, after 15
restimulations. At 15 restimulations, the littermate derived T cell line was still
producing only IFN-y. That T cells expressing the transgenic Th2 TCR a chain had
spontaneously acquired a Th2 like phenotype was further supported by real time PCR
data of Tbet and GATA3 transcription factor expression. The enormous number of
variables involved in CD4+ T cell differentiation can make the relative contribution of
individual factors hard to assess. However, in this system, transgenic and littermate
mice were primed identically and T cells restimulated at identical time points using the
same APCs and the same dose of peptide. Additionally, data presented in chapter 3
demonstrated that levels of TCR heterodimers on the surface of peripheral T cells were
similar between transgenic and littermate animals. T cells were cultured in the
absence of any polarising cytokines, with only a low dose of IL-2 added to the culture
medium and so as far as possible, the only differences between the T cells present in
the different lines are the TCR a chains that they express.
This cytokine and real-time PCR data, while convincing in its demonstration of a Th2
phenotype, is derived from T cell lines grown over a long period of time in vitro. In
vitro studies will always be open to criticism surrounding the role of a particular
variable in normal physiological conditions where interactions and signals are more
complex. More convincing would be a demonstration of phenotype differences
between Th2 TCR a chain transgenic and littermate animals in vivo. To begin to
address this, data presented in this chapter described reduced IFN-y production by
immediately ex vivo T cells bearing the transgenic TCR a chain, in an experiment
designed to investigate the consequences of antigen restimulation in vivo. This data
suggests that, similar to results obtained from in vitro culture, successive restimulation
of transgenic T cells with antigen results in an altered cytokine phenotype, with
respect to littermate animals, with a shift away from a Thl phenotype and IFN-y
production. No Th2 type cytokines were detectable in the immediately ex vivo
responses of transgenic T cells seen to be making less IFN-y, but given the Th 1
promoting environment of CFA immunisation, this is perhaps not surprising. It may
187

be that in these animals, spontaneous induction of a Th2 type phenotype will not occur
in vivo but rather T cell phenotype bias will manifest as a shift away from a polarised
Thl phenotype as the outcome. If this is the case, it may be of interest to determine
whether this inherent bias will have any impact in the context of an IFN-y driven
disease model, such as EAE. In a previously study, Thl T cell responses to the
antigen PLP 56-70 were associated with susceptibility disease, while deviation away
from Thl cytokine responses were associated with protection (Takacs et al., 1995).
Data presented in this chapter appears to support a role for the TCR a chain in
determining CD4+ T cell phenotype and when put back into context with the original
study (Boyton et al., 2002), where molecular modelling predicted that elongated
CDR3a regions of Th2 TCR a chains would make lower affinity interactions with the
pMHC complex, fits with other data suggesting that lower affinity TCR/pMHC
interactions favour Th2 type responses (Malherbe et al., 2000) and that interventions
that impede optimal TCR/pMHC binding, such as the use of APLs, can result in a
switch in T cell phenotype from Thl to Th2 (Nicholson et al., 1995). Altered
signalling through the TCR, as explained by the serial triggering hypothesis previously
discussed, remains the most likely explanation for the link between TCR structure /
affinity and effector outcome. A model where the elongated CDR3a loops of the
transgenic Th2 TCR a chain forces a lower affinity interaction with the pMHC
regardless of the TCR p chain sequence, although where only a limited number of 13
chains can functionally pair to give good antigen specificity, would suggest that this
lower affinity interaction then results in suboptimal signalling, and an altered pattern
of phosphorylation events downstream of the TCR which ultimately result in
preferential induction of Th2 differentiation pathways. Altered patterns of
phosphorylation signalling molecules, for example ZAP70 and Lck, have been
observed upon TCR ligation with APLs (Boutin et al., 1997) and more prolonged
signalling, perhaps via a higher affinity interaction, has been shown to be required for
full mitogen-activated protein kinase (MAPK) activation and Thl differentiation
(Badou et al., 2001). More recent data looking at thymic selection, another T cell
signalling scenario where the affinity of the TCR/pMHC interaction is proposed to
188

play a major role in dictating the outcome of TCR signalling, has shown that the
signalling proteins Ras and MAPK are segregated into different subcellular regions
depending on the affinity of the TCR/ligand interaction (Daniels et al., 2006).
Efforts to identify whether any bias in the TCR [3 chain repertoire had occurred during
antigen restimulation in vivo were limited and the experimental system not sensitive
enough to detect this. Although spectratype analysis appeared to show some evidence
of clonal expansions this was not supported by sequencing data. However, sequencing
data was obtained from whole splenocytes and so is highly unlikely to reflect the
antigen specific TCR repertoire. Further experiments are currently underway to try to
select antigen specific T cells from the spleen following antigen restimulation. The
ideal way to achieve this would be through the use of pMHC tetramers, although
selecting T cells activated in response to peptide presentation on the basis of activation
markers such as CD69, may also be of use. The ultimate test for the role of TCR
structure in CD4+ T cell phenotype bias will be to look at the T cell responses of Thl
and Th2 TCR ar3 transgenic animals, which have been crossed onto a RAG"'"
background and thus do not express any endogenous TCR. The Th2 phenotype of the
antigen specific transgenic T cell lines described in this chapter and the concomitant
clonal expansion of TCR p chains observed through successive restimulation makes
these TCR 13 chains good candidates for transgenic expression. The construction of a
transgene for one of these chains and identification of a founder animal were described
in this chapter and a programme of breeding is currently ongoing to generate mice
carrying both the Th2 TCR a and I chains.
Chronologically, the two independent lines of Th2 TCR a chain mice were established
before the Thl TCR a chain transgenic line and as such, much of the data obtained to
date refers to the Th2 TCR a chain animals. However, expression data presented in
the previous chapter and towards the end of this chapter highlight potential pitfalls in
the analysis of the Thl TCR a chain line. Sequence analyses of TCR sequences from
peripheral T cells of Thl TCR animals were presented in the previous chapter and
showed that less than 50% of sequences obtained were derived from the transgene.
189

Percentages were also highly variable between animals and in one sample, transgenic
sequences made up less than 10% of the repertoire. To examine whether the
transgenic a chain may be more favoured and thus become more dominant in the
context of antigen specificity, mice were primed with antigen (PLP 56-70) and T cell
lines derived from the primed draining lymph nodes (DLNs) of these animals grown in
vitro. This was also with the view to identifying an antigen specific TCR (3 chain
partner for this Thl TCR a chain. However, following 6 restimulations with antigen,
TCR sequence analysis revealed a complete lack of transgenic TCR a chains in the
line. This finding has now been reproduced for 4 separate Thl TCR a chain
transgenic derived T cell lines and suggests that in the context of antigen specificity,
the transgenic TCR a chain is highly disfavoured in preference for endogenous chains.
The reason for this bias is unclear and needs further investigation. From previous
studies it has been predicted that Th 1 TCRs bind pMHC with high affinity (Malherbe
et al., 2000). Given that high affinity TCRs show a preference for expansion during
immune responses (Busch and Pamer, 1999), why would a TCR a chain from a high
affinity receptor be disfavoured in responses to its cognate antigen? One possibility is
that the answer may lie in the relationship between the polarising environment and
costimulation. The T cell line from which the TCR a chain was originally identified
was a short term T cell line, grown in vitro under highly Thl polarising conditions
(Boyton et al., 2002) i.e. high levels of the Thl polarising cytokine IL-12, and an anti-
IL-4 monoclonal antibody (mAb) were present in the culture medium. Cytokines
secreted during the course of an immune response, whether particularly polarising or
not, will influence expression of costimulatory molecules (Creery et al., 1996) and
whether through modulating the avidity of the T cell-APC interaction, or through
signalling, costimulatory molecules can have an enormous impact on the outcome of T
cell activation (Graf et al., 2007). It may be that under non-polarising conditions, such
as those used in this study where only a low concentration of IL-2 was added to the
culture medium, conditions of costimulation are such that high affinity interactions are
disfavoured e.g. by increasing the dwell time of the TCR/pMHC complex such that
rates of TCR signalling and T cell activation are suboptimal (Kalergis et al., 2001).
Under these conditions, T cells bearing TCRs with lower affinity endogenous TCR a
190

chains may proliferate faster and consequently become dominant. To circumvent the
problem of endogenous TCR a chain expansion, Thl TCR a chain animals could be
crossed with animals carrying a disrupted TCR a chain locus. These animals would
not express any endogenous TCR a chains and so questions of selection,
costimulatory requirements and phenotype bias could more easily be addressed.
Alternatively, it would be of interest to grow transgenic T cell lines in the same highly
polarising culture medium used to grow the short term Thl cell line in the first place,
to determine whether the transgenic TCR a chain is more favoured under these
conditions.
With data presented in this chapter serving to confirm the hypothesis that TCR
structure can influence T cell phenotype, also of interest is whether TCR transgenic
mice could be used to develop models of Th 1 and Th2 mediated disease. The lung is
one site at which populations of polarised Thl and Th2 T cells are found associated
with disease pathology and the following chapter describes the generation of a novel
model, using lung targeted expression of the antigen PLP 56-70, which could be
combined with the TCR transgenics discussed in this chapter to create new models of
Thl and Th2 mediated lung disease.
191
Chapter 5
Generation of transgenic lines for inducible, lung targeted, antigen
expression.
Results
5.1 Design and construction of transgenes for inducible, lung targeted, expression of
the antigen PLP56-70.
The antigen PLP 56-70 is the peptide epitope for which the Thl and Th2 TCRs,
described in chapter 3, are specific. One long-term aim is to use these TCR
transgenic lines to study inflammatory responses in the lung, by expressing antigen
(PLP56-70) in a tissue specific and inducible manner. The inducible system chosen
for this study is the Cre/Lox system (figure 1.5). Figure 5.1 outlines the overall
expression strategy.
In an uninduced animal, expression of the peptide is prevented by the presence of a
stop sequence in the transgene. The stop sequence is flanked by two loxP sites and
was first described by Lakso et al. (1992) as a way of temporally controlling oncogene
expression in mice. Transgenic mice were generated that carried a transgene
containing the simian virus 40 large tumor antigen gene driven by a murine lens
specific promoter but where the tumor antigen gene was separated from the promoter
by a floxed stop sequence. These mice showed no sign of tumor development, but
when crossed with another transgenic line carrying the Cre recombinase protein under
the control of the same lens specific promoter, Cre mediated deletion of the stop
sequence resulted in all double transgenic offspring developing lens tumors (Lakso et
al., 1992). The stop sequence comprises the 550 bp C-terminal sequence of the yeast
His3 gene, 823 bp of the SV40 polyadenylation signal region and a DNA
192

oligonucleotide that contains a false translational initiation signal. The sequence was
kindly supplied by Brian Sauer for use in this study.
Upon administration of the drug tamoxifen the bacteriophage enzyme Cre
recombinase excises the stop sequence by catalysing recombination between the two
flanking loxP sites. This allows expression of the peptide, driven by the lung specific
promoter CC10. The vector used for this strategy means that the peptide will be
expressed within the protein Hen Egg Lysozyme (HEL). Antigen processing within
APCs will cleave the HEL protein to yield the peptide PLP 56-70 which can then be
presented in the context of the MHC class II molecule I-Age. Correct expression of the
HEL/PLP fusion protein is aided by the presence of rabbit 13 globin intronic and PolyA
sequence at the 5' and 3' ends of the coding region respectively. This HEL expression
cassette has been used successfully by Vowles et al. (Vowles et al., 2000) to express a
peptide of Myelin Basic Protein (MBP 84-105). In that study they showed that the
HEL/MBP fusion protein could be expressed as a secreted or membrane bound
protein, depending on whether the membrane domain of the influenza virus A
hemagglutinin protein (HA) was present at the C terminus of the coding region and
that, particularly in the case of the membrane bound version of the protein, transgenic
expression resulted in resistance of these mice to EAE induction using the MBP
peptide. It is not known whether membrane bound or secreted forms of the HEL/PLP
protein will result in the PLP peptide being processed and presented most efficiently
and so both membrane bound and secreted forms of the expression cassette were
kindly supplied by Helen Bodmer for use in this study.
Several different promoters have been used to target transgene expression to the lung.
The three most common are CC10, K18 and SP-C. The promoter of pulmonary
surfactant protein C (SP-C) drives lung specific expression in mature alveolar type II
cells (Glasser et al., 2000) with little or no expression observed in more proximal
bronchiolar structures. Conversely, CC10 and K18 promoters direct transgene
expression to the trachea and all levels of the bronchial tree with no expression
observed in alveoli (Stripp et al., 1992 and Chow et al., 1997). As many chronic lung
193

diseases affect larger airway structures, the CC10 promoter was selected for this study.
It is well characterised and has been more widely used than the K18 promoter, for
example in targeting expression of the Th2 type cytokines IL-4 and IL-13 to the mouse
lung in order to study the role of these cytokines in Th2 type lung inflammation
(Zheng et al., 2000 and Rankin et al., 1996). The DNA sequence of the CC10
promoter used for this study is derived from rat. This DNA sequence was
characterised as the genetic element responsible for cell specific regulation of the
CC10 gene by linking stretches of DNA sequence upstream of the CC10 coding region
to a reporter gene and transfecting a lung cell line in vitro. Transgenic mice carrying a
transgene containing this regulatory sequence and the reporter gene were then
generated and lung specific expression using this promoter was confirmed (Stripp et
al., 1992). The DNA sequence used in this study was kindly supplied by Jeffrey
Whitsett.
194

Hen egg lysozyme (HEL)
(3 globin 'HI globtn Intron PolyA
Transmembrane anchor
(a)
CC10 lung promoter STOP
PLP (56-701
IQ4erCreMer Tamoxifen
J V
PLP (56-70) expressed within HEL
CC 10 lung promoter
Figure 5.1 The strategy for inducible, lung specific, expression of antigen PLP (56-70). Lung specific expression is achieved using the clara cell specific promoter, CC10. Clara cells are found only in the bronchi and bronchioles of the lung. The peptide PLP (56-70) is expressed within the protein Hen egg lysozyme (HEL), and correct mRNA processing is achieved using intronic and poly A sequence from rabbit p globin. 2 constructs were created. One construct contains a transmembrane anchor sequence and results in the expression of membrane bound HEL/PLP (56-70). In the construct not containing this anchor the HEL/PLP protein is secreted. (a) In an uninduced animal, expression of HEL and PLP (56-70) is prevented by the presence of a translational stop sequence flanked by 2 loxP sites. (b) On administration of tamoxifen, Cre recombinase previously sequestered in the cytoplasm (figure 1.5) moves to the nucleus and excises the stop sequence by recombination between the two loxP sites. Expression of HEL and PLP (56-70) is therefore induced only on administration of tamoxifen and only in clara cells of the lung.
195
(b) loxP
The expression strategy outlined in figure 5.1 depends upon both the Cre recombinase
and the CC10 promoter being active within the same cell. The strain of MerCreMer
transgenic mouse available in our laboratory ((3m70) (created by L. Bugeon and M.
Dallman) expresses the MerCreMer protein under the control of the chicken 13 actin
promoter. The MerCreMer protein expressed in these animals is known to be
functional (unpublished data), but expression in the lung is not characterised. In an
uninduced mouse the MerCreMer protein should be present diffusely in the cell
cytoplasm. On administration of tamoxifen the Cre protein translocates to the cell
nucleus where it should be detectable by immunohistochemistry. Inflated lung
sections from uninduced and tamoxifen induced (3m70 mice were stained with an
antibody specific for the Cre protein (figure 5.2). No specific staining was observed in
the uninduced mouse, but widespread nuclear staining can be seen upon induction
with tamoxifen. Not all cells are positive for nuclear localised Cre protein, but some
staining was observed in all structures of the lung. An antibody specific for the CC10
protein was also used (figure 5.2). As expected, staining was only observed in the
bronchiolar structures of the lung. Staining of the CC10 protein was the same in
uninduced and induced animals indicating that the activity of the CC10 promoter is
unaffected by the tamoxifen induction protocol.
Although, from the biotin based immunohistochemistry shown in figure 5.2, the
nuclear Cre protein appears to be present in CC10 positive bronchiolar structures of
the lung, it was important to establish that both proteins were present within exactly
the same cell. Inflated lung sections from induced animals were therefore stained with
Cre and CC10 specific antibodies at the same time, and co-localisation of these
proteins visualised using fluorescently labelled secondary antibodies (figure 5.3). The
data shows that some, but not all, CC10 positive cells also contained nuclear localised
Cre protein and that activity of the CC10 promoter was unaffected by the presence of
the Cre protein within the nucleus. Excision of the stop sequence in the transgene and
expression of PLP 56-70 in the lung should therefore be possible using the (3m70
transgenic line.
196

(a) CC10 (b) Cre
Uninduced
bronchi
alveoli Tamoxifen
induced
blood vessel
Secondary antibody only
Figure 5.2 The localisation of Cre and CC10 proteins in uninduced and tamoxifen induced lung sections from iii m70 MerCreMer mice. Mice were induced with tamoxifen i.p. for 5 days prior to harvesting of the lung. The binding of primary antibodies specific for Cre and CC10 proteins was visualised using biotin labelled secondary antibodies. (a) CC10 staining is confined to the bronchi and bronchiole structures of the lung and expression of the CC10 protein is not affected by the tamoxifen induction protocol. (b) No nuclear Cre staining can be seen in the uninduced lung, but on induction with tamoxifen, nuclear localised Cre is observed in both bronchiolar and alveolar structures of the lung. All photos are at x20 original magnification and the main structures of the lung are marked.
197

(a) x40 magnification x20 magnification
(b)
(c)
bronchi
Figure 5.3 Co-localisation of Cre and CC10 in the lung of a tamoxifen induced 13m70 MerCreMer mouse. (a) CC10 was visualised using a FITC labelled secondary antibody and is confined to the bronchi and bronchioles of the lung. (b) Cre was visualised using a TRITC labelled antibody and nuclear staining is observed in both alveolar and bronchiolar structures. (c) Co-localisation of CC10 and Cre stains shows that some but not all cells expressing CC10 also contain nuclear localised Cre protein. Photos are at x20 or x40 original magnification and main lung structures are marked.
198

The cloning strategies used to create the membrane bound and secreted versions of the
inducible, lung targeted, PLP 56-70 constructs are shown in figure 5.4. A synthetic
oligonucleotide sequence of PLP 56-70 was inserted into both the membrane and
bound and secreted HEL expression cassettes by directional cloning, replacing the
MBP peptide used previously in the constructs. PCR was used to confirm correct
insertion of the PLP 56-70 oligonucleotide into both constructs and presence of the
HA transmembrane domain in the membrane bound version of the transgene (figure
5.5). To join the HEL expression cassettes to the floxed stop component it was
necessary to introduce SfiI sites, by PCR, to the 5' and 3' ends of the rabbit 13 globin
sequences. The SfiI PCR fragments and restriction digests used to confirm successful
joining of HEL and stop sequence fragments are shown in figure 5.5.
The final step in the assembly of each transgene was the joining of the lung specific
CC1 0 promoter using NotI. The final sequence of each transgene was contained
within the cloning vector pBluescript II. A PCR using primers specific for the CCI 0
promoter and rabbit 13 globin sequence, and a XhoI restriction digest, demonstrate that
the transgenes are complete (figure 5.6). Both transgenes were also verified by
sequencing. Complete secreted and membrane bound, inducible, lung PLP constructs
are subsequently referred to as SIPLP and MIPLP respectively. Full nucleotide
sequences of membrane bound and secreted PLP transgenes are shown in appendices
23 and 25. Coding nucleotide and amino acid sequences are shown in appendices 24
and 26.
Bacterial sequence was removed from the pBluescript II vectors, by digestion with
BssHII, prior to pronuclear injection. The 6000 bp fragments of each transgene
purified for injection are shown in figure 5.6. Final plasmid maps of the MIPLP and
SIPLP constructs are shown in appendices 13 and 14 respectively.
199

PLP (56-70) 122
Nar I S Sac II
MBP peptide exchanged for PLP (56-70) oligonucleotide using Narl and SacII
(a)
loxP
II" STOP
Sf I N loxP ot I
PI" Intron HEL PLP HEL PolyA
BodXhoSfiR
Not I
(b)
Sfi I sites introduced at either end of PLP construct by PCR and the construct joined to foxed stop sequence using Sfi I
(c)
—I CC I 0 promoter
SfiIBamHIBodF
Not I
BssHII Not I PLP loxP
BssHII Not I
CCIO promoter
loxP
STOP 0101-1
(d)
Floxed stop-PLP fragment joined to CC10 promoter using Not I
Intron HEL MBP HEL PoIyA
Constructs linearised for injection using BssHII
Figure 5.4 A schematic diagram of the cloning strategy used to create the inducible, lung specific PLP (56-70) transgenes. (a) The peptide PLP (56-70) was introduced into the HEL expression cassette (Vowles et al., 2000) using Nan and SacII, replacing an MBP peptide used previously. (b) SfiI sites were introduced at either end of the HEL construct by PCR and SfiI then used to join this fragment to the floxed stop sequence (Lakso et al., 1992) (c). The lung specific promoter of CC10 (Stripp et al., 1992), was joined using NotI (d). Bacterial sequences were removed from the vector by digestion with BssHII prior to pronuclear injection.
200

z
ZD v)
a. a, 6
P.0
cip
bp Z O 8 Z VD
a. cc a.
HELA / PLPB HELA / TMCYTOB
1000 750-0-500
250
(a)
3000 2000
1000-0. 750 500
EcoRI r_.A....___
S fi I PCR ,.)a r—A—AT.
at4 al. ..-1
P-I P. 6 C) 6
CU ▪ a. .4• 6 v) bp -o
-o 6 o
— s-, o 0
)-- I) .q a. ia
CID CIO
Figure 5.5 Assembly of the inducible, lung specific, membrane bound and secreted PLP (56-70) transgenes. (a) PCRs using primers specific to HEL and PLP (56-70) demonstrate successful introduction of this peptide into the HEL expression cassette. The presence of the transmembrane anchor is also demonstrated using a primer specific to this region. (b) PCR was used to introduce SfiI sites at either end of the PLP constructs and products are 1755 bp and 1888 bp for the secreted and membrane forms respectively. These products were TA cloned and then joined to the floxed stop sequence using SfiI. EcoRI digests demonstrate correct joining of these two fragments and also the presence of the transmembrane anchor, as EcoRI sites flank the HEL coding sequence (see appendices 13 and 14). HEL fragments are 548 bp and 681 bp for secreted and membrane forms respectively.
(b)
201

CCI0/13globin PCR Xho I
I-I f A ---774 a t r__..k— bp t: -c
tu
j 'ci) cil
4000—* 3000 2500 2000-*
6000 --Po.
3000 2500-0.
(a)
(b) SIPLP MIPLP
-0 a) . k: .f) E 0 E 0
4:1
Figure 5.6 Complete inducible, lung specific, PLP constructs (membrane [MIPLP] and secreted [SIPLP]) (a) A PCR using primers specific to the CC10 promoter and rabbit 13 globin sequence demonstrates complete assembly of the construct. Products are 3239 bp and 3372 bp for the secreted and membrane constructs respectively. A XhoI digest also demonstrates that all components are present in the correct configuration. Fragments should be (3505 bp, 3006 bp, and 2175 bp) or (3505 bp, 3006 bp and 2378 bp) for SIPLP and MIPLP respectively (see appendices 13 and 14). (b) Prior to pronuclear injection bacterial sequence was removed from each vector. This was achieved by digestion with BssHII and purification of the upper 6000 bp band.
202
bp

5.2 Identification of an MIPLP transgenic founder animal.
The MIPLP construct was injected into FVB/N oocytes at the Nuffield department of
Medicine in Oxford. 24 potential founder animals were screened for the presence of
the MIPLP transgene. An initial PCR screen, using genomic DNA extracted from a
tail biopsy, identified 1 founder animal (figure 5.7). This animal is subsequently
referred to as MIPLP line 11, based on a number assigned to the animal at the point of
tail biopsy. Southern blot also confirmed the transgenic status of this animal (figure
5.7). A single intense band seen on the Southern blot for this transgenic line suggests
that multiple copies of the transgene have integrated at a single locus. The sequence
and product sizes of all PCR and Southern primers used for screening of the MIPLP
transgenic founder animal are shown in appendix 7.
Prior to generation of the MIPLP transgenic line, Pm70 MerCreMer transgenic
animals had been backcrossed for at least 3 generations onto a NOD.E genetic
background. The MHC class II molecule I-Ag7 expressed by the NOD.E strain is
required for presentation of the peptide PLP 56-70. These NOD.E backcrossed I3m70
transgenic animals were used for subsequent breeding of MIPLP line 11.
203

3000 2000
1000 750 500 250
CC101500F
CC l0 promoter
CC10210OR
3rdexonF
loxP loxP PLP STOP
(a)
2 Potential founders 1-10 "c 'CS bp 3233
(b)
(c)
kb Line
11 fo
unde
r
EcoRV
600bp DIG labelled probe
BetaglobinB
12-18
4 --11o.
3 —*
Figure 5.7 Identification of an MIPLP transgenic founder animal. The transgenic founder was identified by PCR and by Southern blot. The location of primers used for PCR screening (3rdexonF and BetaglobinB) and for generation of the Southern probe (CC101500F and CC102100R) are shown in (a). One transgenic animal was identified from an initial PCR screen of 24 potential founders (b). The transgenic status of this animal (number 11) was then confirmed by Southern blot (c). The restriction enzyme used to digest genomic DNA for Southern blotting was EcoRV. This enzyme only cuts the integrated construct once, on the 3' side of the CC10 promoter region being used as a probe (c), giving information about construct integration sites and copy number.
204

5.3 Determination of stop sequence excision and MIPLP transgene expression.
Lung expression of the antigen PLP 56-70 requires that the stop sequence present in
the transgene be removed. Cre recombinase is activated to excise the stop sequence
following administration of the drug tamoxifen. Animals carrying both the MIPLP
and Cre transgenes were identified. Following administration of tamoxifen, lung
tissue was harvested, and a PCR strategy used to determine whether stop sequence
excision had occurred (figure 5.8). A change in size of PCR product in tamoxifen
induced animals carrying both the MIPLP and Cre transgenes demonstrated that
removal of the stop sequence had occurred in the lung tissue of these animals and that
the CC10 promoter and HEL expression cassette were subsequently juxtaposed. No
stop sequence excision was observed in animals that had not received tamoxifen or in
induced animals carrying the MIPLP transgene alone. PCR was also used to
demonstrate expression of the HEL/PLP protein at the level of cDNA in lung tissue
following tamoxifen induction (figure 5.8). To detect expression of the HEL/PLP
transgene at the level of protein, immunohistochemistry of inflated lung sections from
induced and uninduced animals using an anti-HEL antibody was attempted. However,
no positive staining was observed (data not shown).
Lung tissue was harvested from transgenic animals at different time points following
tamoxifen induction. PCR demonstrates that removal of the stop sequence from the
transgene does start to occur immediately following administration of tamoxifen, but
takes many days to be removed from all copies in the lung (figure 5.9). 2 days after
tamoxifen induction, many copies of the transgene still contain the stop sequence. No
HEL/PLP protein was detectable in lung mRNA from these animals. Removal of the
stop sequence from the transgene is irreversible. However, following clearance of
tamoxifen from the circulation, new cells formed as a consequence of normal lung cell
turnover will carry the full length transgene and will therefore not express the
HEL/PLP protein. Estimates of the rate of turnover of lung epithelial cells are quite
varied and probably depend upon many factors such as the age, strain and pathogen
status of the animal. The most consistent studies have used pulse/chase experiments
205

with tritiated thymidine ([3H]) to calculate airway cell turnover and the consensus is
that the turnover time of tracheal-bronchial epithelium of adult rodents is more than
100 days (4 months) (Kauffman, 1980). The PCR data, shown in figure 5.9, show that
most copies of the stop sequence in the lung are still deleted more than 100 days after
tamoxifen induction. This suggests a very slow rate of cell turnover.
206

4— 1647bp 2000 --It. 1500 P
500 —111,- 250 --110- I 264bp
110-264hp
PLPB
U
a., a., 5 2 a. CI.)
1647bp 10-
(a)
stopfloxedF loxP loxP
stooiloxedR
PLP
lax])
HELA
PLP
CC10 promoter
(b)
(c)
bp z C C z
a a U;?..
a 2 -+-+
a a a. (d)
,_.1 i_a a a P. 5 2 2
9 U U 0 _ + + + ':' z MIP
LP g
DN
A
U
a. a a a a a a a 2 5 a a >< a) X o x
2 d 6' U + + + +
bp
2000 —IP. 1000 500 -÷
500 250
Figure 5.8 Removal of the foxed stop sequence and expression of MIPLP in lung tissue following induction with tamoxifen. (a) PCR strategies were used to demonstrate removal of the fluxed stop sequence (using primers stopfloxedF and stopfloxedR) and expression of PLP (using primers HELA and PLPB) in lung tissue from transgenic animals that had been induced with tamoxifen for 5 days. (b) Following tamoxifen induction, lung genomic DNA was used as a template to demonstrate removal of the floxed stop sequence in animals carrying both the Cre and MIPLP transgenes. No change in size of PCR product was observed in animals carrying the MIPLP transgene alone. Lung cDNA was then used to demonstrate low levels of expression of HEL/PLP. (c) HPRT was used as positive control for successful cDNA synthesis and cDNA reactions with (+) and without (-) the reverse transcriptase enzyme were used to control for any contaminating genomic DNA in lung RNA preparations. PLP expression was observed only in those animals shown to have deleted the stop sequence (d).
207

(a)
a) bp 7:1
Cre x
MIP
LP
(c)
bp z 9 O z Cr
e x M
un i
nduc
ed
a. a.
a. V
5U
2000 —0.- 1600
500 —OP-220
Figure 5.9 Complete removal of the foxed stop sequence occurs over many days and persists for many weeks following induction with tamoxifen. (a) Genomic DNA from lung tissue harvested 2 days after completion of the tamoxifen induction protocol contains copies of the transgene in which the stop sequence has been removed, but many copies of the transgene still remain unfloxed. (b) 2 weeks after completion of the tamoxifen induction protocol, almost all copies of the stop sequence in the lung have been deleted. (c) Copies of the transgene that do not contain the stop sequence remain present in the lung at least 100 days after tamoxifen induction.
208

5.4 Re-design of the SIPLP transgene.
Initial data from the MIPLP line 11 founder animal demonstrates that the lung
expression constructs designed are functional, i.e. correct deletion of the stop sequence
is observed and that HEL/PLP 56-70 mRNA transcripts can be detected in the lung.
However, levels of expression seen are very low (figure 5.8). One possible
explanation for the low levels of expression observed is that the sequence of the loxP
site, which remains in the transgene following stop sequence excision, contains an
ATG triplet and may act as a false translational start site (figure 5.10). The simplest
solution is to invert the stop cassette such that the loxP sites are still functional but are
in the reverse orientation.
No SIPLP transgenic founders were generated from an initial round of pronuclear
injections. As re-injection of the construct was required, a new SIPLP construct was
generated containing an inverted stop cassette. The cloning strategy used to create the
new SIPLP transgene is shown in figure 5.11. The complete nucleotide sequence and
final plasmid map of the new SIPLP construct are shown in appendices 27 and 15
respectively.
Bacterial sequence was removed from the construct prior to pronuclear injection as
described previously.
209

CC10 promoter WE
x ► loxP
(b) loxP PLP
CC 10 promoter
(a) fi x► loxP
Cre mediated recombination
loxP I PLP CC 10 promoter
ATAACTTCGTATAATGTATGCTATACGAAGT
loxP PLP
Cre mediated recombination
loxP r:,P
ATAACTTCGTATAGCATACATTATACGAAG
Figure 5.10 A schematic diagram to demonstrate the potential importance of loxP site orientation. (a) Recombination between loxP sites in a forward orientation results in the presence of an ATG triplet upstream of the coding region, which has the potential to act as a false translational start site. Use of this false start site may affect the efficiency of translation from the intended start site and protein expression levels may be low. Potential start sites are marked (*). (b) If loxP sites are in the reverse orientation, no ATG triplet will remain following recombination and translation of the protein of interest should be unaffected by the remaining loxP sequence.
210

HindIII KpnI
BamHI
XhoI
Mr/A. Intron HEL PLP HEL PolyA
XbaI XbaI
HindIII BssHII BssHII
I I I
WAN CC I 0 promoter
CC 10 promoter joined using HindIII
Nod Nod KpnI
HindIII HindIII BssHII
•
KpnI BamHI XhoI XbaI BssHII
(c)
Stop sequence cloned, using NotI, into a pBluescriptll vector that has been modified, using an oligonucleotide linker, to contain two KpnI sites. Stop sequence then joined to CCIO promoter and PLP fragment using KpnI
HindIII KpnI
CC I 0 promoter __LAI STOP
V
BamHI KpnI
HindIII BssHII XhoI XbaI BssHII
(d)
KpnI
4 STOP 4
CCIO promoter
PBluescriptll vector modified to destroy the KpnI site using T4 DNA polymerase
(a) InI
Rabbit 13 globin /PLP fragment cloned into the shuttle vector pCle2.1 using BamHI and XhoI
Directional cloning using HindIII and XbaI
(b) HindIII BssHII KpnI
BamHI V XhoI
1 1.4.1 1 Intron HEL PLP HEL PolyA
XbaI BssHII
HindlII HindlII
PLP inducible lung construct linearised for injection using BssHII
Figure 5.11 A schematic diagram of the cloning strategy used to invert the foxed stop sequence of the SIPLP construct. (a) A pBluescriptll shuttle vector was modified to remove a KpnI restriction site and the Rabbit 13 globin/PLP fragment inserted into this vector using HindIII and XbaI (b). The CC10 promoter was joined using HindIII (c). The floxed stop sequence was cloned into a modified pBluescriptll vector such that it was flanked by KpnI sites which were then used to clone the stop sequence into the final vector, with loxP sites in the opposite direction to those in the previous inducible PLP constructs (d). Bacterial sequence was removed from the vector by digestion with BssHII prior to pronuclear injection.
211

5.5 Identification of SIPLP transgenic founder animals.
The new SIPLP construct was injected into C57BL/6 oocytes at the MRC Clinical
Sciences Centre of Imperial College, London. 56 potential founder animals were
screened for the presence of the SIPLP transgene. An initial PCR screen, using
genomic DNA extracted from a tail biopsy, identified 4 founder animals (figure 5.12).
These animals are subsequently referred to as SIPLP line 48, SIPLP line 50, SIPLP
line 60 and SIPLP line 69, based on numbers assigned at the point of tail biopsy. The
transgenic status of each of these animals was then confirmed by Southern blot (figure
5.12). No positive band was seen on the Southern blot of SIPLP line 50. Based on
this data, SIPLP line 50 was not selected for further breeding. Positive bands on the
Southern blot for SIPLP line 69 are more intense than those for lines 48 and 60. This
suggests that the number of copies of the transgene integrated into the genome is the
greatest in line 69. Two bands are visible on the blot for SIPLP line 48 suggesting
several sites of integration of the construct in this line.
All SIPLP transgenic founders were crossed with (3m70 MerCreMer transgenic
animals that had been backcrossed for at least 6 generations onto a NOD.E genetic
background. 3 litters derived from SIPLP line 60 were screened by PCR for the
presence of the SIPLP transgene. From a total of 18 pups, no positive mice were
identified. The transgenic status of the breeding founder animal was confirmed by
PCR from a 2nd tail biopsy but, as no germ line transmission of the transgene was
observed, the line was terminated.
To date, a single transgene positive animal has been identified from a total of 20 mice
derived from the breeding of SIPLP line 69. Therefore, no further analysis of this line
has so far been possible.
The frequency of germ line transmission of the SIPLP transgene has been the greatest
for litters derived from the breeding of SIPLP line 48 (19 positive animals from a total
of 40). Litters derived from SIPLP line 48 were screened by PCR for the presence of
212
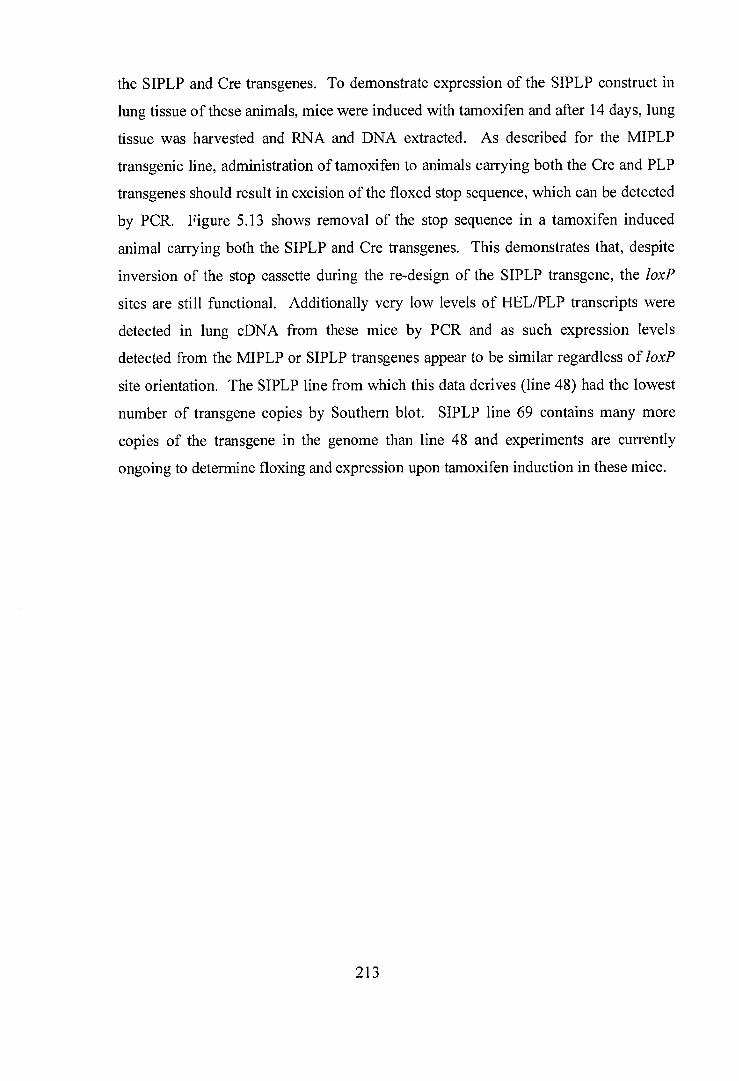
the SIPLP and Cre transgenes. To demonstrate expression of the SIPLP construct in
lung tissue of these animals, mice were induced with tamoxifen and after 14 days, lung
tissue was harvested and RNA and DNA extracted. As described for the MIPLP
transgenic line, administration of tamoxifen to animals carrying both the Cre and PLP
transgenes should result in excision of the foxed stop sequence, which can be detected
by PCR. Figure 5.13 shows removal of the stop sequence in a tamoxifen induced
animal carrying both the SIPLP and Cre transgenes. This demonstrates that, despite
inversion of the stop cassette during the re-design of the SIPLP transgene, the loxP
sites are still functional. Additionally very low levels of HEL/PLP transcripts were
detected in lung cDNA from these mice by PCR and as such expression levels
detected from the MIPLP or SIPLP transgenes appear to be similar regardless of loxP
site orientation. The SIPLP line from which this data derives (line 48) had the lowest
number of transgene copies by Southern blot. SIPLP line 69 contains many more
copies of the transgene in the genome than line 48 and experiments are currently
ongoing to determine floxing and expression upon tamoxifen induction in these mice.
213

bp 70-75 61-68
(e)
EcoRV
CC 10 STOP HEL/PLP —
600bp DIG labelled probe
1000 500
0
1000 HO. 500 —1111.
(a) loxP loxP
CC10210OR
3rdexonF
PLP
BetaglobinB
CC101500F
CC 10 rornoter STOP 4
-,,rcc u-) (b) ¢ 7..
V 6? 51-59 a.)
Z 0-, Potential founders 39-47 -= = ,... e =
1::: 2 . .
Figure 5.12 Identification of SIPLP transgenic founder animals. The transgenic founders were identified by PCR and by Southern blot. The location of primers used for PCR screening (3rdexonF and BetaglobinB) and for generation of the Southern probe (CC101500F and CC102100R) are shown in (a). Three transgenic animals were identified from an initial PCR screen of 56 potential founders (b). The transgenic status of these animals (numbers 48, 50, 60 and 69) was then confirmed by Southern blot (c). The location of bands on the Southern blot are marked by grey arrows. The restriction enzyme used to digest genomic DNA for Southern blotting was EcoRV. This enzyme only cuts the integrated construct once, on the 3' side of the CC10 promoter region being used as a probe (c), giving information about construct integration sites and copy number. Based on the result of Southern analysis, founder animal 50 was not selected for further breeding.
214
Qa 5
bp

(b)
bp
2000 1600
500 —P.- 500 —111,. 340 —IP'
z O z IP
LPxC
re u
nind
uced
SIPL
PxC
re
(c)
SIPL
PxC
re
1736 bp
stopfloxe loxP loxP PLP
cciop noter 4 STOP 4 —E111 SUPLPstoptioxedR
(a)
CC1CproMoter
HELA loxP PLP
4 —1=1/11 44-00. PLPB
353 bp
Figure 5.13 Removal of the floxed stop sequence and expression of SIPLP in lung tissue following induction with tamoxifen. (a) PCR strategies were used to demonstrate removal of the foxed stop sequence (using primers stopfloxedF and stopfloxedR) and expression of PLP (using primers HELA and PLPB) in lung tissue from transgenic animals that had been induced with tamoxifen for 5 days. (b) Following tamoxifen induction, lung genomic DNA was used as a template to demonstrate removal of the foxed stop sequence in animals carrying both the Cre and SIPLP transgenes. No change in size of PCR product was observed in animals carrying the MIPLP transgene alone. Lung cDNA was then used to demonstrate very low levels of expression of HEL/PLP. (c) cDNA reactions with (+) and without (-) the reverse transcriptase enzyme were used to control for any contaminating genomic DNA in lung RNA preparations. PLP expression was observed only in those animals shown to have deleted the stop sequence.
215

Discussion
Polarised populations of Thl or Th2 CD4+ T cells, and the cytokines that they
produce, are an important inflammatory component of a number of different lung
diseases. Thl type cytokines such as IL-12 and IFN-y, and Thl mediated immune
responses, have been found associated with chronic lung diseases such as sarcoidosis,
while Th2 type responses, involving cytokines such as IL-4, IL-5 and IL-13, are
thought to be involved in the pathogenesis of lung diseases such as cryptogenic
fibrosing alveolitis and asthma. One of the main aims of this thesis was to explore the
hypothesis that the structure of the TCR could lead to an inherent Thl or Th2 bias in
CD44- T cell phenotype, and chapters 3 and 4 have described the generation and
characterisation of TCR transgenic animals to test this hypothesis. An extension of
this main hypothesis however is an additional question of whether TCR transgenic
animals, displaying inherent bias towards Thl or Th2 type immune responses, could
be used to generate new models of Thl and Th2 mediated lung disease. Data
presented in this chapter has described the generation of inducible transgenic mice
with lung targeted expression of the Thl and Th2 TCR cognate epitope, PLP 56-70.
The inducible system selected for this study was the Cre/lox system (figure 1.5) and
lung targeted expression was achieved using the lung specific CC10 promoter. Two
versions of the transgene were created. In both versions the PLP peptide is expressed
as part of the hen egg lysozyme (HEL) protein, but one version contains a membrane
anchor sequence at the 3' end of the coding region and so results in the antigen being
membrane bound rather than secreted. Administration of the drug tamoxifen to
transgenic animals results in nuclear translocation of a ubiquitously expressed Cre
recombinase, which catalyses the removal of a translational stop sequence situated 5'
to the start of the coding sequence. Immunohistochemistry was used to demonstrate
that the Cre recombinase would become nuclear localised in Clara cells of the lung,
the cell type in which the CC10 promoter is specifically activated, validating the use
of the pm70 line of Cre mice selected for this study. One important issue of this
transgenic approach, mentioned previously in discussions of the Cre/lox system, is the
216

issue of Cre toxicity. Cre toxicity has been widely reported in mammalian cells
(Loonstra et al., 2001) and while in this inducible Cre system toxicity is unlikely to be
an issue until administration of tamoxifen, the possibility that any lung pathologies
observed in these mice might be due to the Cre protein itself must be considered.
Indeed the ubiquitous expression pattern of the Cre protein means that effects in
tissues other than the lung are also possible. While the issue of Cre toxicity is
unavoidable in this system and will persist for the lifetime of the drug within the
mouse, it is straightforward to control for by using animals carrying the Cre transgene
but not the inducible lung constructs. Any secondary effects of the Cre protein on
lung tissue and in causing lung pathology will also be observed in these animals.
Data presented in this chapter have described the cloning of secreted (SIPLP) and
membrane bound (MIPLP) lung constructs and the identification of transgenic animals
carrying each of these transgenes. A PCR strategy was used to demonstrate that
tamoxifen induction resulted in correct excision of the floxed stop sequence in lung
tissue and low levels of transgene expression were detected in lung cDNA from the
MIPLP line and SIPLP line 48. Poor germline transmission of the transgene in SIPLP
line 60 meant that this line was not carried forward for characterisation and
experiments are currently ongoing to determine transgene floxing and expression
levels in SIPLP line 69. Yet to be demonstrated in any transgenic line is the presence
of the HEL/PLP in the lung at the protein level. Attempts to visualise the protein
intracellularly using immunohistochemistry and an anti-HEL antibody have been
unsuccessful. One likely explanation for this is that the HEL protein present in the
lungs of these animals is not the native form. The coding sequence of PLP 56-70 is
inserted into the centre of the protein and as such is likely to affect the structure of this
molecule. The antibody used was polyclonal, but if the structural impact of PLP 56-70
addition to the protein is severe enough, normal antibody binding epitopes may be
destroyed. Another approach currently ongoing is to try to demonstrate the presence
of antigen using antigen specific T cell lines. If the HEL/PLP antigen is being
expressed in the SIPLP lines then protein should be present in the BAL of induced
animals. However, the presence of the membrane anchor in the MIPLP transgene
217

means that this will not be true for MIPLP transgenic mice and disruption of the lung
tissue to release intracellular protein would be required. Indeed, membrane bound
expression of antigen, and data presented in this chapter showing large numbers of
foxed transgene copies present in the lung more than 100 days following tamoxifen
induction, raises important questions about how efficiently this protein will be
presented to T cells in the lung. Presentation of PLP 56-70 in the lungs of induced
MIPLP animals will rely on natural breakdown of the airway epithelium to release the
protein. As turnover of the airway epithelium is low (Kaufmann, 1980), the amount of
antigen presented by lung APCs to resident T cells may be tiny. It may be that in this
system, infliction of mild lung injury, for example by low dose LPS exposure (Rojas et
al., 2005), may be required in order to potentiate death of airway epithelial cells,
release of antigen and initiation of an inflammatory response in the lung.
From PCR data obtained to date for both MIPLP and SIPLP lines, levels of expression
appear to be low although, from PCR data of the floxed transgene, expression should
persist for many days. In previous discussion of different lung diseases, difficulties in
modelling the chronic nature of many of these diseases, and also the unknown nature
of the antigens to which the immune system is responding, were mentioned. When the
SIPLP and MIPLP transgenic lines have been crossed with the TCR transgenic
animals bearing Thl or Th2 antigen specific TCRs, it may be that the low levels of
expression of the TCR antigen over an extended period of time that can be induced in
these animals is an effective model for some of these disease processes, particularly if
some of the antigens yet to be identified in these diseases derive from endogenous
lung proteins. Immune responses to weakly expressed endogenous antigens in the
lung, perhaps following an initial mild insult or injury, would provide an explanation
for the chronic and progressive nature of many of these lung pathologies. However,
an alterative outcome of low levels of peptide expression in the lung may turn out to
be tolerance rather than inflammation. Central tolerance to the PLP 56-70 antigen
would not be expected as the transgene is inducible and as such, especially given the
presence of the translational stop sequence 5' to the coding sequence, should not be
presented as part of the repertoire of self antigens during thymic selection. However,
218

as was noted in the original OVA TCR transgenic mice, subsequent presence of the
peptide antigen, in the case of the OVA study, by giving peptide intraperitoneally, can
result in clonal deletion of T cells bearing the OVA specific TCR in the thymus
(Murphy et al., 1990). Additionally, following tamoxifen induction and removal of
the floxed stop sequence in all tissue, i.e. not just in the lung, the potential for Aire
protein mediated tolerance induction in the thymus would exist, and recent evidence
for the existence of gene microclusters expressed by Aire suggest that this may depend
on the site of transgene integration in the genome (Derbinski et al., 2005). In the
periphery, it is well established that TCR ligation in the absence of APC-derived
costimulatory signals, such as those of the CD28 or CD4OL pathways, leads to
functional inactivation and anergy (Howland et al., 2000). This idea has been
explored in the field of allergen immunotherapy, where administration of therapeutic
doses of protein or peptide can lead to tolerance and attenuation of the normal immune
response to allergen. Peptide studies have administered antigens subcutaneously
(Norman et al., 1996), intradermally (Alexander et al., 2005) orally (Takagi et al.,
2005) and intranasally (Hall et al., 2003) and have all demonstrated improvements in
outcome measures of allergic airways disease, suggesting that the peptides have
indeed induced tolerance to the allergen. However, although many of these studies
have described using low doses of peptide, in the study of peptide tolerance by
intranasal peptide administration, therapeutic doses of peptide were quite high (100
!Ag), and such levels are unlikely to be reached in this inducible system, especially
given the low levels of transcription observed from PCR data. However, as there are
currently no reports in the literature of inducible peptide antigens in the lung, the
outcome of either low or high levels of expression on potential tolerance induction is
unknown. Peptide expression levels are likely to be a key determinant of which
immune mechanisms are initiated in these mice and the time course of any response
will also be of interest. In mouse models of lung inflammation, chronic exposure to
antigen actually decreases inflammatory responses and a suppressed, or more tolerant,
immune response is observed (Yiamouyiannis et al., 1999). Again, antigen dose is
probably a key issue and in mouse models of asthma, doses used to initiate disease are
very high. It would be interesting to observe whether the chronic stages of any
219

inflammation induced by peptide expression in the lung in this model are different and
perhaps better reflect the ongoing chronic inflammation observed in many human
diseases.
The nature of the inflammation induced using this model, in combination with the Thl
and Th2 TCR transgenic models, will depend very much on the phenotype of the TCR
transgenic T cells that traffic to the site of antigen expression. Whether prior priming
of TCR transgenic T cells with antigen and adjuvant, or as previously mentioned, the
generation of some form of mild inflammation in the lung, before T cells will traffic
there, remains to be seen. Ideally no adjuvant or other inflammatory stimulus would
be required as this will inevitably bias the Thl/Th2 nature of the subsequent
inflammatory reaction. If the TCR structural hypothesis holds true then Thl and Th2
TCR transgenic T cells in vivo will have an inherent phenotype bias. If phenotypes
observed in vitro are similar to those subsequently seen in vivo, then you would expect
T cells from the Th2 TCR transgenic line, chains for which have now both been
expressed transgenically and mice lines of which are currently being crossed together,
to express predominantly IL-5, with some IL-4 and low levels of IFN-y. In the context
of lung inflammation, one major action of the cytokine IL-5 is in the recruitment of
eosinophils. Eosinophilic inflammation may therefore be a predicted outcome in these
mice, as might several other Th2 immune pathologies, as mice constitutively
expressing high levels of IL-5 in the lung have evidence of goblet cell hyperplasia,
collagen deposition, eosinophil infiltration and airway hyperresponsiveness (Lee et al.,
1997).
As cytokine signalling pathways both antagonise and synergise in the context of
immune responses in the lung, exactly what pathologies may arise in the transgenic
mice and models of this study are unknown. However, that polarised CD4+ T cell
responses may be generated without having to artificially manipulate one cytokine,
e.g. IL-5 (Lee et al., 1997) or component of T cell differentiation, e.g. Tbet (Finotto et
al., 2002) in the context of continuous antigen presentation in the lung without having
to administer a biasing adjuvant or exceptionally high dose of antigen, means that the
220

transgenics described in this chapter and in chapters 3 and 4 of this thesis may lead to
valuable new models of Thl and Th2 mediated pulmonary pathology, particularly in
the context of chronic lung disease.
221

Chapter 6
Generation and initial characterisation of transgenic lines with lung
targeted expression of human interleukin 8.
Results
6.1 Design and construction of a transgene for lung targeted expression of human
interleukin 8.
A schematic diagram of the cloning strategy used to construct a transgene for lung
targeted expression of human interleukin 8 (hIL-8) is shown in figure 6.1. The lung
specific promoter of CC10, and the rabbit beta globin expression cassette, are the same
as those used for the inducible lung targeted antigen transgenes discussed in chapter 5.
Use of the CC10 promoter means that the human IL-8 protein will only be expressed
within bronchial epithelial cells. In human cells, the IL-8 protein is expressed as a 99
amino acid precursor (Matsushima et al., 1988). Following removal of a 20 amino
acid signal peptide, this precursor is secreted, and then cleaved extracellularly at the
N-terminus into several possible biologically active forms of the protein (Padrines et
al., 1994). To ensure secretion and correct subsequent processing of the hIL-8 protein
it was therefore necessary to use the coding sequence for the entire 99 amino acid
precursor protein in this transgene. Low levels of hIL-8 cDNA transcripts are found in
normal human peripheral blood mononuclear cells (PMBCs) (Matsushima et al.,
1988). RNA was therefore isolated from a human PBMC sample and, following
cDNA synthesis, PCR was used to clone the coding sequence of hIL-8 (figure 6.2).
The cloned PCR product was verified by sequencing prior to proceeding with the
cloning strategy. The nucleotide and amino acid sequence of hIL-8 used in this
construct is shown in appendix 29. The hIL-8 coding sequence was inserted into an
expression cassette that uses rabbit beta globin derived intronic and polyA sequences,
at the 5' and 3' ends of the cassette respectively, to aid correct processing and mRNA
222

stability of the gene of interest. The hIL-8 sequence replaced the coding sequence of
Hen Egg Lysoszyme (HEL) and the antigen PLP 56-70, used in a previous construct
(chapter 5). Removal of the HEL/PLP sequence and insertion of hIL-8 required the
use of the restriction enzyme EcoRl. An endogenous EcoR1 restriction site is present
at the 3' end of the hIL-8 sequence and so a single base pair mutation (T-->C) was
introduced by PCR at the time of cloning from cDNA such that there was no change in
amino acid sequence of the protein but that the EcoRl site was destroyed.
Joining of the lung specific CC10 promoter to the hIL-8 expression cassette was by
directional cloning using BamHI and XbaI restriction enzymes. The final construct
was checked by restriction digest (figure 6.2) and also by sequencing. The complete
sequence of the lung targeted hIL-8 transgene is shown in appendix 28. A plasmid
map of the construct is shown in appendix 16.
Bacterial sequences were removed from the construct, prior to pronuclear injection, by
digestion of the construct with Xho I and purification of the upper 3930 bp band. This
injection fragment is shown in figure 6.2.
223

PolyA tail \-7(-1
EcoR1 Rabbit beta HEL cDNA globin intron
(c) B amH 1 Xho 1
Endogenous EcoR1 site destroyed by point Xba 1 BamHl EcoRl EcoRl mutation Xho 1
I I
EcoRl hIL-8
(a) cDNA 40-• • •
hIL-8 cDNA cloned into rabbit beta globin expression cassette using EcoR1
Fragments joined using BamHl and Xbal
EcoRl IL-8
Xbal EcoRl Xhol
CC I 0 promoter
(b) Xhol BamH1 Xbal
BamHl
I CC 10 promoter
EcoR1 EcoRl Xba 1 Xho 1
I IL-8 I MA I
Construct linearised for injection using Xhol
Figure 6.1 A schematic diagram of the cloning strategy used to create the lung targeted hIL-8 transgene. (a) Human IL-8 cDNA was cloned from human PBMC cDNA using PCR primers specific for IL-8 (IL-8F and IL-8R) modified to contain EcoR1 sites at each end of the transcript and to destroy an endogenous EcoRl site. The point mutation (T—>C) did not alter the amino acid sequence of the protein. (b) hIL-8 cDNA was inserted into a rabbit beta globin expression cassette using EcoRl. (c) The rabbit beta globin expression cassette containing hIL-8 cDNA was joined to the lung specific promoter of CC10, contained in the shuttle vector pBluescriptII, using BamHl and Xbal. Bacterial sequences were removed from the vector, by digestion with Xhol, prior to pronuclear injection.
224

(a)
bp
o re
vers
e tr
ansc
ript
ase
2000 —010- 1000-10. 750 500
250
(c)
bp 0 ..z
6000 —Ow 4000 —11,- 3000 —10'
2000 --110- 1500
1 000 --Ow
Inje
ctio
n fr
agm
ent
bp
(b)
4000 2000
Figure 6.2 Cloning of human IL-8 cDNA into a lung targeted expression construct (a) The coding sequence of human IL-8 was cloned by PCR from human PBMC cDNA. The cloned PCR product inserted into a lung expression construct containing the rat lung specific promoter, CC10, and intronic sequence from rabbit beta globin. (b) The final construct was verified by restriction digest. A BamHI/XbaI digest gives expected restriction fragments of 5516 bp and 1500 bp. A XhoI digest gives expected restriction fragments of 3930 bp and 3086 bp. (c) Bacterial sequences were removed from the construct prior to pronuclear injection by digestion of the construct with XhoI and purification of the upper 3930 bp band.
225

6.2 Identification of lung targeted hIL-8 transgenic founder animals.
The lung targeted hIL-8 construct was injected into FVB/N oocytes at the Nuffield
department of Medicine in Oxford. 36 potential founder animals were screened for the
presence of the hIL-8 transgene. An initial PCR screen, using gDNA extracted from
tail biopsy, identified 2 founder animals (figure 6.3). These animals are subsequently
referred to as hIL-8 line 19 and line 33 based on numbers assigned to each animal at
the point of tail biopsy. Following the PCR screen, the transgenic status of animals 19
and 33 was confirmed by Southern blotting (figure 6.3). EcoRV was the restriction
enzyme selected to cut genomic DNA used for Southern blotting, as this enzyme
cleaves the transgene only once. The Southern blot for hIL-8 lines 19 and 33 show
that in both lines the transgene has integrated at more than one locus. These
integration sites are represented by bands that are differential between the two
transgenic lines. The EcoRV restriction site is located 2473 bp from the 5' end of the
transgene. The intense band present in both lanes represents multiple copies of the
transgene that have inserted as head to tail concatamers at one or more of the
integration loci. The sequence and product sizes of all PCR and Southern primers used
for screening of lung targeted hIL-8 transgenic founder animals are shown in appendix
8.
Both transgenic founders were subsequently bred with C57BL/6 animals to obtain
lung targeted hIL-8 transgenics for further analysis.
226

CC I 0 IL-8
600bp DIG labelled probe
EcoRV
-o Potential founders 20 - 32 o
34-36 bp
z oc
(c)
1000 750 --10- 500 —10- 250 —÷
Line
19 f
ound
er
Line
33
foun
der
CC101500F 1L-8F
IL-8 (a)
CCIO promoter
CC1021001R. IL-8R
(b)
Figure 6.3 Identification of lung targeted hIL-8 transgenic founder animals. Transgenic founders were identified by PCR and by Southern blot. The location of primers used for PCR screening (IL-8F and IL-8R) and for generation of the Southern probe (CC101500F and CC102100R) are shown in (a). Two transgenic animals were identified from an initial PCR screen of 36 potential founders (b). The transgenic status of these animals (numbers 19 and 33) was then confirmed by Southern blot (c), using rat genomic DNA as a positive control for the CC10 sequence. The restriction enzyme used to digest genomic DNA for Southern blotting was EcoRV. This enzyme only cuts the integrated construct once, on the 3' side of the CC10 promoter region being used as a probe (c), giving information about construct integration sites and copy number.
227
6.3 Determination of lung specific hIL-8 transgene expression.
The lung specific promoter used in the transgene is derived from the rat CC10 gene
and should direct expression of the gene of interest (hIL-8) in epithelial cells lining the
trachea, bronchi and bronchioles of the murine lung (Stripp et al., 1992). PCR was
used to determine the presence of hIL-8 cDNA transcripts in lung tissue from both
hIL-8 transgenic lines (figure 6.4). No hIL-8 cDNA transcripts were detected in lung
tissue from littermate control animals. In line 33 animals, hIL-8 cDNA transcripts
were only detected in the lung. In line 19, very low levels of hIL-8 transcripts were
also detected in brain tissue. The CC 10 sequence used in this transgene is well
characterised as a promoter for lung specific expression of a target gene. Expression
of hIL-8 cDNA transcripts in brain tissue is therefore unlikely to be driven by this
promoter. The observation of hIL-8 transcripts in brain tissue from line 19 but not line
33 suggests that in line 19, one or more copies of the transgene has integrated close to
a strong promoter that is active in the brain. The data shown in figure 6.4
demonstrates that hIL-8 cDNA transcripts are present in lung tissue of both hIL-8
transgenic lines. Real-time PCR was then used to investigate whether there was a
difference in relative levels of transcripts between line 19 and line 33 (figure 6.5). The
data shows that line 19 animals have a greater number of hIL-8 cDNA transcripts in
the lung compared to line 33 animals (P = 0.0005). A difference in level of hIL-8
expression between the two lines was also observed at the level of protein. hIL-8
levels in bronchoalveolar lavage (BAL) fluid (P = 0.0005) and in lung homogenate (P
= 0.0098) were higher in line 19 than in line 33. The BAL data also confirms that the
hIL-8 protein is being secreted by the lung cells expressing the transgene, and failure
to detect any hIL-8 protein in serum samples from these animals suggested that the
secreted hIL-8 protein remained in the local lung environment and was not present in
the peripheral circulation. Activity of the rat CC10 promoter has been shown to be
localised to bronchial epithelial cells of the lung rather than lung alveoli. This pattern
of expression for the transgenic hIL-8 protein was confirmed for both lines of mice
using immunohistochemistry (figure 6.6). In keeping with the cDNA transcript and
protein data shown in figure 6.5, more IL-8 staining was observed in lung sections
228

from line 19 animals. However, for both lines, IL-8 staining was patchy suggesting
that, at any one time, the transgene is not being expressed by all bronchial epithelial
cells in the lung.
229

18s IL-8
bp
750 —10. 500-0.
250-0.
(a) Line 19
Smal
l int
estin
e
r=4 0 0
0 0
0 a. V)
by z
>, 0 $... • 0 0 ▪ . - cat -0 6-..i
(b) Line 33
-4—I8s
bp
o o O 0 • —• • •4-.> o
• - • —•
.0 •—• tao 77-1) E "
E
(c) Litterm ate
Figure 6.4 Tissue specific expression of hIL-8 in both transgenic lines. (a) and (b) RNA was isolated from a range of different tissues, and primers specific for hIL-8 cDNA (IL-8F and IL-8R) were used to demonstrate lung specific expression of the transgene in both transgenic lines. cDNA reactions where no reverse transcriptase (RT) enzyme had been included were used as negative controls to ensure that any PCR product seen was not due to genomic DNA carried over during the RNA isolation procedure. (c) No hIL-8 transcripts were detectable in littermate control samples. Primers specific for 18s RNA (Ambion-1716) were used as an internal control for each sample. (a) Low levels of hIL-8 expression were also detected in brain tissue from line 19. Gels shown are representative of 3 animals per group.
230

(a)
rela
tive
mRN
A ex
pres
sion
* * * * *
10000-
Line 19
_ 7500-E. a) a. 5000-
c° J_ 2500-
0 Line 33 Littermates
I
1200
1000 --.. E 800
7:1) ra. 600
_1 400
200
Line 19 Line 33 Littermates 0
(b)
* * *
Line 19 Line 33 LittermI ates
(c)
Figure 6.5 Levels of hIL-8 cDNA transcripts and hIL-8 protein in the lung of both lines of hIL-8 transgenic mice. (a) Real-time PCR was used to compare levels of hIL-8 cDNA transcripts in lung tissue from hIL-8 line 19 and line 33 transgenic animals. Levels of IL-8 protein in BAL fluid (b) and lung homogenate (c) were determined by ELISA. hIL-8 cDNA transcripts and protein were both shown to be more abundant in lung tissue from line 19 animals. Data shown represent means + SE for each group. n = 9 for line 19, n = 11 for line 33, n = 8 for littermate controls. Statistical significance of differences between line 19 and line 33 were tested using a Mann-Whitney U test. ** P < 0.01, *** P < 0.001.
231

Secondary antibody only hIL-8 CC10
Line 19
bronchi
Line 33
Littermatc
alveoli
Figure 6.6 hIL-8 expression is confined to bronchial epithelial cells of the lung in both lines of transgenic mice. Inflated lung sections from line 19, line 33 and littermate control mice were stained using primary antibodies specific for the CC10 protein and hIL-8. Staining was visualised using a peroxidase based immunohistochemistry protocol. CC10 staining was observed in bronchiolar epithelial cells of all mice. hIL-8 staining was observed in some bronchiolar epithelial cells of lungs from both lines of transgenic animals while no staining was observed in littermate control samples. More staining was observed in samples from line 19 animals than from line 33. Images shown are representative of staining observed for more than 5 animals per group and are x20 normal magnification. The main structures of the lung are marked.
232

6.4 Lung function and lung cell infiltrate in lung targeted hIL-8 transgenics.
Having established lung specific expression of hIL-8 in both lines of transgenic mice,
the impact of constitutive expression of hIL-8 in the murine lung on lung function and
lung cell infiltrate was investigated. hIL-8 is a neutrophil chemoattractant and the
ability of hIL-8 to be chemotactic for the neutrophils of other species, including
mouse, has previously been demonstrated (Rot, 1991). Analysis of the numbers and
types of cells infiltrating both the BAL and lung of hIL-8 transgenic and littermate
animals revealed that while the total number of cells in the lung was not elevated in
the presence of hIL-8, the percentage of infiltrating cells that were neutrophils was
significantly increased (figure 6.7). The observed increase in the percentage of
neutrophils infiltrating the lung was greatest in line 19 animals (P = 0.0002), the line
previously shown to be expressing the highest levels of the hIL-8 protein, although a
significant difference was also seen in the lavage of line 33 animals (P = 0.0345). The
percentage increase in neutrophils was most apparent in the BAL, as in normal healthy
animals most cells recovered from BAL are macrophages and the percentage of cells
that are neutrophils is very low. However, in the lung, where normally at least 50 %
of cells are neutrophils, the percentage increase in neutrophils in the lungs of hIL-8
line 19 transgenic animals was still significant (P = 0.0091). Staining of inflated lung
sections with an antibody against myeloperoxidase (MPO), an enzyme that serves as a
specific marker for neutrophils (Schmekel et al., 1990), confirmed increased numbers
in line 19 animals, but also showed the location of neutrophils in the lung tissue of
these animals to be clustered around bronchi and blood vessels compared to a more
diffuse pattern of staining seen for line 33 and littermates (figure 6.8). When
consecutive lung sections from line 19 animals were stained with antibodies against
hIL-8 and myeloperoxidase, areas of neutrophil clustering next to bronchi were seen to
be associated with areas of intense hIL-8 staining (figure 6.8). The clustering of cells
around some airways and blood vessels in the lungs of line 19 animals was also
evident from the staining of lung sections with Haemotoxylin and Eosin (H+E). This
stain does not allow the different types of cells infiltrating the lung to be distinguished,
but when a general inflammatory scoring system was used, mild inflammation was
233

evident around some bronchi and vessels in the lungs of line 19 animals, compared to
very little or no inflammation in the lungs of line 33 or littermate mice (figure 6.9).
Mice used to examine cell infiltrates and lung pathology in hIL-8 transgenics
compared to littermates were 20 to 30 weeks in age and despite some evidence of mild
inflammation around bronchi and blood vessels of the transgenic line expressing the
highest levels of hIL-8, lung histology by H+E staining showed no evidence of other
lung pathology.
Lung diseases associated with high levels of IL-8 such as asthma and chronic
obstructive pulmonary disesase (COPD) (Nocker et al., 1996) are also invariably
associated with altered lung function (Cherniack, 1956). The three main
measurements of lung function used routinely in other mouse models of lung disease,
bronchial hyperreactivity (Penh), resistance and compliance were measured in the hIL-
8 transgenic lines and littermate animals. Neither hIL-8 transgenic line showed any
difference, compared to littermates, in bronchial hyperreactivity or airway resistance
in response to the muscarinic receptor agonist methacholine (figure 6.10). However,
line 19 animals and to a lesser extent, line 33 animals showed decreased airway
compliance compared to littermates although the difference was not statistically
significant.
234

Lung
Line 19 Line 33 Littermates
cell
num
ber (
x10 4
)
100-,
75-
50-
25-
0
BAL
Line 19 Line 33 Liftamates
(a)
cell
num
ber (
x104 )
10.0
7.5-
5.0-
2.5-
0.0
(b)
40- -J Ca 30- •_
.c 20-C. 0
10-C
Line 19 FTTI Line 33 Littamates
*
* * *
0 Line 19 Line 33 Littermates
* *
*
75- 01 C
50-o a. 0 0
25-o
Figure 6.7 Baseline cell infiltrates in the lungs of IL-8 transgenics and littermate animals. (a) The total number of cells recovered from the bronchoalveolar lavage (BAL) and whole lung lobe of IL-8 transgenic and littermate mice were determined by cell counting. (b) Differential cell counts of cytospins from BAL and lung were used to determine the percentage neutrophils in each sample. Mice used were 20-30 weeks of age and the data shown represents the mean values for 9 animals for line 19, 11 animals for line 33 and 8 littermate animals + SE. The statistical significance of differences between line 19, line 33 and littermate groups were tested using a Mann-Whitney U test. * P <0.05, ** P < 0.01, *** P < 0.0005
235

(a)
aver
age
MPO
score
3
2
=lbronchi =vessels
0
Line 19 Line 33 Littermate
(b) Line 19
Line 33 Littermate
(c)
IL-8
Myeloperoxidase
Figure 6.8 Neutrophil staining by immunohistochemistry of lung sections from IL-8 transgenic and littermate animals. Inflated frozen lung sections from IL-8 transgenic and littermate control animals aged 20 -30 weeks were stained using a primary antibody specific for the neutrophil marker myeloperoxidase. Staining was visualised using a peroxidase based immunohistochemistry protocol. (a) The number of neutrophils surrounding bronchi and blood vessels in each section were assessed using an inflammatory score system (appendix 30). The data is presented as a mean value + SE for each group and represents 9 line 19, 9 line 33 and 3 littermate animals. The statistical significance of differences between transgenic and littermate groups was tested using a Mann-Whitney U test. *P <0.05, **P <0.005. (b) Line 19 animals were found to have a greater number of neutrophils around both bronchi and blood vessels compared to line 33 and littermate animals. (c) Staining of consecutively cut sections with myeloperoxidase and IL-8 antibodies showed a relationship between clustering of neutrophils around bronchi and secretion of IL-8 by bronchial epithelial cells in line 19 animals. All photos are x20 normal magnification.
236

(a)
aver
age
infla
mm
atio
n sc
ore
=J bronchi =vessels
3
2
0 line 19 line 33 littermate
(b) Line 19
Line 33
Littermate
Figure 6.9 Mild inflammation in line 19 transgenics compared to line 33 and littermate animals. Inflated frozen lung sections from IL-8 transgenic and littermate animals aged 20-30 weeks were stained with Haematoxylin and Eosin (H+E). (a) Cell infiltrates around bronchi and blood vessels were assessed using an inflammatory score system. Data is presented as mean values per group + SE and represents 9 line 19, 9 line 33 and 3 littermate animals. The statistical significance of differences between groups was tested using a Mann-Whitney U test. ** P < 0.01. (b) Lung sections from line 19 animals showed evidence of mild cell infiltrates around some bronchi and vessels. Very few or no cell infiltrates were present in the lung sections from line 33 and littermate animals. All photos are x20 normal magnification.
237

25 50 75 100 Methacholine (mg/ml)
(c)
(a)
(b)
0.020
6 o cu 0 0.015 c cs • 4
0.000 25 50 75 100 0 Methacholine (mg/ml)
a 0.010 o
U ct 2 0.005
25 50 75 Methacholine (mg/ml)
100
Figure 6.10 Lung function of IL-8 transgenic and littermate animals. Mice aged 20-30 weeks were used to obtain Penh (a), resistance (b) and compliance (c) lung function measurements for IL-8 transgenic and littermate animals. Penh data shown is shown as mean values for 14 line 19 (0), 16 line 33 (A) and 8 littermate animals (0) + SE and is representative of three independent experiments. Resistance and compliance data is shown as mean values for 4 line 19, 5 line 33 and 3 littermate animals + SE and is representative of a single experiment.
238

6.5 Investigation of the impact of hIL-8 expression in the murine lung during
ovalbumin induced lung inflammation.
Lung data obtained for the hIL-8 transgenic lines thus far was obtained in the absence
of any external inflammatory stimulus. To examine the effect of hIL-8 expression in
the lung, in the context of an inflammatory response, an ovalbumin (OVA) model of
lung inflammation was used. Mice used for this experiment were 20-30 weeks in age
and were sensitised to OVA antigens by intra-peritoneal (i.p) injection of OVA, using
alum as an adjuvant. Control mice received PBS and alum. All mice were then
exposed to aerosolised OVA for 5 consecutive days before analysis of lung function
and lung tissue. Lung function measurements showed greater bronchial
hyperreactvity, greater resistance and reduced compliance in OVA sensitised mice
compared to controls, but differences were small and not statistically significant
(figure 6.11). In the OVA sensitised groups no significant differences were observed
between transgenic and littermate control animals for Penh, resistance or compliance
measurements. Line 33 OVA sensitised animals appeared to show increased
resistance compared to line 19 and littermate controls but this difference did not reach
statistical significance. However, of note was an apparent difference in bronchial
hyperreactivity between hIL-8 transgenic and littermate animals that had received just
alum as part of the sensitisation protocol. hIL-8 transgenic animals showed increased
bronchial hyperreactivity compared to littermate controls with the difference reaching
statistical significance in the case of line 33 animals (P=0.0159) (figure 6.11).
Despite the lack of significant changes in lung function between OVA sensitised and
alum control groups upon antigen challenge, there were differences in lung cell
infiltrates and pathology. Figure 6.12 shows differential cell counts for BAL and lung
in all groups. In the BAL of control mice, dominant cell types were macrophages and
lymphocytes although some neutrophils and eosinophils were also present. The
percentage of neutrophils in the BAL of these animals followed the same pattern as
seen previously in the absence of any antigen challenge, with the greatest percentage
in the line 19 hIL-8 transgenic group. This was also true in the BAL of mice
239

sensitised to OVA, although in all groups of OVA sensitised mice, the dominant cell
type was the eosinophil and actual neutrophil numbers found in the lung were not
greatly increased. In the lung tissue of control mice the most dominant cell type was
the neutrophil. Again, the greatest percentage was in the line 19 hIL-8 transgenic
group, although this was not the case in lung tissue of mice sensitised to OVA. In all
OVA sensitised groups, the dominant cell type was the eosinophil, numbers of which
were greatly increased compared to controls. The number of neutrophils in the lungs
of these mice remained largely unchanged even in hIL-8 transgenic lines.
Inflammation scores for H+E and myeloperoxidase (MPO) (figure 6.13) stained lung
sections from all groups of mice revealed significant differences in severity of
inflammation and pathology between control and OVA sensitised groups, but very
little difference between hIL-8 transgenic groups and littermates. The biggest,
although not statistically significant difference, was in the H+E inflammation scores of
bronchi and vessels for the hIL-8 line 33 transgenic control group which appeared to
show a greater degree of mild inflammation. However, the same trend was not
observed in the MPO inflammation score and so any differential inflammation that
may be present in this group is not due to neutrophils. Equivalent inflammation by
H+E and MPO staining was seen around the bronchi and blood vessels in all groups of
OVA sensitised animals.
Periodic Acid Schiff (PAS) staining was also performed. PAS is used to identify cells
containing high levels of glycoproteins. Glycoproteins known as mucins are the major
component of mucus which is secreted by airway epithelial goblet cells (Rogers 1994).
Unlike in humans, goblet cells are not found in murine airways in the absence of an
inflammatory stimulus (Pack et al., 1981), however, goblet cell mucus hypersecretion
is a common characteristic of airway inflammation in both species. PAS staining of
lung tissue from hIL-8 transgenic and littermate animals following OVA challenge
showed increased numbers of mucus secreting globlet cells in the airways of hIL-8
transgenic animals in both control and OVA sensitised groups compared to littermates
(figure 6.14). No mucus secreting cells at all were found in the airways of littermate
240

control animals and while OVA sensitisation and challenge did induce globlet cell
mucus secretion in some airways of littermate animals, the number of airways
secreting mucus and the average number of globlet cells in each airway was greater in
hIL-8 transgenic animals. Statistical significance was not reached with this data
however, and so further experiments are necessary.
241

0.020
0.015 c., c co Q 0.010 E 0 0 0.005
0.000 0 25 50 75
Methacholine (mg/ml)
(c)
100
(a) —N— Line 19 OVA —o— Line 33 OVA —*— Littermate OVA —a— Line 19 Alum —o— Line 33 Alum —it— Littermate Alum
0 25 50 75
100 Methacholine (mg/ml)
0 25 50 75 100 Methacholine (mg/ml)
(b)
Res
ista
nce
10
8
6
4
2
0
Figure 6.11 Lung function measurements in IL-8 transgenic and littermate animals following ovalbumin sensitisation and challenge. Mice were sensitised to ovalbumin by i.p injection of ovalbumin and alum on days 0 and 12. Control mice received PBS and alum. All mice received an ovalbumin aerosol on days 19, 20, 21, 22 and 23. (a) Penh lung function measurements were obtained on day 24. Resistance (b) and compliance (c) measurements were obtained on day 25. Data shown represents mean values for a minimum of 3 animals per group + SE.
242

PBS OVA PBS OVA
'Lung
Neutrophils =Eosinophils
Macrophages 5553 Lymphocytes
Line 19 Line 33 Littermate Line 19 Line 33 Littermate
PBS OVA
Neutrophils =Eosinophils 71- =Macrophages cV
5553 Lymphocytes
300
200
E _o
e • 100 a) V
Line 19 Line 33 Littermate Line 19 Line 33 Littermate Line 19 Line 33 Littermate Line 19 Line 33 Littermate
Figure 6.12 Differential BAL and lung cell counts from IL-8 transgenic and littermate animals following ovalbumin sensitisation and challenge. Cytospins of BAL and lung cells were stained with Wright Geimsa and numbers of neutrophils, eosinsophils, macrophages and lymphocytes counted in each sample. The percentage of each cell type (a) was calculated and converted to a total number of cells in BAL or lung (b) by multiplying the cell percentage by the total number of cells isolated for each sample. Data shown represents a minimum of 3 animals per group and is presented as a mean value for the group ± SE.
(a) 100-
co 80-
0 111111 .111
BAL
I
— Line 33
NM.
Littermate 4111
Line 19 Line 33 Littermate Line 19
PBS
400
300
-0 200 E
= 100
OVA (b)

(a) (b)
PBS OVA PBS OVA
bronchi Line 33
(c) Littermate Line 19
PBS
OVA
blood vessels
aver
age in
flam
mat
ion s
core
3- 3
2
1
0
2-
Ave
rage
MPO
sco
re =lbronchi
=vessels
1-
0 Line 19 Line 33 Littermate Line 19 Line 19 Line 33 Littermate Line 19 Line 33 Littermate Line 33 Littermate
Figure 6.13 Lung inflammation in OVA sensitised and challenged IL-8 transgenic and littermate animals. IL-8 transgenic and littermate animals were sensitised by i.p injection of OVA and alum on days 0 and 12. Control mice received PBS and alum. All mice were challenged with aerosolised OVA on days 19 to 23. Lung tissue was harvested on day 25 and frozen lung sections stained with H+E (a) or an antibody specific for the neutrophil marker myeloperoxidase (b). Cell infiltrates around bronchi and blood vessels were assessed using an inflammatory score system (appendix 30). Data is presented as mean values per group ± SE and represents a minimum of 3 animals per group. The statistical significance of differences between groups was tested using a Mann-Whitney U test. (c) H+E stained lung sections from line 33 PBS control animals showed evidence of mild cell infiltrates around some bronchi and vessels but equivalent inflammation was seen in lung sections from all groups of OVA sensitised animals.
244

(a)
PBS OVA
Line 19 Line 33 Littermate Line 19 Line 33 Littermate
aver
age
PAS s
core
2
1
0
(b) Line 19
Line 33
Littcrmate
PBS
OVA
Figure 6.14 Prevalence of mucus secreting goblet cells in inflated lung sections from OVA sensitised and challenged IL-8 transgenic and littermate animals. IL-8 transgenic and littermate animals were sensitised by i.p injection of OVA and alum on days 0 and 12. Control mice received PBS and alum. All mice were challenged with aerosolised OVA on days 19 to 23. Lung tissue was harvested on day 25 and frozen lung sections stained with PAS to identify mucus secreting goblet cells (bright purple staining). (a) A score system based on the percentage of each airway containing goblet cells was used to assess the prevalence of goblet cells in each sample. Data is presented as mean values per group + SE and represents a minimum of 3 animals per group. The statistical significance of differences between groups was tested using a Mann-Whitney U test. (b) Small numbers of goblet cells were found in the airways of PBS control IL-8 transgenic animals. In animals that had been sensitised to OVA, goblet cells were most prevalent in the airways of line 19 animals and the least prevalent in the airways of littermate animals.
245

Discussion
IL-8 is a CXC chemokine with potent chemoattractant properties. It is secreted by
many different cell types including T cells, neutrophils and NK cells, as well as by
somatic cells such as endothelial cells, fibroblasts and epithelial cells. It acts
predominantly to recruit and activate neutrophils at sites of infection or injury and
high levels of IL-8 have been detected in a variety of disease states including lung
diseases such as cystic fibrosis, bronchiecstasis, COPD and asthma. There are
currently no reports in the literature of human IL-8 having been overexpressed in the
mouse lung, but the reported associations between high levels of this protein and
disease and increasing evidence for neutrophil independent roles of this cytokine in
disease processes make IL-8 an attractive target for transgenesis. Data presented in
this chapter has described the generation of two mouse lines with lung targeted
expression of human IL-8 and initial basic characterisation of their phenotype.
The IL-8 transgene created for this study contained the human IL-8 (hIL-8) cDNA
sequence, intronic and polyA sequences from the rabbit beta globin protein and the rat
lung specific CC10 promoter. Two founder animals carrying this transgene were
identified by PCR and southern blot, which revealed both lines to be carrying multiple
copies of the transgene at multiple integration loci. Transgene expression levels in
each line were assessed by PCR, ELISA and antibody staining. Each revealed line 19
animals to be expressing higher levels of hIL-8 than those of line 33 and in both lines
expression was restricted to lung tissue, although in line 19 low levels of expression
were also detected in the brain. The CC10 promoter has been used extensively in lung
targeted transgenesis and is well characterised as a lung specific promoter whose
activity is restricted to Clara cells of the airway epithelium (Hagen et al., 1990). The
promoter regions surrounding the CC10 gene that confer lung specific expression have
been characterised (Stripp et al., 1992) and while exactly how this tissue specific
expression is achieved is not yet completely understood, negative regulators thought to
repress CC10 expression in non-Clara cells have been identified (Navab et al., 2002).
There are no reports in the literature of the CC10 protein being expressed, or the CC10
246

promoter being active, in brain tissue and so the low levels of expression found in the
brain tissue of line 19 animals are most likely to be due to position effects at the site of
transgene integration in this line. Brain expression of IL-8 in line 19 animals was not
explored further in this study, but it may be worthwhile to do so in the future. IL-8 is
known to be expressed by neural cells, such as microglia, and upregulation has been
associated with some inflammatory pathologies in the brain, such as that mediated by
the amyloid beta peptide in Alzheimer's disease (Walker et al., 2006). Whether
constitutive hIL-8 expression in brain tissue of these mice causes any kind of
inflammatory cell recruitment or other pathology to be observed may therefore be of
interest. Different integration loci between the two lines are also the most likely
explanation for the higher levels of expression seen in line 19 compared to line 33 and
that transgene expression can be affected by the flanking 5' and 3' chromosomal
regions at an integration locus has been well documented (Cranston et al., 2001).
Although immunohistochemical staining of inflated lung sections demonstrated that
lung expression in both lines was restricted to the bronchial epithelium, expression
patterns in both lines were patchy. This may reflect the impact of 5' and 3'
chromosomal regions on the activity of the transgenic CC10 promoter or perhaps
suggests that some elements that control endogenous CC10 gene expression are
missing from the sequence used in the transgene. The CC10 protein, also known as
the Clara cell secretory protein (CCSP) is the predominant protein product of Clara
cells (Patton et al., 1986) and has been proposed to function as a downregulator of
airway inflammation. Indeed, altered levels of this protein have been associated with
some lung diseases, such as sarcoidosis, where lower levels of the CC10 protein in
serum and in BAL were found in patients with progressive compared to regressive
disease (Shijubo et al., 2000). However, inflammatory cytokines are also major
secretory products of the bronchial epithelium with lung insults or infection being
potent inducers of production. For example, exposure to cigarette smoke, the main
known cause of COPD, is known to induce high levels of IL-8 production by human
bronchial epithelial cells (Mio et al., 1997) and recently the bacterial compound LPS
was found to induce production of the murine IL-8 homologue KC in Clara cells
247
(Elizur et al., 2007). IL-8 expression therefore constitutes a normal function of the
airway epithelium.
As discussed previously, the major function of IL-8 is in mediating chemoattraction
and activation of leukocytes, particularly neutrophils. That hIL-8 is able to mediate
chemotaxis of mouse neutrophils has been described (Rot, 1991) and although mice do
not possess an IL-8 gene, murine proteins with potent neutrophil chemoattractant
properties which bind the murine CXCR2 receptor have been identified (Bozic et al.,
1994). The murine CXC chemokine KC has been overexpressed in the murine lung
under the control of the CC10 promoter and has been reported to result in enhanced
neutrophil migration within the lungs of transgenic animals, although the neutrophils
were not activated and no tissue damage was apparent (Lira, 1996). Given that mouse
neutrophils can respond to hIL-8 and the similarities in function between KC and IL-8,
it might be predicted that overexpression of hIL-8 in the lungs of the two mouse lines
described in this study would also result in elevated numbers of neutrophils in the
lungs of these animals. Differential cell counts from BAL and lung tissue of IL-8
transgenic and littermate animals showed that IL-8 expression in the mouse lung did
result in an increased percentage of neutrophils in the lungs of transgenic animals and
this increase was observed to be the greatest in line 19 animals, the line also reported
to have the highest levels of IL-8 protein expression. However, perhaps unexpectedly,
no real differences were observed in terms of absolute cell numbers, although scoring
of transgenic and littermate inflated lung sections did suggest that some bronchi and
vessels showed signs of inflammation with the degree of inflammation being the
greatest in the lungs of line 19 animals. Although no large infiltrates of neutrophils
were observed in either line, the increased percentage of neutrophils in both BAL and
lung tissue suggests that the hIL-8 expressed by the lung epithelial cells in this model
is biologically active. This was also implied by immunohistochemistry staining for
neutrophils in inflated lung sections where areas of neutrophil clustering in the lungs
of transgenic mice were found to be associated with areas of greatest IL-8 protein
expression. This suggests that hIL-8 can indeed bind to and activate the CXCR2
receptor expressed by murine neutrophils and as expression is limited to bronchial
248

epithelial cells, the IL-8 protein secreted into airways of these mice is likely to be
capable of endothelial transcytosis in order to mediate neutrophil recruitment from
vessels into the lung tissue and BAL fluid. This is also supported by studies in which
recombinant hIL-8 has been administered directly into an organ and neutrophil
infiltration reported (Singer and Sansonetti 2004). However, this study by Singer and
Sansonetti, which reports colitis type pathology in mice given intracolonic rhIL-8
concomitantly with bacterial infection, also reports a lack of pathology or infiltrate
when rhIL-8 was administered alone. The authors speculate that lack of neutrophilic
infiltrates in mice given rhIL-8 alone may be due to the short half life of the protein in
the gut or due to a low affinity for murine CXCR2 compared to the murine
homologues, KC and MIP-2. In relation to the data presented in this chapter, where
expression of hIL-8 in the lung results in only mild inflammatory cell infiltrates, short
half-life of the protein is an unlikely explanation as IL-8 expression is constitutive.
However, it is possible that low affinity binding of hIL-8 to the mouse CXCR2
receptor means that much higher levels than those reported in lines 19 and line 33 of
this study would be required to mediate infiltration of large numbers of neutrophils
into the lung. This hypothesis is supported by the increased percentage of neutrophils
found in BAL and lung of line 19 animals compared to the lower expressing line 33
and the increased numbers of neutrophils and greater levels of lung inflammation
found in BAL and lung of some, although not all, line 19 animals. However, an
alternative explanation, which also has some support in the literature, is that
constitutive expression of the IL-8 protein results in downregulation of trafficking,
perhaps though altered adhesion molecule expression or reduced expression of the
chemokine receptor itself on the surface of circulating leukocytes. In support of
reduced neutrophil chemotaxis, a recent study of neutrophils from COPD patients who
also display high levels of IL-8 protein in the lung over long periods of time, found
COPD patient neutrophils to have reduced chemotactic responsiveness compared to
cells from healthy controls (Yoshikawa et al., 2007). Although there are no previous
reports of hIL-8 overexpression in the mouse lung, hIL-8 has been targeted to other
organs. The first report of a hIL-8 transgenic mouse described hIL-8 under the control
of a liver specific promoter (Simonet et al., 1994). In this study by Simonet et al. high
249

levels of circulating neutrophils in the peripheral blood were observed, but neutrophil
migration in response to localised administration of rhIL-8 was impaired. It is of note
that concentrations of rhIL-8 used in this study to induce local neutrophil trafficking
when given intraperitoneally are similar and often lower than those used by Singer and
Sansonetti, (2004) intracolonically, where no infiltrates were reported, suggesting that
mechanisms dictating levels of neutrophil trafficking may be different depending on
the site of IL-8 administration. In the transgenic study by Simonet et al. where
impaired neutrophil migration was reported, peripheral blood neutrophils were found
to have reduced levels of the adhesion molecule L-selectin. L-selectin is an important
mediator of neutrophil recruitment as it supports rolling of leukocytes along the
vascular endothelium. Downregulation of this molecule was proposed to be mediated
by the long term elevation of hIL-8 in the serum of these transgenic mice. With
constitutive expression of hIL-8 in the lungs of the two IL-8 transgenic lines described
in this chapter, that some IL-8 protein may reach the peripheral circulation is not
implausible and may have meant that a similar mechanism of adhesion molecule
downregulation was occurring. However, there were no detectable levels of hIL-8
protein in serum from either transgenic line described in this study. Other studies have
described receptor desensitisation as a mechanism of reducing neutrophil migration
(Wiekowski et al., 2001b). In this study by Wiekowski et al. inducible expression of
KC was targeted to many different tissues using the chicken beta actin promoter. No
inflammatory cell infiltrates were observed in any organ expressing KC and CXCR2
mediated signals were found to be attenuated in peripheral blood neutrophils
compared to cells from non transgenic animals. In keeping with the study by Simonet
et al. high levels of KC were detectable in serum, a finding not consistent with data
obtained from the lung targeted hIL-8 mice described in this study. However IL-8 is
known to regulate receptor expression on the cell surface (Samanta et al., 1990) and
the observation of downmodulation of CXCR1 and CXCR2 on peripheral blood and
also sputum neutrophils from COPD and asthmatic patients suggests that high levels
of local as well as systemic IL-8 protein may be able to mediate this mechanism of
regulation (Pignatti et al., 2005). To determine the reason for the lack of
inflammatory cell infiltrates in the mice described in this chapter several different
250

approaches are possible. If concentration of hIL-8 is the issue then intranasal
administration of rhIL-8 should induce neutrophil trafficking into the lungs of these
mice. However, additional evidence against this hypothesis includes a report into the
effects of rhIL-8 in guinea pigs where intranasal administration of this protein induced
bronchoconstriction but with no evidence of leukocyte accumulation (Fujimura et al.,
1999). Additionally, peripheral blood neutrophils and indeed neutrophils from the
lungs of these animals should migrate normally to rhIL-8 in in vitro chemotaxis
assays. If neutrophil migration has in some way become impaired, through the
constitutive expression of IL-8 over a long period of time, then in vitro neutrophil
chemotaxis should also be impaired. In addition you would expect neutrophils
transferred from a non transgenic animal to traffic normally to the lung in response to
IL-8 expression there. Analysis of the cell surface expression levels of adhesion
molecules such as L-selectin, CD11 b and CD11c and the CXCR2 receptor on
neutrophils from these transgenic animals would also be of interest as would intranasal
administration of KC or MIP-2 to determine whether impaired migration is also in
response to endogenous CXC chemokines.
Although at a baseline level, neutrophil accumulation in the lungs of both line 19 and
line 33 transgenic animals is not induced or is impaired, other studies have reported
that even when neutrophils are recruited in response to overexpression of CXC
chemokines, they do not appear to be activated (Lira, 1996 and Kucharzik et al.,
2005). Further experiments presented in this chapter attempted to determine whether
patterns of neutrophil recruitment would be different between transgenic and littermate
animals in the context of an inflammatory response. The well characterised
ovalbumin model of allergic airway inflammation was used in this study as it is a
potent inducer of inflammation in the lung and although neutrophilic infiltrates and
elevated IL-8 levels are a common feature of chronic asthma, the inflammation
observed in the ovalbumin model is predominantly eosinophilic. Any subtle changes
in neutrophil infiltration into the lungs of the IL-8 transgenic mice of this study should
therefore be more apparent, but the effect of hIL-8 on the other disease outcome
measures of this model of asthma could also be measured. However, despite seeing
251

the same increased percentage of neutrophils in the BAL of transgenic animals
compared to littermates as was reported previously in the baseline data, no significant
increase in neutrophil numbers was observed in any group following sensitisation and
exposure to ovalbumin. In both transgenic and littermate groups the lung infiltrate
was predominantly and equally eosinophilic and no major differences in general
inflammation scores or neutrophilic inflammation scores were found. From this data,
any impairments in neutrophil accumulation in the lung targeted hIL-8 transgenic mice
cannot be overcome by inflammatory signals in the ovalbumin lung disease model and
the migration of eosinophils to the lung is not impaired or indeed augmented by the
presence of the IL-8 protein. However, impaired neutrophil migration is difficult to
assess here as no significant neutrophilic infiltrate is expected in normal non-
transgenic animals. It would be of interest to determine whether migration in response
to a well characterised neutrophil activating stimulus, such as LPS, is perturbed.
However, a study by Remick et al. showing normal recruitment of neutrophils in
response to acid induced lung injury in transgenic mice with high levels of serum IL-8,
previously described as having impaired neutrophil migration, suggests that it might
not be (Remick et al., 2001). In that study, neutrophil migration was found to be
mediated normally by the endogenous murine chemokines KC and MIP-2.
If neutrophil migration is indeed impaired in the lung targeted hIL-8 transgenic mice
described in this chapter, then this effect could be circumvented with the use of
conditional transgenic mice. There are now several reports in the literature of
conditional IL-8 expression. In one study an adenoviral vector was used to
overexpress hIL-8 in the cornea (Oka et aL, 2006) and in another the tetracycline
system was used to induce hIL-8 expression in the intestine (Kucharzik et al., 2005).
In both cases, significant infiltration of neutrophils to the site of hIL-8 expression was
induced. However, it may be of interest to study the impact of hIL-8 in the lung in the
absence of large numbers of neutrophils and neutrophil driven inflammation and
damage as there is increasing evidence for potential neutrophil independent roles for
IL-8 in human lung pathology. One important study recently published concerned a
potential role for IL-8 in impaired lung function and lung remodelling with evidence
252
that IL-8 could induce Ca2+ release in human airway smooth muscle cells as well as
causing cell contraction and inducing cell migration (Govindaraju et al., 2006). Lung
responses to methacholine, measured as Perth, resistance and compliance are the most
commonly used markers of lung function in the mouse and so these parameters were
determined in the two lung targeted hIL-8 transgenic lines and compared to littermate
animals. No differences in lung function by any of these measures were observed
however, except perhaps for lower compliance measurements particularly in line 19
compared to littermates, although differences were not significant. From this data it
appears that constitutively high levels of IL-8 in the mouse lung do not affect lung
responses to methacholine, i.e. there is no apparent increase in bronchial
hyperreactivity, as might have been suggested from studies with guinea pigs (Fujimura
et al., 1999). However, in the study by Fujimura et al. IL-8 was not expressed by the
lung but delivered as a single dose at a single time point and the constitutive nature of
IL-8 expression in this study may have a major impact, for example by decreasing
CXCR2 expression levels on the surface of murine airway smooth muscle. Of interest
however were the findings of differences in bronchial hyperreactivity between hIL-8
transgenic mice and littermate controls that had been sensitised with alum alone but
then exposed to aerosolised OVA. Reasons for increased bronchial hyperreactivity in
transgenic animals compared to littermate controls in this situation, but not in the
absence of antigen challenge, are not clear but it may be that chronic exposure to hIL-
8 over long periods of time in these mice somehow predisposes to impaired lung
function upon challenge with antigen in a way that is independent of a T cell mediated
immune response e.g. by directly impacting on the lung tissue itself in terms of airway
remodelling or smooth muscle reactivity, the consequences of which are more
pronounced in the context of aerosolised exposure to a foreign protein
Despite this small difference in lung function between alum treated transgenic and
littermate control groups, differences in lung function measurements between
transgenic and littermate control disease groups were not observed. Also importantly,
although in all transgenic and littermate groups sensitisation and exposure to
253

ovalbumin was associated with slightly worse lung function measurements,
differences between disease and alum only control groups were very slight. As other
parameters, such as eosinophilic lung inflammation and goblet cell scoring suggested
that disease had indeed been successfully induced, the lack of large changes in lung
function is most likely due to the genetic background of mice used in this study.
Ovalbumin protocols involving lung function measurements most commonly use
BALB/c mice as they show good susceptibility and marked outcomes of disease
compared to other strains. Strain dependent variations in lung function measurements
are well reported (Reinhard et al., 2002) and it is likely that larger differences between
disease and control groups, and perhaps even at a baseline as a consequence of IL-8
expression, may be more evident on a different genetic background.
Despite no observed differences between IL-8 transgenic and littermate disease groups
with respect to cell infiltrates and lung function, one disease parameter was found to
be altered. The disease groups of both lines of lung targeted hIL-8 transgenic animals
showed an increased prevalence of mucus secreting goblet cells in the airways of the
lung when compared to littermate control animals. Goblet cell mucus hypersecretion
and goblet cell metaplasia is a common characteristic of allergic airway inflammation
in both humans and mice and is associated with airway remodelling. Metaplasia is the
process by which goblet cells arise from normal airway epithelial cells, such as Clara
cells, and once formed, produce mucins in response to many factors including Th2
type cytokines IL-13 and IL-4 (Kuperman et al., 2005). Mucus hypersecretion is not
just a feature of asthma, but is found in association with many other lung diseases such
as cystic fibrosis, chronic bronchitis, bronchiectasis and COPD, and excessive mucus
plays a major part in the pathology of these diseases by plugging airways and causing
recurrent infections. Neutrophils have been implicated in pathways leading to goblet
cell hyperplasia (Shao and Nadel, 2005) but aside from their role in neutrophil
recruitment, there have been no reports directly implicating CXC chemokines in this
process. Data presented in this chapter suggests that there is no difference in the
number of goblet cells or mucus secretion in the lungs of transgenic compared to
control mice in the absence of disease induction. This argues against a hypothesis
254

where IL-8 is acting directly on the airway epithelium in the absence of other
inflammatory stimuli to mediate hyperplasia. The lack of a neutrophil infiltrate in
these animals also argues against a neutrophil mediated mechanism and so perhaps
one more likely hypothesis is that IL-8 may be affecting the IL-4 and IL-13 mediated
pathways of goblet cell production and activation. Mice that overexpress IL-4 or IL-
13 show evidence of increased goblet cell hyperplasia and mucus production (Temann
et al., 1997 and Zhu et al., 1999). It would therefore be of great interest to look at
levels of IL-4 and IL-13 in the BAL and lung of all disease groups in the ovalbumin
experiment described in this study to try to determine whether presence of the hIL-8
protein in the lung has affected endogenous cytokine production in the context of this
disease model. If no differences in IL-4 or IL-13 levels are observed then possible
novel mechanisms involving IL-8, probably in conjunction with another inflammatory
mediator(s) should start to be explored and, as Clara cells themselves can both become
goblet cells and are constitutively expressing the IL-8 protein, the possibility that any
mechanism could be mediated by IL-8 protein inside the cell should also be borne in
mind. As goblet cell hyperplasia and mucus secretion is one measure of airway
remodelling, other markers of this process, such as collagen deposition and fibrosis
should also be considered. Angiogenesis is one part of the fibrotic process in which
CXC chemokines are heavily implicated (Strieter et al., 1995) and in a broader picture
of fibrosis, neutralisation of the murine IL-8 homologue, MIP-2, was found to be
protective in a mouse model of fibrotic lung disease (Keane et al., 1999). Of interest
would be assessment of fibrosis in lung tissue from the ovalbumin disease experiment
described in this chapter, but also important would be characterisation of any fibrotic
pathologies in lungs of these transgenic animals prior to disease induction. Indeed
subtle changes in airway structure may be able to account for the small changes
observed in baseline airway compliance and increased bronchial hyperreactivity upon
aerosol exposure to OVA of these lines.
255

Overview
Transgenesis, CD4+ T cells and lung inflammation have been the main themes of this
thesis, but while much has been achieved, much work still remains in characterising
the new transgenic lines that have been created, answering questions surrounding
observed phenotypes and in creating new models to try to answer key questions about
disease pathogenesis and basic T cell biology.
One of the main aims at the start of this thesis was to address a possible role for the T
cell receptor in determining CD4+ T cell effector phenotype. Evidence from previous
studies suggested that preferred structural motifs may expand during the course of Thl
or Th2 type immune response and that these motifs may convey TCR/pMHC binding
characteristics that inherently skew the process of differentiation and Thl or Th2 T
cell development. This thesis described identification of Th 1 and Th2 derived TCR a
chains that were successfully expressed transgenically, although levels of Thl TCR a
chain expression were much lower than those seen in the Th2 TCR a transgenic lines.
Ongoing work is needed to establish the cause of this apparent low transgene
expression level in the Thl TCR a chain transgenic mice as this low level of
expression and lack of expansion of the transgenic TCR sequence in the context of
peptide specificity in in vitro culture is precluding the use of this line to determine
inherent T cell phenotype and p chain pairing. It may be necessary to cross this mouse
line with mice carrying a disrupted TCR a locus in order to achieve these aims. High
levels of expression in the Th2 TCR a chain transgenic lines meant that experiments
to determine 1 chain pairing and inherent effector cell phenotype were possible. It
was found that transgenic expression of this Th2 TCR a chain, with an elongated
CDR3a region, did not bias the naïve TCR [3 chain repertoire of these mice, but that in
the context of peptide specificity a [3 chain pair could quickly be established. A
dominant a13 TCR in peptide specific T cell lines derived from these animals was also
associated with a Th2 type cytokine and transcription factor profile suggesting that
expression of the elongated Th2 derived TCR a chain is sufficient to bias TCR p chain
selection and pMHC binding such that development of a Th2 phenotype is favoured.
256

In vivo data supported this argument by demonstrating that during a memory response
to peptide, T cells bearing the elongated transgenic TCR a chain produced less IFNI.
Experiments are currently ongoing to determine whether these cells that make less
IFN-y are associated with a dominant TCR 13 chain, and further work to establish an
inherent Thl or Th2 bias in vivo could include a disease model such as EAE, to
demonstrate increased resistance or susceptibility to disease as a consequence of
inherent T cell phenotype. It will also be of interest to look at Th17 and regulatory T
cell phenotypes in these animals. The question of inherent phenotype bias will
nevertheless be most easily and most conclusively answered in mice expressing a
transgenic TCR a and 13 chain that have been subsequently crossed onto a RAG
knockout background and thus do not express any endogenous TCR at all. One TCR
[3 chain pair identified from in vitro studies has now been expressed transgenically and
breeding of these animals with Th2 TCR a chain animals is now currently underway.
Basic characterisation of these animals in terms of normal proliferative and cytokine
responses to peptide stimulation will be required both in vitro and in vivo, leading to
the ultimate test of the original hypothesis using a RAG knockout background and
comparing these animals to those with a Thl TCR a and 13 chain pair. At this point,
comparisons of TCR binding affinity for pMHC can be achieved using MHC class II
tetramers and signalling experiments to determine differential downstream
consequences of TCR/pMHC ligation will also be possible. The predicted outcome
from these studies would be that the Th2 TCR makes lower affinity interactions with
the pMHC ligand and consequently has an altered pattern of phosphorylation and
downstream signalling events that lead to a Th2 rather than Thl profile of gene
expression.
A second hypothesis leading from these studies concerned Thl and Th2 responses in
the context of lung inflammation. If transgenic expression of Thl and Th2 derived
TCRs can lead to inherent T cell phenotype bias then these transgenic animals could
be used to generate Thl and Th2 type models of lung inflammation. As a starting
point for this question this thesis has described the generation of an inducible
transgene that confers lung specific, but inducible expression of the TCR cognate
257

peptide, PLP 56-70, in the mouse lung. Results obtained to date have shown the
inducible mechanism of this approach to be functioning correctly and low levels of
transgene expression have been detected using both membrane bound and secreted
versions of the construct. Trafficking of T cells to the lung in response to this peptide
expression has yet to be demonstrated and should become the immediate focus of
work with these lines. In the absence of a complete TCR transgenic animal,
experiments to try to prime and induce T cell trafficking in mice transgenic for the
lung construct and the Cre protein have been started. Priming with peptide followed
by induction of lung expression has been the first approach, but it may be that due to
peptide induced tolerance mechanisms priming with whole PLP protein will be
required. Whether any priming at all will be required and whether Thl or Th2 biased
T cells will successfully traffic to the lung upon transgene induction awaits the
existence of complete Thl and Th2 TCR transgenic animals and so at present this
second hypothesis remains far from being properly addressed. However, if transgenic
T cells do successfully traffic in this model, there is great potential for modelling some
of the chronic inflammatory processes in the lung that have so far eluded many others.
An alternative approach to lung inflammation and the last section of this thesis
described overexpression of the human interleukin 8 cytokine in the bronchial
epithelial cells of the mouse lung. High levels of IL-8 protein and concomitant
neutrophilia in the lung are found in association with a number of different lung
diseases but, despite much evidence that the human protein is biologically active in the
mouse, there are as yet no reports in the literature of this protein having been
overexpressed in the lung. This thesis has described the generation of two lines of IL-
8 expressing mice and lung specific expression has been demonstrated in both.
Despite well known functions of IL-8 as a chemoattractant for leukocytes, especially
neutrophils, no significant inflammatory cell infiltrates were observed in these animals
in response to the constitutive IL-8 expression, although that the protein was
biologically active was suggested by altered neutrophil percentages and distribution in
the lung. Levels of IL-8 protein, as well as mechanisms of impaired recruitment such
as receptor desensitisation have been suggested to explain these findings and further
258
work is required to establish the reason for the lack of neutrophil trafficking into the
lungs of these mice. Lack of neutrophilic infiltrates in these animals could aid the
analysis of neutrophil independent IL-8 mediated disease mechanisms in the lung.
The finding of increased goblet cell numbers and mucus production in the lungs of
transgenic animals compared to littermate controls, in the context of ovalbumin
induced lung inflammation, is of particular interest and leads to further questions
about potential roles for IL-8 in lung remodelling and fibrosis. Further work to
establish whether there are any changes in lung structure as a consequence of IL-8
overexpression, in the absence of lung inflammation, is required as well as
experiments to try to determine the mechanism of increased mucus production in the
context of disease. To establish a model of lung neutrophilia and the pathologies
associated with these infiltrates it may be necessary to generate mice carrying an
inducible version of this hIL-8 transgene, but despite the absence of these cells in the
lungs of mice described here, this model still holds much potential for dissecting
mechanisms of IL-8 mediated pathology in the lung.
259

Bibliography
Abadie, V; Badell, E; Douillard, P; Ensergueix, D; Leenen, PJM; Tanguy, M; Fiette, L; Saeland, S; Gicquel, B; and Winter, N; 2005. Neutrophils rapidly migrate via lymphatics after Mycobacterium bovis BCG intradermal vaccination and shuttle live bacilli to the draining lymph nodes. Blood. 106. 1843-1850
Adamson, IY; and Bowden, DH; 1974. The pathogenesis of bleomycin-induced pulmonary fibrosis in mice. Am. J Pathol. 77. 185-197
Agarwal, S; and Rao, A; 1998. Modulation of chromatin structure regulates cytokine gene expression during T cell differentiation. Immunity 9. 765-775
Aggarwal, A; Baker, CS; Evans, TW; and Haslam, PL; 2000. G-CSF and IL-S but not GM-CSF correlate with severity of pulmonary neutrophilia in actue respiratory distress syndrome. Eur. Respir. J. 15. 895-901
Aggarwal, S; Ghilardi, N; Xie, M; Sauvage, FJ; and Gurney, AL; 2003. Interleukin-23 promotes a distinct CD4 T cell activation state characterised by the production of interleukin-17. 1 Biol. Chem. 278. 1910-1914.
Aifantis, I; Buer, J; von Boehmer, H; and Azogui, 0; 1997. Essential role of the pre-T cell receptor in allelic exclusion of the T cell receptor p locus. Immunity. 7. 601-607
Aifantis, I; Pivniouk, VI; Gartner, F; Feinberg, J; Swat, W; Alt, FW; von Boehmer, H; and Geha, RS; 1999. Allelic exclusion of the T cell receptor p locus requires the SH2 domain-containing leukocyte protein (SLP)-76 adaptor protein. J Exp. Med. 190. 1093-1102
Aifantis, I; Gounari, F; Scorrano, L; Borowski, C; and von Boehmer, H; 2001. Constitutive pre-TCR signaling promotes differentiation through Ca2+ mobilization and activation of NF-KB and NFAT. Nature Immunology. 2. 403-409
Aifantis, I; Borowski, C; Gounari, F; Lacorazza, HD; Nikolich-Zugich, J; and von Boehmer, H; 2002. A critical role for the cytoplasmic tail of pTa in T lymphocyte development. Nature Immunology 3. 483-488
Akinbi, HT; Epaud, R; Bhatt, H; and Weaver, TE; 2000. Bacterial killing is enhanced by expression of lysozyme in the lungs of transgenic mice. J. Immunol. 165. 5760-5766
Akira, S; Okazaki, K; and Sakano, H; 1987. Two pairs of recombination signals are sufficient to cause immunoglobulin V-(D)-J joining. Science 238. 1134-1138
260

Alam, SM; Crispe, IN; and Gascoigne, NR; 1995. Allelic exclusion of mouse T cell receptor alpha chains occurs at the time of thymocyte TCR up-regulation. Immunity. 3. 449-458
Alam, SM; Travers, PJ; Wung, JL; Nasholds, W; Redpath, S; Jameson, SC and Gascoigne, NR; 1996. T cell receptor affinity and thymocyte positive selection. Nature. 381. 616-620
Alam, SM; and Gascoigne, NRJ; 1998. Posttranslational regulation of TCR Va allelic exclusion during T cell differentiation. J. Immunol. 160. 3883-3890
Alexander, C; Tarzi, M; Larche, M; and Kay, AB; 2005. The effect of Fel d 1-derived T cell peptides on upper and lower airway outcome measurements in cat-allergic subjects. Allergy. 60. 1269-1274
Allen, S; Read, S; DiPaolo, R; McHugh, RS; Shevach, EM; Gleeson, PA and van Driel, IR; 2005. Promiscuous thymic expression of an autoantigen gene does not result in negative selection of pathogenic T cells. .1 Immunol. 175. 5759-5764
Allen, TC; Fudala, R; Nash, SE; and Kurdowska, A; 2007. Anti-Interleukin 8 autoantibody:Interleukin 8 immune complexes visualised by laser confocal microscopy in injured lung. Arch. Pathol. Lab. Med. 131. 452-456
Allison, JP; Mcintyre, BW; and Bloch, D; 1982. Tumor-specific antigen of murine T-lymphoma defined with monoclonal antibody. J Immunol. 129. 1144-1151
Allison, TJ; Winter, CC; Fournie, J; Bonneville, M; and Garboczi, DN; 2001. Structure of a human yS T-cell antigen receptor. Nature. 411. 820-824
Andersen, P; Andersen AB; Sorensen, AL; and Nagai, S; 1995. Recall of long-lived immunity to mycobacterium tuberculosis infection in mice. J. Immunol. 154. 3359-3372
Anderson, MS; Venanzi, ES; Klein, L; Chen, Z; Berzins, SP; Turley, SJ; von Boehmer, H; Bronson, R; Dierich, A; Benoist, C and Mathis, D; 2002. Projection of an immunological self shadow within the thymus by the Aire protein. Science. 298. 1395-1401
Andres, PG; Howland, KC; Nirula, A; Kane, LP; Barron, L; Dresnek, D; Sadra, A; Imboden, J; Weiss, A and Abbas, AK; 2004. Distinct regions in the CD28 cytoplasmic domain are required for T helper type 2 differentiation. Nature Immunology. 5. 435-442
Annacker, 0; Pimenta-Araujo, R; Burlen-Defranoux, 0; Barbosa, TC; Cumano, A; and Bandeira, A; 2001. CD25+ CD4+ T cells regulate the expansion of peripheral CD4 T cells through the production of IL-10. J. Immunol. 166. 3008-3018
261

Argaet, VP; Schmidt, CW; Burrows, SR; Silins, SL; Kurilla, MG; Doolan, DL; Suhrbier, A; Moss, DJ; Kieff, E; Sculley, TB and Misko, IS; 1994. Dominant selection of an invariant T cell antigen receptor in response to persistent infection by Epstein-Barr virus. I Exp. Med. 180. 2335-2340
Ariga, H; Shimohakamada, Y; Nakada, M; Tokunaga, T; Kikuchi, T; Kariyone, A; Tamura, T and Takatsu, K; 2007. Instruction of naïve CD4+ T cell fate to T-bet expression and T helper 1 development: roles of T cell receptor mediated signals. Immunology (on-line ahead of print).
Arnett, KL; Harrison, SC; and Wiley, DC; 2004. Crystal structure of a human CD3-E / 8 dimer in complex with a UCHT1 single-chain antibody fragment. Proc. Natl. Acad Sci. 101. 16268-16273
Arshad, SH; Hamilton, RG; and Adkinson, NF; 1998. Repeated aerosol exposure to small doses of allergen. A model for chronic allergic asthma. Am. I Respir. Crit. Med. 157. 1900-1906
Arstila, TP; Casrouge, A; Baron, V; Even, J; Kanellopoulos, J; and Kourilsky, P; 1999. A direct estimate of the human ct13 T cell receptor diversity. Science. 286. 958-961
Avni, 0; Lee, D; Macian, F; Szabo, SJ; Glimcher, LH; and Roa, A; 2002. TH cell differentiation is accompanied by dynamic changes in histone acetylation of cytokine genes. Nature Immunology. 3. 643-651
Badou, A; Savignac, M; Moreau, M; Leclerc, C; Foucras, G; Cassar, G; Paulet, P; Lagrange, D; Druet, P; Guery, J-C; and Pelletier, L; 2001. Weak TCR stimulation induces a calcium signal that triggers IL-4 synthesis, stonger TCR stimulation induces MAP kinases that control IFN-y production. Eur. I. Immunol. 31. 2487-2496
Baker, BM; Gagnon, SJ; Biddison, WE; and Wiley, DC; 2000. Conversion of a T cell antagonist into an agonist by repairing a defect in the TCR/peptide/MHC interface: Implications for TCR signaling. Immunity. 13. 475-484
Baker, BM; and Wiley, DC; 2001. al3 T cell receptor ligand-specific oligomerization revisited. Immunity. 14. 681-692
Baldwin, ET; Weber, IT; St Charles, R; Xuan, J; Appella, E; Yamada, M; Matsushima, K; Edwards, BFP; Clore, GM; Gronenborn, AM; and Wlodawer, A; 1991. Crystal structure of interleukin 8: Symbiosis of NMR and crystallography. Proc. Natl. Acad. Sci. 88. 502-506
262

Baldwin, TA; Sandau, MM; Jameson, SC; and Hogquist, KA; 2005. The timing of TCRa expression critically influences T cell development and selection. J Exp. Med. 202. 111-121
Bancroft, AJ; Grencis, RK; Else, KJ and Devaney, E; 1994. The role of CD4 cells in protective immunity to Brugia pahangi. Parasite Immunology. 16. 385-387
Bassing, CH; Alt, FW; Hughes, MM; D'Auteuil, M; Wehrly, TD; Woodman, BB; Gartner, F; White, JM; Davidson, L; and Sleckman, BP; 2000. Recombination signal sequences restrict chromosomal V(D)J recombination beyond the 12/23 rule. Nature. 405. 583-586
Belcher, RW; and Reid, JD; 1975. Sarcoid granulomas in CBA/J mice. Histologic response after inoculation with saroid and nonsarcoid tissue homogenates. Arch. Pathol. 99. 283-285
Belperio, JA; Dy, M; Burdick, MD; Xue, YY; Li, K; Elisa, JA and Keane, MP; 2002. Interaction of IL-13 and C10 in the pathogenesis of bleomycin-induced pulmonary fibrosis. Am. J. Respir. Cell Mol. Biol. 27. 419-427
Belz, GT; Stevenson, PG; and Doherty, PC; 2000. Contemporary analysis of MHC-related immunodominance hierarchies in the CD8+ T cell response to influenza A viruses. I Immunol. 165. 2404-2409
Bennouna, S; Bliss, SK; Curiel, TJ; and Denkers, EY; 2003. Cross-talk in the innate immune system: Neutrophils instruct recruitment and activation of dendritic cells during microbial infection. J. Immunol. 171. 6052-6058
Bergeron, A; Laissy, J-P; Schouman-Claeys, E; Hance, AJ; and Tazi, A; 2001. Computed tomography of pulmonary sarcoid-like granulomas induced by complete Freund's adjuvant in rats. Eur. Respir. 1 18. 357-361
Bettelli, E; Carrier, Y; Gao, W; Korn, T; Strom, TB; Oukka, M; Weiner, HL; and Kuchroo, VK; 2006. Reciprocal developmental pathways for the generation of pathogenic effector TH17 and regulatory T cells. Nature. 441. 235-238
Biedermann, T; Zimmermann, S; Himmelrich, H; Gumy, A; Egeter, 0; Sakrauski, AK; Seegmuller, I; Voigt, H; Launois, P; Levine, AD; Wagner, H; Heeg, K; Louis, JA; and Rocken, M; 2001. IL-4 instructs TH1 responses and resistance to Leishmania major in susceptible BALB/c mice. Nature Immunology. 2. 1054-1060
Birk, OS; Douek, DC; Elias, D; Takacs, K; Dewchand, H; Gur, SL; Walker, MD; van der Zee, R; Cohen, IR; and Altmann, DM; 1996. The role of Hsp60 in autoimmune diabetes: Analysis in a transgenic model. Proc. Natl. Acad. Sci. 93. 1032-1037
263

Blanchard, D; van Els, C; Borst, J; Carrel, S; Boylston, A; de Vries, JE; and Spits, H; 1987. The role of the T cell receptor, CD8, and LFA-1 in different stages of the cytolytic reaction mediated by alloreactive T lymphocyte clones. J Immunol. 138. 2417-2421
Blander, JM; Sant'Angelo, DB; Bottomly, K; and Janeway, CA; 2000. Alteration at a single amino acid residue in the T cell receptor a chain complementarity determining region 2 changes the differentiation of naive CD4 T cells in response to antigen from T helper cell type 1 (Thl) to Th2. I Exp. Med. 191. 2065-2074
Blease, K; Schuh, JM; Jakubzick, C; Lukacs, NW; Kunkel, SL; Joshi, BH; Puri, RK; Kaplan, MH; and Hogaboam, CM; 2002. Stat6-deficient mice develop airway hyperresponsiveness and peribroncial fibrosis during chronic fungal asthma. Am. J. Path. 160. 481-490
Boniface, JJ; Reich, Z; Lyons, DS; and Davis, MM; 1999. Thermodynamics of T cell receptor binding to peptide-MHC: Evidence for a general mechanism of molecular scanning. Proc. Natl. Acad. Sci. 96. 11446-11451
Bonniaud, P; Kolb, M; Galt, T; Roberston, J; Robbins, C; Stampfli, M; Lavery, C; Margetts, PJ; Roberts, AB; and Gauldie, J; 2004. Smad3 null mice develop airspace enlargement and are resistant to TGF-(3-mediated pulmonary fibrosis. J. Immunol. 173. 2099-2108
Borg, NA; Ely, LK; Beddoe, T; Macdonald, WA; Reid, HH; Clements, CS; Purcell, AW; Kjer-Nielsen, L; Miles, JJ; Burrows, SR; McCluskey, J; and Rossjohn, J; 2005. The CDR3 regions of an immunodominant T cell receptor dictate the "energetic landscape" of peptide-MHC recognition. Nature Immunology. 6. 171-180
Borgulya, P; Kishi, H; Uematsu, Y; and von Boehmer, H; 1992. Exclusion and inclusion of alpha and beta T cell receptor alleles. Cell. 69. 529-537
Born, W; Yague, J; Palmer, E; Kappler, J; and Marrack, P; 1985. Rearrangement of T cell receptor (3-chain genes during T-cell development. Proc. Natl. Acad. Sci. 82. 2925-2929
Borowski, C; Li, X; Aifantis, I; Gounari, F; and von Boehmer, H; 2004. Pre-TCRa and TCRa are not interchangeable partners of TCR13 during T lymphocyte development. J. Exp. Med. 199. 607-615
Bosma, GC; Custer, RP; and Bosma, MJ; 1983. A severe combined immunodeficiency mutation in the mouse. Nature. 301. 527-530
264

Bousso, P; Bhakta, NR; Lewis, RS; and Robey, E; 2002. Dynamics of thymocyte-stromal cell interactions visualized by two-photon microscopy. Science. 296. 1876-1880
Boutin, Y; Leitenberg, D; Tao, X; and Bottomly, K; 1997. Distinct biochemical signals characterize agonist and altered peptide ligand-induced differentiation of naïve CD4+ T cells into Thl and Th2 subsets. J Immunol. 159. 5802-5809
Boyd, R; Kozieradzki, I; Chidgey, A; Mittrucker, H; Bouchard, D; Timms, E; Kishihara, K; Ong, CJ; Chui, D; Marth, JD; Mak, TW; and Penninger, JM; 1998. Receptor-specific allelic exclusion of TCRVa-chains during development. J. Immunol. 161. 1718-1727
Boyton, RJ; Zaccai, N; Jones, EY; and Altmann, D; 2002. CD4 T Cells Selected by Antigen Under Th2 Polarizing Conditions Favor an Elongated TCRa Chain Complementarity-Determining Region 3. J. Immunol. 168. 1018-1027
Bozic, CR; Gerard, NP; von Uexkull-Guldenand, C; Kolakowski, LF; Conklyn, MJ; Breslow, R; Showell, HJ; and Gerard, C; 1994. The murine interleukin 8 type B receptor homologue and its ligands. J Biol. Chem. 269. 29355-29358
Brandle, D; Muller, C; Rulicke, T; Hengartner, H; and Pircher, H; 1992. Engagement of the T cell receptor during positive selection in the thymus down-regulates RAG-1 expression. Proc. Nati. Acad. Sci. 89. 9529-9533
Brenner, MB; McLean, J; Dialynas, DP; Stominger, JL; Smith, JA; Owen, FL; Seidman, JG; Ip, S; Rosen, F; and Krangel, MS; 1986. Identification of a putative second T cell receptor. Nature. 322. 145-149
Brinster, RL; Chen, HY; Trumbauer, ME; Yagle, MK; and Palmiter, RD; 1985. Factors affecting the efficiency of introducing foreign DNA into mice by microinjecting eggs. Proc. Natl. Acad. Sci. 82. 4438-4442
Brocke, S; Gijbels, K; Allegretta, M; Ferber, I; Piercy, C; Blankenstein, T; Martin, R; Utz, U; Karin, N; Mitchell, D; Veromaa, T; Waisman, A; Gaur, A; Conlon, P; Ling, N; Fairchild, PJ; Wraith, DC; O'Garra, A; Fathman, CG; and Steinman, L; 1996. Treatment of experimental encephalomyelitis with a peptide analogue of myelin basic protein. Nature. 379. 343-346
Bruijnzeel, PL; Kuijper, PH; Rihs, S; Betz, S; Warringa, RA; and Koenderman, L; 1993. Eosinophil migration in atopic dermatitis. 1: increased migratory responses to N-formyl-methionyl-leucyl-phenylalanine, neutrophil-activating factor, platelet-activating factor, and platelet factor 4. J Invest. Dermatol. 100. 137-142
265

Buer, J; Aifantis, I; DiSanto, JP; Fehling, HJ; and von Boehmer, H; 1997. Role of different T cell receptors in the development of Pre-T cells. J. Exp. Med. 185. 1541-1547
Bullens, DMA; Truyen, E; Coteur, L; Dilissen, E; Hellings, PW; Dupont, LJ; and Ceuppens, JL; 2006. IL-17 mRNA in sputum of asthmatic patients: linking T cell driven inflammation and granulocytic influx. Respiratory Research. 7. 135-143
Bunnell, SC; Hong, DI; Kardon, JR; Yamazaki, T; McGlade, CJ; Barr, VA; and Samelson, LE; 2002. T cell receptor ligation induces the formation of dynamically regulated signaling assemblies. I Cell Biol. 158. 1263-1275
Burrows, SD; Doyle, ML; Murphy, KP; Franklin, SG; White, JR; Brooks, I; McNulty, DE; Scott, MO; Knutson, JR; and Porter, D; 1994. Determination of the monomer-dimer equilibrium of interleukin-8 reveals it is a monomer at physiological concentrations. Biochemistry. 33. 12741-12745
Burrows, SR; Mins, SL; Moss, DJ; Khanna, R; Misko, IS; and Argaet, VP; 1995. T cell receptor repertoire for a viral epitope in humans is diversified by tolerance to a background major histocompatibility complex antigen. I Exp. Med. 182. 1703-1715
Busch, DH; and Pamer, EG; 1999. T cell affinity maturation by selective expansion during infection. I Exp. Med. 189. 701-709
Bush, A; Cole, P; Hariri, M; Mackay, I; Phillips, G; O'Callaghan, C; Wilson, R; and Warner, JO; 1998. Primary ciliary dyskinesia: diagnosis and standards of care. Eur. Respir. 1 12. 982-988
Cabaniols, JP; Fazilleau, N; Casrouge, A; Kourilsky, P; and Kanellopoulos, JM; 2001. Most oc/I3 T cell receptor diversity is due to terminal deoxynucleotidyl transferase. I Exp. Med. 194. 1385-1390
Call, ME; Pyrdol, J; Wiedmann, M; and Wucherpfennig, KW; 2002. The organizing principle in the formation of the T cell receptor-CD3 complex. Cell. 111. 967-979
Campanelli, D; Detmers, PA; Nathan, CF; and Gabay, JE; 1990. Azurocidin and a homologous serine protease from Neutrophils. J Clin. Invest. 85. 904-915
Campbell, JJ; Qin, S; Unutmaz, D; Soler, D; Murphy, KE; Hodge, MR; Wu, L; and Butcher, EC; 2001. Unique subpopulations of CD56+ NK and NK-T peripheral blood lymphocytes identified by chemokine receptor expression repertoire. I Immunol. 166. 6477-6482
266

Candeias, S; Katz, J; Benoist, C; Mathis, D; and Haskins, K; 1991. Islet-specific T-cell clones from nonobese diabetic mice express heterogeneous T-cell receptors. Proc. Natl. Acad. Sci. USA. 88. 6167-6170
Candon, S; McHugh, RS; Foucras, G; Natarajan, K; Shevach, EM; and Margulies, DH; 2004. Spontaneous organ-specific Th2 mediated autoimmunity in TCR transgenic mice. J. Immunol. 172. 2917-2924
Carre, PC; Mortenson, RL; King, TE; Noble, PW; Sable, CL; and Riches, DWH; 1991. Increased expressioin of the interleukin-8 gene by alveolar macrophages in idiopathic pulmonary fibrosis. J. Clin. Invest. 88. 1802-1810
Carson, RT; Vignali, KM; Woodland, DL; and Vignali, DAA; 1997. T cell receptor recognition of MHC class II bound peptide flanking residues enhances immunogenicity and results in altered TCR V region usage. Immunity. 7. 387-399
Casanova, E; Lemberger, T; Fehsenfeld, S; Mantamadiotis, T; and Schutz, G; 2003. a complementation in the Cre recombinase enzyme. Genesis 37. 25-29
Casrouge, A; Beaudoing, E; Dalle, S; Pannetier, C; Kanellopoulos, J; and Kourilsky, P; 2000. Size estimate of the cc(3 TCR repertoire of naive mouse splenocytes. J. Immunol. 164. 5782-5787
Chan, AC; Irving, BA; Fraser, JD; and Weiss, A; 1991. The chain is associated with a tyrosine kinase and upon T cell antigen receptor stimulation associates with ZAP-70, a 70-kDa tyrosine phosphoprotein. Proc. Natl. Acad. Sci. 88. 9166-9170
Chan, AC; Dalton, M; Johnson, R; Kong, G; Wang, T; Thoma, R; and Kurosaki, T; 1995. Activation of ZAP-70 kinase activity by phosphorylation of tyrosine 493 is required for lymphocyte antigen receptor function. EMBO J. 14. 2499-2508
Chan, MM; Chmura, K; and Chan, ED; 2006. Increased NaCl-induced interleukin-8 production by human bronchial epithelial cells is enhanced by the AF508/W1282X mutation of the cystic fibrosis transmembrane conductance regulator gene. Cytokine. 33. 309-316
Chen, M; Pittet, MJ; Gorelik, L; Flavell, RA; Weissleder, R; von Boehmer, H; and Khazale, K; 2005. Regulatory T cells suppress tumor-specific CD8 T cell cytotoxicity through TGF-13 signals in vivo. Proc. Natl. Acad. Sci. 102. 419-424
Chen, Q; Rabach, L; Noble, P; Zheng, T; Lee, CG; Homer, RJ; and Elias, JA; 2005. IL-11 receptor a in the pathogenesis of IL-13 induced inflammation and remodeling. J. Immunol. 174. 2305-2313
Cheng, D; Han, W; Chen, SM; Sherrill, TP; Chont, M; Park, G; Sheller, JR; Polosukhin, VV; Christman, JW; Yull, FE; and Blackwell, TS; 2007. Airway
267

epithelium controls lung inflammation and injury through the NF-KB pathway. I Immunol. 178. 6504-6513
Cherniack, RM; 1956. The physical properties of the lung in chronic obstructive pulmonary emphysema. J. Clin. Invest. 35. 394-404
Chertov, 0; Michiel, DF; Xu, L; Wang, JM; Tani, K; Murphy, WJ; Longo, DL; Taub, DD; and Oppenheim, JJ; 1996. Identification of defensin-1, defensin-2, and CAP37/Azurocidin as T cell chemoattractant proteins released from interleukin-8 stimulated neutrophils. J. Biol. Chem.. 6. 2935-2940
Chien, YH; Gascoigne, NR; Kavaler, J; Lee, NE; and Davis, MM; 1984. Somatic recombination in a murine T cell receptor gene. Nature 309. 322-326
Chikuma, S; Abbas, AK; and Bluestone, JA; 2005. B7-independent inhibition of T cells by CTLA-4. J. Immunol. 175. 177-181
Chlewicki, LK; Holler, PD; Monti, BC; Clutter, MR; and Kranz, DM; 2005. High-affinity, peptide-specific T cell receptors can be generated by mutations in CDR1, CDR2 or CDR3. J. MoL Biol. 346. 223-239
Choudhuri, K; Wiseman, D; Brown, MH; Gould, K; and van der Merwe, PA; 2005. T cell receptor triggering is critically dependent on the dimensions of its peptide-MHC ligand. Nature 436. 578-582
Chow, Y; O'Brodovich, H; Plumb, J; Wen, Y; Sohn, K; Lu, Z; Zhang, F; Lukacs, GL; Tanswell, AK; Hui, C; Buchwald, M; and Hu, J; 1997. Development of an epithelium-specific expression cassette with human DNA regulatory elements for transgene expression in lung airways. Proc. Natl. Acad. Sci. USA. 94. 14695-14700
Ciofani, M; Schmitt, TM; Ciofani, A; Michie, AM; Cuburu, N; Aublin, A; Maryanski, JL; and Zuniga-Pflucker, JC; 2004. Obligatory role for cooperative signaling by pre-TCR and notch during thymocyte differentiation. J. Immunol. 172. 5230-5239
Colbert, RA; Rowland-Jones, SL; McMichael, AJ; and Frelinger, JA; 1993. Allele specific B pocket transplant in class I major histocompatibility complex protein changes requirement for anchor residue at P2 of peptide. Proc. Natl. Acad. Sci. 90. 6879-6883
Cole, AM; Liao, HI; Stuchlik, 0; Tilan, J; Pohl, J; and Ganz, T; 2002. Cationic polypeptides are required for antibacterial activity of human airway fluid. J. Immunol. 169. 6985-6991
268

Cole, AM; Thapa, DR; Gabayan, V; Liao, H; Liu, L; and Ganz, T; 2005. Decreased clearance of Pseudomonas aeruginosa from airways of mice deficient in lysozyme M. J Leuk Biol. 78. 1081-1085
Colf, LA; Bankovich, AJ; Hanick, NA; Bowerman, NA; Jones, LL; Kranz, DM; and Garcia, KC; 2007. How a single T cell receptor recognizes both self and foreign MHC. Cell.129. 135-146
Constant, S; Pfeiffer, C; Woodard, A; Pasqualini, T; and Bottomly, K; 1995. Extent of T cell receptor ligation can determine the functional differentiation of naïve CD4+ T cells. J. Exp. Med. 182. 1591-1596
Constant, SL; Lee, KS; and Bottomly, K; 2000. Site of antigen delivery can influence T cell priming: pulmonary evironment promotes preferential Th2 type differentiation. Eur. J. Immunot 30. 840-847
Cooper, CJ; Orr, MT; McMahan, CJ; and Fink, PJ; 2003. T cell receptor revision does not solely target recent thymic emigrants. J. ImmunoL 171. 226-233
Corthay, A; Nandakumar, KS; and Holmdahl, R; 2001. Evaluation of the percentage of peripheral T cells with two different T cell receptor a-chains and of their potentital role in autoimmunity. Journal of autoimmunity 16. 423-429
Cranston, A; Dong, C; Howcroft, J and Clark AJ; 2001. Chromosomal sequences flanking an efficiently expressed transgene dramatically enhance its expression. Gene 269. 217-225
Creery, WD; Diaz-Mitoma, F; Filion, L and Kumar, A; 1996. Differential modulation of B7-1 and B7-2 isoform expression on human monocytes by cytokines which influence the development of T helper cell phenotype. Eur. J Immunol. 26. 1273-1277
Cua, DJ; Sherlock, J; Chen, Y; Murphy, CA; Joyce, B; Seymour, B; Lucian, L; To, W; Kwan, S; Churakova, T; Zurawski, S; Wiekowski, M; Lira, SA; Gorman, D; Kastelein, RA; and Sedgwick, JD; 2003. Interleukin-23 rather than interleukin-12 is the critical cytokine for autoimmune inflammation of the brain. Nature 421. 744-478
Dahl, ME; Dabbagh, K; Liggitt, D; Kim, S; and Lewis, DB; 2004. Viral-induced T helper type 1 responses enhance allergic disease by effects on lung dendritic cells. Nature Immunlogy. 5. 337-343
Daniels, MA; Teixeiro, E; Gill, J; Hausmann, B; Roubaty, D; Holmberg, K; Werlen, G; Hollander, GA; Gascoigne, NRJ; and Palmer, E; 2006. Thymic selection threshold defined by compartmentalization of Ras/MAPK signalling. Nature 444. 724-729
269

Das, MP; Nicholson, LB; Greer, JM; and Kuchroo, VK; 1997. Autopathogenic T helper cell type 1 (Thl) and protective Th2 clones differ in their recognition of the autoantigenic peptide of myelin proteolipid protein. J. Exp. Med 186. 867-876
Davis, MM; and Chien YH in Fundamental Immunology (ed. Paul, W.E) 341-366 (Lippincott-Raven, Philadelphia, 1999)
de Jong, EC; Vieira, PL; Kalinski, P; Schuitemaker, JHN; Tanaka, Y; Wierenga, EA; Yazdanbakhsh, M; and Kapsenberg, ML; 2002. Microbial compounds selectively induce Thl cell-promoting or Th2 cell-promoting dendritic cells in vitro with diverse Th cell polarizing signals. J. Immunol. 168. 1704-1709
Delon, J; Gregoire, C; Malissen, B; Darche, S; Lemaitre, F; Kourilsky, P; Abastado, JP; and Trautmann, A; 1998. CD8 expression allows T cell signaling by monomeric peptide-MHC complexes. Immunity. 9. 467-473
Derbinski, J; Schulte, A; Kyewski, B; and Klein, L; 2001. Promiscuous gene expression in medullary thymic epithelial cells mirrors the peripheral self. Nature Immunology. 2. 1032-1039
Derbinski, J; Gabler, J; Brors, B; Tierling, S; Jonnakuty, S; Hergenhahn, M; Peltonen, L; Walter, J; and Kyewski, B; 2005. Promiscuous gene expression in thymic epithelial cells is regulated at multiple levels. J. Exp. Med. 202. 33-45
Detmers, PA; Lo, SK; Olsen-Egbert, E; Walz, A; Baggiolini, M; and Cohn, ZA; 1990. Neutrophil-activating protein 1/interleukin 8 stimulates the binding activity of the leukocyte adhesion receptor CD11b/CD18 on human neutrophils. J. Exp. Med. 171. 1155-1162
Dickins, RA; McJunkin, K; Hernando, E; Premsrirut, PK; Krizhanovsky, V; Burgess, DJ; Kim, SY; Cordon-Cardo, C; Zender, L; Hannon, GJ; and Lowe, SW; 2007. Tissue-specific and reversible RNA interference in transgenic mice. Nature genetics 39. 914-921
DiMolfetto, L; Neal, H; Wu, A; Reilly, C; and Lo, D; 1998. The density of the class II MHC T cell receptor ligand influences IFN-y / IL-4 ratios in immune responses in vivo. Cellular Immunology. 183. 70-79
Ding, Y; Smith, KJ; Garboczi, DN; Utz, U; Biddison, WE; and Wiley, DC; 1998. Two human T cell receptors bind in a similar diagonal mode to the HLA-A2/Tax peptide complex using different TCR amino acids. Immunity. 8. 403-411
Donnelly, SC; Strieter, RM; Kunkel, SL; Walz, A; Robertson, CR; Carter, DC; Grant, IS; Pollok, AJ; and Haslett, C; 1993. Interleukin-8 and development of adult respiratory distress syndrome in at-risk patient groups. Lancet 341. 643-647
270

Douek, DC; Corley, KTT; Zal, T; Mellor, A; Dyson, PJ; and Altmann, DM; 1996. Negative selection by endogenous antigen and superantigen occurs at multiple thymic sites. Int. Immunol. 8. 1413-1420
Dubin, RF; Robinson, SK; and Widdicombe, JH; 2004. Secretion of lactoferrin and lysozyme by cultures of human airway epithelium. Am. J Physiol. Lung Cell Mol. Physiol. 286. L750-L755
Duez, C; Tsicopoulos, A; Janin, A; Tillie-Leblond, I; Thyphronitis,G; Marquillies, P; Hamid, Q; Wallaert, B; Tonnel, AB; and Pestel, J; 1996. An in vivo model of allergic inflammation: pulmonary human cell infiltrate in allergen-challenged allergic Hu-SCID mice. Eur. J. Immunol. 26. 1088-1093
Dupuy, AJ; Clark, K; Carlson, CM; Fritz, S; Davidson, AE; Markley, KM; Finley, K; Fletcher, CF; Ekker, SC; Hackett, PB; Horn, S; and Largaespada, DA; 2002. Mammalian germ-line transgenesis by transposition. Proc. Natl. Acad. Sci. 99. 4495-4499
Edwards, RJ; Taylor, GW; Ferguson, M; Murray, S; Rendell, N; Wrigley, A; Bai, Z; Boyle, J; Finney, SJ; Jones, A; Russell, HH; Turner, C; Cohen, J; Faulkner, L; and Sriskandan, S; 2005. Specific C-terminal cleavage and inactivation of lnterleukin-8 by invasive disease isolates of Streptococcus pyogenes. J. Infect. Dis. 192. 783-790
Elder, ME; Lin, D; Clever, J; Chan, AC; Hope, TJ; Weiss, A; and Parslow, TG; 1994. Human severe combined immunodeficiency due to a defect in ZAP-70, a T cell tyrosine kinase. Science 264. 1596-1599
Elizur, A; Adair-Kirk, TL; Kelley, DG; Griffin, GL; deMello, DE; and Senior, RM; 2007. Clara cells impact the pulmonary innate immune response to LPS. Am. J Physiol. Lung Cell Mol. Physiol. 293. L383-L392
Elliott, JI; and Altmann, DM; 1995. Dual T cell receptor alpha chain T cells in autoimmunity. J. Exp. Med. 182. 953-959
Elliott, JI; and Altmann, DM; 1996. Non-obese diabetic mice hemizygous at the T cell receptor alpha locus are susceptible to diabetes and sialitis. Eur. J. Immunol. 26. 953-956
Ellmerich, S; Mycko, M; Takacs, K; Waldner, H; Wahid, FN; Boyton, RJ; King, KHM; Smith, PA; Amor, S; Herlihy, AH; Hewitt, RE; Jutton, M; Price, DA; Hafler, DA; Kuchroo, VK; and Altmann, DM; 2005. High incidence of spontaneous disease in an HLA-DR15 and TCR transgenic multiple sclerosis model. I Immunol. 174. 1938-1946
271

Ely, LK; Beddoe, T; Clements, CS; Matthews, JM; Purcell, AW; Kjer-Nielsen, L; McCluskey, J; and Rossjohn, J; 2006. Disparate thermodynamics governing T cell receptor-MHC-I interactions implicate extrinsic factors in guiding MHC restriction. Proc. Natl. Acad. Sci. 103. 6641-6646
Emi, M; Keicho, N; Tokunaga, K; Katsumata, H; Souma, S; Nakata, K; Taguchi, Y; Ohishi, N; Azuma, A; and Kudoh, S; 1999. Association of diffuse panbronchiolitis with microsatellite polymorphism of the human interleukin 8 (IL-8) gene. J Hum. Genetics 44. 169-172
Erger, RA; and Casale, TB; 1998. Interleukin-8 plays a significant role in IgE-mediated lung inflammation. Eur. Respir. J 11. 299-305
Ethuin, F; Gerard, B; Benna, JE; Boutten, A; Gougereot-Pocidalo, M; Jacob, L; and Chollet-Martin, S; 2004. Human neutrophils produce interferon gamma upon stimulation by interleukin-12. Laboratory Investigation. 84. 1363-1371
Fahy, JV; Fleming HE; Wong, HH; Liu, JT; Su, JQ; Reimann, J; Fick, RB; and Boushey, HA; 1997. The effect of an anti-IgE monoclonal antibody on the early and late phase responses to allergen inhalation in asthmatic subjects. Am.J Respir. Crit. Care Med. 155. 1828-1834
Falk, K; Rotzschke, 0; Stevanovic, S; Jung, G; and Rammensee, H; 1991. Allele specific motifs revealed by sequencing of self-peptides eluted from MHC molecules. Nature 351. 290-296
Fang, TC; Yashiro-Ohtani, Y; Del Bianco, C; Knoblock, DM; Blacklow, SC; and Pear, WS; 2007. Notch directly regulates Gata3 expression during T helper 2 cell differentiation. Immunity 27. 100-110
Fasso, M; Anandasabapathy, N; Crawford, F; Kappler, J; Fathman, CG; and Ridgeway, WM; 2000. T cell receptor (TCR)-mediated repertoire selection and loss of TCR vp diversity during the initiation of a CD4+ T cell response in vivo. J. Exp. Med. 192. 1719-1730
Faurschou, M; and Borregaard, N; 2003. Neutrophil granules and secretory vesicles in inflammation. Microbes and Infection 5. 1317-1327
Fehling, HJ; Krotkova, A; Saint-Ruf, C; and von Boehmer, H; 1995. Crucial role of the pre-T cell receptor alpha gene in development of alpha beta but not gamma delta T cells. Nature. 375. 795-798
Ferber, IA; Brocke, S; Taylor-Edwards, C; Ridgway, W; Dinisco, C; Steinman, L; Dalton, D; and Fathman, CG; 1996. Mice with a disrupted IFNI gene are susceptible to the induction of experimental autoimmune encephalomyelitis (EAE). J. Immunol. 156. 5-7
272

Fernandez-Miguel, G; Alarcon, B; Iglesias, A; Bluethmann, H; Alvarez-Mon, M; Sanz, E; and de la Hera, A; 1999. Multivalent structure of an al3T cell receptor. Proc. Natl. Acad. Sci. 96. 1547-1552
Finnish German APECED consortium. 1997. An autoimmune disease, APECED, caused by mutations in a novel gene featuring two PHD-type zinc-finger domains. Nature Genetics 17. 399-403
Finotto, S; Neurath, MF; Glickman, JN; Qin, S; Lehr, HA; Green, FHY; Ackerman, K; Haley, K; Galle, PR; Szabo, SJ; Drazen, JM; De Sanctis, GT; and Glimcher, LH; 2002. Development of spontaneous airway changes consistent with human asthma in mice lacking T-bet. Science 295. 336-338
Fontenot, JD; Rasmussen, JP; Williams, LM; Dooley, JL; Farr, AG; and Rudensky, AY; 2005. Regulatory T cell lineage specification by the forkhead transcription factor Foxp3. Immunity 22. 329-341
Foster, PS; Hogan, SP; Ramsay, AJ; Matthaei, KI and Young, IG; 1996. Interleukin 5 deficiency abolishes eosinophilia, airways hyperrreactivity, and lung damgage in a mouse asthma model. J. Exp.Med. 183. 195-201
Fowell, DJ; Magram, J; Turck, CW; Killeen, N; and Locksley, RM; 1997. Impaired Th2 subset development in the absence of CD4. Immunity. 6. 559-569
Freeman, GJ; Borriello, F; Hodes, RJ; Reiser, H; Gribben, JG; Hg, JW; Kim, J; Goldberg, JM; Hathcock, K; and Laszlo, G; 1993. Murine B7-2, an alternative CTLA4 counter-receptor that costimulates T cell proliferation and interleukin 2 production. J. Exp. Med. 178. 2185-2192
Freeman, GJ; Boussiotis, VA; Anumanthan, A; Bernstein, GM; Ke, XY; Rennert, PD; Gray, GS; Gribben, JG; and Nadler, LM; 1995. B7-1 and B7-2 do not deliver identical costimulatory signals, since B7-2 but not B7-1 preferentially costimulates the initial production of IL-4. Immunity 2. 523-532
Fujimura, M; Myou, S; Nomura, M; Mizuguchi, M; Matsuda, T; Harada, A; Mukaida, N; Matsushima, K; and Nonomura, A; 1999. Interleukin-8 inhalation directly provokes bronchoconstriction in guinea pigs. Allergy 54. 386-391
Fujiwara, M; Hirose, K; Kagami, S; Takatori, H; Wakashin, H; Tamachi, T; Watanabe, N; Saito, Y; Iwamoto, I; and Nakajima, H; 2007. T-bet inhibits both TH2 cell-mediated eosinophil recruitment and TH 17 cell-mediated neutrophil recruitment into the airways. J. Allergy Clin. Immunol. 119. 662-670
Gallegos, AM; and Bevan, MJ; 2004. Central tolerance to tissue-specific antigens mediated by direct and indirect antigen presentation. J Exp. Med. 200. 1039-1049
273

Ganzalo, JA; Jia, GQ; Aguirre, V; Friend, D; Coyle, AJ; Jenkins, NA; Lin, GS; Katz, H; Lichtman, A; Copeland, N; Kopf, M; and Gutierrez-Ramos, JC; 1996. Mouse Eotaxin expression parallels eosinophil accumulation during lung allergic inflammation but it is not restricted to a Th2 type response. Immunity. 4. 1-14
Garcia, KC; Degano, M; Stanfield, RL; Brunmark, A; Jackson, MR; Peterson, PA, Teyton, L; and Wilson, IA; 1996. An alphabeta T cell receptor structure at 2.5 A and its orientation in the TCR-MHC complex. Science 274. 209-219
Garcia, KC; Degano, M; Pease, LR; Huang, M; Peterson, P; Teyton, L; and Wilson, IA; 1998. Structural basis of plasticity in T cell receptor recognition of a self peptide-MHC antigen. Science 279. 1166-1172
Geiser, T; Dewald, B; Ehrengruber, MU; Clark-Lewis, I; and Baggiolini, M; 1993. The interleukin-8 related chemotactic cytokines GROa, GROG, and GROy activate human neutrophil and basophil leukocytes. J. Biol Chem. 268. 15419-15424
Geisler, C; 1992. Failure to synthesize the CD3-y chain: consequences for T cell antigen receptor assembly, processing and expression. I Immunot 148. 2437-2445
Gibson, PG; Simpson, JL; and Saltos, N; 2001. Heterogeneity of airway inflammation in persistent asthma. Chest 119. 1329-1336
Gil, D; Schamel, W; Montoya, M; Sanchez-Madrid, F; and Alarcon, B; 2002. Recruitment of Nck by CDR reveals a ligand-induced conformational change essential for T cell receptor signaling and synapse formation. Cell 109. 901-912
Gil, D; Schrum, AG; Alarcon, B; and Palmer, E; 2005. T cell receptor engagement by peptide-MHC ligands induces a conformational change in the CD3 complex of thymocytes. J. Exp. Med. 201. 517-522
Gilfillan, S; Bachmann, M; Trembleau, S; Adorini, L; Kalinke, U; Zinkernagel, R; Benoist, C and Mathis, D; 1995. Efficient immune responses in mice lacking N-region diversity. Eur. J. Immunol. 25. 3115-3122
Giraldo, P; and Montoliu, L; 2001. Size matters: use of YACs, BACs and PACs in transgenic animals. Transgenic Research. 10. 83-103
Glasser, SW; Burhans, MS; Eszterhas, SK; Bruno, MD; and Korfhagen, TR; 2000. Human SP-C gene sequences that confer lung epithelium-specific expression in transgenic mice. Am. J. Physiol. Lung Cell Mol. Physiol. 278. L933-L945
Golding, A; Chandler, S; Ballestar, E; Wolffe, A; and Schlissel, MS; 1999. Nucleosome structure completely inhibits in vitro cleavage by the V(D)J recombinase. EMBO J. 18. 3712-3723
274

Good, RA; Quie, PG; Windhorst, DB; Page, AR; Rodey, GE; White, J; Wolfson, JJ; and Holmes, BH; 1968. Fatal (chronic) granulomatous disease of childhood: a hereditary defect of leukocyte function. Sem. Hematol. 5. 215-254
Gordon, JW; Scangos, GA; Plotkin, DJ; Barbosa, JA and Ruddle, FH; 1980. Genetic transformation of mouse embryos by microinjection of purified DNA. Proc. Natl. Acad Sc!. 77. 7380-7384
Gorham, JD; Guler, ML; Steen, RG; Mackey, AJ; Daly, MJ; Frederick, K; Dietrich, WF; and Murphy, KM; 1996. Genetic mapping of a murine locus controlling development of T helper 1/T helper 2 type responses. Proc. Natl. Acad. Sci. 93. 12467-12472 •
Govindaraju, V; Michoud, M; Al-Chalabi, M; Ferraro, P; Powell, WS; and Martin, JG; 2006. Interleukin-8: novel roles in human airway smooth muscle cell contraction and migration. Am. J. Physiol. Cell Physiol. 291. C957-C965
Graf, B; Bushnell, T; and Miller, J; 2007. LFA-1 mediated T cell costimulation through increased localization of TCR./class II complexes to the central supramolecular activation cluster and exclusion of CD45 from the immunological synapse. J. Immunol. 179. 1616-1624
Groettrup, M; Ungewiss, K; Azogui, 0; Palacios, R; Owen, MJ; Hayday, AC; and von Boehmer, H; 1993. A novel disulphide-linked heterodimer on pre-T cells consists of the T cell receptor beta chain and a 33 kd glycoprotein. Cell 75. 283-294
Grun, JL; and Maurer, PH; 1989. Different T helper cell subsets elicited in mice utilizing two different adjuvant vehicles: the role of endogenous interleukin 1 in proliferative responses. Cell Immunol. 121. 134-145
Grunewald, J; Wahlstrom, J; Berlin, M; Wigzell, H; Eklund, A; and Olerup, 0; 2002. Lung restricted T cell receptor AV2S3 + CD4 + T cell expansions in sarcoidosis patients with a shared HLA-DR(3 chain conformation. Thorax 57. 348-352
Guillen, C; McInnes, IB; Vaughan, DM; Kommajosyula, S; Van Berkel, PHC; Leung, BP; Aguila, A; and Brock, JH; 2002. Enhanced Thl repsonse to Staphylococcus aureus infection in human lactoferrin-transgenic mice. J Immunol. 168. 3950-3957
Hagen, G; Wolf, M; Katyal, S; Singh, G; Beato, M; and Suske, G; 1990. Tissue-specific expression, hormonal regulation and 5'-flanking gene region of the rat Clara cell 10 kDa protein: comparison to rabbit uteroglobin. Nuc. Acids. Res. 18. 2939-2946
275
Hahn, M; Nicholson, MJ; Pyrdol, J; and Wucherpfennig, KW; 2005. Unconventional topology of self peptide-major histocompatibility complex binding by a human autoimmune T cell receptor. Nature Immunlogy. 6. 490-496
Hajizadeh, R; Sato, H; Carlisle, J; Nadaf, MT; Evans, W; Shepherd, BE; Miller, RF; Kalams, SA; and Drake W; 2007. Mycobacterium tuberculosis Antigen 85A induces Th1-1 immune responses in systemic sarcoidosis. J. Clin. Immunol. 27. 445-454
Hall, G; Houghton, CG; Rahbek, JU; Lamb, JR; and Jarman, ER; 2003. Suppression of allergen reactive Th2 mediated responses and pulmonary eosinophilia by intranasal administration of an immunodominant peptide is linked to IL-10 production. Vaccine. 21. 549-561
Hamelmann, E; Schwarze, J; Takeda, K; Oshiba, A; Larsen, GL; Irvin, CG; and Gelfand, EW; 1997. Noninvasive Measurement of Airway Responsiveness in Allergic Mice Using Barometric Plethysmography. Am. J. Respir. Crit. Care Med. 156. 766-775
Han, X; Fan, Y; Wang, S; Yang, J; Bilenki, L; Qiu, H; Jiao, L; and Yang, X; 2004. Dendritic cells from Chlamydia-infected mice show altered Toll-like receptor expression and play a crucial role in inhibition of allergic responses to ovalbumin. Eur. J. Immunol. 34. 981-989
Hansen, G; Berry, G; DeKruyff, RH; and Umetsu, DT; 1999. Allergen-specific Thl cells fail to counterbalance Th2 cell-induced airway hyperreactivity but cause severe airway inflammation. J. Clin.Invest. 103. 175-183
Harrington, CJ; Paez, A; Hunkapiller, T; Mannikko, V; Brabb, T; Ahearn, M; Beeson, C; and Goverman, J; 1998. Differential tolerance is induced in T cells recognizing distinct epitopes of myelin basic protein. Immunity 8. 571-580
Haskins, K; Kubo, R; White, J; Pigeon, M; Kappler, J; and Marrack, P; 1983. The major histocompatibility complex-restrcited antigen receptor on T cells. 1. Isolation with a monoclonal antibody. J. Exp. Med. 157. 1149-1169
Haslam, PL; Turton, CW; Heard, B; Lukoszek, A; Collins, JV; Salsbury, AJ; and Turner-Warwick, M; 1980. Bronchoalveolar lavage in pulmonary fibrosis: comparison of cells obtained with lung biopsy and clinical features. Thorax 35. 9-18
He, X; Janeway, CA; Levine, M; Robinson, E; Preston-Hurlburt, P; Viret, C; and Bottomly, K; 2002. Dual receptor T cells extend the immune repertoire for foreign antigens. Nature Immunology 3. 127-134
Hebert, CA; Luscinskas, FW; Kiely, J; Luis, E; Darbonne, WC; Bennett, GL; Liu, CC; Obin, MS; Gimbrone, MA; and Baker, JB; 1990. Endothelial and
276

leukocyte forms of IL-8: Conversion by thrombin and interactions with neutrophils. J.Immunol. 145. 3033-3040
Hedrick, SM; Cohen, DI; Nielsen, EA; and Davis, MM; 1984. Isolation of cDNA clones encoding T cell-specific membrane-associated proteins. Nature 308. 149-153
Hibbert, L; Pflanz, S; de waal Malefyt, R; and Kastelein, R; 2003. IL-27 and IFN-a signal via Statl and Stat3 and induce T-Bet and IL-12R(32 in naïve T cells. J Interferon and Cyt. Res. 23. 513-522
Hirsch, E; Katanaev, VL; Garlanda, C; Azzolino, 0; Pirola, L; Silengo, L; Sozzani, S; Mantovani, A; Altruda, F; and Wymann, MP; 2000. Central role for G protein-coupled phosphoinositide 3-kinase y in inflammation. Science 287. 1049-1053
Ho, IC; Hodge, MR; Rooney, JW; and Glimcher, LH; 1996. The proto-oncogene c-maf is responsible for tissue-specific expression of interleukin-4. Cell 85. 973-983
Ho, L; Urban, BC; Thickett, DR; Davies, RJO; and McMichael, AJ; 2005. Deficiency of a subset of T cells with immunoregulatory properties in sarcoidosis. Lancet 365. 1062-1072
Hoffman, ES; Passoni, L; Crompton, T; Leu, TMJ; Schatz, DG; Koff, A; Owen, MJ; and Hayday, AC; 1996. Productive T-cell receptor (3 chain gene rearrangement: coincident regulation of cell cycle and clonality during development in vivo. Genes and Development 10. 948-962
Hogan, SP; Matthaei, KI; Young, JM; Koskinen, A; Young, IG; and Foster, PS; 1998. A novel T cell regulated mechanism modulating allergen-induced airways hyperreactivity in BALB/c mice independently of IL-4 and IL-5. J Immunol. 161. 1501-1509
Holler, PD; Holman, PO; Shusta, EV; O'Herrin, S; Wittrup, KD; and Kranz, DM; 2000. In vitro evolution of a T cell receptor with high affinity for peptide/MHC. Proc. Natl. Acad. Sci. 97. 5387-5392
Holmes, WE; Lee, J; Kuang, WJ; Rice, GC; and Wood, WI; 1991. Structure and functional expression of a human interleukin-8 receptor. Science 253. 1278-1280
Hori, S; Nomura, T; and Sakaguchi, S; 2003. Control of regulatory T cell development by the transcription factor Foxp3. Science 299. 1057-1061
Hosken, NA; Shibuya, K; Heath, AW; Murphy, KM; and O'Garra A; 1995. The effect of antigen dose on CD4+ T helper cell phenotype development in a T cell receptor al3 transgenic model. I Exp. Med. 182. 1579-1584
277

Howland, KC; Ausubel, LJ; London, CA; and Abbas, AK; 2000. The roles of CD28 and CD40 ligand in T cell activation and tolerance. J. Immunol. 164. 4465-4470
Hozumi, N; and Tonegawa, S; 1976. Evidence for somatic rearrangement of immunoglobulin genes coding for variable and constant regions. Proc. Natl. Acad. Sci. 73. 3628-3632
Huang, T; MacAry, PA; Eynott, P; Moussavi, A; Daniel, KC; Askenase, PW; Kemeny, DM; and Chung KF; 2001. Allergen-specific Thl cells counteract efferent Th2 cell-dependent bronchial hyperresponsiveness and eosinophilic inflammation partly via IFN-y. J. Immunol. 166. 207-217
Huang, C-Y; Golub, R; Wu, GE; and Kanagawa, 0; 2002. Superantigen-induced TCR a locus secondary rearrangement: Role in tolerance induction. I Immunol. 168. 3259-3265
Huang, C-Y; and Kanagawa, 0; 2004. Impact of early expression of TCR a chain on thymocyte development. Eur. J. Immunol. 34. 1532-1541
Huang, C-Y; Sleckman, BP; and Kanagawa, 0; 2005. Revision of T cell receptor a chain genes is required for normal T lymphocyte development. Proc. Natl. Acad. Sci.102. 14356-14361
Huber, AR; Kunkel, SL; Todd, RF; and Weiss, SJ; 1991. Regulation of transendothelial neutrophil migration by endogenous interleukin-8. Science 254. 99-102
Hunninghake, GM; Soto-Quiros, ME; Avila, L; Su, J; Murphy, A; Demeo, DL; Ly, NP; Liang, C; Sylvia, JS; Klanderman, BJ; Lange, C; Raby, BA; Silverman, EK; and Celedon, JC; 2007. Polymorphisms in IL13, total IgE, eosinophilia, and asthma exacerbations in childhood. J. Allergy Clin. Immunol. 120. 84-90
Huseby, ES; White, J; Crawford, F; Vass, T; Becker, D; Pinilla, C; Marrack, P; and Kappler, JW; 2005. How the T cell repertoire becomes peptide and MHC specific. Cell 122. 247-260
Huseby, ES; Crawford, F; White, J; Marrack, P and Kappler, JW; 2006. Interface-disrupting amino acids establish specificity between T cell receptors and complexes of major histocompatibility complex and peptide. Nature Immunology 7. 1191-1199
Imanishi, T; Hara, H; Suzuki, S; Susuki, N; Akira, S; and Saito, T; 2007. TLR2 directly triggers Thl effector functions. J.Immunol. 178. 6715-6719
Irvine, DJ; Purbhoo, MA; Krogsgaard, M; and Davis, MM; 2002. Direct observation of ligand recognition by T cells. Nature 419. 845-849
278

Irving, BA; and Weiss, A; 1991. The cytoplasmic domain of the T cell receptor zeta chain is sufficient to couple to receptor-associated signal transduction pathways. Cell. 64. 891-901
Ivanov, II; McKenzie, BS; Zhou, L; Tadokoro, CE; Lepelley, A; Lafaille, JJ; Cua, DJ; and Littman, DR; 2006. The orphan nuclear receptor RORyt directs the differentiation program of proinflammatory IL-17+ T helper cells. Cell 126. 1121-1133
Iwasaki, A; and Kelsall, BL; 1999. Freshly isolated Peyer's patch, but not spleen, dendritic cells produce interleukin 10 and induce the differentiation of T helper type 2 cells. J. Exp. Med. 190. 229-239
Jain, J; McCaffrey, PG; Valge-Archer, VE; and Rao, A; 1992. Nuclear factor of activated T cells contains Fos and Jun. Nature 356. 801-804
Jin, FY; Nathan, C; Radzioch, D; and Ding, A; 1997. Secretory leukocyte protease inhibitor: a macrophage product induced by and antagonistic to bacterial lipopolysaccharide. Cell. 88. 417-426
Johnston, SL; Papi, A; Monick, MM; and Hunninghake, GW; 1997. Rhinoviruses induce interleukin-8 mRNA and protein production in human monocytes. J Infect. Dis. 175. 323-329
Jordan, MS; Boesteanu, A; Reed, AJ; Petrone, AL; Holenbeck, AE; Lerman, MA; Naji, A; and Caton, AJ; 2001. Thymic selection of CD4+ CD25+ regulatory T cells induced by an agonist self-peptide. Nature Immunology 2. 301-306
Jorgensen, JL; Esser, U; Fazekas de St. Groth, B; Reay, PA; and Davis, MM; 1992. Mapping T-cell receptor-peptide contacts by variant peptide immunization of single-chain transgenic. Nature. 355. 224-230
June, CH; Fletcher, MC; Ledbetter, JA; and Samelson, LS; 1990. Increases in tyrosine phosphorylation are detectable before phospholipase C activation after T cell receptor stimulation. I Immunol. 144. 1591-1599
Kalergis, AM; Boucheron, N; Doucey, M-A; Palmieri, E; Goyarts, EC; Vegh, Z; Luescher, IF; and Nathenson, SG; 2001. Efficient T cell activation requires an optimal dwell-time of interactioin between the TCR and the pMHC complex. Nature Immunology 2. 229-234
Kang, H-R; Cho, SJ; Lee, CG; Homer, RJ; and Elias, JA; 2007. Transforming growth factor (TGF)-13 stimulates pulmonary fibrosis and inflammation via a Bax-dependent, Bid-activated pathway that involves Matrix Metalloproteinase-12. J. Biol. Chem. 282. 7723-7732
279

Kappler, J; Kubo, R; Haskins, K; Hannum, C; Marrack, P; Pigeon, M; McIntyre, B; Allison, J; and Trowbridge, I; 1983. The major histocompatibility complex-restricted antigen receptor on T cells in mouse and man: Identification of constant and variable peptides. Cell 35. 295-302
Kappler, JW; Roehm, N; and Marrack, P; 1987. T cell tolerance by clonal elimination in the thymus. Cell 49. 273-280
Kauffman, SL; 1980. Cell proliferation in the mammalian lung. Int. Rev. Exp. Pathol. 22. 131-191
Kaviratne, M; Hesse, M; Leusink, M; Cheever, AW; Davies, SJ; McKerrow, JH; Wakefield, LM; Letterio, JJ; and Wynn, TA; 2004. IL-13 activates a mechanism of tissue fibrosis that is completely TGF-P independent. J. Immunol. 173. 4020-4029
Kawabe, T; Naka, T; Yoshida, K; Tanaka, T; Fujiwara, H; Suematsu, S; Yoshida, N; Kishimoto, T; and Kikutani, H; 1994. The immune responses in CD40-deficient mice: impaired immunoglobulin class switching and germinal center formation. Immunity 1. 167-178
Keane, MP; Belperio, JA; Moore, TA; Moore, BB; Arenberg, DA; Smith, RE; Burdick, MD; Kunkel, SL; and Strieter, RM; 1999. Neutralization of CXC chemokine, macrophage inflammatory protein-2, attenuates bleomycin-induced pulmonary fibrosis. J. Immunol. 162. 5511-5518
Kersh, GJ; Kersh, EN; Fremont, DH; and Allen, PM; 1998. High and low potency ligands with similar affinities for the TCR: The importance of kinetics in TCR signaling. Immunity 9. 817-826
Kiani, A; Viola, JPB; Lichtman, AH; and Rao, A; 1997. Down-regulation of IL-4 gen transcription and control of Th2 cell differentiation by a mechanism involving NFAT1. Immunity 7. 849-860
Kiani, A; Garcia-Cozar, FJ; Habermann, I; Laforsch, S; Aebischer, T; Ehninger, G; and Anjana, R; 2001. Regulation of interferon-y gene expression by nuclear factor of activated T cells. Blood 98. 1480-1488
Kim, DO; Kim, B-S; Lee, SJ; Park, I-S; and Nam, YK; 2004. Comparative analysis of inherited patterns of the transgene in transgenic mud loach Misgurnus mizolepis lines carrying the CAT reporter gene. Fisheries Science 70 201-210
Kimata, H; Yoshida, A; Ishioka, C; Lindley, I; and Mikawa, H; 1992. Interleukin-8 (IL-8) selectively inhibits immunoglobulin E production induced by IL-4 in human B cells. J. Exp Med. 176. 1227-1231
280
Kishi, H; Borgulya, P; Scott, B; Karjalainen, K; Traunecker, A; Kaufman, J; and von Boehmer, H; 1991. Surface expression of the 13 T cell receptor (TCR) chain in the absence of other TCR or CD3 proteins on immature T cells. EMBO 1 10. 93-100
Kisielow, P; Bluthmann, H; Staerz, UD; Steinmetz, M; and von Boehmer, H; 1988. Tolerance in T-cell-receptor transgenic mice involves deletion of nonmature CD4+8+ thymocytes. Nature. 333. 742-746
Kjer-Nielsen, L; Holmberg, K; Perera, JD; and McCluskey, J; 1992. Impaired expression of chimaeric major histocompatibility complex transgenes associated with plasmid sequences. Transgenic Research. 1. 182-187
Kjer-Nielsen, L; Clements, CS; Purcell, AW; Brooks, AG; Whisstock, JC; Burrows, SR; McCluskey J; and Rossjohn, J; 2003. A structural basis for the selection of dominant af3 T cell receptors in antivral immunity. Immunity 18. 53-64
Kjer-Nielsen, L; Dunstone, MA; Kostenko, L; Ely, LK; Beddoe, T; Mifsud, NA; Purcell, AW; Brooks, AG; McCluskey, J; and Rossjohn, J; 2004. Crystal structure of the human T cell receptor CD3Ey heterodimer complexed to the therapeutic mAb OKT3. Proc. Natl. Acad. Sci. 101. 7675-7680
Klein, L; Klugmann, M; Nave, K-A; Tuohy, VK; and Kyewski, B; 2000. Shaping of the autoreactive T-cell repertoire by a splice variant of self protein expressed in thymic epithelial cells. Nature Medicine 6. 56-61
Knall, C; Young, S; Nick, JA; Buhl, AM; Worthen, GS; and Johnson, GL; 1996. Interleukin-8 regulation of the Ras/Raf/Mitogen-activated protein kinase pathway in human neutrophils. 1 Biol. Chem. 271. 2832-2838
Ko, Y-C; Mukaida, N; Ishiyama, S; Tokue, A; Kawai, T; Matsushima, K; and Kasahara, T; 1993. Elevated interleukin-8 levels in the urine of patients with urinary tract infections. Infection and Immunity 61. 1307-1314
Koch, M; Witzenrath, M; Reuter, C; Herma, M; Schutte, H; Suttorp, N; Collins, H; and Kaufmann, SHE; 2006. Role of local pulmonary IFN-y expression in murine allergic airway inflammation. Am. J Respir. Cell. MoL Biol. 35. 211-219
Koga, T; 1993. Neutrophilia and high level of interleukin-8 in the bronchoalveolar lavage fluid of diffuse panbronchiolitis. Kurume Med. 1 40. 139-146
Kohno, K; Kataoka, J; Ohtsuki, T; Suemoto, Y; Okamoto, I; Usui, M; Ikeda, M; and Kurimoto, M; 1997. IFN-y-inducing factor (IGIF) is a costimulatory factor on the activation of Thl but not Th2 cells and exerts its effect independently of IL-12. J. Immunol. 158. 1541-1550
281

Kolanus, W; Romeo, C; and Seed, B; 1993. T cell activation by clustered tyrosine kinases. Cell 74. 171-183
Komori, S; Katsumata, M; Greene, MI; and Yui, K; 1993. Frequent deletion of the transgene in T cell receptor beta chain transgenic mice. Int. ImmunoL 5. 161-167
Komori, T; Okada, A; Stewart, V; and Alt, FW; 1993. Lack of N regions in antigen receptor variable region genes of TdT-deficient lymphocytes. Science 261. 1171-1175
Konstan, MW; Hilliard, KA; Norvell, TM; and Berger, M; 1994. Bronchoalveolar lavage findings in cystic fibrosis patients with stable, clinically mild lung disease suggest ongoing infection and inflammation. Am. J Respir. Crit. Care Med. 150. 448-454
Kopf, M; Le Gros, G; Bachmann, M; Lamers, MC; Bluethmann, H; and Kohler, G; 1993. Disruption of the murine IL-4 gene blocks Th2 cytokine responses. Nature 362. 245-248
Kouskoff, V; Signorelli, K; Benoist, C; and Mathis, D; 1995. Cassette vectors directing expression of T cell receptor genes in transgenic mice. Journal of Immunological Methods. 180. 273-280
Krogsgaard, M; Prado, N; Adams, EJ; He, X-I; Chow, D-C; Wilson, DB; Garcia, KC; and Davis, MM; 2003. Evidence that structural rearrangements and / or flexibility during TCR binding can contribute to T cell activation. Mol. Cell 12. 1367-1378
Krug, N; Madden, J; Redington, AE; Lackie, P; Djukanovic, R; Schauer, U; Holgate, ST; Frew, AJ; and Howarth, PH; 1996. T-cell cytokine profile evaluated at the single cell level in BAL and blood in allergic asthma. Am. J Respir. Cell MoL Biol. 14. 319-326
Kruit, A; Grutters, JC; Ruven, HJT; van Moorsel, CHM; Weiskirchen, R; Mengsteab, S; and van den Bosch, JMM; 2006. Transforming growth factor-f3 gene polymorphisms in sarcoidosis patients with and without fibrosis. Chest 129. 1584-1591
Kucharzik, T; Hudson, JT; Lugering, A; Abbas, JA; Bettini, M; Lake, JG; Evans, ME; Ziegler, TR; Merlin, D; Madara, JL; and Williams, IR; 2005. Acute induction of human IL-8 production by intestinal epithelium triggers neutrophil infiltration without mucosal injury. Gut 54. 1565-1572
Kung, TT; Jones, H; Adams, GK; Umland, SP; Kreutner, W; Egan, RW; Chapman, RW; and Watnick, AS; 1994. Characterization of a murine model of allergic pulmonary inflammation. Int. Arch. Allergy ImmunoL 105. 83-90
282

Kuperman, DA; Huang, X; Nguyenvu, L; Holscher, C; Brombacher, F; and Erle, DJ; 2005. IL-4 receptor signaling in clara cells is required for allergen induced mucus production. J Immunol. 175. 3746-3752
Kurashima, K; Mukaida, N; Fujimura, M; Schroder, J-M; Matsuda, T; and Matsushima, K; 1996. Increase of chemokine levels in sputum precedes exacerbation of acute asthma attacks. J Leukoc. Biol. 59. 313-316
Kurdowska, A; Noble, JM; Steinberg, KP; Ruzinski, JT; Hudson, LD; and Martin, TR; 2001. Anti-interleukin 8 autoantibody:interleukin 8 complexes in the acute respiratory distress syndrome. Am. J. Respir. Crit. Care. Med. 163. 463-468
Kurup, VP; Mauze, S; Choi, H; Seymour, BWP; and Coffman, RL; 1992. A murine model of allergic bronchopulmonary aspergillosis with elevated eosinophils and IgE. J. Immunol. 148. 3783-3788
Kurup, VP; Seymour, BW; Choi, H; and Coffman, RL; 1994. Particulate Aspergillus fumigatus antigens elicit a Th2 response in BALB/c mice. J. Allergy Clin. Immunol. 93. 1013-1020
Kwan, J; and Killeen, N; 2004. CCR7 directs the migration of thymocytes into the thymic medulla. J. Immunol. 172. 3999-4007
Lakso, M; Sauer, B; Mosinger, B; Lee, EJ; Manning, RW; Yu, SH; Mulder, KL; and Westphal, H. 1992. Targeted oncogene activation by site-specific recombination in transgenic mice. Proc. Natl. Acad. Sci. USA. 89. 6232-6236
Langrish, CL; Chen, Y; Blumenschein, WM; Mattson, J; Basham, B; Sedgwick, JD; McClanahan, T; Kastelein, RA; and Cua, DJ; 2005. IL-23 drives a pathogenic T cell population that induces autoimmune inflammation. J Exp. Med. 201. 233-240
Lansford, R; Manis, JP; Sonoda, E; Rajewsky, K; and Alt, FW; 1998. Ig heavy chain class switching in rag-deficient mice. Int. Immunol. 10. 325-332
Lanzavecchia, A; Lezzi G; and Viola, A; 1999. From TCR engagement to T cell activation: a kinetic view of T cell behavior. Cell 96. 1-4
Larsen, CG; Anderson, AO; Appella, E; Oppenheim, JJ; and Matsushima, K; 1989. The neutrophil-activating protein (NAP-1) is also chemotactic for T lymphocytes. Science 243. 1464-1466
Lebman, DA; and Coffman, RL; 1988. Interleukin 4 causes isotype switching to IgE in T cell-stimulated clonal B cell cultures..1 Exp. Med. 168. 853-862
Lee, JJ; McGarry, MP; Farmer, SC; Kenzler, KL; Larson, KA; Carrigan, PE; Brenneise, IE; Horton, MA; Haczku, A; Gelfand, EW; Leikauf, GD; and Lee,
283

NA; 1997. Interleukin-5 expression in the lung epithelium of transgenic mice leads to pulmonary changes pathognomonic of asthma. J Exp. Med. 185. 2143-2156
Lee, YL; Fu, CL; Ye, YL; and Chiang, BL; 1999. Administration of interleukin-12 prevents mite Der p 1 allergen-IgE antibody production and airway eosinophil infiltration in an animal model of airway inflammation. Scand. J Immunol. 49. 229-236
Lee, HJ; Takemoto, N; Kurata, H; Kamogawa, Y; Miyatake, S; O'Garra, A; and Arai, N; 2000. GATA-3 induces T helper cell type 2 (Th2) cytokine expression and chromatin remodeling in committed Thl cells. J. Exp. Med. 192. 105-115
Lee, CG; Homer, RJ; Zhu, Z; Lanone, S; Wang, X; Koteliansky, V; Shipley, JM; Gotwals, P; Noble, P; Chen, Q; Senior, RM; and Elisa, JA; 2001. Interleukin-13 induces tissue fibrosis by selectively stimulating and activating transforming growth factor p. J. Exp. Med. 194. 809-821
Lee, DU; Agarwal, S; and Rao, A; 2002. Th2 lineage commitment and efficient IL-4 production involves extended demethylation of the IL-4 gene. Immunity 16. 649-660
Lee, CG; Cho, SJ; Kang, MJ; Chapoval, SP; Lee, PJ; Noble, PW; Yehualaeshet, T; Lu, B; Flavell, RA; Milbrandt, J; Homer, RJ; and Elias, JA; 2004. Early growth response gene-1 mediated apoptosis is essential for transforming growth factor P.-induced pulmonary fibrosis. J Exp. Med. 200. 377-389
Lezzi, G; Scotet, E; Scheidegger, D; and Antonio, L; 1999. The interplay between the duration of TCR and cytokine signalling determines T cell polarization. Eur. J. ImmunoL 29. 4092-4101
Li, Y; Huang, Y; Lue, J; Quandt, JA; Martin, R; and Mariuzza, RA; 2005. Structure of a human antoimmune TCR bound to a myelin basic protein self-peptide and a multiple sclerosis-associated MHC class II molecule. EMBO J 24. 2968-2979
Lin, J; and Weiss, A; 2003. The tyrosine phosphatase CD148 is excluded from the immunologic synapse and down-regulates prolonged T cell signaling. J. Cell Biol. 162. 673-682
Lira, SA; 1996. Genetic approaches to study chemokine function. J. Leuk. Biol. 59. 45-52
Listman, JA; Rimm, IJ; Wang, Y; Geller, M; Tang, JC; Ho, S; Finn, PW; and Perkins, DL; 1996. Plasticity of the T cell receptor repertoire in TCR p-chain transgenic mice. Cellular Immunology 167. 44-55
Liston, A; Lesage, S; Gray, DHD; O'Reilly, LA; Strasser, A; Fahrer, AM; Boyd, RL; Wilson, J; Baxter, AG; Gallo, EM; Crabtree, GR; Peng, K; Wilson, SR; and
284

Goodnow, CC; 2004. Generalised resistance to thymic deletion in the NOD mouse: a Polygenic trait characterized by defective induction of Bim. Immunity 21. 817-830
Lobito, AA; Yang, B; Lopes, MF; Miagkov, A; Adams, RN; Palardy, GR; Johnson, MM; McFarland, HI; Recher, M; Drachman, DB; and Lenardok, MJ; 2002. T cell receptor transgenic mice recognizing the immunodominant epitope of the Torpedo californica acetylcholine receptor. Eur. J. Immunol. 32. 2055-2067
Loetscher, P; Seitz, M; Clark-Lewis, I; Baggiolini, M; and Moser, B; 1996. Activation of NK cells by CC chemokines: chemotaxis, Ca2+ mobilization, and enzyme release. J. Immunol. 156. 322-327
Lois, C; Hong, EJ; Pease, S; Brown, EJ; and Baltimore, D; 2002. Germline transmission and tissue-specific expression of transgenes delivered by lentiviral vectors. Science 295. 868-872
Loonstra, A; Vooijs, M; Beverloo, HB; Allak, BA; van Drunen, E; Kanaar, R; Berns, A; and Jonkers, J; 2001. Growth inhibition and DNA damage induced by Cre recombinase in mammalian cells. Proc. Natl. Acad. Sci. 98. 9209-9214
Lund, T; O'Reilly, L; Hutchings, P; Kanagawa, 0; Simpson, E; Gravely, R; Chandler, P; Dyson, J; Picard, JK; Edwards, A; Kioussis, D; and Cooke, A; 1990. Prevention of insulin-dependent diabetes mellitus in non-obese diabetic mice by transgenes encoding modified I-A I3-chain or normal I-E a chain. Nature. 345. 727-729
Lund, RJ; Loytomaki, M; Naumanen, T; Dixon, C; Chen, Z; Ahlfors, H; Tuomela, S; Tahvanainen, J; Scheinin, J; Henttinen, T; Rasool, 0; and Lahesmaa, R; 2007. Genome-wide identification of novel genes involved in early Thl and Th2 differentiation. J. Immunol. 178. 3648-3660
Lyons, DS; Lieberman, SA; Hampl, J; Boniface, JJ; Chien, Y; Berg, LJ; and Davis, MM; 1996. A TCR binds to antagonist ligands with lower affinities and faster dissociation rates than to agonists. Immunity 5. 53-61
Ma, B; Liu, W; Homer, RJ; Lee, PJ; Coyle, AJ; Lora, JM; Lee, CG; and Elias, JA; 2006. Role of CCR5 in the pathogenesis of IL-13 induced inflammation and remodeling. J. Immunol. 176. 4968-4978
Macatonia, SE; Hosken, NA; Litton, M; Vieira, P; Hsieh, C-S; Culpepper, JA; Wysocka, M; Trinchieri, G; Murphy, KM; and O'Garra, A; 1995. Dendritic cells produce IL-12 and direct the development of Thl cells from naïve CD4+ T cells. .1 Immunol. 154. 5071-5079
285

Madrenas, J; Wange, RL; Wang, JL; Isakov, N; Samelson, LE; and Germain, RN; 1995. Zeta phosphorylation without ZAP-70 activation induced by TCR antagonists or partial agonists. Science 267. 515-518
Magram, J; Connaughton, SE; Warrier, RR; Carvajal, DM; Wu, C; Ferrante, J; Stewart, C; Sarmiento, U; Faherty, DA; and Gately, MK; 1996. IL-12-defieicent mice are defective in IFN-y production and type 1 cytokine responses. Immunity 4. 471-481
Mahler, DA; Huang, S; Tabrizi M; and Bell, GM; 2004. Efficacy and safety of a monoclonal antibody recognizing interleukin-8 in COPD. Chest 126. 926-934
Malherbe, L; Filippi, C; Julia, V; Foucras, G; Moro, M; Appel, H; Wucherpfennig, K; Guery, J-C; and Glaichenhaus, N; 2000. Selective activation and expansion of high affinity CD4+ T cells in resistant mice upon infection with Leishmania major. Immunity 13. 771-782
Manning, TC; Parke, EA; Teyton, L; and Kranz, DM; 1999. Effects of complementarity determining region mutations on the affinity of an a/f3 T cell receptor: measuring the energy associated with CD4/CD8 repertoire skewing. J Exp. Med. 189. 461-470
Marcoval, J; Benitez, MA; Alcaide, F; and Mana, J; 2005. Absence of ribosomal RNA of Mycobacterium tuberculosis complex in sarcoidosis. Arch. Dermatol. 141. 57-59
Marolleau, JP; Fondell, JD; Malissen, M; Trucy, J; Barbier, E; Marcu, KB; Cazenave, PA; and Primi, D; 1988. The joining of germ-line V alpha to J alpha genes replaces the preexisting V alpha-J alpha complexes in a T cell receptor alpha, beta positive T cell line. Cell 55. 291-300
Martich, GD; Danner, RL; Ceska, M; and Suffredini, AF; 1991. Detectioni of interleukin 8 and tumor necrosis factor in normal humans after intravenous endotoxin: the effect of anti-inflammatory agents. I Exp. Med. 173. 1021-1024
Matsui, K; Boniface, JJ; Steffner, P; Reay, PA; and Davis, MM; 1994. Kinetics of T-cell receptor binding to peptide/I-Ek complexes: Correlation of the dissociation rate with T-cell responsiveness. Proc. Natl. Acad. Sci. 91. 12862-12866
Matsui, H; Wagner, VE; Hill, DB; Schwab, UE; Rogers, TD; Button, B; Taylor, RM; Superfine, R; Rubinstein, M; Iglewski, BH; and Boucher, RC; 2006. A physical linkage between cystic fibrosis airway surface dehydration and Pseudomonas aeruginosa biofilms. Proc. Natl. Acad. Sci. 103. 18131-18136
Matsushima, K; Morishita, K; Yoshimura, T; Lavu, S; Kobayashi, Y; Lew, W; Appella, E; Kung, HF; Leonard, EJ; and Oppenheim, JJ. 1988. Molecular cloning
286

of a human monocyte-derived neutrophil chemotactic factor (MDNCF) and the induction of MDNCF mRNA by interleukin 1 and tumor necrosis factor. J. Exp. Med. 167. 1883-1893
Mayerova, D; and Hogquist, KA; 2004. Central tolerance to self-antigen expressed by cortical epithelial cells. J. Immunol. 172. 851-856
Mazza, C; Auphan-Anezin, N; Gregoire, C; Guimezanes, A; Kellengerger, C; Roussel, A; Kearney, A; van der Merwe, PA; Schmitt-Verhulst, A; and Malissen, B; 2007. How much can a T-cell antigen receptor adapt to structurally distinct antigenic peptides. EMBO J 26. 1972-1983
McBlane, JF; van Gent, DC; Ramsden, DA; Romeo, C; Cuomo, CA; Gellert, M; and Oettinger, MA; 1995. Cleavage at a V(D)J recombination signal requires only RAG1 and RAG2 proteins and occurs in two steps. Cell 83. 387-395
McGargill, MA: Derbinski, JM; and Hogquist, KA; 2000. Receptor editing in developing T cells. Nature Immunology 1. 336-341
McHeyzer-Williams, LJ; Panus, JF; Mikszta, JA; and McHeyzer-Williams, MG; 1999. Evolution of antigen-specific T cell receptors in vivo: preimmune and antigen-driven selection of preferred complimentarity-determining region 3 (CDR3) motifs. J Exp.Med. 189. 1823-1837
McHugh, RS; Shevach, EM; Marguiles DH and Natarajan, K; 2001. A T cell receptor transgenic model of severe, spontaneous organ-specific autoimmunity. Eur. J. Immunol. 31. 2094-2103
McMahan, CJ; and Fink, PJ; 1998. RAG Reexpression and DNA recombination at T cell receptor loci in peripheral CD4+ T cells. Immunity 9. 637-647
McMillan, SJ; and Lloyd, CM; 2004. Prolonged allergen challenge in mice leads to persistent airway remodelling. Clin. Exp. Allergy 34. 497-507
Mee, PJ; Turner, M; Basson, AM; Costello, PS; Zamoyska, R; and Tybulewicz, VLJ; 1999. Greatly reduced efficiency of both positive and negative selection of thymocytes in CD45 tyrosine phosphatase-deficient mice. Eur. J. Immunol. 29. 2923-2933
Mehlhop, PD; van de Run, M; Goldberg, AB; Brewer, JP; Kurup, VP; Martin, TR; and Oettgen, HC; 1997. Allergen-induced bronchial hyperreactivity and eosinophilic inflammation occur in the absence of IgE in a mouse model of asthma. Proc. Natl. Acad. Sci. 94. 1344-1349
Mendel, I; Natarajan, K; Ben-Nun, A; and Shevach, EM; 2004. A novel protective model against experimental allergic encephalomyelitis in mice expressing a transgenic
287

TCR-specific for myelin oligodendrocyte glycoprotein. Journal of Neuroimmunology. 149. 10-23
Metzger, D; Clifford, J; Chiba, H; and Chambon, P; 1995. Conditional site-specific recombination in mammalian cells using a ligand-dependent chimeric Cre recombinase. Proc. Natl. Acad. Sci. 92. 6991-6995
Middleton, J; Neil, S; Wintle, J; Clark-Lewis, I; Moore, H; Lam, C; Auer, M; Hub, E; and Rot, A; 1997. Transcytosis and surface presentation of IL-8 by venular endothelial cells. Cell 91. 385-395
Minguet, S; Swamy, M; Alarcon, B; Luescher, IF; and Schamel, WWA; 2007. Full activation of the T cell receptor requires both clustering and conformational changes at CD3. Immunity. 26. 43-54
Mio, T; Romberger, DJ; Thompson, AB; Robbins, RA; Heires, A; and Rennard, SI; 1997. Cigarette smoke induces interleukin-8 release from human bronchial epithelial cells. Am. J Respir. Crit. Care Med. 155. 1770-1776
Mitchell, DN; Rees, RJ; and Goswami, KK; 1976. Transmissible agents from human sarcoid and Crohn's disease tissues. Lancet 2. 761-765
Moller, DR; Forman, JD; Liu, MC; Noble, PW; Greenlee, BM; Vyas, P; Holden, DA; Forrester, JM; Lazarus, A; Wysocka, M; Trinchieri, G; and Karp, C; 1996. Enhanced expression of IL-12 associated with Thl cytokine profiles in active pulmonary sarcoidosis. J. Immunol. 156. 4952-4960
Moller, DR; 2003. Pulmonary fibrosis of sarcoidosis. New approaches, old ideas. Am. J. Respir. Cell Mot Biol. 29. S37-S41
Mombaerts, P; Iacomini, J; Johnson, RS; Herrup, K; Tonegawa, S; and Papaioannou, VE; 1992a. RAG-1 deficient mice have no mature B and T lymphocytes. Cell 68. 869-877
Mombaerts, P; Clarke, AR; Rudnicki, MA; Iacomini, J; Itohara, S; Lafaille, JJ; Wang, L; Ichikawa, Y; Jaenisch, R; and Hooper ML; 1992b. Mutations in T-cell antigen receptor genes alpha and beta block thymocyte development at different stages. Nature. 360. 225-231
Monks, CRF; Freiberg, BA; Kupfer, H; Sciaky, N; and Kupfer, A; 1998. Three-dimensional segregation of supramolecular activation clusters in T cells. Nature 395. 82-86
Montalbano, A; Ogwaro, KM; Tang, A; Matthews, AG; Larijani, M; Oettinger, MA; and Feeney, AJ; 2003. V(D)J recombination frequencies can be profoundly affected by changes in the spacer sequences. J. Immunol. 171. 5296-5304
288

Monticelli, S; and Rao, A; 2002. NFAT1 and NFAT2 are positive regulators of IL-4 gene transcription. Eur. .1 Immunol. 32. 2971-2978
Morohashi, H; Miyawaki, T; Nomura, H; Kuno, K; Murakami, S; Matsushima, K; and Mukaida, N; 1995. Expression of both types of human interleukin-8 receptors on mature neutrophils, monocytes, and natural killer cells. I Leukoc. Biol. 57. 180-187
Mosmann, TR; and Coffman, RL; 1989. Thl and Th2 cells: Different patterns of lymphokine secretion lead to different functional properties. Ann. Rev. Immunol. 7. 145-173
Muhlebach, MS; Stewart, PW; Leigh, MW; and Noah, TL; 1999. Quantitation of inflammatory responses to bacteria in young cystic fibrosis and control patients. Am. J. Respir. Crit. Care Med. 160. 186-191
Muhlebach, MS; Reed, W; Noah, TL; 2004. Quantitative cytokine gene expression in CF airway. Pediatric Pulmonology 37. 393-399
Mul, FPJ; Zuurbier, AEM; Janssen, H; Calafat, J; van Wetering, S; Hiemstra, PS; Roos, D; and Hordijk, PL; 2000. Sequential migration of neutrophils across monolayers of endothelial and epithelial cells. I Leukoc. Biol. 68. 529-537
Muramatsu, M; Sankaranand, VS; Anant, S; Sugai, M; Kinoshita, K; Davidson, NO; and Honjo, T; 1999. Specific expression of activation-induced cytidine deaminase (AID), a novel member of the RNA-editing deaminase family in germinal center B cells. I Biol. Chem. 274. 18470-18476
Murayama, T; Ohara, Y; Obuchi, M; Khabar, K; Higashi, H; Mukaida, N; and Matsushima, K; 1997. Human cytomegalovirus induces interleukin-8 production by a human monocytic cell lines, THP-1, through acting concurrently on AP-1 and NF-xB binding sites of the Interleukin-8 gene. J. Virology 71. 5692-5695
Murphy, KM; Heimberger, AB; and Loh, DY; 1990. Induction by antigen of intrathymic apoptosis of CD4+ CD8+ TCRlo thymocytes in vivo. Science 250. 1720-1723
Murphy, PM; and Tiffany, HL; 1991. Cloning of complementary DNA encoding a functional human interleukin-8 receptor. Science 253. 1280-1283
Murray, JS; Pfeiffer, C; Madri, J; and Bottomly, K; 1992. Major histocompatibility complex (MHC) control of CD4 T cell subset activation. II. A single peptide induces either humoral or cell-mediated responses in mice of distinct MHC genotype. Eur. .1 Immunol. 22. 559-565
289

Mustelin, T; Coggeshall, MK; and Altman A; 1989. Rapid activation of the T-cell tyrosine protein kinase pp56" by the CD45 phosphotyrosine phosphatase. Proc. Natl. Acad. Sci. 86. 6302-6306
Nakagawa, H; Hatakeyama, S; Ikesue, A; and Miyai, H; 1991. Generation of interleukin-8 by plasmin from AVLPR interleukin-8, the human fibroblast derived neutrophil chemotactic factor. FEBS 282. 412-414
Navab, R; Wang, Y; Chow, Y; Wang, A; Jankov, RP; Takamoto, N; Tsai, SY; Tsai, M; Transwell, AK; and Hu, J; 2002. Regulation of Human Clara Cell 10 kD protein expression by chicken Ovalbumin upstream promoter transcription factors (COUP-Tfs) Am. J. Respir. Cell Mot Biol. 27. 273-285
Nicholson, LB; Greer, JM; Sobel, RA; Lees, MB; and Kuchroo, VK; 1995. An altered peptide ligand mediates immune deviation and prevents autoimmune encephalomyelitis. Immunity 3. 397-405
Niederberger, N; Holmberg, K; Alam, SM; Sakati, W; Naramura, M; Gu, H; and Gascoigne, NRJ; 2003. Allelic exclusion of the TCR a-chain is an active process requiring TCR mediated signaling and c-Cbl. J. Immunol. 170. 4557-4563
Nishiwaki, T; Yoneyama, H; Eishi, Y; Matsuo, N; Tatsumi, K; Kimura, H; Kuriyama, T; and Matsushima, K; 2004. Indigenous pulmonary propionibacterium acnes primes the host in the development of sarcoid-like pulmonary granulomatosis in mice. Am. J. Path. 165. 631-639
Nocker, RE; Schoonbrood, DF; van de Graaf, EA; Hack, CE; Lutter, R; Jansen, HM; and Out, TA; 1996. Interleukin-8 in airway inflammation in patients with asthma and chronic obstructive pulmonary disease. Int. Arch. Allergy Immunol. 109. 183-191
Norman, PS; Ohman, JL; Long, AA; Creticos, PS; Gefter, MA; Shaked, Z; Wood, RA; Eggleston, PA; Hafner, KB; Rao, P; Lichtenstein, LM; Jones, NH; and Nicodemus, CF; 1996. Treatment of cat allergy with T-cell reactive peptides. Am. J. Respir. Crit. Care Med. 154. 1623-1628
O'Shea, H; Yousaf, N; Altmann, D; Fehervari, Z; Tonks, P; Hetherington, C; Harach, S; Bland, C; Cooke A; and Lund, T; 2006. Effect of X- and Y- Box Deletions on the Development of Diabetes in H-2Ea-Chain Transgenic Nonobese Diabetic Mice. Scandinavian Journal of Immunology. 63. 17-25
Oestreich, KJ; Cobb, RM; Pierce, S; Chen, J; Ferrier, P; and Oltz, EM; 2006. Regulation of TCR(3 gene assembly by a promoter/enhancer holocomplex. Immunity 24. 381-391
290

Ohshima, Y; Yang, L-P; Uchiyama, T; Tanaka, Y; Baum, P; Sergerie, M; Hermann, P and Delespesse, G; 1998. OX40 costimulation enhances interleukin-4 (IL-4) expression at priming and promotes the differentiation of naive human CD4+ T cells into high IL-4 producing effectors. Blood 92. 3338-3345
Oka, M; Norose, K; Matsushima, K; Nishigori, C; and Herlyn, M; 2006. Overexpression of IL-8 in the cornea induces ulcer formation in the SCID mouse. Br. J Ophthalmol 90. 612-615
Ono, M; Yaguchi, H; Ohkura, N; Kitabayashi, I; Nagamura, Y; Nomura, T; Miyachi, Y; Tsukada, T; and Sakaguchi, S; 2007. Foxp3 controls regulatory T-cell function by interacting with AML1/Runxl. Nature 446. 685-689
Oosterwijk, MF; Juwana, H; Arens, R; Tesselaar, K; van Oers, MHJ; Eldering, E; and van Lier, RAW; 2007. CD27-CD70 interactions sensitise naive CD4+ T cells for IL-12 induced Thl cell development. Int. Immunot 19. 713-718
Pack, RJ; Al-Ugaily, LH; and Morris G; 1981. The cells of the tracheobronchial epithelium of the mouse: a quantitative light and electron microscope study. Journal of Anatomy. 132. 71-84.
Padovan, E; Casorati, G; Dellabona, P; Meyer, S; Brockhaus, M; and Lanzavecchia, A; 1993. Expressioni of two T cell receptor alpha chains: dual receptor T cells. Science 262. 422-424
Padovan, E; Giachino, C; Cella, M; Valitutti, S; Acuto, 0; and Lanzavecchia, A; 1995. Normal T lymphocytes can express two different T cell receptor beta chains: implications for the mechanism of allelic exclusion. J Exp. Med. 181. 1587-1591
Padrines, M; Wolf, M; Walz, A; and Baggiolini, M; 1994. Interleukin-8 processing by neutrophil elastase, cathepsin G and proteinase-3. FEBS Letters. 352. 231-235
Pai, S; Truitt, M; and Ho, I-C; 2004. GATA-3 deficiency abrogates the development and maintenance of T helper type 2 cells. Proc. Natl. Acad. Sci. 101. 1993-1998
Palmiter, RD; Brinster, RL; Hammer, RE; Trumbauer, ME; Rosenfeld, MG; Brinberg, NC; and Evans, RM; 1982. Dramatic growth of mice that develop from eggs microinjected with metallothionein-growth hormone fusion genes. Nature 300. 611-615
Pannetier, C; Cochet, M; Darche, S; Casrouge, A; Zoller, M; and Kourilsky, P; 1993. The sizes of the CDR3 hypervariable regions of the murine T-cell receptor l chains vary as a function of the recombined germ-line segments. Proc. Natl. Acad. Sci. USA. 90. 4319-4323.
291

Park, H; Li, Z; Yang, ZO; Chang, SH; Nurieva, R; Wang, Y-H; Wang, Y; Hood, L; Zhu, Z; Tian, Q; and Dong, C; 2005. A distinct lineage of CD4 T cells regulates tissue inflammation by producing interleukin 17. Nature Immunology 6. 1133-1141
Park, JH; Chang, HS; Park, C-S; Jang, A-S; Park, BL; Rhim, TY; Uh, S-T; Kim, YH; Chung, IY; and Shin, HD; 2007. Association analysis of CD40 polymorphisms with asthma and the level of serum total IgE. Am. I Respir. Crit. Care Med. 175. 775-782
Patton, SE; Gilmore, LB; Jetten, AM; Nettesheim, P; and Hook, GE; 1986. Biosynthesis and release of proteins by isolated pulmonary Clara cells. Exp. Lung Res. 11. 277-294
Paust, S; Lu, L; McCarty, N; and Cantor, H; 2004. Engagement of B7 on effector T cells by regulatory T cells prevents autoimmune disease. Proc. Natl. Acad. Sci. 101. 10398-10403
Peng, SL; Gerth, AJ; Ranger, AM; and Glimcher, LH; 2001. NFATcl and NFATc2 together control both T and B cell activation and differentiation. Immunity. 14. 13-20
Perez, A; Issler, AC; Cotton, CU; Kelley, TJ; Verkman, AS; and Davis, PB; 2007. CFTR inhibition mimics the cystic fibrosis inflammatory profile. Am. J. Physiol. Lung Cell Mol. Physiol. 292. L383-L395
Pfeiffer, C; Stein, J; Southwood, S; Ketelaar, H; Sette, A; and Bottomly, K; 1995. Altered peptide ligands can control CD4 T lymphocyte differentiation in vivo. J. Exp. Med. 181. 1569-1574
Pignatti, P; Moscato, G; Casarini, S; Delmastro, M; Poppa, M; Brunetti, G; Pisati, P; and Balbi, B; 2005. Downmodulation of CXCL8/IL-8 receptors on neutrophils after recruitment in the airways. I Allergy Clin. Immunol. 115. 88-94
Porter, CM; and Clipstone, NA; 2002. Sustained NFAT signaling promotes a Thl - like pattern of gene expression in primary murine CD4+ T cells. I Immunol. 168. 4936-4945
Punnonen, J; Aversa, G; Cocks, BG; McKenzie, ANJ; Menon, S; Zurawski, G; de waal Malefyt, R; and de Vries, JE; 1993. Interleukin 13 induces interleukin 4 independent IgG4 and IgE synthesis and CD23 expressiono by human B cells. Proc. Natl. Acad. Sci. 90. 3730-3734
Rajarathnam, K; Sykes, BD; Kay, CM; Dewald, B; Geiser, T; Baggiolini, M; and Clark-Lewis, I; 1994. Neutrophil activation by monomeric interleukin-8. Science 264. 90-92
292

Randolph, DA; Carruthers, CJL; Szabo, SJ; Murphy, KM; and Chaplin, DD; 1999. Modulation of airway inflammation by passive transfer of allergen-specific Thl and Th2 cells in a mouse model of asthma. J Immunol. 162. 2375-2383
Ranger, AM; Oukka, M; Rengarajan, J; and Glimcher, LH; 1998a. Inhibitory function of two NFAT family members in lymphoid homeostasis and Th2 development. Immunity 9. 627-635
Ranger, AM; Hodge, MR; Gravallesse, EM; Oukka, M; Davidson, L; Alt, FW; de la Brousse, FC; Hoey, T; Grusby, M; and Glimcher, LH; 1998b. Delayed lymphoid repopulation with defects in IL-4 driven responses produced by inactivation of NF-ATc. Immunity 8. 125-134
Rankin, JA; Picarella, DE; Geba, GP; Temann, UA; Prasad, B; DiCosmo, B; Tarallo, A; Stripp, B; Whitsett, J; and Flavell, RA; 1996. Phenotypic and physiologic characterisation of transgenic mice expressing interleukin 4 in the lung; Lymphocytic and eosinophilic inflammation without airway hyperreactivity. Proc. Natl. Acad. Sci. USA. 93. 7821-7825.
Rathmell, JC; Lindsten, T; Zong, W; Cinalli, RM; and Thompson, CB; 2002. Deficiency in Bak and Bax perturbs thymic selection and lymphoid homeostasis. Nature Immunology 3. 932-939
Raulet, DH; Garman, RD; Saito, H; and Tonegawa, S; 1985. Developmental regulation of T-cell receptor gene expression. Nature 314. 103-107
Redecke, V; Hacker, H; Datta, SK; Fermin, A; Pitha, PM; Broide, DH; and Raz, E; 2004. Activation of Toll-like receptor 2 induces a Thl immune response and promotes experimental asthma. J. Immunol. 172. 2739-2743
Reich, Z; Boniface, JJ; Lyons, DS; Borochov, N; Wachtel, EJ; Davis, MM; 1997. Ligand-specific oligomerization of T-cell receptor molecules. Nature 387. 617-620
Reinhard, C; Eder, G; Fuchs, H; Ziesenis, A; Heyder, J; and Schulz, H; 2002. Inbred strain variation in lung function. Mammalian Genome 13. 429-437
Reinherz, EL; Tan, K; Tang, L; Kern, P; Liu, J; Xiong, Y; Hussey, RE; Smolyar, A; Hare, B; Zhang, R; Joachimlak, A; Chang, H; Wagner, G; and Wang, J; 1999. The crystal structure of a T cell receptor in complex with peptide and MHC class II. Science 286. 1913-1921
Reiser, H; Freeman, GJ; Razi-Wolf, Z; Gimmi, CD; Benacerraf, B; and Nadler, LM; 1992. Murine B7 antigen provides an efficient costimulatory signal for activation of murine T lymphocytes via the T-cell receptor/CD3 complex. Proc. Natl. Acad. Sci. 89. 271-275
293

Reiser, J; Gergoire, C; Darnault, C; Mosser, T; Guimezanes, A; Schmitt-Verhulst, A; Fontecilla-Camps, JC; Mazza, G; Malissen, B; and Housset, D; 2002. A T cell receptor CDR3 (3 loop undergoes conformational changes of unprecedented magnitude upon binding to a peptide/MHC class I complex. Immunity 16. 345-354
Reiser, J; Darnault, C; Gregoire, C; Mosser, T; Mazza, G; Kearney, A; van der Mervwe, PA; Fontecilla-Camps, JC; Housset, D; and Malissen, B; 2003. CDR3 loop flexibility contributes to the degeneracy of TCR recognition. Nature Immunology 4. 241-247
Remick, DG; Green, LB; Newcomb, DE; Garg, SJ; Bolgos, GL; and Call, DR; 2001. CXC chemokine redundancy ensures local neutrophil recruitment during acute inflammation. Am. J. Path. 159. 1149-1157
Richman-Eisenstat, JBY; Jorens, PG; Hebert, CA; Ueki, I; and Nadel, JA; 1993. Interleukin-8: an important chemoattractant in sputum of patients with chronic inflammatory airway diseases. Am. J Physiol. 264. L413-L418
Risueno, RM; van Santen, HM; and Alarcon, B; 2006. A conformational change senses the strength of T cell receptor-ligand interaction during thymic selection. Proc. Natl. Acad. Sci. 103. 9625-9630
Ritchie, WA; Neil, C; King, T; Bruce, C; and Whitelaw, A; 2007. Transgenic embryos and mice produced from low titre lentiviral vectors. Transgenic Res. (online ahead of print)
Robertson, G; Garrick, D; Wu, W; Kearns, M; Martin, D; and Whitelaw, E; 1995. Position-dependent variegation of globin transgene expression in mice. Proc. Natl. Acad. ScL 92. 5371-5375
Robinson, DS; Hamid, Q; Ying, S; Tsicopoulos, A; Barkans, J; Bentley, AM; Corrigan, C; Durham, DR; and Kay, AB; 1992. Predominant Th2 like bronchoalveolar T-lymphocyte population in atopic asthma. N Eng. J Med. 326. 298-304
Rogers, DF; 1994. Airway goblet cells: responsive and adaptable front-line defenders. EurRespir. J 7. 1690-1706
Rojas, M; Woods, CR; Mora, AL; Xu, J; Brigham, KL; 2005. Endotoxin-induced lung injury in mice: structural, functional and biochemical responses. Am. J Physiol. Lung Cell MoL Physiol. 288. L333-L341
Rot, A; 1991. Chemotactic potency of recombinant human neutrophil attractant / activation protein-1 (Interleukin-8) for polymorphonuclear leukocytes of different species. Cytokine. 3. 21-27
294

Roth, DB; Nakajima, PB; Menetski, JP; Bosma, MJ; and Gellert, M; 1992. V(D)J recombination in mouse thymocytes: Double-strand breaks near T cell receptor 8 rearrangement signals. Cell 69. 41-53
Ruiz, M; Giudicelli, V; Ginestoux, C; Stoehr, P; Robinson, J; Bodmer, J; Marsh, SGE; Bontrop, R; Lemaitre, M; Lefranc, G; Chaume, D; and Lefranc, M; 2000. IMGT, the international ImMunoGeneTics database. Nuc. Acids Res. 28. 219-221
Saint-Ruf, C; Ungewiss, K; Groettrup, M; Bruno, L; Fehling, HJ; and von Boehmer, J; 1994. Analysis and expression of a cloned pre-T cell receptor gene. 266. 1208-1212
Sakaguchi, S; Sakaguchi, N; Asano, M; Itoh, M; and Toda, M; 1995. Immunologic self tolerance maintained by activated T cells expressing IL-2 receptor a chains (CD25). J. Immunol. 155. 1151-1164
Salmon, P; Boyer, 0; Lores, P; Jami, J; and Klatzmann, D; 1996. Characterization of an intronless CD4 minigene expressed in mature CD4 and CD8 T cells, but not expressed in immature thymocytes..1 Immunol. 156. 1873-1879
Samanta, AK; Oppenheim, JJ; and Matsushima, K; 1990. Interleukin 8 (Monocyte derived neutrophil chemotactic factor) dynamically regulates its own receptor expression on human neutrophils. J. Biol. Chem. 265. 183-189
Samelson, LE; Harford, JB; and Klausner, RD; 1985. Identification of the components of the murine T cell antigen receptor complex. Cell 43. 223-231
Sant'Angelo, DB; Cresswell, P; Janeway, CD; and Denzin, LK; 2001. Maintenance of TCR clonality in T cells expressing genes for two TCR heterodimers. Proc. Natl. Acad. Sci. 98. 6824-6829
Sarukhan, A; Garcia, C; Lanoue, A; and von Boehmer, H; 1998. Allelic inclusion of T cell receptor a genes poses an autoimmune hazard due to low level expression of autospecific receptors. Immunity 8. 563-570
Scapini, P; Carletto, A; Nardelli, B; Calzetti, F; Roschke, V; Mergio, F; Tamassia, N; Pieropan, S; Biasi, 0; Sbarbati, A; Sozzani, S; Bambara, L; and Cassatella, MA; 2005. Proinflammatory mediators elicit secretion of the intracellular B lymphocyte stimulator pool (BLys) that is stored in activated neutrophils: implications for inflammatory diseases. Blood 105. 830-837
Schamel, WWA; Arechaga, I; Risueno, RM; van Santen, HM; Cabezas, P; Risco, C; Valpuesta, JM; and Alarcon, B; 2005. Coexistence of multivalent and monovalent TCRs explains high sensitivity and wide range of response. J. Exp. Med. 202. 493-503
295

Schilham, MW; Fung-Leung, WP; Rahemtulla, A; Kuendig, T; Zhang, L; Potter, J; Miller, RG; Hengartner, H; and Mak, TW; 1993. Alloreactive cytotoxic T cells can develop and function in mice lacking both CD4 and CD8. Eur. J. Immunol. 23. 1299-1304
Schmekel, B; Karlsson, SE; Linden, M; Sundstrom, C; Tegner, H; and Venge, P; 1990. Myeloperoxidase in human lung lavage. I. A marker of local neutrophil activity. Inflammation. 14. 447-454
Schmidt-Supprian, M; Tian, J; Grant, EP; Pasparakis, M; Maehr, R; Ovaa, H; Ploegh, HL; Coyle, AJ; and Rajewsky, K; 2004. Differential dependence of CD4+CD25+ regulatory and natural killer-like T cells on signals leading to NF-KB activation. Proc. Natl. Acad. Sci. 101. 4566-4571
Schmielau, J; and Finn, OJ; 2001. Activated granulocytes and granulocyte-derived hydrogen peroxide are the underlying mechanism of suppression of T-cell function in advanced cancer patients. Cancer Research. 61. 4756-4760
Schmitt, E; Hoehn, P, Huels, C; Goedert, S; Palm, N; Rude, E; and Germann, T; 1994. T helper type 1 development of naïve CD4+ T cells requires the coordinate action of interleukin-12 and interferon-gamma and is inhibited by transforming growth factor-beta. Eur. J. Immunol. 24. 793-798
Schroder, J; Mrowietz. U; Morita, E; and Christophers, E; 1987. Purification and partial biochemical characterization of a human monocyte-derived, Neutrophil-activating peptide that lacks interleukin 1 activity. I Immunol. 139. 3474-3483
Secrist, JP; Burns, LA; Karnitz, L; Koretzky, GA; and Abraham, RT; 1993. Stimulatory effects of the protein tyrosine phosphatase inhibitor, pervanadate, on T-cell activation events. J. Biol.Chem. 268. 5886-5893
Segal, DM; Taurog, JD; and Metzger, H; 1977. Dimeric immunoglobulin E serves as a unit signal for mast cell degranulation. Proc. Natl. Acad. Sci. 74. 2993-2997
Seidman, JG; Nau, MM; Norman, B; Kwan, S-P; Scharff, M; and Leder, P; 1980. Immunoglobulin V/J recombination is accompanied by deletion of joining site and variable region segments. Proc. Natl. Acad. Sci. 77. 6022-6026
Serfling, E; Barthelmas, R; Pfeuffer, I; Schenk, B; Zarius, S; Swoboda, R; Mercurio, F; and Karin, M; 1989. Ubiquitous and lymphocyte-specific factors are involved in the induction of the mouse interleukin 2 gene in T lymphocytes. EMBO J. 8. 465-473
296

Shao, MXG; and Nadel, JA; 2005. Neutrophil elastase induces MUC5AC mucin production in human airway epithelial cells via a cascade involving protein kinase C, reactive oxygen species, and TNF-a-converting enzyme. J Immunol. 175. 4009-4016
Shaw, JP; Utz, PJ; Durand, DB; Toole, JJ; Emmel, EA; and Crabtree, GR; 1988. Identification of a putative regulator of early T cell activation genes. Science 241. 202-205
Shijubo, N; Itoh, Y; Shigehara, K; Yamaguchi, T; Itoh, K; Shibuya, Y; Takahashi, R; Ohchi, T; Ohmichi, M; Hiraga, Y; and Abe, S; 2000. Association of Clara cell 10-kDa protein, spontaneous regression and sarcoidosis. Eur. Respir. J 16. 414-419
Shimoda, K; van Deursen, J; Sangster, MY; Sarawar, SR; Carson, RT; Tripp, RA; Chu, C; Quelle, FW; Nosaka, T; Vignali, DA; Doherty, PC; Grosveld, G; Paul, WE; and Ihle, JN; 1996. Lack of IL-4 induced Th2 response and IgE class switching in mice with disrupted Stat6 gene. Nature 380. 630-633
Shinkai, Y; Rathbun, G; Lam, KP; Oltz, EM; Stewart, V; Mendelsohn, M; Charron, J; Datta, M; Young, F; and Stall, AM; 1992. RAG-2 deficient mice lack mature lymphocytes owing to ability to initate V(D)J rearrangement. Cell 68. 855-867
Shinkai, Y; Koyasu, S; Nakayama, K; Murphy, KM; Loh, DY; Reinherz, EL; and Alt, FW; 1993. Restoration of T cell development in RAG-2 deficient mice by functional TCR transgenes. Science 259. 822-825
Sigurs, N; Gustafsson, PM; Bjarnason, R; Lundberg, F; Schmidt, S; Sigurbergsson, F; and Kjellman, B; 2005. Severe respiratory syncytial virus bronchiolitis in infancy and asthma and allergy at age 13. Am. J. Respir. Crit. Care Med. 171. 137-141
Sime, PJ; Xing, Z; Graham, FL; Csaky, KG; and Gauldie, J; 1997. Adenovector-mediated gene transfer of active transforming growth factor pi induces prolonged severe fibrosis in rat lung. J. Clin. Invest. 100. 768-776
Simonet, WS; Hughes, TM; Nguyen, HQ; Trebasky, LD; Danllenko, DM; and Medlock, ES; 1994. Long-term impaired neutrophil migration in mice overexpressing interleukin-8. J. Clin. Invest. 94. 1310-1319
Singer, M; and Sansonetti, PJ; 2004. IL-8 is a key chemokine regulating neutrophil recruitment in a new mouse model of Shigella-induced colitis. J. Immunol. 173. 4197-4206
Sisson, TH; Hansen, JM; Shah, M; Hanson, KE; Du, M; Ling, T; Simon, RH; and Christensen, PJ; 2006. Expression of the reverse tetracycline transactivator gene causes emphysema-like changes in mice. Am. J Respir. Cell MoL Biol. 34. 552-560
297

Sloan-Lancaster, J; Shaw, AS; Rothbard, JB; and Allen, PM; 1994. Partial T cell signalling: altered phospho-zeta and lack of zap70 recruitment in APL-induced T cell anergy. Cell 79. 913-922
Sloane, AJ; Linder, RA; Prasad, SS; Sebastian, LT; Pedersen, SK; Robinson, M; Bye, PT; Nielson, DW; and Harry, JL; 2005. Proteomic analysis of sputum from adults and children with cystic fibrosis and from control subjects. Am. J Respir. Crit. Care. Med. 172. 1416-1426
Song, Z; Marzilli, L; Greenlee, BM; Chen, ES; Silver, RF; Askin, FB; Teirstein, AS; Zhang, Y; Cotter, RJ; and Moller, DR; 2005. Mycobacterial catalase-peroxidase is a tissue antigen and target of the adaptive immune response in systemic sarcoidosis. J. Exp. Med. 201. 755-767
Sospedra, M; Ferrer-Francesch, X; Dominguez, 0; Juan, M; Foz-Sala, M; and Pujoll-Borrell, R; 1998. Transcription of a broad range of self-antigens in human thymus suggests a role for central mechanisms in tolerance toward peripheral antigens. J. Immunol. 161. 5918-5929
Speir, JA; Stevens, J; Joly, E; Butcher, GW; and Wilson, IA; 2001. Two different, highly exposed, bulged structures for an unusually long peptide bound to rat MHC class I RT1-A. Immunity 14. 81-92
Spiotto, MT; Reth, MA; and Schreiber, H; 2003. Genetic changes occurring in established tumors rapidly stimulate new antibody responses. Proc. Natl. Acad. Sci. 100. 5425-5430
Sporri, R; and e Sousa, CR; 2002. Self peptide/MHC class I complexes have a negligible effect on the response of some CD8+ T cells to foreign antigen. Eur. J. Immunol. 32. 3161-3170
Stern, LJ; and Wiley, DC; 1994. Antigenic peptide binding by class I and class II histocompatibility proteins. Structure 2. 245-251
Stoll, S; Delon, J; Brotz, TM; and Germain, RN; 2002. Dynamic imaging of T cell-dendritic cell interactions in lymph nodes. Science 296. 1873-1876
Straus, DB; and Weiss, A; 1992. Genetic evidence for the involvement of the lck tyrosine kinase in signal transduction through the T cell antigen receptor. Cell 70. 585-593
Stricter, RM; Polverini, PJ; Kunkel, SL; Arenberg, DA; Burdick, MD; Kasper, J; Dzuiba, J; Van Damme, J; Walz, A; Marriott, D; Chan, S-Y; Roczniak, S; and Shanafelt, AB; 1995. The functional role of the ELR motif in CXC chemokine-mediated angiogenesis. J. Biol. Chem. 270. 27348-27357
298

Stripp, BR; Sawaya, PL; Luse, DS; Wikenheiser, KA; Wert, SE; Huffman, JA; Lattier, DL; Singh, G; Katyal, SL; and Whitsett, JA; 1992. cis- Acting Elements That Confer Lung Epithelial Cell Expression of the CCio Gene. I Biol. Chem. 267. 14703-14712
Sugiyama, S; Kohyama, M; Oda, M; Azuma, T; Wither, JE; and Hozumi, N; 2004. Molecular basis of antigen recognition by insulin specific T cell receptor. Immunol. Letters 91. 133-139
Suri-Payer, E; and Cantor, H; 2001. Differential cytokine requirements for regulation of autoimmune gastritis and colitis by CD4+ CD25+ T cells. I Autoimmunity 16. 115-123
Sussman, JJ; Bonifacino, JS; Lippincott-Schwartz, J; Weissman, AM; Saito, T; Klausner, RD; and Ashwell, JD; 1988. Failure to synthesize the T cell CD3-zeta chain: structure and function of a partial T cell receptor complex. Cell 52. 85-95
Suzuki, I; Hizawa, N; Yamaguchi, E; and Kawakami, Y; 2000. Association between a C+33T polymorphism in the IL-4 promoter region and total serum IgE levels. Clin. Exp. Allergy 30. 1746-1749
Sykulev, Y; Brunmark, A; Jackson, M; Cohen, RJ; Peterson, PA; and Eisen, HN; 1994. Kinetics and affinity of reactions between an antigen-specific T cell receptor and peptide-MHC complexes. Immunity 1. 15-22
Sykulev, Y; Joo„M; Vturina, I; Tsomides, TJ; and Eisen, HN; 1996. Evidence that a single peptide-MHC complex on a target cell can elicit a cytolytic T cell response. Immunity 4. 565-571
Szabo, SJ; Kim, ST; Costa, GL; Zhang, X; Fathman, CG; and Glimcher, LH; 2000. A novel transcription factor, T-bet, directs Thl lineage commitment. Cell 100. 655-669
Szymczak, AL; Workman, CJ; Gil, D; Dilioglou, S; Vignali, KM; Palmer, E; and Vignali, DAA; 2005. The CD3E proline-rich sequence, and its interaction with Nck, is not required for T cell development and function. J. Immunol. 175. 270-275
Taboit-Dameron, F; Malassagne, B; Viglietta, C; Puissant, C; Leroux-Coyau, M; Chereau, C; Attal, J; Weill, B; and Houdebine, L-M; 1999. Association of the 5'HS4 sequence of the chicken P-globin locus control region with human EF la gene promoter induces ubiquitous and high expression of human CD55 and CD59 cDNAs in transgenic rabbits. Transgenic Research 8. 223-235
299

Takacs, K; Douek, DC; and Altmann, DM; 1995. Exacerbated autoimmunity associated with a T helper-1 cytokine profile shift in H-2E transgenic mice. Eur. J. Immunol. 25. 3134-3141
Takagi, H; Hiroi, T; Yang, L; Tada, Y; Yuki, Y; Takamura, K; Ishimitsu, R; Kawauchi, H; Kiyono, H; and Takaiwa, F; 2005. A rice based edible vaccine expressing multiple T cell epitopes induces oral tolerance for inhibition of Th2-mediated IgE responses. Proc. Natl. Acad Sci. 102. 17525-17530
Takhar, P; Corrigan, CJ; Smurthwaite, L; O'Connor, BJ; Durham, SR; Lee, TH; and Gould, HJ; 2007. Class switch recombination to IgE in the bronchial mucosa of atopic and nonatopic patients with asthma. J. Allergy Clin. Immunol. 119. 213-218
Takizawa, H; Ohtoshi, T; Kawasaki, S; Kohyama, T; Desaki, M; Kasama, T; Kobayashi, K; Nakahara, K; Yamamoto, K; Matsushima, K; and Kudoh, S; 1999. Diesel exhaust particles induce NF-KB activation in human bronchial epithelial cells in vitro: Importance in cytokine transcription. J. Immunol. 162. 4705-4711
Tao, X; Grant, C; Constant, S; and Bottomly, K; 1997. Induction of IL-4 producing CD4÷ T cells by antigenic peptides altered for TCR binding. J. Immunol. 158. 4237-4244
Taubert, R; Schwendermann, J; and Kyewski, B; 2007. Highly variable expression of tissue restricted self-antigens in human thymus: Implications for self tolerance and autoimmunity. Eur. J. Immunol. 37. 838-848
Temann, UA; Prasad, B; Gallup, MW; Basbaum, C; Ho, SB; Flavell, RA; and Rankin, JA; 1997. A novel role for murine IL-4 in vivo: induction of MUC5AC gene expression and mucin hypersecretion. Am. J. Respir. Cell Mol. Biol. 16. 471-478
Temann, UA; Geba, GP; Rankin, JA; and Flavell, RA; 1998. Expression of interleukin 9 in the lungs of transgenic mice causes airway inflammation, mast cell hyperplasia, and bronchial hyperresponsiveness. J. Exp. Med. 188. 1307-1320
Thierfelder, WE; van Deursen, JM; Yamamoto, K; Tripp, RA; Sarawar, SR; Carson, RT; Sangster, MY; Vignali, DA; Doherty, PC; Grosveld, GC and Ihle, JN; 1996. Requirement for Stat4 in interleukin-12 mediated responses of natural killer and T cells. Nature 382. 171-174
Thompson, AB; Bohling, T; Payvandi, F; and Rennard, SI; 1990. Lower respiratory tract lactoferrin and lysozyme arise primarily in the airways and are elevated in association with chronic bronchitis. .1 Lab Clin. Med. 115. 148-158
Thompson, C; Cloutier, A; Bosse, Y; Thivierge, M; Le Gouill, C; Larivee, P; McDonald, PP; Stankova, J; and Rola-Pleszczynski, M; 2006. CysLT1 receptor
300

engagement inducese activator protein-1 and NF-KB dependent IL-8 expression. Am. J. Respir. Cell Mol. Biol. 35. 697-704
Tonics, NK; Charbonneau, H; Diltz, CD; Fisher, EH; and Walsh, KA; 1988. Demonstration that the leukocyte common antigen CD45 is a protein tyrosine phosphatase. Biochemistry 27. 8695-8701
Trautmann, A; and Randriamampita, C; 2003. Initiation of TCR signalling revisited. Trends in Immunology. 24. 425-428
Trautmann, L; Rimbert, M; Echasserieau, K; Saulquin, X; Neveu, B; Dechanet, J; Cerundolo, V; and Bonneville, M; 2005. Selection of T cell clones expressing high-affinity public TCRs within human cytomegalovirus-specific CD8 T cell responses. J. Immunol. 175. 6123-6132
Trembleau, S; Germann, T; Gately, MK; and Adorini, L; 1995. The role of IL-12 in the induction of organ-specific autoimmune diseases. Immunology Today 16. 383-386
Tripathi, R; Jackson, A; and Krangel, MS; 2002. A change in the structure of 1/13 chromatin associated with TCR p allelic exclusion. J. Immunol. 168. 2316-2324
Trop, S; Rhodes, M; Wiest, DL; Hugo, P; and Zuniga-Pflucker, JC; 2000. Competitive displacement of pTa by TCR a during TCR assembly prevents surface coexpression of Pre-TCR and a13 TCR. J. Immunol. 165. 5566-5572
Troughton, PR; Platt, R; Bird, H; el-Manzalawi, E; Bassiouni, M; and Wright, V; 1996. Synovial fluid interleukin-8 and neutrophil function in rheumatoid arthritis and seronegative polyarthritis. Br. J. Rheumatol. 35. 1244-1251
Tsai, WC; Strieter, RM; Wilkowski, JM; Bucknell, KA; Burdick, MD; Lira, SA; and Standiford, TJ; 1998. Lung-specific Transgenic expression of KC enhances resistance to Klebsiella pneumoniae in mice. J Immunol. 161. 2435-2440
Tsai, WC; Strieter, RM; Mehrad, B; Newstead, MW; Zeng, X; and Standford, TJ; 2000. CXC chemokine receptor CXCR2 is essential for protective innate host response in murine Pseudomonas aeruginosa pneumonia. Infection and Immunity 68. 4289-4296
Turner, SJ; Cose, SC; and Carbone, FR; 1996. TCR a chain usage can determine antigen-selected TCR p chain repertoire diversity. J. Immunol. 157. 4979-4985
Tynan, FE; Burrows, SR; Buckle, AM; Clements, CS; Borg, NA; Miles, JJ; Beddoe, T; Whisstock, JC; Wilce, MC; Silins, SL; Burrows, JM; Kjer-Nielsen, L; Kostenko, L; Purcell, AW; McCluskey, J; and Rossjohn, J; 2005. T cell receptor
301

recognition of a "super-bulged" major histocompatibility complex class I-bound peptide. Nature Immunology 11. 1114-1122
Uematsu, Y; Ryser, S; Dembic, Z; Borgulya, P; Krimpenfort, P; Berns, A; von Boehmer, H; and Steinmetz, M; 1988. In transgenic mice the introduced functional T cell receptor beta gene prevents expression of endogenous beta genes. Cell 52. 831-841
Underhill, DM; Ozinsky, A; Smith, KD; and Aderem A; 1999. Toll-like receptor -2 mediates mycobacteria-induced proinflammatory signalling in macrophages. Proc. Natl. Acad. Sci. 96. 14459-14463
Usui, T; Preiss, JC; Kanno, Y; Yao, ZJ; Bream, JH; O'Shea, JJ; and Strober, W; 2006. T-bet regulates Thl responses through essential effects on GATA-3 function rather than on IFNG gene acetylation and transcription. J Exp. Med. 203. 755-766
Vaitaitis, GM; Poulin, M; Sanderson, RJ; Haskins, K; and Wagner, DH; 2003. CD40 induced expression of recombination activating gene (RAG) 1 and RAG2: A mechanism for the generation of autoaggressive T cells in the periphery. J. Immunol. 170. 3455-3459
van der Merwe, PA; Davis, SJ; Shaw, AS; and Dustin, ML; 2000. Cytoskeletal polarization and redistribution of cell-surface molecules during T cell antigen recognition. Sem. Immunol. 12. 5-21
van Gent, DC; Ramsden, DA; and Gellert, M; 1996. The RAG1 and RAG2 proteins establish the 12/23 rule in V(D)J recombination. Cell 85. 107-113
van Gisbergen, K; Sanchez-Hernandez, M; Geijtenbeek, T; and van Kooyk, Y; 2005. Neutrophils mediate immune modulation of dendritic cells through glycosylation-dependent interactions between Mac-1 and DC-SIGN. J. Exp. Med. 201. 1281-1292
Vowles, C; Chan, VSF; and Bodmer, HC; 2000. Subtle Effects on Myelin Basic Protein-Specific T Cell Responses Can Lead to a Major Reduction in Disease Susceptibility in Experimental Allergic Encephalomyelitis. J Immunol. 165. 75-82
Walker, DG; Link, J; Lue, L-F; Dalsing-Hemandez, JE; and Boyes, BE; 2006. Gene expression changes by amyloid (3 peptide-stimulated human postmortem brain microglia identify activation of multiple inflammatory processes. J. Leukoc. Biol. 79. 596-610
Wallace, WAH; Ramage, EA; Lamb, D; and Howie, SEM; 1995. A type2 (Th2-like) pattern of immune response predominates in the pulmonary interstitium of patients with cryptogenic fibrosing alveolitis (CFA). Clin. Exp. Immunol. 101. 436-441
302

Walz, A; Peveri, P; Aschauer, H; and Baggiolini, M; 1987. Purification and amino acid sequencing of NAF, a novel neutrophil-activating factor produced by monocytes. Biochem. Biophys. Res. Commun. 149. 755-761
Wang, J; Wakeham, J; Harkness, R; and Xing, Z; 1999. Macrophages are a significant source of type 1 cytokines during mycobacterial infection. J. Clin. Invest. 103. 1023-1029
Wang, Z; Zheng, T; Zhu, Z; Homer, RJ; Riese, RJ; Chapman, HA; Shapiro, SD; and Elias, JA; 2000. Interferon y induction of pulmonary emphysema in the adult murine lung. J. Exp. Med. 192. 1587-1599
Weaver, CT; Pingel, JT; Nelson, JO; and Thomas, ML; 1991. CD8 T cell clones deficient in the expression of the CD45 protein tyrosine phosphatase have impaired responses to T cell receptor stimuli. Mol. Cell. Biol. 11. 4415-4422
Wedderburn, LR; O'Hehir, RE; Hewitt, CR; and Lamb, JR; 1993. In vivo clonal dominance and limited T cell receptor usage in human CD4+ T cell recognition of house dust mite allergens. Proc. Natl. Acad Sci. 90. 8214-8218
Whitehurst, CE; Schlissel, MS; and Chen, J; 2000. Deletion of germline promoter PD[31 from the TCR13 locus causes hypermethylation that impairs D[31 recombination by multiple mechanisms. Immunity. 13. 703-714
Wiekowski, MT; Leach, MW; Evans, EW; Sullivan, L; Chen, S-C; Vassileva, G; Bazan, JF; Gorman, DM; Kastelein, RA; Narula, S; and Lira, SA; 2001a. Ubiquitous transgenic expression of the IL-23 subunit p19 induces multiorgan inflammation, runting, infertility, and premature death. J. Immunol. 166. 7563-7570
Wiekowski, MT; Chen, S-C; Zalamea, P; Wilburn, BP; Kinsley, DJ; Sharif, WW; Jensen, KK; Hedrick, JA; Manfra, D; and Lira, SA; 2001b. Disruption of neutrophil migration in a conditional transgenic model: Evidence for CXCR2 densensitization in vivo. J. Immunol. 167. 7102-7110
Wilcox, BE; Gao, GF; Wyer, JR; Ladbury, JE; Bell, JI; Jakobsen, BK; and van der Merwe, PA; 1999. TCR binding to peptide-MHC stabilizes a flexible recognition interface. Immunity 10. 357-365
Williams, LM; and Rudensky, AY; 2007. Maintenance of the Foxp3-dependent develeopmental program in mature regulatory T cells requires continued expression of Foxp3. Nature Immunology. 8. 277-284
Wilson, A; Held, W; and MacDonald, HR; 1994. Two waves of recombinase gene expression in developing thymocytes. J. Exp. Med. 179. 1355-1360
303

Wu, LC; Tuot, DS; Lyons, DS; Garcia, KC; and Davis, MM; 2002. Two-step binding mechanism for T-cell receptor recognition of peptide-MHC. Nature 418. 552-556
Wu, Y; Borde, M; Heissmeyer, V; Feuerer, M; Lapan, AD; Stroud, JC; Bates, DL; Guo, L; Han, A; Ziegler, SF; Mathis, D; Benoist, C; Chen, L; and Rao, A; 2006. FOXP3 controls regulatory T cell function through cooperation with NFAT. Cell 126. 375-387
Wynn, TA; Eltoum, I; Cheever, AW; Lewis, FA; Gause, WC; and Sher, A; 1993. Analysis of cytokine mRNA expression during primary granuloma formation induced by eggs of Schistosoma mansoni. J. Immunol. 151. 1430-1440
Wynn, TA; Cheever, AW; Jankovic, D; Poindexter, RW; Caspar, P, Lewis, FA; and Sher, A; 1995. An IL-12 based vaccination method for preventing fibrosis induced by schistosome infection. Nature 376. 594-596
Xu, L; Xie, K; Mukaida, N; Matsushima, K; and Fidler, I; 1999. Hypoxia-induced elevation in interleukin-8 expression by human ovarian carcinoma cells. Cancer Research. 59. 5822-5829
Xiong, D; Yajima, T; Lim, B; Stenbit, A; Dublin, A; Dalton, ND; Summers-Torres, D; Molkentin, JD; Duplain, H; Wessely, R; Chen, J; and Knowlton, KU; 2007. Inducible cardiac-restricted expression of enteroviral protease 2A is sufficient to induce dilated cardiomyopathy. Circulation. 115. 94-102
Yamamoto, C; Yoneda, T; Yoshikawa, M; Fu, A; Tokuyama, T; Tsukaguchi, K; and Narita, N; 1997. Airway inflammation in COPD assessed by sputum levels of interleukin-8. Chest 112. 505-510
Yang, Y; Ochando, J; Yopp, A; Bromberg, JS; and Ding, Y; 2005. IL-6 plays a unique role in initiating c-Maf expression during early stage of CD4 T cell activation. J. Immunol. 174. 2720-2729
Yiamouyiannis, CA; Schramm, CM; Puddington, L; Stengel, P; Baradaran-Hosseini, E; Wolyniec, WW; Whiteley, HE; and Thrall, RS; 1999. Shifts in lung lymphocyte profiles correlate with the sequential development of acute allergic and chronic tolerant stages in a murine asthma model. Am. J. Path. 154. 1911-1921
Yokosuka, T; Takase, K; Suzuki, M; Nakagawa, Y; Taki, S; Takahashi, H; Fujisawa, T; Arase, H; and Saito, T; 2002. Predominant role of T cell receptor (TCR) a chain in forming preimmune TCR repertoire revealed by clonal TCR reconstitution system. J. Exp. Med. 195. 991-1001
Yoshida, H; Nishina, H; Takimoto, H; Marengere, LEM; Wakeham, AC; Bouchard, D; Kong, Y-Y; Ohteki, T; Shahinian, A; Bachmann, M; Ohashi, PS;
304

and Penninger, JM; 1998. The transcription factor NF-ATcl regulates lymphocyte proliferation and Th2 cytokine production. Immunity. 8. 115-124
Yoshikawa, T; Dent, G; Ward, J; Angel:), G; Nong, G; Nomura, N; Hirata, K; and Djukanovic, R; 2007. Impaired neutrophil chemotaxis in chronic obstructive pulmonary disease. Am. J Respir. Crit. Care Med. 175. 473-479
Yoshimura, T; Matsushima, K; Tanaka, S; Robinson, EA; Appella, E; Oppenheim, JJ; and Leonard, EJ; 1987. Purification of a human monocyte-derived neutrophil chemotactic factor that has a peptide sequence similarity to other host defence cytokines. Proc. Natl. Acad. Sci. 84. 9233-9237
Zal, T; Weiss, S; Mellor, A; and Stockinger, B; 1996. Expression of a second receptor rescues self-specific T cells from thymic deletion and allows activation of autoreactive effector function. Proc. Natl. Acad. Sci. 93. 9102-9107
Zerrahn, J; Held, W; and Raulet, DH; 1997. The MHC reactivity of the T cell reperoire prior to positive and negative selection. Cell 88. 627-636
Zhang, W; Sloan-Lancaster, J; Kitchen, J; Trible, RP; and Samelson, LE; 1998. LAT: The ZAP-70 tyrosine kinase substrate that links T cell receptor to cellular activation. Cell 92. 83-92
Zhang, W, Irvin, BJ; Trible, RP; Abraham, RT; and Samelson, LE; 1999. Functional analysis of LAT in TCR—mediated signalling pathways using a LAT deficient Jurkat cell line. Int. ImmunoL 11. 943-950
Zheng, W; and Flavell, RA; 1997. The transcription factor GATA-3 is necessary and sufficient for Th2 cytokine gene expression in CD4 T cells. Cell 89. 587-596
Zheng, T; Zhu, Z; Wang, Z; Homer, RJ; Ma, B; Riese, RJ; Chapman, HA; Shapiro, SD; and Elias, JA; 2000. Inducible targeting of IL-13 to the adult lung causes matrix metalloproteinase- and cathepsin- dependent emphysema. J Clin. Invest. 106. 1081-1093
Zhong, W; and Reinherz, EL; 2004. In vivo selection of a TCR V13 repertoire directed against an immunodominant influenza virus CTL epitope. Int. Immunol. 16. 1549-1559
Zhu, Z; Homer, RJ; Wang, Z; Chen, Q; Geba, GP, Wang, J; Zhang, Y; and Elias, JA; 1999. Pulmonary expression of interleukin-13 causes inflammation, mucus hypersecretion , subepithelial fibrosis, physiologic abnormalities, and eotaxin producton. J. Clin. Invest. 103. 779-788
305

Zhu, Z; Ma, B; Homer, RJ; Zheng, T; and Elisas, JA; 2001. Use of the tetracycline-controlled transcriptional silencer (tTS) to eliminate transgene leak in inducible overexpression transgenic mice. J. Biol. Chem. 278. 25222-25229
Zhu, Z; Zheng, T; Lee, CG; Homer, RJ; and Elias, JA; 2002. Tetracycline-controlled transcriptional regulation systems: advances and application in transgenic animal modelling. Cell & Dev. Biol. 13. 121-128
Zhu, J; Nathan, C; Jin, W; Sim, D; Ashcroft, GS; Wahl, SM; Lacomis, L; Erdjument-Bromage, H; Tempst, P; Wright, CD; and Ding, A; 2002. Conversion of proepithelin to epithelins: roles of SLPI and elastase in host defense and wound repair. Cell. 111. 867-878
Zissel, G; Homolka, J; Schlaak, J; Schlaak, M; and Muller-Quernheim , J; 1996. Anti-inflammatory cytokine release by alveolar macrophages in pulmonary sarcoidosis. Am. J. Respir. Crit. Care Med. 154. 713-719
Zlotnik, A; and Yoshie, 0; 2000. Chemokines: A new classification system and their role in immunity. Immunity 12. 121-127
306

Appendices
Appendix 1. Stock solutions and Buffers
TE
■ 10 mM Tris (pH 8.0) (Sigma-T1503)
■ 1 mM EDTA (pH 8.0) (Sigma-E4884)
TAE
■ 40 mM Tris-acetate
■ 1 mM EDTA (pH 8.0)
Tissue digestion buffer for genomic DNA extraction
■ 100 mM Tris (pH 8.0)
■ 5 mM EDTA
■ 200 mM NaC1 (Sigma-S7653)
■ 0.2 % w/v SDS (Calbiochem-428015)
Competent cell preparation solution A
■ 10 mM MgC12 (Sigma-M2670)
■ 0.2 mM MES (Sigma-M5287)
■ 0.05 mM CaC12 (Sigma-C7902)
Competent cell preparation solution B
■ 15 % glycerol (BDH-101186M)
■ 50 mM CaC12
■ 10 mM MgC12
■ 2 mM MES
Southern blot depurination solution
■ 11 mM HC1 (BDH-101254M)
307

Southern blot denaturing buffer
■ 1.5 M NaC1
■ 0.5 M NaOH (BDH-102524X)
Southern blot neutralisation buffer
■ 1.5 M NaC1
■ 0.5 M Tris (pH 7.5)
1 x SSC
■ 0.015 M Tri-sodium citrate (Sigma-S4641)
■ 0.15 M NaC1
Maleic acid wash buffer
■ 0.1 M Maleic acid (Sigma-M0375)
■ 0.15 M NaC1
adjust to pH 7.5 with concentrated NaOH
■ 0.3 % v/v Tween 20 (Sigma-P7949)
DIG detection buffer
■ 0.1 M Tris
■ 0.1 M NaC1
adjust to pH 9.5
Immunohistochemistry block solution
Solution should be made up with PBS
■ 1 % BSA (Sigma-A9647)
■ 0.2 % TritonX100 (Sigma-X100)
■ 0.1 % NaN3 (BDH-10369)
■ 10 % Normal mouse serum (Sigma-M5905)
■ 10 % goat serum (Sigma-G9023) or 10 % donkey serum (Sigma-D9663) depending
on species origin of secondary antibody
308

ELISA block solution
Solution should be made up with PBS
■ 1% BSA
■ 5% sucrose (Sigma-S7903)
■ 0.05% NaN3
ELISA wash buffer
■ 0.05% Tween 20 in PBS
Turks stain
■ 0.01% crystal violet
■ 1% acetic acid (BDH-10001)
309
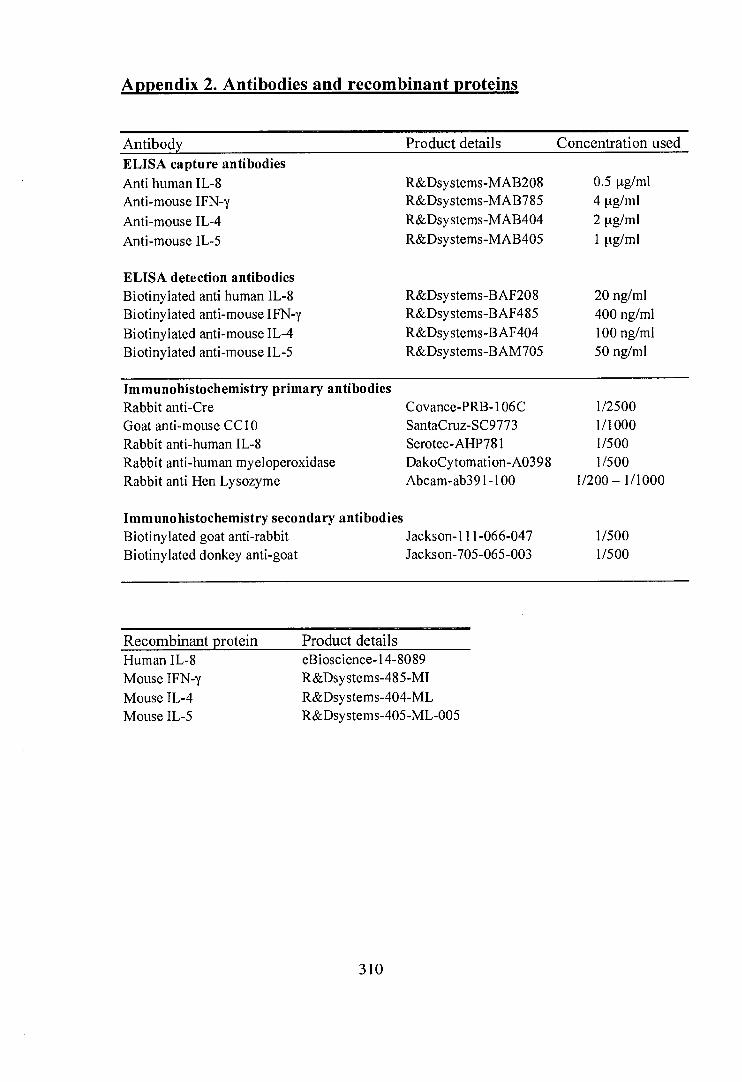
Appendix 2. Antibodies and recombinant proteins
Antibody ELISA capture antibodies Anti human IL-8 Anti-mouse IFN-y Anti-mouse IL-4 Anti-mouse IL-5
Product details Concentration used
R&Dsystems-MAB208 R&Dsystems-MAB785 R&Dsystems-MAB404 R&Dsystems-MAB405
0.5 µg/m1 4 vg/m1 2 vg/m1 1 µg/m1
ELISA detection antibodies Biotinylated anti human IL-8 Biotinylated anti-mouse IFN-y Biotinylated anti-mouse IL-4 Biotinylated anti-mouse IL-5
R&Dsystems-BAF208 R&Dsystems-BAF485 R&Dsystems-BAF404 R&Dsystems-BAM705
20 ng/ml 400 ng/ml 100 ng/ml 50 ng/m1
Immunohistochemistry primary antibodies Rabbit anti-Cre Goat anti-mouse CC10 Rabbit anti-human IL-8 Rabbit anti-human myeloperoxidase Rabbit anti Hen Lysozyme
Covance-PRB-106C SantaCruz-SC9773 Serotec-AHP781 DakoCytomation-A0398 Abcam-ab391-100
1/2500 1/1000 1/500 1/500
1/200— 1/1000
Immunohistochemistry secondary antibodies Biotinylated goat anti-rabbit Jackson-111-066-047
1/500
Biotinylated donkey anti-goat Jackson-705-065-003
1/500
Recombinant protein
Product details
Human IL-8 eBioscience-14-8089 Mouse IFN-y R&Dsystems-485-MI Mouse IL-4
R&Dsystems-404-ML Mouse IL-5 R&Dsystems-405-ML-005
310

Appendix 3. Restriction enzymes and buffers
Enzyme BamHI BssHII EcoR1 EcoRV HindIII KpnI Nan NcoI NotI Sad SacII Sall SfiI XbaI XhoI XmaI
Product details Promega-R6021 Promega-R6831 Promega-R6011 Promega-R6351 Promega-R6041 Promega-R6341 Promega-R6861 Promega-R6513 Promega-R6431 Promega-R6061 Promega-R6221 Roche-348-783 Promega-R6391 Promega-R6 181 Promega-R6161 Promega-R6491
Cleavage site (A) (5'-3') G A GATCC G A CGCGC G A AATTC GAT A ATC A A AGCTT GGTAC A C GG A CGCC C A CATGG GC A GGCCGC GAGCT A C CCGC A GG G A TCGAC GGCCNNNN A NGGCC T A CTAGA C A TCGAG C A CCGGG
Optimal buffer
E H H D E J G D D J C
suRE/cut H B D D B
Temperature (°C) 37.0 50.0 37.0 37.0 37.0 37.0 37.0 37.0 37.0 37.0 37.0 37.0 50.0 37.0 37.0 37.0
Buffer (1x) B C D E G H J suRE/cut H
Tris (mM) MgC12 (mM) NaC1 (mM) KC1 (mM) DTT (mM) 6 6 50 1 10 10 50 1
150 1 100 1
50 50 1
150
pH 7.5 7.9 7.9 7.5 8.2 7.5 7.5 7.6
6 6 50 90 10 100
6 6 5 10 7 10
311

Appendix 4. PCR primers for analysis of TCR a and 13 gene usage
Primer Sequence (5' - 3') TCR a V region primers NW36 (F) GTCCTGACCTCGCATGCTHCMMBWMYYTCYYSTGGTAY NW37 (F) GTCCTGACCTCGCATGCTTCDWYTRYHTCYTYTGGTAY NW38 (F) GTCCTGACCTCGCATGCRYSASRRYYGTSCWGTGGTTY
TCR a C region primers NJ108 (R) GGCCCCATTGCTCTTGGAATC NJ109 (R) CGGCACATTGATTTGGGAGTC NJ110 (R) TCTCGAATTCAGGCAGAGGGTGCTGTCC
TCR f3 V region primers NK121 (F) GTCCTGACCTCGCATGCCAYMAYDMYRTKKAYTGGTAY NK122 (F) GTCCTGACCTCGCATGCCAYCMADMWRTKTWYTGGTAY NK123 (F) GTCCTGACCTCGCATGCMCYWMSRTMRMYTGGTAY
TCR p C region primers MQ284
(R) AGCACACGAGGGTAGCCTT MS175
(R) GACAGAACTTTGAATTCCTCTGCTTTTGATGG
M13 (sequencing primer) (F) CTGGCCGTCGTTTTAC
B=CorGorT R=AorG
D=AorGorT S=CorG
H=AorCorT W=AorT
K=GorT Y=CorT
M=AorC
(F)= forward primer (R) = reverse primer
312

Appendix 5. TCR CDR3I3 spectratyping primers
primer Sequence (5' - 3') TCR V ri (TRBV) primer V(3 1 TRBV 5 vp 2 TRBV I Vi3 3.1 TRBV26 VI3 4 TRBV 2 Vi3 5.1 TRBV 12-2 V(3 5.2 TRBV 12-1 V13 5.3 TRBV 12-3 Vi3 6 TRBV 19 VP 7 TRBV 29 VI3 8.1 TRBV 13-3 V(3 8.2 TRBV 13-2 V(3 8.3 TRBV 13-1 V(3 9 TRBV 17 V13 10 TRBV 4 V(3 11 TRBV 16 V(3 12 TRBV 15 V(3 13 TRBV 14 vp 14 TRBV 31 VI3 15 TRBV 20 V13 16 TRBV 3 V13 17 TRBV 24 VI3 18 TRBV 30 V13 19 TRBV 21 Vi3 20 TRBV 23
(F) CTGAATGCCCAGACAGCTCCAAGC (F) TCACTGATACGGAGCTGAGGC (F) CCTTGCAGCCTAGAAATTCAGT (F) GCCTCAAGTCGCTTCCAACCTC (F) CATTATGATAAAATGGAGAGAGAT (F) AAGGTGGAGAGAGACAAAGGATTC (F) AGAAAGGAAACCTGCCTGGTT (F) CTCTCACTGTGACATCTGCCC (F) TACAGGGTCTCACGGAAGAAGC (F) CATTACTCATATGTCGCTGAC (F) CATTATTCATATGGTGCTGGC (F) TGCTGGCAACCTTCGAATAGGA (F) TCTCTCTACATTGGCTCTGCAGGC (F) ATCAAGTCTGTAGAGCCGGAGGA (F) GCACTCAACTCTGAAGATCCAGAGC (F) GATGGTGGGGCTTTCAAGGATC (F) AGGCCTAAAGGAACTAACTCCCAC (F) ACGACCAATTCATCCTAAGCAC (F) CCCATCAGTCATCCCAACTTATCC (F) CACTCTGAAAATCCAACCCAC (F) AGTGTTCCTCGAACTCACAG (F) CAGCCGGCCAAACCTAACATTCTC (F) CTGCTAAGAAACCATGTACCA (F) TCTGCAGCCTGGGAATCAGAA
Constant 3 region primer C(3 - FAM labelled (R) 6FAM-CTTGGGTGGAGTCACATTTCTC
6FAM = 6-carboxyflurorescein-amino-hexy fluorescent dye (F) = forward primer (R) = reverse primer
313
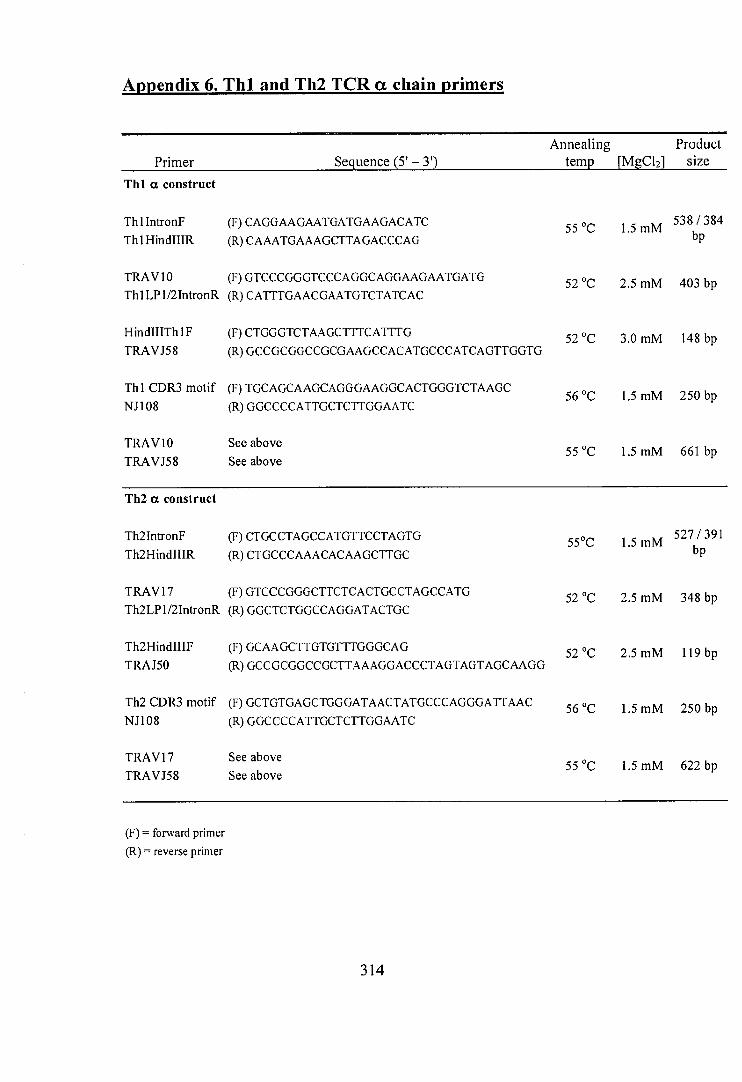
Appendix 6. Thl and Th2 TCR a chain primers
Primer Sequence (5' — 3') Annealing Product
temp [MgC12] size Thl a construct
ThlIntronF (F) CAGGAAGAATGATGAAGACATC ThlHindIIIR (R) CAAATGAAAGCTTAGACCCAG
TRAV 10 (F) GTCCCGGGTCCCAGGCAGGAAGAATGATG Th1 LP1/2IntronR (R) CATTTGAACGAATGTCTATCAC
HindIIITh I F (F) CTGGGTCTAAGCTTTCATTTG TRAVJ58 (R) GCCGCGGCCGCGAAGCCACATGCCCATCAGTTGGTG
Thl CDR3 motif (F) TGCAGCAAGCAGGGAAGGCACTGGGTCTAAGC NJ108 (R) GGCCCCATTGCTCTTGGAATC
TRAVIO See above TRAVJ58 See above
55 °C
52 °C
52 °C
56 °C
55 °C
1.5 mM
2.5 mM
3.0 mM
1.5 mM
1.5 mM
538 / 384 bp
403 by
148 bp
250 by
661 by
Th2 a construct
Th2lntronF (F) CTGCCTAGCCATGTTCCTAGTG Th2HindIIIR (R) CTGCCCAAACACAAGCTTGC
TRAV17 (F) GTCCCGGGCTTCTCACTGCCTAGCCATG Th2LP1/2IntronR (R) GGCTCTGGCCAGGATACTGC
Th2HindIIIF (F) GCAAGCTTGTGTTTGGGCAG TRAJ50 (R) GCCGCGGCCGCTTAAAGGACCCTAGTAGTAGCAAGG
Th2 CDR3 motif (F) GCTGTGAGCTGGGATAACTATGCCCAGGGATTAAC NJ108 (R) GGCCCCATTGCTCTTGGAATC
TRAV17 See above TRAVJ58 See above
55°C
52 °C
52 °C
56 °C
55 °C
1.5 mM
2.5 mM
2.5 mM
1.5 mM
1.5 mM
527 / 391 bp
348 by
119 bp
250 by
622 by
(F) = forward primer (R) = reverse primer
314

Appendix 7. MIPLP and SIPLP trans2ene primers and oli2onucleotides
Primer Sequence (5' — 3') Annealing Product size
temp [MgCl2] Sec./Memb. PLP constructs
HELA PLPB
HELA TM/CYTOB
SfilBamHlBodF BodXho I Sfi1R
CC102000F BetaglobinB
3rdexonF BetaglobinB
CC101500F CC10210OR
StopfloxedF StopfloxedR SIPLPStopfloxedR
(F) CTGCTCTGGGGAAAGTCTTT (R) GTTCCATAGATGACATACTG
(F) CTGCTCTGGGGAAAGTCTTT (R) TATTCTGCACTGCAAAGATC
(F) GGCCATTGCGGCCGGATCCTGAGAACTTCA (R) GGCCGCAATGGCCCTCGAGGGATCTCCATA
(F) GCCTCTGGTTCTCCAGGGTT (R) TGATAGGCAGCCTGCACCTG
(F) CTGGGCAACGTGCTGGTTAT See above
(F) ATAAAAGCACTGGAGAAGTA (R) CAGAGGTCGTGGAACTGTAG
(F) CATCAGCCCACATCTACAGAC (R) CAATGGCCAGTACTAGTGAAC (R) CCTGAAGTTCTCAGGATCCG
53 °C
53 °C
68 °C
53 °C
55 °C
53 °C
60 °C
1.5 mM
1.5 mM
1.5 mM
1.5 mM
1.5 mM
1.5 mM
2.5/1.5 mM
214 bp
611 bp
1755 / 1888 by
3239 / 3372 by
625 / 758 by
629 bp
1736/1647 bp
Oligonucleotide Sequence (5' — 3')
PLP 56-70 top
PLP 56-70 bottom
Kpnl linker top Kpnl linker bottom
(T) CGCCAAAAACTACCAGGACTATGAGTATCTCATTAATGTGATTCATGCTTTCC AGTATGTCATCTATGGAACCCGC
(B) GGGTTCCATAGATGACATACTGGAAAGCATGAATCACATTAATGAGATA CTCATA GTCCTGGTAGTTTTTGG
(T) GGAGAGGTACCAACTTGAACGCTATGGGCATCCAATGCATCCATGGAGCT (B) CCATGGATGCATTGGATGCCCATAGCGTTCAAGTTGGTACCTCTCCGC
(F) = forward primer (R) = reverse primer (T) = top strand (B) = bottom strand
315
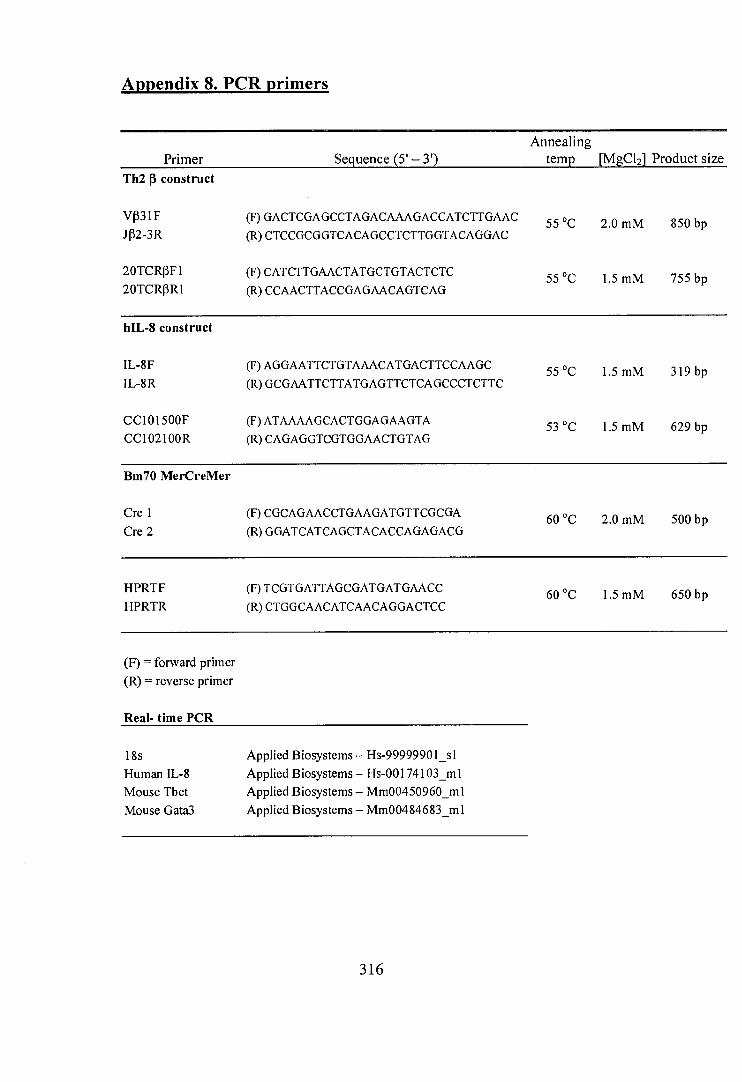
Appendix 8. PCR primers
Primer Sequence (5' — 3') Annealing
temp [MgCl2] Product size Th2 13 construct
VP3 1 F J(32-3R
20TCRI3F1 20TCROR1
(F) GACTCGAGCCTAGACAAAGACCATCTTGAAC (R) CTCCGCGGTCACAGCCTCTTGGTACAGGAC
(F) CATCTTGAACTATGCTGTACTCTC (R) CCAACTTACCGAGAACAGTCAG
55 °C
55 °C
2.0 mM
1.5 mM
850 by
755 by
hIL-8 construct
IL-8F IL-8R
CC101500F CC10210OR
(F) AGGAATTCTGTAAACATGACTTCCAAGC (R) GCGAATTCTTATGAGTTCTCAGCCCTCTTC
(F) ATAAAAGCACTGGAGAAGTA (R) CAGAGGTCGTGGAACTGTAG
55 °C
53 °C
1.5 mM
1.5 mM
319 by
629 by
Bm70 MerCreMer
Cre 1 Cre 2
(F) CGCAGAACCTGAAGATGTTCGCGA (R) GGATCATCAGCTACACCAGAGACG
60 °C 2.0 mM 500 by
HPRTF HPRTR
(F) TCGTGATTAGCGATGATGAACC (R) CTGGCAACATCAACAGGACTCC
60 °C 1.5 mM 650 by
(F) = forward primer (R) = reverse primer
Real- time PCR
18s Human IL-8 Mouse Tbet Mouse Gata3
Applied Biosystems — Hs-99999901_sl Applied Biosystems — Hs-00174103_ml Applied Biosystems— Mm00450960_m1 Applied Biosystems — Mm00484683_ml
316

Appendix 9. Wright-Giemsa stain — cell morphology
A = Macrophage
B = Lymphocyte
C = Eosinophil
D = Neutrophil
317

Cla 118941 Sal 119941
Not I, Sac 112841
BamH112441
Appendix 10. Thl TCR a chain construct - plasmid map
318

Appendix 11. Th2 TCR a chain construct - plasmid map
BamHI 0 Sal 11990
Cla 1 18956
/mai 2180
pEMBL18 Th2 V17/J50 of I, Sac II 2802
JA2
Sal 1 1510 Th2 pTA cassette
19902 bp BamH1 4947
Bam1-11 1445 constant region
BamH 112456
319

Appendix 12. Th2 TCR 13 chain construct - plasmid map
Kpn 1 20670 BamHI 860
coR1 2190
Kpn 117740
BamHI 17740
EcoRI 17590
_____X ho 14470
Th2 pTB cassette
Th2 VB31/JB2-3 20670 bp
--Sac II 5320 J62.6
amHI 6490
coRl 6690
BamHI 1259
constant region
\coRI 7590
320
PTZ 18

BssH II 601 S
Sac 115971 Not 1595 • Sfi 15958
Xho 15945
EcoR 15410
Rabbit beta globin
TM region HEL
PLP (56-70) HEL
ind III 2465 EcoR 12477 amH 12495 of 1 2514
EcoR 1 2595 ind III 2605
amH 1 2612 ind III 2686
LoxP
Floxed STOP
LoxP Xho 13557
Appendix 13. MIPLP construct — plasmid map
ssH111 hoI53
Hind III 74 amH 18D
EcoR 1340
EcoR 1744
CC10 promoter
MIPLP
8793 bp
Sac II 500 Nar 14926
EcoR I 4729
amH 13995 fi 1 4083
amH 14089
321

Appendix 14. SIPLP construct - plasmid map
-=--1"-Flind III 2465 EcoR 1 2477 BamH 1 2495 Not 1 2514
EcoR 1 2595 ind 111 2605 amH 1 2612
Hind III 2686
BssH II 5877 Sac II 5838 Not 1 5826 Sfi 1 5825
Xho 1 581
amH 1 3995
fi 1 4083 amH 1 4089
EcoR 1 5277
Sac II 5002
Nar 1 492
ssH 111 ho 153 indlIl 74 amH 180
EcoR 1 340
322

ind1112461 pnl 2471
Notl 2485
SacI12479
BamH1 2574 LoxP
SIPLP (LSL rev)
8733 bp
CC10 promoter
BssH 115948
Sacll 5906 Notl 5894
Xbal 5887 Xhol 5875
Rabbit beta globin
HEL PLP (56-70)
HEL
Floxed STOP
Lox P EcoR15340/
Xhol 3012
Sacll 5065-j
Nan 4989
EcoRl 479
hol 4125 pnl 4144
amHI 4152
'nal 3883 BamHI 3957
ind1113964 otl 4055 EcoR1 3974
Xbal 4062 amH14074
coR1 4092 Hind111 4104
Appendix 15. Inverted stop sequence SIPLP construct — plasmid map
BssH111
Xhol 49 ind11170
EcoRl 332
EcoR1 739
323

BasH11405 Not1 4002
Xbal 3995 Xhol 398
\----EcoR1 3135 indlIl 3352
coR1 3448
BssH11 1 Kpnl 42
hol 53 indlIl 74
HindlIl 2465
NN N.-,--NE, csoRV 2473 ---EcoR1 2477
amHi 2495
Appendix 16. Lung targeted hIL-8 construct — plasmid map
324

Appendix 17. Thl TCR a complete V-J insert nucleotide sequence
1 TCCCAGGCAG GAAGAATGAT GAAGACATCC CTTCACACTG TATTCCTATT
51 CTTGTGGCTG TGGATGGACT GTGAGTTGGA AGATTTGGGT CAAGAGAAAA
101 AAATGGTGGA TGTTAGACAT CTATGGGCAA TCTATTTTAT ACAGTTCCTT
151 CTAGTTGTGG ACAAAGAGAT TTAGCAGAGT ACTGCCTGAC TGCTCCTCTC
201 CTTTCTGTTT TTCTTTCTGT GTAGGGGAAA GCCATGGAGA GAAGGTCGAG
251 CAACACCAGT CTACACTGAG TGTTCGAGAG GGAGACAGCG CTGTCATCAA
301 CTGCACTTAC ACAGATACTG CCTCATCATA CTTCCCTTGG TACAAGCAAG
351 AAGCTGGAAA GAGTCTCCAC TTTGTGATAG ACATTCGTTC AAATGTGGAC
401 AGAAAACAGA GCCAAAGACT TACAGTTTTA TTGGATAAGA AAGCCAAACG
451 ATTCTCCCTG CACATCACAG CCACACAGCC TGAAGATTCA GCCATCTACT 501 TCTGTGCAGC AAGCAGGGAA GGCACTGGGT CTAAGCTTTC ATTTGGGAAG
551 GGGGCAAAGC TCACAGTGAG TCCAGGTAAG TGTGAGGCTA TCTAACCATC
601 TTTCTAAATG CGATTTGAGA ATTTTTTTTT CTTTCACACC AACTGATGGG
651 CATGTGGCTT C
Black = intronic sequence. Blue = coding sequence Red = mutated base pair (G—>T)
325

Appendix 18. Thl TCR a rearranged V-J insert nucleotide/protein sequence
1 - ATG AAG ACA TCC CTT CAC ACT GTA TTC CTA TTC TTG TGG CTG GAA 1-M K T S L H T VF L F LW L E
46 - AGC CAT GGA GAG AAG GTC GAG CAA CAC CAG TCT ACA CTG AGT GTT 16-S HGE KVEQHQST L S V
91 - CGA GAG GGA GAC AGC GCT GTC ATC AAC TGC ACT TAC ACA GAT ACT 31-R E G D S A V I N C T YT D T
136 - GCC TCA TCA TAC TTC CCT TGG TAC AAG CAA GAA GCT GGA AAG AGT 46-A S S YFPWYKQE AGK S
181 - CTC CAC TTT GTG ATA GAC ATT CGT TCA AAT GTG GAC AGA AAA CAG 61-L H F V ID I R S N V D R K Q
226 - AGC CAA AGA CTT ACA GTT TTA TTG GAT AAG AAA GCC AAA CGA TTC 76-S Q R LT V L L D K K A K R F
271 - TCC CTG CAC ATC ACA GCC ACA CAG CCT GAA GAT TCA GCC ATC TAC 91-S L H IT A T Q P E D S A I Y
316 - TTC TGT GCA GCA AGC AGG GAA GGC ACT GGG TCT AAG CTT TCA TTT 106-F CAA SR E G T G S K L S F
361 - GGG AAG GGG GCA AAG CTC ACA GTGAGT CCA 121-G K GA K LT VSP
Light blue = Leader sequence of TRAV10 Dark blue = TRAV10 Red = CDR3a region Green = TRAJ58
326

Appendix 19. Th2 TCR a complete V-J insert nucleotide sequence
1 CTTCTCACTG CCTAGCCATG TTCCTAGTGA CCATTCTGCT GCTCAGCGCG
51 TTCTTCTCAC TGAGTAAGTA TTATTTCAGT CCTTGCTTGC TTTTGTTTCC
1 01 ACAGACAGAA CATGTTCCTA GTCAGAATCT ACACAAGGGA CATAGTATCA
151 TTACAGGTAG GTCTATTCTG GTCTCACTGC TGCTACGTTG GTATTACAGG
201 AGGAAACAGT GCCCAGTCCG TGGACCAGCC TGATGCTCAC GTCACGCTCT
251 ATGAAGGAGC CTCCCTGGAG CTCAGATGCA GTTATTCATA CAGTGCAGCA
301 CCTTACCTCT TCTGGTACGT GCAGTATCCT GGCCAGAGCC TCCAGTTTCT
351 CCTCAAATAC ATCACAGGAG ACGCCGTTGT TAAAGGCACC AAGGGCTTTG
401 AGGCCGAGTT TAGGAAGAGT AACTCCTCTT TCAACCTGAA GAAATCCCCA
451 GCCCATTGGA GCGACTCAGC CAAGTACTTC TGTGCACTGG AGGGTATAGC
501 ATCCTCCTCC TTCAGCAAGC TTGTGTTTGG GCAGGGGACA TCCTTATCAG
551 TCGTTCCAAG TAAGTTTGCA GGCTGCCTGT GGGGCAATGG TTCTCAACCT
601 TGCTACTACT AGGGTCCTTT AA
Black = intronic sequence. Blue = coding sequence Red = mutated base pair (G—T)
327

Appendix 20. Th2 TCR a rearranged V-J insert nucleotide/protein sequence
1 - ATG TTC CTA GTG ACC ATT CTG CTG CTC AGC GCG TTC TTC TCA CTG 1-M F L V T I L LL S AF FS L
46 - AGA GGA AAC AGT GCC CAG TCC GTG GAC CAG CCT GAT GCT CAC GTC 16-R G N S A QS V D Q P D A II V
91 - ACG CTC TAT GAA GGA GCC TCC CTG GAG CTC AGA TGC AGT TAT TCA 31-T LYE G A SL E L R CS YS
136 - TAC AGT GCA GCA CCT TAC CTC TTC TGG TAC GTG CAG TAT CCT GGC 46-YS A A P Y L F W Y V Q Y P G
181 - CAG AGC CTC CAG TTT CTC CTC AAA TAC ATC ACA GGA GAC GCC GTT 61-Q SLQFLL KYI T G D A V
226 - GTT AAA GGC ACC AAG GGC TTT GAG GCC GAG TTT AGG AAG AGT AAC 76-V K G T K G F E AEFR K S N
271 - TCC TCT TTC AAC CTG AAG AAA TCC CCA GCC CAT TGG AGC GAC TCA 91-SS F N L K K SPA H W S D S
316 - GCC AAG TAC TTC TGT GCA CTG GAG GUT ATA GCA TCC TCC TCC TTC 106-A K YFCAL E GI A SS SF
361 - AGC AAG CTT GTG TTT GGG CAG GGG ACA TCC TTA TCA GTC GTT CCA 121-S K L V F G Q G T SL S V V P
Light blue = Leader sequence of TRAV17 Dark blue = TRAV17 Red = CDR3a region Green = TRAJ50
328

Appendix 21. Th2 TCR 13 complete V-J insert nucleotide sequence
CCTAGACAAA GACCATCTTG AACTATGCTG TACTCTCTCC TTGCCTTTCT 51
CCTGGGCATG TTCTTGGGTG GGTGCATTCC CCTGTTGAAA ACCTACTTTC 101
AAATTGTTGC TTCCATCTCT CCACCTGTTA AAGGTGTAGA TTCTTTGGTA 151
CTGGCTTGCC TCTCTTGACC ACAGTCCTCC AATTACTGAG ATATGGGCAT 201 TTCACACTCT TTCAGTATTG ACTCTCAGTT TTGTATCTTT TAGAAAGGAT
251 TTGTCTCCCC TTGCCCTGTA ACATTTTTCA TCCCTGGCTC TTCTAGTATA
301 CTCCCTGAGA CTGATTACAT GTAACCCCTT CAGAGGGAAG GCAAGCAAGC
351 TGGTGTGTGT GTATGTGTAG AGGTGTGTGT TTCTACTCTA AATGACTCTA
401 TTTCTTTACA GGTGTTAGTG CTCAGACTAT CCATCAATGG CCAGTTGCCG
451 AGATCAAGGC TGTGGGCAGC CCACTGTCTC TGGGGTGTAC CATAAAGGGG
501 AAATCAAGCC CTAACCTCTA CTGGTACTGG CAGGCCACAG GAGGCACCCT
551 CCAGCAACTC TTCTACTCTA TTACTGTTGG CCAGGTAGAG TCGGTGGTGC
601 AACTGAACCT CTCAGCTTCC AGGCCGAAGG ACGACCAATT CATCCTAAGC
651 ACGGAGAAGC TGCTTCTCAG CCACTCTGGC TTCTACCTCT GTGCCTGGAG
701 TCTGGGGGGA GGTGCAGAAA CGCTGTATTT TGGCTCAGGA ACCAGACTGA
751 CTGTTCTCGG TAAGTTGGGA GCTAGTAATG AAGGGGAGGG AGCATTTCCC
801 AGGCTAAGGA TAGCCAGAGC CAGTTTTTGT CCTGTACCAA GAGGCTGTGA
Black = intronic sequence Blue = coding sequence
329

Appendix 22. Th2 TCR 13 rearranged V-J insert nucleotide/protein sequence
1 - ATG CTG TAC TCT CTC CTT GCC TTT CTC CTG GGC ATG TTC TTG GGT 1-ML YS LL A FLLG M F L G
46 - GTT AGT GCT CAG ACT ATC CAT CAA TGG CCA GTT GCC GAG ATC AAG 16-VS A Q T I H Q W P V A E I K
91- GCT GTG GGC AGC CCA CTG TCT CTG GGG TGT ACC ATA AAG GGG AAA 31-AVG S P L S L GCTIK GK
136- TCA AGC CCT AAC CTC TAC TGG TAC TGG CAG GCC ACA GGA GGC ACC 46-S SP N L Y W Y W Q A T G G T
181- CTC CAG CAA CTC TTC TAC TCT ATT ACT GTT GGC CAG GTA GAG TCG 61-LQQLFYSI T VGQVES
226- GTG GTG CAA CTG AAC CTC TCA GCT TCC AGG CCG AAG GAC GAC CAA 76-VV Q L N L S A SR P K D D Q
271- TTC ATC CTA AGC ACG GAG AAG CTG CTT CTC AGC CAC TCT GGC TTC 91-F IL S T E K L L L S HS G F
316- TAC CTC TGT GCC TGG AGT CTG GGG GGA GGT GCA GAA ACG CTG TAT 106-YLCAWSLGGGA E L Y
361- ITT GGC TCA GGA ACC AGA CTG ACT GTT CTC 121-FGS GTR L T V L
Light blue = Leader sequence of TRBV31 Dark blue = TRBV31 Red = CDR313 region Green = TRBJ2-3
330

Appendix 23. MIPLP construct — complete nucleotide sequence
1 GCGCGCAATT AACCCTCACT AAAGGGAACA AAAGCTGGGT ACCGGGCCCC
51 CCCTCGAGGT CGACGGTATC GATAAGCTTA TCGATTTCGA ACCCTGTAGC
101 AGGGCCTCTG TGCAGCAGAG GGTGCACACT ACAGGTTGTG CACACGCGTG
151 TGCGTGCATG CATGCAAGGG TGCACATGCA CAGGGTGGAG GTCAGAGGTC
201 AACGTCAGGT GTCTTCGTCT GTCACCCACA GTCTTGTTTT TCAGACAGGA
251 CTTCTCACTG AATCTGAATC CTGCCCATTT GATGGGCTCA TCAGTCAGTT
301 TCCAGGTTTC CCTGGTCCCC ACCTCCCCAG GGCTGGAATT CAAGGCATAT
351 CTAGCTTTTT TGCATGAATG TTTGAGAGCC AAATTCAGTT CCTCATACTT
401 GCCCAATAGG CATAGTATAT CCACTGAGCC ATGTCCCCAA CTCATTATGT
451 TCACCTCATT CATTCATTCA TCCATCCATC CATCCATCCA TCCATTCATT
501 CATTCAGGTT TGGTTTGGTT TGGTTTTAGT GTTTTGGGTT TTTTTTCAAG
551 ACAGGGTTTC TCTGTGTAGC CCTGGCTGCC CTGAAACTAA CTTTCTTACT
601 TACTTTCTTT CTTTCTTCCT TCCTTCCTTT CTTTCTTTAA GTTGGTTTGG
651 GTTTTTTGGG GGGGGGAGGG TTTGGGTTTT TTTGTTTGTT TGTATTTTAT
701 TCAAGGAAAG GCTCCTCTGG GTTGCCCTGG CTGCCCTGGA AGGAATTCTA
751 TAGCCAGGCT GACCATGAAC TCAGAAATCT ACCTGCCTCT CCCTCTGCCT
801 CCCAAGTGCT AGGATTAAAG GTGTGTGACA CACACACAAC TGGCTCTACA
851 TTTGACACTC ACAGTATTCT GCACACAGCC ACAGGGCTGT ATCGCTAAGA
901 GGCCATGTCA CAGGTCCAGG AAGGCTTCAC TGTTTAATAA CTGGTTTGGA
951 ATTTGGAAGT GGGAAAGTAT GTAGAGACAA TCTCACTCTA GGACTCAAAG
1001 ACAGAGATAA AATGCTCTTT AGAAACCTAT TCTGTGGGGG AACAGAATCA
1051 GAACTCTATG TCAGCCTCTG TGCTAGCTGG GGTCAGGCCA GAGACACAGA
331

1101 AATGAGCTAA GCCTACAGTG AGAACTGATA CGCAGGACAG TTGAGAACAA
1151 TGGGAAAGTG CATCTGAAGG GCCCAAGGCC ACTAGGAAAA AGGCAACCCA
1201 AAATGCCCAC AACTTTAAAT CCCCTTCCTG ATGTGTCATT AGATGCAAAC
1251 GGCCCTGGGG AGGATGTGAC GTTAAACAAG GCAGTGTTCT GTACAGGGGC
1301 AGATCCTGCA GTTACTGGAA GCTGAAGGCT CCAGGCTGAC CACACTAGGT
1351 AGGAAGTTCA TGAAATGAGC TCTCGAAGCG CCTCTTCAGG TCTTCCCCGA
1401 TGTCCAGCCC CACCAGCACC GTAGCAGGTA CTGGGCATCT ATTGATTGGG
1451 TGGGTAGGTG AACATTTGAG ACAACCTGGA AGTTTAAATG GGATTTGTGG
1501 AAATAGAGAG GGTGTTGGTT CCAGCCAAGC CAGGTTCCAT GCTAAGACAT
1551 AAAAGCACTG GAGAAGTAAA AGAGTTAACG CTGAACATGG CCGTGGGAAG
1601 CGAGGAGACC AAGGTAAAGC CTGGGAATGG CTAACACTTG AGAACTGTCA
1651 ACATCATGAA AGGATAAGAA AGAATGGCCA AGGAAAGAAA ACAGGAAAGA
1701 GCTGAGTGTG GGAGAGGCCT GGAGAGAATG GGGCAAGAAG TGGGAGGCTA
1751 AAGGGTAAGG GCAAGGGAGG GTCAAGTCAG ATGAGGACTG AAGGTGCTTT
1801 CAACTGGTAG GACTTGAGGG CTGCTCTGGG TAGGAGCCAG CCCGGTCTGG
1851 GCCCTGGGTC TCTCATGTGT TCTATGGAGA AGTCTTTATA TTTGTTCATG
1901 TGTATTGTAT GTGGGCTCTA ACCTGGCCAA CAATGCCCAA GAATCAAGTG
1951 ATTTTTGTGG CTTGAAGTCT AGCCACCTTC CTTGGAGGGA GGCAATAGAA
2001 GGAGCCTAGT GACATCTCGG ACGGAGTCTG GGGTCTTTGT CCTTCCCCTT
2051 GATCCCTGAA GGGTCTCCAG CCTCTGGTTC TCCAGGGTTG GCAAGTCTAC
2101 AATTGCTTCC CGGAACCTGG AGTGCTCAGT GCTTGACTTT AAAGAGGACA
2151 CAGGTGCCTA CAGTTCCACG ACCTCTGGGT TCCCCGACGC CCCCCCCCCC
2201 GCACTGCCCA TTGCCCAAAC ACCCCACAAG TGGCCTATTG TGTGAGCTCA
332

2251 GTTTCAATGG GAAAAGAAAC TGGGTTTATG AAAAGAGATT ATTTGCTTAT
2301 TGCATGGAGA TGACTAAGTA AATAGTGCAA TTTCTTGAGT GGAGCACAAT
2351 CCCTGCCCCT ACCTCTTGTG GGCTGCCAGG AACATATAAA AAGCCACACG
2401 CATACCCACA CATACCCACA CATACCCTCA CATTACAACA TCAGCCCACA
2451 TCTACAGACA GCCCAAGCTT GATATCGAAT TCCTGCAGCC CGGGGGATCC
2501 ACTAGTTCTA GAGCGGCCGC ACGTCTAAGA AACCATTATT ATCATGACAT
2551 TAACCTATAA AAATAGGCGT ATCACGAGGC CCTTTCGTCT TCAAGAATTC
2601 CATCAAGCTT AGGATCCGGA ACCCTTAATA TAACTTCGTA TAATGTATGC loxP
2651 f site TATACGAAGT TAT TAGGTCC CTCGACCTGC AGCCCAAGCT TACTTACCATJ
2701 GTCAGATCCA GACATGATAA GATACATTGA TGAGTTTGGA CAAACCACAA
2751 CTAGAATGCA GTGAAAAAAA TGCTTTATTT GTGAAATTTG TGATGCTATT
2801 GCTTTATTTG TAACCATTAT AAGCTGCAAT AAACAAGTTA ACAACAACAA
2851 TTGCATTCAT TTTATGTTTC AGGTTCAGGG GGAGGTGTGG GAGGTTTTTT
2901 AAAGCAAGTA AAACCTCTAC AAATGTGGTA TGGCTGATTA TGATCTCTAG
2951 TCAAGGCACT ATACATCAAA TATTCCTTAT TAACCCCTTT ACAAATTAAA
3001 AAGCTAAAGG TACACAATTT TTGAGCATAG TTATTAATAG CAGACACTCT
3051 ATGCCTGTGT GGAGTAAGAA AAAACAGTAT GTTATGATTA TAACTGTTAT
3101 GCCTACTTAT AAAGGTTACA GAATATTTTT CCATAATTTT CTTGTATAGC
3151 AGTGCAGCTT TTTCCTTTGT GGTGTAAATA GCAAAGCAAG CAAGAGTTCT
3201 ATTACTAAAC ACAGCATGAC TCAAAAAACT TAGCAATTCT GAAGGAAAGT
3251 CCTTGGGGTC TTCTACCTTT CTCTTCTTTT TTGGAGGAGT AGAATGTTGA
3301 GAGTCAGCAG TAGCCTCATC ATCACTAGAT GGCATTTCTT CTGAGCAAAA
3351 CAGGTTTTCC TCATTAAAGG CATTCCACCA CTGCTCCCAT TCATCAGTTC
333

3401 CATAGGTTGG AATCTAAAAT ACACAAACAA TTAGAATCAG TAGTTTAACA
3451 CATTATACAC TTAAAAATTT TATATTTACC TTAGAGCTTT AAATCTCTGT
3501 AGGTAGTTTG TCCAATTATG TCACACCACA GAAGTAAGGT TCCTTCACAA
3551 AGATCCCTCG AGAAAAAAAA TATAAAAGAG ATGGAGGAAC GGGAAAAAGT
3601 TAGTTGTGGT GATAGGTGGC AAGTGGTATT CCGTAAGAAC AACAAGAAAA
3651 GCATTTCATA TTATGGCTGA ACTGAGCGAA CAAGTGCAAA ATTTAAGCAT
3701 CAACGACAAC AACGAGAATG GTTATGTTCC TCCTCACTTA AGAGGAAAAC
3751 CAAGAAGTGC CAGAAATAAC AGTAGCAACT ACAATAACAA CAACGGCGGC
3801 TACAACGGTG GCCGTGGCGG TGGCAGCTTC TTTAGCAACA ACCGTCGTGG
3851 TGGTTACGGC AACGGTGGTT TCTTCGGTGG AAACAACGGT GGCAGCAGAT
3901 CTAACGGCCG TTCTGGTGGT AGATGGATCG ATGGCAAACA TGTCCCAGCT
3951 CCAAGAAACG AAAAGGCCGA GATCGCCATA TTTGGTGTCC CCGAGGATCC
4001 GGAACCCTTA ATIATAACTTC GTATAATGTA TGCTATACGA AGTTATTAGG loxP
4051 site TCCCTCGAAG AGGTTCACTA GTACTGGCCA TTGCGGCCGG ATCCTGAGAA
4101 CTTCAGGGTG AGTTTGGGGA CCCTTGATTG TTCTTTCTTT TTCGCTATTG
4151 TAAAATTCAT GTTATATGGA GGGGGCAAAG TTTTCAGGGT GTTGTTTAGA
4201 ATGGGAAGAT GTCCCTTGTA TCACCATGGA CCCCCATGAT AATTTTGTTT
4251 CTTTCACTTT CTACTCTGTT GACAACCATT GTCTCCTCTT ATTTTCTTTT
4301 CATTTTCTGT AACTTTTTCG TTAAACTTTA GCTTGCATTT GTAACGAATT
4351 TTTAAATTCA CTTTTGTTTA TTTGTCAGAT TGTAAGTACT TTCTCTAATC
4401 ACTTTTTTTT CAAGGCAATC AGGGTATATT ATATTGTACT TCAGCACAGT
4451 TTTAGAGAAC AATTGTTATA ATTAAATGAT AAGGTAGAAT ATTTCTGCAT
4501 ATAAATTCTG GCTGGCGTGG AAATATTCTT ATTGGTAGAA ACAACTACAC
334

4551 CCTGGTCATC ATCCTGCCTT TCTCTTTATG GTTACAATGA TATACACTGT
4601 TTGAGATGAG GATAAAATAC TCTGAGTCCA AACCGGGCCC CTCTGCTAAC
4651 CATGTTCATG CCTTCTTCTC TTTCCTACAG CTCCTGGGCA ACGTGCTGGT
4701 TGTTGTGCTG TCTCATCATT TTGGCAAAGA ATTCTGGCAA CATGAGGTCT
4751 TTGCTAATCT TGGTGCTTTG CTTCCTGCCC CTGGCTGCTC TGGGGAAAGT
4801 CTTTGGACGA TGTGAGCTGG CAGCGGCTAT GAAGCGTCAC GGACTTGATA
4851 ACTATCGGGG ATACAGCCTG GGAAACTGGG TGTGTGCCGC AAAATTCGAG
4901 AGTAACTTCA ACACCCAGGC TACAGGCGCC AAAAACTACC ACIGACTATGA
4951 GTATCTCATT AATGTGATTC ATGCTTTCCA GTATGTC ATC TATGGAACCC
5001 GCGGAAACCG TAACACCGAT GGGAGTACCG ACTACGGAAT CCTACAGATC
5051 AACAGCCGCT GGTGGTGCAA CGATGGCAGG ACCCCAGGCT CCAGGAACCT
5101 GTGCAACATC CCGTGCTCAG CCCTGCTGAG CTCAGACATA ACAGCGAGCG
5151 TGAACTGCGC GAAGAAGATC GTCAGCGATG GAAACGGCAT GAACGCGTGG
5201 GTCGCCTGGC GCAACCGCTG CAAGGGCACC GACGTCCAGG CGTGGATCAG
5251 AGGCTGCCGG CTGGGCTCGT CCAGCTCAGG GATCTATCAG ATTCTGGCGA
5301 TCTACTCAAC TGTCGCCAGT TCACTGGTGC TTTTGGTCTC CCTGGGGGCA
5351 ATCAGTTTCT GGATGTGTTC TAATGGATCT TTGCAGTGCA GAATATGCAT
5401 CTGAGATTAG AATTCACTCC TCAGGTGCAG GCTGCCTATC AGAAGGTGGT
5451 GGCTGGTGTG GCCAATGCCC TGGCTCACAA ATACCACTGA GATCGATCTT
5501 TTTCCCTCTG CCAAAAATTA TGGGGACATC ATGAAGCCCC TTGAGCATCT
5551 GACTTCTGGC TAATAAAGGA AATTTATTTT CATTGCAATA GTGTGTTGGA
5601 ATTTTTTGTG TCTCTCACTC GGAAGGACAT ATGGGAGGGC AAATCATTTA
5651 AAACATCAGA ATGAGTATTT GGTTTAGAGT TTGGCAACAT ATGCCCATAT
PLP(: -70)
335

5701 GCTGGCTGCC ATGAACAAAG GTTGGCTATA AAGAGGTCAT CAGTATATGA
5751 AACAGCCCCC TGCTGTCCAT TCCTTATTCC ATAGAAAAGC CTTGACTTGA
5801 GGTTAGATTT TTTTTATATT TTGTTTTGTG TTATTTTTTT CTTTAACATC
5851 CCTAAAATTT TCCTTACATG TTTTACTAGC CAGATTTTTC CTCCTCTCCT
5901 GACTACTCCC AGTCATAGCT GTCCCTCTTC TCTTATGGAG ATCCCTCGAG
5951 GGCCATTGCG GCCGCCACCG CGGTGGAGCT CCAGCTTTTG TTCCCTTTAG
6001 TGAGGGTTAA TTGCGCGC
Black = pBluescript II vector sequence Brown = CC10 promoter Blue = Floxed STOP sequence Green = Rabbit beta globin intronic and PolyA sequence Red = HEL/PLP (56-70) coding region
336

Appendix 24. Transmembrane HEL/PLP(56-70) nucleotide/protein sequence
1- ATG AGG TCT TTG CTA ATC TTG GTG CTT TGC TTC CTG CCC CTG GCT 1-MR S L L I LV LCF L P L A
46- GCT CTG GGG AAA GTC TTT GGA CGA TGT GAG TTG GCA GCG GCT ATG 16-ALGK V F G R CE LAAA M
91- AAG CGT CAC GGA CTT GAT AAC TAT CGG GGA TAC AGC CTG GGA AAC 31-K R H G L D N Y R G YS L G N
136-TGG GTG TGT GCC GCA AAA TTC GAG AGT AAC TTC AAC ACC CAG GCT 46-WV CA AK FE S N F N T QA
181-ACA GGC GCC AAA AAC TAC CAG GAC TAT GAG TAT CTC ATT AAT GTG 61-T G AKNYQDYE YLINV
226-ATT CAT GCT TTC CAG TAT GTC ATC TAT GGA ACC CGC GGA AAC CGT 76-IHA F Q YV I Y G T R G N R
271-AAC ACC GAT GGG AGT ACC GAC TAC GGA ATC CTA CAG ATC AAC AGC 91-N TDGS T D Y G I L Q I N S
316-CGC TGG TGG TGC AAC GAT GGC AGG ACC CCA GGC TCC AGG AAC CTG 106-R WWCND GRIP GSRNL
361-TGC AAC ATC CCG TGC TCA GCC CTG CTG AGC TCA GAC ATA ACA GCG 121-C N I P C S A L L S SDI TA
406-AGC GTG AAC TGC GCG AAG AAG ATC GTC AGC GAT GGA AAC GGC ATG 136-S V N C A K K IV SD G N GM
451-AAC GCG TGG GTC GCC TGG CGC AAC CGC TGC AAG GGC ACC GAC GTC 151-N A W VA NW RNR C K G T D V
496-CAG GCG TGG ATC AGA GGC TGC CGG CTG GGC TCG TCC AGC TCA GGG 166-Q A W I R G C R L G S SS SG
541-ATC TAT CAG ATT CTG GCG ATC TAC TCA ACT GTC GCC AGT TCA CTG 181-IYQILA I Y S T VAS S L
586-GTG CTT TTG GTC TCC CTG GGG GCA ATC AGT TTC TGG ATG TGT TCT 196-V L L V S L G A I S F W M C S
337

631-AAT GGA TCT TTG CAG TGC AGA ATA TGC ATC 211-N G S L Q C R I CI
Black = HEL Red = PLP (56-70) Green = joining sequence Blue = Transmembrane anchor region
338

Appendix 25. SIPLP construct - complete nucleotide sequence
1 GCGCGCAATT AACCCTCACT AAAGGGAACA AAAGCTGGGT ACCGGGCCCC
51 CCCTCGAGGT CGACGGTATC GATAAGCTTA TCGATTTCGA ACCCTGTAGC
101 AGGGCCTCTG TGCAGCAGAG GGTGCACACT ACAGGTTGTG CACACGCGTG
151 TGCGTGCATG CATGCAAGGG TGCACATGCA CAGGGTGGAG GTCAGAGGTC
201 AACGTCAGGT GTCTTCGTCT GTCACCCACA GTCTTGTTTT TCAGACAGGA
251 CTTCTCACTG AATCTGAATC CTGCCCATTT GATGGGCTCA TCAGTCAGTT
301 TCCAGGTTTC CCTGGTCCCC ACCTCCCCAG GGCTGGAATT CAAGGCATAT
351 CTAGCTTTTT TGCATGAATG TTTGAGAGCC AAATTCAGTT CCTCATACTT
401 GCCCAATAGG CATAGTATAT CCACTGAGCC ATGTCCCCAA CTCATTATGT
451 TCACCTCATT CATTCATTCA TCCATCCATC CATCCATCCA TCCATTCATT
501 CATTCAGGTT TGGTTTGGTT TGGTTTTAGT GTTTTGGGTT TTTTTTCAAG
551 ACAGGGTTTC TCTGTGTAGC CCTGGCTGCC CTGAAACTAA CTTTCTTACT
601 TACTTTCTTT CTTTCTTCCT TCCTTCCTTT CTTTCTTTAA GTTGGTTTGG
651 GTTTTTTGGG GGGGGGAGGG TTTGGGTTTT TTTGTTTGTT TGTATTTTAT
701 TCAAGGAAAG GCTCCTCTGG GTTGCCCTGG CTGCCCTGGA AGGAATTCTA
751 TAGCCAGGCT GACCATGAAC TCAGAAATCT ACCTGCCTCT CCCTCTGCCT
801 CCCAAGTGCT AGGATTAAAG GTGTGTGACA CACACACAAC TGGCTCTACA
851 TTTGACACTC ACAGTATTCT GCACACAGCC ACAGGGCTGT ATCGCTAAGA
901 GGCCATGTCA CAGGTCCAGG AAGGCTTCAC TGTTTAATAA CTGGTTTGGA
951 ATTTGGAAGT GGGAAAGTAT GTAGAGACAA TCTCACTCTA GGACTCAAAG
1001 ACAGAGATAA AATGCTCTTT AGAAACCTAT TCTGTGGGGG AACAGAATCA
1051 GAACTCTATG TCAGCCTCTG TGCTAGCTGG GGTCAGGCCA GAGACACAGA
339

1101 AATGAGCTAA GCCTACAGTG AGAACTGATA CGCAGGACAG TTGAGAACAA
1151 TGGGAAAGTG CATCTGAAGG GCCCAAGGCC ACTAGGAAAA AGGCAACCCA
1201 AAATGCCCAC AACTTTAAAT CCCCTTCCTG ATGTGTCATT AGATGCAAAC
1251 GGCCCTGGGG AGGATGTGAC GTTAAACAAG GCAGTGTTCT GTACAGGGGC
1301 AGATCCTGCA GTTACTGGAA GCTGAAGGCT CCAGGCTGAC CACACTAGGT
1351 AGGAAGTTCA TGAAATGAGC TCTCGAAGCG CCTCTTCAGG TCTTCCCCGA
1401 TGTCCAGCCC CACCAGCACC GTAGCAGGTA CTGGGCATCT ATTGATTGGG
1451 TGGGTAGGTG AACATTTGAG ACAACCTGGA AGTTTAAATG GGATTTGTGG
1501 AAATAGAGAG GGTGTTGGTT CCAGCCAAGC CAGGTTCCAT GCTAAGACAT
1551 AAAAGCACTG GAGAAGTAAA AGAGTTAACG CTGAACATGG CCGTGGGAAG
1601 CGAGGAGACC AAGGTAAAGC CTGGGAATGG CTAACACTTG AGAACTGTCA
1651 ACATCATGAA AGGATAAGAA AGAATGGCCA AGGAAAGAAA ACAGGAAAGA
1701 GCTGAGTGTG GGAGAGGCCT GGAGAGAATG GGGCAAGAAG TGGGAGGCTA
1751 AAGGGTAAGG GCAAGGGAGG GTCAAGTCAG ATGAGGACTG AAGGTGCTTT
1801 CAACTGGTAG GACTTGAGGG CTGCTCTGGG TAGGAGCCAG CCCGGTCTGG
1851 GCCCTGGGTC TCTCATGTGT TCTATGGAGA AGTCTTTATA TTTGTTCATG
1901 TGTATTGTAT GTGGGCTCTA ACCTGGCCAA CAATGCCCAA GAATCAAGTG
1951 ATTTTTGTGG CTTGAAGTCT AGCCACCTTC CTTGGAGGGA GGCAATAGAA
2001 GGAGCCTAGT GACATCTCGG ACGGAGTCTG GGGTCTTTGT CCTTCCCCTT
2051 GATCCCTGAA GGGTCTCCAG CCTCTGGTTC TCCAGGGTTG GCAAGTCTAC
2101 AATTGCTTCC CGGAACCTGG AGTGCTCAGT GCTTGACTTT AAAGAGGACA
2151 CAGGTGCCTA CAGTTCCACG ACCTCTGGGT TCCCCGACGC CCCCCCCCCC
2201 GCACTGCCCA TTGCCCAAAC ACCCCACAAG TGGCCTATTG TGTGAGCTCA
340

2251 GTTTCAATGG GAAAAGAAAC TGGGTTTATG AAAAGAGATT ATTTGCTTAT
2301 TGCATGGAGA TGACTAAGTA AATAGTGCAA TTTCTTGAGT GGAGCACAAT
2351 CCCTGCCCCT ACCTCTTGTG GGCTGCCAGG AACATATAAA AAGCCACACG
2401 CATACCCACA CATACCCACA CATACCCTCA CATTACAACA TCAGCCCACA
2451 TCTACAGACA GCCCAAGCTT GATATCGAAT TCCTGCAGCC CGGGGGATCC
2501 ACTAGTTCTA GAGCGGCCGC ACGTCTAAGA AACCATTATT ATCATGACAT
2551 TAACCTATAA AAATAGGCGT ATCACGAGGC CCTTTCGTCT TCAAGAATTC
2601 CATCAAGCTT AGGATCCGGA ACCCTTAAT A TAACTTCGTA TAATGTATGC
/651 TATACGAAGT TATTAGGTCC CTCGACCTGC AGCCCAAGCT TACTTACCAT
2701 GTCAGATCCA GACATGATAA GATACATTGA TGAGTTTGGA CAAACCACAA
2751 CTAGAATGCA GTGAAAAAAA TGCTTTATTT GTGAAATTTG TGATGCTATT
2801 GCTTTATTTG TAACCATTAT AAGCTGCAAT AAACAAGTTA ACAACAACAA
2851 TTGCATTCAT TTTATGTTTC AGGTTCAGGG GGAGGTGTGG GAGGTTTTTT
2901 AAAGCAAGTA AAACCTCTAC AAATGTGGTA TGGCTGATTA TGATCTCTAG
2951 TCAAGGCACT ATACATCAAA TATTCCTTAT TAACCCCTTT ACAAATTAAA
3001 AAGCTAAAGG TACACAATTT TTGAGCATAG TTATTAATAG CAGACACTCT
3051 ATGCCTGTGT GGAGTAAGAA AAAACAGTAT GTTATGATTA TAACTGTTAT
3101 GCCTACTTAT AAAGGTTACA GAATATTTTT CCATAATTTT CTTGTATAGC
3151 AGTGCAGCTT TTTCCTTTGT GGTGTAAATA GCAAAGCAAG CAAGAGTTCT
3201 ATTACTAAAC ACAGCATGAC TCAAAAAACT TAGCAATTCT GAAGGAAAGT
3251 CCTTGGGGTC TTCTACCTTT CTCTTCTTTT TTGGAGGAGT AGAATGTTGA
3301 GAGTCAGCAG TAGCCTCATC ATCACTAGAT GGCATTTCTT CTGAGCAAAA
3351 CAGGTTTTCC TCATTAAAGG CATTCCACCA CTGCTCCCAT TCATCAGTTC
loxP site
341

3401 CATAGGTTGG AATCTAAAAT ACACAAACAA TTAGAATCAG TAGTTTAACA
3451 CATTATACAC TTAAAAATTT TATATTTACC TTAGAGCTTT AAATCTCTGT
3501 AGGTAGTTTG TCCAATTATG TCACACCACA GAAGTAAGGT TCCTTCACAA
3551 AGATCCCTCG AGAAAAAAAA TATAAAAGAG ATGGAGGAAC GGGAAAAAGT
3601 TAGTTGTGGT GATAGGTGGC AAGTGGTATT CCGTAAGAAC AACAAGAAAA
3651 GCATTTCATA TTATGGCTGA ACTGAGCGAA CAAGTGCAAA ATTTAAGCAT
3701 CAACGACAAC AACGAGAATG GTTATGTTCC TCCTCACTTA AGAGGAAAAC
3751 CAAGAAGTGC CAGAAATAAC AGTAGCAACT ACAATAACAA CAACGGCGGC
3801 TACAACGGTG GCCGTGGCGG TGGCAGCTTC TTTAGCAACA ACCGTCGTGG
3851 TGGTTACGGC AACGGTGGTT TCTTCGGTGG AAACAACGGT GGCAGCAGAT
3901 CTAACGGCCG TTCTGGTGGT AGATGGATCG ATGGCAAACA TGTCCCAGCT
3951 CCAAGAAACG AAAAGGCCGA GATCGCCATA TTTGGTGTCC CCGAGGATCC
4001 GGAACCCTTA ATATAACTTC GTATAATGTA TGCTATACGA AGTTATTAGG} loxP
4051 site TCCCTCGAAG AGGTTCACTA GTACTGGCCA TTGCGGCCGG ATCCTGAGAA
4101 CTTCAGGGTG AGTTTGGGGA CCCTTGATTG TTCTTTCTTT TTCGCTATTG
4151 TAAAATTCAT GTTATATGGA GGGGGCAAAG TTTTCAGGGT GTTGTTTAGA
4201 ATGGGAAGAT GTCCCTTGTA TCACCATGGA CCCCCATGAT AATTTTGTTT
4251 CTTTCACTTT CTACTCTGTT GACAACCATT GTCTCCTCTT ATTTTCTTTT
4301 CATTTTCTGT AACTTTTTCG TTAAACTTTA GCTTGCATTT GTAACGAATT
4351 TTTAAATTCA CTTTTGTTTA TTTGTCAGAT TGTAAGTACT TTCTCTAATC
4401 ACTTTTTTTT CAAGGCAATC AGGGTATATT ATATTGTACT TCAGCACAGT
4451 TTTAGAGAAC AATTGTTATA ATTAAATGAT AAGGTAGAAT ATTTCTGCAT
4501 ATAAATTCTG GCTGGCGTGG AAATATTCTT ATTGGTAGAA ACAACTACAC
342

4551 CCTGGTCATC ATCCTGCCTT TCTCTTTATG GTTACAATGA TATACACTGT
4601 TTGAGATGAG GATAAAATAC TCTGAGTCCA AACCGGGCCC CTCTGCTAAC
4651 CATGTTCATG CCTTCTTCTC TTTCCTACAG CTCCTGGGCA ACGTGCTGGT
4701 TGTTGTGCTG TCTCATCATT TTGGCAAAGA ATTCTGGCAA CATGAGGTCT
4751 TTGCTAATCT TGGTGCTTTG CTTCCTGCCC CTGGCTGCTC TGGGGAAAGT
4801 CTTTGGACGA TGTGAGCTGG CAGCGGCTAT GAAGCGTCAC GGACTTGATA
4851 ACTATCGGGG ATACAGCCTG GGAAACTGGG TGTGTGCCGC AAAATTCGAG
4901 AGTAACTTC A ACACCCAGGC TACAGGCGCC AAAAACTACC AG ACTATGA
4951 PLP(5 GTATCTCATT AATGTGATTC ATGCTTTCCA GTATGTC ATC TATGGAACCC 701
5001 GCGGAAACCG TAACACCGAT GGGAGTACCG ACTACGGAAT CCTACAGATC
5051 AACAGCCGCT GGTGGTGCAA CGATGGCAGG ACCCCAGGCT CCAGGAACCT
5101 GTGCAACATC CCGTGCTCAG CCCTGCTGAG CTCAGACATA ACAGCGAGCG
5151 TGAACTGCGC GAAGAAGATC GTCAGCGATG GAAACGGCAT GAACGCGTGG
5201 GTCGCCTGGC GCAACCGCTG CAAGGGCACC GACGTCCAGG CGTGGATCAG
5251 AGGCTGCCGG CTGTGAGGAG CTGCCGGAAT TCTCTATCAG ATTCACTCCT
5301 CAGGTGCAGG CTGCCTATCA GAAGGTGGTG GCTGGTGTGG CCAATGCCCT
5351 GGCTCACAAA TACCACTGAG ATCGATCTTT TTCCCTCTGC CAAAAATTAT
5401 GGGGACATCA TGAAGCCCCT TGAGCATCTG ACTTCTGGCT AATAAAGGAA
5451 ATTTATTTTC ATTGCAATAG TGTGTTGGAA TTTTTTGTGT CTCTCACTCG
5501 GAAGGACATA TGGGAGGGCA AATCATTTAA AACATCAGAA TGAGTATTTG
5551 GTTTAGAGTT TGGCAACATA TGCCCATATG CTGGCTGCCA TGAACAAAGG
5601 TTGGCTATAA AGAGGTCATC AGTATATGAA ACAGCCCCCT GCTGTCCATT
5651 CCTTATTCCA TAGAAAAGCC TTGACTTGAG GTTAGATTTT TTTTATATTT
343

5701 TGTTTTGTGT TATTTTTTTC TTTAACATCC CCTAAAATTTT CCTTACATGT
5751 TTTACTAGCC AGATTTTTCC TCCTCTCCTG ACTACTCCCA GTCATAGCTG
5801 TCCCTCTTCT CTTATGGAGA TCCCTCGAGG GCCATTGCGG CCGCCACCGC
5851 GGTGGAGCTC CAGCTrITGT TCCCTTTAGT GAGGGTTAAT TGCGCGC
Black = pBluescript II vector sequence Brown = CC10 promoter Blue = Floxed STOP sequence Green = Rabbit beta globin intronic and PolyA sequence Red = HEL/PLP (56-70) coding region
344

Appendix 26. Secreted HEL/PLP(56-70) nucleotide/protein sequence
1- ATG AGG TCT TTG CTA ATC TTG GTG CTT TGC TTC CTG CCC CTG GCT 1-MR S L L I LV LCF L P L A
46- GCT CTG GGG AAA GTC TTT GGA CGA TGT GAG TTG GCA GCG GCT ATG 16-A L G K V F G R CE L A A A M
91- AAG CGT CAC GGA CTT GAT AAC TAT CGG GGA TAC AGC CTG GGA AAC 31-K RHGLDNYR G YS L G N
136-TGG GTG TGT GCC GCA AAA TTC GAG AGT AAC TTC AAC ACC CAG GCT 46-WV CA AK FE S N F N T QA
181-ACA GGC GCC AAA AAC TAC CAG GAC TAT GAG TAT CTC ATT AAT GTG 61-T G A K N YQDYE YLINV
226-ATT CAT GCT TTC CAG TAT GTC ATC TAT GGA ACC CGC GGA AAC CGT 76-IHA F Q YV I Y G T R G N R
271-AAC ACC GAT GGG AGT ACC GAC TAC GGA ATC CTA CAG ATC AAC AGC 91-N T D G S T D Y G I L Q I N S
316-CGC TGG TGG TGC AAC GAT GGC AGG ACC CCA GGC TCC AGG AAC CTG 106-R WWCND G R T P G SRNL
361-TGC AAC ATC CCG TGC TCA GCC CTG CTG AGC TCA GAC ATA ACA GCG 121-C N I P C S A L L S SDI TA
406-AGC GTG AAC TGC GCG AAG AAG ATC GTC AGC GAT GGA AAC GGC ATG 136-S V N C A K K IV SD GNGM
451-AAC GCG TGG GTC GCC TGG CGC AAC CGC TGC AAG GGC ACC GAC GTC 151-N A W YAW N W RNR C K G TD V
496-CAG GCG TGG ATC AGA GGC TGC CGG CTG 166-Q A W I R G C R L
Black = HEL Red = PLP (56-70)
Green = joining sequence
345

Appendix 27. Inverted stop sequence SIPLP construct - complete nucleotide sequence
1 GCGCGCAATT AACCCTCACT AAAGGGAACA AAAGCTGGCG GGCCCCCCCT
51 CGAGGTCGAC GGTATCGATA AGCTTATCGA TTTCGAACCC TGTAGCAGGG
101 CCTCTGTGCA GCAGAGGGTG CACACTACAG GTTGTGCACA CGCGTGTGCG
151 TGCATGCATG CAAGGGTGCA CATGCACAGG GTGGAGGTCA GAGGTCAACG
201 TCAGGTGTCT TCGTCTGTCA CCCACAGTCT TGTTTTTCAG ACAGGACTTC
251 TCACTGAATC TGAATCCTGC CCATTTGATG GGCTCATCAG TCAGTTTCCA
301 GGTTTCCCTG GTCCCCACCT CCCCAGGGCT GGAATTCAAG GCATATCTAG
351 CTTTTTTGCA TGAATGTTTG AGAGCCAAAT TCAGTTCCTC ATACTTGCCC
401 AATAGGCATA GTATATCCAC TGAGCCATGT CCCCAACTCA TTATGTTCAC
451 CTCATTCATT CATTCATCCA TCCATCCATC CATCCATCCA TTCATTCATT
501 CAGGTTTGGT TTGGTTTGGT TTTAGTGTTT TGGGTTTTTT TTCAAGACAG
551 GGTTTCTCTG TGTAGCCCTG GCTGCCCTGA AACTAACTTT CTTACTTACT
601 TTCTTTCTTT CTTCCTTCCT TCCTTTCTTT CTTTAAGTTG GTTTGGGTTT
651 TTTGGGGGGG GGAGGGTTTG GGTTTTTTTG TTTGTTTGTA TTTTATTCAA
701 GGAAAGGCTC CTCTGGGTTG CCCTGGCTGC CCTGGAAGGA ATTCTATAGC
751 CAGGCTGACC ATGAACTCAG AAATCTACCT GCCTCTCCCT CTGCCTCCCA
801 AGTGCTAGGA TTAAAGGTGT GTGACACACA CACAACTGGC TCTACATTTG
851 ACACTCACAG TATTCTGCAC ACAGCCACAG GGCTGTATCG CTAAGAGGCC
901 ATGTCACAGG TCCAGGAAGG CTTCACTGTT TAATAACTGG TTTGGAATTT
951 GGAAGTGGGA AAGTATGTAG AGACAATCTC ACTCTAGGAC TCAAAGACAG
1001 AGATAAAATG CTCTTTAGAA ACCTATTCTG TGGGGGAACA GAATCAGAAC
346

1051 TCTATGTCAG CCTCTGTGCT AGCTGGGGTC AGGCCAGAGA CACAGAAATG
1101 AGCTAAGCCT ACAGTGAGAA CTGATACGCA GGACAGTTGA GAACAATGGG
1151 AAAGTGCATC TGAAGGGCCC AAGGCCACTA GGAAAAAGGC AACCCAAAAT
1201 GCCCACAACT TTAAATCCCC TTCCTGATGT GTCATTAGAT GCAAACGGCC
1251 CTGGGGAGGA TGTGACGTTA AACAAGGCAG TGTTCTGTAC AGGGGCAGAT
1301 CCTGCAGTTA CTGGAAGCTG AAGGCTCCAG GCTGACCACA CTAGGTAGGA
1351 AGTTCATGAA ATGAGCTCTC GAAGCGCCTC TTCAGGTCTT CCCCGATGTC
1401 CAGCCCCACC AGCACCGTAG CAGGTACTGG GCATCTATTG ATTGGGTGGG
1451 TAGGTGAACA TTTGAGACAA CCTGGAAGTT TAAATGGGAT TTGTGGAAAT
1501 AGAGAGGGTG TTGGTTCCAG CCAAGCCAGG TTCCATGCTA AGACATAAAA
1551 GCACTGGAGA AGTAAAAGAG TTAACGCTGA ACATGGCCGT GGGAAGCGAG
1601 GAGACCAAGG TAAAGCCTGG GAATGGCTAA CACTTGAGAA CTGTCAACAT
1651 CATGAAAGGA TAAGAAAGAA TGGCCAAGGA AAGAAAACAG GAAAGAGCTG
1701 AGTGTGGGAG AGGCCTGGAG AGAATGGGGC AAGAAGTGGG AGGCTAAAGG
1751 GTAAGGGCAA GGGAGGGTCA AGTCAGATGA GGACTGAAGG TGCTTTCAAC
1801 TGGTAGGACT TGAGGGCTGC TCTGGGTAGG AGCCAGCCCG GTCTGGGCCC
1851 TGGGTCTCTC ATGTGTTCTA TGGAGAAGTC TTTATATTTG TTCATGTGTA
1901 TTGTATGTGG GCTCTAACCT GGCCAACAAT GCCCAAGAAT CAAGTGATTT
1951 TTGTGGCTTG AAGTCTAGCC ACCTTCCTTG GAGGGAGGCA ATAGAAGGAG
2001 CCTAGTGACA TCTCGGACGG AGTCTGGGGT CTTTGTCCTT CCCCTTGATC
2051 CCTGAAGGGT CTCCAGCCTC TGGTTCTCCA GGGTTGGCAA GTCTACAATT
2101 GCTTCCCGGA ACCTGGAGTG CTCAGTGCTT GACTTTAAAG AGGACACAGG
2151 TGCCTACAGT TCCACGACCT CTGGGTTCCC CGACGCCCCC CCCCCCGCAC
347

2201 TGCCCATTGC CCAAACACCC CACAAGTGGC CTATTGTGTG AGCTCAGTTT
2251 CAATGGGAAA AGAAACTGGG TTTATGAAAA GAGATTATTT GCTTATTGCA
2301 TGGAGATGAC TAAGTAAATA GTGCAATTTC TTGAGTGGAG CACAATCCCT
2351 GCCCCTACCT CTTGTGGGCT GCCAGGAACA TATAAAAAGC CACACGCATA
2401 CCCACACATA CCCACACATA CCCTCACATT ACAACATCAG CCCACATCTA
2451 CAGACAGCCC AAGCTTGGTA CCTCTCCGCG GTGGCGGCCG CAATGGCCAG
2501
f 51 TACGAAGTTA TATTAAGGGT TCCGGATCCT CGGGGACACC AAATATGGCG}
loxP site
2601 ATCTCGGCCT TTTCGTTTCT TGGAGCTGGG ACATGTTTGC CATCGATCCA
2651 TCTACCACCA GAACGGCCGT TAGATCTGCT GCCACCGTTG TTTCCACCGA
2701 AGAAACCACC GTTGCCGTAA CCACCACGAC GGTTGTTGCT AAAGAAGCTG
2751 CCACCGCCAC GGCCACCGTT GTAGCCGCCG TTGTTGTTAT TGTAGTTGCT
2801 ACTGTTATTT CTGGCACTTC TTGGTTTTCC TCTTAAGTGA GGAGGAACAT
2851 AACCATTCTC GTTGTTGTCG TTGATGCTTA AATTTTGCAC TTGTTCGCTC
2901 AGTTCAGCCA TAATATGAAA TGCTTTTCTT GTTGTTCTTA CGGAATACCA
2951 CTTGCCACCT ATCACCACAA CTAACTTTTT CCCGTTCCTC CATCTCTTTT
3001 ATATTTTTTT TCTCGAGGGA TCTTTGTGAA GGAACCTTAC TTCTGTGGTG
3051 TGACATAATT GGACAAACTA CCTACAGAGA TTTAAAGCTC TAAGGTAAAT
3101 ATAAAATTTT TAAGTGTATA ATGTGTTAAA CTACTGATTC TAATTGTTTG
3151 TGTATTTTAG ATTCCAACCT ATGGAACTGA TGAATGGGAG CAGTGGTGGA
3201 ATGCCTTTAA TGAGGAAAAC CTGTTTTGCT CAGAAGAAAT GCCATCTAGT
3251 GATGATGAGG CTACTGCTGA CTCTCAACAT TCTACTCCTC CAAAAAAGAA
3301 GAGAAAGGTA GAAGACCCCA AGGACTTTCC TTCAGAATTG CTAAGTTTTT
TACTAGTGAA CCTCTTCGAG GGACCTAATA ACTTCGTATA GCATACATTA
348

3351 TGAGTCATGC TGTGTTTAGT AATAGAACTC TTGCTTGCTT TGCTATTTAC
3401 ACCACAAAGG AAAAAGCTGC ACTGCTATAC AAGAAAATTA TGGAAAAATA
3451 TTCTGTAACC TTTATAAGTA GGCATAACAG TTATAATCAT AACATACTGT
3501 TTTTTCTTAC TCCACACAGG CATAGAGTGT CTGCTATTAA TAACTATGCT
3551 CAAAAATTGT GTACCTTTAG CTTTTTAATT TGTAAAGGGG TTAATAAGGA
3601 ATATTTGATG TATAGTGCCT TGACTAGAGA TCATAATCAG CCATACCACA
3651 TTTGTAGAGG TTTTACTTGC TTTAAAAAAC CTCCCACACC TCCCCCTGAA
3701 CCTGAAACAT AAAATGAATG CAATTGTTGT TGTTAACTTG TTTATTGCAG
3751 CTTATAATGG TTACAAATAA AGCAATAGCA TCACAAATTT CACAAATAAA
3801 GCATTTTTTT CACTGCATTC TAGTTGTGGT TTGTCCAAAC TCATCAATGT
3851 ATCTTATCAT GTCTGGATCT GACATGGTAA GTAAGCTTGG GCTGCAGGTC
3901 GAGGGACCTA ATAACTTCGT ATAGCATACA TTATACGAAG TTATATTAAG} loxP
3951 site GGTTCCGGAT CCTAAGCTTG ATGGAATTCT TGAAGACGAA AGGGCCTCGT
4001 GATACGCCTA TTTTTATAGG TTAATGTCAT GATAATAATG GTTTCTTAGA
4051 CGTGCGGCCG CTCTAGAACT AGTGGATCCC CCGGGCTGCA GGAATTCGAT
4101 ATCAAGCTTA TCGATACCGT CGACCTCGAG GGGGGGCCCG GTACCGAGCT
4151 CGGATCCTGA GAACTTCAGG GTGAGTTTGG GGACCCTTGA TTGTTCTTTC
4201 TTTTTCGCTA TTGTAAAATT CATGTTATAT GGAGGGGGCA AAGTTTTCAG
4251 GGTGTTGTTT AGAATGGGAA GATGTCCCTT GTATCACCAT GGACCCTCAT
4301 GATAATTTTG TTTCTTTCAC TTTCTACTCT GTTGACAACC ATTGTCTCCT
4351 CTTATTTTCT TTTCATTTTC TGTAACTTTT TCGTTAAACT TTAGCTTGCA
4401 TTTGTAACGA ATTTTTAAAT TCACTTTTGT TTATTTGTCA GATTGTAAGT
4451 ACTTTCTCTA ATCACTTTTT TTTCAAGGCA ATCAGGGTAT ATTATATTGT
349

4501 ACTTCAGCAC AGTTTTAGAG AACAATTGTT ATAATTAAAT GATAAGGTAG
4551 AATATTTCTC CATATAAATT CTGGCTGGCG TGGAAATATT CTTATTGGTA
4601 GAAACAACTA CACCCTGGTC ATCATCCTGC CTTTCTCTTT ATGGTTACAA
4651 TGATATACAC TGTTTGAGAT GAGGATAAAA TACTCTGAGT CCAAACCGGG
4701 CCCCTCTGCT AACCATGTTC ATGCCTTCTT CTCTTTCCTA CAGCTCCTGG
4751 GCAACGTGCT GGTTGTTGTG CTGTCTCATC ATTTTGGCAA AGAATTCTGG
4801 CAACATGAGG TCTTTGCTAA TCTTGGTGCT TTGCTTCCTG CCCCTGGCTG
4851 CTCTGGGGAA AGTCTTTGGA CGATGTGAGT TGGCAGCGGC TATGAAGCGT
4901 CACGGACTTG ATAACTATCG GGGATACAGC CTGGGAAACT GGGTGTGTGC
4951 CGCAAAATTC GAGAGTAACT TCAACACCCA GGCTACAGGC GCCAAAAACT
5001 ACCAGIGACTA TGAGTATCTC ATTAATGTGA TTCATGCTTT CCAGTATGTC11 PLP(56-
5051 701
ATCTATGGAA CCCGCGGAAA CCGTAACACC GATGGGAGTA CCGACTACGG 5101
AATCCTACAG ATCAACAGCC GCTGGTGGTG CAACGATGGC AGGACCCCAG 5151
GCTCCAGGAA CCTGTGCAAC ATCCCGTGCT CAGCCCTGCT GAGCTCAGAC 5201
ATAACAGCGA GCGTGAACTG CGCGAAGAAG ATCGTCAGCG ATGGAAACGG 5251
CATGAACGCG TGGGTCGCCT GGCGCAACCG CTGCAAGGGC ACCGACGTCC 5301
AGGCGTGGAT CAGAGGCTGC CGGCTGTGAG GAGCTGCCGG AATTCACTCC 5351
TCAGGTGCAG GCTGCCTATC AGAAGGTGGT GGCTGGTGTG GCCAATGCCC 5401
TGGCTCACAA ATACCACTGA GATCGATCTT TTTCCCTCTG CCAAAAATTA 5451
TGGGGACATC ATGAAGCCCC TTGAGCATCT GACTTCTGGC TAATAAAGGA 5501
AATTTATTTT CATTGCAATA GTGTGTTGGA ATTTTTTGTG TCTCTCACTC 5551 GGAAGGACAT ATGGGAGGGC AAATCATTTA AAACATCAGA ATGAGTATTT
5601 GGTTTAGAGT TTGGCAACAT ATGCCCATAT GCTGGCTGCC ATGAACAAAG
350

5651 GTTGGCTATA AAGAGGTCAT CAGTATATGA AACAGCCCCC TGCTGTCCAT
5701 TCCTTATTCC ATAGAAAAGC CTTGACTTGA GGTTAGATTT TTTTTATATT
5751 TTGTTTTGTG TTATTTTTTT CTTTAACATC CCTAAAATTT TCCTTACATG
5801 TTTTACTAGC CAGATTTTTC CTCCTCTCCT GACTACTCCC AGTCATAGCT
5851 GTCCCTCTTC TCTTATGGAG ATCCCTCGAG CATGCATCTA GAGCGGCCGC
5901 CACCGCGGTG GAGCTCCAGC TTTTGTTCCC TTTAGTGAGG GTTAATTGCG
5951 CGC
Black = pBluescript II vector sequence Brown = CC10 promoter Blue = Floxed STOP sequence Green = Rabbit beta globin intronic and PolyA sequence Red = HEL/PLP (56-70) coding region
351

Appendix 28. Lung targeted h1L-8 construct - complete nucleotide sequence
1 GCGCGCAATT AACCCTCACT AAAGGGAACA AAAGCTGGG ACCGGGCCCC
51 CCCTCGAGGT CGACGGTATC GATAAGCTTA TCGATTTCGA ACCCTGTAGC
101 AGGGCCTCTG TGCAGCAGAG GGTGCACACT ACAGGTTGTG CACACGCGTG
151 TGCGTGCATG CATGCAAGGG TGCACATGCA CAGGGTGGAG GTCAGAGGTC
201 AACGTCAGGT GTCTTCGTCT GTCACCCACA GTCTTGTTTT TCAGACAGGA
251 CTTCTCACTG AATCTGAATC CTGCCCATTT GATGGGCTCA TCAGTCAGTT
301 TCCAGGTTTC CCTGGTCCCC ACCTCCCCAG GGCTGGAATT CAAGGCATAT
351 CTAGCTTTTT TGCATGAATG TTTGAGAGCC AAATTCAGTT CCTCATACTT
401 GCCCAATAGG CATAGTATAT CCACTGAGCC ATGTCCCCAA CTCATTATGT
451 TCACCTCATT CATTCATTCA TCCATCCATC CATCCATCCA TCCATTCATT
501 CATTCAGGTT TGGTTTGGTT TGGTTTTAGT GTTTTGGGTT TTTTTTCAAG
551 ACAGGGTTTC TCTGTGTAGC CCTGGCTGCC CTGAAACTAA CTTTCTTACT
601 TACTTTCTTT CTTTCTTCCT TCCTTCCTTT CTTTCTTTAA GTTGGTTTGG
651 GTTTTTTGGG GGGGGGAGGG TTTGGGTTTT TTTGTTTGTT TGTATTTTAT
701 TCAAGGAAAG GCTCCTCTGG GTTGCCCTGG CTGCCCTGGA AGGAATTCTA
751 TAGCCAGGCT GACCATGAAC TCAGAAATCT ACCTGCCTCT CCCTCTGCCT
801 CCCAAGTGCT AGGATTAAAG GTGTGTGACA CACACACAAC TGGCTCTACA
851 TTTGACACTC ACAGTATTCT GCACACAGCC ACAGGGCTGT ATCGCTAAGA
901 GGCCATGTCA CAGGTCCAGG AAGGCTTCAC TGTTTAATAA CTGGTTTGGA
951 ATTTGGAAGT GGGAAAGTAT GTAGAGACAA TCTCACTCTA GGACTCAAAG
1001 ACAGAGATAA AATGCTCTTT AGAAACCTAT TCTGTGGGGG AACAGAATCA
352

1051 GAACTCTATG TCAGCCTCTG TGCTAGCTGG GGTCAGGCCA GAGACACAGA
1101 AATGAGCTAA GCCTACAGTG AGAACTGATA CGCAGGACAG TTGAGAACAA
1151 TGGGAAAGTG CATCTGAAGG GCCCAAGGCC ACTAGGAAAA AGGCAACCCA
1201 AAATGCCCAC AACTTTAAAT CCCCTTCCTG ATGTGTCATT AGATGCAAAC
1251 GGCCCTGGGG AGGATGTGAC GTTAAACAAG GCAGTGTTCT GTACAGGGGC
1301 AGATCCTGCA GTTACTGGAA GCTGAAGGCT CCAGGCTGAC CACACTAGGT
1351 AGGAAGTTCA TGAAATGAGC TCTCGAAGCG CCTCTTCAGG TCTTCCCCGA
1401 TGTCCAGCCC CACCAGCACC GTAGCAGGTA CTGGGCATCT ATTGATTGGG
1451 TGGGTAGGTG AACATTTGAG ACAACCTGGA AGTTTAAATG GGATTTGTGG
1501 AAATAGAGAG GGTGTTGGTT CCAGCCAAGC CAGGTTCCAT GCTAAGACAT
1 551 AAAAGCACTG GAGAAGTAAA AGAGTTAACG CTGAACATGG CCGTGGGAAG
1601 CGAGGAGACC AAGGTAAAGC CTGGGAATGG CTAACACTTG AGAACTGTCA
1651 ACATCATGAA AGGATAAGAA AGAATGGCCA AGGAAAGAAA ACAGGAAAGA
1701 GCTGAGTGTG GGAGAGGCCT GGAGAGAATG GGGCAAGAAG TGGGAGGCTA
1751 AAGGGTAAGG GCAAGGGAGG GTCAAGTCAG ATGAGGACTG AAGGTGCTTT
1801 CAACTGGTAG GACTTGAGGG CTGCTCTGGG TAGGAGCCAG CCCGGTCTGG
1851 GCCCTGGGTC TCTCATGTGT TCTATGGAGA AGTCTTTATA TTTGTTCATG
1901 TGTATTGTAT GTGGGCTCTA ACCTGGCCAA CAATGCCCAA GAATCAAGTG
1951 ATTTTTGTGG CTTGAAGTCT AGCCACCTTC CTTGGAGGGA GGCAATAGAA
2001 GGAGCCTAGT GACATCTCGG ACGGAGTCTG GGGTCTTTGT CCTTCCCCTT
2051 GATCCCTGAA GGGTCTCCAG CCTCTGGTTC TCCAGGGTTG GCAAGTCTAC
2101 AATTGCTTCC CGGAACCTGG AGTGCTCAGT GCTTGACTTT AAAGAGGACA
2151 CAGGTGCCTA CAGTTCCACG ACCTCTGGGT TCCCCGACGC CCCCCCCCCC
353

2201 GCACTGCCCA TTGCCCAAAC ACCCCACAAG TGGCCTATTG TGTGAGCTCA
2251 GTTTCAATGG GAAAAGAAAC TGGGTTTATG AAAAGAGATT ATTTGCTTAT
2301 TGCATGGAGA TGACTAAGTA AATAGTGCAA TTTCTTGAGT GGAGCACAAT
2351 CCCTGCCCCT ACCTCTTGTG GGCTGCCAGG AACATATAAA AAGCCACACG
2401 CATACCCACA CATACCCACA CATACCCTCA CATTACAACA TCAGCCCACA
2451 TCTACAGACA GCCCAAGCTT GATATCGAAT TCCTGCAGCC CGGGGGATCC
2501 TGAGAACTTC AGGGTGAGTT TGGGGACCCT TGATTGTTCT TTCTTTTTCG
2551 CTATTGTAAA ATTCATGTTA TATGGAGGGG GCAAAGTTTT CAGGGTGTTG
2601 TTTAGAATGG GAAGATGTCC CTTGTATCAC CATGGACCCC CATGATAATT
2651 TTGTTTCTTT CACTTTCTAC TCTGTTGACA ACCATTGTCT CCTCTTATTT
2701 TCTTTTCATT TTCTGTAACT TTTTCGTTAA ACTTTAGCTT GCATTTGTAA
2751 CGAATTTTTA AATTCACTTT TGTTTATTTG TCAGATTGTA AGTACTTTCT
2801 CTAATCACTT TTTTTTCAAG GCAATCAGGG TATATTATAT TGTACTTCAG
2851 CACAGTTTTA GAGAACAATT GTTATAATTA AATGATAAGG TAGAATATTT
2901 CTGCATATAA ATTCTGGCTG GCGTGGAAAT ATTCTTATTG GTAGAAACAA
2951 CTACACCCTG GTCATCATCC TGCCTTTCTC TTTATGGTTA CAATGATATA
3001 CACTGTTTGA GATGAGGATA AAATACTCTG AGTCCAAACC GGGCCCCTCT
3051 GCTAACCATG TTCATGCCTT CTTCTCTTTC CTACAGCTCC TGGGCAACGT
3101 GCTGGTTGTT GTGCTGTCTC ATCATTTTGG CAAAGAATTC TGTAAACATG
3151 ACTTCCAAGC TGGCCGTGGC TCTCTTGGCA GCCTTCCTGA TTTCTGCAGC
3201 TCTGTGTGAA GGTGCAGTTT TGCCAAGGAG TGCTAAAGAA CTTAGATGTC
3251 AGTGCATAAA GACATACTCC AAACCTTTCC ACCCCAAATT TATCAAAGAA
3301 CTGAGAGTGA TTGAGAGTGG ACCACACTGC GCCAACACAG AAATTATTGT
354

3351 AAAGCTTTCT GATGGAAGAG AGCTCTGTCT GGACCCCAAG GAAAACTGGG
3401 TGCAGAGGGT TGTGGAGAAG TTTTTGAAGA GGGCTGAGAA CTCATAAGAA
3451 TTCACTCCTC AGGTGCAGGC TGCCTATCAG AAGGTGGTGG CTGGTGTGGC
3501 CAATGCCCTG GCTCACAAAT ACCACTGAGA TCGATCTTTT TCCCTCTGCC
3551 AAAAATTATG GGGACATCAT GAAGCCCCTT GAGCATCTGA CTTCTGGCTA
3601 ATAAAGGAAA TTTATTTTCA TTGCAATAGT GTGTTGGAAT TTTTTGTGTC
3651 TCTCACTCGG AAGGACATAT GGGAGGGCAA ATCATTTAAA ACATCAGAAT
3701 GAGTATTTGG TTTAGAGTTT GGCAACATAT GCCCATATGC TGGCTGCCAT
3751 GAACAAAGGT TGGCTATAAA GAGGTCATCA GTATATGAAA CAGCCCCCTG
3801 CTGTCCATTC CTTATTCCAT AGAAAAGCCT TGACTTGAGG TTAGATTTTT
3851 TTTATATTTT GTTTTGTGTT ATTTTTTTCT TTAACATCCC TAAAATTTTC
3901 CTTACATGTT TTACTAGCCA GATTTTTCCT CCTCTCCTGA CTACTCCCAG
3951 TCATAGCTGT CCCTCTTCTC TTATGGAGAT CCCTCGAGCA TGCATCTAGA
4001 GCGGCCGCCA CCGCGGTGGA GCTCCAGCTT TTGTTCCCTT TAGTGAGGGT
4051 TAATTGCGCG C
Black = pBluescript II vector sequence Brown = CC10 promoter Green = Rabbit beta globin intronic and PolyA sequence Blue = Human IL-8
355

Appendix 29. hIL-8 nucleotide/protein sequence
1- ATG ACT TCC AAG CTG GCC GTG GCT CTC TTG GCA GCC TTC CTG ATT 1-MT S K L A V A L L A A F L I
46- TCT GCA GCT CTG TGT GAA GGT GCA GTT TTG CCA AGG AGT GCT AAA 16-SA AL CEGA V L P R SA K
91- GAA CTT AGA TGT CAG TGC ATA AAG ACA TAC TCC AAA CCT TTC CAC 31EL R CQCIK T Y S K P F H
136- CCC AAA TTT ATC AAA GAA CTG AGA GTG ATT GAG AGT GGA CCA CAC 46-P K F I K E L R VIES GP H
181- TGC GCC AAC ACA GAA ATT ATT GTA AAG CTT TCT GAT GGA AGA GAG 61-CAN T E II V K L S D G R E
226- CTC TGT CTG GAC CCC AAG GAA AAC TGG GTG CAG AGG GTT GTG GAG 76-LCLDPK E NWVQR VV E
271- AAG TTT TTG AAG AGG GCT GAG AAC TCA 91-K F L K R A E N S
Red = mutated base pair (T—>C)
356

Appendix 30. Inflammatory cell scoring system
Score Bronchi Blood vessels
0. Bronchi or blood vessel is not surrounded by any inflammatory cells
1. Bronchi or blood vessels is surrounded by the occasional inflammatory cell
2. Inflammation completely surrounds and is 1-4 cells in diameter from the edge of the bronchi or vessel
3. Inflammation completely surrounds and is 5 or more cells in diameter from the edge of the bronchi or vessel
357