Synthesis of Goethite-Coated Sand and Analysis of its Interactions with Uranium
10
Scaling of adsorption reactions: U(VI) experiments and modeling Vijay A. Loganathan, Mark O. Barnett * , T. Prabhakar Clement, Sushil R. Kanel Department of Civil Engineering, 238 Harbert Engineering Center, Auburn University, Auburn, AL 36849, United States article info Article history: Received 10 July 2008 Accepted 9 July 2009 Available online 27 August 2009 Editorial handling by R.N.J. Comans abstract Iron-coated sands were prepared via two common protocols, a precipitation method, where Fe was pre- cipitated directly onto the sand in a single step, and an adsorption method, where pure goethite was pre- pared in the first step and then adsorbed onto the sand in a second step. The coated sands from both the systems were characterized using scanning electron microscopy, energy-dispersive spectroscopy, X-ray diffraction, and selective Fe extraction. Although neither of the methods produced a completely crystal- line Fe coating, the precipitation method produced sands with larger portions of amorphous Fe than the adsorption method, with the fraction of amorphous Fe decreasing with increasing Fe content. Uranium(VI) adsorption isotherms and pH adsorption edges were measured on three coated sands with Fe contents ranging from 0.04% to 0.3%. Experimentally, the adsorption of U(VI) onto the three sands was more comparable when normalized to surface area than when normalized to Fe content. A surface com- plexation model, although originally developed for U(VI) adsorption onto amorphous Fe oxide, captured the differences in adsorption when adjusted for the surface area of the coated sand. The findings indicate that surface area is a better scaling parameter than Fe content in predicting U(VI) adsorption to Fe-dom- inated media. These findings are significant because many common surface complexation models are parameterized on the basis of Fe content rather than specific surface area. Although the interactions of U(VI) and Fe-coated sands were used as representative adsorbate and adsorbent, the general principles may be applicable to other adsorbate–adsorbent systems as well. Ó 2009 Elsevier Ltd. All rights reserved. 1. Introduction Iron(III) (oxyhydr)oxide coatings on soils and sediments are one of the most important factors in controlling the adsorption and transport of U(VI) in the subsurface (Um et al., 2007; Davis et al., 2004; Barnett et al., 2002). Various forms of Fe(III) oxides occur in nature and can be broadly classified into crystalline (e.g., goe- thite, hematite) and amorphous forms (e.g., hydrous ferric oxide, ferrihydrite). Amorphous and crystalline Fe oxides differ signifi- cantly in their structure and properties. Crystalline Fe oxides exhi- bit lower specific surface area and microporosity compared to the non-crystalline, amorphous Fe oxides (Schwertmann and Cornell, 2000). Though much work has been reported on the interaction of U(VI) with pure Fe oxides (Bruno et al., 1995; Giammar and Her- ing, 2001; Hsi and Langmuir, 1985; Waite et al., 1994), fewer re- ports are available in which Fe oxide-coated media was used as the adsorbent. At U(VI)-contaminated sites, Fe oxides often appear as coatings on other geomedia rather than discrete minerals (Davis et al., 2004; Payne et al., 1994; Um et al., 2007). However, Fe oxide- coatings exhibit different adsorption properties than pure Fe oxi- des (Xu and Axe, 2005). Two different methods have typically been used for the synthe- sis of Fe-coated sand, the precipitation method and the adsorption method (Xu and Axe, 2005; Schwertmann and Cornell, 2000; Sche- idegger et al., 1993). In the precipitation method, sometimes called the homogenous method, sand is initially mixed with soluble Fe. Reaction conditions favorable for goethite (a-FeOOH) precipitation are then maintained, and goethite particles are in principle coated onto the sand as the Fe precipitates. The adsorption method is a two-step process, in which pure goethite is synthesized in the first step and the coating occurs in the second step, where the goethite prepared in the first step is adsorbed onto the surface of the sand. This method of coating sand is also referred to as the heteroge- neous suspension method (Scheidegger et al., 1993). The coated sands obtained from both of these methods have been used as sur- rogates for subsurface materials to study trace metal or anion adsorption (Gabriel et al., 1998; Meeussen et al., 1996; Roden et al., 2000; Xu and Axe, 2005). Previous studies have indicated that the reactive transport processes can be successfully modeled using a known amount of sand and Fe oxide in the system irrespec- tive of the coating method (Scheidegger et al., 1994; Meeussen et al., 1999; Cheng et al., 2004). Surface complexation models have frequently been used to de- scribe the adsorption of U(VI) to Fe oxides. A number of different models have proven capable of adequately simulating the adsorp- tion of U(VI) onto a particular Fe oxide under a range of conditions 0883-2927/$ - see front matter Ó 2009 Elsevier Ltd. All rights reserved. doi:10.1016/j.apgeochem.2009.07.016 * Corresponding author. Fax: +1 334 844 6290. E-mail addresses: [email protected] (V.A. Loganathan), mark.barnett@auburn. edu (M.O. Barnett). Applied Geochemistry 24 (2009) 2051–2060 Contents lists available at ScienceDirect Applied Geochemistry journal homepage: www.elsevier.com/locate/apgeochem
Transcript of Synthesis of Goethite-Coated Sand and Analysis of its Interactions with Uranium
Applied Geochemistry 24 (2009) 2051–2060
Contents lists available at ScienceDirect
Applied Geochemistry
journal homepage: www.elsevier .com/ locate/apgeochem
Scaling of adsorption reactions: U(VI) experiments and modeling
Vijay A. Loganathan, Mark O. Barnett *, T. Prabhakar Clement, Sushil R. KanelDepartment of Civil Engineering, 238 Harbert Engineering Center, Auburn University, Auburn, AL 36849, United States
a r t i c l e i n f o
Article history:Received 10 July 2008Accepted 9 July 2009Available online 27 August 2009
Editorial handling by R.N.J. Comans
0883-2927/$ - see front matter � 2009 Elsevier Ltd. Adoi:10.1016/j.apgeochem.2009.07.016
* Corresponding author. Fax: +1 334 844 6290.E-mail addresses: [email protected] (V.A. Logana
edu (M.O. Barnett).
a b s t r a c t
Iron-coated sands were prepared via two common protocols, a precipitation method, where Fe was pre-cipitated directly onto the sand in a single step, and an adsorption method, where pure goethite was pre-pared in the first step and then adsorbed onto the sand in a second step. The coated sands from both thesystems were characterized using scanning electron microscopy, energy-dispersive spectroscopy, X-raydiffraction, and selective Fe extraction. Although neither of the methods produced a completely crystal-line Fe coating, the precipitation method produced sands with larger portions of amorphous Fe than theadsorption method, with the fraction of amorphous Fe decreasing with increasing Fe content.Uranium(VI) adsorption isotherms and pH adsorption edges were measured on three coated sands withFe contents ranging from 0.04% to 0.3%. Experimentally, the adsorption of U(VI) onto the three sands wasmore comparable when normalized to surface area than when normalized to Fe content. A surface com-plexation model, although originally developed for U(VI) adsorption onto amorphous Fe oxide, capturedthe differences in adsorption when adjusted for the surface area of the coated sand. The findings indicatethat surface area is a better scaling parameter than Fe content in predicting U(VI) adsorption to Fe-dom-inated media. These findings are significant because many common surface complexation models areparameterized on the basis of Fe content rather than specific surface area. Although the interactions ofU(VI) and Fe-coated sands were used as representative adsorbate and adsorbent, the general principlesmay be applicable to other adsorbate–adsorbent systems as well.
� 2009 Elsevier Ltd. All rights reserved.
1. Introduction
Iron(III) (oxyhydr)oxide coatings on soils and sediments are oneof the most important factors in controlling the adsorption andtransport of U(VI) in the subsurface (Um et al., 2007; Davis et al.,2004; Barnett et al., 2002). Various forms of Fe(III) oxides occurin nature and can be broadly classified into crystalline (e.g., goe-thite, hematite) and amorphous forms (e.g., hydrous ferric oxide,ferrihydrite). Amorphous and crystalline Fe oxides differ signifi-cantly in their structure and properties. Crystalline Fe oxides exhi-bit lower specific surface area and microporosity compared to thenon-crystalline, amorphous Fe oxides (Schwertmann and Cornell,2000). Though much work has been reported on the interactionof U(VI) with pure Fe oxides (Bruno et al., 1995; Giammar and Her-ing, 2001; Hsi and Langmuir, 1985; Waite et al., 1994), fewer re-ports are available in which Fe oxide-coated media was used asthe adsorbent. At U(VI)-contaminated sites, Fe oxides often appearas coatings on other geomedia rather than discrete minerals (Daviset al., 2004; Payne et al., 1994; Um et al., 2007). However, Fe oxide-coatings exhibit different adsorption properties than pure Fe oxi-des (Xu and Axe, 2005).
ll rights reserved.
than), mark.barnett@auburn.
Two different methods have typically been used for the synthe-sis of Fe-coated sand, the precipitation method and the adsorptionmethod (Xu and Axe, 2005; Schwertmann and Cornell, 2000; Sche-idegger et al., 1993). In the precipitation method, sometimes calledthe homogenous method, sand is initially mixed with soluble Fe.Reaction conditions favorable for goethite (a-FeOOH) precipitationare then maintained, and goethite particles are in principle coatedonto the sand as the Fe precipitates. The adsorption method is atwo-step process, in which pure goethite is synthesized in the firststep and the coating occurs in the second step, where the goethiteprepared in the first step is adsorbed onto the surface of the sand.This method of coating sand is also referred to as the heteroge-neous suspension method (Scheidegger et al., 1993). The coatedsands obtained from both of these methods have been used as sur-rogates for subsurface materials to study trace metal or anionadsorption (Gabriel et al., 1998; Meeussen et al., 1996; Rodenet al., 2000; Xu and Axe, 2005). Previous studies have indicatedthat the reactive transport processes can be successfully modeledusing a known amount of sand and Fe oxide in the system irrespec-tive of the coating method (Scheidegger et al., 1994; Meeussenet al., 1999; Cheng et al., 2004).
Surface complexation models have frequently been used to de-scribe the adsorption of U(VI) to Fe oxides. A number of differentmodels have proven capable of adequately simulating the adsorp-tion of U(VI) onto a particular Fe oxide under a range of conditions
2052 V.A. Loganathan et al. / Applied Geochemistry 24 (2009) 2051–2060
(Cheng et al., 2004; Hsi and Langmuir, 1985; Jang et al., 2007;Waite et al., 1994). However, the authors’ review indicates thatthere is no unique set of parameters or surface complexation reac-tions that can describe the adsorption processes of U(VI) to a spe-cific Fe oxide. Mathur and Dzombak (2006) have compiled anextensive database for metal and anion adsorption onto goethiteand found similar intrinsic surface complexation constants for hy-drous ferric oxide (HFO) and goethite. Hence, they suggested thatadsorption onto different Fe oxides would be similar, provided thatthe site density and surface area, which are typically higher forHFO than for goethite, were taken into account.
Prikryl et al. (2001) showed experimental evidence for U(VI)adsorption onto silicate mineral mixtures that scaled to surfacearea. Similarly, Jang et al. (2007) developed a surface complexa-tion model for U(VI) adsorption onto HFO and showed that thesame model could describe the adsorption onto pure Fe oxideminerals like hematite if adjusted for the specific surface areaof the minerals. However, the above studies did not show theapplication of scaling principles onto Fe oxide-coated media thatare common in the environment. Moreover, the study of Xu andAxe (2005) shows that surface area normalized adsorption of Nionto pure goethite and goethite-coated sand could be different.The authors surmise that the higher adsorption of Ni to the goe-thite-coated sands when compared to goethite could be due tothe presence of nano scale Fe, indicating that pure mineralsand media coated with these minerals can behave quitedifferently.
Accordingly, the study focuses on U(VI) interactions with labo-ratory-synthesized Fe oxide-coated sand under well-controlledconditions as an intermediate between pure Fe oxides and Fe-con-taining soils and sediments. As opposed to natural geomedia, Fe-coated sands synthesized in the laboratory under well-controlledconditions avoid other materials and species [e.g., pre-adsorbedphosphate (Bostick et al., 2002)] that can influence adsorption.Understanding the adsorption of U(VI) onto coated sands is animportant step towards developing scalable reaction models thatcan ultimately describe and predict the fate and transport ofU(VI) in the subsurface.
In this study, it is hypothesized that the adsorption of U(VI) toFe-coated sand is predominantly a surface area-driven process asopposed to an Fe content-driven process. To test the hypothesis,Fe-coated sands were synthesized, characterized, and batchadsorption experiments were conducted under well-controlledconditions using U(VI). The experimental data describing the inter-action of Fe-coated sand with U(VI) were tested by different scalingapproaches to verify the hypothesis.
Table 1Experimental setups.
System pH in 0.1 M NaNO3 Loading Total U(VI)
(g Fe L�1) (g sand L�1) (lM)
Batch isotherm experimentPT-1 4.45 ± 0.1 0.174 436 0–5PT-2 4.45 ± 0.1 0.167 91.9 0–5PT-3 4.45 ± 0.1 0.158 50.2 0–5pH edge experimentPT-1 3–8 0.158 396 4.2PT-2 3–8 0.158 86.7 4.2PT-3 3–8 0.158 50.2 4.2
2. Materials and methods
2.1. Synthesis of iron oxide-coated sand
All chemicals used were certified analytical grade and obtainedfrom Fisher Scientific (Pittsburgh, PA) unless otherwise noted. Ironoxide-coated sand was synthesized using two common protocols,the precipitation method and the adsorption method. Pure med-ium-sized crystalline white quartz obtained from Sigma–Aldrich,MO, with a particle size ranging between 0.210 and 0.297 mm,was chosen as the substrate. The purity and crystallinity of thewhite quartz was tested using X-ray diffraction (XRD). The XRDspectrum exactly matched with the quartz peaks and no impuritywas detected. In addition to being a common subsurface mineral,quartz was chosen as the substrate because at the coating pH of7, quartz carries a negative charge whereas goethite carries a posi-tive charge (Scheidegger et al., 1993), resulting in a stronger bind-ing between the two minerals.
In the precipitation method, 1 kg of sand was added to 0.05 MFeCl2�4H2O in 1 M NaHCO3 buffered at pH 7. Atmospheric O2 wasvigorously added to the system using a jumbo stirrer. Under theseconditions, the Fe(II) was oxidized to Fe(III), which was marked bya series of color changes before finally forming a reddish-browncoating (Schwertmann and Cornell, 2000). After 1.5 h of mixing,the coated sand was washed using deionized water (18.2 MX cm).The supernatant was analyzed for conductivity using an ion chro-matograph and the washing was continued until the conductivityof the supernatant reached the DI water conductivity. The sandswere then oven dried at 110 �C for 24 h. Any changes that occurredas a result of this drying process (e.g., conversion of amorphous Feoxides into more crystalline forms) should be noted. The precipita-tion method was repeated sequentially to produce three coatedsands (PT-1, PT-2 and PT-3) with increasing Fe content (0.04–0.32%). A batch experiment was performed at pH 3 to check forthe residual Fe(II) adsorption on the coated sand. At the end ofthe 24 h equilibration period samples were analyzed using flameatomic absorption spectrophotometer and no residual Fe was ob-served in the solution.
Another common method for synthesizing coated sand is theadsorption method (Scheidegger et al., 1993), where pure goethiteis synthesized first and then coated onto the sand in a subsequentstep. In this process, 1 M Fe(NO3)3�9H2O served as the Fe source,which under rapid hydrolysis resulted in amorphous ferrihydrite(Schwertmann and Cornell, 2000). The ferrihydrite was convertedto goethite under alkaline conditions (pH 12) maintained by 5 MKOH at 65 �C for at least 60 h. The yellow-colored goethite precip-itate was placed in dialysis tubing (MWCO 2000) and suspended ina deionized water bath for approximately 1 week as described byAnschutz and Penn (2005). The supernatant was then decantedand the pure goethite was freeze dried. In the second (coating)step, �100 g of goethite was suspended in 10 L of 0.01 M NaNO3
for 24 h at room temperature and a pH of �7 was maintained.Approximately 2.5 kg of quartz sand that had been washed with1 M HCl and dried at 110 �C was added to the suspension andmixed slowly. After 24 h, the sand was washed with 0.01 M NaNO3
solution that was adjusted to pH 3 (Scheidegger et al., 1993) to re-move weakly bound goethite and then washed with copious deion-ized water until the pH stabilized at �5.8. The initial Fe content ofthe sand coated in this manner was �0.02%. The efficiency of thiscoating method was low (only 0.8–1.2% of the available Fe wascoated onto the sand grains).
2.2. Characterization
Scanning electron microscopy (SEM) along with energy-disper-sive spectroscopy (EDS) and powder X-ray diffraction were usedfor characterizing the morphology and identifying the specificphases present. The SEM imaging was performed using a fieldemission high resolution JEOL 7000F scanning electron microscopeunder a 20 kV accelerating voltage. X-ray diffraction was
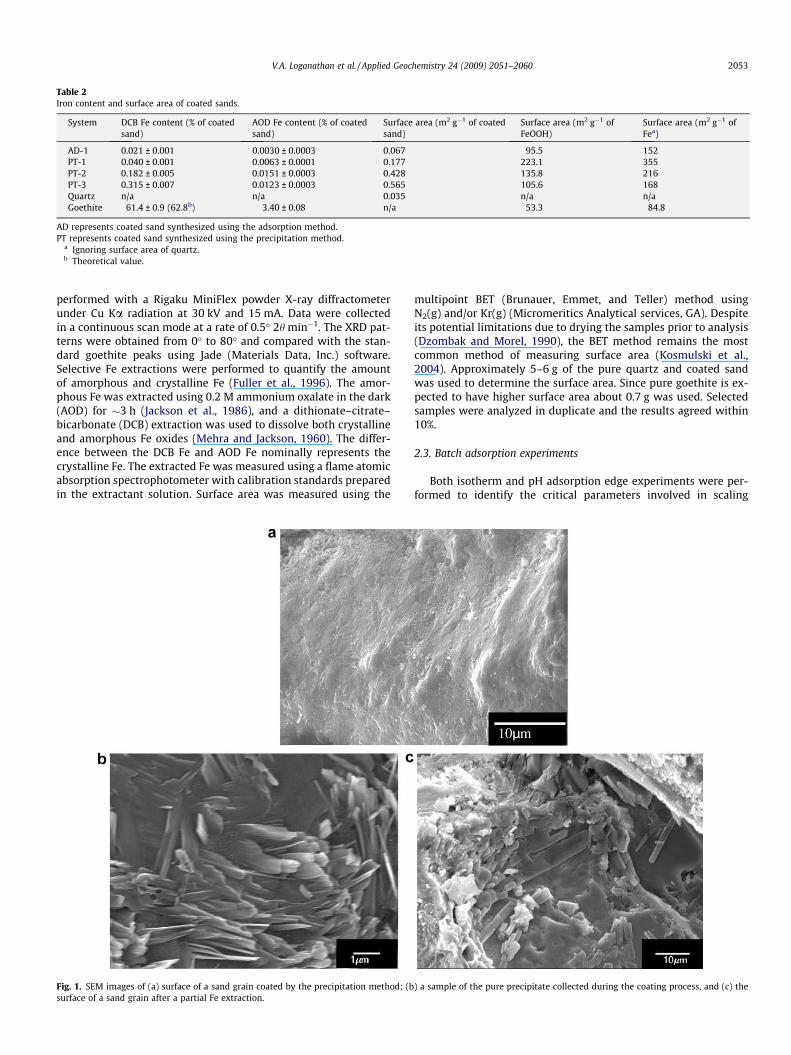
Table 2Iron content and surface area of coated sands.
System DCB Fe content (% of coatedsand)
AOD Fe content (% of coatedsand)
Surface area (m2 g�1 of coatedsand)
Surface area (m2 g�1 ofFeOOH)
Surface area (m2 g�1 ofFea)
AD-1 0.021 ± 0.001 0.0030 ± 0.0003 0.067 95.5 152PT-1 0.040 ± 0.001 0.0063 ± 0.0001 0.177 223.1 355PT-2 0.182 ± 0.005 0.0151 ± 0.0003 0.428 135.8 216PT-3 0.315 ± 0.007 0.0123 ± 0.0003 0.565 105.6 168Quartz n/a n/a 0.035 n/a n/aGoethite 61.4 ± 0.9 (62.8b) 3.40 ± 0.08 n/a 53.3 84.8
AD represents coated sand synthesized using the adsorption method.PT represents coated sand synthesized using the precipitation method.
a Ignoring surface area of quartz.b Theoretical value.
V.A. Loganathan et al. / Applied Geochemistry 24 (2009) 2051–2060 2053
performed with a Rigaku MiniFlex powder X-ray diffractometerunder Cu Ka radiation at 30 kV and 15 mA. Data were collectedin a continuous scan mode at a rate of 0.5� 2h min�1. The XRD pat-terns were obtained from 0� to 80� and compared with the stan-dard goethite peaks using Jade (Materials Data, Inc.) software.Selective Fe extractions were performed to quantify the amountof amorphous and crystalline Fe (Fuller et al., 1996). The amor-phous Fe was extracted using 0.2 M ammonium oxalate in the dark(AOD) for �3 h (Jackson et al., 1986), and a dithionate–citrate–bicarbonate (DCB) extraction was used to dissolve both crystallineand amorphous Fe oxides (Mehra and Jackson, 1960). The differ-ence between the DCB Fe and AOD Fe nominally represents thecrystalline Fe. The extracted Fe was measured using a flame atomicabsorption spectrophotometer with calibration standards preparedin the extractant solution. Surface area was measured using the
Fig. 1. SEM images of (a) surface of a sand grain coated by the precipitation method; (bsurface of a sand grain after a partial Fe extraction.
multipoint BET (Brunauer, Emmet, and Teller) method usingN2(g) and/or Kr(g) (Micromeritics Analytical services, GA). Despiteits potential limitations due to drying the samples prior to analysis(Dzombak and Morel, 1990), the BET method remains the mostcommon method of measuring surface area (Kosmulski et al.,2004). Approximately 5–6 g of the pure quartz and coated sandwas used to determine the surface area. Since pure goethite is ex-pected to have higher surface area about 0.7 g was used. Selectedsamples were analyzed in duplicate and the results agreed within10%.
2.3. Batch adsorption experiments
Both isotherm and pH adsorption edge experiments were per-formed to identify the critical parameters involved in scaling
) a sample of the pure precipitate collected during the coating process, and (c) the
2θ (Degrees)20 40 60 80
Nor
mal
ized
Inte
nsity
PDF # 29-0713
Experimental
a
b
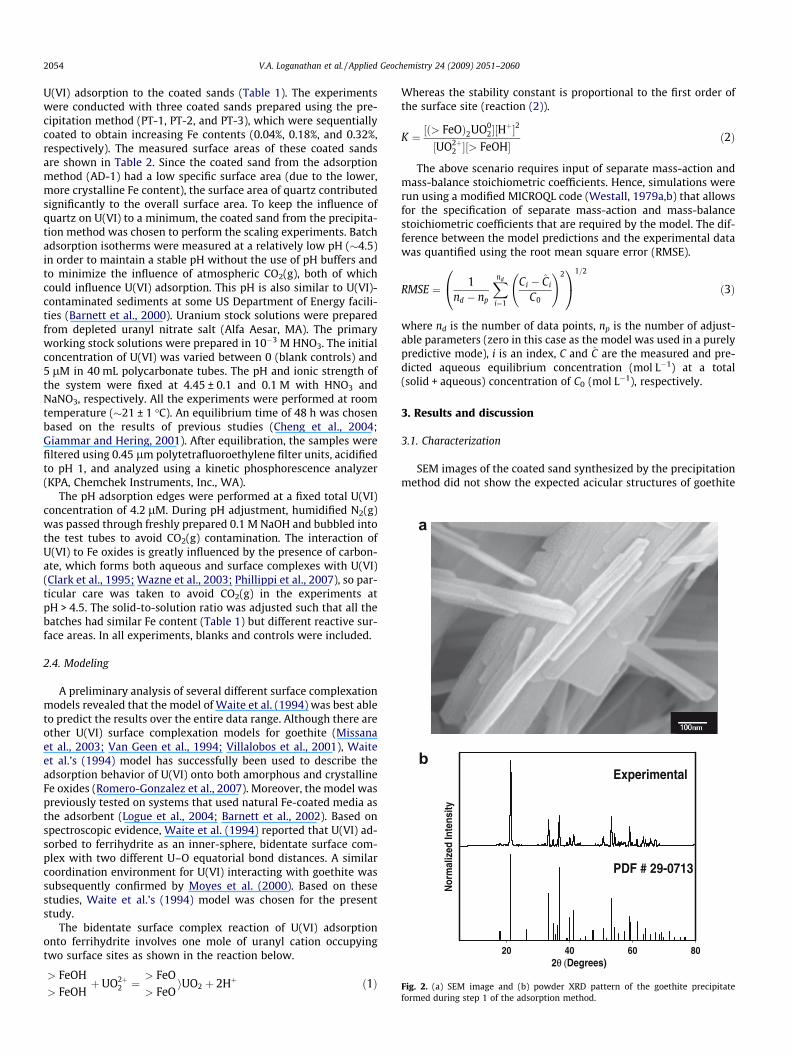
Fig. 2. (a) SEM image and (b) powder XRD pattern of the goethite precipitateformed during step 1 of the adsorption method.
2054 V.A. Loganathan et al. / Applied Geochemistry 24 (2009) 2051–2060
U(VI) adsorption to the coated sands (Table 1). The experimentswere conducted with three coated sands prepared using the pre-cipitation method (PT-1, PT-2, and PT-3), which were sequentiallycoated to obtain increasing Fe contents (0.04%, 0.18%, and 0.32%,respectively). The measured surface areas of these coated sandsare shown in Table 2. Since the coated sand from the adsorptionmethod (AD-1) had a low specific surface area (due to the lower,more crystalline Fe content), the surface area of quartz contributedsignificantly to the overall surface area. To keep the influence ofquartz on U(VI) to a minimum, the coated sand from the precipita-tion method was chosen to perform the scaling experiments. Batchadsorption isotherms were measured at a relatively low pH (�4.5)in order to maintain a stable pH without the use of pH buffers andto minimize the influence of atmospheric CO2(g), both of whichcould influence U(VI) adsorption. This pH is also similar to U(VI)-contaminated sediments at some US Department of Energy facili-ties (Barnett et al., 2000). Uranium stock solutions were preparedfrom depleted uranyl nitrate salt (Alfa Aesar, MA). The primaryworking stock solutions were prepared in 10�3 M HNO3. The initialconcentration of U(VI) was varied between 0 (blank controls) and5 lM in 40 mL polycarbonate tubes. The pH and ionic strength ofthe system were fixed at 4.45 ± 0.1 and 0.1 M with HNO3 andNaNO3, respectively. All the experiments were performed at roomtemperature (�21 ± 1 �C). An equilibrium time of 48 h was chosenbased on the results of previous studies (Cheng et al., 2004;Giammar and Hering, 2001). After equilibration, the samples werefiltered using 0.45 lm polytetrafluoroethylene filter units, acidifiedto pH 1, and analyzed using a kinetic phosphorescence analyzer(KPA, Chemchek Instruments, Inc., WA).
The pH adsorption edges were performed at a fixed total U(VI)concentration of 4.2 lM. During pH adjustment, humidified N2(g)was passed through freshly prepared 0.1 M NaOH and bubbled intothe test tubes to avoid CO2(g) contamination. The interaction ofU(VI) to Fe oxides is greatly influenced by the presence of carbon-ate, which forms both aqueous and surface complexes with U(VI)(Clark et al., 1995; Wazne et al., 2003; Phillippi et al., 2007), so par-ticular care was taken to avoid CO2(g) in the experiments atpH > 4.5. The solid-to-solution ratio was adjusted such that all thebatches had similar Fe content (Table 1) but different reactive sur-face areas. In all experiments, blanks and controls were included.
2.4. Modeling
A preliminary analysis of several different surface complexationmodels revealed that the model of Waite et al. (1994) was best ableto predict the results over the entire data range. Although there areother U(VI) surface complexation models for goethite (Missanaet al., 2003; Van Geen et al., 1994; Villalobos et al., 2001), Waiteet al.’s (1994) model has successfully been used to describe theadsorption behavior of U(VI) onto both amorphous and crystallineFe oxides (Romero-Gonzalez et al., 2007). Moreover, the model waspreviously tested on systems that used natural Fe-coated media asthe adsorbent (Logue et al., 2004; Barnett et al., 2002). Based onspectroscopic evidence, Waite et al. (1994) reported that U(VI) ad-sorbed to ferrihydrite as an inner-sphere, bidentate surface com-plex with two different U–O equatorial bond distances. A similarcoordination environment for U(VI) interacting with goethite wassubsequently confirmed by Moyes et al. (2000). Based on thesestudies, Waite et al.’s (1994) model was chosen for the presentstudy.
The bidentate surface complex reaction of U(VI) adsorptiononto ferrihydrite involves one mole of uranyl cation occupyingtwo surface sites as shown in the reaction below.
> FeOH> FeOH
þ UO2þ2 ¼
> FeO> FeO
iUO2 þ 2Hþ ð1Þ
Whereas the stability constant is proportional to the first order ofthe surface site (reaction (2)).
K ¼ ½ð> FeOÞ2UO02�½H
þ�2
½UO2þ2 �½> FeOH�
ð2Þ
The above scenario requires input of separate mass-action andmass-balance stoichiometric coefficients. Hence, simulations wererun using a modified MICROQL code (Westall, 1979a,b) that allowsfor the specification of separate mass-action and mass-balancestoichiometric coefficients that are required by the model. The dif-ference between the model predictions and the experimental datawas quantified using the root mean square error (RMSE).
RMSE ¼ 1nd � np
Xnd
i¼1
Ci � Ci
C0
!20@
1A
1=2
ð3Þ
where nd is the number of data points, np is the number of adjust-able parameters (zero in this case as the model was used in a purelypredictive mode), i is an index, C and C are the measured and pre-dicted aqueous equilibrium concentration (mol L�1) at a total(solid + aqueous) concentration of C0 (mol L�1), respectively.
3. Results and discussion
3.1. Characterization
SEM images of the coated sand synthesized by the precipitationmethod did not show the expected acicular structures of goethite
V.A. Loganathan et al. / Applied Geochemistry 24 (2009) 2051–2060 2055
on the surface (Fig. 1a), suggesting the presence of non-crystallineFe minerals. Hence, a sample of the precipitate collected during thecoating process was analyzed directly. The SEM image of a sampleof the pure precipitate collected during the coating process showedtypical acicular particles characteristic of goethite (Fig. 1b). More-over, the SEM image of the coated sand after a partial DCB Feextraction (to remove the outermost layer of Fe oxide) revealedacicular goethite structures, confirming the presence of goethitein the coated sand (Fig. 1c). Thus, it is believed that the sands pre-pared using the precipitation method consisted of a mixture ofboth amorphous Fe oxides and crystalline goethite. Specific surfacearea measurements intermediate between goethite and HFO sup-ported this interpretation (Table 2).
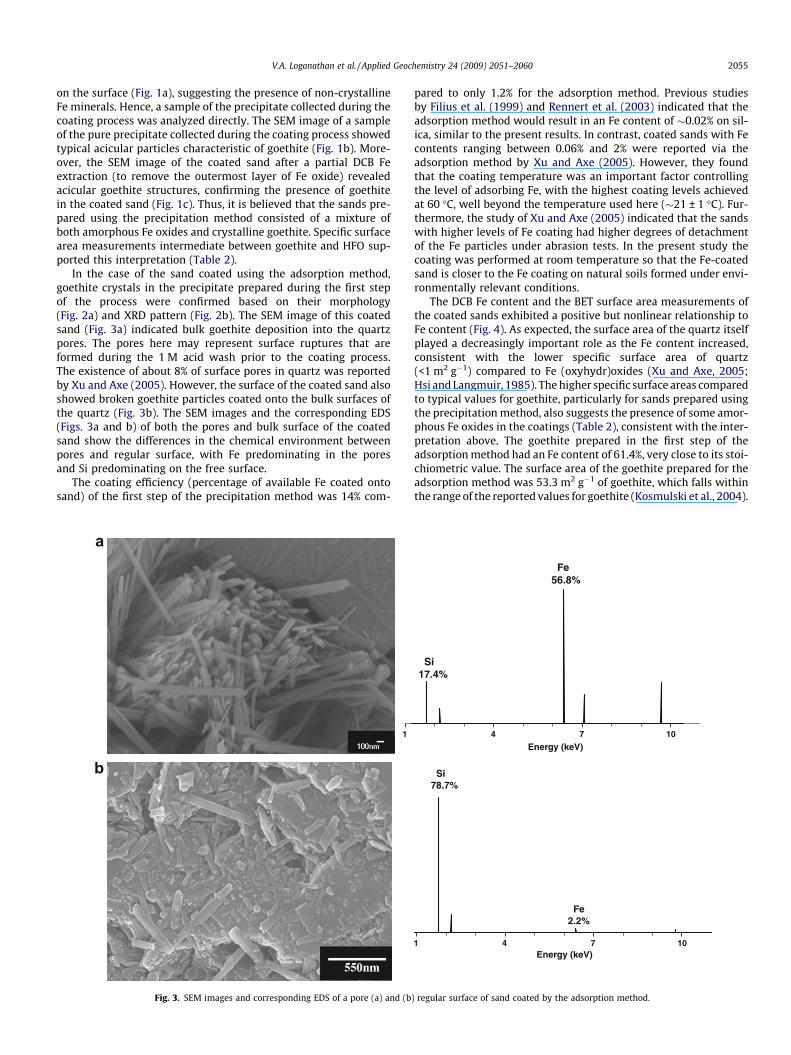
In the case of the sand coated using the adsorption method,goethite crystals in the precipitate prepared during the first stepof the process were confirmed based on their morphology(Fig. 2a) and XRD pattern (Fig. 2b). The SEM image of this coatedsand (Fig. 3a) indicated bulk goethite deposition into the quartzpores. The pores here may represent surface ruptures that areformed during the 1 M acid wash prior to the coating process.The existence of about 8% of surface pores in quartz was reportedby Xu and Axe (2005). However, the surface of the coated sand alsoshowed broken goethite particles coated onto the bulk surfaces ofthe quartz (Fig. 3b). The SEM images and the corresponding EDS(Figs. 3a and b) of both the pores and bulk surface of the coatedsand show the differences in the chemical environment betweenpores and regular surface, with Fe predominating in the poresand Si predominating on the free surface.
The coating efficiency (percentage of available Fe coated ontosand) of the first step of the precipitation method was 14% com-
1
a
b
Fig. 3. SEM images and corresponding EDS of a pore (a) and (b
pared to only 1.2% for the adsorption method. Previous studiesby Filius et al. (1999) and Rennert et al. (2003) indicated that theadsorption method would result in an Fe content of �0.02% on sil-ica, similar to the present results. In contrast, coated sands with Fecontents ranging between 0.06% and 2% were reported via theadsorption method by Xu and Axe (2005). However, they foundthat the coating temperature was an important factor controllingthe level of adsorbing Fe, with the highest coating levels achievedat 60 �C, well beyond the temperature used here (�21 ± 1 �C). Fur-thermore, the study of Xu and Axe (2005) indicated that the sandswith higher levels of Fe coating had higher degrees of detachmentof the Fe particles under abrasion tests. In the present study thecoating was performed at room temperature so that the Fe-coatedsand is closer to the Fe coating on natural soils formed under envi-ronmentally relevant conditions.
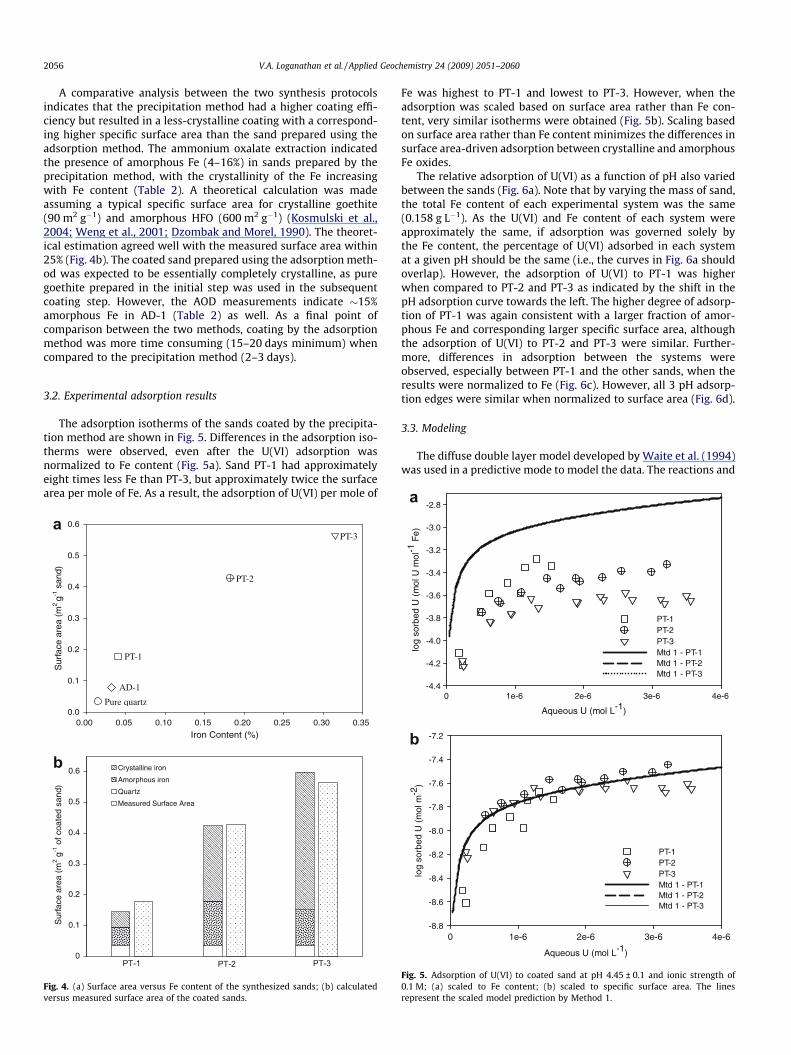
The DCB Fe content and the BET surface area measurements ofthe coated sands exhibited a positive but nonlinear relationship toFe content (Fig. 4). As expected, the surface area of the quartz itselfplayed a decreasingly important role as the Fe content increased,consistent with the lower specific surface area of quartz(<1 m2 g�1) compared to Fe (oxyhydr)oxides (Xu and Axe, 2005;Hsi and Langmuir, 1985). The higher specific surface areas comparedto typical values for goethite, particularly for sands prepared usingthe precipitation method, also suggests the presence of some amor-phous Fe oxides in the coatings (Table 2), consistent with the inter-pretation above. The goethite prepared in the first step of theadsorption method had an Fe content of 61.4%, very close to its stoi-chiometric value. The surface area of the goethite prepared for theadsorption method was 53.3 m2 g�1 of goethite, which falls withinthe range of the reported values for goethite (Kosmulski et al., 2004).
4 7 10
Energy (keV)
Si17.4%
Fe56.8%
1 4 7 10Energy (keV)
Si78.7%
Fe2.2%
) regular surface of sand coated by the adsorption method.
2056 V.A. Loganathan et al. / Applied Geochemistry 24 (2009) 2051–2060
A comparative analysis between the two synthesis protocolsindicates that the precipitation method had a higher coating effi-ciency but resulted in a less-crystalline coating with a correspond-ing higher specific surface area than the sand prepared using theadsorption method. The ammonium oxalate extraction indicatedthe presence of amorphous Fe (4–16%) in sands prepared by theprecipitation method, with the crystallinity of the Fe increasingwith Fe content (Table 2). A theoretical calculation was madeassuming a typical specific surface area for crystalline goethite(90 m2 g�1) and amorphous HFO (600 m2 g�1) (Kosmulski et al.,2004; Weng et al., 2001; Dzombak and Morel, 1990). The theoret-ical estimation agreed well with the measured surface area within25% (Fig. 4b). The coated sand prepared using the adsorption meth-od was expected to be essentially completely crystalline, as puregoethite prepared in the initial step was used in the subsequentcoating step. However, the AOD measurements indicate �15%amorphous Fe in AD-1 (Table 2) as well. As a final point ofcomparison between the two methods, coating by the adsorptionmethod was more time consuming (15–20 days minimum) whencompared to the precipitation method (2–3 days).
a
3.2. Experimental adsorption results
The adsorption isotherms of the sands coated by the precipita-tion method are shown in Fig. 5. Differences in the adsorption iso-therms were observed, even after the U(VI) adsorption wasnormalized to Fe content (Fig. 5a). Sand PT-1 had approximatelyeight times less Fe than PT-3, but approximately twice the surfacearea per mole of Fe. As a result, the adsorption of U(VI) per mole of
Iron Content (%)0.00 0.05 0.10 0.15 0.20 0.25 0.30 0.35
Sur
face
are
a (m
2 g-1
san
d)
0.0
0.1
0.2
0.3
0.4
0.5
0.6
0
0.1
0.2
0.3
0.4
0.5
0.6
Sur
face
are
a (m
2 g-1
of c
oate
d sa
nd)
Crystalline iron
Amorphous iron
Quartz
Measured Surface Area
Pure quartz
AD-1
PT-1
PT-2
PT-3
PT-1 PT-2 PT-3
a
b
Fig. 4. (a) Surface area versus Fe content of the synthesized sands; (b) calculatedversus measured surface area of the coated sands.
Fe was highest to PT-1 and lowest to PT-3. However, when theadsorption was scaled based on surface area rather than Fe con-tent, very similar isotherms were obtained (Fig. 5b). Scaling basedon surface area rather than Fe content minimizes the differences insurface area-driven adsorption between crystalline and amorphousFe oxides.
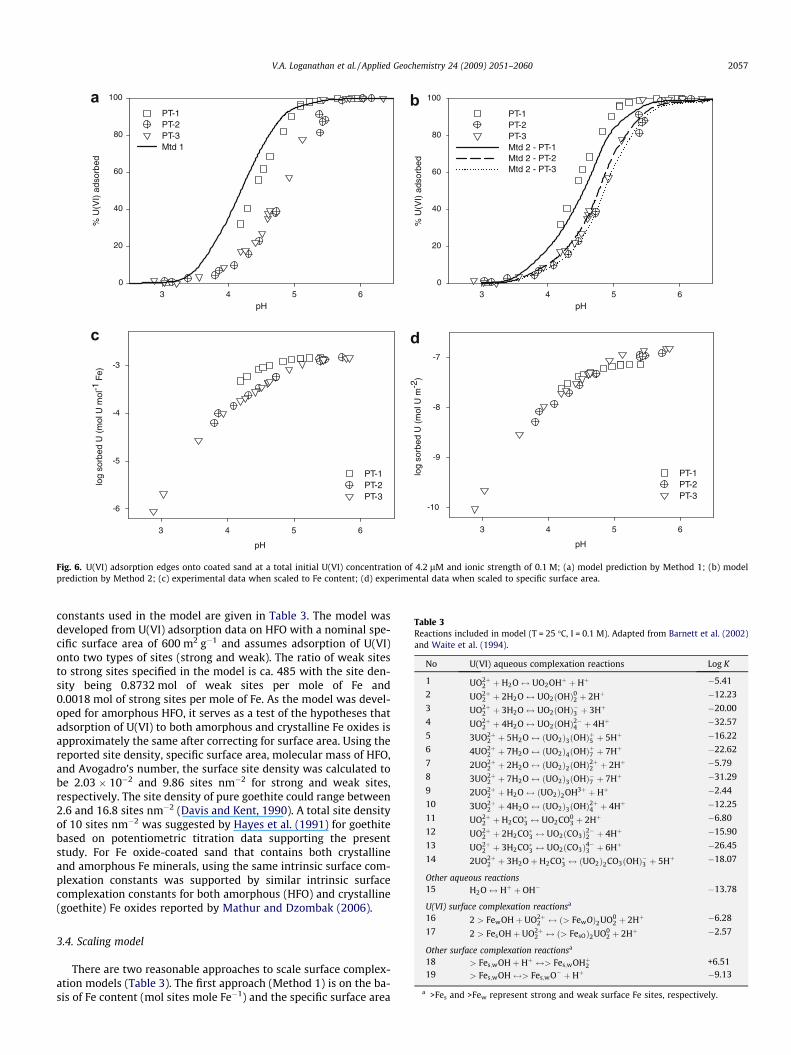
The relative adsorption of U(VI) as a function of pH also variedbetween the sands (Fig. 6a). Note that by varying the mass of sand,the total Fe content of each experimental system was the same(0.158 g L�1). As the U(VI) and Fe content of each system wereapproximately the same, if adsorption was governed solely bythe Fe content, the percentage of U(VI) adsorbed in each systemat a given pH should be the same (i.e., the curves in Fig. 6a shouldoverlap). However, the adsorption of U(VI) to PT-1 was higherwhen compared to PT-2 and PT-3 as indicated by the shift in thepH adsorption curve towards the left. The higher degree of adsorp-tion of PT-1 was again consistent with a larger fraction of amor-phous Fe and corresponding larger specific surface area, althoughthe adsorption of U(VI) to PT-2 and PT-3 were similar. Further-more, differences in adsorption between the systems wereobserved, especially between PT-1 and the other sands, when theresults were normalized to Fe (Fig. 6c). However, all 3 pH adsorp-tion edges were similar when normalized to surface area (Fig. 6d).
3.3. Modeling
The diffuse double layer model developed by Waite et al. (1994)was used in a predictive mode to model the data. The reactions and
Aqueous U (mol L-1)
0 1e-6 2e-6 3e-6 4e-6
log
sorb
ed U
(m
ol U
mol
-1 F
e)
-4.4
-4.2
-4.0
-3.8
-3.6
-3.4
-3.2
-3.0
-2.8
PT-1PT-2PT-3Mtd 1 - PT-1Mtd 1 - PT-2 Mtd 1 - PT-3
Aqueous U (mol L-1)
0 1e-6 2e-6 3e-6 4e-6
log
sorb
ed U
(m
ol m
-2)
-8.8
-8.6
-8.4
-8.2
-8.0
-7.8
-7.6
-7.4
-7.2
PT-1PT-2PT-3Mtd 1 - PT-1Mtd 1 - PT-2Mtd 1 - PT-3
b
Fig. 5. Adsorption of U(VI) to coated sand at pH 4.45 ± 0.1 and ionic strength of0.1 M; (a) scaled to Fe content; (b) scaled to specific surface area. The linesrepresent the scaled model prediction by Method 1.
pH3 4 5 6
% U
(VI)
ads
orbe
d
0
20
40
60
80
100
PT-1PT-2PT-3Mtd 1
pH3 4 5 6
% U
(VI)
ads
orbe
d
0
20
40
60
80
100
PT-1PT-2PT-3Mtd 2 - PT-1 Mtd 2 - PT-2 Mtd 2 - PT-3
pH
3 4 5 6
log
sorb
ed U
(m
ol U
mol
-1 F
e)
-6
-5
-4
-3
PT-1PT-2PT-3
pH
3 4 5 6
log
sorb
ed U
(m
ol U
m-2
)
-10
-9
-8
-7
PT-1PT-2PT-3
a b
c d
Fig. 6. U(VI) adsorption edges onto coated sand at a total initial U(VI) concentration of 4.2 lM and ionic strength of 0.1 M; (a) model prediction by Method 1; (b) modelprediction by Method 2; (c) experimental data when scaled to Fe content; (d) experimental data when scaled to specific surface area.
Table 3Reactions included in model (T = 25 �C, I = 0.1 M). Adapted from Barnett et al. (2002)and Waite et al. (1994).
No U(VI) aqueous complexation reactions Log K
1 UO2þ2 þ H2O$ UO2OHþ þHþ �5.41
2 UO2þ2 þ 2H2O$ UO2ðOHÞ02 þ 2Hþ �12.23
3 UO2þ2 þ 3H2O$ UO2ðOHÞ�3 þ 3Hþ �20.00
4 UO2þ2 þ 4H2O$ UO2ðOHÞ2�4 þ 4Hþ �32.57
5 3UO2þ2 þ 5H2O$ ðUO2Þ3ðOHÞþ5 þ 5Hþ �16.22
6 4UO2þ2 þ 7H2O$ ðUO2Þ4ðOHÞþ7 þ 7Hþ �22.62
7 2UO2þ2 þ 2H2O$ ðUO2Þ2ðOHÞ2þ2 þ 2Hþ �5.79
8 3UO2þ2 þ 7H2O$ ðUO2Þ3ðOHÞ�7 þ 7Hþ �31.29
9 2UO2þ2 þ H2O$ ðUO2Þ2OH3þ þ Hþ �2.44
10 3UO2þ2 þ 4H2O$ ðUO2Þ3ðOHÞ2þ4 þ 4Hþ �12.25
11 UO2þ2 þ H2CO�3 $ UO2CO0
3 þ 2Hþ �6.80
12 UO2þ2 þ 2H2CO�3 $ UO2ðCO3Þ2�2 þ 4Hþ �15.90
13 UO2þ2 þ 3H2CO�3 $ UO2ðCO3Þ4�3 þ 6Hþ �26.45
14 2UO2þ2 þ 3H2Oþ H2CO�3 $ ðUO2Þ2CO3ðOHÞ�3 þ 5Hþ �18.07
Other aqueous reactions15 H2O$ Hþ þ OH� �13.78
U(VI) surface complexation reactionsa
V.A. Loganathan et al. / Applied Geochemistry 24 (2009) 2051–2060 2057
constants used in the model are given in Table 3. The model wasdeveloped from U(VI) adsorption data on HFO with a nominal spe-cific surface area of 600 m2 g�1 and assumes adsorption of U(VI)onto two types of sites (strong and weak). The ratio of weak sitesto strong sites specified in the model is ca. 485 with the site den-sity being 0.8732 mol of weak sites per mole of Fe and0.0018 mol of strong sites per mole of Fe. As the model was devel-oped for amorphous HFO, it serves as a test of the hypotheses thatadsorption of U(VI) to both amorphous and crystalline Fe oxides isapproximately the same after correcting for surface area. Using thereported site density, specific surface area, molecular mass of HFO,and Avogadro’s number, the surface site density was calculated tobe 2.03 � 10�2 and 9.86 sites nm�2 for strong and weak sites,respectively. The site density of pure goethite could range between2.6 and 16.8 sites nm�2 (Davis and Kent, 1990). A total site densityof 10 sites nm�2 was suggested by Hayes et al. (1991) for goethitebased on potentiometric titration data supporting the presentstudy. For Fe oxide-coated sand that contains both crystallineand amorphous Fe minerals, using the same intrinsic surface com-plexation constants was supported by similar intrinsic surfacecomplexation constants for both amorphous (HFO) and crystalline(goethite) Fe oxides reported by Mathur and Dzombak (2006).
16 2 > FewOHþ UO2þ2 $ ð> FewOÞ2UO0
2 þ 2Hþ �6.28
17 2 > FesOHþ UO2þ2 $ ð> FesOÞ2UO0
2 þ 2Hþ �2.57
Other surface complexation reactionsa
18 > Fes;wOHþ Hþ $> Fes;wOHþ2 +6.5119 > Fes;wOH$> Fes;wO� þHþ �9.13
a >Fes and >Few represent strong and weak surface Fe sites, respectively.
3.4. Scaling model
There are two reasonable approaches to scale surface complex-ation models (Table 3). The first approach (Method 1) is on the ba-sis of Fe content (mol sites mole Fe�1) and the specific surface area
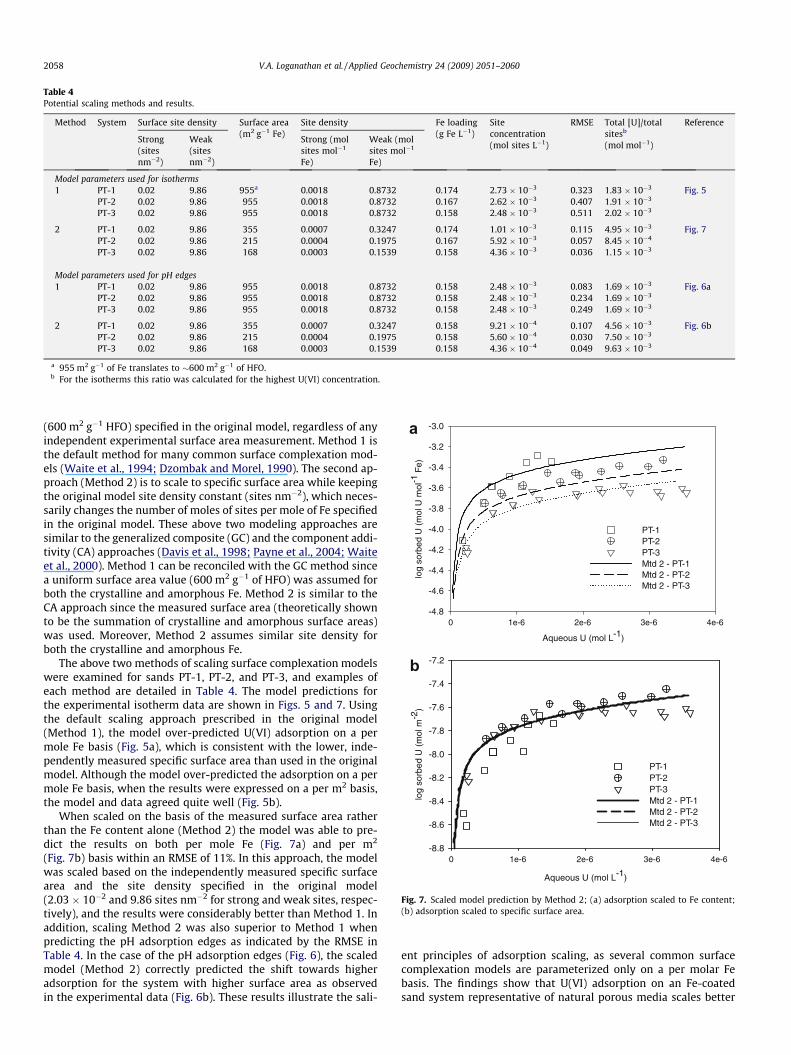
Table 4Potential scaling methods and results.
Method System Surface site density Surface area(m2 g�1 Fe)
Site density Fe loading(g Fe L�1)
Siteconcentration(mol sites L�1)
RMSE Total [U]/totalsitesb
(mol mol�1)
Reference
Strong(sitesnm�2)
Weak(sitesnm�2)
Strong (molsites mol�1
Fe)
Weak (molsites mol�1
Fe)
Model parameters used for isotherms1 PT-1 0.02 9.86 955a 0.0018 0.8732 0.174 2.73 � 10�3 0.323 1.83 � 10�3 Fig. 5
PT-2 0.02 9.86 955 0.0018 0.8732 0.167 2.62 � 10�3 0.407 1.91 � 10�3
PT-3 0.02 9.86 955 0.0018 0.8732 0.158 2.48 � 10�3 0.511 2.02 � 10�3
2 PT-1 0.02 9.86 355 0.0007 0.3247 0.174 1.01 � 10�3 0.115 4.95 � 10�3 Fig. 7PT-2 0.02 9.86 215 0.0004 0.1975 0.167 5.92 � 10�3 0.057 8.45 � 10�4
PT-3 0.02 9.86 168 0.0003 0.1539 0.158 4.36 � 10�3 0.036 1.15 � 10�3
Model parameters used for pH edges1 PT-1 0.02 9.86 955 0.0018 0.8732 0.158 2.48 � 10�3 0.083 1.69 � 10�3 Fig. 6a
PT-2 0.02 9.86 955 0.0018 0.8732 0.158 2.48 � 10�3 0.234 1.69 � 10�3
PT-3 0.02 9.86 955 0.0018 0.8732 0.158 2.48 � 10�3 0.249 1.69 � 10�3
2 PT-1 0.02 9.86 355 0.0007 0.3247 0.158 9.21 � 10�4 0.107 4.56 � 10�3 Fig. 6bPT-2 0.02 9.86 215 0.0004 0.1975 0.158 5.60 � 10�4 0.030 7.50 � 10�3
PT-3 0.02 9.86 168 0.0003 0.1539 0.158 4.36 � 10�4 0.049 9.63 � 10�3
a 955 m2 g�1 of Fe translates to �600 m2 g�1 of HFO.b For the isotherms this ratio was calculated for the highest U(VI) concentration.
Aqueous U (mol L-1)
0 1e-6 2e-6 3e-6 4e-6
log
sorb
ed U
(m
ol U
mol
-1 F
e)
-4.8
-4.6
-4.4
-4.2
-4.0
-3.8
-3.6
-3.4
-3.2
-3.0
PT-1PT-2PT-3Mtd 2 - PT-1Mtd 2 - PT-2 Mtd 2 - PT-3
Aqueous U (mol L-1)
0 1e-6 2e-6 3e-6 4e-6
log
sorb
ed U
(m
ol m
-2)
-8.8
-8.6
-8.4
-8.2
-8.0
-7.8
-7.6
-7.4
-7.2
PT-1PT-2PT-3Mtd 2 - PT-1Mtd 2 - PT-2Mtd 2 - PT-3
a
b
Fig. 7. Scaled model prediction by Method 2; (a) adsorption scaled to Fe content;(b) adsorption scaled to specific surface area.
2058 V.A. Loganathan et al. / Applied Geochemistry 24 (2009) 2051–2060
(600 m2 g�1 HFO) specified in the original model, regardless of anyindependent experimental surface area measurement. Method 1 isthe default method for many common surface complexation mod-els (Waite et al., 1994; Dzombak and Morel, 1990). The second ap-proach (Method 2) is to scale to specific surface area while keepingthe original model site density constant (sites nm�2), which neces-sarily changes the number of moles of sites per mole of Fe specifiedin the original model. These above two modeling approaches aresimilar to the generalized composite (GC) and the component addi-tivity (CA) approaches (Davis et al., 1998; Payne et al., 2004; Waiteet al., 2000). Method 1 can be reconciled with the GC method sincea uniform surface area value (600 m2 g�1 of HFO) was assumed forboth the crystalline and amorphous Fe. Method 2 is similar to theCA approach since the measured surface area (theoretically shownto be the summation of crystalline and amorphous surface areas)was used. Moreover, Method 2 assumes similar site density forboth the crystalline and amorphous Fe.
The above two methods of scaling surface complexation modelswere examined for sands PT-1, PT-2, and PT-3, and examples ofeach method are detailed in Table 4. The model predictions forthe experimental isotherm data are shown in Figs. 5 and 7. Usingthe default scaling approach prescribed in the original model(Method 1), the model over-predicted U(VI) adsorption on a permole Fe basis (Fig. 5a), which is consistent with the lower, inde-pendently measured specific surface area than used in the originalmodel. Although the model over-predicted the adsorption on a permole Fe basis, when the results were expressed on a per m2 basis,the model and data agreed quite well (Fig. 5b).
When scaled on the basis of the measured surface area ratherthan the Fe content alone (Method 2) the model was able to pre-dict the results on both per mole Fe (Fig. 7a) and per m2
(Fig. 7b) basis within an RMSE of 11%. In this approach, the modelwas scaled based on the independently measured specific surfacearea and the site density specified in the original model(2.03 � 10�2 and 9.86 sites nm�2 for strong and weak sites, respec-tively), and the results were considerably better than Method 1. Inaddition, scaling Method 2 was also superior to Method 1 whenpredicting the pH adsorption edges as indicated by the RMSE inTable 4. In the case of the pH adsorption edges (Fig. 6), the scaledmodel (Method 2) correctly predicted the shift towards higheradsorption for the system with higher surface area as observedin the experimental data (Fig. 6b). These results illustrate the sali-
ent principles of adsorption scaling, as several common surfacecomplexation models are parameterized only on a per molar Febasis. The findings show that U(VI) adsorption on an Fe-coatedsand system representative of natural porous media scales better
V.A. Loganathan et al. / Applied Geochemistry 24 (2009) 2051–2060 2059
with surface area than Fe content alone. Moreover, the scaling pro-cesses can be predicted within the paradigm of surface complexa-tion models.
4. Summary and conclusions
Iron-coated sands were prepared via two common protocols, aprecipitation method, where Fe was precipitated directly ontothe sand in a single step, and an adsorption method, where puregoethite was prepared in the first step and then adsorbed ontothe sand in a second step. Although neither of the methods pro-duced a completely crystalline Fe coating, the precipitation meth-od produced sands with larger portions of amorphous Fe than theadsorption method, with the fraction of amorphous Fe decreasingwith increasing Fe content. Despite producing a less crystallineFe coating, the precipitation method was a more efficient and lesstime consuming method of preparing Fe-coated sand.
Uranium(VI) adsorption isotherms and pH adsorption edgeswere measured on three coated sands with Fe contents rangingfrom 0.04% to 0.3%. Experimentally, the adsorption of U(VI) ontothe three sands was more comparable when normalized to surfacearea than when normalized to Fe content. The ability of severalsurface complexation models to predict the adsorption data wasalso examined. Although several different models could predictthe data with a reasonable degree of accuracy, the model of Waiteet al. (1994) predicted the complete range of data better than theother models tested. As the model was developed for amorphousHFO, it also served as a test of the hypotheses that adsorption ofU(VI) to both amorphous and crystalline Fe oxides is approxi-mately the same after correcting for surface area.
Two different methods of scaling adsorption models wereexamined, an Fe content based method and a surface area basedmethod. Consistent with the experimental data, scaling the adsorp-tion model on the basis of surface area was the best approach.These findings are significant because many common surface com-plexation models are parameterized on the basis of Fe contentrather than surface area. Finally, although the interactions ofU(VI) and Fe-coated sands were used as representative adsorbateand adsorbent, the general principles may be applicable to otheradsorbate–adsorbent systems as well.
Acknowledgements
The authors would like to thank Mr. Jinling Zhuang, Mr. ThomasCarrington, and Mr. Roy Howard for their laboratory support. Theauthors would also like to extend their thanks to the two anony-mous reviewers for their comments and suggestions. This workwas funded by the US Department of Energy, Environmental Reme-diation Science Program, Grant No: DE-FG02-06ER64213.
References
Anschutz, A.J., Penn, R.L., 2005. Reduction of crystalline iron(III) oxyhydroxidesusing hydroquinone: influence of phase and particle size. Geochem. Trans. 6,60–66.
Barnett, M.O., Jardine, P.M., Brooks, S.C., 2002. U(VI) adsorption to heterogeneoussubsurface media: application of a surface complexation model. Environ. Sci.Technol. 36, 937–942.
Barnett, M.O., Jardine, P.M., Brooks, S.C., Selim, H.M., 2000. Adsorption and transportof uranium(VI) in subsurface media. Soil Sci. Soc. Am. J. 64, 908–917.
Bostick, B.C., Fendorf, S.E., Barnett, M.O., Jardine, P.M., Brooks, S.C., 2002. Uranylsurface complexes formed on subsurface media from DOE facilities. Soil Sci. Soc.Am. J. 66, 99–108.
Bruno, J., Depablo, J., Duro, L., Figuerola, E., 1995. Experimental-study and modelingof the U(VI)–Fe(OH)3 surface precipitation coprecipitation equilibria. Geochim.Cosmochim. Acta 59, 4113–4123.
Cheng, T., Barnett, M.O., Roden, E.E., Zhuang, J.L., 2004. Effects of phosphate onuranium(VI) adsorption to goethite-coated sand. Environ. Sci. Technol. 38,6059–6065.
Clark, D.L., Hobart, D.E., Neu, M.P., 1995. Actinide carbonate complexes and theirimportance in actinide environmental chemistry. Chem. Rev. 95, 25–48.
Davis, J.A., Kent, D.B., 1990. Surface complexation modeling in aqueousgeochemistry. In: Hochella, M.F., White, A.F. (Eds.), Reviews in Mineralogy,Mineralogical Society of America, vol. 23, pp. 177–260.
Davis, J.A., Coston, J.A., Kent, D.B., Fuller, C.C., 1998. Application of the surfacecomplexation concept to complex mineral assemblages. Environ. Sci. Technol.32, 2820–2828.
Davis, J.A., Meece, D.E., Kohler, M., Curtis, G.P., 2004. Approaches to surfacecomplexation modeling of uranium(VI) adsorption on aquifer sediments.Geochim. Cosmochim. Acta 68, 3621–3641.
Dzombak, D.A., Morel, F.M.M., 1990. Surface Complexation Modeling: HydrousFerric Oxide. John Wiley & Sons.
Filius, J.D., Meeussen, J.C.L., Van Riemsdijk, W.H., 1999. Transport of malonate in agoethite–silica sand system. Colloids Surf., A 151, 245–253.
Fuller, C.C., Davis, J.A., Coston, J.A., Dixon, E., 1996. Characterization of metaladsorption variability in a sand and gravel aquifer, Cape Cod, Massachusetts,USA. J. Contam. Hydrol. 22, 165–187.
Gabriel, U., Gaudet, J.P., Spadini, L., Charlet, L., 1998. Reactive transport of uranyl in agoethite column: an experimental and modelling study. Chem. Geol. 151, 107–128.
Giammar, D.E., Hering, J.G., 2001. Time scales for sorption–desorption and surfaceprecipitation of uranyl on goethite. Environ. Sci. Technol. 35, 3332–3337.
Hayes, K.F., Redden, G., Ela, W., Leckie, J.O., 1991. Surface complexation models anevaluation of model parameter-estimation using FITEQL and oxide mineraltitration data. J. Colloid Interf. Sci. 142, 448–469.
Hsi, C.K.D., Langmuir, D., 1985. Adsorption of uranyl onto ferric oxyhydroxides –application of the surface complexation site-binding model. Geochim.Cosmochim. Acta 49, 1931–1941.
Jackson, M.L., Lim, C.H., Zelazny, L.W., 1986. Oxides, hydroxides, andaluminisilicates. In: Klute, A. (Ed.), Methods of Soil Analysis. Part I, second ed.ASA and SSA, Madison, WI, pp. 113–119.
Jang, J.H., Dempsey, B.A., Burgos, W.D., 2007. A model-based evaluation of sorptivereactivities of hydrous ferric oxide and hematite for U(VI). Environ. Sci. Technol.41, 4305–4310.
Kosmulski, M., Durand-Vidal, S., Maczka, E., Rosenholm, J.B., 2004. Morphology ofsynthetic goethite particles. J. Colloid Interf. Sci. 271, 261–269.
Logue, B.A., Smith, R.W., Westall, J.C., 2004. U(VI) adsorption on natural iron-coatedsands: comparison of approaches for modeling adsorption on heterogeneousenvironmental materials. Appl. Geochem. 19, 1937–1951.
Mathur, S.S., Dzombak, D.A., 2006. Surface complexation modeling: goethite. In:Lutzenkirchen, J. (Ed.), Surface Complexation Modeling. Elsevier, TheNetherlands, pp. 443–468.
Meeussen, J.C.L., Kleikemper, J., Scheidegger, A., Borkovec, M., Paterson, E., VanRiemsdijk, W.H., Sparks, D.L., 1999. Multicomponent transport of sulfate in agoethite–silica sand system at variable pH and ionic strength. Environ. Sci.Technol. 33, 3443–3450.
Meeussen, J.C.L., Scheidegger, A., Hiemstra, T., Van Riemsdijk, W.H., Borkovec, M.,1996. Predicting multicomponent adsorption and transport of fluoride atvariable pH in a goethite–silica sand system. Environ. Sci. Technol. 30, 481–488.
Mehra, O.P., Jackson, M.L., 1960. Iron oxide removal from soils and clays bydithionite–citrate system buffered with sodium bicarbonate. Clays Clay Miner.7, 317–327.
Missana, T., Garcia-Gutierrez, M., Maffiotte, C., 2003. Experimental and modelingstudy of the uranium(VI) sorption on goethite. J. Colloid Interf. Sci. 260, 291–301.
Moyes, L.N., Parkman, R.H., Charnock, J.M., Vaughan, D.J., Livens, F.R., Hughes, C.R.,Braithwaite, A., 2000. Uranium uptake from aqueous solution by interactionwith goethite, lepidocrocite, muscovite, and mackinawite: an X-ray absorptionspectroscopy study. Environ. Sci. Technol. 34, 1062–1068.
Payne, T.E., Davis, J.A., Ochs, M., Olin, M., Tweed, C.J., 2004. Uranium adsorption onweathered schist – intercomparison of modelling approaches. Radiochim. Acta9–11, 651–661.
Payne, T.E., Davis, J.A., Waite, T.D., 1994. Uranium retention by weathered schists –the role of iron minerals. Radiochim. Acta, 297–303.
Phillippi, J.M., Loganathan, V.A., McIndoe, M.J., Barnett, M.O., Clement, T.P., Roden,E.E., 2007. Theoretical solid/solution ratio effects on adsorption and transport:uranium(VI) and carbonate. Soil Sci. Soc. Am. J. 71, 329–335.
Prikryl, J.D., Jain, A., Turner, D.R., Pabalan, R.T., 2001. Uranium(VI) sorption behavioron silicate mineral mixtures. J. Contam. Hydrol. 47, 241–253.
Rennert, T., Mansfeldt, T., Totsche, K.U., Greef, K., 2003. Sorption and transport ofiron–cyanide complexes in goethite-coated sand. Soil Sci. Soc. Am. J. 67, 756–764.
Roden, E.E., Urrutia, M.M., Mann, C.J., 2000. Bacterial reductive dissolution ofcrystalline Fe(III) oxide in continuous-flow column reactors. Appl. Environ.Microbiol. 66, 1062–1065.
Romero-Gonzalez, M.R., Cheng, T., Barnett, M.O., Roden, E.E., 2007. Surfacecomplexation modeling of the effects of phosphate on uranium(VI)adsorption. Radiochim. Acta 95, 251–259.
Scheidegger, A., Borkovec, M., Sticher, H., 1993. Coating of silica sand with goethite– preparation and analytical identification. Geoderma 58, 43–65.
Scheidegger, A., Burgisser, C.S., Borkovec, M., Sticher, H., Meeussen, H., VanRiemsdijk, W., 1994. Convective-transport of acids and bases in porous-media. Water Resour. Res. 30, 2937–2944.
Schwertmann, U., Cornell, R.M., 2000. Iron Oxides in the Laboratory. Wiley-VCH,Weinheim (pp. 67–92).

2060 V.A. Loganathan et al. / Applied Geochemistry 24 (2009) 2051–2060
Um, W., Serne, R.J., Brown, C.F., Last, G.V., 2007. U(VI) adsorption on aquifersediments at the Hanford site. J. Contam. Hydrol. 93, 255–269.
Van Geen, A., Robertson, A.P., Leckie, J.O., 1994. Complexation of carbonate speciesat the goethite surface – implications for adsorption of metal-ions in natural-waters. Geochim. Cosmochim. Acta 58, 2073–2086.
Villalobos, M., Trotz, M.A., Leckie, J.O., 2001. Surface complexation modeling ofcarbonate effects on the adsorption of Cr(VI), Pb(II), and U(VI) on goethite.Environ. Sci. Technol. 35, 3849–3856.
Waite, T.D., Davis, J.A., Fenton, B.R., Payne, T.E., 2000. Approaches to modellinguranium(VI) adsorption on natural mineral assemblages. Radiochim. Acta 88,687–693.
Waite, T.D., Davis, J.A., Payne, T.E., Waychunas, G.A., Xu, N., 1994. Uranium(VI)adsorption to ferrihydrite – application of a surface complexation model.Geochim. Cosmochim. Acta 58, 5465–5478.
Wazne, M., Korfiatis, G.P., Meng, X.G., 2003. Carbonate effects on hexavalenturanium adsorption by iron oxyhydroxide. Environ. Sci. Technol. 37, 3619–3624.
Weng, L., Temminghoff, E.J.M., Van Riemsdijk, W.H., 2001. Contribution ofindividual sorbents to the control of heavy metal activity in sandy soil.Environ. Sci. Technol. 35, 4436–4443.
Westall, J.C., 1979a. MICROQL. I. A chemical equilibrium program in BASIC,Technical Report. Swiss Federal Institute of Technology, EAWAG, Dubendorf,Switzerland.
Westall, J.C., 1979b. MICROQL. II. Computation of adsorption equilibria in BASIC,Technical Report. Swiss Federal Institute of Technology, EAWAG, Dubendorf,Switzerland.
Xu, Y., Axe, L., 2005. Synthesis and characterization of iron oxide-coated silica andits effect on metal adsorption. J. Colloid Interf. Sci. 282, 11–19.