Application of uranium exploration data and techniques in ...
337
1AEA-TECDOC-827 Application of uranium exploration data and techniques in environmentalstudies Proceedings of a Technical Committee meeting held in Vienna, 9-12 November 1993 WJ INTERNATIONAL ATOMIC ENERGY AGENCY October 1995
-
Upload
khangminh22 -
Category
Documents
-
view
0 -
download
0
Transcript of Application of uranium exploration data and techniques in ...
1AEA-TECDOC-827
Application ofuranium exploration data
and techniquesin environmental studies
Proceedings of a Technical Committee meetingheld in Vienna, 9-12 November 1993
WJINTERNATIONAL ATOMIC ENERGY AGENCY
October 1995
The IAEA does not normally maintain stocks of reports in this series.However, microfiche copies of these reports can be obtained from
IN IS ClearinghouseInternational Atomic Energy AgencyWagramerstrasse 5P.O. Box 100A-1400 Vienna, Austria
Orders should be accompanied by prepayment of Austrian Schillings 100,-in the form of a cheque or in the form of IAEA microfiche service couponswhich may be ordered separately from the IN IS Clearinghouse.
IAEA-TECDOC-827
Application ofuranium exploration data
and techniquesin environmental studies
Proceedings of a Technical Committee meetingheld in Vienna, 9-12 November 1993
fflINTERNATIONAL ATOMIC ENERGY AGENCY /A>
The originating Section of this publication in the IAEA was:
Nuclear Materials and Fuel Cycle Technology SectionInternational Atomic Energy Agency
Wagramerstrasse 5P.O. Box 100
A-1400 Vienna, Austria
APPLICATION OF URANIUM EXPLORATION DATA ANDTECHNIQUES IN ENVIRONMENTAL STUDIES
IAEA, VIENNA, 1995IAEA-TECDOC-827
ISSN 1011-4289
© IAEA, 1995
Printed by the IAEA in AustriaOctober 1995
FOREWORD
During recent years, the degradation of the environment has become the subject of dailyconversation, as well as popular and scientific articles. Usually the concern is man's destruction oralteration of the perceived natural environment. More often than not there is little understanding thatthe earth's natural environment is largely determined by the underlying geology, and its derivatives,modified by the local biosphere and climatic conditions. Without reliable baseline information, studiesand monitoring of the environment may be distorted.
Exploration for mineral commodities, uranium included, normally utilizes extensive,systematic geophysical and geochemical surveys covering very large areas, often entire countries. Thisinformation represents a great wealth of data that could be used to produce baseline information forenvironmental studies and monitoring. It is with this appreciation that IAEA convened a TechnicalCommittee meeting with the purpose of bringing together experts in uranium exploration, geophysicsand geochemistry to discuss and exchange information on the benefits of past exploration data andcommonly applied techniques in environmental studies.
The Technical Committee Meeting on the Use of Uranium Exploration Data and Techniquesin Environmental Studies was held in Vienna from 9 to 12 November 1993 and was attended by 44participants from 23 countries and one international organization. Thirty-two papers covering casehistories on the use of old uranium exploration data to prepare exposure dose rate and radon potentialmaps, the use of airborne gamma ray spectrometric systems to monitor nuclear power plants andnuclear fuel cycle facilities, and the use of similar systems in response to emergency measures in thecase of accidental releases were presented.
The IAEA is grateful to those participants who contributed papers and took part in thediscussion. Special thanks are extended to F. Barthel (Germany), A.G. Darnley (Canada), J.K. Otton(USA) and M. Matolin (Czech Republic), who chaired the sessions.
The IAEA staff member responsible for the organization and implementation of the meetingwas M. Tauchid of the Division of Nuclear Fuel Cycle and Waste Management.
EDITORIAL NOTE
In preparing this publication for press, staff of the IAEA have made up the pages from theoriginal manuscripts as submitted by the authors. The views expressed do not necessarily reflect thoseof the governments of the nominating Member States or of the nominating organizations.
Throughout the text names of Member States are retained as they were when the text wascompiled.
The use of particular designations of countries or territories does not imply any judgement bythe publisher, the IAEA, as to the legal status of such countries or territories, of their authorities andinstitutions or of the delimitation of their boundaries.
The mention of names of specific companies or products (whether or not indicated as registered)does not imply any intention to infringe proprietary rights, nor should it be construed as anendorsement or recommendation on the part of the IAEA.
The authors are responsible for having obtained the necessary permission for the IAEA toreproduce, translate or use material from sources already protected by copyrights.
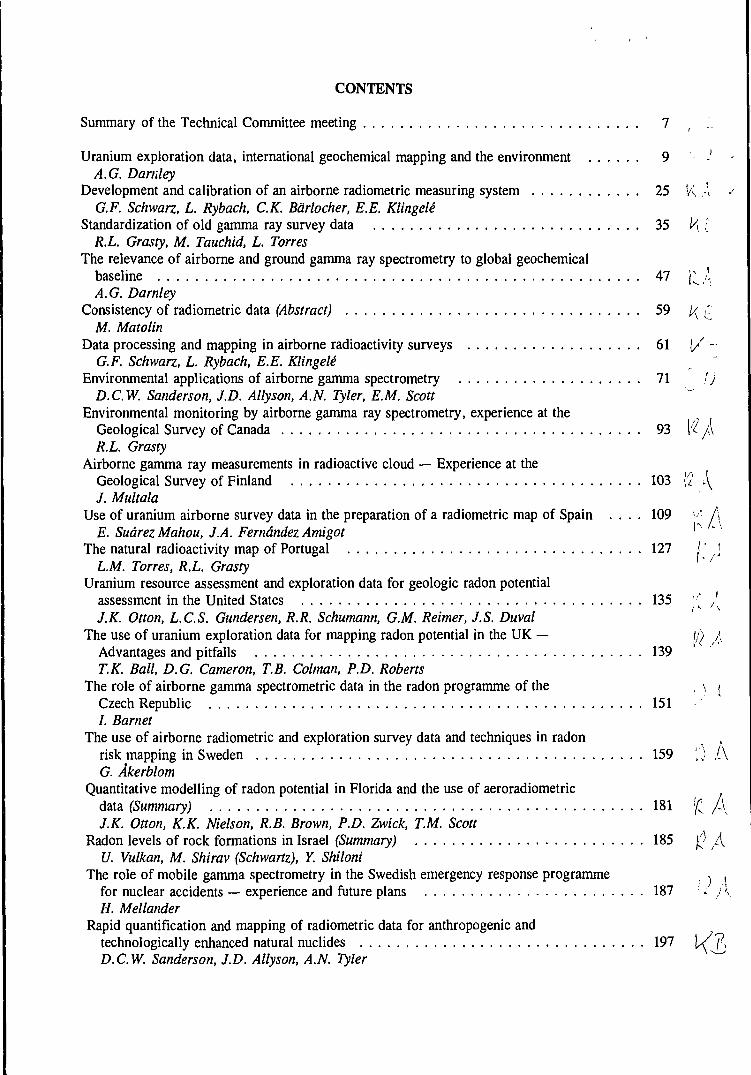
CONTENTS
Summary of the Technical Committee meeting 7 r '
Uranium exploration data, international geochemical mapping and the environment 9 -'A.G. Darnley
Development and calibration of an airborne radiometric measuring system 25 V-. ,\G.F. Schwarz, L. Rybach, C.K. Bdrlocher, E.E. Klingele
Standardization of old gamma ray survey data 35 \/\{R.L. Grasty, M. Tauchid, L. Torres
The relevance of airborne and ground gamma ray spectrometry to global geochemicalbaseline 47 j ^ , ' ,A.G. Darnley
Consistency of radiometric data (Abstract) 59 / {•'M. Matolin
Data processing and mapping in airborne radioactivity surveys 61 [/ -•G.F. Schwarz, L. Rybach, E.E. Klingele
Environmental applications of airborne gamma spectrometry 71 fjD.C.W. Sanderson, J.D. Allyson, A.N. Tyler, EM. Scott
Environmental monitoring by airborne gamma ray spectrometry, experience at theGeological Survey of Canada 93 \'l j \R.L. Grasty
Airborne gamma ray measurements in radioactive cloud — Experience at theGeological Survey of Finland 103 \fl ^J. Multala
U s e o f u r a n i u m a i r b o r n e s u r v e y d a t a i n t h e p r e p a r a t i o n o f a r a d i o m e t r i c m a p o f S p a i n . . . . 1 0 9 '/• AE. Sudrez Mahou, J.A. Fernandez Amigot '""
The natural radioactivity map of Portugal 127 /" ,]LM. Torres, R.L. Grasty ''
Uranium resource assessment and exploration data for geologic radon potentialassessment in the United States 135 '/[ /v
J.K. Otton, L.C.S. Gundersen, R.R. Schumann, G.M. Reimer, J.S. DuvalThe use of uranium exploration data for mapping radon potential in the UK — ify /
Advantages and pitfalls 139T.K. Ball, D.G. Cameron, T.B. Colman, P.D. Roberts
The role of airborne gamma spectrometric data in the radon programme of the , \ <Czech Republic 151/. Barnet
The use of airborne radiometric and exploration survey data and techniques in radon ,risk mapping in Sweden 159 ',v AG. Akerblom
Quantitative modelling of radon potential in Florida and the use of aeroradiometricdata (Summary) 181 ^ f\J.K. Otton, K.K. Nielson, R.B. Brown, P.D. Zwick, T.M. Scott
Radon levels of rock formations in Israel (Summary) 185 ^ ^U. Vulkan, M. Shirav (Schwartz), Y. Shiloni
The role of mobile gamma spectrometry in the Swedish emergency response programme ( ,-, .for nuclear accidents — experience and future plans 187 ' j \H. Mellander
Rapid quantification and mapping of radiometric data for anthropogenic andtechnologically enhanced natural nuclides 197D.C.W. Sanderson, J.D. Allyson, A.N. Tyler
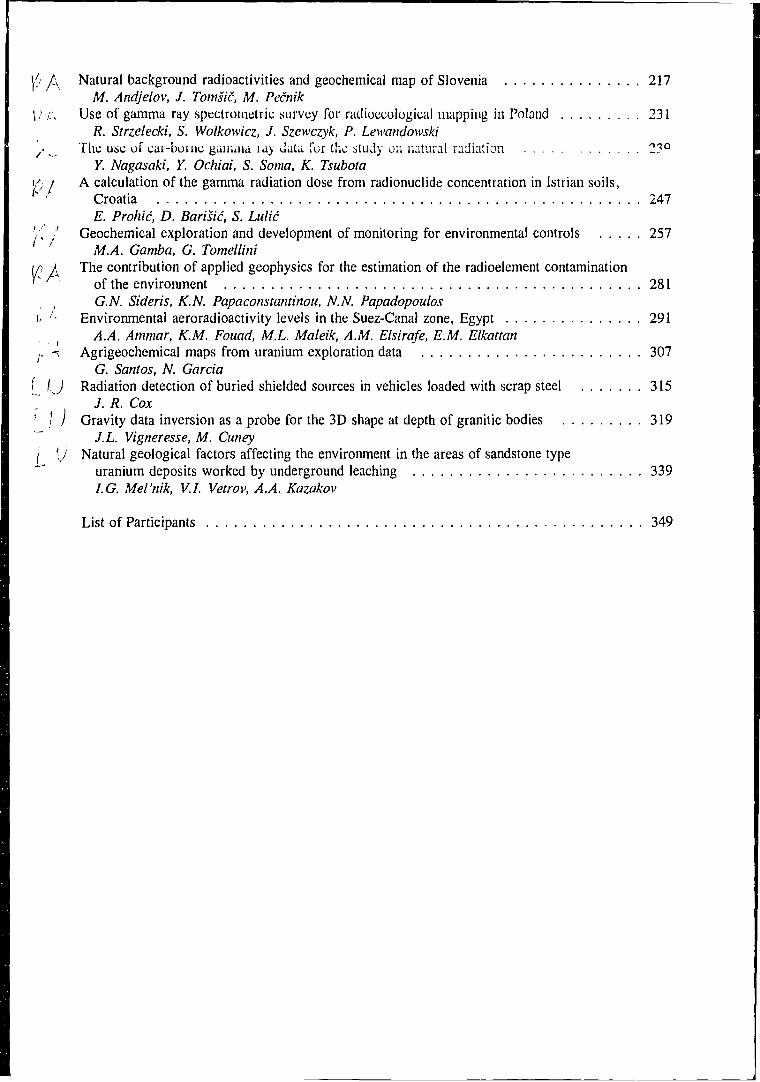
j / 1 y\ Natural background radioactivities and geochemical map of Slovenia 217M. Andjelov, J. Tomsic, M. Pecnik
\J l\ Use of gamma ray spectrometric survey for radioecological mapping in Poland 231R. Strzelecki, S. Wolkowicz, J. Szewczyk, P. Lewandowski
y ^ The use of cai-boine gamma lay data for the study on natural radiation 2?°Y. Nagasaki, Y. Ochiai, S. Soma, K. Tsubota
i/; / A calculation of the gamma radiation dose from radionuclide concentration in Istrian soils,/v ' Croatia 247
E. Prohic, D. Barisic, S. Lulic'/[ ' Geochemical exploration and development of monitoring for environmental controls 257
MA. Gamba, G. Tomellini\p A The contribution of applied geophysics for the estimation of the radioelement contamination' ' of the environment 281. , G.N. Sideris, K.N. Papaconstantinou, N.N. Papadopoulosi' ;- Environmental aeroradioactivity levels in the Suez-Canal zone, Egypt 291
A A. Ammar, KM. Fouad, M.L. Maleik, A.M. Elsirafe, E.M. Elkattan,. -% Agrigeochemical maps from uranium exploration data 307
G. Santos, N. GarciaC' f.J Radiation detection of buried shielded sources in vehicles loaded with scrap steel 3157 J- R. Cox' / / Gravity data inversion as a probe for the 3D shape at depth of granitic bodies 319
J.L. Vigneresse, M. CuneyI [) Natural geological factors affecting the environment in the areas of sandstone type
uranium deposits worked by underground leaching 339I.G. Mel'nik, V.I. Vetrov, A.A. Kazakov
List of Participants 349
SUMMARY OF THE TECHNICAL COMMITTEE MEETING
It is not uncommon that a technique developed for a certain purpose might find an applicationin a completely different field. A notable example is the use of airborne gamma ray spectrometertechniques, developed primarily lor uranium exploration, tor locating and mapping debris of the fallenRussian satellite, COSMOS-954, in northern Canada in 1978; finding lost cobalt sources in the USA;and more recently, rapidly mapping fallout from Chernobyl. Similarly, information collected for theassessment of uranium resources has also been the base for the preparation of natural radioactivityor exposure dose rate and radon potential maps in a number of countries. It is for this reason that aTechnical Committee Meeting on the Use of Uranium Exploration Data and Techniques inEnvironmental Studies was organized by the International Atomic Energy Agency. The meeting washeld in Vienna from 9 to 12 November 1993 and attracted a large number of prominent workers inthis field.
The technical papers presented represent a collection of important contributions by earthscientists (geologists, geophysicists and geochemists) to the understanding of the earth's environmentand the use of environment monitoring techniques. These papers can be divided into the followinggroupings:
(a) the use of old uranium exploration data, airborne and vehicle-borne (car-borne) radiometricsurveys in particular, to produce exposure dose rate and radon potential maps;
(b) new developments in the use of widely spaced ground gamma ray spectrometer surveys toassess the natural radioactivity level of the country;
(c) experiences in the use of airborne gamma ray spectrometer systems for environmentalmonitoring over nuclear power plants, nuclear fuel cycle facilities and large industrialcomplexes;
(d) the use of vehicle-borne gamma ray spectrometer systems in emergency response situation;
(e) and other uses of uranium exploration data and techniques.
Almost without exception, all the papers presented recognized the importance and the needfor a correctable baseline information on the earth's environment. Darnley's first paper addresses theexisting problem of the inconsistency and incompleteness of available information/database on thedistribution of chemical elements, radioactive elements included, in the earth's surface materials. Thefirst two groups of papers presented at the meeting addressed this particular problem. Descriptionsof methodology developed and presented at the meeting offer useful guides to other countries wishingto carry out similar programmes, even those with very limited resources.
Excellent case studies on how 20 to over 30 years old ground and airborne radiometric datafor uranium exploration can be successfully used in the preparation of the natural radioactivity leveland radon potential maps of the country were presented in the papers by Grasty et al.; Suarez Mahouand Fernandez Amigot; Torres and Grasty; Otton et al.; Barnet; and Akerblom.
As noted in a map showing the extent of gamma ray survey coverage in the world (Grastyet al.), a large part of the earth's surface has not been and most likely will never be covered by suchsurveys. Regardless, there are still a number of areas in the world where this valuable informationhas been collected but not used for production of maps showing the natural radiation of the earth'ssurface. On the radon problem, all speakers commented that uranium exploration data (radiometric)are of obvious benefit in identifying areas with high level radon concentration. This informationalone, however, is not sufficient to estimate the risk that might be caused by it. It needs to becombined with other relevant information.

It is well known that airborne survey is costly and beyond the capability of many countries.The development of a large spacing ground spectrometer survey for the production of radioelementand natural radioactivity level maps, and possible anthropogenic pollution were successfullydemonstrated in Poland (Strzelecki et al.) and in Slovenia (Andjelov et al.)- This approach offers apractical alternative that is within the means of most government survey organizations.
For the past five years, there has been an increasing number of airborne gamma rayspectrometer systems used to monitor nuclear power plants, nuclear fuel cycle facilities, nuclearresearch institutes and large industrial complexes. Good examples of these works are noted in thepapers by Schwarz et al.; Grasty and that of Sanderson et al. Parallel to this, are the establishmentof similar systems that are dedicated to respond in the case of an emergency (the second paper ofSanderson et al. and Mellander).
In summary, the meeting was successful in bringing together important workers in this field.The various papers presented demonstrated the side benefit that can be drawn from past uraniumexploration activities and the technology developed for this purpose. Since the environment does notrecognize political boundaries, the meeting indicated the need for better co-ordination/collaborationamong these workers in their studies of the earth's environment. The various activities presented atthe meeting represent a step towards the improved assessment of the level of natural radioactivity ofthe earth's surface, a basic information often neglected in discussing our environment.
URANIUM EXPLORATION DATA, INTERNATIONAL GEOCHEMICALMAPPING AND THE ENVIRONMENT
A.G. DARNLEYGeological Survey of Canada, Ottawa, Ontario, Canada
Abstract
Public concern about environmental problems, about the possibility of irreversible changes affecting climate,sea level, vegetation patterns etc., and thus the capacity of the earth to support human life, has highlighted the needto obtain a much more complete description of present conditions. One field of knowledge where current informationis inconsistent and incomplete concerns the distribution of chemical elements in the earth's surface materials. TheInternational Geochemical Mapping (IGM) project, which was launched in 1987 to address this problem, was anoutgrowth of earlier IAEA-sponsored activities directed towards methods of uranium exploration. The IGM projectis organized under the International Geological Correlation Program, sponsored by UNESCO and IUGS. The IAEAhas supported that part of the IGM project which relates lo radioactive elements. These elements, both natural andman-made, are part of the geochemical environment and subject to the same chemical and physical processes as non-radioactive elements. For many reasons information about their spatial distribution and the processes which controlthem should be compatible and available from a common database. A series of recommendations have been preparedas part of the IGM project, to extend many of the concepts developed under IAEA auspices to assist uraniumexploration, into the field of non-radioactive elements. Recommendations are concerned with acquisition and adoptionof standard reference materials, standardization of methods, emphasis on sensitivity and quality control, internationalcompatibility of data, and the establishment of a global geochemical database. The recommendations will be publishedby the International Council of Scientific Unions. The objectives of the IGM project cannot be attained without theparticipation of leading national laboratories. In many countries the national atomic energy agency often possessesthe best trained analytical staff, the best equipped laboratories, and in some countries an extensive earth sciencedatabase relating to radioactive minerals. It is suggested that it would materially benefit the countries involved, andfacilitate the establishment of a comprehensive global geochemical database if national atomic energy organizationscould participate in meeting the objectives of the IGM project. The end products will have both economic andenvironmental applications.
1. INTRODUCTION
There is steadily increasing public concern over the condition of the global environment. Thepast and present work of the IAEA in the field of uranium exploration has considerable relevance toan important sector of environmental knowledge, namely, the chemical composition of the Earth'ssurface. Considering the world as a whole, this topic has been relatively neglected, resulting in ascattered patchwork of incomplete and inconsistent information. Current literature describing pollutionstudies (e.g., Heavy Metals in the Environment, Conference Proceedings, 1993) often omits tomention the elemental composition of the natural surface environment, seemingly implying that it isknown, is relatively constant, and can be ignored. In fact, the natural variations in surfacegeochemistry have important environmental and economic implications.
A systematic database is a necessary starting point for any scientific study. Over the past 25years the efforts of the IAEA to increase knowledge concerning the world's uranium resources havesimultaneously, as a by-product, contributed to increasing knowledge concerning the geochemistryof the earth's surface. Both radioactive and non-radioactive minerals occur side-by side within thenatural environment and are subject to identical external processes. IAEA-sponsored activities haveencouraged the development of an approach which is equally applicable to radioactive and non-radioactive elements. Geochemical mapping, using a variety of methods, is an essential componentof uranium exploration (IAEA, 1988). It is not possible to search for one element withoutsimultaneously gathering information about the distribution of others in the same region, and it isalways advantageous to do this.
The task of trying to assemble an international (or national) database containing informationon the natural distribution of a metal (there is much less information on non-metals) quickly identifiesthe deficiences, incompleteness and heterogeneity of existing geochemical datasets. Work specificallyrelating to uranium, coordinated through the IAEA, has demonstrated the need for internationalreference materials, standardised methodologies, reporting methods, improved detection limits, andbetter quality control. It has also demonstrated the need for coordination in the provision of technicaladvice and training, and the benefits flowing from international standardization of geoscientificinformation. Much ot the experience which has oeen gained in working lowuida a global database foiuranium could and should be applied to the task of building a comprehensive database for nil theelements in the natural surface environment. This paper explains why and how.
2. THE IMPORTANCE OF GEOCHEMICAL MAPPING
Multielement geochemical mapping, showing the spatial distribution of the elements at thesurface of the Iithosphere, is directly lelevant to economic and environmental problems involvingminerals, agriculture, forestry, animal and human health and land-use planning. Mapping is necessaryfor the establishment of valid baselines for the regulation of industrial pollution and should beconducted so as to provide data against which any subsequent change can be measured. Geochemicalmapping has resulted in the discovery of many mineral deposits over the past four decades (Thorntonand Howarth, 1986); a variety of biochemical phenomena have been discovered through therecognition of empirical associations between trace element and morbidity patterns (Thornton, 1983).Thus, a geochemical database and its representation in map form is directly pertinent to humanoccupation and exploitation of the earth's surface. The need for an adequate geochemical databaseincreases in step with population. World population is now in excess of 5.5 billion and it is increasingat the rate of 90 million per year. All projections of population growth, based on a variety ofassumptions, show that within 50 years, unless there is some unforeseen catastrophe, world populationwill grow to 8 billion, approximately a 50 per cent increase on present numbers (Arizpe et al., inICSU 1992). If present growth rates continue, this will happen by 2015; if growth slows down, itwill happen by 2040. Within 50 years world population could considerably exceed 8 billion.Population expansion will inevitably cause more intensive exploitation of minerals, agricultural land,forests, water and living space and btv .:use most people aspire to a higher standard of living than theycurrently have, there will be additional pressure upon these resources. Greater efforts will have to bemade to keep the planet habitable and recycle the resources now in use. Much more energy will berequired, even assuming that usage becomes more efficient. This could increase the use of nuclearenergy and increase the consumption of uranium. To anticipate all these demands and react in anintelligent way it will be essential to establish a comprehensive database concerning all types ofresources and all aspects of the environment. Geochemical information is an essential part of thisdatabase.
Public interest in matters relating to sustainable development and the maintenance of theenvironment has been reflected in and stimulated by the work of the World Commission onEnvironment and Development (published in the Brundtland Report of 1987), and the ASCEND 21and Rio de Janeiro UNCED Conferences of 1991/1992 (ICSU, 1992). The need for a comprehensivedatabase describing the principal features of the global environment is amongst the many issuesidentified at these meetings. Such a database is an essential foundation for the many studies requiredto understand complex natural processes. Public concern is focussed around the possibility of ill-defined "global change". The fact that change cannot be detected or measured if there is anincomplete description of present conditions is often overlooked; furthermore, the real consequencesof changing conditions cannot be anticipated if all the variables have not been recognised.
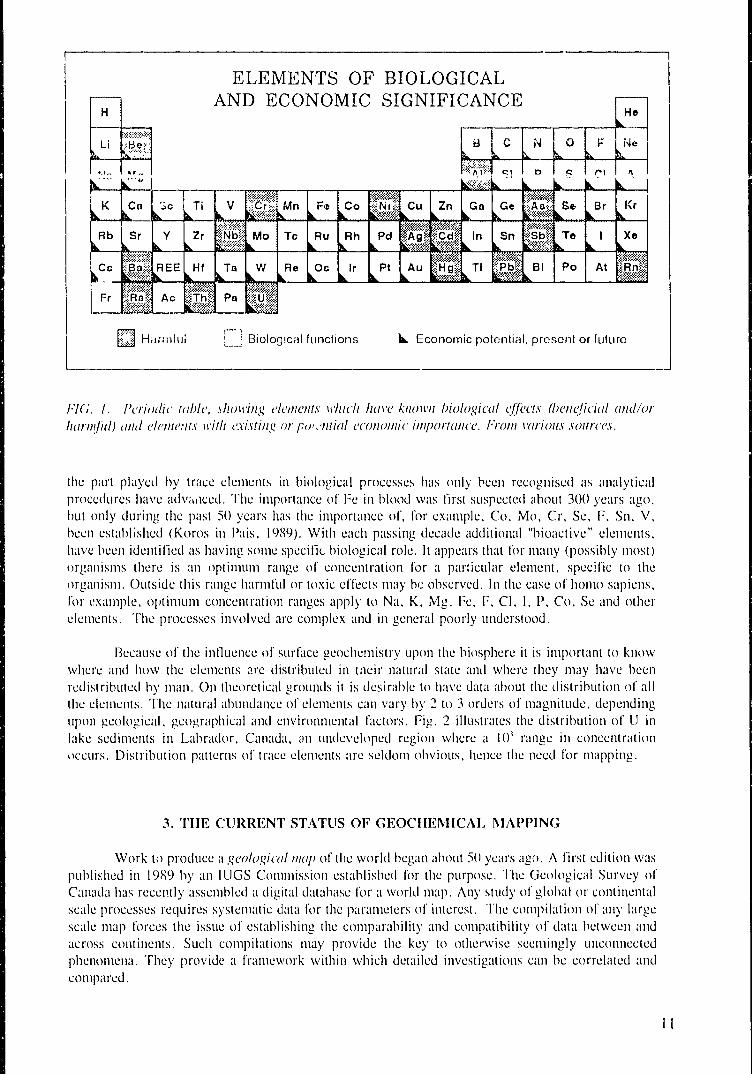
The earth's surface layer is the source of all the chemical elements involved in biologicalprocesses and all the elements exploited by man (Fig. 1). Life on earth has evolved in the presenceof all the elements, and possibly every element has some function in the biosphere. Recognition of
10
ELEMENTS OF BIOLOGICALAND ECONOMIC SIGNIFICANCE
g j j Harmlu! J Biological functions Economic potential, present or future
FIG. I. Periodic table, showing elements which have known biological effects (beneficial and/orharmful) and elements with existing or puwiitial economic importance. From various sources.
the part played by trace elements in biological processes has only been recognised as analyticalprocedures have advanced. The importance of Ft* in blood was first suspected about 300 years ago,but only during the past 50 years has the importance of, for example, Co, Mo, Cr, Se, F, Sn, V,been established (Koros in Pais, 1989). With each passing decade additional "bioactive" elements,have been identified as having some specific biological role. It appears that for many (possibly most)organisms there is an optimum range of concentration for a particular element, specific to theorganism. Outside this range harmful or toxic effects may be observed. In the case of homo sapiens,for example, optimum concentration ranges apply to Na, K, Mg, Fe, F, Cl, I, P, Co, Se and otherelements. The processes involved are complex and in general poorly understood.
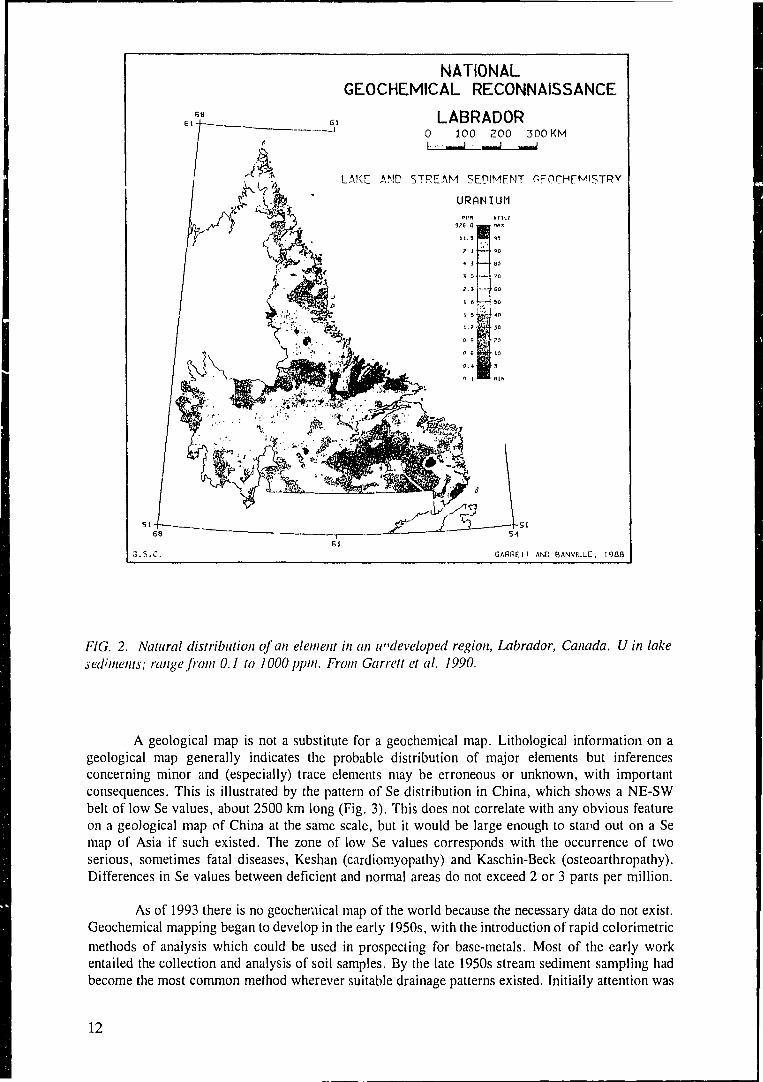
Because of the influence of surface geochemistry upon the biosphere it is important to knowwhere and how the elements are distributed in tneir natural state and where they may have beenredistributed by man. On theoretical grounds it is desirable to have data about the distribution of allthe elements. The natural abundance of elements can vary by 2 to 3 orders of magnitude, dependingupon geological, geographical and environmental factors. Fig. 2 illustrates the distribution of U inlake sediments in Labrador, Canada, an undeveloped region where a 10' range in concentrationoccurs. Distribution patterns of trace elements are seldom obvious, hence the need for mapping.
3. THE CURRENT STATUS OF GEOCIIEMICAL MAPPING
Work to produce a geological map of the world began about 50 years ago. A first edition waspublished in 1989 by an IUGS Commission established for the purpose. The Geological Survey ofCanada has recently assembled a digital database for a world map. Any study of global or continentalscale processes requires systematic data for the parameters of interest. The compilation of any largescale map forces the issue of establishing the comparability and compatibility of data between andacross continents. Such compilations may provide the key to otherwise seemingly unconnectedphenomena. They provide a framework within which detailed investigations can be correlated andcompared.
NATIONALGEOCHEMICAL RECONNAISSANCE
LABRADORO 100 200 300 KM
LAKE! AMD STREAM SEDIMENT CFCCHEMISTRY
URANIUM
rn miu
CARREII AND BANVILLE. 1908
FIG. 2. Natural distribution of an element in an undeveloped region, Labrador, Canada. U in lakesediments; range from 0.1 to 1000 ppm. From Garrett et al. 1990.
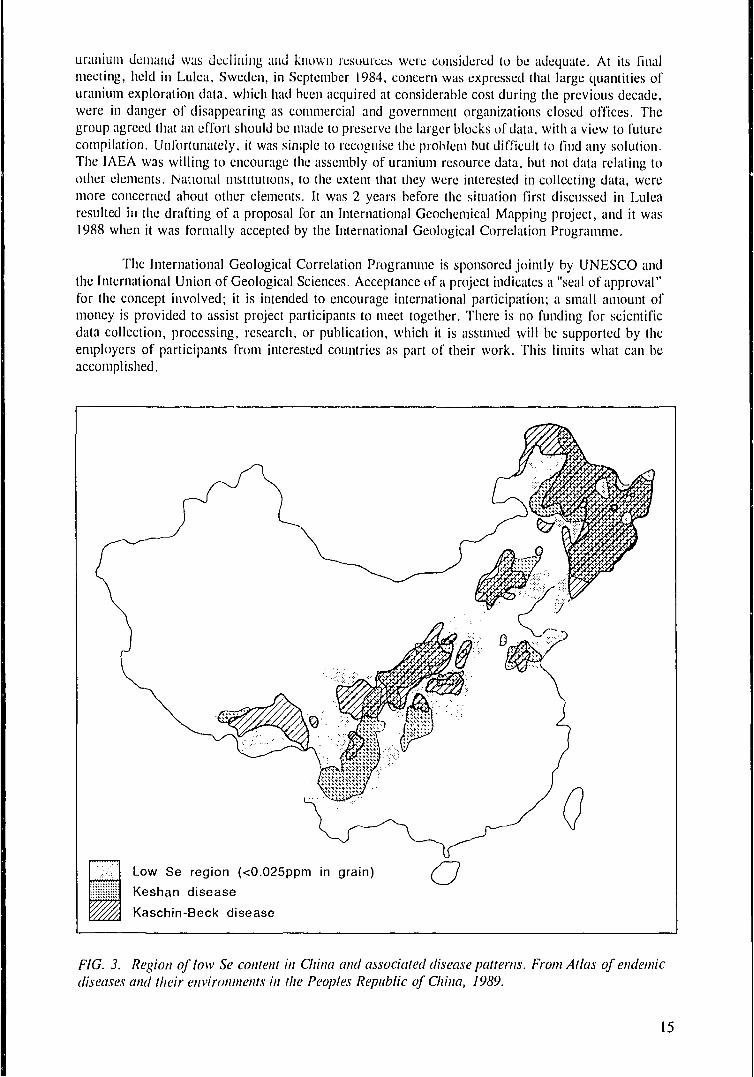
A geological map is not a substitute for a geochemical map. Lithological information on ageological map generally indicates the probable distribution of major elements but inferencesconcerning minor and (especially) trace elements may be erroneous or unknown, with importantconsequences. This is illustrated by the pattern of Se distribution in China, which shows a NE-SWbelt of low Se values, about 2500 km long (Fig. 3). This does not correlate with any obvious featureon a geological map of China at the same scale, but it would be large enough to stand out on a Semap of Asia if such existed. The zone of low Se values corresponds with the occurrence of twoserious, sometimes fatal diseases, Keshan (cardiomyopathy) and Kaschin-Beck (osteoarthropathy).Differences in Se values between deficient and normal areas do not exceed 2 or 3 parts per million.
As of 1993 there is no geocheniical map of the world because the necessary data do not exist.Geochemical mapping began to develop in the early 1950s, with the introduction of rapid colorimetricmethods of analysis which could be used in prospecting for base-metals. Most of the early workentailed the collection and analysis of soil samples. By the late 1950s stream sediment sampling hadbecome the most common method wherever suitable drainage patterns existed. Initially attention was
12
limited to a few elements of immediate economic interest, such as Cu, Ni, Pb and Zn. Uranium beganto be a target for some geochemical surveys during the 1960s. In recent years, as a result of majordevelopments in analytical techniques, as many as 50 elements have been included in the analyticallist for some national surveys. Geochemical mapping methodologies have now evolved to the pointwhere it is possible to obtain reproducible quantitative information about the chemical compositionof the surface environment with whatever spatial resolution is required.
The use of radioactivity surveys, initially employing Geiger counters, to find uraniummineralization began in the late 1940s, before geochemical exploration methods became established.Initially radiomelric surveys only provided a method of measuring total radioactivity, caused by somecombination of U, Th, and K, possibly with some contribution from radioactive fallout. These earlyradiometric surveys cannot be considered as geochemical surveys. It was not until the developmentof high-sensitivity gamma ray spectrometry in the late 60s, which made it possible to producequantitative radioelement maps for K, U and Th (plus specific fallout products), that radiometricsurveys became a geochemical mapping method for these elements. Because K, U and Th are large-ion lithophile elements with distinctive properties they happen to be sensitive indicators of a varietyof economically significant geological and geochemical processes. For these and other reasonsdescribed in a companion paper, airborne gamma ray spectrometry provides a valuable complementto conventional geochemical surfac • sampling.
Although scattered geochemical mapping programs had been started by government agenciesin a few countries prior to 1970, the oil embargo of 1973 resulted in funds being made available tostart national geochemical mapping programs in Canada, the USA and elsewhere. It provided anopportunity to apply recently developed methods. Nuclear energy was seen as a way of reducingdependance upon imported oil, so more uranium would be needed, and this could be found throughradiometric and geochemical exploration. Although uranium was the prime target, work was plannedso as to gather data for other elements simultaneously. In Canada and the USA a broadly similarapproach was taken. It involved two components: systematic airborne gamma ray spectrometry to mapeU, eTh and K; and surface sampling of stream sediment and (in Canada) lake sediment, to obtainmultielement data (initially 12 to 15 elements in Canada, 30+ in the USA). Both the US andCanadian programs operated principally through private contractors, according to predefinedspecifications. The Canadian programme required the use of approved equipment, standardisedtechniques, reference materials for geochemical analysis, and calibration facilities for radiometricinstruments (Darnley et al. 1975). The US programme allowed its larger number of contractors moreflexibility in execution.
The concept of internationally approved methodology and standards for geochemical mappingevolved from the need to introduce order into gamma ray spectrometry measurements. The problemwas identified at an IAEA panel meeting in Vienna in 1972 (IAEA, 1973). This led to a series ofIAEA Consultants' meetings in 1973/74. An IAEA technical report with recommendations waspublished in 1976 (IAEA, 1976). Those recommendations, with subsequent revisions and additions,have provided the international standards for ground and airborne gamma ray surveys from that timeforward (IAEA 1979, IAEA 1991). As a parallel step, during the 70s the IAEA was responsible forpreparing laboratory reference materials for radiometric and chemical analyses. These activities wereinfluential because of the IAEA 's mandate, arising from its UN charter, for all matters relating tonuclear energy, including radioactive minerals. The agency can thus act as international coordinatorand facilitator for a wide range of technical activities in its field. A number of large airborne gammaray surveys undertaken over the last 15 years, for example in Thailand, have a degree of conformityand standardization because of IAEA influence. Regrettably, neither the IAEA nor any otherinternational agency has a mandate for sponsoring standardization for data relating to non-nuclearelements in the environment. There has been no institutional support to facilitate systematic datacollection pertaining to the remainder of the periodic table, dispersed alongside radioactive elementsin soil, rocks and natural waters. Consequently, on an international basis, there has been nocoordination of methodology or data with respect to geochemical surveys. In general, data fromneighbouring countries can only be correlated in a qualitative manner, if at all.
13
3.1. THE DEFICIENCIES OF EXISTING MULTIELEMENT DATASETS
Although a few countries have produced geochemical atlases, beginning in the 1970s, nocountry, or region within any country, has geochemical maps for more than a sometimes ratherarbitrary mix of eiements. The selection has commonly been determined by the limitations of theresponsible institution's analytical facilities or analytical budget. As a result of an ambitious programthroughout the past decade a large part of China has been covered with detailed systematicgeochemical mapping (,Xie and Ren, 1991). Recently published national geochemicai atlases fromGermany, Austria and Finland are of high quality, but, as elsewhere, they are stand-alone items withrespect to their neighbours (see references). Each country or organization has developed its own codeof practice and style of presenting data. This can be readily appreciated by comparing the products.Geochemical databases vary from country to country and many countries do not have any. Thosewhich exist are incomplete, inconsistent across (often within) national boundaries, and often lackinformation on quality control. Different sample media, methods of sample collection and preparation,extraction and analytical techniques have been used. As a result, numerical values can only becompared within areas where consistent methods and standards have been applied.
Table I lists countries where some geochemical mapping is known to have taken place, andshows the percentage of their area which has been covered. It is important to recognise that thisindicates nothing about the number of elements analysed, or the quality or consistency of data.Table II indicates one of the inconsistencies which exist in a selection of the available large-areadatasets from different parts of the world. This table shows how few elements are included in themajority of published regional map sets. Of 18 regions considered on 6 different continents, only 3elements (Cr, Cu and Zn) are included in all the map sets. Analytical suites have normally beendecided primarily according to short term mineral exploration priorities, coupled with a need tominimize costs. In some survey programs there has been what can be termed as "analytical fallout",that is to say, elements for which analytical data have been obtained, for little or no extra cost, as aby-product of the methods selected for the elements of immediate economic interest.
The dimensions of geochemical phenomena are an important consideration with respect to theamount of on-the-ground-data, i.e. sampling density, required to recognise them and the scale atwhich useful geochemical information can be conveyed. There are patterns in nature, that is to say,non-random arrangements of like-objects, at all scales, from the atomic to the galactic. Patterns arerecognisable at all scales in geology, for example, ranging from rhythmic sedimentation to thestructure of orogenic belts. Similarly there are patterns at all scales in geochemistry (for a recentdiscussion see Bolviken at al, 1992). It has been known for a century that the major elementcomposition of the continents is different from the major element composition of the ocean floor.However, it is only within the last decade that data have been compiled over sufficiently largecontinental areas to demonstrate that trace element distribution exhibits large as well as small-dimension patterns. There are examples from China (Xie and Yin, 1993), Fennoscandia (Gustavssonet al, in press) and USA. Compilations for the latter are based on airborne gamma ray spectrometry,showing K, eU, and eTh (Duval,1991), and conventional ground sampling for multielement analysis(Shacklette et al 1981). Both the airborne and ground data measure the composition of the regolith.The latest geochemical atlas published by the Geological Survey of Finland is based on the analysisof till samples collected at a density of 1 per 300 km2. This volume displays much interestinginformation relating to varying levels of element abundance, showing the existence of large and insome cases unexpected and difficult-to-explain features. Over most of the world there is a seriousdata-deficiency, with, at best, patchy coverage for a few elements. In many countries data are limitedto scattered small areas which are insufficient to permit continuity of large features to be traced.
4. THE INTERNATIONAL GEOCHEMICAL MAPPING PROJECT
The International Geochemical Mapping project grew out of the Joint IAEA/NEA R&D Groupon Uranium Exploration Methods, which was active from 1976-1984. This group disbanded because
14
uranium demand was declining and known resources were considered to be adequate. At its finalmeeting, held in Lulea, Sweden, in September 1984, concern was expressed that large quantities ofuranium exploration data, which had been acquired at considerable cost during the previous decade,were in danger of disappearing as commercial and government organizations closed offices. Thegroup agreed that an effort should be made to preserve the larger blocks of data, with a view to futurecompilation. Unfortunately, it was simple to recognise the problem but difficult to find any solution.The IAEA was willing to encourage the assembly of uranium resource data, but not data relating toother elements. National institutions, to the extent that they were interested in collecting data, weremore concerned about other elements. It was 2 years before the situation first discussed in Lulearesulted in the drafting of a proposal for an International Geochemical Mapping project, and it was1988 when it was formally accepted by the International Geological Correlation Programme.
The International Geological Correlation Programme is sponsored jointly by UNESCO andthe International Union of Geological Sciences. Acceptance of a project indicates a "seal of approval"for the concept involved; it is intended to encourage international participation; a small amount ofmoney is provided to assist project participants to meet together. There is no funding for scientificdata collection, processing, research, or publication, which it is assumed will be supported by theemployers of participants from interested countries as part of their work. This limits what can beaccomplished.
Low Se region (<0.025ppm in grain)
Keshan disease
Kaschin-Beck disease
FIG. 3. Region of low Se content in China and associated disease patterns. From Atlas of endemicdiseases and their environments in the Peoples Republic of China, 1989.
15
It has taken time for the deficiencies of the existing scattered, locally oriented, geocheniicaldatabases to become recognised outside the geochemical profession. However, during the 6 yearssince the International Geochemical Mapping project began, it has become apparent to a growingnumber of scientists concerned with the environment that standardised geochemical data are anecessary component of the public scientific infrastructure.
The objective for Phase 1 of the International Geochemical Mapping project, which wascompleted in 1992, was to take steps which would promote the greater standardisation ot regionalsurficial geochemical surveys. This was done by:
1) making an inventory of existing data and methods;2) conducting research to overcome recognised problems;3) compiling demonstration products from different regions of the world;4) developing recommendations that can be applied to future systematic geochemical mapping.
Recommendations will be published in full by the International Council of Scientific Unionsin 1994 as part of a report prepared by members of the project's five Technical Committees, to whichmore than 20 people have contributed. Leading contributors from China, Europe, North America andRussia, are named in the acknowledgments section of this report.
4.1. RECOMMENDATIONS FOR PHASE 2 OF THE IGM PROJECT
The recommendations for the implementation of Phase 2 ot the International GeochemicalMapping project are focussed around the establishment of Global Geochemical Baselines. Thefollowing is a summary of salient points.
The area of the world's land surface is approximately 140 million km2. Even if it could beafforded, it would be impracticable to initiate a one-stage operation to collect 1 sample/km2 over theEarth's land surface and ensure adequate quality control at each stage of the work. Such an approachis possible for measurements that can be made from satellite platforms, but no technique exists whichis applicable to multielement geochemical mapping of the surface. International geochemical mappingcan only be accomplished in stages on, or in the case of the radioactive elements, close to the ground.
Geochemical mapping should be regarded as a continuum of activities, extending from amultipurpose planetary overview at one extremity to a wide variety of specialized and detailedinvestigations (possibly confined to small areas) at the other. To the greatest extent possible, data atall scales should be interlinked. Conceptually, national and international surveys can be linked bymeans of a hierarchial sampling pattern based on a 10 x 10 km cell. National surveys can subdividethis cell, for example into 5, 2 or 1 km units to provide better definition of local geochemical patternsin economically important and populated areas. For international correlation and initial reconnaissanceof large areas (and also for the preparation of a world atlas) a larger cell is advocated, for example20, 40 or 80 km. But, as a first step, to tie all regions and continents together, a global collection ofstandard reference materials is recommended based on a 160 x 160 km cell. This is the equivalentof a geodetic network in topographic surveys.
Sample spacing and sample media are interrelated issues in any type of geochemical mapping.For area mapping, samples should be representative of as large an area as possible. There are 2 waysof obtaining representative large area samples, either by using a natural composite, such as flood plainsediment derived from a very large area, or devising a statistically valid sampling pattern for materialswith a more restricted derivation. Either way, wide-spaced sampling is crucial to the initiation ofinternational geochemical mapping because it provides the only practical method of obtaining arelatively rapid and consistent overview of global geochemistry. It can be organized and undertakenby a relatively small number of people in each region of the world. This is a key factor in obtainingconsistency. Valuable demonstrations of the effectiveness of wide-spaced sampling are available from
16
China (Xie and Yin 1993) Canada (Garrett 1993), Fennoscandia (Koljonen et al. 1992) and USA(Shacklette and Boerngen 1984).
The earth's land surface can be covered by approximately five thousand 160 x 160 km cells.Ideally, the sampling pattern should be more-or-less evenly distributed, with a site in each quarter ofthe 160 km grid cell. This is easy to carry out over large populated regions with a good roadnetwork, such as the North American prairies, the North European plain, etc. Where equi-spaced two-dimensional sampling is difficult to execute, it is recommended that as an alternative measure adatabase can be obtained from reference materials collected along corridors, for example by followingsuitably located transportation routes, spaced not more than 160 km apart. Where possible, routesshould be chosen which are normal to the regional strike. Airborne gamma ray spectrometry, whichhas a complementary role in the acquisition of geochemical baseline data, collects data in continuoustraverses, and these can be laid-out to coincide with ground corridors. This is the subject of a separatepaper. The work of Shacklette in the USA, demonstrated that sampling the regolith at about 80 kmintervals, adjacent to the national interstate highway system, was capable of providing a coherentnational geochemical overview, based on 1318 sites (Shacklette et Boerngen 1984).
In remote areas where there is no convenient surface access, it will be necessary to useaircraft to reach sample collection sites. Whatever the mode of access, whether the sampling patternis equidimensional, or linear along a corridor, a minimum of 5 sites should be sampled within eachglobal reference cell, 2 of these sites being close together in order to check site reproducibility. Adetailed sampling protocol is contained in the recommendations (Darnley et al. 1994).
With respect to the types of sample to be collected, mineral exploration geochemists,wherever the landscape permits, have adopted stream sediments as the preferred sampling mediumfor regional geochemical surveys. Therefore, wherever possible this type of sample should be taken.However, for environmental scientists, soil and the surfaces on which people live are of greaterinterest. Hence emphasis must be placed upon the upper regolith, which may consist of residual ortransported soils, flood plain sediments, raised beaches, etc. Because there is public concern in manycountries about radioactivity, radioactive dose-rates and in situ radioelement concentration should bemeasured at each reference siie, using a calibrated field gamma ray spectrometer. Geologists seekinformation about bedrock if they can obtain it, therefore a "C" horizon sample should be collectedwherever the weathering profile permits. Water, for obvious reasons, is of great environmentalconcern, and the inorganic composition of water samples must form part of a global dataset. Similarlyhumus should be collected wherever it is present, to provide a link with more specializedbiogeochemical surveys.
It is important to stress that in order to obtain sufficient baseline data to produce atlas-scalemaps, the primary 160 km grid must be subdivided and sampled (either at the time the referencesamples are collected, or subsequently) in smaller cells, 80 x 80 km, 40 x 40 km etc., accordingto the spatial definition that can be afforded. The latter, or closer spacing, is recommended for thepurpose of establishing national baseline data in a small country. Note that planning documentsprepared in connection with the International Global Change Programme often refer to a hierarchyof investigative sites for different types of monitoring and research, so we are advocating a similarapproach in the International Geochemical Mapping project.
5. IMPLEMENTATION OF THE IGM PROJECT
It is expected that Phase 2 of the IGM project, IGCP 360 Global Geochemical Baselines, willcommence in 1994, beginning with the collection and analysis of wide-spaced reference materials.These will be for ongoing use by both national and international institutions. However, before thiswork can proceed very far some important decisions must be taken. Currently the only scientific datacollection and research work taking place which is relevant to the IGM project is being accomplished
17

in countries where there are geochemical mapping projects with activities which closely resemble therequirements of the international project. In these situations progress is largely dependant upon theinterest and persistence of the individual project scientists, and upon their persuasiveness with respectto local funding agencies. This is an unsatisfactory foundation on which to build a permanentinternational database. For substantial progress to be made it is necessary for the project to be adoptedby responsible national institutions, which could include geological surveys, environmental andnuclear energy organizations. They are in a position to implement the recommendations relating tostandards, methods and quality control, to a nation's advantage. In many countries excellent analyticaland computing laboratories are to be found in nuclear energy institutes and, especially where otherfacilities are lacking, consideration should be given to utilising these for geochemical purposes.
To make it possible for national organizations to collaborate in an international project andfollow common specifications, there is a need for an international coordinating agency with expertisein the relevant field of activity. The IAEA has performed this function for matters relating touranium. In order to obtain a global multielement geochemical database the following practicalconsiderations need to be addressed:
data acquisition will require a minimum of a decade, it could be much longer;the quality and consistency of data must be controlled throughout the acquisition period;standard reference materials must be provided and renewed as necessary;there should be a mechanism for assessing and introducing new techniques as they becomeavailable;there should be a central record of work undertaken;global and regional data must be accessible to be useful;a single world geochemical data centre is required to facilitate links to other global-scalephenomena, including population, environmental, natural resource and global change datasets.
Because the scientific and technical requirements of systematic geochemical mapping havepractical significance for all countries:
all countries should be encouraged to participate in every stage of the work;appropriate training and technical assistance should be offered where required.
These various considerations lead to the conclusion that:
management continuity and assured funding will be necessary;global co-operation must be encouraged and assisted by a small technical secretariat, fundedand administered through a permanent international agency.
The work of the IAEA over the past 25 years in providing a scientific infrastructure relatingto uranium geochemistry provides a model of what is required to establish baseline data concerningthe whole periodic table. Given the importance of the task, it is to be hoped that, if the IAEA isunable to include it within its own mandate, then it will encourage and assist the creation ofappropriate arrangements elsewhere.
18

TABLE I. GEOCHEMICAL MAP COVERAGE, BY COUNTRY (EXCLUDING RADIOMETRICMAPPING)
Country Coverage Area Percent
21
7
503911291
219571
211
81001619745040102171
321
993810011
3241
5630
16
421168
297100544427
3
19
AlbaniaAigeiuinuAustraliaAustriaBelgiumBoliviaBrazilBurmaCanadaChinaCzech+Slovak RepublicsEcuadorEgyptEthiopiaFinlandFranceGabonGermanyGreenlandHungaryIndonesiaIranIsraelItalyJapanJordanKenyaMalaysiaMozambiqueNorwayPakistanPeruPolandRussiaSaudi ArabiaSierra LeoneSolomon Is.SomaliaSouth AfricaSpainSwedenSyriaTanzaniaThailandUgandaUKUSAVenezuelaZambiaZimbabwe
6 000200 000566 00042 00012 000
130 0002 428 343
9 4302 084 0009 500 000
91 0006 000
110 00096 000
337 03090 00050 000
264 000190 00037 000
190 000349 500
15 00010 00079 000
ns50 00031 000
306 100324 219
6 0006 300
100 0001 000 000
10 50040 250
8 600ns
200 000ns
190 00021 000
643 00012 000
230 000244 820
4 959 539400 000207 000
13 200
28 7482 766 SS97 686 848
83 83530 513
1 098 5818 511 965
676 5529 976 1399 596 968
127 870283 561
1 001 4491 207 808
337 030547 026267 667356 910
383 600*93 030
1 919 4401 648 000
20 770301 230377 835
91 880582 646329 750801 590324 219803 943
1 285 216312 680
22 402 2002 149 690
71 74028 450
637 6571 221 037
504 750449 964185 180945 090506 880236 040244 820
9 235 699912 050752 614390 580

Country Coverage Area Percent
TOTAL(51 countries with listeddata) 25 894 540 94 740 685 27
TOTAL (WORLD LANDSURFACE•excluding icecaps)
25 894 540 136 000 000 19
(N.B. This list is compiled solely to indicate that some geochemical map data exist over the areas shown forthe various countries. There is a great diversity in methods used and elements for which there is analyticalinformation. Data are unstandardized between countries and commonly also within countries)
TABLE II. ELEMENTS MAPPED IN 18 REGIONAL GEOCHEMICAL SURVEYS FROMAMERICA, EUROPE, AFRICA, ASIA
Bioactive elements in italics1
No. of regions in which the following elements have been mapped2
18
17
16
15
14
13
12
11
10
9
8
7
6
5
4
3
2
1
0
Cr Cu Zn
Co Pb
Ni
Mn Fe Ba
V
Sn
SrW
As Mo
KZTU
Al Ca 71 Ag
Sc YLa
Be Mg Rb Nb Ce Au Th
NaPSb
Cd RE Ta
Li B Si Ga Br Cs Hf
pH F Se Bi
C(LOI), Cl Hg
Te / Re Os Ir Pt
He N O Ne S Ar Ge Kr Tc Ru Rh Pd In Xe 77 Po At Fr Ac Pa
20
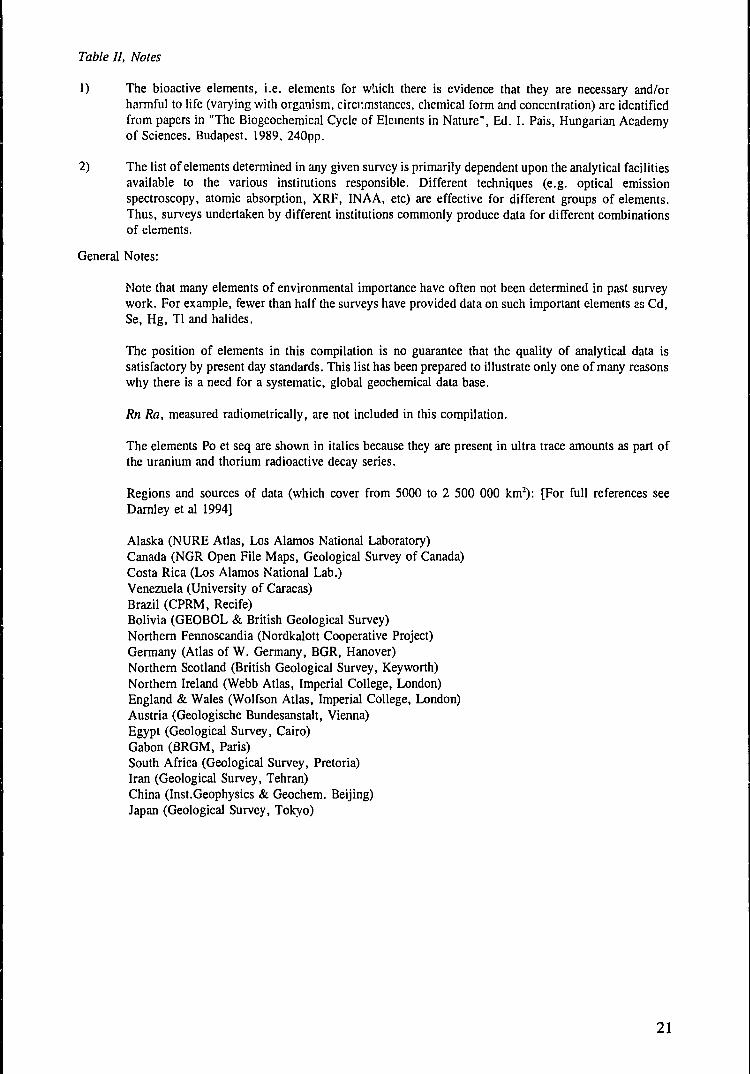
Table II, Notes
1) The bioactive elements, i.e. elements for which there is evidence that they are necessary and/orharmful to life (varying with organism, circumstances, chemical form and concentration) arc identifiedfrom papers in "The Biogeochemical Cycle of Elements in Nature", Ed. I. Pais, Hungarian Academyof Sciences. Budapest. 1989. 240pp.
2) The list of elements determined in any given survey is primarily dependent upon the analytical facilitiesavailable to the various institutions responsible. Different techniques (e.g. optical emissionspectroscopy, atomic absorption, XRF, INAA, etc) are effective for different groups of elements.Thus, surveys undertaken by different institutions commonly produce data for different combinationsof elements.
General Notes:
Note that many elements of environmental importance have often not been determined in past surveywork. For example, fewer than half the surveys have provided data on such important elements as Cd,Se, Hg, Tl and halides.
The position of elements in this compilation is no guarantee that the quality of analytical data issatisfactory by present day standards. This list has been prepared to illustrate only one of many reasonswhy there is a need for a systematic, global geochemical data base.
Rn Ra, measured radiometrically, are not included in this compilation.
The elements Po et seq are shown in italics because they are present in ultra trace amounts as part ofthe uranium and thorium radioactive decay series.
Regions and sources of data (which cover from 5000 to 2 500 000 km2): [For full references seeDarnley et al 1994]
Alaska (NURE Atlas, Los Alamos National Laboratory)Canada (NGR Open File Maps, Geological Survey of Canada)Costa Rica (Los Alamos National Lab.)Venezuela (University of Caracas)Brazil (CPRM, Recife)Bolivia (GEOBOL & British Geological Survey)Northern Fennoscandia (Nordkalott Cooperative Project)Germany (Atlas of W. Germany, BGR, Hanover)Northern Scotland (British Geological Survey, Key worth)Northern Ireland (Webb Atlas, Imperial College, London)England & Wales (Wolfson Atlas, Imperial College, London)Austria (Geologische Bundesanstalt, Vienna)Egypt (Geological Survey, Cairo)Gabon (BRGM, Paris)South Africa (Geological Survey, Pretoria)Iran (Geological Survey, Tehran)China (Inst.Geophysics & Geochem. Beijing)Japan (Geological Survey, Tokyo)
21
BIBLIOGRAPHY
ATLASES
Atlas of endemic diseases and their environments in the People's Republic of China, Science Press,Beijing (,1989).
Geochemischer Atlas, Bundesrepublik Deutschland, Verteilung von Schwermetall in Wassern undBachsedimenten, H.Fauth, R.Hindel, U.Sievers, and J.Zinner, Bundeanstalt fur Geowissenschaftenund Rohstoffe, Hannover (1985) 79pp.
Geochemical Atlas of Finland, Part 2, Till., T.Koljonen, (ed). Geological Survey of Finland (1992)218pp.
Geochemical Atlas of the Republic of Austria, 1:1 000 000, Bohemian Massif and Central Zone ofthe Eastern Alps (Stream Sediments <80 mesh), F. Thalmann, O. Schermann, E. Schroll and G.Hausberger, Geological Survey of Austria, Vienna, (in 2 volumes, maps and text) (1989).
GENERAL
CEP Consultants Ltd., Heavy Metals in the Environment, Proceedings of an InternationalConference, Toronto, September 1993. CEP Consultants Ltd, Albany Street, Edinburgh (1993)750pp.
DARNLEY, A.G., CAMERON, E.M. and RICHARDSON, K.A., The Federal-Provincial UraniumReconnaissance Program, in Uranium Exploration '75, Geological survey of Canada Paper 75-26(1975) 49-71.
DARNLEY, A.G., BJORKLUND, A.J., BOLVIKEN, B., GUSTAVSSON, N., KOVAL, P.,PLANT, J.A., STEENFELT, A., TAUCHID, M., and XIE XUEJING, A global geochemicaldatabase: recommendations for international geochemical mapping. Final report for IGCP project 259.ICSU Paris (1994) (in preparation).
DUVAL, J.S., Potassium, uranium and thorium geochemical maps of the conterminous U.S.A.Transactions Institution of Mining and Metallurgy (Sect.B: Applied earth science) (1991) p.B66-B73.
GARRETT, R.G., Ultra-low density geochemical mapping on the Canadian prairie. Abstracts, 16thInternational Geochemical Mapping Symposium, 1-6 September 1993, Beijing, China (1993) p.50.
GARRETT, R.G., BANVILLE, R.M.P., and ADCOCK, S.W., Regional data compilation and mappreparation, Labrador, Canada. Journal of Geochemical Exploration, 39 (1990) 91-116.
GUSTAVSSON, N., LAMPIO, E., NILSSON, B., NORBLAD, G., ROS, F. and SALMINEN, R.,Geochemical Maps of Finland and Sweden. Journal of Geochemical Exploration (1994) (in press).
INTERNATIONAL ATOMIC ENERGY AGENCY, Geochemical exploration for uranium, TechnicalReport Series No. 284, IAEA, Vienna (1988) 96pp.
INTERNATIONAL ATOMIC ENERGY AGENCY, Uranium Exploration Methods, Proceedings ofa Panel, IAEA, Vienna (1973) 320 pp.
INTERNATIONAL ATOMIC ENERGY AGENCY, Radiometric Reporting Methods and Calibrationin Uranium Exploration, Technical Report Series No. 174, IAEA, Vienna (1976) 57 pp.
22
INTERNATIONAL ATOMIC ENERGY AGENCY, Gamma ray surveys in uranium exploration,Technical Report Series No. 186, IAEA, Vienna (1979) 90 pp.
INTERNATIONAL ATOMIC ENERGY AGENCY, Airborne gamma ray spectrometer surveying,Technical Report Series No. 323, IAEA, Vienna (1991) 97 pp.
ICSU, International conference on an agenda of science for environment and development into the21st Century. Compiled by M. Brennan. Cambridge University Press (1992) 331pp.
PAIS, I. Ed., The Biogeochemical Cycle of Elements in Nature, Proceedings of a conference,Hungarian Academy of Sciences, Budapest (1989) 240pp.
THORNTON, I. Ed., Applied Environmental Geochemistry. Academic Press, London(1983) 501pp.
THORNTON, I. and HOWARTH, R.J. Eds., Applied Geochemistry in the 1980s Graham &Trotman, London (1986) 347pp.
XIE, X. and REN, T., A decade of regional geochemistry in China — the national reconnaissanceproject. Transactions Institution of Mining and Metallurgy (Sect.B: Applied earth science) (1991)P.B57-B65.
XIE, X. and YIN, B., Geochemical patterns from local to global. Journal of GeochemicalExploration, 47 (1993) p 109-129.
23
DEVELOPMENT AND CALIBRATION OF AN AIRBORNERADIOMETRIC MEASURING SYSTEM
G.F. SCHWARZ, L. RYBACH, C.K. BARLOCHER, E.E. KLINGELEInstitut Fur Geophysik, Eidgenossische Technische Hochschule, Zurich, Switzerland
Abstract
Airborne radiometric measurements are the most efficient tool to delimit surface contaminations and to locatelost radioactive sources. To increase the efficiency of airborne radiometric system in emergency situations an existingequipment has completely been renewed.
The new system is to its main part self-developed and is based on a modern airborne spectrometer withautomatic gain control. It covers the gamma ray energy range of 40 keV to 3000 keV with 256 channels. The detectorused for the survey consists of a package of four 4" x 4" x 16" prismatic, thallium-doped, sodium iodide crystals(total volume 16.8 liters). A PC-based data acquisition system equipped with rack keyboard and 9"-monitorsynchronizes and controls the measurements. Positioning is done with the satellite navigation system GPS. Thepositions and the raw data are displayed to the operator for navigation and stored together with the spectrum data.
The calibration of an airborne radiometric system is ideally performed on concrete calibration pads with aprecisely known radioisotope content. Unfortunately there are no full sized calibration pads available in centralEurope. The calibration factors where therefore determined using radioactive point sources and mathematicallycorrected for the different source geometry. The results of this calibration procedure were controlled by high precisionin-situ gamma spectrometric measurements together with laboratory measurements on rock samples and show goodcorrelation between airborne and ground measurements.
The detection limit of the airborne radiometric system lies between 0.4 GBq (10 mCi) and 1.9 GBq (50 mCi)depending on vegetation cover, background and topography.
1. INTRODUCTION
The continuous observation of artificial radioactivity in Switzerland is mainly based on threemonitoring networks. The NADAM system (Net for Automatic Dose Alert and Measurement), 51stationary dose measuring installations with remote data transfer that records the radioactivity levelon a nation wide scale. The radioactivity of the air and the environs of the nuclear power stations aresurveyed in more detail with two additional networks (RADAIR and MADUK).
Besides these punctual routine measurements spot checks and measurement series on samplesof air, rain, food and so on are carried out. In case of accidents with radioactive material (transportand industry accidents) or contamination with debris of nuclear-powered satellites airbornemeasurements will be used to locate the radioactive sources or to get an overview of thecontamination situation.
Airborne radiometric measurements are the most efficient tool to delimit surfacecontaminations and to locate lost radioactive sources. Because of the larger ground clearance and thehigher speed, the coverage per unit time of an airborne system is about 2500 times larger than of acomparable ground system, which is of key importance in radiological accidents. The emergencymeasurements will be done by military helicopters under the control of the Swiss National EmergencyOperation Center (NAZ). Training flights are made each year in order to deploy the measuring systemoptimally.
25
To increase the efficiency of the airborne radiometric system in emergency situations an existingequipment from EG&G Geometries has completely been renewed. The configuration and thecalibration of the new system will be described in this paper.
2. MEASURING EQUIPMENT
The measuring system consists of a helicopter-borne gamma ray spectrometer with datacontrol and storage and flight positioning instrumentation. The intention in the development of themeasuring equipment was to construct a system with high data quality and security that is easy tooperate and to maintain. This aim was achieved by using a spectrometer with automatic gain controland a PC-based data acquisition system.
The gain control in older systems was accomplished by using temperature stabilizationmethods. The new system monitors each of the input detectors during operation and uses the peak ofthe natural potassium isotope K40 as stabilization peak for the gain control. The automatic gain controleliminates the need of heating systems to keep the detector temperature constant, which reduceslogistic problems significantly. Furthermore the drift is reduced and there is no more need ofmanually calibrating the spectrometer.
SpectrometerExploranlumGR-820254 Channel40 to 3000 kiVAutomatic gain control
F
Data acquisitionPersonal computerKontron IR-386Monitor/rack keyboardAnalofl/dJflHal oonv«ri«r
Remote controlPCS-600
r
Data storageMemory card driveMPL MC-DiskStatic RAU2MB capacity
PoclcetdlskConrtvr 40 MBPortable horddltk
A
4\
d
' 1
DetectorExploranlumGPX-10244 Suberyslafs4 PhotomutttpBw lube*18-7 U. total volume
PerlpherialsRadar altimeterSparry
BarometerRotemount
Attitude gyro251 ECFR
ThermometerPt 100
PositioningGPS-3ecelverTrimble 4000 SSIC/A cod* and phaMInternal memory
Flight pathcamera Automax35 mm FilmsFWi «y« obfeeffy
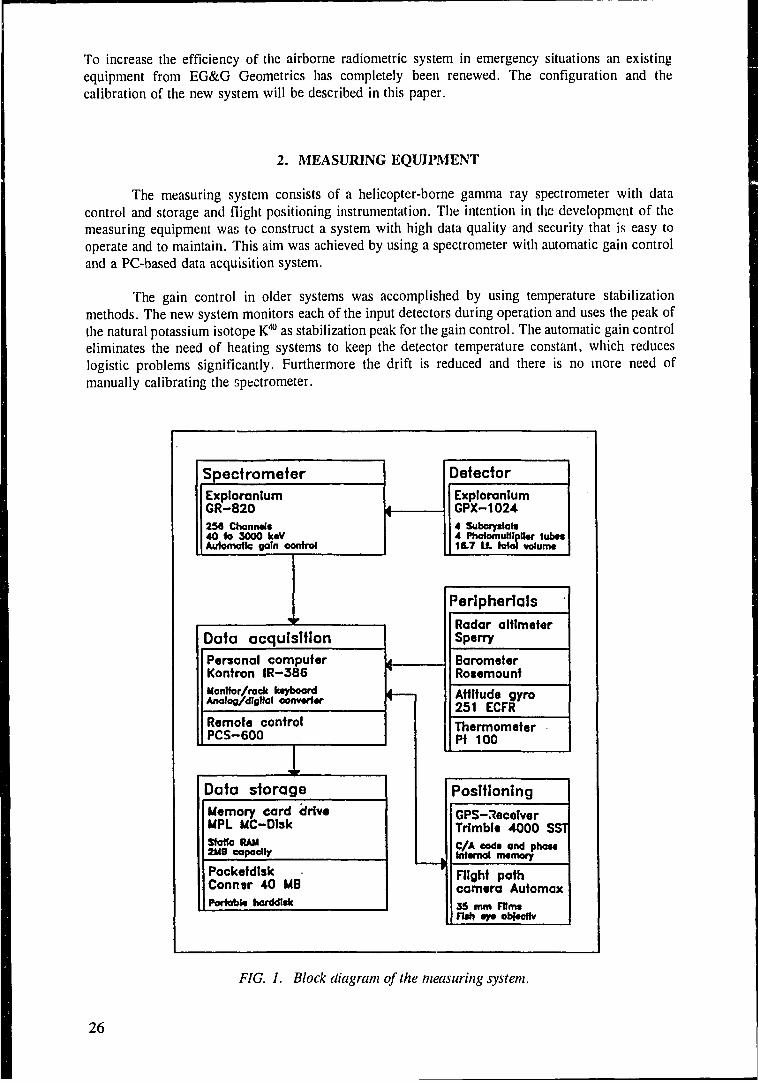
FIG. 1. Block diagram of the measuring system.
26
The use of a powerful personal computer as data acquisition system has several advantages.The maintenance is simplified since reserve components are generally available. Because the sourcecode of the control program is at hand, changes and extensions to the system can be realized easily.
Fig. 1 shows the block diagram of the complete system. The system is presented in more detailbelow. The equipment consists of the following components:
A detector package (Cxploranium GPX-1024) consisting of four 4" x 4" x 16" sizedprismatic thallium doped sodium iodide crystals. Each crystal is equipped with its ownphotomultiplier tube (PMT). The whole package is heat and shock isolated and includes thehigh voltage power supplies and controls for the PMT's.
A Multi channel spectrometer (GR-820) from Exploranium, a modern airborne spectrometeroriginally designed for uranium exploration. It covers the gamma ray energy range of 40 keVto 3000 keV with 255 channels. An additional channel is used for the registration of highenergy cosmic radiation. The main advantage of the spectrometer is the automatic gaincontrol. During operation the system monitors each of the crystals and a separate spectrumis accumulated for every crystal. Based on the K40 peak the gains of each spectrum aredetermined. The aligned spectra are stacked together afterwards. The spectrometer isequipped with a small graphic display to show the raw data and can be controlled with anintegrated keyboard.
A data acquisition system based on an industrial PC equipped with rack keyboard and9"-monitor. It synchronizes and controls the measurements. The spectrometer data arecollected together with time, fiducial, and flight number. Additional peripheral devices canbe added to the system using one of the eight available analog/digital converters. Themeasured data are stored on JEIDA memory cards with a storage capacity of 2 Mb. This new
storage medium in credit card size works without moving mechanical parts and is thereforeinsensitive against vibrations, humidity and temperature changes. During operation the systemis controlled by a remote control console.
Additionally radar altitude (Sperry AA-200), barometric pressure (Rosemount 1241), outsideair temperature (Pt 100) and attitude angles of the helicopter (AIM 251 CFR) are registeredcontinuously. The signals are recorded with a commercial ADC board.
Positioning is done with the satellite navigation system GPS (Trimble TN4000 SST). Theacquired positions are displayed to the operator for navigation and stored together with thespectrum data. If no satellite signal is available a vertically mounted camera is used for flightpath recovery.
All electronic components are combined in a 19" rack. Fig. 2 shows the front view and aschematic rear view of the Rack. The spectrometer is installed at the top position. It is succeeded bythe computer and the accompanying keyboard. The following assembly unit contains the controlelectronics for the attitude gyro and the barometric altimeter, followed by the attitude gyro display.Beneath are the systems circuit breakers and the transceiver of the radar altimeter.
The equipment can be installed into three different kinds of helicopters. Normally anAS350B1 Ecureuil helicopter of Heliswiss AG (Belp/BE) is used for routine surveys. Emergencyflights are performed with Swiss army Alouette-III or Super Puma helicopters. The detector and therack are mounted behind the two front seats, in place of the passenger's seats. For the installation ofthe equipment no modifications to the helicopter are needed. The whole equipment can be fixed tostandard attach points in the cabin and installed within an hour.
27

to00
SHE
|
SHE
i
2 HEi
IHEi
i
SHE
i
2H£
Konkon IR-M4" 0 |
o0
o
Cyto M1ECFR Qjafe g. S
KowonIR3M
Q-
d-
ExtJotnumGPX-102*
3A&PCSCOI
r-Hy*
TrtnbtoGPS
FIG. 2. Front and rear view of the rack containing the spectrometer (first), the computer (second)the rack keyboard (third), the assembly unit with the control electronics for the attitude gyro and thebarometric altimeter (fourth), the attitude gyro display (fifth), the shunt box (sixth) and the transceiverof the radar altimeter (last).
3. DATA ACQUISITION
In order to achieve uniform coverage of the surveyed area the flights are carried out on aregular grid of flight lines. The flight line spacing depends on the flight altitude and on the desiredground coverage. It is desirable to fly as low as possible because of the absorption of gamma-raysby the air. For safety reasons (flight obstacles, flight limitations) the flight altitude can not be lowerthan 92 m (300 ft) in flat terrain resp. 122 m (400 ft) in mountainous areas. For overview surveysUbUally a Iliglu line spacing of 500 in is used which corresponds roughly to a ground coverage ot75% at 122 m ground clearance. Detailed surveys are flown with 250 m line spacing and 90 mground clearance. The ground speed is only of minor importance if the measurements are carried outwith helicopters which always fly relatively slow.
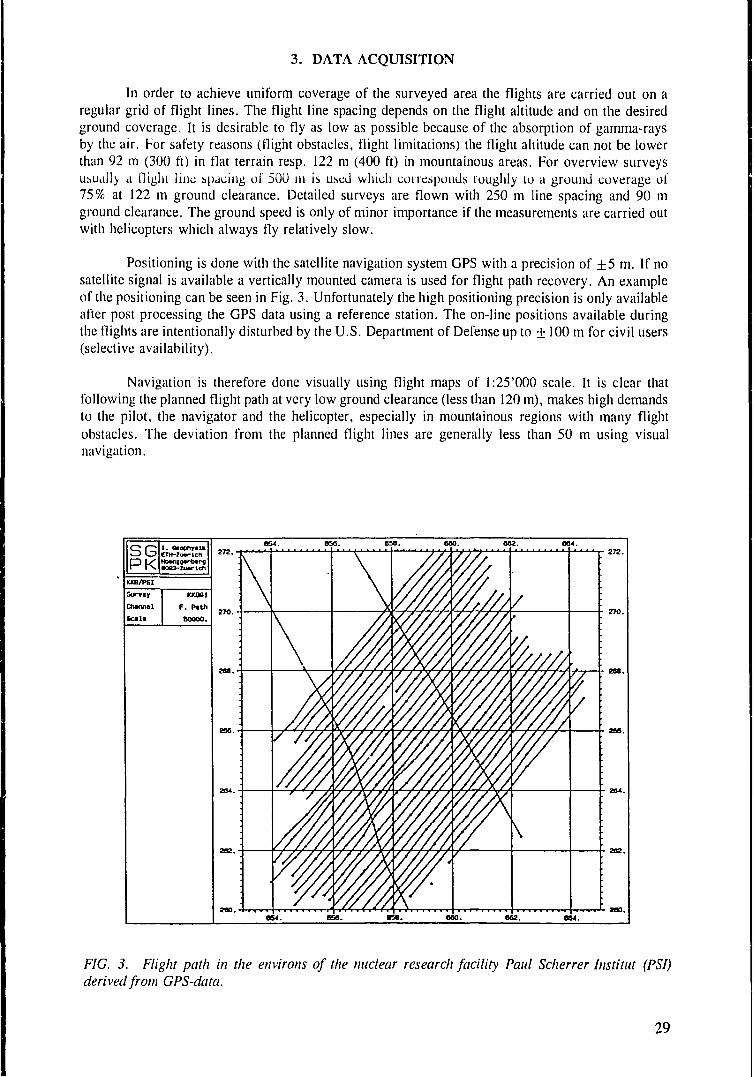
Positioning is done with the satellite navigation system GPS with a precision of ±5 in. If nosatellite signal is available a vertically mounted camera is used for flight path recovery. An exampleof the positioning can be seen in Fig. 3. Unfortunately the high positioning precision is only availableafter post processing the GPS data using a reference station. The on-line positions available duringthe flights are intentionally disturbed by the U.S. Department of Defense up to + 100 m for civil users(selective availability).
Navigation is therefore done visually using flight maps of l:25'000 scale. It is clear thatfollowing the planned flight path at very low ground clearance (less than 120 m), makes high demandsto the pilot, the navigator and the helicopter, especially in mountainous regions with many flightobstacles. The deviation from the planned flight lines are generally less than 50 m using visualnavigation.
KWPSI
SGPK
x. renwuaricn
B o f l•003-Zuarleft
Survey
Ctunntl
Cola
KK80I
F. Pattieoooo.
058. 600. 052. DS4.
FIG. 3. Flight path in the environs of the nuclear research facility Paul Scherrer Institut (PSI)derived from GPS-data.
29
During the measurements the incoming gamma rays arc accumulated during one second bythe spectrometer. The resulting spectrum is written together with the fiducial number, the outside airtemperature, the radar altitude, the barometric pressure, the actual time and the GPS position to thememory card.
Totally 512 Bytes of information are stored every second. The characteristic data of eachflight line (fiducial of line start and line end, heading and time) are noted on a flight protocol forcontrol purposes.
To check the function of the measuring system a test is carried out at the beginning and theend of every flight. For this the system is run for about 30 s at ground. The second test, a flight linealways flown at the same place, provides information about the actual radon concentration.Measurements that vary heavily from the average of all other test lines indicate an increase of radonconcentration.
At a base station barometric pressure, temperature, humidity and the GPS reference positionare recorded simultaneously with the flights.
The quality check takes place directly after landing. For this purpose the complete processingsoftware including the modules for corrections and map outputs has been implemented on atransportable personal computer. This enables not only the quality control of the acquired raw data,but also the complete processing directly in the field, a facility of great importance in the event of aradiological accident.
4. CALIBRATION
The spectral stripping factors, the attenuation coefficient of air and the detector efficiency andsensitivity are determined ideally on large concrete calibration pads with a precisely knownradioisotope content [1]. Unfortunately there are no such calibration pads available in central Europe.
The stripping factors where determined using radioactive point sources with small activitiesaround 37 kBq. The precise activity of the calibration sources must not be known, since only ratiosare used in the calculations. For each energy window a corresponding calibration source is needed.The factors determined with point sources have been corrected mathematically to account for thedifferent geometry of the pads [2, 3].
The determination of the detector sensitivity is based on the detector efficiency and modelcalculation of the gamma ray flux. For detector efficiency determination a Csl37 and a Co60 source(each of 1.9 GBq) were used. The measurements were carried out with the helicopter at differentsource distances. The measured count rate of the point source leads to the detector efficiency and theattenuation coefficient of the air at the corresponding gamma energies. The detector efficiency at otherenergies can be derived by extrapolation using an approximation of the efficiency curve of sodiumiodide detectors [2]. In a last step the detector sensitivity at flight altitude is calculated from thedetector efficiency and gamma ray tlux calculations [3, 4].
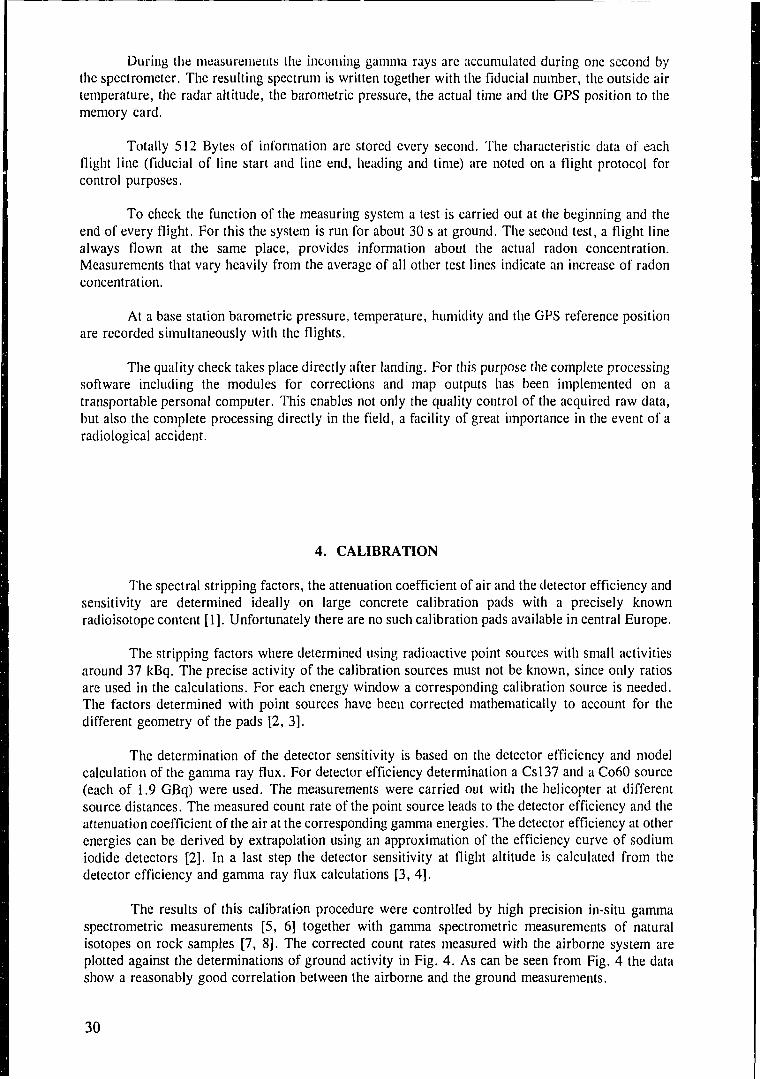
The results of this calibration procedure were controlled by high precision in-situ gammaspectrometric measurements [5, 6] together with gamma spectrometric measurements of naturalisotopes on rock samples [7, 8]. The corrected count rates measured with the airborne system areplotted against the determinations of ground activity in Fig. 4. As can be seen from Fig. 4 the datashow a reasonably good correlation between the airborne and the ground measurements.
30
ISO
^ . 1
i 100
DC
* soE
o
180-1
80
£60
§80
r
' 80 100 Vib" jt6o 2&0 300C s - 1 3 7 o e t t v l l y G R O U N D ( A )
o110
SO 100 1 9 0 2 0 0 250 300Bi-214 activity GR0UNO (Bq/kg)
120?
0 23Q 900 730 tOOO 12S0 1500 1790 2000
K-40 oct'tvity GROUND (Bq/kg)
j T l M I M J M a OK-40 acth/ily GROUND (Bq/kg)
FIG. 4. Experimentally determined detector sensitivities.
TABLE I. SUMMARY OF THE DETECTOR SENSITIVITY DETERMINATIONS (100 M ABOVEGROUND).
Window
Cesium
Potassium
Uranium
Thorium
Radionuclide
Cs137
K 4 0
B J2.4
T1208
Activity[Bq/kg]
100
100
100
100
Zpx,, Model[cps]
50
9
27
41
ZET,, Exp.[cps]
-
7
27
42
Dose rate[nSv/h]
17
5
52
73
The ratio count rate/ground activity allows to determine the detector sensitivity for the specificflight altitude (100 m in this case) for each energy window. As can be seen from Table I theexperimentally found values are in good agreement with the values derived from point sources. Theadvantage of the calibration using point sources is that it is not limited to isotopes abundant in thenatural environment.
31
5. DETECTION LIMITS
Airborne radiometric measurements are the most efficient tool to delimit surfacecontaminations and to locate lost radioactive sources. Extended contamination can be detected andmapped easily even with a relative simple measuring system. The precise localization of lostradioactive point sources from transport accidents or debris from nuclear-powered satellites is muchmore difficult, since the radiation intensity of a point source decreases very fast with increasingdistance.
Due to the limited precision of navigation the smallest attainable flight line spacing is about200 m. The minimal flight altitude lies between 60 m and 120 m depending on topography and flightobstacles. To determine the minimal detectable source strength at these flight parameters one mustkeep in mind that a radioactive source can only be detected if its count rate (IQ) exceeds theconfidence interval of the background count rate (IB, normally around 100 cps). This is satisfied if
IQ=2.JTB (confidence interval^ ±lo)
The detector efficiency is known from the calibration measurements (see chapter 4). Usingthese data and the preceding relation, a cesium source with a minimal activity of 0.4 GBq (10 mCi)should be detectable at a flight altitude of 90 m and a flight line spacing of 250 m with our system.
I . GeophyaikETH-ZuerichHaenggerberg8093-Zuerlch
Point Source
Survey
Channel
Sam In t
Area
Scale
KKB93
5
68.
98.
25000.
Parameter
Average
Std Dev
Minimum
Maximum
121.5
31.9
34.0
1309.5
Legend
Minimum
0 .0
80.0
160.0
240.0
320.0
Maximum
80.0
160.0
240.0
320.0
1309.5
267.
264.
266. -H
265. -i| ^ - • " - ' — ^ ;->'/- ^; - -- ^ \ v " r\ "*'
658. 659. 660.
267.
266.
265.
264.661 .
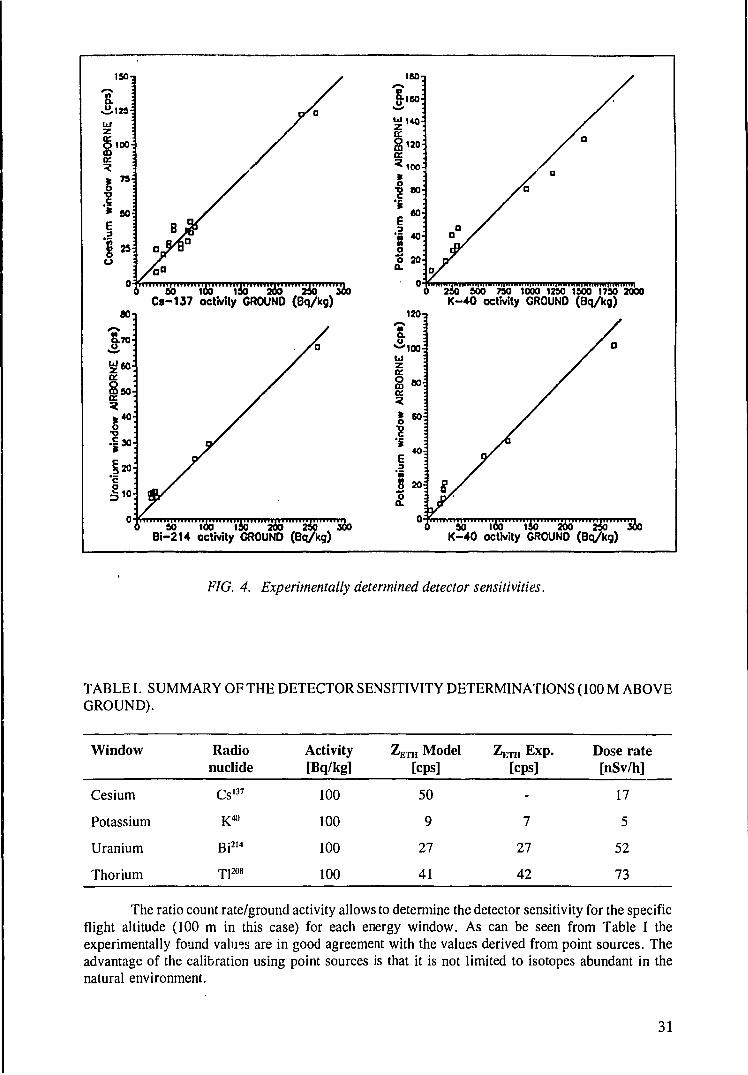
FIG. 5. Map of the raw count rate in the cesium window acquired during a test flight in the environsof the research facility Paul Scherrer Institut (PS1). The black spot to the right is caused by a Cs'17
source (activity -2.6 GBq) on the ground. The other two anomalies are caused by the direct radiationof the storage areas for radioactive components and waste of the PSI.
32
1 1
• i-H
r—<
500:
400:
300^
-
200^
100-i
0 -00
/
/
/ /
-300 -200
^ l
40 \ \ \
/ /^ 600 \ \ ) J 1
-100 0 100 200 300 400
Distance [m]
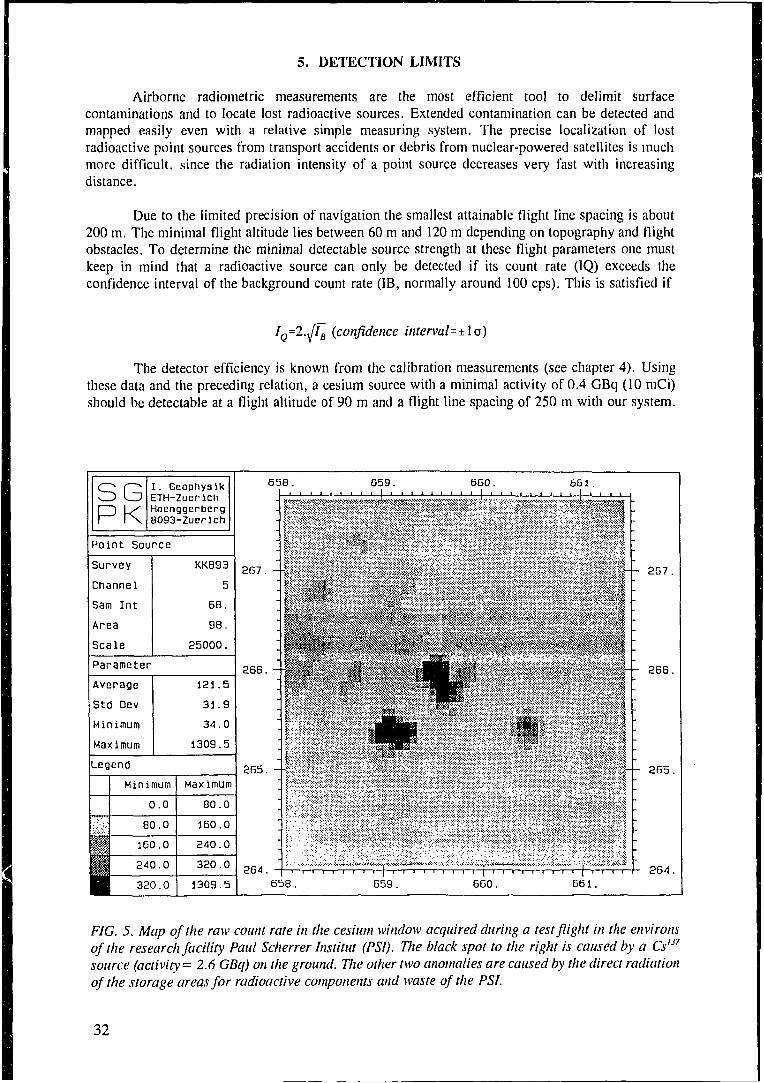
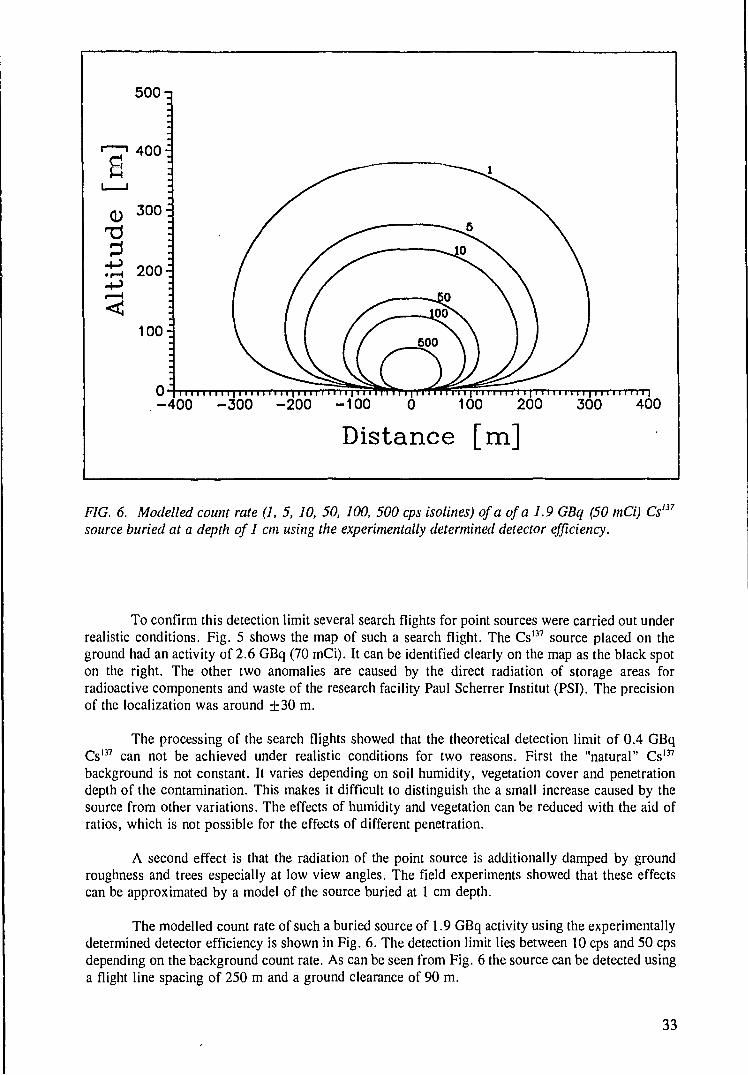
FIG. 6. Modelled count rate (1, 5, 10, 50, 100, 500 cps isolines) of a of a 1.9 GBq (50 mCi) Cs137
source buried at a depth of 1 cm using the experimentally determined detector efficiency.
To confirm this detection limit several search flights for point sources were carried out underrealistic conditions. Fig. 5 shows the map of such a search flight. The Cs137 source placed on theground had an activity of 2.6 GBq (70 mCi). It can be identified clearly on the map as the black spoton the right. The other two anomalies are caused by the direct radiation of storage areas forradioactive components and waste of the research facility Paul Scherrer Institut (PSI). The precisionof the localization was around ±30 m.
The processing of the search flights showed that the theoretical detection limit of 0.4 GBqCs137 can not be achieved under realistic conditions for two reasons. First the "natural" Cs137
background is not constant. It varies depending on soil humidity, vegetation cover and penetrationdepth of the contamination. This makes it difficult to distinguish the a small increase caused by thesource from other variations. The effects of humidity and vegetation can be reduced with the aid ofratios, which is not possible for the effects of different penetration.
A second effect is that the radiation of the point source is additionally damped by groundroughness and trees especially at low view angles. The field experiments showed that these effectscan be approximated by a model of the source buried at 1 cm depth.
The modelled count rate of such a buried source of 1.9 GBq activity using the experimentallydetermined detector efficiency is shown in Fig. 6. The detection limit lies between 10 cps and 50 cpsdepending on the background count rate. As can be seen from Fig. 6 the source can be detected usinga flight line spacing of 250 m and a ground clearance of 90 m.
33

The detection limit of the airborne radiometric system lies between 0.4 GBq (10 mCi) and1.9 GBq (50 mCi) depending on vegetation cover, background and topography.
REFERENCES
[1] PURVANCE, D., NOVAK, E., General procedure for calibration and reduction of aerialgamma-ray measurements: Specification BFEC 1250-B, U.S. Department of Energy, Rep.GJBX-16(83) DE84004974 (1983).
[2] GRASTY, R.L., Uranium measurements by airborne gamma-ray spectrometry, Geophysics40 (1975) 503-519.
[3] SCHWARZ, G.F., Methodische Entwicklungen zur Aerogammaspektrometrie, Beitrage zurGeologie der Schweiz, Geophysik Nr.23, Schweizerische Geophysikalische Kommission(1991).
[4] L0VBORG, L., B0TTER-JENSEN, L., CHRISTIANSEN, Gamma-ray measurements in anarea of high natural radioactivity, Proc. of the third international symposium on the naturalradiation environment, Houston (Texas), CONF-780422, US DOE Technique InformationCenter (1975).
[5] LEUPIN, A., Vergleich aeroradiometrischer Messungen in der Umgebung von KKB/PSI mitIn-Situ-Gamma-Spektrometrie-Messungen am Boden, Interner HSK-Bericht, Bundesamt fiirEnergiewirtschaft (1990).
[6] MURITH, C , VOELKLE, H.R., SURBECK, H., PILLER, G., BAERISWIL, L., BEURET,P., FERRERI, G., GOBET, M., GURTNER, A., RIBODRY, L., Mesures in situ mesuresaeroradiometrie dans le voisinage du PSI, Interner SUeR-Bericht, Bundesamt furGesundheitswesen; Abteilung Strahlenschutz (1990).
[7] KISSLING, E., Radiometrische Untersuchungen im Rotondogranit, Diplomarbeit, Institut furGeophysik ETHZ, Zurich (1976).
[8] LABHART, T.P., RYBACH, L., Abundance and distribution of uranium and thorium in thesyenite of Piz Giuv (Aar-Massif, Switzerland). Chemical Geology 7 (1971) 237-251.
34
STANDARDIZATION OF OLD GAMMA RAY SURVEY DATA
R.L. GRASTYGeological Survey of Canada, Ottawa, Canada
M. TAUCHIDInternational Atomic Energy Agency, Vienna, Austria
L.M. de M. TORRESInstituto Geologico e Mineiro, Lisbon, Portugal
Abstract
A large part of the world has been covered by ground and airborne gamma ray surveys, many of which havenot been standardized. In 1990, the IAEA supported a mission to Malaysia to produce background radiation mapsfrom a large airborne gamma ray survey flown in 1981. The airborne count rate data were successfully converted toground concentrations of potassium, uranium and thorium by comparing the airborne measurements with those madewith a calibrated portable gamma ray spectrometer along an aircraft flight line. The resulting ground concentrationsof potassium, uranium and thorium were then used to produce a background exposure rate map. A similar programmeof back-calibration of old gamma ray survey data was recently initiated by the Portuguese government through anIAEA sponsored programme. However, in this case, the gamma ray measurements were made using three differenttypes of equipment — ground and car-borne total count gamma ray scintillometers as well as airborne gamma rayspectrometry. This paper describes how three different modes of gamma ray measurements can be standardized toproduce maps showing the potassium, uranium and thorium concentration of the ground as well as the exposure rateat ground level.
1. INTRODUCTION
In the last few years there has been increasing public concern regarding the safe use ofnuclear energy, particularly since the nuclear reactor accident at Chernobyl. This concern has led toan increased interest in natural background radiation levels. Unless these levels are known, it isdifficult to assess the effect on man of the increased radiation caused by man-made radiation.
A large part of the world's land area has been covered by ground and airborne gamma raymeasurements. This vast source of gamma ray data is potentially valuable for assessing backgroundradiation levels throughout the world. The extent of world-wide coverage is shown in Fig. 1., basedon an International Atomic Energy Agency (IAEA) questionnaire to member states and publishedinformation. Many additional survey areas may have been covered through private contracts to surveycompanies.
Ground gamma ray surveys commenced in the late 1950s and early 1960s due to the interestfor uranium, and were mostly made with small hand-held Nal (Tl) total count scintillometers.Airborne gamma ray spectrometry started around the mid-1960's following the development of muchlarger scintillator detectors.
Procedures for standardizing airborne and ground gamma ray measurements were developedin the late 1970's as a result of large government uranium exploration programmes such as thosecarried out in the United States and Canada [1,2]. These procedures were developed because manysystems with different detector volumes were involved in these national programmes. However, theresults for these national programmes were not presented in units of general interest to the health
35
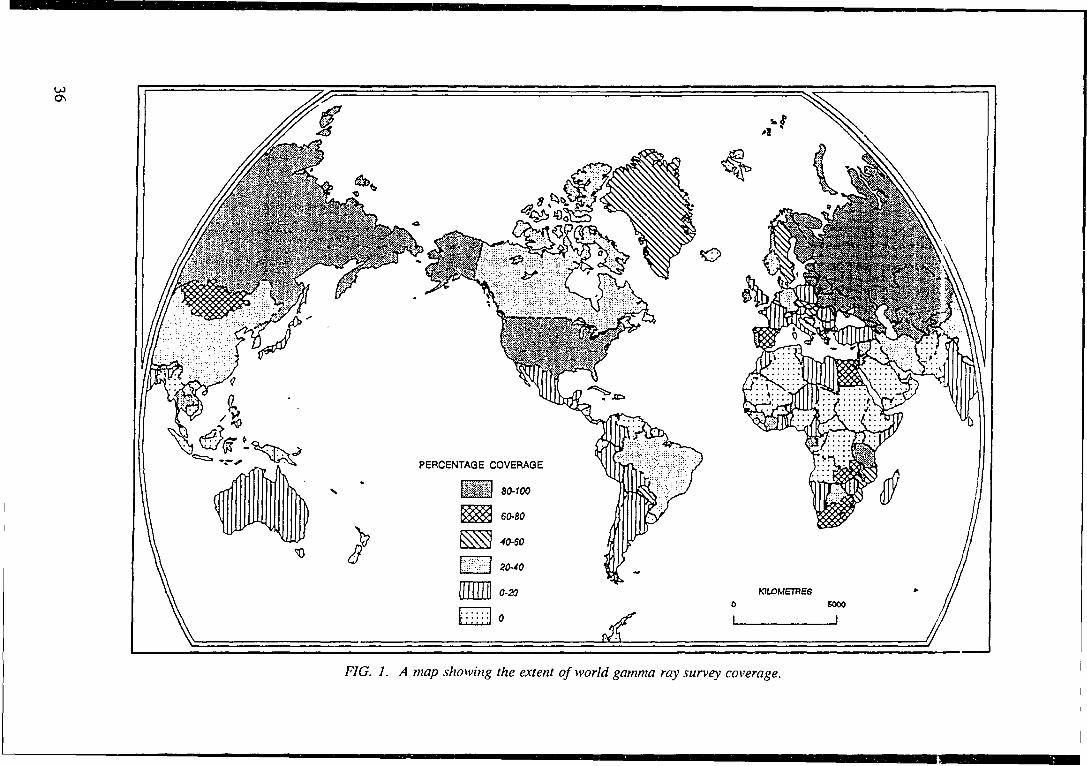
Ul
KILOMETRES
0 5000
FIG. 1. A map showing the extent of world gamma ray survey coverage.
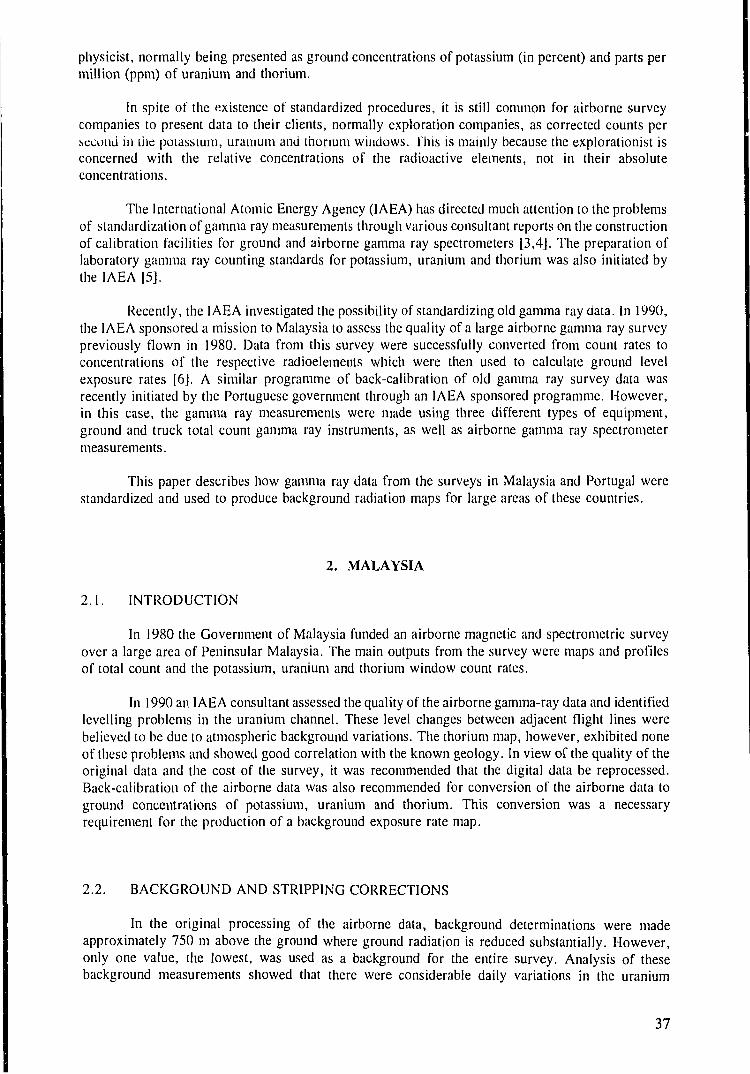
physicist, normally being presented as ground concentrations of potassium (in percent) and parts permillion (ppm) of uranium and thorium.
In spite of the existence of standardized procedures, it is still common for airborne surveycompanies to present data to their clients, normally exploration companies, as corrected counts persecond in die potassium, uranium and thorium windows. This is mainly because the explorationist isconcerned with the relative concentrations of the radioactive elements, not in their absoluteconcentrations.
The International Atomic Energy Agency (IAEA) has directed much attention to the problemsof standardization of gamma ray measurements through various consultant reports on the constructionof calibration facilities for ground and airborne gamma ray spectrometers [3,4]. The preparation oflaboratory gamma ray counting standards for potassium, uranium and thorium was also initiated bythe IAEA [5].
Recently, the IAEA investigated the possibility of standardizing old gamma ray data. In 1990,the IAEA sponsored a mission to Malaysia to assess the quality of a large airborne gamma ray surveypreviously flown in 1980. Data from this survey were successfully converted from count rates toconcentrations of the respective radioelements which were then used to calculate ground levelexposure rates [6]. A similar programme of back-calibration of old gamma ray survey data wasrecently initiated by the Portuguese government through an IAEA sponsored programme. However,in this case, the gamma ray measurements were made using three different types of equipment,ground and truck total count gamma ray instruments, as well as airborne gamma ray spectrometermeasurements.
This paper describes how gamma ray data from the surveys in Malaysia and Portugal werestandardized and used to produce background radiation maps for large areas of these countries.
2. MALAYSIA
2.1. INTRODUCTION
In 1980 the Government of Malaysia funded an airborne magnetic and spectrometric surveyover a large area of Peninsular Malaysia. The main outputs from the survey were maps and profilesof total count and the potassium, uranium and thorium window count rates.
In 1990 an IAEA consultant assessed the quality of the airborne gamma-ray data and identifiedlevelling problems in the uranium channel. These level changes between adjacent flight lines werebelieved to be due to atmospheric background variations. The thorium map, however, exhibited noneof these problems and showed good correlation with the known geology. In view of the quality of theoriginal data and the cost of the survey, it was recommended that the digital data be reprocessed.Back-calibration of the airborne data was also recommended for conversion of the airborne data toground concentrations of potassium, uranium and thorium. This conversion was a necessaryrequirement for the production of a background exposure rate map.
2.2. BACKGROUND AND STRIPPING CORRECTIONS
In the original processing of the airborne data, background determinations were madeapproximately 750 m above the ground where ground radiation is reduced substantially. However,only one value, the lowest, was used as a background for the entire survey. Analysis of thesebackground measurements showed that there were considerable daily variations in the uranium
37

3.5
-0.510 12 14
Distance (km)16 18 20
• Airborne Profile Ground Measurement
FIG. 2. The relationship between the potassium ground concentration and the calibrated airbornemeasurements in Malaysia.
-54 6 8 10 12 14 16 18 20
Distance (km)
• Airborne Profile Ground Measurement
FIG. 3. The relationship between the uranium ground concentration and the calibrated airbornemeasurements in Malaysia.
38
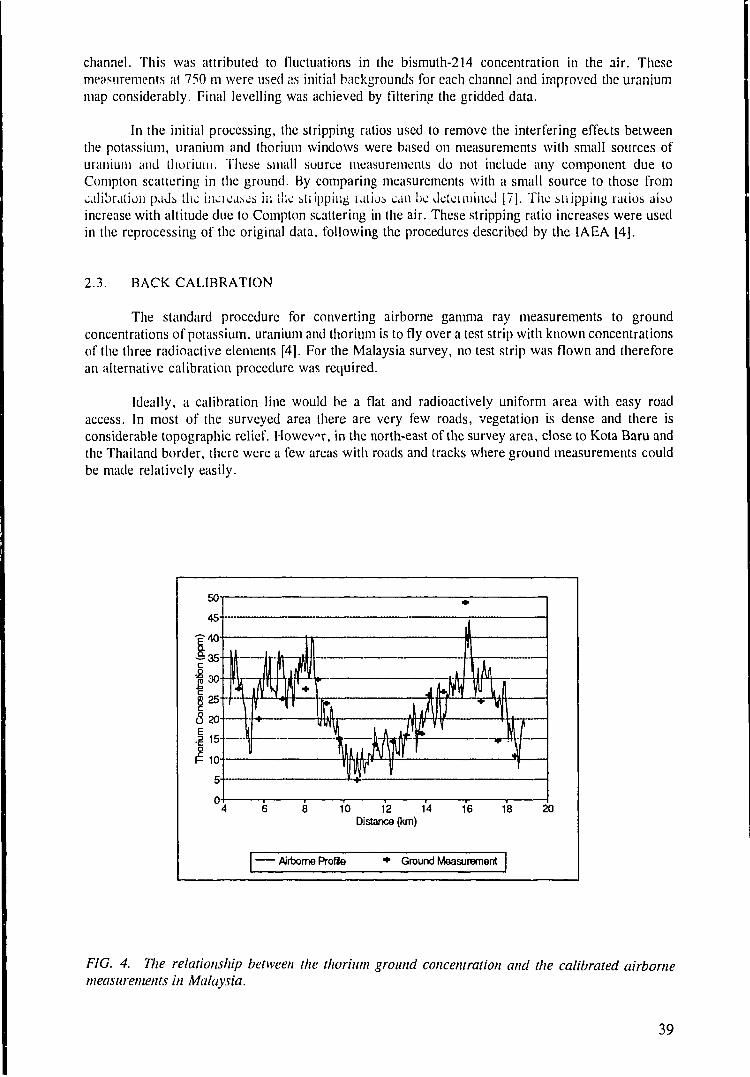
channel. This was attributed to fluctuations in the bismuth-214 concentration in the air. Thesemeasurements at 750 m were used ns initial backgrounds for each channel and improved the uraniummap considerably. Final levelling was achieved by filtering the gridded data.
In the initial processing, the stripping ratios used to remove the interfering effects betweenthe potassium, uranium and thorium windows were based on measurements with small sources ofuranium and thorium. These small source measurements do not include any component due toCompton scattering in the ground. By comparing measurements with a small source to those fromcalibration paJs the macacos in the snipping latios CMI be Jotei mined [7J. The suipping ratios alsoincrease with altitude due to Compton scattering in the air. These stripping ratio increases were usedin the reprocessing of the original data, following the procedures described by the IAEA [4J.
2.3. BACK CALIBRATION
The standard procedure for converting airborne gamma ray measurements to groundconcentrations of potassium, uranium and thorium is to fly over a test strip with known concentrationsof the three radioactive elements [4]. For the Malaysia survey, no test strip was flown and thereforean alternative calibration procedure was required.
Ideally, a calibration line would be a flat and radioactively uniform area with easy roadaccess. In most of the surveyed area there are very few roads, vegetation is dense and there isconsiderable topographic relief. However, in the north-east of the survey area, close to Kota Baru andthe Thailand border, there were a few areas with roads and tracks where ground measurements couldbe made relatively easily.
50
10 12 14Distance (km)
16 18 20
• Airborne Profile • Ground Measurement
FIG. 4. The relationship between the thorium ground concentration and the calibrated airbornemeasurements in Malaysia.
39
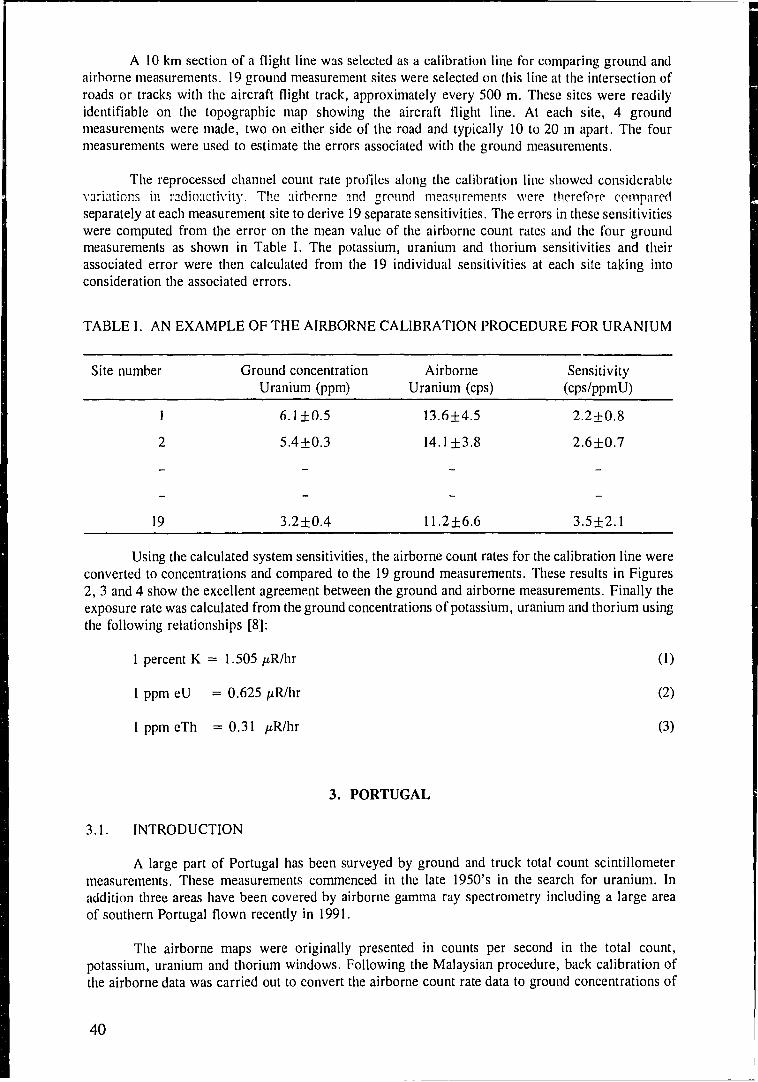
A 10 km section of a flight line was selected as a calibration line for comparing ground andairborne measurements. 19 ground measurement sites were selected on this line at the intersection ofroads or tracks with the aircraft flight track, approximately every 500 m. These sites were readilyidentifiable on the topographic map showing the aircraft flight line. At each site, 4 groundmeasurements were made, two on either side of the road and typically 10 to 20 m apart. The fourmeasurements were used to estimate the errors associated with the ground measurements.
The reprocessed channel count rate profiles along the calibration line showed considerablevariations in radioactivity. The airborne and ground measurements were therefore comparedseparately at each measurement site to derive 19 separate sensitivities. The errors in these sensitivitieswere computed from the error on the mean value of the airborne count rates and the four groundmeasurements as shown in Table I. The potassium, uranium and thorium sensitivities and theirassociated error were then calculated from the 19 individual sensitivities at each site taking intoconsideration the associated errors.
TABLE I. AN EXAMPLE OF THE AIRBORNE CALIBRATION PROCEDURE FOR URANIUM
Site number Ground concentration Airborne SensitivityUranium (ppm) Uranium (cps) (cps/ppmU)
1 6.1±0.5 13.6±4.5 2.2+0.8
2 5.4+0.3 14.1 ±3.8 2.6±0.7
19 3.2±0.4 11.2+.6.6 3.5±2.1
Using the calculated system sensitivities, the airborne count rates for the calibration line wereconverted to concentrations and compared to the 19 ground measurements. These results in Figures2, 3 and 4 show the excellent agreement between the ground and airborne measurements. Finally theexposure rate was calculated from the ground concentrations of potassium, uranium and thorium usingthe following relationships [8]:
1 percent K = 1.505 fiRJhr (1)
1 ppm eU =0.625 ^R/hr (2)
1 ppmeTh = 0.31 nRlhr (3)
3. PORTUGAL
3.1. INTRODUCTION
A large part of Portugal has been surveyed by ground and truck total count scintillometermeasurements. These measurements commenced in the late 1950's in the search for uranium. Inaddition three areas have been covered by airborne gamma ray spectrometry including a large areaof southern Portugal flown recently in 1991.
The airborne maps were originally presented in counts per second in the total count,potassium, uranium and thorium windows. Following the Malaysian procedure, back calibration ofthe airborne data was carried out to convert the airborne count rate data to ground concentrations of
40
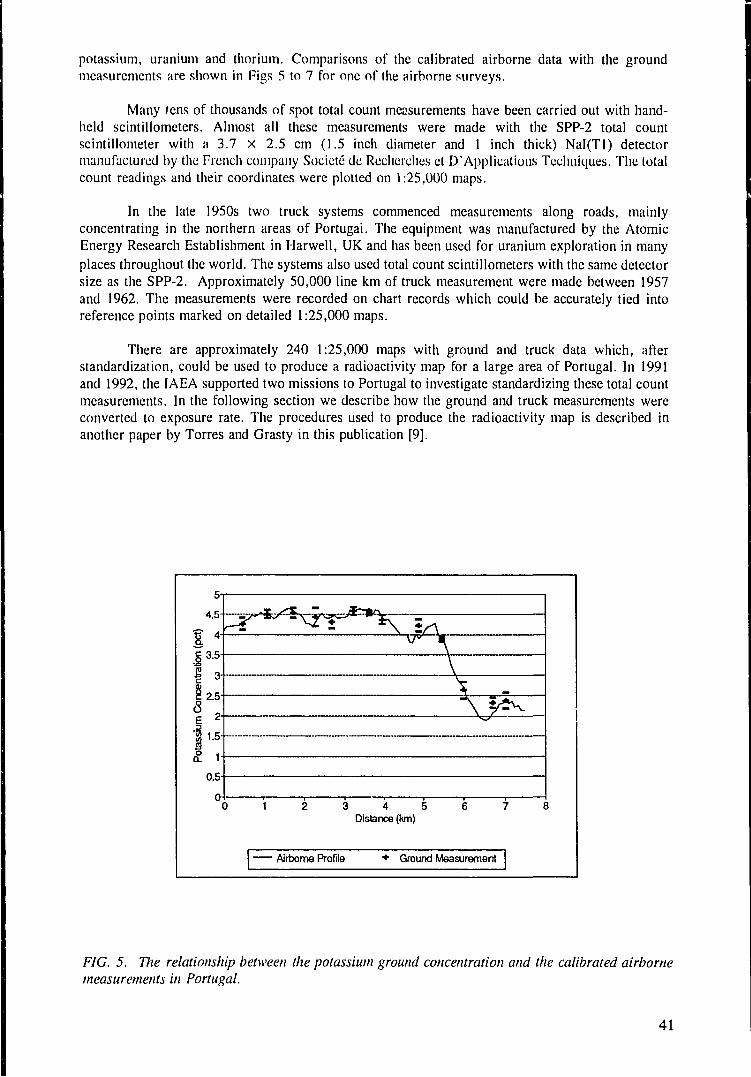
potassium, uranium and thorium. Comparisons of the calibrated airborne data with the groundmeasurements are shown in Figs 5 to 7 for one of the airborne surveys.
Many tens of thousands of spot total count measurements have been carried out with hand-held scintillometers. Almost all these measurements were made with the SPP-2 total countscintillometer with a 3.7 x 2.5 cm (1.5 inch diameter and 1 inch thick) Nal(Tl) detectormanufactured by the French company Societe de Recherclies el D'Applications Techniques. The totalcount readings and their coordinates were plotted on 1:25,000 maps.
In the late 1950s two truck systems commenced measurements along roads, mainlyconcentrating in the northern areas of Portugal. The equipment was manufactured by the AtomicEnergy Research Establishment in Harwell, UK and has been used for uranium exploration in manyplaces throughout the world. The systems also used total count scintillometers with the same detectorsize as the SPP-2. Approximately 50,000 line km of truck measurement were made between 1957and 1962. The measurements were recorded on chart records which could be accurately tied intoreference points marked on detailed 1:25,000 maps.
There are approximately 240 1:25,000 maps with ground and truck data which, afterstandardization, could be used to produce a radioactivity map for a large area of Portugal. In 1991and 1992, the IAEA supported two missions to Portugal to investigate standardizing these total countmeasurements. In the following section we describe how the ground and truck measurements wereconverted to exposure rate. The procedures used to produce the radioactivity map is described inanother paper by Torres and Grasty in this publication [9].
5
4.5-
1 *ID fi-
E
1.5-
S. 10.5
2 3 4 5Distance (km)
• Airborne Profile • Ground Measurement
FIG. 5. The relationship between the potassium ground concentration and the calibrated airbornemeasurements in Portugal.
41
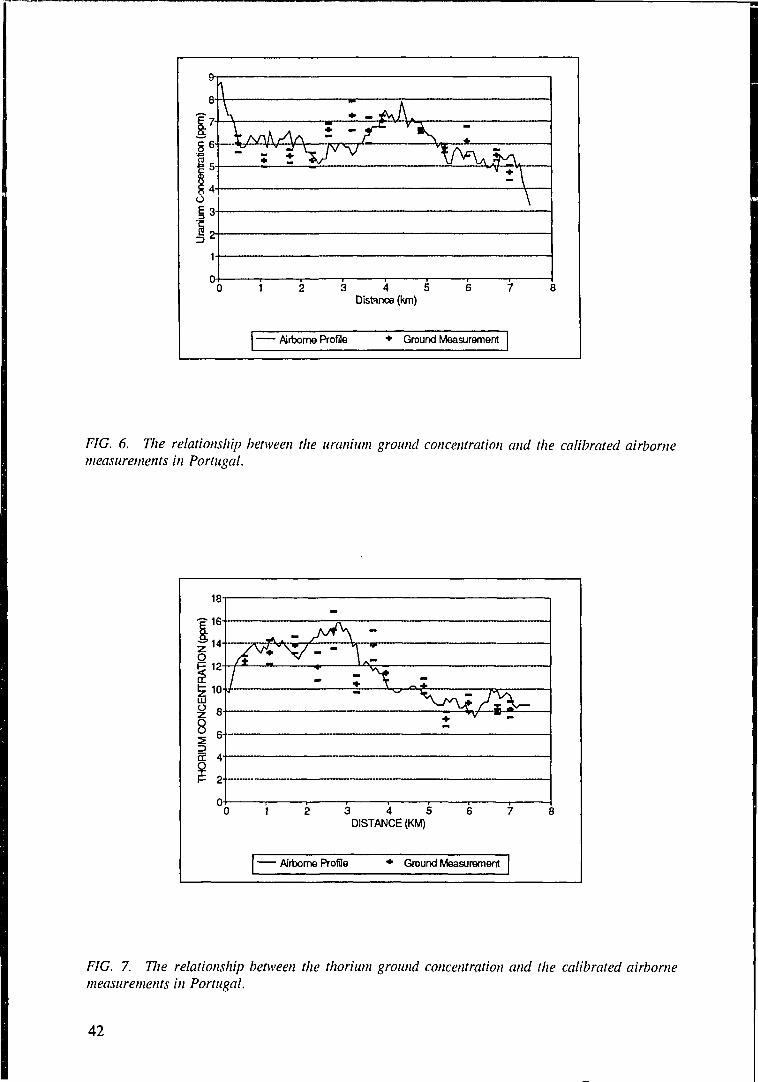
^ .
0 1 2 3 4 5 6 7 8Distance (km)
• Airborne Profile Ground Measurement
FIG. 6. The relationship between the uranium ground concentration and the calibrated airbornemeasurements in Portugal.
18
•16
O5 12
UJ
i2
2-
- T
3 4 5DISTANCE (KM)
• Airborne Profile Ground Measurement
FIG. 7. The relationship between the thorium ground concentration and the calibrated airbornemeasurements in Portugal.
42
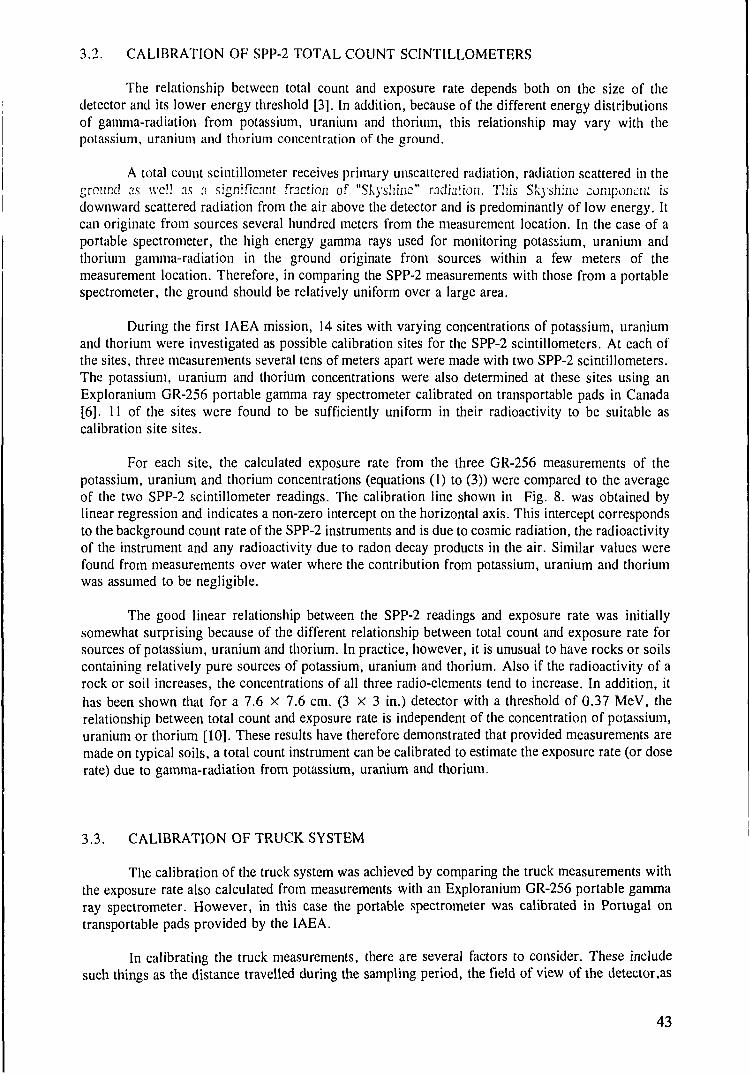
3.2. CALIBRATION OF SPP-2 TOTAL COUNT SCINTILLOMETERS
The relationship between total count and exposure rate depends both on the size of thedetector and its lower energy threshold [3]. In addition, because of the different energy distributionsof gamma-radiation from potassium, uranium and thorium, this relationship may vary with thepotassium, uranium and thorium concentration of the ground.
A total count scintillometer receives primary unscattered radiation, radiation scattered in theground as well as a significant fraction of "Skyshinc" radiation. This Skyshinc component isdownward scattered radiation from the air above the detector and is predominantly of low energy. Itcan originate from sources several hundred meters from the measurement location. In the case of aportable spectrometer, the high energy gamma rays used for monitoring potassium, uranium andthorium gamma-radiation in the ground originate from sources within a few meters of themeasurement location. Therefore, in comparing the SPP-2 measurements with those from a portablespectrometer, the ground should be relatively uniform over a large area.
During the first IAEA mission, 14 sites with varying concentrations of potassium, uraniumand thorium were investigated as possible calibration sites for the SPP-2 scintillometers. At each ofthe sites, three measurements several tens of meters apart were made with two SPP-2 scintillometers.The potassium, uranium and thorium concentrations were also determined at these sites using anExploranium GR-256 portable gamma ray spectrometer calibrated on transportable pads in Canada[6]. 11 of the sites were found to be sufficiently uniform in their radioactivity to be suitable ascalibration site sites.
For each site, the calculated exposure rate from the three GR-256 measurements of thepotassium, uranium and thorium concentrations (equations (1) to (3)) were compared to the averageof the two SPP-2 scintillometer readings. The calibration line shown in Fig. 8. was obtained bylinear regression and indicates a non-zero intercept on the horizontal axis. This intercept correspondsto the background count rate of the SPP-2 instruments and is due to cosmic radiation, the radioactivityof the instrument and any radioactivity due to radon decay products in the air. Similar values werefound from measurements over water where the contribution from potassium, uranium and thoriumwas assumed to be negligible.
The good linear relationship between the SPP-2 readings and exposure rate was initiallysomewhat surprising because of the different relationship between total count and exposure rate forsources of potassium, uranium and thorium. In practice, however, it is unusual to have rocks or soilscontaining relatively pure sources of potassium, uranium and thorium. Also if the radioactivity of arock or soil increases, the concentrations of all three radio-elements tend to increase. In addition, ithas been shown that for a 7.6 x 7.6 cm. ( 3 x 3 in.) detector with a threshold of 0.37 MeV, therelationship between total count and exposure rate is independent of the concentration of potassium,uranium or thorium [10]. These results have therefore demonstrated that provided measurements aremade on typical soils, a total count instrument can be calibrated to estimate the exposure rate (or doserate) due to gamma-radiation from potassium, uranium and thorium.
3.3. CALIBRATION OF TRUCK SYSTEM
The calibration of the truck system was achieved by comparing the truck measurements withthe exposure rate also calculated from measurements with an Exploranium GR-256 portable gammaray spectrometer. However, in this case the portable spectrometer was calibrated in Portugal ontransportable pads provided by the IAEA.
In calibrating the truck measurements, there are several factors to consider. These includesuch things as the distance travelled during the sampling period, the field of view of the detector,as
43
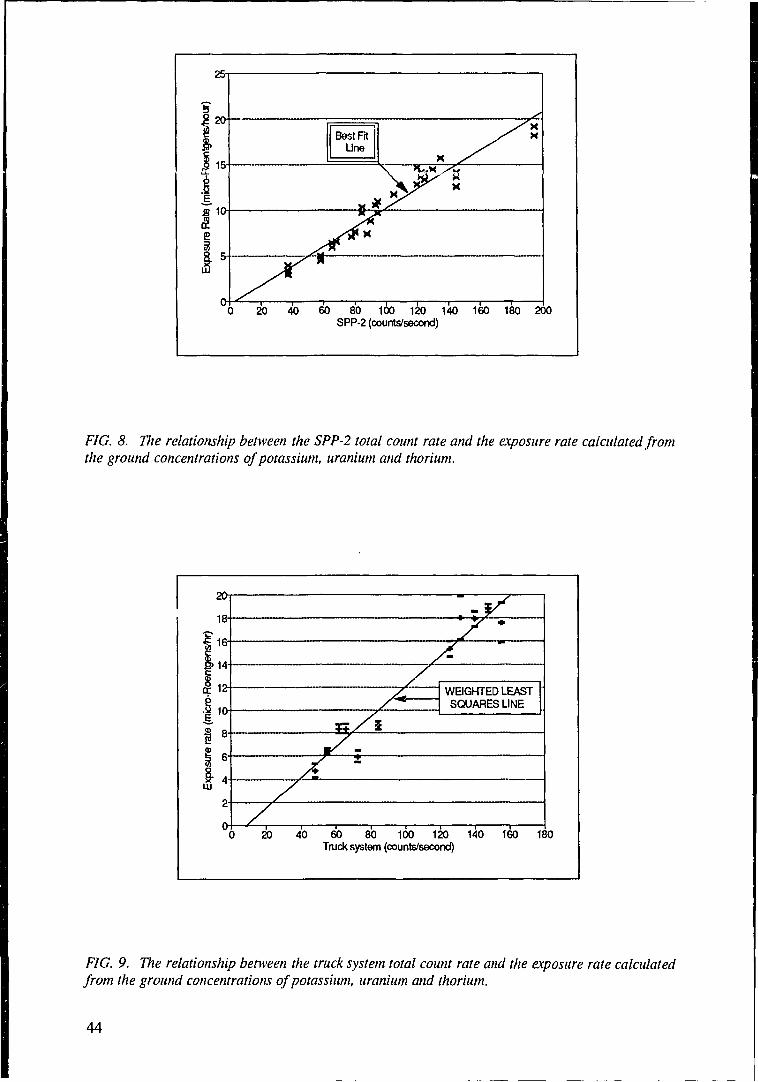
25-
0 20 40 60 80 100 120 140 160 180 200SPP-2 (counts/second)
FIG. 8. The relationship between the SPP-2 total count rate and the exposure rate calculated fromthe ground concentrations of potassium, uranium and thorium.
WEIGHTED LEASTSQUARES LINE
40 60 80 100 120 140 160 180Truck system (counts/second)
FIG. 9. The relationship between the truck system total count rate and the exposure rate calculatedfrom the ground concentrations of potassium, uranium and thorium.
44
well as possible differences in the road surface or surrounding ground from the time themeasurements were taken, 30 to 35 years previously.
Based on the sampling speed and time constant of the equipment as well as on the estimatedspeed of the vehicle, it was determined that each measurement on the chart record would correspondto a distance of approximately 50 m along the road. The sites for calibration of the truck system wereselected to cover a wide range of radioactivity as indicated by the analog total count traces. All themeasurement sites could be clearly identified on the 1:25,000 maps showing the tracks of the trucksurveys. These sites were typically road intersections, but also included the boundaries of fields, gatesetc.
Three measurements were made with the GR-256 portable gamma ray spectrometer on theroad surface at each selected site. One measurements was made at the location indicated on the mapof the vehicle routes, with two additional measurements being taken 25 m either side of the firstmeasurement. These 3 measurements took into consideration the distance travelled by the vehicle andpermitted an estimate of the errors in the measurements at each site.
Approximately 50 sites were visited as possible calibration sites. However, only 19 werefound to be suitable. Sites were rejected if they were close to man-made features such as a building,or if the road was surfaced with asphalt or material that may have originated from another location.At several locations, the road was narrow with high stone walls. These sites were rejected on thebasis of the different geometries of the truck system and the portable spectrometer which wascalibrated for use at ground level. In the truck system, the detector which was mounted near the roofof the vehicle, could 'see' over the stone walls. Because of the proximity of the walls, the walls couldhave a significant effect on the ground spectrometer measurements.
At each selected calibration site, the potassium, uranium and thorium concentrations werecalculated from the portable gamma ray spectrometer measurements. These measurements were thenused to calculate the exposure rate using equation (1) to (3) which was then compared to the countrates digitized from the old truck records.
Fig. 9. shows the comparison between the calculated exposure rates and the count rates fromthe truck systems. The data presented is the mean value of the exposure rate for all truckmeasurements with the same value. By sorting the data in this manner all the errors (indicated in thefigure) are associated with the exposure rate axis. It is then justified to compute a calibration line byweighted least squares regression. This calibration line as shown in the figure was used to convertall the truck measurements to exposure rate.
ACKNOWLEDGMENTS
We would like to thank Mr Mohd Zaidi and Mr Dzazali of the Geological Survey of Malaysiaand Mr Leote from the Geological Survey of Portugal for co-ordinating the field work during theIAEA missions to Malaysia and Portugal. Without their valuable assistance, back-calibration of thegamma ray measurements would not have been so successful.
REFERENCES
[1] DUVAL, J.S., Potassium, uranium and thorium geochemical maps of the conterminousU.S.A.; Transactions of the Institution of Mining and Metallurgy (Section B; Applied earthscience), 100(1991)66-73.
[2] DARNLEY A.G., CAMERON E.M. RICHARDSON K.A. 1975. The Federal-Provincial
45
Uranium Reconnaissance Program, Geological Survey of Canada Paper 75-26, UraniumExploration '75 (1975) 49-63.
[3] INTERNATIONAL ATOMIC ENERGY AGENCY, Construction and use of calibrationfacilities for radiometric field equipment, IAEA Technical Report Series-309, Vienna (1989).
[4| INTERNATIONAL ATOMIC ENERGY AGENCY, Airborne gamma ray spectrometersurveying, IAEA Technical Reports Series-323, Vienna (1991).
(51 INTERNATIONAL ATOMIC ENERGY AGENCY, Preparation and certification of IAEAgamma ray spectrometry reference materials RGU-1, RGTh-1 and RGK-1, IAEA TechnicalReport IAEA/RL/148, Vienna (1987). p.
[6] GRASTY R.L. WHITTON R.M. and DUFFY A, Back calibration and reprocessing anairborne gamma ray survey, Malaysia. Expanded abstracts. Society of ExplorationGeophysicists annual meeting, New Orleans (1992) 550-551.
[7] GRASTY R.L., Holman P.B. and Blanchard, Y. 1991: Transportable calibration pads forground and airborne gamma ray spectrometers, Geol. Surv. Canada pap. 90-23 (1991).
[8] GRASTY R.L., CARSON J.M., CHARBONNEAU B.W. and HOLMAN P.B., Naturalbackground radiation in Canada. Geol. Surv. Canada, Bull. 360, (1984).
19] TORRES L.M. and GRASTY R.L., The natural radioactivity map of Portugal: Baselineinformation on natural radioactivity background, Proceedings IAEA technical meeting on theUse of Uranium Exploration Data and Techniques in Environmental Studies, IAEA-TECDOC(This publication).
[10] L0VBORG L., and KIRKEGAARD P., Response of 3" x 3" Nal(Tl) detectors to terrestrialgamma radiation; Nucl. Instr. and Meth. 121, (1974), 239-251.
46
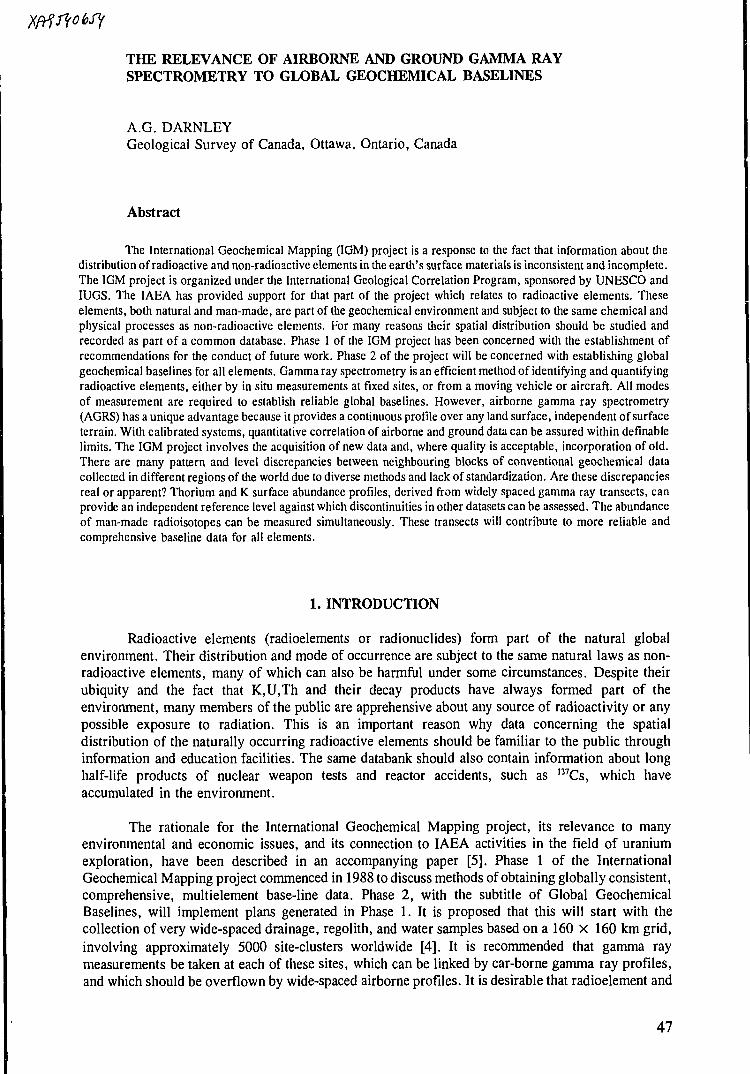
THE RELEVANCE OF AIRBORNE AND GROUND GAMMA RAYSPECTROMETRY TO GLOBAL GEOCHEMICAL BASELINES
A.G. DARNLEYGeological Survey of Canada, Ottawa, Ontario, Canada
Abstract
The International Geochemical Mapping (IGM) project is a response to the fact that information about thedistribution of radioactive and non-radioactive elements in the earth's surface materials is inconsistent and incomplete.The IGM project is organized under the International Geological Correlation Program, sponsored by UNESCO andIUGS. The IAEA has provided support for that part of the project which relates to radioactive elements. Theseelements, both natural and man-made, are part of the geochemical environment and subject to the same chemical andphysical processes as non-radioactive elements. For many reasons their spatial distribution should be studied andrecorded as part of a common database. Phase 1 of the IGM project has been concerned with the establishment ofrecommendations for the conduct of future work. Phase 2 of the project will be concerned with establishing globalgeochemical baselines for all elements. Gamma ray spectrometry is an efficient method of identifying and quantifyingradioactive elements, either by in situ measurements at fixed sites, or from a moving vehicle or aircraft. All modesof measurement are required to establish reliable global baselines. However, airborne gamma ray spectrometry(AGRS) has a unique advantage because it provides a continuous profile over any land surface, independent of surfaceterrain. With calibrated systems, quantitative correlation of airborne and ground data can be assured within definablelimits. The IGM project involves the acquisition of new data and, where quality is acceptable, incorporation of old.There are many pattern and level discrepancies between neighbouring blocks of conventional geochemical datacollected in different regions of the world due to diverse methods and lack of standardization. Are these discrepanciesreal or apparent? Thorium and K surface abundance profiles, derived from widely spaced gamma ray transects, canprovide an independent reference level against which discontinuities in other datasets can be assessed. The abundanceof man-made radioisotopes can be measured simultaneously. These transects will contribute to more reliable andcomprehensive baseline data for all elements.
1. INTRODUCTION
Radioactive elements (radioelements or radionuclides) form part of the natural globalenvironment. Their distribution and mode of occurrence are subject to the same natural laws as non-radioactive elements, many of which can also be harmful under some circumstances. Despite theirubiquity and the fact that K,U,Th and their decay products have always formed part of theenvironment, many members of the public are apprehensive about any source of radioactivity or anypossible exposure to radiation. This is an important reason why data concerning the spatialdistribution of the naturally occurring radioactive elements should be familiar to the public throughinformation and education facilities. The same databank should also contain information about longhalf-life products of nuclear weapon tests and reactor accidents, such as 137Cs, which haveaccumulated in the environment.
The rationale for the International Geochemical Mapping project, its relevance to manyenvironmental and economic issues, and its connection to IAEA activities in the field of uraniumexploration, have been described in an accompanying paper [5]. Phase 1 of the InternationalGeochemical Mapping project commenced in 1988 to discuss methods of obtaining globally consistent,comprehensive, multielement base-line data. Phase 2, with the subtitle of Global GeochemicalBaselines, will implement plans generated in Phase 1. It is proposed that this will start with thecollection of very wide-spaced drainage, regolith, and water samples based on a 160 X 160 km grid,involving approximately 5000 site-clusters worldwide [4]. It is recommended that gamma raymeasurements be taken at each of these sites, which can be linked by car-borne gamma ray profiles,and which should be overflown by wide-spaced airborne profiles. It is desirable that radioelement and
47
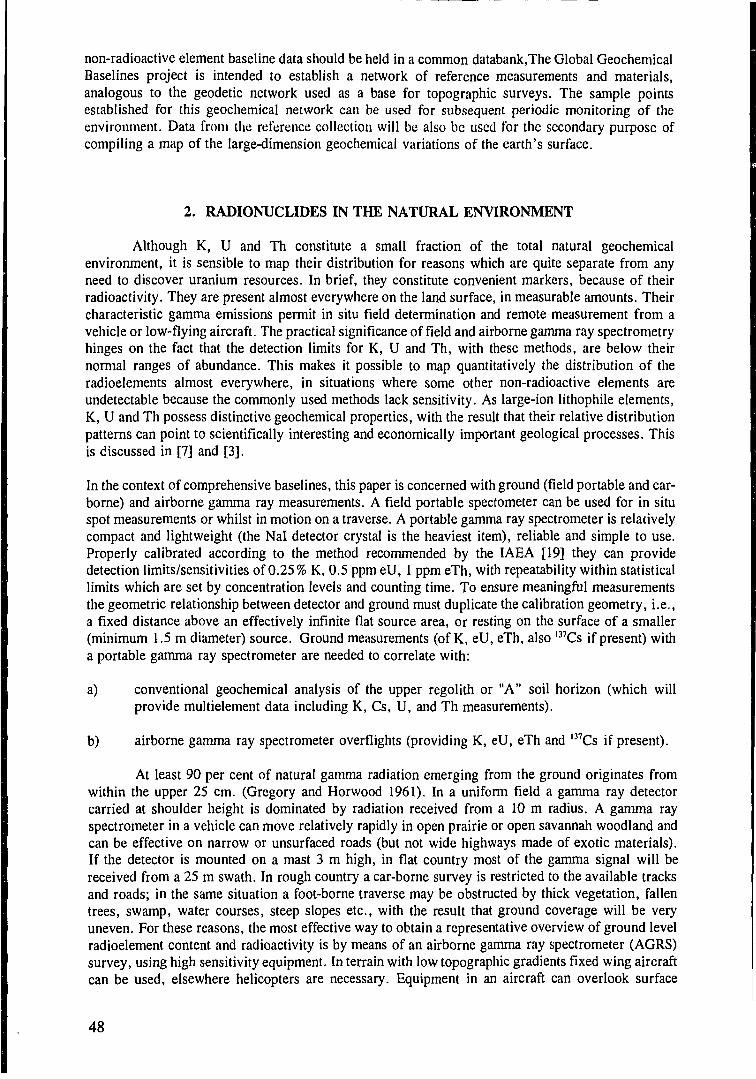
non-radioactive element baseline data should be held in a common databank.The Global GeochemicalBaselines project is intended to establish a network of reference measurements and materials,analogous to the geodetic network used as a base for topographic surveys. The sample pointsestablished for this geochemical network can be used for subsequent periodic monitoring of theenvironment. Data from the reference collection will be also be used for the secondary purpose ofcompiling a map of the large-dimension geochemical variations of the earth's surface.
2. RADIONUCLIDES IN THE NATURAL ENVIRONMENT
Although K, U and Th constitute a small fraction of the total natural geochemicalenvironment, it is sensible to map their distribution for reasons which are quite separate from anyneed to discover uranium resources. In brief, they constitute convenient markers, because of theirradioactivity. They are present almost everywhere on the land surface, in measurable amounts. Theircharacteristic gamma emissions permit in situ field determination and remote measurement from avehicle or low-flying aircraft. The practical significance of field and airborne gamma ray spectrometryhinges on the fact that the detection limits for K, U and Th, with these methods, are below theirnormal ranges of abundance. This makes it possible to map quantitatively the distribution of theradioelements almost everywhere, in situations where some other non-radioactive elements areundetectable because the commonly used methods lack sensitivity. As large-ion lithophile elements,K, U and Th possess distinctive geochemical properties, with the result that their relative distributionpatterns can point to scientifically interesting and economically important geological processes. Thisis discussed in [7] and [3].
In the context of comprehensive baselines, this paper is concerned with ground (field portable and car-borne) and airborne gamma ray measurements. A field portable spectometer can be used for in situspot measurements or whilst in motion on a traverse. A portable gamma ray spectrometer is relativelycompact and lightweight (the Nal detector crystal is the heaviest item), reliable and simple to use.Properly calibrated according to the method recommended by the IAEA [19] they can providedetection limits/sensitivities of 0.25% K, 0.5 ppm eU, 1 ppm eTh, with repeatability within statisticallimits which are set by concentration levels and counting time. To ensure meaningful measurementsthe geometric relationship between detector and ground must duplicate the calibration geometry, i.e.,a fixed distance above an effectively infinite flat source area, or resting on the surface of a smaller(minimum 1.5 m diameter) source. Ground measurements (of K, eU, eTh, also 137Cs if present) witha portable gamma ray spectrometer are needed to correlate with:
a) conventional geochemical analysis of the upper regolith or "A" soil horizon (which willprovide multielement data including K, Cs, U, and Th measurements).
b) airborne gamma ray spectrometer overflights (providing K, eU, eTh and l37Cs if present).
At least 90 per cent of natural gamma radiation emerging from the ground originates fromwithin the upper 25 cm. (Gregory and Horwood 1961). In a uniform field a gamma ray detectorcarried at shoulder height is dominated by radiation received from a 10 m radius. A gamma rayspectrometer in a vehicle can move relatively rapidly in open prairie or open savannah woodland andcan be effective on narrow or unsurfaced roads (but not wide highways made of exotic materials).If the detector is mounted on a mast 3 m high, in flat country most of the gamma signal will bereceived from a 25 m swath. In rough country a car-borne survey is restricted to the available tracksand roads; in the same situation a foot-borne traverse may be obstructed by thick vegetation, fallentrees, swamp, water courses, steep slopes etc., with the result that ground coverage will be veryuneven. For these reasons, the most effective way to obtain a representative overview of ground levelradioelement content and radioactivity is by means of an airborne gamma ray spectrometer (AGRS)survey, using high sensitivity equipment. In terrain with low topographic gradients fixed wing aircraftcan be used, elsewhere helicopters are necessary. Equipment in an aircraft can overlook surface
48
access problems, can be carried in a straight line, responds to a broad swath (with 125 m terrainclearance a 250 m swath is covered), and collects data rapidly. The principles, development, andtechnical requirements for high sensitivity quantitative AGRS have been fully described in variouspublications [21]. Airborne gamma ray spectrometry is a major component of the InternationalGeochemical Mapping project because it can provide:
a) continuous profiles measuring the variations in the concentration of natural and man-maderadionuclides on and in the surface layer of the earth;
b) a method of making radioelement maps for geoscience and environmental purposes;
c) a method of comparing and linking regions, countries and continents by providing eTh and/orK reference profiles across any land surface.
The importance of the latter function is discussed in the following two sections.
3. THE BASELINE PROBLEM IN GEOCHEMICAL DATA
The concept of international geochemical mapping requires that numerical values for theabundance of elements in, for example, the regolith are equally valid and related to the same scaleof absolute values wherever regolith samples are taken. Unfortunately geochemical mapping aspracticed during the past 40 years has had many variations. Different sample media have been usedin different geographic regions; e.g. soils, laterites, and desert wash; stream and lake sediments;heavy minerals; glacial till. Bolviken et al.(1986) illustrate the effects of different sample media anddifferent analytical treatments upon spatial patterns and quantitative values. Even within regions wherea single sample medium and a nominally similar sample preparation and analytical approach havebeen used, level discrepancies between adjacent data blocks are often apparent, due to work beingcarried out at different times [see Geochemical Atlas of Alaska, 1989] or by different organizationsusing non-identical procedures [12]. Inconsistencies become obvious when compilations are attemptedusing existing data. Major discontinuities are present where changes in methodology have takenplace, commonly, but not exclusively, at administrative boundaries. An extreme example of artificialdiscontinuities, due to the averaging of data within political units, is provided by the Radiation Atlasfor Europe [15]. Plant and Ridgway [23] have listed the heterogeneities of geochemical data withinWestern Europe.
A method of normalizing broadly similar adjoining or overlapping sets of lake sediment datahas been demonstrated by Garrett et al. [12]. The problems of relating overlapping lake and streamsediment data have been discussed by Davenport [9] and Garrett et al. [11]. In these examples thedatasets under consideration have involved relatively close-spaced sampling. The problems increaseas sample density decreases. The levelling of scattered "islands" of dissimilar data presents additionaldifficulties.
In order to compile a world geochemical map or establish reliable baselines, there is clearlya need for a worldwide geochemical reference datum (a geochemical "mean sea-level") against whichall surveys can be compared. Ideally this would be a datum for all elements, all types of media andall analytical methods. Wide-spaced sampling which is the starting point for multi-element baselinescan only go part way towards meeting the levelling requirement. It provides a series of geochemicalcontrol points or "spot-heights". Wide-spaced drainage samples are selected to be representative oflarge areas, but they are necessarily few in number. This is in order to restrict the number of samplesto a quantity that can be processed by a small number of internationally recognised laboratories, toensure consistent quality. The resulting coverage is therefore discontinuous and it cannot show theexact position of boundaries or easily distinguish anthropogenic from geological effects.
49
1000 km
K
FIG. 1. Potassium in the regolith of the USA; based on 1314 samples (20 cm depth) collected closeto major highways; analysed by flame photometry. Prepared by N.Gustavsson et al. (GeologicalSurvey of Finland) from data by Shacklette and Boerngen.
Ms&i';'^
^
FIG. 2. Potassium in the regolith of the USA; from airborne gamma ray spectrometry; E. half ofcountry mostly 10 km line spacing, W. half mostly 5 km. From Duval (1991).
50
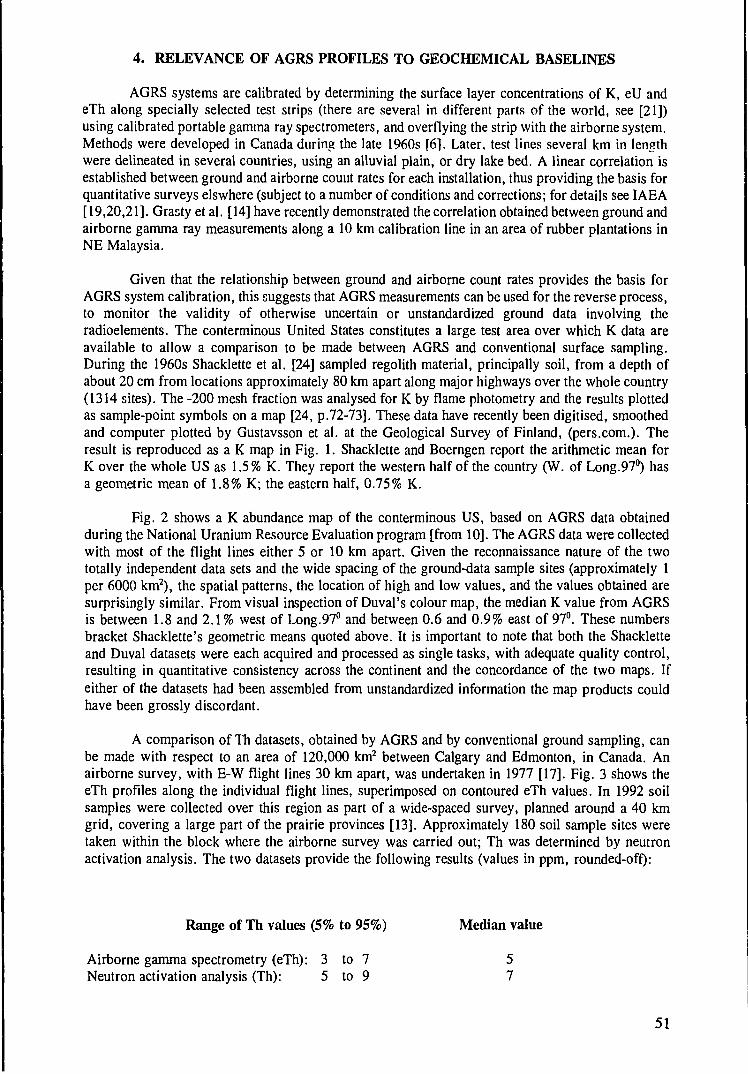
4. RELEVANCE OF AGRS PROFILES TO GEOCHEMICAL BASELINES
AGRS systems are calibrated by determining the surface layer concentrations of K, eU andeTh along specially selected test strips (there are several in different parts of the world, see [21])using calibrated portable gamma ray spectrometers, and overflying the strip with the airborne system.Methods were developed in Canada during the late 1960s [6], Later, test lines several km in lengthwere delineated in several countries, using an alluvial plain, or dry lake bed. A linear correlation isestablished between ground and airborne count rates for each installation, thus providing the basis forquantitative surveys elswhere (subject to a number of conditions and corrections; for details see IAEA[19,20,21]. Grasty et al. [14] have recently demonstrated the correlation obtained between ground andairborne gamma ray measurements along a 10 km calibration line in an area of rubber plantations inNE Malaysia.
Given that the relationship between ground and airborne count rates provides the basis forAGRS system calibration, this suggests that AGRS measurements can be used for the reverse process,to monitor the validity of otherwise uncertain or unstandardized ground data involving theradioelements. The conterminous United States constitutes a large test area over which K data areavailable to allow a comparison to be made between AGRS and conventional surface sampling.During the 1960s Shacklette et al. [24] sampled regolith material, principally soil, from a depth ofabout 20 cm from locations approximately 80 km apart along major highways over the whole country(1314 sites). The -200 mesh fraction was analysed for K by flame photometry and the results plottedas sample-point symbols on a map [24, p.72-73]. These data have recently been digitised, smoothedand computer plotted by Gustavsson et al. at the Geological Survey of Finland, (pers.com.). Theresult is reproduced as a K map in Fig. 1. Shacklette and Boerngen report the arithmetic mean forK over the whole US as 1.5% K. They report the western half of the country (W. of Long.97°) hasa geometric mean of 1.8% K; the eastern half, 0.75% K.
Fig. 2 shows a K abundance map of the conterminous US, based on AGRS data obtainedduring the National Uranium Resource Evaluation program [from 10]. The AGRS data were collectedwith most of the flight lines either 5 or 10 km apart. Given the reconnaissance nature of the twototally independent data sets and the wide spacing of the ground-data sample sites (approximately 1per 6000 km2), the spatial patterns, the location of high and low values, and the values obtained aresurprisingly similar. From visual inspection of Duval's colour map, the median K value from AGRSis between 1.8 and 2.1% west of Long.97° and between 0.6 and 0.9% east of 97°. These numbersbracket Shacklette's geometric means quoted above. It is important to note that both the Shackletteand Duval datasets were each acquired and processed as single tasks, with adequate quality control,resulting in quantitative consistency across the continent and the concordance of the two maps. Ifeither of the datasets had been assembled from unstandardized information the map products couldhave been grossly discordant.
A comparison of Th datasets, obtained by AGRS and by conventional ground sampling, canbe made with respect to an area of 120,000 km2 between Calgary and Edmonton, in Canada. Anairborne survey, with E-W flight lines 30 km apart, was undertaken in 1977 [17]. Fig. 3 shows theeTh profiles along the individual flight lines, superimposed on contoured eTh values. In 1992 soilsamples were collected over this region as part of a wide-spaced survey, planned around a 40 kmgrid, covering a large part of the prairie provinces [13]. Approximately 180 soil sample sites weretaken within the block where the airborne survey was carried out; Th was determined by neutronactivation analysis. The two datasets provide the following results (values in ppm, rounded-off):
Range of Th values (5% to 95%) Median value
Airborne gamma spectrometry (eTh): 3 to 7 5Neutron activation analysis (Th): 5 to 9 7
51
to
54 00
53 00
LEGEND
Line Nurrtoer
FHght Lina and Fiducial _
3A
Thorium Profile .(FSght Lina Base at 3.0 [.pm)
995
VJ.O ppm / a n
52 00
51 00
Airborne Gamma Ray Spectrometer Survey 50_
KILOMITRES
FIG. 3. Thorium in the regolith, SE Alberta, Canada; profiles and contours from airborne gamma ray spectrometry. From Hetu (1991).
The AGRS values are 2 ppm lower than the neutron activation analyses of soil from the sameregion. It is relevant to note that the airborne and ground surveys were undertaken 15 years apart,with separate objectives. As with the K data in the USA discussed above, the regolith was measuredwith different analytical methods, at nominally representative but non-coincident sites. No correctionhas been applied to the AGRS data for a possible soil moisture effect; taking the variables intoaccount, the agreement between these datasets is considered to be within reasonable limits.
The concordance between ground and airborne gamma ray data which can be observed on testranges and, with less precision, over much larger regions, provides the evidence for believing thatAGRS can assist in geochemical levelling. AGRS equipment gathers data continuously in a uniformway whatever the nature of the surface and so it offers a method of linking and comparing disparatedata blocks. Extensive surveys over the past 20 years in regions ranging from the arctic to equatorialrainforest have provided many opportunities to examine the relationship between AGRS and grounddata [7]. In cold dry climates where there is negligeable chemical weathering the correlation betweenAGRS data and data from conventional ground sampling appears to have been generally satisfactoryfor all elements. For Th, the correlation between airborne eTh and ground eTh (or Th) in the Ayhorizon, shows consistency in all environments. Potassium correlation tends to be somewhat inferiorto that observed for Th because more corrections are required in order to derive K abundance fromAGRS data, and errors in the correction factors may be cumulative. Also K minerals, particularlymicas, are more susceptible to weathering than Th minerals. Data reduction procedures are discussedin the relevant IAEA Technical reports. Uranium correlation, arising from the geochemistry of theelement, is inherently the most uncertain, depending upon mineralogy and climate. The correlationobserved between airborne and ground eU determination (i.e. both determinations by gamma rayspectrometry) can be good provided both measurements are obtained when a similar soil moistureprofile applies [Grasty, pers.com.]. Where a direct method of U analysis (e.g. XRF or NAA) hasbeen employed for determination of U in ground samples, discrepancies are present where chemicalweathering has caused parent and/or daughter element migration and separation over distances ofmore than a few cm. The influence of chemical weathering depends in part on the mineralogicalassemblage. Because 214Bi is used as a proxy for U (and expressed as eU) in gamma ray mapping,there is the potential for gross discrepancies between chemically determined U and eU, in partbecause of gross differences in sample size. In conventional geochemistry the sample weight ismeasured in gm; in AGRS, tonnes. Because each AGRS sample is very large, migration ofconstituents can take place and still remain within the sample. However, for the reasons indicated,quantitative estimation of U by AGRS is inherently more uncertain than is the case for Th and K;AGRS responds to 214Bi not U. Thus, discrepancies in U abundance obtained by direct (U) andindirect (eU) methods of analysis do occur, and because of the number of factors which may beinvolved, if a problem is suspected a detailed investigation may be needed to find the reason.
The use of AGRS to "flag" the existence of suspect data blocks is well within the currentstate of the art. It involves flying AGRS profiles at a line-spacing determined by the dimensions andcomplexity of the data blocks to be checked. For example, AGRS profiles at 10 km line-spacingprovide continuous sampling over a 250 m strip along each line, representing 2.5 per cent of a block'stotal area. Thirty km line-spacing, as in the Alberta example referred to above, samples 0.8 per cent.For the reasons given above, median Th and K abundances determined by AGRS and conventionalsoil sampling along common profiles should normally be expected to agree within ±2 ppm Th and±0.5 per cent K, provided that the soil is not abnormally wet or dry at the time of the airbornemeasurements and that geochemical analyses of surface soil samples are based upon natural gammaray spectrometry, neutron activation, XRF or other total estimation methods. Regrettably, Thdeterminations have rarely been included in past analytical work on soils or regolith. Potassium isoften determined for agricultural purposes, but has seldom been included in geochemical mappingwhere mineral exploration has been the prime objective. Thorium and K determinations are essentialif AGRS eTh and K profiles are to be used for reference purposes. It must be possible to compareairborne and ground analyses of A25 regolith material.
53

A problem with data quality may be indicated where there is an abrupt change in the Th/Kratio of ground versus airborne data. This would occur where there is a level change in either Th orK ground survey data which is not reflected in coincident airborne data. This may be an indicationof methodological inconsistencies with respect to the ground data, involving a change in samplecollection, sample preparation or analytical techniques. In this case it is probable that inconsistencieswill apply to other elemem • in addition to Th and K, depending upon the details of the work. Thisis important information v h respect to the establishment of geochemical baselines, because aspreviously indicated, the lac . of consistency in past data collection methods can make it difficult todistinguish between real and tpparem regional differences. By continuously observing the relationshipbetween airborne and ground Th and K data, discrepant blocks of data may be identified. If aconsistent serious discrepancy is observed over some clearly defined area, if it is not possible to verifythis on the ground (e.g. access is impossible), consideration could be given to calculating andapplying a normalization factor to data in this block. Subject to further research, the use of AGRSto compare and correlate resistate element levels (Th being a resistate element) in survey blocks wheredifferent sample media have been employed for conventional geochemical mapping may prove to bea useful extension of the level-monitoring technique.
5. RECOMMENDATIONS RELATING TO THE USE OF GAMMA RAYSPECTROMETRY IN ESTABLISHING GLOBAL
GEOCHEMICAL BASELINES
This section summarises the relevant section of the report "A Global Geochemical Database:recommendations for International Geochemical Mapping", [8]. It is based on the work of severalIAEA consultants' and technical committees, established in support of the radioactive elementcomponent of the IGM project. These committees have published their own reports, the contents ofwhich extend beyond what is included here [20, 21, also 22].
5.1. GENERAL STATEMENT
1) Radioactive elements are of special public concern. Data to show their spatial distributionshould be an essential part of any comprehensive global (and also regional) geochemicaldatabases.
2) The technique of gamma ray spectrometry enables the abundance of radioactive elements tobe determined quantitatively. Its principal advantage is that in addition to being a laboratorytechnique, determinations can be undertaken rapidly, in situ, from a moving vehicle or froma low-flying aircraft. Gamma ray spectrometry is a standardised technique which can providea continuous quantitative profile of radioelement abundance over any type of land surface. Ifprofiles are closely spaced, an entire surface can be mapped. In addition to profiling ormapping natural radioelement distribution, radioactive fallout can be identified, measured anddelineated. The relevant data should be acquired as part of the collection of baselineinformation.
3) Airborne gamma ray spectrometry can be used to provide an inter- and trans-continental Threference datum to assist in levelling geochemical maps from geographically diverse regions.
4) In order to obtain standardized data, methodologies recommended by and promulgatedthrough the publications of the International Atomic Energy Agency should be followed (seereferences).
54
5.2. USE OF EXISTING DATA
It is recognised that in many countries there has been a significant past investment inradiometric (gamma radiation) surveys of various types, especially during the 1960s and 70s,primarily related to uranium exploration. Much of this work was sponsored by national governmentsor international agencies; in general, where surveys were sponsored by the mineral industry, attentionwas focusscd on small areas selected according to suspected mineral potential. This often resulted inoverlapping patchwork coverage of priority areas. The early work, and most industry-sponsoredsurveys, were of a qualitative nature. Standardized methodology began to be introduced into someof the national/international agency large-area surveys during the 1970s. In the interests of economy,before new work is commissioned, there should be a review of existing data:
1) Countries should make an inventory of all regional airborne and car-borne gamma rayspectrometric surveys, and note all the relevant information (date of survey, system used,calibration, type of data processing and storage used, type of map produced, availability ofthe data). Data quality and completeness of documentation is more important than age,although older data is likely to have been obtained with low-sensitivity equipment. Note thatit is important to make a repository of all records and assure adequate storage of the data toprevent damage. The shelf life of most magnetic tapes is 10 years and where possible datashould be transferred to an optical disk type of storage medium.
2) If radiometric calibration facilities exist, but they have not been compared (intercalibrated)with internationally recognized facilities, this should be arranged through the IAEA.
3) Where several separate areas have been surveyed, numerical data should benormalized/levelled, using the nearest available recognized calibration facility. If results ofthese surveys were not presented in terms of radioelement abundances (concentration of thethree radioelements), a back-calibration exercise should be carried out so as to allow thepreparation of quantitative geochemical maps.
4) For environmental health radiation monitoring puposes, a map of air dose rate (Gy s1) oreffective dose equivalent (mSv a1), should be produced.
5) Where sufficient data are available, they should be sub-sampled onto an appropriate gridsuitable for the production of a regional or national atlas and ultimately the radioelement mapof the world.
5.3. COLLECTION OF NEW DATA
Although it is desirable from the point of view of minimising costs to make the maximumpossible use of existing data, it should be recognized that many past surveys were undertaken withinadequate equipment and insufficient quality control. At best, they were qualitative rather thanquantitative. There is often incomplete information concerning equipment, survey and data reductionparameters. If the data were not digitally recorded in a readily recoverable format the difficulty andcost of retrieving information can greatly exceed its value. In these circumstances, and for the manyparts of the world where no gamma ray surveys have been carried out, it is necessary to collect newdata, following recommended procedures.
1) Many of the comments made above are applicable to newly collected data. Particular attentionmust be paid to calibration and standardised data reduction procedures, according to IAEAguidelines.
2) In situ ground measurements. In order to link airborne with ground measurements, includingconventional sampling for the non-radioactive elements, in situ measurements with a field
55
portable gamma ray spectrometer (GRS) should be made at each sub-site where a geochemicalrcgolith reference sample is collected. Thus, several measurements should be made at eachsite in the 160 x 160 km primary sampling grid.
3) With a modest increase in the equipment required, useful additional information can beobtained by using the same portable GRS to obtain a continuous profile whilst in transit ina road vehicle between sample sites (i.e., a car-borne survey). If the 160 km cell sample sitesare located close to surface transportation routes, then a continuous profile could be recordedalong these routes where conditions are suitable, as a modification of the method used forreconnaissance purposes by Shacklette et al. [24].
4) Airborne gamma ray spectrometry. The preferred method of obtaining comprehensiveradioelement baseline data over a large region is by means of airborne gamma rayspectrometry. Widely spaced profiles are of comparable significance to widely spaced surfacesamples, but with the important advantage of being continuous along-line and not restrictedor diverted by difficulties of surface travel or access. Continuous profiles enable theboundaries encountered en route to be identified as gradational or sharp, and in the lattercase, their exact position can be located. In order to complement the 160 x 160 km primarysampling reference grid it is recommended that flight-line spacing must not be less than 160km, and preferably 80 km, 40 km or 20 km in populated areas, so that most points in theground sampling network (which may be irregularly spaced for reasons of access) can beoverflown. Where the ground sampling follows a straight (or nearly straight) corridor, it isobviously much simpler to arrange to overfly the sample sites. For the purpose of checkingfor possible level problems between isolated blocks of ground geochemical data it may bedesirable and advantageous to insert additional flight lines whilst a suitably equipped aircraftis in the region.
5) Irrespective of the flight line-spacing, data are normally collected along each line at constantIs intervals. In order to produce a map which is not directionally biassed, along-line datamust be smoothed over a distance proportional to line spacing. This reduces the amplitudeof features. For this reason contoured maps are progressively les,s satisfactory as line spacingincreases, so that when this exceeds 10 km profile maps are usually the preferred product.
6. CONCLUSION
Subject to proper calibration and use, gamma ray spectrometry is a unique tool for mappingthe distribution of all radioactive elements, whatever their origin, in the surface of the regolith(termed the A^ horizon); the data which are acquired are an essential part of the description of thegeochemical environment. In addition to providing baseline data for radioelements, the use of gammaray spectrometry facilitates the acquisition of a common database with non-radioactive elements andoffers a partial solution to a fundamental problem associated with the concept of internationalgeochemical mapping, namely, that of establishing a standardized base for all measurements.
ACKNOWLEDGEMENTS
The recommendations for A Global Geochemical Database referred to in this report have beenprepared as a result of a prolonged joint effort by members of the IGCP 259 Steering Comittee:A.J.Bjorklund, Finland, leader Global Sampling Committee; B.Bolviken, Norway, leaderFent oscandian Regional Committee; N.Gustavsson, Finland, leader Data Management Committee;P.Kcval, Russia, co-leader Russian Regional Committee; J. A.Plant, UK, leader European CommunityRegional Committee; A.Steenfelt, Denmark, leader Field Methods Committee; Xie Xuejing, China,
56
leader Analytical Methods Committee and Chinese Regional Committee. In particular, thanks are dueto M.Tauchid, IAEA, leader Radiometric Methods Committee for obtaining the support of the IAEAfor activities pertaining to nuclear minerals exploration. The writer (A.G.Darnley) is chairman of theSteering Committee.
REFERENCES
[I] BOLVIKEN, B., BERGSTROM, J., BJORKLUND, A., KONTIO, M., LEHMUSPELTOP., LINDHOLM, T., MAGNUSSON, J., OTTESEN, R.T., STEENFELT, A. andVOLDEN, T., Geochemical Atlas of Northern Fennoscandia, Scale 1:4,000,000, NordkalottProject, Geological Survey of Sv/eden (1986) 170pp.
[2] DARNLEY, A.G., International geochemical mapping: a new global project. Journal ofGeochemical Exploration, 39 (1990) 1-13.
[3] DARNLEY, A.G., The development of airborne gamma ray spectrometry: a case study intechnological innovation and acceptance. Journal of Nuclear Geophysics, 5 (1991) 377-402
[4] DARNLEY, A.G., News item: International Geochemical Mapping, Journal of GeochemicalExploration, 48 (1993) 97-104.
[5] DARNLEY, A.G., Uranium exploration data, international geochemical mapping and theenvironment, (this volume), (1994).
[6] DARNLEY, A.G. and FLEET, M., Evaluation of airborne gamma ray spectrometry in theBancroft and Elliot Lake areas of Ontario, Canada. In Proc. 5th Symp. Remote Sensing ofthe Environment, pp 833-853. University of Michigan, Ann Arbor (1968).
[7] DARNLEY, A.G. and FORD, K.L., Regional airborne gamma-ray surveys: a review. InProceedings of Exploration '87; Third Decennial International Conference on Geophysical andGeochemical Exploration for Minerals and Groundwater, ed. G.D. Garland, OntarioGeological Survey, Special Volume 3 (1989) 229-240.
[8] DARNLEY, A.G., BJORKLUND, A.J., BOLVIKEN, B., GUSTAVSSON, N., KOVAL,P., PLANT, J.A., STEENFELT, A., TAUCHID, M., and XIE, XUEJING, A globalgeochemical database: recommendations for international geochemical mapping. Final reportfor IGCP project 259. ICSU (1994) (in press).
[9] DAVENPORT, P.H., A comparison of regional geochemical data from lakes and streams innorthern Labrador: implications for mixed-media geochemical mapping. Journal ofGeochemical Exploration, 39 (1990) 117-151.
[10] DUVAL, J.S., Modern aerial gamma ray spectrometry and regional potassium map of theconterminous United States. Journal of Geochemical Exploration, 39 (1990) 249-253.
[II] GARRETT, R.G., BANVILLE, R.M.P. and ADCOCK, S.W., Regional geochemical datacompilation and map preparation, Labrador, Canada. Journal of Geochemical Exploration,39(1990)91-116.
[12] GARRETT, R.G., BEAUMIER M. and DAVENPORT, P.H., Quebec-Labrador geochemicaltransect, James Bay to the Labrador Sea 53-55°N. in Current Activities Forum, Program withAbstracts, January 1991, Geological Survey of Canada, 8 (1991).
[13] GARRETT R.G., Ultra-low density geochemical mapping on the Canadian prairie. Abstracts,16th International Geochemical Mapping Symposium, 1-6 September 1993, Beijing, China(1993) p.50.
[14] GRASTY, R.L., WHITTON, R.M. and DUFFY, A., Back calibration and reprocessing anairborne gamma ray survey, Malaysia. Expanded Abstracts with Biographies, 1992 TechnicalPror . 62nd Annual International SEG Meeting, New Orleans (1992) 550-551
[15] GR;^ , B.M.R., HUGHES, J.S. and LOMAS, P.R., Radiation atlay, national sources ofionising radiation in Europe. Environment Directorate, Nuclear Safety and Civil Protection,Commission of European Communities, Luxembourg (1991) 34pp.
57
[16] GREGORY, A.F. and HORWOOD, J.L, A laboratory study of gamma ray spectra at thesurface of rocks. Mines Branch Research Report R 85, Department of Mines and TechnicalSurveys, Ottawa (1961) 52p.
[17] HETU, R.J. (Compiler), Airborne geophysical survey of the Edmonton-Calgaryreconnaissance area, Alberta. GSC Open File 2442 (1992).
[18] INTERNATIONAL ATOMIC ENERGY AGENCY, Radiometric Reporting Methods andCalibration in Uranium Exploration, Technical Report Series No. 174, Vienna (1976) 57p.
[19] INTERNATIONAL ATOMIC ENERGY AGENCY, Gamma ray surveys in uraniumexploration, Technical Report Series No. 18b, Vienna (1979) 90p.
[20] INTERNATIONAL ATOMIC ENERGY AGENCY, The use of gamma ray data to definethe natural radiation environment, IAEA-TECDOC-566, Vienna (1990) 48pp.
[21] INTERNATIONAL ATOMIC ENERGY AGENCY, Airborne gamma ray spectrometersurveying. Technical Report Series No. 323, Vienna (1991) 97p.
[22] MELLANDER, H., Airborne gamma spectrometric measurements of the fall-out over Swedenafter the nuclear reactor accident at Chernobyl, USSR. Internal report IAEA/NENF/NM-89-1, IAEA, Vienna (1989) 41.
[23] PLANT, J.A. and RIDGWAY, J., Inventory of geochemical surveys in Western Europe. InA.Demetriades, J.Locutura, R.T. Ottesen (compilers), Geochemical Mapping of WesternEurope towards the year 2000, Pilot Project Report, Appendix 10, NGU Report 90-105,Geol. Surv. Norway (1990) 400pp.
[24] SHACKLETTE, H.T. and BOERNGEN, J.G., Elemental concentrations in soils and othersurficial materials of the conterminous United States. U.S. Geological Survey ProfessionalPaper 1270, United States Government Printing Office, Washington (1984).
58
CONSISTENCY OF RADIOMETRIC DATA
(Abstract)
M. MATOLINCharles University, Prague, Czech Republic
Radiometric data of uranium exploration and data of other field radiometric measurements are applicablefor studies of the radiation environment. Quantitative data on radiation field and radon concentration in rocks arerequisite to the assessment of environmental radioactivity. Consistency of radiometric data, which is essential in thisprocedure, has been studied. Total count (TC) measurements, reflect also' the used detectors, energy rays of thenatural environment, reflect also the used detectors, energy tliresholds of instruments and the way of their calibration.TC results, expressed in units of air dose rate, are further dependent on ratios of K, U and Th in rocks. Current TCinstruments, calibrated with Ra-226 point source, indicate air dose rate values that can exceed acceptable limits oferrors, instruments calibrated over extensive U source can differ from the correct value of the air dose rate up to 25 %relatively. Gamma ray spectrometry analyses of K, U and Th in rocks has been improved substantially by introducingthe IAEA laboratory reference materials for geological analyses (RG-set), and by research, development andestablishment of world net of calibration facilities for field radiometric equipment. Experience shows that K, U andTh concentrations in rocks can be determined with relative differences in the range of 1 - 5%. Air dose rate values,calculated from K, U Th concentrations in rocks, can be influenced by differences of the element composition andmoisture of applied theoretical model and real rock environment. Radon risk mapping employs data on Rn-222 inrocks. The dispersion of attainable quantitative data on Rn-222 volume activity in soil air, reported by singleorganizations, is caused by differences in soil air sampling, depth of sampling, methods of radon detection, methodsof measurement and the way of equipment calibration, in addition to radon climatic variation. Experimental resultsof the 1991 — 1993 comparison measurements, realized under the programme of radon risk mapping in the CzechRepublic, on 5 test areas of various radon levels (10 - 100 kBq.m'3), exhibit the relative spread of reported averageRn-222 volume activity in the range 0.55 - 1.43 with most cases in the range 0.8 - 1.2 (well acceptable limits).
59
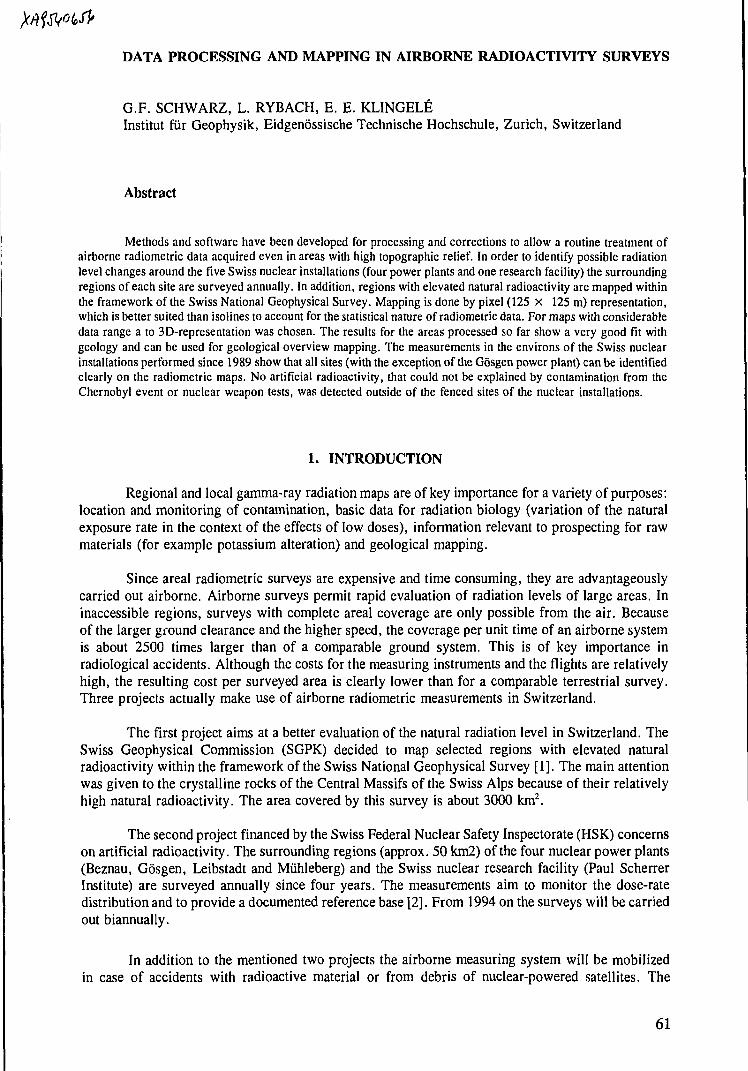
DATA PROCESSING AND MAPPING IN AIRBORNE RADIOACTIVITY SURVEYS
G.F. SCHWARZ, L. RYBACH, E. E. KLINGELEInstitut fur Geophysik, Eidgenossische Technische Hochschule, Zurich, Switzerland
Abstract
Methods and software have been developed for processing and corrections to allow a routine treatment ofairborne radiometric data acquired even in areas with high topographic relief. In order to identify possible radiationlevel changes around the five Swiss nuclear installations (four power plants and one research facility) the surroundingregions of each site are surveyed annually. In addition, regions with elevated natural radioactivity are mapped withinthe framework of the Swiss National Geophysical Survey. Mapping is done by pixel (125 X 125 m) representation,which is better suited than isolines to account for the statistical nature of radiometric data. For maps with considerabledata range a to 3D-representation was chosen. The results for the areas processed so far show a very good fit withgeology and can be used for geological overview mapping. The measurements in the environs of the Swiss nuclearinstallations performed since 1989 show that all sites (with the exception of the GQsgen power plant) can be identifiedclearly on the radiometric maps. No artificial radioactivity, that could not be explained by contamination from theChernobyl event or nuclear weapon tests, was detected outside of the fenced sites of the nuclear installations.
1. INTRODUCTION
Regional and local gamma-ray radiation maps are of key importance for a variety of purposes:location and monitoring of contamination, basic data for radiation biology (variation of the naturalexposure rate in the context of the effects of low doses), information relevant to prospecting for rawmaterials (for example potassium alteration) and geological mapping.
Since areal radiometric surveys are expensive and time consuming, they are advantageouslycarried out airborne. Airborne surveys permit rapid evaluation of radiation levels of large areas. Ininaccessible regions, surveys with complete areal coverage are only possible from the air. Becauseof the larger ground clearance and the higher speed, the coverage per unit time of an airborne systemis about 2500 times larger than of a comparable ground system. This is of key importance inradiological accidents. Although the costs for the measuring instruments and the flights are relativelyhigh, the resulting cost per surveyed area is clearly lower than for a comparable terrestrial survey.Three projects actually make use of airborne radiometric measurements in Switzerland.
The first project aims at a better evaluation of the natural radiation level in Switzerland. TheSwiss Geophysical Commission (SGPK) decided to map selected regions with elevated naturalradioactivity within the framework of the Swiss National Geophysical Survey [1]. The main attentionwas given to the crystalline rocks of the Central Massifs of the Swiss Alps because of their relativelyhigh natural radioactivity. The area covered by this survey is about 3000 km2.
The second project financed by the Swiss Federal Nuclear Safety Inspectorate (HSK) concernson artificial radioactivity. The surrounding regions (approx. 50 km2) of the four nuclear power plants(Beznau, Gosgen, Leibstadt and Miihleberg) and the Swiss nuclear research facility (Paul ScherrerInstitute) are surveyed annually since four years. The measurements aim to monitor the dose-ratedistribution and to provide a documented reference base [2]. From 1994 on the surveys will be carriedout biannually.
In addition to the mentioned two projects the airborne measuring system will be mobilizedin case of accidents with radioactive material or from debris of nuclear-powered satellites. The
61
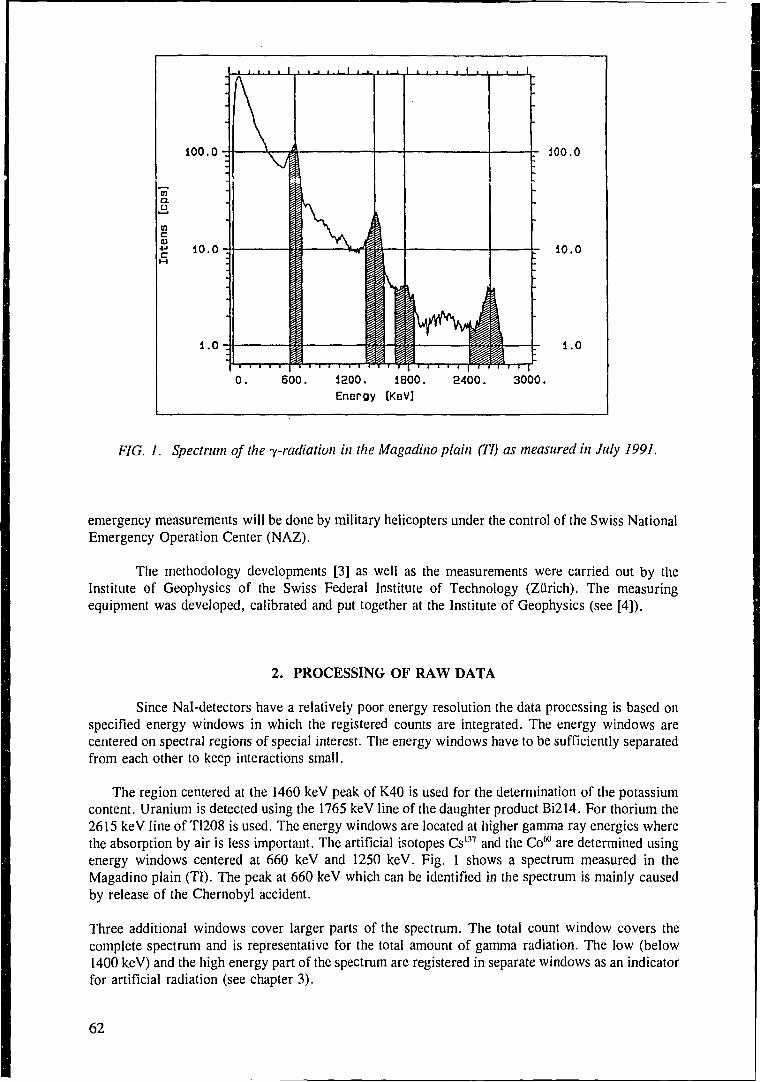
100 .0-
10.0
1.0
Ml
r 100.0
10.0
1.0
0. 600. 1200. 1800.Energy [KBV]
2400. 3000.
FIG. 1. Spectrum of the y-radiation in the Magadino plain (TI) as measured in July 1991.
emergency measurements will be done by military helicopters under the control of the Swiss NationalEmergency Operation Center (NAZ).
The methodology developments [3] as well as the measurements were carried out by theInstitute of Geophysics of the Swiss Federal Institute of Technology (Zurich). The measuringequipment was developed, calibrated and put together at the Institute of Geophysics (see [4]).
2. PROCESSING OF RAW DATA
Since Nal-detectors have a relatively poor energy resolution the data processing is based onspecified energy windows in which the registered counts are integrated. The energy windows arecentered on spectral regions of special interest. The energy windows have to be sufficiently separatedfrom each other to keep interactions small.
The region centered at the 1460 keV peak of K40 is used for the determination of the potassiumcontent. Uranium is detected using the 1765 keV line of the daughter product Bi214. For thorium the2615 keV line of T1208 is used. The energy windows are located at higher gamma ray energies wherethe absorption by air is less important. The artificial isotopes Cs137 and the Co60 are determined usingenergy windows centered at 660 keV and 1250 keV. Fig. 1 shows a spectrum measured in theMagadino plain (TI). The peak at 660 keV which can be identified in the spectrum is mainly causedby release of the Chernobyl accident.
Three additional windows cover larger parts of the spectrum. The total count window covers thecomplete spectrum and is representative for the total amount of gamma radiation. The low (below1400 keV) and the high energy part of the spectrum are registered in separate windows as an indicatorfor artificial radiation (see chapter 3).
62
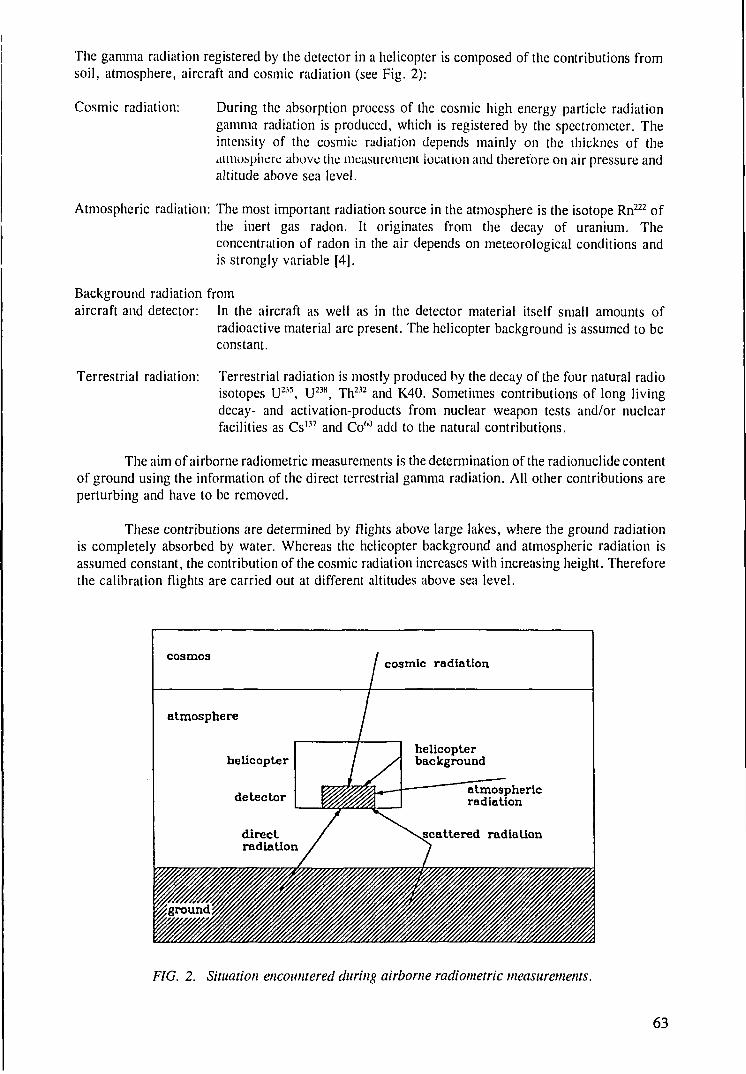
The gamma radiation registered by the detector in a helicopter is composed of the contributions fromsoil, atmosphere, aircraft and cosmic radiation (see Fig. 2):
Cosmic radiation: During the absorption process of the cosmic high energy particle radiationgamma radiation is produced, which is registered by the spectrometer. Theintensity of the cosmic radiation depends mainly on the thicknes of theaiino.spiiere above the measurement location and therefore on air pressure andaltitude above sea level.
Atmospheric radiation: The most important radiation source in the atmosphere is the isotope Rn222 ofthe inert gas radon. It originates from the decay of uranium. Theconcentration of radon in the air depends on meteorological conditions andis strongly variable [4].
Background radiation fromaircraft and detector: In the aircraft as well as in the detector material itself small amounts of
radioactive material are present. The helicopter background is assumed to beconstant.
Terrestrial radiation: Terrestrial radiation is mostly produced by the decay of the four natural radioisotopes U235, U238, Th232 and K40. Sometimes contributions of long livingdecay- and activation-products from nuclear weapon tests and/or nuclearfacilities as Cs137 and Co60 add to the natural contributions.
The aim of airborne radiometric measurements is the determination of the radionuclide contentof ground using the information of the direct terrestrial gamma radiation. All other contributions areperturbing and have to be removed.
These contributions are determined by flights above large lakes, where the ground radiationis completely absorbed by water. Whereas the helicopter background and atmospheric radiation isassumed constant, the contribution of the cosmic radiation increases with increasing height. Thereforethe calibration flights are carried out at different altitudes above sea level.
cosmos cosmic radiation
helicopterbackground
atmosphericradiation
atmosphere
FIG. 2. Situation encountered during airborne radiometric measurements.
63
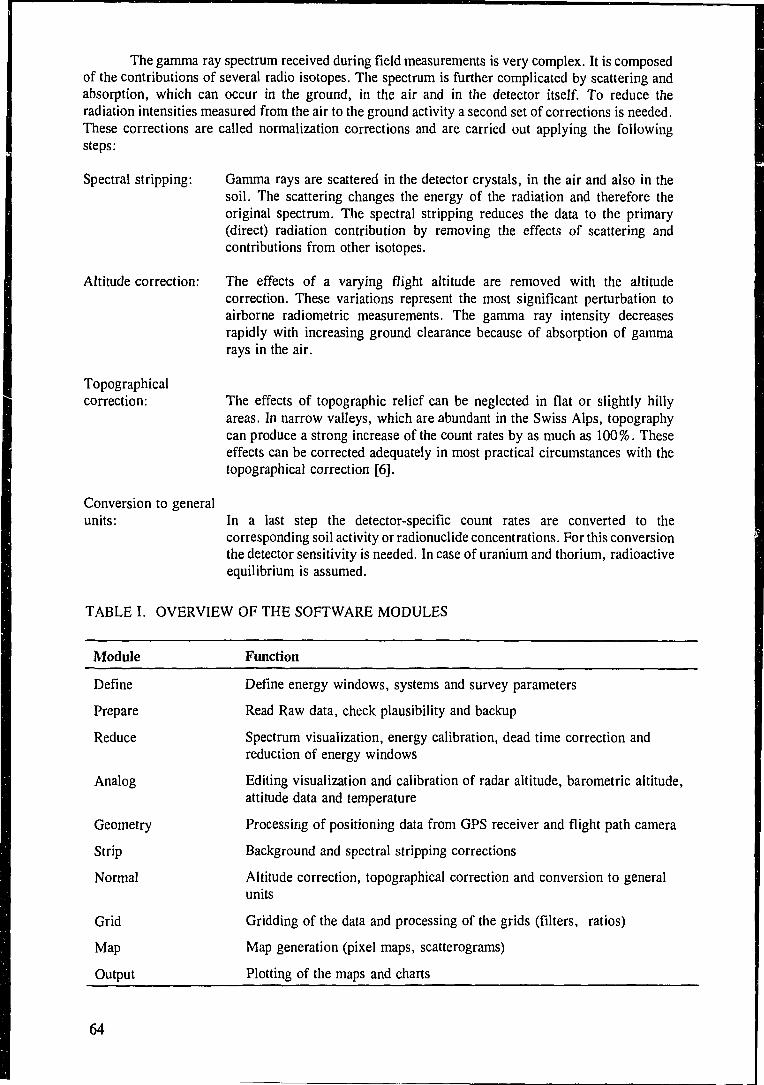
The gamma ray spectrum received during field measurements is very complex. It is composedof the contributions of several radio isotopes. The spectrum is further complicated by scattering andabsorption, which can occur in the ground, in the air and in the detector itself. To reduce theradiation intensities measured from the air to the ground activity a second set of corrections is needed.These corrections are called normalization corrections and are carried out applying the followingsteps:
Spectral stripping:
Altitude correction:
Topographicalcorrection:
Conversion to generalunits:
Gamma rays are scattered in the detector crystals, in the air and also in thesoil. The scattering changes the energy of the radiation and therefore theoriginal spectrum. The spectral stripping reduces the data to the primary(direct) radiation contribution by removing the effects of scattering andcontributions from other isotopes.
The effects of a varying flight altitude are removed with the altitudecorrection. These variations represent the most significant perturbation toairborne radiometric measurements. The gamma ray intensity decreasesrapidly with increasing ground clearance because of absorption of gammarays in the air.
The effects of topographic relief can be neglected in flat or slightly hillyareas. In narrow valleys, which are abundant in the Swiss Alps, topographycan produce a strong increase of the count rates by as much as 100%. Theseeffects can be corrected adequately in most practical circumstances with thetopographical correction [6].
In a last step the detector-specific count rates are converted to thecorresponding soil activity or radionuclide concentrations. For this conversionthe detector sensitivity is needed. In case of uranium and thorium, radioactiveequilibrium is assumed.
TABLE I. OVERVIEW OF THE SOFTWARE MODULES
Module Function
Define
Prepare
Reduce
Analog
Geometry
Strip
Normal
Grid
Map
Output
Define energy windows, systems and survey parameters
Read Raw data, check plausibility and backup
Spectrum visualization, energy calibration, dead time correction andreduction of energy windows
Editing visualization and calibration of radar altitude, barometric altitude,attitude data and temperature
Processing of positioning data from GPS receiver and flight path camera
Background and spectral stripping corrections
Altitude correction, topographical correction and conversion to generalunits
Gridding of the data and processing of the grids (filters, ratios)
Map generation (pixel maps, scatterograms)
Plotting of the maps and charts
64
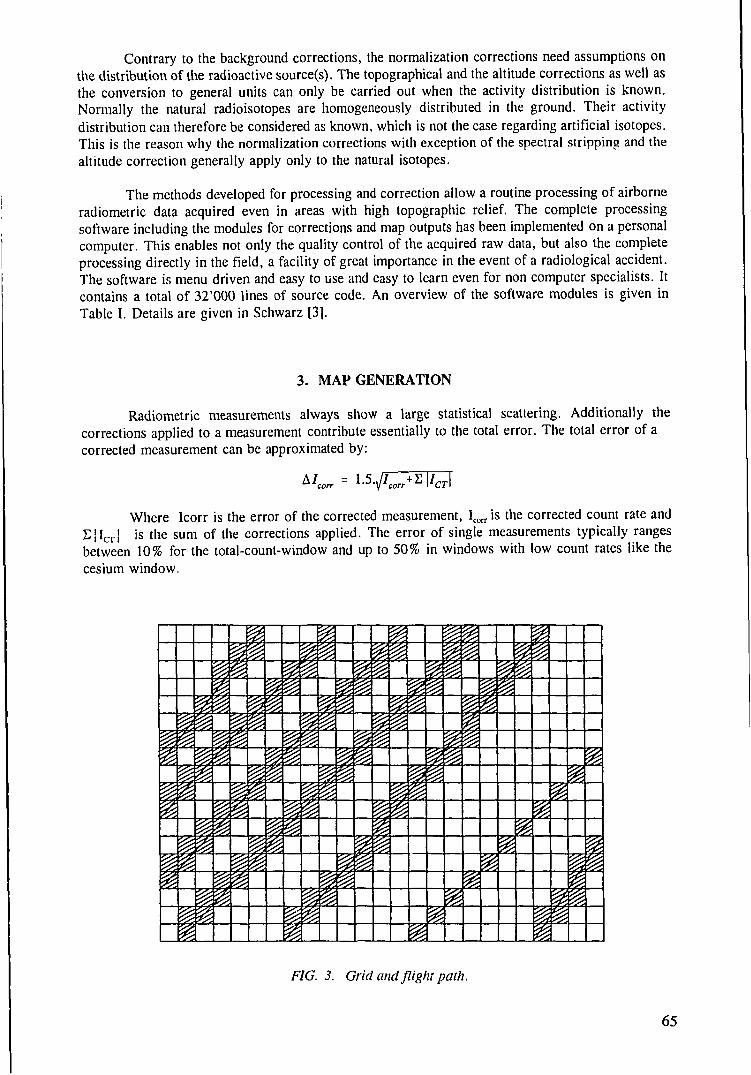
Contrary to the background corrections, the normalization corrections need assumptions onthe distribution of the radioactive source(s). The topographical and the altitude corrections as well asthe conversion to general units can only be carried out when the activity distribution is known.Normally the natural radioisotopes are homogeneously distributed in the ground. Their activitydistribution can therefore be considered as known, which is not the case regarding artificial isotopes.This is the reason why the normalization corrections with exception of the spectral stripping and thealtitude correction generally apply only to the natural isotopes.
The methods developed for processing and correction allow a routine processing of airborneradiometric data acquired even in areas with high topographic relief. The complete processingsoftware including the modules for corrections and map outputs has been implemented on a personalcomputer. This enables not only the quality control of the acquired raw data, but also the completeprocessing directly in the field, a facility of great importance in the event of a radiological accident.The software is menu driven and easy to use and easy to learn even for non computer specialists. Itcontains a total of 32'000 lines of source code. An overview of the software modules is given inTable I. Details are given in Schwarz [3].
3. MAP GENERATION
Radiometric measurements always show a large statistical scattering. Additionally thecorrections applied to a measurement contribute essentially to the total error. The total error of acorrected measurement can be approximated by:
corr lCT\
Where Icorr is the error of the corrected measurement, Icorr is the corrected count rate and£jl c r j is the sum of the corrections applied. The error of single measurements typically rangesbetween 10% for the total-count-window and up to 50% in windows with low count rates like thecesium window.
li ii
II
FIG. 3. Grid and flight path.
65
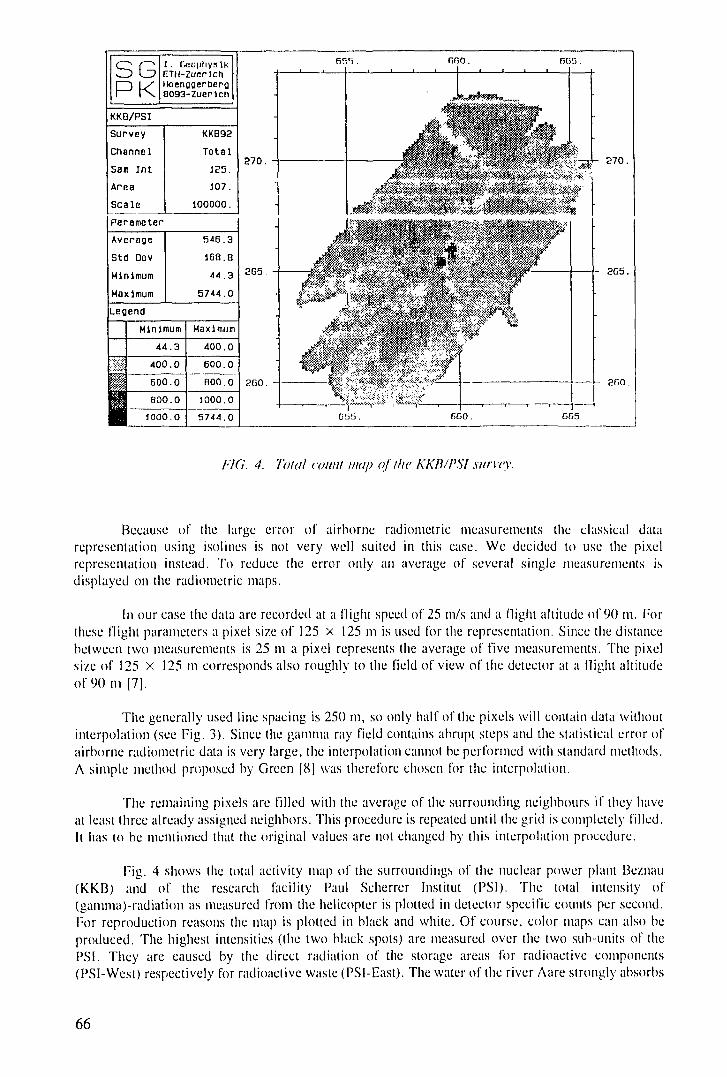
SGPK
I . CuupliyslkETH-Zuerlchtaenagerbera
8093-Zuerich
KKB/PSI
Survey
Channel
Sam in t
Area
Scale
KKB92
To ta l
125.
107.
100000.
Parameter
Average
Std Dev
Minimum
Maximum
546.3
168.8
44.3
5744.0
Legend
m1
Minimum
44.3
400.0
600.0
HH 800.0
m 1000.0
Maximum
400.0
600.0
BOO.O
1000.0
57-14.0
fi60. OC55 .
270.
265.
2C0. -
270.
- 2G5.
2G0.
GSS. 6G0. 055
FIG. 4. Total count map of the KKB/PSI .survey.
Because of the large error of airborne radiometric measurements the classical datarepresentation using isolines is not very well suited in this case. We decided to use the pixelrepresentation instead. To reduce the error only an average of several single measurements isdisplayed on the radiometric maps.
In our case the data are recorded at a flight speed of 25 m/s and a flight altitude of 90 in. Forthese flight parameters a pixel size of 125 x 125 m is used for the representation. Since the distancebetween two measurements is 25 m a pixel represents the average of five measurements. The pixelsize of 125 x 125 m corresponds also roughly to the field of view of the detector at a flight altitudeof '90m|7].
The generally used line spacing is 250 m, so only half of the pixels will contain data withoutinterpolation (see Tig. 3). Since the gamma ray field contains abrupt steps and the statistical error ofairborne radiometric data is very large, the interpolation cannot be performed with standard methods.A simple method proposed by Green |8 | was therefore chosen for the interpolation.
The remaining pixels are filled with the average of the surrounding neighbours if they haveat least three already assigned neighbors. This procedure is repeated until the grid is completely filled.It has to be mentioned that the original values are not changed by this interpolation procedure.
Fig. 4 shows the total activity map of the surroundings of the nuclear power plant Beznau(KKB) and of the research facility Paul Scherrer Institut (PSI). The total intensity of(gamma)-radiation as measured from the helicopter is plotted in detector specific counts per second.For reproduction reasons the map is plotted in black and white. Of course, color maps can also beproduced. The highest intensities (the two black spots) are measured over the two sub-units of thePSI. They are caused by the direct radiation of the storage areas for radioactive components(PSI-West) respectively for radioactive waste (PSI-East). The water of the river Aare strongly absorbs
66
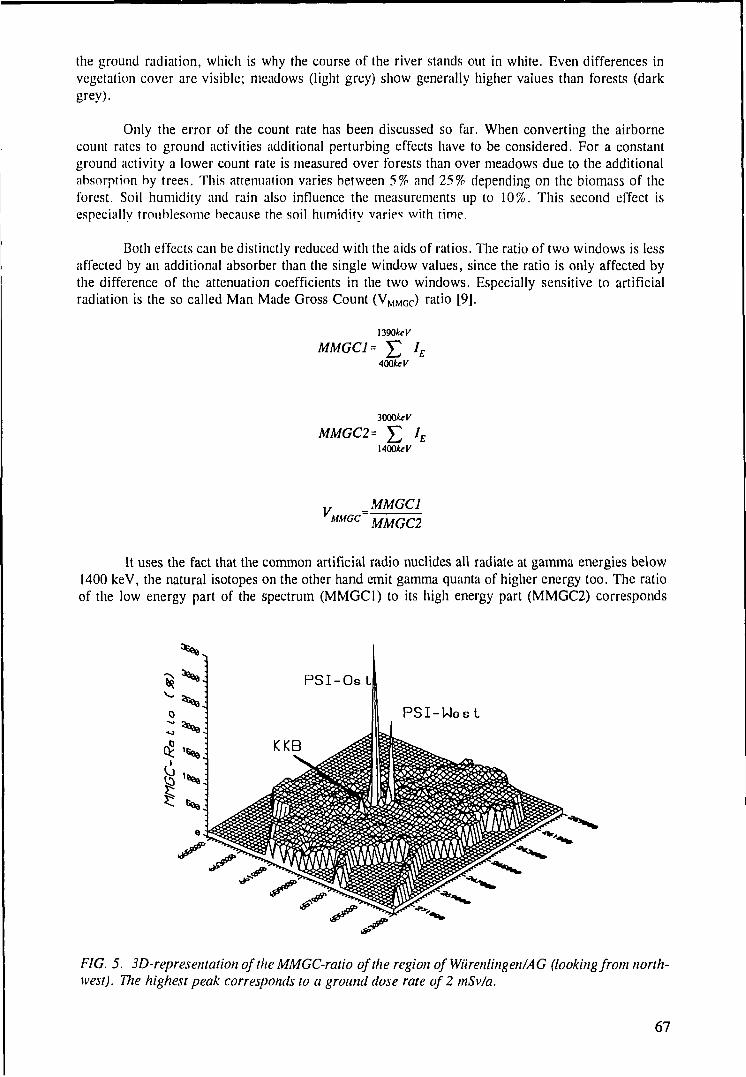
the ground radiation, which is why the course of the river stands out in white. Even differences invegetation cover are visible; meadows (light grey) show generally higher values than forests (darkgrey).
Only the error of the count rate has been discussed so far. When converting the airbornecount rates to ground activities additional perturbing effects have to be considered. For a constantground activity a lower count rate is measured over forests than over meadows due to the additionalabsorption by trees. This attenuation varies between 5% and 25% depending on the biomass of theforest. Soil humidity and rain also influence the measurements up to 10%. This second effect isespecially troublesome because the soil humidity varies with time.
Both effects can be distinctly reduced with the aids of ratios. The ratio of two windows is lessaffected by an additional absorber than the single window values, since the ratio is only affected bythe difference of the attenuation coefficients in the two windows. Especially sensitive to artificialradiation is the so called Man Made Gross Count (VMMGC) ratio [9].
\390keV
MMGCl =400J(*K
3000&V
MMGC2=UOQkeV
v _ MMGClMUGC MMGCl
It uses the fact that the common artificial radio nuclides all radiate at gamma energies below1400 keV, the natural isotopes on the other hand emit gamma quanta of higher energy too. The ratioof the low energy part of the spectrum (MMGCl) to its high energy part (MMGC2) corresponds
FIG. 5. 3D-representation of the MMGC-ratio of the region of Wiirenlingen/AG (looking from north-west). Tfie highest peak corresponds to a ground dose rate of 2 mSv/a.
67
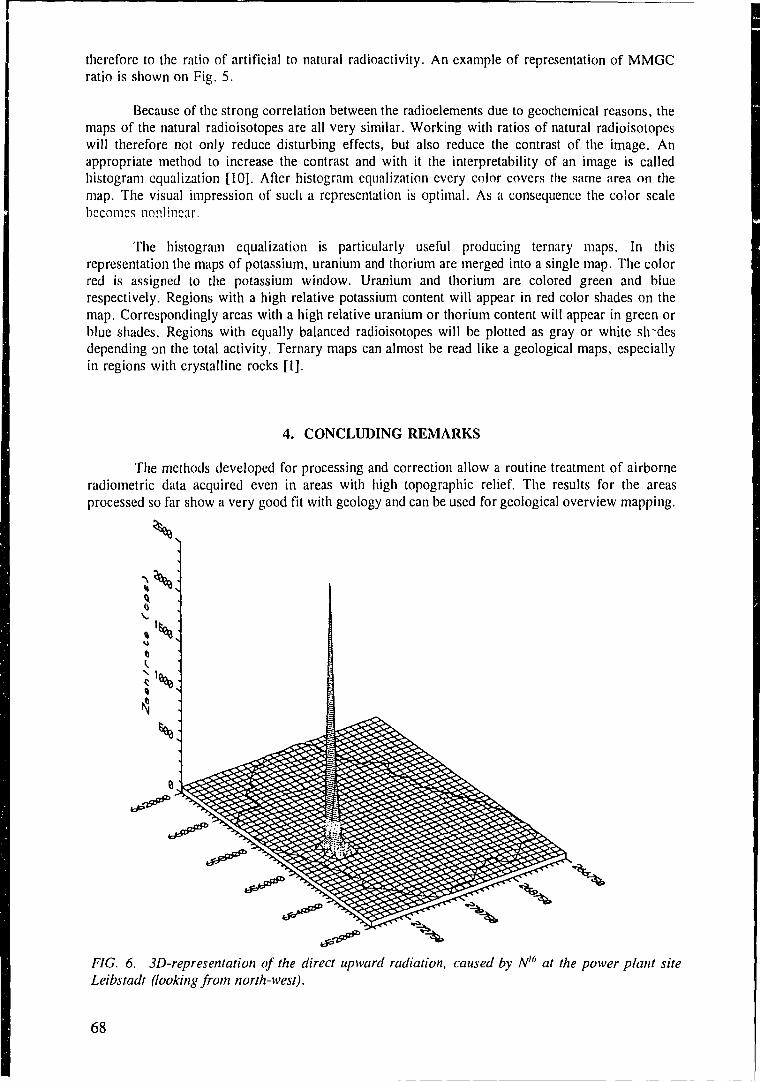
therefore to the ratio of artificial to natural radioactivity. An example of representation of MMGCratio is shown on Fig. 5.
Because of the strong correlation between the radioelements due to geochemical reasons, themaps of the natural radioisotopes are all very similar. Working with ratios of natural radioisotopeswill therefore not only reduce disturbing effects, but also reduce the contrast of the image. Anappropriate method to increase the contrast and with it the interpretability of an image is calledhistogram equalization [10]. After histogram equalization every color covers the same area on themap. The visual impression of such a representation is optimal. As a consequence the color scalebecomes nonlinear.
The histogram equalization is particularly useful producing ternary maps. In thisrepresentation the maps of potassium, uranium and thorium are merged into a single map. The colorred is assigned to the potassium window. Uranium and thorium are colored green and bluerespectively. Regions with a high relative potassium content will appear in red color shades on themap. Correspondingly areas with a high relative uranium or thorium content will appear in green orblue shades. Regions with equally balanced radioisotopes will be plotted as gray or white slrdesdepending on the total activity. Ternary maps can almost be read like a geological maps, especiallyin regions with crystalline rocks [1].
4. CONCLUDING REMARKS
The methods developed for processing and correction allow a routine treatment of airborneradiometric data acquired even in areas with high topographic relief. The results for the areasprocessed so far show a very good fit with geology and can be used for geological overview mapping.
FIG. 6. 3D-representation of the direct upward radiation, caused by N'6 at the power plant siteLeibstadt (looking from north-west).
68
The airborne radiometric survey conducted so far covers about ten percent of the area ofSwitzerland. The results of the survey allow to describe the mean radioactivity level in Switzerlandand its variation in broad outline [1]. Together with in situ ground measurements and data from rocksamples the airborne survey can serve as a good base for the compilation of a radiometric (dose rate)map of whole Switzerland including the contributions of artificial isotopes and cosmic radiation.
The measurements in the environs of the Swiss nuclear installations showed that all sites (withthe exception of the Gosgen power plant) can be identified clearly on the MMGC-ratio maps.
P'ig. 5 shows a three dimensional representation of the MMGC-ratio of the surroundings ofWiirenlingen/AG (looking from north east). The two locations of the Paul Scherrer Institute PSI-Ostand PSl-West show up particularly well. The signal is caused by the direct radiation of the storageareas for radioactive components (PSI-West) and radioactive waste (PSI-Ost). The smaller peak iscaused by the Beznau nuclear power plant. The highest peak corresponds to a ground dose rate of2 mSv/a.
At sites of operating boiling water reactors (BWR) the high energy radiation of the activationproduct N16 is clearly visible in the data. The N16 (from the reaction 016 (n,p) N16, T,/2=7.3 s)reaches the machine building through the steam line. Since the roof of this building is comparativelyless shielded, the high energy gamma radiation of the N16 (two gamma ray lines at 6.13 MeV and7.11 MeV) can be detected easily by airborne measurements. The scattered radiation of the emittedN16 quanta can be observed in the whole spectrum. Fig. 6 shows a three dimensional representationof the direct upward radiation, caused by N'6 at the power plant site Leibstadt.
No artificial radioactivity, that could not be explained by Chernobyl or nuclear weapon test,was detected outside of the fenced sites of the nuclear installations. The repeated measurements in thelast four years [2] showed that the radioactivity level in the environs remained more or less constantwithin the measurement errors.
REFERENCES
[11 SCHWARZ, G.F., KLINGELE, E.K., RYBACH, L., Airborne radiometric mapping inSwitzerland, Beitrage zur Geologie der Schweiz, Geophysik Nr.25, SchweizerischeGeophysikalische Kommission (1992a).
[2] SCHWARZ, G.F., KLINGELE, E.K., RYBACH, L., Aeroradiometrische Messungen in derUmgebung der schweizerischen Kernanlagen; Bericht zuhanden der Hauptabteilung fur dieSicherheit der Kernanlagen, Interner Bericht, Institut fur Geophysik ETHZ, Zurich (1989,1990, 1991 and 1992b).
[3] SCHWARZ, G.F., Methodische Entwicklungen zur Aerogammaspektrometrie. Beitrage zurGeologie der Schweiz, Geophysik Nr. 23, Schweizerische Geophysikalische Kommission(1991).
[4] SCHWARZ, G.F., KLINGELE, E.K., RYBACH, L., these Proceedings.[5] KOGAN, R.M., NAZAROV, I.M., FRIDMAN, S.D., Gamma Spectrometry of Natural
Environments and Formations, Atomizdat, Moskau, (English Translation: Israel Program forScientific Translations Ltd., Jerusalem, 1971, Microfiche-TT-70-50092) (1969).
[6] SCHWARZ, G.F., KLINGELE, E.K., RYBACH, L., How to handle rugged topography inairborne gamma-ray spectrometry surveys, First break 10 (1992c) 11-17.
[7] PITKIN, J.A., DUVAL, J.S., Design parameters for aerial gamma-ray surveys, Geophysics45 (1980) 1427-1439.
69
[8] GREEN, A.A., Leveling airborne gamma-radiation data using between-channel correlationinformation. Geophysics 52 (1987) 1557-1562.
[9] HOOVER, R.A., An aerial radiological survey of the River Bend Station and surroundingarea, National Technical Information Service, U.S. Department of Commerce, Springfield(Virginia) (1988).
[10] HABERAECKER, P., Digitale Bildverarbeitung, Grundlagen und Anwendungen. HanserStudienbiicher, Miinchen/Wien (1985).
70
ENVIRONMENTAL APPLICATIONS OF AIRBORNEGAMMA SPECTROMETRY
D ^WJSANDERSON, J.D. ALLYSON, A.N. TYLERSco^fe\Jniversities Research & Reactor Centre,East Kilbride
E.M. SCOTTDepartment of Statistics, University of Glagow, Glasgow
United Kingdom
Abstract
Over the last few years the Scottish Universities Research & Reactor Centre has conducted a programmeof developmental and baseline radiometric surveys aimed at quantifying existing levels of anthropogenic, natural andtechnologically enhanced activity in the environment. This has included an epidemiological study of variations innatural sources, searches for lost sources, a series of surveys of upland areas of the UK affected by the Chernobylaccident, and detailed investigations of the local radiation environment of several nuclear sites. These include theSellafield reprocessing site, the Springfields fuel fabrication plant, and power reactors at Hinkley Point, Trawsfynedd,Calder Hall, Chapelcross and Hunterston. Emergency response plans have been prepared for some sites to providerapid environmental monitoring in the event of an accident. The surveys have been conducted using a combinationof standard geometry prismatic Nal detectors, a thin Nal and Csl scintillation geometry and, most recently Gespectrometers utilized to supplement spectral resolution. Spectrometers have been developed which incorporate """Kgain monitoring, multidetector spectral recording, real time data analysis, and facilities for rapid mapping immediatelyon landing. It has been necessary to extend the international standard (IEC.1992 IAEA,1991) calibration methods toinclude anthropogenic and technologically enhanced natural nuclides. This has been achieved using a combination oflaboratory and field measurements of system parameters together with Monte-Carlo simulation of the spectral responseof airborne gamma spectrometers. The methods developed, and main findings, are described here with an emphasison case studies which demonstrate the ability of aerial radiometrics to define the radiation background and it'scomposition. Examples will be presented illustrating the contributions from aged fallout, Chernobyl derived activity,dynamic signals in the e-;tiiarine and coastal environment, and technologically enhanced natural signals. The resultsare highly complementary to those obtained using ground based methods. However the mobility, cost effectivenessand speed of airborne approaches offer a unique contribution to environmental studies where large scale mapping,inaccessibility, or the presence of dynamic sources limit other approaches.
1. INTRODUCTION
Airborne gamma ray spectrometry has a number of key features of value to studies ofenvironmental radioactivity. The technique originated in uranium exploration and geological mapping,where the abilities to provide effective and economical radiometric data covering large scale surveysof remote areas, and to direct the more costly ground based effort to places of greatest interest, haveproved highly successful [1-6]. The potential of using existing uranium exploration data to define thenatural radiation background has been recognized [7], as have the potential of utilizing standardgeophysical spectrometers [8,9] in source searches [10,11], and in response to accidents [12-15].However recent developments in instrumentation and technique have taken place which considerablyenhance the utility of airborne gamma ray spectrometry methods for resolving and mapping differentcomponents of the radiation environment. These developments have taken place against a post-Chernobyl background of increased appreciation of the importance of recording changes in theradiation environment, of providing clear comparisons between natural and other sources of radiation,and of the need for rapid preparation and dissemination of radiometric results, including underemergency response conditions. This paper aims to show that aerial gamma ray surveys can separateand define natural, anthropogenic and technologically enhanced natural radiation sources in the
71
environment, to highlight the main strengths of this approach, AND to demonstrate its complementarynature to conventional methods. Areas where capabilities have been strengthened by recent technicaldevelopments are indicated together with advances which may be expected to further enhance themethod in the future.
2. METHODS
Conventional environmental core sampling and high resolution laboratory spectrometry canbe highly accurate and sensitive, and are essential for studies of speciation, vertical profiling andmeasurements by alpha, beta or mass spectrometry. However this is an essentially time consumingapproach which is more appropriate to detailed characterization of environmental radioactivity thanto large scale surveys or monitoring schemes. Furthermore since the concentrations of environmentalradionuclides are generally low, core samples may be prone to high subsampling variability, and arenot always representative of the complete ground level radiation environment. In-situ measurementsat ground level can improve spatial averaging, at the expense of knowledge of vertical profile. Onindividual sites in-situ methods can be highly effective; for large scale studies adoption of eitherground based approach inevitably leads to a low sampling density, and can be hampered by localobstacles and hazards (peat bogs, irate bulls, barbed wire etc). In a situation where large scalemapping is required at short notice aerial gamma spectrometry has many advantages.
When a gamma ray spectrometer is elevated above the ground it's field of view [16,17] isenlarged; for high energy photon sources the 90% circle of investigation of a static detector isapproximately 4-5 times the height above ground. In practice useful spectroscopic information is mostreadily available at ground clearances of 100 m or less, although in emergency response conditionshigher altitude flights may still be useful. Thus the signal recorded at 100 m height are spatiallyaveraged over some 1.2 x 10⁵ m2; whereas those from 50 m survey correspond to 3 x 10⁴ m2. Bycontrast ground level spectrometers record a signal from some 50-100 m2, whereas core samplesrepresent perhaps 102 m2. The sampling scale, of some 106-107 times larger than cores, and 102-103
times greater than ground based readings can be extremely beneficial in large scale surveys. Itprovides the means of conducting effectively total environmental sampling, if flight lines are spacedwith parallel separation of a few hundred metres or less. High sensitivity spectrometers capable ofmaking measurements in a few seconds or less from helicopters or fixed wing aircraft, provide themeans to conducting large scale surveys describing the major spatial variations in terrestrialradioactivity distribution with total sampling where needed, and a measurement rate of at least 2orders of magnitude greater than ground based observations. The method of recording data directlytogether with positional and ground clearance information leads to unsurpassed potential for rapidmapping of environmental radioactivity. This is particularly effective in studying remote, or uplandareas where ground based access is limited, or in the estuarine or marine context, where surface levelaccess may be complex or hazardous. The high speed of sampling means that dynamic environmentalsources, for example gaseous or aqueous discharges, or active sedimentary systems can be studied,and short term changes revealed.
A series of developmental and application surveys was initiated at SURRC in 1987, inspiredby the recognition of the scale of the problems posed in attempting to mount an effective ground-based national response to the Chernobyl fallout. The facilities and techniques have been continuallydeveloped through these studies. The earliest work was conducted using large volume cylindricalwhole body monitoring Nal (Tl) detectors from fixed and rotary wing aircraft, together with relativelysimple navigational and recording systems. Since 1989 an array of prismatic Nal detectors wasadopted of standard geophysical geometry. The use of computer-based acquisition systems withmultiple distributed pulse height analyzers has been in use since 1989, allowing direct combinationof spectral data, positional information and radar-altimetry within the primary flight records. On lineGPS, in stand alone (50-100 m precision) and differential (<5m precision) has been used since 1992for navigational purposes. As noted previously in 1990 [18,19] there are many attractions to the
72
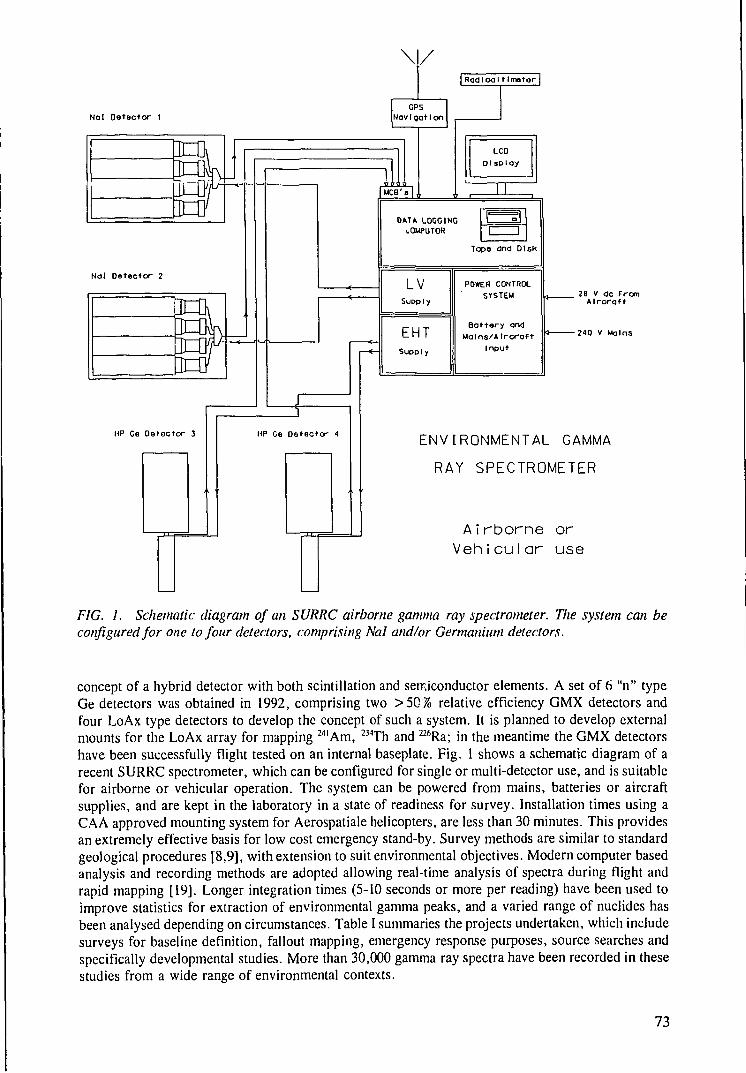
Nal Detector 1
Rod loo It1 meter|
GPSNavigation
Nol Detector 2
HP Ge Detector 3 HP Ce Detector 4
LCDDisplay
OAT* LOGGING<,OMPUTOR
Tope and Disk
LVSupply
EHTSUDD Iy
POWER CONTROLSYSTEM
B a t t e r y andMolns/Alrcroft
Input
28 V dc FromAircraft
•210 V Mains
ENVIRONMENTAL GAMMA
RAY SPECTROMETER
Airborne orVehicular use
FIG. 1. Schematic diagram of an SURRC airborne gamma ray spectrometer. The system can beconfigured for one to four detectors, comprising Nal and/or Germanium detectors.
concept of a hybrid detector with both scintillation and semiconductor elements. A set of 6 "n" typeGe detectors was obtained in 1992, comprising two >50% relative efficiency GMX detectors andfour LoAx type detectors to develop the concept of such a system. It is planned to develop externalmounts for the LoAx array for mapping 24lAm, 234Th and 226Ra; in the meantime the GMX detectorshave been successfully flight tested on an internal baseplate. Fig. 1 shows a schematic diagram of arecent SURRC spectrometer, which can be configured for single or multi-detector use, and is suitablefor airborne or vehicular operation. The system can be powered from mains, batteries or aircraftsupplies, and are kept in the laboratory in a state of readiness for survey. Installation times using aCAA approved mounting system for Aerospatiale helicopters, are less than 30 minutes. This providesan extremely effective basis for low cost emergency stand-by. Survey methods are similar to standardgeological procedures [8,9], with extension to suit environmental objectives. Modern computer basedanalysis and recording methods are adopted allowing real-time analysis of spectra during flight andrapid mapping [19]. Longer integration times (5-10 seconds or more per reading) have been used toimprove statistics for extraction of environmental gamma peaks, and a varied range of nuclides hasbeen analysed depending on circumstances. Table I summaries the projects undertaken, which includesurveys for baseline definition, fallout mapping, emergency response purposes, source searches andspecifically developmental studies. More than 30,000 gamma ray spectra have been recorded in thesestudies from a wide range of environmental contexts.
73
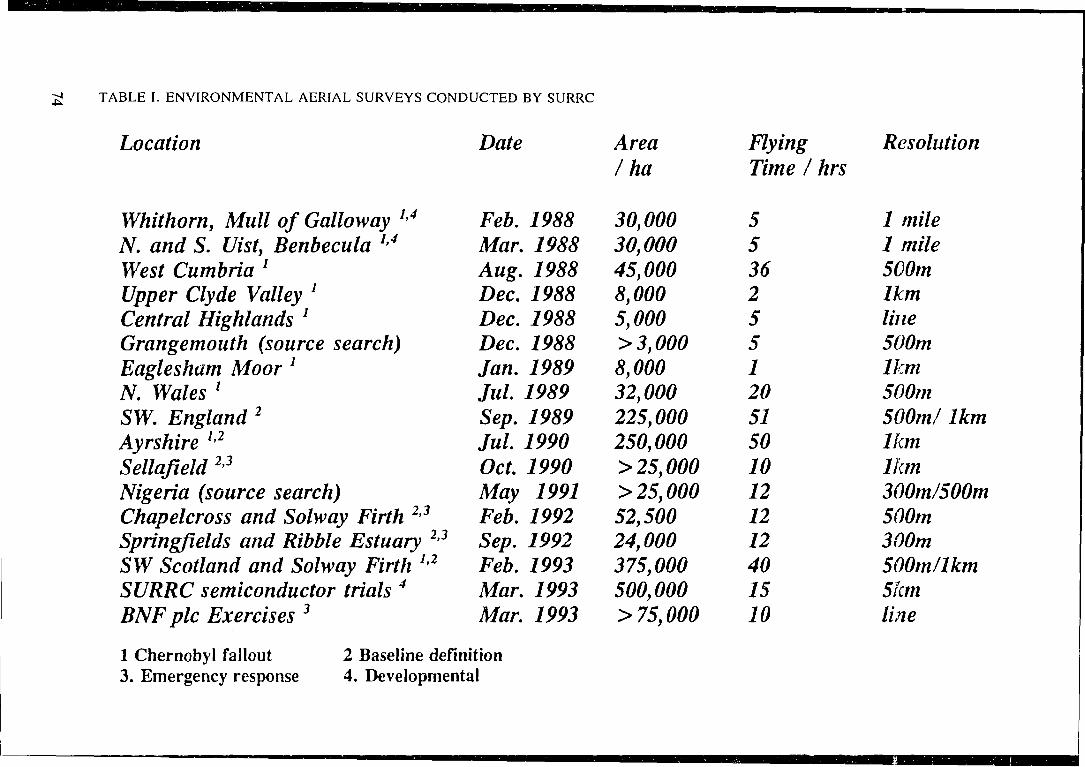
TABLE I. ENVIRONMENTAL AERIAL SURVEYS CONDUCTED BY SURRC
Location
Whithorn, Mull of Galloway 1>4
N. and S. Uist, Benbecula 1>4
West Cumbria 1
Upper Clyde Valley l
Central Highlands !
Grangemouth (source search)Eaglesham Moor 7
N. Wales 'SW. England 2
Ayrshire l>2
Sellafield 2'3
Nigeria (source search)Chapelcross and Solway Firth 2'3
Springfields and Ribble Estuary 2>3
SW Scotland and Solway Firth ia
SURRC semiconductor trials 4
BNF pic Exercises 3
Date
Feb. 1988Mar. 1988Aug. 1988Dec. 1988Dec. 1988Dec. 1988Jan. 1989Jul 1989Sep. 1989Jul 1990Oct. 1990May 1991Feb. 1992Sep. 1992Feb. 1993Mar. 1993Mar. 1993
1 Chernobyl fallout 2 Baseline definition3. Emergency response 4. Developmental
Area/ha
30,00030,00045,0008,0005,000> 3,0008,00032,000225,000250,000> 25,000> 25,00052,50024,000375,000500,000> 75,000
FlyingTime 1 hrs
5536255120515010121212401510
Resolution
1 mile1 mile500mlkmline500mlkm500m500m/ lkm1kmlkm300m/500m500m300m500m/lkm5kmline
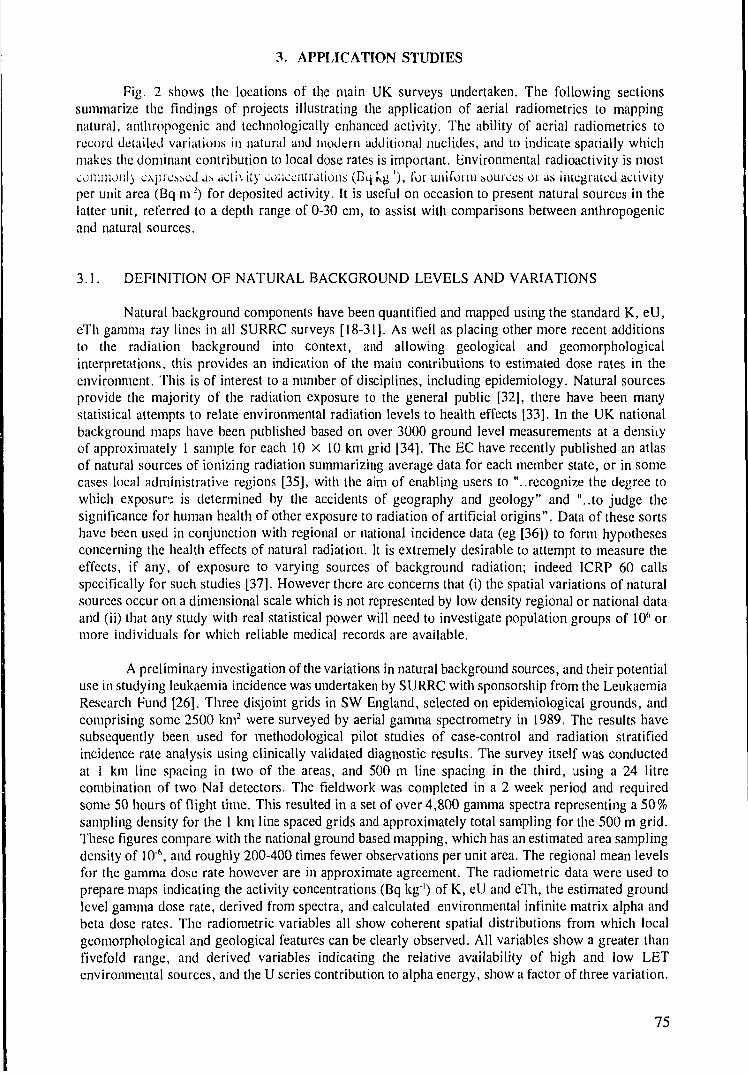
3. APPLICATION STUDIES
Fig. 2 shows the locations of the main UK surveys undertaken. The following sectionssummarize the findings of projects illustrating the application of aerial radiometrics to mappingnatural, anthropogenic and technologically enhanced activity. The ability of aerial radiometrics torecord detailed variations in natural and modern additional nuclides, and to indicate spatially whichmakes the dominant contribution to local dose rates is important. Environmental radioactivity is mostcommon!} expressed as activity concentrations (Bqkg '), for uniform sources or as integrated activityper unit area (Bq nr2) for deposited activity. It is useful on occasion to present natural sources in thelatter unit, referred to a depth range of 0-30 cm, to assist with comparisons between anthropogenicand natural sources.
3.1. DEFINITION OF NATURAL BACKGROUND LEVELS AND VARIATIONS
Natural background components have been quantified and mapped using the standard K, eU,eTh gamma ray lines in all SURRC surveys [18-31]. As well as placing other more recent additionsto the radiation background into context, and allowing geological and geomorphologicalinterpretations, this provides an indication of the main contributions to estimated dose rates in theenvironment. This is of interest to a number of disciplines, including epidemiology. Natural sourcesprovide the majority of the radiation exposure to the general public [32], there have been manystatistical attempts to relate environmental radiation levels to health effects [33]. In the UK nationalbackground maps have been published based on over 3000 ground level measurements at a densityof approximately 1 sample for each 10 x 10 km grid [34]. The EC have recently published an atlasof natural sources of ionizing radiation summarizing average data for each member state, or in somecases local administrative regions [35], with the aim of enabling users to "..recognize the degree towhich exposure is determined by the accidents of geography and geology" and "..to judge thesignificance for human health of other exposure to radiation of artificial origins". Data of these sortshave been used in conjunction with regional or national incidence data (eg [36]) to form hypothesesconcerning the health effects of natural radiation. It is extremely desirable to attempt to measure theeffects, if any, of exposure to varying sources of background radiation; indeed ICRP 60 callsspecifically for such studies [37]. However there are concerns that (i) the spatial variations of naturalsources occur on a dimensional scale which is not represented by low density regional or national dataand (ii) that any study with real statistical power will need to investigate population groups of 106 ormore individuals for which reliable medical records are available.
A preliminary investigation of the variations in natural background sources, and their potentialuse in studying leukaemia incidence was undertaken by SURRC with sponsorship from the LeukaemiaResearch Fund [26]. Three disjoint grids in SW England, selected on epidemiological grounds, andcomprising some 2500 km2 were surveyed by aerial gamma spectrometry in 1989. The results havesubsequently been used for methodological pilot studies of case-control and radiation stratifiedincidence rate analysis using clinically validated diagnostic results. The survey itself was conductedat 1 km line spacing in two of the areas, and 500 m line spacing in the third, using a 24 litrecombination of two Nal detectors. The fieldwork was completed in a 2 week period and requiredsome 50 hours of flight time. This resulted in a set of over 4,800 gamma spectra representing a 50%sampling density for the 1 km line spaced grids and approximately total sampling for the 500 m grid.These figures compare with the national ground based mapping, which has an estimated area samplingdensity of 10A, and roughly 200-400 times fewer observations per unit area. The regional mean levelsfor the gamma dose rate however are in approximate agreement. The radiometric data were used toprepare maps indicating the activity concentrations (Bq kg1) of K, eU and eTh, the estimated groundlevel gamma dose rate, derived from spectra, and calculated environmental infinite matrix alpha andbeta dose rates. The radiometric variables all show coherent spatial distributions from which localgeomorphological and geological features can be clearly observed. All variables show a greater thanfivefold range, and derived variables indicating the relative availability of high and low LETenvironmental sources, and the U series contribution to alpha energy, show a factor of three variation.
75
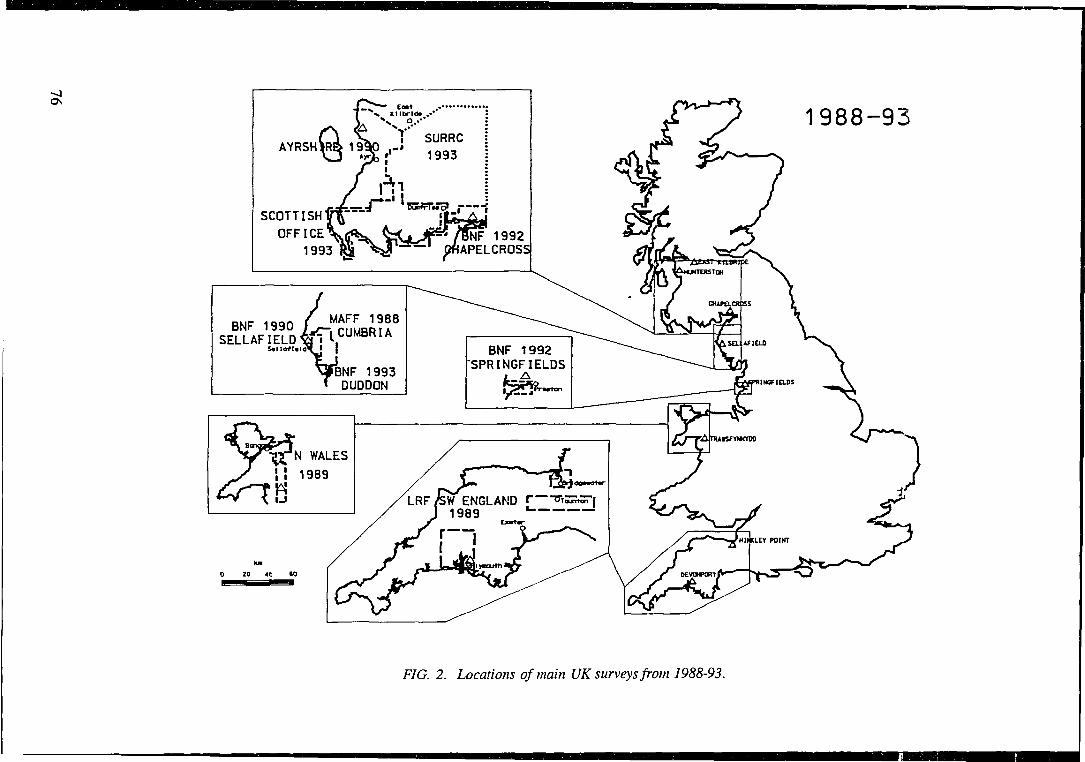
1988-93
SCOTTISHOFFICE
19931992
APELCROSS
MAFF 1988CUMBRIABNF 1990
SELLAFIELDBNF 1992
SPRINGFIELDSABNF 1993
< DUDDON
LRF/SW ENGLAND «1 1989 '
FIG. 2. Locations of main UK surveys from 1988-93.
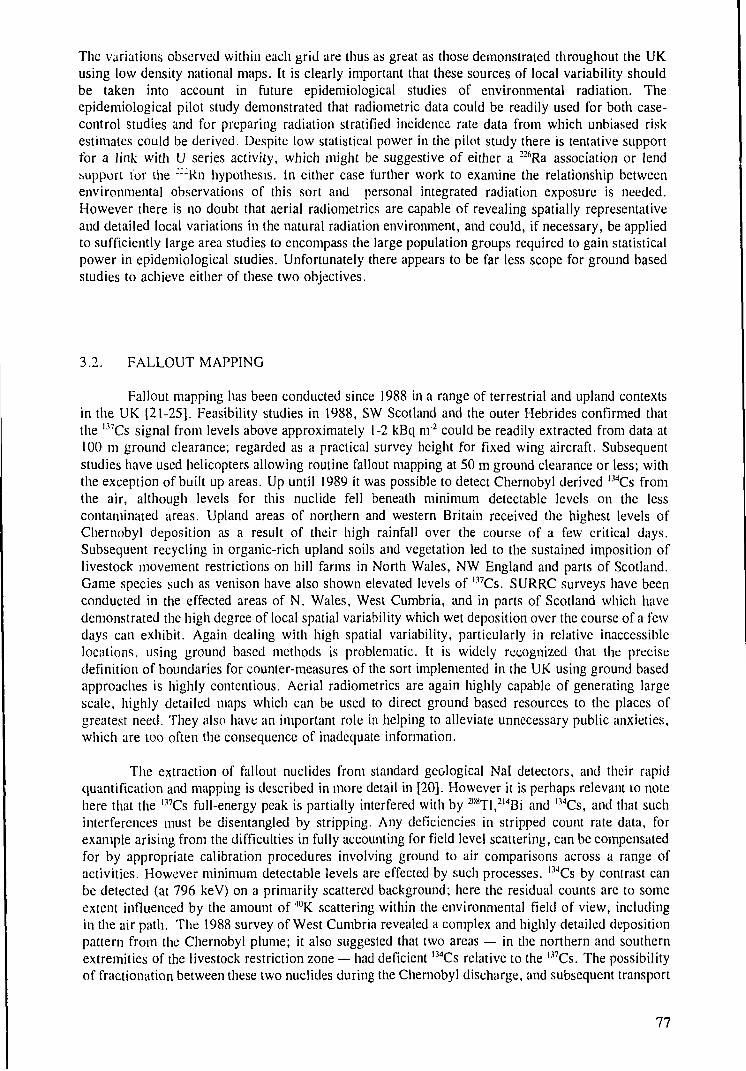
The variations observed within each grid are thus as great as those demonstrated throughout the UKusing low density national maps. It is clearly important that these sources of local variability shouldbe taken into account in future epidemiological studies of environmental radiation. Theepidemiological pilot study demonstrated that radiometric data could be readily used for both case-control studies and for preparing radiation stratified incidence rate data from which unbiased riskestimates could be derived. Despite low statistical power in the pilot study there is tentative supportfor a link with U series activity, which might be suggestive of either a 226Ra association or lendbuppuri tor the :::Rn hypothesis, in either case further work to examine the relationship betweenenvironmental observations of this sort and personal integrated radiation exposure is needed.However there is no doubt that aerial radiometrics are capable of revealing spatially representativeand detailed local variations in the natural radiation environment, and could, if necessary, be appliedto sufficiently large area studies to encompass the large population groups required to gain statisticalpower in epidemiological studies. Unfortunately there appears to be far less scope for ground basedstudies to achieve either of these two objectives.
3.2. FALLOUT MAPPING
Fallout mapping has been conducted since 1988 in a range of terrestrial and upland contextsin the UK [21-25]. Feasibility studies in 1988, SW Scotland and the outer Hebrides confirmed thatthe l37Cs signal from levels above approximately 1-2 kBq nr2 could be readily extracted from data at100 m ground clearance; regarded as a practical survey height for fixed wing aircraft. Subsequentstudies have used helicopters allowing routine fallout mapping at 50 m ground clearance or less; withthe exception of built up areas. Up until 1989 it was possible to detect Chernobyl derived 134Cs fromthe air, although levels for this nuclide fell beneath minimum detectable levels on the lesscontaminated areas. Upland areas of northern and western Britain received the highest levels ofChernobyl deposition as a result of their high rainfall over the course of a few critical days.Subsequent recycling in organic-rich upland soils and vegetation led to the sustained imposition oflivestock movement restrictions on hill farms in North Wales, NW England and parts of Scotland.Game species such as venison have also shown elevated levels of i37Cs. SURRC surveys have beenconducted in the effected areas of N. Wales, West Cumbria, and in parts of Scotland which havedemonstrated the high degree of local spatial variability which wet deposition over the course of a fewdays can exhibit. Again dealing with high spatial variability, particularly in relative inaccessiblelocations, using ground based methods is problematic. It is widely recognized that the precisedefinition of boundaries for counter-measures of the sort implemented in the UK using ground basedapproaches is highly contentious. Aerial radiometrics are again highly capable of generating largescale, highly detailed maps which can be used to direct ground based resources to the places ofgreatest need. They also have an important role in helping to alleviate unnecessary public anxieties,which are too often the consequence of inadequate information.
The extraction of fallout nuclides from standard geological Nal detectors, and their rapidquantification and mapping is described in more detail in [20]. However it is perhaps relevant to notehere that the 137Cs full-energy peak is partially interfered with by ™Tl,214Bi and l34Cs, and that suchinterferences must be disentangled by stripping. Any deficiencies in stripped count rate data, forexample arising from the difficulties in fully accounting for field level scattering, can be compensatedfor by appropriate calibration procedures involving ground to air comparisons across a range ofactivities. However minimum detectable levels are effected by such processes. l34Cs by contrast canbe detected (at 796 keV) on a primarily scattered background; here the residual counts are to someextent influenced by the amount of '"'K scattering within the environmental field of view, includingin the air path. The 1988 survey of West Cumbria revealed a complex and highly detailed depositionpattern from the Chernobyl plume; it also suggested that two areas — in the northern and southernextremities of the livestock restriction zone — had deficient l34Cs relative to the i37Cs. The possibilityof fractionation between these two nuclides during the Chernobyl discharge, and subsequent transport
77
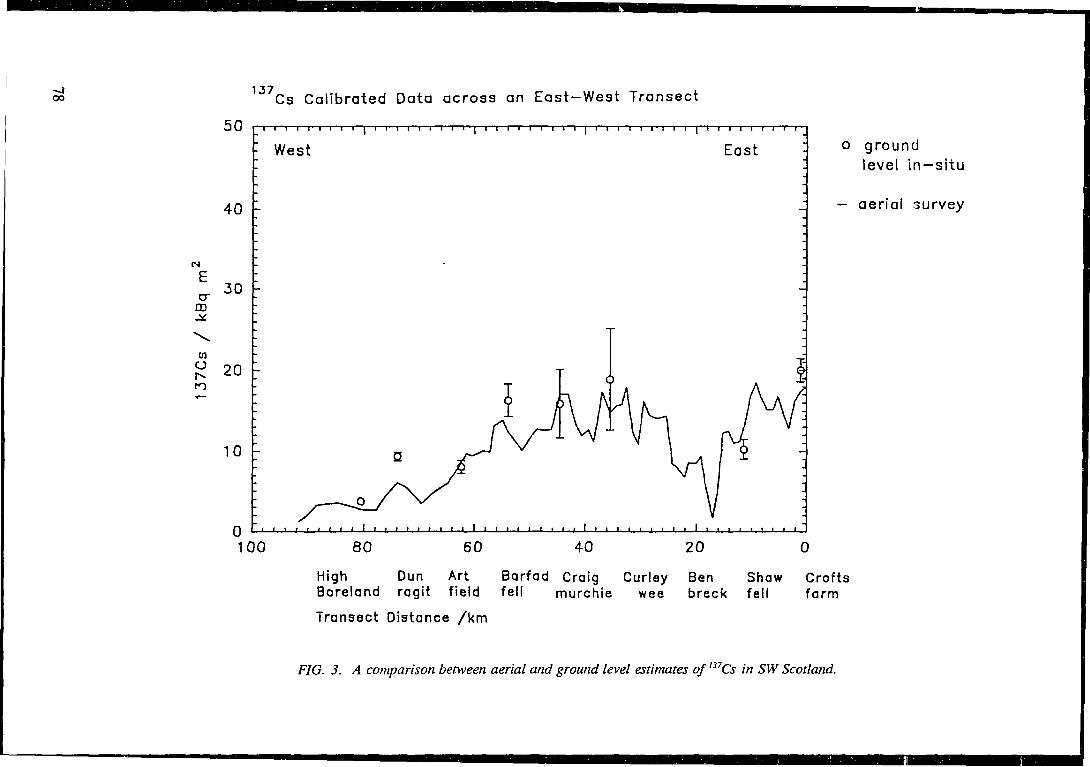
OO137 Cs Calibrated Data across an East—West Transect
100 40 20
o groundlevel i n -s i tu
— aerial survey
0
High Dun Art Barfad Craig Curley Ben Shaw CroftsBoreland ragit field fell murchie wee breck fell farm
Transect Distance /km
FIG. 3. A comparison between aerial and ground level estimates of l37Cs in SW Scotland.
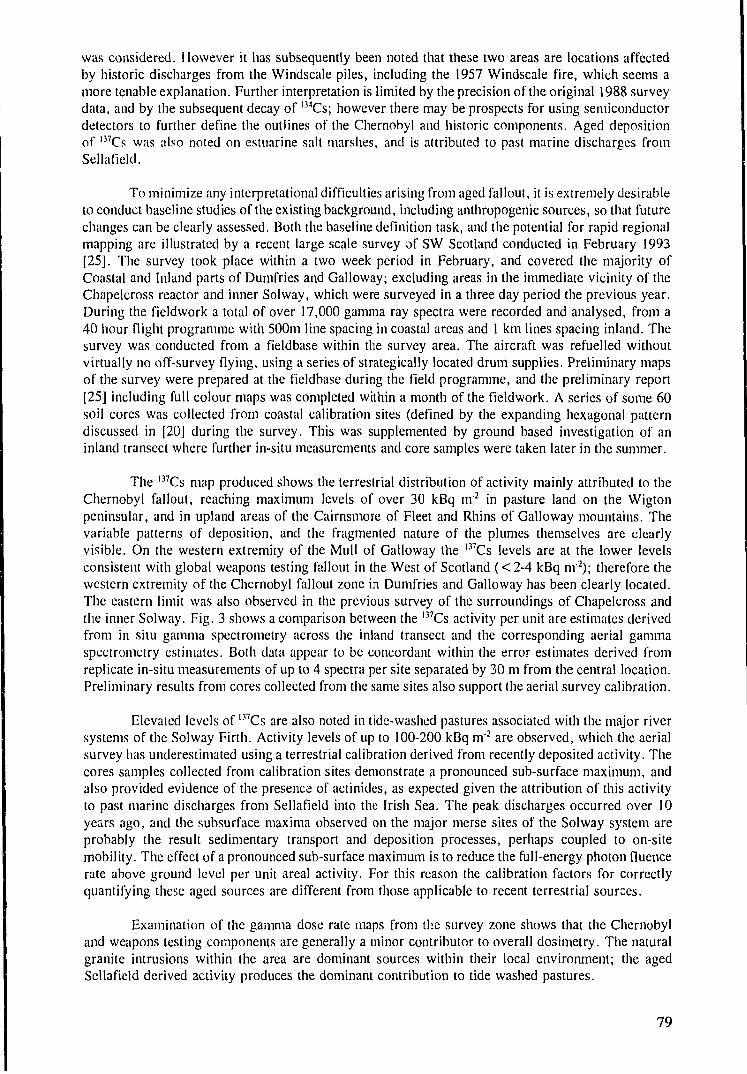
was considered. However it has subsequently been noted that these two areas are locations affectedby historic discharges from the Windscale piles, including the 1957 Windscale fire, which seems amore tenable explanation. Further interpretation is limited by the precision of the original 1988 surveydata, and by the subsequent decay of l34Cs; however there may be prospects for using semiconductordetectors to further define the outlines of the Chernobyl and historic components. Aged depositionof l37Cs was also noted on estiiarine salt marshes, and is attributed to past marine discharges fromSellafield.
To minimize any interpretational difficulties arising from aged fallout, it is extremely desirableto conduct baseline studies of the existing background, including anthropogenic sources, so that futurechanges can be clearly assessed. Both the baseline definition task, and the potential for rapid regionalmapping are illustrated by a recent large scale survey of SW Scotland conducted in February 1993[25]. The survey took place within a two week period in February, and covered the majority ofCoastal and Inland parts of Dumfries and Galloway; excluding areas in the immediate vicinity of theChapelcross reactor and inner Solway, which were surveyed in a three day period the previous year.During the fieldwork a total of over 17,000 gamma ray spectra were recorded and analysed, from a40 hour flight programme with 500m line spacing in coastal areas and 1 km lines spacing inland. Thesurvey was conducted from a fieldbase within the survey area. The aircraft was refuelled withoutvirtually no off-survey flying, using a series of strategically located drum supplies. Preliminary mapsof the survey were prepared at the fieldbase during the field programme, and the preliminary report[25] including full colour maps was completed within a month of the fieldwork. A series of some 60soil cores was collected from coastal calibration sites (defined by the expanding hexagonal patterndiscussed in [20] during the survey. This was supplemented by ground based investigation of aninland transect where further in-situ measurements and core samples were taken later in the summer.
The l37Cs map produced shows the terrestrial distribution of activity mainly attributed to theChernobyl fallout, reaching maximum levels of over 30 kBq m2 in pasture land on the Wigtonpeninsular, and in upland areas of the Cairnsmore of Fleet and Rhins of Galloway mountains. Thevariable patterns of deposition, and the fragmented nature of the plumes themselves are clearlyvisible. On the western extremity of the Mull of Galloway the l37Cs levels are at the lower levelsconsistent with global weapons testing fallout in the West of Scotland (<2-4 kBq nr2); therefore thewestern extremity of the Chernobyl fallout zone in Dumfries and Galloway has been clearly located.The eastern limit was also observed in the previous survey of the surroundings of Chapelcross andthe inner Solway. Fig. 3 shows a comparison between the l37Cs activity per unit are estimates derivedfrom in situ gamma spectrometry across the inland transect and the corresponding aerial gammaspectrometry estimates. Both data appear to be concordant within the error estimates derived fromreplicate in-situ measurements of up to 4 spectra per site separated by 30 m from the central location.Preliminary results from cores collected from the same sites also support the aerial survey calibration.
Elevated levels of l37Cs are also noted in tide-washed pastures associated with the major riversystems of the Solway Firth. Activity levels of up to 100-200 kBq nr2 are observed, which the aerialsurvey has underestimated using a terrestrial calibration derived from recently deposited activity. Thecores samples collected from calibration sites demonstrate a pronounced sub-surface maximum, andalso provided evidence of the presence of actinides, as expected given the attribution of this activityto past marine discharges from Sellafield into the Irish Sea. The peak discharges occurred over 10years ago, and the subsurface maxima observed on the major merse sites of the Solway system areprobably the result sedimentary transport and deposition processes, perhaps coupled to on-sitemobility. The effect of a pronounced sub-surface maximum is to reduce the full-energy photon fluencerate above ground level per unit areal activity. For this reason the calibration factors for correctlyquantifying these aged sources are different from those applicable to recent terrestrial sources.
Examination of the gamma dose rate maps from the survey zone shows that the Chernobyland weapons testing components are generally a minor contributor to overall dosimetry. The naturalgranite intrusions within the area are dominant sources within their local environment; the agedSellafield derived activity produces the dominant contribution to tide washed pastures.
79
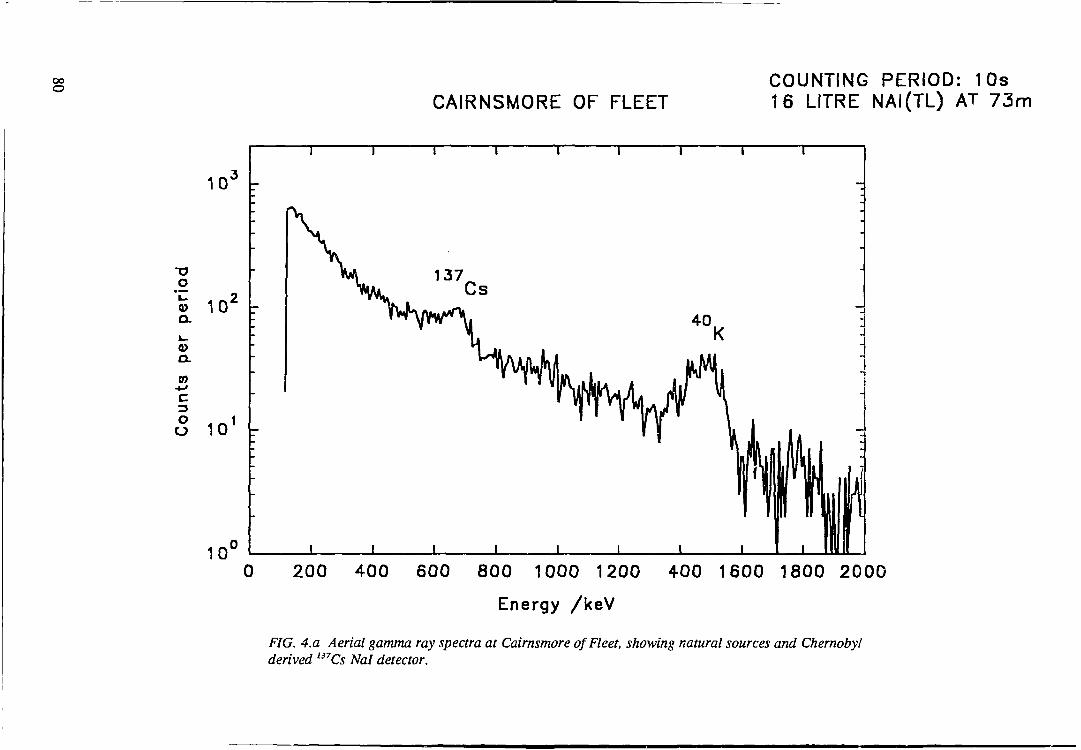
COO
CAIRNSMORE OF FLEETCOUNTING PERIOD: 10s16 LITRE NAI(TL) AT 73rn
10'
• oo"* 102
Q.
Q>a.mc
-
•
-
-
S 101
T r
40K
0 200 400 600 800 1000 1200 400 1600 1800 2000
Energy /keV
FIG. 4.a Aerial gamma ray spectra at Cairnsmore of Fleet, showing natural sources and Chernobylderived 137Cs Nal detector.
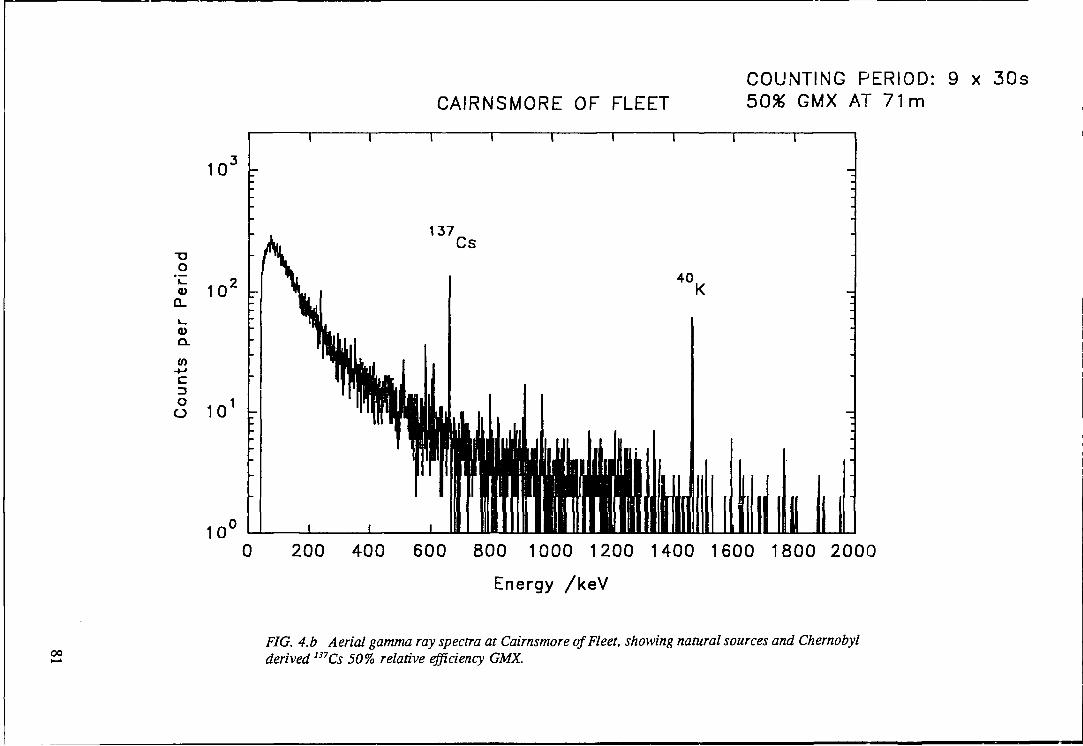
1CT r
O
Q_
(0
-M
c
I 101
10'
CAIRNSMORE OF FLEETCOUNTING PERIOD: 9 x 30s50% GMX AT 71m
0 200 400 600 800 1000 1200 1400 1600 1800 2000
Energy /keV
FIG. 4.b Aerial gamma ray spectra at Cairnsmore of Fleet, showing natural sources and Chernobylderived 137Cs 50% relative efficiency GMX.
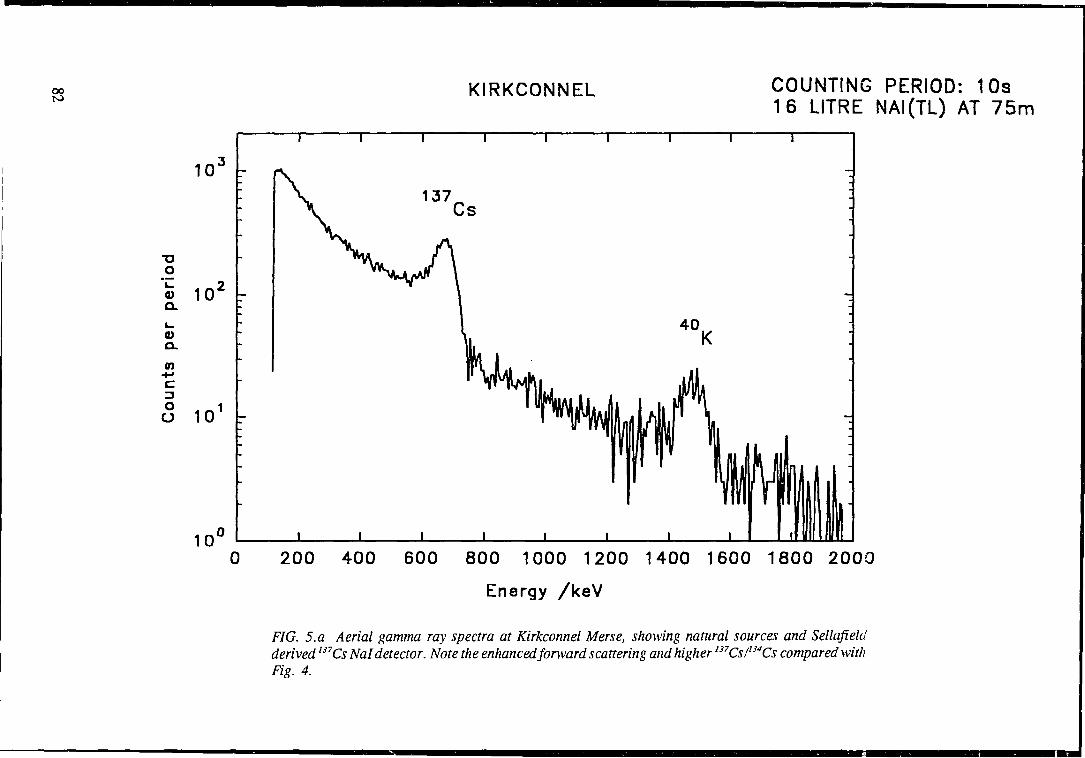
oo
T3O
10° r
102
0)
mc
5 101
10'0
KIRKCONNEL COUNTING PERIOD: 10s16 LITRE NAI(TL) AT 75m
200 400 600 800 1000 1200 1400 1600 1800 2000
Energy /keV
FIG. 5.a Aerial gamma ray spectra at Kirkconnel Merse, showing natural sources and Sellafieldderived 137Cs Nal detector. Note the enhanced forward scattering and higher 137CsflMCs comparedwithFig. 4.
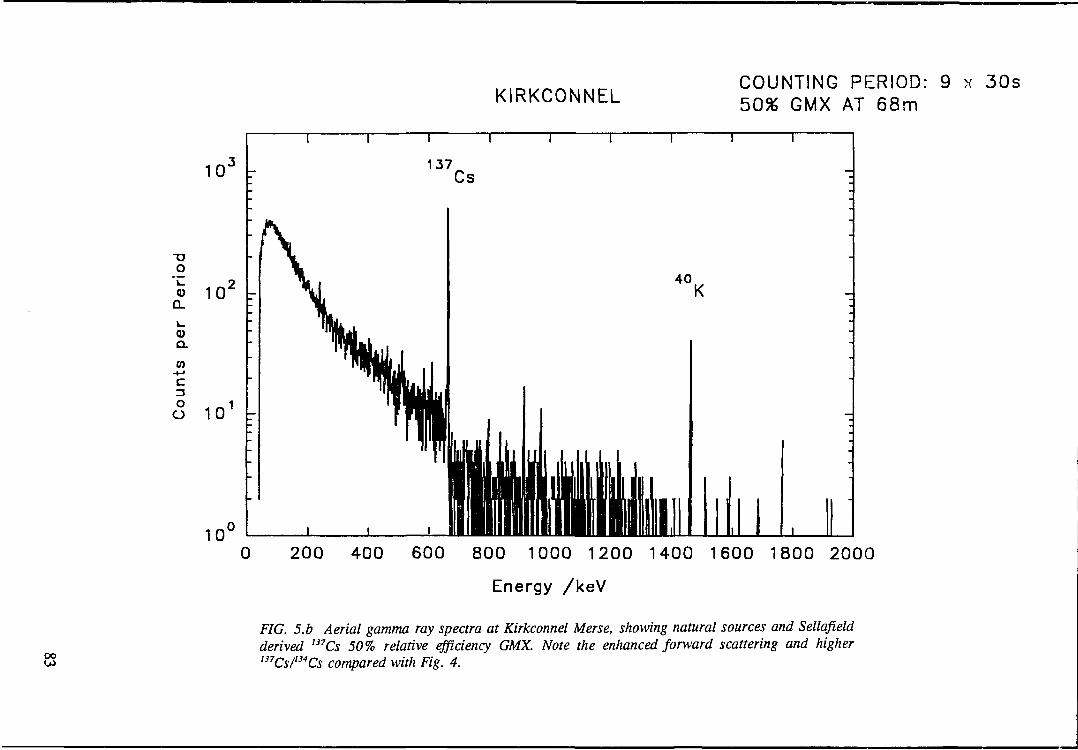
10'
a.
enc
5 101
100
KIRKCONNELCOUNTING PERIOD: 9 x 30s50% GMX AT 68m
200 400 600 800 1000 1200 1400 1600 1800 2000
Energy /keV
oo
FIG. 5.b Aerial gamma ray spectra at Kirkconnel Merse, showing natural sources and Sellafieldderived 137Cs 50% relative efficiency GMX. Note the enhanced forward scattering and higher137Cs/1S4Cs compared with Fig. 4.
Separate flight trials of a composite Nal, Ge spectrometer were conducted in SW Scotlandand NW England by SURRC in late March, demonstrating the successful operation of such a systemfrom a helicopter. There are encouraging signs that the semiconductor data may be of use indistinguishing between aged and recent anthropogenic activity. Examples of spectra recorded fromboth detectors at aerial survey heights above Cairnsmore of Fleet (predominantly Chernobyl) andKirkconnel Merse (aged Sellafield marine discharge) are shown in Figs 4 and 5 respectively. Despitethe lower count rates the semiconductor spectra add considerable information. The 137Cs peak at662 keV is clearly resolved from 2l1Bi at 609 keV and 3nsTI and 583 keV. It is still possible to discernthe 796 keV l34Cs signal on both sites, and to recognize tlie different ratio arising from the distinctbouicc age. Fuiihennoie the enhanced levels of scattering, and particularly forward scatteringassociated with the aged 137Cs source can be clearly identified in the semiconductor spectra, andthereafter recognized in the Nal spectra from the tide washed pasture. This leads to importantpossibilities for recognizing buried profiles using aerial survey results alone, and potentially forcorrecting calibration factors using scattered information.
It is clear that aerial radiometrics can provide detailed regional mapping which producesconcordant results with ground based measurements. It is further notable that the fieldwork timescaleto map the complete region was similar to that needed to investigate a single upland transect of some12 sites using ground based methods. Quantitative interpretation using Nal detector depends onunderstanding the recent and aged sources within the mapping zone, which at present is approachedby considered sampling during and after the survey. However there are signs that semiconductordetectors may be of assistance, both in reliable identification of individual nuclides in complexspectra, and potentially in recognizing and correcting for source burial effects on calibration.
3.3. ENVIRONMENTAL RADIOACTIVITY NEAR NUCLEAR SITES
Several SURRC surveys have incidentally included the environment of nuclear sites; forexamples the Trawsfynydd, Hinkley Point and Hunterston power stations, and the Devonport NavalDockyard fell within the scope of fallout mapping and general baseline studies. Where necessarypermission to fly within air exclusion zones was obtained to enable off-site mapping.
More specific surveys of the environment of BNF nuclear sites have been conducted to defineexisting levels as part of an emergency response development programme. As has been pointed outthe self powered spectrometers developed by SURRC can be rapidly installed in helicopters, anddeployed within the time span of a few hours. Maintaining spectrometric equipment in a state readyfor use is in many ways more effective in a laboratory environment than as part of a permanentinstallation in an aircraft. This minimizes delays due to aircraft unavailability, and reduces the needfor regular spectrometer inspection and servicing in an aircraft hangar. Adoption of this model foremergency response purposes thus leads to an extremely economic, and effective way of providingfor the eventuality of needing a survey at short notice. At present SURRC maintains two independentsystems in flight ready condition. Baseline surveys of the Sellafield Works and Calder Hall reactors,of the Chapelcross reactor site, and of the Springfields fuel fabrication plant have been conducted.Rapid response plans have also been prepared for the reactor sites and exercised. The approachadopted is to prepare a flight path which encircles the site at 10 km, 5 km and 2 km distances —based on a series of waypoints which could be recognized visually in the event of failure ofnavigational instruments. In the event of an incident involving the release of activity from the sitesan aerial survey could be mobilized immediately following deposition (thus minimizing risks ofcontaminating the aircraft). The initial exploratory approach to the site can be conducted within 45minutes flying time, and would identify trajectories for further investigation, such as retrospectiveplume tracking.
The detailed investigations of nuclear sites have, unsurprisingly, shown local radiation fieldsdue to the sites. Magnox reactors in particular show readily detectable signals from 4lAr and I6N, plus
84
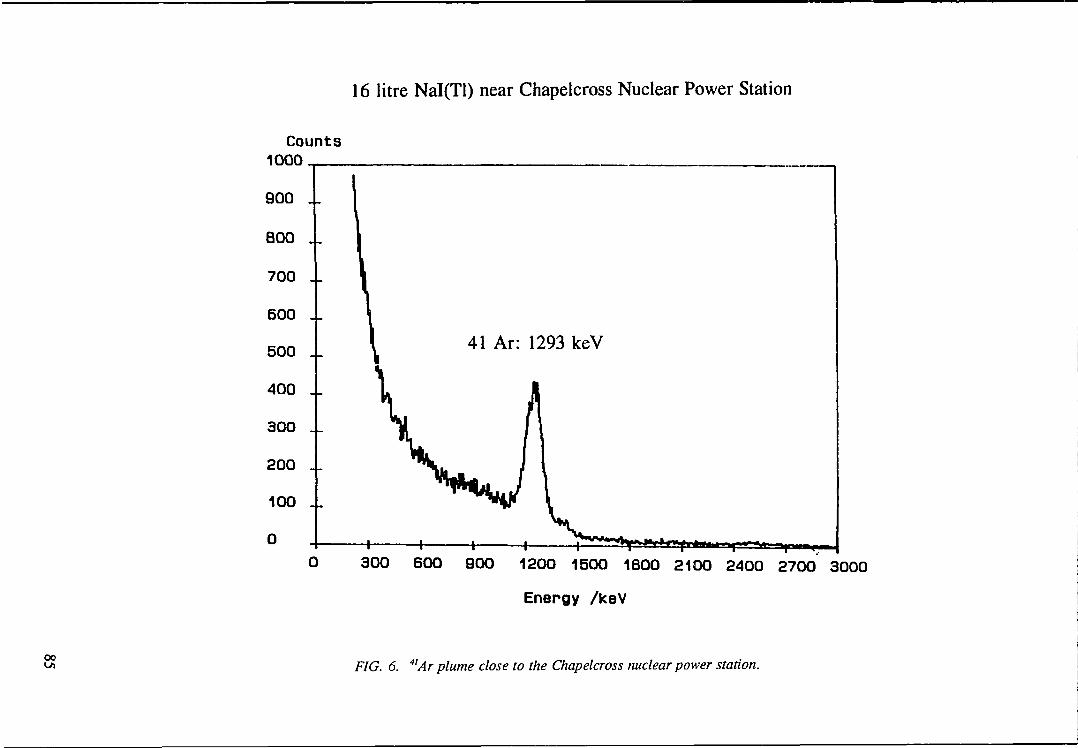
16 litre Nal(Tl) near Chapelcross Nuclear Power Station
Counts1000
900 ..
BOO ..
700 ..
600 ..
500 ..
400 ..
300 ..
200 ..
100 ..
0 -+•
41 Ar: 1293 keV
300 600 900H 1 - | -T I - I " | I B I I — - H " ii tftmrn^,
1200 1500 1800 2100 2400 2700 3000
Energy /keV
oo FIG. 6. 4lAr plume close to the Chapelcross nuclear power station.

occasional evidence of residual activity due to fuel handling. Two spectral examples of such signalsare presented in Figs 6 and 7, showing the 41Ar plume close to the Chapelcross site recorded in 1992[28], and a signal recorded near the Hunterston "A" station during baseline mapping in 1990. Thesecond of these shows clear evidence of both l37Cs and "'Co, recorded above a field adjacent to theMagnox station after it had ceased operation. On further investigation in collaboration with ScottishNuclear [24] it was possible to show that the signal was due to contained activity within an unshieldedpipe on-sitc, which was part of a water treatment facility designed to remove low level radioactivityfrom cooling pond water.
The environment of AGR-only stations in the UK has not been investigated in detail, althoughno anomalies due to the Hunterston B station were detected off-site in 1990. The local radiationenvironment of nuclear sites can be investigated effectively within a single day, producing maps whichclearly reveal any local radiation or contamination signals. The incorporation of aerial radiometricswithin routine discharge monitoring and environmental quality assurance programmes could play animportant additional role in assuring the public that well designed and operated nuclear facilities neednot result in extensive environmental contamination.
HUNTERSTON PRECIPITATOR PLANT 1990
16 LITRE NAI(TL) ARRAY
1500 r-rr-T
1000 -
Q .
oO 500 -
00 100 200 300 400 500
Channel number
FIG. 7. U7Cs and MCo signals recorded dose to the Hunterston "A " station in 1990.
86
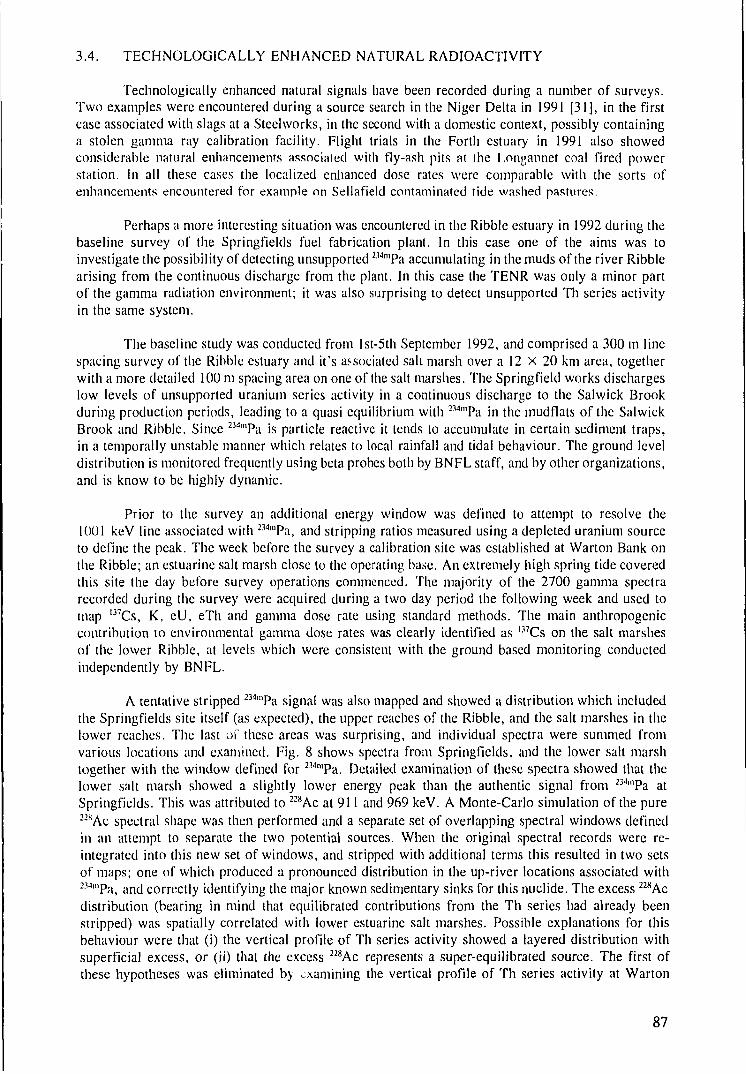
3.4. TECHNOLOGICALLY ENHANCED NATURAL RADIOACTIVITY
Technologically enhanced natural signals have been recorded during a number of surveys.Two examples were encountered during a source search in the Niger Delta in 1991 [31], in the firstcase associated with slags at a Steelworks, in the second with a domestic context, possibly containinga stolen gamma ray calibration facility. Flight trials in the Forth estuary in 1991 also showedconsiderable natural enhancements associated with fly-ash pits at the Longannet coal Fired powerstation. In all these cases the localized enhanced dose rates were comparable with the sorts ofenhancements encountered for example on Sellafield contaminated tide washed pastures.
Perhaps a more interesting situation was encountered in the Ribble estuary in 1992 during thebaseline survey of the Springfields fuel fabrication plant. In this case one of the aims was toinvestigate the possibility of detecting unsupported 2MlllPa accumulating in the muds of the river Ribblearising from the continuous discharge from the plant. In this case the TENR was only a minor partof the gamma radiation environment; it was also surprising to detect unsupported Th series activityin the same system.
The baseline study was conducted from lst-5th September 1992, and comprised a 300 m linespacing survey of the Ribble estuary and it's associated salt marsh over a 12 x 20 km area, togetherwith a more detailed 100 m spacing area on one of the salt marshes. The Springfield works dischargeslow levels of unsupported uranium series activity in a continuous discharge to the Salwick Brookduring production periods, leading to a quasi equilibrium with 234mPa in the mudflats of the SalwickBrook and Ribble. Since 234mPa is particle reactive it tends to accumulate in certain sediment traps,in a temporally unstable manner which relates to local rainfall and tidal behaviour. The ground leveldistribution is monitored frequently using beta probes both by BNFL staff, and by other organizations,and is know to be highly dynamic.
Prior to the survey an additional energy window was defined to attempt to resolve the1001 keV line associated with 2Ml"Pa, and stripping ratios measured using a depleted uranium sourceto define the peak. The week before the survey a calibration site was established at Warton Bank onthe Ribble; an estuarine salt marsh close to the operating base. An extremely high spring tide coveredthis site the day before survey operations commenced. The majority of the 2700 gamma spectrarecorded during the survey were acquired during a two day period the following week and used tomap l37Cs, K, eU, eTh and gamma dose rate using standard methods. The main anthropogeniccontribution to environmental gamma dose rates was clearly identified as l37Cs on the salt marshesof the lower Ribble, at levels which were consistent with the ground based monitoring conductedindependently by BNFL.
A tentative stripped 234mPa signal was also mapped and showed a distribution which includedthe Springfields site itself (as expected), the upper reaches of the Ribble, and the salt marshes in thelower reaches. The last of these areas was surprising, and individual spectra were summed fromvarious locations and examined. Fig. 8 shows spectra from Springfields, and the lower salt marshtogether with the window defined for 234mPa. Detailed examination of these spectra showed that thelower salt marsh showed a slightly lower energy peak than the authentic signal from 2MmPa atSpringfields. This was attributed to 22sAc at 911 and 969 keV. A Monte-Carlo simulation of the pure"sAc spectral shape was then performed and a separate set of overlapping spectral windows definedin an attempt to separate the two potential sources. When the original spectral records were re-integrated into this new set of windows, and stripped with additional terms this resulted in two setsof maps; one of which produced a pronounced distribution in the up-river locations associated with2Wr"Pa, and correctly identifying the major known sedimentary sinks for this nuclide. The excess 228Acdistribution (bearing in mind that equilibrated contributions from the Th series had already beenstripped) was spatially correlated with lower estuarine salt marshes. Possible explanations for thisbehaviour were that (i) the vertical profile of Th series activity showed a layered distribution withsuperficial excess, or (ii) that the excess 228Ac represents a super-equilibrated source. The first ofthese hypotheses was eliminated by examining the vertical profile of Th series activity at Warton
87
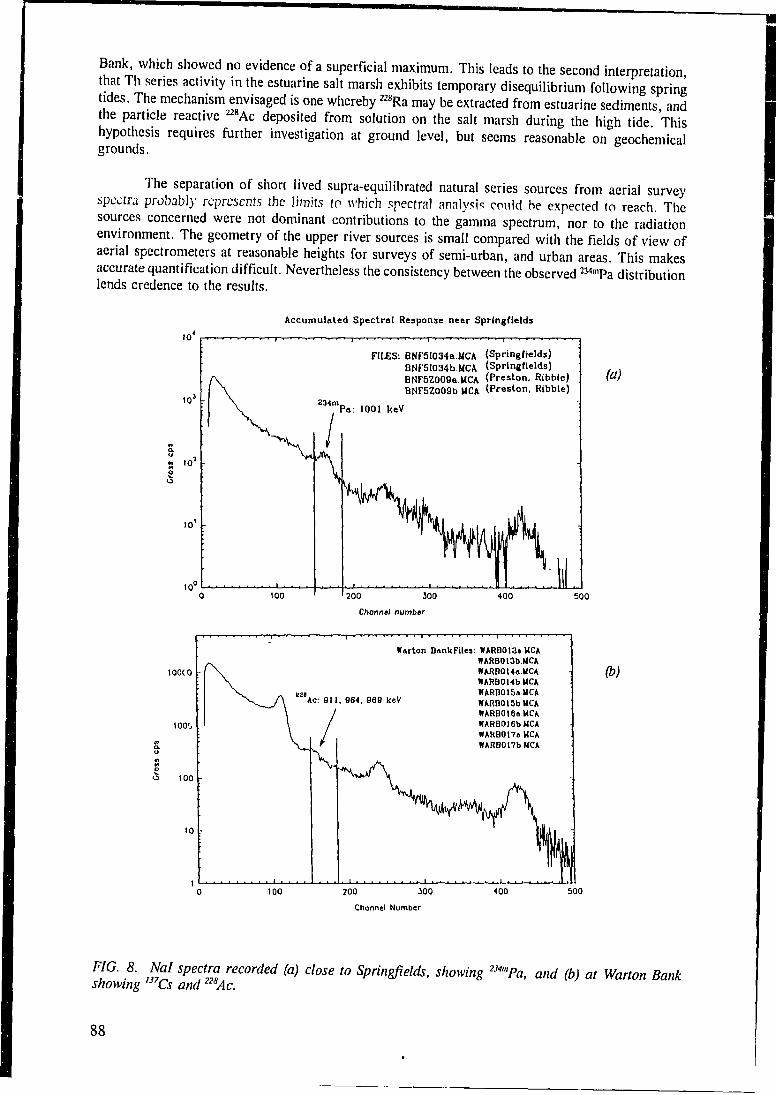
Bank, which showed no evidence of a superficial maximum. This leads to the second interpretationthat Th series activity in the estuarine salt marsh exhibits temporary disequilibrium following springtides. The mechanism envisaged is one whereby 228Ra may be extracted from estuarine sediments andthe particle reactive ""Ac deposited from solution on the salt marsh during the high tide Thishypothesis requires further investigation at ground level, but seems reasonable on geochemicalgrounds.
The separation of short lived supra-equilibrated natural series sources from aerial surveyspectra probably represents (he limits to which spectral analysis could be expected to reach. Thesources concerned were not dominant contributions to the gamma spectrum, nor to the radiationenvironment. The geometry of the upper river sources is small compared with the fields of view ofaerial spectrometers at reasonable heights for surveys of semi-urban, and urban areas. This makesaccurate quantification difficult. Nevertheless the consistency between the observed 234mPa distributionlends credence to the results.
Accumulated Spectral Response near Springfietds
FILES: BNF5I034a.MCA (Springtields)BNF5I034b.UCA (Sprlngflelds)BNF5Z009a.WCA (Preston, Ribble)BNF5Z009b MCA (Preston, Ribble)
234mPa; 1001 keV
10
10'
(a)
200 300
Channel number
400 500
100CO
1000
IflQ.u¥1
oo 100
10
i
N.
\ ^
^ \ . - 820\ ^ _ _ A Ac: 911
\ /\ /\ /
f
V
Warton BankFiles: WARB013a MCAHARBOiab.MCAWARBOUo.UCANARBOMbHCAWARBOI5aMCA
. 9 6 4 . 969 keV WARBOlSb MCANARB016aMCAWARBOISbUCAWARB017aMCAWARBOHbMCA
%
(b)
100 200 300
Channel Number
400 500
FIG. 8. Nal spectra recorded (a) close to Springfields, showing 234mPa, and (b) at Warton Bankshowing l37Cs and 228Ac.
88

It appears therefore that aerial radiometrics are not only able to detect pronouncedtechnologically enhanced nuclides, but also to map subtle disequilibria in both uranium and thoriumseries in timescales which are meaningful compared with the environmental dynamics of tidally drivensystems. This also represents a considerable potential capability for investigating environmentalsystems.
4. DISCUSSION AND CONCLUSIONS
The main strengths of aerial gamma ray spectrometry arise from its ability to produce rapidand large scale data sets which are spatially representative of the total environment. In naturalmapping there is considerable potential for utilizing these methods to produce background radiationmaps which reveal the inherent variability of environmental fields, such information may be ofinterest to epidemiological studies. By extending the recording and analytical methods to include thecapacity for fallout mapping, unique capabilities for investigating remote upland areas are available.Data can be recorded at a rate which is at least 2 orders of magnitude greater than ground basedstudies, and can be used to produce complete maps of the deposition patterns of aged and recentfallout in short timescales. This has important implications for both definition of existing levels, andfor measuring future changes. The results are compatible with ground based estimates. The samebenefits may be applied to definition of the environments of nuclear sites. While nuclear site maypresent local radiation enhancements, their impact on a wider scale can be readily appreciated byrelatively short scale surveys. The emergency response potential is clear. Finally aerial surveymethods are also able to put technologically enhanced natural sources into context, and to recorddynamic environmental systems where temporary disequilibria may exist for natural or technologicalreasons.
REFERENCES
[I] DARNLEY, A.G., Airborne gamma ray survey techniques — present and future, UraniumExploration Methods, IAEA, Vienna, 67 (1973).
[2] INTERNATIONAL ATOMIC ENERGY AGENCY, Recommended Instrumentation forUranium and Thorium exploration, Technical Report Series No. 158, Vienna (1974).
[3] GRASTY, R.L., Uranium measurement by airborne gamma-ray spectrometry, Geophysics40, 503-519 (1975).
[4] INTERNATIONAL ATOMIC ENERGY AGENCY, Radiometric reporting methods andcalibration in uranium exploration, Technical Report Series No. 174, IAEA, Vienna (1976).
[5] INTERNATIONAL ATOMIC ENERGY AGENCY, Gamma ray surveys in uraniumexploration, Technical Report Series No. 186, IAEA, Vienna (1979).
[6] INTERNATIONAL ATOMIC ENERGY AGENCY, Construction and use of calibrationfacilities for radiometric field equipment, Technical Report Series No. 309, IAEA, Vienna(1989).
[7] INTERNATIONAL ATOMIC ENERGY AGENCY, The use of gamma ray data to definethe natural radiation environment, IAEA-TECDOC-566, Vienna (1990).
[8] INTERNATIONAL ATOMIC ENERGY AGENCY, Airborne gamma ray spectrometersurveying, Technical Reports Series No. 323, IAEA, Vienna (1991).
[9] IEC, Airborne Instrumentation for Measurement of Terrestrial Gamma Radiation, IEC 1134,International Electrotechnical Commission, Geneva (1992).
[10] DEAL, L.J., DOYLE, J.F., BURSON, Z.G., BOYNS, P.K., Locating the lost Athenamissile in Mexico by the Aerial Radiological Measuring System (ARMS), Health Physics 23,95 (1968).
[II] GRASTY, R.L., The search for Cosmos 954, in "Search Theory and Applications", ed.Hevlev and Stone, Plenum Publishing Corporation, New York (1980).
89
[12] WILLIAMS, P., Cambray, R.S., Maskell, S.C.. An airborne radiometric survey of theWindscale area, October 19-22nd, AERE report R-2890 (1957).
[13] CHAMBERLAIN, A.C., GARNER, R.J., WILLIAMS, D., Environmental monitoring afteraccidental deposition of radioactivity, Reactor Science and Technology 14, 155-167 (1961).
[14] LINDEN, A., MELLANDER, H., Airborne measurements in Sweden of the radioactivefallout after the nuclear accident in Chernobyl, TFRAP 8606 (1986).
[15] MELLANDER, H., Airborne gamma spectrometric measurements of the fallout over Swedenafter the nuclear reactor accident at Chernobyl USSR, IAEA'NENF'NM-80-1 (]OW)
[16] DUVAL, J.S., COOK, B., ADAMS, J.A.S., Circle of investigation of an airborne gammaray spectrometer, J. Geophys. Res. 76, 8466-8470 (1971).
[17] GRASTY, R.L., KOSANKE, K.L., FOOTE, R.S., Fields of view of airborne gamma raydetectors, Geophysics 44 (8), 1444-1457 (197^;.
[18] SANDERSON, D.C.W., SCOTT, E.M., BAXTER, M.S., The Use and potential of AerialRadiometrics for Monitoring Water Resource Contamination, in "Nuclear Contamination ofWater Resources", Thomas Telford, London, pp 99-106 (1990a).
[19] SANDERSON, D.C.W., SCOTT, E.M., BAXTER, M.S., Use of airborne radiometricmeasurements for monitoring environmental radioactive contamination, IAEA SM-306/138,411-421, IAEA, Vienna (1990b).
[20] SANDERSON, D.C.W., ALLYSON, J.D.,TYLER, A.N., Rapid quantification and mappingof radiometric data for anthropogenic and technologically enhanced natural nuclides, Thismeeting (1993).
[21] SANDERSON, D.C.W, SCOTT, E.M., BAXTER, M.S., PRESTON, T., A feasibility studyof the use of airborne radiometric survey for UK fallout, SURRC report (1988).
[22] SANDERSON, D.C.W., SCOTT, E.M., Aerial Radiometric Survey in West Cumbria in1988, MAFF Report N611 and Technical Annex (1989) 120p.
[23] SANDERSON, D.C.W., EAST, B.W. SCOTT, E.M., Aerial Radiometric Survey of Partsof North Wales in July 1989, SURRC Report (1989) 9p.
[24] SANDERSON, D.C.W., ALLYSON, J.D., MARTIN, E., TYLER, A.N., SCOTT, E.M.,An Aerial Gamma Ray Survey of Three Ayrshire Districts, Commissioned by the DistrictCouncils of Cunninghame, Kilmarnock & Loudon, and Kyle and Carrick, SURRC AerialSurvey Report (1990) 22p.
[25] SANDERSON, D.C.W, ALLYSON, J.D., TYLER, A.N., NI RIAIN, S., MURPHY, S.,An airborne gamma ray survey of parts of SW Scotland in February 1993, SURRC AerialSurvey Report (1993a) 26p.
[26] SANDERSON, D.C.W., SCOTT, E.M., BAXTER, M.S., MARTIN, E., NI RIAIN, S., Theuse of aerial radiometrics for epidemiological studies of leukaemia, SURRC Report (1993)165 p.
[27] SANDERSON, D.C.W., ALLYSON, J.D., CAIRNS, K.J., MACDONALD, P.A., A BriefAerial Survey in the Vicinity of Sellafield, SURRC Aerial Survey Report (1991) 34p.
[28] SANDERSON, D.C.W, ALLYSON, J.D., TYLER, A.N., An aerial gamma ray survey ofChapelcross and its surroundings in February 1992, SURRC Aerial Survey Report, to BNFL(1992) 36p.
[29] SANDERSON, D.C.W, ALLYSON, J.D., TYLER, A.N., MURPHY, S., An aerial gammaray survey of Springfields and the Ribble Estuary in September 1992, SURRC Aerial SurveyReport, to BNFL (1993b) 46p.
[30] SANDERSON, D.C.W., EAST, B.W., ROBERTSON, I., SCOTT, E.M.Jhe use of aerialradiometrics in the search for a lost 137-Cs source, SURRC report to BP Oil (1989) 8p.
[31] SANDERSON, D.C.W., ALLYSON, J.D., An Aerial Gamma Ray Search for a missing 137Cssource in the Niger Delta, May 1991, SURRC Aerial Survey Report (1991) 29p.
[32] HUGHES, J.S., SHAW, K.B., O'RIORDAN, M.C., Radiation exposure of the UKpopulation -1988 Review, NRPB Report, NRPB-R227 (1989).
[33] ROSE, K.S.B., Clusters of Health Effects associated with radiation around the worldexcluding the UK, AERE R13776 (1988).
[34] GREEN, B.M.R., LOMAS, P.R., BRADLEY, E.J., WRIXON, A.D., Gamma radiationlevels outdoors in Great Britain, NRPB Report, NRPB-191 (1989).
90
[35] GREEN, B.M.R., HUGHES, J.S., LOMAS, P.R., Radiation Atlas. Natural sources ofionising radiation in Europe, Commission of the European Communities (1992).
[36] HENSHAW, D.L., EATOUGH, J.P, RICHARDSON, R.B., Radon as a causative factor ininduction of myeloid leukaemia and other cancers, The Lancet 335 (1990) pp 1008-1012.
[37] ICRP 60, 1990.
91
ENVIRONMENTAL MONITORING BY AIRBORNEGAMMA RAY SPECTROMETRY, EXPERIENCE AT THEGEOLOGICAL SURVEY OF CANADA
R.L. GRASTYGeological Survey of Canada, Ottawa, Canada
Abstract
At the Geological Survey of Canada (GSC), techniques have been developed for detecting and mapping man-made sources of radiation by airborne gamma ray spectrometry. Using a gamma ray spectrum ratio technique, theGSC airborne gamma ray spectrometer detected the first piece of radioactive debris from the Russian nuclear satellitewhich fell in northern Canada in 1978. In co-operation with the Finnish Geological Survey, a technique has beendeveloped to remove the natural gamma ray contribution from the measured spectrum. This technique was used inFinland for mapping radioactive fallout from the Chernobyl nuclear accident. Using the same technique, an airbornegamma ray survey in the vicinity of the Kozloduy nuclear reactor identified areas contaminated by wCo and 137Cs.
1. INTRODUCTION
Since 1968, the GSC has been routinely flying airborne gamma ray surveys for mineralexploration and geological mapping. Standardized procedures have been developed to convert theairborne measurements to ground concentrations of potassium, uranium and thorium [1]. Originallythese surveys were flown with four channel gamma ray spectrometers to monitor total gamma-radioactivity and natural gamma-radiation from potassium and the uranium and thorium decay series.
In 1977, the GSC developed a 256 gamma ray spectrometer with which it was possible tomonitor gamma-radiation from both natural or man-made sources [2]. This development proved tocome at an opportune time, since in January, 1978, the nuclear powered Russian satellite crashed innorthern Canada [3]. The new spectrometer was flown in the search operation and analysis of theairborne data confirmed that radioactive debris from the satellite had reached the earth's surface.
The nuclear accident at Chernobyl occurred during the night of 25-26 April 1986,contaminating large parts of Europe. The techniques developed for mapping natural sources ofradiation were adapted to monitor man-made radiation and once again proved to be very effective formapping the extent of the contamination [1].
In Canada, there was very little fallout from Chernobyl. However, airborne data collected bythe Finnish Geological Survey in contaminated areas of Finland was analyzed at the GSC and resultedin the development of a simple technique for separating man-made and natural radiation [4].Subsequently, this technique was used in Finland to map the contamination from Chernobyl and wasalso used to map man-made contamination in the vicinity of the nuclear facility at Kozloduy inBulgaria [5].
This paper describes the search for Cosmos-954 and the technique developed at the GSC formapping contamination from the Chernobyl nuclear accident and from the nuclear power plant atKozloduy, Bulgaria. These three examples demonstrate how airborne gamma ray spectrometry canbe an effective tool for environmental monitoring.
93

2. THE COSMOS-954 INCIDENT
On January 24 1978, COSMOS-954, a nuclear powered Soviet satellite, disintegrated on re-entering the earth's atmosphere and scattered radioactive debris over a large area of northern Canada.The U.S. Government offered the Canadian Government the assistance of their Nuclear EmergencySearch Team (NEST) with three gamma ray spectrometers. These three gamma ray spectrometers,tocether with one from the Geological Survey of Canada were all involved in the search and recoveryoperation [3,6,7].
Based on computer reentry predictions, the probable impact zone covered an area 800 kmlong by 50 km wide. For logistical reasons, this initial search area was divided into 8 sectors. Tocover this large area, four C-130 Hercules aircraft flew a reconnaissance survey along lines 1 nauticalmile apart at an altitude of 500 m (1500 ft). The first of the three U.S. gamma ray spectrometers wasairborne early on the morning of January 25. The Canadian system was in the air 24 hours later.
Fission products of a reactor emit gamma radiation with a higher pioportion of low energygamma rays than naturally occurring radioactive isotopes. Gamma rays from the neutron activation
-
azo"oUJ
^ -CO
z13
oo
TOTAL COUNT(0.3-2.8 MeV)
n o
CCLU1-< 1
1 "I, R—i nj] n f] Pi n r i \ \\u u i.M-JU TJ ip Lnl li
ocUJH< rill
n n
QZ
I™1
L\
3 4 5 6 7DISTANCE (KM)
RATIO
2 3 4 5 6 7DISTANCE (KM)
90%CONFIDENCELEVELMEANRATIO
FIG. 1. Total count profile and ratio of high to low energy showing the detection of man-maderadiation from Cosmos-954 debris in northern Canada.
94

of steel are also predominantly of low energy. Table I shows the major gamma rays emitted byfission and neutron activation products which are most likely to be observed soon after reactorshutdown f l | . The half-lives of the various isotopes are also indicated. The more volatile elementssuch as cesium and iodine were not expected to have reached the ground because of the heat of re-entry.
Because of the high levels of radioactivity of rocks in the search area, a ratio technique wasused to detect the artificial sources of radiation. This technique makes use of the fact that theradiation from the satellite debris is predominantly of low energy. The ratio of gamma rays in a 300to 1400 keV window to those from 1400 to 2800 keV was found to remain constant for all naturalsources of radioactivity. Radioactive satellite debris was indicated by an increase in this ratio asshown in Fig. 1.
T A B L E I. PRINCIPAL M A N - M A D E NUCLIDES
Nuclide Principal Energies (keV) Half-life (days)
<)5Zr 724, 756 6595Nb 765 35
" M o 740 3H)3Ru 497 40IOftRu 512 368m I 364 8132Te 230 3l34Cs 605, 795 730137Cs 662 11,00014OBa/l4oLa 1596 13
On the night of the 26/27 January, the Canadian spectrometer detected a radioactive sourceon the ice of Great Slave Lake. Subsequent computer analysis of the data recorded on magnetic tapeconfirmed the presence of gamma rays characteristic of the products of nuclear fission. The gammaray spectrum of the source, obtained by subtracting the spectrum from neighbouring points is shownin Fig. 2 together with the total count profile, shows the significant low energy component.
By January 31 the search had shown that all large radioactive fragments from the satellite hadfallen within a strip ten kilometers wide along part of the predicted reentry path. As much of the areawas north of the tree line with few reference points, considerable difficulty was found in pinpointingthe location of radioactive debris detected. In order to provide accurate and systematic coverage ofthe narrow zone where radioactive debris had been found, two microwave ranging systems (MRS)were employed. Detailed coverage of this narrow search area was flown at a line spacing of 500 m(1500 ft) at a nominal terrain clearance of 250 m (750 ft).
On February 10, by chance, a low flying helicopter discovered many radioactive sources somedistance from the original search area. These sources were too weak to be detected at the altitudeflown by the Hercules. Later analyses of these minute pieces showed them to be part of the missingreactor core . In the next few days, other low flying helicopters detected more radioactive particleseven farther from the satellite track. The reactor core had apparently disintegrated on entering theearth 's atmosphere and minute pieces of the core had been carried by the wind to dust manythousands of square kilometers of northern Canada. These minute particles were not considered tobe cause for concern [7].
95
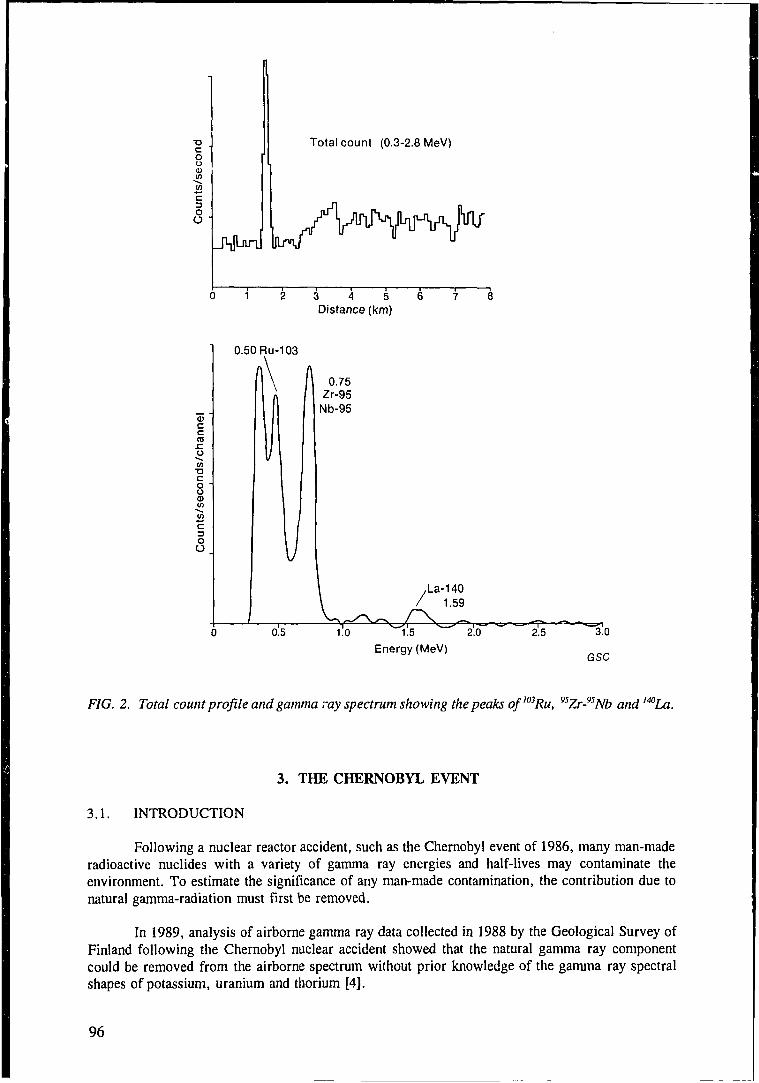
T3Coo0)V)
O
O
Total count (0.3-2.8 MeV)
3 4 5Distance (km)
0)
cas
—.tnT3Cou<D0)
CDOO
0.50
i
Ru-103
0.75Zr-95
Nb-95
I ,La-140/ 1.59
0.5 1.0 1.5Energy (MeV)
2.0 2.5 3.0
GSC
FIG. 2. Total count profile and gamma ray spectrum showing the peaks of'03Ru, 9SZr-9SNb and l40La
3. THE CHERNOBYL EVENT
3.1. INTRODUCTION
Following a nuclear reactor accident, such as the Chernobyl event of 1986, many man-maderadioactive nuclides with a variety of gamma ray energies and half-lives may contaminate theenvironment. To estimate the significance of any man-made contamination, the contribution due tonatural gamma-radiation must first be removed.
In 1989, analysis of airborne gamma ray data collected in 1988 by the Geological Survey ofFinland following the Chernobyl nuclear accident showed that the natural gamma ray componentcould be removed from the airborne spectrum without prior knowledge of the gamma ray spectralshapes of potassium, uranium and thorium [4].
96
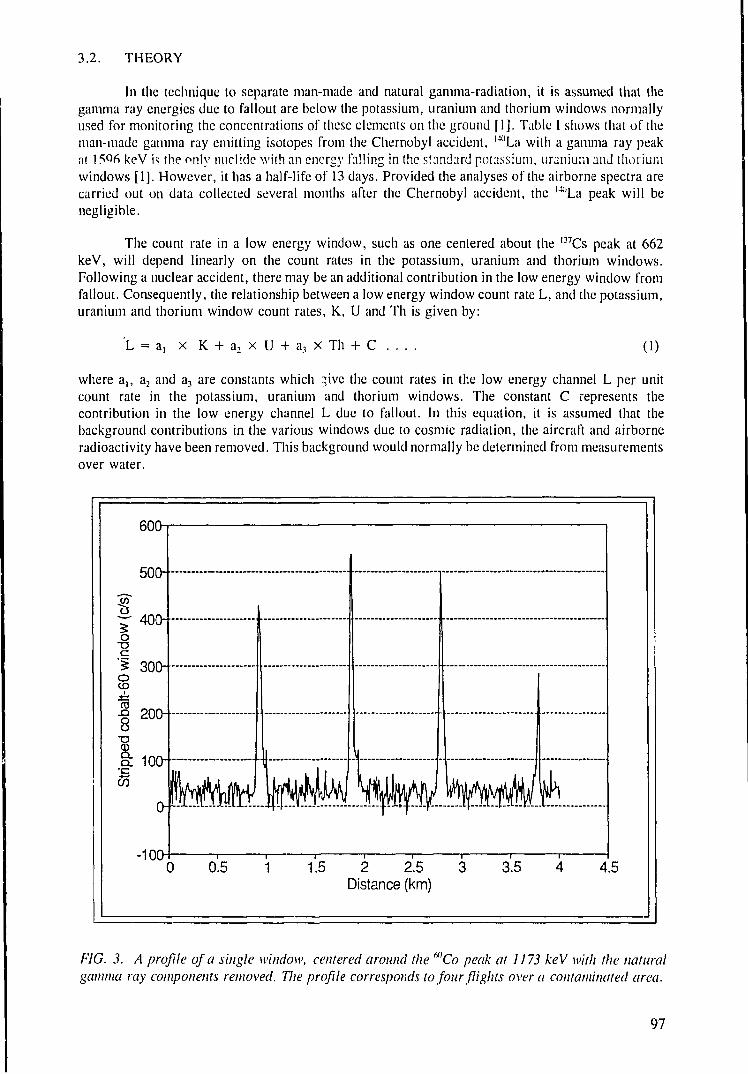
3.2. THEORY
In the technique to separate man-made and natural gamma-radiation, it is assumed that thegamma ray energies due to fallout are below the potassium, uranium and thorium windows normallyused for monitoring the concentrations of these elements on the ground [1]. Table I shows that of theman-made gamma ray emitting isotopes from the Chernobyl accident, l4(lLa with a gamma ray peaknt 15% keV is the only nuclide with an energy falling in the standard potassium, uranium and thoriumwindows [1]. However, it has a half-life of 13 days. Provided the analyses of the airborne spectra arecarried out on data collected several months after the Chernobyl accident, the |lWLa peak will benegligible.
The count rate in a low energy window, such as one centered about the l37Cs peak at 662keV, will depend linearly on the count rates in the potassium, uranium and thorium windows.Following a nuclear accident, there may be an additional contribution in the low energy window fromfallout. Consequently, the relationship between a low energy window count rate L, and the potassium,uranium and thorium window count rates, K, U and Th is given by:
L = a, x K + a2 x U + a, X Th + C (1)
where a,, a2 and a3 are constants which ive the count rates in the low energy channel L per unitcount rate in the potassium, uranium and thorium windows. The constant C represents thecontribution in the low energy channel L due to fallout. In this equation, it is assumed that thebackground contributions in the various windows due to cosmic radiation, the aircraft and airborneradioactivity have been removed. This background would normally be determined from measurementsover water.
FIG. 3. A profile of a single window, centered around the "'Co peak at 1173 keV with the naturalgamma ray components removed. The profile corresponds to four flights over a contaminated area.
97
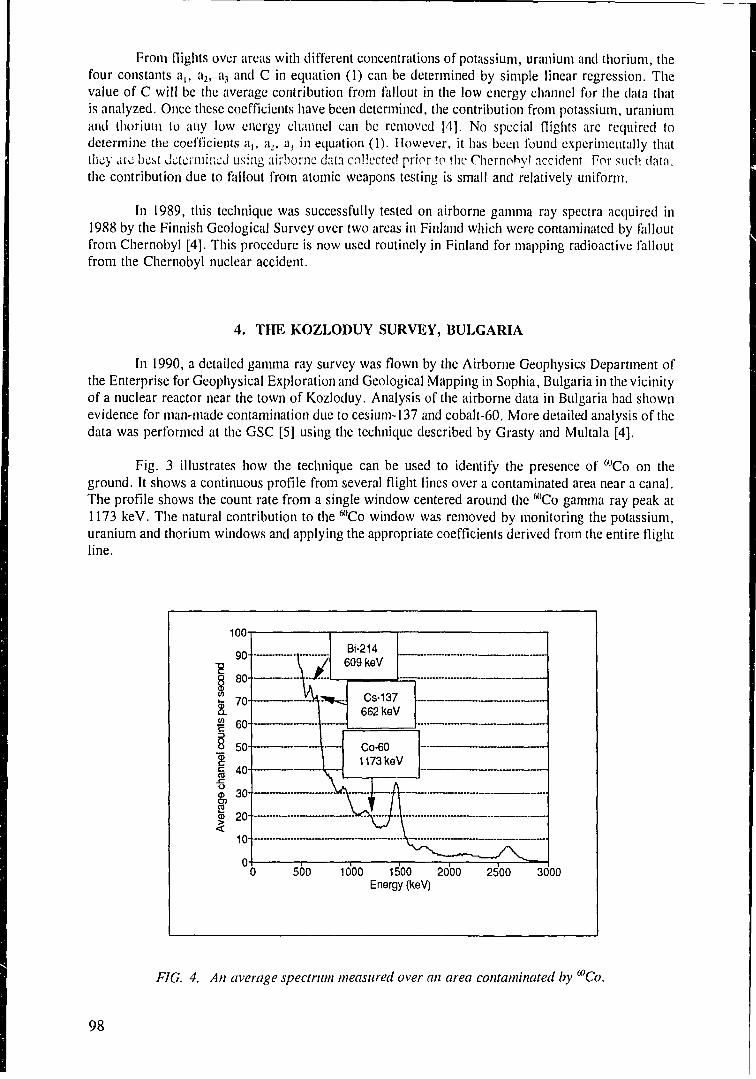
From flights over areas with different concentrations of potassium, uranium and thorium, thefour constants a,, a2, a3 and C in equation (1) can be determined by simple linear regression. Thevalue of C will be the average contribution from fallout in the low energy channel for the data thatis analyzed. Once these coefficients have been determined, the contribution from potassium, uraniumand thorium to any low energy channel can be removed [4]. No special flights are required todetermine the coefficients a,, a,, a3 in equation (1). However, it has been found experimentally thatthey arc best determined using airborne data collected prior to the Chernobyl nccident. For such data,the contribution due to fallout from atomic weapons testing is small and relatively uniform.
In 1989, this technique was successfully tested on airborne gamma ray spectra acquired in1988 by the Finnish Geological Survey over two areas in Finland which were contaminated by falloutfrom Chernobyl [4]. This procedure is now used routinely in Finland for mapping radioactive falloutfrom the Chernobyl nuclear accident.
4. THE KOZLODUY SURVEY, BULGARIA
In 1990, a detailed gamma ray survey was flown by the Airborne Geophysics Department ofthe Enterprise for Geophysical Exploration and Geological Mapping in Sophia, Bulgaria in the vicinityof a nuclear reactor near the town of Kozloduy. Analysis of the airborne data in Bulgaria had shownevidence for man-made contamination due to cesium-137 and cobalt-60. More detailed analysis of thedata was performed at the GSC [5] using the technique described by Grasty and Multala [4].
Fig. 3 illustrates how the technique can be used to identify the presence of "'Co on theground. It shows a continuous profile from several flight lines over a contaminated area near a canal.The profile shows the count rate from a single window centered around the N'Co gamma ray peak at1173 keV. The natural contribution to the ^Co window was removed by monitoring the potassium,uranium and thorium windows and applying the appropriate coefficients derived from the entire flightline.
Bi-214609 keV
11
Cs-137662 keV
Co-601173keV
I
500 1000 1500 2000Energy (keV)
2500 3000
FIG. 4. An average spectrum measured over an area contaminated by Co
98
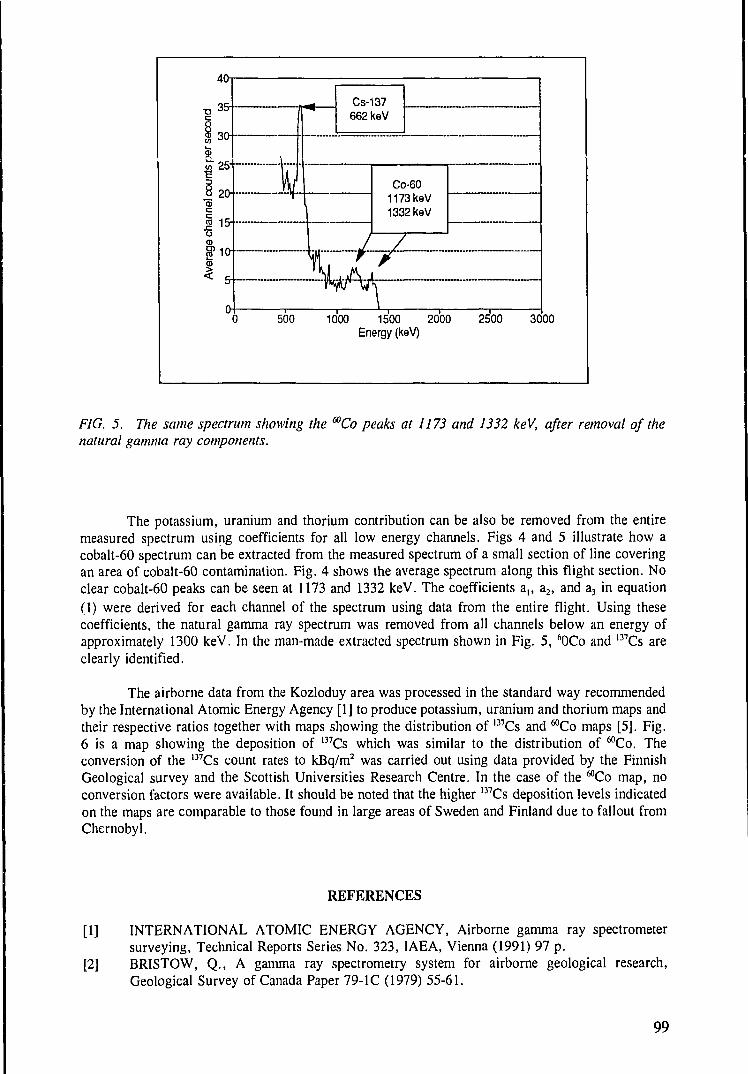
35- Cs-137662 keV
Co-601173keV1332keV
1000 1500 2000Energy (keV)
2500 3000
FIG. 5, The same spectrum showing the mCo peaks at 1173 and 1332 keV, after removal of thenatural gamma ray components.
The potassium, uranium and thorium contribution can be also be removed from the entiremeasured spectrum using coefficients for all low energy channels. Figs 4 and 5 illustrate how acobalt-60 spectrum can be extracted from the measured spectrum of a small section of line coveringan area of cobalt-60 contamination. Fig. 4 shows the average spectrum along this flight section. Noclear cobalt-60 peaks can be seen at 1173 and 1332 keV. The coefficients a,, a2, and a3 in equation(1) were derived for each channel of the spectrum using data from the entire flight. Using thesecoefficients, the natural gamma ray spectrum was removed from all channels below an energy ofapproximately 1300 keV. In the man-made extracted spectrum shown in Fig. 5, 60Co and 137Cs areclearly identified.
The airborne data from the Kozloduy area was processed in the standard way recommendedby the International Atomic Energy Agency [1] to produce potassium, uranium and thorium maps andtheir respective ratios together with maps showing the distribution of l37Cs and ^Co maps [5]. Fig.6 is a map showing the deposition of l37Cs which was similar to the distribution of ^Co. Theconversion of the 137Cs count rates to kBq/m2 was carried out using data provided by the FinnishGeological survey and the Scottish Universities Research Centre. In the case of the mCo map, noconversion factors were available. It should be noted that the higher 137Cs deposition levels indicatedon the maps are comparable to those found in large areas of Sweden and Finland due to fallout fromChernobyl.
REFERENCES
[1] INTERNATIONAL ATOMIC ENERGY AGENCY, Airborne gamma ray spectrometersurveying, Technical Reports Series No. 323, IAEA, Vienna (1991) 97 p.
[2] BRISTOW, Q., A gamma ray spectrometry system for airborne geological research,Geological Survey of Canada Paper 79-1C (1979) 55-61.
99
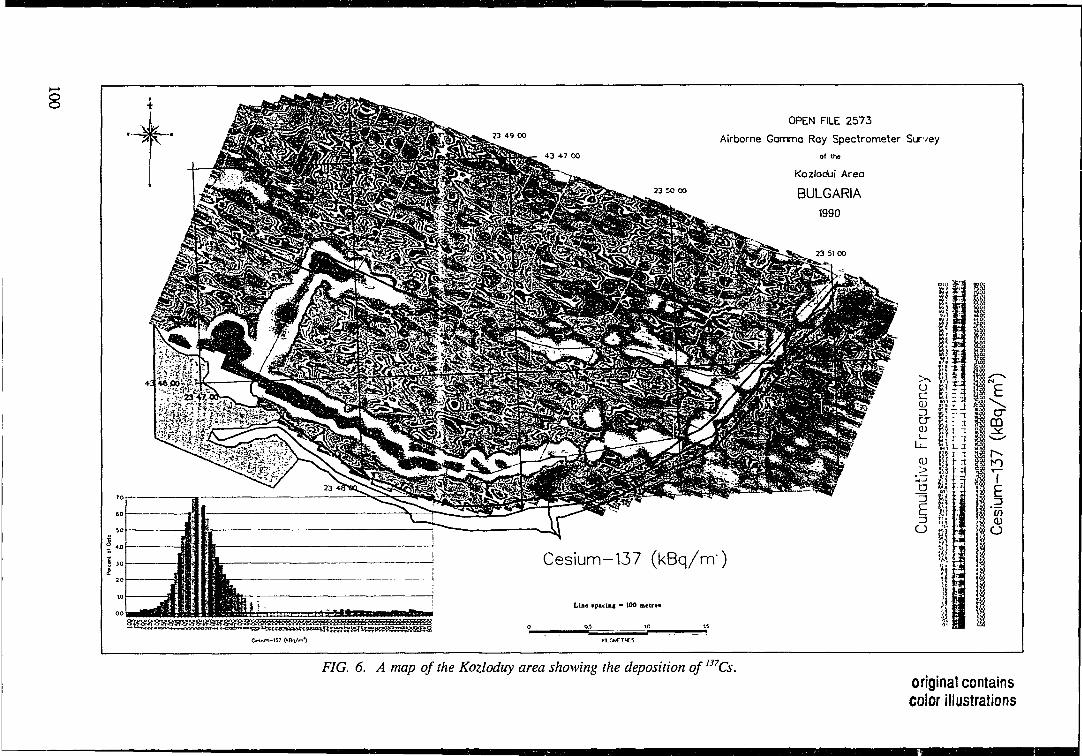
23 49 00
OPEN FILE 2573
Airborne Gamma Ray Spectrometer Survey
of the
Kozlodui Area
BULGARIA1990
23 51 00
Cesium-137 (kBq/m)
Liaa »pacing • 100 sictre*
FIG. 6. A map of the Kozloduy area showing the deposition of Csoriginal containscolor illustrations
[3] GRASTY, R.L., The Search for COSMOS-954, Proceedings of the NATO Conference onSearch Theory and Applications, Portugal 1979, Plenum Press, New York and London (1980)211-220.
|4| GRASTY, R.L., MULTALA, J., A correlation technique for separating natural and man-maeairborne gamma ray spectra, Geological Survey of Canada Paper 90-lD (1991) 111-116.
[5] HETU, R., RANGELOV. R.. GRANT, J.A.. GRASTY, R.L.. GRAHAM. D.. MonitoringNatural and Man-made Radiation by Airborne Gamma ray Spectrometry, Kozlodui Area,Bulgaria, 1990. Geological Survey of Canada Open File 2573 (1993).
[6] UNITED STATES DEPARTMENT OF ENERGY, Operation Morning Light, NorthwestTerritories, Canada - 1978, U.S. Dept. of Energy Report NV-198; United States Departmentof Commerce, Springfield, Virginia (1978) 81 p.
[7] GUMMER, W.K., CAMPBELL, F.R., KNIGHT, G. B., RICARD, J.L., Cosmos-954, theoccurence and nature of recovered debris, Atomic Energy Control Board, Canada, Info-0006(1980) 60 p.
101

AIRBORNE GAMMA RAY MEASUREMENTS IN RADIOACTIVE CLOUDEXPERIENCE AT THE GEOLOGICAL SURVEY OF FINLAND
J. MULTALAGeological Survey of Finland, Espoo, Finland
Abstract
On April 29, 1986 the airborne gamma ray measurement system of Geological Survey of Finland flew bymisfortune thorough the radiating cloud from Chernobyl accident. The measured gamma ray data shows how theradioactivity varied in different parts of that cloud. Due to that flight it came obvious how seriously the aircraft cancontaminate, how difficult it is to clean the aircraft and what kind of technical problems that introduces formeasurement systems and techniques
1. THE AEROGEOPHYSICAL EQUIPMENT OF GSF
The second national aerogeophysical mapping program in Finland was started in 1972. Thesurvey is carried out using 200 m line spacing at the nominal altitude of 30 meters. At the momentGeological Survey of Finland (GSF) has covered more than 70 % of the country with these flightsand the program is scheduled to run about 2005. The aerogeophysical system of GSF consist offollowing instrumentation:
• Gamma ray measurement system: 6 Nal crystals total volume 25 liters and multichannelanalyser. Nowadays also 2 upward looking crystals has been installed. 120 channels arerecorded once in second covering energy range from about 0.2 MeV to 3.1 MeV and thewidth of one channel is about 24 keV.
• Two Cesium magnetometers.
• Active electromagnetic system.
• VLF system.
• GPS-satellite navigation system.
The instruments are installed on DHC-6/300 Twin Otter aircraft owned and operated byKarair Oy. The nominal ground speed during the survey flights is about 50 m/s. Annually this systemflies about 65 000 line kilometers (550 hours) mainly for aerogeophysical mapping.
2. THE FLIGHT THROUGH THE RADIATING CLOUD
Background spectra measured above the sea at the altitude of 60 meters on April 24 in 1986is shown in Fig. 1. This spectra is from the first test flight which was done in 1986 and it is like allthe other background spectra recorded before that. The next flight in 1986 was done on April 27 andthe background spectra is also shown in Fig. 1. In the lower energy part of the spectra some new
peaks can bee seen around the energies 355 keV and 537 keV. It is estimated that the first part of theradiating cloud from Chernobyl was above the South coast of Finland on that day, but hardly anyobservations were made on ground level. That means that these peaks in the background spectra are
103
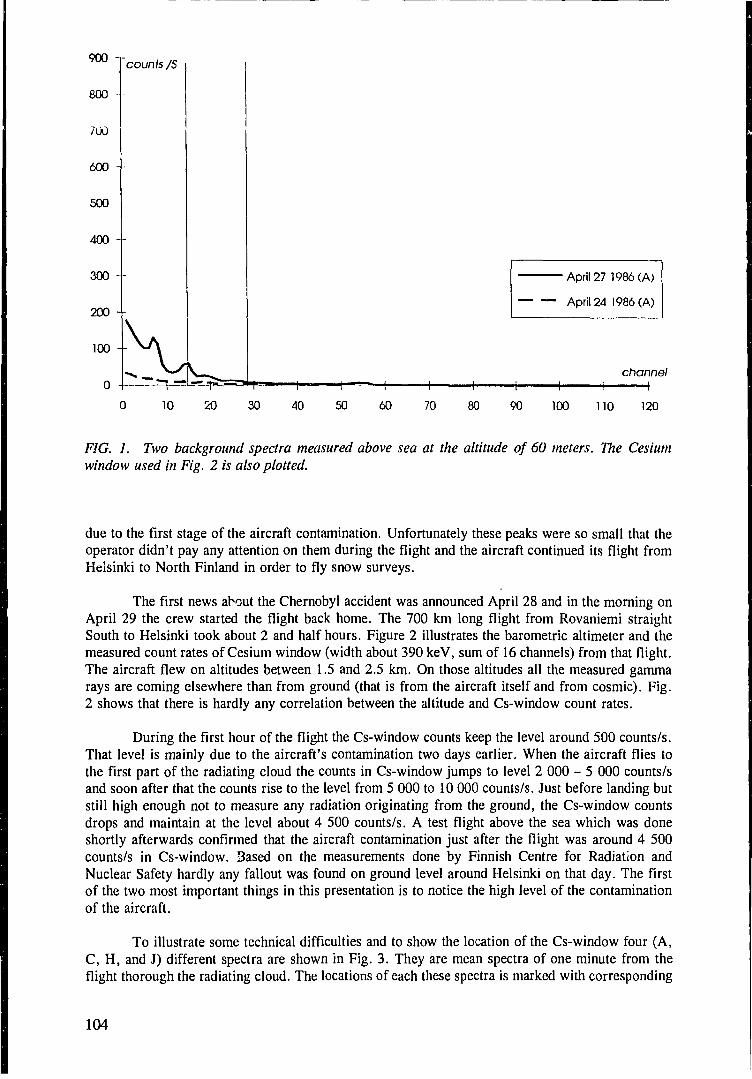
900
800
700
600 --
500
400 --
300 --
200 --
100 --
counts/S
-^ —I — -p
10 20
April 27 1986 (A)
April 24 1986 (A)
channel
30
- t —
40 50 60
—(—
70 80 90 100 110 120
FIG. 1. Two background spectra measured above sea at the altitude of 60 meters. The Cesiumwindow used in Fig. 2 is also plotted.
due to the first stage of the aircraft contamination. Unfortunately these peaks were so small that theoperator didn't pay any attention on them during the flight and the aircraft continued its flight fromHelsinki to North Finland in order to fly snow surveys.
The first news about the Chernobyl accident was announced April 28 and in the morning onApril 29 the crew started the flight back home. The 700 km long flight from Rovaniemi straightSouth to Helsinki took about 2 and half hours. Figure 2 illustrates the barometric altimeter and themeasured count rates of Cesium window (width about 390 keV, sum of 16 channels) from that flight.The aircraft flew on altitudes between 1.5 and 2.5 km. On those altitudes all the measured gammarays are coming elsewhere than from ground (that is from the aircraft itself and from cosmic). Fig.2 shows that there is hardly any correlation between the altitude and Cs-window count rates.
During the first hour of the flight the Cs-window counts keep the level around 500 counts/s.That level is mainly due to the aircraft's contamination two days earlier. When the aircraft flies tothe first part of the radiating cloud the counts in Cs-window jumps to level 2 000 - 5 000 counts/sand soon after that the counts rise to the level from 5 000 to 10 000 counts/s. Just before landing butstill high enough not to measure any radiation originating from the ground, the Cs-window countsdrops and maintain at the level about 4 500 counts/s. A test flight above the sea which was doneshortly afterwards confirmed that the aircraft contamination just after the flight was around 4 500counts/s in Cs-window. Based on the measurements done by Finnish Centre for Radiation andNuclear Safety hardly any fallout was found on ground level around Helsinki on that day. The firstof the two most important things in this presentation is to notice the high level of the contaminationof the aircraft.
To illustrate some technical difficulties and to show the location of the Cs-window four (A,C, H, and J) different spectra are shown in Fig. 3. They are mean spectra of one minute from theflight thorough the radiating cloud. The locations of each these spectra is marked with corresponding
104
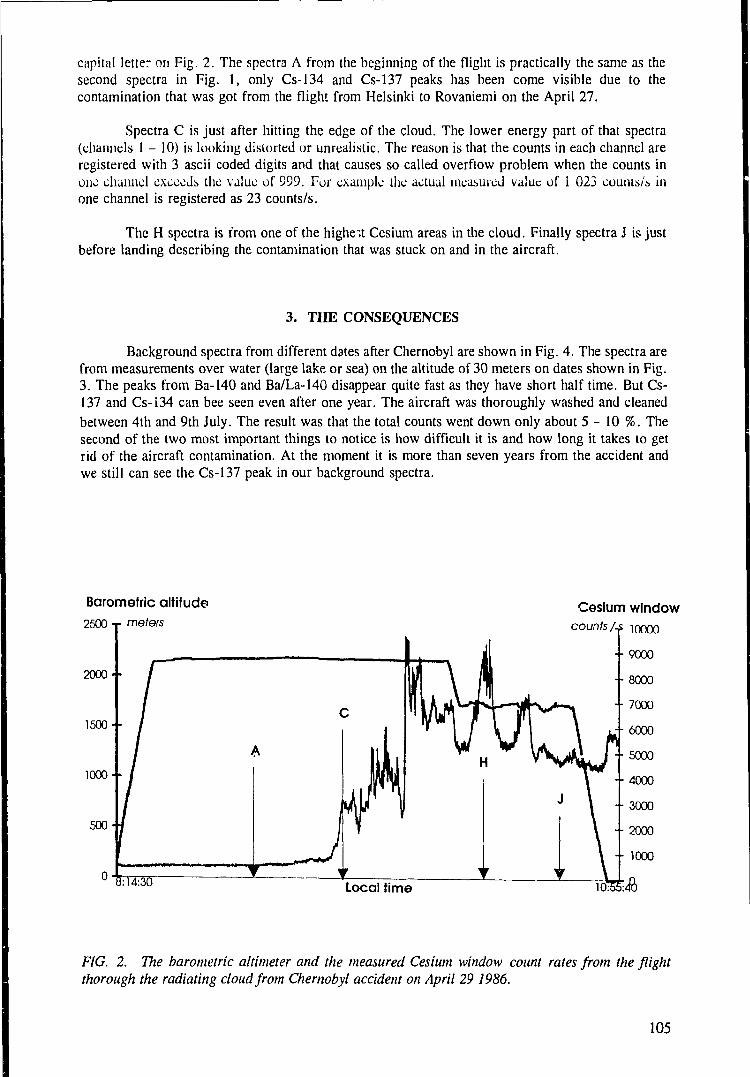
capital letter on Fig. 2. The spectra A from the beginning of the flight is practically the same as thesecond spectra in Fig. 1, only Cs-134 and Cs-137 peaks has been come visible due to thecontamination that was got from the flight from Helsinki to Rovaniemi on the April 27.
Spectra C is just after hitting the edge of the cloud. The lower energy part of that spectra(channels 1 - 10) is looking distorted or unrealistic. The reason is that the counts in each channel areregistered with 3 ascii coded digits and that causes so called overflow problem when the counts inone channel exceeds the value of 999. For example the actual measured value of 1 023 couuts/s inone channel is registered as 23 counts/s.
The H spectra is from one of the highest Cesium areas in the cloud. Finally spectra J is justbefore landing describing the contamination that was stuck on and in the aircraft.
3. THE CONSEQUENCES
Background spectra from different dates after Chernobyl are shown in Fig. 4. The spectra arefrom measurements over water (large lake or sea) on the altitude of 30 meters on dates shown in Fig.3. The peaks from Ba-140 and Ba/La-140 disappear quite fast as they have short half time. But Cs-137 and Cs-134 can bee seen even after one year. The aircraft was thoroughly washed and cleanedbetween 4th and 9th July. The result was that the total counts went down only about 5 - 10 %. Thesecond of the two most important things to notice is how difficult it is and how long it takes to getrid of the aircraft contamination. At the moment it is more than seven years from the accident andwe still can see the Cs-137 peak in our background spectra.
Barometric altitude
2500- •
2000- -
1500 • •
Cesium windowcounts U 10000
1000"
Local time
FIG. 2. The barometric altimeter and the measured Cesium window count rates from the flightthorough the radiating cloud from Chernobyl accident on April 29 1986.
105
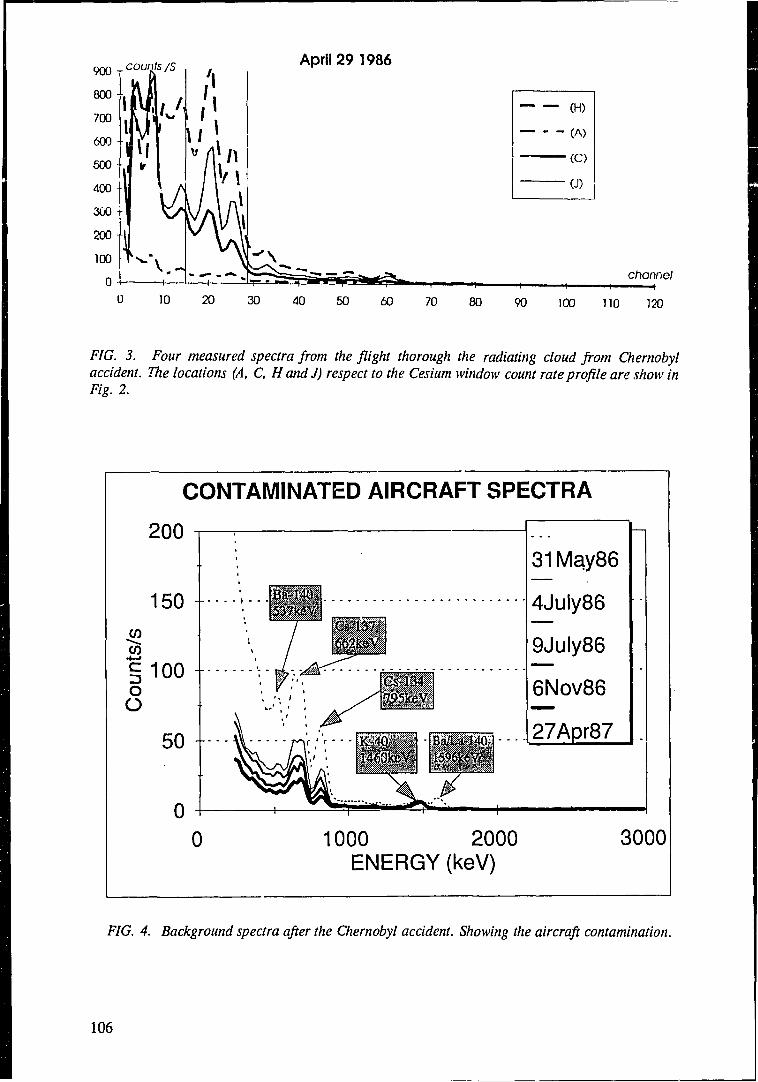
counts /s April 29 1986
channel
90 100 110 120
FIG. 3. Four measured spectra from the flight thorough the radiating cloud from Chernobylaccident. The locations (A, C, HandJ) respect to the Cesium window count rate profile are show inFig. 2.
CONTAMINATED AIRCRAFT SPECTRA
200
150 -.CO
100|oO
50 -
00
31 May86
4July86
9July86
6Nov86
27Apr87
1000 2000ENERGY (keV)
3000
FIG. 4. Background spectra after the Chernobyl accident. Showing the aircraft contamination.
106
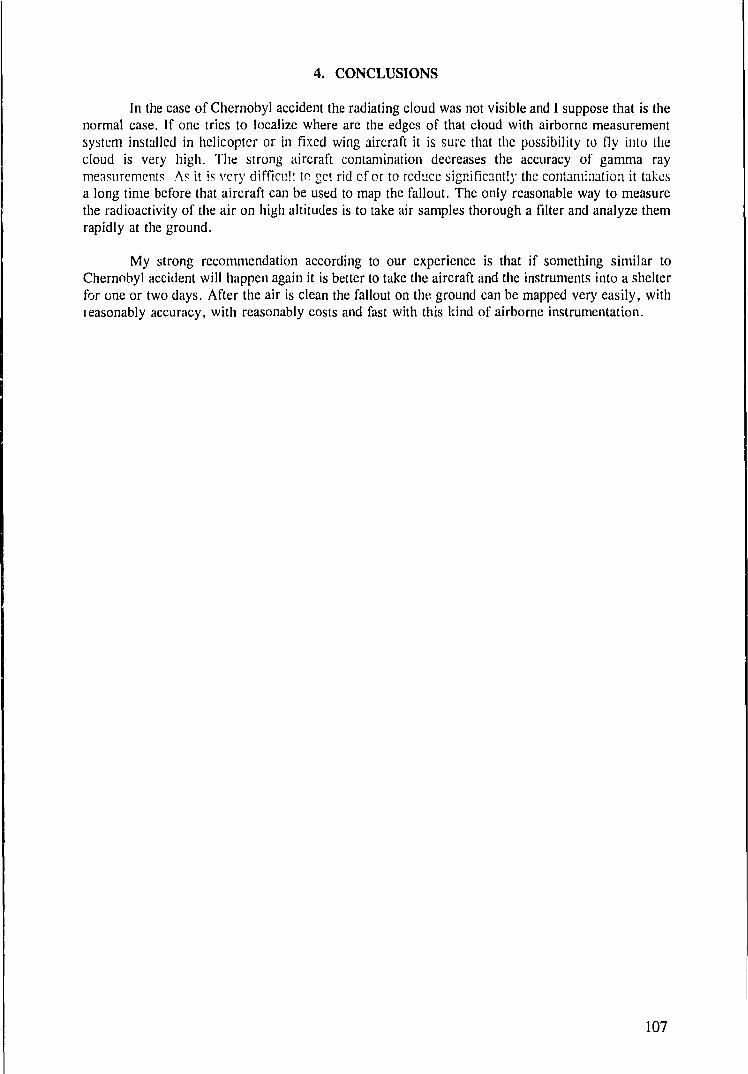
4. CONCLUSIONS
In the case of Chernobyl accident the radiating cloud was not visible and I suppose that is thenormal case. If one tries to localize where are the edges of that cloud with airborne measurementsystem installed in helicopter or in fixed wing aircraft it is sure that the possibility to fly into Lhecloud is very high. The strong aircraft contamination decreases the accuracy of gamma raymeasurements As it is very difficult to get rid of or to reduce significantly the contamination it takesa long time before that aircraft can be used to map the fallout. The only reasonable way to measurethe radioactivity of the air on high altitudes is to take air samples thorough a filter and analyze themrapidly at the ground.
My strong recommendation according to our experience is that if something similar toChernobyl accident will happen again it is better to take the aircraft and the instruments into a shelterfor one or two days. After the air is clean the fallout on the ground can be mapped very easily, withieasonably accuracy, with reasonably costs and fast with this kind of airborne instrumentation.
107
USE OF URANIUM AIRBORNE SURVEY DATA IN THEPREPARATION OF A RADIOMETRIC MAP OF SPAIN
E. SUAREZ MAHOU, J.A. FERNANDEZ AMIGOTENUSA, Spain
Abstract
In December 1991, upon the initiative of the Nuclear Safety Council (CSN), an agreement was signedbetween the latter and the Empresa Nacional del Uranio, S.A. (ENUSA) for the purpose of mapping a NationalRadioactivity Map of Spain, i.e. a map of Spain showing gamma radiation in the soil and external cosmicradiation. The MARNA Project, which has been carried out over a period of four years, summarizes andstandardizes an important radiometric data bank covering approximately 70 per cent of the country and generatedby aerial gamma spectrometrics methods, by car-borne, field prospecting and through investigations, undertakenas part of the former PNEIU (National Uranium Exploration and Research Plan). It likewise generates thenecessary data in the 30 % of the country lacking radiometric cover. This publication lists the most important datafrom the Project, the methodology used and the results obtained. Two universities, eight teachers and severalscholarship holders are actively participating in the technological development of the MARNA Project, with a shortterm increase in university participation being anticipated in addition to that of some regional governmentsresponsive to the Project and eager to boost its budget.
1. INTRODUCTION
The need for knowing the levels of natural radiation in order to be able to use them infuture studies has been set forth by the International Atomic Energy Agency and by the EECCommission which are promoting a research project related to the drawing-up of a NaturalRadiation Atlas of Europe.
For the purpose of planning the drawing-up of this atlas, the EEC Commission made apilot study which showed that the technical difficulties involved in carrying it out were notinsurmountable.
Several atlas trials have been performed since then with data provided by a large numberof scientists from EEC and neighbouring countries (e.g. EUR 14.470. 1993).
With regard to the aforementioned Atlas, the CSN deemed that Spain ought to approachthe matter on the basis of the information available to it as well as of complementary fieldmeasurements in areas with little or no cover. The Spanish contribution will therefore refer tonatural radiation due to the cosmic component and to that related to gamma radiation from externalsoil, all of which should be carried out in accordance with the relevant EEC standards in such away that information on Spain may subsequently be integrated with that obtained by the otherparticipating countries.
Law 15/80 of 22 April and Royal Decree 1157/82 of 30 April entrust the CSN with settingup R + D plans for matters within its sphere and, therefore, this body is interested in drawing upa Natural Radioactive Map of Spain.
Royal Decree 296/1979 of 7 December (Official State Gazette 14.01.80) entrusted ENUSAwith carrying out the National Uranium Exploration and Research Plan which had hitherto been
109
the responsibility of the Nuclear Energy Board (JEN). Therefore, all documentation produced bythe successive programmes related to this matter can currently be found in the files of ENUSA.Likewise, ENUSA has the necessary means and technology to carry out the project.
As a result of the above, in December 1991 the two bodies signed an agreement forcarrying out the MARNA Project, the outline of which is set out below:
2. TARGETS OF THE PROJECT
The Project targets are to produce the following maps:
A natural radiation map and a dosimetric map of Spain on a 1/1 000 000 scale.
A natural radiation pilot map and a pilot dosimetric map on a 1/200 000 scale of twoSpanish regions in which sufficient data are available prior to carrying out the Project.
A natural radiation pilot map and a dosimetric map, on a 1/50 000 scale, of fourparticularly interesting areas of Spain.
3. DATABANK
There are abundant data available in Spain as regards natural radiation, as a result of 30years' work, and they cover a large part of the country. They have been obtained using differenttechniques and methodologies and they are expressed in different units and are not of uniformquality. They were taken from the following sources:
Radiometric flights, without energy discrimination, carried out by the JEN.Radiometric flights with multichannel spectrometers contracted by the JEN.Car-borne radiometric prospecting campaigns.Field prospecting campaigns either general, regional or detailed.Appraisals of "hot" areas.Sundry reports.
4. PROJECT DEVELOPMENT
The stages and sub-stages developed during the course of the Project are, from a schematicstandpoint, as follows:
4.1. PREPARATION STAGE
a) Creation of a specific file with the documentation applicable to the project existingin ENUSA.
b) Capture and drawing-up of the radiometric data necessary to complete the file inareas with deficient information.
c) Computering of the file data.
d) Setting-up of correlations between measurements obtained with differentequipment, homogenizing and standardizing them in microroentgens/hour (/*R/h).
110
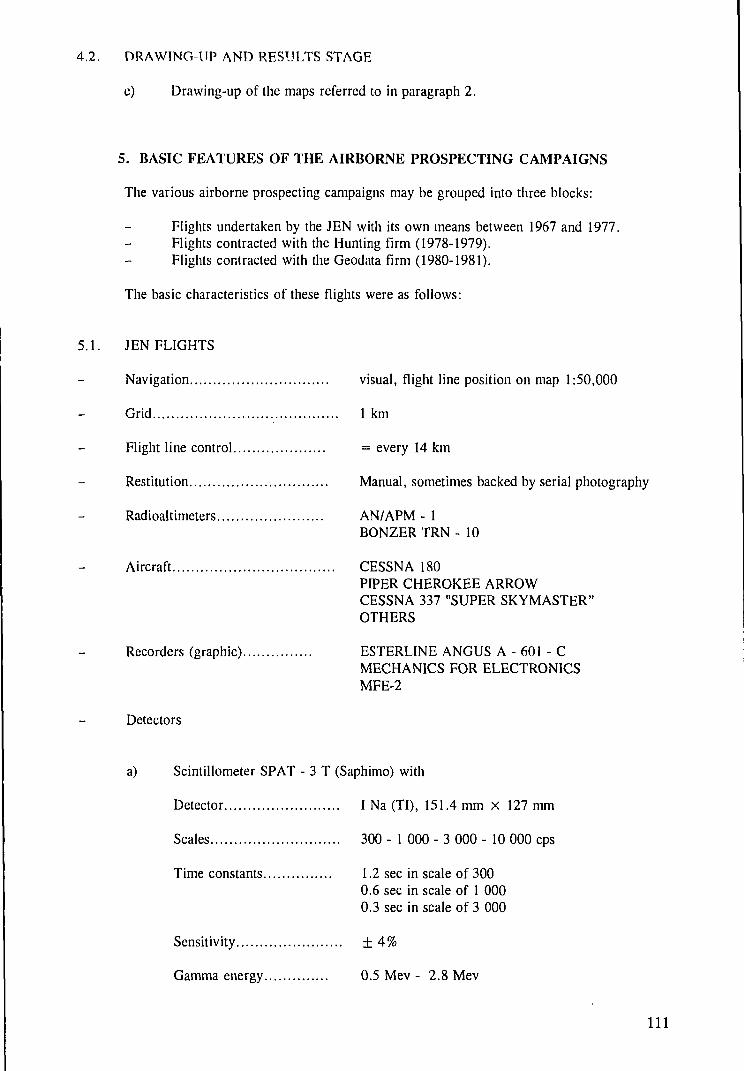
4.2. DRAWING-HP AND RESULTS STAGE
e) Drawing-up of the maps referred to in paragraph 2.
5. BASIC FEATURES OF THE AIRBORNE PROSPECTING CAMPAIGNS
The various airborne prospecting campaigns may be grouped into three blocks:
Flights undertaken by the JEN with its own means between 1967 and 1977.Flights contracted with the Hunting firm (1978-1979).Flights contracted with the Geodata firm (1980-1981).
The basic characteristics of these flights were as follows:
5.1. JEN FLIGHTS
Navigation visual, flight line position on map 1:50,000
Grid 1 km
Flight line control = every 14 km
Restitution Manual, sometimes backed by serial photography
Radioaltimeters AN/APM - 1BONZER TRN - 10
Aircraft CESSNA 180PIPER CHEROKEE ARROWCESSNA 337 "SUPER SKYMASTER"OTHERS
Recorders (graphic) ESTERLINE ANGUS A - 601 - CMECHANICS FOR ELECTRONICSMFE-2
Detectors
a) Scintillometer SPAT - 3 T (Saphimo) with
Detector I Na (TI), 151.4 mm x 127 mm
Scales 300 - 1 000 - 3 000 - 10 000 cps
Time constants 1.2 sec in scale of 3000.6 sec in scale of 1 0000.3 sec in scale of 3 000
Sensitivity ± 4%
Gamma energy 0.5 Mev - 2.8 Mev
111
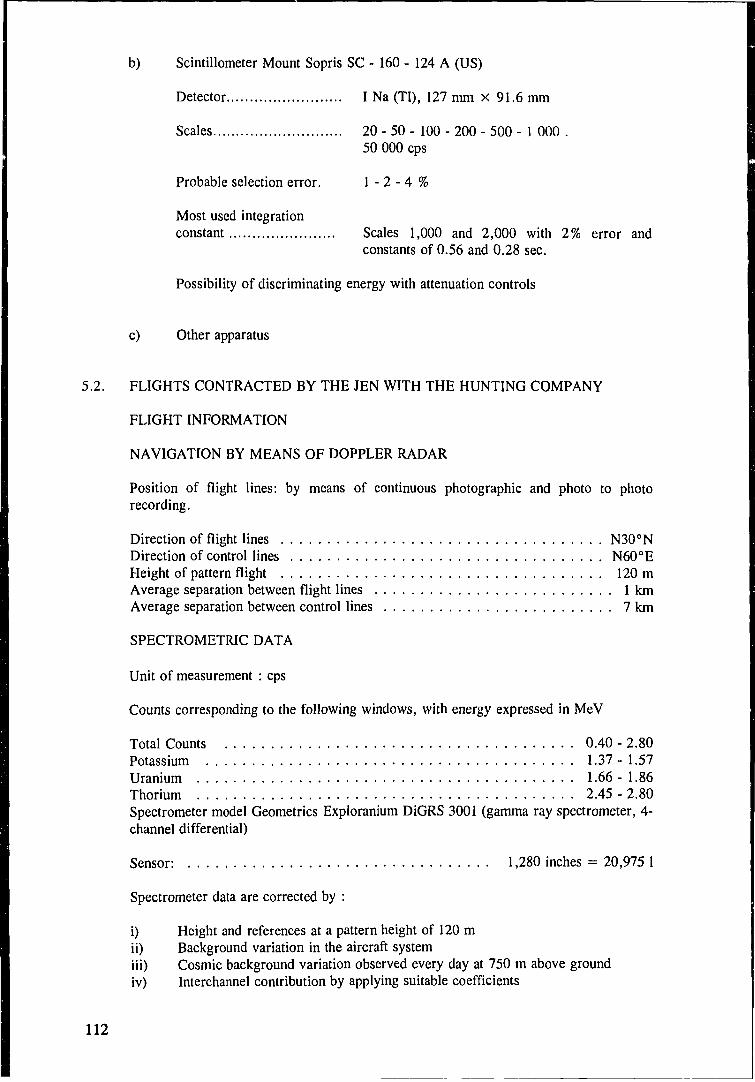
b) Scintillometer Mount Sopris SC - 160 - 124 A (US)
Detector I Na (TI), 127 mm x 91.6 mm
Scales 20 - 50 - 100 - 200 - 500 - 1 000 .
50 000 cps
Probable selection error. 1 - 2 - 4 %
Most used integrationconstant Scales 1,000 and 2,000 with 2% error and
constants of 0.56 and 0.28 sec.Possibility of discriminating energy with attenuation controls
c) Other apparatus
5.2. FLIGHTS CONTRACTED BY THE JEN WITH THE HUNTING COMPANY
FLIGHT INFORMATION
NAVIGATION BY MEANS OF DOPPLER RADAR
Position of flight lines: by means of continuous photographic and photo to photorecording.
Direction of flight lines N30cNDirection of control lines N60°EHeight of pattern flight 120 mAverage separation between flight lines 1 kmAverage separation between control lines 7 km
SPECTROMETRIC DATA
Unit of measurement : cps
Counts corresponding to the following windows, with energy expressed in MeV
Total Counts 0.40 - 2.80Potassium 1.37 - 1.57Uranium 1.66-1.86Thorium 2.45 - 2.80Spectrometer model Geometries Exploranium DiGRS 3001 (gamma ray spectrometer, 4-channel differential)
Sensor: 1,280 inches = 20,975 1
Spectrometer data are corrected by :
i) Height and references at a pattern height of 120 mii) Background variation in the aircraft systemiii) Cosmic background variation observed every day at 750 m above groundiv) Interchannel contribution by applying suitable coefficients
112
Aeroradiactivity maps :Total Counts (cps)Uranium (ppm)Thorium (ppm)Potassium (%)Ratios
5.3. FLIGHTS CONTRACTED BY THE JEN WITH GEODATA INTERNATIONAL
FLIGHT INFORMATION
NAVIGATION BY MEANS OF DOPPLER RADAR
Position of flight lines: by video-camera recording.
Direction of flight lines, bearings 030' - 210'Direction of control lines, bearings 120' - 300'Average separation between flight lines 1 kmAverage separation between control lines 14 km
SPECTROMETRIC DATA
Counts corresponding to the following windows, with energy expressed in Mev
Thorium 2.41 - 2.81Uranium 1.66 - 1.87Potassium 1.36-1.57Total counts 0.40 - 2.81
Spectrometer model Geodata Int. LAMA 4 (512 channels)
Sensor: 33.5 1 (2,048 inches) of I Na (TI)
Spectrometer data corrected and standardized by:
1 Cosmic radiation every second2 Dispersion due to the Compton effect3 Background and dead time4 Contribution of atmospheric Bi - 2145 Pattern height of 120 m, at 760 mm and 0°C6 eTh (ppm); eU (ppm); K (%)
Aeroradiactivity maps :
Total Counts (cps)Uranium (ppm)Thorium (ppm)Potassium (%)Ratios
113
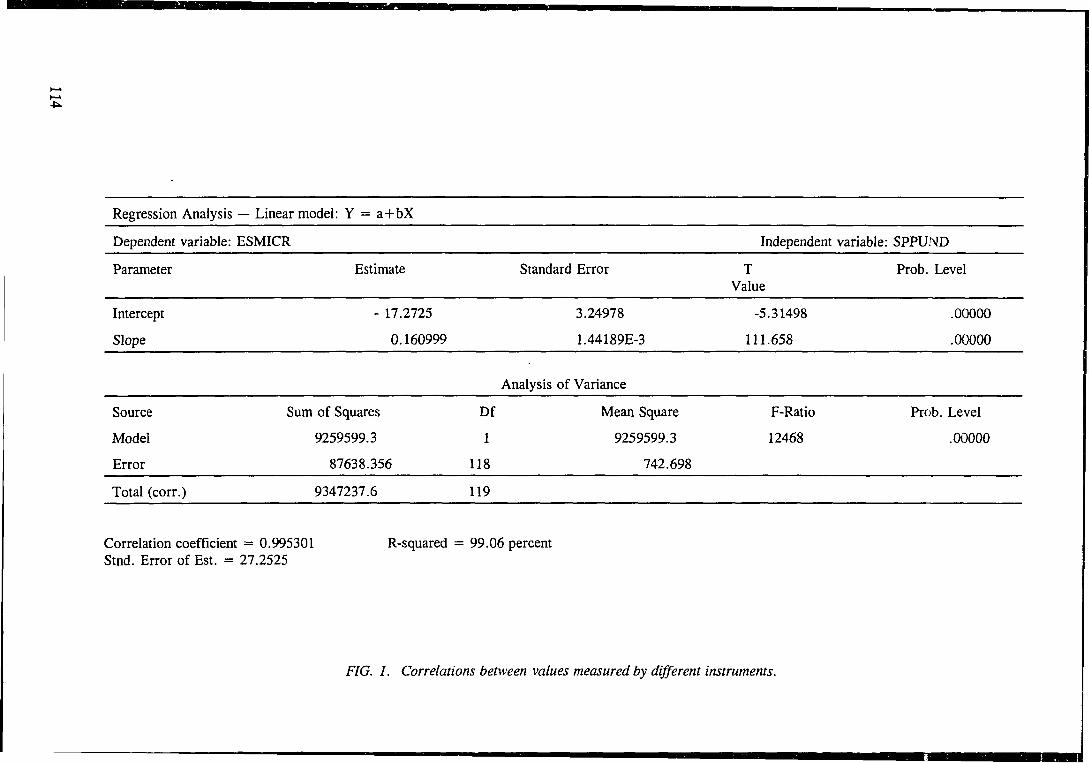
Regression Analysis
Dependent variable:
Parameter
Intercept
Slope
— Linear model:
ESMICR
Y = a+bX
Estimate
- 17.2725
0.160999
Standard Error
3.24978
1.44189E-3
Analysis of Variance
Independent variable:
TValue
-5.31498
111.658
SPPUND
Prob. Level
.00000
.00000
Source
Model
Error
Sum of Squares
9259599.3
87638.356
Df
1
118
Mean Square
9259599.3
742.698
F-Ratio
12468
Prob. Level
.00000
Total (corr.) 9347237.6 119
Correlation coefficient = 0.995301Stnd. Error of Est. = 27.2525
R-squared = 99.06 percent
FIG. 1. Correlations between values measured by different instruments.
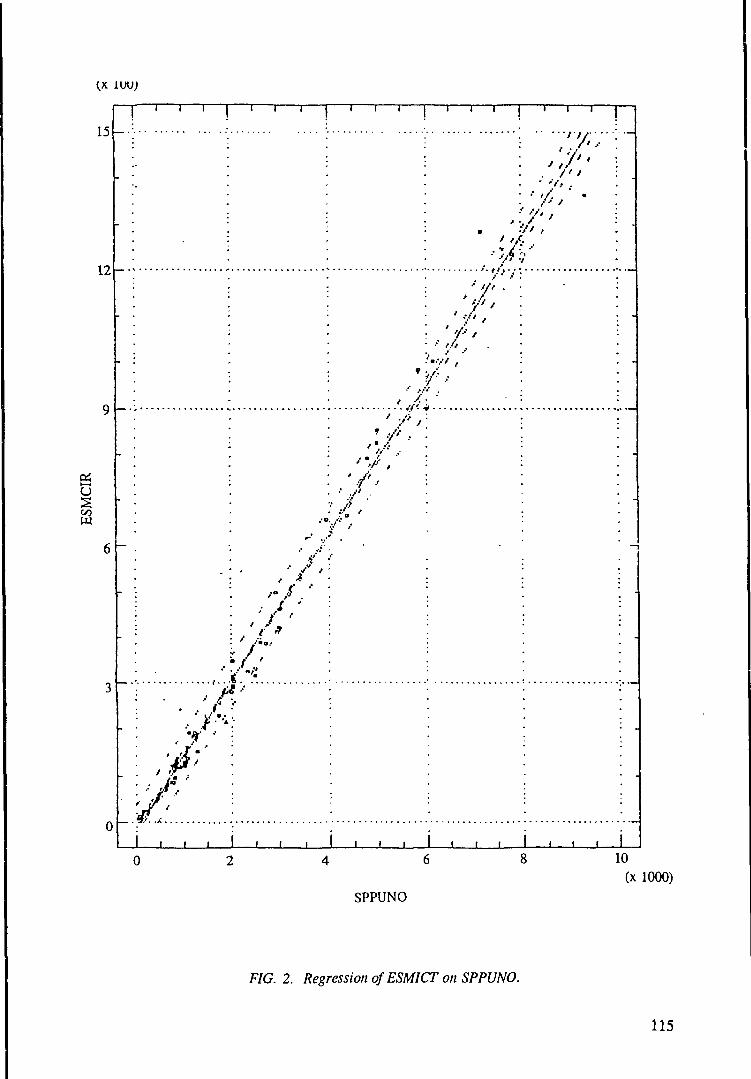
u
15
12
9
6
3
0
" 1 ' ' ' 1
-
—
-
-
• •
v ••
WI f . .
• •I)
£ ":•...
i . . .
1 • ' i
9
•* / /
'.„*,/ ./>' Jl ,'
if 1•' l '
'£*'•f ,-
i i i ,
. . . , i i i j
m <
. '/'
-
-
—1
; •
• -
i . . . i . . . i
SPPUNO
10(x 1000)
FIG. 2. Regression of ESMICT on SPPUNO.
115
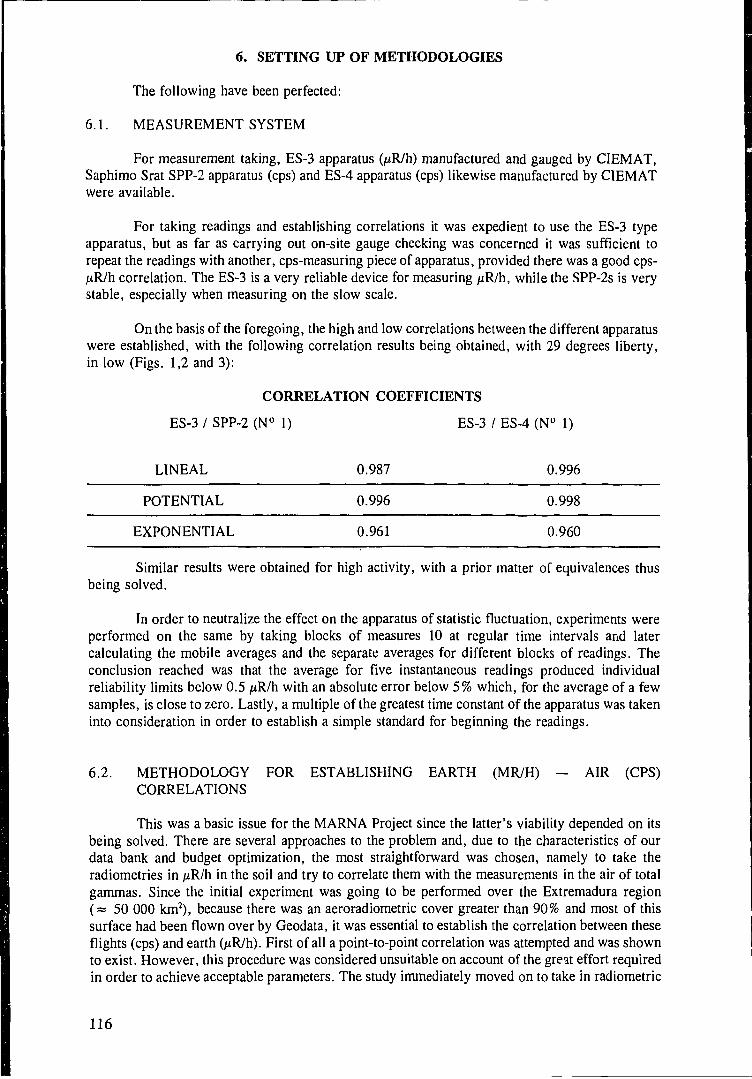
6. SETTING UP OF METHODOLOGIES
The following have been perfected:
6.1. MEASUREMENT SYSTEM
For measurement taking, ES-3 apparatus (/xR/h) manufactured and gauged by CIEMAT,Saphimo Srat SPP-2 apparatus (cps) and ES-4 apparatus (cps) likewise manufactured by CIEMATwere available.
For taking readings and establishing correlations it was expedient to use the ES-3 typeapparatus, but as far as carrying out on-site gauge checking was concerned it was sufficient torepeat the readings with another, cps-measuring piece of apparatus, provided there was a good cps-fiR/h correlation. The ES-3 is a very reliable device for measuring /xR/h, while the SPP-2s is verystable, especially when measuring on the slow scale.
On the basis of the foregoing, the high and low correlations between the different apparatuswere established, with the following correlation results being obtained, with 29 degrees liberty,in low (Figs. 1,2 and 3):
CORRELATION COEFFICIENTS
ES-3 / SPP-2 (N° 1) ES-3 / ES-4 (N° 1)
LINEAL
POTENTIAL
EXPONENTIAL
0.987
0.996
0.961
0.996
0.998
0.960
Similar results were obtained for high activity, with a prior matter of equivalences thusbeing solved.
In order to neutralize the effect on the apparatus of statistic fluctuation, experiments wereperformed on the same by taking blocks of measures 10 at regular time intervals and latercalculating the mobile averages and the separate averages for different blocks of readings. Theconclusion reached was that the average for five instantaneous readings produced individualreliability limits below 0.5 ixR/h with an absolute error below 5% which, for the average of a fewsamples, is close to zero. Lastly, a multiple of the greatest time constant of the apparatus was takeninto consideration in order to establish a simple standard for beginning the readings.
6.2. METHODOLOGY FOR ESTABLISHING EARTH (MR/H) — AIR (CPS)CORRELATIONS
This was a basic issue for the MARNA Project since the latter's viability depended on itsbeing solved. There are several approaches to the problem and, due to the characteristics of ourdata bank and budget optimization, the most straightforward was chosen, namely to take theradiometries in /*R/h in the soil and try to correlate them with the measurements in the air of totalgammas. Since the initial experiment was going to be performed over the Extremadura region( = 50 000 km2), because there was an aeroradiometric cover greater than 90% and most of thissurface had been flown over by Geodata, it was essential to establish the correlation between theseflights (cps) and earth (juR/h). First of all a point-to-point correlation was attempted and was shownto exist. However, this procedure was considered unsuitable on account of the great effort requiredin order to achieve acceptable parameters. The study immediately moved on to take in radiometric
116
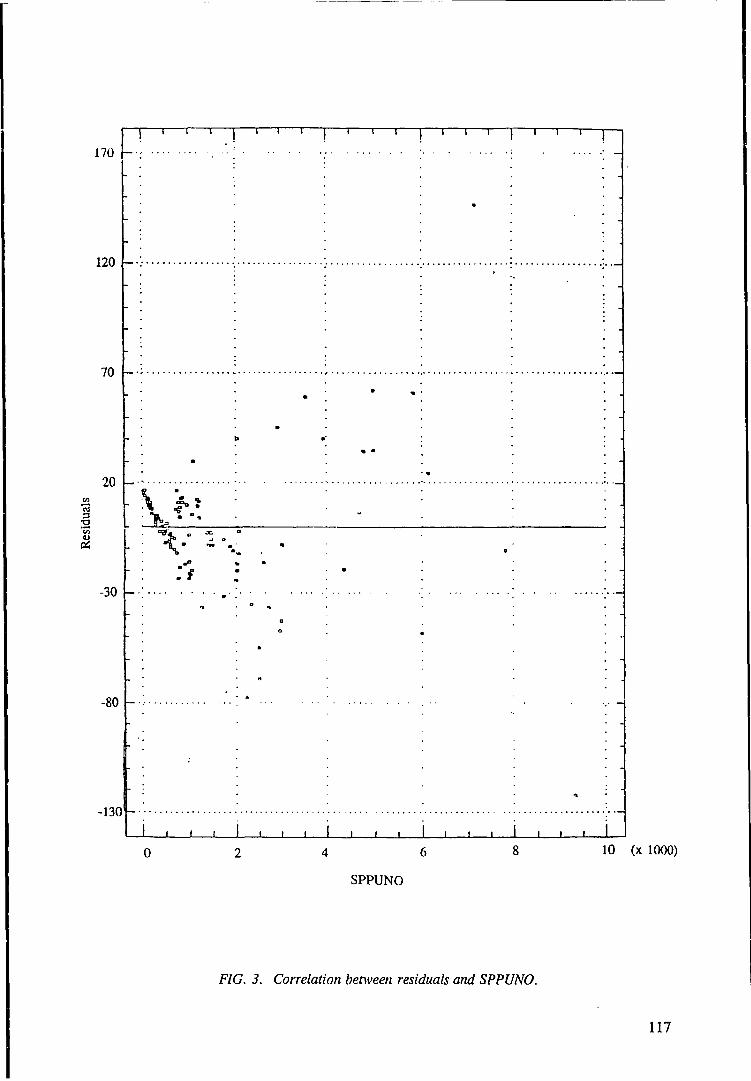
170
120
70
20
-30
-80
-130
!
-
- •
i i i | i i i
•
•
•
1 1 1
Vfc : : -ft : '
m
" n
a
m
n
1 1 1
a
•
1
-
-
1 I 1 I 1 I i I 1 I I i 1 I i I 1 I I i 1
4 6
SPPUNO
10 (x 1000)
FIG. 3. Correlation between residuals and SPPUNO.
117
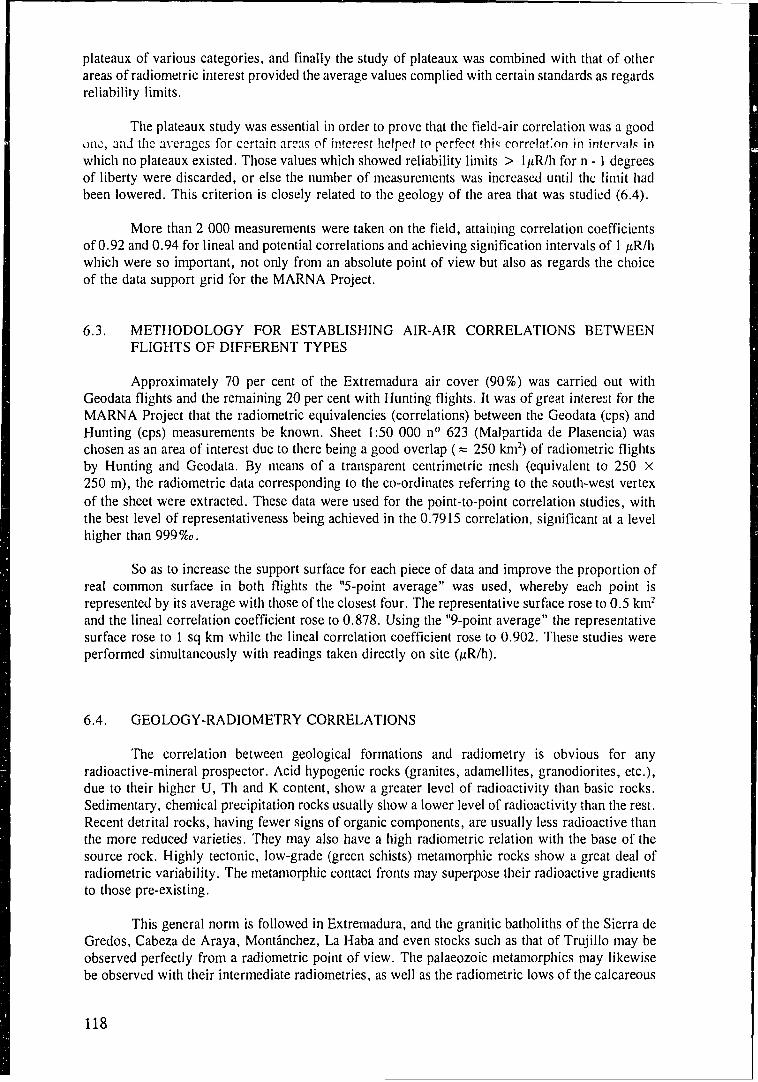
plateaux of various categories, and finally the study of plateaux was combined with that of otherareas of radiometric interest provided the average values complied with certain standards as regardsreliability limits.
The plateaux study was essential in order to prove that the field-air correlation was a goodone, and the averages for certain areas of interest helped to perfect this correlation in intervals inwhich no plateaux existed. Those values which showed reliability limits > l/*R/h for n -1 degreesof liberty were discarded, or else the number of measurements was increased until the limit hadbeen lowered. This criterion is closely related to the geology of the area that was studied (6.4).
More than 2 000 measurements were taken on the field, attaining correlation coefficientsof 0.92 and 0.94 for lineal and potential correlations and achieving signification intervals of 1 /*R/hwhich were so important, not only from an absolute point of view but also as regards the choiceof the data support grid for the MARNA Project.
6.3. METHODOLOGY FOR ESTABLISHING AIR-AIR CORRELATIONS BETWEENFLIGHTS OF DIFFERENT TYPES
Approximately 70 per cent of the Extremadura air cover (90%) was carried out withGeodata flights and the remaining 20 per cent with Hunting flights. It was of great interest for theMARNA Project that the radiometric equivalencies (correlations) between the Geodata (cps) andHunting (cps) measurements be known. Sheet 1:50 000 n° 623 (Malpartida de Plasencia) waschosen as an area of interest due to there being a good overlap (= 250 km2) of radiometric flightsby Hunting and Geodata. By means of a transparent centrimetric mesh (equivalent to 250 x250 m), the radiometric data corresponding to the co-ordinates referring to the south-west vertexof the sheet were extracted. These data were used for the point-to-point correlation studies, withthe best level of representativeness being achieved in the 0.7915 correlation, significant at a leveihigher than 999 %o.
So as to increase the support surface for each piece of data and improve the proportion ofreal common surface in both flights the "5-point average" was used, whereby each point isrepresented by its average with those of the closest four. The representative surface rose to 0.5 km2
and the lineal correlation coefficient rose to 0.878. Using the "9-point average" the representativesurface rose to 1 sq km while the lineal correlation coefficient rose to 0.902. These studies wereperformed simultaneously with readings taken directly on site (/xR/h).
6.4. GEOLOGY-RADIOMETRY CORRELATIONS
The correlation between geological formations and radiometry is obvious for anyradioactive-mineral prospector. Acid hypogenic rocks (granites, adamellites, granodiorites, etc.),due to their higher U, Th and K content, show a greater level of radioactivity than basic rocks.Sedimentary, chemical precipitation rocks usually show a lower level of radioactivity than the rest.Recent detrital rocks, having fewer signs of organic components, are usually less radioactive thanthe more reduced varieties. They may also have a high radiometric relation with the base of thesource rock. Highly tectonic, low-grade (green schists) metamorphic rocks show a great deal ofradiometric variability. The metamorphic contact fronts may superpose their radioactive gradientsto those pre-existing.
This general norm is followed in Extremadura, and the granitic batholiths of the Sierra deGredos, Cabeza de Araya, Montanchez, La Haba and even stocks such as that of Trujillo may beobserved perfectly from a radiometric point of view. The palaeozoic metamorphics may likewisebe observed with their intermediate radiometries, as well as the radiometric lows of the calcareous
118
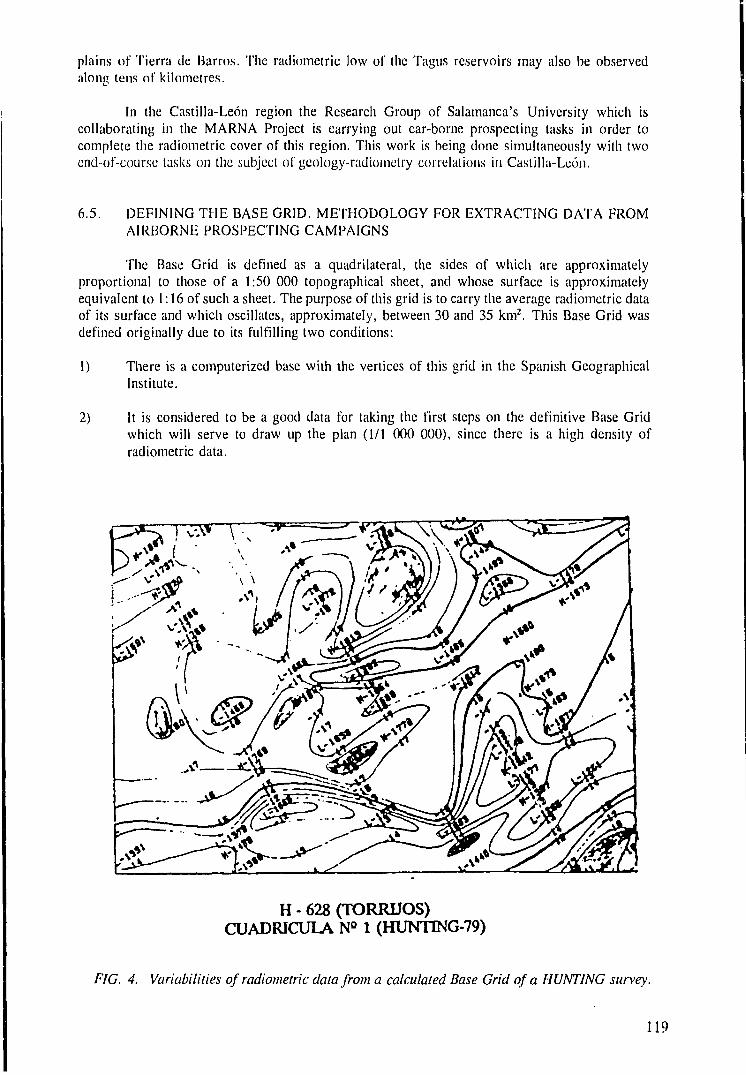
plains of Tierra de Barros. The radiometric low of the Tagus reservoirs may also be observedalong tens of kilometres.
In the Castilla-Leon region the Research Group of Salamanca's University which iscollaborating in the MARNA Project is carrying out car-borne prospecting tasks in order tocomplete the radiometric cover of this region. This work is being done simultaneously with twocnd-of-coursc tasks on the subject of geology-radiometry correlations in Castilla-Leon.
6.5. DEFINING THE BASE GRID. METHODOLOGY FOR EXTRACTING DATA FROMAIRBORNE PROSPECTING CAMPAIGNS
The Base Grid is defined as a quadrilateral, the sides of which are approximatelyproportional to those of a 1:50 000 topographical sheet, and whose surface is approximatelyequivalent to 1:16 of such a sheet. The purpose of this grid is to carry the average radiometric dataof its surface and which oscillates, approximately, between 30 and 35 km2. This Base Grid wasdefined originally due to its fulfilling two conditions:
1) There is a computerized base with the vertices of this grid in the Spanish GeographicalInstitute.
2) It is considered to be a good data for taking the first steps on the definitive Base Gridwhich will serve to draw up the plan (1/1 000 000), since there is a high density ofradiometric data.
H - 628 (TORRUOS)CUADRICULA N° 1 (HUNTING-79)
FIG. 4. Variabilities of radiometric data from a calculated Base Grid of a HUNTING survey.
119
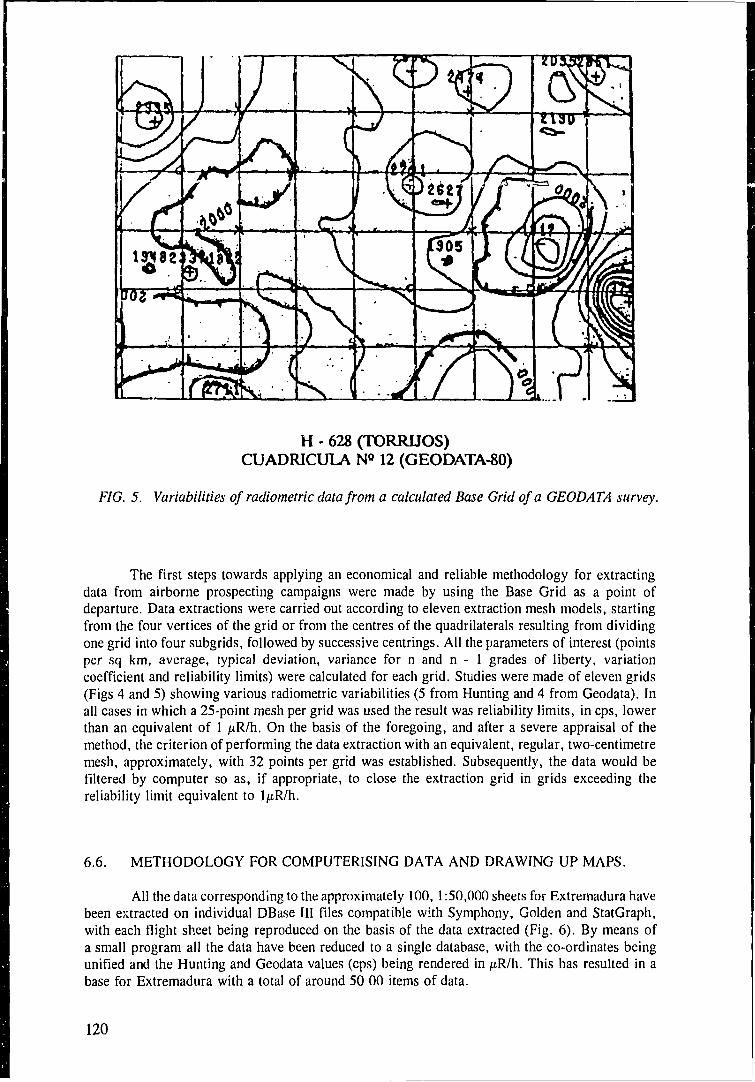
H - 628 (TORRUOS)CUADRICULA N° 12 (GEODATA-80)
FIG. 5. Variabilities of radiometric data from a calculated Base Grid of a GEODATA survey.
The first steps towards applying an economical and reliable methodology for extractingdata from airborne prospecting campaigns were made by using the Base Grid as a point ofdeparture. Data extractions were carried out according to eleven extraction mesh models, startingfrom the four vertices of the grid or from the centres of the quadrilaterals resulting from dividingone grid into four subgrids, followed by successive centrings. All the parameters of interest (pointsper sq km, average, typical deviation, variance for n and n - 1 grades of liberty, variationcoefficient and reliability limits) were calculated for each grid. Studies were made of eleven grids(Figs 4 and 5) showing various radiometric variabilities (5 from Hunting and 4 from Geodata). Inall cases in which a 25-point mesh per grid was used the result was reliability limits, in cps, lowerthan an equivalent of 1 fxR/h. On the basis of the foregoing, and after a severe appraisal of themethod, the criterion of performing the data extraction with an equivalent, regular, two-centimetremesh, approximately, with 32 points per grid was established. Subsequently, the data would befiltered by computer so as, if appropriate, to close the extraction grid in grids exceeding thereliability limit equivalent to l^R/h.
6.6. METHODOLOGY FOR COMPUTERISING DATA AND DRAWING UP MAPS.
All the data corresponding to the approximately 100, 1:50,000 sheets for Extremadura havebeen extracted on individual DBase HI files compatible with Symphony, Golden and StatGraph,with each flight sheet being reproduced on the basis of the data extracted (Fig. 6). By means ofa small program all the data have been reduced to a single database, with the co-ordinates beingunified and the Hunting and Geodata values (cps) being rendered in /xR/h. This has resulted in abase for Extremadura with a total of around 50 00 items of data.
120
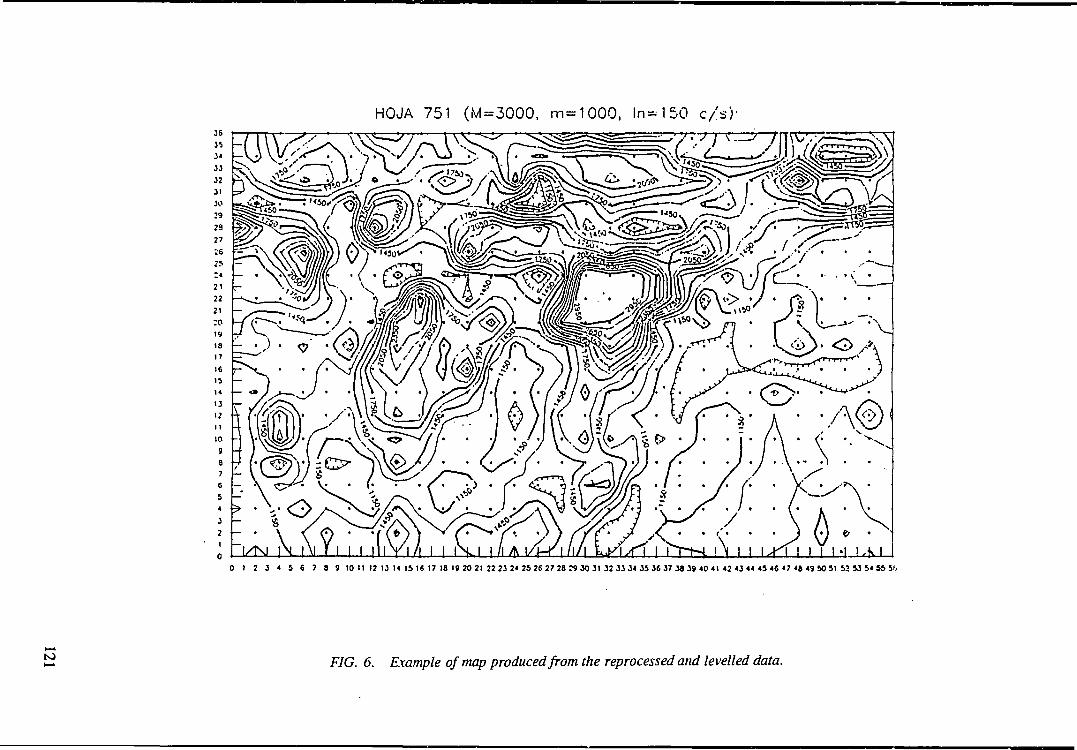
HOJA 751 (M=3000. m=1000, ln=150 c/s)
I \l I I I I I Y I /I I I I I I -I I A I0 1 2 3 4 5 6 7 8 9 10 II 12 13 14 15 16 17 18 19 20 21 22 23 24 25 26 27 28 29 30 31 32 33 34 35 36 37 38 39 40 41 42 43 44 45 46 47 4ft 49 50 51 52 53 54 55 50
FIG. 6. Example of map produced from the reprocessed and levelled data.
The maps are being drawn up with the collaboration of Computer Science teachers fromthe Polytechnic University School of Caceres (E.U.P.C.) and, in addition, teachers of Physics fromthe Caceres Faculty of Veterinary Science and their associates from the E.U.P.C. are helping toperfect equivalences.
Value ranks and isocurves of 1 jiR/h in 1 iR/h have been drawn up for the interval > 4- > 20 ixR/h, with a first solution being observed for the maps with a scale of 1:10'' using all thedata.
On a scale of 1:50 000 the use of around 500 data per sheet is extremely attractive,especially if a detailed analysis of the geology-radiometry correspondence is to be made.
On a scale of 1:200 000 the information is excessive, and so tests were made with basegrids equivalent to 1/64, 1/16 and 1/4 of the 1:50 000 sheet.
In principle, one solution to the l:106 problem is that described above. However, in theevent of using isocurves, recourse must be had to a base grid which, furthermore, is morerepresentative in dose terms.
BIBLIOGRAPHY
Atlas of Natural Radiation Levels in the European Communities. Phase II. Final Report - Nov.1988, CEC Contract Nr 85.420 (1988).
BETTENCOURT, A. O. de, GALVAO, J. P., LOWDER W., OLAST, M., SINNAEVE, J., Eds;Natural Radiactivity, Proceedings of the Fourth International Symposium on the Natural RadiationEnvironment held at Lisbon, Portugal, December 7-11, 1987, Conf 871208; EUR 11895 RadiationProtection Dosimetry 24, (1 - 4) Publ. by Nuclear Technology Publishing (1988).
Book of Abstracts, Int. Conf on High Levels of Natural Radiation, 3-7 Nov, Ramsar, IslamicRepublic of Iran. AEOI, IAEA, WHO, UNEP, INTS (1990).
BRADLEY, E.J., GREEN B.M.R., Outdoor gamma-ray dose rates in Great Britain - PreliminaryResults, Radiol. Prot. Bull. 59 (1987) p 16.
BROWN, et. al. Radon en Espaiia, Forum Atomico Espanol, Madrid (1992).
CAULCUT, R., Statistics in Research and Development (2nd ed.), Champman and Hall, London(1991).
CEC, Radiation protection, exposure to natural radiation in dwellings of the EuropeanCommunities, CEC, Luxembourg (1987).
CERRAJERO, J. C , Investigacion de minerales radiactivos en Espana mediante prospeccion aerea,Tesis doctoral, ETSIM, Madrid (1973).
CSN, La vigilancia de la radiation, Consejo de Seguridad Nuclear, Madrid (1992).
DAVIES, O. L., Metodos estadfsticos para investigacion y production, Aguilar, Madrid (1960).
FERNANDEZ AMIGOT, J. A., Valoracion estadisticadel yacimiento uranffero Mina FE. JEN.,Ciudad Rodrigo (1968).
122
FERNANDEZ AMIGOT, J. A., Valoracion estadfstica de trece yacimientos uranfferos en laprovincia de Salamanca, JEN., Ciudad Rodrigo. (1969).
FERNANDEZ AMIGOT, J. A., Desmuestres y sus tipos. Studia Geologica, U, Salamanca (1975).
GARZON RUIPEREZ, L., Radiactividad y mcdio ambicntc, Scrv. Publ. Univcrsidad Oviedo,Oviedo (1979).
GEODATA, Prospeccion Aerea. Proyecto AR - 1 / 80, Caracteristicas de los equipos empleadosen la campana, Geodata, Madrid (1981).
GEODATA, Prospeccion Aerea. Proyecto AR - 1 / 81. Caracteristicas de los equipos empleadosen la campana Geodata, Madrid (1982)
GMURNAN, V. E., Teorfa de las probabilidades y estadistica matematica, MIR. Moscu (1983).
GREEN, B.M., HUGHES J. S., Lomas, P. R., Natural sources of ionising radiation in Europe,Radiation Atlas, Commission of the European Communities, Luxembourg (1991).
GREEN, B.M.R., Atlas of natural radiation levels in the European Community Pilot Study, Reportto the CEC, Oct. 1986.
GREEN, B.M.R., LOMAS P. R., BRADLEY, E. J., WRIXON, A.D., Gamma - radiation leveloutdoors in Great Britain, NRPB Chilton, R - 191 (1988).
HUNTING, Prospeccion Aerea. Proyecto AR - 1 / 7 8 . Caracteristicas de los equipos empleadosen la campana, Hunting, Madrid (1979).
I.T.G.E., Proyecto de reprocesado e interpretation de varias campanas de geoffsica en el MacizoHesperico. I.T.G.E. Madrid (Oct. 1992).
KNOLL, G.F., Radiation detection and measurement, John Willy & Sons, New York (1979).
LOWDER, W., External terrestrial and cosmic radiation. Proceeding of the Fifth InternationalSymposium on the Natural Radiation Enrivonment, Salzburg (1991).
MORO B., M a . C , CEMBRANOS, Ma. L., PEREZ del V., L. Aplicacion de la prospeccionaereo-radiometrica y litogeoquimica del uranio a la localization de indicios de fosfatos siliiricosen la Provincia de Zamora. Reunion de la Sociedad Geologica de Espaiia, Madrid (1993).
MORO B., M a . C , PEREZ del V., L. Estudio de la distribution de K, U y Th en el batolito deCabeza de Araya mediante prospeccion aereo-radiometrica. Implicaciones petrogeneticas ymetalogeneticas. Libro Jubilar de Figuerola L. D. Omega, Madrid (1988).
MERINO, J. L., JOSA, J. M., Study of Spanish uraniferous sandstones. En: Jones, M. J. (ed),Geology, Mining and Extractive Processing of Uranium, I.M.M. London (1977) 63 - 70.
QU1NDOS, L. S., FERNANDEZ, P. L., SOTO, J., Exposure to natural sources of radiation inSpain. En Int. Conf on Implications of the New ICRP Recomendations on Radiation Protection,Practices and Interventions, Salamanca 26 -29 Nov. 1991, CIEMAT, Madrid, Vol 2 (1992) 273 -282.
QUINDOS, L., S., FERNANDEZ, P. L., SOTO, J., NEWTON, G., PENA, J., ARTECHE, J.,VILLAR, E., Radon principal fuente de radiation natural. Rev. Espanola de Ffsica 3 (2) 22 - 27(1989).
123
SANCHEZ LEON, J. G., Radiactividad y medio ambiente, Estratos (26) Invierno 93, 12 - 18.
SCHEAFFER, R. L., MENDENHALL, W., OTT, L., Elementos de muestreo, G. E.Iberoamericana, Mexico (1986).
Seminar on the Radiological Burden of Man from Natural Radiactivity in the Countries of theEuropean Communities, CEC, V/2.408/80 (1980).
SIERRA, M. A. Ejercicios resueltos de estadistica, CENRA, Madrid (1987).
SOCIEDAD NUCLEAR ESPANOLA. Jornada sobre el control del fondo radiactivo ambiental.Barcelona, 15 Diciembre 1992 (1992).
STEINHAUSLER, F., The natural radiation environment: future perspective. Proceedings of theFifth International Symposium on the Natural Radiation Environment, Salzburg (1991).
SUAREZ MAHOU, E., CERRAJERO H., J., CREGO, A. Relacion Interna JEN. Prospeccionaerea sistematica de Cuenca y Guadalajara, Madrid (1964).
SUAREZ MAHOU, E., CERRAJERO H., J., CREGO, A. Relacion Interna JEN. Prospecciondetallada de la zona de Huete-Saelices-Montalvo, Madrid (1964).
SUAREZ MAHOU, E., CERRAJERO H., J., CREGO, A. Relacion Interna JEN. Prospeccionaerea sistematica del valle del Guadiana, Madrid (1064).
SUAREZ MAHOU, E., CERRAJERO H., J., CREGO, A. Relacion Interna JEN. Prospeccionaerea sistematica de la zona de la Sierra de la Demanda, Madrid (1965).
SUAREZ MAHOU, E., CERRAJERO H., J., CREGO, A. Relacion Interna JEN. Prospeccionaerea sistematica del Valle del Tajo, Madrid (1965).
SUAREZ MAHOU, E., CERRAJERO H., J., CREGO, A. Relacion Interna JEN. Prospeccionaerea sistematica del valle del Duero, Madrid (1965).
SUAREZ MAHOU, E., CERRAJERO H., J., CREGO, A. Relacion Interna JEN. Prospeccionaerea sistematica de la zona de Cordoba, Madrid (1966).
SUAREZ MAHOU, E., CERRAJERO H., J., CREGO, A. Relacion Interna JEN. prospeccionaerea sistematica de la zona de Almeria, Madrid (1966).
SUAREZ MAHOU, E.: CERRAJERO H., J., CREGO, A. Relacion Interna JEN. Prospeccionaerea sistematica de la zona de Sevilla, Madrid (1966).
SUAREZ MAHOU, E.: CERRAJERO H., J., CREGO, A. Relacion Interna JEN. Prospeccionaerea sistematica de la zona de Badajoz, Madrid (1967).
SUAREZ MAHOU, E.: CERRAJERO H., J., CREGO, A. Relacion Interna JEN. Prospeccionaerea sistematica de la zona de Ciudad Real, Madrid (1967).
SUAREZ MAHOU, E., CERRAJERO H., J., CREGO, A. Relacion Interna JEN. Prospeccionaerea sistematica de la zona de Valencia, Madrid (1967).
SUAREZ MAHOU, E., CERRAJERO H., J., CREGO, A. Relacion Interna JEN. Prospeccionaerea sistematica de la zona de Atienza, Madrid (1068).
124

SUAREZ MAHOU, E., CERRAJERO H., J., CREGO, A. Relacion Interna JEN. Prospeccionaerea sistematica de la zona de Belchite-Caspe, Madrid (1968).
SUAREZ MAHOU, E., CERRAJERO H., J., CREGO, A. Relacion Interna JEN. Prospeccionaerea sistematica de la zona de Leon, Madrid (1968).
SUAREZ MAHOU, E., CERRAJERO H., J., CREGO, A. Relacion Interna JEN. Prospeccionacrca sistematica dc la zona do Burgos, Madrid (1969).
SUAREZ MAHOU, E., CERRAJERO H., J., CREGO, A. Relacion Interna JEN. Prospeccionaerea sistematica de la zona de Orense, Madrid (1969).
SUAREZ MAHOU, E., CERRAJERO H., J., CREGO, A. Relacion Interna JEN. Prospeccionaerea sistematica de la zona de Zamora, Madrid (1970).
SUAREZ MAHOU, E., CERRAJERO H., J., CREGO, A. Relacion Interna JEN. Prospeccionaerea sistematica de la zona de Cuenca, Madrid (1970).
SUAREZ MAHOU, E., CERRAJERO H., J., CREGO, A. Relacion Interna JEN. Prospeccionaerea sistematica de la zona de Calatayud, Madrid (1971).
SUAREZ MAHOU, E., CERRAJERO H., J., CREGO, A. Relacion Interna JEN. Prospeccionaerea sistematica de la zona de Montalban, Madrid (1971).
SUAREZ MAHOU, E., CERRAJERO H., J., CREGO, A. Relacion Interna JEN. Prospeccionaerea sisteinatica de la zona de Albacete. Madrid (1971).
Mapa de radiometria aerea de Espana (parcial), Escala 1/1000.000 (1972).
Mapa de radiometria aerea de Espana (parcial), Escala 1/200.000 (1972).
Mapa de radiometria aerea de Espana (parcial), Escala 1/50.000 (1972).
UNSCEAR, Sources, effects and risks of ionizing radiation. United Nations Scientific Committeeon the Effects of Atomics Radiation. 1988. Report to the General Assembly with annexes. UnitedNations, New York (1998).
125
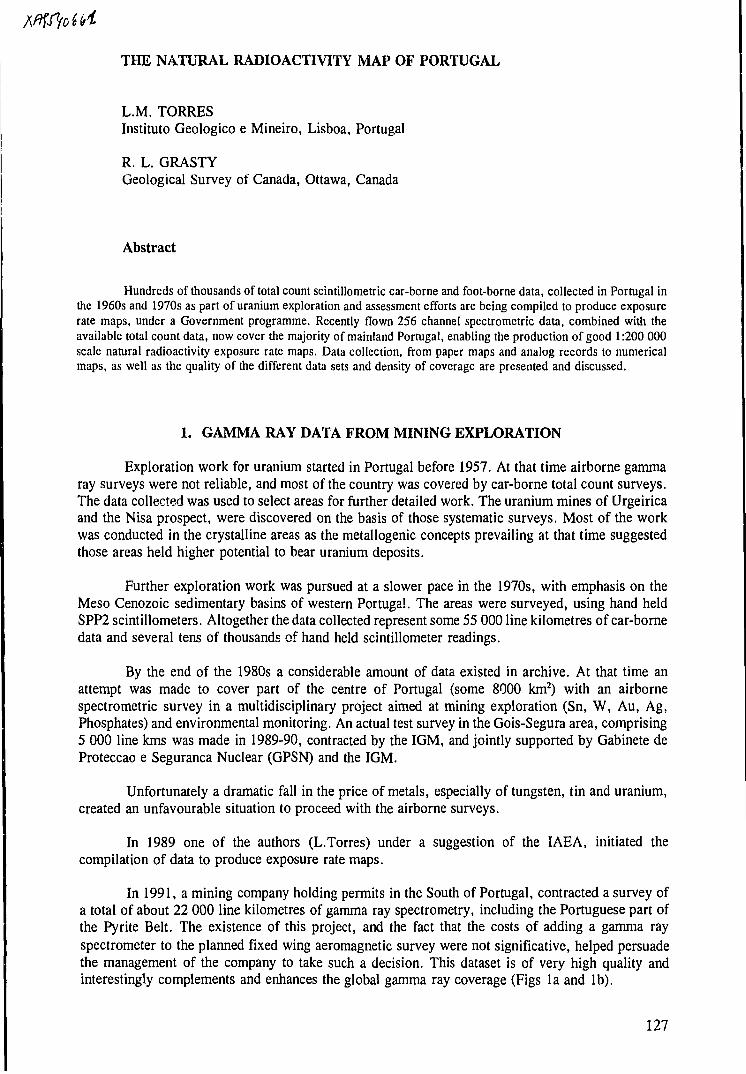
THE NATURAL RADIOACTIVITY MAP OF PORTUGAL
L.M. TORRESInstituto Geologico e Mineiro, Lisboa, Portugal
R. L. GRASTYGeological Survey of Canada, Ottawa, Canada
Abstract
Hundreds of thousands of total count scintillometric car-borne and foot-borne data, collected in Portugal inthe 1960s and 1970s as part of uranium exploration and assessment efforts are being compiled to produce exposurerate maps, under a Government programme. Recently flown 256 channel spectrometric data, combined with theavailable total count data, now cover the majority of mainland Portugal, enabling the production of good 1:200 000scale natural radioactivity exposure rate maps. Data collection, from paper maps and analog records to numericalmaps, as well as the quality of the different data sets and density of coverage are presented and discussed.
1. GAMMA RAY DATA FROM MINING EXPLORATION
Exploration work for uranium started in Portugal before 1957. At that time airborne gammaray surveys were not reliable, and most of the country was covered by car-borne total count surveys.The data collected was used to select areas for further detailed work. The uranium mines of Urgeiricaand the Nisa prospect, were discovered on the basis of those systematic surveys. Most of the workwas conducted in the crystalline areas as the metallogenic concepts prevailing at that time suggestedthose areas held higher potential to bear uranium deposits.
Further exploration work was pursued at a slower pace in the 1970s, with emphasis on theMeso Cenozoic sedimentary basins of western Portugal. The areas were surveyed, using hand heldSPP2 scintillometers. Altogether the data collected represent some 55 000 line kilometres of car-bornedata and several tens of thousands of hand held scintillometer readings.
By the end of the 1980s a considerable amount of data existed in archive. At that time anattempt was made to cover part of the centre of Portugal (some 8000 km2) with an airbornespectrometric survey in a multidisciplinary project aimed at mining exploration (Sn, W, Au, Ag,Phosphates) and environmental monitoring. An actual test survey in the Gois-Segura area, comprising5 000 line kms was made in 1989-90, contracted by the IGM, and jointly supported by Gabinete deProteccao e Seguranca Nuclear (GPSN) and the IGM.
Unfortunately a dramatic fall in the price of metals, especially of tungsten, tin and uranium,created an unfavourable situation to proceed with the airborne surveys.
In 1989 one of the authors (L.Torres) under a suggestion of the IAEA, initiated thecompilation of data to produce exposure rate maps.
In 1991, a mining company holding permits in the South of Portugal, contracted a survey ofa total of about 22 000 line kilometres of gamma ray spectrometry, including the Portuguese part ofthe Pyrite Belt. The existence of this project, and the fact that the costs of adding a gamma rayspectrometer to the planned fixed wing aeromagnetic survey were not significative, helped persuadethe management of the company to take such a decision. This dataset is of very high quality andinterestingly complements and enhances the global gamma ray coverage (Figs la and lb).
127
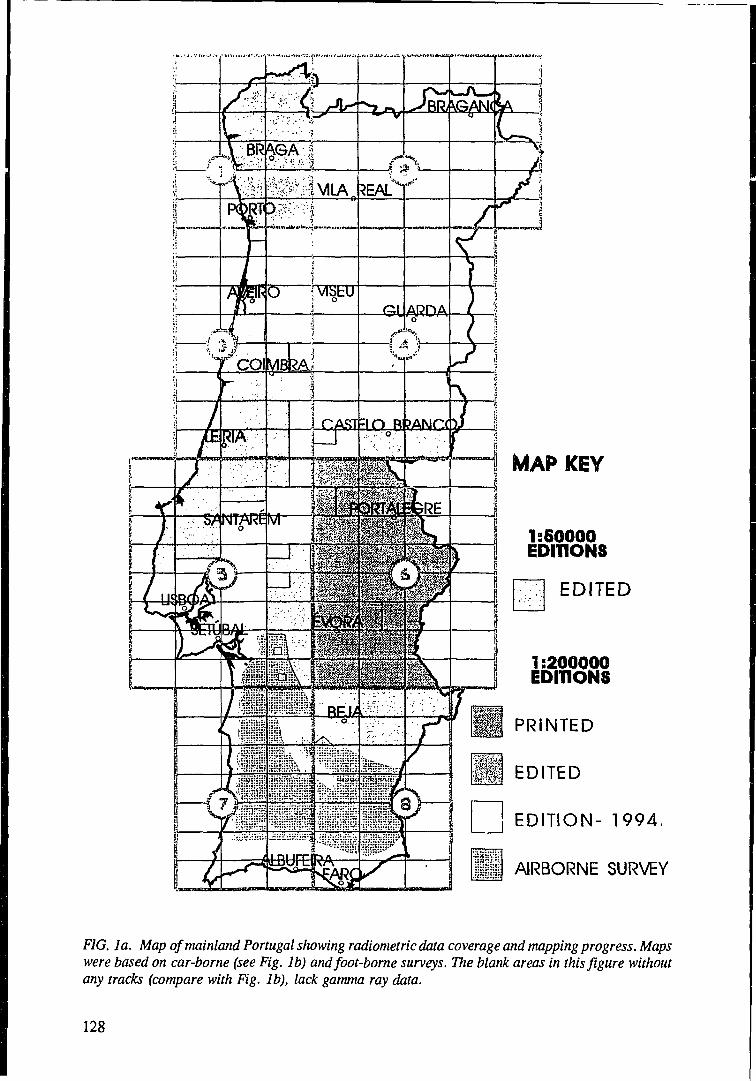
MAP KEY
I36OOOOEDITIONS
EDITED
1:200000EDITIONS
PRINTED
EDITED
EDITION- 1994.
AIRBORNE SURVEY
FIG. la. Map of mainland Portugal showing radiometric data coverage and mapping progress. Mapswere based on car-borne (see Fig. 1b) and foot-borne surveys. The blank areas in this figure withoutany tracks (compare with Fig. 1b), lack gamma ray data.
128

All airborne work, was made with fixed wing aircraft, 256 channel spectrometers, 32 1volume crystals without upward looking detectors, 120 m terrain clearance and 500 m line spacingand is available in digital form at the IGM. Unfortunately none of the surveys was presented inconcentrations of equivalent radioisotopes as recommend by the IAEA.
The foot-borne data exists as 1:25 000 topographic maps with the location of the readings,which are presented in counts per second. The car-borne data is archived in folded 1:25 000 withtruck itineraries and fiducial marks along the tracks. A complementary set of analog charts pertainingto the itineraries, and tied to the location maps by the fiducial marks is also available. Those recordsare in arbitrary units (millimetres), and from the instructions of the car-borne system, supplied by themanufacturer, the function to convert scale units of the analog charts to counts per second wasobtained.
2. PRODUCTION OF THE EXPOSURE RATE MAPS
2.1. FIRST PHASE OF THE PROJECT
Before the start of the project a feasibility study was carried out. The first point to test washow reliable the old car-borne records were. The good quality was confirmed by reproducing theanalog charts, driving a GAD-6 Scintrex spectrometer at about 20 km/h along the same tracks usedby the old car-borne system of the 1960s. Dirty roads, practically in the same virgin state as at thetime of the former surveys, were used for the tests. A second point concerned the development ofeconomically efficient procedures to digitize the data and an assessment of the work involved in theproduction of suitable cartographic products and reliable digital data. As a result a decision was takento digitize only the fiducials and not the complete records, to reduce the costs.
So, by 1989 the.project actually started, under a protocol of GPSN and Servico de FomentoMineiro (now part of IGM). As both institutions wanted quick results the first maps were producedat. 1:50 000 scale. However it was soon, realized that the data coverage was too coarse for acomprehensive national coverage at that scale. It was decided that as soon as back calibrations of thedifferent sensors were available and reliable exposure rate maps could be produced, mapping scaleshould be changed to 1:200 000. The experience obtained so far was invaluable in the production of1:200 000 maps.
2.1. BRIEF DESCRIPTION OF THE MAP MAKING PROCEDURES
First, analog records are sorted by 1:25 000 base maps, enabling easy control of the digitizingand keying in of data.
Simplified base maps (at 1:50 000 or 1:200 000) are accurately digitized and organized inlayered Autocad drawing files, with roads, railways, hydrography and '.oponymy. Simultaneously,a database of anomalies from paper records collected in uranium exploration work, was created andis also included as a layer of the respective map sheets. Separate data, grid and drawing files withcoloured isolines, are generated for the radiometric data by 1:50 000 map sheet. Data is posted andverified at this scale, enabling checking and easy correlation with published geological maps. Anumber of routines were coded to automate some of the tasks, to keep track of data files, organizinga database with records sorted by sensor type, year of collection, map sheets, coordinates and values,allowing easy update, import and export and calibration of data in exposure rate units.
Simple routines were coded to produce fast and inexpensive printer plots of uncovered areas,enabling quick planning for fill in field work. Suspect values, which do not match known geology,or present abnormally low or high values are checked, as part of the fill in work.
129
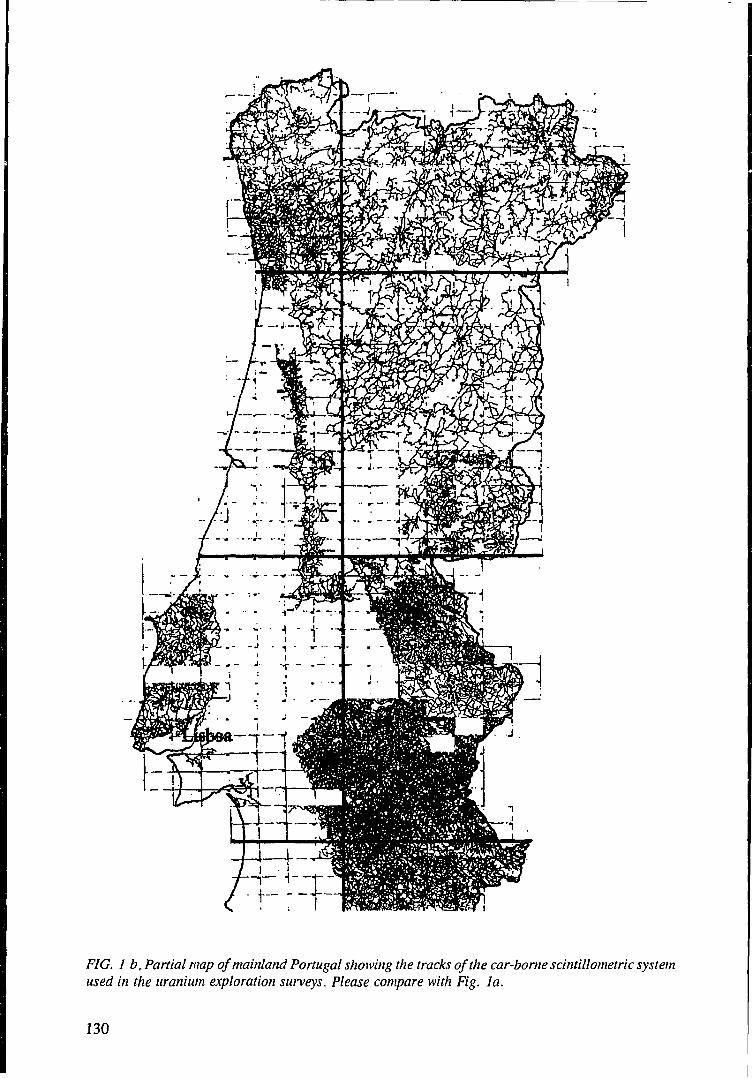
FIG. 1 b. Partial map of mainland Portugal showing the tracks of the car-borne scintillometric systemused in the uranium exploration suiyeys. Please compare with Fig. la.
130
The foot-borne data was organized by 1:25 000 map sheets. Some of the data for thesedimentary areas existed in digital form, and was validated. Owing to the multiple surveys ofdisparate quality, oversampling in some areas (readings every 2 m, for instance) and lack of data inadjacent areas, some simple criteria was adopted, to get a more evenly distribution of data to ensure1-2 samples per km2. Some fill in work was done, to get a better representation of the backgroundwhile depicting the anomalous zones known from previous surveys.
Compilation is done in-house, while digitizing and cartography is contracted, relieving IGMfrom the most time consuming phases. Calibrations were made under the methodology devised by oneof us (Grasty [1]). Data organization and reprocessing allows full control at all stages of the process.
A National database of all the anomaly locations, calibrated in mR/h and with a shortdescription of the geology was also built from the exploration archives and included as a layer in thenumerical maps both at 1:50 000 and 1:200 000 scales. Mineral occurrences were also organized ina database and fed as a layer to the correspondent base maps.
Final raster copies and colour separations were produced for map sheet nQ6 (Fig. 2), at theGeological Survey of Canada, while one of the authors (L.Torres) was at the GSC under an IAEAfellowship.
3. CALIBRATION PROCEDURES
Using a calibrated a GR-256 Exploranium spectrometer a dozen sites previously surveyed bythe car-borne and foot-borne scintillometers, covering a large range of values and encompassingdiverse geological units, were reoccupied. Exposure rates were calculated from the concentrations ofequivalent Uranium, Thorium and Potassium supplied by the GR-256. Exposure rates calculated fromthose concentrations were linearly correlated with the values in counts per second of thescintilometers. The reader is referred to [1], for further details. The linear relationships establishedfor the different sensors are used to calculate the exposure rates from the original data. The authorsalso calibrated the Gois-Segura airborne survey detector, and more recently the Pyrite Belt airbornesurvey detector was also back calibrated.
4. GENERAL COMMENTS ABOUT SHEET NQ6
Taking in consideration the limitations of the original data the final map is surprisingly good.A simple comparison of the exposure rate map with the most recent edition of the geological map ofPortugal at 1:500 000 (in press), easily allows correlation between several geological and radiometricunits.
Careful examination of the map shows an East-West artificial lineament, at the border betweenfoot-borne and car-borne survey areas, which are clearly outlined in the legend of the map. This isindicative that users should be warned of some limitations of the original data and the recoveringprocess used. Actually it must be pointed out that at least two different car-borne systems and severaldozens of hand held SPP2 scintilometers were used in those surveys, which span more than 35 years.
One source of error in the car-borne data is the non-linearity of the analog unit response inthe low and high end ranges of the scale owing to electronic and mechanical problems. Larger relativeerrors are expected in such areas.
Perhaps the principal source of error results from the interpolation itself, owing to poorsampling. Average density of readings used in the map is about 1.5 point per kma. The interpolation
131
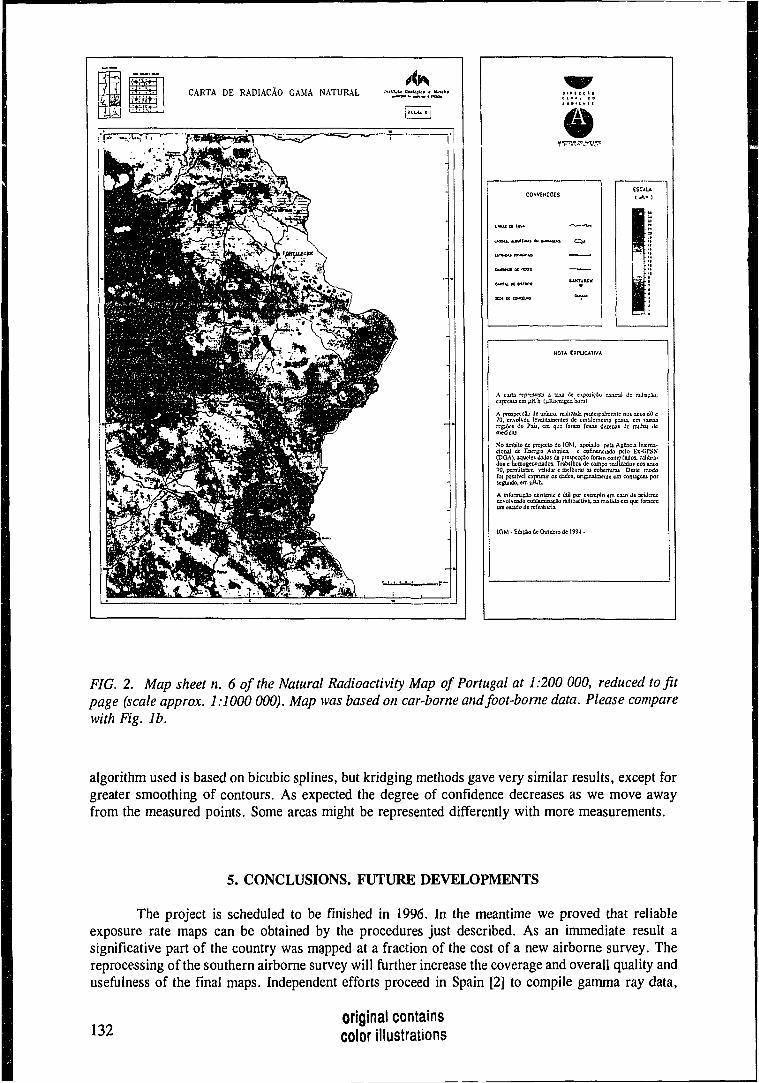
CARTA DE RADIACAO GAMA NATURAL
ESCAU
NOT* EXPUUTiVA
A carta represent! a tau JeRT R 1
A proipcccJo dc urJnio. rcahzada proicipslmenlc noi anoi 60 c70, cmohcu levantaraenloj de cinulomcma g^nu. cm t u t urcgjijci do POJJ. cm quc foraxn faUu dcunas dc milhu tiemcdidas
No imblio de projecio do IOM, apoiiio peb Afiincii Inienia-cional de Enciipj Auimica, c cofuumcudo pclo Ex-GPSK(DOA), iqucleJ ibtloi *lu prospectao foraxn corapiladoj, ulibra-doi c horoogcficuadoj, Trabtlcot de compo [uitzodoi DOJ anoj90, pcrmiuram vaJidar e iselhorar as cobenuia* Dute modofoi pouivc] cxpmau o$ dados, onpiulaeaic cm contagcw porscgundo, cm pR/h.
A infonmifao exiiUnte t iitJi por excmplo cm cam de aridenlccnvolvcndo coniamiiu(io radioactiva, na mcdida cm que faracccum ciiaAo it jtfetiiKii.
IGM - EdicAa de Dutubro d£ 199-1 •
FIG. 2. Map sheet n. 6 of the Natural Radioactivity Map of Portugal at 1:200 000, reduced to fitpage (scale approx. 1:1000 000). Map was based on car-borne and foot-borne data. Please comparewith Fig. lb.
algorithm used is based on bicubic splines, but kridging methods gave very similar results, except forgreater smoothing of contours. As expected the degree of confidence decreases as we move awayfrom the measured points. Some areas might be represented differently with more measurements.
5. CONCLUSIONS. FUTURE DEVELOPMENTS
The project is scheduled to be finished in 1996. In the meantime we proved that reliableexposure rate maps can be obtained by the procedures just described. As an immediate result asignificative part of the country was mapped at a fraction of the cost of a new airborne survey. Thereprocessing of the southern airborne survey will further increase the coverage and overall quality andusefulness of the final maps. Independent efforts proceed in Spain [2] to compile gamma ray data,
132original containscolor illustrations
and it will soon be possible to produce homogeneous exposure rate maps of the Iberian Peninsula,an important base line information for environmental studies.
Byproducts of the mapping project, like numerical base maps, databases, etc, will be usefulby themselves in other projects.
Another interesting development of the project is that a new truck mounted EnvironmentalMonitoring System, comprising an 256 channel spectrometer, a 4 1 volume crystal and a GPSnavigation system will start to operate in the beginning of 1994. The system will be used to fill inareas without any radiometric data, and enable the monitoring of man-made radiation in environmentalstudies.
ACKNOWLEDGEMENTS
This project is the result of teamwork, but we must stress some important contributions.
The key role of Jaime Leote, formerly with Junta de Energia Nuclear, with his remarkableknowledge of the radiometrics of Portugal and his commitment in the field work and compilation ofold data.
The technical and financial support of the IAEA under biennial assistance programmes, ofwhich the enthusiastic support of M. Tauchid is not a minor point.
Last but not least, the professionalism of the cartographic unit of the Geological Survey ofCanada under Gary Labelle, which produced the final version of map sheet nQ6 and the colourseparations.
REFERENCES
[1] GRASTY, R.L., TAUCHID, M., Standardization of old gamma ray survey data. {IAEA,Tech. Committee Meeting 9-12 November 1993.)
[2] MAHOU, E.M., AMIGOT, F., Use of uranium airborne survey data in the preparation ofradiometric map of Spain.
133
URANIUM RESOURCE ASSESSMENT AND EXPLORATIONDATA FOR GEOLOGIC RADON POTENTIAL ASSESSMENTSIN THE UNITED STATES
J. K. OTTON, L.C.S. GUNDERSEN, R. R. SCHUMANN, G. M. REIMERU.S. Geological Survey, Denver, Colorado, United States of America
J. S. DUVALU.S. Geological Survey, Reston, Virginia, United States of America
Uranium resource assessment and exploration programmes funded by the United StatesGovernment since the late 1940s have yielded a substantial body of earth science data, much of whichis now maintained by the U.S. Geological Survey (USGS). These data have been used since 1987 toassess the geologic radon potential of various counties, States, and regions throughout the entireUnited States Included in the database are three distinct types of data that have been used in radonassessments: (1) aeroradiometric data, covering the continental United States and parts of Alaska, thatinclude potassium (derived from K-40 spectra), uranium (derived from Bi-214 spectra), and thorium(derived from Tl-208 spectra) coverage flown at a nominal 166-m altitude at flightline spacings of1.6, 5, or 10 km; (2) uranium occurrence and deposit data that contain detailed geologic andgeochemical descriptions and production information; and (3) rock geochemical data, includinguranium and thorium analyses of rocks and related soils from many regional geochemical studies. Thespectral aeroradiometric survey of the entire United States was produced during the National UraniumResource Evaluation (NURE) program funded by the U.S. Department of Energy. Some of these datawere compiled and combined with estimates of soil permeability from county soil surveys to developa preliminary evaluation of radon potential in the Pacific Northwest (Duval and Otton, 1990; Ottonand Duval, 1990). In a later, modified version of this methodology, the NURE aeroradiometric datawere used with indoor radon data, geology, soil permeability estimates, and house-construction datato provide semiquantitative estimates of radon potential of geologic provinces in individual States aspart of a national assessment (Schumann, 1993). In more recent studies, detailed evaluation of theNURE aeroradiometric data for Florida provided quantitative estimates of the radium concentrationsof near-surface soil layers that were used in a mathematical model to assess geologic radon potentialin Florida (Nielson and others, 1993a,b: Holt and others, 1993a,b,c; Otton and others, this volume).The NURE data and the total-count data from a USGS survey of northern Florida (Grosz and others,1989) also were used with drillhole descriptions to estimate the radium content of underlying geologicunits for the mathematical model. The uranium deposit and occurrence data identify small, specificlocalities where anomalous concentrations of uranium are present in soils and rocks and where highindoor radon levels may therefore occur (Otton, 1993, Henry and others, 1991). Areas such as GrandJunction, Colo, where mine and mill wastes are present, define areas of elevated radon concentrationsin soils (Landa, 1991). The rock geochemical data identify specific geologic map units, like theextensive marine black shales in the Central United States (Coveney and others 1987; Harrell andothers, 1991) and the granites in the Northeast (Boudette and Olszewski, 1986) and the RockyMountains (Castor and others, 1977), that, on the basis of their radioelement content, are likely toyield high average indoor radon. Each of these data sets has some limitations. None of them directlyaccount for the other factors that control radon availability, such as soil permeability, soil moisture,and radon emanation coefficient. Aeroradiometric surveys are limited by a relatively shallow depthof view (about 90 percent of the gamma signature is from the upper 40 cm). The national coverageis fairly widely spaced and provides detailed coverage only in limited areas. Uranium deposit andoccurrence descriptions usually do not describe the dispersion of lower-grade uranium enrichment,if any, surrounding the mineralized rock. Rock formations with high uranium content may be maskedby transported soils of lower uranium content. Despite these limitations, uranium resource assessmentand exploration data are the most useful sources of information on the distribution of uranium-richrocks and soils that create radon hazards and other environmental problems in the United States.
135
BIBLIOGRAPHY
BOUDETTE, E.L., and OLSZEWSKI, W.J., Jr., Generalized bedrock geologic map of NewEngland, with emphasis on uranium endowment and radon production: Concord, New HampshireWater Supply and Pollution Control Commission and U.S. Environmental Protection Agency, scale1 : 1 000 000(1986).
CASTOR, S.B., BERRY, M.A. and ROBINS, J.W., Uranium and thorium content of intrusive rocksin northeastern Washington and northern Idaho, In Bendix Field Engineering Corporation, 1977NURE uranium geology symposium; abstracts and visual presentations, Grand Junction, Colo., Dec.7-8, 1977: U.S. Department of Energy Report No. GJBX-12(78) (1977) 167-172.
COVENEY, R. M., JR., HILPMAN, P. L., ALLEN, A. V., and GLASCOCK, M. D.,Radionuclides in Pennsylvanian black shales of the midwestern United States, in Marikos, M. A. andHansman, R. H., eds., Geologic causes of natural radionuclide anomalies, proceedings of theGEORAD conference, St. Louis, Mo., Apr. 21-22, 1987: Missouri Department of Natural ResourcesSpecial Publication 4 (1987) 180 p.
DUVAL, J.S., and OTTON, J.K., Radium distribution and indoor radon in the Pacific Northwest:Geophysical Res. Letters, v. 17, n. 6 (1990) 801-804.
GROSZ, A.E., CATHCART, J.B., MACKE, D.L., KNAPP, M.S., SCHMIDT, WALTER, andSCOTT, T.M., Geologic interpretation of the gamma-ray acroradiometric maps of central andnorthern Florida: U.S. Geological Survey Professional Paper 1461(1989) 48 p.
HARRELL, J.A., BELSITO, M.E., and KUMAR, A., Radon hazards associated with outcrops ofOhio shale in Ohio: Jour, of Environmental Geology and Water Science, v. 18., n. 1 (1991) 17-26.
HENRY, M.E., KAEDING, M.E., and MONTEVERDE, D., Radon in soil gas and gamma-rayactivity of rocks and soils at the Mulligan Quarry, Clinton, New Jersey, in Gundersen, L.C.S., andWanty, R.B., Field studies of radon in rocks, soils, and water: U.S.Geological Survey Bulletin 1971(1991) 65-76.
HOLT, R.B., NIELSON, K.K., and ROGERS, V.C., Soil radon potential mapping of nine countiesin northern Florida: Salt Lake City, Rogers and Associates Engineering Report RAE-9226/1-6 (1993a)152 p.
—, 1993b, Soil radon potential mapping of fourteen counties in central Florida: Salt Lake City,Rogers and Associates Engineering Report RAE-9226/1-9, 219 p.
—, 1993c, Soil radon potential mapping of fourteen counties in south Florida: Salt Lake City, Rogersand Associates Engineering Report RAE-9226/1-13, 203 p.
LANDA, E.R., Radon emanation from uranium mill tailings, in Gundersen, L.C.S., and Wanty,R.B., Field studies of radon in rocks, soils, and water: U.S.G.S. Bulletin 1971 (1991) 145-154.
NIELSON, K.K., HOLT, R.B., and ROGERS, V.C., Soil radon potential mapping of twelve countiesin northcentral Florida: Salt Lake City, Rogers and Associates Engineering Report RAE-9226/1-1(1993a) 267 p.
—, 1993b, Soil radon potential mapping of eighteen counties in the Florida Panhandle: Salt LakeCity, Rogers and Associates Engineering Report RAE-9226/1-5, 271 p.
136
OTTON, J.K., and DUVAL, J.S., Geologic controls on indoor radon in the Pacific Northwest: U.S.Environmental Protection Agency, Proceedings of the 1990 EPA Symposium on Radon and RadonReduction Technology, Atlanta, GA., Feb. 19-23, v. Ill (1990) unpag.
OTTON, J.K., Preliminary geologic radon assessment of Washington, in Schumann, R.R., editor,Geologic radon potential of USEPA Region 10: U.S. Geological Survey Open-File Report 93-292J(1993) 125-146.
SCHUMANN, R.R., ed., Geologic radon potential of USEPA Regions 1-10: U.S. Geological SurveyOpen-File Report 93-292 (A-J) (1993) 1799 p.
137
THE USE OF URANIUM EXPLORATION DATA FOR MAPPING RADONPOTENTIAL IN THE UK - ADVANTAGES AND PITFALLS
T.K. BALL, D.G. CAMERON, T.B. COLMAN, P.D. ROBERTSBritish Geological Survey, Keyworth, Nottingham, United Kingdom
Abstract
Radon is generated during the decay of uranium and thorium and knowledge of uranium concentrations maybe of help in identifying areas with high radon emissions. The primary determinant for a potential radon problem isthe mineralogy of the uranium bearing phases in bed-rock or overburden. The controls over radon escape from themineral is governed by the effective specific surface area of the uranium phases. Once in the disperse phase radonmigration is controlled by the dispersion characteristics of the fluids. The uranium-rich province of the south-westpeninsula has undergone many campaigns of uranium exploration. The techniques include drainage geochemicalsurveys, airborne total count radiometric surveys, more limited airborne gamma spectrometric surveys, soilgeochemical surveys which have included gamma spectrometric measurements, non-systematic drilling etc. There isa very large data-set for house radon levels in the area and this is examined in relation to the geochemical data. Ingranitic areas the relationship between high uranium background and radon in house measurements is close, but thisrelationship is obscured in mudstone dominated, low permeability lithologies. There are other areas where thepermeability of the ground is high, the uranium concentration close to or below the crustal abundance, yet having ahigh proportion of buildings above the action level. Limestones in the U.K. are usually low in uranium, but a limiteduranium exploration programme in Derbyshire identified uranium mineralization in reef limestones in contact withuraniferous black shale. However radon generated from non-radioactive limestones is close to the values observedin uraniferous varieties and a high proportion of buildings are above the 200 Bq/m3 action level. The three maincontrols on radon generation are the source mineralogy, the concentration of uranium and the permeability. The firsttwo factors are usually addressed during uranium exploration. Generally the question of permeability is irrelevant toprospecting, but essential to the assessment of radon potential.
1. INTRODUCTION
Radon is now recognized as a major human health hazard. Radon emanates from bed-rockand overburden and may accumulate in houses. As in many countries, the main impetus for uraniumexploration stemmed from the requirements for nuclear raw materials to support the defence effortand for the nuclear electricity industry. The main periods of uranium exploration were during the late1950s and late 1960s. In the early 1970s the main effort in finding domestic supplies of uranium cameto an end. An understanding of the major controls on uranium mineralization suggested that largetonnages of uranium ore were unlikely, whilst the finding of very large deposits in Canada, Australiaand in Southern Africa reduced the requirement for secure domestic supplies.
Much of the uranium exploration effort and techniques were subsumed by two otherprogrammes:
1. The Mineral Reconnaissance Programme, incorporated techniques developed for uraniumsearch into a large scale exploration programme for other metals, within which uranium wasbut one of the large range of elements sought.
2. The Geochemical Survey Programme which investigates the distribution of many elementsincluding uranium. The collection is systematic, started in the north of Great Britain and hascurrently covered about two thirds of the main island. This has been mainly a drainage basedsurvey, stream sediment and water samples being the main sampling media.
139

K-100km
Approximate limit of glaciation
FIG. 1. Location map also showing the approximate southern limit of Pleistocene ice.
Because of the decline of interest in the early 1970s there has been no extensive airbornegamma spectrometric survey programme, although some early seminal work had been undertakenusing total count instruments. The main source of data for assessing uranium distribution is thereforegeochemical and of this most data is for stream sediments, supplemented by soil geochemical andground gamma spectrometric surveys in selected areas. Boreholes, mostly for stratigraphic purposes,may be radiometrically logged with both total count and more rarely gamma spectrometricmeasurements, supplemented by chemical analyses where appropriate. Large area radon in overburdengas surveys were not used in reconnaissance uranium exploration, although more detailed follow-upinvestigations frequently used these techniques. Large area radon surveys have awaited the recognitionthat radon enters houses and in the UK at least, this approach is proving a very effective method inpredicting areas with potential for high radon in houses.
140
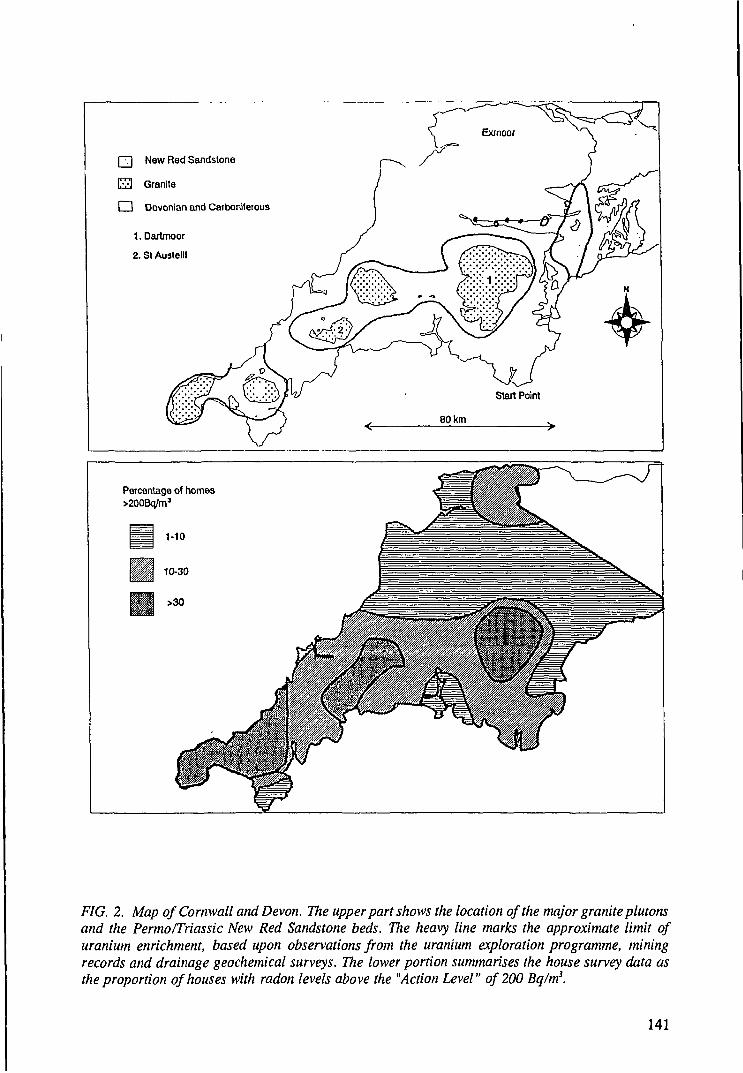
[T] New Red Sandstone
E 3 Granite
I I Devonian and Cat coniferous
I.Dartmoor
2. St Austelll
Percentage of homes>200Bq/m'
FIG. 2. Map of Cornwall and Devon. The upper part shows the location of the major granite plutonsand the Permo/Triassic New Red Sandstone beds. The heavy line marks the approximate limit ofuranium enrichment, based upon observations from the uranium exploration programme, miningrecords and drainage geochemical surveys. The lower portion summarises the house survey data asthe proportion of houses with radon levels above the "Action Level" of 200 Bq/m3.
141
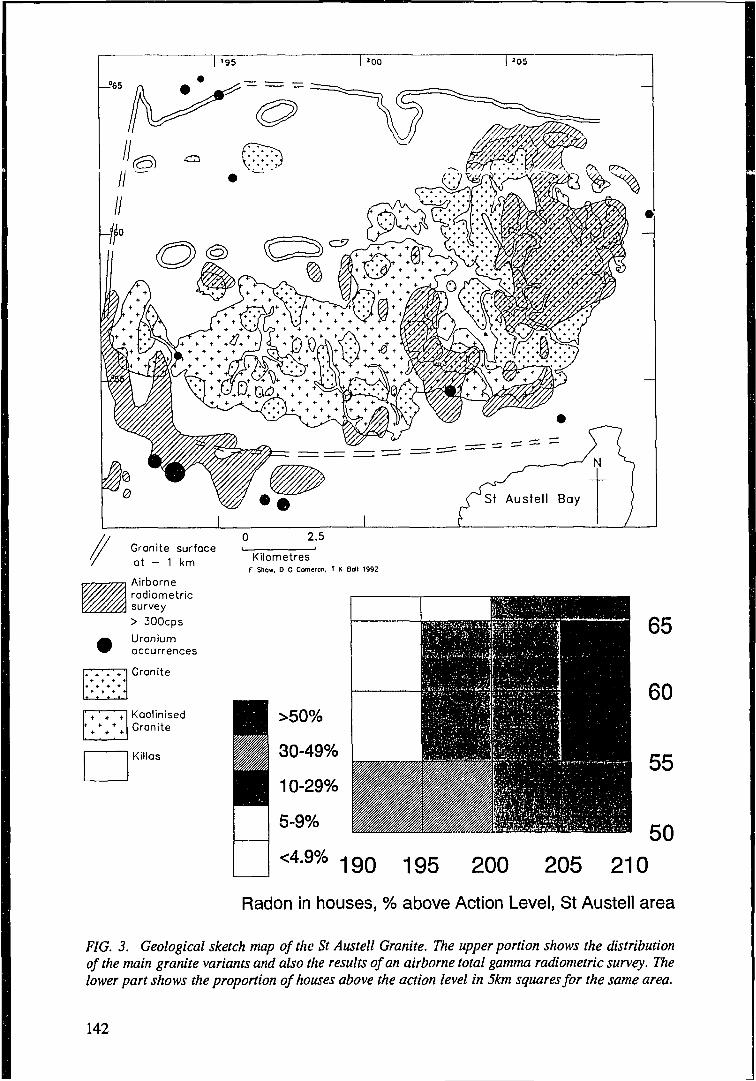
Granite surfaceat - 1 km
Airborneradiometricsurvey> 300cpsUraniumoccurrences
Granite
KilometresF Shaw, D G Comeron, T K Ball 1992
t- + ++ +
* + +
KaolinisedGranite
Killas
65
60
55
50
190 195 200 205 210Radon in houses, % above Action Level, St Austell area
FIG. 3. Geological sketch map of the St Austell Granite. The upper portion shows the distributionof the main granite variants and also the results of an airborne total gamma radiometric survey. Thelower part shows the proportion of houses above the action level in 5km squares for the same area.
142
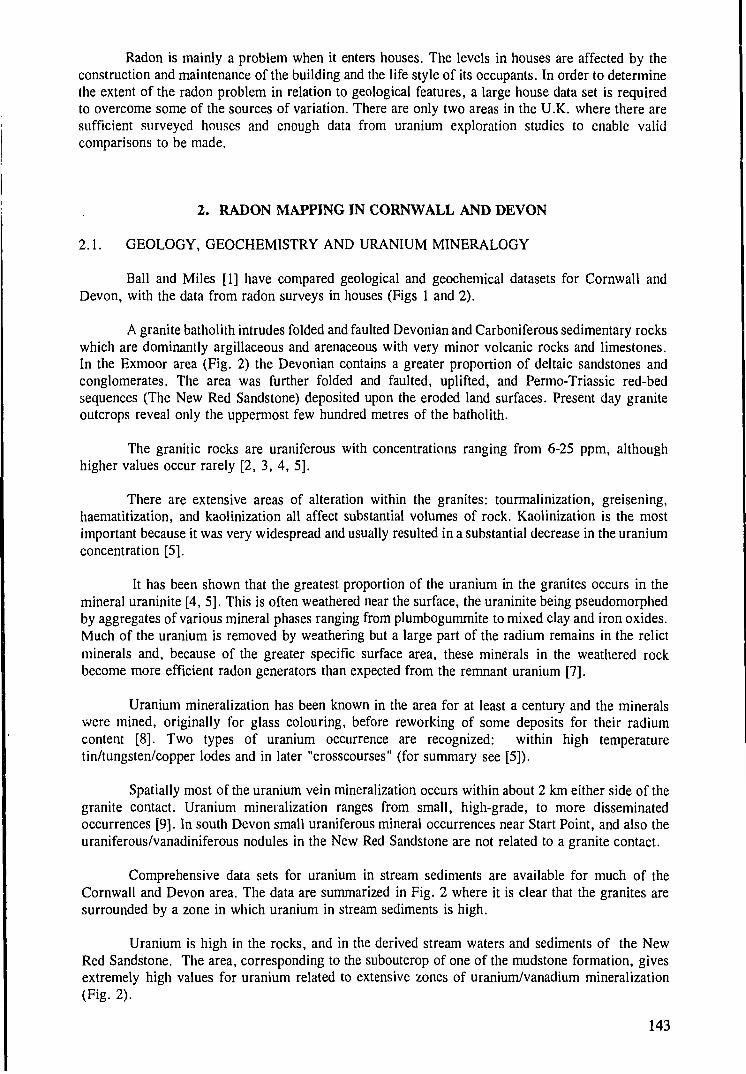
Radon is mainly a problem when it enters houses. The levels in houses are affected by theconstruction and maintenance of the building and the life style of its occupants. In order to determinethe extent of the radon problem in relation to geological features, a large house data set is requiredto overcome some of the sources of variation. There are only two areas in the U.K. where there aresufficient surveyed houses and enough data from uranium exploration studies to enable validcomparisons to be made.
2. RADON MAPPING IN CORNWALL AND DEVON
2.1. GEOLOGY, GEOCHEMISTRY AND URANIUM MINERALOGY
Ball and Miles [1] have compared geological and geochemical datasets for Cornwall andDevon, with the data from radon surveys in houses (Figs 1 and 2).
A granite batholith intrudes folded and faulted Devonian and Carboniferous sedimentary rockswhich are dominantly argillaceous and arenaceous with very minor volcanic rocks and limestones.In the Exmoor area (Fig. 2) the Devonian contains a greater proportion of deltaic sandstones andconglomerates. The area was further folded and faulted, uplifted, and Permo-Triassic red-bedsequences (The New Red Sandstone) deposited upon the eroded land surfaces. Present day graniteoutcrops reveal only the uppermost few hundred metres of the batholith.
The granitic rocks are uraniferous with concentrations ranging from 6-25 ppm, althoughhigher values occur rarely [2, 3, 4, 5].
There are extensive areas of alteration within the granites: tourmalinization, greisening,haematitization, and kaolinization all affect substantial volumes of rock. Kaolinization is the mostimportant because it was very widespread and usually resulted in a substantial decrease in the uraniumconcentration [5].
It has been shown that the greatest proportion of the uranium in the granites occurs in themineral uraninite [4, 5]. This is often weathered near the surface, the uraninite being pseudomorphedby aggregates of various mineral phases ranging from plumbogummite to mixed clay and iron oxides.Much of the uranium is removed by weathering but a large part of the radium remains in the relictminerals and, because of the greater specific surface area, these minerals in the weathered rockbecome more efficient radon generators than expected from the remnant uranium [7].
Uranium mineralization has been known in the area for at least a century and the mineralswere mined, originally for glass colouring, before reworking of some deposits for their radiumcontent [8]. Two types of uranium occurrence are recognized: within high temperaturetin/tungsten/copper lodes and in later "crosscourses" (for summary see [5]).
Spatially most of the uranium vein mineralization occurs within about 2 km either side of thegranite contact. Uranium mineralization ranges from small, high-grade, to more disseminatedoccurrences [9]. In south Devon small uraniferous mineral occurrences near Start Point, and also theuraniferous/vanadiniferous nodules in the New Red Sandstone are not related to a granite contact.
Comprehensive data sets for uranium in stream sediments are available for much of theCornwall and Devon area. The data are summarized in Fig. 2 where it is clear that the granites aresurrounded by a zone in which uranium in stream sediments is high.
Uranium is high in the rocks, and in the derived stream waters and sediments of the NewRed Sandstone. The area, corresponding to the suboutcrop of one of the mudstone formation, givesextremely high values for uranium related to extensive zones of uranium/vanadium mineralization(Fig. 2).
143

The Devonian rocks of the Exmoor area show a low and restricted range of uranium values.747 samples of stream sediments give a geometric mean of 2.6 and a median of 2.7 ppm U.
2.1. HOUSE SURVEYS
House survey data for the two counties are summarized in Fig. 2. For detailed discussionof the procedures for estimating and smoothing the data see [10]. The data are considered in relationto a 5 km grid in order to maintain confidentiality.
There is a close correspondence between areas where more than 30% of the house radonlevels are above the 200 Bq/m3 Action Level, and the granites. The granites are characterized by highuranium concentrations, a deep weathering profile, and uranium in a mineral phase that is easilyweathered; however, whilst the uranium may be removed, the radium can remain in situ. Radon isthus easily emanated from the host rock and high values of radon have been detected in ground andsurface waters and soil gases.
One of the zones where 10-30% of houses exceed the Action Level surrounds the >30%contour and is broadly coincident with rocks in which sub-economic grade uranium mineralizationis common. This usually occurs as small high-grade discrete veins but there are also numerousdisseminated uranium occurrences. This area is further underlain by microgranitic intrusions and smallgranite plugs which also contribute to the overall moderate to high levels of radon. This zone is alsocharacterized by high values of uranium in stream sediments.
There are subtleties in house distribution features, within the granite zone, which are alsoexplained by the uranium exploration data. The St Austell Granite Pluton has two major variants (Fig.3). The western section is largely kaolinized and uranium depleted, whereas the eastern portion isrelatively unaltered. Later work has shown that there is relatively little variation otherwise in thepotassium and thorium distributions in rock and overburden, most of the changes in gamma activityare due to uranium variation. The airborne total count survey reflects this relationship with highervalues of total gamma over the eastern section of the pluton and also over the aureole rocks to thesouth west. Here there is evidence of a large volume "soak" of uranium mineralization, culminatingin one large high grade uranium vein at the South Terras Mine [8].
House data (Fig. 3) reflects these relationships with a higher frequency of affected housesover the eastern granite, slightly lower frequencies over the mineralized aureole and lower values overthe western granite.
There are other areas, however, within the 10-30% category (Fig. 2), which are more difficultto explain, since they are not characterized by anomalous values of uranium in drainage samples. Thismay be partly due to the cover of thick overburden over a deep weathering profile where theunderlying geology is poorly known. The area south of the Dartmoor granite for example, has noknown uranium mineralization apart from that exposed at the coast near Start Point. There is noevidence for uranium enrichment either from the stream sediments or the airborne surveys. Yet thereare zones with high radon in soil gases.
Another zone difficult to explain is the 10-30% incidence in Exmoor where, despite extensiveinvestigations, only one anomalous concentration of uranium was found in the whole of the area, allother values were very close to the crustal average of 2.7 ppm [11].
Very high values of uranium occur in stream sediments and waters related to sub-zones withinthe Permo-Triassic mudstones. Based purely upon the uranium concentrations in surface drainagesamples, a comparable frequency of houses above the radon action level to granitic areas would beexpected. In reality the proportion of houses above the action level is about 1 %. The mudstones are
144
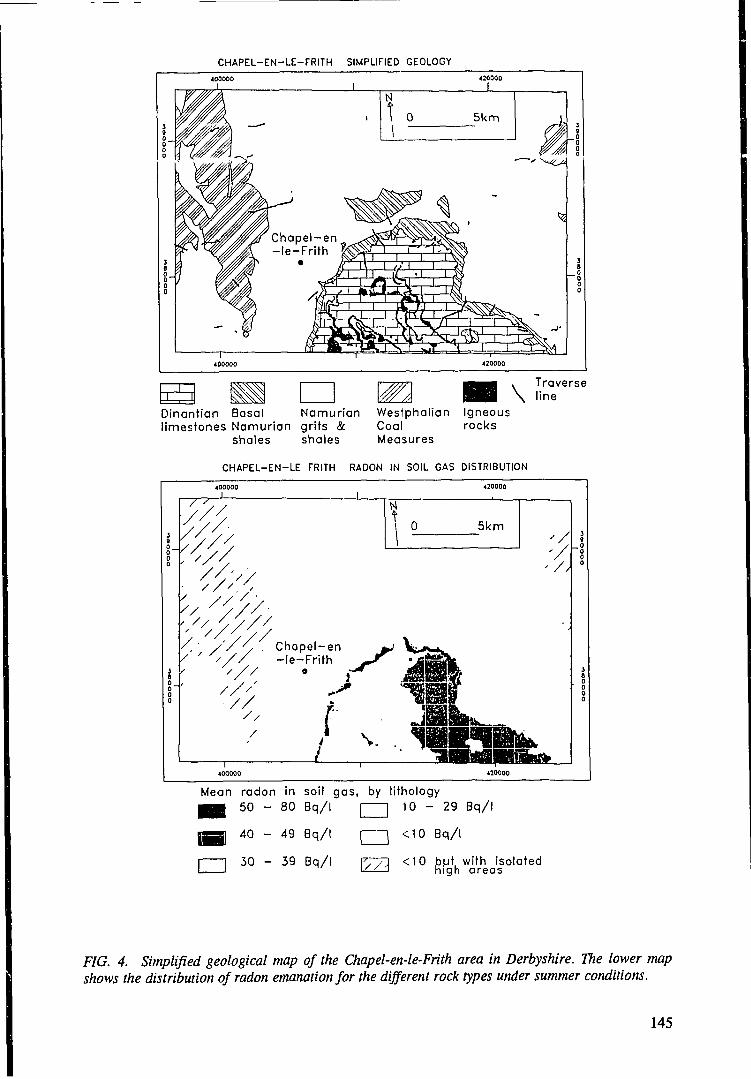
CHAPEL-EN-LE-FRITH SIMPLIFIED GEOLOGY
. Traverse\ line
Dinantian Basal Namurian Westphalian Igneouslimestones Namurian grits & Coal rocks
shales shales Measures
CHAPEL-EN-LE FRITH RADON IN SOIL GAS DISTRIBUTION
5km
Mean radon in soil gas, by lithologyH 50 - 80 Bq/I | 1 1 0 - 2 9 Bq/I
40 - 49 Bq/I | 1 <10 Bq/I
:ut v _.ugh areas•
30 - 39 Bq/I P771 <10 but with isolatedl-x/ 1 nigh ai
FIG. 4. Simplified geological map of the Chapel-en-le-Frith area in Derbyshire. The lower mapshows the distribution of radon emanation for the different rock types under summer conditions.
145
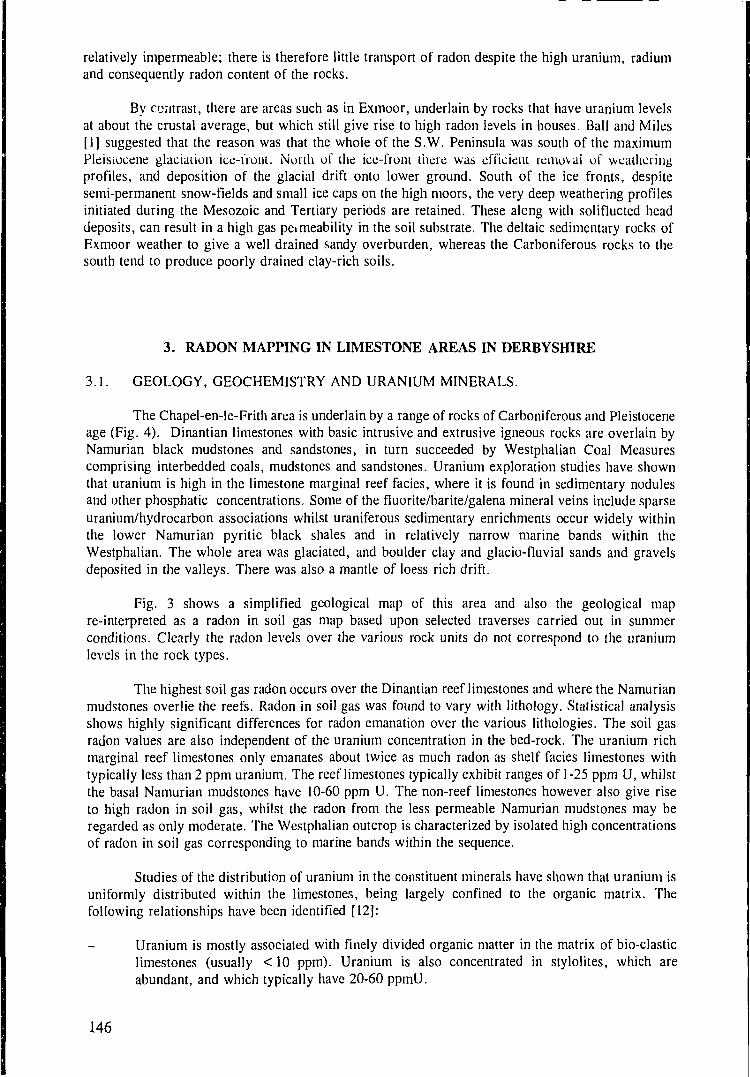
relatively impermeable; there is therefore little transport of radon despite the high uranium, radiumand consequently radon content of the rocks.
By contrast, there are areas such as in Exmoor, underlain by rocks that have uranium levelsat about the crustal average, but which still give rise to high radon levels in houses. Ball and Miles[1] suggested that the reason was that the whole of the S.W. Peninsula was south of the maximumPleistocene glaciation ice-iront. Norih of the ice-front there was efficient removal of weatheringprofiles, and deposition of the glacial drift onto lower ground. South of the ice fronts, despitesemi-permanent snow-fields and small ice caps on the high moors, the very deep weathering profilesinitiated during the Mesozoic and Tertiary periods are retained. These alcng with soliflucted headdeposits, can result in a high gas peimeability in the soil substrate. The deltaic sedimentary rocks ofExmoor weather to give a well drained sandy overburden, whereas the Carboniferous rocks to thesouth tend to produce poorly drained clay-rich soils.
3. RADON MAPPING IN LIMESTONE AREAS IN DERBYSHIRE
3.1. GEOLOGY, GEOCHEMISTRY AND URANIUM MINERALS.
The Chapel-en-le-Frith area is underlain by a range of rocks of Carboniferous and Pleistoceneage (Fig. 4). Dinantian limestones with basic intrusive and extrusive igneous rocks are overlain byNamurian black mudstones and sandstones, in turn succeeded by Westphalian Coal Measurescomprising interbedded coals, mudstones and sandstones. Uranium exploration studies have shownthat uranium is high in the limestone marginal reef facies, where it is found in sedimentary nodulesand other phosphatic concentrations. Some of the fluorite/barite/galena mineral veins include sparseuranium/hydrocarbon associations whilst uraniferous sedimentary enrichments occur widely withinthe lower Namurian pyritic black shales and in relatively narrow marine bands within theWestphalian. The whole area was glaciated, and boulder clay and glacio-fluvial sands and gravelsdeposited in the valleys. There was also a mantle of loess rich drift.
Fig. 3 shows a simplified geological map of this area and also the geological mapre-interpreted as a radon in soil gas map based upon selected traverses carried out in summerconditions. Clearly the radon levels over the various rock units do not correspond to the uraniumlevels in the rock types.
The highest soil gas radon occurs over the Dinantian reef limestones and where the Namurianmudstones overlie the reefs. Radon in soil gas was found to vary with lithology. Statistical analysisshows highly significant differences for radon emanation over the various lithologies. The soil gasradon values are also independent of the uranium concentration in the bed-rock. The uranium richmarginal reef limestones only emanates about twice as much radon as shelf facies limestones withtypically less than 2 ppm uranium. The reef limestones typically exhibit ranges of 1-25 ppm U, whilstthe basal Namurian mudstones have 10-60 ppm U. The non-reef limestones however also give riseto high radon in soil gas, whilst the radon from the less permeable Namurian mudstones may beregarded as only moderate. The Westphalian outcrop is characterized by isolated high concentrationsof radon in soil gas corresponding to marine bands within the sequence.
Studies of the distribution of uranium in the constituent minerals have shown that uranium isuniformly distributed within the limestones, being largely confined to the organic matrix. Thefollowing relationships have been identified [12]:
Uranium is mostly associated with finely divided organic matter in the matrix of bio-clasticlimestones (usually < 10 ppm). Uranium is also concentrated in stylolites, which areabundant, and which typically have 20-60 ppmU.
146
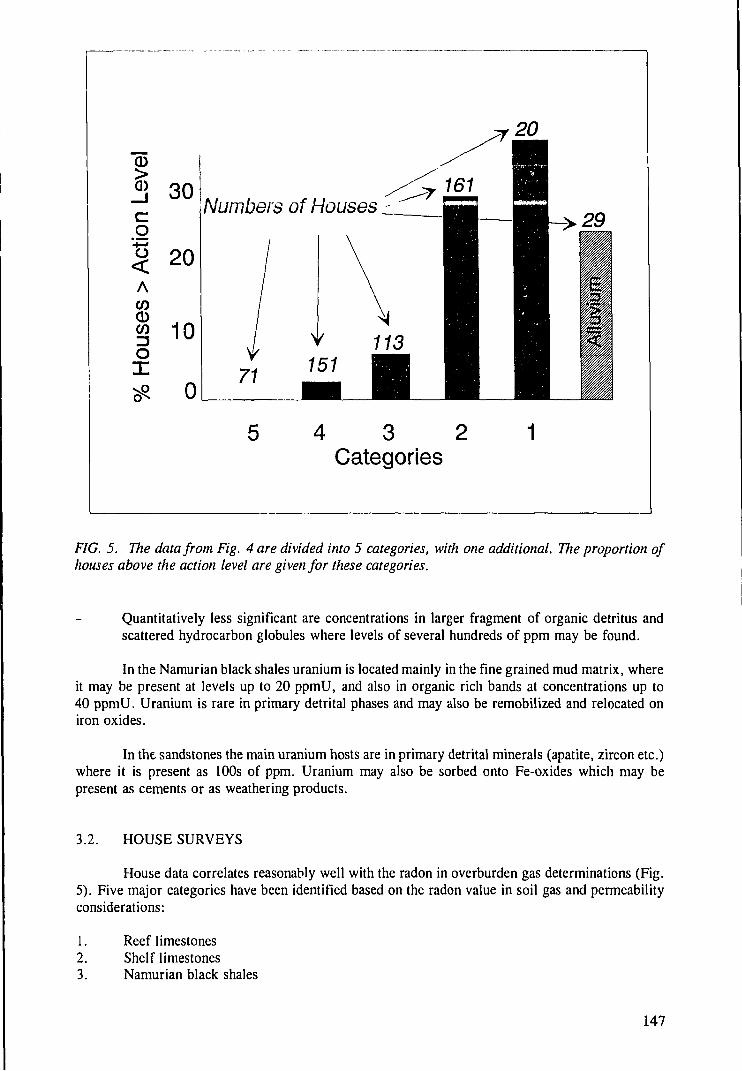
CD
a)_ jcg
<
COCDCOZJ
oI
Numbers of Houses
4 3 2Categories
F/G. 5. The data from Fig. 4 are divided into 5 categories, with one additional. The proportion ofhouses above the action level are given for these categories.
Quantitatively less significant are concentrations in larger fragment of organic detritus andscattered hydrocarbon globules where levels of several hundreds of ppm may be found.
In the Namurian black shales uranium is located mainly in the fine grained mud matrix, whereit may be present at levels up to 20 ppmU, and also in organic rich bands at concentrations up to40 ppmU, Uranium is rare in primary detrital phases and may also be remobilized and relocated oniron oxides.
In the sandstones the main uranium hosts are in primary detrital minerals (apatite, zircon etc.)where it is present as 100s of ppm. Uranium may also be sorbed onto Fe-oxides which may bepresent as cements or as weathering products.
3.2. HOUSE SURVEYS
House data correlates reasonably well with the radon in overburden gas determinations (Fig.5). Five major categories have been identified based on the radon value in soil gas and permeabilityconsiderations:
1. Reef limestones2. Shelf limestones3. Namurian black shales
147
4. Coal measures (identified as being mostly low with isolated zones of high potential).5. Namurian grey shales and sandstones.
A further category of river terrace alluvium was added at a later stage. This relates to thosefossil terraces that are currently well above the present flood plain. Material in the terraces arederived from adjacent areas and these features usually result in a much higher proportion of housesbeing above the action level than do the parent materials. The figure shows the proportion of housesabove the action level of 200 Bq/mJ for each geological feature.
4. CONCLUSIONS
There are two considerations in considering the mobility of radon:
1. the extent to which radon can escape from the primary mineral phase;
2. the nature of transport mechanisms that are governed by permeability and carrier fluidtransport in bed-rock and overburden.
In many rocks despite uranium being present as a trace element it is frequently found in traceminerals in which the uranium is a major component. The emanation from such minerals will dependupon the density, the number of imperfections in the mineral and most importantly upon the surfacearea. The surface area of the uranium bearing phases is thus of considerable importance in radonemanation and this is only partly a function of the uranium concentrations in rocks. Whether the radonrich ground gas moves into zones within the influence of a rouse is dependent upon the fluid flowcharacteristics of the ground.
In conclusion, regional geochemical distribution patterns for uranium, as obtained duringgeochemical surveys and /or by airborne gamma spectrometric measurements, can be an useful firstindicator of high radon potential in such areas as South West England. However there areenvironments where sole reliance on such data can be misleading. This is because radon potential isa function not only of uranium concentration, but also of the nature of the minerals and permeability.High permeability can result in high radon potential, even where the bed-rock uranium concentrationsare a* or even slightly below the average crustal abundance. Soil gas radon measurements gives themost useful indication of radon potential and this is also in accord with the findings in Sweden [13]),and the eastern USA [14].
REFERENCES
[1] BALL, T.K., MILES, J.C.H., Geological and geochemical factors affecting the radonconcentration in homes in Cornwall and Devon, UK, Environmental Geochemistry and Health15 1 (1993) 27-36.
[2] TAMMEMAGI, H.Y., SMITH, N.L., A radiogeologic study of the granites of SW England.Geological Society of London Journal. 131 (1975) 425-427.
[3] SIMPSON, P.R., PLANT, J., COPE, M.J., "Uranium abundance and distribution in somegranites from northern Scotland southwest England as indicators of uranium provinces",Geology, mining and extractive processing of uranium (JONES, M.J. Ed.), Institution ofMining and Metallurgy, London (1976) 126-139.
[4] BALL, T. K., BASHAM, I.R., Radioactive accessory minerals in granite from south westEngland, Proceedings of the Ussher Society 4 (1979) 432-438.
148
[5] BALL, T.K., BASHAM, I.R. & MICHIE, U.McL., "Uraniferous vein occurrences ofsouth-west England - paragenesis and genesis", Vein-type and similar uranium deposits inrocks younger than Proterozoic, (Proc Int. Conf. Vienna, 1982) IAEA, Vienna (1982)113-156.
[6] ASHAM, I.R, BALL, T.K., BEDDOE-STEPHENS, B. & MICHIE, U.McL."Uranium-bearing . xessory minerals and granite fertility: 1. Methods of identification andevaluation", "II. St\ Mes of granites from the British Isles", Proc. Int. Symposium onUranium Exploratio: Methods - review of the NEA/IAEA R & D programme, Paris (1-4June 1982).
[7] BALL T.K., CAMERON D.G., COLMAN T.B. & ROBERTS P.D. Behaviour of radon inthe geological environment: a review. Quarterly Journal Of Engineering Geology. 24 (1991)169-182.
[8] DINES H.G., The metalliferous mining region of South West England, Memoir GeologicalSurvey Great Britain, HMSO, London (1956).
[9] BOWIE, S.H.U., OSTLE, D. & CAMPBELL, C.B., Uranium mineralisation inN. Scotland,Wales, the Midlands and S.W. England, Transactions Institution of Mining and Metallurgy,Section B, 82 (1973) B177-179.
[10] MILES, J.C.H., GREEN, B.M.R., LOMAS, P.R. & CLIFF, K.D., Radon affected areas:Cornwall and Devon, Documents of the National Radiological Protection Board, 1, 4 (1990).
[11] TAYLOR, S.R., Abundance of elements in the continental crust: a new table, Geochimicaet Cosmochimica Acta 28 (1964) 1273-1284.
[12] HYSLOP, E.K., Uranium distribution studies of potential radon source rocks from theAshover area, Derbyshire UK, British Geological Survey Technical Report WG/92/4C (1993)32pp.
[13] AKERBLOM, G., ANDERSSON, P., CLAVENSJO, B., Soil Gas Radon - A source forindoor radon daughters, Radiation Protection Dosimetry. 7 (1-4) (1984) 49-54.
[14] REIMER, G.M. & GUNDERSEN, L.C.S., A direct correlation among indoor Rn, soil gasRn and geology in the Reading Prong near Boyertown, Pennsylvania, Health Physics, 57,(1989) 155-160.
149
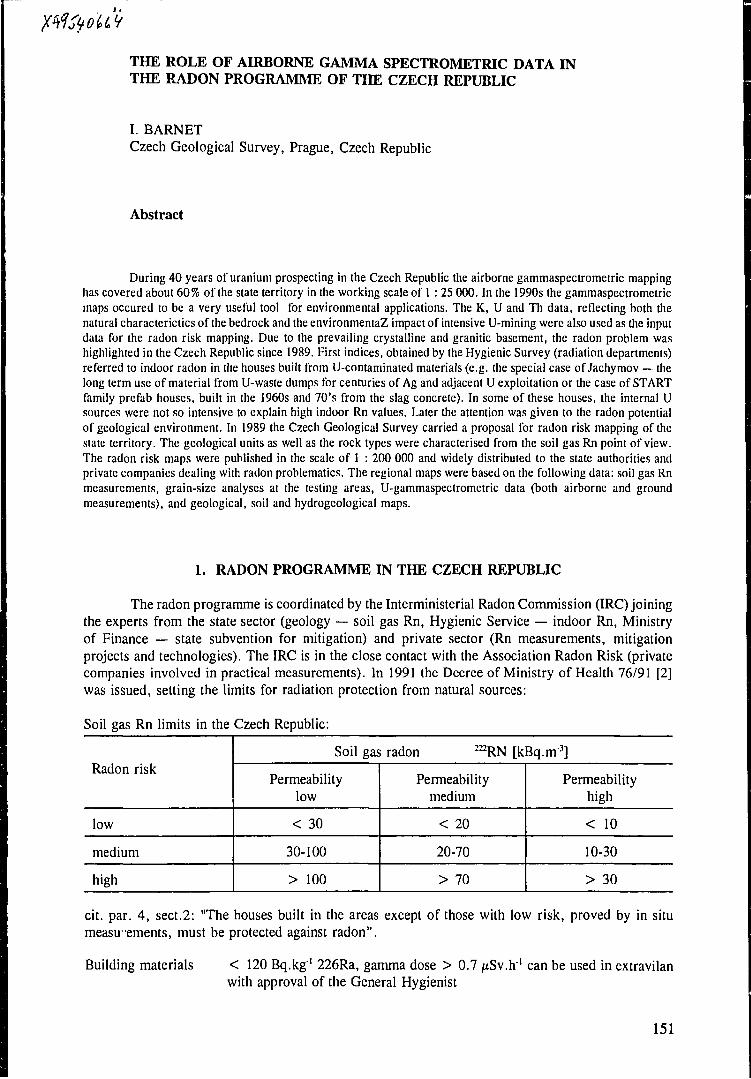
THE ROLE OF AIRBORNE GAMMA SPECTROMETRIC DATA INTHE RADON PROGRAMME OF THE CZECH REPUBLIC
I. BARNETCzech Geological Survey, Prague, Czech Republic
Abstract
During 40 years of uranium prospecting in the Czech Republic the airborne gammaspectrometric mappinghas covered about 60% of the state territory in the working scale of 1 : 25 000. In the 1990s the gammaspectrometricmaps occured to be a very useful tool for environmental applications. The K, U and Th data, reflecting both thenatural characterictics of the bedrock and the environmentaZ impact of intensive U-mining were also used as the inputdata for the radon risk mapping. Due to the prevailing crystalline and granitic basement, the radon problem washighlighted in the Czech Republic since 1989. First indices, obtained by the Hygienic Survey (radiation departments)referred to indoor radon in the houses built from U-contaminated materials (e.g. the special case of Jachymov — thelong term use of material from U-waste dumps for centuries of Ag and adjacent U exploitation or the case of STARTfamily prefab houses, built in the 1960s and 70's from the slag concrete). In some of these houses, the internal Usources were not so intensive to explain high indoor Rn values. Later the attention was given to the radon potentialof geological environment. In 1989 the Czech Geological Survey carried a proposal for radon risk mapping of thestate territory. The geological units as well as the rock types were characterised from the soil gas Rn point of view.The radon risk maps were published in the scale of 1 : 200 000 and widely distributed to the state authorities andprivate companies dealing with radon problematics. The regional maps were based on the following data: soil gas Rnmeasurements, grain-size analyses at the testing areas, U-gammaspectrometric data (both airborne and groundmeasurements), and geological, soil and hydrogeological maps.
1. RADON PROGRAMME IN THE CZECH REPUBLIC
The radon programme is coordinated by the Interministerial Radon Commission (IRC) joiningthe experts from the state sector (geology — soil gas Rn, Hygienic Service — indoor Rn, Ministryof Finance — state subvention for mitigation) and private sector (Rn measurements, mitigationprojects and technologies). The IRC is in the close contact with the Association Radon Risk (privatecompanies involved in practical measurements). In 1991 the Decree of Ministry of Health 76/91 [2]was issued, setting the limits for radiation protection from natural sources:
Soil gas Rn limits
Radon risk
low
medium
high
in the Czech Republic:
Soil
Permeabilitylow
< 30
30-100
> 100
gas radon 222RN
Permeabilitymedium
< 20
20-70
> 70
[kBq.m3]
Permeabilityhigh
< 10
10-30
> 30
cit. par. 4, sect.2: "The houses built in the areas except of those with low risk, proved by in situmeasu'ements, must be protected against radon".
Building materials < 120 Bq.kg1 226Ra, gamma dose > 0.7 /xSv.h1 can be used in extravilanwith approval of the General Hygienist
151
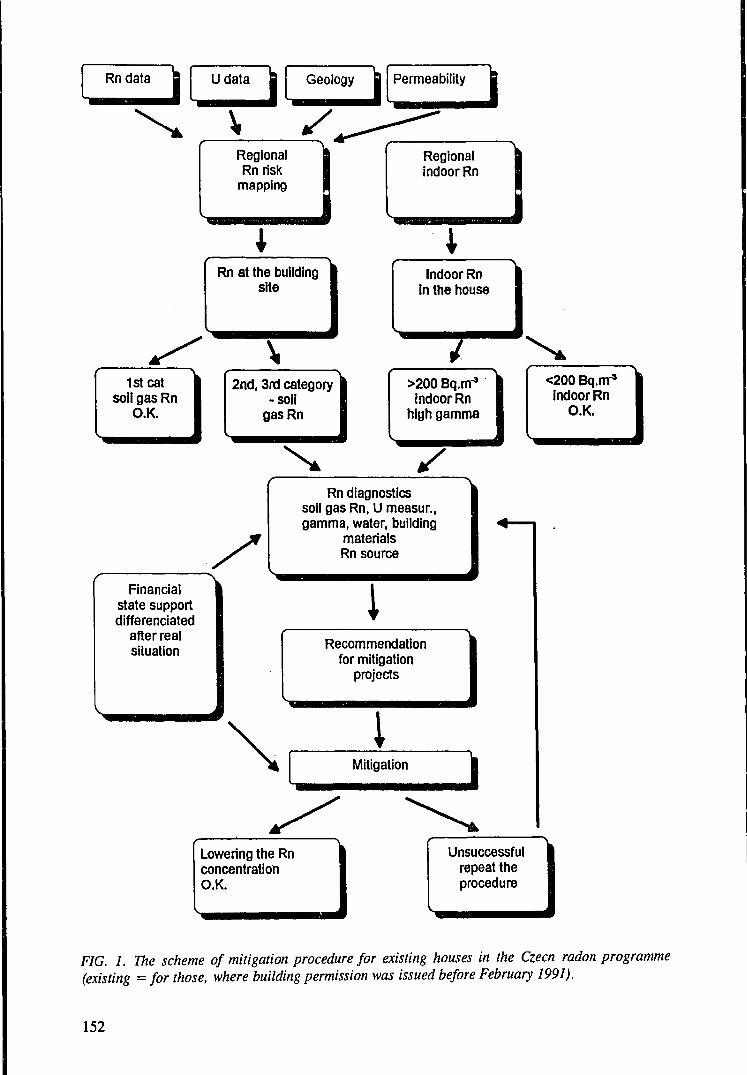
Permeability
RegionalRn risk
mapping
Regionalindoor Rn
Rn at the buildingsite
Indoor Rnin the house
<200 Bq.nT*indoor Rn
O.K.
>200 Bq.nr3
indoor Rnhigh gamma
1st catsoil gas Rn
O.K.
2nd, 3rd category-soil
gasRn
Rn diagnosticssoil gas Rn, U measur.,gamma, water, building
materialsRn source
Financialstate supportdifferenciated
after realsituation Recommendation
for mitigationprojects
Unsuccessfulrepeat theprocedure
Lowering the RnconcentrationO.K.
FIG. 1. The scheme of mitigation procedure for existing houses in the Czecn radon programme(existing = for those, where building permission was issued before February 1991).
152
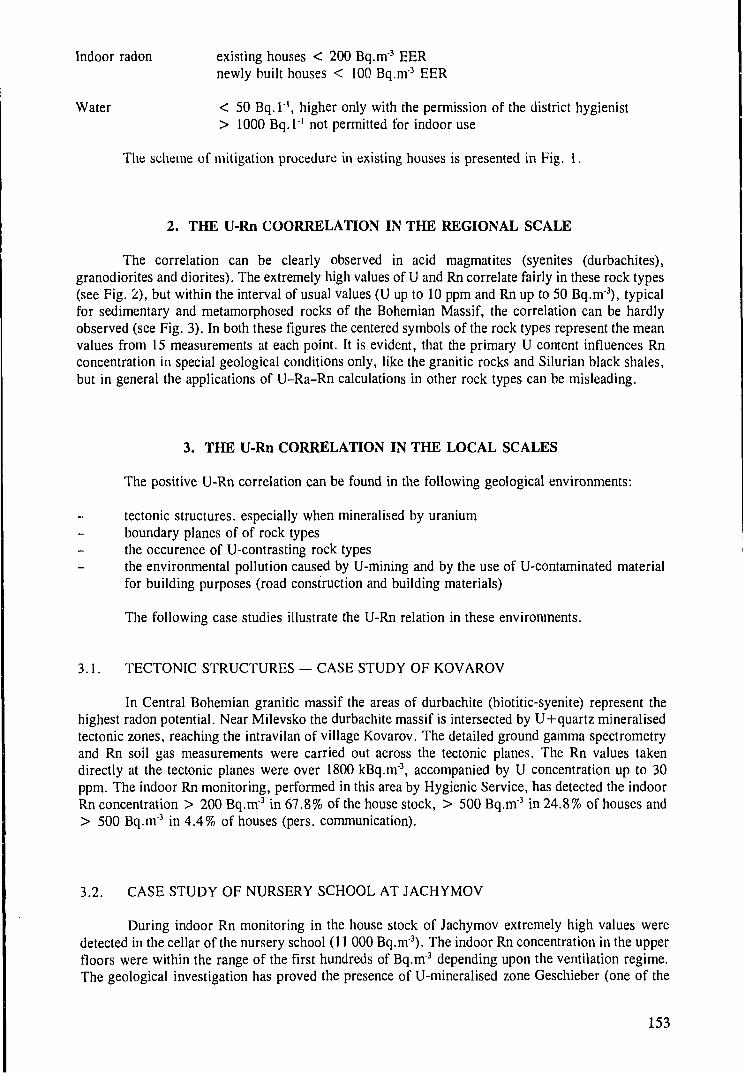
Indoor radon existing houses < 200 Bq.m'3 EERnewly built houses < 100 Bq.nr3 EER
Water < 50 Bq.l"1, higher only with the permission of the district hygienist> 1000 Bq.l1 not permitted for indoor use
The scheme of mitigation procedure in existing houses is presented in Fig. i.
2. THE U-Rn COORRELATION IN THE REGIONAL SCALE
The correlation can be clearly observed in acid magmatites (syenites (durbachites),granodiorites and diorites). The extremely high values of U and Rn correlate fairly in these rock types(see Fig. 2), but within the interval of usual values (U up to 10 ppm and Rn up to 50 Bq.m3), typicalfor sedimentary and metamorphosed rocks of the Bohemian Massif, the correlation can be hardlyobserved (see Fig. 3). In both these figures the centered symbols of the rock types represent the meanvalues from 15 measurements at each point. It is evident, that the primary U content influences Rnconcentration in special geological conditions only, like the granitic rocks and Silurian black shales,but in general the applications of U-Ra-Rn calculations in other rock types can be misleading.
3. THE U-Rn CORRELATION IN THE LOCAL SCALES
The positive U-Rn correlation can be found in the following geological environments:
tectonic structures, especially when mineralised by uraniumboundary planes of of rock typesthe occurence of U-contrasting rock typesthe environmental pollution caused by U-mining and by the use of U-contaminated materialfor building purposes (road construction and building materials)
The following case studies illustrate the U-Rn relation in these environments.
3.1. TECTONIC STRUCTURES — CASE STUDY OF KOVAROV
In Central Bohemian granitic massif the areas of durbachite (biotitic-syenite) represent thehighest radon potential. Near Milevsko the durbachite massif is intersected by U+quartz mineralisedtectonic zones, reaching the intravilan of village Kovarov. The detailed ground gamma spectrometryand Rn soil gas measurements were carried out across the tectonic planes. The Rn values takendirectly at the tectonic planes were over 1800 kBq.m"3, accompanied by U concentration up to 30ppm. The indoor Rn monitoring, performed in this area by Hygienic Service, has detected the indoorRn concentration > 200 Bq.m3 in 67.8% of the house stock, > 500 Bq.m"3 in 24.8% of houses and> 500 Bq.m"3 in 4.4% of houses (pers. communication).
3.2. CASE STUDY OF NURSERY SCHOOL AT JACHYMOV
During indoor Rn monitoring in the house stock of Jachymov extremely high values weredetected in the cellar of the nursery school (11 000 Bq.m'3). The indoor Rn concentration in the upperfloors were within the range of the first hundreds of Bq.m"3 depending upon the ventilation regime.The geological investigation has proved the presence of U-mineralised zone Geschieber (one of the
153
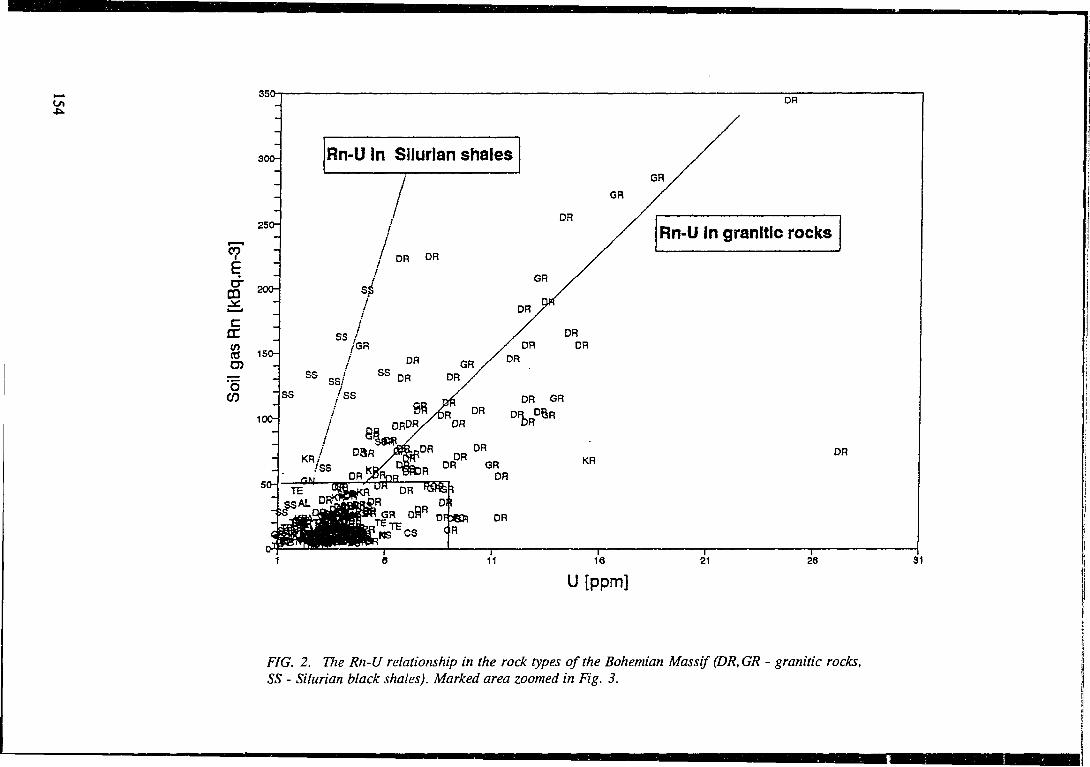
IS!
CO
E&m
Soen
350
300-
250-
200-
150-
100-
50-
DR
Rn-U in Silurian shales
// DR DR
ss
KR
Rn-U in granitic rocks
11I
16
U [ppm]
i21
DR
I26 31
FIG. 2. The Rn-U relationship in the rock types of the Bohemian Massif (DR,GR - granitic rocks,SS - Silurian black shales). Marked area zoomed in Fig. 3.
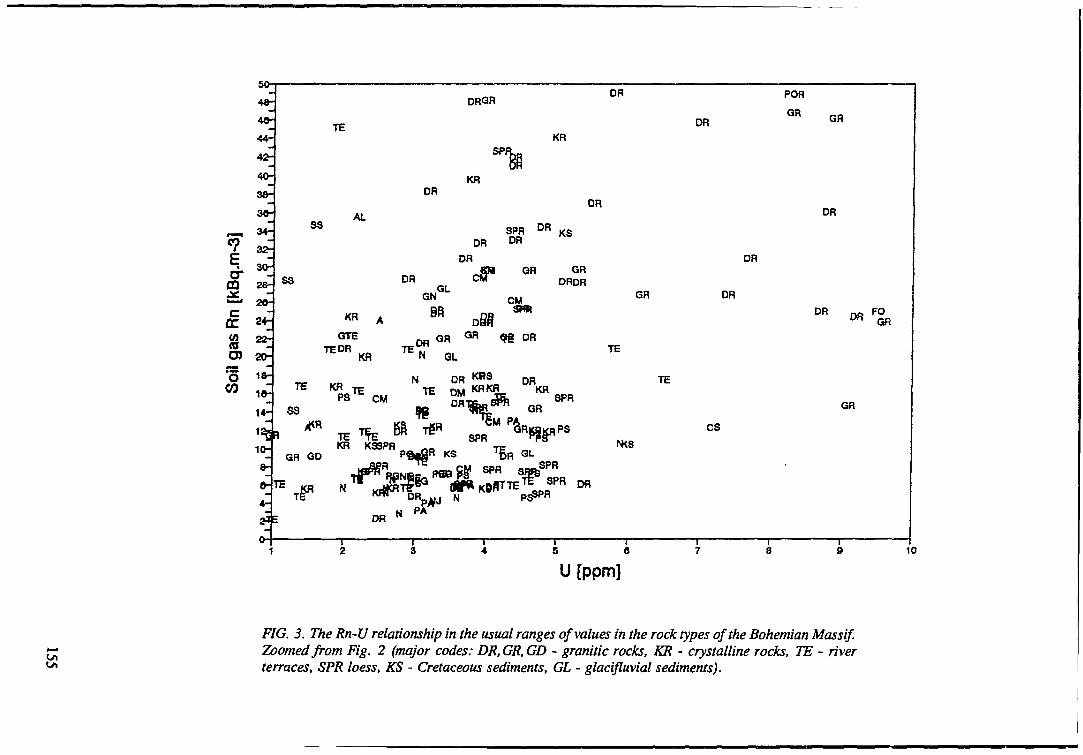
CD
O)
"5CO
50-
48-48-
44-
42-
40-
38-
38-
34-
32-
30-
28-28-
22^
20-
18-
18-
14-
1&»
10-
8-
e-
4-
23
0-
SS
SS
TE
SS
R
GR GD
TE jQ,
TE
AL
KR
GTETEDR
KR -rrP8
TE 1
KR
N
I
A
<R
: CM
re_ ^B p LaKSSPR
K # «
DR *
DRGR
SP
KRDR
DR
DR
DR cS™GN
BB"™ nR
n n GR G R <?
TE'JJ' QL
N DR K B S
H SPR
Pft*9R KS "'I
pJUJ ^1 PA
I I
SPR D R
DR
GR
CM
am
tg DR
DRKR
3GR
GRKBKI
DR
KR
OR
KS
GRDRDR
GR
TE
TE
SPR
3 PS
N<S
R
t i
DR
OR
OR
CS
i i
POfl
Q R GR
DR
DR n D FOUH GR
GR
10
U [ppm]
F/G. 5. TTze /f«-J7 relationship in the usual ranges of values in the rock types of the Bohemian Massif.Zoomed from Fig. 2 (major codes: DR.GR.GD - granitic rocks, KR - crystalline rocks, TE - riverterraces, SPR loess, KS - Cretaceous sediments, GL - glacifluvial sediments).
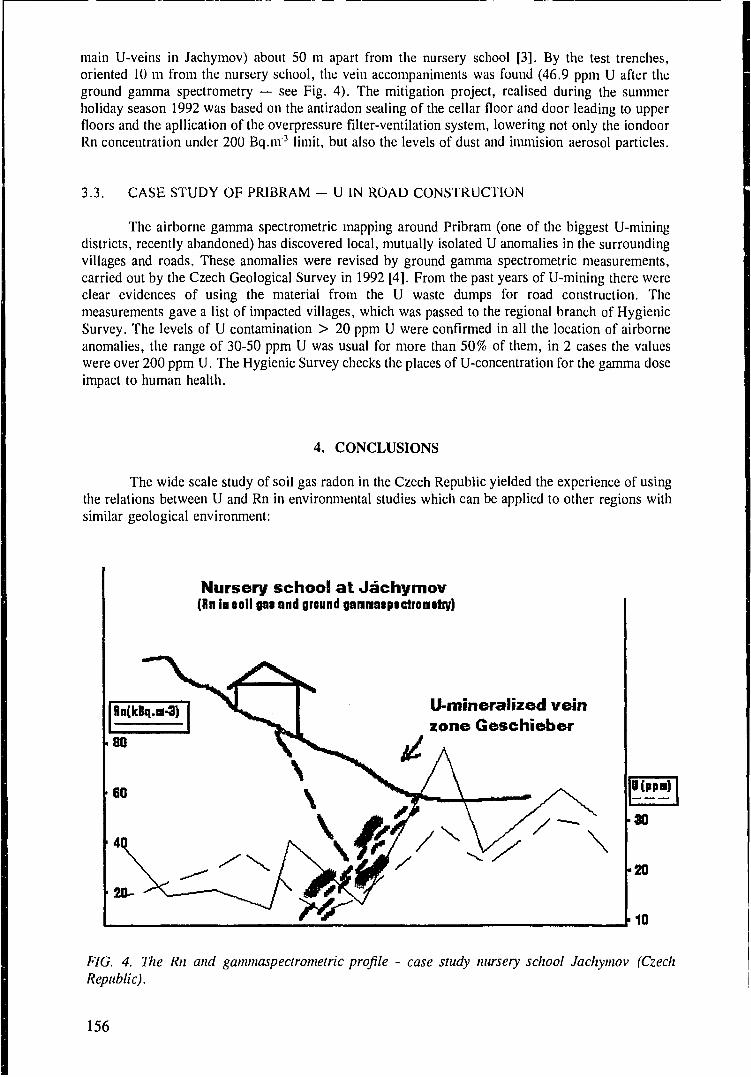
main U-veins in Jachymov) about 50 m apart from the nursery school [3]. By the test trenches,oriented 10 m from the nursery school, the vein accompaniments was found (46.9 ppm U after theground gamma spectrometry — see Fig. 4). The mitigation project, realised during the summerholiday season 1992 was based on the antiradon sealing of the cellar floor and door leading to upperfloors and the apllication of the overpressure filter-ventilation system, lowering not only the iondoorRn concentration under 200 Bq.nv3 limit, but also the levels of dust and immision aerosol particles.
3.3. CASE STUDY OF PR1BRAM - U IN ROAD CONSTRUCTION
The airborne gamma spectrometric mapping around Pribram (one of the biggest U-miningdistricts, recently abandoned) has discovered local, mutually isolated U anomalies in the surroundingvillages and roads. These anomalies were revised by ground gamma spectrometric measurements,carried out by the Czech Geological Survey in 1992 [4]. From the past years of U-mining there wereclear evidences of using the material from the U waste dumps for road construction. Themeasurements gave a list of impacted villages, which was passed to the regional branch of HygienicSurvey. The levels of U contamination > 20 ppm U were confirmed in all the location of airborneanomalies, the range of 30-50 ppm U was usual for more than 50% of them, in 2 cases the valueswere over 200 ppm U. The Hygienic Survey checks the places of U-concentration for the gamma doseimpact to human health.
4. CONCLUSIONS
The wide scale study of soil gas radon in the Czech Republic yielded the experience of usingthe relations between U and Rn in environmental studies which can be applied to other regions withsimilar geological environment:
Nursery school at Jachymov(Rn in soil gat and ground gannasptctrouetry)
U-mineralized veinzone Geschieber
20-
30
20
10
FIG. 4. The Rn and gammaspectrometric profile - case study nursery school Jachymov (CzechRepublic).
156
In the regional scales the U-Rn correlation is well expressed in acid magmatic rocks.Therefore the U data can contribute to distinguishing the expected levels of radon in the rocktypes, especially the contrasting ones, but cannot be used for direct transformation to radondata in the rock types with lower uranium contents. In these rock types, the resulting levelsof radon are strongly influenced by local geological environment and soil characteristics(permeability, soil moisture, the vertical profile of the soil cover).
2. In the local scales the U data can be used as additive information for radon diagnostics of thetest sites. The strong correlation can be found in specific geological environments like thetectonic zones (especially when mineralized by U), at the boundary planes of the rock types.The U data can also serve as a useful tool for determining the radon sources and migrationpaths in the houses and for monitoring the environmental impact of U-mining and the use ofU-enriched material for building purposes.
REFERENCES
[1] Radon investigations in Czechoslovakia I-III (1990-1992), Radon investigations in the CzechRepublic IV (1993), I. Barnet ed., Czech Geol. Survey, Prague (1993).
[2] Decree 76/1991 "on the lowering the radiation risk from radon and natural radionuclides",Ministry of Health, Prague (1991) (in Czech).
[3] BARNET, I., PROCHAZKA, J., Report on the Rn and gamma spectrometry measurements- case study Jachymov, nursery school, Ministry of Environment, Prague (in Czech) (1992).
[4] PROCHAZKA, J., MANOVA, M., BARNET, I., The radioactive pollution of the villagesin the vicinity of Pribram uranium mines.- in Radon investigations in the Czech Republic IV,ed. I. Barnet, Czech Geol. Survey, Prague (1993).
157
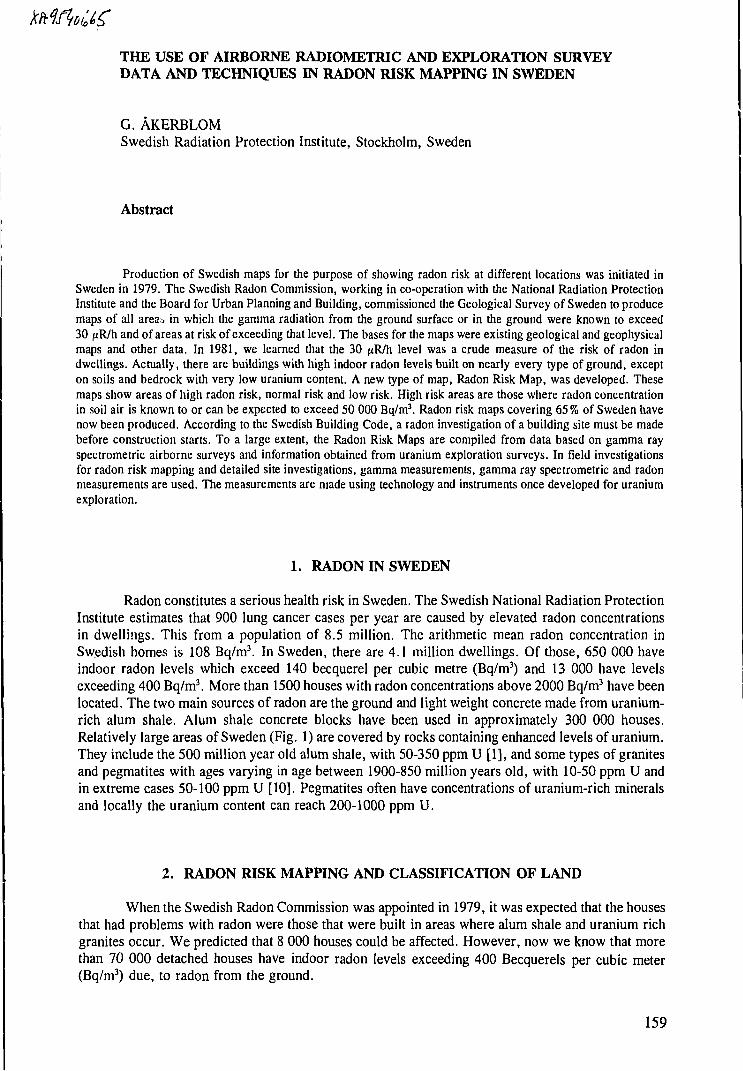
THE USE OF AIRBORNE RADIOMETRIC AND EXPLORATION SURVEYDATA AND TECHNIQUES IN RADON RISK MAPPING IN SWEDEN
G. AKERBLOMSwedish Radiation Protection Institute, Stockholm, Sweden
Abstract
Production of Swedish maps for the purpose of showing radon risk at different locations was initiated inSweden in 1979. The Swedish Radon Commission, working in co-operation with the National Radiation ProtectionInstitute and the Board for Urban Planning and Building, commissioned the Geological Survey of Sweden to producemaps of all area;, in which the gamma radiation from the ground surface or in the ground were known to exceed30 /*R/h and of areas at risk of exceeding that level. The bases for the maps were existing geological and geophysicalmaps and other data. In 1981, we learned that the 30 /*R/h level was a crude measure of the risk of radon indwellings. Actually, there are buildings with high indoor radon levels built on nearly every type of ground, excepton soils and bedrock with very low uranium content. A new type of map, Radon Risk Map, was developed. Thesemaps show areas of high radon risk, normal risk and low risk. High risk areas are those where radon concentrationin soil air is known to or can be expected to exceed 50 000 Bq/m3. Radon risk maps covering 65 % of Sweden havenow been produced. According to the Swedish Building Code, a radon investigation of a building site must be madebefore construction starts. To a large extent, the Radon Risk Maps are compiled from data based on gamma rayspectrometric airborne surveys and information obtained from uranium exploration surveys. In field investigationsfor radon risk mapping and detailed site investigations, gamma measurements, gamma ray spectrometric and radonmeasurements are used. The measurements are made using technology and instruments once developed for uraniumexploration.
1. RADON IN SWEDEN
Radon constitutes a serious health risk in Sweden. The Swedish National Radiation ProtectionInstitute estimates that 900 lung cancer cases per year are caused by elevated radon concentrationsin dwellings. This from a population of 8.5 million. The arithmetic mean radon concentration inSwedish homes is 108 Bq/m3. In Sweden, there are 4.1 million dwellings. Of those, 650 000 haveindoor radon levels which exceed 140 becquerel per cubic metre (Bq/m3) and 13 000 have levelsexceeding 400 Bq/m3. More than 1500 houses with radon concentrations above 2000 Bq/m3 have beenlocated. The two main sources of radon are the ground and light weight concrete made from uranium-rich alum shale. Alum shale concrete blocks have been used in approximately 300 000 houses.Relatively large areas of Sweden (Fig. 1) are covered by rocks containing enhanced levels of uranium.They include the 500 million year old alum shale, with 50-350 ppm U [1], and some types of granitesand pegmatites with ages varying in age between 1900-850 million years old, with 10-50 ppm U andin extreme cases 50-100 ppm U [10]. Pegmatites often have concentrations of uranium-rich mineralsand locally the uranium content can reach 200-1000 ppm U.
2. RADON RISK MAPPING AND CLASSIFICATION OF LAND
When the Swedish Radon Commission was appointed in 1979, it was expected that the housesthat had problems with radon were those that were built in areas where alum shale and uranium richgranites occur. We predicted that 8 000 houses could be affected. However, now we know that morethan 70 000 detached houses have indoor radon levels exceeding 400 Becquerels per cubic meter(Bq/m3) due, to radon from the ground.
159
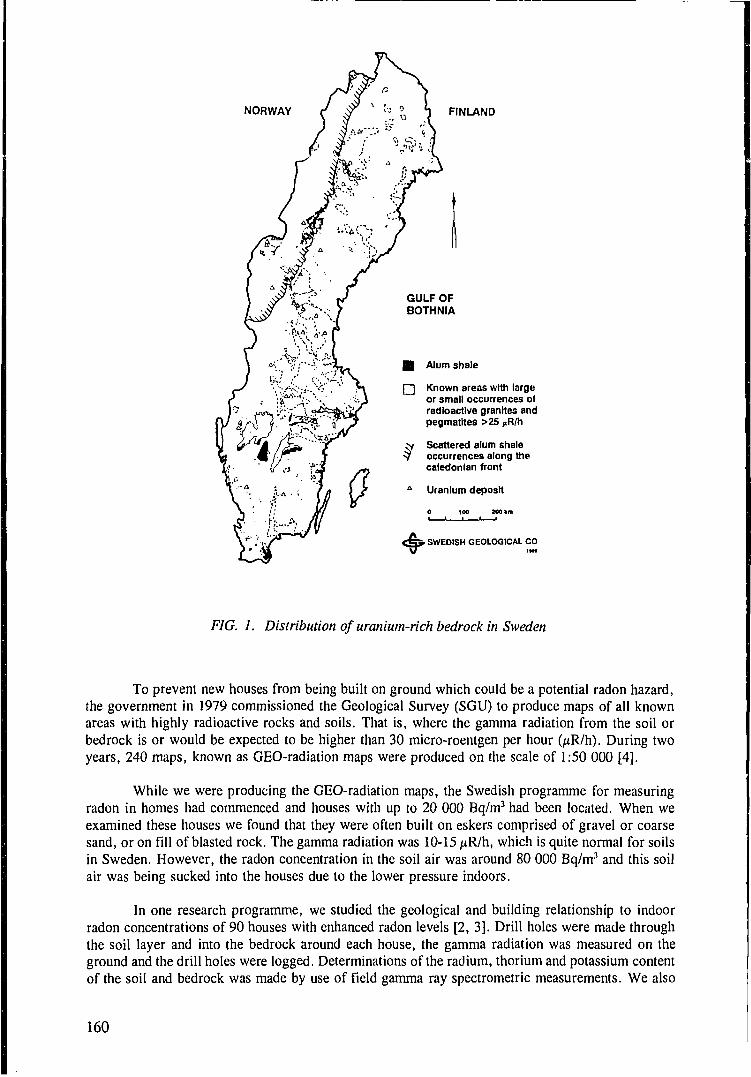
NORWAY FINLAND
GULF OFBOTHNIA
Alum shale
Known areas with largeOr small occurrences ofradioactive granites andpegmatites >25 MR/h
Scattered alum shaleoccurrences along theCaledonian front
Uranium deposit
SWEDISH GEOLOGICAL CO
FIG. 1. Distribution of uranium-rich bedrock in Sweden
To prevent new houses from being built on ground which could be a potential radon hazard,the government in 1979 commissioned the Geological Survey (SGU) to produce maps of all knownareas with highly radioactive rocks and soils. That is, where the gamma radiation from the soil orbedrock is or would be expected to be higher than 30 micro-roentgen per hour (fxR/h). During twoyears, 240 maps, known as GEO-radiation maps were produced on the scale of 1:50 000 [4].
While we were producing the GEO-radiation maps, the Swedish programme for measuringradon in homes had commenced and houses with up to 20 000 Bq/m3 had been located. When weexamined these houses we found that they were often built on eskers comprised of gravel or coarsesand, or on fill of blasted rock. The gamma radiation was 10-15 /*R/h, which is quite normal for soilsin Sweden. However, the radon concentration in the soil air was around 80 000 Bq/m3 and this soilair was being sucked into the houses due to the lower pressure indoors.
In one research programme, we studied the geological and building relationship to indoorradon concentrations of 90 houses with enhanced radon levels [2, 3]. Drill holes were made throughthe soil layer and into the bedrock around each house, the gamma radiation was measured on theground and the drill holes were logged. Determinations of the radium, thorium and potassium contentof the soil and bedrock was made by use of field gamma ray spectrometric measurements. We also
160

measured the radon concentration of the soil air around the houses and under the bottom slabs at adepth of one metre or more. The radon concentration in soil air at one metre was never less than 5000 Bq/m3. Some houses were obtaining more than one third of their incoming ventilation air fromthe ground.
The building authorities were eventually convinced that GEO-radiation maps did not giveenough information concerning the risk of radon. From the National Board of Planning and Building,1 was asked about the possibility of producing maps that could predict where special radon buildingtechnical requirements had to be used in building to prevent the problem of indoor radon.
My answer was that it was not possible to make such maps. We had learned that any houseanywhere can have indoor radon levels higher than 400 Bq/m3, the limit (compulsory) for existingbuildings in Sweden (Table I). If there is enough available soil air containing radon to maintain acontinuous flow of radon into the building, as there would be in the gravel and sand typical of anesker, the limit is easily exceeded.
TABLE I. CURRENT LIMITS (COMPULSORY) IN SWEDEN FOR RADON GASCONCENTRATION* AND GAMMA RADIATION IN BUILDINGS:
400 Bq/m3
200 Bq/m3
50
for existing buildingsfor new buildingsfor new buildings
* The Swedish limits were expressed in units of radon daughter concentration until January 1, 1994.For existing buildings, the limit was 200 Bq/m3 and for new buildings 70 Bq/m3.
TABLE II. CLASSIFICATION OF GROUND ACCORDING TO THE RISK OF RADON GAS.RECOMMENDATIONS ISSUED BY THE NATIONAL SWEDISH BOARD OF URBANPLANNING AND BUILDING, 1982.
Regional Classification Examples of ground types
High risk areas
Normal risk areas
Low risk areas
Ground around building
Bedrock and soil containing radium rich material,e.g.uranium-rich granites and alum shale.Soils with high emanation, e.g. gravel or gravellysandy till.
Ground where the radium content is normal, about25-50 Bq/kg, e.g. gneisses and shales.
Ground where the radium content is low, less than30 Bq/kg, e.g. limestone, sandstone, and basicigneous and volcanic rocks.Soils with low permeability, e.g. clay and silt.
Radon cone, in soil air(Bq/m3)
Technical constructionrequirements
High radon ground
Normal radon ground
Low radon ground
> 50 000
10 000 - 50 000
< 10 000
Radon safe construction
Radon protectiveconstruction
None
161
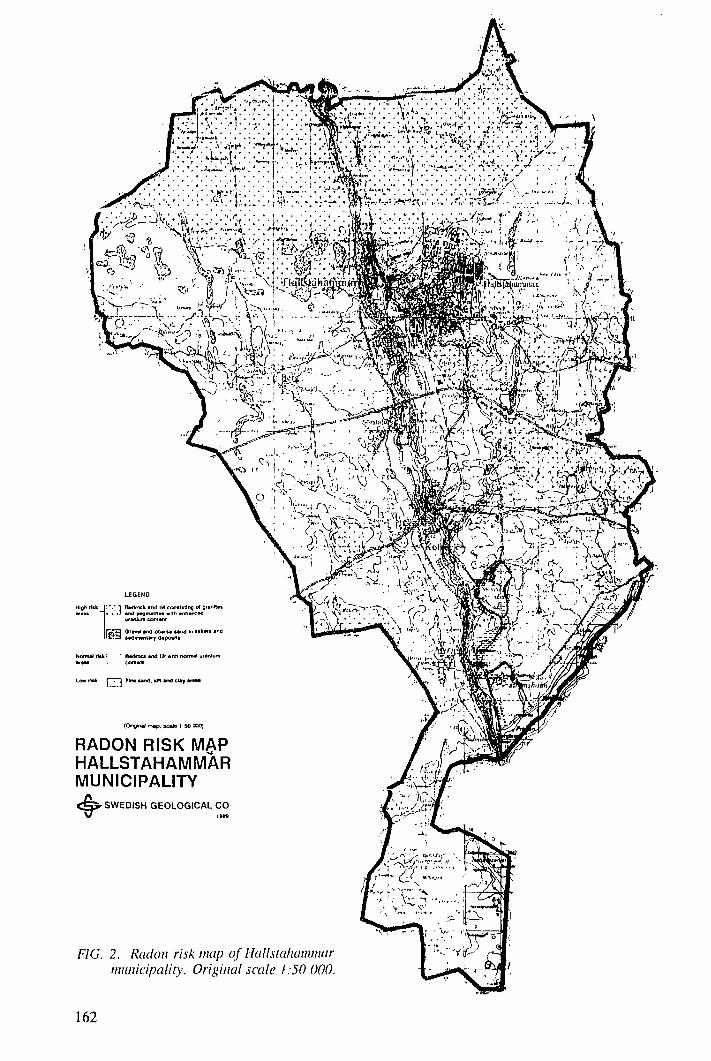
RADON RISK MAPHALLSTAHAMMARMUNICIPALITY
FIG. 2. Radon risk map of Hallstahammarmunicipality. Original scale 1:50 000.
162
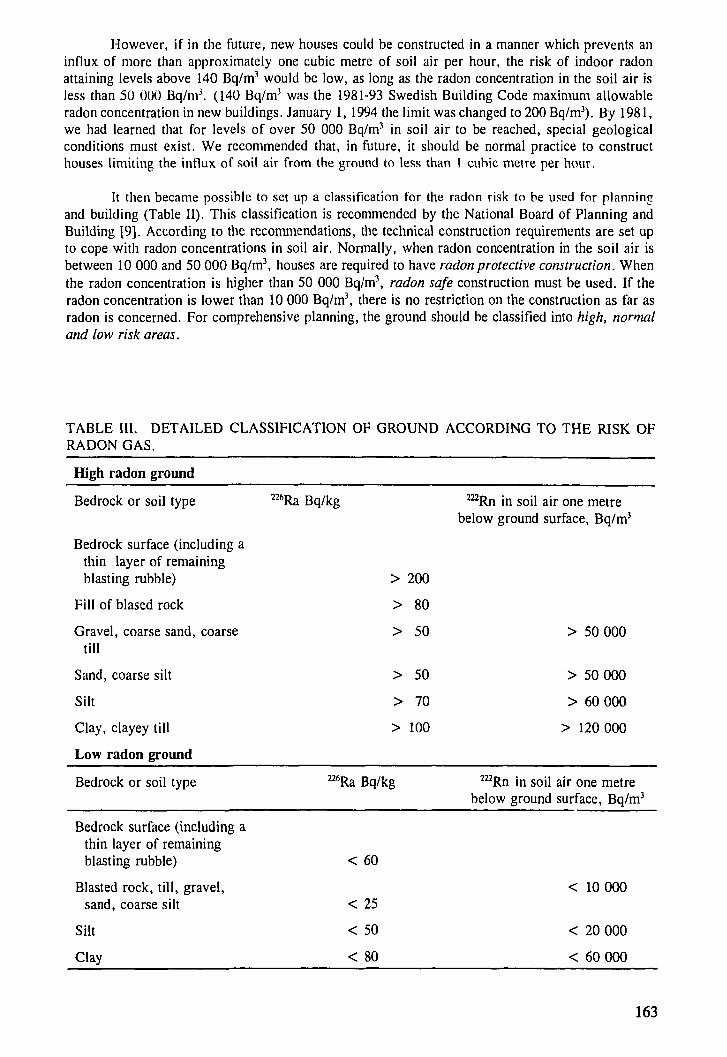
However, if in the future, new houses could be constructed in a manner which prevents aninflux of more than approximately one cubic metre of soil air per hour, the risk of indoor radonattaining levels above 140 Bq/m3 would be low, as long as the radon concentration in the soil air isless than 50 000 Bq/m3. (140 Bq/m3 was the 1981-93 Swedish Building Code maximum allowableradon concentration in new buildings. January 1, 1994 the limit was changed to 200 Bq/m3). By 1981,we had learned that for levels of over 50 000 Bq/m3 in soil air to be reached, special geologicalconditions must exist. We recommended that, in future, it should be normal practice to constructhouses limiting the influx of soil air from the ground to less than 1 cubic metre per hour.
It then became possible to set up a classification for the radon risk to be used for planningand building (Table II). This classification is recommended by the National Board of Planning andBuilding [9]. According to the recommendations, the technical construction requirements are set upto cope with radon concentrations in soil air. Normally, when radon concentration in the soil air isbetween 10 000 and 50 000 Bq/m3, houses are required to have radon protective construction. Whenthe radon concentration is higher than 50 000 Bq/m3, radon safe construction must be used. If theradon concentration is lower than 10 000 Bq/m3, there is no restriction on the construction as far asradon is concerned. For comprehensive planning, the ground should be classified into high, normaland low risk areas.
TABLE III. DETAILED CLASSIFICATION OF GROUND ACCORDING TO THE RISK OFRADON GAS.
High radon ground
Bedrock or soil type
Bedrock surface (including athin layer of remainingblasting rubble)
Fill of biased rock
Gravel, coarse sand, coarsetill
Sand, coarse silt
Silt
Clay, clayey till
Low radon ground
226Ra Bq/kg mRn in soil air one metrebelow ground surface, Bq/m3
200
80
50
50
70
100
> 50 000
> 50 000
> 60 000
> 120 000
Bedrock or soil type Bq/kg 222Rn in soil air one metrebelow ground surface, Bq/m3
Bedrock surface (including athin layer of remainingblasting rubble)
Blasted rock, till, gravel,sand, coarse silt
Silt
Clay
< 60
< 25
< 50
< 80
< 10 000
< 20 000
< 60 000
163
The classification given in Table II is to rough too be used for site evaluations. Atinvestigations for building constructions a more detailed classification of the radon risk for differenttypes of ground is used (Table III). This classification includes the situation of a building founded onbedrock or fill, and also takes into consideration the permeability of silt and clay. In the latter casehigher soil air radon concentrations can be tolerated due to the low permeability of the sediments.
3. RADON RISK MAPS AND INVESTIGATION BEFORE BUILDING
The local authorities are advised to investigate the radon situation within their districts. TodayRadon Risk Maps on a scale of 1:50 000 or larger'cover more than 60% of Sweden. The maps aremade by geological consultants and paid for by the municipalities. Most of the maps represent a wholedistrict, but some cover only the urban sections. More attention is given to urban areas whenmapping. The radon risk map of Hallstahammar municipality is shown in Fig. 2.
According to the Building Code of 1988, a geotechnical investigation is required for allbuildings, including a report on the radon situation. Today radon investigations are made of mostbuilding sites and plans.
The methods used for mapping and more detailed investigations include the following; butI must emphasize that none of these methods alone can predict the radon risk for any given area:
For mapping of larger areas, on a scale 1:50 000 or greater:
• Geological maps• Results from airborne radiometric surveys, where available• Results from radiometric surveys on the ground, where available• Results from measurements of radon in buildings, where available• Results from earlier geotechnical investigations such as soil composition, thickness and
permeability of the soil layer, and the level of the ground water table• Field surveys including measurements of gamma radiation• Orientating radon measurements
For detailed surveys, for example a building site:
• Geological examination or mapping of the area• Gamma radiation measurements• Gamma ray spectrometric measurements to determine
the radium concentration in bedrock and soilMeasurements of radon concentration in the soil air
All available information and results from the measurements and observations are used topredict the radon potential. The technical requirements needed to build radon safe houses are givenin the report.
In the report, it is also important to consider changes which are likely during the course ofthe construction project: soil removal, soil or blasted bedrock fill, and lowered ground water table.Such changes are likely to influence the radon situation.
4. SWEDISH GEOLOGY AND RADON RISK
In Sweden, exploration for uranium ore began in the early 1950s. At that time, most attentionwas directed to the alum shale formation which was thoroughly investigated and mapped. A
164
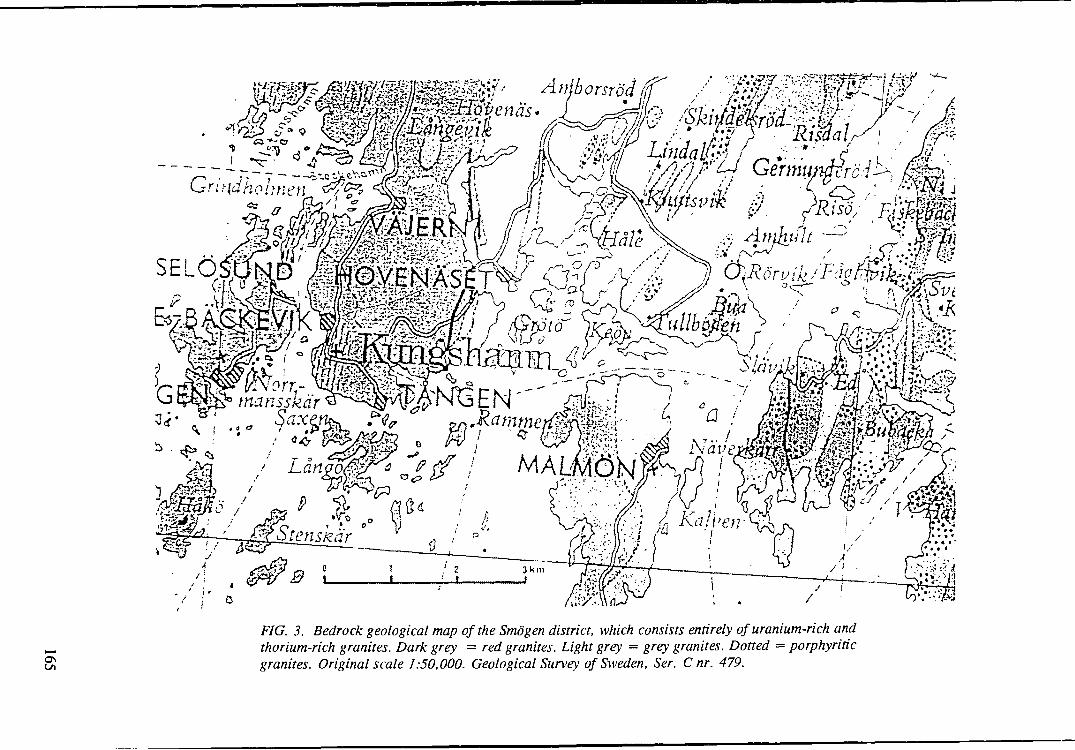
•MTjrU Girmuntirc^ M* .Grindholmen
\S<kJ(:':>\ <n KalWnA
ON
FIG. 3. Bedrock geological map of the Smogen district, which consists entirely of uranium-rich andthorium-rich granites. Dark grey = red granites. Light grey = grey granites. Dotted = porphyriticgranites. Original scale 1.:50,000. Geological Survey of Sweden, Ser. C nr. 479.
compilation of all known occurrences of alum shale was made for the GEO-radiation maps. However,information was insufficient in some regions. Those areas were surveyed especially to obtaininformation to make the GEO-radiation maps.
Data on the occurrence of uranium-rich granites and other rocks with enhanced uranium andthorium content have gradually been accumulated through exploration for uranium and the regionalprogramme of geophysical mapping at the Geological Survey of Sweden. The most valuable methodsof obtaining information on the occurrence and extent of rocks with enhanced radiation has come fromairborne and car-borne surveys, and the follow-up of these surveys on the ground by boulder tracing,regional measurements with hand held scintillometers, in situ gamma ray spectrometers measurementsand geochemical investigations.
Airborne gamma ray spectrometric surveys have been completed for 65% of Sweden's450 000 km2. Until 1984, when the Swedish programme for uranium exploration was brought to anend, most surveys where carried out for the purpose of uranium exploration. After which time, themeasurements were made within the programme for geophysical mapping. The first airbornemeasurements were made around 1955 when vast areas were searched by small aircraft equipped withGM-counters. Since 1960, all surveys have been made with the use of gamma ray spectrometers. Theairborne surveys carried out today by the Geological Survey are made from an altitude of 30 metres.The line spacing is 200 metres and a recording of the gamma spectra is made every 40 metres alongthe flight path. The gamma spectrometer is of Geometric/SGAB design. It has four crystals providinga total volume of 17 litres. The energy interval between 0 and 3187.5 keV is divided into 255channels, each 12.5 eV wide. The primary channels are grouped into 24 or 40 channel configurations.The recordings from all separate channels are used to calculate the uranium, thorium and potassium-40 concentrations at the surface level. The concentrations are given as equivalent concentrations ofppm U, ppm Th and per cent K. The results of the measurements are plotted on maps which usuallyhave a scale of 1:50 000. On the maps, the measured concentrations of eU, eTh and eK are markedas coloured lines (eU = red, eTh = blue and eK = yellow), the lengths of which are proportionalto the registered equivalent concentration. A full description of the Swedish system for airbornespectrometric surveys is given by Mellander [8].
A problem which has restricted the use of the airborne surveys is that the airspace abovetowns and villages has a strictly enforced minimum flight altitude of 300 m. At that height, almostall gamma radiation from the surface is shielded by the air. Thus, information on the radioactivityof the ground is lacking where it is most needed. To cope with this problem, the Geological Surveyobtained special permission to fly at an altitude of 50 m above densely populated areas, provided theresults are used for predicting radon risk.
The technique used by the Geological Survey provides very good ground coverage and enablesus to detect, for example, a single outcrop of uranium-rich pegmatite [7]. Combining the results fromthe airborne measurements with information from geological maps, it is often possible to delimit areaswith different potential radon risks and to point out areas of special interest.
Sweden was covered by a continental ice sheet during the ice age, therefore, till is the mostcommon soil type. Generally, glacial drift is derived from the bedrock directly underlying the driftcover, and recorded gamma radiation thus gives a relatively good idea of the extent of a rockcontaining enhanced uranium. However, when interpreting airborne measurements, the effects ofshielding by soil and water must be taken into consideration.
Figs 3 and 4 show an area of uranium- and thorium-rich granite at Smogen, on the west coastof Sweden. The entire district consists mainly of granite outcroppings. In this case, the gammaradiation map may be used directly to determine areas of enhanced radon risk and delimit of suchareas. As shown, the south-eastern part of the area consists of uranium-rich granites and the north-western part of thorium-rich granite, which often have fairly low uranium concentrations. The totalmeasured gamma radiation from outcropping granite is almost equal in both areas, 20-40 fiR/h.
166
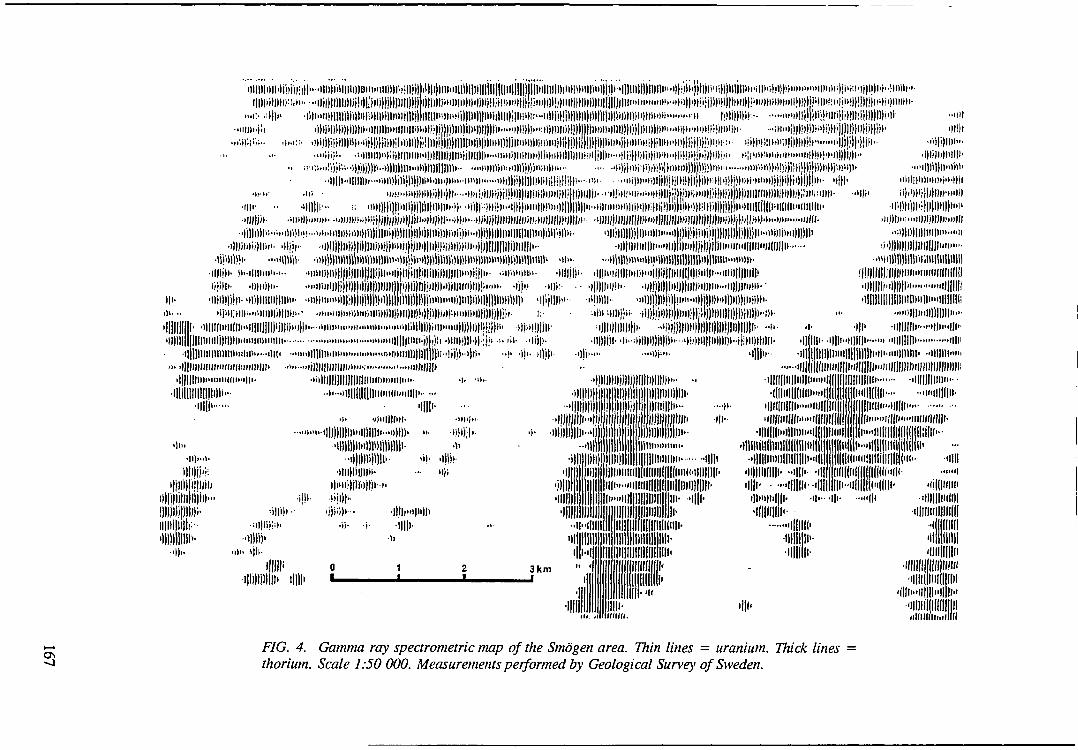
|)|||||!|(|||j||iii)|l|||||^ ) } ; i U > } ! ) | j | j ! | !
i H
| l | | | f ! i ! M
..Illl
null••IIIHlllh..
•I)|M)H- illl! IIHIll)) tlHi|irt!
Hill' 'lllllll»llllll'<il-" •IHHI
ll- .111111
I l l l llllliiiilJllllllMiiiiiniiiinii-•Oil-
,\U
•mil'-•"•"••'•I| | | |) | | | | |I.I| | | | | |I. )||). ..• nil)
Ill- • »
•ijH' -lijlll--
|iiiil)>H i l l l l l l l
||i)|)
•HlllllHll-lllllll'illllllli.
•rtllllli'illllH" "'1111lln.lllH
••mfr -I'l! !*»ll))>»l!Hlil)|l»lll)l!HiHI)))-:i>'l l l l H •' li!!||||llii|||||||l!|H|l||
•illlllll- •ii-;iill|i|)il)ll"-'ltHlil||lilll»i-iJl»llHilli- <H
•ill
•i- •iiliillilli"-:..in
•ill-HI
•Hi' •iiiiiiiii-"'iii«»iii-im- -mi'-mini 'niiini' »iin
!i>"ill||||)l))i»i •iniDi' 'innii'»"
'IIIIIIIIIIIM'
i l inl l l i i-l))l))||)!)in
»».ii|| I
| l | l |'illlliilllDiilllllllllltHI
mil
IIIHHJ
HI iniiiiiii!
'illlilllll
3km " (
f
:li
llllllllDIIIIII-
IIIIIHIIIIIIIIIIIlllIlKII-ii'
Hi- Hllllc 'II
III'-
NHIIili-Hi""
Mllllliiil
ll nimlillli-
"
lilllliilj ||||||«l«in -
I < ' I
iiiim.
urn
) | | |•mm lilil
i
FIG. 4. Gamma ray spectrometric map of the Smogen area. Thin lines = uranium. Thick lines =thorium. Scale 1:50 000. Measurements performed by Geological Survey of Sweden.
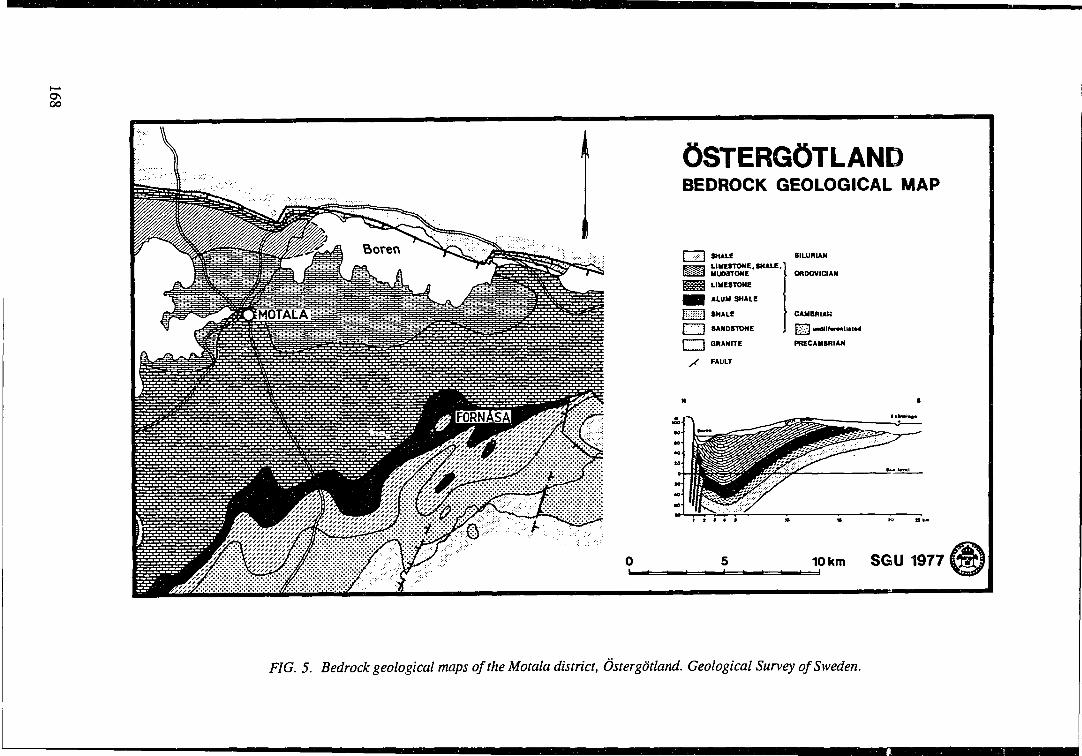
ON
00
OSTERGOTLANDBEDROCK GEOLOGICAL MAP
SHALELIMESTONE, SHALE. I
|S!;lj!iijj LIMESTONE
^ 1 ALUM SHALE
PM3 SHALE
fT^"] SANDSTONE
| | GRANITE
S FAULT
PRECAMBRIAN
I i » * »
10 km SGU 1977
F/G. 5. Bedrock geological maps oftheMotala district, Ostergotland. Geological Survey of Sweden.
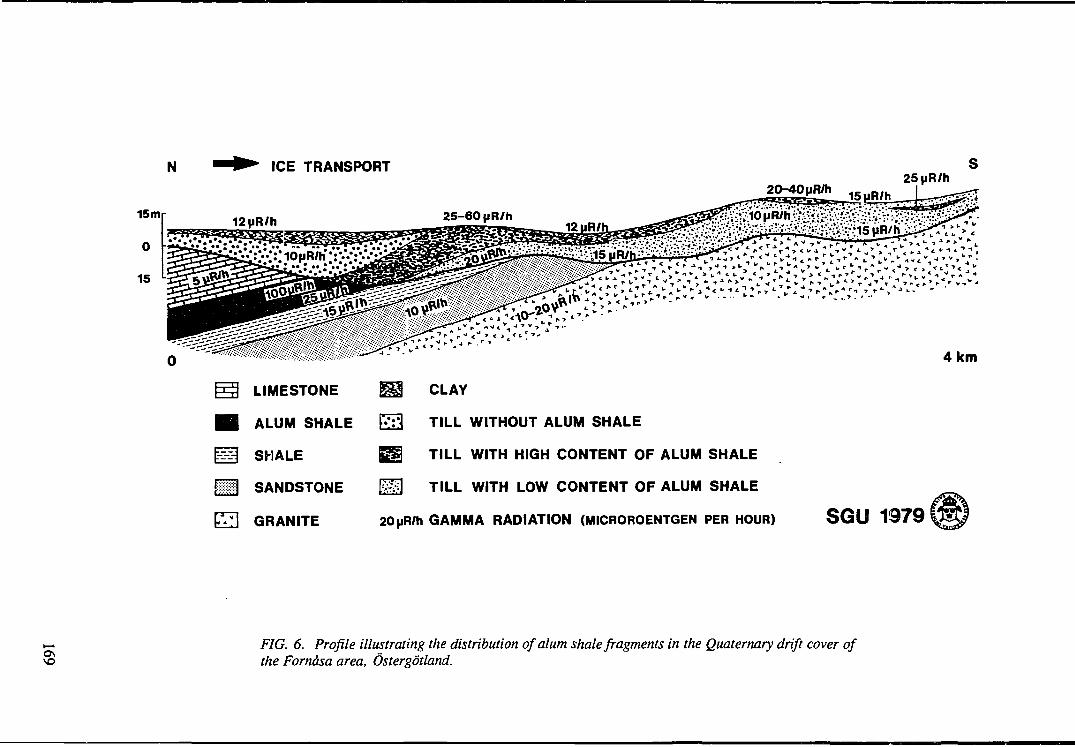
N ICE TRANSPORT
20-40 pR/h i K iI IH 'p i • • • • !
25(iR/h
4 km
LIMESTONE
ALUM SHALE
SHALE
SANDSTONE
GRANITE
^ CLAY
FJ53 TILL WITHOUT ALUM SHALE
^ TILL WITH HIGH CONTENT OF ALUM SHALE
^ 1 TILL WITH LOW CONTENT OF ALUM SHALE
20pR/h GAMMA RADIATION (MICROROENTGEN PER HOUR) SGU 1379
FIG. 6. Profile illustrating the distribution of alum shale fragments in the Quaternary drift cover ofthe Forndsa area, Ostergotland.
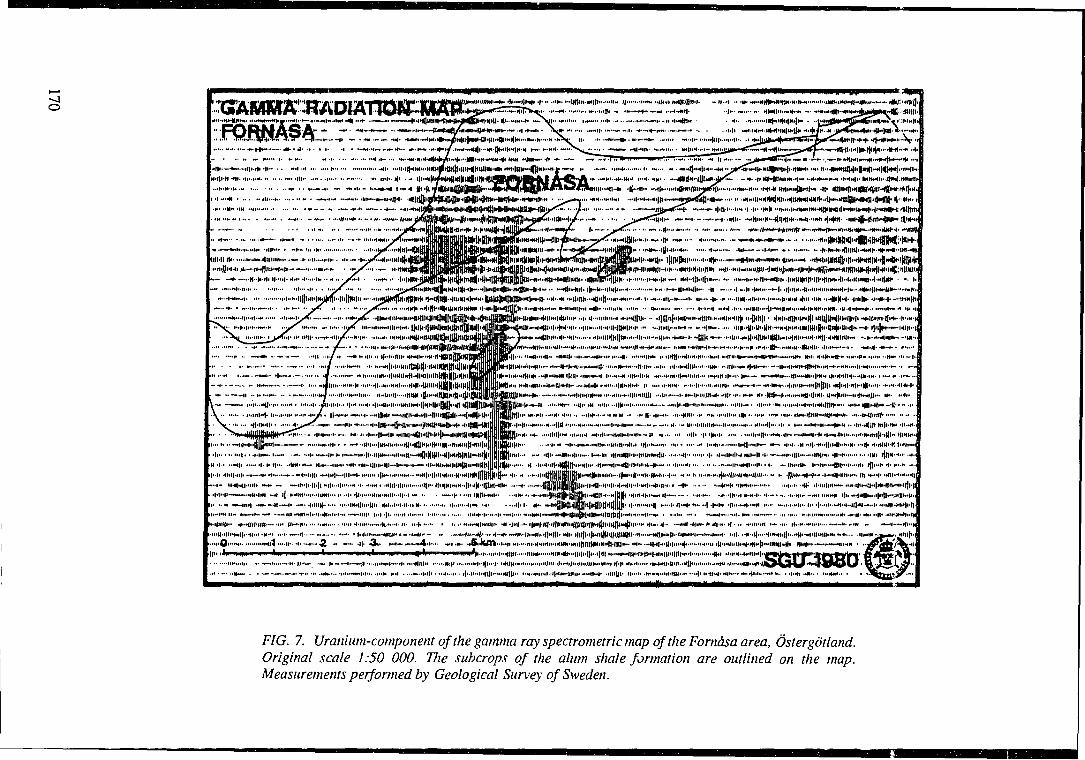
o .i». -Intl..—Hi I I . i| i.~. ..I|H
HI tt||*. i. l|H]||.<f|liH.||.'"lM.
H* . - i . m• H..IMHIIW. »ll* 'i*- **-H Hi
' •••Ill'* • •Il."« -I
I H M •• -I* H- 4f»». -il>H4IH' ••• .*• .l"lll*l> llfi " 'Ml* > >
•»••• •••it !• •*•«- >itHiil> -•tHi,l>>*>Un * l - i " t - t i - i t m | , . ( . . .H I» *»
.•.-II- t-..42 •• - • • i|- 3»*
F/G. 7. Uranium-component of the gamma ray spectrometric map of the Forn&sa area, Ostergotland.Original scale 1:50 000. Die subcrops of the alum shale formation are outlined on the map.Measurements performed by Geological Survey of Sweden.
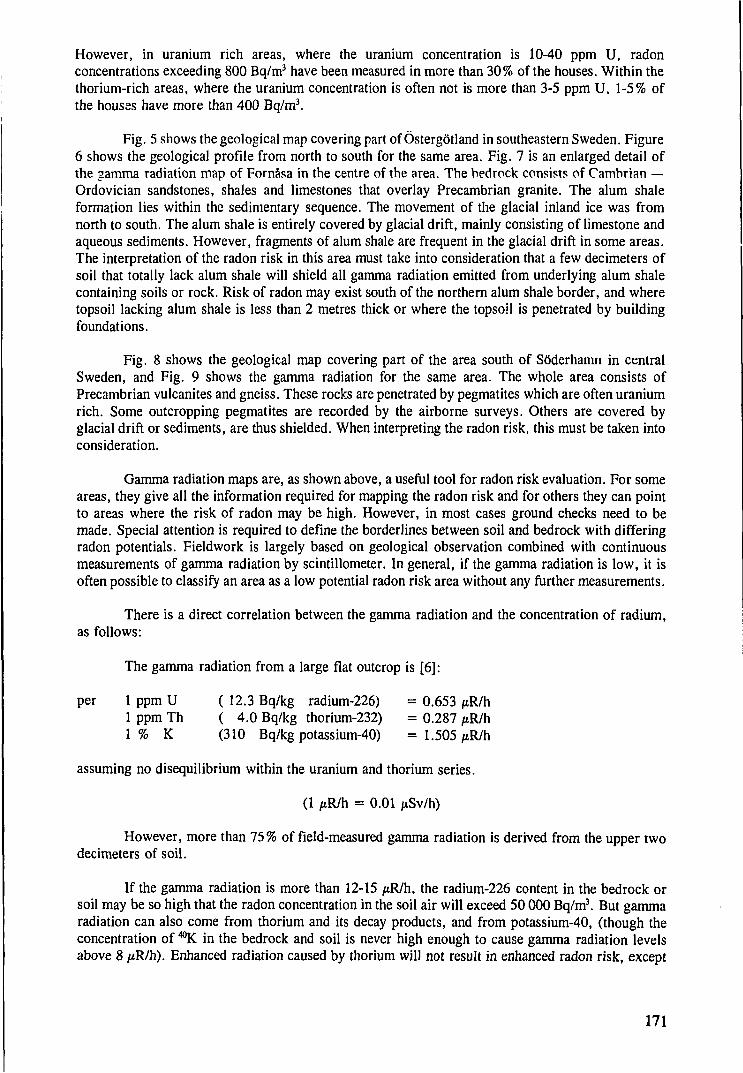
However, in uranium rich areas, where the uranium concentration is 10-40 ppm U, radonconcentrations exceeding 800 Bq/m3 have been measured in more than 30% of the houses. Within thethorium-rich areas, where the uranium concentration is often not is more than 3-5 ppm U, 1-5% ofthe houses have more than 400 Bq/m3.
Fig. 5 shows the geological map covering part of Ostergotland in southeastern Sweden. Figure6 shows the geological profile from north to south for the same area. Fig. 7 is an enlarged detail ofthe gamma radiation map of Fornasa in the centre of the area. The bedrock consists of Cambrian —Ordovician sandstones, shales and limestones that overlay Precambrian granite. The alum shaleformation lies within the sedimentary sequence. The movement of the glacial inland ice was fromnorth to south. The alum shale is entirely covered by glacial drift, mainly consisting of limestone andaqueous sediments. However, fragments of alum shale are frequent in the glacial drift in some areas.The interpretation of the radon risk in this area must take into consideration that a few decimeters ofsoil that totally lack alum shale will shield all gamma radiation emitted from underlying alum shalecontaining soils or rock. Risk of radon may exist south of the northern alum shale border, and wheretopsoil lacking alum shale is less than 2 metres thick or where the topsoil is penetrated by buildingfoundations.
Fig. 8 shows the geological map covering part of the area south of Soderhamn in centralSweden, and Fig. 9 shows the gamma radiation for the same area. The whole area consists ofPrecambrian vulcanites and gneiss. These rocks are penetrated by pegmatites which are often uraniumrich. Some outcropping pegmatites are recorded by the airborne surveys. Others are covered byglacial drift or sediments, are thus shielded. When interpreting the radon risk, this must be taken intoconsideration.
Gamma radiation maps are, as shown above, a useful tool for radon risk evaluation. For someareas, they give all the information required for mapping the radon risk and for others they can pointto areas where the risk of radon may be high. However, in most cases ground checks need to bemade. Special attention is required to define the borderlines between soil and bedrock with differingradon potentials. Fieldwork is largely based on geological observation combined with continuousmeasurements of gamma radiation by scintillometer. In general, if the gamma radiation is low, it isoften possible to classify an area as a low potential radon risk area without any further measurements.
There is a direct correlation between the gamma radiation and the concentration of radium,as follows:
The gamma radiation from a large flat outcrop is [6]:
per 1 ppm U ( 12.3 Bq/kg radium-226) = 0.653 /xR/h1 ppm Th ( 4.0 Bq/kg thorium-232) = 0.287 /xR/h1% K (310 Bq/kg potassium-40) = 1.505 /tR/h
assuming no disequilibrium within the uranium and thorium series.
(1 fiR/h = 0.01
However, more than 75% of field-measured gamma radiation is derived from the upper twodecimeters of soil.
If the gamma radiation is more than 12-15 fiRJh, the radium-226 content in the bedrock orsoil may be so high that the radon concentration in the soil air will exceed 50 000 Bq/m3. But gammaradiation can also come from thorium and its decay products, and from potassium-40, (though theconcentration of ^K in the bedrock and soil is never high enough to cause gamma radiation levelsabove 8 /xR/h). Enhanced radiation caused by thorium will not result in enhanced radon risk, except
171
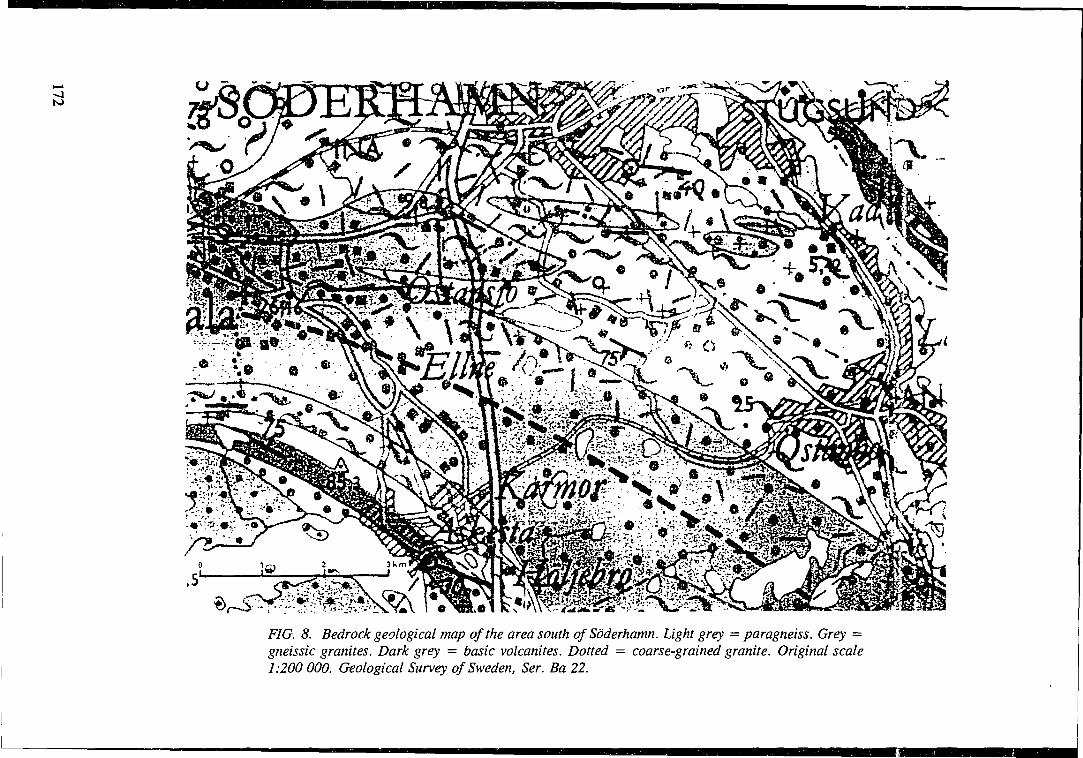
4to
.5
FIG. 8. Bedrock geological map of the area south of Soderhamn. Light grey = paragneiss. Grey =gneissic granites. Dark grey = basic volcanites. Dotted - coarse-grained granite. Original scale1:200 000. Geological Survey of Sweden, Ser. Ba 22.
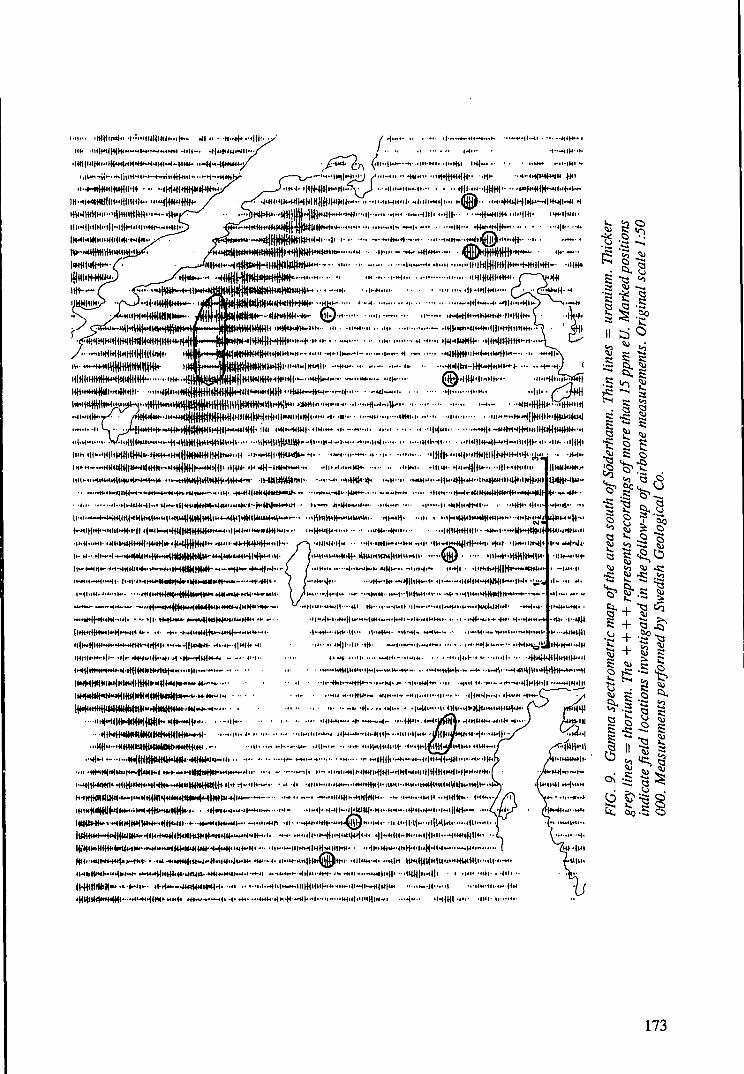
173
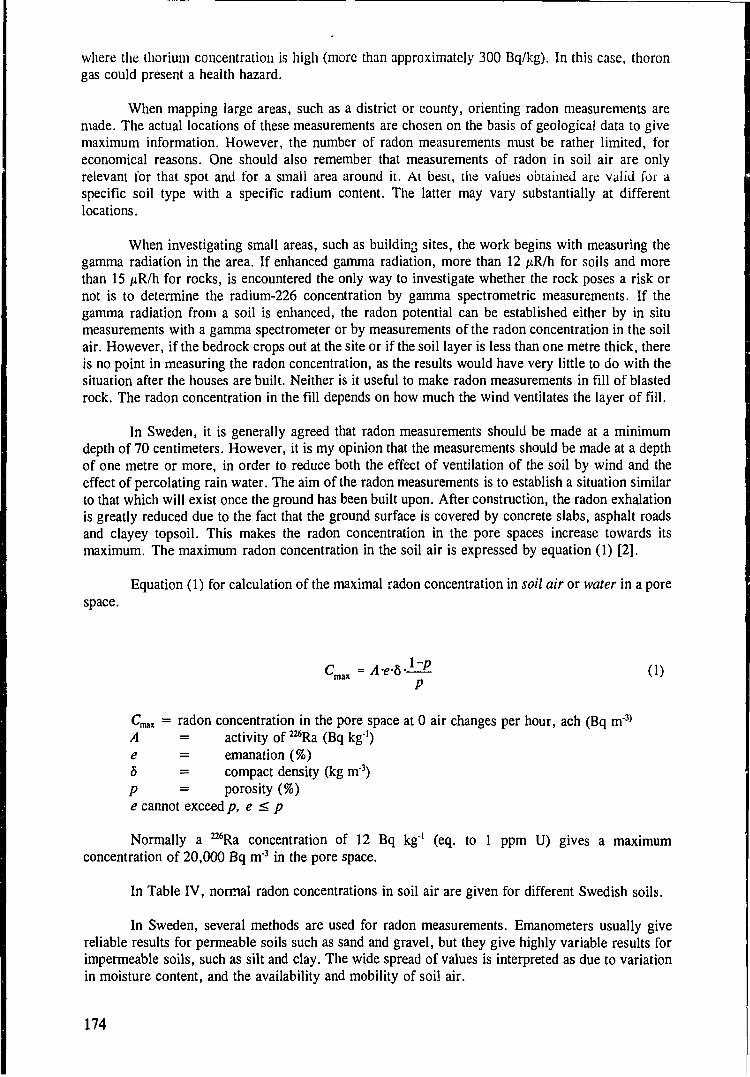
where the thorium concentration is high (more than approximately 300 Bq/kg). In this case, thorongas could present a health hazard.
When mapping large areas, such as a district or county, orienting radon measurements aremade. The actual locations of these measurements are chosen on the basis of geological data to givemaximum information. However, the number of radon measurements must be rather limited, foreconomical reasons. One should also remember that measurements of radon in soil air are onlyrelevant for that spot and for a small area around it. At best, the values obtained are valid for aspecific soil type with a specific radium content. The latter may vary substantially at differentlocations.
When investigating small areas, such as building sites, the work begins with measuring thegamma radiation in the area. If enhanced gamma radiation, more than 12 /xR/h for soils and morethan 15 fiR/h for rocks, is encountered the only way to investigate whether the rock poses a risk ornot is to determine the radium-226 concentration by gamma spectrometric measurements. If thegamma radiation from a soil is enhanced, the radon potential can be established either by in situmeasurements with a gamma spectrometer or by measurements of the radon concentration in the soilair. However, if the bedrock crops out at the site or if the soil layer is less than one metre thick, thereis no point in measuring the radon concentration, as the results would have very little to do with thesituation after the houses are built. Neither is it useful to make radon measurements in fill of blastedrock. The radon concentration in the fill depends on how much the wind ventilates the layer of fill.
In Sweden, it is generally agreed that radon measurements should be made at a minimumdepth of 70 centimeters. However, it is my opinion that the measurements should be made at a depthof one metre or more, in order to reduce both the effect of ventilation of the soil by wind and theeffect of percolating rain water. The aim of the radon measurements is to establish a situation similarto that which will exist once the ground has been built upon. After construction, the radon exhalationis greatly reduced due to the fact that the ground surface is covered by concrete slabs, asphalt roadsand clayey topsoil. This makes the radon concentration in the pore spaces increase towards itsmaximum. The maximum radon concentration in the soil air is expressed by equation (1) [2].
Equation (1) for calculation of the maximal radon concentration in soil air or water in a porespace.
(1)
Cmax = radon concentration in the pore space at 0 air changes per hour, ach (Bq m3)
A = activity of ^Ra (Bq kg1)e = emanation (%)5 = compact density (kg m3)p = porosity (%)e cannot exceed p, e < p
Normally a ^Ra concentration of 12 Bq kg'1 (eq. to 1 ppm U) gives a maximumconcentration of 20,000 Bq m'3 in the pore space.
In Table IV, normal radon concentrations in soil air are given for different Swedish soils.
In Sweden, several methods are used for radon measurements. Emanometers usually givereliable results for permeable soils such as sand and gravel, but they give highly variable results forimpermeable soils, such as silt and clay. The wide spread of values is interpreted as due to variationin moisture content, and the availability and mobility of soil air.
174
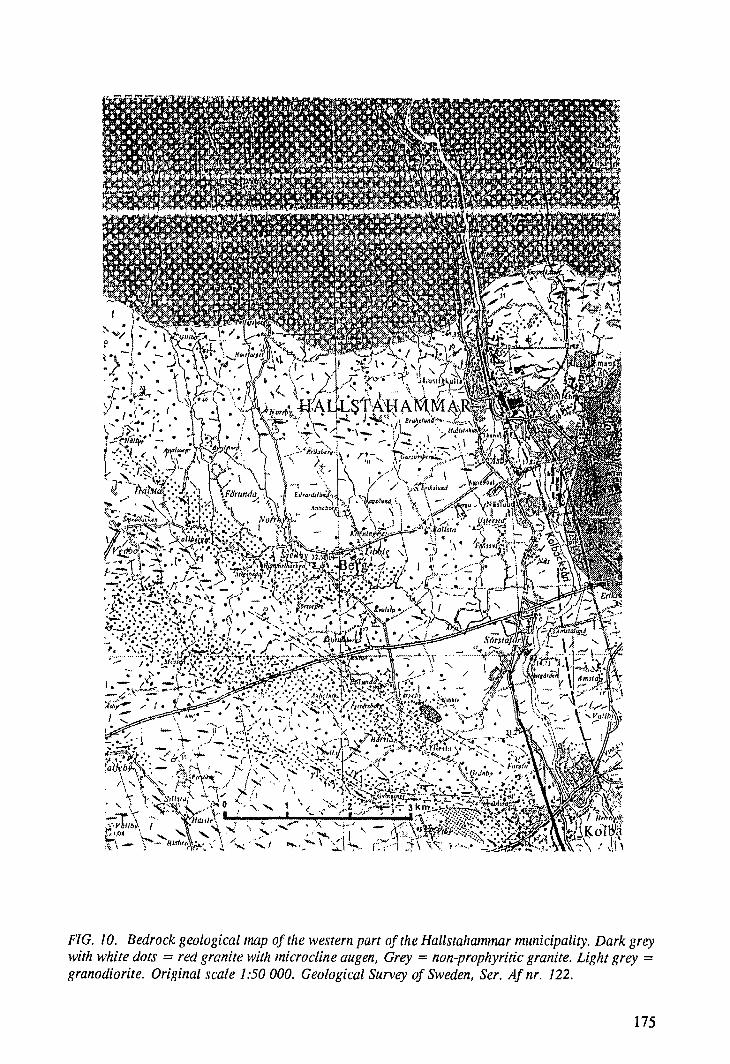
FIG. 10. Bedrock geological map of the western part of the Hallstahammar municipality. Dark greywith white dots = red granite with microcline augen, Grey = non-prophyritic granite. Light grey =granodiorite. Original scale 1:50 000. Geological Survey of Sweden, Ser. Afnr. 122.
175
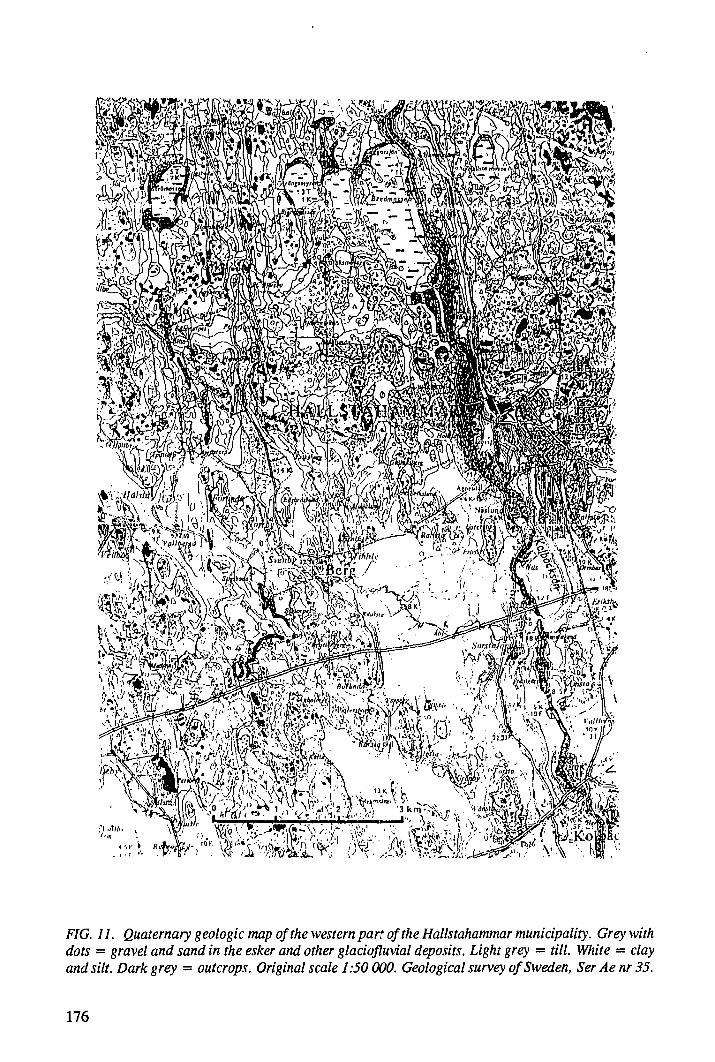
FIG. 11. Quaternary geologic map of the western part of the Hallstahammar municipality. Grey withdots = gravel and sand in the esker and other glaciofluvial deposits. Light grey = till. White = clayand silt. Dark grey = outcrops. Original scale 1:50 000. Geological survey of Sweden, SerAenr35.
176
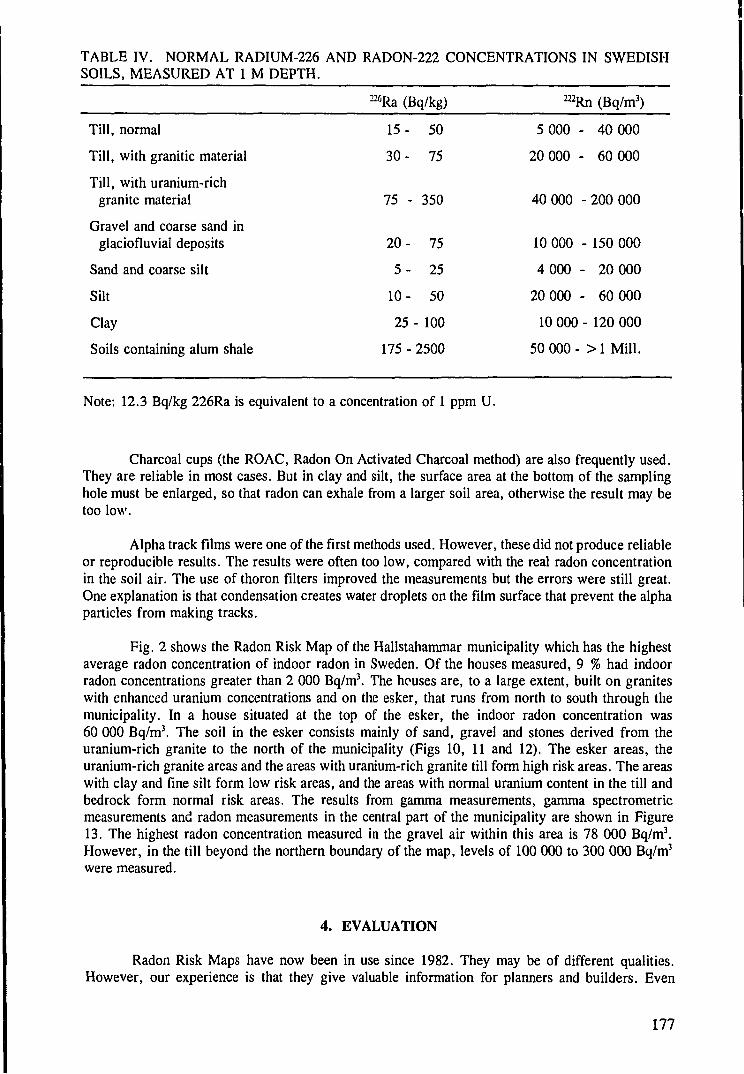
TABLE IV. NORMAL RADIUM-226 AND RADON-222 CONCENTRATIONS IN SWEDISHSOILS, MEASURED AT 1 M DEPTH.
^Ra (Bq/kg) mRn (Bq/m3)
Till, normal 1 5 - 5 0 5 000 - 40 000
Till, with granitic material 30 - 75 20 000 - 60 000
Till, with uranium-richgranite material 75 - 350 40 000 - 200 000
Gravel and coarse sand inglaciofluvial deposits 20 - 75 10 000 - 150 000
Sand and coarse silt 5 - 2 5 4 000 - 20 000
Silt 10- 50 20 000 - 60 000
Clay 25 - 100 10 000 - 120 000
Soils containing alum shale 175 - 2500 50 000 - > 1 Mill.
Note: 12.3 Bq/kg 226Ra is equivalent to a concentration of 1 ppm U.
Charcoal cups (the ROAC, Radon On Activated Charcoal method) are also frequently used.They are reliable in most cases. But in clay and silt, the surface area at the bottom of the samplinghole must be enlarged, so that radon can exhale from a larger soil area, otherwise the result may betoo low.
Alpha track films were one of the first methods used. However, these did not produce reliableor reproducible results. The results were often too low, compared with the real radon concentrationin the soil air. The use of thoron filters improved the measurements but the errors were still great.One explanation is that condensation creates water droplets on the film surface that prevent the alphaparticles from making tracks.
Fig. 2 shows the Radon Risk Map of the Hallstahammar municipality which has the highestaverage radon concentration of indoor radon in Sweden. Of the houses measured, 9 % had indoorradon concentrations greater than 2 000 Bq/m3. The houses are, to a large extent, built on graniteswith enhanced uranium concentrations and on the esker, that runs from north to south through themunicipality. In a house situated at the top of the esker, the indoor radon concentration was60 000 Bq/m3. The soil in the esker consists mainly of sand, gravel and stones derived from theuranium-rich granite to the north of the municipality (Figs 10, 11 and 12). The esker areas, theuranium-rich granite areas and the areas with uranium-rich granite till form high risk areas. The areaswith clay and fine silt form low risk areas, and the areas with normal uranium content in the till andbedrock form normal risk areas. The results from gamma measurements, gamma spectrometricmeasurements and radon measurements in the central part of the municipality are shown in Figure13. The highest radon concentration measured in the gravel air within this area is 78 000 Bq/m3.However, in the till beyond the northern boundary of the map, levels of 100 000 to 300 000 Bq/m3
were measured.
4. EVALUATION
Radon Risk Maps have now been in use since 1982. They may be of different qualities.However, our experience is that they give valuable information for planners and builders. Even
177
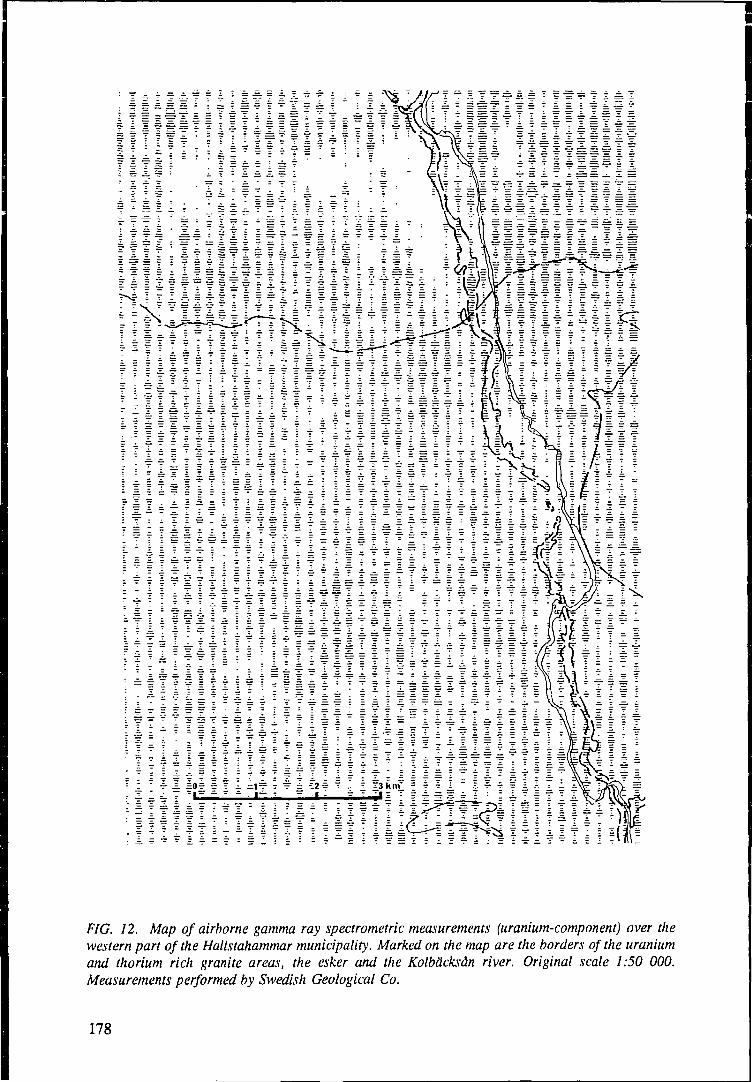
I
rj$immfi#tifi
F/G. 72. A/a/j of airborne gamma ray spectrometric measurements (uranium-component) over thewestern part of the Hallstahammar municipality. Marked on the map are the borders of the uraniumand thorium rich granite areas, the esker and the Kolbacksan river. Original scale 1:50 000.Measurements performed by Swedish Geological Co.
178
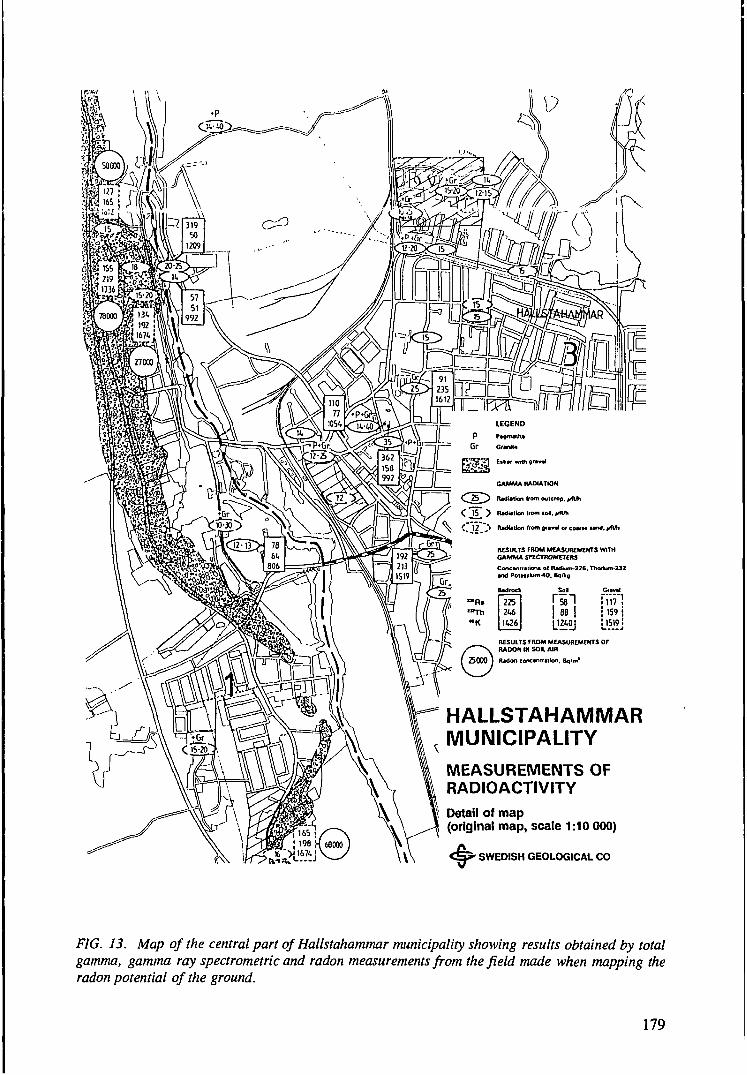
RESULTS FROM MEASUREMENTS WITHGAMMA SPECTROMETERS
HALLSTAHAMMARMUNICIPALITYMEASUREMENTS OFRADIOACTIVITYDetail of map(original map, scale 1:10 000)
SWEDISH GEOLOGICAL CO
FIG. 13. Map of the central part of Hallstahammar municipality showing results obtained by totalgamma, gamma ray spectrometric and radon measurements from the field made when mapping theradon potential of the ground.
179

though the main purpose of the maps was to provide information for the planning and building of newhouses, they have also proved to be useful in pointing out areas where existing houses have enhancedlevels of indoor radon.
REFERENCES
[1] ANDERSSON, A., DAHLMAN, B., GEE, D.G., SNALL, S., The Scandinavian AlumShales. Geological Survey of Sweden Ser. Ca, nr 56, Uppsala (1985) 50 p. ISBN 91-7158-334-3.
[2] ANDERSSON, P., CLAVENSJO, B., AKERBLOM, G., The effect of the ground on theconnection of radon and gamma radiation indoors. Report R 9:1983, Swedish Council forBuilding Research, Stockholm (1983) (in Swedish), 442 p. ISBN 91-540-3866-9.
[3] AKERBLOM, G., CLAVENSJO, B., ANDERSSON, P., Soil gas radon - a source forindoor radon daughters. Radiation Protection Dosimetry. Vol. 7. No. 1-4 (1983) 49-54.
[4] AKERBLOM, G., WILSON, C , Radon - geological aspects of an environmental problem.Papers presented at the International Meeting on Radon - Radon Progeny Measurements,Montgomery, Alabama, August 27-28 (1981) Geological Survey of Sweden, Reports andcommunications no. 30, Uppsala (1982) 47 p. ISBN 91-7158-271-1.
[5] AKERBLOM, G., Investigation and mapping of radon risk areas. Paper presented at theInternational Symposium on Geological Mapping in the Service of Environmental Planning:Subcommission for Maps on environmental Geology, Trondheim, Norway. May 6-9 1986.In: Geology for Environmental Planning, edited by Wolff F C. Geological Survey of Norway.Special papers 2 (1986) 96-106. ISBN 82-7385-029-3.
[6] INTERNATIONAL ATOMIC ENERGY AGENCY, Airborne Gamma Ray SpectrometerSurveying, Technical Reports Series No. 323, IAEA, Vienna, (1991).
[7] LINDEN, A., AKERBLOM, G., Method of detecting small or indistinct radioactive sourcesby airborne gamma ray spectrometry. In: Geology, mining and extractive processing ofuranium. Editor: Jones M J, Institute of Mining and Metallurgy. London (1976) p. 111-120.
[8] MELLANDER, H., Airborne gamma spectrometric measurements of the fall-out over Swedenafter the nuclear reactor accident at Chernobyl, USSR. IAEA/NENF/NM-89-1, Internalreport (1989).
[9] THE NATIONAL SWEDISH BOARD OF URBAN PLANNING AND BUILDING, Radon— planning, building permit and protective measures. Statens planverk report 59, Stockholm(1982) (in Swedish), p. 28.
[10] WILSON, M.R., AKERBLOM, G. V., Geological setting and geochemistry of uranium-richgranites in the Proterozoic of Sweden, Mineralogical Magazine, Vol 46 (1982) 233-45.
180
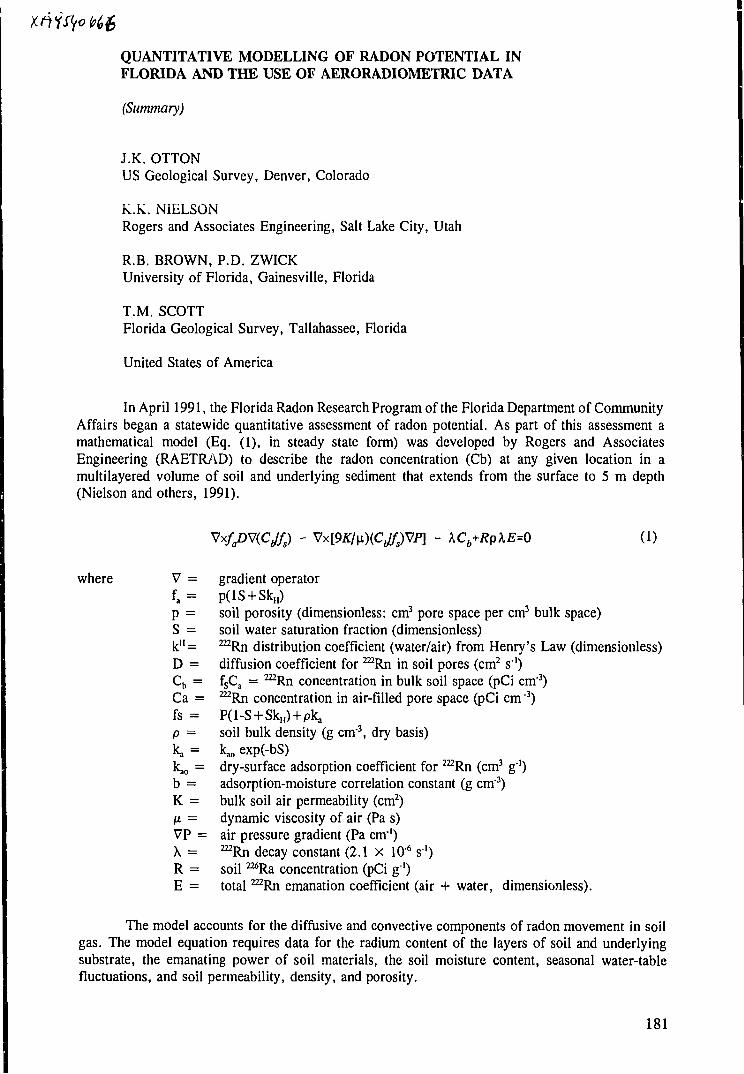
QUANTITATIVE MODELLING OF RADON POTENTIAL INFLORIDA AND THE USE OF AERORADIOMETRIC DATA
(Summary)
J.K. OTTONUS Geological Survey, Denver, Colorado
k.K. NIELSONRogers and Associates Engineering, Salt Lake City, Utah
R.B. BROWN, P.D. ZWICKUniversity of Florida, Gainesville, Florida
T.M. SCOTTFlorida Geological Survey, Tallahassee, Florida
United States of America
In April 1991, the Florida Radon Research Program of the Florida Department of CommunityAffairs began a statewide quantitative assessment of radon potential. As part of this assessment amathematical model (Eq. (1), in steady state form) was developed by Rogers and AssociatesEngineering (RAETRAD) to describe the radon concentration (Cb) at any given location in amultilayered volume of soil and underlying sediment that extends from the surface to 5 m depth(Nielson and others, 1991).
VxfJJWCJ® - Vx[9K/\x)(CJfs)W] - kCb+Rp\E=Q (1)
where V = gradient operatorf. = p(lS+SkH)p = soil porosity (dimensionless: cm3 pore space per cm3 bulk space)S = soil water saturation fraction (dimensionless)k"= 222Rn distribution coefficient (water/air) from Henry's Law (dimensionless)D = diffusion coefficient for 222Rn in soil pores (cm2 s1)Cb = fsCa = ^Rn concentration in bulk soil space (pCi cm'3)Ca = ^Rn concentration in air-filled pore space (pCi cm 3)fs = P(l-S+SkH)+pka
p = soil bulk density (g cm3, dry basis)k, = k^ exp(-bS)ka,, = dry-surface adsorption coefficient for ^Rn (cm3 g"1)b = adsorption-moisture correlation constant (g cm3)K = bulk soil air permeability (cm2)fi = dynamic viscosity of air (Pa s)VP = air pressure gradient (Pa cm1)\ = ^Rn decay constant (2.1 x 10⁶ s1)R = soil ^Ra concentration (pCi g"1)E = total ^Rn emanation coefficient (air + water, dimensionless).
The model accounts for the diffusive and convective components of radon movement in soilgas. The model equation requires data for the radium content of the layers of soil and underlyingsubstrate, the emanating power of soil materials, the soil moisture content, seasonal water-tablefluctuations, and soil permeability, density, and porosity.
181
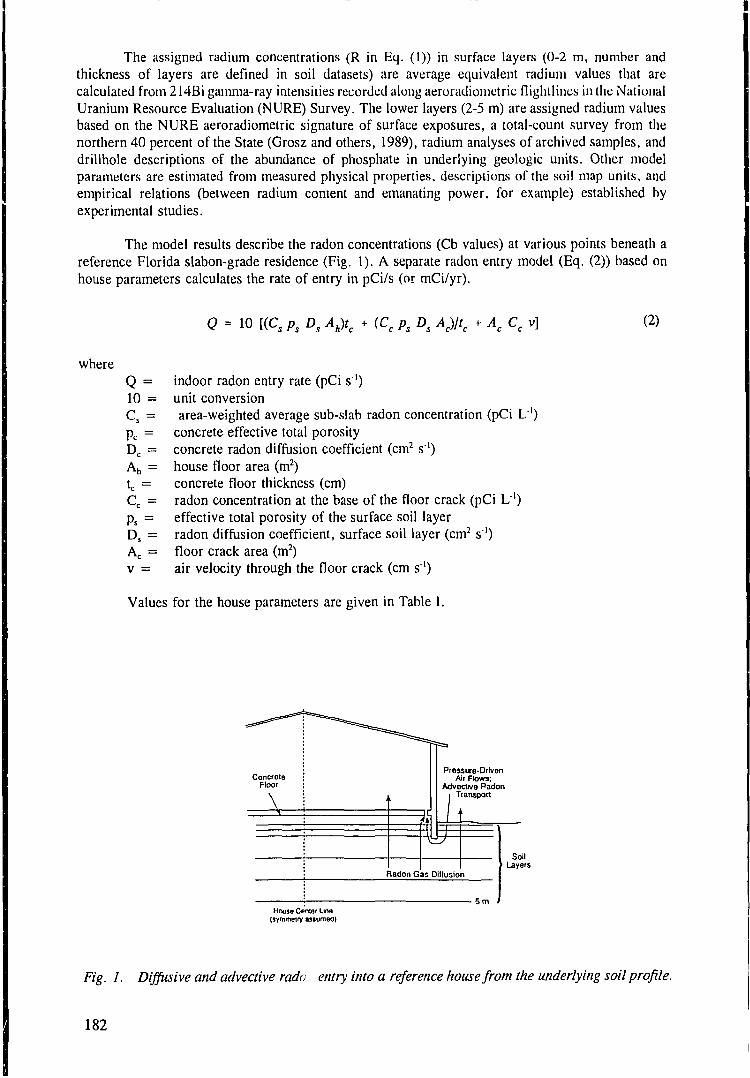
The assigned radium concentrations (R in Eq. (1)) in surface layers (0-2 m, number andthickness of layers are defined in soil datasets) are average equivalent radium values that arecalculated from 214Bi gamma-ray intensities recorded along aeroradiometric flightlines in the NationalUranium Resource Evaluation (NURE) Survey. The lower layers (2-5 m) are assigned radium valuesbased on the NURE aeroradiometric signature of surface exposures, a total-count survey from thenorthern 40 percent of the State (Grosz and others, 1989), radium analyses of archived samples, anddrillhole descriptions of the abundance of phosphate in underlying geologic units. Other modelparameters are estimated from measured physical properties, descriptions of the soil map units, andempirical relations (between radium content and emanating power, for example) established byexperimental studies.
The model results describe the radon concentrations (Cb values) at various points beneath areference Florida slabon-grade residence (Fig. 1). A separate radon entry model (Eq. (2)) based onhouse parameters calculates the rate of entry in pCi/s (or mCi/yr).
Q = 10 [(C, ps Ds Ah)tc + (Cc ps Ds Ac)ltc + Ac Cc v] (2)
whereQ = indoor radon entry rate (pCi s"')10 = unit conversionCs = area-weighted average sub-slab radon concentration (pCi L/1)pc = concrete effective total porosityDc = concrete radon diffusion coefficient (cm2 s1)Ah = house floor area (m2)tc = concrete floor thickness (cm)Cc = radon concentration at the base of the floor crack (pCi L1)ps = effective total porosity of the surface soil layerDs = radon diffusion coefficient, surface soil layer (cm2 s"1)Ac = floor crack area (m2)v = air velocity through the floor crack (cm s1)
Values for the house parameters are given in Table I.
ConcroteFloor
Press urD-DrlvenAit Flows:
Advoctwo PadonTransport
Radon Gas Dilluslon
5 mHouse Csnlor Una
tsymmotry assumed)
Fig. 1. Diffusive and advective rado entry into a reference house from the underlying soil profile.
182
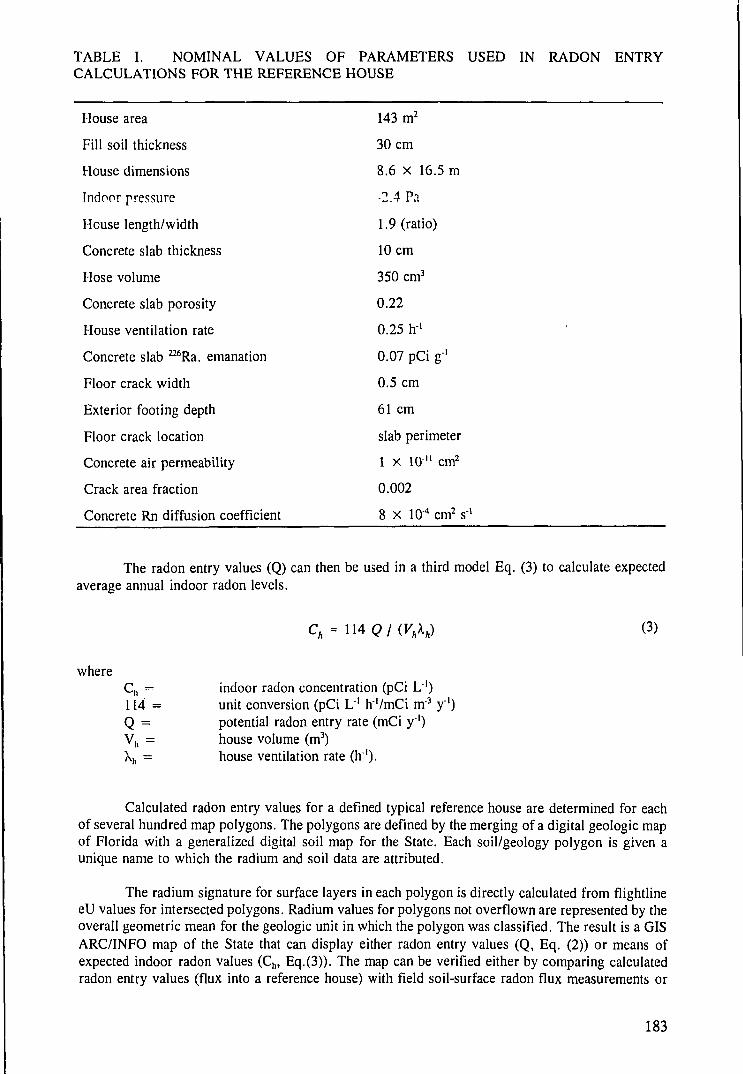
TABLE I. NOMINAL VALUES OF PARAMETERS USED IN RADON ENTRYCALCULATIONS FOR THE REFERENCE HOUSE
House area 143 m2
Fill soil thickness 30 cm
House dimensions 8.6 x 16.5 m
Indoor pressure -2.4 Pa
House length/width 1.9 (ratio)
Concrete slab thickness 10 cm
Hose volume 350 cm3
Concrete slab porosity 0.22
House ventilation rate 0.25 h1
Concrete slab ^Ra. emanation 0.07 pCi g"1
Floor crack width 0.5 cm
Exterior footing depth 61 cm
Floor crack location slab perimeter
Concrete air permeability 1 x 10" cm2
Crack area fraction 0.002
Concrete Rn diffusion coefficient 8 X 10"4 cm2 s1
The radon entry values (Q) can then be used in a third model Eq. (3) to calculate expectedaverage annual indoor radon levels.
Ch = IU Q I (VhXh) (3)
whereCh = indoor radon concentration (pCi L'1)114 = unit conversion (pCi L1 h'/mCi m3 y1)Q = potential radon entry rate (mCi y1)Vh = house volume (m3)Xh = house ventilation rate (h1).
Calculated radon entry values for a defined typical reference house are determined for eachof several hundred map polygons. The polygons are defined by the merging of a digital geologic mapof Florida with a generalized digital soil map for the State. Each soil/geology polygon is given aunique name to which the radium and soil data are attributed.
The radium signature for surface layers in each polygon is directly calculated from flightlineeU values for intersected polygons. Radium values for polygons not overflown are represented by theoverall geometric mean for the geologic unit in which the polygon was classified. The result is a GISARC/INFO map of the State that can display either radon entry values (Q, Eq. (2)) or means ofexpected indoor radon values (Ch, Eq.(3)). The map can be verified either by comparing calculatedradon entry values (flux into a reference house) with field soil-surface radon flux measurements or
183
by comparing expected indoor radon values with observed indoor radon measurements. For the Stateof Florida, the 10-km flightline spacing of the NURE dataset is a primary limitation of the resolutionachievable for the radon potential map. The minimum permitted size of a geology/soil polygon willprobably be in the range of 2.56 to 10 km2.
BIBLIOGRAPHY
GROSZ, A.E., CATHCART, J.B., MACKE, D.L., KNAPP, M.S., SCHMIDT, WALTER andSCOTT, T.M., Geologic interpretation of the gamma-ray aeroradiometric maps of central andnorthern Florida: U.S. Geological Survey Professional Paper 1461 (1989) 48 p.
NIELSON, K.K., ROGERS, V.C., BROWN, R.B., HARRIS, W.G., and OTTON, J.K., Prototypemapping of radon potentials in Florida: The 1991 Annual American Association of Radon Scientistsand Technologists National Fall Conference: Preprints volume I (1991) 145-162.
184
RADON LEVELS OF ROCK FORMATIONS IN ISRAEL
(Summary)
U.VULKANSoreq Nuclear Research Center, Yavne, Israel
M. SHIRAV (SCHWARTZ), Y. SHILONIGeological Survey of Israel, Jerusalem, Israel
Radon concentrations of rock formations (and soils) were measured directly at more than 70sites, representing stratigraphic units which constitute the main rock exposures in Israel. The purposeof this project is the production of a map indicating radon levels in rocks, as a planning means forthe pertinent authorities. In order to meet local conditions, a modified alpha-track detection systemwas implemented, consisting essentially of a polycarbonate foil within a PVC pipe. The detectors areinserted into shallow (~50 cm) drillholes at the test sites (usually 20-30 detectors for each location).The detector is attached to a plastic cup which serves as a thermal isolator and minimizes vapourcondensation. Thoron (220Rn) signal is reduced by a membrane placed in front of the polycarbonatefoil. The detectors are buried for a period of up to 28 days (according to the radon level). Afterremoval, the foils are electrochemically etched and track densities are counted. Calibration of thetrack density versus absolute activity is accomplished by a special designed calibration cell with aknown radon source. Nearly all stratigraphic units which were studied (Precambrian basement;Cenomanian — Turonian limestones and dolomites; Eocene carbonates and Neogene to Recent basalts,sediments and soils) exhibit radon levels (less than 250 pCi/1) which do not require any special sealingin buildings founded on these rocks' exposures (based on Swedish guidelines). Average radon levelsin southern outcrops of the Campanian — Maastrichtian Mount Scopus Group, which consists ofchalks, cherts and phosphoritic layers, are usually higher than 1000 pCi/1, demanding appropriatesealing during construction. Rock units within the Mount Scopus Group in northern Israel showintermediate radon levels (250-1000 pCi/1), calling for local, specific studies in limited areas beforeconstruction. Summary of the radon levels which were determined for each group is given in Fig. 1.The radon source in the Mount Scopus Group rock units is the apatite (calcium phosphate) content— from ~ 2 Wt. % P2O5 up to ~ 30 % in the phosphate layers, corresponding to uranium concentrationsof up to 150 ppm. These rock units, which are down-faulted and buried along the Dead Sea RiftZone, are believed to be also the source for high radon emanations in the vicinity of some faults andthermal water springs in this area.
185
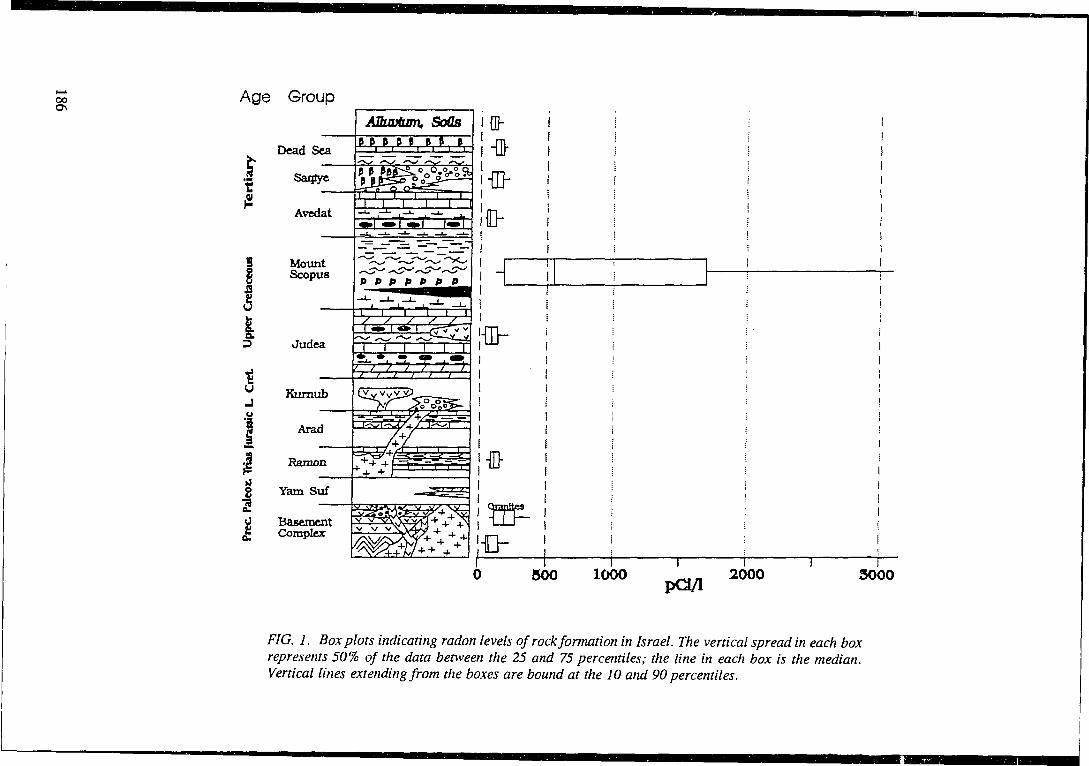
00 Age Group
r
tu
•3
Dead Sea
Saqtye
Avedat
MountScopus
Judea
Kumub
Arad
Ramon
Yam Suf
BasementComplex
ABuvbwn. Sods
1 . '
1—r 1—r
/ / f t / f^
WE. 1u_r— j
500 1000pa/1
2000 3000
F/G. 1. Box plots indicating radon levels of rock formation in Israel. The vertical spread in each boxrepresents 50% of the data between the 25 and 75 percentiles; the line in each box is the median.Vertical lines extending from the boxes are bound at the 10 and 90 percentiles.

THE ROLE OF MOBILE GAMMA SPECTROMETRY IN THE SWEDISHEMERGENCY RESPONSE PROGRAMME FOR NUCLEAR ACCIDENTS- EXPERIENCE AND FUTURE PLANS
H.MELLANDERSwedish Radiation Protection Institute,Division of Environmental Radiology,Stockholm, Sweden
Abstract
The airborne gamma spectrometry measurements in Sweden after the 1986 Chernobyl accident are widelyacknowledged as having been of significant importance in all stages of the radiation protection work following theaccident. The Swedish Radiation Protection Institute (SSI) and other government organizations, local and regionalSwedish authorities and scientists have been working on the effects of the accident for years. Maps and data producedfrom the airborne radiometric measurements are often used as background material. The airborne measurements werecarried out without proper preparation and calibration due to the urgency of the task and the unexpected situation.Many problems were encountered, some of them affecting the quality of the results. The scientific work performedsince 1986 has revealed some errors in the data and maps. The experience can be used to make the mobile gammaspectrometry resource significantly more powerful than the one available in 1986. Changes in the Swedish emergencyresponse organization is presented and the proposed use of additional light weight moveable and mobile gammaspectrometry systems is described.
1. BACKGROUND - THE EVENTS IN 1986 SUMMARIZED
At the time of the Chernobyl nuclear power plant accident in April 1986 the emergencyplanning in Sweden was primarily focused on the possibility of a fault in one of the twelve domesticlight water reactors. The fixed station monitoring system consisted of 25 [7] ionization chambers. Thestations were not automatic. Results were usually reported weekly unless the local operator decidedotherwise. Seven ultra high volume air sampling devices were operated by the Swedish DefenseResearch Establishment (FOA) characterized by an extremely low detection limit for airborneradioactivity. The gamma measuring instrumentation suitable for environmental monitoring were highresolution solid state gamma spectrometers operated by FOA and a few other organizations and alarge number of scintillation counters and a few Nal gamma spectrometers owned and operated bythe Swedish Geological Company (SGAB).
SGAB had two airborne gamma spectrometer systems, one of them barely returned from amission in Botswana.
The first alarm came from the nuclear power plant at Forsmark (100 km north of Stockholm)on Monday morning, 28 April, where activity was detected on personnel entering the plant. Thegamma station at Olands Sodra Udde showed an activity increase already on Sunday morning [8] butdue to the delayed reporting this was not known at the time. After a few hours of confusion it wasconcluded that the activity source must be outside Sweden [11] and probably in the Soviet Union. Achain of frantic efforts had been started aiming at getting a good picture of the accident and itsconsequences in Sweden.
The airborne division of SGAB in Uppsala was contacted by SSI on Wednesday 30 April, andwas asked if one airborne system could be used for mapping of fallout in Sweden. The SGAB systemswere at that time not in use and it took approximately 24 hours to get the requested system in air.
187
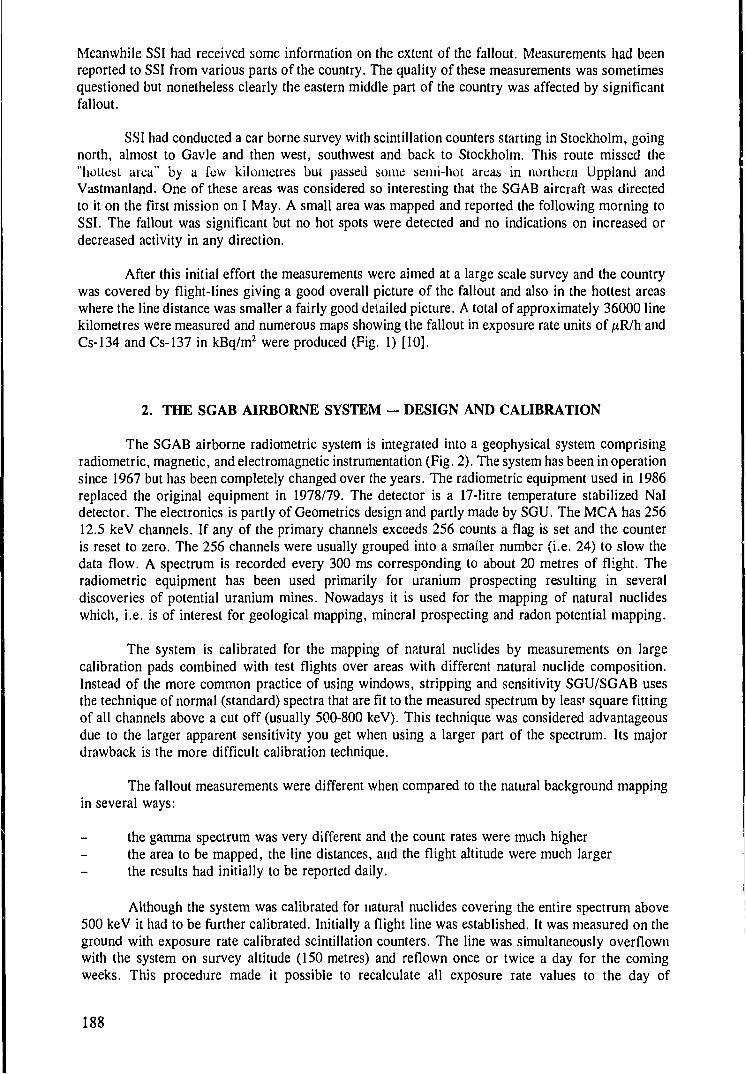
Meanwhile SSI had received some information on the extent of the fallout. Measurements had beenreported to SSI from various parts of the country. The quality of these measurements was sometimesquestioned but nonetheless clearly the eastern middle part of the country was affected by significantfallout.
SSI had conducted a car borne survey with scintillation counters starting in Stockholm, goingnorth, almost to Gavle and then west, southwest and back to Stockholm. This route missed the"hottest area" by a few kilometres but passed some semi-hot areas in northern Uppland andVastmanland. One of these areas was considered so interesting that the SGAB aircraft was directedto it on the first mission on I May. A small area was mapped and reported the following morning toSSI. The fallout was significant but no hot spots were detected and no indications on increased ordecreased activity in any direction.
After this initial effort the measurements were aimed at a large scale survey and the countrywas covered by flight-lines giving a good overall picture of the fallout and also in the hottest areaswhere the line distance was smaller a fairly good detailed picture. A total of approximately 36000 linekilometres were measured and numerous maps showing the fallout in exposure rate units of ^R/h andCs-134 and Cs-137 in kBq/m2 were produced (Fig. 1) [10].
2. THE SGAB AIRBORNE SYSTEM - DESIGN AND CALIBRATION
The SGAB airborne radiometric system is integrated into a geophysical system comprisingradiometric, magnetic, and electromagnetic instrumentation (Fig. 2). The system has been in operationsince 1967 but has been completely changed over the years. The radiometric equipment used in 1986replaced the original equipment in 1978/79. The detector is a 17-litre temperature stabilized Naldetector. The electronics is partly of Geometries design and partly made by SGU. The MCA has 25612.5 keV channels. If any of the primary channels exceeds 256 counts a flag is set and the counteris reset to zero. The 256 channels were usually grouped into a smaller number (i.e. 24) to slow thedata flow. A spectrum is recorded every 300 ms corresponding to about 20 metres of flight. Theradiometric equipment has been used primarily for uranium prospecting resulting in severaldiscoveries of potential uranium mines. Nowadays it is used for the mapping of natural nuclideswhich, i.e. is of interest for geological mapping, mineral prospecting and radon potential mapping.
The system is calibrated for the mapping of natural nuclides by measurements on largecalibration pads combined with test flights over areas with different natural nuclide composition.Instead of the more common practice of using windows, stripping and sensitivity SGU/SGAB usesthe technique of normal (standard) spectra that are fit to the measured spectrum by leas' square fittingof all channels above a cut off (usually 500-800 keV). This technique was considered advantageousdue to the larger apparent sensitivity you get when using a larger part of the spectrum. Its majordrawback is the more difficult calibration technique.
The fallout measurements were different when compared to the natural background mappingin several ways:
the gamma spectrum was very different and the count rates were much higherthe area to be mapped, the line distances, and the flight altitude were much largerthe results had initially to be reported daily.
Although the system was calibrated for natural nuclides covering the entire spectrum above500 keV it had to be further calibrated. Initially a flight line was established. It was measured on theground with exposure rate calibrated scintillation counters. The line was simultaneously overflownwith the system on survey altitude (150 metres) and reflown once or twice a day for the comingweeks. This procedure made it possible to recalculate all exposure rate values to the day of
188
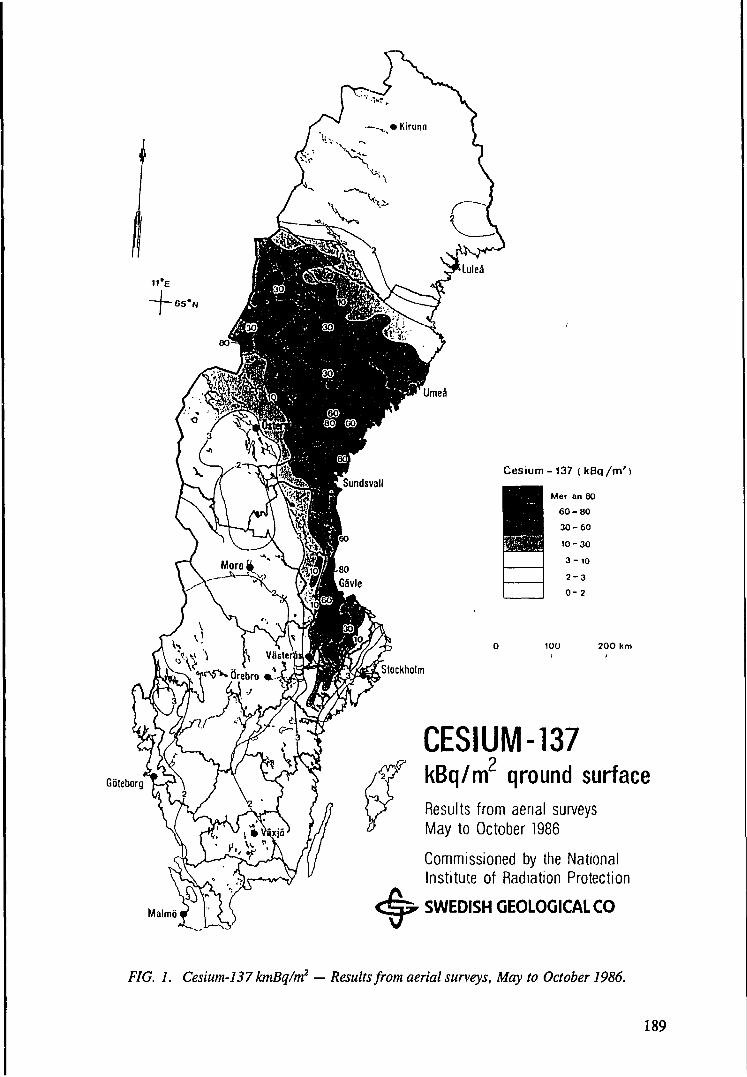
Goteborg
C e s i u m - 1 3 7 ( k B q / m ' )
Mer an 80
60-80
30-60
10-30
3-10
2-3
0-2
100 200 km
Malmo
CESIUM-137kBq/m qround surfaceResults from aerial surveysMay to October 1986
Commissioned by the NationalInstitute of Radiation Protection
SWEDISH GEOLOGICAL CO
FIG. 1. Cesium-137 kmBq/m2 — Results from aerial surveys, May to October 1986.
189
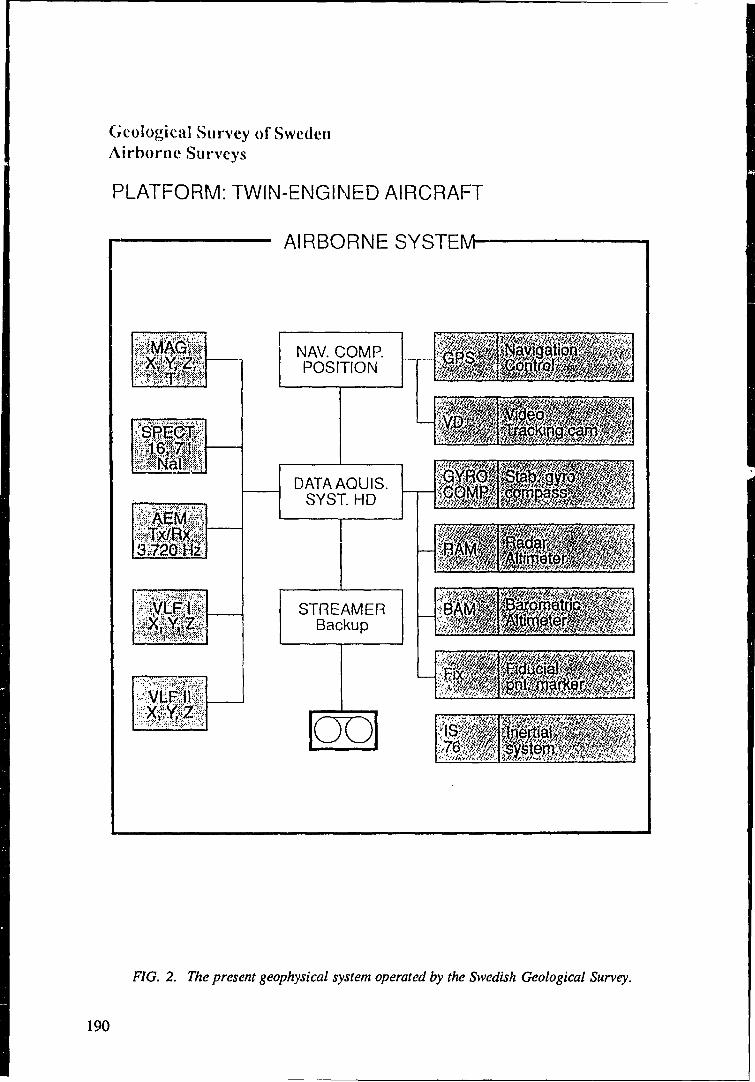
Geological Survey of SwedenAirborne Surveys
PLATFORM: TWIN-ENGINED AIRCRAFT
AIRBORNE SYSTEM-
NAV. COM P.POSITION
DATAAQUIS.vSYST. HD
STREAMERBackup
OD
I
F/G. 2. 77ie present geophysical system operated by the Swedish Geological Survey.
190
establishment of the line (assuming similar nuclide composition everywhere). This calibration wasused to produce total exposure rate maps including the natural background and contamination maps(without the natural background).
A cesium calibration of the SGAB system was first made in May by comparing one groundpoint measured with a high resolution system situated under one of the flight lines. In September thecalibration was remade using a well-documented grass airfield that was measured from the air atdifferent altitudes and on the ground with HPGe- and Nal-systems. Spectra measured after 15 Maycould be used to calculate activity levels of Cs-134 and Cs-137. Before producing the final maps inthe autumn of 1986 a set of long inter calibration lines were flown that covered the country fromnorth to south. These were used to level the data.
3. HOW WERE THE MEASUREMENTS USED?
The aim of the airborne measurements was to locate and quantify, map, the fallout. Othermonitoring resources were not suitable for that task. Within a week the entire country had beenmapped with a wide line spacing. At this stage the measurements were reported daily to SSI and atpress conferences. The final maps produced during the autumn of 1986 were used to inform thepublic directly and via media. The maps comprised a general background material for local andregional authorities and researchers studying the effects of the Chernobyl fallout during the yearsfollowing 1986. Another important use of the data was the calculation of the population dose invarious parts of the country and for the entire population [2]. These calculations had to include thehigh resolution ground spectrometry and soil sampling made by the Swedish Defense ResearchEstablishment. The latter measurements were used to correct the airborne measurements in certainareas (see below).
4. THE CHERNOBYL FALLOUT MAPPING IN PERSPECTIVE —PROBLEMS AND ERRORS
Some of the problems encountered by SGAB were related to the gamma spectrum and itsrapid change in time initially. The gamma emitting nuclides in the fallout were numerous and mostof them were short lived resulting in a rapid dose rate decrease in affected areas. Gamma peaks wereseen in the spectrum up to 1.6 MeV. Most peaks were however in the lower part of the spectrum.This fact was used to subtract the natural part of the measured spectra by calculations based on theupper half of the spectrum and knowledge of spectral shapes based on the calibration as describedabove. The Ba/La-140 peak at 1.6 MeV interfered with these calculations and had to be handled byapplying a special "unit spectrum" for this nuclide.
The presence of other (not accounted for) emitters above cesium-134 at 795 keV made thecesium calculations uncertain in the dry deposited areas where the cesium concentration was relativelylow compared to the interfering nuclides. The cesium deposition in these areas was oftenoverestimated by a factor 2-3 [2]. In the wet deposited areas with a high relative cesium depositionand the highest activity levels the agreement was much better, usually within 20% when comparedto ground measurements with HPGe detectors.
The fallout nuclides initially deposited on the ground surface soon migrated into the groundmaking all nuclide specific measurements uncertain since the vertical profile of each nuclide dependson the soil and its chemistry. The presented deposition values of Cs-137 are an underestimation by,on an average, a factor of 1.6. This fact shows that it is very important to use ground measurementswith high resolution gamma spectrometers as well as soil sampling to adjust the areal measurements.
191
If information on the vertical nuclide soil profile is missing, it is recommended to reportnuclide activities as surface equivalent activities, which always will be an underestimation whenanalyzing gamma spectra of an aged fallout [6].
5. CHANGES IN TIIE EMERGENCY RESPONSE ORGANIZATION
The Swedish emergency response organization has been changed since the Chernobylaccident. Many improvements have been made that influence the importance and use of mobilegamma spectrometry units based on Nal detectors. The most important of these monitoring resourcesadded or changed since 1986 can be summarized:
1. An improved network of fixed gamma stations 11 new stations, all 36 fully automatic. Theprimary use of this network of stations is for early warning especially if the treaty basednotification system fails and for dose calculations and prediction. The density of the networkis such that all plumes originating abroad and resulting in deposition in Sweden are expectedto be detected by at least one station.
2. All local communities now havr one simple but well calibrated dose-rate instrument whichcan be used to measure dose-rate at selected stations. During the initial face of an accidentthe instrument will be used for measurements at one location each hour. Later it will be usedfor daily measurements at max 4 different locations. This means that 286 points will bereported to SSI once an hour during the first face of the accident and approximately 800points once a day in the second face. These data can be used to produce dose rate mapscovering the entire country.
3. The number of high purity germanium in-situ systems has been increased and will be animportant resource for nuclide specific measurements and dose predictions as well as supporttor semi nuclide specific systems like those presented below.
4. The radiometric components of the airborne system, nowadays operated by the SwedishGeological Survey, is essentially the same as the ones used in 1986. The Swedish RadiationProtection Institute is a large contributor to a modernization taking place now and during thewinter of 93/94. A new detector of the same volume and a new gamma spectrometer has beenordered. It is the modern Exploranium GR800 that will facilitate an increase in measurementquality. The system is equipped with GPS navigation which gives a better position accuracyand a greater freedom to change the flight line setup during flight. Improved calibrationroutines are planned as well as the possibility to install the real time data processing andpresentation system described below.
5. A number of small light weight mobile gamma spectrometer systems including GPSpositioning, Nal detectors and real time data processing and presentation are being developedand will be in operation in 1994, according to present plans. They will be used for carmeasurements and/or helicopter measurements These systems are further described in the nextsection.
6. THE DEVELOPMENT OF SMALL UNITS FOR MOBILE GAMMA SPECTROMETRY
An important background material to the following discussion on the benefits of mobilegamma spectrometry units is the possible types of nuclear accidents that can be anticipated in Sweden.These are briefly summarized below [4].
192
1. A major accident in a domestic nuclear power plant. All Swedish reactors are nowadaysequipped with a filtering system that will significantly limit the release of nuclides to theenvironment in most accident types. The fallout can therefore be expected to be much smallerthan from a plant not equipped with filters, but nevertheless quite significant.
2. Accidents in nuclear power plants in neighbouring countries. Within a distance of 1000 km,the distance to Chernobyl, 40 nuclear facilities with 1-4 units each are located. Most of thesereactors do not have any filtering facilities and a number of reactors do not even have acontainment. To this category should be added the risk for military nuclear power accidentsand nuclear device accidents in neighbouring countries and on ships and aircraft in the BalticSea region.
3. Re-entry of nuclear powered satellites. The probability is small for this event but it cannotbe excluded. This type of accident will result in highly radioactive fragments and particlesthat must be located.
4. Accidents in domestic temporary or final repository for spent nuclear fuel. An unlikely eventwith limited effects.
5. Accidents when transporting radiation sources.
6. Illegal handling of radioactive sources and nuclear material.
The usefulness of the airborne gamma spectrometry measurements after Chernobyl is welldocumented. But considering the changing threat spectrum and the added monitoring resourcesdescribed above, how will mobile gamma measurement resources be used in future accidents? Thisquestion is of course difficult to answer since no accidents can be fully foreseen regarding theirnature, extent and effects and therefore it is difficult to be entirely prepared for them.
The present policy of the Swedish Radiation Protection Institute in this area is to maintain theradiometric capabilities of the airborne system operated by the Swedish Geological Survey and, ifpossible, initiate further development of the technique to achieve more accurate dose rate and nuclideactivity estimates as well as shorter processing time. It has been discussed to add one similar systemthat should be dedicated to emergency response and that could be installed in a fixed wing aircraftor a helicopter on a relatively short notice. This system would probably have been maintained by theSwedish Geological Survey. A system like this would, perhaps, never be used except on exercises andstill be quite costly to maintain.
Instead of this single extra system it is likely that a few small low cost systems will bepurchased based on present development of a prototype system. These systems will be maintained bydifferent contract laboratories in the country. 'They are designed to be used in measurements on foot,in a cars, with helicopters or small fixed wing aircraft. They can also be used for stationary loggingof time events or other tasks where gamma spectrometry is required. The primary use will, however,be mobile car or helicopter measurements.
They are based on a light weight 256 or 512 channel gamma spectrometer with a 3 x 3"(maybe one or two systems will be equipped with a larger detector as well) Nal detector, a satellitepositioning system (GPS) and a portable computer. The whole system shall be powered by internalbattery systems that should last for a day or by an external DC source. It is easily installed inavailable cars and helicopters, which can be changed if contaminated. The portable computer ispowerful enough to facilitate real time data processing including various dose rate calculations andnuclide estimates. It also presents the results in real time on the computer screen on maps thatincludes some geographic information, i.e. roads. Thus it facilitates a useful tool for in-field decisionmaking which can be of significant importance in an emergency when support from ihe basesometimes is limited due to overloading of various tasks. If future telecommunication development
193
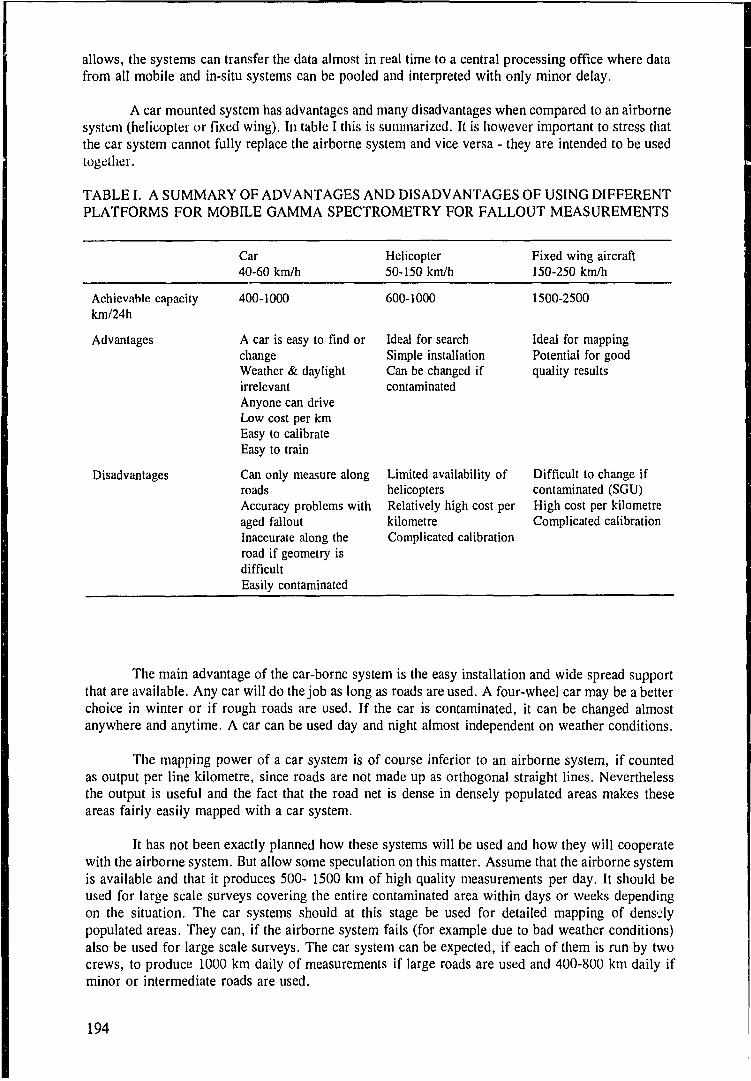
allows, the systems can transfer the data almost in real time to a central processing office where datafrom all mobile and in-situ systems can be pooled and interpreted with only minor delay.
A car mounted system has advantages and many disadvantages when compared to an airbornesystem (helicopter or fixed wing). In table I this is summarized. It is however important to stress thatthe car system cannot fully replace the airborne system and vice versa - they are intended to be usedtogether.
TABLE I. A SUMMARY OF ADVANTAGES AND DISADVANTAGES OF USING DIFFERENTPLATFORMS FOR MOBILE GAMMA SPECTROMETRY FOR FALLOUT MEASUREMENTS
Achievable capacitykm/24h
Advantages
Disadvantages
Car40-60 km/h
400-1000
A car is easy to find orchangeWeather & daylightirrelevantAnyone can driveLow cost per kmEasy to calibrateEasy to train
Can only measure alongroadsAccuracy problems withaged falloutInaccurate along theroad if geometry isdifficultEasily contaminated
Helicopter50-150 km/h
600-1000
Ideal for searchSimple installationCan be changed ifcontaminated
Limited availability ofhelicoptersRelatively high cost perkilometreComplicated calibration
Fixed wing aircraft150-250 km/h
1500-2500
Ideal for mappingPotential for goodquality results
Difficult to change ifcontaminated (SGU)High cost per kilometreComplicated calibration
The main advantage of the car-borne system is the easy installation and wide spread supportthat are available. Any car will do the job as long as roads are used. A four-wheel car may be a betterchoice in winter or if rough roads are used. If the car is contaminated, it can be changed almostanywhere and anytime. A car can be used day and night almost independent on weather conditions.
The mapping power of a car system is of course inferior to an airborne system, if countedas output per line kilometre, since roads are not made up as orthogonal straight lines. Neverthelessthe output is useful and the fact that the road net is dense in densely populated areas makes theseareas fairly easily mapped with a car system.
It has not been exactly planned how these systems will be used and how they will cooperatewith the airborne system. But allow some speculation on this matter. Assume that the airborne systemis available and that it produces 500- 1500 km of high quality measurements per day. It should beused for large scale surveys covering the entire contaminated area within days or weeks dependingon the situation. The car systems should at this stage be used for detailed mapping of denselypopulated areas. They can, if the airborne system fails (for example due to bad weather conditions)also be used for large scale surveys. The car system can be expected, if each of them is run by twocrews, to produce 1000 km daily of measurements if large roads are used and 400-800 km daily ifminor or intermediate roads are used.
194
All mobile systems must be calibrated to produce dose rate values referring to both naturaland fallout nuclides. The car system can easily and frequently be checked by measuring on a grassfield and comparing with a well calibrated dose rate instrument. All systems should also use a moregeneral dose rate calibration that can accept widely different energy spectra. All systems should alsohave the possibility to calculate nuclide concentration assuming a two dimensional perfectly planesource. This is only possible for some nuclides due to the poor energy resolution of these systems.Since all systems are logging the entire gamma spectrum all data can be reprocessed if the systemsare recalibrated in the midst of operations. The car measurements along roads are affected by avarying geometry that will result in a larger spread of the data. The averages can however beexpected to be fairly accurate, especially if the data are "levelled""by frequent stops at "perfectgeometry fields". The final map production should include data from all mobile systems as well ashigh resolution in-situ gamma spectrometry and soil sampling.
The combined efforts of all these mobile systems, the in situ HPGe systems, the gammastations and the dose rate measurements in each local community has the potential of being a powerfulmapping tool in case of a nuclear accident. The mobile systems can also be used for search of lostsources or radioactive debris from a crashed nuclear powered satellite. The small light weight systemsare also useful for various other nuclide specific monitoring tasks and research.
REFERENCES
[I] ARNTSING, R., BJURMAN, B., DEGEER, L.-E., EDVARSSON, K., FINCK, R.,JAKOBSSON, S. and VINTERSVED, I., Field gamma ray spectrometry and soil samplemeasurements in Sweden following the Chernobyl accident. A data report. National DefenseResearch Establishment (1991).
[2] EDVARSSON, K., Fallout over Sweden from the Chernobyl accident. In "The Chernobylfallout in Sweden" edited by L Moberg, The Swedish Radiation Protection Institute (1991)47-66.
[3] EDVARSSON, K., External doses in Sweden from the Chernobyl fallout. In "The Chernobylfallout in Sweden" edited by L Moberg, The Swedish Radiation Protection Institute,Stockholm (1991) 527-546.
[4] FINCK, R., PERSSON, A., Overview of monitoring programmes and strategies in Sweden.Swedish Radiation Protection Institute. Internal report (1988).
[6] FINCK, R., High resolution field gamma spectrometry and its application to problems inenvironmental radiology, Department of Radiophysics, Malmo and Lund University, Malmo(1992).
[7] KJELLE, P-E., Nedfall fran Tjernobyl (in Swedish), SSI-rapport 86-07, ISSN 0282-4434,May (1986).
[8] KJELLE, P-E., First registration of the Chernobyl accident in the west by the gammaradiation monitoring stations in Sweden. In "The Chernobyl fallout in Sweden" edited by LMoberg, The Swedish Radiation Protection Institute, Stockholm (1991) 21-28.
[9] MELLANDER, H., Airborne gamma spectrometric measurements of the fallout over Swedenafter the nuclear reactor accident at Chernobyl, USSR. IAEA/NENF/NM-89-1, Vienna(1991).
[10] SGAB deposition maps published in 1986.[II] VINTERSVED, I., DEGEER, L.-E., BJURMAN, B., MELLANDER, H., Early
measurements of the Chernobyl fallout in Sweden, IEEE vol NS-34, No 1, February 1987,590-594.
195
RAPID QUANTIFICATION AND MAPPING OF RADIOMETRICDATA FOR ANTHROPOGENIC AND TECHNOLOGICALLYENHANCED NATURAL NUCLIDES
D.C.W. SANDERSON, J.D. ALLYSON, A.N. TYLERScottish Universities Research & Reactor Centre,East Kilbride, United Kingdom
Abstract
The environmental contribution which aerial radiometrics can make to baseline mapping and measurementof future changes to the radiation environment has been increasingly recognized in recent years, particularly incountries affected by fallout from the Chernobyl accident. In emphasizing the environmental role, the internationalstandard methods for reporting uranium exploration data [1,2] require extension to a broader range of nuclides ofenvironmental interest. Methodologies for rapid extraction and quantification of 137Cs, 13l|Cs, 234mPa, 4lAr, 16N andsupra-equilibrated 228Ac from airborne gamma ray spectra have been developed, and are discussed here. Particularattention has been paid to the form of the altitude dependence of stripping ratios for anthropogenic nuclides, whichhave been determined using a combination of transportable calibration pads, extended area layered sources, perspexabsorbers and Monte-Carlo simulation. No previous values for these parameters are known from the literature.Sensitivity factors and altitude correction constants have been determined on calibration sites, whose inventories weredefined by high resolution gamma spectrometry of environmental core samples, supplemented by in situ gammaspectrometry. It is important to take the spatial variability of results from core samples, and the centre weighted fieldof view of the radiation spectrometer into account when defining calibration sites. For anthropogenic nuclides inparticular the sensitivity depends on the vertical distribution of the source, which can be determined from thecalibration sites using core data. Monte-Carlo simulation of spectral response supports the calibration proceduresderived in this manner, and supplements them with sensitivity factors for other, particularly short-lived nuclides whichare not usually present in the environment. System sensitivities determined over a series of surveys are quite stable,and are consistent with theoretical values for the detector geometries. The procedures could therefore be applied toexisting uranium exploration data to define baseline levels for a broader range of environmental nuclides.
1. INTRODUCTION
The aim of this paper is to illustrate methodologies developed at SURRC for analysis andmapping of environmental 7-ray spectra. There have been significant developments in the applicationof airborne gamma spectrometry since its origins in geological exploration [1-9]. It has been necessaryto extend the standard methods to encompass a wider range of nuclides and applications.
The approaches outlined here illustrate techniques for rapid spectral reduction and calibrationprocedures, developed for environmental mapping and emergency response applications. Near real-time spectral processing can identify features requiring priority investigation and provide maps toassess environmental impact. In addition to natural radionuclides, 137Cs, 134Cs and ^ T a have beensuccessfully investigated and mapped. The technique can also be readily applied to 131I mapping and41 Ar plume dispersion. Current developments include the use of germanium detectors in combinationwith Nal systems to assist with spectral interpretation. An array of externally mounted low energysemiconductor detectors is being developed for mapping 241Am and complex low energy emittingradionuclides. Semiconductor detectors can overcome the difficulties associated with determiningaccurate stripping ratios for scintillation detectors; however they are inherently less sensitive.
Data can be calibrated in Bq kg"1 or Bq m"2 on the basis of ground to air comparisons withspatially matched areas which have been subjected to sampling and high resolution gamma
197
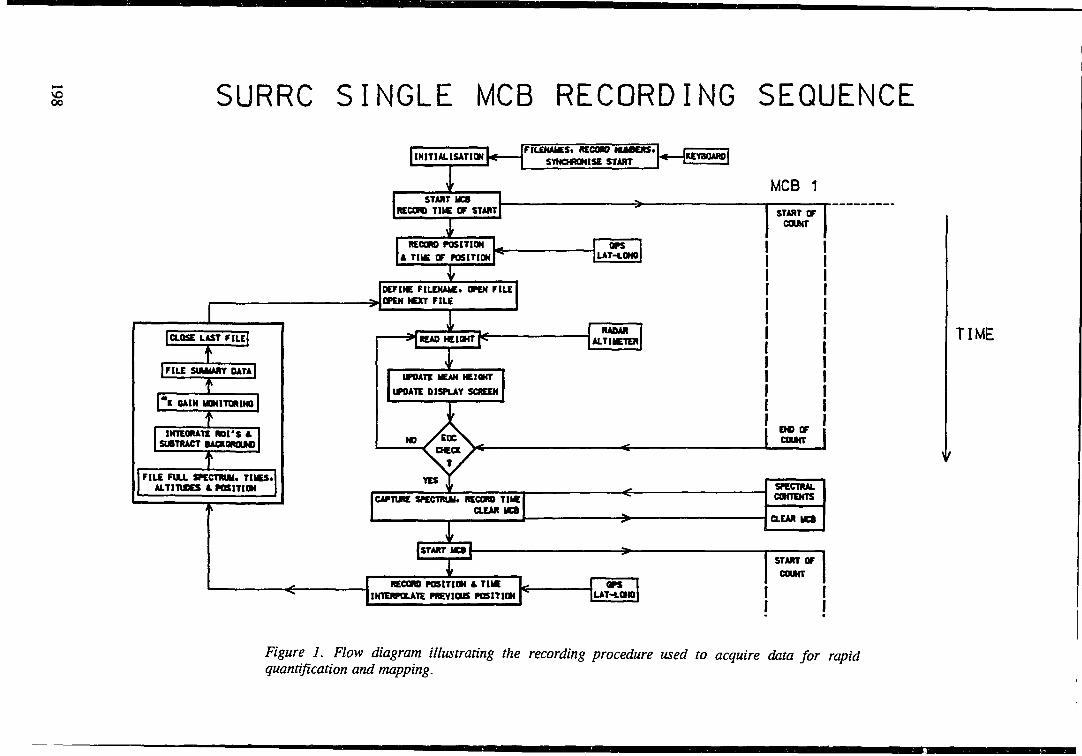
00 SURRC SINGLE MCB RECORDING SEQUENCE
|CLOSE LAST riLE|
t|FILE SUMMARY DATA|
t1 l'* 8*»N
INTEGRATE ROI'S ASUBTRACT BACK0ROUMD
FILE FUX SKCTIUI. T1UES.ALTITUDES 1 POSITION
•INITIALISATIONFILENAMES. RECORD MUMKRS.
SYNCMtOHISE START
START MCBRECORD TIIC OF START
RECORD POSITIONA THE OF POSITION
OPSLAT-IONO
±DEFINE FILENMC. OPEN FILEOPEN NEXT FILE
READ HEIOHT j<~
UPDATE MEAN tCIOHTUPDATE DISPLAY SCREEN
(START yea
RECORD POSITIOH A TIMEINTERPOLATE PREVIOUS POSITION
RADARALTIMETER
LAT-IONO
MCB 1START OFCOUNT
END OFCOUNT
CAPTURE SPECTRUM. RECORD TIMECLEM MCB
>1
SPECTRALCONTENTS
aEAR MCB
START OFCOUNT
TIME
Figure 1. Flow diagram illustrating the recording procedure used to acquire data for rapidquantification and mapping.
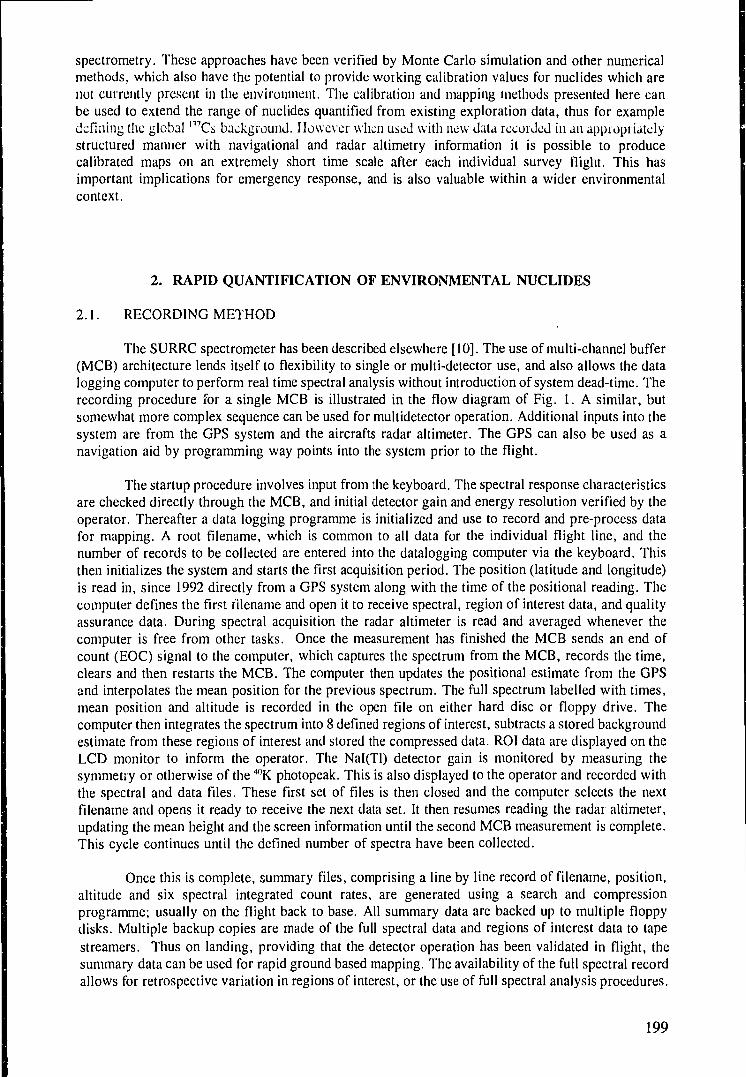
spectrometry. These approaches have been verified by Monte Carlo simulation and other numericalmethods, which also have the potential to provide working calibration values for nuclides which arenot currently present in the environment. The calibration and mapping methods presented here canbe used to extend the range of nuclides quantified from existing exploration data, thus for exampledefining the global n7Cs background. However when used with new data recorded in an appropriatelystructured manner with navigational and radar altimetry information it is possible to producecalibrated maps on an extremely short time scale after each individual survey flight. This hasimportant implications for emergency response, and is also valuable within a wider environmentalcontext.
2. RAPID QUANTIFICATION OF ENVIRONMENTAL NUCLIDES
2.1. RECORDING METHOD
The SURRC spectrometer has been described elsewhere [10]. The use of multi-channel buffer(MCB) architecture lends itself to flexibility to single or multi-detector use, and also allows the datalogging computer to perform real time spectral analysis without introduction of system dead-time. Therecording procedure for a single MCB is illustrated in the flow diagram of Fig. 1. A similar, butsomewhat more complex sequence can be used for multidetector operation. Additional inputs into thesystem are from the GPS system and the aircrafts radar altimeter. The GPS can also be used as anavigation aid by programming way points into the system prior to the flight.
The startup procedure involves input from the keyboard. The spectral response characteristicsare checked directly through the MCB, and initial detector gain and energy resolution verified by theoperator. Thereafter a data logging programme is initialized and use to record and pre-process datafor mapping. A root filename, which is common to all data for the individual flight line, and thenumber of records to be collected are entered into the datalogging computer via the keyboard. Thisthen initializes the system and starts the first acquisition period. The position (latitude and longitude)is read in, since 1992 directly from a GPS system along with the time of the positional reading. Thecomputer defines the first filename and open it to receive spectral, region of interest data, and qualityassurance data. During spectral acquisition the radar altimeter is read and averaged whenever thecomputer is free from other tasks. Once the measurement has finished the MCB sends an end ofcount (EOC) signal to the computer, which captures the spectrum from the MCB, records the time,clears and then restarts the MCB. The computer then updates the positional estimate from the GPSand interpolates the mean position for the previous spectrum. The full spectrum labelled with times,mean position and altitude is recorded in the open file on either hard disc or floppy drive. Thecomputer then integrates the spectrum into 8 defined regions of interest, subtracts a stored backgroundestimate from these regions of interest and stored the compressed data. ROI data are displayed on theLCD monitor to inform the operator. The Nal(Tl) detector gain is monitored by measuring thesymmetry or otherwise of the '"'K photopeak. This is also displayed to the operator and recorded withthe spectral and data files. These first set of files is then closed and the computer selects the nextfilename and opens it ready to receive the next data set. It then resumes reading the radar altimeter,updating the mean height and the screen information until the second MCB measurement is complete.This cycle continues until the defined number of spectra have been collected.
Once this is complete, summary files, comprising a line by line record of filename, position,altitude and six spectral integrated count rates, are generated using a search and compressionprogramme; usually on the flight back to base. All summary data are backed up to multiple floppydisks. Multiple backup copies are made of the full spectral data and regions of interest data to tapestreamers. Thus on landing, providing that the detector operation has been validated in flight, thesummary data can be used for rapid ground based mapping. The availability of the full spectral recordallows for retrospective variation in regions of interest, or the use of full spectral analysis procedures.
199
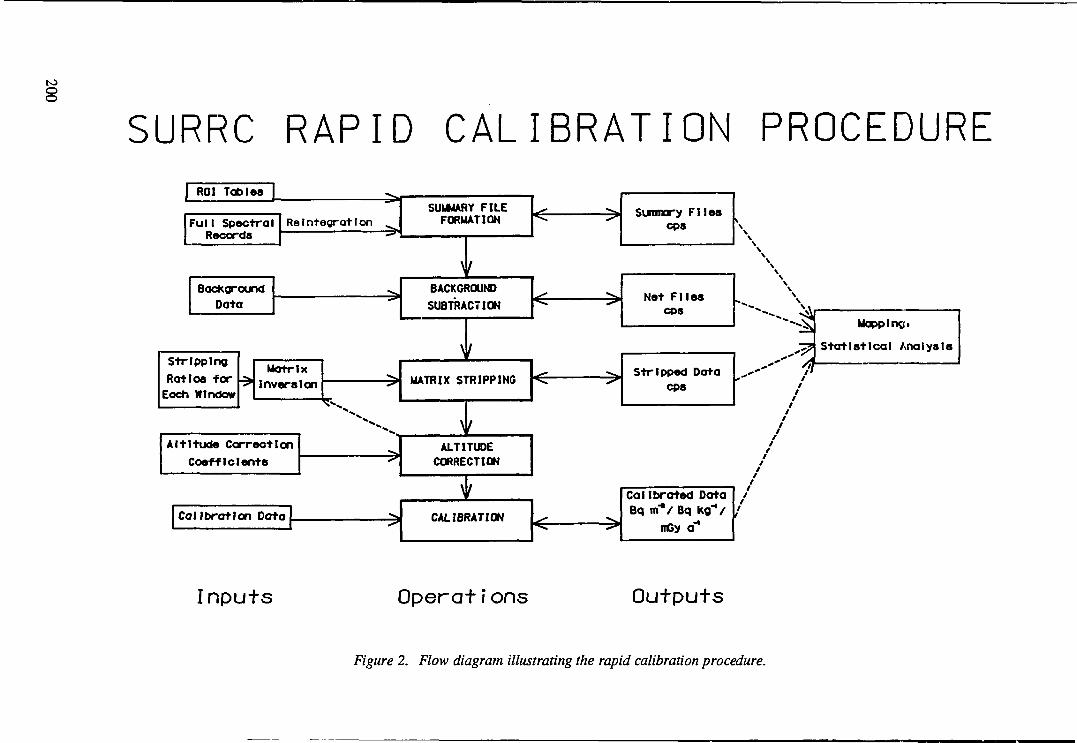
SURRC RAPID CALIBRATION PROCEDUREROI Tables
Full SpectralRecords
ReIntegratIon
BackgroundData
StrippingRatios forEach Window
Matrix" Inversion
Altitude Correction
Coefficients
Calibration Data
SUMMARY FILEFORMATION
\fBACKGROUND
SUBTRACTION
MATRIX STRIPPING
ALTITUDECORRECTION
CALIBRATION
Summary Filescps
Net Filescps
Stripped Datacps
Calibrated DataBq m*/ Bq kg"V
fflSy a"
Mapping.
Statistical Analysis
Inputs Operations Outputs
Figure 2. Flow diagram illustrating the rapid calibration procedure.
2.2. WINDOWS AND FULL SPECTRAL PROCESSING
The analysis of spectral information has been developed by quantifying peak energy countrates at an early stage, and relating them through a calibration procedure to estimated concentrationsof radionuclides or dose rales. The use of predefined windows, in an analogous manner to theinternational standard 3 window methods for K, eU, and eTh, is arguably the simplest means ofextending calibration to a wider suite of environmental nuclides. Interferences from Compton scatterand nearby peaks eonlribute lo window count rates and therefore must be separated to heightcorrection and calibration. This could be achieved by peak shape fitting, but the window method,coupled to matnx stripping remains the preferred means for rapid quantification. This method can beapplied to both scintillation and semiconductor detectors, although in the latter case it is possible toestimate full-energy peak count rates using an interpolated continuum subtraction, rather than adoptingmatrix stripping methods. IAEA recommends specific windows for the measurement of potassium,urani'i'.n and thorium [9], but general guidelines for the definition of other peaks have not yet beenagreed. The selection criteria for regions of interest must be based upon detector resolution. Formulti-crystal array systems it may be necessary to allow a greater tolerance to take account ofspectral broadening and small gain drifts. As a result of drift, either underestimates or overestimatesof true window count rates may occur. Continuous monitoring of gain drifts during survey providesa means of ensuring data integrity, at the outset. In practice it is easily possible to maintain better than1 % gain stability using the methods developed. It would be possible to recover data showing gaindrifts survey during post-processing, with appropriate energy calibration and re-integrationprocedures, however again this would be achieved at the expense of rapid quantification.
Full spectial deconvolution has become increasingly feasible in the field with fast, powerful,compact PC based systems becoming available. With successive stripping from high to low energies,of pure spectra from net data (determined by experiment, spectral analysis, interpolative methods andsimulation), the residual data may lead to information regarding individual sources and source burialdepth characteristics.
2.3. QUANTIFICATION PROCEDURE
The rapid calibration procedure is illustrated in the flow diagram in Fig. 2. For small scalesurveys the detector background can be measured over large bodies of water or at ground clearancesabove 1500-2000 feet altitude. For large scale surveys in areas of considerable relief it may benecessary to adopt the full procedures recommended elsewhere [2]. In either case it is advantageousto define, and preload, the background at the start of survey, and to conduct regular checks duringthe survey to ensure that the values are representative.
Upon landing at the base, if not already done so, summary files are formed from the regionsof interest files. The summary files can also be regenerated automatically by reintegrating the spectraif necessary, although this of course adds to the processing time. The background is then subtractedfrom the summary data, and used to form an identically structured file of net count rates.
The stripping ratios are determined as appropriate for the mean flying altitude for the surveyand tabulated in a matrix. This matrix is inverted and used to estimate stripped count rates from thenet count rate data. The stripped count rates are again stored in an identically structured file to thesummary and net records. A case could be made for modifying the stripping matrix for eachobservation to take account of individual radar altimetry observations. However the inversion of thestripping matrix for each data point would add significantly to the computing time, and there aredoubts as to whether this would make a practical difference to survey data which do not generallyshow extreme altitude variations. If it were necessary to make individual adjustments for altitudedependence of stripping then a more efficient approach would be to parameterize the effects on theinverse stripping matrix. The absolute determination of the stripping coefficients is in any caseproblematic given the finite geometry involved in concrete calibration pads and the determination of
201
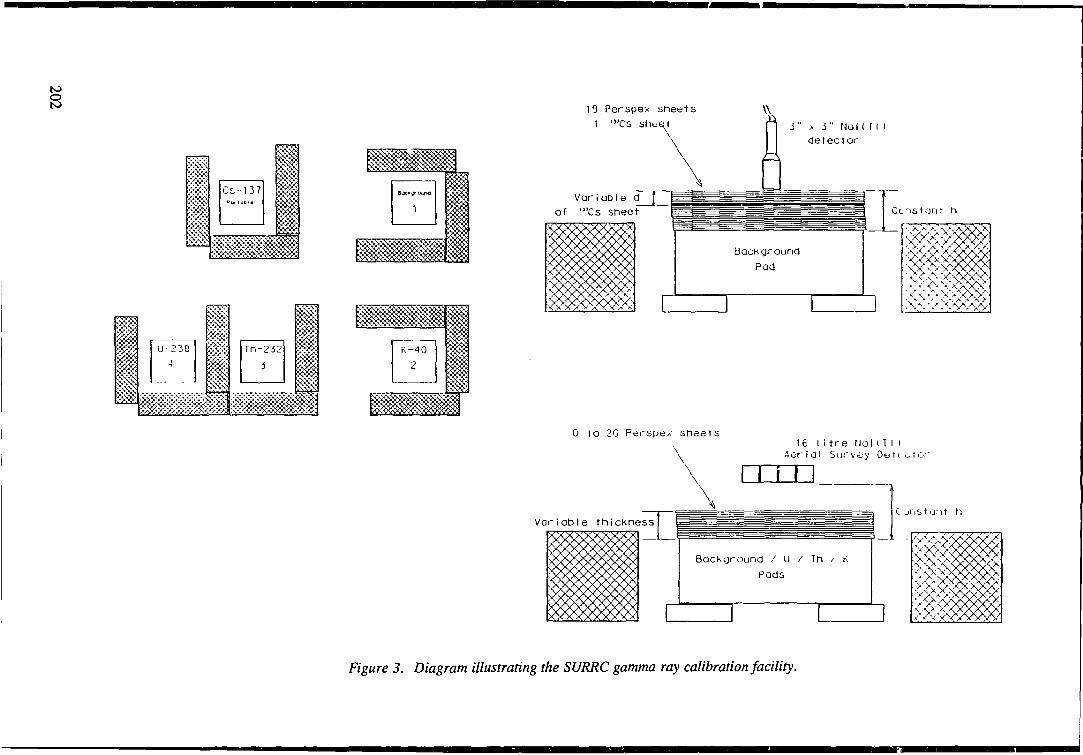
8
mC c - 1 3 7
P C t c c < a
ifU-238
A
19 Perspex sheets1 "'Cs she-et 3 " > 3 " tla I ( T l )
detector
Variable d J
of "'Cs sheet Constant h
•ON."* X V\\KX.x
0 t o 20 Perspex shee ts16 I i t r e tJal ( T I )
Aer i a l Si i rvey Deit etc
T i r
Variable thickness
Background / U / Th / K
Pads
C jnsta.it h
I I
Figure 3. Diagram illustrating the SURRC gamma ray calibration facility.
the altitude dependence. This is discussed in further detail below. However, by calibrating the systemrelative to a range of activities on different calibration sites, it is possible to overcome any systematicerrors in stripped count rates using an intercept. Similarly the measurement of a non-zero interceptin calibrations using a range of activities could be taken as an indication of deficiencies in thestripping procedure. The incorporation of HPGe detectors in the system removes the need to stripdata, and thus removes a potential source of uncertainty in calibrated data.
Altitude correction coefficients are determined by making sequential measurements over arange of heights above a calibration site. The profile can be approximated by an exponential formabove approximately 30 m. Problems incurred through spatial variability in the calibration site canbe accounted for as described below. These correction coefficients are used to normalize the data toa standard altitude before calibration.
The data are then converted to activity per unit area (Bq m'2), activity concentration (Bq kg'1),or dose rate (mGy a1) based on linear relationships between ground based estimates from calibrationsites and the altitude corrected stripped count rates. Again the standard file format is maintained, sothat subsequent statistical analysis and mapping routines can operate on raw, net, stripped orcalibrated data.
3. STRIPPING SPECTRAL INTERFERENCES
3.1. STRIPPING METHOD
The stripping of net spectral data can be extended to many radionuclides, providing that purereference spectral shapes can be determined. The fractional contributions between energy windowscorresponding to each individual source are calculated and assembled into a stripping matrix. Netwindow count rates are deconvoluted by their multiplication with corresponding inverse strippingmatrices. Whereas for geological mapping a great deal of attention has been paid to the constructionof calibration pads from which approximate stripping ratios can be determined, there are fewexamples of the extension of such facilities to environmental uuclides. It is possible to supplementcalibration pads for natural sources by additional laboratory scale facilities; initial SURRC surveysused pure reference materials in point source, or as pure radiochemical solutions. However it isimportant to attempt to account for the scattering conditions within the environmental sources beingmapped, and in the intervening air path it realistic stripping ratios are to be determined.
Unfortunately experimental simulations of ground-air interfaces, between sources anddetectors are limited to an artificial geometry which is not encountered under full scale fieldconditions. The use of calibration pads, with absorbers goes some way towards simulating air-pathscattering, and in the absence of any other information, then corrections of this sort are valid, but notideal. Although in principle it may be possible to conduct full scale experimental simulations of purespectra using arrays of many sources at ground level, or by geometrically reconstructing the responseto an accurately flown trajectory over a single strong point source, there are practical limitations inattempting to determine stripping ratios in this manner. Therefore Monte-Carlo simulation of purespectral response appears to offer the only means of overcoming the limitations of experimentalstripping ratios. Examination of residuals after stripping can lead to semi-empirical optimization ofsome stripping coefficients, above some suitable test sites [11], but must be used with caution.
3.2. THE USE OF PADS AND SHEETS
Doped concrete calibration pads provide a convenient source of activity to represent naturalradionuclides to determine spectral characteristics. Additional sheets of anthropogenic spikes havebeen produced by SURRC on lm2 plywood boards to represent fallout activity (Fig. 3). This
203
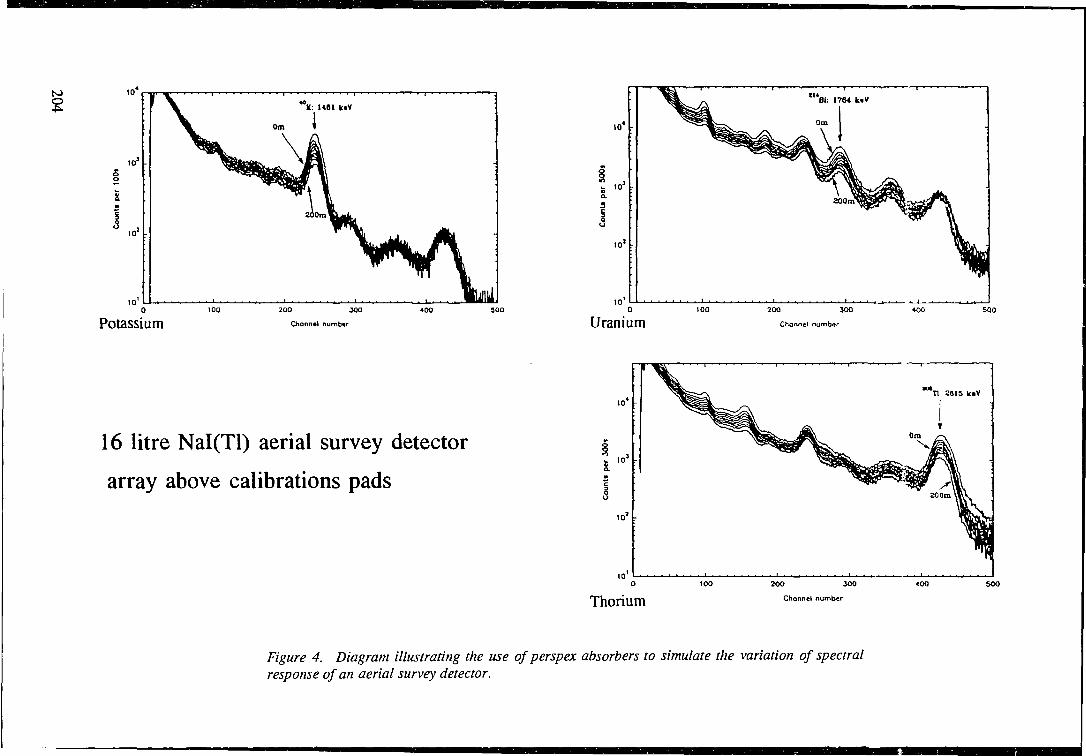
to
2
Potassium200 300
Channsl number
400 300
16 litre Nal(Tl) aerial survey detector
array above calibrations pads
Uranium200 300
Channel number
Thorium200 J00
Channel number
•00 500
«00 500
Figure 4. Diagram illustrating the use of perspex absorbers to simulate the variation of spectralresponse of an aerial survey detector.
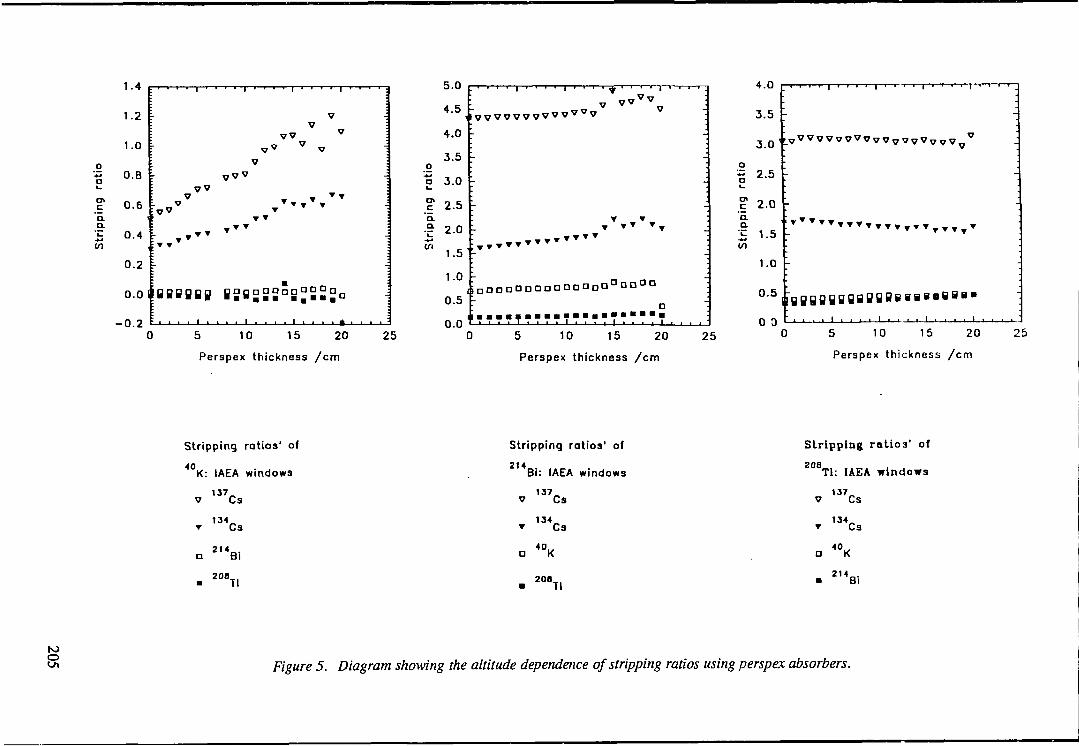
5 10 15 20
Perspex thickness /cm
25 5 10 15 20
Perspex thickness /cm
25
in
5 10 15 20
Perspex thickness / c m
Stripping ratios' of
*°K: IAEA windows
v Cs
T C3
D Bi
Stripping ratios' of
Bi: IAEA windows
137v Cs
• Cs
a 4°K
208Tl
Stripping ratios' of206
Tl: IAEA windows
v U 7 C s
T 134Cs40..21V,
OFigure 5. Diagram showing the altitude dependence of stripping ratios using perspex absorbers.
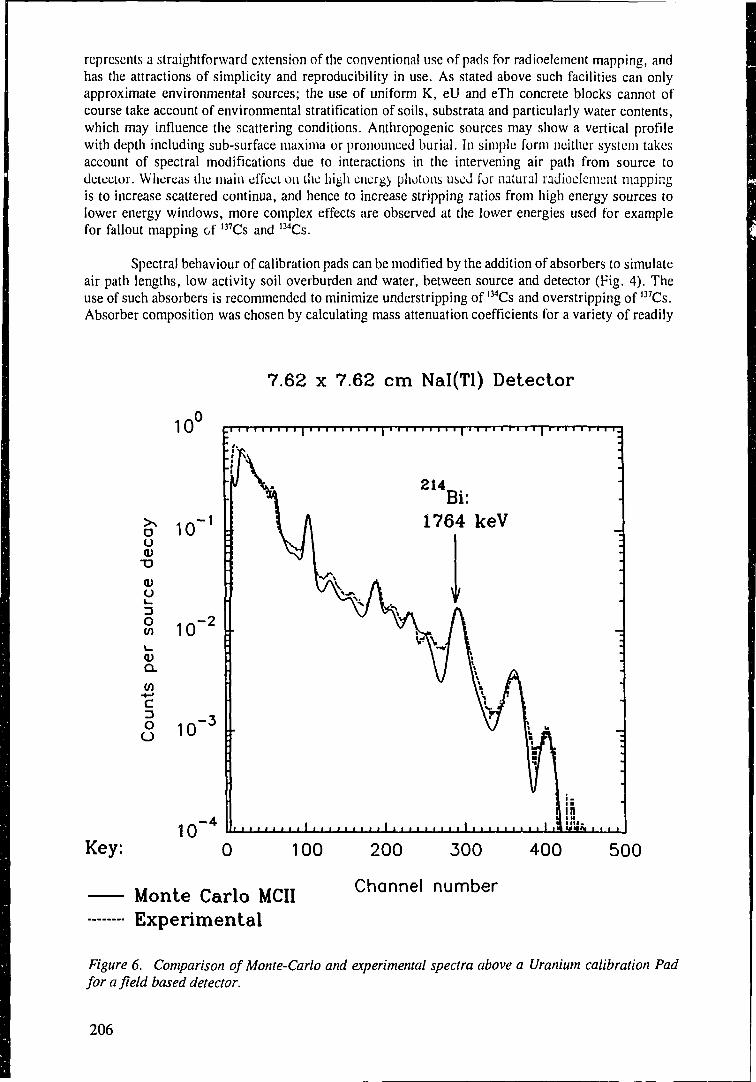
represents a straightforward extension of the conventional use of pads for radioelement mapping, andhas the attractions of simplicity and reproducibility in use. As stated above such facilities can onlyapproximate environmental sources; the use of uniform K, eU and eTh concrete blocks cannot ofcourse take account of environmental stratification of soils, substrata and particularly water contents,which may influence the scattering conditions. Anthropogenic sources may show a vertical profilewith depth including sub-surface maxima or pronounced burial. In simple form neither system takesaccount of spectral modifications due to interactions in the intervening air path from source todetector. Whereas the main effect on the high energy photons used for natural radioelcmcnt mappingis to increase scattered continua, and hence to increase stripping ratios from high energy sources tolower energy windows, more complex effects are observed at the lower energies used for examplefor fallout mapping of 137Cs and l34Cs.
Spectral behaviour of calibration pads can be modified by the addition of absorbers to simulateair path lengths, low activity soil overburden and water, between source and detector (Fig. 4). Theuse of such absorbers is recommended to minimize understripping of 134Cs and overstripping of l37Cs.Absorber composition was chosen by calculating mass attenuation coefficients for a variety of readily
7.62 x 7.62 cm Nal(Tl) Detector
Key:
O
o
1O l
- 1o 10o0)
"D
0)O
O i r .-2tn 10
DQ.
(A)
C
10- 3
10—4
2 UBi:1764 keV
0 100
Monte Carlo MCIIExperimental
200 300
Channel number
400 500
Figure 6. Comparison of Monte-Carlo and experimental spectra above a Uranium calibration Padfor afield based detector.
206
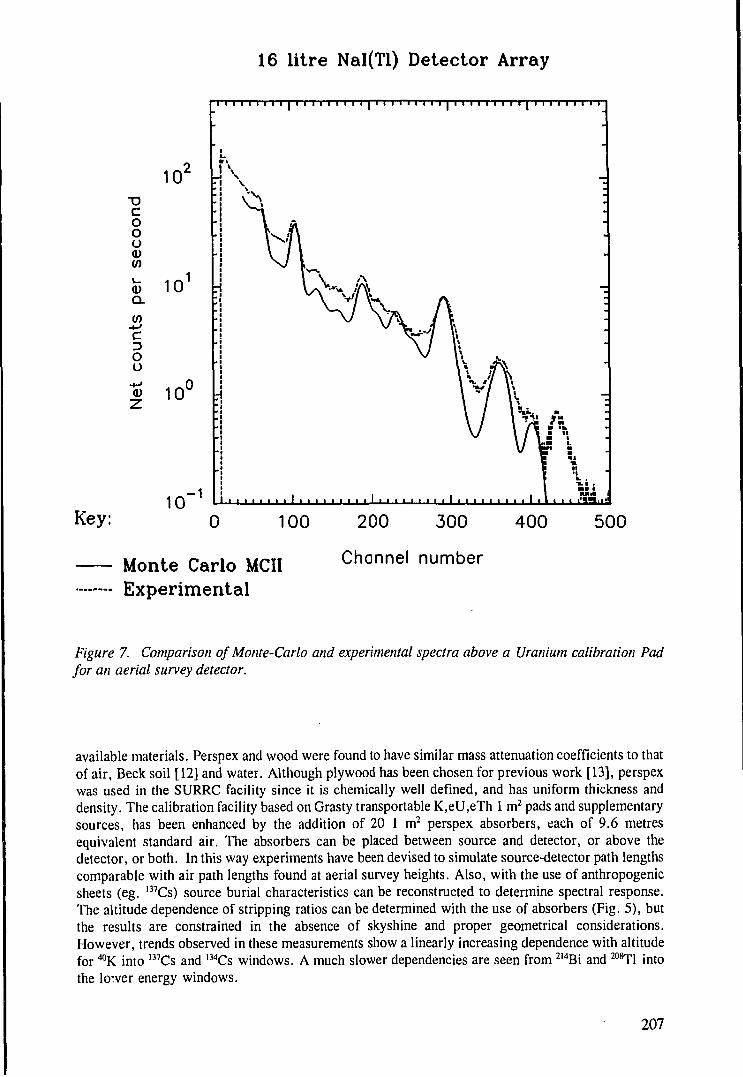
16 litre Nal(Tl) Detector Array
Key: 0 100
Monte Carlo MCIIExperimental
200 300
Channel number
400 500
Figure 7. Comparison of Monte-Carlo and experimental spectra above a Uranium calibration Padfor an aerial survey detector.
available materials. Perspex and wood were found to have similar mass attenuation coefficients to thatof air, Beck soil [12] and water. Although plywood has been chosen for previous work [13], perspexwas used in the SURRC facility since it is chemically well defined, and has uniform thickness anddensity. The calibration facility based on Grasty transportable K,eU,eTh 1 m2 pads and supplementarysources, has been enhanced by the addition of 20 1 m2 perspex absorbers, each of 9.6 metresequivalent standard air. The absorbers can be placed between source and detector, or above thedetector, or both. In this way experiments have been devised to simulate source-detector path lengthscomparable with air path lengths found at aerial survey heights. Also, with the use of anthropogenicsheets (eg. 137Cs) source burial characteristics can be reconstructed to determine spectral response.The altitude dependence of stripping ratios can be determined with the use of absorbers (Fig. 5), butthe results are constrained in the absence of skyshine and proper geometrical considerations.However, trends observed in these measurements show a linearly increasing dependence with altitudefor ^K into 137Cs and l34Cs windows. A much slower dependencies are seen from 214Bi and 208Tl intothe lever energy windows.
207
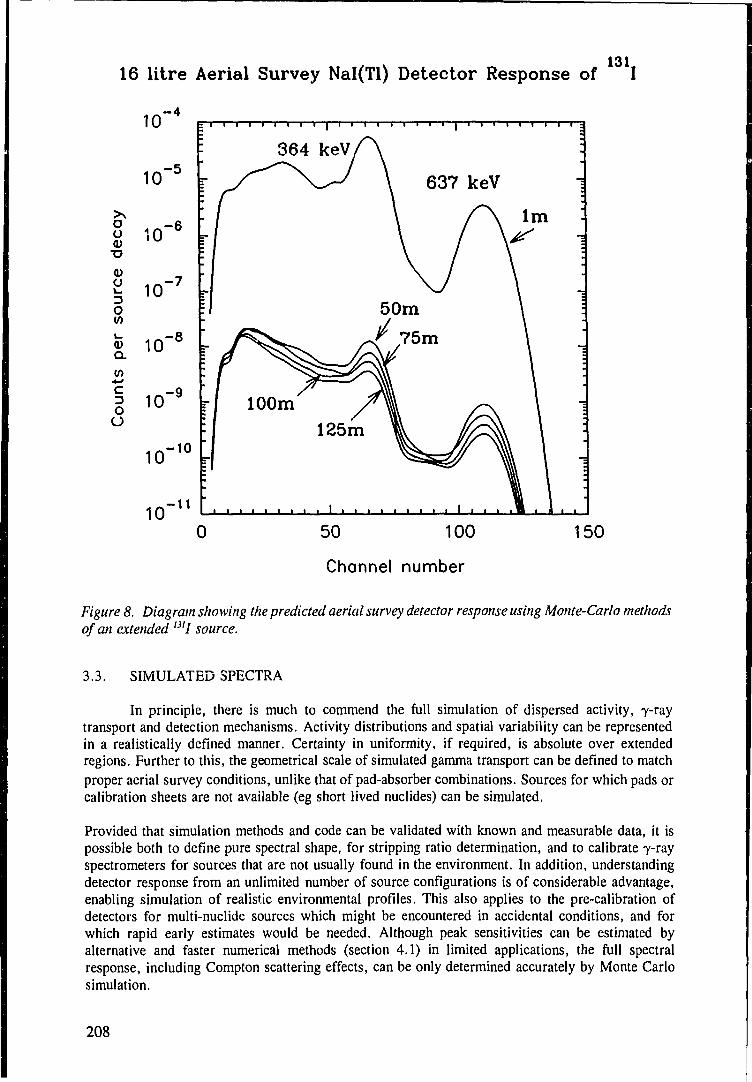
131.16 litre Aerial Survey Nal(Tl) Detector Response of I
•o
oV)
10-4
10-5
10
8. 10-8
-9
10-10
10-11
: 364
rl
rj 100m
keV/"
125m
\\ 637
\J50m
/ 75m
keVT
ill 1 1 1 1
lm :
r i
1 ..1
.
0 50 100
Channel number
150
Figure 8. Diagram showing the predicted aerial survey detector response using Monte-Carlo methodsof an extended I3II source.
3.3. SIMULATED SPECTRA
In principle, there is much to commend the full simulation of dispersed activity, 7-raytransport and detection mechanisms. Activity distributions and spatial variability can be representedin a realistically defined manner. Certainty in uniformity, if required, is absolute over extendedregions. Further to this, the geometrical scale of simulated gamma transport can be defined to matchproper aerial survey conditions, unlike that of pad-absorber combinations. Sources for which pads orcalibration sheets are not available (eg short lived nuclides) can be simulated.
Provided that simulation methods and code can be validated with known and measurable data, it ispossible both to define pure spectral shape, for stripping ratio determination, and to calibrate 7-rayspectrometers for sources that are not usually found in the environment. In addition, understandingdetector response from an unlimited number of source configurations is of considerable advantage,enabling simulation of realistic environmental profiles. This also applies to the pre-calibration ofdetectors for multi-nuclide sources which might be encountered in accidental conditions, and forwhich rapid early estimates would be needed. Although peak sensitivities can be estimated byalternative and faster numerical methods (section 4.1) in limited applications, the full spectralresponse, including Compton scattering effects, can be only determined accurately by Monte Carlosimulation.
208
Figs 6 and 7 show Monte Carlo simulations of hand held and aerial survey detectors abovea transportable uranium calibration pad. Comparisons are made with experimental measurements anddifferences that can be attributable to both approaches [14]. Such comparisons are beneficial forvalidation of codes. Stripping ratio estimates by Monte Carlo methods have been made for standardgeometry detectors [14] and compared with determinations from pads.
Fig. 8 shows the 16 litre Nal(Tl) detector response predicted by Monte Carlo simulation ofan extended plane source of 131I, as would probably be observed after an accidental release. Otherradionuclides may be treated also. The response of a 16 litre aerial survey detector to a pure sourceof 228Ac has been simulated and stripping ratios derived. This enabled, the separation and mappingof 228Ac and 234mPa in an estuarine environment [24].
4. SENSITIVITY DETERMINATION
4.1. ANALYTICAL AND NUMERICAL ESTIMATION
It is possible to calculate fluence rates from line emissions of radionuclides, and to predictthe count rates observed per unit activity concentration in detectors whose energy and angularefficiencies have been determined with laboratory sources [12]. Such analytical and numericalmethods can be readily developed to determine detector sensitivities for a wide range of anthropogenicsources. Scintillation and semiconductor detector sensitivities can be easily estimated by these meansalthough for full detector calibration, Monte Carlo methods provide a more comprehensive approach.Numerical integration of analytical transport equations in combination with measured or Monte Carloderived detector response characterization can yield rapid sensitivity estimates for short livedenvironmental radionuclides.
Stepwise integration of analytical or numerical expressions can also be used to estimate thedetector fields of view [15-16]. The angular response of the detector may be important aspect in this,especially for non-spherical geometries. For commonly used prismatic Nal(Tl) arrays, the effect ofangular response is to narrow the effective field of view. Field of view is dependent upon the altitudeof the detector, 7-ray energy and source depth characteristics, and therefore is a relevant parameterto use in survey designs [17].
The problems with using this approach to sensitivity determination for aerial surveys are that(i) any systematic errors due to imperfections in stripping ratios are maintained in calibrated data, and(ii) it is necessary to know the environmental depth distribution and form to predict fluence ratesaccurately. The conventional assumption of an exponential burial profile is not justified on many sites,and therefore it may be necessary to extend the equations normally used to deal with generalizedsource distributions.
4.2. GROUND-TO-AIR COMPARISONS
Historically, ground-to-air comparisons have been made with in situ spectrometer systemscalibrated from the same concrete calibration pads as aerial based spectrometers, and used tocharacterize calibration areas [4-8, 18, 19]. Whilst providing good traceability between similarlycalibrated systems [20], which is useful for geological characterization, and being a relatively rapidfield approach, there are circumstances where uncertainties in source distribution characteristics maylead to correlated errors in both in situ and aerial measurements. Under these circumstances apparentagreement between both data sources does not guarantee freedom from systematic errors.
As indicated above it is possible to estimate detector calibration parameters (as in theconventional in situ method) using analytical photon transport equations, and assuming a fixed vertical
209
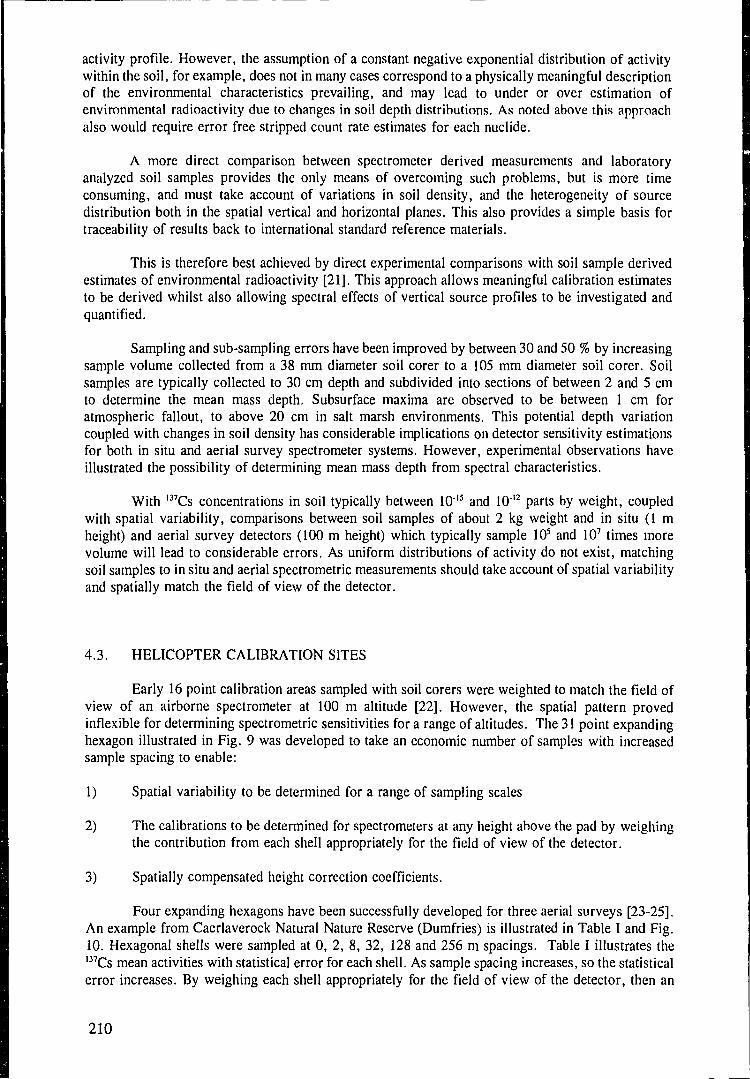
activity profile. However, the assumption of a constant negative exponential distribution of activitywithin the soil, for example, does not in many cases correspond to a physically meaningful descriptionof the environmental characteristics prevailing, and may lead to under or over estimation ofenvironmental radioactivity due to changes in soil depth distributions. As noted above this approachalso would require error free stripped count rate estimates for each nuclide.
A more direct comparison between spectrometer derived measurements and laboratoryanalyzed soil samples provides the only means of overcoming such problems, but is more timeconsuming, and must take account of variations in soil density, and the heterogeneity of sourcedistribution both in the spatial vertical and horizontal planes. This also provides a simple basis fortraceability of results back to international standard reference materials.
This is therefore best achieved by direct experimental comparisons with soil sample derivedestimates of environmental radioactivity [21]. This approach allows meaningful calibration estimatesto be derived whilst also allowing spectral effects of vertical source profiles to be investigated andquantified.
Sampling and sub-sampling errors have been improved by between 30 and 50 % by increasingsample volume collected from a 38 mm diameter soil corer to a 105 mm diameter soil corer. Soilsamples are typically collected to 30 cm depth and subdivided into sections of between 2 and 5 cmto determine the mean mass depth. Subsurface maxima are observed to be between 1 cm foratmospheric fallout, to above 20 cm in salt marsh environments. This potential depth variationcoupled with changes in soil density has considerable implications on detector sensitivity estimationsfor both in situ and aerial survey spectrometer systems. However, experimental observations haveillustrated the possibility of determining mean mass depth from spectral characteristics.
With l37Cs concentrations in soil typically between 10'15 and 10"12 parts by weight, coupledwith spatial variability, comparisons between soil samples of about 2 kg weight and in situ (1 mheight) and aerial survey detectors (100 m height) which typically sample 105 and 107 times morevolume will lead to considerable errors. As uniform distributions of activity do not exist, matchingsoil samples to in situ and aerial spectrometric measurements should take account of spatial variabilityand spatially match the field of view of the detector.
4.3. HELICOPTER CALIBRATION SITES
Early 16 point calibration areas sampled with soil corers were weighted to match the field ofview of an airborne spectrometer at 100 m altitude [22]. However, the spatial pattern provedinflexible for determining spectrometric sensitivities for a range of altitudes. The 31 point expandinghexagon illustrated in Fig. 9 was developed to take an economic number of samples with increasedsample spacing to enable:
1) Spatial variability to be determined for a range of sampling scales
2) The calibrations to be determined for spectrometers at any height above the pad by weighingthe contribution from each shell appropriately for the field of view of the detector.
3) Spatially compensated height correction coefficients.
Four expanding hexagons have been successfully developed for three aerial surveys [23-25].An example from Caerlaverock Natural Nature Reserve (Dumfries) is illustrated in Table I and Fig.10. Hexagonal shells were sampled at 0, 2, 8, 32, 128 and 256 m spacings. Table I illustrates thel37Cs mean activities with statistical error for each shell. As sample spacing increases, so the statisticalerror increases. By weighing each shell appropriately for the field of view of the detector, then an
210
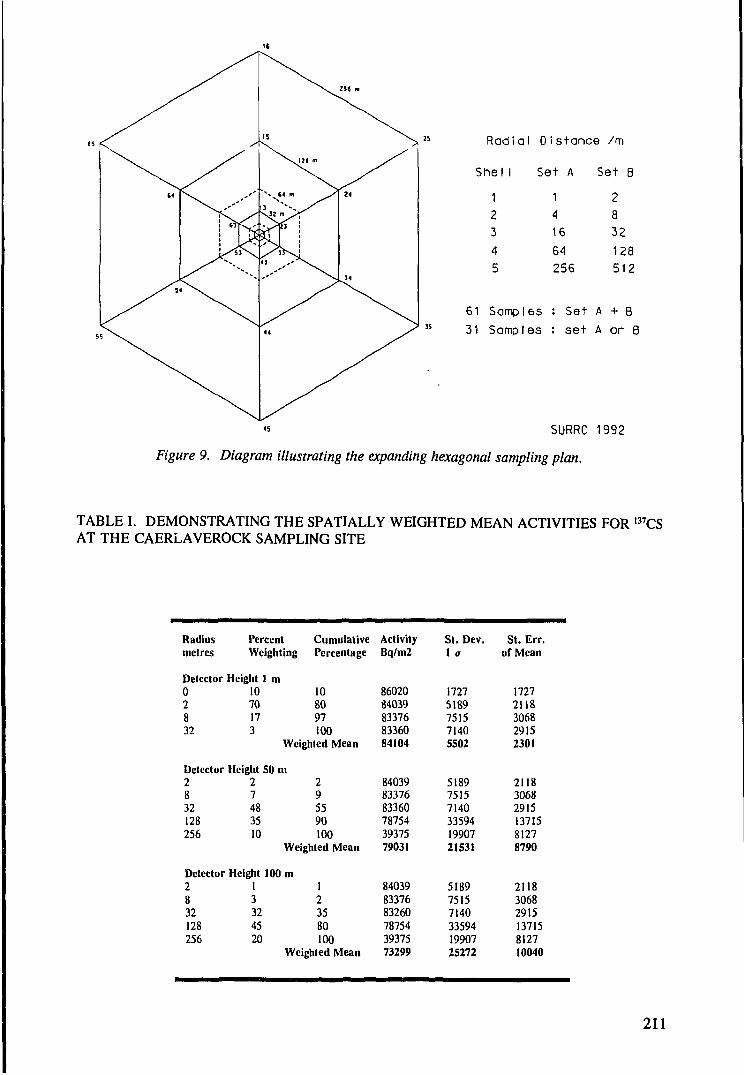
256 It
Radial
Shel 1
1
23
4
5
Distance /m
Set A
1
4
16
64
256
Set B
28
32
128
512
61 Samples : Set A + B31 Samples : set A or B
SURRC 1992
Figure 9. Diagram illustrating the expanding hexagonal sampling plan.
TABLE I. DEMONSTRATING THE SPATIALLY WEIGHTED MEAN ACTIVITIES FOR I37CSAT THE CAERLAVEROCK SAMPLING SITE
Radiusmetres
Detector02832
Detector2832128256
Detector2832128256
Percent CumulativeWeighting Percentage
Height1070173
Height27483510
Height13324520
1 ni108097100
Weighted Mean
SO HI
295590100
Weighted Mean
100 m123580100
Weighted Mean
ActivityBq/m2
8602084039833768336084104
840398337683360787543937579031
840398337683260787543937573299
St. Dev.1 a
17275189751571405502
518975157140335941990721531
518975157140335941990725272
St. Err.of Mean
17272118306829152301
2118306829151371581278790
21183068291513715812710040
211
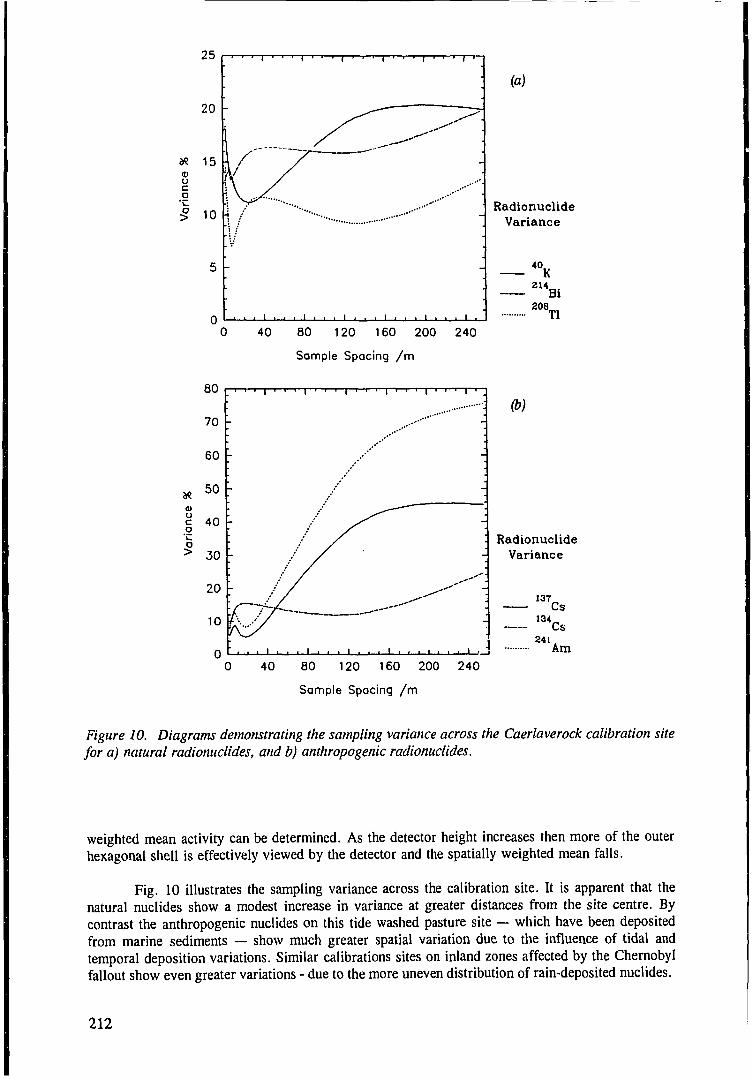
(a)
RadionuclideVariance
214
208Bi
Tl0 40 80 120 160 200 240
Sample Spacing / m
(b)
RadionuclideVariance
241Am
0 40 80 120 160 200 240
Sample Spacing / m
Figure 10. Diagrams demonstrating the sampling variance across the Caerlaverock calibration sitefor a) natural radionuclides, and b) anthropogenic radionuclides.
weighted mean activity can be determined. As the detector height increases then more of the outerhexagonal shell is effectively viewed by the detector and the spatially weighted mean falls.
Fig. 10 illustrates the sampling variance across the calibration site. It is apparent that thenatural nuclides show a modest increase in variance at greater distances from the site centre. Bycontrast the anthropogenic nuclides on this tide washed pasture site — which have been depositedfrom marine sediments — show much greater spatial variation due to the influence of tidal andtemporal deposition variations. Similar calibrations sites on inland zones affected by the Chernobylfallout show even greater variations - due to the more uneven distribution of rain-deposited nuclides.
212
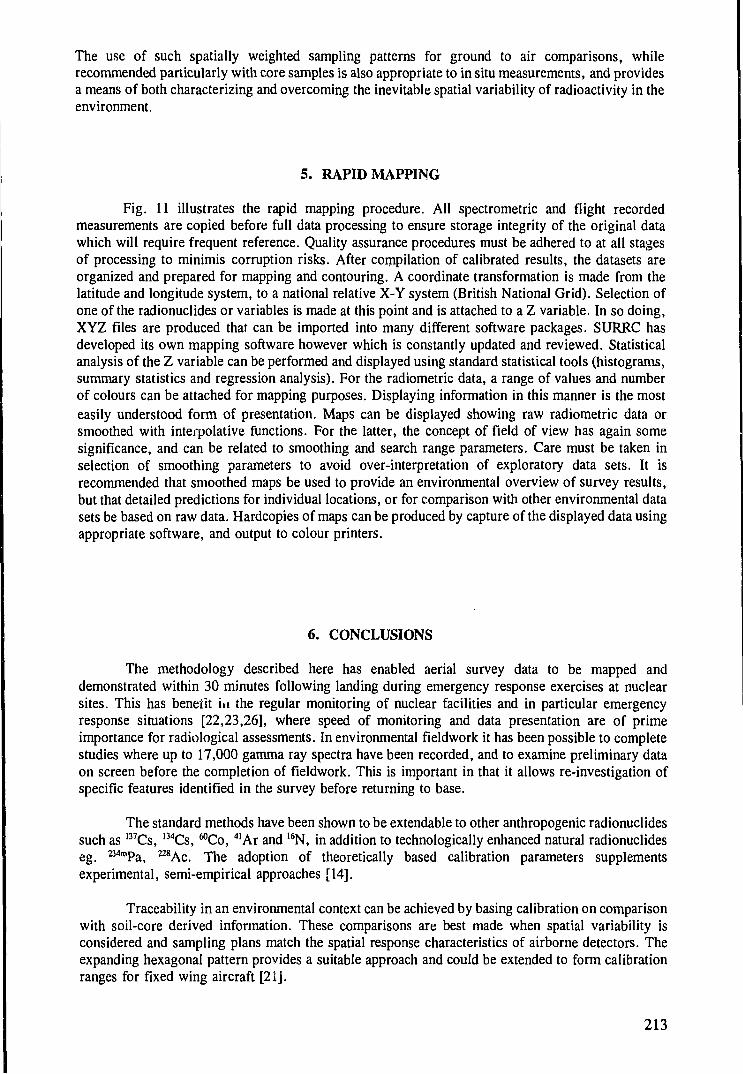
The use of such spatially weighted sampling patterns for ground to air comparisons, whilerecommended particularly with core samples is also appropriate to in situ measurements, and providesa means of both characterizing and overcoming the inevitable spatial variability of radioactivity in theenvironment.
5. RAPID MAPPING
Fig. 11 illustrates the rapid mapping procedure. All spectrometric and flight recordedmeasurements are copied before full data processing to ensure storage integrity of the original datawhich will require frequent reference. Quality assurance procedures must be adhered to at all stagesof processing to minimis corruption risks. After compilation of calibrated results, the datasets areorganized and prepared for mapping and contouring. A coordinate transformation is made from thelatitude and longitude system, to a national relative X-Y system (British National Grid). Selection ofone of the radionuclides or variables is made at this point and is attached to a Z variable. In so doing,XYZ files are produced that can be imported into many different software packages. SURRC hasdeveloped its own mapping software however which is constantly updated and reviewed. Statisticalanalysis of the Z variable can be performed and displayed using standard statistical tools (histograms,summary statistics and regression analysis). For the radiometric data, a range of values and numberof colours can be attached for mapping purposes. Displaying information in this manner is the mosteasily understood form of presentation. Maps can be displayed showing raw radiometric data orsmoothed with interpolative functions. For the latter, the concept of field of view has again somesignificance, and can be related to smoothing and search range parameters. Care must be taken inselection of smoothing parameters to avoid over-interpretation of exploratory data sets. It isrecommended that smoothed maps be used to provide an environmental overview of survey results,but that detailed predictions for individual locations, or for comparison with other environmental datasets be based on raw data. Hardcopies of maps can be produced by capture of the displayed data usingappropriate software, and output to colour printers.
6. CONCLUSIONS
The methodology described here has enabled aerial survey data to be mapped anddemonstrated within 30 minutes following landing during emergency response exercises at nuclearsites. This has benefit in the regular monitoring of nuclear facilities and in particular emergencyresponse situations [22,23,26], where speed of monitoring and data presentation are of primeimportance for radiological assessments. In environmental fieldwork it has been possible to completestudies where up to 17,000 gamma ray spectra have been recorded, and to examine preliminary dataon screen before the completion of fieldwork. This is important in that it allows re-investigation ofspecific features identified in the survey before returning to base.
The standard methods have been shown to be extendable to other anthropogenic radionuclidessuch as 137Cs, 134Cs, ^Co, 41Ar and 16N, in addition to technologically enhanced natural radionuclideseg. ^ T a , ^Ac . The adoption of theoretically based calibration parameters supplementsexperimental, semi-empirical approaches [14].
Traceability in an environmental context can be achieved by basing calibration on comparisonwith soil-core derived information. These comparisons are best made when spatial variability isconsidered and sampling plans match the spatial response characteristics of airborne detectors. Theexpanding hexagonal pattern provides a suitable approach and could be extended to form calibrationranges for fixed wing aircraft [21 j .
213

to
LIHEAR/LOOAftlTNVIC
RANGE/MUER OF CaOURS
SPATIAL ANALYSIS
PARAICTERS
RADICftETRIC DATA
(SuBU-y/nat/rtrlpfMdor Calibration f l las l
i
COORDINATE TRANSFORMATION
\ t
SELECTION OF
NUCLIDE/VARIABLE
\ i
STATISTICAL ANALYSIS
COLOUR CODINO
\
-p
i
UAPPINO RAW DATA
OR suaoncD
nr
XYZ FILES
**HISTOORAUS
SUUURY STATISTICS
TRANSECTS ETC.
BIT IIMGCS FOR
HARDCOPY
SURRC RAPID MAPPINGPROCEDURE
SMOOTHING
R
Z
/af %\°
PROCEDURE
= Search Range
= Iz,
-2 < P <
?r,
-1
Figure 11. Flow diagram illustrating the SURRC rapid mapping procedure.
Current developments include the incorporation of high efficiency, multi-semiconductordetector arrays to aid interpretation of source burial, complex decay series and low energy photonemitting radionuclides.
REFERENCES
[I] IEC, Airborne Instrumentation for Measurement of Terrestrial Gamma Radiation, 1HC 1134,International Electrotechnical Commission, Geneva (1992).
[2] INTERNATIONAL ATOMIC ENERGY AGENCY, Airborne gamma ray spectrometersurveying, Technical Reports Series No. 323, IAEA, Vienna (1991).
[3] DARNLEY, A.G., Airborne gamma ray survey techniques — present and future, UraniumExploration Methods, IAEA, Vienna, 67 (1973).
[4] INTERNATIONAL ATOMIC ENERGY AGENCY, Recommended instrumentation forUranium and Thorium exploration, Technical Reports Series No. 158, IAEA, Vienna (1974).
[5] GRASTY R.L., Uranium measurement by airborne gamma-ray spectrometry, Geophysics 40,503-519 (1975).
[6] INTERNATIONAL ATOMIC ENERGY AGENCY, Radiometric reporting methods andcalibration in uranium exploration, Technical Report Series No. 174, IAEA, Vienna (1976).
[7] INTERNAIONAL ATOMIC ENERGY AGENCY, Gamma ray surveys in uraniumexploration, Technical Report Series No. 186, IAEA Vienna (1979).
[8] INTERNATIONAL ATOMIC ENERGY AGENCY, Construction and use of calibrationfacilities for radiometric field equipment, Technical Report Series No. 309, IAEA Vienna(1989).
[9] INTERNATIONAL ATOMIC ENERGY AGENCY, The use of gamma ray data to definethe natural radiation environment, IAEA-TECDOC-566, Vienna (1990).
[10] SANDERSON, D.C.W., Allyson, J.D., TYLER, A.N., SCOTT, E.M., 1993, EnvironmentalApplications of Airborne Gamma Spectrometry, IAEA Vienna (??)
II1] SANDERSON, D.C.W., Allyson, J.D., Search for a missing l37Cs source in the Niger Delta,SURRC aerial survey report (1991) 29pp.
[12] BECK, H.L., DECAMPO, J., GOGOLAK, C , In-situ Ge(Li) and Nal(Tl) Gamma-rayspectrometry, HASL-258, USAEC, Health and Safety (TID-4500) (1972).
[13] GRASTY, R., Skyshine and the Calibration of Ground Gamma-ray Spectometry, GeologicalSociety of Canada. Current research part A, 80-1-A (1981).
[14] ALLYSON, J.D., In-situ and aerial environmental radioactivity measurements: Aninvestigation of some factors relating to calibration by simulation and experiment, Universityof Glasgow (1974).
[15] DUVAL, J.S., Cook B., Adams J.A.S., Circle of investigation of an airborne gamma rayspectrometer, J. Geophys. Res. 76, 8466-8470 (1971).
[16] GRASTY, R.L., KOSANKE, K.L., FOOTE, R.S., Fields of view of airborne gamma raydetectors, Geophysics 44(8), 1444-1457 (1979).
[17] DICKSON, B.H., BAILEY, R.C., GRASTY, R.L., Utilizing multichannel airborne gamma-ray spectra, Can. J. Earth Sciences, 18(2), 1793-1801 (1981).
[18] ALEXANDER, P., KOSANKE, K., The Quality of Airborne Radiometric data. NevadaSection - American Nuclear Soc. Aerial Techniques for Environmental Monitoring, Top.symp. proc. (1978).
[19] L0VBORG, L., GRASTY, R.L., KIRKEGAARD, P., A Guide to the Calibration Constantsfor Aerial Gamm?.-ray Surveys in Geoexploration. Top. Symp. Proc. Nevada Section -American Nuclear Soc. Aerial Techniques for Environmental Monitoring (1978).
[20] L0VBORG, L., Error Analysis of Calibration and Field Trials with Spectrometers andCounters. Symp. on Uranium Exploration Methods. OECD Nuclear Energy Agency incollaboration with IAEA, Paris l-4th June (1982).
[21] TYLER, A.N., Environmental Influences on Radionuclide Inventories and ActivityEstimations through Laboratory Based, In-situ and Aerial Gamma Spectrometry. TheUniversity of Glasgow (1994).
215
[22] SANDERSON, D.C.W., AILYSON, J.D., MARTIN, E., TYLER, A.N., SCOTT, E.M.,An Aerial Gamma Ray Survey of Three Ayrshire Districts, Commissioned by the DistrictCouncils of Cunninghame, Kilmarnock & Loudon, and Kyle and Carrick, SURRC AerialSurvey Report (1990) 22p.
[23] SANDERSON, D.C.W, ALLYSON, J.D., TYLER, A.N., An aerial gamma ray survey ofChapelcross and it's surroundings in February 1992,SURRC Aerial Survey Report, to BNFL(1992) 36p.
[24] SANDERSON, D.C.W, ALLYSON, J.D., TYLER, A.N., MURPHY, S., An aerial gammaray survey of Springfields and the Ribble Estuary in September 1992,SURRC Aerial SurveyReport, to BNFL (1993a) 46p.
[25] SANDERSON, D.C.W, ALLYSON, J.D., TYLER, A.N., NI RIAIN, S., MURPHY, S.,An airborne gamma ray survey of parts of SW Scotland in February 1993,SURRC AerialSurvey Report, to the Scottish Office (1993b) 26p.
[26] SANDERSON D.C.W., ALLYSON, J.D., CAIRNS, K.J., MACDONALD, P.A., A BriefAerial Survey in the Vicinity of Sellafield, SURRC Aerial Survey Report to BNFL (1991b)34p.
216
NATURAL BACKGROUND RADIOACTIVITIES ANDGEOCHEMICAL MAP OF SLOVENIA
M. ANDJELOV, J. TOMSIClnstitut. za geologijo, geotehniko in geofiziko, Ljubljana, Slovenia
M. PECNIKInternational Atomic Energy Agency, Vienna, Austria
Abstract
In 1990, a programme was initiated as an alternative to airborne survey to obtain the background radiometricmap of Slovenia using a very modest resources. The radiometric mapping was performed using portable gamma rayspectrometer on 5 x 5 km grid. Five gamma ray measurements were taken at each of 816 locations. Soil samplesof the upper 10 cm were collected for laboratory analysis. Uranium in samples was determined by delayed neutronmethod. Other 35 elements: Ag, Al, As, Ba, Be, Bi, Ca, C6, Co, Cr, Cu, Fe, K, La, Mg, Mn, Mo, Na, Nb, Ni,P, Pb, Sb, Sc, Sn, Sr, Th, U, V, W, Y, Zn, and Zr were analysed by plasma emission spectrometry (ICP). Thedistribution of man-made radiation caused by nuclear weapon tests and the Chernobyl fallout was not the subject ofthis study. Essential for production of representative map of radioelements was the calibration of spectrometer onconcrete pads which were kindly made available by the Geological Survey of Austria at the airfield near Vienna. Thedata were partly processed at Geological Survey of Canada in Ottawa. The field gamma ray measurements wereconverted to ground concentrations of potassium, uranium and thorium. The results show a good correlation with thelaboratory analyses of soil samples. The ground radioelement concentrations were used to produce maps showing thenatural distribution of radioelements, the radioelement ratio map and the maps of individual radioelements. Regardlessof the wide spaced sampling, the maps show a relatively good correlation with major geological units in the country.The results have proven that the selected methodology gives good results at minimum costs in a relatively short time.The method demonstrated that it can be successfully implemented in environmental monitoring, geological mappingand mineral exploration. The product of this project represents the first natural background radioactivities andgeochemical map of Slovenia covering the entire country.
1. INTRODUCTION
Environment monitoring and meaningful interpretation of man-made pollution is impossiblewithout knowledge about natural abundance of elements in the environment. The main purpose of thisstudy was to produce the geochemical maps showing the distribution of natural radioelements and 35other elements on the territory of Slovenia. It is also hoped that the results of this study willcontribute to the UNESCO International Geological Correlation Programme (IGCP), project 259 —International Geochemical Mapping.
The distribution of chemical elements in the environment in Slovenia has been studied in thepast primarily in the context of geological exploration for base metals and nuclear raw materials. Suchexploration projects were usually devoted to the specific geological environments and associations ofbase metals, therefore, they were task oriented. For this reason the territory of Slovenia has neverbeen systematically covered with geochemical exploration using the unique methodology.
The most systematical study of distribution of radioelements was carried out during theuranium exploration programme in 1969, when a fifth of Slovenia's territory was covered by airbornegamma ray spectrometry. Unfortunately only contour maps of the airborne data are now available.
217
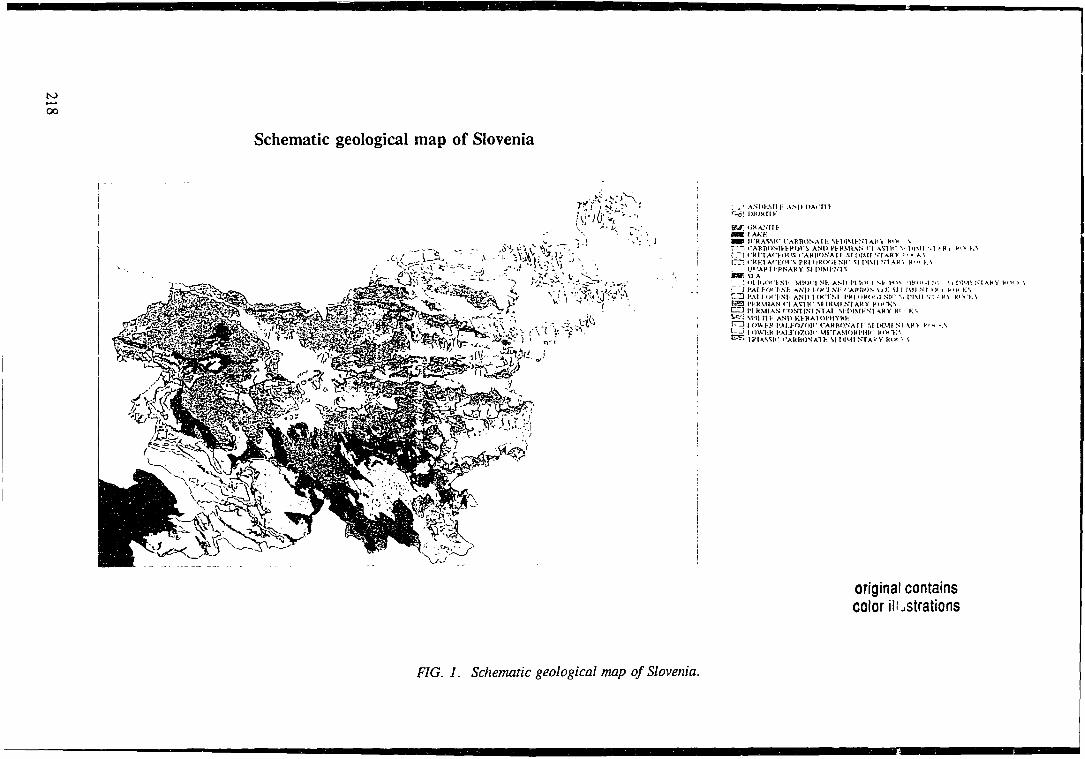
oo
Schematic geological map of Slovenia
• ; • ANI>K.\MI: A^|)I>A^^^
VJT. <;RANIII
< * IIRAV.II- lARIlOSArK Nll>IMhNlAI<1 Km i •>i < ("ARIlONIH-ROri AN(> Cl-RMIAN ' [ ASTK* '•• hl'.ll M - 1 V i f" " K'<m I'RIT.MHII'S CARIIONAff SI tltMl .'-TAK V !••» K'.CTi <'RK1 A'T.IX'S PRI OROM NK' SI I l | \ ! l M A I ' i R' " K*v
IJI'ARtHRNARY SHHMI-.VISran si A: ! u l Ii .orl-Nl- M l ^ ' l Nh ASI> t'l lo< I *.V l-*»s ' Ipt i - . IM M PIMl :."If ~7 I'AI KOf'l-.VK ^,VI) J-^' l Nl- '"APHON \ i K SM 1VH NIA^ t f"M K%! H I'AI K'M'I-Sl-. ANH I <HTM I'RUiRtH .1 Nl'" '.. PIM! '.T - H) R»>«>.%E S 1-hKMIAN I I A7I1C SI DIMIN'tARV HVK:I 3 I'l RM1AN rrWIINl NTAI SUMMKVI ^KY K' • KS'"-'j SPII rrr AND Ki-RArui-iivRkt ^ 3 IOW1W l'.AI>'n/l)ll' CARIlDNAn' M IMMIS1 \V> f i x -A[—^ t OWI-R l*Al.R>7.O|f MITAMORt'HIr R<w>;',E-*" I R U ^ I i - i-AkHOS'Alh SIl'IMINTARY R<» I S
original containscolor (lustrations
FIG. 1. Schematic geological map of Slovenia.
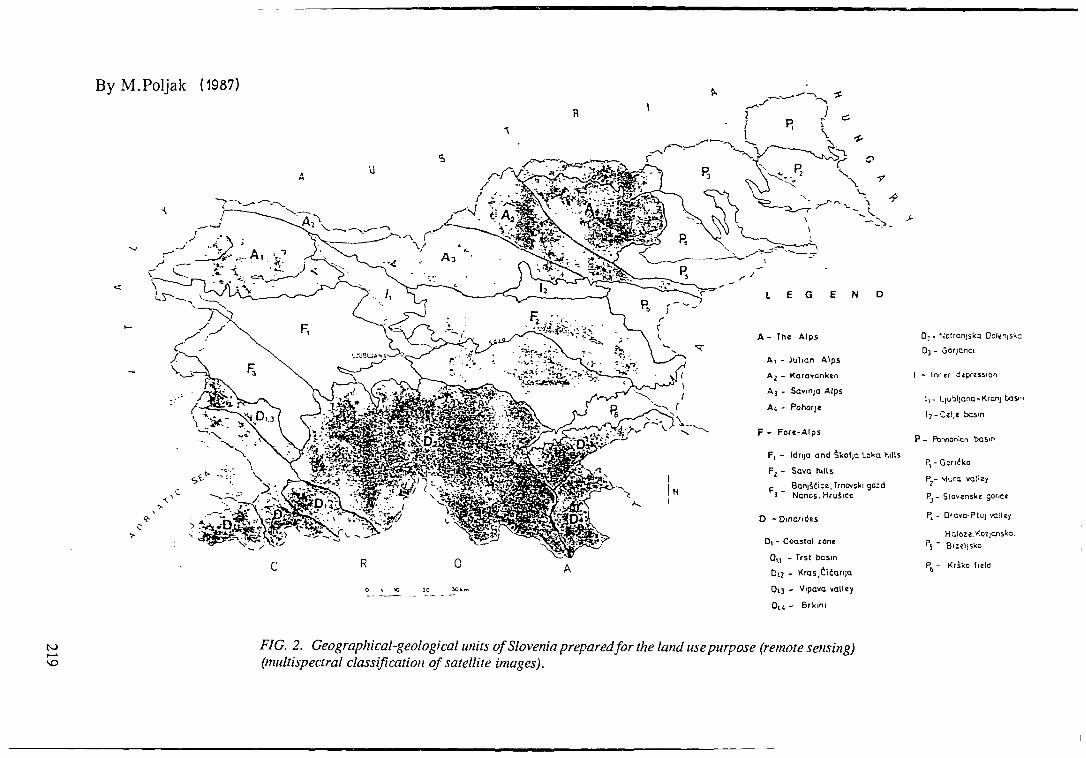
By M.Poljak (1987)
L E G E N D
Ai - Julian Alps
- Karavanken
A3 - Sovinja Aips
At - Pohorje
F - Fore-Alps
F, - Idnja and §kofja laka hills
Fj - Sava hills
P Banisiice.rrnovski go;d3 " Nanos.Hrusicc
D - Dinandes
•1 - Coastal zone
Oul - frsl basin
Di2 - Kras.ii ianja
O13 - Vipava valley
Dlt - Brkmi
Oi - Notranjska Oo'eijsVc
D j - Gorjcnci
I ~ Inrzr depression
l i - Liubljana-Kranj basin
l2 - Celje basm
P- Fb-inonian basin
P, - Gondko
Pj- >.(ura valley
Rj- Slovenske goric!
P4 - Drava-Ptuj valley
Haloze.Koziansko.
t o FIG. 2. Geographical-geological units of Slovenia prepared for the land use purpose (remote sensing)(multispectral classification of satellite images).
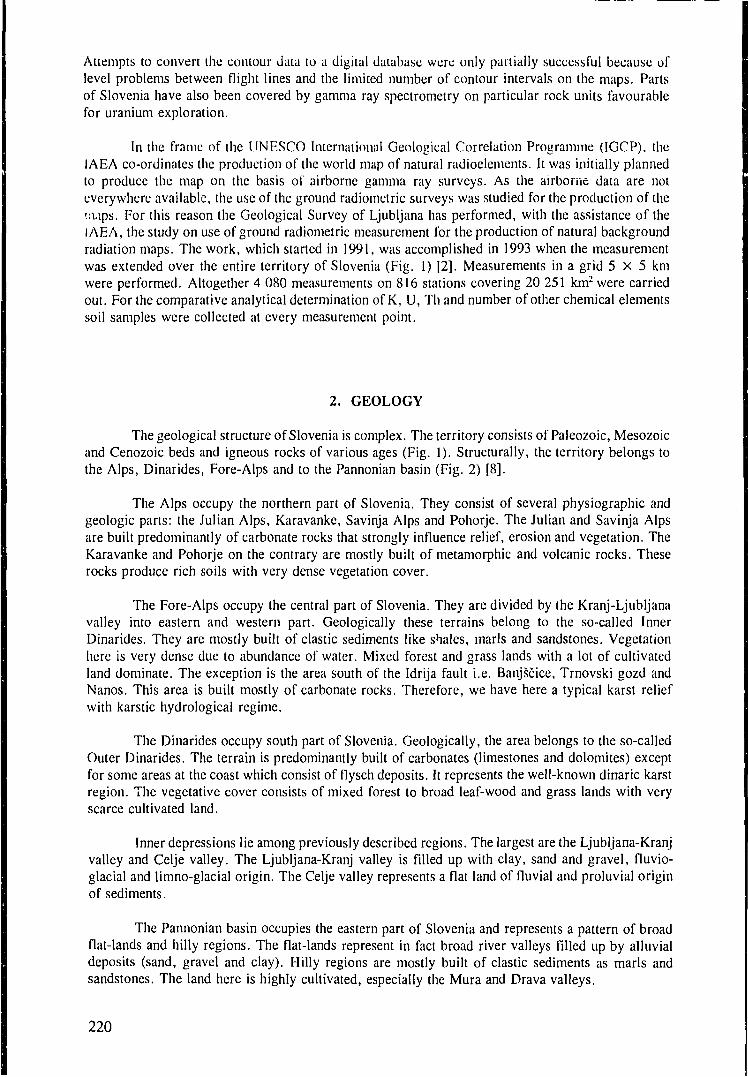
Attempts to convert the contour data to a digital database were only partially successful because oflevel problems between flight lines and the limited number of contour intervals on the maps. Partsof Slovenia have also been covered by gamma ray spectrometry on particular rock units favourablefor uranium exploration.
In the frame of the UNESCO International Geological Correlation Programme (IGCP), theIAEA co-ordinates the production of the world map of natural radioelements. It was initially plannedto produce the map on the basis of airborne gamma ray surveys. As the airborne data are noteverywhere available, the use of the ground radioinetric surveys was studied for the production of them.ips. For this reason the Geological Survey of Ljubljana has performed, with the assistance of theIAEA, the study on use of ground radiometric measurement for the production of natural backgroundradiation maps. The work, which started in 1991, was accomplished in 1993 when the measurementwas extended over the entire territory of Slovenia (Fig. 1) [2]. Measurements in a grid 5 x 5kmwere performed. Altogether 4 080 measurements on 816 stations covering 20 251 km2 were carriedout. For the comparative analytical determination of K, U, Th and number of other chemical elementssoil samples were collected at every measurement point.
2. GEOLOGY
The geological structure of Slovenia is complex. The territory consists of Paleozoic, Mesozoicand Cenozoic beds and igneous rocks of various ages (Fig. 1). Structurally, the territory belongs tothe Alps, Dinarides, Fore-Alps and to the Pannonian basin (Fig. 2) [8].
The Alps occupy the northern part of Slovenia. They consist of several physiographic andgeologic parts: the Julian Alps, Karavanke, Savinja Alps and Pohorje. The Julian and Savinja Alpsare built predominantly of carbonate rocks that strongly influence relief, erosion and vegetation. TheKaravanke and Pohorje on the contrary are mostly built of metamorphic and volcanic rocks. Theserocks produce rich soils with very dense vegetation cover.
The Fore-Alps occupy the central part of Slovenia. They are divided by the Kranj-Ljubljanavalley into eastern and western part. Geologically these terrains belong to the so-called InnerDinarides. They are mostly built of clastic sediments like shales, marls and sandstones. Vegetationhere is very dense due to abundance of water. Mixed forest and grass lands with a lot of cultivatedland dominate. The exception is the area south of the Idrija fault i.e. Banjscice, Trnovski gozd andNanos. This area is built mostly of carbonate rocks. Therefore, we have here a typical karst reliefwith karstic hydrological regime.
The Dinarides occupy south part of Slovenia. Geologically, the area belongs to the so-calledOuter Dinarides. The terrain is predominantly built of carbonates (limestones and dolomites) exceptfor some areas at the coast which consist of flysch deposits. It represents the well-known dinaric karstregion. The vegetative cover consists of mixed forest to broad leaf-wood and grass lands with veryscarce cultivated land.
Inner depressions lie among previously described regions. The largest are the Ljubljana-Kranjvalley and Celje valley. The Ljubljana-Kranj valley is filled up with clay, sand and gravel, fluvio-glacial and limno-glacial origin. The Celje valley represents a flat land of fluvial and proluvial originof sediments.
The Pannonian basin occupies the eastern part of Slovenia and represents a pattern of broadflat-lands and hilly regions. The flat-lands represent in fact broad river valleys filled up by alluvialdeposits (sand, gravel and clay). Hilly regions are mostly built of clastic sediments as marls andsandstones. The land here is highly cultivated, especially the Mura and Drava valleys.
220
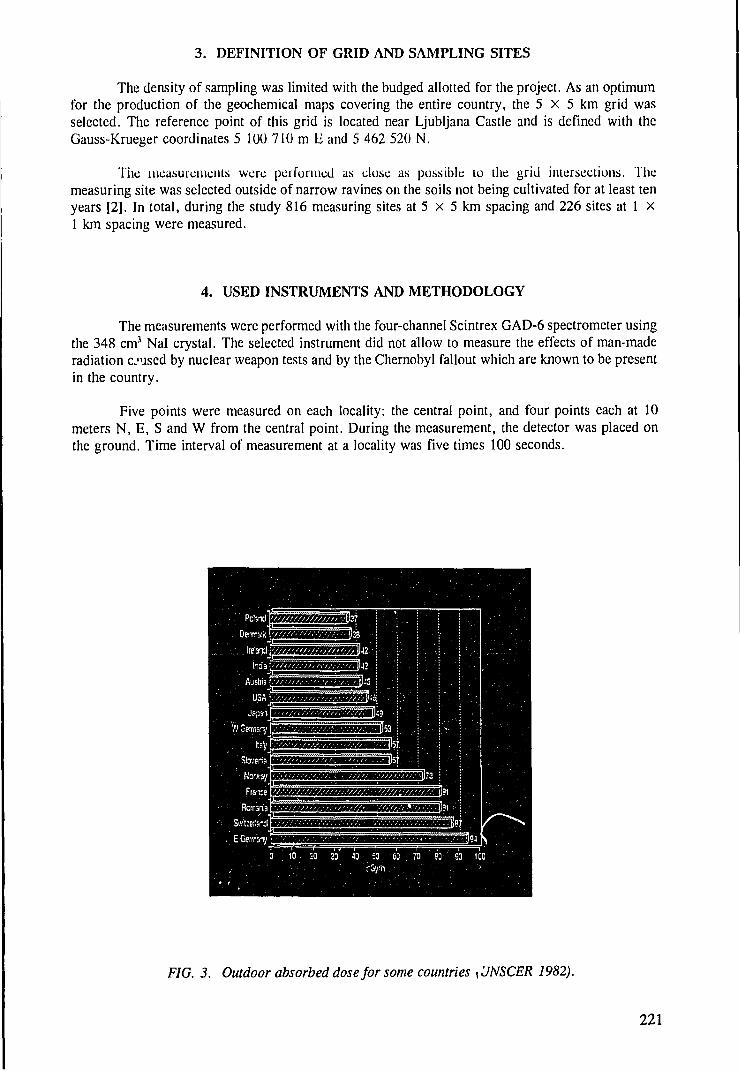
3. DEFINITION OF GRID AND SAMPLING SITES
The density of sampling was limited with the budged allotted for the project. As an optimumfor the production of the geochemical maps covering the entire country, the 5 x 5 km grid wasselected. The reference point of this grid is located near Ljubljana Castle and is defined with theGauss-Krueger coordinates 5 100 710 m E and 5 462 520 N.
The measurements were performed as close as possible to the grid intersections. Themeasuring site was selected outside of narrow ravines on the soils not being cultivated for at least tenyears [2]. In total, during the study 816 measuring sites at 5 x 5 km spacing and 226 sites at 1 x1 km spacing were measured.
4. USED INSTRUMENTS AND METHODOLOGY
The measurements were performed with the four-channel Scintrex GAD-6 spectrometer usingthe 348 cm3 Nal crystal. The selected instrument did not allow to measure the effects of man-maderadiation caused by nuclear weapon tests and by the Chernobyl fallout which are known to be presentin the country.
Five points were measured on each locality: the central point, and four points each at 10meters N, E, S and W from the central point. During the measurement, the detector was placed onthe ground. Time interval of measurement at a locality was five times 100 seconds.
FIG. 3. Outdoor absorbed dose for some countries {UNSCER 1982).
221
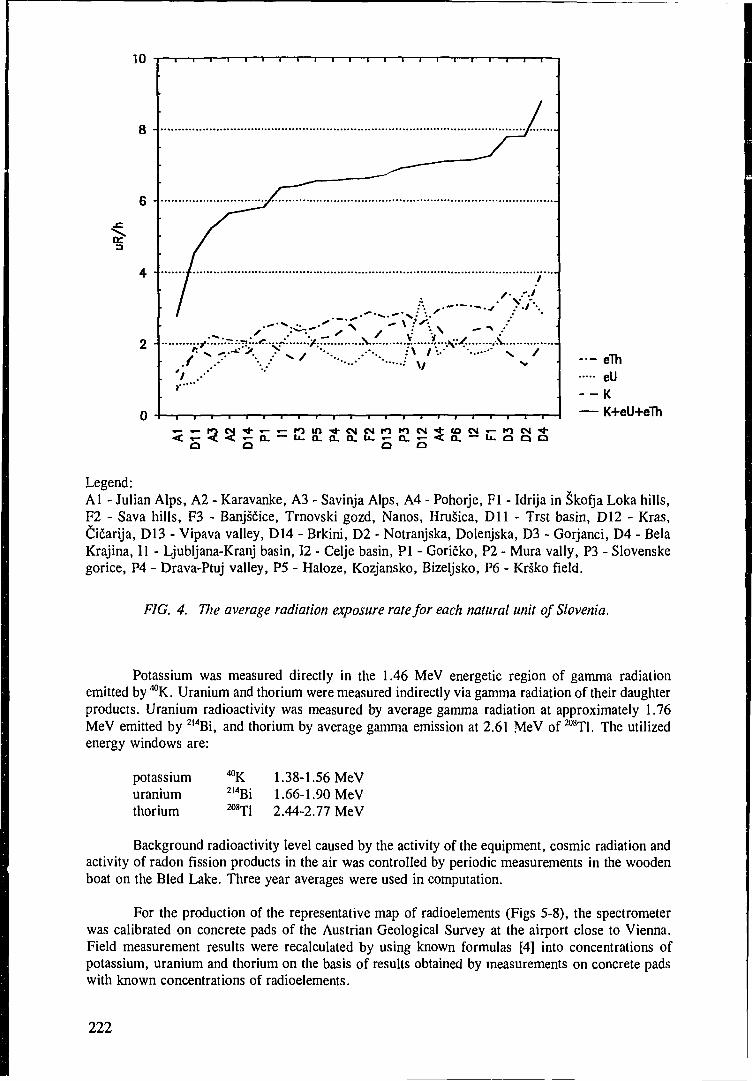
10
8 -
6 -
f
— eTheU
- - K— K+eU+eTh
Q Q Q Q
Legend:A l - Julian Alps, A2 - Karavanke, A3 - Savinja Alps, A4 - Pohorje, F l - Idrija in Skofja Loka hills,F2 - Sava hills, F3 - Banjscice, Trnovski gozd, Nanos, Hrusica, D l l - Trst basin, D12 - Kras,Ci5arija, D13 - Vipava valley, D14 - Brkini, D2 - Notranjska, Dolenjska, D3 - Gorjanci, D4 - BelaKrajina, II - Ljubljana-Kranj basin, 12 - Celje basin, PI - Goricko, P2 - Mura vally, P3 - Slovenskegorice, P4 - Drava-Ptuj valley, P5 - Haloze, Kozjansko, Bizeljsko, P6 - Krsko field.
FIG. 4. The average radiation exposure rate for each natural unit of Slovenia.
Potassium was measured directly in the 1.46 MeV energetic region of gamma radiationemitted by ^K. Uranium and thorium were measured indirectly via gamma radiation of their daughterproducts. Uranium radioactivity was measured by average gamma radiation at approximately 1.76MeV emitted by 2l4Bi, and thorium by average gamma emission at 2.61 MeV of 208Tl. The utilizedenergy windows are:
potassiumuraniumthorium
2MBi208^1
1.38-1.56 MeV1.66-1.90 MeV2.44-2.77 MeV
Background radioactivity level caused by the activity of the equipment, cosmic radiation andactivity of radon fission products in the air was controlled by periodic measurements in the woodenboat on the Bled Lake. Three year averages were used in computation.
For the production of the representative map of radioelements (Figs 5-8), the spectrometerwas calibrated on concrete pads of the Austrian Geological Survey at the airport close to Vienna.Field measurement results were recalculated by using known formulas [4] into concentrations ofpotassium, uranium and thorium on the basis of results obtained by measurements on concrete padswith known concentrations of radioelements.
222
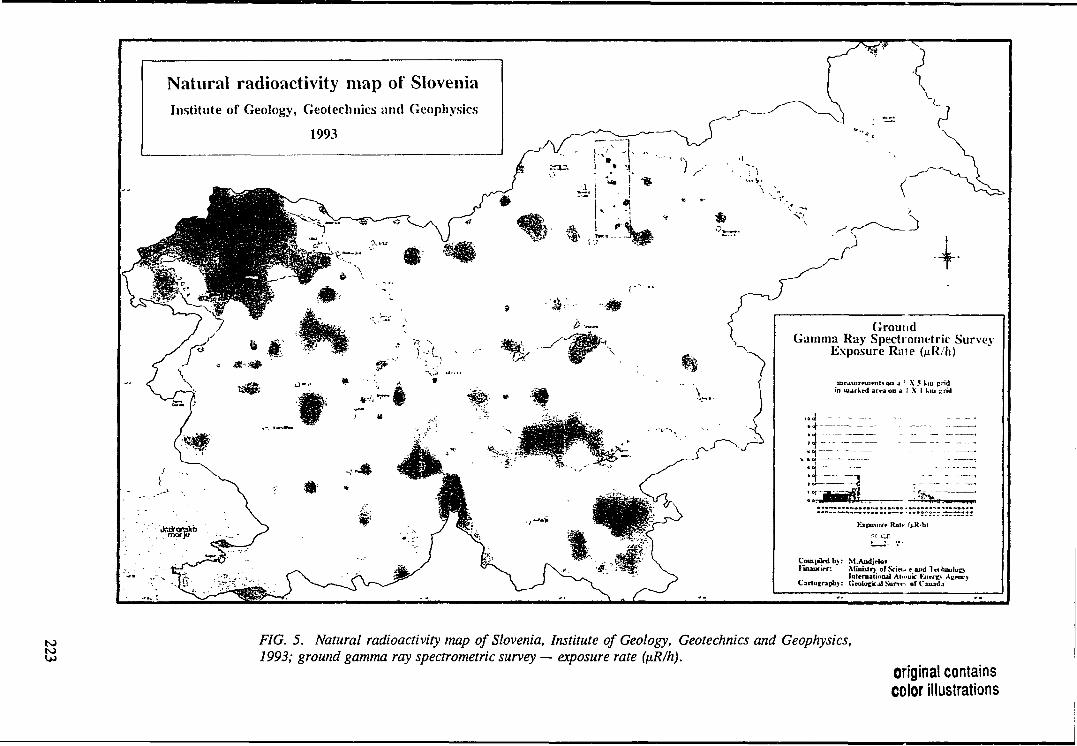
Natural radioactivity map of SloveniaInstitute of Geology, Geotechnics and Geophysics
1993
GroundGammn Ray Spectroinetric Survey
Exposure Rate (R'h)
i uu J ' X 5 Km cridin uurLcd an*a OD a I X I km zrid
Exposure
Coui|drdb>: M.AiidjrlotFuuiKirr: Miuulo of Scin.. mild It
lateniatinaal Atmuir KjirrCariuitrapli): OrolocicjlSur\t-'. of Caiui
to FIG. 5. Natural radioactivity map of Slovenia, Institute of Geology, Geotechnics and Geophysics,1993; ground gamma ray spectrometric survey — exposure rate foR/h).
original containscolor illustrations
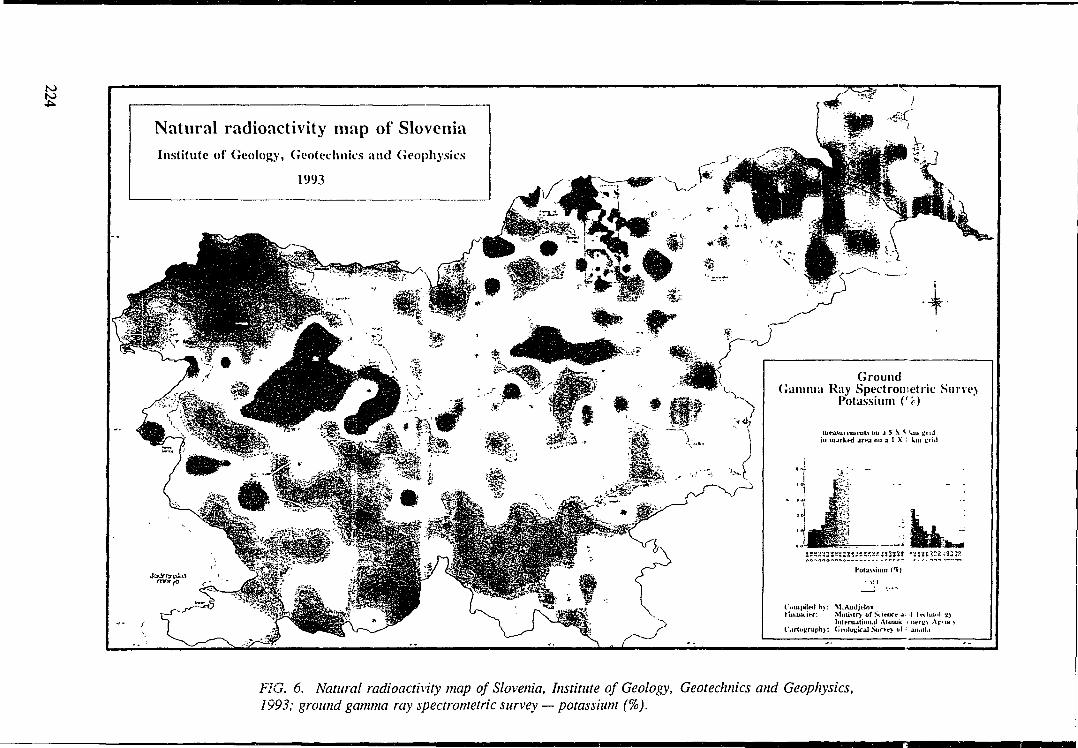
Natural radioactivity map of SloveniaInstitute of Geology, Geoteclinics and Geophysics
1993
GroundGamma Ray Spectrometric Survej
Potassium ("c)
Cutufiilnt h>: Nl.AiiJji-lovM t e r : Mnii\lr> o f S i
lnlenutji)ii.U Alumk i ut-rv> A>: (it^)luuical Stir»r> of ' an.ul.i
FIG. 6. Natural radioactivity map of Slovenia, Institute of Geology, Geotechnics and Geophysics,1993; ground gamma ray spectrometric survey — potassium (%).
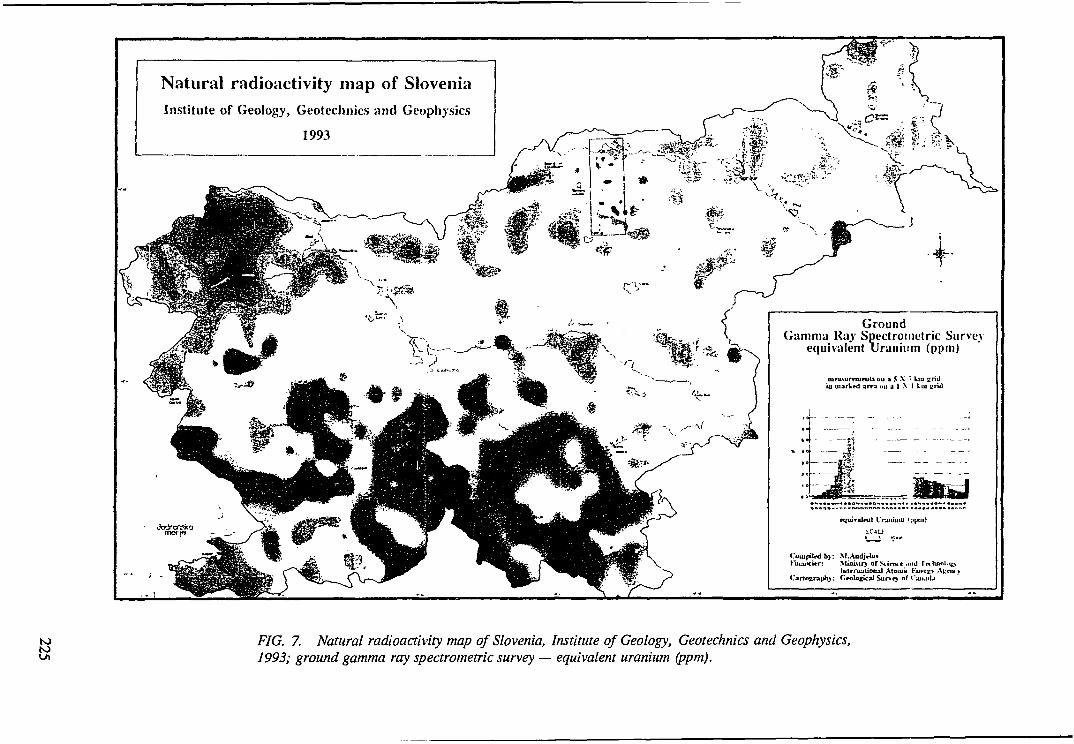
Natural radioactivity map of SloveniaInstitute of Geology, Geotechnics and Geophysics
1993
GroundGamma Ray Spectrometric Survey
equivalent Uranium (ppm)
CotupUfd 1)>: M.Aadjrlo*FinaJtcier: Miui\Iry ofStirtKe .mil rptluml'io
lulenutiotu) Atouiit Kjifryv Acnic>Cartosrapb>: Geological Sur»e> of ('aii.ntj
FIG. 7. Natural radioactivity map of Slovenia, Institute of Geology, Geotechnics and Geophysics,1993; ground gamma ray spectrometric survey — equivalent uranium (ppm).
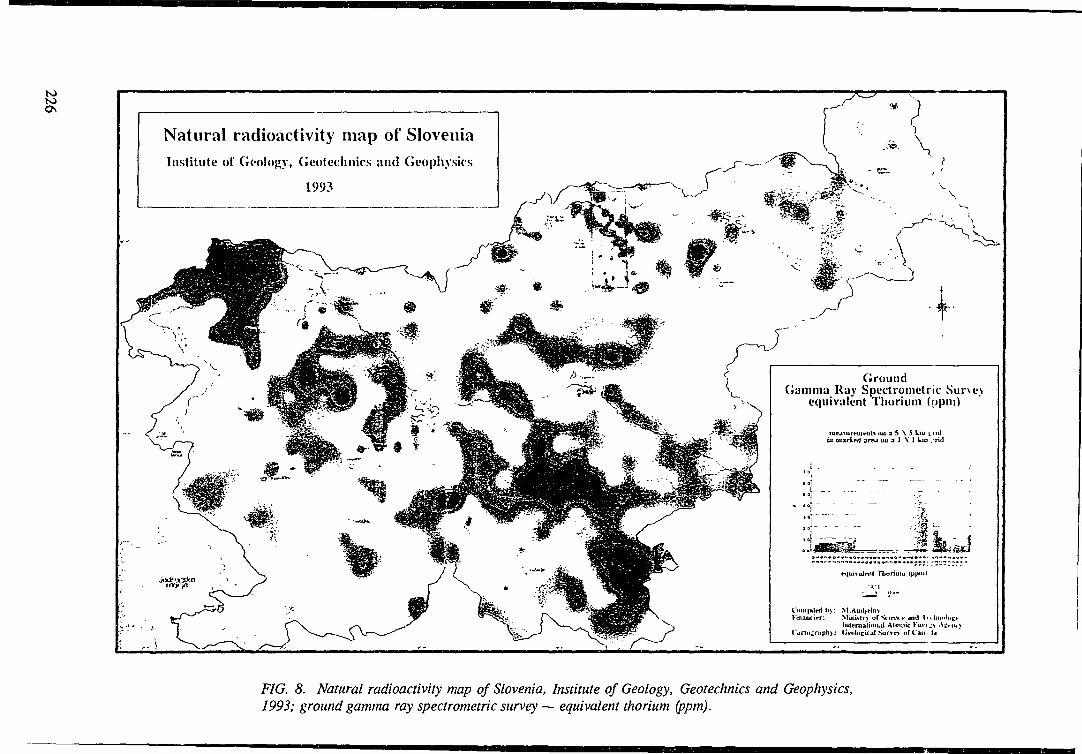
Natural radioactivity map of SloveniaInstitute of Geology, Geotechnics and Geophysics
1993
GroundGamma Ray Spectrometric S
equivalent Thorium ([)pm)
iitruMtrttimiL* »u a 5 \ 5 Wiu i nilin uiarkrtt arrj uu a 1 \ I l>ui .rid
: M.Aiidjrlnvirr: Ministry of Scitnu «• JIIII I
Iutcniation.il Alnntic Furn|ih>: (jViIncuraJ Sur%r> of Can
FIG. 8. Natural radioactivity map of Slovenia, Institute of Geology, Geotechnics and Geophysics,1993; ground gamma ray spectrometric survey ~ equivalent thorium (ppm).
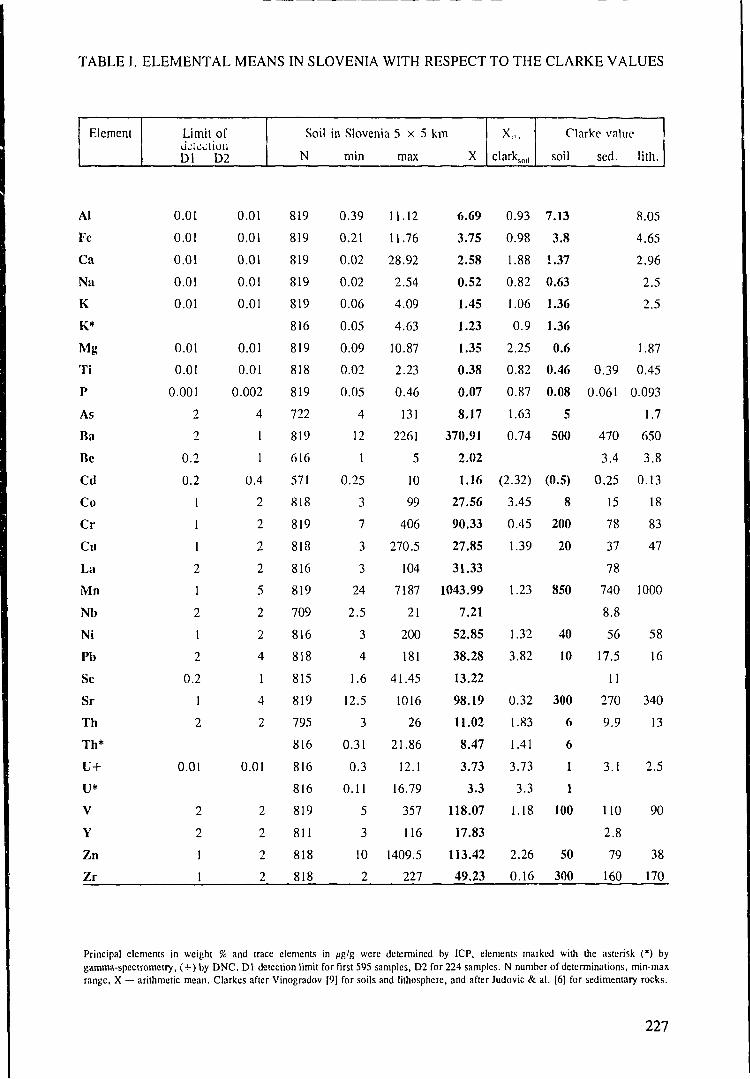
TABLE I. ELEMENTAL MEANS IN SLOVENIA WITH RESPECT TO THE CLARKE VALUES
Element
Al
Fe
Ca
Na
K
K*
Mg
Ti
P
As
Ba
Be
Cd
Co
Cr
Cu
La
Mn
Nb
Ni
Pb
Sc
Sr
Th
Th*
U+
U*
V
Y
Zn
Zr
Limit ofdetectionDl D2
0.01
0.01
0.01
0.01
0.01
0.01
0.01
0.001
2
2
0.2
0.2
1
1
1
2
1
2
1
2
0.2
1
2
0.01
2
2
1
1
0.01
0.01
0.01
0.01
0.01
0.01
0.01
0.002
4
1
1
0.4
2
2
2
2
5
2
2
4
1
4
2
0.01
2
2
2
2
Soil
N
819
819
819
819
819
816
819
818
819
722
819
616
571
818
819
818
816
819
709
816
818
815
819
795
816
816
816
819
811
818
818
in Slovenia 5 x 5
min max
0.39
0.21
0.02
0.02
0.06
0.05
0.09
0.02
0.05
4
12
1
0.25
3
7
3
3
24
2.5
3
4
1.6
12.5
3
0.31
0.3
0.11
5
3
10
2
11.12
11.76
28.92
2.54
4.09
4.63
10.87
2.23
0.46
131
2261
5
10
99
406
270.5
104
7187
21
200
181
41.45
1016
26
21.86
12.1
16.79
357
116
1409.5
227
km
X
6.69
3.75
2.58
0.52
1.45
1.23
1.35
0.38
0.07
8.17
370.91
2.02
1.16
27.56
90.33
27.85
31.33
1043.99
7.21
52.85
38.28
13.22
98.19
11.02
8.47
3.73
3.3
118.07
17.83
113.42
49.23
xt,,,clarksoll
0.93
0.98
1.88
0.82
1.06
0.9
2.25
0.82
0.87
1.63
0.74
(2.32)
3.45
0.45
1.39
1.23
1.32
3.82
0.32
1.83
1.41
3.73
3.3
1.18
2.26
0.16
Clarke value
soil sed. lith.
7.13
3.8
1.37
0.63
1.36
1.36
0.6
0.46
0.08
5
500
(0.5)
8
200
20
850
40
10
300
6
6
1
1
100
50
300
0.39
0.061
470
3.4
0.25
15
78
37
78
740
8.8
56
17.5
11
270
9.9
3.1
110
2.8
79
160
8.05
4.65
2.96
2.5
2.5
1.87
0.45
0.093
1.7
650
3.8
0.13
18
83
47
1000
58
16
340
13
2.5
90
38
170
Principal elements in weight % and trace elements in /ig/g were determined by ICP, elements marked with the asterisk (*) bygamma-spectrometry, ( + ) by DNC. Dl detection limit for first 595 samples, D2 for 224 samples. N number of determinations, min-maxrange, X — arithmetic mean. Clarkes after Vinogradov [9] for soils and lithosphere, and after Judovic & al. [6] for sedimentary rocks.
227
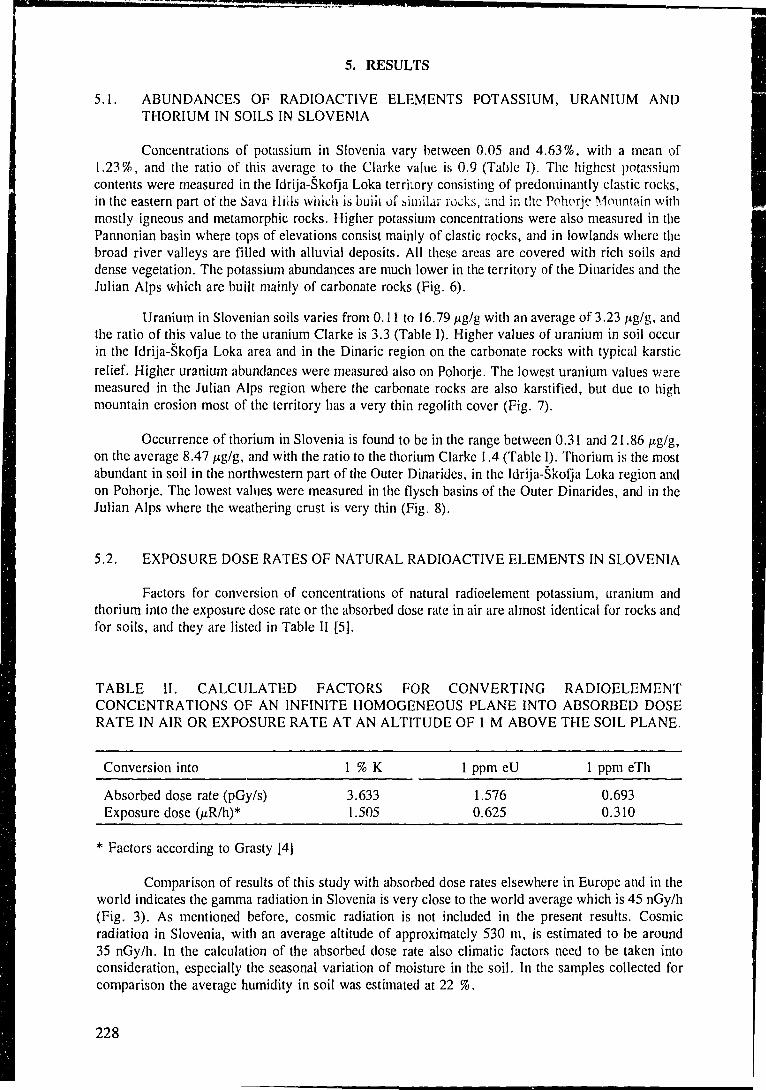
5.1.
5. RESULTS
ABUNDANCES OF RADIOACTIVE ELEMENTS POTASSIUM,THORIUM IN SOILS IN SLOVENIA
URANIUM AND
Concentrations of potassium in Slovenia vary between 0.05 and 4.63%, with a mean of1.23%, and the ratio of this average to the Clarke value is 0.9 (Table I). The highest potassiumcontents were measured in the Idrija-Skofja Loka terriiory consisting of predominantly clastic rocks,in the eastern part of the Sava Hills which is buill of similar rocks, and in the Pohorjc Mountain withmostly igneous and metamorphic rocks. Higher potassium concentrations were also measured in thePannonian basin where tops of elevations consist mainly of clastic rocks, and in lowlands where thebroad river valleys are filled with alluvial deposits. All these areas are covered with rich soils anddense vegetation. The potassium abundances are much lower in the territory of the Dinarides and theJulian Alps which are built mainly of carbonate rocks (Fig. 6).
Uranium in Slovenian soils varies from 0.11 to 16.79 /ug/g with an average of 3.23 /ig/g, andthe ratio of this value to the uranium Clarke is 3.3 (Table I). Higher values of uranium in soil occurin the Idrija-Skofja Loka area and in the Dinaric region on the carbonate rocks with typical karsticrelief. Higher uranium abundances were measured also on Pohorje. The lowest uranium values v/eremeasured in the Julian Alps region where the carbonate rocks are also karstified, but due to highmountain erosion most of the territory has a very thin regolith cover (Fig. 7).
Occurrence of thorium in Slovenia is found to be in the range between 0.31 and 21.86 /^g/g,on the average 8.47 /ug/g, and with the ratio to the thorium Clarke 1.4 (Table I). Thorium is the mostabundant in soil in the northwestern part of the Outer Dinarides, in the Idrija-Skofja Loka region andon Pohorje. The lowest values were measured in the flysch basins of the Outer Dinarides, and in theJulian Alps where the weathering crust is very thin (Fig. 8).
5.2. EXPOSURE DOSE RATES OF NATURAL RADIOACTIVE ELEMENTS IN SLOVENIA
Factors for conversion of concentrations of natural radioelement potassium, uranium andthorium into the exposure dose rate or the absorbed dose rate in air are almost identical for rocks andfor soils, and they are listed in Table II [5].
TABLE II. CALCULATED FACTORS FOR CONVERTING RADIOELEMENTCONCENTRATIONS OF AN INFINITE HOMOGENEOUS PLANE INTO ABSORBED DOSERATE IN AIR OR EXPOSURE RATE AT AN ALTITUDE OF 1 M ABOVE THE SOIL PLANE.
Conversion into 1 % K 1 ppm eU 1 ppm eTh
Absorbed dose rate (pGy/s)Exposure dose (/xR/h)*
3.6331.505
1.5760.625
0.6930.310
* Factors according to Grasty [4]
Comparison of results of this study with absorbed dose rates elsewhere in Europe and in theworld indicates the gamma radiation in Slovenia is very close to the world average which is 45 nGy/h(Fig. 3). As mentioned before, cosmic radiation is not included in the present results. Cosmicradiation in Slovenia, with an average altitude of approximately 530 m, is estimated to be around35 nGy/h. In the calculation of the absorbed dose rate also climatic factors need to be taken intoconsideration, especially the seasonal variation of moisture in the soil. In the samples collected forcomparison the average humidity in soil was estimated at 22 %.
228
Important factors governing the exposure dose are in first place the geologic characteristicsof the terrain, especially the lithology and the structure, and the geographic characteristics such asthe relief and vegetation, as well as the climate. For the land use management in Slovenia, so-called'natural areas' were defined using the topographic, geologic, pedologic, forestry and climatic mapsand the satellite images. The 'natural areas', shown in Fig. 2, were defined on the basis ofgeographical-geological characteristics which differ from the usual geological and geographicalsubdivisions of the Slovenian territory [8]. The average radiation exposure rate calculated for each'natural area' of Slovenia are shown on Fig. 4.
5.3. ANALYSIS OF SOIL SAMPLES
For the comparison of measurements with the chemical composition of soils and its moisture,in the central point of each measurement site a soil sample from the uppermost 10 cm of soil profilewas collected. The average weight of the sampled material was 1.5 to 2 kg. Samples for geochemistrywere air dried. By weighing the humidity of soil sample was determined (22 weight per cent on theaverage). The material was gently disintegrated and passed through a 2 mm sieve, and subsequentlyreduced and ballmilled to grain size below > 0.063 mm. Uranium was determined by delayed neutroncounting (DNC), and 35 chemical elements (Ag, Al, As, Ba, Be, Bi, Ca, Cd, Co, Cr, Cu, Fe, K,La, Mg, Mn, Mo, Na, Nb, Ni, P, Pb, Sb, Sc, Sn, Sr, Th, U, V, W, Y, Zn, and Zr) weredetermined by plasma emission spectrometry (ICP).
The results of 819 chemical analyses of soil samples at a 5 x 5 km grid in Slovenia wereused to calculate the averages for 28 chemical elements listed in Table I. About equal to Clarke(±25%) are means for 8 elements, Al, Fe, Na, K, K*, Ti, P, Mn and V. Higher (up to 100%) aremeans for 6 elements: Ca, As, Cu, Ni, Sr, Th and Th*, and much higher (above 100%) means of6 elements Mg, Cd, Co, Pb, U, U* and Zn. Lower are means of 3 elements Ba, Cr and Zr. We donot have data for Clarke values of Be, La, Nb, Sc and Y in soil.
Generally it appears that the elemental averages in soils in Slovenia exceed the worldaverages. These first data on distribution of chemical elements represent a challenge for furthergeochemical investigations of the Slovenian territory.
For some of the elements the geochemical maps were produced. Each elemental distributionwas subdivided into 9 classes corresponding to 0-5, 5-10, 10-20, 20-40, 40-60, 60-80, 80-90, 90-95,95-100 percentiles of the given distribution.
The comparison of field measurements and soil analyses of the radioelement shows arelatively good correlation. The correlation of radiometrically determined K and ICP determined Kis good, the correlation coefficient is 0.72. The correlation coefficient between radiometric U and ICPU is 0.65, and the slope of the regression line is about 45 degrees. However, some of themeasurements show poor correlation. This is because of the disequilibrium between uranium and itsdecay products which were actually measured by the gamma spectrometer. The correlation betweenthe two methods of Th determination is low, probably because of low sensitivity of the ICP methodfor Th.
6. CONCLUSIONS
The average total exposure rate for potassium, uranium and thorium in Slovenia is 6.54±2.32 ixR/h. This result is not corrected for soil humidity which is on the average 22%, and whicheither increases or reduces the calculated exposure rate in the areas. Of the total mean exposure rate
229
6.54 /iR/h 28% is related to potassium, 32% to uranium and 40% to thorium. The contribution ofpotassium is lower than the world average for the Earth's crust. The reason is probably the lithology.since more than half of the Slovenian territory consists of carbonate rocks for which lower potassiumabundances are typical, and higher (in insoluble residue) abundances of uranium and thorium.
The applied methodology has provided useful information for environment monitoring andgeological mapping. The product of this project represents the first natural background radioactivitiesand geochemical map of Slovenia covering the entire country (Fig. 5). The maps show the baselineinfonnation of disliibulion of elements in the country and represent a good base for the study ofconsequences of eventual radioactive and other pollution. It is hoped that the information obtainedthrough this project will meet the UNESCO/IGCP and IAEA standards for the production of theGeochemical maps of the world.
Regardless of the relatively large spacing between measurement sites, the principal geologicalunits and trends of the distribution of radioactive elements potassium, uranium and thorium ingeological structures are well differentiated on the maps. However, 5 x 5km density of observationprovides just a general impression about the distribution of elements in the country. It is well knownthat some smaller litostratigraphical units are significantly enriched with particular elements. For thisreason it will be necessary to increase the density of sampling in the areas where more detailedinformation on distribution on natural radio elements and other elements will be needed.
REFERENCES
[1] ANDJELOV, M., TOMSIC, J., BRAJNIK, D., Osnove za pripravo radiometricne karteSlovenije, Onesnazevanje in varstvo okolja. Geologija in tehnika za okolje, Zbornik, Zavodza tehnicno izobrazevenje, Ljubljana (1992) 222-225.
[2] ANDJELOV, M., Use of ground gamma ray spectrometric survey for elaboration ofradioelement geochemical maps, Manuscript, Final report for 1993, Research Contract No.6793/R1/RB, IAEA, Vienna (1993).
[4] GRASTY, R. L.,CARSON, J. M., CHARBONNEAU, B. W., HOLMAN, P. B., Naturalbackground radiation in Canada, Bulletin 360, Geological Survey of Canada, Ottawa (1984).
[5] INTERNATIONAL ATOMIC ENERGY AGENCY, The use of gamma ray data to definethe natural radiation environment, Technical Reports Series No. 566, IAEA, Vienna (1990).
[6] JUDOVIC, JA. E., KETRIS, M. P., MERC, A. B., Elementi-primesi v iskopajemih ugljah,Nauka, Leningradskoje otdelenije, Leningrad (1985) 239 p.
[7j PIRC, S., ZUPANCIC N., Geokemicna karta Istre in Slovenskega primorja. Manuscript,Geokemija kamnin Slovenije. FNT Montanistika, Ljubljana (1989).
[8] POLJAK, M., Homogone naravne enote, bazirane na geografsko-geoloskih znacilnostih SRSlovenije, Uporaba satelitskih metod teledetekcije za ocenjevanje izrabe tal in za potrebekmetijstva in gozdarstva, Projekt: FAO:TCP/YUG/4502(T), Ljubljana (1987) 7 p.
[9] ROSLER, H. J., LANGE, H., Geochemical tables, Elsevier Publishing Company,Amsterdam (1972).
[10] UNSCER, Sources and biological effects of ionizing radiation, United Nations ScientificCommittee on the Effects of Atomic Radiation 1982, United Nations, New York (1982).
230
USE OF GAMMA RAY SPECTROMETRIC SURVEYFOR RADIOECOLOGICAL MAPPING IN POLAND
R. STRZELECKI, S. WOLKOWICZ, J. SZEWCZYK, P. LEWANDOWSKIPolish Geological Institute, Warsaw, Poland
Abstract
A large spacing ground radiometric survey was carried out over the entire territory of Poland to map thesurface concentrations of natural as well as artificial radioelements. The survey was done along N-S lines atapproximately 17 km spacing using a 256 channel gamma ray spectrometer. Results of the survey are the productionsof, for the first time, gamma dose rate and cesium pollution maps of Poland. The gamma dose rate map reflectslargely the geological make up of the country. The cesium map, while indicating very low concentration (from 0 to8 kBq/m2) in most parts of the country, shows areas in the country that are polluted. The patterns of the polluted areashave no correlation with the underlying soil types nor vegetation covers. It is deduced that metereological conditionsduring deposition was the main controlling factor of these patterns.
1. INTRODUCTION
The cover of the Quaternary postglacial sediments is the dominating element in the image ofsurface geology of Poland. Quaternary sediments represented by moraine clays, fluvioglacial andeolian sands are covering 70 percent of the territory. Their thickness is varying from few up till 300meters. Older formations are exposed in southern and south-western part of Poland in form of:metamorphic, granitoid massifs and sedimentary Palaeozoic formations in the Sudetes (SW Poland),Palaeozoic and Mesozoic sedimentary formations in the Holy Cross Mountains, Upper Silesian CoalBassin and Malopolska Highland (Middle and south Poland), Cretaceous-Paleogene flysch sedimentsexposed in the Carpathians (along souther border of Poland), older granitoid and metamorphic rocksexposed in the Tatras (Inner Carpathians).
The radiometric and gamma ray spectrometric methods were applied in Poland since 1950 forthe purpose of uranium exploration in the Sudetes and at the smaller scale in Carpathians and in HolyCross Mountains. The above mentioned regional surveys covered only 10% of the territory of Poland.Gamma ray spectrometric and radiometric survey of the whole country has been yet not carried out.Since 1990, after stopping the construction of nuclear plant in Zarnowiec (near Gdansk) andrestraining up till the year 2000 the concept of development of nuclear power industry in Poland, alluranium prospection programmes in Poland carried out up till then by the Polish Geological Institutewere stopped.
In 1989 Polish Geological Institute proposed studies and gamma-ray spectrometric surveycovering the territory of the whole country under the national programme entitled "Protection of theLithosphere". The main tasks of this survey are:
mapping of the cesium pollution after the Chernobyl accident:
compilation of individual radioelements distribution maps which are necessary to prepare theradon risk maps and to calculate effective dose equivalent:
estimation of concentration and distribution of pollution (with uranium and radium) of therecent river sediments of the Vistula and Odra rivers, provoked by dropping of the pollutedmine-waters from the coal mines of Upper Silesian Coal Bassin area.
231
The dose rate map and Cs concentration maps are already compiled and will be soon printedwhile the map of the distribution of natural radionuclides is now compiled.
2. WORK METHODOLOGY
The accident at the nuclear plant in Chernobyl, disturbed very significantly the terrestrialgamma ray over the big area or Europe.
The spectrometric survey conducted by Polish Geological Institute in 1986 in the Sudetes di-rectly before as well as after the Chernobyl accident, delivered very interesting and unique at theEuropean scale experimental data [1]. The few years period between the accident and the beginningof the field works resulted in decrease of the amount of radionuclides from several tens presented inthe fallout just after the accident to only two - l37Cs (T 1/2 = 30 years) and l34Cs (Tl/2=2 years) aswell as in the change of the spatial distribution of these elements from surface distribution just afterthe accident to spatial distribution depending from many factors such as the type of soil, soilpermeability and type of vegetation cover.
The results of the above mentioned field works have been used among others to work out theeffective methodology of determination of "in situ" total concentration of Cs isotopes. This methoddetermines the gamma radiation dose rate related to the above radionuclides expressed as thedifference between the measured total dose rate and the total dose rate from the natural gammaradiation emitters. The concentration of the latter is determined by the measurements coveringrespectively for potassium, uranium and thorium the decay energies of: 1.46 MeV, 1.76 MeV and2.62 MeV and decay energy higher than 0.56 MeV for the TC window. Concentration of the latterdecay energies does not influence the gamma spectrum in this energetic areas. The calibrationcoefficients are determined by measurements with gamma-ray spectrometer at the calibration pads inBratkovice near Prybram (Czech Republic).
Cosmic background was measured on the Zegrze lake, 100 m from the nearest bank.Calibration of the spectrometer with respect to Cs is more difficult due to lack of possibilities ofcreation spatial calibration standards meeting the field standards. Here the method of approximatecalibration, based on point measurements, used by the Central Laboratory of Radiological Protectionwas used.
Concentration of the natural isotopes was determined using the known formula:
Qi = Y,aipxNf (1)
where: Qi - percentage concentration for K, ppm concentration for U and Th for i - of this isotope
ajp - calibration coefficientsA - count rate in energic windows
Concentration of cesium QCs isotopes was determined using the formula:
QCs = Ka x d (NT - NNAT) (2)
where: Ka - calibration factor determining relation between count rate from Cs and theirdose rate
232
d - calibration factor determining relation between 137Cs dose rate and itsconcentration in soils. The value of this factor is depending of the deepdistribution of radionuclide concentration in soils, in the interpretationprocess usually the average value characteristic for each type of soil is used
NT, N"AT- measured (NT) count rate in TC energic window and calculated (NNAT) on thebasis of concentration of natural radionuclides.
3. FIELD MEASUREMENTS
Measurements were made along N-S oriented profile lines spaced 15' (about 17 km). Mea-surements were made each 1 000 m. In the case of certifying in the TC window of the value higherthan 5 500 counts/2 minutes, measurements were made each 500 m in order to recognize moreprecisely the anomalies. Measurements were also made each 500 m or even less in the places ofintersection of the profile lines with the Odra and Vistula rivers valleys so, that at least 1 measu-rement point was located on the flood- or over-flood terrace. The purpose of such procedure was tocollect water pollution with radioactive elements transported by mine-waters data [2].
Measurements were made using hand held type gamma-ray spectrometer, model GS-256produced by "Geofizyka" Brno with 3" X 3" Na (Tl) detector. 2 minute time of measurement wasused. The detector was placed 1.5 m above the terrain in order to eliminate the influence of theterrain denivelations.
The field works were carried out in the period from June till December, 1992. Out of 20 000measurements made during this period 19 528 was used for the map compilation.
Data were collected in the DBase system. For map compilation Surfer computer program andGIS Arc/Info system were used. Calculations were made using the SPSS/PC statistical system.
4. RESULTS OF INVESTIGATIONS
4.1. GAMMA DOSE RATE MAP
Gamma dose rate is the compilation of gamma radiation related to the natural radionuclidesof: uranium 238U, thorium B2Th and potassium ^K and artificial isotopes of cesium 137+134Csintroduced into the environment and considered as elements polluting the environment (Fig. 1).
The average gamma dose rate for Poland is 34.2 nGy/h however it is varying from 23.3nGy/h for the Zielona Gora voyevodship (W Poland) to 62.25 nGy/h for Walbrzych voyevodship (SWPoland).
Highest gamma radiation is noted in S Poland (The Sudetes and Carpathians regions) as wellas in the Holy Cross Mountains and Lublin area. The central and northern part of the country ischaracterized by the low total gamma dose rate except for some small areas in the region of Mazuryand Suwalki. Such distribution of the gamma dose rate is related to the geological surface image ofPoland. It has been changed only on a small part of the territory after the Chernobyl accident.
Highest values of the gamma dose rate — over 70 nGy/h are observed in the Sudetes and arerelated to the presence on the land surface of rocks containing higher concentration of naturalradionuclides presented by: granitoides, gneisses and crystalline schists in Karkonosze and Izery Mts,sedimentary (shales and sandstones) and vulcanic rocks (ryolites) of Permian and Carboniferous in
233

original containscolor illustrations
Gamma dose rater : <10 nGy/hr~~_ 10 - 207 2 0 - 3 0
JO - 4040 - 5050 - 6060 - 70
___;: 70 - 80WM 80 - 90: ' 9 0 - 1 0 0r.~'] 100 - 1101 : ->nn
FIG. 1. Map of gamma dose Rate in Poland.
the Intra-Sudetic Depression, Precambrian metamorphic and magmatic rocks in Ztote Gory andSnieznik Massif. Few small uranium deposits and few-tens of indices of uranium and thoriummineralization are known from this area. High values of gamma dose rate in western part of Opoleregion (SW Poland) is related to the post-Chernobyl pollution.
Another area characterized by relatively high values of gamma dose rate - over 40 nGy/h isthe region of Carpathians. This high value is related to the occurrence on the surface of the flyschsediments represented by silt shales and fine-grained sandstones.
234
The gamma dose rate varying from 40 to 70 nGy/h is also noted from the Lublin area (SEPoland) and from Holy Cross Mountains. In the Lublin area it is related to Creataceous sediments andQuaternary loess cover. The higher gamma dose rate noted in loesses is very interesting as loessesdue to their high permeability present a good collector properties and can collect radon emitted fromthe subsoil [3]. In the Holy Cross Mountains high gamma dose rate are noted from the outcrops ofthe Palaeozoic sediments covered with thin loess cover in the eastern part of the region.
The middle and northern part of Poland is characterized by relatively low values of thegamma dose rate varying between 20 and 40 nGy/h. This area is covered with the Quaternarysediments. The mosaic image of the gamma dose rate value corresponds in general with the variablelithology. Due to the scale of the map only big lithological units are presented. The lowest gammadose rate values of 20 - 30 nGy/h are recorded from the areas covered with fluvioglacial and eoliansands. Among the river sediments highest gamma dose rate is described from the Vistula riversediments and can be related to the above mentioned pollution of the waters by the mining industryof the Upper Silesia region.
Moraine uplands build of clays are characterized by gamma dose rate of 30 to 40 nGy/h al-though in some places a higher dose rate of 60 nGy/h is noted from the boulder clay containinggranitoids erratics in Mazury (Ketrzyn) and Suwalki (NE Poland) regions [4].
4.2. CESIUM POLLUTION MAP
In examination of the distribution of concentration of radioactive cesium isotopes the followingfactors should be taken into consideration:
the main part of Cs was introduced into the environment as the result of Chernobyl accidentin April and May, 1986;
some amounts of Cs may be related to military nuclear bomb tests, carried especially in1959-1962;
regional distribution of Cs fallout was depending from the meteorological conditions, otherenvironmental factors such as type of soil seem to be less important.
Results of the field works indicate that more than 90% of the territory is characterized by verylow Cs concentration varying from 0 to 8 kBq/m2 (Fig. 2). The average Cs concentration calculatedfor Poland is 4.67 kBq/m2 with standard variation of 5.51 kBq/m2. Taking into consideration theassumption, that the average value plus the value of 2 standard variations determines the anomalousconcentration, 15 kBq/m2 isoline is considered as indicating the anomalies.
The highest Cs pollution was noted from SW Poland, from E part of Fore-Sudetes Monoclineand from Silesia Lowlands. These anomalous concentrations are a part of zone characterized byhigher Cs pollution running in SW-NE direction from the Klodzko Valley area (Czech border) to theregion of Warsaw. Three anomalous areas can be distinguished within this zone, mainly: Opole region(surface of 4 500 km2), vicinity of Radomsko and vicinity of Warsaw.
The highest values of Cs pollution up to 96 kBq/m2 are noted from the Opole region. Smalleranomalies are also observed from:
southern Poland - W Carpathians, Cs concentrations up to 25 kBq/m2,
small parts of the Sudetes, Cs concentration up to 25 kBq/m2,
235
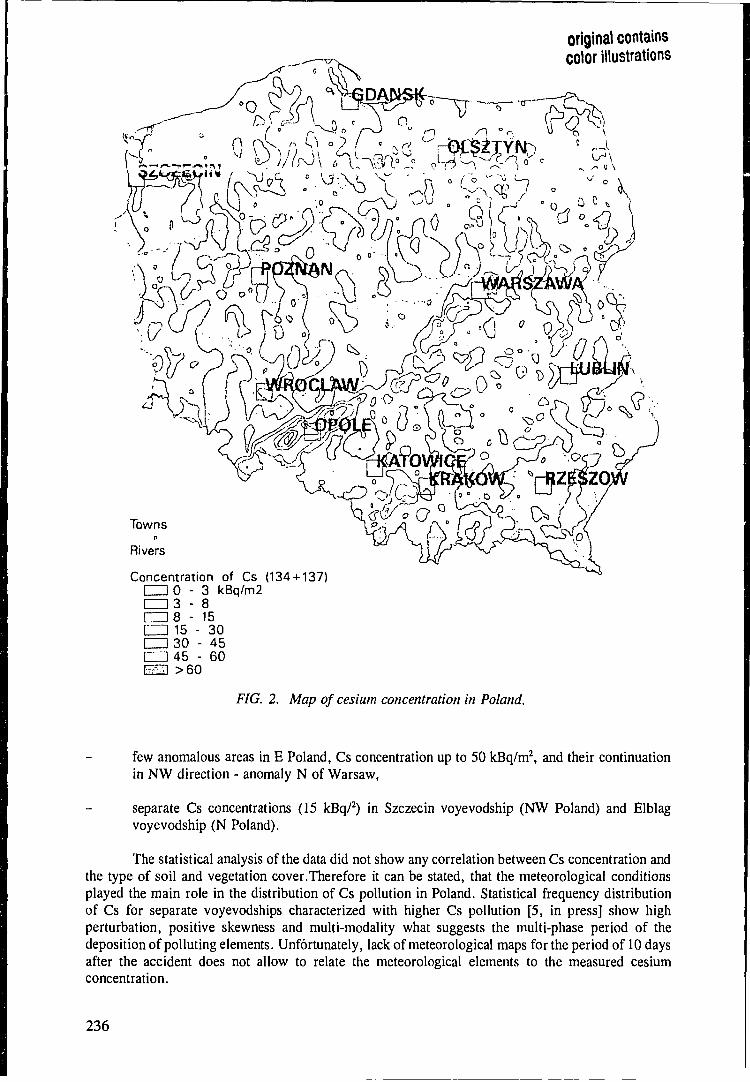
original containscolor illustrations
. U.*J^tiJjti
Towns
Rivers
Concentration of Cs (134 + 137)CZDO - 3 kBq/m2I 13 - 8\ 1 8 - 1 5[ 1 15 - 30CZI3 30 - 45[ZZl 45 - 60EED >60
FIG. 2. Map of cesium concentration in Poland.
few anomalous areas in E Poland, Cs concentration up to 50 kBq/m2, and their continuationin NW direction - anomaly N of Warsaw,
separate Cs concentrations (15 kBq/2) in Szczecin voyevodship (NW Poland) and Elblagvoyevodship (N Poland).
The statistical analysis of the data did not show any correlation between Cs concentration andthe type of soil and vegetation cover.Therefore it can be stated, that the meteorological conditionsplayed the main role in the distribution of Cs pollution in Poland. Statistical frequency distributionof Cs for separate voyevodships characterized with higher Cs pollution [5, in press] show highperturbation, positive skewness and multi-modality what suggests the multi-phase period of thedeposition of polluting elements. Unfortunately, lack of meteorological maps for the period of 10 daysafter the accident does not allow to relate the meteorological elements to the measured cesiumconcentration.
236
BIBLIOGRAPHY
SZEWCZYK, J., Wplyw skazen promieniotworczych na pole naturalnego promieniowania garnma,Prz. geol. nr 10 (1990).
STRZELECKI, R., SZEWCZYK, J., WOLKOWICZ, S., JEDRZEJCZAK, Z, Badaniapromieniotworczosci garnma na obszarze Polski: efekt Czarnobyla, skazenia przemystowe.promieniotworczosc naturalna, Prz. geol. nr 6 (1992).
STRZELECKI, R., WOLKOWICZ, S., Radon - zagrozenie wieksze niz "Czarnobyl", Prz. geol.nr 3 (1993).
STRZELECKI, R., WOLKOWICZ, S., LEWANDOWSKI, P., Wyniki badan promieniotworczoscigamma na Suwalszczyznie. Prz. geol. nr 8 (1993).
STRZELECKI, R., WOLKOWICZ, S., LEWANDOWSKI, P., Koncentracje cezu w Polsce. Prz.geol. 1994 nr 1 (in press).
237
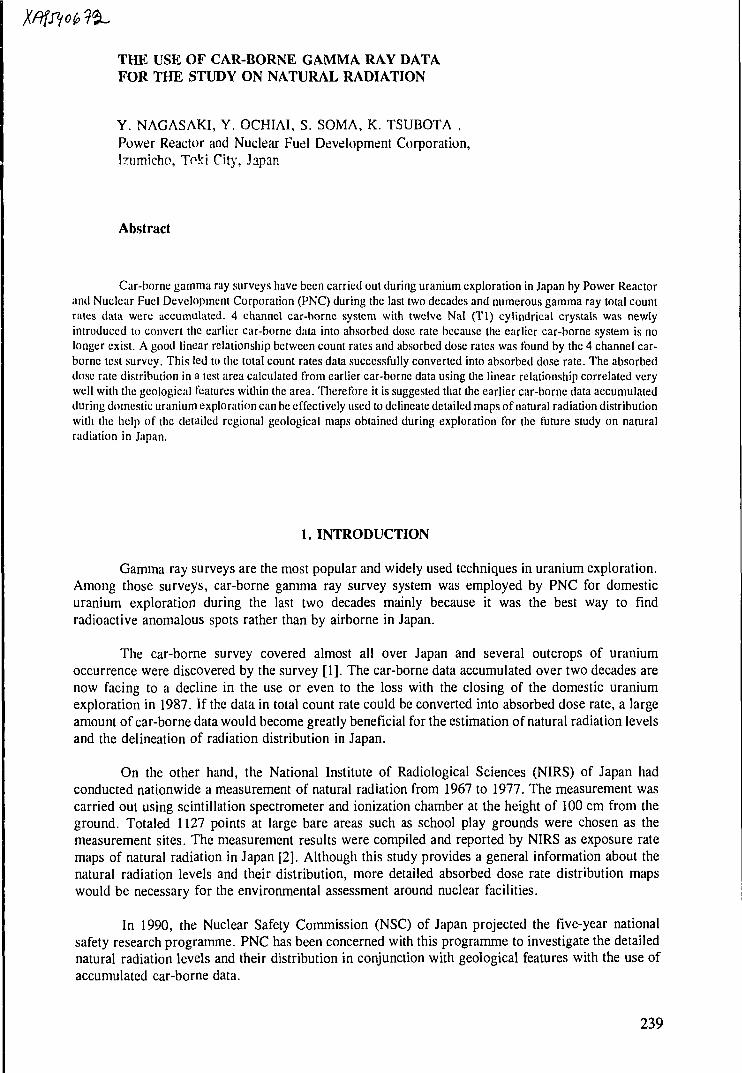
THE USE OF CAR-BORNE GAMMA RAY DATAFOR THE STUDY ON NATURAL RADIATION
Y. NAGASAKI, Y. OCHIAI, S. SOMA, K. TSUBOTA ,Power Reactor and Nuclear Fuel Development Corporation,Izumicho, Toki City, Japan
Abstract
Car-borne gamma ray surveys have been carried out during uranium exploration in Japan by Power Reactorand Nuclear Fuel Development Corporation (PNC) during the last two decades and numerous gamma ray total countrates data were accumulated. 4 channel car-borne system with twelve Nal (Tl) cylindrical crystals was newlyintroduced to convert the earlier car-borne data into absorbed dose rate because the earlier car-borne system is nolonger exist. A good linear relationship between count rates and absorbed dose rates was found by the 4 channel car-borne test survey. This led to the total count rates data successfully converted into absorbed dose rate. The absorbeddose rate distribution in a test area calculated from earlier car-borne data using the linear relationship correlated verywell with the geological features within the area. Therefore it is suggested that the earlier car-borne data accumulatedduring domestic uranium exploration can be effectively used to delineate detailed maps of natural radiation distributionwith the help of the detailed regional geological maps obtained during exploration for the future study on naturalradiation in Japan.
1. INTRODUCTION
Gamma ray surveys are the most popular and widely used techniques in uranium exploration.Among those surveys, car-borne gamma ray survey system was employed by PNC for domesticuranium exploration during the last two decades mainly because it was the best way to findradioactive anomalous spots rather than by airborne in Japan.
The car-borne survey covered almost all over Japan and several outcrops of uraniumoccurrence were discovered by the survey [1]. The car-borne data accumulated over two decades arenow facing to a decline in the use or even to the loss with the closing of the domestic uraniumexploration in 1987. If the data in total count rate could be converted into absorbed dose rate, a largeamount of car-borne data would become greatly beneficial for the estimation of natural radiation levelsand the delineation of radiation distribution in Japan.
On the other hand, the National Institute of Radiological Sciences (NIRS) of Japan hadconducted nationwide a measurement of natural radiation from 1967 to 1977. The measurement wascarried out using scintillation spectrometer and ionization chamber at the height of 100 cm from theground. Totaled 1127 points at large bare areas such as school play grounds were chosen as themeasurement sites. The measurement results were compiled and reported by NIRS as exposure ratemaps of natural radiation in Japan [2]. Although this study provides a general information about thenatural radiation levels and their distribution, more detailed absorbed dose rate distribution mapswould be necessary for the environmental assessment around nuclear facilities.
In 1990, the Nuclear Safety Commission (NSC) of Japan projected the five-year nationalsafety research programme. PNC has been concerned with this programme to investigate the detailednatural radiation levels and their distribution in conjunction with geological features with the use ofaccumulated car-borne data.
239
Data Procatior
/ /
as •
Pen Recorder
5^X5' Nal (T£) Scintillation Spectrometer
5'i X 5'Nal (TK)
i m i
S PholomulliplwfTub*
S> X 5'Nal (T£) Crystal
GPS Receiver
TOSHIBAComputer
H.V. Power Supply — DC/DC Converter
5" + X5" Nal(TI)
R S-23ac
Computer Selecler
Spectrum Analyzer
Printer
Data Processor Pen Recorder
FIG. 1. New 4 channel car-borne system and data acquisition block diagram.
240
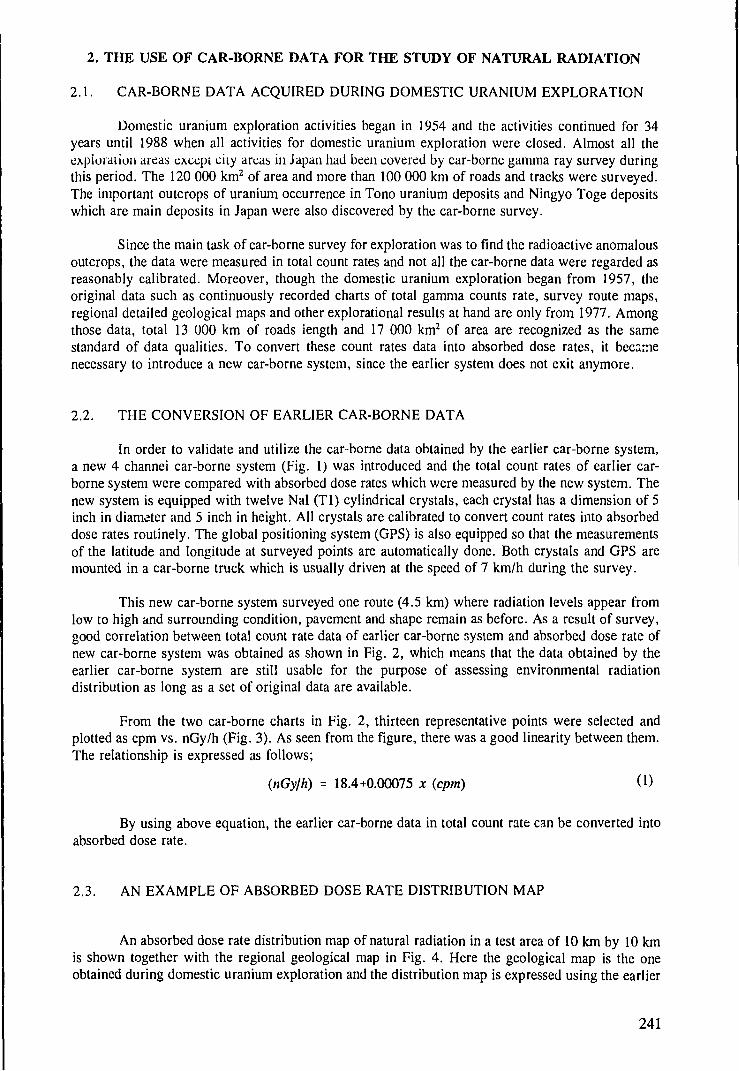
2. THE USE OF CAR-BORNE DATA FOR THE STUDY OF NATURAL RADIATION
2.1. CAR-BORNE DATA ACQUIRED DURING DOMESTIC URANIUM EXPLORATION
Domestic uranium exploration activities began in 1954 and the activities continued for 34years until 1988 when all activities for domestic uranium exploration were closed. Almost all theexploration areas except city areas in Japan had been covered by car-borne gamma ray survey duringthis period. The 120 000 km2 of area and more than 100 000 km of roads and tracks were surveyed.The important outcrops of uranium occurrence in Tono uranium deposits and Ningyo Toge depositswhich are main deposits in Japan were also discovered by the car-borne survey.
Since the main task of car-borne survey for exploration was to find the radioactive anomalousoutcrops, the data were measured in total count rates and not all the car-borne data were regarded asreasonably calibrated. Moreover, though the domestic uranium exploration began from 1957, theoriginal data such as continuously recorded charts of total gamma counts rate, survey route maps,regional detailed geological maps and other explorational results at hand are only from 1977. Amongthose data, total 13 000 km of roads length and 17 000 km2 of area are recognized as the samestandard of data qualities. To convert these count rates data into absorbed dose rates, it becamenecessary to introduce a new car-borne system, since the earlier system does not exit anymore.
2.2. THE CONVERSION OF EARLIER CAR-BORNE DATA
In order to validate and utilize the car-borne data obtained by the earlier car-borne system,a new 4 channel car-borne system (Fig. 1) was introduced and the total count rates of earlier car-borne system were compared with absorbed dose rates which were measured by the new system. Thenew system is equipped with twelve Nal (Tl) cylindrical crystals, each crystal has a dimension of 5inch in diameter and 5 inch in height. All crystals are calibrated to convert count rates into absorbeddose rates routinely. The global positioning system (GPS) is also equipped so that the measurementsof the latitude and longitude at surveyed points are automatically done. Both crystals and GPS aremounted in a car-borne truck which is usually driven at the speed of 7 km/h during the survey.
This new car-borne system surveyed one route (4.5 km) where radiation levels appear fromlow to high and surrounding condition, pavement and shape remain as before. As a result of survey,good correlation between total count rate data of earlier car-borne system and absorbed dose rate ofnew car-borne system was obtained as shown in Fig. 2, which means that the data obtained by theearlier car-borne system are still usable for the purpose of assessing environmental radiationdistribution as long as a set of original data are available.
From the two car-borne charts in Fig. 2, thirteen representative points were selected andplotted as cpm vs. nGy/h (Fig. 3). As seen from the figure, there was a good linearity between them.The relationship is expressed as follows;
(nGy/h) = 18.4+0.00075 x (cpm) 0 )
By using above equation, the earlier car-borne data in total count rate can be converted intoabsorbed dose rate.
2.3. AN EXAMPLE OF ABSORBED DOSE RATE DISTRIBUTION MAP
An absorbed dose rate distribution map of natural radiation in a test area of 10 km by 10 kmis shown together with the regional geological map in Fig. 4. Here the geological map is the oneobtained during domestic uranium exploration and the distribution map is expressed using the earlier
241
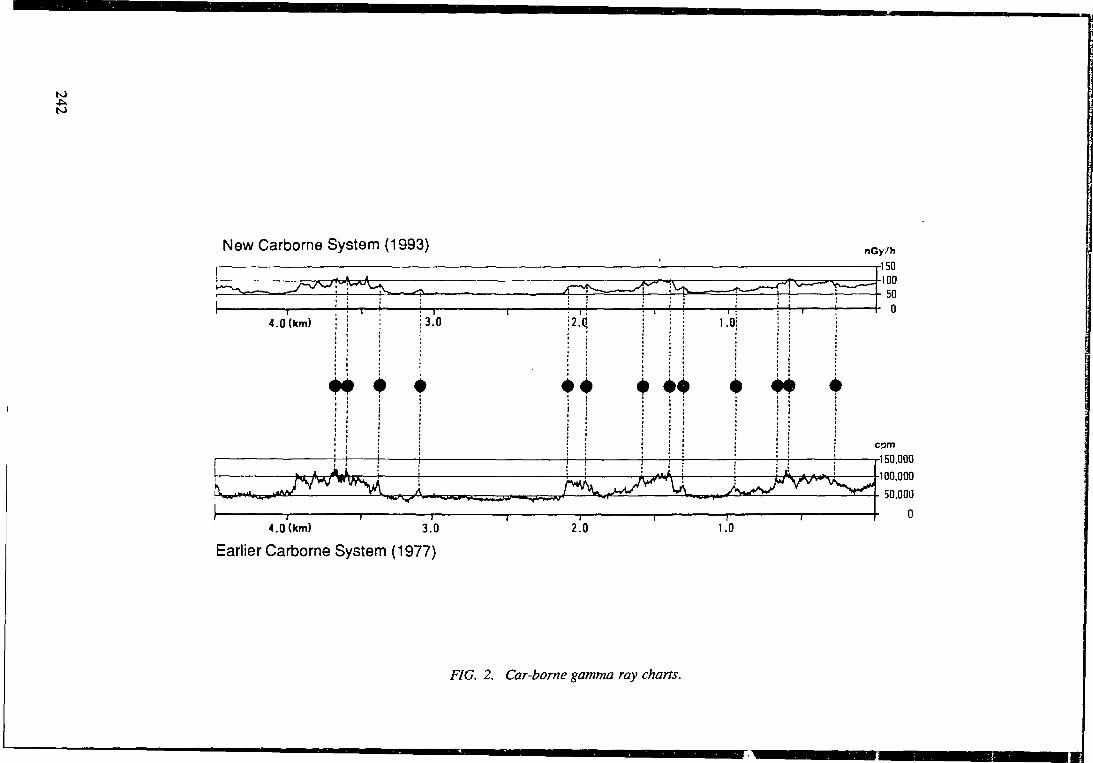
to
6
New Carborne System (1993) nGy/hr150-100
50
4.0 (km) 3.0
4.0 (km) 3.0
Earlier Carborne System (1977)
2.q 1.0
1.0
FIG. 2. Car-borne gamma ray charts.
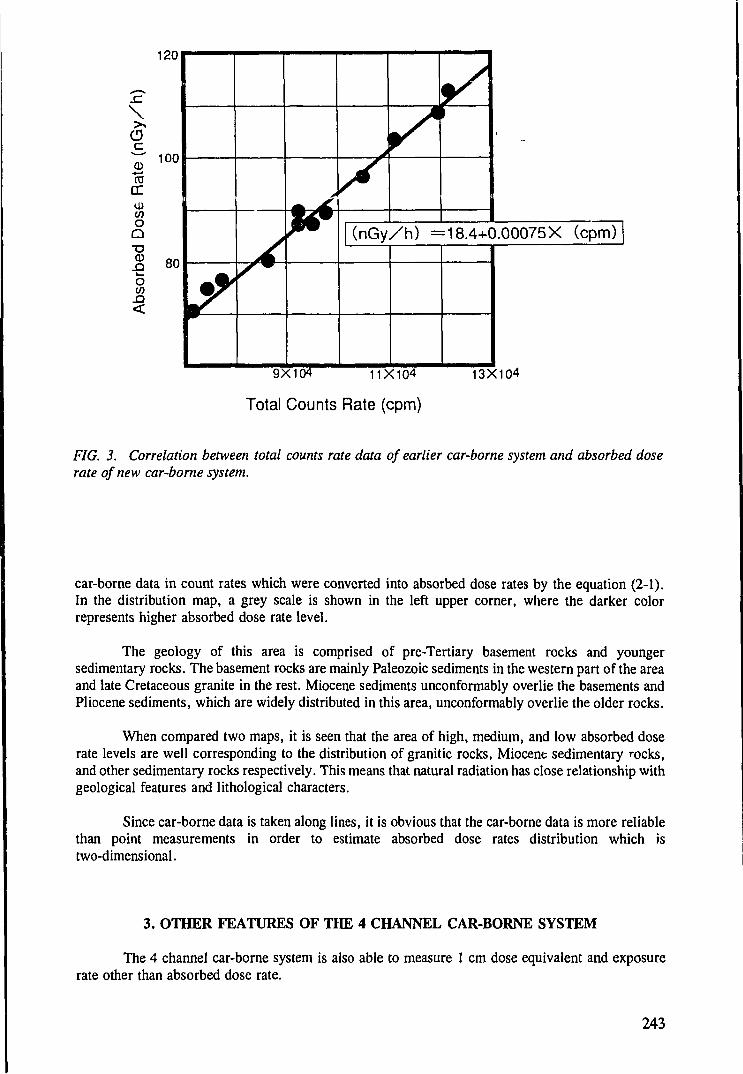
120
(3
Qi"CO
<rwoQT>Q).QOW
<
100
(nGy/h) =18.4+0.00075X (cpm)
9X10⁴ 11X104 13X104
Total Counts Rate (cpm)
FIG. 3. Correlation between total counts rate data of earlier car-borne system and absorbed doserate of new car-borne system.
car-borne data in count rates which were converted into absorbed dose rates by the equation (2-1).In the distribution map, a grey scale is shown in the left upper corner, where the darker colorrepresents higher absorbed dose rate level.
The geology of this area is comprised of pre-Tertiary basement rocks and youngersedimentary rocks. The basement rocks are mainly Paleozoic sediments in the western part of the areaand late Cretaceous granite in the rest. Miocene sediments unconformably overlie the basements andPliocene sediments, which are widely distributed in this area, unconformably overlie the older rocks.
When compared two maps, it is seen that the area of high, medium, and low absorbed doserate levels are well corresponding to the distribution of granitic rocks, Miocene sedimentary rocks,and other sedimentary rocks respectively. This means that natural radiation has close relationship withgeological features and lithological characters.
Since car-borne data is taken along lines, it is obvious that the car-borne data is more reliablethan point measurements in order to estimate absorbed dose rates distribution which istwo-dimensional.
3. OTHER FEATURES OF THE 4 CHANNEL CAR-BORNE SYSTEM
The 4 channel car-borne system is also able to measure 1 cm dose equivalent and exposurerate other than absorbed dose rate.
243
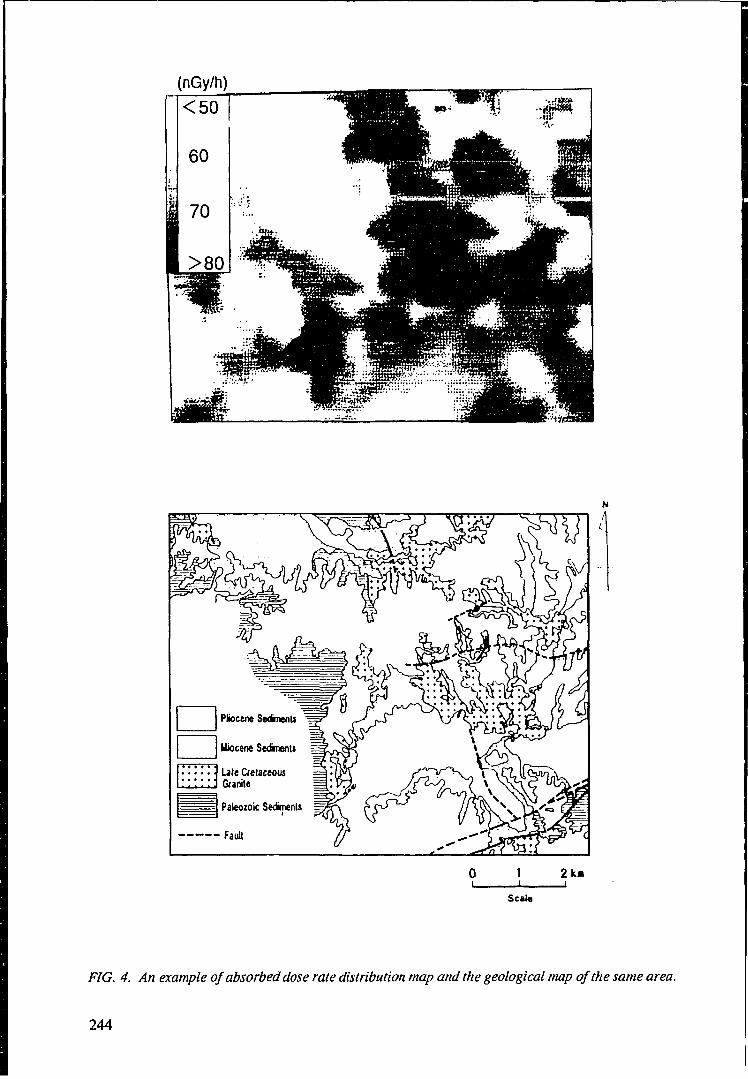
(nGy/h)
Pliocene Segments
Miocene SedknenU
Lite CretaceousGranite
Paleozoic Sediments
Fault
N/
Scale
FIG. 4. An example of absorbed dose rate distribution map and the geological map of the same area.
244
The true gamma ray energy spectra are deconvolved from a measured energy spectrum bya mathematical method called unfolding. This unfolding method leads to absorbed dose rates whichcorrespond to each true energy spectrum.
The exposure rate is obtained by dividing absorbed dose rate by a factor of 0.00873. For the1 cm dose equivalent, true energy spectrum is multiplied by the conversion coefficients which aresuggested in the ICRP Publ. 51.
These features contribute greatly to the natural radiation measurements in the areas where noearlier data is available or in the cities.
4. CONCLUSION
The earlier car-borne data in total count rates is successfully converted into absorbed doserates. It suggests that earlier car-borne data accumulated during domestic uranium exploration can beused to delineate detailed maps of natural radiation distribution in conjunction with the detailedregional geological maps and contributes to the estimation of national background absorbed dose levelin Japan.
ACKNOWLEDGEMENTS
We acknowledge gratefully all members of the committee named "Technical Committee onthe Study of Geological Features and Environmental Radioactivity" which is organized by PNC. Thisstudy was conducted as part of the technical committee's activity.
We would like to express our gratitude and special thanks to Dr. M. Sakanoue, prof, emeritusof Kanazawa University.
REFERENCES
[1] OKADA, S., HASHIMOTO, Y., ITOH, K., Historical review of uranium exploration inJapan. IAEA-TC-543/14 (1985) 193-205.
[2] FUJITAKA, K., ABE, S., FUJIMOTO, M., Distribution of Natural Radiation in Japan inRelation to Geologic Properties. J.Nucl.Sci.Technol. 18 (1981) 222 p.
[3] NELSON, W.R. et al., The EGS4 Code System, SLAC265 (1985).
245
A CALCULATION OF THE GAMMA RADIATION DOSE FROM RADIONUCLIDECONCENTRATION IN ISTRIAN SOILS, CROATIA
E. PROHICFaculty of Natural Sciences, University of Zagreb, Croatia
D. BARISIC, S. LULICRuder Boskovic Institute, Zagreb, Croatia
Abstract
The gamma dose-rates were calculated from the results of spectrometric measurements of radionuclideconcentrations in soils in the area of Istria peninsula, Croatia. Calculated gamma dose-rate conversion factors(GDRCF) for external exposure above ground give external dose rates per unit natural radionuclide concentration insoil. GDRCF in air at a height of 100 cm above ground are tabulated for 40K, 235U decay series + 238U decay series(up to 23OTh), 226Ra decay series as part of 238U decay series, 232Th decay series and complete 238U decay seriesincluding contribution from 235U decay series for various source depths in soil between 4 cm and 100 cm. Thepreliminary results clearly reveal the dependence of natural gamma dose on the lithological characteristics of thebedrock units. The radiometric maps must take into consideration gamma doses from soils as well as from underlayingrocks in the first meters of soil profile. This is of crucial importance especially for the carbonate terrains, where thedifferences between natural radionuclide concentrations in carbonate derived soils and carbonate bedrock could beof two order of magnitude. Furthermore, for soils itself the role of drainage network in migration processes isundoubtedly very important. All these dependences makes us believe that spectrometric measurements and related doserate conversions in connection with in situ dose measurements could be the best choice for radiometric mapping atleast for carbonate terrains with numerous rock outcrops, poor drainage and lithological variability at local scale. Asthese parts of Croatia and Slovenia are well known as world recognized locus typicus of karst terrains, our studycould be taken as a very first step in solving problems of radiometric mapping in similar carbonate terrainsworldwide. The preliminary radiometric map of Istria is our attempt to solve this problem.
1. INTRODUCTION
This work is a part of the national project "General Geochemical Map of Croatia" and alsoin the frame of the UNESCO International Geological Correlation Programme (IGCP) Project 259— International Geochemical Mapping.
Airborne gamma surveys which has been applied and recommended for radiometric mappingof most national territories are not suitable method everywhere mostly due to the complexity of theterrains especially in the areas predominantly covered by carbonate rocks. Additionally, the high costof this technique and some other technical reasons makes this technique unsuitable for the radiometricmapping of the national territory of Republic of Croatia for the time being. In 1969, when part ofRepublic of Slovenia was covered by airborne measurement, only the negligible part along theCroatian-Slovenian border was included. In 70's, during the uranium explorations in Slovenia andCroatia, a part of Croatia mostly covered by clastic rocks (Lika, Gorski Kotar) and terrainspredominantly built of eruptive and metamorphic rocks (Slavonia) were covered by ground gammaray spectrometry. Unfortunately, this territory is, in general, not accessible for the field worknowadays, as well as some data of this investigations. So, any checking of reliability and usefulnessof these data are impossible.
Tht i. A goal of this paper is to give a very first insight into the radionuclide distributionin a typical karst terrain. However, we studied the parameters and factors which could influence theradionuclide concentrations in soils overlaying carbonate rocks together with resulting gamma doses.
247

(
~"-" JPc,E PaUtocene -Eocene
Birremum • Aptun
M 1:500 000
FIG. 1. Geological map of Istria (after Tisljar, J., Velic, I., Radovcic, J., Crnkovic, B., UpperJurassic and Cretaceous peritidal, lagoonal, shallow marine and perireefal carbonate sediments ofIstria, (From: Excursion guide-book, eds. Babi}, LJ., andJelaska, V., Contributions to Sedimentologyof some carbonate and clastic units of the coastal Dinarides), 4h I. A. S. Regional meeting Split,Zagreb (1983) 13-35. ) .
248
Different lithological units, drainage net, thickness of the soil profile, etc, pointed out the influenceof various factors upon the radionuclide concentrations in Istrian soils. It is well known fact that theresulted gamma dose in air is a function of the radionuclide concentration in the first meter of the soilprofile. In carbonate terrains the thickness of the soil is ranging from few centimeters up to severalmeters, even completely missing at significant areas. However, the differences between naturalradionuclide concentrations in carbonate derived soils and carbonate bedrock could be of two orderof magnitude, which additionally complicate the calculations. So, it is necessary to use differentgamma dose-rate conversion factors (depend on soils thickness) in carbonate terrains.
2. GEOLOGY AND HYDROGEOLOGY OF ISTRIA
The Istria peninsula is considered to be the western part of a vast Mesozoic carbonateplatform today recognized as the Outer Dinarides region. This is the classic karst area, where karstphenomena were first studied and from which the name originated. The relief consists of plains, hillsand mountains rising eastwards from the coast to heights of about 1400 m and gradually declining inelevation towards the interior. The belt is characterized by distinct zones of climate, soil developmentand vegetation. The area is composed of Jurassic, Cretaceous, Tertiary and Quaternary sediments(Fig. 1). While western and southern Istria is mainly characterized by shallow marine Jurassic andCretaceous carbonate rocks, the rest of the peninsula is composed of Tertiary foraminiferal limestonesand flysch.
The oldest strata exposed in Istria are Kimmeridgian in age. A very short emergence tookplace after this period, thus causing a local deposition of bauxites. Cretaceous sequence consists ofcarbonate rocks deposited from Tithonian to the Lower Campanian. These sediments had been liftedabove the sea level by the Laramian orogeny and since then they were intensively eroded andkarstified. The final results of these processes are numerous small bauxite deposits covered byPaleogene sediments.
The Early Paleocene was marked with the sedimentation of fresh-water and brackish"Liburnian strata" with coal in the isolated basin. This strata are specially important to this study dueto the high content of radionuclides in coal associated with these strata. These layers are discordantto the intensively karstified Cretaceous base. The large and significant transgression invaded thisregion entirely in the Early Eocene thus causing the marine sedimentation of foraminiferal limestonesand flysch (conglomerates, sandstones, marls and clayey limestones) throughout this period [1].
The total and final emersion occurred at the end of Eocene or at the beginning of Oligocene.The emersion since Early Oligocene until Recent has caused continuous denudation of the Eocene andPaleocene sediments from the greater parts of Istria.
The Quaternary consists of different deposits along the river valleys and in the big karstpoljes. These are black and grey soils, terra rossa, talus deposits, various stream deposits, coastaldeposits and lacustrine clays and sands.
The main feature of the hydrogeology of investigated area is connected with the presence ofcarbonate rocks. A regular surface-drainage system is absent or fragmentary (except in the flyscharea) because most of the rainfall drains underground.
3. SAMPLING AND METHODS
3.1. SAMPLING PROCEDURE
Soil was sampled by channel sampling the upper 15 cm of the soil profile (below the 01 andOf horizons, if present). The fraction of air-dried material that passed through a 2-mm sieve was
249
reduced by repeated comminution and quartering to a grain size less then 0.5 mm. The soil typessampled included rendzinas of the A-C soil profile; brown soil on limestone and dolomite, and terrarossa, of the A-(B)-C soil profile (calcocambiosol); leached brown soils on limestone and dolomite,and terra rossa and rendzina on flysch bedrock [2]. Samples were taken in a regular 5x5 km grid withsample points in the middle of the square with the randomly selected position of the grid of theGeneral Geochemical Map of Croatia. On the same samples the content of inorganic constituents weremeasured for the performing of the geochemical map of Istria. This gives us additional possibilitiesto compare the element and radionuclide contents in the same samples. In this way 131 samples forwhole Istria were collected and 125 of them were analysed by the gamma ray spectrometry.
3.2. GAMMA RAY SPECTROMETRY
Soil samples were placed in the counting vessels, sealed and stored at least for 4 weeks toallow ingrowth period of gaseous 222Rn. At the end of the ingrowth period, the samples were countedon a Ge-Li semiconductor detector joined to 4096 channel analyser "Canberra". The detector systemwas calibrated using standards supplied by both the National Bureau of Standards (USA) andAmersham International (UK). Precision and accuracy was checked by simultaneous measurement ofIAEA standards (IAEA-306, IAEA-313 and IAEA-314). Depending on radionuclide activities, spectrawere recorded for times ranging from 80,000 to 150,000 seconds. Activities of '"'K were calculatedfrom the 1460.75 keV-peak, 137Cs from 661.6 keV-peak, 226Ra (as a mean value) from 609.3 keV-peak of its 214Bi progeny and 352 keV-peak of its 2MPb progeny, 228Ac from 911.1 keV-peak and 235Ufrom 186 keV-peak (after subtraction of the overlapping 226Ra peak). Concentrations of 238U werecalculated from the 235U activity assuming the 235U/238U activity ratio of 0.04603 [3].
3.3. CALCULATION OF GAMMA DOSE-RATE
Radionuclides presented in soil can be classified into two main categories; naturalradionuclides (primordial with their radioactive daughters) and radionuclides generated by man'sactivities (in practice, mainly l37Cs from fallout after atmospheric nuclear tests and Chernobylaccident).
Primordial radionuclides can be considered to be relatively uniformly distributed in the firsthundred centimeters of vertical soil profile and the natural radionuclides concentrations at any depthin soil is assumed to be uniform over an infinite surface parallel to the ground plane. The dose-rate,at a point on the ground surface from a monoenergetic gamma source, can be found by integratingthe plane source over the depth of soil [4]. The calculation of GDRCF, presented in Table I, wasbased on dose-rate conversion factors in air published by [6] and assumption than soil density is 1.4g cm'3. Obtained GDRCF are in excelent agreement with previously published [5] and [7] in case ofmK and ^Th decay series while in case of 238U decay series calculated values are about 9% higher.Calculated values are obtained on basis of both, [8] and [9], gamma energy and intensity of emissionsand results were practically the same. Radioactive equilibrium in decay series was supposed in allcases although it wasn't found in 238U decay series in Istrian soils [10]. That was reason for tabulatingGDRCF for 226Ra including it's decay products.
GDRCF, for exponentially distributed 137Cs in soils, of 112.5 pGy h'1 per Bq kg'1 was foundon the basis of, by [11] published l37Cs dose-rate conversion factor (4.5 x 10'13 Gy h"1 per Bq m2),and assumption that 137Cs concentration of 1 Bg kg'1 in the first 15 cm of soil is equivalent to l37Cscontamination of 250 Bg m'2.
250
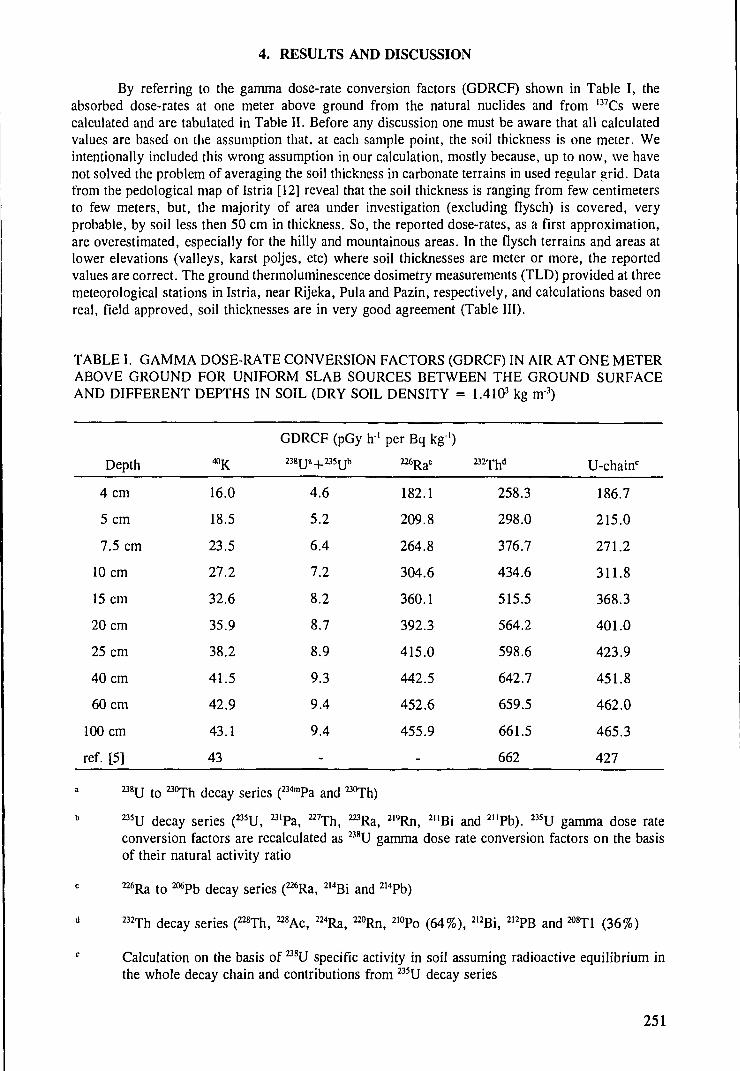
4. RESULTS AND DISCUSSION
By referring to the gamma dose-rate conversion factors (GDRCF) shown in Table I, theabsorbed dose-rates at one meter above ground from the natural nuclides and from 137Cs werecalculated and are tabulated in Table II. Before any discussion one must be aware that all calculatedvalues are based on the assumption that, at each sample point, the soil thickness is one meter. Weintentionally included this wrong assumption in our calculation, mostly because, up to now, we havenot solved the problem of averaging the soil thickness in carbonate terrains in used regular grid. Datafrom the pedological map of Istria [12] reveal that the soil thickness is ranging from few centimetersto few meters, but, the majority of area under investigation (excluding flysch) is covered, veryprobable, by soil less then 50 cm in thickness. So, the reported dose-rates, as a first approximation,are overestimated, especially for the hilly and mountainous areas. In the flysch terrains and areas atlower elevations (valleys, karst poljes, etc) where soil thicknesses are meter or more, the reportedvalues are correct. The ground thermoluminescence dosimetry measurements (TLD) provided at threemeteorological stations in Istria, near Rijeka, Pula and Pazin, respectively, and calculations based onreal, field approved, soil thicknesses are in very good agreement (Table III).
TABLE I. GAMMA DOSE-RATE CONVERSION FACTORS (GDRCF) IN AIR AT ONE METERABOVE GROUND FOR UNIFORM SLAB SOURCES BETWEEN THE GROUND SURFACEAND DIFFERENT DEPTHS IN SOIL (DRY SOIL DENSITY = 1.4103 kg m'3)
Depth
4 cm
5 cm
7.5 cm
10 cm
15 cm
20 cm
25 cm
40 cm
60 cm
100 cm
ref. [5]
4O K
16.0
18.5
23.5
27.2
32.6
35.9
38.2
41.5
42.9
43.1
43
GDRCF (pGy h1
238Ua + 235Ub
4.6
5.2
6.4
7.2
8.2
8.7
8.9
9.3
9.4
9.4
-
per Bq kg1)
2 2 6 R a C 2
182.1
209.8
264.8
304.6
360.1
392.3
415.0
442.5
452.6
455.9
-
258.3
298.0
376.7
434.6
515.5
564.2
598.6
642.7
659.5
661.5
662
U-chainc
186.7
215.0
271.2
311.8
368.3
401.0
423.9
451.8
462.0
465.3
427
a 8 U to 23OTh decay series (234mPa and °°Th)
M5U decay series (235U, "'Pa, "Th , ^Ra, 2l9Rn, 2llBi and 2IIPb). 235U gamma dose rateconversion factors are recalculated as 238U gamma dose rate conversion factors on the basisof their natural activity ratio
226Ra t Q 206pb d e c a y s e r i e s (226Ra> 2l4Ri a n ( ] 2I4pb)
B2Th decay series (228Th, 228Ac, 224Ra, 2aRn, 2l0Po (64%), 212Bi, 2I2PB and 2O8T1 (36%)
Calculation on the basis of a8U specific activity in soil assuming radioactive equilibrium inthe whole decay chain and contributions from 235U decay series
251
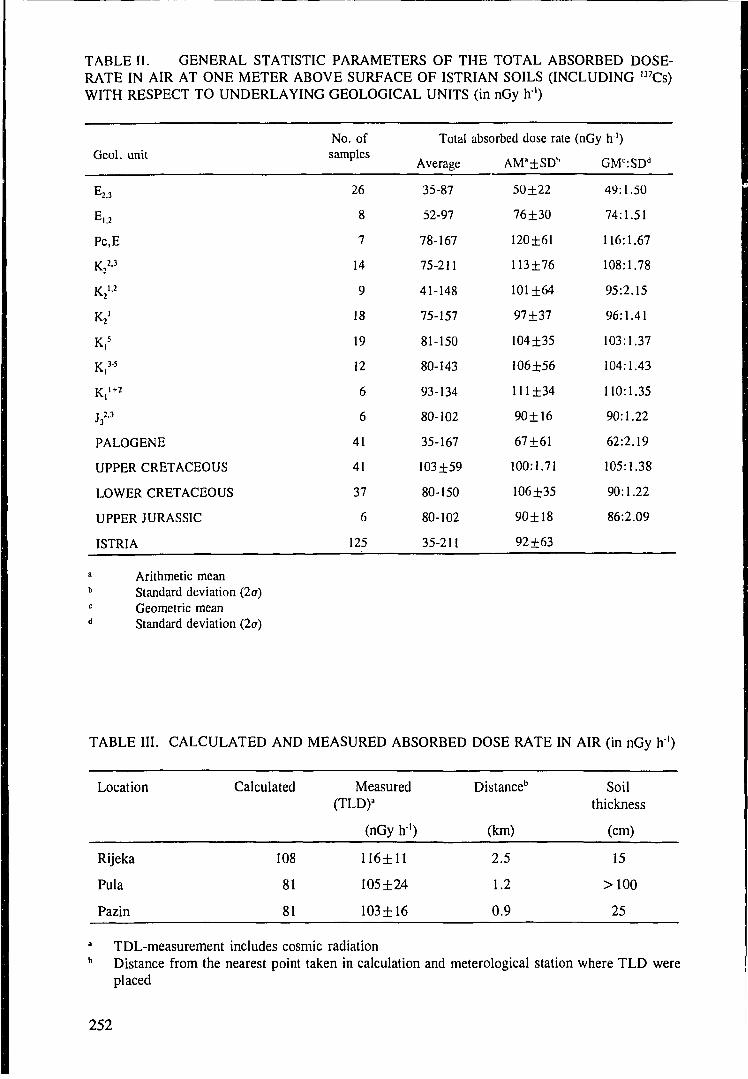
TABLE II. GENERAL STATISTIC PARAMETERS OF THE TOTAL ABSORBED DOSE-RATE IN AIR AT ONE METER ABOVE SURFACE OF ISTRIAN SOILS (INCLUDING 137Cs)WITH RESPECT TO UNDERLAYING GEOLOGICAL UNITS (in nGy h')
Geol. unit
E2.3
E,,2
Pc,E
K2"
K2''2
K2'
K,5
K «
K,1+2
J , "
PALOGENE
UPPER CRETACEOUS
LOWER CRETACEOUS
UPPER JURASSIC
ISTRIA
No. ofsamples
26
8
7
14
9
18
19
12
6
6
41
41
37
6
125
Total
Average
35-87
52-97
78-167
75-211
41-148
75-157
81-150
80-143
93-134
80-102
35-167
103 ±59
80-150
80-102
35-211
absorbed dose rate
AMa±SDb
50 ±22
76 ±30
120±61
113±76
101 ±64
97 ±37
104±35
106±56
111±34
90+16
67 ±61
100:1.71
106±35
90±18
92 ±63
(nGy h ' )
GMc:SDd
49:1.50
74:1.51
116:1.67
108:1.78
95:2.15
96:1.41
103:1.37
104:1.43
110:1.35
90:1.22
62:2.19
105:1.38
90:1.22
86:2.09
Arithmetic meanStandard deviation (2a)Geometric meanStandard deviation (2a)
TABLE HI. CALCULATED AND MEASURED ABSORBED DOSE RATE IN AIR (in nGy h1)
Location Calculated
108
81
81
Measured(TLD)a
(nGy h1)
116±11
105 ±24
103 ±16
Distance"
(km)
2.5
1.2
0.9
Soilthickness
(cm)
15
>100
25
Rijeka
Pula
Pazin
a TDL-measurement includes cosmic radiationb Distance from the nearest point taken in calculation and meterological station where TLD were
placed
252
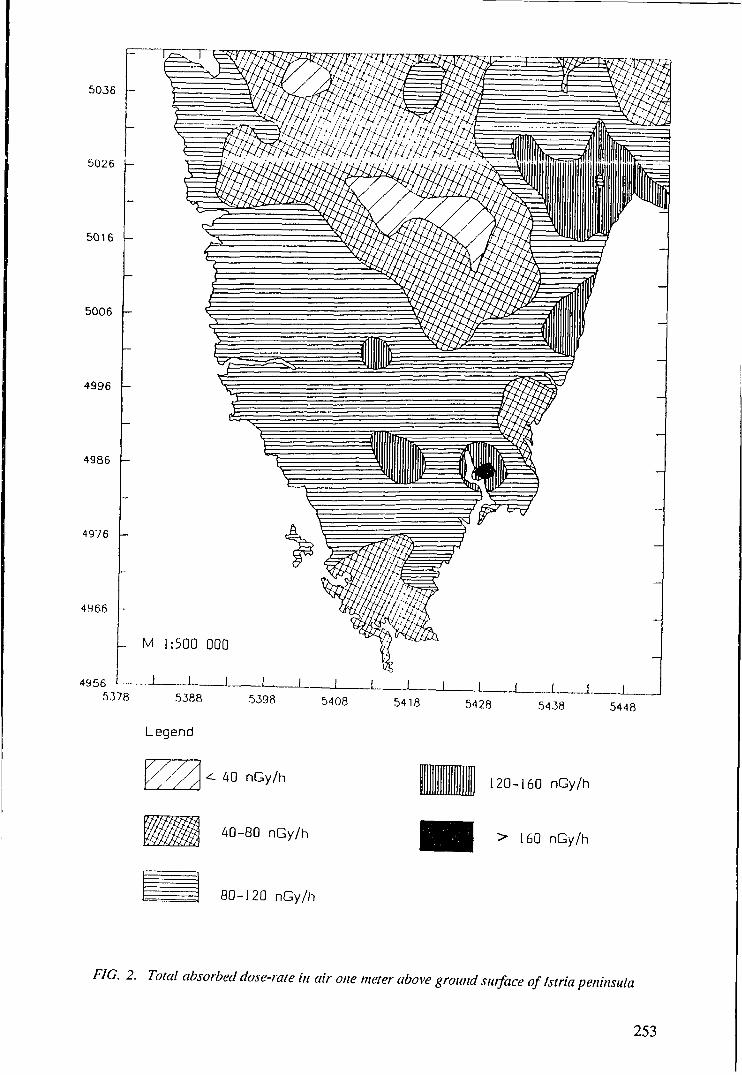
50 3 6 -
5026 t-
5016 -
5006 -
4996 -
5388 5398 5408 5418 5428 5438 5448
Legend
40 nGy/h
40-80 nGy/h
80-120 nGy/h
120-160 nGy/h
> 160 nGy/h
FIG. 2. Total absorbed dose-rate in air one meter above ground surface of /stria peninsula
253
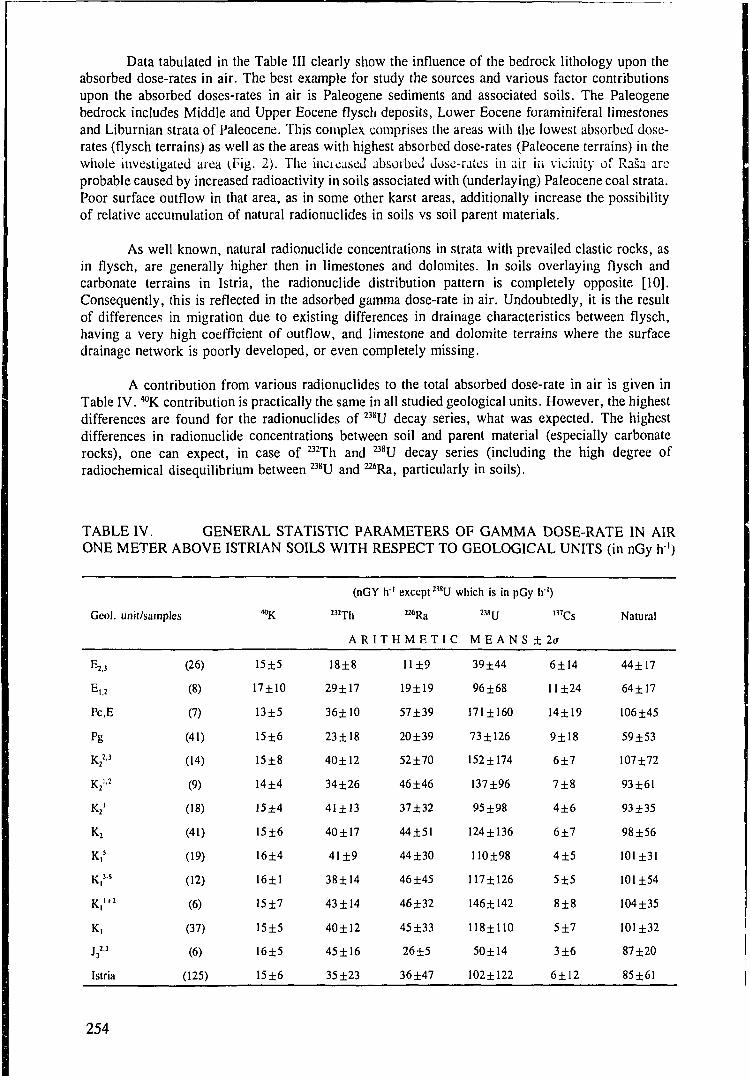
Data tabulated in the Table III clearly show the influence of the bedrock lithology upon theabsorbed dose-rates in air. The best example for study the sources and various factor contributionsupon the absorbed doses-rates in air is Paleogene sediments and associated soils. The Paleogenebedrock includes Middle and Upper Eocene flysch deposits, Lower Eocene foraminiferal limestonesand Liburnian strata of Paleocene. This complex comprises the areas with the lowest absorbed dose-rates (flysch terrains) as well as the areas with highest absorbed dose-rates (Paleocene terrains) in thewhole investigated area (.Fig. 2). The increased absorbed Jose-rates in air in vicinity of Rasa arcprobable caused by increased radioactivity in soils associated with (underlaying) Paleocene coal strata.Poor surface outflow in that area, as in some other karst areas, additionally increase the possibilityof relative accumulation of natural radionuclides in soils vs soil parent materials.
As well known, natural radionuclide concentrations in strata with prevailed clastic rocks, asin flysch, are generally higher then in limestones and dolomites. In soils overlaying flysch andcarbonate terrains in Istria, the radionuclide distribution pattern is completely opposite [10].Consequently, this is reflected in the adsorbed gamma dose-rate in air. Undoubtedly, it is the resultof differences in migration due to existing differences in drainage characteristics between flysch,having a very high coefficient of outflow, and limestone and dolomite terrains where the surfacedrainage network is poorly developed, or even completely missing.
A contribution from various radionuclides to the total absorbed dose-rate in air is given inTable IV. ^K contribution is practically the same in all studied geological units. However, the highestdifferences are found for the radionuclides of 238U decay series, what was expected. The highestdifferences in radionuclide concentrations between soil and parent material (especially carbonaterocks), one can expect, in case of a2Th and B8U decay series (including the high degree ofradiochemical disequilibrium between H8U and ^Ra, particularly in soils).
TABLE IV. GENERAL STATISTIC PARAMETERS OF GAMMA DOSE-RATE IN AIRONE METER ABOVE ISTRIAN SOILS WITH RESPECT TO GEOLOGICAL UNITS (in nGy h1)
Geol.
E2.3
E,2
Pc,E
Pg
K2«
K2'
K2
K,5
K,»
K, l+2
K,
J »
Istria
unit/samples
(26)
(8)
(7)
(41)
(14)
(9)
(18)
(41)
(19)
(12)
(6)
(37)
(6)
(125)
<°K
15±5
17±10
13±5
15±6
15±8
14±4
15±4
15±6
16±4
16±1
15±7
15±5
16±5
15±6
(nGYh
"2Th
A R I T
18±8
29 ±17
36±10
23±18
40±12
34 ±26
41 ±13
40 ±17
41±9
38±14
43±14
40±12
45±16
35±23
1 except 238U
"6Ra
H M E T I
11 ±9
19±19
57 ±39
20 ±39
52 ±70
46 ±46
37 ±32
44±51
44 ±30
46±45
46±32
45 ±33
26±5
36±47
which is in pGy
»8U
C M E A N S
39±44
96±68
171±160
73 ±126
152±174
137±96
95 ±98
124±136
110±98
117±126
146±142
118±110
50±14
102±122
IV)
l37Cs
± la
6±14
11 ±24
14±19
9±18
6±7
7±8
4±6
6±7
4±5
5±5
8±8
5±7
3±6
6±12
Natural
44±17
64 ±17
106±45
59±53
107±72
93±61
93 ±35
98±56
101±31
101 ±54
104 ±35
101 ±32
87 ±20
85±61
254
5. CONCLUSIONS
The presented paper suggests that, for the carbonate terrains, various factors should beconsidered in order to make a radiometric map of good quality. The main problems are: averagingthe soil thickness for the entire sampling grid which the particular sampling point represents;significant difference in radionuclide concentrations between soils and underlaying carbonate rocksand high degree of radiocliemical disequilibrium between :JSU and ::°Ra in soils derived fromcarbonate rocks.
The airborne gamma survey in carbonate terrains could provide only very general picture ofradiometric characteristics of this terrains. For our opinion, the radiometric mapping of carbonateterrains should include data from in situ gamma dose-rate measurements together with laboratorygamma ray spectrometry of samples taken at the same locality. Due to the high variability of soiltypes and thicknesses and lithologic types of bedrocks at local scale, the much denser sampling gridmust be applied.
For the proposed study, as the model area for carbonate terrains, or karst sensus stricto, thearea of the Istria peninsula seems to be highly promising. This paper presents the beginning ofcomplex study under the project of Radiometric Map of Croatia.
BIBLIOGRAPHY
TISLJAR, J., VELIC, I., RADOVCIC, J., CRNKOVIC, B., Upper Jurassic and Cretaceous peritidal,lagoonal, shallow marine and perireefal carbonate sediments of Istria, (From: Excursion guide-book,eds. Babi}, LJ., and Jelaska, V., Contributions to Sedimentology of some carbonate and clastic unitsof the coastal Dinarides), 4Ul I. A. S. Regional meeting Split, Zagreb (1983) 13-35.
PIRC, S., McNEAL, J. M., LENARCIC, E., PROHIC, E., SVRKOTA, E., Geochemical mappingof carbonate terrains, Trans. Instn. Min. Metall. (Sec. B: Appl. Earth Sci.) 100 (1991) B74-B87.
MURRAY, A. S., AITKEN, M. J., Analysis of low-level natural radioactivity in small mineralsamples for use in thermoluminescence dating, using high-resolution gamma spectrometry, Int. J.Appl. Radiat. Isot. 39 2 (1988) 145-158.
DICKSON, H. W., KERR, G. D., Dose Rates from Plane Sources of Gamma Rays, Health Phys.29(1975) 131-136.
UNITED NATIONS, Sources, Effects and Risk of Ionizing Radiation, United Nations ScientificCommittee on the Effects of Atomic Radiation 1988 Report to the General Assembly, with annexes,UN sales publication No. E.88.IX.7. New York (1988).
KOCHER, D. C , SJOREEN, A. L., Dose-Rate Conversion Factors for External Exposure to PhotonEmitters in Soil, Health Phys. 48 2 (1985) 193-205.
UNITED NATIONS, Ionizing Radiation: Sources and Biological Effects, United Nations ScientificCommittee on the Effects of Atomic Radiation 1982 Report to the General Assembly, with annexes,UN sales publication No. E.82.IX.8. New York (1982).
ERDTMAN, G., SOYKA, W., The gamma rays of the radionuclides, Werlag Chemie, Weinheim,New York (1979).
INTERNATIONAL COMMISSION ON RADIOLOGICAL PROTECTION, Radionuclidetransformations. Energy and intensity of emissions, ICRP publication 38. Pergamon Press, (1983).
255
BARSlC, D., Radionuclides in soils of Istria, PhD Thesis, Zagreb University, Zagreb (1993). (inCroatian, extended abstract in English)
LEUNG, K. C , LAU, S. Y., POON, C. B., Gamma Radiation Dose from Radionuclides in HongKong Soil, J. Environ. Radioactivity, 11 (1990) 279-290.
SKORIC, A., ADAM, M., BASIC, F., BOGUNOVIC, M., CESTAR, D., MARTINOVIC, J.,MAYER, B., MILOS, B., VFDA^EK, Z., Pedosfera Istre, Mladost, Zagreb (1987).
256
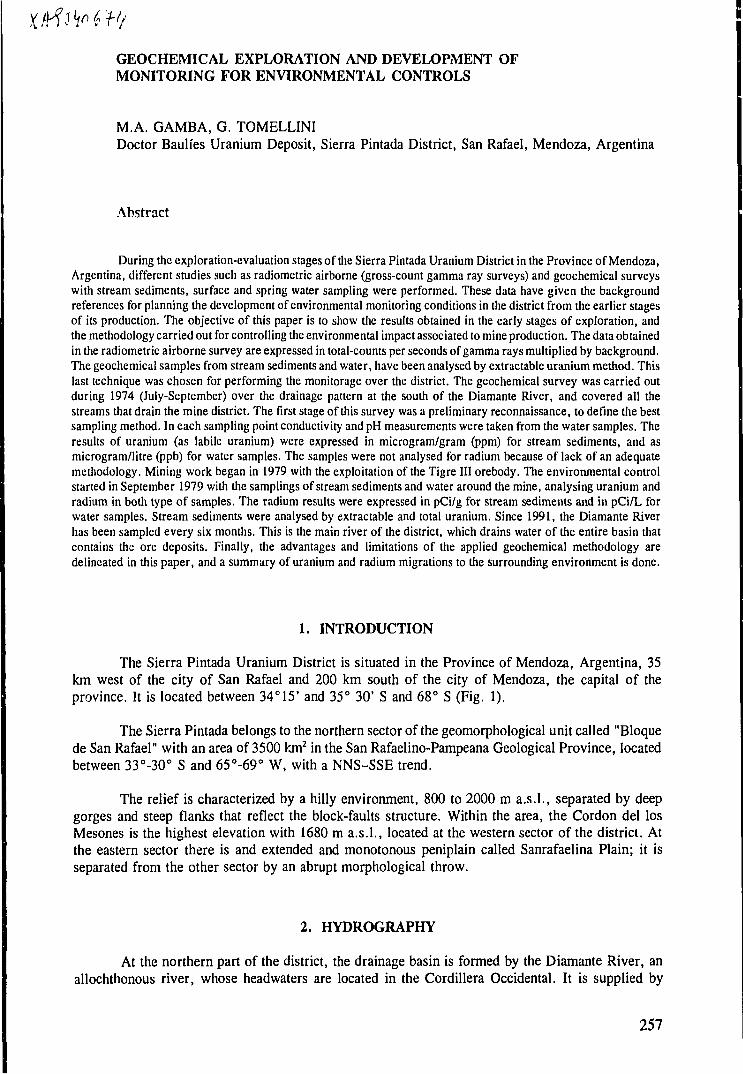
GEOCHEMICAL EXPLORATION AND DEVELOPMENT OFMONITORING FOR ENVIRONMENTAL CONTROLS
M.A. GAMBA, G. TOMELLINIDoctor Baulfes Uranium Deposit, Sierra Pintada District, San Rafael, Mendoza, Argentina
Abstract
During the exploration-evaluation stages of the Sierra Pintada Uranium District in the Province of Mendoza,Argentina, different studies such as radiometric airborne (gross-count gamma ray surveys) and geochemical surveyswith stream sediments, surface and spring water sampling were performed. These data have given the backgroundreferences for planning the development of environmental monitoring conditions in the district from the earlier stagesof its production. The objective of this paper is to show the results obtained in the early stages of exploration, andthe methodology carried out for controlling the environmental impact associated to mine production. The data obtainedin the radiometric airborne survey are expressed in total-counts per seconds of gamma rays multiplied by background.The geochemical samples from stream sediments and water, have been analysed by extractable uranium method. Thislast technique was chosen for performing the monitorage over the district. The geochemical survey was carried outduring 1974 (July-September) over the drainage pattern at the south of the Diamante River, and covered all thestreams that drain the mine district. The first stage of this survey was a preliminary reconnaissance, to define the bestsampling method. In each sampling point conductivity and pH measurements were taken from the water samples. Theresults of uranium (as labile uranium) were expressed in microgram/gram (ppm) for stream sediments, and asmicrogram/litre (ppb) for water samples. The samples were not analysed for radium because of lack of an adequatemethodology. Mining work began in 1979 with the exploitation of the Tigre III orebody. The environmental controlstarted in September 1979 with the samplings of stream sediments and water around the mine, analysing uranium andradium in both type of samples. The radium results were expressed in pCi/g for stream sediments and in pCi/L forwater samples. Stream sediments were analysed by extractable and total uranium. Since 1991, the Diamante Riverhas been sampled every six months. This is the main river of the district, which drains water of the entire basin thatcontains the ore deposits. Finally, the advantages and limitations of the applied geochemical methodology aredelineated in this paper, and a summary of uranium and radium migrations to the surrounding environment is done.
1. INTRODUCTION
The Sierra Pintada Uranium District is situated in the Province of Mendoza, Argentina, 35km west of the city of San Rafael and 200 km south of the city of Mendoza, the capital of theprovince. It is located between 34° 15' and 35° 30' S and 68° S (Fig. 1).
The Sierra Pintada belongs to the northern sector of the geomorphological unit called "Bloquede San Rafael" with an area of 3500 km2 in the San Rafaelino-Pampeana Geological Province, locatedbetween 33°-3O° S and 65°-69° W, with a NNS-SSE trend.
The relief is characterized by a hilly environment, 800 to 2000 m a.s.l., separated by deepgorges and steep flanks that reflect the block-faults structure. Within the area, the Cordon del losMesones is the highest elevation with 1680 m a.s.l., located at the western sector of the district. Atthe eastern sector there is and extended and monotonous peniplain called Sanrafaelina Plain; it isseparated from the other sector by an abrupt morphological throw.
2. HYDROGRAPHY
At the northern part of the district, the drainage basin is formed by the Diamante River, anallochthonous river, whose headwaters are located in the Cordillera Occidental. It is supplied by
257
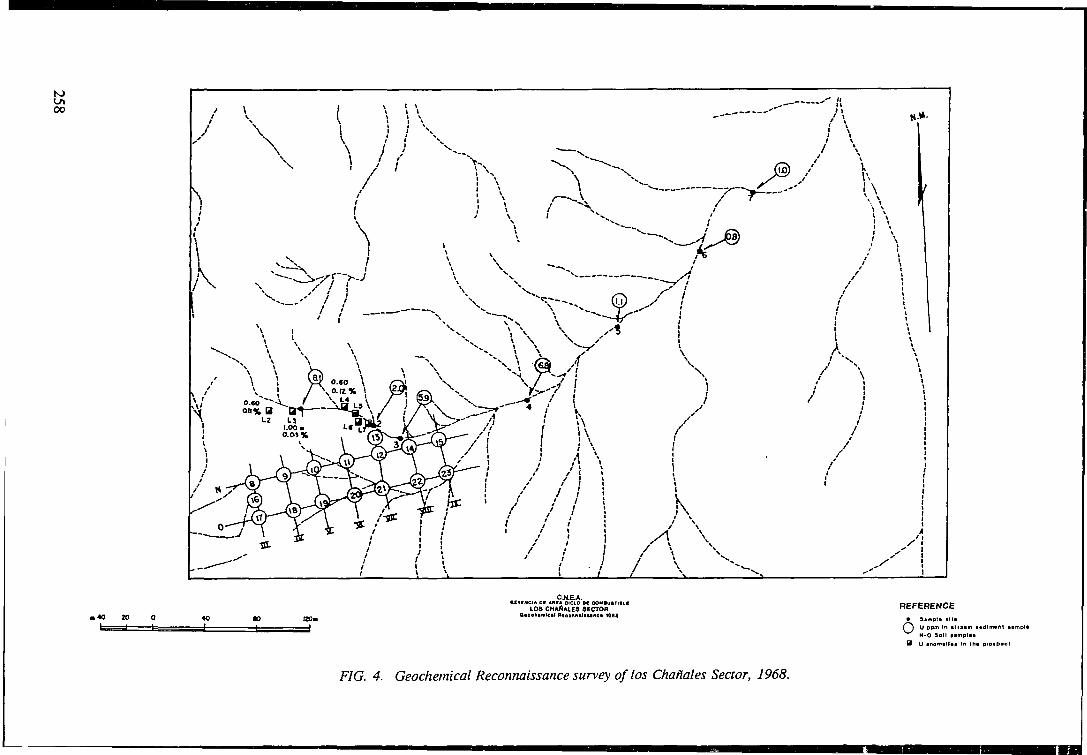
0 0I
\
* » •
i\
C.RE.A.•MCMCIA Of AREA CtCtO OC COUIUITItLC
LOS CHADAIE9 SECTOROaochamical RaoonnaltMnoa 1S««
REFERENCE
•B
SampU a | | *U DC"" In allN-0 Soil ••«
3am •«nplsa
dim* ni lamp)*
f/G. 4. Geochemical Reconnaissance survey oflos Chanales Sector, 1968.
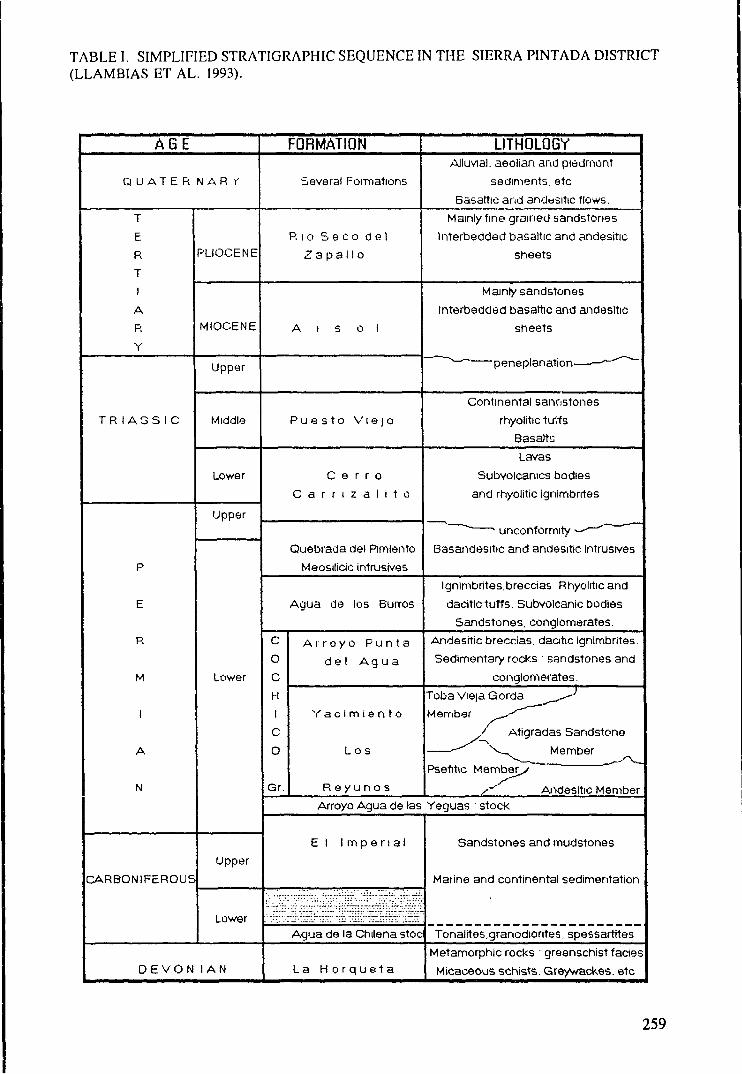
TABLE I. SIMPLIFIED STRATIGRAPHIC SEQUENCE IN THE SIERRA PINTADA DISTRICT(LLAMBIAS ET AL. 1993).
A G E
Q UAT E R N AR r
T
E
R
T
1
A
R
Y
T R 1 A 3 S 1 C
P
E
R
M
1
A
N
CARBONIFEROUS
PLIOCENE
MIOCENE
Upper
Middle
Lower
Upper
Lower
Upper
Lower
D E V O N I A N
FORMATION
Several Formations
R i o S e c o d e l
Z a p a l 1 o
A 1 S O I
P u e s t o V i e | o
C e r r o
C a r r i z a 1 i t o
Quebrada del Pimiento
Meosilicic intrusives
Agua de los Burros
C
O
C
H
1
C
O
Gr.
A r r o y o Pun ta
de l A g u a
Y a c i m i e n t o
Los
R e y u n o s
LITHOLOGYAlluvial, aeolian and piedmont
sediments, etc
Basaltic and andesitic flows.
Mainly fine grained sandstones
Interbedded basaltic and andesitic
sheets
Mainly sandstones
Interbedded basaltic and andesitic
sheets
^ peneplanation—•—•~-~^^~
Continental sancistones
rhyolitic fulls
Basalts
Lavas
Subvolcanics bodies
and rhyolitic ignimbrrtes
"*~ v unconformity -^—"" " ~
Basandesitic and andesitic intrusives
Ignimbrites. breccias Rhyohtic and
dacitic tuffs. Subvolcanic bodies
Sandstones, conglomerates.
Andesitic breccias, dacitic ignimbrites.
Sedimentary rocks • sandstones and
conglomerates.
Toba Vie|aGorda ^ ^ ^
Member _^""
' Atigradas Sandstone
\ Member
Psefitic Member^/
/^ Andesitic MemberArroyo Agua de las Yeguas : stock
E l I m p e r i a l
Agua de la Chilena stoc
L a H o r q u e t a
Sandstones and mudstones
Maiine and continental sedimentation
Tonalites.granodiorites, spessartites
Metamorphic rocks greenschist fades
Micaceous schists. Greywackes. etc
259
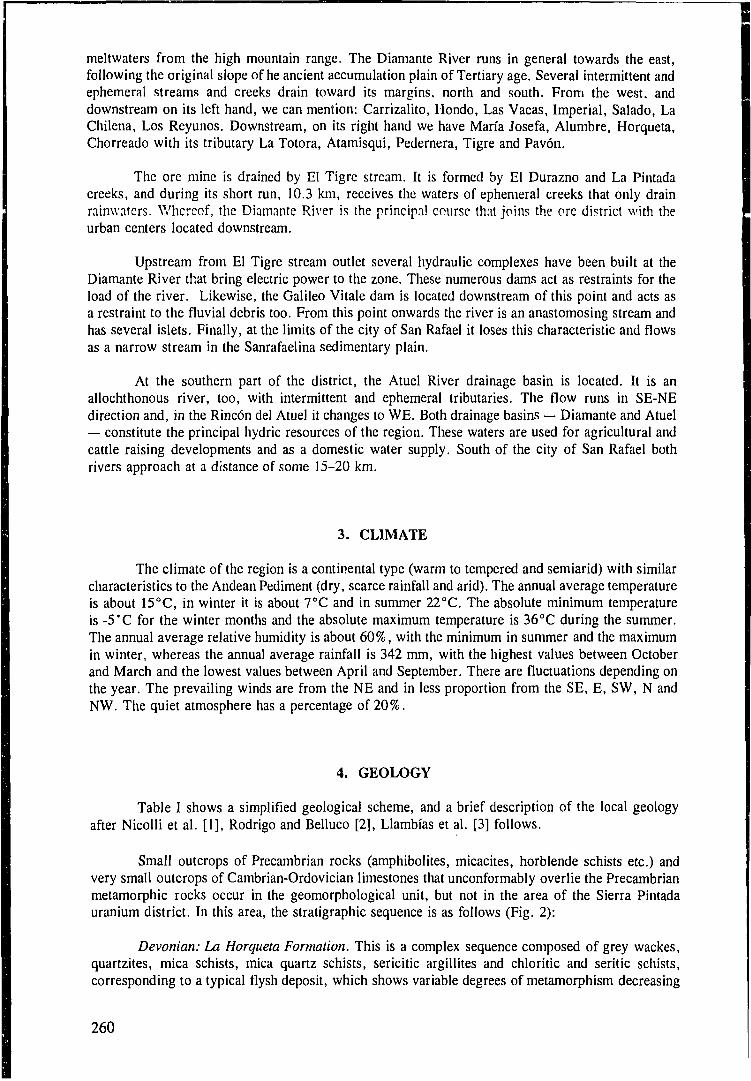
meltwaters from the high mountain range. The Diamante River runs in general towards the east,following the original slope of he ancient accumulation plain of Tertiary age. Several intermittent andephemeral streams and creeks drain toward its margins, north and south. From the west, anddownstream on its left hand, we can mention: Carrizalito, Hondo, Las Vacas, Imperial, Salado, LaChilena, Los Reyunos. Downstream, on its right hand we have Maria Josefa, Alumbre, Horqueta,Chorreado with its tributary La Totora, Atamisqui, Pedernera, Tigre and Pavon.
The ore mine is drained by El Tigre stream. It is formed by El Durazno and La Pintadacreeks, and during its short run, 10.3 km, receives the waters of ephemeral creeks that only drainrainwaters. Whereof, the Diamante River is the principal course that joins the ore district with theurban centers located downstream.
Upstream from El Tigre stream outlet several hydraulic complexes have been built at theDiamante River that bring electric power to the zone. These numerous dams act as restraints for theload of the river. Likewise, the Galileo Vitale dam is located downstream of this point and acts asa restraint to the fluvial debris too. From this point onwards the river is an anastomosing stream andhas several islets. Finally, at the limits of the city of San Rafael it loses this characteristic and flowsas a narrow stream in the Sanrafaelina sedimentary plain.
At the southern part of the district, the Atuel River drainage basin is located. It is anallochthonous river, too, with intermittent and ephemeral tributaries. The flow runs in SE-NEdirection and, in the Rincon del Atuel it changes to WE. Both drainage basins — Diamante and Atuel— constitute the principal hydric resources of the region. These waters are used for agricultural andcattle raising developments and as a domestic water supply. South of the city of San Rafael bothrivers approach at a distance of some 15-20 km.
3. CLIMATE
The climate of the region is a continental type (warm to tempered and semiarid) with similarcharacteristics to the Andean Pediment (dry, scarce rainfall and arid). The annual average temperatureis about 15°C, in winter it is about 7°C and in summer 22°C. The absolute minimum temperatureis -5'C for the winter months and the absolute maximum temperature is 36°C during the summer.The annual average relative humidity is about 60%, with the minimum in summer and the maximumin winter, whereas the annual average rainfall is 342 mm, with the highest values between Octoberand March and the lowest values between April and September. There are fluctuations depending onthe year. The prevailing winds are from the NE and in less proportion from the SE, E, SW, N andNW. The quiet atmosphere has a percentage of 20%.
4. GEOLOGY
Table I shows a simplified geological scheme, and a brief description of the local geologyafter Nicolli et al. [1], Rodrigo and Belluco [2], Llambias et al. [3] follows.
Small outcrops of Precambrian rocks (amphibolites, micacites, horblende schists etc.) andvery small outcrops of Cambrian-Ordovician limestones that unconformably overlie the Precambrianmetamorphic rocks occur in the geomorphological unit, but not in the area of the Sierra Pintadauranium district. In this area, the stratigraphic sequence is as follows (Fig. 2):
Devonian: La Horqueta Formation. This is a complex sequence composed of grey wackes,quartzites, mica schists, mica quartz schists, sericitic argillites and chloritic and seritic schists,corresponding to a typical flysh deposit, which shows variable degrees of metamorphism decreasing
260
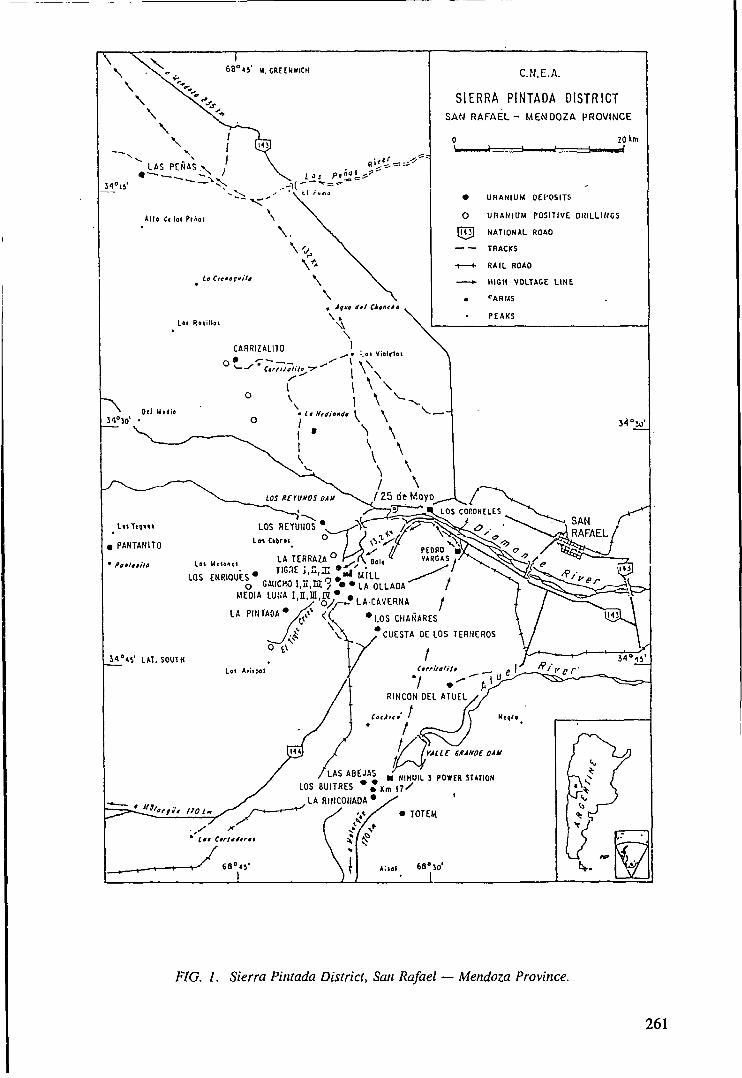
6 8 ° < j ' yf. GREENWICHC.N.E.A.
SIERRA PINTAOA DISTRICTSAN R A F A E L - M E N O O Z A PROVINCE
20 km
• URANIUM OEHOSITS
O URANIUM POSITIVE OKILLIHGS
NATIONAL ROAO
TRACKS
RAIL ROAO
HIGH VOLTAGE LINE
CARMS
PEAKS
MEDIA LUKAI,K f f i,
LA PINTAOA # /J> <;
\ \ "CUESTA OE LOS TERHEROS
FIG. 1. Sierra Pintada District, San Rafael — Mendoza Province.
261
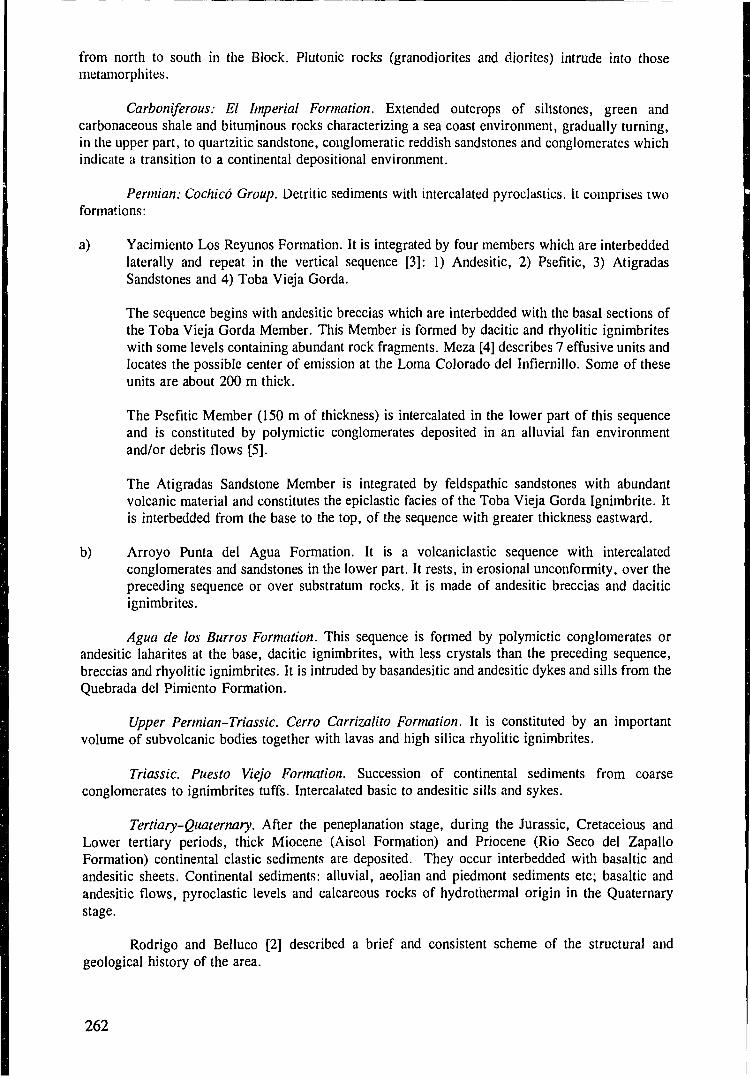
from north to south in the Block. Plutonic rocks (granodiorites and diorites) intrude into thosemetamorphites.
Carboniferous: El Imperial Formation. Extended outcrops of siltstones, green andcarbonaceous shale and bituminous rocks characterizing a sea coast environment, gradually turning,in the upper part, to quartzitic sandstone, conglomeratic reddish sandstones and conglomerates whichindicate a transition to a continental depositional environment.
Permian: Cochico Group. Detritic sediments with intercalated pyroclasiics. It comprises twoformations:
a) Yacimiento Los Reyunos Formation. It is integrated by four members which are interbeddedlaterally and repeat in the vertical sequence [3]: 1) Andesitic, 2) Psefitic, 3) AtigradasSandstones and 4) Toba Vieja Gorda.
The sequence begins with andesitic breccias which are interbedded with the basal sections ofthe Toba Vieja Gorda Member. This Member is formed by dacitic and rhyolitic ignimbriteswith some levels containing abundant rock fragments. Meza [4] describes 7 effusive units andlocates the possible center of emission at the Loma Colorado del Infiernillo. Some of theseunits are about 200 m thick.
The Psefitic Member (150 m of thickness) is intercalated in the lower part of this sequenceand is constituted by polymictic conglomerates deposited in an alluvial fan environmentand/or debris flows [5].
The Atigradas Sandstone Member is integrated by feldspathic sandstones with abundantvolcanic material and constitutes the epiclastic facies of the Toba Vieja Gorda Ignimbrite. Itis interbedded from the base to the top, of the sequence with greater thickness eastward.
b) Arroyo Punta del Agua Formation. It is a volcaniclastic sequence with intercalatedconglomerates and sandstones in the lower part. It rests, in erosional unconformity, over thepreceding sequence or over substratum rocks. It is made of andesitic breccias and daciticignimbrites.
Agua de los Burros Formation. This sequence is formed by polymictic conglomerates orandesitic laharites at the base, dacitic ignimbrites, with less crystals than the preceding sequence,breccias and rhyolitic ignimbrites. It is intruded by basandesitic and andesitic dykes and sills from theQuebrada del Pimiento Formation.
Upper Permian-Triassic. Cerro Carrizalito Formation. It is constituted by an importantvolume of subvolcanic bodies together with lavas and high silica rhyolitic ignimbrites.
Triassic. Puesto Viejo Formation. Succession of continental sediments from coarseconglomerates to ignimbrites tuffs. Intercalated basic to andesitic sills and sykes.
Tertiary-Quaternary. After the peneplanation stage, during the Jurassic, Cretaceious andLower tertiary periods, thick Miocene (Aisol Formation) and Priocene (Rio Seco del ZapalloFormation) continental clastic sediments are deposited. They occur interbedded with basaltic andandesitic sheets. Continental sediments: alluvial, aeolian and piedmont sediments etc; basaltic andandesitic flows, pyroclastic levels and calcareous rocks of hydrothermal origin in the Quaternarystage.
Rodrigo and Belluco [2] described a brief and consistent scheme of the structural andgeological history of the area.
262
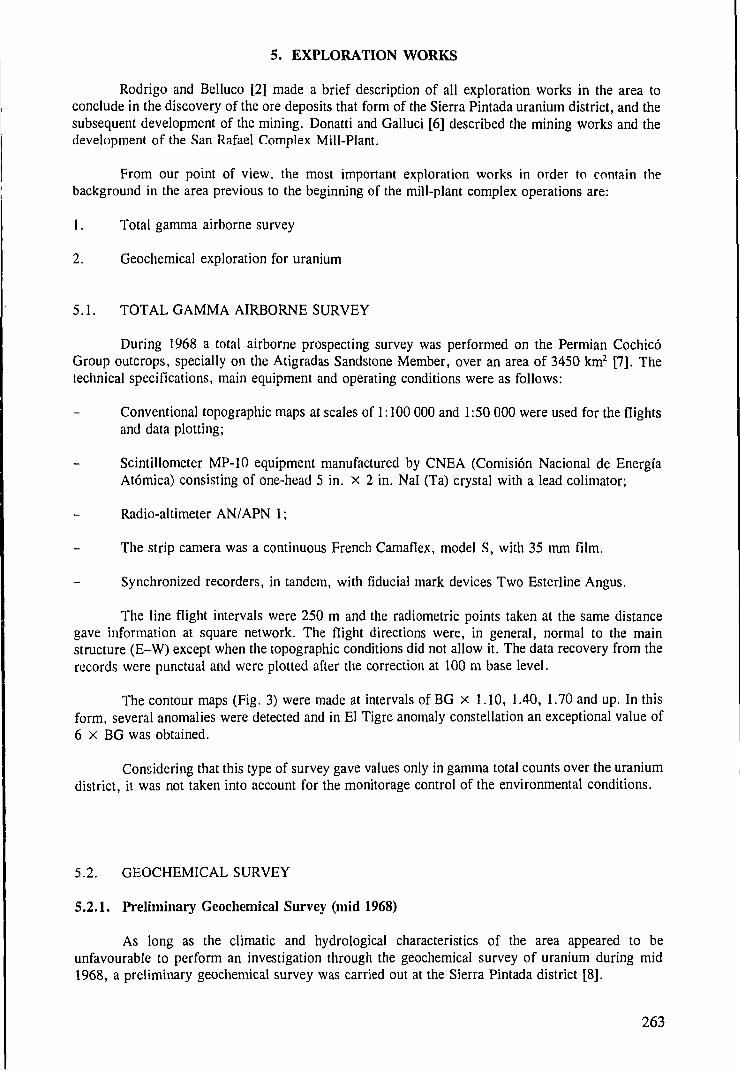
5. EXPLORATION WORKS
Rodrigo and Belluco [2] made a brief description of all exploration works in the area toconclude in the discovery of the ore deposits that form of the Sierra Pintada uranium district, and thesubsequent development of the mining. Donatti and Galluci [6] described the mining works and thedevelopment of the San Rafael Complex Mill-Plant.
From our point of view, the most important exploration works in order to contain thebackground in the area previous to the beginning of the mill-plant complex operations are:
1. Total gamma airborne survey
2. Geochemical exploration for uranium
5.1. TOTAL GAMMA AIRBORNE SURVEY
During 1968 a total airborne prospecting survey was performed on the Permian CochicoGroup outcrops, specially on the Atigradas Sandstone Member, over an area of 3450 km2 [7]. Thetechnical specifications, main equipment and operating conditions were as follows:
Conventional topographic maps at scales of 1:100 000 and 1:50 000 were used for the flightsand data plotting;
Scintillometer MP-10 equipment manufactured by CNEA (Comision Nacional de EnergfaAtomica) consisting of one-head 5 in. x 2 in. Nal (Ta) crystal with a lead colimator;
Radio-altimeter AN/APN 1;
The strip camera was a continuous French Camaflex, model S, with 35 mm film.
Synchronized recorders, in tandem, with fiducial mark devices Two Esterline Angus.
The line flight intervals were 250 m and the radiometric points taken at the same distancegave information at square network. The flight directions were, in general, normal to the mainstructure (E-W) except when the topographic conditions did not allow it. The data recovery from therecords were punctual and were plotted after the correction at 100 m base level.
The contour maps (Fig. 3) were made at intervals of BG x 1.10, 1.40, 1.70 and up. In thisform, several anomalies were detected and in El Tigre anomaly constellation an exceptional value of6 x BG was obtained.
Considering that this type of survey gave values only in gamma total counts over the uraniumdistrict, it was not taken into account for the monitorage control of the environmental conditions.
5.2. GEOCHEMICAL SURVEY
5.2.1. Preliminary Geochemical Survey (mid 1968)
As long as the climatic and hydrological characteristics of the area appeared to beunfavourable to perform an investigation through the geochemical survey of uranium during mid1968, a preliminary geochemical survey was carried out at the Sierra Pintada district [8].
263
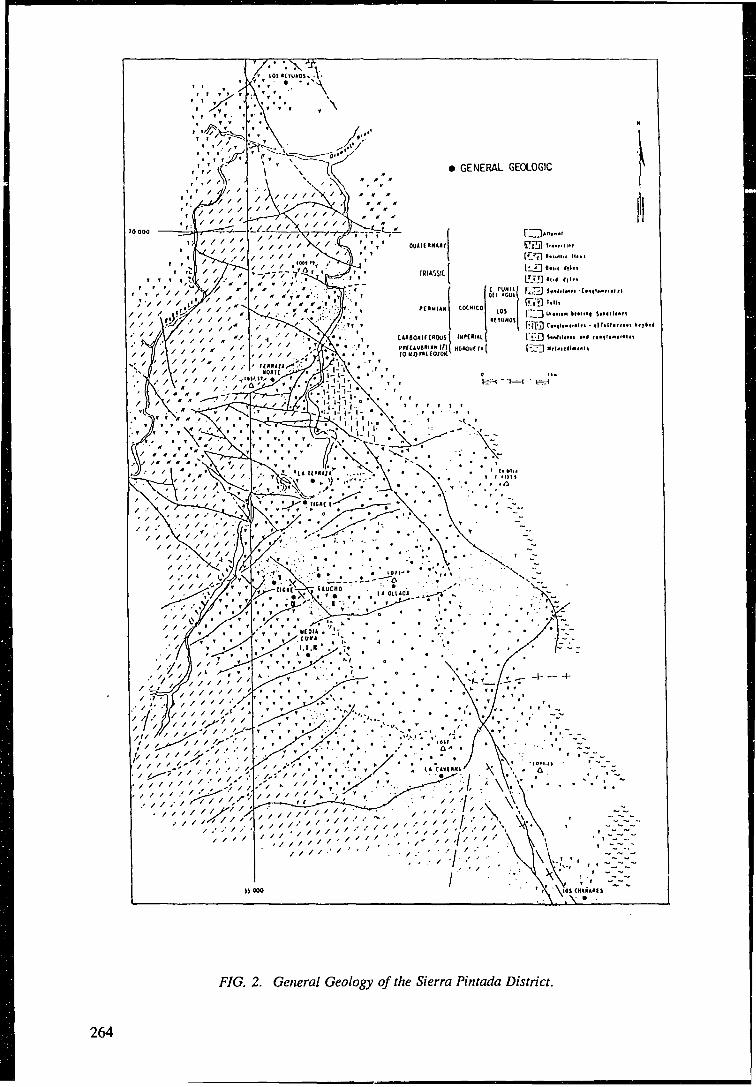
• GENERAL GEOLOGIC
'•'•'. ; . : M \ W V ,
FIG. 2. General Geology of the Sierra Pintada District.
264
The first phase consisted of a reconnaissance survey over ore deposits (prospects) known upto that moment in the zone, previous to the discovery of the Dr. Baulies ore. Among the mostfavourable anomalies the following were chosen: Las Penas, Los Chanares and Cuesta de los Terneros(Fig. 1).
Drainage sediments and soil sampling were performed according to the possibilities of eachsector. A total of 97 samples were taken, 52 of which correspond to stream sediments and 45 to soilsamples.
Sampling techniques
a) stream sediment samples: 200 g to 300 g of the finest fraction were taken, preferably theclay fraction over the river bed which was dry at the moment of sampling, avoiding thedeposits of eolian origin. Sampling interval was between 50 an 200 m.
b) soil samples: Using a soil auger 200 g of the soil sample were taken at different depths of10, 20, 25, 30 and 50 cm, according to the possibility of each profile. Those soils arecharacterized as arid soils without a developed soil profile. The sampling pattern was twolines according to the structure of the ore deposition.
Sample preparation and analytical techniques
The stream sediment and soil samples were dried 80°C in a stove, sieved and stored. Thesieving was made in a stainless steel sieve of -150 mesh after Tyler norms. The portion 4-150 meshwas discarded.
For the uranium analysis, the sample was attacked with HNO3 2.5 N. The uranium wasseparated to avoid the quenching effect by an organic solvent (ethyl acetate) and analysed by thefluorimetric method. The Jarrell Ash Fluorimeter, type 26010 was used. The sensibility of theanalytical method was of 0.3 /tg/1 (0.3 ppm U).
Results
The data of Los Chanares sector (Fig. 4) were the best obtained in this work. The streamsediments had a scattered over the creek, downstream the prospect, with values ranging from 8.1 ppmU, near the prospect, down to 0.8 ppm U (background value) 400 m downstream. The conclusionwas that, in these conditions, the uranium dispersion over the stream was only 150 m from themineralized sector.
The data on soil samples have an uranium dispersion more limited than the stream sedimentsamples. The values obtained were slightly over the background (1 ppm U), between 1.3 and2.1 ppm, except for the samples taken directly over the mineralized material.
5.2.2. Reconnaissance Geochemical Survey (mid 1974-1976)
A new stage of geochemical prospecting was carried out in different years. It began in July1974 and was continued in April-July 1976. In this opportunity, besides the stream sediment samples,an hydrogeochemical sampling was carried out, with collection of surficial and spring water samples[9].
265
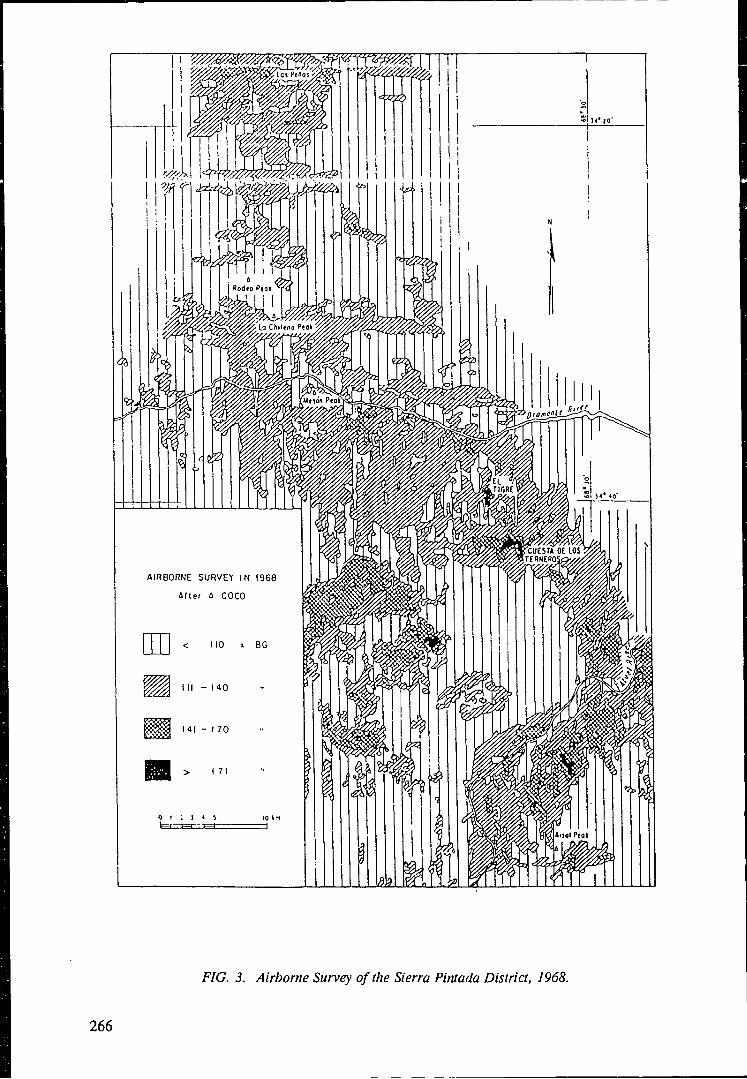
AIRBORNE SURVEY IN I9G8
Alter A COCO
FIG. 3. Airborne Survey of the Sierra Pintada District, 1968.
266
In the initial stage, a preliminary sampling was performed near the "Doctor Baulfes" ore, in"El Tigre" stream, in order to observe the answer to hydrogeochemical sampling in the region wherethe stream and creeks are intermittent.
The teams, following common instructions for sampling, obtained at the end of work 1427samples (977 stream sediment and 450 water samples) in 977 station points in the streams and creeks,over the area of 450 knr with a density of 2 samples per 1 km2.
Sampling techniques
a) stream sediment samples: 200 to 300 g of the finest fraction was obtained in each point. Inthe preliminary stage samples were collected surficially and at different depths (20, 40 and60 cm) in order to obtain vertical variations of uranium in the river bed and to determine thebest depth of sampling. 90% of data did not show noticeable variations at different depths,for this reason, only the surficial samples were taken. In some locations also spring sedimentsamples were obtained.
b) water samples: where it was possible a water sample was obtained following the generalinstructions of the best sampling. In some cases spring water samples were obtained togetherwith a spring sediment. Immediately after its extraction the following systematicmeasurements were made in each water sample:
• pH determinations with a portable Methrom device with standard electrodes;
• oxidation-reduction potential (Eh) with a portable Methrom device with hydrogen andPt electrodes;
• conductivity measurements with a portable conductimeter WTW device, type LF-54and a type cell LTA-100;
Sample preparation and analytical techniques
a) stream sediment samples: they were dried in a stove at 80°C and then, to test the behaviourof uranium in the samples, some of them were sieved at different mesh in stainless steelsieves. 80, 120 and 150 mesh after Tyler norms were used. The best results for uranium wereobtained in the finest fraction (150 mesh) and, for this reason, this size was adopted.
b) water samples: after 12 hours of decantation, an aliquot was concentrated by evaporationover chromatographic paper Whatman N. 1 bands, using an evaporator manufactured byCNEA.
Uranium determinations. In this opportunity, a portable laboratory situated in the area ofsurveying was used. The analytical technique was based on the Berthollet method [10]. Labileuranium was analysed by fluorimetry, after acid attack with HNO3, 2.5 N and separated toavoid the quenching effect by paper partition with tri-n-butyl phosphate in white spirit. Theupper part of the paper was calcinated in an infrared drier and its ashes melted with NaF-Na2CO3 flux in platinum discs. The flux discs were measured in a portable Fluorimeter"Nucleometre" type F.P.D.T.U.l. The sensibility was 0.3 /xg/g (ppm U).
The water samples on the chromatographic paper bands were attacked directly with dilutenitric acid (2,5 N) and then treated in the same way as the stream sediment samples. Thesensibility for the water samples was 1 /xg/L (ppb U).
267

N>
00AREA E
C.N.E.A.OERCHCIA DE AREA CICLO OE COMOUSTIflLE
ig74 - 1 9 7 6
FIG. 5. Geochemical survey of El Tigre Drainage System, 1974 - 1976.
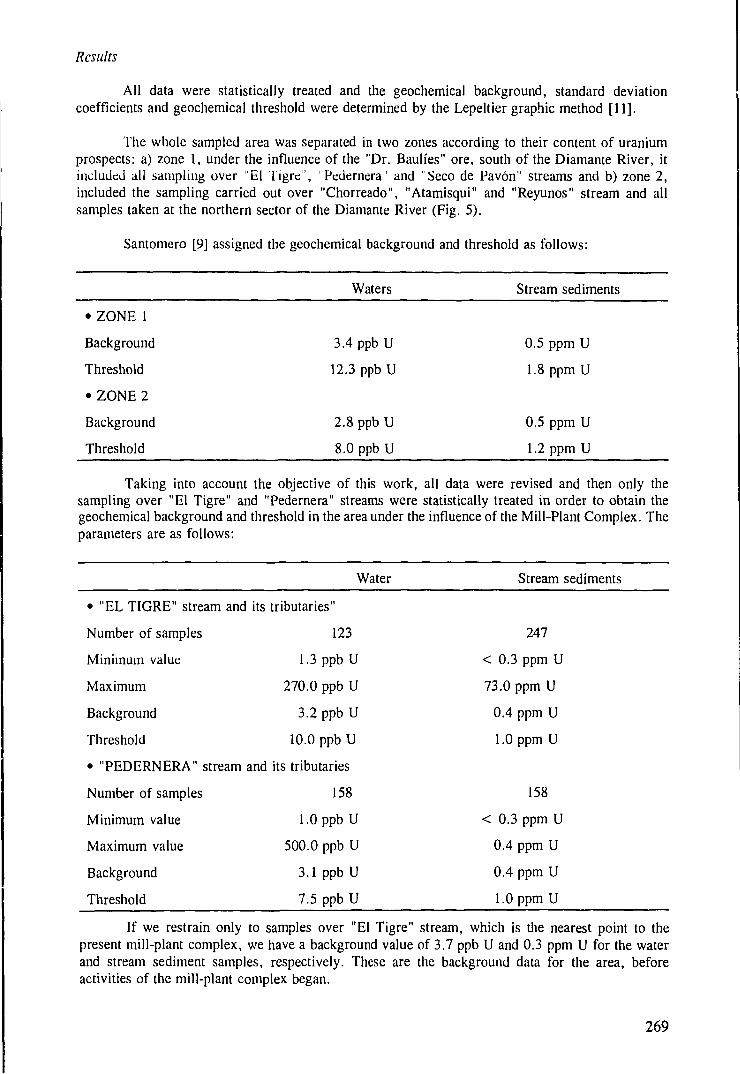
Results
All data were statistically treated and the geochemical background, standard deviationcoefficients and geochemical threshold were determined by the Lepeltier graphic method [11].
The whole sampled area was separated in two zones according to their content of uraniumprospects: a) zone 1, under the influence of the "Dr. Baulies" ore, south of the Diamante River, itincluded all sampling over "El Tigre", "Pedernera" and "Seco de Pavon" streams and b) zone 2,included the sampling carried out over "Chorreado", "Atamisqui" and "Reyunos" stream and allsamples taken at the northern sector of the Diamante River (Fig. 5).
Santomero [9] assigned the geochemical background and threshold as follows:
Waters Stream sediments
• ZONE 1
Background 3.4 ppb U 0.5 ppm U
Threshold 12.3 ppb U 1.8 ppm U
• ZONE 2
Background 2.8 ppb U 0.5 ppm U
Threshold 8.0 ppb U 1.2 ppm U
Taking into account the objective of this work, all data were revised and then only thesampling over "El Tigre" and "Pedernera" streams were statistically treated in order to obtain thegeochemical background and threshold in the area under the influence of the Mill-Plant Complex. Theparameters are as follows:
Water Stream sediments
• "EL TIGRE" stream and its tributaries"
Number of samples 123 247
Minimum value 1.3 ppb U < 0.3 ppm U
Maximum 270.0 ppb U 73.0 ppm U
Background 3.2 ppb U 0.4 ppm U
Threshold 10.0 ppb U 1.0 ppm U
• "PEDERNERA" stream and its tributaries
Number of samples 158 158
Minimum value 1.0 ppb U < 0.3 ppm U
Maximum value 500.0 ppb U 0.4 ppm U
Background 3.1 ppb U 0.4 ppm U
Threshold 7.5 ppb U 1.0 ppm U
If we restrain only to samples over "El Tigre" stream, which is the nearest point to thepresent mill-plant complex, we have a background value of 3.7 ppb U and 0.3 ppm U for the waterand stream sediment samples, respectively. These are the background data for the area, beforeactivities of the mill-plant complex began.
269
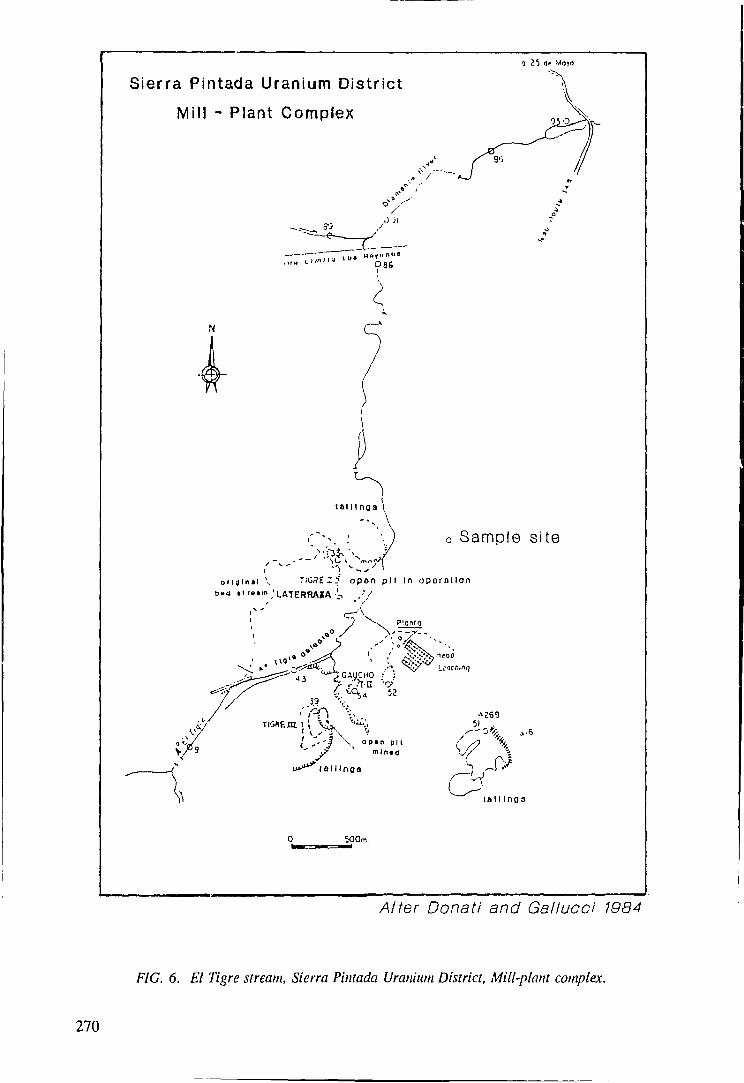
a 25 d>
Sierra Pintada Uranium District
Mill - Plant Complex
t a i l i n g s
Sample site
o t i g i n n \ T i c a £ ; y opon p i t in o p e r a t i o n
t»d • i r . . m ,'LATERRAKA '^ . - /
-APlpnlO
/ . . V.A°s*
**#•12S9
;>9c - ' ' J \ ° p • n P • t^ ^7 mln«0
u " ^ l a l l l n o s
l a l l l n g s
5O0m.
/\/7er Donati and Gallucci 1984
FIG. 6. El Tigre stream, Sierra Pintada Uranium District, Mill-plant complex.
270
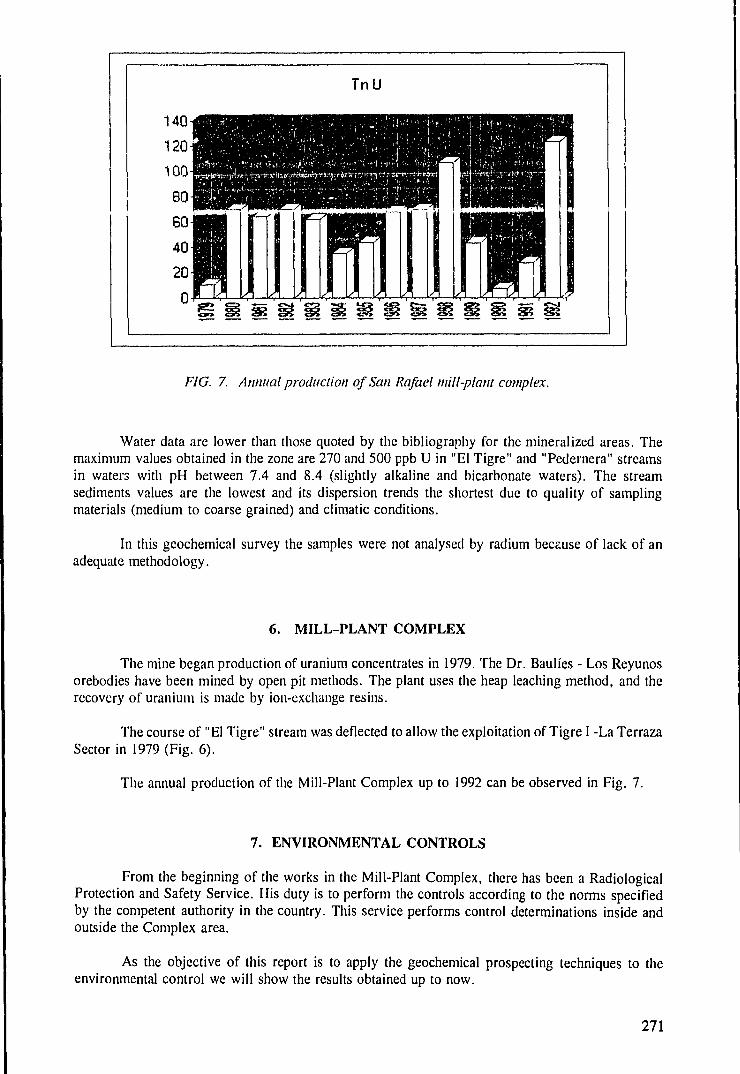
FIG. 7. Annual production of San Rafael mill-plant complex.
Water data are lower than those quoted by the bibliography for the mineralized areas. Themaximum values obtained in the zone are 270 and 500 ppb U in "El Tigre" and "Pedernera" streamsin waters with pH between 7.4 and 8.4 (slightly alkaline and bicarbonate waters). The streamsediments values are the lowest and its dispersion trends the shortest due to quality of samplingmaterials (medium to coarse grained) and climatic conditions.
In this geochemical survey the samples were not analysed by radium because of lack of anadequate methodology.
6. MILL-PLANT COMPLEX
The mine began production of uranium concentrates in 1979. The Dr. Baulfes - Los Reyunosorebodies have been mined by open pit methods. The plant uses the heap leaching method, and therecovery of uranium is made by ion-exchange resins.
The course of "El Tigre" stream was deflected to allow the exploitation of Tigre I -La TerrazaSector in 1979 (Fig. 6).
The annual production of the Mill-Plant Complex up to 1992 can be observed in Fig. 7.
7. ENVIRONMENTAL CONTROLS
From the beginning of the works in the Mill-Plant Complex, there has been a RadiologicalProtection and Safety Service. His duty is to perform the controls according to the norms specifiedby the competent authority in the country. This service performs control determinations inside andoutside the Complex area.
As the objective of this report is to apply the geochemical prospecting techniques to theenvironmental control we will show the results obtained up to now.
271
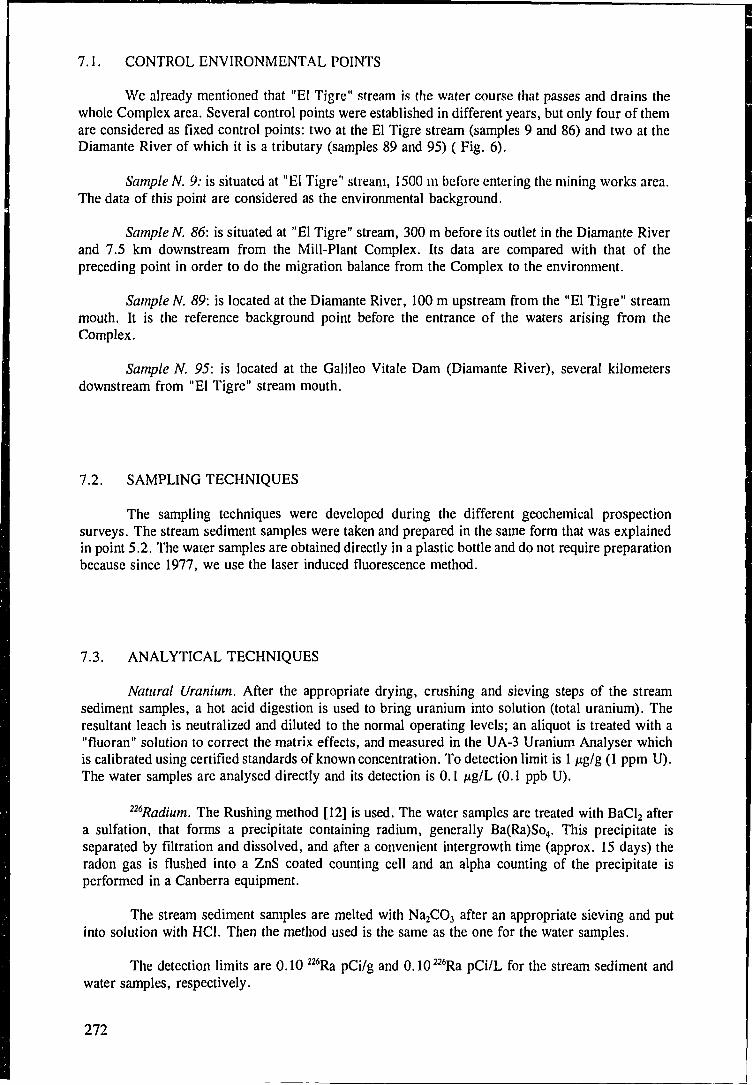
7.1. CONTROL ENVIRONMENTAL POINTS
We already mentioned that "El Tigre" stream is the water course that passes and drains thewhole Complex area. Several control points were established in different years, but only four of themare considered as fixed control points: two at the El Tigre stream (samples 9 and 86) and two at theDiamante River of which it is a tributary (samples 89 and 95) ( Fig. 6).
Sample N. 9: is situated at "El Tigre" stream, 1500 in before entering the mining works area.The data of this point are considered as the environmental background.
Sample N. 86: is situated at "El Tigre" stream, 300 m before its outlet in the Diamante Riverand 7.5 km downstream from the Mill-Plant Complex. Its data are compared with that of thepreceding point in order to do the migration balance from the Complex to the environment.
Sample N. 89: is located at the Diamante River, 100 m upstream from the "El Tigre" streammouth. It is the reference background point before the entrance of the waters arising from theComplex.
Sample N. 95: is located at the Galileo Vitale Dam (Diamante River), several kilometersdownstream from "El Tigre" stream mouth.
7.2. SAMPLING TECHNIQUES
The sampling techniques were developed during the different geochemical prospectionsurveys. The stream sediment samples were taken and prepared in the same form that was explainedin point 5.2. The water samples are obtained directly in a plastic bottle and do not require preparationbecause since 1977, we use the laser induced fluorescence method.
7.3. ANALYTICAL TECHNIQUES
Natural Uranium. After the appropriate drying, crushing and sieving steps of the streamsediment samples, a hot acid digestion is used to bring uranium into solution (total uranium). Theresultant leach is neutralized and diluted to the normal operating levels; an aliquot is treated with a"fluoran" solution to correct the matrix effects, and measured in the UA-3 Uranium Analyser whichis calibrated using certified standards of known concentration. To detection limit is 1 jtg/g (1 ppm U).The water samples are analysed directly and its detection is 0.1 /xg/L (0.1 ppb U).
226Radium. The Rushing method [12] is used. The water samples are treated with BaCl2 aftera sulfation, that forms a precipitate containing radium, generally Ba(Ra)So4. This precipitate isseparated by filtration and dissolved, and after a convenient intergrowth time (approx. 15 days) theradon gas is flushed into a ZnS coated counting cell and an alpha counting of the precipitate isperformed in a Canberra equipment.
The stream sediment samples are melted with Na2CO3 after an appropriate sieving and putinto solution with HC1. Then the method used is the same as the one for the water samples.
The detection limits are 0.10 ^Ra pCi/g and O.lO^Ra pCi/L for the stream sediment andwater samples, respectively.
272
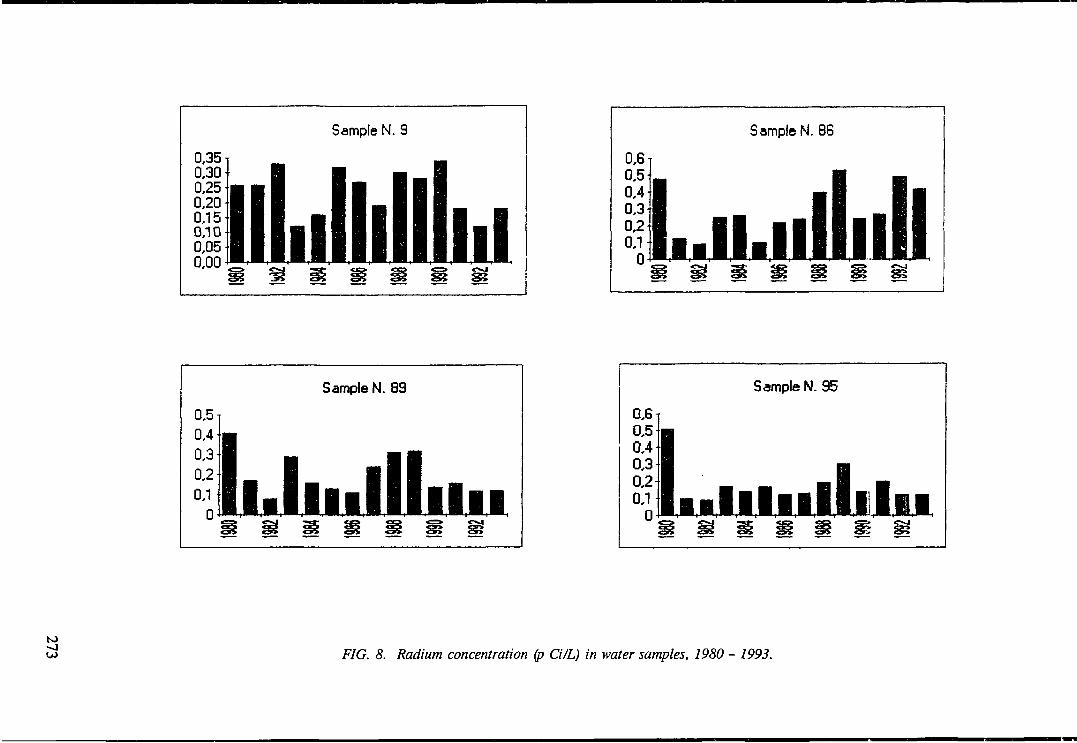
to3 FIG. 8. Radium concentration (p Ci/L) in water samples, 1980 - 1993.
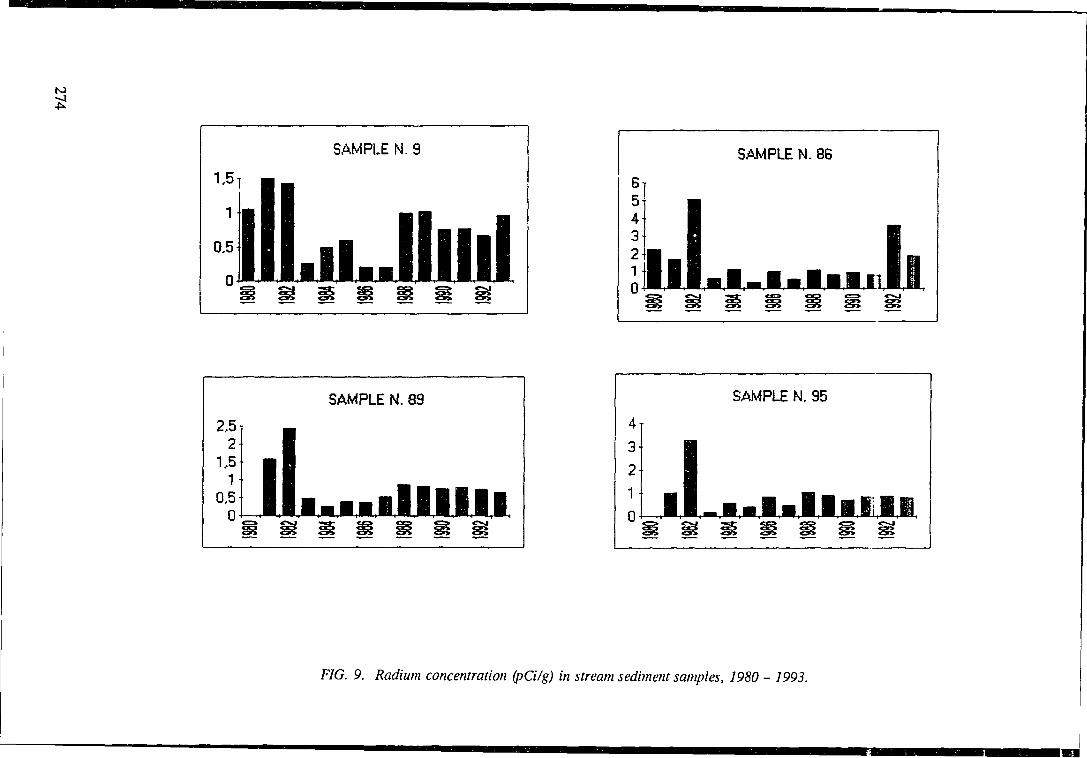
to
SAMPLE N. 95
••S.llalBss
FIG. 9. Radium concentration (pCi/g) in stream sediment samples, 1980 - 1993.
7.4. HYDRIC CHARACTERISTICS OF "EL TIGRE" STREAM AND THE DIAMANTE RIVER
El Tigre. This stream is formed by the confluence of "El Durazno" and "La Pintada" creeks,about 2 km before the uranium mining district and runs with a SE-NE trend to outlet in the DiamanteRiver. Its drainage basin has an extension of 297 km2. Originally, the middle part of its coursebisected the Tigre I — La Terraza ores. For that reason it was necessary to deflect its natural course.Its drainage basin is characterized by a great amount of alluvial deposits in its high and mediumcourse and is dangerous during the short torrential rainfalls. The sediments are of fluvial, alluvial anddetrital origin: sand and silty sand fractions are predominant with abundant gravel and blocks. Itsnormal How is low, 0.10-0.30 nvVs and, fundamentally, it depends on the pluviometric regime:distribution, frequency and type of rainfall precipitations. During the rainy season, the contributionfrom the eastern mountain range increases its flow in a disproportionate form in a short interval oftime. These freshets principally occur from November to March with low annual frequencies.
Diamante River. It forms the principal drainage basin of the mill-Plant Complex. It has apermanent current with an average flow of 40 mVs and maximum values form November to Marchwhich seldom are more than 100 mVs.
7.5. MIGRATIONS OF NATURAL URANIUM AND 226RADIUM FROM THE SAN RAFAELMILL-PLANT COMPLEX TO THE ENVIRONMENT
Figs 8 to 11 show the annual average (median) values of natural uranium and 226Ra for thewater and stream sediment samples in the four control environmental points for the period between1980 and 1993. From these, we can deduce the following:
Sample N. 9: The natural uranium content in the water samples is similar to that measured duringthe geochemical prospection survey in 1974, whereas the 226Radium values arefluctuating and low. No 226Ra measurements were done before 1980.
The stream sediment samples increased this natural uranium content 6-fold accordingto the background obtained in 1974. The "''Radium values are fluctuating and low.
Sample N. 86: The natural uranium content of the water samples increased between 8 up to 30 timesover 1974 values, but they are not higher than the maximum value obtained at themoment. If we compare with sample N. 9 values, the maximum increase is 20-foldand, on an average, only 9 times the background value. The 226Radium values arefluctuating, low and without significant increase.
The natural uranium content in stream sediment samples increased 6-fold accordingto the background in 1974 and twice with respect to sample N. 9. The ^Radiumvalues are fluctuating and increased 4 times in relation to sample N. 9.
Sample N. 89: The natural uranium content in the water samples is similar to the 1974 background,while the 22('Radium contents are fluctuating and low.
In the stream sediment samples we observed a low increase in the natural uraniumcontents in relation to the 1974 background. It is necessary to say that the number ofdeterminations in the geochemical prospecting were limited and for that reason thestatistic confidence is low. As for the water samples, the 226Radium ,'alues arefluctuating and low.
275
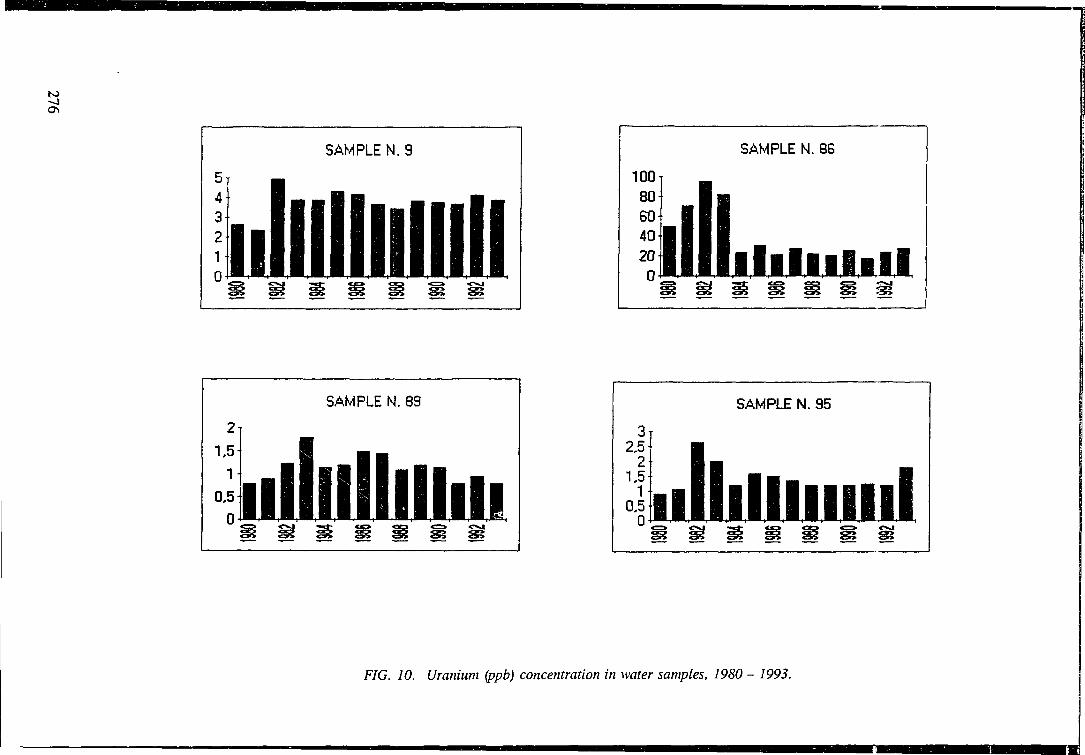
SAMPLE N. 86
10080GO40200I llllllllll
••llilliiiml
FIG. 10. Uranium (ppb) concentration in water samples, 1980 - 1993.
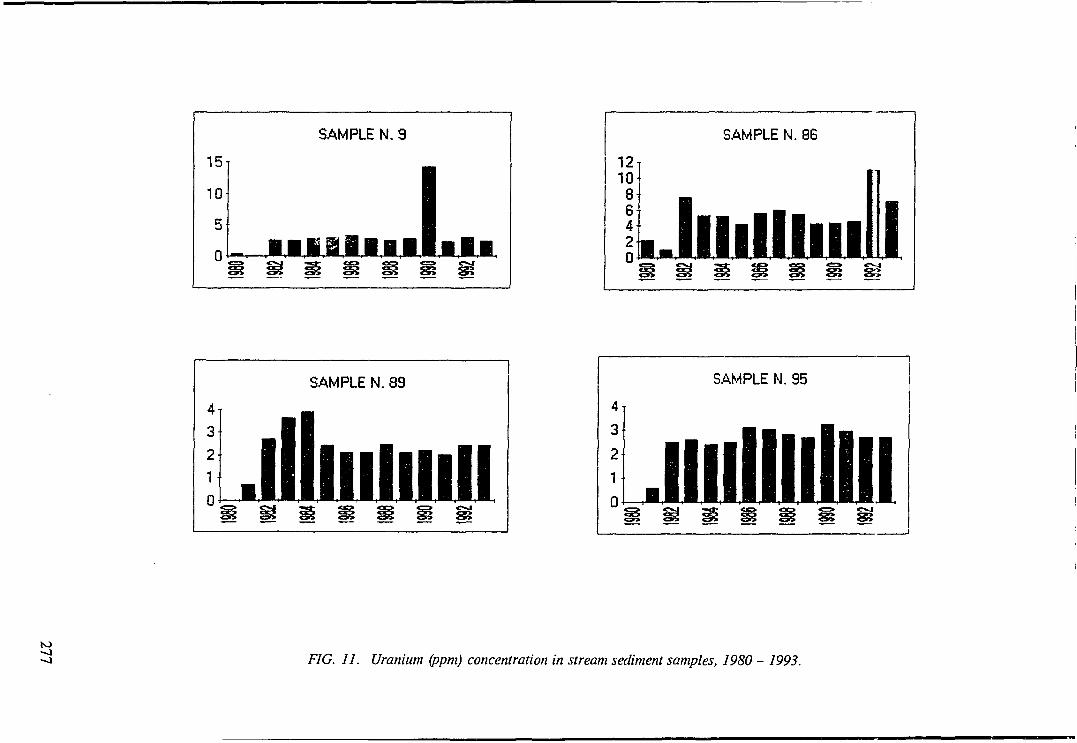
to-J
FIG. 11. Uranium (ppm) concentration in stream sediment samples, 1980 - 1993.
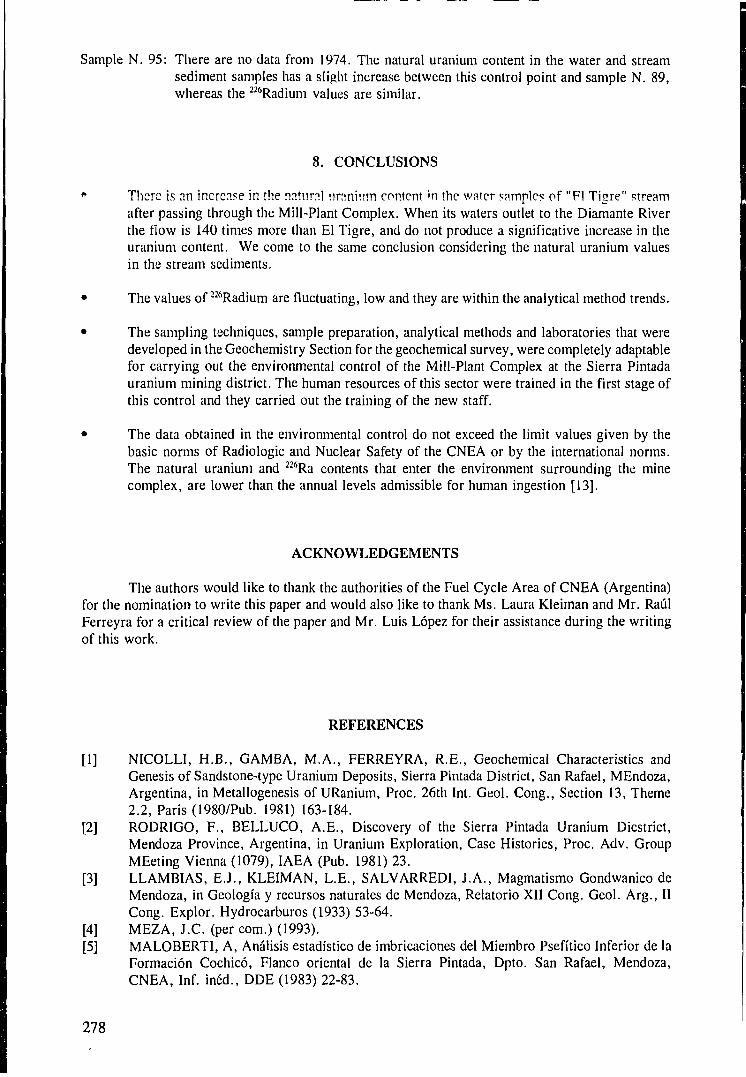
Sample N. 95: There are no data from 1974. The natural uranium content in the water and streamsediment samples has a slight increase between this control point and sample N. 89,whereas the 226Radium values are similar.
8. CONCLUSIONS
There is an increase in the natural uranium content in the water samples of "Fl Tigre" streamafter passing through the Mill-Plant Complex. When its waters outlet to the Diamante Riverthe flow is 140 times more than El Tigre, and do not produce a significative increase in theuranium content. We come to the same conclusion considering the natural uranium valuesin the stream sediments.
The values of 226Radium are fluctuating, low and they are within the analytical method trends.
The sampling techniques, sample preparation, analytical methods and laboratories that weredeveloped in the Geochemistry Section for the geochemical survey, were completely adaptablefor carrying out the environmental control of the Mill-Plant Complex at the Sierra Pintadauranium mining district. The human resources of this sector were trained in the first stage ofthis control and they carried out the training of the new staff.
The data obtained in the environmental control do not exceed the limit values given by thebasic norms of Radiologic and Nuclear Safety of the CNEA or by the international norms.The natural uranium and 226Ra contents that enter the environment surrounding the minecomplex, are lower than the annual levels admissible for human ingestion [13].
ACKNOWLEDGEMENTS
The authors would like to thank the authorities of the Fuel Cycle Area of CNEA (Argentina)for the nomination to write this paper and would also like to thank Ms. Laura Kleiman and Mr. RaulFerreyra for a critical review of the paper and Mr. Luis Lopez for their assistance during the writingof this work.
REFERENCES
[1] NICOLLI, H.B., GAMBA, M.A., FERREYRA, R.E., Geochemical Characteristics andGenesis of Sandstone-type Uranium Deposits, Sierra Pintada District, San Rafael, MEndoza,Argentina, in Metallogenesis of URanium, Proc. 26th Int. Geol. Cong., Section 13, Theme2.2, Paris (1980/Pub. 1981) 163-184.
[2] RODRIGO, F., BELLUCO, A.E., Discovery of the Sierra Pintada Uranium Dicstrict,Mendoza Province, Argentina, in Uranium Exploration, Case Histories, Proc. Adv. GroupMEeting Vienna (1079), IAEA (Pub. 1981) 23.
[3] LLAMBIAS, E.J., KLEIMAN, L.E., SALVARREDI, J.A., Magmatismo Gondwanico deMendoza, in Geologia y recursos naturales de Mendoza, Relatorio XII Cong. Geol. Arg., IICong. Explor. Hydrocarburos (1933) 53-64.
[4] MEZA, J.C. (per com.) (1993).[5] MALOBERTI, A, Analisis estadistico de imbricaciones del Miembro Psefitico Inferior de la
Formation Cochico, Flanco oriental de la Sierra Pintada, Dpto. San Rafael, Mendoza,CNEA, Inf. ined., DDE (1983) 22-83.
278
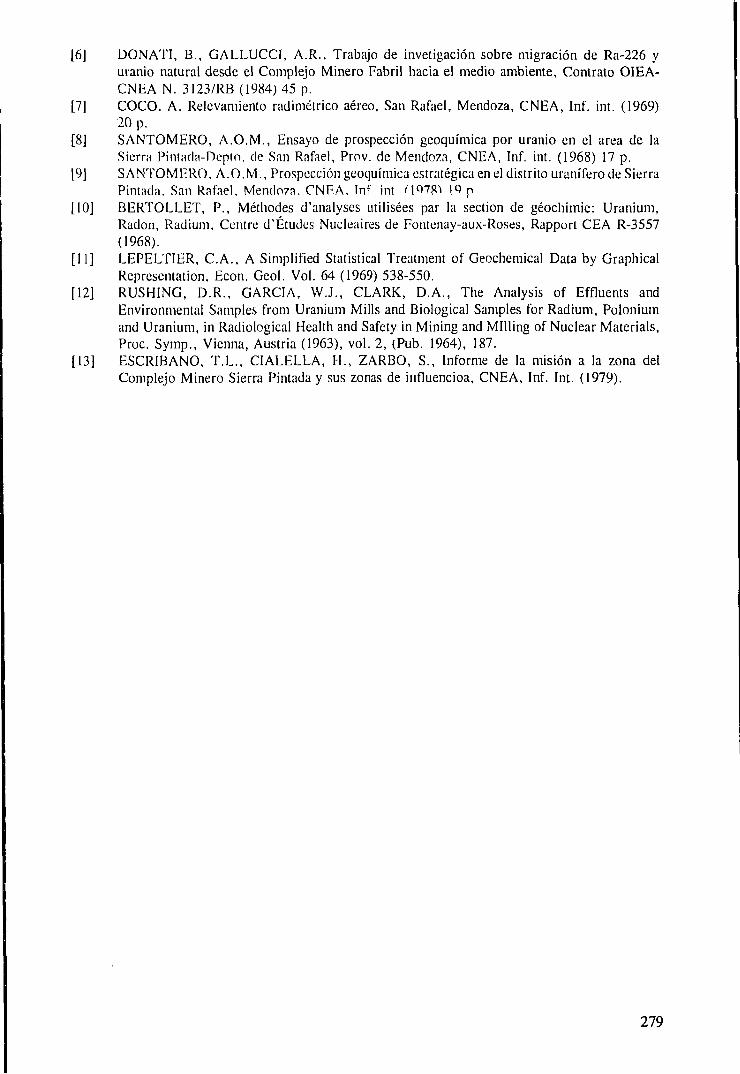
16] DONATI, B., GALLUCCI, A.R., Trabajo de invetigacion sobre migration de Ra-226 yuranio natural desde el Complejo Minero Fabril hacia el medio ambiente, Contrato OIEA-CNEA N. 3123/RB (1984) 45 p.
[7] COCO. A. Relevamiento radimetrico aereo, San Rafael, Mendoza, CNEA, Inf. int. (1969)20 p.
[8] SANTOMERO, A.O.M., Ensayo de prospeccion geoquimica por uranio en el area de laSierra Pintacla-Depto. de San Rafael, Prov. de Mendoza, CNEA, Inf. int. (1968) 17 p.
19] SANTOMERO, A.O.M., Prospeccion geoquimica estrategica en el distrito uranfferode SierraPintada. San Rafael. Mendoza. CNF.A. Inf int (10781 IQ p
[10] BERTOLLET, P., Methodes d'analyses utilisees par la section de geochimie: Uranium,Radon, Radium, Centre d'Etudes Nucleates de Fontenay-aux-Roses, Rapport CEA R-3557(1968).
[11] LEPELTIER, C.A., A Simplified Statistical Treatment of Geochemical Data by GraphicalRepresentation, Econ. Geol. Vol. 64 (1969) 538-550.
[12] RUSHING, D.R., GARCIA, W.J., CLARK, D.A., The Analysis of Effluents andEnvironmental Samples from Uranium Mills and Biological Samples for Radium, Poloniumand Uranium, in Radiological Health and Safety in Mining and Milling of Nuclear Materials,Proc. Symp., Vienna, Austria (1963), vol. 2, (Pub. 1964), 187.
[13] ESCRIBANO, T.L., CIALELLA, H., ZARBO, S., Informe de la mision a la zona delComplejo Minero Sierra Pintada y sus zonas de influencioa, CNEA, Inf. Int. (1979).
279

THE CONTRIBUTION OF APPLIED GEOPHYSICS FOR THE ESTIMATION OFTHE RADIOELEMENT CONTAMINATION OF THE ENVIRONMENT
G.N. SIDERISI.G.M.E., Athens, Greece
K.N. PAPACONSTANTINOUColorado School of Mines, Dep. of Geophysics, Golden, Colorado,United States of America
N.N. PAPADOPOULOSN.C.S.R. "Demokritos", Athens, Greece
Abstract
One of the most significant advances in uranium exploration has been the development of nuclear geophysicalmethods. It has been proved that, under certain conditions, it is possible to use such techniques to estimate theradioactive pollution of the Natural Environment. Portable gamma-ray spectrometers, threshold type, are instrumentswhich have been used for many years for the research of both uranium and radioactive raw materials deposits. Duringthe disaster at the Chernobyl nuclear facility, this kind of equipment contributed effectively to the recording andestimation of radioactive pollution not only of the environment but of various products of the food chain as well.Besides this, a HpGe spectrometer system which has been obtained from an IAEA-TC programme for radiometricmeasurements of uranium and for multielement neutron activation analysis of geological and other samples, hasalso been used for measurements of the radiation effects from the Chernobyl accident. Furthermore a short-livednuclide activation analysis system, which has been used extensively for uranium exploration by delayed neutroncounting, can also be used for environmental pollution studies. By the use of the technique which is presented in thisreport, it became possible to determine with accuracy and speed the radioactivity burdening to various primary foodproducts like milk, meat and fruit (cherries, etc.). On the other hand, the extent of the radioactivity burdening of theEnvironment has been calculated through the difference among the rates of total count gamma-ray intensity obtainedwith the gamma-ray spectrometers, threshold type, before, during and after the nuclear accident at Chernobyl,Ukraine. The measurements of the environmental radiation have been obtained before the accident of Chernobylthrough the calibration of the equipment at the calibration pads for instruments of applied geophysics at the N.C.S.R."Demokritos" campus, in order to use them in any geoscientific exploration project. Therefore, we were aware ofthe background radiation recorded under normal conditions and it was easy to determine the level of any radioactivecontamination and to estimate the percentage of burdening in Greece.
1. INTRODUCTION
The accident at the Nuclear Reactor No. 4, of Chernobyl, Ukraine, according to theinformation given by the I.A.E.A. in Vienna, Austria, happened on the 26th of April 1986. Theradioactivity cloud which has been formed, moved towards the Greek territory following two (2) maindirections. One of them moved through the Black Sea and the other one moved through the Territoryof the Former Republic of Yugoslavia. Finally, the radioactivity cloud reached Athens, Greece onMay 3rd, 1986 around 12:00 GMT. This was the first time that the instruments of the NationalCentre for Scientific Research (N.C.S.R.) "Demokritos", Athens, Greece, indicated high levels ofradioactivity [1].
The danger of the abnormal radioactivity values made necessary to check the radioactivitypollution levels not only of the natural environment but also of various products of the food chain that
281
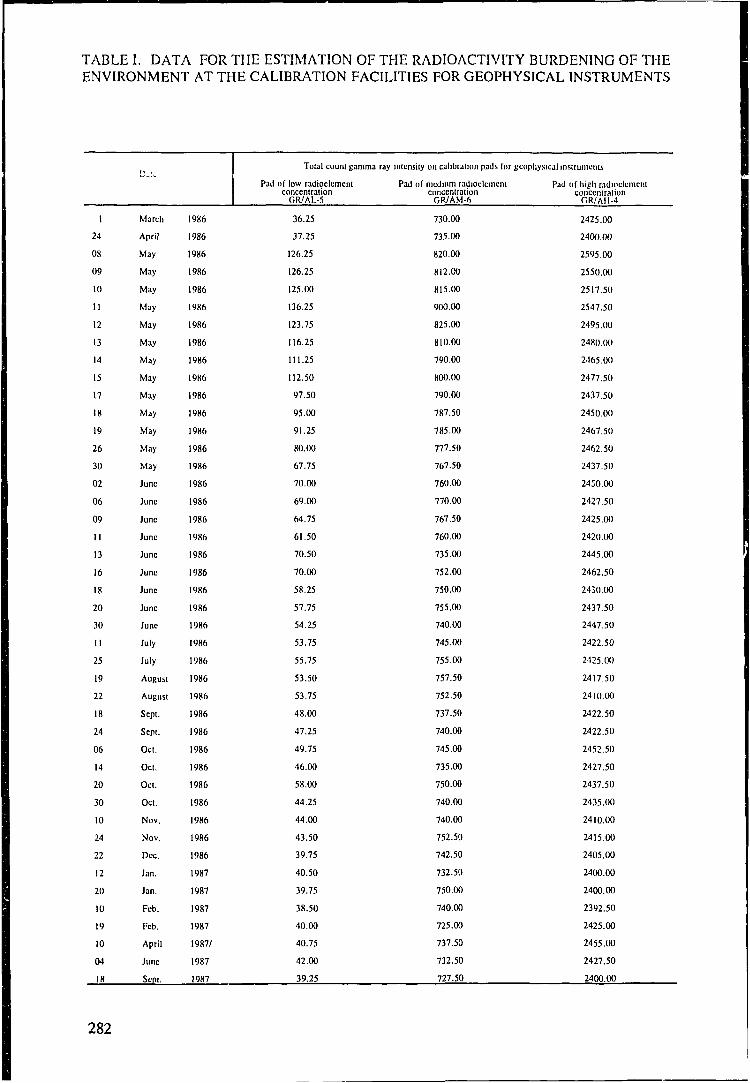
TABLE I. DATA FOR THE ESTIMATION OF THE RADIOACTIVITY BURDENING OF THEENVIRONMENT AT THE CALIBRATION FACILITIES FOR GEOPHYSICAL INSTRUMENTS
Total count ganima ray intensity on calibration pads for geophysical instruments
Pad of low radioclemcnlconcentration
GR/AL-5
Pad of medium radioclcmcntconcentration
OR/AM-6
Pad of high radioclcmcntconcentration
OR/AI1-4
1
24
08
09
10
11
12
13
14
15
17
18
19
26
30
02
06
09
11
13
16
18
20
30
11
25
19
22
18
24
06
14
20
30
10
24
22
12
20
10
19
10
04
18
March
April
May
May
May
May
May
May
May
May
May
May
May
May
May
June
June
June
June
June
June
June
June
June
July
July
August
August
Sept.
Sept.
Oct.
Oct.
Oct.
Oct.
Nov.
Nov.
Dec.
Jan.
Jan.
Feb.
Feb.
April
June
Sent.
1986
1986
1986
1986
1986
1986
1986
1986
1986
1986
1986
1986
1986
1986
1986
1986
1986
1986
1986
1986
1986
1986
1986
1986
1986
1986
1986
1986
1986
1986
1986
1986
1986
1986
1986
1986
1986
1987
1987
1987
1987
1987/
1987
1987
36.25
37.25
126.25
126.25
125.00
136.25
123.75
116.25
111.25
112.50
97.50
95.00
91.25
80.00
67.75
70.00
69.00
64.75
61.50
70.50
70.00
58.25
57.75
54.25
53.75
55.75
53.50
53.75
48.00
47.25
49.75
46.00
58.00
44.25
44.00
43.50
39.75
40.50
39.75
38.50
40.00
40.75
42.00
39.25
730.00
735.00
820.00
812.00
815.00
900.00
825.00
810.00
790.00
800.00
790.00
787.50
785.00
777.50
767.50
760.00
770.00
767.50
760.00
735.00
752.00
750.00
755.00
740.00
745.00
755.00
757.50
752.50
737.50
740.00
745.00
735.00
750.00
740.00
740.00
752.50
742.50
732.50
750.00
740.00
725.00
737.50
732.50
727.50
2425.00
2400.00
2595.00
2550.00
2517.50
2547.50
2495.00
2480.00
2465.00
2477.50
2437.50
2450.00
2467.50
2462.50
2437.50
2450.00
2427.50
2425.00
2420.00
2445.00
2462.50
2430.00
2437.50
2447.50
2422.50
2425.00
2417.50
2410.00
2422.50
2422.50
2452.50
2427.50
2437.50
2435.00
2410.00
2415.00
2405.00
2400.00
2400.00
2392.50
2425.00
2455.00
2427.50
2400.00
282

were existing at that period of the year. For this reason we have developed a technique based onrather simple measurements obtained with light, non expensive, portable geophysical instruments ofthe specific gamma-ray spectrometer, threshold type.
The radioactivity pollution levels have been measured by the GlS-4 of Scintrex GeophysicalCompany, threshold type gamma-ray spectrometers:
At the calibration facility for the geophysical radiometric instruments which were located atthe N.C.S.R. "Demokritos" campus [2].
In the Laboratory for Measuring the Radioactivity of the Environment (L.M.R.E.) of theN.C.S.R. "Demokritos".
TABLE II. MEASUREMENTS SHEET
1-131
1-132
Cs-137
Cs-134
Tc-132
La-140
Ba-140
Ru-103
Ce-141
E7
364.5
667.0
661.6
604.7
795.8
228.0
487.0
537.3
497.1
145.0
T O T A
A cps
0.095
0.470
0.230
0.250
0.090
0.090
1.360
L
(I.3)-lFilter
27.9
43.8
40.9
40.0
60.2
17.6
69.4
145.0
36.2
24.3
Bq
2.65
23.92
9.29
15.05
6.25
13.05
49.20
Bq/kg
66.26
598.07
230.00
376.25
156.15
326.25
1230.80
3619
correctedBq/kg
89.45
M.A.
907.40
310.50
507.94
M.A.
210.80
440.44
166 1.58
M.A.
Bq/kg
Sample No.: 7583 L.M.R.E./N.C.R.P.S. "Democritos"
Date of sampling: 03.06.1986Date of measurement: 05.06.1986Instrument:
M.A.:Instrument:Counting:Background:Net count:Nc/sec:Nc/sec.kg
Canberra-90
non detectable elementGIS-4 (Scintrex)C = 255 c/30 secBg = 45 c/30 secNc = 210 c/30 sec= 7 c/30 sec= 175 c/ sec.kg
Comments:Weight of sample:
soil sample40 g
283
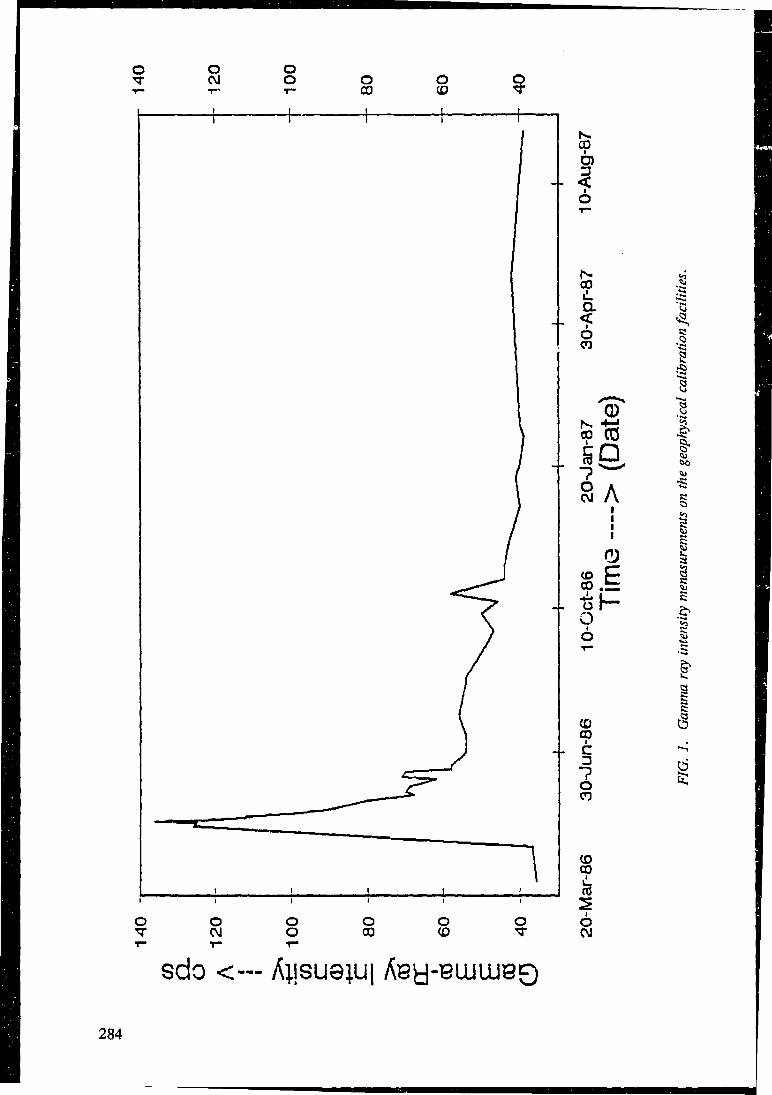
oCM oo oCO oCO
CO
NCO
a<oen
co
8 Aii
o6
1
i60
s!a355
I
oCM
oo
oco o
°?c
oCO
CDGO
II
oCM
sdo <—
284
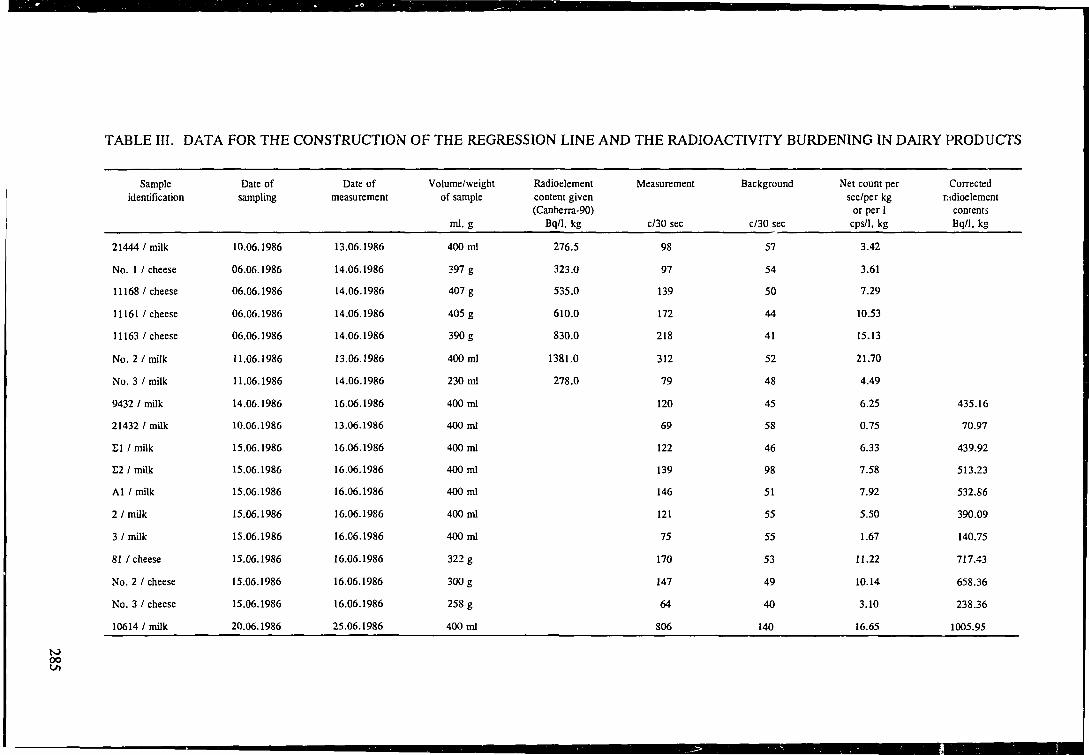
TABLE III. DATA FOR THE CONSTRUCTION OF THE REGRESSION LINE AND THE RADIOACTIVITY BURDENING IN DAIRY PRODUCTS
Sampleidentification
21444 / milk
No. 1 / cheese
11168/cheese
11161 /cheese
11163 /cheese
No. 2 / milk
No. 3 / milk
9432 / milk
21432 / milk
El / milk
E2 / milk
Al / milk
2/milk
3 /milk
81 /cheese
No. 2 / cheese
No. 3 / cheese
10614 / milk
Date ofsampling
10.06.1986
06.06.1986
06.06.1986
06.06.1986
06.06.1986
11.06.1986
11.06.1986
14.06.1986
10.06.1986
15.06.1986
15.06.1986
15.06.1986
15.06.1986
15.06.1986
15.06.1986
15.06.1986
15.06.1986
20.06.1986
Date ofmeasurement
13.06.1986
14.06.1986
14.06.1986
14.06.1986
14.06.1986
13.06.1986
14.06.1986
16.06.1986
13.06.1986
16.06.1986
16.06.1986
16.06.1986
16.06.1986
16.06.1986
16.06.1986
16.06.1986
16.06.1986
25.06.1986
Volume/weightof sample
ml, g
400 ml
397 g
407 g
405 g
390 g
400 ml
230 ml
400 ml
400 ml
400 ml
400 ml
400 ml
400 ml
400 ml
322 g
300 g
258 g
400 ml
Radioelementcontent given(Canberra-90)
Bq/1, kg
276.5
323.0
535.0
610.0
830.0
1381.0
278.0
Measurement
c/30 sec
98
97
139
172
218
312
79
120
69
122
139
146
121
75
170
147
64
806
Background
c/30 sec
57
54
50
44
41
52
48
45
58
46
98
51
55
55
53
49
40
140
Net count persec/per kg
or per Icps/1, kg
3.42
3.61
7.29
10.53
15.13
21.70
4.49
6.25
0.75
6.33
7.58
7.92
5.50
1.67
11.22
10.14
3.10
16.65
Correctedradioelement
contentsBq/1, kg
435.16
70.97
439.92
513.23
532.S6
390.09
140.75
717.43
658.36
238.36
1005.95
toooU
2. METHODOLOGY - INSTRUMENTATION
Measurements of the radioactivity levels in the Greek territory have been recorded before theNuclear Accident al Chernobyl, Ukraine. These measurements have been performed with portable,GIS-4 (Scintrex Geophysical Company), threshold type, gamma ray spectrometer instruments, duringtheir calibration procedure at the N.C.S.R "TVmpcritos" calibration facility for radiometricinstruments of Applied Geophysics [3]. The calibration of gamma ray spectrometers, as every portableradiometric instrument, is necessary to be applied prior to the beginning of each geocxplorationproject [4]. These data enabled us to localize and estimate the magnitude of the radioactivity pollutionof the natural environment in Greece, during that Nuclear Accident.
Measurements with the GIS-4 instruments were taken, systematically, in the calibration facilityat the N.C.S.R. "Demokritos", during the radioactivity burdening in Greece. These measurements(Table [) have given a diagram of the change of the gamma ray intensity values with respect to time(Fig. 1.).
On the other hand the calculation of the magnitude of the radioactivity contamination of thefood chain products was based on the remark that there is a relation between the radionuclideconcentration, in Bq/kg or 1, and the gamma ray intensity, in cps/kg or 1. According to that remarkthe pairs of the values which have been recorded, correspond, graphically, to points of a line(regression line) traced with the least square fitting method. The value of the radioelementconcentration of each product, in Bq/kg or 1, has been measured in the Laboratory for Measuring theRadioactivity of the Environment (L.M.R.E.) at the N.C.S.R. "Demokritos" with the Canberra-90type, Gamma ray Spectroscopy instrument (Table II). The measurements of the gamma ray intensityhave been taken with the geophysical radiometric instruments of the Scintrex company, type GIS-4gamma ray spectrometers, threshold type. The measurements recorded by these particular instrumentsare given in units of counts per second over the time during which the product is exposed tomeasurement. The duration of the measurement varies from one (1) to one hundred (100) seconds.The GIS-4 geophysical instruments which have been used are light, easy to carry and sensitivetowards the influence of the gamma ray intensity. They are composed of probes equipped with Nalcrystals connected with photomultiplier tubes. With the GIS-4 gamma ray spectrometer, thresholdtype, one has the possibility to record the gamma ray intensity of the pre-selected energy levelaccording to the seeking target cut-off level, in the energy spectrum.
In order to keep the background radiation level as low as possible we have placed the wholeinstrument within a lead castle, properly shaped with lead bricks (of the known 10 cm X 5 cm x 3cm size). Within the lead castle there was enough space for the measuring sample as well. In this waywe succeeded to bring the background level as low as one count per second (1 cps). Consequently,even samples with low radiation levels could easily be measured, because of the extremely lowbackground radiation achieved. The values of the gamma ray intensity were converted tocorresponding values of counts per second over kg or 1 (cps/kg or 1) with respect to the condition ofthe product, solid or liquid (Table III).
On the basis of these measurements we have constructed regression lines for each particularinstrument and for each food product, separately. For the construction of each regression line we usedvarious, randomly selected samples from each product of which we have measured both theradioelement concentration (in Bq/kg or 1) with the Canberra-90 system and the gamma ray intensitywith the GIS-4 instrument of Scintrex.
After the construction of the regression lines, for each particular instrument and each foodproduct, separately, we were in position to estimate the corresponding radioelement concentration forevery single sample of any food product. All we had to consider was the gamma ray intensity value(in cps/kg or 1) for each one of them.
286
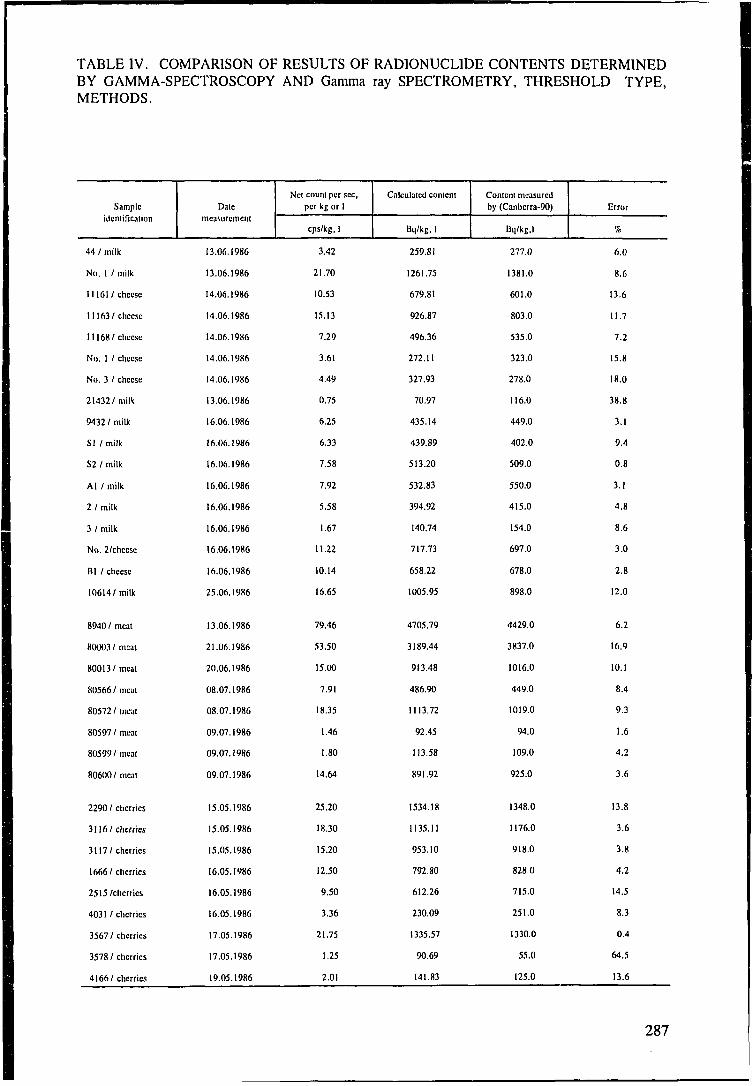
TABLE IV. COMPARISON OF RESULTS OF RADIONUCLIDE CONTENTS DETERMINEDBY GAMMA-SPECTROSCOPY AND Gamma ray SPECTROMETRY, THRESHOLD TYPE,METHODS.
Sample
identification
44 / milk
No. 1 / milk
11161/cheese
11163/cheese
11168/cheese
No. 1 / cheese
No. 3 / cheese
21432/milk
9432 / milk
SI /milk
S2 / milk
Al / milk
2 / milk
3 / milk
No. 2/chccsc
Bl / cheese
10614/ milk
8940 / meat
80003 / meat
80013/meat
80566 / meat
80572 / meat
80597/meat
80599/meat
80600/ meat
2290/cherries
3116/ cherries
3117/ cherries
1666/ cherries
2515/cherries
4031 / cherries
3567 / cherries
3578/ cherries
4166/ cherries
Date
measurement
13.06.1986
13.06.1986
14.06.1986
14.06.1986
14.06.1986
14.06.1986
14.06.1986
13.06.1986
16.06.1986
16.06.1986
16.06.1986
16.06.1986
16.06.1986
16.06.1986
16.06.1986
16.06.1986
25.06.1986
13.06.1986
21.06.1986
20.06.1986
08.07.1986
08.07.1986
09.07.1986
09.07.1986
09.07.1986
15.05.1986
15.05.1986
15.05.1986
16.05.1986
16.05.1986
16.05.1986
17.05.1986
17.05.1986
19.05.1986
Net count per sec,per kg or 1
cps/kg, 1
3.42
21.70
10.53
15.13
7.29
3.61
4.49
0.75
6.25
6.33
7.58
7.92
5.58
1.67
11.22
10.14
16.65
79.46
53.50
15.00
7.91
18.35
1.46
1.80
14.64
25.20
18.30
15.20
12.50
9.50
3.36
21.75
1.25
2.01
Calculated content
Bq/kg, 1
259.81
1261.75
679.81
926.87
496.36
272.11
327.93
70.97
435.14
439.89
513.20
532.83
394.92
140.74
717.73
658.22
1005.95
4705.79
3189.44
913.48
486.90
1113.72
92.45
113.58
891.92
1534.18
1135.11
953.10
792.80
612.26
230.09
1335.57
90.69
141.83
Content measuredby (Canbcrra-90)
Bq/kg,l
277.0
1381.0
601.0
803.0
535.0
323.0
278.0
116.0
449.0
402.0
509.0
550.0
415.0
154.0
697.0
678.0
898.0
4429.0
3837.0
1016.0
449.0
1019.0
94.0
109.0
925.0
1348.0
1176.0
918.0
828.0
715.0
251.0
1330.0
55.0
125.0
Error
%
6.0
8.6
13.6
11.7
7.2
15.8
18.0
38.8
3.1
9.4
0.8
3.1
4.8
8.6
3.0
2.8
12.0
6.2
16.9
10.1
8.4
9.3
1.6
4.2
3.6
13.8
3.6
3.8
4.2
14.5
8.3
0.4
64.5
13.6
287
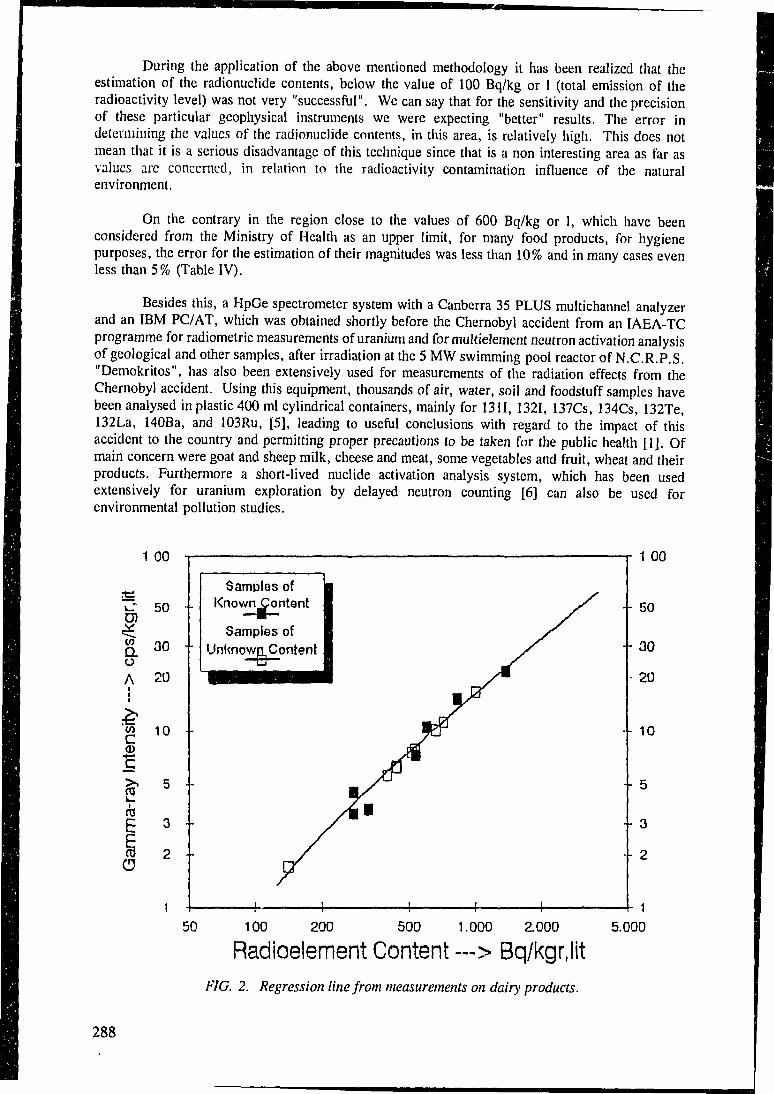
During the application of the above mentioned methodology it has been realized that theestimation of the radionuclide contents, below the value of 100 Bq/lcg or 1 (total emission of theradioactivity level) was not very "successful". We can say that for the sensitivity and the precisionof these particular geophysical instruments we were expecting "better" results. The error indetermining the values of the radionuclide contents, in this area, is relatively high. This does notmean that it is a serious disadvantage of this technique since that is a non interesting area as far asvalues arc concerned, in relation to the radioactivity contamination influence of the naturalenvironment.
On the contrary in the region close to the values of 600 Bq/kg or 1, which have beenconsidered from the Ministry of Health as an upper limit, for many food products, for hygienepurposes, the error for the estimation of their magnitudes was less than 10% and in many cases evenless than 5% (Table IV).
Besides this, a HpGe spectrometer system with a Canberra 35 PLUS multichannel analyzerand an IBM PC/AT, which was obtained shortly before the Chernobyl accident from an IAEA-TCprogramme for radiometric measurements of uranium and for multielement neutron activation analysisof geological and other samples, after irradiation at the 5 MW swimming pool reactor of N.C.R.P.S."Demokritos", has also been extensively used for measurements of the radiation effects from theChernobyl accident. Using this equipment, thousands of air, water, soil and foodstuff samples havebeen analysed in plastic 400 ml cylindrical containers, mainly for 1311, 1321, 137Cs, 134Cs, 132Te,132La, 140Ba, and 103Ru, [5], leading to useful conclusions with regard to the impact of thisaccident to the country and permitting proper precautions to be taken for the public health [1]. Ofmain concern were goat and sheep milk, cheese and meat, some vegetables and fruit, wheat and theirproducts. Furthermore a short-lived nuclide activation analysis system, which has been usedextensively for uranium exploration by delayed neutron counting [6] can also be used forenvironmental pollution studies.
1 00
CO
aoA 20
TO
50
30 -
C 1°a>C
3
2
Samples ofKnownContent
Samples ofUnknown Content
50 100 200 500 1.000 2.000
Radioelement Content —> Bq/kgr.litFIG. 2. Regression line from measurements on dairy products.
1 00
• 50
-• 30
20
- 10
- 5
• - 3
- 2
15.000
288
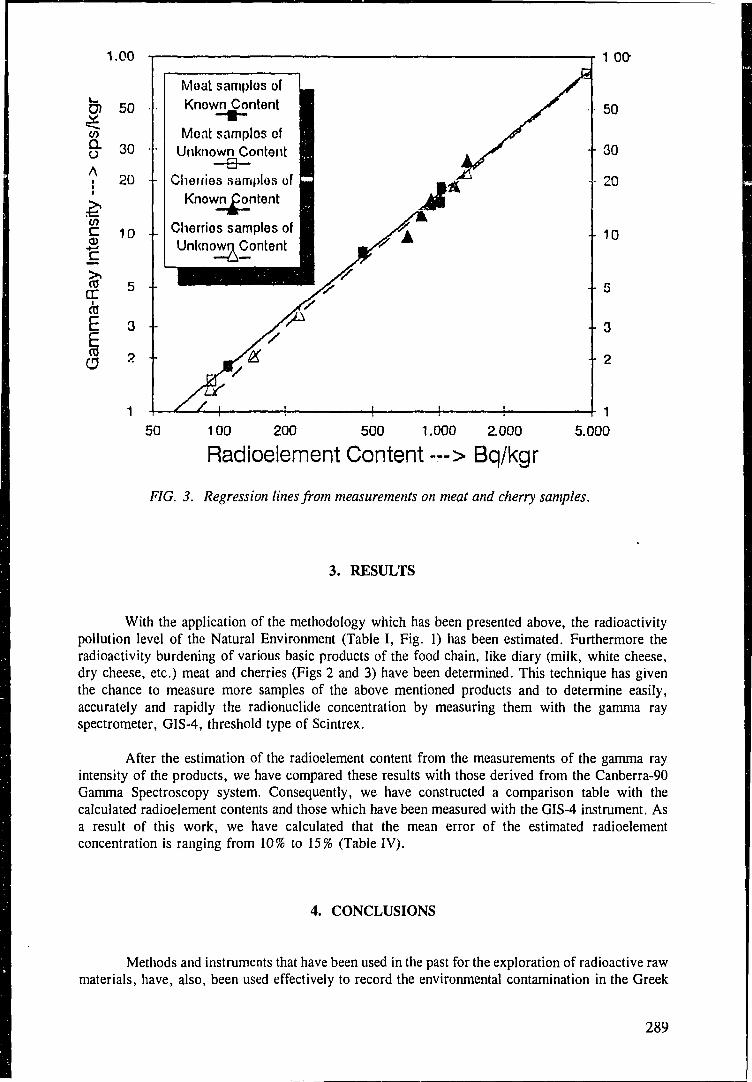
a.oA•
1.00
50
30
20
CD
1CE0J
10 --
5 -
3
2
50
Moat samples ofKnown Content
Moat samplos ofUnknown Content
Cheiries samples ofKnown pontent
Cherries samples ofUnknown Content
1 00
100 200 500 1.000 2.000
Radioelement Content—> Bq/kgr5.000
FIG. 3. Regression lines from measurements on meat and cherry samples.
3. RESULTS
With the application of the methodology which has been presented above, the radioactivitypollution level of the Natural Environment (Table I, Fig. 1) has been estimated. Furthermore theradioactivity burdening of various basic products of the food chain, like diary (milk, white cheese,dry cheese, etc.) meat and cherries (Figs 2 and 3) have been determined. This technique has giventhe chance to measure more samples of the above mentioned products and to determine easily,accurately and rapidly the radionuclide concentration by measuring them with the gamma rayspectrometer, GIS-4, threshold type of Scintrex.
After the estimation of the radioelement content from the measurements of the gamma rayintensity of the products, we have compared these results with those derived from the Canberra-90Gamma Spectroscopy system. Consequently, we have constructed a comparison table with thecalculated radioelement contents and those which have been measured with the GIS-4 instrument. Asa result of this work, we have calculated that the mean error of the estimated radioelementconcentration is ranging from 10% to 15% (Table IV).
4. CONCLUSIONS
Methods and instruments that have been used in the past for the exploration of radioactive rawmaterials, have, also, been used effectively to record the environmental contamination in the Greek
289
territory and to estimate, with precision, the radioelement pollution of various products of the foodchain during the period of the nuclear accident at Chernobyl, Ukraine.
The radioactivity pollution of the area, around the calibration facilities for geophysicalinstruments, being installed in the campus of the N.C.S.R. "Demokrkos", was four times greater, incomparison with the "before Chernobyl" period. The greatest value has been measured on the 1st ofJuly, 1986. We can say that the value of the radioactivity pollution was near to the pro-Chernobylone, close to the end of November 1986 and reached the same level as the one we used to have inthe past, very close to October 1987.
The gamma ray spectrometers GIS-4 of Scintrex, threshold type, gave a better estimation ofboth the radioelement pollution of the environment and the total contamination of the food products,in comparison with instruments like scintillometers, Geiger-Muller counters etc., due to the fact thatthey have the possibility to measure the total count gamma ray intensity for a period up to 100seconds.
With the technique that has been developed during the period of "Chernobyl" and has beendescribed above, we have calculated, with accuracy, the radioactivity contamination of a large numberof food products as well as of the natural environment, in a simple, quick and inexpensive way.
REFERENCES
[1] ANTONIOU, N., KAPPAS, A., KOLLAS, I., KRITIDIS, P., BARTZIS, I., PANTELIAS,G., PAPANIKOLAOU, E., E., PARADELIS, Th., SIDERIS, E., The Nuclear Accident atChernobyl, U.S.S.R., and its consequences in Greece: G.A.E.C. Technical Report, Athens,Greece (1986).
[2] SIDERIS, G.N., BARTOSEC J., CHLUPACOVA, M., PAPAKONSTANTINOU, Ek. N.,Recent Possibilities of quantitative calibration of Portable Gamma ray Spectrometry inGreece. Paper published in the 1st Hellenic Geophysical Congress Proceedings, Athens,Greece (1989).
[3] SIDERIS, G.N., Evaluation of Uranium Potential of Serres Basin, N. Greece with surfaceand subsurface Radiometric Methods of Applied Geophysics. Ph.D thesis, University ofAthens, Geophysics and Geothermy Division. Athens, Greece (1985).
[4] L0VBORG, L., Total Count Calibration Blocks for use in Uranium Exploration. Riso -R-490, Roskilde, Denmark (1983).
[5] PAPADOPOULOS, N.N., Development of nuclear techniques for national requirements, Int.Symp. on the Significance and Impact of Nuclear Research in Developing Countries, Athens,Greece (1986). Proceedings, I.A.E.A., Vienna (1987), 339.
[6] PAPADOPOULOS, N.N., J. Radioanal. Chem., 72, (1982), 463.
290
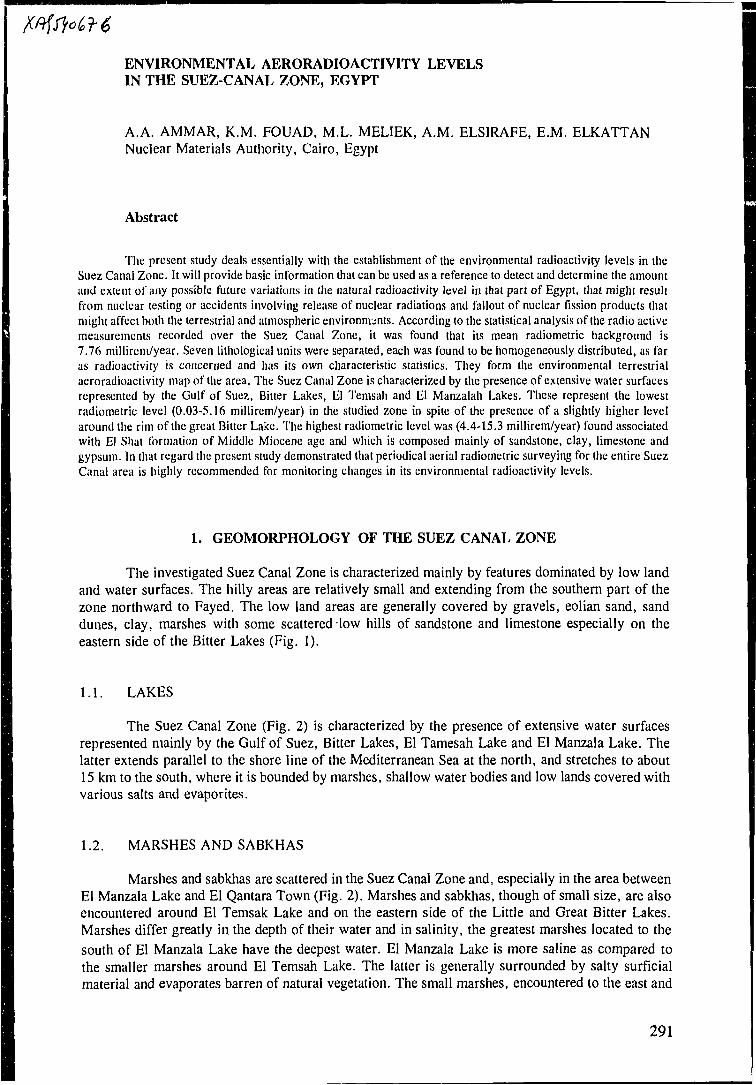
ENVIRONMENTAL AERORADIOACTIVITY LEVELSIN THE SUEZ-CANAL ZONE, EGYPT
A.A. AMMAR, K.M. FOUAD, M.L. MELIEK, A.M. ELSIRAFE, E.M. ELKATTANNuclear Materials Authority, Cairo, Egypt
Abstract
The present study deals essentially with the establishment of the environmental radioactivity levels in theSuez Canal Zone. It will provide basic information that can be used as a reference to detect and determine the amountand extent of any possible future variations in the natural radioactivity level in that part of Egypt, that might resultfrom nuclear testing or accidents involving release of nuclear radiations and fallout of nuclear fission products thatmight affect both the terrestrial and atmospheric environments. According to the statistical analysis of the radio activemeasurements recorded over the Suez Canal Zone, it was found that its mean radiometric background is7.76 millirem/year. Seven lithological units were separated, each was found to be homogeneously distributed, as faras radioactivity is concerned and lias its own characteristic statistics. They form the environmental terrestrialaeroradioactivity map of the area. The Suez Canal Zone is characterized by the presence of extensive water surfacesrepresented by the Gulf of Suez, Bitter Lakes, El Temsah and El Manzalah Lakes. These represent the lowestradiometric level (0.03-5.16 millirem/year) in the studied zone in spite of the presence of a slightly higher levelaround the rim of the great Bitter Lake. The highest radiometric level was (4.4-15.3 millirem/year) found associatedwith El Shat formation of Middle Miocene age and which is composed mainly of sandstone, clay, limestone andgypsum. In that regard the present study demonstrated that periodical aerial radiometric surveying for the entire SuezCanal area is highly recommended for monitoring changes in its environmental radioactivity levels.
1. GEOMORPHOLOGY OF THE SUEZ CANAL ZONE
The investigated Suez Canal Zone is characterized mainly by features dominated by low landand water surfaces. The hilly areas are relatively small and extending from the southern part of thezone northward to Fayed. The low land areas are generally covered by gravels, eolian sand, sanddunes, clay, marshes with some scattered low hills of sandstone and limestone especially on theeastern side of the Bitter Lakes (Fig. 1).
1.1. LAKES
The Suez Canal Zone (Fig. 2) is characterized by the presence of extensive water surfacesrepresented mainly by the Gulf of Suez, Bitter Lakes, El Tamesah Lake and El Manzala Lake. Thelatter extends parallel to the shore line of the Mediterranean Sea at the north, and stretches to about15 km to the south, where it is bounded by marshes, shallow water bodies and low lands covered withvarious salts and evaporites.
1.2. MARSHES AND SABKHAS
Marshes and sabkhas are scattered in the Suez Canal Zone and, especially in the area betweenEl Manzala Lake and El Qantara Town (Fig. 2). Marshes and sabkhas, though of small size, are alsoencountered around El Temsak Lake and on the eastern side of the Little and Great Bitter Lakes.Marshes differ greatly in the depth of their water and in salinity, the greatest marshes located to thesouth of El Manzala Lake have the deepest water. El Manzala Lake is more saline as compared tothe smaller marshes around El Temsah Lake. The latter is generally surrounded by salty surficialmaterial and evaporates barren of natural vegetation. The small marshes, encountered to the east and
291
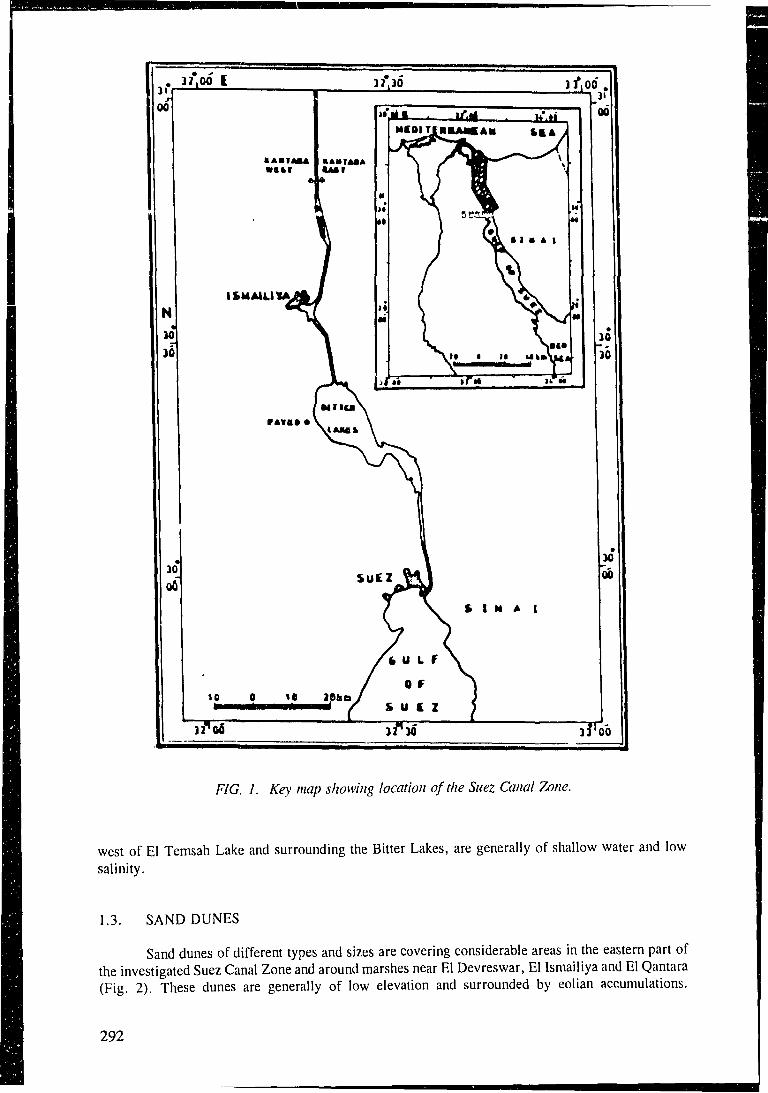
. 31\ 00 E
• ABIMLft
331*30
• * • • * • *
10
j f 06
«I*
II
10M
MCBI TJ
/
if*• •JUICAII
ft) "%' \
,—L t
V\
M'.II
ilAy
i a * I
1
— r
r
i
i
00)
ft I M A I
3 rob
F/G. 7. Key map showing location of the Suez Canal Zone.
west of El Temsah Lake and surrounding the Bitter Lakes, are generally of shallow water and low
salinity.
1.3. SAND DUNES
Sand dunes of different types and sizes are covering considerable areas in the eastern part ofthe investigated Suez Canal Zone and around marshes near El Devreswar, El Ismailiya and El Qantara(Fig. 2). These dunes are generally of low elevation and surrounded by eolian accumulations.
292
Marshes and vegetation are occasionally found in low lands between these sand dunes, especially tothe east and west of El Temsali Lake, near El Devreswar and south of El Qantara El Sharkiya (Fig.2).
1.4. NATURAL VEGETATION
Natural vegetation growth is encountered around the marshes, Lakes and the lee side of sanddunes. In general, vegetation belongs to two major types, namely short shrubs and taller trees. Theshortest shrubs are haphazardly distributed on the surface of the eolian sand, while the taller treessuch as tamarex and palm trees are concentrated around the marshes and lakes.
1.5. DRAINAGE
The western side of the Suez Canal Zone is dissectrJ by numerous drainage lines, includingsome pronounced valleys (wadis) which drain eastward to the Gulf of Suez and the Bitter Lakes. Onthis side of the Suez Canala, drainage lines are nearly concentrated in the hilly area south of ElDevreswar. On the eastern side of the Canal, however, drainage lines are nearly absent except in thearea between the Little Bitter Lake and the Gulf of Suez.
2. SURFACE GEOLOGIC ENVIRONMENT OF THE SUEZ CANAL ZONE
The Suez Canal Zone is covered by sedimentary rocks which belong to the Cretaceous,Middle Eocene, Late Eocene, Oligocene, Early Miocene, Middle Miocene, Late Miocene andPleistocene-Holocene ages. The following is a general outline of the surface geology of the zoneunder consideration as given by El Shazly et al. [3] and illustrated on the geological map of the zone(Fig. 2).
2.2. CRETACEOUS SEDIMENTS
The Cretaceous sediments in the investigated Suez Canal Zone belong mainly to the LateCretaceous and partly to the top od the Early Cretaceous. These are exposed in the Gebel Ataqa andGebel shabrawet areas (Fig. 2). In the former area these sediments are composed mainly of thick,apparently unfossiliferous gypseous marl with variegated caly and limestone bands. In the latter areathey are generally constituted of limestone and marl.
2.3. MIDDLE EOCENE SEDIMENTS
These are represented by the Khaboba Formation which is exposed in Gebel Ataqa and GebelGineifa areas (Fig. 2). In the first area this formation is composed mainly of limestone beds whichare hard massive, white, occasionally dolomitic and sandy, especially in the lower part. In the GebelGineifa area, however, the formation in question is mainly composed of thickly bedded limestonewhich is white to light grey and occasionally dolomitic.
2.4. LATE EOCENE SEDIMENTS
These are represented by the Tanka Formation which is of limited occurrence in the SuezCanal Zone. In the Gebel Ataqa area this formation is composed mainly of grit, marl, sandylimestone, sandstone and conglomerates, while in the Gebel Gineifa area, it is mainly composed of
293
Iw l i l£-T»'. HiG.I?)OtOLOGICAL MAP OF THE SUEZ CAHAL ZONEM NOHTHtASTtHN EGYPT
(AlUr t l Shaily t l ui 1«74 )
QjoOlVIUtO NCW CUUTIVATLU LM*U
T. OUiMUM Of COCUil,feKACM KlbGK
» „ , " - WAIT liANU* L1MLVIUJU NJI1I
F/G. 2. Geological map of the Suez Canal Zone Northeastern Egypt.
294
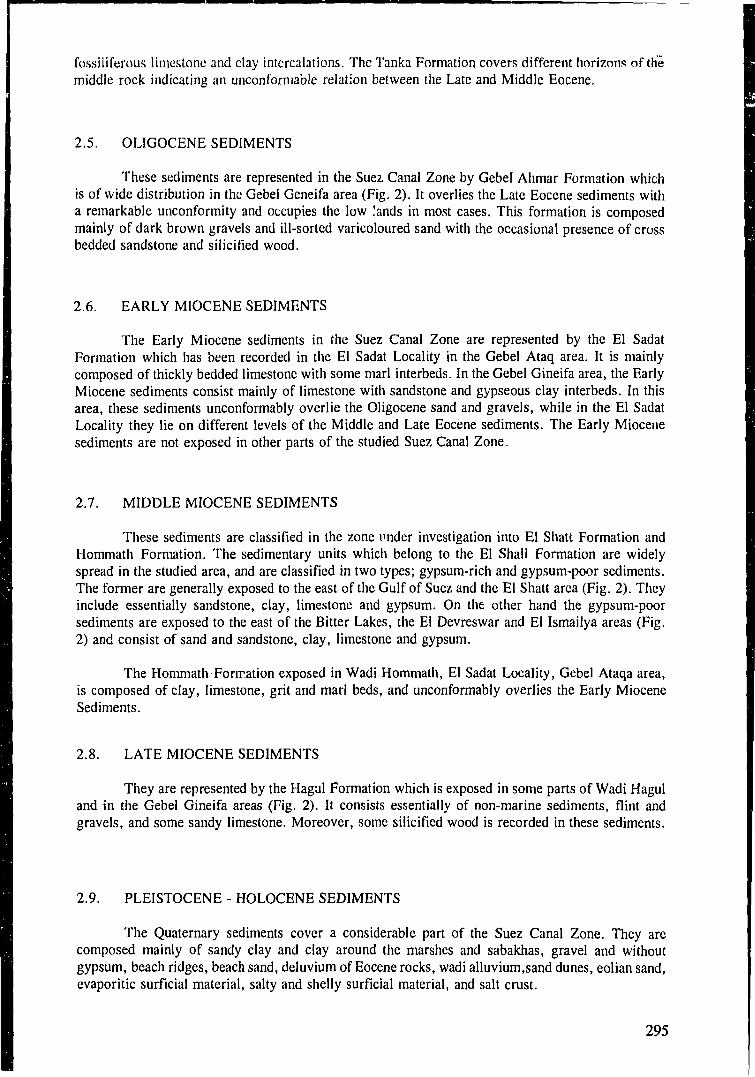
fossiliferous limestone and clay intercalations. The Tanka Formation covers different horizons of themiddle rock indicating an unconformable relation between the Late and Middle Eocene.
2.5. OLIGOCENE SEDIMENTS
These sediments are represented in the Suez Canal Zone by Gebel Ahmar Formation whichis of wide distribution in the Gebel Geneifa area (Fig. 2). It overlies the Late Eocene sediments witha remarkable unconformity and occupies the low lands in most cases. This formation is composedmainly of dark brown gravels and ill-sorted varicoloured sand with the occasional presence of crossbedded sandstone and silicified wood.
2.6. EARLY MIOCENE SEDIMENTS
The Early Miocene sediments in the Suez Canal Zone are represented by the El SadatFormation which has been recorded in the El Sadat Locality in the Gebel Ataq area. It is mainlycomposed of thickly bedded limestone with some marl interbeds. In the Gebel Gineifa area, the EarlyMiocene sediments consist mainly of limestone with sandstone and gypseous clay interbeds. In thisarea, these sediments unconformably overlie the Oligocene sand and gravels, while in the El SadatLocality they lie on different levels of the Middle and Late Eocene sediments. The Early Miocenesediments are not exposed in other parts of the studied Suez Canal Zone.
2.7. MIDDLE MIOCENE SEDIMENTS
These sediments are classified in the zone imder investigation into El Shatt Formation andHommath Formation. The sedimentary units which belong to the El Shall Formation are widelyspread in the studied area, and are classified in two types; gypsum-rich and gypsum-poor sediments.The former are generally exposed to the east of the Gulf of Suez and the El Shatt area (Fig. 2). Theyinclude essentially sandstone, clay, limestone and gypsum. On the other hand the gypsum-poorsediments are exposed to the east of the Bitter Lakes, the El Devreswar and El Ismailya areas (Fig.2) and consist of sand and sandstone, clay, limestone and gypsum.
The Hommath Formation exposed in Wadi Hommath, El Sadat Locality, Gebel Ataqa area,is composed of clay, limestone, grit and marl beds, and unconformably overlies the Early MioceneSediments.
2.8. LATE MIOCENE SEDIMENTS
They are represented by the Hagul Formation which is exposed in some parts of Wadi Haguland in the Gebel Gineifa areas (Fig. 2). It consists essentially of non-marine sediments, flint andgravels, and some sandy limestone. Moreover, some silicified wood is recorded in these sediments.
2.9. PLEISTOCENE - HOLOCENE SEDIMENTS
The Quaternary sediments cover a considerable part of the Suez Canal Zone. They arecomposed mainly of sandy clay and clay around the marshes and sabakhas, gravel and withoutgypsum, beach ridges, beach sand, deluvium of Eocene rocks, wadi alluvium.sand dunes, eolian sand,evaporitic surficial material, salty and shelly surficial material, and salt crust.
295
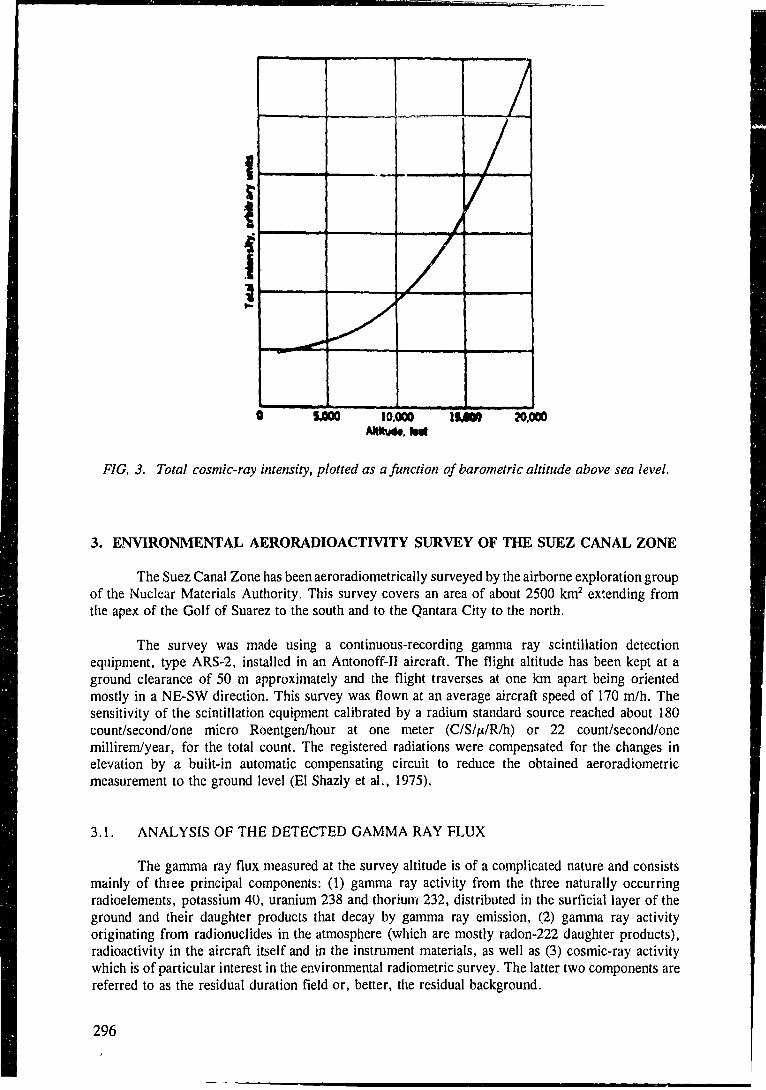
!
1
3
11/
MOO 10.000 1 M M 20.000MMudt.tNt
FIG. 3. Total cosmic-ray intensity, plotted as a Junction of barometric altitude above sea level.
3. ENVIRONMENTAL AERORADIOACTIVITY SURVEY OF THE SUEZ CANAL ZONE
The Suez Canal Zone has been aeroradiometrically surveyed by the airborne exploration groupof the Nuclear Materials Authority. This survey covers an area of about 2500 km2 extending fromthe apex of the Golf of Suarez to the south and to the Qantara City to the north.
The survey was made using a continuous-recording gamma ray scintillation detectionequipment, type ARS-2, installed in an Antonoff-II aircraft. The flight altitude has been kept at aground clearance of 50 m approximately and the flight traverses at one km apart being orientedmostly in a NE-SW direction. This survey was flown at an average aircraft speed of 170 m/h. Thesensitivity of the scintillation equipment calibrated by a radium standard source reached about 180count/second/one micro Roentgen/hour at one meter (C/S//x/R/h) or 22 count/second/onemillirem/year, for the total count. The registered radiations were compensated for the changes inelevation by a built-in automatic compensating circuit to reduce the obtained aeroradiometricmeasurement to the ground level (El Shazly et al., 1975).
3.1. ANALYSIS OF THE DETECTED GAMMA RAY FLUX
The gamma ray flux measured at the survey altitude is of a complicated nature and consistsmainly of thtee principal components: (1) gamma ray activity from the three naturally occurringradioelements, potassium 40, uranium 238 and thorium 232, distributed in the surficial layer of theground and their daughter products that decay by gamma ray emission, (2) gamma ray activityoriginating from radionuclides in the atmosphere (which are mostly radon-222 daughter products),radioactivity in the aircraft itself and in the instrument materials, as well as (3) cosmic-ray activitywhich is of particular interest in the environmental radiometric survey. The latter two components arereferred to as the residual duration field or, better, the residual background.
296
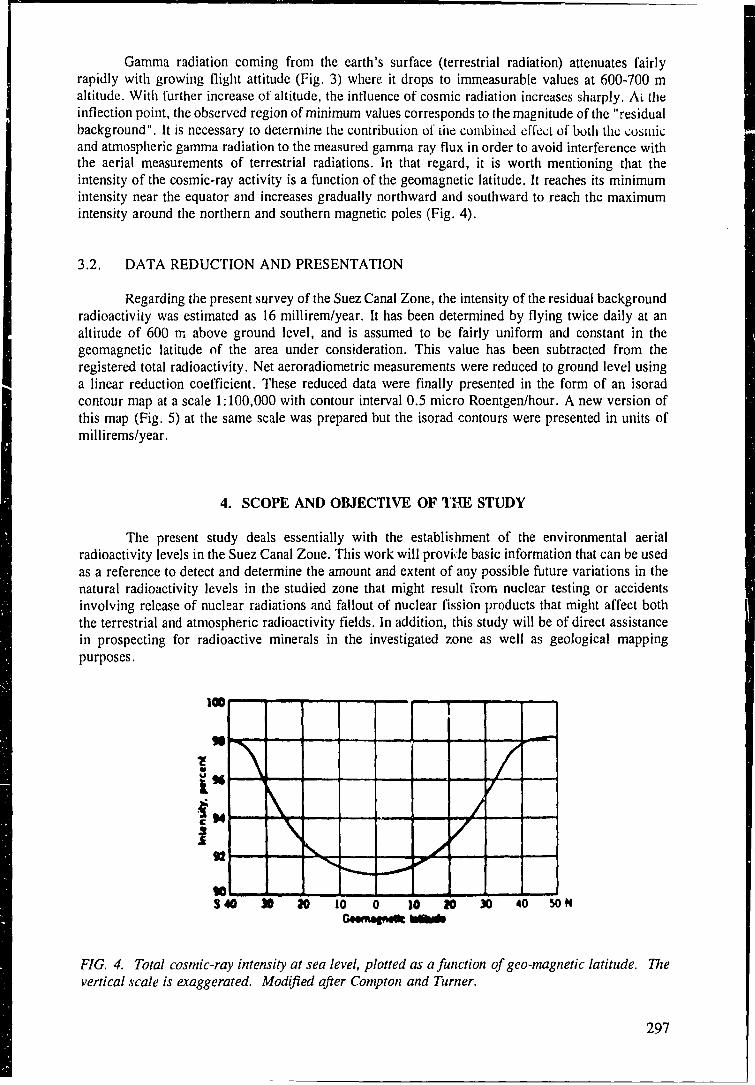
Gamma radiation coming from the earth's surface (terrestrial radiation) attenuates fairlyrapidly with growing flight attitude (Fig. 3) where it drops to immeasurable values at 600-700 maltitude. With further increase of altitude, the influence of cosmic radiation increases sharply. Ai theinflection point, the observed region of minimum values corresponds to the magnitude of the "residualbackground". It is necessary to determine the contribution of the combined effect of both the cosmicand atmospheric gamma radiation to the measured gamma ray flux in order to avoid interference withthe aerial measurements of terrestrial radiations. In that regard, it is worth mentioning that theintensity of the cosmic-ray activity is a function of the geomagnetic latitude. It reaches its minimumintensity near the equator and increases gradually northward and southward to reach the maximumintensity around the northern and southern magnetic poles (Fig. 4).
3.2. DATA REDUCTION AND PRESENTATION
Regarding the present survey of the Suez Canal Zone, the intensity of the residual backgroundradioactivity was estimated as 16 millirem/year. It has been determined by flying twice daily at analtitude of 600 rr. above ground level, and is assumed to be fairly uniform and constant in thegeomagnetic latitude of the area under consideration. This value has been subtracted from theregistered total radioactivity. Net aeroradiometric measurements were reduced to ground level usinga linear reduction coefficient. These reduced data were finally presented in the form of an isoradcontour map at a scale 1:100,000 with contour interval 0.5 micro Roentgen/hour. A new version ofthis map (Fig. 5) at the same scale was prepared but the isorad contours were presented in units ofmillirems/year.
4. SCOPE AND OBJECTIVE OF THE STUDY
The present study deals essentially with the establishment of the environmental aerialradioactivity levels in the Suez Canal Zone. This work will provide basic information that can be usedas a reference to detect and determine the amount and extent of any possible future variations in thenatural radioactivity levels in the studied zone that might result from nuclear testing or accidentsinvolving release of nuclear radiations and fallout of nuclear fission products that might affect boththe terrestrial and atmospheric radioactivity fields. In addition, this study will be of direct assistancein prospecting for radioactive minerals in the investigated zone as well as geological mappingpurposes.
100
\
N\*-—-* /
///
S40 » 20 10 0 10 20 » 40 WH
FIG. 4. Total cosmic-ray intensity at sea level, plotted as a function of gco-magnetic latitude. Thevertical scale is exaggerated. Modified after Compton and Turner.
297
N
L
7*10
tEGCNO
{ ) HAOIOMtTRlC CONTOUR .
COKTOU« INTERVAL. 1.0 rn.lhr.rn/year
3? 20iT ~
3? 30
30
00
FIG. 5. Environmental total count aeroradiometric contour map of the Suez Canal Zone, Egypt.
298
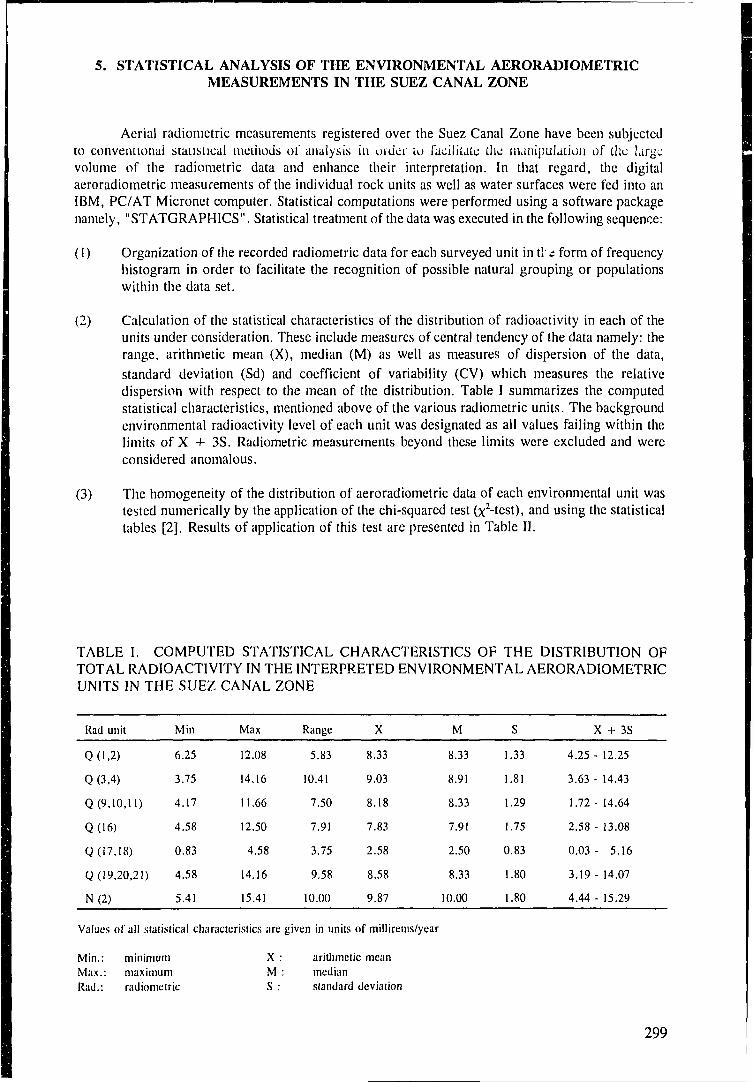
5. STATISTICAL ANALYSIS OF THE ENVIRONMENTAL AERORADIOMETRICMEASUREMENTS IN THE SUEZ CANAL ZONE
Aerial radiometric measurements registered over the Suez Canal Zone have been subjectedto conventional statistical methods of analysis in order to facilitate the manipulation of the largevolume of the radiometric data and enhance their interpretation. In that regard, the digitalaeroradiometric measurements of the individual rock units as well as water surfaces were fed into anIBM, PC/AT Micronet computer. Statistical computations were performed using a software packagenamely, "STATGRAPHICS". Statistical treatment of the data was executed in the following sequence:
(1) Organization of the recorded radiometric data for each surveyed unit in t!' c form of frequencyhistogram in order to facilitate the recognition of possible natural grouping or populationswithin the data set.
(2) Calculation of the statistical characteristics of the distribution of radioactivity in each of theunits under consideration. These include measures of central tendency of the data namely: therange, arithmetic mean (X), median (M) as well as measures of dispersion of the data,standard deviation (Sd) and coefficient of variability (CV) which measures the relativedispersion with respect to the mean of the distribution. Table I summarizes the computedstatistical characteristics, mentioned above of the various radiometric units. The backgroundenvironmental radioactivity level of each unit was designated as all values failing within thelimits of X 4- 3S. Radiometric measurements beyond these limits were excluded and wereconsidered anomalous.
(3) The homogeneity of the distribution of aeroradiometric data of each environmental unit wastested numerically by the application of the chi-squared test (x2-test), and using the statisticaltables [2]. Results of application of this test are presented in Table II.
TABLE I. COMPUTED STATISTICAL CHARACTERISTICS OF THE DISTRIBUTION OFTOTAL RADIOACTIVITY IN THE INTERPRETED ENVIRONMENTAL AERORADIOMETRICUNITS IN THE SUEZ CANAL ZONE
Rad unit
Q0.2)
Q (3,4)
Q (9,10,11)
Q(16)
Q (17,18)
Q (19,20,21)
N(2)
Min
6.25
3.75
4.17
4.58
0.83
4.58
5.41
Max
12.08
14.16
11.66
12.50
4.58
14.16
15.41
Values of all statistical characteristics are
Min.: minimumMax.: maximumRail.: radiometric
X :M :S :
Range
5.83
10.41
7.50
7.91
3.75
9.58
10.00
given in units
X
8.33
9.03
8.18
7.83
2.58
8.58
9.87
of millireins/year
arithmetic meanmedianstandard deviation
M
8.33
8.91
8.33
7.91
2.50
8.33
10.00
S
1.33
1.81
1.29
1.75
0.83
1.80
1.80
4.25
3.63
1.72
2.58
0.03
3.19
4.44
X + 3S
- 12.25
- 14.43
- 14.64
- 13.08
- 5.16
- 14.07
- 15.29
299
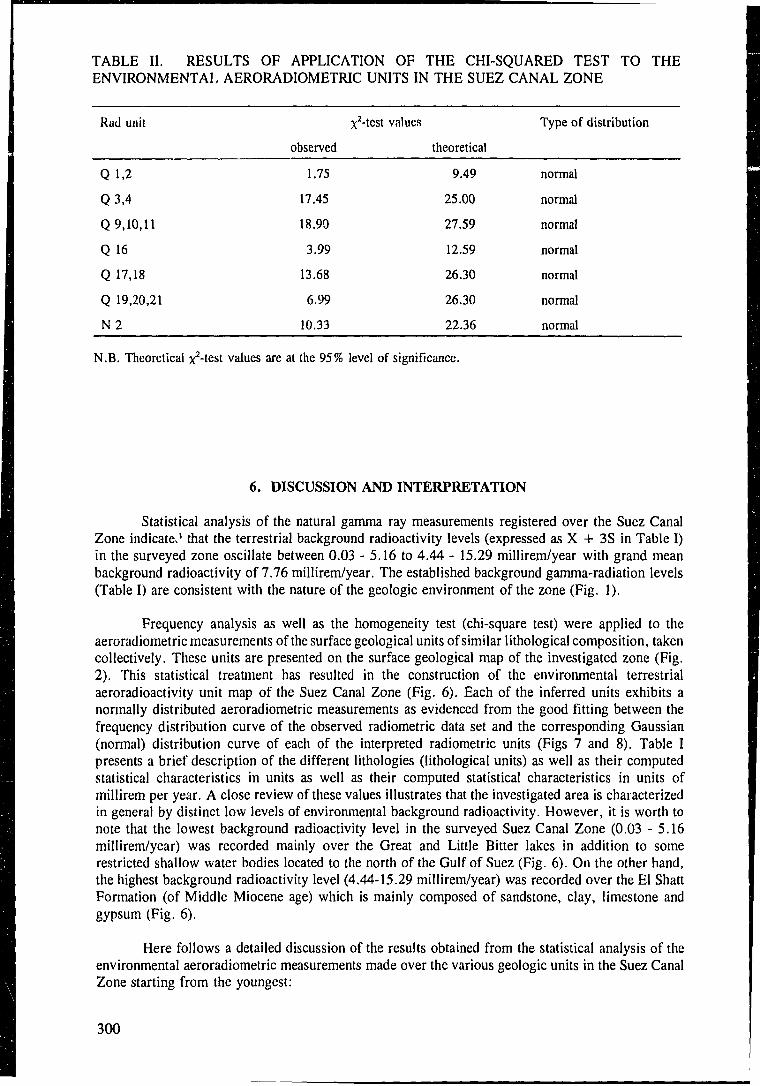
TABLE II. RESULTS OF APPLICATION OF THE CHI-SQUARED TEST TO THEENVIRONMENTAL AERORADIOMETRIC UNITS IN THE SUEZ CANAL ZONE
Rad unit X2-test values
observed theoretical
Type of distribution
Q1.2
Q3.4
Q9.10. l l
Q 16
Q 17,18
Q 19,20,21
N 2
1.75
17.45
18.90
3.99
13.68
6.99
10.33
9.49
25.00
27.59
12.59
26.30
26.30
22.36
normal
normal
normal
normal
normal
normal
normal
N.B. Theoretical x2-test values are at the 95% level of significance.
6. DISCUSSION AND INTERPRETATION
Statistical analysis of the natural gamma ray measurements registered over the Suez CanalZone indicated that the terrestrial background radioactivity levels (expressed as X + 3S in Table I)in the surveyed zone oscillate between 0.03 - 5.16 to 4.44 - 15.29 millirem/year with grand meanbackground radioactivity of 7.76 millirem/year. The established background gamma-radiation levels(Table I) are consistent with the nature of the geologic environment of the zone (Fig. 1).
Frequency analysis as well as the homogeneity test (chi-square test) were applied to theaeroradiometric measurements of the surface geological units of similar lithological composition, takencollectively. These units are presented on the surface geological map of the investigated zone (Fig.2). This statistical treatment has resulted in the construction of the environmental terrestrialaeroradioactivity unit map of the Suez Canal Zone (Fig. 6). Each of the inferred units exhibits anormally distributed aeroradiometric measurements as evidenced from the good fitting between thefrequency distribution curve of the observed radiometric data set and the corresponding Gaussian(normal) distribution curve of each of the interpreted radiometric units (Figs 7 and 8). Table Ipresents a brief description of the different lithologies (lithological units) as well as their computedstatistical characteristics in units as well as their computed statistical characteristics in units ofmillirem per year. A close review of these values illustrates that the investigated area is characterizedin general by distinct low levels of environmental background radioactivity. However, it is worth tonote that the lowest background radioactivity level in the surveyed Suez Canal Zone (0.03 - 5.16millirem/year) was recorded mainly over the Great and Little Bitter lakes in addition to somerestricted shallow water bodies located to the north of the Gulf of Suez (Fig. 6). On the other hand,the highest background radioactivity level (4.44-15.29 millirem/year) was recorded over the El ShattFormation (of Middle Miocene age) which is mainly composed of sandstone, clay, limestone andgypsum (Fig. 6).
Here follows a detailed discussion of the results obtained from the statistical analysis of theenvironmental aeroradiometric measurements made over the various geologic units in the Suez CanalZone starting from the youngest:
300
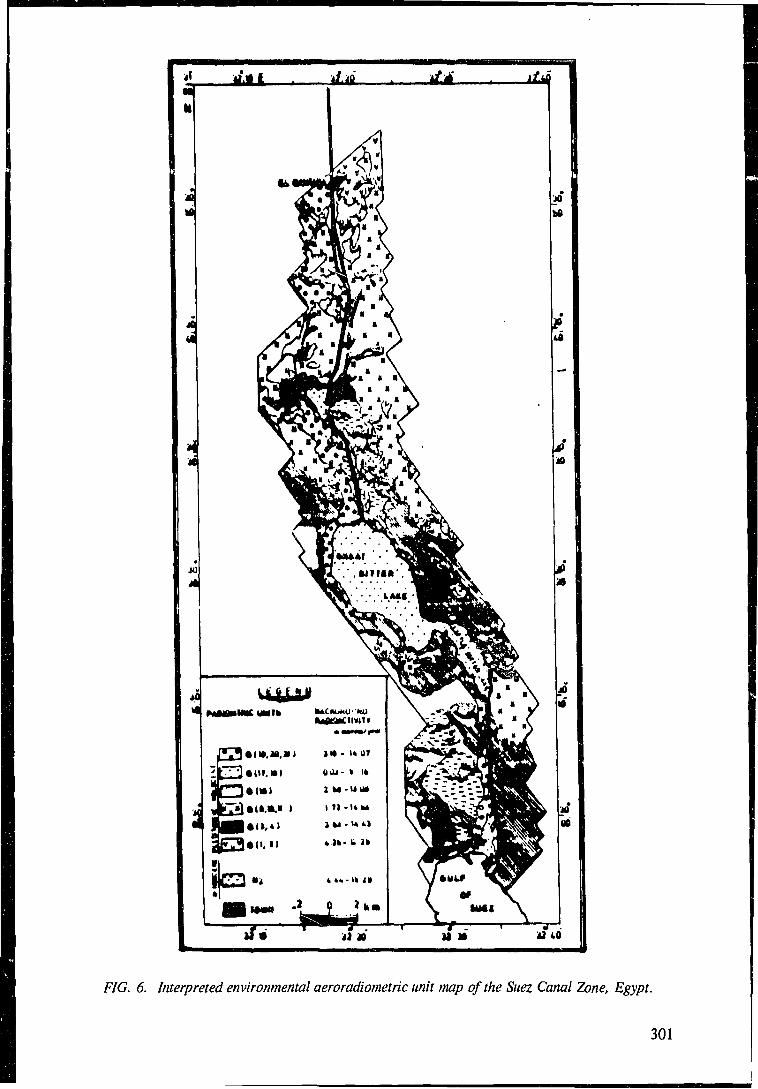
FIG. 6. Interpreted environmental aeroradiometric unit map of the Suez Canal Zone, Egypt.
301
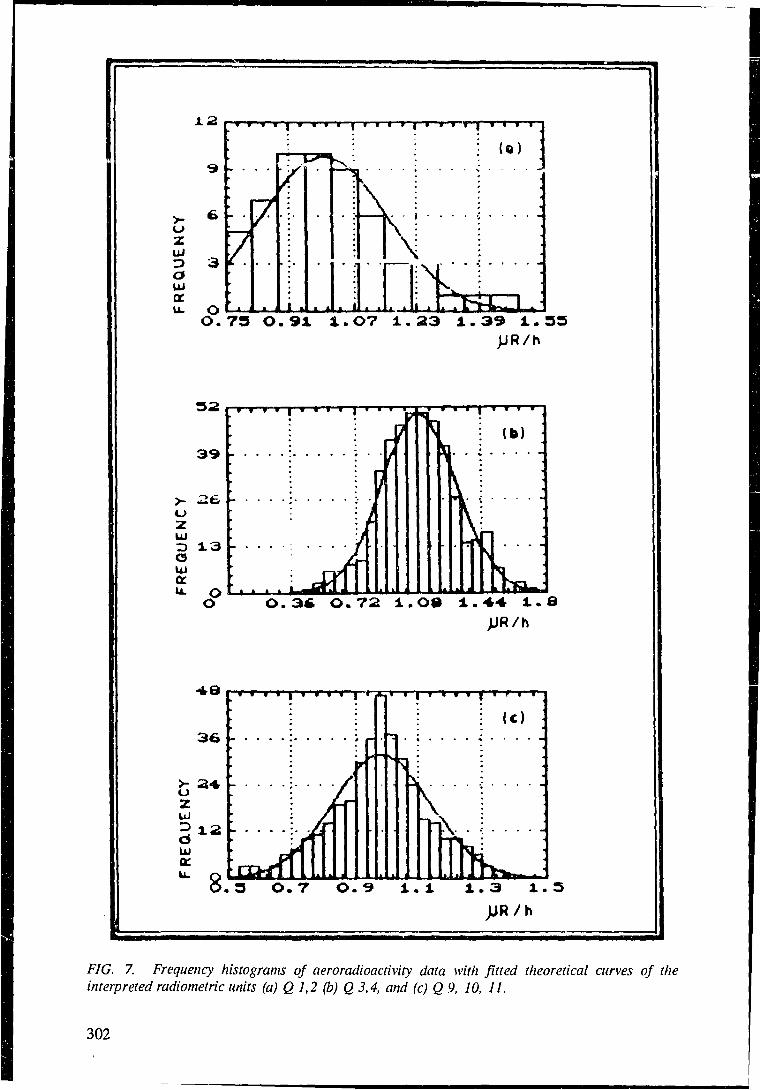
JL2
OUJacu. O
. . . .
f
• . 1
^ • •
\
O.73 O.91 1.O7 1 . 2 3 1 . 3 9 1 .55UR/h
^u.O.34 O.72 1.O0 1. 8
pR/h
Z
8.
• Y: . . /: /
3 O . 7 O . 9 1 . 1 1 . 3 1 . 5>JR/h
FIG. 7. Frequency histograms of aeroradioactivity data with fitted theoretical curves of theinterpreted radiometric units (a) Q 1,2 (b) Q 3,4, and (c) Q 9, 10, 11.
302

6.1. PLEISTOCENE - IIOLOCENE
Statistical treatment of the aeroradiometric measurements acquired over the surface lithologicalunits related to the Pleistocene-Holocene epochs (Plate I) has enabled the recognition and delineationof six environmental aeroradiometric units (Fig. 6.). Each of these units has its own backgroundgamma-radiation level (Table 1). The outlines units, however, showed some interfering values ofradioactivity levels. The lowest background radioactivity level (0.03 - 5.16) was recorded over lakesand ponds as well as shallow water bodies (unit 17, IS, Table I), whereas the highest backgroundradiation level (3.63 - 14.43 millirem/year) was recorded over plains covered with gravel (unit 3, 4,Table I).
Among the interpreted environmental aeroradiometric units of the Pleistocene-Holoceneepochs the lakes, ponds and shallow water bodies proved to have the lowest range(3.75 millirem/year), mean (2.58 millirem/year), median (2.50 millirem/year) and standard deviation(0.83 millirem/year). This may reflect the low abundance and the relatively higher degree ofhomogeneity of the distribution of radionuclides in such water environment of this radiometric unit.On the contrary, the gravel plains (unit Q3-4 Table I) showed the highest range (10.41 millirem/year),mean (9.03 millirem/year), median (8.91 millirem/year) and standard deviation (1.81 millirem/year).These figures give a quantitative estimate of the degree of dispersion of the values of the naturalaeroradioactivity measurement around the mean background radioactivity of this unit. Such highdegree of dispersion is a reflection of the high degree of heterogeneous distribution of radioelementsin the environment. This may be attributed to the heterogeneities in the lithological composition ofthe source rocks from which these transported gravel were derived, and/or to the mode of depositionof these rocks during the last 2.5 million years.
6.2. MIOCENE (MIDDLE MIOCENE)
Statistical analysis of the aeroradiometric measurements made over the Middle Mioceneoutcrops demonstrated that the El Shatt Formation which is mainly composed of sandstone, limestoneand gypsum can be regarded as representing a radiometric unit (Fig. 6) of normal pattern ofradioactivity distribution (Fig. 5d). Besides, these sediments displayed the highest natural backgroundgamma-radiation level, median and mean in the studied Suez Canal Zone (4.44-15.29, 10 and9.87 millirem/year respectively). On the other hand, it was observed that this radiometric unit showeda remarkably high range and standard deviation values (10 and l.B millirem/year respectively). Thismay reflect the heterogeneous lithological composition of the El Shatt Formation, which may havetaken up to 19 million years of deposition.
7. CONCLUSION AND RECOMMENDATION
From the environmental point of view, the established background terrestrial gamma-radiationlevels of the various rock types, soils and water bodies in the Suez Canal Zone provided the necessary-basic information that can be used as a reference to determine the amount and extent of any possiblefuture variations in the environmental radioactivity of he area, that might result either from accidentsinvolving release of nuclear radiations and radioactive contamination of the ground or introductionof radioactive materials to the area (waste, leakage or fallout), especially taking into consideration thatthe Suez Canal is traversed by ships that may carry, and/or run by, nuclear materials. Consequently,a periodical airborne radiometric surveying for the entire Suez Canal Zone is highly recommendedfor monitoring changes in the environmental radiation levels in this zone.
303
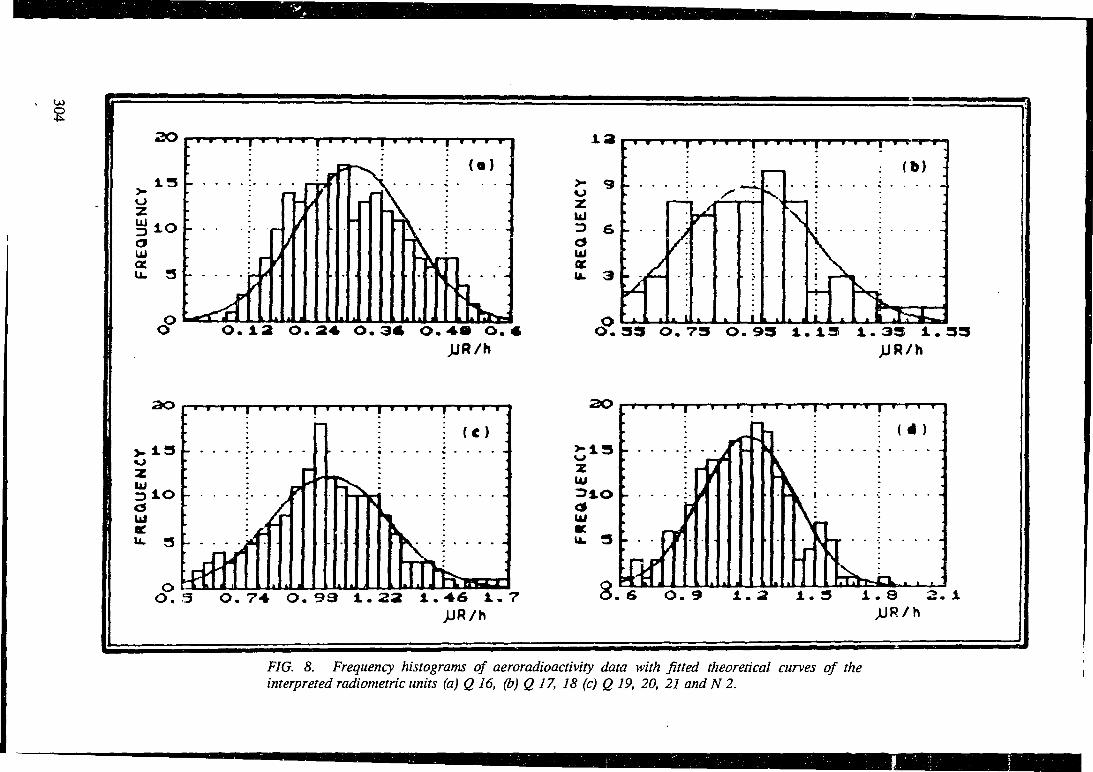
82 0
1 3
I 1OaUi
£ 3
O°
•
_ . .
4
1
t9
•
•
\
•m\ jv
>K
| w w w w
: ( o )
O.12 O.24 O.3« O.40 O. 6JJR/h
ZUJ
C5UJQCU. 3
( b )
\
O.33 O.73 O.93 1.19 1.33 1.33JJR/h
11OUJ
O . 5
HI
1
( e )
2 0
O.99 1.22 1.46 1.7JUR/h
2UJ
u. 3
8
i . . . , . , .
: • • • • : • - - j
9
• i • • • • i
- s - - - ;
V1 ..f
411 ipNn
6 O.9 1.2 1.3 1.8 2.1
FIG. 8. Frequency histograms of aeroradioactivity data with fitted theoretical curves of theinterpreted radiometric units (a) Q 16, (b) Q 17, 18 (c) Q 19, 20, 21 and N 2.
REFERENCES
[1] ADAMS L., The natural radiation environment, Rice University Semicentennial Publications(1965).
[2] CLARK G.M. and CROOK D., A basic course in statistics, English LanguageSociety/Edward Arnold (publishers) (1988).
[3] EL SHA7LY P.M., ABPF1. HADY, MFSHRFF W.M.. AMMAR A.A.. MELEIK M.L..SALMAN A.B., MORSEY M.A., EL RAKAIBY M.M., EL AASSY I.E.E. and KAMELA.F., Geological and geophysical investigations of the Suez Canal Zone, Remote SensingResearch Project, Academy of Scientific Research and Technology (1975) 38p.
[4] INTERNATIONAL ATOMIC ENERGY AGENCY, Radiometric reporting methods andcalibration in uranium exploration, Technical Reports Series No. 174, Vienna, Austria (1976)57 p.
[5] INTERNATIONAL ATOMIC ENERGY AGENCY (IAEA), Gamma ray surveys in uraniumexploration, Technical Reports Series No. 186, Vienna, Austria (1979) 90 p.
[61 RICHARD V. BLARICAN, Practical Geophysics for tte exploration geologist, NorthwestMining Association, USA (1980).
305
AGRIGEOCIIEMICAL MAPS FROM URANIUM EXPLORATION DATA
G. SANTOS, JR., N. GARCIAPhilippine Nuclear Research Institute, Quezon City, Philippines
Abstract
Trace element data (mainly Cu) obtained during the course of uranium geochemical exploration inPangasinan province, Luzon were transformed or converted to reflect micronutrient copper distribution. Thetransformed copper data (their range of values) were plotted as contours in the agrigeochemical map of copper. Soilsamples were collected from different parts of the province and were analyzed for copper. The copper analysis resultsof these soil samples, i.e. range of values were compared with those plotted in the agrigeochemical map. Thecomparison indicates close agreement between the soil samples and the copper agrigeochemical map with the maphaving generally slightly higher copper range values than those found in the soil. The high copper range values alsoshow possible extent of copper mine tails siltation in central Pangasinan. It is suggested that the map could be usedas an interim guide on the copper micronutrient level in Pangasinan province as copper is one of the essentialmicronutrients needed for healthy plant growth.
1. INTRODUCTION
As part of the Philippine Nuclear Power Programme, the former Philippine Atomic EnergyCommission (PAEC) embarked on a nationwide uranium reconnaissance exploration project in thelate 1970s. Considerable geochemical data were accumulated as a result of the exploration in thedifferent parts of the country. The surveys were patterned after the work of Tauchid et al. (1978).The geochemical analysis used the method of Smith and Lynch [12]. Santos et al. (1989) recognizedthe potential usefulness of the geochemical data in agriculture.
A study on micronutrients in soils of the entire Philippines was made by Agustin et al. [1],however, Santos et al. (1989) noted that the study did not adequately cover large areas. They furtherobserved that the geochemical values obtained from stream sediments could be converted ortransformed to reflect the micronutrient element distribution in the soil. This conversion was done bygetting the soil-sediment background concentration ratio. By using this ratio, stream sedimentgeochemical maps could be converted to agrigeochemical maps. These maps indicate the amount oftrace elements that could be available to the plant.
In agriculture it is essential to know the areas which have anomalously high or low traceelement concentrations especially the essential micronutrients such as zinc, copper, manganese andiron, among others. These micronutrients in soil could significantly affect the growth of plants.According to Castro [4], there are about 5 000 sq km in the Philippines which have soils deficientin zinc. The locations of the zinc-deficient areas, however, are not clear. Iron toxicity in soil isanother problem in agricultural production as noted by Benckiser et al. [3]. According to them, thisproblem is found not only in the Philippines but in other Asian countries as well. Their studiesindicate that rice affected by iron toxicity develop poor root system. Of course, other factors such asacidity, alkalinity, salinity and excess organic matter, in addition to iron toxicity could hinder plantgrowth. Benckiser et al. observed that iron-rich soil could give rise to iron toxicity if phosphorous,potassium, calcium and zinc are deficient. According to Ponnamperuma [7] and Benckiser et al. [3],excess or deficiency in certain minor elements in soil could lead to nutritional disorders in rice plants.The observations of these investigators suggest that the presence of excessive concentrations of anelement in soil does not always result in element toxicity in plant. Rosales [8] suggests that applicationof zinc as zinc sulfate tends to increase rice yield.
307
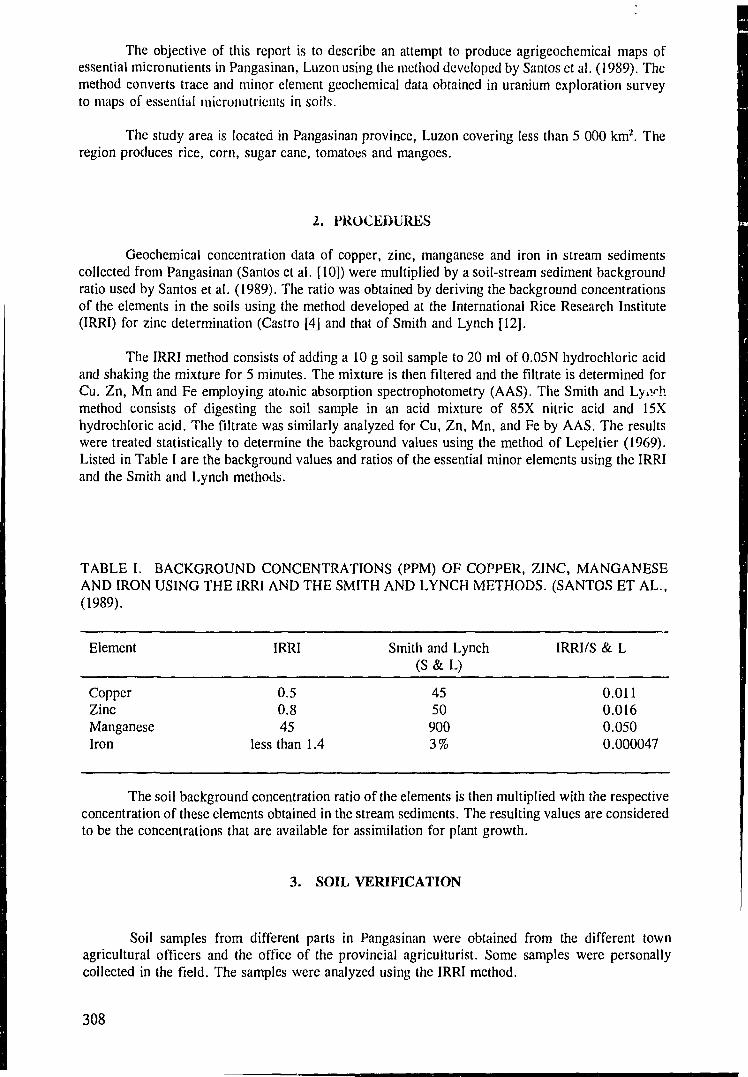
The objective of this report is to describe an attempt to produce agrigeochemical maps ofessential micronutients in Pangasinan, Luzon using the method developed by Santos et al. (1989). Themethod converts trace and minor element geochemical data obtained in uranium exploration surveyto maps of essential microuutrients in soils.
The study area is located in Pangasinan province, Luzon covering less than 5 000 km2. Theregion produces rice, corn, sugar cane, tomatoes and mangoes.
2. PROCEDURES
Geochemical concentration data of copper, zinc, manganese and iron in stream sedimentscollected from Pangasinan (Santos et al. [10]) were multiplied by a soil-stream sediment backgroundratio used by Santos et al. (1989). The ratio was obtained by deriving the background concentrationsof the elements in the soils using the method developed at the International Rice Research Institute(IRRI) for zinc determination (Castro [4] and that of Smith and Lynch [12].
The IRRI method consists of adding a 10 g soil sample to 20 ml of 0.05N hydrochloric acidand shaking the mixture for 5 minutes. The mixture is then filtered and the filtrate is determined forCu. Zn, Mn and Fe employing atomic absorption spectrophotometry (AAS). The Smith and Ly.yhmethod consists of digesting the soil sample in an acid mixture of 85X nitric acid and 15Xhydrochloric acid. The filtrate was similarly analyzed for Cu, Zn, Mn, and Fe by AAS. The resultswere treated statistically to determine the background values using the method of Lepeltier (1969).Listed in Table I are the background values and ratios of the essential minor elements using the IRRIand the Smith and Lynch methods.
CopperZincManganeseIron
0.50.845
less than 1.4
45509003%
TABLE I. BACKGROUND CONCENTRATIONS (PPM) OF COPPER, ZINC, MANGANESEAND IRON USING THE IRRI AND THE SMITH AND LYNCH METHODS. (SANTOS ET AL.,(1989).
Element IRRI Smith and Lynch IRRI/S & L(S&L)
0.0110.0160.0500.000047
The soil background concentration ratio of the elements is then multiplied with the respectiveconcentration of these elements obtained in the stream sediments. The resulting values are consideredto be the concentrations that are available for assimilation for plant growth.
3. SOIL VERIFICATION
Soil samples from different parts in Pangasinan were obtained from the different townagricultural officers and the office of the provincial agriculturist. Some samples were personallycollected in the field. The samples were analyzed using the IRRI method.
308
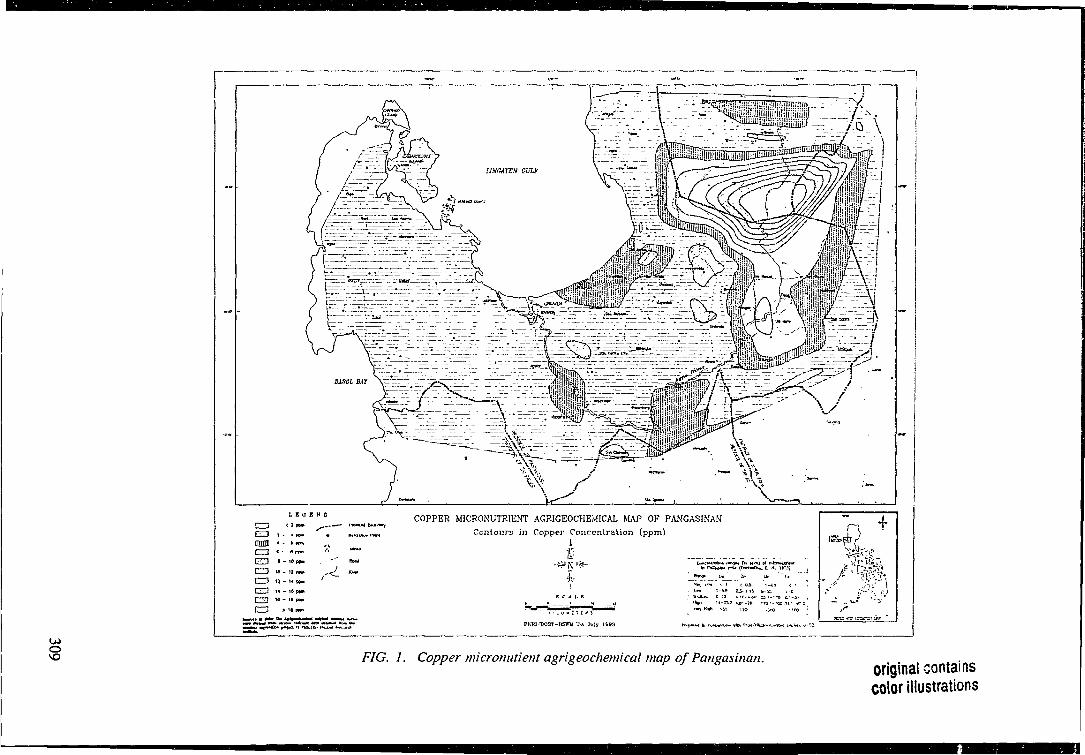
O
L K O E K D
Hi ,".Z "".DHDJ « - * « « ^
a • • • " • '•
tm
C 3 » - i« *m
COPPER M1CR0NUTRIENT AGRIGEOCHEMICAL MAP OF PANGASINAN
Contours in Capper Concentration (ppm)If
.ino - 'TO
PKRIDOST-BSWM.'DA Juir 1S93
FIG. 1. Copper ttiicronutient agrigeochemical map of Pangasinan. original containscolor illustrations
1.3 PLOTTING OF SAMPLING POINTS
Before data processing, the stream sediment sampling points were re-plotted or relocatedmidway between the sediment sampling location and the headwater of the stream or midway betweensampling points along the same stream. This was considered the better location to reflect the soilvalues of a drainage area.
In contrast, the work of Santos et al. (1989) did not include the relocation of the streamsediment sampling points before data processing which used the method of moving averages.
4. DATA PROCESSING
Computerized contour mapping of the converted values of copper, zinc, manganese and ironwas performed using the Arc/Info mapping software which utilizes the method of moving averages.Map contouring was done in cooperation with the Soils Research and Development Center of theBureau of Soils and Water Management (BSWM).
5. RESULTS AND DISCUSSIONS
Four preliminary agrigeochemical maps were produced. These were for copper, zinc,manganese and iron. However, in this report the copper map is considered in its final stage. As forthe other '.hree agrigeochemical maps, it is hoped that these maps when finalized will be reproduced,demonstrated and distributed to the provincial agriculturist and the different municipal or townagricultural officers. The maps of zinc, manganese and iron are still being reviewed for slightmodifications. The contours plotted in the map are ranges of element concentrations, such that anygiven point in the map could be easily identified as belonging to a certain range of possible values.
Shown in Fig. 1 is the copper micronutrient agrigeochemical map of Pangasinan. The highcopper concentration in th; northern part is due mainly to the presence of mineralized area enrichedin copper (Philex Mines).
This map as compared to the contour map of Santos et al. (1989) is deemed to be moreunderstandable to the municipal agricultural officers and farmer endusers. This map also includes arange of class limits for Philippine soils. These range of class limits by Pantastico [6] is classified asvery low, low, medium, high and very high. See Table II.
TABLE II. THE CONCENTRATION RANGES (IN PPM) OF MICRONUTRIENT IN PHILIPPINESOILS [6].
Range
Very lowLowMediumHighVery high
16
14
Cu
<1-5.9- 13-30.9>31
Zn
<0.50.5- 1.151.16-4.804.81 - 20
>20
Mn
1 -4.95-55
55.1 - 170170.1 - 300
>300
634.
Fe
<11 - 6.1-341 -99.9>100
Agustin et al. [1] on the other hand categorized the micronutrients usingdiethelenetriaminepentaacetic acid (DTPA) as extractant. The different categories are: well below
310
average, below average, average, above average and well above average. Agustin et al. (1988) andSillanpaa fill suggested that critical deficiency limit for several plant crops usingethylenediaminetetraacetic acid (EDTA) extractable micronutrients are as follows: Zn -0.5 ppm, Cu-0.2 ppm, Fe -4.5 ppm and Mn -1.0 ppm.
TABLE III. RESULTS OF MICRONUTRIENT ANALYSIS (SOIL RANGE VALUE) OF SOILCOMPARED TO AGRIGEOCHEMICAL MAP RANGE VALUES FOR COPPER OBTAINEDFROM DIFFERENT TOWNS IN PANGASINAN.
Location Map Range Value Soil Range Value
AguilarAlcalaAsinganAlaminosBayambangBalungaoBinmaleyBugallonCalasiaoDagupanInfantaLabradorLingayenMangaldanMabiniMalasiquiManaoagMangataremNatividadPozorrubioRosalesSan CarlosSan JacintoSan FabianSan ManuelSan NicolasSta. BarbaraSan QuintinSta. MariaSualTayugVillasisUminganUrdanetaUrbistondo
Low - MediumLow - MediumMediumLowLow - MediumLow - MediumLowLowLowMediumLowLowMediumLowLowLowLowLowMediumVery lowLow - MediumLowLow - MediumLow - MediumMediumMediumLowLowMediumLowLowLowLowVery lowLow
Very lowVery lowVery lowVery lowMediumVery lowVery lowVery lowVery lowVery lowVery lowVery lowLowVery lowVery lowVery lowVery lowVery lowVery lowVery lowVery lowVery lowVery lowVery lowMediumVery lowVery lowVery lowVery lowLowVery lowVery lowV .ry lowVery lowVery low
The copper results of the soil verification analysis are closely in agreement with the copperagrigeochemical map produced from geochemical data. The stream sediments which are consideredto contain more micronutrients than the soil, tend to give a higher copper range than the soil samples.That is, there is an apparent trend that the "Low" range values in the map correspond to the "VeryLow" range values in the soils. Although the work of Agustin et al. [1] did not cover all of
311
Pangasinan, there is also some general agreement between the micronutrient map of Pangasinan forcopper obtained by Agustin et al. [1] and the present work. For instance in western Pangasinan andcertain areas in southeastern Pangasinan the range of "Below Average" corresponds to the "Low"lange in the present work. However, there are differences between the Agustin map and the presentwork in the copper distribution for the central part of Pangasinan. This suggests that the map couldbe used as a guide for predicting copper micronutrient concenration in soil in Pangasinan. 1 he soilanalyses for Zn, Mn and Fe are also consistent with their values in the preliminary agrigeochemicalmaps of the said micronutrients which are not included in this report. The copper map clearly showsthe possible extent of mine tails siltation in central Pangasinan.
It is interesting to note that the central part is drained by Agno River and its tributaries whichhave been affected by copper mine tails siltation (NEPC and NCTAD, 1974).
6. CONCLUSION
We have demonstrated that the conversion or transformation of copper data obtained fromuranium geochemical exploration to micronutrient copper agrigeochemical map of Pangasinan haspotential application in agriculture. A comparison of the soil analyses from different parts of theProvince show close agreement with those range of values in the agrigeochemical map. However, thecopper agrigeochemical map tends to exhibit slightly higher values than those obtained in the soils.The possible extent of copper mine tailings siltation in Pangasinan is clearly evident in the map.
REFERENCES
[1] AGUSTIN, L.C., AGNES, P.S. Jr., ANGELES, E.L. and AMURAO, G.G., Micronutrientstatus in some Philippine soils Part 1. Special Issue, Soils and Water Technical Bull., Bu.of Soils and Water Management (1988) pp. 196.
[2] Arc/Info, 1979. TIN Users Guide, Environmental Systems Research Institute, Inc., Redlands,Calif.
[3] BENCKISER, G., ATTOIR, J., SANTIAGO, S. and WATANABE, 1., Physicochemicalcharacterization of iron-toxic soils in some Asian countries. IRRI Res. Paper Series No. 85(1982) 11 p.
14] CASTRO, R.U., Zinc deficiency in rice: a review of research at the International RiceResearch Institute, IRRI Research Paper Series, no. 9 (1977) 18 p.
[5] NATIONAL ENVIRONMENTAL PROTECTION COUNCIL AND NATIONAL COUNCILON INTEGRATED AREA DEVELOPMENT, Ecological Profile of Pangasinan. Q.C.(1984).
16] PANTASTICO, E.B., SISTONA, G.M., DE PADUA, L.S. and NERY, V.S., Trace elementstatus of Philippine soils and its relation to crop production. NRCP Bull., V. 28. No. 4(1973).
[7] PONNAMPERUMA, F.N., Behavior of minor elements in paddy soils. IRRI Res. PaperSeries No. 5, (1977) 15 p.
[8] ROSALES, CM. , The efficiency of fertilizer-zinc by rice grown under wetland condition.Soils Technical Bull. No. 2, Bu. of Soils, Manila (1979).
[9] SANTOS, G. JR. and ILAGAN, L., Uranium geochemical mapping in the Philippines:Explanatory text of the regional reconnaissance geochemistry of Northwestern Luzon andSamar. PAEC Tech. Report (1) IB 85003 (1985).
[10] SANTOS, G. JR., BERNIDO, C. and FERNANDEZ, L., Trace element content of streamsediments in Pangasinan. NSTA Techno. J., v. 11, no. 4 (1986) pp. 30-42.
312
[11] SILLANPAA, M., Micronutrients and the nutrient status of soils. FAO Soil Bull., v. 48,FAO, ROME (1987) 444 p.
[12] SMITH, A Y., LYNCH, J.J., Field and laboratory methods used by the Geological Surveyin Canada in geochemical surveys, No. 11, Uranium in soil stream sediments and water.Surv. Can. Paper 69-40 (1969).
[13] TAUCIIID, M., Reconnaissance gcochemical survey for uranium deposit in Samar, Reportto the Government of the Republic of the Philippines: Unpublished (1978).
ACKNOWLEDGEMENT
We are grateful to Dr. Nora Inchiong, Bureau of Soils and Water ffanagement (BSWM) foradvice and encouraging us in the preparation of micronutrient maps as well as to Mr. J. Mundin,Pangasinan Provincial Agriculturist and his staff for assistance in soil sample collection. Thanks aredue to R.N, Gonzales, E. Menguito and N. Concepcion of Integrated Soil Resources InformationServices in the computer map production. We want to express our thanks to Director C.R. Aleta,PNRI and Director G.N. Alcasid. Jr. for their kind suppart. We are thankful to the AAS group, L.Fernandez, M. Castillo and E. Tabora. Thanks are due to C. Petrache and N. Bugaoisan for computerassistance. This work was partly supported by NRCP-assisted project G-52.
313
aRADIATION DETECTION OF BURIED SHIELDED SOURCESIN VEHICLES LOADED WITH SCRAP STEEL
J.R. COXExploranium G.S. Ltd., Bolton, Ontario, Canada
Abstract
There are about 600 000 registered radioactive sources in North America alone. During the past 10 years,there have been a number of documented accidents caused by discarded sources. Some of these sources ended up asscrap material and found their way into steel furnaces. A system using a plastic (PVT) detector was successfullydeveloped to detect sources that might be buried in vehicles loaded with scrap steel.
1. BACKGROUND
In 1983, Auburn Steel, New York accidentally loaded a shielded cobalt-60 source (estimatedat 50 Ci) into a steel making furnace, and melted it. The accident was discovered almost immediately,but by the time that 150 tons of contaminated steel had been disposed of and the site cleared ofradioactive debris, the clean up bill was over 10 million dollars.
In 1984 a steel plant in Juarez, Mexico melted another cobalt-60 source but unfortunately thiswas not discovered until 3 months later, when a load of contaminated construction steel tripped adetector on the Los Alamos test site. All the contaminated steel had to be recovered from acrossNorthamerica and several buildings erected with radioactive steel had to be torn down, at anenormous cost.
In 1992 in Taiwan, a research worker brought a survey meter home to demonstrate simpleradiometric principles to his son for school, and measured very high radiation readings in hisapartment. He assumed that the instrument was defective but next day the instrument was tested andfound to be functioning correctly. An investigation showed that the radiation was caused by structuralsteel imported from the USSR over 7 years ago and many buildings were torn down as a result of thisincident, and medical assessments are in progress.
In the USA alone 3 large Cesium-137 sources were melted in the last 18 months and reportsfrom Italy indicate 2 recent incidents there as well. In the last 10 years at least 7 serious accidentshave occurred including one in Brazil which resulted in loss of life.
In Moscow more than 200 tons of steel was contaminated from an accident in 1989.
There is some evidence to show that in Northamerica alone there are over 600 000 registeredsources and these include sources ranging from very large (200 Ci+ research sources to 1 mCilaboratory sources). Authorities such as the US-NRC admit to a list of over 15 missing sources inexcess of 1 Curie!
The data (from Nuclear News) gives an idea of the scale of these incidents which seem to beaveraging 5 a year since 1944. However it is not clear that the reporting method is accurate, as recentreports indicate a much higher rate.
315
As a result of these early accidents (1983/84) many us steel plants rushed to implementradiation protection on their incoming scrap using simple detection systems usually based on smalldetectors. The basic idea was that if the sources are that dangerous they must be easy to detect.Unfortunately buried shielded sources are heavily shielded by the scrap steel so emitted levels on theoutside of the vehicle are very low (as will be shown shortly).
Source size is very variable but all sources are designed to similar safety guidelines, so to afirst approximation the exposure rate on the outside of sources are similar.
This means that from a radiation detection viewpoint — all sources emit approximately thesame "signature". This is not always the case as the use of over size shields is common (a 100 mCisource in a ICi shield), but in principle a system capable of detecting one type of source will havereasonable detection capabilities to the range of sources in use.
In 1985 a steel plant in Canada approached exploranium to see whether such protection wastechnically possible, and the balance of this paper describes the technical research into this matter andthe results.
2. THE PROBLEM
In the majority of cases the furnace in these plants are 100-250 tonne capacity. An AtomicEnergy of Canada research group investigated the problem in 1987 and computed the source size vsfurnace size, to assess contamination limits. This data indicates that for Cobalt-60, a 60 mCi wouldcontaminate a 250 tonne furnace. Other researchers indicate a very wide range of estimates, but it isclear that even a source as small as 100 mCi could cause significant contamination.
For radio-chemistry reasons — in the event of melting a source, cobalt alloys directly into thesteel, cesium contaminates the dust from the furnace and iridium/radium contaminate the slag.
A large source enclosed in the relatively small volume of a scrap vehicle should be easilydetectable, but unfortunately (from a radiation detection viewpoint) all these sources are normally inprotective safety shields, so emission levels are very low. A typical source may give a 13.5 R/h rateat the source but only 1 mR/h on the outside of the shield.
Since all these sources are originally supplied in safety shields there is a high probability thatthey will still be inside such shields, so the real problem is to detect the presence of a shielded sourceburied in scrap material.
Simple calculations made using typical scrap densities and assuming the solid steel equivalent,indicate that such sources increase background by about 0.04% which clearly is undetectable in a fieldenvironment.
3. FIELD EXPERIMENTS
The first series of tests involved a 1 curie Cesium-137 source enclosed in a 7 mm steel walledbox buried in a railcar of scrap. Emission levels on the outside of the steel container before burialgave exposure rates of 1 mR/h.
A 21 cu. ins sodium-iodide detector was used to take static measurements with and withoutthe source in the rail car. The results were plotted and they show that some increase in radiation wasnoted, but local changes in radiation of the ground were very dominant.
316
It became clear that in the inflexible logistics of a scrap yard static monitoring was impracticalso a series of tests were initiated using a geophysical airborne system with a xtal array of 768 Cu insheavily shielded to suppress the ground effects. It was shown that even with such large xtal volumeonly a marginal response was achieved.
The next series of experiments involved analysis of the effects of scrap material shielding onthe spectral shape. Similar experiments were carried out by Lamastra and all these data show clearlythat deeply buried sources only have significant emissions at the very bottom of the spectrumessentially below 300 keV.
This data shows clearly that isotopic analysis to enhance signal sensitivity is pointless so theuse of expensive sodium-iodide arrays is unnecessary, so system development concentrated on the useof PVT (plastic) detection systems.
4. SYSTEM DEVELOPMENT
The scrap yard environments is an extremely difficult place to work as the detectors mustwork in all climatic conditions (-40 to +150"C) and remain unaffected by rain/snow/dirt/vibrationetc., vehicle size is irregular, speed is highly erratic, personnel are essentially totally unwilling tomodify their operating logistics and most hands-on users are totally unskilled in technical matters.
A prototype system was developed so extensive on-site testing could be carried out to closelyinvestigate the various problems likely to occur.
The first major problem was vehicle suppression. The typical radiation profile of a vehicleas it passes a detector shows that the local background radiation is suppressed by absorption in thevehicle, so the actual background significantly reduces. This reduction is enormously variable as itis affected by vehicle size, density, detector spacing/size etc. But ranges typically from 5 to 45%.
Another problem is radon. When long term monitoring is carried out significant increases inbackground radiation occur during precipitation. These increases have been measured in excess of100% increase over a short period of time. Thus fixed alarm level systems false-alarm duringprecipitation unless their alarm threshold are set unacceptably high.
Another problem is that in the busy environment vehicles are everywhere. A simplisticconcept indicates where a passing vehicle alarm can be cancelled by another vehicle passing. Thisproblem is easily solved by shielding the rear of the detector which also significantly improves systemsensitivity by essentially doubling the signal to background ratio.
To solve these problems statistical analysis methods must be used so very low alarm thresholdcan be used which can compensate with these practical problems.
A typical profile may show the following: Inside the source it may be 13 R/h, outside thesource it may be 2.5 mR/h but on the outside of the vehicle, exposure rate levels as less than 1 uR/hare common.
The final developed system in a typical installation uses a very large detector volume (73L)of plastic (PVT) detectors. The system uses an external console mounted in the scale operators shackand the whole system operates in a 'go — no go' mode, so technically unsophisticated personnelrequire no special training beyond "call Mr. X is the alarm goes off".
317
5. TESTING
To verify the performance of the final system a series of experiments were carried out al alocal steel plant. Two sources were used;
A REAL SHIELDED SOURCE — comprising a 100 mCi cesium-137 source in a safetyshield encased in a wooden box for protection, This source had an exposure rate of 0.3 to0.5 mR/h on the outside of its container.
A SIMULATED SHIELDED SOURCE - comprising a 300 Uci cesium-137 source in anempty thin walled steel container.
These two sources were loaded into a rail car packed with heavy scrap material.
Effort was made to locate the sources in approximately equivalent geometric locations, so thatscrap attenuation is hopefully a semi-worst case scenario.
The results indicate system performance, note the depressed vehicle in background caused byvehicle shielding, the computed system reliable detection level and the size of the source responses.
6. USER FEEDBACK
After a few years of operating these systems in the field some interesting results haveoccurred.
To date these systems have detected the presence of over 7 very large sources and literallythousands of radium contaminated oil-field pipe. Most of the sources were NOT on the NRC missinglist.
A common problem is X ray gauging activities. Recently some users reported problems withtheir system alarming as a result of X ray crack testing 2 kms away from the detectors, butpresumably boresited accidentally on the detectors.
Reports have been received of systems alarming as a result of a train carrying legalradioactive waste passing at 60 kph more than 100 m behind the detectors.
A common question asked is we have been melting steel for many years and have nevermelted a source, so what s the fuss. The "fuss" is that a large number of large sources have beenaccidentally melted, not discovered and manufactured into a huge array of goods. With the enormouspotential legal liability of such accidents many governments are tightening regulations to restricttransport of contaminated material. The current rash of reports of radioactive material being smuggledacross the porous borders of European states bordering on the CIS, shows that public awareness ofthese problems is increasing, and governmental action will follow.
318
GRAVITY DATA INVERSION AS A PROBE FOR THE3D SHAPE AT DEPTH OF GRANITIC BODIES
J.L. VIGNERESSE, M. CUNEYCREGU, Vandoeuvre/Nancy, France
Abstract
Granitic intrusions represent potential sites for waste disposal. A well constrained determination of theirgeometry at depth is of importance to evaluate possible leakage and seepage within the surroundings. Amonggeophysical techniques, gravity remains the best suited method to investigate the 3D shape of the granitic bodies atdepth. During uranium exploration programmes, many plutons emplaced within different geochemical and tectonicenvironment have been surveyed. The quality of gravity surveying depends on the intrinsic accuracy of themeasurements, and also on their density of coverage. Accuracy depends on the precision of elevation measurementswhich have to be better than 0.5 meter to reach detection of 0.1 mGal anomaly. A regularly spaced and densecoverage (about 1 point/km2) of measurements over the whole pluton and its nearby surroundings is needed torepresent the gravity effect of density variations. This yields a lateral resolution of about 0.5 kilometre, or lessdepending on depth and roughness of the floor, for the interpretation of the Bouguer anomaly map. We recommendthe use of a 3D iterative method of data inversion, simpler to run when the geometry and distribution of the sourcesare already constrained by surface data. This method must take into account the various density changes within thegranite and its surroundings, as well as the regional effect of deep regional sources. Because the input of the inversionprogramme may differ, not in raw gravity data, but in density contrasts, surface shape, maximum expected depth,regional anomaly, the result is not unique. Several tests are used that increase the confidence on the result, mainlyby looking at its stability. The map of the computed depth of the floor of the pluton is then drawn. A total error inthe input data (measurements, densities, regional field) is estimated at 6%. Errors due to data inversion reflect theuncertainties on the density contrasts at depth. We estimate that the total uncertainty on the calculated depth valuesdoes not exceed ±15%. Because of the good coverage of gravity measurements, the overall shape of the pluton iscertainly better constrained than the depth values themselves. We present several examples of gravity data inversionover granitic intrusions displaying various 3D morphologies. Joint studies of the magmatic structures in plutonsprovide complementary constraints to validate the shape at depth. They mostly record the conditions of emplacementof the plutons and show how their morphology at depth varies according to the regional deformation field. At asmaller scale mineralizations are also observed above or close to the root zones. Those examples demonstrate theadequacy of joint studies in constraining the mode of magma emplacement before further studies focussing toenvironmental problems.
1. INTRODUCTION
Numerous studies are presently developed in the world to qualify granitic intrusions aspotential sites for the storage of nuclear waste disposal. A precise knowledge of the 3D shape of thegranitic batholiths represents an important parameter to select more favorable sites and the bestappropriated areas within the batholiths.
Granitic intrusions have also been recognized as preferential places for intrusive ore deposits,specially for U, Sn, W and Au [21]. However, veins and mineralized lode are about 10 to 100 m inscale and must be found out from quite larger bodies, the scale of which is about 1000 km3 foralkaline to 500-1000 km3 for calcalkaline or peraluminous plutons when volume is estimated fromgravity data inversion [56]. Mineralizations largely depend on the chemical evolution of acidicmagmas, which are mostly related to the conditions of emplacement and on the movement of residualmelts and fluids. The position and number of the root zones that provide magma to the upper levelsdetermine the mode of emplacement of the successive magma batches which also controls thedistribution of the mineralization. Thus, determining the 3D shape at depth of a granitic intrusionwould inform on the spot places to investigate for mineralizations.
319
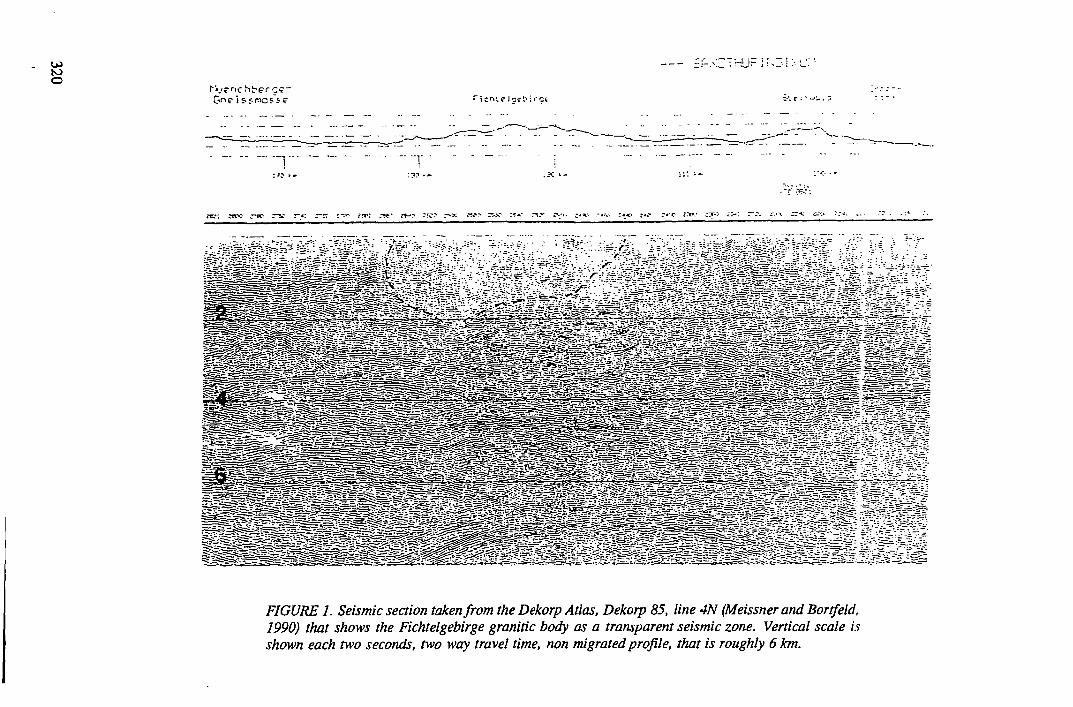
G>r> e i s s m
T" - T •
FIGURE 1. Seismic section taken from the Dekorp Atlas, Dekorp 85, line 4N (Meissner and Bortfeld,1990) that shows the Fichtelgebirge granitic body as a transparent seismic zone. Vertical scale isshown each two seconds, two way travel time, non migrated profile, that is roughly 6 km.
Information on magma emplacement, since it relates to magma dynamics, is not directlyaccessible by simple observation, but internal structures of the magma record its last movement beforeit was fully crystallized. They can be observed in the field by usual observations, or by laboratorymeasurements. Deep structures such as the root zones or the feeding conduits are also too far fordirect observation. But, remote sensing methods provide indirect tools to describe such structures.Therefore, an integrated method of surveying granitic intrusions is suggested, in which the shape atdepth is obtained by detailed gravity data inversion and then is correlated to internal structures of themagma described by usual structural measurements. This method has been tested for exploration ofintragranitic U deposits for more than ten years, mostly in the mid-European Variscan belt.
2. GEOPHYSICAL METHODS
Classic geological observations are limited to the uppermost kilometer through directobservation along erosional cross-sections. Geophysical studies are required to achieve resolution atdepth. Seismic data are usually collected along two dimensional profiles because of the high cost ofsurveying, but this precludes a full three-dimensional shaping at depth. Reflection of seismic wavesoccurs when impedances, the product of the density by the seismic velocity, are very contrasted atan interface. The ratio of the difference to the sum of seismic impedances indicates the strength ofthe interface in reflecting elastic waves. Variations in granitic facies result in very small variationsin the physical properties of rocks [28]. So, in the case of granitic facies variations, the reflectioncoefficient remains very low, and the seismic waves are not affected by low reflections coefficientsat usual seismic frequencies (up to 10 Hz). Therefore, granitic bodies are essentially transparent (Fig.1) to seismic waves [35, 47, 37]. To register the facies changes and to produce coherent reflectionwaves at an interface, provided it is a sharp boundary, higher frequencies (40-120 Hz) are required.Preferential filtering of these frequencies produces a less energetical signal and less efficient depthpenetration at depth [24]. This is partly overcome by using a closer seismic array when low resolutionis needed at a depth corresponding to the bottom of the granitic intrusions (6 to 8 km, or 2 to 2.5 stwo way time).
Other geophysical methods are of lesser use over granitic intrusions. Acidic rocks do notgenerally show very large amount of magnetic minerals and thus present a weak magnetic signature,except for alkaline granites which are often associated with basic, that is magnetic, components [1].However, the contrast between granite and metamorphic aureole, often enriched by oxidation inmagnetic and opaque minerals can be used to map and to delineate granitic intrusions. The magneticfield is very flat over acid igneous rocks [59, 39], but a magnetic aureole is produced by themetamorphic aureole [50]. The magnetic susceptibility of minerals in acid rocks is more sensitive tovariations in the iron and magnesium content of minerals. In granites of the ilmenite-series [34], themore magnetic minerals (biotite, amphibole) are paramagnetic with low susceptibility. Its valueincrease linearly with the iron content in biotites [12]. In granites from the magnetite-series,ferromagnetic minerals predominate, and magnetic susceptibility values also increase with the totaliron content of those minerals. Therefore, at the scale of a pluton, mapping of the magneticsusceptibility represents a complementary tool to map facies within a granitic massif.
Electrical methods are very sensitive to conductors located out of the profiles ofmeasurements. In a granitic massif, late fractures infilled with water and altered minerals greatlyinfluence the trajectory of electric currents. These structures perturbate the measurements to infer thedeep structures in a granitic batholith. Conversely, electrical methods are well suited to determine andto map the late fracture zones, infilled with water. As a result, eletromagnetic mapping shows theresistant and unaltered blocks of fresh granite in between altered and water seeping fractures [14].Magneto-telluric soundings lack of resolution at depth because of the unwanted boundary effectswhich disturb the penetration of electro-magnetic waves in depth. Thus, those methods can be usedas one-dimensional soundings to determine the depth of the floor in one point [7], extended totwo-dimensional interpretation, but cannot produce a map of the floor all over the pluton.
321
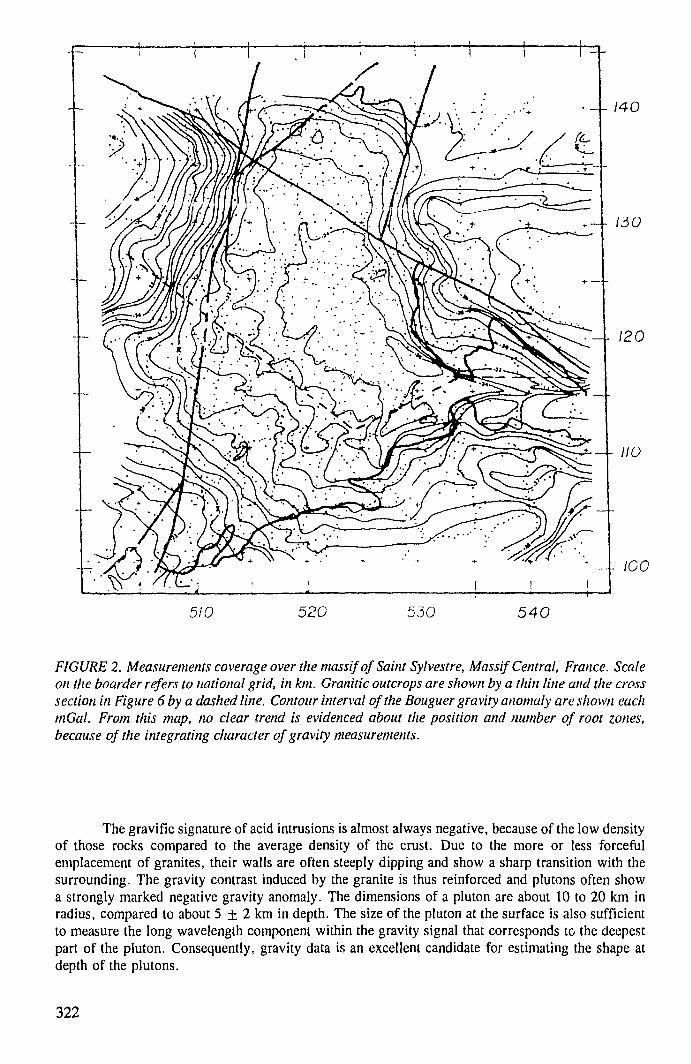
- - 140
- - 130
120
•— ICO
510 520 530 540
FIGURE 2. Measurements coverage over the massif of Saint Sylvestre, Massif Central, France. Scaleon the boarder refers to national grid, in km. Granitic outcrops are shown by a thin line and the crosssection in Figure 6 by a dashed line. Contour interval of the Bouguer gravity anomaly are shown eachmGal. From this map, no clear trend is evidenced about the position and number of root zones,because of the integrating character of gravity measurements.
The gravific signature of acid intrusions is almost always negative, because of the low densityof those rocks compared to the average density of the crust. Due to the more or less forcefulemplacement of granites, their walls are often steeply dipping and show a sharp transition with thesurrounding. The gravity contrast induced by the granite is thus reinforced and plutons often showa strongly marked negative gravity anomaly. The dimensions of a pluton are about 10 to 20 km inradius, compared to about 5 ± 2 km in depth. The size of the pluton at the surface is also sufficientto measure the long wavelength component within the gravity signal that corresponds to the deepestpart of the pluton. Consequently, gravity data is an excellent candidate for estimating the shape atdepth of the plutons.
322
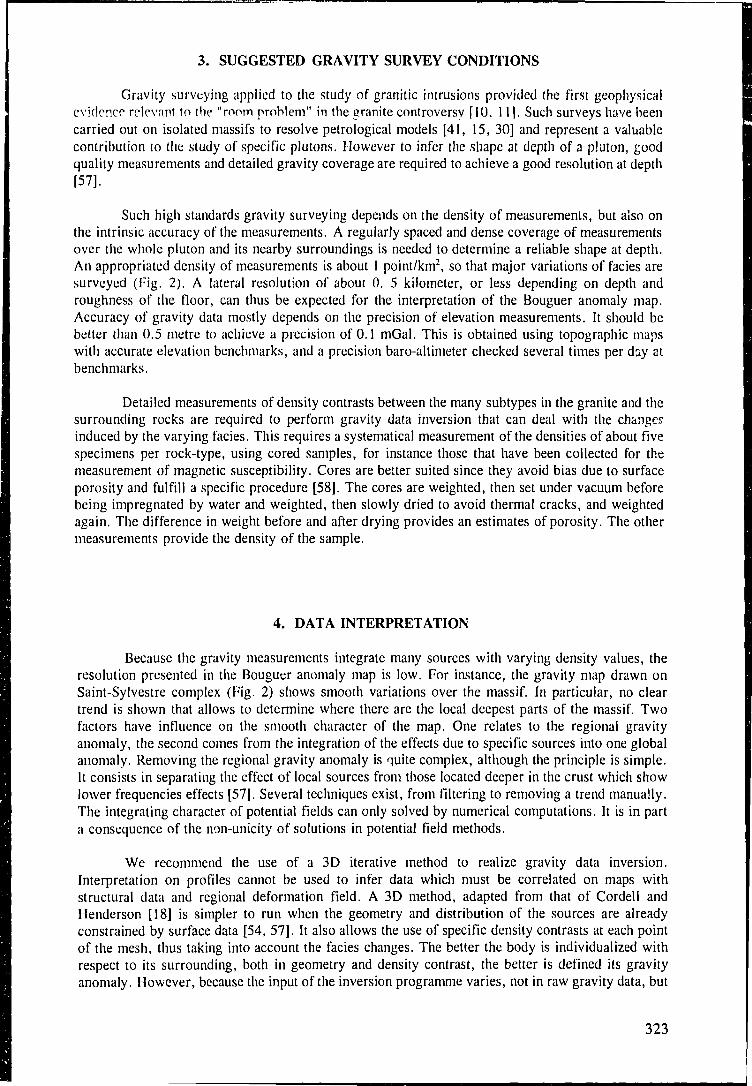
3. SUGGESTED GRAVITY SURVEY CONDITIONS
Gravity surveying applied to the study of granitic intrusions provided the first geophysicalevidence relevant to the "room problem" in the granite controversy f 10. 111. Such surveys have beencarried out on isolated massifs to resolve petrological models [41, 15, 30] and represent a valuablecontribution to the study of specific plutons. However to infer the .shape at depth of a p'uton, goodquality measurements and detailed gravity coverage are required to achieve a good resolution at depth[57].
Such high standards gravity surveying depends on the density of measurements, but also onthe intrinsic accuracy of the measurements. A regularly spaced and dense coverage of measurementsover the whole pluton and its nearby surroundings is needed to determine a reliable shape at depth.An appropriated density of measurements is about 1 point/km2, so that major variations of facies aresurveyed (Fig. 2). A lateral resolution of abour 0. 5 kilometer, or less depending on depth androughness of the floor, can thus be expected for the interpretation of the Bouguer anomaly map.Accuracy of gravity data mostly depends on the precision of elevation measurements. It should bebetter than 0.5 metre to achieve a precision of 0.1 mGal. This is obtained using topographic mapswith accurate elevation benchmarks, and a precision baro-altimeter checked several times per day atbenchmarks.
Detailed measurements of density contrasts between the many subtypes in the granite and thesurrounding rocks are required to perform gravity data inversion that can deal with the changesinduced by the varying facies. This requires a systematical measurement of the densities of about fivespecimens per rock-type, using cored samples, for instance those that have been collected for themeasurement of magnetic susceptibility. Cores are better suited since they avoid bias due to surfaceporosity and fulfill a specific procedure [58]. The cores are weighted, then set under vacuum beforebeing impregnated by water and weighted, then slowly dried to avoid thermal cracks, and weightedagain. The difference in weight before and after drying provides an estimates of porosity. The othermeasurements provide the density of the sample.
4. DATA INTERPRETATION
Because the gravity measurements integrate many sources with varying density values, theresolution presented in the Bouguer anomaly map is low. For instance, the gravity map drawn onSaint-Sylvestre complex (Fig. 2) shows smooth variations over the massif. In particular, no cleartrend is shown that allows to determine where there are the local deepest parts of the massif. Twofactors have influence on the smooth character of the map. One relates to the regional gravityanomaly, the second comes from the integration of the effects due to specific sources into one globalanomaly. Removing the regional gravity anomaly is quite complex, although the principle is simple.It consists in separating the effect of local sources from those located deeper in the crust which showlower frequencies effects [57]. Several techniques exist, from filtering to removing a trend manually.The integrating character of potential fields can only solved by numerical computations. It is in parta consequence of the non-unicity of solutions in potential field methods.
We recommend the use of a 3D iterative method to realize gravity data inversion.Interpretation on profiles cannot be used to infer data which must be correlated on maps withstructural data and regional deformation field. A 3D method, adapted from that of Cordell andHenderson [18] is simpler to run when the geometry and distribution of the sources are alreadyconstrained by surface data [54, 57], It also allows the use of specific density contrasts at each pointof the mesh, thus taking into account the facies changes. The better the body is individualized withrespect to its surrounding, both in geometry and density contrast, the better is defined its gravityanomaly. However, because the input of the inversion programme varies, not in raw gravity data, but
323
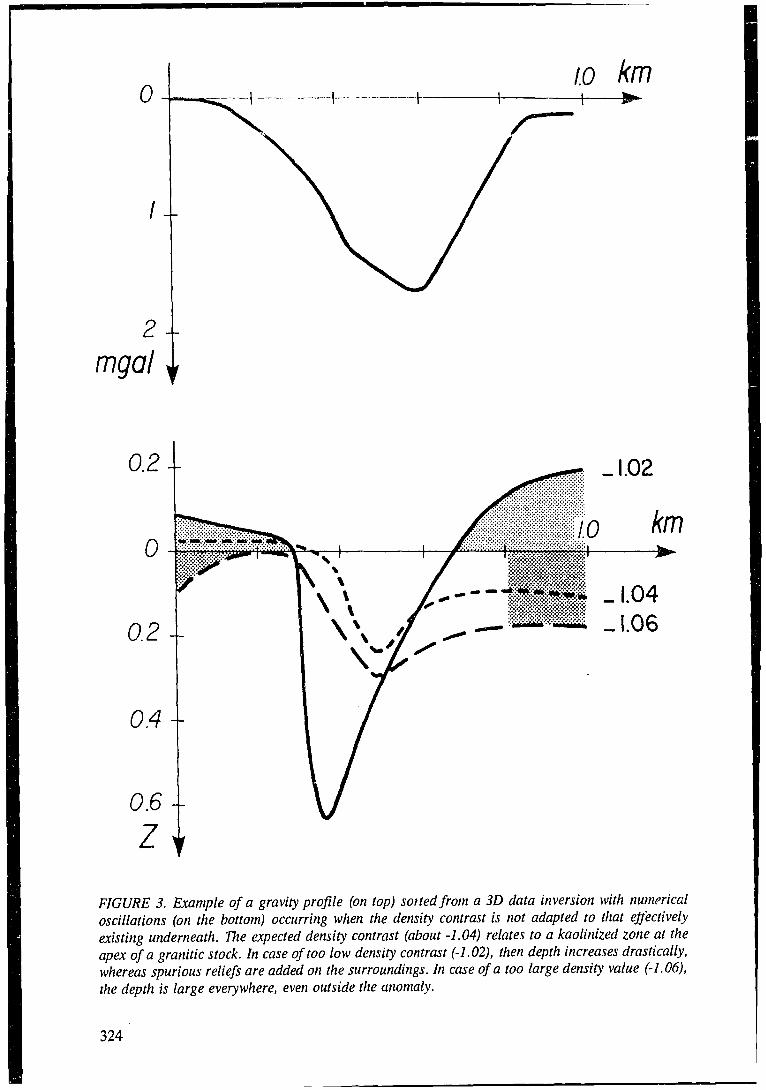
0
0.2 i -1.02
FIGURE 3. Example of a gravity profile (on top) so) ted from a 3D data inversion with numericaloscillations (on the bottom) occurring when the density contrast is not adapted to that effectivelyexisting underneath. The expected density contrast (about -1.04) relates to a kaolinized zone at theapex of a granitic stock. In case of too low density contrast (-1.02), then depth increases drastically,whereas spurious reliefs are added on the surroundings. In case of a too large density value (-1.06),the depth is large everywhere, even outside the anomaly.
324
in density contrasts, surface shape, maximum expected depth, regional anomaly, the result is thereforenot unique. Several tests are used that increase the confidence on the result, mainly by looking at itsstability.
One major cause of uncertainty is the representativity of the density at depth. During theinversion process, a density is assigned to each prism under die giidded map of the gravity anomaly.The density is assumed to be constant with depth within that prism and the resulting depth is thatwhich better fits the value of the total gravity anomaly. No control exists that can insure the realityof that assumption, since it is impossible to assume neither a density change with depth, nor lateralvariations of the density contrast at depth. However, a series of tests can be run during the iterativecomputation to keep control on the process. When the density is too low, the computer lacks massand accommodates that mass deficiency by increasing the depth of the prism. But, a deeper sourcealso increases the low frequencies content of the signal, not present in the measurements, and thus,the programme must reduce that low frequencies trend by adding spurious reliefs, to compensate themass deficiency at depth (Fig. 3). This phenomenon creates numerical oscillations that are easilyrecognized when examining the successive iterations. Conversely, when the density is too large, thecomputer has too much masses and cannot deal with that extra mass underneath. So, it tries to placeas much as possible that extra mass outside the place of the expected body which creates the anomaly(Fig. 3). As a result, the body is thick everywhere, even outside its limits estimated from the shapeof the contours of the anomaly on the map. Again a close inspection at the various steps of iterationeasily eliminates those unexpected values and thus allows an indirect test on the distribution ofdensities at depth. The map of the computed depth of the floor of the pluton is then drawn.
These depth values give a good first-order picture of the pluton. Error on the input data,shared by the gravimeter and the precision in elevation data, is estimated to be about 2%. Error inthe estimation of the far-field gravity anomaly may exceed 3 %. Therefore, after estimating the erroron the densities to be less than 1 %, a total error on the input data is estimated at about 6%. It is moredifficult to estimate the errors due to the inversion of the data. They reflect the uncertainties on thedensity contrasts at depth. We consider, however, that the total uncertainty on the calculated valuesof the depths does not exceed ±15%. Because of the good coverage of gravity measurements, theoverall shape of the pluton is certainly better constrained than the depth values themselves. The mainconsequence is the uncertainty on the depth of the deepest parts of the floor, and also on the dips ofthe walls of the pluton.
5. STRUCTURAL DATA
Structural studies describe the present geometry of granitic bodies, from which inferences aremade on how they have been emplaced into the upper crust, thus perturbing the regional deformationfield. The strain field is recorded in the schistosity of the surrounding rocks [29, 44] or is shown bythe interference between internal granitic structures and regional deformation [17]. Mapping theinternal structures in granites [8, 25, 27] relates to deformation recorded by the magma as it intrudesthe surrounding crust. They are commonly restricted to surface observations, or in a few cases tostructures eroded down to 1 or 2 km, still limited compared to the inferred thickness of graniticplutons, which averages about 5 + 2 km [56]. Information on the magma flow is obtained bymeasuring the preferred orientation of crystals. Early anisometric crystallized minerals define a planarfabric, or foliation, through the average orientation of their most developed face. These crystals aremostly Fe (+ Mg) bearing silicates (biotite, amphibole), but plagioclase and K-feldspar megacrystsare also used to determine the internal fabrics of a granite pluton. Within the foliation plane, alineation is defined as parallel either to the average elongation of the crystals, or to the zone axis oftheir orientation. In the field, a compass is used to measure the planar and linear orientations of thecrystals [42]. The results become approximate on equigranular and fine-grained rocks. Grain by grainstudies are also realized, using a U-stage mounted on a microscope [46, 13], but they are timeconsuming, hence not applicable in routine.
325
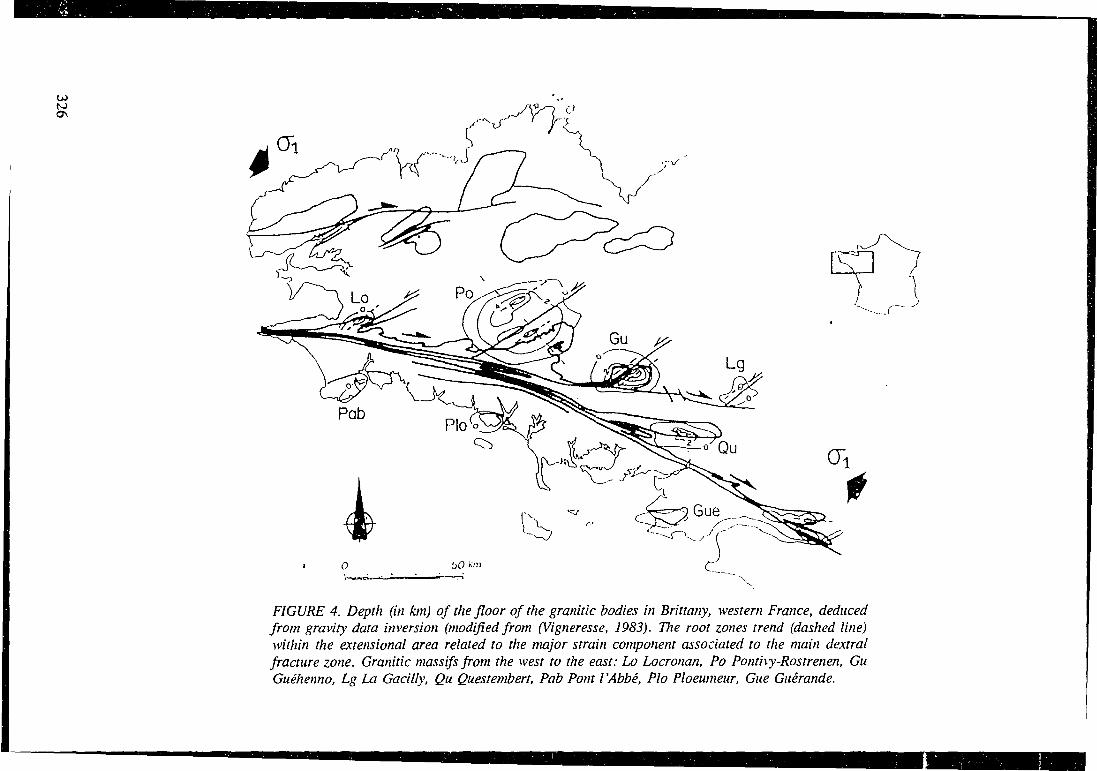
to o
FIGURE 4. Depth (in km) of the floor of the granitic bodies in Brittany, western France, deducedfrom gravity data inversion (modified from (Vigneresse, 1983). The root zones trend (dashed line)within the extensional area related to the major strain component associated to the main dextralfracture zone. Granitic massifs from the west to the east: Lo Locronan, Po Ponthy-Rostrenen, GuGuehenno, Lg La Gacilly, Qu Questembert, Pab Pont I 'Abbe, Plo Ploeumeur, Gue Guerande.
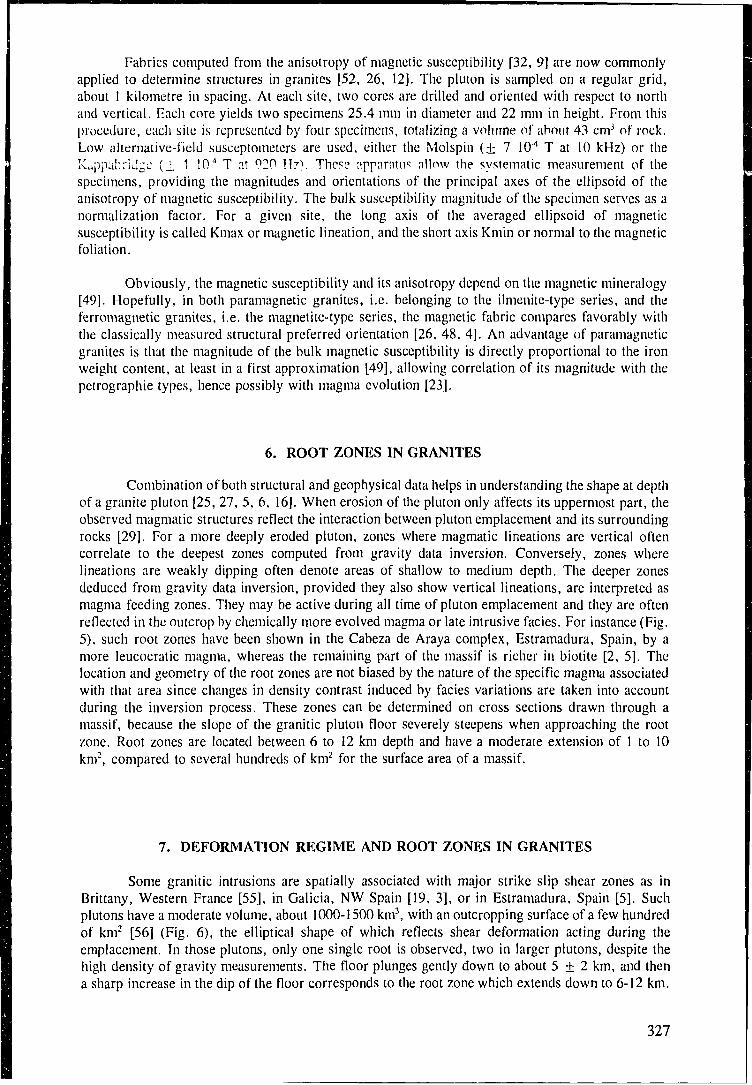
Fabrics computed from the anisotropy of magnetic susceptibility [32, 9] are now commonlyapplied to determine structures in granites [52, 26, 12]. The pluton is sampled on a regular grid,about 1 kilometre in spacing. At each site, two cores are drilled and oriented with respect to northand vertical. Each core yields two specimens 25.4 mm in diameter and 22 mm in height. From thisprocedure, each site is represented by four specimens, totalizing a volume of about 43 cm3 of rock.Low alternative-field susceptometers are used, either the Molspin ( ± 7 104 T at 10 kHz) or theKappa'oriugc ( 1 1 !04 T at °20 H7). These apparatus allow the systematic measurement of thespecimens, providing the magnitudes and orientations of the principal axes of the ellipsoid of theanisotropy of magnetic susceptibility. The bulk susceptibility magnitude of the specimen serves as anormalization factor. For a given site, the long axis of the averaged ellipsoid of magneticsusceptibility is called Kmax or magnetic lineation, and the short axis Kmin or normal to the magneticfoliation.
Obviously, the magnetic susceptibility and its anisotropy depend on the magnetic mineralogy[49]. Hopefully, in both paramagnetic granites, i.e. belonging to the ilmenite-type series, and theferromagnetic granites, i.e. the magnetite-type series, the magnetic fabric compares favorably withthe classically measured structural preferred orientation [26, 48, 4]. An advantage of paramagneticgranites is that the magnitude of the bulk magnetic susceptibility is directly proportional to the ironweight content, at least in a first approximation [49], allowing correlation of its magnitude with thepetrographie types, hence possibly with magma evolution [23].
6. ROOT ZONES IN GRANITES
Combination of both structural and geophysical data helps in understanding the shape at depthof a granite pluton [25, 27, 5, 6, 16]. When erosion of the pluton only affects its uppermost part, theobserved magmatic structures reflect the interaction between pluton emplacement and its surroundingrocks [29]. For a more deeply eroded pluton, zones where magmatic Iineations are vertical oftencorrelate to the deepest zones computed from gravity data inversion. Conversely, zones wherelineations are weakly dipping often denote areas of shallow to medium depth. The deeper zonesdeduced from gravity data inversion, provided they also show vertical lineations, are interpreted asmagma feeding zones. They may be active during all time of pluton emplacement and they are oftenreflected in the outcrop by chemically more evolved magma or late intrusive facies. For instance (Fig.5), such root zones have been shown in the Cabeza de Araya complex, Estramadura, Spain, by amore leucocratic magma, whereas the remaining part of the massif is richer in biotite [2, 5]. Thelocation and geometry of the root zones are not biased by the nature of the specific magma associatedwith that area since changes in density contrast induced by facies variations are taken into accountduring the inversion process. These zones can be determined on cross sections drawn through amassif, because the slope of the granitic pluton floor severely steepens when approaching the rootzone. Root zones are located between 6 to 12 km depth and have a moderate extension of 1 to 10km2, compared to several hundreds of km2 for the surface area of a massif.
7. DEFORMATION REGIME AND ROOT ZONES IN GRANITES
Some granitic intrusions are spatially associated with major strike slip shear zones as inBrittany, Western France [55], in Galicia, NW Spain [19, 3], or in Estramadura, Spain [5]. Suchplutons have a moderate volume, about 1000-1500 km3, with an outcropping surface of a few hundredof km2 [56] (Fig. 6), the elliptical shape of which reflects shear deformation acting during theemplacement. In those plutons, only one single root is observed, two in larger plutons, despite thehigh density of gravity measurements. The floor plunges gently down to about 5 ± 2 km, and thena sharp increase in the dip of the floor corresponds to the root zone which extends down to 6-12 km.
327
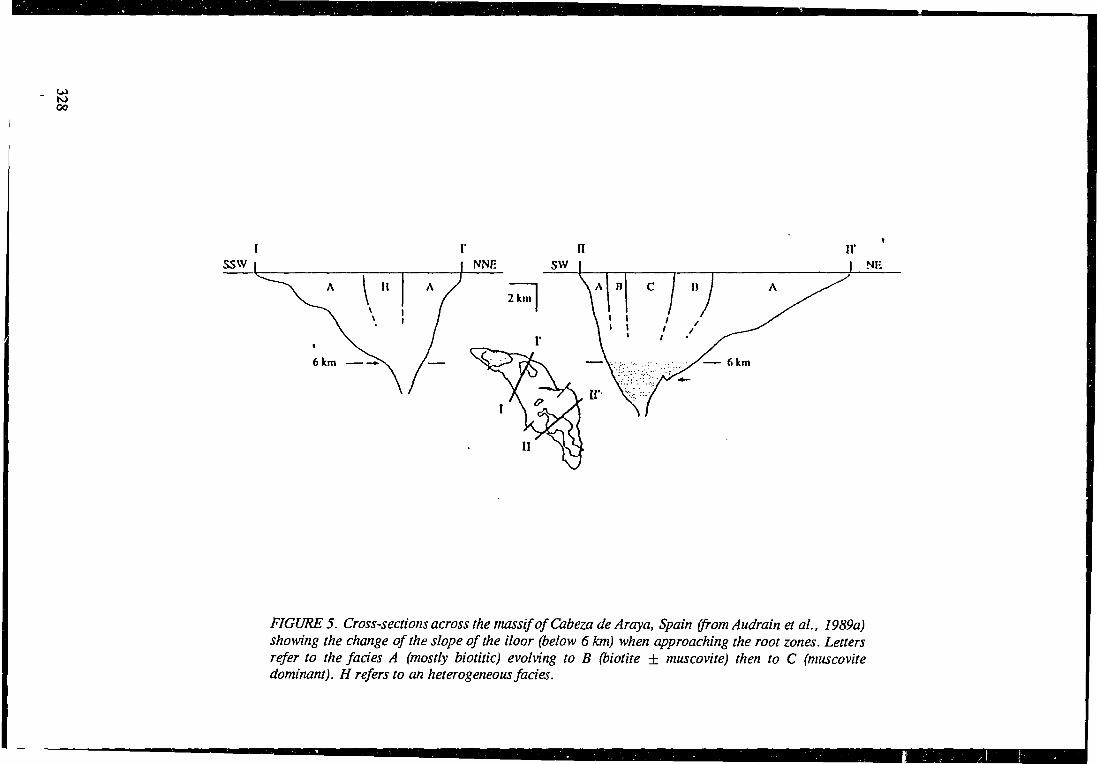
00
SSW
6 km ->\ / —
FIGURE 5. Cross-sections across the massif of Cabeza de Araya, Spain (from Audrain et al., 1989a)showing the change of the slope of the iloor (below 6 km) when approaching the root zones. Lettersrefer to the fades A (mostly biotitic) evolving to B (biotite ± muscovite) then to C (muscovitedominant). H refers to an heterogeneous fades.
no
520 530 540
FIGURE 6. it'iif- of the depth (in km) of the floor in the Saint Sylvestre granitic complex (FrenchMassif Central) reduced from gravity data inversion. Note the overall shallow depth of the floor andthe great number of small areas with a deeper floor interpreted as secondary root zones.
When magma infills anamostosing shear planes, the amount of granite is generally small anddeformation is apparently enhanced [31]. When the shear zone is wider or non continuous, with enechelon relay faults, or when a tensional component exists, magma fills the room created by theopening of pull-apart like structures at retreating bends [27, 33, 51]. The granitic pluton of Mortagne,Brittany, France, represents a good illustration of that situation [27]. In that case, the granitic bodyhas steep walls associated with the shear zone. The average depth of the floor is generally greater thanthe one of plutons connected with non overlapping shear zones. This situation is restricted totranstensive environment which provides simultaneous shear and place due to the extensionalcomponent.
In the remaining cases, which are the majority, the root zones are always located off themajor deformation plane, with no connection between the root and the shear plane. Numerous
329
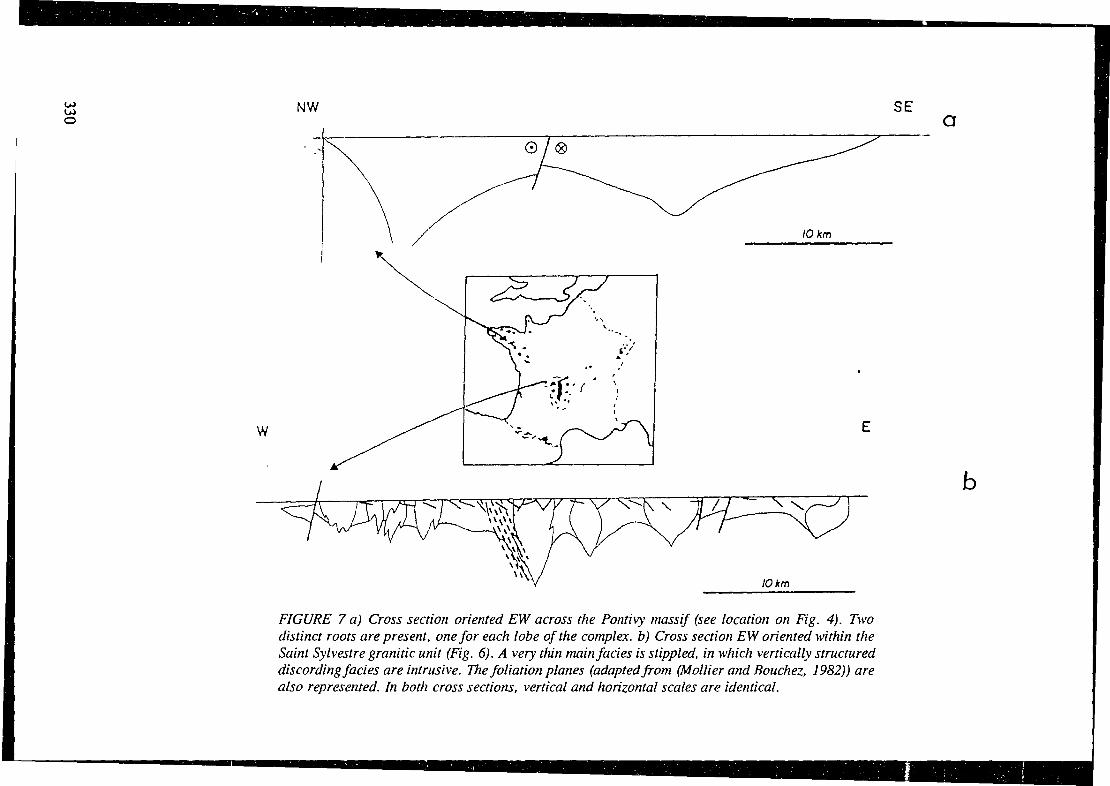
NW SE
w
FIGURE 7 a) Cross section oriented EW across the Pontivy massif (see location on Fig. 4). Twodistinct roots are present, one for each lobe of the complex, b) Cross section EW oriented within theSaint Sylvestre granitic unit (Fig. 6). A very thin main fades is stippled, in which vertically structureddiscording fades are intrusive. The foliation planes (adapted from (Mollier and Bouchez, 1982)) arealso represented. In both cross sections, vertical and horizontal scales are identical.
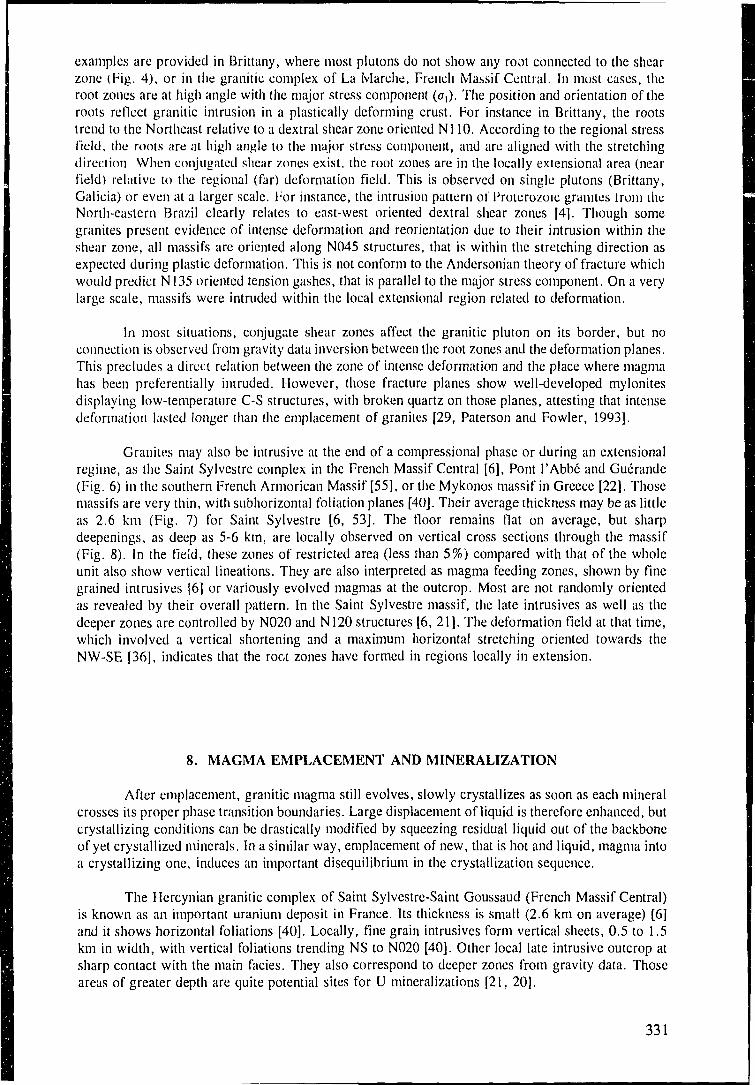
examples are provided in Brittany, where most plutons do not show any root connected to the shearzone (Fig. 4), or in the granitic complex of La Marche, French Massif Central. In most cases, theroot zones are at high angle with the major stress component (a,). The position and orientation of theroots reflect granitic intrusion in a plastically deforming crust. For instance in Brittany, the rootstrend to the Northeast relative to a dextral shear zone oriented Nl 10. According to the regional stressfield, ihe roots are at high angle to the major stress component, and are aligned with the stretchingdirection. When conjugated shear zones exist, the root zones are in the locally extensional area (nearfield) relative to the regional (far) deformation field. This is observed on single plutons (Brittany,Galicia) or even at a larger scale. For instance, the intrusion pattern of Proterozoic granites trom theNorth-eastern Brazil clearly relates to east-west oriented dextral shear zones [4]. Though somegranites present evidence of intense deformation and reorientation due to their intrusion within theshear zone, all massifs are oriented along N045 structures, that is within the stretching direction asexpected during plastic deformation. This is not conform to the Andersonian theory of fracture whichwould predict N135 oriented tension gashes, that is parallel to the major stress component. On a verylarge scale, massifs were intruded within the local extensional region related to deformation.
In most situations, conjugate shear zones affect the granitic pluton on its border, but noconnection is observed from gravity data inversion between the root zones and the deformation planes.This precludes a direct relation between the zone of intense deformation and the place where magmahas been preferentially intruded. However, those fracture planes show well-developed mylonitesdisplaying low-temperature C-S structures, with broken quartz on those planes, attesting that intensedeformation lasted longer than the emplacement of granites [29, Paterson and Fowler, 1993].
Granites may also be intrusive at the end of a compressional phase or during an extensionalregime, as the Saint Sylvestre complex in the French Massif Central [6], Pont l'Abbe and Guerande(Fig. 6) in the southern French Armorican Massif [55], or the Mykonos massif in Greece [22]. Thosemassifs are very thin, with subhorizontal foliation planes [40]. Their average thickness may be as littleas 2.6 km (Fig. 7) for Saint Sylvestre [6, 53]. The floor remains flat on average, but sharpdeepenings, as deep as 5-6 km, are locally observed on vertical cross sections through the massif(Fig. 8). In the field, these zones of restricted area (less than 5%) compared with that of the wholeunit also show vertical lineations. They are also interpreted as magma feeding zones, shown by finegrained intrusives [6] or variously evolved magmas at the outcrop. Most are not randomly orientedas revealed by their overall pattern. In the Saint Sylvestre massif, the late intrusives as well as thedeeper zones are controlled by N020 and N120 structures [6, 21]. The deformation field at that time,which involved a vertical shortening and a maximum horizontal stretching oriented towards theNW-SE [36], indicates that the root zones have formed in regions locally in extension.
8. MAGMA EMPLACEMENT AND MINERALIZATION
After emplacement, granitic magma still evolves, slowly crystallizes as soon as each mineralcrosses its proper phase transition boundaries. Large displacement of liquid is therefore enhanced, butcrystallizing conditions can be drastically modified by squeezing residual liquid out of the backboneof yet crystallized minerals. In a similar way, emplacement of new, that is hot and liquid, magma intoa crystallizing one, induces an important disequilibrium in the crystallization sequence.
The Hercynian granitic complex of Saint Sylvestre-Saint Goussaud (French Massif Central)is known as an important uranium deposit in France. Its thickness is small (2.6 km on average) [6]and it shows horizontal foliations [40]. Locally, fine grain intrusives form vertical sheets, 0.5 to 1.5km in width, with vertical foliations trending NS to N020 [40], Other local late intrusive outcrop atsharp contact with the main facies. They also correspond to deeper zones from gravity data. Thoseareas of greater depth are quite potential sites for U mineralizations [21, 20].
331
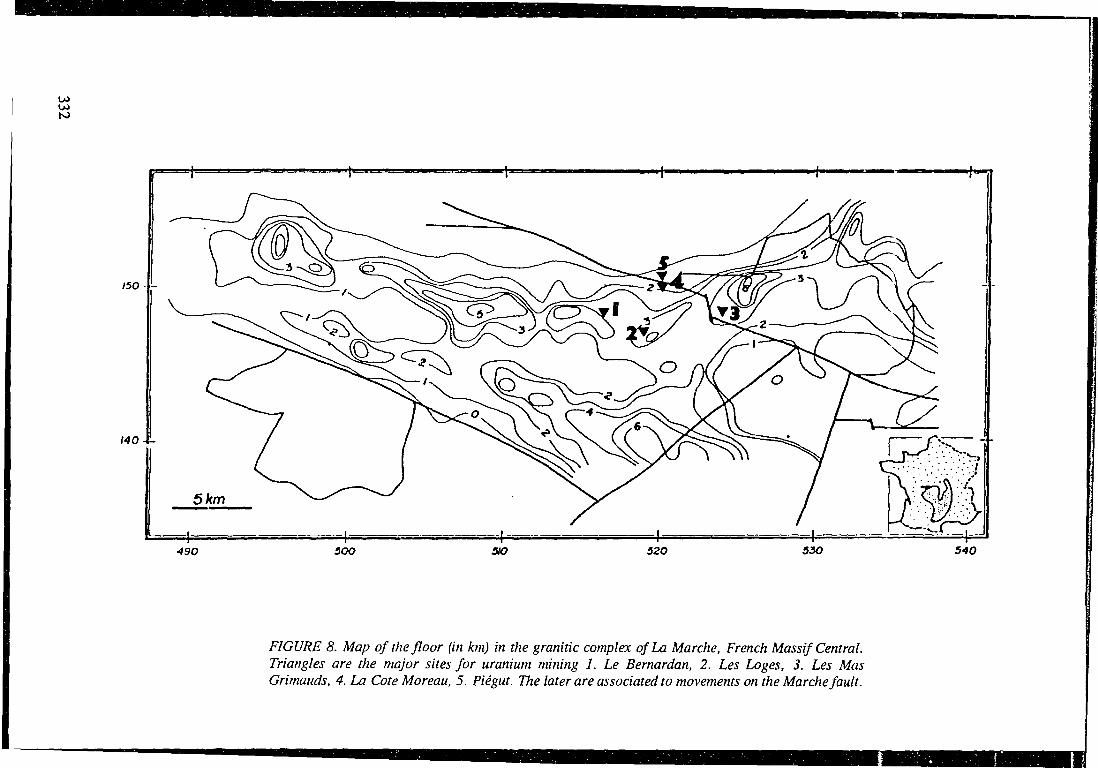
I5O
140
490 SOO SiO 520 530 540
FIGURE 8. Map of the floor (in km) in the granitic complex of La Marche, French Massif Central.Triangles are the major sites for uranium mining 1. Le Bernardan, 2. Les Loges, 3. Les MasGrimauds, 4. La Cote Moreau, 5. Piegut. The later are associated to movements on the Marche fault.
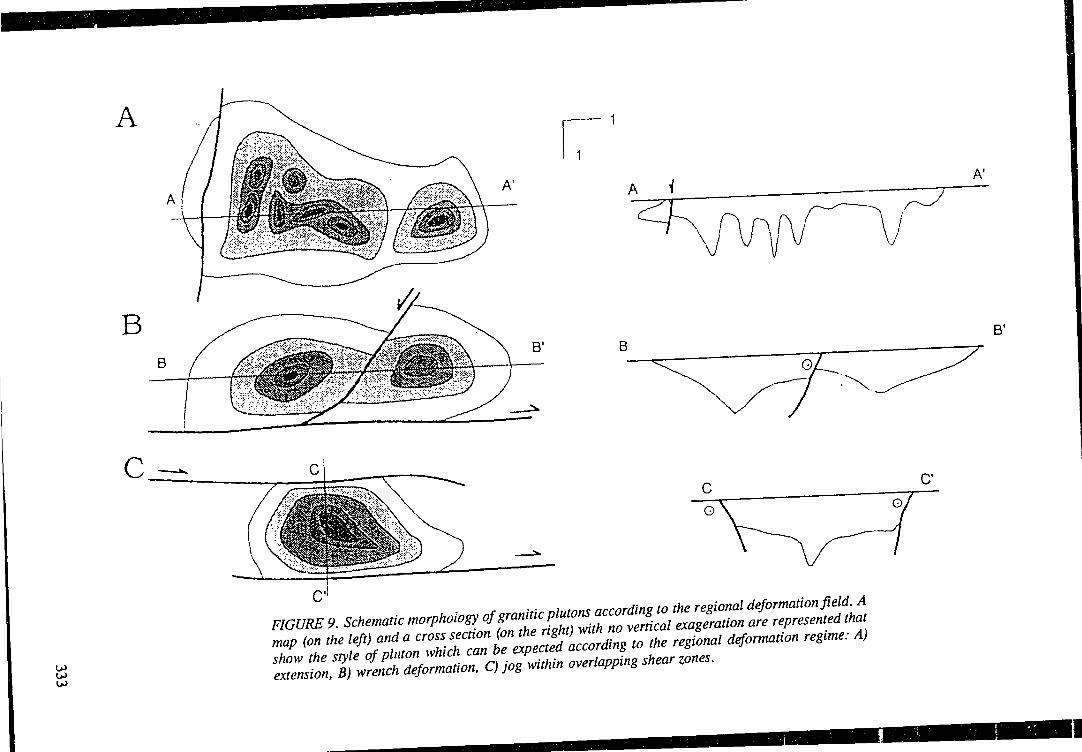
c
C"FIGURE 9. Schematic morphology of granitic plutons according to the regional deformation field. Amap (on the left) and a cross section (on the right) with no vertical exageration are represented that
- i ...i,,vi, rnn hP pxnected according to the regional deformation regime: A)map (on the left) and a cross section (on the right) wun nu ve;m,ui < . 6>.show the style of pluton which can be expected according to the regional deformation regime: A)extension, B) wrench deformation, C) jog within overlapping shear zones.
A1
Close to that complex, the granitic complex of La Marche is presently the last place of activemining for uranium in France (Fig. 8). It shows a very thin cross-section, in which late fine grainintrusives, richer in biotite are definitively thicker. Zones of uranium deposits have been mined,connected with very late movements on faults, but also within the complex, in relation with fluidmovements. Those sites are associated to the zones of deeper roots, and probably represent the effectof late fluids circulation, in relation with the late intrusive.
9. CONCLUSIONS
An integrated method of observations has been tailored to describe the deep structures andthe shape at depth of a granitic pluton. It mostly consists in surveying the area with detailed gravitymeasurements using a density of coverage of about 1 point per km2. It also benefits of structuralmeasurements recording the last movements of magmas while it was partly crystallized. Both sets ofdata are required to understand perfectly the mode of magma emplacement. The deepest zonesinferred from gravity data inversion, that also show vertical lineations are interpreted as the magmaroot zones. They are controlled by the regional deformation field (Fig. 9). Granitic massifs intrusiveduring a shear regime are about 5 ± 2 km thick and present only one feeding zone, sometimes twoin larger massifs, extending down to a maximum of about 6-12 km. In contrast, those granitesintrusive during extensional regime show a thin, about 2-3 km, main unit with subhonzontal magmaticfoliation planes and horizontal lineations, intruded by variously evolved facies in which magmaticstructures are subvertical. When correlating chemical evolution of the magma to its position relativeto the root zone, it appears that the rate of magma outcoming and the regional deformation rate haveinfluence on the position of the mineralization. Therefore, we suggest that integrated studies are arequisite to most studies on granite emplacement and later chemical evolution. Such a joint studyseems necessary to understand what has been the structural evolution of the magma duringemplacement. It therefore has importance in determining the mechanical response of the pluton as awhole during later phases of tectonic activities and chemical alteration.
REFERENCES
[1] AJAKAIYE, D.E., HALL, D.R. and MILLAR, T.W., Interpretation of aeromagnetic dataacross the central crystalline shield area of Nigeria. Geophys. J. R. Astron. Soc. London, 83(1985)563-571.
[2] AMICE, M., and BOUCHEZ, J.L., Susceptibilite magnetique et zonation du batholithegranitique de Cabeza de Araya (Extremadura, Espagne). C.R. Acad. Sci. Paris, 308, 2,(1989),1171-1178.
[3] ARANGUREN, A., TUBIA, J.M., VIGNERESSE, J.L. and BOUCHEZ, J.L., Settlementof the granitic massif of Guitiriz, Spain. EOS Trans. AGU, 73 (1992) 275.
[4] ARCHANJO, C.J., OLIVIER, P. and BOUCHEZ, J.L., Plutons granitiques du Serido(Nordeste du Bresil): ecoulement magmatique parallele a la chaine releve par leur anisotropiemagnetique. Bull. Soc. Geol. Fr., 163 (1992) 509-520.
[5] AUDRAIN, J., AMICE, M., VIGNERESSE, J.L. and BOUCHEZ, J.L., Gravimetrie etgeometrie tridimensionelle du pluton granitique de Cabeza de Araya (Extremadure, Espagne).C.R. Acad. Sci. Paris., 309 (1989a) 1757-1764.
[6] AUDRAIN, J., VIGNERESSE, J.L., CUNEY, M. AND FRIEDRICH, M., Modelegravimetrique et mise en place du complexe granitique hyperalumineux de Saint Sylvestre(Massif Central frangais). C.R. Acad. Sci. Paris., 309, 2 (1989b) 1907-1914.
[7] BEAMISH, D., A deep geoelectric survey of the Carnmenellis granite. Geophys. J. Int., 102,679-693 (1990).
[8] BLANCHARD, P., GAGNY, C. and LAURENT, J., Le mecanisme de decantation et sesimplications geologiques: differenciation continue et litage (layering) magmatiques. C. R.Acad. Sci. Paris, 287, D (1978) 775-778.
334
[9] BORRADAILE, G.J., Magnetic susceptibility, petrofabrics and strain. Tectonophysics, 156(1988) 1-20.
[10] BOTT, M.H.P., A geophysical study of the granite problem. Geol. Soc. London Quart., 112,45-67(1955).
[11J BOTT, M.H.P., and SIMPSON, S.P., Gravity investigations of subsurface shape and massdistibutions of granite batholiths. Geol. Soc. Am. Bull., 78 (1967) 859-878.
[12] BOUCHEZ, J.L., GLEIZES, G., DJOUADI, T. and ROCHETTE, P., Microstructure andmagnetic susceptibility applied to emplacement kinematics of granites: the example of theFoix pluton (French Pyrenees). Tectonophy;;ics, 184 (1990) 157-171.
[13] BOUCHEZ, J.L., GUILLET, P. and CHEVALIER, F., Structures d'ecoulement liees a lamise en place du granite de Guerande (Loire-Ailaniique, Fiance). Bull. Soc. Gecl. Fr., 7, 23(1981)387-399.
[14] BOURGEOIS, B., MATHIEU, F. and VALLA, P., La detection de gisements conducteursprofonds par la methode electromagnetique de surface "Melis". Bull. Soc. Geol. Fr., 161,(1992) 31-49.
[15] BRISBIN, W.C., and GREEN, A.G., Gravity model of the Aulneau batholith, northwesternOntario. Can. J. Earth Sci., 17 (1980) 968-977.
[16] BRUN, J.P., GAPAIS, D., COGNE, J.P., LEDRU, P. and VIGNERESSE, J.L., TheFlamanville granite (NW France): An unequivocal example of an expanding pluton. Geol. J.,25 (1990) 271-286.
[17] BRUN J.P. AND PONS, J., Strain patterns of pluton emplacement in a crust undergoing noncoaxial deformation. J. Struct. Geol., 3 (1981)219-229.
[18] CORDELL, L., HENDERSON, R.G., Iterative three dimensional solution of gravity anomalyusing a digital computer. Geophysics, 33 (1968) 596-601.
[19] COURRIOUX, G., Exemple de mise en place d'un ieucogranite pendant le fonctionnementd'une zone de cisaillement: le granite de Puentedeume (Galice, Espagne). Bull. Soc. Geol.Fr. 25 (1982) 301-307.
[20] CUNEY, M., Controles magmatiques et structuraux de la melallogenese uranifere tardi-hercynienne: exemple du district de la Crouzille (Haute Vienne). Chron. Rech. Min., 499(1990)9-17.
[21] CUNEY, M., FRIEDRICH, M., BLUMENFELD, P., BOURGUIGNON, A., BOIRON,M.C., VIGNERESSF, J.L. and POTY, B., Metallogenesis in the French part of the Variscanorogen. Part I: U preconcentrations in the pre-Variscan formations - a comparison with Sn,W and Au. Tectonophysics, 177 (1990) 39-57.
[22] FAURE, M., BONNEAU, M. and PONS, J., Ductile deformation and syntectonic graniteemplacement during the late Miocene extension of the Aegea (Greece). Bull. Soc. Geol. Fr.162(1991) 3-11.
[23] GLEIZES, G., NEDELEC, A., BOUCHEZ, J.L., AUTRAN, A. and ROCHETTE, P.,Magnetic susceptibility of the Mont-Louis Andorra ilmenite-type granite (Pyrenees): a newtool for the petrographic characterization and regional mapping of zoned granite plutons. J.Geophys. Res., 98, 4317-4331 (1993).
[24] GREEN, A.G., and. MAIR, J.R., Subhorizontal fractures in a granitic pluton: Their detectionand implications for radioactive waste disposal. Geophysics, 48 (1983) 1428-1449.
[25] GUILLET, P., BOUCHEZ, J.L. and VIGNERESSE, J.L., Le complexe granitique dePlouaret: mise en evidence structurale et gravimetrique de diapirs emboites. Bull. Soc. Geol.Fr., 8 (1985)503-513.
[26] GUILLET, P., BOUCHEZ, J.L. and WAGNER, J.J., Anisotropy of magnetic susceptibilityand magmatic structures in the Guerande granite massif (France). Tectonics, 2 (1983)419-429.
[27] GUINEBERTEAU, B., BOUCHEZ, J.L. and VIGNERESSE, J.L., The Mortagne granitepluton (France) emplaced by pull-apart along a shear zone: stuctural and gravimetricarguments and regional implication. Geol. Soc. Am. Bull ., 99 (1987) 763-770.
[28] HAJNAL, Z., STAUFFER, M.R., KING, M.S., WALLIS, P.F., WANG, H.F. and JONES,L.E.A., Seismic characteristics of a Precambrian pluton and its adjacent rocks. Geophysics,48 (1983)569-581.
335
[29] HANMER, S.K., VIGNERESSE, J.L., Mise en place de diapirs syntectoniques dans lachaine hercynienne: exemple des massifs leucogranitiques de Locronan et de Pontivy. Bull.Soc. Geol. Fr., 22 (1980) 193-202.
[30[ HODGE, D.S., ABBEY, D.A., HARBIN, M.A., PATTERSON, J.L., RING, M.J. andSWEENY, J.F., Gravity studes of subsurface mass distributions of granites in Maine andNew Hampshire. Am. J. Sci., 282 (1982) 1289-1324.
[31] HOLLISTER, L.S., CRAWFORD, M.L., Melt-enhanced deformation: a major tectonicprocess. Geology, 14 (1986) 558-561.
[32] HROUDA, F., Magnetic anisotropy of rocks and its application in geology and geophysics.Geophys. Surveys, 5, (1982) 37-82.
[33] HUTTON. D.H.W., DEMPSTER, T.J., BROWN, P.E. and DECKER, S.D., A newmechanism of granite emplacement: intrusion in active extensional shear zones. Nature, 343(1990) 452-455.
[34] ISHIHARA, S., The magnetite series and ilmenite series granitic rocks. J. Petrol., 25 (1977)956-983.
[35] JURDY, D.M., PHINNEY, R.A., Seismic imaging of the Elberton granite Inner PiedmontGeorgia, using COCORP southern Appalachian data. J. Geophys. Res., 88 (1983)5863-5873,.
[36] LESPINASSE, M., PECHER, A., Microfracturing and regional stress field: a study of thepreferred orientations of fluid inclusions planes in a granite from the Massif Central France.J. Struct. Geol., 8 (1986) 169-180.
[37] MATTHEWS, D.H., Can we see granites on reflection profiles? Annales Geophysicae, 5B(1986) 353-356.
[38] MEISSNER, R., BORTFELD, R.K., DEKORP Atlas, Springer Verlag, Heidelberg, 182 p.(1990).
[39] MILLER, H.G., TUACH, J., Gravity and magnetic signatures of the Auckley granite suite,southeastern Newfoundland: implications for magma emplacement. Can. J. Earth Sci., 26(1989) 2697-2709.
[40] MOLLIER, B., BOUCHEZ, J.L., Structuration magmatique du complexe granitique deBrame-St Sylvestre-St Goussaud (Limousin, Massif Central francais). C. R. Acad. Sci. Paris,294, 2 (1982) 1329-1333.
[41] NABETANI, S., KANO, H., NARITAMI, K., TAKAGI, A., SUZUKI, M. andFUJIMOTO, Y., Gravimetric investigations on granitic plutons in the Kitakami Mountains,NE Japan. Butsuri Tanko. Geophys. Explor., 25, 4 (1976) 9-26.
[42] OERTEL, G., Der Pluton von Loch Doon in Sudscotland. Geoteckt. Forsh., 11 (1955) 1-83.[43] PATERSON, S.R., TOBISH, O.T., Rates of processes in magmatic arcs: implications for the
timing nature of pluton emplacement and wall rock deformation. J. Struct. Geol., 14 (1992)291-300.
[44] PATERSON, S.C., VERNON, R.H. and TOBISCH, O.T., A review of criteria for theidentification of magmatic and tectonic foliations in granitoids. J. Struct. Geol., 11 (1989)349-363.
[45] PITCHER, W.S., Granites and yet more granites forty years on. Geol. Rund.,76 (1987)51-79.
[46] PONS, J., Relations entre la structure et la petrofrabrique des roches eruptives de laborduremeridionale du massif granitique du Querigut (Ariege, France). CR. Acad. Sci. Paris, 271,D (1970) 1665-1668.
[47] PRATT, T.L., COSTAIN, J.K., CORUTH, C , GLOVER, L. and ROBINSON, E.S.,Geophysical evidence for an allotochnous Appalachian granitoid beneath the basement surfaceof the coastal plain near Lumberton North Carolina. Geol. Soc. Am. Bull., 96 (1985)1070-1076.
[48] RICHTER, C , Particle motion and the modelling of strain response in magnetic fabrics:Geophys. J. Int., 110 (1992) 451-464.
[49] ROCHETTE, P., JACKSON, M. and AUBOURG, C , Rock magnetism and theinterpretation of anisotropy of magnetic susceptibility, Rev. Geophys., 30 (1992) 209-226.
[50] SCHWARZ, E.J., Magnetic expressions of intrusions including magnetic aureoles.
336
Tectonophysics, 192 (1992) 191-200.[51] TIKOFF, B., TEYSSIER, C , Crustal scale en echelon "P-shear" tensional bridges: A
possible solution to the batholithic room problem. Geology, 20 (1992) 927-930.[52] VAN DER VOO, R., KLOOTWIJK, C.T., Paleomagnetic reconnaissance study of the
Flamanville granite with special reference to the anisotropy of its susceptibility. Geol. Mijnb.,51 (1972) 609-617.
[53] VASSEUR, G., DUPIS, A., GALLART, J.G. and ROBIN, G., DonnSes geophysiques surla structure du massif leucogranitique du Eimousin. Bull. Soc. Geol. France, 8 (1990) 3-11.
[54] VIGNERESSE, J.L. Damped and constrained least squares method with application to gravityinterpretation. J. Geophys. 45 (1978) 17-28.
[55] VIGNERESSE, J.L., Enracinement des granites armoricains estime d'apres la gravimetrie.Bull. Soc. Geol. Min. Bretagne, 15C, (1983) 1-15.
[56] VIGNERESSE, J.L., Formes et volumes des plutons granitiques. Bull. Soc. Geol. Fr., 8(1988) 897-906.
[57] VIGNERESSE, J.L., Use and misuse of geophysical data to determine the shape at depth ofgranitic intusions. Geol. J., 25 (1990) 248-260.
[58] VIGNERESSE, J.L., CANNAT, M., Mesure des parametres physiques dans le sondaged'Echassieres (vitesse sismique, porosit6, densite). Mem. Geol. Prof. France 1, Geol. Fr.,2-3 (1987) 145-148.
[59] WEBSTER, S.S., SCHEIBNER, E., Introduction to magnetic properties of New Englandgranitoids. Explor. Geophys., 15 (1984) 67-73.
337
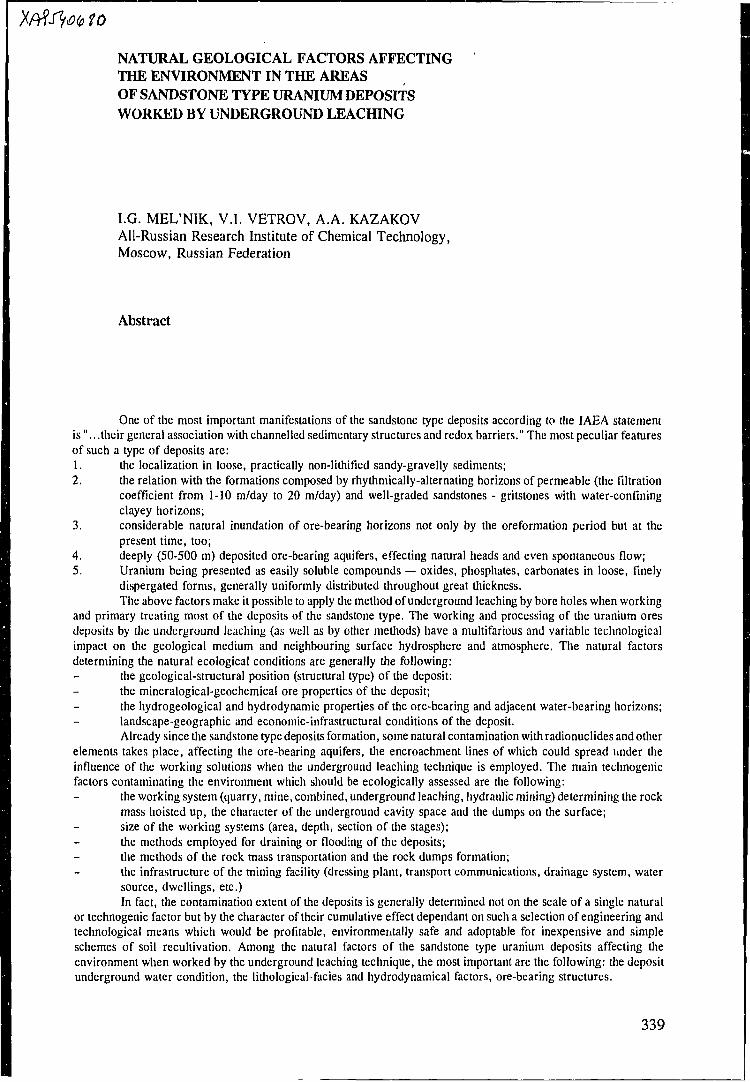
to
NATURAL GEOLOGICAL FACTORS AFFECTINGTHE ENVIRONMENT IN THE AREASOF SANDSTONE TYPE URANIUM DEPOSITSWORKED BY UNDERGROUND LEACHING
I.G. MEL'NIK, V.I. VETROV, A.A. KAZAKOVAll-Russian Research Institute of Chemical Technology,Moscow, Russian Federation
Abstract
One of the most important manifestations of the sandstone type deposits according to the IAEA statementis". . .their general association with channelled sedimentary structures and redox barriers." The most peculiar featuresof such a type of deposits are:1. the localization in loose, practically non-lithified sandy-gravelly sediments;2. the relation with the formations composed by rhythmically-alternating horizons of permeable (the filtration
coefficient from 1-10 m/day to 20 m/day) and well-graded sandstones - gritstones with water-confiningclayey horizons;
3. considerable natural inundation of ore-bearing horizons not only by the oreformation period but at thepresent time, too;
4. deeply (50-500 m) deposited ore-bearing aquifers, effecting natural heads and even spontaneous flow;5. Uranium being presented as easily soluble compounds — oxides, phosphates, carbonates in loose, finely
dispergated forms, generally uniformly distributed throughout great thickness.The above factors make it possible to apply the method of underground leaching by bore holes when working
and primary treating most of the deposits of the sandstone type. The working and processing of the uranium oresdeposits by the underground leaching (as well as by other methods) have a multifarious and variable technologicalimpact on the geological medium and neighbouring surface hydrosphere and atmosphere. The natural factorsdetermining the natural ecological conditions are generally the following:
the geological-structural position (structural type) of the deposit:the mineralogical-geochemical ore properties of the deposit;the hydrogeological and hydrodynamic properties of the ore-bearing and adjacent water-bearing horizons;landscape-geographic and economic-infrastructural conditions of the deposit.Already since the sandstone type deposits formation, some natural contamination with radionuclides and other
elements takes place, affecting the ore-bearing aquifers, the encroachment lines of which could spread under theinfluence of the working solutions when the underground leaching technique is employed. The main technogenicfactors contaminating the environment which should be ecologically assessed are the following:
the working system (quarry, mine, combined, underground leaching, hydraulic mining) determining the rockmass hoisted up, the character of the underground cavity space and the dumps on the surface;size of the working systems (area, depth, section of the stages);the methods employed for draining or flooding of the deposits;the methods of the rock mass transportation and the rock dumps formation;the infrastructure of the mining facility (dressing plant, transport communications, drainage system, watersource, dwellings, etc.)In fact, the contamination extent of the deposits is generally determined not on the scale of a single natural
or technogenic factor but by the character of their cumulative effect dependant on such a selection of engineering andtechnological means which would be profitable, environmentally safe and adoptable for inexpensive and simpleschemes of soil recultivation. Among the natural factors of the sandstone type uranium deposits affecting theenvironment when worked by the underground leaching technique, the most important are the following: the depositunderground water condition, the lithological-facies and hydrodynamical factors, ore-bearing structures.
339
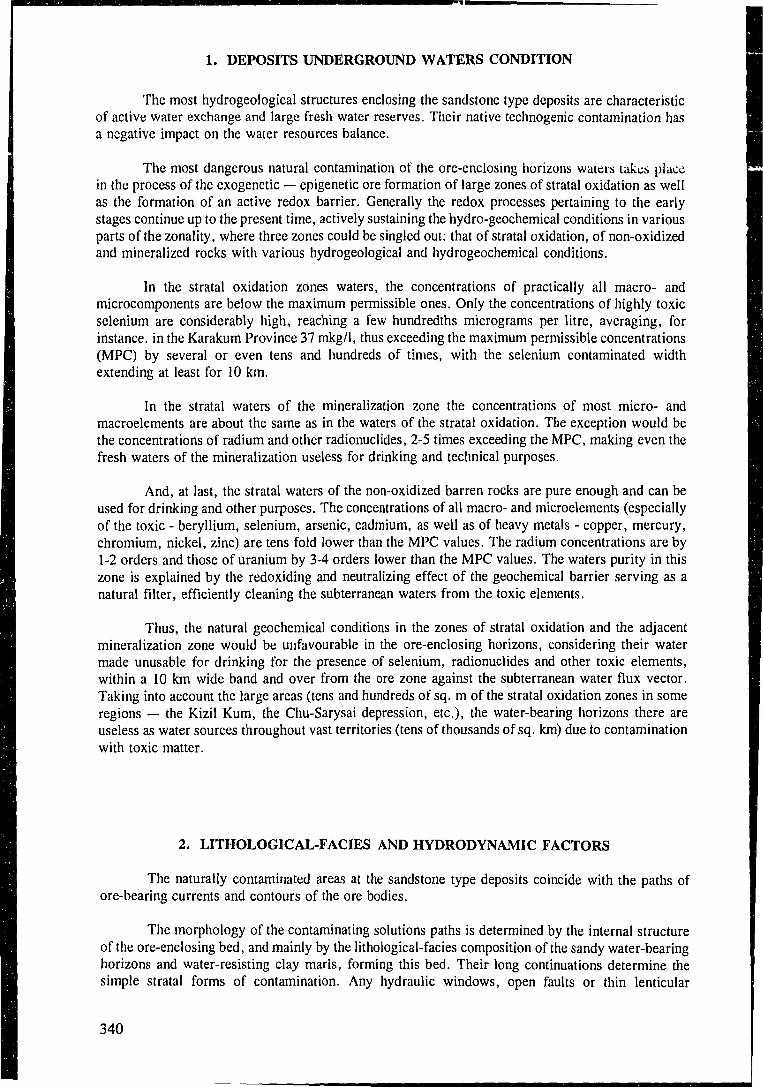
1. DEPOSITS UNDERGROUND WATERS CONDITION
The most hydrogeological structures enclosing the sandstone type deposits are characteristicof active water exchange and large fresh water reserves. Their native technogenic contamination hasa negative impact on the water resources balance.
The most dangerous natural contamination of the ore-enclosing horizons waters takes placein the process of the exogenetic — epigenetic ore formation of large zones of stratal oxidation as wellas the formation of an active redox barrier. Generally the redox processes pertaining to the earlystages continue up to the present time, actively sustaining the hydro-geochemical conditions in variousparts of the zonality, where three zones could be singled out: that of stratal oxidation, of non-oxidizedand mineralized rocks with various hydrogeological and hydrogeochemical conditions.
In the stratal oxidation zones waters, the concentrations of practically all macro- andmicrocomponents are below the maximum permissible ones. Only the concentrations of highly toxicselenium are considerably high, reaching a few hundredths micrograms per litre, averaging, forinstance, in the Karakum Province 37 mkg/1, thus exceeding the maximum permissible concentrations(MPC) by several or even tens and hundreds of times, with the selenium contaminated widthextending at least for 10 km.
In the stratal waters of the mineralization zone the concentrations of most micro- andmacroelements are about the same as in the waters of the stratal oxidation. The exception would bethe concentrations of radium and other radionuclides, 2-5 times exceeding the MPC, making even thefresh waters of the mineralization useless for drinking and technical purposes.
And, at last, the stratal waters of the non-oxidized barren rocks are pure enough and can beused for drinking and other purposes. The concentrations of all macro- and microelements (especiallyof the toxic - beryllium, selenium, arsenic, cadmium, as well as of heavy metals - copper, mercury,chromium, nickel, zinc) are tens fold lower than the MPC values. The radium concentrations are by1-2 orders and those of uranium by 3-4 orders lower than the MPC values. The waters purity in thiszone is explained by the redoxiding and neutralizing effect of the geochemical barrier serving as anatural filter, efficiently cleaning the subterranean waters from the toxic elements.
Thus, the natural geochemical conditions in the zones of stratal oxidation and the adjacentmineralization zone would be unfavourable in the ore-enclosing horizons, considering their watermade unusable for drinking for the presence of selenium, radionuclides and other toxic elements,within a 10 km wide band and over from the ore zone against the subterranean water flux vector.Taking into account the large areas (tens and hundreds of sq. m of the stratal oxidation zones in someregions — the Kizil Kum, the Chu-Sarysai depression, etc.), the water-bearing horizons there areuseless as water sources throughout vast territories (tens of thousands of sq. km) due to contaminationwith toxic matter.
2. LITHOLOGICAL-FACIES AND HYDRODYNAMIC FACTORS
The naturally contaminated areas at the sandstone type deposits coincide with the paths ofore-bearing currents and contours of the ore bodies.
The morphology of the contaminating solutions paths is determined by the internal structureof the ore-enclosing bed, and mainly by the lithological-facies composition of the sandy water-bearinghorizons and water-resisting clay marls, forming this bed. Their long continuations determine thesimple stratal forms of contamination. Any hydraulic windows, open faults or thin lenticular
340
water-resisting layers make the ore-bearing solutions leak into the adjacent non-ore horizons and formthere some small ore generating centres, resulting in native contamination of the waters.
The stratal waters in the sandstone type deposits, considering the native contaminationprotection degree, are classified as follows:
Naturally unprotected waters — the ones confined to the ore-enclosing horizons, the limitsof which contain both naturally contaminated and pure waters that could potentially getcontaminated during the process of ore formation, regeneration or while being treated by theunderground leaching method;
weakly naturally protected — to these belong the oreless aquifers hydraulically linked withore-forming structures and lithological ducts. These horizons bear the potential be locallycontaminated;
protected waters — these are the waters of aquifers isolated at the top and the bottom fromthe ore-bearing ones with thick (over 5 m) and steadfast water-resistant layers without anylithological windows nor faults.
The easiest passages for the ore-forming solutions, mapped by the natural contaminationsources, of course would be as permeable for the productive solutions, if the deposit is being workedby the underground leaching method.
One can draw a conclusion that the natural contamination centres actually predetermine (map)the areas of probable spreading of technogenic contaminating reagents. Therefore any mapping of thenative contamination areas will assists the forecasting of the technogenic solutions run-out dynamics.It follows that the geological survey and exploration data can be useful for the purposes ofenvironmental mapping.
3. ORE-ENCLOSING STRUCTURES OF SANDSTONE TYPE DEPOSITS
According to the structure, size, impact on the ore process scale and the native environmentconditions, we have singled out the following types of ore-enclosing structures (Figs 1 and 2):
1 ) Open type small erosio-tectonic troughs (valleys);
2) Semi-open type small erosio-tectonic troughs;
3) Large semi-open syneclises with multistaged mineralization;
4) Large semi-open graben-synclinoria with mineralization in basal levels;
5) Buried erosio-tectonic troughs.
3.1. OPEN TYPE EROSIO-TECTONIC TROUGHS
They represent shallow (30-100 m) cuttings into the crystalline basement of shields or foldingregions. The valleys are up to 3-4 km wide extending from tens to a few hundred kilometres. Theore-controlling body there is the thin layer of flooded alluvial and lacustrine marsh deposits ofpaleoriverbeds, undergone surface oxidation. The ore bodies are generally confined to the interlayersof peats or sandstones enriched by the vegetal remnants. The form is lenticular, the thickness 1-10m, the width - a few hundred metres, the length — a few kilometres.
341
FIG. 1. Ore-bearing structures of sandstone type deposits (schematic): Small open erosio-tectonictroughs.
The ore-bearing areas (together with the anomalous contents) comprise ca. 30% and more ofthe troughs area, being unevenly distributed throughout the section, containing rather highconcentrations of radionuclides.
The absence of water-resisting layers around the ore-bearing bed can make its waters contactthe surface currents and water intakes in the crystalline basement. In such a case the working of thedeposit by the underground Caching method would endanger the environment.
3.2. SEMI-OPEN TYPE SMALL EROSIO-TECTONIC TROUGHS
They do not differ from the above in size. They are filled with unicomposed alluvialwater-bearing rather steadfast sandy-gravelly deposits, 5-10 m thick, overlapped with anargillo-aleurolite bed, which the water-bearing horizon from the surface currents.
The ore deposits formation is related to the development of the stratal oxidation zones, whichoften develop from two borts and together with the ore deposits take up practically all the space of
1 aquifers — sands; water-resisting horizons2 clay3 aleurolites4 coals, peats5 oxidized rocks6 ore7 basement rocks8 basalts9 faults
Scale verticalhorizontal
100
1 KM
1O0M
•••::•••-:] 1
• " . " ' . • * . - • : '
u u
FIG. 2. Ore-bearing structures of sandstone type deposits (schematic): Small semi-open erosio-tc ~ •: troughs.
342
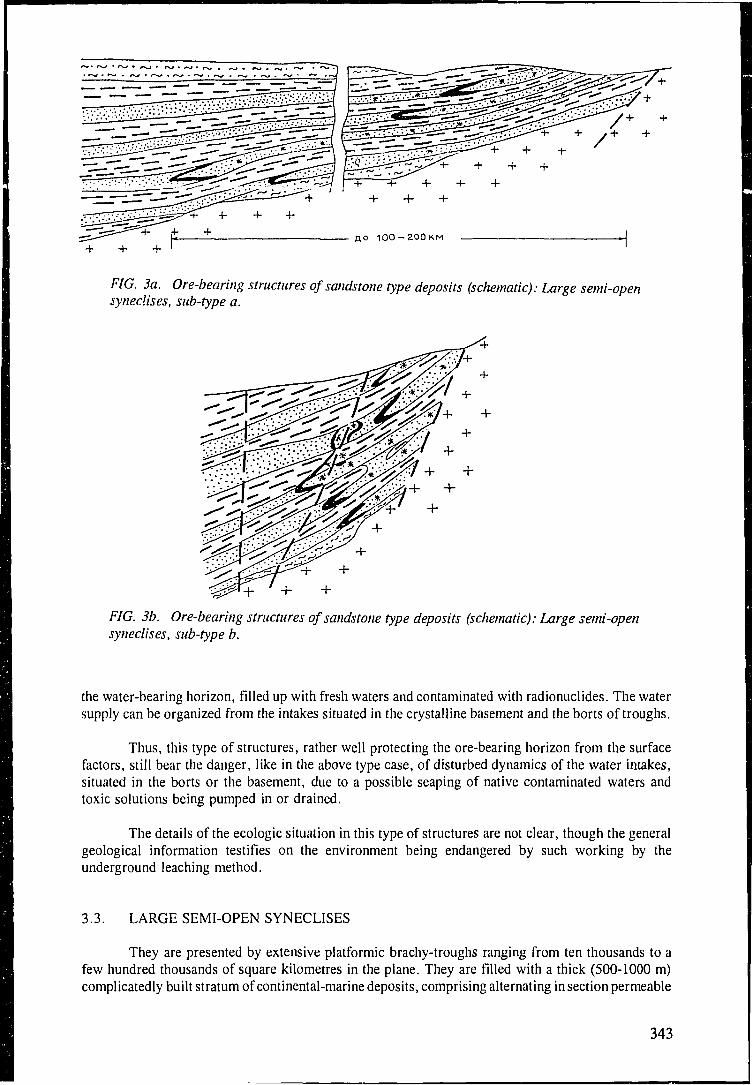
F/G. 3«. Ore-bearing structures of sandstone type deposits (schematic): Large semi-opensyneclises, sub-type a.
FIG. 3b. Ore-bearing structures of sandstone type deposits (schematic): Large semi-opensyneclises, sub-type b.
the water-bearing horizon, filled up with fresh waters and contaminated with radionuclides. The watersupply can be organized from the intakes situated in the crystalline basement and the borts of troughs.
Thus, this type of structures, rather well protecting the ore-bearing horizon from the surfacefactors, still bear the danger, like in the above type case, of disturbed dynamics of the water intakes,situated in the borts or the basement, due to a possible seaping of native contaminated waters andtoxic solutions being pumped in or drained.
The details of the ecologic situation in this type of structures are not clear, though the generalgeological information testifies on the environment being endangered by such working by theunderground leaching method.
3.3. LARGE SEMI-OPEN SYNECLISES
They are presented by extensive platformic brachy-troughs ranging from ten thousands to afew hundred thousands of square kilometres in the plane. They are filled with a thick (500-1000 m)complicatedly built stratum of continental-marine deposits, comprising alternating in section permeable
343
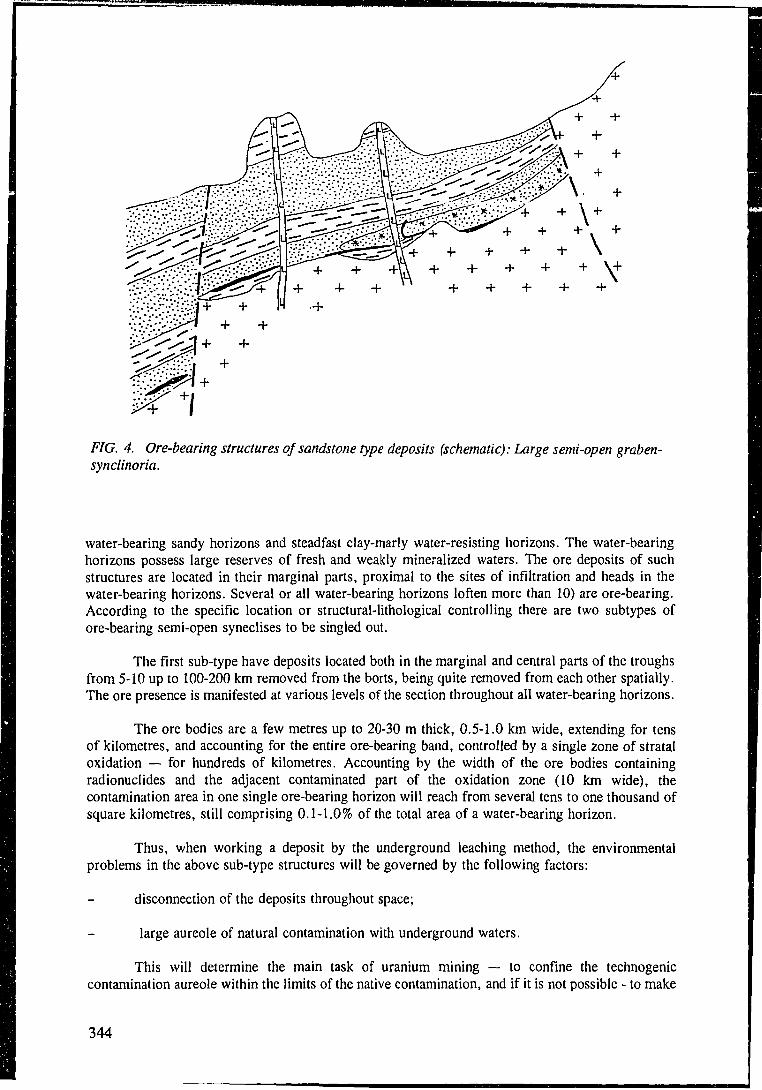
FIG. 4. Ore-bearing structures of sandstone type deposits (schematic): Large semi-open graben-synclinoria.
water-bearing sandy horizons and steadfast clay-marly water-resisting horizons. The water-bearinghorizons possess large reserves of fresh and weakly mineralized waters. The ore deposits of suchstructures are located in their marginal parts, proximal to the sites of infiltration and heads in thewater-bearing horizons. Several or all water-bearing horizons loften more than 10) are ore-bearing.According to the specific location or structural-lithological controlling there are two subtypes ofore-bearing semi-open syneclises to be singled out.
The first sub-type have deposits located both in the marginal and central parts of the troughsfrom 5-10 up to 100-200 km removed from the borts, being quite removed from each other spatially.The ore presence is manifested at various levels of the section throughout all water-bearing horizons.
The ore bodies are a few metres up to 20-30 m thick, 0.5-1.0 km wide, extending for tensof kilometres, and accounting for the entire ore-bearing band, controlled by a single zone of strataloxidation — for hundreds of kilometres. Accounting by the width of the ore bodies containingradionuclides and the adjacent contaminated part of the oxidation zone (10 km wide), thecontamination area in one single ore-bearing horizon will reach from several tens to one thousand ofsquare kilometres, still comprising 0.1-1.0% of the total area of a water-bearing horizon.
Thus, when working a deposit by the underground leaching method, the environmentalproblems in the above sub-type structures will be governed by the following factors:
disconnection of the deposits throughout space;
large aureole of natural contamination with underground waters.
This will determine the main task of uranium mining — to confine the technogeniccontamination aureole within the limits of the native contamination, and if it is not possible - to make
344
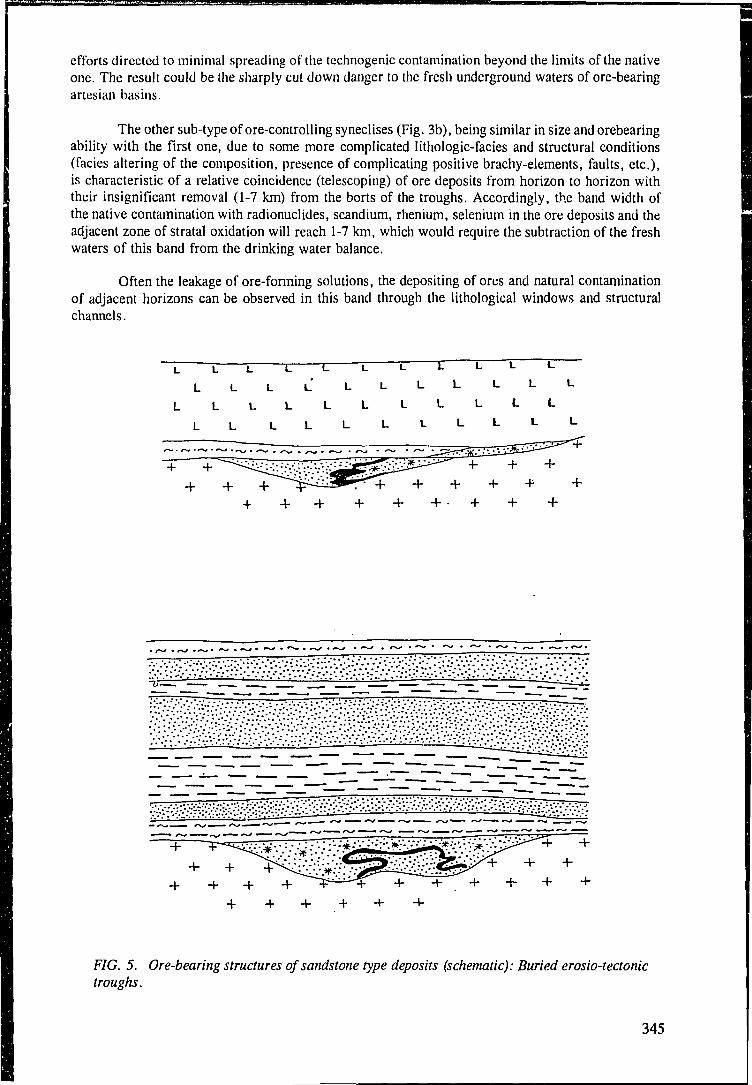
efforts directed to minimal spreading of the technogenic contamination beyond the limits of the nativeone. The result could be the sharply cut down danger to the fresh underground waters of ore-bearingartesian basins.
The other sub-type of ore-controlling syneclises (Fig. 3b), being similar in size and orebearingability with the first one, due to some more complicated lithologic-facies and structural conditions(facies altering of the composition, presence of complicating positive brachy-elements, faults, etc.),is characteristic of a relative coincidence (telescoping) of ore deposits from horizon to horizon withtheir insignificant removal (1-7 km) from the borts of the troughs. Accordingly, the band width ofthe native contamination with radionuclides, scandium, rhenium, selenium in the ore deposits and theadjacent zone of stratal oxidation will reach 1-7 km, which would require the subtraction of the freshwaters of this band from the drinking water balance.
Often the leakage of ore-forming solutions, the depositing of ores and natural contaminationof adjacent horizons can be observed in this band through the lithological windows and structuralchannels.
+
-.. :.,. ~> ~. ,— -
. ^ • • • • • . • • • : - . . _ .
FIG. 5. Ore-bearing structures of sandstone type deposits (schematic): Buried erosio-tectonictroughs.
345
The negative environmental factors present in the above subtype of ore-bearing structures arethe following:
telescoping of the various horizons deposits, presenting environmental and technogenic strainduring the working;
native contamination of the most accessible parts of artesian basins, used for supplying ofwater in the bort adjacent areas in proximity to surface;
troughs in a crystalline frame, where water intake should be eliminated due to possibleleaking of the technogenic solutions.
Similarly to the foregoing subtype, one should take into account the zone of nativecontamination, which must not be used for the water intake, the decision be made prior to thebeginning of the working of the deposit.
3.4. LARGE GRABEN-SYNECLINES
Large graben-syneclines (sized over 5 000km2) present fault-attached troughs, filled withrhythmically formed beds of continental-marine deposits 1 000 m thick, intermitted with sandywater-bearing horizons.
The ore sills are located on the upraised structure limb in the basal water-bearing horizon,well isolated from the superjacent oreless water-bearing layers by a steadfast thick (over 50 m)water-resistant horizon, and by a lensing water-resistant horizon — from the crystalline basement. Theore deposition depth is 200 - 700 m. The ore deposits form a large oval ore field sized up to1 000 km2 with the aureole of non-payable ores and radioactivity anomalies. The young strataloxidation zone is noted to regenerate the ore deposits, increasing the native contamination of thewater-bearing horizon with radionuclides.
There is no natural leakage of ore-forming solutions into superjacent aquifers. There havebeen only slight anomalies observed in the proximity of some large faults, implying possible leaksof the technological solutions through these structures into the superjacent aquifers.
3.5. BURIED EROSIO-TECTONIC TROUGHS (PALEOVELLEYS)
They belong to the Mesozoic structures, overlapped with sedimentary (ya) or volcanogenic(yb) strata with the water-resistant horizons in the basement during the postore-formation period.
The deposits in this structure type are reliably isolated by the water-resistant horizons fromthe superjacent aquifers and water currents of the day surface. The ore bodies and stratal oxidationzones take up to 10-30% of the ore-bearing horizon area, where radionuclides, molybdenum,scandium and selenium are contained in the quantities exceeding the maximum permissibleconcentration values. The deposits working in this type of structure is considered environmentallysafe.
Thus, the various types of ore-bearing structures considerably differ in their size, constructionand distribution of the native contamination of aquifers. The smaller structures are relatively morenaturally contaminated than the large ones.
346
4. LANDSCAPE-GEOGRAPHIC AND ECONOMIC SITUATION OF DEPOSITS
The effect of this factor is determined by the value of land taken for the construction of sites,roads, water supply lines, adsorption columns, eLc.
It is natural that in poorly populated plain deserts or semi-desert the expenditures for theabove purposes would be relatively low and the environmental impact weaker as compared withchernozem, forestly densely populated areas, where the environment would be endangered not onlyby the underground leaching working but by the industrial and agricultural activities too.
The environmental impact ot the above factor should be evaluated for each single regionspecifically.
5. GENERAL CONCLUSIONS
1. Most structures enclosing the sandstone type deposits generally possess large reserves offreshwater, which could be sources of potable and communal water supply. The knowledgeon the relationships concerning the location and degree of native contamination is vital whenevaluating the environment conditions of orebearing structures, balancing thedrinking-communal water-supply and conducting the deposits working by the undergroundleaching method.
2. The native conditions of ore-bearing aquifers are not favourable for the potable water intakewithin the limits of ore deposits and the oxidated rocks zone (at least up to 10 km and moreremoved from the ore zone against the vector of the underground water currents movement)due to the specific process of ore formation in the sandstone type deposits. The concentrationsof radionuclides, selenium, iron, manganese and other elements in the waters there wouldexceed the maximum permissible concentrations 10- 100 times.
3. The native contamination morphology and the protection of adjacent horizons is determinedby the internal structure of the ore-bearing strata, the stability of aquifers and water-resistinghorizons, the presence of tectonic windows and faults.
4. The degree of native contamination directly relates to the type and extent of the ore-bearingstructures with native contamination. In large syneclises and graben synclinora, thecontaminated aquifers areas reach extensions of thousands of square kilometers, though inrelation to the very structures they do not exceed 0.1-1.0%. In small erosio-tectonic valleys,the native contamination exceeds 30% of the ore-bearing horizons space.
5. The setting-up of the underground leaching fields according to the data on the naturallycontaminated ore-bearing horizons would considerably decrease the ecological danger to waterresources of aquifers undergoing technogenic contamination .
347
LIST OF PARTICIPANTS
Akerblom, G.
Andjelov, M.
Armour-Brown, A.
Ball, T.K.
Balla, Z.
Barisic, D.
Barnet, I.
Barthel, F.H.
Bartosek, J.
Baxter, M.S.
uz, T.
Bourgeois, C.
Cox, J.R.
Swedish Radiation Protection Institute,S-171 16 Stockholm, Sweden
Institute of Geology, Geotechnics and Geophysics,Dimiceva 14,SLO-61000 Ljubljana, Slovenia
Consultant,1 Lyndewode Road, Cambridge CB1 2HL,United Kingdom
British Geological Survey,Key worth, Nottingham NG12 5GG,United Kingdom
Hungarian Geological Survey,Stefa'nia 14,H-1142 Budapest, Hungary
Ruder BoSkovic Institute,Bijenicka c. 88,Zagreb, Croatia
Czech Geological Survey,Malostranske nam. 19,CZ-11821 Prague 1, Czech Republic
Bundesanstalt fur Geowissenschaftenund Rohstoffe,
Stilleweg 2, P.O. Box 510153,D-30631 Hannover 51, Germany
ENVI-2000,Vaculilcova la,CZ-63800 Brno, Czech Republic
IAEA - Marine Environment LaboratoryB.P. 800,MC-98012 Monaco Cedex, Monaco
Rudnik Zirovski Vrh,Todraz 1,SLO-64 224 Gorenja Vas, Slovenia
Commissariat a l'Energie Atomique (C.E.A.),Centre Valduc, Service S.P.R.F-21120 Is-sur-Tille, France
EXPLORANIUM G.S. Ltd.,95 Healy Road, Unit 7,Bolton, Ontario, Canada L7E 5A2
349
Darnley, A.G.
Fernandez Amigot, J.A.
Gamba, M.A.
Grasty, R.L.
Hogg, S.
Hovgaard, J.
Jurza, P.
Kazakov, A.A.
Koczynski, A.
Lindgren, P.J.S.
Logar, Z.
Lovenhofer, P.
Maleik, M.L.
Geological Survey of Canada,601 Booth Street,Ottawa, Ontario, Canada K1A 0E8
ENUSA,Santiago Rusinol 12,E-28040 Madrid, Spain
Comision Nacional de Energia Atomica,Avenida del Libertador 8250,(1429) Buenos Aires, Argentina
Geological Survey of Canada,601 Booth Street,Ottawa, Ontario, Canada K1A 0E8
UDL,47 Jefferson Avenue,Toronto, Ontario, Canada M6K 1Y3
Ministry of the Interior,Emergency Management Agency,Datavej 16,DK-3460 Birkerod, Denmark
GMS a.s. Prague,Pristam 24,CZ-12004 Prague 1, Czech Republic
Ministry of the Russian Federation forAtomic Energy,
Staromonetny per. 26,109180 Moscow, Russian Federation
Central Laboratory for Radiological Protection,Ul. Konwaliowa 7,PL-03-194 Warsaw, Poland
Geological Survey of Sweden,P.O. Box 670,S-751 28 Uppsala, Sweden
Rudnik Zirovski Vrh,Todraz 1,SLO-64 224 Gorenja Vas, Slovenia
PICODAS Group Inc.,Vinohradska 131,Prague 3, Czech Republic
Nuclear Materials Authority,Maadi, P.O. Box 530,Cairo, Egypt
350
Matolin, M.
Mellander, H.O.
Multala, J.T.
Ochiai, Y.
Otton, J.K.
Papadopoulos, N.N.
Prohic, E.
Roux, Z.X.L,
Rybach, L.
Sanderson, D.C.W.
Schwas, G.F.
Seiberl, W.A.
Charles University,Faculty of Science,Albertov 6,CZ-128 43 Prague 2, Czech Republic
Swedish Radiation Protection Institute,S-171 16 Stockholm, Sweden
Geological Survey of Finland,Betonimiehenkuja 4,FIN-02150 Espoo, Finland
Power Reactor and Nuclear Fuel,Development Corporation,
Chubu Works,953-31, Sonodo, Jyourinnji,Izumi-cho, Toki City, Gifu-ken, Japan
US Geological Survey,P.O. Box 25046, M.S. 939,Denver Federal Center,Denver, Colorado 80225, United States of America
National Centre for Scientific Research,DEMOKRITOS,Aghia Paraskevi, P.O. Box 60228,GR-15310 Athens, Greece
Faculty of Natural Science,University of Zagreb,Zvonimirova 8,41000 Zagreb, Croatia
Cogema2, Rue Paul Dautier, BP 4,F-78141 Velizy Cedex, France
Institute of Geophysics,Swiss Federal Institute of Technology,ETH-H6nggerberg,CH-8093 Zurich, Switzerland
Scottish Universities Research & Reactor Centre(SURRC),
East Kilbride, Glasgow G75 0QU,United Kingdom
Institute of Geophysics,Swiss Federal Institute of Technology,ETH-H6nggerberg,CH-8093 Zurich, Switzerland
Geologische Bundesanstalt (Geological Survey of Austria),Rasumofskygasse 23,A-1030 Vienna, Austria
351
Shiloni, Y.
Shirav, M.
Sideris, G.N.
Strzelecki, R.S.
Tauchid, M.
Torres, L.M. de M.
Vigneresse, J.L.
Geological Survey of Israel,30 Malkhe Israel Str.,Jerusalem 95501, Israel
Geological Survey of Israel,30 Malklie Israel Str..Jerusalem 95501, Israel
Institute of Geology and Mineral Exploration,70 Messoghion St.,GR-115 27 Athens, Greece
Polish Geological Institute,Ul. Rakowiecka 4,PL-00-975 Warsaw, Poland
International Atomic Energy Agency
Instituto Geologico e Mineiro,Rua Diogo do Couto, No. 1 3°,P-1100 Lisbon, Portugal
CREGU,Centre de Recherches sur la Geologie des Materes
Premieres Minerales et Energetiques,3, Rue du Bois de la Champelle, BP 23F-54501 Vandoevre-les-Nancy Cedex, France
352
01Mr>(Moin
QUESTIONNAIRE ON IAEA-TECDOCs
// would greatly assist the Inlt'i national Atomic Energy Agency in its analysis of the effectiveness of us Technical Document programme if you could kindly answer the following questionsana lentm tin jouu io ilu iu!u/i.\.t .w'.cju;; !)L!O',V. }'.;;// i \ ; i;//V/'.i\f/i'.v: is giwitlv cipprcriatcc!
Title: Application of uranium exploration data and techniques in environmentalstudies
Number: IAEA-TECDOC-827
1. How did you obtain this TECDOC?
[ ] From the IAEA:[ ] At own requestL ] Without requestf ] As participant at an IAEA meeting
[ ] From a professional colleague[ ] From library
2. How do you rate the content of the TECDOC?
[ ] Useful, includes information not found elsewhere[ ] Useful as a survey of the subject area[ ] Useful for reference[ ] Useful because of its international character[ ] Useful for training or study purposes[ J Not very useful. If not, why not?
3. How do you become aware of the TECDOCs available from the IAEA?
[ 1 From references in:[ J IAEA publications[ ] Other publications
[ ] From IAEA meetings[ ] From IAEA newsletters[ ] By other means (please specify)
[ ] If you find it difficult to obtain information on TECDOCs please tick this box
4. Do you make use of IAEA-TECDOCs?
[ ] Frequently[ ] Occasionally[ ] Rarely
5. Please state the institute (or country) in which you are working:
Please return to: R.F. KelleherHead, Publishing SectionInternational Atomic Energy AgencyP.O. Box 100Wagramerstrasse 5A-1400 Vienna, Austria