Enzymatically triggered polymeric drug delivery systems for ...
Upload
independentCategory
view
1download
0
Brunel university research archive
Article
Post PrintThis article is a version after peer-review, with revisions having been made. In terms of appearance only this might not be the same as the published article.
Author(s)
Title
Original Citation
This version is available at:
Access to and use of the material held within the Brunel University Research Archives, is based on your acceptance of the BURA End User Licence Agreement (EULA)
Patterns of morphological and genetic variability in UK populations of the shore crab,
Carcinus maenas Linnaeus, 1758 (Crustacea: Decapoda: Brachyura)
Jayne V. Brian1*, Teresa Fernandes1, Richard J. Ladle2, Peter A. Todd3
1School of Life Sciences, Napier University, 10 Colinton Road, Edinburgh, EH10
5DT, UK.
2School of Geography and the Environment, University of Oxford, Mansfield Road,
Oxford, OX1 3TB, UK.
3Department of Biology, National University of Singapore, Block S2, 14 Science
Drive, 117543, Singapore.
Tel: 01895 266 264
Fax: 01895 274 348
Email: [email protected]
*Present address: Institute for the Environment, Brunel University, Uxbridge,
Middlesex, UB8 3PH, UK.

2
ABSTRACT
Previous research has identified extensive inter-population variability in the
morphology of the shore crab (Carcinus maenas L.). To determine the source of this
variation (genetic or environmental), morphological and genetic data were analysed
from crabs collected from eight sites around the coast of the UK. Ten morphometric
traits were measured from over 800 crabs and the degree of morphological similarity
among sites calculated using multivariate techniques. Allozyme electrophoresis was
used to investigate patterns of genetic similarity. Extensive morphological variability
was detected; eight out of the ten morphometric traits analysed were useful when
discriminating between crabs from each site. Discriminant function analysis revealed
that over 35% of individuals could be classified to their site of origin on the basis of
their morphology. In contrast, the allozyme analysis revealed low levels of genetic
variability, both within the meta-population and among the crab population at each
site. Pairwise comparisons revealed a moderate correlation between the degree of
morphological and genetic similarity of crabs at each site, which suggests that the
observed phenotypic variability has a genetic component. However, only around 20%
of the phenotypic variability detected was associated with the patterns of genetic
similarity. This means that patterns of morphological variability in this species are
largely determined by the local environmental conditions: local factors could have a
within-generation selective influence on mean trait values or C. maenas may exhibit
phenotypic plasticity.
Key words: Carcinus maenas, genetic variation, morphology, phenotypic plasticity,
shore crab.
3
INTRODUCTION
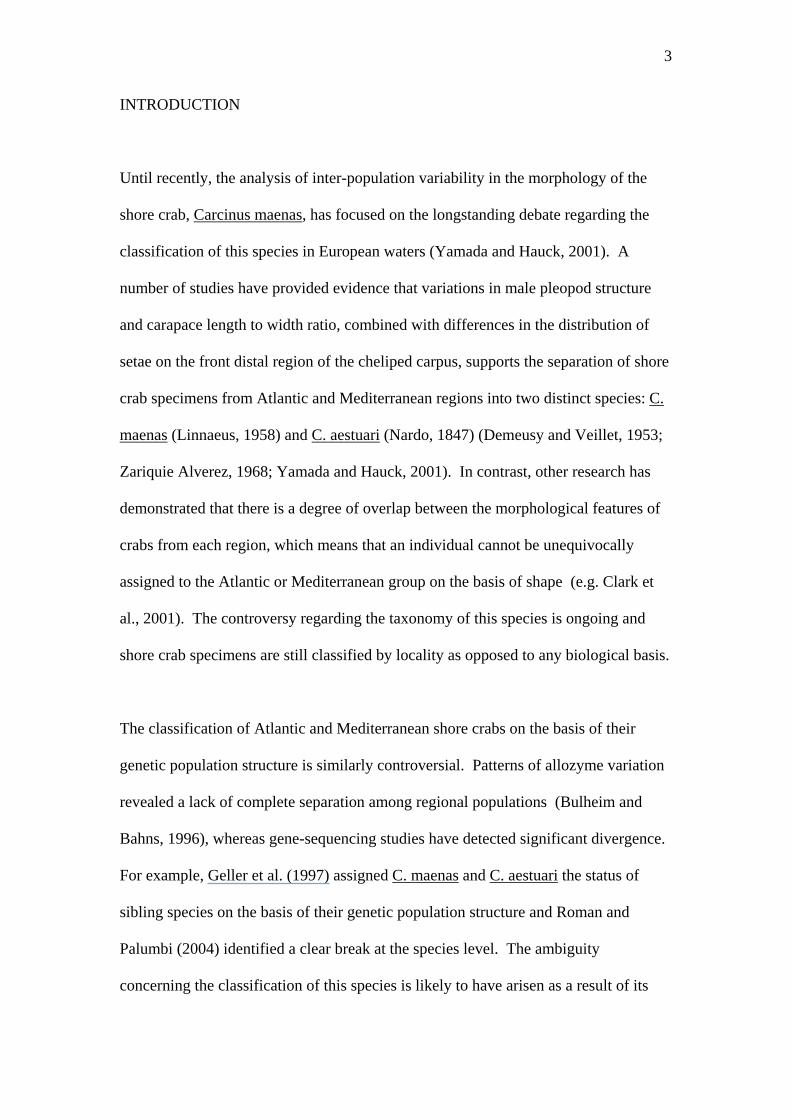
Until recently, the analysis of inter-population variability in the morphology of the
shore crab, Carcinus maenas, has focused on the longstanding debate regarding the
classification of this species in European waters (Yamada and Hauck, 2001). A
number of studies have provided evidence that variations in male pleopod structure
and carapace length to width ratio, combined with differences in the distribution of
setae on the front distal region of the cheliped carpus, supports the separation of shore
crab specimens from Atlantic and Mediterranean regions into two distinct species: C.
maenas (Linnaeus, 1958) and C. aestuari (Nardo, 1847) (Demeusy and Veillet, 1953;
Zariquie Alverez, 1968; Yamada and Hauck, 2001). In contrast, other research has
demonstrated that there is a degree of overlap between the morphological features of
crabs from each region, which means that an individual cannot be unequivocally
assigned to the Atlantic or Mediterranean group on the basis of shape (e.g. Clark et
al., 2001). The controversy regarding the taxonomy of this species is ongoing and
shore crab specimens are still classified by locality as opposed to any biological basis.
The classification of Atlantic and Mediterranean shore crabs on the basis of their
genetic population structure is similarly controversial. Patterns of allozyme variation
revealed a lack of complete separation among regional populations (Bulheim and
Bahns, 1996), whereas gene-sequencing studies have detected significant divergence.
For example, Geller et al. (1997) assigned C. maenas and C. aestuari the status of
sibling species on the basis of their genetic population structure and Roman and
Palumbi (2004) identified a clear break at the species level. The ambiguity
concerning the classification of this species is likely to have arisen as a result of its

4
immense capacity for dispersal: shore crabs can be transported over vast distances by
tides and currents during their planktonic larval stage, which can last for up to 90 days
(Crothers, 1967; Rainbow et al., 1999). Organisms that exhibit this type of dispersal
pattern typically lack clear patterns of population divergence due to low levels of
genetic differentiation and limited inter-population variability (Hilbish, 1996).
It is therefore surprising that a number of recent studies have detected extensive
phenotypic variability in shore crabs within relatively restricted geographical areas.
For example, specimens collected from locations around the coast of the UK have
been found to differ in terms of their morphology (Bentley et al., 2002; Brian, 2005;
Lye et al., 2005) and camouflage pigmentation (Todd et al., 2005). Given that
population divergence is prevented by gene flow, these patterns of phenotypic
variability are likely to reflect differences between the local environmental conditions,
resulting in within-generation selection pressures and/or phenotypic plasticity.
The aim of this study is to assess patterns of morphological and genetic variability in
UK shore crab populations in order to investigate the source of this inter-population
variability. The decoupling of these parameters will help to establish the extent to
which environmental factors influence the expression of phenotypic variability in C.
maenas, as well as improving our understanding of the ecology and biogeography of
this species. These fundamental issues are of current interest given that the shore crab
is a highly successful global invader, having colonised Australia, Tasmania, South
Africa, Japan and both coasts of North America (in Roman and Palumbi, 2004). It
poses a significant risk to the intertidal ecosystem in these areas, causing changes in
the abundance, size structure and defence response of native species (Yamada, 2001).

5
The expression of inter-population variability in this species is also of interest from
the perspective of biomonitoring: the shore crab has recently been championed as a
sentinel for assessing the effects of chemical contamination (e.g. Galloway et al.,
2004). However, in order to detect the effects of anthropogenic factors, it is important
to consider the potential for natural variation in the biomarker response in order to
establish the limits of normality (Brian, 2005; Sumpter and Johnson, 2005).
MATERIALS AND METHODS
Adult green shore crabs (classified as those with a carapace width of >30mm) were
collected by hand from the inter-tidal zone at eight sites around the coast of the UK
(Figure 1). Sites on the west coast consisted of the Dee, Mersey and Clyde estuaries,
as well as two Scottish sea lochs, located near Appin and Arisaig. East coast sites
comprised the Tyne and Tees estuaries and the Firth of Forth. All specimens were
collected within a six-week period during the summer of 2001. Individuals that
exhibited symptoms of infection by Sacculina carcinii were discarded. The remaining
crabs were transported live, back to the laboratory, in cool-boxes for the
morphometric and genetic analyses.
The morphological dimensions are illustrated in Brian (2005). These measurements
were made using digital callipers (±0.01mm). The length and width of the carapace,
and the depth of the cephalothorax, were measured at the widest, longest and deepest
points, respectively. Chelae depth was measured at the deepest points and the degree
of heterochely was calculated as the depth of the right cheliped minus that of left.
The morphology of each claw was also determined by dividing the depth of the

6
cheliped by its width. Individuals that had lost chelae, or that were suspected to have
regenerated one or more cheliped (on the basis of their body size ratio), were omitted
from the analysis of claw morphology. Periopod and propodus lengths were recorded
by averaging these measurements for the fourth and fifth pairs of limbs, respectively.
Again, data from individuals with missing or regenerating limbs were excluded. The
area of the abdomen was calculated using the image analysis package, Image Tool V3
(UTHSCSA, San Antonio, USA). The lengths of the major pleopods were
determined under a dissecting microscope with a graticule (±0.2mm). The influence
of body size was removed by using the residuals for each trait plotted against carapace
width as adjusted trait values (Debuse et al., 2001). Where necessary, these values
were log-transformed to achieve normality, before being entered into a stepwise
discriminant function analysis (DFA) using Statistica V7 (Statsoft) to determine
Mahalanobis distances between each pair of sites.
The analysis of genetic population structure was conducted using samples of muscle
tissue taken from the chelae of 50 crabs from each site: 25 males and 25 females.
Allozyme electrophoresis was performed using horizontal starch gels, run for four
hours at -4˚C. The gel and bridging buffers were prepared according to Wendel and
Weeden (1989) and Creasey et al (1997). Staining protocols were obtained from
Cheliak and Pitel (1984). Initially, 14 enzyme systems were trailed using six different
buffer systems. This yielded six loci that could be consistently resolved (Table 1).
Each zymogram was scored by two independent observers and the alleles were scored
according to their rate of migration. There were no differences between the allele
frequencies of male and female crabs, which meant that the results from both sexes
were pooled. The data were analysed with an online version of the population

7
genetics analysis package, GENEPOP (Curtin University of Technology, Australia).
This was used to determine the genetic structure and heterozygosity of crabs from
each population, in addition to estimating the degree of genetic variation among
populations. The latter was based on Wright’s F-statistics (Weir and Cockerham,
1984), which were used to determine the degree of genetic differentiation between
each pair of sites.
Cluster analysis was performed to assess the patterns of morphological and genetic
variability among sites. These were plotted in the form of dendrograms, which were
constructed according to the unweighted pairgroup method of analysis (UPGMA) in
Statistica V7. The relationship between the degree of morphological differentiation
(Mahalanobis distance) and the genetic distance (Fst) between crabs at each pair of
sites was analysed by calculating Pearson’s product moment correlation coefficient in
Minitab V13.1 (Minitab Inc.). The data was normalised prior to analysis and the
correlation was performed independently for male and female crabs to account for
differences in their morphology.
RESULTS
The DFA and cluster analysis reveal that there is extensive inter-population variability
in the morphology of male and female shore crabs (Figure 2). Differences are more
pronounced in males (evident from the difference in the scale on each dendrogram),
although the patterns exhibited by each sex are similar. Inter-population differences
in the mean values for each trait are presented in Brian (2005). Male crabs from
Arisaig, Appin, and the Dee and Clyde estuaries are most alike in terms of their

8
overall morphology, with males from the Tyne and Tees exhibiting the greatest
difference from this group (Figure 2a). Distances between the morphology of female
crabs reveal three main clusters: females from the Dee and Clyde are most similar and
form a cluster with those from the Mersey. This cluster then joins with another,
comprising of females from Arisaig, Appin and the Forth. Tyne and Tees females
were most distinct in terms of their morphology (Figure 2b). DFA revealed eight
characters that are informative in differentiating between male crabs from each site
(F56,1760 = 4.02, p<0.01). Six of these are significant functions (abdominal area,
cephalothorax depth, periopod length, right chelae depth, right chelae morphology
and heterochelae). DFA was moderately successful at reclassifying males according
to their site of origin: 33.1% of individuals were assigned correctly, compared to the
12.5% that would have been assigned to the correct site by chance. Eight functions
are also useful when discriminating among female crabs (F56,1572 = 3.22, p<0.01),
although only three of these are significant (abdominal area, cephalothorax depth and
periopod length). 37.3% of females were correctly assigned to site on the basis of
their morphological variability.
The analysis of genetic variability reveals that four out of the six loci studied are
polymorphic. The PGM and PGI loci exhibit the highest variability: the overall
frequency of genotypes, other than the most common, is approximately 25% and 5%,
respectively. Low levels of genetic variability (~1%) are found at the AAT and MDH
loci. The distribution of genetic variability does not differ between the populations at
each site and the observed heterozygosities (Arisaig=0.14; Appin=0.11; Clyde=0.11;
Forth=0.10; Tyne=0.09; Tees=0.11; Mersey=0.09; Dee=0.12) are consistent with
those expected on the basis of random mating (in line with the Hardy Weinberg
9
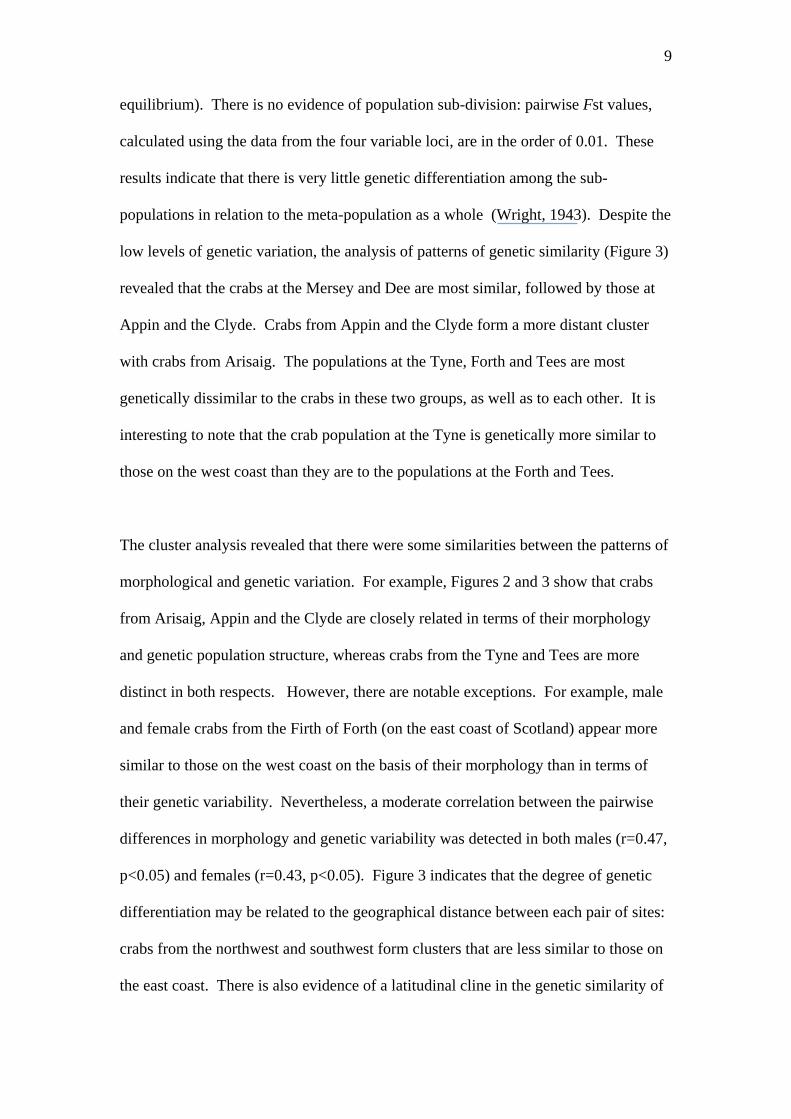
equilibrium). There is no evidence of population sub-division: pairwise Fst values,
calculated using the data from the four variable loci, are in the order of 0.01. These
results indicate that there is very little genetic differentiation among the sub-
populations in relation to the meta-population as a whole (Wright, 1943). Despite the
low levels of genetic variation, the analysis of patterns of genetic similarity (Figure 3)
revealed that the crabs at the Mersey and Dee are most similar, followed by those at
Appin and the Clyde. Crabs from Appin and the Clyde form a more distant cluster
with crabs from Arisaig. The populations at the Tyne, Forth and Tees are most
genetically dissimilar to the crabs in these two groups, as well as to each other. It is
interesting to note that the crab population at the Tyne is genetically more similar to
those on the west coast than they are to the populations at the Forth and Tees.
The cluster analysis revealed that there were some similarities between the patterns of
morphological and genetic variation. For example, Figures 2 and 3 show that crabs
from Arisaig, Appin and the Clyde are closely related in terms of their morphology
and genetic population structure, whereas crabs from the Tyne and Tees are more
distinct in both respects. However, there are notable exceptions. For example, male
and female crabs from the Firth of Forth (on the east coast of Scotland) appear more
similar to those on the west coast on the basis of their morphology than in terms of
their genetic variability. Nevertheless, a moderate correlation between the pairwise
differences in morphology and genetic variability was detected in both males (r=0.47,
p<0.05) and females (r=0.43, p<0.05). Figure 3 indicates that the degree of genetic
differentiation may be related to the geographical distance between each pair of sites:
crabs from the northwest and southwest form clusters that are less similar to those on
the east coast. There is also evidence of a latitudinal cline in the genetic similarity of

10
crabs on the west coast of the UK. This was investigated by correlating the degree of
genetic similarity (Fst) with the latitudinal distance between each pair of sites, which
revealed that a close association between these factors (r=0.86, p<0.01).
DISCUSSION
The results of this study provide further evidence that UK shore crab populations
exhibit extensive morphological variability, which is consistent with the findings of
Bentley et al. (2002), Brian (2005) and Lye et al. (2005). There is evidence that
patterns of morphological similarity are, to some extent, related to genetic population
structure, although the relationship is not clear. The genetic analyses reveal trends
that are typical of decapods i.e. low levels of variability across the shore crab meta-
population as a whole, but large variations in the degree of heterozygosity expressed
from locus to locus (Tracey et al., 1975). The PGM locus exhibits the greatest
variability, with heterozygosities of between 0.33 and 0.5 at each site. The majority
of loci, however, have heterozygosities of 0.05 or less, and a high proportion of loci
are fixed at all sites. These patterns are consistent with allozyme data describing the
population genetics of this species on a larger spatial scale (Bulnheim and Bahns,
1996). There is no evidence of genetic divergence within the crab population at each
site, which indicates that there is a high degree of genetic mixing and similar selection
pressures. The distribution of genetic variability does, however, reveal evidence of a
latitudinal cline, which is likely to reflect larval drift (the movement of adult crabs is
more limited). This cline is consistent with ocean circulation patterns, which result in
the movement of water in a northerly direction along the west coast of the UK.

11
The correlation between the pairwise differences in the degree of morphological and
genetic similarity of crabs from each site suggests that the phenotypic characteristics
of this species are related to patterns of genetic variability (although this relationship
is not necessarily causal). The relationship is not strong: the correlation revealed that
only around 22% and 18% of the morphological variability exhibited by males and
females, respectively, could be linked to the patterns of genetic variability. This
suggests that these two parameters are relatively independent and, hence, that the
expression of phenotype is largely determined by the environmental conditions. The
environment may affect the phenotypic characteristics of a population by selecting
for, or against, particular genotypes (Hilbish, 1996). Alternatively, phenotypic
variations may arise as a plastic response to the local environmental conditions.
Phenotypic plasticity, which is the environment-dependent expression of a genotype,
is an evolutionary strategy that enables organisms to adjust their morphology and
physiology to match the local conditions within their own lifespan (Bradshaw, 1965;
Schlichting, 1986). Although plasticity is usually associated with sessile organisms
such as plants (Bradshaw, 1965) and corals (Todd, et al. 2004) that cannot escape
their environment once they have become established, reports of plastic responses in
motile organisms are not unknown (e.g. Imre et al. 2001; Moore et al., 2004).
The PCA revealed that both male and female shore crabs exhibited the greatest inter-
population variability in abdominal area, cephalothorax depth and periopod length.
This suggests that variations in the morphology of these characteristics are associated
with the differential ability of shore crabs to compete or reproduce in the environment
at each site. For example, variations in periopod length may have arisen in response
to differences in the local substrate conditions. It is also possible to discriminate

12
between male crabs from each site on the basis of the size and shape of the right
(dominant) chelae. Variations in the morphology of this structure have previously
been linked to diet and prey resistance (Smith and Palmer, 1994; Smith, 2004).
Differences in chelal morphology are less pronounced in female crabs, which
indicates that the patterns observed in this study may be sex linked. The male crab
uses the dominant chela as a sexual ornament and as a weapon, in addition to a
feeding structure (Mariappan et al., 2000). Variations in the morphology of this trait
may be associated with population density, as this is likely to influence the rate and
intensity of intra-specific interactions. MacFarlane et al. (2000) reported variations in
chelal pigmentation in the semaphore crab, Heloecius cordiformis, which varied with
environmental quality. This was attributed to an indirect relationship with population
density and levels of inter and intra-specific competition. The chelal morphology of
the European lobster, Homarus gammarus, has also been found to vary with
population density (Debuse et al., 2001).
Although it is possible to suggest how variations in shore crab morphology could be
adaptive in different environments, it is difficult to tease apart the possible causal
explanations due to the complexity of the relationship between phenotype and the
local physical and synecological conditions. The genetic similarities among crab
populations indicate that there is little local adaptation (long term genetic change).
Nevertheless, in the period of development from first juvenile instar to adulthood,
crabs may encounter site-specific biotic and abiotic selection pressures that result in
the differential survival of individuals on the basis of their morphology (within-
generation selection). For example, both predation pressure and physical
environmental factors could influence mean trait values by removing maladaptive

13
phenotypes (De Witt et al., 1998). Alternatively, or concurrently, the morphology of
this species may respond plastically to site-specific selection pressures, causing
changes in the expression of particular morphological traits. For example,
manipulative diet experiments have revealed plasticity in the claw size of decapods,
including Cancer productus and Callinectes sapidus (Smith and Palmer, 1994; Davis
et al., 2005), and evidence from the USA indicates that C. maenas has responded, in a
plastic manner, to geographic differences in the prey armor of Littorina obtusata,
which is a key prey species (Smith, 2004).
Although larval shore crabs are strong swimmers (Hedvall et al., 1998), they have
limited control over where they settle. Given their generalist genotype, combined
with the environmental heterogeneity associated with their native habitat, the ability
to respond to challenges in this plastic manner is likely to be a highly advantageous
strategy. This has probably contributed to the invasive capability of the shore crab
(Roman and Palumbi, 2004) and indicates that the accidental introduction of its larvae
to alien environments will continue to pose a threat to the integrity of the coastal
environment on a global scale. The apparent plasticity exhibited by this species also
has implications in terms of biomonitoring. Low genetic variability indicates that
patterns of phenotypic variability among shore crab populations are likely to reflect
differences between local environments. However, there is a risk that the effects of
exposure to anthropogenic stressors on phenotype may be masked by natural inter-
population variability (Brian, 2005). Hence, the results of this study demonstrate that
the expression of inter-population variability in the morphology of C. maenas has
both environmental and genetic components that need to be accounted for in future
biomonitoring, taxonomic and population-level research.

14
ACKNOWLEDGEMENTS
This work was funded by Napier University. The authors would like to thank Jennifer
Batty and Trevor Blackall for assisting with the collection of crabs and Richard Ennos
for providing the facilities required to perform the genetic analyses.

Table 1. Enzyme and buffer systems that provided the best resolution for allozyme analysis using horizontal starch gel electrophoresis.
Enzyme (abbreviation) E.C. Number Buffer System No. Loci Alleles per locus
Phosphoglucomutase (PGM) 2.7.5.1 Morpholine/Citrate pH 6.1 1 2
6 Phosphogluconic dehydrogenase (6PGD) 1.1.1.44 Morpholine/Citrate pH 6.1 1 1
Malate dehydrogenase (MDH) 1.1.1.37 Morpholine/Citrate pH 6.1 2 2
Aspartate aminotransferase (AAT) 2.6.1.1 ) Lithium Borate pH8.2 1 2
Phosphoglucose isomerase (PGI) 5.3.1.9 Tris/citrate pH 8.3 1 3
General Protein (GP) - Tris/citrate pH8.3 1 1
Buffer systems described in Wendel and Weeden (1989) and Creasey et al. (1997).

REFERENCES
Bentley, M.G., Clare, A.S., Scott, C.L., Ladle, J.L., 2002. Multi-level analyses of
endocrine disruption in shore crabs from estuarine and coastal environments. Comp.
Biochem. Physiol. A. 132, S1-S12.
Bradshaw A.D., 1965. Evolutionary significance of phenotypic plasticity in plants.
Adv. Genet. 13, 115-151.
Brian, J.V., (2005). Inter-population variability in the reproductive morphology of the
shore crab (Carcinus maenas): evidence of endocrine disruption in a marine
crustacean? Mar. Pollut. Bull. 50, 410-416.
Bulnheim, H. P., Bahns, S., (1996). Genetic variation and divergence in the genus
Carcinus (Crustacea, Decapoda). Int. Rev. Ges. Hydrobio. 81, 611-619.
Cheliak, W. M., Pitel, J. A., 1984. Genetic control of allozyme variants in mature
tissues of white spruce trees. J. Hered. 75, 34-40.
Clark, P. F., Neale, M., Rainbow, P. S., 2001. A morphometric analysis of regional
variation in Carcinus Leach, 1814 (Brachyura: Portunidae: Carcininae) with particular
reference to the status of the two species C. maenas (Linnaeus, 1758) and C. aestuarii
(Nardo, 1847). J. Crustacean Biol. 21, 288-303.

17
Creasey, S., Rogers, A. D., Tyler, P., Young, C., Gage, J., 1997. The population
biology and genetics of the deep-sea spider crab, Encephaloides armstrongi
(Decapoda: Majidae). Phil. Trans. Royal Soc. London B. 352, 365-379.
Crothers, J.H., 1967. The biology of the shore crab Carcinus maenas (L.) I. The
background, growth and life history. Field Studies 2, 407-434.
Davis, J.L.D., Eckert-Mills, M.G., Young-Williams, A.C., Hines, A.H., Zohar, Y.,
2005. Morphological conditioning of a hatchery-raised invertebrate, Callinectes
sapidus, to improve field survivorship after release. Aquaculture, 243(1-4), 147-158
Debuse, V. J., Addison, J. T., Reynolds, A. D., 2001. Morphometric variability in UK
populations of the European lobster. J. Mar. Biol. Assoc. UK. 81, 469-474.
Demeusy, N., Veillet, M.A., 1953. Sur l’existence de deux populations de Carcinus
maenas pennant et sur les characteres morphologiques qui les distinguent. C.R. Hebo.
Acad. Sci. 236, 1088-1090.
DeWitt T.J., Sih A., Wilson D.S., 1998. Costs and Limits of Phenotypic Plasticity.
Trends in Ecol. and Evol. 13, 77-81
Galloway, T.S., Brown, R.J., Browne, M.A., Dissanayake, A., Lowe, D., Jones, M.B.,
Depledge, M.H., 2004. A multibiomarker approach to environmental assessment.
Env. Sci. Technol. 38, 1723-1731.

18
Geller, J.B., Walton, E.D., Grosholz, E.D., Ruiz, G.M. 1997. Cryptic invasions of the
crab Carcinus detected by molecular phylogeny. Mol. Ecol. 6, 901-906.
Hedvall, O., Moksnes, P., Pihl, L., (1998) Active habitat selection by megalopae and
juvenile shore crabs Carcinus maenas: a laboratory study in an annular flume.
Hydrobiologia, 375, 89-100.
Hilbish, T.J., 1996. Population genetics of marine species: The interaction of natural
selection and historically differentiated populations. J. Exp. Mar. Biol Ecol. 200, 67-
83.
Imre, I., McLaughlin, R.L., Noakes, D.L.G., 2001. Phenotypic plasticity in brook
charr: changes in caudal fin induced by water flow. J. Fish Biol. 61, p1171-1181.
Lye, C.M., Bentley, M.G., Clare, A.S., Sefton, E.M. 2005. Endocrine disruption in the
shore crab Carcinus maenas – a biomarker for benthic marine invertebrates? Mar.
Ecol. Prog. Ser. 288, 221-232.
MacFarlane, G.R., Booth, D.J., Brown, K.R., 2000. The semaphore crab, Heloecius
cordiformis: bio-indication potential for heavy metals in estuarine systems. Aquatic
Toxicol. 50, 153-166.
Mariappan, P., Balasundarum, C. and Schmitz, B. (2000). Decapod crustacean
chelipeds: an overview. J. Bioscience. 25(3), 301-313.

19
Moore, R.D., Griffiths, R.A., O'Brien, C.M., Murphy, A., Jay, D., 2004. Induced
defences in an endangered amphibian in response to an introduced snake predator.
Oecologia 141(1), 139-147.
Rainbow, P. S., Amiard-Triquet, C., Amiard, J. C., Smith, B. D., Best, S. L., Nassiri,
Y., Langston, W. J., 1999. Trace metal uptake rates in crustaceans (amphipods and
crabs) from coastal sites in NW Europe differentially enriched with trace metals. Mar.
Ecol. Prog. Ser. 183, 189-203.
Reid, D. G., Abello, P., Kaiser, M. J., Warman, C. G., 1997. Carapace colour, inter-
moult duration and the behavioural and physiological ecology of the shore crab
Carcinus maenas. Estuar. Coast. Shelf. S. 44, 203-211.
Roman, J., Palumbi, S.R. 2004. A global invader at home: population structure of the
green crab, Carcinus maenas, in Europe. Mol. Ecol. 13, 2891-2898.
Schlichting, C.D., 1986. The evolution of phenotypic plasticity in plants. Annu. Rev.
Ecol. Syst. 17, 667-693.
Smith, L.D. (2004). Biogeographic differences in claw size and performance in an
introduced crab predator Carcinus maenas. Mar. Ecol. Prog. Ser. 276, 209-222.
Smith, L.D., Palmer, A.R., 1994. Effects of manipulated diet on size and performance
of brachyuran crab claws. Science 264, 710-712.
20
Sumpter, J.P., Johnson, A.C. 2005.. Lessons from endocrine disruption and their
application to other issues concerning trace organics in the aquatic environment. Env.
Sci. Technol. 39, 4321-4332.
Todd, P.A., Ladle, R.J., Lewin-Koh, N.J.I., Chou, L.M., 2004. Genotype ×
environment interactions in transplanted clones of the massive corals Favia speciosa
and Diploastrea heliopora. Mar. Ecol. Prog. Ser., 271, 167-182.
Todd, P.A., Ladle, R.J., Briers, R., Brunton, A. 2005. Quantifying two-dimensional
dichromatic patterns using a photographic technique: case study on the shore crab
(Carcinus maenas, L.). Ecol. Research. 30, 497-502.
Tracey, M.L., Nelsen, K., Hedgecock, D. Shleser, R.A., Pressick, M.L., 1975.
Biochemical genetics of lobsters: genetic variation and the structure of American
Lobster (Homarus americanus) populations. J. Fish. Res. Board. Can. 32(11), 2091-
2102.
Weir, B.S., Cockerham, C.C., 1984. Covariances of relatives stemming from a
population undergoing mixed self and random mating. Biometrics 40(1), 157-164.
Wendel, J., Weeden, N., 1989. Visualisation and interpretation of plant isozymes. In:
Soltis, D., Soltis, P.S., (Eds.) Isozymes in Plant Biology. P5-46. Discirides Press,
Portland.
Wright, S., 1943. Isolation by distance. Genetics 28, 114-138.
21
Yamada, S.B. 2001. Global Invader: the European Green Crab. Oregon Sea Grant,
Corvallis.
Yamada, S.B., Hauck, L., 2001. Field identification of the European green crab
species: Carcinus maenas and Carcinus aestuarii. J. Shellfish Res. 20, 905-912.
Zariquiey Alvarez, R., 1968. Crustaceos decapodus Ibericos. Invest. Pesq. 32, 353-
357.
22
FIGURE LEGENDS
Figure 1. Locations of sampling sites around the UK. Arisaig: 56° 53’ N, 5° 53’ W;
Appin: 56° 33’ N, 5° 24’ W; Forth: 56° 00’ N, 2° 32’ W; Dee: 53° 21’ N, 3° 10’ W;
Clyde: 55° 58’ N, 4° 41’ W; Mersey: 53° 19’ N, 2° 51’ W; Tyne: 55° 00’ N, 1° 25’
W; Tees: 54° 35’ N, 1° 13’ W.
Figure 2. Dendrograms illustrating the patterns of morphological similarity among
male (a) and female (b) shore crabs from eight sites around the coast of the UK.
Clustering is based on UPGMA.
Figure 3. Dendrogram illustrating the patterns of genetic similarity among eight UK
shore crab populations. Clustering is based on UPGMA.

23
Figure 1

24
Figure 2

25
Figure 3
Copyright © 2022 FDOKUMEN


![Nickel-catalyzed [2+2+2] cycloaddition of two alkynes and an ...](https://static.fdokumen.com/doc/165x107/6323ae61be5419ea700eb69b/nickel-catalyzed-222-cycloaddition-of-two-alkynes-and-an-.jpg)