Synthesis and characterization of Beta zeolites for catalytic ...
Upload
khangminh22Category
view
0download
0
SYNTHESIS AND CHARACTERIZATION OF
BIO-BASED POLYURETHANES
Kelly J. Stark
Department of Chemical Engineering
McGill University
Montréal, Quebec, Canada
April, 2019
A thesis submitted to McGill University in partial fulfillment of the
requirements for the degree of Master of Engineering
© Kelly J. Stark, 2019

ii
ABSTRACT
Hybrid polyurethanes are commonly made by reacting two chemical building blocks: a polyol and
diisocyanate, followed by end-capping with appropriately functionalized silanes to permit
moisture curing. This project aims to provide a framework to fully characterize an industrial
sealant resin, before incorporating bio-based polyols and isocyanates into the original formulation.
The original formulation is derived from petroleum-based monomers. By substituting bio-based
molecules in the place of both building blocks, the resulting commercial product will have a higher
renewable content. In recent years, finding bio-based alternatives for petroleum products has
become a focus of research and industrial efforts in order to decrease petroleum consumption. The
industrial partner’s (Adfast Corp.) original product was replicated on a small scale and benchmarks
for the molecular weight, viscosity, and stress-strain properties were determined. Gel permeation
chromatography (GPC) was used to evaluate and compare the molecular weight distributions of
multiple resins. Knowing the molecular weight distribution permitted the elucidation of the
relationship between the molar ratio of diisocyanate to polyol in terms of chain length (dimer,
trimer formation etc.). Once the original resin was fully characterized, three different bio-based
polyols were selected and substituted in place of the original petroleum-based polyol. These new
formulations were tested in the same manner as the original formulation, and the molecular weight
distributions, viscosities, and stress-strain properties were compared. Of the three polyurethanes
produced using bio-based polyols, one, using the commercial Myrinol™ DG-110 polyester polyol,
showed promising physical properties: having high elasticity and tensile strength. This formula
was then further optimized by the incorporation of a bio-based isocyanate: L-lysine diisocyanate.
The properties of this final resin were measured and compared to the original petroleum-based
product. It was found that by incorporating the bio-based isocyanate, the physical properties of the
PU became more similar to Adfast’s original resin. With additional testing (scale-up, adhesion
testing, UV stability etc.) and optimization there is potential to have partial and fully bio-based
polyurethanes incorporated into Adfast’s product line. This project has opened doors for Adfast
and McGill to pursue different avenues in order to develop a competitive, commercial bio-sourced
product.

iii
RÉSUMÉ
Les polyuréthanes hybrides sont généralement fabriqués en faisant réagir deux monomères, un
polyol et un diisocyanate, puis en les modifiant avec des silanes fonctionnalisés de manière
appropriée pour permettre la réticulation au contact de l'humidité. Ce projet vise à caractériser
complètement une résine d'étanchéité industrielle, avant d'incorporer des polyols et des isocyanates
biosourcés à la formulation d'origine. La formulation originale est obtenue à partir de monomères
à base de pétrole. En substituant ces deux composants par des monomères biosourcés, le produit
commercial obtenu aura un fort contenu renouvelable. Au cours des dernières années, la recherche
de solutions à base de produits biosourcés pour remplacer les produits pétroliers est devenue
primordiale. Le produit original du partenaire industriel (Adfast Corp.) a été répliqué à petite
échelle et des critères de référence comme la masse molaire moyenne, la viscosité, et la résistance
à la traction ont été déterminés. La chromatographie par perméation de gel (GPC) a été utilisée
pour évaluer et comparer les distributions de masses molaire moyennes de la résine. Connaître la
distribution de la masse molaire moyenne a permis d’élucider la relation entre le rapport molaire
diisocyanate/polyol et la longueur de chaîne moyenne (dimères, formation de trimères, …) Une
fois que la résine industrielle fut entièrement caractérisée, trois différents polyols biosourcés ont
été sélectionnés afin de substituer le polyol provenant de ressources pétrolières. Ces nouvelles
formulations ont été testées de la même manière que la formulation d'origine et la distribution de
la masse molaire moyenne, la viscosité et les propriétés en contrainte-déformation ont été
comparées. Parmi les trois polyuréthanes produits à partir de polyols biosourcés, celui à base de
polyol Myrinol™ DG-110 a présenté des propriétés physiques prometteuses. Cette formule a
ensuite été optimisée par l'incorporation d'un isocyanate d'origine naturelle: le diisocyanate de L-
lysine. Les propriétés de cette résine finale ont été mesurées et comparées au produit original à
base de pétrole. Avec des tests supplémentaires (échelle industrielle, tests d’adhérence, stabilité
UV, ...) et une optimisation, il est possible d’inclure un polyuréthane entièrement biosourcé dans
la gamme de produits d’Adfast.

iv
ACKNOWLEGMENTS
I would first like to thank my supervisor Dr. Milan Maric for giving me the opportunity to come
to McGill and pursue graduate studies, as well as for his guidance and support throughout my
master’s.
Thank you to the rest of the Maric group for their help in the lab, their friendship, and for their
passion for having cake at all group meetings. You all made McGill feel like home and made my
time here so memorable. Special thanks to Adrien, Sharmaine, Faezeh, Saeid, Georges, and Roya
for training me to use lab equipment and helping me to troubleshoot my experiments.
Thank you to my friends and family spread across Canada for their support throughout the last
year and a half. Every phone call, FaceTime, and in-person visit to Montréal was much
appreciated. I am also immensely grateful to my aunt and uncle in Montréal for having me over
for dinner every Sunday. Thank you to my sister, Jamie, for always being able to make me smile,
even on the hardest days.
Last but not least: thank you to my parents, Susan and Shane, for their constant love and support
(emotional, financial and academic) throughout my undergraduate and master’s degrees. You both
are examples of the kind of engineer, mentor, and person I aspire to be. Thank you for instilling in
me the desire to always do my best and for loving me unconditionally while I try to do so. Here’s
to me being financially independent now!

v
TABLE OF CONTENTS
Page
ABSTRACT .................................................................................................................................... ii
RÉSUMÉ ....................................................................................................................................... iii
ACKNOWLEGMENTS ................................................................................................................ iv
TABLE OF CONTENTS ................................................................................................................ v
LIST OF FIGURES ...................................................................................................................... vii
LIST OF TABLES ......................................................................................................................... ix
LIST OF ABBREVIATIONS ......................................................................................................... x
CONTRIBUTION OF AUTHORS................................................................................................ xi
1.0 INTRODUCTION ............................................................................................................... 1
1.1 OBJECTIVES .................................................................................................................. 4
2.0 LITERATURE REVIEW .................................................................................................... 6
2.1 POLYURETHANE CHEMISTRY .................................................................................. 6
2.2 BIO-BASED POLYOLS.................................................................................................. 7
2.4 BIO-BASED ISOCYANATES ...................................................................................... 13
2.5 NON-ISOCYANATE POLURETHANES .................................................................... 14
3.0 EXPERIMENTAL ............................................................................................................. 16
3.1 MATERIALS ................................................................................................................. 16
3.2 SYNTHESIS .................................................................................................................. 16
3.3 CHARACTERIZATION ............................................................................................... 21
4.0 RESULTS AND DISCUSSION ........................................................................................ 23
4.1 REPLICATION OF ADFAST PRODUCT ................................................................... 23
4.2 OPTIMIZATION OF PPG/IPDI SYSTEM ................................................................... 31
4.3 CHARACTERIZATION OF BIO-BASED POLYOLS ................................................ 34
4.4 CHARACTERIZATION OF BIO-BASED ISOCYANATES ...................................... 40
4.5 CHARACTERIZATION OF PU RESINS .................................................................... 40
4.5.1 MOLECULAR WEIGHT ....................................................................................... 41
4.5.2 PHYSICAL PROPERTIES .................................................................................... 47
4.6 OPTIMIZATION OF MYRINOL™ DG-110 POLYOL SYSTEM WITH BIO-BASED
ISOCYANATE ......................................................................................................................... 52
4.7 FUTURE WORK ........................................................................................................... 57

vi
5.0 CONCLUSION .................................................................................................................. 61
6.0 REFERENCES .................................................................................................................. 63
7.0 APPENDIX A .................................................................................................................... 67
8.0 APPENDIX B .................................................................................................................... 68

vii
LIST OF FIGURES
Page
Figure 1: Estimated plastics production worldwide for 2012. ‘Others’ include polyamides and
synthetic rubbers.6 ........................................................................................................................... 1
Figure 2: Mechanism for addition of PPG and IPDI with silane end-capper to synthesize hybrid
polyurethanes.19 .............................................................................................................................. 3
Figure 3: Polyurethane synthesis from a diol and a diisocyanate. .................................................. 7
Figure 4: Graphical explanation of segmented polyurethanes. ....................................................... 7
Figure 5: Structure of a typical triglyceride. ................................................................................... 8
Figure 6: Structures of common fatty acids. ................................................................................... 8
Figure 7: Molecular structure of ricinoleic acid. .......................................................................... 10
Figure 8: Synthesis of a Myrinol™ polyester polyol from bio-succinic acid. .............................. 11
Figure 9: Laboratory scale synthesis of isocyanates: a) Curtius, b) Hoffman and c) Lossen
rearrangements. ............................................................................................................................. 13
Figure 10: Calibration curve for determining NCO content (mol%) from NCO peak height (%
transmittance). ............................................................................................................................... 21
Figure 11: FTIR spectra of polyurethane reaction for 1.7 mol IPDI/mol PPG reaction. NCO peak
located at ~2270 cm-1 indicates the presence of NCO groups from free isocyanate. Urethane peak
at ~1720 cm-1 indicates the formation of urethane bonds. ............................................................ 24
Figure 12: Intensity of NCO peak (% transmittance) over reaction time and calculated
conversion for 1.7 mol IPDI/mol PPG reaction. ........................................................................... 24
Figure 13: FTIR spectra of 1.7 mol IPDI/mol PPG PU before and after end-capping. Spectra
have been shifted vertically by 15% and 30% in order to compare. ............................................. 26
Figure 14: FTIR spectra of 1.7 mol IPDI/mol PPG sample vs. Adfast standard sample. Spectra
have been shifted vertically by 15% transmittance in order to compare. ..................................... 27
Figure 15: Comparison of normalized GPC traces of multiple 1.7 mol IPDI/mol PPG trials. ..... 28
Figure 16: Normalized GPC traces for 1.7 mol IPDI/mol PPG over 3 hour reaction time. ......... 30
Figure 17: Mn vs. time for 1.7 mol IPDI/mol PPG reaction. ........................................................ 30
Figure 18: Normalized GPC traces for IPDI/PPG ratio experiments. .......................................... 31
Figure 19: Determination of number of PPG units in molecular weight distribution. ................. 33
Figure 20: Chemical structure of Myrinol™ DG-110 polyol (poly(diethylene glycol succinate)).
....................................................................................................................................................... 34
Figure 21: 1H NMR spectra for Myrinol™ DG-110 polyol (poly(diethylene glycol succinate)). 35
Figure 22: Hypothesized chemical structure of Sovermol® 908 polyol. ..................................... 35
Figure 23: 1H-NMR spectra for Sovermol® 908 polyol. ............................................................. 36
Figure 24: Normalized GPC traces for PPG 4,000 g/mol and bio-based polyols......................... 37
Figure 25: Viscosities of bio-based polyols vs. PPG. ................................................................... 39
Figure 26: Structure of ethyl ester L-lysine diisocyanate (LDI). .................................................. 40
Figure 27:Normalized GPC traces for bio-based PUs compared to 1.7 mol IPDI/mol PPG PU. 41
Figure 28: Normalized GPC traces for Sovermol® 830 PUs. ...................................................... 42
Figure 29: Normalized GPC traces for Sovermol® 908 PUs. ...................................................... 42
Figure 30: Normalized GPC traces for Myrinol™ DG-110. ........................................................ 44

viii
Figure 31: Normalized GPC traces for 1.7 mol IPDI/mol Myrinol™ DG-110 PU reaction over
time. .............................................................................................................................................. 45
Figure 32: Mn (measured by GPC via PMMA calibration) vs. reaction time for 1.7 mol IPDI/mol
Myrinol™ DG-110 and 1.7 mol IPDI/mol PPG PU. .................................................................... 45
Figure 33: Normalized GPC traces for Myrinol™ DG-110 PU reaction without use of catalyst. 46
Figure 34: Viscosity of 1.7 mol IPDI/mol PPG PU vs PPG 4,000 g/mol polyol. ........................ 47
Figure 35: Curing curves for 1.7 mol IPDI/mol PPG using 2 wt% catalyst. ................................ 49
Figure 36: Stress-strain properties for IPDI/bio-based polyol PUs vs. 1.7 mol IPDI/mol PPG PU.
....................................................................................................................................................... 50
Figure 37: Graphical representation of Adfast’s product markets. ............................................... 51
Figure 38: Graphical explanation of soft and hard segments. ...................................................... 52
Figure 39: Normalized GPC traces for 1.7 mol LDI/mol Myrinol™ DG-110 PU with catalyst.. 53
Figure 40: Normalized GPC traces for 1.7 mol LDI/mol Myrinol™ DG-110 PU without use of
catalyst. ......................................................................................................................................... 53
Figure 41: Mn vs. reaction time for 1.7 mol LDI/mol Myrinol™ DG-110 (no catalyst) and 1.7
mol IPDI/mol Myrinol™ DG-110. ............................................................................................... 54
Figure 42: Viscosities of Myrinol™ DG-110 PU resins at room temperature vs. 1.7 mol
IPDI/mol PPG PU. ........................................................................................................................ 55
Figure 43: Structures of IPDI and LDI. ........................................................................................ 55
Figure 44: 1.7 mol LDI/mol Myrinol™ DG-110 vs. 1.7 mol IPDI/mol PPG and 1.7 mol
IPDI/mol Myrinol™ DG-110 stress-strain properties. ................................................................. 56
Figure 45: Tensile bars after testing: bars returned to their original shape. ................................. 56
Figure 46: Potential future Adfast PU resins using polyols/isocyanates, ranked in order of
effectiveness from a green perspective. ........................................................................................ 60

ix
LIST OF TABLES
Page
Table 1: Summary of commercial bio-based polyol properties. ................................................... 12
Table 2: Reaction steps in polyol/isocyanate polyurethane synthesis. ......................................... 18
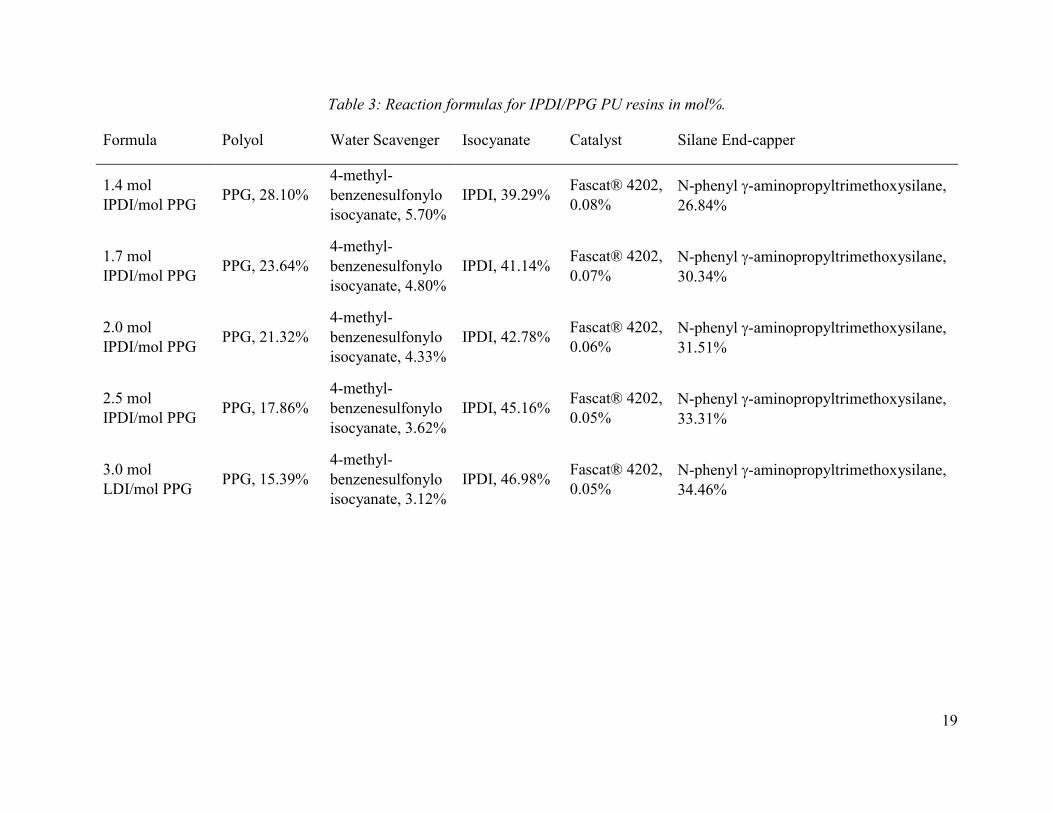
Table 3: Reaction formulas for IPDI/PPG PU resins in mol%. .................................................... 19
Table 4: Reaction formulas for bio-based polyol PU resin in mol%. ........................................... 20
Table 5: GPC Mn values for 1.7 mol IPDI/mol PPG trials. .......................................................... 28
Table 6: Formulations for Adfast standard samples in wt%. ........................................................ 29
Table 7: Mn values for IPDI/PPG ratio experiments. ................................................................... 32
Table 8: Theoretical Mn values vs. GPC Mn for raw materials. .................................................... 32
Table 9: Theoretical Mn values for polyurethanes with varying number of PPG units. ............... 33
Table 10: Summary of key properties for bio-based polyols. ....................................................... 34
Table 11: Water content of PPG vs. bio-based polyols (from Adfast labs). ................................. 37
Table 12: GPC Mn values vs. theoretical molecular weights for polyols. .................................... 38
Table 13: GPC Mn values for Sovermol® 830 and Sovermol® 908 PU resins. .......................... 43
Table 14: GPC Mn and Ð values for Myrinol™ DG-110 PU resins. ........................................... 44
Table 15: Viscosities of un-capped PU resins vs. capped PU resins. ........................................... 48
Table 16: Summary of physical properties of 1.7 mol IPDI/mol polyol polyurethanes. .............. 51
Table 17: Summary of properties for 1.7 mol LDI/mol Myrinol™ DG-110 without catalyst PU
compared to other PU resins. ........................................................................................................ 57

x
LIST OF ABBREVIATIONS
Ð dispersity
FTIR Fourier-transform infrared spectroscopy
GPC gel permeation chromatography
IPDI isophorone diisocyanate
LDI ethyl ester L-lysine diisocyanate
MSDS material safety and data sheet
Mn number average molecular weight
Mp molecular weight of highest peak
NIPU(s) non-isocyanate polyurethane(s)
1H-NMR proton nuclear magnetic resonance spectroscopy
P(MMA) poly(methyl methacrylate)
PPG poly(propylene glycol)
PU(s) polyurethane(s)
THF tetrahydrofuran

xi
CONTRIBUTION OF AUTHORS
The following manuscript is primarily the work of the author with contributions by Dr. Adrien
Métafiot, Adfast’s technical team, and Dr. Milan Maric.
Dr. Adrien Métafiot performed the 1H-NMR analysis to determine the structures of the bio-based
polyols in Section 4.3.
Adfast’s technical team: Sergio Andres Perez, Sergio Murillo, and Yves Dandurand, kindly
provided a majority of the raw materials used, in addition to their technical guidance throughout
the entire project. They also performed the analysis to determine the water content of the bio-based
polyols in Section 4.3.
Dr. Milan Maric supported the experimental planning and helped in editing the manuscript.

1
1.0 INTRODUCTION
Due to the decline in the world’s petroleum resources, advances in renewable petroleum substitutes
have become a large focus of academic and industrial research.1 Of the global annual oil
production, ~8% is used in the production of polymers.2 Of this 8%, half is converted directly from
petrochemicals into polymer products. The energy demands of polymer manufacturing processes
account for the remaining 4%.3 From both an environmental and social perspective, bio-based
polymers have developed a significant demand.4 Compared to the 330 million tons of worldwide
plastic production in 2016, 2 million tons of bioplastics were produced in 2017.5 The global market
for bioplastics is predicted to grow 20% per year between 2017 and 2022.5 Polyurethanes,
traditionally formed by reacting hydrocarbon derived polyols and isocyanates, are one area which
has gained much attention recently. Polyurethanes are used to manufacture a wide range of
foams—for furniture, packing, and insulation—as well as adhesives, sealants, and coatings.
Polyurethanes are the 5th most produced polymer worldwide, as shown in Figure 1.6 Of the global
production of polyurethanes, petroleum-based polyurethanes account for 14,000 kton. The bio-
based polyurethane market (polyols from renewable resources combined with petroleum
isocyanates) is comparatively small at 28 kton.6
Figure 1: Estimated plastics production worldwide for 2012. ‘Others’ include polyamides and
synthetic rubbers.6
polyethylene
polypropylene
poly(vinyl chloride)
polystyrene
polyurethane
poly(ethylene terephthalate)
Others
85
54
3121
21
19
57
Total: 288 Mt/year

2
Besides trying to reduce the global consumption of petroleum, another driving force for bio-based
polyurethanes is to reduce hazardous synthesis methods. Isocyanates are toxic if inhaled, and
therefore undesirable in industrial scale polyurethane manufacturing.7 For example, the
isocyanate: methyl isocyanate, was responsible for the 1984 Bhopal disaster.3 Isocyanates are
industrially produced using the toxic gas phosgene, which was used as a chemical weapon in
WWII.8 Polyurethanes can also be produced through alternate pathways without the use of
isocyanates, and these can be fully bio-based.9
Many researchers have developed bio-based polyols from feedstocks of natural oils and chemical
companies are starting to commercialize bio-based polyols on a large scale.10-14 Although less
common, processes yielding bio-based isocyanates have been published as well.15-17 Cases of
polyurethanes synthesized using bio-based polyols and petroleum derived isocyanates are
common, however there is limited research completed on using both bio-based polyols and
isocyanates to synthesize polyurethanes.18
Adfast Corp., Canada’s largest supplier of commercial adhesives and sealants,
has partnered with McGill University on this research venture to develop a new polyurethane
formulation using renewable feedstocks. Their wide range of products are used throughout homes
and commercial buildings on roofing, windows, floors, etc. While their adhesives are popular in
construction, they are also gaining attention across the transportation industry. For example,
adhesives are becoming more popular than traditional metallic fasteners in transport trucks due to
their increased durability and aerodynamic benefits.
The polyurethane formulation currently used by Adfast combines a 4,000 g/mol poly(propylene
glycol) (PPG) and isophorone diisocyanate (IPDI). The reaction mechanism for forming
polyurethanes from PPG and IPDI is shown below in Figure 2.19 The –OH end group, found on
both ends of the polyol, forms a urethane linkage when reacted with an isocyanate.

3
Figure 2: Mechanism for addition of PPG and IPDI with silane end-capper to synthesize hybrid
polyurethanes.19
Before adding the IPDI to the PPG, a water scavenger, 4-methyl-benzenesulfonylo isocyanate, is
added to the polyol. It is necessary to react any moisture in the polyol with this water scavenger
first so that the IPDI does not react with water. When an isocyanate reacts with water, an amine
and carbon dioxide are formed. This is the reaction mechanism responsible for the production of
PU foams10, however it is not desired in the synthesis of PU adhesives. The reaction between the
PPG and IPDI is driven by an organotin catalyst, Fascat® 4202 (Dibutyltin dilaurate:
Sn(C4H9)2(COOC11H23)2). After three hours of reaction, the silane end-capper, N-phenyl -
aminopropyltrimethoxysilane, is added, terminating the polymerization reaction. The silane end-
capper allows for curing of the polyurethane through reaction of the labile trimethoxysilane groups
with atmospheric moisture. Adfast’s formulation uses an excess of IPDI to achieve a product with
the desired physical properties.

4
1.1 OBJECTIVES
This thesis covers three main objectives: 1) the characterization of Adfast’s original product and
the measurement of benchmark properties, 2) the incorporation of bio-based polyols in the place
of the original petroleum based polyol, and 3) the incorporation of a bio-based isocyanate into the
formula as well, to produce a fully bio-based polyurethane.
While this thesis project focuses on developing a bio-based product for Adfast with the same key
characteristics as the current product, the first step (Objective 1) was to provide the framework for
analysis of the current product using techniques available in the Maric labs (1H-NMR, GPC) which
can then be used as benchmarks for succeeding products. The initial phase of the thesis project
was to characterize the polyurethane that is currently formulated at the Adfast facility. In order to
replicate Adfast’s product, a small scale reactor was set up to simulate the industrial process. Using
the formulation provided, the polyurethane product was synthesized on a small scale (~30 mL)
and characterized. The product was compared to samples of Adfast’s product using Fourier-
transform infrared spectroscopy (FTIR) and gel permeation chromatography (GPC) and they were
concluded to be the same product. This polyurethane was characterized, and the analysis was
shared with Adfast in order to help them troubleshoot their current product.
The second step of this project was to incorporate a selection of bio-based polyols into the formula
in the place of the 4,000 g/mol PPG polyol (Objective 2). The Maric lab received samples of
commercial bio-based polyols from GC Innovation America and Sovermol® (a subsidiary of
BASF). The polyols were characterized and compared to the 4,000 g/mol PPG polyol that Adfast
currently uses. Adfast’s formula was adjusted to account for the different molecular weights and
functionalities of the bio-based polyols and polyurethanes were synthesized using bio-based
polyols and the original isocyanate IPDI. The resulting polyurethanes were characterized and the
effect of using the different grades of bio-based polyols was assessed. Key physical properties
(viscosity and stress-strain properties) were measured for the different polyurethane formulations.
Based on the promising properties of one formulation using a bio-based polyol, Myrinol™ DG-
110 (from GC Innovation America), a bio-based isocyanate, ethyl ester L-lysine diisocyanate
(LDI, derived from the amino acid L-lysine), was also incorporated into the formulation (Objective
3). The properties of this resin were assessed and compared to those of Adfast’s original resin.

5
This system was investigated further, and it was found that catalyst was not needed to drive the
reaction. The properties of this bio-based PU were found to be similar to the original IPDI/PPG
PU produced by Adfast.
Future work for this project includes the economic assessment of the bio-based formulations
presented here and further testing and optimization in order to determine if a bio-based
polyurethane can be compatible with Adfast’s products. Based on the viscosity and stress-strain
properties, both the IPDI/Myrinol™ DG-110 and LDI/Myrinol™ DG-110 PU formulations show
promise, however there are limitations in terms of scale-up for both of these formulations, and
many other properties that must be assessed before either can be incorporated into a commercial
product.

6
2.0 LITERATURE REVIEW
2.1 POLYURETHANE CHEMISTRY
Polyurethanes were first synthesized by Otto Bayer in 1937.20 Today, the same method that Bayer
used originally is still the most commonly used: the reaction between an isocyanate and a polyol.
Polyols are compounds that contain two or more hydroxyl groups.21 Based on the number of
hydroxyl groups per molecule, called the functionality of the molecule, polyols can be classified
as diols (having two hydroxyl groups per molecule), triols (having three hydroxyl groups per
molecule) etc.10 Polyols for polyurethane reactions can generally be classified as polyether polyols
or polyester polyols. Polyester polyols are used in foam applications while polyether polyols are
mainly used for thermoplastics and elastomers.19 As of 2012, the polyol market consisted mostly
of polyester polyols (69%) with polyether polyols making up 19%.22 Polyurethanes were the 6th
most used polymer globally as of 2006, having a global production of 14 Mt.12
Isocyanates are defined as molecules containing an N=C=O group and can be aromatic or aliphatic.
In general, aromatic isocyanates exhibit greater reactivity due to the electron attracting
hydrocarbon group. Due to the difference in reactivity, aromatic isocyanates are mostly used for
foams while aliphatic isocyanates are more commonly applied in coatings and adhesives.10 In
general, aromatic isocyanates produce more brittle resins and aliphatic isocyanates produce chains
with more elasticity.23 Polyurethanes from aliphatic isocyanates are more resistant to UV radiation
and degrade at a slower rate, making them more appropriate for applications that will be exposed
to sunlight.23 Isocyanates are most commonly synthesized from primary amines through
phosgenation followed by dehydro-halogenation.10 Phosgenation is the only method of
synthesizing isocyanates that is currently used on an industrial scale. Phosgenation involves
dissolving amines in a solvent and then treating with phosgene to produce isocyanates.24
Polyurethanes have also been synthesized without the use of isocyanates, using alternate reaction
mechanisms. This is an attractive option as it eliminates isocyanates and phosgene, both toxic,
from the process. Cyclic carbonates can be reacted with polyfunctional amines to produce
polyurethanes, and both of these molecules can be bio-based.9, 25 Non-isocyanate polyurethanes
will be covered further in following sections of this thesis.

7
When combined, the isocyanate group and the hydroxyl group of the polyol form a urethane
linkage (NHCOO).19 The general reaction mechanism for the polyaddition reaction between a
diisocyanate and a polyol with two hydroxyl groups (a diol) is shown below in Figure 3.
Figure 3: Polyurethane synthesis from a diol and a diisocyanate.
Depending on the functionality of both the polyol and the isocyanate, the resulting polyurethane
will have different properties. When the polyol and isocyanate both have a functionality of two, in
the case of Adfast’s original formulation, the polyurethane will be linear in structure. Cross-linking
or branching of the polyurethane will occur if either the polyol or isocyanate has a functionality of
three or greater.10 Segmented polyurethanes can be formed using polyols and diisocyanates.
Segmented polyurethanes contain both rigid and soft segments: the polyol typically forms the soft
segment and the diisocyanates the hard segment (Figure 4). The proportion of soft and hard
segments can be controlled to produce a product with the desired characteristics.26
Figure 4: Graphical explanation of segmented polyurethanes.
2.2 BIO-BASED POLYOLS
Vegetable oils are the primary feedstock for bio-based polyols.21 Vegetable oils are triglycerides,
meaning they are made of molecules containing three fatty acids (see Figure 5). The most common
fatty acids found in vegetable oils are palmitic acid, stearic acid, oleic acid, linoleic acid, and
linolenic acid.27 The structures of these common acids are shown in Figure 6. Castor oil, a non-
edible oil, contains ricinoleic acid which has naturally occurring hydroxyl groups.28
+ n n
n
Hard segment: isocyanate
Soft segment: polyol
Urethane bond

8
Figure 5: Structure of a typical triglyceride.
Figure 6: Structures of common fatty acids.
In 2012, 156 million tons of vegetable oils were produced.29 Of this annual production 75% was
used for food and most of the remainder went towards industrial applications including fuels and
chemicals such as polyols.30 In terms of large scale synthesis, soybean, palm and rapeseed oils are
the most logical in terms of price.30 For North American research and applications, soybean oil is
the most attractive natural oil as 60% of the world’s soybean oil is produced in the United States.30
Five methods are currently being used to experimentally derive polyols from vegetable oils: 1)
epoxidation and oxirane ring-opening, 2) hydroformylation and hydrogenation, 3) ozonolysis, 4)
thiol-ene coupling, and 5) transesterification/amidation.10 These methods use either the double
carbon bond or the ester moieties of vegetable oils to transform them into polyols.
Palmitic acid
Stearic acid
Oleic acid
Linoleic acid
Linolenic acid

9
Epoxidation occurs at the double carbon bond of vegetable oils. Using a protic compound such as
an alcohol, acid, or water, epoxidation followed by oxirane ring-opening can produce a polyol.
Vegetable oils with more unsaturation, (i.e. more double carbon bonds), will produce polyols with
higher functionalities. Consequentially, the more functional a polyol is, the more viscous it tends
to be. Polyols produced by this method using inorganic acids are generally waxes at room
temperature.31 Today, epoxidation with oxirane ring-opening is the most common method used for
the synthesis of bio-based polyols. It is widely used and patented due to the variety of nucleophiles
that can be used in the reaction.12
During hydroformylation of vegetable oils, double bonds are transformed into aldehydes using
catalyzed syngas. These aldehydes are then converted to hydroxyl groups via hydrogenation. One
hydroxyl group is formed for every double bond of the original vegetable oil, meaning that the
functionality of the polyols will be the same as that of the vegetable oils.32 Currently, two industrial
scale processes for the hydroformylation of natural oils have been used. Dow Chemical Company
used hydroformylation to synthesize their Renuva™ product from soybean oil. Dow has recently
discontinued their Renuva™ product due to a high variability in the double bond composition of
the fatty acids.12 BASF also used hydroformylation for its Lupranol® Balance product.11
In order to use ozonolysis to produce a polyol from vegetable oil, two steps are followed. First, an
ozonide is formed at the double bond and is decomposed into an aldehyde and carboxylic acid.
The aldehyde is then reduced into an alcohol using a catalyst. While epoxidation and
hydroformylation produce polyols with hydroxyl groups in the middle of their chains, ozonolysis
results in a hydroxyl group at the end of the chain. This leads to faster curing and allows for more
crosslinking.33
Thiol-ene coupling employs UV irradiation to graft thiols onto the double bonds of fatty acids.34
Although using UV radiation is used most commonly with vegetable oils, heat-initiation of the
reaction is also possible but results in a longer reaction time.10 Thiol-ene coupling has been noted
in literature to synthesize bio-based polyols from both rapeseed oil and soybean oil.34, 35
While the four methods discussed above take place at the fatty acid double bond, transesterification
occurs using the ester moiety of vegetable oils. Most commonly, glycerol is used with a small
amount of soap and a basic catalyst to create glycerides. All resulting hydroxyl groups will be

10
located along the chain, meaning that polyols synthesized using transesterification will make more
flexible polyurethanes when combined with isocyanates.30
While natural oils such as soybean and sunflower do not contain hydroxyl groups, one of the five
methods above is commonly used to add the necessary hydroxyl groups to create a polyol. Castor
oil naturally contains hydroxyl groups, found in the ricinoleic acid molecule (see Figure 7) which
makes up approximately 90% of castor oil. Castor oil can either be modified using
transesterification or amidation in order to increase the functionality but it can also be used as it
exists naturally to produce polyurethanes.27
Figure 7: Molecular structure of ricinoleic acid.
In addition, polyols have been derived from biomass through oxypropylation.1 This method uses
waste biomass rather than food oils, making it more attractive in terms of a green chemistry
perspective. Succinic acid has also been investigated as a starting material to produce polyols.
Succinic acid is conventionally produced through hydrolysis of maleic anhydride, a petrochemical
product6, but it can also be produced via fermentation of sugars giving bio-succinic acid. As of
2013 there was an estimated annual global market of 40 kton of succinic acid, in which 1kton
(2.5%) was bio-based.6 This is a promising process as CO2 is consumed by microorganisms during
succinic acid production36, an additional green aspect. GC Innovation America has developed
several grades of commercial polyols based on bio-derived succinic acid under the name
Myrinol™. Bio-succinic acid is combined with a petroleum-based diol, such as diethylene glycol
or 1,4-butanediol, to form polyols that are 40-66% bio-based as seen in Figure 8.37

11
Figure 8: Synthesis of a Myrinol™ polyester polyol from bio-succinic acid.
Multiple commercial bio-based polyols are available today (see Table 1 for summary), and most
are synthesized through epoxidation of various vegetable oils. Agrol®, a range of products
developed by Biobased Technologies, are soybean oil-based polyols with a renewable content of
96%.12 The double bond of the soybean oil is first epoxidized using peroxy acid, and then
undergoes a ring opening.38 The Agrol® line of products includes one polyol, Agrol® Diamond,
which, in addition to epoxidation and ring opening, undergoes aminolysis of the ester functions
using an alcohol amine.39 This leads to the Agrol® Diamond product having a higher hydroxyl
index compared to the rest of the Agrol® product line.12
Cargill has developed a bio-based polyol, BiOH®, also derived from soybean oil.12 Cargill uses
epoxidation followed by ring opening using methanol with a fluoroboric acid catalyst to synthesize
polyols.13 These polyols contain secondary alcohols only and have no double bonds which gives
greater thermal stability. BiOH® polyols are used in polyurethane foam applications and have a
renewable carbon content of 95%.12 Cargill claims that for every 1 million pounds of bio-based
polyols used, approximately 2,200 barrels of crude oil can be saved.40 Additionally, Cargill’s
process for soy-based polyols requires less energy than a traditional polyol synthesis process.40
BASF has a wide range of polyols available that are derived from various vegetable oils.12 These
polyols, under the name of Sovermol®, are synthesized by epoxidation of vegetable oils followed
by ring opening using an alcohol. The resulting hydroxylated oil then undergoes transesterification
using the same alcohol to form the polyol.14

12
Table 1: Summary of commercial bio-based polyol properties.
Company Product Functionality OH # (mg KOH/g) Viscosity (cP) Bio-Based Content (%)
Agrol®12 Agrol® 2.0 2.0 65-75 230 N/A
Agrol® Diamond 3.0 320-350 3,400 N/A
Cargill BiOH®12 BiOH® X-0500 2.0 56 4,500 N/A
BiOH® X-0210 4.4 235 8,900 N/A
BASF Sovermol®41
(See Appendix A)
Sovermol® 830 2.6 241 875 80-100
Sovermol® 908 2.0 206 2,300 80-100
GC Innovation
America42
Myrinol™ DG-110 2.0, linear 113 440 (60°C) 50
Myrinol™ EG-110 2.0, linear 107 400 (80°C) 66
Myrinol™ HD-110 2.0, linear 108 450 (60°C) 40
Myrinol™ DGTA-56 ~2.4, branched 61 3,150 (60°C) 47
Myrinol™ DGTB-56 ~2.7, branched 64 5,000 (60°C) 47

13
2.4 BIO-BASED ISOCYANATES
While extensive research has been conducted on producing polyols from natural resources, limited
cases of bio-based isocyanates are available.10 Most polyurethanes that have been produced from
bio-based polyols have used petroleum-based isocyanates.15, 18, 43 Finding alternatives to traditional
petroleum based isocyanates synthesized through phosgenation is a priority of researchers due to
the toxicity of phosgene.10
Three well-known methods of producing isocyanates without phosgene exist: via Curtius
rearrangement, Hofmann rearrangement and Lossen rearrangement (see Figure 9).17, 44 All three
of these reactions include an intermediate product of nitrenes, making them unsuited for scale-up.5,
17 The Curtius rearrangement also involves azides which are hazardous at a large scale due to their
explosive properties.15
Figure 9: Laboratory scale synthesis of isocyanates: a) Curtius, b) Hoffman and c) Lossen
rearrangements.
The production of a diisocyanate from fatty-acids is reported in a U.S patent.16 Using hydrogenated
dinitrile compounds, diamine precursors were prepared and then used to synthesize diisocyanates.
Diisocyanates have been created from isosorbides through double esterification with succinic
anhydride.18 An isocyanate has been produced from soybean oil by substituting the allylic
bromides of the oil with AgNCO.17 The Curtius rearrangement has been used to synthesis oleic-
acid based diisocyanates on a lab scale. Using this fatty-acid based isocyanate and a lipid-based

14
polyol it was shown that it was possible to produce an entirely bio-based polyurethane.15 The
diisocyanate, L-lysine diisocyanate (LDI) has been derived from L-lysine amino acid and has been
used to synthesize non-toxic biodegradable polyurethanes.45-47 LDI is an attractive option for bio-
medical PU applications as its degradation products are ethanol and L-lysine, both which are
biocompatible. Dimeryldiisocyanate (DDI), synthesized from fatty acids, has also been used to
create fully renewable polyurethanes.43 One commercial bio-based isocyanate that is available is
a fatty-acid based diisocyanate (dimer diisocyanate) from Henkel Corporation Company and
General Mills.27
2.5 NON-ISOCYANATE POLURETHANES
While this thesis focuses on creating polyurethanes from bio-based polyols and diisocyanates, it
will lead to subsequent projects looking into bio-based non-isocyanate polyurethanes. Non-
isocyanate polyurethanes (NIPUs) are attractive as the common isocyanates used for polyurethane
synthesis (methylene diphenyl diisocyanate (MDI) and toluene diisocyanate (TDI)) have been
found to be toxic.48 Isocyanates are a leading cause of occupational asthma, not only from
inhalation but also from skin exposure.49 Fully cured polyurethanes formed using isocyanates have
no health concerns, but the exposure to isocyanates that industrial plant workers face is a concern.7
The traditional synthesis of isocyanates also involves phosgene, which is a highly toxic gas. Non-
isocyanate polyurethanes present a greener alternative by completely eliminating exposure to both
isocyanates and phosgene.50 In addition to relying on renewable resources rather than petroleum
and having safer process conditions for workers, non-isocyanate polyurethanes are not as sensitive
to moisture as traditional polyurethanes are.51
Four methods of synthesizing NIPUs have been reported in literature: polycondensation,
polyaddition, rearrangement52, 53, and ring opening polymerization54, 55. Of these four methods,
polyaddition is the most attractive option as there are no isocyanates, phosgene or other harmful
chemicals involved in the reaction.56 The issue with the polyaddition mechanism is that cyclic
carbonates are not widely available commercially.57 Thiol-ene addition has also been used to

15
synthesize non-isocyanate polyurethanes by way of a urethane monomer containing both thiol and
-ene functional groups.48
Research efforts have also been focused on combining NIPU chemistry with carbon dioxide
fixation. Using catalytic copolymerization of carbon dioxide with oxiranes, aliphatic carbonates
can be synthesized. Using a ring opening polymerization with di- and poly-amines, these
carbonates can form non-isocyanate polyurethanes.55 Terpenes, ester-free and highly unsaturated
molecules have been investigated for the production of dicarbonates. Limonene, a waste product
from citrus fruits, can be transformed into carbonates and allows for more carbon fixation than
traditional natural oil feedstocks.58 Amines can also be derived from biological materials, and have
been combined with bio-based carbonates to form completely bio-based NIPUs.9 Other than ring-
opening of cyclic carbonates by amines, the other most cited method of forming non-isocyanate
polyurethanes is self-condensation of AB monomers containing both hydroxyl and acyl azide
groups.53
Both polyurethanes from bio-based polyols and isocyanates, and non-isocyanate polyurethanes are
of interest to Adfast and McGill. Bio-based PUs based on polyols and diisocyanates could provide
Adfast with a fully bio-based product. This is desirable to stay relevant in the market as bio-based
plastics become more popular and the world’s reliance on petroleum products decreases. This route
is limited by the difficulty of scaling-up the synthesis of bio-based isocyanates. NIPUs, which can
also be completely bio-based, offer the additional advantage of eliminating the hazard of the
toxicity of isocyanates. NIPUs also come with the challenge of scale-up, which has not been
explored in detail. The main factor limiting the scale-up of NIPUs is the lack of commercial
suppliers of carbonates.57
Currently, since the polyol makes up the majority of the mass of Adfast’s formulation, developing
PUs from bio-based polyols and petroleum-based isocyanates is of immediate interest to Adfast.
While this thesis focusses on the synthesis and characterization of polyurethanes from bio-based
polyols and petroleum isocyanates, and one case of a bio-based polyol with a bio-based isocyanate,
the results will be useful when developing further PUs for sealant applications. The benchmark
properties of Adfast’s original IPDI/PPG resin will be used as a comparison for future NIPUs as
well as additional bio-based polyol/diisocyanate systems.

16
3.0 EXPERIMENTAL
3.1 MATERIALS
Poly(propylene glycol) (PPG, >95%, Bayer), 4-methyl-benzenesulfonylo isocyanate (L.V.
Lomas), isophorone diisocyanate (IPDI, 99.8%, Vestanat®, Evonik), Fascat® 4202 catalyst
(>95%, Arkema), N-phenyl -aminopropyltrimethoxysilane (60-100%, GE Canada), and Reaxis®
C417VM (55-65% dioctyltin oxide, 35-45% trimethoxy(vinyl) silane, >5% methanol) were kindly
provided by Adfast and were used as received. The sample of 1.7 mol IPDI/mol PPG PU resin
used as a standard (for FTIR and GPC analysis) was provided by Adfast.
Tetrahydrofuran (THF, 99.9% HPLC grade), used as the solvent for GPC analysis, was received
from Fisher Scientific. Deuterated chloroform (CDCl3, 99.8%), used as the solvent for 1H-NMR
was obtained from Cambridge Isotopes Laboratory.
Two different bio-based polyols were received from Sovermol®: Sovermol® 830 and Sovermol®
908. One grade of polyol, Myriant™ DG-110, was received from Myriant™. After this material
was received, Myriant™ changed their name to GC Innovation America, and the Myriant™ DG-
110 polyol was renamed Myrinol™ DG-110. According to the new data sheet, all product
specifications are the same. For the remainder of this thesis, the polyol will be referred to as
Myrinol™ DG-110. All polyols were used as received without further purification.
Ethyl ester L-lysine diisocyanate (LDI, 97%) was purchased from Alfa Aesar (through Thermo
Fisher Scientific).
3.2 SYNTHESIS
All polyurethane reactions were conducted in a 100 mL three-necked round-bottom glass flask
(with the exception of the LDI/Myrinol™ DG-110 syntheses which were conducted in a 50 mL
round-bottom flask) equipped with an overhead reflux condenser connected to the second neck.
The flask was placed in a heating mantle which was held on a magnetic stir plate. A magnetic stir-
bar with a high energy magnet, specially designed for high viscosity materials, was used. After the
addition of the polyol, the system was sealed and an ultrapure nitrogen atmosphere was introduced
(nitrogen needle was inserted through a rubber septum in the third neck of the reactor) and held

17
for the duration of the reaction. A needle was inserted into the top of the overhead condenser to
vent the nitrogen purge. The thermocouple was inserted into the first neck of the reactor through a
rubber septum. The magnetic stir bar was turned on and used throughout the entire reaction. When
synthesizing the bio-based PUs, the stirring rate was continuously adjusted to ensure adequate
stirring when the reaction media was very viscous. An ethylene glycol/reverse osmosis water
(30/70 vol%) mixture was supplied to the condenser from the chiller (Fisher Scientific Isotemp
3016D Digital Refrigerated Bath) at 5°C.
With the exception of the polyols, which were measured into the reactor gravimetrically, all
reactants were added using syringes directly into the reactor through the rubber septum due to their
hazardous nature. The addition volumes were calculated based on the densities of the materials.
Samples were taken throughout the reaction by briefly removing the rubber septum and taking a
small amount of resin from the reactor with a metal spatula (as the resin was too viscous to use a
syringe to remove samples). The rubber septum was then replaced immediately after the sample
was extracted in order to maintain the inert atmosphere. The same addition process (see Table 2)
was performed for all formulas, except for those which were performed without the use of catalyst
(Step 4, Table 2), in which the catalyst addition was simply skipped. For the curing tests performed,
Step 6 (Table 2) was followed after the completion of the one-hour end-capping reaction.

18
Table 2: Reaction steps in polyol/isocyanate polyurethane synthesis.
Step Actions Time Reactor Temperature
1 Weigh polyol into reactor using scale. Seal
reactor, start nitrogen flow, start condenser, start
magnetic stir bar.
~10 minutes ~21°C (room
temperature)
2 Add 4-methyl-benzenesulfonylo isocyanate
(water-scavenger) to reactor using reusable 1.0
mL syringe through rubber septum.
10 minutes ~21°C (room
temperature)
3 Add isocyanate to reactor using disposable
syringe through rubber septum. Increase
temperature to 45°C.
10 minutes 45°C
4 Addition of Fascat ® 4202 catalyst to reactor
using reusable 1.0 mL syringe. Increase
temperature to 65°C.
3 hours 65°C
5 Addition of silane end-capper using disposable
syringe through rubber septum. 1 hour 65°C
6 Addition of Reaxis® C417VM using reusable 1.0
mL syringe through rubber septum. ~3 minutes 65°C
In total, 11 differing polyurethane resins were synthesized, characterized, and their physical
properties tested. Five different molar ratios of IPDI/PPG PUs were synthesized using the reactants
as listed in Table 3. Additionally, six resins were synthesized using bio-based polyols in the place
of the PPG polyol. The latter two of these six formulas used the bio-based isocyanate, LDI. These
formulas are detailed in Table 4. At the end of the three-hour reaction time, the reactions were
ceased by stopping the stir bar, removing the reactor from the heating mantle and then pouring the
resin out while still warm. Measurement of viscosity was performed immediately following the
removal of the resin from the reactor (letting the resin cool to room temperature as it was
transferred from the reactor to the rheometer). In order to form tensile bars, the resin was poured
directly from the reactor while still warm into silicone tensile bar molds where it was left to cure
over time (~15 days) at atmospheric conditions.
19
Table 3: Reaction formulas for IPDI/PPG PU resins in mol%.
Formula Polyol Water Scavenger Isocyanate Catalyst Silane End-capper
1.4 mol
IPDI/mol PPG PPG, 28.10%
4-methyl-
benzenesulfonylo
isocyanate, 5.70%
IPDI, 39.29% Fascat® 4202,
0.08%
N-phenyl -aminopropyltrimethoxysilane,
26.84%
1.7 mol
IPDI/mol PPG PPG, 23.64%
4-methyl-
benzenesulfonylo
isocyanate, 4.80%
IPDI, 41.14% Fascat® 4202,
0.07%
N-phenyl -aminopropyltrimethoxysilane,
30.34%
2.0 mol
IPDI/mol PPG PPG, 21.32%
4-methyl-
benzenesulfonylo
isocyanate, 4.33%
IPDI, 42.78% Fascat® 4202,
0.06%
N-phenyl -aminopropyltrimethoxysilane,
31.51%
2.5 mol
IPDI/mol PPG PPG, 17.86%
4-methyl-
benzenesulfonylo
isocyanate, 3.62%
IPDI, 45.16% Fascat® 4202,
0.05%
N-phenyl -aminopropyltrimethoxysilane,
33.31%
3.0 mol
LDI/mol PPG PPG, 15.39%
4-methyl-
benzenesulfonylo
isocyanate, 3.12%
IPDI, 46.98% Fascat® 4202,
0.05%
N-phenyl -aminopropyltrimethoxysilane,
34.46%

20
Table 4: Reaction formulas for bio-based polyol PU resin in mol%.
Formula Polyol Water Scavenger Isocyanate Catalyst Silane End-capper
1.7 mol IPDI/mol
Sovermol® 830
Sovermol®
830, 20.27%
4-methyl-
benzenesulfonylo
isocyanate, 0.04%
IPDI, 45.85% Fascat®
4202, 0.01% N-phenyl -
aminopropyltrimethoxysilane, 33.83%
1.7 mol IPDI/mol
Sovermol® 908
Sovermol®
908, 24.83%
4-methyl-
benzenesulfonylo
isocyanate, 0.09%
IPDI, 43.21% Fascat®
4202, 0.01% N-phenyl -
aminopropyltrimethoxysilane, 31.86%
1.7 mol IPDI/mol
Myrinol™ DG-110
Myrinol™
DG-110,
24.85%
4-methyl-
benzenesulfonylo
isocyanate, 0.04%
IPDI, 43.21% Fascat®
4202, 0.03% N-phenyl -
aminopropyltrimethoxysilane, 31.88%
1.7 mol IPDI/mol
Myrinol™ DG-110
Myrinol™
DG-110,
24.85%
4-methyl-
benzenesulfonylo
isocyanate, 0.04%
IPDI, 43.22% N/A N-phenyl -
aminopropyltrimethoxysilane, 31.89%
1.7 mol LDI/mol
Myrinol™ DG-110
Myrinol™
DG-110,
36.01%
4-methyl-
benzenesulfonylo
isocyanate, 0.18%
LDI, 63.70% Fascat®
4202, 0.11% N/A
1.7 mol LDI/mol
Myrinol™ DG-110
Myrinol™
DG-110,
24.83%
4-methyl-
benzenesulfonylo
isocyanate, 0.13%
LDI, 63.70% N/A N-phenyl -
aminopropyltrimethoxysilane, 31.85%

21
3.3 CHARACTERIZATION
FTIR (Spectrum BX, Perkin-Elmer) was used to verify the composition and estimate the NCO
content of the PU resins. The peak heights were measured using Spectrum software. A calibration
curve (Figure 10) was produced in order to quantify the amount of free NCO in the PU resin
throughout the reaction. Known concentration samples of IPDI in PPG (5-70 mol%) were tested
using FTIR, and a relationship was found between the concentration of NCO end-groups and the
intensity of the FTIR spectra NCO peak transmittance (~2270 cm-1).
Figure 10: Calibration curve for determining NCO content (mol%) from NCO peak height (%
transmittance).
The number-average molecular weights (Mn, GPC) and the molecular weight distributions (Đ =
Mw/Mn) were measured using gel permeation chromatography (GPC, Water Breeze). HPLC grade
tetrahydrofuran (THF) was used as the mobile phase at a flow rate of 0.3 mL/min. The GPC was
equipped with three Waters Styragel HR columns (HR1 with a molecular weight measurement
range of 102 − 5 × 10³ g/mol, HR2 with a molecular weight measurement range of 5 × 10² − 2 ×
104 g/mol, and HR4 with a molecular weight measurement range of 5 × 10³ − 6 × 10⁵ g/mol), and
a guard column. During the analysis the columns were heated to 40°C. A differential refractive
index (RI 2414) detector was used. The Mn values for all PU resins and raw materials were
TNCO (%) = -0.377[mol% IPDI in PPG] + 103
R² = 0.9376
0
20
40
60
80
100
120
0 20 40 60 80
NC
O P
eak
Tra
nsm
itta
nce
(%
)
mol% IPDI in PPG

22
determined by calibration with 10 linear narrow molecular weight distribution P(MMA) standards
(Varian Polymer Standards, molecular weights ranging from 875 to 1,677,000 g/mol).
The structures of the bio-based polyols were determined using a Varian NMR Mercury
spectrometer (1H-NMR, 300 MHz, 32 scans) using CDCl3 deuterated solvent.
A strain-controlled rheometer (Anton Paar MCR 302, Anton Paar Canada, St-Laurent, QC,
Canada) with parallel plate geometry (25 mm plate diameter) was used to measure the viscosities
of the resins. Disposable sets of parallel plates were used as the resins were of high viscosity and
the disposable plates allowed for easier cleaning. Disposable plates were also used so that in cases
where the resin cured to the plate, the plate could be disposed of after the test. PU resin viscosity
was measured using steady shear, with a shear rate from 0.1 1/s to 10 1/s using a 1.0 mm gap
measuring position. This shear rate range is within the linear viscoelastic regime. An average
viscosity over the shear rate is reported. Polyol viscosity was measured using steady shear, with a
shear rate from 0.1 1/s to 1,000 1/s using a 1.0 mm gap measuring position. A DMTA curing test
with 0.05% strain and a frequency of 1 Hz, was used to calculate the storage modulus (G´) and
loss modulus (G") over time to estimate the gel time, and curing time of the PU resin. Anton Paar
Rheoplus software (RHEOPLUS/32 version 3.61, Anton Paar Germany, Ostfildern, Germany,
2011) was used to perform both the viscosity and curing time tests. All rheology measurements
were conducted at room temperature (~20°C).
The stress-strain properties of the cured PU resins were measured using a Shimadzu EZ Test
testing system at room temperature and a cross-head speed of 15 mm/min. Dog-bone style tensile
specimens were made using a silicone mold (ASTM D638, type V, overall length = 63.5 mm,
overall width = 9.53 mm). The width and thickness of each sample was measured with a digital
caliper before each test (width = 3.5 ± 0.3 mm, thickness = 1.9 ± 0.4 mm). Using WinAGS Lite
software, the tensile strength and elongation at break were determined. For each PU formulation a
minimum of five samples were tested and the average values for tensile strength and elongation at
break are reported. The plots shown for elongation (%) vs. stress (MPa) were created by averaging
all PU sample data sets. All original stress-strain data is available in Appendix B.
Water content of bio-based polyols was determined through Karl Fisher titration (Mettler Toledo
automatic titrator DL31).
23
4.0 RESULTS AND DISCUSSION
4.1 REPLICATION OF ADFAST PRODUCT
The first phase of this project focused on the original polyurethane formula currently produced by
Adfast. This polyurethane is the base for many of their commercial sealant products. The reaction
was replicated on a small scale at McGill and the product was compared to a sample of Adfast’s
product from their facility.
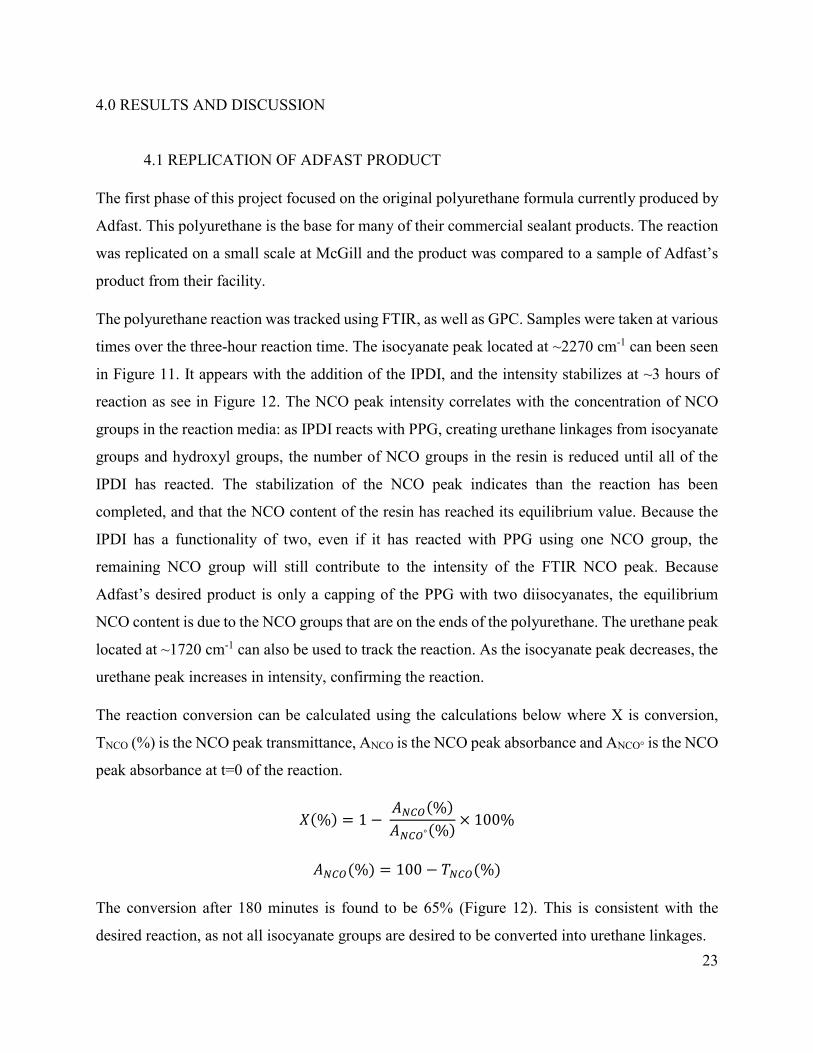
The polyurethane reaction was tracked using FTIR, as well as GPC. Samples were taken at various
times over the three-hour reaction time. The isocyanate peak located at ~2270 cm-1 can been seen
in Figure 11. It appears with the addition of the IPDI, and the intensity stabilizes at ~3 hours of
reaction as see in Figure 12. The NCO peak intensity correlates with the concentration of NCO
groups in the reaction media: as IPDI reacts with PPG, creating urethane linkages from isocyanate
groups and hydroxyl groups, the number of NCO groups in the resin is reduced until all of the
IPDI has reacted. The stabilization of the NCO peak indicates than the reaction has been
completed, and that the NCO content of the resin has reached its equilibrium value. Because the
IPDI has a functionality of two, even if it has reacted with PPG using one NCO group, the
remaining NCO group will still contribute to the intensity of the FTIR NCO peak. Because
Adfast’s desired product is only a capping of the PPG with two diisocyanates, the equilibrium
NCO content is due to the NCO groups that are on the ends of the polyurethane. The urethane peak
located at ~1720 cm-1 can also be used to track the reaction. As the isocyanate peak decreases, the
urethane peak increases in intensity, confirming the reaction.
The reaction conversion can be calculated using the calculations below where X is conversion,
TNCO (%) is the NCO peak transmittance, ANCO is the NCO peak absorbance and ANCO° is the NCO
peak absorbance at t=0 of the reaction.
𝑋(%) = 1 − 𝐴𝑁𝐶𝑂(%)
𝐴𝑁𝐶𝑂°(%)× 100%
𝐴𝑁𝐶𝑂(%) = 100 − 𝑇𝑁𝐶𝑂(%)
The conversion after 180 minutes is found to be 65% (Figure 12). This is consistent with the
desired reaction, as not all isocyanate groups are desired to be converted into urethane linkages.

24
Figure 11: FTIR spectra of polyurethane reaction for 1.7 mol IPDI/mol PPG reaction. NCO
peak located at ~2270 cm-1 indicates the presence of NCO groups from free isocyanate.
Urethane peak at ~1720 cm-1 indicates the formation of urethane bonds.
Figure 12: Intensity of NCO peak (% transmittance) over reaction time and calculated
conversion for 1.7 mol IPDI/mol PPG reaction.
Adfast measures the NCO content of their PU resins before the addition of the end-capper using
titrations. Theoretical calculations for calculating NCO content of polyurethanes are shown
below.59 Theoretically, the 1.7 mol IPDI/mol PPG formula results in a free NCO content of 1.4%.
0
20
40
60
80
100
120
5001000150020002500300035004000
Tra
nsm
itta
nce
(%
)
Frequency (cm-1)
t=0 minutes
t=5 minutes
t=10 minutes
t=15 minutes
t=20 minutes
t=40 minutes
t=60 minutes
t=90 minutes
t=120 minutes
t=150 minutes
t=180 minutes
0
10
20
30
40
50
60
70
80
90
100
0 20 40 60 80 100 120 140 160 180 200NC
O P
eak
T
ran
smit
tan
ce (
%),
Con
ver
sion
(%
)
Time (minutes)
NCO Peak Transmittance (%)
Conversion (%)
*catalyst addition at 10 minutes

25
If an equal number of equivalents of PPG and IPDI were added to one another (1.0 mol IPDI/mol
PPG, since both reactants have a functionality of 2.0), the resulting resin would have a theoretical
free NCO content of 0%.
To calculate the theoretical NCO content, the following equations are used:
𝑛 =(
42𝑦 ) × 𝑧
𝑥 + 𝑦 + 𝑧
where x = polyol equivalent weight
y = isocyanate equivalent weight
n = desired % NCO of pre-polymer (as fraction)
z = additional grams of isocyanate needed
Using the equation above, the NCO content of Adfast’s original 1.7 mol IPDI/mol PPG
formulation is calculated:
where x = 2000 g/mol
y = 111 g/mol
Given that 1.7 mol IPDI/mol PPG 0.87 mol IPDI/0.5 mol PPG
𝑇𝑜𝑡𝑎𝑙 𝐼𝑃𝐷𝐼 = 0.87 𝑚𝑜𝑙 × 222𝑔
𝑚𝑜𝑙= 193 𝑔
Therefore:
𝑧 = 193 𝑔 − 111 𝑔 = 82 𝑔
Solving for n, the % NCO gives:
𝑛 =(
42111) × 82
2000 + 111 + 82= 0.01 = 1.4% 𝑁𝐶𝑂

26
Samples were also taken before and after the one-hour reaction of the PU with the silane end-
capper to verify the end-capping reaction. As the silane end-capper reacts with the free isocyanate
in the resin, the NCO groups will no longer be visible in the FTIR spectra. To ensure that all free-
NCO in the resin has been end-capped, Adfast uses FTIR. In Figure 13, the NCO peak (~2270
cm-1) is seen after 180 minutes of reaction. The peak is eliminated after 1 hour of reaction with the
silane end-capper. The urethane peak (~1720 cm-1) is seen in both the un-capped and capped resin.
Figure 13: FTIR spectra of 1.7 mol IPDI/mol PPG PU before and after end-capping. Spectra
have been shifted vertically by 15% and 30% in order to compare.
In order to verify that the final resin produced in the McGill lab was the polyurethane desired,
FTIR was used. Figure 14 compares the FTIR spectra for the PPG/IPDI PU resin (after addition
of end-capper) produced at McGill with a sample of resin provided by Adfast. It should be noted
that in the trial displayed in Figure 14, all free NCO was eliminated in the product by the end-
capping reaction. This is confirmed by the lack of any NCO peak (~2270 cm-1) in the FTIR spectra.
10
20
30
40
50
60
70
80
90
100
5001000150020002500300035004000
Tra
nsm
itta
nce
(%
)
Frequency (cm-1)
PPG A
1.7 mol IPDI/mol PPG, t=180 minutes
1.7 mol IPDI/mol PPG, After end-capping

27
Figure 14: FTIR spectra of 1.7 mol IPDI/mol PPG sample vs. Adfast standard sample. Spectra
have been shifted vertically by 15% transmittance in order to compare.
When comparing multiple batches of 1.7 mol IPDI/mol PPG PU synthesized at McGill, a variation
in the shape of the molecular weight distribution from the GPC traces is seen in Figure 15. This
same variation is seen between three batches of Adfast product with the same ratios of reactants
(Figure 15). The molecular weights of the resins were estimated based on a PMMA calibration
using GPC and are presented in Table 5. The formulations for these resins are presented in Table
6. The molar ratios of IPDI/PPG in each Adfast formulation were calculated to be as follows: 1.76
mol IPDI/mol PPG for LAB-6708, 1.74 for LAB 7064 and 1.73 for LAB 7065. LAB 7065 used
an alternate end-capper, N-(n-butyl)-3 aminopropyltrimethoxysilane, but it has a comparative
molecular weight and should not affect the molecular weight distribution. Because Adfast is
targeting short chains of PPG macro-monomers, the molecular weight distribution and the average
molecular weight of the resin is sensitive to varying chain lengths (±1 PPG unit). Based on the
varying molecular weight distributions and calculated molecular weights from the GPC traces, it
was concluded that variability among formulations was expected and acceptable. From Adfast’s
perspective, since they were not aware of this variability, it can be concluded that these variations
in molecular weight distributions did not greatly affect the final product qualities.
10
20
30
40
50
60
70
80
90
100
5001000150020002500300035004000
Tra
nsm
itta
nce
(%
)
Frequency (cm-1)
Adfast Standard PU
1.7 mol IPDI/mol PPG PU

28
Figure 15: Comparison of normalized GPC traces of multiple 1.7 mol IPDI/mol PPG trials.
Table 5: GPC Mn values for 1.7 mol IPDI/mol PPG trials.
Formula Average Mn
(g/mol) Dispersity (Ð)
Left Peak Mn
(g/mol)
Right Peak Mn
(g/mol)
LAB-6708 14,000 1.62 20,800 8,500
LAB-7064 20,800 1.65 29,000 11,200
LAB-7065 14,300 1.36 20,400 10,500
Trial A 11,500 1.53 20,800 8,500
Trial B 10,200 1.45 15,900 8,400
Trial C 16,800 2.18 28,000 7,800
Trial D 21,100 1.80 20,100 8,700
0
1
2
3
4
5
6
20 22 24 26 28 30
Det
ecto
r S
ign
al
Elution Time (minutes)
Trial A
Trial B
Trial C
Trial D
Adfast LAB-6708
Adfast LAB-7064
Adfast LAB-7065

29
Table 6: Formulations for Adfast standard samples in wt%.
Adfast
Formulation
PPG
4,000
g/mol
Water
Scavenger
(4-methyl-
benzenesul
phonylo
isocyanate)
IPDI Fascat®
4202 Silane End-capper
IPDI/PPG
Molar ratio
LAB-6708 83.10% 0.83% 8.11% 0.05% 7.91% (30% excess
end-capper*) 1.76
LAB-7064 83.97% 0.83% 8.13% 0.05% 6.89% (3% excess
end-capper*) 1.74
LAB-7065 84.55% 0.84% 8.14% 0.05% 6.35% (3% excess
end-capper**) 1.73
*End-capper: N-phenyl -aminopropyltrimethoxysilane
**End-capper: N-(n-butyl)aminopropyltrimethooxysilane
GPC was used to track the molecular weight of the resin as the reaction occurred, as shown in
Figure 16. The polyurethane was found to have a bimodal molecular weight distribution. From the
integration of the polyurethane GPC curves, shown in Figure 16, the average molecular weight of
the leftmost peak is greater than twice the molecular weight of the right peak. This suggests that
the bimodal distribution is due to PPG units reacting with two IPDI molecules (the right-most
peak) as well as the formation of dimers (polymer chains containing two PPG units) and trimers
(chains with three PPG units) which result in the left peak on the GPC traces. The number average
molecular weight (Mn) is seen to increase linearly throughout the 180 minute reaction time, after
the addition of catalyst, as seen in Figure 17. The Mn of the rightmost peak stays fairly constant
over time and the Mn of the leftmost peak increases with time. This supports the hypothesis that
will be discussed further in the following section: that the left peak is due to polymer chains
containing more than one PPG unit.

30
Figure 16: Normalized GPC traces for 1.7 mol IPDI/mol PPG over 3 hour reaction time.
Figure 17: Mn vs. time for 1.7 mol IPDI/mol PPG reaction.
0
1
2
3
4
5
6
20 22 24 26 28 30
Det
ecto
r S
ign
al
Elution Time (minutes)
t=0 minutes
t=5 minutes
t=10 minutes
t=15 minutes
t=20 minutes
t=40 minutes
t=60 minutes
t=90 minutes
t=120 minutes
t=150 minutes
t=180 minutes
Mn, reaction time
0
5,000
10,000
15,000
20,000
25,000
0 50 100 150 200
Nu
mb
er A
ver
age
Mole
cula
r W
eigh
t (M
n)
(g/m
ol)
Time (minutes)
Average MnLeft Peak MnRight Peak Mn
*catalyst addition at 10 minutes
Average Mn
Left Peak Mn
Right Peak Mn

31
4.2 OPTIMIZATION OF PPG/IPDI SYSTEM
Based on the results from the 1.7 mol IPDI/mol PPG synthesis and the GPC curves of the other
Adfast samples, a series of experiments were conducted to further explore the bimodal molecular
weight distribution of the polyurethane. It was hypothesized that by increasing the IPDI
concentration in the formulation, the polymer chains in the final PU resin would be shorter (contain
chains made up of fewer additional PPG units). Three additional syntheses were performed, each
gradually increasing the amount of IPDI that was added. All three experiments with increased
IPDI/PPG molar ratios (2.0, 2.5 and 3.0) were found to have narrower molecular weight
distributions and lower molecular weights as seen in Figure 18. One more experiment was
performed, this time decreasing the amount of IPDI added, and the molecular weight was found to
increase greatly. In the 1.4 mol IPDI/mol PPG experiment the viscosity was qualitatively seen to
have a higher viscosity than the other formulas.
Figure 18: Normalized GPC traces for IPDI/PPG ratio experiments.
GPC was used to estimate the molecular weights of the PU resins, as well as to estimate the
molecular weights of each of the two peaks in the distributions (Table 7). GPC was also used to
find the comparable molecular weights of the PPG 4,000 g/mol, IPDI, and silane end-capper (Table
8). Based on these molecular weights, the compositions of the PU resins were estimated. A
0
1
2
3
4
5
6
18 20 22 24 26 28 30
Det
ecto
r S
ign
al
Elution Time (minutes)
PPG 4,000 g/mol
IPDI/PPG Ratio=1.4
IPDI/PPG Ratio=1.7
IPDI/PPG Ratio=2.0
IPDI/PPG Ratio=2.5
IPDI/PPG Ratio=3.0

32
graphical explanation is offered in Figure 19 for the calculation of molecular weights for varying
polyurethane chain lengths. By comparing the Mn values from the GPC for each of the resins, to
the theoretical resin Mn values (based on differing chain lengths) listed in Table 9, the composition
of each peak for each PU resin can be estimated. Based on this method, the right-most peak of the
PU resins is believed to be chains containing only one PPG unit (Mn ≈ 8,700 g/mol). The left peaks
for each of the resins are believed to be chains with multiple PPG units. The left peaks in the 3.0,
2.5, 2.0 and 1.7 mol IPD/mol PPG samples (15,600 < Mn < 22,500), are suspected to be chains
made up of 2-3 PPG units. The large left peak in the 1.4 mol IPDI/mol PPG sample is expected to
contain longer chains up to 5 PPG units (Mn ≈ 36,300 g/mol) to have a Mn of 33,500 g/mol).
Table 7: Mn values for IPDI/PPG ratio experiments.
Formula Average Mn
(g/mol)
Dispersity (Ð) Left Peak Mn
(g/mol)
Right Peak Mn
(g/mol)
1.4 mol
IPDI/mol PPG 14,300 1.63 33,500 7,900
1.7 mol
IPDI/mol PPG 10,200 1.45 15,900 8,400
2.0 mol
IPDI/mol PPG 9,700 1.34 18,000 8,400
2.5 mol
IPDI/mol PPG 8,600 1.24 18,200 8,400
3.0 mol
IPDI/mol PPG 9,400 1.31 18,700 8,700
Table 8: Theoretical Mn values vs. GPC Mn for raw materials.
Component Symbol used in
Figure 19
Theoretical Mn
(g/mol)
GPC Mn Based on
PMMA Standard
(g/mol)
PPG 4,000 g/mol 4,000 6,300
IPDI 222 600
Silane End-capper 226 600

33
Figure 19: Determination of number of PPG units in molecular weight distribution.
Table 9: Theoretical Mn values for polyurethanes with varying number of PPG units.
# of PPG Units # of IPDI Units # of End-capper Units Theoretical Mn
(g/mol)
1 2 2 8,700
2 3 2 15,600
3 4 2 22,500
4 5 2 29,300
5 6 2 36,300
This analysis provided new information to Adfast about the composition of their polymers. It
proved that the resin molecular weight distribution could be tailored by adjusting the molar ratio
of IPDI/PPG. For this project, a narrower distribution was deemed unnecessary for Adfast’s
products as the current standard product has a broad, bimodal distribution, resulting in the
properties that Adfast desired in their sealants. Achieving a narrower distribution would also come
at the extra cost of increased IPDI in the formulation. Based on the bimodal and varying
distributions of Adfast’s current products, it was concluded that a narrow distribution was not a
critical parameter when developing bio-based polyurethanes, therefore a starting point of 1.7 mol
IPDI/mol bio-based polyol would be used in this project.

34
4.3 CHARACTERIZATION OF BIO-BASED POLYOLS
Three commercial bio-based polyols were ordered to assess their potential as replacements to the
PPG diol currently used to produce Adfast’s polyurethanes. From Sovermol®, a subsidiary of
BASF, the polyols Sovermol® 830 and Sovermol® 908 were ordered. A sample of the
experimental polyol Myrinol™ DG-110 was also ordered from GC Innovation America. A
summary of the properties provided from the suppliers for each of these three bio-based polyols is
presented below in Table 10.
Table 10: Summary of key properties for bio-based polyols.
Polyol Functionality OH # (mg KOH/g) Description
Sovermol® 830 (see
Appendix A) 2.6 241
Branched oleochemical
polyether/polyester
Sovermol® 90841 2.0 206 Aliphatic dimer alcohol
Myrinol™ DG-11042 2.0 113
Linear polyester polyol,
derived from bio-succinic
acid and diethylene glycol.
For Myrinol™ DG-110, the MSDS identified the polyol as poly(diethylene glycol succinate)
(Figure 20) and 1H-NMR was used to verify the structure. Figure 21 shows the 1H-NMR spectra
of Myrinol™ DG-110 and identifies the protons that correspond to those identified on the chemical
structure in Figure 20.
Figure 20: Chemical structure of Myrinol™ DG-110 polyol (poly(diethylene glycol succinate)).

35
Figure 21: 1H NMR spectra for Myrinol™ DG-110 polyol (poly(diethylene glycol succinate)).
Sovermol® did not provide the structures of their polyols: Sovermol® 830 and Sovermol® 908.
Using 1H-NMR (Figure 23) and the information provided by the supplier, the structure of the
Sovermol® 908 polyol was hypothesized to be that shown in Figure 22. Sovermol® produces
their polyols from epoxidation of natural oils such as rapeseed oil, castor oil, soybean oil and
palm kernel oil.14, 41
Figure 22: Hypothesized chemical structure of Sovermol® 908 polyol.

36
Figure 23: 1H-NMR spectra for Sovermol® 908 polyol.
The Sovermol® 830 polyol has an average functionality of 2.6, meaning it is likely a mixture of
polyols with different functionalities. Because of this, the structure was not able to be determined
conclusively. For the purpose of this thesis, the bulk material was assumed to have the particular
functionality and OH# as stated by the supplier (Table 10). Formulations for using the Sovermol®
830 were still derived without knowing the explicit structure and composition of the polyol. From
the supplier it is known that the Sovermol® 830 polyol is a “branched oleochemical
polyether/polyester”.
Samples of the bio-based polyols were sent to the Adfast lab where they were tested for water
content using Karl Fischer titration. This was valuable information as the water content of the
polyol determines how much water scavenger should be added to the polyol before the addition of
the diisocyanate. The results from these tests are displayed in Table 11.

37
Table 11: Water content of PPG vs. bio-based polyols (from Adfast labs).
Polyol Water Content
PPG 4,000 g/mol 0.5%
Sovermol® 830 0.04%
Sovermol® 908 0.05%
Myrinol™ DG-110 0.03%
The water content testing showed that all three bio-based polyols had very low water content—
therefore less water scavenger could be added during the synthesis. The amount of scavenger to
be added was calculated based on keeping the molar ratio of scavenger/water the same as the
original Adfast formulation.
GPC was used to compare the molecular weights of the three bio-based polyols to the original
4,000 g/mol PPG diol (Figure 24). The two Sovermol® polyols were found to have narrow
molecular weight distributions (Ð = 1.04 for Sovermol® 830 and Ð = 1.05 for Sovermol® 908),
similar to the PPG polyol (Ð = 1.11). The Myrinol™ polyol was found to have a broader molecular
weight distribution (Ð = 1.74), likely due to the Myrinol™ polyol being synthesized by the step-
growth polymerization of succinic acid and diethylene glycol. Products of step-growth
polymerizations have a theoretical Ð = 2.0 at large reaction extents, explaining the higher
dispersity of the Myrinol™ DG-110 polyol.60
Figure 24: Normalized GPC traces for PPG 4,000 g/mol and bio-based polyols.
0
1
2
3
4
5
6
22 24 26 28 30 32 34 36
Det
ecto
r S
ign
al
Elution Time (minutes)
PPG 4,000 g/mol
Myrinol™ DG-110Sovermol® 908
Sovermol® 830

38
In order to calculate the amount of IPDI to be added to each bio-based polyol, the molecular
weights of the three bio-based polyols had to be calculated. From the suppliers, the hydroxyl
number (OH #) and functionality were given for each polyol (Table 10). Using the equations
below, the molecular weights were calculated.61 Sample calculations are shown for determining
the molecular weight of the Myrinol™ DG-110 polyol.
𝐸𝑞𝑢𝑖𝑣𝑎𝑙𝑒𝑛𝑡 𝑊𝑒𝑖𝑔ℎ𝑡 (𝑔
𝑚𝑜𝑙) =
56.1 × 1000
𝑂𝐻 #
𝑀𝑜𝑙𝑒𝑐𝑢𝑙𝑎𝑟 𝑊𝑒𝑖𝑔ℎ𝑡 (𝑔
𝑚𝑜𝑙) = 𝐸𝑞𝑢𝑖𝑣𝑎𝑙𝑒𝑛𝑡 𝑊𝑒𝑖𝑔ℎ𝑡 (
𝑔
𝑚𝑜𝑙) × 𝐹𝑢𝑛𝑐𝑡𝑖𝑜𝑛𝑎𝑙𝑖𝑡𝑦
For Myrinol™ DG-110 polyol: OH# = 113, Functionality = 2.0
𝐸𝑞𝑢𝑖𝑣𝑎𝑙𝑒𝑛𝑡 𝑊𝑒𝑖𝑔ℎ𝑡 (𝑔
𝑚𝑜𝑙) =
56.1 × 1000
113= 497
𝑔
𝑚𝑜𝑙
𝑀𝑜𝑙𝑒𝑐𝑢𝑙𝑎𝑟 𝑊𝑒𝑖𝑔ℎ𝑡 (𝑔
𝑚𝑜𝑙) = 497 (
𝑔
𝑚𝑜𝑙) × 2.0 = 993
𝑔
𝑚𝑜𝑙
When the GPC molecular weight distributions are integrated to determine the molecular weights,
a PMMA calibration is used, meaning that the molecular weights can be used for comparison and
for estimation of composition of resins, but they are not the true values and should not be compared
to the theoretical molecular weight values calculated using the polyol OH# and functionality. The
GPC molecular weights, dispersities and theoretical molecular weights for the polyols used in this
project are displayed below in Table 12.
Table 12: GPC Mn values vs. theoretical molecular weights for polyols.
Polyol
GPC Molecular Weight
(Mn) based on PMMA
calibration (g/mol)
GPC Dispersity
(Ð) Theoretical Molecular
Weight (g/mol)
PPG 4,000 g/mol 6,300 1.11 4,000
Sovermol® 830 1,800 1.04 605
Sovermol® 908 1,100 1.05 545
Myrinol™ DG-110 1,400 1.74 993

39
The viscosities of the bio-based polyols were compared to the viscosity of the 4,000 g/mol PPG
polyol at room temperature (Figure 25). It was found that the Sovermol® polyols had viscosities
similar to PPG, but the Myrinol™ DG-110 polyol had a higher viscosity. This is likely due to the
Myrinol™ DG-110 polyol being a polyester which is not as flexible as the polyether PPG.
Figure 25: Viscosities of bio-based polyols vs. PPG.
0
2
4
6
8
10
12
14
0 200 400 600 800
Vis
coci
ty (
Pa s
)
Shear Rate (1/s)
PPG 4,000 g/mol
Myrinol™ DG-110
Sovermol® 830
Sovermol® 908

40
4.4 CHARACTERIZATION OF BIO-BASED ISOCYANATES
The final stage in this project was to create a fully bio-based PU resin, using both a bio-based
polyol and a bio-based diisocyanate. Ethyl ester L-lysine diisocyanate (LDI) was selected as a
suitable bio-based isocyanate based on its structure (see Figure 26) and commercial availability.
LDI is derived from the amino acid L-lysine. Because of its linear structure, it was hypothesized
that it would result in a more elastic and less viscous PU than IPDI. LDI has been used to synthesize
polyurethanes with poly(lactic acid), poly(ethylene glycol) and poly(ε-caprolactone) because of
its non-toxic degradation products. 46, 47
Figure 26: Structure of ethyl ester L-lysine diisocyanate (LDI).
4.5 CHARACTERIZATION OF PU RESINS
The initial formulations for the polyurethanes using bio-based polyols (Table 4) were derived from
keeping the same molar ratio of 1.7 mol IPDI/mol polyol as the original Adfast formula had used.
The bio-based polyurethanes were synthesized (using the procedure outlined in Table 2) and
characterized in order to compare them to the original Adfast PPG polyurethane. GPC was used
to assess the molecular weight distributions and track the reaction. The viscosity and stress-strain
properties were tested for all bio-based polyurethanes in order to compare them to the original
IPDI/PPG resin.

41
4.5.1 MOLECULAR WEIGHT
Figure 27 shows the normalized GPC traces for the original PPG PU resin in comparison to the
bio-based PU resins using IPDI. While the Sovermol® 830 and Sovermol® 908 polyols produced
PU resins with molecular weight distributions similar to that of Adfast original IPDI/PPG formula,
these resins were found to be very viscous, and very hard once cured. Based on these physical
properties they were deemed to be unsuitable for the sealant application. These physical properties
will be discussed in length in following sections of this thesis. More in-depth analysis was
conducted on the IPDI/Myrinol™ DG-110 PU resin as its lower viscosity and high elongation
were more suitable for incorporation into Adfast’s sealant products.
Figure 27:Normalized GPC traces for bio-based PUs compared to 1.7 mol IPDI/mol PPG PU.
Similar to the original IPDI/PPG formulation, using the molecular weights of the raw materials,
the composition of the bio-based PUs was estimated. For the IPDI/Sovermol® polyols, two trials
were performed using each polyol (Figure 28, Figure 29). From the integration of the normalized
GPC traces, the average Mn values as well as the Mn values for each of the peaks were estimated
and presented in Table 13. From these Mn values and the bimodal molecular weight distribution,
the composition of the Sovermol® PU resins was determined to be similar to the IPDI/PPG PU
resins. The rightmost peak is believed to be composed of polymer chains with one Sovermol®
0
1
2
3
4
5
6
20 22 24 26 28 30 32 34
Det
ecto
r S
ign
al
Elution Time (minutes)
PPG PU Sovermol® 830 PUSovermol® 908 PU Myrinol™ DG-110 PU

42
polyol unit and the left peak is made of chains of 2-3 polyol units. In the case of Sovermol® 830
PU Trial A (Figure 28), there is a high molecular weight shoulder on the left peak resulting in a
high average Mn.
Figure 28: Normalized GPC traces for Sovermol® 830 PUs.
Figure 29: Normalized GPC traces for Sovermol® 908 PUs.
0
1
2
3
4
5
6
20 22 24 26 28 30 32 34
Det
ecto
r S
ign
al
Elution Time (minutes)
Sovermol® 830 polyol
Sovermol® 830 PU Trial A
Sovermol® 830 PU Trial B
0
1
2
3
4
5
6
20 22 24 26 28 30 32 34
Det
ecto
r S
ign
al
Elution Time (minutes)
Sovermol® 908 polyol
Sovermol® 908 PU Trial A
Sovermol® 908 PU Trial B

43
Table 13: GPC Mn values for Sovermol® 830 and Sovermol® 908 PU resins.
Formula Trial Average Mn
(g/mol)
Dispersity
(Ð)
Left Peak Mn
(g/mol)
Right Peak Mn
(g/mol)
1.7 mol
IPDI/mol
Sovermol® 830
A 10,800 2.06 6,900 3,200
B 5,700 1.52 5,500 2,800
1.7 mol
IPDI/mol
Sovermol® 908
A 3,700 1.35 4,300 1,700
B 3,100 1.22 3,700 2,000
When the normalized GPC traces from the reaction of 1.7 mol IPDI/mol Myrinol™ DG-110 are
plotted (Figure 30), this reaction does not produce a bimodal distribution as the PPG and
Sovermol®-containing PU resins did. This is due to the broad distribution of the Myrinol™ DG-
110, and instead of a bimodal distribution, a steady shift in the molecular weight distribution
(traces shift left as Mn increases) is seen. The GPC traces were integrated to estimate the sample
molecular weights (Table 14), and these were used to determine the compositions. Based on the
GPC Mn of the resin in Trial A (5,400 g/mol) and the GPC Mn of the Myrinol™ DG-110 polyol
(1,400 g/mol) the resin is suspected to be composed of chains of 1-2 polyols units. In Trial B, the
resin Mn was higher (9,800 g/mol), suggesting that it is composed of longer chains with up to 4
polyol units per polymer. Both of these trials used the same ratio of 1.7 mol IPDI/mol Myrinol™
DG-110. Compared to the variation in molecular weight distribution of the 1.7 mol IPDI/mol PPG
resins (discussed in Section 4.1), this variation in composition is not unexpected. As seen for all
of the PU systems, some variation in molecular weight is expected—likely due to the small scale
of the reaction where control of the stoichiometric ratios is more difficult.

44
Figure 30: Normalized GPC traces for Myrinol™ DG-110.
Table 14: GPC Mn and Ð values for Myrinol™ DG-110 PU resins.
Formula Trial Average Mn
(g/mol) Dispersity (Ð)
1.7 mol IPDI/mol
Myrinol™ DG-110
A 5,400 1.78
B 9,800 2.34
When the normalized GPC traces for the reaction of 1.7 mol IPDI/mol Myrinol™ DG-110 over
the reaction time are plotted, the shift in molecular weight (molecular weight increasing as the
distribution shifts to the left) is seen. In Figure 31, the peak due to the IPDI is also seen at ~35
minutes elution time. As the reaction progresses, the height of the IPDI peak decreases, verifying
that the IPDI is being consumed by the polyurethane reaction. By integrating the GPC traces shown
in Figure 31, the composition of the resin can be estimated. After 180 minutes of reaction time,
the polymer resin (Mn = 3,100 g/mol) is suspected to be composed of 1-2 units of polyol (polyol
Mn = 1,400 g/mol). When the 1.7 mol IPDI/mol Myrinol™ DG-110 average resin Mn is plotted
over time, the molecular weight is seen to increase linearly, but more slowly than the IPDI/PPG
formulation—the slower increase in Mn being due to the Myrinol™ DG-110 polyol having a lower
Mn than the PPG diol (1,400 g/mol vs. 6,300 g/mol) (Figure 32). Both reactions have an Mn at t=0
approximately equal to the Mn of the monomer (Myrinol™ DG-110: 1,400 g/mol, PPG: 6,300
g/mol).
0
1
2
3
4
5
6
22 24 26 28 30 32 34 36
Det
ecto
r S
ign
al
Elution Time (minutes)
Myrinol™ DG-110 polyol
Myrinol™ DG-110 PU Trial A
Myrinol™ DG-110 PU Trial B

45
Figure 31: Normalized GPC traces for 1.7 mol IPDI/mol Myrinol™ DG-110 PU reaction over
time.
Figure 32: Mn (measured by GPC via PMMA calibration) vs. reaction time for 1.7 mol IPDI/mol
Myrinol™ DG-110 and 1.7 mol IPDI/mol PPG PU.
0
1
2
3
4
5
6
20 25 30 35 40
Det
ecto
r S
ign
al
Elution Time (minutes)
t=0 minutes
t=20 minutes
t=40 minutes
t=60 minutes
t=120 minutes
t=180 minutes
Mn increasing
R² = 0.9124
R² = 0.9845
0
5000
10000
15000
0 50 100 150 200Aver
age
Mole
cula
r W
eigh
t, M
n (
g/m
ol)
Time (minutes)
IPDI/PPG PUPPG PolyolIPDI/Myrinol™ DG-110 PUMyrinol™ DG-110 Polyol
*catalyst addition at 10 minutes

46
It was hypothesized that the Myrinol™ DG-110 polyol may have a higher reactivity than the 4,000
g/mol PPG, because of its primary hydroxyl groups. In general, the reactivity of a polyol increases
as the primary hydroxyl content increases.62 A synthesis was attempted without the use of any
catalyst. Unfortunately, from the normalized GPC traces shown in Figure 33, very little
polymerization occurred without the use of catalyst.
Figure 33: Normalized GPC traces for Myrinol™ DG-110 PU reaction without use of catalyst.
0
1
2
3
4
5
6
23 25 27 29 31 33
Det
ecto
r S
ign
al
Elution Time (minutes)
t=0 minutes
t=20 minutes
t=60 minutes
t=120 minutes
t=180 minutes
Mn increasing

47
4.5.2 PHYSICAL PROPERTIES
Using the parallel plate configuration on the rheometer, the viscosity of a sample of end-capped
1.7 mol IPDI/mol PPG PU (after 1 hr reaction with silane end-capper) was measured. Compared
to the viscosity of the 4,000 g/mol PPG polyol, the viscosity increased by a factor of 10 with the
polyurethane reaction (Figure 34).
Figure 34: Viscosity of 1.7 mol IPDI/mol PPG PU vs PPG 4,000 g/mol polyol.
The bio-based polyol PU resins were measured using the same parallel plate configuration on the
rheometer. Immediately following the completion of the end-capping reaction (1 hr reaction of the
base PU resin with silane) a sample of resin was removed from the reactor and the viscosity was
measured using the rheometer. The viscosities of the bio-based PUs were significantly higher than
that of the PPG PU resin. This was expected, as the viscosities of the bio-based polyols (Figure
25) were already higher than the viscosity of the 4,000 g/mol PPG.
Additional experiments were conducted to investigate if the high viscosities of the bio-based resins
could be due to the resins beginning to cure immediately after being removed from the reactor.
The viscosities of each of the bio-based PUs were measured without the addition of the silane end-
capper in order to ensure that no curing would be affecting the viscosity measurement. These
values are compared to the viscosities of the end-capped bio-based PU resins in Table 15. The
viscosities were still found to be very high (1,200-5,800 Pa s), but >50% lower than the end-capped
1
10
100
1 10
log V
isco
sity
(P
a s
)
log Shear Rate (1/s)
1.7 mol IPDI/mol PPG PPG 4,000 g/mol polyol
Average Viscosity: 20 Pa s
Average Viscosity: 1.3 Pa s

48
resin viscosities (4,200-17,700 Pa s). From this data it was concluded that it was unlikely that there
was premature curing taking place, and that the difference in un-capped and capped viscosities
was only due to the extra length of the molecules after addition of the silane end-capper
Table 15: Viscosities of un-capped PU resins vs. capped PU resins.
Formula Un-capped Viscosity (Pa s) Capped Viscosity (Pa s,
20 °C)
1.7 mol IPDI/mol PPG N/A 24
1.7 mol IPDI/mol
Sovermol® 830 5,800 17,700
1.7 mol IPDI/mol
Sovermol® 908 5,600 14,800
1.7 mol IPDI/mol
Myrinol™ DG-110 1,200 4,200
The curing rate for only the 1.7 mol IPDI/mol PPG PU was assessed. For this test, 2 wt% of
Reaxis® C417VM catalyst was used to increase the curing rate so that changes in the properties
of the resin would be visible over a relatively short period of time. In Figure 35, it is seen that both
the loss modulus (G") and the storage modulus (G') of the resin increase over time—an indication
of curing. The time at which the two curves cross is referred to as the gel time63. While this
experiment was interesting, to see the PU curing over time, since it is not a standardized test it was
not repeated for the other PU formulations. This test must be standardized by using controlled
conditions in order to be able to compare different PU resins. From conversations with Adfast, a
more carefully constructed (i.e. smaller plate diameter) parallel plate geometry may also be
necessary to get an accurate estimate of curing time. Because the resin relies on the reaction with
atmospheric moisture in order to cure, the area of the resin that is against the plate has no access
to moisture, therefore the area of sample in contact with the plate should be reduced as much as
possible. The curing rate is a key variable for PU formulations as different products will require
different curing time ranges. Adfast has products marketed for short curing times and long curing
times. The curing rate in general is manipulated by the amount of curing catalyst added to the
resin, however it is important to understand how the bio-based resins react with the curing catalyst
in order to determine what kind of products they would be appropriate for.

49
Figure 35: Curing curves for 1.7 mol IPDI/mol PPG using 2 wt% catalyst.
Samples of the PU resins (after silane addition) were cured over a period of ~1 week in a silicone
tensile bar mold without the use of catalyst. Once a skin had formed on the sample, the bars were
able to be removed from the mold and left on a Teflon plate in the lab for additional curing time
(~ 15 days) before being tested for their tensile strength. The tensile bars were tested 2-3 weeks
after the resins were synthesized to ensure they were cured. For future PU formulations the curing
time before testing of tensile bars should be standardized to ensure that all specimens are
comparable. The stress-strain data for the resins is shown in Figure 36. The structure of the polyol
has been found to be related to the tensile strength of a polyurethane, due to the intermolecular
association and crystallization during stretching. In general, polyester polyols result in PUs with
higher tensile strengths than polyether polyols.19 This is consistent with the results of testing the
bio-based PUs. It has also been found that in general, polyether polyurethanes have a greater
hysteresis compared to polyester polyurethanes.19 While the hysteresis of the PU samples was not
measured, qualitatively it was seen that the PPG PU samples returned to their original length
immediately after tensile testing, whereas the Myrinol™ DG-110 PU samples were slower to
return to their original length.
0.00E+00
2.00E+03
4.00E+03
6.00E+03
8.00E+03
1.00E+04
1.20E+04
0 50 100 150 200 250 300
Mod
ulu
s (P
a s
)
Time (minutes)
Loss Modulus, G"
Storage Modulus, G'
Gel time ~110 minutes

50
Figure 36: Stress-strain properties for IPDI/bio-based polyol PUs vs. 1.7 mol IPDI/mol PPG
PU.
While this thesis focussed on producing a PU resin with properties similar to Adfast’s 1.7 mol
IPDI/mol PPG resin, Adfast has numerous other products for different applications. The product
that was being imitated in this research had high elongation and elasticity. Adfast also has adhesive
products that require high strength and lower elasticity. A graphical representation of Adfast’s
different product characteristics is shown in Figure 37. The PUs produced from the Sovermol®
polyols were hard and brittle, which is undesirable for sealant applications, however they have
potential to be used in an adhesive/coating application based on their properties. Based on the
physical properties of the Sovermol® 830 PU (tensile strength = 1.2 MPa , elongation at break =
100%) and Sovermol® 908 PU (tensile strength = 0.6 MPa, elongation at break = 140%) (Table
16), investigation of these formulations for bio-based PUs for sealants was not pursued further in
this thesis. The Myrinol™ DG-110 polyol/IPDI showed properties more suited to sealants (tensile
strength = 4.8 MPa, elongation at break = 220%). The remaining research covered in this thesis
focuses only on the use of the Myrinol™ DG-110 bio-based polyol and the optimization of that
system.
0.0
0.5
1.0
1.5
2.0
2.5
3.0
3.5
4.0
4.5
5.0
0 50 100 150 200 250
Str
ess
(MP
a)
% Elongation
PPG PU
Sovermol® 830 PU
Sovermol® 908 PU
Myrinol™ DG-110 PU

51
Figure 37: Graphical representation of Adfast’s product markets.
Table 16: Summary of physical properties of 1.7 mol IPDI/mol polyol polyurethanes.
PU Formulation Viscosity (Pa s) Tensile Strength
(MPa)
Elongation at
Break (%)
1.7 mol IPDI/mol
PPG 20 0.6 ± 0.2 60 ± 25
1.7 mol IPDI/mol
Sovermol® 830 17,700 1.2 ± 0.5 100 ± 30
1.7 mol IPDI/mol
Sovermol® 908 14,800 0.6 ± 0.2 140 ± 40
1.7 mol IPDI/mol
Myrinol™ DG-110 4,200 4.8 ± 0.8 220 ± 40

52
4.6 OPTIMIZATION OF MYRINOL™ DG-110 POLYOL SYSTEM WITH BIO-
BASED ISOCYANATE
From the results discussed already, it was seen that the 1.7 mol IPDI/mol Myrinol™ DG-110
polyol had the most promise to be used in an Adfast sealant. One characteristic that was
undesirable was the high viscosity of the resin. The 1.7 mol IPDI/mol Myrinol™ DG-110 PU had
a viscosity of 4,200 Pa s, compared to the maximum feasible viscosity that Adfast can mix being
2,000 Pa s. In order to both improve the physical properties of the Myrinol™-based PU and
increase the bio-based content of the final product, the substitution of a bio-based isocyanate in
the place of IPDI was investigated. It was hypothesized that using LDI instead of IPDI could lower
the viscosity of the resin based on the more linear structure of LDI compared to IPDI. In terms of
the soft segment/hard segment polyurethane structure (see Figure 38), having a linear, more
flexible diisocyanate, the polyurethane would be expected to have a lower viscosity and more
elastic mechanical properties.
Figure 38: Graphical explanation of soft and hard segments.
When 1.7 mol LDI/mol Myrinol™ DG-110 was combined under the standard reaction conditions
(following procedure detailed in Table 2), the reaction proceeded very quickly and was only
allowed to continue for 20 minutes due to the very high viscosity of the resin and the loss of stirring
in the reactor. The normalized GPC traces over the course of this reaction are shown below in
Figure 39. The molecular weight after 20 minutes of reaction was found to be 6,100 g/mol (based
on PMMA standard calibration).
Hard segment: IPDI
Soft segment: Myrinol™ DG-110
Urethane bond
Hard segment: LDI

53
Figure 39: Normalized GPC traces for 1.7 mol LDI/mol Myrinol™ DG-110 PU with catalyst.
A second experiment was conducted using LDI and Myrinol™ DG-110, this time without the use
of any catalyst to drive the reaction. In this case, the reaction proceeded with much more control
and produced the normalized GPC traces seen in Figure 40 over 180 minutes of reaction time. The
molecular weight of the resin was found to be 3,000 g/mol after 180 minutes. Based on the
integration of the GPC traces and the molecular weights of the reactants, it was calculated that the
resin was composed of mainly polymers with one Myrinol™ DG-110 unit.
Figure 40: Normalized GPC traces for 1.7 mol LDI/mol Myrinol™ DG-110 PU without use of
catalyst.
0
1
2
3
4
5
6
20 25 30 35
Det
ecto
r S
ign
al
Elution Time (minutes)
t=0 minutes
t=5 minutes
t=10 minutes
t=15 minutes
t=20 minutes
Mn increasing
0
1
2
3
4
5
6
20 25 30 35
Det
ecto
r S
ign
al
Elution Time (minutes)
5 minutes
10 minutes
15 minutes
20 minutes
30 minutes
40 minutes
60 minutes
90 minutes
120 minutes
150 minutes
180 minutes
Mn increasing

54
When compared to the reaction of 1.7 mol IPDI/mol Myrinol™ DG-110 (see Figure 41), the 1.7
mol LDI/mol Myrinol™ DG-110 (no catalyst used) reaction rate is similar. Both reactions use the
Myrinol™ DG-110™ polyol (GPC Mn = 1,400 g/mol) and the two isocyanates have the same GPC
Mn (600 g/mol). Since the Mn of both resins increase over time at a similar rate, but the
LDI/Myrinol™ formulation does not use a catalyst, the reactivity of the LDI isocyanate must be
greater than that of IPDI. As discussed earlier, the 1.7 mol IPDI/mol Myrinol™ reaction was
attempted without the use of catalyst, and it was found that the reaction did not progress at all. No
information is available regarding the reactivity of LDI compared to that of IPDI. It is known that
the reactivity of the two NCO groups (one primary and one secondary) of IPDI have different
reactivity, which could also be true for LDI (also has one primary and one secondary NCO group).
In the case of IPDI, when reacted without a catalyst or with dibutyl tin dilaurate the secondary
NCO group is more reactive.64
Figure 41: Mn vs. reaction time for 1.7 mol LDI/mol Myrinol™ DG-110 (no catalyst) and 1.7
mol IPDI/mol Myrinol™ DG-110.
The viscosity of the 1.7 mol LDI/mol Myrinol™ DG-110 resin was found to be 600 Pa s,
significantly lower than the 1.7 mol IPDI/mol Myrinol™ DG-110 resin (4,200 Pa s) (see Figure
42). The two samples that were used to measure the viscosities for the 1.7 mol IPDI/mol Myrinol™
and 1.7 mol LDI/mol Myrinol™ resins had similar molecular weights (~3,000 g/mol), therefore
the difference in viscosity is hypothesized to be due to the difference in structure between IPDI
1000
1500
2000
2500
3000
3500
0 20 40 60 80 100 120 140 160 180 200
Mn
(g/m
ol)
Reaction Time (minutes)
1.7 mol IPDI/mol Myrinol™ DG-110
1.7 mol LDI/mol Myrinol™ DG-110 no catalyst

55
and LDI. While the two diisocyanates have almost the same molecular weights (Mn, IPDI = 222
g/mol vs. Mn, LDI = 226 g/mol), IPDI is cyclic and LDI is linear in structure (see Figure 43).
Figure 42: Viscosities of Myrinol™ DG-110 PU resins at room temperature vs. 1.7 mol
IPDI/mol PPG PU.
Figure 43: Structures of IPDI and LDI.
The stress-strain data for the 1.7 mol LDI/mol Myrinol™ DG-110 formulation is shown in Figure
44. The 1.7 mol LDI/mol Myrinol™ DG-110 PU was found to have stress-strain properties similar
to the original 1.7 mol IPDI/mol PPG PU. Compared to the 1.7 mol IPDI/mol Myrinol™ DG-110
PU, the replacement of IPDI with LDI decreased the tensile strength and elongation at break. While
all three samples shown in Figure 44 are elastic, the IPDI/Myrinol™ PU has much higher
toughness (larger area under the stress-strain curve).
1
10
100
1000
10000
0 2 4 6 8 10
log V
isco
sity
(P
a s
)
Shear Rate (1/s)
1.7 mol IPDI/mol PPG PU1.7 mol IPDI/mol Myrinol™ DG-110 PU1.7 mol LDI/mol Myrinol™ DG-110 PUmaximum mixer viscosity: 2,000 Pa s
Average Viscosity: 4,200 Pa s
Average Viscosity: 600 Pa s
Average Viscosity: 20 Pa s

56
Figure 44: 1.7 mol LDI/mol Myrinol™ DG-110 vs. 1.7 mol IPDI/mol PPG and 1.7 mol
IPDI/mol Myrinol™ DG-110 stress-strain properties.
Hysteresis testing was not performed, however it can be seen visually in Figure 45 that the
IPDI/PPG, IPDI/Myrinol™ DG-110, and LDI/Myrinol™ DG-110 PUs all returned to their
original length after tensile testing. An example of a test that could be performed to investigate the
hysteresis of the PUs is a cyclic tensile test. This would produce a hysteresis loop and the energy
loss due to the viscoelasticity of the resin could be estimated. The defects present in the 1.7 mol
LDI/mol Myrinol™ DG-110 tensile bars are due to the silicone mold that the bars were cured in.
While the defects were present in the top/bottom sections of the bars (where the clamps hold the
samples while testing), there were no defects in the middle section of the bars that would affect
the stress-strain measurements.
Figure 45: Tensile bars after testing: bars returned to their original shape.
0.0
0.5
1.0
1.5
2.0
2.5
3.0
3.5
4.0
4.5
5.0
0 50 100 150 200 250
Str
ess
(MP
a)
% Elongation
IPDI/PPG PUIPDI/Myrinol™ DG-110 PULDI/Myrinol™ DG-110 PU
1.7 mol IPDI/mol
PPG PU
1.7 mol IPDI/mol
Myrinol™ DG-110 PU
1.7 mol LDI/mol
Myrinol™ DG-110 PU

57
Based on the physical properties of the 1.7 mol LDI/mol Myrinol™ DG-110 PU (see Table 17) it
shows potential to be used as a sealant product by Adfast, however using a bio-based isocyanate
at a large scale is the limitation of this formula. There are currently no commercial suppliers of
bio-based isocyanates at the scale required by Adfast. For Adfast to pursue a PU with a bio-based
diisocyanate at this time the bio-based diisocyanate would have to be produced in house.
Table 17: Summary of properties for 1.7 mol LDI/mol Myrinol™ DG-110 without catalyst PU
compared to other PU resins.
PU Formulation Viscosity (Pa s) Tensile Strength
(MPa)
Elongation at
Break (%)
1.7 mol IPDI/mol
PPG 20 0.6 ± 0.2 60 ± 25
1.7 mol IPDI/mol
Sovermol® 830 17,700 1.2 ± 0.5 100 ± 30
1.7 mol IPDI/mol
Sovermol® 908 14,800 0.6 ± 0.2 140 ± 40
1.7 mol IPDI/mol
Myrinol™ DG-110 4,200 4.8 ± 0.8 220 ± 40
1.7 mol LDI/mol
Myrinol™ DG-110
600 0.3 ± 0.1 90 ± 20
4.7 FUTURE WORK
While this thesis has led to the synthesis of polyurethanes from bio-based components that show
promise to be incorporated into a sealant, there is still further optimization and testing required.
The viscosity and stress-strain properties of both the 1.7 mol IPDI/mol Myrinol™ DG-110
(viscosity = 4,200 Pa s, tensile strength = 4.8 MPa, elongation at break = 220%) and 1.7 mol
LDI/mol Myrinol™ DG-110 (viscosity = 600 Pa s, tensile strength = 0.3 MPa, elongation at break
= 90%) formulations show promise to be suitable for sealants, but there are still issues with both
of these resins that need to be addressed. The PUs produced from the Sovermol® polyols were

58
found to be too hard and brittle for sealant products, but in the future Adfast may be interested in
revisiting these formulations for adhesive or coating applications.
The high viscosity of the 1.7 mol IPDI/mol Myrinol™ DG-110 resin is an issue in terms of scale-
up. The maximum viscosity that Adfast can mix in their reactor is 2,000 Pa s, however the desirable
range is 10-500 Pa s. The viscosity of the 1.7 mol IPDI/mol Myrinol™ DG-110 was found to be
4,800 Pa s, which is too high to be scaled up by Adfast. The addition of a plasticizer could lower
the viscosity to make this resin feasible. Because the IPDI/Myrinol™ resin shows promising stress-
strain properties, lowering the viscosity should be investigated.
The issue with the 1.7 mol LDI/mol Myrinol™ DG-110 PU is the price and availability of LDI,
and in general any bio-based isocyanate. The economic feasibility of using bio-based components,
Myrinol™’s DG-110 polyol and LDI, must also be assessed. From Adfast’s purchasing
department, PPG and IPDI cost $4.70 CAD/kg and $15.00 CAD/kg respectively when purchased
in bulk by Adfast. Myrinol™ DG-110 is priced at $3.20 CAD/kg ($1.10 USD/lb) which is
competitive with the price of PPG. The price of LDI used in this project ($66.00 CAD/5 g), when
used only on a small scale, is much too high to be applied at a commercial scale. There are no
large-scale suppliers of bio-based isocyanates, and synthesizing bio-based isocyanates at a
commercial scale poses many challenges due to dangerous synthesis methods (nitrenes, azides or
phosgene), even when using bio-based materials.17
Adfast is interested in performing a scale-up of a bio-based PU at their facility, once a formula has
been reached with a low enough viscosity to be handled by their mixer. This PU resin (20-60% of
final product) would be blended with UV/oxidation stabilizers (< 3%), plasticizer (5-30%),
calcium carbonate (5-40%), pigment (< 5%), silica (< 15%) and catalyst (< 5%) and could be
tested as a sealant end-product. Adfast tests the properties of their sealants using a series of Instron
tests. From the Instron machine they measure the elongation, tensile strength and modulus of
samples. Lapshear assemblies are also prepared and tested with the Instron to determine the
adhesion of the sealants. To determine the stability of sealant formulations, the samples are
exposed to conditions such as water immersion, freezing, salt spraying, UV radiation and heat and
are then tested using the Instron.

59
One other parameter that has not been assessed for the bio-based PUs is the curing time and the
effect of the curing catalyst that Adfast currently uses. Qualitatively, curing has been observed
over long periods of time (~15 days), but there has been no precise measurement of the curing
time, shelf life, etc. of the bio-based PUs when catalyst is used. This should be assessed before a
scale-up to ensure that the bio-based PUs are capable of curing in a reasonable amount of time
when catalyst is added. While the curing time is largely dependent on the amount of catalyst added
to the resin, it should be verified that the curing mechanism (atmospheric moisture’s reaction with
the silane-functionalized end-capper) behaves the same for the bio-based formulations.
Going forward, there are three options within the diisocyanate/polyol synthesis route for Adfast to
consider. By mass%, the polyol makes up the majority of the PU resin, therefore replacing the
petroleum-based PPG with a bio-based polyol is the logical first step to scale-up. The prospect of
Adfast synthesizing their own bio-based polyols from raw bio-sourced oils is of interest as an
alternative to using a commercial bio-based polyol. Alternate commercial bio-based polyols
should be assessed, as well as synthesis methods in order for Adfast to produce their own bio-
based polyols on a large scale. While this would still involve a petroleum-based isocyanate
(derived through the use of phosgene) it would result in a project with a high renewable content
and would likely have an economical benefit to Adfast due to the low price of bio-based polyols.
By incorporating a bio-based isocyanate, the renewable content of the product would increase to
close to 100%, however the large-scale synthesis of bio-based isocyanates comes with many
issues, and there are currently no commercial providers of bio-based isocyanates on an industrial
scale. Adfast could also produce their own bio-based isocyanates internally, and do so without
using phosgenation. This would involve the scale-up of Curtius, Hofmann or Lossen
rearrangements, which has not been explored due to the involvement of nitrenes and acyl azides
in the process. The dangers of phosgene versus acyl azides should be assessed to determine if the
pursuit of non-phosgene isocyanates at large scale has merit. From a green perspective, this option
is currently seen as the most beneficial as it eliminates all reliance on petroleum resources and
does not involve toxic phosgene in the synthesis process. However, even this product still involves
an isocyanate. Regardless of the bio-based nature, isocyanates are still toxic and require extreme
care in large scale production. These three options are summarized graphically in
Figure 46.

60
Figure 46: Potential future Adfast PU resins using polyols/isocyanates, ranked in order of
effectiveness from a green perspective.
In order to avoid isocyanates completely, an entirely different approach: using dicarbonates and
diamines to produce non-isocyanate polyurethanes (NIPUs) is also being considered by McGill
and Adfast. These can both be bio-based, and the synthesis of dicarbonates involves CO2 as a
reactant, another green aspect of this method. If this route is followed, Adfast could have a
completely bio-based NIPU that involves no phosgene, isocyanate or other toxic reactants. This
method of preparing NIPUs is in preliminary stages of research in parallel with the bio-based
polyol/diisocyanate method. Both of these routes should be pursued, and through one or both of
them, McGill may be able to provide Adfast with an economical, non-petroleum based and green
product.
Bio-based Polyol
+
Petroleum Isocyanate
(phosgene synthesis route)
Bio-based Polyol
+
Bio-based Isocyanate
(phosgene synthesis route)
Bio-based Polyol
+
Bio-based Isocyanate
(non-phosgene synthesis route)
2 1
3

61
5.0 CONCLUSION
The main purpose of this thesis was to investigate the possibility of substituting bio-based
components into an existing industrial polyurethane base resin made from petroleum-sourced
building blocks. In order to compare bio-based PU resins to the original product, the original
formula had to be replicated on a small scale and studied before measuring its physical properties.
The analysis of the molecular weight distribution of the PU lead to the discovery that dimers and
trimers were present, in addition to the chains containing only one PPG monomer (reacted with
two moles of IPDI) that Adfast was expecting. It was concluded that by decreasing the molar ratio
of IPDI/PPG, the number of PPG units in the polymer could be increased. This is valuable new
information for Adfast that can help them to tailor the properties of their resins going forward.
Values for the viscosity (20 Pa s) and stress-strain properties (elongation at break = 60%, break
stress = 0.6 MPa) were gathered, were used as benchmarks to compare the bio-based PUs
developed during this project, and will continue to be used as comparisons for new bio-based PU
formulas going forward.
A selection of commercial bio-based polyols was then evaluated and used to make bio-based PU
resins by substituting the polyol portion of Adfast’s formulation. The viscosity and stress-strain
properties were gathered for these new bio-based resins and compared to the benchmark of
Adfast’s original PU formulation. The two PU resins derived from Sovermol® polyols,
Sovermol® 830 and Sovermol® 908, with IPDI were found to have higher break stresses (1.2 MPa
and 0.6 MPa respectively), but were hard and brittle, making them poor candidates for the desired
sealant application. These polyols may be assessed for alternate applications such as adhesives or
coatings.
After seeing promising results with polyurethanes produced from the Myrinol™ DG-110 polyol
with IPDI (viscosity = 4,200 Pa s, break stress = 4.8 MPa, elongation at break = 220%), this system
was further studied by inserting the bio-based diisocyanate, LDI, instead of the original petroleum
based diisocyanate IPDI. This all bio-based system was notable by not requiring catalyst for the
polymerization to proceed. By substituting LDI for IPDI, the viscosity of the resin before curing
became lower (600 Pa s), and the cured resin exhibited lower elongation at break (90%) and break

62
stress (0.3 MPa). The stress-strain properties of the LDI/Myrinol™ PU were most similar (vs. the
other PUs produced during this project) to those of the original IPDI/PPG PU.
Both the 1.7 mol IPDI/mol Myrinol™ DG-110 formulation and the 1.7 mol LDI/mol Myrinol™
DG-110 formulation show promise to be included in Adfast’s product line. The viscosity of the
1.7 mol IPDI/mol Myrinol™ DG-110 is too currently too high for Adfast to handle at a large scale,
but the incorporation of a plasticizer could reduce this viscosity. Further testing including
adhesion, UV resistance, and scale up/blending of this resin is necessary to determine if either of
these formulations would result in a suitable sealant product. The economics of using bio-based
components must also be investigated: compared to PPG, Myrinol™ DG-110 is available at a
competitive price ($ 4.70 CAD/kg, PPG vs. $3.20 CAD/kg, Myrinol™ DG-110), however
incorporating a bio-based isocyanate is currently infeasible as there are no bulk suppliers of LDI
or any other bio-based isocyanates.
This project has paved the way for Adfast and the Maric lab to collaborate on many new
polyurethane formulations and potential commercial products. The incorporation of bio-based
polyols into the formulation was tested, showed promise, and should be explored further, perhaps
with alternative bio-based polyols. A PU from a bio-based polyol and a petroleum-based
diisocyanate will have a high renewable content since the polyol makes up a majority of the mass
of the resin. Different commercial polyols should be explored as well as the large-scale production
of bio-based polyols from raw feedstocks—which could also give Adfast an economic advantage.
By using both a bio-based polyol and diisocyanate, the renewable content of the PU would be even
higher, but the process would still include an isocyanate and phosgene. The bio-based isocyanate,
since not available commercially at a large scale yet, would have to be produced by Adfast. If a
bio-based isocyanate could be synthesized via a phosgene-free route, then Adfast could have a
product with very high renewable content, and a significantly greener process, however at the end
of the day there is still an isocyanate in the process. The alternative pathway is to pursue NIPUs,
which can meet the renewable content, non-phosgene, and non-isocyanate desires of Adfast.
Regardless of which direction Adfast decides to go in the future, this thesis has opened the door to
multiple different options that could result in a green and economically competitive product.

63
6.0 REFERENCES
1. Aniceto, J. P.; Portugal, I.; Silva, C. M., Biomass‐Based Polyols through Oxypropylation
Reaction. ChemSusChem 2012, 5 (8), 1358-1368.
2. Schneiderman, D. K.; Hillmyer, M. A., 50th anniversary perspective: There is a great
future in sustainable polymers. Macromolecules 2017, 50 (10), 3733-3749.
3. Hopewell, J.; Dvorak, R.; Kosior, E., Plastics recycling: challenges and opportunities.
Philosophical Transactions of the Royal Society B: Biological Sciences 2009, 364 (1526), 2115-
26.
4. Lu, Y.; Larock, R. C., New hybrid latexes from a soybean oil-based waterborne
polyurethane and acrylics via emulsion polymerization. Biomacromolecules 2007, 8 (10), 3108-
3114.
5. Furtwengler, P.; Avérous, L., Renewable polyols for advanced polyurethane foams from
diverse biomass resources. Polymer Chemistry 2018, 9 (32), 4258-4287.
6. Harmsen, P. F.; Hackmann, M. M.; Bos, H. L., Green building blocks for bio‐based
plastics. Biofuels, Bioproducts, and Biorefining 2014, 8 (3), 306-324.
7. Ulrich, H., The Chemistry of Sulfonyl Isocyanates. Chemical Reviews 1965, 65 (3), 369-
376.
8. Evison, D.; Hinsley, D.; Rice, P., Chemical weapons. BMJ 2002, 324 (7333), 332-335.
9. Mahendran, A.; Aust, N.; Wuzella, G.; Müller, U.; Kandelbauer, A., Bio-based non-
isocyanate urethane derived from plant oil. Journal of Polymers and the Environment 2012, 20
(4), 926-931.
10. Li, Y.; Luo, X.; Hu, S., Bio-based polyols and polyurethanes. Springer: Cham, 2015.
11. Vanbésien, T.; Monflier, E.; Hapiot, F., Hydroformylation of vegetable oils: More than
50 years of technical innovation, successful research, and development. European journal of
lipid science technology 2016, 118 (1), 26-35.
12. Desroches, M.; Escouvois, M.; Auvergne, R.; Caillol, S.; Boutevin, B., From vegetable
oils to polyurethanes: synthetic routes to polyols and main industrial products. Polymer Reviews
2012, 52 (1), 38-79.
13. Herrington, R.; Malsam, J. Flexible polyurethane foams prepared using modified
vegetable oil-based polyols. US8293808B2, 2012.
14. Kluth, H.; Gruber, B.; Meffert, A.; Huebner, W. Polyurethane prepolymers based on
oleochemical polyols, their production and use. US4742087A, 1988.
15. Hojabri, L.; Kong, X.; Narine, S. S., Novel long chain unsaturated diisocyanate from
fatty acid: Synthesis, characterization, and application in bio‐based polyurethane. Journal of
Polymer Science Part A: Polymer Chemistry 2010, 48 (15), 3302-3310.
16. Kamal, M. R.; Rogier, E. R. Polyisocyanates and derivatives. 3455883A, 1969.
17. Çaylı, G.; Küsefoğlu, S., Biobased polyisocyanates from plant oil triglycerides:
Synthesis, polymerization, and characterization. Journal of Applied Polymer Science 2008, 109
(5), 2948-2955.
18. Zenner, M. D.; Xia, Y.; Chen, J. S.; Kessler, M. R., Polyurethanes from Isosorbide‐Based Diisocyanates. ChemSusChem 2013, 6 (7), 1182-1185.
19. Szycher, M., Szycher's handbook of polyurethanes. CRC press: Boca Raton, 1999.
20. Bayer, O.; Siefken, W.; Rinke, H.; Orthner, L.; Schild, H. A process for the production
of polyurethanes and polyureas. German Patent DRP 728981, 1937.

64
21. Gómez‐Jiménez‐Aberasturi, O.; Ochoa‐Gómez, J. R., New approaches to producing
polyols from biomass. Journal of Chemical Technology and Biotechnology 2017, 92 (4), 705-
711.
22. Ionescu, M., Chemistry and technology of polyols for polyurethanes. iSmithers Rapra
Publishing: Shawbury, Shrewsbury, Shropshire, U.K., 2005.
23. Polymer Database Polymer Properties Database.
https://polymerdatabase.com/polymer%20classes/Polyurethane%20type.html (accessed January,
2019).
24. Waldman, T. E.; McGhee, W. D., Isocyanates from primary amines and carbon
dioxide:‘dehydration’of carbamate anions. Journal of the Chemical Society, Chemical
Communications 1994, (8), 957-958.
25. Fleischer, M.; Blattmann, H.; Mülhaupt, R., Glycerol-, pentaerythritol-and
trimethylolpropane-based polyurethanes and their cellulose carbonate composites prepared via
the non-isocyanate route with catalytic carbon dioxide fixation. Green Chemistry 2013, 15 (4),
934-942.
26. Galià, M.; de Espinosa, L. M.; Ronda, J. C.; Lligadas, G.; Cádiz, V., Vegetable oil‐based thermosetting polymers. European journal of lipid science and technology 2010, 112 (1),
87-96.
27. Petrović, Z. S.; Cvetković, I.; Hong, D.; Wan, X.; Zhang, W.; Abraham, T.; Malsam,
J., Polyester polyols and polyurethanes from ricinoleic acid. Journal of Applied Polymer Science
2008, 108 (2), 1184-1190.
28. Pfister, D. P.; Xia, Y.; Larock, R. C., Recent advances in vegetable oil‐based
polyurethanes. ChemSusChem 2011, 4 (6), 703-717.
29. Alagi, P.; Hong, S. C., Vegetable oil-based polyols for sustainable polyurethanes.
Macromolecular Research 2015, 23 (12), 1079-1086.
30. Petrović, Z. S., Polyurethanes from vegetable oils. Polymer Reviews 2008, 48 (1), 109-
155.
31. Pan, X.; Webster, D. C., New biobased high functionality polyols and their use in
polyurethane coatings. ChemSusChem 2012, 5 (2), 419-429.
32. Guo, A.; Demydov, D.; Zhang, W.; Petrovic, Z. S., Polyols and polyurethanes from
hydroformylation of soybean oil. Journal of Polymers and the Environment 2002, 10 (1-2), 49-
52.
33. Petrović, Z. S.; Zhang, W.; Javni, I., Structure and properties of polyurethanes prepared
from triglyceride polyols by ozonolysis. Biomacromolecules 2005, 6 (2), 713-719.
34. Caillol, S.; Desroches, M.; Carlotti, S.; Auvergne, R.; Boutevin, B., Synthesis of new
polyurethanes from vegetable oil by thiol-ene coupling. Green Materials 2013, 1 (1), 16-26.
35. Desroches, M.; Caillol, S.; Lapinte, V.; Auvergne, R.; Boutevin, B., Synthesis of
biobased polyols by thiol− ene coupling from vegetable oils. Macromolecules 2011, 44 (8),
2489-2500.
36. Bechthold, I.; Bretz, K.; Kabasci, S.; Kopitzky, R.; Springer, A., Succinic acid: a new
platform chemical for biobased polymers from renewable resources. Chemical Engineering
Technology 2008, 31 (5), 647-654.
37. GC Innovation America Bio-Based Polyurethanes that Work.
https://www.gcinnovationamerica.com/wp-content/uploads/2018/10/Polyols-that-work-2018.pdf
(accessed February, 2019).

65
38. Casper, D.; Newbold, T. Methods of preparing hydroxy functional vegetable oils.
US20060041156A1, 2006.
39. Luo, N.; Newbold, T. Method for vegetable oil derived polyols and polyurethanes made
therefrom. US 20080262259A1, 2008.
40. Cargill BiOH® polyol and polymer FAQs. https://www.cargill.com/bioindustrial/bioh-
faqs (accessed January, 2019).
41. BASF Solutions from the Nature – Sovermol®. (accessed January, 2019).
42. GC Innovation America Products: Product Literature.
http://myrifilm.myriant.com/products/product-literature.cfm (accessed January).
43. Calvo-Correas, T.; Martin, M. D.; Retegi, A. a.; Gabilondo, N.; Corcuera, M. A.;
Eceiza, A.; Engineering, Synthesis and characterization of polyurethanes with high renewable
carbon content and tailored properties. ACS Sustainable Chemistry 2016, 4 (10), 5684-5692.
44. More, A. S.; Lebarbé, T.; Maisonneuve, L.; Gadenne, B.; Alfos, C.; Cramail, H., Novel
fatty acid based di-isocyanates towards the synthesis of thermoplastic polyurethanes. European
Polymer Journal 2013, 49 (4), 823-833.
45. Wang, Z.; Yu, L.; Ding, M.; Tan, H.; Li, J.; Fu, Q., Preparation and rapid degradation
of nontoxic biodegradable polyurethanes based on poly (lactic acid)-poly (ethylene glycol)-poly
(lactic acid) and L-lysine diisocyanate. Polymer Chemistry 2011, 2 (3), 601-607.
46. Storey, R. F.; Wiggins, J. S.; Puckett, A., Hydrolyzable poly (ester‐urethane) networks
from L‐lysine diisocyanate and D, L‐lactide/ϵ‐caprolactone homo‐and copolyester triols. Journal
of Polymer Science Part A: Polymer Chemistry 1994, 32 (12), 2345-2363.
47. Pavelková, A.; Kucharczyk, P.; Kuceková, Z.; Zedník, J.; Sedlařík, V., Non-toxic
polyester urethanes based on poly (lactic acid), poly (ethylene glycol) and lysine diisocyanate.
Journal of Bioactive and Compatible Polymers 2017, 32 (3), 225-241.
48. Calle, M.; Lligadas, G.; Ronda, J. C.; Galià, M.; Cádiz, V., An efficient nonisocyanate
route to polyurethanes via thiol‐ene self‐addition. Journal of Polymer Science Part A: Polymer
Chemistry 2014, 52 (21), 3017-3025.
49. Bello, D.; Herrick, C. A.; Smith, T. J.; Woskie, S. R.; Streicher, R. P.; Cullen, M. R.;
Liu, Y.; Redlich, C. A., Skin exposure to isocyanates: reasons for concern. Environmental Health
Perspectives 2006, 115 (3), 328-335.
50. Rokicki, G.; Parzuchowski, P. G.; Mazurek, M., Non‐isocyanate polyurethanes:
synthesis, properties, and applications. Polymers for Advanced Technologies 2015, 26 (7), 707-
761.
51. Kathalewar, M. S.; Joshi, P. B.; Sabnis, A. S.; Malshe, V. C., Non-isocyanate
polyurethanes: from chemistry to applications. Rsc Advances 2013, 3 (13), 4110-4129.
52. Ghatge, N.; Jadhav, J., Synthesis, characterization, and properties of novel poly (ether
urethanes). Journal of Polymer Science: Polymer Chemistry Edition 1983, 21 (7), 1941-1950.
53. Palaskar, D. V.; Boyer, A.; Cloutet, E.; Alfos, C.; Cramail, H., Synthesis of biobased
polyurethane from oleic and ricinoleic acids as the renewable resources via the AB-type self-
condensation approach. Biomacromolecules 2010, 11 (5), 1202-1211.
54. Neffgen, S.; Keul, H.; Höcker, H., Cationic ring-opening polymerization of trimethylene
urethane: A mechanistic study. Macromolecules 1997, 30 (5), 1289-1297.
55. Blattmann, H.; Fleischer, M.; Bähr, M.; Mülhaupt, R., Isocyanate‐and Phosgene‐Free
Routes to Polyfunctional Cyclic Carbonates and Green Polyurethanes by Fixation of Carbon
Dioxide. Macromolecular Rapid Communications 2014, 35 (14), 1238-1254.

66
56. Cornille, A.; Auvergne, R.; Figovsky, O.; Boutevin, B.; Caillol, S., A perspective
approach to sustainable routes for non-isocyanate polyurethanes. European Polymer Journal
2017, 87, 535-552.
57. Figovsky, O.; Shapovalov, L.; Leykin, A.; Birukova, O.; Potashnikova, R., Recent
advances in the development of non-isocyanate polyurethanes based on cyclic carbonates. PU
Magazine 2013, 10 (4), 1-9.
58. Bähr, M.; Bitto, A.; Mülhaupt, R., Cyclic limonene dicarbonate as a new monomer for
non-isocyanate oligo-and polyurethanes (NIPU) based upon terpenes. Green Chemistry 2012, 14
(5), 1447-1454.
59. Dow Answer Center What is the general process for preparation of prepolymers in the
laboratory? https://dowac.custhelp.com/app/answers/detail/a_id/5224 (accessed January, 2019).
60. Odian, G. G., Principles of polymerization. Fourth edition. ed.; Wiley: Hoboken, N.J.,
2004.
61. Dow Answer Center Define polyurethane functionality, OH Number, and equivalent
weight. https://dowac.custhelp.com/app/answers/detail/a_id/13359 (accessed January, 2019).
62. Dow Answer Center How are polyols characterized?
https://dowac.custhelp.com/app/answers/detail/a_id/5693 (accessed January, 2019).
63. Anton-Paar Polymers. http://www.world-of-
rheology.com/industries/polymers/?tx_news_pi1[overwriteDemand][categories]=30 (accessed
January, 2019).
64. Ono, H. K.; Jones, F. N.; Pappas, S. P., Relative reactivity of isocyanate groups of
isophorone diisocyanate. Unexpected high reactivity of the secondary isocyanate group. Journal
of Polymer Science: Polymer Letters Edition 1985, 23 (10), 509-515.

67
7.0 APPENDIX A
Data sheet containing Sovermol® 830 properties.

68
8.0 APPENDIX B
Stress-strain Data
For each PU formulation, multiple tensile bars were tested and an average of all data sets was
used as a representative curve in the body of the thesis. Below, all raw data sets are shown with
the average representative curves.
Raw stress-strain data for 1.7 mol IPDI/mol PPG tensile bars.
Raw stress-strain data for 1.7 mol IPDI/mol Sovermol® 830 tensile bars.
0
0.1
0.2
0.3
0.4
0.5
0.6
0.7
0.8
0.9
0 20 40 60 80 100 120
Str
ess
(MP
a)
% Elongation
9 samples tested
Average elongation at break: 60±25%
Average break stress: 0.6±0.2 MPa
1.7 mol IPDI/mol PPG PU
x
0.0
0.5
1.0
1.5
2.0
2.5
0 50 100 150
Str
ess
(MP
a)
% Elongation
1.7 mol IPDI/mol Sovermol® 830 PU5 samples tested
Average elongation at break: 100±30%
Average break stress: 1.2±0.5 MPa
x

69
Raw stress-strain data for 1.7 mol IPDI/mol Sovermol® 908 tensile bars.
Raw stress-strain data for 1.7 mol IPDI/mol Myrinol™ DG-110 tensile bars.
0.0
0.1
0.2
0.3
0.4
0.5
0.6
0.7
0.8
0.9
0 50 100 150 200
Str
ess
(MP
a)
% Elongation
1.7 mol IPDI/mol Sovermol® 908 PU
5 samples tested
Average elongation at break: 140±40%
Average break stress: 0.6±0.2 MPa
x
0
1
2
3
4
5
6
7
0 50 100 150 200 250 300
Str
ess
(MP
a)
Elongation (%)
1.7 mol IPDI/mol Myrinol™ DG-110 PU
6 samples tested
Average elongation at break: 220±40%
Average break stress: 4.8±0.8 MPa
x

70
Raw stress-strain data for 1.7 mol LDI/mol Myrinol™ DG-110 tensile bars.
0.00
0.05
0.10
0.15
0.20
0.25
0.30
0.35
0.40
0.45
0.50
0 20 40 60 80 100 120 140
Str
ess
(MP
a)
Elongation (%)
1.7 mol LDI/mol Myrinol™ DG-110 PU
5 samples tested
Average elongation at break: 90±20%
Average break stress: 0.3±0.1 MPa
x
Copyright © 2022 FDOKUMEN