Synthesis and characterization of Beta zeolites for catalytic ...
59
Anna Zaykovskaya Synthesis and characterization of Beta zeolites for catalytic applications: influence of synthesis parameters Master of science Thesis Anna Zaykovskaya Laboratory of Industrial Chemistry and Reaction Engineering Faculty of Science and Engineering Åbo Akademi University Turku/Åbo, 2018
-
Upload
khangminh22 -
Category
Documents
-
view
0 -
download
0
Transcript of Synthesis and characterization of Beta zeolites for catalytic ...
Anna Zaykovskaya
Synthesis and characterization of Beta zeolites for catalytic
applications: influence of synthesis parameters
Master of science Thesis
Anna Zaykovskaya
Laboratory of Industrial Chemistry and Reaction Engineering
Faculty of Science and Engineering
Åbo Akademi University
Turku/Åbo, 2018
Anna Zaykovskaya
2
ABSTRACT
Zaykovskaya Anna Olegovna Synthesis and characterization of Beta
zeolites for catalytic applications:
influence of synthesis parameters
Master’s Thesis Carried out under the supervision of
Prof. Dmitry Yu. Murzin and Docent
Narendra Kumar at the Laboratory of
Industrial Chemistry and Reaction
Engineering, Faculty of Science and
Engineering,
Åbo Akademi University
Keywords Zeolites, Beta zeolites, catalytic material,
catalyst synthesis, catalyst characterization
The aim of this work is synthesis and physico-chemical characterization of Beta-zeolite catalysts
using various synthesis parameters, and their further application in catalytic processes.
Beta-zeolite catalysts were synthesized by two different methods varying such synthesis
parameters as time, pH, synthesis temperature, gel composition and gel ripening. Proton forms
were obtained by an ion exchange of sodium forms.
Determination of the physico-chemical characteristics of the synthesized catalysts is
essential for understanding of catalytic properties of zeolite materials. A range of analytical
methods was applied in this work including nitrogen physisorption to analyze surface area, pore
volume, and pore size distribution; scanning electron microscopy to study the morphology (shape,
size, and distribution of crystals); energy dispersive X-ray spectroscopy for the quantitative study
of the elemental composition; transmission electron microscopy to determine the structure and size
of pores; temperature-programmed CO2 desorption to determine the basicity (presence, number
and strength of the main areas); temperature-programmed desorption of NH3 to assess the acidity
(presence, amount and strength of acid sites), X-ray powder diffraction to determine the structure,
crystallinity and phase purity. Other methods used to characterize the catalysts were nuclear
magnetic resonance spectroscopy – 27A1-MAS-NMR and 29Si-MAS-NMR for analyzing the

Anna Zaykovskaya
3
framework and speciation of A1 and Si in Beta zeolite; Fourier transform infrared spectroscopy to
study the acidic properties of the H-Beta-zeolite catalyst for the presence of Brønsted and Lewis
acid sites, their number and strength.
Anna Zaykovskaya
4
PREFACE
The present Master of Science Thesis work was performed at the Laboratory of Industrial
Chemistry and Reaction Engineering, (Åbo Akademi University, Turku, Finland) during the
period 1.2.2018-30.7.2018.
I would like to express my appreciation to Professor Esther M. Sulman and Professor
Valentina G. Matveeva for their support, faith in me, and giving me a chance to be engaged in this
Double Master 's program.
I would like to express my deep appreciation to my supervisors – Docent Narendra Kumar
and Professor Dmitry Yu. Murzin for their great help with my thesis work and my new knowledge.
Besides, I would like to thank Atte Aho and Kari Eränen for their help during the
experimental work.
Anna Zaykovskaya
5
ABBREVIATION, ACRONYMS AND SYMBOLS
EDX – energy-dispersive X-ray spectroscopy
NMR – nuclear magnetic resonance spectroscopy
TPD – temperature programmed desorption
SDD – silicon drift detector
TPD-NH3 – temperature programmed desorption of ammonia
XRD – X-ray powder diffraction
FTIR – Fourier-transform infrared spectroscopy
SEM – scanning electron microscopy
TEM – transmission electron microscopy
MOR – mordenite
PHAPTMS – Phenylaminopropyl-trimethoxysilane
GR – gel ripening
R – rotation mode
S – static mode
M1 – 1st method of preparation
M2 – 2d method of preparation
IE – ion exchange
h – hour
g – gram
nm – nanometer
T – temperature
LAS – Lewis acid sites
BAS – Brønsted acid sites

Anna Zaykovskaya
6
CONTENT
1. Introduction 7
2. Theory 8
2.1 Aluminosilicate zeolite type materials 8
2.2 Classification and framework composition of synthetic zeolites 9
2.3 Beta zeolite 10
2.4 Synthesis of zeolites 11
3. Experimental 17
3.1 Synthesis of Beta zeolites 17
3.2 Characterization of prepared materials 19
3.2.1 N2-physisorption 19
3.2.2 Scanning electron microscopy and energy dispersive X-ray micro-analysis spectroscopy 20
3.2.3 Transmission electron microscopy 20
3.2.4 X-ray powder diffraction 20
3.2.5 27A1-MAS NMR and 29Si MAS NMR spectrometers 21
3.2.6 Fourier-transform infrared spectroscopy 22
4. Results and discussion 23
4.1. Beta zeolite synthesis results 23
4.2 Beta zeolite physico-chemical characterization results 24
4.2.1 N2-physisorption 25
4.2.2 Scanning electron microscopy 27
4.2.3 Energy dispersive X-ray micro-analysis 39
4.2.4 Transmission electron microscopy 40
4.2.5 X-ray powder diffraction 47
4.2.6 29Si and 27Al MAS NMR spectrometry 51
4.2.7 Fourier transform infrared spectrometry 54
5. Conclusions 55
References 56
Anna Zaykovskaya
7
1. Introduction
Zeolite catalysts with varying pore size, structures, acidic properties (Brønsted and Lewis acid
sites), ion-exchange and isomorphous substitution of framework alumina have found applications
in several industrial processes in oil refinery, production of petrochemicals, synthesis of speciality
and fine chemicals, solving environmental-related problems for industrial waste water and exhaust
emission control for the motor-driven engines. The reasons for so many industrial catalytic
processes are unique properties of microporous zeolites such as a possibility to tailor the crystal
size and distributions, uniform channel systems and creation of varying pore sizes in a given zeolite
structure. Furthermore, design of pristine parent Beta zeolite catalysts and their proton forms with
well-defined structure, crystal size, Brønsted and Lewis acid sites is of immense importance for
catalytic applications. Creation of framework Al and Si species with a particular defined co-
ordination, formation of hydroxyl groups such as SiOH, AlOH, Si(OH)2 and A1 (OLTL) are
challenging tasks, which need in-depth understanding of the silicate solution chemistry, as well as
chemistry of aluminates. It should be noted that zeolite synthesis parameters such as synthesis
time, temperature, pH and mode of stirring, influence the formation of different aluminate and
silicate species during the preparation of zeolite gel mixtures and their subsequent hydrothermal
synthesis at elevated temperature. The insertion of A1 species in the framework of Beta zeolite,
formation of Brønsted and Lewis acid sites, zeolite crystal formations, their uniformity and
distributions can be influenced by varying synthesis time, temperature and pH of the gel solution.
Furthermore, sources of silica and alumina, structure directing organic templates and their addition
sequence have a potential of influencing the crystal morphology, pore size distributions and
crystallinity of the final synthesized Beta zeolite microporous materials. Hence, an in-depth study
of these synthesis parameters is necessary for synthesizing Beta zeolite catalysts with a high
crystallinity, tuned Brønsted and Lewis acid sites, suitable crystal morphology, the desired
physico-chemical and catalytic properties.
As a result of the work twenty-five Beta zeolite samples were synthesized. Physico-
chemical and catalytic properties of Beta zeolite catalysts were studied using different
characterization methods. It was shown that received zeolites have a surface area higher than
reported in the literature. Besides, the number of Brønsted acid sites in some samples was higher
compared to H-Beta-25, H-Beta-150 and H-Beta-300.
Anna Zaykovskaya
8
2. Theory
2.1 Aluminosilicate zeolite type materials
Zeolites are a special group of aluminosilicates, which are highly crystalline, can contain protons,
alkali or alkaline earth metals to counterbalance the charge deficit introduced by replacing silicon
by aluminum in the framework [1]. There material have numerous applications as catalysts,
adsorbents, sensors, separators and ion-exchangers. Catalytic cracking, alkylation, and
isomerization can be mentioned as representative catalytic processes in oil refining and chemical
industry [2–6]. The industrial interest in zeolites is due to a combination of several favorable
properties, including high surface area, good ion-exchange capability, shape-selectivity, tunable
Brønsted and Lewis acid sites, high thermal and hydrothermal stability.
Zeolites are made up of micropores with dimensions close to those of many molecules.
This feature has endowed them with the remarkable property of shape selectivity, which makes it
possible to discriminate among different substrates according to their size [7].
However, the use of zeolite catalysts is hindered in many reactions involving bulky
substrates, which cannot enter the zeolite micropores. In this case, the reaction may occur
exclusively over the active sites located on the external surface of the zeolite crystals, which value
for a conventional micrometer size zeolite is very small (< 10 m2 g-1) [8].
This drawback of zeolites has been circumvented by the development of hierarchical
zeolites, which are characterized by the occurrence of a bimodal pore size distribution within the
micro/mesopore ranges [9-11]. In these materials, the zeolitic micropore system is complemented
by a secondary porosity, with sizes usually in the mesopore range. Depending on the preparation
method and the zeolite structure, the contribution of the secondary porosity may vary in a broad
range, with values of the mesopore surface area as high as 200 – 300 m2 g-1. Presence of these
mesopores facilitates the accessibility of the zeolite inner active sites to bulky substrates. Likewise,
it shortens the diffusional pathway length within the zeolite particles and crystals [12]. Hence, this
increased accessibility leads to remarkable changes in the catalytic behaviour of the zeolites:
enhanced activities [13,14], better dispersion of deposited metal phase [15,16] and lower
deactivation rates [17,18].
Anna Zaykovskaya
9
2.2 Classification and framework composition of synthetic zeolites
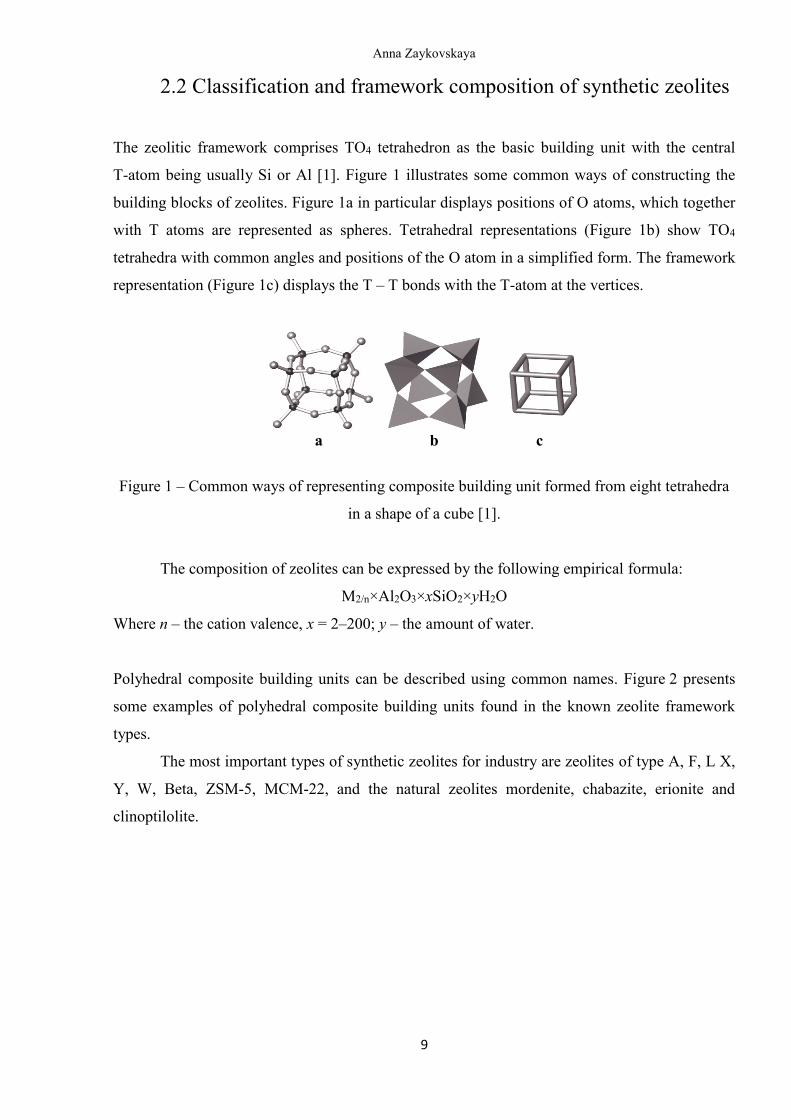
The zeolitic framework comprises TO4 tetrahedron as the basic building unit with the central
T-atom being usually Si or Al [1]. Figure 1 illustrates some common ways of constructing the
building blocks of zeolites. Figure 1a in particular displays positions of O atoms, which together
with T atoms are represented as spheres. Tetrahedral representations (Figure 1b) show TO4
tetrahedra with common angles and positions of the O atom in a simplified form. The framework
representation (Figure 1c) displays the T – T bonds with the T-atom at the vertices.
a b c
Figure 1 – Common ways of representing composite building unit formed from eight tetrahedra
in a shape of a cube [1].
The composition of zeolites can be expressed by the following empirical formula:
M2/n×Al2O3×xSiO2×yH2O
Where n – the cation valence, x = 2–200; y – the amount of water.
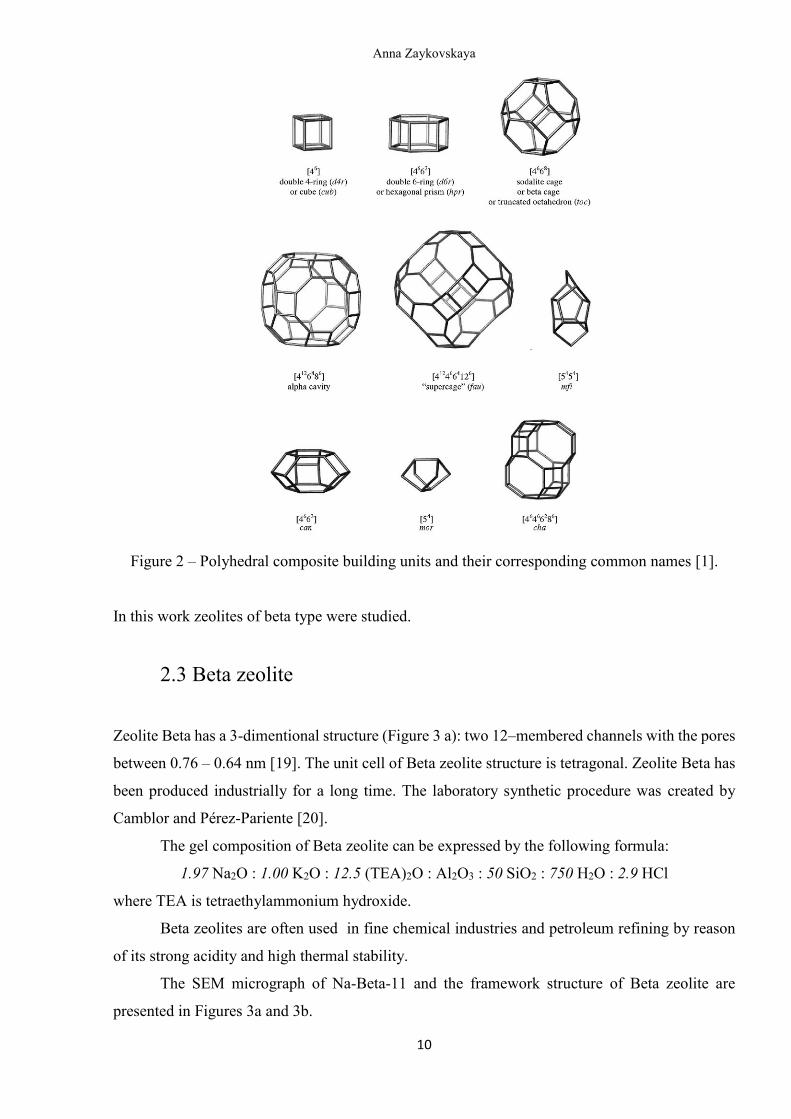
Polyhedral composite building units can be described using common names. Figure 2 presents
some examples of polyhedral composite building units found in the known zeolite framework
types.
The most important types of synthetic zeolites for industry are zeolites of type A, F, L X,
Y, W, Beta, ZSM-5, MCM-22, and the natural zeolites mordenite, chabazite, erionite and
clinoptilolite.
Anna Zaykovskaya
10
Figure 2 – Polyhedral composite building units and their corresponding common names [1].
In this work zeolites of beta type were studied.
2.3 Beta zeolite
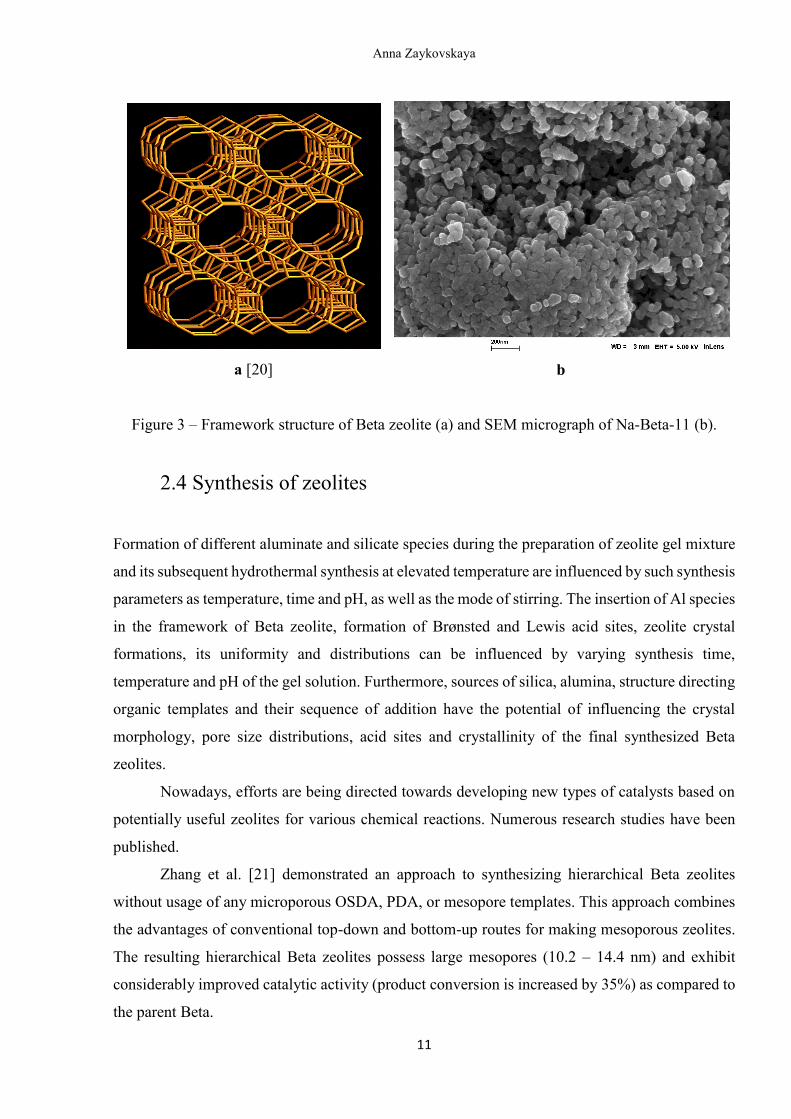
Zeolite Beta has a 3-dimentional structure (Figure 3 a): two 12–membered channels with the pores
between 0.76 – 0.64 nm [19]. The unit cell of Beta zeolite structure is tetragonal. Zeolite Beta has
been produced industrially for a long time. The laboratory synthetic procedure was created by
Camblor and Pérez-Pariente [20].
The gel composition of Beta zeolite can be expressed by the following formula:
1.97 Na2O : 1.00 K2O : 12.5 (TEA)2O : Al2O3 : 50 SiO2 : 750 H2O : 2.9 HCl
where TEA is tetraethylammonium hydroxide.
Beta zeolites are often used in fine chemical industries and petroleum refining by reason
of its strong acidity and high thermal stability.
The SEM micrograph of Na-Beta-11 and the framework structure of Beta zeolite are
presented in Figures 3a and 3b.
Anna Zaykovskaya
11
a [20] b
Figure 3 – Framework structure of Beta zeolite (a) and SEM micrograph of Na-Beta-11 (b).
2.4 Synthesis of zeolites
Formation of different aluminate and silicate species during the preparation of zeolite gel mixture
and its subsequent hydrothermal synthesis at elevated temperature are influenced by such synthesis
parameters as temperature, time and pH, as well as the mode of stirring. The insertion of Al species
in the framework of Beta zeolite, formation of Brønsted and Lewis acid sites, zeolite crystal
formations, its uniformity and distributions can be influenced by varying synthesis time,
temperature and pH of the gel solution. Furthermore, sources of silica, alumina, structure directing
organic templates and their sequence of addition have the potential of influencing the crystal
morphology, pore size distributions, acid sites and crystallinity of the final synthesized Beta
zeolites.
Nowadays, efforts are being directed towards developing new types of catalysts based on
potentially useful zeolites for various chemical reactions. Numerous research studies have been
published.
Zhang et al. [21] demonstrated an approach to synthesizing hierarchical Beta zeolites
without usage of any microporous OSDA, PDA, or mesopore templates. This approach combines
the advantages of conventional top-down and bottom-up routes for making mesoporous zeolites.
The resulting hierarchical Beta zeolites possess large mesopores (10.2 – 14.4 nm) and exhibit
considerably improved catalytic activity (product conversion is increased by 35%) as compared to
the parent Beta.
Anna Zaykovskaya
12
Santos et al. [22] studied the effect of the alkaline treatment time at 338 K, varying it from
10 to 240 min for Beta 40 and 73. In the latter case, it was observed that these conditions were too
drastic to develop meso-area preserving microporosity: while meso-area was formed easily, only
30% of MiPV was preserved. It seems Beta 40 was a better precursor for following the stepwise
transformation during the alkaline treatment. Optimal conditions to create mesopore while
maintaining the micropore structure could be found.
First, under mild alkaline treatment, silica is removed from the framework forming
mesopores and increasing the area of mesopores. Micropore volume and crystallinity are lost.
Some silica is dissolved to the solution and some amorphous phase is formed on the solid
(amorphization). The amorphous phase mainly consists of silica.
Then after an increase of the treatment time or performing the treatment under more severe
conditions, a part of the amorphous silica returns to the framework in a recrystallization process,
diminishing the number of defects. The average size of mesopores is increased and the pore
structure is re-organized.
Manrique et al. [23] introduced a new composition in the synthesis gel to prepare zeolite
Beta with a low SiO2/Al2O3 ratio (20<Si/Al<10 in the final product) at 170ºC in 24 h. The three
synthesized zeolites Beta differed significantly in their physico-chemical properties as a
consequence of the synthesis conditions variations. The final compositions have shown important
effects on the resulting pore system and the acidic properties after calcination. Although the acid
strength of solid Brønsted acids is the desired catalytic property for hydrocracking of vacuum gas
oil, mesoporosity characteristics should be always taken into account. Acid sites of the moderate
strength may exert control over selectivity to gasoline. Moreover, it has been shown that the
catalyst formulations with a higher fraction of the zeolite have influenced metal deposition as well
as its dispersion. Despite a twofold higher conversion with the catalyst having a higher zeolite
content, the middle distillate selectivity was maintained.
Huang et al. [24] reported that one-step and fast synthesis of hierarchical Beta zeolite
aggregates, assembled from the nanosized crystals with very small dominant pore sizes, can be
successfully achieved by employing H-Kanemite as a layered silicate precursor in hydrothermal
conditions using TEAOH as a structure directing agent. Hierarchically structured Beta zeolites
with uniform nanosized crystals retain the intracrystal microporosity, and simultaneously possess
extremely high mesopore volumes (0.80 - 0.86 mL g-1) and external surface areas (266 - 349 m2
g-1) derived from the assembly of nanosized crystals. The nanosized Beta zeolite exhibits acidity
stronger than the commercial one.
Rutkowska et al. [25] made a comparison of the catalytic performance of different
transition metal (Fe, Cu and Co) species introduced to conventional and mesopore-modified Beta
Anna Zaykovskaya
13
zeolite in N2O decomposition reaction. The highest N2O conversion (under conditions simulating
the composition of gases emitted from nitric acid plants) was obtained over the Fe-Beta catalyst.
This result, together with a high hydrothermal stability (50 h, 773 K), makes this catalyst the most
interesting for the application in industry in a studied series of materials.
Jin et al. [26] reported that acidic zeolites with broad Si/Al ratios were modified
by alkali–acid treatments, i.e. the sequential combination of alkaline pre-etching, bulk alkaline and
acid leaching. H-Beta zeolites that have undergone desilication and dealumination displayed
hierarchical porous structures with regular mesopore size distributions, characteristic of pore sizes
centering at 4.6-6.1 nm, specific surface areas increasing to 611 m2 g-1 and mesopore volumes up
to 0.64 cm3 g-1. An increase in the framework Al concentration appeared to play a predominant
role of controlling desilication, leading to significant mesoporosity with a regular mesopore size
distribution. No clear threshold for the initial Si/Al ratio preferable for mesopore modification
under the same treatment condition was identified. The combined treatment to Beta zeolites gavr
a moderate increase in the Si/Al ratio. Larger losses of the zeolite yields and a relative crystallinity
related to excessive dissolution of the parent zeolites.
Besides changes in textural properties of mesopores observed by SEM and TEM, the
volumetric fraction of intraparticle to total BJH mesopores decreased from 95.3% to 86.6% as the
initial Si/Al ratio increased from 9.4 to 64. Selectivity of T-atoms removal was associated with the
Si/Al ratio of the dissolved phases. H-Beta zeolites exhibited selectivity above 95% for desilication
and less than 5% for dealumination.
For alkylation of benzene with 1-dodecene, the catalytic performance of hierarchical
zeolites Beta was shown to be correlated with the accessible mesoporosity and a regular mesopore
size distribution. Both 1-dodecene conversion and linear alkyl benzene selectivity were improved
with varying time-on-stream. Despite comparable acidic properties, the modified sample was
shown to have a narrow mesopore size distribution and hence to exhibit the enhanced catalytic
performance for selective production of linear alkylbenzenes compared with the purely desilicated
sample with a broader mesopore size distribution. A correlation between acidity and the
hierarchical structure indicated that the synergy between the regular mesopore structure and a
relatively mild acidity is the key for the modified Beta zeolites to promote alkylation.
Fang et al. [27] described a novel in situ microwave hydrothermal synthesis technique for
the NaA zeolite monolithic adsorbent on a honeycomb ceramic matrix. The synthesis process, the
morphology and the adsorption/desorption performance of the monolithic adsorbent were
systematically investigated. It was indicated that seeding coating can induce formation of pure
NaA zeolite on the ceramic support and prevent NaA crystals from further crystalline
Anna Zaykovskaya
14
transformation. The optimal synthesis process by the microwave hydrothermal treatment required
the microwave time of 45 min and the reaction temperature of 160 oC.
Khalil and Muraza [28] synthesized pure Mordenite (MOR) zeolite with different gel
compositions (i.e. Si/Al 12, 25 and 50). A higher alkalinity of the gel mixture was required to
obtain pure MOR with a higher Si/Al ratio under the same conditions. Microwave-assisted
hydrothermal synthesis of the seed free mordenite zeolite decreased the crystallization time to
12 h while addition of OSDAs in the gel solution further diminished the time to 6 h at the same
conditions. On the contrary, minimum 24 h were needed for the crystallization of pure MOR with
OSDA under conventional heating. Aging and crystallization time were optimized to get a pure
mordenite phase. Aging time of 6 h gave a higher crystallinity while a further increase in the aging
time up to 12 h resulted in an amorphous phase. Spherical and rectangular shaped crystals of the
size below 1 mm were obtained at optimized conditions.
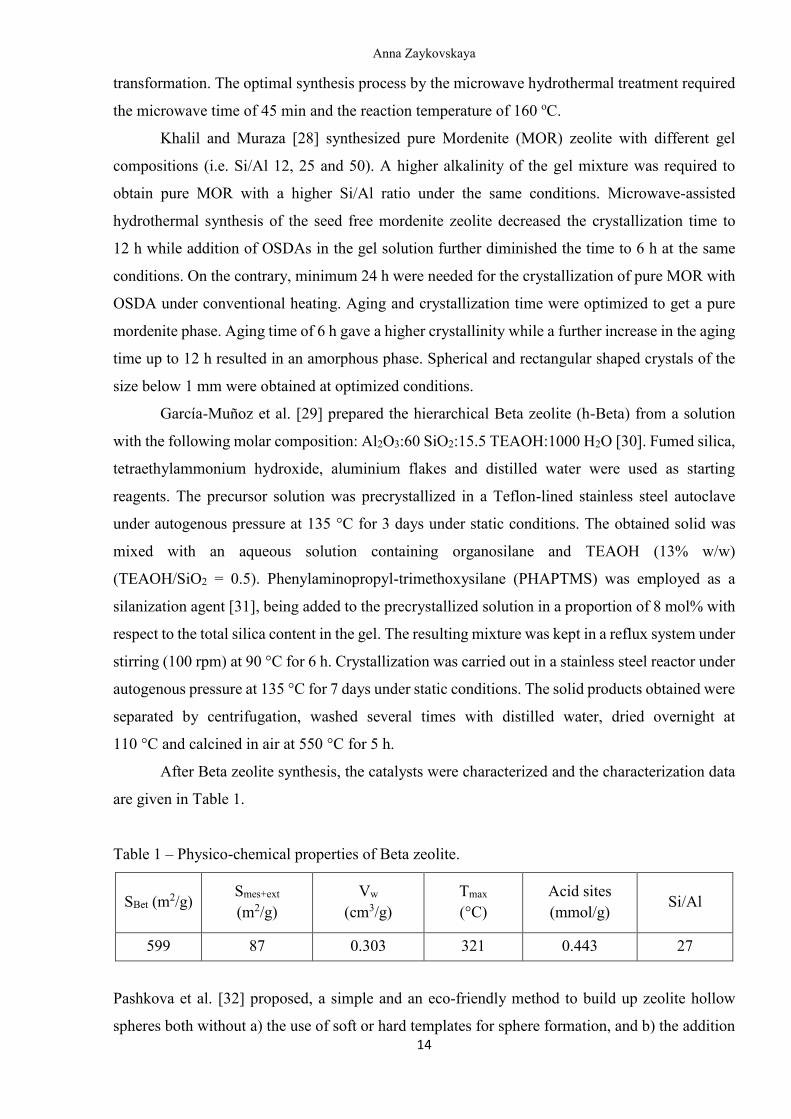
García-Muñoz et al. [29] prepared the hierarchical Beta zeolite (h-Beta) from a solution
with the following molar composition: Al2O3:60 SiO2:15.5 TEAOH:1000 H2O [30]. Fumed silica,
tetraethylammonium hydroxide, aluminium flakes and distilled water were used as starting
reagents. The precursor solution was precrystallized in a Teflon-lined stainless steel autoclave
under autogenous pressure at 135 °C for 3 days under static conditions. The obtained solid was
mixed with an aqueous solution containing organosilane and TEAOH (13% w/w)
(TEAOH/SiO2 = 0.5). Phenylaminopropyl-trimethoxysilane (PHAPTMS) was employed as a
silanization agent [31], being added to the precrystallized solution in a proportion of 8 mol% with
respect to the total silica content in the gel. The resulting mixture was kept in a reflux system under
stirring (100 rpm) at 90 °C for 6 h. Crystallization was carried out in a stainless steel reactor under
autogenous pressure at 135 °C for 7 days under static conditions. The solid products obtained were
separated by centrifugation, washed several times with distilled water, dried overnight at
110 °C and calcined in air at 550 °C for 5 h.
After Beta zeolite synthesis, the catalysts were characterized and the characterization data
are given in Table 1.
Table 1 – Physico-chemical properties of Beta zeolite.
SBet (m2/g)
Smes+ext
(m2/g)
Vw
(cm3/g)
Tmax
(°C)
Acid sites
(mmol/g) Si/Al
599 87 0.303 321 0.443 27
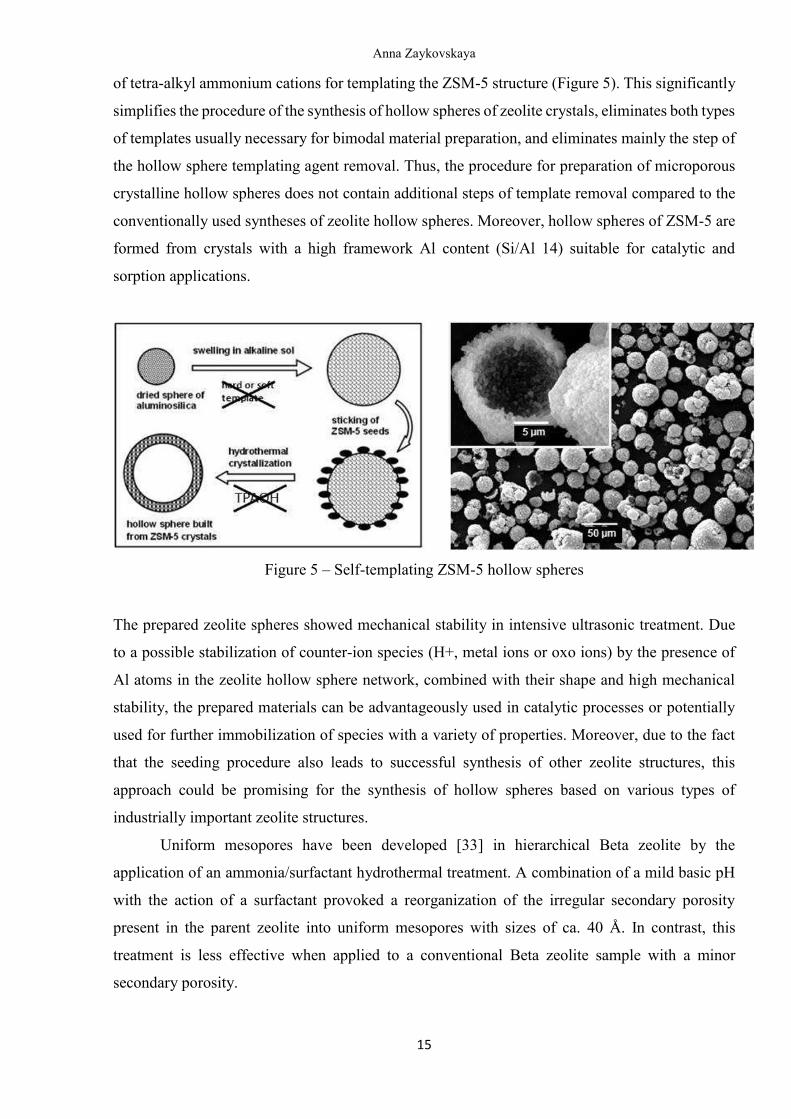
Pashkova et al. [32] proposed, a simple and an eco-friendly method to build up zeolite hollow
spheres both without a) the use of soft or hard templates for sphere formation, and b) the addition
Anna Zaykovskaya
15
of tetra-alkyl ammonium cations for templating the ZSM-5 structure (Figure 5). This significantly
simplifies the procedure of the synthesis of hollow spheres of zeolite crystals, eliminates both types
of templates usually necessary for bimodal material preparation, and eliminates mainly the step of
the hollow sphere templating agent removal. Thus, the procedure for preparation of microporous
crystalline hollow spheres does not contain additional steps of template removal compared to the
conventionally used syntheses of zeolite hollow spheres. Moreover, hollow spheres of ZSM-5 are
formed from crystals with a high framework Al content (Si/Al 14) suitable for catalytic and
sorption applications.
Figure 5 – Self-templating ZSM-5 hollow spheres
The prepared zeolite spheres showed mechanical stability in intensive ultrasonic treatment. Due
to a possible stabilization of counter-ion species (H+, metal ions or oxo ions) by the presence of
Al atoms in the zeolite hollow sphere network, combined with their shape and high mechanical
stability, the prepared materials can be advantageously used in catalytic processes or potentially
used for further immobilization of species with a variety of properties. Moreover, due to the fact
that the seeding procedure also leads to successful synthesis of other zeolite structures, this
approach could be promising for the synthesis of hollow spheres based on various types of
industrially important zeolite structures.
Uniform mesopores have been developed [33] in hierarchical Beta zeolite by the
application of an ammonia/surfactant hydrothermal treatment. A combination of a mild basic pH
with the action of a surfactant provoked a reorganization of the irregular secondary porosity
present in the parent zeolite into uniform mesopores with sizes of ca. 40 Å. In contrast, this
treatment is less effective when applied to a conventional Beta zeolite sample with a minor
secondary porosity.
Anna Zaykovskaya
16
The main aim of this work is a systematic study of the influence of synthesis parameters
such as synthesis time, temperature, pH of the gel mixture, gel ripening and mode of stirring on
the physico-chemical and catalytic properties of Beta zeolite catalysts. Beta zeolite synthesis
research reported in the open literature is briefly summarized in Table 2.
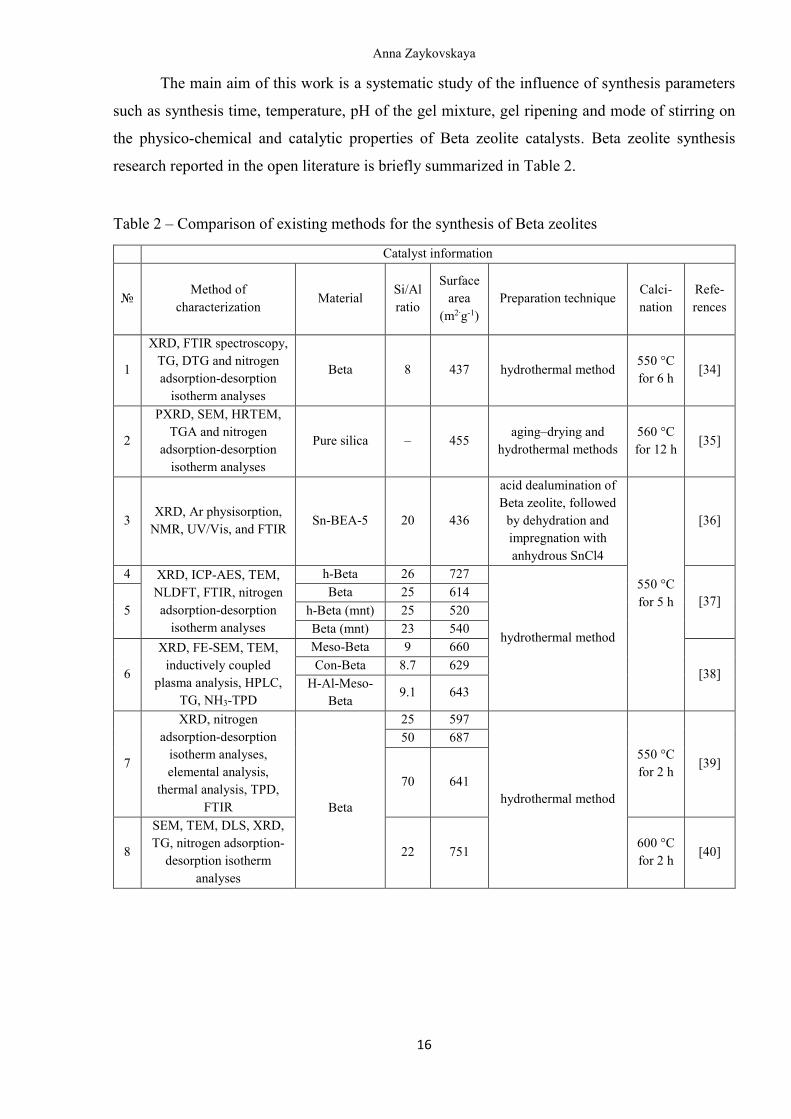
Table 2 – Comparison of existing methods for the synthesis of Beta zeolites
Catalyst information
№ Method of
characterization Material
Si/Al
ratio
Surface
area
(m2∙g-1)
Preparation technique Calci-
nation
Refe-
rences
1
XRD, FTIR spectroscopy,
TG, DTG and nitrogen
adsorption-desorption
isotherm analyses
Beta 8 437 hydrothermal method 550 °C
for 6 h [34]
2
PXRD, SEM, HRTEM,
TGA and nitrogen
adsorption-desorption
isotherm analyses
Pure silica – 455 aging–drying and
hydrothermal methods
560 °C
for 12 h [35]
3 XRD, Ar physisorption,
NMR, UV/Vis, and FTIR Sn-BEA-5 20 436
acid dealumination of
Beta zeolite, followed
by dehydration and
impregnation with
anhydrous SnCl4
550 °C
for 5 h
[36]
4 XRD, ICP-AES, TEM,
NLDFT, FTIR, nitrogen
adsorption-desorption
isotherm analyses
h-Beta 26 727
hydrothermal method
[37] 5
Beta 25 614
h-Beta (mnt) 25 520
Beta (mnt) 23 540
6
XRD, FE-SEM, TEM,
inductively coupled
plasma analysis, HPLC,
TG, NH3-TPD
Meso-Beta 9 660
[38] Con-Beta 8.7 629
H-Al-Meso-
Beta 9.1 643
7
XRD, nitrogen
adsorption-desorption
isotherm analyses,
elemental analysis,
thermal analysis, TPD,
FTIR
Beta
25 597
hydrothermal method
550 °C
for 2 h [39]
50 687
70 641
8
SEM, TEM, DLS, XRD,
TG, nitrogen adsorption-
desorption isotherm
analyses
22 751 600 °C
for 2 h [40]
Anna Zaykovskaya
17
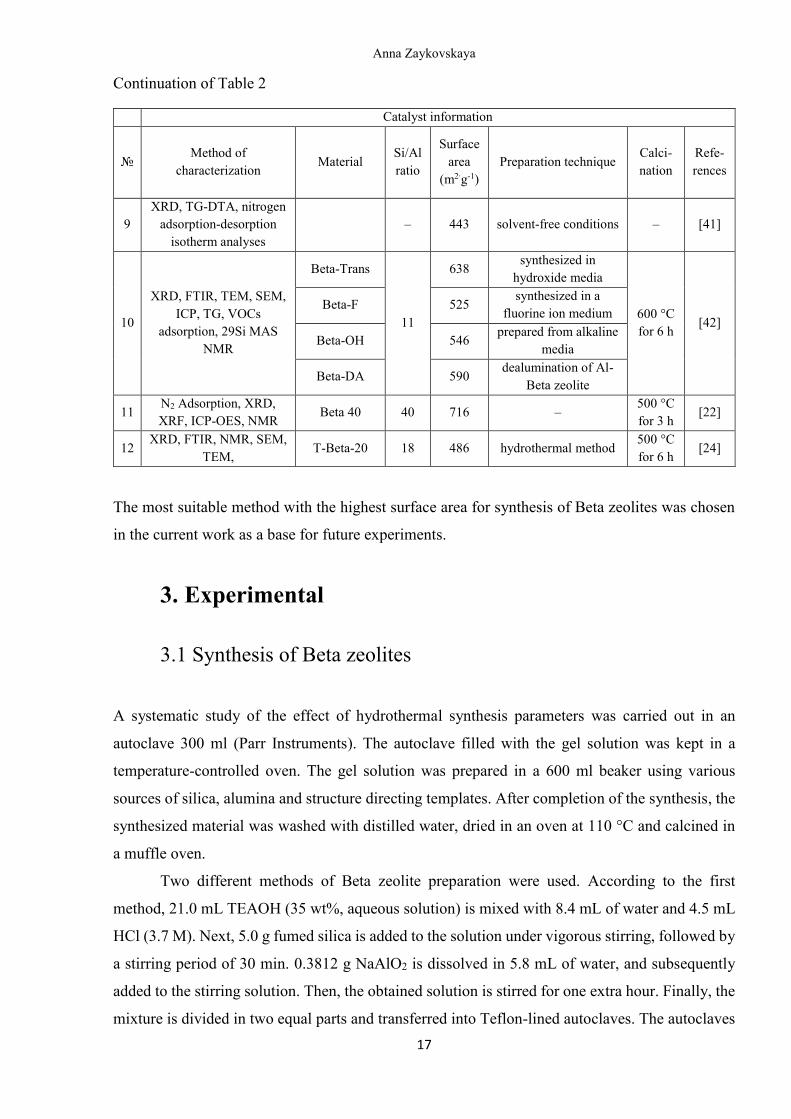
Continuation of Table 2
Catalyst information
№ Method of
characterization Material
Si/Al
ratio
Surface
area
(m2∙g-1)
Preparation technique Calci-
nation
Refe-
rences
9
XRD, TG-DTA, nitrogen
adsorption-desorption
isotherm analyses
– 443 solvent-free conditions – [41]
10
XRD, FTIR, TEM, SEM,
ICP, TG, VOCs
adsorption, 29Si MAS
NMR
Beta-Trans
11
638 synthesized in
hydroxide media
600 °C
for 6 h [42]
Beta-F 525 synthesized in a
fluorine ion medium
Beta-OH 546 prepared from alkaline
media
Beta-DA 590 dealumination of Al-
Beta zeolite
11 N2 Adsorption, XRD,
XRF, ICP-OES, NMR Beta 40 40 716 –
500 °C
for 3 h [22]
12 XRD, FTIR, NMR, SEM,
TEM, T-Beta-20 18 486 hydrothermal method
500 °C
for 6 h [24]
The most suitable method with the highest surface area for synthesis of Beta zeolites was chosen
in the current work as a base for future experiments.
3. Experimental
3.1 Synthesis of Beta zeolites
A systematic study of the effect of hydrothermal synthesis parameters was carried out in an
autoclave 300 ml (Parr Instruments). The autoclave filled with the gel solution was kept in a
temperature-controlled oven. The gel solution was prepared in a 600 ml beaker using various
sources of silica, alumina and structure directing templates. After completion of the synthesis, the
synthesized material was washed with distilled water, dried in an oven at 110 °C and calcined in
a muffle oven.
Two different methods of Beta zeolite preparation were used. According to the first
method, 21.0 mL TEAOH (35 wt%, aqueous solution) is mixed with 8.4 mL of water and 4.5 mL
HCl (3.7 M). Next, 5.0 g fumed silica is added to the solution under vigorous stirring, followed by
a stirring period of 30 min. 0.3812 g NaAlO2 is dissolved in 5.8 mL of water, and subsequently
added to the stirring solution. Then, the obtained solution is stirred for one extra hour. Finally, the
mixture is divided in two equal parts and transferred into Teflon-lined autoclaves. The autoclaves
Anna Zaykovskaya
18
are placed in an oven for a hydrothermal treatment in a static mode for different time (24, 48, 72,
96, 120 and 144 h) at 150 °C resulting in the Beta zeolite nanoparticles solutions. After
centrifugation and washing with distilled water, drying of the zeolite was performed at 100 °C in
an oven. The Beta zeolite was thereafter calcined at 525 °C for 7 h.
In the second method 59.4 g of water, 89.6 g of TEAOH (40%) are mixed with 1.44 g of
KCl and 0.53 g of NaCl. Then, 30 g fumed silica is added to the solution and stirred until being
homogenized (10 minutes minimum). Next 20.0 g of water is mixed with 0.33 of NaOH and
1.79 g of NaAlO2 and stirred until dissolved. After that, two resulting liquids are combined and
stirred for 10 min (gives a thick gel). Finally, the mixture is put in two Teflon cups. The autoclaves
are placed in an oven. A subsequent step of centrifugation was followed by washing with distilled
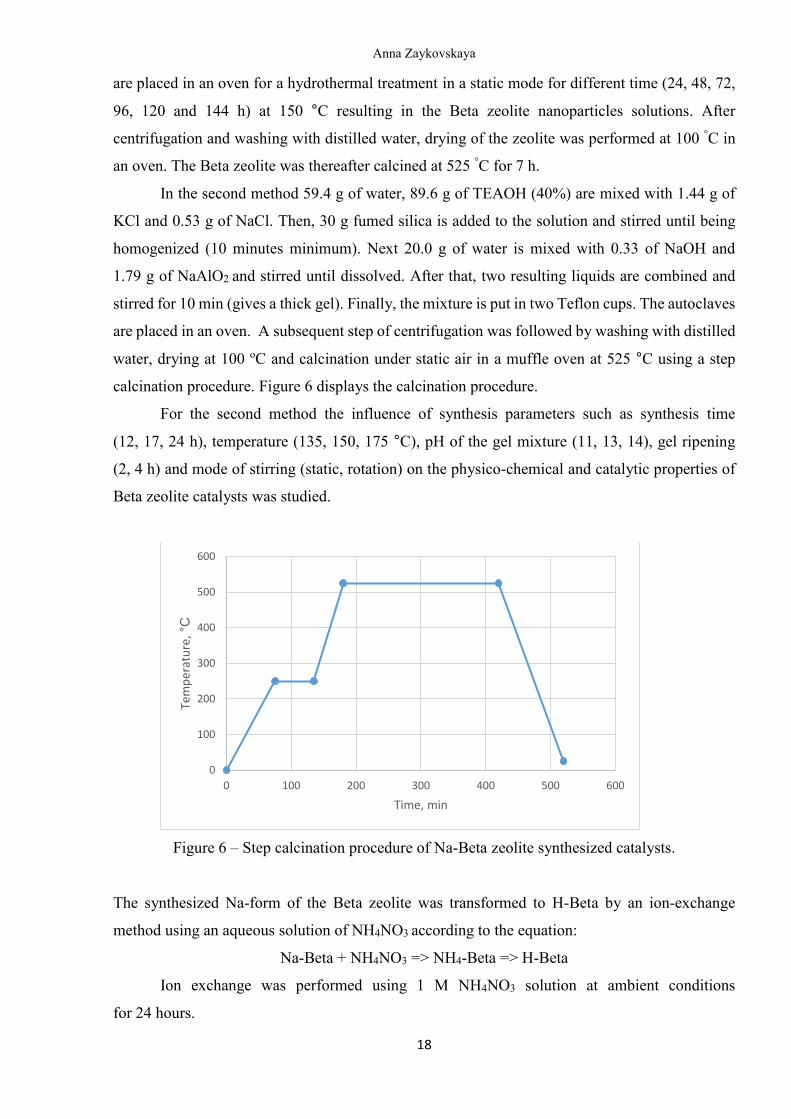
water, drying at 100 oC and calcination under static air in a muffle oven at 525 °C using a step
calcination procedure. Figure 6 displays the calcination procedure.
For the second method the influence of synthesis parameters such as synthesis time
(12, 17, 24 h), temperature (135, 150, 175 °C), pH of the gel mixture (11, 13, 14), gel ripening
(2, 4 h) and mode of stirring (static, rotation) on the physico-chemical and catalytic properties of
Beta zeolite catalysts was studied.
Figure 6 – Step calcination procedure of Na-Beta zeolite synthesized catalysts.
The synthesized Na-form of the Beta zeolite was transformed to H-Beta by an ion-exchange
method using an aqueous solution of NH4NO3 according to the equation:
Na-Beta + NH4NO3 => NH4-Beta => H-Beta
Ion exchange was performed using 1 M NH4NO3 solution at ambient conditions
for 24 hours.
0
100
200
300
400
500
600
0 100 200 300 400 500 600
Tem
per
atu
re, °C
Time, min
Anna Zaykovskaya
19
The ion-exchanged zeolite was washed with distilled water until it was free from Cl ions
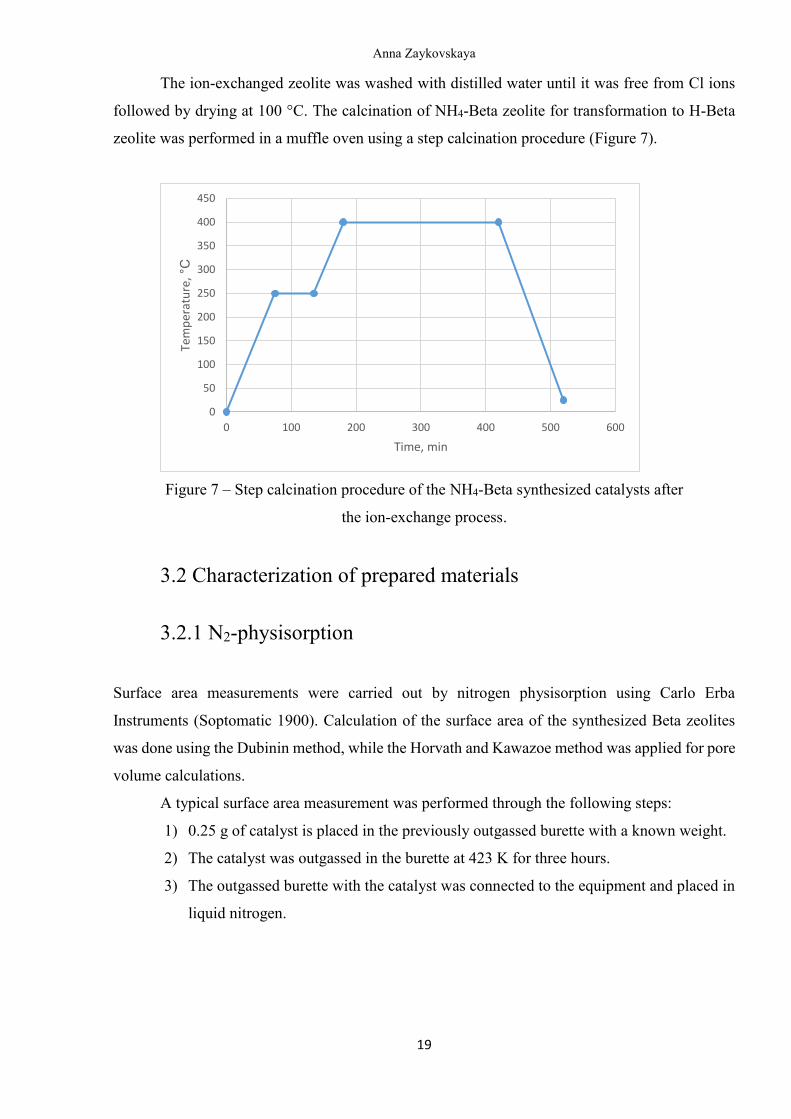
followed by drying at 100 °C. The calcination of NH4-Beta zeolite for transformation to H-Beta
zeolite was performed in a muffle oven using a step calcination procedure (Figure 7).
Figure 7 – Step calcination procedure of the NH4-Beta synthesized catalysts after
the ion-exchange process.
3.2 Characterization of prepared materials
3.2.1 N2-physisorption
Surface area measurements were carried out by nitrogen physisorption using Carlo Erba
Instruments (Soptomatic 1900). Calculation of the surface area of the synthesized Beta zeolites
was done using the Dubinin method, while the Horvath and Kawazoe method was applied for pore
volume calculations.
A typical surface area measurement was performed through the following steps:
1) 0.25 g of catalyst is placed in the previously outgassed burette with a known weight.
2) The catalyst was outgassed in the burette at 423 K for three hours.
3) The outgassed burette with the catalyst was connected to the equipment and placed in
liquid nitrogen.
0
50
100
150
200
250
300
350
400
450
0 100 200 300 400 500 600
Tem
per
atu
re, °C
Time, min
Anna Zaykovskaya
20
3.2.2 Scanning electron microscopy and energy dispersive X-ray
micro-analysis spectroscopy
In the current work, SEM was used to analyze the morphology, distribution of crystals, size and
shape of Beta zeolites. The main advantage of SEM is the possibility to observe solid-state
topography with a resolution and depth of field far exceeding the corresponding parameters of
optical microscopes.
Measurements were carried out using LEO Gemini 1530 with a Thermo Scientific UltraDry
Silicon Drift Detector equipped with a secondary electron, a backscattered electron and an In-Lens
detector.
Determining of the elemental composition was done using Energy dispersive X-ray micro-
analysis spectroscopy (EDX).
3.2.3 Transmission electron microscopy
The morphology, structure, porosity and channel systems of catalysts was investigated with
transmission electron microscopy. The measurements were carried out at the Laboratory of
Electron Microscopy, Institute of Biomedicine, Faculty of Medicine, Turku University, with a
JEM 1400 plus instrument having an acceleration voltage of 120 kV and a resolution of 0.98 nm
using a Quemsa II MPix bottom mounted digital camera.
3.2.4 X-ray powder diffraction
The PANalytical Empyrean X-ray powder diffractometer was used for determination of the
structural properties and phase purity of Beta zeolite catalysts. The diffractometer was operated in
the Bragg-Brentano diffraction mode, and the monochromatized Cu-Kα radiation (λ = 1.541874
Å) was generated with a voltage of 45 kV and a current of 40 mA. The primary X-ray beam was
collimated with a fixed 0.25° divergence slit, a fixed 10 mm mask and a fixed 1° anti-scatter slit.
A 7.5 mm anti-scatter slit was used in the diffracted beam side prior to the proportional counter.
The measured 2θ angle range was 2.0° ̶ 80.0°, with a step size of 0.026° and a measurement time
of 80 s per step. The samples were ground gently before the measurements to minimize the sample
texture (preferred crystal orientation).
Anna Zaykovskaya
21
The samples were measured on stainless steel sample holders. It must be stressed that the
phase detection threshold of this kind of an X-ray powder diffraction measurement is limited to
approximately 5%. The measured diffractograms were analyzed with Philips XPert HighScore and
MAUD programs. HighScore together with MAUD was used for the phase analysis, while MAUD
was utilized for the Rietveld refinement. The Powder Diffraction database, IZA Structure
Commission Database of Zeolite Structures and Inorganic Crystal Structure Database (ICSD) were
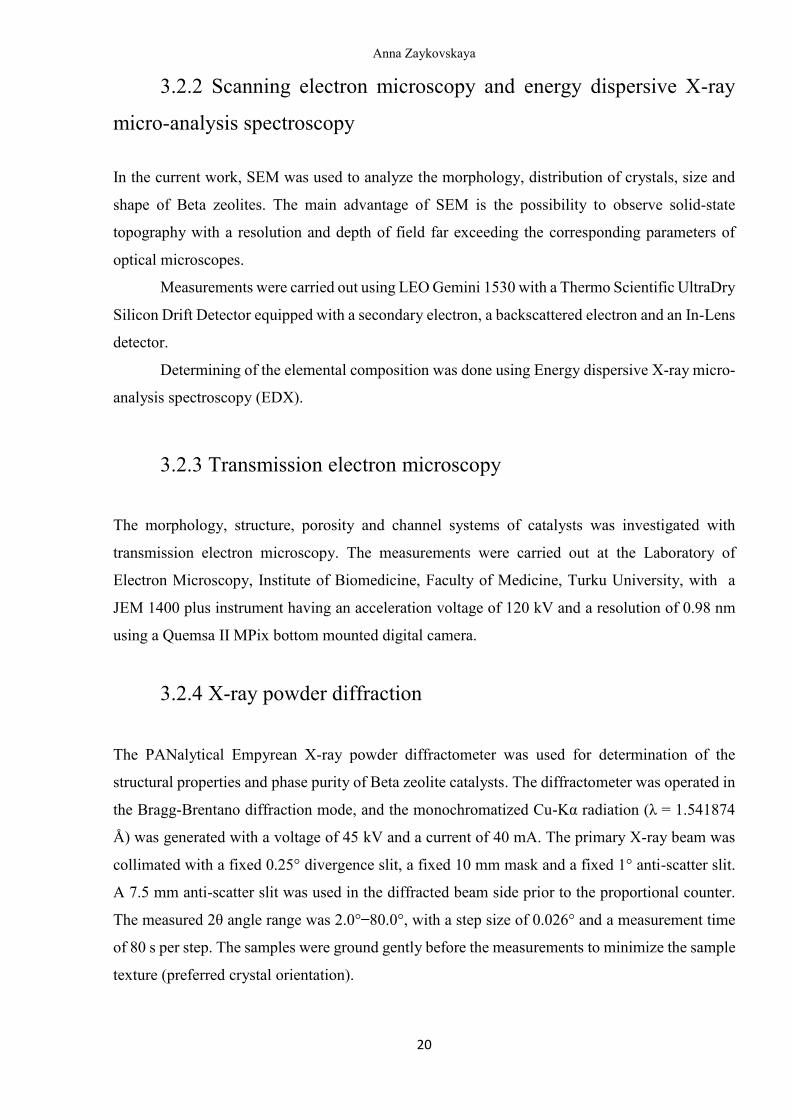
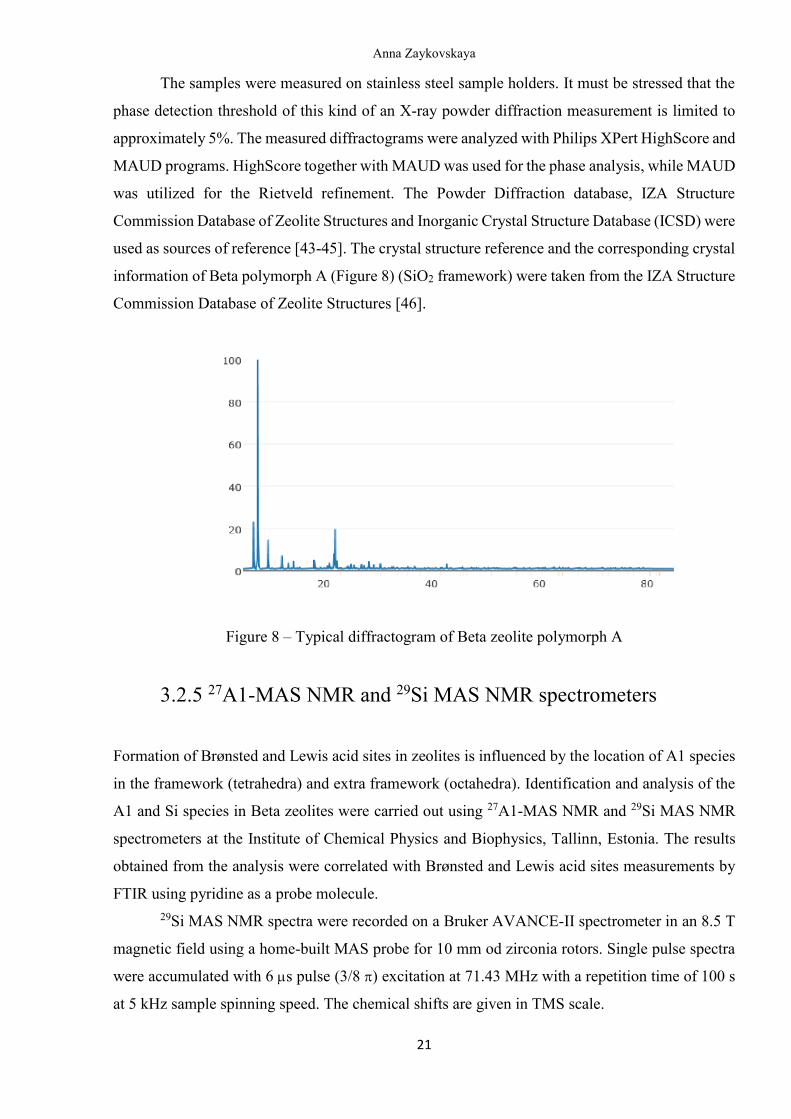
used as sources of reference [43-45]. The crystal structure reference and the corresponding crystal
information of Beta polymorph A (Figure 8) (SiO2 framework) were taken from the IZA Structure
Commission Database of Zeolite Structures [46].
Figure 8 – Typical diffractogram of Beta zeolite polymorph A
3.2.5 27A1-MAS NMR and 29Si MAS NMR spectrometers
Formation of Brønsted and Lewis acid sites in zeolites is influenced by the location of A1 species
in the framework (tetrahedra) and extra framework (octahedra). Identification and analysis of the
A1 and Si species in Beta zeolites were carried out using 27A1-MAS NMR and 29Si MAS NMR
spectrometers at the Institute of Chemical Physics and Biophysics, Tallinn, Estonia. The results
obtained from the analysis were correlated with Brønsted and Lewis acid sites measurements by
FTIR using pyridine as a probe molecule.
29Si MAS NMR spectra were recorded on a Bruker AVANCE-II spectrometer in an 8.5 T
magnetic field using a home-built MAS probe for 10 mm od zirconia rotors. Single pulse spectra
were accumulated with 6 s pulse (3/8 ) excitation at 71.43 MHz with a repetition time of 100 s
at 5 kHz sample spinning speed. The chemical shifts are given in TMS scale.
Anna Zaykovskaya
22
27Al MAS-NMR spectra were recorded at 208.49 MHz on a Bruker AVANCE-III
spectrometer at an 18.8 T external field using a Bruker MAS probe and 3.2 mm zirconia rotors.
The spectra were collected by single 0.6 s pulse (/18) excitation with repetition time 60ms and
22 kHz sample spinning frequency. The spectra are referenced to the frequency of Al(NO3)3
solution.
The intensity in the NMR spectra is normalized to the number of accumulations and to the
mass of the sample.
3.2.6 Fourier-transform infrared spectroscopy
Acidity of the catalysts was determined with ATI Mattson FTIR of adsorbed pyridine (Sigma-
Aldrich, >99.5%, a.r.) as a probe molecule. Infrared transmission spectra were recorded on the thin
pressed tablets of ca. 10-20 mg. Pretreatment of the pellets was made at 450 °C for 1 hour at 7 Pa
before the measurement. First pyridine was adsorbed for 30 min at 100 °C. To obtain the
distribution of weak, medium and strong Brønsted and Lewis acid sites, desorption of pyridine
was made at different temperatures: 250, 350 and 450 °C. Brønsted and Lewis acid site
concentrations were calculated by the integration of the infrared bands at 1545 cm-1 (with 1.67
cm/mm as the molar absorption coefficient) and at 1455 cm-1 (with 2.22 cm/mm the molar
absorption coefficient), respectively. The molar extinction coefficients were taken from the work
of Emeis [47].
Anna Zaykovskaya
23
4. Results and discussion
4.1. Beta zeolite synthesis results
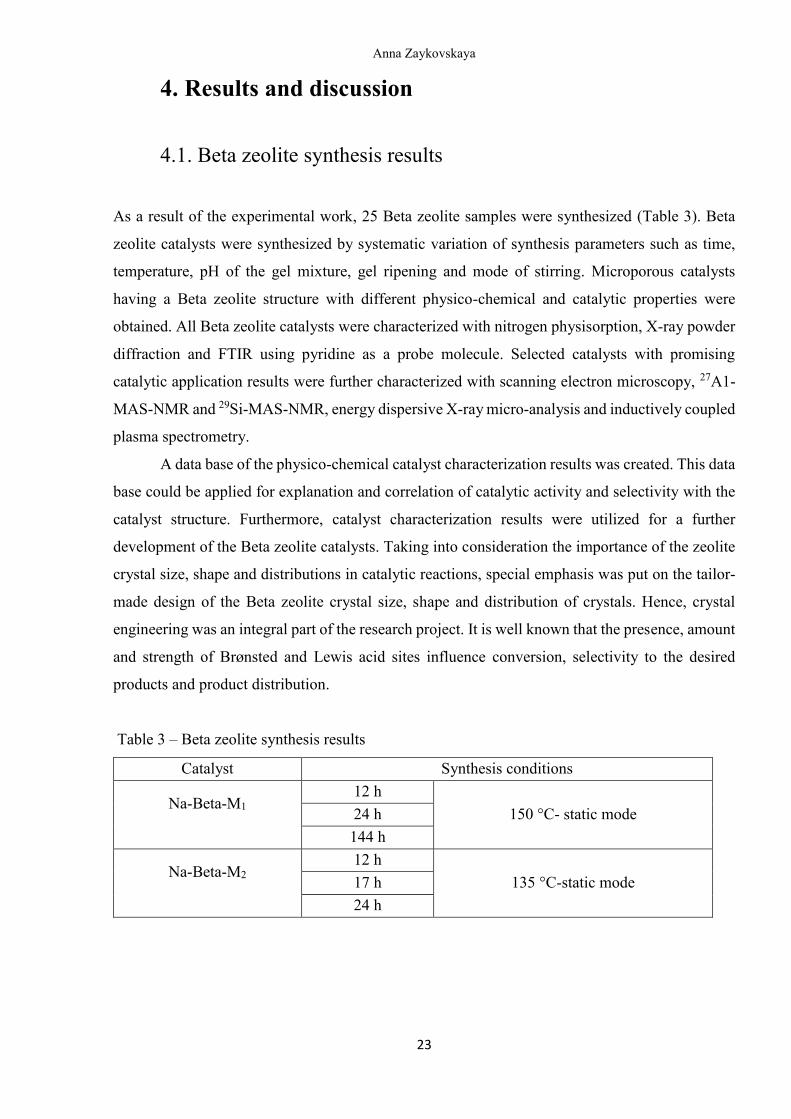
As a result of the experimental work, 25 Beta zeolite samples were synthesized (Table 3). Beta
zeolite catalysts were synthesized by systematic variation of synthesis parameters such as time,
temperature, pH of the gel mixture, gel ripening and mode of stirring. Microporous catalysts
having a Beta zeolite structure with different physico-chemical and catalytic properties were
obtained. All Beta zeolite catalysts were characterized with nitrogen physisorption, X-ray powder
diffraction and FTIR using pyridine as a probe molecule. Selected catalysts with promising
catalytic application results were further characterized with scanning electron microscopy, 27A1-
MAS-NMR and 29Si-MAS-NMR, energy dispersive X-ray micro-analysis and inductively coupled
plasma spectrometry.
A data base of the physico-chemical catalyst characterization results was created. This data
base could be applied for explanation and correlation of catalytic activity and selectivity with the
catalyst structure. Furthermore, catalyst characterization results were utilized for a further
development of the Beta zeolite catalysts. Taking into consideration the importance of the zeolite
crystal size, shape and distributions in catalytic reactions, special emphasis was put on the tailor-
made design of the Beta zeolite crystal size, shape and distribution of crystals. Hence, crystal
engineering was an integral part of the research project. It is well known that the presence, amount
and strength of Brønsted and Lewis acid sites influence conversion, selectivity to the desired
products and product distribution.
Table 3 – Beta zeolite synthesis results
Catalyst Synthesis conditions
Na-Beta-M1
12 h
150 °C- static mode 24 h
144 h
Na-Beta-M2
12 h
135 °C-static mode 17 h
24 h
Anna Zaykovskaya
24
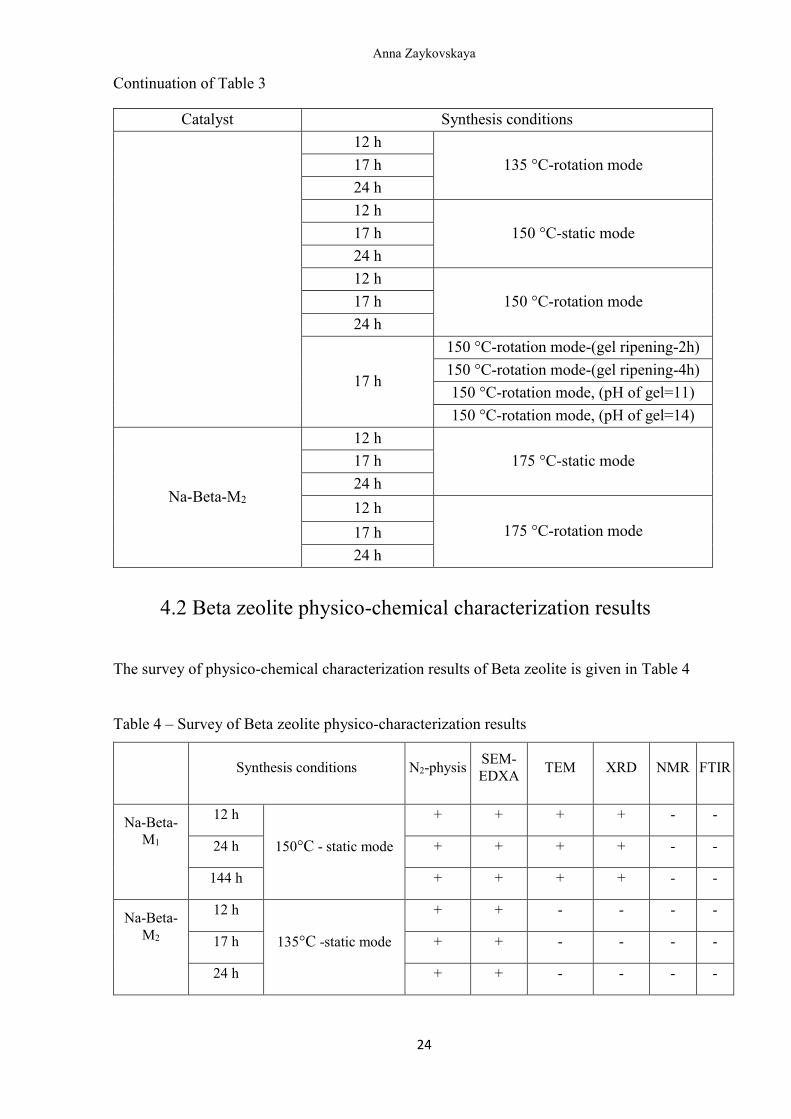
Continuation of Table 3
Catalyst Synthesis conditions
12 h
135 °C-rotation mode 17 h
24 h
12 h
150 °C-static mode 17 h
24 h
12 h
150 °C-rotation mode 17 h
24 h
17 h
150 °C-rotation mode-(gel ripening-2h)
150 °C-rotation mode-(gel ripening-4h)
150 °C-rotation mode, (pH of gel=11)
150 °C-rotation mode, (pH of gel=14)
Na-Beta-M2
12 h
175 °C-static mode 17 h
24 h
12 h
175 °C-rotation mode 17 h
24 h
4.2 Beta zeolite physico-chemical characterization results
The survey of physico-chemical characterization results of Beta zeolite is given in Table 4
Table 4 – Survey of Beta zeolite physico-characterization results
Synthesis conditions N2-physis
SEM-
EDXA TEM XRD NMR FTIR
Na-Beta-
M1
12 h
150°C - static mode
+ + + + - -
24 h + + + + - -
144 h + + + + - -
Na-Beta-
M2
12 h
135°C -static mode
+ + - - - -
17 h + + - - - -
24 h + + - - - -
Anna Zaykovskaya
25
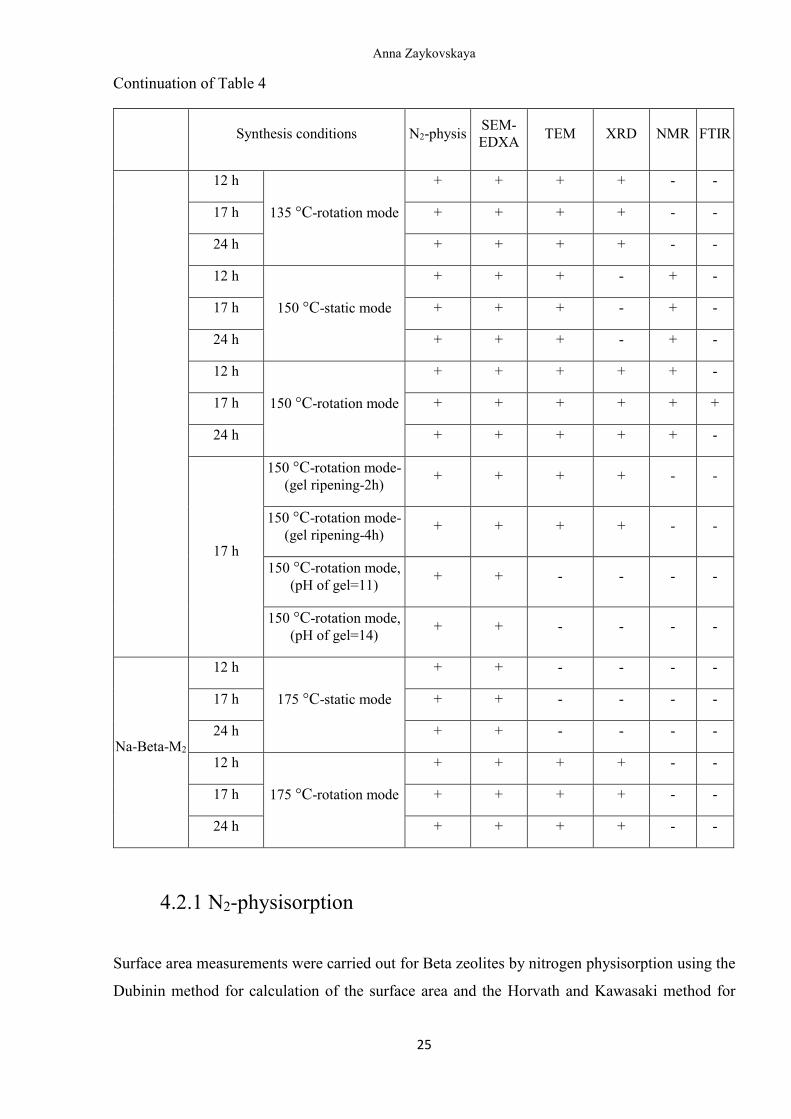
Continuation of Table 4
Synthesis conditions N2-physis
SEM-
EDXA TEM XRD NMR FTIR
12 h
135 °C-rotation mode
+ + + + - -
17 h + + + + - -
24 h + + + + - -
12 h
150 °C-static mode
+ + + - + -
17 h + + + - + -
24 h + + + - + -
12 h
150 °C-rotation mode
+ + + + + -
17 h + + + + + +
24 h + + + + + -
17 h
150 °C-rotation mode-
(gel ripening-2h) + + + + - -
150 °C-rotation mode-
(gel ripening-4h) + + + + - -
150 °C-rotation mode,
(pH of gel=11) + + - - - -
150 °C-rotation mode,
(pH of gel=14) + + - - - -
Na-Beta-M2
12 h
175 °C-static mode
+ + - - - -
17 h + + - - - -
24 h + + - - - -
12 h
175 °C-rotation mode
+ + + + - -
17 h + + + + - -
24 h + + + + - -
4.2.1 N2-physisorption
Surface area measurements were carried out for Beta zeolites by nitrogen physisorption using the
Dubinin method for calculation of the surface area and the Horvath and Kawasaki method for
Anna Zaykovskaya
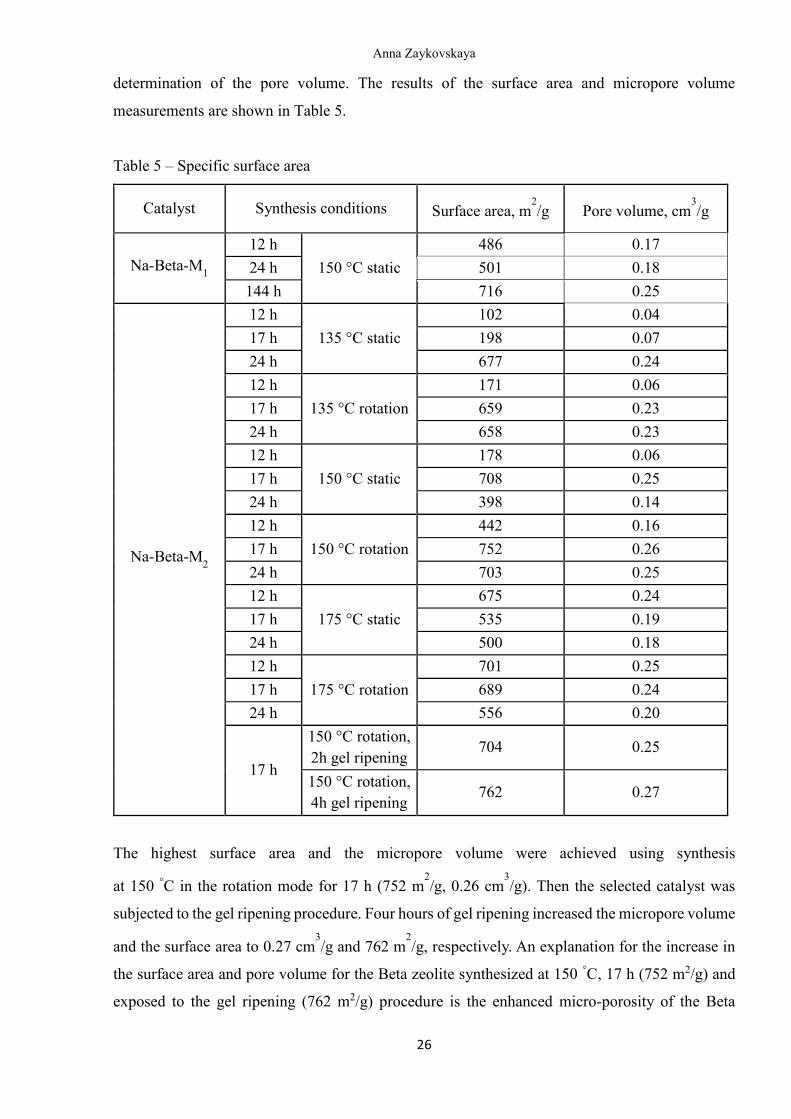
26
determination of the pore volume. The results of the surface area and micropore volume
measurements are shown in Table 5.
Table 5 – Specific surface area
Catalyst Synthesis conditions Surface area, m2/g Pore volume, cm
3/g
Na-Beta-M1
12 h
150 °C static
486 0.17
24 h 501 0.18
144 h 716 0.25
Na-Beta-M2
12 h
135 °C static
102 0.04
17 h 198 0.07
24 h 677 0.24
12 h
135 °C rotation
171 0.06
17 h 659 0.23
24 h 658 0.23
12 h
150 °C static
178 0.06
17 h 708 0.25
24 h 398 0.14
12 h
150 °C rotation
442 0.16
17 h 752 0.26
24 h 703 0.25
12 h
175 °C static
675 0.24
17 h 535 0.19
24 h 500 0.18
12 h
175 °C rotation
701 0.25
17 h 689 0.24
24 h 556 0.20
17 h
150 °C rotation,
2h gel ripening 704 0.25
150 °C rotation,
4h gel ripening 762 0.27
The highest surface area and the micropore volume were achieved using synthesis
at 150 °C in the rotation mode for 17 h (752 m2/g, 0.26 cm
3/g). Then the selected catalyst was
subjected to the gel ripening procedure. Four hours of gel ripening increased the micropore volume
and the surface area to 0.27 cm3/g and 762 m
2/g, respectively. An explanation for the increase in
the surface area and pore volume for the Beta zeolite synthesized at 150 °C, 17 h (752 m2/g) and
exposed to the gel ripening (762 m2/g) procedure is the enhanced micro-porosity of the Beta
Anna Zaykovskaya
27
zeolite. It is noteworthy to mention here, that the surface area of Beta zeolite synthesized in 12 h,
135 °C static), 12 h, 135 °C (rotation), 12 h, 150 °C (static) showed the lowest surface area
of 102 m2/g, 171 m2/g, 178 m2/g, respectively. The presence of an amorphous phase, a decrease in
the pore dimensions and diminished porosity are the most plausible reasons for such decrease in
the surface area.
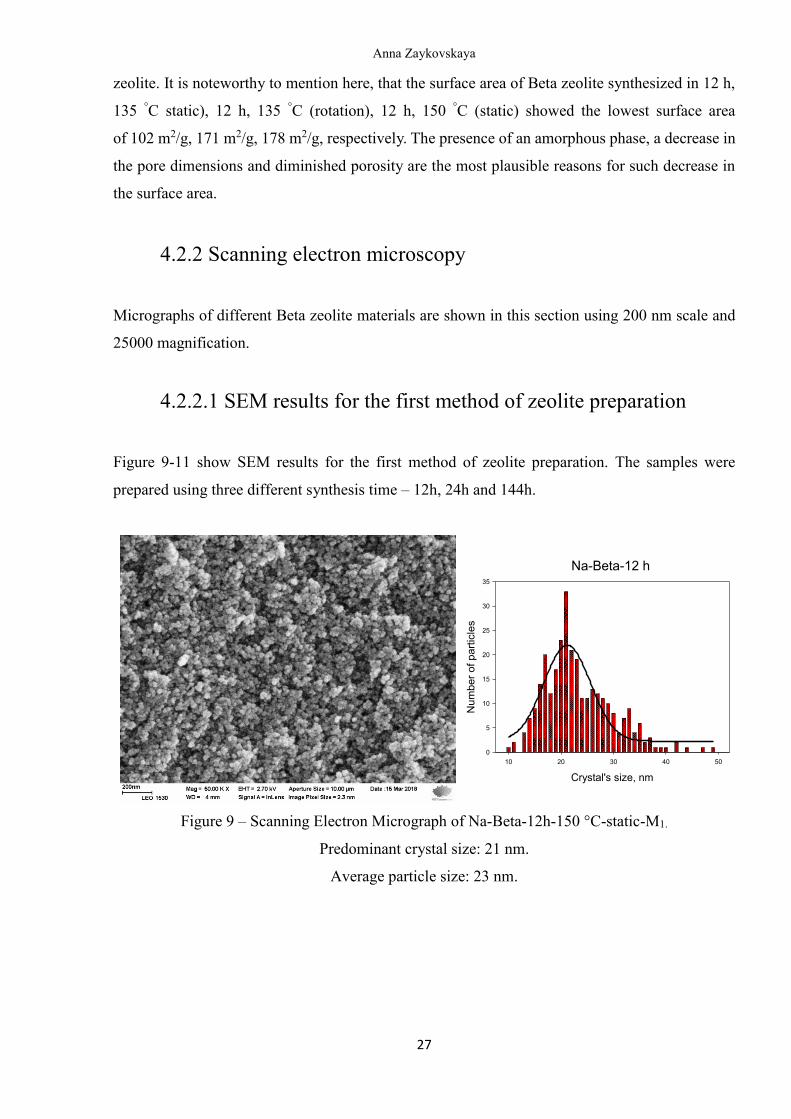
4.2.2 Scanning electron microscopy
Micrographs of different Beta zeolite materials are shown in this section using 200 nm scale and
25000 magnification.
4.2.2.1 SEM results for the first method of zeolite preparation
Figure 9-11 show SEM results for the first method of zeolite preparation. The samples were
prepared using three different synthesis time – 12h, 24h and 144h.
Na-Beta-12 h
Crystal's size, nm
10 20 30 40 50
Num
ber
of
pa
rtic
les
0
5
10
15
20
25
30
35
Figure 9 – Scanning Electron Micrograph of Na-Beta-12h-150 °C-static-M1.
Predominant crystal size: 21 nm.
Average particle size: 23 nm.
Anna Zaykovskaya
28
Na-Beta-24 h
Crystal's size, nm
20 40 60 80
Num
be
r o
f p
art
icle
s
0
20
40
60
80
100
120
140
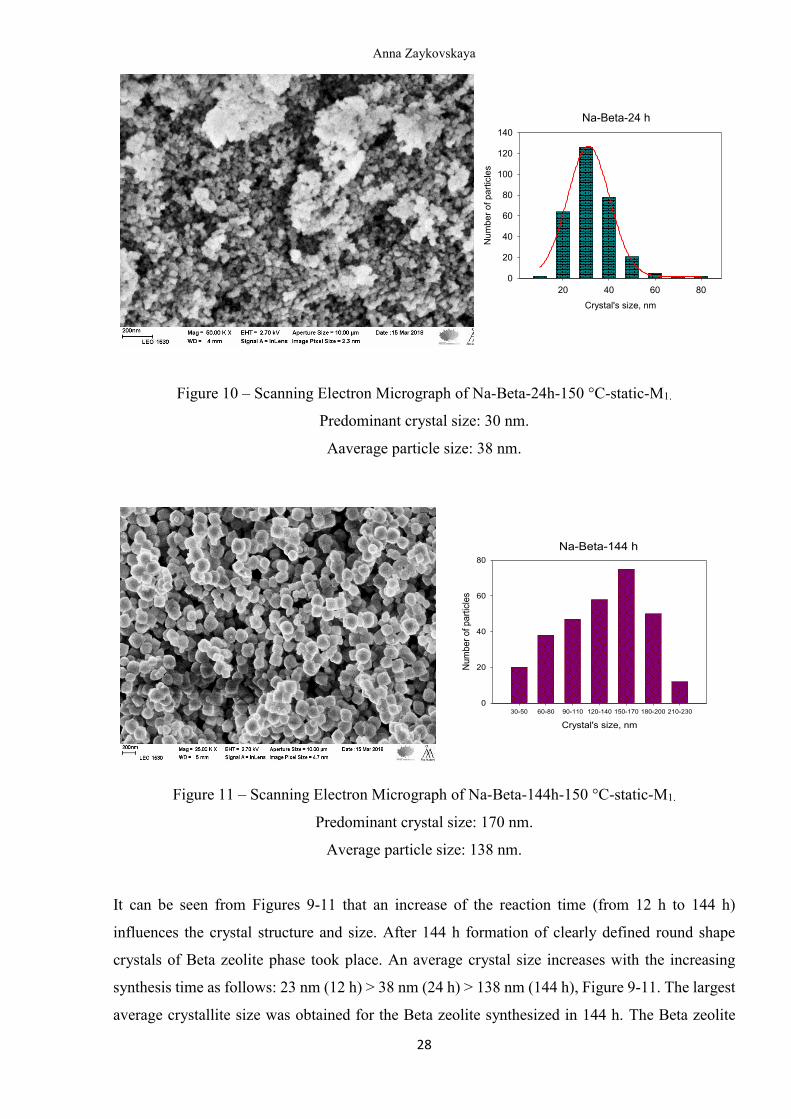
Figure 10 – Scanning Electron Micrograph of Na-Beta-24h-150 °C-static-M1.
Predominant crystal size: 30 nm.
Aaverage particle size: 38 nm.
Na-Beta-144 h
Crystal's size, nm
30-50 60-80 90-110 120-140 150-170 180-200 210-230
Num
ber
of
pa
rtic
les
0
20
40
60
80
Figure 11 – Scanning Electron Micrograph of Na-Beta-144h-150 °C-static-M1.
Predominant crystal size: 170 nm.
Average particle size: 138 nm.
It can be seen from Figures 9-11 that an increase of the reaction time (from 12 h to 144 h)
influences the crystal structure and size. After 144 h formation of clearly defined round shape
crystals of Beta zeolite phase took place. An average crystal size increases with the increasing
synthesis time as follows: 23 nm (12 h) > 38 nm (24 h) > 138 nm (144 h), Figure 9-11. The largest
average crystallite size was obtained for the Beta zeolite synthesized in 144 h. The Beta zeolite
Anna Zaykovskaya
29
synthesized in 12 h did not exhibit the typical crystal shape of Beta zeolite, which was confirmed
by the X-ray powder diffraction patterns. These patterns for the sample synthesized in 12 h
exhibited an amorphous hump typical for the non-crystalline amorphous materials.
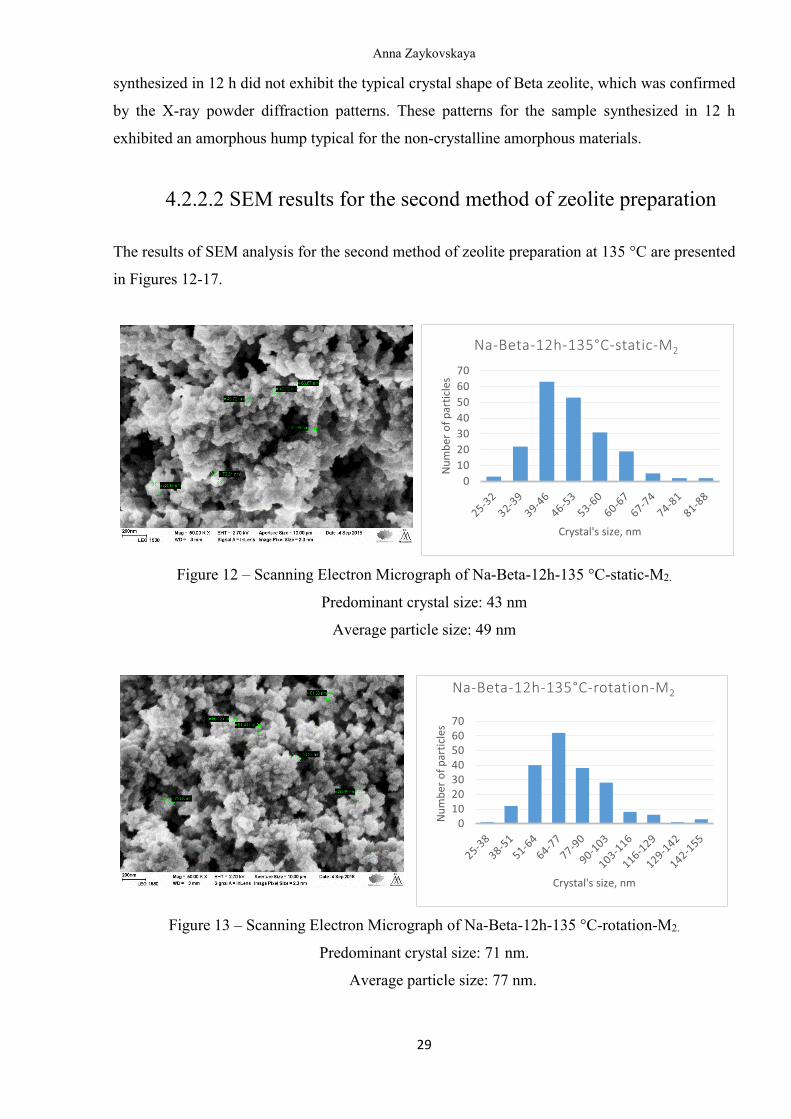
4.2.2.2 SEM results for the second method of zeolite preparation
The results of SEM analysis for the second method of zeolite preparation at 135 °C are presented
in Figures 12-17.
Figure 12 – Scanning Electron Micrograph of Na-Beta-12h-135 °C-static-M2.
Predominant crystal size: 43 nm
Average particle size: 49 nm
Figure 13 – Scanning Electron Micrograph of Na-Beta-12h-135 °C-rotation-M2.
Predominant crystal size: 71 nm.
Average particle size: 77 nm.
0
10
20
30
40
50
60
70
Nu
mb
er o
f p
arti
cles
Crystal's size, nm
Na-Beta-12h-135°C-static-M2
010203040506070
Nu
mb
er o
f p
arti
cles
Crystal's size, nm
Na-Beta-12h-135°C-rotation-M2
Anna Zaykovskaya
30
The Beta zeolite synthesis carried out at 135 °C, 12 h, rotation mode exhibited a larger average
crystal size (77 nm) than the average crystal size (49 nm) for the synthesis performed at 135 °C,
12 h, static mode, Figure 12-13. It was inferred from the above result that the rotation mode
enhanced the crystal size formation.
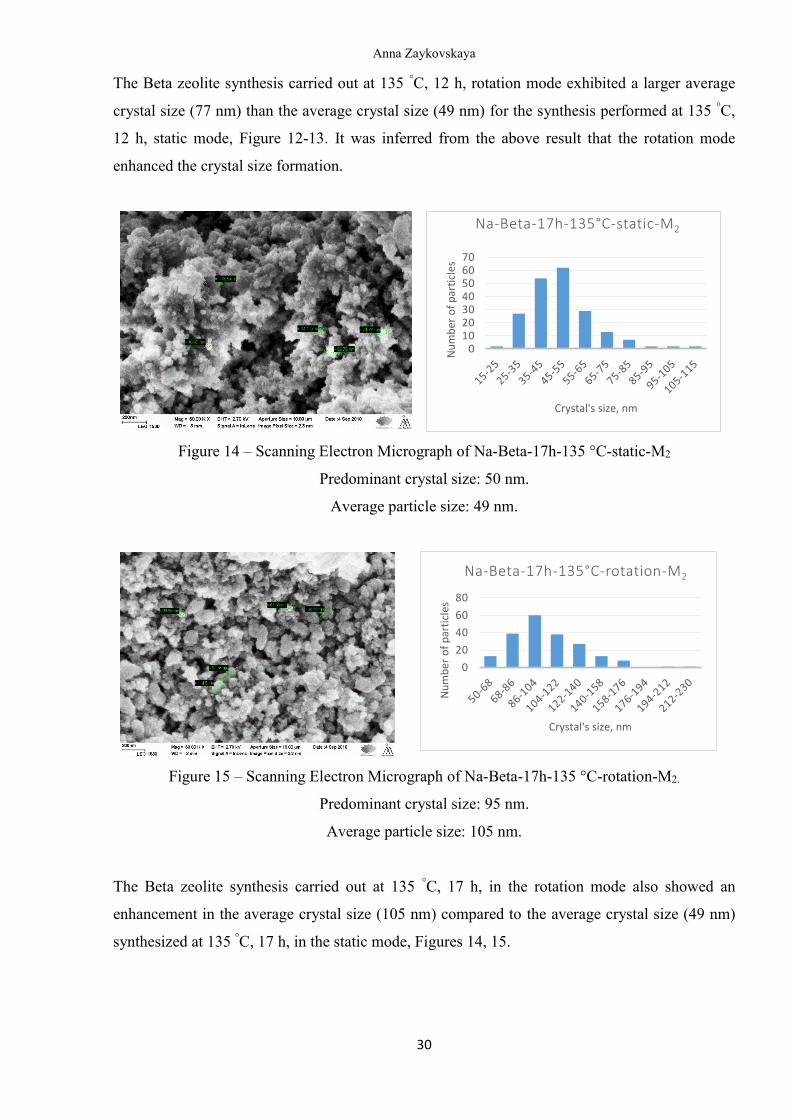
Figure 14 – Scanning Electron Micrograph of Na-Beta-17h-135 °C-static-M2
Predominant crystal size: 50 nm.
Average particle size: 49 nm.
Figure 15 – Scanning Electron Micrograph of Na-Beta-17h-135 °C-rotation-M2.
Predominant crystal size: 95 nm.
Average particle size: 105 nm.
The Beta zeolite synthesis carried out at 135 °C, 17 h, in the rotation mode also showed an
enhancement in the average crystal size (105 nm) compared to the average crystal size (49 nm)
synthesized at 135 °C, 17 h, in the static mode, Figures 14, 15.
010203040506070
Nu
mb
er o
f p
arti
cles
Crystal's size, nm
Na-Beta-17h-135°C-static-M2
0
20
40
60
80
Nu
mb
er o
f p
arti
cles
Crystal's size, nm
Na-Beta-17h-135°C-rotation-M2
Anna Zaykovskaya
31
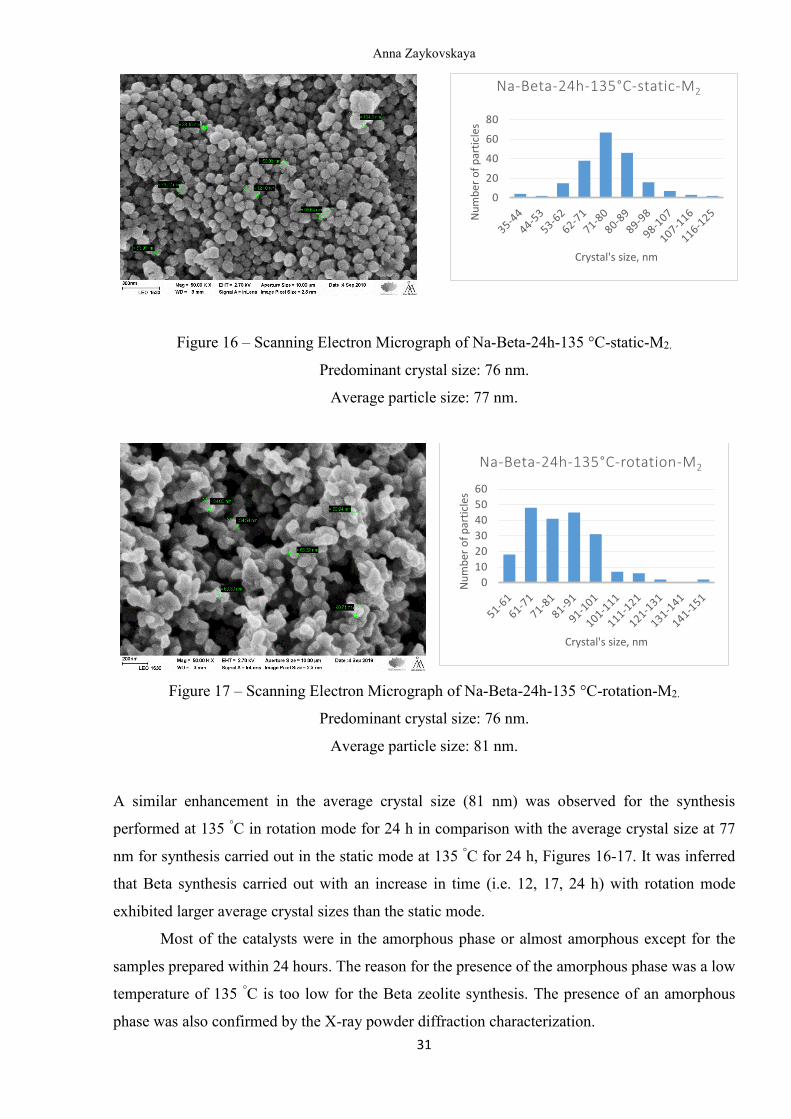
Figure 16 – Scanning Electron Micrograph of Na-Beta-24h-135 °C-static-M2.
Predominant crystal size: 76 nm.
Average particle size: 77 nm.
Figure 17 – Scanning Electron Micrograph of Na-Beta-24h-135 °C-rotation-M2.
Predominant crystal size: 76 nm.
Average particle size: 81 nm.
A similar enhancement in the average crystal size (81 nm) was observed for the synthesis
performed at 135 °C in rotation mode for 24 h in comparison with the average crystal size at 77
nm for synthesis carried out in the static mode at 135 °C for 24 h, Figures 16-17. It was inferred
that Beta synthesis carried out with an increase in time (i.e. 12, 17, 24 h) with rotation mode
exhibited larger average crystal sizes than the static mode.
Most of the catalysts were in the amorphous phase or almost amorphous except for the
samples prepared within 24 hours. The reason for the presence of the amorphous phase was a low
temperature of 135 °C is too low for the Beta zeolite synthesis. The presence of an amorphous
phase was also confirmed by the X-ray powder diffraction characterization.
0
20
40
60
80
Nu
mb
er o
f p
arti
cles
Crystal's size, nm
Na-Beta-24h-135°C-static-M2
0
10
20
30
40
50
60
Nu
mb
er o
f p
arti
cles
Crystal's size, nm
Na-Beta-24h-135°C-rotation-M2
Anna Zaykovskaya
32
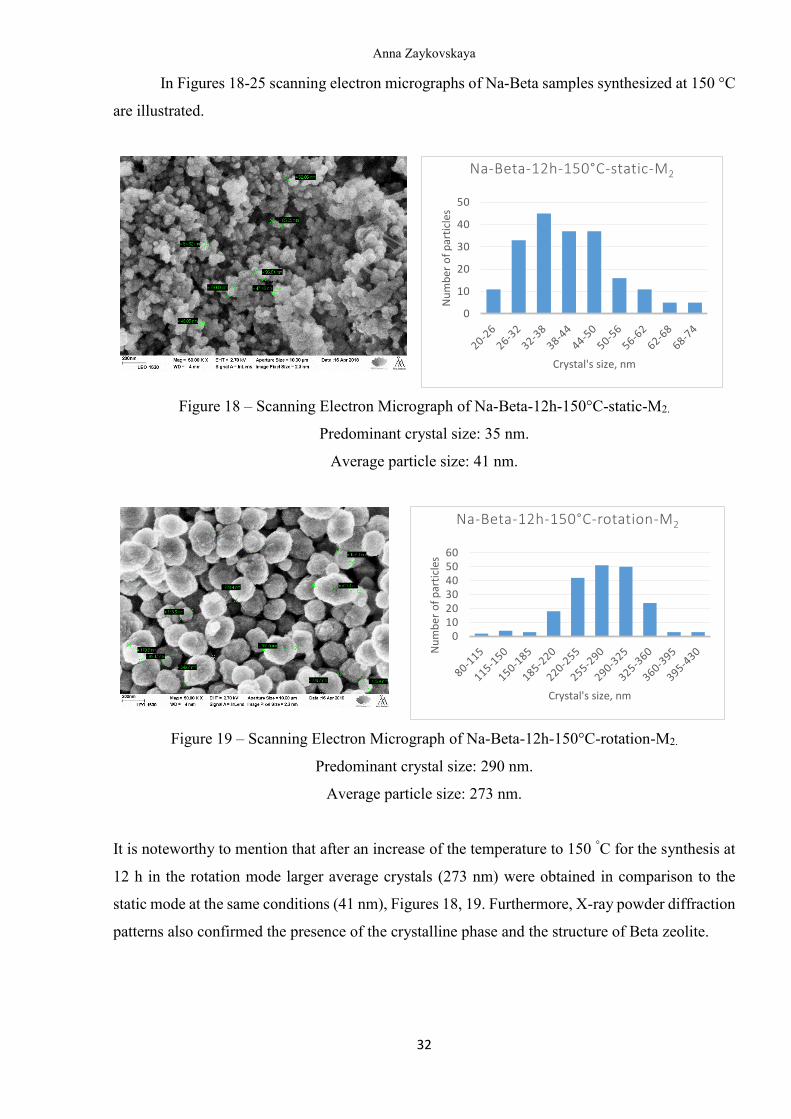
In Figures 18-25 scanning electron micrographs of Na-Beta samples synthesized at 150 °C
are illustrated.
Figure 18 – Scanning Electron Micrograph of Na-Beta-12h-150°C-static-M2.
Predominant crystal size: 35 nm.
Average particle size: 41 nm.
Figure 19 – Scanning Electron Micrograph of Na-Beta-12h-150°C-rotation-M2.
Predominant crystal size: 290 nm.
Average particle size: 273 nm.
It is noteworthy to mention that after an increase of the temperature to 150 °C for the synthesis at
12 h in the rotation mode larger average crystals (273 nm) were obtained in comparison to the
static mode at the same conditions (41 nm), Figures 18, 19. Furthermore, X-ray powder diffraction
patterns also confirmed the presence of the crystalline phase and the structure of Beta zeolite.
0
10
20
30
40
50
Nu
mb
er o
f p
arti
cles
Crystal's size, nm
Na-Beta-12h-150°C-static-M2
0102030405060
Nu
mb
er o
f p
arti
cles
Crystal's size, nm
Na-Beta-12h-150°C-rotation-M2
Anna Zaykovskaya
33
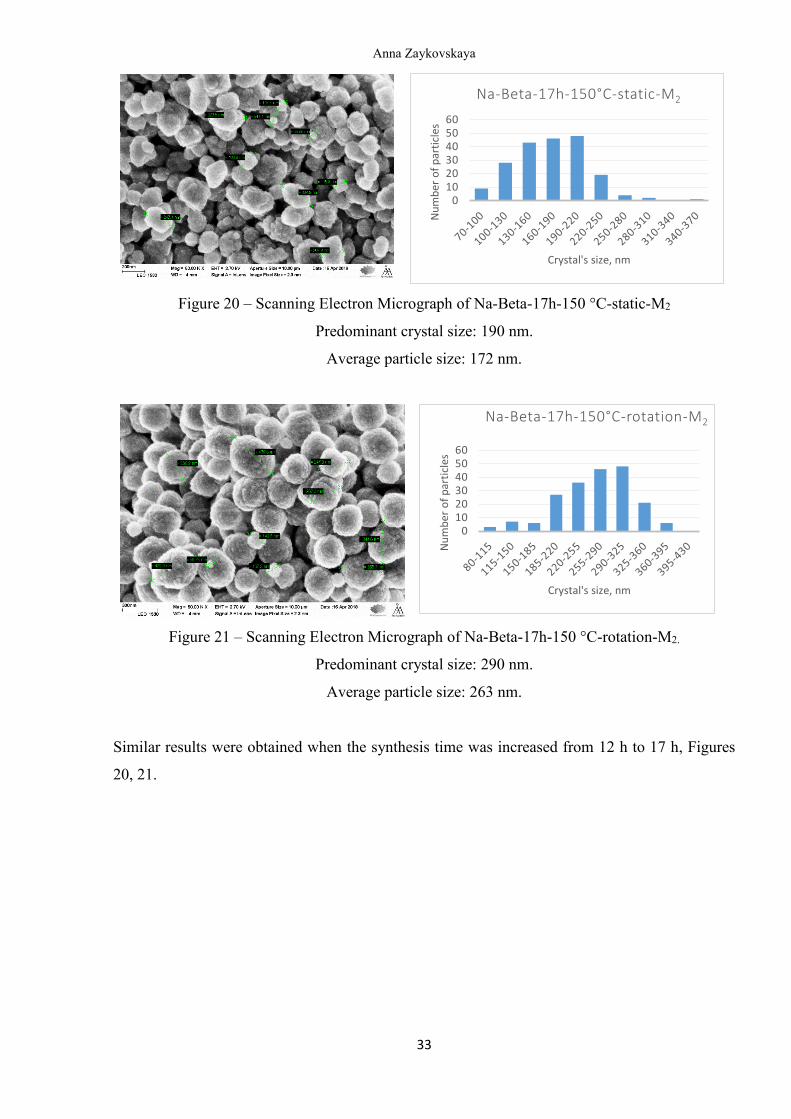
Figure 20 – Scanning Electron Micrograph of Na-Beta-17h-150 °C-static-M2
Predominant crystal size: 190 nm.
Average particle size: 172 nm.
Figure 21 – Scanning Electron Micrograph of Na-Beta-17h-150 °C-rotation-M2.
Predominant crystal size: 290 nm.
Average particle size: 263 nm.
Similar results were obtained when the synthesis time was increased from 12 h to 17 h, Figures
20, 21.
0102030405060
Nu
mb
er o
f p
arti
cles
Crystal's size, nm
Na-Beta-17h-150°C-static-M2
0102030405060
Nu
mb
er o
f p
arti
cles
Crystal's size, nm
Na-Beta-17h-150°C-rotation-M2
Anna Zaykovskaya
34
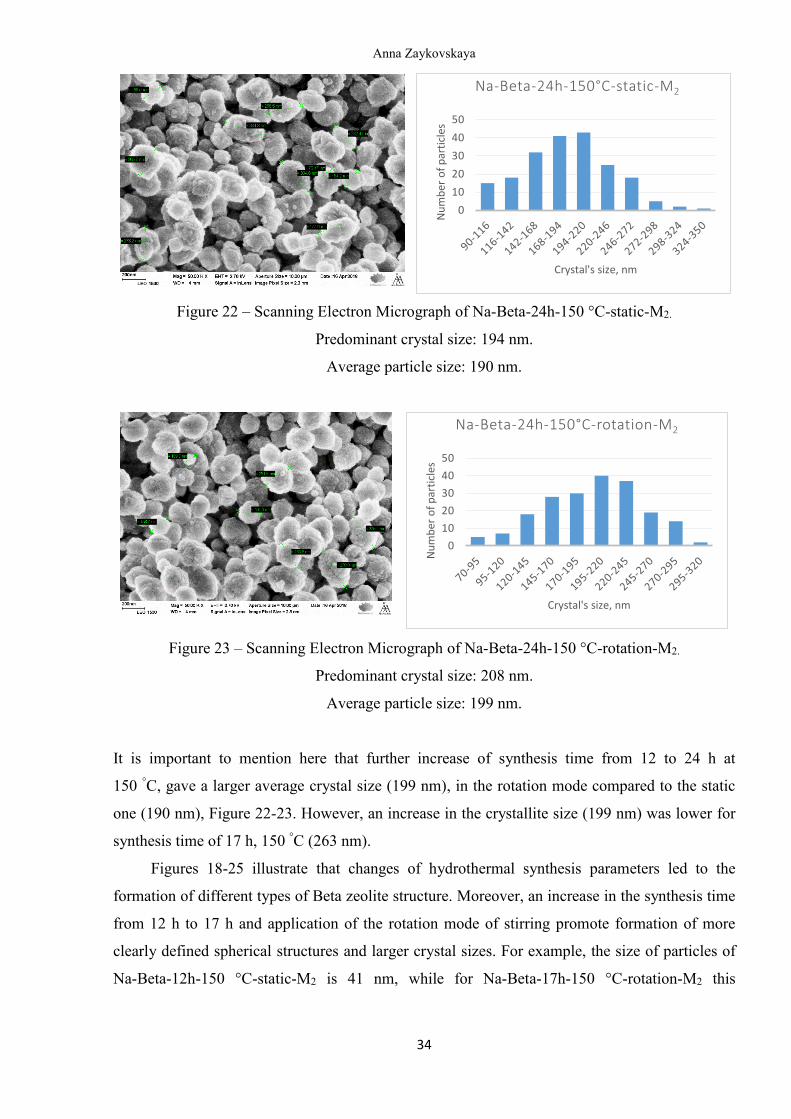
Figure 22 – Scanning Electron Micrograph of Na-Beta-24h-150 °C-static-M2.
Predominant crystal size: 194 nm.
Average particle size: 190 nm.
Figure 23 – Scanning Electron Micrograph of Na-Beta-24h-150 °C-rotation-M2.
Predominant crystal size: 208 nm.
Average particle size: 199 nm.
It is important to mention here that further increase of synthesis time from 12 to 24 h at
150 °C, gave a larger average crystal size (199 nm), in the rotation mode compared to the static
one (190 nm), Figure 22-23. However, an increase in the crystallite size (199 nm) was lower for
synthesis time of 17 h, 150 °C (263 nm).
Figures 18-25 illustrate that changes of hydrothermal synthesis parameters led to the
formation of different types of Beta zeolite structure. Moreover, an increase in the synthesis time
from 12 h to 17 h and application of the rotation mode of stirring promote formation of more
clearly defined spherical structures and larger crystal sizes. For example, the size of particles of
Na-Beta-12h-150 °C-static-M2 is 41 nm, while for Na-Beta-17h-150 °C-rotation-M2 this
0
10
20
30
40
50
Nu
mb
er o
f p
arti
cles
Crystal's size, nm
Na-Beta-24h-150°C-static-M2
0
10
20
30
40
50
Nu
mb
er o
f p
arti
cles
Crystal's size, nm
Na-Beta-24h-150°C-rotation-M2
Anna Zaykovskaya
35
parameter is equal to 263 nm. In addition, an increase in temperature from 135 °C to 150 °C also
positively affected the hydrothermal synthesis.
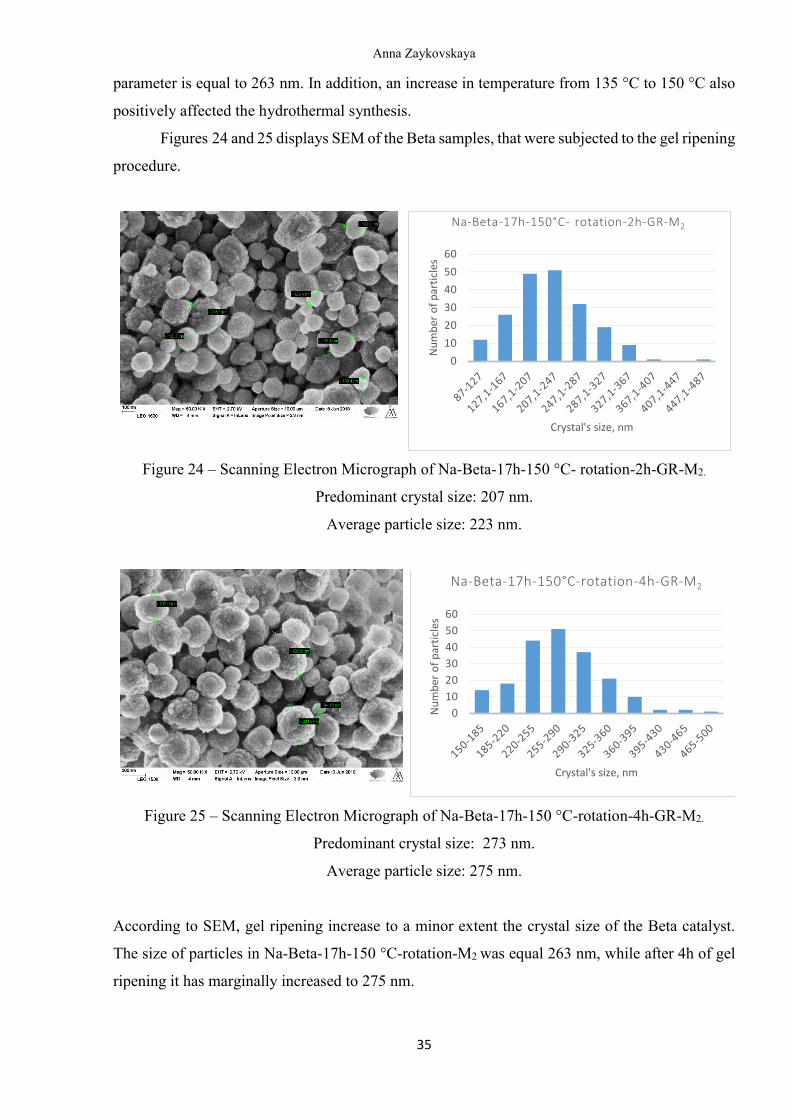
Figures 24 and 25 displays SEM of the Beta samples, that were subjected to the gel ripening
procedure.
Figure 24 – Scanning Electron Micrograph of Na-Beta-17h-150 °C- rotation-2h-GR-M2.
Predominant crystal size: 207 nm.
Average particle size: 223 nm.
Figure 25 – Scanning Electron Micrograph of Na-Beta-17h-150 °C-rotation-4h-GR-M2.
Predominant crystal size: 273 nm.
Average particle size: 275 nm.
According to SEM, gel ripening increase to a minor extent the crystal size of the Beta catalyst.
The size of particles in Na-Beta-17h-150 °C-rotation-M2 was equal 263 nm, while after 4h of gel
ripening it has marginally increased to 275 nm.
0
10
20
30
40
50
60
Nu
mb
er o
f p
arti
cles
Crystal's size, nm
Na-Beta-17h-150°C- rotation-2h-GR-M2
0
10
20
30
40
50
60
Nu
mb
er o
f p
arti
cles
Crystal's size, nm
Na-Beta-17h-150°C-rotation-4h-GR-M2
Anna Zaykovskaya
36
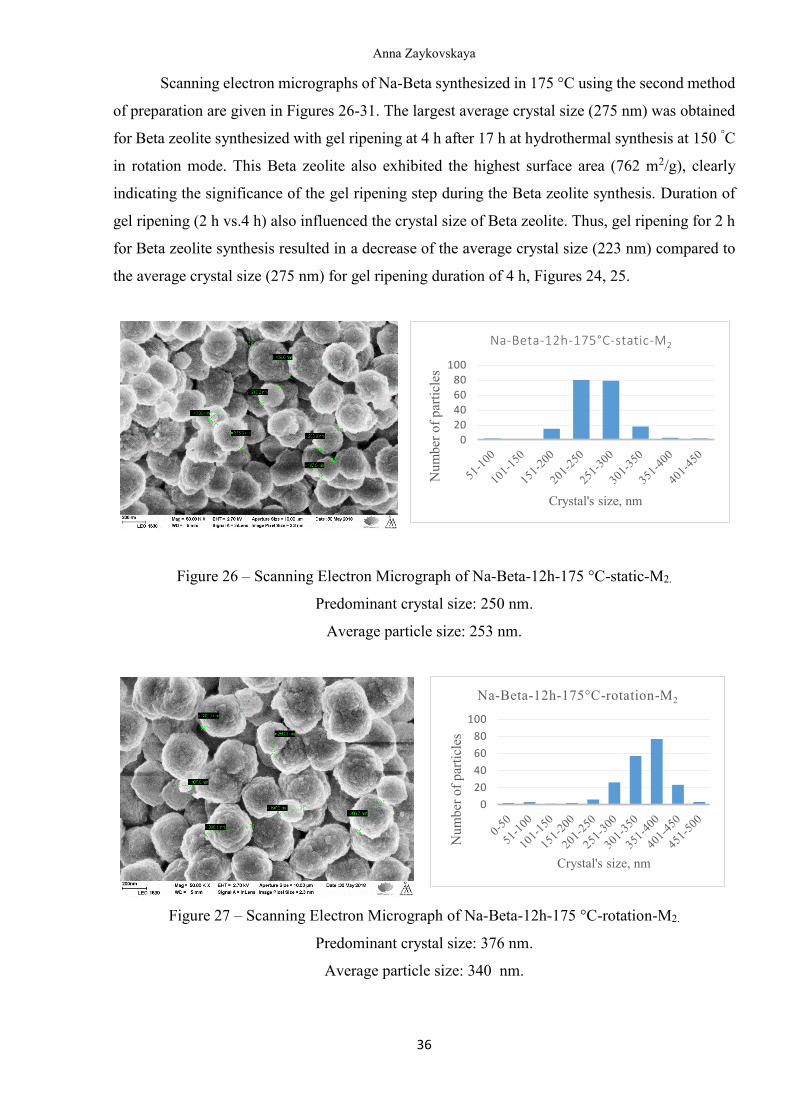
Scanning electron micrographs of Na-Beta synthesized in 175 °C using the second method
of preparation are given in Figures 26-31. The largest average crystal size (275 nm) was obtained
for Beta zeolite synthesized with gel ripening at 4 h after 17 h at hydrothermal synthesis at 150 °C
in rotation mode. This Beta zeolite also exhibited the highest surface area (762 m2/g), clearly
indicating the significance of the gel ripening step during the Beta zeolite synthesis. Duration of
gel ripening (2 h vs.4 h) also influenced the crystal size of Beta zeolite. Thus, gel ripening for 2 h
for Beta zeolite synthesis resulted in a decrease of the average crystal size (223 nm) compared to
the average crystal size (275 nm) for gel ripening duration of 4 h, Figures 24, 25.
Figure 26 – Scanning Electron Micrograph of Na-Beta-12h-175 °C-static-M2.
Predominant crystal size: 250 nm.
Average particle size: 253 nm.
Figure 27 – Scanning Electron Micrograph of Na-Beta-12h-175 °C-rotation-M2.
Predominant crystal size: 376 nm.
Average particle size: 340 nm.
0
2040
60
80100
Num
ber
of
par
ticl
es
Crystal's size, nm
Na-Beta-12h-175°C-static-M2
0
20
40
60
80
100
Num
ber
of
par
ticl
es
Crystal's size, nm
Na-Beta-12h-175°C-rotation-M2
Anna Zaykovskaya
37
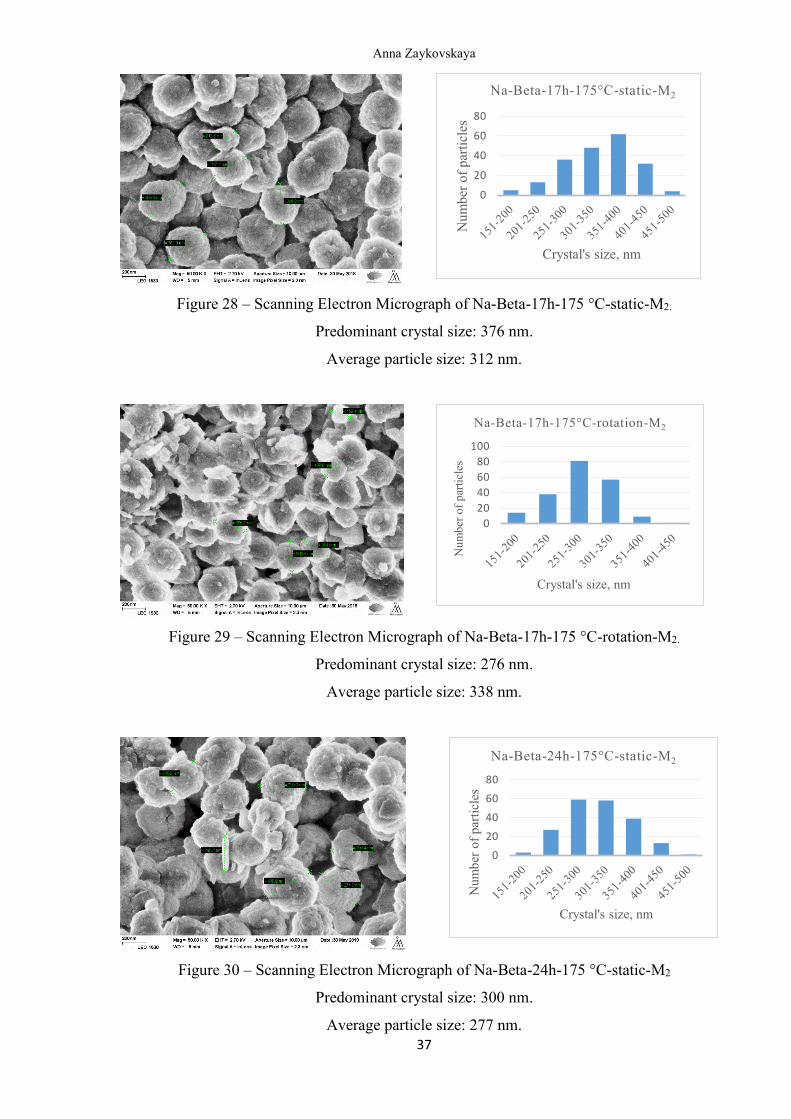
Figure 28 – Scanning Electron Micrograph of Na-Beta-17h-175 °C-static-M2.
Predominant crystal size: 376 nm.
Average particle size: 312 nm.
Figure 29 – Scanning Electron Micrograph of Na-Beta-17h-175 °C-rotation-M2.
Predominant crystal size: 276 nm.
Average particle size: 338 nm.
Figure 30 – Scanning Electron Micrograph of Na-Beta-24h-175 °C-static-M2
Predominant crystal size: 300 nm.
Average particle size: 277 nm.
0
20
40
60
80
Nu
mb
er o
f p
arti
cles
Crystal's size, nm
Na-Beta-17h-175°C-static-M2
0
20
40
60
80
100N
um
ber
of
par
ticl
es
Crystal's size, nm
Na-Beta-17h-175°C-rotation-M2
0
20
40
60
80
Num
ber
of
par
ticl
es
Crystal's size, nm
Na-Beta-24h-175°C-static-M2
Anna Zaykovskaya
38
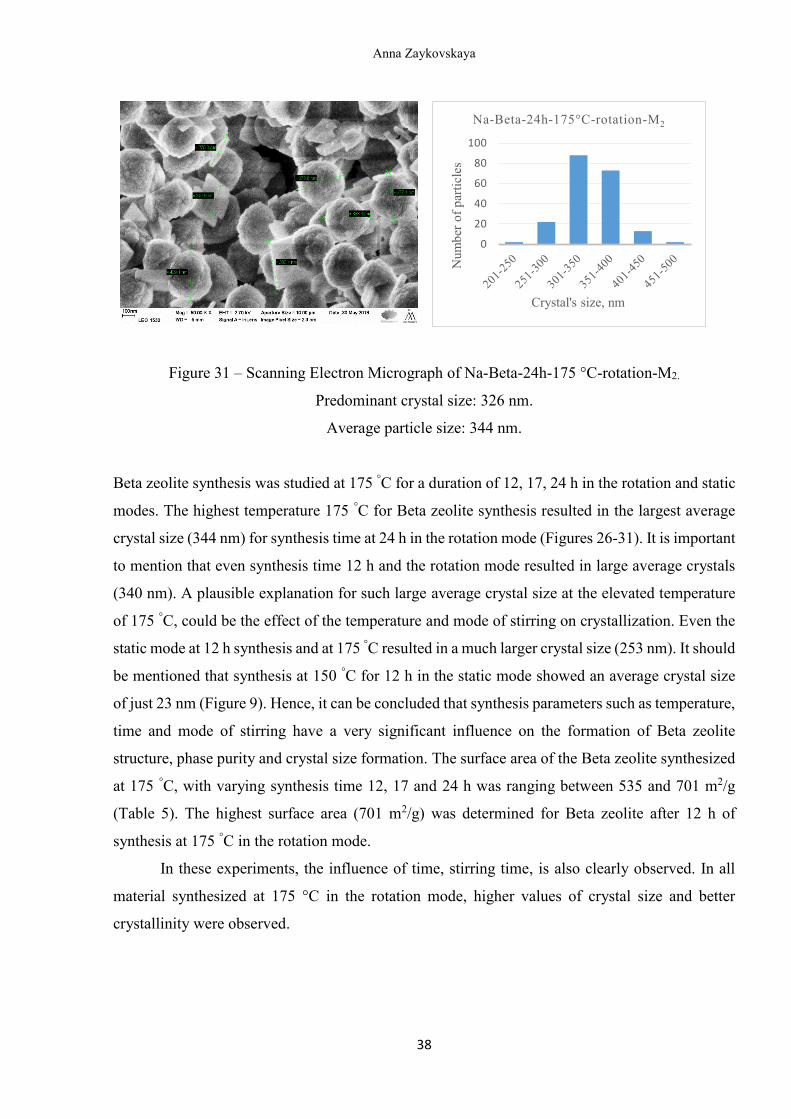
Figure 31 – Scanning Electron Micrograph of Na-Beta-24h-175 °C-rotation-M2.
Predominant crystal size: 326 nm.
Average particle size: 344 nm.
Beta zeolite synthesis was studied at 175 °C for a duration of 12, 17, 24 h in the rotation and static
modes. The highest temperature 175 °C for Beta zeolite synthesis resulted in the largest average
crystal size (344 nm) for synthesis time at 24 h in the rotation mode (Figures 26-31). It is important
to mention that even synthesis time 12 h and the rotation mode resulted in large average crystals
(340 nm). A plausible explanation for such large average crystal size at the elevated temperature
of 175 °C, could be the effect of the temperature and mode of stirring on crystallization. Even the
static mode at 12 h synthesis and at 175 °C resulted in a much larger crystal size (253 nm). It should
be mentioned that synthesis at 150 °C for 12 h in the static mode showed an average crystal size
of just 23 nm (Figure 9). Hence, it can be concluded that synthesis parameters such as temperature,
time and mode of stirring have a very significant influence on the formation of Beta zeolite
structure, phase purity and crystal size formation. The surface area of the Beta zeolite synthesized
at 175 °C, with varying synthesis time 12, 17 and 24 h was ranging between 535 and 701 m2/g
(Table 5). The highest surface area (701 m2/g) was determined for Beta zeolite after 12 h of
synthesis at 175 °C in the rotation mode.
In these experiments, the influence of time, stirring time, is also clearly observed. In all
material synthesized at 175 °C in the rotation mode, higher values of crystal size and better
crystallinity were observed.
0
20
40
60
80
100
Num
ber
of
par
ticl
es
Crystal's size, nm
Na-Beta-24h-175°C-rotation-M2
Anna Zaykovskaya
39
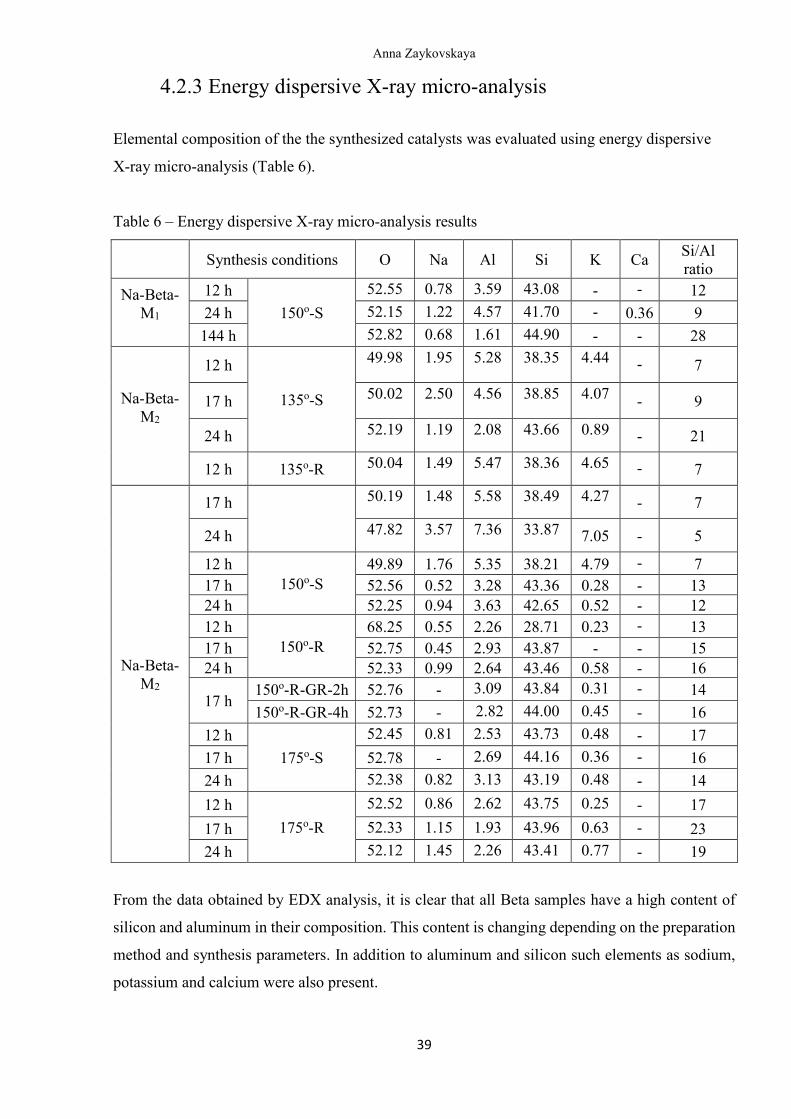
4.2.3 Energy dispersive X-ray micro-analysis
Elemental composition of the the synthesized catalysts was evaluated using energy dispersive
X-ray micro-analysis (Table 6).
Table 6 – Energy dispersive X-ray micro-analysis results
Synthesis conditions O Na Al Si K Ca Si/Al
ratio
Na-Beta-
M1
12 h
150o-S
52.55 0.78 3.59 43.08 - - 12
24 h 52.15 1.22 4.57 41.70 - 0.36 9
144 h 52.82 0.68 1.61 44.90 - - 28
Na-Beta-
M2
12 h
135o-S
49.98 1.95 5.28 38.35 4.44 - 7
17 h 50.02 2.50 4.56 38.85 4.07
- 9
24 h 52.19 1.19 2.08 43.66 0.89 - 21
12 h 135o-R 50.04 1.49 5.47 38.36 4.65 - 7
Na-Beta-
M2
17 h
50.19 1.48 5.58 38.49 4.27 - 7
24 h 47.82 3.57 7.36 33.87 7.05 - 5
12 h
150o-S
49.89 1.76 5.35 38.21 4.79 - 7
17 h 52.56 0.52 3.28 43.36 0.28 - 13
24 h 52.25 0.94 3.63 42.65 0.52 - 12
12 h
150o-R
68.25 0.55 2.26 28.71 0.23 - 13
17 h 52.75 0.45 2.93 43.87 - - 15
24 h 52.33 0.99 2.64 43.46 0.58 - 16
17 h 150o-R-GR-2h 52.76 - 3.09 43.84 0.31 - 14
150o-R-GR-4h 52.73 - 2.82 44.00 0.45 - 16
12 h
175o-S
52.45 0.81 2.53 43.73 0.48 - 17
17 h 52.78 - 2.69 44.16 0.36 - 16
24 h 52.38 0.82 3.13 43.19 0.48 - 14
12 h
175o-R
52.52 0.86 2.62 43.75 0.25 - 17
17 h 52.33 1.15 1.93 43.96 0.63 - 23
24 h 52.12 1.45 2.26 43.41 0.77 - 19
From the data obtained by EDX analysis, it is clear that all Beta samples have a high content of
silicon and aluminum in their composition. This content is changing depending on the preparation
method and synthesis parameters. In addition to aluminum and silicon such elements as sodium,
potassium and calcium were also present.
Anna Zaykovskaya
40
4.2.4 Transmission electron microscopy
Structure, pore size, along with periodicity of the pores were studied by transmission electron
microscopy as discussed in this section.
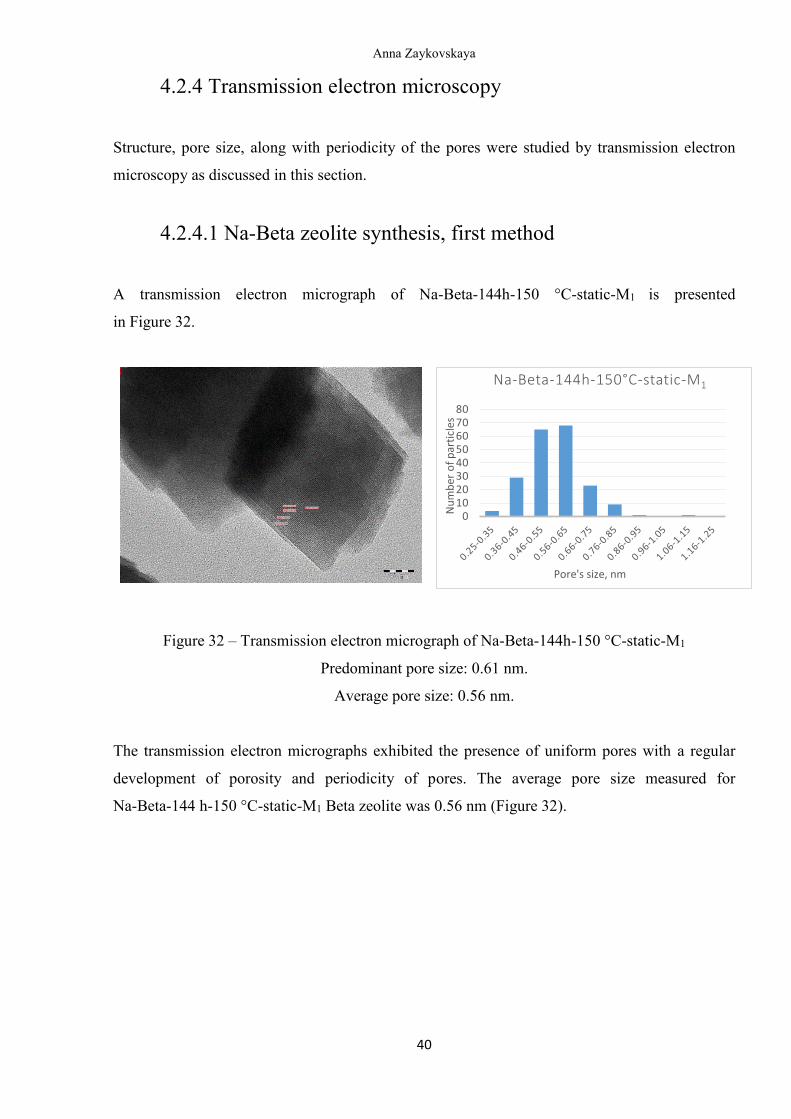
4.2.4.1 Na-Beta zeolite synthesis, first method
A transmission electron micrograph of Na-Beta-144h-150 °C-static-M1 is presented
in Figure 32.
Figure 32 – Transmission electron micrograph of Na-Beta-144h-150 °C-static-M1
Predominant pore size: 0.61 nm.
Average pore size: 0.56 nm.
The transmission electron micrographs exhibited the presence of uniform pores with a regular
development of porosity and periodicity of pores. The average pore size measured for
Na-Beta-144 h-150 °C-static-M1 Beta zeolite was 0.56 nm (Figure 32).
01020304050607080
Nu
mb
er o
f p
arti
cles
Pore's size, nm
Na-Beta-144h-150°C-static-M1
Anna Zaykovskaya
41
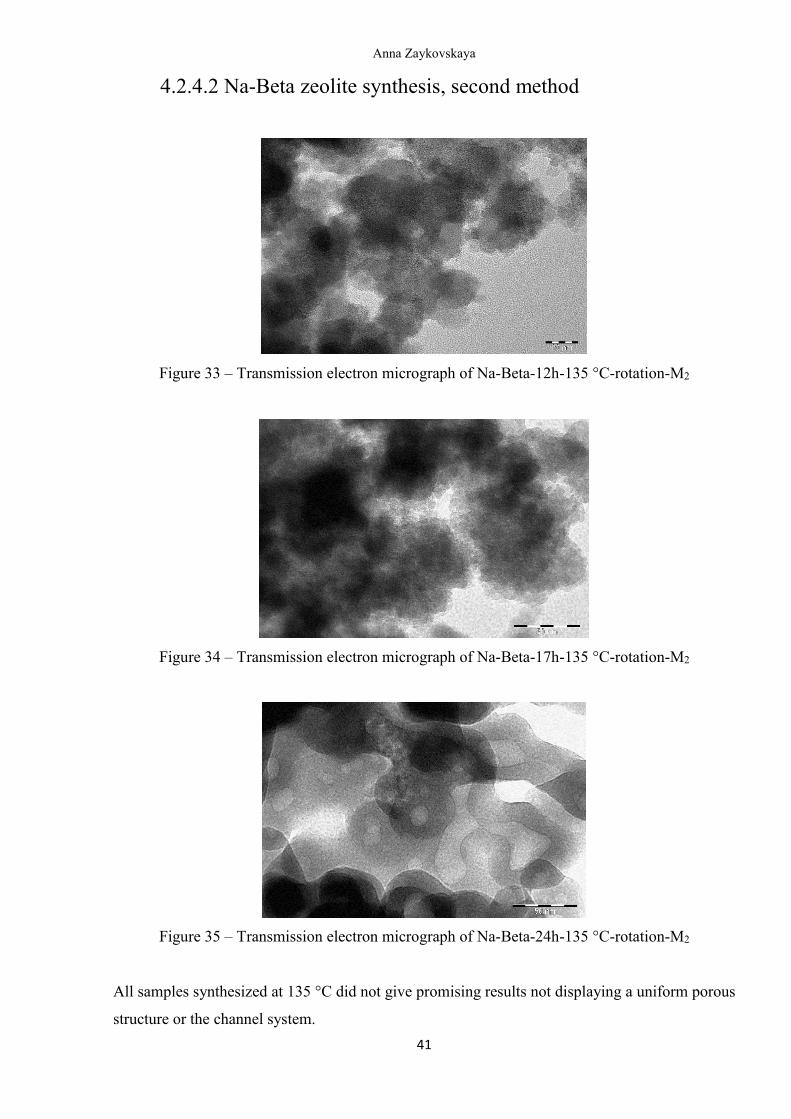
4.2.4.2 Na-Beta zeolite synthesis, second method
Figure 33 – Transmission electron micrograph of Na-Beta-12h-135 °C-rotation-M2
Figure 34 – Transmission electron micrograph of Na-Beta-17h-135 °C-rotation-M2
Figure 35 – Transmission electron micrograph of Na-Beta-24h-135 °C-rotation-M2
All samples synthesized at 135 °C did not give promising results not displaying a uniform porous
structure or the channel system.
Anna Zaykovskaya
42
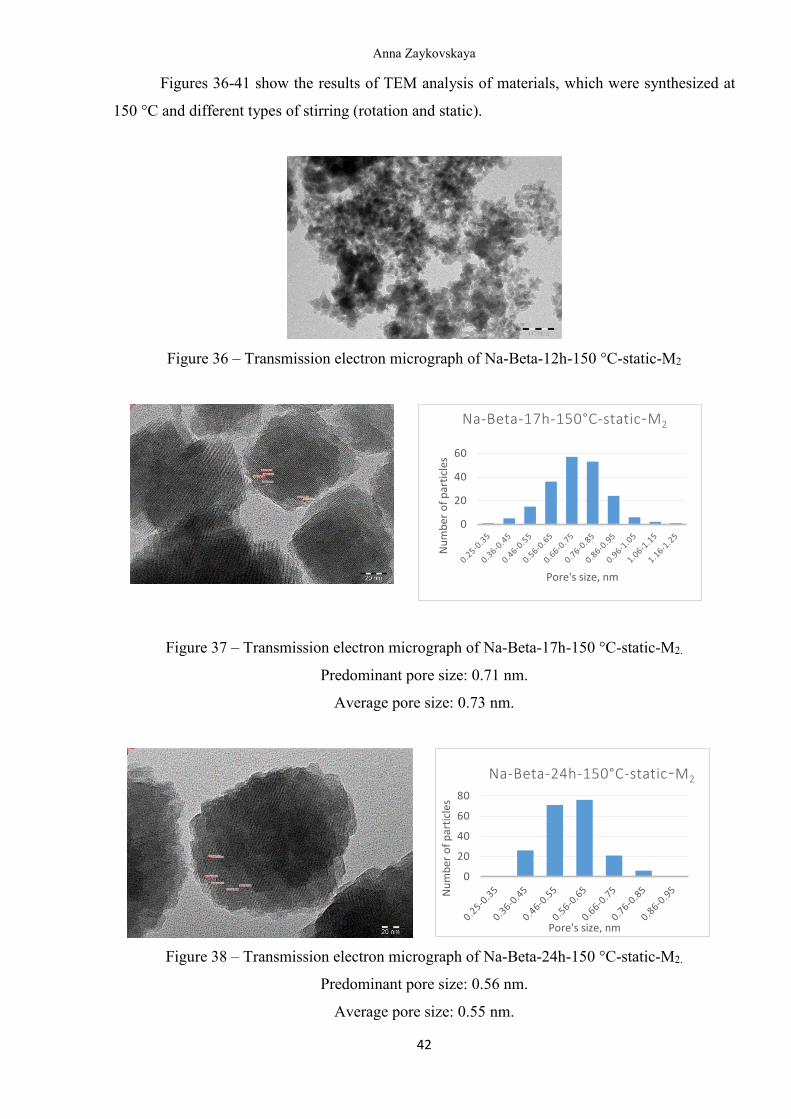
Figures 36-41 show the results of TEM analysis of materials, which were synthesized at
150 °C and different types of stirring (rotation and static).
Figure 36 – Transmission electron micrograph of Na-Beta-12h-150 °C-static-M2
Figure 37 – Transmission electron micrograph of Na-Beta-17h-150 °C-static-M2.
Predominant pore size: 0.71 nm.
Average pore size: 0.73 nm.
Figure 38 – Transmission electron micrograph of Na-Beta-24h-150 °C-static-M2.
Predominant pore size: 0.56 nm.
Average pore size: 0.55 nm.
0
20
40
60N
um
ber
of
par
ticl
es
Pore's size, nm
Na-Beta-17h-150°C-static-M2
0
20
40
60
80
Nu
mb
er o
f p
arti
cles
Pore's size, nm
Na-Beta-24h-150°C-static-M2
Anna Zaykovskaya
43
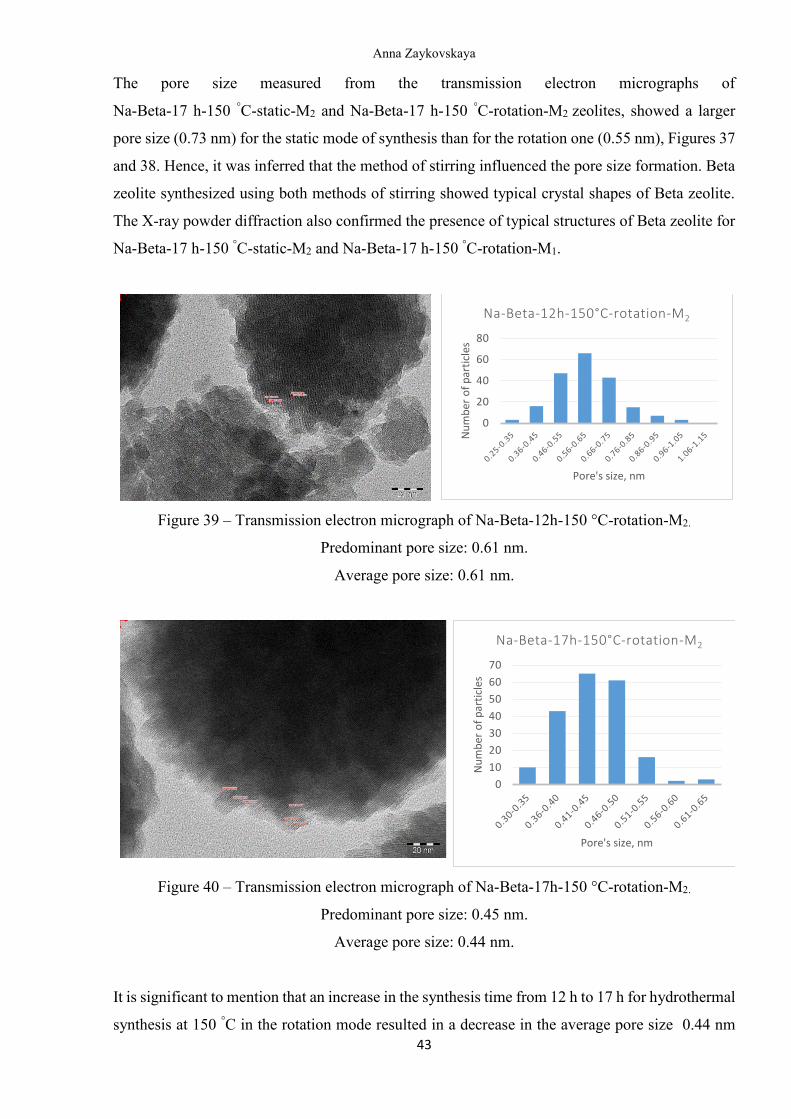
The pore size measured from the transmission electron micrographs of
Na-Beta-17 h-150 °C-static-M2 and Na-Beta-17 h-150 °C-rotation-M2 zeolites, showed a larger
pore size (0.73 nm) for the static mode of synthesis than for the rotation one (0.55 nm), Figures 37
and 38. Hence, it was inferred that the method of stirring influenced the pore size formation. Beta
zeolite synthesized using both methods of stirring showed typical crystal shapes of Beta zeolite.
The X-ray powder diffraction also confirmed the presence of typical structures of Beta zeolite for
Na-Beta-17 h-150 °C-static-M2 and Na-Beta-17 h-150 °C-rotation-M1.
Figure 39 – Transmission electron micrograph of Na-Beta-12h-150 °C-rotation-M2.
Predominant pore size: 0.61 nm.
Average pore size: 0.61 nm.
Figure 40 – Transmission electron micrograph of Na-Beta-17h-150 °C-rotation-M2.
Predominant pore size: 0.45 nm.
Average pore size: 0.44 nm.
It is significant to mention that an increase in the synthesis time from 12 h to 17 h for hydrothermal
synthesis at 150 °C in the rotation mode resulted in a decrease in the average pore size 0.44 nm
0
20
40
60
80
Nu
mb
er o
f p
arti
cles
Pore's size, nm
Na-Beta-12h-150°C-rotation-M2
0
10
20
30
40
50
60
70
Nu
mb
er o
f p
arti
cles
Pore's size, nm
Na-Beta-17h-150°C-rotation-M2
Anna Zaykovskaya
44
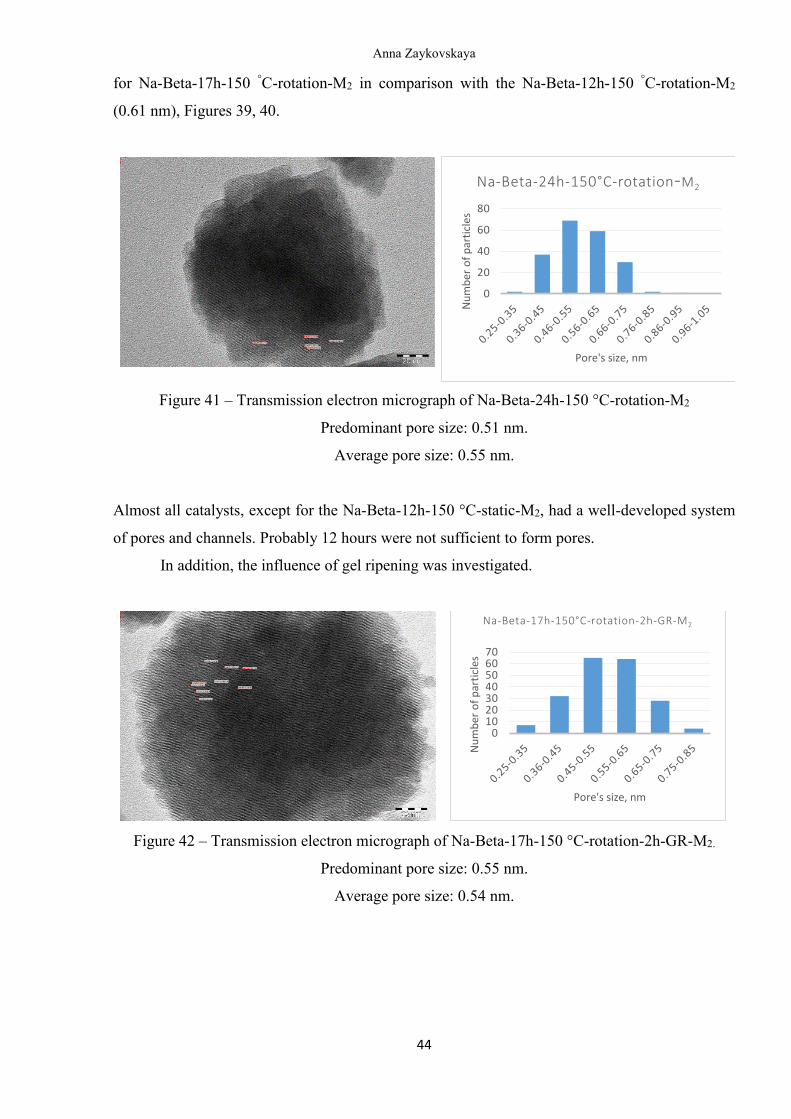
for Na-Beta-17h-150 °C-rotation-M2 in comparison with the Na-Beta-12h-150 °C-rotation-M2
(0.61 nm), Figures 39, 40.
Figure 41 – Transmission electron micrograph of Na-Beta-24h-150 °C-rotation-M2
Predominant pore size: 0.51 nm.
Average pore size: 0.55 nm.
Almost all catalysts, except for the Na-Beta-12h-150 °C-static-M2, had a well-developed system
of pores and channels. Probably 12 hours were not sufficient to form pores.
In addition, the influence of gel ripening was investigated.
Figure 42 – Transmission electron micrograph of Na-Beta-17h-150 °C-rotation-2h-GR-M2.
Predominant pore size: 0.55 nm.
Average pore size: 0.54 nm.
0
20
40
60
80
Nu
mb
er o
f p
arti
cles
Pore's size, nm
Na-Beta-24h-150°C-rotation-M2
010203040506070
Nu
mb
er o
f p
arti
cles
Pore's size, nm
Na-Beta-17h-150°C-rotation-2h-GR-M2
Anna Zaykovskaya
45
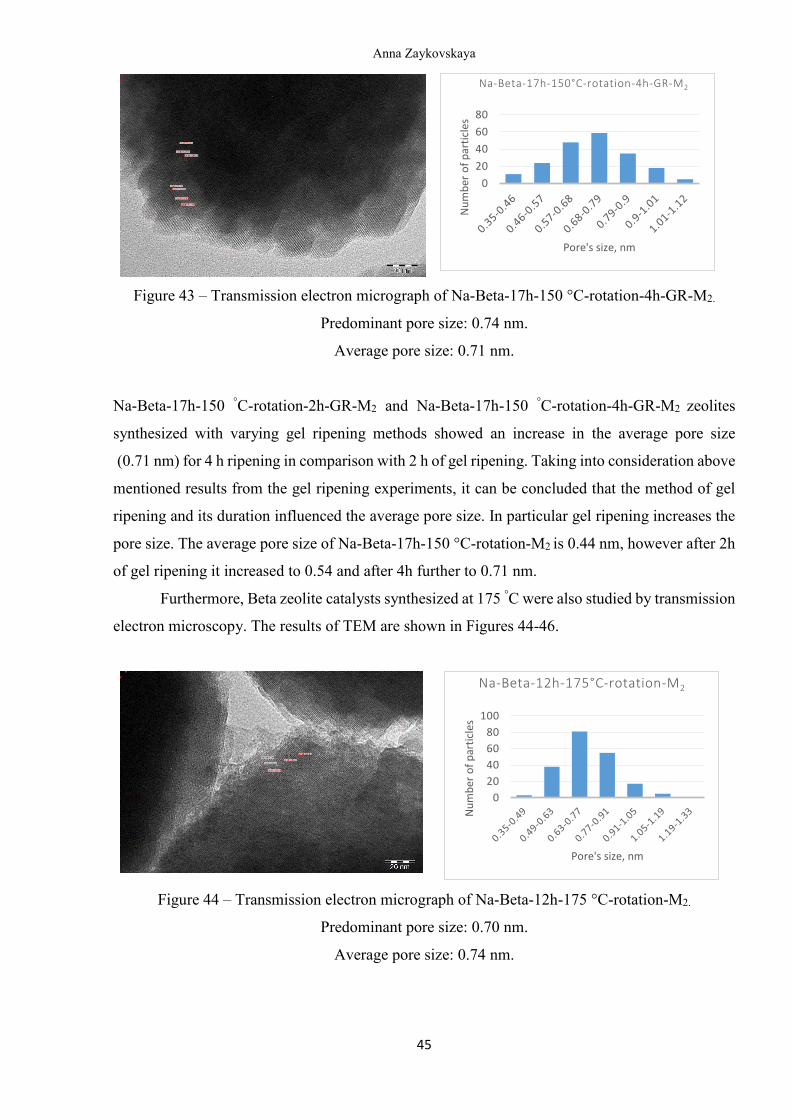
Figure 43 – Transmission electron micrograph of Na-Beta-17h-150 °C-rotation-4h-GR-M2.
Predominant pore size: 0.74 nm.
Average pore size: 0.71 nm.
Na-Beta-17h-150 °C-rotation-2h-GR-M2 and Na-Beta-17h-150 °C-rotation-4h-GR-M2 zeolites
synthesized with varying gel ripening methods showed an increase in the average pore size
(0.71 nm) for 4 h ripening in comparison with 2 h of gel ripening. Taking into consideration above
mentioned results from the gel ripening experiments, it can be concluded that the method of gel
ripening and its duration influenced the average pore size. In particular gel ripening increases the
pore size. The average pore size of Na-Beta-17h-150 °C-rotation-M2 is 0.44 nm, however after 2h
of gel ripening it increased to 0.54 and after 4h further to 0.71 nm.
Furthermore, Beta zeolite catalysts synthesized at 175 °C were also studied by transmission
electron microscopy. The results of TEM are shown in Figures 44-46.
Figure 44 – Transmission electron micrograph of Na-Beta-12h-175 °C-rotation-M2.
Predominant pore size: 0.70 nm.
Average pore size: 0.74 nm.
0
20
40
60
80
Nu
mb
er o
f p
arti
cles
Pore's size, nm
Na-Beta-17h-150°C-rotation-4h-GR-M2
0
20
40
60
80
100
Nu
mb
er o
f p
arti
cles
Pore's size, nm
Na-Beta-12h-175°C-rotation-M2
Anna Zaykovskaya
46
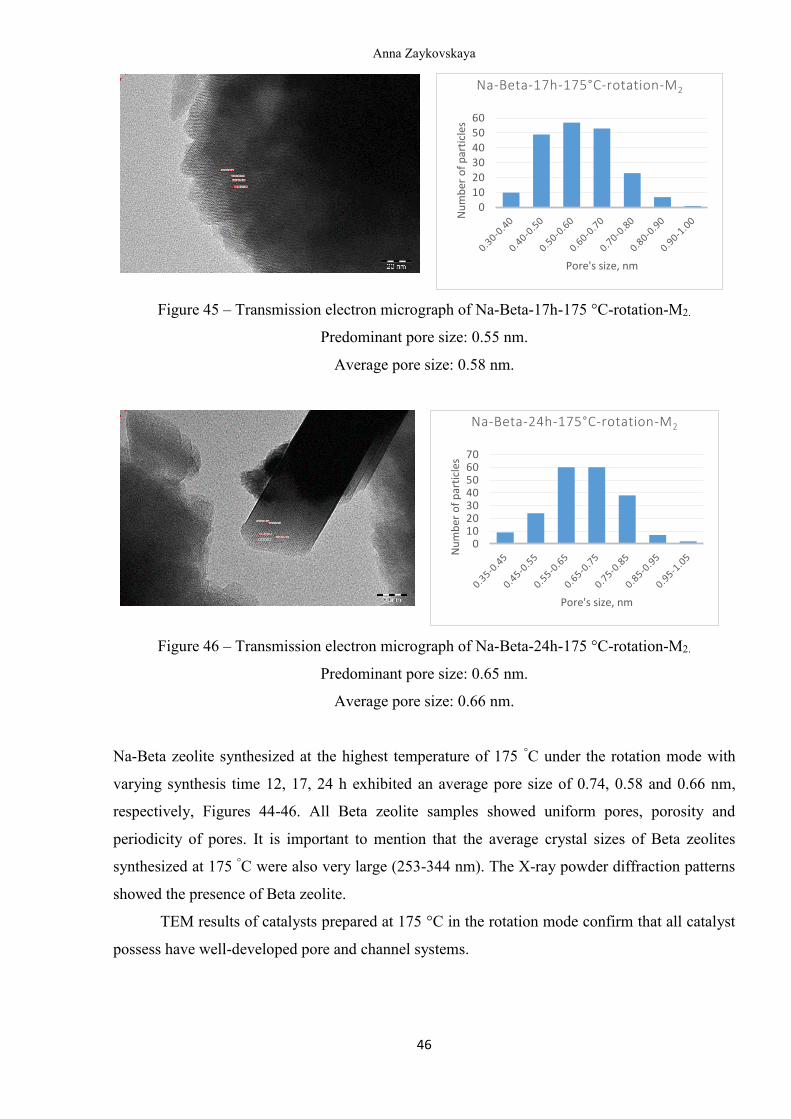
Figure 45 – Transmission electron micrograph of Na-Beta-17h-175 °C-rotation-M2.
Predominant pore size: 0.55 nm.
Average pore size: 0.58 nm.
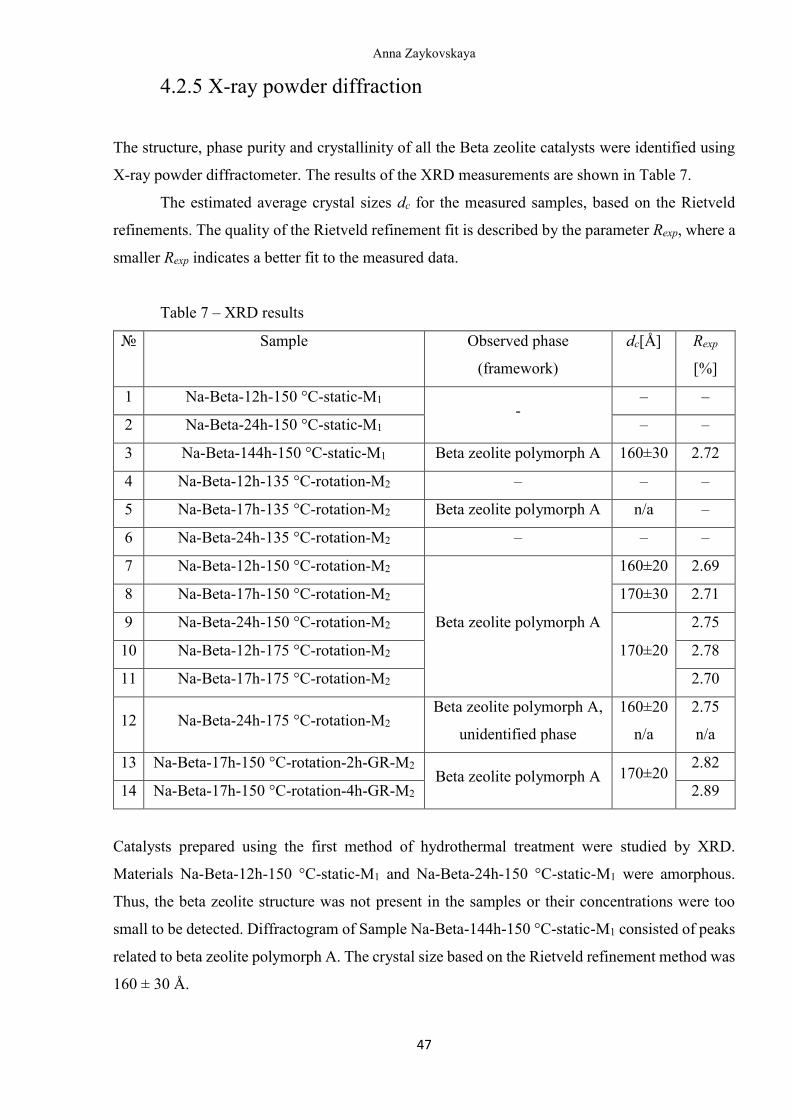
Figure 46 – Transmission electron micrograph of Na-Beta-24h-175 °C-rotation-M2.
Predominant pore size: 0.65 nm.
Average pore size: 0.66 nm.
Na-Beta zeolite synthesized at the highest temperature of 175 °C under the rotation mode with
varying synthesis time 12, 17, 24 h exhibited an average pore size of 0.74, 0.58 and 0.66 nm,
respectively, Figures 44-46. All Beta zeolite samples showed uniform pores, porosity and
periodicity of pores. It is important to mention that the average crystal sizes of Beta zeolites
synthesized at 175 °C were also very large (253-344 nm). The X-ray powder diffraction patterns
showed the presence of Beta zeolite.
TEM results of catalysts prepared at 175 °C in the rotation mode confirm that all catalyst
possess have well-developed pore and channel systems.
0102030405060
Nu
mb
er o
f p
arti
cles
Pore's size, nm
Na-Beta-17h-175°C-rotation-M2
010203040506070
Nu
mb
er o
f p
arti
cles
Pore's size, nm
Na-Beta-24h-175°C-rotation-M2
Anna Zaykovskaya
47
4.2.5 X-ray powder diffraction
The structure, phase purity and crystallinity of all the Beta zeolite catalysts were identified using
X-ray powder diffractometer. The results of the XRD measurements are shown in Table 7.
The estimated average crystal sizes dc for the measured samples, based on the Rietveld
refinements. The quality of the Rietveld refinement fit is described by the parameter Rexp, where a
smaller Rexp indicates a better fit to the measured data.
Table 7 – XRD results
№ Sample Observed phase
(framework)
dc[Å] Rexp
[%]
1 Na-Beta-12h-150 °C-static-M1 -
– –
2 Na-Beta-24h-150 °C-static-M1 – –
3 Na-Beta-144h-150 °C-static-M1 Beta zeolite polymorph A 160±30 2.72
4 Na-Beta-12h-135 °C-rotation-M2 – – –
5 Na-Beta-17h-135 °C-rotation-M2 Beta zeolite polymorph A n/a –
6 Na-Beta-24h-135 °C-rotation-M2 – – –
7 Na-Beta-12h-150 °C-rotation-M2
Beta zeolite polymorph A
160±20 2.69
8 Na-Beta-17h-150 °C-rotation-M2 170±30 2.71
9 Na-Beta-24h-150 °C-rotation-M2
170±20
2.75
10 Na-Beta-12h-175 °C-rotation-M2 2.78
11 Na-Beta-17h-175 °C-rotation-M2 2.70
12 Na-Beta-24h-175 °C-rotation-M2 Beta zeolite polymorph A,
unidentified phase
160±20
n/a
2.75
n/a
13 Na-Beta-17h-150 °C-rotation-2h-GR-M2 Beta zeolite polymorph A 170±20
2.82
14 Na-Beta-17h-150 °C-rotation-4h-GR-M2 2.89
Catalysts prepared using the first method of hydrothermal treatment were studied by XRD.
Materials Na-Beta-12h-150 °C-static-M1 and Na-Beta-24h-150 °C-static-M1 were amorphous.
Thus, the beta zeolite structure was not present in the samples or their concentrations were too
small to be detected. Diffractogram of Sample Na-Beta-144h-150 °C-static-M1 consisted of peaks
related to beta zeolite polymorph A. The crystal size based on the Rietveld refinement method was
160 ± 30 Å.
Anna Zaykovskaya
48
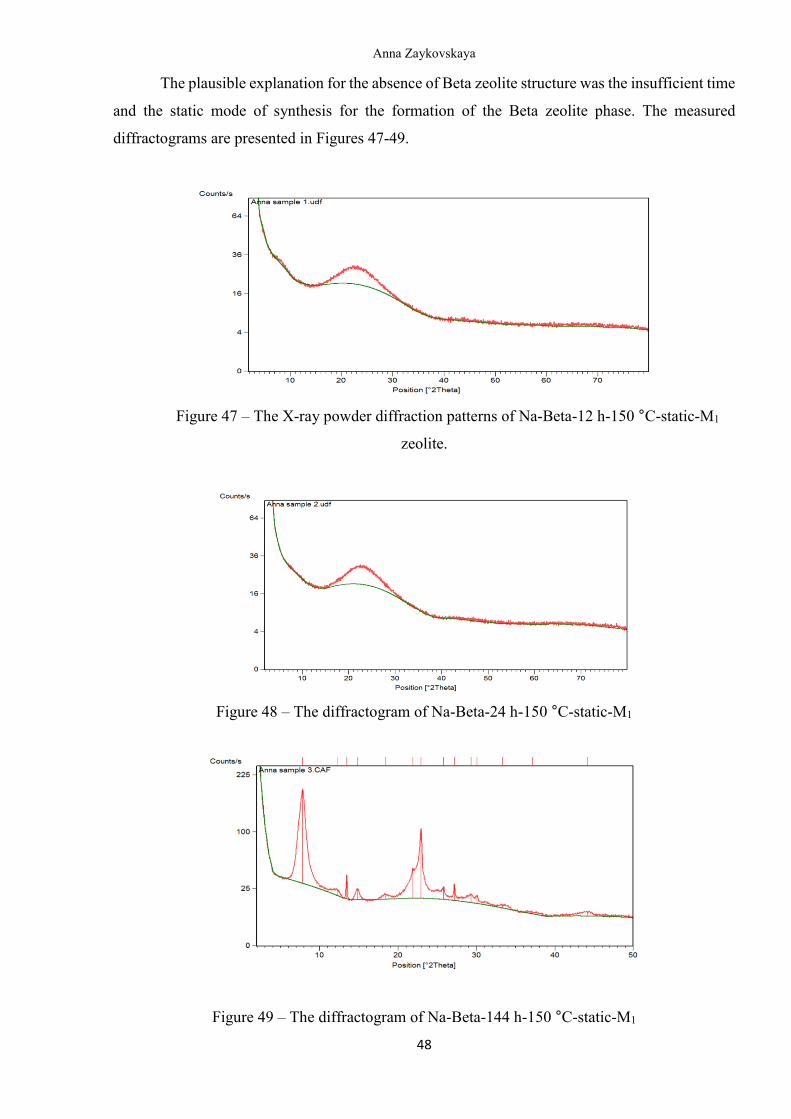
The plausible explanation for the absence of Beta zeolite structure was the insufficient time
and the static mode of synthesis for the formation of the Beta zeolite phase. The measured
diffractograms are presented in Figures 47-49.
Figure 47 – The X-ray powder diffraction patterns of Na-Beta-12 h-150 °C-static-M1
zeolite.
Figure 48 – The diffractogram of Na-Beta-24 h-150 °C-static-M1
Figure 49 – The diffractogram of Na-Beta-144 h-150 °C-static-M1
Anna Zaykovskaya
49
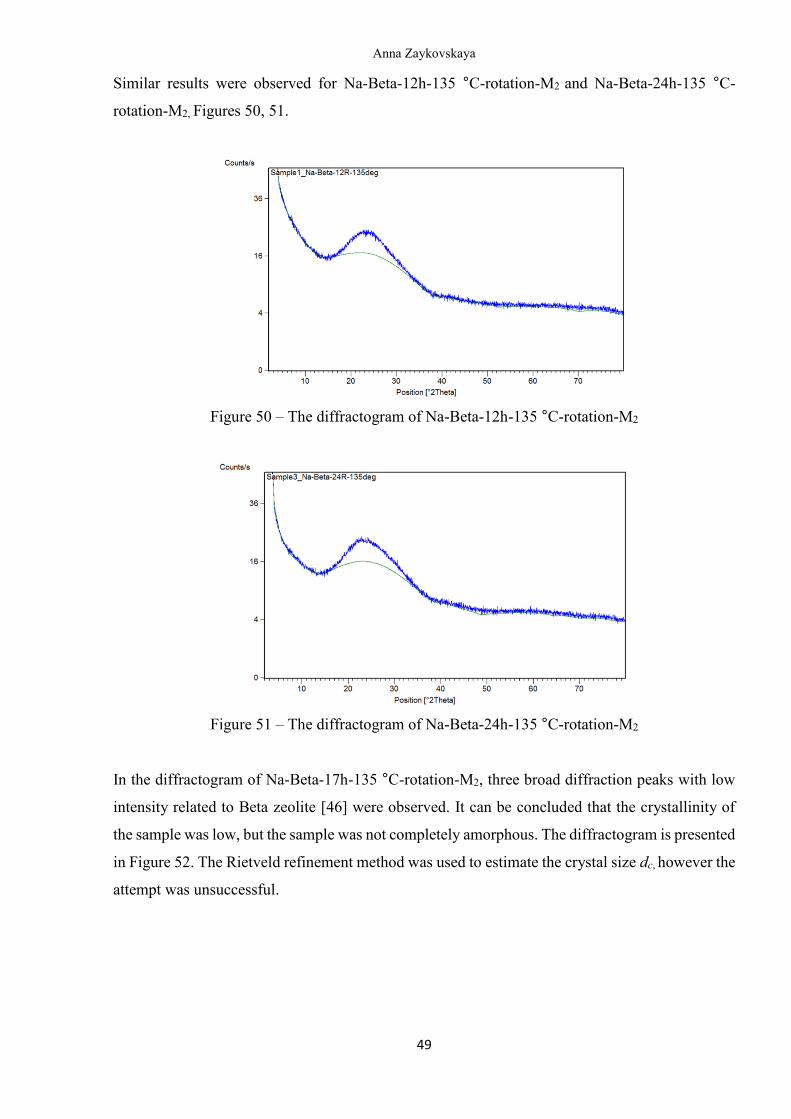
Similar results were observed for Na-Beta-12h-135 °C-rotation-M2 and Na-Beta-24h-135 °C-
rotation-M2, Figures 50, 51.
Figure 50 – The diffractogram of Na-Beta-12h-135 °C-rotation-M2
Figure 51 – The diffractogram of Na-Beta-24h-135 °C-rotation-M2
In the diffractogram of Na-Beta-17h-135 °C-rotation-M2, three broad diffraction peaks with low
intensity related to Beta zeolite [46] were observed. It can be concluded that the crystallinity of
the sample was low, but the sample was not completely amorphous. The diffractogram is presented
in Figure 52. The Rietveld refinement method was used to estimate the crystal size dc, however the
attempt was unsuccessful.
Anna Zaykovskaya
50
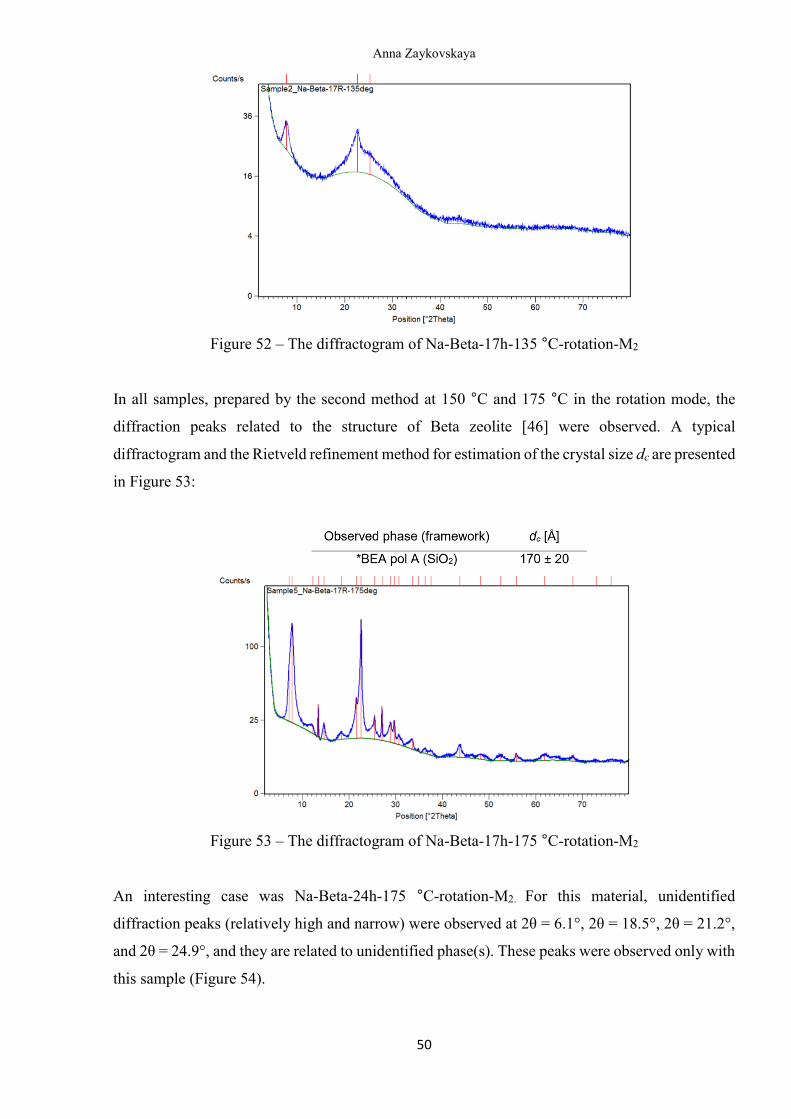
Figure 52 – The diffractogram of Na-Beta-17h-135 °C-rotation-M2
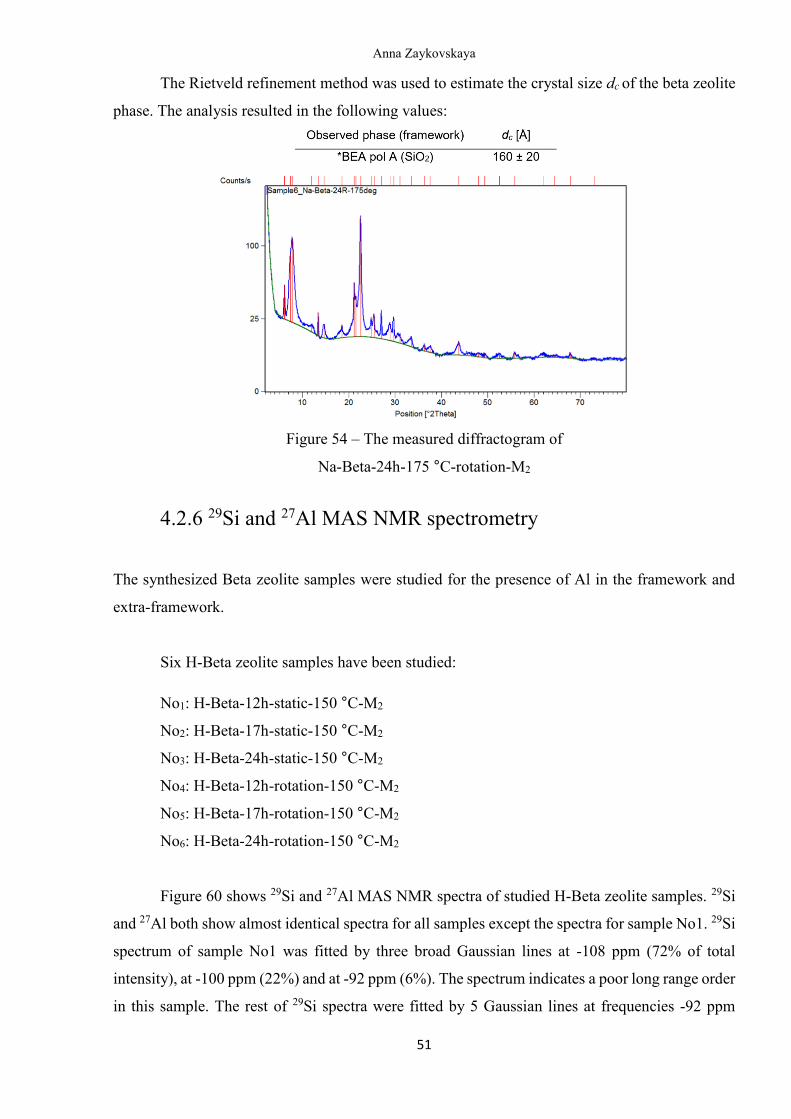
In all samples, prepared by the second method at 150 °C and 175 °C in the rotation mode, the
diffraction peaks related to the structure of Beta zeolite [46] were observed. A typical
diffractogram and the Rietveld refinement method for estimation of the crystal size dc are presented
in Figure 53:
Figure 53 – The diffractogram of Na-Beta-17h-175 °C-rotation-M2
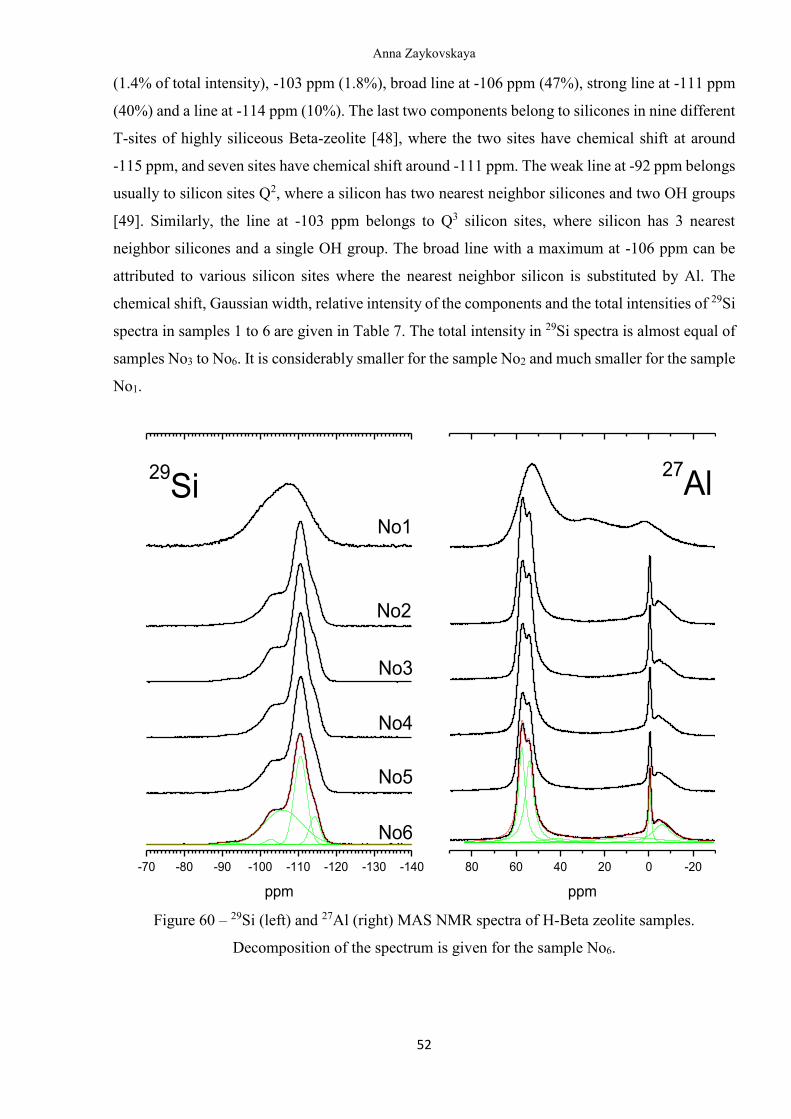
An interesting case was Na-Beta-24h-175 °C-rotation-M2. For this material, unidentified
diffraction peaks (relatively high and narrow) were observed at 2θ = 6.1°, 2θ = 18.5°, 2θ = 21.2°,
and 2θ = 24.9°, and they are related to unidentified phase(s). These peaks were observed only with
this sample (Figure 54).
Anna Zaykovskaya
51
The Rietveld refinement method was used to estimate the crystal size dc of the beta zeolite
phase. The analysis resulted in the following values:
Figure 54 – The measured diffractogram of
Na-Beta-24h-175 °C-rotation-M2
4.2.6 29Si and 27Al MAS NMR spectrometry
The synthesized Beta zeolite samples were studied for the presence of Al in the framework and
extra-framework.
Six H-Beta zeolite samples have been studied:
No1: H-Beta-12h-static-150 °C-M2
No2: H-Beta-17h-static-150 °C-M2
No3: H-Beta-24h-static-150 °C-M2
No4: H-Beta-12h-rotation-150 °C-M2
No5: H-Beta-17h-rotation-150 °C-M2
No6: H-Beta-24h-rotation-150 °C-M2
Figure 60 shows 29Si and 27Al MAS NMR spectra of studied H-Beta zeolite samples. 29Si
and 27Al both show almost identical spectra for all samples except the spectra for sample No1. 29Si
spectrum of sample No1 was fitted by three broad Gaussian lines at -108 ppm (72% of total
intensity), at -100 ppm (22%) and at -92 ppm (6%). The spectrum indicates a poor long range order
in this sample. The rest of 29Si spectra were fitted by 5 Gaussian lines at frequencies -92 ppm
Anna Zaykovskaya
52
(1.4% of total intensity), -103 ppm (1.8%), broad line at -106 ppm (47%), strong line at -111 ppm
(40%) and a line at -114 ppm (10%). The last two components belong to silicones in nine different
T-sites of highly siliceous Beta-zeolite [48], where the two sites have chemical shift at around
-115 ppm, and seven sites have chemical shift around -111 ppm. The weak line at -92 ppm belongs
usually to silicon sites Q2, where a silicon has two nearest neighbor silicones and two OH groups
[49]. Similarly, the line at -103 ppm belongs to Q3 silicon sites, where silicon has 3 nearest
neighbor silicones and a single OH group. The broad line with a maximum at -106 ppm can be
attributed to various silicon sites where the nearest neighbor silicon is substituted by Al. The
chemical shift, Gaussian width, relative intensity of the components and the total intensities of 29Si
spectra in samples 1 to 6 are given in Table 7. The total intensity in 29Si spectra is almost equal of
samples No3 to No6. It is considerably smaller for the sample No2 and much smaller for the sample
No1.
80 60 40 20 0 -20-70 -80 -90 -100 -110 -120 -130 -140
ppm
27Al
ppm
No6
29Si
No1
No2
No3
No4
No5
Figure 60 – 29Si (left) and 27Al (right) MAS NMR spectra of H-Beta zeolite samples.
Decomposition of the spectrum is given for the sample No6.
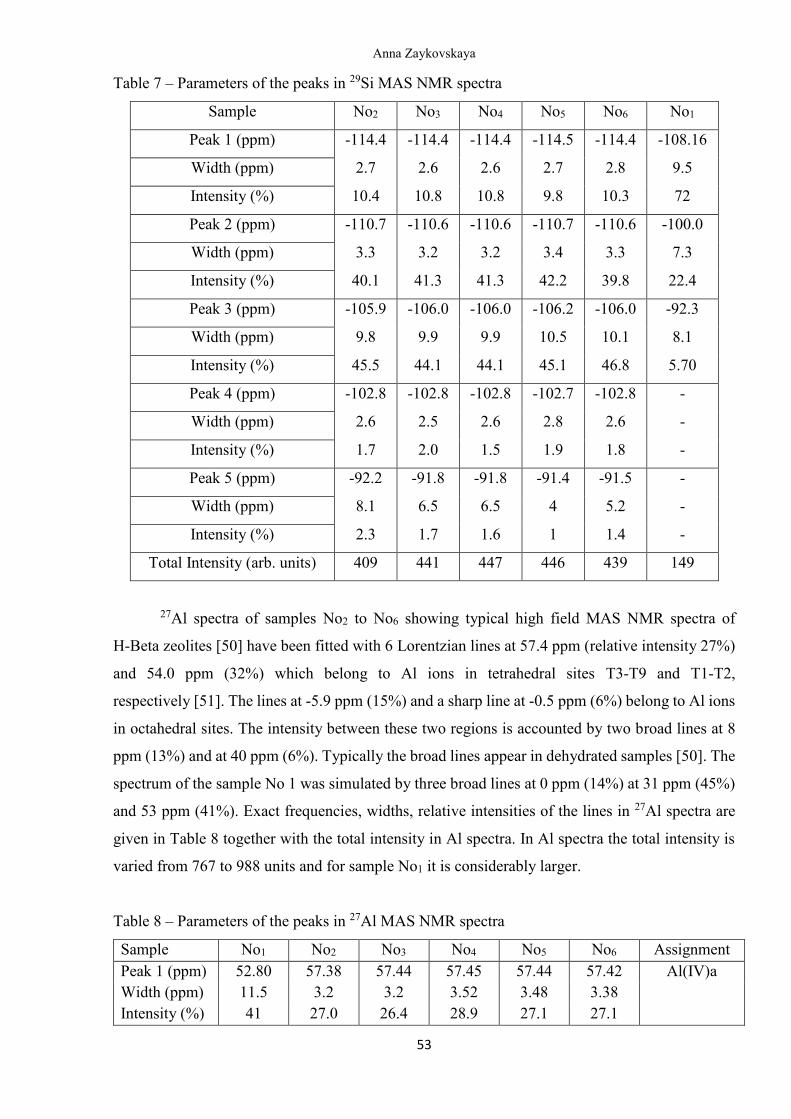
Anna Zaykovskaya
53
Table 7 – Parameters of the peaks in 29Si MAS NMR spectra
Sample No2 No3 No4 No5 No6 No1
Peak 1 (ppm) -114.4 -114.4 -114.4 -114.5 -114.4 -108.16
Width (ppm) 2.7 2.6 2.6 2.7 2.8 9.5
Intensity (%) 10.4 10.8 10.8 9.8 10.3 72
Peak 2 (ppm) -110.7 -110.6 -110.6 -110.7 -110.6 -100.0
Width (ppm) 3.3 3.2 3.2 3.4 3.3 7.3
Intensity (%) 40.1 41.3 41.3 42.2 39.8 22.4
Peak 3 (ppm) -105.9 -106.0 -106.0 -106.2 -106.0 -92.3
Width (ppm) 9.8 9.9 9.9 10.5 10.1 8.1
Intensity (%) 45.5 44.1 44.1 45.1 46.8 5.70
Peak 4 (ppm) -102.8 -102.8 -102.8 -102.7 -102.8 -
Width (ppm) 2.6 2.5 2.6 2.8 2.6 -
Intensity (%) 1.7 2.0 1.5 1.9 1.8 -
Peak 5 (ppm) -92.2 -91.8 -91.8 -91.4 -91.5 -
Width (ppm) 8.1 6.5 6.5 4 5.2 -
Intensity (%) 2.3 1.7 1.6 1 1.4 -
Total Intensity (arb. units) 409 441 447 446 439 149
27Al spectra of samples No2 to No6 showing typical high field MAS NMR spectra of
H-Beta zeolites [50] have been fitted with 6 Lorentzian lines at 57.4 ppm (relative intensity 27%)
and 54.0 ppm (32%) which belong to Al ions in tetrahedral sites T3-T9 and T1-T2,
respectively [51]. The lines at -5.9 ppm (15%) and a sharp line at -0.5 ppm (6%) belong to Al ions
in octahedral sites. The intensity between these two regions is accounted by two broad lines at 8
ppm (13%) and at 40 ppm (6%). Typically the broad lines appear in dehydrated samples [50]. The
spectrum of the sample No 1 was simulated by three broad lines at 0 ppm (14%) at 31 ppm (45%)
and 53 ppm (41%). Exact frequencies, widths, relative intensities of the lines in 27Al spectra are
given in Table 8 together with the total intensity in Al spectra. In Al spectra the total intensity is
varied from 767 to 988 units and for sample No1 it is considerably larger.
Table 8 – Parameters of the peaks in 27Al MAS NMR spectra
Sample No1 No2 No3 No4 No5 No6 Assignment
Peak 1 (ppm) 52.80 57.38 57.44 57.45 57.44 57.42 Al(IV)a
Width (ppm) 11.5 3.2 3.2 3.52 3.48 3.38 Intensity (%) 41 27.0 26.4 28.9 27.1 27.1
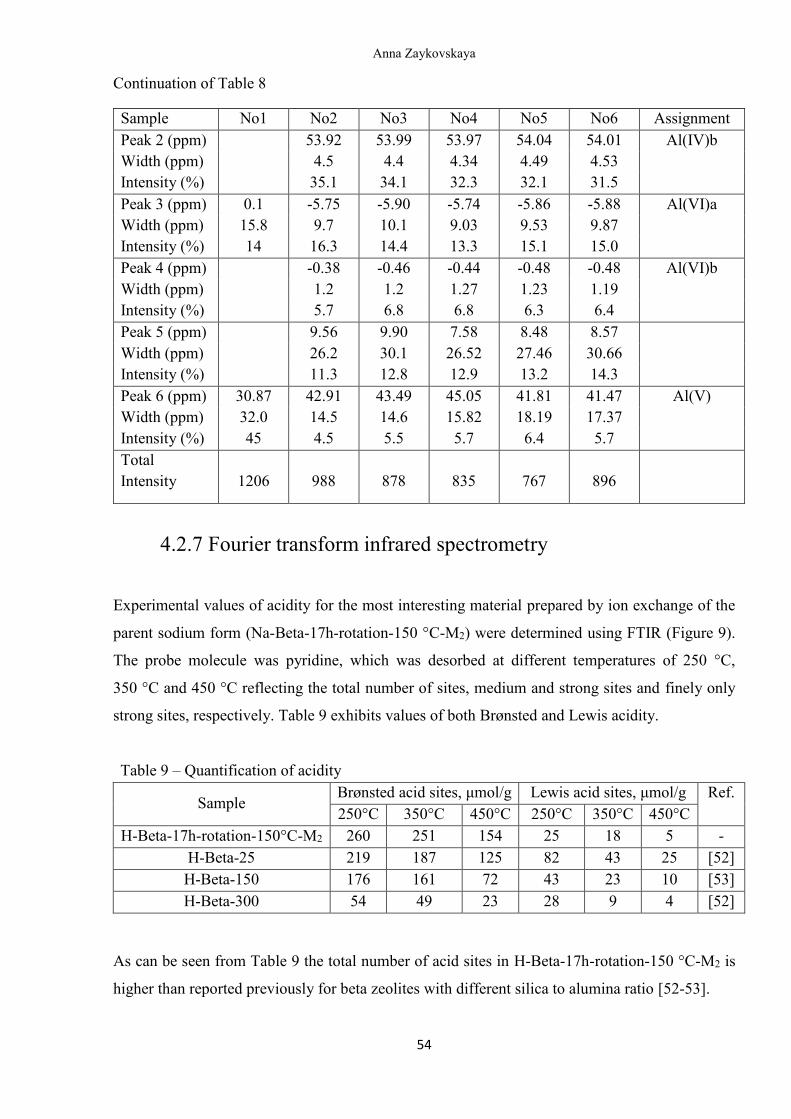
Anna Zaykovskaya
54
Continuation of Table 8
Sample No1 No2 No3 No4 No5 No6 Assignment
Peak 2 (ppm) 53.92 53.99 53.97 54.04 54.01 Al(IV)b
Width (ppm) 4.5 4.4 4.34 4.49 4.53 Intensity (%) 35.1 34.1 32.3 32.1 31.5 Peak 3 (ppm) 0.1 -5.75 -5.90 -5.74 -5.86 -5.88 Al(VI)a
Width (ppm) 15.8 9.7 10.1 9.03 9.53 9.87 Intensity (%) 14 16.3 14.4 13.3 15.1 15.0 Peak 4 (ppm) -0.38 -0.46 -0.44 -0.48 -0.48 Al(VI)b
Width (ppm) 1.2 1.2 1.27 1.23 1.19 Intensity (%) 5.7 6.8 6.8 6.3 6.4 Peak 5 (ppm) 9.56 9.90 7.58 8.48 8.57 Width (ppm) 26.2 30.1 26.52 27.46 30.66 Intensity (%) 11.3 12.8 12.9 13.2 14.3 Peak 6 (ppm) 30.87 42.91 43.49 45.05 41.81 41.47 Al(V)
Width (ppm) 32.0 14.5 14.6 15.82 18.19 17.37 Intensity (%) 45 4.5 5.5 5.7 6.4 5.7 Total
Intensity 1206 988 878 835 767 896
4.2.7 Fourier transform infrared spectrometry
Experimental values of acidity for the most interesting material prepared by ion exchange of the
parent sodium form (Na-Beta-17h-rotation-150 °C-M2) were determined using FTIR (Figure 9).
The probe molecule was pyridine, which was desorbed at different temperatures of 250 °C,
350 °C and 450 °C reflecting the total number of sites, medium and strong sites and finely only
strong sites, respectively. Table 9 exhibits values of both Brønsted and Lewis acidity.
Table 9 – Quantification of acidity
Sample Brønsted acid sites, μmol/g Lewis acid sites, μmol/g Ref.
250°C 350°C 450°C 250°C 350°C 450°C
H-Beta-17h-rotation-150°C-M2 260 251 154 25 18 5 -
H-Beta-25 219 187 125 82 43 25 [52]
H-Beta-150 176 161 72 43 23 10 [53]
H-Beta-300 54 49 23 28 9 4 [52]
As can be seen from Table 9 the total number of acid sites in H-Beta-17h-rotation-150 °C-M2 is
higher than reported previously for beta zeolites with different silica to alumina ratio [52-53].
Anna Zaykovskaya
55
5. Conclusions
The influence of such synthesis parameters as time, pH, mode of stirring and temperature, along
with an extra pre-synthesis step of gel ripening was studied using synthesis of Beta zeolite as a
show case. Physico-chemical characterizations of the synthesized materials was performed using
an arsenal of modern analytical methods comprising nitrogen physisorption, SEM, TEM, EDX,
XRD, FTIR with pyridine as the probe molecule and 29Si and 27Al MAS NMR. Variation of the
synthesis parameters significantly influenced the physico-chemical properties of Beta zeolite. It
was observed that the rotation mode of stirring and temperature above 135 C in hydrothermal
synthesis are necessary to obtain phase pure Beta zeolites structure. Synthesized Beta zeolites
exhibited a large surface area (>500 m2/g). The highest surface area (762 m2/g) was obtained for
Na-Beta-17h-150°C-M2-4h-GR while the second highest surface area (704 m2/g) was present in
Na-Beta-17h-150°C-M2-2h-GR. Hence, it was concluded that gel ripening in the Beta zeolite
synthesis was of immense importance for the creation of porosity, pore volume and surface area.
It should be noted that the achieved result of the surface area measurement is significantly higher
than reported in the literature [22, 24, 39-42].
The X-ray powder diffraction patterns of Na-Beta-144h-150°C-static-M1,
Na-Beta-12h-150 °C-rotation-M2, Na-Beta-17h-150°C-rotation-M2, Na-Beta-24h-150°C-rotation-
M2, Na-Beta-12 h-175°C-rotation-M2, Na-Beta-17 h-175°C-rotation M2, and Na-Beta-17 h-175°C-
rotation-M2, Na-Beta-24h-175°C-M2 and Na-Beta-17h-150°C-M2-GR-2h and Na-Beta-17h-
150°C-rotation-M2-GR-4h Beta zeolites exhibited highly crystalline phase pure structures. The
physico-chemical characterization results of the synthesized Beta zeolites confirmed that the
crystal structure, surface area, pore volume and pore size varied depending on the synthesis
conditions. The largest average crystallite size (344 nm) using scanning electron microscopy was
obtained for Na-Beta-24 h-175°C-rotation-M2 and the second largest (340 nm) was achieved for
Na-beta-12h-175°C-rotation-M2, clearly indicating the influence of high temperature (175 °C) in
the formation of Beta zeolite crystals.
Synthesized materials, prepared at 150 C, were analyzed by Al-NMR. 29Si and 27Al both
show almost identical spectra for all samples except the spectra for
H-Beta-12h-static-150C-M2. It was inferred that 12 h of hydrothermal synthesis was not enough
to form tetrahedral Al in the structure of Beta zeolite. The measurement of the acidic properties of
the Beta zeolite using FTIR showed the presence of Brønsted and Lewis acid sites. Moreover, the
number of Brønsted acid sites in H-Beta-17h-rotation-150C-M2 was higher compared to
H-Beta-25, H-Beta-150 and H-Beta-300 [52-53].
Anna Zaykovskaya
56
References
1 E.M. Flanigen, R.W. Broach, S.T. Wilson in: S. Kulprathipanja (Ed.), Zeolites in industrial
separation and catalysis, Wiley-VCH, (2010), 618.
2 M.E. Davis, R.F. Lobo, Zeolite and molecular-sieve synthesis, Chem. Mater., 4 (1992)
756–768.
3 M.E. Davis, New vistas in zeolite and molecular-sieve catalysis, Acc. Chem. Res., 26
(1993) 111–115.
4 M.E. Davis, Zeolites from a materials chemistry perspective, Chem. Mater., 26 (2014)
239–245.
5 A. Corma, Inorganic solid acids and their use in acid-catalyzed hydrocarbon reactions,
Chem. Rev., 95 (1995) 559–614.
6 C.S. Cundy, P.A. Cox, The hydrothermal synthesis of zeolites: history and development
from the earliest days to the present time, Chem. Rev., 103 (2003) 663–701.
7 E. M. Flanigen, Chapter 2. Zeolites and molecular sieves: An historical perspective, Stud.
Surf. Sci. Catal., 137 (2001) 11 – 35.
8 D. P. Serrano, J. Aguado, J. M. Escola, J. M. Rodríguez, Influence of nanocrystalline hzsm-
5 external surface on the catalytic cracking of polyolefins, J. Anal. Appl. Pyrolysis., 74 (2005)
353–360.
9 D. P. Serrano, J. M. Escola, P. Pizarro, Synthesis strategies in the search for hierarchical
zeolites, Chem. Soc. Rev., 42 (2013) 4004 – 4035.
10 J. Pérez-Ramírez, C. H. Christensen, K. Egeblad, C. H. Christensen, J. C. Groen,
Hierarchical zeolites: enhanced utilisation of microporous crystals in catalysis by advances in
materials design, Chem. Soc. Rev., 37 (2008) 2530 – 2542.
11 K. Egeblad, C. H. Christensen, M. Kustova, C. H. Christensen, Templating mesoporous
zeolites, Chem. Mater., 20 (2008) 946 – 960.
12 C. H. Christensen, K. Johannsen, E. Törnqvist, I. Schmidt, H. Topsøe, C. H. Christensen,
Mesoporous zeolite single crystal catalysts: Diffusion and catalysis in hierarchical zeolites, Catal.
Today, 128 (2007) 117 – 122.
13 D. H. Park, S. S. Kim, H. Wang, T. J. Pinnavaia, M. C. Papapetrou, A. A. Lappas, K. S.
Triantafyllidis, Selective petroleum refining over a zeolite catalyst with small intracrystal
mesopores, Angew. Chem. Int. Ed., 48 (2009) 7645 – 7648.
14 Y. Sun, R. Prins, Hydrodesulfurization of 4,6-dimethyldibenzothiophene over noble metals
supported on mesoporous zeolites, Angew. Chem. Int. Ed., 47 (2008) 8478 – 8481.
Anna Zaykovskaya
57
15 C. H. Christensen, I. Schmidt, A. Carlsson, K. Johannsen, K. Herbst, Crystals in crystals –
nanocrystals within mesoporous zeolite single crystals, J. Am. Chem. Soc., 127 (2005) 8098 –
8102.
16 J. M. Escola, J. Aguado, D. P. Serrano, A. García, A. Peral, L. Briones, R. Calvo, E.
Fernández, Catalytic hydroreforming of the polyethylene thermal cracking oil over Ni supported
hierarchical zeolites and mesostructured aluminosilicates, Appl. Catal., B 106 (2011) 405 – 415.
17 R. Srivastava, M. Choi, R. Ryoo, Mesoporous materials with zeolite framework:
remarkable effect of the hierarchical structure for retardation of catalyst deactivation, Chem.
Commun., (2006) 4489 – 4491.
18 J. Kim, M. Choi, R. Ryoo, Effect of mesoporosity against the deactivation of MFI zeolite
catalyst during the methanol-to-hydrocarbon conversion process, J. Catal., 269 (2010) 219 – 228.
19 W. M. Meier, D. H. Olson, C. Baerlocher, Atlas of zeolite structure types, Zeolites-Int. J.
of Molec. Sieves, 1996, 405.
20 M.A. Camblor, J. Pérez-Pariente, Crystallization of zeolite Beta – effect of Na and K-ions,
Zeolites, 11 (1991) 202 – 210.
21 K. Zhang, S. Fernandez, J. T. O’Brien, T. Pilyugina, S. Kobaslija, M. L. Ostraat,.
Organotemplate-free synthesis of hierarchical beta zeolites. Catal. Today, 316 (2017), 26–30.
22 L.R.M. dos Santos, M.A.P. da Silva, S.C. de Menezes, L.S. Chinelatto, Jr., Y.L. Lam,
Creation of mesopores and structural re-organization in Beta zeolite during alkaline treatment,
Microp. Mesopor. Mater., 226 (2016), 260-266.
23 K. Zhang, S. Fernandez, J. T. O’Brien, T. Pilyugina, S. Kobaslija, M. L. Ostraat,
Organotemplate-free synthesis of hierarchical beta zeolites. Catal. Today, 234 (2017), 347–360.
24 G. Huang, P. Ji, H. Xu, J.-G. Jiang, L. Chen, P. Wu, Fast synthesis of hierarchical Beta
zeolites with uniform nanocrystals from layered silicate precursor, Microp. Mesopor. Mater., 248
(2017), 30-39.
25 M. Rutkowska, Z. Piwowarska, E. Micek, L. Chmielarz, Hierarchical Fe-, Cu- and Co-Beta
zeolites obtained by mesotemplate-free method. Part I: Synthesis and catalytic activity in N2O
decomposition, Microp. Mesopor. Mater., 209 (2015) 54–65.
26 Y. Jin, L. Zhang, J. Liu, S. Zhang, S. Sun, S. Asaoka, K. Fujimoto, Mesopore modification
of beta zeolites by sequential alkali and acid treatments: Composition-dependent T-atoms removal
behavior back donating to hierarchical structure and catalytic activity in benzene alkylation.
Microp. Mesopor. Mater., 248 (2017) 7–17.
27 Y. Fang, Y. Hu, X. Liang, S. Wang, S. Zuo, X. Gao, Z. Zhang, Microwave hydrothermal
synthesis and performance of NaA zeolite monolithic adsorbent with honeycomb ceramic matrix.
Microp. Mesopor. Mater., 259 (2018) 116–122.
Anna Zaykovskaya
58
28 U. Khalil, O. Muraza, Microwave-assisted hydrothermal synthesis of mordenite zeolite:
Optimization of synthesis parameters. Microp. Mesopor. Mater., 232 (2016) 211–217.
29 R. A. García-Muñoz, D. P. Serrano, G. Vicente, M. Linares, D. Vitvarova, J. Čejka,
Remarkable catalytic properties of hierarchical zeolite-Beta in epoxide rearrangement reactions,
Catal. Today, 243 (2015) 141–152.
30 M. A. Camblor, A. Corma, A. Mifsud, J. Pérez-Pariente, S. Valencia, Synthesis of
nanocrystalline zeolite beta in the absence of alkali metal cations. Stud. Surf. Sci. Catal.,
105 (1997) 341–348.
31 J. Aguado, D. P. Serrano, J. M. Rodrígueza, J. Aguado, Zeolite Beta with hierarchical
porosity prepared from organofunctionalized seeds. Microp. Mesopor. Mater.,
115(3) (2008) 504–513.
32 V. Pashkova, V. Tokarova, L. Brabec, J. Dedecek, Self-templating synthesis of hollow
spheres of zeolite ZSM-5 from spray-dried aluminosilicate precursor. Microp. Mesopor. Mater.,
228 (2016) 59–63.
33 J.M. Escola, D.P. Serrano, R. Sanz, R.A. Garcia, A. Peral, I. Moreno, M. Linares, Synthesis
of hierarchical Beta zeolite with uniform mesopores: effect on its catalytic activity for veratrole
acylation, Catal. Today, 304 (2018) 89-96.
34 A. R. do Nascimento, G. P. de Figueredo, E. M. F. Silva, M. A. F. Melo, D. M. A. Melo,
M. J. B. de Souza, Synthesis, optimization and characterization of zeolite Beta (BEA): Production
of ZSM-5 and NaAlSiO4 as secondary phases, Rev. Virtual Quim, 9 (2017)
1570-1582.
35 F. Taborda, T. Willhammar, Z. Wang, C. Montes, X. Zou, Synthesis and characterization
of pure silica zeolite beta obtained by an aging–drying method, Microp. Mesopor. Mater.,
143 (2011) 196–205.
36 N. P. William. van der Graaff, Guanna Li, B. Mezari, E. A. Pidko, E. J. M. Hensen,
Synthesis of Sn-Beta with exclusive and high framework Sn content, ChemCatChem, 7 (2015)
1152-1160.
37 J. M. Escola, D. P. Serrano, R. Sanz, R. A. Garcia, A. Peral, I. Moreno, M. Linares,
Synthesis of hierarchical Beta zeolite with uniform mesopores: effect on its catalytic activity for
veratrole acylation, Catal. Today, 304 (2018) 89-96.
38 J. Jin, X. Ye, Y.Li, Y. Wang, L. Li, J. Gu, W. Zhaoa, J.Shi, Synthesis of mesoporous Beta
and Sn-Beta zeolites and their catalytic performances, Dalton Trans., 43 (2014) 8196-8204.
39 C. Manrique, A. Guzman, J. Pérez-Pariente, C. Márquez-Álvarez, A. Echavarría, Effect of
synthesis conditions on zeolite Beta properties and its performance in vacuum gas oil
hydrocracking activity, Microp. Mesopor. Mater., 234 (2016) 347-360.
Anna Zaykovskaya
59
40 K. Möller, B. Yilmaz, R. M. Jacubinas, U. Müller, T. Bein, One-step synthesis of
hierarchical zeolite Beta via network formation of uniform nanocrystals, JACS, 133 (2011) 5284-
5295.
41 C. Bian, C. Zhang, S. Pan, F. Chen, W. Zhang, X. Meng, S. Maurer, D. Dai, A. Parvulescu,
U. Müller, F. Xiao Generalized high-temperature synthesis of zeolite catalysts with unpredictably
high space-time yields (STYs), J. Mater. Chem. A, 5 (2017) 2613-2618.
42 Z. Zhu, H. Xu, J. Jiang, H. Wu, P. Wu, Hydrophobic nanosized all-silica Beta zeolite:
Efficient synthesis and adsorption application, ACS Appl. Mater. Interfaces, 9 (2017) 27273-27283
43 Powder Diffraction File 2 (PDF-2), sets 1-46, 1996 release, International Centre for
Diffraction Data (ICDD).
44 Database of Zeolite Structures, http://www.iza-structure.org/databases/ [Cited 25.07.18].
45 Inorganic Crystal Structure Database (ICSD), version 3.7.0,
http://www2.fiz-karlsruhe.de/icsd_home.html, [Cited 17.05.18]., Fiz Karlsruhe.
46 J. M. Newsam, M. M. J. Treacy, W. T. Koetsier, C. B. de Gruyter, Structural
characterization of zeolite beta, Proc. R. Soc. Lond. A, 420 (1988) 375-405.
47 C.A. Emeis, Determination of integrated molar extinction coefficients for infrared
absorption bands of pyridine adsorbed on solid acid catalysts, J. Catal., 141 (1993), 347-354.
48 C. A. Fyfe, H. Strobl, G. T. Kokotailo, C. T. Pasztor, G. E. Barlow, S. Bradly, Correlations
between lattice structures of zeolites and their 29Si MAS n.m.r. spectra: zeolites KZ-2, ZSM-12,
and Beta, Zeolites, 8(2) (1988) 132-136.
49 G. Engelhardt, D. Michel, High-resolution solid-state NMR of silicates and zeolites, John
Wiley & Sons, 1987, 485.
50 Z. Zhao, S. Xu, M. Y. Hu, X. Bao, C. H. F. Peden, J. Hu, Investigation of aluminum site
changes of dehydrated zeolite H-Beta during rehydration process by high field solid state NMR.
J. Phys. Chem., 119 (2015) 1410-1417.
51 J. A. von Bokhoven, D. C. Konigsberger, P. Kunkeler, H. van Bekkum, A. P. M. Kentgens.
Stepwise dealumination of zeolite Beta at specified T-sites observed with 27Al MAS and 27Al
MQ MAS NMR. J. Am. Chem. Soc., 122 (2000) 12842-12847.
52 A. Aho, N. Kumar, K. Eränen, T. Salmi, M. Hupa, D. Y. Murzin, Catalytic pyrolysis of
biomass in afluidized bed reactor: Influence of the acidity of H-beta zeolite. Proc. Saf. Environ.
Prot., 85 (2007) 473–480.
53 A. Torozova, P. Mäki-Arvela, A. Aho, N. Kumar, A. Smeds, M. Peurla, R. Sjöholm, L.
Heinmaa, D. V. Korchagina, K. P. Volcho, Heterogeneous catalysis for transformation of biomass
derived compoundsbeyond fuels: Synthesis of monoterpenoid dioxinols with analgesic activity. J.
Mol. Catal. A. Chem., 397 (2015) 48–55.