A New Mapping/Exploration Approach for HT Synthesis of Zeolites
10
A New Mapping/Exploration Approach for HT Synthesis of Zeolites Avelino Corma,* Manuel Moliner, Jose M. Serra, Pedro Serna, Marı ´a J. Dı ´az-Caban ˜as, and Laurent A. Baumes Instituto de Tecnologı ´a Quı ´mica, UPV-CSIC, UniVersidad Polite ´ cnica de Valencia, AVda. de los Naranjos s/n, 46022 Valencia, Spain ReceiVed March 15, 2006. ReVised Manuscript ReceiVed May 4, 2006 This work shows a methodology for the synthesis of self-assembled organic-inorganic materials which integrates high-throughput tools for the synthesis and characterization of solid materials and data-mining techniques in materials science. This is illustrated by a detailed exploration of the hydrothermal synthesis in the system SiO 2 :GeO 2 :Al 2 O 3 :F - :H 2 O:N(16) methylsparteinium. Data analysis and dimensional reduction were conducted by using principal components analysis and clustering algorithms, allowing the definition of a new and suitable structural vector which summarizes the X-ray diffraction characterization data as well as an improvement of data visualization and interpretation. Different modeling techniques were applied for the prediction of the properties of the materials considering the synthesis descriptors as input of the model. Furthermore, different “material property” descriptors were considered as outcome of the model, that is, the crystallinity of the formed phases, structural principal components computed by principal component analysis, or clustering results. It was found that the final properties of the materials could be successfully modeled using artificial neural networks and decision trees. 1. Introduction The application of combinatorial and high-throughput (HT) techniques to materials science can help chemists to increase the number of variables of a given process that can be studied in a reasonable time period as well as to increase the number of samples produced and characterized. 1-3 Moreover, data mining and database technology are applied for the analysis and modeling of the large amounts of data generated, allowing in turn a speeding up of the discovery and optimization process while establishing scientific principles. In recent years, the usefulness of HT methods has been proven for the discovery of solid functional materials. 4-8 Indeed, these methods allow the simultaneous study of numerous synthesis and processing variables, this being especially important when dealing with highly nonlinear and multidimensional systems as is the case for the synthesis of microporous molecular sieve systems. The hydrothermal crystallization processes of microporous materials are governed by a large number of parameters which determine the phases formed and the crystallization kinetics. Despite the notable efforts made to rationalize the synthesis of zeolites, 9-12 the relationship between synthesis variables and the zeolitic structure formed is not clearly understood, because of the metastable nature of zeolites and the complexity of the involved synthesis mechanisms. As a result of this, the discovery of new microporous materials is still predominantly an empirical process, though strongly helped by accumulated experience. High-throughput methods should be useful in this field 13-17 to determine the effect of different synthesis parameters and to help in the discovery of new zeolites. Very recently, a new zeolite, named ITQ-21, containing Si, Ge, and optionally Al as framework cations was reported. 18 This material presents a unique pore topology formed by nearly spherical large cavities of 1.18 nm diameter joined to six other neighbored cavities by circular 12-ring pore windows with an aperture of 0.74 nm, which results in a three-directional channel system of fully interconnected * To whom correspondence should be addressed. Tel.: 34(96)3877800. Fax: 34(96)3877809. E-mail: [email protected]. (1) Combinatorial Materials Science; Xiang, X. D., Takeuchi, I., Eds.; Dekker: New York, 2003. (2) Koinuma, H.; Takeuchi, I. Nat. Mater. 2004, 3, 429-438. (3) Hanak, J. J. Appl. Surf. Sci. 2004, 223,1-8. (4) Gorer, A. U.S. Patent 6.723.678, 2004, to Symyx Technologies Inc. (5) Sohn, K. S.; Seo, S. Y.; Park, H. D. Electrochem. Solid State Lett. 2001, 4, H26-H29. (6) Boussie, T. R.; Diamond, G. M.; Goh, C.; Hall, K. A.; LaPointe, A. M.; Cheryl Lund, M. L.; Murphy, V.; Shoemaker, J. A. W.; Tracht, U.; Turner, H.; Zhang, J.; Uno, T.; Rosen, R. K.; Stevens, J. C. J. Am. Chem. Soc. 2003, 125, 4306-4317. (7) Corma, A.; Serra, J. M.; Serna, P.; Argente, E.; Valero, S.; Botti, V. J. Catal. 2005, 229, 513-524. (8) Klanner, C.; Farrusseng, D.; Baumes, L. A.; Mirodatos, C.; Schuth, F. Angew. Chem., Int. Ed. 2004, 43 (40), 5347-5349. (9) Piccione, P. M.; Yang, S.; Navrotsky, A.; Davis, M. E. J. Phys Chem. B 2002, 106, 3629. (10) Corma, A.; Davis, M. E. ChemPhysChem. 2004, 5 (3), 304-313. (11) Schu ¨th, F.; Schmidt, W. AdV. Eng. Mater. 2002, 4 (5), 269-279. (12) Rajagopalan, A.; Suh, C.; Li, X.; Rajan, K. Appl. Catal., A 2003, 254, 147-160. (13) Akporiaye, D. E.; Dahl, I. M.; Karlsson, A.; Wendelbo, R. Angew. Chem., Int. Ed. 1998, 37 (5), 609-611. (14) Holmgren, J.; Bem, D.; Bricker, M.; Gillespie, R.; Lewis, G.; Akporiaye, D.; Dahl, I.; Karlsson, A.; Plassen, M.; Wendelbo, R. Stud. Surf. Sci. Catal. 2001, 135, 461-470. (15) Bricker, M. L.; Sachtler, J. W. A.; Gillespie, R. D.; McGoneral, C. P.; Vega, H.; Bem, D. S.; Holmgren, J. S. Appl. Surf. Sci. 2004, 223 (1-3), 109-117. (16) Pescarmona, P. P.; Rops, J. J. T.; van der Waal, J. C.; Jansen, J. C.; Maschmeyer, T. J. Mol. Chem. A 2002, 182-183, 319-325. (17) Klein, J.; Lehmann, C. W.; Schmidt, H. W.; Maier, W. F. Angew. Chem., Int. Ed. 1999, 38, 3369. (18) Corma, A.; Dı ´az-Caban ˜ as, M. J.; Martı ´nez-Triguero, J.; Rey, F.; Rius, J. Nature 2002, 418, 514-517. 3287 Chem. Mater. 2006, 18, 3287-3296 10.1021/cm060620k CCC: $33.50 © 2006 American Chemical Society Published on Web 06/20/2006
-
Upload
goldsmiths -
Category
Documents
-
view
3 -
download
0
Transcript of A New Mapping/Exploration Approach for HT Synthesis of Zeolites
A New Mapping/Exploration Approach for HT Synthesis of Zeolites
Avelino Corma,* Manuel Moliner, Jose M. Serra, Pedro Serna, Marı´a J. Dıaz-Caban˜as, andLaurent A. Baumes
Instituto de Tecnologı´a Quımica, UPV-CSIC, UniVersidad Politecnica de Valencia,AVda. de los Naranjos s/n, 46022 Valencia, Spain
ReceiVed March 15, 2006. ReVised Manuscript ReceiVed May 4, 2006
This work shows a methodology for the synthesis of self-assembled organic-inorganic materials whichintegrates high-throughput tools for the synthesis and characterization of solid materials and data-miningtechniques in materials science. This is illustrated by a detailed exploration of the hydrothermal synthesisin the system SiO2:GeO2:Al2O3:F-:H2O:N(16) methylsparteinium. Data analysis and dimensional reductionwere conducted by using principal components analysis and clustering algorithms, allowing the definitionof a new and suitable structural vector which summarizes the X-ray diffraction characterization data aswell as an improvement of data visualization and interpretation. Different modeling techniques wereapplied for the prediction of the properties of the materials considering the synthesis descriptors as inputof the model. Furthermore, different “material property” descriptors were considered as outcome of themodel, that is, the crystallinity of the formed phases, structural principal components computed by principalcomponent analysis, or clustering results. It was found that the final properties of the materials could besuccessfully modeled using artificial neural networks and decision trees.
1. Introduction
The application of combinatorial and high-throughput (HT)techniques to materials science can help chemists to increasethe number of variables of a given process that can be studiedin a reasonable time period as well as to increase the numberof samples produced and characterized.1-3 Moreover, datamining and database technology are applied for the analysisand modeling of the large amounts of data generated,allowing in turn a speeding up of the discovery andoptimization process while establishing scientific principles.In recent years, the usefulness of HT methods has beenproven for the discovery of solid functional materials.4-8
Indeed, these methods allow the simultaneous study ofnumerous synthesis and processing variables, this beingespecially important when dealing with highly nonlinear andmultidimensional systems as is the case for the synthesis ofmicroporous molecular sieve systems.
The hydrothermal crystallization processes of microporousmaterials are governed by a large number of parameterswhich determine the phases formed and the crystallization
kinetics. Despite the notable efforts made to rationalize thesynthesis of zeolites,9-12 the relationship between synthesisvariables and the zeolitic structure formed is not clearlyunderstood, because of the metastable nature of zeolites andthe complexity of the involved synthesis mechanisms. As aresult of this, the discovery of new microporous materials isstill predominantly an empirical process, though stronglyhelped by accumulated experience. High-throughput methodsshould be useful in this field13-17 to determine the effect ofdifferent synthesis parameters and to help in the discoveryof new zeolites.
Very recently, a new zeolite, named ITQ-21, containingSi, Ge, and optionally Al as framework cations wasreported.18 This material presents a unique pore topologyformed by nearly spherical large cavities of 1.18 nm diameterjoined to six other neighbored cavities by circular 12-ringpore windows with an aperture of 0.74 nm, which results ina three-directional channel system of fully interconnected
* To whom correspondence should be addressed. Tel.: 34(96)3877800.Fax: 34(96)3877809. E-mail: [email protected].(1) Combinatorial Materials Science; Xiang, X. D., Takeuchi, I., Eds.;
Dekker: New York, 2003.(2) Koinuma, H.; Takeuchi, I.Nat. Mater.2004, 3, 429-438.(3) Hanak, J. J.Appl. Surf. Sci. 2004, 223, 1-8.(4) Gorer, A. U.S. Patent 6.723.678, 2004, to Symyx Technologies Inc.(5) Sohn, K. S.; Seo, S. Y.; Park, H. D.Electrochem. Solid State Lett.
2001, 4, H26-H29.(6) Boussie, T. R.; Diamond, G. M.; Goh, C.; Hall, K. A.; LaPointe, A.
M.; Cheryl Lund, M. L.; Murphy, V.; Shoemaker, J. A. W.; Tracht,U.; Turner, H.; Zhang, J.; Uno, T.; Rosen, R. K.; Stevens, J. C.J.Am. Chem. Soc.2003, 125, 4306-4317.
(7) Corma, A.; Serra, J. M.; Serna, P.; Argente, E.; Valero, S.; Botti, V.J. Catal.2005, 229, 513-524.
(8) Klanner, C.; Farrusseng, D.; Baumes, L. A.; Mirodatos, C.; Schuth,F. Angew. Chem., Int. Ed. 2004, 43 (40), 5347-5349.
(9) Piccione, P. M.; Yang, S.; Navrotsky, A.; Davis, M. E.J. Phys Chem.B 2002, 106, 3629.
(10) Corma, A.; Davis, M. E.ChemPhysChem.2004, 5 (3), 304-313.(11) Schu¨th, F.; Schmidt, W.AdV. Eng. Mater.2002, 4 (5), 269-279.(12) Rajagopalan, A.; Suh, C.; Li, X.; Rajan, K.Appl. Catal., A2003, 254,
147-160.(13) Akporiaye, D. E.; Dahl, I. M.; Karlsson, A.; Wendelbo, R.Angew.
Chem., Int. Ed.1998, 37 (5), 609-611.(14) Holmgren, J.; Bem, D.; Bricker, M.; Gillespie, R.; Lewis, G.;
Akporiaye, D.; Dahl, I.; Karlsson, A.; Plassen, M.; Wendelbo, R.Stud.Surf. Sci. Catal.2001, 135, 461-470.
(15) Bricker, M. L.; Sachtler, J. W. A.; Gillespie, R. D.; McGoneral, C.P.; Vega, H.; Bem, D. S.; Holmgren, J. S.Appl. Surf. Sci.2004, 223(1-3), 109-117.
(16) Pescarmona, P. P.; Rops, J. J. T.; van der Waal, J. C.; Jansen, J. C.;Maschmeyer, T.J. Mol. Chem. A2002, 182-183, 319-325.
(17) Klein, J.; Lehmann, C. W.; Schmidt, H. W.; Maier, W. F.Angew.Chem., Int. Ed.1999, 38, 3369.
(18) Corma, A.; Dı´az-Caban˜as, M. J.; Martı´nez-Triguero, J.; Rey, F.; Rius,J. Nature2002, 418, 514-517.
3287Chem. Mater.2006,18, 3287-3296
10.1021/cm060620k CCC: $33.50 © 2006 American Chemical SocietyPublished on Web 06/20/2006
large cavities. This zeolite was synthesized using a large andrigid structure-directing agent, N(16)-methylsparteinium(MSTP), and the directing effect of Ge toward the formationof structures containing double four rings seems decisive forthe synthesis of ITQ-21.19 Zeolite ITQ-3020 is a new structureof the MWW family, which is more closely related to MCM-5621 but with clearly different X-ray diffraction (XRD)features. The thermal and hydrothermal stability of zeolitesincreases as the germanium content decreases. Furthermore,it is important for catalytic applications to find out thesynthesis conditions in which fully crystalline samples ofITQ-21 could be obtained with the lowest amount (or none)of Ge and the highest acidity [determined by the (Si+ Ge)/Al ratio].
Classical designs of experiments (DoE),22 like factorialor combination designs, have been applied successfully, whenexploring the synthesis gel conditions aimed at the discoveryof new zeolites or the optimization of existing ones.23-25 Itis clear that the synthesis variables should be carefullyselected in order to cover the largest part of the mostpromising parameter space, while keeping the total numberof experiments at a reasonable and feasible level. Moreover,the HT methods currently applied for parallel hydrothermalsynthesis strongly constrain how the synthesis parameterscan be experimentally studied. For instance, when usingautoclave arrays (multiautoclaves with 15-96 wells), theintensive exploration of crystallization temperature and timeis restricted. Therefore, DoE strategies should be developedwhich consider the specific aspects of HT methods in thisfield, while minimizing the number of experiments. On thebasis of the data analysis/mining methodology applied in thiswork, we propose a new mapping/exploration approach forreducing the screening of low-promise conditions, within themultivariate synthesis spaces found in microporous systems.
2. Experimental Section and the Design ofExperiments
A detailed exploration of the hydrothermal synthesis in systemSiO2:GeO2:Al2O3:F-:H2O:MSPT has been performed, to understandthe influence of these factors on the growth of ITQ-21 and ITQ-30,at 175°C under static conditions. Parallel syntheses were developedusing a robotic system and 15-fold Teflon-lined stainless steelautoclaves for the crystallization.25 Crystallinity was measured bymeans of XRD, using a multisample Phillips X’Pert diffractometeremploying Cu KR radiation. A factorial experimental design (4.32.22
) 144) was selected for studying simultaneously the concentrationsof the components in the starting gel, that is, Al/(Si+ Ge), MSPT/(Si + Ge), F-/(Si + Ge), and Si/Ge molar ratios, as well as thecrystallization time. Table 1 shows the values and levels consideredfor the different variables. For experimental details, see theSupporting Information.
Different data-mining techniques have been applied to extractknowledge about the relationships between synthesis conditions andthe occurrence of different zeolite phases, minimizing the humanparticipation in the analysis of the great amount of data generated.Furthermore, the advantages of data-mining techniques whenprocessing, visualizing, and interpreting this type of nonlinear datahave been shown. In this sense, three issues are key in ourmethodology: (i) the analysis and extraction of knowledge (i.e.,Pareto analysis and data visualization techniques), (ii) a reductionof the complexity/dimensionality of the problem, minimizing theinformation loss (i.e., clustering analysis and principal componentanalysis, PCA), and (iii) modeling, enabling one to make a prioripredictions (i.e., classification trees and neural networks, NNs).Moreover, this approach combining diverse data-mining techniqueshas been shown as a realistic way of statistically treating data frommaterials science. At last, we have used the NN model based onITQ-21 crystallinity to minimize the germanium content presentin the final structure, to increase its thermal stability, whilemaintaining high crystallinity. More details for data-mining tech-niques are described in the Supporting Information.
3. Results and Discussion
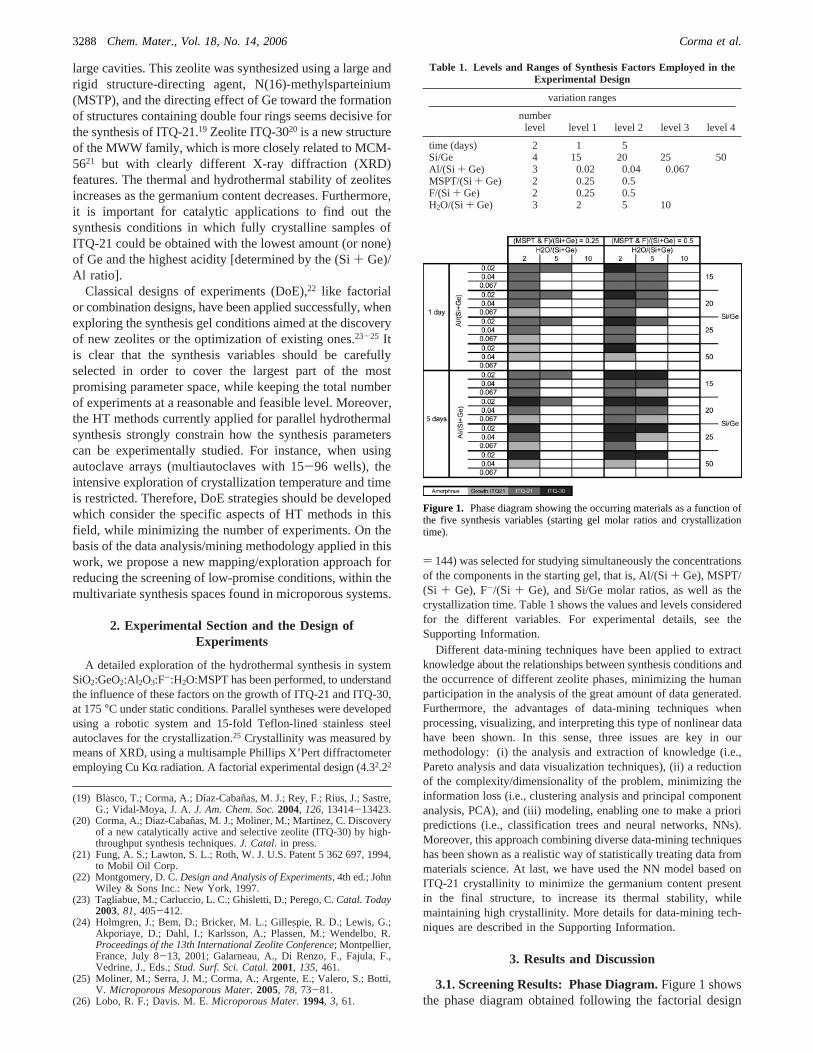
3.1. Screening Results: Phase Diagram.Figure 1 showsthe phase diagram obtained following the factorial design
(19) Blasco, T.; Corma, A.; Dı´az-Caban˜as, M. J.; Rey, F.; Rius, J.; Sastre,G.; Vidal-Moya, J. A.J. Am. Chem. Soc.2004, 126, 13414-13423.
(20) Corma, A.; Dı´az-Caban˜as, M. J.; Moliner, M.; Martı´nez, C. Discoveryof a new catalytically active and selective zeolite (ITQ-30) by high-throughput synthesis techniques.J. Catal. in press.
(21) Fung, A. S.; Lawton, S. L.; Roth, W. J. U.S. Patent 5 362 697, 1994,to Mobil Oil Corp.
(22) Montgomery, D. C.Design and Analysis of Experiments, 4th ed.; JohnWiley & Sons Inc.: New York, 1997.
(23) Tagliabue, M.; Carluccio, L. C.; Ghisletti, D.; Perego, C.Catal. Today2003, 81, 405-412.
(24) Holmgren, J.; Bem, D.; Bricker, M. L.; Gillespie, R. D.; Lewis, G.;Akporiaye, D.; Dahl, I.; Karlsson, A.; Plassen, M.; Wendelbo, R.Proceedings of the 13th International Zeolite Conference; Montpellier,France, July 8-13, 2001; Galarneau, A., Di Renzo, F., Fajula, F.,Vedrine, J., Eds.;Stud. Surf. Sci. Catal.2001, 135, 461.
(25) Moliner, M.; Serra, J. M.; Corma, A.; Argente, E.; Valero, S.; Botti,V. Microporous Mesoporous Mater.2005, 78, 73-81.
(26) Lobo, R. F.; Davis. M. E.Microporous Mater.1994, 3, 61.
Table 1. Levels and Ranges of Synthesis Factors Employed in theExperimental Design
variation ranges
numberlevel level 1 level 2 level 3 level 4
time (days) 2 1 5Si/Ge 4 15 20 25 50Al/(Si + Ge) 3 0.02 0.04 0.067MSPT/(Si+ Ge) 2 0.25 0.5F/(Si + Ge) 2 0.25 0.5H2O/(Si + Ge) 3 2 5 10
Figure 1. Phase diagram showing the occurring materials as a function ofthe five synthesis variables (starting gel molar ratios and crystallizationtime).
3288 Chem. Mater., Vol. 18, No. 14, 2006 Corma et al.

described above. ITQ-21, ITQ-30, and amorphous materialwere obtained in the explored space. The standard X-raydiffractograms for each crystalline phase are shown in Figure2. Automatic calculation of the occurrence and crystallinitywas done integrating the area of the characteristic peaks foreach phase and referring this to the fully crystalline materials.For ITQ-21, the integrated area is comprised of a 2θ anglebetween 25.4 and 27.2°, and for ITQ-30, the range is between24.6 and 25.4°. Because ITQ-30 also presents diffractionpeaks in the 25.4-27.2° region, the percentage of ITQ-30is subtracted considering the crystallinity measured from thepeak located at 25.0°. Considering the crystallinity of thesynthesized materials, three different groups have beencreated. A material is qualified as “amorphous” if both theITQ-21 and ITQ-30 crystallinities are below 20%. “ITQ-21” is defined as a material for which the ITQ-21 crystallinityis higher than 20% and ITQ-30 below 20%. If the ITQ-30crystallinity is greater than 20%, the material is noted as“ITQ-30”.
A first approach using Pareto analysis shows in Figure 3the relative influence of each synthesis factor over thecrystallinity of ITQ-21 and ITQ-30 samples. In this chart,the length of each bar is the estimated effect divided by itsstandard error, which is equivalent to computing at statisticfor each effect. The vertical line on the plot means that barswhich extend beyond the line correspond to effects that arestatistically significant at the 95% confidence level. Thisstatistical way of understanding the results allows quantifica-tion of the hypothetical weight of the factors in the growthof materials. Both ITQ-21 and ITQ-30 seem to be quiteinfluenced in a negative sense by water and aluminumcontent; that is, the more water or the higher Al/(Si+ Ge),the less crystalline are the samples. Afterwards, MSPT/
(Si + Ge) and F/(Si+ Ge) play a positive role in theformation of ITQ-21 and ITQ-30. However, some importantdifferences can be observed when comparing the analysesfor ITQ-21 and ITQ-30. On one hand, the relative importanceof MSPT/(Si+ Ge) and F/(Si+ Ge) is higher for ITQ-30,because only in a few small zones can this material beobtained with the minimum content of MSPT/(Si+ Ge) andF/(Si + Ge). On the other hand, Si/Ge appears as animportant negative factor for ITQ-21 samples, while itbecomes slightly positive for ITQ-30 samples. This resulthas to be understood as a penalization for the growth of ITQ-21 when increasing the Si/Ge ratio, because the crystallinitydecreases but also some syntheses change to ITQ-30. Thisreason can be applied for the slight benefit of Si/Ge for ITQ-30, taking into account a balance between the loss ofcrystallinity and the appearance of new ITQ-30 points.However, ITQ-21 samples appear with a lower Si/Ge content.Finally, the relative influence of time for these materials isquite different, being much more important in the case ofITQ-30 than in that of ITQ-21. This effect of time could beunderstood as a retransformation process of ITQ-21, in sucha way that ITQ-30 can only be obtained in 1 day if it isworked with the maximum levels of MSPT/(Si+ Ge) andF/(Si + Ge) and the minimum level of Al/(Si+ Ge).
3.2. Analysis and Knowledge Extraction from HTExperimental Data. In this section, different techniques ofunsupervised analysis will be applied to the original dataset derived from the XRD characterization of the whole setof samples, allowing an improvement in data visualization,classification, and the ulterior knowledge extraction. Indeed,structural vectors will be computed from the raw character-ization data by means of dimensional reduction and analysistechniques, that is, clustering algorithms and PCA.
Figure 2. XRD patterns of ITQ-21 and ITQ-30.
Figure 3. Standardized Pareto chart for ITQ-21 and ITQ-30 formation, showing the effect of the different synthesis factors on the crystallinity of eachzeolite. The length of each bar displayed in the frequency histogram is proportional to the absolute value of its associated estimated effect.
A New Mapping/Exploration Approach Chem. Mater., Vol. 18, No. 14, 20063289

Clustering analyses of raw XRD data allow classificationof the as-synthesized samples into different structural groupswithout applying any previous knowledge. That can be ofinterest when the resulting materials contain mixtures ofphases or unknown phases, where the conventional phaseidentification systems find difficulties. Moreover, this typeof data classification allows the achievement of high degreesof automation in the high-throughput experimental workflow.
3.2.A. Clustering Analysis.The k-means clustering algo-rithm examines each sample from the population and assignsit to one of the clusters trying to minimize the varianceintraclass and maximize the variance interclass. The centroidof one cluster is iteratively computed when a new componentis added to the cluster, this process being repeated until allof the components are grouped into the selected number ofclusters. This methodology suffers from the initialization ofcentroids. Depending on the first randomly chosen centroids,the final solution can highly change. Therefore, numerousassignments have been performed in order to get a stableand representative solution.
A first data set constituted by the XRD data of each samplehas been taken into account for the clustering analysis. Thisinvolves vectors with 800 attributes, corresponding to theintensities obtained for each diffraction angle of the 144samples. The number of clusters chosen to perform the lateranalysis was investigated by means of a tree diagram (calleda dendrogram), using Ward’s clustering method (see theClustering Analysis section in the Supporting Information).In this tree diagram (Figure 4), the different groups ofsamples are plotted as a function of the relative diversity ofeach group (linkage distance). This classification analysisshows that two big clusters can be clearly recognized,corresponding to amorphous and crystalline materials, whereasthe last cluster can be split into two new groups, correspond-
ing to ITQ-21 and ITQ-30 samples. More specific subclusterscan be related to slight differences in the XRD diffractogramsfor a given structure, because of changes in their crystallinityor germanium contents. From a practical point of view, wehave selected a number of three clusters, to make a firstclassification based on the three types of materials identifiedmanually, that is, amorphous, ITQ-21, and ITQ-30.
A second data set constituted by XRD data from thecharacteristic 2θ range (24.5-27.5°) of ITQ-30 for eachsample was considered. Figure 5 shows a general visualiza-
Figure 4. Tree diagram (dendrogram) showing the Euclidean distances between the different clusters and subclusters.
Figure 5. XRD measurements of the as-synthesized samples orderedconsidering the cluster distribution obtained by thek-means algorithm usingthe second data set.
3290 Chem. Mater., Vol. 18, No. 14, 2006 Corma et al.

tion of the XRD data, ordered according to their belongingto the different clusters obtained by thek-means clusteringalgorithm using the second data set. Figure 6 shows the goodmatch between the clusters obtained byk-means analysis forboth data sets and the corresponding material/phase. Theclustering analysis using the whole of the XRD data allowsone to accurately distinguish amorphous and crystallinematerials, whereas it fails only in a few samples whendistinguishing between ITQ-21 and ITQ-30 phases (Table2). However, it is possible to improve the quality of theseparation between ITQ-21 and ITQ-30 samples taking onlyinto account the range of 2θ where these two structurespresent different peaks (24.5° and 27.5°). The k-meansclustering in this way allows a strong improvement of theclassification between both phases, although the classification
Figure 6. Identification of the formed phase using ak-means clustering analysis.
Figure 7. Averaged XRD diffractogram for the three clusters obtained byk-means analysis.
Figure 8. Distribution of the three different phases in the SPC coordinates.(PCA computed using the whole of the XRD data, first data set.)
Table 2. Clustering Analysis Carried out Using the XRD Data,Showing the Match between Clustering Results and Phase
Identification
clusteringk-means match
clustersspecific 2θ range
match (%)complete 2θ range
match (%)
1. amorphous 87.3 99.02. ITQ-21 100.0 89.73. ITQ-30 92.3 69.2
A New Mapping/Exploration Approach Chem. Mater., Vol. 18, No. 14, 20063291

accuracy of the amorphous samples is reduced. Figure 7presents the averaged XRD pattern for each cluster (first dataset), showing the good match between the clustering analysisand phase identification (see the real diffractograms ofstandard ITQ-21 and ITQ-30 samples mentioned previously).The characteristic peaks of ITQ-30 can be observed, and theaveraged diffractogram can be clearly distinguished from theITQ-21 XRD pattern.
3.2.B. Principal Component Analysis.The PCA computedfrom the whole of the XRD data will be referred to asstructural principal components (SPCs) from here on. WhenPCA techniques are applied, it is possible to reduce the XRDvector of each sample (vectors with 800 intensities for each2θ angle) to a vector with only three new variables (SPCs),without a loss of the main information of the original databecause 81.8% of the cumulative variance has been extracted.The corresponding percentage of variance for each compo-nent (SPC#1, SPC#2, and SPC#3) is 39.8%, 32.8%, and
9.2%, respectively. Because of the simplification of theoriginal vector, we can provide now an easy visualizationof the distribution of the samples into the virtual three-dimensional SPC space. The results of thek-means clusteringalgorithm and the PCA can be combined, as it is shown inFigure 8. SPC projections of the samples are clearly separatedfrom one cluster to another.
Diffraction data usually contain information about the typeof crystalline phase as well as about the crystallinity of thematerial, crystallite size, zeolite framework composition, andso forth. Indeed, the fine-tuning of ITQ-21 crystallite sizehas been reported19 from nanocrystals to large crystals bycontrolling the rates of nucleation and crystal growth, throughthe H2O/(Si + Ge) ratio. In the present study, trying torationalize the meaning of SPC space, we will study thevariation of phase crystallinity and framework compositioninside this new space. On one hand, Figure 9 shows thedistribution of ITQ-21 and ITQ-30 samples with differentdegrees of crystallinity into the SPC space. It can be seenthat they are clearly distributed in the space, it being possibleto correlate crystallinity against SPCs. On the other hand,the correlation between the germanium content in the ITQ-21 framework and the SPC was studied. Given that the Si/Ge ratio in the starting gel has been shown as a veryinfluencing factor on the final crystallinity of ITQ-21 (seethe Pareto analysis in Figure 3), the variation of the Si/Gewas followed apart from the correlation between the SPCand crystallinity. Concretely, Figure 10 represents the thirdSPC as a function of Si/Ge, for three different degrees ofcrystallinity. It is clear that SPC#3 is strongly correlated withthe structural changes produced by the Si/Ge frameworkvariation. In fact, this correlation is attributed to the informa-tion extracted by PC analysis from the XRD peak shiftproduced by the isomorphic substitution of Si by Ge in thezeolite framework, as can be clearly seen in the Figure 10inset. No correlation was found between Si/Ge and theremaining two SPCs.
Figure 9. Identification of different structural properties in the SPC space:distribution of ITQ-21 and ITQ-30 with different ranges of crystallinity.
Figure 10. Identification of different structural properties in the SPC space for ITQ-21 samples: correlation between SPC#3 and Si/Ge in the starting gel,for three different degrees of crystallinity. Inset: Partial diffractograms corresponding to four samples with different Si/Ge ratios and the samecrystallinity(20%), showing the peak shift.
3292 Chem. Mater., Vol. 18, No. 14, 2006 Corma et al.

Consequently, SPCs contain the summarized informationof XRD patterns concerning the different structural andmorphological changes in the whole of the materialsexplored. These results demonstrate that the application ofdimensional reduction techniques, just as with PCA, of the
raw XRD data allows one to obtain a new series of structuralcomponents in a fully automated manner, which entirelydescribes the properties of the synthesized samples. Inaddition, these structural vectors can be used to improve theprediction performance of QSAR/QSPR models, such asNNs, as well as the development of new exploration tools(mapping) of nonlinear and multidimensional spaces, suchas those found in the development of new microporousmaterials.
3.3. Construction of Predictive Models (QSPR/QSAR).3.3.A. PredictiVe Modeling of Material Properties fromSynthesis Descriptors.As a first step, NN models wereobtained using the synthesis descriptors as input and thezeolite crystallinity as output. Very good prediction resultscould be obtained using a NN with a two-hidden-layertopology and the back propagation training algorithm (R )0.3). A total of 70% of the data were employed for thetraining process and the rest for testing. Figure 11 showsthe experimental and predicted crystallinity for both zeolites,clearly illustrating the high accuracy of the model despitethe experimental error associated with the synthesis andcharacterization steps. Subsequently, this predictive modelwas applied for finding the theoretical synthesis conditionsthat optimize the ITQ-21 crystallinity by keeping the molarratio Si/Ge> 30. Three different sets of conditions withpredicted crystallinity around 60% were selected for experi-mental testing, with 2 days of crystallization time. The
Figure 11. Prediction performance of the NN model using the synthesisfactors as input and the crystallinity of ITQ-21 and ITQ-30 as output. (Nettopology 5_10_4_2, trained using BackProp with the Momentum algorithmand 80% data.)
Figure 12. Decision tree ID3-IV obtained using synthesis descriptors as model input and phase clusters as output. [The importance of each factors asfollows: Si/Ge 100%, Al/(Si+ Ge) 79%, MSTP/(Si+ Ge) 72%, H2O/(Si + Ge) 70%, and crystallization time 38%.] The initial data partition called theinitial branch or root encompasses all data records. This root is split into subsets or child branches, on the basis of the value of a particular input field, whichmay in turn be split again into sub-branches and so on.
Table 3. NN and Decision Tree Prediction Performances of theObtained Phase Using the Synthesis Variables as Model Input
class % DT accuracy % NN accuracy
amorphous 92.16 96.08ITQ-21 93.10 93.10ITQ-30 92.31 92.31
A New Mapping/Exploration Approach Chem. Mater., Vol. 18, No. 14, 20063293

experimental crystallinity achieved was slightly lower thanexpected, being for the samples close to 50, as can be shownin Figure 11 (filled squares).
Subsequently, predictive models based on decision treesand NNs were computed using just the type of formedmaterial as output data. Figure 12 shows the best decisiontree found, describing successfully the type of materialformed as a function of the synthesis variables. Table 3compares the prediction performance of the NN and decisiontree models, with very high accuracy, although the NN modelis slightly better. The relative importance of each input factorin the occurrence of each phase follows, in both models, theorder Si/Ge> Al/(Si + Ge) > MSPT≈ H2O/(Si + Ge) >time, contrasting with the standardized effect observed forthe crystallinity of each phase (Figure 3), where H2O/(Si +Ge) and Al/(Si+ Ge) played the major roles for ITQ-21and ITQ-30, respectively.
As a second step, predictive models were computed usingthe SPCs as output for the model, whereas synthesis variableswere used as input. This approach may allow prediction ofthe structural properties of a material, it being possible todistinguish between the type of phase (known or unknown),crystallinity, framework composition, and so forth. The SPC
output is well-suited when the aims of the exploration areboth the discovery of new structures and the optimizationof a determined feature when competing phases are alsoformed. Given that synthesis variables have been shown asthe main factors in the growth of both ITQ-21 and ITQ-30by the Pareto analysis, and bearing in mind that SPCs arestrongly correlated with the type of material formed, itscrystallinity, and its framework composition, there is nodoubt about the existence of clear relationships betweensynthesis descriptors and SPCs. Following this approach, anaccurate NN model was obtained using the available data(70% for training and 30% for validation), trained followingthe back propagation algorithm (R ) 0.3). Figure 13 showsthe observed SPCs versus the predicted ones, the averagedprediction error to the test samples being in the range of10%.
Considering all of the predictive results based on decisiontrees and NNs, we can see in Figure 12 that the lowest Gecontent in the ITQ-21 zeolite that can be synthesizedwith high crystallinity is for a Si/Ge ratio of 37.5. This isin agreement with previous results19 that suggest thatITQ-21 could be obtained for a Si/Ge ratio of 25, but notfor 50.
Figure 13. NN prediction performance of the SPC using the synthesis factors as input. The correlation factor for the crystallinity of ITQ-21 and ITQ-30is 0.960 and 0.958, respectively. The inset shows the topology of the best NN.
Figure 14. Eigenvalues for two different data set sizes: on the left-hand side, 60% of the whole available amount of experiments is considered, while onthe right side, only 40% is used for the calculation of the eigenvectors.
3294 Chem. Mater., Vol. 18, No. 14, 2006 Corma et al.
This helps to fine-tune the better synthesis conditions forthe lowest Ge-content ITQ-21 samples that will have themaximum stability and better catalytic performance.
3.3.B. PredictiVe Modeling of Phase Type from theStructural Principal Components.Finally, the correlationbetween SPCs and the type of structure by NN modelingwas studied. Carefulness is compulsory during this study inorder to not overfit the data but also to present a realistic
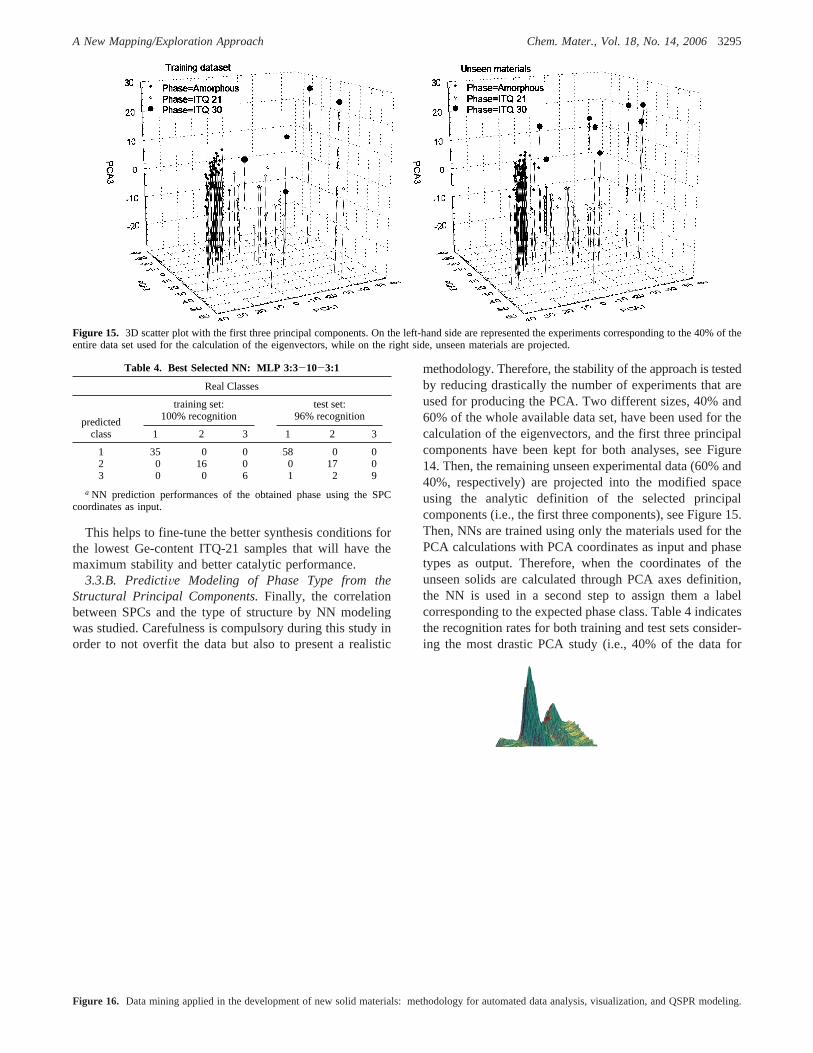
methodology. Therefore, the stability of the approach is testedby reducing drastically the number of experiments that areused for producing the PCA. Two different sizes, 40% and60% of the whole available data set, have been used for thecalculation of the eigenvectors, and the first three principalcomponents have been kept for both analyses, see Figure14. Then, the remaining unseen experimental data (60% and40%, respectively) are projected into the modified spaceusing the analytic definition of the selected principalcomponents (i.e., the first three components), see Figure 15.Then, NNs are trained using only the materials used for thePCA calculations with PCA coordinates as input and phasetypes as output. Therefore, when the coordinates of theunseen solids are calculated through PCA axes definition,the NN is used in a second step to assign them a labelcorresponding to the expected phase class. Table 4 indicatesthe recognition rates for both training and test sets consider-ing the most drastic PCA study (i.e., 40% of the data for
Figure 15. 3D scatter plot with the first three principal components. On the left-hand side are represented the experiments corresponding to the 40% of theentire data set used for the calculation of the eigenvectors, while on the right side, unseen materials are projected.
Table 4. Best Selected NN: MLP 3:3-10-3:1
Real Classes
training set:100% recognition
test set:96% recognition
predictedclass 1 2 3 1 2 3
1 35 0 0 58 0 02 0 16 0 0 17 03 0 0 6 1 2 9
a NN prediction performances of the obtained phase using the SPCcoordinates as input.
Figure 16. Data mining applied in the development of new solid materials: methodology for automated data analysis, visualization, and QSPR modeling.
A New Mapping/Exploration Approach Chem. Mater., Vol. 18, No. 14, 20063295
component calculation). It can be argued that the NN playsa rather small role because the separation between classesinto the PCA space is sharp. However, the results areexcellent, and this approach appears to be of great interest.
4. Conclusions
This works shows a complete study integrating high-throughput tools for the synthesis and characterization ofsolid materials and data-mining techniques in the discoveryand optimization of new microporous materials. The phasediagram of the system SiO2:GeO2:Al2O3:F-:H2O:N(16) me-thylsparteinium hydroxide has been systematically exploredfollowing a factorial design, the effect of the starting gelcomposition being determined, as well as the crystallizationtime. Two different zeolites (ITQ-21 and ITQ-30) weredetected within the explored space.
Data visualization and dimensional reduction were con-ducted by using principal components analysis and clusteringalgorithms, allowing extraction of the desired structuralvectors from the XRD characterization data. These unsu-pervised techniques allow the obtainment of a view of thescreening results closer to the topology of the exploredmultidimensional space, including information about theformed phase(s), crystallinity of the material, particle size,and isomorphic substitution degree, allowing as well thereduction of the experimental noise of the original charac-terization data. Moreover, the automation of this type ofanalysis can be easily implemented without any priorknowledge of the problem.
Different modeling techniques were applied for the predic-tion of the properties of the materials obtained consideringthe synthesis data as input of the model. Furthermore,
different “material property” descriptors were considered asoutcome of the model, that is, crystallinity of the formedphase, SPCs computed by PCA, or clustering results. It wasfound that the final properties of the materials could besuccessfully modeled using neural networks, obtaining high-quality predictions, especially when applying SPCs as modeloutput.
This proposed methodology (see Figure 16) for unsuper-vised characterization analysis and subsequent predictivemodeling could be applied when other material propertiesare to be explored or optimized, such as, for instance, acidity,fluorescence/phosphorescence, or adsorption properties, andwhen other characterization techniques are employed, suchas RAMAN, NMR, photoluminescence spectroscopy, andIR imaging. Finally, these predictive models could be usedfor guiding the next experimental round, allowing one toskip the screening ofVirtually low-performing materials andpromoting the synthesis of new dissimilar materials (withrespect to the explored space) and therefore accelerating themultiparametric space exploration.
Acknowledgment. Financial support from the Spanishgovernment (Project MAT 2003-07945-C02-01 and GrantsTIC2003-07369-C02-01 and FPU AP2003-4635) and the E.U.Commission (TOPCOMBI Project) is gratefully acknowledged.The authors thank I. Millet and J. Herrera for technicalassistance.
Supporting Information Available: Details for data miningtechniques. This material is available free of charge via the Internetat http://pubs.acs.org.
CM060620K
3296 Chem. Mater., Vol. 18, No. 14, 2006 Corma et al.