Synthesis and Characterization of Saccharinato Complexes of ...
121
i Synthesis and Characterization of Saccharinato Complexes of Various Group 9-12 Metals by Fezile Siphiwe Wiseman Potwana Dissertation submitted in fulfilment of the academic requirements for the degree of Master of Science School of Chemistry and Physics, University of KwaZulu-Natal, Durban As the candidate's supervisor I have approved this dissertation for submission. January 2013
-
Upload
khangminh22 -
Category
Documents
-
view
5 -
download
0
Transcript of Synthesis and Characterization of Saccharinato Complexes of ...

i
Synthesis and Characterization of Saccharinato Complexes of
Various Group 9-12 Metals
by
Fezile Siphiwe Wiseman Potwana
Dissertation submitted in fulfilment of the academic requirements for the degree of
Master of Science
School of Chemistry and Physics, University of KwaZulu-Natal, Durban
As the candidate's supervisor I have approved this dissertation for submission.
January 2013

ii
DECLARATION 1: PLAGIARISM
I, Fezile Siphiwe Wiseman Potwana, declare that the experimental work described in this
dissertation was carried out at the School of Chemistry and Physics, University of KwaZulu-
Natal, Westville campus, between January 2011 and November 2012, under the supervision
of Dr. W. E. van Zyl, and that:
1. The research reported in this thesis, except where otherwise indicated, is my
original research.
2. This thesis has not been submitted for any degree or examination at any other
university.
3. This thesis does not contain other persons’ data, pictures, graphs or other
information, unless specifically acknowledged as being sourced from other
persons.
4. This thesis does not contain other persons' writing, unless specifically
acknowledged as being sourced from other researchers. Where other written
sources have been quoted, then:
a. Their words have been re-written but the general information attributed to
them has been referenced.
b. Where their exact words have been used, then their writing has been placed in
italics and inside quotation marks, and referenced.
5. This thesis does not contain texts, graphics or tables copied and pasted from the
Internet, unless specifically acknowledged, and the source being detailed in the
thesis and in the references sections.
Signed
_______________________________
Fezile Siphiwe Wiseman Potwana

iii
DECLARATION 2: PUBLICATIONS
Details of publications:
1. F. S. W. Potwana and W. E. Van Zyl, Acta Cryst. (2011). E67, m1635.
2. F. S. W. Potwana and W. E. Van Zyl, Acta Cryst. (2011). E67, m1667–m1668.
3. Potwana et al., Acta Cryst. (2011). E67, m1665.
From all the above publications, my role included carrying out all the experimental work and
contributing to the writing of the publications along with my supervisor. The other co-authors
contribution was that of an editorial nature and checking on the scientific content and
evaluation of my interpretation. Based on their expertise, they have added minor parts to the
papers above.
Signed
_______________________________
Fezile Siphiwe Wiseman Potwana

iv
ABSTRACT
The aim of the study was the synthesis and characterization of new mixed ligand saccharinato
complexes of various groups 9, 10, 11 and 12 metals, i.e. M = Cd(II), Co(II), Zn(II), Hg(II),
Cu(II), and Ni(II) using dimethyl sulfoxide (DMSO) and amine-based ligands such as
ethylenediamine (en), N-methyldiethanolamine (MDEA) and 2-(methylamino)ethanol
(MEA) from the precursor [M(C7H5SO3N)2(H2O)4]·2H2O. The new complexes were
characterized by elemental analyses, solution Nuclear Magnetic Resonance (NMR), UV–Vis
spectroscopy, IR ATR spectroscopy, thermal analysis and single crystal X-ray diffraction.
All complexes are mononuclear except complex (9) which is a dinuclear Cu(II) complex. A
number of the saccharinato complexes are diamagnetic, i.e. trans-[Cd(sac)2(dmso)2(H2O)2]
(1), cis-[Zn(sac)2(dmso)2] (3), [Hg(sac)2(dmso)(H2O)] (4) and trans-[Cd(sac)2(en)2] (11) and
were characterised by NMR. Some of the complexes are paramagnetic, including trans-
[Co(sac)2(dmso)2(H2O)2] (2), [Cu(sac)2(dmso)(H2O)2] (5), [Cu(sac)2(N,O,O-mdea)2] (7),
[Co(sac)2(N,O,O-mdea)2] (8) and [Ni(sac)2(en)2] (10). All complexes containing the DMSO
ligand were successfully analysed by single crystal X-ray diffraction, i.e. complexes (1) to
(5). The complexes crystallized in the monoclinic P21/c space group together with complex
(11). Complexes [Ni(N,O,O-mdea)]·2(sac) (6), [Cu2(µ-O)2(mea)4]·2(sac) (9), and
[Co2(en)4(CO3)2]·2(sac)3H2O (12) were found to crystallize in the triclinic P-1 space group.
In DMSO complexes, the metal ion is positioned at the centre of symmetry and complexes
(1) and (2) are octahedrally coordinated by two monodentate DMSO ligands which are trans
to each other and two aqua-ligands which are also trans to each other. The ligands in
complex (3) are tetrahedrally coordinated to the Zn(II) ion in the cis position and in complex
(4) a distorted trigonal bipyramidal complex was found whereby the DMSO groups are
disordered over two places and the site occupancy factors were refined to 0.504(4) and
0.496(4), respectively. Complex (5) consisted of Cu(II) ions in a trigonal bipyramidal
geometry. Complexes (6) and (12) have an octahedral coordination geometry with the metal
ion positioned at the centre of symmetry. Complex (9) is a centrosymmetric binuclear
complex containing two strongly distorted square-pyramidal coordinated copper(II) ions
bound together by two alkoxo bridges. The bridging oxygen is a deprotonated oxygen of the
ethanolic group of MDEA. The MDEA ligand also coordinates to the copper(II) ions through
its nitrogen, while the other ethanolic group is not involved in the coordination. For
complexes (6), (9) and (12) the saccharin acts as a weak counter ion and complex (12) has a

v
lattice containing three water molecules of crystallization held together by a hydrogen-
bonded network.
The saccharin ligands in the mononuclear complexes are coordinated via the N-atom.
Thermal behaviour of the complexes was studied using DTA and TGA in nitrogen
atmosphere. The complexes are stable below 200 °C and after that they start to show
degradation and decomposition characteristics. The complexes lose ligands first and the
saccharinate anion at higher temperatures for complexes (1) to (5) and (11). For complexes
(6), (9) and (12) there is an interchangeable loss of amine ligands with saccharin anions. All
the complexes show either endothermic or exothermic DTA peaks at various stages.

vi
DEDICATION
To my father, mother and siblings.

vii
"Everything of importance has been said by someone who didn't invent it. Alfred North
Whitehead."

viii
ACKNOWLEDGEMENTS
I would like to give all the praises and glory to God the Almighty, in the name of my Lord
and Saviour Jesus Christ, through whose inspiration and divine power has made it possible,
for me, to accomplish and finally achieve this academic level and more.
I would like to thank my parents, Michael and Florence, my sisters Phumelele and Nikiwe for
their unconditional loving support and encouragement in all spheres of my life.
I would like to thank my supervisor, Dr. Werner van Zyl for his support and guidance during
my time as a Masters student and for making this thesis possible through his rich and wealth
of knowledge in synthetic chemistry.
I would like to thank the University of KwaZulu-Natal and the School of Chemistry and
Physics for accepting me as a Masters student in their campus , to further my studies.
I would like to thank my colleagues and friends Michael Pillay, Vashen Moodley, Sicelo
Sithole, Shirveen Sewpersad, Monisola Ikhile and Halliru Ibrahim for all their support and
help in my academic career and private life.
I would like to thank the National Research Foundation (NRF) for their financial support
during the course of this study and for understanding that young African minds need their
support to advance their education, and increase the knowledge of the nation.
I would like to thank everyone who has played a major role in my study career whom I didn't
mention by name in my list, my sincere gratitude's.
“Thank you for everything”
ix
LIST OF ABBREVIATIONS
The elements will be annotated on the periodic table.
°C degree Celsius nm nanometre
g ml-1 grams per millilitre 1H proton NMR
r.t. room temperature 13C carbon NMR
ml milliletre MHz mega hertz
g gram ppm part per million
o- ortho trans- transatlantic
α alpha λmax maximum wavelength
β beta mmol milimole
Å Angstrom Mp melting point
K Kelvin ν infrared absorption
% percentage m multiplets
M2+ or M(II) metal centre s singlets
(º) or º degree sym symmetric
cm-1 per centimetre δ chemical shift
°C min-1 degree per minute mg milligram
cm3 min-1 centimetre cube per minute SiMe4 tetramethylsilane
T temperature Calc. calculated
M-1 cm-1 per molar per centimetre ε molar absorptiviy
M−1cm−1 per molarity per centimetre asym asymmetric

x
pKa acid dissociation constant at logarithmic scale
[M (sac)2(H2O)4]·2H2O tetraaquabis(saccharinato)MII dihydrate
List of Instrumentations
XRD X-ray diffractometry
FTIR-ATR Fourier Transform Infrared- Attenuated Total Reflectance
TGA Thermogravimetric Analyser
UV-Vis ultraviolet-visible spectrophotometer
NMR Nuclear Magnetic Resonance
List of Chemicals
HSac saccharin MAE 2-(Methylamino)ethanol
en ethylenediamine MDEA N-methyldiethanolamine
DMSO dimethyl sulfoxide MeOD deuterated methanol
Sac saccharinato anion

xi
TABLE OF CONTETS
DECLARATION 1: PLAGIARISM .................................................................................................. ii
DECLARATION 2: PUBLICATIONS ............................................................................................. iii
ABSTRACT .......................................................................................................................................... iv
DEDICATION ...................................................................................................................................... vi
ACKNOWLEDGEMENTS ............................................................................................................. viii
LIST OF ABBREVIATIONS ........................................................................................................... ix
List of Instrumentations ..................................................................................................................... x
List of Chemicals ................................................................................................................................. x
LIST OF FIGURES ............................................................................................................................... xv
LIST OF SCHEMES .......................................................................................................................... xviii
LIST OF TABLES ............................................................................................................................... xix
CHAPTER 1 .......................................................................................................................................... 1
INTRODUCTION .................................................................................................................................. 1
1.1 General Description of Saccharin ........................................................................................... 1
1.2 The AH-B-X Taste Receptor Theory of Artificial Sweeteners .............................................. 2
1.3 Artificial Sweeteners .............................................................................................................. 3
1.4 Advantages and Disadvantages of Saccharin ......................................................................... 8
1.5 Synthesis of Saccharin ............................................................................................................ 8
1.6 Sodium Saccharinate and Thiosaccharin .............................................................................. 10
1.7 Saccharinato Ligand: Metal Complexes of Saccharin and Its Salts ..................................... 11
1.7.1 Saccharinate Salts ......................................................................................................... 11
1.7.2 Monodentate Coordination of Saccharinato Complexes via the N-atom ..................... 12
1.7.3 Saccharinato Mixed Ligand Complexes ....................................................................... 13
1.7.4 Metal Complexes of Zn(II) Coordinated to a Mono-or Bidentate Ligand .................... 14
1.7.5 Metal Complexes of M(II) Coordinated to a Monodenate, Bidentate, Tridenate and Bridging Ligand: M(II) = Cu, Co, Cd, Ni and Hg ........................................................ 15
1.7.6 Monodentate Coordination of Saccharinato Complexes via the O-atom ..................... 17
1.7.7 Bidentate (N, O) and Tridentate (N, O, O) Coordination of Saccharinato Complexes 19
1.7.8 Unusual Ambidentate Coordination Behaviour of Saccharinato Complexes ............... 20
1.7.9 Bonded and Non-Bonded Saccharinate Anion and Free Saccharin in the Complex .... 21
1.8 Characteristics of Saccharinato Complexes on Biological Studies ...................................... 23
1.9 Coordinating Ligand: Dimethyl Sulfoxide ........................................................................... 24

xii
1.9.1 Dimethyl Sulfoxide ...................................................................................................... 24
1.9.2 Synthesis of Dimethyl Sulfoxide and Its Reactivity Properties .................................... 24
1.10 General Overview of Amines ............................................................................................... 25
1.10.1 Amines ......................................................................................................................... 25
1.11 The Aims and Objectives of this Study ................................................................................ 26
1.11.1 Motivation for study ..................................................................................................... 27
1.11.2 Aims of the study ......................................................................................................... 27
1.12 References ............................................................................................................................ 28
CHAPTER 2 ........................................................................................................................................ 37
EXPERIMENTAL SECTION ............................................................................................................. 37
2.1 Introduction .......................................................................................................................... 37
2.2 Materials and Instrumentation .............................................................................................. 37
2.2.1 Materials ....................................................................................................................... 37
2.2.2 Instrumentation ............................................................................................................. 38
2.3 Synthesis of Saccharinato Complexes of Dimethyl Sulfoxide ............................................. 39
2.3.1 Synthesis of trans-[Cd(sac)2(dmso)2(H2O)2] (1) .......................................................... 39
2.3.2 Synthesis of trans-[Co(sac)2(dmso)2(H2O)2] (2) .......................................................... 39
2.3.3 Synthesis of [Zn(sac)2(dmso)2] (3) ............................................................................... 40
2.3.4 Synthesis of [Hg(sac)2(dmso)(H2O)] (4) ...................................................................... 40
2.3.5 Synthesis of [Cu(sac)2(dmso)(H2O)2] (5) ..................................................................... 41
2.4 Synthesis of Saccharinato Complexes of N-methyldiethanolamine and 2- (methylamino)ethanol .......................................................................................................... 41
2.4.1 Synthesis of [Ni(N,O,O-mdea)2]·2(sac) (6) .................................................................. 41
2.4.2 Synthesis of [Cu(sac)2(N,O,O-mdea)2] (7) ................................................................... 42
2.4.3 Synthesis of [Co(sac)2(N,O,O-mdea)2] (8) ................................................................... 42
2.4.4 Synthesis of [(Cu2(µ-O)2(mea)4]·2(sac) (9) .................................................................. 42
2.5 Synthesis of Saccharinato Complexes of Ethylenediamine .................................................. 43
2.5.1 Synthesis of [Ni(sac)2(en)2] (10) .................................................................................. 43
2.5.2 Synthesis of trans-[Cd(sac)2(en)2] (11) ........................................................................ 43
2.5.3 Synthesis of [Co2(en)4(CO3)2]·2(sac)3H2O (12) ........................................................... 44
2.6 X-ray Crystallography .......................................................................................................... 44
2.6.1 Crystal Structure Determination for Complexes (2) and (6). ....................................... 44
2.6.2 Crystal Structure Determination for Complexes (1), (3), (4) and (9). .......................... 44
2.6.3 Crystal Structure Determination for Complexes (11) and (12). ................................... 45

xiii
2.7 References ............................................................................................................................ 47
CHAPTER 3 ........................................................................................................................................ 49
SACCHARINATO COMPLEXES WITH A DIRECT M-N BOND .................................................. 49
3.1 Introduction .......................................................................................................................... 49
3.2 Results and Discussion ......................................................................................................... 50
3.2.1 Synthesis of Tetraaquabis(saccharinato)M(II) dihydrate Precursors ................................ 50
3.2.2 Synthesis of Mixed Aqua-and Dimethyl Sulfoxide Saccharinato Complexes ................. 51
3.2.3 Synthesis of Amine Saccharinato Complexes .................................................................. 52
3.3 Spectroscopic Properties ...................................................................................................... 53
3.3.1 Nuclear Magnetic Resonance (NMR) Analysis of Complexes ........................................ 53
3.3.2 Fourier Transform Infrared Spectroscopy (FTIR) Using ATR Spectra ............................ 55
3.3.3 UV-Vis spectroscopy ....................................................................................................... 57
3.4 Description of the X-ray Crystal Structures of Saccharinato Complexes ............................. 59
3.4.1 Crystal Structures ............................................................................................................. 59
3.4.1.1 trans-[Cd(sac)2(dmso)2(H2O)2] and trans-[Co(sac)2(dmso)2(H2O)2] ................................ 60
3.4.1.2 Hydrogen Bonding of Complexes (1) and (2) .................................................................. 63
3.4.1.3 [Zn(sac)2(dmso)2] ............................................................................................................. 65
3.4.1.4 [Hg(sac)2(dmso)(H2O)] .................................................................................................... 66
3.4.1.5 Hydrogen Bonding of Complexes (3) and (4) .................................................................. 68
3.4.1.6 [Cu(sac)2(dmso)(H2O)2] ................................................................................................... 71
3.4.1.7 Hydrogen bonding of complex (5) ................................................................................... 72
3.4.1.8 trans-[Cd(sac)2(en)2] ........................................................................................................ 73
3.4.1.9 Hydrogen bonding of complex (11) ................................................................................. 74
3.5 Thermal analysis .................................................................................................................. 75
3.6 References: ........................................................................................................................... 79
CHAPTER 4 ........................................................................................................................................ 82
SCARCE CATIONIC COMPLEXES WITH SACCHARINATE AS ANION ................................... 82
4.1 Introduction .......................................................................................................................... 82
4.2 Results and Discussion ......................................................................................................... 83
4.2.1 Synthesis of Precursors, [M(sac)2(H2O)4]·2H2O .............................................................. 83
4.2.2 Preparation of Metal Complexes ...................................................................................... 83
4.3 Spectral Properties ................................................................................................................ 85
4.3.1 Fourier Transform Infrared spectroscopy (FTIR) Spectral Data of Complexes ............... 85
4.3.2 UV-Vis spectroscopy ....................................................................................................... 86

xiv
4.4 Description of the Crystal Structures of Saccharinato Complexes ....................................... 87
4.4.1 X-ray Structure Determination of the Complexes ............................................................ 87
4.4.2 Crystal structures .............................................................................................................. 88
4.4.2.1 [Ni(N,O,O-mdea)2]·2(sac) (6) .......................................................................................... 88
4.4.2.2 [Cu2(µ-O)2(mea)4]·2(sac) (9) ............................................................................................ 89
4.4.2.3 Hydrogen bonding of the complexes ................................................................................ 90
4.4.2.4 Co2(en)4(CO3)2]·2(sac)3H2O (12) ..................................................................................... 93
4.5 Thermal analysis .................................................................................................................. 95
4.6 References ............................................................................................................................ 97
CHAPTER 5 ........................................................................................................................................ 99
CONCLUSION AND FUTURE PROSPECTS ................................................................................... 99
5.1 CONCLUSION .................................................................................................................... 99
5.2 FUTURE PROSPECTS ..................................................................................................... 100
APPENDIX ........................................................................................................................................ 101

xv
LIST OF FIGURES
Figure 1.1 The A-H, B theory of artificial sweeteners. ............................................................ 2
Figure 1.2 The most commonly used artificial sweeteners. ..................................................... 4
Figure 1.3 Schematic diagram of the selected naturally occurring sweeteners. ....................... 5
Figure 1.4 The schematic structures of saccharin and saccharinato anion. .............................. 6
Figure 1.5 Formation of sodium saccharinate from saccharin and sodium hydroxide. ......... 10
Figure 1.6 Contributing resonance structures of saccharinate and thiosaccharin. ................ 10
Figure 1.7 The crystal view of Na(sac)·2H2O whereby the Na ions are represented by pink
shaded atoms, O atoms red shaded, N atoms blue shaded, S atoms yellow shaded, C atoms
grey shaded and H atoms cream shaded. ................................................................................ 11
Figure 1.8 Drawing of the structure of the [M(sac)2(H2O)4]·2H2O type complexes where
M(II) could be Co, Cd, Cu, and Zn. ........................................................................................ 12
Figure 1.9 The coordination mode of Zn saccharinato complexes, X and Y are donor atoms
in mono- or bidentate ligands. ................................................................................................. 14
Figure 1.10 The possible coordination modes of ligands in Cu(II), Co(II), Cd(II), Ni(II) and
Hg(II) metal centres. ............................................................................................................... 16
Figure 1.11 The coordination mode of metal complexes via carbonyl oxygen donor atom. . 18
Figure 1.12 Monodentate N ligands of complex [Cu(sac)2(iqn)4] with a bulky ligand. ........ 18
Figure 1.13 Monodentate mode via O atom of saccharinato complexes: [Cu(pyr)2(sac)2] and
[Co(sac)2(ppzea)2] with bidentate (N, O) donor atoms and (N, N) donor atoms, respectively19
Figure 1.14 The molecular view of [Ag4(sac)4(pypr)2] showing a tetranuclear silver(I)-
saccharinato complex. ............................................................................................................. 20
Figure 1.15 The molecular view of [Cu(sac)2(py)3] showing the ambidentate behaviour of
saccharin. ................................................................................................................................ 21
Figure 1.16 The complex [Cd(dipyr)2(sac)(H2O)](sac)·(H2O) showing bonded saccharinato
ligand and non-bonded saccharinate anion. ............................................................................ 23
Figure 1.17 A molecular representation of dimethyl sulfoxide. ............................................ 24
Figure 1.18 A representation of primary, secondary and tertiary amines. ............................. 25
Figure 3.1 NMR labelling scheme for different complexes. .................................................. 54
Figure 3.2 The ORTEP molecular structure of (1) showing the labelling scheme. The dash
interactions show intramolecular hydrogen bonding.. ............................................................ 61

xvi
Figure 3.3 The ORTEP molecular structure of (2) showing the labelling scheme. The atom
displacement ellipsoids are at 50% probability level. The dashed interactions shows
hydrogen bonding. .................................................................................................................. 62
Figure 3.4 The ORTEP crystal packing diagram of (1) viewed along the crystallographic c
axis. The elements are shown as (C = dark grey, H = light grey, S = yellow, O = red, N =
blue and Cd = cream). ............................................................................................................. 64
Figure 3.5 The ORTEP crystal unit cell packing of (2) viewed along the crystallographic c
axis. The elements are shown as (C = dark grey, H = light grey, S = yellow, O = red, N =
blue and Co = grey). ................................................................................................................ 64
Figure 3.6 ORTEP molecular structure of (3) showing the labelling scheme. The atom
displacement ellipsoids are drawn at 50% probability level. The dashed interactions show
intramolecular hydrogen bonding. .......................................................................................... 65
Figure 3.7 The ORTEP molecular structure of (4) showing the labelling scheme. The atom
displacement ellipsoids are drawn at 50% probability level. .................................................. 66
Figure 3.8 The ORTEP crystal unit cell packing of (3) viewed along the crystallographic c
axis. The elements are shown as (C = dark grey, H = light grey, S = yellow, O = red, N =
blue and Zn = light blue). ........................................................................................................ 69
Figure 3.9 The ORTEP crystal packing of (4) view along the reciprocal cell a* axis, i.e.
perpendicular to bc. The elements are shown as (C = dark grey, H = light grey, S = yellow, O
= red, N = light blue and Hg = silver). .................................................................................... 70
Figure 3.10 The ORTEP molecular structure of (5) showing the labelling scheme. The atom
displacement ellipsoids are drawn at 50% probability level. The dash interactions show
hydrogen bonding. .................................................................................................................. 71
Figure 3.11 The unit cell packing of complex (5) viewed down the crystallographic a axis. 72
Figure 3.12 The ORTEP molecular structure of (11) showing the labelling scheme. The
atoms displacement ellipsoids are drawn at 50% probability level. The dash interactions
show hydrogen bonding. ......................................................................................................... 73
Figure 3.13 The ORTEP crystal unit cell packing of (11) viewed along crystallographic b
axis. The elements are shown as (C = dark grey, H = light grey, S = yellow, O = red, N =
light blue and Cd = cream). ..................................................................................................... 75
Figure 4.1 Molecular structure of (6) showing the atom labelling scheme. The atom
displacement ellipsoids are drawn at 50% probability level. Only atoms in the asymmetric
unit are labelled and the other half of the complex were generated via symmetry code -x, -y,
2-z. The dashed lines indicate hydrogen bonding. ................................................................. 88

xvii
Figure 4.2 The ORTEP crystal structure of (9) showing the labelling scheme. The atom
displacement ellipsoids are drawn at 50% probability level. The atoms in the asymmetric
unit are labelled and the other half of the complex was generated via symmetry code 1-x, 1-y,
1-z. The dashed interactions show hydrogen bonding of the complex. ................................. 89
Figure 4.3 The ORTEP crystal unit cell packing of (6) viewed along the crystallographic b
axis. The elements are shown as (C = dark grey, H = light grey, S = yellow, O = red, N =
blue and Ni = green). .............................................................................................................. 91
Figure 4.4 The ORTEP crystal packing of (9) view down along the crystallographic b axis.
The elements are shown as (C = dark grey, H = light grey, S = yellow, O = red, N = blue and
Cu = orange). .......................................................................................................................... 92
Figure 4.5 The ORTEP crystal structure of (12) showing the labeling scheme. The atom
displacement ellipsoids are drawn at 50% probability level. The dashed interactions show
hydrogen bonding of the complex. ......................................................................................... 93
Figure 4.6 The ORTEP crystal packing of (12) viewed down along crystallographic b axis.
The elements are shown as (C = dark grey, H = light grey, S = yellow, O = red, N = blue and
Co = light green). .................................................................................................................... 95

xviii
LIST OF SCHEMES
Scheme 1.1 The schematic illustration of saccharinate ligand coordination modes. ............... 7
Scheme 1.2 The synthetic scheme of saccharin via the sulfonation of toluene. ....................... 9
Scheme 1.3 Synthesis of saccharin via diazotization starting from methyl ester o-
aminobenzoic acid. .................................................................................................................... 9
Scheme 1.4 The oxidation reaction of dimethyl sulfide to yield DMSO. .............................. 24
Scheme 3.1 The schematic representation of N-M saccharinato complexes of the present
study. ....................................................................................................................................... 49
Scheme 3.2 Formation of [M(sac)2(H2O)4]·2H2O precursor complex. .................................. 50
Scheme 3.3 Reactions showing the formation of DMSO saccharinato complexes. ............... 51
Scheme 3.4 Reaction scheme showing the formation of amine saccharinato complexes. ..... 52
Scheme 4.1 Synthesis of [M(sac)2(H2O)4]·2H2O precursors. ................................................ 83
Scheme 4.2 Reactions showing the formation of saccharinato complexes containing amines
................................................................................................................................................. 84
Scheme 5.1 Reduction of sulfonyl O-donor atom leading to sulfinyl type derivative which
can be further coordinated to metals, RA is a reducing agent .............................................. 100
Scheme 5.2 A possible ring-opening reaction of saccharin .................................................. 100

xix
LIST OF TABLES
Table 1.1 Coordination modes of Zn saccharinato complexes ............................................... 15
Table 1.2 The octahedral complexes of non-bonded saccharinate anion ............................... 22
Table 3.1 Tabulated analytical results of saccharinato complexes ......................................... 52
Table 3.2 The NMR data of the saccharinato complexes ....................................................... 55
Table 3.3 IR spectral data for the metal complexes ............................................................... 56
Table 3.4 Electronic spectra results of saccharinato complexes ............................................ 58
Table 3.5 Crystal data and structure refinement for complexes (1), (2), (3) and (4) .............. 59
Table 3.6 Crystal data and structure refinement for complexes (5) and (11) ......................... 60
Table 3.7 Tabulated selected bond lengths (Å) and angles (°) for complexes (1) and (2) and
hydrogen bonding coordination geometry for complexes (1)b and (2)d ................................. 63
Table 3.8 Tabulated selected bond lengths (Å) and angles (°) for complexes (3) and (4) and
hydrogen bonding coordination geometry for complexes (3)f and (4)k .................................. 68
Table 3.9 Tabulated selected bond lengths (Å) and angles (°) for complex (5)b ................... 72
Table 3.10 Tabulated selected bond lengths (Å) and angles (°) for complex (11)h ............... 74
Table 3.11 Thermoanalytical data for selected complexes .................................................... 76
Table 4.1 Tabulated analytical results of saccharinato complexes ......................................... 84
Table 4.2 IR spectral data for the metal complexes ............................................................... 85
Table 4.3 Electronic spectra results of saccharinato complexes ............................................ 86
Table 4.4 Crystal data and structure refinement for complexes (6), (9) and (12) .................. 87
Table 4.5 Tabulated selected bond lengths (Å ) and angles (°) for complexes (6) and (9)and
hydrogen bonding coordination geometry for complexes (6)b and (9)e .................................. 90
Table 4.6 Tabulated selected bond lengths (Å) and bond angles (°) for complex (12) and
hydrogen bonding coordination geometry for complex (12)k ................................................. 94
Table 4.7 Thermoanalytical data for selected metal complexes ............................................. 95

1
CHAPTER 1
INTRODUCTION
1.1 General Description of Saccharin
This chapter gives an overview of saccharin and focuses on the literature review of
saccharinato metal complexes, which are derived from saccharin and its salts. It also gives an
overview of the mixed-ligand saccharinato complexes, including dimethyl sulfoxide and
ethylenediamine ligands, which are encountered in coordination chemistry. This study
entails the synthesis and characterization of new saccharinato coordination complexes.
For the past 20000 years, mankind has realised the necessity of enjoying the “sweet” life by
robbing beehives of honey. This attitude shows that humanity presumably had the desire for
sweetness as part of their daily food diet, a habit which continues to this day.1 This became
more evident and prominent in the 20th century when the change to machineries and
technology became part of life and became advantageous, due to health reasons, for people to
have sweetness without extra calories. This idea later led to the discovery of low-calorie
sweeteners and one of those sweeteners is called saccharin.2, 3
In 1878, a young researcher named Constantin Fahlberg worked in Ira Remsen’s laboratory at
Johns Hopkins University and accidentally made the magnificent discovery of saccharin
when he was working on a project related to coal tar derivatives. As with other discoveries,
Fahlberg accidentally spilled a chemical on his hand and later that evening while eating
noticed that his bread tasted sweeter than usual. Being naturally curious, he traced the
sweetness back to the chemical he used and the artificial sweetener saccharin was
discovered.2, 4

2
1.2 The AH-B-X Taste Receptor Theory of Artificial Sweeteners
It is important to understand the relationship between the biological activities and chemical
structure of saccharin and other artificial sweeteners. The receptors on the tongue refer to
proteins which are responsible for any chemical response or signal recognition and can
therefore initiate biological activities. It is one of the reasons that the tongue can differentiate
between sweet and bitter. 4-6
The sweetness of most artificial sweeteners including saccharin can be explained by means of
a trifunctional unit system of AH-B-X whereby the units represent an acidic proton, an
electronegative atom or centre and the hydrophobic group, respectively. This scheme was
explained by Shallenberger and Acree.7 Their system of explaining sweetness states that
sweet tasting compounds consist of a hydrogen bond donor containing group (AH) and a
hydrogen bond acceptor containing group (B) which are likely to be separated from each
other at a distance of 2.5 to 4.0 angstroms.8 They also suggested that the receptor must
contain a complimentary receptor of B-AH pair that forms two hydrogen bonds when the
sweeteners interact with the receptor. Since the formulation of this concept, there has been a
number of known exceptions which helps us to understand the ways in which the artificial
sweeteners work, see Figure 1.1.7, 9
Figure 1. 1 The A-H, B theory of artificial sweeteners.

3
This theory is very simple and there are numerous known exceptions concerning the ways it
works. The model which was proposed served the very important function of stimulating
thought about the way sweeteners work. The model was further refined by Shallenberger,
Acree and Lee by adding the "steric barrier" to account for many D-amino acids which are
said to be sweet and the L-amino acids which are not. Kier also added to the AH-B pair a
dispersion binding side of 3.5 Å from the AH group and 5.5 Å from the B. The recalculated
distances by van der Heijden and co-workers suggest that there are four different receptor
types distinguished by different distances and the three functional groups. From all these
exceptions and reasons which explain the realistic and unrealistic view about the model,
Nofre and co-workers showed that the model worked successfully. These scientists scored a
major breakthrough by combining two known sweeteners of moderate potency to form a
compound with higher and remarkable potency.7,8
Saccharin is an excellent food additive and it is used in manufactured products since its
sweetening power cannot be reduced by heating. It is stable at elevated temperatures and it
does not chemically react with other food ingredients. During the manufacture of blended
sweeteners, saccharin is used , because it provides stability properties to maintain the product
sweetness for a long time as it has a long shelf-life.2 Saccharin and other low-calorie
sweeteners like acesulfame, neotame, sucralose, cyclamate and aspartame, when blended
together can either increase or decrease the concentration of the sweet taste depending on the
choice and the ratios in which they are mixed together. 1
1.3 Artificial Sweeteners
Sweetness in simple terms is that desirable sensational taste derived from starch/
carbohydrates such as sugar to bring that prototypical sweet taste. Sugar together with some
artificial sweeteners are blended together and added to foods and beverages to enhance taste.
It has been demonstrated that sweet taste stimuli originating from sugar and artificial
sweeteners is admired by both adults and newborns.10, 11

4
From a long list of existing artificial sweeteners discovered by organic chemists, about five of
them are approved by the US Food and Drug Administration (FDA), and these include
saccharin, acesulfame potassium, aspartame, neotame and sucralose.12 Artificial sweeteners
are synthetically man-made sugar substitutes which in taste exceed sweetness of normal sugar
and they do not occur naturally, although some of which are not in the above list can be
derived from nature.4, 13 Aspartame was discovered in 1965 by Schlatter of the Mazur
Pharmaceutical company. This was an important discovery because aspartame is a sweetener
that can be metabolised and broken down into natural amino acids and methanol which are
present in most of our foods.14 In 1973, Clauss and Jense of Hoechst AG, discovered
acesulfame, in structure more similar to saccharin. It is used in the same way as saccharin in
foods and beverages and as a salt or also in its acidic form.15 Sucralose was discovered in
1976 by Hough and Phadnis, and was obtained when the sugar hydroxyl group of sucrose
was substituted with chlorine.16 Neotame is the sweetest sweetener of these listed and was
discovered in 2000 by Nofre and Tinti.17
Below are the examples of artificial sweeteners that are currently registered by the FDA:
Figure 1. 2 The most commonly used artificial sweeteners.

5
Aspartame and acesulfame potassium are approximately 200 times sweeter than sucrose,
neotame 7000 to 13000 sweeter than sucrose, cyclamate about 30 to 50 times sweeter than
sucrose and sucralose about 600 times sweeter than sucrose. Sucrose, xylitol, and steviol,
listed below, are naturally occurring sweeteners.18, 19
Figure 1. 3 Schematic diagram of the selected naturally occurring sweeteners.
In 1907, saccharin was mostly given to patients with diabetes, who could not take any
sweetener containing calories, such as sugar, the source of carbohydrates and energy.
Saccharin did not interfere with their lifestyle as it was directly taken into their digestive
system without being digested. Another advantage saccharin for diabetics, was that it could
produce insulin through simple tasting, as with the other common artificial sweetener,
aspartame. Saccharin was also greatly used during the two World Wars when there was
shortage of sugar in Europe and the US.1
Saccharin is a heterocyclic compound with systematic name o-Sulfobenzimide or 1,2-
benzothiazole-3(2H)-one-1,1-dioxide, abbreviated HSac, and it is one of the best known and
widely used artificial sweeteners in the world.20 The chemical structure consists of three
functional groups which are carbonyl, imino and sulfonyl, connected to each other via a five
membered ring attached to a benzene ring. It is a polyfunctional ligand in transition-metal
chemistry and can be used as an anion, typically coordinated to metals atoms via the nitrogen
atom; but potentially also through the oxygen atom of the carbonyl, or two oxygen atoms of
the sulfonyl group. As a neutral ligand, the nitrogen atom and the carbonyl oxygen atom can
act as donor atoms for the ligand. The coordination modes of the saccharinato ligand is thus
varied, and can act as a mono-, bi- and tri-dentate ligand,20, 21 see scheme 1.1 below. The

6
crystal structure was first elucidated by Bart and Okaya 22, 23 and Figure 1.4 show the
molecular diagram of saccharin and saccharinato anion.
Figure 1. 4 The schematic structures of saccharin and saccharinato anion.
Saccharin has a melting point of 228-229.7°C, a pKa value of 1.60 and a density of 0.828 g
mL-1, respectively24 and in its acidic form, HSac is insoluble in water, but dissolves in
alcohols such as methanol and ethanol, as well as solvents such as acetone, glycerol and is
slightly soluble in ether and chloroform. The sodium and calcium salts of saccharin are both
highly soluble in water: 0.67 g mL-1 at room temperature, or 1.00 g dissolve in 290 mL of
water, or in 25 mL of boiling water.19 The sweetness of saccharin can be detected in a
1:100000 dilution.18 The standard molar enthalpies of composition, sublimation- and
formation- enthalpies of saccharin have only recently been reported using calorimetric
methods.25-27
Saccharin has no food energy and it is 300 to 700 times sweeter than sucrose and at high
concentrations it leaves a metallic bitterness aftertaste. 2, 18, 28, 29 The reason it is so sweet is
still unclear but its molecular structure obviously fit appropriate receptors on the tongue.
This idea is further brought forth by the fact that when the hydrogen atom on the N atom is
removed and replaced with a methyl group, the sweetness virtually disappears. The alkyl
halide derivatives of saccharin class of compounds occur in large variety derived from
haloalkane.30
Scheme 1.1 is a representation of the different coordination modes of the saccharinato ligand
with different metals centres.31

7
Scheme 1. 1 The schematic illustration of saccharinate ligand coordination modes.31, 32

8
1.4 Advantages and Disadvantages of Saccharin
Research has shown that saccharin is taken by people to maintain in an excellent health
condition and to control their body weight. Regardless of being proven by the health
profession to be beneficial for diabetics, it is also proven to reduce dental cavities. This low-
calorie sweetener is being used in products such as soft drinks, jams, chewing gums, canned
fruits, dessert toppings, baked goods, salad dressing and candy. It is also widely used in
health and beauty products such as tooth pastes, mouthwash, cosmetics products, vitamins
and pharmaceuticals. Many of us are familiar with saccharin in the pink package of Sweet’N
Low.20, 33
Saccharin can be synthesised by toluene or ortho-toluenesulfonamide. The starting material
ortho-toluenesulfonamide is a main threat to human life because without the correct
assessment in the saccharin production, it could be incorporated in the product and cause
cancer.3, 34 Many nitrogen containing compounds are known to be carcinogenic such as
aromatic amines, nitrosamines and nitrosamides, nitroquinolines, nitrofurans and
mycotoxin.3, 35, 36 Sodium saccharin is associated with health risks such as allergies and
weight gain, but can increase chances of diabetes to non-diabetics. Sodium saccharin is a
sugar substitute without calories and is easily absorbed in the human intestines. This is a
sweetener which is able to stimulate an endocrinological response like insulin from the
pancreas. Sodium saccharin is capable of causing allergies in the human body due to the
presence of sulphonamides. These allergies symptoms include headaches, difficulty in
breathing, skin rash and diarrhoea.37
1.5 Synthesis of Saccharin
There are two synthetic preparations of saccharin which are mostly used by industrial
manufactures and in academic laboratories. The first method involves the preparation of
saccharin starting from toluene and the second procedure is with methyl ester o-
aminobenzoic acid cyclization,8 see Scheme 1.2.

9
The first route was reported by Remsen and Fahlberg, whereby toluene is sulfonated by
chlorosulfonic acid which results into two isomers namely 4- and 2-toluenesulfonyl chlorides.
The isomeric products are separated by chilling the products in an ice-bath. The liquid part is
2-toluenesulfonyl chloride which is separated from the crystallized isomer 4-toluenesulfonyl
chlorides and reacted with ammonia to give 2-toluenesulfonylamide. An oxidation of the
product with sodium permanganate or chromium(VI) oxide in sulfonic acid gives saccharin.4
Scheme 1. 2 The synthetic scheme of saccharin via the sulfonation of toluene.
A second route for preparing saccharin is from methyl ester o-aminobenzoic acid cyclization,
see scheme 1.3. This is a diazotization reaction whereby nitrous acid is used and the resulting
diazonium salt is reacted with sulphur dioxide in the presence of copper dichloride forming
the methyl ester o-sulfobenzoic acid. The reaction of the resulting product with chlorine
gives o-chlorosulfonylbenzoic acid methyl ester of which upon reaction with ammonia gives
o-sulfonylamidobenzoic acid methyl ester. In the presence of hydrogen chloride, the
resulting product undergoes cyclization into saccharin.2
Scheme 1. 3 Synthesis of saccharin via diazotization from methyl ester o-aminobenzoic acid
cyclization.

10
The treatment of saccharin with sodium hydroxide in ethanol results in the substitution of imide
hydrogen atom with the sodium ion to give sodium saccharinate.38
Figure 1. 5 Formation of sodium saccharinate from saccharin and sodium hydroxide.
1.6 Sodium Saccharinate and Thiosaccharin
It exists in an ionised form and can therefore act as a nucleophile. It has been shown to exist
in different contributing resonance forms in solution which makes it an ambidentate ligand as
it can bind metals through the N or O donor atoms, see figure 1.6. This has been
demonstrated by spectroscopic (NMR) and crystallographic data.39, 40
Thiosaccharin abbreviated (tsac) with systematic name 1,2-benzisothiazol-3(2H)-thione-1,1-
dioxide differs from saccharin by replacing the carbonyl group (C=O) with the thiocarbonyl
group (C=S).41 Thiosaccharin is derived from saccharin and obtained through two thionation
methods: i) the treatment of saccharin with phosphorous pentasulfide (P2S5)/(structurally
P4S10) in a suitable organic solvent41, 42, and ii) the reaction of saccharin with Lawesson’s
reagent in hot toluene.42
Figure 1. 6 Contributing resonance structures of saccharinate and thiosaccharin.

11
In general, deprotonation of thiosaccharin causes the negative charge on the N donor atom to
decrease and this affects the structural and electronic properties of the ligand making it less
effective to bind to the first row transition-metals, while the saccharinato ligand readily binds
through the N atom under the same conditions. The thiosaccharin contains the S donor atom
which is a soft atom that can readily bind to soft metal centres such as the Cd(II), Hg(II) and
Pb(II).21
1.7 Saccharinato Ligand: Metal Complexes of Saccharin and Its Salts
1.7.1 Saccharinate Salts
Examples of simple saccharinate salts which behave as cation/ anion species include
Na(sac)·H2O, Mg(sac)2·7H2O, K2Na(sac)2·H2O,43 NH4(sac)44 and many others which are
presented in the list of coordination modes (see Scheme 1.1 above). Sodium saccharin is of
great importance since it is commonly used commercially, whilst the others are not. When
sodium saccharin is recrystallized it produces two hydrates. In 95% ethanol, it occurs in the
form Na(sac)·2/3H2O which appears to crystallized in triclinic space group P1 and when
water is used instead, in the process, Na(sac)·15/8H2O is afforded.45, 46
Figure 1.7 The crystal view of Na(sac)·2H2O whereby the Na ions are represented by pink
shaded atoms, O atoms red shaded, N atoms blue shaded, S atoms yellow shaded, C atoms
grey shaded and H atoms cream shaded. 47

12
Na(sac)·15/8H2O crystallises in a monoclinic space group P21/n. From a crystallographic
point of view, the structure has a molecular formula Na64(sac)·120H2O and it generates a
large unit cell with a cell volume of 15560.0 Ǻ and Z= 64.47, 48
The ammonium salt NH4(sac)44 is the only ionic saccharinate that shows no water of
hydration.
The cesium saccharinates, Cs(sac)·0.5H2O have only been characterised by IR spectroscopy
and their molecular structure remain unknown.48, 49 This is common to other group 1 salts
including Rb(sac)·0.5H2O which is obtained by the reaction of saccharin and Rb2CO3.48, 50
Rb(sac)(Hsac)·H2O is another complex whose analysis is incomplete.50
With regard to the alkaline-earth ionic saccharinates, except for Mg(II), none are fully
characterised, including Ca(sac)2·4H2O, Sr(sac)2·4H2O and Ba(sac)2·8H2O. The complexes
of Ca(II), Sr(II) and Ba(II) are not soluble in water. The mixed ligand complexes of alkaline
earth metals have been synthesised and characterised. 51
1.7.2 Monodentate Coordination of Saccharinato Complexes via the N-atom
The isomorphous coordination of saccharinato complexes is produced by the reaction of the
first row divalent transition metals in aqueous solution and has been extended to the various
late transition metal complexes.52, 53 The complexes are usually prepared from soluble
sodium saccharinate in aqueous media as saccharin (Hsac) is only partially soluble in water.
The complexes have the following formula: [M(sac)2(H2O)4]·2H2O, whereby M(II) could be
V, Cr, Mn, Fe, Ni, Cu, and Zn. Cadmium also forms part of this list of isomorphous
compounds. 53-55 Figure 1.8, demonstrate an octahedral geometry of [M(sac)2(H2O)4]·2H2O.
Figure 1. 8 Drawing of the structure of the [M(sac)2(H2O)4]·2H2O type complexes where
M(II) could be Co, Cd, Cu, and Zn.
13
Crystallographic data have shown that these complexes possess octahedral coordination
geometry. Their structures consist of two saccharin anions trans to each other and four aqua
ligands, with two waters of crystallisation that form a tetraaquabis(saccharinato)MIIdihydrate
complex.49, 55 This is the most established coordination geometry of saccharinate
chemistry,55 see scheme 1.1.
The present study focuses on the following late-transition metal centres: Co, Ni, Cu, and the
three group 12 metals Zn, Cd, Hg. All these transition metals have an oxidation state of +2.
1.7.3 Saccharinato Mixed Ligand Complexes
It is common practice in this system to displace the labile aqua ligands in the saccharinato
aqua metal complexes (Fig.1.9) with stronger donating, mostly neutral ligands. This is
readily accomplished by the direct addition of the neutral ligand into the intermediate aqua
saccharinato complexes whereby water is typically used as solvent.54 The neutral complexes
are formed by substitution reactions which lead to new stable mixed-ligand complexes. The
complexes can therefore occur as octahedral, tetrahedral, square-planare, trigonal planar and
other geometries depending on the metal type used during the reactions.21, 56
Copper(I) has shown to be a three coordination metal centre. In some cases copper(I) metal
centres have coordinated through the N-saccharinato ligand which upon treatment with PPh3
gives a three coordinated Cu(I) complex of the type [Cu(sac)(PPh3)2] (PPh3 =
triphenylphosphine).57 Most complexes of silver(I) are dimeric or polymeric in nature, and
the structures often display Ag···Ag interactions (argentophilic), for example in
[Ag2(sac)2(pyet)2] (pyet = 2-pyridylethanol),58 [Ag(sac)(PPh3)2],59 [Ag(sac)(py)n] (py =
pyridine),60 [Ag(sac)(pym)n] (pym = 2-pridylmethanol)61 and [Ag2(sac)2(dmen)2] (dmen =
N,N-dimethylenediamine).59, 62
14
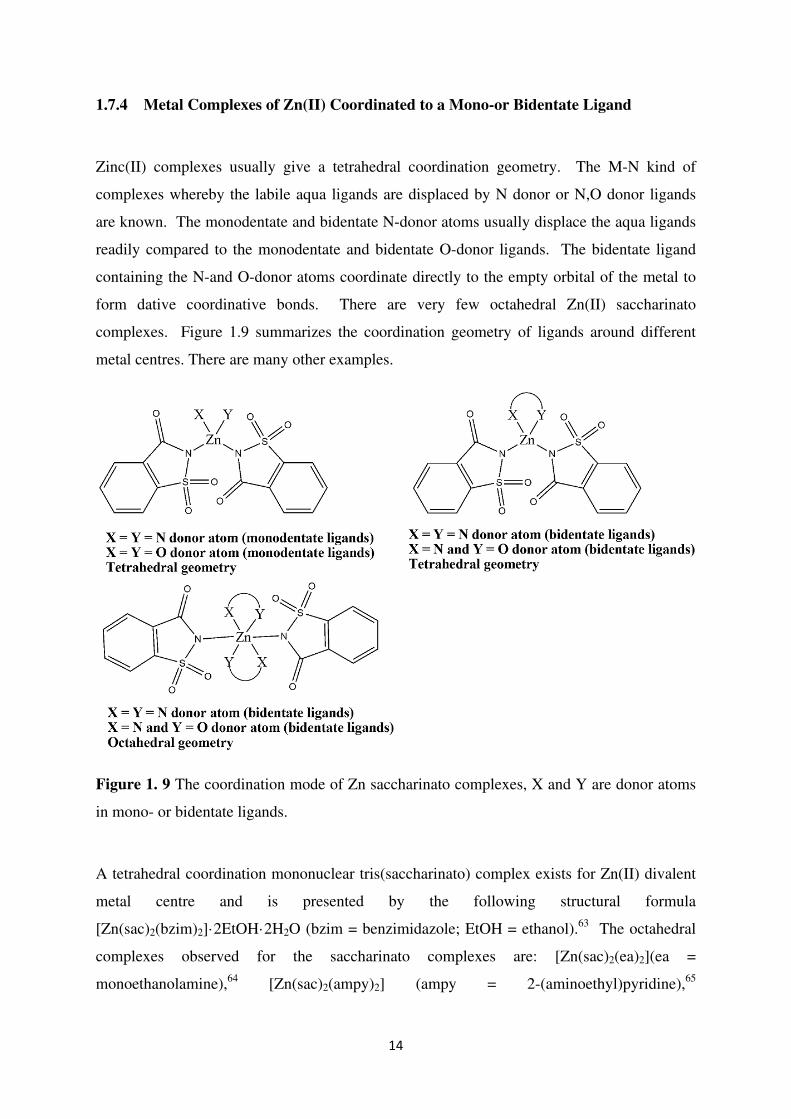
1.7.4 Metal Complexes of Zn(II) Coordinated to a Mono-or Bidentate Ligand
Zinc(II) complexes usually give a tetrahedral coordination geometry. The M-N kind of
complexes whereby the labile aqua ligands are displaced by N donor or N,O donor ligands
are known. The monodentate and bidentate N-donor atoms usually displace the aqua ligands
readily compared to the monodentate and bidentate O-donor ligands. The bidentate ligand
containing the N-and O-donor atoms coordinate directly to the empty orbital of the metal to
form dative coordinative bonds. There are very few octahedral Zn(II) saccharinato
complexes. Figure 1.9 summarizes the coordination geometry of ligands around different
metal centres. There are many other examples.
Figure 1. 9 The coordination mode of Zn saccharinato complexes, X and Y are donor atoms
in mono- or bidentate ligands.
A tetrahedral coordination mononuclear tris(saccharinato) complex exists for Zn(II) divalent
metal centre and is presented by the following structural formula
[Zn(sac)2(bzim)2]·2EtOH·2H2O (bzim = benzimidazole; EtOH = ethanol).63 The octahedral
complexes observed for the saccharinato complexes are: [Zn(sac)2(ea)2](ea =
monoethanolamine),64 [Zn(sac)2(ampy)2] (ampy = 2-(aminoethyl)pyridine),65

15
[Zn(sac)(bpy)2·(H2O)]sac66 and many others not mentioned in this list. Table 1.1 show the
coordination mode of ligands mostly used in the formation of zinc saccharinato complexes.
Table 1. 1 Coordination modes of Zn saccharinato complexes
Type of structural mode Binding mode of ligand Examples
Monodentate via N,
Tetrahedral
[Zn(sac)2(im)2]63
Bidentate via N,
Tetrahedral
[Zn(sac)2(aepy)]65
Monodendate via N and O,
Tetrahedral
ApyH[Zn(sac)3(H2O)]67a
Bidentate via N,
Octahedral
[Zn(sac)2(aepy)2]65
Abbreviations:
(im) = imidazole
(aepy) = 2-(2-aminoethyl)pyridine
(ApyH)=2-aminopyridinium
1.7.5 Metal Complexes of M(II) Coordinated to a Monodenate, Bidentate, Tridenate
and Bridging Ligand: M(II) = Cu, Co, Cd, Ni and Hg
Copper(II), cobalt(II) and nickel(II) are late -transition metal centres and when complexed
with ligands they usually display octahedral, trigonal bipyramidal and square planar
coordination geometry. Dimers usually form when the ligand used forms alkoxo-bridges via
the O atoms. Cadmium(II) and mercury(II) also form monodentate and bidentate complexes.
When labile aqua ligands are displaced by N donor or N,O donor ligands in
tetraaquabis(saccharinato)M(II)dihydrate, new complexes readily forms. The saccharinato
metal complexes of Cu(II), Pt(II) and Pd(II) possess a square planar coordination geometry.
There are two types of saccharinato copper(II) dimer complexes, namely [Cu2(sac)2(dea)2]
(dea = diethanolamine anion)64 and [Cu2(sac)2(µ-pypr)2] (pypr = 2-pyridinepropanoxy

16
anion)67b. These two dimers are linked together by two alkoxo-bridges which have relatively
short Cu···Cu interactions separated at 2.99 Å for [Cu2(sac)2(dea)2] and 3.04 Å for
[Cu2(sac)2(µ-pypr)2]. These two copper(II) atoms are responsible for antiferromagnetic
coupling in the Cu-Cu pair. 67b The Cu(II) complexes exhibit octahedral coordination
geometry. Octahedral complexes observed for the saccharinato ligand include [M(sac)2(ea)2]
(ea = monoethanolamine) where M(II) = Ni,68 Cu,69 Hg(I),64 [M(sac)2(ampy)2] (ampy = 2-
(aminoethyl)pyridine) where M(II) = Ni,70 Cu71 and Cd72, [M(sac)2(HydEt-en)2] (HydEt-en =
N-2(-hydroxyethyl)-ethyendiamine) where M(II) = Cd and Cu73 and the complexes of
[M(sac)(bpy)2(H2O)]sac, where M = Co74 and Ni75, [Cd(sac)2(bpy)2] and [Hg(sac)2(bpy)]76
(bpy = α, α'-bipyridine). Most of the complexes of the type [M(sac)2(NH3)4] (NH3 =
ammonia) where M(II) = Cd, Co, Cu, Hg(I) have been synthesised but not fully
characterised.57, 77 Figure1.10 show the possible coordination modes of the N or/ and N, O
donor atoms which forms in most chemical reactions.
Figure 1. 10 The possible coordination modes of ligands in Cu(II), Co(II), Cd(II), Ni(II) and
Hg(II) metal centres.

17
The trigonal bipyramidal coordination geometry is most likely formed by Cr(II), copper(II),
mercury(II) and cadmium (II) depending on the type of ligand. Trigonal bipyramidal
coordination geometry for saccharinato complexes include [Cr(sac)2(py)]·2py78,
[Cu(ophen)2(sac)]sac·2H2O (ophen = o-phenothroline) and [Cu(bpy)2(sac)2(sac)3·H2O]79,80.
Other examples include [Hg(Cl)(sac)],81 [Hg2(Cl)2(sac)2(py)2],76(a) [Hg(sac)2(pyet)],
[Hg(sac)2(aepy)],82 [Cd(sac)2(H2O)(DMSO)(pyet)], [Cd(sac)2(pyet)2],82(a),83 [Cd(sac)2(dea)2]
and [Cd(sac)2(H2O)2(nic)2].84
Significant saccharinato stretching vibration frequencies of these metal centres occurs in
similar regions. The shifts differ according to the binding type and is influenced by the metal
type. In general, the IR wavenumbers of Zn saccharinato complexes slightly differ to the IR
shifts of other late transition metal complexes. The d10system is not as red shifted as those of
the d6 to d9 because they have less energy to be excited as compared to d6 to d9 systems.
Ag(I) can be coordinated via the N atom of the saccharinato anion to produce T-shaped
geometries, for example [Ag(sac)(ampy)] and [Ag2(sac)2(aepy)2].59, 85, 86
1.7.6 Monodentate Coordination of Saccharinato Complexes via the O-atom
Although there are two donor atoms of the saccharinate anion to which metals can coordinate
differently to form metal complexes, very few saccharinato complexes involve the oxygen
atom of the carbonyl group. Coordination through the oxygen atoms of the sulfonyl group is
even more scarce. For the saccharinato ligand to engage in M-O bonding, it has to act as a
chelating ligand.21 Below, Figure 1.11 show the coordination modes of the ligands in a
saccharinato system engaged in M-O bonding mode.

18
Figure 1. 11 The coordination mode of metal complexes via carbonyl oxygen donor atom.
Coordination chemistry that involves the oxygen donor atom of the carbonyl group is mostly
observed when bulky co-ligands are used in the reactions, (e.g. N,N-dimethylethylenediamine
= dmen). The first complexes of this nature concerned metal centres such as V(II), Ni(II) and
Cu(II). The monodentate O-coordinated metal centres complexes reported to date include
[M(sac)2(py)4]·2py whereby M(II) = V and Ni, 87, 88 [V(sac)2(py)4]·2thf (thf =
tetrahydrofuran),88 [VO(OH)(sac)(H2O)]Hsac,89 [Cu(sac)2(prz)4] (prz = pyrazole)90 and
[Cu(pyr)2(sac)2],67 [Cu(sac)(H2O)2(mpy)4] (mpy = 4-methylpyridine) 91and [Cu(sac)2(iqn)4]
(iqn = isoquinoline).91 An example is shown in Figure 1.12.
Figure 1. 12 Monodentate N ligands of complex [Cu(sac)2(iqn)4] with a bulky ligand.
The following complexes contain the bidentate chelating ligand containing a M-O bond
where O atom is from the saccharinate carbonyl group: [M(pypr)2(sac)2] (pypr = 2-
pyridinepropanol) where M = Cu,67 Co, Ni92 and [Ni(sac)2(aepy)2]70 and [M(sac)2(aeppz)2] (

19
aeppz = N-(2-aminoethyl)piperazine) where M = Co, Ni,93 Zn and Cd.94 These bidentate
complexes have shown to crystallise in octahedral coordination geometry. The ligands like
pyridine, piperazine derivatives consisting of alkylhydroxy and alkylamino groups have
shown to possess similar octahedral geometry.95 Examples are shown in Figure 1.13.
Figure 1. 13 Monodentate mode via O atom of saccharinato complexes: [Cu(pyr)2(sac)2] and
[Co(sac)2(ppzea)2] with bidentate (N, O) donor atoms and (N, N) donor atoms, respectively.
1.7.7 Bidentate (N, O) and Tridentate (N, O, O) Coordination of Saccharinato
Complexes
The saccharinate anion can act as a bidentate ligand through the N, O donor atoms and a
tetranuclear ligand via the N, O, O atoms, Figure 1.14, see previous comment. Amongst
those which show this kind of coordination behaviour is the dimeric structure of
[Cr2(sac)4]·2thf88 in which the saccharinato moiety coordinates via the sulfonyl oxygen donor
atoms and also for a polymeric silver(I) complex of the type [Ag(sac)(dmpy)]n (dmpy = 2,6-
dimethanolpyridine). Complexes such as Na[Ag(sac)2] and the [Ag(sac)2]+cation83 have been
synthesised and crystallise in a three-dimensional structure leading to bi-and tridentate
saccharinato complexes with the chelating agents binding to the Ag(I) and the Na(I) cations.
Also, in this kind of coordination chemistry, a few tetranuclear coordination geometries are
known such as [Ag4(sac)4(pypr)2]88, 96 which is an interesting structure because of the
chelating mode shown by the saccharinato moieties that have coordinated to the four Ag(I)
metal centres. There are also the newly discovered coordination mode of saccharinato via the
two oxygen atoms of the sulfonyl in complexes of the type [Ag2(µ3-sac)2(µ-nmpen)]n and

20
[Ag(sac)(mpr)]231 (nmpen =N-nitroso-N-methylpentylamine), mpr =2-methyl-1-pyrroline ).
It shows the saccharinato ligand in a µ3-coordination mode by means of µ2-bridging atoms of
the two sulfonyl oxygen atoms and the N atoms of the imido group. This structural complex
further shows the dimeric structure of the complex linked by the Ag···Csac(ɳ1) interactions of
the ions of Ag(I) complex and the phenyl of the adjacent molecule through weak π· · ·π and
the Ag···Ag interactions.21 Other complexes such as [Tl2(sac)2(H2O)]n21 can either have 8 or
5 coordination resulting in a polymeric structure with both N-and O donor atoms chelating.
Figure 1. 14 The molecular view of [Ag4(sac)4(pypr)2] showing a tetranuclear silver(I)-
saccharinato complex.
1.7.8 Unusual Ambidentate Coordination Behaviour of Saccharinato Complexes
Saccharinato complexes can act as monodentate ligands via the N donor atom and as
monodentate ligand through the O donor atom (carbonyl). This shows ambidentate
behaviour and there are a number of other examples, using the pym ligand, such as
[M(sac)2(pym)4] whereby M(II) = Co, Zn, Cd and Ni, [Cu(sac)2(py)3] and
[Cu(sac)2(dipy)(H2O)] (dipy = dipyridylamine)90 and the tris of ApyH[Cu(H2O)2(sac)3].64 An
example is shown in Figure 1.15.

21
Figure 1. 15 The molecular view of [Cu(sac)2(py)3] showing the ambidentate behaviour of
saccharin.
1.7.9 Bonded and Non-Bonded Saccharinate Anion and Free Saccharin in the
Complex
The saccharinato ligand is multi-functional which can coordinate to metal centres in the inner
coordination sphere, but also act as a counter-anion in the outer coordination sphere thus non-
bonding to the metal. This feature has been observed in the present study and previously
reported for the following complexes: [Zn(dien)2](sac)2(dien = diethylenetriamine),97
[Zn(nic)2(H2O)4](sac)2,98 [Cd(dien)2(sac)2],
97 [Sr(tea)2(sac)2],69(a) [Zn(H2O)2(pyet)2](sac)2,
99
[Fe(4,4’-bpy)(H2O)4](sac)2,100 [Cd(tea)2(sac)2],
69 [Hg(tea)2(sac)2],69 [M(H2O)2(pyet)2](sac)2,
M = Ni, [Ba2S2(C12H24O6)2(H2O)2](sac)2 (C12H24O6 = the 18-crown-6 ring of 1,4,7,10,13,16-
hexaoxaacyclooctadecane),101 [Mn(H2O)2(phen)2](sac)2·H2O, [Cu(H2O)2(dmen)2](sac)2,102
[Co(im)4(H2O)2](sac)2,95[Cu(H2O)2(apy)2](sac)2(apy = 4-aminopyridine),90 [Zn(tea)2(sac)2]
(tea = triethanolaminate),69(b) [Cu(H2O)2(aim)2] (sac)2 (aim = N-alkylimidazole),103 and
[Zn(dmpy)2](sac)2·2H2O.104
These metal complexes are non-hygroscopic and stable in air. They are very soluble in DMF
and DMSO, and sparingly soluble in warm n-butanol and in methanol isopropanol mixtures.
Dissolution of the complexes in water occurs with decomposition. From Table 1.2, not much
difference is observed for the different metal-ligand bond lengths.

22
Table 1. 2 The octahedral complexes of non-bonded saccharinate anion
Complexes Binding mode of ligand
[Ni(sac)(H2O)(bipy)2](sac)66(b)
[Ni(dmpy)2](sac)2.2H2O104
[Ni(H2O)2(pyet)2](sac)2105
[Ni(tea)2(sac)2]106
[Ni(dien)2](sac)2·H2O97
[Ni(nic)2(H2O)4](sac)107
[Ni(H2O)4(py)2](sac)2108
Bidentate via N donor
Tridentate via N, O, O donors
Bidentate via N and O donor
Tridentate via N, O, O donors
Tridentate via N, N, N donors
Monodentate via N and O donors
Monodentate via N and O donors
[Co(sac)(H2O)(bpy)2](sac)109
[Co(dmpy)2](sac)2·2H2O110
[Co(H2O)2(pyet)2](sac)2111
[Co(tea)2(sac)2]112
[Co(nic)2(H2O)4](sac)107
[Co(H2O)4(py)2](sac)2108
Bidentate via N donor atoms
Tridentate via N, O, O donors
Bidentate via N and O donor
Tridentate via N, O, O donors
Monodentate via N and O donors
Monodentate via N and O donors
[Cu(sac)(byp)2](sac)·2H2O66(a)
[Cu(dmpy)2](sac)2·2H2O97
[Cu(H2O)2(pyet)2](sac)2113
[Cu(dien)2](sac)2·H2O97
Bidentate via N donor atoms
Tridentate via N, O, O donors
Bidentate via N and O donor
Tridentate via N, N, N donors
The following complexes are also closely related to those presented in the Table 1.2
[M(sac)(H2O)(bpy)2](sac) whereby M(II) = Mn74 and Zn,66 [Mn(sac)(H2O)(phen)2](sac),75
[Cu(sac)(dpy)2](sac)·2H2O114 and [Cu2(sac)2(H2O)2(bypm)3](sac)·2(sac)4H2O (bypm =
bipyrimidine)115. To reinforce the structural packing of the crystal, hydrogen bonds in the
ligands of the complexes exist as supermolecular architectures. An example is shown in
Figure 1.16.

23
Figure 1. 16 The complex [Cd(dipyr)2(sac)(H2O)](sac)·(H2O) showing bonded saccharinato
ligand and non-bonded saccharinate anion.
1.8 Characteristics of Saccharinato Complexes on Biological Studies
The complex [Zn(sac)2(H2O)4]·2H2O116, 117 has been shown to have certain inhibitory
properties over the carbonic anhydrase enzyme family when they were tested in vitro. These
types of enzymes are normally referred to as metalloenzymes because they can catalytically
convert carbon dioxide and water into bicarbonate and protons. The active side of carbonic
anhydrase is usually made of Zn(II) which maintains the balance in the blood and tissues of
animals to help with the transportation of carbon dioxide out of the tissue.118 This complex
has the potential to be used as a therapeutic additive for dentifrices.119 These are the agents to
clear and brighten natural teeth. These occur as paste, powder, gels and liquid forms. A
similar complex exhibiting inhibitory effects over the carbonic anhydrase is
[Cu(sac)2(H2O)4]·2H2O except that it cannot be used as a tooth brightening agent, but other
complexes with similar properties include dioxouranium (VI), oxovanadium (IV), Ce(IV),
Hg(II) and Pb(II).120
Most of the Ag(I) saccharinato complexes are polymeric and insoluble in nature, but are of
great importance because they have antibacterial activities with sulfadiazine. Due to their
insolubility, when examined for biological properties they show a slow liberation of Ag,
which makes them a suitable candidate for antibacterial agent. They have been used in
pharmaceutical formulation because they can slowly kill and slow down the growth of
bacteria.20, 121

24
Studies on lanthanide saccharinato complexes have proven to be important in medical
applications. Some of the thiosaccharinato complexes have also showed great potential in
antimicrobial activities.32
1.9 Coordinating Ligand: Dimethyl Sulfoxide
1.9.1 Dimethyl Sulfoxide
Dimethyl sulfoxide (DMSO) is used considerably in the present study and a brief
introduction is presented here. DMSO is a polar aprotic hygroscopic organosulfur
compound, a by-product of wood industry and can also dissolve both polar and non-polar
compounds. It is a reagent that can act either as a coordinating ligand or a solvent in many
chemical reactions. It easily penetrates through the skin of mammalians and human beings.
It gives a garlic-like taste in the mouth once it has entered the skin, as a sign of detection.122,
123
Figure 1. 17 A molecular representation of dimethyl sulfoxide.
1.9.2 Synthesis of Dimethyl Sulfoxide and Its Reactivity Properties
DMSO was first synthesised in 1867 by A. M. Zaitsev. DMSO was obtained by an
exothermic oxidative reaction with slow addition of dimethyl sulphide to a concentrated nitric
acid to yield the dimethyl sulfoxide.122
Scheme 1. 4 The oxidation reaction of dimethyl sulfide to yield DMSO.

25
Nitric acid, oxygen mixed with nitrogen oxides, hydrogen peroxide and many other oxidising
reagents can be utilised to oxidise dimethyl sulfide to DMSO.124
DMSO is a good Lewis base and can thus act as ligand due to the two pairs lone electrons on
the O atom. It also contains two methyl groups which are acidic in nature with a pKa value
of 35, as opposed to water which is 15.7. Reactivity properties of DMSO resembles those of
the reagents like dimethylformide, dimethylacetamide, N-methyl-2-pyrrolidane and
hexamethylphosphoramide. In biochemistry and cell biology it is used as an extracting
solvent. In chemistry it is not only used as a reaction solvent by as an important solvent in
spectroscopy, i.e. DMSO-d6 because of its solubilising ability.125, 126 DMSO is utilised in
pharmaceuticals as an anti-inflammatory and an antioxidant.
1.10 General Overview of Amines
1.10.1 Amines
Considerably use of amines was made in the study as coordinating ligands and a brief
introduction is presented here. Compounds such as ethylenediamine, 2-
(methylamino)ethanol, N-methyldiethanolamine and related compounds are organic amines
which are derived from ammonia and are usually characterised by a strong smell of fish.
Amines are formed by the process whereby one or more hydrogen atom(s) are replaced by
hydrocarbon groups such as alkyl and/ or aryl groups. These are represented by the following
formulas: RNH2, NHR2 and NR3, where an electron lonepair resides on the atom.127, 128
Figure 1. 18 A representation of primary, secondary and tertiary amines.

26
The N atoms of amines are basic in nature, although the primary and secondary amines are
slightly weak acids with the pKa value of 36. This is due to the influence of degree of
solvation of the protonated amines, the steric factor which is more dependent on the group
attached to the nitrogen, and the electronic properties of the substituent that replaces
hydrogen atom during the synthesis. It should be noted that the same factor that increases the
acidity of the amines also decreases their basicity.128
Amines are weak hydrogen forming compounds compared to alcohols and this is due to the
fact that the N atom is less electronegative than O atom of the alcohols, decreasing the force
of attraction between the hydrogen and the nitrogen of the corresponding amine.129
1.11 The Aims and Objectives of this Study
Based on the background information provided, that indicates a lack of area not previously
investigated, it was felt necessary to further investigate the coordination chemistry of the
saccharinato metal complexes. [M(sac)2(H2O)4]·2H2O where M(II) represents metal centres
such as Co, Cu, Zn, Cd, Hg and Ni, was felt to provide interesting structural motifs and they
may also have important biological applications, as indicated. The nucleophilic reaction and
the strength of the O donor atom of the DMSO reagent was investigated whereby DMSO was
reacted directly at elevated temperature in the presence of the common starting material
[M(sac)2(H2O)4]·2H2O. The pKa value of DMSO is greater than water, i.e. 35 and 15.7,
respectively, allowing displacement of the labile aqua ligands. Based on the above
discussion, amines were used as Lewis bases and bonded to the Lewis acidic metal centres
via coordinative dative bonds. This was further investigated with the following amines:
ethylenediamine, 2-(methylamino)ethanol and (N-methyldiethanolamine).

27
1.11.1 Motivation for study
Investigating the coordination patterns of saccharinato complexes and determining the
binding modes in late transition metal centres is an interesting study to undertake. A
literature search revealed where there is still a number of new areas that could be explored.
The polyfunctional nature of saccharin displays different coordination geometry in various
complexes thus giving it unique spectral properties. Saccharinato complexes are also of great
interest in catalytic studies. These factors combined proved to be a fruitful endeavour to
synthesize these complexes which can contribute in the growth and development of the
saccharin chemistry.
1.11.2 Aims of the study
• To synthesize several saccharinato complexes of various group 9 to 12 metal
complexes with varying neutral auxiliary ligands such as dmso and amines.
• To form a series of stable, isolable complexes with the saccharinato ligand either
binding directly to the metal, or in the second coordination sphere forming salts.
• To characterize the synthesized complexes by infra-red, UV-vis and NMR
spectroscopy, elemental analyses, determine their melting/decomposition points,
thermal studies (TGA and DSC) and to perform single crystal X-ray crystallography
on the majority of the new complexes.

28
1.12 References
1. http://www.saccharin.org/healthy_links.html (Accessed 21 June, 2010).
2. B. Schulze and K. Illgen, J. Prakt. Chem./Chem-Ztg, 1997, 339, 1-14.
3. M. L. Mitchell and R. L. Pearson, Alternative Sweeteners, 1991, 127-156.
4. J. W. Ellis, J. Chem. Educ., 1995, 72, 671-675.
5. D. E. Walters, J. Chem. Educ., 1995, 72, 680-683.
6. F. M. Assadi-Porter, M. Tonelli, E. Maillet, K. Hallenga, O. Benard, M. Max and J. L.
Markley, J. Am. Chem. Soc., 2008, 130, 7212-7213.
7. R. S. Shallenberger, T. E. Acree and C. Y. Lee, Nature, 1969, 221, 555-556.
8. D. P. P. David, J. Ager, S. A. Henderson, A. R. Katritzky, I. Prakash, D. E.
Walters, Angew. Chem. Int. Ed., 1998, 37, 1802–1817.
9. Y. Nosho, T. Seki, M. Kondo, T. Ohfuji, M. Tamura and H. Okai, J. Agric. Food.
Chem., 1990, 38, 1368-1373.
10. T. R. Scott and J. V. Verhagen, Nutrition, 2000, 16, 874-885.
11. R. S. Shallenberger, Taste Chemistry, Blackie Academic & Professional, 1993, 8-16.
12. M. Soffritti, F. Belpoggi, E. Tibaldi, D. D. Esposti and M. Lauriola, Environ. Health
Perspect., 2007, 115, 1293-1297.
13. H. Mitchell, Sweeteners and Sugar Alternatives in Food Technology, Blackwell
Publishing, Oxford, 2006, 103-129.
14. R. H. Mazur, J. M. Schlatter and A. H. Goldkamp, J. Am. Chem. Soc., 1969, 91, 2684-
2691.
15. K. Clauss and H. Jensen, Angew. Chem. Int. Ed., 1973, 12, 869-876.
16. L. Hough and S. P. Phadnis, Nature, 1976, 263, 800-800.
17. J.-M. Tinti and C. Nofre, Chem. Senses, 2001, 26, 231-237.

29
18. M. J. O'Neil, The Merck index : An Encyclopedia of Chemicals, Drugs, and
Biologicals, Merck & Co., Whitehouse Station, 2001, 440-462.
19. R. Mazur, Sweeteners, Wiley, New York, 1983, 22, 448-449.
20. E. J. Baran, Quim. Nova, 2005, 28, 326-328.
21. E. J. Baran and V. T. Yilmaz, Coord. Chem. Rev., 2006, 250, 1980-1999.
22. J. C. J. Bart, J. Chem. Soc. B, 1968, 376-382.
23. Y. Okaya, Acta Cryst., 1969, B25, 2257-2263.
24. R. Bell, South. Med. J., 1949, 42, 141-144.
25. L. Williams-Seton, R. J. Davey and H. F. Lieberman, J. Am. Chem. Soc., 1999, 121,
4563-4567.
26. I. Remsen and C. Fahlberg, Chem. Ber., 1879, 12: 469–473.
27. V. M. F. Morais, M. S. Miranda, M. A. R. Matos and J. F. Liebman, Mol. Phys.,
2006, 104, 325-334.
28. J. Junge, Deutsch. Lebensm.-Rundschau, 1951, 47, 7.
29. G. A. Iacobucci, Ing. Quim., 1998, 334, 18.
30. G. H. Hamor and T. O. Soine, J. Am. Pharm. Assoc., 1954, 43, 120-123.
31. O. Z. Yeşilel, G. Günay and O. Büyükgüngör, Polyhedron, 2011, 30, 364-371.
32. E. J. Baran and V. T. Yilmaz, Coord. Chem. Rev., 2006, 250, 1980-1999.
33. K. Rosenman, Environ. Res., 1978, 15, 70-81.
34. D. B. Clayson, Committee on Amines, Assembly of Life Sciences . Board on
Toxicology, Environmental Health Hazards, Assembly Of Life Sciences, Aromatic
Amines: An Assessment of the Biological and Environmental Effects, National
Academy Press, 1981, 60-85.
35. L. B. Ellwein and S. M. Cohen, Crit. Rev. Toxicol., 1990, 20, 311-326.

30
36. S. M. Cohen, L. L. Arnold and J. L. Emerson, Agro Food Industry Hi-Tech, 2008, 19,
24-28.
37. S. M. Cohen, Toxicology, 1995, 102, 149-159.
38. V. J. H. Ṛuben Vardanyan, ed. V. J. Hruby, Elsevier, 2006, 51-52.
39. J. W. Lehman, Operational Organic Chemistry: A Problem-Solving Approach to the
Laboratory Course, Pearson Prentice Hall, 2009, 177- 179.
40. Lehman, J. W. Operational Organic Chemistry: A Problem-Solving Approach to the
Laboratory Course, 3rd Ed., Prentice-Hall, Inc., Upper Saddle River, New Jersey,
1999, 150-155.
41. E. Klingsberg and D. Papa, J. Am. Chem. Soc., 1951, 73, 4988-4989.
42. J. R. Meadow and J. C. Cavagnol, J. Org. Chem., 1951, 16, 1582-1587.
43. K. M. A. Malik, S. Z. Haider, M. A. Hossain and M. B. Hursthouse, Acta Cryst.,
1984, C40, 1696-1698.
44. S. W. Ng, Acta Cryst., 1998, C54, 649-651.
45. P. Naumov, G. Jovanovski, O. Grupče, B. Kaitner, A. D. Rae and S. W. Ng, Angew.
Chem. Int. Ed., 2005, 44, 1251-1254.
46. G. Jovanovski and B. Kamenar, Acta Cryst., 1982, C11, 247-255.
47. R. Banerjee, P. M. Bhatt, M. T. Kirchner and G. R. Desiraju, Angew. Chem. Int. Ed.,
2005, 44, 2515-2520.
48. P. Naumov, G. Jovanovski, S. Abbrent and L. E. Tergenius, Thermochim. Acta, 2000,
359, 123-130.
49. P. Naumov and G. Jovanovski, Vib. Spectrosc., 2000, 24, 201-211.
50. P. Naumov and G. Jovanovski, Spectrochim. Acta PartA Mol. Biomol. Spectrosc.,
2000, 56, 1305-1318.
51. P. Naumov and G. Jovanovski, Curr. Org. Chem., 2001, 5, 1059-1077.

31
52. S. Z. Haider, K. M. A. Malik and K. J. Ahmed, J. Bangladesh Acad. Sci., 1981, 5, 81-
90.
53. F. A. Cotton, G. E. Lewis, C. A. Murillo, W. Schwotzer and G. Valle, Inorg. Chem.,
1984, 23, 4038-4041.
54. S. Z. Haider, K. M. A. Malik, K. J. Ahmed, G. B. Kauffman and M. Karbassi, in
Inorg. Synth., John Wiley & Sons, Inc., 2007, 47-51.
55. S. Z. Haider, K. M. A. Malik, K. J. Ahmed, H. Hess, H. Riffel and M. B. Hursthouse,
Inorg. Chim. Acta, 1983, 72, 21-27.
56. S. Z. Haider, K. M. A. Malik, S. Das and M. B. Hursthouse, Acta Cryst., 1984, C40,
1147-1150.
57. L. R. Falvello, J. Gomez, I. Pascual, M. Tomás, E. P. Urriolabeitia and A. J. Schultz,
Inorg. Chem., 2001, 40, 4455-4463.
58. V. T. Yilmaz, E. Senel, E. Guney and C. Kazak, Inorg. Chem. Commun., 2008, 11,
1330-1333.
59. S. W. Ng, Acta Cryst., 1996, C52, 1365-1367.
60. S. Hamamci, V. T. Yilmaz and W. T. A. Harrison, Struct. Chem., 2005, 16, 379-383.
61. S. Hamamci, V. T. Yilmaz, W. T. A. Harrison and C. Thöne, Solid State Sci., 2005, 7,
423-429.
62. V. T. Yilmaz, S. Hamamci and C. Kazak, Z. Anorg. Allg. Chem., 2005, 631, 1961-
1965.
63. P. A. M. Williams, E. G. Ferrer, M. J. Correa, E. J. Baran, E. E. Castellano and O. E.
Piro, J. Chem. Crystallogr., 2004, 34, 285-290.
64. V. T. Yilmaz, Y. Topcu, F. Yilmaz and C. Thoene, Polyhedron, 2001, 20, 3209-3217.
65. V. T. Yilmaz, S. Caglar and W. T. A. Harrison, Acta Cryst., 2004, C60, m35-m38.
66. (a) A. Hergold-Brundic, O. Grupce and G. Jovanovski, Acta Cryst., 1991, C47, 2659-
2660. (b) V. T. Yilmaz, S. Guney, O. Andac and W. T. A. Harrison, J. Coord.
Chem., 2003, 56, 21-32.

32
67. (a) V. Yilmaz, F. Yilmaz and C. Kazak, Transition Met. Chem., 2005, 30, 95-102.
(b) V. Yilmaz, S. Hamamci, O. Andac, C. Thöne and W. A. Harrison, Trans. Met.
Chem., 2003, 28, 676-681.
68. O. Andac, Y. Topcu, V. T. Yilmaz and W. T. A. Harrison, J. Chem. Crystallogr.,
2000, 30, 767-771.
69. O. Andac, Y. Topcu, V. T. Yilmaz and K. Guven, Acta Cryst., 2001, C57, 1381-1384.
(a) C. Kazak, S. Hamamci, Y. Topcu, V.T. Yilmaz, J. Mol. Struct. 2003, 657, 351-
536.
(b) Y. Topcu, V.T. Yilmaz and C. Thoene, Acta Cryst., 2001, E57, m600-m602.
70. V. T. Yilmaz, S. Caglar and W. T. A. Harrison, Transition Met. Chem., 2004, 29, 477-
482.
71. V. T. Yilmaz, S. Caglar and W. T. A. Harrison, J. Coord. Chem., 2005, 58, 549-558.
72. O. Andac, Y. Topcu, V. T. Yilmaz and W. T. A. Harrison, Acta Cryst., 2002, C58,
m14-m16.
73. V. Yilmaz, A. Karadag and C. Thoene, J. Coord. Chem., 2002, 55, 609-618.
74. K. B. Dillon, C. Bilton, J. A. K. Howard, V. J. Hoy, R. M. K. Deng and D. T.
Sethatho, Acta Cryst., 1999, C55, 330-332.
75. R. M. K. Deng, C. Bilton, K. B. Dillon and J. A. K. Howard, Acta Cryst., 2000, C56,
142-145.
76. A. Hergold-Brundic, B. Kamenar and G. Jovanovski, Acta Cryst., 1989, C45, 556-
558. (a) O. Grupče, G. Jovanovski, B. Kaitner and P. Naumov, Croat. Chem. Acta,
1999, 72, 465-476.
77. I. Pascual, Acta Cryst., 1995, C51, 2028-2030.
78. N. M. Alfaro, F. A. Cotton, L. M. Daniels and C. A. Murillo, Inorg. Chem., 1992, 31,
2718-2723.

33
79. Z. Yugeng, L. Jianmin, W. Jing, W. Xingtao and D. Shaowu, Cryst. Res. Technol.,
1994, 29, 975-980.
80. L. Jianmin, L. Wenbin, Z. Yugeng, L. Shixiong and H. Jinling, Polyhedron, 1991, 10,
403-407.
81. G. Jovanovski, B. Kamenar, G. Ferguson and B. Kaitner, Acta Cryst., 1988, C44, 616-
618.
82. V. T. Yilmaz, S. Hamamci and C. Thöne, Cryst. Res. Technol., 2002, 37, 1143-1148.
(a) V. T. Yilmaz, S. Hamamci and C. Thöne, Z. Anorg. Allg. Chem., 2003, 629, 711-
715
83. V. T. Yilmaz, S. Hamamci, C. Thoene, Z. Anorg. Allg. Chem., 2004, 630, 1641-1644.
84. S. Cakir at al., Acta. Cryst., 2001, E57, m431-m432.
85. S. W. Ng, C. Wei, V. G. Kumar Das and T. C. W. Mak, J. Organomet. Chem., 1989,
373, 21-27.
86. S. W. Ng, A. J. Kuthubutheen, Z. Arifin, C. Wei, V. G. Kumar Das, B. Schulze, K. C.
Molloy, W. H. Yip and T. C. W. Mak, J. Organomet. Chem., 1991, 403, 101-109.
87. O. V. Quinzani, S. Tarulli, C. Marcos, S. Garcia Granda and E. J. Baran, Z. Anorg.
Allg. Chem., 1999, 625, 1848-1852.
88. V. T. Yilmaz, S. Hamamci, W. T. A. Harrison and C. Thoene, Polyhedron., 2004, 24,
1693-699.
89. E. G. Ferrer, S. B. Etcheverry and E. J. Baran, Monatsh. Chem., 1993, 124, 355-366.
90. P. Naumov, G. Jovanovski, M. G. B. Drew and S. W. Ng, Inorg. Chim. Acta, 2001,
314, 154-162.
91. P. Naumov, G. Jovanovski, M. Ristova, I. A. Razak, S. Çakir, S. Chantrapromma, H.
K. Fun and S. W. Ng, Z. Anorg. Allg. Chem., 2002, 628, 2930-2939.
92. S. Hamamci, V. T. Yilmaz and W. T. A. Harrison, J. Coord. Chem., 2003, 56, 1033-
1039.
93. V. T. Yilmaz, S. Hamamci and C. Thöne, Cryst. Res. Technol., 2003, 38, 992-995.

34
94. S. Guney, V. T. Yilmaz and W. T. A. Harrison, J. Coord. Chem., 2005, 58, 1667-
1674.
95. L. Jianmin, Z. Yugeng, L. Wenbin and L. Shixiong, Polyhedron, 1992, 11, 419-422.
96. V. T. Yilmaz, S. Hamamci and O. Büyükgüngör, Polyhedron, 2008, 27, 1761-1766.
97. C. A. Johns and K. M. Abdul Malik, Polyhedron, 2002, 21, 395-401.
98. B. S. Parajón-Costa, E. J. Baran, O. E. Piro and E. E. Castellano, Z. Naturforsch.,B:
Chem. Sci., 2002, 57, 43-46.
99. S. Hamamci, V. T. Yilmaz and C. Thone, Acta Cryst., 2002, E58, m369-m371.
100. P. D. L. Williams, J. Navig., 2002, 55, 405-418.
101. S. Chantrapromma, A. Usman and H. K. Fun, Acta Cryst., 2002, C58, m534-m536.
102. H. Icbudak, H. Olmez, O. Z. Yesilel, F. Arslan, P. Naumov, G. Jovanovski, A. R.
Ibrahim, A. Usman, H.-K. Fun, S. Chantrapromma and S. W. Ng, J. Mol. Struct.,
2003, 657, 255-270.
103. P. Naumov, G. Jovanovski, M. Ristova, I. A. Razak, S. Cakir, S. Chantrapromma, H.
K. Fun and S. W. Ng , Z. Anorg. Allg. Chem., 2002, 628, 2930-2939.
104. V. T. Yilmaz, S. Guney, O. Andac and W. T. A. Harrison, J. Coord. Chem., 2003, 56,
21-32.
105. V. T. Yilmaz, S. Guney, O. Andac and W. T. A. Harrison, J. Coord. Chem., 2003, 56,
21-32.
106. Y. Topcu, O. Andac, V. T. Yilmaz and W. T. A. Harrison, Acta Cryst., 2001,
E57, m82-m84.
107. E. E. Castellano, O. E. Piro, B. S. Parajón-Costa and E. J. Baran, Z. Naturforsch.,B:
Chem. Sci., 2002, 57, 657-660.
108. G. Jovanovski, P. Naumov, O. Grupče and B. Kaitner, Eur. J. Solid State Inorg.
Chem., 1998, 35, 579-590.

35
109. R. M. K. Deng, C. Bilton, K. B. Dillon and J. A. K. Howard, Acta Cryst., 2000,
C56, 142-145.
110. O. Andac, S. Guney, Y. Topcu, V. T. Yilmaz and W. T. A. Harrison, Acta Cryst.,
2002, C58, m17-m20.
111. V. T. Yilmaz, S. Hamamci and C. Thone, Acta Cryst., 2002, 58, m702-m704.
112. Y. Topcu, O. Andac, V. Yilmaz and W. Harrison, J. Coord. Chem., 2002, 55, 805-
815.
113. V. T. Yilmaz, S. Hamamci and C. Thöne, J. Coord. Chem., 2003, 56, 787-795.
114. A. Hergold-Brundic, O. Grupce and G. Jovanovski, Acta Cryst., 1991, C47, 2659-
2660.
115. G. A. van Albada, I. Riggio, J. Reedijk, I. Mutikainen and U. Turpeinen, Trans.
Met. Chem., 2002, 27, 341-345.
116. C. T. Supuran and I. Puscas, Helicon: Timisoara, 1994, 29-111.
117. F. Mincione, L. Menabuoni, F. Briganti, G. Mincione, A. Scozzafava and C. T.
Supuran, J. Enzym Inhib. Med. Chem., 1998, 13, 267-284.
118. M. R. Badger and G. D. Price, Ann. Rev. Plant Physiol. Plant Mol. Biol., 1994, 45,
369-392.
119. G. L. Christie, D. Cummins, J. R. Duffield, S. R. Hurford, C. R. Morris, P. I. Riley, J.
A. Vesey and D. R. Williams, J. Inorg. Biochem., 1991, 42, 273-287.
120. C. T. Supuran, J. Y. Winum and B. Wang, Drug Design of Zinc-Enzyme Inhibitors:
Functional, Structural, and Disease Applications, John Wiley & Sons, 2009, 15-35.
121. R. Weber, M. Gilles and G. Bergerhoff, Z. Kristallogr., 1993, 206, 273-274.
122. K.-M. Roy, in Ullmann's Encyclopedia of Industrial Chemistry, Wiley-VCH Verlag
GmbH & Co. KGaA, 2000, 716-717.
123. F. G. Bordwell, Acc. Chem. Res., 1988, 21, 456-463.

36
124. M. V. Gavrilin, G. V. Sen'chukova and E. V. Kompantseva, Pharm. Chem. J., 2000,
34, 490-493.
125. K. V. Balakin, N. P. Savchuk and I. V. Tetko, Curr. Med. Chem., 2006, 13, 223-241.
126. G. Kvakovszky, A. McKim and J. C. Moore, ECS Trans., 2007, 11, 227-234.
127. C. W. Hoerr, H. J. Harwood and A. W. Ralston, J. Org. Chem., 1944, 09, 201-210.
128. M. A. Fox and J. K. Whitesell, Organic Chemistry, Jones and Bartlett Publishers,
2004, 64-74.
129. F. A. Bettelheim and J. M. Landesberg, Laboratory Experiments for Introduction to
General, Organic and Biochemistry, Cengage Learning, 2012, 341-345.

37
CHAPTER 2
EXPERIMENTAL SECTION
2.1 Introduction
This chapter outlines the experimental methods and conditions used to prepare the complexes
described in this thesis. The synthetic methods are generalized for a similar series of
complexes. The complexes are represented in bold in the experimental procedure. The TGA
results will be tabulated in the discussion section for those complexes in which the TGA was
performed.
2.2 Materials and Instrumentation
2.2.1 Materials
All chemicals and solvents used were Analytical Grade purchased from Sigma-Aldrich and
were used without further purification. Double distilled water was utilized. All reactions
were performed under atmospheric conditions. Crystals which were used for single crystal
X-ray crystallographic studies were obtained by slow evaporation of the solvent.
As suggested on the preparation procedures below of [M(sac)2(H2O)4]·2H2O whereby M
represent the metal centre, complexes were prepared as per literature method.1-6

38
2.2.2 Instrumentation
IR spectra were recorded on an ATR spectrophotometer in the range of 380-4000 cm-1 using
Perkin-Elmer® Precisely, Universal ATR Sampling Accessory.
UV-Vis spectrophotometry, were performed at different concentration ranges and were
recorded on a Shimadzu, UV-3600, UV-VIS-NIT spectrophotometer in the range of 250-900
nm for complexes (2), (5), (6)-(10) and (12) and 200-700 nm complexes (1), (3), (4) and (11).
All complexes were run in DMF except (6) and (10) which were analysed in DMSO.
1H and 13C NMR spectra of complexes (1), (3), (4) and (11) were recorded in deuterated
solvents on a Bruker Ultra-Shield™ spectrometer AVANCEIII operating at 400 MHz. The
chemical shifts were recorded as δ values in reference to SiMe4 at 0.00 parts per million
(ppm) at 25°C (298.15K).
The purity of the complexes was determined by melting point on a SMP3, Stuart Scientific
melting point apparatus/hot stage, made in UK.
The CHN elemental analyses were carried out using Thermo Scientific Flash 2000 Elemental
Analyser at the Mass Spectrometry laboratory, School of Chemistry and Physics, UKZN.
Thermal analysis curves (TG, DTA and DTG) were obtained using TA instruments SDT
Q600, second generation simultaneous TGA/ DSC thermal analyzer in a dynamic nitrogen
atmosphere with the flow rate of 80 cm3 min-1 at the temperature range of 25 to 1000 °C . A
sample size of 5-10 mg and a heating rate of 10 °C min-1 were used.

39
2.3 Synthesis of Saccharinato Complexes of Dimethyl Sulfoxide
Complexes (1) to (5) were synthesized using the same general procedure as described below
where DMSO = (dimethyl sulfoxide).
2.3.1 Synthesis of trans-[Cd(sac)2(dmso)2(H2O)2] (1)
Colourless microcrystals of [Cd(sac)2(H2O)4]·2H2O (1.13 g; 2.10 mmol) were placed in a 100
mL beaker and dissolved in excess amounts of dimethyl sulfoxide (20 mL). The reaction
mixture was gently heated on a heating plate with stirring to reduce the volume of DMSO to
~7 mL. The beaker was removed from the heat source and allowed to stand for 6 days during
which time large colourless blocky crystals of complex were obtained. Yield (1.30 g, 92%);
Mp 114°C; Anal. Calc. for C18H24CdN2O10S4: C, 32.3; H, 3.6; N, 4.5. Found: C, 33.2; H,
3.7; N, 4.8 %. 1H NMR (CD3OD, 400MHz) δ(ppm):3.36 (m, 4H, H2O), 2.53 (s, 12H,
DMSO), 7.57-7.67 (m. 8H, C6H4); 13C NMR (MeOD, 101MHz) d(ppm.): 40.36 (CH3-dmso),
119.15 (C6-ring), 122.54 (C6-ring), 131.46 (C6-ring), 131.15 (C6-ring), 134.46 (C6-ring),
145.14 (C6-ring) 167.86 (C=O); IR (ATR) 3481, 3016 ν(OH), 1646, 1609 ν(C=O), 1583,
1460 ν(C=C), 1271, 1256 ν(O=S=O); 1054, 1036 ν(S=O).
2.3.2 Synthesis of trans-[Co(sac)2(dmso)2(H2O)2] (2)
Red microcrystals of [Co(sac)2(H2O)4]·2H2O (0.932 g; 1.80 mmol) were used in the reaction.
The crystals grew to convenient size after 10 days in a beaker by slow evaporation of DMSO
solvent yielding large light red blocky crystals of (2). Yield (1.00 g, 93.0%); Mp 120°C.
Anal. Calc. for C18H24CoN2O10S4: C, 35.1; H, 3.9; N, 5.0. Found: C, 35.5; H, 4.0; N, 5.1 %.
IR-ATR (cm-1): 3486, 3005 ν(OH); 1618 ν(C=O); 1584, 1460 ν(C=C); 1256 ν(O=S=O); 1141
ν(S=O).

40
2.3.3 Synthesis of [Zn(sac)2(dmso)2] (3)
Colourless microcrystals of [Zn(sac)2(H2O)4]·2H2O (1.60 g; 2.82 mmol) were used in the
reaction. The crystals grew to convenient size after 6 days in a beaker by the method of slow
evaporation of DMSO solvent yielding colourless blocky crystals of (3). Yield (1.51 g,
92%); Mp 190°C; Anal. Calc. for C18H20ZnN2O6S4: C, 36.8; H, 4.1; N, 4.5. Found: C, 36.6;
H, 4.0; N, 4.6 %. 1H NMR (MeOD, 400MHz) δ(ppm): 2.56 (s, 12H, DMSO), 7.62-7.76 (m.
8H, C6H4); 13C NMR (MeOD, 101 MHz) δ(ppm.): 40.37 (CH3-DMSO), 121.23 (C6-ring),
124.89 (C6-ring), 133.32 (C6-ring), 134.21 (C6-ring), 134.27 (C6-ring), 144.80 (C6-ring)
171.57 (C=O); IR (ATR) 1687 ν(C=O), 1596, 1419ν(C=C), 1274, 1245 ν(O=S=O); 1138
ν(S=O).
2.3.4 Synthesis of [Hg(sac)2(dmso)(H2O)] (4)
Colourless microcrystals of [Hg(sac)2(H2O)4]·2H2O ( 2.00 g; 2.97 mmol) were used in the
reaction. The crystals grew to convenient size after 9 days in a beaker by the method of slow
evaporation of DMSO solvent yielding colourless blocky crystals of (4). Yield (1.75 g, 80
%); Mp 135°C; Anal. Calc. for C16H24HgN2O8S3: C, 32.8; H, 3.9; N, 4.5. Found: C, 30.5; H,
3.5; N, 4.1 %. 1H NMR (CD3OD, 400MHz) δ(ppm): 2.49 (m, 2H, H2O), 2.53 (s, 6H,
DMSO), 7.87-8.09 (m. 8H, C6H4); 13C NMR (CD3OD, 101MHz) d(ppm.): 40.38 (CH3-
dmso), 120.74 (C6-ring), 124.42 (C6-ring), 128.96 (C6-ring), 134.03 (C6-ring), 134.68 (C6-
ring), 142.34 (C6-ring) 163.87 (C=O); IR (ATR) 3414ν(OH), 1674, 1674ν(C=O), 1594, 1458
ν(C=C), 1310, 1285, 1302 ν(CNS)sym; 1284, 1243 ν(O=S=O)asym; 1154, 1170 ν(O=S=O)sym;
947 ν(CNS)asym; 1121, 1138 ν(S=O).

41
2.3.5 Synthesis of [Cu(sac)2(dmso)(H2O)2] (5)
Blue microcrystals of [Cu(sac)2(H2O)4]·2H2O (1.13 g; 2.10 mmol) were used in the reaction.
The crystals grew after 9 days in a beaker by the method of slow evaporation of DMSO
solvent yielding deep blue crystals of (5). Yield (1.02g, 90%); Mp 184-185°C; Anal. Calc.
for C16H24HgN2O8S3: C, 35.8; H, 3.3; N, 5.2. Found: C, 35.5; H, 3.4; N, 5.2 %. 13C NMR
(CD3OD, 101MHz) d(ppm.): 40.39 (CH3-dmso), 121.20 (C6-ring), 124.91 (C6-ring), 133.42
(C6-ring), 134.21 (C6-ring), 134.24 (C6-ring), 144.90 (C6-ring) 171.90 (C=O); IR (ATR) 3275
ν(OH), 1651, 1619 ν(C=O), 1586 ν(C=C), 1256, 1300 ν(O=S=O)asym;1161 ν(O=S=O)sym,
1345 ν(CNS)sym, 951ν(CNS)asym, 1147 ν(S=O). Single crystals were obtained by slow
evaporation of DMSO solvent.
2.4 Synthesis of Saccharinato Complexes of N-methyldiethanolamine
and 2-(methylamino)ethanol
Complexes (6) to (9) were synthesized using the same general procedure as described below
where mdea = (N-methyldiethanolamine) and mea = (2-(methylamino)ethanol).
2.4.1 Synthesis of [Ni(N,O,O-mdea)2]·2(sac) (6)
Green coloured microcrystals of [Ni(sac)2(H2O)4]·2H2O (0.350g; 0.659 mmol) were placed in
a 250 mL beaker and dissolved in methanol (30 mL) and N-methyldiethanolamine (1 mL)
was added and the reaction mixture was gently stirring for 15 minutes at 80°C. The beaker
was removed from the heat source and allowed to stand for 3 days during which time large
violet block crystals of (6) were obtained. Yield (0.325 g, 75%); Mp 225°C (decompose);
Anal. Calc. for C24H34CoN4O10S2: C, 43.3; H, 4.8; N, 8.4. Found: C, 43.0; H, 4.6; N, 8.6 %.
IR (ATR) 2917 ν(N-CH3), 2690 ν(CH2),1613 ν(C=O), 1580, 1441 ν(C=C), 1336 ν(CNS)sym;
1286 ν(S=O)asym,1155 ν(S=O)sym, 979 ν(CNS)asym, 535 ν(Co-N). Single crystals were
obtained by slow evaporation of methanol solvent.

42
2.4.2 Synthesis of [Cu(sac)2(N,O,O-mdea)2] (7)
Green crystals of [Cu(sac)2(H2O)4]·2H2O (0.350g; 0.651 mmol) were used in the reaction.
The crystals grew after 3 days in a beaker by the method of slow evaporation of water/
methanol solvent yielding large blue block crystals of (7). Yield (0.375 g, 86%); Mp 195°C;
Anal. Calc. for C24H34CuN4O10S2: C, 43.3; H, 5.1; N, 8.4. Found: C, 44.3; H, 5.2; N, 8.7 %.
IR (ATR) 3407 ν(OH), 2921 ν(CH), 1638 ν(C=O), 1454 ν(C=C), 1347 ν(CNS)sym; 1295
ν(S=O)asym,1168, 1144 ν(S=O)sym, 965 ν(CNS)asym, 554 ν(Co-N). Single crystals were
obtained by slow evaporation of water solvent.
2.4.3 Synthesis of [Co(sac)2(N,O,O-mdea)2] (8)
Red crystals of [Co(sac)2(H2O)4]·2H2O (0.350g; 0.653 mmol) were used in the reaction. The
crystals grew to convenient size after 3 days in a beaker by the method of slow evaporation of
methanol solvent yielding large light orange block crystals of (8). Yield (0.367 g, 87%); Mp
210°C (decompose); Anal. Calc. for C24H34CoN4O10S2: C, 43.6; H, 5.2; N, 8.4. Found: C,
43.3; H, 5.1; N, 8.0 %. IR (ATR) 2917, 2858 ν(N-CH3), 2672 ν(CH), 1620 ν(C=O), 1580,
1453 ν(C=C), 1346 ν(CNS)sym; 1284 ν(S=O)asym,1146 ν(S=O)sym, 962 ν(CNS)asym, 533 ν(Co-
N). Single crystals were obtained by slow evaporation of methanol solvent.
2.4.4 Synthesis of [(Cu2(µ-O)2(mea)4]·2(sac) (9)
Blue crystals of [Cu(sac)2(H2O)4]·2H2O (0.350g; 0.653 mmol) were placed in a 250 mL
beaker and dissolved in double distilled water (30 mL) and 2-(methylamino)ethanol (1 mL)
was added and the reaction mixture was gently stirred on a hotplate for 15 minutes at 80°C.
The beaker was removed from the heat source and allowed to stand for 3 days during which
time large blue plate crystals of (9) were obtained. Yield (0.390 g. 76%); Mp 165°C; Anal.
Calc. for [(C12H34Cu2N2O4)].2(C7H4NO3S): C, 39.5; H, 5.4; N, 10.6. Found: C, 39.2; H, 5.0;
N, 10.2 %.IR (ATR) 3187 ν(NH), 2823, 2876 ν(NH), 1627 ν(C=O), 1583, 1456 ν(C=C),
1330 ν(CNS)sym; 1255 ν(S=O)asym,1147 ν(S=O)sym, 947 ν(CNS)asym, 527 ν(Cu-N). Single
crystals were obtained by slow evaporation of water solvent.

43
2.5 Synthesis of Saccharinato Complexes of Ethylenediamine
Complexes (10) to (12) were synthesis using the same general procedure as described below
where en = (ethylenediamine).
2.5.1 Synthesis of [Ni(sac)2(en)2] (10)
Green crystals of [Ni(sac)2(H2O)4]·2H2O (0.350g; 0.653 mmol) were placed in a 250 ml
beaker and dissolved in methanol ( 15 mL) and ethylenediamine (1 mL) was added and the
reaction mixture was gently stirred for 15 minutes at 80°C. The beaker was removed from
the heat source and allowed to stand for two days during which time large purple block
crystals of (10) were obtained. The same complex was prepared in double distilled water and
the crystals grew within a week. Yield (0.348 g, 98%); Mp 154°C (decompose); Anal. Calc.
for C18H24NiN6O6S2: C, 39.8; H, 4.4; N, 15.5. Found: C, 39.5; H, 4.2; N, 15.8 %. IR (ATR)
3330, 3266 ν(NH for en), 2928, 2884 ν(CH), 1621 ν(C=O), 1571, 1455 ν(C=C), 1339
ν(CNS)sym; 1262, 1275 ν(S=O)asym, 1134 ν(S=O)sym, 94 6 ν(CNS)asym, 515 ν(Ni-N). Single
crystals were obtained by slow evaporation of methanol solvent.
2.5.2 Synthesis of trans-[Cd(sac)2(en)2] (11)
Colourless microcrystals of [Cd(sac)2(H2O)4]·2H2O (0.350g; 0.653 mmol) were used in the
reaction. The crystals grew to convenient size after 4 days in a beaker by the method of slow
evaporation of methanol solvent yielding large colourless block crystals of (11). The crystal
can be grown in water as well. Yield (0.361 g, 93%); Mp 189°C (decompose); Anal. Calc.
for C18H24CdN6O6S2: C, 36.2; H, 4.0; N, 14.0. Found: C, 36.0; H, 3.9; N, 14.3 %. 1H NMR
(CD3OD, 400MHz) d(ppm): 2.61 (s, 8H, NH2), 2.76(s, 8H, CH2 of en), 7.58-7.68 (m. 8H,
C6H4). 13C NMR (CD3OD, 101MHz) δ(ppm.): 40.00 (C-en), 119.19 (C6-ring), 122.58 (C6-
ring), 131.22 (C6-ring), 131.71 (C6-ring), 134.44 (C6-ring), 144.96 (C6-ring) 167.78 (C=O);
IR (ATR) 3365, 3296 ν(NH for en), 3070, 2883 ν(CH), 1654 ν(C=O), 1565, 1457 ν(C=C),
1324 ν(CNS)sym; 1251 ν(S=O)asym, 1137 ν(S=O)sym, 943 ν(CNS)asym, 476 ν(Cd-N).

44
2.5.3 Synthesis of [Co2(en)4(CO3)2]·2(sac)3H2O (12)
Red microcrystals of [Co(sac)2(H2O)4]·2H2O (0.350g; 0.653 mmol) were used in the reaction.
The crystals grew after a week in a beaker by the method of slow evaporation of methanol
solvent yielding needle red crystals of (12). Yield (0.339 g, 95%); Mp 135°C decomposes;
Anal. Calc. for C18H24CoN6O6S2: C, 33.2; H, 4.4; N, 15.0. Found: C, 33.5; H, 4.9; N, 15.3
%. IR (ATR) 3458 ν(OH); 3235, 3096 ν(NH for en), 2954 ν(CH for en), 1577 ν(C=O), 1457
ν(C=C), 1331 ν(CNS)sym; 1248 ν(S=O)asym, 1141 ν(S=O)sym, 949 ν(CNS)asym, 464 ν(Co-N).
Single crystals were obtained by slow evaporation of methanol and water solvent.
2.6 X-ray Crystallography
2.6.1 Crystal Structure Determination for Complexes (2) and (6).
X-ray single crystal intensity data was collected on a Nonius Kappa-CCD diffractometer
using graphite monochromated Mo-Kα radiation (λ = 0.71073 Å). The temperature was
controlled by an Oxford Cryostream cooling system (Oxford Cryostat). The data collection
was evaluated using the Bruker Nonius "Collect” program. Data were scaled and reduced
using DENZO-SMN software.8 Absorption corrections were performed using SADABS.9
The structure was solved by direct methods and refined employing full-matrix least-squares
with the program SHELXL-979 refining on F2. A molecular diagram was initially produced
using the program Pov-Ray and graphic interface X-seed.7 The crystal structures were re-
drawn using 50% probability ellipsoids on the ORTEP program. The software program used
for crystal packing diagrams was Mercury 3.0.
2.6.2 Crystal Structure Determination for Complexes (1), (3), (4) and (9).
Single-crystal X-ray diffraction data was collected on a Bruker KAPPA APEX II DUO
diffractometer using graphite-monochromated Mo-Kα radiation (χ = 0.71073 Å). Data were

45
carried out at 173(2) K. The temperature was controlled by an Oxford Cryostream cooling
system (Oxford Cryostat). Cell refinement and data reduction were performed using the
program SAINT.10 The data was scaled and absorption correction performed using
SADABS.11
The structure was solved by direct methods using SHELXS-9711 and refined by full-matrix
least-squares methods based on F2 using SHELXL-9711 and using the graphics interface
program X-Seed.12 The programs X-Seed and POV-Ray13 were both used to prepare
molecular graphic images. The crystal structures were re-drawn using 50% probability
ellipsoids on the ORTEP program. The software program used for crystal packing diagrams
was Mercury 3.0.
2.6.3 Crystal Structure Determination for Complexes (11) and (12).
The crystal was mounted in a stream of cold nitrogen at 100(1) K and centred in the X-ray
beam using a video camera.14, 16, 17, 19, 20
The crystal evaluation and data collection were performed on a Bruker Smart APEXII
diffractometer with Mo-Kα radiation (λ = 0.71073 Å). The diffractometer to crystal distance
was set at 4.00 cm. The initial cell matrix was obtained from three series of scans at different
starting angles. Each series consisted of 12 frames collected at intervals of 0.5º in a 6º range
with the exposure time of 10 seconds per frame. The reflections were successfully indexed
by an automated indexing routine built in the APEXII program suite.15 The final cell
constants were calculated from a set of 6460 strong reflections from the actual data collection
for (11).
Data collection method involved ω scans of width 0.5°. Data reduction was carried using the
program SAINT+.15 The structure was solved by direct methods using SHELXS18 and
refined.15 Non-H atoms were first refined isotropically and then by anisotropic refinement
with full-matrix least-squares calculations based on F2 using SHELXS. All H atoms were
positioned geometrically and allowed to ride on their respective parent atoms. The carboxyl
H atoms were located from the difference map and allowed to ride on their parent atoms. All

46
H atoms were refined isotropically. The absorption correction was based on fitting a function
to the empirical transmission surface as sampled by multiple equivalent measurements.15
The final least-squares refinement of 151 parameters against 2754 data resulted in residuals R
(based on F2 for I≥2σ) and wR(based on F2 for all data) of 0.0526 and 0.0186, respectively,
for (11). The final difference Fourier map was featureless. The molecular diagrams were
drawn with 50% probability ellipsoids using ORTEP program.

47
2.7 References
1. K. J. Ahmed, A. Habib, S. Z. Haider, K. M. A. Malik and M. B. Hurthouse, Inorg.
Chim. Acta, 1981, 56, L37.
2. S. Z. Haider, K. M. A. Malik, K. J. Ahmed, H. Hess, H. Riffel and M. B. Hursthouse, Inorg. Chim. Acta, 1983, 72, 21-27.
3. S. Z. Haider, K. M. A. Malik, S. Das and M. B. Hursthouse, Acta Crystallogr. Sect.
C: Cryst. Struct. Commun., 1984, 40, 1147-1150.
4. F. A. Cotton, G. E. Lewis, C. A. Murillo, W. Schwotzer and G. Valle, Inorg. Chem., 1984, 23, 4038-4041.
5. F. A. Cotton, E. Libby, C. A. Murillo, G. Valle, M. Bakir, D. R. Derringer and R. A. Walton, in Inorg. Synth., John Wiley & Sons, Inc., 2007, 306-310.
6. S. Z. Haider, K. M. A. Malik, K. J. Ahmed, G. B. Kauffman and M. Karbassi, in Inorg. Synth., John Wiley & Sons, Inc., 2007, 47-51.
7 L. J. Barbour, X-Seed: A Software Tool for Supramolecular Crystallography, J.
Supramol. Chem., 2001, 1, 189-191.
8. Z. Otwinowski and W Minor, Methods in Enzymology, Macromolecular
Crystallography, ed. Carter Jr, C. W. & Sweet, R. M., part A, Academic Press, 1997, 276, 307-326.
9. G. M. Sheldrick, SHELXL-97, SHELXS-97 and SADABS, University of Göttingen, Germany, 1997.
10. SAINT Version 7.60a, Bruker AXS Inc., Madison, WI, USA, 2006.
11. G. M. Sheldrick, SHELXS-97, SHELXL-97 and SADABS version 2.05, University of Göttingen, Germany, 1997.
12. (a) L. J. Barbour, J. Supramol. Chem., 2001, 1, 189-191; (b) J. L. Atwood and L. J. Barbour, Cryst. Growth Des., 2003, 3, 3.
13. Bruker-AXS, APEX2, SADABS, and SAINT Software Reference Manuals. Bruker AXS, Madison, Wisconsin, USA, 2009.
14. G. M. Sheldrick, SHELXL. Acta Cryst., 2008,A64, 112-122.
15. L.J. Farrugia, J. Appl. Cryst., 1999, 32, 837-838.
16. ORTEP3 for Windows - L. J. Farrugia, J. Appl. Crystallogr. 1997, 30, 565.

48
17. SHELX [Includes SHELXS86, SHELXS97, SHELXL97, CIFTAB (and SHELXA)] - G. M. Sheldrick, Acta Cryst., 2008, A64, 112-122.
18. ORTEP-III - M. N. Burnett and C. K. Johnson, Report ORNL-6895. Oak Ridge National Laboratory, Oak Ridge, Tennessee, 1996.
19. SAINT: Area-Detector Integration Software.; Siemens Industrial Automation, Inc.: Madison, WI, 1995.
20. SADABS: Area-Detector Absorption Correction; Siemens Industrial Automation, Inc.: Madison, WI, 1996

49
CHAPTER 3
SACCHARINATO COMPLEXES WITH A
DIRECT M-N BOND
3.1 Introduction
The chemistry of saccharin (1,2-benzisothiazoline-3-(2H)one 1,1-dioxide or o-sulphobenzimide) has
attracted attention during the past decade partly because of its biological significance.1, 2 Saccharine
exhibits a number of diverse coordination bonding modes with a combination of potential donor
atoms such as (N or O)-monodentate, (N,O)-bidentate and (N, O, O)-tridentate chelating and bridging
ligands. The coordination is capable of forming different complexes, ranging from monomers,
coordination polymers to alkoxo-bridging dinuclear complexes.3, 4, 35 The chemistry of M-Nsac varies
with small changes in the complexes’ composition and configurations, i.e. the XRD data of previously
reported complexes differs in coordination geometries, tetrahedral for Zn(II) metal centres and
octahedral for Cd(II), Co(II) and Cu(II) complexes.5 The study herein focuses on the bonding of M-N
saccharinato complexes and the ligand coordination modes containing the O donor atoms and the N
donor atoms. The neutral complexes obtained from dimethyl sulfoxide, N-methyldiethanolamine and
ethylenediamine are reported and discussed in Chapter 3, together with the characterization methods.
Scheme 3.1 The schematic representation of N-M saccharinato complexes of the present study.

50
The complex [Cd(sac)2(H2O)(dmso)(pyet)]6 consists of both M-N and M-O ligating function of
DMSO. Other important complexes are discussed in the crystal structure section. [M(3,5-
DNB)2(dmso)2(H2O)2], (M(II) is Zn, Cu, Ni or Co, 3,5-DNB is the 3,5-dinitrobenzoato)7, is a complex
that shows similar coordination mode to ones previously reported.
3.2 Results and Discussion
3.2.1 Synthesis of Tetraaquabis(saccharinato)M(II) dihydrate Precursors
The tetraaquabis(saccharinato)M(II) dihydrate metal complexes, [M(sac)2(H2O)4]·2H2O, were
synthesised using an aqueous metathesis reaction at a temperature of 80°C, see Scheme 3.2. This
involved the addition of 2 molar equivalents of sodium saccharin aqueous solution (50 mL) to an
aqueous solution of 1 molar equivalent metal salt (50 mL). Upon heating the reaction mixture the
volume of water eventually reduced to 50 mL and by allowing the solution to stand undisturbed,
[M(sac)2(H2O)4]·2H2O crystals were formed from the solution. The crystals are obtained by filtration
using a Buchner funnel with suction. The products typically have similar colours to the metal salts.
The structures of these starting metal complexes have been previously determined and characterised
by Fourier Transform Infrared spectroscopy (FTIR), UV-Vis spectroscopy, thermal analysis curves
(TG, DTA, DSC and DTG).8, 9
Scheme 3.2 Formation of [M(sac)2(H2O)4]·2H2O precursor complex.
The above reaction produces a variety of complexes in satisfactory to good yields, ranging from 60 to
90%.

51
3.2.2 Synthesis of Mixed Aqua-and Dimethyl Sulfoxide Saccharinato Complexes
According to the literature, the aqua ligands from the [M(sac)2(H2O)4]·2H2O complexes are easily
displaced by strong neutral ligands when the reaction is performed in polar protic solvents like water,
methanol and ethanol because they are weakly coordinated to the metal centres.
[M(sac)2(H2O)4]·2H2O complexes of M = Cd, Co, Zn, Hg and Cu were prepared.8 The precursor
complexes were reacted by refluxing each complex in excess DMSO. The reaction mixture was
heated until the volume of DMSO was reduced from 20 ml to 7 ml. This readily allowed the
crystallization process to occur. The resulting solutions of the complexes were allowed to stand at
room temperature from a few days to two weeks for slow evaporation of the solvent to take place.
The crystals which formed were collected by filtration and are air-stable which is very convenient.
The [Ni(sac)2(H2O)4]·2H2O complex failed to give the desired product. The IR data showed the
complex co-crystallized with the starting material yielding a micro-crystalline material. The IR data
was inconclusive because it showed a mixture of the product and the starting material. The products
which were obtained from the above outlined brief method were complexes (1) to (5) which had a
good percentage yield which ranged from 80 to 93 % and the micro-analysis confirms the formation
of the products (see Chapter 2 and Scheme 3.3 for chemical properties). Table 3.1 shows a list of
physical properties of the complexes.
Scheme 3.3 Reactions showing the formation of DMSO saccharinato complexes.

52
3.2.3 Synthesis of Amine Saccharinato Complexes
The four mixed-ligand amine containing complexes were synthesised from the [M(sac)2(H2O)4]·2H2O
complexes for M = Cd(II), Co(II) and Cu(II) which were prepared according to the reaction in
Scheme 3.4.
Scheme 3.4 Reaction scheme showing the formation of amine saccharinato complexes
The complexes (7) and (8) and (10) and (11) were isolated in excellent yield, which ranged from 86 to
98 %. The CHN micro-analysis confirmed the formation of the bulk products (see Chapter 2 and
Scheme 3.3 for chemical properties). Table 3.1 shows a list physical properties of the complexes.
Table 3. 1 Tabulated analytical results of saccharinato complexes
Complexes Colour Melting point (°C) Molecular weight Yield (%)
1 Colourless 112-115 669.03
92.0
2
Pink 110*, a
615.56 93.0
3 Colourless 190-191
585.97 92.0
4 Colourless 135
1322.22 80.0
5 Blue 145a
538.05 90.0
7 Blue 195
665.10 86.0
8
Light orange 210a 661.10 87.0
10 Violet 154a 543.23
98.0
11
Colourless 189a 596.95 93.0
* change colour to blue, a decomposes

53
3.3 Spectroscopic Properties
3.3.1 Nuclear Magnetic Resonance (NMR) Analysis of Complexes
For complexes (1), (3), (4) and (11), shown in Figure 3.1, the 1H and 13C NMR spectral data is
presented in Table 3.2. The 1H NMR demonstrated that the H atoms of the H2O ligand for complexes
(1) and (4) varies with solvent. The aqua-ligand protons of complex (4) appears at 2.50 ppm which
appears to overlap with the deuterated DMSO peak and for complex (1) the aqua-ligand proton peak
resonate at 3.36 ppm in deuterated DMSO. Both the aqua-ligand peaks in complexes (1) and (4)
integrate to a multiplet of 4H for complex (1) and 2H for complex (4). The ambiguous behaviour of
this peak and the overlapping are due to the hygroscopic and the hydrophilic nature of the deuterated
solvent when the complexes are in solution which led to hydrogen bonding interaction that alter the
peak intensity and proton numbers in the spectra.10, 11 The amine protons show a similar feature
which have strong hydrogen bonding that result in broader peaks in NMR spectra. Another multiplet
was attributed to the peaks of the saccharinate protons in the range of 7.56 to 8.00 ppm which
integrate to 8 protons for all four complexes. A singlet proton of the monodentate coordinated DMSO
for complexes (1), (3) and (4) was noted to be in the range 2.53 to 2.56 ppm which integrate to 12
protons of the methyl protons of all DMSO ligands for complexes (1) and (3), and 6 protons of the
methyl protons for complex (4). The NMR protons of (11) show that the amine protons integrate to
8H which appears resonate at 2.76 ppm and the protons of CH2 of the amine ligand integrate to 8H
which appears at 2.61 ppm. The proton signal intensities in the NMR spectra corresponds with the
proposed structure. In general, the H signals of all the new complex was shifted slightly downfield
compared with the signal of the starting material. The 13C NMR spectra accounted for all the C atoms
of the complexes to be present, further supporting the solution structures.

54
Figure 3. 1 NMR labelling scheme for different complexes
The 13C NMR spectra of complexes (1), (3), (4) and (11) showed chemical shifts very similar to
saccharinate anion. The difference is observed in the C atoms present in the ligands of the
coordinating species to the metal centres, see Table 3.2. The signal in the range of 163.86 to 171.90
ppm was attributed to the carbonyl carbon. The C atom chemical shifts in the range of 142.34 to
144.95 ppm correspond to the carbon atom on the benzene ring, labelled (a). These are shifted further
downfield due to the electron withdrawing C=O group of the ligand so are shielded. In the range
122.56 to 124.96 ppm, the chemical shift of C atoms, (c), on the benzene ring next to the carbon
labelled (a) was observed with low intensity of the peak. In the range 133.24 to 134.67 ppm, the
chemical shift of the carbon atom labelled (c), was observed. The signal in the range of 131.71 to
134.21 ppm was assigned and labelled (d), which is in-between carbon atoms (c) and (e). The
chemical shift of the carbon atom in the range of 119.19 to 121.23 ppm belongs to the carbon atom
labelled (e). And the carbon labelled (f) have the chemical shift signals which ranges from 128.96 to
133.42 ppm and it is attributed to the carbon atom which is adjacent to the sulfonyl group of the
saccharinate anion. The chemical shifts observed at the signal shift between 40.36 to 40.39 ppm are
assigned to the methyl groups of DMSO in (1), (3) and (4). Their presence are important as it means
the aqua ligands had been displaced. This chemical shift for complex (4) is incorporated within the
carbons of the solvent peaks, see appendix. Complex (11) consists of the amine carbon atoms at
40.00 ppm which is also incorporated in the solvent peak. The reference chemical shifts are
reported.12
No NMR data was recorded due to the paramagnetic nature of Co(II), Ni(II) and Cu(II) complexes.
However, this is the result of Oh geometry in the Ni(II) and Co(II) complexes, as Oh geometry of

55
these complexes are paramagnetic. It should be indicated that not all Ni(II) complexes are
paramagnetic as square planar Ni(II) complexes are not.
Table 3. 2 The NMR data of the saccharinato complexes 1H and 13C NMR Positions The NMR of complexes and their frequencies (ppm) 1H*** 13C**** 1* 3** 4* 11*
1H 13C 1H 13C 1H 13C 1H 13C
a a ‒ 145.14 ‒ 144.80 ‒ 142.34 ‒
144.95
b, c , d and e
b 8H, m,
7.57-
7.67
122.54 8H, m,
7.62-
7.76
124.88 8H, m,
7.87-
8.09
128.96 8H, m,
7.58-
7.68
122.57
c 131.65 134.27 134.67 134.44
d 134.46 134.21 134.03
131.71
e 119.15 121.23 120.74
119.19
f ‒ 131.15 ‒ 133.32 ‒ 128.96 ‒
131.21
g g 12H, s,
2.53
40.36 12H, s,
2.56
40.36 6H, s,
2.53
40.38 8H, s,
2.76
40.00
h 4H, m,
3.36
‒ ‒ 2H,
m,2.49
‒
i ‒ ‒ ‒ 8H, s,
2.61
‒
j 167.86 171.57 163.86
167.77
*Solvent: DMSO-d6, **Solvent: MeOH, ***1H NMR (400MHz) and ****13C NMR (101MHz)
Complexes (2) and (5), (7) and (8), and (10) have paramagnetic metal centres and no attempt was
made to record their NMR spectra. There were no experimental determined values for the
ferromagnetic nature of complexes in this thesis, hence paramagnetic compounds were simply
compared with the literature for related metals and oxidation states.23, 41
3.3.2 Fourier Transform Infrared Spectroscopy (FTIR) Using ATR Spectra
The IR spectra of saccharinato complexes are displayed in Table 3.3, where key wavenumbers of the
complexes can be seen. The wavenumbers for the starting [M(sac)2(H2O)4]·2H2O complex was
reported.8, 13 The current complexes possess much similar infrared properties. The important infrared
peaks are observed at the following frequencies: 3500 to 3100 cm-1 for different types of the aqua-
ligands which are present in the complexes; 1610 cm-1 for carbonyl group; 1280 cm-1 for SO2(asym);

56
1150 cm-1 for SO2(sym);1570 to 1479 cm-1 for C=C and 942 cm-1 for CNS(asym) and 1327 cm-1 for
CNS(sym).9, 14
Table 3. 3 IR spectral data for the metal complexes
Complexes ν(OH) ν(NH)/
N-CH
ν(C=O) ν(SO2) ν(CNS) ν(C=C) ν(SO)
asym sym asym sym dmso
1 3481,
3016
‒ 1646,
1609
1271,
1256
1152,
1141
953 1330 1583,
1460
1054,
1036
2 3486,
3005
‒ 1618 1256 1141 949 1317 1584,
1460
1141
3 ‒ ‒ 1687 1274,
1245
1153 941 1324 1596 1138
4 3414 ‒ 1697 1284 1154 947 1302 1594,
1458
1138,
1138
5
3275 ‒ 1651,
1619
1256,
1300
1161 951 1345 1586,
1460
1147
7
3407 2921 1635 1262,
1295
1144 965 1347 1590,
1454
‒
8
‒ 2858,
2672
1620 1264,
1284
1146 957 1346 1580,
1453
‒
10
‒ 2948,
2928
1621 1262,
1275
1134 946 1339 1571,
1455
‒
11 ‒ 2882,
2949
1654 1272,
1254
1137 943 1324 1565,
1457
‒
The high energy broad absorption band at the range of 3005 to 3486 cm-1 shows the characteristics of
ν(OH) vibration intensity which can be attributed to the hydroxyl group of the aqua ligands for
complexes (1), (2), (4) and ν(OH) vibration intensity for complex (7) correspond to the hydroxyl
group of alcohol of the ligand. The bands at 2672 to 2949 cm-1 which are observed in complexes (7)
to (8) and (10) to (11) are attributed to ν(NH) and ν(N-CH) stretches, respectively, as indicated in
Table 3.3. The distinct strong absorption vibration band of the ν(C=O) band for complexes (1) to (5)
and (7) to (8) and (10) to (11), appears in the range 1609 to 1697 cm-1. There has been a slight
increase in wavenumber of the C=O of all complexes compared to that of the starting material. The
free saccharin ligand has a vibration band at 1720 cm-1. The band which is observed to be at the range
1453 to 1594 cm-1 is assigned to the ν(C=C) stretch in the saccharin ring. For pure saccharin this
band occur at 1600 to 1462 cm-1.5 The vibration stretch at 1289 to 1347 cm-1 and 941 to 977 cm-1
vibration intensity are assigned to (CNS)sym and (CNS)sym moieties, respectively. These CNS
vibration bands correlate with those of the starting material which are in the region of 942 and 1327
cm-1 for (CNS)sym and (CNS)sym. There are closely related intensity peaks in the range 1248 to 1300
and 1134 to 1161 cm-1 which are assigned to νasym(O=S=O) and νsym(O=S=O) stretches, respectively.
The most important absorption bands are those observed at the range of 1036 to 1147 cm-1 for ν(S=O)
corresponding to the complexes containing DMSO as ligands, complexes (1), (2), (3), (4) and (5).
The frequencies in this range 300 to 550 cm-1 are due to M-O and M-N vibration bands.15, 16 These

57
are not listed in Table 3.3, see Appendix. Although IR is a secondary characterization tool, the
functional groups identified for the complexes support and confirm the formation of the relevant
complexes.
3.3.3 UV-Vis spectroscopy
The behaviour of complexes (1) to (5) and (7) to (8) and (10) to (11) in the different solvents DMF
and DMSO, were analysed by UV-Vis absorption spectroscopy under normal atmospheric conditions
in the range of 900 nm to 200 nm. The spectral data of the complexes are shown in Table 3.4, listing
with the λmax values and molar absorptivity in parenthesis. The λmax values of complexes (1) to (5)
and (7) to (8) and (10) to (11) are compared with those that have been previously reported for sodium
saccharinate which exhibit two absorption bands at λmax = 220 nm, ε = 10166 L mol-1 cm-1 and at λmax
= 268nm, ε = 1628 L mol-1 cm-1 which are assigned to the ligand-to-ligand charge-transfer intraligand
L-L* transition,17 and [M(sac)2(H2O)4]·2H2O complexes at λmax = 525 nm and 280 nm for Co(II), λmax
= 680 nm, 400 nm and 280 nm for Ni(II), and λmax = 780 nm and 355 nm for Cu(II).13, 18 Amongst
these complexes, colourless complexes of (1), (3), (4) and (11) show similar λmax values compared to
Na(sac) whereby the absorption peak appears in the range 260 to 374 nm. These absorption bands are
due to the strong conjugated π· · ·π interaction in the benzene ring. These are accompanied by small
absorption peaks at the shoulder of the broad peaks in the similar region of the UV-vis which is
observed at lower concentrations of the sample. These are attributed to the intraligand L-L* transition
of the saccharinate anion. Similar absorption peaks are observed for the complex
[M(sac)2(H2O)4]·2H2O.5 The peaks which are visible at the shoulders of the broad ones are in ranges
260 to 374 nm which are also observable at very low concentration. Complexes (2) and (8) are two
different complexes that possess the same metal centres, Co(II) and they show similar UV-visible
absorption behaviour at slightly different region of the spectra. These complexes display three
absorption bands. The intraligand L-L* transition observed in these complexes appears to be slightly
red shifted compared to the starting [M(sac)2(H2O)4]·2H2O complexes,8 presumably due to the
different ligands involved which can influence the spectral shift. The intraligand L-L* transition of
the saccharinate anion of the complexes are observed in the ranges 259 to 287 nm. In the visible
region, in the ranges 379 to 871 nm, small absorption peaks are noted due to d-d transition, usually
observed in an octahedral coordination geometry of the metal centre. For complexes containing a
Co(II) centre, the metal-to-ligand charge transfer is photostable. The molar extinction (absorptivity),
ε, of complexes having d-d transitions are known to fall in the range 5 to 500 M−1cm−1 (where M =
mol dm−3).19, 20 The molar absorptivity range of these complexes is 19.2 to 164 M−1cm−1. These
values are within the known range mentioned above. The Cu(II) complexes (5) and (7) present three
absorption bands. In the range 255 to 374 nm, complexes (5) and (7) consist of two peaks
corresponding to the saccharinate anion of the complexes. These absorption peaks are associated with

58
intraligand L-L* transition due to ligand-to-metal-charge-transfer (LMCT) arising from an un-
occupied ligand π -orbital to the empty d-orbital of Cu(II). A low energy intensity from 638 to 802
nm resulting from the d-d transition is noticed due metal-to-ligand-charge-transfer (MLCT) transition
which occurs when the saccharinato complexes and other related complexes are in a low oxidation
state and this shows the activity whereby the ligands are easily reduced in solution. This is also
similar to the behaviour seen with the Co(II) and Ni(II) systems due to the paramagnetism of the
metal centres which arises because of the influence of the LMCT transition. The range of the molar
absorptivity of the Cu(II) complexes is from 77 to 137 M−1cm−1. These values correspond with the
ranges ε of octahedral complexes.19, 21 Complex (10) has three absorption bands. These bands appear
at 273, 588 and 774 nm close to the values of one's reported earlier. The d-d transition state of the
two octahedral coordination geometry metal centred complexes are the a range of 419 to 774 nm. The
values of λmax of the complexes (1) to (5) and (7) to (8) and (10) to (11) are slightly shifted at the red-
shift region compared to those of the starting material of these complexes. Molar absorptivities of the
ligands that participates in the charge-transfer absorption are normally larger than 10,000 L mol-1 cm-
1,17 see Table 3.4. The region which indicates the presence of intraligand L-L* transition in the
complexes is greater than 500 M−1cm−1 and less than 10, 000 M−1cm−1 which indicates the formation
of the sacharinato complexes. The complexes, which include a variety of metal centres such as
Zn(II), Cd(II) and Hg(II), do not show absorption activities in the visible region of the spectra because
of the nature of the d10 metal system which has a fully occupied electron system decreasing the
HOMO-LUMO energy gap for excitation of electron to radiate coloured properties. Only ligand
transitions are shown due to the saccharinate anion.
Table 3. 4 Electronic spectra results of saccharinato complexes
Complexes λmax (nm), ԑ (M-1 cm-1)x
Ligands d‒d
1 260(3274) 262(3923) ‒
2 259(1879) 262(3541) 536(36.9)
3 259(2176) 277(2321) ‒
4 253(2867) 261(3628) ‒
5 255(3850) 260(4472) 802(104)
7 287(7028) 374(1339) 719(137)
8 272(3752) ‒ 598(21.6),871(31.3)
10 273(2576) ‒ 558(19.2),774(21.9)
11 275(2815) ‒ ‒
x ԑ Values given in parentheses.

59
Complexes (2), (5) to (8) and (10) have paramagnetic properties. Copper(II), (5), complex have weak
antiferromagnetic interaction due a spin-orbit coupling contribution and high spin ligand coordinated
to the metal centre.22,23 Nickel(II), (10), is a (d8) system and cobalt(II),(2) is a (d7) complex which
show a strong antiferromagnetism due to an increase in the size of the saccharin π systems observed in
the packing of the complexes which then produces a stabilisation of the low spin case resulting in a
strong antiferromagnetic coupling for both metal centres.23,24 Other reasons are that the spin
polarisation is usually predominant in extended π systems and a ligand to metal electron-transfer
appears to be large enough for π systems. This must be kept in mind because it is an influence of
strong antiferromagnetic which lead to unresolved NMR spectra's.41
3.4 Description of the X-ray Crystal Structures of Saccharinato Complexes
3.4.1 Crystal Structures
Table 3. 5 Crystal data and structure refinement for complexes (1), (2), (3) and (4)
1 2 3 4
Formula C18H24CdN4O10S4 C18H24CoN2O10S4 C18H20N2O8S4Zn C32H32Hg2N4O16S6
Mr Crystal system
669.08 Monoclinic
615.60 Monoclinic
586.03 Monoclinic
1322.22 Monoclinic
Space group P21/c (No.14) P21/c (No.14) P21/c (No.14) P21/c (No.14) a, Å 10.2613(5) 10.2304(3) 19.2506(7) 8.0133(4) b, Å 15.4294(8) 15.1418(6) 8.2855(3) 10.5317(5) c, Å 7.9951(4) 7.8615(3) 14.8880(5) 23.8346(11) α, deg 90 90 90 90 β, deg 98.8890(10) 98.068(2) 103.4600(10) 90.0010(10) γ, deg 90 90 90 90 V 2384.2(3) 2421.0(2) 1900.7(2) 1905.9(5)
Z 2 2 4 2
ρcalcd, g cm–3 1.777 1.696 1.686 2.183 Μ, mm–1 F(000) Crystal size (mm3) Θ Range (º) Index range (h,k,l)
1.262 604 0.08x0.11x0.14 2.0,28.4 -13/13, -20/19, -10/10
1.115 634 0.10x0.15x0.27 2.4,28.3 -13/13, -20/20, -10/10
1.473 1200 0.05x0.11x0.14 2.2,28.4 -25/25, -11/11, -19/19
8.012 1272 0.08x0.08x0.17 2.5,28.4 -10/10, -14/14, -31/31
T, K 173(2) 173(2) 173(2) 173(2) Reflections collected 12452 5888 44984 18460 Independent reflections 3121 3000 5730 4998 Rint
Completeness to Goodness-of-fit on F2
0.038 Θ = 26.4º 100% 1.03
0.018 Θ = 28.4º 100% 1.06
0.047 Θ = 28.4º 100% 1.02
0.028 Θ = 28.4º 100% 1.33
Final R indices [I > 2σ(I)] R1 = 0.0272, wR2 = 0.0657
R1 = 0.0207 wR2 = 0.0459
R1 = 0.0518 wR2 = 0.1251
R1 = 0.0637 wR2 = 0.1473
R indices (all data) R1 = 0.0253 wR2 = 0.0608
R1 = 0.0304 wR2 = 0.0814
R1 = 0.0268 wR2 = 0.0668
R1 = 0.0315 wR2 = 0.0668
Largest diff. peak and hole, e / Å -0.41 and -0.41 -0.49 and -0.071 -0.30 and -0.42 -1.78 and -1.08

60
Table 3. 6 Crystal data and structure refinement for complexes (5) and (11)
5 11
Formula C16H14CdN2O9S3 C18H24CdN6O6S2
Mr Crystal system
538.05 Monoclinic
596.95 Monoclinic
Space group P21/c (No.14) P21/c a, Å 7.763(2) 11.4307(2) b, Å 10.889(3) 6.93280(10) c, Å 24.420(6) 15.1437(3) α, deg 90 90 β, deg 98.221(5) 112.2700(10) γ, deg 90 90 V 2043.0(9) 1110.57(3) Z 4 2 ρcalcd, g cm–3 1.749 1.785 Μ, mm–1 F(000) Crystal size (mm3) Θ Range (º) Index range (h,k,l)
1.429 1029 0.02x0.04x0.08 1.7,28.3 -10/10, -14/14, -32/31
1.221 604 0.51x0.24x0.30 2.2,26.4 -12/15, -9/17, -18/20
T, K 173(2) 173(2) Reflections collected 18859 21415 Independent reflections 5052 2764
Rint
Completeness to Goodness-of-fit on F2
0.059 Θ = 26.4º 100% 1.08
0.0192 Θ = 26.4º 100% 1.144
Final R indices [I > 2σ(I)] R1 = 0.0916, wR2 = 0.2504
R1 = 0.0184 wR2 = 0.0523
R indices (all data) R1 = 0.0916, wR2 = 0.2504
R1 = 0.0186 wR2 = 0.0526
Largest diff. peak and hole, e / Å -0.81 and 5.27 0.370 and -0.663
w = 1/[\s^2^(Fo^2^)+(0.0260P)^2^+0.4033P] where P=(Fo^2^+2F for complex (1), w = 1/[\s^2^(Fo^2^)+(0.0497P)^2^] where P=(Fo^2^+2Fc^2^)/3 for complex (2), w = 1/[\s^2^(Fo^2^)+(0.0289P)^2^+1.4252P] where P=(Fo^2^+2Fc^2^)/3 for complex (3) ,w = 1/[\s^2^(Fo^2^)+(0.0000P)^2^+9.9656P] where P=(Fo^2^+2Fc^2^)/3 for complex (4), w = 1/[\s^2^(Fo^2^)+(0.1487P)^2^+8.2144P] where P=(Fo^2^+2Fc^2^)/3 for complex (5)
3.4.1.1 trans-[Cd(sac)2(dmso)2(H2O)2] and trans-[Co(sac)2(dmso)2(H2O)2]
A view of the molecular structure of complexes (1) and (2) is shown in Figure 3.2 and Figure 3.3,
respectively. The selected bond distances and angels are tabulated in Table 3.7. The unit cell
dimensions of the crystal structure are shown in Table 3.5.

61
Figure 3. 2 The ORTEP molecular structure of (1) showing the labelling scheme. The dash
interactions show intramolecular hydrogen bonding.
The two molecular structures differ from one another by the metal centres, i.e. complex (1) has Cd(II)
and complex (2) has Co(II) as a metal centre. The structures are isomorphous (isostructures), all non-
hydrogen atoms were refined anisotropically. All hydrogen atoms could be found in the different
electron density maps. All, except H5A and H5B on O5, were placed in idealised positions refining
in riding models with Uiso set at 1.2 or 1.5 times those of their parent atoms. The water hydrogen
atoms H5A and H5B were located in the different electron density maps and refined with independent
isotropic temperature factors and simple bond length constraints of d(O-H) = 0.980(2) Å. The
structure was refined to R factor of 0.0253 and 0.0304, respectively, for complexes (1) and (2). For
parameters for crystal data collection and structure refinements, the bond lengths, angles and torsion
angles are contained in file of complexes (1) and (2), see Appendix.

62
Figure 3. 3 The ORTEP molecular structure of (2) showing the labelling scheme. The atom
displacement ellipsoids are at 50% probability level. The dashed interactions shows
hydrogen bonding.
The structure of complexes (1) and (2) comprises ligands of aqua and neutral dmso, as well as the
saccharinato ligands. The crystallographic data for both complexes indicates the crystallization of the
single X-ray crystal structure, in the monoclinic system in the space group P21/c. For both complexes
the metal centre is positioned at the centre of the ligand. The metal centre in each complex is
coordinated to the six-coordinating ligands which all act as monodentate ligands. The complexes
have an octahedral coordination geometry through which the two saccharinate anion ligands are
bonded to the metal centre via the nitrogen atoms. The two aqua and DMSO ligands have
coordinated in the trans position to each other. There are many examples of these closely related
complexes which illustrate the ranges of the bond distances and angles that could be used to compare
with those of complexes, (1) and (2).6 The Cd1-O4, Cd1-O5 and the Cd1-N1 have the bond lengths
of 2.2817(15), 2.2817(15) and 2.2366(18) Å, respectively. The bond length of Cd-O of M-OH2 and
Cd-N of the starting material is 2.2755(17) and 2.2612(14) Å,25 respectively. The bond lengths of
Cd1-O4 and Cd1-O5 are thus longer whilst Cd1-N1 of the complex (1) is shorter. Complex (2) shows
that the Co1-O4, Co1-O5 and the Co1-N1 have a bond distance of 2.0932(12), 2.0620(12) and
2.2396(15) Å, respectively, which are all shorter than those of (1). The difference of Co1-O4 and
Co1-O5 is caused by the relative bulkiness of the (CH3)2SO ligand present, compared to the less bulky
H2O ligand. A comparison of the bond distances show that the M-O bond distance of the (CH3)2SO is

63
longer than the H2O ligand. The bond distances of Cd–Nsac and Cd–Osac are similar to those
reported for [Cd(sac)2(pym)2] which are 2.2612(14) and 2.2755(17) Å,23 respectively.26, 27
3.4.1.2 Hydrogen Bonding of Complexes (1) and (2)
The tables below contains selected bond lengths and angels of both complexes (1) and (2).
Table 3. 7 Tabulated selected bond lengths Å and angles° for complexes (1) and (2) and
hydrogen bonding coordination geometry for complexes (1)b and (2)d
M = Cd M = Co M = Cd M = Co
M1-N1 2.2366(18) 2.2396(15) O4-M1-O5 91.14(6) 91.94(5)
M1-O4 2.2817(15) 2.0932(12) O4-M1-N1 94.42(6) 94.77(5)
M1-O5 2.2817(15) 2.0620(12) O4-M1-O4a 180.00 180.00
S1-O4 2.2864(15) 1.572(13) O5-M1-N1 98.14(5) 95.03(5)
M1-O4a 2.2864(15) 2.0932(12) N1-M1-N1a 180.00 180.00
O4a-M1-O5a 91.14(6) 91.94(5)
Hydrogen bonding for complex (1)
D-H···A d(D-H) (Å) d(H···A) (Å) d(D···A) (Å) <(DHA) (°)
O(5)˗H(5A)···O(3)a 0.979(18) 1.78(3) 2.685(2) 153(3)
O(5)-H(5B)···O(1) 0.980(18) 2.35(3) 2.904(2) 114.8(19)
O(5)-H(5B)···O(1)d 0.980(18) 1.934(16) 2.866(2) 158(3)
N(8)-H(8B)···O(5)i 0.980 2.5700 2.363(3) 128.00
C(8)-H(8B)···O(4)g 0.980 2.4700 3.328(3) 145.00
C(9)-H(9B)···O(4)g 0.980 2.5700 3.393(3) 142.00 b Translation of Symmetry Code: (a); 1-x,2-y,-z (g) x,y,-1+z; (d) 1-x,2-y,1-z; (i) 1-x,-1/2+y,1/2-z. Hydrogen bonding for complex (2)
D-H···A d(D-H) (Å) d(H···A) (Å) d(D···A) (Å) <(DHA) (°)
O(5)˗H(5A)···O(3)a 0.980(17) 1.73(2) 2.6458(17) 155(3)
O(5)-H(5B)···O(1) 0.981(19) 2.09(3) 2.8028(17) 127.9(19)
O(5)-H(5B)···O(1)d 0.981(19) 2.058(16) 2.9036(17) 143(2)
N(8)-H(8B)···O(5)i 0.980 2.5400 3.277(2) 132.00
C(8)-H(8B)···O(4)g 0.980 2.5100 3.383(2) 148.00
C(9)-H(9B)···O(3)g 0.980 2.5800 3.363(2) 137.00
C(9)-H(9B)···O(4)g 0.980 2.5800 3.432(2) 146.00 d Translation of Symmetry Code: (a); 1-x,1-y,-z ; (b) 1-x,1-y,1-z ; (c) x,3/2-y,1/2+z (i) 1-x,1/2+y,1/2-z.
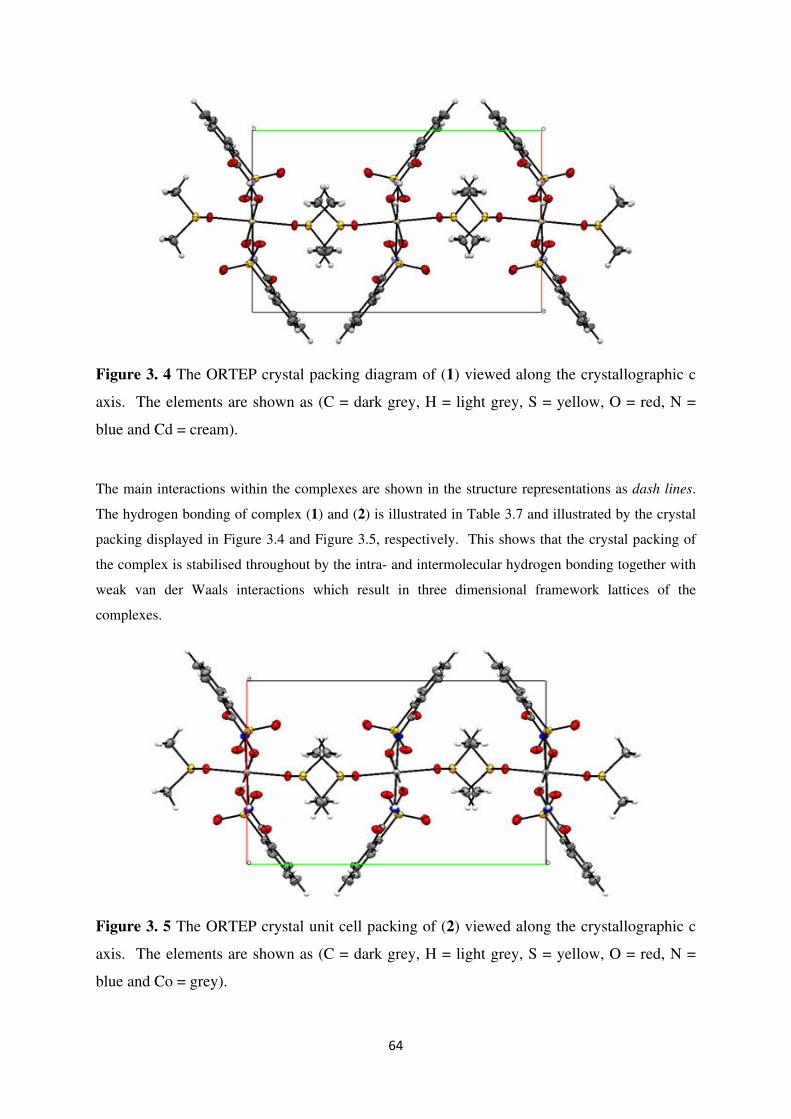
64
Figure 3. 4 The ORTEP crystal packing diagram of (1) viewed along the crystallographic c
axis. The elements are shown as (C = dark grey, H = light grey, S = yellow, O = red, N =
blue and Cd = cream).
The main interactions within the complexes are shown in the structure representations as dash lines.
The hydrogen bonding of complex (1) and (2) is illustrated in Table 3.7 and illustrated by the crystal
packing displayed in Figure 3.4 and Figure 3.5, respectively. This shows that the crystal packing of
the complex is stabilised throughout by the intra- and intermolecular hydrogen bonding together with
weak van der Waals interactions which result in three dimensional framework lattices of the
complexes.
Figure 3. 5 The ORTEP crystal unit cell packing of (2) viewed along the crystallographic c
axis. The elements are shown as (C = dark grey, H = light grey, S = yellow, O = red, N =
blue and Co = grey).

65
The aqua ligand H atoms which form strong hydrogen bonding with the carbonyl group and sulfonyl
group of the saccharinate anion, see Table 3.7 and Figure 3.4, respectively, e.g. O(5)˗H(5A)···O(3)
and O(5)-H(5B)·· ·O(1), 153(3) and 158(3)º respectively for complex (1). The O(7)˗H(7A)···O(1)
angle is 167(7)º for complex (2). These have a contact distance of 2.904(2) Å between atoms
O1···O5 and a contact distance of 2.866(2) Å between O1···O5d, respectively. H-bonding of the
(CH3)2SO ligand is C(8)-H(8B)···O(4) and C(9)-H(9B)·· ·O(4) each with an angle of 145 and 142º,
respectively. There are weak hydrogen bonds which involves the sulfonyl oxygen atom with the
adjacent molecule in a weak intermolecular C-H···O interaction with the aqua-ligands. The aqua
ligand H atoms which are involved in strong hydrogen bonding with the carbonyl group of the
saccharinate anion and helps to stabilize the 3-D lattice which is observed in Figure 3.4 and Figure
3.5.
3.4.1.3 [Zn(sac)2(dmso)2]
The molecular structure of complex (3) consists of direct Zn-N and Zn-O bonds, as shown in Figure
3.4. The selected bond distances and angles are shown in Table 3.8. The unit cell dimensions of the
crystal structure are shown in Table 3.5. The parameters for crystal data collection and structure
refinements, the bond lengths, angles, and torsion angles are contained in the file of complex (3) see
Appendix.
Figure 3. 6 ORTEP molecular structure of (3) showing the labelling scheme. The atom
displacement ellipsoids are drawn at 50% probability level. The dashed interactions show
intramolecular hydrogen bonding.

66
The structure is formed from two neutral DMSO ligands and two anionic sac ligands. The
crystallographic data indicates that the single X-ray structure of complex (3) crystallises in a
monoclinic system with the space group of P21/c whereby the metal centre is positioned at the centre.
The metal centre is coordinated to four ligands which all act as monodentate ligands in the tetrahedral
complex. The N-M-N bond angles fall within the range 105.6(1) to 114.8(1)º,30 and the one reported
for this complex is 113.85(7)º. There are many examples of closely related complexes to (3). The
Zn-N bond distances are 1.996(3) and 2.000(3) Å reported for [Zn(sac)2(NH3)2]28 for the two Zn-N
saccharinate anions, and 2.006(3) and 2.007(3) Å for the two ammonia ligands. For complex
[Zn(C7H4NO3S)2(C2H6OS)2]29, it is observed that the Zn-N bond distances are 1.9742(16) and
2.0025(16)Å. These bond distances are comparable to the Zn-N bond distances observed for
[Zn(sac)2(NH3)2]. Other complexes have shown that the bond distance of Zn-O and Zn-N is 2.1642(3)
and 2.0873(9) Å, respectively, and that the Zn-O of the H2O ligands in the starting
[M(sac)2(H2O)4]·2H2O complex is 2.2423(9) Å.30 These lengths are longer than those of (3) which is
Zn1-O8 = 1.9807(13) and Zn1-O7 = 1.9468(13) Å. This correlates well with other Zn saccharinato
complexes.28, 31
3.4.1.4 [Hg(sac)2(dmso)(H2O)]
The ORTEP molecular structure of complex (4) is shown in Figure 3.7, together with the numbering
scheme of the atoms present in the structure. The selected bond distances and angels are in Table
3.8.
Figure 3. 7 The ORTEP molecular structure of (4) showing the labelling scheme. The atom
displacement ellipsoids are drawn at 50% probability level.

67
The unit cell dimensions of the crystal structure are shown in Table 3.5.
The crystallographic data indicate that complex (4) crystallizes in a monoclinic system within the
space group P21/c, see Table 3.5. In this structure the (CH3)2SO groups caused disorder over two
sites and the site occupancy factors were refined to 0.504(4) and 0.496(4), respectively. The metal
centre is coordinated to four ligands that act as monodentate ligands. This gives the complex a
distorted trigonal pyramidal coordination geometry through which the two saccharinate anion ligands
are bonded to the metal centre via the nitrogen atoms which forms a neutral complex to metal centre
which has a +2 oxidation state.
The angles of the tetrahedral complexes of this type falls within the range of 105.6(1) to 114.8(1)º and
due to the molecular strain in (4), the angles are smaller than 109º, which indicates ideal tetrahedral
geometry. Key bond angles for (4) include O7-Hg1-O8A = 89.2(3), O7-Hg1-N1 = 84.77(14), O7-
Hg1-N2 = 100.77(14), O7-Hg1-O8B = 76.5(3), O8A-Hg1-N1 = 99.7(3), O8B-Hg1-N1 103.8(3) and
O8B-Hg1-N2 = 94.2(3)º, which supports a distorted trigonal pyramidal geometry, see Table 3.8.
Bond lengths of 2.614(4) for Hg1-O7, 2.457(11) for Hg1-O8A, 2.076(4) for Hg1-N1, 2.068(4) for
Hg1-N2, and 2.452(11) Å for Hg1-O8B were obtained. These selected bond distances of (4) for Hg-
N saccharinate are related to those of the previously reported [Hg(sac)2] complexes which are 2.037,
2.049, 2.029 and 2.058 Å.32 Other reported bond length examples include: 2.019 Å for
[Hg(Cl)(sac)]33 2.120 and 2.140 Å for [Hg(sac)2(bipy)] which are shorter than [Hg(sac)2(ampy)2]34
and [Hg(ea)2(sac)2]25 at 2.739(3) and 2.7955(16)Å, respectively. The bond distance of M-OH2 for (4)
is 2.614(4) for Hg1-O7 which is slightly shorter than that of Hg–OW (W= H2O) which is 2.820(9)
which has been shown to have weaker interaction with the mercuric metal centre.35

68
3.4.1.5 Hydrogen Bonding of Complexes (3) and (4)
Table 3. 8 Tabulated selected bond lengths Å and angles° for complexes (3) and (4) and
hydrogen bonding coordination geometry for complexes (3)f and (4)k
Zn1-N1 1.9742(16) O7-Zn1-O8 98.92(8)
Zn1-N2 2.0025(16) O7-Zn1-N1 116.96(6)
Zn1-O7 1.9468(13) O7-Zn1-N2 103.92(2)
Zn1-O8 1.9807(13) O8-Zn1-N1 113.93(6)
N1-Zn1-N2 113.85(7)
Hg1-O7 2.614(4) O7-Hg1-O8A 89.2(3)
Hg1-O8A 2.457(11) O7-Hg1-N1 84.77(14)
Hg1-N1 2.076(4) O7-Hg1-N2 100.77(14)
Hg1-N2 2.068(4) O7-Hg1-O8B 76.5(3)
Hg1-O8B 2.452(11) O8A-Hg1-N1 99.7(3)
S3A-O8A 1.231(11) O8A-Hg1-N2 99.5(3)
S3A-C16A 1.805(15) N1-Hg1-N2 161.94(16)
O8B-S3B 1.805(15) O8B-Hg1-N1 103.8(3)
O8B-Hg1-N2 94.2(3)
H7A-O7-H7B 103(5)
Hg1-N1-S1 127.0(2)
Hg1-N2-S2 125.3(2)
Hg1-N2-C8 120.1(3)
Hydrogen bonding for complex (3)
D-H···A d(D-H) (Å) d(H···A) (Å) d(D···A) (Å) <(DHA) (°)
C(3)˗H(3)···O(1)m 0.9500 2.5900 3.480(3) 155.00
C(4)-H(4)···O(8)a 0.9500 2.5100 3.318(3) 142.00
C(9)-H(9)···O(4)d 0.9500 2.399 3.318(3) 167.00
C(15)-H(15A)···O(1)c 0.9500 2.4800 3.231(3) 134.00
C(15)-H(15C)···O(3) 0.9800 2.5400 3.156(3) 121.00
C(16)-H(16B)···O(2)b 0.9800 2.5500 3.221(3) 125.00
C(16)-H(16C)···O(6)l 0.9800 2.4900 3.438(3) 163.00
C(18)-H(18B)···O(5)c 0.9800 2.5600 3.2500(3) 127.00
f Translation of Symmetry Code: (a) 1-x,1-y,1-z ; (b) x,1/2-y,-1/2+z; (c) x,1+y,z; (d) x,3/2-y,1/2+z ;(l) 1-x,-1/2+y,3/2-z; (m) x,3/2-y,-1/2+z.

69
Hydrogen bonding for complex (4)
D-H···A d(D-H) (Å) d(H···A) (Å) d(D···A) (Å) <(DHA) (°)
O(7)˗H(7A)···O(1)c 0.87(4) 1.96(5) 2.815(5) 167(7)
O(7)-H(7B)···O(3) 0.86(5) 2.39(4) 2.937(5) 122(4)
O(7)-H(7B)···O(4)c 0.86(5) 2.39(5) 3.082(6) 138(6)
C(4)-H(4)···O(3)i 0.9500 2.5500 3.373(6) 145.00
C(13)-H(13)···O(2)h 0.9500 2.5800 3.282(2) 131.00
C(15A)-H(15A)···O(5) 0.9800 2.4200 3.231(12) 139.00
C(15A)-H(15B)···O(8A)a 0.9800 2.5600 3.375(16) 141.00 k Translation of Symmetry Code: (a) -x,1-y,1-z ; (c) 1-x,-y,1-z; (h) x,1/2-y,1/2+z; (i) 1-x,-1/2+y,1/2
Figure 3. 8 The ORTEP crystal unit cell packing of (3) viewed along the crystallographic c
axis. The elements are shown as (C = dark grey, H = light grey, S = yellow, O = red, N =
blue and Zn = light blue).
The hydrogen bonding of complex (3) is shown in Table 3.8. The results show that the crystal
packing of the complex is stabilised throughout by the intra-and intermolecular hydrogen bonding
together with weak van der Waals interactions which results in a 3D framework lattice, see Figure 3.8.
The DMSO ligands consists of the hydrogen atoms which forms a strong hydrogen bonding with the
carbonyl group of the adjacent saccharinate anion of the complex which involves the intermolecular
C-H···O interaction of 155º for C(3)˗H(3)·· ·O(1) and 167º for C(9)-H(9)·· ·O(4) and 163º for C(16)-
H(16C)·· ·O(6). The contact distance between these intermolecular hydrogen bonds of the carbonyl
group and hydrogen atoms of DMSO, H16C-O6_1 is 2.490, sac(π)· · ·sac(π) stacking interactions
between the two saccharinate anions of the adjacent molecules is 3.384 Å, the π· · ·O-S is 2.514 Å, the

70
sulfonyl oxygen atoms interactions with H-atoms of the benzene and adjacent (CH3)2SO molecule is
2.593Å and 2.475Å, respectively. The interaction between the atom of H-dmso and S-atom of the
adjacent dmso is non-bonding due to a 3.000 Å (S4-H16B_d) contact distance. The sulfonyl oxygen
atoms of the adjacent molecule are interacting with the S-atoms of the adjacent (CH3)2SO molecule at
a contact distance of 3.115(16) Å (O2-S3). The crystal packing of complex (3) shows that the angle
between the two saccharinate anions on the complex has a dihedral angle of 73.08 º. These
interactions help in stabilizing the complex so that it forms the 3D-lattice system shown in Figure 3.8.
Figure 3. 9 The ORTEP crystal packing of (4) view along the reciprocal cell a* axis, i.e.
perpendicular to bc. The elements are shown as (C = dark grey, H = light grey, S = yellow, O
= red, N = light blue and Hg = silver).
The hydrogen bonding of complex (4) is shown in Table 3.8. This shows that the crystal structure
packing of the complex is stabilised throughout by the intra-and intermolecular hydrogen bonding
together with weak van der Waals interactions which results in 3D framework lattice of the
complexes. The hydrogen atom in the dmso ligand forms a strong hydrogen bond with the sulfonyl
group of the saccharin anion of the same atoms in the molecular structure and the adjacent molecular
structure, see Figure 3.9. This is also observed in the aqua-ligands with the sulfonyl oxygen atoms.
There are weak hydrogen bonds which involves the conjugated π electrons of atom of the adjacent
phenyl hydrogen atom with the hydrogen atoms of the π molecule system that involves a weak
intermolecular sac(π)· · ·sac(π) interaction. The saccharinato ligands of the complexes are calculated
to lie planar. These ligands possesses the dihedral angle of 8.00º that result into the 3D system
observed in Figure 3.9.

71
3.4.1.6 [Cu(sac)2(dmso)(H2O)2]
A view of the molecular structure of complex (5) is shown in Figure 3.10, together with the
numbering scheme of the atoms. The selected bond distances and angels are givenin Table 3.9. The
unit cell dimensions of the crystal structure are shown in Table 3.6.
Figure 3. 10 The ORTEP molecular structure of (5) showing the labelling scheme. The atom
displacement ellipsoids are drawn at 50% probability level. The dash interactions show
hydrogen bonding.
The molecular structure of complex (5) is composed of two H2O and one (CH3)2SO monodentate
ligands. The Cu(II) metal centre is directly bonded to the saccharinato ligand via the N donor atom.
The crystallographic data reveals that complex (5) crystallises in a monoclinic system within the
space group of P21/c (14). The crystal is twinned and forms a distorted trigonal bipyramidal
coordination geometry with the metal centre centrosymmetric to the ligands. These complexes and
many others are used to compare the bond lengths and angles with those of complex (5):
[Cu(sac)2(H2O)(eapy)]36 and [Cu(sac)2(H2O)(bzim)2]37. From Table 3.9, the N-O(W) bond distances
are similar for Cu-O7 and lesser for Cu-O8 and Cu-O9 at 1.967(4) and 1.953(5), respectively. This
might be due to twinning of the complex which resulted in the ellipsoid of the O8 and O9 to be
slightly larger than expected. The average range M-N bond of complexes [Cu(sac)2(H2O)(eapy)] and
[Cu(sac)2(H2O)(bzim)2] is 2.012 to 2.058Å, refer to Table 3.9 for complex (5). The bond angels of (5)

72
are also presented in Table 3.9, which are 150.2(2) º for N1-Cu1-N2, 178.3(2)º for O8-Cu1-O9,
84.0(2)º for O7-Cu1-O9, 94.4(18)º for O7-Cu1-O8 and 124.4(3)º for Cu1-O7-S3.
3.4.1.7 Hydrogen bonding of complex (5)
The hydrogen bonding of complex (5) is presented in Figure 3.10 as dashed lines.
Table 3. 9 Tabulated selected bond lengths Å and angles° for complex (5)b
Cu1-N1 2.032(5) N1-Cu1-N2 150.7(2)
Cu1-N2 2.030(5) O8-Cu1-O9 178.3(2)
Cu1-O8 1.967(4) O7-Cu1-O9 84.0(2)
Cu1-O7 2.174(4) O7-Cu1-O8 94.41(18)
Cu1-O9 1.953(5) Cu1-O7-S3 124.4(3)
D-H···A d(D-H) (Å) d(H···A) (Å) d(D···A) (Å) <(DHA) (°)
C(4)-H(4)···O(3)e 0.9500 2.5200 3.271(9) 137.00
C(15)-H(15A)···O(7)i 0.9800 2.5800 3.510(10) 159.00
C(15)-H(15C)···O(2) 0.9800 2.5200 3.362(9) 144.00
C(16)-H(16A)···O(5) 0.9800 2.5500 3.404(9) 146.00 b Translation of Symmetry Code: (e) ;1-x,2-y,-z; ( i) -x,-1/2+y,-1/2-z.
Figure 3. 11 The unit cell packing of complex (5) viewed down the crystallographic a axis.
Complex (5) is stabilized by intermolecular hydrogen bonding together with weak van der Waals
interactions. This structure forms a polymeric 3D framework via the O8, O9, O4 and O1 atoms which
create an intermolecular hydrogen bonding network with the adjacent molecules via (C-H···O)
interactions, see Table 3.9 and Figure 3.11.

73
3.4.1.8 trans-[Cd(sac)2(en)2]
A view of the molecular structure of complex (11) is shown in Figure 3.12, together with selected
bond distances and angels which are in Table 3.6.
Figure 3. 12 The ORTEP molecular structure of (11) showing the labelling scheme. The
atoms displacement ellipsoids are drawn at 50% probability level. The dash interactions
show hydrogen bonding.
The crystallographic data indicates that the single X-ray structure of complex (11) crystallises in a
monoclinic system within the space group of P21/c. The metal centre is coordinated to the six-
coordinating ligands in which the ethylenediamine acts as a bidentate chelating ligand and the
saccharinato ligand is monodentate. The complex has an octahedral coordination geometry through
which the two saccharinato ligands are bonded to the metal centre via the N atoms which forms a
neutral complex. The saccharinato ligands are coordinated trans to each other. There are many
examples of closely related complexes which illustrate the ranges of bond distances and angles that
could be used to compare with those of the complex (11). It is noted from the previously reported
complexes that the Cd1-N1 have the bond distance of 2.2366(18). The bond distance of Cd-N
saccharinate of the starting material is 2.2612(14) Å. Herein, the bond distance of Cd1-N1 is

74
2.4157(11), Cd1-N2 is 2.3440(11) and Cd1-N3 is 2.4720(17) Å. The bond distance of complex (11),
i.e. Cd1-N1 is 2.4157(11), Cd1-N2 is 2.3440(11) and Cd1-N3 is 2.4720(17) Å are longer than that of
those previously reported, but is similar to those of Cdl-N2 which is 2.324 (11), Cd-N is 2.423(8), Cd-
N is 2.338 (11) of the complex [Cd(sac)2(NH3)4]38 ,[Cd(sac)2(bpy)2]
39and [Cd(sac)2(ampy)2]40 and the
N2-Cdl-N3 is 93.6 (4), N3-Cdl-N1 is 88.5 (4) and N2-Cdl-N1 is 94.6 (3). The bond angles of (11) are
as follows: N1-Cd1-N3 is 90.75(4) and N1-Cd1-N2 is 91.89(4), and these are similar to
[Cd(sac)2(NH3)4]38 ,[Cd(sac)2(bpy)2]
39and [Cd(sac)2(ampy)2].40
3.4.1.9 Hydrogen bonding of complex (11)
Table 3.10, below shows the bond lengths and angles of complex (11). The atoms which show
interactions within the complexes are shown in the main structures Figure 3.12.
Table 3. 10 Tabulated selected bond lengths Å and angles° for complex (11)h
Cd1-N1 2.4157(11) N1-Cd1-N3 90.75(4)
Cd1-N2 2.3440(11) N1-Cd1-N3o 89.25(4)
Cd1-N3 2.4720(17) N2-Cd1-N3 77.11(4)
C9-N3 1.4720(17) N2-Cd1-N3o 102.89(4)
C8-C9 1.523(2) N1-Cd1-N1o 180.0
Hydrogen bonding for complex (11)
D-H···A d(D-H) (Å) d(H···A) (Å) d(D···A) (Å) <(DHA) (°)
1 N(2)˗H(2B)···O(2)a 0.92 2.39 3.1627(17) 141
1 N(3)-H(3A)···O(2)b 0.92 2.29 2.9497(16) 128
1 N(3)-H(3A)···O(3)c 0.92 2.34 2.9966(18) 128
1 N(3)-H(3B)···O(1) 0.92 2.46 3.2964(16) 151
1 C(2)-H(2)···O(3)b 0.92 2.52 3.1697(18) 128
1 C(8)-H(8A)···O(3)d 0.92 2.46 3.4225(18) 173 h Translation of Symmetry code: (a) 1-x,-y,1-z ;(b) x,1+y,z;(c) 1-x,1-y,1-z;(d) x,-1/2-y,1/2+z.

75
Figure 3. 13 The ORTEP crystal unit cell packing of (11) viewed along crystallographic b
axis. The elements are shown as (C = dark grey, H = light grey, S = yellow, O = red, N =
light blue and Cd = cream).
The hydrogen bonding of complex (11) is shown in Table 3.10. The crystal packing of the complex is
stabilised throughout by the intra-and intermolecular hydrogen bonding together with weak van der
Waals interactions which result in three dimensional framework lattice of the complexes. The
ethylenediamine ligand hydrogen atoms which form a mono-, bi- and trifurcated intra-and
intermolecular strong hydrogen bonding with the carbonyl group oxygen atom and sulfonyl oxygen
atoms of the adjacent saccharinate ligands, see Table 3.10. There are strong hydrogen bonding which
involves the sulfonyl oxygen atom with the adjacent molecule resulting in a strong intermolecular of
N-H···O interaction. The phenyl and ethylene hydrogen atoms are also showing a weak interaction
with the oxygen atoms of the carbonyl of the adjacent molecule of the saccharinate ligand. The
sac(cπ)· · ·sac(π) interaction help stabilize the molecular structure in the 3D lattice observed in Figure
3.13.
3.5 Thermal analysis
The thermal analysis of the saccharinato complexes containing mixed-ligands was performed on
selected complexes of (1) to (5) and (7) and (11) using the thermal analysis curves (TG, DTA and
DTG). See Chapter 2 for experimental details. Results are shown in Table 3.11. From the thermal
graphs it was observed that most complexes are stable from 25 to approximately 200 °C at which
point they start decomposing.

76
Table 3. 11 Thermoanalytical data for selected complexes
Complexes Stage Temperature
range (°C)
DTGmax
(°C)a,b
Mass loss (%) Total mass loss
(%)
Solid residue
Found Calc. Found Calc.
1 1
2
89.9-122.6
416.3-445.0
112a
430b
17.62
39.12
17.06
38.90
56.74
55.96
[Cd(sac)2(DMSO)
[Cd(sac)]
2 1
2
3
104.2-131.9
148.4-391.4
414.9-444.8
129a
302b, 430b
17.41
3.02
30.76
12.69
2.93
29.59
51.19
45.21
[Co(sac)2(H2O)
[Co(sac)2]
[Co(sac)]
3 1
2
188.8-222.5
450.3-466.9
190; 214a
467b
26.69
31.17
26.66
31.08
58.84
57.83
[Zn(sac)2]
[Zn(sac)
4 1
2
3
4
60.0-70.0
135.1-148.0
331.7-370.2
418.6-441.0
60.6a
227, 144a
223, 307a
426a
2.81
11.62
28.81
33.93
2.72
11.82
27.56
32.40
87.75
87.72
[Hg(sac)2(DMSO)
[Hg(sac)2
[Hg(sac)]
Hg
5 1
2
3
128.3-173.44
335.7-363.6
463.0-488.9
145a
347a, 481a
6.83
14.56
26.52
6.65
14.44
27.76
77.16
78.10
[Cu(sac)2(DMSO)
[C(sac)2]
[Cu(sac)(O)
7 1
2
191.7-207.9
274.83-352.9
57.1b
200.7b
16.10
45.53
17.91
45.30
70.24
63.21
[Cu(sac)2(MDEA)]
[Cu(sac)]
11 1
2
3
162.4-179.6
302.9-406.3
824.0-914.9
58.4b
280a,328b
633a,689b
7.959
48.33
30.36
10.07
40.57
30.52
86.21
81.16
[Cd(sac)2(en)]
[Cd(sac)]
[Cd] a endothermic, b exothermic
The complexes (1), (2), (3), (4) and (5) consists of aqua- and DMSO ligands. Complex (3) does not
have aqua ligands coordinated to the metal centre. These complexes show two to four stages of
decomposition which appears at different temperature rates depending on the number of present
ligands coordinated to the metal centre. Complex (1) consists of two decomposition processes in
which the complex lose mass. Stage 1 of complex (1) on the thermal curve occurs at temperature
range of 89.9-122.6°C. The complex decomposes with melting at an endothermic peak at 112°C and
this is attributed to the mass loss of two aqua-ligands and one DMSO ligand with a weight loss
percentage of 17.60% (calc. 17.06%). The second stage involves the mass loss of saccharinate ion
and DMSO with a weight loss mass of 39.12% (calc. 38.90%) which left the solid residue of
[Cd(sac)]. This stage takes place at the temperature range of 416.3-445.0°C and it has the exothermic
weight loss peak of 430 °C. The total mass lost was 56.74% (calc. 55.96%), see Table 3.11, above
The thermal analysis of complex (2) consists of three decomposition stages. The first one occurs at a
temperature range of 89.9-122.6°C and it decomposes without melting at the endothermic temperature
of 129°C. The mass loss on this stage was 17.41% (calc. 12.69%) and was due to the loss of two
DMSO ligands and one aqua-ligand. Stage two shows complex degradation at the temperature range
of 148.4-391.4°C and it undergoes two exothermic temperature peaks at 302 and 430°C. This was
due to the mass loss of one aqua-ligand losing a mass of 3.02% (calc. 2.93%). Stage three takes place

77
at the temperature range of 414.9-444.8°C and this shows the mass loss of 30.76% (calc. 28.59%)
which is found to be the loss of saccharinate ion. The solid residue was attributed to [Cd(sac)]. The
total mass loss was 51.19% (calc. 45.12%).
There are two stages observed for complex (3), the first stage shows the mass loss of two DMSO
ligands. A 26.69% (calc. 26.66%) weight loss of DMSO ligands was found and it occurs at the
temperature range of 188.8-222.5°C with a endothermic melting peak at 190°C and degradation
temperature at 214°C. At the temperature range of 450.3-466.9°C the saccharinate ion decomposes
with an exothermic peak at 467°C. The mass loss of saccharinate ion was 31.17% (calc. 31.08%).
The total mass loss was 58.84% (calc. 57.83%). The solid residue was [Zn(sac)].
Complex (4) shows many decomposition stages and some of these were due to the distorted electronic
structure of the complex. This results in many melting phases. Those stages which correspond to the
complex were identified and matched those of the calculated values. The complex consists of four
phases and stage one shows the mass loss of 2.81% (calc. 2.72%) which was attributed to the mass
loss of the aqua ligand. This occurs at the temperature range of 60.0-70.0°C with an endothermic
peak at 60.6°C. Stage two indicated that the complex melts within the temperature range of 135.1-
148.0°C and later decomposes at the endothermic peak of 144 and 227°C. There was a mass loss of
11.62% (calc. 11.82%) this was attributed to a mass loss of DMSO. Stage three of complex (4)
happens at the temperature range of 331.7-370.2°C and it consists of two endothermic peaks at the
temperatures of 223 and 307°C. This stage showed the decomposition of saccharinate ion of the
complex. The mass loss of saccharinate ion was 28.81% (calc. 27.56%). The last stage occurred at
the temperature range of 418.6-441.0°C and showed the degradation of second saccharinate and its
combustion with the weight mass loss of 33.93% (calc. 32.40%). The stages of this complex are all
endothermic and the fourth stage shows the peak at 462°C. The total mass loss was 87.75% (Cal.
87.72%). The solid residue was attributed to Hg metal.
Complex (5) underwent two stages and the first stage was due to the loss of two aqua-ligands which
occurred at the temperature range of 128.3-173.44°C. The complex decomposed without melting
with an endothermic temperature peak of 145°C. There was a sub-stage before Stage two which
showed a mass loss of 29.25%. Stage 2 was due to mass loss of DMSO at the temperature range of
335.7-363.6°C with an endothermic temperature of 347 and 481°C. The mass loss of 14.65% (calc.
14.44%) was observed. The last stage occurred at the temperature range of 414.9-444.8°C and
showed no degradation temperature peak, but the elimination of saccharinate ion ligand with a mass
loss of 26.52% (calc. 27.76%) was observed. The total mass loss was 77.16% (calc. 78.10%). The
end product was [Cu(sac)(O)].
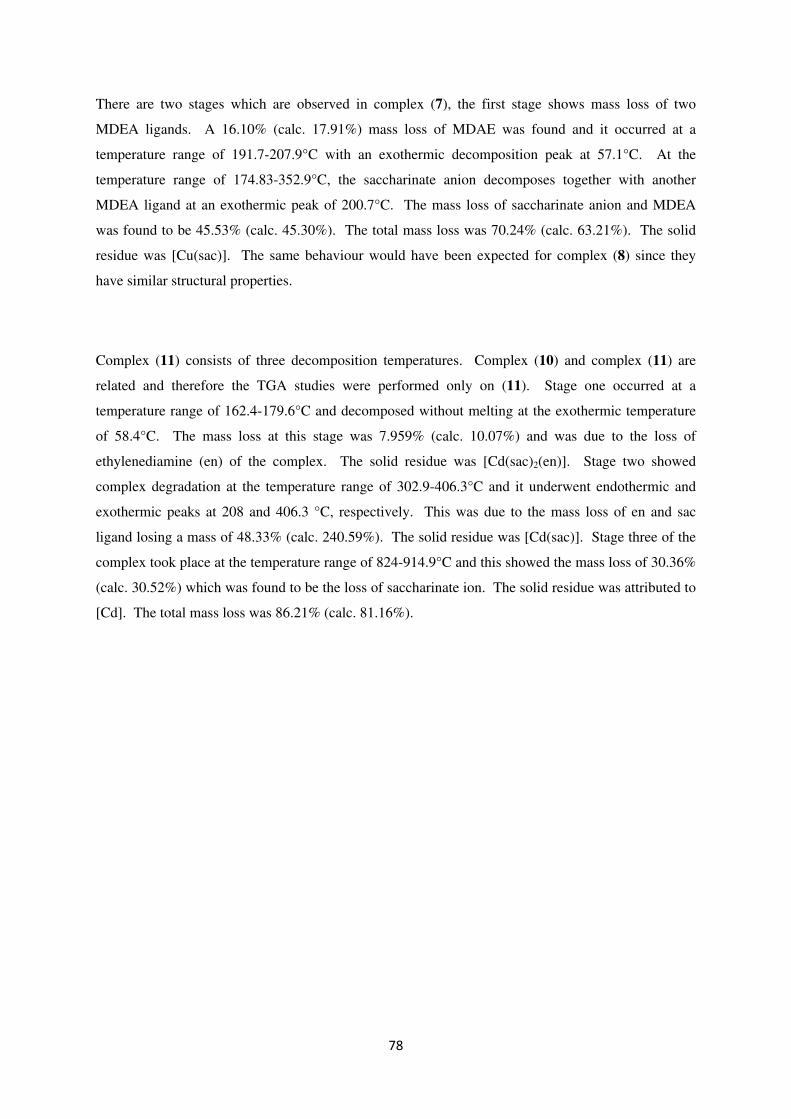
78
There are two stages which are observed in complex (7), the first stage shows mass loss of two
MDEA ligands. A 16.10% (calc. 17.91%) mass loss of MDAE was found and it occurred at a
temperature range of 191.7-207.9°C with an exothermic decomposition peak at 57.1°C. At the
temperature range of 174.83-352.9°C, the saccharinate anion decomposes together with another
MDEA ligand at an exothermic peak of 200.7°C. The mass loss of saccharinate anion and MDEA
was found to be 45.53% (calc. 45.30%). The total mass loss was 70.24% (calc. 63.21%). The solid
residue was [Cu(sac)]. The same behaviour would have been expected for complex (8) since they
have similar structural properties.
Complex (11) consists of three decomposition temperatures. Complex (10) and complex (11) are
related and therefore the TGA studies were performed only on (11). Stage one occurred at a
temperature range of 162.4-179.6°C and decomposed without melting at the exothermic temperature
of 58.4°C. The mass loss at this stage was 7.959% (calc. 10.07%) and was due to the loss of
ethylenediamine (en) of the complex. The solid residue was [Cd(sac)2(en)]. Stage two showed
complex degradation at the temperature range of 302.9-406.3°C and it underwent endothermic and
exothermic peaks at 208 and 406.3 °C, respectively. This was due to the mass loss of en and sac
ligand losing a mass of 48.33% (calc. 240.59%). The solid residue was [Cd(sac)]. Stage three of the
complex took place at the temperature range of 824-914.9°C and this showed the mass loss of 30.36%
(calc. 30.52%) which was found to be the loss of saccharinate ion. The solid residue was attributed to
[Cd]. The total mass loss was 86.21% (calc. 81.16%).

79
3.6 References:
1. S. Z. Haider and K. M. A. Malik, J. Bangladesh Acad. Sci., 1982, 6, 119-125.
2. O. Z. Yeşilel, G. Günay and O. Büyükgüngör, Polyhedron, 2011, 30, 364-371.
3. E. J. Baran, Quim. Nova, 2005, 28, 326-328.
4. E. J. Baran and V. T. Yilmaz, Coord. Chem. Rev., 2006, 250, 1980-1999.
5. Z. Yugeng, Trans. Met. Chem., 1994, 19, 446-448.
6. V. T. Yilmaz, S. Hamamci and C. Thöne, Z. Anorg. Allg. Chem., 2003, 629, 711-715.
7. E. B. Miminoshvili, A. N. Sobolev, T. N. Sakvarelidze, K. E. Miminoshvili and E. R.
Kutelia, Acta Cryst., 2003, C59, m118-m120.
8. S. Z. Haider, K. M. A. Malik, S. Das and M. B. Hursthouse, Acta Cryst., 1984, C40,
1147-1150.
9. S. Kirschner, Inorg. Synth., Wiley, 2009, 47-50.
10. A. T. Raad, D. M. Boghaei and H. Reza Khavasi, J. Coord. Chem., 2009, 63, 273-283.
11. S. M. Teleb, Quim. Argent., 2004, 92, 31-40.
12. J. Clayden, N. Greeves and S. Warren, Organic Chemistry, OUP Oxford, 2012, 56-64.
13. S. Z. Haider, K. M. A. Malik, K. J. Ahmed, G. B. Kauffman and M. Karbassi, in Inorg.
Synth., John Wiley & Sons, Inc., 2007, 47-51.
14. S. Guney, V. T. Yilmaz and W. T. A. Harrison, J. Coord. Chem., 2006, 59, 1123-1130.
15. G. Gliemann, Ber. Bunsen-Ges. Phys. Chem, 1978, 82, 1263-1263.
16. F. A. Cotton, R. Francis and W. D. Horrocks, J. Phys. Chem., 1960, 64, 1534-1536.
17. M. A. Cinellu, L. Maiore, A. Schier, H. Schmidbaur and D. Rossi, Z. Naturforsch.,
2008, 63b, 1027-1034.
18. S. Z. Haider, K. M. A. Malik, K. J. Ahmed, H. Hess, H. Riffel and M. B. Hursthouse,
Inorg. Chim. Acta, 1983, 72, 21-27.
19. L. E. Orgel, An Introduction to Transition-metal Chemistry Ligand-field Theory, Methuen,
1963, 392-408.

80
20. H. Icbudak, H. Olmez, O. Z. Yesilel, F. Arslan, P. Naumov, G. Jovanovski, A. R.
Ibrahim, A. Usman, H.-K. Fun, S. Chantrapromma and S. W. Nge, J. Mol. Struct.,
2003, 657, 255-270.
21. I. B. Bersuker, Electronic Structure and Properties of Transition Metal Compounds:
Introduction to the Theory, John Wiley & Sons, 2010, 393-425.
22. S. A. Shaker, Y. Farina, S. Mahmmod and M. Eskender, Sains Malaysiana, 2010, 39,
957-962.
23. V. T. Yilmaz, Y. Topcu, F. Yilmaz and C. Thoene, Polyhedron, 2001, 20, 3209-3217.
24. C.-C. Wang, W.-C. Lo, C.-C. Chou, G.-H. Lee, J.-M. Chen and S.-M. Peng, Inorg.
Chem., 1998, 37, 4059-4065.
25. O. Andac, Y. Topcu, V. T. Yilmaz and W. T. A. Harrison, Acta Cryst., 2002, C58, m14-
m16.
26. F. S. W. Potwana and W. E. Van Zyl, Acta Cryst., 2011, E67, m1667-m1668.
27. F. S. W. Potwana and W. E. Van Zyl, Acta Cryst., 2011, E67, m1635.
28. P. A. M. Williams, E. G. Ferrer, N. Baeza, O. E. Piro and E. J. Baran, Z. Anorg. Allg.
Chem., 2006, 632, 619-623.
29. F. S. W. Potwana, B. E. Shandu and W. E. Van Zyl, Acta Cryst., 2011, E67, m1665.
30. V. T. Yilmaz, Y. Topcu, F. Yilmaz and C. Thoene, Polyhedron, 2001, 20, 3209-3217.
31. O. V. Quinzani, S. Tarulli, O. E. Piro, E. J. Baran and E. E. Castellano, Z.
Naturforsch., 1997, 52, 183-187.
32. G. Jovanovski and B. Kamenar, Acta Cryst., 1982, C11, 247-255.
33. G. Jovanovski, B. Kamenar, G. Ferguson and B. Kaitner, Acta Cryst., 1988, C44, 616-618.
34. V. T. Yilmaz, S. Caglar and W. T. A. Harrison, Acta Cryst., 2004, C60, m35-m38.
35. V. T. Yilmaz, V. Kars and C. Kazak, Z. Naturforsch., 2006, 61b, 555-229.
36. V. T. Yilmaz, S. Caglar and W. T. A. Harrison, J. Coord. Chem., 2005, 58, 549-558.
37. P. A. M. Williams, E. G. Ferrer, K. A. Pasquevich, E. J. Baran, Z. Chaia, E. E. Castellano
and O. E. Piro, Z. Anorg. Allg. Chem., 2000, 626, 2509-2514.

81
38. I. Pascual, Acta Cryst., 1995, C51, 2028-2030.
39. C. A. Johns, G. M. Golzar Hossain, K. M. Abdul Malik, S. Zahir Haider and U. K.
Rowzatur Romman, Polyhedron, 2001, 20, 721-726.
40. V. T. Yilmaz, S. Caglar and W. T. A. Harrison, Z. Anorg. Allg. Chem., 2004, 630,
1126-1130.
41. F. Nunzi, E. Ruiz, J. Cano and S. Alvarez, J. Phys. Chem., 2007, C111, 618-621

82
CHAPTER 4
SCARCE CATIONIC COMPLEXES WITH
SACCHARINATE AS ANION
4.1 Introduction
Saccharin, also known as 1,2-benzisothiazoline-3-(2H)one 1,1-dioxide or o-sulphobenzimide is a very
interesting and a diverse polyfunctional ligand in inorganic chemistry.1 Its alkali and alkali-earth salts
are very soluble in water and are used to prepared saccharinato complexes. These salts are used as
non-caloric artificial sweeteners and as food additives.2 The deprotonated form has the ability to bind
to the metal centres via the amino nitrogen, carbonyl oxygen or the sulfonyl oxygen atoms.3-5 In the
recent past there has been an increasing interest in the synthesis of amine saccharinato complexes due
to their ability to modify DNA in order to fight cancer.6 Sen and Dotson,7 and Brannon et al.8 have
shown that amines readily coordinate to divalent late metal centres.9 Depending on the type of amine
used in the reaction, these can either coordinate in a mono-, bi- or tridentate mode to the metal
complexes.10 The alcohol amines can dissociate and lose the alcoholic proton to form an aminate
which can also behave as a strong chelating agent. This behaviour is mostly observed in dimers
which are mostly formed by copper(II) cations and cobalt(II) cations. A number of complexes have
been reported where the saccharinate anion acts as a counter ion, and this is one of the reasons that
saccharin is an interesting ligand because it possesses various possible ligation modes as observed in
the following complexes where sac resides in the outer coordination sphere:[M(dmpy)2](sac)2·2H2O,
(M =Co),11 [Cu(H2O)2(pyet)2](sac)2,12 [Ni(pyet)2(H2O)2](sac)2,
13 [Ni(dien)2]·2(sac)·H2O,14
[Ni(dmpy)2](sac)2·2H2O,15 and [M(H2O)4(py)2](sac)2·4H2O (M = Co, Ni)16 except complexes
[Cu2(dea)2(sac)2](dea = diethanolamine)17 and [Cu2(pypr)2(sac)2] (pypr = 2-pyridinepropanoxy anion).
The reason saccharin can be a counter ion in a structural complex is that, when a bulky ligands is used
in the reaction it might result in one saccharin bonding directly to the metal centre or both the
saccharin ligand displacing and forming part of the coordination sphere. The present study
demonstrates the characterisation of three structures in which the transition metal centres Ni(II),
Cu(II) and Co(II) are coordinated in a variety of denticities. The amines used in this study are: N-
methyldiethanolamine (3º), 2-(methylamino)ethanol (2º) and ethylenediamine (1º). These are a class
of organic molecules which consists of the moiety of the amine and alcohol groups.

83
4.2 Results and Discussion
4.2.1 Synthesis of Precursors, [M(sac)2(H2O)4]·2H2O
The saccharinato complex of the type [M(sac)2(H2O)4]·2H2O shown in Scheme 4.1, was prepared
according to the preparation procedure outlined by Haider et al.18
see Chapter 3. The reaction
produces complexes in good yield of 75 to 85%.
Scheme 4. 1 Synthesis of [M(sac)2(H2O)4]·2H2O precursors.
4.2.2 Preparation of Metal Complexes
The following set of amines were used to prepared complexes(6), (9) and (12), respectively: N-
methyldiethanolamine (MDEA),2-(methylamino)ethanol (MEA) and ethylenediamine (en). The
direct addition of amines in the methanolic solution of [M(sac)2(H2O)4]·2H2O at ~80°C yielded a
colour change of the solutions to produce complexes (6), (9) and (12). Upon standing for three days,
the solution of complex (6) yielded violet crystals. The crystals of complex (9) were also harvested
after three days when the solution was allowed to stand at room temperature (r.t.) to cool down. The
crystals of complex (12) were obtained after a week of allowing the solution to stand at r.t.. The X-
ray crystal analysis indicated that the complex (12) contains bicarbonate ion from the starting material
of cobalt bicarbonate hexahydrate. This occurred due the strong binding constant of CO32- ions to the
Co2+cation which could not be removed. Real et al. studied cobalt dissolution in a carbonate/
bicarbonate media, and found that when cobalt(II) dissolves in an aqueous media, it forms a Co(OH)
as intermediate-adsorbed species and this species participates at some equilibrium reactions with other
adsorbed species as Co(OH)+ and CoCO3, making it hard to separate the products.19 Below is the
schematic representation of [M(sac)2(H2O)4]·2H2O reacting with amines to replace the labile aqua
ligands of the starting material to yield desired products. The yield of the complexes ranged from 75

84
to 95 %. The CHN micro-analysis confirms the formation of the products, refer to the experimental
procedure Chapter 2 and see Scheme 4.2 for chemical properties. Table 4.1 shows a list of physical
properties of the complexes.
Scheme 4. 2 Reactions showing the formation of saccharinato complexes containing amines
Complexes (6) and (12) have a decomposition temperature indicating that the metal centres are
coordinated to N-methyldiethanolamine for (6); and ethylenediamine and carbonate ions for (12),
respectively, which indicates that they are strongly held together by the ionic bonds of saccharinate
counter ions. Complex (9) has a sharp melting point temperature which shows high purity and that it
is weakly held by the alkoxo-bridging groups of the ligand which collapses when heated causing the
molecule to melt easily.
Table 4. 1 Tabulated analytical results of saccharinato complexes
Complexes Colour Melting point
(°C)
Molecular
weight
Yield (%) Anal. Found (Cal.) (%)
C H N
6 Violet 225a
661.38 75.0 43.0
(43.3)
4.6
(4.8)
8.6
(8.4)
9 Blue 165 789.90 76.0 39.2
(39.5)
5.0
(5.4)
10.2
(10.6)
12
Red 135a 896.69 95.0 33.5
(33.2)
4.9
(4.4)
15.3
(15.0) a decomposition temperature

85
The complexes could not be analysed by Nuclear Magnetic Resonance (NMR) due their paramagnetic
nature. This behaviour is common for metal centres like Ni2+, Cu2+ and Co2+. In this case the ligands
are high-spin and are likely to be drawn towards the strong magnetic field which are positioned in a
parallel position to the field lines.
4.3 Spectral Properties
4.3.1 Fourier Transform Infrared spectroscopy (FTIR) Spectral Data of Complexes
The most significant IR bands of the complexes are outlined in Table 4.2. The bands in the range of
3187 to 3485 cm-1 show characteristic ν(OH)vibrations which can be attributed to the hydroxyl group
of the ethanol group with strong hydrogen bonding for complex (9) and to the water of crystallization
for complex (12). Complexes (6), (9)and (12) showed sharp stretching bands in the range 2823 to
3095 cm-1 and 2690 to 2954 cm-1which belong to the ν(NH) and ν(N-CH) of amines, respectively.
The distinct strong absorption vibration band of the carbonyl group ν(C=O) for these complexes
appears at the range 1577 to 1627 cm-1. The free saccharin has a vibration band of 1720 cm-1 20. The
vibrational stretches at 1289 to 1336 cm-1 and 947 to 979 cm-1 vibration intensity are assigned to
ν(CNS)sym and ν(CNS)asym moiety of the saccharin ligand of the counter ion, respectively. There are
closely related stretches at a range of 1248 to 1286 and 1141 to 1155 cm-1 which are assigned to
νasym(O=S=O) and νsym(O=S=O), respectively. The band which was observed to be in the range of
1456 to 1583cm-1was assigned to the ν(C=C) stretch of the saccharin ring. For pure saccharin, this
band occur at 1462 to 1600 cm-1 20. The wavenumbers in the range 300 to 550 cm-1 are due to M-O
and M-N vibration bands.21
Table 4. 2 IR spectral data for the metal complexes
Complexes ν(OH) ν(NH)/
N-CH
ν(C=O) ν(SO2) ν(CNS) ν(C=C)
asym sym asym Sym
6 ‒ 2917,
2690
1613 1286 1155 979 1336 1580
9 3187 2823,
2876
1627 1255 1147 947 1330 1583,
1456
12 3458 3095,
2954
1577 1248 1141 949 1289 1457
The bands obtained in the experimental data lie very close to those of the [M(sac)2(H2O)4]·2H2O
complex whereby M(II) = Ni, Cu and Co. The spectral frequencies of the [M(sac)2(H2O)4]·2H2O was
previously reported.22 The current complexes have been shown to possess similar infrared properties.

86
The important infrared peaks are observed at the following wavenumbers: 3500 to 3100 cm-1 for
different types of the aqua ligands ; 1610cm-1 for carbonyl group; 1280 cm-1 for ν(SO2)asym; 1150 cm-1
for ν(SO2)sym;1570 to 1479 cm-1 for C=C and 942 cm-1 for ν(CNS)asym and 1327 cm-1 for ν(CNS)sym.23,
24
4.3.2 UV-Vis spectroscopy
The UV-Vis spectroscopy data for complexes (6), (9) and (12) are reported in Table 4.3, together with
the λmax values and molar absorptiviy in parenthesis. The λmax values of complexes (6), (9) and (12)
are compared with those that have been previously reported for sodium saccharin which exhibits two
absorption bands at λmax = 220 nm, ε = 10166 L mol-1 cm-1 and at λmax = 268nm, ε = 1628 L mol-1 cm-
1. This was assigned as a ligand-to-ligand charge-transfer intraligand L-L* transition25, and
[M(sac)2(H2O)4]·2H2O complexes at λmax = 525 nm and 280 nm where M(II) =Co, λmax = 680 nm, 400
nm and 280 nm where M(II) =Ni and λmax = 780 nm and 355 nm where M(II) =Cu.18, 22 Not too much
information is known about the UV-Vis spectroscopy of complexes that contain saccharinate counter
ion.
Table 4. 3 Electronic spectra results of saccharinato complexes
Complexes λmax (nm), ԑ (M-1 cm-1)x
ligands d‒d
6 275(28266) ‒ 419(164), 783(127)
9 270(5223) 370(5010) 652(77.8)
12 276(4142) ‒ 379(69.7),527(74.5)
The UV spectrum of complex (6) consists of three absorption bands which appeared at 275 nm for
complex (6) which are close to the values of those reported previously. The d-d transition state of
these two octahedral coordination geometries are in the range 419 to 783 nm. The values of λmax of
(6) are red-shifted compared to the starting [M(sac)2(H2O)4]·2H2O. Molar absorptivities of the
ligands that participate in the charge-transfer absorption are normally larger than 10,000 L mol-1 cm-
1in Table 4.3. The area which indicates the presence of intraligand L-L* transition is greater than 500
M−1cm−1 and less than 10, 000 M−1cm−1 which indicates the formation of the sacharinato complexes.
The UV spectrum of the saccharinato complex (9) reported herein consists of three absorption bands.
The bands at 270and 370 nm corresponds to the saccharinate anion of the complexes. These
absorption peaks are correspond with intraligand L-L* transition due to LMCT arising from an un
occupied ligand π -orbital to the empty d-orbital of Cu(II). The low energy intensity at 652 nm
resulting from the d-d transition are noticed due to MLCT transition which occurs when the
saccharinato complexes and other related complexes are in a low oxidation state and this shows the

87
activity whereby the ligands are easily reduced in solution. Complex (12) containing Co(II) showed
distinct UV-visible absorption behaviour at a different region of the spectra. This complex's UV
spectrum displays three absorption bands. The intraligand L-L* transition observed appeared to be
red shifted compared to the values of those observed in saccharin anion and the
[M(sac)2(H2O)4]·2H2O complex.18, 20, 26 The intraligand L-L* transition of the saccharinate anion of
the complexes are observed at 276 nm.
4.4 Description of the Crystal Structures of Saccharinato Complexes
4.4.1 X-ray Structure Determination of the Complexes
The instruments, conditions and programs in which the crystal structures were solved are outlined in
Chapter 2, the experimental section. Herein is the summary of the crystallographic data of complexes
which is given in Table 4.4.
Table 4. 4 Crystal data and structure refinement for complexes (6), (9) and (12)
6 9 12
Formula (C10H26N2NiO4).2(sac) (C12H34N2Cu2N4O4).2(sac) C24 H46 Co2 N10 O15 S2
Mr Crystal system
661.38 Triclinic
789.90 Triclinic
896.69 Triclinic
Space group P-1 (No.2) P-1 (No.2) P-1 (No.2) a, Å 8.5680(5) 8.9048(13) 8.8000(2) b, Å 9.0490(7) 10.6791(8) 11.9050(3) c, Å 10.5720(9 10.7255(7) 17.9938(4) α, deg 106.139(3) 118.4340(10) 74.3790(10) β, deg 94.681(4) 107.640(2) 88.4700(10) γ, deg 111.196(4) 111.196(4) 78.4910(10) V 718.76(10) 821.46(15) 1778.24(7) Z 1 1 2 ρcalcd, g cm–3 1.528 1.597 1.675 Μ, mm–1 F(000) Crystal size (mm3) Θ Range (º) Index range (h,k,l)
0.881 346 0.18x0.22x0.28 2.6,25.0 0/10, -10/10, -12/12
1.484 410 0.12x0.18x0.22 2.4,28.3 -11/11, -12/13, -13/7
1.133 932 0.41x0.20x0.14 1.8,28.4 -11/11, -15/15, -24/21
T, K 173(2) 173(2) 100(2) Reflections collected 20824 10027 46448 Independent reflections 2538 3365 8818 Rint
Completeness to Goodness-of-fit on F2
0.048 Θ = 25.0º 100% 1.12
0.027 Θ = 26.4º 100% 1.06
0.0427 Θ = 28.4º 99.1% 1.046
Final R indices [I > 2σ(I)] R1 = 0.03719, wR2 = 0.0711
R1 = 0.0344 wR2 = 0.0893
R1 = 0.0416 wR2 = 0.1151
R indices (all data) R1 = 0.03719 wR2 = 0.0711
R1 = 0.0344 wR2 = 0.0893
R1 = 0.0501 wR2 = 0.1230
Largest diff. peak and hole, e / Å
-0.42 and -0.36 -0.56 and -1.25 1.370 and -1.170
w = 1/[\s^2^(Fo^2^)+(0.0204P)^2^+0.7574P] where P=(Fo^2^+2Fc^2^)/3 for complex(6), w = 1/[\s^2^(Fo^2^)+(0.0366P)^2^+1.1365P] where P=(Fo^2^+2Fc^2^)/3 for complex (9)
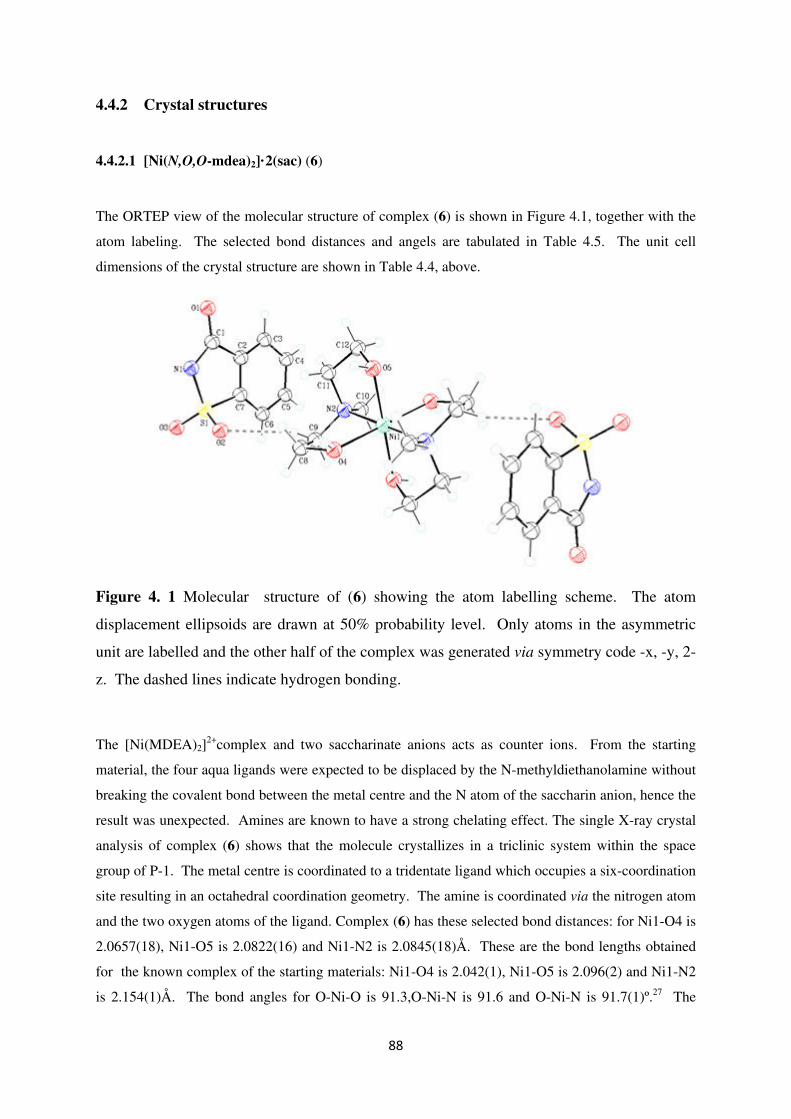
88
4.4.2 Crystal structures
4.4.2.1 [Ni(N,O,O-mdea)2]·2(sac) (6)
The ORTEP view of the molecular structure of complex (6) is shown in Figure 4.1, together with the
atom labeling. The selected bond distances and angels are tabulated in Table 4.5. The unit cell
dimensions of the crystal structure are shown in Table 4.4, above.
Figure 4. 1 Molecular structure of (6) showing the atom labelling scheme. The atom
displacement ellipsoids are drawn at 50% probability level. Only atoms in the asymmetric
unit are labelled and the other half of the complex was generated via symmetry code -x, -y, 2-
z. The dashed lines indicate hydrogen bonding.
The [Ni(MDEA)2]2+complex and two saccharinate anions acts as counter ions. From the starting
material, the four aqua ligands were expected to be displaced by the N-methyldiethanolamine without
breaking the covalent bond between the metal centre and the N atom of the saccharin anion, hence the
result was unexpected. Amines are known to have a strong chelating effect. The single X-ray crystal
analysis of complex (6) shows that the molecule crystallizes in a triclinic system within the space
group of P-1. The metal centre is coordinated to a tridentate ligand which occupies a six-coordination
site resulting in an octahedral coordination geometry. The amine is coordinated via the nitrogen atom
and the two oxygen atoms of the ligand. Complex (6) has these selected bond distances: for Ni1-O4 is
2.0657(18), Ni1-O5 is 2.0822(16) and Ni1-N2 is 2.0845(18)Å. These are the bond lengths obtained
for the known complex of the starting materials: Ni1-O4 is 2.042(1), Ni1-O5 is 2.096(2) and Ni1-N2
is 2.154(1)Å. The bond angles for O-Ni-O is 91.3,O-Ni-N is 91.6 and O-Ni-N is 91.7(1)º.27 The

89
average bond distances of the Ni-N of different ligands range from 2.094–2.119Å for complexes
[Ni(pyet)2(H2O)2](sac)2, [Ni(dien)2]·2(sac)·H2O and [Ni(dmpy)2](sac)2·2H2O and their Ni-Nsac bond
distances are 2.262(2) and 2.2874(19)Å28, 29. These bond lengths and bond angles agree with the bond
lengths and bond angles of [Ni(pyet)2(H2O)2](sac)2 and others.
4.4.2.2 [Cu2(µ-O)2(mea)4]·2(sac) (9)
A view of the molecular structure of complex (9) is shown in Figure 4.2, together with selected bond
distances and bond angles in Table 4.5.
Figure 4. 2 The ORTEP crystal structure of (9) showing the labelling scheme. The atom
displacement ellipsoids are drawn at 50% probability level. The atoms in the asymmetric
unit are labelled and the other half of the complex was generated via symmetry code 1-x, 1-y,
1-z. The dashed interactions show hydrogen bonding of the complex.
The unit cell dimensions of the crystal structure are shown in Table 4.4. The molecular structure of
(9) shows that 2-(methylamino)ethanol is a bidentate chelating ligand via the N and O-atoms. This
amine is a neutral ligand and is coordinated to the two copper(II) metal centres forming a binuclear
molecular complex in which the saccharinate anions acts as a counter ion. The crystallographic data
indicates that the single X-ray structure of complex (9) crystallises in a triclinic system with the space
group of P-1 whereby the metal centre is are positioned at the inversion centre of the four amine
ligands. The coordination geometry of complex (9) is a distorted square planar around each copper
centre. This complex is formed by two alkoxo-bridges whereby the two copper centres are connected
by the deprotonated oxygen atoms of the 2-(methylamino)ethanol. The loss of one hydrogen atom
from both ligands of ethanol resulted in 2-(methylamino)ethanol acting as a bidentate donor via the

90
oxygen and nitrogen atoms which bridge the two copper atoms. This geometry resulted from the
addition of the strong amine ligand to the precursor complex, which caused the covalent bond of the
staring material to be broken and replaced by the stronger covalent bonding of the amines. The
distance between the Cu···Cu atoms is 3.016Å which falls within the Cu···Cu interaction distance of
2.99(2)Å for [Cu2(sac)2(µ-dea)2] and 3.0404(7)Å for [Cu2(sac)2(µ-pypr)2] and other observed alkoxo-
the bridged copper(II) dimeric structures.17,31 There are many examples of the closely related
complex which illustrate the ranges of bond distances and angles that could be used to compare with
those of the complexes. From Table 4.5, the bond distance of Cu1-O4 is 2.290(2), Cu1-O5 is
1.942(2), Cu1-N2 is 2.017(3), Cu1-N3 is 2.026(3) and Cu1-O5a is 1.959(2)Å for complex (9). In
previously reported complexes of dinuclear copper(II) complexes, the Cu-N saccharinate bond
distance is 1.9792(13)Å and it is shorter than these average bond distances 2.032(2), 2.033, 2.073 and
2.1776(16)Å found in the following complexes: [Cu(H2O)(py)2(sac)2]30, [Cu(H2O)2(pyet)2](sac)2,
[Cu(sac)2(bzim)(H2O)(EtOH)]·2EtOH31 and [Cu(dipyr)2(sac)]sac·0.25H2O31.
4.4.2.3 Hydrogen bonding of the complexes
The atoms which are most likely to participate in hydrogen bonding interactions are O, H, N and some
short interaction which result from the S-atoms and the π· · ·π stacking interactions as a result of the
rich electronic system. There are two significant hydrogen bonding interactions which can help
stabilise the molecule: intra-and intermolecular hydrogen bonding.
Table 4. 5 Tabulated selected bond lengths (Å ) and angles (°) for complexes (6) and (9) and
hydrogen bonding coordination geometry for complexes (6)b and (9)e
Ni1-O4 2.0657(18)
O4-Ni1-O5 94.92(7)
Ni1-O5 2.0822(16) O4-Ni1-N2 82.15(7)
Ni1-N2 2.0845(18) O4-Ni1-O4a 180.00
O4-Ni1-O5a 85.09(7)
O4-Ni1-N2a 97.85(7)
O5-Ni1-N2 83.70(7)
O4a-Ni1-O5 85.09(7)
O5-Ni1-O5a 180.00
Cu1-O4 2.290(2) O4-Cu1-O5 100.24(8) O5a-Cu1-N3 151.71(12)
Cu1-O5 1.942(2) O4-Cu1-N2 79.71(9) Cu1-O4-C8 106.95(15)
Cu1-N2 2.017(3) O4-Cu1-N3 104.88(11) Cu1-N2-H2N 110(2)
Cu1-N3 2.026(3) O4-Cu1-O5a 100.49(8) Cu1-N2-H3N 107(2)
Cu1-O5a 1.959(2) O5-Cu1-N2 178.20(10) Cu1a-O5-C11 112.7(2)
O5-Cu1-N3 84.60(12) Cu1-O5-C11 112.7(2)
O5-Cu1-O5a 78.72(9) Cu1-N3-C12 107.0(2)
O5a-Cu1-N2 99.51(10) ‒ ‒

91
D-H···A d(D-H) (Å) d(H···A) (Å) d(D···A) (Å) <(DHA) (°)
O(4)˗H(4O)···O(1) 0.97(3) 1.64(3) 2.601(2) 170(3)
O(5)-H(5O)···N(1) 0.97(3) 1.72(3) 2.679(3) 176(3)
C(4)-H(4)···O(3)m 0.9500 2.5100 3.421(3) 162.00
C(6)-H(6)···O(2)h 0.9500 2.5700 3.383(3) 144.00
C(8)-H(8B)···O(1)c 0.9900 2.4400 3.291(3) 144.00
C(9)-H(9A)···O(3)e 0.9900 2.5900 3.428(3) 143.00 b Translation of Symmetry Code: (m) 1+x,y,z ; (h) 1-x,1-y,1-z; (c) 1-x,-y,2-z; (e) x,y,1+z
D-H···A d(D-H) (Å) d(H···A) (Å) d(D···A) (Å) <(DHA) (°)
N(2)˗H(2N)···N(1)d 0.97(2) 2.15(2) 3.005(4) 147(3)
N(3)-H(3N)···O(2)b 0.97(4) 2.21(4) 3.036(4) 142(3)
O(4)-H(4O)···O(1) 0.97(4) 1.72(4) 2.671(4) 166(4)
C(8)-H(8B)···O(1)d 0.9900 2.4900 3.411(4) 154.00
C(10)-H(10B)···O(2)b 0.980 2.5000 3.376(4) 149.00 e Translation of Symmetry Code: (d) -1+x,y,-1+z; (d) 1-x,-y,1-z
Figure 4. 3 The ORTEP crystal unit cell packing of (6) viewed along the crystallographic b
axis. The elements are shown as (C = dark grey, H = light grey, S = yellow, O = red, N =
blue and Ni = green).
The hydrogen bonding of complexes (6) and (9) are shown in Table 4.5 and presented as dash lines in
Figure 4.1 and Figure 4.2, respectively. This shows that the crystal packing of the complex is
stabilised throughout by intermolecular hydrogen bonding together with weak van der Waals
interactions which result in 3D framework lattice of the complexes. Complex (6) shows that the CH
and OH of the N-methyldiethanolamine have a strong intermolecular hydrogen bonding with the N
atom of the saccharinate counter ions and the S atoms of the sulfonyl group and the O atom of the
carbonyl group. The N-methyldiethanolamine ligand H atoms of the OH and CH groups, carbonyl

92
oxygen atoms and the oxygen sulfonyl atoms form a mono-, bi- and trifurcated intermolecular
hydrogen bonding with the hydrogen of the phenyl from the adjacent saccharinate counter ions, see
Table 4.5. Therefore these bonds helps in forming a 3D infinite network for complex (6) in Figure
4.3.
Figure 4. 4 The ORTEP crystal packing of (9) view down along the crystallographic b axis.
The elements are shown as (C = dark grey, H = light grey, S = yellow, O = red, N = blue and
Cu = orange).
The 3D framework of complex (9) is stabilised by the hydrogen bonding caused by OH, .i.e. (N-
H···O) of the 2-(methylamino)ethanol forming a intermolecular interaction with the oxygen atom of
the saccharinate counter ions and the N-H··N of the amine also participating in forming the
intermolecular hydrogen bonding with the oxygen atom of the sulfonyl atoms, see Table 4.5. This is
accompanied by the hydrogen atoms of the benzene ring interacting with the OH of the amine and the
methylene hydrogen atoms interacting with the oxygen atom of the sulfonyl group. The hydrogen
bonding interactions help to stabilise the complex into an infinite 3D network structure, see Figure
4.4.
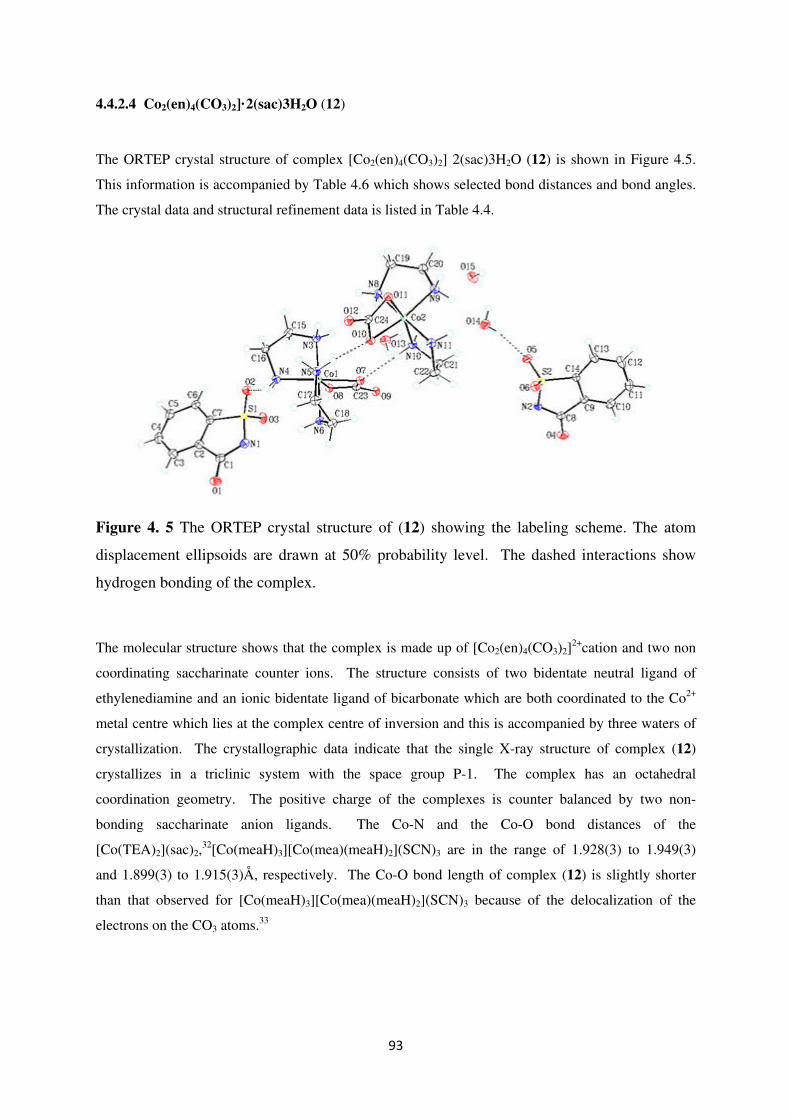
93
4.4.2.4 Co2(en)4(CO3)2]·2(sac)3H2O (12)
The ORTEP crystal structure of complex [Co2(en)4(CO3)2] 2(sac)3H2O (12) is shown in Figure 4.5.
This information is accompanied by Table 4.6 which shows selected bond distances and bond angles.
The crystal data and structural refinement data is listed in Table 4.4.
Figure 4. 5 The ORTEP crystal structure of (12) showing the labeling scheme. The atom
displacement ellipsoids are drawn at 50% probability level. The dashed interactions show
hydrogen bonding of the complex.
The molecular structure shows that the complex is made up of [Co2(en)4(CO3)2]2+cation and two non
coordinating saccharinate counter ions. The structure consists of two bidentate neutral ligand of
ethylenediamine and an ionic bidentate ligand of bicarbonate which are both coordinated to the Co2+
metal centre which lies at the complex centre of inversion and this is accompanied by three waters of
crystallization. The crystallographic data indicate that the single X-ray structure of complex (12)
crystallizes in a triclinic system with the space group P-1. The complex has an octahedral
coordination geometry. The positive charge of the complexes is counter balanced by two non-
bonding saccharinate anion ligands. The Co-N and the Co-O bond distances of the
[Co(TEA)2](sac)2,32[Co(meaH)3][Co(mea)(meaH)2](SCN)3 are in the range of 1.928(3) to 1.949(3)
and 1.899(3) to 1.915(3)Å, respectively. The Co-O bond length of complex (12) is slightly shorter
than that observed for [Co(meaH)3][Co(mea)(meaH)2](SCN)3 because of the delocalization of the
electrons on the CO3 atoms.33

94
Table 4. 6 Tabulated selected bond lengths (Å) and bond angles (°) for complex (12) and
hydrogen bonding coordination geometry for complex (12)k
Co1-O7 1.9303(15) N8-Co2-N11 178.47(8)
Co1-O8 1.9207(15) O1-Co2-N11 167.63(7)
Co1-N6 1.9404(17) O16-Co2-N9 97.38(7)
Co1-N5 1.9525(17) N6-Co2-N3 178.58(8)
Co1-N3 1.9596(18) N4-Co1-O7 167.73(7)
Co1-N4 1.9465(18) N5-Co1-O8 167.08(7)
C23-O9 1.244(3) N6-Co1-N4 93.89(8)
Co2-O11 1.9256(15) O7-Co1-N5 98.82(7)
Co2-O10 1.9231(15)
Co2-N11 1.9395(18)
Co2-N8 1.9473(18)
Co2-N9 1.9418(18)
Co2-C24 2.332(2)
Co2-C23 2.336(2)
Co2-N10 1.9485(17)
D-H···A d(D-H) (Å) d(H···A) (Å) d(D···A) (Å) <(DHA) (°)
N(3)-H(3A)···O(12)b 0.92 2.08 2.990(2) 168
N(3)-H(3B)···O(9)a 0.92 2.03 2.934(2) 166
N(4)-H(4A)···O(2) 0.92 2.19 2.996(2) 145
N(4)-H(4B)···O(14) 0.92 2.11 2.999(3) 162
N(5)-H(5A)···O(10) 0.92 1.92 2.839(2) 174
N(5)-H(5B)···O(11)b 0.92 2.27 3.101(2) 150
N(6)-H(6A)···O(15) 0.92 1.91 2.818(2) 170
N(6)-H(6B)···O(4) 0.92 1.98 2.855(3) 158
N(8)-H(8A)···O(9)a 0.92 2.05 2.966(2) 175
N(8)-H(8B)···O(12)b 0.92 2.00 2.922(2) 175
N(9)-H(9A)···O(5)e 0.92 2.24 3.088(3) 153
N(9)-H(9B)···O(3)a 0.92 2.08 2.855(3) 141
N(10)-H(10A)···O(7) 0.92 2.04 2.962(2) 175
N(10)-H(10B)···O(8)a 0.92 2.11 2.950(2) 151
N(11)-H(11A)···N(2)e 0.92 1.93 2.841(2) 173
N(11)-H(11B) · · ·O(13)f 0.92 2.16 2.960(3) 145
O(13)-H(13A)···O(12) 0.86(4) 2.04(4) 2.875(2) 168(3)
O(13)-H(13B)···O(6)g 0.90(4) 2.24(3) 3.091(2) 156(4)
O(14)-H(14A)···O(5)e 0.80(4) 1.99(4) 2.780(3) 170(4)
O(14)-H(14B)···O(1)h 0.87(4) 2.04(4) 2.884(3) 165(4)
O(15)-H(15C)···O(1)h 0.77(4) 2.03(5) 2.762(3) 160(4)
O(15)-H(15D)···N(1) 0.85(4) 2.00(4) 2.829(3) 166(3)
C(16)-H(16A)···O(11)b 0.99 2.55 3.482(3) 156
C(17)-H(17A)···O(14) 0.99 2.44 3.295(3) 144
C(18)-H(18B)·· ·O(2)g 0.99 2.56 3.433(3) 148
C(22)-H(22B)·· ·O(9)e 0.99 2.46 3.423(3) 163
k Translation of Symmetry Code:(a) 1-x,1-y,1-z; (b) 1-x,-y,1-z;(c) 1+x,-1+y,z; (d) -1+x,y,z; (e) -x,1-y,1-z; (f)-x,-y,1-z; (h) x,-1+y,z; (i) 1-x,1-y,-z.

95
Figure 4. 6 The ORTEP crystal packing of (12) viewed down along crystallographic b axis.
The elements are shown as (C = dark grey, H = light grey, S = yellow, O = red, N = blue and
Co = light green).
4.5 Thermal analysis
The thermal analysis of the saccharinato complexes of (6), (9) and (12) were performed according to
the experimental conditions outlined on Chapter 2. The complexes start decomposing at temperatures
between 180 to 230°C where degradation process start occurring with an increase in temperature.
Table 4. 7 Thermoanalytical data for the selected metal complexes
Complexes Stage Temperature
range (°C)
DTGmax
(°C)a,b
Mass loss (%) Total mass
loss (%)
Solid residue
Found Calc. Found Calc.
6 1
2
243.1-261.4
321.2-351.6
57.09b,268.6a
‒
28.11
43.90
27.63
36.03
72.26
63.66
[Ni(MDEA)2]
[Ni]
9 1
2
172.4-177.0
465.1-521.2
57.1b, 180.1a
‒
39.35
40.14
38.13
46.38
79.53
84.51
[Cu(sac)2]
[Cu]
12 1
2
3
4
5
117.5-143.7
204.7-221.2
293.4-329.3
402.1-420.6
443-825
139.1a
216a
306.3a
‒
645b, 822.3a
6.95
13.09
30.14
6.15
20.49
6.03
13.69
27.08
6.69
20.38
77.46
73.87
[Co2(en)4(CO3)2]·2sac
[Co2(en)4]·2sac
[Co2(en)2]·sac
[Co2]·sac
[Co2] a endothermic, b exothermic

96
Complex (6) is a salt complex which does not melt but begins to decomposes at 243.1 to 261.4°C.
This decomposition process leads to the degradation step which was the first stage in which the
complex loses its weak counter ions. The process occurs at the two exothermic DTA peaks at 57.09
and 268.6°C. The experimental mass loss is 28.11% (calc. 27.63%). This leaves behind the solid
residue of the complex [Ni(MDEA)2] which later decomposes at 321.2 to 351.6°C losing a mass of
43.90% (calc. 36.03%) with no observable endothermic-or exothermic TDA peaks. The total mass
loss was 72.26% (63.66%).
Complex (9) is a dimeric structure in which the ligands were lost in two stages. Stage one involves
the melt phase of the four 2-(methylamino)ethanol with a mass loss of 39.35% (calc. 38.13%). This
stage takes place at the temperature range of 172.4-177.0°C with an exothermic TDA peak at 57.1°C
and endothermic DTA peak at 180.1°C. The DTA peak at 180.1°C is a melt phase temperature which
occurs in the vicinity of the melting temperature of the complex. At the temperature range of 465.1 to
521.2°C, the complex completely decomposes, losing the two saccharin counter ions to leave residue
metallic copper losing 40.14% (calc. 46.38%) with no observed endothermic-or exothermic TDA
peaks. The residual solids that was lost was79.53% (calc. 84.51%).
Complex (12) is a molecular complex which undergoes five stages of decomposition. The first
decomposition temperature starts at 117.5 to 143.7°C. This decomposition is attributed to the three
waters of crystallization, 6.95%, (calc. 6.02%). It occurs at an exothermic DTA peak of 139.1°C
leaving a solid residue of [Co2(en)4(CO3)2]·2sac. Stage one was followed by stage two which took
place at the DTA peak of 216.4°C, and it was exothermic. The decomposition temperature proceeds at
204.7 to 221.5°C. This process eliminates the two carbonate ions. The weight loss of these ions was
13.09% (calc. 13.69%). The solid residue was [Co2(en)4]·2sac. The third stage was assigned to the
weight loss of two (en) ligand and sac ligand at the DTA peak of 306.4°C. The decomposition
temperature was exothermic and it occurred in the temperature range of 293.4 to 329.3°C. The
weight loss was 30.14% (calc. 27.08%) with the solid residue of [Co2(en)2]·sac. Stage four took place
in the temperature range of 402.1 to 420.6°C and it occurred without any endothermic or exothermic
DTA temperature peaks. This implies the loss of the two en ligands, which was found to be 6.15%
(calc. 6.69%) and it leaves the solid residue of [Co2]sac. The last stage happens in the temperature
range of 443 to 825°C. It has two DTA peaks, one at 645°C (exothermic) and the other one at
822.3°C (endothermic). The degradation loses the sac ion and leaves the solid residue of [Co2] metal.
The sac ion lost had a weight loss of 20.49% (calc. 20.38%).

97
4.6 References
1. D. P. P. David J. Ager, Scott A. Henderson, Alan R. Katritzky, Indra Prakash, D. Eric
Walters, Angew. Chem. Int. Ed., 1998, 37, 1802-1817.
2. G. Jovanovski and B. Kamenar, Acta Cryst., 1982, C11, 247-255.
3. S. Z. Haider, K. M. A. Malik and K. J. Ahmed, J. Bangladesh Acad. Sci., 1981, 5, 81-90.
4. S. Z. Haider and K. M. A. Malik, J. Bangladesh Acad. Sci., 1982, 6, 119-125.
5. V. T. Yilmaz, S. Guney, O. Andac and W. T. A. Harrison, Polyhedron, 2002, 21, 2393-
2402.
6. O. Z. Yeşilel, C. Darcan and E. Şahin, Polyhedron, 2008, 27, 905-913.
7. B. Sen and R. L. Dotson, J. Inorg. Nucl. Chem., 1970, 32, 2707-2716.
8. D. G. Brannon, R. H. Morrison, J. L. Hall, G. L. Humphrey and D. N. Zimmerman, J.
Inorg. Nucl. Chem., 1971, 33, 981-990.
9. A. Karadag, V. T. Yilmaz and C. Thoene, Polyhedron, 2001, 20, 635-641.
10. N. S. Poonia, N. Chhabra, W. S. Sheldrick, G. Hundal, S. Obrai and M. S. Hundal,
Acta Cryst., 1999, C55, 24-26.
11. O. Andac, S. Guney, Y. Topcu, V. T. Yilmaz and W. T. A. Harrison, Acta Cryst., 2002,
C58, m17-m20.
12. V. T. Yilmaz, S. Hamamci and C. Thöne, J. Coord. Chem., 2003, 56, 787-795.
13. S. Hamamci, V. T. Yilmaz and C. Thone, Acta Cryst., 2002, E58, m700-m701.
14. C. A. Johns and K. M. Abdul Malik, Polyhedron, 2002, 21, 395-401.
15. V. T. Yilmaz, S. Guney, O. Andac and W. T. A. Harrison, J. Coord. Chem., 2003, 56, 21- 32.
16. G. Jovanovski, P. Naumov, O. Grupcče and B. Kaitner, Eur. J. Solid State Inorg. Chem.,
1998, 35, 579-590.
17. V. T. Yilmaz, Y. Topcu, F. Yilmaz and C. Thoene, Polyhedron, 2001, 20, 3209-3217.
18. S. Z. Haider, K. M. A. Malik, S. Das and M. B. Hursthouse, Acta Cryst., 1984, C40,
1147-1150.

98
19. S. G. Real, S. B. Ribotta and A. J. Arvia, Corros. Sci., 2008, 50, 463-472.
20. Z. Yugeng, L. Jianmin, W. Jing, W. Xingtao and D. Shaowu, Cryst. Res. Technol.,
1994, 29, 975-980.
21. K. Nakamoto, in Handbook of Vibrational Spectroscopy, John Wiley & Sons, Ltd,
2006.
22. S. Z. Haider, K. M. A. Malik, K. J. Ahmed, G. B. Kauffman and M. Karbassi, in Inorg.
Synth., John Wiley & Sons, Inc., 2007, 47-51.
23. S. Kirschner, Inorg. Synth., Wiley, 2009, 47-50.
24. S. Guney, V. T. Yilmaz and W. T. A. Harrison, J. Coord. Chem., 2006, 59, 1123-1130.
25. M. A. Cinellu, L. Maiore, A. Schier, H. Schmidbaur and D. Rossi, Z.Naturforsch.,
2008, b63, 1027-1034.
26. Z. Yugeng, Trans. Met. Chem., 1994, 19, 446-448.
27. S. Z. Haider, K. M. A. Malik, K. J. Ahmed, H. Hess, H. Riffel and M. B. Hursthouse,
Inorg. Chim. Acta, 1983, 72, 21-27.
28. I. Bulut, H. Pasaoglu, G. Kastas and A. Bulut, Acta Cryst., 2007, E63, m2409-m2410.
29. J. Bernstein, R. E. Davis, L. Shimoni and N.-L. Chang, Angew. Chem. Int. Ed., 1995, 34,
1555-1573.
30. O. V. Quinzani, S. Tarulli, O. E. Piro, E. J. Baran and E. E. Castellano, Z.
Naturforsch., 1997, 52, 183-187.
31. P. A. M. Williams, E. G. Ferrer, K. A. Pasquevich, E. J. Baran, Z. Chaia, E. E. Castellano
and O. E. Piro, Z. Anorg. Allg. Chem., 2000, 626, 2509-2514.
32. Y. Topcu, O. Andac, V. Yilmaz and W. Harrison, J. Coord. Chem., 2002, 55, 805-815.
33. V. T. Yilmaz, O. Andac, A. Karadag and W. T. A. Harrison, J. Mol. Struct., 2002, 641,
119-124.
99
CHAPTER 5
CONCLUSION AND FUTURE PROSPECTS
5.1 CONCLUSION
This study focused on the synthesis and characterization of saccharinato complexes of
various group 9 to group 12 metals using dimethyl sulfoxide and ethylenediamine, N-
methyldiethanolamine and 2-(methylamino)ethane as auxiliary ligands. The ligands were
coordinated to the common starting complexes [M(sac)2(H2O)4]·2H2O. The study
successfully demonstrated the synthesis and characterization of 12 new saccharinato
complexes using the following metal centres: Cd2+, Zn2+, Co2+, Ni2+, Hg2+ and Cu2+. A
number of complexes were characterized by solution NMR, i.e. complexes (1), (3), (4) and
(11), supporting their proposed molecular structures. All complexes in the study were
analysed by IR and have distinctive peak stretches owing to the presence of coordinated
ligands. Micro-analysis performed on the complexes proved useful in demonstrating bulk
purity. The complexes all had good to excellent percentage yields ranging from 75 to 95%.
Melting points were sharp, further indicating sample purity. Some of the complexes
decomposed at various temperature ranges. The thermal behaviour of the complexes were
studied using DTA and TG in nitrogen atmosphere, and showed complex stability up to 200
°C. Single crystals of suitable quality for X-ray studies were grown for eight of the twelve
complexes. All complexes containing DMSO were successfully solved by single crystal X-
ray diffraction. Interestingly, this study reports on synthesis methods for complexes ((6), (9)
and (12)) whereby saccharine acts as a weak counter ion, i.e. not in the first coordination
sphere of the metal centre. Complex (9) also had a weak cuprophilic Cu···Cu interaction of
3.016 Å. The UV-vis spectroscopy showed λmax for ligand-to-ligand charge-transfer
intraligand for d10 complexes and λmax for metal-to ligand charge transfer (MLCT) transition
at very low energy intensities.

100
5.2 FUTURE PROSPECTS
The saccharinato ligand has been successfully applied to transition-metal coordination
chemistry. Most such complexes coordinate to metal centres in a number of different
coordination modes via the N-donor atom, O-donor atoms of sulfonyl and carbonyl group.
The chemistry of sulfonyl coordination through the O-donor atom needs further development.
Removal of one sulfonyl O atom leading to sulfinyl type derivatives can also be interesting as
it could lead to isomers as chirality is introduced. Another branch of unexplored coordination
chemistry is possible ring-opening reactions of saccharin.
Scheme 5. 1 Reduction of sulfonyl O-donor atom leading to sulfinyl type derivative which
can be further coordinated to metals, RA is a reducing agent
Scheme 5. 2 A possible ring-opening reaction of saccharin

101
APPENDIX The work on this dissertation is supported by the spectral data, TGA graphs and the (cif file)
which include the X-ray crystallographic data. All this appendix is attached on the CD.

102