Syntheses, characterization, and antibacterial study of titanium complexes
10
Turk J Chem (2013) 37: 936 – 945 c ⃝ T ¨ UB ˙ ITAK doi:10.3906/kim-1302-36 Turkish Journal of Chemistry http://journals.tubitak.gov.tr/chem/ Research Article Syntheses, characterization, and antibacterial study of titanium complexes Raj KAUSHAL, 1, * Nitesh KUMAR, 1 Pamita AWASTHI, 1 Kiran NEHRA 2 1 Department of Chemistry, National Institute of Technology, Hamirpur, India 2 Department of Biotechnology, Deenbandhu Chhotu Ram University of Science and Technology, Murthal (Sonepat), Haryana, India Received: 19.02.2013 • Accepted: 01.06.2013 • Published Online: 04.11.2013 • Printed: 29.11.2013 Abstract: Titanium(II) complexes of composition TiCl 2 (L) 2 [where L = 2,2’-bipyridine (bipy), 4,4’-dimethyl-2,2’- bipyridine (bpMe), 4,4’-dimethoxy-2,2’-bipyridine (bpoMe), 6,6’-dimethyl-2,2’-bipyridine (dpMe), adamantylamine (ada)] were prepared by reacting titanium tetrachloride and N-containing bulky ligands in predetermined molar ratios. The complexes synthesized were characterized by different spectroscopic techniques, viz. UV-visible, FTIR, 1 H NMR, and mass spectrometry. The stoichiometry of the complexes was established by their elemental analysis (chlorine and ti- tanium estimation). The unit cell parameters calculated by using the powder XRD tool confirm the monoclinic unit system and P lattice type for all complexes. Antibacterial screening of the ligands as well as the complexes was carried out to check their biological potential. It was found that the complex with 4,4’-dimethyl-2,2’-bipyridine ligand was a more potent bactericide than complexes with other ligands. Key words: Titanium, FTIR, 1 H NMR, mass spectra, powder XRD, 2,2’-bipyridine, antibacterial activity 1. Introduction The role of transition metal complexes in medicinal chemistry has been known since the serendipitous discovery of platinum-based cisplatin by Rosenberg in 1969. 1,2 Transition metal complexes have been widely studied as antibacterial 3,4 and anticancer agents 5,6 for many years. Due to different oxidation states, coordination sphere, and redox potential, coordination complexes show kinetic and thermodynamic properties towards biological receptors. The nonplatinum drugs after cisplatin were budotitane and titanocene dichloride, which are titanium- based anticancer drugs. 7,8 In addition to anticancer properties, titanocene dichloride also exhibits antiviral, antiarithmetic, and anti-inflammatory activities. 9 Since titanium is present in many biomaterials such as food in the form of whitening pigment, it may be incorporated into living systems. 10 The complexes of 2,2’-bipyridine and substituted bipyridine with cobalt, copper, zinc, 11 and gold 12 have been found to show antibacterial and anticancer activity, respectively. Due to bacterial resistance to the currently available antibiotics, there has been growing interest in developing new drugs with better activity. Since metal and ligand interact with various steps of the pathogen life cycle, 13 they can be used to synthesize new drugs. Moreover, it is known that ligands having N, O, and S atoms show pronounced biological activity due to enhancement in coordination behaviour. 14,15 After chelation, metal complexes are assumed to act as antimicrobial agents due to inhibition of enzymes, interaction with intracellular biomolecules, and enhanced lipophilicity. 16 In the present paper, synthesis of * Correspondence: [email protected] 936
-
Upload
independent -
Category
Documents
-
view
3 -
download
0
Transcript of Syntheses, characterization, and antibacterial study of titanium complexes

Turk J Chem
(2013) 37: 936 – 945
c⃝ TUBITAK
doi:10.3906/kim-1302-36
Turkish Journal of Chemistry
http :// journa l s . tub i tak .gov . t r/chem/
Research Article
Syntheses, characterization, and antibacterial study of titanium complexes
Raj KAUSHAL,1,∗ Nitesh KUMAR,1 Pamita AWASTHI,1 Kiran NEHRA2
1Department of Chemistry, National Institute of Technology, Hamirpur, India2Department of Biotechnology, Deenbandhu Chhotu Ram University of Science and Technology, Murthal (Sonepat),
Haryana, India
Received: 19.02.2013 • Accepted: 01.06.2013 • Published Online: 04.11.2013 • Printed: 29.11.2013
Abstract: Titanium(II) complexes of composition TiCl2 (L)2 [where L = 2,2’-bipyridine (bipy), 4,4’-dimethyl-2,2’-
bipyridine (bpMe), 4,4’-dimethoxy-2,2’-bipyridine (bpoMe), 6,6’-dimethyl-2,2’-bipyridine (dpMe), adamantylamine (ada)]
were prepared by reacting titanium tetrachloride and N-containing bulky ligands in predetermined molar ratios. The
complexes synthesized were characterized by different spectroscopic techniques, viz. UV-visible, FTIR, 1H NMR, and
mass spectrometry. The stoichiometry of the complexes was established by their elemental analysis (chlorine and ti-
tanium estimation). The unit cell parameters calculated by using the powder XRD tool confirm the monoclinic unit
system and P lattice type for all complexes. Antibacterial screening of the ligands as well as the complexes was carried
out to check their biological potential. It was found that the complex with 4,4’-dimethyl-2,2’-bipyridine ligand was a
more potent bactericide than complexes with other ligands.
Key words: Titanium, FTIR, 1H NMR, mass spectra, powder XRD, 2,2’-bipyridine, antibacterial activity
1. Introduction
The role of transition metal complexes in medicinal chemistry has been known since the serendipitous discovery
of platinum-based cisplatin by Rosenberg in 1969.1,2 Transition metal complexes have been widely studied as
antibacterial3,4 and anticancer agents5,6 for many years. Due to different oxidation states, coordination sphere,
and redox potential, coordination complexes show kinetic and thermodynamic properties towards biological
receptors. The nonplatinum drugs after cisplatin were budotitane and titanocene dichloride, which are titanium-
based anticancer drugs.7,8 In addition to anticancer properties, titanocene dichloride also exhibits antiviral,
antiarithmetic, and anti-inflammatory activities.9 Since titanium is present in many biomaterials such as food
in the form of whitening pigment, it may be incorporated into living systems.10 The complexes of 2,2’-bipyridine
and substituted bipyridine with cobalt, copper, zinc,11 and gold12 have been found to show antibacterial and
anticancer activity, respectively. Due to bacterial resistance to the currently available antibiotics, there has been
growing interest in developing new drugs with better activity. Since metal and ligand interact with various steps
of the pathogen life cycle,13 they can be used to synthesize new drugs. Moreover, it is known that ligands having
N, O, and S atoms show pronounced biological activity due to enhancement in coordination behaviour.14,15
After chelation, metal complexes are assumed to act as antimicrobial agents due to inhibition of enzymes,
interaction with intracellular biomolecules, and enhanced lipophilicity.16 In the present paper, synthesis of
∗Correspondence: [email protected]
936

KAUSHAL et al./Turk J Chem
titanium(II) complexes with nitrogen-containing ligands is reported. The structure of the synthesized complexes
was confirmed by UV-visible, FTIR, 1H NMR, mass spectrometry, and powder XRD techniques. The average
crystallite size of the complexes, calculated by using Scherrer’s formula, confirms the nano dimension of the
complexes. The antibacterial screening of complexes was performed against different bacterial strains and
compared with standard antibiotic ampicillin.
2. Materials and methods
Ligands (2,2’-bipyridine, 4,4’-dimethyl-2,2’-bipyridine, 4,4’-dimethoxy-2,2’-bipyridine, 6,6’-dimethyl-2,2’-bipyridine,
and adamantylamine) from Sigma Aldrich were used as such after checking their melting points. Titanium tetra-
chloride and solvents were obtained from E. Merck. Solvents were purified by the standard procedure. UV-visible
spectra of the complexes were recorded on a PerkinElmer Lambda 750 and FTIR spectra were recorded on a
PerkinElmer 1600 spectrophotometer by making KBr pellets. 1H NMR spectra were recorded on a Bruker
Avance 400 MHz spectrometer. Electrospray mass spectrum (ESIMS) was obtained by using electron spray
ionization on a Waters Micromass Q-Tof Micro. Powder XRD was recorded on Philips 1710 X-ray diffractometer
and molecular weight was determined by Rast’s method.
3. Experimental
3.1. Synthesis of bis(2,2’-bipyridyl) dichloro titanium(II), TiCl2 (bipy)2, (A1)
To a white solution of titanium tetrachloride (1 g, 5.27 mmol) in dichloromethane (15 mL), a colorless solution
of 2,2’-bipyridine (1.64 g, 10.54 mmol) in dichloromethane (30 mL) was added dropwise in ice cold conditions
with continuous stirring and the color of the solution changed to dark yellow during addition. The reaction
mixture was stirred for 20 h and resulted in a light yellow solution. The reaction mixture was refluxed for 5
h to ensure the completion of the reaction until the cessation of evolution of chlorine gas. The complex was
extracted from the reaction mixture by vacuum filtration and dried under vacuum. A light yellow complex was
obtained. Recrystallization of the complex was carried out in methanol. Yield 87%, mp 220 ◦C; UV (MeOH)
λmax 235, 281 nm; FTIR (KBr) ν (cm−1) 3077, 3034 (C-H stretching), 1602 (C=C stretching), 1472, 1441
(C=N stretching), 1278 (C-H bending), 767 (C-H out of plane deformation), 416 (Ti-N stretching); 1H NMR
(DMSO-d6 , 400 MHz) δ , ppm = 8.94 (d, 3J = 5.1 Hz, 4H, H6), 8.83 (d, 3J = 8.1, 4H, H3), 8.4 (t, 3J = 7.9,
7.7 Hz, 4H, H4), 7.88 (t, 3J = 5.7, 6.9 Hz, 4H, H5).
3.2. Synthesis of bis(4,4’-dimethyl-2,2’-bipyridyl) dichloro titanium(II), TiCl2 (bpMe)2 , (B1)
To a white solution of titanium tetrachloride (0.125 g, 0.659 mmol) in dichloromethane (10 mL), a colorless
solution of 4,4’-dimethyl-2,2’-bipyridine (0.24 g, 1.31 mmol) in dichloromethane (10 mL) was added dropwise
with continuous stirring in ice cold conditions. The color of solution changed to light yellow for a few minutes and
then turned colorless. The reaction mixture was stirred for 45 h to ensure the completion of the reaction until
the evolution of chlorine gas ceased. The solvent was removed from the reaction mixture by vacuum filtration
and complex was dried under vacuum. A white complex was obtained, which was recrystallized from methanol.
Yield 85%, mp 200–210 ◦C; UV (MeOH) λmax 243, 283 nm; FTIR (KBr) ν (cm−1) 3026 (C-H stretching),
1619 (C=C stretching), 1504, 1432 (C=N stretching), 1218, 1116 (C-H bending), 834 (C-H deformation), 419
(Ti-N stretching); 1H NMR (DMSO-d6 , 400 MHz) δ , ppm = 8.75 (d, 3J = 5.5 Hz, 4H, H6), 8.63 (s, 4H, H3),
7.72 (d, 3J = 5.4 Hz, 4H, H5), 2.65 (s, 12H, CH3).
937

KAUSHAL et al./Turk J Chem
3.3. Synthesis of bis(4,4’-dimethoxy-2,2’-bipyridyl) dichloro titanium(II) TiCl2 (bpoMe)2 , (C1)
To a colorless solution of titanium tetrachloride (0.2 g, 1.05 mmol) in benzene (15 mL), a solution of 4,4’-
dimethoxy-2,2’-bipyridine (0.456 g, 2.10 mmol) in benzene (20 mL) was added dropwise in ice cold conditions.
The color of the solution changed from colorless to pale yellow after addition. The reaction mixture was stirred
for 3 h and then refluxed for 15 h until the evolution of chlorine gas ceased; with the passage of refluxing, a light
yellow solid separated out. The solvent was removed by vacuum filtration and the complex was dried under
vacuum. A light yellow complex was obtained. Recrystallization of the complex was done in methanol. Yield
95%, mp 180–185 ◦C (decompose); UV (MeOH) λmax 215, 279 nm; FTIR (KBr) ν (cm−1) 3088, 3007 (C-H
stretching), 1617 (C=C stretching), 1481, 1452 (C=N stretching), 1292 (C-H bending), 825 (C-H out of plane
deformation), 430 (Ti-N stretching); 1H NMR (DMSO-d6 , 400 MHz) δ , ppm = 8.65 (d, 3J = 6.2 Hz, 4H, H6),
8.34 (s, 4H, H3), 7.32 (d, 3J = 3.8 Hz, 4H, H5), 4.15 (s, 12H, OCH3).
3.4. Synthesis of bis(6,6’-dimethyl-2,2’-bipyridyl) dichloro titanium(II) TiCl2 (dpMe)2 , (D1)
To a colorless solution of titanium tetrachloride (0.2 g, 1.05 mmol) in benzene (15 mL), a colorless turbid solution
of 6,6’-dimethyl-2,2’-bipyridine (0.388 g, 2.10 mmol) in benzene (20 mL) was added dropwise with continuous
stirring. The color of solution changed from colorless to light yellow immediately. The reaction mixture was
stirred for 3 h, and then refluxed for 10 h until the evolution of chlorine gas ceased. The solvent was removed
through vacuum filtration and the complex was dried under vacuum. Recrystallization of the complex was done
in methanol. Yield 85%, mp 170–175 ◦C (decompose); UV (MeOH) λmax 235, 290 nm; FTIR (KBr) ν (cm−1)
3030 (C-H stretching), 1634 (C=C stretching), 1413 (C=N stretching), 1282 (C-H bending), 794 (C-H out of
plane deformation), 447 (Ti-N stretching); 1H NMR (DMSO-d6 , 400 MHz) δ , ppm = 8.45 (d, 3J = 7.8 Hz,
4H, H3), 8.25 (t, 3J = 7.9, 7.8 Hz, 4H, H4), 7.7 (d, 3J = 7.84 Hz, 4H, H5), 2.87 (s, 12H, CH3).
3.5. Synthesis of bis(adamantylamine) dichloro titanium(IV), TiCl2 (ada)2 , (E1)
To a white solution of titanium tetrachloride (0.08 g, 0.439 mmol) in dichloromethane (10 mL), a solution
of adamantylamine (0.132 g, 0.878 mmol) in dichloromethane (15 mL) was added dropwise with continuous
stirring in ice cold conditions. The color of the solution changed to yellow for a moment and then to orange
immediately. The reaction mixture was stirred for 12 h and color changed to light yellow. Completion of the
reaction was indicated by cessation of the evolution of HCl gas. The solvent was decanted out and the complex
was dried under vacuum. A light yellow complex was obtained and recrystallized in methanol. Yield = 83.3%,
mp 210–215 ◦C; UV (MeOH) λmax 224 nm; FTIR (KBr) ν (cm−1) 3347 (N-H stretching), 2920, 2854 (C-H
stretching), 1595 (C-C stretching), 1360 (C-N stretching), 412 (Ti-N stretching); 1H NMR (DMSO-d6 , 400
MHz) δ , ppm = 2.12 (s, NH proton), 1.84 (d, 3J = 2 Hz, CH protons), 1.7, 1.6 (d, 3J = 12.5, 12.2 Hz, CH2
protons).
4. Results and discussion
Complexes of composition TiCl2 (L)2 were prepared by reacting titanium tetrachloride and nitrogen containing
ligands in 1:2 molar ratio, which can be rationalized in terms of the following chemical equations:
938

KAUSHAL et al./Turk J Chem
TiCl4 + 2LCH2CL2 or C6H6−−−−−−−−−−−→ TiCl2(L)2(II) + Cl2 where, L = 2,2-bipyridine
= 4,4’dimethyl-2,2’-bipyridine= 4,4’-dimethoxy-2,2’-bipyridine= 6,6’-dimethyl-2,2’-bipyridine
TiCl4 + 2 adamantylamineCH2Cl2−−−−−→ TiCl2(ada)(IV ) + 2HCl
Elemental analyses, i.e. chlorine and titanium estimations, were performed to check the composition of
the complexes (Table 1) by using Volhard’s method and through gravimetrical measurements.
4.1. Electronic spectra
The electronic spectrum was recorded in 10−7 M solution of respective complex within 200–600 nm range in dry
methanol. The values of transition observed in the UV region (Figure 1) were assigned to intraligand Π → Π∗
and n → Π∗ charge transfer transitions. The band in the range 280–285 nm due to n → Π∗ transition of
2,2’-bipyridine and substituted bipyridine gets shifted to a lower wavelength and the band due to Π → Π∗
transition gets shifted to a slightly higher wavelength in the metal complexes, confirming the coordination of
ligand to the metal atom.17 Since the metal ion has d0 configuration, there is no possibility of d-d transition;
however, the color of complexes may be due to charge transfer transitions from the ligand to metal.
Table 1. Physical and analytical data of titanium complexes.
Complex Color Yield (%)Melting Found (calculated) %point (◦C) Cl Ti MW
TiCl2(bipy)2 (A1) Light yellow 87 220 16 (16.4) 11.9 (11.2) 430 (431)TiCl2(bpMe)2 (B1) White 85 200–210 14.42 (14.56) 10 (9.8) 490 (487)TiCl2(bpoMe)2 (C1) Light yellow 95 180–185 12.42 (12.88) 8.99 (8.69) 550 (551)Ti(Cl)2(dpMe)2 (D1) Light yellow 85 170–175 14.2 (14.57) 9 (9.8) 490 (487)TiCl2(ada)2 (E1) Light yellow 83 210–215 17.7 (17) 10.6 (11) 420 (419)
200 220 240 260 280 300 320 340 360 380 400
0.0
0.2
0.4
0.6
Ab
sorb
ance
Wavelength (nm)
TiCl2(bipy)
2
TiCl2(bpMe)
2
TiCl2(bpoMe)
2
TiCl2(dpMe)
2
TiCl2(ada)
2
Figure 1. Electronic spectra of complexes.
939

KAUSHAL et al./Turk J Chem
TiCl2(ada)
2
TiCl2(dpMe)
2
TiCl2(bpoMe)
2
TiCl2(bpMe)
2
10 15 20 25 30 35 40 45 50
In
ten
sit
y
Angle (2theta)
TiCl2(bipy)
2
Figure 2. Powder XRD pattern of complexes.
4.2. FTIR study
Generally, the νC=C and νC=N stretching vibrations of 2,2’-bipyridine and substituted bipyridine are observed
around 1580–1590 cm−1 , which get shifted by 20–25 cm−1 to higher wave numbers on coordination.18 The
absorption bands due to νC=C in these ligands at around 1589 cm−1 get shifted to 1602, 1619, 1617, and 1634
cm−1 for complexes A1, B1, C1, and D1, respectively. This upward shift of about 20–25 cm−1 due to νC=C
stretching shows increased conjugation due to complexation with metal. This shift may be due to a reduction
in electron density after complexation with metal, and spatial effects (field effect, steric effect, and ring strain)
may also be responsible for the frequency change in the vibrational spectrum. Bands around 3000–2900 cm−1
were due to νC−H stretching of the ring, which remained unaltered even after the formation of the complex.
The absorption bands of complexes A1, B1, C1, and D1 at 1026, 1061, 1104, 1156, 1236, 1316 cm−1 ; 1026, 1116,
1218, 1292, 1363 cm−1 ; 1076, 1117, 1233, 1292, 1317 cm−1 ; and 1010, 1047, 1089, 1184, 1282, 1336 cm−1 ,
respectively, were assigned to in-plane νC−H bending vibrations of respective ligands. The bands at 1082 and
1305 cm−1 were attributed to νC−N stretching of adamantylamine in E1 complex. Moreover, the absorption at
1600 cm−1 in complex E1 represents νN−H bending and formation of the single peak at 3347 cm−1 in complex
E1 indicates deprotonation of primary amine, i.e. adamantylamine. Appearance of new absorption bands at
416, 419, 430, 447, and 412 cm−1 can be attributed to νTi−N stretching in complexes A1, B1, C1, D1, and E1,
respectively, indicating the coordination of nitrogen atom to titanium.19
4.3. 1H NMR spectra
1H NMR spectra of the complexes were recorded in DMSO-d6 solution using TMS as internal standard and the
data are given in Table 2. There is a considerable downfield shift in 2,2’-bipyridine and substituted bipyridine
protons on complexation in complexes A1, B1, C1, and D1. The downfield shift in delta values of protons
indicates the coordination of ligand to metal. These shifts may be assigned to the deshielding of protons
due to transfer of electron density from aromatic protons to the metal atom (N→M). Similar observations
have been reported for gold(III) complexes with modified bipyridine and bipyridyl amine ligands.12 The
940

KAUSHAL et al./Turk J Chem
appearance of signals in the upfield region (2.12–1.62 ppm) in the spectra of complex E1 confirms the presence
of adamantylamine protons. Integration of signals also supports the formation of complexes.
Table 2. 1H NMR data of complexes (δ , ppm).
Ligand/Complex Bipyridine CH3 OCH3 AdamantylamineH6 H3 H4 H5 - NH CH CH2
2,2’-bipyridine 8.68 8.4 7.82 7.314,4’-dimethyl-2,2’-bipyridine 8.54 8.26 - 7.15 2.454,4’-dimethoxy-2,2’-bipyridine 8.47 7.99 - 6.85 3.956,6’-dimethyl-2,2’-bipyridine - 7.15 7.68 8.18 2.63adamantylamine - - - - - 2.04 1.64 1.6, 1.29TiCl2(bipy)2 (A1) 8.94 8.83 8.4 7.88 - - -TiCl2(bpMe)2 (B1) 8.75 8.63 - 7.72 2.65 - - -TiCl2(bpoMe)2 (C1) 8.65 8.34 - 7.32 - 4.15TiCl2(dpMe)2 (D1) - 8.45 8.25 7.70 2.87TiCl2(ada)2 (E1) 2.12 1.84 1.69, 1.62
4.4. Electrospray mass spectral data of titanium complexes
The formation of complexes was further established by recording the mass spectrum of each of the complexes.
The mass spectrum of TiCl2 (bipy)2 showed a base peak due to the C10H8N2 fragment that appeared at m/z
= 157. Complexes TiCl2 (bpMe)2 and TiCl2 (bpoMe)2 showed their respective base peaks at m/z = 325 and
185 due to formation of C18H18N3Ti and C12H12N2 fragment ions, respectively. Complex TiCl2 (bpoMe)2
also shows peaks at m/z = 202 and 239 due to TiC10H6N2 and TiClC10H6N2 fragments. The mass spectrum
of complex TiCl2 (dpMe)2 shows a base peak at m/z = 185 due to 6,6’-dimethyl-2,2’-bipyridine ligand with
100% intensity. A detailed description of the results of mass spectrometry of all complexes is given in Table 3.
Complex TiCl2 (ada)2 shows a base peak due to fragment ion TiCl2C12H17N2 at m/z = 306. The presence
of different fragment peaks in these complexes may be considered to support their stoichiometric formulation.
Table 3. Electrospray mass spectral data.
Complex Major ESMS fragment ions (m/z, %)TiCl2(bipy)2 C10H8N2 (157, 100%); TiCl2C15H12N3+Na+ (377, 17%); TiCl2C20H16N4+Na+ (453,
7%).TiCl2(bpMe)2 C12H12N2 (185, 98%); C12H12N2TiCl2 (304, 25%); C18H18N3Ti (325, 100%),
C21H15N4TiCl (406, 4%); C20H12N4Cl2Ti (427, 3%), C24H24N4TiCl (453, 17%).TiCl2(bpoMe)2 C12H12N2O2 (217, 100%); TiC10H6N2 (202, 5%); TiClC10H6N2 (239, 100%).TiCl2(dpMe)2 C12H12N2 (185, 100%); TiClC11H9N2 (249, 35%); TiClC12H12N2 (265, 25%); TiC15H9N3
(276, 100%); TiCl2C21H15N4 (443, 5%); TiClC24H24N4 (453, 10%)TiCl2(ada)2 C9H14NTi (185, 99%); C9H14NTiCl2 (249, 7%); C11H17N2TiCl2 (299, 3%);
C12H17N2TiCl2 (306, 100%); C16H25N2TiCl2 (360, 6%); C19H30N2TiCl2 (408, 95%);C20H32N2TiCl2 (419, 15%).
4.5. Powder XRD study
The XRD study was done on a Philips 1710 X-ray diffractometer with CuKα radiation (λ = 1.5405 A).
Scherrer’s equation D = (λ× 0.9)/(β× Cosθ),20 [where D is the crystallite size of (h k l) plane, β is full width
half maximum (FWHM) in radians, and λ is the wavelength of incident radiation] was used to calculate the
941
KAUSHAL et al./Turk J Chem
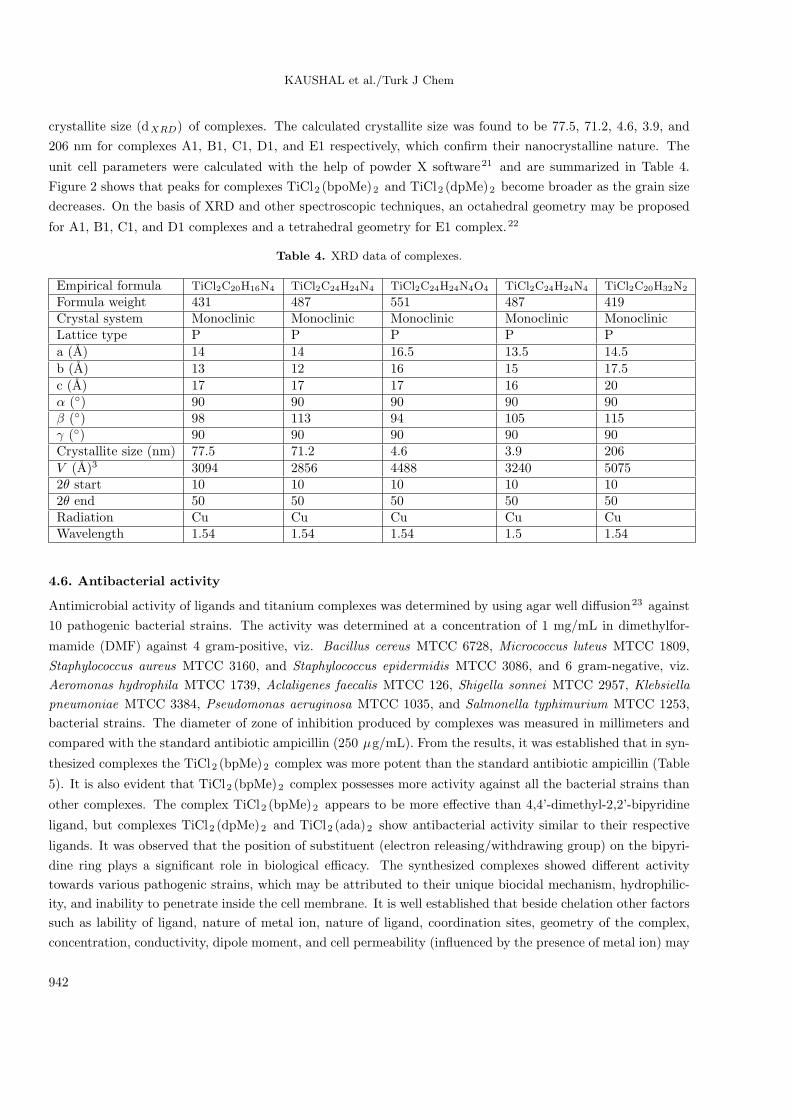
crystallite size (dXRD) of complexes. The calculated crystallite size was found to be 77.5, 71.2, 4.6, 3.9, and
206 nm for complexes A1, B1, C1, D1, and E1 respectively, which confirm their nanocrystalline nature. The
unit cell parameters were calculated with the help of powder X software21 and are summarized in Table 4.
Figure 2 shows that peaks for complexes TiCl2 (bpoMe)2 and TiCl2 (dpMe)2 become broader as the grain size
decreases. On the basis of XRD and other spectroscopic techniques, an octahedral geometry may be proposed
for A1, B1, C1, and D1 complexes and a tetrahedral geometry for E1 complex.22
Table 4. XRD data of complexes.
Empirical formula TiCl2C20H16N4 TiCl2C24H24N4 TiCl2C24H24N4O4 TiCl2C24H24N4 TiCl2C20H32N2
Formula weight 431 487 551 487 419Crystal system Monoclinic Monoclinic Monoclinic Monoclinic MonoclinicLattice type P P P P P
a (A) 14 14 16.5 13.5 14.5
b (A) 13 12 16 15 17.5
c (A) 17 17 17 16 20α (◦) 90 90 90 90 90β (◦) 98 113 94 105 115γ (◦) 90 90 90 90 90Crystallite size (nm) 77.5 71.2 4.6 3.9 206
V (A)3 3094 2856 4488 3240 50752θ start 10 10 10 10 102θ end 50 50 50 50 50Radiation Cu Cu Cu Cu CuWavelength 1.54 1.54 1.54 1.5 1.54
4.6. Antibacterial activity
Antimicrobial activity of ligands and titanium complexes was determined by using agar well diffusion23 against
10 pathogenic bacterial strains. The activity was determined at a concentration of 1 mg/mL in dimethylfor-
mamide (DMF) against 4 gram-positive, viz. Bacillus cereus MTCC 6728, Micrococcus luteus MTCC 1809,
Staphylococcus aureus MTCC 3160, and Staphylococcus epidermidis MTCC 3086, and 6 gram-negative, viz.
Aeromonas hydrophila MTCC 1739, Aclaligenes faecalis MTCC 126, Shigella sonnei MTCC 2957, Klebsiella
pneumoniae MTCC 3384, Pseudomonas aeruginosa MTCC 1035, and Salmonella typhimurium MTCC 1253,
bacterial strains. The diameter of zone of inhibition produced by complexes was measured in millimeters and
compared with the standard antibiotic ampicillin (250 µg/mL). From the results, it was established that in syn-
thesized complexes the TiCl2 (bpMe)2 complex was more potent than the standard antibiotic ampicillin (Table
5). It is also evident that TiCl2 (bpMe)2 complex possesses more activity against all the bacterial strains than
other complexes. The complex TiCl2 (bpMe)2 appears to be more effective than 4,4’-dimethyl-2,2’-bipyridine
ligand, but complexes TiCl2 (dpMe)2 and TiCl2 (ada)2 show antibacterial activity similar to their respective
ligands. It was observed that the position of substituent (electron releasing/withdrawing group) on the bipyri-
dine ring plays a significant role in biological efficacy. The synthesized complexes showed different activity
towards various pathogenic strains, which may be attributed to their unique biocidal mechanism, hydrophilic-
ity, and inability to penetrate inside the cell membrane. It is well established that beside chelation other factors
such as lability of ligand, nature of metal ion, nature of ligand, coordination sites, geometry of the complex,
concentration, conductivity, dipole moment, and cell permeability (influenced by the presence of metal ion) may
942

KAUSHAL et al./Turk J Chem
be responsible for increased activity.24,25 From our studies we find that position of substituent, aromaticity,
lipophilicity, and lability of ligand are important factors in determining the antibacterial activity of a complex.
Table 5. Antibacterial activity results of the ligands and their titanium complexes.
B.ce
reus
M.lu
teus
S.aure
us
S.ep
ider
mid
is
A.hydro
phila
A.
faec
alis
S.so
nnei
P.pneu
monia
e
P.aer
ugi
nosa
S.ty
phim
uri
um
Ligand/ComplexDiameter of inhibition in mm after 24 hGram-positive Gram-negative
bipy 12 10 9 7 9 7 9 7 9 8bpMe 13 11 11 9 10 9 11 10 13 12bpoMe 14 10 11 13 9 9 10 - 11 12dpMe 5 11 7 - 7 6 6 - 6 6ada 6 5 5 7 5 8 - 4 - 6TiCl2(bipy)2 6 5 6 6 - 7 - - - 6TiCl2(bpMe)2 15 13 12 9 13 12 12 7 5 11TiCl2(bpoMe)2 9 6 11 6 8 7 8 6 6 8TiCl2(dpMe)2 6 6 6 - 8 6 8 6 6 6TiCl2(ada)2 6 7 8 5 7 6 6 6 - 6Ampicillin 7 8 11 9 10 9 5 7 10 9
4.7. MIC measurements
MIC is the lowest concentration of an antimicrobial agent that will inhibit the visible growth of a microorganism
after 24 h incubation at 37 ◦C. Ten bacterial species, 4 gram-positive (B. cereus, M. luteus, S. aureus, and S.
epidermidis), and 6 gram-negative (A. hydrophila, A. faecalis, S. sonnei, K. pneumoniae, P. aeruginosa, and
S. typhimurium), were used. The calculation of MICs involves a semiquantitative test procedure. It gives an
approximate value of minimum concentration of an antibacterial agent needed to prevent bacterial growth. The
serial dilution method was used for the determination of MICs of these complexes. The method involves the
addition of 10 µL of microbes grown in nutrient broth and 10 µL of solutions of varying concentrations of each
complex dissolved in DMF to small tubes containing 300 µL of nutrient broth. The end result of the test is the
minimum concentration of the complex that gives a clear solution, i.e. no visible growth after 24 h in a BOD
incubator at 37 ◦C. Amongst the various bacterial strains tested, the lowest MICs were obtained against S.
sonnei and A. hydrophila, showing that these bacteria were most sensitive to the complexes. The MICs of all
complexes against each bacterial strain are given in Table 6. The lowest MICs were observed for the complex
TiCl2 (bpMe)2 against most of the bacterial strains, which indicates the high effectiveness of this complex.
We have described the synthesis of titanium complexes with bipyridine, substituted bipyridine, and
adamantylamine ligands. The synthesized complexes were characterized by using FTIR, UV-visible, 1H NMR,
and mass spectrometry techniques. The downfield shift in protons and formation of νTi−N bond in the far
IR region (400–450 cm−1) confirms the formation of complexes. Scherrer’s equation was used to calculate the
crystallite size (dXRD) of complexes, and the calculations showed that the complexes were nanocrystalline.
The study of antibacterial screening showed variation in activity across different complexes, and TiCl2 (bpMe)2
complex was found to be the most potent complex.
943

KAUSHAL et al./Turk J Chem
Table 6. Minimum inhibitory concentrations (MICs) of titanium complexes (µg/mL).
Complex Gram-positive Gram-negative
TiCl2(bipy)2 62.5 1000 62.5 1000 500 500 125 – – 500TiCl2(bpMe)2 31.25 125 62.5 250 250 125 62.5 1000 250 125TiCl2(bpoMe)2 1000 1000 500 1000 500 250 500 250 1000 500TiCl2(dpMe)2 500 500 1000 - 250 1000 250 31.25 1000 1000TiCl2(ada)2 1000 500 31.25 1000 500 1000 125 250 500 1000
B.ce
reus
M.lu
teus
S.aure
us
S.ep
ider
mid
is
A.hydro
phila
A.
faec
alis
S.so
nnei
P.pneu
monia
e
P.aer
ugi
nosa
S.ty
phim
uri
um
References
1. Cepeda, V.; Fuertes, M. A.; Castilla, J.; Alonso, C.; Quevedo, C.; Perez, J. M. Anti-Cancer Agents Med. Chem.
2007, 7, 3–18.
2. Reedijk, J. Chem. Rev. 1999, 99, 2499–2510.
3. Kamalakannan, P.; Venkappayya, D. J. Inorg. Biochem. 2002, 90, 22–37.
4. Islam, M. S.; Farooque, M. A.; Bodruddoza, M. A. K.; Mosaddik, M. A.; Alam, M. S. Online J. Biol. Sci. 2002,
2, 797–799.
5. Marzano, C.; Pellei, M.; Colavito, D.; Alidori, S.; Lobbia, G. G.; Gandin V.; Tisato, F.; Santini, C. J. Med. Chem.
2006, 49, 7317–7324.
6. Immel, T. A.; Groth, U.; Huhn, T.; Ohlschlager, P. PLoS One. 2011, 6, e17869.
7. Melendez, E. Crit. Rev. Oncol. Hemat. 2002, 42, 309–315.
8. Dubler, E.; Buschmann, R.; Schmalle, H. W. J. Inorg. Biochem. 2003, 95, 97–104.
9. Fairlie, D. P.; Whitehouse, M. W.; Broomhead, J. A. Chem.-Biol. Interact. 1987, 61, 277–291.
10. Tshuva, E. Y.; Peri, D. Coord. Chem. Rev. 2009, 253, 2098–2115.
11. Agwara, M. O.; Ndifon, P. T.; Ndosiri, N. B.; Paboudam, A. G.; Yufanyi, D. M.; Mohamadou, A. B. Chem. Soc.
Ethiopia. 2010, 24, 383–389.
12. Casini, A.; Diawara, M. C.; Scopelliti, R.; Zakeeruddin, S. M.; Gratzel, M.; Dyson, P. J. Dalton Trans. 2010, 39,
2239–2245.
13. Travis, J.; Potempa, J. Biochim. Biophys. Acta. 2000, 1477, 35–50.
14. Halder, S.; Peng, S.-M.; Lee, G.-H.; Chatterjee, T.; Mukherjee, A.; Dutta, S.; Sanyal, U.; Bhattacharya, S. New J.
Chem. 2008, 32, 105–114.
15. Kovala-Demertzi, D.; Dermertzis, M A.; Miller, J R.; Papadopoulou, C.; Dodorou, C.; Filousis, G. J. Inorg.
Biochem. 2001, 86, 555–563.
16. Dharmaraj, N.; Viswanathamurthi, P.; Natarajan, K. Transit. Metal Chem. 2001, 26, 105–109.
17. Poonia, K.; Swami, M.; Chaudhary, A.; Singh, R. V. Indian J. Chem. 2008, 47A, 996–1003.
18. Shi, X.-M; Wang, H.-Y.; Li, Y.-B.; Yang, J.-G.; Chen, L.; Hui, G.; Xu, W.-Q.; Zhao, B. Chem. Res. Chinese Univ.
2010, 26, 1011–1015.
19. Gulcan, M.; Sonmez, M.; Berber, I. Turk. J. Chem. 2012, 36, 189–200.
944

KAUSHAL et al./Turk J Chem
20. Dhanaraj, C. J.; Nair, M. S. Eur. Polym. J. 2009, 45, 565–572.
21. Ade, S. B.; Deshpande, M. N.; Kolhatkar, D. G. Int. J. Chem. Tech. Res. 2012, 4, 474–478.
22. Priya, N. P.; Arunachalam, S. V.; Sathya, N.; Chinnusamy, V.; Jayabalakrishnan, C. Transit. Metal Chem. 2009,
34, 437–445.
23. Sathisha, M. P.; Revankar, V. K.; Pai, K. S. R. Met.-Based Drugs. 2008, 2008, 1–11.
24. Murukan, B.; Mohanan, K. Transit. Metal Chem. 2006, 31, 441–446.
25. Supuran, C. T.; Scozzafava, A.; Saramet, I.; Banciu, M. D. J. Enzyme Inhib. Med. Chem. 1998, 13, 177–194.
945