Electrolytic Synthesis and Structural Chemistry of Intermetallic ...
Upload
khangminh22Category
view
1download
0
Comptes Rendus
Chimie
Žiko B.Milanovic, Zoran S.Markovic, Dušan S. Dimic, Olivera R.Klisuric, Ivana D. Radojevic, Dragana S. Šeklic, Marko N. Živanovic,Jasmina Dimitric Markovic, Milanka Radulovic and Edina H. Avdovic
Synthesis, structural characterization, biological activity and moleculardocking study of 4,7-dihydroxycoumarin modified by aminophenolderivatives
Volume 24, issue 2 (2021), p. 215-232
<https://doi.org/10.5802/crchim.68>
© Académie des sciences, Paris and the authors, 2021.Some rights reserved.
This article is licensed under theCreative Commons Attribution 4.0 International License.http://creativecommons.org/licenses/by/4.0/
Les Comptes Rendus. Chimie sont membres duCentre Mersenne pour l’édition scientifique ouverte
www.centre-mersenne.org
Comptes RendusChimie2021, 24, n 2, p. 215-232https://doi.org/10.5802/crchim.68
Full paper / Article
Synthesis, structural characterization, biological
activity and molecular docking study of
4,7-dihydroxycoumarin modified by aminophenol
derivatives
Žiko B.Milanovica, Zoran S.Markovic∗, b, Dušan S. Dimicc, Olivera R. Klisuricd,Ivana D. Radojevice, Dragana S. Šeklicb, Marko N. Živanovicb,Jasmina Dimitric Markovicc, Milanka Radulovic f and Edina H. Avdovicb
a University of Kragujevac, Faculty of Science, Department of Chemistry, RadojaDomanovica 12, 34000 Kragujevac, Serbia
b University of Kragujevac, Institute of Information Technologies, Department ofScience, Jovana Cvijica bb, 34000 Kragujevac, Serbia
c Faculty of Physical Chemistry, University of Belgrade, 12-16 Studentski trg, 11000Belgrade, Serbia
d University of Novi Sad, Faculty of Sciences, Department of Physics, Trg DositejaObradovica 4, 21 000 Novi Sad, Serbia
e University of Kragujevac, Faculty of Science, Department of Biology and Ecology,Radoja Domanovica 12, 34000 Kragujevac, Serbia
f State University of Novi Pazar, Department of Chemical-Technological Sciences,Vuka Karadžica bb, 36300, Novi Pazar, Republic of Serbia
E-mails: [email protected] (Ž. B. Milanovic), [email protected](Z. S. Markovic), [email protected] (D. S. Dimic), [email protected] (O. R. Klisuric),[email protected] (I. D. Radojevic), [email protected](D. S. Šeklic), [email protected] (M. N. Živanovic), [email protected](J. D. Markovic), [email protected] (M. Radulovic), [email protected](E. H. Avdovic)
Abstract. In the present manuscript, three different 4,7-dihydroxycoumarin derivatives were pre-pared and structurally characterized by crystallographic and spectroscopic techniques in combi-nation with the B3LYP-D3BJ theoretical method. Cytotoxic and antimicrobial activities of investi-gated compounds were screened against different cell lines and microorganisms. HCT-116 cells weremost sensitive to the 3-(1-(2-hydroxyphenyl)amino) ethylidene)-2,4-dioxochroman-7-yl acetate de-rivative, while the best antimicrobial activity against Bacillus subtilis ATCC 6633 was shown by 3-(1-(2-hydroxyphenyl)amino)ethylidene)-2,4-dioxochroman-7-yl acetate. The molecular docking study for
∗Corresponding author.
ISSN (electronic) : 1878-1543 https://comptes-rendus.academie-sciences.fr/chimie/
216 Žiko B.Milanovic et al.
all compounds with important epidermal growth factor receptors (EGFR) was performed. The resultsindicate that the largest contribution to the binding energy is through conventional hydrogen bonds.
Keywords. Coumarin-derived ligands, 4,7-dihydroxycoumarin, Biological activity, DFT calculations,Molecular docking.
Manuscript received 1st December 2020, revised 30th January 2021, accepted 1st February 2021.
1. Introduction
Coumarin (known as 1,2-benzopyron) and its deriva-tives consist of an aromatic ring coupled to an α-pyrone ring. These compounds are widely spreadin nature, being found as secondary metabolites ingreen plants, fruits, green tea, fungi, bacteria, andsome animal species [1]. Coumarins display a re-markable array of biochemical activities such as anti-inflammatory, antioxidant, anticancer, antiviral, andanticoagulant properties [2,3]. Few studies evaluatedthe consumption of coumarins in foods and theirclinical relevance. Thus, because of their beneficialeffects on human health, coumarins raised consider-able interest in the pharmaceutical industry [4]. Forthis reason, extensive investigations have led to thedevelopment of numerous techniques for their syn-thesis.
Many of the described biological and pharma-cological activities of coumarins might be a conse-quence of their antioxidant activities [5]. High lev-els of free radicals, in the first-line reactive oxygenspecies (ROS), cause significant damage to impor-tant biological macromolecules, such as lipids, pro-teins, and DNA, and thus may contribute to thedevelopment of many diseases such as cancer, in-flammation, diabetes, cataracts, autism, cardiovas-cular, and Alzheimer’s disease, and aging in aero-bic organisms [6]. Coumarin derivatives with antiox-idant properties may contribute to the protection ofcells from oxidative stress and also lower the risk ofchronic diseases [7]. Theoretical methods were, aswell, employed to investigate the antioxidant activityof simple coumarins and coumarin–chalcone deriva-tives [8,9]. On the one hand, different studies indi-cate the effective action of coumarin derivatives inpreventing cell proliferation of various cancers [10]as well as interference with the normal functioning ofdiverse strains of microorganisms [11]. Therefore, thedesign of new coumarin derivatives that can be usedas drugs and complementary medicine supplementspresents a challenge in modern science. On the otherhand, the design of new coumarin derivatives with
antioxidant properties can be beneficial for the phar-maceutical industry.
4,7-Dihydroxycoumarin and its derivatives are animportant class of the coumarin family. However,the biological activities of 4,7-dihydroxycoumarinderivatives have not been extensively studied in thescientific literature so far. Due to the pronounced bi-ological and pharmacological properties of the par-ent molecule, three new aminophenol derivatives aresynthesized in this work.
This work aims to structurally and theoreticallydescribe three novel coumarin derivatives withaminophenols, along with their antimicrobial andcytotoxic activities. The crystallographic structure of(E)-3-(1-((3-hydroxyphenyl)amino)ethylidene)-2,4-dioxochroman-7-yl acetate is obtained and solved.All compounds are characterized by different spec-troscopic methods (IR, 1H NMR, 13C NMR, andUV/Vis) in conjunction with DFT optimization ofthe structure. Also, the results of cytotoxic activ-ity of investigated compounds against four differ-ent cell lines, human colon cancer (HCT-116), hu-man cervix cancer (HeLa), human breast cancer(MDA-MB-231), and healthy human lung fibroblast(MRC-5), are reported. The antimicrobial activitywas screened against 13 strains of microorganismsdetermining the minimum inhibitory concentration(MIC) and the minimum microbicidal concentration(MMC) using the microdilution method. The molec-ular docking simulation of synthesized compoundswith epidermal growth factor receptors (EGFR) wasperformed.
2. Experimental section
2.1. Chemicals and instrumentations
All chemicals of analytical grade were purchasedfrom commercial suppliers: Sigma-Aldrich ChemicalCompany (St. Louis, MO), Difco, and Merck Labo-ratory Supplies (Darmstadt, Germany). The elemen-tal microanalysis of C, H, and N was performed on
C. R. Chimie — 2021, 24, n 2, 215-232
Žiko B.Milanovic et al. 217
the Vario EL III C, H, and N Elemental Analyzer.For IR spectral measurements, Perkin–Elmer Spec-trum spectrophotometer was employed using theKBr pellet technique (range of wavenumbers 4000–400 cm−1). 1H and 13C NMR spectral analyses werecarried out using Varian Gemini-2000 spectrometer(1H NMR at 200 MHz, 13C NMR at 50 MHz) at 298 Kin CDCl3 with tetramethylsilane (TMS) as an inter-nal standard. The UV–Vis spectra were measured ona Thermo Scientific Evolution 220 spectrophotome-ter in the range between 200 and 450 nm.
2.2. General synthesis procedure
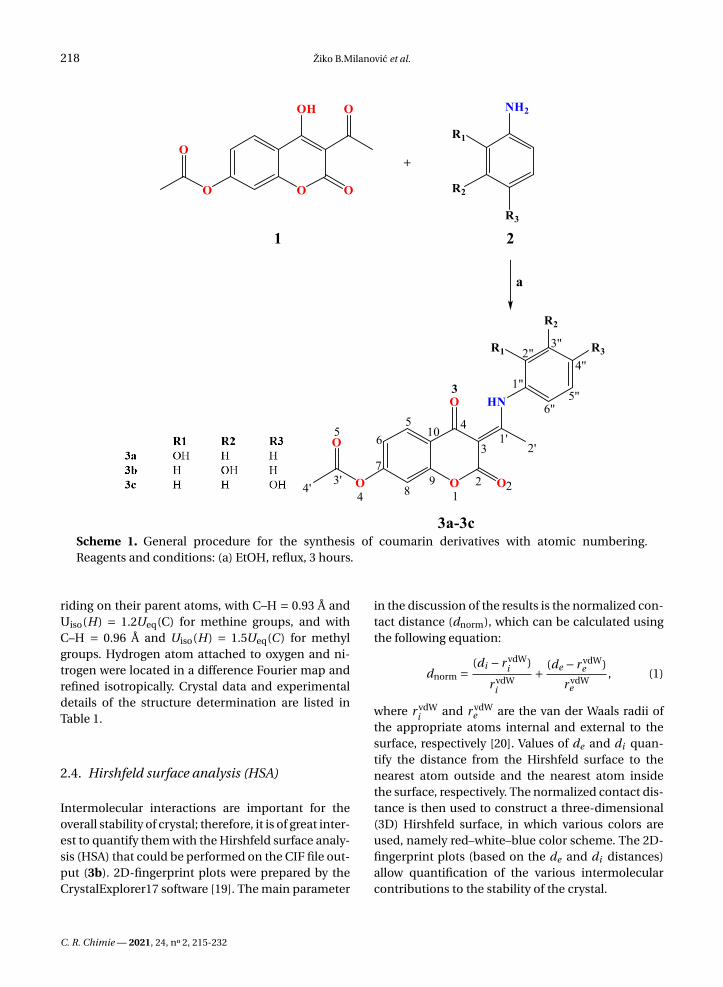
The synthesis of the 4,7-dihydroxycoumarin deriva-tives (3a–3c) was performed according to Scheme 1.New coumarin derivatives were synthesized in thereaction of the previously synthesized compound(1) [12] and different aminophenol derivatives (2)(0.002 mol) at 3-hour reflux in ethanol (50 ml).Progress of reactions was monitored by Thin Layerchromatography (toluene:acetone = 7:3). When thereaction was completed the mixture was cooled toroom temperature. The obtained precipitate was fil-tered and air-dried. Recrystallization was performedby dissolving the obtained compounds in methanolthrough stirring and heating, and then cooling toroom temperature. The structures of the synthe-sized compounds were confirmed by FT-IR, 1H NMR,13C NMR, and UV/Vis spectroscopic methods, whilecompound 3b was characterized by X-ray analyses.
(E)-3-(1-((2-hydroxyphenyl)amino)ethylidene)-2,4-dioxochroman-7-yl acetate (3a) Yield, 0.416 g(83.37%). 1H NMR (DMSO-d6, 200 MHz) (δ ppm):2.32 (3H, s, C4′–H), 2.61 (3H, s, C2′–H), 6.94 (1H, m,C3′′–H), 7.15 (5H, m, C6–H, C8–H, C4′′–H, C5′′–H,C6′′–H), 8.03 (1H, m, C5–H), 10.42 (1H, bs, OH), 15.17(1H, bs, NH). 13C NMR (DMSO-d6, 50 MHz) (δ ppm):20.59 (C2′), 21.08 (C4′), 96.69 (C3), 109.88 (C8), 116.64(10), 117.75 (C3′′), 118.07 (C6), 119.12 (C5′′), 119.49(C6′′), 123.25 (C4′′), 127.16 (C1′′), 129.65 (C5), 151.54(C2′′), 153.86 (C7), 154.87 (C9), 161.42 (C2) 168.68(C1′), 176.02 (C3′), 179.60 (C4). IR (KBr) ν cm−1: 3078(O–H), 2935 (N–H), 1765, 1711 (C=O), 1608, 1570,1552, 1508, 1462, 1441 (C=C), 1207 (C–O).
(E)-3-(1-((3-hydroxyphenyl)amino)ethylidene)-2,4-dioxochroman-7-yl acetate (3b) Yield, 0.404 g(80.96%). 1H NMR (DMSO-d6, 200 MHz) (δ ppm):2.32 (3H, s, C4′–H), 2.63 (3H, s, C2′–H), 6.81 (3H,
m, C4′′–H, C5′′–H, C6′′–H), 7.20 (3H, m, C6–H, C8–H, C2′′–H), 8.01 (1H, m, C5–H), 9.98 (1H, bs, OH),15.37 (1H, bs, NH). 13C NMR (DMSO-d6, 50 MHz)(δ ppm): 20.63 (C2′), 21.06 (C4′), 96.92 (C3), 109.88(C2′′), 112.46 (C8), 115.47 (C4′′), 116.14 (C10), 117.61(C6′′), 119.17 (C6), 126.72 (C5′′) 127.15 (C5), 130.53(C1′′), 136.81 (C7), 153.86 (C9), 154.93 (C3′′), 158.36(C2), 168.64 (C1′), 175.75 (C3′), 179.70 (C4). IR (KBr)ν cm−1: 3331 (O–H), 3080 (N–H), 1765, 1678 (C=O),1618, 1579, 1497, 1458 (C=C), 1205 (C–O).
(E)-3-(1-((4-hydroxyphenyl)amino)ethylidene)-2,4-dioxochroman-7-yl acetate (3c) Yield, 0.425 g(85.17%). 1H NMR (DMSO-d6, 200 MHz) (δ ppm):2.31 (3H, s, C4–’H), 2.56 (3H, s, C2′–H), 6.88 (2H, m,C2′′–H, C6′′–H), 7.12 (2H, m, C3′′–H, C5′′–H), 7.23(2H, m, C6–H, C8–H), 8.00 (1H, d, 3JH−5,H−6 = 8.4 Hz,C5–H), 9.91 (1H, bs, OH), 15.24 (1H, bs, NH). 13CNMR (DMSO-d6, 50 MHz) (δ ppm): 20.49 (C2′), 21.05(C4′), 96.73 (C3), 109.84 (C8), 116.09 (C10), 117.71(C3′′, C5′′), 118.04 (C6), 126.85 (C2′′, C6′′), 127.00(C5), 127.10 (C1′′), 153.82 (C4′′), 154.83 (C7), 157.35(C9), 161.48 (C2), 168.64 (C1′), 175.75 (C3′), 179.50(C4). IR (KBr) ν cm−1: 3188 (O–H), 3080 (N–H), 1768,1714 (C=O), 1614, 1549, 1518, 1443 (C=C), 1203(C–O).
2.3. X-ray
X-ray diffraction data for 3b were collected at roomtemperature using graphite-monochromated MoKαradiation (λ = 0.71073 Å) on an Oxford DiffractionGemini S diffractometer. CrysAlisPro and CrysAlisRED software packages [13] were employed for datacollection and data integration. Final cell parameterswere determined by a global refinement of 942 re-flections (3.0 < θ < 25.3°). Collected data for 3b werecorrected for absorption effects using the Multiscanmethod, applying an empirical absorption correctionusing spherical harmonics [14] as implemented inSCALE3 ABSPACK [13] scaling algorithm.
Structure solution and refinement for 3b werecarried out with the programs SHELXT [15] andSHELXL-2018/3 [16], respectively. MERCURY [17]was employed for molecular graphics and OLEX2 [18]software was used to prepare the material for pub-lication. Non-hydrogen atoms were refined freelywith anisotropic displacement parameters. Hydro-gen atoms attached to carbon atoms were placedin geometrically idealized positions and refined as
C. R. Chimie — 2021, 24, n 2, 215-232
218 Žiko B.Milanovic et al.
Scheme 1. General procedure for the synthesis of coumarin derivatives with atomic numbering.Reagents and conditions: (a) EtOH, reflux, 3 hours.
riding on their parent atoms, with C–H = 0.93 Å andUiso(H) = 1.2Ueq(C) for methine groups, and withC–H = 0.96 Å and Uiso(H) = 1.5Ueq(C ) for methylgroups. Hydrogen atom attached to oxygen and ni-trogen were located in a difference Fourier map andrefined isotropically. Crystal data and experimentaldetails of the structure determination are listed inTable 1.
2.4. Hirshfeld surface analysis (HSA)
Intermolecular interactions are important for theoverall stability of crystal; therefore, it is of great inter-est to quantify them with the Hirshfeld surface analy-sis (HSA) that could be performed on the CIF file out-put (3b). 2D-fingerprint plots were prepared by theCrystalExplorer17 software [19]. The main parameter
in the discussion of the results is the normalized con-tact distance (dnorm), which can be calculated usingthe following equation:
dnorm = (di − r vdWi )
r vdWi
+ (de − r vdWe )
r vdWe
, (1)
where r vdWi and r vdW
e are the van der Waals radii ofthe appropriate atoms internal and external to thesurface, respectively [20]. Values of de and di quan-tify the distance from the Hirshfeld surface to thenearest atom outside and the nearest atom insidethe surface, respectively. The normalized contact dis-tance is then used to construct a three-dimensional(3D) Hirshfeld surface, in which various colors areused, namely red–white–blue color scheme. The 2D-fingerprint plots (based on the de and di distances)allow quantification of the various intermolecularcontributions to the stability of the crystal.
C. R. Chimie — 2021, 24, n 2, 215-232
Žiko B.Milanovic et al. 219
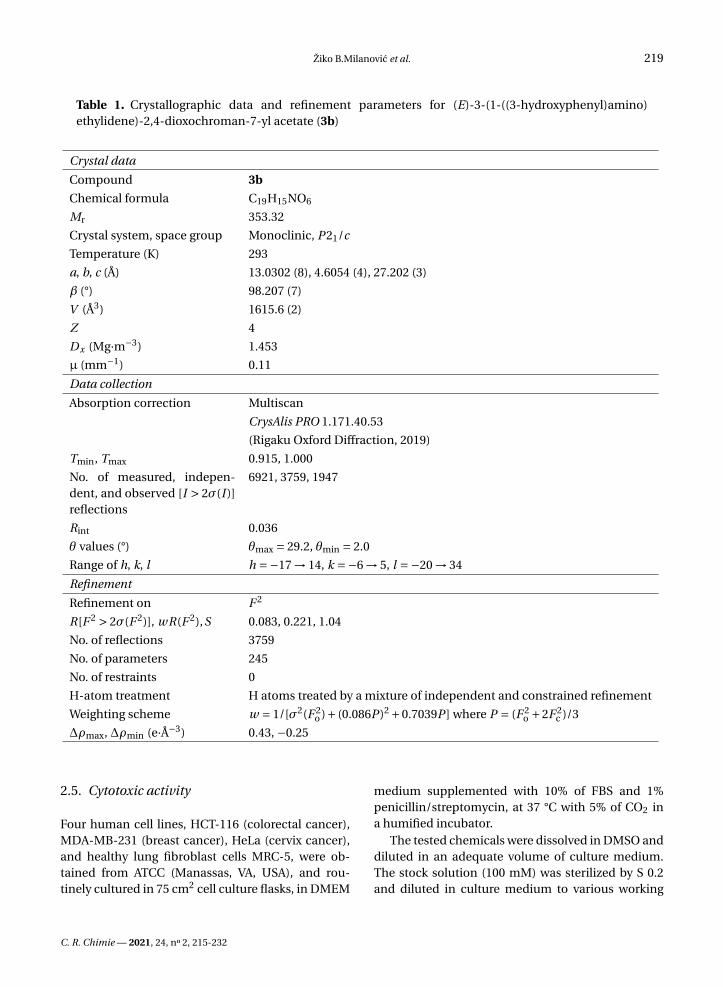
Table 1. Crystallographic data and refinement parameters for (E)-3-(1-((3-hydroxyphenyl)amino)ethylidene)-2,4-dioxochroman-7-yl acetate (3b)
Crystal data
Compound 3b
Chemical formula C19H15NO6
Mr 353.32
Crystal system, space group Monoclinic, P21/c
Temperature (K) 293
a, b, c (Å) 13.0302 (8), 4.6054 (4), 27.202 (3)
β (°) 98.207 (7)
V (Å3) 1615.6 (2)
Z 4
Dx (Mg·m−3) 1.453
µ (mm−1) 0.11
Data collection
Absorption correction Multiscan
CrysAlis PRO 1.171.40.53
(Rigaku Oxford Diffraction, 2019)
Tmin, Tmax 0.915, 1.000
No. of measured, indepen-dent, and observed [I > 2σ(I )]reflections
6921, 3759, 1947
Rint 0.036
θ values (°) θmax = 29.2, θmin = 2.0
Range of h, k, l h =−17 → 14, k =−6 → 5, l =−20 → 34
Refinement
Refinement on F 2
R[F 2 > 2σ(F 2)], wR(F 2),S 0.083, 0.221, 1.04
No. of reflections 3759
No. of parameters 245
No. of restraints 0
H-atom treatment H atoms treated by a mixture of independent and constrained refinement
Weighting scheme w = 1/[σ2(F 2o )+ (0.086P )2 +0.7039P ] where P = (F 2
o +2F 2c )/3
∆ρmax, ∆ρmin (e·Å−3) 0.43, −0.25
2.5. Cytotoxic activity
Four human cell lines, HCT-116 (colorectal cancer),MDA-MB-231 (breast cancer), HeLa (cervix cancer),and healthy lung fibroblast cells MRC-5, were ob-tained from ATCC (Manassas, VA, USA), and rou-tinely cultured in 75 cm2 cell culture flasks, in DMEM
medium supplemented with 10% of FBS and 1%penicillin/streptomycin, at 37 °C with 5% of CO2 ina humified incubator.
The tested chemicals were dissolved in DMSO anddiluted in an adequate volume of culture medium.The stock solution (100 mM) was sterilized by S 0.2and diluted in culture medium to various working
C. R. Chimie — 2021, 24, n 2, 215-232
220 Žiko B.Milanovic et al.
concentrations. The final DMSO concentration intreatment was less than 0.5%, hence not toxic to thecells [21].
2.5.1. MTT test of cytotoxicity
The cytotoxic effects of tested chemical com-pounds were measured on HCT-116, MDA-231,HELA, and healthy MRC-5 cells using MTT test, 24and 72 hours after treatment. The assay was doneaccording to the protocol previously described indetail [22]. The evaluation of the cytotoxic effects oftested compounds was based on the obtained IC50
values, which represent the treatment doses thatinduce the death of 50% of treated cells.
2.6. Antimicrobial activity
The antimicrobial activity of the compounds wastested against 13 microorganisms. The experimentinvolved 12 strains of bacteria (4 standard strains, 3clinical isolates, 5 isolates from nature) and 1 yeastspecies. All clinical isolates were a generous gift fromthe Institute of Public Health, Kragujevac. The othermicroorganisms were provided from the collectionheld by the Microbiology Laboratory Faculty of Sci-ence, University of Kragujevac.
The bacterial suspensions were prepared by thedirect colony method. The turbidity of the initial sus-pension was adjusted using a densitometer (DEN-1,BioSan, Latvia). When adjusted to the turbidity ofthe 0.5 McFarland’s standard [23] the bacteria sus-pension contains about 108 colony forming units(CFU)/mL and the suspension of yeast contains106 CFU/mL. Ten-fold dilutions of the initial sus-pension were additionally prepared into sterile 0.85%saline. Microbial inocula were obtained from cul-tures incubated for 24 hours at 37 °C for bacteria and48 hours at 27 °C for yeast and brought up by dilutionaccording to the 0.5 McFarland standard to approxi-mately 106 CFU/mL and 108 CFU/mL, respectively.
Antimicrobial activity was tested by determiningthe minimum inhibitory concentrations (MIC) andminimum microbicidal concentration (MMC) usingthe microdilution plate method with resazurin [24].The 96-well plates were prepared by dispensing100 µL of nutrient broth, Mueller–Hinton broth forbacteria and Sabouraud dextrose broth for yeast,into each well. The tested compounds were dis-solved in DMSO and then diluted into a nutrient
liquid medium to achieve a concentration of 10%. A100 µL aliquot from the stock solution of the testedcompound (with a concentration of 2000µg/mL) wasadded to the first row of the plate. Then, two-fold se-rial dilutions were performed by using a multichan-nel pipette. The obtained concentration range wasfrom 1000 to 7.8 µg/mL. The method is described indetail in the reported paper [25].
Doxycycline and fluconazole were used as a posi-tive control. 10% DMSO (as solvent control test) wasrecorded not to inhibit the growth of microorgan-isms. Each test included growth control and steril-ity control. All the tests were performed in duplicateand the MICs were constant. Minimum microbicidalconcentrations were determined by plating 10 µL ofsamples from wells with no indicator color changeon nutrient agar medium. At the end of the incuba-tion period, the lowest concentration with no growth(no colony) was defined as the minimum microbici-dal concentration.
2.7. Computational methodology
All calculations were performed by employing theGaussian09 program package and B3LYP-D3BJfunctional in conjunction with 6-311++G(d,p) ba-sis set (with polarization and diffuse functions in-cluded) [26,27]. In previous studies, it has beenshown that the B3LYP-D3BJ method reproducesexperimental geometrical parameters well [28,29].The vibrational spectra were analyzed by the Po-tential Energy Distribution (PED) analysis [30] andFCART version 7.0 software [31]. The solvent effectin NMR and UV–Vis spectra was approximated bythe Conductor-like Polarizable Continuum Model(CPCM) [32]. The Gauge Independent Atomic Or-bital (GIAO) approach was used to calculate the 1Hand 13C NMR chemical shifts of investigated com-pounds [33,34]. The UV–Vis spectra were calculatedwith Time-Dependent Density Functional Theory(TD-DFT) in methanol. For the theoretical spectra,the pre-defined peak half-width at half-height in theGaussView Program was used.
2.8. Molecular docking simulation
Various studies indicate the importance of epider-mal growth factor receptor (EGFR) inhibition as aneffective method in the treatment of different types of
C. R. Chimie — 2021, 24, n 2, 215-232
Žiko B.Milanovic et al. 221
cancer. Inhibition of EGFR, as a potential therapeutictarget, limits the proliferation of cancer cells [35]. Forthis reason, the potential inhibitory effect of newlysynthesized coumarin derivatives was investigatedand the contribution of different positions of aro-matic OH groups on inhibitory activity was discussedin detail.
Docking studies have been performed using theAutoDock 4.2 software package for predicting theprotein–ligand interactions between the EGFR recep-tor and the newly synthesized compounds [36]. Thestructures of the investigated compounds were sub-jected to full geometry optimization using the pro-gram package Gaussian09 [26]. The geometries forall structures were optimized using quantum chem-ical calculations based on density functional theoryB3LYP-D3BJ functional with a 6-311++G(d,p) basisset. The X-ray structure of the EGFR receptor cocrys-tallized with pyrollo derivative, at 1.9 Å resolution,was taken from RCSB Protein Data Bank in PDB for-mat (PDB:3W2S) [37,38]. The graphical user interfaceAutoDockTools (ADT) was used to generate the dock-ing input files. Grid maps were computed using Au-toGrid considered grid box of dimension 60×60×60(grid size) in −x, −y , and −z directions. Grid spacing,with the point separated by 0.375 Å (approximatelyone-fourth of the length of a carbon–carbon covalentbond) was used for the calculation of the energeticmap. The Lamarckian genetic algorithm was chosenfor the search of the best conformers of investigatedcompounds in the receptor. The pose of investigatedcompounds with the lowest energy of binding wasextracted and aligned with receptor structure for fur-ther analysis. The Discovery Studio 4.0 (BIOVIA Dis-covery Studio 2016) was used to visualize and analyzedocking results after simulation [39].
3. Results and discussion
3.1. X-ray structure and optimized geometricconfigurations
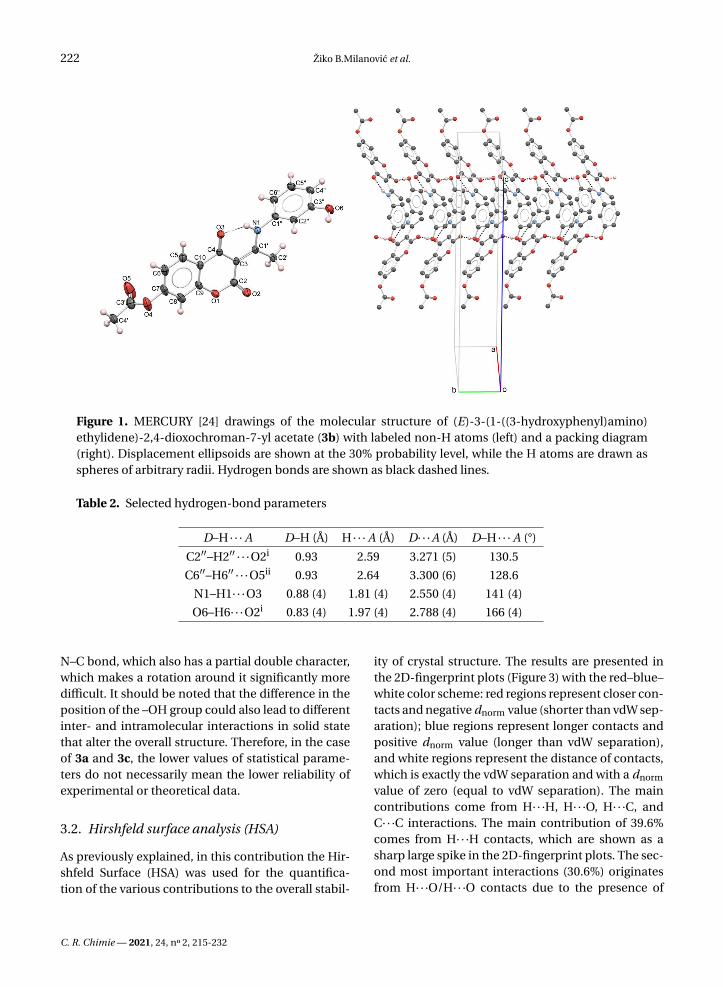
The crystallographic structure of 3b with the adoptedatom-numbering scheme is shown in Figure 1.Compound 3b crystallizes in the monoclinic crys-tal system and P21/c space group in which theasymmetric part of the unit cell contains one neu-tral molecule. Selected bond lengths, bond angles,and dihedral angles of 3b are listed in Tables S1,
S2, and S3. Based on the values of dihedral an-gles (Table S3), it can be noticed that the 7-acetatepart (∠C3’–O4–C7–C8 = 96.7 (5)°) and aniline de-rivative (∠C1’–N1–C1′′–C2′′ = 78.6 (4)°) give rise tothe distortion from planarity. Moreover, the valueof the angle between C5/C6/C7/C8/C9/C10 andC1′′/C2′′/C3′′/C4′′/C5′′/C6′′ weighted least-squaresplanes is 76.7 (4)°, which confirms the non-planarmolecular structure of 3b.
The structure of 3b is additionally stabilized bythe intramolecular hydrogen bond between N1 andO3 atoms (Figure 1) with the following parameters(Table 2): N1–H1 = 0.88(4)Å, H1· · ·O3 = 1.81(4) Å,N1· · ·O3 = 2.550(4) Å, and ∠ N1–H1· · ·O3 = 141(4)°.
Molecular arrangement in the crystal structureof 3b (Figure 1) is governed by a network of O6–H6· · ·O2i (i: −x+1, y +1/2, −z+3/2) hydrogen bonds(O6–H6 = 0.83(4) Å, H6· · ·O2 = 1.97(4) Å, O6· · ·O2 =2.788(4) Å, ∠ O6–H6· · ·O6 = 166(4)°) in a head-to-tailmanner, grouping molecules into chains parallel tothe b crystallographic axis.
Symmetry code(s): (i) −x + 1, y + 1/2, −z + 3/2;(ii) −x +1, −y , −z +1.
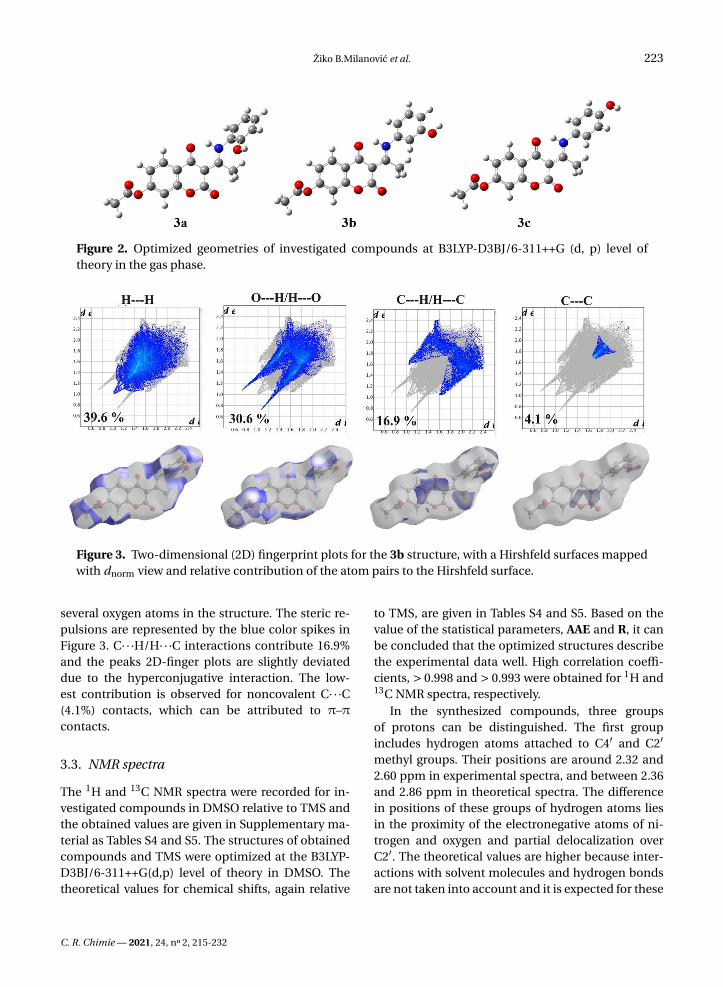
The structures of obtained compounds were op-timized based on the crystallographic structure of3b (Figure 2). The crystallographic and theoreticalbond lengths and angles, as well as other experimen-tal and calculated values, were mutually correlated.The quality of correlations was measured using twostatistical parameters, namely the correlation coeffi-cient (R) and the average absolute error (AAE). Thefirst parameter gives the correlation between exper-imental and theoretical values, while the second pa-rameter presents the average value of the differencebetween these values. The high value of R and lowvalue of AAE define a good description of the ex-perimental system by calculated values. As observedin Tables S1–S3, correlation coefficients for 3b arehigher than 0.97 for bond lengths, bond angles, anddihedral angles, while AAEs are 0.02 Å, 0.91°, and3.13°, respectively. This result proved that the chosenlevel of theory described the experimental structurewell. In the case when bond lengths and bond an-gles of 3a are compared to those of 3b, the AAEs are0.03 Å and 0.26°, respectively, while the differencesin structural parameters between 3c and 3b are evenlower, namely 0.0008 Å and 0.18°, respectively. This isan expected result since the investigated moleculeshave a rigid structure, i.e., the rotatable part is the
C. R. Chimie — 2021, 24, n 2, 215-232
222 Žiko B.Milanovic et al.
Figure 1. MERCURY [24] drawings of the molecular structure of (E)-3-(1-((3-hydroxyphenyl)amino)ethylidene)-2,4-dioxochroman-7-yl acetate (3b) with labeled non-H atoms (left) and a packing diagram(right). Displacement ellipsoids are shown at the 30% probability level, while the H atoms are drawn asspheres of arbitrary radii. Hydrogen bonds are shown as black dashed lines.
Table 2. Selected hydrogen-bond parameters
D–H · · · A D–H (Å) H · · · A (Å) D· · ·A (Å) D–H · · · A (°)
C2′′–H2′′ · · ·O2i 0.93 2.59 3.271 (5) 130.5
C6′′–H6′′ · · ·O5ii 0.93 2.64 3.300 (6) 128.6
N1–H1· · ·O3 0.88 (4) 1.81 (4) 2.550 (4) 141 (4)
O6–H6· · ·O2i 0.83 (4) 1.97 (4) 2.788 (4) 166 (4)
N–C bond, which also has a partial double character,which makes a rotation around it significantly moredifficult. It should be noted that the difference in theposition of the –OH group could also lead to differentinter- and intramolecular interactions in solid statethat alter the overall structure. Therefore, in the caseof 3a and 3c, the lower values of statistical parame-ters do not necessarily mean the lower reliability ofexperimental or theoretical data.
3.2. Hirshfeld surface analysis (HSA)
As previously explained, in this contribution the Hir-shfeld Surface (HSA) was used for the quantifica-tion of the various contributions to the overall stabil-
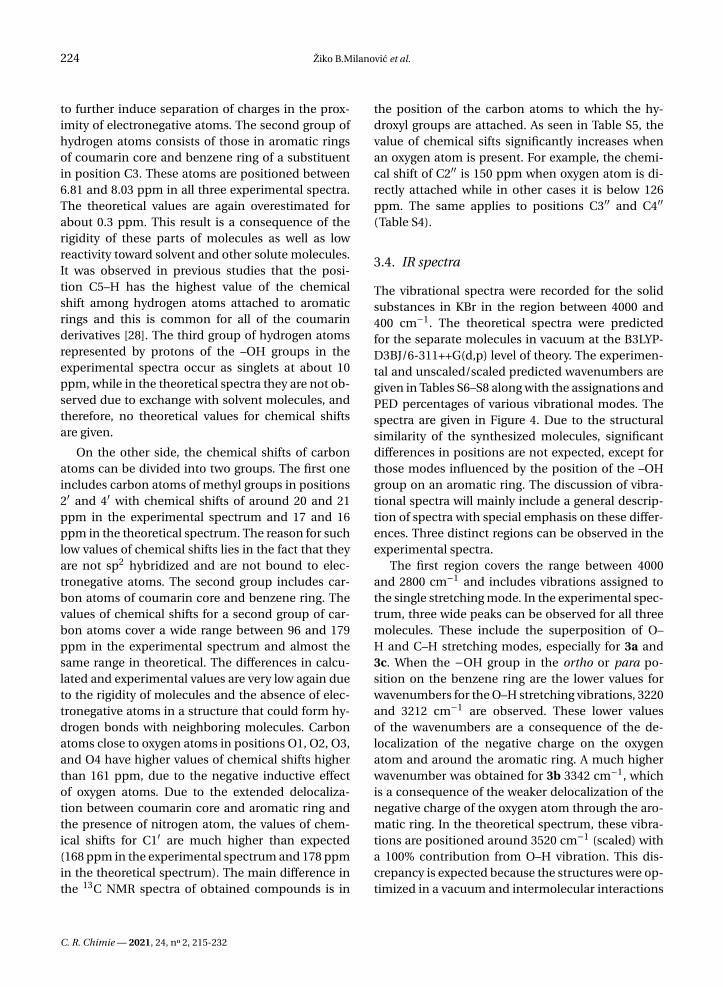
ity of crystal structure. The results are presented inthe 2D-fingerprint plots (Figure 3) with the red–blue–white color scheme: red regions represent closer con-tacts and negative dnorm value (shorter than vdW sep-aration); blue regions represent longer contacts andpositive dnorm value (longer than vdW separation),and white regions represent the distance of contacts,which is exactly the vdW separation and with a dnorm
value of zero (equal to vdW separation). The maincontributions come from H· · ·H, H· · ·O, H· · ·C, andC· · ·C interactions. The main contribution of 39.6%comes from H· · ·H contacts, which are shown as asharp large spike in the 2D-fingerprint plots. The sec-ond most important interactions (30.6%) originatesfrom H· · ·O/H· · ·O contacts due to the presence of
C. R. Chimie — 2021, 24, n 2, 215-232
Žiko B.Milanovic et al. 223
Figure 2. Optimized geometries of investigated compounds at B3LYP-D3BJ/6-311++G (d, p) level oftheory in the gas phase.
Figure 3. Two-dimensional (2D) fingerprint plots for the 3b structure, with a Hirshfeld surfaces mappedwith dnorm view and relative contribution of the atom pairs to the Hirshfeld surface.
several oxygen atoms in the structure. The steric re-pulsions are represented by the blue color spikes inFigure 3. C· · ·H/H· · ·C interactions contribute 16.9%and the peaks 2D-finger plots are slightly deviateddue to the hyperconjugative interaction. The low-est contribution is observed for noncovalent C· · ·C(4.1%) contacts, which can be attributed to π–πcontacts.
3.3. NMR spectra
The 1H and 13C NMR spectra were recorded for in-vestigated compounds in DMSO relative to TMS andthe obtained values are given in Supplementary ma-terial as Tables S4 and S5. The structures of obtainedcompounds and TMS were optimized at the B3LYP-D3BJ/6-311++G(d,p) level of theory in DMSO. Thetheoretical values for chemical shifts, again relative
to TMS, are given in Tables S4 and S5. Based on thevalue of the statistical parameters, AAE and R, it canbe concluded that the optimized structures describethe experimental data well. High correlation coeffi-cients, > 0.998 and > 0.993 were obtained for 1H and13C NMR spectra, respectively.
In the synthesized compounds, three groupsof protons can be distinguished. The first groupincludes hydrogen atoms attached to C4′ and C2′
methyl groups. Their positions are around 2.32 and2.60 ppm in experimental spectra, and between 2.36and 2.86 ppm in theoretical spectra. The differencein positions of these groups of hydrogen atoms liesin the proximity of the electronegative atoms of ni-trogen and oxygen and partial delocalization overC2′. The theoretical values are higher because inter-actions with solvent molecules and hydrogen bondsare not taken into account and it is expected for these
C. R. Chimie — 2021, 24, n 2, 215-232
224 Žiko B.Milanovic et al.
to further induce separation of charges in the prox-imity of electronegative atoms. The second group ofhydrogen atoms consists of those in aromatic ringsof coumarin core and benzene ring of a substituentin position C3. These atoms are positioned between6.81 and 8.03 ppm in all three experimental spectra.The theoretical values are again overestimated forabout 0.3 ppm. This result is a consequence of therigidity of these parts of molecules as well as lowreactivity toward solvent and other solute molecules.It was observed in previous studies that the posi-tion C5–H has the highest value of the chemicalshift among hydrogen atoms attached to aromaticrings and this is common for all of the coumarinderivatives [28]. The third group of hydrogen atomsrepresented by protons of the –OH groups in theexperimental spectra occur as singlets at about 10ppm, while in the theoretical spectra they are not ob-served due to exchange with solvent molecules, andtherefore, no theoretical values for chemical shiftsare given.
On the other side, the chemical shifts of carbonatoms can be divided into two groups. The first oneincludes carbon atoms of methyl groups in positions2′ and 4′ with chemical shifts of around 20 and 21ppm in the experimental spectrum and 17 and 16ppm in the theoretical spectrum. The reason for suchlow values of chemical shifts lies in the fact that theyare not sp2 hybridized and are not bound to elec-tronegative atoms. The second group includes car-bon atoms of coumarin core and benzene ring. Thevalues of chemical shifts for a second group of car-bon atoms cover a wide range between 96 and 179ppm in the experimental spectrum and almost thesame range in theoretical. The differences in calcu-lated and experimental values are very low again dueto the rigidity of molecules and the absence of elec-tronegative atoms in a structure that could form hy-drogen bonds with neighboring molecules. Carbonatoms close to oxygen atoms in positions O1, O2, O3,and O4 have higher values of chemical shifts higherthan 161 ppm, due to the negative inductive effectof oxygen atoms. Due to the extended delocaliza-tion between coumarin core and aromatic ring andthe presence of nitrogen atom, the values of chem-ical shifts for C1′ are much higher than expected(168 ppm in the experimental spectrum and 178 ppmin the theoretical spectrum). The main difference inthe 13C NMR spectra of obtained compounds is in
the position of the carbon atoms to which the hy-droxyl groups are attached. As seen in Table S5, thevalue of chemical sifts significantly increases whenan oxygen atom is present. For example, the chemi-cal shift of C2′′ is 150 ppm when oxygen atom is di-rectly attached while in other cases it is below 126ppm. The same applies to positions C3′′ and C4′′
(Table S4).
3.4. IR spectra
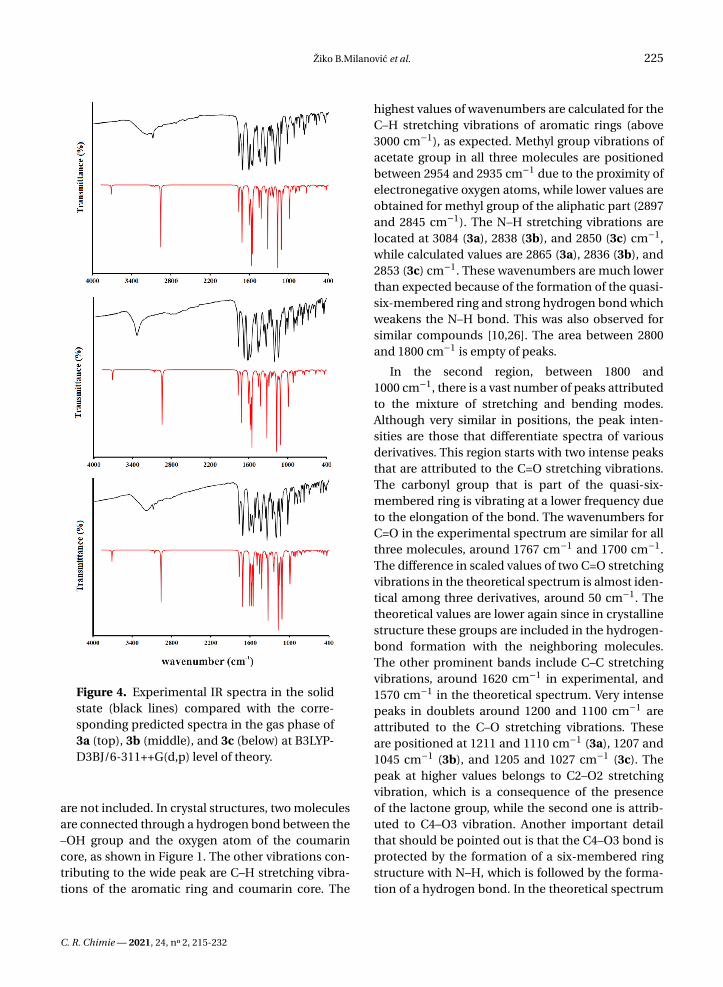
The vibrational spectra were recorded for the solidsubstances in KBr in the region between 4000 and400 cm−1. The theoretical spectra were predictedfor the separate molecules in vacuum at the B3LYP-D3BJ/6-311++G(d,p) level of theory. The experimen-tal and unscaled/scaled predicted wavenumbers aregiven in Tables S6–S8 along with the assignations andPED percentages of various vibrational modes. Thespectra are given in Figure 4. Due to the structuralsimilarity of the synthesized molecules, significantdifferences in positions are not expected, except forthose modes influenced by the position of the –OHgroup on an aromatic ring. The discussion of vibra-tional spectra will mainly include a general descrip-tion of spectra with special emphasis on these differ-ences. Three distinct regions can be observed in theexperimental spectra.
The first region covers the range between 4000and 2800 cm−1 and includes vibrations assigned tothe single stretching mode. In the experimental spec-trum, three wide peaks can be observed for all threemolecules. These include the superposition of O–H and C–H stretching modes, especially for 3a and3c. When the −OH group in the ortho or para po-sition on the benzene ring are the lower values forwavenumbers for the O–H stretching vibrations, 3220and 3212 cm−1 are observed. These lower valuesof the wavenumbers are a consequence of the de-localization of the negative charge on the oxygenatom and around the aromatic ring. A much higherwavenumber was obtained for 3b 3342 cm−1, whichis a consequence of the weaker delocalization of thenegative charge of the oxygen atom through the aro-matic ring. In the theoretical spectrum, these vibra-tions are positioned around 3520 cm−1 (scaled) witha 100% contribution from O–H vibration. This dis-crepancy is expected because the structures were op-timized in a vacuum and intermolecular interactions
C. R. Chimie — 2021, 24, n 2, 215-232
Žiko B.Milanovic et al. 225
Figure 4. Experimental IR spectra in the solidstate (black lines) compared with the corre-sponding predicted spectra in the gas phase of3a (top), 3b (middle), and 3c (below) at B3LYP-D3BJ/6-311++G(d,p) level of theory.
are not included. In crystal structures, two moleculesare connected through a hydrogen bond between the–OH group and the oxygen atom of the coumarincore, as shown in Figure 1. The other vibrations con-tributing to the wide peak are C–H stretching vibra-tions of the aromatic ring and coumarin core. The
highest values of wavenumbers are calculated for theC–H stretching vibrations of aromatic rings (above3000 cm−1), as expected. Methyl group vibrations ofacetate group in all three molecules are positionedbetween 2954 and 2935 cm−1 due to the proximity ofelectronegative oxygen atoms, while lower values areobtained for methyl group of the aliphatic part (2897and 2845 cm−1). The N–H stretching vibrations arelocated at 3084 (3a), 2838 (3b), and 2850 (3c) cm−1,while calculated values are 2865 (3a), 2836 (3b), and2853 (3c) cm−1. These wavenumbers are much lowerthan expected because of the formation of the quasi-six-membered ring and strong hydrogen bond whichweakens the N–H bond. This was also observed forsimilar compounds [10,26]. The area between 2800and 1800 cm−1 is empty of peaks.
In the second region, between 1800 and1000 cm−1, there is a vast number of peaks attributedto the mixture of stretching and bending modes.Although very similar in positions, the peak inten-sities are those that differentiate spectra of variousderivatives. This region starts with two intense peaksthat are attributed to the C=O stretching vibrations.The carbonyl group that is part of the quasi-six-membered ring is vibrating at a lower frequency dueto the elongation of the bond. The wavenumbers forC=O in the experimental spectrum are similar for allthree molecules, around 1767 cm−1 and 1700 cm−1.The difference in scaled values of two C=O stretchingvibrations in the theoretical spectrum is almost iden-tical among three derivatives, around 50 cm−1. Thetheoretical values are lower again since in crystallinestructure these groups are included in the hydrogen-bond formation with the neighboring molecules.The other prominent bands include C–C stretchingvibrations, around 1620 cm−1 in experimental, and1570 cm−1 in the theoretical spectrum. Very intensepeaks in doublets around 1200 and 1100 cm−1 areattributed to the C–O stretching vibrations. Theseare positioned at 1211 and 1110 cm−1 (3a), 1207 and1045 cm−1 (3b), and 1205 and 1027 cm−1 (3c). Thepeak at higher values belongs to C2–O2 stretchingvibration, which is a consequence of the presenceof the lactone group, while the second one is attrib-uted to C4–O3 vibration. Another important detailthat should be pointed out is that the C4–O3 bond isprotected by the formation of a six-membered ringstructure with N–H, which is followed by the forma-tion of a hydrogen bond. In the theoretical spectrum
C. R. Chimie — 2021, 24, n 2, 215-232
226 Žiko B.Milanovic et al.
of 3c, the values are lower for 36 cm−1 for the firstpeak and 6 cm−1 for the second. As can be seen, thehydrogen bond in the subunit is formed betweenthe –OH group in ortho position and C2–O2 whichchanges the energy of the bond. The bond C4–O3is much more protected by the formation of a ringstructure with N–H. Several bending modes addi-tionally contribute to the peaks in this area. Some ofthem in the spectrum of 3a are C–C–H (1464, 1211,and 1110 cm−1), C–C–O (1442 cm−1), and H–C–H(1346 cm−1). Also, the torsion vibrations, for exam-ple, H–C–C–O (1026 cm−1), are present in this partof the spectrum. The positions of these vibrations inthe spectrum of 3b and 3c differ for several cm−1.The predicted values are within 20 cm−1 of exper-imental ones which can be justified by the low re-activity of the present groups and the inexistenceof intermolecular interactions with the surroundingmolecules.
The third region covers the values below1000 cm−1 and it is characterized by the mediumto low-intensity peaks assigned to the bending andtorsion vibrations, or their combination with stretch-ing vibrations. In the spectrum of 3a, the most in-tense peaks are positioned at 999 (δ(C–C–H), ν(C–C),and ν(C–O)), 904 (τ(H–C–C–H), τ( C–C–C–H)), 569(τ(O–C–O–C), τ(H–C–C–O)), and 445 cm−1 (δ(C–C–O), ν(C–C), and δ(C–O–C)). Similar vibration modescan be assigned to 3b and 3c. In the theoretical spec-trum, the number of calculated wavenumbers ismuch higher, and it should be kept in mind that PEDanalysis cannot cover all of the contributions due tothe mixture of modes.
The correlation coefficients for all three spec-tra are given in Tables S6–S8. As can be seen, theoptimized structures describe the experimentalwavenumbers well for all three derivatives. The val-ues of R are 0.991 (3a), 0.998 (3b), and 0.996 (3c). Thisis an additional proof, besides the analysis of NMRspectra, that the optimized structures represent theinvestigated molecules well and that they can beused for further theoretical analysis.
3.5. UV–Vis spectra
The UV–vis spectra of obtained compounds wererecorded in the region between 200 and 450 nm,while the electronic transitions were predicted for
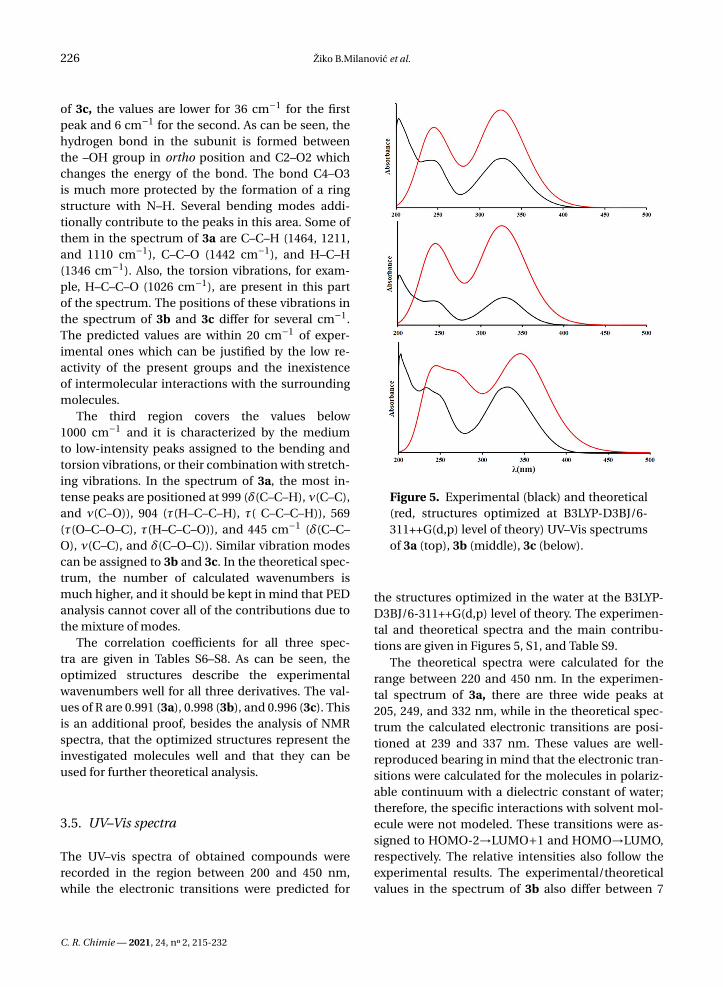
Figure 5. Experimental (black) and theoretical(red, structures optimized at B3LYP-D3BJ/6-311++G(d,p) level of theory) UV–Vis spectrumsof 3a (top), 3b (middle), 3c (below).
the structures optimized in the water at the B3LYP-D3BJ/6-311++G(d,p) level of theory. The experimen-tal and theoretical spectra and the main contribu-tions are given in Figures 5, S1, and Table S9.
The theoretical spectra were calculated for therange between 220 and 450 nm. In the experimen-tal spectrum of 3a, there are three wide peaks at205, 249, and 332 nm, while in the theoretical spec-trum the calculated electronic transitions are posi-tioned at 239 and 337 nm. These values are well-reproduced bearing in mind that the electronic tran-sitions were calculated for the molecules in polariz-able continuum with a dielectric constant of water;therefore, the specific interactions with solvent mol-ecule were not modeled. These transitions were as-signed to HOMO-2→LUMO+1 and HOMO→LUMO,respectively. The relative intensities also follow theexperimental results. The experimental/theoreticalvalues in the spectrum of 3b also differ between 7
C. R. Chimie — 2021, 24, n 2, 215-232
Žiko B.Milanovic et al. 227
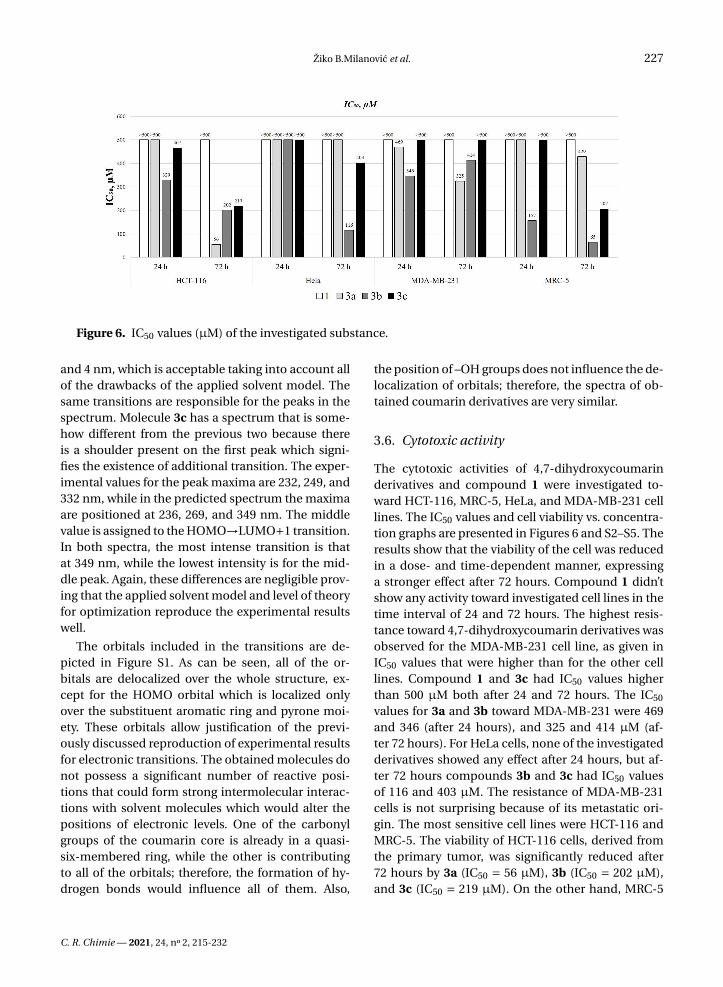
Figure 6. IC50 values (µM) of the investigated substance.
and 4 nm, which is acceptable taking into account allof the drawbacks of the applied solvent model. Thesame transitions are responsible for the peaks in thespectrum. Molecule 3c has a spectrum that is some-how different from the previous two because thereis a shoulder present on the first peak which signi-fies the existence of additional transition. The exper-imental values for the peak maxima are 232, 249, and332 nm, while in the predicted spectrum the maximaare positioned at 236, 269, and 349 nm. The middlevalue is assigned to the HOMO→LUMO+1 transition.In both spectra, the most intense transition is thatat 349 nm, while the lowest intensity is for the mid-dle peak. Again, these differences are negligible prov-ing that the applied solvent model and level of theoryfor optimization reproduce the experimental resultswell.
The orbitals included in the transitions are de-picted in Figure S1. As can be seen, all of the or-bitals are delocalized over the whole structure, ex-cept for the HOMO orbital which is localized onlyover the substituent aromatic ring and pyrone moi-ety. These orbitals allow justification of the previ-ously discussed reproduction of experimental resultsfor electronic transitions. The obtained molecules donot possess a significant number of reactive posi-tions that could form strong intermolecular interac-tions with solvent molecules which would alter thepositions of electronic levels. One of the carbonylgroups of the coumarin core is already in a quasi-six-membered ring, while the other is contributingto all of the orbitals; therefore, the formation of hy-drogen bonds would influence all of them. Also,
the position of –OH groups does not influence the de-localization of orbitals; therefore, the spectra of ob-tained coumarin derivatives are very similar.
3.6. Cytotoxic activity
The cytotoxic activities of 4,7-dihydroxycoumarinderivatives and compound 1 were investigated to-ward HCT-116, MRC-5, HeLa, and MDA-MB-231 celllines. The IC50 values and cell viability vs. concentra-tion graphs are presented in Figures 6 and S2–S5. Theresults show that the viability of the cell was reducedin a dose- and time-dependent manner, expressinga stronger effect after 72 hours. Compound 1 didn’tshow any activity toward investigated cell lines in thetime interval of 24 and 72 hours. The highest resis-tance toward 4,7-dihydroxycoumarin derivatives wasobserved for the MDA-MB-231 cell line, as given inIC50 values that were higher than for the other celllines. Compound 1 and 3c had IC50 values higherthan 500 µM both after 24 and 72 hours. The IC50
values for 3a and 3b toward MDA-MB-231 were 469and 346 (after 24 hours), and 325 and 414 µM (af-ter 72 hours). For HeLa cells, none of the investigatedderivatives showed any effect after 24 hours, but af-ter 72 hours compounds 3b and 3c had IC50 valuesof 116 and 403 µM. The resistance of MDA-MB-231cells is not surprising because of its metastatic ori-gin. The most sensitive cell lines were HCT-116 andMRC-5. The viability of HCT-116 cells, derived fromthe primary tumor, was significantly reduced after72 hours by 3a (IC50 = 56 µM), 3b (IC50 = 202 µM),and 3c (IC50 = 219 µM). On the other hand, MRC-5
C. R. Chimie — 2021, 24, n 2, 215-232
228 Žiko B.Milanovic et al.
cells are epithelial cells and thus very sensitive to theinvestigated derivatives. The reduction of their via-bility was not efficient after 24 hours, except for 3b(IC50 = 157 µM). After 72 hours, the IC50 values for3a, 3b, and 3c were 429, 65, and 207 µM, respectively.In general, the obtained derivatives show only mod-erate activity that also depends on the position of the–OH group. The meta-derivative in this study provedto be the most active one probably because there areno intramolecular hydrogen bonds and steric hin-drance that could prevent the formation of specificinteractions with important proteins. The most selec-tive derivative was 3a, as proven by high reduction ofHCT-116 viability after 72 hours and low impact onMRC-5.
3.7. Antimicrobial activity
The results of in vitro antimicrobial activity oftested and control compounds against 13 strainsof microorganisms, determined by the microdilu-tion method, are presented in Table 3. MICs andMMCs values were in the range from 15.63 µg/mL to>1000 µg/mL with significant differences betweenspecies of microorganisms. The antibacterial activ-ity of derivatives was moderate and partially selec-tive, except in a few cases that are explained in thefollowing paragraph.
The difference in sensitivity of G− and G+ bacteriatoward tested substances was observed. The mostsensitive microorganism was Bacillus subtilis ATCC6633 (MIC 15.63 µg/mL for 3b). The MIC value of3b was lower than that for doxycycline. The high-est resistances were demonstrated by Escherichiacoli standard and clinical strain, and Staphylococ-cus aureus ATCC 25923 (MICs and MMCs were>1000 µg/mL). Among all derivatives, compound1 showed slightly higher activity especially towardBacillus altitudinis, Bacillus pumilus, Bacillus cereus,and Pantoea agglomerans. In the previous studiesperformed on 4-hydroxycoumarin derivatives withchloroaniline and other molecules and their corre-sponding Pd(II)-complexes, the intensity of the an-timicrobial action varied depending on the speciesof microorganism and the tested compound. Thetested substances showed selective, moderate, orlow antimicrobial activity [28,40]. Some of the lig-ands showed better antibacterial activity than thecorresponding complexes, against bacteria from
the genus Bacillus [40]. In the study by Chin andcoworkers, twenty 5,7-dihydroxycoumarin deriva-tives were tested for antibacterial activities [41].These compounds showed a broad range of an-timicrobial activity. Some coumarins showed mild(MIC 320–>640µg/mL), some moderate (MIC 160–639 µg/mL), and some strong antibacterial activity(MIC 10–160 µg/mL). Two compounds exhibitedpotent activity against Staphylococcus aureus with aMIC value of 2.5 µg/mL. Therefore, the results fromthis study are in line with literature data, and furtherexperiments are needed to verify the activity andreaction mechanism of 3b toward Bacillus subtilis.
3.8. Molecular docking
The results of thermodynamic parameters for theperformed molecular docking study are given in Ta-ble 4. The values in Table 4 represent: the free en-ergy of binding (∆Gbind), constant of inhibition (Ki ),total internal energy (∆Gtotal), torsional free energy(∆Gtor), unbound system’s energy (∆Gunb), electro-static energy (∆Gelec) energy of dispersion and re-pulsion (∆Gvdw), hydrogen-bond energy (∆Ghbond),and desolvation (∆Gdesolv) energy. By observing theobtained thermodynamic values, it is clear that theEGFR-3b (−8.6 kJ·mol−1, 0.6 µM) complex had thelowest predicted binding free energy (∆Gbind) and thelowest values of constant of inhibition (Ki ) amongthree 4,7-dihydroxycoumarin derivatives, while thevalues for EGFR-3a and EGFR-3c complexes were−8.4 kJ·mol−1/0.7 µM and −8.3 kJ·mol−1/0.8 µM, re-spectively. Based on the obtained results, it can beconcluded that the 3b compound showed the highestinhibitory activity toward the EGFR receptor, whichexplains the results of biological activity. All of thecompounds have almost equal values for the sum ofenergy of dispersion and repulsion, hydrogen-bondenergy, and desolvation energy, which is expecteddue to the similarity in structure. The torsional freeenergies are also equal. The most prominent differ-ences are observed for the electrostatic energy proba-bly because the –OH group and the rest of the 3b mol-ecule do not form any kind of intramolecular bonds,which allows stronger interactions with neighboringamino acids.
According to the results of molecular dockingsimulation, newly synthesized compounds achieve
C. R. Chimie — 2021, 24, n 2, 215-232
Žiko B.Milanovic et al. 229
Table 3. Antimicrobial activity of tested compounds and positive controls
Doxycycline/
Species 1 3a 3b 3c Fluconazole
MIC1 MMC2 MIC MMC MIC MMC MIC MMC MIC MMC
Bacillus subtilis ATCC 6633 250 500 500 1000 15.63 500 500 1000 31.25 62.5
Bacillus altitudinis 125 500 >1000 >1000 500 1000 >1000 >1000 <0.5 <0.5
Bacillus pumilus 500 1000 >1000 >1000 500 >1000 >1000 >1000 <0.5 <0.5
Bacillus cereus 500 >1000 1000 1000 >1000 >1000 >1000 >1000 <0.5 3.91
Sarcina lutea nt nt >1000 >1000 >1000 >1000 500 500 <0.5 7.81
Staphylococcus aureus ATCC 25923 >1000 >1000 >1000 >1000 >1000 >1000 >1000 >1000 1.95 15.63
Pseudomonas aeruginosa ATCC 27853 1000 >1000 1000 >1000 1000 >1000 1000 >1000 7.812 62.5
Pseudomonas veronii >1000 >1000 >1000 >1000 500 1000 500 1000 0.5 7.81
Proteus mirabilis ATCC 12453 1000 >1000 >1000 >1000 1000 >1000 >1000 >1000 125 125
Escherichia coli ATCC 25922 >1000 >1000 >1000 >1000 >1000 >1000 >1000 >1000 0.976 3.906
Escherichia coli >1000 >1000 >1000 >1000 >1000 >1000 >1000 >1000 1.953 3.906
Pantoea agglomerans 250 500 >1000 >1000 >1000 >1000 500 1000 0.5 7.81
Candida albicans ATCC 10231 >1000 >1000 1000 1000 >1000 >1000 >1000 >1000 0.5 1.95
MIC values (µg/mL)—mean inhibitory activity.
MMC values (µg/mL)—mean microbicidal activity.
nt—not tested.
Table 4. Predict an important thermodynamic parameter for most stable docking conformations
Conf. ∆Gbind Ki (µM) ∆Ginter ∆Gvdw+hbond+desolv ∆Gelec ∆Gtotal ∆Gtor ∆Gunb
EGFR-3a −8.4 0.7 −10.2 −10.1 −0.1 −1.6 1.8 −1.6
EGFR-3b −8.6 0.6 −10.4 −10.1 −0.3 −1.2 1.8 −1.2
EGFR-3c −8.3 0.8 −10.1 −10.0 −0.1 −1.2 1.8 −1.2
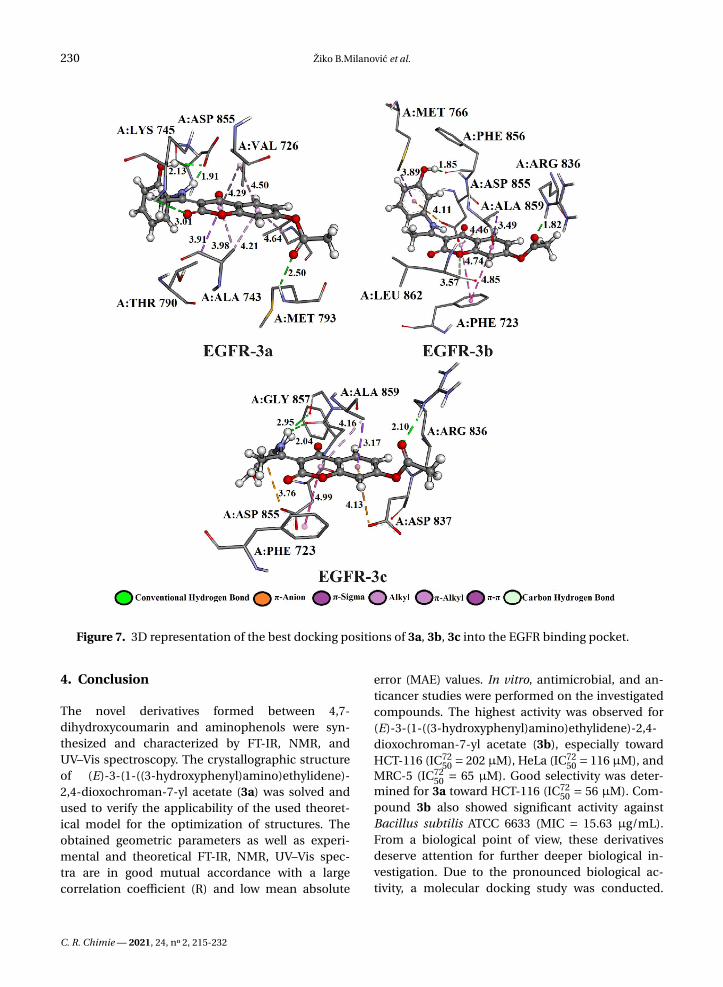
strong EGFR inhibitory activity mainly through theconventional hydrogen bonds with the active sitepocket of the receptor. The binding site and dock-ing pose of the investigation compounds as well asthe most significant interactions with amino acidresidues are shown in Figure 7 and Table S10.
The hydrogen atom of the amino group (–NH2) ofamino acids A:MET 793 and A:ARG 836 establisheshydrogen bonded with the oxygen of the carbonylgroup of the investigated compounds: 3a (2.50 Å), 3b(1.82 Å), and 3c (2.10 Å). Amino acid A:ASP 855 estab-lished bifurcated geometry across oxygen atom withhydrogen atoms of –NH– (1.91 Å) and –OH (2.13 Å)groups of 3a. On the other hand, the hydrogen atomof –NH2 group of 3c formed bifurcated hydrogenbonding geometry with the oxygen atom of carbonylgroups of dipeptide A:PHE 856–A:GLY 857 (2.04 and2.95 Å).
The affinity of investigated compounds to theEGFR receptor might also be accounted for someelectrostatic contacts, such as π-cation interactions.The binding modes of 3b, 3c compounds were en-hanced by electrostatic interaction formed betweenthe partially negative oxygen atom of A:ASP 855 andthe aromatic rings of 3b (4.11 Å) and 3c (3.76 Å) com-pounds. Residues in a hydrophobic pocket, A:PHE723, A:VAL 726, A:ALA 743, A:THR 790, and A:ALA 859were observed to provide stability support by form-ing π–π, π–sigma, and π–alkyl interactions due to thepresence of aromatic rings. The complexes EGFR-3band EGFR-3b showπ–π interactions formed betweenthe phenyl rings of 3b (3.57 and 4.85 Å), 3c (4.99Å), and A:PHE 723. The σ electron cloud of residuesA:THR 790 and A:ALA 859 formed π–σ interactionswith the aromatic rings of 3a (3.91 Å), 3b (3.49 Å), and3c (3.17 Å), respectively.
C. R. Chimie — 2021, 24, n 2, 215-232
230 Žiko B.Milanovic et al.
Figure 7. 3D representation of the best docking positions of 3a, 3b, 3c into the EGFR binding pocket.
4. Conclusion
The novel derivatives formed between 4,7-dihydroxycoumarin and aminophenols were syn-thesized and characterized by FT-IR, NMR, andUV–Vis spectroscopy. The crystallographic structureof (E)-3-(1-((3-hydroxyphenyl)amino)ethylidene)-2,4-dioxochroman-7-yl acetate (3a) was solved andused to verify the applicability of the used theoret-ical model for the optimization of structures. Theobtained geometric parameters as well as experi-mental and theoretical FT-IR, NMR, UV–Vis spec-tra are in good mutual accordance with a largecorrelation coefficient (R) and low mean absolute
error (MAE) values. In vitro, antimicrobial, and an-ticancer studies were performed on the investigatedcompounds. The highest activity was observed for(E)-3-(1-((3-hydroxyphenyl)amino)ethylidene)-2,4-dioxochroman-7-yl acetate (3b), especially towardHCT-116 (IC72
50 = 202 µM), HeLa (IC7250 = 116 µM), and
MRC-5 (IC7250 = 65 µM). Good selectivity was deter-
mined for 3a toward HCT-116 (IC7250 = 56 µM). Com-
pound 3b also showed significant activity againstBacillus subtilis ATCC 6633 (MIC = 15.63 µg/mL).From a biological point of view, these derivativesdeserve attention for further deeper biological in-vestigation. Due to the pronounced biological ac-tivity, a molecular docking study was conducted.
C. R. Chimie — 2021, 24, n 2, 215-232
Žiko B.Milanovic et al. 231
The results of the molecular docking study indicatedthat compound 3b also had the highest inhibitory ef-fect against the EGFR receptor. The essence of thesestudies is in the preliminary screening, which simplyselects possible candidates for potential drugs.
Acknowledgments
The authors wish to acknowledge the Ministry ofEducation, Science, and Technological Devel-opment of the Republic of Serbia (AgreementsNo. 451-03-68/2020-14/200122, 451-03-68/2020-14/200125, 451-03-68/2020-14/200146, 451-03-68/2020-14/200378) for financial support.
Supplementary data
Supporting information for this article is available onthe journal’s website under https://doi.org/10.5802/crchim.68 or from the author.
CCDC 2043985 contains the supplementarycrystallographic data for (E)-3-(1-((3-hydroxyphenyl)amino)ethylidene)-2,4-dioxochroman-7-yl acetate(3b). This data can be obtained free of charge viahttps://summary.ccdc.cam.ac.uk/structure-summary-form, or from the Cambridge Crys-tallographic Data Centre, 12 Union Road, Cam-bridge CB2 IEZ, UK; fax: (+044)1223-336-033; [email protected].
References
[1] J. W. Hinman, E. L. Caron, H. Hoeksema, J. Am. Chem. Soc.,1957, 79, 3789.
[2] C. A. Kontogiorgis, D. J. Hadjipavlou-Litina, J. Med. Chem.,2005, 48, 6400.
[3] Z. M. Nofal, M. I. El-Zahar, S. S. Abd El-Karim, Molecules, 2000,5, 99.
[4] S. H. Bairagi, P. P. Salaskar, S. D. Loke, N. N. Surve, D. V. Tandel,M. D. Dusara, Int. J. Pharm. Sci. Res., 2012, 4, 16.
[5] C. Kontogiorgis, D. J. Hadjipavlou-Litina, J. Enzyme., Inhib.Med. Chem., 2003, 18, 63.
[6] B. Halliwell, J. M. C. Gutteridge, Free Radicals in Biology andMedicine, 3rd ed., vol. 1–25, Clarendon Press, Oxford, 1999.
[7] M. Traykova, I. Kostova, Int. J. Pharm., 2005, 1, 29.[8] T. Marino, N. Russo, A. Galano, Comput. Theoret. Chem., 2016,
1077, 133-138.[9] G. Mazzone, N. Malaj, A. Galano, N. Russo, M. Toscano, RSC
Adv., 2015, 5, no. 1, 565-575.[10] M. A. Musa, J. S. Cooperwood, M. O. F. Khan, Curr. Med.
Chem., 2008, 15, 2664.[11] O. Kayser, H. Kolodziej, Planta Med., 1997, 63, 508.
[12] Ž. B. Milanovic, D. S. Dimic, E. H. Avdovic, D. A. Milenkovic,J. D. Markovic, O. R. Klisuric, S. R. Trifunovic, Z. S. Markovic,J. Mol. Struct., 2020, 1225, article no. 129256.
[13] O. D. Rigaku, CrysAlis PRO, Rigaku Oxford Diffraction Ltd,Yarnton, Oxfordshire, England, 2015.
[14] R. H. Blessing, Acta Crystallogr. Sect. A Found. Adv., 1995, 51,33.
[15] G. M. Sheldrick, Acta Crystallogr. Sect. A Found. Adv., 2015, 71,3.
[16] G. M. Sheldrick, Acta Crystallogr. Sect. C Struct. Chem., 2015,71, 3.
[17] I. J. Bruno, J. C. Cole, P. R. Edgington, M. Kessler, C. F. Macrae,P. McCabe, J. Pearson, R. Taylor, Acta Crystallogr. Sect. B Struct.Sci., 2002, 58, 389.
[18] O. V. Dolomanov, L. J. Bourhis, R. J. Gildea, J. A. K. Howard,H. Puschmann, J. Appl. Cryst., 2009, 42, 339.
[19] M. A. Spackman, D. Jayatilaka, CrystEngComm, 2009, 11, 19-32.
[20] K. S. Dey, R. Saha, S. Singha, S. Biswas, A. Layek, S. Middya, P. P.Raya, D. Bandhyopadhyay, S. Kumar, Spectrochim. Acta Part AMol. Biomol. Spectrosc., 2015, 144, 43-52.
[21] K. Hostanska, G. Jürgenliemk, G. Abel, A. Nahrstedt, R. Saller,Cancer Detect Prev., 2007, no. 31, 129-139.
[22] D. S. Šeklic, M. S. Stankovic, M. G. Milutinovic, M. D. Topu-zovic, A. Š. Štajn, S. D. Markovic, Arch. Biol. Sci., 2016, 68, 93.
[23] J. M. Andrews, J. Antimicrob. Chemoth., 2005, 56, 60.[24] S. D. Sarker, L. Nahar, Y. Kumarasamy, Methods, 2007, 42, 321.[25] G. P. Radic, V. V. Glodovic, I. D. Radojevic, O. D. Stefanovic,
L. R. Comic, Z. R. Ratkovic, A. Valkonen, K. Rissanen, S. R.Trifunovic, Polyhedron, 2012, 31, 69.
[26] M. J. Frisch, G. W. Trucks, H. B. Schlegel, G. E. Scuseria, M. A.Robb, J. R. Cheeseman, G. Scalmani, V. Barone, B. Mennucci,G. A. Petersson et al., Gaussian 09, Gaussian, Inc., Wallingford,CT, 2009.
[27] A. D. Becke, E. R. Johnson, J. Chem. Phys., 2005, 123, articleno. 154101.
[28] E. H. Avdovic, Ž. B. Milanovic, M. N. Živanovic, D. S. Šeklic,I. D. Radojevic, L. R. Comic, S. R. Trifunovic, A. D. Amic, Z. S.Markovic, Inorg. Chim. Acta, 2020, 504, article no. 119465.
[29] D. Milenkovic, E. Avdovic, D. Dimic, S. Sudha, D. Ramarajan,Ž. Milanovic, S. Trifunovic, Z. Markovic, J. Mol. Struct., 2020,1209, article no. 127935.
[30] R. A. Munos, Y. N. Panchenko, G. S. Koptev, N. F. Stepanov,J. Appl. Spectrosc., 1970, 12, 428.
[31] C. R. Legler, N. R. Brown, R. A. Dunbar, M. D. Harness,K. Nguyen, O. Oyewole, W. B. Collier, Spectrochim. Acta A.,2015, 145, 15-24.
[32] Y. Takano, K. N. Houk, J. Chem. Theory Comput., 2005, 1, 70-77.
[33] K. Wolinski, J. F. Hinton, P. Pulay, J. Am. Chem. Soc., 1990, 112,8251-8260.
[34] R. Zielinski, H. Szymusiak, Polish J. Food Nutr. Sci., 2003, 12,157-162.
[35] T. Sasaki, K. Hiroki, Y. Yamashita, Biomed. Res. Int., 2013, 2013,article no. 546318.
[36] G. M. Morris, R. Huey, W. Lindstrom, M. F. Sanner, R. K. Belew,D. S. Goodsell, A. J. Olson, J. Comput. Chem., 2009, 30, 2785-2791.
C. R. Chimie — 2021, 24, n 2, 215-232
232 Žiko B.Milanovic et al.
[37] K. Mandal, S. B. Kent, Angew. Chem. Int. Ed., 2011, 50, 8029-8033.
[38] S. Sogabe, Y. Kawakita, S. Igaki, H. Iwata, H. Miki, D. R. Cary,T. Ishikawa, ACS Med. Chem. Lett., 2012, 4, 201-205.
[39] BIOVIA, Dassault Sysèmes, Discovery Studio Modeling Envi-ronment, Release 2017, Dassault Systèmes, San Diego, 2017.
[40] E. H. Avdovic, D. L. Stojkovic, V. V. Jevtic, D. Milenkovic, Z. S.Markovic, N. Vukovic, I. Potocnák, I. D. Radojevic, L. R. Comic,S. R. Trifunovic, Inorg. Chim. Acta, 2019, 206, 421.
[41] Y. P. Chin, W. J. Huang, F. L. Hsu, M. H. Lin, Y. L. Lin, Arch.Pharm., 2011, 344, 386.
C. R. Chimie — 2021, 24, n 2, 215-232
Copyright © 2022 FDOKUMEN