Electrolytic Synthesis and Structural Chemistry of Intermetallic ...
267
Dissertation zur Erlangung des Doktorgrades der Fakultät Chemie und Pharmazie der Ludwig-Maximilians-Universität München Electrolytic Synthesis and Structural Chemistry of Intermetallic Phases with Polar Metal-Metal Bonding Frank Tambornino aus Bocholt, Deutschland 2016
-
Upload
khangminh22 -
Category
Documents
-
view
2 -
download
0
Transcript of Electrolytic Synthesis and Structural Chemistry of Intermetallic ...
Dissertation zur Erlangung des Doktorgradesder Fakultät Chemie und Pharmazie
der Ludwig-Maximilians-Universität München
Electrolytic Synthesisand Structural Chemistryof Intermetallic Phases
with Polar Metal-Metal Bonding
Frank Tambornino
aus
Bocholt, Deutschland
2016

Erklärung
Diese Disstertation wurde im Sinne von §7 der Promotionsordnung vom 28. November2011 von Herrn Prof. Dr. W. Schnick betreut.
Eidesstattliche Versicherung
Diese Dissertation wurde eigenständig und ohne unerlaubte Hilfe erarbeitet.
München, 20.10.2016...........................................Frank Tambornino
Dissertation eingereicht am 20.10.2016
1. Gutachter Prof. Dr. Wolfgang Schnick
2. Gutachter Prof. Dr. Dirk Johrendt
Mündliche Prüfung am 19.12.2016


to my family


It is the mark of an educated mindto be able to entertain a thought
without accepting it.— Aristotle

Mein ganz besonderer Dank gilt Herr Prof. W. Schnick für die Möglichkeit , die Disser-tation in seinem Arbeitskreis anzufertigen.
Prof. Dirk Johrendt danke ich für die Bereitschaft, das Koreferat für diese Arbeit zuübernehmen.
Prof. Dr. O. Oeckler, Prof. Dr. A. Hartschuh, Prof. Dr. K. Karaghiosoff und Prof.Dr. T. Klapötke danke ich für ihre Bereitschaft, als Teil der Prüfungskommission für diemündliche Prüfung zur Verfügung zu stehen.
Mein ganz spezieller Dank gilt Dr. Constantin Hoch für die intensive Betreuung, dieÜberlassung dieses spannenden Themas und dafür, dass er mir immer mit Rat und Tatzur Seite stand. Du warst und bist eine Inspiration!
Ebenso danke ich allen meinen Praktikanten, Jonny Sappl, Philipp Bielec, Arthur Haf-fner, Felix Pultar, Sabine Hübner, Minh Trung Cong, Tobias Giftthaler und KunoSchwärzer, die mich mit großem Eifer unterstützen.
Herrn Christian Minke gilt mein Dank für das Suchen so manchen NMR-Signals beihöchsten Verschiebungen, Herrn Thomas Miller für die Betreuung der IPDS-Geräte undHerrn Wolfgang Wünschheim für die Rechnerbetreuung und Hilfe bei jedwedem Com-puterproblem.
Frau Olga Lorenz danke ich ganz herzlich für ihre organisatorischen Tätigkeiten undHilfsbereitschaft bei allen Arten von Problemen.
Meinen ehemaligen und aktuellen Laborkollegen Florian Pucher, Sebastian Schneider,Alexey Marchuk, Matthias Wörsching, Eva-Maria Bertschler, Simon Kloß, Philipp Bi-elec, Sebastian Vogel und Sebastian Wendl danke ich für die wahnsinnig tolle Zeit inD2.110.
Natürlich danke ich auch allen bisher unerwähnten Mitgliedern der AKs Schnick, Hoch,Lotsch und Oeckler für allerlei Tips, Ratschläge und die hervorragende Zusammenarbeit.
Danken möchte ich auch Pamela "Pam" Hathway, Thomas Riffelmacher, Simon Peschke,Philipp Schmid und Daniel Terwilliger für die Stunden gemeinsamen "Lernens" währenddes Bachelorstudiums. Mein spezieller Dank gebührt Simon Peschke, Philipp Schmid undDaniel Terwilliger für die wöchentlichen mittäglichen Besprechungen über Chemie undalle anderen Aspekte des Lebens.
Mein allergrößter Dank geht jedoch an meine Eltern, meinen Bruder Philipp und meineFreundin Steffi: Ohne euch wäre diese Arbeit nie entstanden.

Contents
1 Introduction 11.1 Historical Aspects on Discovery and Ethymology of Mercury . . . . . . . 11.2 Amalgams of the Less-Noble Metals . . . . . . . . . . . . . . . . . . . . . 31.3 Polar Metal-Metal Bonding . . . . . . . . . . . . . . . . . . . . . . . . . 7
2 Aims and Scope of this Work 13
3 Results 153.1 Methods . . . . . . . . . . . . . . . . . . . . . . . . . . . . . . . . . . . . 15
3.1.1 Synthetic Methods . . . . . . . . . . . . . . . . . . . . . . . . . . 153.1.2 Analytical Methods . . . . . . . . . . . . . . . . . . . . . . . . . . 183.1.3 Quantum-Mechanical Calculations . . . . . . . . . . . . . . . . . 20
3.2 Metal Iodide Solvates . . . . . . . . . . . . . . . . . . . . . . . . . . . . . 223.2.1 Single Crystal Structures . . . . . . . . . . . . . . . . . . . . . . . 223.2.2 Redetermination of [EuCl2(H2O)6]Cl . . . . . . . . . . . . . . . . 43
3.3 Lanthanide Amalgams . . . . . . . . . . . . . . . . . . . . . . . . . . . . 493.3.1 The Mercury-richest Europium Amalgam Eu10Hg55 . . . . . . . . 503.3.2 The Gd14Ag51 Structure Type and its Relation to Some Complex
Amalgam Structures . . . . . . . . . . . . . . . . . . . . . . . . . 633.3.3 Synthesis and characterization of La11+xHg45−x and RE11Hg44.5
(RE = Nd, Sm) as hettotypes of the Sm11Cd45 structure type . . 873.3.4 Crystal Structure of Yb11Hg54 . . . . . . . . . . . . . . . . . . . . 1053.3.5 Crystal Structures of the REHg, REHg2 and REHg3 Amalgams . 110
3.4 Alkali and alkaline earth metal amalgams . . . . . . . . . . . . . . . . . . 1153.4.1 Bad Metal Behaviour in the New Hg-Rich Amalgam KHg6 with
Polar Metallic Bonding . . . . . . . . . . . . . . . . . . . . . . . . 1163.4.2 NMR Investigations on the Li Amalgams Li3Hg, LiHg and LiHg3 1333.4.3 AHg11−xInx . . . . . . . . . . . . . . . . . . . . . . . . . . . . . . 139
3.5 Electrolyses on Mercury-Free Cathode Materials . . . . . . . . . . . . . . 1453.5.1 Electrocrystallization – A Synthetic Method for Intermetallic Phases
with Polar Metal–Metal Bonding . . . . . . . . . . . . . . . . . . 1463.5.2 Li3Ga14-xSnx with x ≈ 1 . . . . . . . . . . . . . . . . . . . . . . . 171
4 Discussion 1754.1 Syntheses . . . . . . . . . . . . . . . . . . . . . . . . . . . . . . . . . . . 176
4.1.1 Syntheses I: Preparative Electrocrystallisation . . . . . . . . . . . 1764.1.2 Syntheses II: Distillation Method . . . . . . . . . . . . . . . . . . 183
4.2 Evaluation of Crystal Structures and Measures of Complexity . . . . . . 1854.2.1 Metal Iodide Solvate Structures as Decorated Variants of Simple
Sphere Packings . . . . . . . . . . . . . . . . . . . . . . . . . . . . 185
I
4.2.2 Amalgams . . . . . . . . . . . . . . . . . . . . . . . . . . . . . . . 1924.3 Polar Intermetallics – Aspects of Chemical Bonding . . . . . . . . . . . . 199
4.3.1 What is a Polar Metal? . . . . . . . . . . . . . . . . . . . . . . . . 1994.3.2 Polarity in Amalgams . . . . . . . . . . . . . . . . . . . . . . . . 1994.3.3 Structures Derived from the BaHg11 Structure Type . . . . . . . . 2084.3.4 Polarity in Li3Ga14 and Li3Ga13Sn . . . . . . . . . . . . . . . . . 212
5 Conclusion 2215.1 DMF Solvates of Metal Iodides as Educts for Electrocrystallisation . . . 2215.2 Electrolysis on Unary, Binary and Ternary Reactive Cathodes . . . . . . 2215.3 Crystal Structures of Hg-rich Amalgams . . . . . . . . . . . . . . . . . . 2225.4 Evaluation of Polarity in Amalgams and Related Phases . . . . . . . . . 223
6 Outlook 225
A Crystallographic Data 227
B Performed Experiments 241
C Curriculum Vitae 251
II
1. Introduction
Quecksilber und Quecksilberverbin-dungen sind für Lebewesen nicht essentiell
(der Mensch enthält normalerweise kein Quecksilber) [...]
Holleman, Wiberg: "Lehrbuch der Anorganischen Chemie",102. ed., de Gruyter, Berlin, New York, page 1497, footnote 11.
It is impossible not to be captivated by the beauty of mercury. As the only metal liquidat room temperature it exhibits a shiny, silvery lustre. If pure, it does not wet a glasssurface, forms little droplets with very low viscosity and was therefore named "liquidsilver".[1] A puddle of pure mercury is a perfect mirror.
In compounds, mercury predominantly exhibits oxidation states +1 (e.g. Hg2Cl2) and +2(e.g. HgCl2). The former always exhibit dimercury cations with a covalent bond [Hg −Hg]2+. The latter always occur as monoatoms dications as they are a closed-shell speciesakin to noble gases with electron configuration [Xe]4f145d10. Due to relativistic effectsthe 6s electrons are lowered in energy leading to a series of unusual effects: Mercury isliquid at room temperature, in contrast to its lighter homologues it is a noble-metal anddue to its high electronegativity and electron affinity it is prone to formation of covalentbonds.
As all salts and organic compounds of mercury are highly toxic its use has been reduced.However, because of its unusual properties it is still of high interest to chemists whichare just as fascinated by it as ancient civilisations.
1.1. Historical Aspects on Discovery and Ethymology of Mercury
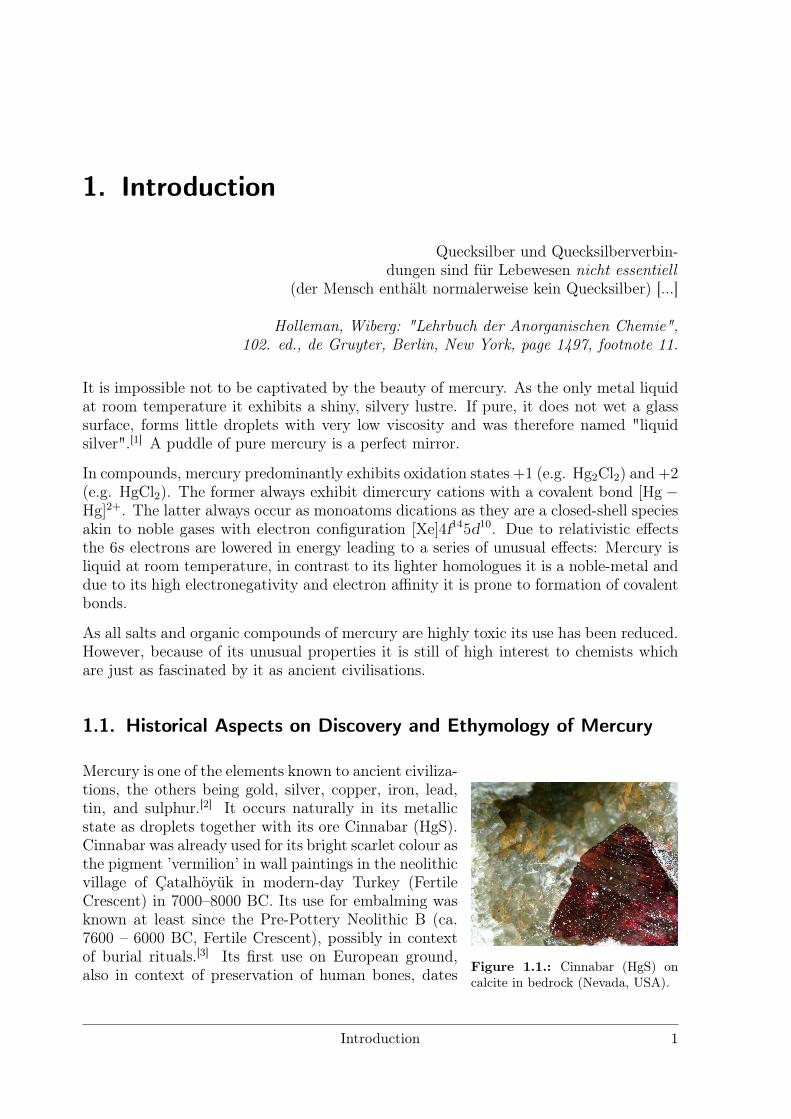
Figure 1.1.: Cinnabar (HgS) oncalcite in bedrock (Nevada, USA).
Mercury is one of the elements known to ancient civiliza-tions, the others being gold, silver, copper, iron, lead,tin, and sulphur.[2] It occurs naturally in its metallicstate as droplets together with its ore Cinnabar (HgS).Cinnabar was already used for its bright scarlet colour asthe pigment ’vermilion’ in wall paintings in the neolithicvillage of Çatalhöyük in modern-day Turkey (FertileCrescent) in 7000–8000 BC. Its use for embalming wasknown at least since the Pre-Pottery Neolithic B (ca.7600 – 6000 BC, Fertile Crescent), possibly in contextof burial rituals.[3] Its first use on European ground,also in context of preservation of human bones, dates
Introduction 1
back to ca. 5000 BC (’La Velilla’, Palencia, Spain).[4] Since then, cinnabar was usedfor colouring and/or ritual purposes by high cultures of Ancient Egypt, Indus ValleyCivilisation and Chinese Shang dynasty.[2, 5]
Elemental mercury was discovered in an Egyptian tomb ceremonial cup at Kurna datingback between 1500–1600 BC.[6, 7] Whether the Egypts had knowledge of isolation ofmercury from cinnabar or whether they used mercury droplets commonly found togetherwith cinnabar is not known. The first written account of knowledge of elemental mercuryis found in ancient Greek texts. Although Aristotle (384 – 322 BC) had knowledgeof mercury (ἄργνρος ὁ χντὀς, ’liquid silver’), the first instructions on synthesis fromCinnabar were given by his successor Theophrastus (ca. 371 – ca. 287 BC) in his book’On Stones’.[8, 9] He stated that mercury "is made when cinnabar mixed with vinegar isground in a copper vessel with a pestle made of copper". Most likely a copper amalgamwas obtained, purification by filtration and distillation was known little later as bothDioscorides (40–90 AD) and Pliny the elder (23 – 79 AD) describe those methods.[10]This description given by Theophrastus is the earliest written account of the synthesisof a metal from its ore.[9, 11]
First applications of mercury are described by Dioscorides (40–90 AD), Pliny the elder(23 – 79 AD) and Vitruv (80-70 – ca. 15 BC) who used it to gild silver and copper byfire-gilding (lat. inaurare).[10–12] They give detailed instructions for the isolation of goldfrom used clothing. Common to all processes is the use of gold amalgam which readilyforms upon combining the elements.
In the middle ages, chemistry on mercury was commonly either of medical or alchemicalnature.[13] Agricola lists several methods for preparation and refinement of mercury[14]. Itwas widely used as auxiliary reagent in mining and metallurgy and the cold amalgamationprocess for silver refinement (1571/72). Hot amalgamation as a superior process for silverrefinement was invented by A. A. Barba in 1640.[2]
A breakthrough in the use of amalgams took place shortly after the Voltaic pile waspresented to the general public.[15] The process of electrolysis on a mercury cathode wascrucial for the works of Berzelius (Stockholm) and Davy (London) who independentlyperformed electrolyses in 1806.[16–22] Both connected a small pool of mercury (cathode)to small amounts of wet salts (anode) which they placed on top of each other. Amal-gam formation was observed and the elements sodium (from Na2CO3 and NaHCO3)and potassium (from K2CO3) were discovered after distillative removal of mercury. Byfollowing this idea of distilling off the mercury from the amalgams a number of elementswere discovered over the next years.
The word "amalgam" most likely originates from Greek μαλακὁς (malakós, "soft") whichverbifies into μαλἁσσω (malásso, "to soften"). The direct connection to kneadable goldamalgam is obvious.[23] A similar root word μάλαγμα (málagma, "gold") is also found inArabic (al-malgam, "emollient poultice or unguent for sores") which points towardsthe use of mercury for various skin diseases.[24] In old Latin language, amalgama directlytranslates to "mercury alloy", its use transferred to modern day chemistry through themiddle ages.
The element symbol Hg originates from the Greek ΰδραργυρος (hydrargyros from ΰδωρ= water and αργυρος = silver), the English mercury was chosen by the antique Romans
2 Introduction
following the Greek’s adjunction of the metal with the god Hermes, the vivid messengerof the gods, and adapting it to its Roman analogue, the god Mercurius.
1.2. Amalgams of the Less-Noble Metals
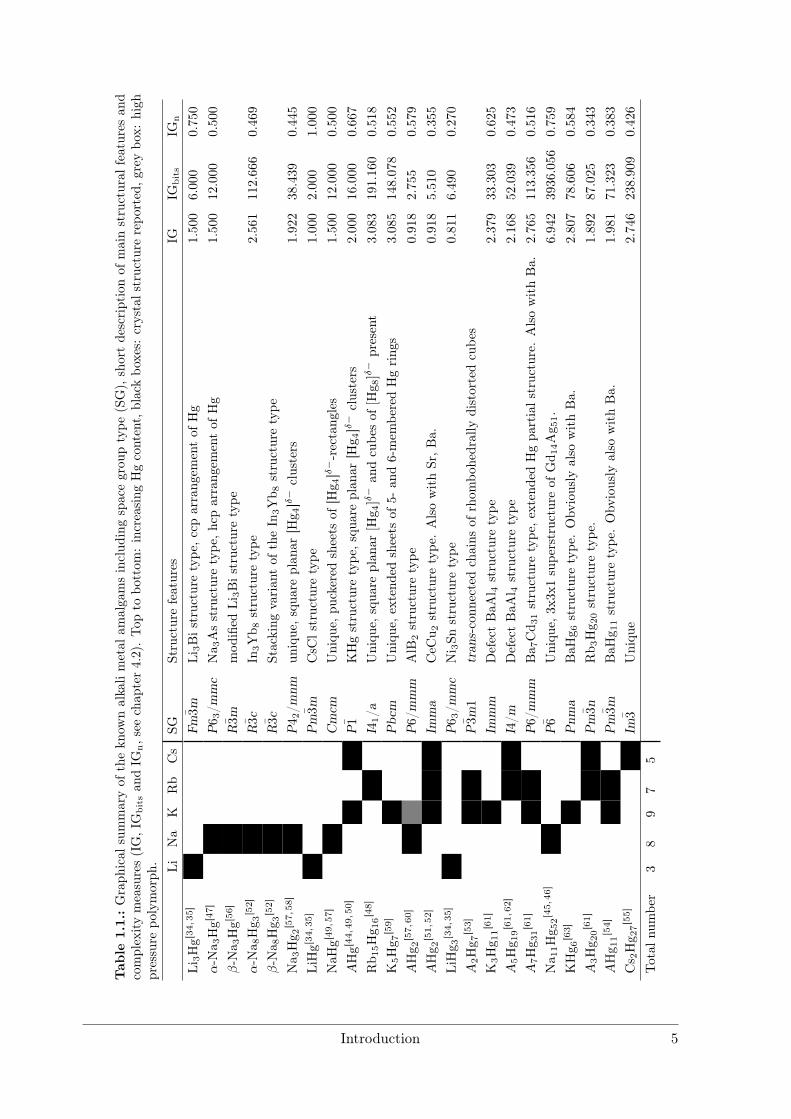
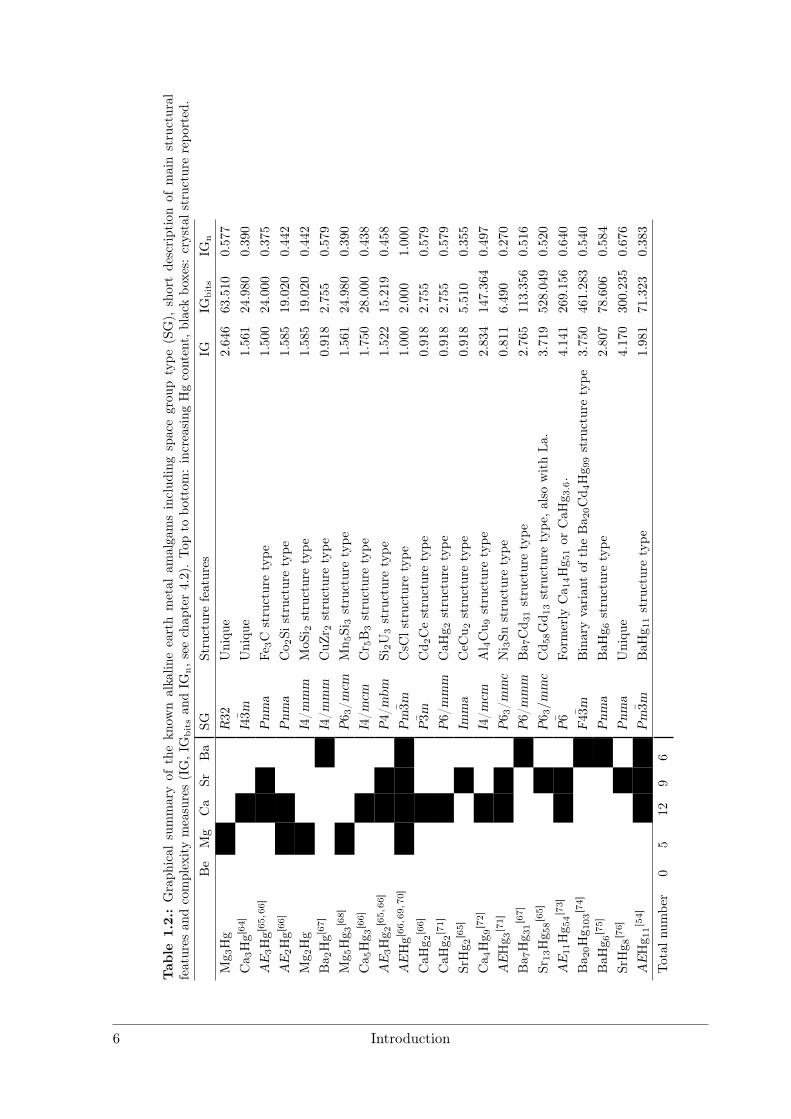
Amalgams of less noble metals are the respective metallic mercury-containing compoundsof the alkali, alkaline earth and rare earth elements. An overview of the literaturereported alkali metal amalgams is given in Table 1.1, of alkaline earth metal amalgamsin Table 1.2 and of rare earth metal amalgams in Table 1.3.
"Amalgam" is a general term, it makes no distinction between line phases, solid solutionsor border solubilities and was used well before knowledge on crystal structures waspresent. A naturally occurring amalgam is Ag2Hg3 (Moschellandsbergite). Togetherwith Ag3Sn it forms a substantial amount of the amalgam filling in dentistry, the restof which is the γ phase of the Sn-Hg system.[25] Dental amalgam was used since 1826,its current form contains silver 40–70%, tin 12–30% and copper 12–24%. It may alsoinclude indium 0–4%, palladium 0.5% and zinc up to 1%.[26–28] Its widespread use is dueto its low toxicity, easy availability and superior mechanical properties; after combiningthe educts it is kneadable and solidifies after a short time span.
Ag3Sn + Hg → γ1(Ag − Hg) + γ2(Sn− Hg) + unreacted Ag3Sn
Alkali metal amalgams are intermediate products of synthesis of sodium hydroxide andchlorine in Castner cells patented in 1894.[29] The process involves electrolysis of asaturated brine between a shallow stream of mercury (cathode) and an assembly ofgraphite or iron anodes. During electrolysis, chlorine forms at the anodes, while sodiumis reduced at and dissolved in mercury. The amalgam is then reacten with water in adecomposer to liberate concentrated sodium hydroxide solution.
After discovery of X-ray diffraction, the crystal structure of mercury was characterised in1922,[30] the two modifications of HgS in 1924/25.[31, 32] Coloradoite (HgTe)[33] as the firstintermetallic mercury mineral and LiHg as the first synthetic amalgam were characterisedshortly after.[34] All three Li amalgams were first examined in the 1930s,[34, 35] followedby Mg amalgams in 1940s (see refs. in Table 1.2). During the 1950s, the first Na, K, Srand Ba amalgams were structurally characterised (see refs. in Tables 1.1 and 1.2) andas the first rare earth metal amalgams REHg (RE = La, Ce, Pr, Nd) appeared.[36]
Although reports on rare earth amalgam structures are scarce, it was already known atthat time that rare earth metals readily form amalgams. As early as 1928 it was triedto separate the rare earth metals from one another by formation of their amalgams.[37]Focussing on electrolytic processes from aqueous solutions of their respective acetates,amalgams of La, Nd, Ce, Sm and Y were reported on.[38] Subsequent studies focusedon the separation of Eu and Yb from their respective neighbours.[39–43] It was foundthat the properties of the liquid or kneadable amalgams were too similar for a cleanseparation of the rare earth metals and fractionated crystallisation was developed as asuperior process.
Introduction 3
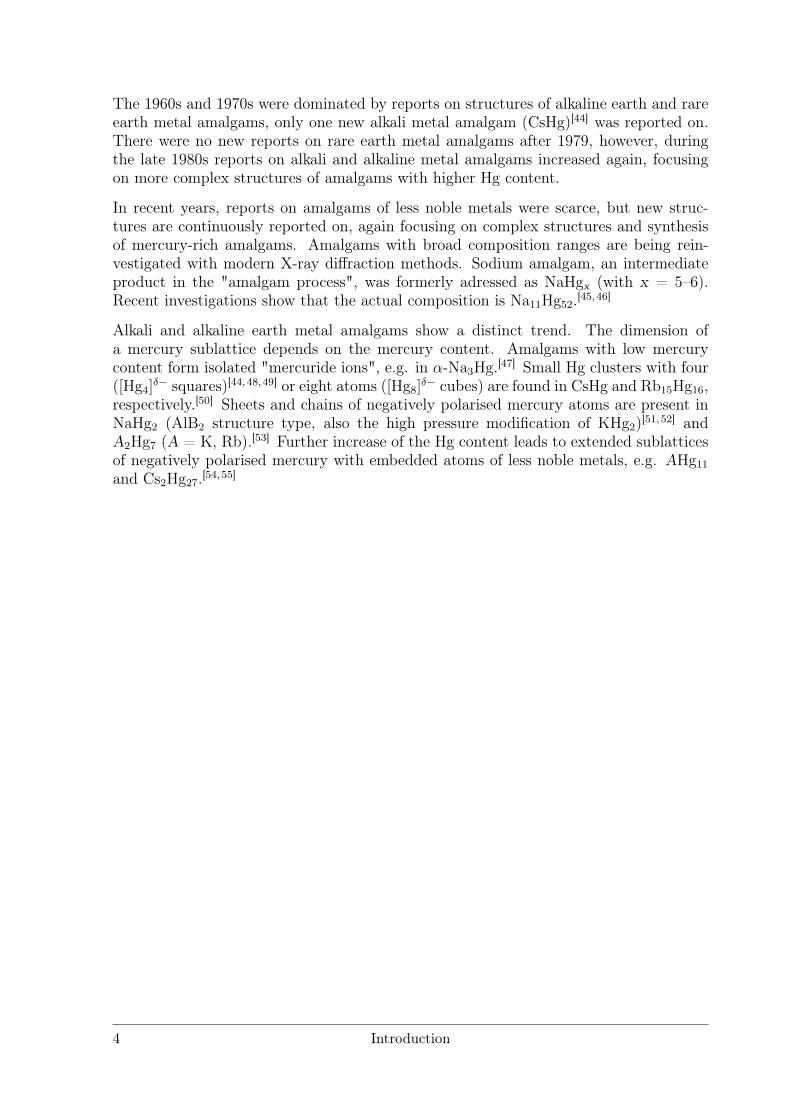
The 1960s and 1970s were dominated by reports on structures of alkaline earth and rareearth metal amalgams, only one new alkali metal amalgam (CsHg)[44] was reported on.There were no new reports on rare earth metal amalgams after 1979, however, duringthe late 1980s reports on alkali and alkaline metal amalgams increased again, focusingon more complex structures of amalgams with higher Hg content.
In recent years, reports on amalgams of less noble metals were scarce, but new struc-tures are continuously reported on, again focusing on complex structures and synthesisof mercury-rich amalgams. Amalgams with broad composition ranges are being rein-vestigated with modern X-ray diffraction methods. Sodium amalgam, an intermediateproduct in the "amalgam process", was formerly adressed as NaHgx (with x = 5–6).Recent investigations show that the actual composition is Na11Hg52.[45, 46]
Alkali and alkaline earth metal amalgams show a distinct trend. The dimension ofa mercury sublattice depends on the mercury content. Amalgams with low mercurycontent form isolated "mercuride ions", e.g. in α-Na3Hg.[47] Small Hg clusters with four([Hg4]
δ− squares)[44, 48,49] or eight atoms ([Hg8]δ− cubes) are found in CsHg and Rb15Hg16,
respectively.[50] Sheets and chains of negatively polarised mercury atoms are present inNaHg2 (AlB2 structure type, also the high pressure modification of KHg2)[51, 52] andA2Hg7 (A = K, Rb).[53] Further increase of the Hg content leads to extended sublatticesof negatively polarised mercury with embedded atoms of less noble metals, e.g. AHg11
and Cs2Hg27.[54, 55]
4 Introduction
Tab
le1.
1.:Graph
ical
summaryof
thekn
ownalkalimetal
amalgamsinclud
ingspacegrou
ptype
(SG),
shortdescriptionof
mainstructural
features
and
complexitymeasures(IG,IG
bitsan
dIG
n,see
chap
ter4.2).Top
tobo
ttom
:increasing
Hgcontent,blackbo
xes:
crystalstructure
repo
rted,g
reybo
x:high
pressure
polymorph
. LiNa
KRb
Cs
SGStructurefeatures
IGIG
bits
IGn
Li 3
Hg[34,35
]Fm
3mL
i 3B
istructuretype
,ccp
arrang
ementof
Hg
1.500
6.000
0.750
α-N
a3H
g[47]
P63/m
mc
Na 3
Asstructuretype
,hcp
arrang
ementof
Hg
1.500
12.000
0.500
β-N
a3H
g[56]
R3m
mod
ified
Li 3
Bistructuretype
α-N
a8H
g 3[52]
R3c
In3Y
b8structuretype
2.561
112.666
0.469
β-N
a8H
g 3[52]
R3c
Stacking
varian
tof
the
In3Y
b8structuretype
Na3H
g 2[57,58
]P
42/m
nmun
ique,s
quareplan
ar[H
g 4]δ−
clusters
1.922
38.439
0.445
LiHg[34
,35]
Pm3m
CsC
lstructure
type
1.000
2.000
1.000
NaH
g[49
,57]
Cmcm
Uniqu
e,pu
ckered
sheets
of[H
g 4]δ−-rectang
les
1.500
12.000
0.500
AHg[44
,49,50
]P1
KHgstructuretype
,squ
areplan
ar[H
g 4]δ−
clusters
2.000
16.000
0.667
Rb15H
g16[48]
I41/a
Uniqu
e,squa
replan
ar[H
g 4]δ−
andcube
sof
[Hg 8
]δ−
present
3.083
191.160
0.518
K5H
g7[59]
Pbc
mUniqu
e,extend
edsheets
of5-
and6-mem
beredHgring
s3.085
148.078
0.552
AH
g 2[57,60
]P6/mmm
AlB
2structuretype
0.918
2.755
0.579
AH
g 2[51,52
]Im
ma
CeC
u2structuretype
.AlsowithSr,B
a.0.918
5.510
0.355
LiH
g3[34,35
]P
63/m
mc
Ni 3
Snstructuretype
0.811
6.490
0.270
A2H
g 7[53]
P3m
1tran
s-conn
ectedchains
ofrhom
bohedrally
distortedcube
sK
3H
g 11[61]
Immm
Defect
BaA
l 4structuretype
2.379
33.303
0.625
A5H
g 19[61,62
]I4/m
Defect
BaA
l 4structuretype
2.168
52.039
0.473
A7H
g 31[61]
P6/mmm
Ba7C
d31structuretype
,extendedHgpa
rtials
truc
ture.AlsowithBa.
2.765
113.356
0.516
Na11H
g52[45,46
]P6
Uniqu
e,3x
3x1supe
rstructure
ofG
d14A
g 51.
6.942
3936.056
0.759
KH
g 6[63]
Pnm
aB
aH
g 6structuretype
.Obv
iously
also
withBa.
2.807
78.606
0.584
A3H
g 20[61]
Pm3n
Rb3H
g20structuretype
.1.892
87.025
0.343
AH
g 11[54]
Pm3m
BaH
g 11structuretype
.Obv
iously
also
withBa.
1.981
71.323
0.383
Cs 2
Hg 2
7[55]
Im3
Uniqu
e2.746
238.909
0.426
Total
numbe
r3
89
75
Introduction 5
Tab
le1.
2.:Graph
ical
summaryof
thekn
ownalkalin
eearthmetal
amalgamsinclud
ingspacegrou
ptype
(SG),
shortdescriptionof
mainstructural
features
andcomplexitymeasures(IG,IG
bitsan
dIG
n,s
eechap
ter4.2).Top
tobo
ttom
:increasing
Hgcontent,blackbo
xes:
crystals
tructure
repo
rted
.Be
Mg
Ca
SrBa
SGStructurefeatures
IGIG
bits
IGn
Mg 3
Hg
R32
Uniqu
e2.646
63.510
0.577
Ca3H
g[64]
I43m
Uniqu
e1.561
24.980
0.390
AE3H
g[65,66
]Pnm
aF
e 3C
structuretype
1.500
24.000
0.375
AE2H
g[66]
Pnm
aC
o2S
istructuretype
1.585
19.020
0.442
Mg 2
Hg
I4/m
mm
MoS
i 2structuretype
1.585
19.020
0.442
Ba2H
g[67]
I4/m
mm
Cu
Zr 2
structuretype
0.918
2.755
0.579
Mg 5
Hg3[68]
P63/m
cmM
n5S
i 3structuretype
1.561
24.980
0.390
Ca5H
g 3[66]
I4/m
cmC
r 5B
3structuretype
1.750
28.000
0.438
AE3H
g2[65,66
]P4/mbm
Si 2
U3structuretype
1.522
15.219
0.458
AEHg[66
,69,70
]Pm3m
CsC
lstructure
type
1.000
2.000
1.000
CaH
g2[66]
P3m
Cd2C
estructuretype
0.918
2.755
0.579
CaH
g2[71]
P6/mmm
CaH
g2structuretype
0.918
2.755
0.579
SrH
g 2[65]
Imma
CeC
u2structuretype
0.918
5.510
0.355
Ca4H
g 9[72]
I4/m
cmA
l 4C
u9structuretype
2.834
147.364
0.497
AE
Hg 3
[71]
P63/m
mc
Ni 3
Snstructuretype
0.811
6.490
0.270
Ba7H
g 31[67]
P6/mmm
Ba7C
d31structuretype
2.765
113.356
0.516
Sr 1
3H
g 58[65]
P63/m
mc
Cd58G
d13structuretype
,alsowithLa
.3.719
528.049
0.520
AE11H
g54[73]
P6
Form
erly
Ca 1
4H
g 51or
CaH
g3.6.
4.141
269.156
0.640
Ba20H
g 103[74]
F43m
Binaryvarian
tof
the
Ba20C
d4H
g 99structuretype
3.750
461.283
0.540
BaH
g6[75]
Pnm
aB
aH
g6structuretype
2.807
78.606
0.584
SrH
g 8[76]
Pnm
aUniqu
e4.170
300.235
0.676
AE
Hg 1
1[54]
Pm3m
BaH
g11structuretype
1.981
71.323
0.383
Total
numbe
r0
512
96
6 Introduction
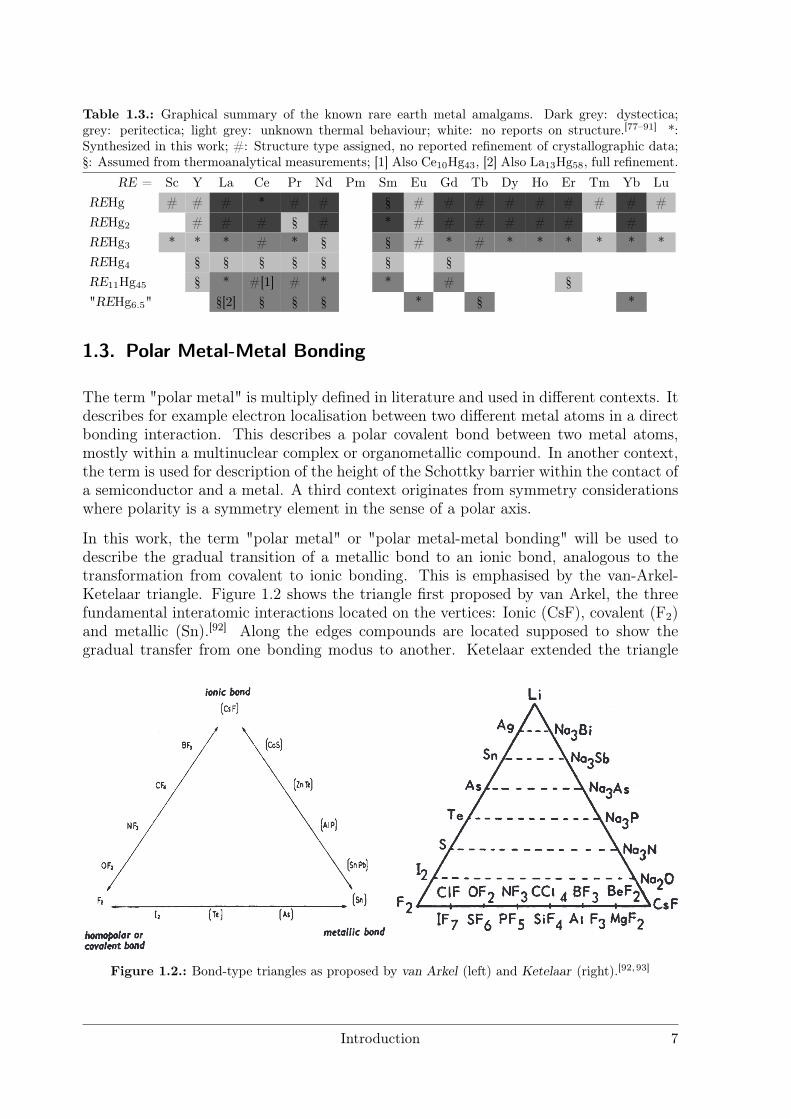
Table 1.3.: Graphical summary of the known rare earth metal amalgams. Dark grey: dystectica;grey: peritectica; light grey: unknown thermal behaviour; white: no reports on structure.[77–91] *:Synthesized in this work; #: Structure type assigned, no reported refinement of crystallographic data;§: Assumed from thermoanalytical measurements; [1] Also Ce10Hg43, [2] Also La13Hg58, full refinement.
RE = Sc Y La Ce Pr Nd Pm Sm Eu Gd Tb Dy Ho Er Tm Yb LuREHg # # # * # # § # # # # # # # # #REHg2 # # # § # * # # # # # # #REHg3 * * * # * § § # * # * * * * * *REHg4 § § § § § § §RE11Hg45 § * #[1] # * * # §"REHg6.5" §[2] § § § * § *
1.3. Polar Metal-Metal Bonding
The term "polar metal" is multiply defined in literature and used in different contexts. Itdescribes for example electron localisation between two different metal atoms in a directbonding interaction. This describes a polar covalent bond between two metal atoms,mostly within a multinuclear complex or organometallic compound. In another context,the term is used for description of the height of the Schottky barrier within the contact ofa semiconductor and a metal. A third context originates from symmetry considerationswhere polarity is a symmetry element in the sense of a polar axis.
In this work, the term "polar metal" or "polar metal-metal bonding" will be used todescribe the gradual transition of a metallic bond to an ionic bond, analogous to thetransformation from covalent to ionic bonding. This is emphasised by the van-Arkel-Ketelaar triangle. Figure 1.2 shows the triangle first proposed by van Arkel, the threefundamental interatomic interactions located on the vertices: Ionic (CsF), covalent (F2)and metallic (Sn).[92] Along the edges compounds are located supposed to show thegradual transfer from one bonding modus to another. Ketelaar extended the triangle
Figure 1.2.: Bond-type triangles as proposed by van Arkel (left) and Ketelaar (right).[92, 93]
Introduction 7
by making use of the space inside the triangle (horizontal lines) and adding compoundsalong these.[93]
Since the initial proposal of the van-Arkel-Ketelaar triangle, it was modified numeroustimes with emphasis on different aspects.[94] All authors use electronegativity difference(∆χ) and average electronegativity (χav) of binary compounds as coordinate system.However, quantification is difficult as many compounds exhibit characteristics of allthree bonding modi involved. Thus, the van-Arkel-Ketelaar triangle is a considerableoversimplification of the "true" bonding in those materials.[94] Despite its shortcomings,the triangle is still useful to make rough estimations on the nature of compounds and ofcourse for teaching purposes.
Polar metals often show "bad metal" behaviour. Following the Drude model, electricconductance σ is dependent on the lifetime τ of scattering events. Those take placeon lattice vibration (temperature dependence) and disorder, as electrons are stronglyinfluenced by kinks, impurities and grain boundaries. Other dependences include thefree electron concentration n, the effective electron (or hole) mass m* and elementarycharge q : σ = nq2τ/m*. In metallic conductors, the scattering rate of electrons onphonons increases with increasing temperature resulting in a linear dependence. Ac-cording to Heisenberg’s uncertainty principle, a minimum lifetime limit τmin implies aminimum metallic conductance σMIR which is called Mott-Ioffe-Regel limit. For metalswith conductivities lower than this limit, non-physically high scattering rates are calcu-lated, and thus should by theory be insulating. Most metals melt before reaching thislimit, however, "bad metals" reach and can exceed this limit.[95–97]
Strong electron correlation leading to bad metal behaviour has shown to procure inter-esting magnetic properties, unconventional superconductivity and non-classical tempera-ture dependence of the resistance.[98, 99] Polar metal-metal bonding unlocks potential fornew combinations of electric and magnetic properties. Describing the degree of polaritywithin a metallic system calls for quantitative approaches both in theory and experi-ment. Concepts dealing with polar metallic systems are scarce when compared withthe widespread concepts describing and quantifying ionic contributions within a polarcovalent system.
References
[1] A. F. Holleman, N. Wiberg, G. Fischer, Lehrbuch der Anorganischen Chemie, Walterde Gruyter, Berlin, New York, 102nd edition (2007).
[2] H. M. Leicester, Discovery of the Elements, Journal of chemical education, Easton,7th edition (1968).
[3] Y. Goren, A. Goring-Morris, I. Segal, J. Archaeol. Sci., 28(7), 671–690 (2001).
[4] J. Martín-Gil, F. J. Martín-Gil, G. Delibes-de Castro, P. Zapatero-Magdaleno, F. J.Sarabia-Herrero, Experientia, 51(8), 759–761 (1995).
[5] K.-H. Schlote, Chronologie der Naturwissenschaften, Wissenschaftlicher VerlagHarri Deutsch GmbH, Frankfurt am Main, 1st edition (2002).
8 Introduction
[6] P. W. D’Itri, F. M. D’Itri, Mercury contamination: a human tragedy, Wiley, NewYork (1977).
[7] J. M. Stillman, The Story of Early Chemistry, D. Appleton and Co., New York City(1924).
[8] Aristotle, H. D. P. Lee, Aristotle: Meteorologica, Harvard University Press (1952).
[9] E. R. Caley, J. F. C. Richards, Theophrastus, Theophrastus on stones: Introduc-tion, Greek text, English translation, and commentary, The Ohio State University,Columbus (1956).
[10] P. Dioscorides, J. M. Riddle, De Materia Medica, Univ. of Texas Pr., 1st edition(1986).
[11] Pliny, H. Rackham, Natural History, Book XXXIV, Harvard University Press, 1stedition (1952).
[12] Vitruvius, F. Granger, De architectura, VII, Harvard University Press, 1st edition(1934).
[13] A. Greenberg, From alchemy to chemistry in picture and story, Wiley-Interscience,New Jersey, 1st edition (2007).
[14] G. Agricola, H. C. Hoover, H. L. Hoover, De Re Metallica, Dover Publications, 1stedition (1950).
[15] A. Volta, Philos. Trans. R. Soc. London, 90, 403–431 (1800).
[16] W. Cruickshank, Philos. Mag. J. Sci., 4, 187–191 (1800).
[17] W. Cruickshank, Philos. Mag. J. Sci., 4, 254–264 (1800).
[18] J. W. Ritter, Beyträge zur nähern Kenntniss des Galvanismus und der Resultateseiner Untersuchung, Frommann, Jena (1805).
[19] J. W. Ritter, Physisch-Chemische Abhandlungen in chronologischer Folge, Reclam,Leipzig (1806).
[20] C. J. T. Grotthuß, Mémoire sur la décomposition de l’eau et des corps qu’il tient endissolution à l’aide de l’electricité galvanique, Rom (1805).
[21] H. Davy, Philos. Trans. R. Soc. London, 97, 1–56 (1807).
[22] J. J. Berzelius, Föreläsningar i Djurkemien, Carl Delen, Stockholm (1806).
[23] W. W. Skeat, An etymological dictionary of the English language, Oxford ClaredonPress, Oxford (1835).
[24] F. Johnson, F. Meninski, J. Richardson, C. Wilkins, A dictionary, Persian, Arabicand English, W.H. Allen, London (1852).
[25] C. W. Fairhurst, J. B. Cohen, Acta Crystallogr. B, 28(2), 371–378 (1972).
[26] G. Ryge, C. W. Fairhurst, C. M. Fischer, Int. Dent. J., 11(2), 1–5 (1961).
Introduction 9
[27] G. V. Black, Dent. Cosmos, 37, 553–557 (1895).
[28] R. Bharti, K. Wadhwani, A. Tikku, A. Chandra, J Conserv. Dent., 13(4), 204(2010).
[29] H. Y. Castner, US-Patent No. 528322 (1894).
[30] C. S. Barrett, Acta Crystallogr., 10(1), 58–60 (1957).
[31] W. M. Lehmann, Z. Kristallogr., 60(1-6) (1924).
[32] H. E. Buckley, Miner. Mag., 20(110), 382–392 (1925).
[33] W. H. Zachariasen, Nor. geol. Tidsskr., 8(3), 5 (1926).
[34] E. Zintl, G. Brauer, Z. Phys. Chem., 20, 245–271 (1933).
[35] E. Zintl, A. Schneider, Z. Elektrochem. Angew. Phys. Chem., 41(11), 771–774(1935).
[36] A. Iandelli, R. Ferro, Atti Accad. Nazl. Lincei, Rend., Classe Sci. Fis., Mat. Nat.,10, 48–52 (1951).
[37] J. W. Neckers, H. C. Kremers, J. Am. Chem. Soc., 50(4), 950–954 (1928).
[38] E. E. Jukkola, L. F. Audrieth, B. S. Hopkins, J. Am. Chem. Soc., 56(2), 303–304(1934).
[39] H. N. McCoy, J. Am. Chem. Soc., 63(2), 7–8 (1937).
[40] H. N. McCoy, R. P. Hammond, J. Am. Chem. Soc., 64(4), 1009–1009 (1942).
[41] J. K. Marsh, J. Chem. Soc., 53(9), 8–10 (1943).
[42] J. K. Marsh, J. Chem. Soc., 53(9), 531–335 (1943).
[43] T. Moeller, H. E. Kremers, Industrial & Engineering Chemistry Analytical Edition,17(12), 798–800 (1945).
[44] H.-J. Deiseroth, A. Strunck, Angew. Chem., 99(7), 701–702 (1987); b) H.-J. Deis-eroth, A. Strunck, Angew. Chem. Int. Ed., 26(7), 687–688 (1987).
[45] W. Hornfeck, C. Hoch, Acta Crystallogr. B, 71(6), 752–767 (2015).
[46] C. Hoch, A. Simon, Angew. Chem., 124(13), 3316–3319 (2012); b) C. Hoch, A. Si-mon, Angew. Chem. Int. Ed., 51(13), 3262–3265 (2012).
[47] H.-J. Deiseroth, M. Rochnia, Z. Anorg. Allg. Chem., 620(10), 1736–1740 (1994).
[48] H.-J. Deiseroth, A. Strunck, Angew. Chem., 101(9), 1286–1287 (1989); b) H.-J.Deiseroth, A. Strunck, Angew. Chem. Int. Ed., 28(9), 1251–1252 (1989).
[49] H.-J. Deiseroth, A. Stupperich, R. Pankaluoto, N. E. Christensen, Z. Anorg. Allg.Chem., 597(1), 41–50 (1991).
[50] H.-J. Deiseroth, A. Strunck, W. Bauhofer, Z. Anorg. Allg. Chem., 575(1), 31–38
10 Introduction
(1989).
[51] H.-J. Deiseroth, Prog. Solid State Chem., 25(1-2), 73–123 (1997).
[52] H.-J. Deiseroth, A. Strunck, W. Bauhofer, Z. Anorg. Allg. Chem., 558(1), 128–136(1988).
[53] E. Biehl, H.-J. Deiseroth, Z. Anorg. Allg. Chem., 625(8), 1337–1342 (1999).
[54] E. Biehl, H.-J. Deiseroth, Z. Anorg. Allg. Chem., 625(7), 1073–1080 (1999).
[55] C. Hoch, A. Simon, Z. Anorg. Allg. Chem., 634(5), 853–856 (2008).
[56] H.-J. Deiseroth, M. Rochnia, Angew. Chem., 105(10), 1556–1558 (1993); b) H.-J.Deiseroth, M. Rochnia, Angew. Chem. Int. Ed., 32(10), 1494–1495 (1993).
[57] J. W. Nielsen, N. C. Baenziger, Acta Crystallogr., 7(3), 277–282 (1954).
[58] A. V. Tkachuk, A. Mar, Acta Crystallogr. E, 62(6), i129–i130 (2006).
[59] E. J. Duwell, N. C. Baenziger, Acta Crystallogr., 13(6), 476–479 (1960).
[60] E. J. Duwell, N. C. Baenziger, Acta Crystallogr., 8(11), 705–710 (1955).
[61] E. Todorov, S. C. Sevov, J. Solid State Chem., 149(2), 419–427 (2000).
[62] E. Biehl, H.-J. Deiseroth, Z. Anorg. Allg. Chem., 625(3), 389–394 (1999).
[63] F. Tambornino, C. Hoch, J. Alloys Compd., 618, 299–304 (2015).
[64] M. Pušelj, Z. Ban, Croat. Chem. Acta, 51(1), 75–79 (1978).
[65] G. Bruzzone, F. Merlo, J. Less-Common Met., 35(1), 153–157 (1974).
[66] G. Bruzzone, F. Merlo, J. Less-Common Met., 32(2), 237–241 (1973).
[67] G. Bruzzone, F. Merlo, J. Less-Common Met., 39(2), 271–276 (1975).
[68] G. Brauer, R. Rudolph, Z. Anorg. Allg. Chem., 248(4), 405–424 (1941).
[69] G. Brauer, W. Haucke, Z. Phys. Chem., 33, 304–310 (1936).
[70] R. Ferro, Acta Crystallogr., 7(11), 781 (1954).
[71] A. Iandelli, A. Palenzona, Atti Accad. Nazl. Lincei, Rend., Classe Sci. Fis., Mat.Nat., 8, 164–168 (1964).
[72] Z. Ban, M. Pušelj, Z. Naturforsch. B, 35(12), 1594–1595 (1980).
[73] A. V. Tkachuk, A. Mar, Inorg. Chem., 47(4), 1313–8 (2008).
[74] M. Wendorff, C. Röhr, Z. Naturforsch. B, 67, 893–906 (2012).
[75] M. Wendorff, C. Röhr, J. Alloys Compd., 546, 320–328 (2013).
[76] A. V. Tkachuk, A. Mar, Dalton Trans., 39(30), 7132–5 (2010).
[77] C. Guminski, J. Phase Equilib., 14(1), 97–99 (1993).
Introduction 11
[78] C. Guminski, J. Phase Equilib., 14(3), 382–387 (1993).
[79] C. Guminski, J. Phase Equilib., 16(1), 86–91 (1995).
[80] C. Guminski, J. Phase Equilib., 16(1), 73–76 (1995).
[81] C. Guminski, J. Phase Equilib., 16(2), 181–185 (1995).
[82] C. Guminski, J. Phase Equilib., 16(1), 77–80 (1995).
[83] C. Guminski, J. Phase Equilib., 16(2), 186–192 (1995).
[84] C. Guminski, J. Phase Equilib., 16(3), 276–276 (1995).
[85] C. Guminski, J. Phase Equilib., 16(5), 448–453 (1995).
[86] C. Guminski, J. Phase Equilib., 16(6), 526–526 (1995).
[87] C. Guminski, J. Phase Equilib., 16(5), 454–458 (1995).
[88] C. Guminski, J. Phase Equilib., 14(3), 391–392 (1993).
[89] C. Guminski, J. Phase Equilib., 16(2), 193–196 (1995).
[90] C. Guminski, J. Phase Equilib., 16(5), 459–459 (1995).
[91] C. Guminski, J. Phase Equilib., 16(4), 348–352 (1995).
[92] A. E. van Arkel, Molecules and Crystals, Butterworths, London (1949).
[93] J. A. A. Ketelaar, Chemical Constitutions - An Introduction to the Theory of theChemical Bond, Elsevier, Amsterdam, London, New York (1958).
[94] T. L. Meek, L. D. Garner, J. Chem. Educ., 82(2), 325 (2005).
[95] O. Gunnarsson, M. Calandra, J. E. Han, Rev. Modern Phys., 75(4), 1085–1099(2003).
[96] N. E. Hussey, K. Takenaka, H. Takagi, Philos. Mag., 84(27), 2847–2864 (2004).
[97] R. Jaramillo, S. D. Ha, D. M. Silevitch, S. Ramanathan, Nature Physics, 10(4),304–307 (2014).
[98] X. Deng, J. Mravlje, R. Žitko, M. Ferrero, G. Kotliar, A. Georges, Phys. Rev. Lett.,110(8), 1–5 (2013).
[99] V. J. Emery, S. A. Kivelson, Phys. Rev. Lett., 74(16), 3253–3256 (1995).
12 Introduction
2. Aims and Scope of this Work
The aim of this work is to investigate polar metal-metal bonding on the basis of synthesisand characterisation of new compounds, quantification of the electron transfer from theelectropositive to the electronegative element as the ultimate goal. Mercury-rich amal-gams of less noble metals (alkali, alkaline earth and rare earth metals) serve as modelsystems for polar metallic bonding. As those compounds often decompose peritecticallyat low temperatures, they are synthesised by electrocrystallisation at low temperatures.Their structures as well as their properties are characterised on the basis of X-ray crystal-lography, magnetic measurements, NMR investigations and band structure calculations.
The emphasis on experimental work is the development of an electrolytic approach. DMFsolvate complexes of metal iodides serve as educts and will be structurally characterisedbefore employment. Electrocrystallisation is expanded from Hg as cathode materialto Ga and low melting eutectics of Ga/Sn, InHg and GalInStan. The outcome of thereactions gives insight into the reaction mechanisms. As electrolysis at high temperatures(> 150 C) is currently not feasible, a distillation method as a complementary approachfor higher temperatures is developed.
The products are subject to structural analysis by single-crystal and powder diffrac-tion methods. Mercury-rich amalgams often show high structural complexity which isrationalised and quantified by complexity measures. The role of disorder phenomenaon the complexity of the crystal structures is investigated. Band structure calculationsincluding Bader analysis lead to understanding of the underlying principles of chemicalbonding.
Investigations for quantification of the electron transfer are performed on Li amalgamsas model systems. A combination of synthesis, NMR Knight shift measurements andband structure calculations in combination with electrical conduction measurements isemployed. The question if Bader charges can satisfactorily be used for the quantificationof polarity is addressed.
Aims and Scope of this Work 13

3. Results
3.1. Methods
3.1.1. Synthetic Methods
The first section of the following chapter contains the procedures of the synthetic methodsused in this work: Electrocrystallisation as a pathway toward metallic compounds withlow peritectic decomposition temperatures, especially amalgams of less noble metals, dis-tillation processes as a complementary high-temperature method and solvate syntheses ofthe educts (metal iodide solvates) for electrolysis. The second part contains the analyticalmethods: Single crystal and powder X-ray diffraction methods and subsequent refine-ment of data, elemental analysis, determination of physical properties with magnetic,electrical conductance, thermoanalytical and nuclear magnetic resonance measurements.Quantum mechanical calculations were used to gain insight into bonding modi of thesubstances in question.
Electrolysis
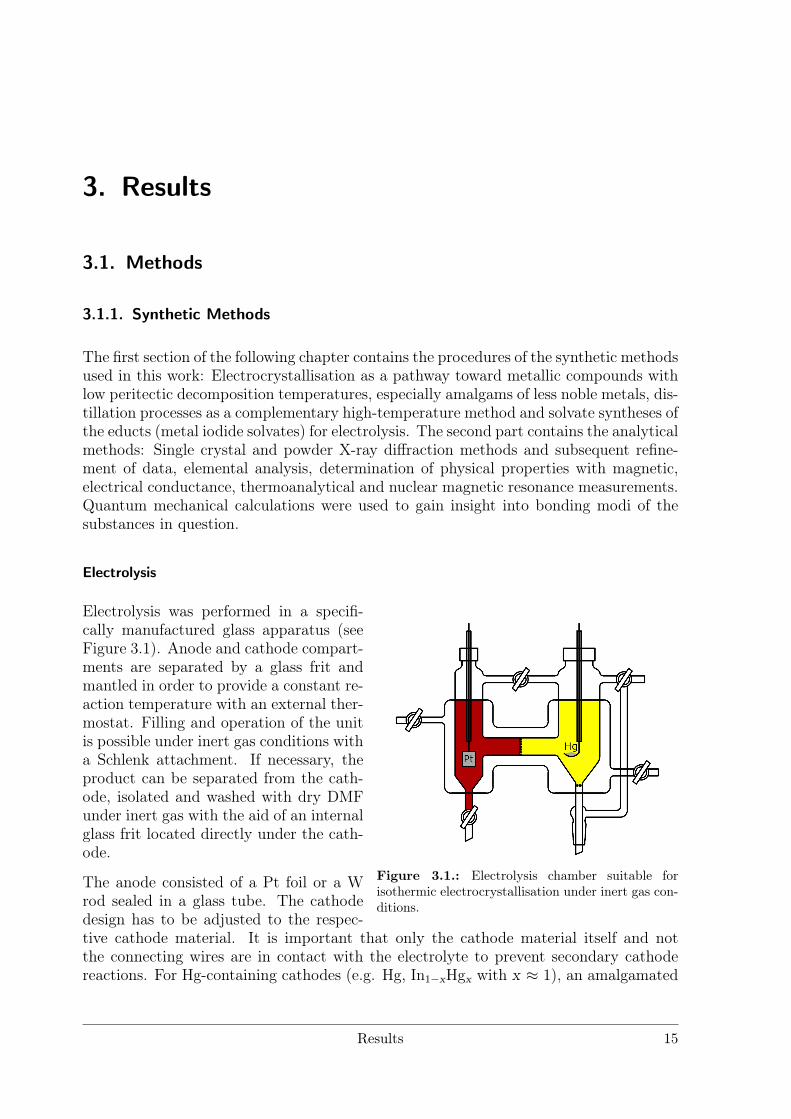
Figure 3.1.: Electrolysis chamber suitable forisothermic electrocrystallisation under inert gas con-ditions.
Electrolysis was performed in a specifi-cally manufactured glass apparatus (seeFigure 3.1). Anode and cathode compart-ments are separated by a glass frit andmantled in order to provide a constant re-action temperature with an external ther-mostat. Filling and operation of the unitis possible under inert gas conditions witha Schlenk attachment. If necessary, theproduct can be separated from the cath-ode, isolated and washed with dry DMFunder inert gas with the aid of an internalglass frit located directly under the cath-ode.
The anode consisted of a Pt foil or a Wrod sealed in a glass tube. The cathodedesign has to be adjusted to the respec-tive cathode material. It is important that only the cathode material itself and notthe connecting wires are in contact with the electrolyte to prevent secondary cathodereactions. For Hg-containing cathodes (e.g. Hg, In1−xHgx with x ≈ 1), an amalgamated
Results 15
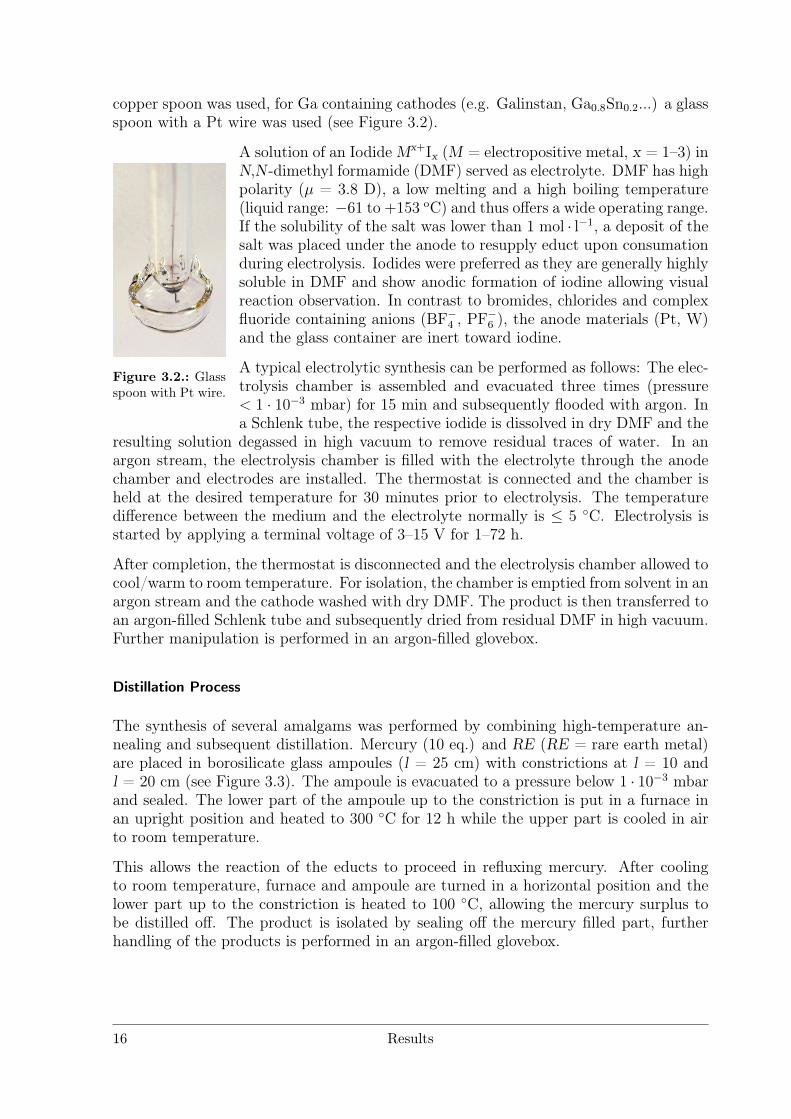
copper spoon was used, for Ga containing cathodes (e.g. Galinstan, Ga0.8Sn0.2...) a glassspoon with a Pt wire was used (see Figure 3.2).
Figure 3.2.: Glassspoon with Pt wire.
A solution of an Iodide Mx+Ix (M = electropositive metal, x = 1–3) inN,N -dimethyl formamide (DMF) served as electrolyte. DMF has highpolarity (µ = 3.8 D), a low melting and a high boiling temperature(liquid range: −61 to +153 oC) and thus offers a wide operating range.If the solubility of the salt was lower than 1 mol · l−1, a deposit of thesalt was placed under the anode to resupply educt upon consumationduring electrolysis. Iodides were preferred as they are generally highlysoluble in DMF and show anodic formation of iodine allowing visualreaction observation. In contrast to bromides, chlorides and complexfluoride containing anions (BF−
4 , PF−6 ), the anode materials (Pt, W)
and the glass container are inert toward iodine.
A typical electrolytic synthesis can be performed as follows: The elec-trolysis chamber is assembled and evacuated three times (pressure< 1 · 10−3 mbar) for 15 min and subsequently flooded with argon. Ina Schlenk tube, the respective iodide is dissolved in dry DMF and the
resulting solution degassed in high vacuum to remove residual traces of water. In anargon stream, the electrolysis chamber is filled with the electrolyte through the anodechamber and electrodes are installed. The thermostat is connected and the chamber isheld at the desired temperature for 30 minutes prior to electrolysis. The temperaturedifference between the medium and the electrolyte normally is ≤ 5 C. Electrolysis isstarted by applying a terminal voltage of 3–15 V for 1–72 h.
After completion, the thermostat is disconnected and the electrolysis chamber allowed tocool/warm to room temperature. For isolation, the chamber is emptied from solvent in anargon stream and the cathode washed with dry DMF. The product is then transferred toan argon-filled Schlenk tube and subsequently dried from residual DMF in high vacuum.Further manipulation is performed in an argon-filled glovebox.
Distillation Process
The synthesis of several amalgams was performed by combining high-temperature an-nealing and subsequent distillation. Mercury (10 eq.) and RE (RE = rare earth metal)are placed in borosilicate glass ampoules (l = 25 cm) with constrictions at l = 10 andl = 20 cm (see Figure 3.3). The ampoule is evacuated to a pressure below 1 · 10−3 mbarand sealed. The lower part of the ampoule up to the constriction is put in a furnace inan upright position and heated to 300 C for 12 h while the upper part is cooled in airto room temperature.
This allows the reaction of the educts to proceed in refluxing mercury. After coolingto room temperature, furnace and ampoule are turned in a horizontal position and thelower part up to the constriction is heated to 100 C, allowing the mercury surplus tobe distilled off. The product is isolated by sealing off the mercury filled part, furtherhandling of the products is performed in an argon-filled glovebox.
16 Results
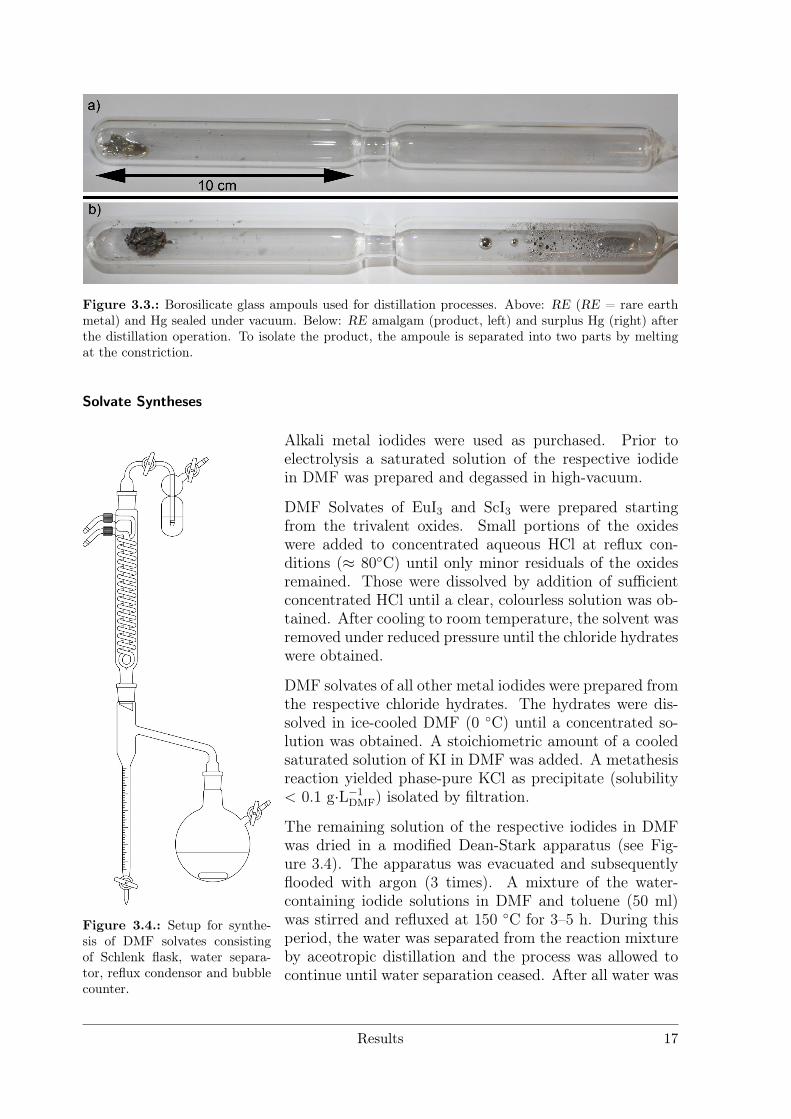
Figure 3.3.: Borosilicate glass ampouls used for distillation processes. Above: RE (RE = rare earthmetal) and Hg sealed under vacuum. Below: RE amalgam (product, left) and surplus Hg (right) afterthe distillation operation. To isolate the product, the ampoule is separated into two parts by meltingat the constriction.
Solvate Syntheses
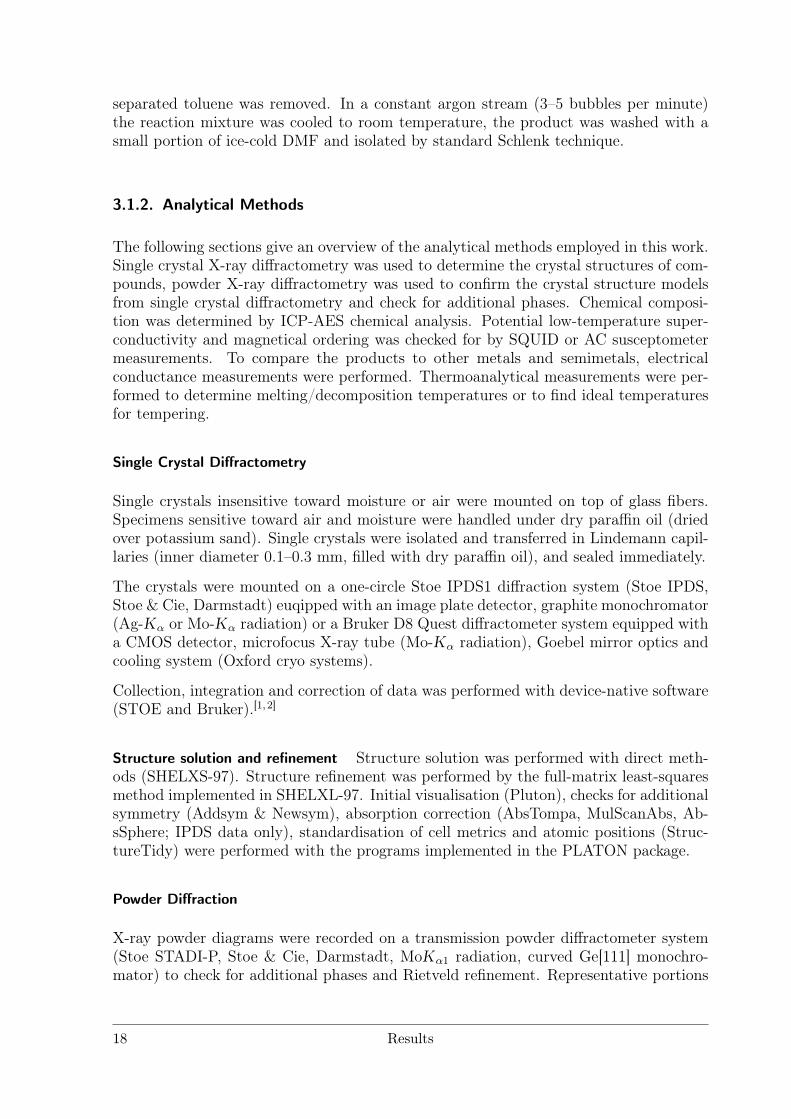
Figure 3.4.: Setup for synthe-sis of DMF solvates consistingof Schlenk flask, water separa-tor, reflux condensor and bubblecounter.
Alkali metal iodides were used as purchased. Prior toelectrolysis a saturated solution of the respective iodidein DMF was prepared and degassed in high-vacuum.
DMF Solvates of EuI3 and ScI3 were prepared startingfrom the trivalent oxides. Small portions of the oxideswere added to concentrated aqueous HCl at reflux con-ditions (≈ 80C) until only minor residuals of the oxidesremained. Those were dissolved by addition of sufficientconcentrated HCl until a clear, colourless solution was ob-tained. After cooling to room temperature, the solvent wasremoved under reduced pressure until the chloride hydrateswere obtained.
DMF solvates of all other metal iodides were prepared fromthe respective chloride hydrates. The hydrates were dis-solved in ice-cooled DMF (0 C) until a concentrated so-lution was obtained. A stoichiometric amount of a cooledsaturated solution of KI in DMF was added. A metathesisreaction yielded phase-pure KCl as precipitate (solubility< 0.1 g·L−1
DMF) isolated by filtration.
The remaining solution of the respective iodides in DMFwas dried in a modified Dean-Stark apparatus (see Fig-ure 3.4). The apparatus was evacuated and subsequentlyflooded with argon (3 times). A mixture of the water-containing iodide solutions in DMF and toluene (50 ml)was stirred and refluxed at 150 C for 3–5 h. During thisperiod, the water was separated from the reaction mixtureby aceotropic distillation and the process was allowed tocontinue until water separation ceased. After all water was
Results 17
separated toluene was removed. In a constant argon stream (3–5 bubbles per minute)the reaction mixture was cooled to room temperature, the product was washed with asmall portion of ice-cold DMF and isolated by standard Schlenk technique.
3.1.2. Analytical Methods
The following sections give an overview of the analytical methods employed in this work.Single crystal X-ray diffractometry was used to determine the crystal structures of com-pounds, powder X-ray diffractometry was used to confirm the crystal structure modelsfrom single crystal diffractometry and check for additional phases. Chemical composi-tion was determined by ICP-AES chemical analysis. Potential low-temperature super-conductivity and magnetical ordering was checked for by SQUID or AC susceptometermeasurements. To compare the products to other metals and semimetals, electricalconductance measurements were performed. Thermoanalytical measurements were per-formed to determine melting/decomposition temperatures or to find ideal temperaturesfor tempering.
Single Crystal Diffractometry
Single crystals insensitive toward moisture or air were mounted on top of glass fibers.Specimens sensitive toward air and moisture were handled under dry paraffin oil (driedover potassium sand). Single crystals were isolated and transferred in Lindemann capil-laries (inner diameter 0.1–0.3 mm, filled with dry paraffin oil), and sealed immediately.
The crystals were mounted on a one-circle Stoe IPDS1 diffraction system (Stoe IPDS,Stoe & Cie, Darmstadt) euqipped with an image plate detector, graphite monochromator(Ag-Kα or Mo-Kα radiation) or a Bruker D8 Quest diffractometer system equipped witha CMOS detector, microfocus X-ray tube (Mo-Kα radiation), Goebel mirror optics andcooling system (Oxford cryo systems).
Collection, integration and correction of data was performed with device-native software(STOE and Bruker).[1, 2]
Structure solution and refinement Structure solution was performed with direct meth-ods (SHELXS-97). Structure refinement was performed by the full-matrix least-squaresmethod implemented in SHELXL-97. Initial visualisation (Pluton), checks for additionalsymmetry (Addsym & Newsym), absorption correction (AbsTompa, MulScanAbs, Ab-sSphere; IPDS data only), standardisation of cell metrics and atomic positions (Struc-tureTidy) were performed with the programs implemented in the PLATON package.
Powder Diffraction
X-ray powder diagrams were recorded on a transmission powder diffractometer system(Stoe STADI-P, Stoe & Cie, Darmstadt, MoKα1 radiation, curved Ge[111] monochro-mator) to check for additional phases and Rietveld refinement. Representative portions
18 Results
of the products were ground and sealed in capillaries with inner diameter of 0.1–0.5 mm,depending on the absorption coefficients of the samples. Some samples were diluted withdiamond powder to account for either strong absorption or high ductility.
During Rietveld refinement (Topas Academic), peak shapes were modelled with a funda-mental parameters approach (direct convolution of source emission profiles, axial instru-ment contributions) and a double-Voigt approach to compensate size-strain effects. Ashifted Chebychev polynomial was applied for background modelling. Careful absorptioncorrection was performed by assuming a cylindrical sample with a packing density of 0.5– 0.7. If necessary, preferred orientation was corrected by spherical harmonics function(order no higher than 4) or a March-Dollase function.
Magnetic Measurements
Magnetic measurements on polycrystalline samples were either performed with a com-mercial SQUID magnetometer (MPMS-XL5, Quantum Design, Inc.) or a self-manufac-tured ac susceptometer.[3]
The SQUID magnetometer operates in a temperature range from 1.8 K to 400 K withexternal fields up to 50 kOe. The fully automated differential dual-coil ac susceptometeroperates in the temperature range 3.4 K – 320 K with alternating magnetic fields up to8 Oe and frequencies between 100 Hz and 10 kHz. Sample amounts of about 20 to 50 mgwere loaded into gelatine capsules and fixed in a straw as sample holder. The outputdata files were processed directly in ORIGIN.[4] Data were corrected for sample holderand core diamagnetism.
Electric Conductance Measurements
One of the following methods was applied:
Electrical resistances were measured by the van-der-Pauw method.[5] The samples werecold-pressed into pellets (Ø = 6 mm, thickness 1 mm) and fixed on a brass samplecarrier using the epoxy resin Stycast TM 2850FT (EMERSON & CUMING, catalystTetraethylenepentamine), and copper wires (LAKESHORE, Quad-TwistT-Cryogenicwire 36 AWG) were fixed to the surface of the sample by silver conductive paint.
Temperature-dependent measurements of the dc resistances between 10 K and 300 Kwere performed with a closed-cycle He cryostat (Cold Head, CTI CRYOGENICS, Model22 CP) connected to a temperature controller (LAKESHORE, Model 331) with a silicondiode temperature sensor. Data logging was performed by the program LEITMESS.Primary data evaluation and interpretation was performed with ORIGIN.[4]
DSC
Differential scanning calorimetry (DSC) measurements were performed to determine de-composition/transformation temperatures of the samples (about 20 mg of material) inO-ring sealed (Vitron Rubber W.0.22") Fe containers (Perkin Elmer Large Volume Cap-
Results 19
sules, capacity 60 µL). A nitrogen flow of 20 mL per minute was applied on a LinseisPT 10 DSC device calibrated with pure indium and zinc standards at a heating rate of5 C·min−1. Evaluation of data was performed with the device’s own software.[6]
Melting temperatures
Melting temperatures were either measured by DSC (see above) or estimated visuallywith a Büchi melting-point B-450 device. In a glove box, the substance was put in a glasscapillary, temporarily sealed with grease, brought on air and sealed immediately. Themelting temperature was roughly determined with a heating rate of 10 C·min−1. Then,three measurements were performed with a heating rate of 0.1 C·min−1 in a narrowtemperature interval and the values were averaged.
Elemental Analysis (ICP-AES)
ICP-AES (Inductively coupled plasma – atomic emission spectroscopy) served as ele-mental analysis for all elements except halogenes and Cs, C, H, N, O. Small amounts(≈ 1 mg) were dissolved in analytical grade acid, diluted and sprayed into an argonplasma (T ≈ 10.000 K). Positions and intensities of spectral lines were used for quan-tification, the error is within 5 %. Samples were measured and evaluated on a VarianVista RL CCD simultaneous ICP–AES spectrometer.
Solid-State NMR
Solid-state NMR spectra of 7Li and 199Hg were acquired on a Bruker Avance-III 500spectrometer, with a static magnetic field of B0 = 11.7 T. A commercial static probe wasused for the measurements, with custom-made solenoid coils oriented perpendicular tothe magnetic field. The number of transients required for a good quality spectrum was ofthe order of one hundred for 7Li and several ten thousands for 199Hg, with recycle delaysbetween 1 and 4 s. Chemical shifts were reported relative to the secondary reference ofthe 1H-NMR resonance of 1% Si(CH3)4 in CDCl3.
3.1.3. Quantum-Mechanical Calculations
Quantum-mechanical calculations were performed with the program package Wien2k.[7]It uses the FP-LAPW method (Full Potential Linearized Augmented Planes Waves)including all electrons of the system instead of omitting core electrons and using pseu-dopotentials. All electron models are considered as standard for the numerical accuracyof solid-state DFT and supposed to yield most reliable values for a given functional aslong as numerical accuracy is achieved, usually by means of large basis sets and densek-meshes.[8, 9] This is especially useful for calculations of heavy elements to account forrelativistic effects and f -electrons which can exhibit unusual behaviour.
Calculations were either performed on a PC (64 bit operating system (Linux Mint 16Cinnamon) and a quad-core processor (Intel Core i5-3470 CPU @ 3.20GHz x 4) equipped
20 Results
with 32GiB RAM) or on the LRZ Linux cluster (Leibniz Supercomputing Centre, dualsocket octo-core AMD Opteron Magny Cours (2.0 GHz) processors, varying number ofcores and allocated RAM).
If not mentioned otherwise, exchange correlations were calculated with standard PBE-GGA approximation.[10] It was chosen because of its good results for a wide range ofelements/compounds and as it is widely used it ensues comparability with other calcula-tions from literature.[11] Convergence criteria were charge convergence ≤ 0.0001 eV andcharge distance ≤ 0.00001 eV.
Total and partial density of states (tDOS and pDOS) were determined by means of themodified tetrahedron method.[7] Quantification of the topology of the electron densitywas performed according to Bader’s ’Atoms in molecules’ theory.[12]
References
[1] STOE & Cie GmbH, X-Area: IPDS Control Software Version 1.39 (2006).
[2] Bruker-AXS, APEX2, Version 2014.11-0 (2014).
[3] M. C. Tegel, Iron Pnictide superconductors, Phd thesis, LMU Munich (2011).
[4] OriginLab, Origin, Version 6.1 (2007).
[5] L. J. van der Pauw, Philips Res. Repts., 13, 1–9 (1958).
[6] PerkinElmer, Pyris - Instrument Managing Software, Version 11 (2012).
[7] P. Blaha, K. Schwarz, G. Madsen, D. Kvasnicka, J. Luitz, An Augmented PlaneWave Plus Local Orbitals Program for Calculating Crystal Properties (2013).
[8] K. Lejaeghere, G. Bihlmayer, T. Bjorkman, P. Blaha, S. Blugel, V. Blum, D. Caliste,I. E. Castelli, S. J. Clark, A. Dal Corso, S. de Gironcoli, T. Deutsch, J. K. Dewhurst,I. Di Marco, L. Genovese, P. Giannozzi, M. Giantomassi, S. Goedecker, X. Gonze,O. Granas, E. K. U. Gross, A. Gulans, F. Gygi, D. R. Hamann, P. J. Hasnip,N. A. W. Holzwarth, D. Iu an, D. B. Jochym, F. Jollet, D. Jones, G. Kresse,K. Koepernik, E. Kucukbenli, S. Lubeck, M. Marsman, N. Marzari, U. Nitzsche,L. Nordstrom, T. Ozaki, L. Paulatto, W. Poelmans, M. I. J. Probert, M. Richter,S. Saha, M. Scheffler, M. Schlipf, K. Schwarz, S. Sharma, F. Tavazza, P. Thunstrom,A. Tkatchenko, M. Torrent, D. Vanderbilt, M. J. van Setten, V. Van Speybroeck,J. M. Wills, J. R. Yates, G.-X. Zhang, Science, 351(6280), 1415 (2016).
[9] P. Haas, F. Tran, P. Blaha, Phys. Rev. B, 79(8), 1–10 (2009).
[10] J. P. Perdew, K. Burke, M. Ernzerhof, Phys. Rev. Lett., 77(18), 3865–3868 (1996).
[11] G. I. Csonka, J. P. Perdew, A. Ruzsinszky, P. H. T. Philipsen, S. Lebègue, J. Paier,O. A. Vydrov, J. G. Ángyán, Phys. Rev. B, 79(15), 1–14 (2009).
[12] R. F. W. Bader, Atoms in Molecules, John Wiley & Sons, Ltd, Chichester, UK(2002).
Results 21
3.2. Metal Iodide Solvates
3.2.1. Single Crystal Structures
For electrocrystallisation it is convenient to use the metal iodide solvates as educts ratherthan the respective solvate free metal iodides. Preparation of the latter is often tediousas their syntheses require complicated devices and/or high temperatures. The respectivesolvates are much easier obtained at mild reaction conditions close to room temperature.Also, they are often obtained in one-pot reactions, further simplifing the procedure.Principal reaction pathways are: (1) Recrystallisation of a metal iodide hydrate fromDMF. (2) Reaction of a metal with aqueous HI in DMF. (3) Direct reaction betweena metal and iodide in DMF solvent. (4) Solution metathesis reaction between a metalchloride and KI in DMF.
The metal iodide solvates have been characterised in detail by single crystal and powderdiffraction methods to get knowledge on the employed educts of electrocrystallisation.Their crystal structures were elucidated and put into context with motifs of close packedstructures. The following chapter contains the unpublished results of the structuralinvestigations. Additional data is compiled in the supplementary material chapter A.
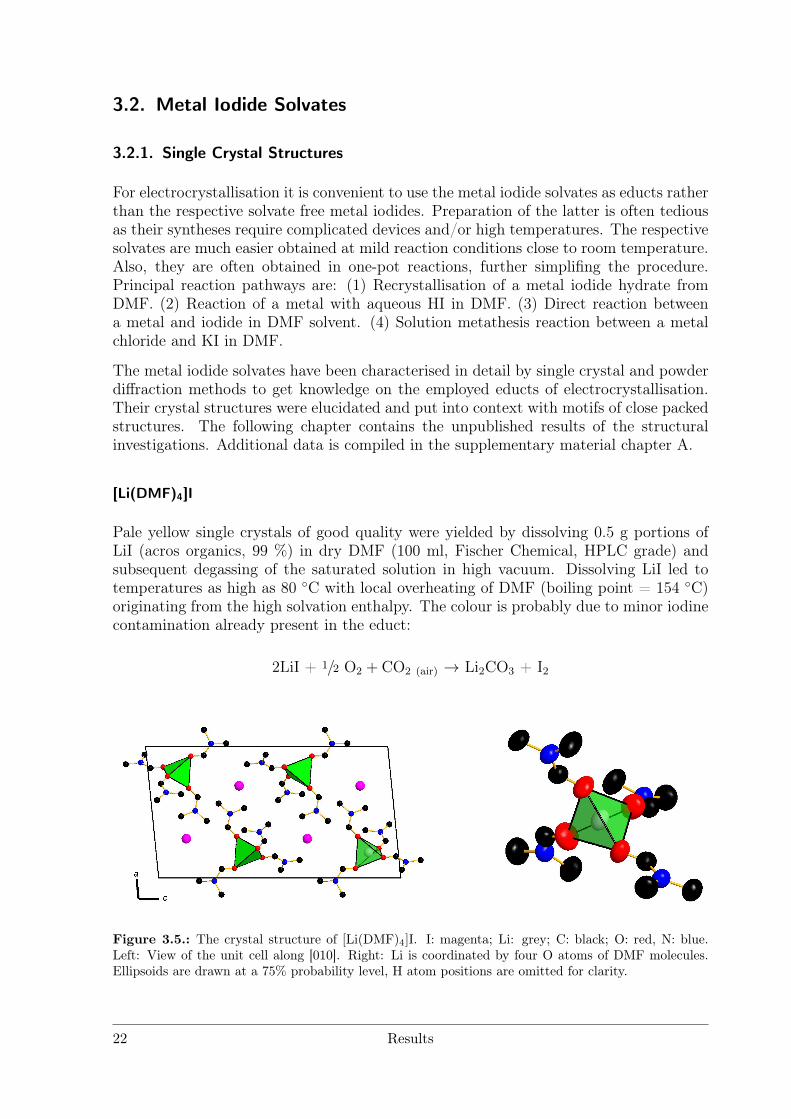
[Li(DMF)4]I
Pale yellow single crystals of good quality were yielded by dissolving 0.5 g portions ofLiI (acros organics, 99 %) in dry DMF (100 ml, Fischer Chemical, HPLC grade) andsubsequent degassing of the saturated solution in high vacuum. Dissolving LiI led totemperatures as high as 80 C with local overheating of DMF (boiling point = 154 C)originating from the high solvation enthalpy. The colour is probably due to minor iodinecontamination already present in the educt:
2LiI + 1/2 O2 + CO2 (air) → Li2CO3 + I2
Figure 3.5.: The crystal structure of [Li(DMF)4]I. I: magenta; Li: grey; C: black; O: red, N: blue.Left: View of the unit cell along [010]. Right: Li is coordinated by four O atoms of DMF molecules.Ellipsoids are drawn at a 75% probability level, H atom positions are omitted for clarity.
22 Results
The resulting anhydrous saturated solution was allowed to cool to room temperatureand within minutes pale yellow block-shaped and hygroscopic crystals formed. A suit-able crystal was selected and centred on a STOE IPDS 1 diffraction system. For addi-tional details on data collection and treatment see Tables 3.3, A.2 and A.3. Indexingyielded a monoclinic cell with systematic absence conditions leading to extinction symbolP 1 21/c 1 (unique axis b), indicating space group P21/c. Solution yielded heavy atompositions (iodine), all other atoms were subsquently located by analysis of the differenceFourier map during refinement. No additional symmetry was found. All atoms except Hwere treated with anisotropic thermal displacement parameters, H atom positions wererefined with rigid-model constraints. Residual electron densities were in close proximityto I and thus treated as termination effects.
[Li(DMF)4]I crystallises in space group P21/c with four formula units in the unit celland one crystallographic position for both Li and I atoms, and two crystallographi-cally independent DMF molecules (see Table 3.1). Li atoms are coordinated by oxygenatoms of four DMF molecules. The resulting tetrahedron is distorted, angles (see TableA.3) range from ]O−Li−O = 103.3(4) to 113.7(4). Distances (table A.2) range fromdLi−O = 1.892(9) Å to 1.948(8) Å (see Table A.3) in accordance with similar coordina-tion compounds (e.g. Li(H2NCONH)).[1, 2]
Table 3.1.: Standardised[3] fractional atomic coordinates and equivalent isotropic displacement param-eters /Å2 for [Li(DMF)4]I. U eq is defined as 1/3 of the trace of the orthogonalized U ij tensor. Standarddeviations in units of the last digit are given in parentheses. All atoms occupy the general position withWyckoff number 4e.
Atom x y z Ueq Atom x y z Ueq
Li1 0.8067(5) 0.1254(10) 0.1233(3) 0.077(12) H9C 0.1650 0.1950 0.1103 0.146I1 0.29887(3) 0.59299(4) 0.129986(13) 0.0901(2) O5 0.6837(3) 0.0551(6) 0.1605(2) 0.127(2)O1 0.7744(3) 0.3414(5) 0.0788(2) 0.1125(11) N5 0.5108(3) 0.0779(5) 0.1784(2) 0.0805(9)N1 0.6504(3) 0.5662(5) 0.0657(2) 0.0748(9) C13 0.6146(4) 0.0649(7) 0.1935(2) 0.0902(13)C1 0.5932(5) 0.6908(9) 0.0251(3) 0.115(2) H13A 0.6371 0.0631 0.2337 0.108H1A 0.6136 0.6700 −0.0139 0.172 H13B 0.6229 −0.0444 0.2173 0.108H1B 0.6111 0.8132 0.0369 0.172 C14 0.4684(5) 0.0956(8) 0.1182(2) 0.112(2)H1C 0.5168 0.6724 0.0253 0.172 H14A 0.5270 0.1022 0.0938 0.167C2 0.6372(5) 0.5857(9) 0.1266(2) 0.116(2) H14B 0.4258 0.2042 0.1133 0.167H2A 0.6671 0.4817 0.1477 0.174 H14C 0.4241 −0.0078 0.1069 0.167H2B 0.5616 0.5952 0.1316 0.174 C15 0.4338(5) 0.0797(10) 0.2221(3) 0.129(2)H2C 0.6739 0.6933 0.1415 0.174 H15A 0.4704 0.0526 0.2602 0.194C3 0.7171(4) 0.4454(7) 0.0485(2) 0.0870(13) H15B 0.3789 −0.0098 0.2121 0.194H3A 0.7212 0.4378 0.0081 0.104 H15C 0.4011 0.1976 0.2230 0.194H3B 0.7664 0.5140 0.0266 0.104 O7 −0.0738(3) 0.1501(5) 0.18277(14) 0.0969(10)O3 0.1562(3) 0.0481(4) −0.06427(13) 0.0936(9) N7 0.0227(3) 0.1501(5) 0.2712(2) 0.0791(9)N3 0.1221(3) 0.1296(5) 0.0266(2) 0.0742(9) C22 −0.0673(4) 0.1449(6) 0.2361(2) 0.0793(11)C7 0.0625(5) 0.2898(7) 0.0079(3) 0.1056(2) H22A −0.1316 0.1364 0.2537 0.095H7A 0.0546 0.2955 −0.0344 0.159 H22B −0.1098 0.2469 0.2477 0.095H7B 0.1008 0.3953 0.0234 0.159 C23 0.0238(5) 0.1417(8) 0.3343(2) 0.100(2)H7C −0.0076 0.2858 0.0221 0.159 H23A −0.0485 0.1550 0.3450 0.150C8 0.1646(3) 0.0231(6) −0.0113(2) 0.0798(11) H23B 0.0682 0.2377 0.3519 0.150H8A 0.2036 −0.0777 0.0033 0.096 H23C 0.0525 0.0266 0.3481 0.150H8B 0.1350 −0.0969 −0.0058 0.096 C24 0.1264(4) 0.1590(10) 0.2476(3) 0.119(2)C9 0.1355(4) 0.0905(7) 0.0892(2) 0.0973(14) H24A 0.1608 0.0423 0.2512 0.179H9A 0.1838 −0.0105 0.0965 0.146 H24B 0.1712 0.2476 0.2691 0.179H9B 0.0666 0.0611 0.1024 0.146 H24C 0.1160 0.1931 0.2068 0.179
[Na(DMF)3]I
Colourless single crystals of good quality were obtained by dissolving NaI (VWR chem-icals, 99.5 %) in dry DMF (100 ml, Fischer Chemical, HPLC grade) under inert gasconditions until a saturated solution was obtained. The solvation enthalpy is negative
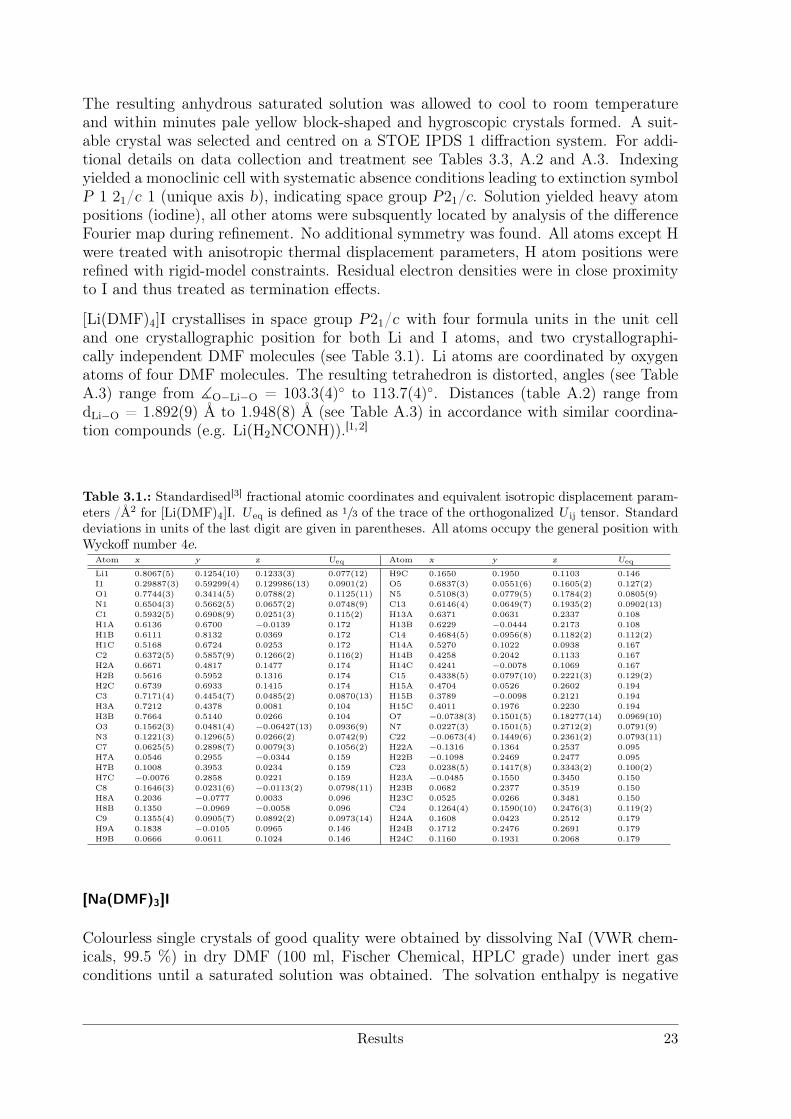
Results 23
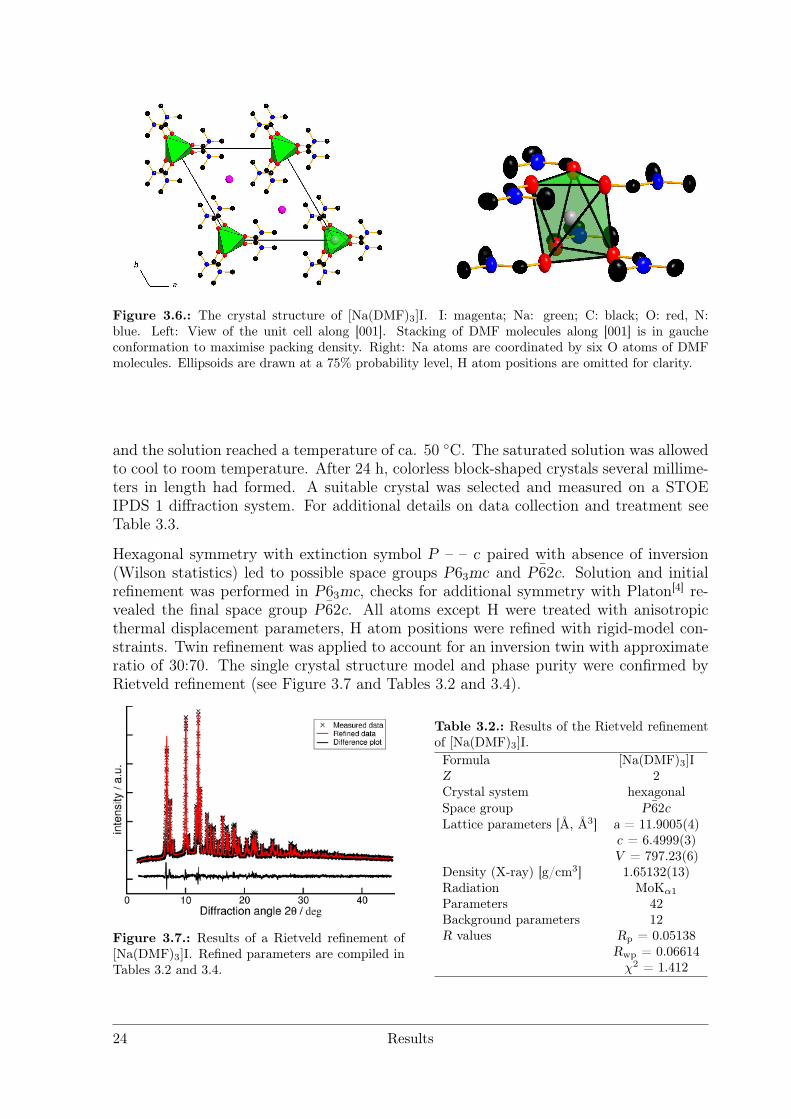
Figure 3.6.: The crystal structure of [Na(DMF)3]I. I: magenta; Na: green; C: black; O: red, N:blue. Left: View of the unit cell along [001]. Stacking of DMF molecules along [001] is in gaucheconformation to maximise packing density. Right: Na atoms are coordinated by six O atoms of DMFmolecules. Ellipsoids are drawn at a 75% probability level, H atom positions are omitted for clarity.
and the solution reached a temperature of ca. 50 C. The saturated solution was allowedto cool to room temperature. After 24 h, colorless block-shaped crystals several millime-ters in length had formed. A suitable crystal was selected and measured on a STOEIPDS 1 diffraction system. For additional details on data collection and treatment seeTable 3.3.
Hexagonal symmetry with extinction symbol P – – c paired with absence of inversion(Wilson statistics) led to possible space groups P63mc and P62c. Solution and initialrefinement was performed in P63mc, checks for additional symmetry with Platon[4] re-vealed the final space group P62c. All atoms except H were treated with anisotropicthermal displacement parameters, H atom positions were refined with rigid-model con-straints. Twin refinement was applied to account for an inversion twin with approximateratio of 30:70. The single crystal structure model and phase purity were confirmed byRietveld refinement (see Figure 3.7 and Tables 3.2 and 3.4).
Figure 3.7.: Results of a Rietveld refinement of[Na(DMF)3]I. Refined parameters are compiled inTables 3.2 and 3.4.
Table 3.2.: Results of the Rietveld refinementof [Na(DMF)3]I.Formula [Na(DMF)3]IZ 2Crystal system hexagonalSpace group P62cLattice parameters [Å, Å3] a = 11.9005(4)
c = 6.4999(3)V = 797.23(6)
Density (X-ray) [g/cm3] 1.65132(13)Radiation MoKα1Parameters 42Background parameters 12R values Rp = 0.05138
Rwp = 0.06614χ2 = 1.412
24 Results
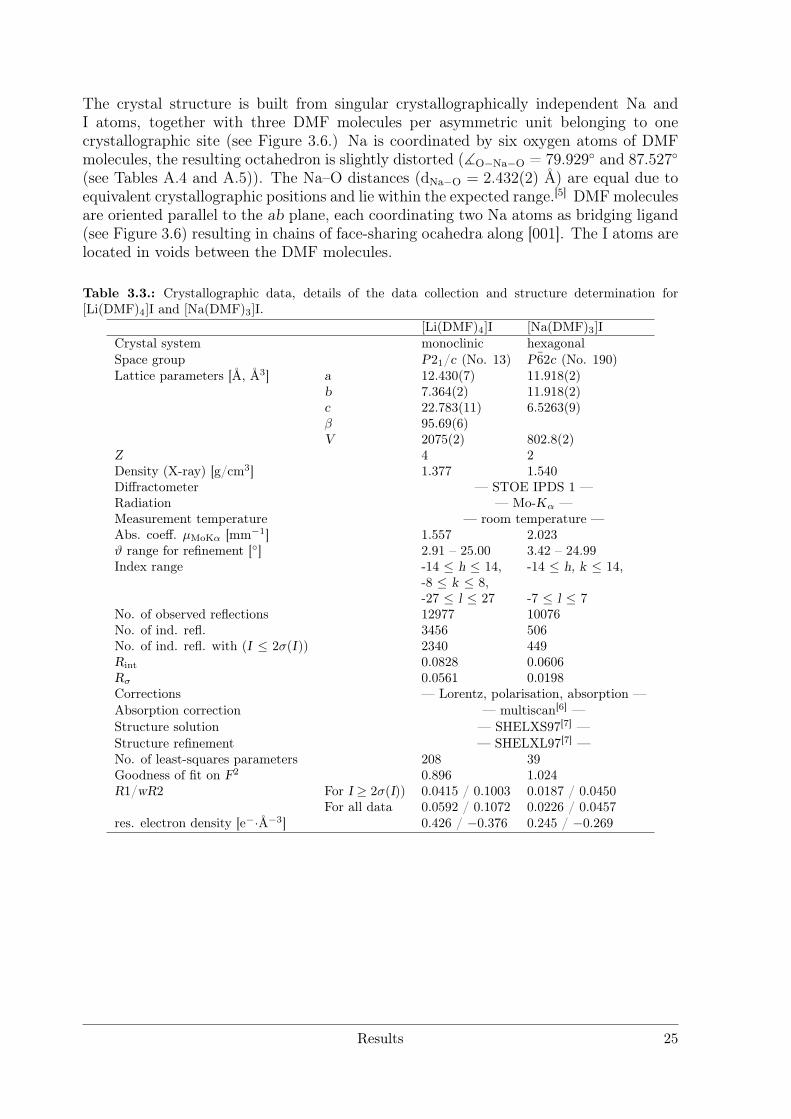
The crystal structure is built from singular crystallographically independent Na andI atoms, together with three DMF molecules per asymmetric unit belonging to onecrystallographic site (see Figure 3.6.) Na is coordinated by six oxygen atoms of DMFmolecules, the resulting octahedron is slightly distorted (]O−Na−O = 79.929 and 87.527(see Tables A.4 and A.5)). The Na–O distances (dNa−O = 2.432(2) Å) are equal due toequivalent crystallographic positions and lie within the expected range.[5] DMFmoleculesare oriented parallel to the ab plane, each coordinating two Na atoms as bridging ligand(see Figure 3.6) resulting in chains of face-sharing ocahedra along [001]. The I atoms arelocated in voids between the DMF molecules.
Table 3.3.: Crystallographic data, details of the data collection and structure determination for[Li(DMF)4]I and [Na(DMF)3]I.
[Li(DMF)4]I [Na(DMF)3]ICrystal system monoclinic hexagonalSpace group P21/c (No. 13) P62c (No. 190)Lattice parameters [Å, Å3] a 12.430(7) 11.918(2)
b 7.364(2) 11.918(2)c 22.783(11) 6.5263(9)β 95.69(6)V 2075(2) 802.8(2)
Z 4 2Density (X-ray) [g/cm3] 1.377 1.540Diffractometer — STOE IPDS 1 —Radiation — Mo-Kα —Measurement temperature — room temperature —Abs. coeff. µMoKα [mm−1] 1.557 2.023ϑ range for refinement [] 2.91 – 25.00 3.42 – 24.99Index range -14 ≤ h ≤ 14, -14 ≤ h, k ≤ 14,
-8 ≤ k ≤ 8,-27 ≤ l ≤ 27 -7 ≤ l ≤ 7
No. of observed reflections 12977 10076No. of ind. refl. 3456 506No. of ind. refl. with (I ≤ 2σ(I)) 2340 449Rint 0.0828 0.0606Rσ 0.0561 0.0198Corrections — Lorentz, polarisation, absorption —Absorption correction — multiscan[6] —Structure solution — SHELXS97[7] —Structure refinement — SHELXL97[7] —No. of least-squares parameters 208 39Goodness of fit on F2 0.896 1.024R1/wR2 For I ≥ 2σ(I)) 0.0415 / 0.1003 0.0187 / 0.0450
For all data 0.0592 / 0.1072 0.0226 / 0.0457res. electron density [e−·Å−3] 0.426 / −0.376 0.245 / −0.269
Results 25
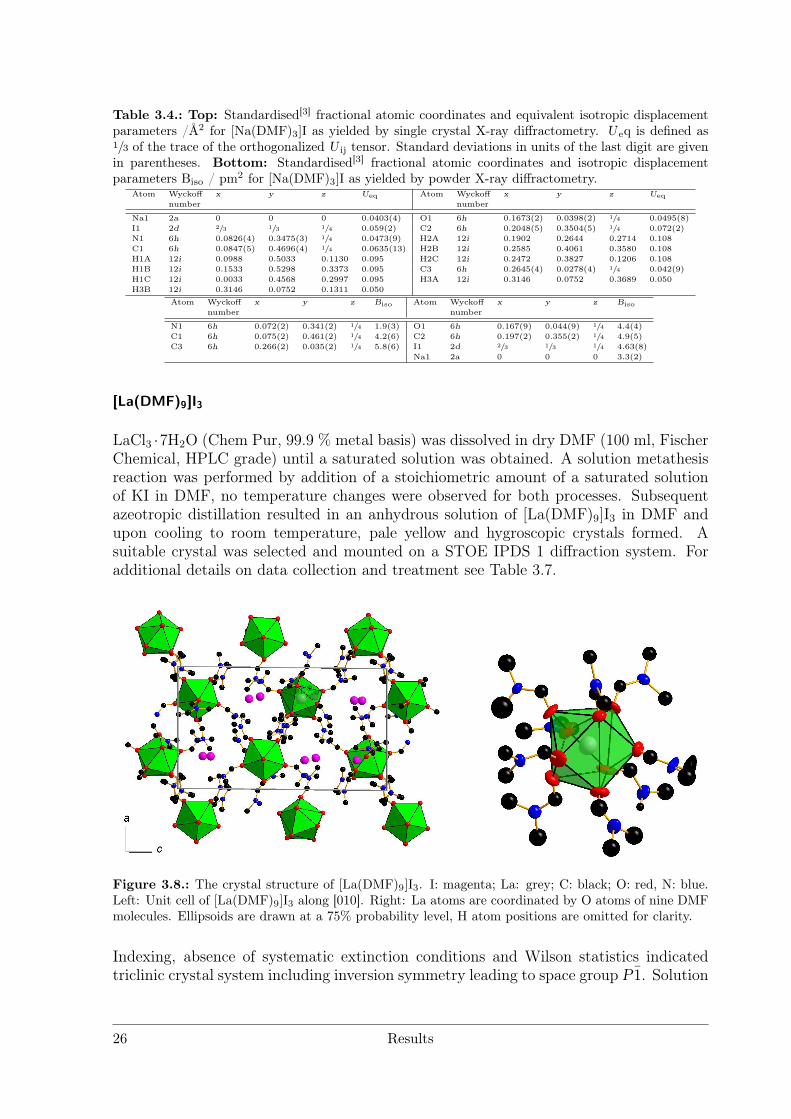
Table 3.4.: Top: Standardised[3] fractional atomic coordinates and equivalent isotropic displacementparameters /Å2 for [Na(DMF)3]I as yielded by single crystal X-ray diffractometry. U eq is defined as1/3 of the trace of the orthogonalized U ij tensor. Standard deviations in units of the last digit are givenin parentheses. Bottom: Standardised[3] fractional atomic coordinates and isotropic displacementparameters Biso / pm2 for [Na(DMF)3]I as yielded by powder X-ray diffractometry.
Atom Wyckoff x y z Ueq Atom Wyckoff x y z Ueq
number number
Na1 2a 0 0 0 0.0403(4) O1 6h 0.1673(2) 0.0398(2) 1/4 0.0495(8)I1 2d 2/3 1/3 1/4 0.059(2) C2 6h 0.2048(5) 0.3504(5) 1/4 0.072(2)N1 6h 0.0826(4) 0.3475(3) 1/4 0.0473(9) H2A 12i 0.1902 0.2644 0.2714 0.108C1 6h 0.0847(5) 0.4696(4) 1/4 0.0635(13) H2B 12i 0.2585 0.4061 0.3580 0.108H1A 12i 0.0988 0.5033 0.1130 0.095 H2C 12i 0.2472 0.3827 0.1206 0.108H1B 12i 0.1533 0.5298 0.3373 0.095 C3 6h 0.2645(4) 0.0278(4) 1/4 0.042(9)H1C 12i 0.0033 0.4568 0.2997 0.095 H3A 12i 0.3146 0.0752 0.3689 0.050H3B 12i 0.3146 0.0752 0.1311 0.050
Atom Wyckoff x y z Biso Atom Wyckoff x y z Biso
number number
N1 6h 0.072(2) 0.341(2) 1/4 1.9(3) O1 6h 0.167(9) 0.044(9) 1/4 4.4(4)C1 6h 0.075(2) 0.461(2) 1/4 4.2(6) C2 6h 0.197(2) 0.355(2) 1/4 4.9(5)C3 6h 0.266(2) 0.035(2) 1/4 5.8(6) I1 2d 2/3 1/3 1/4 4.63(8)
Na1 2a 0 0 0 3.3(2)
[La(DMF)9]I3
LaCl3 ·7H2O (Chem Pur, 99.9 % metal basis) was dissolved in dry DMF (100 ml, FischerChemical, HPLC grade) until a saturated solution was obtained. A solution metathesisreaction was performed by addition of a stoichiometric amount of a saturated solutionof KI in DMF, no temperature changes were observed for both processes. Subsequentazeotropic distillation resulted in an anhydrous solution of [La(DMF)9]I3 in DMF andupon cooling to room temperature, pale yellow and hygroscopic crystals formed. Asuitable crystal was selected and mounted on a STOE IPDS 1 diffraction system. Foradditional details on data collection and treatment see Table 3.7.
Figure 3.8.: The crystal structure of [La(DMF)9]I3. I: magenta; La: grey; C: black; O: red, N: blue.Left: Unit cell of [La(DMF)9]I3 along [010]. Right: La atoms are coordinated by O atoms of nine DMFmolecules. Ellipsoids are drawn at a 75% probability level, H atom positions are omitted for clarity.
Indexing, absence of systematic extinction conditions and Wilson statistics indicatedtriclinic crystal system including inversion symmetry leading to space group P1. Solution
26 Results
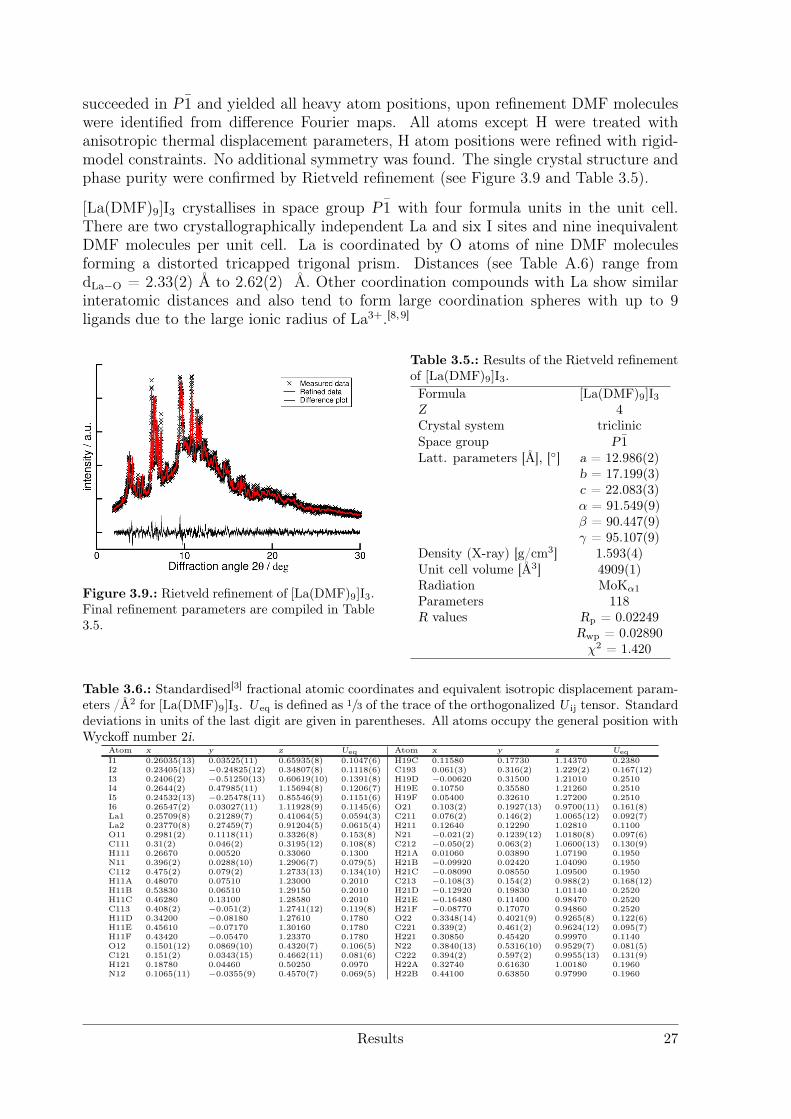
succeeded in P1 and yielded all heavy atom positions, upon refinement DMF moleculeswere identified from difference Fourier maps. All atoms except H were treated withanisotropic thermal displacement parameters, H atom positions were refined with rigid-model constraints. No additional symmetry was found. The single crystal structure andphase purity were confirmed by Rietveld refinement (see Figure 3.9 and Table 3.5).
[La(DMF)9]I3 crystallises in space group P1 with four formula units in the unit cell.There are two crystallographically independent La and six I sites and nine inequivalentDMF molecules per unit cell. La is coordinated by O atoms of nine DMF moleculesforming a distorted tricapped trigonal prism. Distances (see Table A.6) range fromdLa−O = 2.33(2) Å to 2.62(2) Å. Other coordination compounds with La show similarinteratomic distances and also tend to form large coordination spheres with up to 9ligands due to the large ionic radius of La3+.[8, 9]
Figure 3.9.: Rietveld refinement of [La(DMF)9]I3.Final refinement parameters are compiled in Table3.5.
Table 3.5.: Results of the Rietveld refinementof [La(DMF)9]I3.Formula [La(DMF)9]I3Z 4Crystal system triclinicSpace group P1Latt. parameters [Å], [] a = 12.986(2)
b = 17.199(3)c = 22.083(3)α = 91.549(9)β = 90.447(9)γ = 95.107(9)
Density (X-ray) [g/cm3] 1.593(4)Unit cell volume [Å3] 4909(1)Radiation MoKα1Parameters 118R values Rp = 0.02249
Rwp = 0.02890χ2 = 1.420
Table 3.6.: Standardised[3] fractional atomic coordinates and equivalent isotropic displacement param-eters /Å2 for [La(DMF)9]I3. U eq is defined as 1/3 of the trace of the orthogonalized U ij tensor. Standarddeviations in units of the last digit are given in parentheses. All atoms occupy the general position withWyckoff number 2i.
Atom x y z Ueq Atom x y z Ueq
I1 0.26035(13) 0.03525(11) 0.65935(8) 0.1047(6) H19C 0.11580 0.17730 1.14370 0.2380I2 0.23405(13) −0.24825(12) 0.34807(8) 0.1118(6) C193 0.061(3) 0.316(2) 1.229(2) 0.167(12)I3 0.2406(2) −0.51250(13) 0.60619(10) 0.1391(8) H19D −0.00620 0.31500 1.21010 0.2510I4 0.2644(2) 0.47985(11) 1.15694(8) 0.1206(7) H19E 0.10750 0.35580 1.21260 0.2510I5 0.24532(13) −0.25478(11) 0.85546(9) 0.1151(6) H19F 0.05400 0.32610 1.27200 0.2510I6 0.26547(2) 0.03027(11) 1.11928(9) 0.1145(6) O21 0.103(2) 0.1927(13) 0.9700(11) 0.161(8)La1 0.25709(8) 0.21289(7) 0.41064(5) 0.0594(3) C211 0.076(2) 0.146(2) 1.0065(12) 0.092(7)La2 0.23770(8) 0.27459(7) 0.91204(5) 0.0615(4) H211 0.12640 0.12290 1.02810 0.1100O11 0.2981(2) 0.1118(11) 0.3326(8) 0.153(8) N21 −0.021(2) 0.1239(12) 1.0180(8) 0.097(6)C111 0.31(2) 0.046(2) 0.3195(12) 0.108(8) C212 −0.050(2) 0.063(2) 1.0600(13) 0.130(9)H111 0.26670 0.00520 0.33060 0.1300 H21A 0.01060 0.03890 1.07190 0.1950N11 0.396(2) 0.0288(10) 1.2906(7) 0.079(5) H21B −0.09920 0.02420 1.04090 0.1950C112 0.475(2) 0.079(2) 1.2733(13) 0.134(10) H21C −0.08090 0.08550 1.09500 0.1950H11A 0.48070 0.07510 1.23000 0.2010 C213 −0.108(3) 0.154(2) 0.988(2) 0.168(12)H11B 0.53830 0.06510 1.29150 0.2010 H21D −0.12920 0.19830 1.01140 0.2520H11C 0.46280 0.13100 1.28580 0.2010 H21E −0.16480 0.11400 0.98470 0.2520C113 0.408(2) −0.051(2) 1.2741(12) 0.119(8) H21F −0.08770 0.17070 0.94860 0.2520H11D 0.34200 −0.08180 1.27610 0.1780 O22 0.3348(14) 0.4021(9) 0.9265(8) 0.122(6)H11E 0.45610 −0.07170 1.30160 0.1780 C221 0.339(2) 0.461(2) 0.9624(12) 0.095(7)H11F 0.43420 −0.05470 1.23370 0.1780 H221 0.30850 0.45420 0.99970 0.1140O12 0.1501(12) 0.0869(10) 0.4320(7) 0.106(5) N22 0.3840(13) 0.5316(10) 0.9529(7) 0.081(5)C121 0.151(2) 0.0343(15) 0.4662(11) 0.081(6) C222 0.394(2) 0.597(2) 0.9955(13) 0.131(9)H121 0.18780 0.04460 0.50250 0.0970 H22A 0.32740 0.61630 1.00180 0.1960N12 0.1065(11) −0.0355(9) 0.4570(7) 0.069(5) H22B 0.44100 0.63850 0.97990 0.1960
Results 27
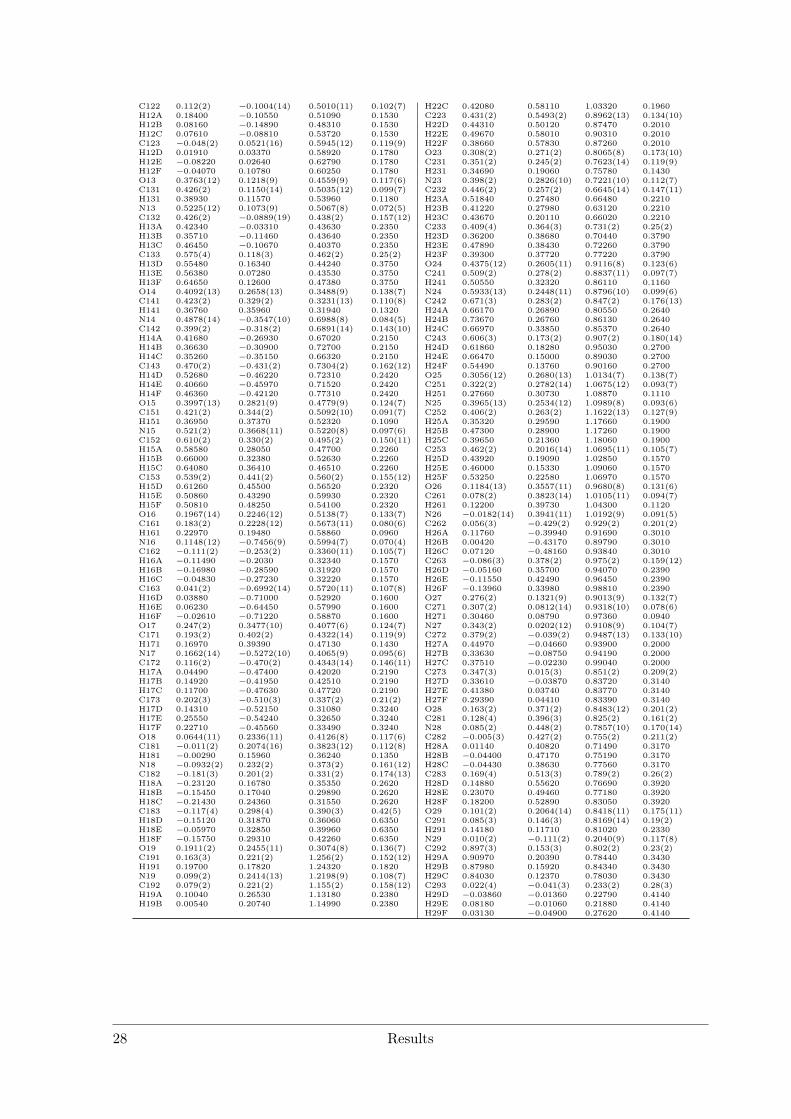
C122 0.112(2) −0.1004(14) 0.5010(11) 0.102(7) H22C 0.42080 0.58110 1.03320 0.1960H12A 0.18400 −0.10550 0.51090 0.1530 C223 0.431(2) 0.5493(2) 0.8962(13) 0.134(10)H12B 0.08160 −0.14890 0.48310 0.1530 H22D 0.44310 0.50120 0.87470 0.2010H12C 0.07610 −0.08810 0.53720 0.1530 H22E 0.49670 0.58010 0.90310 0.2010C123 −0.048(2) 0.0521(16) 0.5945(12) 0.119(9) H22F 0.38660 0.57830 0.87260 0.2010H12D 0.01910 0.03370 0.58920 0.1780 O23 0.308(2) 0.271(2) 0.8065(8) 0.173(10)H12E −0.08220 0.02640 0.62790 0.1780 C231 0.351(2) 0.245(2) 0.7623(14) 0.119(9)H12F −0.04070 0.10780 0.60250 0.1780 H231 0.34690 0.19060 0.75780 0.1430O13 0.3763(12) 0.1218(9) 0.4559(9) 0.117(6) N23 0.398(2) 0.2826(10) 0.7221(10) 0.112(7)C131 0.426(2) 0.1150(14) 0.5035(12) 0.099(7) C232 0.446(2) 0.257(2) 0.6645(14) 0.147(11)H131 0.38930 0.11570 0.53960 0.1180 H23A 0.51840 0.27480 0.66480 0.2210N13 0.5225(12) 0.1073(9) 0.5067(8) 0.072(5) H23B 0.41220 0.27980 0.63120 0.2210C132 0.426(2) −0.0889(19) 0.438(2) 0.157(12) H23C 0.43670 0.20110 0.66020 0.2210H13A 0.42340 −0.03310 0.43630 0.2350 C233 0.409(4) 0.364(3) 0.731(2) 0.25(2)H13B 0.35710 −0.11460 0.43640 0.2350 H23D 0.36200 0.38680 0.70440 0.3790H13C 0.46450 −0.10670 0.40370 0.2350 H23E 0.47890 0.38430 0.72260 0.3790C133 0.575(4) 0.118(3) 0.462(2) 0.25(2) H23F 0.39300 0.37720 0.77220 0.3790H13D 0.55480 0.16340 0.44240 0.3750 O24 0.4375(12) 0.2605(11) 0.9116(8) 0.123(6)H13E 0.56380 0.07280 0.43530 0.3750 C241 0.509(2) 0.278(2) 0.8837(11) 0.097(7)H13F 0.64650 0.12600 0.47380 0.3750 H241 0.50550 0.32320 0.86110 0.1160O14 0.4092(13) 0.2658(13) 0.3488(9) 0.138(7) N24 0.5933(13) 0.2448(11) 0.8796(10) 0.099(6)C141 0.423(2) 0.329(2) 0.3231(13) 0.110(8) C242 0.671(3) 0.283(2) 0.847(2) 0.176(13)H141 0.36760 0.35960 0.31940 0.1320 H24A 0.66170 0.26890 0.80550 0.2640N14 0.4878(14) −0.3547(10) 0.6988(8) 0.084(5) H24B 0.73670 0.26760 0.86130 0.2640C142 0.399(2) −0.318(2) 0.6891(14) 0.143(10) H24C 0.66970 0.33850 0.85370 0.2640H14A 0.41680 −0.26930 0.67020 0.2150 C243 0.606(3) 0.173(2) 0.907(2) 0.180(14)H14B 0.36630 −0.30900 0.72700 0.2150 H24D 0.61860 0.18280 0.95030 0.2700H14C 0.35260 −0.35150 0.66320 0.2150 H24E 0.66470 0.15000 0.89030 0.2700C143 0.470(2) −0.431(2) 0.7304(2) 0.162(12) H24F 0.54490 0.13760 0.90160 0.2700H14D 0.52680 −0.46220 0.72310 0.2420 O25 0.3056(12) 0.2680(13) 1.0134(7) 0.138(7)H14E 0.40660 −0.45970 0.71520 0.2420 C251 0.322(2) 0.2782(14) 1.0675(12) 0.093(7)H14F 0.46360 −0.42120 0.77310 0.2420 H251 0.27660 0.30730 1.08870 0.1110O15 0.3997(13) 0.2821(9) 0.4779(9) 0.124(7) N25 0.3965(13) 0.2534(12) 1.0989(8) 0.093(6)C151 0.421(2) 0.344(2) 0.5092(10) 0.091(7) C252 0.406(2) 0.263(2) 1.1622(13) 0.127(9)H151 0.36950 0.37370 0.52320 0.1090 H25A 0.35320 0.29590 1.17660 0.1900N15 0.521(2) 0.3668(11) 0.5220(8) 0.097(6) H25B 0.47300 0.28900 1.17260 0.1900C152 0.610(2) 0.330(2) 0.495(2) 0.150(11) H25C 0.39650 0.21360 1.18060 0.1900H15A 0.58580 0.28050 0.47700 0.2260 C253 0.462(2) 0.2016(14) 1.0695(11) 0.105(7)H15B 0.66000 0.32380 0.52630 0.2260 H25D 0.43920 0.19090 1.02850 0.1570H15C 0.64080 0.36410 0.46510 0.2260 H25E 0.46000 0.15330 1.09060 0.1570C153 0.539(2) 0.441(2) 0.560(2) 0.155(12) H25F 0.53250 0.22580 1.06970 0.1570H15D 0.61260 0.45500 0.56520 0.2320 O26 0.1184(13) 0.3557(11) 0.9680(8) 0.131(6)H15E 0.50860 0.43290 0.59930 0.2320 C261 0.078(2) 0.3823(14) 1.0105(11) 0.094(7)H15F 0.50810 0.48250 0.54100 0.2320 H261 0.12200 0.39730 1.04300 0.1120O16 0.1967(14) 0.2246(12) 0.5138(7) 0.133(7) N26 −0.0182(14) 0.3941(11) 1.0192(9) 0.091(5)C161 0.183(2) 0.2228(12) 0.5673(11) 0.080(6) C262 0.056(3) −0.429(2) 0.929(2) 0.201(2)H161 0.22970 0.19480 0.58860 0.0960 H26A 0.11760 −0.39940 0.91690 0.3010N16 0.1148(12) −0.7456(9) 0.5994(7) 0.070(4) H26B 0.00420 −0.43170 0.89790 0.3010C162 −0.111(2) −0.253(2) 0.3360(11) 0.105(7) H26C 0.07120 −0.48160 0.93840 0.3010H16A −0.11490 −0.2030 0.32340 0.1570 C263 −0.086(3) 0.378(2) 0.975(2) 0.159(12)H16B −0.16980 −0.28590 0.31920 0.1570 H26D −0.05160 0.35700 0.94070 0.2390H16C −0.04830 −0.27230 0.32220 0.1570 H26E −0.11550 0.42490 0.96450 0.2390C163 0.041(2) −0.6992(14) 0.5720(11) 0.107(8) H26F −0.13960 0.33980 0.98810 0.2390H16D 0.03880 −0.71000 0.52920 0.1600 O27 0.276(2) 0.1321(9) 0.9013(9) 0.132(7)H16E 0.06230 −0.64450 0.57990 0.1600 C271 0.307(2) 0.0812(14) 0.9318(10) 0.078(6)H16F −0.02610 −0.71220 0.58870 0.1600 H271 0.30460 0.08790 0.97360 0.0940O17 0.247(2) 0.3477(10) 0.4077(6) 0.124(7) N27 0.343(2) 0.0202(12) 0.9108(9) 0.104(7)C171 0.193(2) 0.402(2) 0.4322(14) 0.119(9) C272 0.379(2) −0.039(2) 0.9487(13) 0.133(10)H171 0.16970 0.39390 0.47130 0.1430 H27A 0.44970 −0.04660 0.93900 0.2000N17 0.1662(14) −0.5272(10) 0.4065(9) 0.095(6) H27B 0.33630 −0.08750 0.94190 0.2000C172 0.116(2) −0.470(2) 0.4343(14) 0.146(11) H27C 0.37510 −0.02230 0.99040 0.2000H17A 0.04490 −0.47400 0.42020 0.2190 C273 0.347(3) 0.015(3) 0.851(2) 0.209(2)H17B 0.14920 −0.41950 0.42510 0.2190 H27D 0.33610 −0.03870 0.83720 0.3140H17C 0.11700 −0.47630 0.47720 0.2190 H27E 0.41380 0.03740 0.83770 0.3140C173 0.202(3) −0.510(3) 0.337(2) 0.21(2) H27F 0.29390 0.04410 0.83390 0.3140H17D 0.14310 −0.52150 0.31080 0.3240 O28 0.163(2) 0.371(2) 0.8483(12) 0.201(2)H17E 0.25550 −0.54240 0.32650 0.3240 C281 0.128(4) 0.396(3) 0.825(2) 0.161(2)H17F 0.22710 −0.45560 0.33490 0.3240 N28 0.085(2) 0.448(2) 0.7857(10) 0.170(14)O18 0.0644(11) 0.2336(11) 0.4126(8) 0.117(6) C282 −0.005(3) 0.427(2) 0.755(2) 0.211(2)C181 −0.011(2) 0.2074(16) 0.3823(12) 0.112(8) H28A 0.01140 0.40820 0.71490 0.3170H181 −0.00290 0.15960 0.36240 0.1350 H28B −0.04400 0.47170 0.75190 0.3170N18 −0.0932(2) 0.232(2) 0.373(2) 0.161(12) H28C −0.04430 0.38630 0.77560 0.3170C182 −0.181(3) 0.201(2) 0.331(2) 0.174(13) C283 0.169(4) 0.513(3) 0.789(2) 0.26(2)H18A −0.23120 0.16780 0.35350 0.2620 H28D 0.14880 0.55620 0.76690 0.3920H18B −0.15450 0.17040 0.29890 0.2620 H28E 0.23070 0.49460 0.77180 0.3920H18C −0.21430 0.24360 0.31550 0.2620 H28F 0.18200 0.52890 0.83050 0.3920C183 −0.117(4) 0.298(4) 0.390(3) 0.42(5) O29 0.101(2) 0.2064(14) 0.8418(11) 0.175(11)H18D −0.15120 0.31870 0.36060 0.6350 C291 0.085(3) 0.146(3) 0.8169(14) 0.19(2)H18E −0.05970 0.32850 0.39960 0.6350 H291 0.14180 0.11710 0.81020 0.2330H18F −0.15750 0.29310 0.42260 0.6350 N29 0.010(2) −0.111(2) 0.2040(9) 0.117(8)O19 0.1911(2) 0.2455(11) 0.3074(8) 0.136(7) C292 0.897(3) 0.153(3) 0.802(2) 0.23(2)C191 0.163(3) 0.221(2) 1.256(2) 0.152(12) H29A 0.90970 0.20390 0.78440 0.3430H191 0.19700 0.17820 1.24320 0.1820 H29B 0.87980 0.15920 0.84340 0.3430N19 0.099(2) 0.2414(13) 1.2198(9) 0.108(7) H29C 0.84030 0.12370 0.78030 0.3430C192 0.079(2) 0.221(2) 1.155(2) 0.158(12) C293 0.022(4) −0.041(3) 0.233(2) 0.28(3)H19A 0.10040 0.26530 1.13180 0.2380 H29D −0.03860 −0.01360 0.22790 0.4140H19B 0.00540 0.20740 1.14990 0.2380 H29E 0.08180 −0.01060 0.21880 0.4140
H29F 0.03130 −0.04900 0.27620 0.4140
28 Results
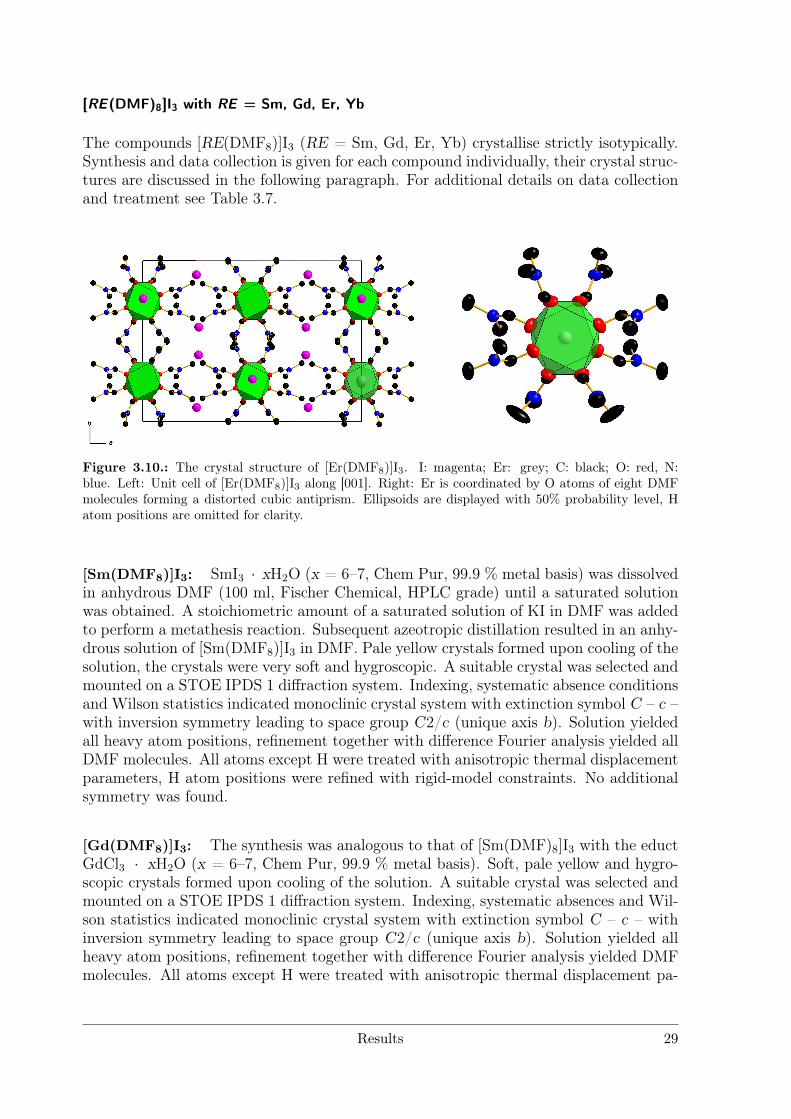
[RE(DMF)8]I3 with RE = Sm, Gd, Er, Yb
The compounds [RE(DMF8)]I3 (RE = Sm, Gd, Er, Yb) crystallise strictly isotypically.Synthesis and data collection is given for each compound individually, their crystal struc-tures are discussed in the following paragraph. For additional details on data collectionand treatment see Table 3.7.
Figure 3.10.: The crystal structure of [Er(DMF8)]I3. I: magenta; Er: grey; C: black; O: red, N:blue. Left: Unit cell of [Er(DMF8)]I3 along [001]. Right: Er is coordinated by O atoms of eight DMFmolecules forming a distorted cubic antiprism. Ellipsoids are displayed with 50% probability level, Hatom positions are omitted for clarity.
[Sm(DMF8)]I3: SmI3 · xH2O (x = 6–7, Chem Pur, 99.9 % metal basis) was dissolvedin anhydrous DMF (100 ml, Fischer Chemical, HPLC grade) until a saturated solutionwas obtained. A stoichiometric amount of a saturated solution of KI in DMF was addedto perform a metathesis reaction. Subsequent azeotropic distillation resulted in an anhy-drous solution of [Sm(DMF8)]I3 in DMF. Pale yellow crystals formed upon cooling of thesolution, the crystals were very soft and hygroscopic. A suitable crystal was selected andmounted on a STOE IPDS 1 diffraction system. Indexing, systematic absence conditionsand Wilson statistics indicated monoclinic crystal system with extinction symbol C – c –with inversion symmetry leading to space group C2/c (unique axis b). Solution yieldedall heavy atom positions, refinement together with difference Fourier analysis yielded allDMF molecules. All atoms except H were treated with anisotropic thermal displacementparameters, H atom positions were refined with rigid-model constraints. No additionalsymmetry was found.
[Gd(DMF8)]I3: The synthesis was analogous to that of [Sm(DMF)8]I3 with the eductGdCl3 · xH2O (x = 6–7, Chem Pur, 99.9 % metal basis). Soft, pale yellow and hygro-scopic crystals formed upon cooling of the solution. A suitable crystal was selected andmounted on a STOE IPDS 1 diffraction system. Indexing, systematic absences and Wil-son statistics indicated monoclinic crystal system with extinction symbol C – c – withinversion symmetry leading to space group C2/c (unique axis b). Solution yielded allheavy atom positions, refinement together with difference Fourier analysis yielded DMFmolecules. All atoms except H were treated with anisotropic thermal displacement pa-
Results 29
rameters, H atom positions were refined with rigid-model constraints. No additionalsymmetry was found.
[Er(DMF8)]I3: The synthesis was analogous to that of [Sm(DMF)8]I3 with the eductErCl3 · xH2O (x = 6–7, Chem Pur, 99.9 % metal basis). Soft, pale magenta and moisture-sensitive crystals formed upon cooling of the solution. A suitable crystal was selectedand mounted on a STOE IPDS 1 diffraction system. Indexing, systematic absences andWilson statistics indicated monoclinic crystal system with extinction symbol C – c –with inversion symmetry leading to space group C2/c (unique axis b). Solution yieldedall heavy atom positions, refinement together with difference Fourier analysis yielded allDMF molecules. All atoms except H were treated with anisotropic thermal displacementparameters, H atom positions were refined with rigid-model constraints. No additionalsymmetry was found. Residual electron density (≤ 0.75 e−) was found in close proximityto Er and was thus treated as termination effect.
[Yb(DMF8)]I3: The synthesis was analogous to that of [Sm(DMF)8]I3 with the eductYbCl3 · xH2O (x = 6–7, Chem Pur, 99.9 % metal basis). Soft, pale yellow and moisturesensitive crystals formed upon cooling of the solution. A suitable crystal was selectedand mounted on a STOE IPDS 1 diffraction system. Upon examination of the reciprocalspace it was revealed that two arbitrarily intergrown crystals were present and subse-quently data was integrated separately for each individual. While essentially similar,only data of the first individuum are discussed here. Indexing, systematic absences andWilson statistics indicated monoclinic crystal system with extinction symbol C – c – withinversion symmetry leading to space group C2/c (unique axis b). Only few systematicabsence violations were observed and can be explained by diffraction contribution of thesecond individuum. Solution yielded all heavy atom positions, refinement together withdifference Fourier analysis yielded DMF molecules. All atoms except H were treatedwith anisotropic thermal displacement parameters, H atom positions were refined withrigid-model constraints. No additional symmetry was found.
Crystal structures of [RE(DMF)8]I3 with RE = Sm, Gd, Er, Yb The crystal structuresof [RE(DMF8)]I3 (RE = Sm, Gd, Er, Yb) are isotypical in space group C2/c with fourformula units per unit cell. There is one crystallographically independent RE site (4e),two I sites (4e, 8f ) and four independent DMF molecules (all atoms on 8f ). RE iscoordinated by the carbonyl oxygen atoms of eight DMF molecules forming a distortedsquare antiprism. The angle between the triangular planes of the "square" is approx.12, the rotation of the squares with respect to each other is 38.03(6) to 39.94(7).
[Sc(DMF)6](I3)3
[Sc(DMF)6](I3)3 was synthesised by dissolving Sc2O3 (smart elements 99.99 % metalbasis) in fuming HCl (VWR chemicals) under reflux conditions followed by metathesisreaction with a saturated solution of KI (Sigma aldrich, 99 %) in DMF and subequentazeotropic distillation (see chapter 3.1.1). During the last step the atmosphere was
30 Results
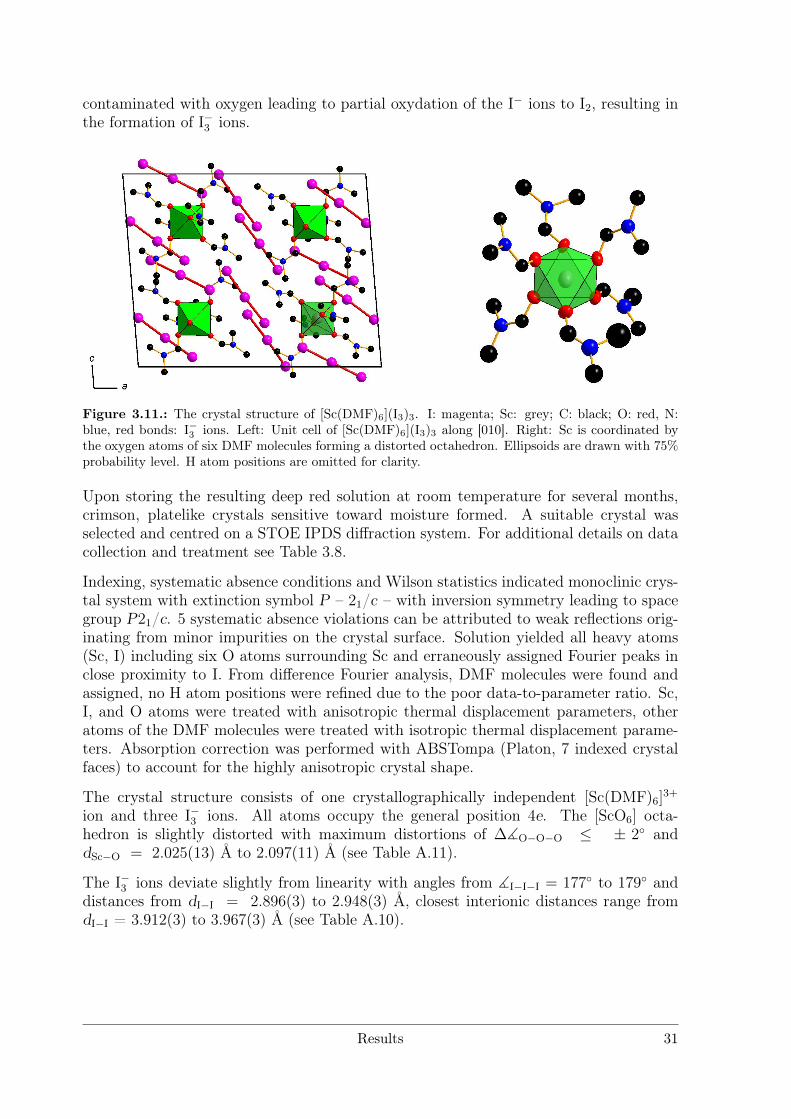
contaminated with oxygen leading to partial oxydation of the I− ions to I2, resulting inthe formation of I−3 ions.
Figure 3.11.: The crystal structure of [Sc(DMF)6](I3)3. I: magenta; Sc: grey; C: black; O: red, N:blue, red bonds: I−3 ions. Left: Unit cell of [Sc(DMF)6](I3)3 along [010]. Right: Sc is coordinated bythe oxygen atoms of six DMF molecules forming a distorted octahedron. Ellipsoids are drawn with 75%probability level. H atom positions are omitted for clarity.
Upon storing the resulting deep red solution at room temperature for several months,crimson, platelike crystals sensitive toward moisture formed. A suitable crystal wasselected and centred on a STOE IPDS diffraction system. For additional details on datacollection and treatment see Table 3.8.
Indexing, systematic absence conditions and Wilson statistics indicated monoclinic crys-tal system with extinction symbol P – 21/c – with inversion symmetry leading to spacegroup P21/c. 5 systematic absence violations can be attributed to weak reflections orig-inating from minor impurities on the crystal surface. Solution yielded all heavy atoms(Sc, I) including six O atoms surrounding Sc and erraneously assigned Fourier peaks inclose proximity to I. From difference Fourier analysis, DMF molecules were found andassigned, no H atom positions were refined due to the poor data-to-parameter ratio. Sc,I, and O atoms were treated with anisotropic thermal displacement parameters, otheratoms of the DMF molecules were treated with isotropic thermal displacement parame-ters. Absorption correction was performed with ABSTompa (Platon, 7 indexed crystalfaces) to account for the highly anisotropic crystal shape.
The crystal structure consists of one crystallographically independent [Sc(DMF)6]3+
ion and three I−3 ions. All atoms occupy the general position 4e. The [ScO6] octa-hedron is slightly distorted with maximum distortions of ∆]O−O−O ≤ ± 2 anddSc−O = 2.025(13) Å to 2.097(11) Å (see Table A.11).
The I−3 ions deviate slightly from linearity with angles from ]I−I−I = 177 to 179 anddistances from dI−I = 2.896(3) to 2.948(3) Å, closest interionic distances range fromdI−I = 3.912(3) to 3.967(3) Å (see Table A.10).
Results 31
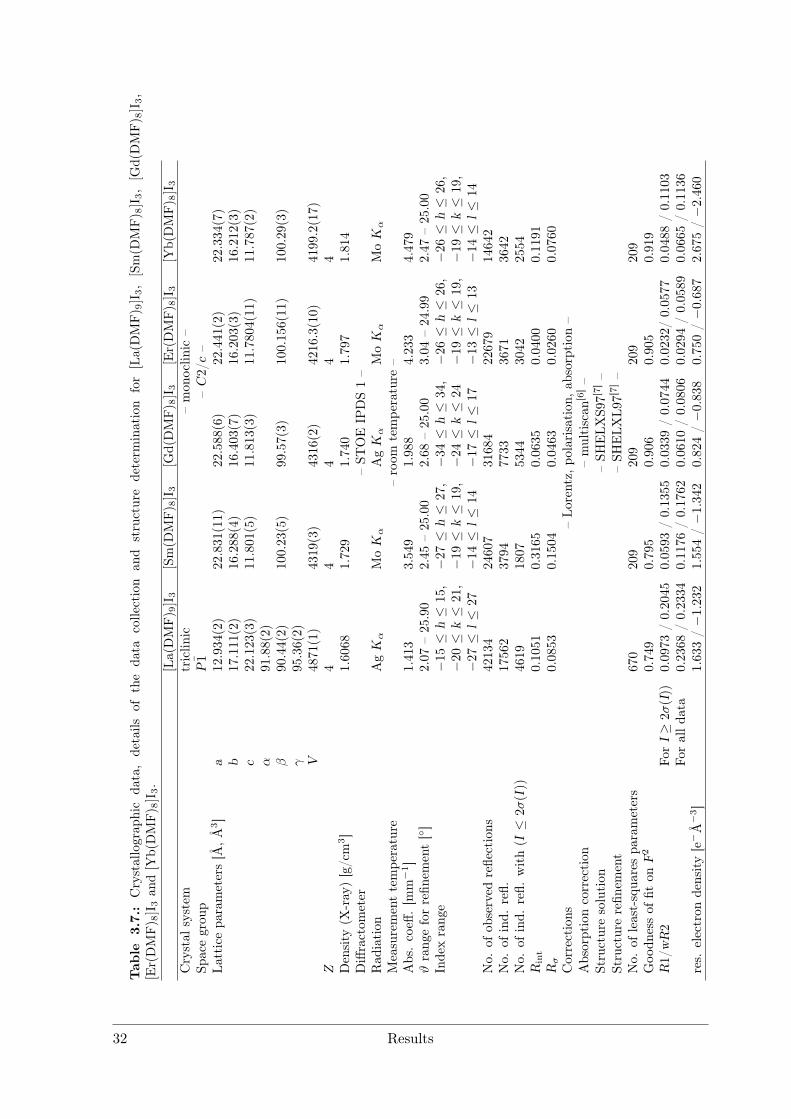
Tab
le3.
7.:Crystallograp
hic
data,details
ofthe
data
collection
and
structure
determ
ination
for
[La(D
MF
) 9]I3,
[Sm
(DM
F) 8
]I3,
[Gd
(DM
F) 8
]I3,
[Er(
DM
F) 8
]I3an
d[Y
b(D
MF
) 8]I3.
[La(D
MF
) 9]I3
[Sm
(DM
F) 8
]I3
[Gd
(DM
F) 8
]I3
[Er(
DM
F) 8
]I3
[Yb
(DM
F) 8
]I3
Crystal
system
triclin
ic–mon
oclin
ic–
Spacegrou
pP1
–C2/c–
Latticepa
rameters[Å
,Å3]
a12.934(2)
22.831(11)
22.588(6)
22.441(2)
22.334(7)
b17.111(2)
16.288(4)
16.403(7)
16.203(3)
16.212(3)
c22.123(3)
11.801(5)
11.813(3)
11.7804(11)
11.787(2)
α91.88(2)
β90.44(2)
100.23(5)
99.57(3)
100.156(11)
100.29(3)
γ95.36(2)
V4871(1)
4319(3)
4316(2)
4216.3(10)
4199.2(17)
Z4
44
44
Density
(X-ray)[g/cm
3]
1.6068
1.729
1.740
1.797
1.814
Diffractom
eter
–ST
OE
IPDS1–
Rad
iation
AgKα
MoKα
AgKα
MoKα
MoKα
Measurementtempe
rature
–room
tempe
rature
–Abs.coeff
.[m
m−1]
1.413
3.549
1.988
4.233
4.479
ϑrang
eforrefin
ement[]
2.07
–25.90
2.45
–25.00
2.68
–25.00
3.04
–24.99
2.47
–25.00
Indexrang
e−15≤
h≤
15,−27≤
h≤
27,−34≤
h≤
34,−26≤
h≤
26,−26≤
h≤
26,
−20≤
k≤
21,−19≤
k≤
19,−24≤
k≤
24−19≤
k≤
19,−19≤
k≤
19,
−27≤
l≤
27−14≤
l≤
14−17≤
l≤
17−13≤
l≤
13−14≤
l≤
14No.
ofob
served
reflections
42134
24607
31684
22679
14642
No.
ofind.
refl.
17562
3794
7733
3671
3642
No.
ofind.
refl.
with(I≤
2σ(I))
4619
1807
5344
3042
2554
Rint
0.1051
0.3165
0.0635
0.0400
0.1191
Rσ
0.0853
0.1504
0.0463
0.0260
0.0760
Corrections
–Lo
rentz,
polarisation
,absorption–
Absorptioncorrection
–multiscan
[6]–
Structuresolution
–SH
ELX
S97[7]
–Structurerefin
ement
–SH
ELX
L97[7]
–No.
ofleast-squa
respa
rameters
670
209
209
209
209
Goo
dnessof
fiton
F2
0.749
0.795
0.906
0.905
0.919
R1/wR2
ForI≥
2σ(I
))0.0973
/0.2045
0.0593
/0.1355
0.0339
/0.0744
0.0232/0.0577
0.0488
/0.1103
Foralld
ata
0.2368
/0.2334
0.1176
/0.1762
0.0610
/0.0806
0.0294
/0.0589
0.0665
/0.1136
res.
electron
density[e
−Å
−3]
1.633/−1.232
1.554/−1.342
0.824/−0.838
0.750/−0.687
2.675/−2.460
32 Results
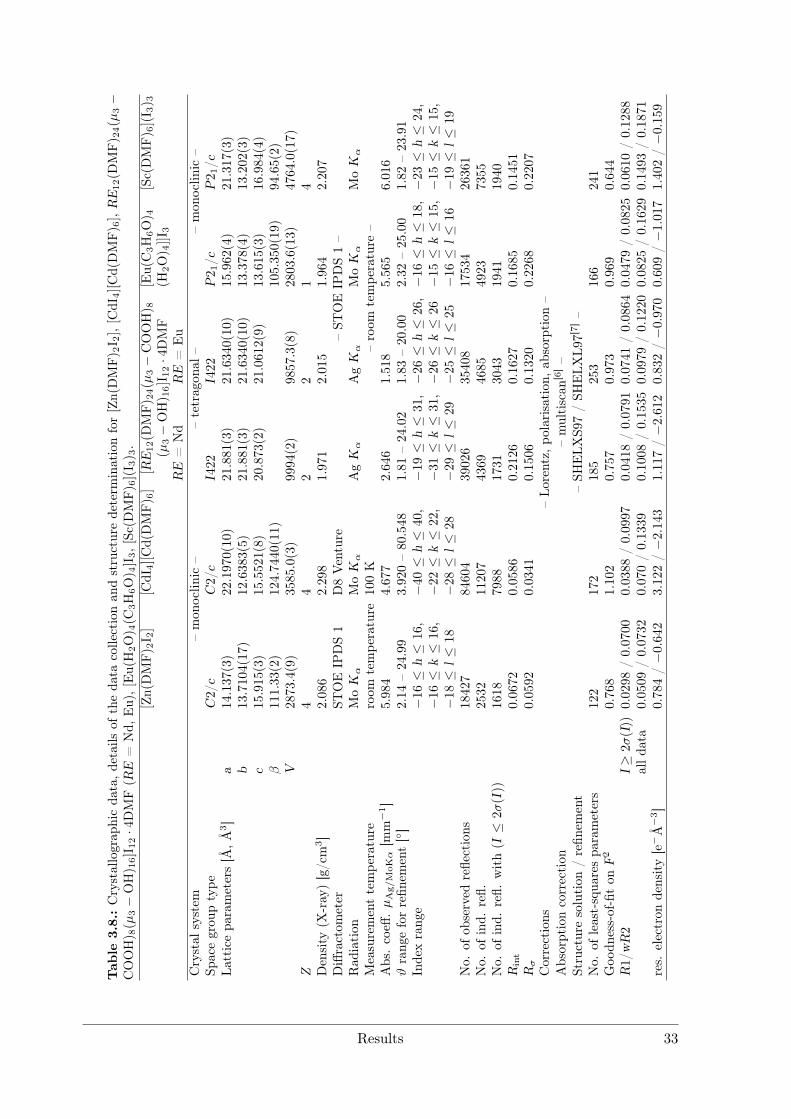
Tab
le3.
8.:Crystallograp
hicda
ta,d
etails
oftheda
tacollectionan
dstructuredeterm
inationfor
[Zn
(DM
F) 2
I 2],
[Cd
I 4][
Cd
(DM
F) 6
],RE12(D
MF
) 24(µ
3−
CO
OH
) 8(µ
3−
OH
) 16]I12·4
DM
F(R
E=
Nd,
Eu),[
Eu
(H2O
) 4(C
3H
6O
) 4]I3,[
Sc(
DM
F) 6
](I 3
) 3.
[Zn
(DM
F) 2
I 2]
[Cd
I 4][
Cd
(DM
F) 6
][R
E12(D
MF
) 24(µ
3−
CO
OH
) 8[E
u(C
3H
6O
) 4[S
c(D
MF
) 6](
I 3) 3
(µ3−
OH
) 16]I12·4
DM
F(H
2O
) 4]]
I 3RE
=Nd
RE
=Eu
Crystal
system
–mon
oclin
ic–
–tetragon
al–
–mon
oclin
ic–
Spacegrou
ptype
C2/c
C2/c
I422
I422
P21/c
P2 1/c
Latticepa
rameters[Å
,Å3]
a14.137(3)
22.1970(10)
21.881(3)
21.6340(10)
15.962(4)
21.317(3)
b13.7104(17)
12.6383(5)
21.881(3)
21.6340(10)
13.378(4)
13.202(3)
c15.915(3)
15.5521(8)
20.873(2)
21.0612(9)
13.615(3)
16.984(4)
β111.33(2)
124.7440(11)
105.350(19)
94.65(2)
V2873.4(9)
3585.0(3)
9994(2)
9857.3(8)
2803.6(13)
4764.0(17)
Z4
42
21
4Density
(X-ray
)[g/cm
3]
2.086
2.298
1.971
2.015
1.964
2.207
Diffractom
eter
STOE
IPDS1
D8Venture
–ST
OE
IPDS1–
Rad
iation
MoKα
MoKα
AgKα
AgKα
MoKα
MoKα
Measurementtempe
rature
room
tempe
rature
100K
–room
tempe
rature
–Abs.coeff
.µAg/M
oKα[m
m−1]
5.984
4.677
2.646
1.518
5.565
6.016
ϑrang
eforrefin
ement[]
2.14
–24.99
3.920–80.548
1.81
–24.02
1.83
–20.00
2.32
–25.00
1.82
–23.91
Indexrang
e−16≤
h≤
16,
−40≤
h≤
40,
−19≤
h≤
31,−26≤
h≤
26,−16≤
h≤
18,−23≤
h≤
24,
−16≤
k≤
16,
−22≤
k≤
22,
−31≤
k≤
31,−26≤
k≤
26−15≤
k≤
15,−15≤
k≤
15,
−18≤
l≤
18−28≤
l≤
28−29≤
l≤
29−25≤
l≤
25−16≤
l≤
16−19≤
l≤
19No.
ofob
served
reflections
18427
84604
39026
35408
17534
26361
No.
ofind.
refl.
2532
11207
4369
4685
4923
7355
No.
ofind.
refl.
with(I≤
2σ(I))
1618
7988
1731
3043
1941
1940
Rint
0.0672
0.0586
0.2126
0.1627
0.1685
0.1451
Rσ
0.0592
0.0341
0.1506
0.1320
0.2268
0.2207
Corrections
–Lo
rentz,
polarisation
,absorption–
Absorptioncorrection
–multiscan
[6]–
Structuresolution
/refin
ement
–SH
ELX
S97/SH
ELX
L97[7]
–No.
ofleast-squa
respa
rameters
122
172
185
253
166
241
Goo
dness-of-fiton
F2
0.768
1.102
0.757
0.973
0.969
0.644
R1/wR2
I≥
2σ
(I))
0.0298
/0.0700
0.0388
/0.0997
0.0418
/0.0791
0.0741
/0.0864
0.0479
/0.0825
0.0610
/0.1288
alld
ata
0.0509
/0.0732
0.070/0.1339
0.1008
/0.1535
0.0979
/0.1220
0.0825
/0.1629
0.1493
/0.1871
res.
electron
density[e
−Å
−3]
0.784/−0.642
3.122/−2.143
1.117/−2.612
0.832/−0.970
0.609/−1.017
1.402/−0.159
Results 33
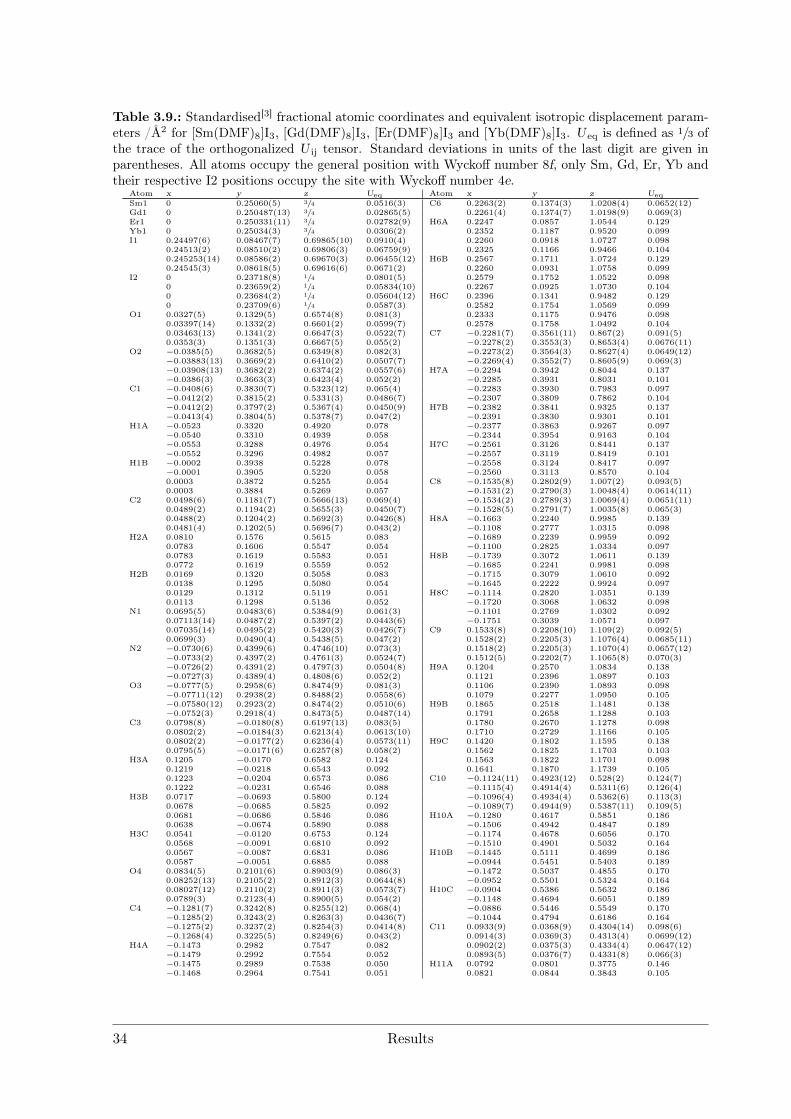
Table 3.9.: Standardised[3] fractional atomic coordinates and equivalent isotropic displacement param-eters /Å2 for [Sm(DMF)8]I3, [Gd(DMF)8]I3, [Er(DMF)8]I3 and [Yb(DMF)8]I3. U eq is defined as 1/3 ofthe trace of the orthogonalized U ij tensor. Standard deviations in units of the last digit are given inparentheses. All atoms occupy the general position with Wyckoff number 8f, only Sm, Gd, Er, Yb andtheir respective I2 positions occupy the site with Wyckoff number 4e.
Atom x y z Ueq Atom x y z Ueq
Sm1 0 0.25060(5) 3/4 0.0516(3) C6 0.2263(2) 0.1374(3) 1.0208(4) 0.0652(12)Gd1 0 0.250487(13) 3/4 0.02865(5) 0.2261(4) 0.1374(7) 1.0198(9) 0.069(3)Er1 0 0.250331(11) 3/4 0.02782(9) H6A 0.2247 0.0857 1.0544 0.129Yb1 0 0.25034(3) 3/4 0.0306(2) 0.2352 0.1187 0.9520 0.099I1 0.24497(6) 0.08467(7) 0.69865(10) 0.0910(4) 0.2260 0.0918 1.0727 0.098
0.24513(2) 0.08510(2) 0.69806(3) 0.06759(9) 0.2325 0.1166 0.9466 0.1040.245253(14) 0.08586(2) 0.69670(3) 0.06455(12) H6B 0.2567 0.1711 1.0724 0.1290.24545(3) 0.08618(5) 0.69616(6) 0.0671(2) 0.2260 0.0931 1.0758 0.099
I2 0 0.23718(8) 1/4 0.0801(5) 0.2579 0.1752 1.0522 0.0980 0.23659(2) 1/4 0.05834(10) 0.2267 0.0925 1.0730 0.1040 0.23684(2) 1/4 0.05604(12) H6C 0.2396 0.1341 0.9482 0.1290 0.23709(6) 1/4 0.0587(3) 0.2582 0.1754 1.0569 0.099
O1 0.0327(5) 0.1329(5) 0.6574(8) 0.081(3) 0.2333 0.1175 0.9476 0.0980.03397(14) 0.1332(2) 0.6601(2) 0.0599(7) 0.2578 0.1758 1.0492 0.1040.03463(13) 0.1341(2) 0.6647(3) 0.0522(7) C7 −0.2281(7) 0.3561(11) 0.867(2) 0.091(5)0.0353(3) 0.1351(3) 0.6667(5) 0.055(2) −0.2278(2) 0.3553(3) 0.8653(4) 0.0676(11)
O2 −0.0385(5) 0.3682(5) 0.6349(8) 0.082(3) −0.2273(2) 0.3564(3) 0.8627(4) 0.0649(12)−0.03883(13) 0.3669(2) 0.6410(2) 0.0507(7) −0.2269(4) 0.3552(7) 0.8605(9) 0.069(3)−0.03908(13) 0.3682(2) 0.6374(2) 0.0557(6) H7A −0.2294 0.3942 0.8044 0.137−0.0386(3) 0.3663(3) 0.6423(4) 0.052(2) −0.2285 0.3931 0.8031 0.101
C1 −0.0408(6) 0.3830(7) 0.5323(12) 0.065(4) −0.2283 0.3930 0.7983 0.097−0.0412(2) 0.3815(2) 0.5331(3) 0.0486(7) −0.2307 0.3809 0.7862 0.104−0.0412(2) 0.3797(2) 0.5367(4) 0.0450(9) H7B −0.2382 0.3841 0.9325 0.137−0.0413(4) 0.3804(5) 0.5378(7) 0.047(2) −0.2391 0.3830 0.9301 0.101
H1A −0.0523 0.3320 0.4920 0.078 −0.2377 0.3863 0.9267 0.097−0.0540 0.3310 0.4939 0.058 −0.2344 0.3954 0.9163 0.104−0.0553 0.3288 0.4976 0.054 H7C −0.2561 0.3126 0.8441 0.137−0.0552 0.3296 0.4982 0.057 −0.2557 0.3119 0.8419 0.101
H1B −0.0002 0.3938 0.5228 0.078 −0.2558 0.3124 0.8417 0.097−0.0001 0.3905 0.5220 0.058 −0.2560 0.3113 0.8570 0.1040.0003 0.3872 0.5255 0.054 C8 −0.1535(8) 0.2802(9) 1.007(2) 0.093(5)0.0003 0.3884 0.5269 0.057 −0.1531(2) 0.2790(3) 1.0048(4) 0.0614(11)
C2 0.0498(6) 0.1181(7) 0.5666(13) 0.069(4) −0.1534(2) 0.2789(3) 1.0069(4) 0.0651(11)0.0489(2) 0.1194(2) 0.5655(3) 0.0450(7) −0.1528(5) 0.2791(7) 1.0035(8) 0.065(3)0.0488(2) 0.1204(2) 0.5692(3) 0.0426(8) H8A −0.1663 0.2240 0.9985 0.1390.0481(4) 0.1202(5) 0.5696(7) 0.043(2) −0.1108 0.2777 1.0315 0.098
H2A 0.0810 0.1576 0.5615 0.083 −0.1689 0.2239 0.9959 0.0920.0783 0.1606 0.5547 0.054 −0.1100 0.2825 1.0334 0.0970.0783 0.1619 0.5583 0.051 H8B −0.1739 0.3072 1.0611 0.1390.0772 0.1619 0.5559 0.052 −0.1685 0.2241 0.9981 0.098
H2B 0.0169 0.1320 0.5058 0.083 −0.1715 0.3079 1.0610 0.0920.0138 0.1295 0.5080 0.054 −0.1645 0.2222 0.9924 0.0970.0129 0.1312 0.5119 0.051 H8C −0.1114 0.2820 1.0351 0.1390.0113 0.1298 0.5136 0.052 −0.1720 0.3068 1.0632 0.098
N1 0.0695(5) 0.0483(6) 0.5384(9) 0.061(3) −0.1101 0.2769 1.0302 0.0920.07113(14) 0.0487(2) 0.5397(2) 0.0443(6) −0.1751 0.3039 1.0571 0.0970.07035(14) 0.0495(2) 0.5420(3) 0.0426(7) C9 0.1533(8) 0.2208(10) 1.109(2) 0.092(5)0.0699(3) 0.0490(4) 0.5438(5) 0.047(2) 0.1528(2) 0.2205(3) 1.1076(4) 0.0685(11)
N2 −0.0730(6) 0.4399(6) 0.4746(10) 0.073(3) 0.1518(2) 0.2205(3) 1.1070(4) 0.0657(12)−0.0733(2) 0.4397(2) 0.4761(3) 0.0524(7) 0.1512(5) 0.2202(7) 1.1065(8) 0.070(3)−0.0726(2) 0.4391(2) 0.4797(3) 0.0504(8) H9A 0.1204 0.2570 1.0834 0.138−0.0727(3) 0.4389(4) 0.4808(6) 0.052(2) 0.1121 0.2396 1.0897 0.103
O3 −0.0777(5) 0.2958(6) 0.8474(9) 0.081(3) 0.1106 0.2390 1.0893 0.098−0.07711(12) 0.2938(2) 0.8488(2) 0.0558(6) 0.1079 0.2277 1.0950 0.105−0.07580(12) 0.2923(2) 0.8474(2) 0.0510(6) H9B 0.1865 0.2518 1.1481 0.138−0.0752(3) 0.2918(4) 0.8473(5) 0.0487(14) 0.1791 0.2658 1.1288 0.103
C3 0.0798(8) −0.0180(8) 0.6197(13) 0.083(5) 0.1780 0.2670 1.1278 0.0980.0802(2) −0.0184(3) 0.6213(4) 0.0613(10) 0.1710 0.2729 1.1166 0.1050.0802(2) −0.0177(2) 0.6236(4) 0.0573(11) H9C 0.1420 0.1802 1.1595 0.1380.0795(5) −0.0171(6) 0.6257(8) 0.058(2) 0.1562 0.1825 1.1703 0.103
H3A 0.1205 −0.0170 0.6582 0.124 0.1563 0.1822 1.1701 0.0980.1219 −0.0218 0.6543 0.092 0.1641 0.1870 1.1739 0.1050.1223 −0.0204 0.6573 0.086 C10 −0.1124(11) 0.4923(12) 0.528(2) 0.124(7)0.1222 −0.0231 0.6546 0.088 −0.1115(4) 0.4914(4) 0.5311(6) 0.126(4)
H3B 0.0717 −0.0693 0.5800 0.124 −0.1096(4) 0.4934(4) 0.5362(6) 0.113(3)0.0678 −0.0685 0.5825 0.092 −0.1089(7) 0.4944(9) 0.5387(11) 0.109(5)0.0681 −0.0686 0.5846 0.086 H10A −0.1280 0.4617 0.5851 0.1860.0638 −0.0674 0.5890 0.088 −0.1506 0.4942 0.4847 0.189
H3C 0.0541 −0.0120 0.6753 0.124 −0.1174 0.4678 0.6056 0.1700.0568 −0.0091 0.6810 0.092 −0.1510 0.4901 0.5032 0.1640.0567 −0.0087 0.6831 0.086 H10B −0.1445 0.5111 0.4699 0.1860.0587 −0.0051 0.6885 0.088 −0.0944 0.5451 0.5403 0.189
O4 0.0834(5) 0.2101(6) 0.8903(9) 0.086(3) −0.1472 0.5037 0.4855 0.1700.08252(13) 0.2105(2) 0.8912(3) 0.0644(8) −0.0952 0.5501 0.5324 0.1640.08027(12) 0.2110(2) 0.8911(3) 0.0573(7) H10C −0.0904 0.5386 0.5632 0.1860.0789(3) 0.2123(4) 0.8900(5) 0.054(2) −0.1148 0.4694 0.6051 0.189
C4 −0.1281(7) 0.3242(8) 0.8255(12) 0.068(4) −0.0886 0.5446 0.5549 0.170−0.1285(2) 0.3243(2) 0.8263(3) 0.0436(7) −0.1044 0.4794 0.6186 0.164−0.1275(2) 0.3237(2) 0.8254(3) 0.0414(8) C11 0.0933(9) 0.0368(9) 0.4304(14) 0.098(6)−0.1268(4) 0.3225(5) 0.8249(6) 0.043(2) 0.0914(3) 0.0369(3) 0.4313(4) 0.0699(12)
H4A −0.1473 0.2982 0.7547 0.082 0.0902(2) 0.0375(3) 0.4334(4) 0.0647(12)−0.1479 0.2992 0.7554 0.052 0.0893(5) 0.0376(7) 0.4331(8) 0.066(3)−0.1475 0.2989 0.7538 0.050 H11A 0.0792 0.0801 0.3775 0.146−0.1468 0.2964 0.7541 0.051 0.0821 0.0844 0.3843 0.105
34 Results
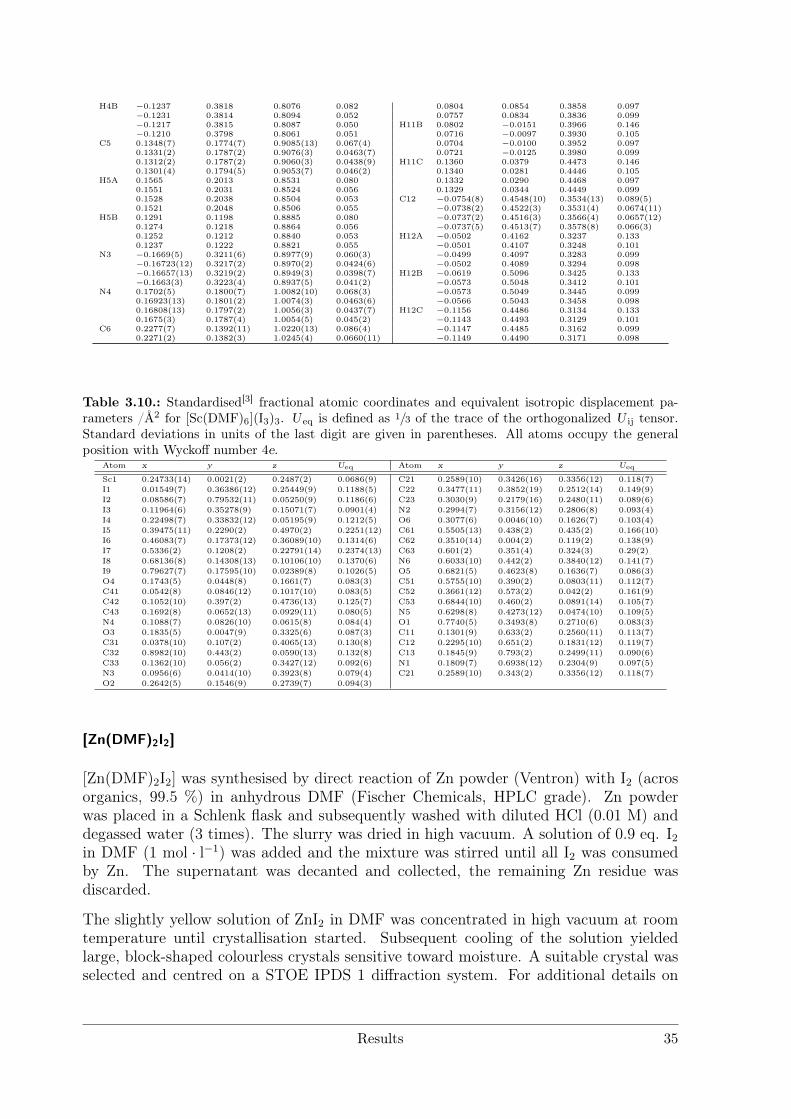
H4B −0.1237 0.3818 0.8076 0.082 0.0804 0.0854 0.3858 0.097−0.1231 0.3814 0.8094 0.052 0.0757 0.0834 0.3836 0.099−0.1217 0.3815 0.8087 0.050 H11B 0.0802 −0.0151 0.3966 0.146−0.1210 0.3798 0.8061 0.051 0.0716 −0.0097 0.3930 0.105
C5 0.1348(7) 0.1774(7) 0.9085(13) 0.067(4) 0.0704 −0.0100 0.3952 0.0970.1331(2) 0.1787(2) 0.9076(3) 0.0463(7) 0.0721 −0.0125 0.3980 0.0990.1312(2) 0.1787(2) 0.9060(3) 0.0438(9) H11C 0.1360 0.0379 0.4473 0.1460.1301(4) 0.1794(5) 0.9053(7) 0.046(2) 0.1340 0.0281 0.4446 0.105
H5A 0.1565 0.2013 0.8531 0.080 0.1332 0.0290 0.4468 0.0970.1551 0.2031 0.8524 0.056 0.1329 0.0344 0.4449 0.0990.1528 0.2038 0.8504 0.053 C12 −0.0754(8) 0.4548(10) 0.3534(13) 0.089(5)0.1521 0.2048 0.8506 0.055 −0.0738(2) 0.4522(3) 0.3531(4) 0.0674(11)
H5B 0.1291 0.1198 0.8885 0.080 −0.0737(2) 0.4516(3) 0.3566(4) 0.0657(12)0.1274 0.1218 0.8864 0.056 −0.0737(5) 0.4513(7) 0.3578(8) 0.066(3)0.1252 0.1212 0.8840 0.053 H12A −0.0502 0.4162 0.3237 0.1330.1237 0.1222 0.8821 0.055 −0.0501 0.4107 0.3248 0.101
N3 −0.1669(5) 0.3211(6) 0.8977(9) 0.060(3) −0.0499 0.4097 0.3283 0.099−0.16723(12) 0.3217(2) 0.8970(2) 0.0424(6) −0.0502 0.4089 0.3294 0.098−0.16657(13) 0.3219(2) 0.8949(3) 0.0398(7) H12B −0.0619 0.5096 0.3425 0.133−0.1663(3) 0.3223(4) 0.8937(5) 0.041(2) −0.0573 0.5048 0.3412 0.101
N4 0.1702(5) 0.1800(7) 1.0082(10) 0.068(3) −0.0573 0.5049 0.3445 0.0990.16923(13) 0.1801(2) 1.0074(3) 0.0463(6) −0.0566 0.5043 0.3458 0.0980.16808(13) 0.1797(2) 1.0056(3) 0.0437(7) H12C −0.1156 0.4486 0.3134 0.1330.1675(3) 0.1787(4) 1.0054(5) 0.045(2) −0.1143 0.4493 0.3129 0.101
C6 0.2277(7) 0.1392(11) 1.0220(13) 0.086(4) −0.1147 0.4485 0.3162 0.0990.2271(2) 0.1382(3) 1.0245(4) 0.0660(11) −0.1149 0.4490 0.3171 0.098
Table 3.10.: Standardised[3] fractional atomic coordinates and equivalent isotropic displacement pa-rameters /Å2 for [Sc(DMF)6](I3)3. U eq is defined as 1/3 of the trace of the orthogonalized U ij tensor.Standard deviations in units of the last digit are given in parentheses. All atoms occupy the generalposition with Wyckoff number 4e.
Atom x y z Ueq Atom x y z Ueq
Sc1 0.24733(14) 0.0021(2) 0.2487(2) 0.0686(9) C21 0.2589(10) 0.3426(16) 0.3356(12) 0.118(7)I1 0.01549(7) 0.36386(12) 0.25449(9) 0.1188(5) C22 0.3477(11) 0.3852(19) 0.2512(14) 0.149(9)I2 0.08586(7) 0.79532(11) 0.05250(9) 0.1186(6) C23 0.3030(9) 0.2179(16) 0.2480(11) 0.089(6)I3 0.11964(6) 0.35278(9) 0.15071(7) 0.0901(4) N2 0.2994(7) 0.3156(12) 0.2806(8) 0.093(4)I4 0.22498(7) 0.33832(12) 0.05195(9) 0.1212(5) O6 0.3077(6) 0.0046(10) 0.1626(7) 0.103(4)I5 0.39475(11) 0.2290(2) 0.4970(2) 0.2251(12) C61 0.5505(13) 0.438(2) 0.435(2) 0.166(10)I6 0.46083(7) 0.17373(12) 0.36089(10) 0.1314(6) C62 0.3510(14) 0.004(2) 0.119(2) 0.138(9)I7 0.5336(2) 0.1208(2) 0.22791(14) 0.2374(13) C63 0.601(2) 0.351(4) 0.324(3) 0.29(2)I8 0.68136(8) 0.14308(13) 0.10106(10) 0.1370(6) N6 0.6033(10) 0.442(2) 0.3840(12) 0.141(7)I9 0.79627(7) 0.17595(10) 0.02389(8) 0.1026(5) O5 0.6821(5) 0.4623(8) 0.1636(7) 0.086(3)O4 0.1743(5) 0.0448(8) 0.1661(7) 0.083(3) C51 0.5755(10) 0.390(2) 0.0803(11) 0.112(7)C41 0.0542(8) 0.0846(12) 0.1017(10) 0.083(5) C52 0.3661(12) 0.573(2) 0.042(2) 0.161(9)C42 0.1052(10) 0.397(2) 0.4736(13) 0.125(7) C53 0.6844(10) 0.460(2) 0.0891(14) 0.105(7)C43 0.1692(8) 0.0652(13) 0.0929(11) 0.080(5) N5 0.6298(8) 0.4273(12) 0.0474(10) 0.109(5)N4 0.1088(7) 0.0826(10) 0.0615(8) 0.084(4) O1 0.7740(5) 0.3493(8) 0.2710(6) 0.083(3)O3 0.1835(5) 0.0047(9) 0.3325(6) 0.087(3) C11 0.1301(9) 0.633(2) 0.2560(11) 0.113(7)C31 0.0378(10) 0.107(2) 0.4065(13) 0.130(8) C12 0.2295(10) 0.651(2) 0.1831(12) 0.119(7)C32 0.8982(10) 0.443(2) 0.0590(13) 0.132(8) C13 0.1845(9) 0.793(2) 0.2499(11) 0.090(6)C33 0.1362(10) 0.056(2) 0.3427(12) 0.092(6) N1 0.1809(7) 0.6938(12) 0.2304(9) 0.097(5)N3 0.0956(6) 0.0414(10) 0.3923(8) 0.079(4) C21 0.2589(10) 0.343(2) 0.3356(12) 0.118(7)O2 0.2642(5) 0.1546(9) 0.2739(7) 0.094(3)
[Zn(DMF)2I2]
[Zn(DMF)2I2] was synthesised by direct reaction of Zn powder (Ventron) with I2 (acrosorganics, 99.5 %) in anhydrous DMF (Fischer Chemicals, HPLC grade). Zn powderwas placed in a Schlenk flask and subsequently washed with diluted HCl (0.01 M) anddegassed water (3 times). The slurry was dried in high vacuum. A solution of 0.9 eq. I2in DMF (1 mol · l−1) was added and the mixture was stirred until all I2 was consumedby Zn. The supernatant was decanted and collected, the remaining Zn residue wasdiscarded.
The slightly yellow solution of ZnI2 in DMF was concentrated in high vacuum at roomtemperature until crystallisation started. Subsequent cooling of the solution yieldedlarge, block-shaped colourless crystals sensitive toward moisture. A suitable crystal wasselected and centred on a STOE IPDS 1 diffraction system. For additional details on
Results 35
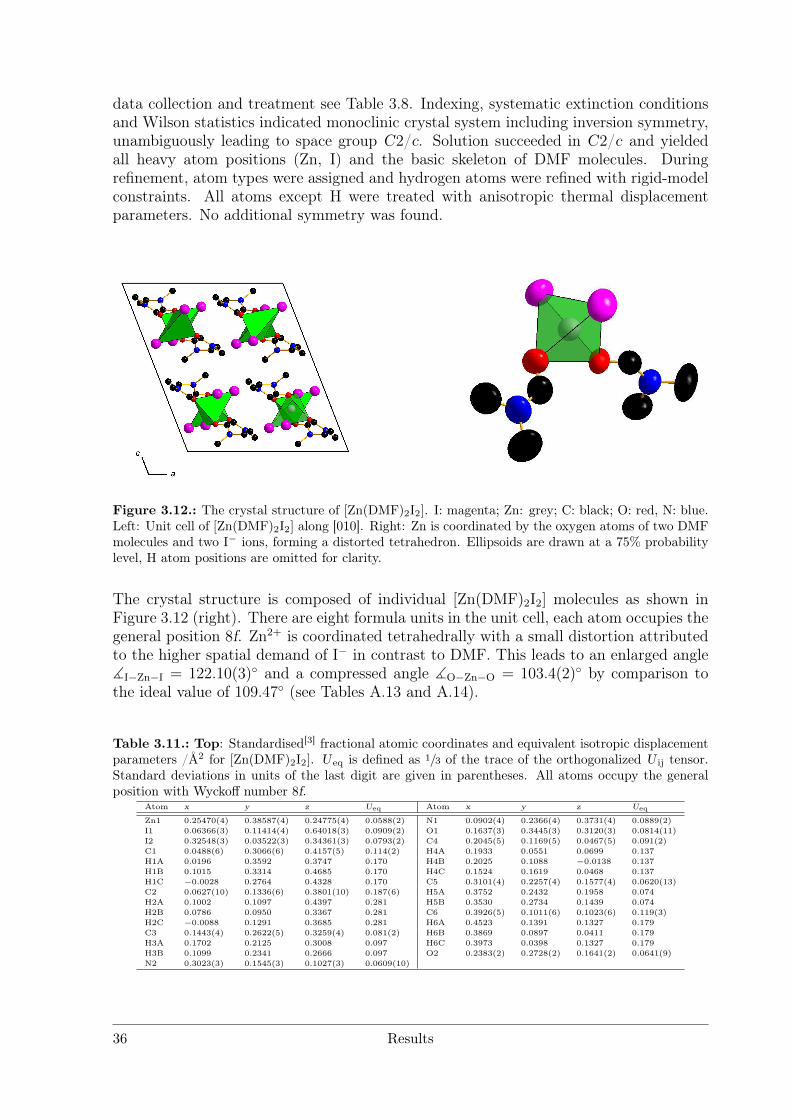
data collection and treatment see Table 3.8. Indexing, systematic extinction conditionsand Wilson statistics indicated monoclinic crystal system including inversion symmetry,unambiguously leading to space group C2/c. Solution succeeded in C2/c and yieldedall heavy atom positions (Zn, I) and the basic skeleton of DMF molecules. Duringrefinement, atom types were assigned and hydrogen atoms were refined with rigid-modelconstraints. All atoms except H were treated with anisotropic thermal displacementparameters. No additional symmetry was found.
Figure 3.12.: The crystal structure of [Zn(DMF)2I2]. I: magenta; Zn: grey; C: black; O: red, N: blue.Left: Unit cell of [Zn(DMF)2I2] along [010]. Right: Zn is coordinated by the oxygen atoms of two DMFmolecules and two I− ions, forming a distorted tetrahedron. Ellipsoids are drawn at a 75% probabilitylevel, H atom positions are omitted for clarity.
The crystal structure is composed of individual [Zn(DMF)2I2] molecules as shown inFigure 3.12 (right). There are eight formula units in the unit cell, each atom occupies thegeneral position 8f. Zn2+ is coordinated tetrahedrally with a small distortion attributedto the higher spatial demand of I− in contrast to DMF. This leads to an enlarged angle]I−Zn−I = 122.10(3) and a compressed angle ]O−Zn−O = 103.4(2) by comparison tothe ideal value of 109.47 (see Tables A.13 and A.14).
Table 3.11.: Top: Standardised[3] fractional atomic coordinates and equivalent isotropic displacementparameters /Å2 for [Zn(DMF)2I2]. U eq is defined as 1/3 of the trace of the orthogonalized U ij tensor.Standard deviations in units of the last digit are given in parentheses. All atoms occupy the generalposition with Wyckoff number 8f.
Atom x y z Ueq Atom x y z Ueq
Zn1 0.25470(4) 0.38587(4) 0.24775(4) 0.0588(2) N1 0.0902(4) 0.2366(4) 0.3731(4) 0.0889(2)I1 0.06366(3) 0.11414(4) 0.64018(3) 0.0909(2) O1 0.1637(3) 0.3445(3) 0.3120(3) 0.0814(11)I2 0.32548(3) 0.03522(3) 0.34361(3) 0.0793(2) C4 0.2045(5) 0.1169(5) 0.0467(5) 0.091(2)C1 0.0488(6) 0.3066(6) 0.4157(5) 0.114(2) H4A 0.1933 0.0551 0.0699 0.137H1A 0.0196 0.3592 0.3747 0.170 H4B 0.2025 0.1088 −0.0138 0.137H1B 0.1015 0.3314 0.4685 0.170 H4C 0.1524 0.1619 0.0468 0.137H1C −0.0028 0.2764 0.4328 0.170 C5 0.3101(4) 0.2257(4) 0.1577(4) 0.0620(13)C2 0.0627(10) 0.1336(6) 0.3801(10) 0.187(6) H5A 0.3752 0.2432 0.1958 0.074H2A 0.1002 0.1097 0.4397 0.281 H5B 0.3530 0.2734 0.1439 0.074H2B 0.0786 0.0950 0.3367 0.281 C6 0.3926(5) 0.1011(6) 0.1023(6) 0.119(3)H2C −0.0088 0.1291 0.3685 0.281 H6A 0.4523 0.1391 0.1327 0.179C3 0.1443(4) 0.2622(5) 0.3259(4) 0.081(2) H6B 0.3869 0.0897 0.0411 0.179H3A 0.1702 0.2125 0.3008 0.097 H6C 0.3973 0.0398 0.1327 0.179H3B 0.1099 0.2341 0.2666 0.097 O2 0.2383(2) 0.2728(2) 0.1641(2) 0.0641(9)N2 0.3023(3) 0.1545(3) 0.1027(3) 0.0609(10)
36 Results
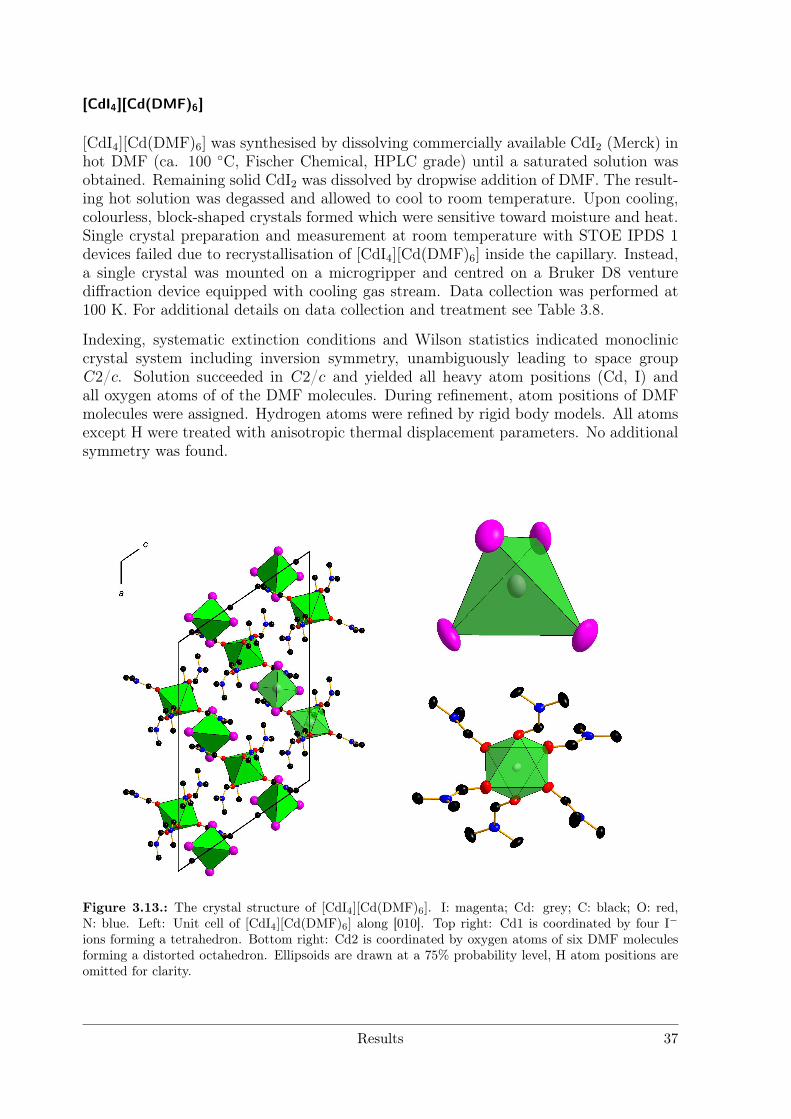
[CdI4][Cd(DMF)6]
[CdI4][Cd(DMF)6] was synthesised by dissolving commercially available CdI2 (Merck) inhot DMF (ca. 100 C, Fischer Chemical, HPLC grade) until a saturated solution wasobtained. Remaining solid CdI2 was dissolved by dropwise addition of DMF. The result-ing hot solution was degassed and allowed to cool to room temperature. Upon cooling,colourless, block-shaped crystals formed which were sensitive toward moisture and heat.Single crystal preparation and measurement at room temperature with STOE IPDS 1devices failed due to recrystallisation of [CdI4][Cd(DMF)6] inside the capillary. Instead,a single crystal was mounted on a microgripper and centred on a Bruker D8 venturediffraction device equipped with cooling gas stream. Data collection was performed at100 K. For additional details on data collection and treatment see Table 3.8.
Indexing, systematic extinction conditions and Wilson statistics indicated monocliniccrystal system including inversion symmetry, unambiguously leading to space groupC2/c. Solution succeeded in C2/c and yielded all heavy atom positions (Cd, I) andall oxygen atoms of of the DMF molecules. During refinement, atom positions of DMFmolecules were assigned. Hydrogen atoms were refined by rigid body models. All atomsexcept H were treated with anisotropic thermal displacement parameters. No additionalsymmetry was found.
Figure 3.13.: The crystal structure of [CdI4][Cd(DMF)6]. I: magenta; Cd: grey; C: black; O: red,N: blue. Left: Unit cell of [CdI4][Cd(DMF)6] along [010]. Top right: Cd1 is coordinated by four I−
ions forming a tetrahedron. Bottom right: Cd2 is coordinated by oxygen atoms of six DMF moleculesforming a distorted octahedron. Ellipsoids are drawn at a 75% probability level, H atom positions areomitted for clarity.
Results 37
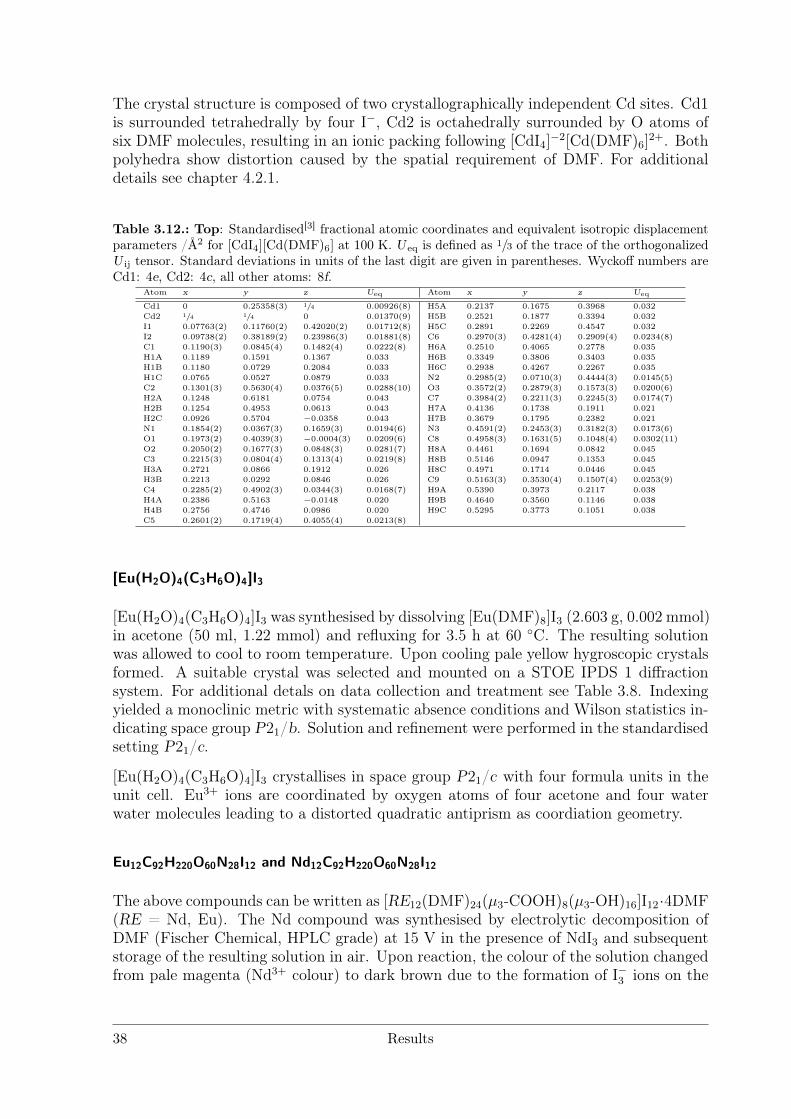
The crystal structure is composed of two crystallographically independent Cd sites. Cd1is surrounded tetrahedrally by four I−, Cd2 is octahedrally surrounded by O atoms ofsix DMF molecules, resulting in an ionic packing following [CdI4]
−2[Cd(DMF)6]2+. Both
polyhedra show distortion caused by the spatial requirement of DMF. For additionaldetails see chapter 4.2.1.
Table 3.12.: Top: Standardised[3] fractional atomic coordinates and equivalent isotropic displacementparameters /Å2 for [CdI4][Cd(DMF)6] at 100 K. U eq is defined as 1/3 of the trace of the orthogonalizedU ij tensor. Standard deviations in units of the last digit are given in parentheses. Wyckoff numbers areCd1: 4e, Cd2: 4c, all other atoms: 8f.
Atom x y z Ueq Atom x y z Ueq
Cd1 0 0.25358(3) 1/4 0.00926(8) H5A 0.2137 0.1675 0.3968 0.032Cd2 1/4 1/4 0 0.01370(9) H5B 0.2521 0.1877 0.3394 0.032I1 0.07763(2) 0.11760(2) 0.42020(2) 0.01712(8) H5C 0.2891 0.2269 0.4547 0.032I2 0.09738(2) 0.38189(2) 0.23986(3) 0.01881(8) C6 0.2970(3) 0.4281(4) 0.2909(4) 0.0234(8)C1 0.1190(3) 0.0845(4) 0.1482(4) 0.0222(8) H6A 0.2510 0.4065 0.2778 0.035H1A 0.1189 0.1591 0.1367 0.033 H6B 0.3349 0.3806 0.3403 0.035H1B 0.1180 0.0729 0.2084 0.033 H6C 0.2938 0.4267 0.2267 0.035H1C 0.0765 0.0527 0.0879 0.033 N2 0.2985(2) 0.0710(3) 0.4444(3) 0.0145(5)C2 0.1301(3) 0.5630(4) 0.0376(5) 0.0288(10) O3 0.3572(2) 0.2879(3) 0.1573(3) 0.0200(6)H2A 0.1248 0.6181 0.0754 0.043 C7 0.3984(2) 0.2211(3) 0.2245(3) 0.0174(7)H2B 0.1254 0.4953 0.0613 0.043 H7A 0.4136 0.1738 0.1911 0.021H2C 0.0926 0.5704 −0.0358 0.043 H7B 0.3679 0.1795 0.2382 0.021N1 0.1854(2) 0.0367(3) 0.1659(3) 0.0194(6) N3 0.4591(2) 0.2453(3) 0.3182(3) 0.0173(6)O1 0.1973(2) 0.4039(3) −0.0004(3) 0.0209(6) C8 0.4958(3) 0.1631(5) 0.1048(4) 0.0302(11)O2 0.2050(2) 0.1677(3) 0.0848(3) 0.0281(7) H8A 0.4461 0.1694 0.0842 0.045C3 0.2215(3) 0.0804(4) 0.1313(4) 0.0219(8) H8B 0.5146 0.0947 0.1353 0.045H3A 0.2721 0.0866 0.1912 0.026 H8C 0.4971 0.1714 0.0446 0.045H3B 0.2213 0.0292 0.0846 0.026 C9 0.5163(3) 0.3530(4) 0.1507(4) 0.0253(9)C4 0.2285(2) 0.4902(3) 0.0344(3) 0.0168(7) H9A 0.5390 0.3973 0.2117 0.038H4A 0.2386 0.5163 −0.0148 0.020 H9B 0.4640 0.3560 0.1146 0.038H4B 0.2756 0.4746 0.0986 0.020 H9C 0.5295 0.3773 0.1051 0.038C5 0.2601(2) 0.1719(4) 0.4055(4) 0.0213(8)
[Eu(H2O)4(C3H6O)4]I3
[Eu(H2O)4(C3H6O)4]I3 was synthesised by dissolving [Eu(DMF)8]I3 (2.603 g, 0.002 mmol)in acetone (50 ml, 1.22 mmol) and refluxing for 3.5 h at 60 C. The resulting solutionwas allowed to cool to room temperature. Upon cooling pale yellow hygroscopic crystalsformed. A suitable crystal was selected and mounted on a STOE IPDS 1 diffractionsystem. For additional detals on data collection and treatment see Table 3.8. Indexingyielded a monoclinic metric with systematic absence conditions and Wilson statistics in-dicating space group P21/b. Solution and refinement were performed in the standardisedsetting P21/c.
[Eu(H2O)4(C3H6O)4]I3 crystallises in space group P21/c with four formula units in theunit cell. Eu3+ ions are coordinated by oxygen atoms of four acetone and four waterwater molecules leading to a distorted quadratic antiprism as coordiation geometry.
Eu12C92H220O60N28I12 and Nd12C92H220O60N28I12
The above compounds can be written as [RE12(DMF)24(µ3-COOH)8(µ3-OH)16]I12·4DMF(RE = Nd, Eu). The Nd compound was synthesised by electrolytic decomposition ofDMF (Fischer Chemical, HPLC grade) at 15 V in the presence of NdI3 and subsequentstorage of the resulting solution in air. Upon reaction, the colour of the solution changedfrom pale magenta (Nd3+ colour) to dark brown due to the formation of I−3 ions on the
38 Results
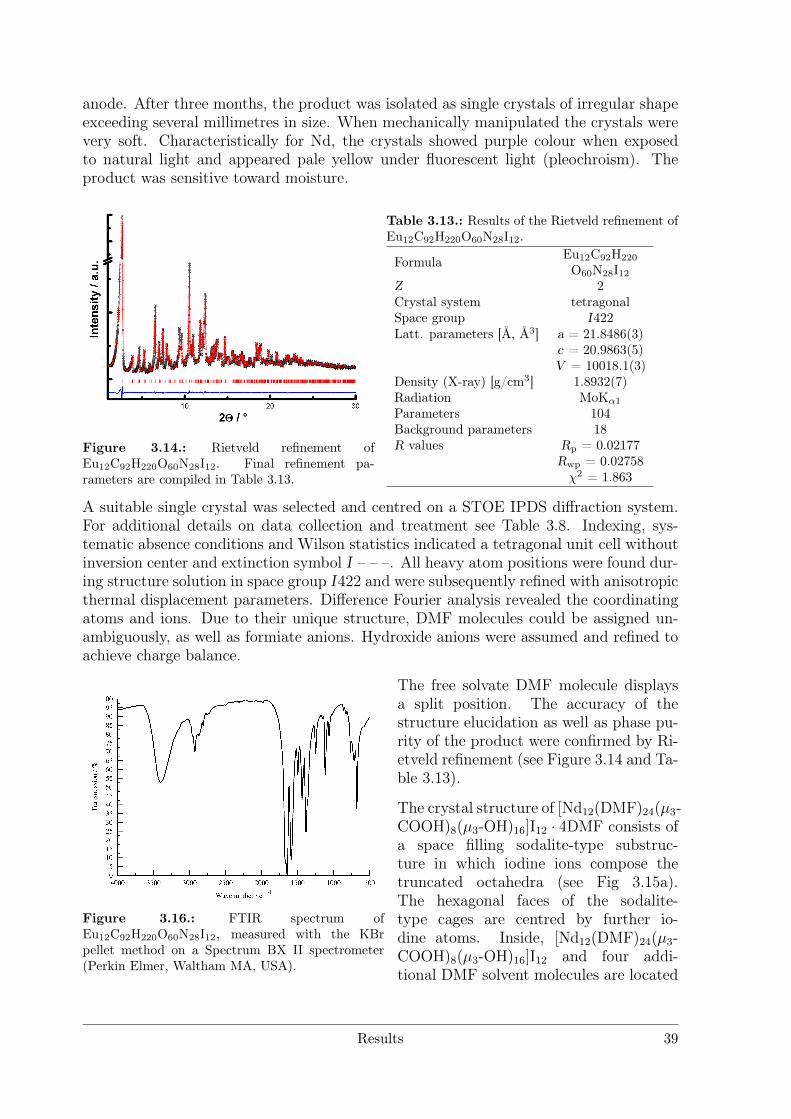
anode. After three months, the product was isolated as single crystals of irregular shapeexceeding several millimetres in size. When mechanically manipulated the crystals werevery soft. Characteristically for Nd, the crystals showed purple colour when exposedto natural light and appeared pale yellow under fluorescent light (pleochroism). Theproduct was sensitive toward moisture.
Figure 3.14.: Rietveld refinement ofEu12C92H220O60N28I12. Final refinement pa-rameters are compiled in Table 3.13.
Table 3.13.: Results of the Rietveld refinement ofEu12C92H220O60N28I12.
Formula Eu12C92H220
O60N28I12Z 2Crystal system tetragonalSpace group I422Latt. parameters [Å, Å3] a = 21.8486(3)
c = 20.9863(5)V = 10018.1(3)
Density (X-ray) [g/cm3] 1.8932(7)Radiation MoKα1Parameters 104Background parameters 18R values Rp = 0.02177
Rwp = 0.02758χ2 = 1.863
A suitable single crystal was selected and centred on a STOE IPDS diffraction system.For additional details on data collection and treatment see Table 3.8. Indexing, sys-tematic absence conditions and Wilson statistics indicated a tetragonal unit cell withoutinversion center and extinction symbol I – – –. All heavy atom positions were found dur-ing structure solution in space group I422 and were subsequently refined with anisotropicthermal displacement parameters. Difference Fourier analysis revealed the coordinatingatoms and ions. Due to their unique structure, DMF molecules could be assigned un-ambiguously, as well as formiate anions. Hydroxide anions were assumed and refined toachieve charge balance.
Figure 3.16.: FTIR spectrum ofEu12C92H220O60N28I12, measured with the KBrpellet method on a Spectrum BX II spectrometer(Perkin Elmer, Waltham MA, USA).
The free solvate DMF molecule displaysa split position. The accuracy of thestructure elucidation as well as phase pu-rity of the product were confirmed by Ri-etveld refinement (see Figure 3.14 and Ta-ble 3.13).
The crystal structure of [Nd12(DMF)24(µ3-COOH)8(µ3-OH)16]I12 · 4DMF consists ofa space filling sodalite-type substruc-ture in which iodine ions compose thetruncated octahedra (see Fig 3.15a).The hexagonal faces of the sodalite-type cages are centred by further io-dine atoms. Inside, [Nd12(DMF)24(µ3-COOH)8(µ3-OH)16]I12 and four addi-tional DMF solvent molecules are located
Results 39
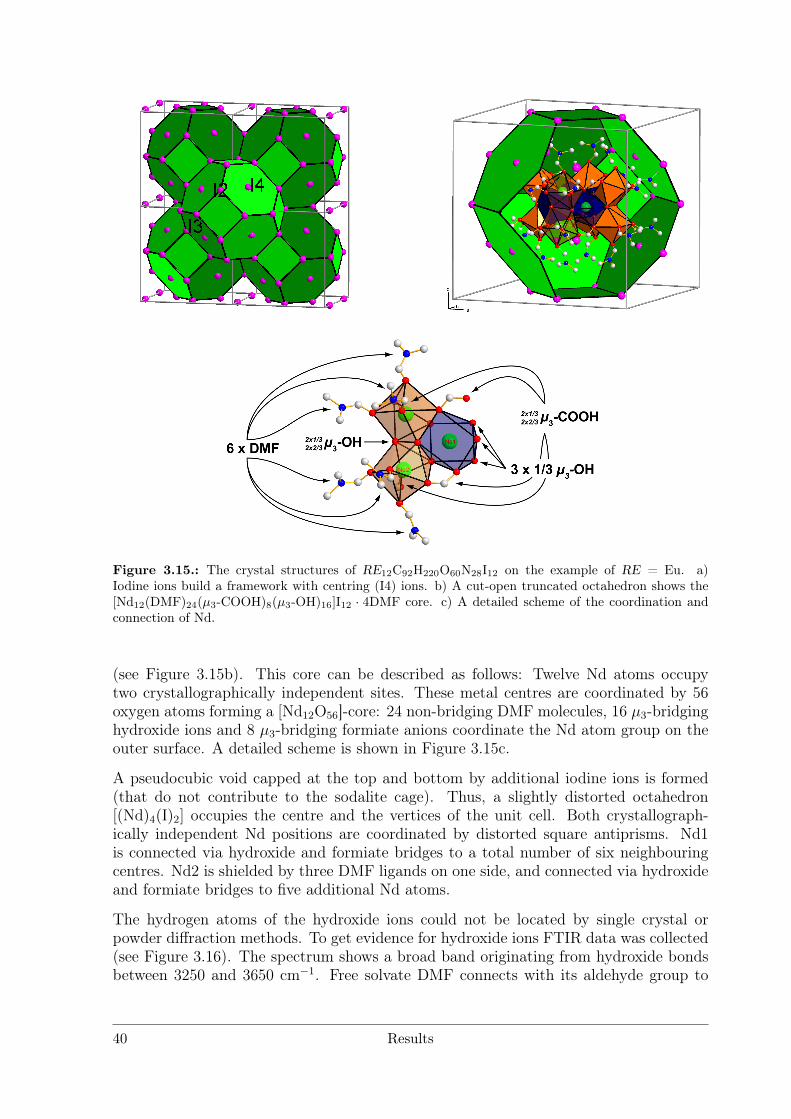
Figure 3.15.: The crystal structures of RE12C92H220O60N28I12 on the example of RE = Eu. a)Iodine ions build a framework with centring (I4) ions. b) A cut-open truncated octahedron shows the[Nd12(DMF)24(µ3-COOH)8(µ3-OH)16]I12 · 4DMF core. c) A detailed scheme of the coordination andconnection of Nd.
(see Figure 3.15b). This core can be described as follows: Twelve Nd atoms occupytwo crystallographically independent sites. These metal centres are coordinated by 56oxygen atoms forming a [Nd12O56]-core: 24 non-bridging DMF molecules, 16 µ3-bridginghydroxide ions and 8 µ3-bridging formiate anions coordinate the Nd atom group on theouter surface. A detailed scheme is shown in Figure 3.15c.
A pseudocubic void capped at the top and bottom by additional iodine ions is formed(that do not contribute to the sodalite cage). Thus, a slightly distorted octahedron[(Nd)4(I)2] occupies the centre and the vertices of the unit cell. Both crystallograph-ically independent Nd positions are coordinated by distorted square antiprisms. Nd1is connected via hydroxide and formiate bridges to a total number of six neighbouringcentres. Nd2 is shielded by three DMF ligands on one side, and connected via hydroxideand formiate bridges to five additional Nd atoms.
The hydrogen atoms of the hydroxide ions could not be located by single crystal orpowder diffraction methods. To get evidence for hydroxide ions FTIR data was collected(see Figure 3.16). The spectrum shows a broad band originating from hydroxide bondsbetween 3250 and 3650 cm−1. Free solvate DMF connects with its aldehyde group to
40 Results
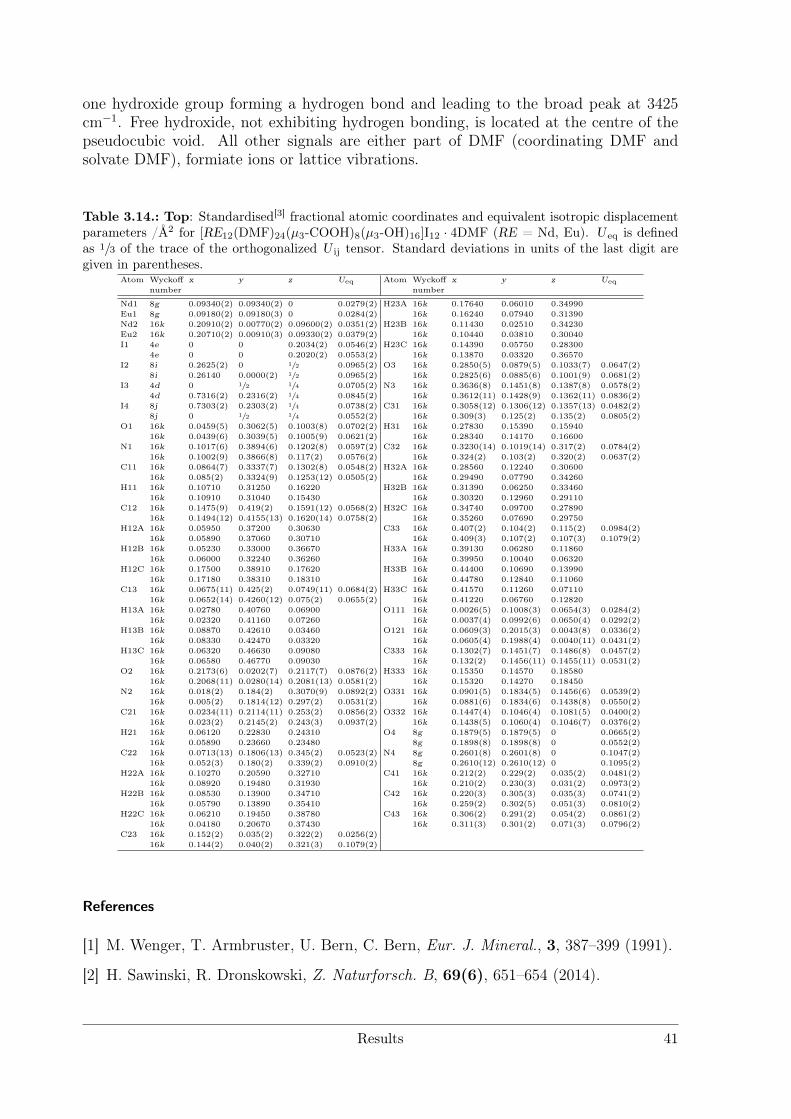
one hydroxide group forming a hydrogen bond and leading to the broad peak at 3425cm−1. Free hydroxide, not exhibiting hydrogen bonding, is located at the centre of thepseudocubic void. All other signals are either part of DMF (coordinating DMF andsolvate DMF), formiate ions or lattice vibrations.
Table 3.14.: Top: Standardised[3] fractional atomic coordinates and equivalent isotropic displacementparameters /Å2 for [RE12(DMF)24(µ3-COOH)8(µ3-OH)16]I12 · 4DMF (RE = Nd, Eu). U eq is definedas 1/3 of the trace of the orthogonalized U ij tensor. Standard deviations in units of the last digit aregiven in parentheses.
Atom Wyckoff x y z Ueq Atom Wyckoff x y z Ueq
number number
Nd1 8g 0.09340(2) 0.09340(2) 0 0.0279(2) H23A 16k 0.17640 0.06010 0.34990Eu1 8g 0.09180(2) 0.09180(3) 0 0.0284(2) 16k 0.16240 0.07940 0.31390Nd2 16k 0.20910(2) 0.00770(2) 0.09600(2) 0.0351(2) H23B 16k 0.11430 0.02510 0.34230Eu2 16k 0.20710(2) 0.00910(3) 0.09330(2) 0.0379(2) 16k 0.10440 0.03810 0.30040I1 4e 0 0 0.2034(2) 0.0546(2) H23C 16k 0.14390 0.05750 0.28300
4e 0 0 0.2020(2) 0.0553(2) 16k 0.13870 0.03320 0.36570I2 8i 0.2625(2) 0 1/2 0.0965(2) O3 16k 0.2850(5) 0.0879(5) 0.1033(7) 0.0647(2)
8i 0.26140 0.0000(2) 1/2 0.0965(2) 16k 0.2825(6) 0.0885(6) 0.1001(9) 0.0681(2)I3 4d 0 1/2 1/4 0.0705(2) N3 16k 0.3636(8) 0.1451(8) 0.1387(8) 0.0578(2)
4d 0.7316(2) 0.2316(2) 1/4 0.0845(2) 16k 0.3612(11) 0.1428(9) 0.1362(11) 0.0836(2)I4 8j 0.7303(2) 0.2303(2) 1/4 0.0738(2) C31 16k 0.3058(12) 0.1306(12) 0.1357(13) 0.0482(2)
8j 0 1/2 1/4 0.0552(2) 16k 0.309(3) 0.125(2) 0.135(2) 0.0805(2)O1 16k 0.0459(5) 0.3062(5) 0.1003(8) 0.0702(2) H31 16k 0.27830 0.15390 0.15940
16k 0.0439(6) 0.3039(5) 0.1005(9) 0.0621(2) 16k 0.28340 0.14170 0.16600N1 16k 0.1017(6) 0.3894(6) 0.1202(8) 0.0597(2) C32 16k 0.3230(14) 0.1019(14) 0.317(2) 0.0784(2)
16k 0.1002(9) 0.3866(8) 0.117(2) 0.0576(2) 16k 0.324(2) 0.103(2) 0.320(2) 0.0637(2)C11 16k 0.0864(7) 0.3337(7) 0.1302(8) 0.0548(2) H32A 16k 0.28560 0.12240 0.30600
16k 0.085(2) 0.3324(9) 0.1253(12) 0.0505(2) 16k 0.29490 0.07790 0.34260H11 16k 0.10710 0.31250 0.16220 H32B 16k 0.31390 0.06250 0.33460
16k 0.10910 0.31040 0.15430 16k 0.30320 0.12960 0.29110C12 16k 0.1475(9) 0.419(2) 0.1591(12) 0.0568(2) H32C 16k 0.34740 0.09700 0.27890
16k 0.1494(12) 0.4155(13) 0.1620(14) 0.0758(2) 16k 0.35260 0.07690 0.29750H12A 16k 0.05950 0.37200 0.30630 C33 16k 0.407(2) 0.104(2) 0.115(2) 0.0984(2)
16k 0.05890 0.37060 0.30710 16k 0.409(3) 0.107(2) 0.107(3) 0.1079(2)H12B 16k 0.05230 0.33000 0.36670 H33A 16k 0.39130 0.06280 0.11860
16k 0.06000 0.32240 0.36260 16k 0.39950 0.10040 0.06320H12C 16k 0.17500 0.38910 0.17620 H33B 16k 0.44400 0.10690 0.13990
16k 0.17180 0.38310 0.18310 16k 0.44780 0.12840 0.11060C13 16k 0.0675(11) 0.425(2) 0.0749(11) 0.0684(2) H33C 16k 0.41570 0.11260 0.07110
16k 0.0652(14) 0.4260(12) 0.075(2) 0.0655(2) 16k 0.41220 0.06760 0.12820H13A 16k 0.02780 0.40760 0.06900 O111 16k 0.0026(5) 0.1008(3) 0.0654(3) 0.0284(2)
16k 0.02320 0.41160 0.07260 16k 0.0037(4) 0.0992(6) 0.0650(4) 0.0292(2)H13B 16k 0.08870 0.42610 0.03460 O121 16k 0.0609(3) 0.2015(3) 0.0043(8) 0.0336(2)
16k 0.08330 0.42470 0.03320 16k 0.0605(4) 0.1988(4) 0.0040(11) 0.0431(2)H13C 16k 0.06320 0.46630 0.09080 C333 16k 0.1302(7) 0.1451(7) 0.1486(8) 0.0457(2)
16k 0.06580 0.46770 0.09030 16k 0.132(2) 0.1456(11) 0.1455(11) 0.0531(2)O2 16k 0.2173(6) 0.0202(7) 0.2117(7) 0.0876(2) H333 16k 0.15350 0.14570 0.18580
16k 0.2068(11) 0.0280(14) 0.2081(13) 0.0581(2) 16k 0.15320 0.14270 0.18450N2 16k 0.018(2) 0.184(2) 0.3070(9) 0.0892(2) O331 16k 0.0901(5) 0.1834(5) 0.1456(6) 0.0539(2)
16k 0.005(2) 0.1814(12) 0.297(2) 0.0531(2) 16k 0.0881(6) 0.1834(6) 0.1438(8) 0.0550(2)C21 16k 0.0234(11) 0.2114(11) 0.253(2) 0.0856(2) O332 16k 0.1447(4) 0.1046(4) 0.1081(5) 0.0400(2)
16k 0.023(2) 0.2145(2) 0.243(3) 0.0937(2) 16k 0.1438(5) 0.1060(4) 0.1046(7) 0.0376(2)H21 16k 0.06120 0.22830 0.24310 O4 8g 0.1879(5) 0.1879(5) 0 0.0665(2)
16k 0.05890 0.23660 0.23480 8g 0.1898(8) 0.1898(8) 0 0.0552(2)C22 16k 0.0713(13) 0.1806(13) 0.345(2) 0.0523(2) N4 8g 0.2601(8) 0.2601(8) 0 0.1047(2)
16k 0.052(3) 0.180(2) 0.339(2) 0.0910(2) 8g 0.2610(12) 0.2610(12) 0 0.1095(2)H22A 16k 0.10270 0.20590 0.32710 C41 16k 0.212(2) 0.229(2) 0.035(2) 0.0481(2)
16k 0.08920 0.19480 0.31930 16k 0.210(2) 0.230(3) 0.031(2) 0.0973(2)H22B 16k 0.08530 0.13900 0.34710 C42 16k 0.220(3) 0.305(3) 0.035(3) 0.0741(2)
16k 0.05790 0.13890 0.35410 16k 0.259(2) 0.302(5) 0.051(3) 0.0810(2)H22C 16k 0.06210 0.19450 0.38780 C43 16k 0.306(2) 0.291(2) 0.054(2) 0.0861(2)
16k 0.04180 0.20670 0.37430 16k 0.311(3) 0.301(2) 0.071(3) 0.0796(2)C23 16k 0.152(2) 0.035(2) 0.322(2) 0.0256(2)
16k 0.144(2) 0.040(2) 0.321(3) 0.1079(2)
References
[1] M. Wenger, T. Armbruster, U. Bern, C. Bern, Eur. J. Mineral., 3, 387–399 (1991).
[2] H. Sawinski, R. Dronskowski, Z. Naturforsch. B, 69(6), 651–654 (2014).
Results 41
[3] L. M. Gelato, E. Parthé, J. Appl Crystallogr., 20(2), 139–143 (1987).
[4] Y. Le Page, J. Appl Crystallogr., 20(3), 264–269 (1987).
[5] R. M. Wood, G. J. Palenik, Inorg. Chem., 38(17), 3926–3930 (1999).
[6] A. L. Spek, Acta Crystallogr. D, 65(2), 148–155 (2009).
[7] G. M. Sheldrick, Acta Crystallogr. A, 64(1), 112–122 (2007).
[8] A. Trzesowska, R. Kruszynski, T. J. Bartczak, Acta Crystallogr. B, 60(2), 174–178(2004).
[9] R. D. Shannon, C. T. Prewitt, Acta Crystallogr. B, 25(5), 925–946 (1969).
42 Results
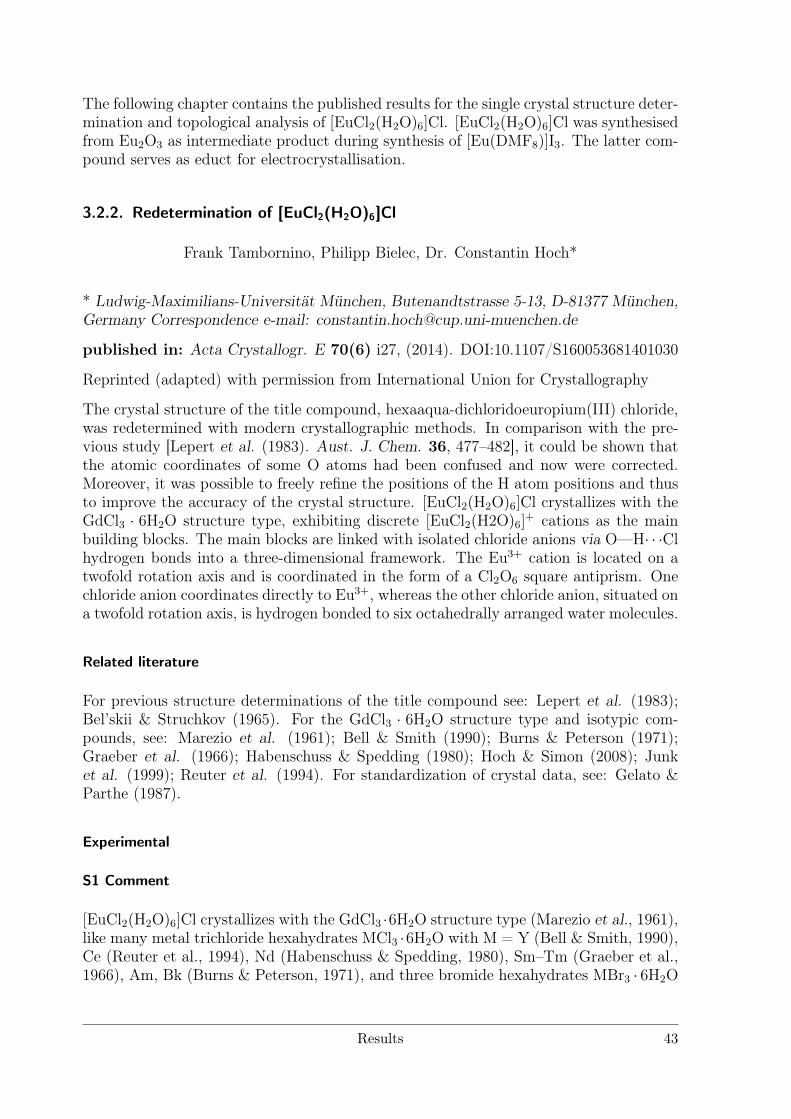
The following chapter contains the published results for the single crystal structure deter-mination and topological analysis of [EuCl2(H2O)6]Cl. [EuCl2(H2O)6]Cl was synthesisedfrom Eu2O3 as intermediate product during synthesis of [Eu(DMF8)]I3. The latter com-pound serves as educt for electrocrystallisation.
3.2.2. Redetermination of [EuCl2(H2O)6]Cl
Frank Tambornino, Philipp Bielec, Dr. Constantin Hoch*
* Ludwig-Maximilians-Universität München, Butenandtstrasse 5-13, D-81377 München,Germany Correspondence e-mail: [email protected]
published in: Acta Crystallogr. E 70(6) i27, (2014). DOI:10.1107/S160053681401030
Reprinted (adapted) with permission from International Union for Crystallography
The crystal structure of the title compound, hexaaqua-dichloridoeuropium(III) chloride,was redetermined with modern crystallographic methods. In comparison with the pre-vious study [Lepert et al. (1983). Aust. J. Chem. 36, 477–482], it could be shown thatthe atomic coordinates of some O atoms had been confused and now were corrected.Moreover, it was possible to freely refine the positions of the H atom positions and thusto improve the accuracy of the crystal structure. [EuCl2(H2O)6]Cl crystallizes with theGdCl3 · 6H2O structure type, exhibiting discrete [EuCl2(H2O)6]
+ cations as the mainbuilding blocks. The main blocks are linked with isolated chloride anions via O—H· · ·Clhydrogen bonds into a three-dimensional framework. The Eu3+ cation is located on atwofold rotation axis and is coordinated in the form of a Cl2O6 square antiprism. Onechloride anion coordinates directly to Eu3+, whereas the other chloride anion, situated ona twofold rotation axis, is hydrogen bonded to six octahedrally arranged water molecules.
Related literature
For previous structure determinations of the title compound see: Lepert et al. (1983);Bel’skii & Struchkov (1965). For the GdCl3 · 6H2O structure type and isotypic com-pounds, see: Marezio et al. (1961); Bell & Smith (1990); Burns & Peterson (1971);Graeber et al. (1966); Habenschuss & Spedding (1980); Hoch & Simon (2008); Junket al. (1999); Reuter et al. (1994). For standardization of crystal data, see: Gelato &Parthe (1987).
Experimental
S1 Comment
[EuCl2(H2O)6]Cl crystallizes with the GdCl3 ·6H2O structure type (Marezio et al., 1961),like many metal trichloride hexahydrates MCl3 ·6H2O with M = Y (Bell & Smith, 1990),Ce (Reuter et al., 1994), Nd (Habenschuss & Spedding, 1980), Sm–Tm (Graeber et al.,1966), Am, Bk (Burns & Peterson, 1971), and three bromide hexahydrates MBr3 · 6H2O
Results 43
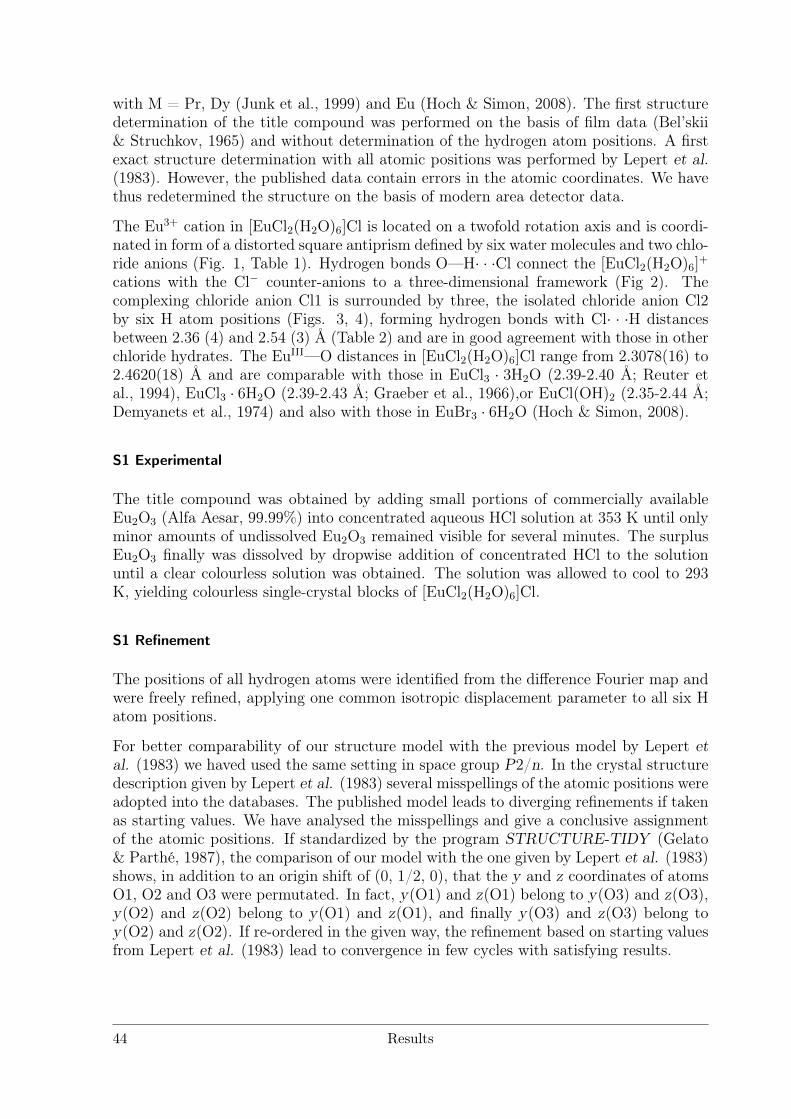
with M = Pr, Dy (Junk et al., 1999) and Eu (Hoch & Simon, 2008). The first structuredetermination of the title compound was performed on the basis of film data (Bel’skii& Struchkov, 1965) and without determination of the hydrogen atom positions. A firstexact structure determination with all atomic positions was performed by Lepert et al.(1983). However, the published data contain errors in the atomic coordinates. We havethus redetermined the structure on the basis of modern area detector data.
The Eu3+ cation in [EuCl2(H2O)6]Cl is located on a twofold rotation axis and is coordi-nated in form of a distorted square antiprism defined by six water molecules and two chlo-ride anions (Fig. 1, Table 1). Hydrogen bonds O—H· · ·Cl connect the [EuCl2(H2O)6]
+
cations with the Cl− counter-anions to a three-dimensional framework (Fig 2). Thecomplexing chloride anion Cl1 is surrounded by three, the isolated chloride anion Cl2by six H atom positions (Figs. 3, 4), forming hydrogen bonds with Cl· · ·H distancesbetween 2.36 (4) and 2.54 (3) Å (Table 2) and are in good agreement with those in otherchloride hydrates. The EuIII—O distances in [EuCl2(H2O)6]Cl range from 2.3078(16) to2.4620(18) Å and are comparable with those in EuCl3 · 3H2O (2.39-2.40 Å; Reuter etal., 1994), EuCl3 · 6H2O (2.39-2.43 Å; Graeber et al., 1966),or EuCl(OH)2 (2.35-2.44 Å;Demyanets et al., 1974) and also with those in EuBr3 · 6H2O (Hoch & Simon, 2008).
S1 Experimental
The title compound was obtained by adding small portions of commercially availableEu2O3 (Alfa Aesar, 99.99%) into concentrated aqueous HCl solution at 353 K until onlyminor amounts of undissolved Eu2O3 remained visible for several minutes. The surplusEu2O3 finally was dissolved by dropwise addition of concentrated HCl to the solutionuntil a clear colourless solution was obtained. The solution was allowed to cool to 293K, yielding colourless single-crystal blocks of [EuCl2(H2O)6]Cl.
S1 Refinement
The positions of all hydrogen atoms were identified from the difference Fourier map andwere freely refined, applying one common isotropic displacement parameter to all six Hatom positions.
For better comparability of our structure model with the previous model by Lepert etal. (1983) we haved used the same setting in space group P2/n. In the crystal structuredescription given by Lepert et al. (1983) several misspellings of the atomic positions wereadopted into the databases. The published model leads to diverging refinements if takenas starting values. We have analysed the misspellings and give a conclusive assignmentof the atomic positions. If standardized by the program STRUCTURE-TIDY (Gelato& Parthé, 1987), the comparison of our model with the one given by Lepert et al. (1983)shows, in addition to an origin shift of (0, 1/2, 0), that the y and z coordinates of atomsO1, O2 and O3 were permutated. In fact, y(O1) and z(O1) belong to y(O3) and z(O3),y(O2) and z(O2) belong to y(O1) and z(O1), and finally y(O3) and z(O3) belong toy(O2) and z(O2). If re-ordered in the given way, the refinement based on starting valuesfrom Lepert et al. (1983) lead to convergence in few cycles with satisfying results.
44 Results
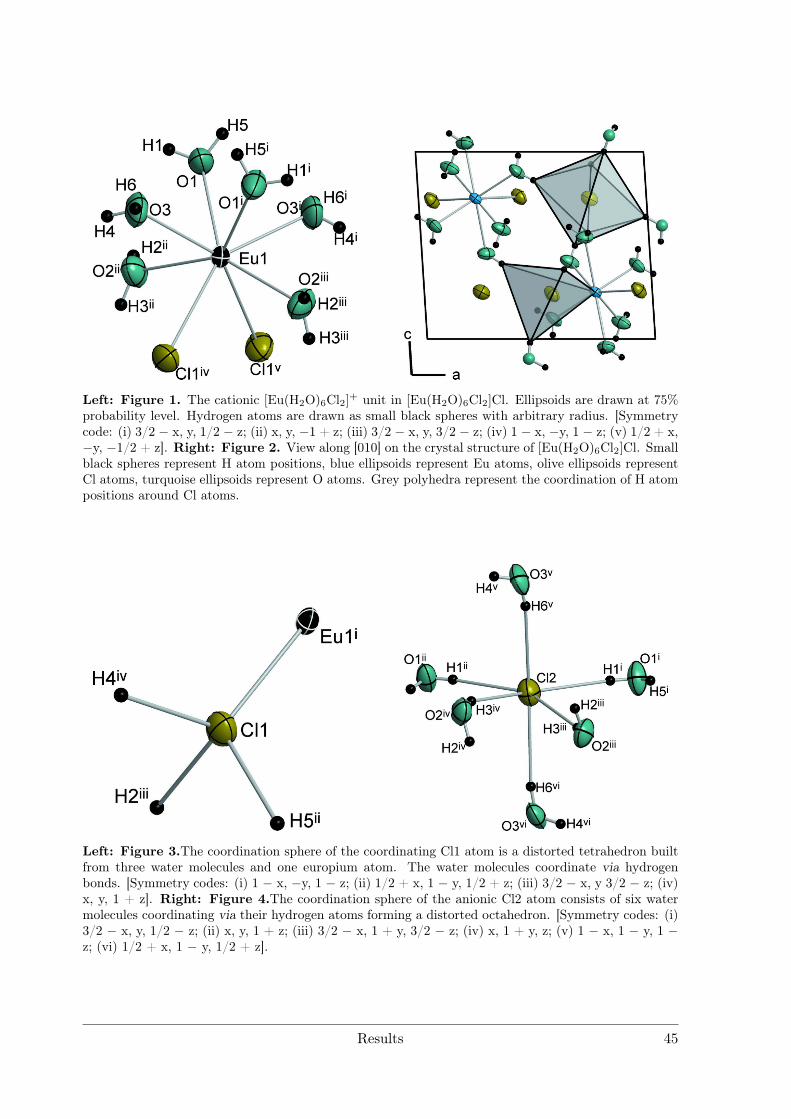
Left: Figure 1. The cationic [Eu(H2O)6Cl2]+ unit in [Eu(H2O)6Cl2]Cl. Ellipsoids are drawn at 75%probability level. Hydrogen atoms are drawn as small black spheres with arbitrary radius. [Symmetrycode: (i) 3/2 − x, y, 1/2 − z; (ii) x, y, −1 + z; (iii) 3/2 − x, y, 3/2 − z; (iv) 1 − x, −y, 1 − z; (v) 1/2 + x,−y, −1/2 + z]. Right: Figure 2. View along [010] on the crystal structure of [Eu(H2O)6Cl2]Cl. Smallblack spheres represent H atom positions, blue ellipsoids represent Eu atoms, olive ellipsoids representCl atoms, turquoise ellipsoids represent O atoms. Grey polyhedra represent the coordination of H atompositions around Cl atoms.
Left: Figure 3.The coordination sphere of the coordinating Cl1 atom is a distorted tetrahedron builtfrom three water molecules and one europium atom. The water molecules coordinate via hydrogenbonds. [Symmetry codes: (i) 1 − x, −y, 1 − z; (ii) 1/2 + x, 1 − y, 1/2 + z; (iii) 3/2 − x, y 3/2 − z; (iv)x, y, 1 + z]. Right: Figure 4.The coordination sphere of the anionic Cl2 atom consists of six watermolecules coordinating via their hydrogen atoms forming a distorted octahedron. [Symmetry codes: (i)3/2 − x, y, 1/2 − z; (ii) x, y, 1 + z; (iii) 3/2 − x, 1 + y, 3/2 − z; (iv) x, 1 + y, z; (v) 1 − x, 1 − y, 1 −z; (vi) 1/2 + x, 1 − y, 1/2 + z].
Results 45
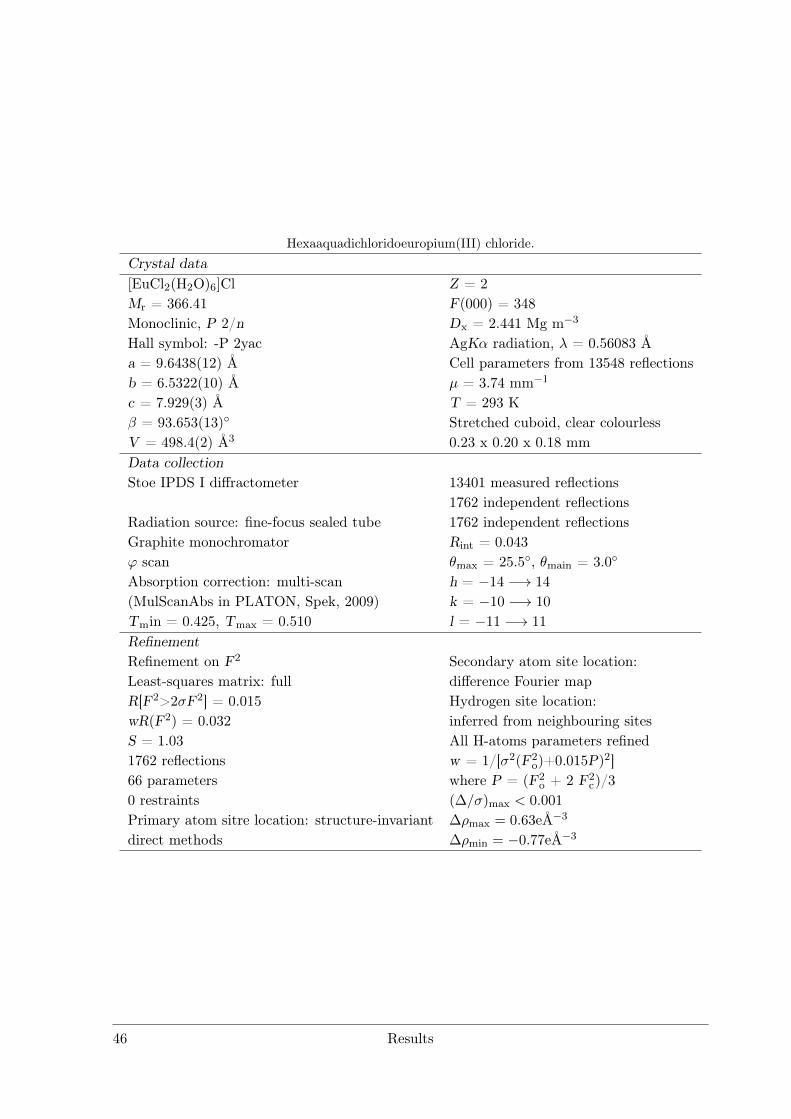
Hexaaquadichloridoeuropium(III) chloride.Crystal data[EuCl2(H2O)6]Cl Z = 2Mr = 366.41 F(000) = 348Monoclinic, P 2/n Dx = 2.441 Mg m−3
Hall symbol: -P 2yac AgKα radiation, λ = 0.56083 Åa = 9.6438(12) Å Cell parameters from 13548 reflectionsb = 6.5322(10) Å µ = 3.74 mm−1
c = 7.929(3) Å T = 293 Kβ = 93.653(13) Stretched cuboid, clear colourlessV = 498.4(2) Å3 0.23 x 0.20 x 0.18 mmData collectionStoe IPDS I diffractometer 13401 measured reflections
1762 independent reflectionsRadiation source: fine-focus sealed tube 1762 independent reflectionsGraphite monochromator Rint = 0.043ϕ scan θmax = 25.5, θmain = 3.0
Absorption correction: multi-scan h = −14 −→ 14
(MulScanAbs in PLATON, Spek, 2009) k = −10 −→ 10
Tmin = 0.425, Tmax = 0.510 l = −11 −→ 11
RefinementRefinement on F2 Secondary atom site location:Least-squares matrix: full difference Fourier mapR[F2>2σF2] = 0.015 Hydrogen site location:wR(F2) = 0.032 inferred from neighbouring sitesS = 1.03 All H-atoms parameters refined1762 reflections w = 1/[σ2(F2
o)+0.015P)2]66 parameters where P = (F2
o + 2 F2c)/3
0 restraints (∆/σ)max < 0.001
Primary atom sitre location: structure-invariant ∆ρmax = 0.63eÅ−3
direct methods ∆ρmin = −0.77eÅ−3
46 Results
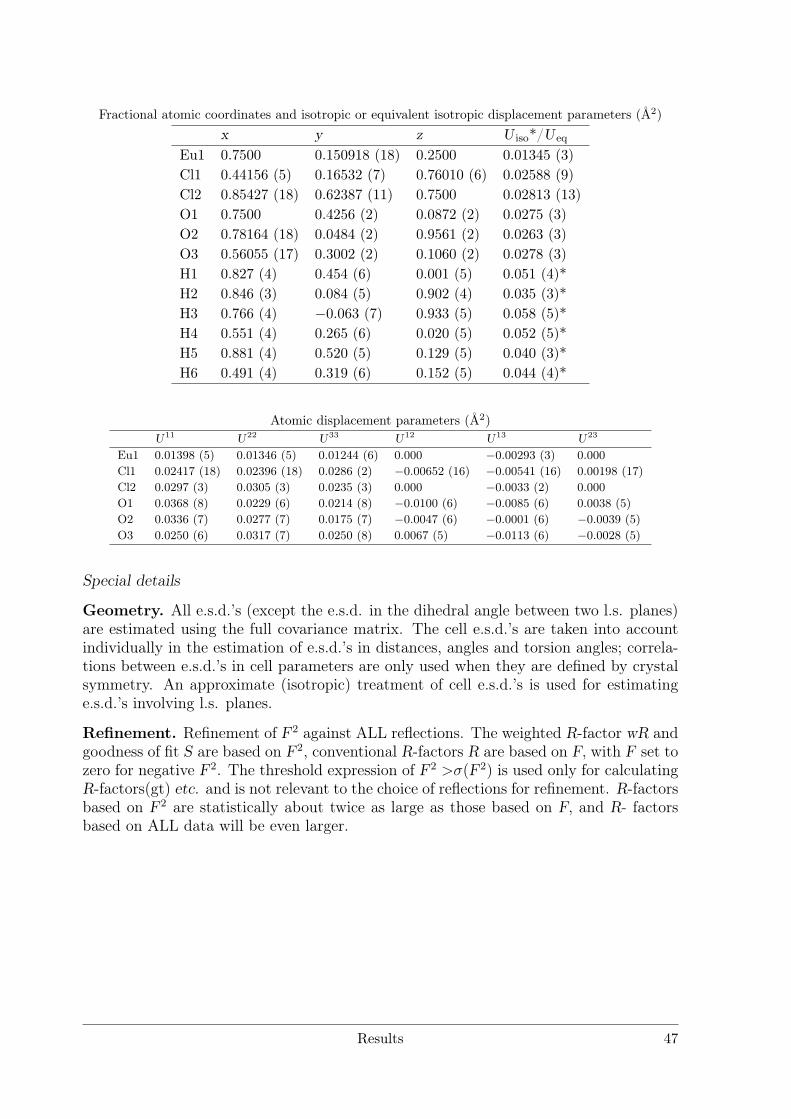
Fractional atomic coordinates and isotropic or equivalent isotropic displacement parameters (Å2)x y z U iso*/U eq
Eu1 0.7500 0.150918 (18) 0.2500 0.01345 (3)Cl1 0.44156 (5) 0.16532 (7) 0.76010 (6) 0.02588 (9)Cl2 0.85427 (18) 0.62387 (11) 0.7500 0.02813 (13)O1 0.7500 0.4256 (2) 0.0872 (2) 0.0275 (3)O2 0.78164 (18) 0.0484 (2) 0.9561 (2) 0.0263 (3)O3 0.56055 (17) 0.3002 (2) 0.1060 (2) 0.0278 (3)H1 0.827 (4) 0.454 (6) 0.001 (5) 0.051 (4)*H2 0.846 (3) 0.084 (5) 0.902 (4) 0.035 (3)*H3 0.766 (4) −0.063 (7) 0.933 (5) 0.058 (5)*H4 0.551 (4) 0.265 (6) 0.020 (5) 0.052 (5)*H5 0.881 (4) 0.520 (5) 0.129 (5) 0.040 (3)*H6 0.491 (4) 0.319 (6) 0.152 (5) 0.044 (4)*
Atomic displacement parameters (Å2)U11 U22 U33 U12 U13 U23
Eu1 0.01398 (5) 0.01346 (5) 0.01244 (6) 0.000 −0.00293 (3) 0.000Cl1 0.02417 (18) 0.02396 (18) 0.0286 (2) −0.00652 (16) −0.00541 (16) 0.00198 (17)Cl2 0.0297 (3) 0.0305 (3) 0.0235 (3) 0.000 −0.0033 (2) 0.000O1 0.0368 (8) 0.0229 (6) 0.0214 (8) −0.0100 (6) −0.0085 (6) 0.0038 (5)O2 0.0336 (7) 0.0277 (7) 0.0175 (7) −0.0047 (6) −0.0001 (6) −0.0039 (5)O3 0.0250 (6) 0.0317 (7) 0.0250 (8) 0.0067 (5) −0.0113 (6) −0.0028 (5)
Special details
Geometry. All e.s.d.’s (except the e.s.d. in the dihedral angle between two l.s. planes)are estimated using the full covariance matrix. The cell e.s.d.’s are taken into accountindividually in the estimation of e.s.d.’s in distances, angles and torsion angles; correla-tions between e.s.d.’s in cell parameters are only used when they are defined by crystalsymmetry. An approximate (isotropic) treatment of cell e.s.d.’s is used for estimatinge.s.d.’s involving l.s. planes.
Refinement. Refinement of F2 against ALL reflections. The weighted R-factor wR andgoodness of fit S are based on F2, conventional R-factors R are based on F, with F set tozero for negative F2. The threshold expression of F2 >σ(F2) is used only for calculatingR-factors(gt) etc. and is not relevant to the choice of reflections for refinement. R-factorsbased on F2 are statistically about twice as large as those based on F, and R- factorsbased on ALL data will be even larger.
Results 47
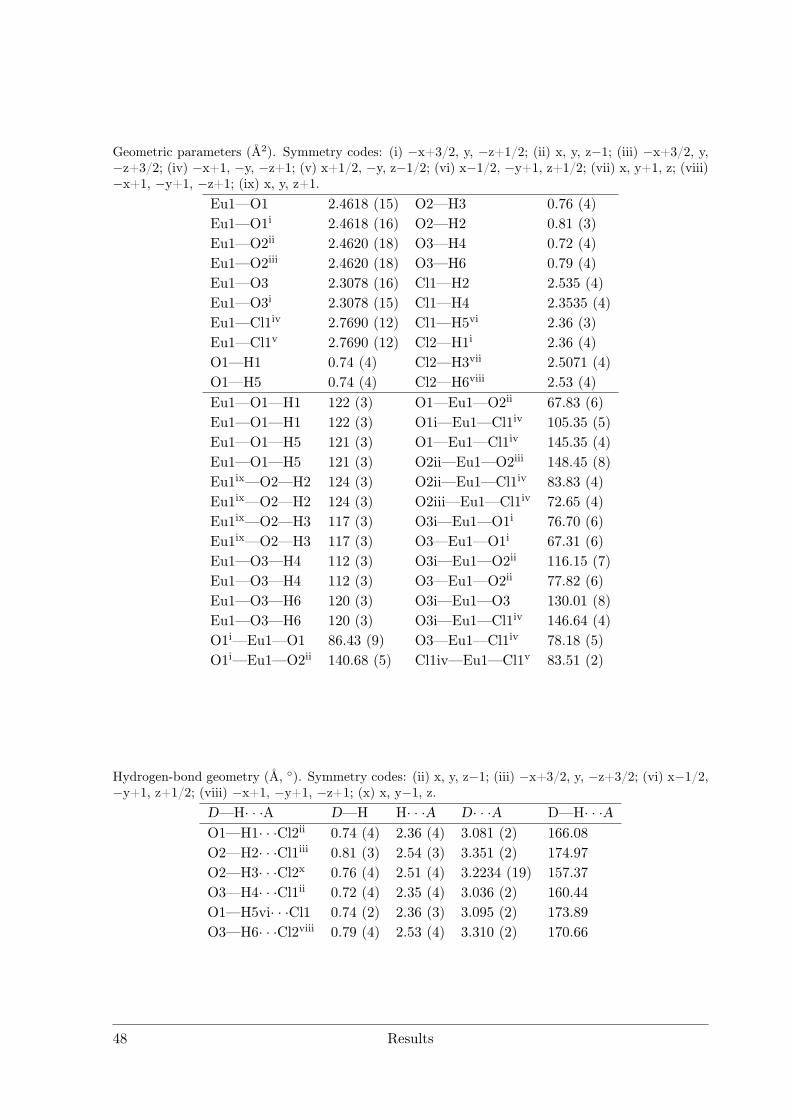
Geometric parameters (Å2). Symmetry codes: (i) −x+3/2, y, −z+1/2; (ii) x, y, z−1; (iii) −x+3/2, y,−z+3/2; (iv) −x+1, −y, −z+1; (v) x+1/2, −y, z−1/2; (vi) x−1/2, −y+1, z+1/2; (vii) x, y+1, z; (viii)−x+1, −y+1, −z+1; (ix) x, y, z+1.
Eu1—O1 2.4618 (15) O2—H3 0.76 (4)Eu1—O1i 2.4618 (16) O2—H2 0.81 (3)Eu1—O2ii 2.4620 (18) O3—H4 0.72 (4)Eu1—O2iii 2.4620 (18) O3—H6 0.79 (4)Eu1—O3 2.3078 (16) Cl1—H2 2.535 (4)Eu1—O3i 2.3078 (15) Cl1—H4 2.3535 (4)Eu1—Cl1iv 2.7690 (12) Cl1—H5vi 2.36 (3)Eu1—Cl1v 2.7690 (12) Cl2—H1i 2.36 (4)O1—H1 0.74 (4) Cl2—H3vii 2.5071 (4)O1—H5 0.74 (4) Cl2—H6viii 2.53 (4)Eu1—O1—H1 122 (3) O1—Eu1—O2ii 67.83 (6)Eu1—O1—H1 122 (3) O1i—Eu1—Cl1iv 105.35 (5)Eu1—O1—H5 121 (3) O1—Eu1—Cl1iv 145.35 (4)Eu1—O1—H5 121 (3) O2ii—Eu1—O2iii 148.45 (8)Eu1ix—O2—H2 124 (3) O2ii—Eu1—Cl1iv 83.83 (4)Eu1ix—O2—H2 124 (3) O2iii—Eu1—Cl1iv 72.65 (4)Eu1ix—O2—H3 117 (3) O3i—Eu1—O1i 76.70 (6)Eu1ix—O2—H3 117 (3) O3—Eu1—O1i 67.31 (6)Eu1—O3—H4 112 (3) O3i—Eu1—O2ii 116.15 (7)Eu1—O3—H4 112 (3) O3—Eu1—O2ii 77.82 (6)Eu1—O3—H6 120 (3) O3i—Eu1—O3 130.01 (8)Eu1—O3—H6 120 (3) O3i—Eu1—Cl1iv 146.64 (4)O1i—Eu1—O1 86.43 (9) O3—Eu1—Cl1iv 78.18 (5)O1i—Eu1—O2ii 140.68 (5) Cl1iv—Eu1—Cl1v 83.51 (2)
Hydrogen-bond geometry (Å, ). Symmetry codes: (ii) x, y, z−1; (iii) −x+3/2, y, −z+3/2; (vi) x−1/2,−y+1, z+1/2; (viii) −x+1, −y+1, −z+1; (x) x, y−1, z.
D—H· · ·A D—H H· · ·A D· · ·A D—H· · ·AO1—H1· · ·Cl2ii 0.74 (4) 2.36 (4) 3.081 (2) 166.08O2—H2· · ·Cl1iii 0.81 (3) 2.54 (3) 3.351 (2) 174.97O2—H3· · ·Cl2x 0.76 (4) 2.51 (4) 3.2234 (19) 157.37O3—H4· · ·Cl1ii 0.72 (4) 2.35 (4) 3.036 (2) 160.44O1—H5vi· · ·Cl1 0.74 (2) 2.36 (3) 3.095 (2) 173.89O3—H6· · ·Cl2viii 0.79 (4) 2.53 (4) 3.310 (2) 170.66
48 Results
3.3. Lanthanide Amalgams
The following chapter contains published as well as unpublished results of lanthanideamalgams examined in this work. Eu10Hg55 was synthesised by electrocrystallisationand is the mercury-richest Eu amalgam, the results were published in Z. Anorg. Allg.Chem.. It crystallises in a hettotype structure of the Gd14Ag51 structure type and thequestion arose whether the structure determination of the aristotype is correct or whethera twinning problem was overlooked, leading to higher pseudo-symmetry.
Following this chain of thought, the aristotype and three isotypical structures (RE14Ag51,RE = Y, Ce, Gd, Tb) were synthesised and examined in detail with the aid of singlecrystal and powder X-ray diffraction and HRTEM. Electric and magnetic propertieswere also investigated. We found the higher symmetry (P6/m) to be true and onecrystallographic position half-occupied. The results were published in J. Alloys Compd..
Another hettotype of the Gd14Ag51 structure type is the crystal structure of Yb11Hg51,prepared by the distillation method (unpublished). In contrast to Eu10Hg55, Yb11Hg51
does not exhibit any mixed- or underoccupied positions, making the link between thehigher symmetry aristotype and the more complex and lower symmetric crystal structureof Eu10Hg55.
Other phases synthesised by the distillation method are La11+xHg45−x and RE11Hg44.5
(RE = Nd, Sm). Both crystallise as hettotypes of the Sm11Cd45 structure type and showdistinct mixed and underoccupied positions not present in the aristotype. A completetopological analysis along with quantum-chemical calculations was published in J. SolidState Chem.
The last part of this chapter contains unpublished results of lanthanide amalgams withgeneral compositions REHg, REHg2 and REHg3. They were synthesised by the distil-lation method and analysed by X-ray diffraction methods. Earlier results of structureanalysis were confirmed, only SmHg2 was found to crystallise in a second modification,unknown from previously published results.
Results 49
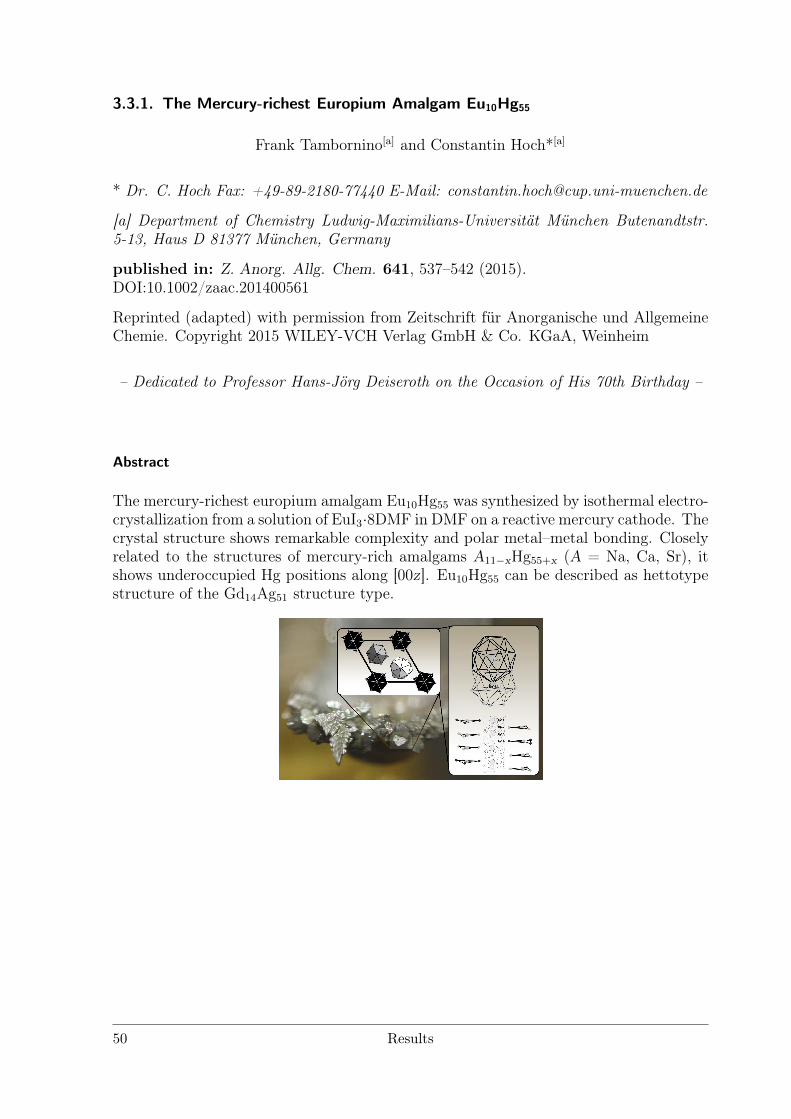
3.3.1. The Mercury-richest Europium Amalgam Eu10Hg55
Frank Tambornino[a] and Constantin Hoch*[a]
* Dr. C. Hoch Fax: +49-89-2180-77440 E-Mail: [email protected]
[a] Department of Chemistry Ludwig-Maximilians-Universität München Butenandtstr.5-13, Haus D 81377 München, Germany
published in: Z. Anorg. Allg. Chem. 641, 537–542 (2015).DOI:10.1002/zaac.201400561
Reprinted (adapted) with permission from Zeitschrift für Anorganische und AllgemeineChemie. Copyright 2015 WILEY-VCH Verlag GmbH & Co. KGaA, Weinheim
– Dedicated to Professor Hans-Jörg Deiseroth on the Occasion of His 70th Birthday –
Abstract
The mercury-richest europium amalgam Eu10Hg55 was synthesized by isothermal electro-crystallization from a solution of EuI3·8DMF in DMF on a reactive mercury cathode. Thecrystal structure shows remarkable complexity and polar metal–metal bonding. Closelyrelated to the structures of mercury-rich amalgams A11−xHg55+x (A = Na, Ca, Sr), itshows underoccupied Hg positions along [00z]. Eu10Hg55 can be described as hettotypestructure of the Gd14Ag51 structure type.
50 Results
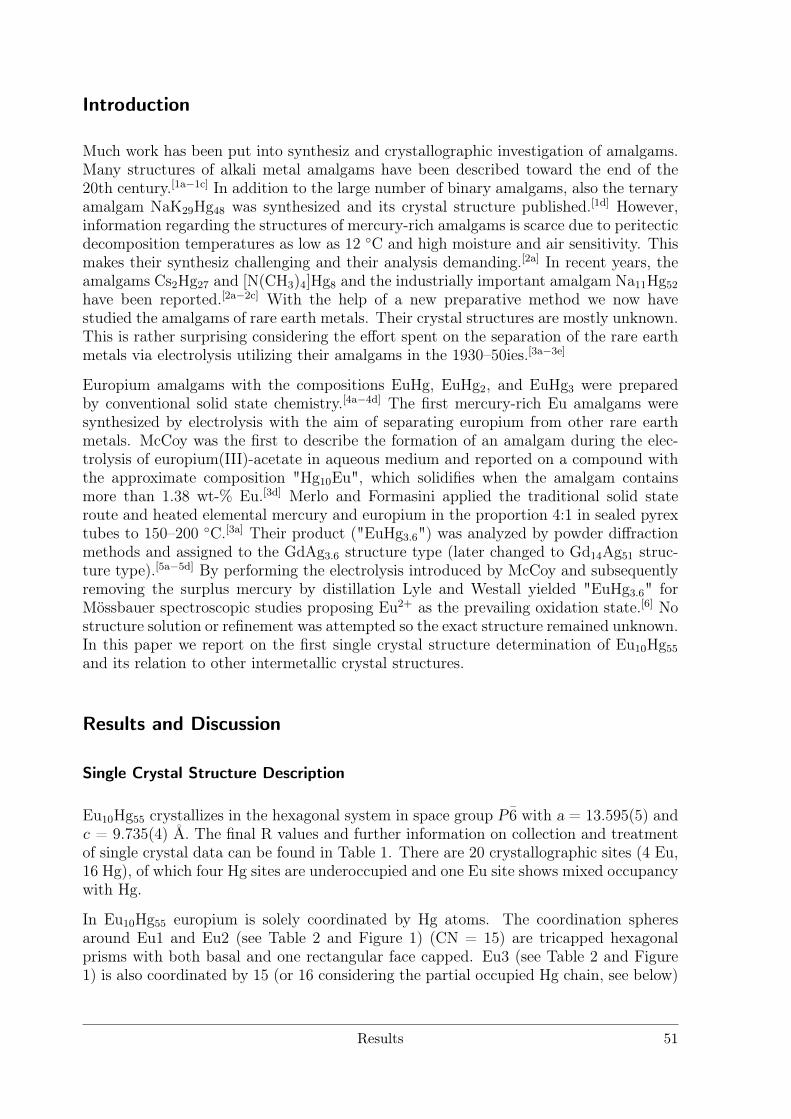
Introduction
Much work has been put into synthesiz and crystallographic investigation of amalgams.Many structures of alkali metal amalgams have been described toward the end of the20th century.[1a−1c] In addition to the large number of binary amalgams, also the ternaryamalgam NaK29Hg48 was synthesized and its crystal structure published.[1d] However,information regarding the structures of mercury-rich amalgams is scarce due to peritecticdecomposition temperatures as low as 12 C and high moisture and air sensitivity. Thismakes their synthesiz challenging and their analysis demanding.[2a] In recent years, theamalgams Cs2Hg27 and [N(CH3)4]Hg8 and the industrially important amalgam Na11Hg52
have been reported.[2a−2c] With the help of a new preparative method we now havestudied the amalgams of rare earth metals. Their crystal structures are mostly unknown.This is rather surprising considering the effort spent on the separation of the rare earthmetals via electrolysis utilizing their amalgams in the 1930–50ies.[3a−3e]
Europium amalgams with the compositions EuHg, EuHg2, and EuHg3 were preparedby conventional solid state chemistry.[4a−4d] The first mercury-rich Eu amalgams weresynthesized by electrolysis with the aim of separating europium from other rare earthmetals. McCoy was the first to describe the formation of an amalgam during the elec-trolysis of europium(III)-acetate in aqueous medium and reported on a compound withthe approximate composition "Hg10Eu", which solidifies when the amalgam containsmore than 1.38 wt-% Eu.[3d] Merlo and Formasini applied the traditional solid stateroute and heated elemental mercury and europium in the proportion 4:1 in sealed pyrextubes to 150–200 C.[3a] Their product ("EuHg3.6") was analyzed by powder diffractionmethods and assigned to the GdAg3.6 structure type (later changed to Gd14Ag51 struc-ture type).[5a−5d] By performing the electrolysis introduced by McCoy and subsequentlyremoving the surplus mercury by distillation Lyle and Westall yielded "EuHg3.6" forMössbauer spectroscopic studies proposing Eu2+ as the prevailing oxidation state.[6] Nostructure solution or refinement was attempted so the exact structure remained unknown.In this paper we report on the first single crystal structure determination of Eu10Hg55
and its relation to other intermetallic crystal structures.
Results and Discussion
Single Crystal Structure Description
Eu10Hg55 crystallizes in the hexagonal system in space group P6 with a = 13.595(5) andc = 9.735(4) Å. The final R values and further information on collection and treatmentof single crystal data can be found in Table 1. There are 20 crystallographic sites (4 Eu,16 Hg), of which four Hg sites are underoccupied and one Eu site shows mixed occupancywith Hg.
In Eu10Hg55 europium is solely coordinated by Hg atoms. The coordination spheresaround Eu1 and Eu2 (see Table 2 and Figure 1) (CN = 15) are tricapped hexagonalprisms with both basal and one rectangular face capped. Eu3 (see Table 2 and Figure1) is also coordinated by 15 (or 16 considering the partial occupied Hg chain, see below)
Results 51
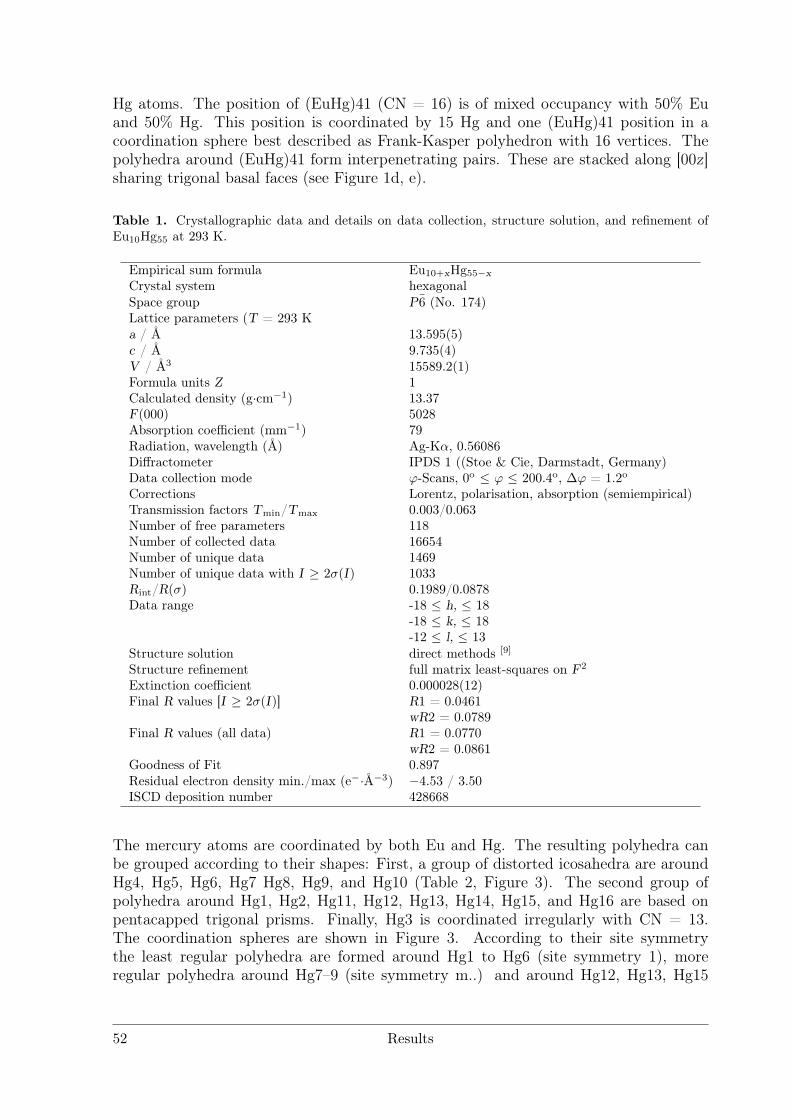
Hg atoms. The position of (EuHg)41 (CN = 16) is of mixed occupancy with 50% Euand 50% Hg. This position is coordinated by 15 Hg and one (EuHg)41 position in acoordination sphere best described as Frank-Kasper polyhedron with 16 vertices. Thepolyhedra around (EuHg)41 form interpenetrating pairs. These are stacked along [00z]sharing trigonal basal faces (see Figure 1d, e).
Table 1. Crystallographic data and details on data collection, structure solution, and refinement ofEu10Hg55 at 293 K.
Empirical sum formula Eu10+xHg55−xCrystal system hexagonalSpace group P6 (No. 174)Lattice parameters (T = 293 Ka / Å 13.595(5)c / Å 9.735(4)V / Å3 15589.2(1)Formula units Z 1Calculated density (g·cm−1) 13.37F(000) 5028Absorption coefficient (mm−1) 79Radiation, wavelength (Å) Ag-Kα, 0.56086Diffractometer IPDS 1 ((Stoe & Cie, Darmstadt, Germany)Data collection mode ϕ-Scans, 0o ≤ ϕ ≤ 200.4o, ∆ϕ = 1.2oCorrections Lorentz, polarisation, absorption (semiempirical)Transmission factors Tmin/Tmax 0.003/0.063Number of free parameters 118Number of collected data 16654Number of unique data 1469Number of unique data with I ≥ 2σ(I) 1033Rint/R(σ) 0.1989/0.0878Data range -18 ≤ h, ≤ 18
-18 ≤ k, ≤ 18-12 ≤ l, ≤ 13
Structure solution direct methods [9]
Structure refinement full matrix least-squares on F2
Extinction coefficient 0.000028(12)Final R values [I ≥ 2σ(I)] R1 = 0.0461
wR2 = 0.0789Final R values (all data) R1 = 0.0770
wR2 = 0.0861Goodness of Fit 0.897Residual electron density min./max (e−·Å−3) −4.53 / 3.50ISCD deposition number 428668
The mercury atoms are coordinated by both Eu and Hg. The resulting polyhedra canbe grouped according to their shapes: First, a group of distorted icosahedra are aroundHg4, Hg5, Hg6, Hg7 Hg8, Hg9, and Hg10 (Table 2, Figure 3). The second group ofpolyhedra around Hg1, Hg2, Hg11, Hg12, Hg13, Hg14, Hg15, and Hg16 are based onpentacapped trigonal prisms. Finally, Hg3 is coordinated irregularly with CN = 13.The coordination spheres are shown in Figure 3. According to their site symmetrythe least regular polyhedra are formed around Hg1 to Hg6 (site symmetry 1), moreregular polyhedra around Hg7–9 (site symmetry m..) and around Hg12, Hg13, Hg15
52 Results
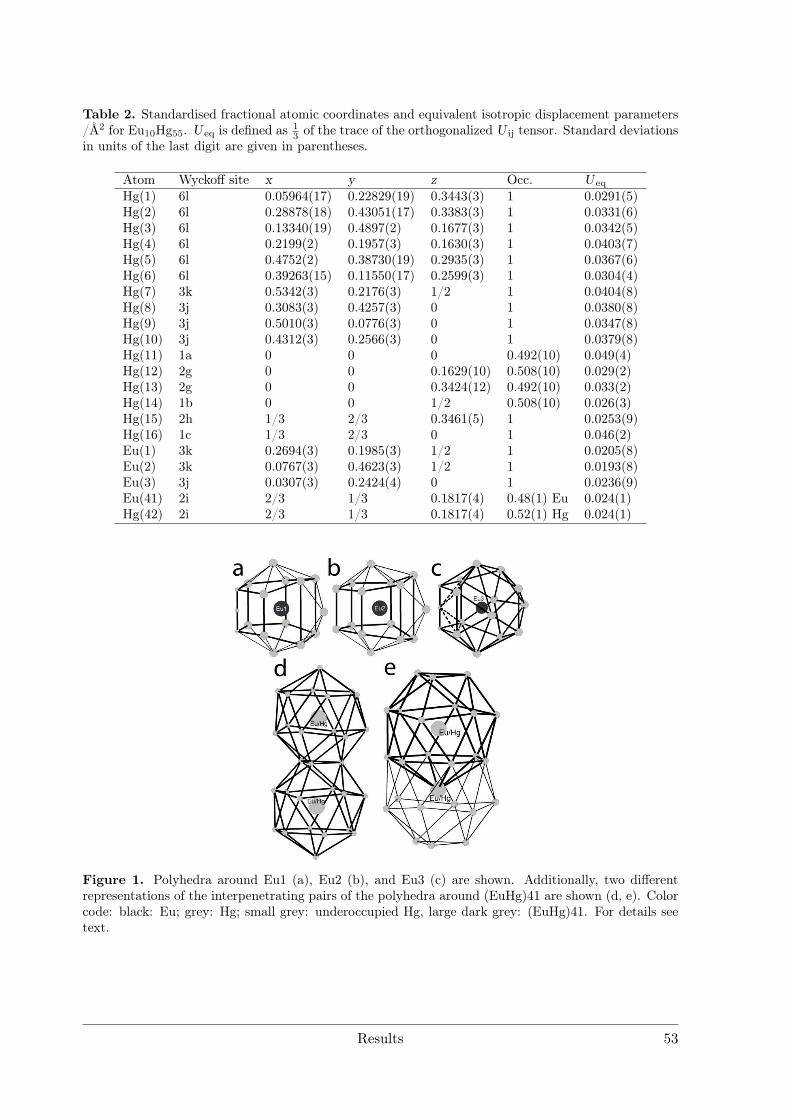
Table 2. Standardised fractional atomic coordinates and equivalent isotropic displacement parameters/Å2 for Eu10Hg55. U eq is defined as 1
3 of the trace of the orthogonalized U ij tensor. Standard deviationsin units of the last digit are given in parentheses.
Atom Wyckoff site x y z Occ. U eq
Hg(1) 6l 0.05964(17) 0.22829(19) 0.3443(3) 1 0.0291(5)Hg(2) 6l 0.28878(18) 0.43051(17) 0.3383(3) 1 0.0331(6)Hg(3) 6l 0.13340(19) 0.4897(2) 0.1677(3) 1 0.0342(5)Hg(4) 6l 0.2199(2) 0.1957(3) 0.1630(3) 1 0.0403(7)Hg(5) 6l 0.4752(2) 0.38730(19) 0.2935(3) 1 0.0367(6)Hg(6) 6l 0.39263(15) 0.11550(17) 0.2599(3) 1 0.0304(4)Hg(7) 3k 0.5342(3) 0.2176(3) 1/2 1 0.0404(8)Hg(8) 3j 0.3083(3) 0.4257(3) 0 1 0.0380(8)Hg(9) 3j 0.5010(3) 0.0776(3) 0 1 0.0347(8)Hg(10) 3j 0.4312(3) 0.2566(3) 0 1 0.0379(8)Hg(11) 1a 0 0 0 0.492(10) 0.049(4)Hg(12) 2g 0 0 0.1629(10) 0.508(10) 0.029(2)Hg(13) 2g 0 0 0.3424(12) 0.492(10) 0.033(2)Hg(14) 1b 0 0 1/2 0.508(10) 0.026(3)Hg(15) 2h 1/3 2/3 0.3461(5) 1 0.0253(9)Hg(16) 1c 1/3 2/3 0 1 0.046(2)Eu(1) 3k 0.2694(3) 0.1985(3) 1/2 1 0.0205(8)Eu(2) 3k 0.0767(3) 0.4623(3) 1/2 1 0.0193(8)Eu(3) 3j 0.0307(3) 0.2424(4) 0 1 0.0236(9)Eu(41) 2i 2/3 1/3 0.1817(4) 0.48(1) Eu 0.024(1)Hg(42) 2i 2/3 1/3 0.1817(4) 0.52(1) Hg 0.024(1)
Figure 1. Polyhedra around Eu1 (a), Eu2 (b), and Eu3 (c) are shown. Additionally, two differentrepresentations of the interpenetrating pairs of the polyhedra around (EuHg)41 are shown (d, e). Colorcode: black: Eu; grey: Hg; small grey: underoccupied Hg, large dark grey: (EuHg)41. For details seetext.
Results 53
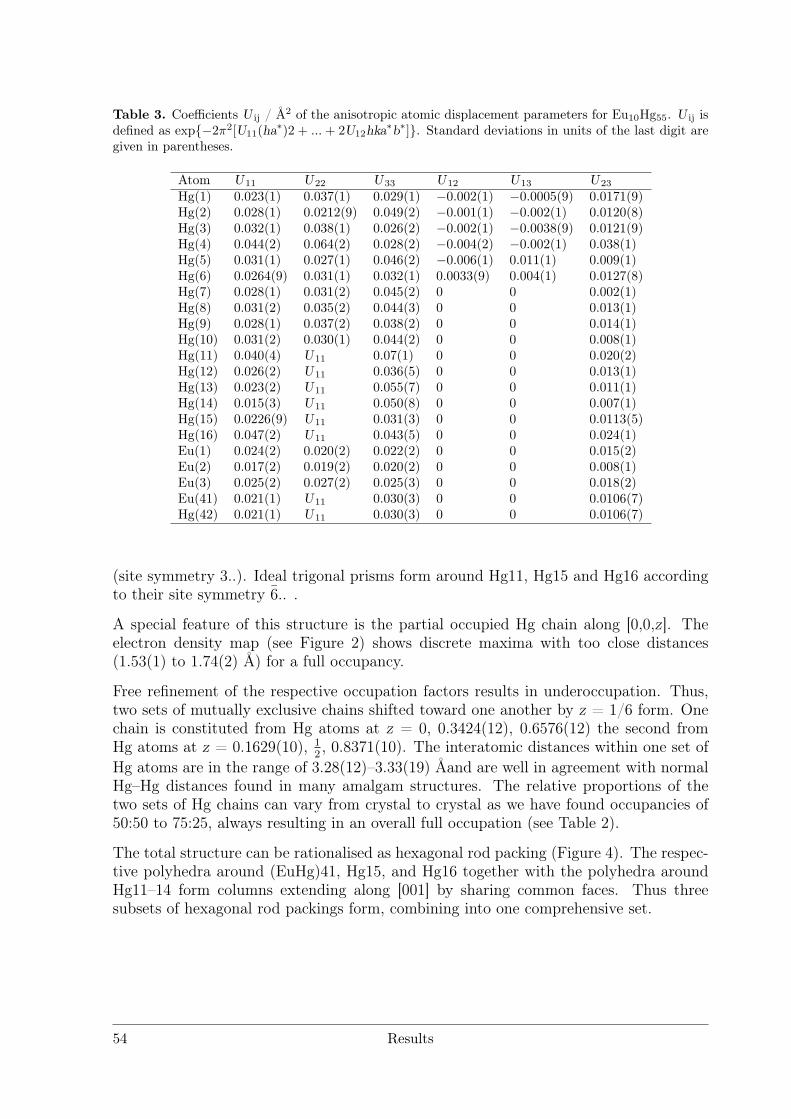
Table 3. Coefficients U ij / Å2 of the anisotropic atomic displacement parameters for Eu10Hg55. U ij isdefined as exp−2π2[U11(ha∗)2 + ...+ 2U12hka∗b∗]. Standard deviations in units of the last digit aregiven in parentheses.
Atom U11 U22 U33 U12 U13 U23
Hg(1) 0.023(1) 0.037(1) 0.029(1) −0.002(1) −0.0005(9) 0.0171(9)Hg(2) 0.028(1) 0.0212(9) 0.049(2) −0.001(1) −0.002(1) 0.0120(8)Hg(3) 0.032(1) 0.038(1) 0.026(2) −0.002(1) −0.0038(9) 0.0121(9)Hg(4) 0.044(2) 0.064(2) 0.028(2) −0.004(2) −0.002(1) 0.038(1)Hg(5) 0.031(1) 0.027(1) 0.046(2) −0.006(1) 0.011(1) 0.009(1)Hg(6) 0.0264(9) 0.031(1) 0.032(1) 0.0033(9) 0.004(1) 0.0127(8)Hg(7) 0.028(1) 0.031(2) 0.045(2) 0 0 0.002(1)Hg(8) 0.031(2) 0.035(2) 0.044(3) 0 0 0.013(1)Hg(9) 0.028(1) 0.037(2) 0.038(2) 0 0 0.014(1)Hg(10) 0.031(2) 0.030(1) 0.044(2) 0 0 0.008(1)Hg(11) 0.040(4) U11 0.07(1) 0 0 0.020(2)Hg(12) 0.026(2) U11 0.036(5) 0 0 0.013(1)Hg(13) 0.023(2) U11 0.055(7) 0 0 0.011(1)Hg(14) 0.015(3) U11 0.050(8) 0 0 0.007(1)Hg(15) 0.0226(9) U11 0.031(3) 0 0 0.0113(5)Hg(16) 0.047(2) U11 0.043(5) 0 0 0.024(1)Eu(1) 0.024(2) 0.020(2) 0.022(2) 0 0 0.015(2)Eu(2) 0.017(2) 0.019(2) 0.020(2) 0 0 0.008(1)Eu(3) 0.025(2) 0.027(2) 0.025(3) 0 0 0.018(2)Eu(41) 0.021(1) U11 0.030(3) 0 0 0.0106(7)Hg(42) 0.021(1) U11 0.030(3) 0 0 0.0106(7)
(site symmetry 3..). Ideal trigonal prisms form around Hg11, Hg15 and Hg16 accordingto their site symmetry 6.. .
A special feature of this structure is the partial occupied Hg chain along [0,0,z]. Theelectron density map (see Figure 2) shows discrete maxima with too close distances(1.53(1) to 1.74(2) Å) for a full occupancy.
Free refinement of the respective occupation factors results in underoccupation. Thus,two sets of mutually exclusive chains shifted toward one another by z = 1/6 form. Onechain is constituted from Hg atoms at z = 0, 0.3424(12), 0.6576(12) the second fromHg atoms at z = 0.1629(10), 1
2, 0.8371(10). The interatomic distances within one set of
Hg atoms are in the range of 3.28(12)–3.33(19) Åand are well in agreement with normalHg–Hg distances found in many amalgam structures. The relative proportions of thetwo sets of Hg chains can vary from crystal to crystal as we have found occupancies of50:50 to 75:25, always resulting in an overall full occupation (see Table 2).
The total structure can be rationalised as hexagonal rod packing (Figure 4). The respec-tive polyhedra around (EuHg)41, Hg15, and Hg16 together with the polyhedra aroundHg11–14 form columns extending along [001] by sharing common faces. Thus threesubsets of hexagonal rod packings form, combining into one comprehensive set.
54 Results
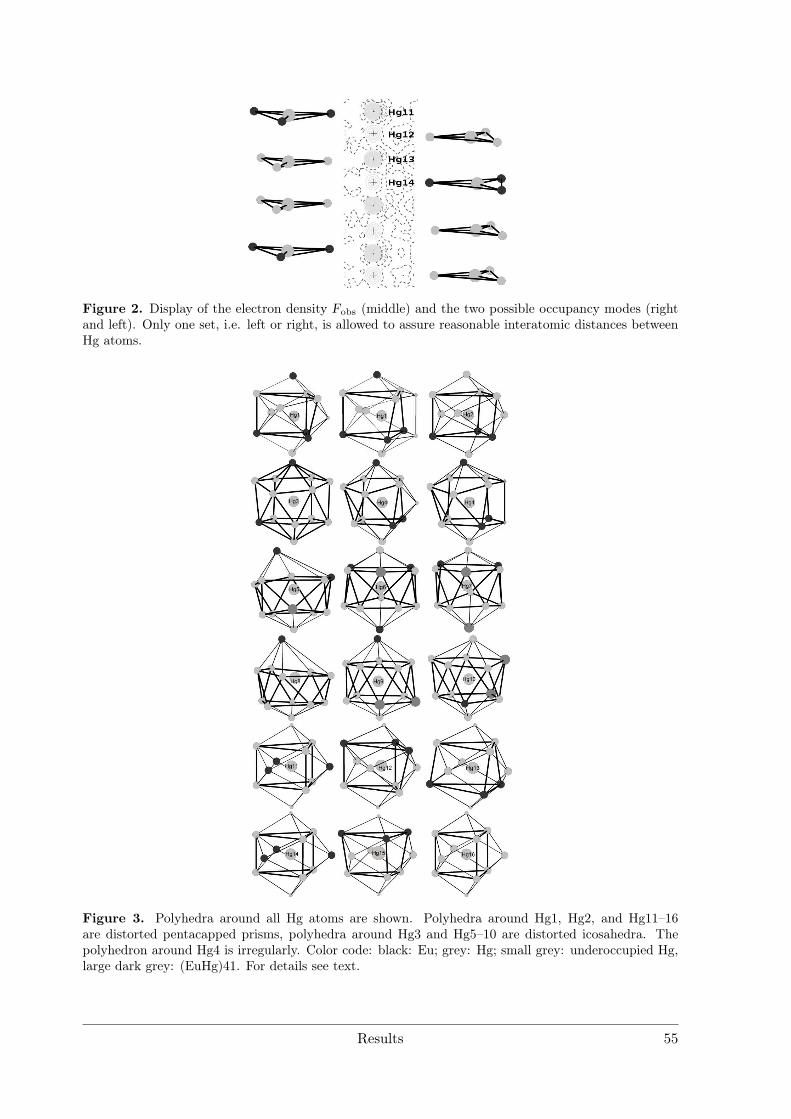
Figure 2. Display of the electron density Fobs (middle) and the two possible occupancy modes (rightand left). Only one set, i.e. left or right, is allowed to assure reasonable interatomic distances betweenHg atoms.
Figure 3. Polyhedra around all Hg atoms are shown. Polyhedra around Hg1, Hg2, and Hg11–16are distorted pentacapped prisms, polyhedra around Hg3 and Hg5–10 are distorted icosahedra. Thepolyhedron around Hg4 is irregularly. Color code: black: Eu; grey: Hg; small grey: underoccupied Hg,large dark grey: (EuHg)41. For details see text.
Results 55
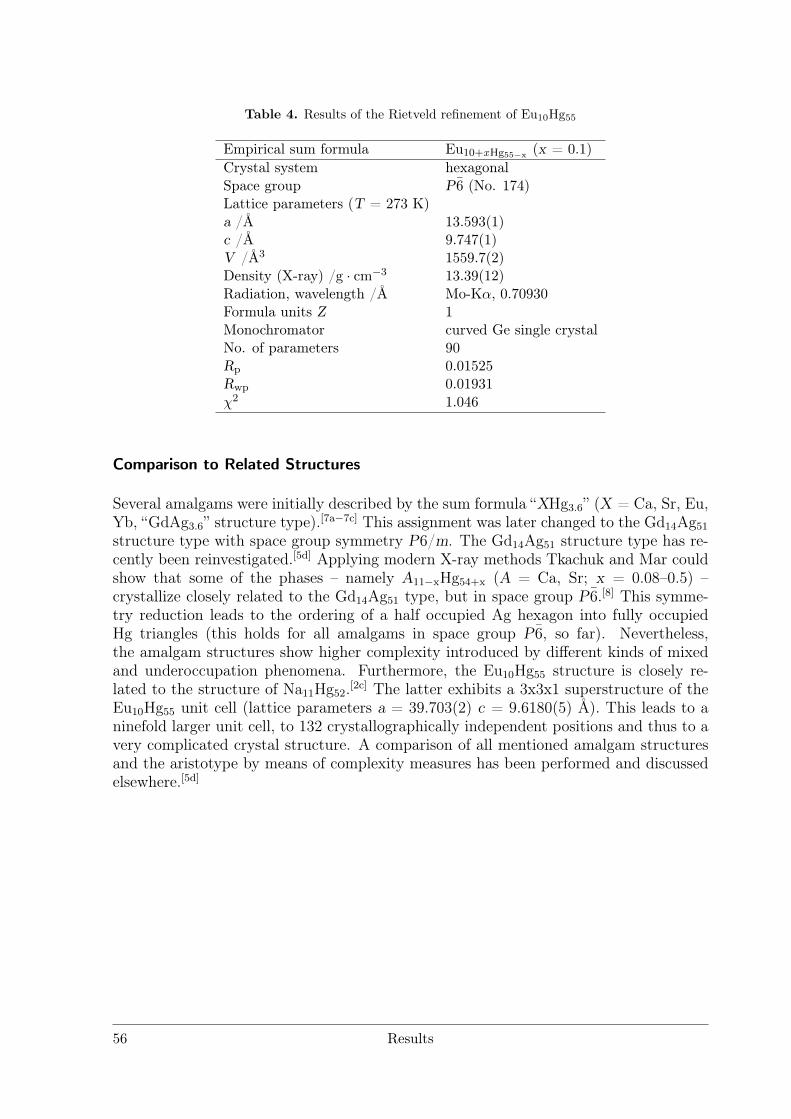
Table 4. Results of the Rietveld refinement of Eu10Hg55
Empirical sum formula Eu10+xHg55−x (x = 0.1)Crystal system hexagonalSpace group P6 (No. 174)Lattice parameters (T = 273 K)a /Å 13.593(1)c /Å 9.747(1)V /Å3 1559.7(2)Density (X-ray) /g · cm−3 13.39(12)Radiation, wavelength /Å Mo-Kα, 0.70930Formula units Z 1Monochromator curved Ge single crystalNo. of parameters 90Rp 0.01525Rwp 0.01931χ2 1.046
Comparison to Related Structures
Several amalgams were initially described by the sum formula “XHg3.6” (X = Ca, Sr, Eu,Yb, “GdAg3.6” structure type).[7a−7c] This assignment was later changed to the Gd14Ag51
structure type with space group symmetry P6/m. The Gd14Ag51 structure type has re-cently been reinvestigated.[5d] Applying modern X-ray methods Tkachuk and Mar couldshow that some of the phases – namely A11−xHg54+x (A = Ca, Sr; x = 0.08–0.5) –crystallize closely related to the Gd14Ag51 type, but in space group P6.[8] This symme-try reduction leads to the ordering of a half occupied Ag hexagon into fully occupiedHg triangles (this holds for all amalgams in space group P6, so far). Nevertheless,the amalgam structures show higher complexity introduced by different kinds of mixedand underoccupation phenomena. Furthermore, the Eu10Hg55 structure is closely re-lated to the structure of Na11Hg52.[2c] The latter exhibits a 3x3x1 superstructure of theEu10Hg55 unit cell (lattice parameters a = 39.703(2) c = 9.6180(5) Å). This leads to aninefold larger unit cell, to 132 crystallographically independent positions and thus to avery complicated crystal structure. A comparison of all mentioned amalgam structuresand the aristotype by means of complexity measures has been performed and discussedelsewhere.[5d]
56 Results
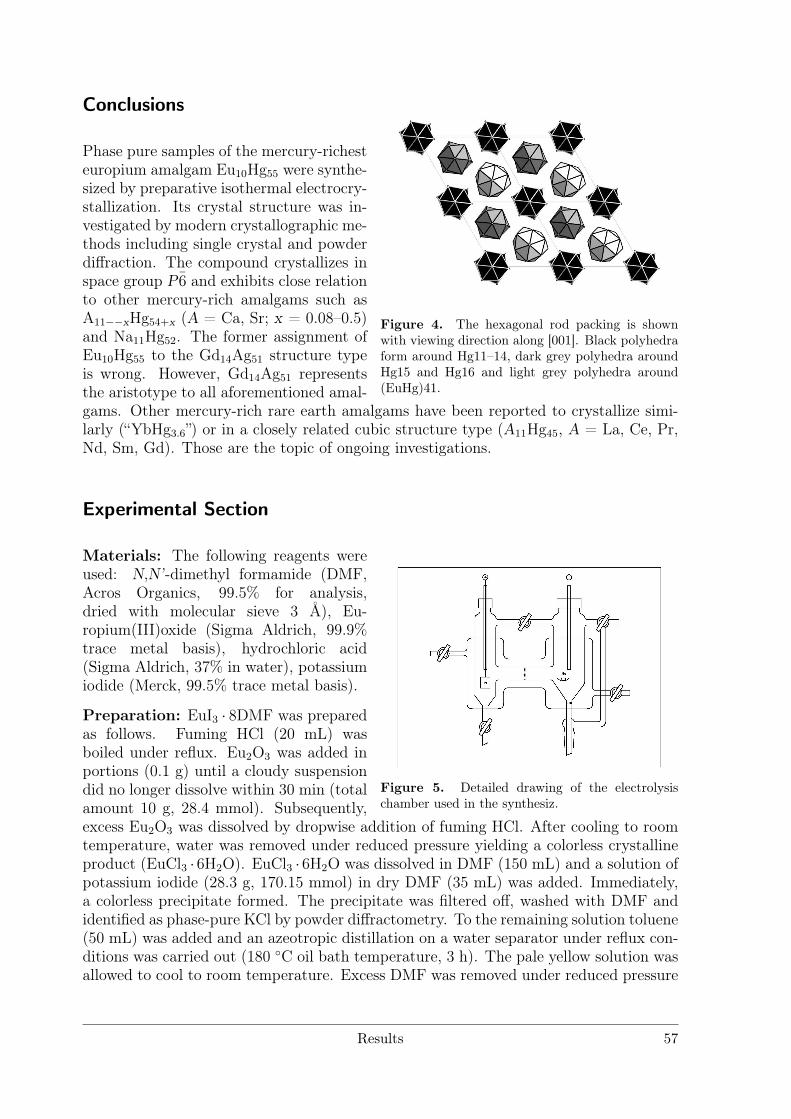
Figure 4. The hexagonal rod packing is shownwith viewing direction along [001]. Black polyhedraform around Hg11–14, dark grey polyhedra aroundHg15 and Hg16 and light grey polyhedra around(EuHg)41.
Conclusions
Phase pure samples of the mercury-richesteuropium amalgam Eu10Hg55 were synthe-sized by preparative isothermal electrocry-stallization. Its crystal structure was in-vestigated by modern crystallographic me-thods including single crystal and powderdiffraction. The compound crystallizes inspace group P6 and exhibits close relationto other mercury-rich amalgams such asA11−−xHg54+x (A = Ca, Sr; x = 0.08–0.5)and Na11Hg52. The former assignment ofEu10Hg55 to the Gd14Ag51 structure typeis wrong. However, Gd14Ag51 representsthe aristotype to all aforementioned amal-gams. Other mercury-rich rare earth amalgams have been reported to crystallize simi-larly (“YbHg3.6”) or in a closely related cubic structure type (A11Hg45, A = La, Ce, Pr,Nd, Sm, Gd). Those are the topic of ongoing investigations.
Experimental Section
Figure 5. Detailed drawing of the electrolysischamber used in the synthesiz.
Materials: The following reagents wereused: N,N’-dimethyl formamide (DMF,Acros Organics, 99.5% for analysis,dried with molecular sieve 3 Å), Eu-ropium(III)oxide (Sigma Aldrich, 99.9%trace metal basis), hydrochloric acid(Sigma Aldrich, 37% in water), potassiumiodide (Merck, 99.5% trace metal basis).
Preparation: EuI3 · 8DMF was preparedas follows. Fuming HCl (20 mL) wasboiled under reflux. Eu2O3 was added inportions (0.1 g) until a cloudy suspensiondid no longer dissolve within 30 min (totalamount 10 g, 28.4 mmol). Subsequently,excess Eu2O3 was dissolved by dropwise addition of fuming HCl. After cooling to roomtemperature, water was removed under reduced pressure yielding a colorless crystallineproduct (EuCl3 · 6H2O). EuCl3 · 6H2O was dissolved in DMF (150 mL) and a solution ofpotassium iodide (28.3 g, 170.15 mmol) in dry DMF (35 mL) was added. Immediately,a colorless precipitate formed. The precipitate was filtered off, washed with DMF andidentified as phase-pure KCl by powder diffractometry. To the remaining solution toluene(50 mL) was added and an azeotropic distillation on a water separator under reflux con-ditions was carried out (180 C oil bath temperature, 3 h). The pale yellow solution wasallowed to cool to room temperature. Excess DMF was removed under reduced pressure
Results 57
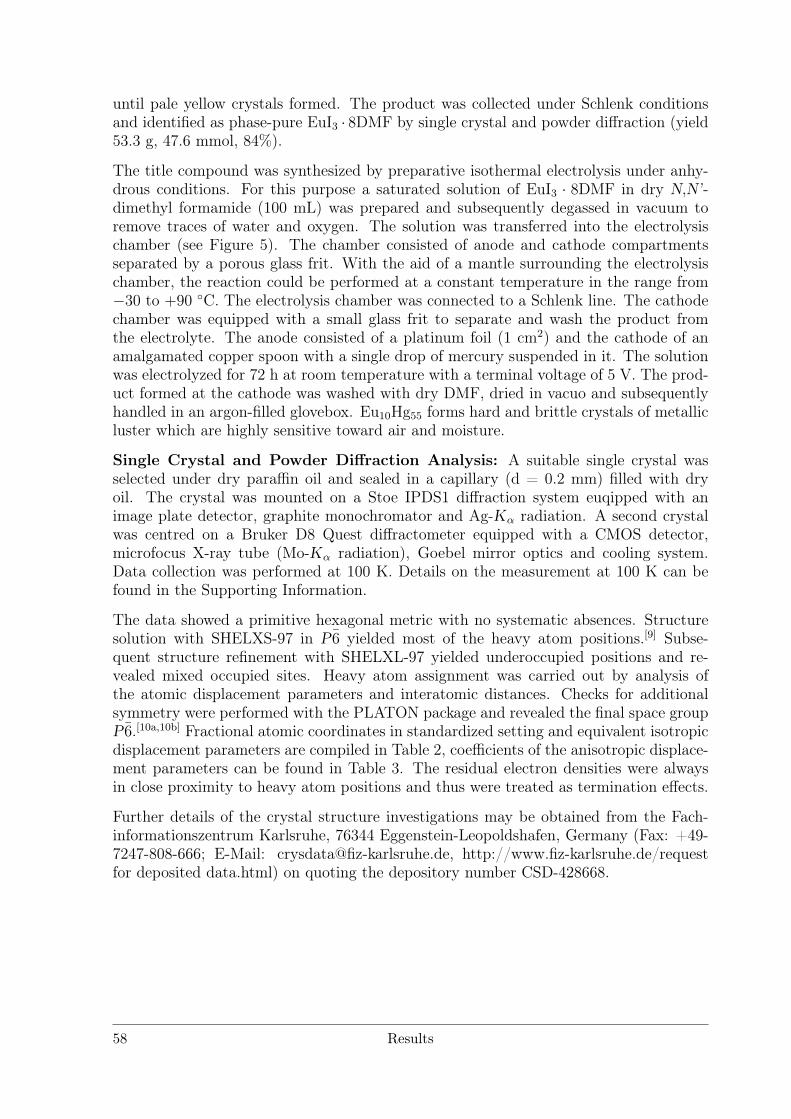
until pale yellow crystals formed. The product was collected under Schlenk conditionsand identified as phase-pure EuI3 · 8DMF by single crystal and powder diffraction (yield53.3 g, 47.6 mmol, 84%).
The title compound was synthesized by preparative isothermal electrolysis under anhy-drous conditions. For this purpose a saturated solution of EuI3 · 8DMF in dry N,N’-dimethyl formamide (100 mL) was prepared and subsequently degassed in vacuum toremove traces of water and oxygen. The solution was transferred into the electrolysischamber (see Figure 5). The chamber consisted of anode and cathode compartmentsseparated by a porous glass frit. With the aid of a mantle surrounding the electrolysischamber, the reaction could be performed at a constant temperature in the range from−30 to +90 C. The electrolysis chamber was connected to a Schlenk line. The cathodechamber was equipped with a small glass frit to separate and wash the product fromthe electrolyte. The anode consisted of a platinum foil (1 cm2) and the cathode of anamalgamated copper spoon with a single drop of mercury suspended in it. The solutionwas electrolyzed for 72 h at room temperature with a terminal voltage of 5 V. The prod-uct formed at the cathode was washed with dry DMF, dried in vacuo and subsequentlyhandled in an argon-filled glovebox. Eu10Hg55 forms hard and brittle crystals of metallicluster which are highly sensitive toward air and moisture.
Single Crystal and Powder Diffraction Analysis: A suitable single crystal wasselected under dry paraffin oil and sealed in a capillary (d = 0.2 mm) filled with dryoil. The crystal was mounted on a Stoe IPDS1 diffraction system euqipped with animage plate detector, graphite monochromator and Ag-Kα radiation. A second crystalwas centred on a Bruker D8 Quest diffractometer equipped with a CMOS detector,microfocus X-ray tube (Mo-Kα radiation), Goebel mirror optics and cooling system.Data collection was performed at 100 K. Details on the measurement at 100 K can befound in the Supporting Information.
The data showed a primitive hexagonal metric with no systematic absences. Structuresolution with SHELXS-97 in P6 yielded most of the heavy atom positions.[9] Subse-quent structure refinement with SHELXL-97 yielded underoccupied positions and re-vealed mixed occupied sites. Heavy atom assignment was carried out by analysis ofthe atomic displacement parameters and interatomic distances. Checks for additionalsymmetry were performed with the PLATON package and revealed the final space groupP6.[10a,10b] Fractional atomic coordinates in standardized setting and equivalent isotropicdisplacement parameters are compiled in Table 2, coefficients of the anisotropic displace-ment parameters can be found in Table 3. The residual electron densities were alwaysin close proximity to heavy atom positions and thus were treated as termination effects.
Further details of the crystal structure investigations may be obtained from the Fach-informationszentrum Karlsruhe, 76344 Eggenstein-Leopoldshafen, Germany (Fax: +49-7247-808-666; E-Mail: [email protected], http://www.fiz-karlsruhe.de/requestfor deposited data.html) on quoting the depository number CSD-428668.
58 Results
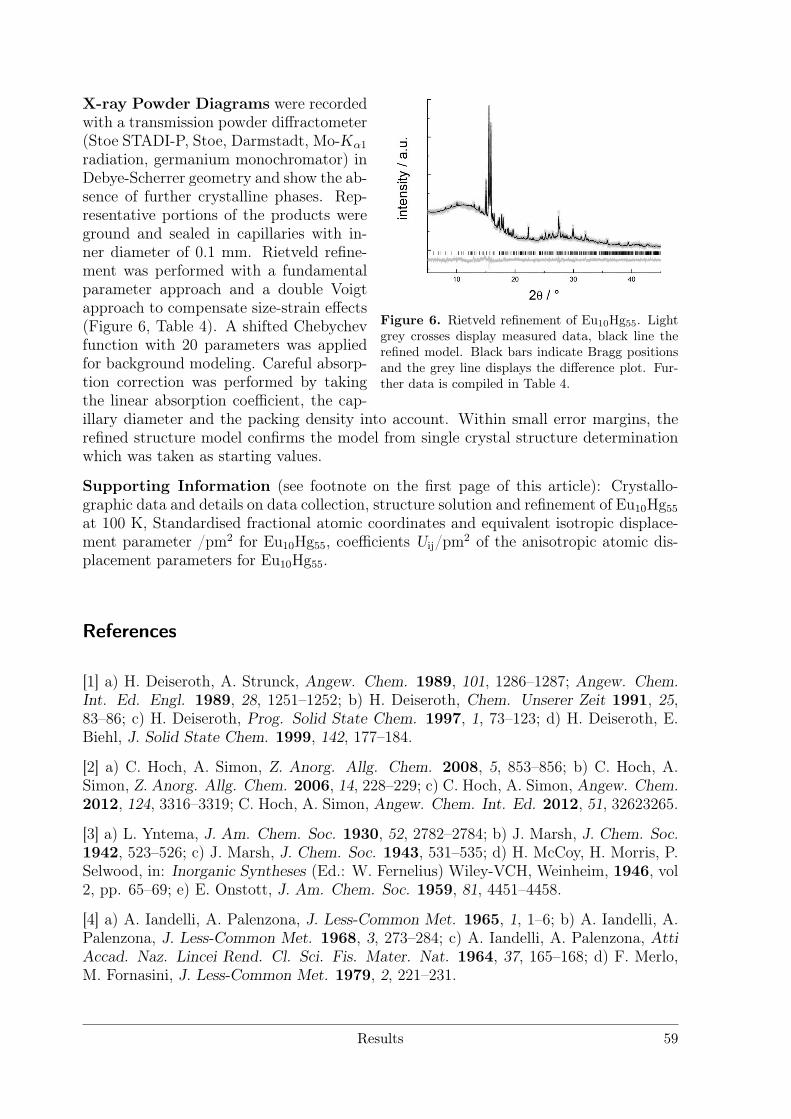
Figure 6. Rietveld refinement of Eu10Hg55. Lightgrey crosses display measured data, black line therefined model. Black bars indicate Bragg positionsand the grey line displays the difference plot. Fur-ther data is compiled in Table 4.
X-ray Powder Diagrams were recordedwith a transmission powder diffractometer(Stoe STADI-P, Stoe, Darmstadt, Mo-Kα1
radiation, germanium monochromator) inDebye-Scherrer geometry and show the ab-sence of further crystalline phases. Rep-resentative portions of the products wereground and sealed in capillaries with in-ner diameter of 0.1 mm. Rietveld refine-ment was performed with a fundamentalparameter approach and a double Voigtapproach to compensate size-strain effects(Figure 6, Table 4). A shifted Chebychevfunction with 20 parameters was appliedfor background modeling. Careful absorp-tion correction was performed by takingthe linear absorption coefficient, the cap-illary diameter and the packing density into account. Within small error margins, therefined structure model confirms the model from single crystal structure determinationwhich was taken as starting values.
Supporting Information (see footnote on the first page of this article): Crystallo-graphic data and details on data collection, structure solution and refinement of Eu10Hg55
at 100 K, Standardised fractional atomic coordinates and equivalent isotropic displace-ment parameter /pm2 for Eu10Hg55, coefficients Uij/pm2 of the anisotropic atomic dis-placement parameters for Eu10Hg55.
References
[1] a) H. Deiseroth, A. Strunck, Angew. Chem. 1989, 101, 1286–1287; Angew. Chem.Int. Ed. Engl. 1989, 28, 1251–1252; b) H. Deiseroth, Chem. Unserer Zeit 1991, 25,83–86; c) H. Deiseroth, Prog. Solid State Chem. 1997, 1, 73–123; d) H. Deiseroth, E.Biehl, J. Solid State Chem. 1999, 142, 177–184.
[2] a) C. Hoch, A. Simon, Z. Anorg. Allg. Chem. 2008, 5, 853–856; b) C. Hoch, A.Simon, Z. Anorg. Allg. Chem. 2006, 14, 228–229; c) C. Hoch, A. Simon, Angew. Chem.2012, 124, 3316–3319; C. Hoch, A. Simon, Angew. Chem. Int. Ed. 2012, 51, 32623265.
[3] a) L. Yntema, J. Am. Chem. Soc. 1930, 52, 2782–2784; b) J. Marsh, J. Chem. Soc.1942, 523–526; c) J. Marsh, J. Chem. Soc. 1943, 531–535; d) H. McCoy, H. Morris, P.Selwood, in: Inorganic Syntheses (Ed.: W. Fernelius) Wiley-VCH, Weinheim, 1946, vol2, pp. 65–69; e) E. Onstott, J. Am. Chem. Soc. 1959, 81, 4451–4458.
[4] a) A. Iandelli, A. Palenzona, J. Less-Common Met. 1965, 1, 1–6; b) A. Iandelli, A.Palenzona, J. Less-Common Met. 1968, 3, 273–284; c) A. Iandelli, A. Palenzona, AttiAccad. Naz. Lincei Rend. Cl. Sci. Fis. Mater. Nat. 1964, 37, 165–168; d) F. Merlo,M. Fornasini, J. Less-Common Met. 1979, 2, 221–231.
Results 59
[5] a) S. Steeb, D. Godel, C. Löhr, J. Less-Common Met. 1968, 2, 137–141; b) O.McMasters, K. Gschneidner Jnr, R. Venteicher, Acta Crystallogr., Sect. B 1970, 9,1224–1229; c) D. Bailey, G. Kline, Acta Crystallogr., Sect. B 1971, 3, 650–653; d) F.Tambornino, J. Sappl, C. Hoch, J. Less-Common Met. 2015, 618, 326–335.
[6] S. Lyle, W. Westall, J. Less-Common Met. 1984, 2, 265–272.
[7] a) G. Bruzzone, F. Merlo, J. Less-Common Met. 1973, 2, 237–241; b) G. Bruzzone,F. Merlo, J. Less-Common Met. 1974, 2, 153–157; c) F. Merlo, M. Fornasini, J. Less-Common Met. 1979, 221–231.
[8] A. Tkachuk, A. Mar, Inorg. Chem. 2008, 47, 1313–1318.
[9] G. M. Sheldrick, Acta Crystallogr., Sect. A 2008, 64, 112–122.
[10] a) A. L. Spek, Acta Crystallogr., Sect. D 2009, 65, 148–155; b) Y. Le Page, J. Appl.Crystallogr. 1987, 20, 264–269.
60 Results
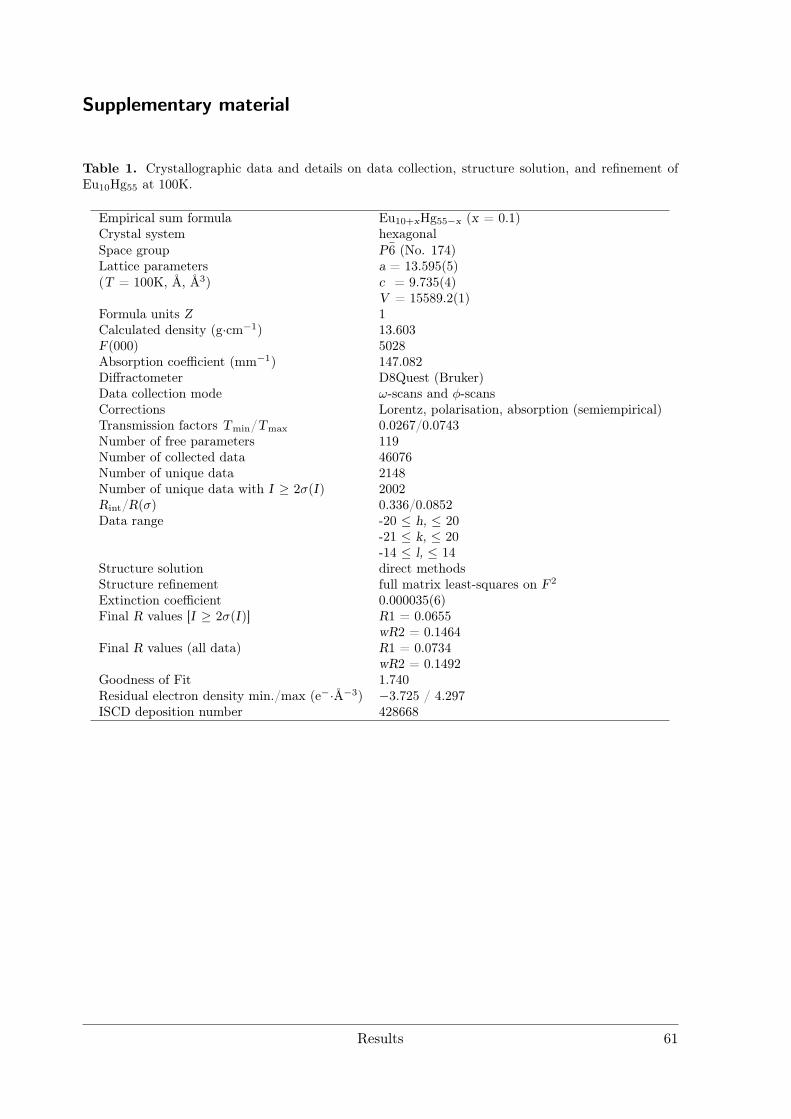
Supplementary material
Table 1. Crystallographic data and details on data collection, structure solution, and refinement ofEu10Hg55 at 100K.
Empirical sum formula Eu10+xHg55−x (x = 0.1)Crystal system hexagonalSpace group P6 (No. 174)Lattice parameters a = 13.595(5)(T = 100K, Å, Å3) c = 9.735(4)
V = 15589.2(1)Formula units Z 1Calculated density (g·cm−1) 13.603F(000) 5028Absorption coefficient (mm−1) 147.082Diffractometer D8Quest (Bruker)Data collection mode ω-scans and φ-scansCorrections Lorentz, polarisation, absorption (semiempirical)Transmission factors Tmin/Tmax 0.0267/0.0743Number of free parameters 119Number of collected data 46076Number of unique data 2148Number of unique data with I ≥ 2σ(I) 2002Rint/R(σ) 0.336/0.0852Data range -20 ≤ h, ≤ 20
-21 ≤ k, ≤ 20-14 ≤ l, ≤ 14
Structure solution direct methodsStructure refinement full matrix least-squares on F2
Extinction coefficient 0.000035(6)Final R values [I ≥ 2σ(I)] R1 = 0.0655
wR2 = 0.1464Final R values (all data) R1 = 0.0734
wR2 = 0.1492Goodness of Fit 1.740Residual electron density min./max (e−·Å−3) −3.725 / 4.297ISCD deposition number 428668
Results 61
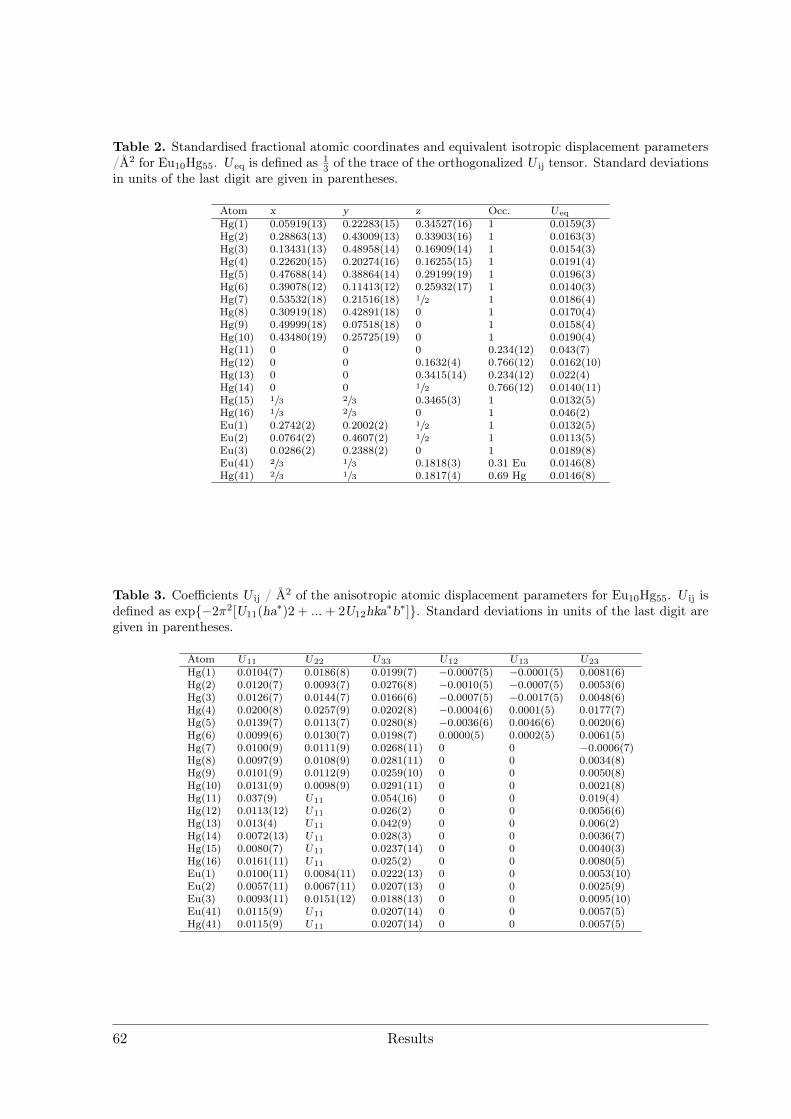
Table 2. Standardised fractional atomic coordinates and equivalent isotropic displacement parameters/Å2 for Eu10Hg55. U eq is defined as 1
3 of the trace of the orthogonalized U ij tensor. Standard deviationsin units of the last digit are given in parentheses.
Atom x y z Occ. Ueq
Hg(1) 0.05919(13) 0.22283(15) 0.34527(16) 1 0.0159(3)Hg(2) 0.28863(13) 0.43009(13) 0.33903(16) 1 0.0163(3)Hg(3) 0.13431(13) 0.48958(14) 0.16909(14) 1 0.0154(3)Hg(4) 0.22620(15) 0.20274(16) 0.16255(15) 1 0.0191(4)Hg(5) 0.47688(14) 0.38864(14) 0.29199(19) 1 0.0196(3)Hg(6) 0.39078(12) 0.11413(12) 0.25932(17) 1 0.0140(3)Hg(7) 0.53532(18) 0.21516(18) 1/2 1 0.0186(4)Hg(8) 0.30919(18) 0.42891(18) 0 1 0.0170(4)Hg(9) 0.49999(18) 0.07518(18) 0 1 0.0158(4)Hg(10) 0.43480(19) 0.25725(19) 0 1 0.0190(4)Hg(11) 0 0 0 0.234(12) 0.043(7)Hg(12) 0 0 0.1632(4) 0.766(12) 0.0162(10)Hg(13) 0 0 0.3415(14) 0.234(12) 0.022(4)Hg(14) 0 0 1/2 0.766(12) 0.0140(11)Hg(15) 1/3 2/3 0.3465(3) 1 0.0132(5)Hg(16) 1/3 2/3 0 1 0.046(2)Eu(1) 0.2742(2) 0.2002(2) 1/2 1 0.0132(5)Eu(2) 0.0764(2) 0.4607(2) 1/2 1 0.0113(5)Eu(3) 0.0286(2) 0.2388(2) 0 1 0.0189(8)Eu(41) 2/3 1/3 0.1818(3) 0.31 Eu 0.0146(8)Hg(41) 2/3 1/3 0.1817(4) 0.69 Hg 0.0146(8)
Table 3. Coefficients U ij / Å2 of the anisotropic atomic displacement parameters for Eu10Hg55. U ij isdefined as exp−2π2[U11(ha∗)2 + ...+ 2U12hka∗b∗]. Standard deviations in units of the last digit aregiven in parentheses.
Atom U11 U22 U33 U12 U13 U23
Hg(1) 0.0104(7) 0.0186(8) 0.0199(7) −0.0007(5) −0.0001(5) 0.0081(6)Hg(2) 0.0120(7) 0.0093(7) 0.0276(8) −0.0010(5) −0.0007(5) 0.0053(6)Hg(3) 0.0126(7) 0.0144(7) 0.0166(6) −0.0007(5) −0.0017(5) 0.0048(6)Hg(4) 0.0200(8) 0.0257(9) 0.0202(8) −0.0004(6) 0.0001(5) 0.0177(7)Hg(5) 0.0139(7) 0.0113(7) 0.0280(8) −0.0036(6) 0.0046(6) 0.0020(6)Hg(6) 0.0099(6) 0.0130(7) 0.0198(7) 0.0000(5) 0.0002(5) 0.0061(5)Hg(7) 0.0100(9) 0.0111(9) 0.0268(11) 0 0 −0.0006(7)Hg(8) 0.0097(9) 0.0108(9) 0.0281(11) 0 0 0.0034(8)Hg(9) 0.0101(9) 0.0112(9) 0.0259(10) 0 0 0.0050(8)Hg(10) 0.0131(9) 0.0098(9) 0.0291(11) 0 0 0.0021(8)Hg(11) 0.037(9) U11 0.054(16) 0 0 0.019(4)Hg(12) 0.0113(12) U11 0.026(2) 0 0 0.0056(6)Hg(13) 0.013(4) U11 0.042(9) 0 0 0.006(2)Hg(14) 0.0072(13) U11 0.028(3) 0 0 0.0036(7)Hg(15) 0.0080(7) U11 0.0237(14) 0 0 0.0040(3)Hg(16) 0.0161(11) U11 0.025(2) 0 0 0.0080(5)Eu(1) 0.0100(11) 0.0084(11) 0.0222(13) 0 0 0.0053(10)Eu(2) 0.0057(11) 0.0067(11) 0.0207(13) 0 0 0.0025(9)Eu(3) 0.0093(11) 0.0151(12) 0.0188(13) 0 0 0.0095(10)Eu(41) 0.0115(9) U11 0.0207(14) 0 0 0.0057(5)Hg(41) 0.0115(9) U11 0.0207(14) 0 0 0.0057(5)
62 Results
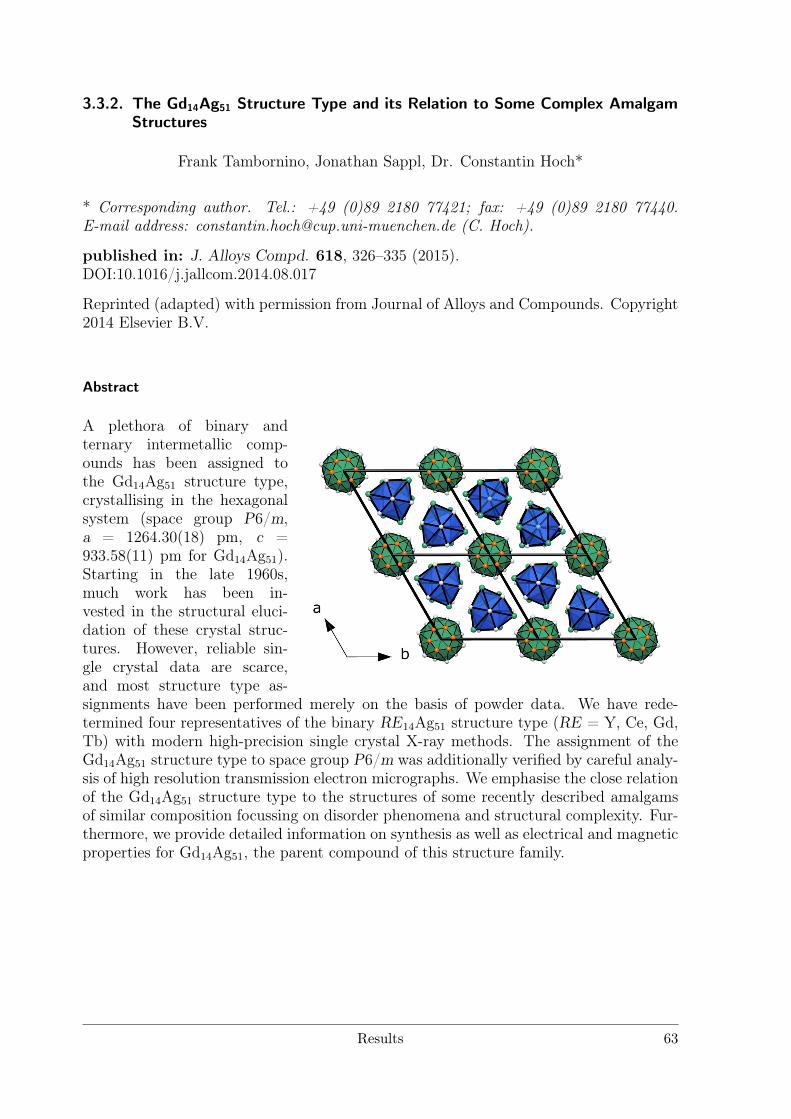
3.3.2. The Gd14Ag51 Structure Type and its Relation to Some Complex AmalgamStructures
Frank Tambornino, Jonathan Sappl, Dr. Constantin Hoch*
* Corresponding author. Tel.: +49 (0)89 2180 77421; fax: +49 (0)89 2180 77440.E-mail address: [email protected] (C. Hoch).
published in: J. Alloys Compd. 618, 326–335 (2015).DOI:10.1016/j.jallcom.2014.08.017
Reprinted (adapted) with permission from Journal of Alloys and Compounds. Copyright2014 Elsevier B.V.
Abstract
A plethora of binary andternary intermetallic comp-ounds has been assigned tothe Gd14Ag51 structure type,crystallising in the hexagonalsystem (space group P6/m,a = 1264.30(18) pm, c =933.58(11) pm for Gd14Ag51).Starting in the late 1960s,much work has been in-vested in the structural eluci-dation of these crystal struc-tures. However, reliable sin-gle crystal data are scarce,and most structure type as-signments have been performed merely on the basis of powder data. We have rede-termined four representatives of the binary RE14Ag51 structure type (RE = Y, Ce, Gd,Tb) with modern high-precision single crystal X-ray methods. The assignment of theGd14Ag51 structure type to space group P6/m was additionally verified by careful analy-sis of high resolution transmission electron micrographs. We emphasise the close relationof the Gd14Ag51 structure type to the structures of some recently described amalgamsof similar composition focussing on disorder phenomena and structural complexity. Fur-thermore, we provide detailed information on synthesis as well as electrical and magneticproperties for Gd14Ag51, the parent compound of this structure family.
Results 63
Introduction
Recently, the Gd14Ag51 structure type attracted new attention as several amalgams ofthe alkali and alkaline-earth metals were described in very closely related crystal struc-tures. [1–3] As a consequence of the observation of disorder phenomena, the Gd14Ag51
structure type could be regarded either as archetype structure for these amalgams oras a possibly overlooked twinning problem. In this context, we found it worthwhile torevisit exemplary representatives of this large family of intermetallic compounds withmodern crystallographic methods.
Gd14Ag51, the parent compound, was first described with the composition ”GdAg3” bySteeb and coworkers in 1968 [4]. On the basis of powder diffraction data it was assignedto the ”Ag3Pu” type. Both ”GdAg3” and ”Ag3Pu” later were reassigned to the Gd14Ag51
type [5]. Bailey and Kline performed the first single crystal structure refinement in1970 and gave the actual composition as ”GdAg3.6”, much closer to 51:14 (= 3.643) [6].Later in the same year, RE14Ag51 with RE = Y, Nd, Sm, Gd, Tb, Dy, Ho, Er wereassigned to the Gd14Ag51 structure type on the basis of powder diffraction patterns [7].Numerous phases followed: Th14Ag51 [8], several copper and gold compounds (M14Cu51
with M = Zr, Hf, Ce [9,10], RE14Au51 with RE = Pr, Nd, Gd, U) [11–16], and also someamalgams RE14Hg51 with RE = Ca, Sr, Eu, Yb [17–19], again on the basis of powderdiffraction patterns. Ordered ternary variants include Gd14Cu48Ga3, Tb14Cu48Ga3 andCa14Au46Sn5 [20,21].
In 2008 the mercury-rich Ca and Sr amalgams were reinvestigated by Mar and coworkerswith modern X-ray single crystal methods [1]. They reported the respective crystalstructures in space group P6 rather than P6/m and described occurring disorder effectsin detail. Mar et al. already marked out the close relation of the amalgam structuresto the Gd14Ag51 structure type and possible problems with its space group assignment.Recently, we reinvestigated the mercury-richest Europium amalgam Eu10Hg55 and refinedits structure from single crystal data. It crystallizes in space group P6 in close relationboth to the Gd14Ag51 and the (Ca/Sr)14Hg51 crystal structures, however, differing in therespective disorder phenomena [3].
The structure of Na11Hg52 [2] shows a (3 x 3 x 1) superstructure of the alkaline-earthmetal amalgams, again in space group P6 and with yet different disorder phenomena.
Thus, all named amalgams have similar structures differing among themselves in theirrespective disorder patterns and from the Gd14Ag51 structure type by the lower symmet-ric space group type. The reported Gd14Ag51 structure in space group P6/m shows Agatoms arranged in a hexagon around the sixfold axis with very short Ag–Ag distancesand an occupation factor of 1
2. This situation is never observed in the named amalgams.
At equivalent Hg positions, ordered and fully occupied triangles occur, as they are de-scribed in space group P6, where no sixfold point symmetry is present. As P6 is a directsubgroup of P6/m, we reinvestigated the crystal structures of some Gd14Ag51-type com-pounds in order to decide whether there was a crystallographic reason for finding highersymmetry in the Gd14Ag51 structure type or whether an overlooked twinning problemcauses the equidistant hexagon of half-occupied silver atoms. Single crystal data werecollected for RE14Ag51 (RE = Y, Ce, Gd, Tb). We refined the data in several spacegroups to compare the results. In addition, we recorded high-resolution trasmission elec-
64 Results
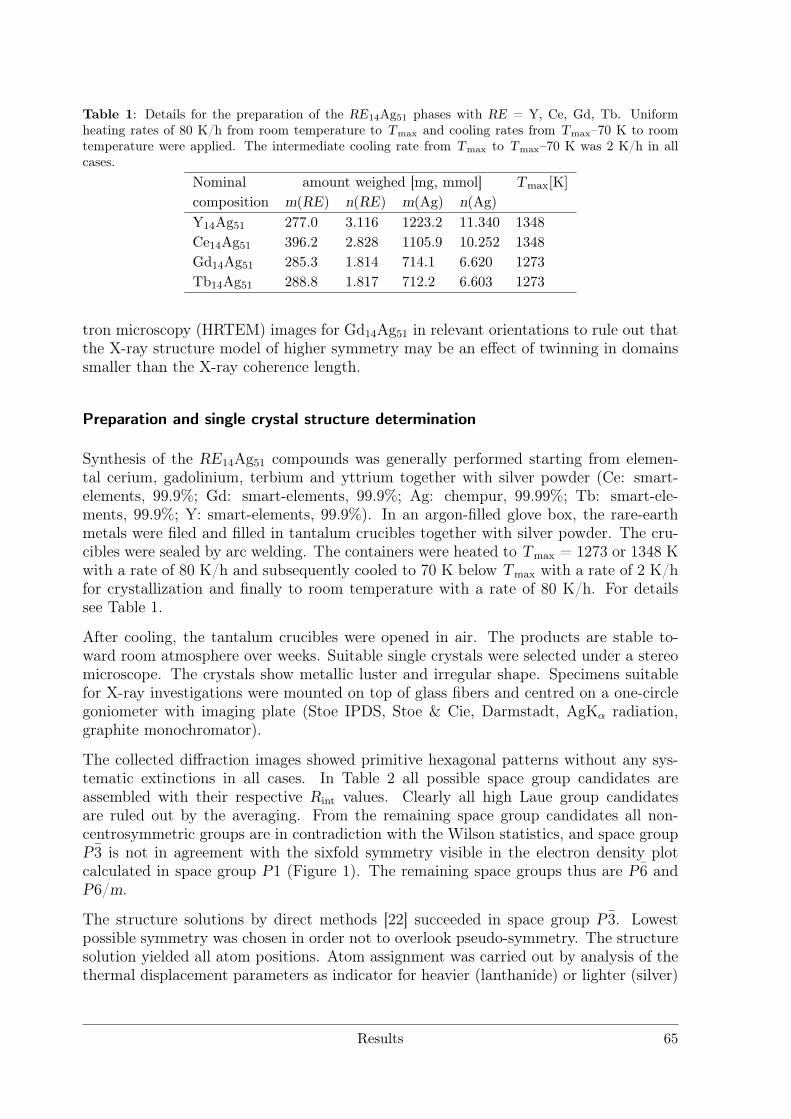
Table 1: Details for the preparation of the RE14Ag51 phases with RE = Y, Ce, Gd, Tb. Uniformheating rates of 80 K/h from room temperature to Tmax and cooling rates from Tmax–70 K to roomtemperature were applied. The intermediate cooling rate from Tmax to Tmax–70 K was 2 K/h in allcases.
Nominal amount weighed [mg, mmol] Tmax[K]
composition m(RE) n(RE) m(Ag) n(Ag)Y14Ag51 277.0 3.116 1223.2 11.340 1348Ce14Ag51 396.2 2.828 1105.9 10.252 1348Gd14Ag51 285.3 1.814 714.1 6.620 1273Tb14Ag51 288.8 1.817 712.2 6.603 1273
tron microscopy (HRTEM) images for Gd14Ag51 in relevant orientations to rule out thatthe X-ray structure model of higher symmetry may be an effect of twinning in domainssmaller than the X-ray coherence length.
Preparation and single crystal structure determination
Synthesis of the RE14Ag51 compounds was generally performed starting from elemen-tal cerium, gadolinium, terbium and yttrium together with silver powder (Ce: smart-elements, 99.9%; Gd: smart-elements, 99.9%; Ag: chempur, 99.99%; Tb: smart-ele-ments, 99.9%; Y: smart-elements, 99.9%). In an argon-filled glove box, the rare-earthmetals were filed and filled in tantalum crucibles together with silver powder. The cru-cibles were sealed by arc welding. The containers were heated to Tmax = 1273 or 1348 Kwith a rate of 80 K/h and subsequently cooled to 70 K below Tmax with a rate of 2 K/hfor crystallization and finally to room temperature with a rate of 80 K/h. For detailssee Table 1.
After cooling, the tantalum crucibles were opened in air. The products are stable to-ward room atmosphere over weeks. Suitable single crystals were selected under a stereomicroscope. The crystals show metallic luster and irregular shape. Specimens suitablefor X-ray investigations were mounted on top of glass fibers and centred on a one-circlegoniometer with imaging plate (Stoe IPDS, Stoe & Cie, Darmstadt, AgKα radiation,graphite monochromator).
The collected diffraction images showed primitive hexagonal patterns without any sys-tematic extinctions in all cases. In Table 2 all possible space group candidates areassembled with their respective Rint values. Clearly all high Laue group candidatesare ruled out by the averaging. From the remaining space group candidates all non-centrosymmetric groups are in contradiction with the Wilson statistics, and space groupP3 is not in agreement with the sixfold symmetry visible in the electron density plotcalculated in space group P1 (Figure 1). The remaining space groups thus are P6 andP6/m.
The structure solutions by direct methods [22] succeeded in space group P3. Lowestpossible symmetry was chosen in order not to overlook pseudo-symmetry. The structuresolution yielded all atom positions. Atom assignment was carried out by analysis of thethermal displacement parameters as indicator for heavier (lanthanide) or lighter (silver)
Results 65
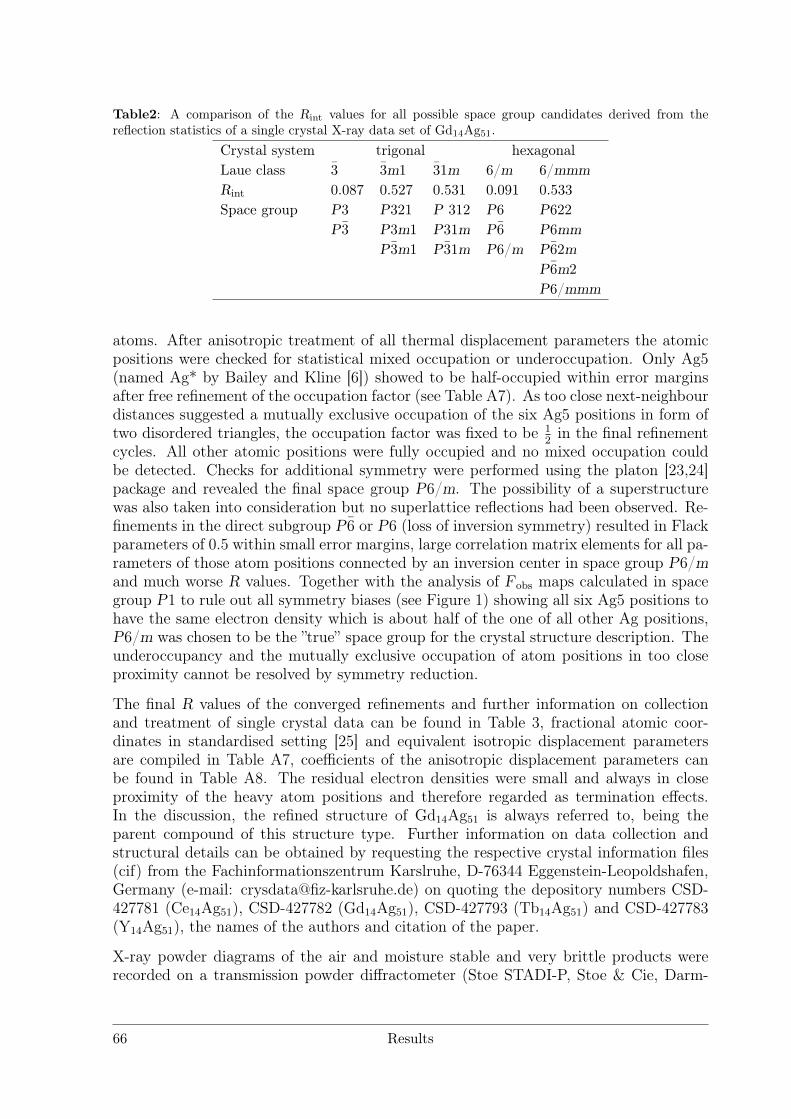
Table2: A comparison of the Rint values for all possible space group candidates derived from thereflection statistics of a single crystal X-ray data set of Gd14Ag51.
Crystal system trigonal hexagonalLaue class 3 3m1 31m 6/m 6/mmmRint 0.087 0.527 0.531 0.091 0.533Space group P3 P321 P 312 P6 P622
P3 P3m1 P31m P6 P6mmP3m1 P31m P6/m P62m
P6m2P6/mmm
atoms. After anisotropic treatment of all thermal displacement parameters the atomicpositions were checked for statistical mixed occupation or underoccupation. Only Ag5(named Ag* by Bailey and Kline [6]) showed to be half-occupied within error marginsafter free refinement of the occupation factor (see Table A7). As too close next-neighbourdistances suggested a mutually exclusive occupation of the six Ag5 positions in form oftwo disordered triangles, the occupation factor was fixed to be 1
2in the final refinement
cycles. All other atomic positions were fully occupied and no mixed occupation couldbe detected. Checks for additional symmetry were performed using the platon [23,24]package and revealed the final space group P6/m. The possibility of a superstructurewas also taken into consideration but no superlattice reflections had been observed. Re-finements in the direct subgroup P6 or P6 (loss of inversion symmetry) resulted in Flackparameters of 0.5 within small error margins, large correlation matrix elements for all pa-rameters of those atom positions connected by an inversion center in space group P6/mand much worse R values. Together with the analysis of Fobs maps calculated in spacegroup P1 to rule out all symmetry biases (see Figure 1) showing all six Ag5 positions tohave the same electron density which is about half of the one of all other Ag positions,P6/m was chosen to be the ”true” space group for the crystal structure description. Theunderoccupancy and the mutually exclusive occupation of atom positions in too closeproximity cannot be resolved by symmetry reduction.
The final R values of the converged refinements and further information on collectionand treatment of single crystal data can be found in Table 3, fractional atomic coor-dinates in standardised setting [25] and equivalent isotropic displacement parametersare compiled in Table A7, coefficients of the anisotropic displacement parameters canbe found in Table A8. The residual electron densities were small and always in closeproximity of the heavy atom positions and therefore regarded as termination effects.In the discussion, the refined structure of Gd14Ag51 is always referred to, being theparent compound of this structure type. Further information on data collection andstructural details can be obtained by requesting the respective crystal information files(cif) from the Fachinformationszentrum Karslruhe, D-76344 Eggenstein-Leopoldshafen,Germany (e-mail: [email protected]) on quoting the depository numbers CSD-427781 (Ce14Ag51), CSD-427782 (Gd14Ag51), CSD-427793 (Tb14Ag51) and CSD-427783(Y14Ag51), the names of the authors and citation of the paper.
X-ray powder diagrams of the air and moisture stable and very brittle products wererecorded on a transmission powder diffractometer (Stoe STADI-P, Stoe & Cie, Darm-
66 Results
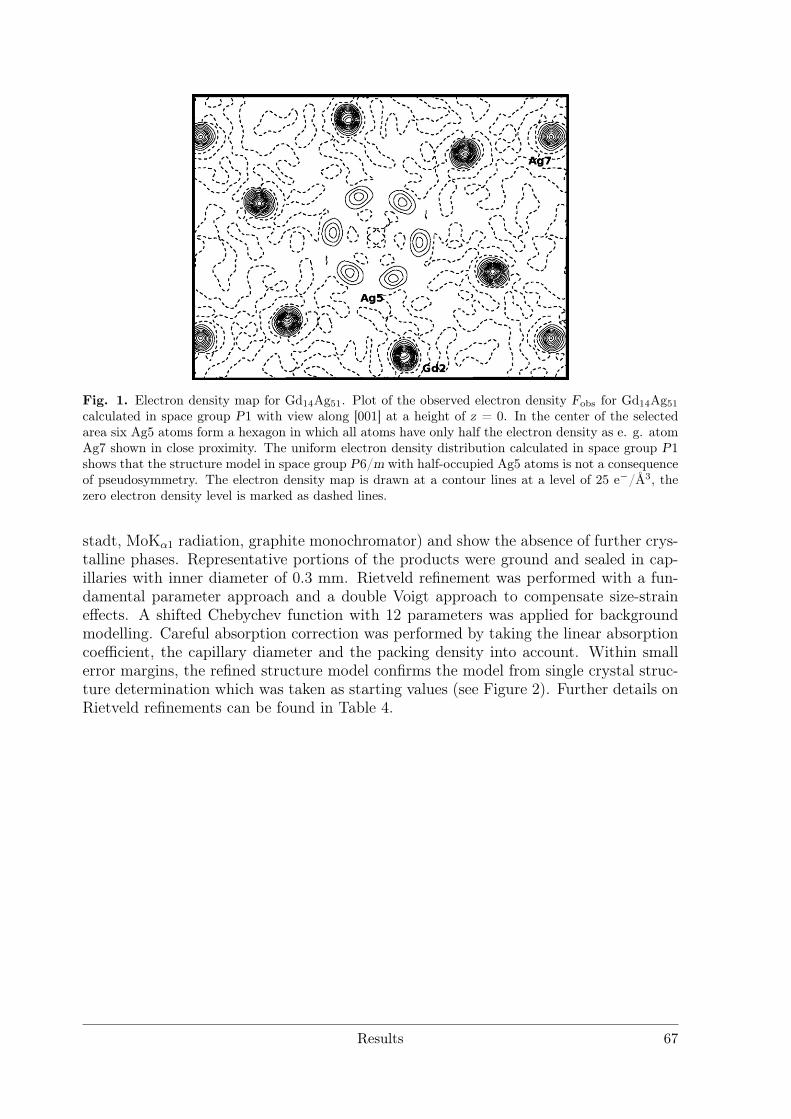
Fig. 1. Electron density map for Gd14Ag51. Plot of the observed electron density Fobs for Gd14Ag51calculated in space group P1 with view along [001] at a height of z = 0. In the center of the selectedarea six Ag5 atoms form a hexagon in which all atoms have only half the electron density as e. g. atomAg7 shown in close proximity. The uniform electron density distribution calculated in space group P1shows that the structure model in space group P6/m with half-occupied Ag5 atoms is not a consequenceof pseudosymmetry. The electron density map is drawn at a contour lines at a level of 25 e−/Å3, thezero electron density level is marked as dashed lines.
stadt, MoKα1 radiation, graphite monochromator) and show the absence of further crys-talline phases. Representative portions of the products were ground and sealed in cap-illaries with inner diameter of 0.3 mm. Rietveld refinement was performed with a fun-damental parameter approach and a double Voigt approach to compensate size-straineffects. A shifted Chebychev function with 12 parameters was applied for backgroundmodelling. Careful absorption correction was performed by taking the linear absorptioncoefficient, the capillary diameter and the packing density into account. Within smallerror margins, the refined structure model confirms the model from single crystal struc-ture determination which was taken as starting values (see Figure 2). Further details onRietveld refinements can be found in Table 4.
Results 67
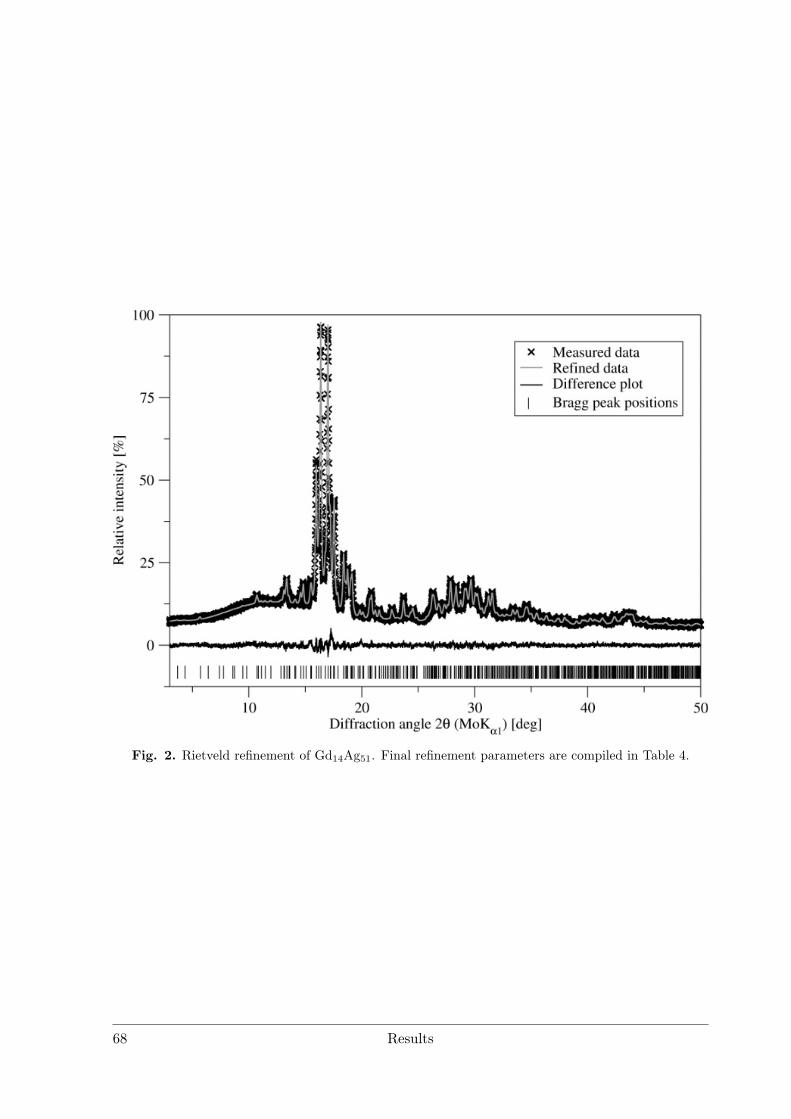
Fig. 2. Rietveld refinement of Gd14Ag51. Final refinement parameters are compiled in Table 4.
68 Results
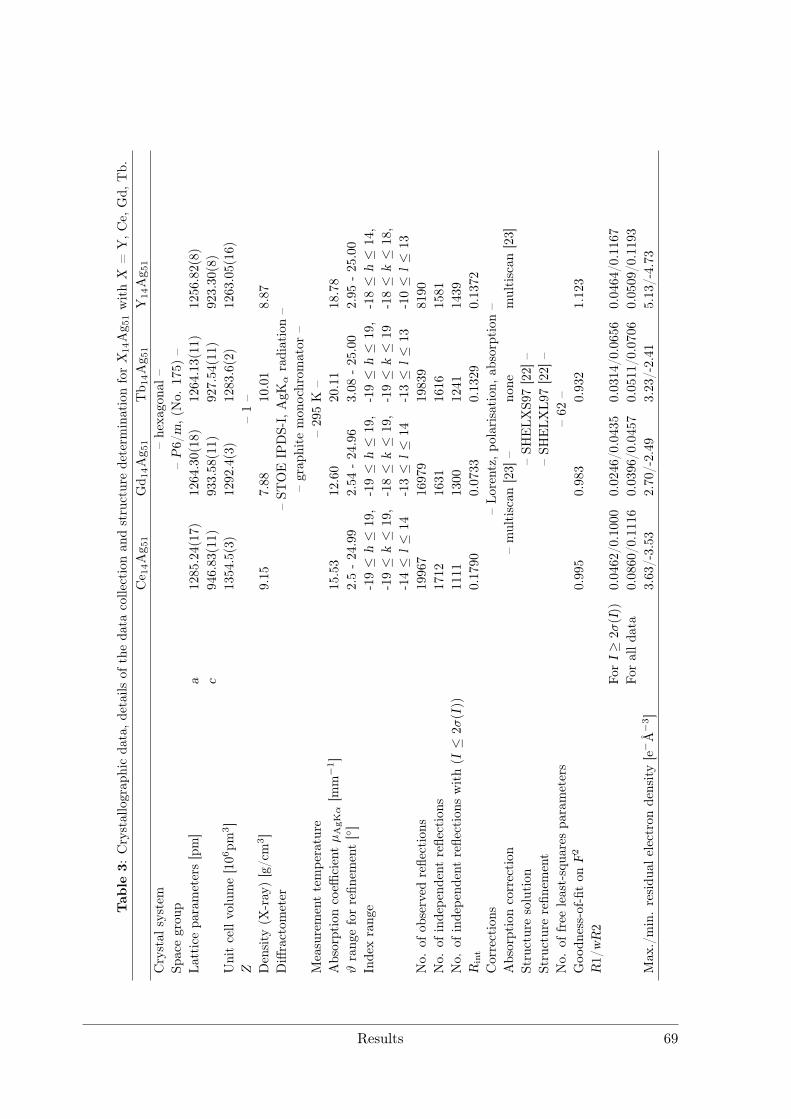
Tab
le3:
Crystallograp
hicda
ta,d
etails
oftheda
tacollectionan
dstructuredeterm
inationforX
14A
g 51withX
=Y,C
e,Gd,
Tb.
Ce 1
4A
g51
Gd14A
g 51
Tb14A
g51
Y14A
g51
Crystal
system
–hexa
gona
l–Sp
acegrou
p–P6/m,(No.
175)
–La
tticepa
rameters[pm]
a1285.24(17)
1264.30(18)
1264.13(11)
1256.82(8)
c946.83(11)
933.58(11)
927.54(11)
923.30(8)
Unitcellvolume[106pm
3]
1354.5(3)
1292.4(3)
1283.6(2)
1263.05(16)
Z–1–
Density
(X-ray)[g/cm
3]
9.15
7.88
10.01
8.87
Diffractom
eter
–ST
OE
IPDS-I,AgK
αradiation–
–grap
hite
mon
ochrom
ator
–Measurementtempe
rature
–295K
–Absorptioncoeffi
cientµAgKα[m
m−1]
15.53
12.60
20.11
18.78
ϑrang
eforrefin
ement[]
2.5-24.99
2.54
-24.96
3.08
-25.00
2.95
-25.00
Indexrang
e-19≤
h≤
19,
-19≤
h≤
19,
-19≤
h≤
19,
-18≤
h≤
14,
-19≤
k≤
19,
-18≤
k≤
19,
-19≤
k≤
19-18≤
k≤
18,
-14≤
l≤
14-13≤
l≤
14-13≤
l≤
13-10≤
l≤
13No.
ofob
served
reflections
19967
16979
19839
8190
No.
ofindepe
ndentreflections
1712
1631
1616
1581
No.
ofindepe
ndentreflections
with(I≤
2σ(I))
1111
1300
1241
1439
Rint
0.1790
0.0733
0.1329
0.1372
Corrections
–Lo
rentz,
polarisation
,absorption–
Absorptioncorrection
–multiscan
[23]
–no
nemultiscan
[23]
Structuresolution
–SH
ELX
S97[22]
–Structurerefin
ement
–SH
ELX
L97[22]
–No.
offree
least-squa
respa
rameters
–62
–Goo
dness-of-fiton
F2
0.995
0.983
0.932
1.123
R1/wR2
ForI≥
2σ
(I))
0.0462/0.1000
0.0246/0.0435
0.0314/0.0656
0.0464/0.1167
Foralld
ata
0.0860/0.1116
0.0396/0.0457
0.0511/0.0706
0.0509/0.1193
Max
./min.residu
alelectron
density[e
−Å
−3]
3.63/-3.53
2.70/-2.49
3.23/-2.41
5.13/-4.73
Results 69
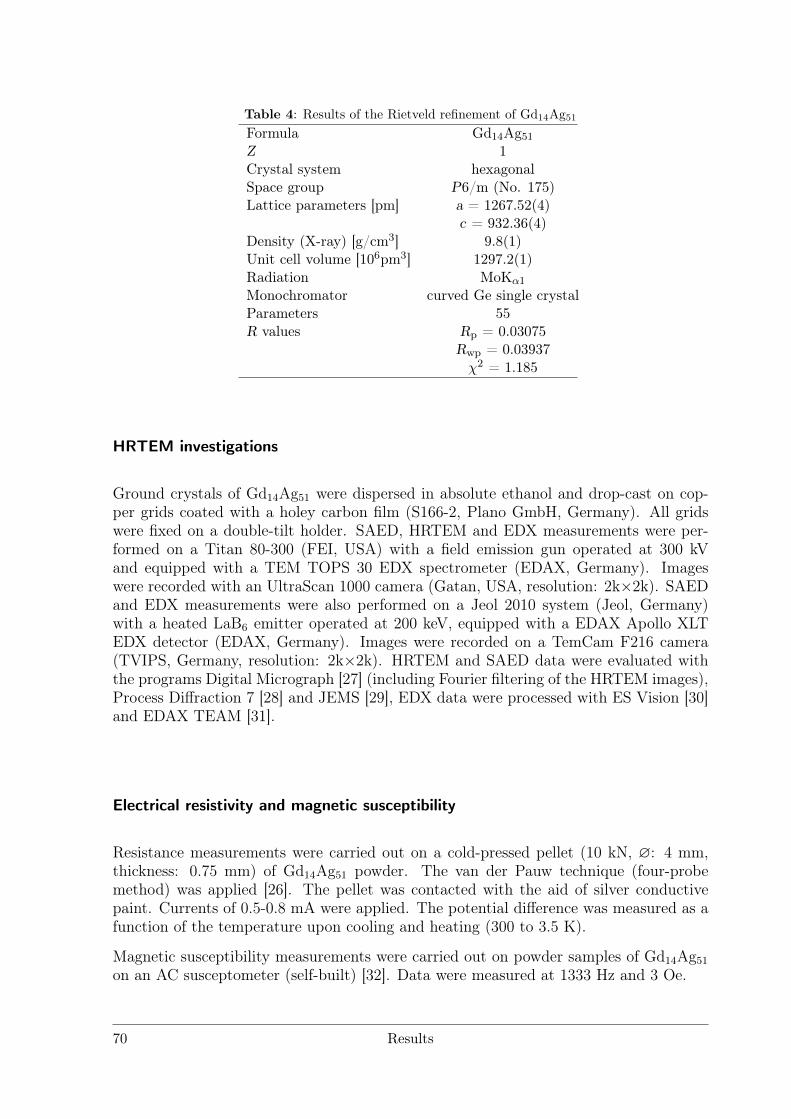
Table 4: Results of the Rietveld refinement of Gd14Ag51
Formula Gd14Ag51Z 1Crystal system hexagonalSpace group P6/m (No. 175)Lattice parameters [pm] a = 1267.52(4)
c = 932.36(4)Density (X-ray) [g/cm3] 9.8(1)Unit cell volume [106pm3] 1297.2(1)Radiation MoKα1
Monochromator curved Ge single crystalParameters 55R values Rp = 0.03075
Rwp = 0.03937χ2 = 1.185
HRTEM investigations
Ground crystals of Gd14Ag51 were dispersed in absolute ethanol and drop-cast on cop-per grids coated with a holey carbon film (S166-2, Plano GmbH, Germany). All gridswere fixed on a double-tilt holder. SAED, HRTEM and EDX measurements were per-formed on a Titan 80-300 (FEI, USA) with a field emission gun operated at 300 kVand equipped with a TEM TOPS 30 EDX spectrometer (EDAX, Germany). Imageswere recorded with an UltraScan 1000 camera (Gatan, USA, resolution: 2k×2k). SAEDand EDX measurements were also performed on a Jeol 2010 system (Jeol, Germany)with a heated LaB6 emitter operated at 200 keV, equipped with a EDAX Apollo XLTEDX detector (EDAX, Germany). Images were recorded on a TemCam F216 camera(TVIPS, Germany, resolution: 2k×2k). HRTEM and SAED data were evaluated withthe programs Digital Micrograph [27] (including Fourier filtering of the HRTEM images),Process Diffraction 7 [28] and JEMS [29], EDX data were processed with ES Vision [30]and EDAX TEAM [31].
Electrical resistivity and magnetic susceptibility
Resistance measurements were carried out on a cold-pressed pellet (10 kN, ∅: 4 mm,thickness: 0.75 mm) of Gd14Ag51 powder. The van der Pauw technique (four-probemethod) was applied [26]. The pellet was contacted with the aid of silver conductivepaint. Currents of 0.5-0.8 mA were applied. The potential difference was measured as afunction of the temperature upon cooling and heating (300 to 3.5 K).
Magnetic susceptibility measurements were carried out on powder samples of Gd14Ag51
on an AC susceptometer (self-built) [32]. Data were measured at 1333 Hz and 3 Oe.
70 Results
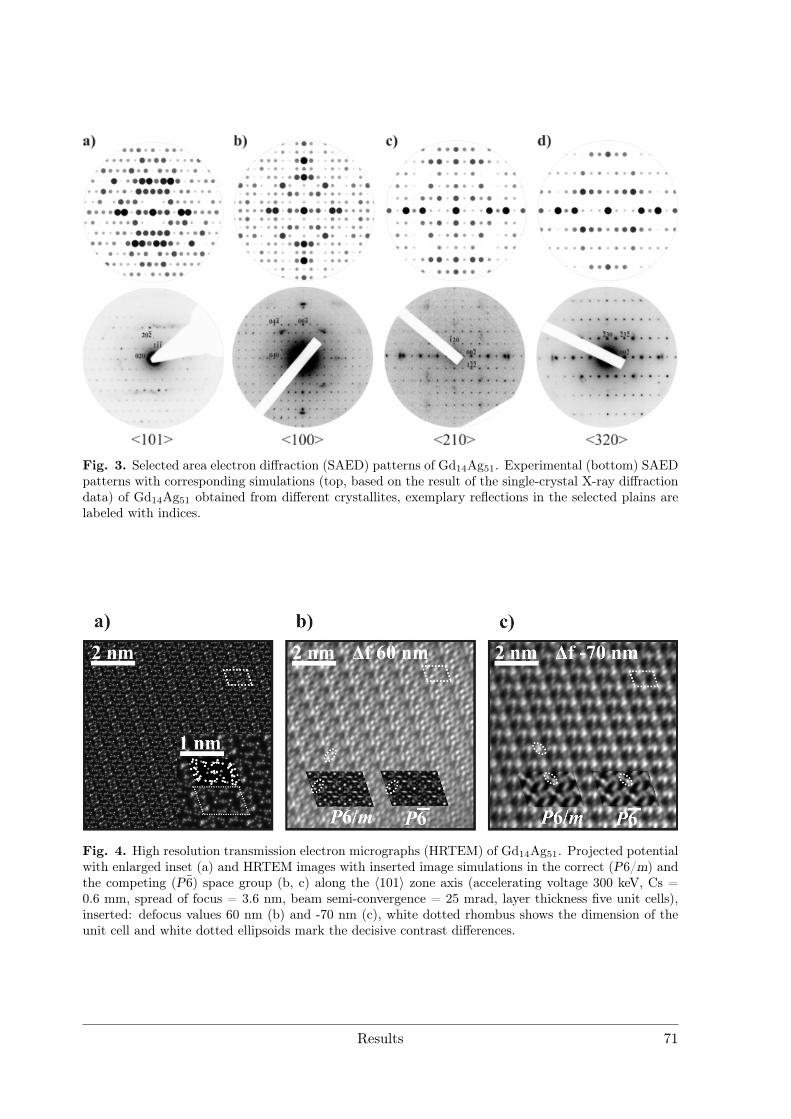
Fig. 3. Selected area electron diffraction (SAED) patterns of Gd14Ag51. Experimental (bottom) SAEDpatterns with corresponding simulations (top, based on the result of the single-crystal X-ray diffractiondata) of Gd14Ag51 obtained from different crystallites, exemplary reflections in the selected plains arelabeled with indices.
Fig. 4. High resolution transmission electron micrographs (HRTEM) of Gd14Ag51. Projected potentialwith enlarged inset (a) and HRTEM images with inserted image simulations in the correct (P6/m) andthe competing (P6) space group (b, c) along the 〈101〉 zone axis (accelerating voltage 300 keV, Cs =0.6 mm, spread of focus = 3.6 nm, beam semi-convergence = 25 mrad, layer thickness five unit cells),inserted: defocus values 60 nm (b) and -70 nm (c), white dotted rhombus shows the dimension of theunit cell and white dotted ellipsoids mark the decisive contrast differences.
Results 71
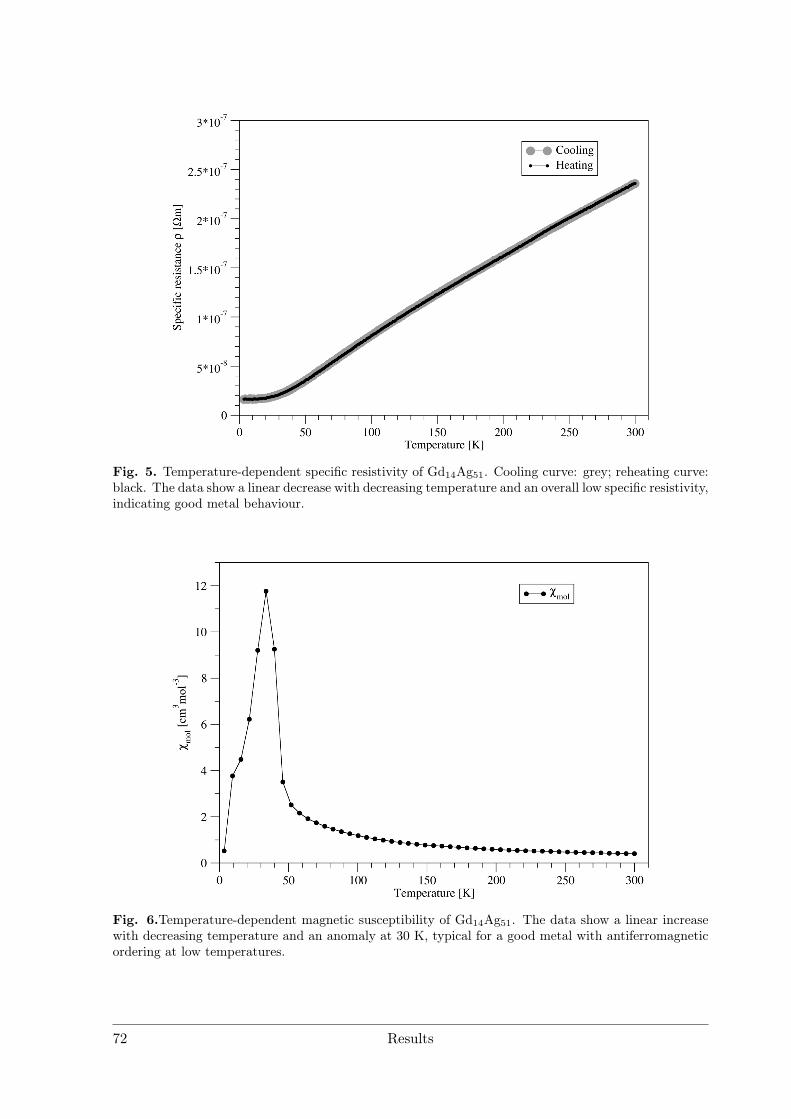
Fig. 5. Temperature-dependent specific resistivity of Gd14Ag51. Cooling curve: grey; reheating curve:black. The data show a linear decrease with decreasing temperature and an overall low specific resistivity,indicating good metal behaviour.
Fig. 6.Temperature-dependent magnetic susceptibility of Gd14Ag51. The data show a linear increasewith decreasing temperature and an anomaly at 30 K, typical for a good metal with antiferromagneticordering at low temperatures.
72 Results
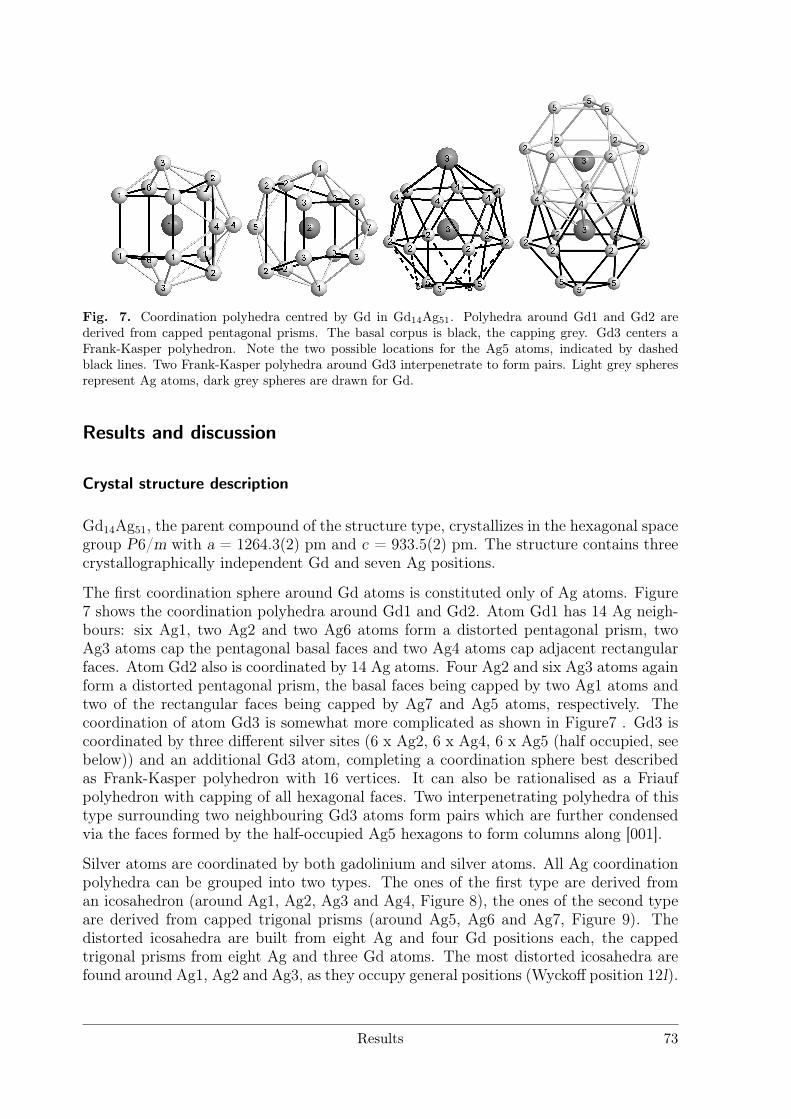
Fig. 7. Coordination polyhedra centred by Gd in Gd14Ag51. Polyhedra around Gd1 and Gd2 arederived from capped pentagonal prisms. The basal corpus is black, the capping grey. Gd3 centers aFrank-Kasper polyhedron. Note the two possible locations for the Ag5 atoms, indicated by dashedblack lines. Two Frank-Kasper polyhedra around Gd3 interpenetrate to form pairs. Light grey spheresrepresent Ag atoms, dark grey spheres are drawn for Gd.
Results and discussion
Crystal structure description
Gd14Ag51, the parent compound of the structure type, crystallizes in the hexagonal spacegroup P6/m with a = 1264.3(2) pm and c = 933.5(2) pm. The structure contains threecrystallographically independent Gd and seven Ag positions.
The first coordination sphere around Gd atoms is constituted only of Ag atoms. Figure7 shows the coordination polyhedra around Gd1 and Gd2. Atom Gd1 has 14 Ag neigh-bours: six Ag1, two Ag2 and two Ag6 atoms form a distorted pentagonal prism, twoAg3 atoms cap the pentagonal basal faces and two Ag4 atoms cap adjacent rectangularfaces. Atom Gd2 also is coordinated by 14 Ag atoms. Four Ag2 and six Ag3 atoms againform a distorted pentagonal prism, the basal faces being capped by two Ag1 atoms andtwo of the rectangular faces being capped by Ag7 and Ag5 atoms, respectively. Thecoordination of atom Gd3 is somewhat more complicated as shown in Figure7 . Gd3 iscoordinated by three different silver sites (6 x Ag2, 6 x Ag4, 6 x Ag5 (half occupied, seebelow)) and an additional Gd3 atom, completing a coordination sphere best describedas Frank-Kasper polyhedron with 16 vertices. It can also be rationalised as a Friaufpolyhedron with capping of all hexagonal faces. Two interpenetrating polyhedra of thistype surrounding two neighbouring Gd3 atoms form pairs which are further condensedvia the faces formed by the half-occupied Ag5 hexagons to form columns along [001].
Silver atoms are coordinated by both gadolinium and silver atoms. All Ag coordinationpolyhedra can be grouped into two types. The ones of the first type are derived froman icosahedron (around Ag1, Ag2, Ag3 and Ag4, Figure 8), the ones of the second typeare derived from capped trigonal prisms (around Ag5, Ag6 and Ag7, Figure 9). Thedistorted icosahedra are built from eight Ag and four Gd positions each, the cappedtrigonal prisms from eight Ag and three Gd atoms. The most distorted icosahedra arefound around Ag1, Ag2 and Ag3, as they occupy general positions (Wyckoff position 12l).
Results 73
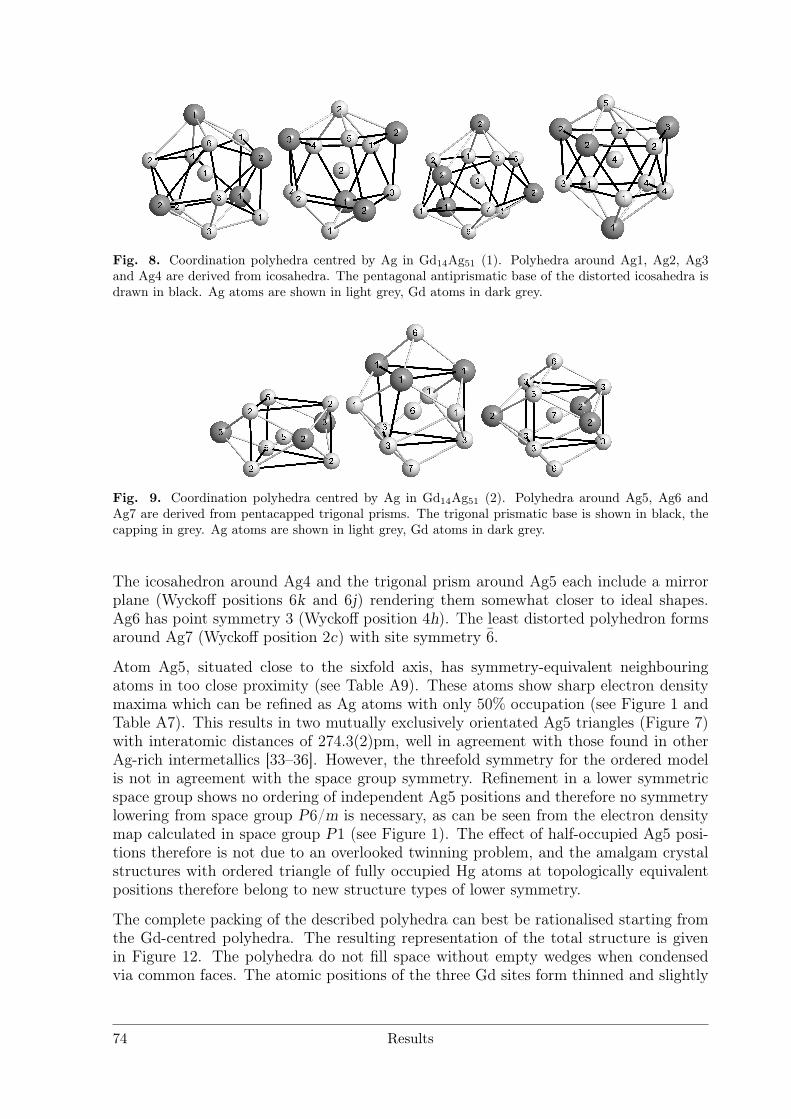
Fig. 8. Coordination polyhedra centred by Ag in Gd14Ag51 (1). Polyhedra around Ag1, Ag2, Ag3and Ag4 are derived from icosahedra. The pentagonal antiprismatic base of the distorted icosahedra isdrawn in black. Ag atoms are shown in light grey, Gd atoms in dark grey.
Fig. 9. Coordination polyhedra centred by Ag in Gd14Ag51 (2). Polyhedra around Ag5, Ag6 andAg7 are derived from pentacapped trigonal prisms. The trigonal prismatic base is shown in black, thecapping in grey. Ag atoms are shown in light grey, Gd atoms in dark grey.
The icosahedron around Ag4 and the trigonal prism around Ag5 each include a mirrorplane (Wyckoff positions 6k and 6j) rendering them somewhat closer to ideal shapes.Ag6 has point symmetry 3 (Wyckoff position 4h). The least distorted polyhedron formsaround Ag7 (Wyckoff position 2c) with site symmetry 6.
Atom Ag5, situated close to the sixfold axis, has symmetry-equivalent neighbouringatoms in too close proximity (see Table A9). These atoms show sharp electron densitymaxima which can be refined as Ag atoms with only 50% occupation (see Figure 1 andTable A7). This results in two mutually exclusively orientated Ag5 triangles (Figure 7)with interatomic distances of 274.3(2)pm, well in agreement with those found in otherAg-rich intermetallics [33–36]. However, the threefold symmetry for the ordered modelis not in agreement with the space group symmetry. Refinement in a lower symmetricspace group shows no ordering of independent Ag5 positions and therefore no symmetrylowering from space group P6/m is necessary, as can be seen from the electron densitymap calculated in space group P1 (see Figure 1). The effect of half-occupied Ag5 posi-tions therefore is not due to an overlooked twinning problem, and the amalgam crystalstructures with ordered triangle of fully occupied Hg atoms at topologically equivalentpositions therefore belong to new structure types of lower symmetry.
The complete packing of the described polyhedra can best be rationalised starting fromthe Gd-centred polyhedra. The resulting representation of the total structure is givenin Figure 12. The polyhedra do not fill space without empty wedges when condensedvia common faces. The atomic positions of the three Gd sites form thinned and slightly
74 Results
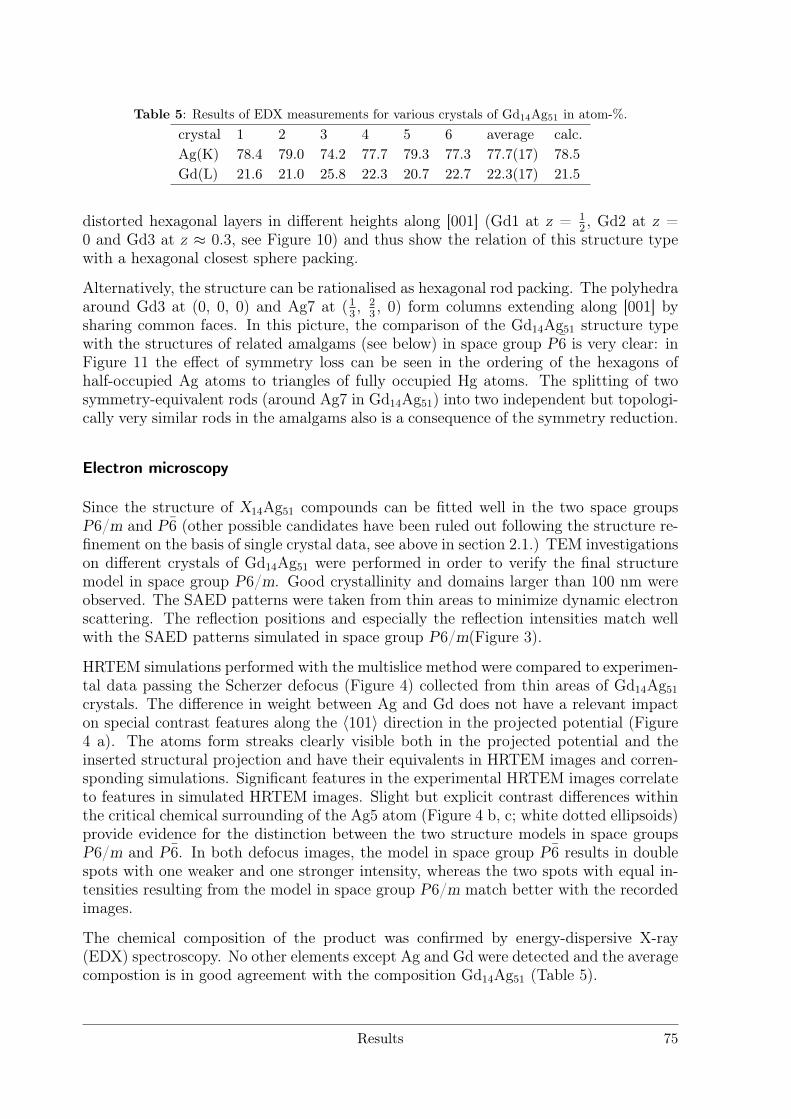
Table 5: Results of EDX measurements for various crystals of Gd14Ag51 in atom-%.crystal 1 2 3 4 5 6 average calc.Ag(K) 78.4 79.0 74.2 77.7 79.3 77.3 77.7(17) 78.5Gd(L) 21.6 21.0 25.8 22.3 20.7 22.7 22.3(17) 21.5
distorted hexagonal layers in different heights along [001] (Gd1 at z = 12, Gd2 at z =
0 and Gd3 at z ≈ 0.3, see Figure 10) and thus show the relation of this structure typewith a hexagonal closest sphere packing.
Alternatively, the structure can be rationalised as hexagonal rod packing. The polyhedraaround Gd3 at (0, 0, 0) and Ag7 at (1
3, 2
3, 0) form columns extending along [001] by
sharing common faces. In this picture, the comparison of the Gd14Ag51 structure typewith the structures of related amalgams (see below) in space group P6 is very clear: inFigure 11 the effect of symmetry loss can be seen in the ordering of the hexagons ofhalf-occupied Ag atoms to triangles of fully occupied Hg atoms. The splitting of twosymmetry-equivalent rods (around Ag7 in Gd14Ag51) into two independent but topologi-cally very similar rods in the amalgams also is a consequence of the symmetry reduction.
Electron microscopy
Since the structure of X14Ag51 compounds can be fitted well in the two space groupsP6/m and P6 (other possible candidates have been ruled out following the structure re-finement on the basis of single crystal data, see above in section 2.1.) TEM investigationson different crystals of Gd14Ag51 were performed in order to verify the final structuremodel in space group P6/m. Good crystallinity and domains larger than 100 nm wereobserved. The SAED patterns were taken from thin areas to minimize dynamic electronscattering. The reflection positions and especially the reflection intensities match wellwith the SAED patterns simulated in space group P6/m(Figure 3).
HRTEM simulations performed with the multislice method were compared to experimen-tal data passing the Scherzer defocus (Figure 4) collected from thin areas of Gd14Ag51
crystals. The difference in weight between Ag and Gd does not have a relevant impacton special contrast features along the 〈101〉 direction in the projected potential (Figure4 a). The atoms form streaks clearly visible both in the projected potential and theinserted structural projection and have their equivalents in HRTEM images and corren-sponding simulations. Significant features in the experimental HRTEM images correlateto features in simulated HRTEM images. Slight but explicit contrast differences withinthe critical chemical surrounding of the Ag5 atom (Figure 4 b, c; white dotted ellipsoids)provide evidence for the distinction between the two structure models in space groupsP6/m and P6. In both defocus images, the model in space group P6 results in doublespots with one weaker and one stronger intensity, whereas the two spots with equal in-tensities resulting from the model in space group P6/m match better with the recordedimages.
The chemical composition of the product was confirmed by energy-dispersive X-ray(EDX) spectroscopy. No other elements except Ag and Gd were detected and the averagecompostion is in good agreement with the composition Gd14Ag51 (Table 5).
Results 75
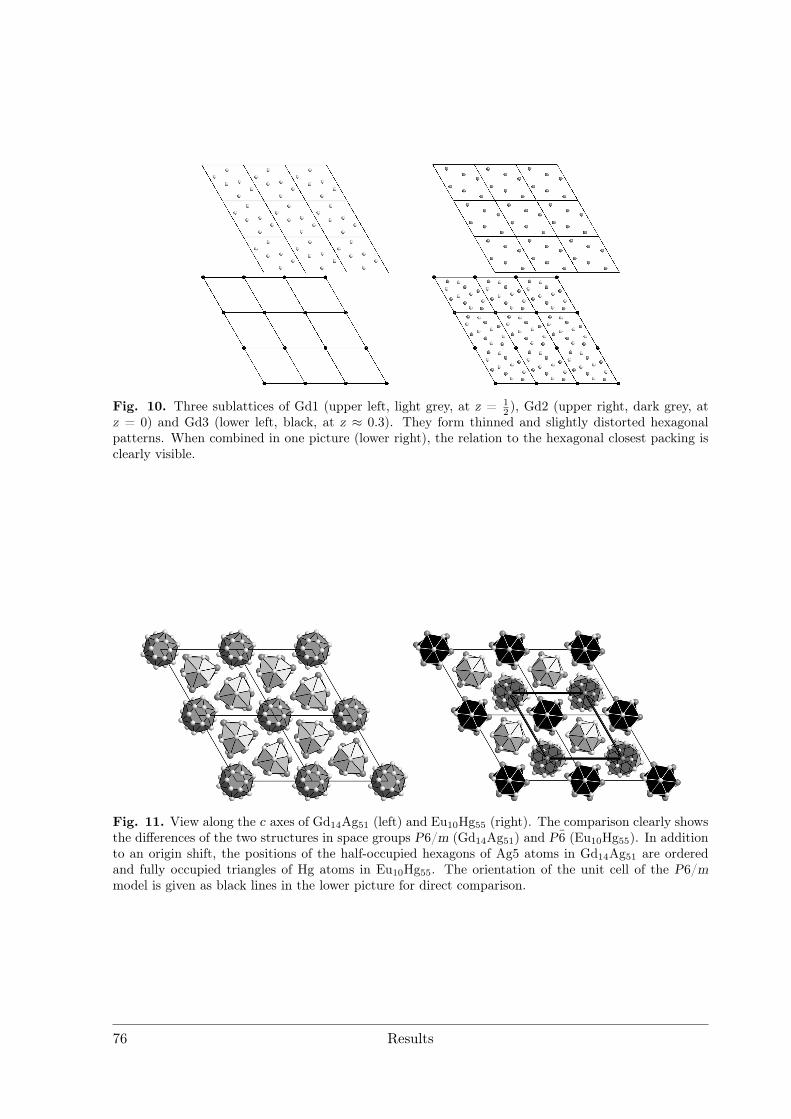
Fig. 10. Three sublattices of Gd1 (upper left, light grey, at z = 12 ), Gd2 (upper right, dark grey, at
z = 0) and Gd3 (lower left, black, at z ≈ 0.3). They form thinned and slightly distorted hexagonalpatterns. When combined in one picture (lower right), the relation to the hexagonal closest packing isclearly visible.
Fig. 11. View along the c axes of Gd14Ag51 (left) and Eu10Hg55 (right). The comparison clearly showsthe differences of the two structures in space groups P6/m (Gd14Ag51) and P6 (Eu10Hg55). In additionto an origin shift, the positions of the half-occupied hexagons of Ag5 atoms in Gd14Ag51 are orderedand fully occupied triangles of Hg atoms in Eu10Hg55. The orientation of the unit cell of the P6/mmodel is given as black lines in the lower picture for direct comparison.
76 Results
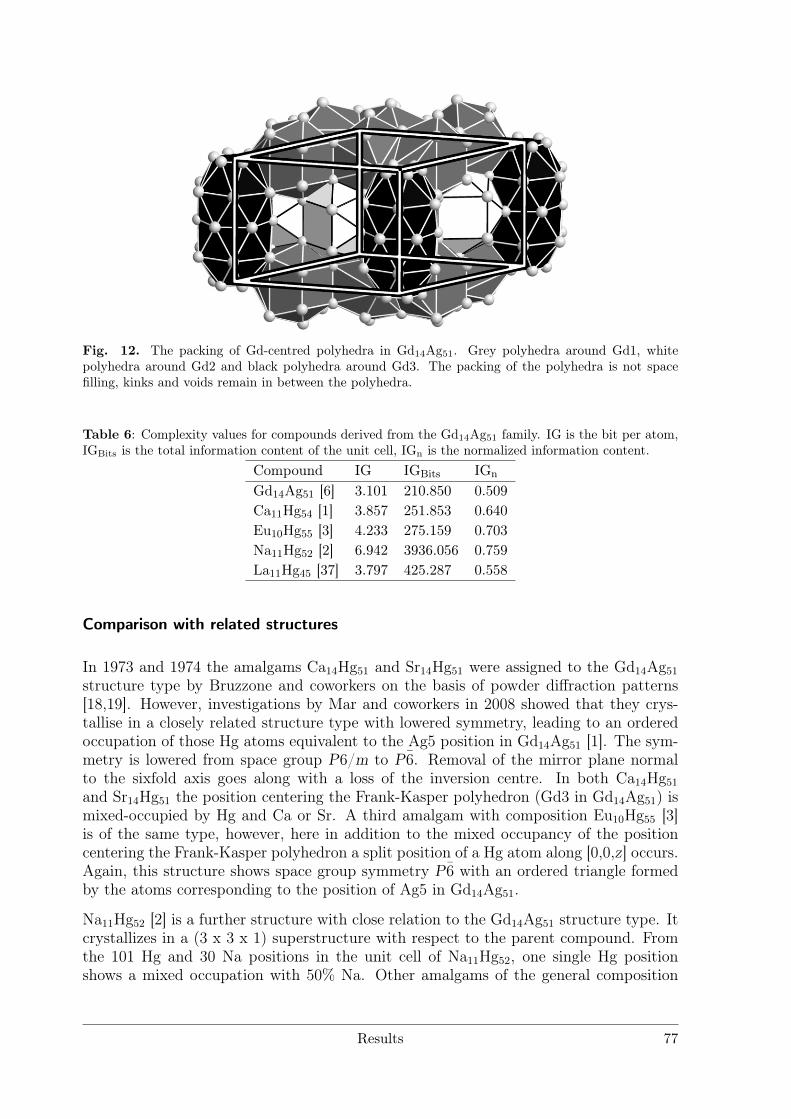
Fig. 12. The packing of Gd-centred polyhedra in Gd14Ag51. Grey polyhedra around Gd1, whitepolyhedra around Gd2 and black polyhedra around Gd3. The packing of the polyhedra is not spacefilling, kinks and voids remain in between the polyhedra.
Table 6: Complexity values for compounds derived from the Gd14Ag51 family. IG is the bit per atom,IGBits is the total information content of the unit cell, IGn is the normalized information content.
Compound IG IGBits IGn
Gd14Ag51 [6] 3.101 210.850 0.509Ca11Hg54 [1] 3.857 251.853 0.640Eu10Hg55 [3] 4.233 275.159 0.703Na11Hg52 [2] 6.942 3936.056 0.759La11Hg45 [37] 3.797 425.287 0.558
Comparison with related structures
In 1973 and 1974 the amalgams Ca14Hg51 and Sr14Hg51 were assigned to the Gd14Ag51
structure type by Bruzzone and coworkers on the basis of powder diffraction patterns[18,19]. However, investigations by Mar and coworkers in 2008 showed that they crys-tallise in a closely related structure type with lowered symmetry, leading to an orderedoccupation of those Hg atoms equivalent to the Ag5 position in Gd14Ag51 [1]. The sym-metry is lowered from space group P6/m to P6. Removal of the mirror plane normalto the sixfold axis goes along with a loss of the inversion centre. In both Ca14Hg51
and Sr14Hg51 the position centering the Frank-Kasper polyhedron (Gd3 in Gd14Ag51) ismixed-occupied by Hg and Ca or Sr. A third amalgam with composition Eu10Hg55 [3]is of the same type, however, here in addition to the mixed occupancy of the positioncentering the Frank-Kasper polyhedron a split position of a Hg atom along [0,0,z] occurs.Again, this structure shows space group symmetry P6 with an ordered triangle formedby the atoms corresponding to the position of Ag5 in Gd14Ag51.
Na11Hg52 [2] is a further structure with close relation to the Gd14Ag51 structure type. Itcrystallizes in a (3 x 3 x 1) superstructure with respect to the parent compound. Fromthe 101 Hg and 30 Na positions in the unit cell of Na11Hg52, one single Hg positionshows a mixed occupation with 50% Na. Other amalgams of the general composition
Results 77
X11Hg45 (X = La, Ce, Pr, Nd, Sm, Gd, U) [37] crystallise in a cubic structure that canbe derived from the hexagonal Gd14Ag51 structure type and exhibits the same structuralbasic building units. This structural relationship is topic of further investigations.
All these different yet closely related structures can be compared in terms of complexityvalues as introduced by Krivovichev [38]. All structures show high but comparablecomplexity. The various disorder phenomena in the amalgams contribute to an increaseof their complexities in comparison with the one of Gd14Ag51, however, the effect ofsymmetry reduction from space group P6/m to P6 and the herewith related highernumber of symmetry-independent atomic positions is by far more relevant. A hugeincrease in complexity for the same reason (symmetry reduction by enlargement of theunit cell in the sense of a klassengleiche subgroup) is found for the sodium amalgam.Here, only a minor disorder phenomenon is present, but there are 131 independent atomicpositions, whereas Ca14Hg51, Sr14Hg51 and Eu10Hg55 have only 20 independent atompositions and Gd14Ag51 has 10. The crystal structure of Na11Hg52 is with this respectthe most complex binary compound hitherto known not representing an approximant toa quasicrystalline structure [39].
Electrical and magnetic properties
The specific resistivity of Gd14Ag51 shows the typical behaviour of a metal and decreaseswith decreasing temperature, see Figure 5. The specific resistivity at room temperature(2.25 · 10−7 Ω · m) is about one order of magnitude lower than the one of metallicsilver (1.59 · 10−8 Ω · m [40]) and about one order of magnitude higher than the oneof metallic gadolinium (1.26 · 10−6 Ω ·m [41]). In contrast, the amalgams with closelyrelated structures show typical ”bad metal behaviour”, as e. g. shown for Na11Hg52. Thisis consistent with the lower electronegativity difference between Ag and the rare-earthmetals compared tothe one between Hg and alkali, alkaline-earth or rare-earth metals.The low Joffe-Regel limit detected for Na11Hg52 also is in good agreement with the verylow-symmetric and extremely complex structure with long translational periodicity.
At temperatures below 30 K, Gd14Ag51 the susceptibility of Gd14Ag51 shows a deviationfrom the behaviour of a simple pauli paramagnet which can be interpreted as antiferro-magnetic ordering, see Figure 6. This has also been observed for Tb14Ag51 (27 - 27.9K)and U14Au51 (23K) [15,42].
Conclusions
We have shown that the Gd14Ag51 structure type can be assigned to space group P6/mby single crystal X-ray structure analysis, careful analysis of the electron density mapand TEM investigations. The observed effect of six symmetry equivalent, half-occupiedand mutually exclusive Ag positions cannot be resolved by symmetry reduction and is anintrinsic feature of this structure type. The comparison of four single crystal refinements(X14Ag51 with X = Y, Ce, Gd and Tb) shows that all compounds crystallise isotypicallyin the strict sense of the word. Recently occured doubts on the few single crystal data
78 Results
available in literature therefore can be outruled, also it is probable that all the structurestructure type assignments based merely on powder diffraction data are correct.
A basic and prominent structure element in the Gd14Ag51 structure type is a rod formedby condensed pairs of two interpenetrating Frank-Kasper polyhedra with 16 Ag verticesand centred by Gd atoms. These rods are packed in a hexagonal rod packing topol-ogy. A class of related structures with general composition X11Ag45 crystallizes in acubic structure type where these rods form a cubic packing. The same rods are also theprominent structure motifs in a number of amalgam structures. They can be regardedas hettotypes to the Gd14Ag51 aristotype as they crystallise in the direct subgroup P6.Their respective structures show different kinds of disorder phenomena and higher com-plexity, mainly due to the lower space group symmetry. However, in all these slightlydifferent structures, the Hg positions equivalent to Ag5 in Gd14Ag51 form ordered andfully occupied triangles. In contrast to these amalgams which show highly polarisedmetal-metal bonding due to the high differences in the electronegativities of Hg and al-kali or alkaline-earth metal, Gd14Ag51 shows the typical behaviour of a good metal andantiferromagnetic ordering at low temperatures.
The reason for the lower symmetric amalgam structures showing ordered atomic posi-tions may lie in the higher ionic contributions. The local Coulomb potentials lead tothe formation of coordination spheres of negatively polarised Hg atoms surrounding thepositively polarised less noble metals, and the ionic bonding contributions may favourstructures with higher order in comparison to the primarily metallic bonding in Gd14Ag51
structure type compounds with low electronegativity differences and good metallic be-haviour. Extensive studies to clarify the degree of electron transfer of the less noblemetals to Hg in the amalgams and the resulting effects on the crystal structures are atthe moment performed in our group both on the basis of quantum mechanical calcula-tions and on NMR spectroscopic investigations. In addition, a new and unconventionalapproach to the rationalisation of highly complex crystal structures [43] may shed alight on local structural details, giving new impulse for the interpretation of the disorderphenomena of both Gd14Ag51 type structures and the related amalgams.
Results 79
Acknowledgements
We would like to thank Gina Friederichs from Prof. Dr. Dirk Johrendts group at Ludwig-Maximilians-Universität München for the temperature-dependent measurements of thespecific resistivity and the magnetic susceptibility of Gd14Ag51. We are especially gratefulfor the valuable contributions of Lukas Neudert who performed the electron microscopicstudies.
References
[1] A.V. Tkachuk, A. Mar, Alkaline-earth metal mercury intermetallics A11−xHg54+x (A = Ca, Sr),Inorg. Chem. 47 (2008) 1313–1318, http://dx.doi.org/10.1021/ ic7015148.
[2] C. Hoch, A. Simon, Na11Hg52 – Komplexität in einem polaren Metall, Angew. Chem. 124 (2012)3316–3319, http://dx.doi.org/10.1002/ange.201108064; C. Hoch, A. Simon, Na11Hg52 – Komplexität ineinem polaren Metall, Angew. Chem. Int. Ed. 51 (2012) 3262–3265,http://dx.doi.org/10.1002/anie.201108064.
[3] F. Tambornino, C. Hoch, The Hg-richest europium amalgam, Eu10Hg55 Z. Kristallogr. Suppl. 32(2013) 79–80.
[4] S. Steeb, D. Godel, C. Löhr, On the structure of the compounds Ag3R.E. (R.E. = Y, La, Ce, Sm,Gd, Dy, Ho, Er), J. Less Common Met. 15 (1968) 137–141,http://dx.doi.org/ 10.1016/0022-5088(68)90047-7.
[5] O.J.C. Runnalls, The crystal structures of some intermetallic compounds of plutonium, Can. J.Chem. 34 (1956) 133–145, http://dx.doi.org/10.1139/v56- 017.
[6] D.M. Bailey, G.R. Kline, The crystal structure of GdAg3.6, Acta Crystallogr. B27 (1971) 650–653,http://dx.doi.org/10.1107/S0567740871002711.
[7] O.D. McMasters, K.A. Gschneidner Jr., R.F. Venteicher, Crystallography of the silver-rich rare-earth-silver intermetallic compounds, Acta Crystallogr. B26 (1970) 1224–1229,http://dx.doi.org/10.1107/S0567740870003928.
[8] S. Cirafici, A. Palenzona, The phase diagram of the Th–Ag system, J. Less Common Met. 135 (1987)1–4, http://dx.doi.org/10.1016/0022-5088(87)90332-8.
[9] J.P. Gabathuler, P. White, E. Parthe, Zr14Cu51 and Hf14Cu51 with GdAg3.6 structure type, ActaCrystallogr. B31 (1975) 608–610,http://dx.doi.org/10.1107/S0567740875003378.
[10] C. Allibert, W. Wong-Ng, S.C. Nyburg, CeCu3.6, a disordered variant of Gd14Ag51 type, ActaCrystallogr. C40 (1984) 211–214,http://dx.doi.org/10.1107/S0108270184003620.
[11] A. Saccone, M.L. Fornasini, D. Macció, S. Delfino, Phase equilibria in the Gd–Au system, Inter-metallics 4 (1996) 111–119, http://dx.doi.org/10.1016/0966- 9795(95)00025-9.
[12] A. Saccone, D. Macció, M. Giovannini, S. Delfino, The praseodymium-gold system, J. Alloy Comp.247 (1997) 134–140, http://dx.doi.org/10.1016/S0925- 8388(96)02606-0.
[13] A. Saccone, D. Maccio, S. Delfino, R. Ferro, The neodymium-gold phase diagram, Metall. Mater.Trans. A30 (1999) 1169–1176, http://dx.doi.org/ 10.1007/s11661-999-0266-7.
80 Results
[14] H. Ott, E. Felder, A. Schilling, A. Dommann, F. Hulliger, Low-temperature properties of U14Au51,Solid State Commun. 71 (1989) 549–551,http:// dx.doi.org/10.1016/0038-1098(89)90533-4.
[15] F. Canepa, A. Palenzona, R. Eggenhoffner, Effects of the Th-substitution on the antiferromagneticcoupling and Kondo-like behaviour in the heavy-fermion system U14Au51, Physica B 176 (1992) 293–300,http://dx.doi.org/10.1016/ 0921-4526(92)90234-J.
[16] A. Schenck, M. Pinkpank, F. Gygax, K.-U. Neumann, K.R.A. Ziebeck, A. Amato, Magnetic prop-erties of U14Au51: an exemplary study by muon spin-rotation spectroscopy, J. Phys. Condons. Matter10 (1998) 8059–8082, http:// dx.doi.org/10.1088/0953-8984/10/36/015.
[17] F. Merlo, M.L. Fornasini, Crystal structure of the R11Hg45 compounds (R = La, Ce, Pr, Nd, Sm,Gd, U), J. Less Common Met. 64 (1979) 221–231,http://dx.doi.org/10.1016/0022-5088(79)90173-5.
[18] G. Bruzzone, F. Merlo, The calcium–mercury system, J. Less Common Met. 32 (1973) 237–241,http://dx.doi.org/10.1016/0022-5088(73)90091-X.
[19] G. Bruzzone, F. Merlo, The strontium–mercury system, J. Less Common Met. 35 (1974) 153–157,http://dx.doi.org/10.1016/0022-5088(74)90154-4.
[20] R.V. Gumenyuk, Y.B. Kuzma, Crystal structure of Gd14Cu48Ga3 and Tb14Cu48Ga3, Inorg. Mater.43 (2007) 135–137, http://dx.doi.org/10.1134/S0020168507020070.
[21] Q. Lin, J.D. Corbett, Ca14Au46Sn5: a colored Gd14Ag51-type structure containing columns of well-differentiated hexagonal gold stars, Inorg. Chem. 50 (2011) 1808–1815,http://dx.doi.org/10.1021/ic102243c.
[22] G.M. Sheldrick, A short history of SHELX, Acta Crystallogr. A64 (2008) 112– 122.doi:01.1107/S0108767307043930.
[23] A.L. Spek, Structure validation in chemical crystallography, Acta Crystallogr. D65 (2009) 148–155,http://dx.doi.org/10.1107/S090744490804362X.
[24] Y. Le Page, Computer derivation of the symmetry elements implied in a structure description,J. Appl. Cryst. 20 (1987) 264–269, http://dx.doi.org/ 10.1107/S0021889887086710; Y. Le Page,MISSSYM1.1 – a flexible new release, J. Appl. Cryst. 21 (1988) 983– 984,http://dx.doi.org/10.1107/S0021889888007022.
[25] L.M. Gelato, E. Parthé, STRUCTURE TIDY – a computer program to standardize crystal structuredata, J. Appl. Cryst. 20 (1987) 139–143, http://dx.doi.org/ 10.1107/S0021889887086965.
[26] L.J. Van der Pauw, A method of measuring specific resistivity and hall effect of discs of arbitraryshape, Philips Res. Rep. 13 (1958) 1–9.
[27] Digital Micrograph v3.6.1, Gatan Software Team, Pleasanton, USA, 1999. [28] J.L. Lábár, Con-sistent indexing of a (set of) single crystal SAED pattern(s) with the ProcessDiffraction program,Ultramicroscopy 103 (2005) 237–249,http:// dx.doi.org/10.1016/j.ultramic.2004.12.004.
[29] JEMS v3.3425U2008, CIME-EPFL, Switzerland, 2008. [30] ES Vision v4.0.164, Emispec SystemsInc., Tempe, USA, 2002. [31] TEAM v3.4.1, EDAX AMETEK, Wiesbaden, Germany, 2013.
[32] M.C. Tegel, Iron Pnictide Superconductors, Ph.D. Thesis, Ludwig-Maximilians-UniversitätMünchen, 2011.
[33] G. Bruzzone, M. Ferretti, F. Merlo, The Ba–Ag system, J. Less Common Met. 128 (1987) 259–264,http://dx.doi.org/10.1016/0022-5088(87)90213-X.
Results 81
[34] G.J. Snyder, A. Simon, Crystal structure of Ag7Ca2 a new intermetallic structure type, J. AlloyComp. 223 (1995) 65–69, http://dx.doi.org/10.1016/0925-8388(94)01485-X.
[35] L.D. Calvert, C. Rand, The crystal structure of Ag8Ca3, Acta Crystallogr. 17 (1964) 1175–1176,http://dx.doi.org/10.1107/S0365110X64003024.
[36] J.K. Brandon, R.Y. Brizard, W.B. Pearson, D.J.N. Tozer, c-Brasses with I and P cells, ActaCrystallogr. B33 (1977) 527–537,http://dx.doi.org/10.1107/ S0567740877003987.
[37] F. Merlo, M.L. Fornasini, Crystal structure of the R11Hg45 compounds (R=La, Ce, Pr, Nd, Sm,Gd, U), J. Less Common Met. 64 (1979) 221–231,http:// dx.doi.org/10.1016/0022-5088(79)90173-5.
[38] S.V. Krivovichev, Topological complexity of crystal structures: quantitative approach, Acta Crys-tallogr. A68 (2012) 393–398,http://dx.doi.org/10.1107/ S0108767312012044; S.V. Krivovichev, Which inorganic structures are themost complex?, Angew Chem. Int. Ed. 53 (2014) 654–661.http://dx.doi.org/0.1002/anie.201304374.
[39] S.V. Krivovichev, Private Communication, 2014.
[40] R.C. Weast, S.M. Shelby, Handbook of Chemistry and Physics, 48th ed., The Chemical RubberCo., Ohio, 1968.
[41] R.V. Colvin, A. Arajs, Electrical resistivity of polycrystalline gadolinium from 4 to 375 K, Phys.Status Solidi 4 (1964) 37–42, http://dx.doi.org/10.1002/ pssb.19640040104.
[42] P. Fischer, V. Pomjakushin, L. Keller, A. Daoud-Aladine, W. Sikora, A. Dommann, F. Hul-liger, Antiferromagnetic three-sublattice Tb ordering in Tb14Ag51, Phys. Rev. B72 (2005) 134413,http://dx.doi.org/10.1103/ PhysRevB.72.134413.
[43] W. Hornfeck, B. Harbrecht, Multiplicative congruential generators, their lattice structure, its rela-tion to lattice–sublattice transformations and applications in crystallography, Acta Crystallogr. A65(2009) 532–542, http://dx.doi.org/ 10.1107/S0108767309037088; W. Hornfeck, Quantitative crystalstructure descriptors from multiplicative congruential generators, Acta Crystallogr. A68 (2012) 167–180,http:// dx.doi.org/10.1107/S0108767311049853.
82 Results
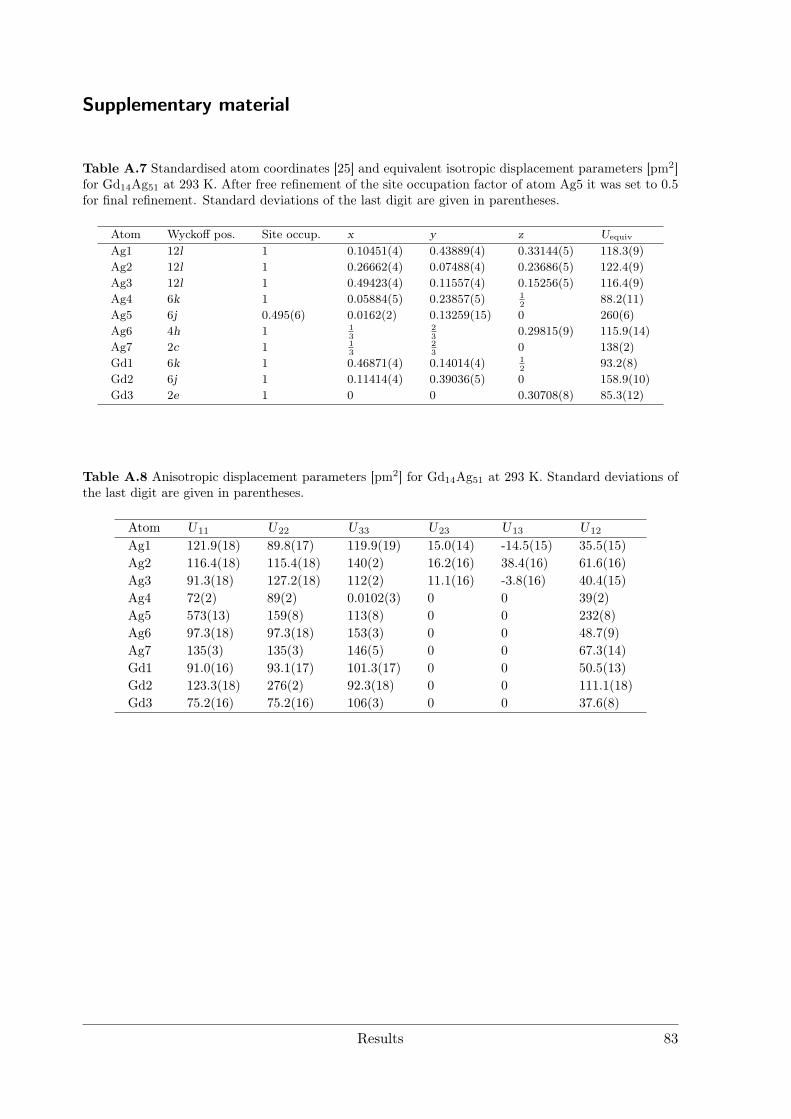
Supplementary material
Table A.7 Standardised atom coordinates [25] and equivalent isotropic displacement parameters [pm2]for Gd14Ag51 at 293 K. After free refinement of the site occupation factor of atom Ag5 it was set to 0.5for final refinement. Standard deviations of the last digit are given in parentheses.
Atom Wyckoff pos. Site occup. x y z Uequiv
Ag1 12l 1 0.10451(4) 0.43889(4) 0.33144(5) 118.3(9)Ag2 12l 1 0.26662(4) 0.07488(4) 0.23686(5) 122.4(9)Ag3 12l 1 0.49423(4) 0.11557(4) 0.15256(5) 116.4(9)Ag4 6k 1 0.05884(5) 0.23857(5) 1
288.2(11)
Ag5 6j 0.495(6) 0.0162(2) 0.13259(15) 0 260(6)Ag6 4h 1 1
323
0.29815(9) 115.9(14)Ag7 2c 1 1
323
0 138(2)Gd1 6k 1 0.46871(4) 0.14014(4) 1
293.2(8)
Gd2 6j 1 0.11414(4) 0.39036(5) 0 158.9(10)Gd3 2e 1 0 0 0.30708(8) 85.3(12)
Table A.8 Anisotropic displacement parameters [pm2] for Gd14Ag51 at 293 K. Standard deviations ofthe last digit are given in parentheses.
Atom U11 U22 U33 U23 U13 U12
Ag1 121.9(18) 89.8(17) 119.9(19) 15.0(14) -14.5(15) 35.5(15)Ag2 116.4(18) 115.4(18) 140(2) 16.2(16) 38.4(16) 61.6(16)Ag3 91.3(18) 127.2(18) 112(2) 11.1(16) -3.8(16) 40.4(15)Ag4 72(2) 89(2) 0.0102(3) 0 0 39(2)Ag5 573(13) 159(8) 113(8) 0 0 232(8)Ag6 97.3(18) 97.3(18) 153(3) 0 0 48.7(9)Ag7 135(3) 135(3) 146(5) 0 0 67.3(14)Gd1 91.0(16) 93.1(17) 101.3(17) 0 0 50.5(13)Gd2 123.3(18) 276(2) 92.3(18) 0 0 111.1(18)Gd3 75.2(16) 75.2(16) 106(3) 0 0 37.6(8)
Results 83
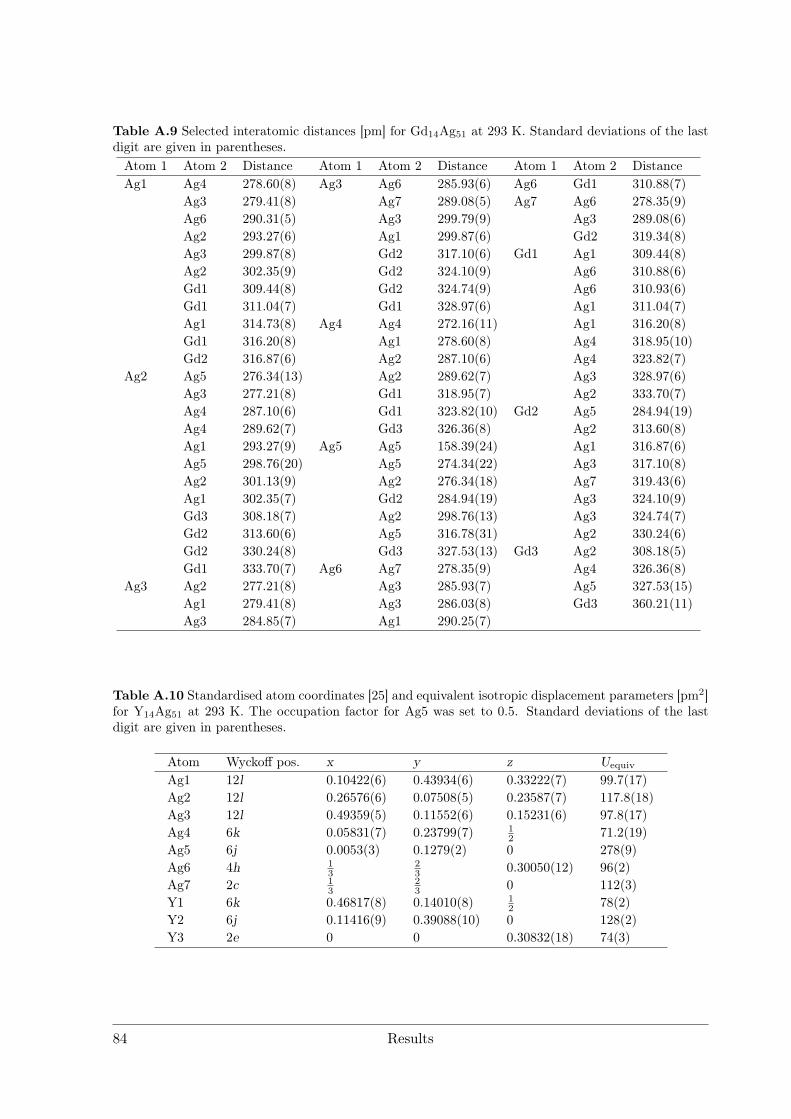
Table A.9 Selected interatomic distances [pm] for Gd14Ag51 at 293 K. Standard deviations of the lastdigit are given in parentheses.Atom 1 Atom 2 Distance Atom 1 Atom 2 Distance Atom 1 Atom 2 DistanceAg1 Ag4 278.60(8) Ag3 Ag6 285.93(6) Ag6 Gd1 310.88(7)
Ag3 279.41(8) Ag7 289.08(5) Ag7 Ag6 278.35(9)Ag6 290.31(5) Ag3 299.79(9) Ag3 289.08(6)Ag2 293.27(6) Ag1 299.87(6) Gd2 319.34(8)Ag3 299.87(8) Gd2 317.10(6) Gd1 Ag1 309.44(8)Ag2 302.35(9) Gd2 324.10(9) Ag6 310.88(6)Gd1 309.44(8) Gd2 324.74(9) Ag6 310.93(6)Gd1 311.04(7) Gd1 328.97(6) Ag1 311.04(7)Ag1 314.73(8) Ag4 Ag4 272.16(11) Ag1 316.20(8)Gd1 316.20(8) Ag1 278.60(8) Ag4 318.95(10)Gd2 316.87(6) Ag2 287.10(6) Ag4 323.82(7)
Ag2 Ag5 276.34(13) Ag2 289.62(7) Ag3 328.97(6)Ag3 277.21(8) Gd1 318.95(7) Ag2 333.70(7)Ag4 287.10(6) Gd1 323.82(10) Gd2 Ag5 284.94(19)Ag4 289.62(7) Gd3 326.36(8) Ag2 313.60(8)Ag1 293.27(9) Ag5 Ag5 158.39(24) Ag1 316.87(6)Ag5 298.76(20) Ag5 274.34(22) Ag3 317.10(8)Ag2 301.13(9) Ag2 276.34(18) Ag7 319.43(6)Ag1 302.35(7) Gd2 284.94(19) Ag3 324.10(9)Gd3 308.18(7) Ag2 298.76(13) Ag3 324.74(7)Gd2 313.60(6) Ag5 316.78(31) Ag2 330.24(6)Gd2 330.24(8) Gd3 327.53(13) Gd3 Ag2 308.18(5)Gd1 333.70(7) Ag6 Ag7 278.35(9) Ag4 326.36(8)
Ag3 Ag2 277.21(8) Ag3 285.93(7) Ag5 327.53(15)Ag1 279.41(8) Ag3 286.03(8) Gd3 360.21(11)Ag3 284.85(7) Ag1 290.25(7)
Table A.10 Standardised atom coordinates [25] and equivalent isotropic displacement parameters [pm2]for Y14Ag51 at 293 K. The occupation factor for Ag5 was set to 0.5. Standard deviations of the lastdigit are given in parentheses.
Atom Wyckoff pos. x y z Uequiv
Ag1 12l 0.10422(6) 0.43934(6) 0.33222(7) 99.7(17)Ag2 12l 0.26576(6) 0.07508(5) 0.23587(7) 117.8(18)Ag3 12l 0.49359(5) 0.11552(6) 0.15231(6) 97.8(17)Ag4 6k 0.05831(7) 0.23799(7) 1
2 71.2(19)Ag5 6j 0.0053(3) 0.1279(2) 0 278(9)Ag6 4h 1
323 0.30050(12) 96(2)
Ag7 2c 13
23 0 112(3)
Y1 6k 0.46817(8) 0.14010(8) 12 78(2)
Y2 6j 0.11416(9) 0.39088(10) 0 128(2)Y3 2e 0 0 0.30832(18) 74(3)
84 Results
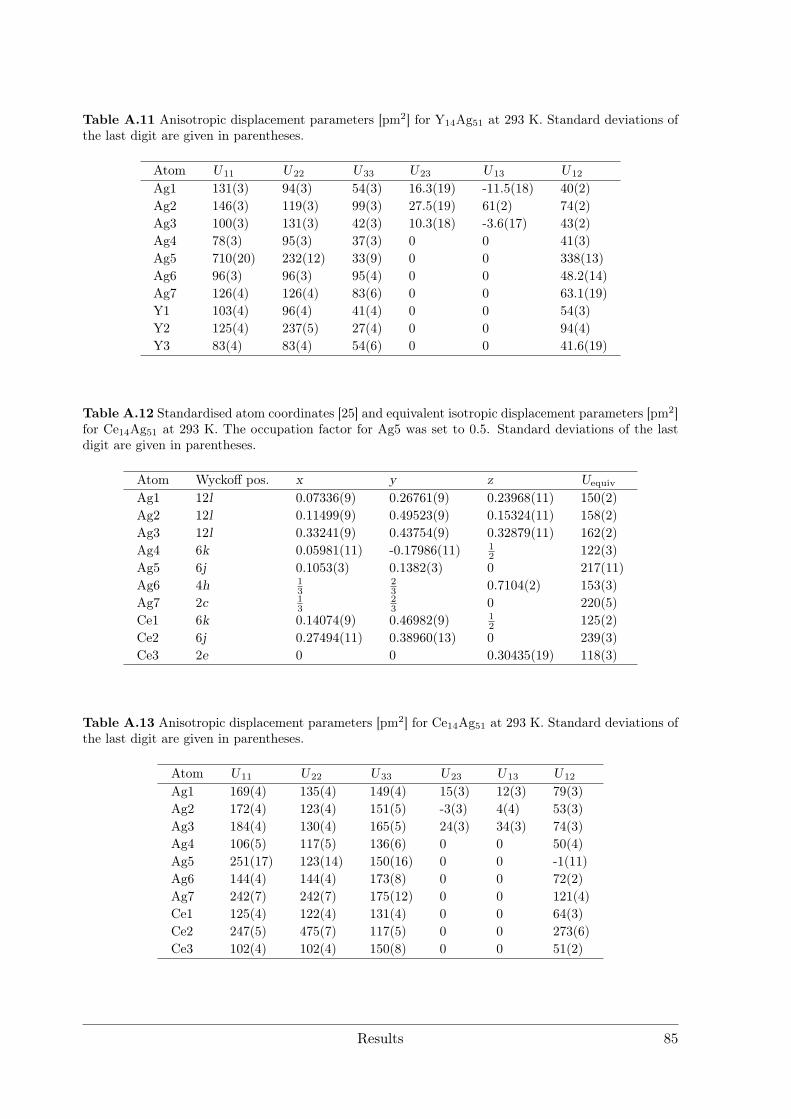
Table A.11 Anisotropic displacement parameters [pm2] for Y14Ag51 at 293 K. Standard deviations ofthe last digit are given in parentheses.
Atom U11 U22 U33 U23 U13 U12
Ag1 131(3) 94(3) 54(3) 16.3(19) -11.5(18) 40(2)Ag2 146(3) 119(3) 99(3) 27.5(19) 61(2) 74(2)Ag3 100(3) 131(3) 42(3) 10.3(18) -3.6(17) 43(2)Ag4 78(3) 95(3) 37(3) 0 0 41(3)Ag5 710(20) 232(12) 33(9) 0 0 338(13)Ag6 96(3) 96(3) 95(4) 0 0 48.2(14)Ag7 126(4) 126(4) 83(6) 0 0 63.1(19)Y1 103(4) 96(4) 41(4) 0 0 54(3)Y2 125(4) 237(5) 27(4) 0 0 94(4)Y3 83(4) 83(4) 54(6) 0 0 41.6(19)
Table A.12 Standardised atom coordinates [25] and equivalent isotropic displacement parameters [pm2]for Ce14Ag51 at 293 K. The occupation factor for Ag5 was set to 0.5. Standard deviations of the lastdigit are given in parentheses.
Atom Wyckoff pos. x y z Uequiv
Ag1 12l 0.07336(9) 0.26761(9) 0.23968(11) 150(2)Ag2 12l 0.11499(9) 0.49523(9) 0.15324(11) 158(2)Ag3 12l 0.33241(9) 0.43754(9) 0.32879(11) 162(2)Ag4 6k 0.05981(11) -0.17986(11) 1
2 122(3)Ag5 6j 0.1053(3) 0.1382(3) 0 217(11)Ag6 4h 1
323 0.7104(2) 153(3)
Ag7 2c 13
23 0 220(5)
Ce1 6k 0.14074(9) 0.46982(9) 12 125(2)
Ce2 6j 0.27494(11) 0.38960(13) 0 239(3)Ce3 2e 0 0 0.30435(19) 118(3)
Table A.13 Anisotropic displacement parameters [pm2] for Ce14Ag51 at 293 K. Standard deviations ofthe last digit are given in parentheses.
Atom U11 U22 U33 U23 U13 U12
Ag1 169(4) 135(4) 149(4) 15(3) 12(3) 79(3)Ag2 172(4) 123(4) 151(5) -3(3) 4(4) 53(3)Ag3 184(4) 130(4) 165(5) 24(3) 34(3) 74(3)Ag4 106(5) 117(5) 136(6) 0 0 50(4)Ag5 251(17) 123(14) 150(16) 0 0 -1(11)Ag6 144(4) 144(4) 173(8) 0 0 72(2)Ag7 242(7) 242(7) 175(12) 0 0 121(4)Ce1 125(4) 122(4) 131(4) 0 0 64(3)Ce2 247(5) 475(7) 117(5) 0 0 273(6)Ce3 102(4) 102(4) 150(8) 0 0 51(2)
Results 85
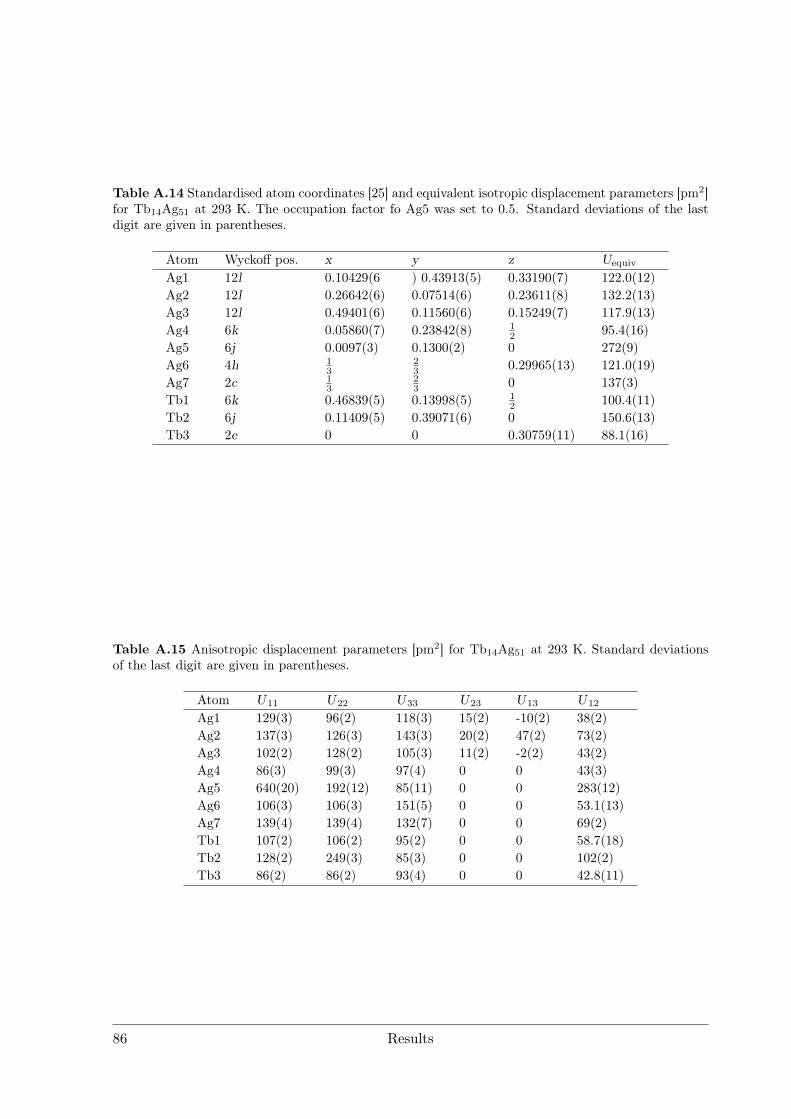
Table A.14 Standardised atom coordinates [25] and equivalent isotropic displacement parameters [pm2]for Tb14Ag51 at 293 K. The occupation factor fo Ag5 was set to 0.5. Standard deviations of the lastdigit are given in parentheses.
Atom Wyckoff pos. x y z Uequiv
Ag1 12l 0.10429(6 ) 0.43913(5) 0.33190(7) 122.0(12)Ag2 12l 0.26642(6) 0.07514(6) 0.23611(8) 132.2(13)Ag3 12l 0.49401(6) 0.11560(6) 0.15249(7) 117.9(13)Ag4 6k 0.05860(7) 0.23842(8) 1
2 95.4(16)Ag5 6j 0.0097(3) 0.1300(2) 0 272(9)Ag6 4h 1
323 0.29965(13) 121.0(19)
Ag7 2c 13
23 0 137(3)
Tb1 6k 0.46839(5) 0.13998(5) 12 100.4(11)
Tb2 6j 0.11409(5) 0.39071(6) 0 150.6(13)Tb3 2e 0 0 0.30759(11) 88.1(16)
Table A.15 Anisotropic displacement parameters [pm2] for Tb14Ag51 at 293 K. Standard deviationsof the last digit are given in parentheses.
Atom U11 U22 U33 U23 U13 U12
Ag1 129(3) 96(2) 118(3) 15(2) -10(2) 38(2)Ag2 137(3) 126(3) 143(3) 20(2) 47(2) 73(2)Ag3 102(2) 128(2) 105(3) 11(2) -2(2) 43(2)Ag4 86(3) 99(3) 97(4) 0 0 43(3)Ag5 640(20) 192(12) 85(11) 0 0 283(12)Ag6 106(3) 106(3) 151(5) 0 0 53.1(13)Ag7 139(4) 139(4) 132(7) 0 0 69(2)Tb1 107(2) 106(2) 95(2) 0 0 58.7(18)Tb2 128(2) 249(3) 85(3) 0 0 102(2)Tb3 86(2) 86(2) 93(4) 0 0 42.8(11)
86 Results
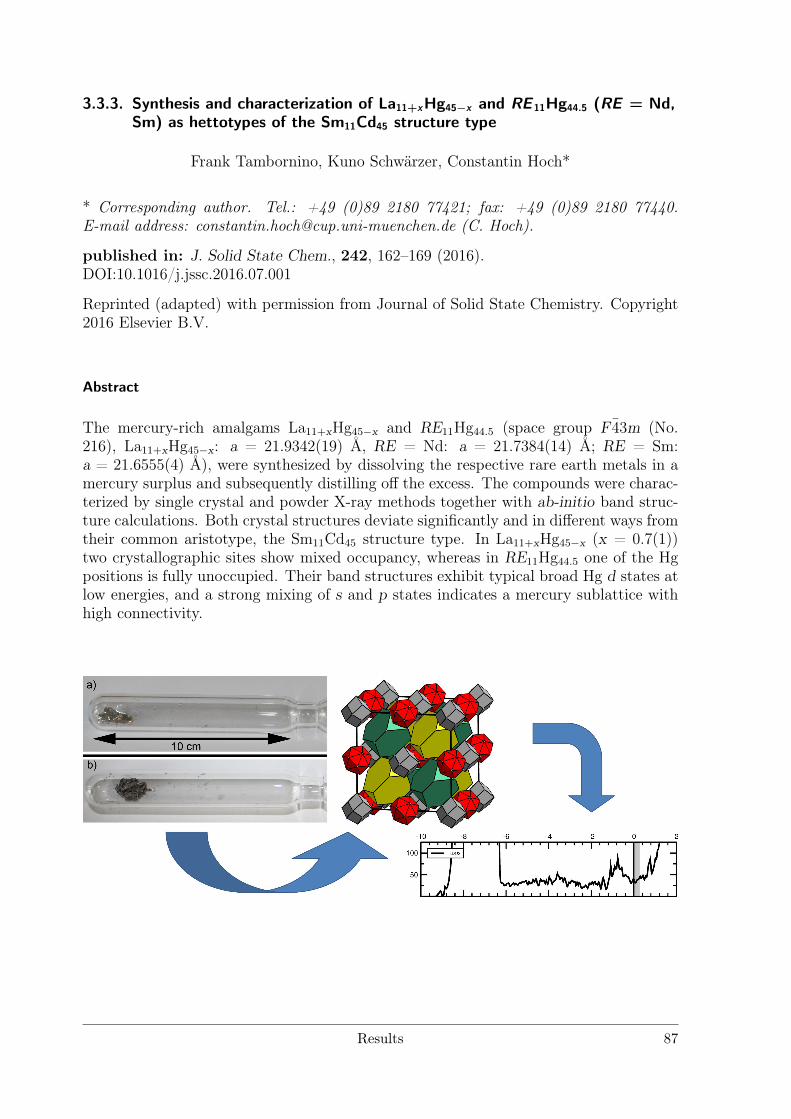
3.3.3. Synthesis and characterization of La11+xHg45−x and RE 11Hg44.5 (RE = Nd,Sm) as hettotypes of the Sm11Cd45 structure type
Frank Tambornino, Kuno Schwärzer, Constantin Hoch*
* Corresponding author. Tel.: +49 (0)89 2180 77421; fax: +49 (0)89 2180 77440.E-mail address: [email protected] (C. Hoch).
published in: J. Solid State Chem., 242, 162–169 (2016).DOI:10.1016/j.jssc.2016.07.001
Reprinted (adapted) with permission from Journal of Solid State Chemistry. Copyright2016 Elsevier B.V.
Abstract
The mercury-rich amalgams La11+xHg45−x and RE11Hg44.5 (space group F 43m (No.216), La11+xHg45−x: a = 21.9342(19) Å, RE = Nd: a = 21.7384(14) Å; RE = Sm:a = 21.6555(4) Å), were synthesized by dissolving the respective rare earth metals in amercury surplus and subsequently distilling off the excess. The compounds were charac-terized by single crystal and powder X-ray methods together with ab-initio band struc-ture calculations. Both crystal structures deviate significantly and in different ways fromtheir common aristotype, the Sm11Cd45 structure type. In La11+xHg45−x (x = 0.7(1))two crystallographic sites show mixed occupancy, whereas in RE11Hg44.5 one of the Hgpositions is fully unoccupied. Their band structures exhibit typical broad Hg d states atlow energies, and a strong mixing of s and p states indicates a mercury sublattice withhigh connectivity.
Results 87
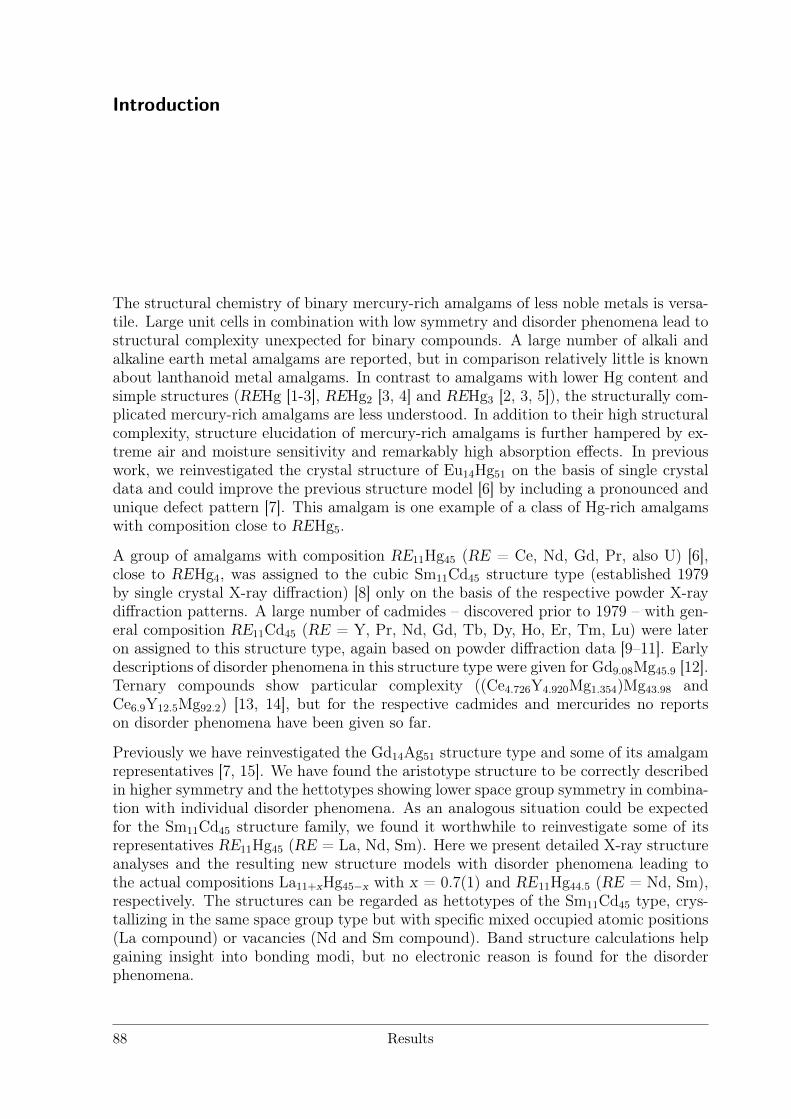
Introduction
The structural chemistry of binary mercury-rich amalgams of less noble metals is versa-tile. Large unit cells in combination with low symmetry and disorder phenomena lead tostructural complexity unexpected for binary compounds. A large number of alkali andalkaline earth metal amalgams are reported, but in comparison relatively little is knownabout lanthanoid metal amalgams. In contrast to amalgams with lower Hg content andsimple structures (REHg [1-3], REHg2 [3, 4] and REHg3 [2, 3, 5]), the structurally com-plicated mercury-rich amalgams are less understood. In addition to their high structuralcomplexity, structure elucidation of mercury-rich amalgams is further hampered by ex-treme air and moisture sensitivity and remarkably high absorption effects. In previouswork, we reinvestigated the crystal structure of Eu14Hg51 on the basis of single crystaldata and could improve the previous structure model [6] by including a pronounced andunique defect pattern [7]. This amalgam is one example of a class of Hg-rich amalgamswith composition close to REHg5.
A group of amalgams with composition RE11Hg45 (RE = Ce, Nd, Gd, Pr, also U) [6],close to REHg4, was assigned to the cubic Sm11Cd45 structure type (established 1979by single crystal X-ray diffraction) [8] only on the basis of the respective powder X-raydiffraction patterns. A large number of cadmides – discovered prior to 1979 – with gen-eral composition RE11Cd45 (RE = Y, Pr, Nd, Gd, Tb, Dy, Ho, Er, Tm, Lu) were lateron assigned to this structure type, again based on powder diffraction data [9–11]. Earlydescriptions of disorder phenomena in this structure type were given for Gd9.08Mg45.9 [12].Ternary compounds show particular complexity ((Ce4.726Y4.920Mg1.354)Mg43.98 andCe6.9Y12.5Mg92.2) [13, 14], but for the respective cadmides and mercurides no reportson disorder phenomena have been given so far.
Previously we have reinvestigated the Gd14Ag51 structure type and some of its amalgamrepresentatives [7, 15]. We have found the aristotype structure to be correctly describedin higher symmetry and the hettotypes showing lower space group symmetry in combina-tion with individual disorder phenomena. As an analogous situation could be expectedfor the Sm11Cd45 structure family, we found it worthwhile to reinvestigate some of itsrepresentatives RE11Hg45 (RE = La, Nd, Sm). Here we present detailed X-ray structureanalyses and the resulting new structure models with disorder phenomena leading tothe actual compositions La11+xHg45−x with x = 0.7(1) and RE11Hg44.5 (RE = Nd, Sm),respectively. The structures can be regarded as hettotypes of the Sm11Cd45 type, crys-tallizing in the same space group type but with specific mixed occupied atomic positions(La compound) or vacancies (Nd and Sm compound). Band structure calculations helpgaining insight into bonding modi, but no electronic reason is found for the disorderphenomena.
88 Results
Material and methods
Preparation
In an argon-filled glovebox, RE (RE = La: 1 g, 7.15 mmol, 99.99% metal base, smartelements; RE = Nd: 0.5 g, 3.47 mmol, 99.99% metal base, smart elements; RE = Sm:0.5 g, 3.33 mmol, 99.99% metal base, smart elements) were mixed with 10 equivalentsof mercury (distilled twice) in a glass ampoule (see Figure 1, total length 22 cm). Theclosed ampoule was brought to air, evacuated to a pressure below 1 ·10−3 mbar and thensealed by fusing.
Fig. 1. Borosilicate glass ampoules for the syn-thesiz of Hg-rich amalgams. Above: La and Hgsealed under vacuum, prior to reaction. Below:Product (left) and surplus Hg (right) after thedistillation. To isolate the product, the ampouleis separated into two parts by sealing off at thecentral constriction.
The lower part of the ampoule up to thecentral constriction was placed in a verticaltube furnace in upright position and heatedto ca. 300±1 C for 12 hours. The boilingmercury reacts with the educt metals to aliquid but viscous amalgam. The surplusmercury condensates at the air-cooled upperpart of the ampoule outside the furnace, cre-ating a Hg reflux. After cooling the ampouleto room temperature, furnace and ampoulewere turned into a horizontal position andthe lower part was heated to ca. 100±1 C.The surplus mercury was distilled into the
cold part, see Figure 1b. The product was separated from the Hg by sealing off themercury-filled part of the ampoule. This method yields polycrystalline material as wellas single crystals and therefore has advantages over the standard technique of heating andtempering stoichiometric educt mixtures. The brittle amalgam crystals showed brightmetallic luster, were very sensitive toward air and moisture and therefore handled in aglovebox or under dried paraffin oil.
Structure determination
Single crystal X-ray diffraction of La11+xHg45−x
In a glovebox, small sample amounts were put in a petri dish and covered with driedparaffin oil. The sample was brought to air and suitable specimens of irregular shapewere isolated and sealed in paraffin-filled glass capillaries (∅ = 0.3 mm). After cen-tering the crystals on a IPDS1 diffractometer system (Stoe & Cie. GmbH, Darmstadt,Germany) equipped with an imaging plate and graphite-monochromatized Ag-Kα radi-ation and determining the orientation matrix, data collection was performed in ϕ scangeometry with ∆ϕ = 0.8o. The intensities of the accessible part of the Ewald spherewere collected between 0 and 200.0 oϕ. Data were subsequently corrected for Lorentz,polarization and absorption effects (multiply-scanned symmetry equivalents [16]). Sys-tematic absences (hkl only observed for h+k, h+l, k+l and consequences on 0kl, h0land 00l and on h00, 0k0 and 00l) together with Wilson statistics indicated face cen-
Results 89
tering and absence of centrosymmetry, suggesting the possible space groups F23 (No.196), F432 (No. 209) and F 43m (No. 216). Structure solution with direct methodssucceeded in space group F23 and yielded all atom positions. Atom assignment wascarried out by analysis of the thermal displacement parameters as indicator for heavier(Hg) or lighter (La) atoms. After anisotropic treatment of all thermal displacement pa-rameters the atomic positions were checked for mixed occupancy. Only two positions(La10/Hg10, 0.23(10):0.77(10) and La13/Hg13, 0.49(18):0.51(18), see Table 2) showedsignificant mixed occupancy and were assumed to be overall fully occupied. Checkingfor additional symmetry (Platon package [20]) revealed the final space group F 43m. Thehigh Rint = 0.1533 is caused by a very thin layer of elemental mercury covering the crystal.Liquid mercury is a very efficient X-ray absorber, even in thin layers and hence influ-ences reflection statistics, not in all cases mended by absorption correction algorithms.Further details on crystal structure, data collection, structure solution and refinementare compiled in Table 1, fractional atomic coordinates in standardized setting [21] andisotropic displacement parameters are compiled in Table 2, anisotriopic displacement pa-rameters for all atoms can be found in Table A5. Further details on the crystal structureinvestigations are available from Fachinformationszentrum Karlsruhe, 76344 Eggenstein-Leopoldshafen, Germany (fax. +49 (0)7247 808 666; e-mail: [email protected];http://www.fiz-informationsdienste.de /en/DB/icsd/depot_anforderung.html) on quot-ing the deposition number CSD-431022.
Powder X-ray diffraction
Samples for powder diffraction studies on Nd11Hg44.5 and Sm11Hg44.5 were prepared ina glovebox by grinding the samples and sealing the powder in glass capillaries (∅ = 0.3mm). To account for the high absorption coefficients, the sample was optically dilutedwith diamond powder, and data were collected in multiple subsequently added rangesbetween 2.0 and 70 o2ϑ.
Fig. 2. Rietveld refinement of Sm11Hg44.5.Final refinement parameters are compiled inTable A4.
Data collection was performed on a diffractome-ter system with position-sensitive linear detec-tor (Stadi P, Stoe & Cie. GmbH, Darmstadt,Germany, MYTHEN 2K detector) in Ge(111)-monochromatized Mo-Kα1 radiation in Debye-Scherrer geometry. Rietveld refinements wereperformed with a fundamental parameter ap-proach [17, 18], and a double-Voigt approachto compensate size-strain effects. A shiftedChebychev function was applied for backgroundmodelling. As starting values the single crystalstructure model of La11+xHg45−x was appliedafter replacing La with either Nd or Sm andavoiding mixed positions. On all positions x, y,z were freely refined. As the data/parameter
ratio was low due to high symmetry, common values for Biso were refined for all Hg andall RE atoms. This allowed to check each atom individually for underoccupation by re-fining the respective occupation parameters. With high significance all atoms showed full
90 Results
Table 1: Crystallographic data and details on data collection, structure solution and refinement ofLa11+xHg45−x.
Empirical sum formula La11+xHg45−x, x = 0.7(1)Crystal system cubicSpace group F43m (No. 216)Lattice parameters (Å, Å3) a = 21.934(2)
V = 10553(3)Formula units Z 8Calculated density (g·cm−1) 13.231Absorption coefficient (mm−1) 75.044Radiation, wavelength (Å) Ag-Kα, 0.56086Diffractometer IPDS 1 (Stoe & Cie, Darmstadt, Germany)Data collection mode ϕ-Scans, 0o ≤ ϕ ≤ 200 o, ∆ϕ = 0.8 o
Corrections Lorentz, polarization, absorption [16]Transmission factors Tmin/Tmax 0.005 / 0.031Number of l.s. parameters 70Number of collected data 31194Number of unique data 1010Number of unique data with I ≥ 2σ(I) 808Rint/Rσ 0.1533 / 0.0421Data range -33 ≤ h ≤ 32, (2ϑmax = 49.8o)
-33 ≤ k,l ≤ 33Structure solution direct methods [19]Structure refinement full matrix least-squares on F2 [19]R1 (I ≥ 2σ(I))/R1 (all data) 0.0428 / 0.0617wR2 (I ≥ 2σ(I))/wR2 (all data) 0.1174 / 0.1251Residual electron density min/max (e−·Å−3) -3.694/5.582Extinction coefficient 0.0000072(15)
occupation. However, the thermal displacement parameter for Hg13 on 0,0,0 appearedto be unreasonably large (>20 pm2) during free refinement. After fixing to 2 pm2 theoccupation factor was refined freely and it became clear that this position is vacant. Theatom was excluded from the list and a difference Fourier map (see Fig. A6) shows noresidual electron density at this position. As a structural consequence, the neighbouringatom Hg8 relaxes toward this vacancy and thus gives further evidence for an actual un-occupied position as the shortened interatomic distances prohibit occupation (d(0,0,0)−Hg8
= 2.2066(7)Å), see inset of Figure 4. A chemical analysis via ICP-AAS or EDX/WDX isunhelpful to prove the lower Hg content in RE11Hg44.5, as the powder may contain someHg metal sticking to the surface of the crystallites, and the effect amounts to a differenceof only 1.1 at.-% Hg in comparison with a structure with fully occupied position of Hg13.
Selected details on the results of the refinement are given in Table A4 and Figure 2.The atomic coordinates together with Wyckoff numbers and isotropic thermal displace-ment parameters U ij are compiled in Tables A6 and A7. Further details can be ob-tained from Fachinformationszentrum Karlsruhe, 76344 Eggenstein- Leopoldshafen, Ger-many (fax. +49 (0)7247 808 666; e-mail: [email protected];http://www.fiz-
Results 91
Table 2: Standardized fractional atomic coordinates [21], Wyckoff numbers, equivalent isotropic dis-placement parameters (Å2) and site occupation factors as result of a single crystal structure refinementof La11+xHg45−x. U eq is defined as 1
3 of the trace of the orthogonalized U ij tensor. Standard deviationsin units of the last digit are given in parentheses.
Atom Wyckoff site x y z U eq s.o.fHg1 48h 0.04581(6) x 0.64056(8) 0.0373(5) 1La1 48h 0.07623(13) x 0.26411(15) 0.0356(6) 1Hg2 48h 0.07671(6) x 0.76178(7) 0.0257(3) 1Hg3 48h 0.16475(8) x 0.01589(12) 0.0430(5) 1Hg4 48h 0.18753(6) x 0.50893(9) 0.0312(4) 1Hg5 48h 0.20458(6) x 0.89269(11) 0.0351(4) 1Hg6 24g 0.09583(14) 1
414 0.0388(6) 1
Hg7 24f 0.16275(12) 0 0 0.0291(5) 1Hg8 16e 0.0761(2) x x 0.0541(10) 1Hg9 16e 0.16150(9) x x 0.0322(6) 1Hg10 16e 0.33370(11) x x 0.046(2) 0.77(10)La10 16e 0.33370(11) x x 0.046(2) 0.23(10)Hg11 16e 0.41279(7) x x 0.0275(5) 1La2 16e 0.65678(11) x x 0.0212(7) 1La3 16e 0.91140(11) x x 0.0224(7) 1Hg12 4d 3
434
34 0.0323(12) 1
La4 4c 14
14
14 0.0196(13) 1
La5 4b 12
12
12 0.0190(13) 1
Hg13 4a 0 0 0 0.049(4) 0.5(2)La13 4a 0 0 0 0.049(4) 0.5(2)
informationsdienste.de /en/DB/icsd/depot_anforderung.html) on quoting the deposi-tion numbers CSD-431027 (Sm compound) and CSD-431028 (Nd compound).
Band structure calculations
DFT calculations of the electronic band structure were performed for the hypotheticalfully ordered structure model La11Hg45 with the program package Wien2k [23], applyingthe FP-LAPWmethod. Lattice parameters and atomic positions were used as the resultsof single crystal analysis, see Tables 1 and 2. The exchange correlation was taken accountof by the generalized gradient approximation, GGA [24], and muffin-tin radii were set to132.29 pm (2.5 a. u.,Rmt · Kmax = 8) for all atoms. The cut-off energy was set to −6 Ry,and 343 k-points of the Brillouin zone (20 thereof in the irreducible wedge of the Brillouinzone) were calculated in a 7x7x7 Monkhorst-Pack grid. K-meshes with higher densitywould be favourable with respect to higher resolution. Due to the high calculation powerneeded for large structures with mixed occupation we were not able to perform largercalculations within reasonable times with our means. Handling of the mixed positionswould have to be accounted for by modeling superstructures with reduced symmetry andordered positions. However, this was not practicable with our means for La11+xHg45−x, asthe crystal structure exhibits 448 atoms per unit cell. Therefore we decided to calculatethe electronic structure based on a model without mixed positions and assumed all mixedpositions to be fully occupied by Hg (Hg/La10 and HgLa/13).
92 Results
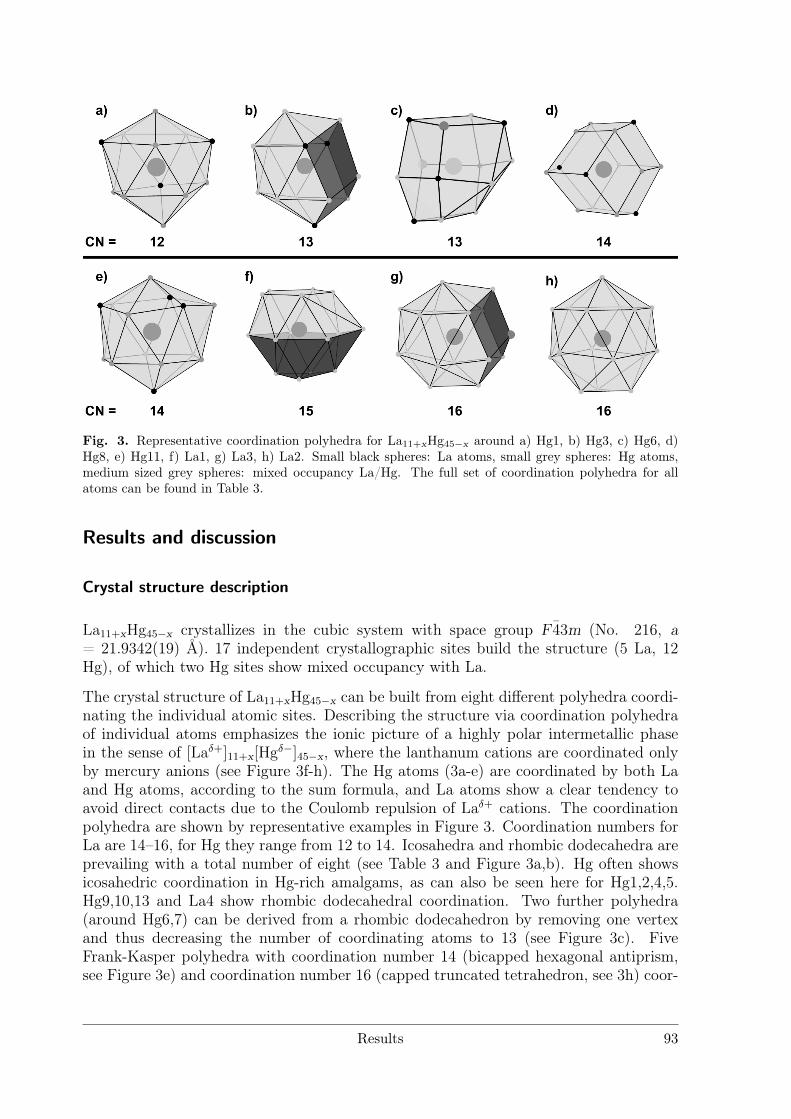
Fig. 3. Representative coordination polyhedra for La11+xHg45−x around a) Hg1, b) Hg3, c) Hg6, d)Hg8, e) Hg11, f) La1, g) La3, h) La2. Small black spheres: La atoms, small grey spheres: Hg atoms,medium sized grey spheres: mixed occupancy La/Hg. The full set of coordination polyhedra for allatoms can be found in Table 3.
Results and discussion
Crystal structure description
La11+xHg45−x crystallizes in the cubic system with space group F 43m (No. 216, a= 21.9342(19) Å). 17 independent crystallographic sites build the structure (5 La, 12Hg), of which two Hg sites show mixed occupancy with La.
The crystal structure of La11+xHg45−x can be built from eight different polyhedra coordi-nating the individual atomic sites. Describing the structure via coordination polyhedraof individual atoms emphasizes the ionic picture of a highly polar intermetallic phasein the sense of [Laδ+]11+x[Hgδ−]45−x, where the lanthanum cations are coordinated onlyby mercury anions (see Figure 3f-h). The Hg atoms (3a-e) are coordinated by both Laand Hg atoms, according to the sum formula, and La atoms show a clear tendency toavoid direct contacts due to the Coulomb repulsion of Laδ+ cations. The coordinationpolyhedra are shown by representative examples in Figure 3. Coordination numbers forLa are 14–16, for Hg they range from 12 to 14. Icosahedra and rhombic dodecahedra areprevailing with a total number of eight (see Table 3 and Figure 3a,b). Hg often showsicosahedric coordination in Hg-rich amalgams, as can also be seen here for Hg1,2,4,5.Hg9,10,13 and La4 show rhombic dodecahedral coordination. Two further polyhedra(around Hg6,7) can be derived from a rhombic dodecahedron by removing one vertexand thus decreasing the number of coordinating atoms to 13 (see Figure 3c). FiveFrank-Kasper polyhedra with coordination number 14 (bicapped hexagonal antiprism,see Figure 3e) and coordination number 16 (capped truncated tetrahedron, see 3h) coor-
Results 93
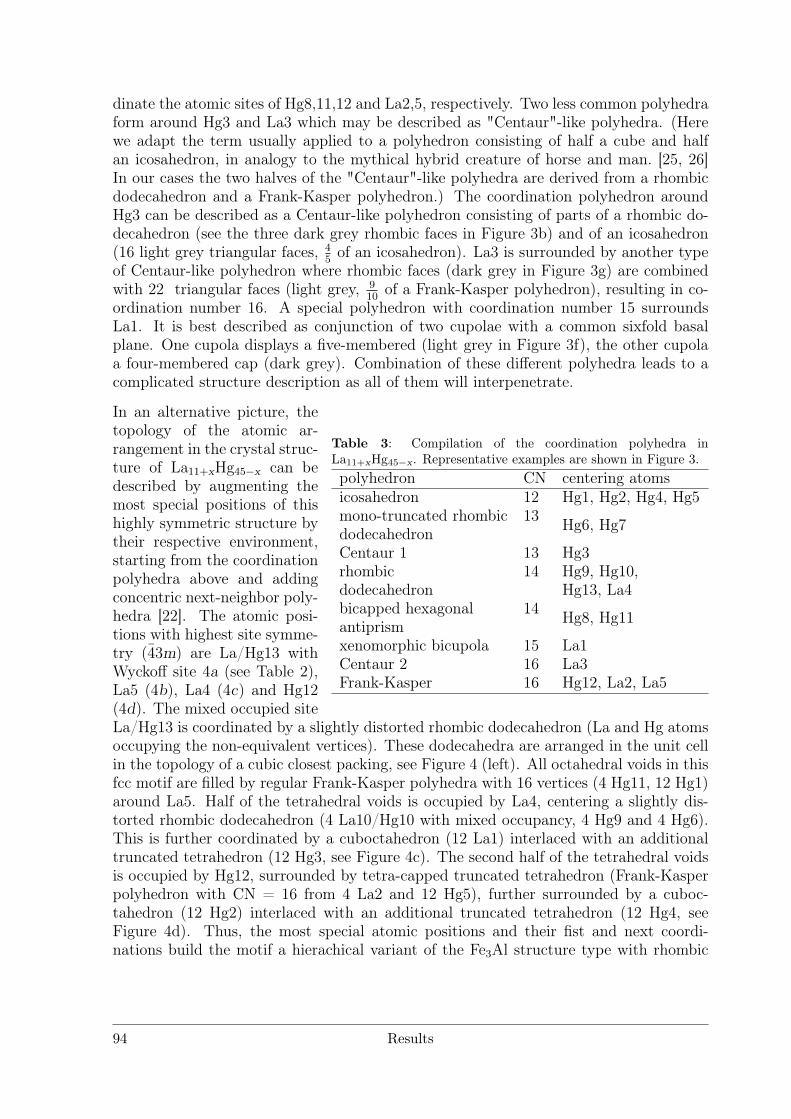
dinate the atomic sites of Hg8,11,12 and La2,5, respectively. Two less common polyhedraform around Hg3 and La3 which may be described as "Centaur"-like polyhedra. (Herewe adapt the term usually applied to a polyhedron consisting of half a cube and halfan icosahedron, in analogy to the mythical hybrid creature of horse and man. [25, 26]In our cases the two halves of the "Centaur"-like polyhedra are derived from a rhombicdodecahedron and a Frank-Kasper polyhedron.) The coordination polyhedron aroundHg3 can be described as a Centaur-like polyhedron consisting of parts of a rhombic do-decahedron (see the three dark grey rhombic faces in Figure 3b) and of an icosahedron(16 light grey triangular faces, 4
5of an icosahedron). La3 is surrounded by another type
of Centaur-like polyhedron where rhombic faces (dark grey in Figure 3g) are combinedwith 22 triangular faces (light grey, 9
10of a Frank-Kasper polyhedron), resulting in co-
ordination number 16. A special polyhedron with coordination number 15 surroundsLa1. It is best described as conjunction of two cupolae with a common sixfold basalplane. One cupola displays a five-membered (light grey in Figure 3f), the other cupolaa four-membered cap (dark grey). Combination of these different polyhedra leads to acomplicated structure description as all of them will interpenetrate.
Table 3: Compilation of the coordination polyhedra inLa11+xHg45−x. Representative examples are shown in Figure 3.polyhedron CN centering atomsicosahedron 12 Hg1, Hg2, Hg4, Hg5mono-truncated rhombic 13dodecahedron Hg6, Hg7
Centaur 1 13 Hg3rhombic 14 Hg9, Hg10,dodecahedron Hg13, La4bicapped hexagonal 14antiprism Hg8, Hg11
xenomorphic bicupola 15 La1Centaur 2 16 La3Frank-Kasper 16 Hg12, La2, La5
In an alternative picture, thetopology of the atomic ar-rangement in the crystal struc-ture of La11+xHg45−x can bedescribed by augmenting themost special positions of thishighly symmetric structure bytheir respective environment,starting from the coordinationpolyhedra above and addingconcentric next-neighbor poly-hedra [22]. The atomic posi-tions with highest site symme-try (43m) are La/Hg13 withWyckoff site 4a (see Table 2),La5 (4b), La4 (4c) and Hg12(4d). The mixed occupied siteLa/Hg13 is coordinated by a slightly distorted rhombic dodecahedron (La and Hg atomsoccupying the non-equivalent vertices). These dodecahedra are arranged in the unit cellin the topology of a cubic closest packing, see Figure 4 (left). All octahedral voids in thisfcc motif are filled by regular Frank-Kasper polyhedra with 16 vertices (4 Hg11, 12 Hg1)around La5. Half of the tetrahedral voids is occupied by La4, centering a slightly dis-torted rhombic dodecahedron (4 La10/Hg10 with mixed occupancy, 4 Hg9 and 4 Hg6).This is further coordinated by a cuboctahedron (12 La1) interlaced with an additionaltruncated tetrahedron (12 Hg3, see Figure 4c). The second half of the tetrahedral voidsis occupied by Hg12, surrounded by tetra-capped truncated tetrahedron (Frank-Kasperpolyhedron with CN = 16 from 4 La2 and 12 Hg5), further surrounded by a cuboc-tahedron (12 Hg2) interlaced with an additional truncated tetrahedron (12 Hg4, seeFigure 4d). Thus, the most special atomic positions and their fist and next coordi-nations build the motif a hierachical variant of the Fe3Al structure type with rhombic
94 Results
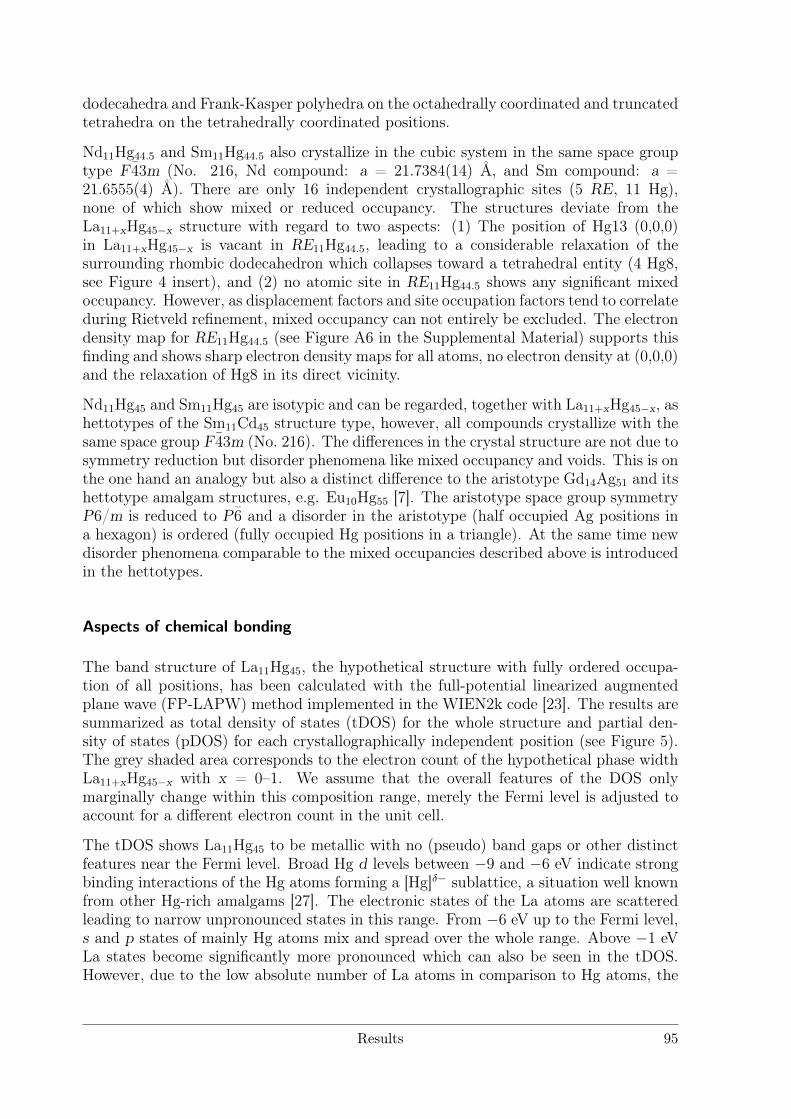
dodecahedra and Frank-Kasper polyhedra on the octahedrally coordinated and truncatedtetrahedra on the tetrahedrally coordinated positions.
Nd11Hg44.5 and Sm11Hg44.5 also crystallize in the cubic system in the same space grouptype F 43m (No. 216, Nd compound: a = 21.7384(14) Å, and Sm compound: a =21.6555(4) Å). There are only 16 independent crystallographic sites (5 RE, 11 Hg),none of which show mixed or reduced occupancy. The structures deviate from theLa11+xHg45−x structure with regard to two aspects: (1) The position of Hg13 (0,0,0)in La11+xHg45−x is vacant in RE11Hg44.5, leading to a considerable relaxation of thesurrounding rhombic dodecahedron which collapses toward a tetrahedral entity (4 Hg8,see Figure 4 insert), and (2) no atomic site in RE11Hg44.5 shows any significant mixedoccupancy. However, as displacement factors and site occupation factors tend to correlateduring Rietveld refinement, mixed occupancy can not entirely be excluded. The electrondensity map for RE11Hg44.5 (see Figure A6 in the Supplemental Material) supports thisfinding and shows sharp electron density maps for all atoms, no electron density at (0,0,0)and the relaxation of Hg8 in its direct vicinity.
Nd11Hg45 and Sm11Hg45 are isotypic and can be regarded, together with La11+xHg45−x, ashettotypes of the Sm11Cd45 structure type, however, all compounds crystallize with thesame space group F 43m (No. 216). The differences in the crystal structure are not due tosymmetry reduction but disorder phenomena like mixed occupancy and voids. This is onthe one hand an analogy but also a distinct difference to the aristotype Gd14Ag51 and itshettotype amalgam structures, e.g. Eu10Hg55 [7]. The aristotype space group symmetryP6/m is reduced to P6 and a disorder in the aristotype (half occupied Ag positions ina hexagon) is ordered (fully occupied Hg positions in a triangle). At the same time newdisorder phenomena comparable to the mixed occupancies described above is introducedin the hettotypes.
Aspects of chemical bonding
The band structure of La11Hg45, the hypothetical structure with fully ordered occupa-tion of all positions, has been calculated with the full-potential linearized augmentedplane wave (FP-LAPW) method implemented in the WIEN2k code [23]. The results aresummarized as total density of states (tDOS) for the whole structure and partial den-sity of states (pDOS) for each crystallographically independent position (see Figure 5).The grey shaded area corresponds to the electron count of the hypothetical phase widthLa11+xHg45−x with x = 0–1. We assume that the overall features of the DOS onlymarginally change within this composition range, merely the Fermi level is adjusted toaccount for a different electron count in the unit cell.
The tDOS shows La11Hg45 to be metallic with no (pseudo) band gaps or other distinctfeatures near the Fermi level. Broad Hg d levels between −9 and −6 eV indicate strongbinding interactions of the Hg atoms forming a [Hg]δ− sublattice, a situation well knownfrom other Hg-rich amalgams [27]. The electronic states of the La atoms are scatteredleading to narrow unpronounced states in this range. From −6 eV up to the Fermi level,s and p states of mainly Hg atoms mix and spread over the whole range. Above −1 eVLa states become significantly more pronounced which can also be seen in the tDOS.However, due to the low absolute number of La atoms in comparison to Hg atoms, the
Results 95
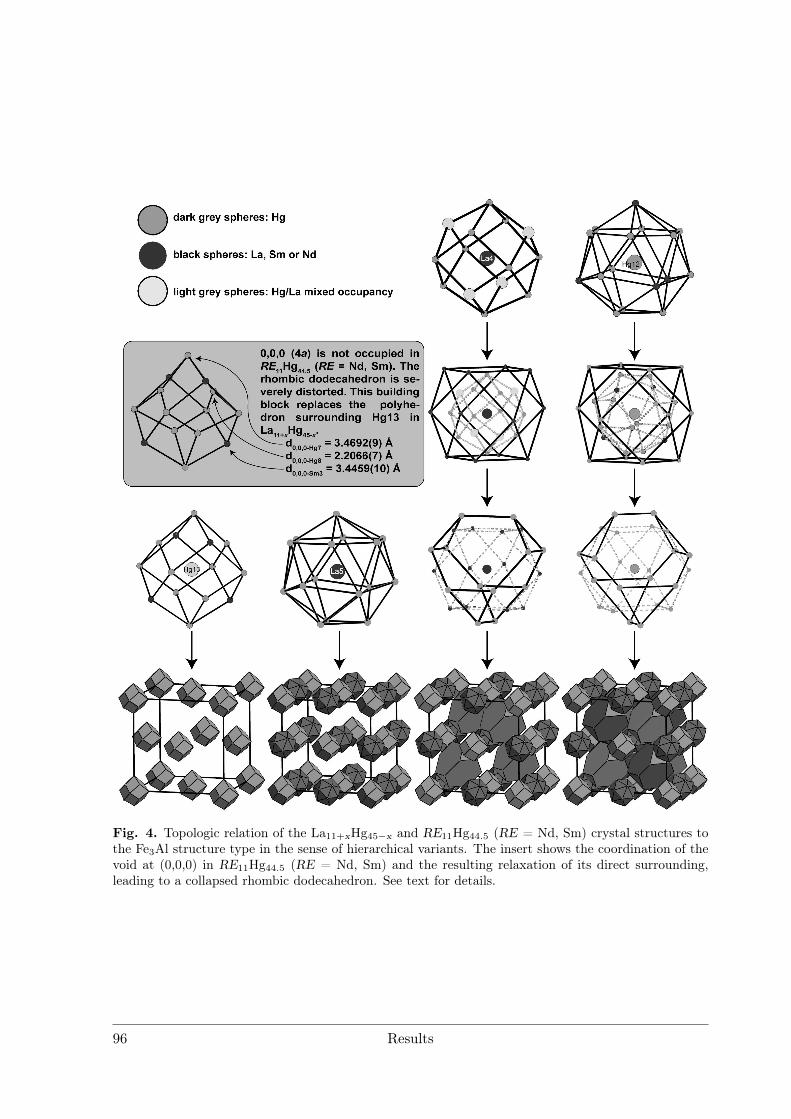
Fig. 4. Topologic relation of the La11+xHg45−x and RE11Hg44.5 (RE = Nd, Sm) crystal structures tothe Fe3Al structure type in the sense of hierarchical variants. The insert shows the coordination of thevoid at (0,0,0) in RE11Hg44.5 (RE = Nd, Sm) and the resulting relaxation of its direct surrounding,leading to a collapsed rhombic dodecahedron. See text for details.
96 Results
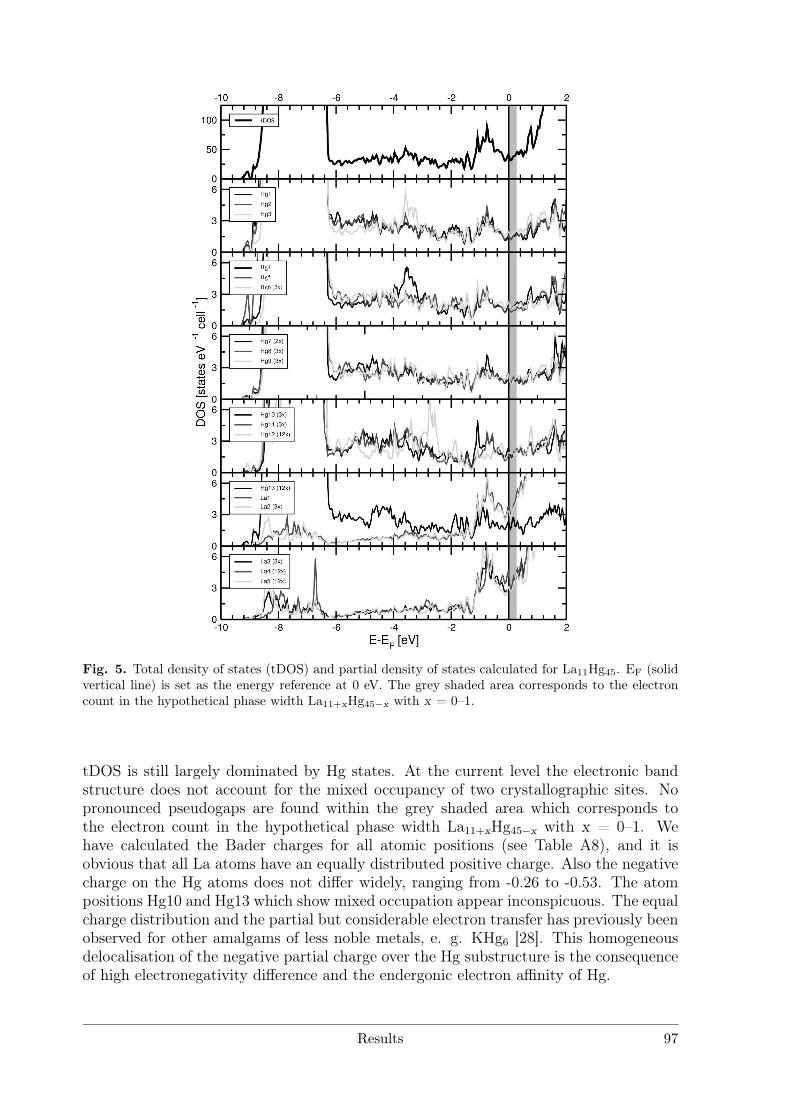
Fig. 5. Total density of states (tDOS) and partial density of states calculated for La11Hg45. EF (solidvertical line) is set as the energy reference at 0 eV. The grey shaded area corresponds to the electroncount in the hypothetical phase width La11+xHg45−x with x = 0–1.
tDOS is still largely dominated by Hg states. At the current level the electronic bandstructure does not account for the mixed occupancy of two crystallographic sites. Nopronounced pseudogaps are found within the grey shaded area which corresponds tothe electron count in the hypothetical phase width La11+xHg45−x with x = 0–1. Wehave calculated the Bader charges for all atomic positions (see Table A8), and it isobvious that all La atoms have an equally distributed positive charge. Also the negativecharge on the Hg atoms does not differ widely, ranging from -0.26 to -0.53. The atompositions Hg10 and Hg13 which show mixed occupation appear inconspicuous. The equalcharge distribution and the partial but considerable electron transfer has previously beenobserved for other amalgams of less noble metals, e. g. KHg6 [28]. This homogeneousdelocalisation of the negative partial charge over the Hg substructure is the consequenceof high electronegativity difference and the endergonic electron affinity of Hg.
Results 97
Conclusions
Hg-rich amalgams of the less noble metals show interesting structural diversity. As mer-cury is the only noble metal with a positive electron affinity and hence no pronouncedtendency toward anion formation, the electron transfer induced by the high electronega-tivity difference is always incomplete. The polarity of the metal-metal bonding in theseamalgams is highest for the Hg-rich phases as a larger Hg sublattice can delocalize thenegative partial charge more efficiently. Intermetallic systems with high polarity canshow interesting electric behavior due to strong scattering of the conduction electronsat the Coulombic potentials located at the positively polarized atoms of the less noblemetals. Especially low Ioffe-Regel limit resistances often are the consequence. Syn-thesis and crystallographic characterization of the Hg-richest amalgams is complicated,and knowledge on these phases is scarce. The amalgams connected with the Sm11Cd45
structure type show interesting features with respect to polar structure motifs (Hgδ−
anions form discrete coordination polyhedra around Laδ+ cations) and at the same timestructural motifs common to classic intermetallic phases (Frank-Kasper polyhedra, highpacking density). However, the band structure clearly shows all features of good metallicbehavior. There is a large family of amalgams of less noble metals with compositionsMHgx with 4 ≤ x ≤ 5. They can be derived from the Gd14Ag51 structure type or, as inthe presented cases, from the Sm11Cd45 structure type. The individual representativesA11−xHg55−x (A = Na, Ca, Sr, Eu) and RE11(+x)Hg45−x (RE = La, Nd, Sm) differ intheir respective disorder phenomena. The mixed occupation patterns always occur in asingular way, and hitherto no electronic reasons have been found. For the most com-plicated structure of Na11−xHg55−x a detailed topological evaluation [29] points towardgeometric reasons for the observed disorder phenomena, however, this has so far notbeen performed for the other representatives. Future work will reveal whether geometricreasons can be identified in all known cases or whether configurational entropic effectsmay be attributed for the observed disorder phenomena. The latter would imply a lowprobability to find a representative of the structure types in question with no disorderat all. As a large number of lanthanides and actinides were reported to form similaramalgams of composition RE11Hg45 (RE = Ce, Gd, Pr, U) but mixed occupancies orother complications were never reported, we strongly encourage to look further into thematter of this interesting part of intermetallic chemistry.
Acknowledgements
We thank Prof. Dr. Wolfgang Schnick for his longstanding and generous financialsupport.
98 Results
References
[1] A. Iandelli, A. Palenzona, Atomic size of rare earths in intermetallic compounds. MX compounds ofCsCl type J. Less Common Met. 9 (1965), 1-6. DOI: 10.1016/0022-5088(65)90028-7
[2] H. R. Kirchmayr Gitterkonstanten und Strukturen der Verbindungen DyHg, HoHg, ErHg; DyHg2,HoHg2, ErHg2; DyHg3, HoHg3 und ErHg3 Monatsh. Chem. 95 (1964), 1667-1670.DOI: 10.1007/BF00901725
[3] A. Iandelli, A. Palenzona, Crystal chemistry of intermetallic compounds In: Handbook on the Physicsand Chemistry of Rare Earths, Vol.2, Chapter 13, Elsevier B. V. (1979), pp. 1-54. DOI: 10.1016/S0168-1273(79)02004-3
[4] A. Iandelli, A. Palenzona On the occurrence of the MX2 phases of the rare earths with the IB, IIBand IIIB group elements and their crystal structures J. Less Common Met. 15 (1968), 273-284. DOI:10.1016/0022-5088(68)90186-0
[5] A. Palenzona MX3 intermetallic phase of the rare earths with Hg, In, Tl, Pb J. Less Common Met.(1966), 290-292. DOI: 10.1016/0022-5088(66)90031-2
[6] F. Merlo, M. L. Fornasini, Crystal structure of the R11Hg45 compounds (R = La, Ce, Pr, Nd, Sm,Gd, U), J. Less Common Met. 64 (1979), 221-231. DOI: 10.1016/0022-5088(79)90173-5
[7] F. Tambornino, C. Hoch, The mercury-richest europium amalgam Eu10Hg55, Z. Anorg. Allg. Chem.641 (2015), 537-542. DOI: 10.1002/zaac.201400561
[8] M. L. Fornasini, B. Chabot, E. Parthé, The crystal structure of Sm11Cd45 with γ-brass and α-Mnclusters, Acta Crystallogr. B34 (1978), 2093-2099. DOI: 10.1107/S0567740878007505
[9] R. Ryba, P. K. Kejriwal, R. Elmendorf, The partial yttrium-cadmium phase diagram, J. Less Com-mon Met. 18 (1969), 419-422. DOI: 10.1016/0022-5088(69)90011-3
[10] G. Bruzzone, M. L. Fornasini, F. Merlo, Rare-earth intermediate phases with cadmium, J. LessCommon Met. 30 (1973), 361-375. DOI: 10.1016/0022-5088(73)90147-1
[11] G. Bruzzone, M. L. Fornasini, F. Merlo, The gadolinium-cadmium system, J. Less Common Met.25 (1971), 295-301. DOI: 10.1016/0022-5088(71)90153-6
[12] M. L. Fornasini, P. Manfrinetti, K. A. Gschneidner Jr, GdMg5: a Complex Structure with a LargeCubic Cell, Acta Crystallogr. C42 (1986), 138-141. DOI: 10.1107/S0108270186097019
[13] H. Flandorfer, A. Kostikas, C. Godart, M. Giovannini, R. Ferro, A. Saccone, P. Rogl, On themagnetic and valence properties of Ce-Mg-Y compounds, J. Alloys Compd. 240 (1996), 116-123. DOI:10.1016/0925-8388(96)02244-X
[14] T.-S. You, Y. Jung, M.-K. Han, G. J. Miller, The Y5−xMg24+x (1.08(4)≤x≤1.30(1)) series and aternary derivative Ce6.9Y12.5(7)Mg92.2: A comparison of their crystal and electronic structures, J. SolidState Chem. 204 (2013), 170-177. DOI: 10.1016/j.jssc.2013.05.037
[15] F. Tambornino, J. Sappl, C. Hoch, The Gd14Ag51 structure type and its relation to some complexamalgam structures, J. Alloys Compd. 618 (2015), 326-335. DOI: 10.1016/j.jallcom.2014.08.017
[16] R. H. Blessing, An empirical correction for absorption anisotropy, Acta Crystallogr. A51 (1995),33-38. DOI: 10.1107/S0108767394005726
[17] H. M. Rietveld, A profile refinement method for nuclear and magnetic structures, J. Appl. Cryst.2 (1969), 65-71. DOI: 10.1107/S0021889869006558
[18] A. Coelho, Topas Academic Version 4.1, Coelho Software, Brisbane, 2007.
Results 99
[19] G. M. Sheldrick, A short history of SHELX, Acta Crystallogr. A64 (2007), 112-122. DOI:10.1107/S0108767307043930
[20] A. L. Spek, Structure validation in chemical crystallography, Acta Crystallogr. D65 (2009), 148-155.DOI: 10.1107/S090744490804362X
[21] L. M. Gelato, E. Parthé, Structure Tidy - a computer program to standardize crystal structuredata, J. Appl. Cryst. 20 (1987), 139-143. DOI: 10.1107/S0021889887086965
[22] M.L. Fornasini, B. Chabot and E. Parthé, The crystal structure of Sm11Cd45 with γ-brass andα-Mn clusters, Acta Crystallogr. B 34 (1978) 2093-2099. DOI: 10.1107/S0567740878007505.
[23] P. Blaha, K. Schwarz, G. K. H. Madsen, D. Kvasnicka, and J. Luitz, WIEN2k: An augmented planewave + local orbitals program for calculating crystal properties, Technische Universität Wien, Austria(2001).
[24] J. P. Perdew, K. Burke, and M. Ernzerhof, Generalized gradient approximation made simple Phys.Rev. Lett. 77 (1996), 3865. DOI: 10.1103/PhysRevLett.77.3865
[25] D. Raschke, Zur Untersuchung fehlgeordneter Strukturen mit dem optischen DiffraktometerOPDIRA und über die Struktur des quaternären Fluoridchlorids Ba9Cd13F43Cl, PhD Thesis, Universityof Stuttgart, Germany 1985.
[26] S. Lidin and A.-K. Larsson, A structural description of β-K2SO4, Acta Chem. Scand. 45 (1991),856-859. DOI: 10.3891/acta.chem.scand.45-0856
[27] M. Wendorff and C. Röhr, The new barium mercuride BaHg6 and ternary indium and galliumderivatives, J. Alloys Compd. 546 (2013), 320-328. DOI: 10.1016/j.jallcom.2012.07.101.
[28] F. Tambornino, C. Hoch, Bad metal behaviour in the new Hg-rich amalgam KHg6 with polarmetallic bonding, J. Alloys Compd. 618 (2015), 299-304. DOI: 10.1016/j.jallcom.2014.08.173
[29] W. Hornfeck, C. Hoch, Structural chemistry and number theory amalgamized: crystal structure ofNa11Hg52, Acta Crystallogr. B71 (2015), 752-767. DOI: 10.1107/S205252061501673X
100 Results
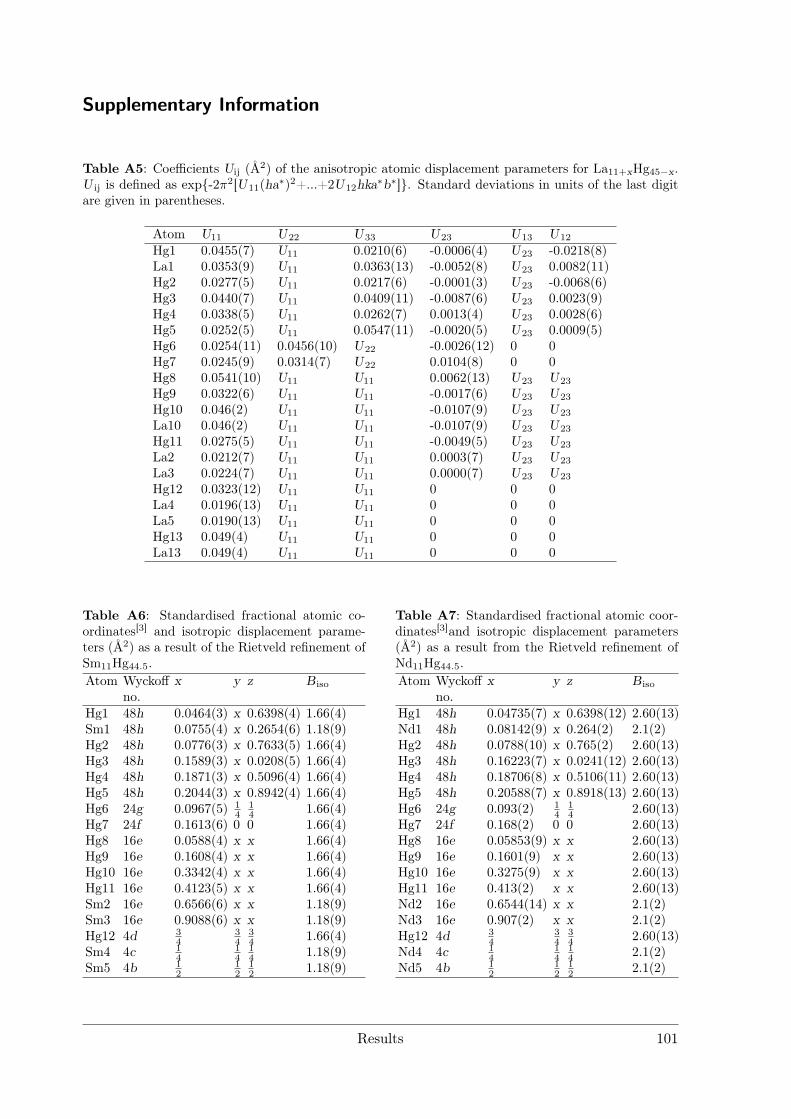
Supplementary Information
Table A5: Coefficients Uij (Å2) of the anisotropic atomic displacement parameters for La11+xHg45−x.U ij is defined as exp-2π2[U11(ha∗)2+...+2U12hka∗b∗]. Standard deviations in units of the last digitare given in parentheses.
Atom U11 U22 U33 U23 U13 U12
Hg1 0.0455(7) U11 0.0210(6) -0.0006(4) U23 -0.0218(8)La1 0.0353(9) U11 0.0363(13) -0.0052(8) U23 0.0082(11)Hg2 0.0277(5) U11 0.0217(6) -0.0001(3) U23 -0.0068(6)Hg3 0.0440(7) U11 0.0409(11) -0.0087(6) U23 0.0023(9)Hg4 0.0338(5) U11 0.0262(7) 0.0013(4) U23 0.0028(6)Hg5 0.0252(5) U11 0.0547(11) -0.0020(5) U23 0.0009(5)Hg6 0.0254(11) 0.0456(10) U22 -0.0026(12) 0 0Hg7 0.0245(9) 0.0314(7) U22 0.0104(8) 0 0Hg8 0.0541(10) U11 U11 0.0062(13) U23 U23
Hg9 0.0322(6) U11 U11 -0.0017(6) U23 U23
Hg10 0.046(2) U11 U11 -0.0107(9) U23 U23
La10 0.046(2) U11 U11 -0.0107(9) U23 U23
Hg11 0.0275(5) U11 U11 -0.0049(5) U23 U23
La2 0.0212(7) U11 U11 0.0003(7) U23 U23
La3 0.0224(7) U11 U11 0.0000(7) U23 U23
Hg12 0.0323(12) U11 U11 0 0 0La4 0.0196(13) U11 U11 0 0 0La5 0.0190(13) U11 U11 0 0 0Hg13 0.049(4) U11 U11 0 0 0La13 0.049(4) U11 U11 0 0 0
Table A6: Standardised fractional atomic co-ordinates[3] and isotropic displacement parame-ters (Å2) as a result of the Rietveld refinement ofSm11Hg44.5.Atom Wyckoff x y z Biso
no.Hg1 48h 0.0464(3) x 0.6398(4) 1.66(4)Sm1 48h 0.0755(4) x 0.2654(6) 1.18(9)Hg2 48h 0.0776(3) x 0.7633(5) 1.66(4)Hg3 48h 0.1589(3) x 0.0208(5) 1.66(4)Hg4 48h 0.1871(3) x 0.5096(4) 1.66(4)Hg5 48h 0.2044(3) x 0.8942(4) 1.66(4)Hg6 24g 0.0967(5) 1
414 1.66(4)
Hg7 24f 0.1613(6) 0 0 1.66(4)Hg8 16e 0.0588(4) x x 1.66(4)Hg9 16e 0.1608(4) x x 1.66(4)Hg10 16e 0.3342(4) x x 1.66(4)Hg11 16e 0.4123(5) x x 1.66(4)Sm2 16e 0.6566(6) x x 1.18(9)Sm3 16e 0.9088(6) x x 1.18(9)Hg12 4d 3
434
34 1.66(4)
Sm4 4c 14
14
14 1.18(9)
Sm5 4b 12
12
12 1.18(9)
Table A7: Standardised fractional atomic coor-dinates[3]and isotropic displacement parameters(Å2) as a result from the Rietveld refinement ofNd11Hg44.5.Atom Wyckoff x y z Biso
no.Hg1 48h 0.04735(7) x 0.6398(12) 2.60(13)Nd1 48h 0.08142(9) x 0.264(2) 2.1(2)Hg2 48h 0.0788(10) x 0.765(2) 2.60(13)Hg3 48h 0.16223(7) x 0.0241(12) 2.60(13)Hg4 48h 0.18706(8) x 0.5106(11) 2.60(13)Hg5 48h 0.20588(7) x 0.8918(13) 2.60(13)Hg6 24g 0.093(2) 1
414 2.60(13)
Hg7 24f 0.168(2) 0 0 2.60(13)Hg8 16e 0.05853(9) x x 2.60(13)Hg9 16e 0.1601(9) x x 2.60(13)Hg10 16e 0.3275(9) x x 2.60(13)Hg11 16e 0.413(2) x x 2.60(13)Nd2 16e 0.6544(14) x x 2.1(2)Nd3 16e 0.907(2) x x 2.1(2)Hg12 4d 3
434
34 2.60(13)
Nd4 4c 14
14
14 2.1(2)
Nd5 4b 12
12
12 2.1(2)
Results 101
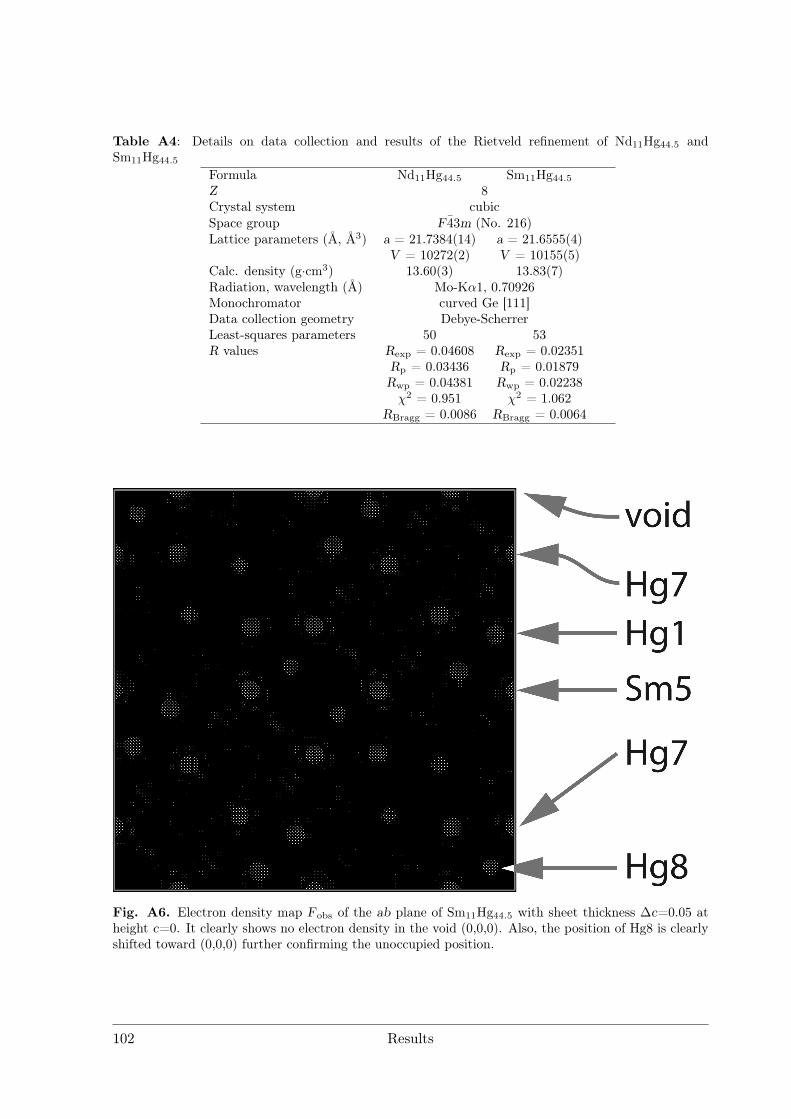
Table A4: Details on data collection and results of the Rietveld refinement of Nd11Hg44.5 andSm11Hg44.5
Formula Nd11Hg44.5 Sm11Hg44.5Z 8Crystal system cubicSpace group F43m (No. 216)Lattice parameters (Å, Å3) a = 21.7384(14) a = 21.6555(4)
V = 10272(2) V = 10155(5)Calc. density (g·cm3) 13.60(3) 13.83(7)Radiation, wavelength (Å) Mo-Kα1, 0.70926Monochromator curved Ge [111]Data collection geometry Debye-ScherrerLeast-squares parameters 50 53R values Rexp = 0.04608 Rexp = 0.02351
Rp = 0.03436 Rp = 0.01879Rwp = 0.04381 Rwp = 0.02238χ2 = 0.951 χ2 = 1.062
RBragg = 0.0086 RBragg = 0.0064
Fig. A6. Electron density map Fobs of the ab plane of Sm11Hg44.5 with sheet thickness ∆c=0.05 atheight c=0. It clearly shows no electron density in the void (0,0,0). Also, the position of Hg8 is clearlyshifted toward (0,0,0) further confirming the unoccupied position.
102 Results
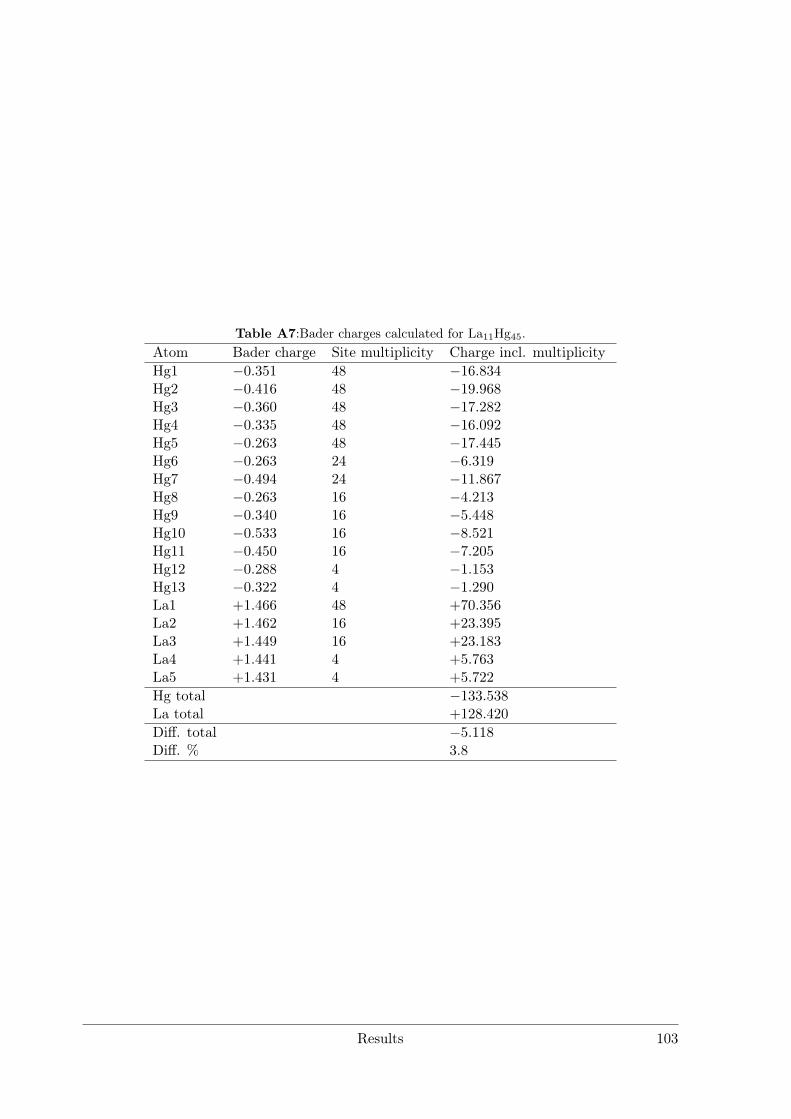
Table A7:Bader charges calculated for La11Hg45.Atom Bader charge Site multiplicity Charge incl. multiplicityHg1 −0.351 48 −16.834Hg2 −0.416 48 −19.968Hg3 −0.360 48 −17.282Hg4 −0.335 48 −16.092Hg5 −0.263 48 −17.445Hg6 −0.263 24 −6.319Hg7 −0.494 24 −11.867Hg8 −0.263 16 −4.213Hg9 −0.340 16 −5.448Hg10 −0.533 16 −8.521Hg11 −0.450 16 −7.205Hg12 −0.288 4 −1.153Hg13 −0.322 4 −1.290La1 +1.466 48 +70.356La2 +1.462 16 +23.395La3 +1.449 16 +23.183La4 +1.441 4 +5.763La5 +1.431 4 +5.722
Hg total −133.538La total +128.420
Diff. total −5.118Diff. % 3.8
Results 103

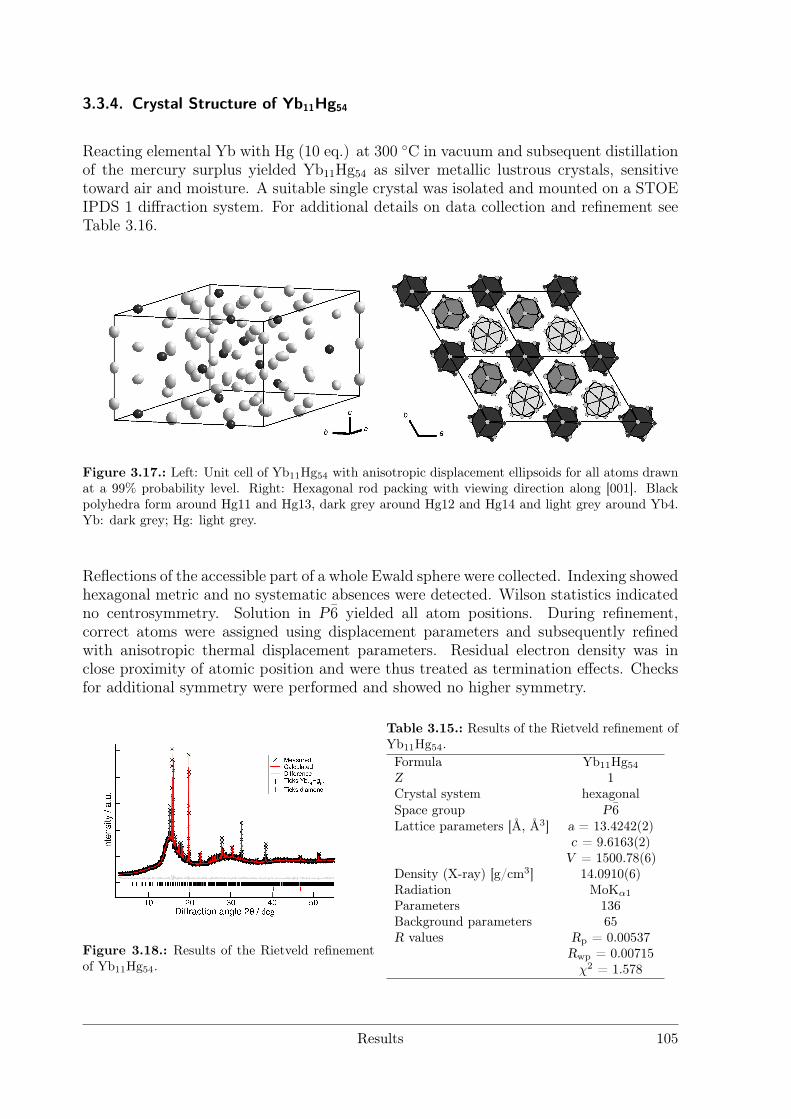
3.3.4. Crystal Structure of Yb11Hg54
Reacting elemental Yb with Hg (10 eq.) at 300 C in vacuum and subsequent distillationof the mercury surplus yielded Yb11Hg54 as silver metallic lustrous crystals, sensitivetoward air and moisture. A suitable single crystal was isolated and mounted on a STOEIPDS 1 diffraction system. For additional details on data collection and refinement seeTable 3.16.
Figure 3.17.: Left: Unit cell of Yb11Hg54 with anisotropic displacement ellipsoids for all atoms drawnat a 99% probability level. Right: Hexagonal rod packing with viewing direction along [001]. Blackpolyhedra form around Hg11 and Hg13, dark grey around Hg12 and Hg14 and light grey around Yb4.Yb: dark grey; Hg: light grey.
Reflections of the accessible part of a whole Ewald sphere were collected. Indexing showedhexagonal metric and no systematic absences were detected. Wilson statistics indicatedno centrosymmetry. Solution in P6 yielded all atom positions. During refinement,correct atoms were assigned using displacement parameters and subsequently refinedwith anisotropic thermal displacement parameters. Residual electron density was inclose proximity of atomic position and were thus treated as termination effects. Checksfor additional symmetry were performed and showed no higher symmetry.
Figure 3.18.: Results of the Rietveld refinementof Yb11Hg54.
Table 3.15.: Results of the Rietveld refinement ofYb11Hg54.Formula Yb11Hg54Z 1Crystal system hexagonalSpace group P6Lattice parameters [Å, Å3] a = 13.4242(2)
c = 9.6163(2)V = 1500.78(6)
Density (X-ray) [g/cm3] 14.0910(6)Radiation MoKα1Parameters 136Background parameters 65R values Rp = 0.00537
Rwp = 0.00715χ2 = 1.578
Results 105
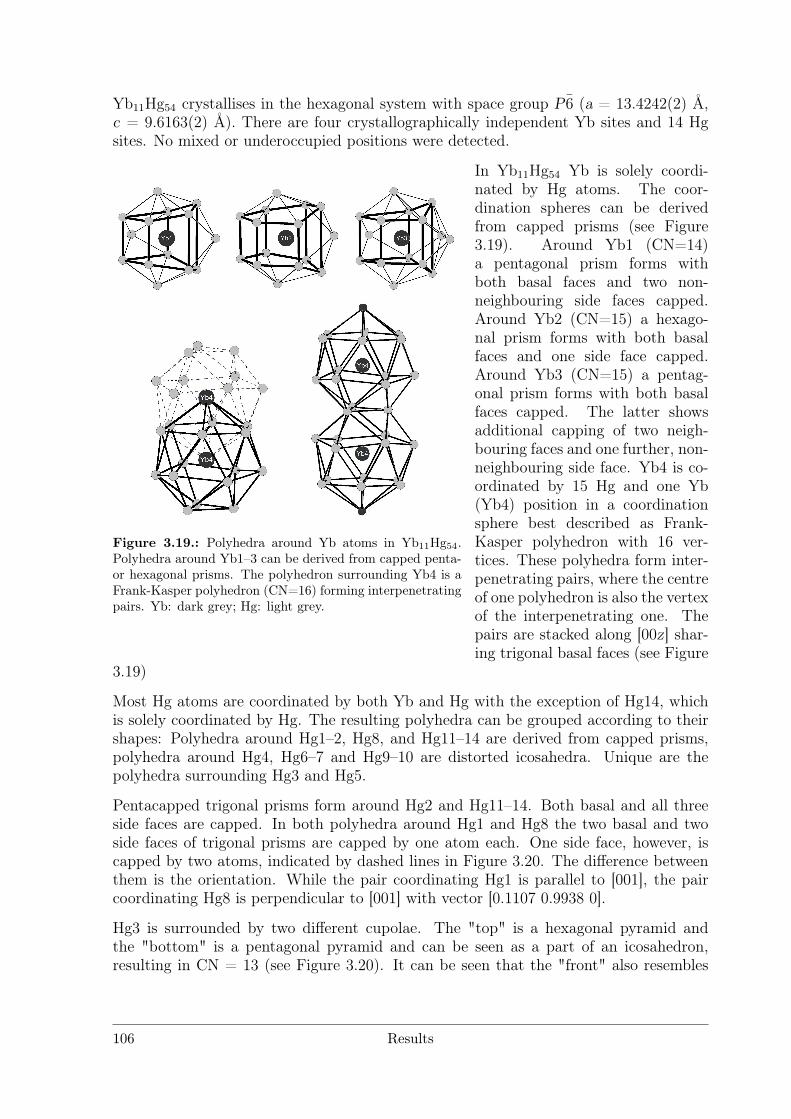
Yb11Hg54 crystallises in the hexagonal system with space group P6 (a = 13.4242(2) Å,c = 9.6163(2) Å). There are four crystallographically independent Yb sites and 14 Hgsites. No mixed or underoccupied positions were detected.
Figure 3.19.: Polyhedra around Yb atoms in Yb11Hg54.Polyhedra around Yb1–3 can be derived from capped penta-or hexagonal prisms. The polyhedron surrounding Yb4 is aFrank-Kasper polyhedron (CN=16) forming interpenetratingpairs. Yb: dark grey; Hg: light grey.
In Yb11Hg54 Yb is solely coordi-nated by Hg atoms. The coor-dination spheres can be derivedfrom capped prisms (see Figure3.19). Around Yb1 (CN=14)a pentagonal prism forms withboth basal faces and two non-neighbouring side faces capped.Around Yb2 (CN=15) a hexago-nal prism forms with both basalfaces and one side face capped.Around Yb3 (CN=15) a pentag-onal prism forms with both basalfaces capped. The latter showsadditional capping of two neigh-bouring faces and one further, non-neighbouring side face. Yb4 is co-ordinated by 15 Hg and one Yb(Yb4) position in a coordinationsphere best described as Frank-Kasper polyhedron with 16 ver-tices. These polyhedra form inter-penetrating pairs, where the centreof one polyhedron is also the vertexof the interpenetrating one. Thepairs are stacked along [00z] shar-ing trigonal basal faces (see Figure
3.19)
Most Hg atoms are coordinated by both Yb and Hg with the exception of Hg14, whichis solely coordinated by Hg. The resulting polyhedra can be grouped according to theirshapes: Polyhedra around Hg1–2, Hg8, and Hg11–14 are derived from capped prisms,polyhedra around Hg4, Hg6–7 and Hg9–10 are distorted icosahedra. Unique are thepolyhedra surrounding Hg3 and Hg5.
Pentacapped trigonal prisms form around Hg2 and Hg11–14. Both basal and all threeside faces are capped. In both polyhedra around Hg1 and Hg8 the two basal and twoside faces of trigonal prisms are capped by one atom each. One side face, however, iscapped by two atoms, indicated by dashed lines in Figure 3.20. The difference betweenthem is the orientation. While the pair coordinating Hg1 is parallel to [001], the paircoordinating Hg8 is perpendicular to [001] with vector [0.1107 0.9938 0].
Hg3 is surrounded by two different cupolae. The "top" is a hexagonal pyramid andthe "bottom" is a pentagonal pyramid and can be seen as a part of an icosahedron,resulting in CN = 13 (see Figure 3.20). It can be seen that the "front" also resembles
106 Results
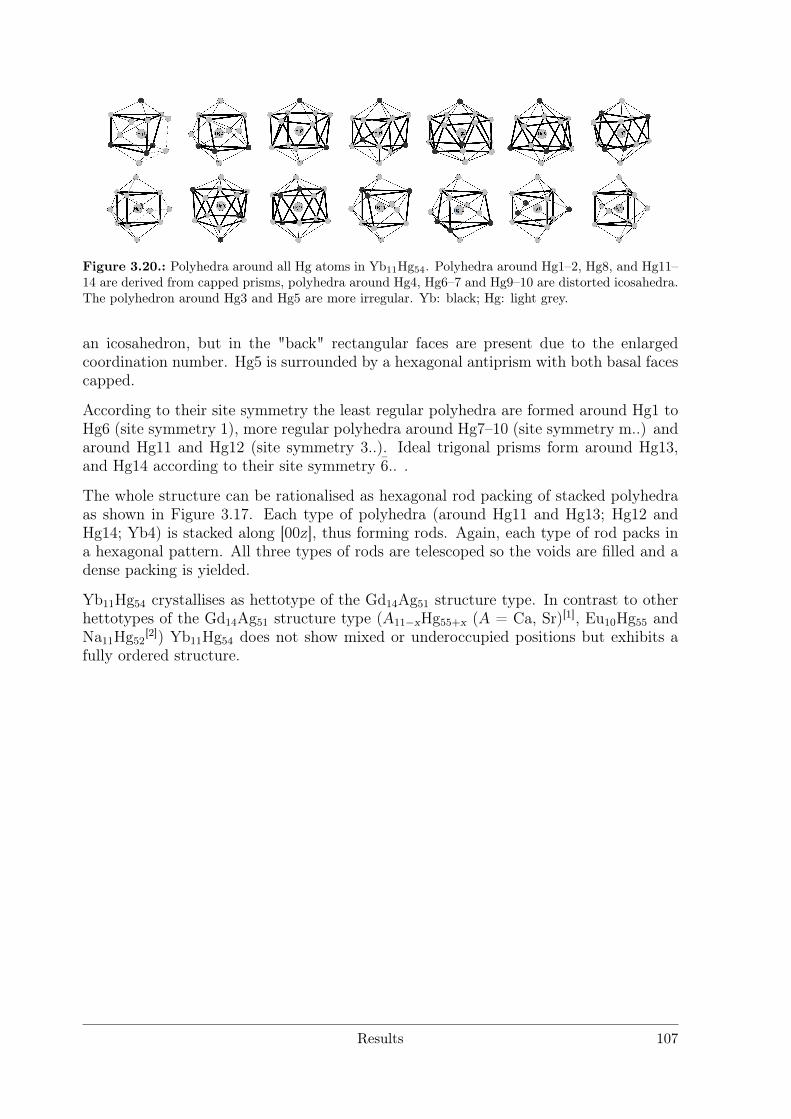
Figure 3.20.: Polyhedra around all Hg atoms in Yb11Hg54. Polyhedra around Hg1–2, Hg8, and Hg11–14 are derived from capped prisms, polyhedra around Hg4, Hg6–7 and Hg9–10 are distorted icosahedra.The polyhedron around Hg3 and Hg5 are more irregular. Yb: black; Hg: light grey.
an icosahedron, but in the "back" rectangular faces are present due to the enlargedcoordination number. Hg5 is surrounded by a hexagonal antiprism with both basal facescapped.
According to their site symmetry the least regular polyhedra are formed around Hg1 toHg6 (site symmetry 1), more regular polyhedra around Hg7–10 (site symmetry m..) andaround Hg11 and Hg12 (site symmetry 3..). Ideal trigonal prisms form around Hg13,and Hg14 according to their site symmetry 6.. .
The whole structure can be rationalised as hexagonal rod packing of stacked polyhedraas shown in Figure 3.17. Each type of polyhedra (around Hg11 and Hg13; Hg12 andHg14; Yb4) is stacked along [00z], thus forming rods. Again, each type of rod packs ina hexagonal pattern. All three types of rods are telescoped so the voids are filled and adense packing is yielded.
Yb11Hg54 crystallises as hettotype of the Gd14Ag51 structure type. In contrast to otherhettotypes of the Gd14Ag51 structure type (A11−xHg55+x (A = Ca, Sr)[1], Eu10Hg55 andNa11Hg52
[2]) Yb11Hg54 does not show mixed or underoccupied positions but exhibits afully ordered structure.
Results 107
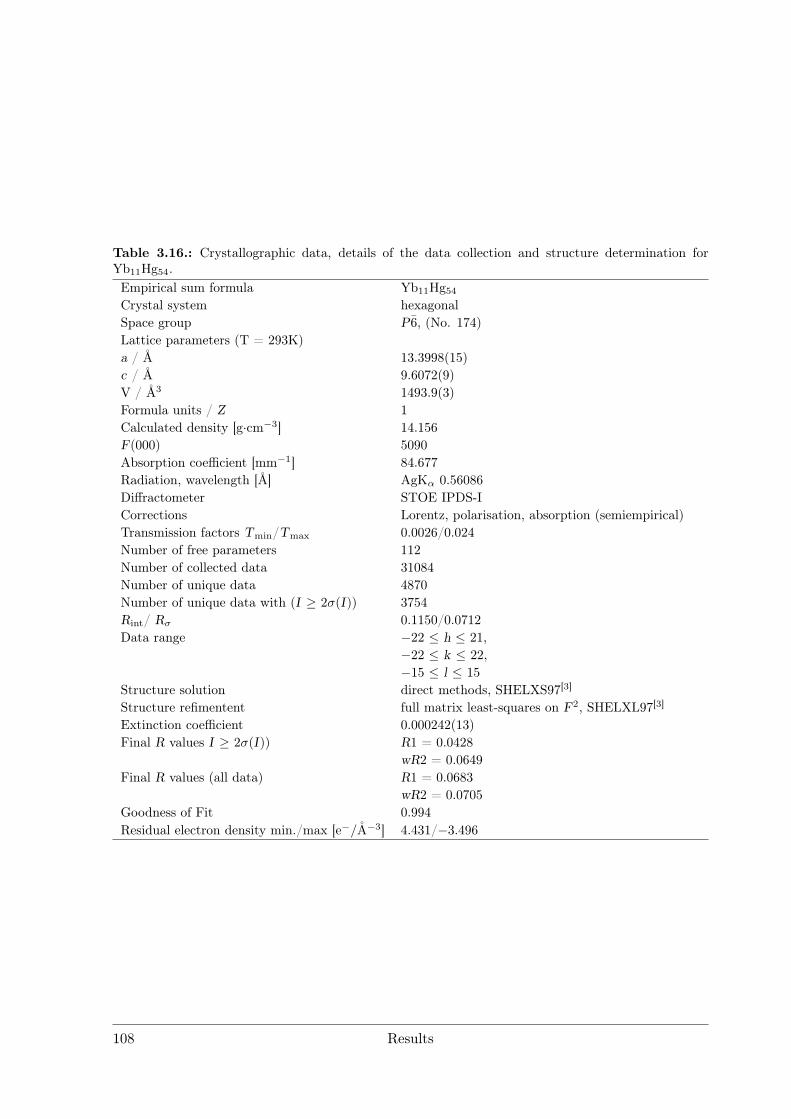
Table 3.16.: Crystallographic data, details of the data collection and structure determination forYb11Hg54.Empirical sum formula Yb11Hg54Crystal system hexagonalSpace group P6, (No. 174)Lattice parameters (T = 293K)a / Å 13.3998(15)c / Å 9.6072(9)V / Å3 1493.9(3)Formula units / Z 1Calculated density [g·cm−3] 14.156F(000) 5090Absorption coefficient [mm−1] 84.677Radiation, wavelength [Å] AgKα 0.56086Diffractometer STOE IPDS-ICorrections Lorentz, polarisation, absorption (semiempirical)Transmission factors Tmin/Tmax 0.0026/0.024Number of free parameters 112Number of collected data 31084Number of unique data 4870Number of unique data with (I ≥ 2σ(I)) 3754Rint/ Rσ 0.1150/0.0712Data range −22 ≤ h ≤ 21,
−22 ≤ k ≤ 22,−15 ≤ l ≤ 15
Structure solution direct methods, SHELXS97[3]
Structure refimentent full matrix least-squares on F2, SHELXL97[3]
Extinction coefficient 0.000242(13)Final R values I ≥ 2σ(I)) R1 = 0.0428
wR2 = 0.0649Final R values (all data) R1 = 0.0683
wR2 = 0.0705Goodness of Fit 0.994Residual electron density min./max [e−/A−3] 4.431/−3.496
108 Results
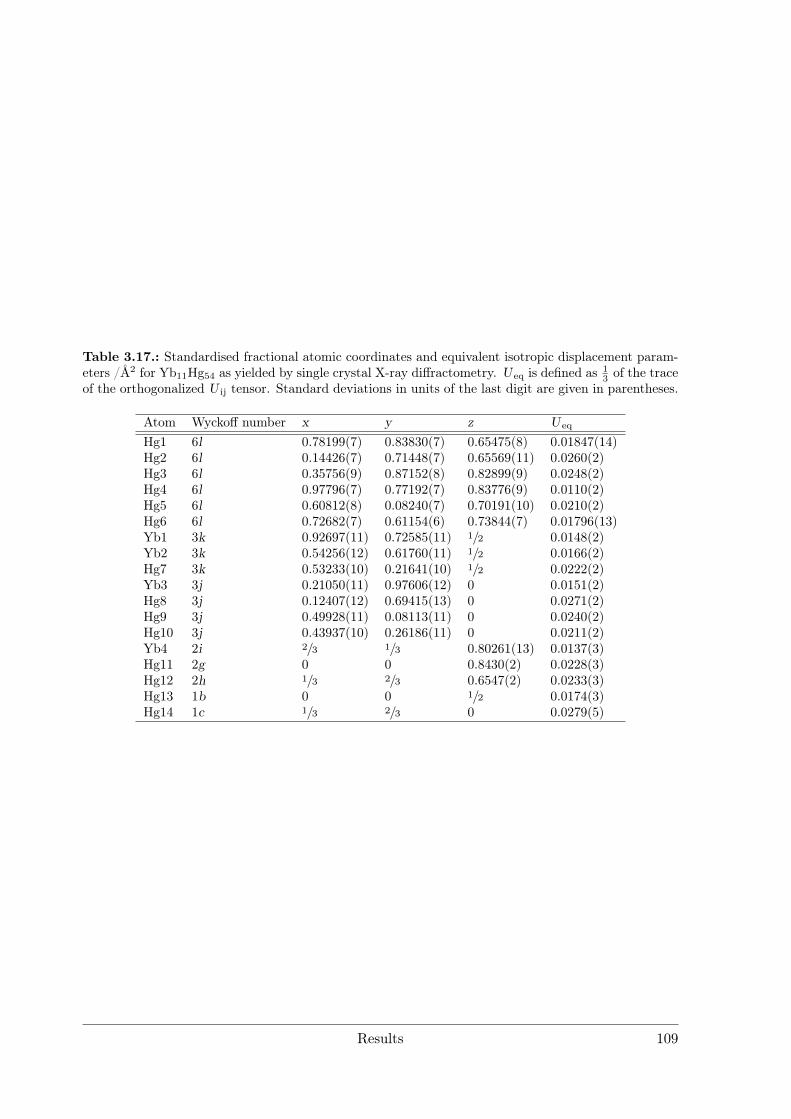
Table 3.17.: Standardised fractional atomic coordinates and equivalent isotropic displacement param-eters /Å2 for Yb11Hg54 as yielded by single crystal X-ray diffractometry. U eq is defined as 1
3 of the traceof the orthogonalized U ij tensor. Standard deviations in units of the last digit are given in parentheses.
Atom Wyckoff number x y z U eq
Hg1 6l 0.78199(7) 0.83830(7) 0.65475(8) 0.01847(14)Hg2 6l 0.14426(7) 0.71448(7) 0.65569(11) 0.0260(2)Hg3 6l 0.35756(9) 0.87152(8) 0.82899(9) 0.0248(2)Hg4 6l 0.97796(7) 0.77192(7) 0.83776(9) 0.0110(2)Hg5 6l 0.60812(8) 0.08240(7) 0.70191(10) 0.0210(2)Hg6 6l 0.72682(7) 0.61154(6) 0.73844(7) 0.01796(13)Yb1 3k 0.92697(11) 0.72585(11) 1/2 0.0148(2)Yb2 3k 0.54256(12) 0.61760(11) 1/2 0.0166(2)Hg7 3k 0.53233(10) 0.21641(10) 1/2 0.0222(2)Yb3 3j 0.21050(11) 0.97606(12) 0 0.0151(2)Hg8 3j 0.12407(12) 0.69415(13) 0 0.0271(2)Hg9 3j 0.49928(11) 0.08113(11) 0 0.0240(2)Hg10 3j 0.43937(10) 0.26186(11) 0 0.0211(2)Yb4 2i 2/3 1/3 0.80261(13) 0.0137(3)Hg11 2g 0 0 0.8430(2) 0.0228(3)Hg12 2h 1/3 2/3 0.6547(2) 0.0233(3)Hg13 1b 0 0 1/2 0.0174(3)Hg14 1c 1/3 2/3 0 0.0279(5)
Results 109
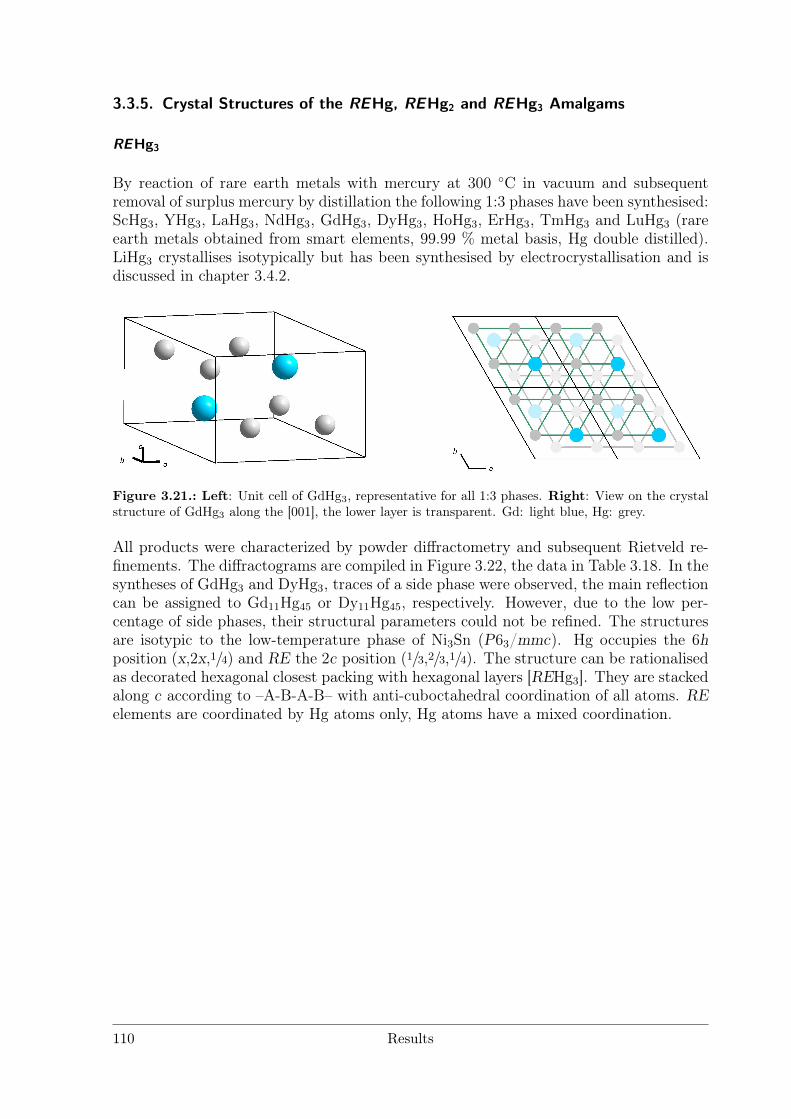
3.3.5. Crystal Structures of the REHg, REHg2 and REHg3 Amalgams
REHg3
By reaction of rare earth metals with mercury at 300 C in vacuum and subsequentremoval of surplus mercury by distillation the following 1:3 phases have been synthesised:ScHg3, YHg3, LaHg3, NdHg3, GdHg3, DyHg3, HoHg3, ErHg3, TmHg3 and LuHg3 (rareearth metals obtained from smart elements, 99.99 % metal basis, Hg double distilled).LiHg3 crystallises isotypically but has been synthesised by electrocrystallisation and isdiscussed in chapter 3.4.2.
Figure 3.21.: Left: Unit cell of GdHg3, representative for all 1:3 phases. Right: View on the crystalstructure of GdHg3 along the [001], the lower layer is transparent. Gd: light blue, Hg: grey.
All products were characterized by powder diffractometry and subsequent Rietveld re-finements. The diffractograms are compiled in Figure 3.22, the data in Table 3.18. In thesyntheses of GdHg3 and DyHg3, traces of a side phase were observed, the main reflectioncan be assigned to Gd11Hg45 or Dy11Hg45, respectively. However, due to the low per-centage of side phases, their structural parameters could not be refined. The structuresare isotypic to the low-temperature phase of Ni3Sn (P63/mmc). Hg occupies the 6hposition (x,2x,1/4) and RE the 2c position (1/3,2/3,1/4). The structure can be rationalisedas decorated hexagonal closest packing with hexagonal layers [REHg3]. They are stackedalong c according to –A-B-A-B– with anti-cuboctahedral coordination of all atoms. REelements are coordinated by Hg atoms only, Hg atoms have a mixed coordination.
110 Results
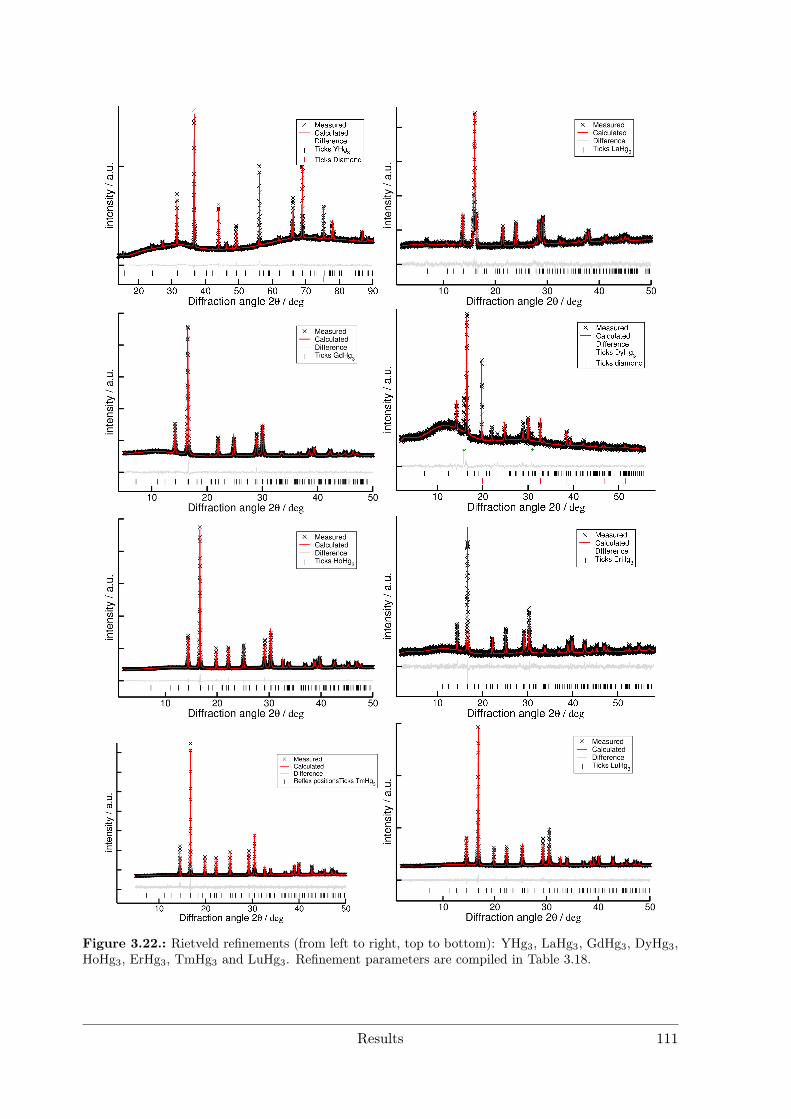
Figure 3.22.: Rietveld refinements (from left to right, top to bottom): YHg3, LaHg3, GdHg3, DyHg3,HoHg3, ErHg3, TmHg3 and LuHg3. Refinement parameters are compiled in Table 3.18.
Results 111
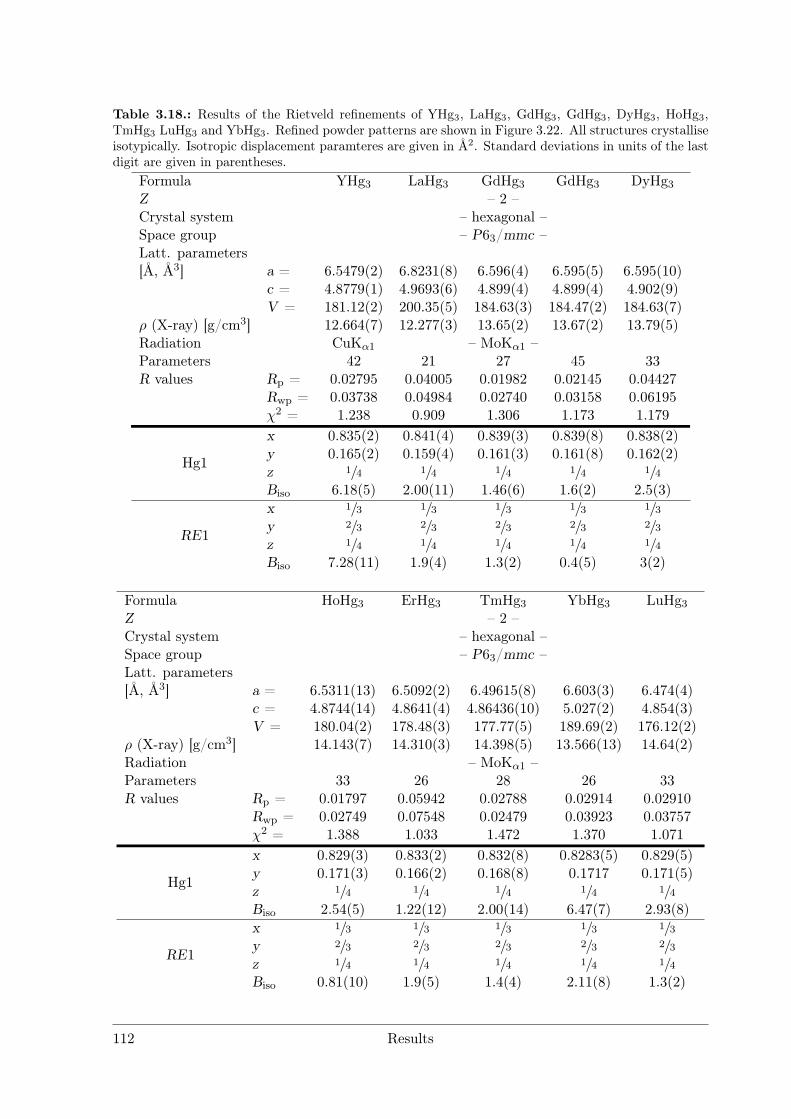
Table 3.18.: Results of the Rietveld refinements of YHg3, LaHg3, GdHg3, GdHg3, DyHg3, HoHg3,TmHg3 LuHg3 and YbHg3. Refined powder patterns are shown in Figure 3.22. All structures crystalliseisotypically. Isotropic displacement paramteres are given in Å2. Standard deviations in units of the lastdigit are given in parentheses.
Formula YHg3 LaHg3 GdHg3 GdHg3 DyHg3Z – 2 –Crystal system – hexagonal –Space group – P63/mmc –Latt. parameters[Å, Å3] a = 6.5479(2) 6.8231(8) 6.596(4) 6.595(5) 6.595(10)
c = 4.8779(1) 4.9693(6) 4.899(4) 4.899(4) 4.902(9)V = 181.12(2) 200.35(5) 184.63(3) 184.47(2) 184.63(7)
ρ (X-ray) [g/cm3] 12.664(7) 12.277(3) 13.65(2) 13.67(2) 13.79(5)Radiation CuKα1 – MoKα1 –Parameters 42 21 27 45 33R values Rp = 0.02795 0.04005 0.01982 0.02145 0.04427
Rwp = 0.03738 0.04984 0.02740 0.03158 0.06195χ2 = 1.238 0.909 1.306 1.173 1.179
Hg1
x 0.835(2) 0.841(4) 0.839(3) 0.839(8) 0.838(2)y 0.165(2) 0.159(4) 0.161(3) 0.161(8) 0.162(2)z 1/4 1/4 1/4 1/4 1/4Biso 6.18(5) 2.00(11) 1.46(6) 1.6(2) 2.5(3)
RE1
x 1/3 1/3 1/3 1/3 1/3y 2/3 2/3 2/3 2/3 2/3z 1/4 1/4 1/4 1/4 1/4Biso 7.28(11) 1.9(4) 1.3(2) 0.4(5) 3(2)
Formula HoHg3 ErHg3 TmHg3 YbHg3 LuHg3Z – 2 –Crystal system – hexagonal –Space group – P63/mmc –Latt. parameters[Å, Å3] a = 6.5311(13) 6.5092(2) 6.49615(8) 6.603(3) 6.474(4)
c = 4.8744(14) 4.8641(4) 4.86436(10) 5.027(2) 4.854(3)V = 180.04(2) 178.48(3) 177.77(5) 189.69(2) 176.12(2)
ρ (X-ray) [g/cm3] 14.143(7) 14.310(3) 14.398(5) 13.566(13) 14.64(2)Radiation – MoKα1 –Parameters 33 26 28 26 33R values Rp = 0.01797 0.05942 0.02788 0.02914 0.02910
Rwp = 0.02749 0.07548 0.02479 0.03923 0.03757χ2 = 1.388 1.033 1.472 1.370 1.071
Hg1
x 0.829(3) 0.833(2) 0.832(8) 0.8283(5) 0.829(5)y 0.171(3) 0.166(2) 0.168(8) 0.1717 0.171(5)z 1/4 1/4 1/4 1/4 1/4Biso 2.54(5) 1.22(12) 2.00(14) 6.47(7) 2.93(8)
RE1
x 1/3 1/3 1/3 1/3 1/3y 2/3 2/3 2/3 2/3 2/3z 1/4 1/4 1/4 1/4 1/4Biso 0.81(10) 1.9(5) 1.4(4) 2.11(8) 1.3(2)
112 Results
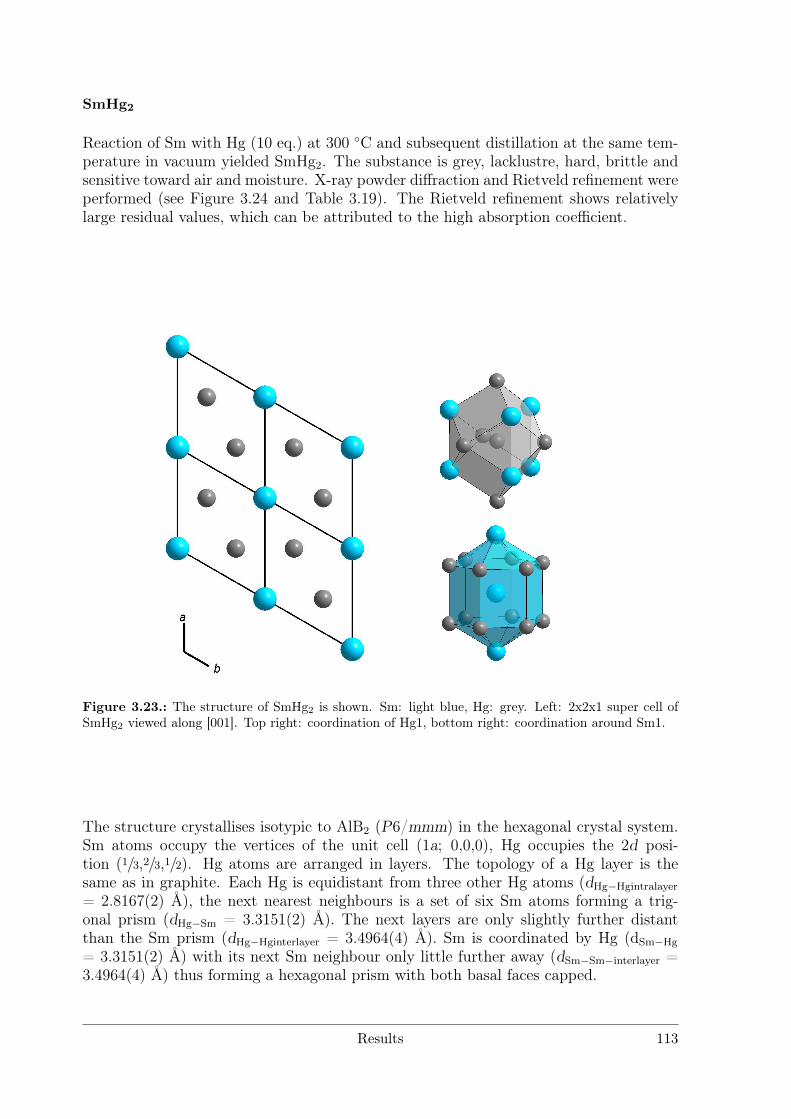
SmHg2
Reaction of Sm with Hg (10 eq.) at 300 C and subsequent distillation at the same tem-perature in vacuum yielded SmHg2. The substance is grey, lacklustre, hard, brittle andsensitive toward air and moisture. X-ray powder diffraction and Rietveld refinement wereperformed (see Figure 3.24 and Table 3.19). The Rietveld refinement shows relativelylarge residual values, which can be attributed to the high absorption coefficient.
Figure 3.23.: The structure of SmHg2 is shown. Sm: light blue, Hg: grey. Left: 2x2x1 super cell ofSmHg2 viewed along [001]. Top right: coordination of Hg1, bottom right: coordination around Sm1.
The structure crystallises isotypic to AlB2 (P6/mmm) in the hexagonal crystal system.Sm atoms occupy the vertices of the unit cell (1a; 0,0,0), Hg occupies the 2d posi-tion (1/3,2/3,1/2). Hg atoms are arranged in layers. The topology of a Hg layer is thesame as in graphite. Each Hg is equidistant from three other Hg atoms (dHg−Hgintralayer
= 2.8167(2) Å), the next nearest neighbours is a set of six Sm atoms forming a trig-onal prism (dHg−Sm = 3.3151(2) Å). The next layers are only slightly further distantthan the Sm prism (dHg−Hginterlayer = 3.4964(4) Å). Sm is coordinated by Hg (dSm−Hg
= 3.3151(2) Å) with its next Sm neighbour only little further away (dSm−Sm−interlayer =3.4964(4) Å) thus forming a hexagonal prism with both basal faces capped.
Results 113
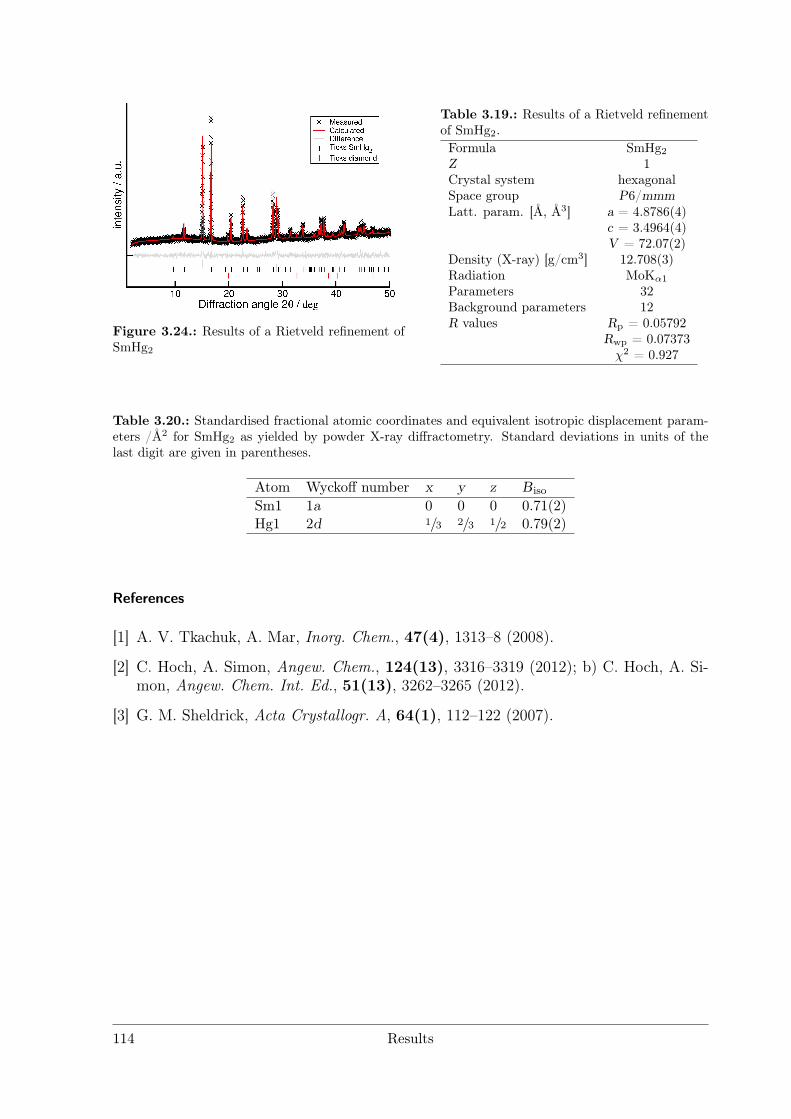
Figure 3.24.: Results of a Rietveld refinement ofSmHg2
Table 3.19.: Results of a Rietveld refinementof SmHg2.Formula SmHg2Z 1Crystal system hexagonalSpace group P6/mmmLatt. param. [Å, Å3] a = 4.8786(4)
c = 3.4964(4)V = 72.07(2)
Density (X-ray) [g/cm3] 12.708(3)Radiation MoKα1Parameters 32Background parameters 12R values Rp = 0.05792
Rwp = 0.07373χ2 = 0.927
Table 3.20.: Standardised fractional atomic coordinates and equivalent isotropic displacement param-eters /Å2 for SmHg2 as yielded by powder X-ray diffractometry. Standard deviations in units of thelast digit are given in parentheses.
Atom Wyckoff number x y z Biso
Sm1 1a 0 0 0 0.71(2)Hg1 2d 1/3 2/3 1/2 0.79(2)
References
[1] A. V. Tkachuk, A. Mar, Inorg. Chem., 47(4), 1313–8 (2008).
[2] C. Hoch, A. Simon, Angew. Chem., 124(13), 3316–3319 (2012); b) C. Hoch, A. Si-mon, Angew. Chem. Int. Ed., 51(13), 3262–3265 (2012).
[3] G. M. Sheldrick, Acta Crystallogr. A, 64(1), 112–122 (2007).
114 Results
3.4. Alkali and alkaline earth metal amalgams
The following chapter contains published as well as unpublished results of alkali metalamalgams examined in this work. Seeds of KHg6 were synthesised by electrocrystallisa-tion together with KHg11 as side phase. Phase-pure samples of KHg6 were synthesisedby using the seeds for crystal growth by tempering stoichiometric mixtures of KHg11
and elemental potassium. Band structure calculations showed considerable but incom-plete electron transfer from potassium to the electronegative sublattice, resulting in "badmetal" behaviour as shown by electric resistance measurements. These results were pub-lished in J. Alloys Compd..
No experimental work was done on alkaline earth metal amalgams but their crystalstructures known from literature are essential for the understandung of some of the newamalgam structures discussed here.
To gain deeper insight into the electron transfer, NMR Knight shift studies in combina-tion with band structure calculations were performed on the three Li amalgams Li3Hg,LiHg and LiHg3, which still have to be published. 7Li as well as 199Hg are NMR activecores and allowed for complementary monitoring of the s electron density at Fermi level.With increasing mercury content of the amalgams, the NMR shift was lowered for 7Liand increased for 199Hg. It was shown that with increasing mercury content a shift in theenergy of bands occurs which is in accordance with increased positive partial charge onLi and taht Knight shift measurements are a convenient tool for monitoring the degreeof polarisation of the metal-metal bonding.
The last part of this chapter contains unpublished results of electrolyses on HgIn cathodeswith KI- and RbI-containing electrolytes. In both cases the incorporation of In in theBaHg11 aristotype structure was observed leading to compositions AHg11−xInx (A = K:x ≈ 1, Rb: x ≈ 6). The geometric implications by incorporation of In were examined.Band structure calculations showed no electronic reason for the incorporation of In onparticular crystallographic sites, the features of the tDOS of the aristotype and hettotypeare similar.
Results 115
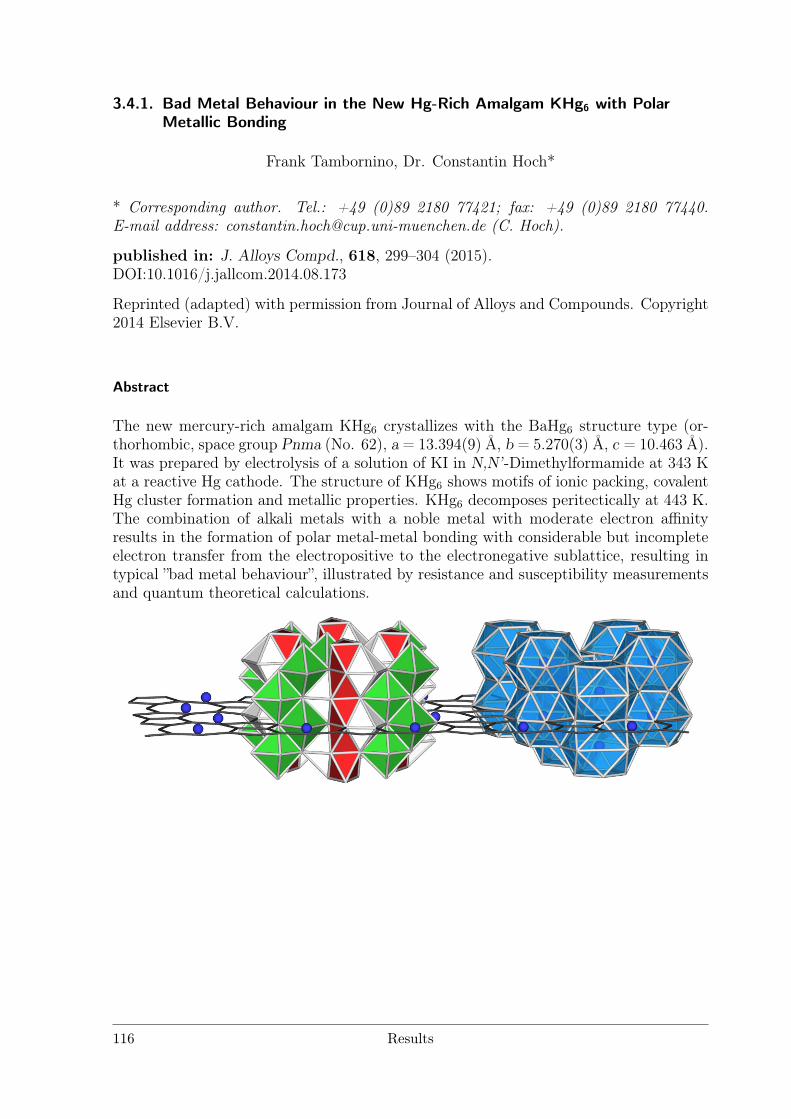
3.4.1. Bad Metal Behaviour in the New Hg-Rich Amalgam KHg6 with PolarMetallic Bonding
Frank Tambornino, Dr. Constantin Hoch*
* Corresponding author. Tel.: +49 (0)89 2180 77421; fax: +49 (0)89 2180 77440.E-mail address: [email protected] (C. Hoch).
published in: J. Alloys Compd., 618, 299–304 (2015).DOI:10.1016/j.jallcom.2014.08.173
Reprinted (adapted) with permission from Journal of Alloys and Compounds. Copyright2014 Elsevier B.V.
Abstract
The new mercury-rich amalgam KHg6 crystallizes with the BaHg6 structure type (or-thorhombic, space group Pnma (No. 62), a = 13.394(9) Å, b = 5.270(3) Å, c = 10.463 Å).It was prepared by electrolysis of a solution of KI in N,N’-Dimethylformamide at 343 Kat a reactive Hg cathode. The structure of KHg6 shows motifs of ionic packing, covalentHg cluster formation and metallic properties. KHg6 decomposes peritectically at 443 K.The combination of alkali metals with a noble metal with moderate electron affinityresults in the formation of polar metal-metal bonding with considerable but incompleteelectron transfer from the electropositive to the electronegative sublattice, resulting intypical ”bad metal behaviour”, illustrated by resistance and susceptibility measurementsand quantum theoretical calculations.
116 Results
Introduction
Amalgams of less noble metals have been studied extensively in the second half of the20th century. Early thermoanalytical studies in the binary system K–Hg [1] reported theexistence of Hg-rich phases with tentative compositions of KHg11, KHg9, KHg4, KHg3,KHg2.7, KHg2 and K5Hg7. The composition of the Hg-richest phase KHg11 (BaHg11
structure type [2]) was confirmed by crystallographic investigations [3], as well as theones of KHg2 [4] and K5Hg7 [5]. The composition KHg4 is close to those of K7Hg31
[6] (KHg4.4), K3Hg11 [6] (KHg3.7) and K2Hg7 [7] (KHg3.5), however, no phases withcompositions close to KHg9, KHg3 or KHg2.7 have been reported so far.
The crystal structures of most amalgams have been thoroughly studied, however, theirrespective physical properties remain widely unknown. Band structure calculations onthese polar amalgams are scarce due to the typically large and low symmetric struc-tures. Those examples available in literature [8] show considerable but incomplete elec-tron transfer from the less noble metal to the mercury sublattice. As the electron affinityof mercury is insufficient for the formation of Zintl-analogous [Hgn]m− anions, partiallynegative polarised [Hgn]δ− networks with equal charge distribution over all Hg atomsare the more favourable consequence. Ongoing NMR experiments on Li3Hg, LiHg andLiHg3 [9,10] in our group reveal that the charge transfer is generally more pronouncedin the Hg-richer amalgams as a larger Hg sublattice can delocalise the negative chargemore efficiently. The negatively polarised Hg sublattice in polar amalgams tends to clus-ter formation as Hgδ− is formally analogous to early p-group elements. In a number ofamalgams with rather low Hg content Hg-Hg-Hg bond angles close to 90o correspondingto σp-type bonds can be found in [Hg4] squares or [Hg8] cubes [11–14]. If the negativecharge is delocalised over a larger number of Hg atoms, d contributions get more domi-nant and the bond angles show larger values resulting in icosahedra or larger polyhedra[15,16]. Following an ionic approach, [Hgn]δ− clusters can be described as negativelycharged coordination spheres surrounding the positively charged cations of the less no-ble metals. However, most Hg-rich amalgam structures can alternatively be describedby motifs from closest sphere packings, emphasising their metallic character. Amalgamsof less noble metals thus show contributions from ionic, covalent and metallic bondingat the same time. The interplay of the three bonding types leads to typical ”bad metalbehaviour”, e. g. high specific resistance, low Ioffe-Regel limit.
The unusual combination of structural motifs and physical properties from both metallicand ionic bonding may lead to interesting materials. High-efficiency thermoelectricsdepend on good electric conductivity, a typical metallic property, in conjunction with lowthermal conductivity, a typical property of ionic compounds. Amalgams, in addition,might fulfil other commonly proposed prerequisites for good thermoelectric materials,such as heavy atoms, ”rattling cages”, high correlation of the electrons and rather lowdensities of state at the Fermi level. In addition, the interplay of covalent and ionicstructure motifs with those of a metallic sphere packing typically leads to complicatedstructures of low symmetry and long translational periods, and the Ioffe-Regel limitresistances are reached already at low temperatures.
The chemical preparation of amalgams of less noble metals suffers from various prob-lems, and knowledge on the Hg-richest phases is especially scarce. The main reason is
Results 117
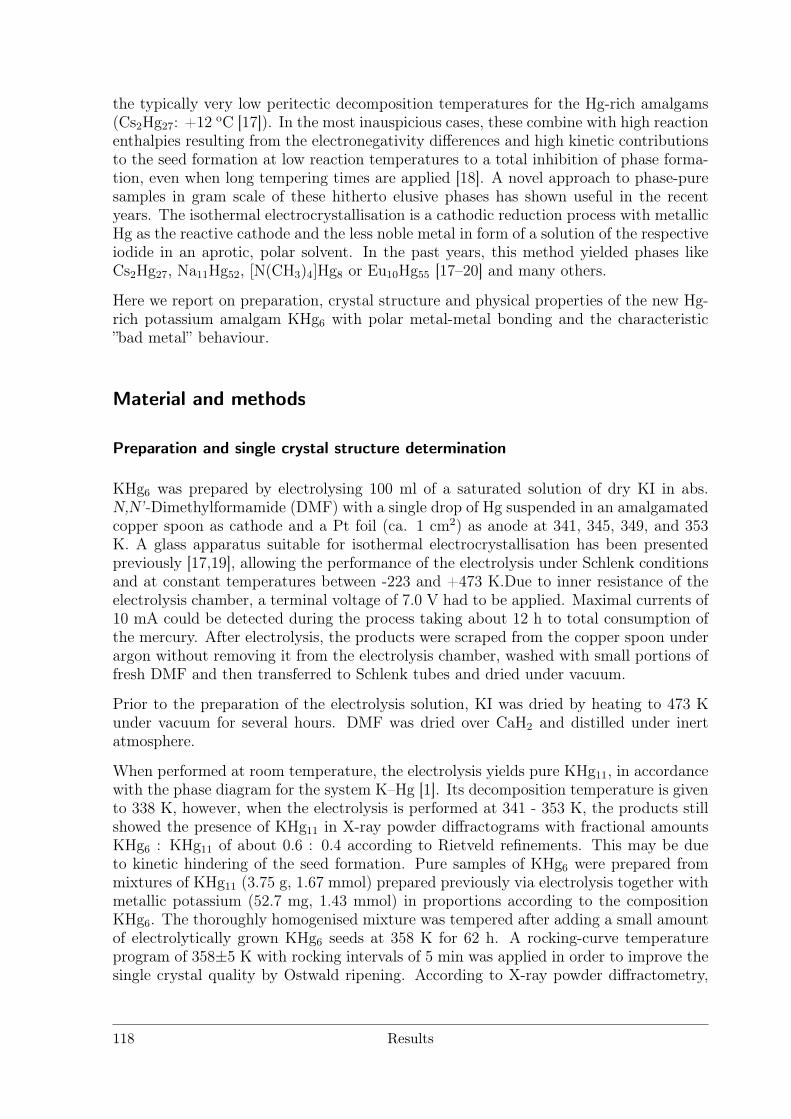
the typically very low peritectic decomposition temperatures for the Hg-rich amalgams(Cs2Hg27: +12 oC [17]). In the most inauspicious cases, these combine with high reactionenthalpies resulting from the electronegativity differences and high kinetic contributionsto the seed formation at low reaction temperatures to a total inhibition of phase forma-tion, even when long tempering times are applied [18]. A novel approach to phase-puresamples in gram scale of these hitherto elusive phases has shown useful in the recentyears. The isothermal electrocrystallisation is a cathodic reduction process with metallicHg as the reactive cathode and the less noble metal in form of a solution of the respectiveiodide in an aprotic, polar solvent. In the past years, this method yielded phases likeCs2Hg27, Na11Hg52, [N(CH3)4]Hg8 or Eu10Hg55 [17–20] and many others.
Here we report on preparation, crystal structure and physical properties of the new Hg-rich potassium amalgam KHg6 with polar metal-metal bonding and the characteristic”bad metal” behaviour.
Material and methods
Preparation and single crystal structure determination
KHg6 was prepared by electrolysing 100 ml of a saturated solution of dry KI in abs.N,N’-Dimethylformamide (DMF) with a single drop of Hg suspended in an amalgamatedcopper spoon as cathode and a Pt foil (ca. 1 cm2) as anode at 341, 345, 349, and 353K. A glass apparatus suitable for isothermal electrocrystallisation has been presentedpreviously [17,19], allowing the performance of the electrolysis under Schlenk conditionsand at constant temperatures between -223 and +473 K.Due to inner resistance of theelectrolysis chamber, a terminal voltage of 7.0 V had to be applied. Maximal currents of10 mA could be detected during the process taking about 12 h to total consumption ofthe mercury. After electrolysis, the products were scraped from the copper spoon underargon without removing it from the electrolysis chamber, washed with small portions offresh DMF and then transferred to Schlenk tubes and dried under vacuum.
Prior to the preparation of the electrolysis solution, KI was dried by heating to 473 Kunder vacuum for several hours. DMF was dried over CaH2 and distilled under inertatmosphere.
When performed at room temperature, the electrolysis yields pure KHg11, in accordancewith the phase diagram for the system K–Hg [1]. Its decomposition temperature is givento 338 K, however, when the electrolysis is performed at 341 - 353 K, the products stillshowed the presence of KHg11 in X-ray powder diffractograms with fractional amountsKHg6 : KHg11 of about 0.6 : 0.4 according to Rietveld refinements. This may be dueto kinetic hindering of the seed formation. Pure samples of KHg6 were prepared frommixtures of KHg11 (3.75 g, 1.67 mmol) prepared previously via electrolysis together withmetallic potassium (52.7 mg, 1.43 mmol) in proportions according to the compositionKHg6. The thoroughly homogenised mixture was tempered after adding a small amountof electrolytically grown KHg6 seeds at 358 K for 62 h. A rocking-curve temperatureprogram of 358±5 K with rocking intervals of 5 min was applied in order to improve thesingle crystal quality by Ostwald ripening. According to X-ray powder diffractometry,
118 Results
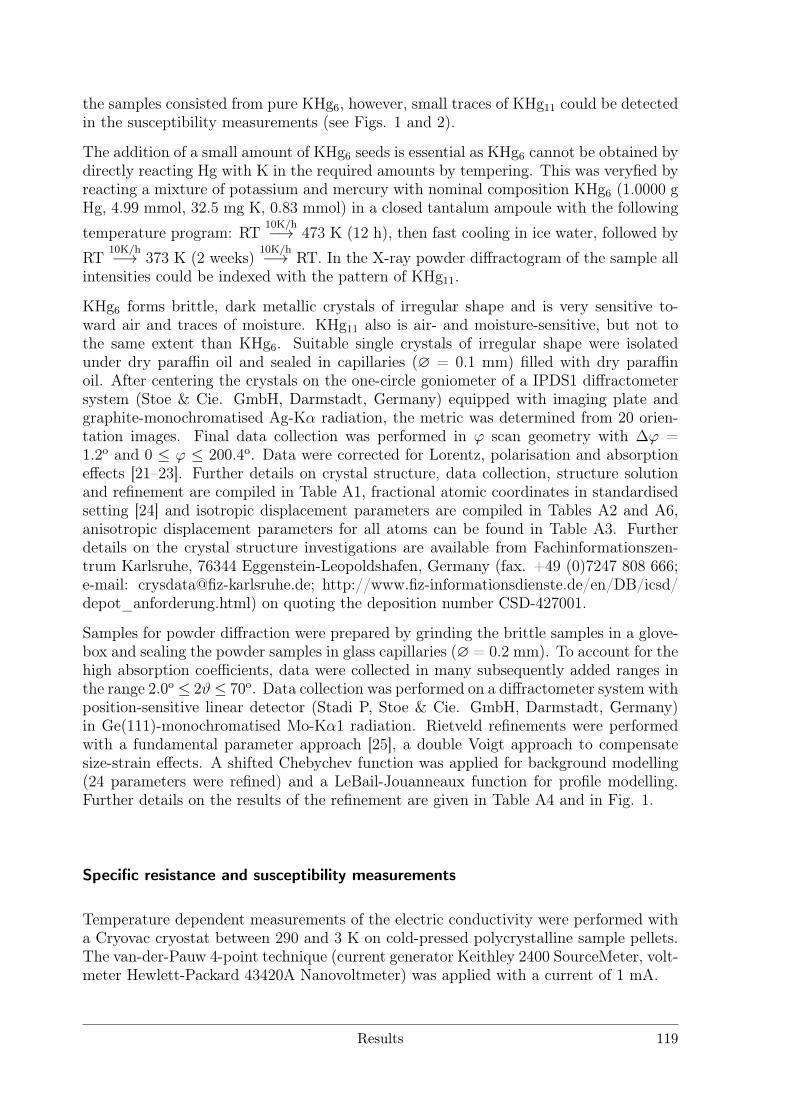
the samples consisted from pure KHg6, however, small traces of KHg11 could be detectedin the susceptibility measurements (see Figs. 1 and 2).
The addition of a small amount of KHg6 seeds is essential as KHg6 cannot be obtained bydirectly reacting Hg with K in the required amounts by tempering. This was veryfied byreacting a mixture of potassium and mercury with nominal composition KHg6 (1.0000 gHg, 4.99 mmol, 32.5 mg K, 0.83 mmol) in a closed tantalum ampoule with the following
temperature program: RT10K/h−→ 473 K (12 h), then fast cooling in ice water, followed by
RT10K/h−→ 373 K (2 weeks)
10K/h−→ RT. In the X-ray powder diffractogram of the sample allintensities could be indexed with the pattern of KHg11.
KHg6 forms brittle, dark metallic crystals of irregular shape and is very sensitive to-ward air and traces of moisture. KHg11 also is air- and moisture-sensitive, but not tothe same extent than KHg6. Suitable single crystals of irregular shape were isolatedunder dry paraffin oil and sealed in capillaries (∅ = 0.1 mm) filled with dry paraffinoil. After centering the crystals on the one-circle goniometer of a IPDS1 diffractometersystem (Stoe & Cie. GmbH, Darmstadt, Germany) equipped with imaging plate andgraphite-monochromatised Ag-Kα radiation, the metric was determined from 20 orien-tation images. Final data collection was performed in ϕ scan geometry with ∆ϕ =1.2o and 0 ≤ ϕ ≤ 200.4o. Data were corrected for Lorentz, polarisation and absorptioneffects [21–23]. Further details on crystal structure, data collection, structure solutionand refinement are compiled in Table A1, fractional atomic coordinates in standardisedsetting [24] and isotropic displacement parameters are compiled in Tables A2 and A6,anisotropic displacement parameters for all atoms can be found in Table A3. Furtherdetails on the crystal structure investigations are available from Fachinformationszen-trum Karlsruhe, 76344 Eggenstein-Leopoldshafen, Germany (fax. +49 (0)7247 808 666;e-mail: [email protected]; http://www.fiz-informationsdienste.de/en/DB/icsd/depot_anforderung.html) on quoting the deposition number CSD-427001.
Samples for powder diffraction were prepared by grinding the brittle samples in a glove-box and sealing the powder samples in glass capillaries (∅ = 0.2 mm). To account for thehigh absorption coefficients, data were collected in many subsequently added ranges inthe range 2.0o ≤ 2ϑ≤ 70o. Data collection was performed on a diffractometer system withposition-sensitive linear detector (Stadi P, Stoe & Cie. GmbH, Darmstadt, Germany)in Ge(111)-monochromatised Mo-Kα1 radiation. Rietveld refinements were performedwith a fundamental parameter approach [25], a double Voigt approach to compensatesize-strain effects. A shifted Chebychev function was applied for background modelling(24 parameters were refined) and a LeBail-Jouanneaux function for profile modelling.Further details on the results of the refinement are given in Table A4 and in Fig. 1.
Specific resistance and susceptibility measurements
Temperature dependent measurements of the electric conductivity were performed witha Cryovac cryostat between 290 and 3 K on cold-pressed polycrystalline sample pellets.The van-der-Pauw 4-point technique (current generator Keithley 2400 SourceMeter, volt-meter Hewlett-Packard 43420A Nanovoltmeter) was applied with a current of 1 mA.
Results 119
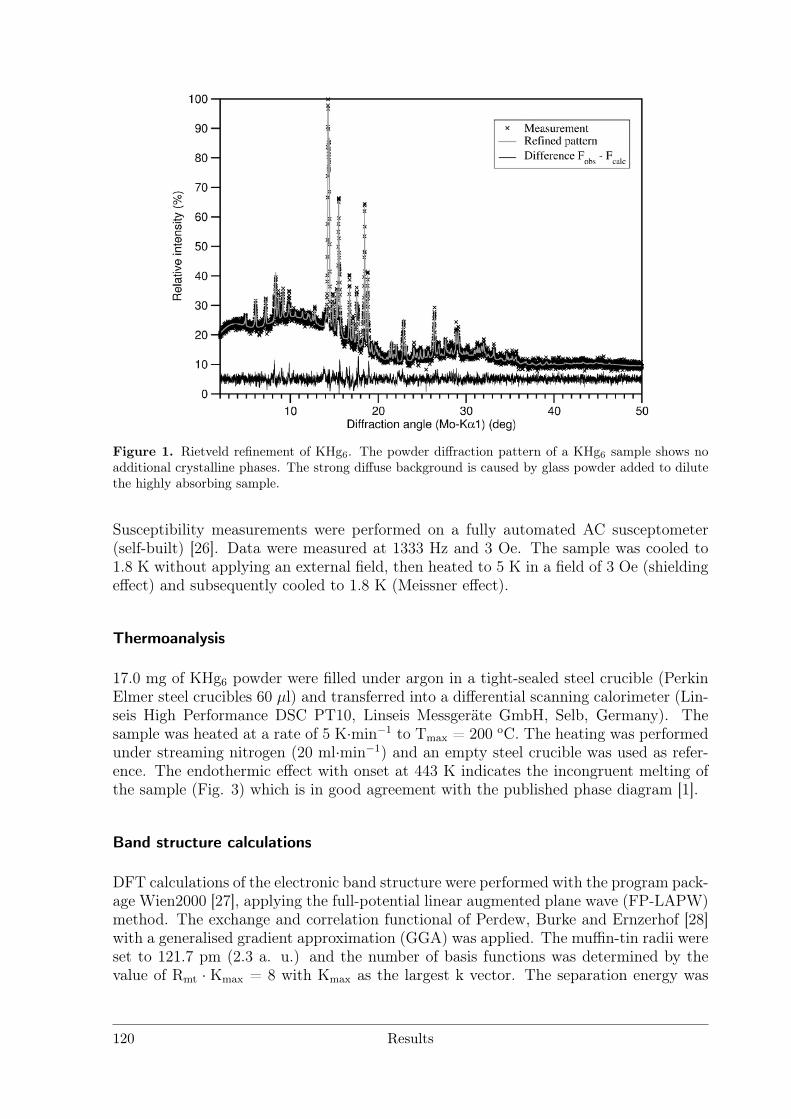
Figure 1. Rietveld refinement of KHg6. The powder diffraction pattern of a KHg6 sample shows noadditional crystalline phases. The strong diffuse background is caused by glass powder added to dilutethe highly absorbing sample.
Susceptibility measurements were performed on a fully automated AC susceptometer(self-built) [26]. Data were measured at 1333 Hz and 3 Oe. The sample was cooled to1.8 K without applying an external field, then heated to 5 K in a field of 3 Oe (shieldingeffect) and subsequently cooled to 1.8 K (Meissner effect).
Thermoanalysis
17.0 mg of KHg6 powder were filled under argon in a tight-sealed steel crucible (PerkinElmer steel crucibles 60 µl) and transferred into a differential scanning calorimeter (Lin-seis High Performance DSC PT10, Linseis Messgeräte GmbH, Selb, Germany). Thesample was heated at a rate of 5 K·min−1 to Tmax = 200 oC. The heating was performedunder streaming nitrogen (20 ml·min−1) and an empty steel crucible was used as refer-ence. The endothermic effect with onset at 443 K indicates the incongruent melting ofthe sample (Fig. 3) which is in good agreement with the published phase diagram [1].
Band structure calculations
DFT calculations of the electronic band structure were performed with the program pack-age Wien2000 [27], applying the full-potential linear augmented plane wave (FP-LAPW)method. The exchange and correlation functional of Perdew, Burke and Ernzerhof [28]with a generalised gradient approximation (GGA) was applied. The muffin-tin radii wereset to 121.7 pm (2.3 a. u.) and the number of basis functions was determined by thevalue of Rmt · Kmax = 8 with Kmax as the largest k vector. The separation energy was
120 Results
Figure 2. Above: Temperature dependence of the resistance of KHg6 (cooling from room temperature).In comparison to NaHg2 [18], KHg6 shows strong deviation from ideal metallic behaviour and a low Ioffe-Regel limit resistance. Below: Susceptibility measurement of KHg6. KHg6 becomes superconductive at3.22 K. A weak additional signal occurs at 2.45 K and belongs to TC of KHg11 impurities [3].
Figure 3. Differential scanning calorimetry showing the incongruent melting point of KHg6 at 443 K.
Results 121
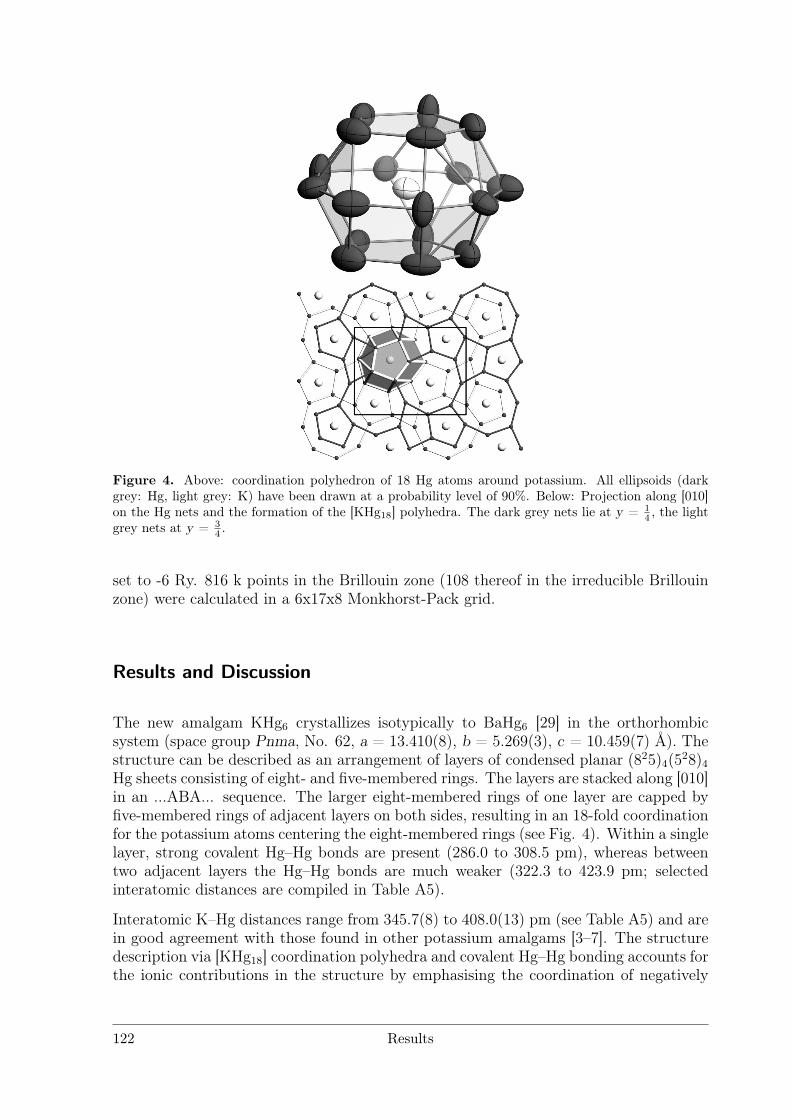
Figure 4. Above: coordination polyhedron of 18 Hg atoms around potassium. All ellipsoids (darkgrey: Hg, light grey: K) have been drawn at a probability level of 90%. Below: Projection along [010]on the Hg nets and the formation of the [KHg18] polyhedra. The dark grey nets lie at y = 1
4 , the lightgrey nets at y = 3
4 .
set to -6 Ry. 816 k points in the Brillouin zone (108 thereof in the irreducible Brillouinzone) were calculated in a 6x17x8 Monkhorst-Pack grid.
Results and Discussion
The new amalgam KHg6 crystallizes isotypically to BaHg6 [29] in the orthorhombicsystem (space group Pnma, No. 62, a = 13.410(8), b = 5.269(3), c = 10.459(7) Å). Thestructure can be described as an arrangement of layers of condensed planar (825)4(5
28)4Hg sheets consisting of eight- and five-membered rings. The layers are stacked along [010]in an ...ABA... sequence. The larger eight-membered rings of one layer are capped byfive-membered rings of adjacent layers on both sides, resulting in an 18-fold coordinationfor the potassium atoms centering the eight-membered rings (see Fig. 4). Within a singlelayer, strong covalent Hg–Hg bonds are present (286.0 to 308.5 pm), whereas betweentwo adjacent layers the Hg–Hg bonds are much weaker (322.3 to 423.9 pm; selectedinteratomic distances are compiled in Table A5).
Interatomic K–Hg distances range from 345.7(8) to 408.0(13) pm (see Table A5) and arein good agreement with those found in other potassium amalgams [3–7]. The structuredescription via [KHg18] coordination polyhedra and covalent Hg–Hg bonding accounts forthe ionic contributions in the structure by emphasising the coordination of negatively
122 Results
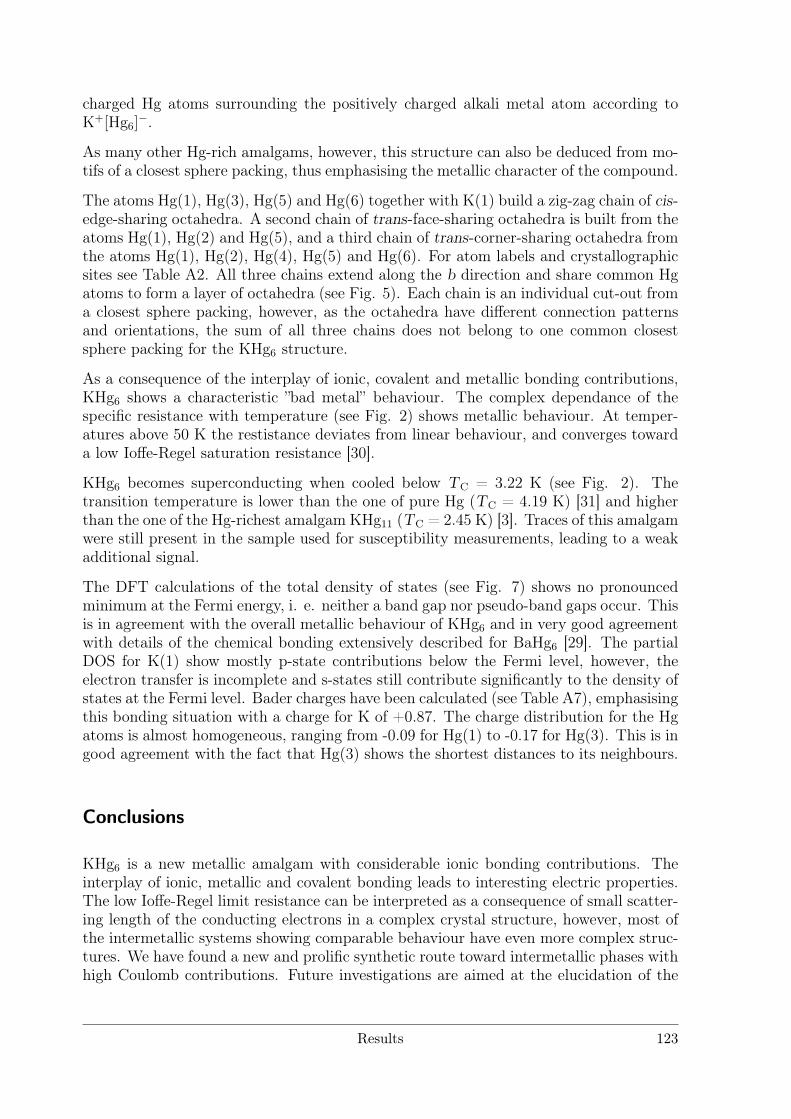
charged Hg atoms surrounding the positively charged alkali metal atom according toK+[Hg6]
−.
As many other Hg-rich amalgams, however, this structure can also be deduced from mo-tifs of a closest sphere packing, thus emphasising the metallic character of the compound.
The atoms Hg(1), Hg(3), Hg(5) and Hg(6) together with K(1) build a zig-zag chain of cis-edge-sharing octahedra. A second chain of trans-face-sharing octahedra is built from theatoms Hg(1), Hg(2) and Hg(5), and a third chain of trans-corner-sharing octahedra fromthe atoms Hg(1), Hg(2), Hg(4), Hg(5) and Hg(6). For atom labels and crystallographicsites see Table A2. All three chains extend along the b direction and share common Hgatoms to form a layer of octahedra (see Fig. 5). Each chain is an individual cut-out froma closest sphere packing, however, as the octahedra have different connection patternsand orientations, the sum of all three chains does not belong to one common closestsphere packing for the KHg6 structure.
As a consequence of the interplay of ionic, covalent and metallic bonding contributions,KHg6 shows a characteristic ”bad metal” behaviour. The complex dependance of thespecific resistance with temperature (see Fig. 2) shows metallic behaviour. At temper-atures above 50 K the restistance deviates from linear behaviour, and converges towarda low Ioffe-Regel saturation resistance [30].
KHg6 becomes superconducting when cooled below TC = 3.22 K (see Fig. 2). Thetransition temperature is lower than the one of pure Hg (TC = 4.19 K) [31] and higherthan the one of the Hg-richest amalgam KHg11 (TC = 2.45 K) [3]. Traces of this amalgamwere still present in the sample used for susceptibility measurements, leading to a weakadditional signal.
The DFT calculations of the total density of states (see Fig. 7) shows no pronouncedminimum at the Fermi energy, i. e. neither a band gap nor pseudo-band gaps occur. Thisis in agreement with the overall metallic behaviour of KHg6 and in very good agreementwith details of the chemical bonding extensively described for BaHg6 [29]. The partialDOS for K(1) show mostly p-state contributions below the Fermi level, however, theelectron transfer is incomplete and s-states still contribute significantly to the density ofstates at the Fermi level. Bader charges have been calculated (see Table A7), emphasisingthis bonding situation with a charge for K of +0.87. The charge distribution for the Hgatoms is almost homogeneous, ranging from -0.09 for Hg(1) to -0.17 for Hg(3). This is ingood agreement with the fact that Hg(3) shows the shortest distances to its neighbours.
Conclusions
KHg6 is a new metallic amalgam with considerable ionic bonding contributions. Theinterplay of ionic, metallic and covalent bonding leads to interesting electric properties.The low Ioffe-Regel limit resistance can be interpreted as a consequence of small scatter-ing length of the conducting electrons in a complex crystal structure, however, most ofthe intermetallic systems showing comparable behaviour have even more complex struc-tures. We have found a new and prolific synthetic route toward intermetallic phases withhigh Coulomb contributions. Future investigations are aimed at the elucidation of the
Results 123
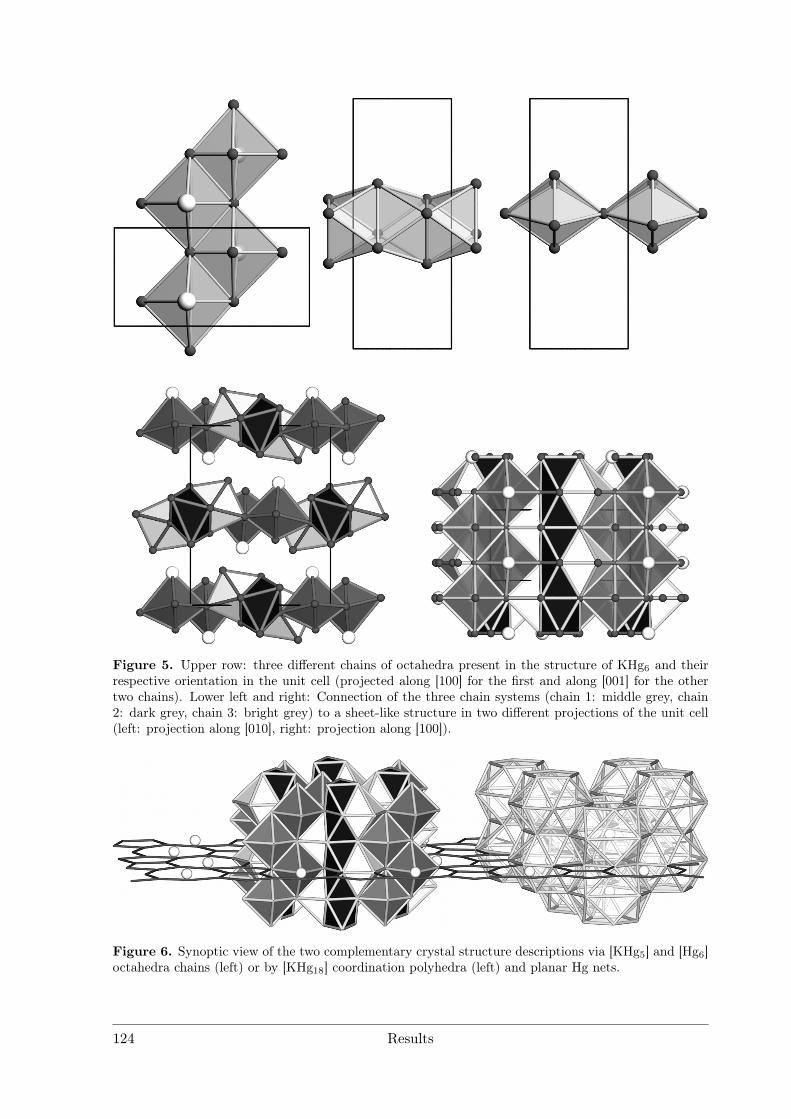
Figure 5. Upper row: three different chains of octahedra present in the structure of KHg6 and theirrespective orientation in the unit cell (projected along [100] for the first and along [001] for the othertwo chains). Lower left and right: Connection of the three chain systems (chain 1: middle grey, chain2: dark grey, chain 3: bright grey) to a sheet-like structure in two different projections of the unit cell(left: projection along [010], right: projection along [100]).
Figure 6. Synoptic view of the two complementary crystal structure descriptions via [KHg5] and [Hg6]octahedra chains (left) or by [KHg18] coordination polyhedra (left) and planar Hg nets.
124 Results
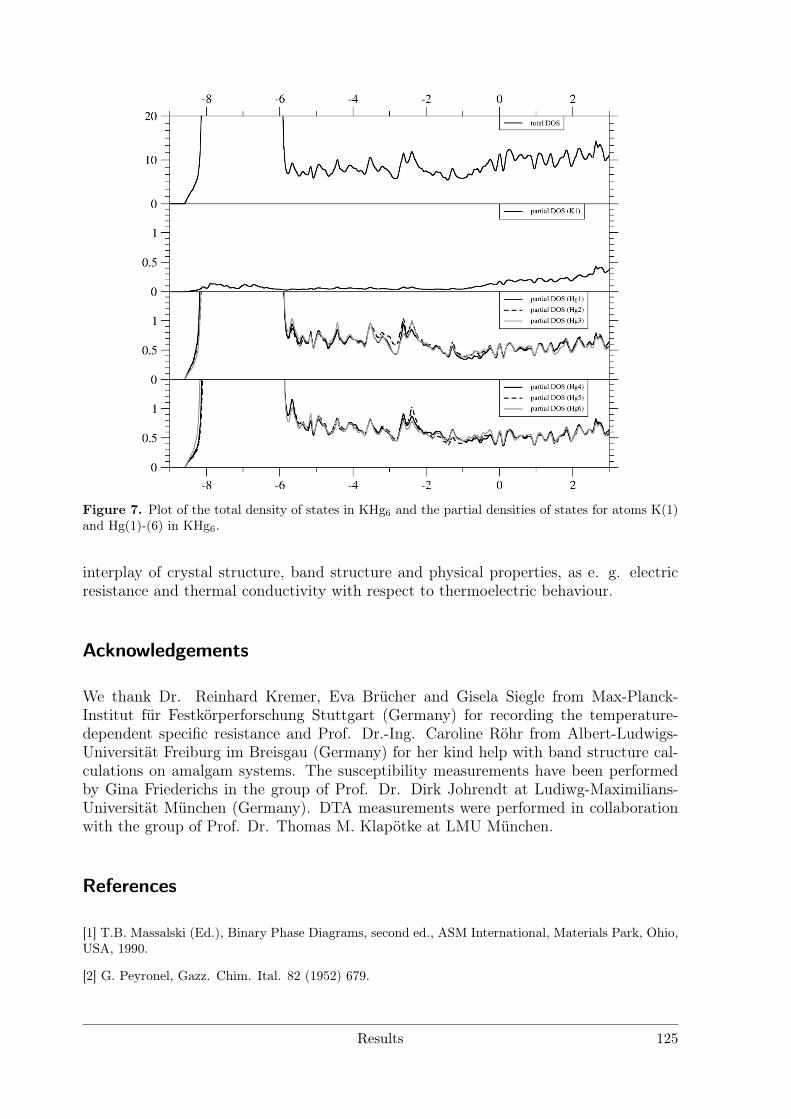
Figure 7. Plot of the total density of states in KHg6 and the partial densities of states for atoms K(1)and Hg(1)-(6) in KHg6.
interplay of crystal structure, band structure and physical properties, as e. g. electricresistance and thermal conductivity with respect to thermoelectric behaviour.
Acknowledgements
We thank Dr. Reinhard Kremer, Eva Brücher and Gisela Siegle from Max-Planck-Institut für Festkörperforschung Stuttgart (Germany) for recording the temperature-dependent specific resistance and Prof. Dr.-Ing. Caroline Röhr from Albert-Ludwigs-Universität Freiburg im Breisgau (Germany) for her kind help with band structure cal-culations on amalgam systems. The susceptibility measurements have been performedby Gina Friederichs in the group of Prof. Dr. Dirk Johrendt at Ludiwg-Maximilians-Universität München (Germany). DTA measurements were performed in collaborationwith the group of Prof. Dr. Thomas M. Klapötke at LMU München.
References
[1] T.B. Massalski (Ed.), Binary Phase Diagrams, second ed., ASM International, Materials Park, Ohio,USA, 1990.
[2] G. Peyronel, Gazz. Chim. Ital. 82 (1952) 679.
Results 125
[3] E. Biehl, H.J. Deiseroth, Z. Anorg. Allg. 625 (1999) 1073.
[4] E.J. Duwell, N.C. Baenziger, Acta Crystallogr. 8 (1955) 705.
[5] E.J. Duwell, N.C. Baenziger, Acta Crystallogr. 13 (1960) 476.
[6] E. Todorov, S.C. Sevov, J. Solid State Chem. 149 (2000) 419.
[7] E. Biehl, H.J. Deiseroth, Z. Anorg. Allg. 625 (1999) 1337.
[8] H.J. Deiseroth, in: M. Driess, H. Nöth (Eds.), Molecular Clusters of the Main Group Elements,Wiley-VCH, Weinheim, Germany, 2003.
[9] F. Tambornino, C. Hoch, T. Bräuniger, in preparation.
[10] E. Zintl, G. Brauer, Z. Phys. Chem. B20 (1933) 245; E. Zintl, A. Schneider, Z. Elektrochem. 41(1935) 771; H. Pauly, A. Weiss, H. Witte, Z. Metallk. 59 (1968) 554.
[11] H.J. Deiseroth, A. Strunck, Angew. Chem. 101 (1989) 1286.
[12] E.J. Duwell, N.C. Baenziger, Acta Crystallogr. 8 (1955) 705.
[13] H.J. Deiseroth, A. Strunck, W. Bauhofer, Z. Anorg. Allg. Chem. 575 (1989) 31; H.J. Deiseroth, A.Strunck, Angew. Chem. 99 (1987) 701.
[14] J.W. Nielson, N.C. Baenziger, Acta Crystallogr. 7 (1954) 277; A.V. Tkachuk, A. Mar, Acta Crys-tallogr. E62 (2006) i129.
[15] H.J. Deiseroth, Prog. Solid State Chem. 25 (1997) 73.
[16] J. Köhler, M.-H. Whangbo, Solid State Sci. 10 (2008) 444.
[17] C. Hoch, A. Simon, Z. Anorg. Allg. Chem. 634 (2008) 853.
[18] C. Hoch, A. Simon, Angew. Chem. 124 (2012) 3316; C. Hoch, A. Simon, Angew. Chem. Int. Ed.51 (2012) 3262.
[19] C. Hoch, A. Simon, Z. Anorg. Allg. Chem. 632 (2006) 2288.
[20] F. Tambornino, C. Hoch, Z. Kristallogr. Suppl. 13 (2012) 79.
[21] IPDS control software X-Area v. 1.39, Stoe & Cie. GmbH, Darmstadt, Germany, 2006.
[22] X-RED, Data Reduction for STADIP and IPDS, Version 1.31, 2005, Stoe & Cie., Darmstadt,Germany.
[23] X-SHAPE, Crystal Optimization for Numerical Absorption Correction Version 2.07, 2005, Stoe &Cie., Darmstadt, Germany.
[24] L.M. Gelato, E. Parthé, J. Appl. Cryst. 20 (1987) 139.
[25] A. Coelho, Topas Academic Version 4.1, Coelho Software, Brisbane, 2007.
[26] M.C. Tegel, Iron Pnictide superconductors, Ph.D. Thesis, Ludwig-Maximilians-UniversitätMünchen, 2011.
[27] P. Blaha, K. Schwarz, G.K.H. Madsen, D. Kvasnicka, J. Luitz, WIEN2k, An Augmented PlaneWave and Local Orbitals Program for Calculating Crystal Properties, Technische Universität Wien,Austria, 2006.
[28] J.P. Perdew, K. Burke, M. Ernzerhof, Phys. Rev. Lett. 77 (1996) 3865.
[29] M. Wendorff, C. Röhr, J. Alloys Compd. 546 (2013) 320.
126 Results
[30] A.F. Ioffe, A.R. Regel, in: A.F. Gibson, F.A. Kroger, R.E. Burgess (Eds.), Prog. Semicond., vol.4, Heywood, London, 1960, p. 237.
[31] L. Bergmann, C. Schaefer (Eds.), Lehrbuch der Experimentalphysik, seventh ed., vol. 2, Walter deGruyter, Berlin, 1987, p. 786.
[32] G.M. Sheldrick, A short history of SHELX, Acta Crystallogr. A64 (2008) 112–122.
Results 127
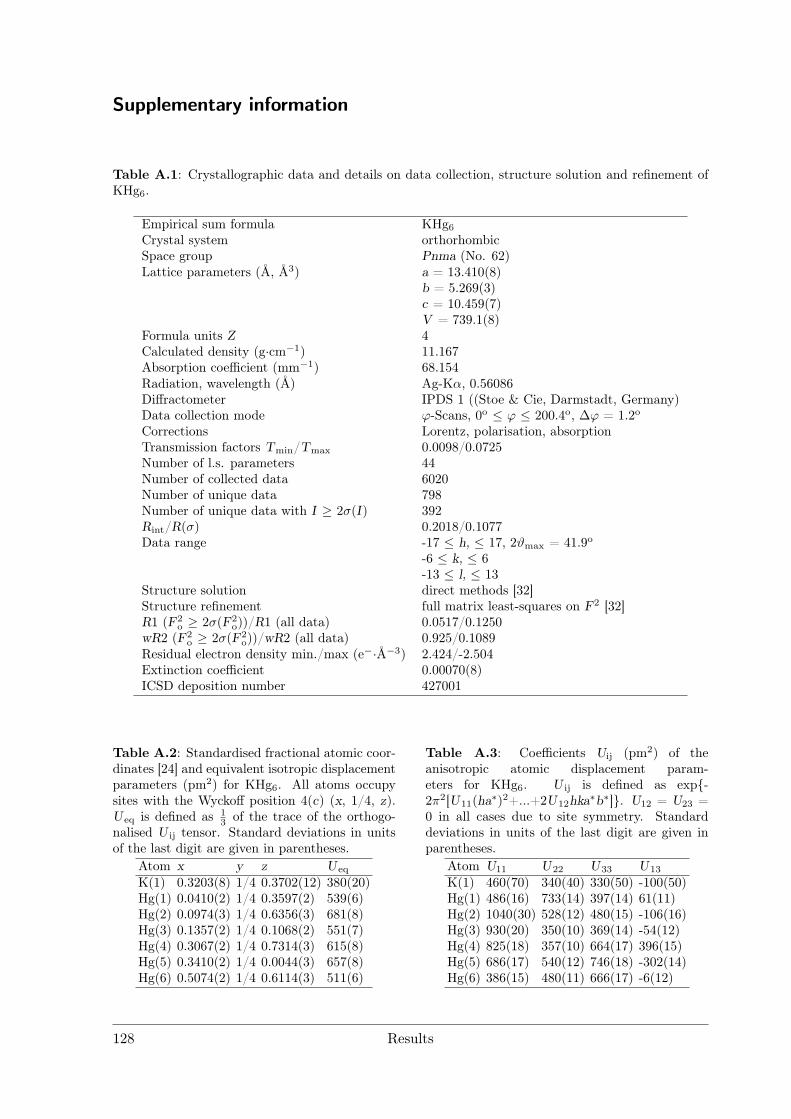
Supplementary information
Table A.1: Crystallographic data and details on data collection, structure solution and refinement ofKHg6.
Empirical sum formula KHg6Crystal system orthorhombicSpace group Pnma (No. 62)Lattice parameters (Å, Å3) a = 13.410(8)
b = 5.269(3)c = 10.459(7)V = 739.1(8)
Formula units Z 4Calculated density (g·cm−1) 11.167Absorption coefficient (mm−1) 68.154Radiation, wavelength (Å) Ag-Kα, 0.56086Diffractometer IPDS 1 ((Stoe & Cie, Darmstadt, Germany)Data collection mode ϕ-Scans, 0o ≤ ϕ ≤ 200.4o, ∆ϕ = 1.2oCorrections Lorentz, polarisation, absorptionTransmission factors Tmin/Tmax 0.0098/0.0725Number of l.s. parameters 44Number of collected data 6020Number of unique data 798Number of unique data with I ≥ 2σ(I) 392Rint/R(σ) 0.2018/0.1077Data range -17 ≤ h, ≤ 17, 2ϑmax = 41.9o
-6 ≤ k, ≤ 6-13 ≤ l, ≤ 13
Structure solution direct methods [32]Structure refinement full matrix least-squares on F2 [32]R1 (F2
o ≥ 2σ(F2o))/R1 (all data) 0.0517/0.1250
wR2 (F2o ≥ 2σ(F2
o))/wR2 (all data) 0.925/0.1089Residual electron density min./max (e−·Å−3) 2.424/-2.504Extinction coefficient 0.00070(8)ICSD deposition number 427001
Table A.2: Standardised fractional atomic coor-dinates [24] and equivalent isotropic displacementparameters (pm2) for KHg6. All atoms occupysites with the Wyckoff position 4(c) (x, 1/4, z).U eq is defined as 1
3 of the trace of the orthogo-nalised U ij tensor. Standard deviations in unitsof the last digit are given in parentheses.
Atom x y z U eq
K(1) 0.3203(8) 1/4 0.3702(12) 380(20)Hg(1) 0.0410(2) 1/4 0.3597(2) 539(6)Hg(2) 0.0974(3) 1/4 0.6356(3) 681(8)Hg(3) 0.1357(2) 1/4 0.1068(2) 551(7)Hg(4) 0.3067(2) 1/4 0.7314(3) 615(8)Hg(5) 0.3410(2) 1/4 0.0044(3) 657(8)Hg(6) 0.5074(2) 1/4 0.6114(3) 511(6)
Table A.3: Coefficients Uij (pm2) of theanisotropic atomic displacement param-eters for KHg6. U ij is defined as exp-2π2[U11(ha∗)2+...+2U12hka∗b∗]. U12 = U23 =0 in all cases due to site symmetry. Standarddeviations in units of the last digit are given inparentheses.
Atom U11 U22 U33 U13
K(1) 460(70) 340(40) 330(50) -100(50)Hg(1) 486(16) 733(14) 397(14) 61(11)Hg(2) 1040(30) 528(12) 480(15) -106(16)Hg(3) 930(20) 350(10) 369(14) -54(12)Hg(4) 825(18) 357(10) 664(17) 396(15)Hg(5) 686(17) 540(12) 746(18) -302(14)Hg(6) 386(15) 480(11) 666(17) -6(12)
128 Results
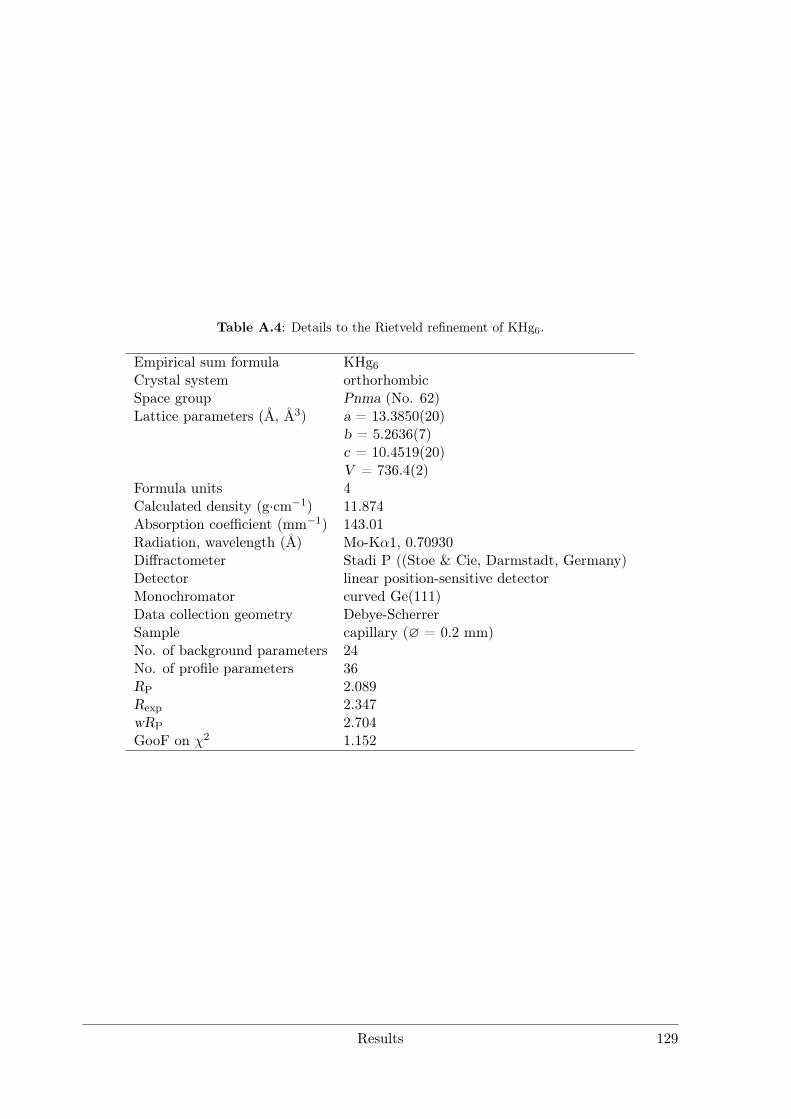
Table A.4: Details to the Rietveld refinement of KHg6.
Empirical sum formula KHg6Crystal system orthorhombicSpace group Pnma (No. 62)Lattice parameters (Å, Å3) a = 13.3850(20)
b = 5.2636(7)c = 10.4519(20)V = 736.4(2)
Formula units 4Calculated density (g·cm−1) 11.874Absorption coefficient (mm−1) 143.01Radiation, wavelength (Å) Mo-Kα1, 0.70930Diffractometer Stadi P ((Stoe & Cie, Darmstadt, Germany)Detector linear position-sensitive detectorMonochromator curved Ge(111)Data collection geometry Debye-ScherrerSample capillary (∅ = 0.2 mm)No. of background parameters 24No. of profile parameters 36RP 2.089Rexp 2.347wRP 2.704GooF on χ2 1.152
Results 129
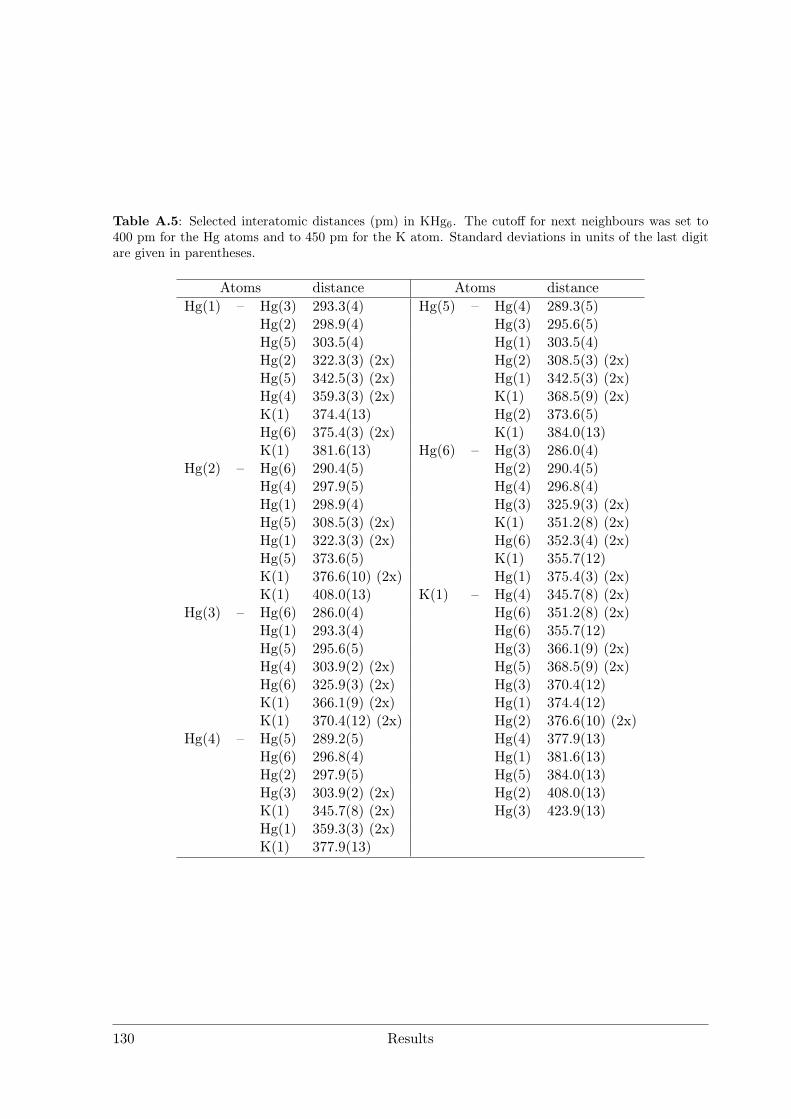
Table A.5: Selected interatomic distances (pm) in KHg6. The cutoff for next neighbours was set to400 pm for the Hg atoms and to 450 pm for the K atom. Standard deviations in units of the last digitare given in parentheses.
Atoms distance Atoms distanceHg(1) – Hg(3) 293.3(4) Hg(5) – Hg(4) 289.3(5)
Hg(2) 298.9(4) Hg(3) 295.6(5)Hg(5) 303.5(4) Hg(1) 303.5(4)Hg(2) 322.3(3) (2x) Hg(2) 308.5(3) (2x)Hg(5) 342.5(3) (2x) Hg(1) 342.5(3) (2x)Hg(4) 359.3(3) (2x) K(1) 368.5(9) (2x)K(1) 374.4(13) Hg(2) 373.6(5)Hg(6) 375.4(3) (2x) K(1) 384.0(13)K(1) 381.6(13) Hg(6) – Hg(3) 286.0(4)
Hg(2) – Hg(6) 290.4(5) Hg(2) 290.4(5)Hg(4) 297.9(5) Hg(4) 296.8(4)Hg(1) 298.9(4) Hg(3) 325.9(3) (2x)Hg(5) 308.5(3) (2x) K(1) 351.2(8) (2x)Hg(1) 322.3(3) (2x) Hg(6) 352.3(4) (2x)Hg(5) 373.6(5) K(1) 355.7(12)K(1) 376.6(10) (2x) Hg(1) 375.4(3) (2x)K(1) 408.0(13) K(1) – Hg(4) 345.7(8) (2x)
Hg(3) – Hg(6) 286.0(4) Hg(6) 351.2(8) (2x)Hg(1) 293.3(4) Hg(6) 355.7(12)Hg(5) 295.6(5) Hg(3) 366.1(9) (2x)Hg(4) 303.9(2) (2x) Hg(5) 368.5(9) (2x)Hg(6) 325.9(3) (2x) Hg(3) 370.4(12)K(1) 366.1(9) (2x) Hg(1) 374.4(12)K(1) 370.4(12) (2x) Hg(2) 376.6(10) (2x)
Hg(4) – Hg(5) 289.2(5) Hg(4) 377.9(13)Hg(6) 296.8(4) Hg(1) 381.6(13)Hg(2) 297.9(5) Hg(5) 384.0(13)Hg(3) 303.9(2) (2x) Hg(2) 408.0(13)K(1) 345.7(8) (2x) Hg(3) 423.9(13)Hg(1) 359.3(3) (2x)K(1) 377.9(13)
130 Results
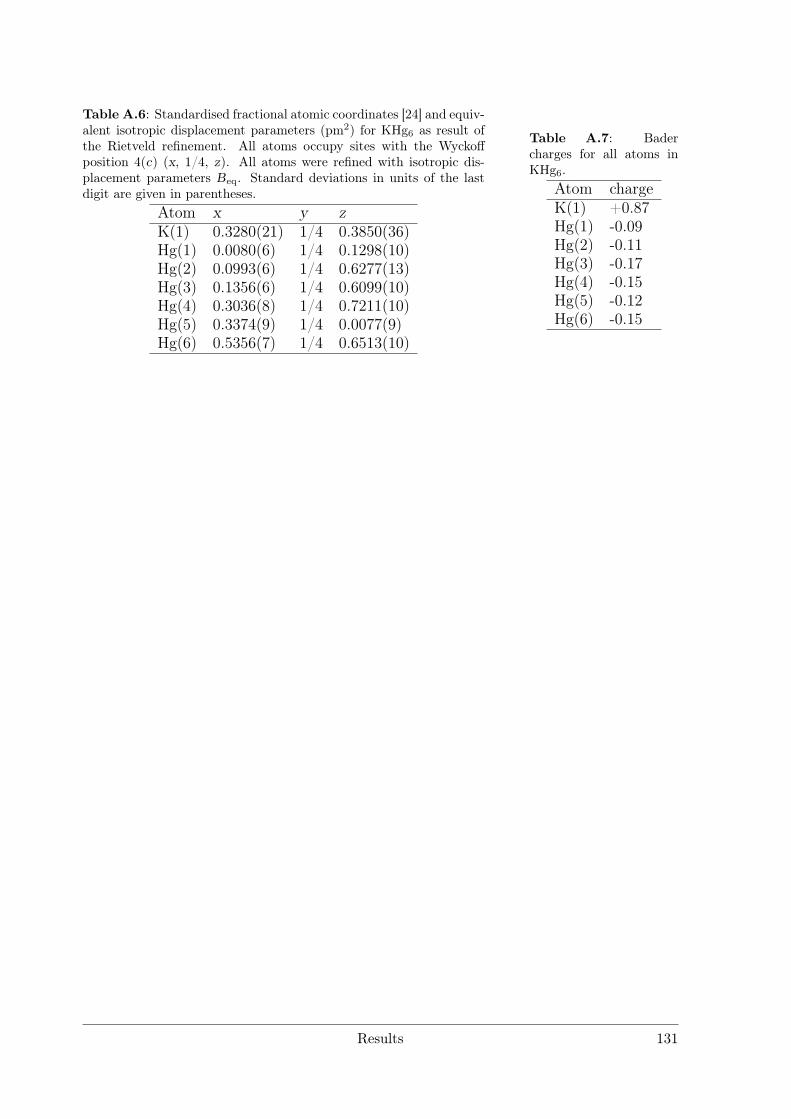
Table A.6: Standardised fractional atomic coordinates [24] and equiv-alent isotropic displacement parameters (pm2) for KHg6 as result ofthe Rietveld refinement. All atoms occupy sites with the Wyckoffposition 4(c) (x, 1/4, z). All atoms were refined with isotropic dis-placement parameters Beq. Standard deviations in units of the lastdigit are given in parentheses.
Atom x y zK(1) 0.3280(21) 1/4 0.3850(36)Hg(1) 0.0080(6) 1/4 0.1298(10)Hg(2) 0.0993(6) 1/4 0.6277(13)Hg(3) 0.1356(6) 1/4 0.6099(10)Hg(4) 0.3036(8) 1/4 0.7211(10)Hg(5) 0.3374(9) 1/4 0.0077(9)Hg(6) 0.5356(7) 1/4 0.6513(10)
Table A.7: Badercharges for all atoms inKHg6.
Atom chargeK(1) +0.87Hg(1) -0.09Hg(2) -0.11Hg(3) -0.17Hg(4) -0.15Hg(5) -0.12Hg(6) -0.15
Results 131

3.4.2. NMR Investigations on the Li Amalgams Li3Hg, LiHg and LiHg3
Introduction
The binary phase diagram Li–Hg was the topic of thermoanalytical studies of the early20th century. The reported phases LiHg6, LiHg2 and Li2Hg were never characterisedin crystallographic studies and most probably are non-existent. The mercury-richest Liamalgam LiHg3 was prepared 1900 by electrolysis and subsequent crystallisation at lowtemperature.[1] In 1911, LiHg and Li3Hg were observed during thermoanalytic studiesand their crystal structures were assigned to simple crystal structure types based onDebye-Scherrer patterns.[2, 3] No refinement of powder or single crystal data was per-formed. As Li amalgams present a structurally simple series from Hg-poor to Hg-richcompounds and both Hg and Li show convenient NMR activity, this system was chosenfor systematic investigations on the quantification of polarity in intermetallic compoundsvia NMR methods, corroborated by ab-initio band structure calculations and measure-ment of physical properties.
The Knight shift is the shift in NMR signals in metallic systems and originates from thehyperfine coupling of the nuclear spin with the spin of conduction electrons. Electrons inorbitals with non-zero probability at the core site (s electrons) have the highest influence.In first approximation, s electrons can be regarded as the only influence on the Knightshift. For many metallic systems Knight shift measurements have been reported: NMRresonance for liquid Hg was observed in 1959, Knight shift for single-crystalline Hg wasreported in 1968.[4, 5] Subsequent NMR studies on metallic Hg focused on expanded filmsor Hg in porous materials.[6–8] In only two instances, Knight shift measurements for Hgin intermetallic compounds have been performed: the mixed crystal series NaHg1−xTlx(x = 0.1–0.9) and Hg1−xCdxTe (x = 0.2–0.28).[9, 10] Only in the latter case, Hg NMRshifts were discussed and put into context with band structure calculations. In contrast,information on lithium NMR is abundant. The Knight shift of metallic lithium wasreported in 1949.[11] Since then, lithium NMR has become a powerful tool in both inor-ganic and organic chemistry. Main focuses lie on ionic lithium compounds (solution orsolid state) and covalently bonded lithium in organometallic compounds.[12–15] Recently,in-situ NMR monitoring of lithium ion batteries has gained reasonable attention.[16–19]However, studies on intermetallic compounds are less common. Herzog-Cance focussedon the temperature dependent mobility of lithium in Li2Ga7, but no detailed discussionof the bonding situation is given.[20] Menetrier focussed on the Knight shift in a numberof Li–Sn compounds showing nonclassical Zintl-like behaviour.[21] Band structure cal-culations were correlated with the observed 7Li Knight shift. However, complementarySn NMR was not reported on. No systematic combined NMR investigation of both theelectropositive and the electronegative elements has been reported so far.
Sample preparation and crystallographic characterization
For the preparation of Li3Hg and LiHg, suitable amounts of Li (abcr 99.9%) and Hg(double distilled) were mixed in an argon filled glovebox and sealed in steel crucibles bymechanical pinching and folding. The sealed crucibles were heated under Ar atmosphereto 575 K over the course of 10 h, held at elevated temperature for 48 h and subsequently
Results 133
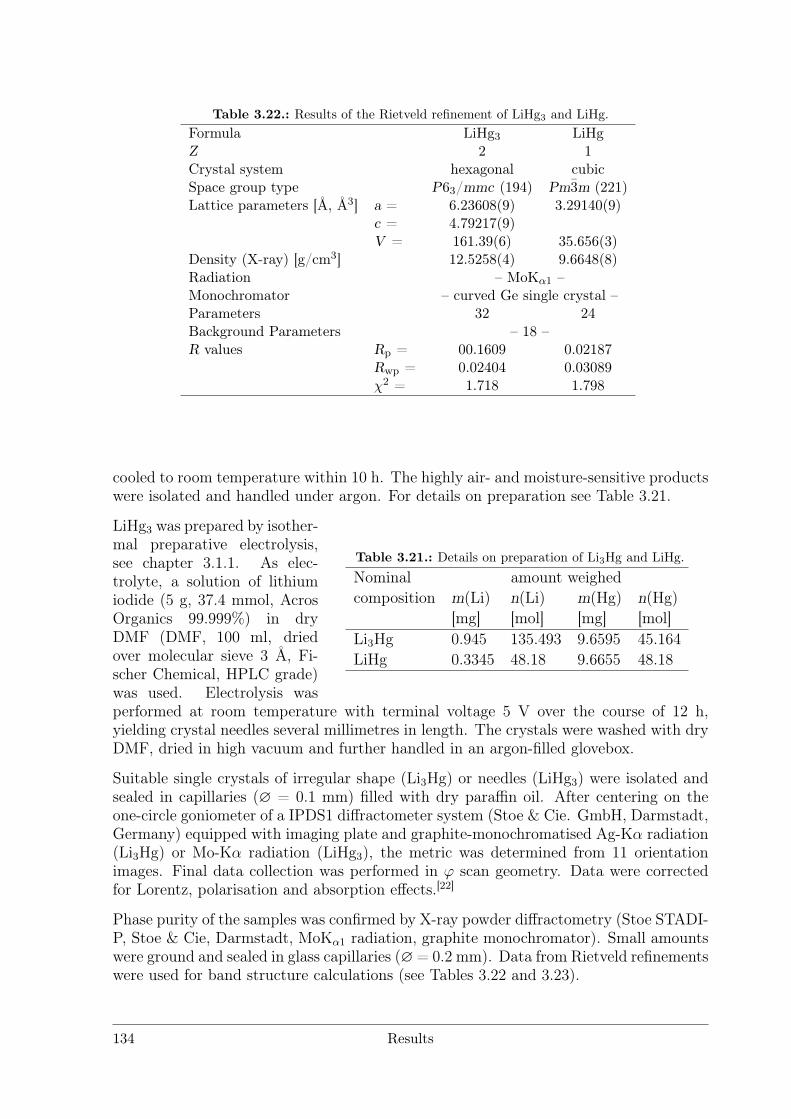
Table 3.22.: Results of the Rietveld refinement of LiHg3 and LiHg.Formula LiHg3 LiHgZ 2 1Crystal system hexagonal cubicSpace group type P63/mmc (194) Pm3m (221)Lattice parameters [Å, Å3] a = 6.23608(9) 3.29140(9)
c = 4.79217(9)V = 161.39(6) 35.656(3)
Density (X-ray) [g/cm3] 12.5258(4) 9.6648(8)Radiation – MoKα1 –Monochromator – curved Ge single crystal –Parameters 32 24Background Parameters – 18 –R values Rp = 00.1609 0.02187
Rwp = 0.02404 0.03089χ2 = 1.718 1.798
cooled to room temperature within 10 h. The highly air- and moisture-sensitive productswere isolated and handled under argon. For details on preparation see Table 3.21.
Table 3.21.: Details on preparation of Li3Hg and LiHg.
Nominal amount weighedcomposition m(Li) n(Li) m(Hg) n(Hg)
[mg] [mol] [mg] [mol]Li3Hg 0.945 135.493 9.6595 45.164LiHg 0.3345 48.18 9.6655 48.18
LiHg3 was prepared by isother-mal preparative electrolysis,see chapter 3.1.1. As elec-trolyte, a solution of lithiumiodide (5 g, 37.4 mmol, AcrosOrganics 99.999%) in dryDMF (DMF, 100 ml, driedover molecular sieve 3 Å, Fi-scher Chemical, HPLC grade)was used. Electrolysis wasperformed at room temperature with terminal voltage 5 V over the course of 12 h,yielding crystal needles several millimetres in length. The crystals were washed with dryDMF, dried in high vacuum and further handled in an argon-filled glovebox.
Suitable single crystals of irregular shape (Li3Hg) or needles (LiHg3) were isolated andsealed in capillaries (∅ = 0.1 mm) filled with dry paraffin oil. After centering on theone-circle goniometer of a IPDS1 diffractometer system (Stoe & Cie. GmbH, Darmstadt,Germany) equipped with imaging plate and graphite-monochromatised Ag-Kα radiation(Li3Hg) or Mo-Kα radiation (LiHg3), the metric was determined from 11 orientationimages. Final data collection was performed in ϕ scan geometry. Data were correctedfor Lorentz, polarisation and absorption effects.[22]
Phase purity of the samples was confirmed by X-ray powder diffractometry (Stoe STADI-P, Stoe & Cie, Darmstadt, MoKα1 radiation, graphite monochromator). Small amountswere ground and sealed in glass capillaries (∅= 0.2 mm). Data from Rietveld refinementswere used for band structure calculations (see Tables 3.22 and 3.23).
134 Results
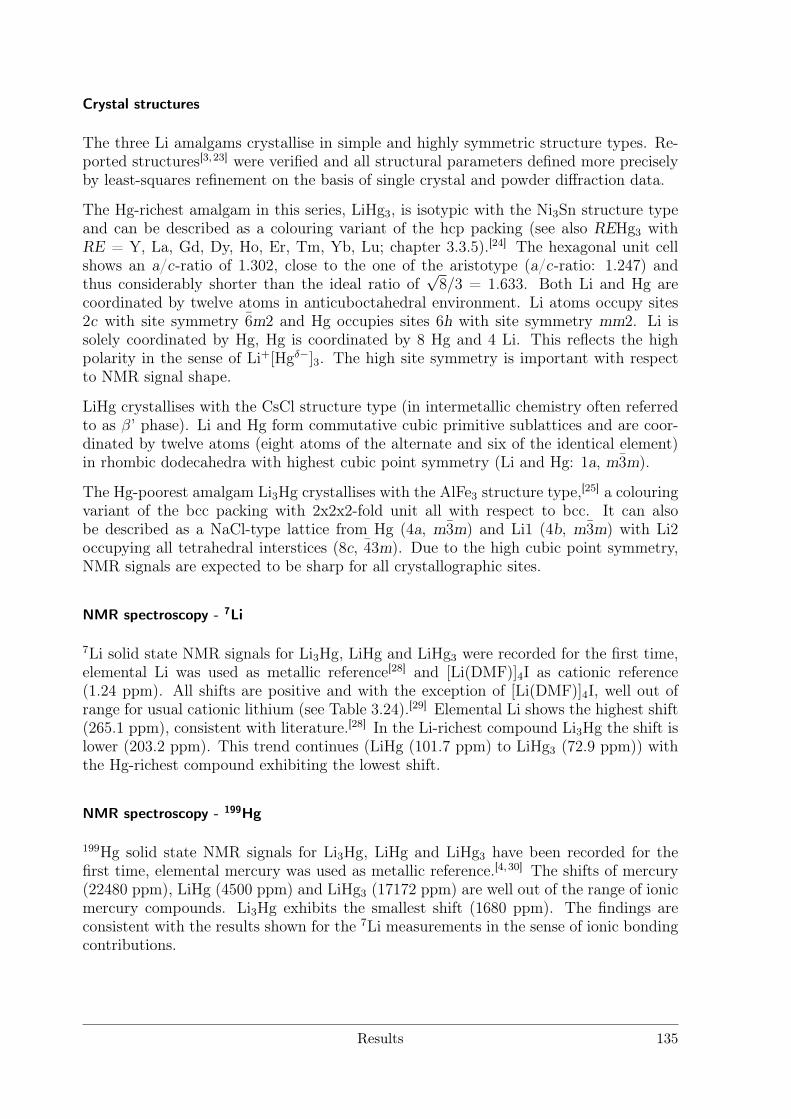
Crystal structures
The three Li amalgams crystallise in simple and highly symmetric structure types. Re-ported structures[3, 23] were verified and all structural parameters defined more preciselyby least-squares refinement on the basis of single crystal and powder diffraction data.
The Hg-richest amalgam in this series, LiHg3, is isotypic with the Ni3Sn structure typeand can be described as a colouring variant of the hcp packing (see also REHg3 withRE = Y, La, Gd, Dy, Ho, Er, Tm, Yb, Lu; chapter 3.3.5).[24] The hexagonal unit cellshows an a/c-ratio of 1.302, close to the one of the aristotype (a/c-ratio: 1.247) andthus considerably shorter than the ideal ratio of
√8/3 = 1.633. Both Li and Hg are
coordinated by twelve atoms in anticuboctahedral environment. Li atoms occupy sites2c with site symmetry 6m2 and Hg occupies sites 6h with site symmetry mm2. Li issolely coordinated by Hg, Hg is coordinated by 8 Hg and 4 Li. This reflects the highpolarity in the sense of Li+[Hgδ−]3. The high site symmetry is important with respectto NMR signal shape.
LiHg crystallises with the CsCl structure type (in intermetallic chemistry often referredto as β’ phase). Li and Hg form commutative cubic primitive sublattices and are coor-dinated by twelve atoms (eight atoms of the alternate and six of the identical element)in rhombic dodecahedra with highest cubic point symmetry (Li and Hg: 1a, m3m).
The Hg-poorest amalgam Li3Hg crystallises with the AlFe3 structure type,[25] a colouringvariant of the bcc packing with 2x2x2-fold unit all with respect to bcc. It can alsobe described as a NaCl-type lattice from Hg (4a, m3m) and Li1 (4b, m3m) with Li2occupying all tetrahedral interstices (8c, 43m). Due to the high cubic point symmetry,NMR signals are expected to be sharp for all crystallographic sites.
NMR spectroscopy - 7Li
7Li solid state NMR signals for Li3Hg, LiHg and LiHg3 were recorded for the first time,elemental Li was used as metallic reference[28] and [Li(DMF)]4I as cationic reference(1.24 ppm). All shifts are positive and with the exception of [Li(DMF)]4I, well out ofrange for usual cationic lithium (see Table 3.24).[29] Elemental Li shows the highest shift(265.1 ppm), consistent with literature.[28] In the Li-richest compound Li3Hg the shift islower (203.2 ppm). This trend continues (LiHg (101.7 ppm) to LiHg3 (72.9 ppm)) withthe Hg-richest compound exhibiting the lowest shift.
NMR spectroscopy - 199Hg
199Hg solid state NMR signals for Li3Hg, LiHg and LiHg3 have been recorded for thefirst time, elemental mercury was used as metallic reference.[4, 30] The shifts of mercury(22480 ppm), LiHg (4500 ppm) and LiHg3 (17172 ppm) are well out of the range of ionicmercury compounds. Li3Hg exhibits the smallest shift (1680 ppm). The findings areconsistent with the results shown for the 7Li measurements in the sense of ionic bondingcontributions.
Results 135
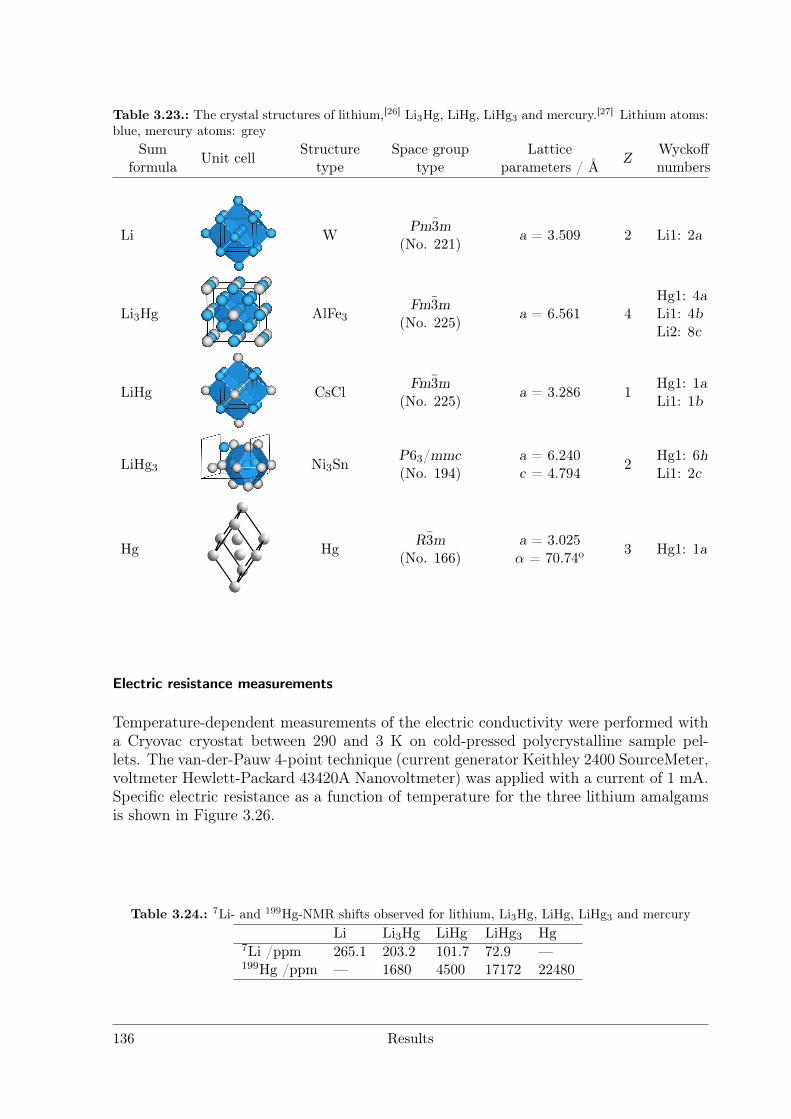
Table 3.23.: The crystal structures of lithium,[26] Li3Hg, LiHg, LiHg3 and mercury.[27] Lithium atoms:blue, mercury atoms: grey
Sumformula Unit cell Structure
typeSpace group
typeLattice
parameters / Å Z Wyckoffnumbers
Li W Pm3m(No. 221) a = 3.509 2 Li1: 2a
Li3Hg AlFe3Fm3m
(No. 225) a = 6.561 4Hg1: 4aLi1: 4bLi2: 8c
LiHg CsCl Fm3m(No. 225) a = 3.286 1 Hg1: 1a
Li1: 1b
LiHg3 Ni3SnP63/mmc(No. 194)
a = 6.240c = 4.794 2 Hg1: 6h
Li1: 2c
Hg Hg R3m(No. 166)
a = 3.025α = 70.74o 3 Hg1: 1a
Electric resistance measurements
Temperature-dependent measurements of the electric conductivity were performed witha Cryovac cryostat between 290 and 3 K on cold-pressed polycrystalline sample pel-lets. The van-der-Pauw 4-point technique (current generator Keithley 2400 SourceMeter,voltmeter Hewlett-Packard 43420A Nanovoltmeter) was applied with a current of 1 mA.Specific electric resistance as a function of temperature for the three lithium amalgamsis shown in Figure 3.26.
Table 3.24.: 7Li- and 199Hg-NMR shifts observed for lithium, Li3Hg, LiHg, LiHg3 and mercuryLi Li3Hg LiHg LiHg3 Hg
7Li /ppm 265.1 203.2 101.7 72.9 —199Hg /ppm — 1680 4500 17172 22480
136 Results
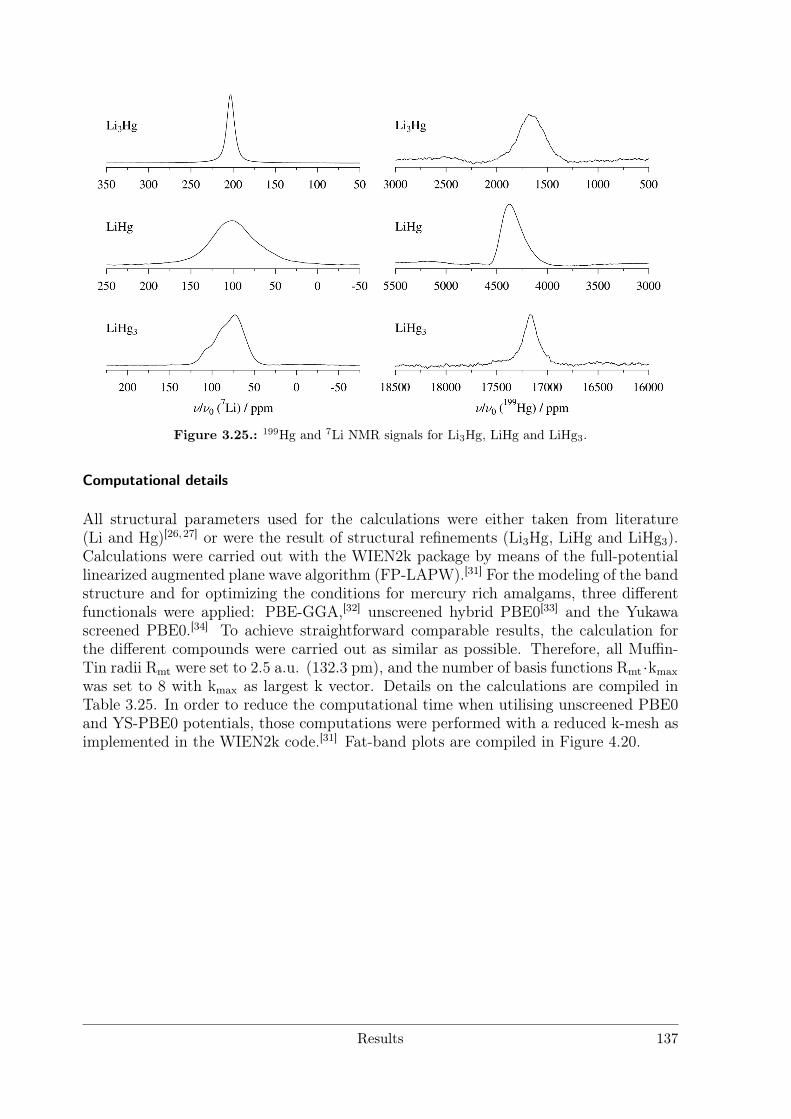
Figure 3.25.: 199Hg and 7Li NMR signals for Li3Hg, LiHg and LiHg3.
Computational details
All structural parameters used for the calculations were either taken from literature(Li and Hg)[26, 27] or were the result of structural refinements (Li3Hg, LiHg and LiHg3).Calculations were carried out with the WIEN2k package by means of the full-potentiallinearized augmented plane wave algorithm (FP-LAPW).[31] For the modeling of the bandstructure and for optimizing the conditions for mercury rich amalgams, three differentfunctionals were applied: PBE-GGA,[32] unscreened hybrid PBE0[33] and the Yukawascreened PBE0.[34] To achieve straightforward comparable results, the calculation forthe different compounds were carried out as similar as possible. Therefore, all Muffin-Tin radii Rmt were set to 2.5 a.u. (132.3 pm), and the number of basis functions Rmt ·kmax
was set to 8 with kmax as largest k vector. Details on the calculations are compiled inTable 3.25. In order to reduce the computational time when utilising unscreened PBE0and YS-PBE0 potentials, those computations were performed with a reduced k-mesh asimplemented in the WIEN2k code.[31] Fat-band plots are compiled in Figure 4.20.
Results 137
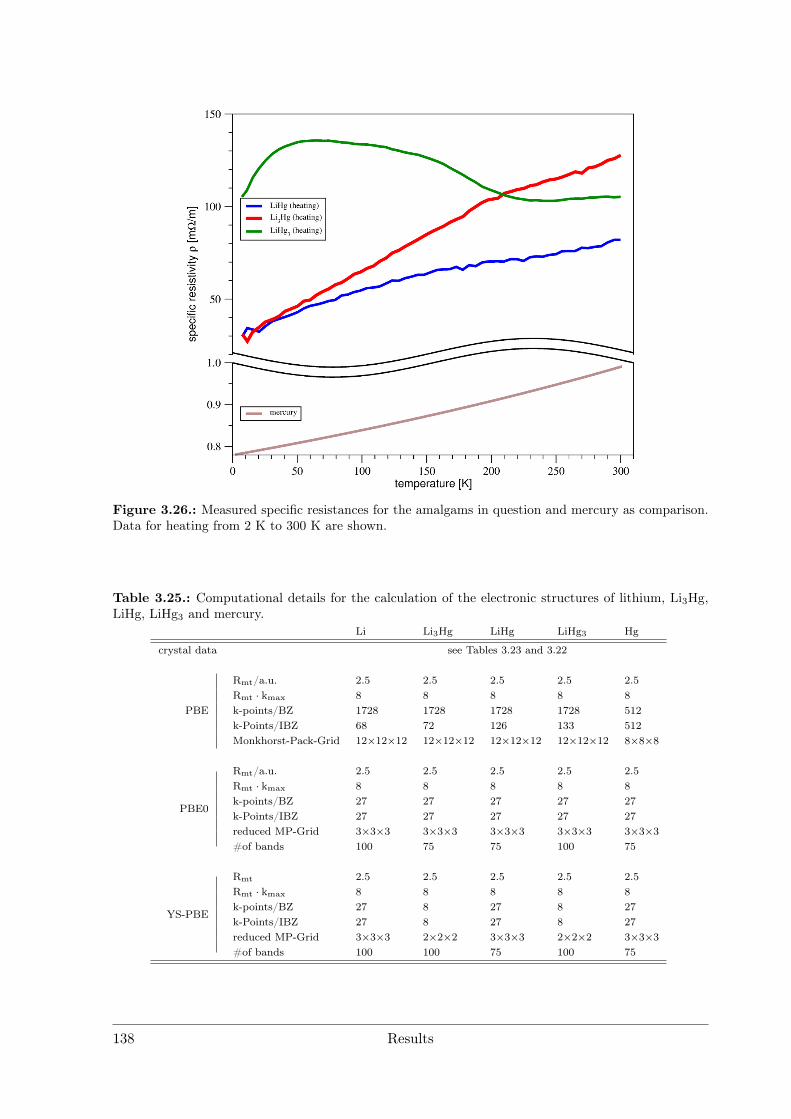
Figure 3.26.: Measured specific resistances for the amalgams in question and mercury as comparison.Data for heating from 2 K to 300 K are shown.
Table 3.25.: Computational details for the calculation of the electronic structures of lithium, Li3Hg,LiHg, LiHg3 and mercury.
Li Li3Hg LiHg LiHg3 Hg
crystal data see Tables 3.23 and 3.22
PBE
Rmt/a.u. 2.5 2.5 2.5 2.5 2.5Rmt · kmax 8 8 8 8 8k-points/BZ 1728 1728 1728 1728 512k-Points/IBZ 68 72 126 133 512Monkhorst-Pack-Grid 12×12×12 12×12×12 12×12×12 12×12×12 8×8×8
PBE0
Rmt/a.u. 2.5 2.5 2.5 2.5 2.5Rmt · kmax 8 8 8 8 8k-points/BZ 27 27 27 27 27k-Points/IBZ 27 27 27 27 27reduced MP-Grid 3×3×3 3×3×3 3×3×3 3×3×3 3×3×3#of bands 100 75 75 100 75
YS-PBE
Rmt 2.5 2.5 2.5 2.5 2.5Rmt · kmax 8 8 8 8 8k-points/BZ 27 8 27 8 27k-Points/IBZ 27 8 27 8 27reduced MP-Grid 3×3×3 2×2×2 3×3×3 2×2×2 3×3×3#of bands 100 100 75 100 75
138 Results
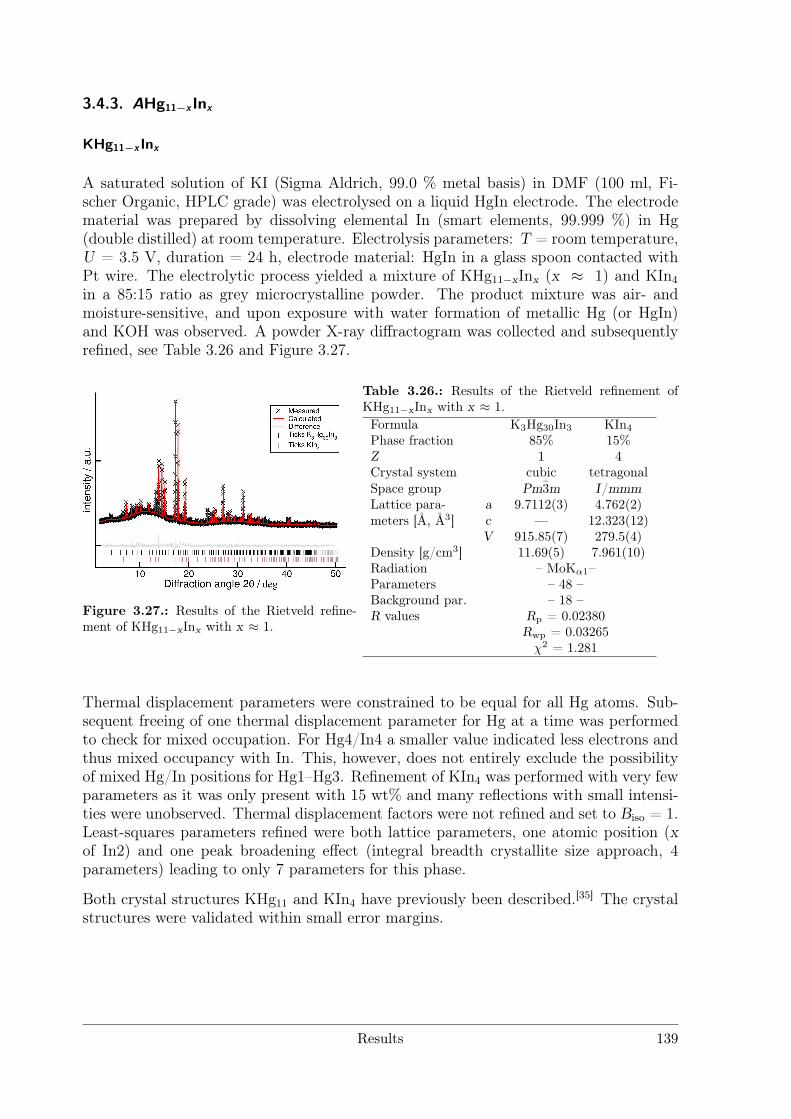
3.4.3. AHg11−x Inx
KHg11−x Inx
A saturated solution of KI (Sigma Aldrich, 99.0 % metal basis) in DMF (100 ml, Fi-scher Organic, HPLC grade) was electrolysed on a liquid HgIn electrode. The electrodematerial was prepared by dissolving elemental In (smart elements, 99.999 %) in Hg(double distilled) at room temperature. Electrolysis parameters: T = room temperature,U = 3.5 V, duration = 24 h, electrode material: HgIn in a glass spoon contacted withPt wire. The electrolytic process yielded a mixture of KHg11−xInx (x ≈ 1) and KIn4
in a 85:15 ratio as grey microcrystalline powder. The product mixture was air- andmoisture-sensitive, and upon exposure with water formation of metallic Hg (or HgIn)and KOH was observed. A powder X-ray diffractogram was collected and subsequentlyrefined, see Table 3.26 and Figure 3.27.
Figure 3.27.: Results of the Rietveld refine-ment of KHg11−xInx with x ≈ 1.
Table 3.26.: Results of the Rietveld refinement ofKHg11−xInx with x ≈ 1.Formula K3Hg30In3 KIn4
Phase fraction 85% 15%Z 1 4Crystal system cubic tetragonalSpace group Pm3m I/mmmLattice para- a 9.7112(3) 4.762(2)meters [Å, Å3] c — 12.323(12)
V 915.85(7) 279.5(4)Density [g/cm3] 11.69(5) 7.961(10)Radiation – MoKα1–Parameters – 48 –Background par. – 18 –R values Rp = 0.02380
Rwp = 0.03265χ2 = 1.281
Thermal displacement parameters were constrained to be equal for all Hg atoms. Sub-sequent freeing of one thermal displacement parameter for Hg at a time was performedto check for mixed occupation. For Hg4/In4 a smaller value indicated less electrons andthus mixed occupancy with In. This, however, does not entirely exclude the possibilityof mixed Hg/In positions for Hg1–Hg3. Refinement of KIn4 was performed with very fewparameters as it was only present with 15 wt% and many reflections with small intensi-ties were unobserved. Thermal displacement factors were not refined and set to Biso = 1.Least-squares parameters refined were both lattice parameters, one atomic position (xof In2) and one peak broadening effect (integral breadth crystallite size approach, 4parameters) leading to only 7 parameters for this phase.
Both crystal structures KHg11 and KIn4 have previously been described.[35] The crystalstructures were validated within small error margins.
Results 139
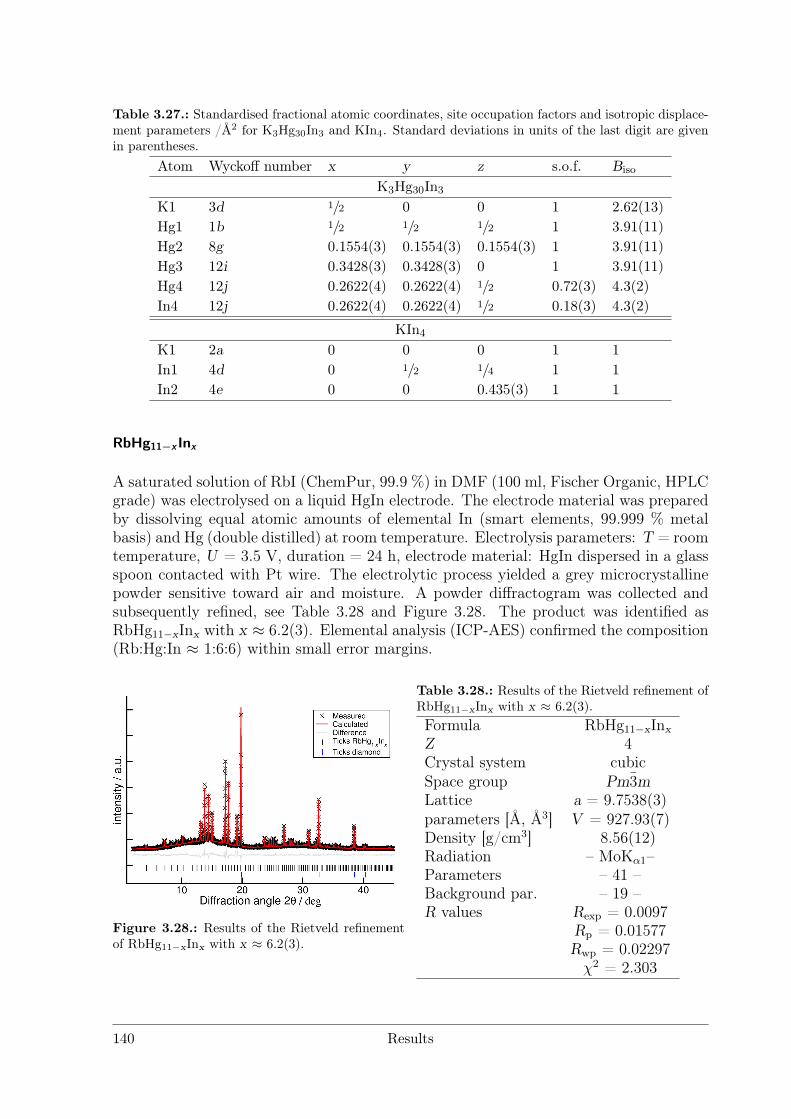
Table 3.27.: Standardised fractional atomic coordinates, site occupation factors and isotropic displace-ment parameters /Å2 for K3Hg30In3 and KIn4. Standard deviations in units of the last digit are givenin parentheses.
Atom Wyckoff number x y z s.o.f. Biso
K3Hg30In3
K1 3d 1/2 0 0 1 2.62(13)Hg1 1b 1/2 1/2 1/2 1 3.91(11)Hg2 8g 0.1554(3) 0.1554(3) 0.1554(3) 1 3.91(11)Hg3 12i 0.3428(3) 0.3428(3) 0 1 3.91(11)Hg4 12j 0.2622(4) 0.2622(4) 1/2 0.72(3) 4.3(2)In4 12j 0.2622(4) 0.2622(4) 1/2 0.18(3) 4.3(2)
KIn4
K1 2a 0 0 0 1 1In1 4d 0 1/2 1/4 1 1In2 4e 0 0 0.435(3) 1 1
RbHg11−x Inx
A saturated solution of RbI (ChemPur, 99.9 %) in DMF (100 ml, Fischer Organic, HPLCgrade) was electrolysed on a liquid HgIn electrode. The electrode material was preparedby dissolving equal atomic amounts of elemental In (smart elements, 99.999 % metalbasis) and Hg (double distilled) at room temperature. Electrolysis parameters: T = roomtemperature, U = 3.5 V, duration = 24 h, electrode material: HgIn dispersed in a glassspoon contacted with Pt wire. The electrolytic process yielded a grey microcrystallinepowder sensitive toward air and moisture. A powder diffractogram was collected andsubsequently refined, see Table 3.28 and Figure 3.28. The product was identified asRbHg11−xInx with x ≈ 6.2(3). Elemental analysis (ICP-AES) confirmed the composition(Rb:Hg:In ≈ 1:6:6) within small error margins.
Figure 3.28.: Results of the Rietveld refinementof RbHg11−xInx with x ≈ 6.2(3).
Table 3.28.: Results of the Rietveld refinement ofRbHg11−xInx with x ≈ 6.2(3).Formula RbHg11−xInxZ 4Crystal system cubicSpace group Pm3mLattice a = 9.7538(3)parameters [Å, Å3] V = 927.93(7)Density [g/cm3] 8.56(12)Radiation – MoKα1–Parameters – 41 –Background par. – 19 –R values Rexp = 0.0097
Rp = 0.01577Rwp = 0.02297χ2 = 2.303
140 Results
RbHg11−xInx crystallises in the BaHg11 type (Pm3m, a = 9.7538(3) Å), all Hg positionsshows mixed occupancy with In in varying amounts. This led to various complicationsduring Rietveld refinement which were dealt with as follows: Prior to measurement, thesubstance was mixed with diamond (approx. 90 wt%) to lower the overall absorption.The absorption was accounted for by modelling a cylindrical shape (∅outer = 0.3 mm,∅inner = 0.28 mm), the packing density was set to 0.7. Isotropic thermal displacementparameters were constrained for all Hg/In mixed positions, the parameter for Rb wasrefined and gave a value similar to the formerly mentioned. Site occupation parametersof each Hg/In position were constrained to be fully occupied.
If every position was assumed to be occupied by Hg only, thermal displacement of Rbbecame negative, indicating too many electrons present. Assuming every position tobe fully occupied by In, thermal displacement of Rb became unreasonably large. Freerefinement of site occupation factors together with thermal displacement factors led tostrong correlation and was thus avoided. χ2 is rather high despite the good fit due tolong measurement (72 h) and the resulting superior counting statistics (see Rexp, Table3.28). It is noteworthy that the refinement is fragile and minor changes may result inlarge deviations from the reported values. For further discussion see chapter 4.3.3.
Table 3.29.: Standardised fractional atomic coordinates, site occupation factors and equivalent isotropicdisplacement parameters /Å2 for RbHg11−xInx. Standard deviations in units of the last digit are givenin parentheses.
Atom Wyckoff number x y z s.o.f. Biso
Rb1 3d 0 0 1/2 1 2.2(4)Hg1 1b 1/2 1/2 1/2 0.88(7) 2.98(13)In1 1b 1/2 1/2 1/2 0.12(7) 2.98(13)Hg2 8g 0.1548(3) x x 0.49(5) 2.98(13)In2 8g 0.1548(3) x x 0.51(5) 2.98(13)Hg3 12i 0.2646(3) 1/2 x 0.38(5) 2.98(13)In3 12i 0.2646(3) 1/2 x 0.62(5) 2.98(13)Hg4 12j 0.3458(3) x 0 0.65(5) 2.98(13)In4 12j 0.3458(3) x 0 0.35(5) 2.98(13)
References
[1] W. Kerp, W. Böttger, Z. Anorg. Allg. Chem., 25(1), 1–71 (1900).
[2] G. J. Zukowsky, Z. Anorg. Allg. Chem., 71(1), 403–418 (1911).
[3] E. Zintl, A. Schneider, Z. Elektrochem. Angew. Phys. Chem., 41(11), 771–774(1935).
[4] W. Knight, A. Berger, V. Heine, Annals of Physics, 8(2), 173–193 (1959).
[5] R. Weinert, R. Schumacher, Phys. Rev., 172(3), 711–717 (1968).
[6] V. S. Kasperovich, E. V. Charnaya, C. Tien, C. S. Wur, Phys. Solid State, 45(9),1802–1807 (2003).
Results 141
[7] W. W. Warren, F. Hensel, Phys. Rev. B, 26(10), 5980–5982 (1982).
[8] U. El-Hanany, W. W. Warren, Phys. Rev. Lett., 34(20), 1276–1279 (1975).
[9] P. C. Schmidt, W. Baden, N. Weiden, A. Weiss, Phys. Stat. Sol. A, 92, 205–212(1985).
[10] J. Shi, M. Wessels, J. H. Ross, Phys. Rev. B, 48(12), 8742–8746 (1993).
[11] W. Knight, Phys. Rev., 76(8), 1259–1260 (1949).
[12] H. Günther, D. Moskau, P. Bast, D. Schmalz, Angew. Chem., 99(12), 1242–1250(1987); b) H. Günther, D. Moskau, P. Bast, D. Schmalz, Angew. Chem., Int. Ed.,26, 1212 (1987).
[13] H. Günther, J. Bras. Chem. Soc., 10(4), 241–262 (1999).
[14] H. J. Reich, J. Org. Chem., 77(13), 5471–5491 (2012).
[15] D. Johnels, G. Harald, in R. Luisi, V. Capriati (editors), Lithium Compounds inOrganic Synthesis: From Fundamentals to Applications, John Wiley & Sons, Inc.,London (2014).
[16] C. P. Grey, Y. J. Lee, Solid State Sci., 5(6), 883–894 (2003).
[17] C. P. Grey, N. Dupré, Chem. Rev., 104, 4493–4512 (2004).
[18] N. M. Trease, T. K. Köster, C. P. Grey, Electrochem. Soc. Inter., 20, 69–73 (2011).
[19] F. Blanc, M. Leskes, C. P. Grey, Accounts of Chemical Research, 46(9), 1952–1963(2013).
[20] M. Tillard-Charbonnel, C. Belin, M. H. Herzog-Cance, Eur. J. Solid State Inorg.Chem, 25, 329 (1988).
[21] E. Bekaert, F. Robert, P. E. Lippens, M. Ménétrier, J. Phys. Chem. C, 114(14),6749–6754 (2010).
[22] A. L. Spek, Acta Crystallogr. D, 65(2), 148–155 (2009).
[23] E. Zintl, G. Brauer, Z. Phys. Chem., 20, 245–271 (1933).
[24] P. Rahlfs, Metallwirtschaft, Metallwissenschaft, Metalltechnik, 16, 343–345 (1937).
[25] A. J. Bradley, A. H. Jay, Proc. R. Soc. A, 125, 339–357 (1932).
[26] A. Hull., Phys. Rev., 10(6), 661–696 (1917).
[27] C. S. Barrett, Acta Crystallogr., 10(1), 58–60 (1957).
[28] R. Schumacher, N. VanderVen, Phys. Rev., 144(1), 357–360 (1966).
[29] D. M. Grant, R. K. Harris, Encyclopedia of Nuclear Magnetic Resonance, 8 VolumeSet, Wiley, 1st edition (1996).
[30] W. E. Blumberg, B. Telephone, J. Eisinger, R. G. Shulman, M. Hill, 26(7), 1187–
142 Results
1194 (1965).
[31] P. Blaha, K. Schwarz, G. Madsen, D. Kvasnicka, J. Luitz, An Augmented PlaneWave Plus Local Orbitals Program for Calculating Crystal Properties (2013).
[32] J. P. Perdew, K. Burke, M. Ernzerhof, Phys. Rev. Lett., 77(18), 3865–3868 (1996).
[33] C. Adamo, V. Barone, J. Chem. Phys., 110(13), 6158 (1999).
[34] F. Tran, P. Blaha, Phys. Rev. B, 83(23), 235118 (2011).
[35] E. Biehl, H.-J. Deiseroth, Z. Anorg. Allg. Chem., 625(7), 1073–1080 (1999).
Results 143

3.5. Electrolyses on Mercury-Free Cathode Materials
The following chapter contains published as well as unpublished results of electrolyseswith emphasis on mercury-free cathode materials. In the first part, electrocrystallisa-tion as a new synthetic method toward intermetallic phases is presented and has beenpublished in Inorg. Chem.. After an introduction focussing on historical aspects ofelectrolysis, the techniques, prerequisites, limitations and overall aptness of electrocrys-tallisation are presented. Products as yielded by electrolysis on elemental (Hg or Ga),binary (Ga/Sn eutectic, HgIn) and ternary (Ga/In/Sn eutectic) cathode systems are in-vestigated. Literature-known compounds previously synthesised by classical solid statemethods were reproduced by electrocrystallisation (Li3Ga14, NaGa4, K8Ga8Sn38). In ad-dition, the new binary main group element compound CsIn12 was synthesised utilisingHg as inert solvent for In in a HgIn cathode material.
Electrolysis on GalInStan yielded Li3Ga14−xSnx with incorporation of Sn on only onecrystallographic site, among side phases LiGa, LiIn and In. The compound Li3Ga13Snwas synthesised phase-pure by electrolysis on a GaSn eutectic cathode material andinvestigated by single crystal and powder X-ray methods. Band structure calculationsfor Li3Ga14 and Li3Ga13Sn were performed and showed the adjustment of Fermi energyby incorporation of Sn as electron donor. For Li3Ga14 the total DOS at Fermi level ishigh whereas Li3Ga13Sn shows a small band gap indicating semiconducting behaviour.The results are not yet published.
Results 145
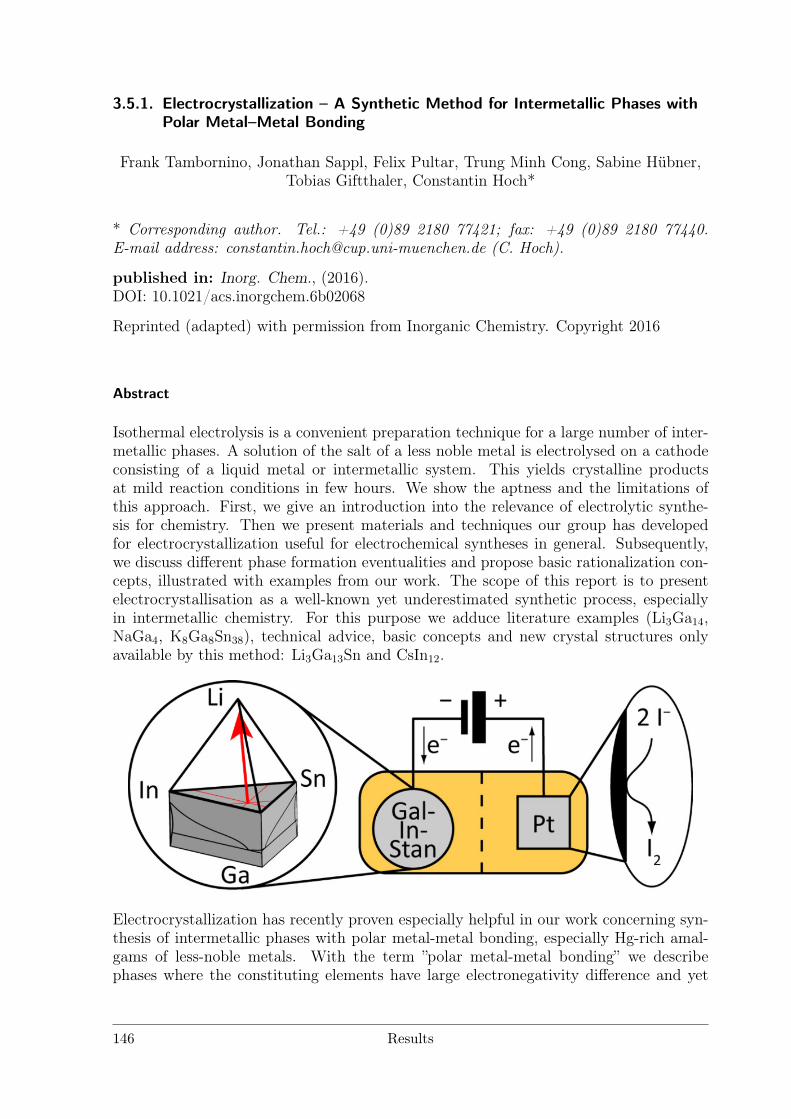
3.5.1. Electrocrystallization – A Synthetic Method for Intermetallic Phases withPolar Metal–Metal Bonding
Frank Tambornino, Jonathan Sappl, Felix Pultar, Trung Minh Cong, Sabine Hübner,Tobias Giftthaler, Constantin Hoch*
* Corresponding author. Tel.: +49 (0)89 2180 77421; fax: +49 (0)89 2180 77440.E-mail address: [email protected] (C. Hoch).
published in: Inorg. Chem., (2016).DOI: 10.1021/acs.inorgchem.6b02068
Reprinted (adapted) with permission from Inorganic Chemistry. Copyright 2016
Abstract
Isothermal electrolysis is a convenient preparation technique for a large number of inter-metallic phases. A solution of the salt of a less noble metal is electrolysed on a cathodeconsisting of a liquid metal or intermetallic system. This yields crystalline productsat mild reaction conditions in few hours. We show the aptness and the limitations ofthis approach. First, we give an introduction into the relevance of electrolytic synthe-sis for chemistry. Then we present materials and techniques our group has developedfor electrocrystallization useful for electrochemical syntheses in general. Subsequently,we discuss different phase formation eventualities and propose basic rationalization con-cepts, illustrated with examples from our work. The scope of this report is to presentelectrocrystallisation as a well-known yet underestimated synthetic process, especiallyin intermetallic chemistry. For this purpose we adduce literature examples (Li3Ga14,NaGa4, K8Ga8Sn38), technical advice, basic concepts and new crystal structures onlyavailable by this method: Li3Ga13Sn and CsIn12.
Electrocrystallization has recently proven especially helpful in our work concerning syn-thesis of intermetallic phases with polar metal-metal bonding, especially Hg-rich amal-gams of less-noble metals. With the term ”polar metal-metal bonding” we describephases where the constituting elements have large electronegativity difference and yet
146 Results
show incomplete electron transfer from the less-noble to the nobler metal. This distin-guishes polar intermetallic phases from classical Zintl phases where the electron transferis virtually complete. Polar metallic phases can show ”bad metal behavior” and inter-esting combinations of ionic and metallic properties. Amalgams of less-noble metals arepreeminent representatives for this class of intermetallic phases as Hg is the only noblemetal with endothermic electron affinity and thus a very low tendency toward anionformation. To illustrate both the aptness of the electrocrystallization process and ourinterest in polar metals in the above-mentioned sense, we present amalgams but alsoHg-free intermetallics.
1. Introduction
1.1. Electrolysis as an Old Preparative Method
Shortly after Alessandro Volta had presented the Voltaic pile,1 the first experimentalistsexploited the new electric power for preparative chemistry and invented electrolysis.2−6
Protagonists were Jöns Jacob Berzelius (Stockholm) and Humphry Davy (London), in-dependently and contemporaneously publishing first results of electrolytic reactions in1806.7,8 In close correspondence and with the highest estimation toward the contribu-tions of their respective colleague,9 they pioneered the fundamental works on electricityby Michael Faraday.10 Both Davy and Berzelius employed a small pool of liquid mercuryas cathode on which they placed small portions of common salts. The salt was moistur-ized and touched with a wire attached to the anode of the Voltaic pile. As they bothobserved (Davy about half a year later than Berzelius) the formation of amalgams, theyconcluded that this was due to a metallic ”base” to the respective salts. As Berzeliuschose natron (NaHCO3) and ”caustic kali” (KOH) for his experiments while Davy tooksoda (Na2CO3) and potash (K2CO3), the same elements subsequently were baptizedsodium and potassium in Anglo-Saxon and by Lavoisier’s instigation in french-speakingcountries or natrium and kalium in several continental european countries, propagatedby Berzelius’ student F. Wöhler. Davy followed the idea of distilling off the mercuryfrom the amalgams, yielding the pure metals. The discovery of a number of elementsis nowadays intimately connected with him whereas Berzelius’ contributions faded intobackground.
1.2. Industrial electrolytic processes
The most energy-consuming technical process in chemical industry is the amalgam pro-cess, one of the three technical realizations of the chloralkali electrolysis for the produc-tion chlorine and soda lye from brine.11.12 Other technically relevant electrolytic processesfocus mainly on anodic oxidation (e. g. production of peroxodisulfate) or on reductionof a metal cation from solution or melt (e. g. aluminum production; raffination of cop-per, gallium, and others). Thus, a considerable number of basic materials for chemicalindustry and everyday life are connected to electrolytic preparation processes.
Results 147
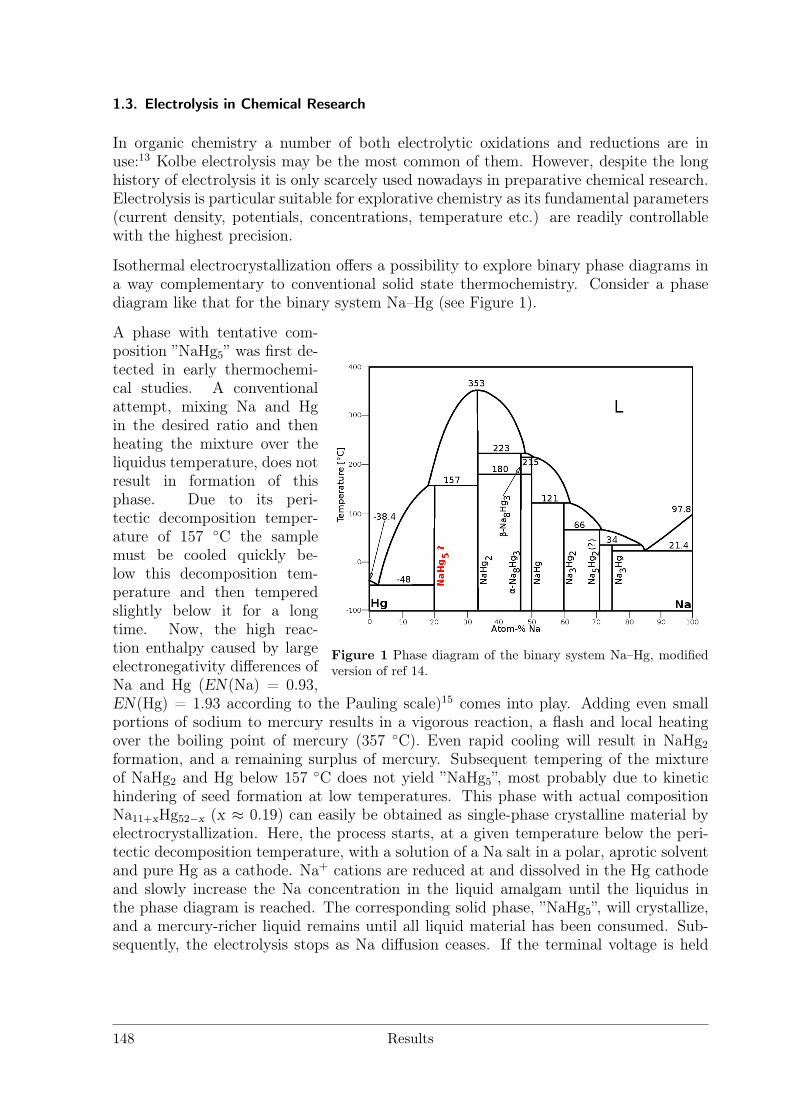
1.3. Electrolysis in Chemical Research
In organic chemistry a number of both electrolytic oxidations and reductions are inuse:13 Kolbe electrolysis may be the most common of them. However, despite the longhistory of electrolysis it is only scarcely used nowadays in preparative chemical research.Electrolysis is particular suitable for explorative chemistry as its fundamental parameters(current density, potentials, concentrations, temperature etc.) are readily controllablewith the highest precision.
Isothermal electrocrystallization offers a possibility to explore binary phase diagrams ina way complementary to conventional solid state thermochemistry. Consider a phasediagram like that for the binary system Na–Hg (see Figure 1).
Figure 1 Phase diagram of the binary system Na–Hg, modifiedversion of ref 14.
A phase with tentative com-position ”NaHg5” was first de-tected in early thermochemi-cal studies. A conventionalattempt, mixing Na and Hgin the desired ratio and thenheating the mixture over theliquidus temperature, does notresult in formation of thisphase. Due to its peri-tectic decomposition temper-ature of 157 C the samplemust be cooled quickly be-low this decomposition tem-perature and then temperedslightly below it for a longtime. Now, the high reac-tion enthalpy caused by largeelectronegativity differences ofNa and Hg (EN(Na) = 0.93,EN(Hg) = 1.93 according to the Pauling scale)15 comes into play. Adding even smallportions of sodium to mercury results in a vigorous reaction, a flash and local heatingover the boiling point of mercury (357 C). Even rapid cooling will result in NaHg2
formation, and a remaining surplus of mercury. Subsequent tempering of the mixtureof NaHg2 and Hg below 157 C does not yield ”NaHg5”, most probably due to kinetichindering of seed formation at low temperatures. This phase with actual compositionNa11+xHg52−x (x ≈ 0.19) can easily be obtained as single-phase crystalline material byelectrocrystallization. Here, the process starts, at a given temperature below the peri-tectic decomposition temperature, with a solution of a Na salt in a polar, aprotic solventand pure Hg as a cathode. Na+ cations are reduced at and dissolved in the Hg cathodeand slowly increase the Na concentration in the liquid amalgam until the liquidus inthe phase diagram is reached. The corresponding solid phase, ”NaHg5”, will crystallize,and a mercury-richer liquid remains until all liquid material has been consumed. Sub-sequently, the electrolysis stops as Na diffusion ceases. If the terminal voltage is held
148 Results
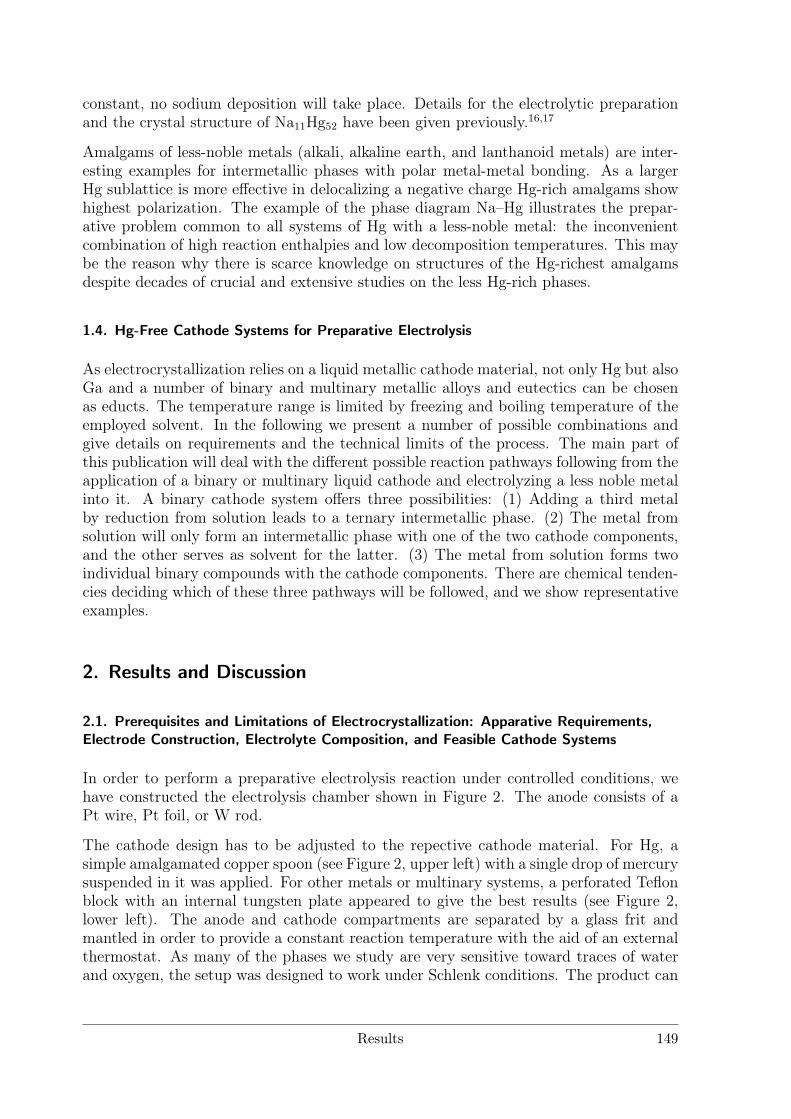
constant, no sodium deposition will take place. Details for the electrolytic preparationand the crystal structure of Na11Hg52 have been given previously.16,17
Amalgams of less-noble metals (alkali, alkaline earth, and lanthanoid metals) are inter-esting examples for intermetallic phases with polar metal-metal bonding. As a largerHg sublattice is more effective in delocalizing a negative charge Hg-rich amalgams showhighest polarization. The example of the phase diagram Na–Hg illustrates the prepar-ative problem common to all systems of Hg with a less-noble metal: the inconvenientcombination of high reaction enthalpies and low decomposition temperatures. This maybe the reason why there is scarce knowledge on structures of the Hg-richest amalgamsdespite decades of crucial and extensive studies on the less Hg-rich phases.
1.4. Hg-Free Cathode Systems for Preparative Electrolysis
As electrocrystallization relies on a liquid metallic cathode material, not only Hg but alsoGa and a number of binary and multinary metallic alloys and eutectics can be chosenas educts. The temperature range is limited by freezing and boiling temperature of theemployed solvent. In the following we present a number of possible combinations andgive details on requirements and the technical limits of the process. The main part ofthis publication will deal with the different possible reaction pathways following from theapplication of a binary or multinary liquid cathode and electrolyzing a less noble metalinto it. A binary cathode system offers three possibilities: (1) Adding a third metalby reduction from solution leads to a ternary intermetallic phase. (2) The metal fromsolution will only form an intermetallic phase with one of the two cathode components,and the other serves as solvent for the latter. (3) The metal from solution forms twoindividual binary compounds with the cathode components. There are chemical tenden-cies deciding which of these three pathways will be followed, and we show representativeexamples.
2. Results and Discussion
2.1. Prerequisites and Limitations of Electrocrystallization: Apparative Requirements,Electrode Construction, Electrolyte Composition, and Feasible Cathode Systems
In order to perform a preparative electrolysis reaction under controlled conditions, wehave constructed the electrolysis chamber shown in Figure 2. The anode consists of aPt wire, Pt foil, or W rod.
The cathode design has to be adjusted to the repective cathode material. For Hg, asimple amalgamated copper spoon (see Figure 2, upper left) with a single drop of mercurysuspended in it was applied. For other metals or multinary systems, a perforated Teflonblock with an internal tungsten plate appeared to give the best results (see Figure 2,lower left). The anode and cathode compartments are separated by a glass frit andmantled in order to provide a constant reaction temperature with the aid of an externalthermostat. As many of the phases we study are very sensitive toward traces of waterand oxygen, the setup was designed to work under Schlenk conditions. The product can
Results 149
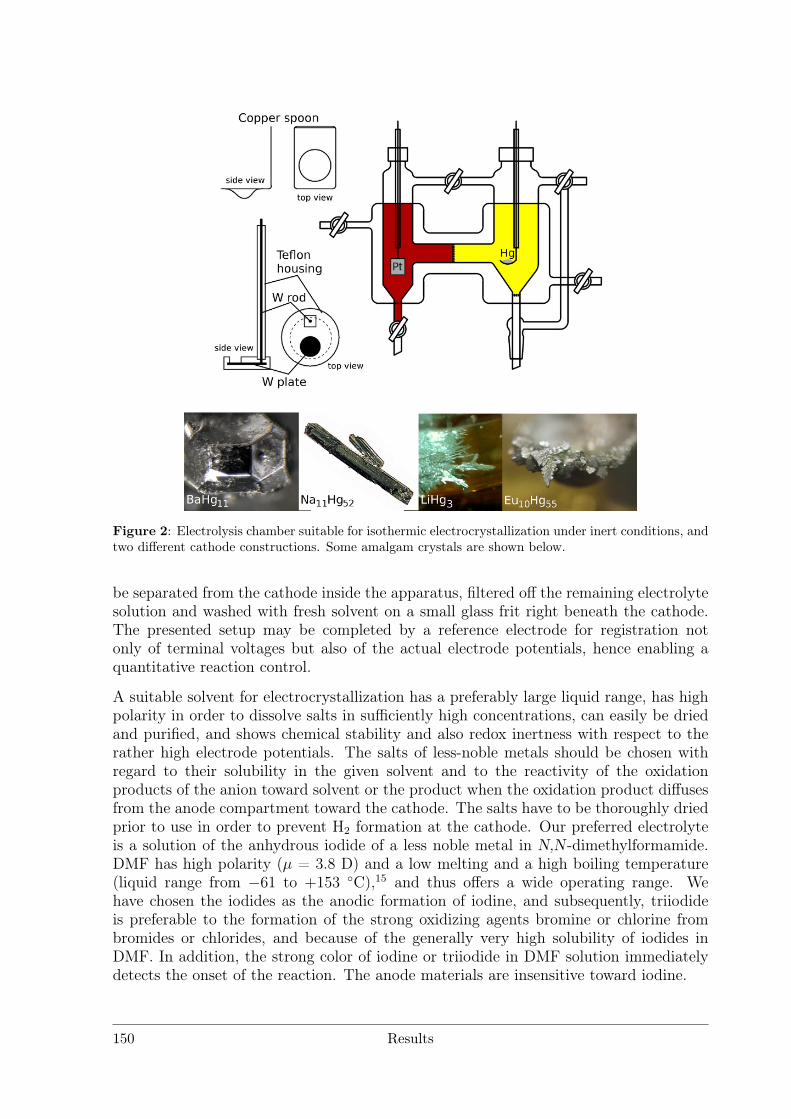
Figure 2: Electrolysis chamber suitable for isothermic electrocrystallization under inert conditions, andtwo different cathode constructions. Some amalgam crystals are shown below.
be separated from the cathode inside the apparatus, filtered off the remaining electrolytesolution and washed with fresh solvent on a small glass frit right beneath the cathode.The presented setup may be completed by a reference electrode for registration notonly of terminal voltages but also of the actual electrode potentials, hence enabling aquantitative reaction control.
A suitable solvent for electrocrystallization has a preferably large liquid range, has highpolarity in order to dissolve salts in sufficiently high concentrations, can easily be driedand purified, and shows chemical stability and also redox inertness with respect to therather high electrode potentials. The salts of less-noble metals should be chosen withregard to their solubility in the given solvent and to the reactivity of the oxidationproducts of the anion toward solvent or the product when the oxidation product diffusesfrom the anode compartment toward the cathode. The salts have to be thoroughly driedprior to use in order to prevent H2 formation at the cathode. Our preferred electrolyteis a solution of the anhydrous iodide of a less noble metal in N,N -dimethylformamide.DMF has high polarity (µ = 3.8 D) and a low melting and a high boiling temperature(liquid range from −61 to +153 C),15 and thus offers a wide operating range. Wehave chosen the iodides as the anodic formation of iodine, and subsequently, triiodideis preferable to the formation of the strong oxidizing agents bromine or chlorine frombromides or chlorides, and because of the generally very high solubility of iodides inDMF. In addition, the strong color of iodine or triiodide in DMF solution immediatelydetects the onset of the reaction. The anode materials are insensitive toward iodine.
150 Results
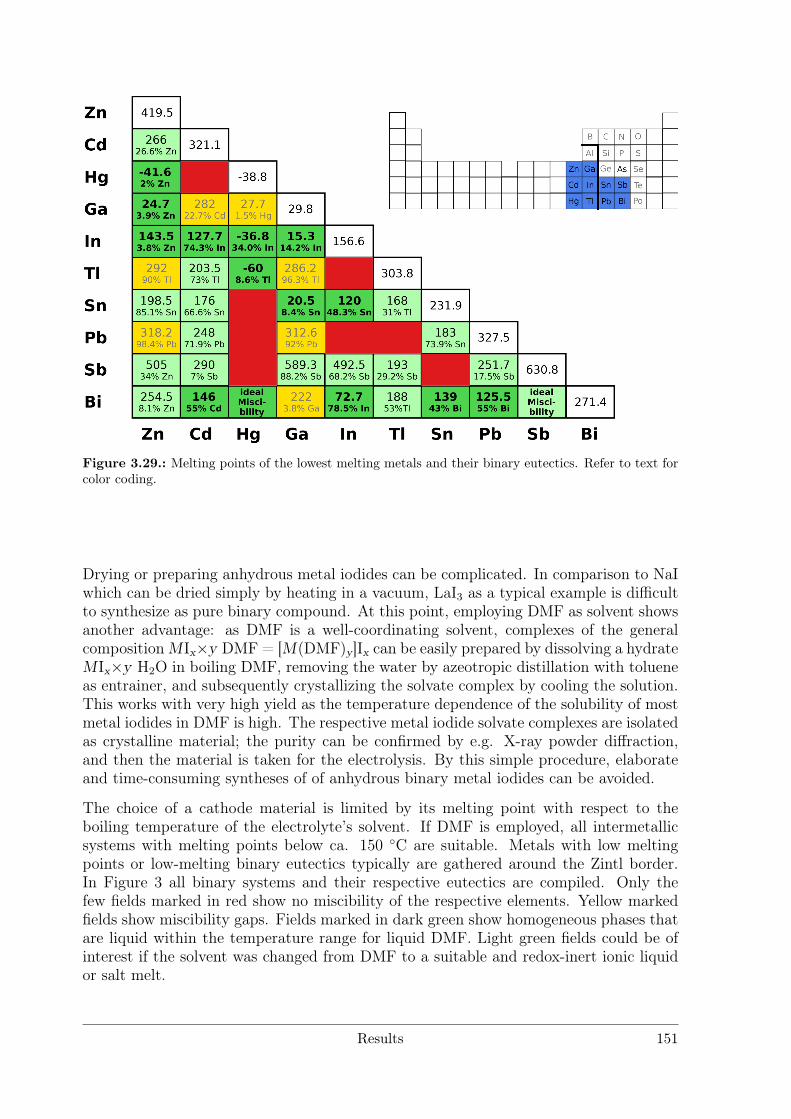
Figure 3.29.: Melting points of the lowest melting metals and their binary eutectics. Refer to text forcolor coding.
Drying or preparing anhydrous metal iodides can be complicated. In comparison to NaIwhich can be dried simply by heating in a vacuum, LaI3 as a typical example is difficultto synthesize as pure binary compound. At this point, employing DMF as solvent showsanother advantage: as DMF is a well-coordinating solvent, complexes of the generalcomposition MIx×y DMF = [M(DMF)y]Ix can be easily prepared by dissolving a hydrateMIx×y H2O in boiling DMF, removing the water by azeotropic distillation with tolueneas entrainer, and subsequently crystallizing the solvate complex by cooling the solution.This works with very high yield as the temperature dependence of the solubility of mostmetal iodides in DMF is high. The respective metal iodide solvate complexes are isolatedas crystalline material; the purity can be confirmed by e.g. X-ray powder diffraction,and then the material is taken for the electrolysis. By this simple procedure, elaborateand time-consuming syntheses of of anhydrous binary metal iodides can be avoided.
The choice of a cathode material is limited by its melting point with respect to theboiling temperature of the electrolyte’s solvent. If DMF is employed, all intermetallicsystems with melting points below ca. 150 C are suitable. Metals with low meltingpoints or low-melting binary eutectics typically are gathered around the Zintl border.In Figure 3 all binary systems and their respective eutectics are compiled. Only thefew fields marked in red show no miscibility of the respective elements. Yellow markedfields show miscibility gaps. Fields marked in dark green show homogeneous phases thatare liquid within the temperature range for liquid DMF. Light green fields could be ofinterest if the solvent was changed from DMF to a suitable and redox-inert ionic liquidor salt melt.
Results 151
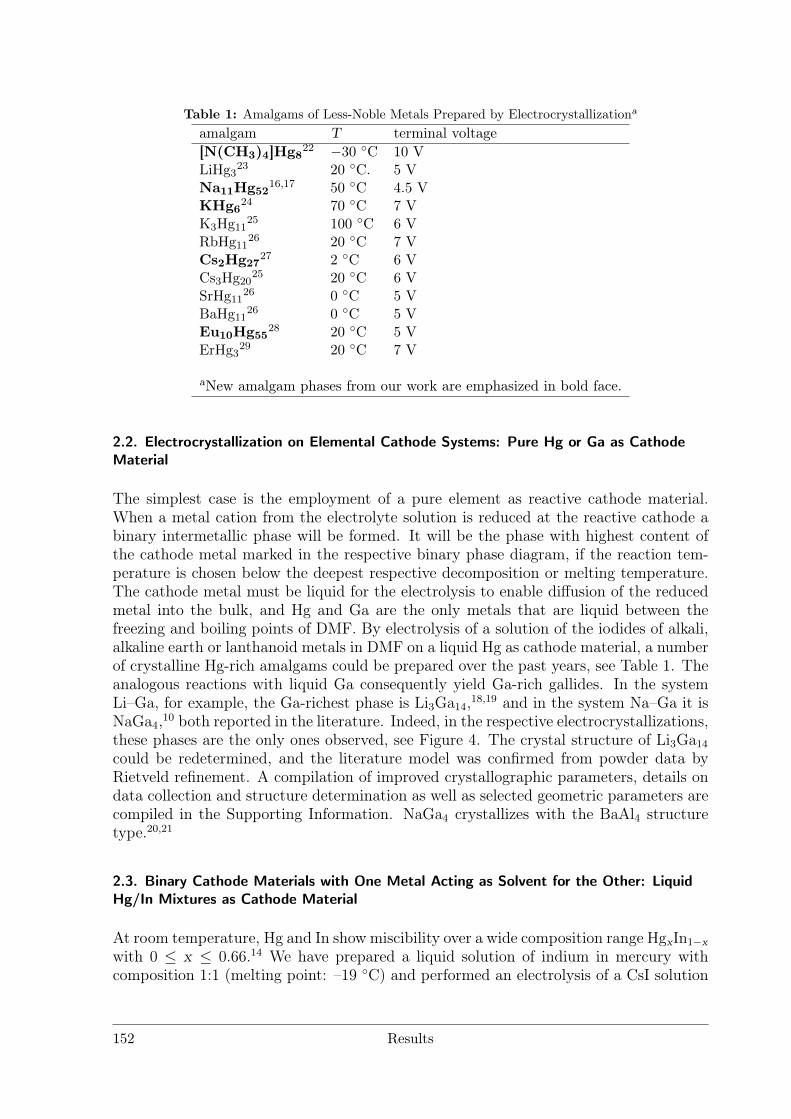
Table 1: Amalgams of Less-Noble Metals Prepared by Electrocrystallizationa
amalgam T terminal voltage[N(CH3)4]Hg8
22 −30 C 10 VLiHg3
23 20 C. 5 VNa11Hg52
16,17 50 C 4.5 VKHg6
24 70 C 7 VK3Hg11
25 100 C 6 VRbHg11
26 20 C 7 VCs2Hg27
27 2 C 6 VCs3Hg20
25 20 C 6 VSrHg11
26 0 C 5 VBaHg11
26 0 C 5 VEu10Hg55
28 20 C 5 VErHg3
29 20 C 7 V
aNew amalgam phases from our work are emphasized in bold face.
2.2. Electrocrystallization on Elemental Cathode Systems: Pure Hg or Ga as CathodeMaterial
The simplest case is the employment of a pure element as reactive cathode material.When a metal cation from the electrolyte solution is reduced at the reactive cathode abinary intermetallic phase will be formed. It will be the phase with highest content ofthe cathode metal marked in the respective binary phase diagram, if the reaction tem-perature is chosen below the deepest respective decomposition or melting temperature.The cathode metal must be liquid for the electrolysis to enable diffusion of the reducedmetal into the bulk, and Hg and Ga are the only metals that are liquid between thefreezing and boiling points of DMF. By electrolysis of a solution of the iodides of alkali,alkaline earth or lanthanoid metals in DMF on a liquid Hg as cathode material, a numberof crystalline Hg-rich amalgams could be prepared over the past years, see Table 1. Theanalogous reactions with liquid Ga consequently yield Ga-rich gallides. In the systemLi–Ga, for example, the Ga-richest phase is Li3Ga14,18,19 and in the system Na–Ga it isNaGa4,10 both reported in the literature. Indeed, in the respective electrocrystallizations,these phases are the only ones observed, see Figure 4. The crystal structure of Li3Ga14
could be redetermined, and the literature model was confirmed from powder data byRietveld refinement. A compilation of improved crystallographic parameters, details ondata collection and structure determination as well as selected geometric parameters arecompiled in the Supporting Information. NaGa4 crystallizes with the BaAl4 structuretype.20,21
2.3. Binary Cathode Materials with One Metal Acting as Solvent for the Other: LiquidHg/In Mixtures as Cathode Material
At room temperature, Hg and In show miscibility over a wide composition range HgxIn1−xwith 0 ≤ x ≤ 0.66.14 We have prepared a liquid solution of indium in mercury withcomposition 1:1 (melting point: –19 C) and performed an electrolysis of a CsI solution
152 Results
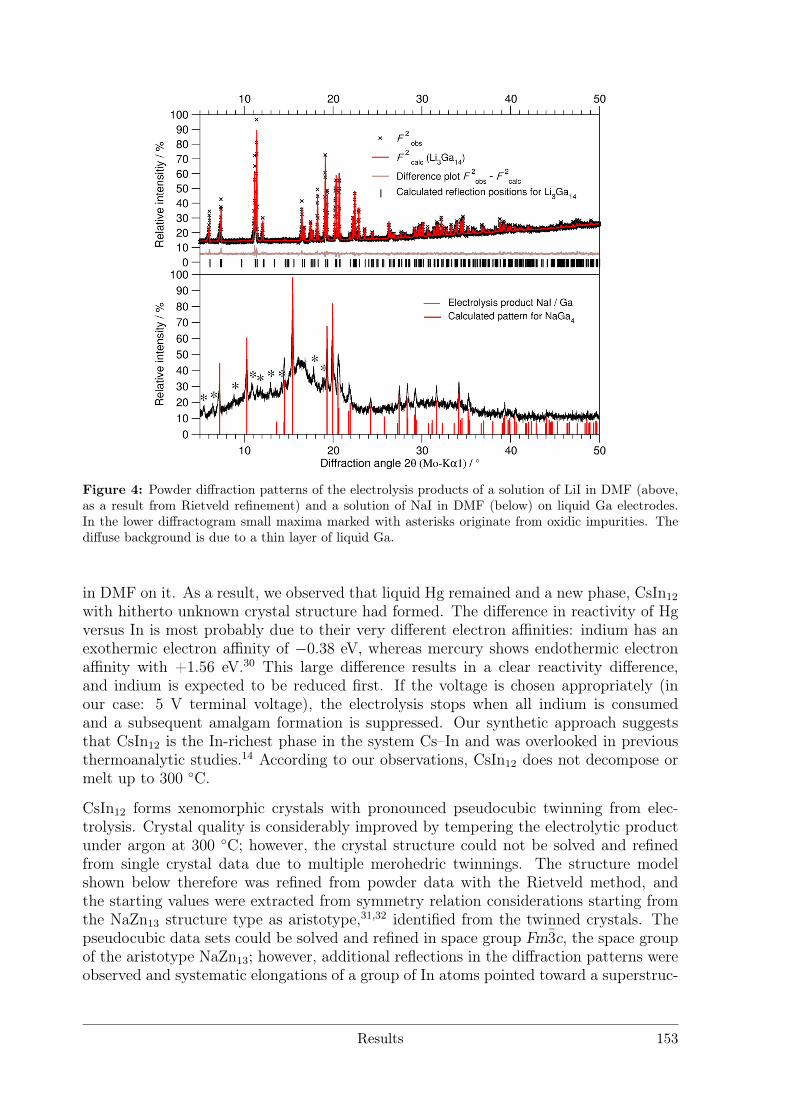
Figure 4: Powder diffraction patterns of the electrolysis products of a solution of LiI in DMF (above,as a result from Rietveld refinement) and a solution of NaI in DMF (below) on liquid Ga electrodes.In the lower diffractogram small maxima marked with asterisks originate from oxidic impurities. Thediffuse background is due to a thin layer of liquid Ga.
in DMF on it. As a result, we observed that liquid Hg remained and a new phase, CsIn12
with hitherto unknown crystal structure had formed. The difference in reactivity of Hgversus In is most probably due to their very different electron affinities: indium has anexothermic electron affinity of −0.38 eV, whereas mercury shows endothermic electronaffinity with +1.56 eV.30 This large difference results in a clear reactivity difference,and indium is expected to be reduced first. If the voltage is chosen appropriately (inour case: 5 V terminal voltage), the electrolysis stops when all indium is consumedand a subsequent amalgam formation is suppressed. Our synthetic approach suggeststhat CsIn12 is the In-richest phase in the system Cs–In and was overlooked in previousthermoanalytic studies.14 According to our observations, CsIn12 does not decompose ormelt up to 300 C.
CsIn12 forms xenomorphic crystals with pronounced pseudocubic twinning from elec-trolysis. Crystal quality is considerably improved by tempering the electrolytic productunder argon at 300 C; however, the crystal structure could not be solved and refinedfrom single crystal data due to multiple merohedric twinnings. The structure modelshown below therefore was refined from powder data with the Rietveld method, andthe starting values were extracted from symmetry relation considerations starting fromthe NaZn13 structure type as aristotype,31,32 identified from the twinned crystals. Thepseudocubic data sets could be solved and refined in space group Fm3c, the space groupof the aristotype NaZn13; however, additional reflections in the diffraction patterns wereobserved and systematic elongations of a group of In atoms pointed toward a superstruc-
Results 153
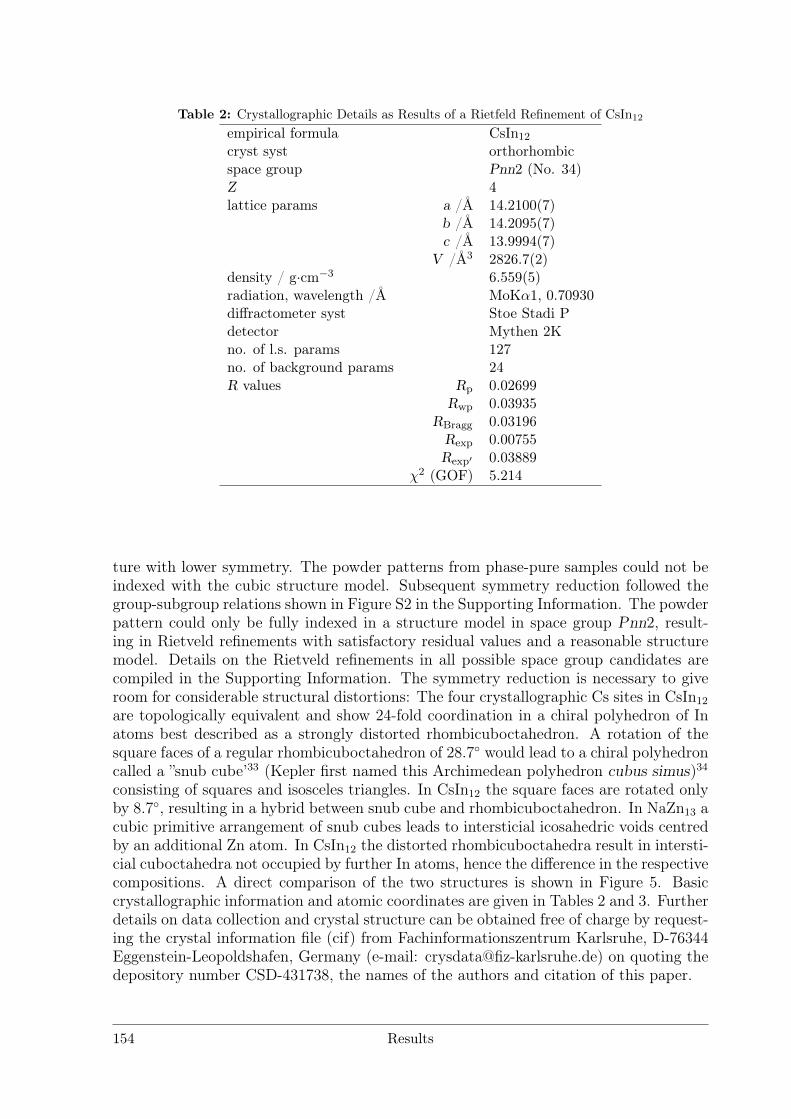
Table 2: Crystallographic Details as Results of a Rietfeld Refinement of CsIn12
empirical formula CsIn12
cryst syst orthorhombicspace group Pnn2 (No. 34)Z 4lattice params a /Å 14.2100(7)
b /Å 14.2095(7)c /Å 13.9994(7)
V /Å3 2826.7(2)density / g·cm−3 6.559(5)radiation, wavelength /Å MoKα1, 0.70930diffractometer syst Stoe Stadi Pdetector Mythen 2Kno. of l.s. params 127no. of background params 24R values Rp 0.02699
Rwp 0.03935RBragg 0.03196Rexp 0.00755Rexp′ 0.03889
χ2 (GOF) 5.214
ture with lower symmetry. The powder patterns from phase-pure samples could not beindexed with the cubic structure model. Subsequent symmetry reduction followed thegroup-subgroup relations shown in Figure S2 in the Supporting Information. The powderpattern could only be fully indexed in a structure model in space group Pnn2, result-ing in Rietveld refinements with satisfactory residual values and a reasonable structuremodel. Details on the Rietveld refinements in all possible space group candidates arecompiled in the Supporting Information. The symmetry reduction is necessary to giveroom for considerable structural distortions: The four crystallographic Cs sites in CsIn12
are topologically equivalent and show 24-fold coordination in a chiral polyhedron of Inatoms best described as a strongly distorted rhombicuboctahedron. A rotation of thesquare faces of a regular rhombicuboctahedron of 28.7 would lead to a chiral polyhedroncalled a ”snub cube’33 (Kepler first named this Archimedean polyhedron cubus simus)34consisting of squares and isosceles triangles. In CsIn12 the square faces are rotated onlyby 8.7, resulting in a hybrid between snub cube and rhombicuboctahedron. In NaZn13 acubic primitive arrangement of snub cubes leads to intersticial icosahedric voids centredby an additional Zn atom. In CsIn12 the distorted rhombicuboctahedra result in intersti-cial cuboctahedra not occupied by further In atoms, hence the difference in the respectivecompositions. A direct comparison of the two structures is shown in Figure 5. Basiccrystallographic information and atomic coordinates are given in Tables 2 and 3. Furtherdetails on data collection and crystal structure can be obtained free of charge by request-ing the crystal information file (cif) from Fachinformationszentrum Karlsruhe, D-76344Eggenstein-Leopoldshafen, Germany (e-mail: [email protected]) on quoting thedepository number CSD-431738, the names of the authors and citation of this paper.
154 Results
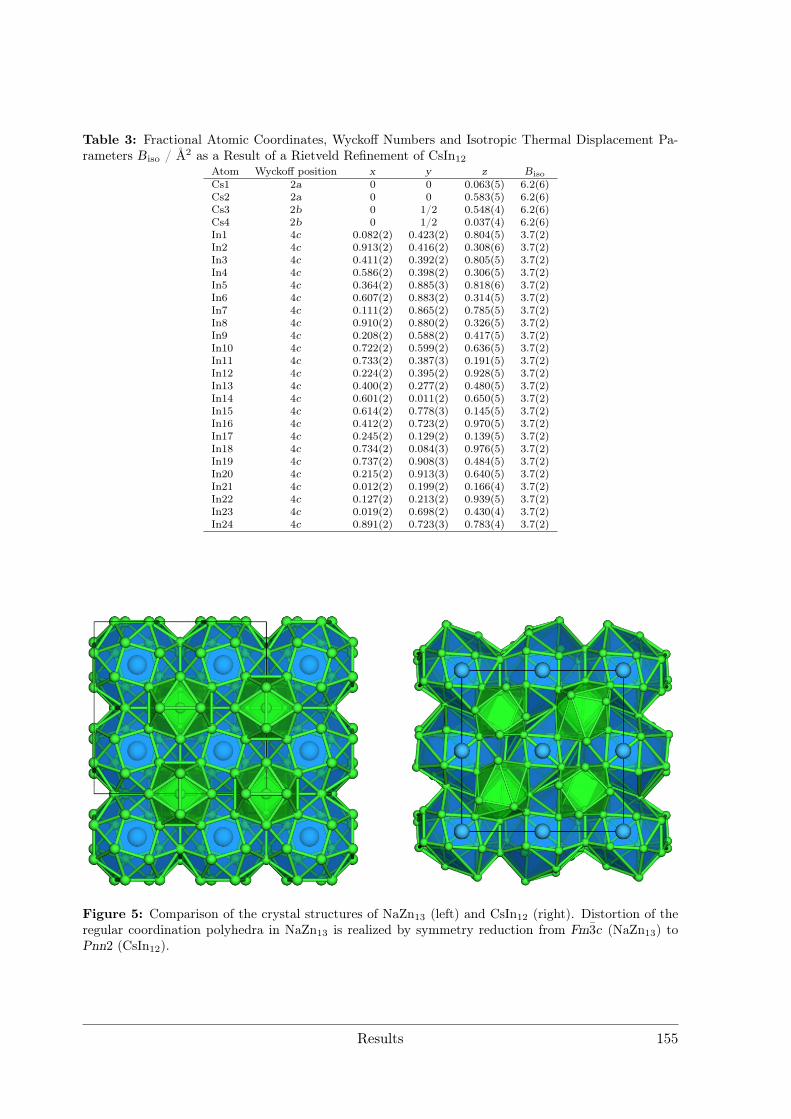
Table 3: Fractional Atomic Coordinates, Wyckoff Numbers and Isotropic Thermal Displacement Pa-rameters Biso / Å2 as a Result of a Rietveld Refinement of CsIn12
Atom Wyckoff position x y z Biso
Cs1 2a 0 0 0.063(5) 6.2(6)Cs2 2a 0 0 0.583(5) 6.2(6)Cs3 2b 0 1/2 0.548(4) 6.2(6)Cs4 2b 0 1/2 0.037(4) 6.2(6)In1 4c 0.082(2) 0.423(2) 0.804(5) 3.7(2)In2 4c 0.913(2) 0.416(2) 0.308(6) 3.7(2)In3 4c 0.411(2) 0.392(2) 0.805(5) 3.7(2)In4 4c 0.586(2) 0.398(2) 0.306(5) 3.7(2)In5 4c 0.364(2) 0.885(3) 0.818(6) 3.7(2)In6 4c 0.607(2) 0.883(2) 0.314(5) 3.7(2)In7 4c 0.111(2) 0.865(2) 0.785(5) 3.7(2)In8 4c 0.910(2) 0.880(2) 0.326(5) 3.7(2)In9 4c 0.208(2) 0.588(2) 0.417(5) 3.7(2)In10 4c 0.722(2) 0.599(2) 0.636(5) 3.7(2)In11 4c 0.733(2) 0.387(3) 0.191(5) 3.7(2)In12 4c 0.224(2) 0.395(2) 0.928(5) 3.7(2)In13 4c 0.400(2) 0.277(2) 0.480(5) 3.7(2)In14 4c 0.601(2) 0.011(2) 0.650(5) 3.7(2)In15 4c 0.614(2) 0.778(3) 0.145(5) 3.7(2)In16 4c 0.412(2) 0.723(2) 0.970(5) 3.7(2)In17 4c 0.245(2) 0.129(2) 0.139(5) 3.7(2)In18 4c 0.734(2) 0.084(3) 0.976(5) 3.7(2)In19 4c 0.737(2) 0.908(3) 0.484(5) 3.7(2)In20 4c 0.215(2) 0.913(3) 0.640(5) 3.7(2)In21 4c 0.012(2) 0.199(2) 0.166(4) 3.7(2)In22 4c 0.127(2) 0.213(2) 0.939(5) 3.7(2)In23 4c 0.019(2) 0.698(2) 0.430(4) 3.7(2)In24 4c 0.891(2) 0.723(3) 0.783(4) 3.7(2)
Figure 5: Comparison of the crystal structures of NaZn13 (left) and CsIn12 (right). Distortion of theregular coordination polyhedra in NaZn13 is realized by symmetry reduction from Fm3c (NaZn13) toPnn2 (CsIn12).
Results 155
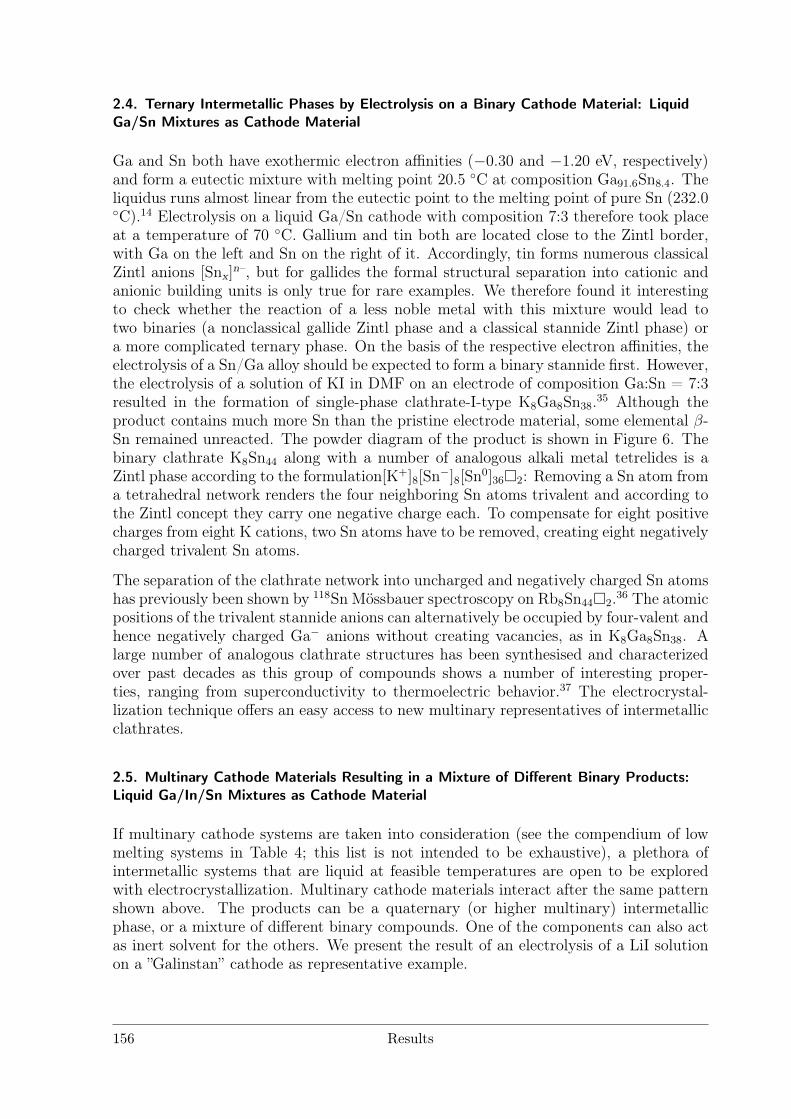
2.4. Ternary Intermetallic Phases by Electrolysis on a Binary Cathode Material: LiquidGa/Sn Mixtures as Cathode Material
Ga and Sn both have exothermic electron affinities (−0.30 and −1.20 eV, respectively)and form a eutectic mixture with melting point 20.5 C at composition Ga91.6Sn8.4. Theliquidus runs almost linear from the eutectic point to the melting point of pure Sn (232.0C).14 Electrolysis on a liquid Ga/Sn cathode with composition 7:3 therefore took placeat a temperature of 70 C. Gallium and tin both are located close to the Zintl border,with Ga on the left and Sn on the right of it. Accordingly, tin forms numerous classicalZintl anions [Snx]
n–, but for gallides the formal structural separation into cationic andanionic building units is only true for rare examples. We therefore found it interestingto check whether the reaction of a less noble metal with this mixture would lead totwo binaries (a nonclassical gallide Zintl phase and a classical stannide Zintl phase) ora more complicated ternary phase. On the basis of the respective electron affinities, theelectrolysis of a Sn/Ga alloy should be expected to form a binary stannide first. However,the electrolysis of a solution of KI in DMF on an electrode of composition Ga:Sn = 7:3resulted in the formation of single-phase clathrate-I-type K8Ga8Sn38.35 Although theproduct contains much more Sn than the pristine electrode material, some elemental β-Sn remained unreacted. The powder diagram of the product is shown in Figure 6. Thebinary clathrate K8Sn44 along with a number of analogous alkali metal tetrelides is aZintl phase according to the formulation[K+]8[Sn−]8[Sn0]362: Removing a Sn atom froma tetrahedral network renders the four neighboring Sn atoms trivalent and according tothe Zintl concept they carry one negative charge each. To compensate for eight positivecharges from eight K cations, two Sn atoms have to be removed, creating eight negativelycharged trivalent Sn atoms.
The separation of the clathrate network into uncharged and negatively charged Sn atomshas previously been shown by 118Sn Mössbauer spectroscopy on Rb8Sn442.36 The atomicpositions of the trivalent stannide anions can alternatively be occupied by four-valent andhence negatively charged Ga− anions without creating vacancies, as in K8Ga8Sn38. Alarge number of analogous clathrate structures has been synthesised and characterizedover past decades as this group of compounds shows a number of interesting proper-ties, ranging from superconductivity to thermoelectric behavior.37 The electrocrystal-lization technique offers an easy access to new multinary representatives of intermetallicclathrates.
2.5. Multinary Cathode Materials Resulting in a Mixture of Different Binary Products:Liquid Ga/In/Sn Mixtures as Cathode Material
If multinary cathode systems are taken into consideration (see the compendium of lowmelting systems in Table 4; this list is not intended to be exhaustive), a plethora ofintermetallic systems that are liquid at feasible temperatures are open to be exploredwith electrocrystallization. Multinary cathode materials interact after the same patternshown above. The products can be a quaternary (or higher multinary) intermetallicphase, or a mixture of different binary compounds. One of the components can also actas inert solvent for the others. We present the result of an electrolysis of a LiI solutionon a ”Galinstan” cathode as representative example.
156 Results
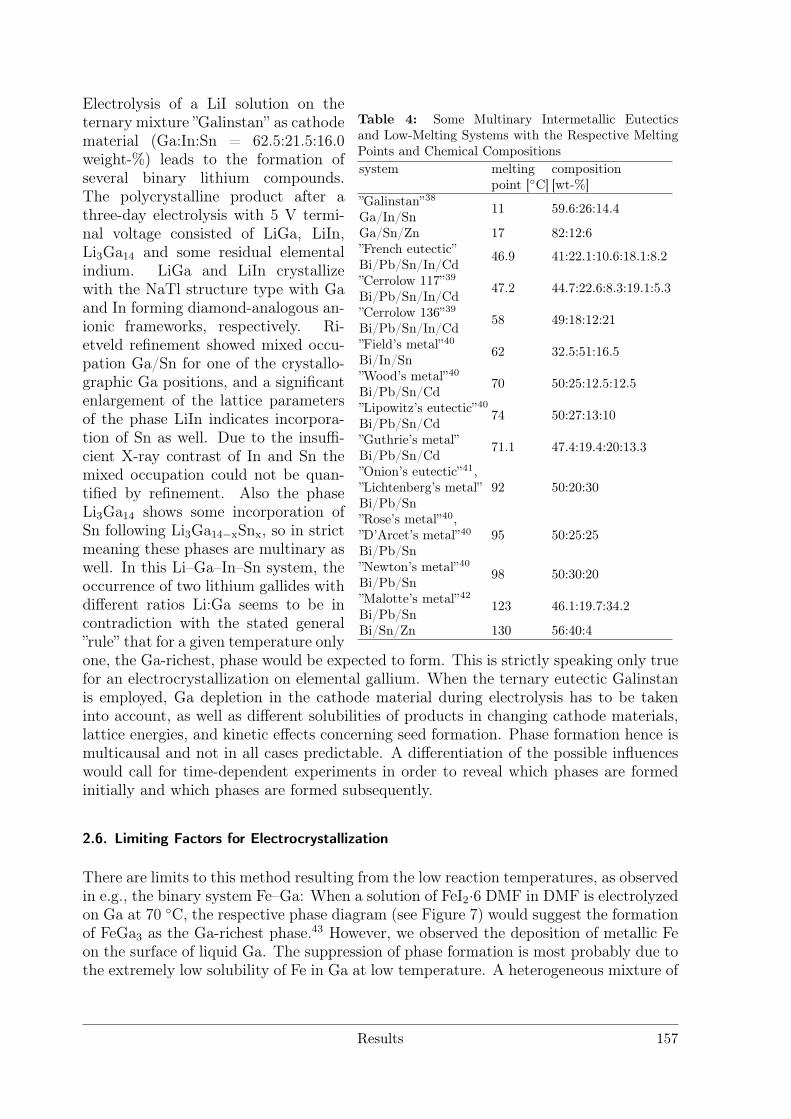
Table 4: Some Multinary Intermetallic Eutecticsand Low-Melting Systems with the Respective MeltingPoints and Chemical Compositionssystem melting composition
point [C] [wt-%]”Galinstan”38Ga/In/Sn
11 59.6:26:14.4
Ga/Sn/Zn 17 82:12:6”French eutectic”Bi/Pb/Sn/In/Cd
46.9 41:22.1:10.6:18.1:8.2
”Cerrolow 117”39Bi/Pb/Sn/In/Cd
47.2 44.7:22.6:8.3:19.1:5.3
”Cerrolow 136”39Bi/Pb/Sn/In/Cd
58 49:18:12:21
”Field’s metal”40Bi/In/Sn
62 32.5:51:16.5
”Wood’s metal”40Bi/Pb/Sn/Cd
70 50:25:12.5:12.5
”Lipowitz’s eutectic”40Bi/Pb/Sn/Cd
74 50:27:13:10
”Guthrie’s metal”Bi/Pb/Sn/Cd
71.1 47.4:19.4:20:13.3
”Onion’s eutectic”41,”Lichtenberg’s metal” 92 50:20:30Bi/Pb/Sn”Rose’s metal”40,”D’Arcet’s metal”40 95 50:25:25Bi/Pb/Sn”Newton’s metal”40Bi/Pb/Sn
98 50:30:20
”Malotte’s metal”42Bi/Pb/Sn
123 46.1:19.7:34.2
Bi/Sn/Zn 130 56:40:4
Electrolysis of a LiI solution on theternary mixture ”Galinstan” as cathodematerial (Ga:In:Sn = 62.5:21.5:16.0weight-%) leads to the formation ofseveral binary lithium compounds.The polycrystalline product after athree-day electrolysis with 5 V termi-nal voltage consisted of LiGa, LiIn,Li3Ga14 and some residual elementalindium. LiGa and LiIn crystallizewith the NaTl structure type with Gaand In forming diamond-analogous an-ionic frameworks, respectively. Ri-etveld refinement showed mixed occu-pation Ga/Sn for one of the crystallo-graphic Ga positions, and a significantenlargement of the lattice parametersof the phase LiIn indicates incorpora-tion of Sn as well. Due to the insuffi-cient X-ray contrast of In and Sn themixed occupation could not be quan-tified by refinement. Also the phaseLi3Ga14 shows some incorporation ofSn following Li3Ga14−xSnx, so in strictmeaning these phases are multinary aswell. In this Li–Ga–In–Sn system, theoccurrence of two lithium gallides withdifferent ratios Li:Ga seems to be incontradiction with the stated general”rule” that for a given temperature onlyone, the Ga-richest, phase would be expected to form. This is strictly speaking only truefor an electrocrystallization on elemental gallium. When the ternary eutectic Galinstanis employed, Ga depletion in the cathode material during electrolysis has to be takeninto account, as well as different solubilities of products in changing cathode materials,lattice energies, and kinetic effects concerning seed formation. Phase formation hence ismulticausal and not in all cases predictable. A differentiation of the possible influenceswould call for time-dependent experiments in order to reveal which phases are formedinitially and which phases are formed subsequently.
2.6. Limiting Factors for Electrocrystallization
There are limits to this method resulting from the low reaction temperatures, as observedin e.g., the binary system Fe–Ga: When a solution of FeI2·6 DMF in DMF is electrolyzedon Ga at 70 C, the respective phase diagram (see Figure 7) would suggest the formationof FeGa3 as the Ga-richest phase.43 However, we observed the deposition of metallic Feon the surface of liquid Ga. The suppression of phase formation is most probably due tothe extremely low solubility of Fe in Ga at low temperature. A heterogeneous mixture of
Results 157
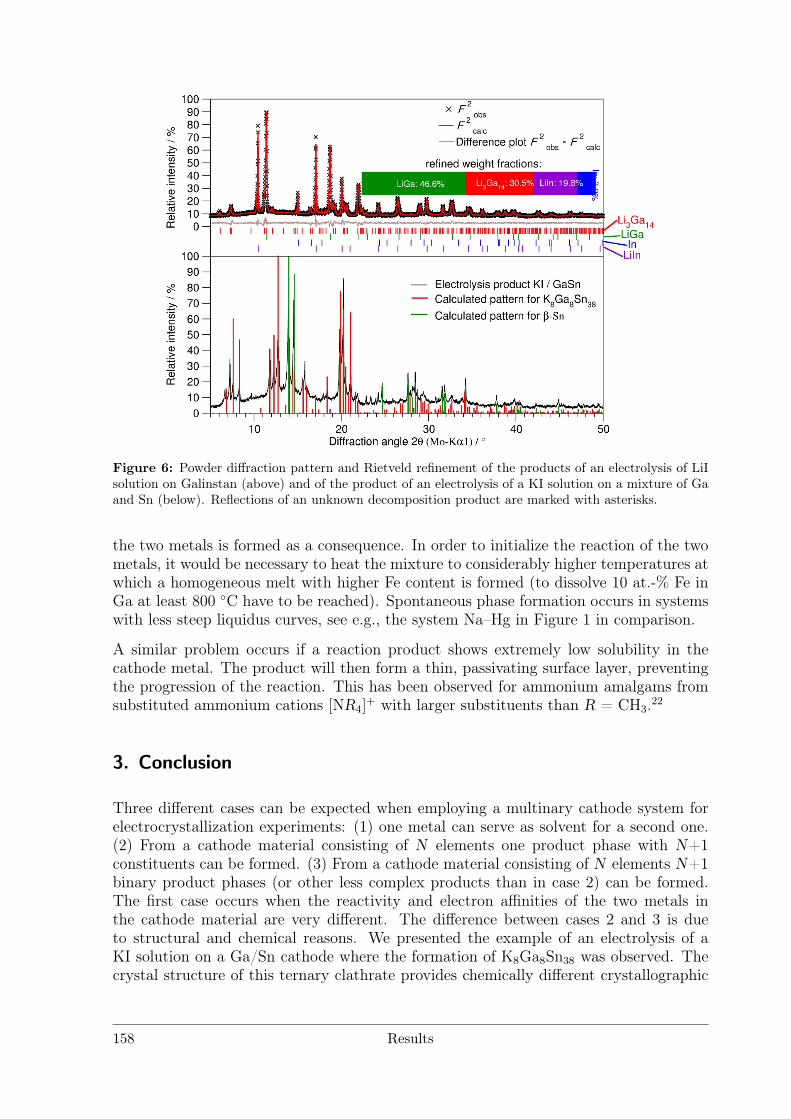
Figure 6: Powder diffraction pattern and Rietveld refinement of the products of an electrolysis of LiIsolution on Galinstan (above) and of the product of an electrolysis of a KI solution on a mixture of Gaand Sn (below). Reflections of an unknown decomposition product are marked with asterisks.
the two metals is formed as a consequence. In order to initialize the reaction of the twometals, it would be necessary to heat the mixture to considerably higher temperatures atwhich a homogeneous melt with higher Fe content is formed (to dissolve 10 at.-% Fe inGa at least 800 C have to be reached). Spontaneous phase formation occurs in systemswith less steep liquidus curves, see e.g., the system Na–Hg in Figure 1 in comparison.
A similar problem occurs if a reaction product shows extremely low solubility in thecathode metal. The product will then form a thin, passivating surface layer, preventingthe progression of the reaction. This has been observed for ammonium amalgams fromsubstituted ammonium cations [NR4]
+ with larger substituents than R = CH3.22
3. Conclusion
Three different cases can be expected when employing a multinary cathode system forelectrocrystallization experiments: (1) one metal can serve as solvent for a second one.(2) From a cathode material consisting of N elements one product phase with N+1constituents can be formed. (3) From a cathode material consisting of N elements N+1binary product phases (or other less complex products than in case 2) can be formed.The first case occurs when the reactivity and electron affinities of the two metals inthe cathode material are very different. The difference between cases 2 and 3 is dueto structural and chemical reasons. We presented the example of an electrolysis of aKI solution on a Ga/Sn cathode where the formation of K8Ga8Sn38 was observed. Thecrystal structure of this ternary clathrate provides chemically different crystallographic
158 Results
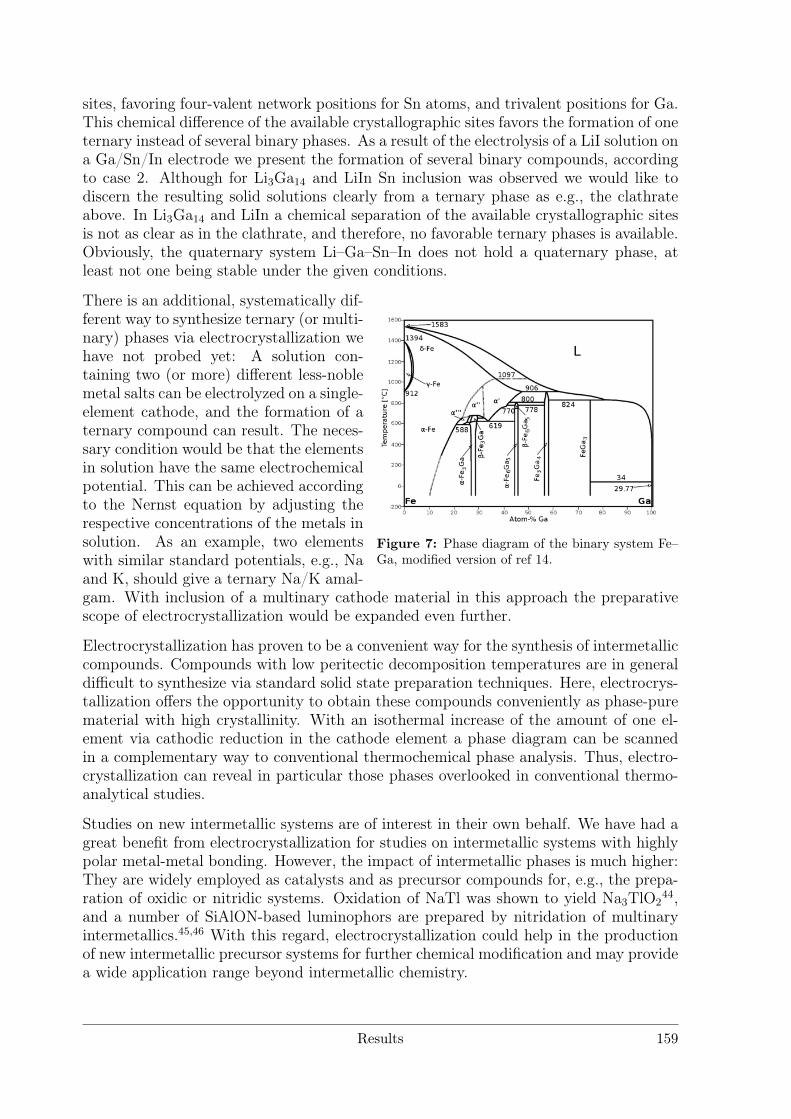
sites, favoring four-valent network positions for Sn atoms, and trivalent positions for Ga.This chemical difference of the available crystallographic sites favors the formation of oneternary instead of several binary phases. As a result of the electrolysis of a LiI solution ona Ga/Sn/In electrode we present the formation of several binary compounds, accordingto case 2. Although for Li3Ga14 and LiIn Sn inclusion was observed we would like todiscern the resulting solid solutions clearly from a ternary phase as e.g., the clathrateabove. In Li3Ga14 and LiIn a chemical separation of the available crystallographic sitesis not as clear as in the clathrate, and therefore, no favorable ternary phases is available.Obviously, the quaternary system Li–Ga–Sn–In does not hold a quaternary phase, atleast not one being stable under the given conditions.
Figure 7: Phase diagram of the binary system Fe–Ga, modified version of ref 14.
There is an additional, systematically dif-ferent way to synthesize ternary (or multi-nary) phases via electrocrystallization wehave not probed yet: A solution con-taining two (or more) different less-noblemetal salts can be electrolyzed on a single-element cathode, and the formation of aternary compound can result. The neces-sary condition would be that the elementsin solution have the same electrochemicalpotential. This can be achieved accordingto the Nernst equation by adjusting therespective concentrations of the metals insolution. As an example, two elementswith similar standard potentials, e.g., Naand K, should give a ternary Na/K amal-gam. With inclusion of a multinary cathode material in this approach the preparativescope of electrocrystallization would be expanded even further.
Electrocrystallization has proven to be a convenient way for the synthesis of intermetalliccompounds. Compounds with low peritectic decomposition temperatures are in generaldifficult to synthesize via standard solid state preparation techniques. Here, electrocrys-tallization offers the opportunity to obtain these compounds conveniently as phase-purematerial with high crystallinity. With an isothermal increase of the amount of one el-ement via cathodic reduction in the cathode element a phase diagram can be scannedin a complementary way to conventional thermochemical phase analysis. Thus, electro-crystallization can reveal in particular those phases overlooked in conventional thermo-analytical studies.
Studies on new intermetallic systems are of interest in their own behalf. We have had agreat benefit from electrocrystallization for studies on intermetallic systems with highlypolar metal-metal bonding. However, the impact of intermetallic phases is much higher:They are widely employed as catalysts and as precursor compounds for, e.g., the prepa-ration of oxidic or nitridic systems. Oxidation of NaTl was shown to yield Na3TlO2
44,and a number of SiAlON-based luminophors are prepared by nitridation of multinaryintermetallics.45,46 With this regard, electrocrystallization could help in the productionof new intermetallic precursor systems for further chemical modification and may providea wide application range beyond intermetallic chemistry.
Results 159
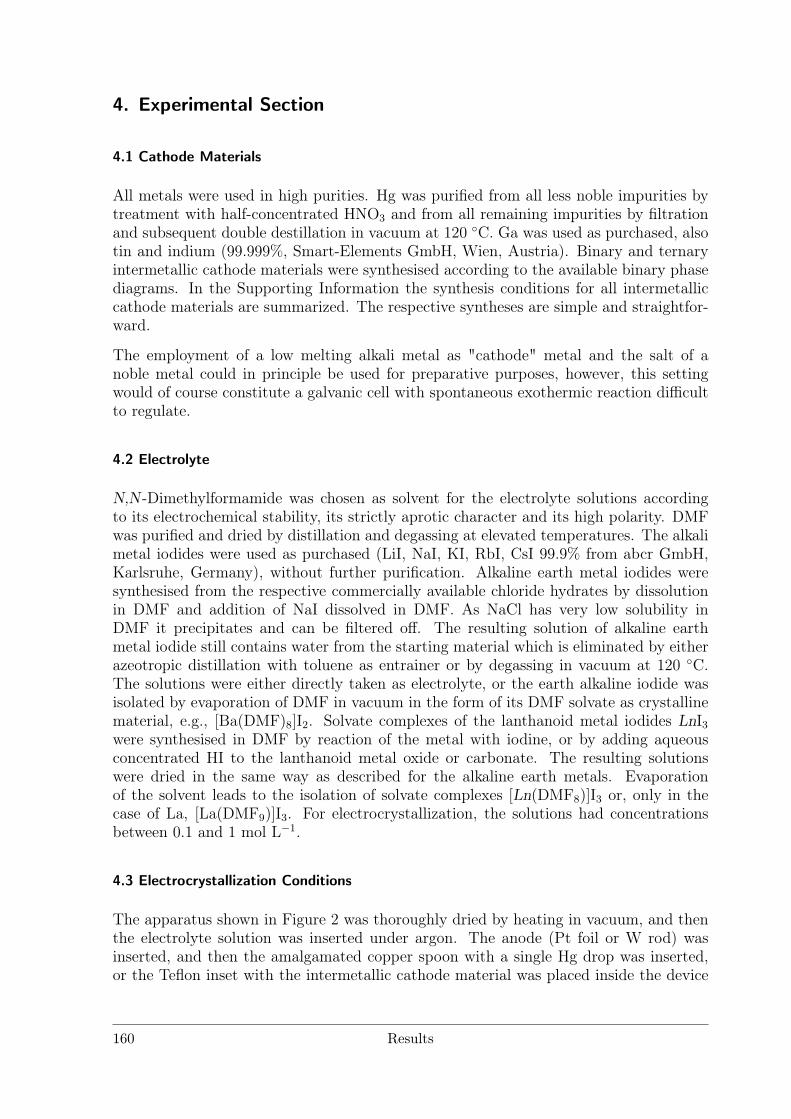
4. Experimental Section
4.1 Cathode Materials
All metals were used in high purities. Hg was purified from all less noble impurities bytreatment with half-concentrated HNO3 and from all remaining impurities by filtrationand subsequent double destillation in vacuum at 120 C. Ga was used as purchased, alsotin and indium (99.999%, Smart-Elements GmbH, Wien, Austria). Binary and ternaryintermetallic cathode materials were synthesised according to the available binary phasediagrams. In the Supporting Information the synthesis conditions for all intermetalliccathode materials are summarized. The respective syntheses are simple and straightfor-ward.
The employment of a low melting alkali metal as "cathode" metal and the salt of anoble metal could in principle be used for preparative purposes, however, this settingwould of course constitute a galvanic cell with spontaneous exothermic reaction difficultto regulate.
4.2 Electrolyte
N,N -Dimethylformamide was chosen as solvent for the electrolyte solutions accordingto its electrochemical stability, its strictly aprotic character and its high polarity. DMFwas purified and dried by distillation and degassing at elevated temperatures. The alkalimetal iodides were used as purchased (LiI, NaI, KI, RbI, CsI 99.9% from abcr GmbH,Karlsruhe, Germany), without further purification. Alkaline earth metal iodides weresynthesised from the respective commercially available chloride hydrates by dissolutionin DMF and addition of NaI dissolved in DMF. As NaCl has very low solubility inDMF it precipitates and can be filtered off. The resulting solution of alkaline earthmetal iodide still contains water from the starting material which is eliminated by eitherazeotropic distillation with toluene as entrainer or by degassing in vacuum at 120 C.The solutions were either directly taken as electrolyte, or the earth alkaline iodide wasisolated by evaporation of DMF in vacuum in the form of its DMF solvate as crystallinematerial, e.g., [Ba(DMF)8]I2. Solvate complexes of the lanthanoid metal iodides LnI3were synthesised in DMF by reaction of the metal with iodine, or by adding aqueousconcentrated HI to the lanthanoid metal oxide or carbonate. The resulting solutionswere dried in the same way as described for the alkaline earth metals. Evaporationof the solvent leads to the isolation of solvate complexes [Ln(DMF8)]I3 or, only in thecase of La, [La(DMF9)]I3. For electrocrystallization, the solutions had concentrationsbetween 0.1 and 1 mol L−1.
4.3 Electrocrystallization Conditions
The apparatus shown in Figure 2 was thoroughly dried by heating in vacuum, and thenthe electrolyte solution was inserted under argon. The anode (Pt foil or W rod) wasinserted, and then the amalgamated copper spoon with a single Hg drop was inserted,or the Teflon inset with the intermetallic cathode material was placed inside the device
160 Results
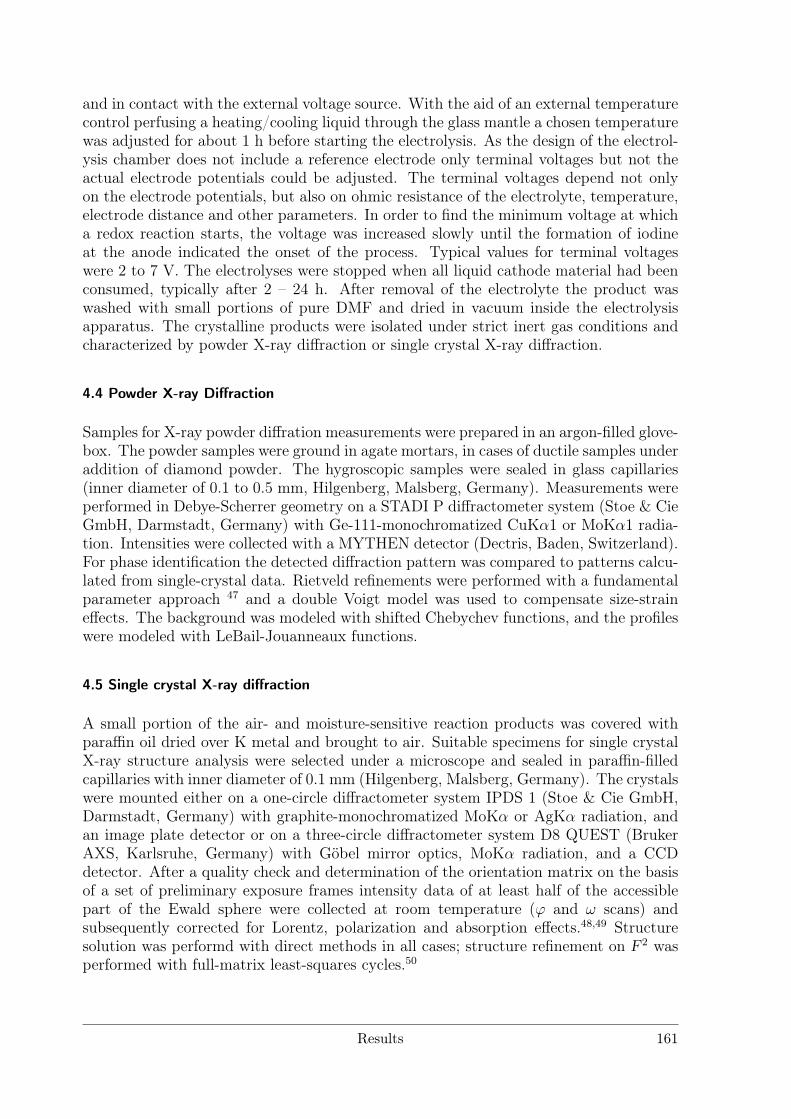
and in contact with the external voltage source. With the aid of an external temperaturecontrol perfusing a heating/cooling liquid through the glass mantle a chosen temperaturewas adjusted for about 1 h before starting the electrolysis. As the design of the electrol-ysis chamber does not include a reference electrode only terminal voltages but not theactual electrode potentials could be adjusted. The terminal voltages depend not onlyon the electrode potentials, but also on ohmic resistance of the electrolyte, temperature,electrode distance and other parameters. In order to find the minimum voltage at whicha redox reaction starts, the voltage was increased slowly until the formation of iodineat the anode indicated the onset of the process. Typical values for terminal voltageswere 2 to 7 V. The electrolyses were stopped when all liquid cathode material had beenconsumed, typically after 2 – 24 h. After removal of the electrolyte the product waswashed with small portions of pure DMF and dried in vacuum inside the electrolysisapparatus. The crystalline products were isolated under strict inert gas conditions andcharacterized by powder X-ray diffraction or single crystal X-ray diffraction.
4.4 Powder X-ray Diffraction
Samples for X-ray powder diffration measurements were prepared in an argon-filled glove-box. The powder samples were ground in agate mortars, in cases of ductile samples underaddition of diamond powder. The hygroscopic samples were sealed in glass capillaries(inner diameter of 0.1 to 0.5 mm, Hilgenberg, Malsberg, Germany). Measurements wereperformed in Debye-Scherrer geometry on a STADI P diffractometer system (Stoe & CieGmbH, Darmstadt, Germany) with Ge-111-monochromatized CuKα1 or MoKα1 radia-tion. Intensities were collected with a MYTHEN detector (Dectris, Baden, Switzerland).For phase identification the detected diffraction pattern was compared to patterns calcu-lated from single-crystal data. Rietveld refinements were performed with a fundamentalparameter approach 47 and a double Voigt model was used to compensate size-straineffects. The background was modeled with shifted Chebychev functions, and the profileswere modeled with LeBail-Jouanneaux functions.
4.5 Single crystal X-ray diffraction
A small portion of the air- and moisture-sensitive reaction products was covered withparaffin oil dried over K metal and brought to air. Suitable specimens for single crystalX-ray structure analysis were selected under a microscope and sealed in paraffin-filledcapillaries with inner diameter of 0.1 mm (Hilgenberg, Malsberg, Germany). The crystalswere mounted either on a one-circle diffractometer system IPDS 1 (Stoe & Cie GmbH,Darmstadt, Germany) with graphite-monochromatized MoKα or AgKα radiation, andan image plate detector or on a three-circle diffractometer system D8 QUEST (BrukerAXS, Karlsruhe, Germany) with Göbel mirror optics, MoKα radiation, and a CCDdetector. After a quality check and determination of the orientation matrix on the basisof a set of preliminary exposure frames intensity data of at least half of the accessiblepart of the Ewald sphere were collected at room temperature (ϕ and ω scans) andsubsequently corrected for Lorentz, polarization and absorption effects.48,49 Structuresolution was performd with direct methods in all cases; structure refinement on F2 wasperformed with full-matrix least-squares cycles.50
Results 161
Supporting information
The Supporting Information is available free of charge on the ACS Publications websiteat DOI 10.1021/acs.inorgchem.6b02068.
Preparation of cathode materials. Crystallographic data and Rietveld refinement resultsfor Li3Ga14 and for the electrolysis product of Galinstan as cathode material with LiIsolution in DMF. Details on structure solution and refinement, crystallographic data,symmetry relations and Rietveld refinement results for CsIn12 (PDF)
The authors declare no competing financial interest.
Acknowledgement
The authors thank Thomas Miller, Wolfgang Wünschheim and Christian Minke from theDepartment of Chemistry at LMU München for technical support. C.H. is much obligedto Professor Dr. Wolfgang Schnick at LMU München for his longstanding financialsupport and for a most fruitful research environment.
References
(1) Volta, A. On the electricity excited by the mere contact of conducting substances of different kinds.Philos. Trans. R. Soc. London 1800, 90, 403–431.
(2) Nicholson, W.; Carlisle, A.; Cruickshank, W. Experiments on galvanic electricity. Philos. Mag. J.Sci. 1800, 7, 337–350.
(3) Ritter, J. W. Beyträge zur nähern Kenntniss des Galvanismus und der Resultate seiner Unter-suchung ; Frommann, Jena, 1805.
(4) Ritter, J. W. Neue Versuche und Bemerkungen über den Galvanismus. Ann. Phys. 1805, 19, 1–44.
(5) Ritter, J. W. Physisch-Chemische Abhandlungen in chronologischer Folge; Reclam, Leipzig, 1806.
(6) Grotthuß, C. J. T. Mémoire sur la décomposition de l’eau et des corps qu’il tient en dissolution àl’aide de l’electricité galvanique; Rom, 1805.
(7) Davy, H. On some chemical agencies of electricity (Bakerian Lecture of 1807). Phil. Trans. Roy.Soc. (London) 1807, 97, 1–56.
(8) Berzelius, J. J. Föreläsningar i Djurkemien; Carl Delén, Stockholm, 1806.
(9) Berzelius, J. J. Traité de Chimie; Firmin Diderot Frères, Paris, 1831; Vol. 1; p 164.
(10) Ross, S. Faraday consults the scholars: the origins of the terms of electrochemistry. Notes Rec. R.Soc. London 1961, 16, 187–220.
(11) O’Brien, T. F.; Bommaraju, T. V.; Hine, F. Handbook of Chlor-Alkali Technology ; Springer, NewYork, 2005.
(12) Moussallem, I.; Jörrisen, J.; Kunz, U.; Pinnow, S.; Turek, T. Chlor-alkali electrolysis with oxygendepolarized cathodes: history, present status and future prospects. J. Appl. Electrochem. 2008, 38,1177–1194.
162 Results
(13) Popp, F. D.; Schultz, H. P. Electrolytic reduction of organic compounds. Chem. Rev. 1962, 62,19–40.
(14) T. B. Massalski, P. R. S., H. Okamoto, Ed. Binary alloy phase diagrams, 2nd ed.; ASM Interna-tional, Materials Park, Ohio, 1990.
(15) Linde, D. R., Ed. CRC Handbook of Physics, 90th ed.; Taylor and Francis, Boca Raton, 2010.
(16) Hoch, C.; Simon, A. Na11Hg52 - Komplexität in einem polaren Metall. Angew. Chem. 2012, 124,3316–3319.
(17) Hoch, C.; Simon, A. Na11Hg52 - complexity in a polar metal. Angew. Chem. Int. Ed. 2012, 51,3262–3265.
(18) Belin, C.; Ling, R.-G. The unexpected lithium-deficient phase of Li3Ga7: Synthesis and X-raystructure of Li3Ga14. J. Solid State Chem. 1982, 45, 290–292.
(19) Stoehr, J.; Schäfer, H. Ga-Clusterverbände im Li3Ga14. Rev. Chim. Minér. 1982, 19, 122–127.
(20) Bruzzone, G. The D13 structure type in intermetallic compounds. Acta Crystallogr. 1969, B25,1206–1207.
(21) Andress, K. R.; Alberti, E. Röntgenographische Untersuchung der Legierungsreihe Al-Ba. Zeitschr.Metallk. 1935, 27, 126–128.
(22) Hoch, C.; Simon, A. Tetramethylammoniumamalgam [N(CH3)4]Hg8. Z. Anorg. Allg. Chem.2006, 632, 2288–2294.
(23) Zintl, E.; Schneider, A. Röngenanalyse der Lithiumamalgame. Z. Elektrochem. 1935, 41, 771–774.
(24) Tambornino, F.; Hoch, C. Bad metal behaviour in the new Hg-rich amalgam KHg6 with polarmetallic bonding. J. Alloys Compd. 2015, 618, 299–304.
(25) Todorov, E.; Sevov, S. C. Synthesis and structure of the alkali metal amalgams A3Hg20 (A =Rb,Cs), K3Hg11, Cs5Hg19, and A7Hg31 (A = K,Rb). J. Solid State Chem. 2000, 149, 419–427.
(26) Biehl, E.; Deiseroth, H.-J. Darstellung, Strukturchemie und Magnetismus der Amalgame MHg11(M: K, Rb, Ba, Sr). Z. Anorg. Allg. Chem. 1999, 625, 1073–1080.
(27) Hoch, C.; Simon, A. Cs2Hg27 , das quecksilberreichste Amalgam - ein naher Verwandter derBergman-Phasen. Z. Anorg. Allg. Chem. 2008, 634, 853–856.
(28) Tambornino, F.; Hoch, C. The mercury-richest europium amalgam, Eu10Hg55. Z. Anorg. Allg.Chem. 2015, 641, 537–542.
(29) Palenzona, A. MX3 intermetallic phase of the rare earths with Hg, In, Tl, Pb. J. Less-Comm. Met.1966, 10, 290–292.
(30) Simons, J. H.; Seward, R. P. Slow electron scattering and the apparent electron affinity of mercury.J. Chem. Phys. 1938, 6, 790.
(31) Ketelaar, J. The crystal structure of alloys of zinc with the alkali and alkaline earth metals and ofcadmium with potassium. J. Chem. Phys. 1937, 5, 668.
(32) Wendorff, M.; Röhr, C. Polar binary Zn/Cd-rich intermetallics: Synthesis, crystal and electronicstructure of A(Zn/Cd)13 (A = al- kali/alkaline earth) and Cs1.34Zn16. J. Alloys Compd. 2006, 421,24–34.
(33) Coxeter, H. S. M.; Longuet-Higgins, M. S. L.; Miller, J. C. P. Uniform polyhedra. Phil. Trans.Royal Soc. London Ser. A 1954, 246, 401–450.
Results 163
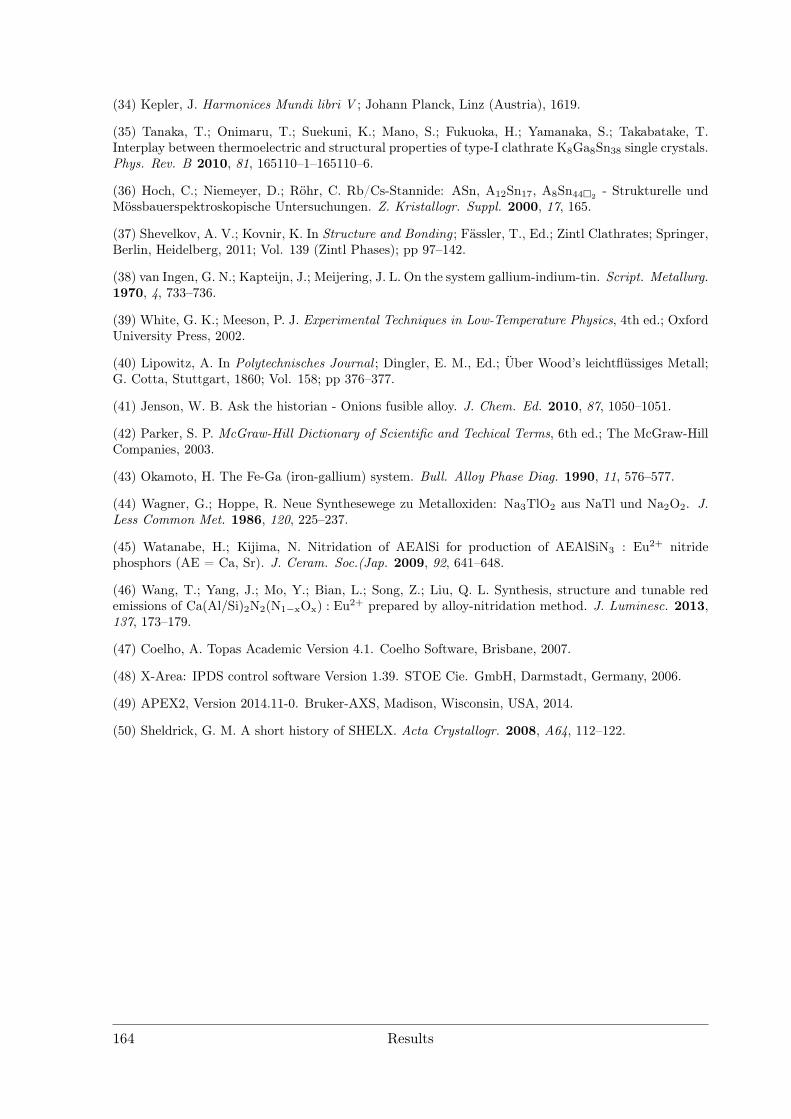
(34) Kepler, J. Harmonices Mundi libri V ; Johann Planck, Linz (Austria), 1619.
(35) Tanaka, T.; Onimaru, T.; Suekuni, K.; Mano, S.; Fukuoka, H.; Yamanaka, S.; Takabatake, T.Interplay between thermoelectric and structural properties of type-I clathrate K8Ga8Sn38 single crystals.Phys. Rev. B 2010, 81, 165110–1–165110–6.
(36) Hoch, C.; Niemeyer, D.; Röhr, C. Rb/Cs-Stannide: ASn, A12Sn17, A8Sn442- Strukturelle und
Mössbauerspektroskopische Untersuchungen. Z. Kristallogr. Suppl. 2000, 17, 165.
(37) Shevelkov, A. V.; Kovnir, K. In Structure and Bonding ; Fässler, T., Ed.; Zintl Clathrates; Springer,Berlin, Heidelberg, 2011; Vol. 139 (Zintl Phases); pp 97–142.
(38) van Ingen, G. N.; Kapteijn, J.; Meijering, J. L. On the system gallium-indium-tin. Script. Metallurg.1970, 4, 733–736.
(39) White, G. K.; Meeson, P. J. Experimental Techniques in Low-Temperature Physics, 4th ed.; OxfordUniversity Press, 2002.
(40) Lipowitz, A. In Polytechnisches Journal ; Dingler, E. M., Ed.; Über Wood’s leichtflüssiges Metall;G. Cotta, Stuttgart, 1860; Vol. 158; pp 376–377.
(41) Jenson, W. B. Ask the historian - Onions fusible alloy. J. Chem. Ed. 2010, 87, 1050–1051.
(42) Parker, S. P. McGraw-Hill Dictionary of Scientific and Techical Terms, 6th ed.; The McGraw-HillCompanies, 2003.
(43) Okamoto, H. The Fe-Ga (iron-gallium) system. Bull. Alloy Phase Diag. 1990, 11, 576–577.
(44) Wagner, G.; Hoppe, R. Neue Synthesewege zu Metalloxiden: Na3TlO2 aus NaTl und Na2O2. J.Less Common Met. 1986, 120, 225–237.
(45) Watanabe, H.; Kijima, N. Nitridation of AEAlSi for production of AEAlSiN3 : Eu2+ nitridephosphors (AE = Ca, Sr). J. Ceram. Soc.(Jap. 2009, 92, 641–648.
(46) Wang, T.; Yang, J.; Mo, Y.; Bian, L.; Song, Z.; Liu, Q. L. Synthesis, structure and tunable redemissions of Ca(Al/Si)2N2(N1−xOx) : Eu2+ prepared by alloy-nitridation method. J. Luminesc. 2013,137, 173–179.
(47) Coelho, A. Topas Academic Version 4.1. Coelho Software, Brisbane, 2007.
(48) X-Area: IPDS control software Version 1.39. STOE Cie. GmbH, Darmstadt, Germany, 2006.
(49) APEX2, Version 2014.11-0. Bruker-AXS, Madison, Wisconsin, USA, 2014.
(50) Sheldrick, G. M. A short history of SHELX. Acta Crystallogr. 2008, A64, 112–122.
164 Results
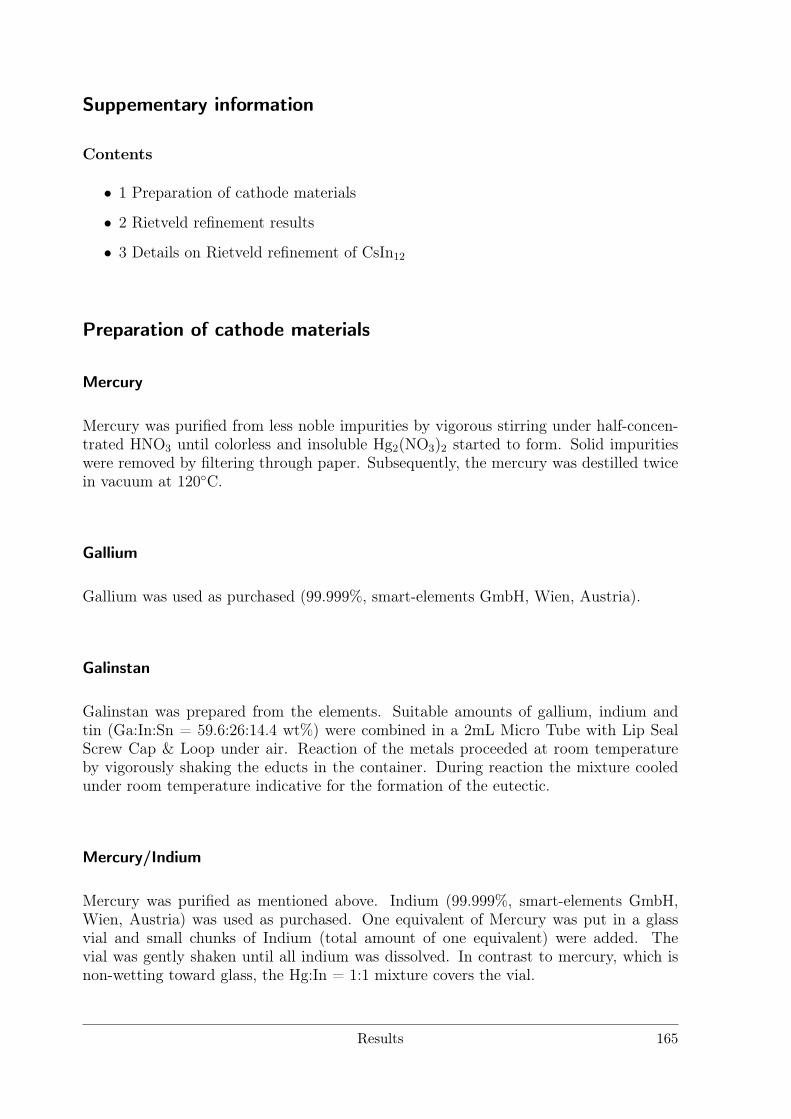
Suppementary information
Contents
• 1 Preparation of cathode materials
• 2 Rietveld refinement results
• 3 Details on Rietveld refinement of CsIn12
Preparation of cathode materials
Mercury
Mercury was purified from less noble impurities by vigorous stirring under half-concen-trated HNO3 until colorless and insoluble Hg2(NO3)2 started to form. Solid impuritieswere removed by filtering through paper. Subsequently, the mercury was destilled twicein vacuum at 120C.
Gallium
Gallium was used as purchased (99.999%, smart-elements GmbH, Wien, Austria).
Galinstan
Galinstan was prepared from the elements. Suitable amounts of gallium, indium andtin (Ga:In:Sn = 59.6:26:14.4 wt%) were combined in a 2mL Micro Tube with Lip SealScrew Cap & Loop under air. Reaction of the metals proceeded at room temperatureby vigorously shaking the educts in the container. During reaction the mixture cooledunder room temperature indicative for the formation of the eutectic.
Mercury/Indium
Mercury was purified as mentioned above. Indium (99.999%, smart-elements GmbH,Wien, Austria) was used as purchased. One equivalent of Mercury was put in a glassvial and small chunks of Indium (total amount of one equivalent) were added. Thevial was gently shaken until all indium was dissolved. In contrast to mercury, which isnon-wetting toward glass, the Hg:In = 1:1 mixture covers the vial.
Results 165
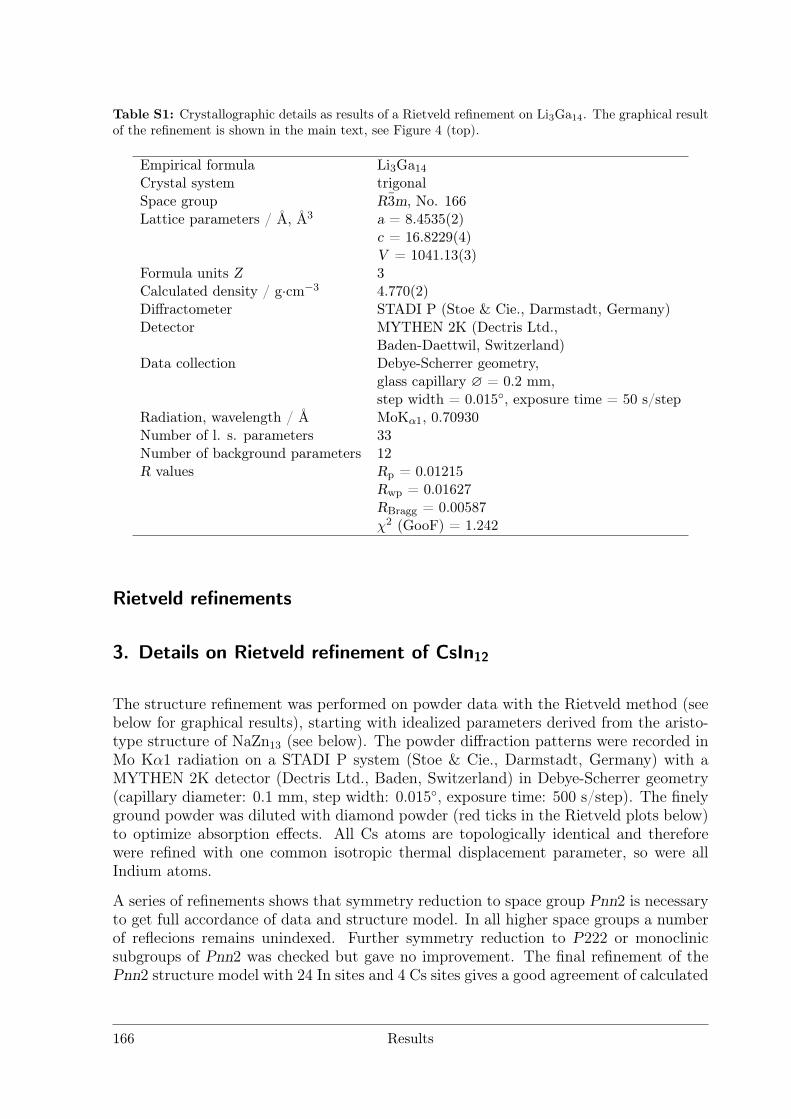
Table S1: Crystallographic details as results of a Rietveld refinement on Li3Ga14. The graphical resultof the refinement is shown in the main text, see Figure 4 (top).
Empirical formula Li3Ga14Crystal system trigonalSpace group R3m, No. 166Lattice parameters / Å, Å3 a = 8.4535(2)
c = 16.8229(4)V = 1041.13(3)
Formula units Z 3Calculated density / g·cm−3 4.770(2)Diffractometer STADI P (Stoe & Cie., Darmstadt, Germany)Detector MYTHEN 2K (Dectris Ltd.,
Baden-Daettwil, Switzerland)Data collection Debye-Scherrer geometry,
glass capillary ∅ = 0.2 mm,step width = 0.015, exposure time = 50 s/step
Radiation, wavelength / Å MoKα1, 0.70930Number of l. s. parameters 33Number of background parameters 12R values Rp = 0.01215
Rwp = 0.01627RBragg = 0.00587χ2 (GooF) = 1.242
Rietveld refinements
3. Details on Rietveld refinement of CsIn12
The structure refinement was performed on powder data with the Rietveld method (seebelow for graphical results), starting with idealized parameters derived from the aristo-type structure of NaZn13 (see below). The powder diffraction patterns were recorded inMo Kα1 radiation on a STADI P system (Stoe & Cie., Darmstadt, Germany) with aMYTHEN 2K detector (Dectris Ltd., Baden, Switzerland) in Debye-Scherrer geometry(capillary diameter: 0.1 mm, step width: 0.015, exposure time: 500 s/step). The finelyground powder was diluted with diamond powder (red ticks in the Rietveld plots below)to optimize absorption effects. All Cs atoms are topologically identical and thereforewere refined with one common isotropic thermal displacement parameter, so were allIndium atoms.
A series of refinements shows that symmetry reduction to space group Pnn2 is necessaryto get full accordance of data and structure model. In all higher space groups a numberof reflecions remains unindexed. Further symmetry reduction to P222 or monoclinicsubgroups of Pnn2 was checked but gave no improvement. The final refinement of thePnn2 structure model with 24 In sites and 4 Cs sites gives a good agreement of calculated
166 Results
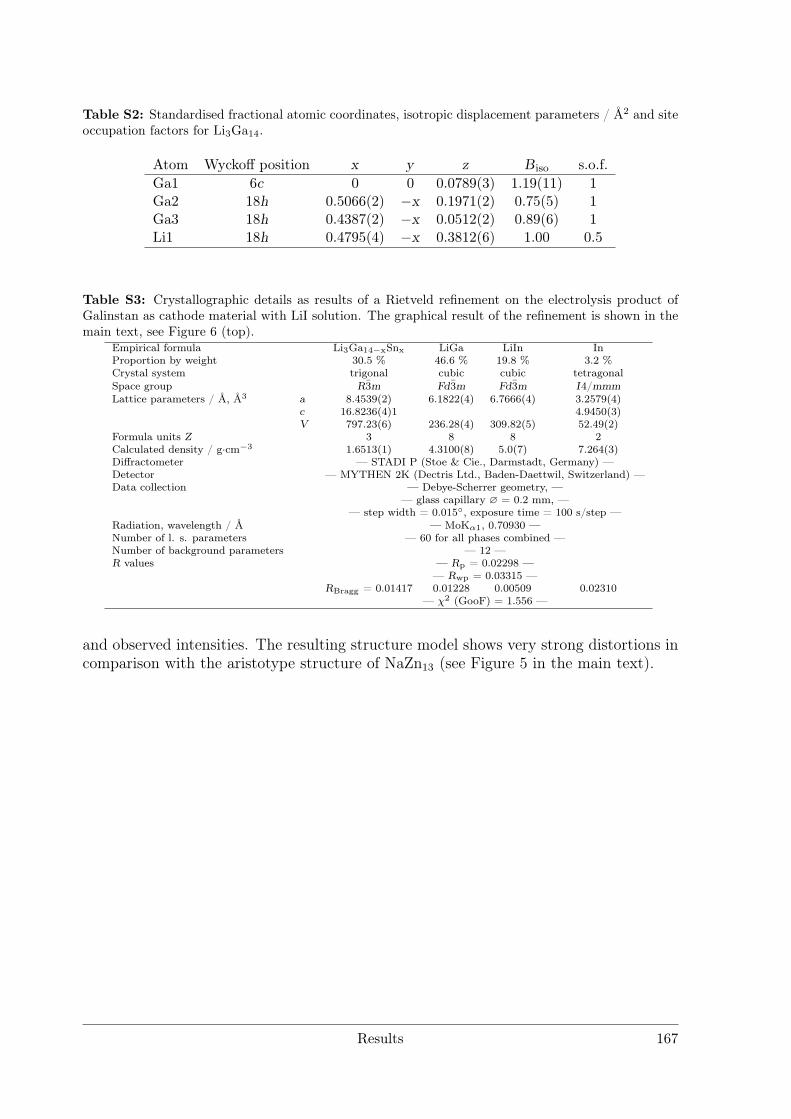
Table S2: Standardised fractional atomic coordinates, isotropic displacement parameters / Å2 and siteoccupation factors for Li3Ga14.
Atom Wyckoff position x y z Biso s.o.f.Ga1 6c 0 0 0.0789(3) 1.19(11) 1Ga2 18h 0.5066(2) −x 0.1971(2) 0.75(5) 1Ga3 18h 0.4387(2) −x 0.0512(2) 0.89(6) 1Li1 18h 0.4795(4) −x 0.3812(6) 1.00 0.5
Table S3: Crystallographic details as results of a Rietveld refinement on the electrolysis product ofGalinstan as cathode material with LiI solution. The graphical result of the refinement is shown in themain text, see Figure 6 (top).
Empirical formula Li3Ga14−xSnx LiGa LiIn InProportion by weight 30.5 % 46.6 % 19.8 % 3.2 %Crystal system trigonal cubic cubic tetragonalSpace group R3m Fd3m Fd3m I4/mmmLattice parameters / Å, Å3 a 8.4539(2) 6.1822(4) 6.7666(4) 3.2579(4)
c 16.8236(4)1 4.9450(3)V 797.23(6) 236.28(4) 309.82(5) 52.49(2)
Formula units Z 3 8 8 2Calculated density / g·cm−3 1.6513(1) 4.3100(8) 5.0(7) 7.264(3)Diffractometer — STADI P (Stoe & Cie., Darmstadt, Germany) —Detector — MYTHEN 2K (Dectris Ltd., Baden-Daettwil, Switzerland) —Data collection — Debye-Scherrer geometry, —
— glass capillary ∅ = 0.2 mm, —— step width = 0.015, exposure time = 100 s/step —
Radiation, wavelength / Å — MoKα1, 0.70930 —Number of l. s. parameters — 60 for all phases combined —Number of background parameters — 12 —R values — Rp = 0.02298 —
— Rwp = 0.03315 —RBragg = 0.01417 0.01228 0.00509 0.02310
— χ2 (GooF) = 1.556 —
and observed intensities. The resulting structure model shows very strong distortions incomparison with the aristotype structure of NaZn13 (see Figure 5 in the main text).
Results 167
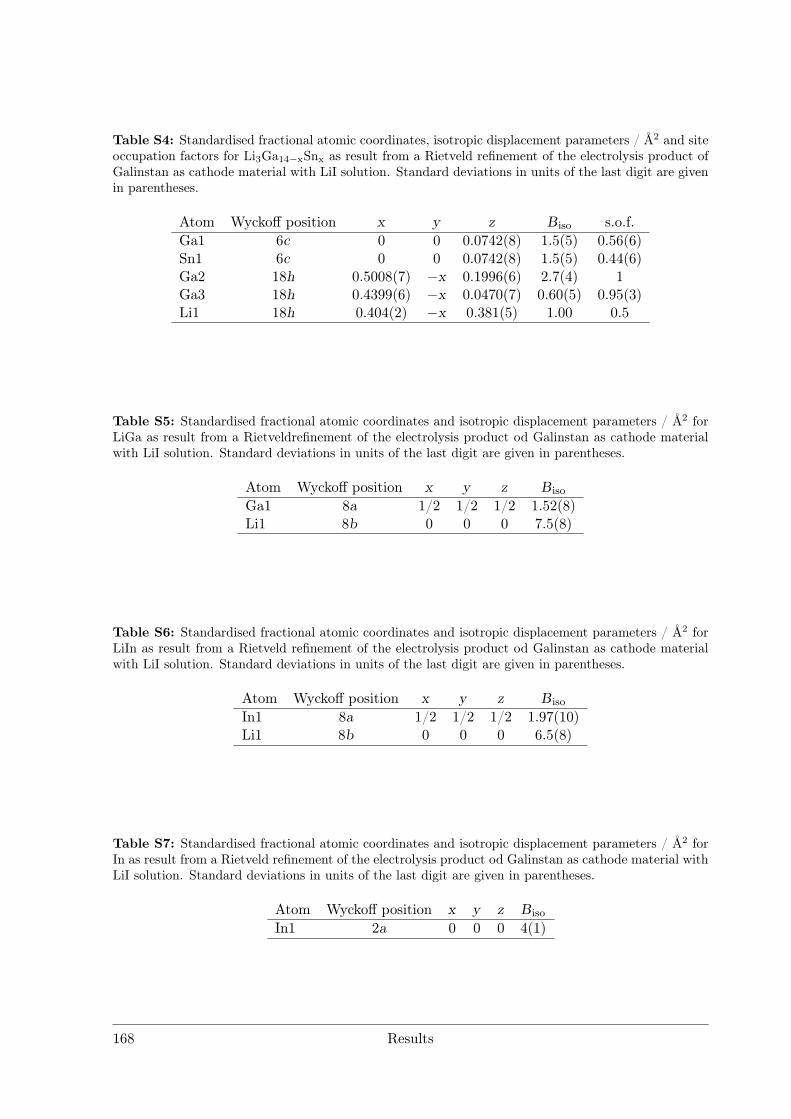
Table S4: Standardised fractional atomic coordinates, isotropic displacement parameters / Å2 and siteoccupation factors for Li3Ga14−xSnx as result from a Rietveld refinement of the electrolysis product ofGalinstan as cathode material with LiI solution. Standard deviations in units of the last digit are givenin parentheses.
Atom Wyckoff position x y z Biso s.o.f.Ga1 6c 0 0 0.0742(8) 1.5(5) 0.56(6)Sn1 6c 0 0 0.0742(8) 1.5(5) 0.44(6)Ga2 18h 0.5008(7) −x 0.1996(6) 2.7(4) 1Ga3 18h 0.4399(6) −x 0.0470(7) 0.60(5) 0.95(3)Li1 18h 0.404(2) −x 0.381(5) 1.00 0.5
Table S5: Standardised fractional atomic coordinates and isotropic displacement parameters / Å2 forLiGa as result from a Rietveldrefinement of the electrolysis product od Galinstan as cathode materialwith LiI solution. Standard deviations in units of the last digit are given in parentheses.
Atom Wyckoff position x y z Biso
Ga1 8a 1/2 1/2 1/2 1.52(8)Li1 8b 0 0 0 7.5(8)
Table S6: Standardised fractional atomic coordinates and isotropic displacement parameters / Å2 forLiIn as result from a Rietveld refinement of the electrolysis product od Galinstan as cathode materialwith LiI solution. Standard deviations in units of the last digit are given in parentheses.
Atom Wyckoff position x y z Biso
In1 8a 1/2 1/2 1/2 1.97(10)Li1 8b 0 0 0 6.5(8)
Table S7: Standardised fractional atomic coordinates and isotropic displacement parameters / Å2 forIn as result from a Rietveld refinement of the electrolysis product od Galinstan as cathode material withLiI solution. Standard deviations in units of the last digit are given in parentheses.
Atom Wyckoff position x y z Biso
In1 2a 0 0 0 4(1)
168 Results
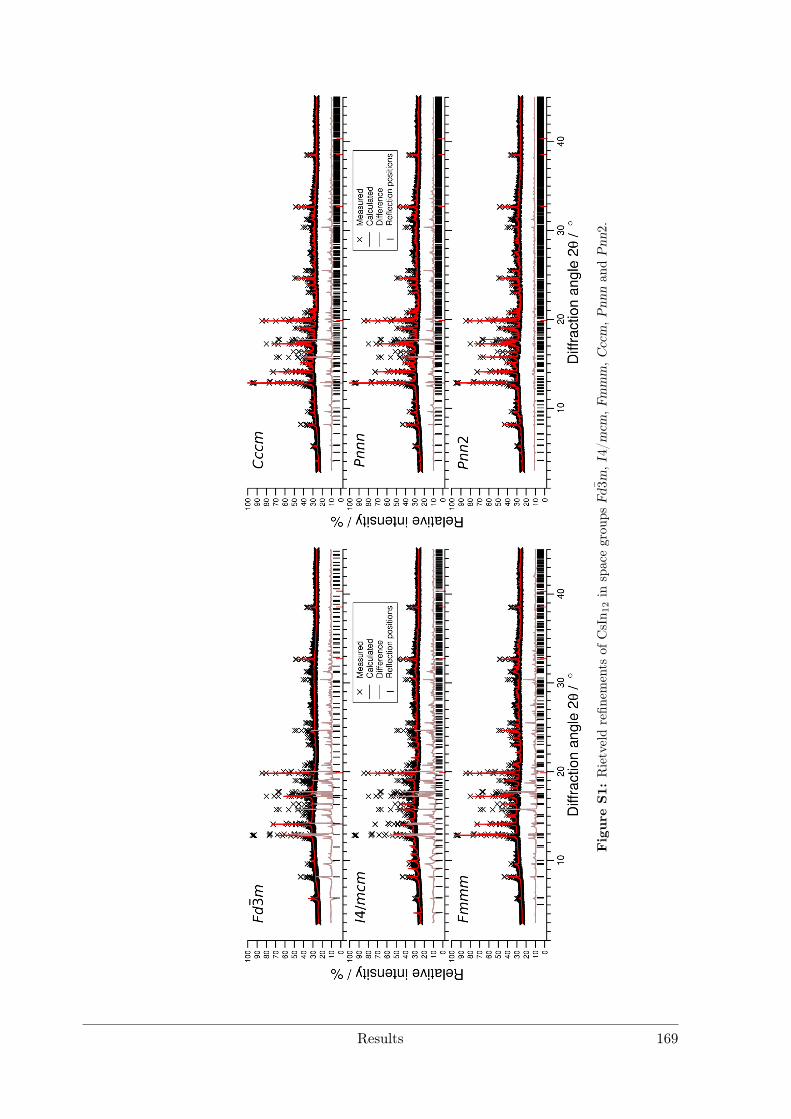
Fig
ure
S1:
Rietveldrefin
ements
ofC
sIn12in
spacegrou
psFd
3m,I
4/mcm
,Fmmm,C
ccm,P
nnnan
dPnn
2.
Results 169
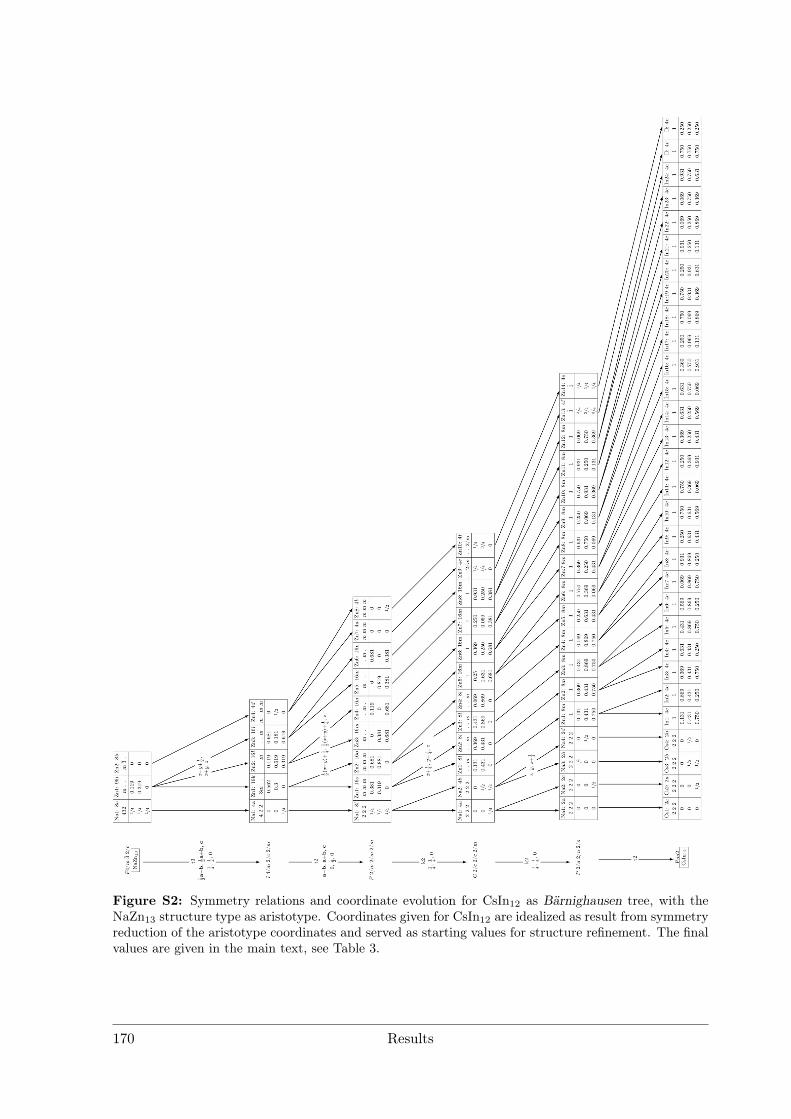
Figure S2: Symmetry relations and coordinate evolution for CsIn12 as Bärnighausen tree, with theNaZn13 structure type as aristotype. Coordinates given for CsIn12 are idealized as result from symmetryreduction of the aristotype coordinates and served as starting values for structure refinement. The finalvalues are given in the main text, see Table 3.
170 Results
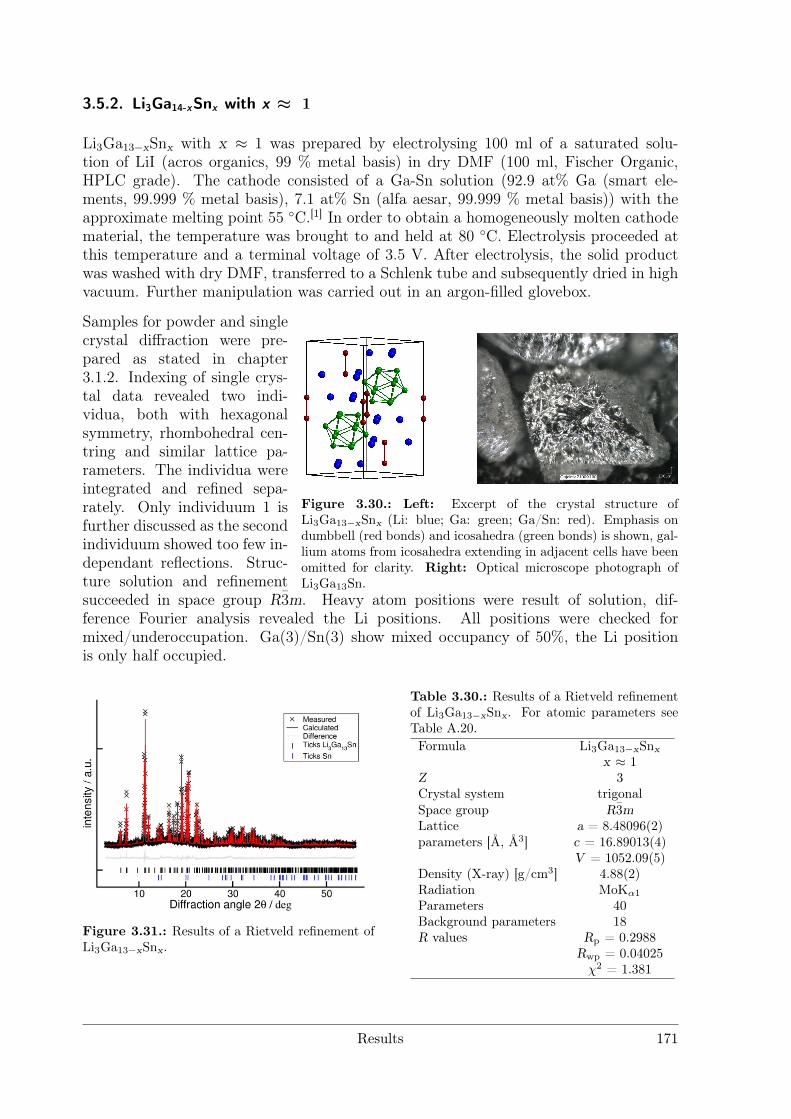
3.5.2. Li3Ga14-xSnx with x ≈ 1
Li3Ga13−xSnx with x ≈ 1 was prepared by electrolysing 100 ml of a saturated solu-tion of LiI (acros organics, 99 % metal basis) in dry DMF (100 ml, Fischer Organic,HPLC grade). The cathode consisted of a Ga-Sn solution (92.9 at% Ga (smart ele-ments, 99.999 % metal basis), 7.1 at% Sn (alfa aesar, 99.999 % metal basis)) with theapproximate melting point 55 C.[1] In order to obtain a homogeneously molten cathodematerial, the temperature was brought to and held at 80 C. Electrolysis proceeded atthis temperature and a terminal voltage of 3.5 V. After electrolysis, the solid productwas washed with dry DMF, transferred to a Schlenk tube and subsequently dried in highvacuum. Further manipulation was carried out in an argon-filled glovebox.
Figure 3.30.: Left: Excerpt of the crystal structure ofLi3Ga13−xSnx (Li: blue; Ga: green; Ga/Sn: red). Emphasis ondumbbell (red bonds) and icosahedra (green bonds) is shown, gal-lium atoms from icosahedra extending in adjacent cells have beenomitted for clarity. Right: Optical microscope photograph ofLi3Ga13Sn.
Samples for powder and singlecrystal diffraction were pre-pared as stated in chapter3.1.2. Indexing of single crys-tal data revealed two indi-vidua, both with hexagonalsymmetry, rhombohedral cen-tring and similar lattice pa-rameters. The individua wereintegrated and refined sepa-rately. Only individuum 1 isfurther discussed as the secondindividuum showed too few in-dependant reflections. Struc-ture solution and refinementsucceeded in space group R3m. Heavy atom positions were result of solution, dif-ference Fourier analysis revealed the Li positions. All positions were checked formixed/underoccupation. Ga(3)/Sn(3) show mixed occupancy of 50%, the Li positionis only half occupied.
Figure 3.31.: Results of a Rietveld refinement ofLi3Ga13−xSnx.
Table 3.30.: Results of a Rietveld refinementof Li3Ga13−xSnx. For atomic parameters seeTable A.20.Formula Li3Ga13−xSnx
x ≈ 1Z 3Crystal system trigonalSpace group R3mLattice a = 8.48096(2)parameters [Å, Å3] c = 16.89013(4)
V = 1052.09(5)Density (X-ray) [g/cm3] 4.88(2)Radiation MoKα1Parameters 40Background parameters 18R values Rp = 0.2988
Rwp = 0.04025χ2 = 1.381
Results 171
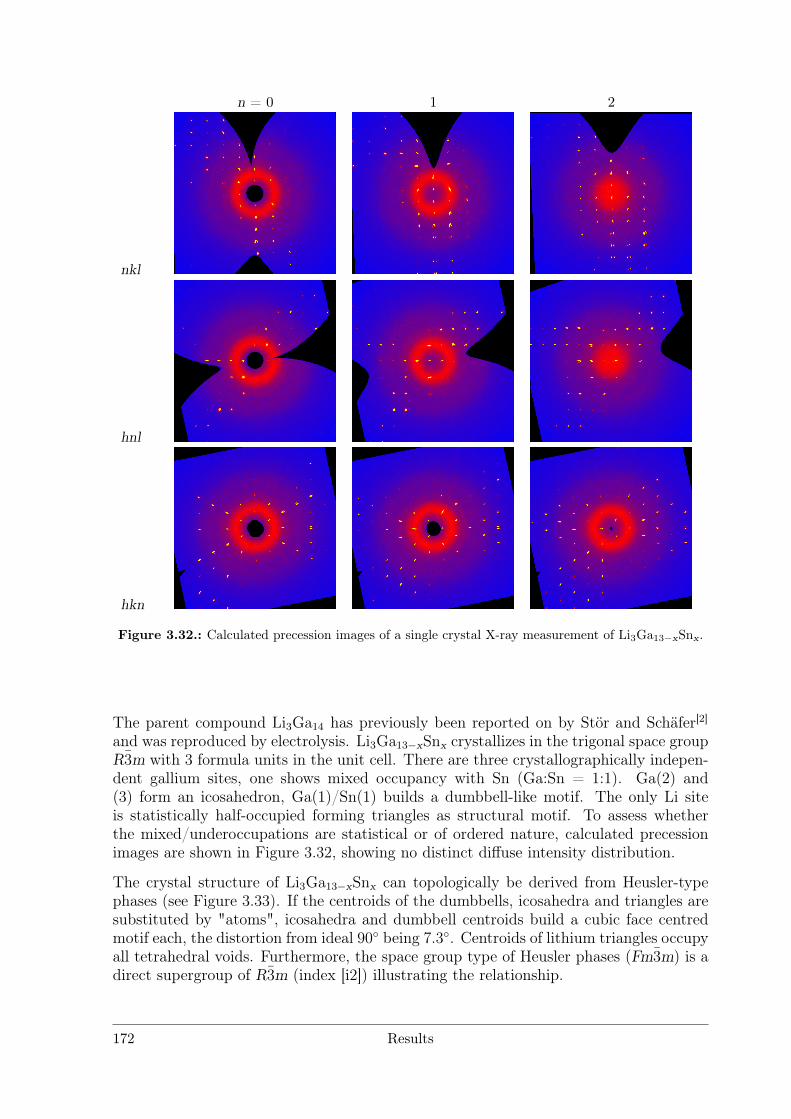
n = 0 1 2
nkl
hnl
hkn
Figure 3.32.: Calculated precession images of a single crystal X-ray measurement of Li3Ga13−xSnx.
The parent compound Li3Ga14 has previously been reported on by Stör and Schäfer[2]and was reproduced by electrolysis. Li3Ga13−xSnx crystallizes in the trigonal space groupR3m with 3 formula units in the unit cell. There are three crystallographically indepen-dent gallium sites, one shows mixed occupancy with Sn (Ga:Sn = 1:1). Ga(2) and(3) form an icosahedron, Ga(1)/Sn(1) builds a dumbbell-like motif. The only Li siteis statistically half-occupied forming triangles as structural motif. To assess whetherthe mixed/underoccupations are statistical or of ordered nature, calculated precessionimages are shown in Figure 3.32, showing no distinct diffuse intensity distribution.
The crystal structure of Li3Ga13−xSnx can topologically be derived from Heusler-typephases (see Figure 3.33). If the centroids of the dumbbells, icosahedra and triangles aresubstituted by "atoms", icosahedra and dumbbell centroids build a cubic face centredmotif each, the distortion from ideal 90 being 7.3. Centroids of lithium triangles occupyall tetrahedral voids. Furthermore, the space group type of Heusler phases (Fm3m) is adirect supergroup of R3m (index [i2]) illustrating the relationship.
172 Results
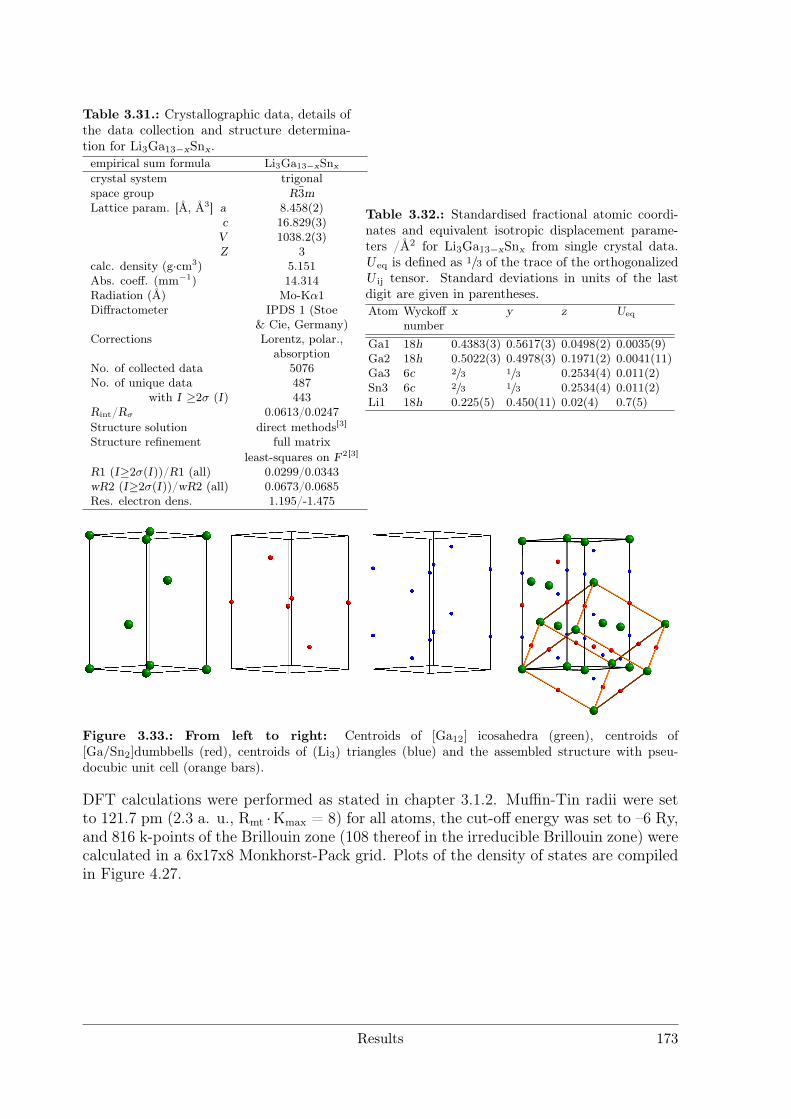
Table 3.31.: Crystallographic data, details ofthe data collection and structure determina-tion for Li3Ga13−xSnx.empirical sum formula Li3Ga13−xSnx
crystal system trigonalspace group R3mLattice param. [Å, Å3] a 8.458(2)
c 16.829(3)V 1038.2(3)Z 3
calc. density (g·cm3) 5.151Abs. coeff. (mm−1) 14.314Radiation (Å) Mo-Kα1Diffractometer IPDS 1 (Stoe
& Cie, Germany)Corrections Lorentz, polar.,
absorptionNo. of collected data 5076No. of unique data 487
with I ≥2σ (I) 443Rint/Rσ 0.0613/0.0247Structure solution direct methods[3]
Structure refinement full matrixleast-squares on F2[3]
R1 (I≥2σ(I))/R1 (all) 0.0299/0.0343wR2 (I≥2σ(I))/wR2 (all) 0.0673/0.0685Res. electron dens. 1.195/-1.475
Table 3.32.: Standardised fractional atomic coordi-nates and equivalent isotropic displacement parame-ters /Å2 for Li3Ga13−xSnx from single crystal data.U eq is defined as 1/3 of the trace of the orthogonalizedU ij tensor. Standard deviations in units of the lastdigit are given in parentheses.Atom Wyckoff x y z Ueq
numberGa1 18h 0.4383(3) 0.5617(3) 0.0498(2) 0.0035(9)Ga2 18h 0.5022(3) 0.4978(3) 0.1971(2) 0.0041(11)Ga3 6c 2/3 1/3 0.2534(4) 0.011(2)Sn3 6c 2/3 1/3 0.2534(4) 0.011(2)Li1 18h 0.225(5) 0.450(11) 0.02(4) 0.7(5)
Figure 3.33.: From left to right: Centroids of [Ga12] icosahedra (green), centroids of[Ga/Sn2]dumbbells (red), centroids of (Li3) triangles (blue) and the assembled structure with pseu-docubic unit cell (orange bars).
DFT calculations were performed as stated in chapter 3.1.2. Muffin-Tin radii were setto 121.7 pm (2.3 a. u., Rmt ·Kmax = 8) for all atoms, the cut-off energy was set to –6 Ry,and 816 k-points of the Brillouin zone (108 thereof in the irreducible Brillouin zone) werecalculated in a 6x17x8 Monkhorst-Pack grid. Plots of the density of states are compiledin Figure 4.27.
Results 173
References
[1] T. B. Massalski, Binary Alloy Phase Diagrams, ASM International, Materials Park,Ohio, USA, 2nd edition (1990).
[2] J. Stöhr, H. Schäfer, Z. Anorg. Allg. Chem., 474(3), 221–225 (1981).
[3] G. M. Sheldrick, Acta Crystallogr. A, 64(1), 112–122 (2007).
174 Results
4. Discussion
The first part of the following chapter contains a comparative discussion of the employedsynthetic methods. Electrolysis on different cathode materials is evaluated with modi-fied Born-Haber cycles. The paths through the respective phase diagrams are assessedfor unary, binary and ternary cathode materials. Crystallisation of multiple productsfrom binary and ternary cathode materials is rationalised as well as the employment ofHg as solvent for In. Electrocrystallisation is compared with the distillation approach,similarities and differences are put into context.
The second part contains the evaluation of the obtained crystal structures. Metal iodidesolvate structures are rationalised as decorated variants of simple sphere packings. Therelations are further illustrated by group-subgroup schemes with the aid of Bärnighausentrees. The crystal structures of the synthesised amalgams are evaluated and put intocontext with literature-known crystal structures. A structure-field diagram for mercury-rich compounds with composition from AHg5 to AHg11 is proposed. In addition, thecrystal structures are analysed by means of complexity measures to quantify multipledisorder phenomena.
The third part contains discussions related to chemical bonding in polar metals. Afterclarification of the term "polar metal", polarity in amalgams is evaluated. The bandstructures of three Li amalgams is examined in detail and correlated with the Knightshift measurements of both 7Li and 199Hg. NMR shifts of 7Li are put into context withdata from literature and compiled in a scheme. Electric conductance is discussed onthe Li amalgams and on KHg6, model systems for polar metals, and on Gd14Ag51 as ametallic reference.
The bonding polarity in Li3Ga14 and Li3Ga13Sn is the subject of the fourth part. Thecrystal structure is described with the aid of Wade formalism and band structure calcu-lations reveal the importance of the underoccupation of the Li site and rationalise theincorporation of Sn on one Ga site. NMR measurements show predominantly Li+ as anindicator for high polarity. In combination with the discussions on structures derivedfrom the BaHg11 structure type, Bader charges are critically evaluated.
Discussion 175
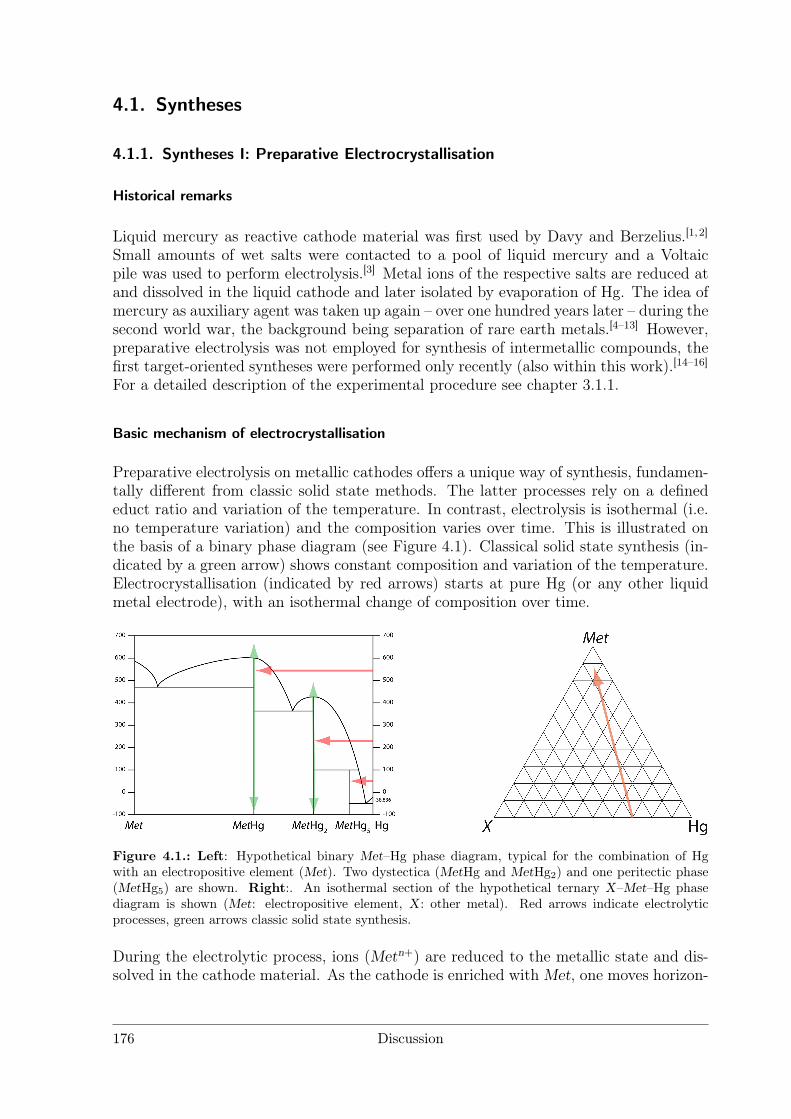
4.1. Syntheses
4.1.1. Syntheses I: Preparative Electrocrystallisation
Historical remarks
Liquid mercury as reactive cathode material was first used by Davy and Berzelius.[1, 2]Small amounts of wet salts were contacted to a pool of liquid mercury and a Voltaicpile was used to perform electrolysis.[3] Metal ions of the respective salts are reduced atand dissolved in the liquid cathode and later isolated by evaporation of Hg. The idea ofmercury as auxiliary agent was taken up again – over one hundred years later – during thesecond world war, the background being separation of rare earth metals.[4–13] However,preparative electrolysis was not employed for synthesis of intermetallic compounds, thefirst target-oriented syntheses were performed only recently (also within this work).[14–16]For a detailed description of the experimental procedure see chapter 3.1.1.
Basic mechanism of electrocrystallisation
Preparative electrolysis on metallic cathodes offers a unique way of synthesis, fundamen-tally different from classic solid state methods. The latter processes rely on a definededuct ratio and variation of the temperature. In contrast, electrolysis is isothermal (i.e.no temperature variation) and the composition varies over time. This is illustrated onthe basis of a binary phase diagram (see Figure 4.1). Classical solid state synthesis (in-dicated by a green arrow) shows constant composition and variation of the temperature.Electrocrystallisation (indicated by red arrows) starts at pure Hg (or any other liquidmetal electrode), with an isothermal change of composition over time.
Figure 4.1.: Left: Hypothetical binary Met–Hg phase diagram, typical for the combination of Hgwith an electropositive element (Met). Two dystectica (MetHg and MetHg2) and one peritectic phase(MetHg5) are shown. Right:. An isothermal section of the hypothetical ternary X–Met–Hg phasediagram is shown (Met: electropositive element, X : other metal). Red arrows indicate electrolyticprocesses, green arrows classic solid state synthesis.
During the electrolytic process, ions (Metn+) are reduced to the metallic state and dis-solved in the cathode material. As the cathode is enriched with Met, one moves horizon-
176 Discussion
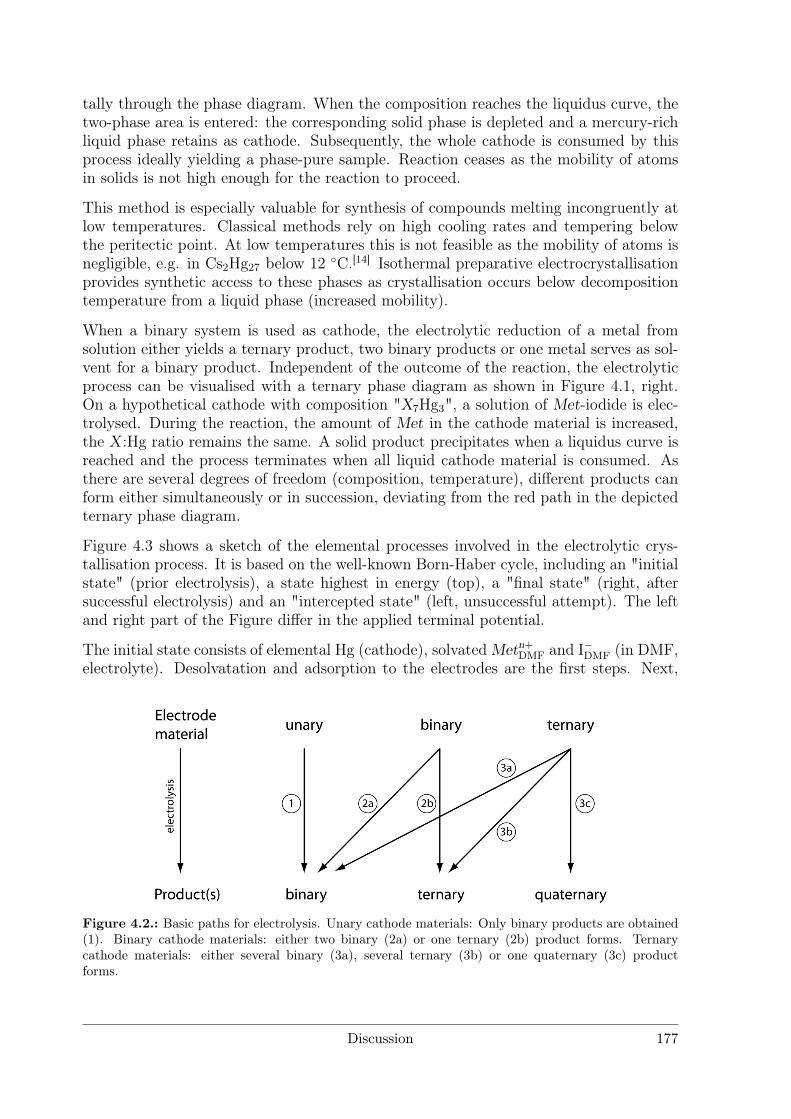
tally through the phase diagram. When the composition reaches the liquidus curve, thetwo-phase area is entered: the corresponding solid phase is depleted and a mercury-richliquid phase retains as cathode. Subsequently, the whole cathode is consumed by thisprocess ideally yielding a phase-pure sample. Reaction ceases as the mobility of atomsin solids is not high enough for the reaction to proceed.
This method is especially valuable for synthesis of compounds melting incongruently atlow temperatures. Classical methods rely on high cooling rates and tempering belowthe peritectic point. At low temperatures this is not feasible as the mobility of atoms isnegligible, e.g. in Cs2Hg27 below 12 C.[14] Isothermal preparative electrocrystallisationprovides synthetic access to these phases as crystallisation occurs below decompositiontemperature from a liquid phase (increased mobility).
When a binary system is used as cathode, the electrolytic reduction of a metal fromsolution either yields a ternary product, two binary products or one metal serves as sol-vent for a binary product. Independent of the outcome of the reaction, the electrolyticprocess can be visualised with a ternary phase diagram as shown in Figure 4.1, right.On a hypothetical cathode with composition "X7Hg3", a solution of Met-iodide is elec-trolysed. During the reaction, the amount of Met in the cathode material is increased,the X :Hg ratio remains the same. A solid product precipitates when a liquidus curve isreached and the process terminates when all liquid cathode material is consumed. Asthere are several degrees of freedom (composition, temperature), different products canform either simultaneously or in succession, deviating from the red path in the depictedternary phase diagram.
Figure 4.3 shows a sketch of the elemental processes involved in the electrolytic crys-tallisation process. It is based on the well-known Born-Haber cycle, including an "initialstate" (prior electrolysis), a state highest in energy (top), a "final state" (right, aftersuccessful electrolysis) and an "intercepted state" (left, unsuccessful attempt). The leftand right part of the Figure differ in the applied terminal potential.
The initial state consists of elemental Hg (cathode), solvated Metn+DMF and I−DMF (in DMF,electrolyte). Desolvatation and adsorption to the electrodes are the first steps. Next,
Figure 4.2.: Basic paths for electrolysis. Unary cathode materials: Only binary products are obtained(1). Binary cathode materials: either two binary (2a) or one ternary (2b) product forms. Ternarycathode materials: either several binary (3a), several ternary (3b) or one quaternary (3c) productforms.
Discussion 177
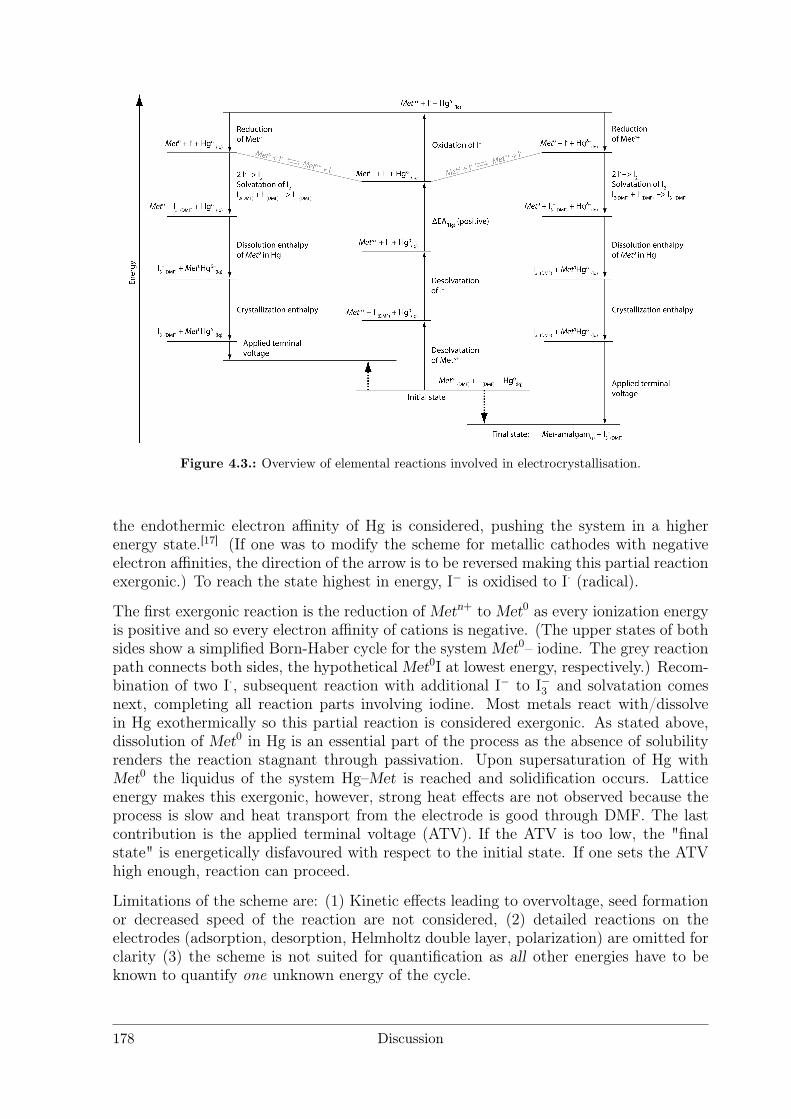
Figure 4.3.: Overview of elemental reactions involved in electrocrystallisation.
the endothermic electron affinity of Hg is considered, pushing the system in a higherenergy state.[17] (If one was to modify the scheme for metallic cathodes with negativeelectron affinities, the direction of the arrow is to be reversed making this partial reactionexergonic.) To reach the state highest in energy, I− is oxidised to I· (radical).
The first exergonic reaction is the reduction of Metn+ to Met0 as every ionization energyis positive and so every electron affinity of cations is negative. (The upper states of bothsides show a simplified Born-Haber cycle for the system Met0– iodine. The grey reactionpath connects both sides, the hypothetical Met0I at lowest energy, respectively.) Recom-bination of two I·, subsequent reaction with additional I− to I−3 and solvatation comesnext, completing all reaction parts involving iodine. Most metals react with/dissolvein Hg exothermically so this partial reaction is considered exergonic. As stated above,dissolution of Met0 in Hg is an essential part of the process as the absence of solubilityrenders the reaction stagnant through passivation. Upon supersaturation of Hg withMet0 the liquidus of the system Hg–Met is reached and solidification occurs. Latticeenergy makes this exergonic, however, strong heat effects are not observed because theprocess is slow and heat transport from the electrode is good through DMF. The lastcontribution is the applied terminal voltage (ATV). If the ATV is too low, the "finalstate" is energetically disfavoured with respect to the initial state. If one sets the ATVhigh enough, reaction can proceed.
Limitations of the scheme are: (1) Kinetic effects leading to overvoltage, seed formationor decreased speed of the reaction are not considered, (2) detailed reactions on theelectrodes (adsorption, desorption, Helmholtz double layer, polarization) are omitted forclarity (3) the scheme is not suited for quantification as all other energies have to beknown to quantify one unknown energy of the cycle.
178 Discussion
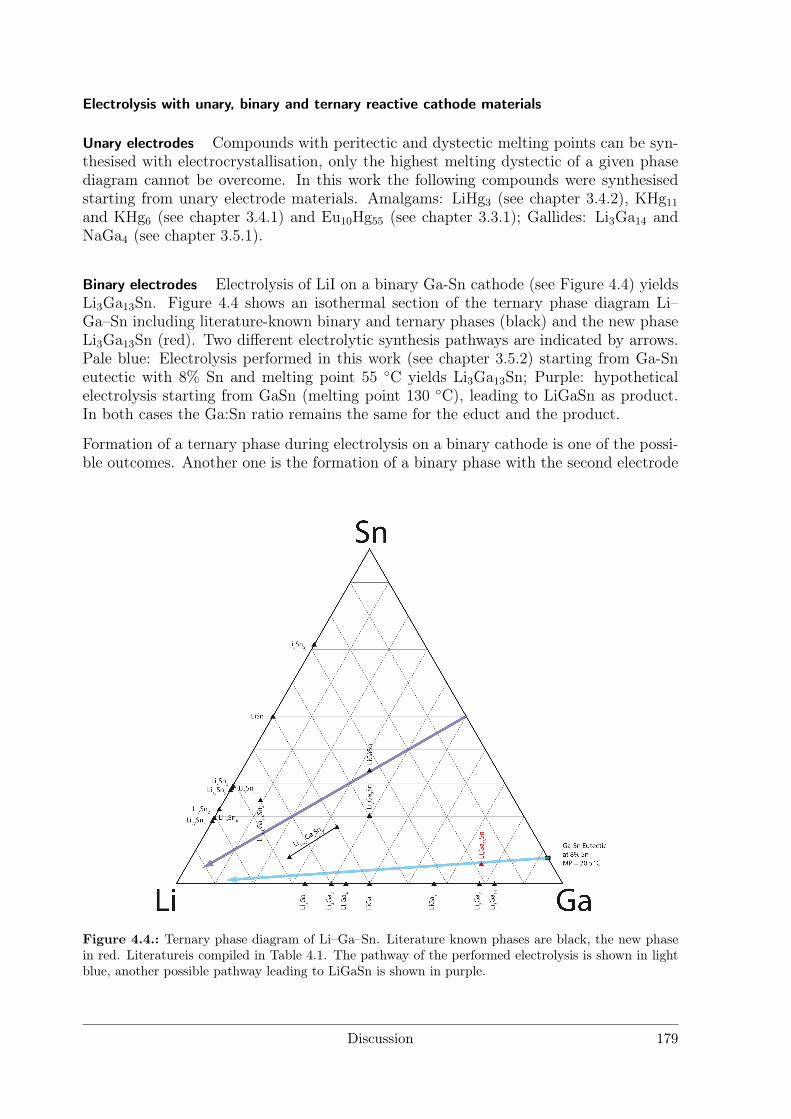
Electrolysis with unary, binary and ternary reactive cathode materials
Unary electrodes Compounds with peritectic and dystectic melting points can be syn-thesised with electrocrystallisation, only the highest melting dystectic of a given phasediagram cannot be overcome. In this work the following compounds were synthesisedstarting from unary electrode materials. Amalgams: LiHg3 (see chapter 3.4.2), KHg11
and KHg6 (see chapter 3.4.1) and Eu10Hg55 (see chapter 3.3.1); Gallides: Li3Ga14 andNaGa4 (see chapter 3.5.1).
Binary electrodes Electrolysis of LiI on a binary Ga-Sn cathode (see Figure 4.4) yieldsLi3Ga13Sn. Figure 4.4 shows an isothermal section of the ternary phase diagram Li–Ga–Sn including literature-known binary and ternary phases (black) and the new phaseLi3Ga13Sn (red). Two different electrolytic synthesis pathways are indicated by arrows.Pale blue: Electrolysis performed in this work (see chapter 3.5.2) starting from Ga-Sneutectic with 8% Sn and melting point 55 C yields Li3Ga13Sn; Purple: hypotheticalelectrolysis starting from GaSn (melting point 130 C), leading to LiGaSn as product.In both cases the Ga:Sn ratio remains the same for the educt and the product.
Formation of a ternary phase during electrolysis on a binary cathode is one of the possi-ble outcomes. Another one is the formation of a binary phase with the second electrode
Figure 4.4.: Ternary phase diagram of Li–Ga–Sn. Literature known phases are black, the new phasein red. Literatureis compiled in Table 4.1. The pathway of the performed electrolysis is shown in lightblue, another possible pathway leading to LiGaSn is shown in purple.
Discussion 179
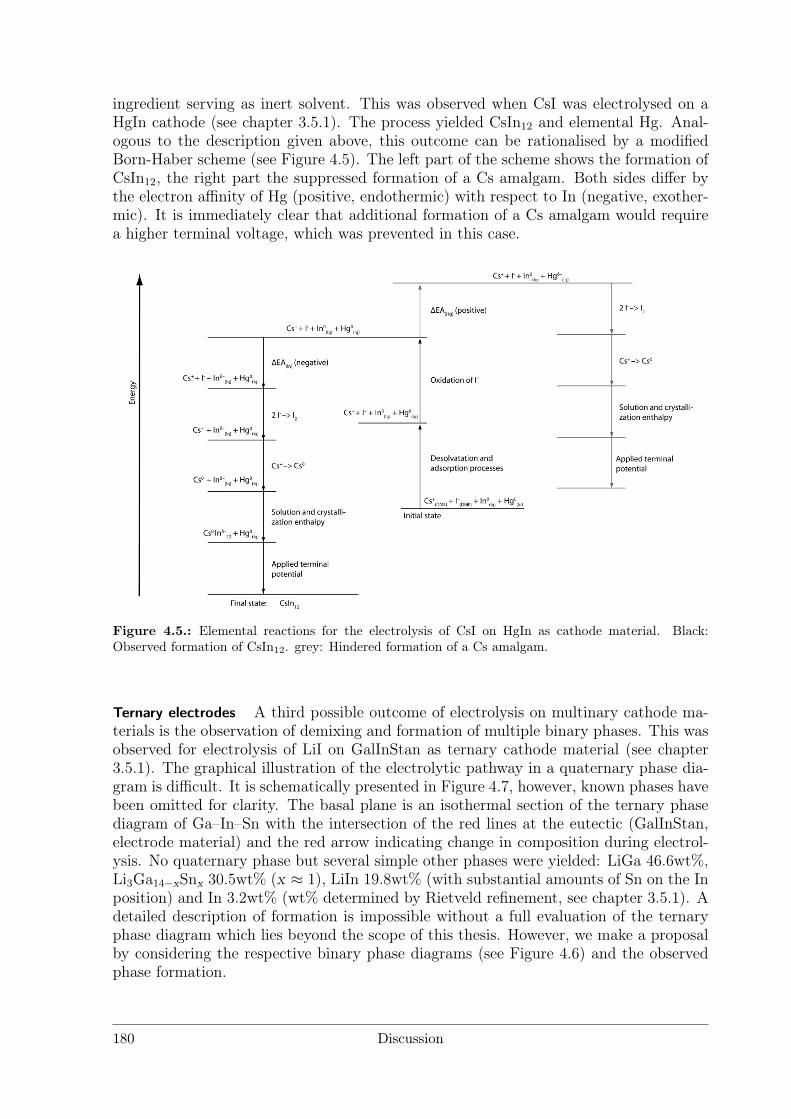
ingredient serving as inert solvent. This was observed when CsI was electrolysed on aHgIn cathode (see chapter 3.5.1). The process yielded CsIn12 and elemental Hg. Anal-ogous to the description given above, this outcome can be rationalised by a modifiedBorn-Haber scheme (see Figure 4.5). The left part of the scheme shows the formation ofCsIn12, the right part the suppressed formation of a Cs amalgam. Both sides differ bythe electron affinity of Hg (positive, endothermic) with respect to In (negative, exother-mic). It is immediately clear that additional formation of a Cs amalgam would requirea higher terminal voltage, which was prevented in this case.
Figure 4.5.: Elemental reactions for the electrolysis of CsI on HgIn as cathode material. Black:Observed formation of CsIn12. grey: Hindered formation of a Cs amalgam.
Ternary electrodes A third possible outcome of electrolysis on multinary cathode ma-terials is the observation of demixing and formation of multiple binary phases. This wasobserved for electrolysis of LiI on GalInStan as ternary cathode material (see chapter3.5.1). The graphical illustration of the electrolytic pathway in a quaternary phase dia-gram is difficult. It is schematically presented in Figure 4.7, however, known phases havebeen omitted for clarity. The basal plane is an isothermal section of the ternary phasediagram of Ga–In–Sn with the intersection of the red lines at the eutectic (GalInStan,electrode material) and the red arrow indicating change in composition during electrol-ysis. No quaternary phase but several simple other phases were yielded: LiGa 46.6wt%,Li3Ga14−xSnx 30.5wt% (x ≈ 1), LiIn 19.8wt% (with substantial amounts of Sn on the Inposition) and In 3.2wt% (wt% determined by Rietveld refinement, see chapter 3.5.1). Adetailed description of formation is impossible without a full evaluation of the ternaryphase diagram which lies beyond the scope of this thesis. However, we make a proposalby considering the respective binary phase diagrams (see Figure 4.6) and the observedphase formation.
180 Discussion
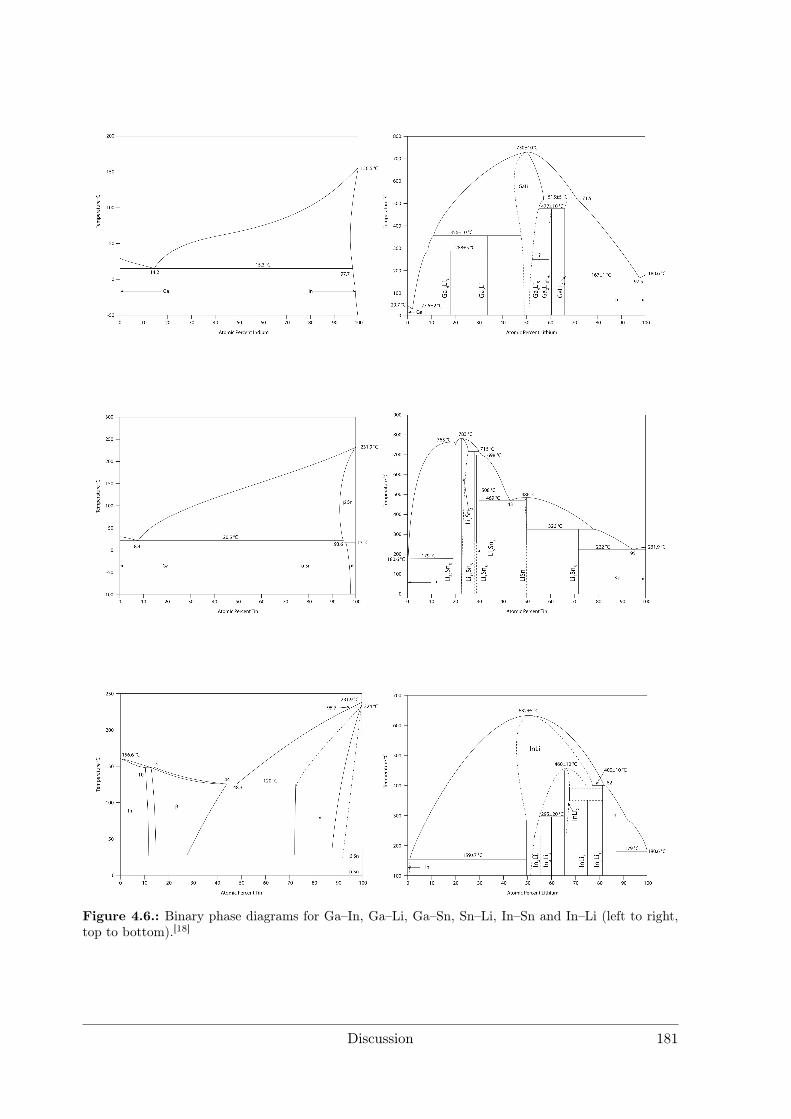
Figure 4.6.: Binary phase diagrams for Ga–In, Ga–Li, Ga–Sn, Sn–Li, In–Sn and In–Li (left to right,top to bottom).[18]
Discussion 181
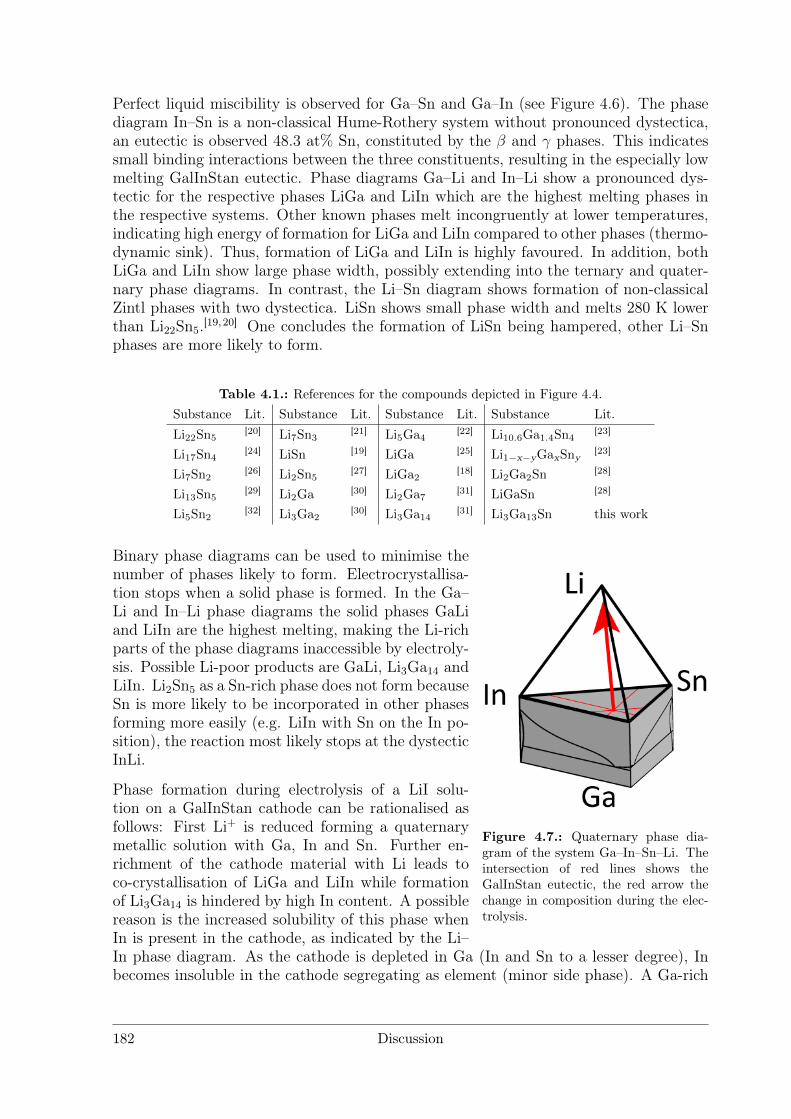
Perfect liquid miscibility is observed for Ga–Sn and Ga–In (see Figure 4.6). The phasediagram In–Sn is a non-classical Hume-Rothery system without pronounced dystectica,an eutectic is observed 48.3 at% Sn, constituted by the β and γ phases. This indicatessmall binding interactions between the three constituents, resulting in the especially lowmelting GalInStan eutectic. Phase diagrams Ga–Li and In–Li show a pronounced dys-tectic for the respective phases LiGa and LiIn which are the highest melting phases inthe respective systems. Other known phases melt incongruently at lower temperatures,indicating high energy of formation for LiGa and LiIn compared to other phases (thermo-dynamic sink). Thus, formation of LiGa and LiIn is highly favoured. In addition, bothLiGa and LiIn show large phase width, possibly extending into the ternary and quater-nary phase diagrams. In contrast, the Li–Sn diagram shows formation of non-classicalZintl phases with two dystectica. LiSn shows small phase width and melts 280 K lowerthan Li22Sn5.[19, 20] One concludes the formation of LiSn being hampered, other Li–Snphases are more likely to form.
Table 4.1.: References for the compounds depicted in Figure 4.4.Substance Lit. Substance Lit. Substance Lit. Substance Lit.Li22Sn5
[20] Li7Sn3[21] Li5Ga4
[22] Li10.6Ga1.4Sn4[23]
Li17Sn4[24] LiSn [19] LiGa [25] Li1−x−yGaxSny
[23]
Li7Sn2[26] Li2Sn5
[27] LiGa2[18] Li2Ga2Sn [28]
Li13Sn5[29] Li2Ga [30] Li2Ga7
[31] LiGaSn [28]
Li5Sn2[32] Li3Ga2
[30] Li3Ga14[31] Li3Ga13Sn this work
Figure 4.7.: Quaternary phase dia-gram of the system Ga–In–Sn–Li. Theintersection of red lines shows theGalInStan eutectic, the red arrow thechange in composition during the elec-trolysis.
Binary phase diagrams can be used to minimise thenumber of phases likely to form. Electrocrystallisa-tion stops when a solid phase is formed. In the Ga–Li and In–Li phase diagrams the solid phases GaLiand LiIn are the highest melting, making the Li-richparts of the phase diagrams inaccessible by electroly-sis. Possible Li-poor products are GaLi, Li3Ga14 andLiIn. Li2Sn5 as a Sn-rich phase does not form becauseSn is more likely to be incorporated in other phasesforming more easily (e.g. LiIn with Sn on the In po-sition), the reaction most likely stops at the dystecticInLi.
Phase formation during electrolysis of a LiI solu-tion on a GalInStan cathode can be rationalised asfollows: First Li+ is reduced forming a quaternarymetallic solution with Ga, In and Sn. Further en-richment of the cathode material with Li leads toco-crystallisation of LiGa and LiIn while formationof Li3Ga14 is hindered by high In content. A possiblereason is the increased solubility of this phase whenIn is present in the cathode, as indicated by the Li–In phase diagram. As the cathode is depleted in Ga (In and Sn to a lesser degree), Inbecomes insoluble in the cathode segregating as element (minor side phase). A Ga-rich
182 Discussion
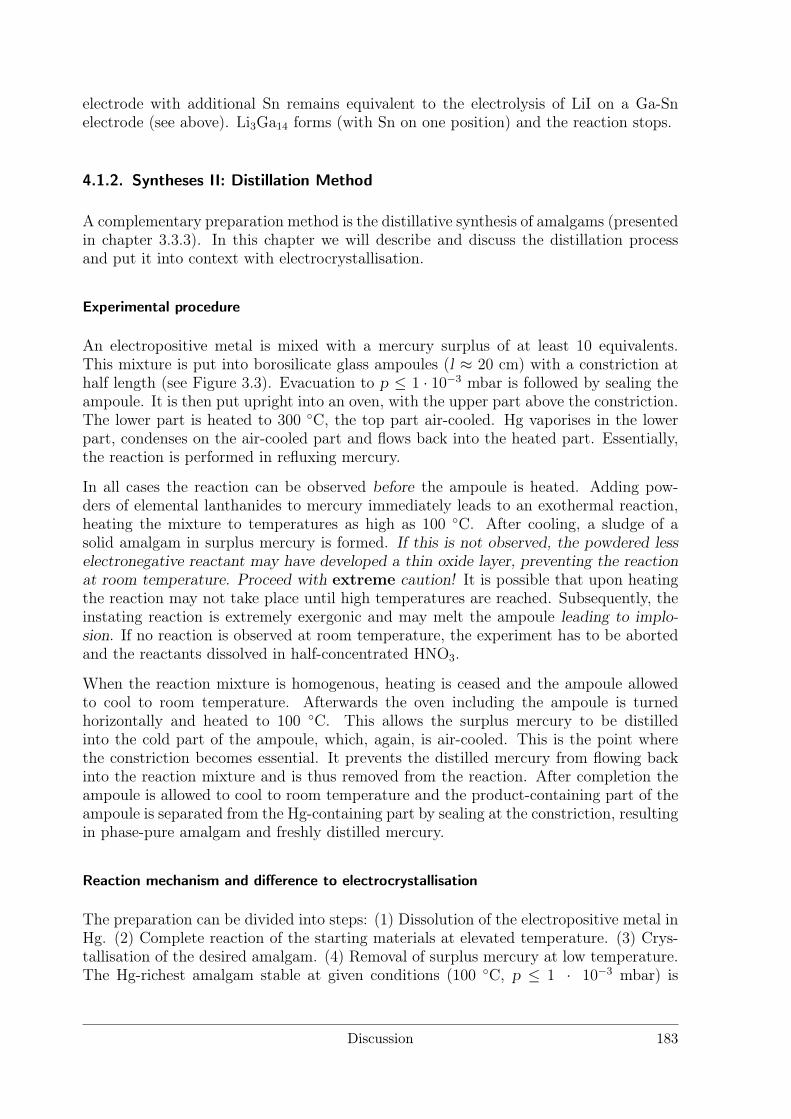
electrode with additional Sn remains equivalent to the electrolysis of LiI on a Ga-Snelectrode (see above). Li3Ga14 forms (with Sn on one position) and the reaction stops.
4.1.2. Syntheses II: Distillation Method
A complementary preparation method is the distillative synthesis of amalgams (presentedin chapter 3.3.3). In this chapter we will describe and discuss the distillation processand put it into context with electrocrystallisation.
Experimental procedure
An electropositive metal is mixed with a mercury surplus of at least 10 equivalents.This mixture is put into borosilicate glass ampoules (l ≈ 20 cm) with a constriction athalf length (see Figure 3.3). Evacuation to p ≤ 1 · 10−3 mbar is followed by sealing theampoule. It is then put upright into an oven, with the upper part above the constriction.The lower part is heated to 300 C, the top part air-cooled. Hg vaporises in the lowerpart, condenses on the air-cooled part and flows back into the heated part. Essentially,the reaction is performed in refluxing mercury.
In all cases the reaction can be observed before the ampoule is heated. Adding pow-ders of elemental lanthanides to mercury immediately leads to an exothermal reaction,heating the mixture to temperatures as high as 100 C. After cooling, a sludge of asolid amalgam in surplus mercury is formed. If this is not observed, the powdered lesselectronegative reactant may have developed a thin oxide layer, preventing the reactionat room temperature. Proceed with extreme caution! It is possible that upon heatingthe reaction may not take place until high temperatures are reached. Subsequently, theinstating reaction is extremely exergonic and may melt the ampoule leading to implo-sion. If no reaction is observed at room temperature, the experiment has to be abortedand the reactants dissolved in half-concentrated HNO3.
When the reaction mixture is homogenous, heating is ceased and the ampoule allowedto cool to room temperature. Afterwards the oven including the ampoule is turnedhorizontally and heated to 100 C. This allows the surplus mercury to be distilledinto the cold part of the ampoule, which, again, is air-cooled. This is the point wherethe constriction becomes essential. It prevents the distilled mercury from flowing backinto the reaction mixture and is thus removed from the reaction. After completion theampoule is allowed to cool to room temperature and the product-containing part of theampoule is separated from the Hg-containing part by sealing at the constriction, resultingin phase-pure amalgam and freshly distilled mercury.
Reaction mechanism and difference to electrocrystallisation
The preparation can be divided into steps: (1) Dissolution of the electropositive metal inHg. (2) Complete reaction of the starting materials at elevated temperature. (3) Crys-tallisation of the desired amalgam. (4) Removal of surplus mercury at low temperature.The Hg-richest amalgam stable at given conditions (100 C, p ≤ 1 · 10−3 mbar) is
Discussion 183
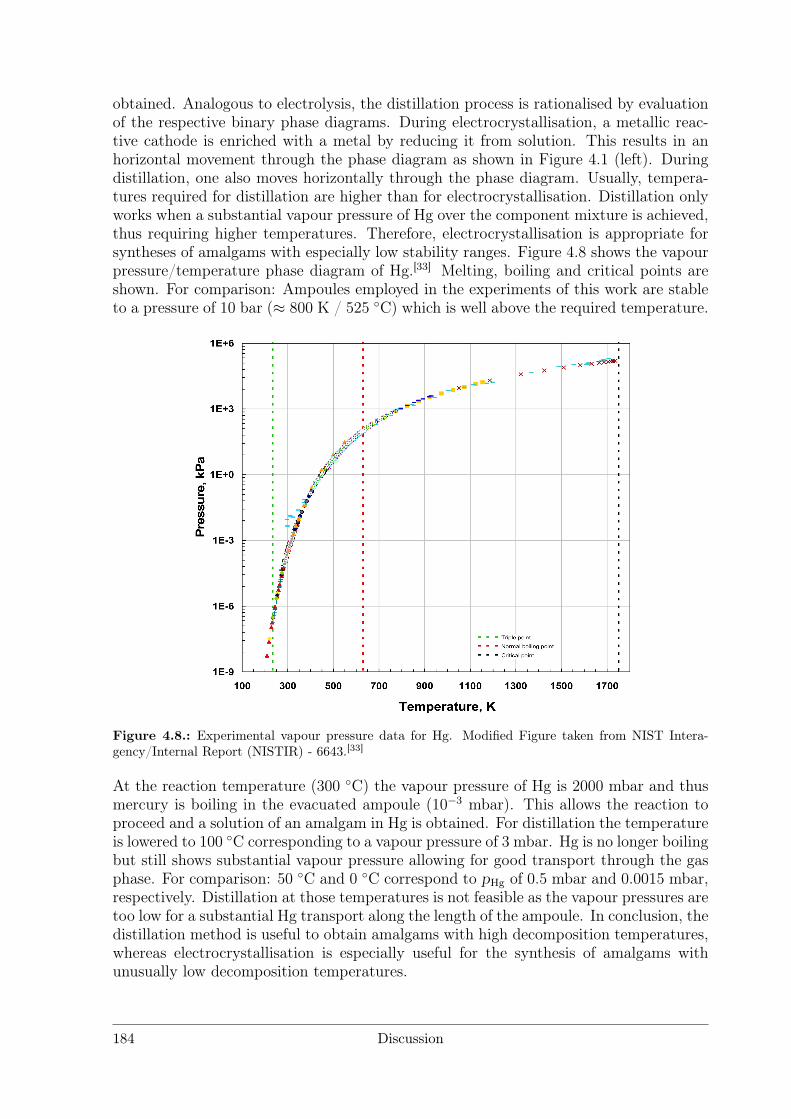
obtained. Analogous to electrolysis, the distillation process is rationalised by evaluationof the respective binary phase diagrams. During electrocrystallisation, a metallic reac-tive cathode is enriched with a metal by reducing it from solution. This results in anhorizontal movement through the phase diagram as shown in Figure 4.1 (left). Duringdistillation, one also moves horizontally through the phase diagram. Usually, tempera-tures required for distillation are higher than for electrocrystallisation. Distillation onlyworks when a substantial vapour pressure of Hg over the component mixture is achieved,thus requiring higher temperatures. Therefore, electrocrystallisation is appropriate forsyntheses of amalgams with especially low stability ranges. Figure 4.8 shows the vapourpressure/temperature phase diagram of Hg.[33] Melting, boiling and critical points areshown. For comparison: Ampoules employed in the experiments of this work are stableto a pressure of 10 bar (≈ 800 K / 525 C) which is well above the required temperature.
Figure 4.8.: Experimental vapour pressure data for Hg. Modified Figure taken from NIST Intera-gency/Internal Report (NISTIR) - 6643.[33]
At the reaction temperature (300 C) the vapour pressure of Hg is 2000 mbar and thusmercury is boiling in the evacuated ampoule (10−3 mbar). This allows the reaction toproceed and a solution of an amalgam in Hg is obtained. For distillation the temperatureis lowered to 100 C corresponding to a vapour pressure of 3 mbar. Hg is no longer boilingbut still shows substantial vapour pressure allowing for good transport through the gasphase. For comparison: 50 C and 0 C correspond to pHg of 0.5 mbar and 0.0015 mbar,respectively. Distillation at those temperatures is not feasible as the vapour pressures aretoo low for a substantial Hg transport along the length of the ampoule. In conclusion, thedistillation method is useful to obtain amalgams with high decomposition temperatures,whereas electrocrystallisation is especially useful for the synthesis of amalgams withunusually low decomposition temperatures.
184 Discussion
4.2. Evaluation of Crystal Structures and Measures of Complexity
Quantification of the vague term "complexity" is possible with the definition of com-plexity measures.[34, 35] For a long time, complexity in crystal structures was regardedas "largely a qualitative, frequently intuitive, notion".[36] This is in contrast to the fre-quent use of the term and related terminology to describe structures, e.g. "complicatedstructure", "the most complex structure", "complex superstructure" or "a masterpieceof structural complexity".[16, 36,37] A new approach towards a numerical interpretationof complexity leading to quantifiable ratings provides important tools for comparisonof structures and was developed recently.[34, 35] Within this new method, structures aredeconstructed and adapted to information theory conceps, more precisely graph theory:total crystal structure (graph), atoms as vertices (nodes) and chemical bonds as edges(links).
The structural information content of one crystal structure per reduced unit cell is IGin [bits/atom] and is calculated as the sum of the number of crystallographic orbits kand the probability of occurrence of the atom on the ith orbit pi. The total informationcontent IGBits (in [bits/unit cell]) is calculated by multiplying IG with the number ofatoms in the unit cell. To make IG independent of the number of atoms, a normalisedinformation content IGn (unitless) is defined by division of IG by IGmax (the maximalinformation content with all non-equivalent atoms). Strong influence on the informationcontent is imposed by the size of the unit cell and therefore the number of atoms inthe unit cell. Structures with low symmetry are generally more complex as they exhibitmore inequivalent crystallographic orbits than a unit cell similar in size but with higherin symmetry. Mixed positions introduce more complexity, they are treated as additionalcrystallographic orbits. Underoccupation is also treated as additional crystallographicorbit.[34, 35]
Another method of rationalising complex crystal structures, especially of coordinationcompounds, is to reduce the coordination moieties to spheres. The topology of thepacking of those centroids can then be analysed topologically. Thus, complex structurescan be reduced to and explained by simple sphere packings.
4.2.1. Metal Iodide Solvate Structures as Decorated Variants of Simple SpherePackings
Preparative electrolysis as synthetic method often yields intermetallic compounds whichare very sensitive towards air and moisture. A dry aprotic solvent is necessary. In orderto dissolve the educts (iodides) it must be polar. In addition, the liquid range andelectrochemical stability should be large and its viscosity low. N,N -dimethyl formamide(DMF) satisfies all requirements. It is liquid from −61 C to 153 C, very polar (3.86 D),of low viscosity (0.802 mPas), electrochemically stable up to ≈ 5 V and easy to dry overCaH2 or by azeotropic distillation.
The starting material for electrolysis, usually an iodide, is dissolved in DMF, the resultingsolution dried and used for electrolysis. However, some iodides are very expensive andit is convenient to synthesise the iodides in DMF as solvent yielding the respective
Discussion 185
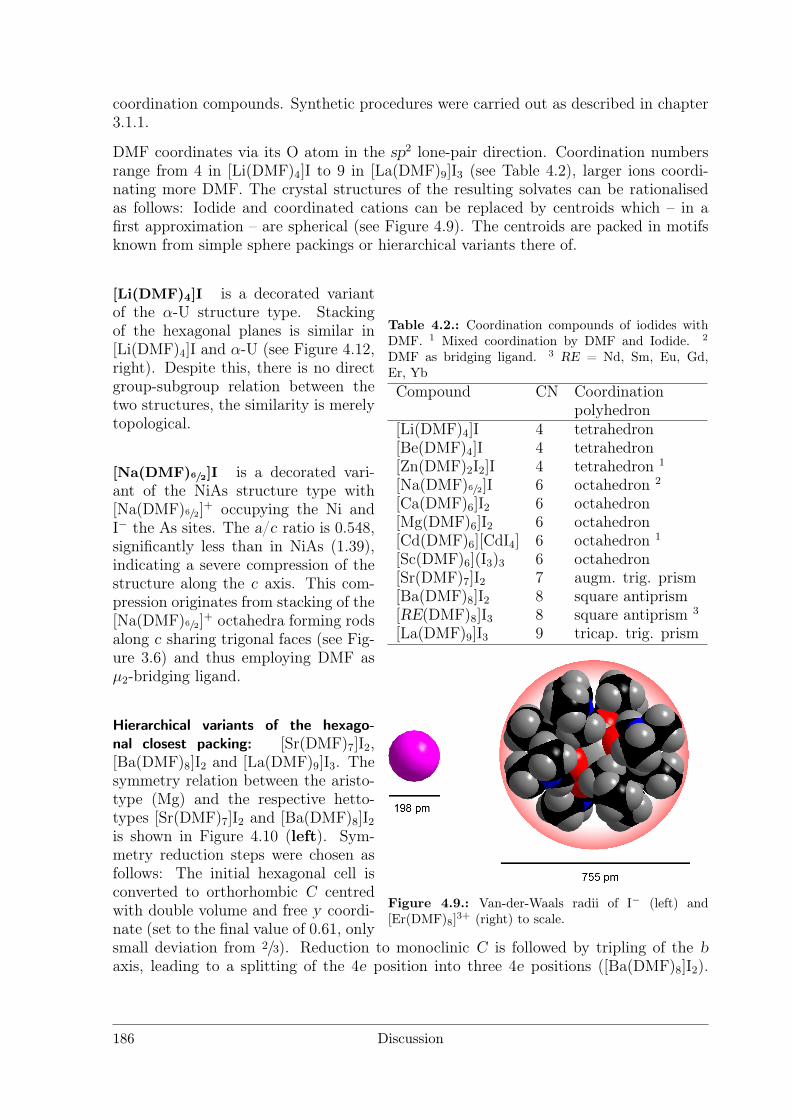
coordination compounds. Synthetic procedures were carried out as described in chapter3.1.1.
DMF coordinates via its O atom in the sp2 lone-pair direction. Coordination numbersrange from 4 in [Li(DMF)4]I to 9 in [La(DMF)9]I3 (see Table 4.2), larger ions coordi-nating more DMF. The crystal structures of the resulting solvates can be rationalisedas follows: Iodide and coordinated cations can be replaced by centroids which – in afirst approximation – are spherical (see Figure 4.9). The centroids are packed in motifsknown from simple sphere packings or hierarchical variants there of.
Table 4.2.: Coordination compounds of iodides withDMF. 1 Mixed coordination by DMF and Iodide. 2
DMF as bridging ligand. 3 RE = Nd, Sm, Eu, Gd,Er, YbCompound CN Coordination
polyhedron[Li(DMF)4]I 4 tetrahedron[Be(DMF)4]I 4 tetrahedron[Zn(DMF)2I2]I 4 tetrahedron 1
[Na(DMF)6/2]I 6 octahedron 2
[Ca(DMF)6]I2 6 octahedron[Mg(DMF)6]I2 6 octahedron[Cd(DMF)6][CdI4] 6 octahedron 1
[Sc(DMF)6](I3)3 6 octahedron[Sr(DMF)7]I2 7 augm. trig. prism[Ba(DMF)8]I2 8 square antiprism[RE(DMF)8]I3 8 square antiprism 3
[La(DMF)9]I3 9 tricap. trig. prism
Figure 4.9.: Van-der-Waals radii of I− (left) and[Er(DMF)8]3+ (right) to scale.
[Li(DMF)4]I is a decorated variantof the α-U structure type. Stackingof the hexagonal planes is similar in[Li(DMF)4]I and α-U (see Figure 4.12,right). Despite this, there is no directgroup-subgroup relation between thetwo structures, the similarity is merelytopological.
[Na(DMF)6/2]I is a decorated vari-ant of the NiAs structure type with[Na(DMF)6/2]
+ occupying the Ni andI− the As sites. The a/c ratio is 0.548,significantly less than in NiAs (1.39),indicating a severe compression of thestructure along the c axis. This com-pression originates from stacking of the[Na(DMF)6/2]
+ octahedra forming rodsalong c sharing trigonal faces (see Fig-ure 3.6) and thus employing DMF asµ2-bridging ligand.
Hierarchical variants of the hexago-nal closest packing: [Sr(DMF)7]I2,[Ba(DMF)8]I2 and [La(DMF)9]I3. Thesymmetry relation between the aristo-type (Mg) and the respective hetto-types [Sr(DMF)7]I2 and [Ba(DMF)8]I2is shown in Figure 4.10 (left). Sym-metry reduction steps were chosen asfollows: The initial hexagonal cell isconverted to orthorhombic C centredwith double volume and free y coordi-nate (set to the final value of 0.61, onlysmall deviation from 2/3). Reduction to monoclinic C is followed by tripling of the baxis, leading to a splitting of the 4e position into three 4e positions ([Ba(DMF)8]I2).
186 Discussion
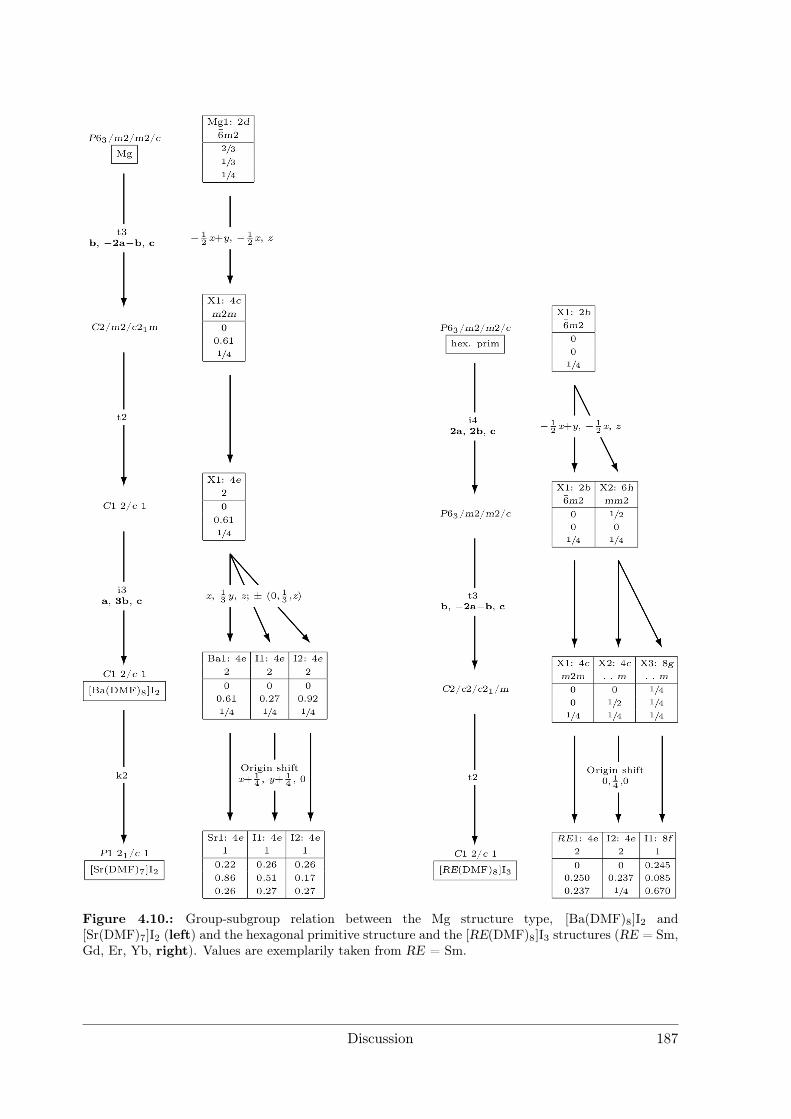
Figure 4.10.: Group-subgroup relation between the Mg structure type, [Ba(DMF)8]I2 and[Sr(DMF)7]I2 (left) and the hexagonal primitive structure and the [RE(DMF)8]I3 structures (RE = Sm,Gd, Er, Yb, right). Values are exemplarily taken from RE = Sm.
Discussion 187
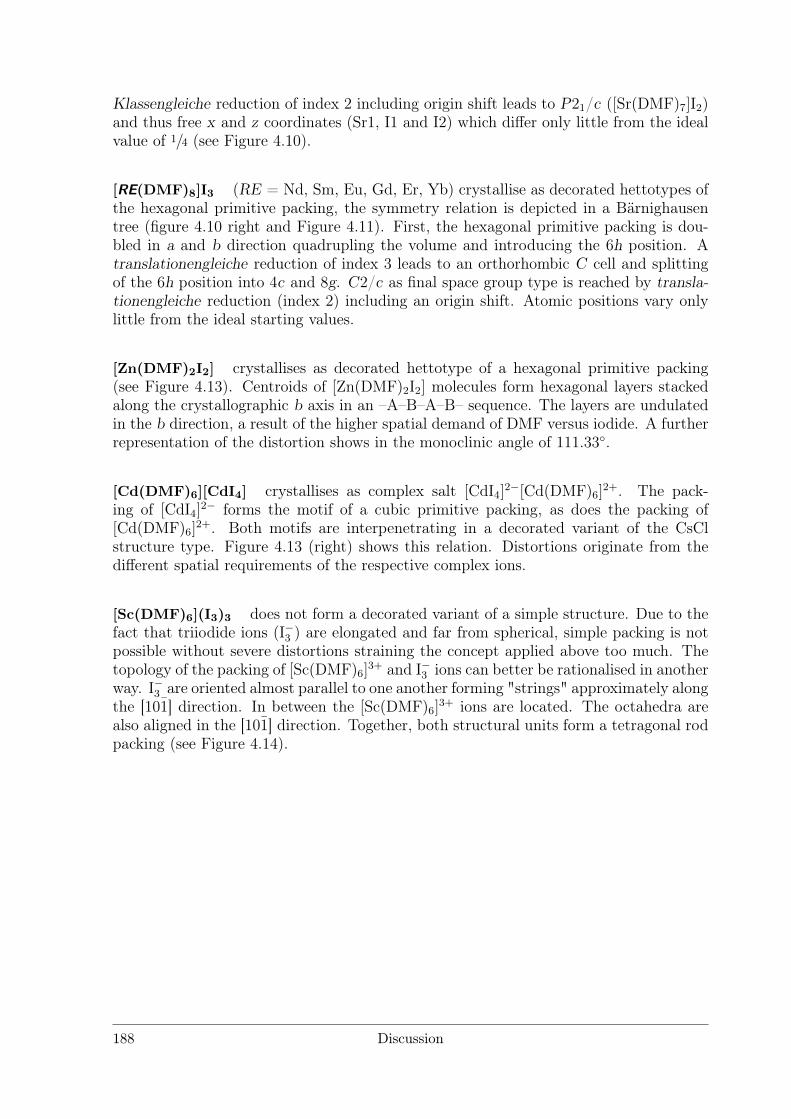
Klassengleiche reduction of index 2 including origin shift leads to P21/c ([Sr(DMF)7]I2)and thus free x and z coordinates (Sr1, I1 and I2) which differ only little from the idealvalue of 1/4 (see Figure 4.10).
[RE(DMF)8]I3 (RE = Nd, Sm, Eu, Gd, Er, Yb) crystallise as decorated hettotypes ofthe hexagonal primitive packing, the symmetry relation is depicted in a Bärnighausentree (figure 4.10 right and Figure 4.11). First, the hexagonal primitive packing is dou-bled in a and b direction quadrupling the volume and introducing the 6h position. Atranslationengleiche reduction of index 3 leads to an orthorhombic C cell and splittingof the 6h position into 4c and 8g. C2/c as final space group type is reached by transla-tionengleiche reduction (index 2) including an origin shift. Atomic positions vary onlylittle from the ideal starting values.
[Zn(DMF)2I2] crystallises as decorated hettotype of a hexagonal primitive packing(see Figure 4.13). Centroids of [Zn(DMF)2I2] molecules form hexagonal layers stackedalong the crystallographic b axis in an –A–B–A–B– sequence. The layers are undulatedin the b direction, a result of the higher spatial demand of DMF versus iodide. A furtherrepresentation of the distortion shows in the monoclinic angle of 111.33.
[Cd(DMF)6][CdI4] crystallises as complex salt [CdI4]2−[Cd(DMF)6]
2+. The pack-ing of [CdI4]
2− forms the motif of a cubic primitive packing, as does the packing of[Cd(DMF)6]
2+. Both motifs are interpenetrating in a decorated variant of the CsClstructure type. Figure 4.13 (right) shows this relation. Distortions originate from thedifferent spatial requirements of the respective complex ions.
[Sc(DMF)6](I3)3 does not form a decorated variant of a simple structure. Due to thefact that triiodide ions (I−3 ) are elongated and far from spherical, simple packing is notpossible without severe distortions straining the concept applied above too much. Thetopology of the packing of [Sc(DMF)6]
3+ and I−3 ions can better be rationalised in anotherway. I−3 are oriented almost parallel to one another forming "strings" approximately alongthe [101] direction. In between the [Sc(DMF)6]
3+ ions are located. The octahedra arealso aligned in the [101] direction. Together, both structural units form a tetragonal rodpacking (see Figure 4.14).
188 Discussion
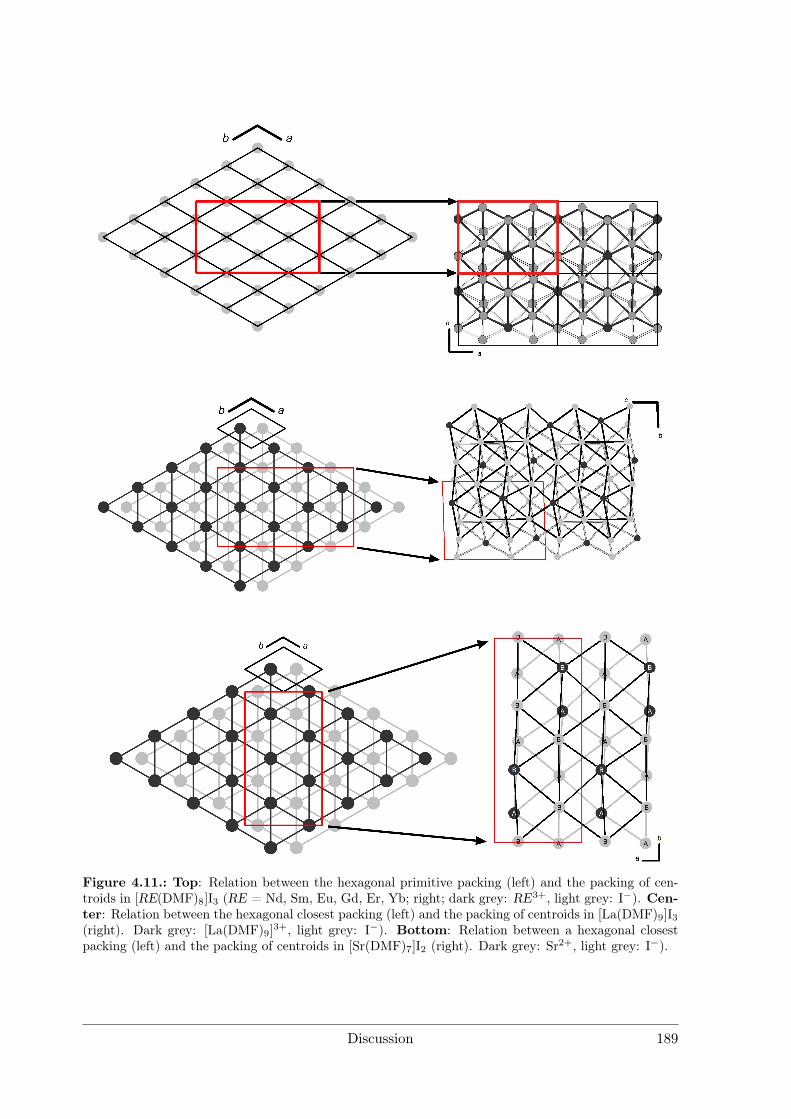
Figure 4.11.: Top: Relation between the hexagonal primitive packing (left) and the packing of cen-troids in [RE(DMF)8]I3 (RE = Nd, Sm, Eu, Gd, Er, Yb; right; dark grey: RE3+, light grey: I−). Cen-ter: Relation between the hexagonal closest packing (left) and the packing of centroids in [La(DMF)9]I3(right). Dark grey: [La(DMF)9]3+, light grey: I−). Bottom: Relation between a hexagonal closestpacking (left) and the packing of centroids in [Sr(DMF)7]I2 (right). Dark grey: Sr2+, light grey: I−).
Discussion 189
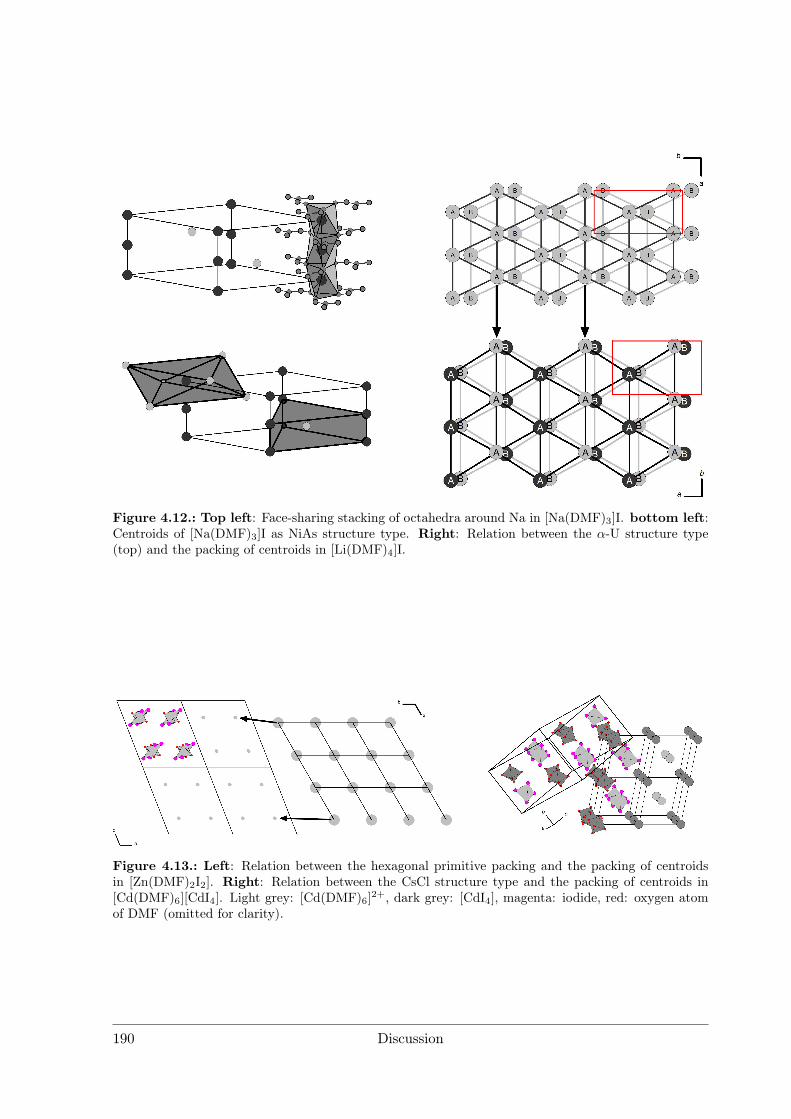
Figure 4.12.: Top left: Face-sharing stacking of octahedra around Na in [Na(DMF)3]I. bottom left:Centroids of [Na(DMF)3]I as NiAs structure type. Right: Relation between the α-U structure type(top) and the packing of centroids in [Li(DMF)4]I.
Figure 4.13.: Left: Relation between the hexagonal primitive packing and the packing of centroidsin [Zn(DMF)2I2]. Right: Relation between the CsCl structure type and the packing of centroids in[Cd(DMF)6][CdI4]. Light grey: [Cd(DMF)6]2+, dark grey: [CdI4], magenta: iodide, red: oxygen atomof DMF (omitted for clarity).
190 Discussion
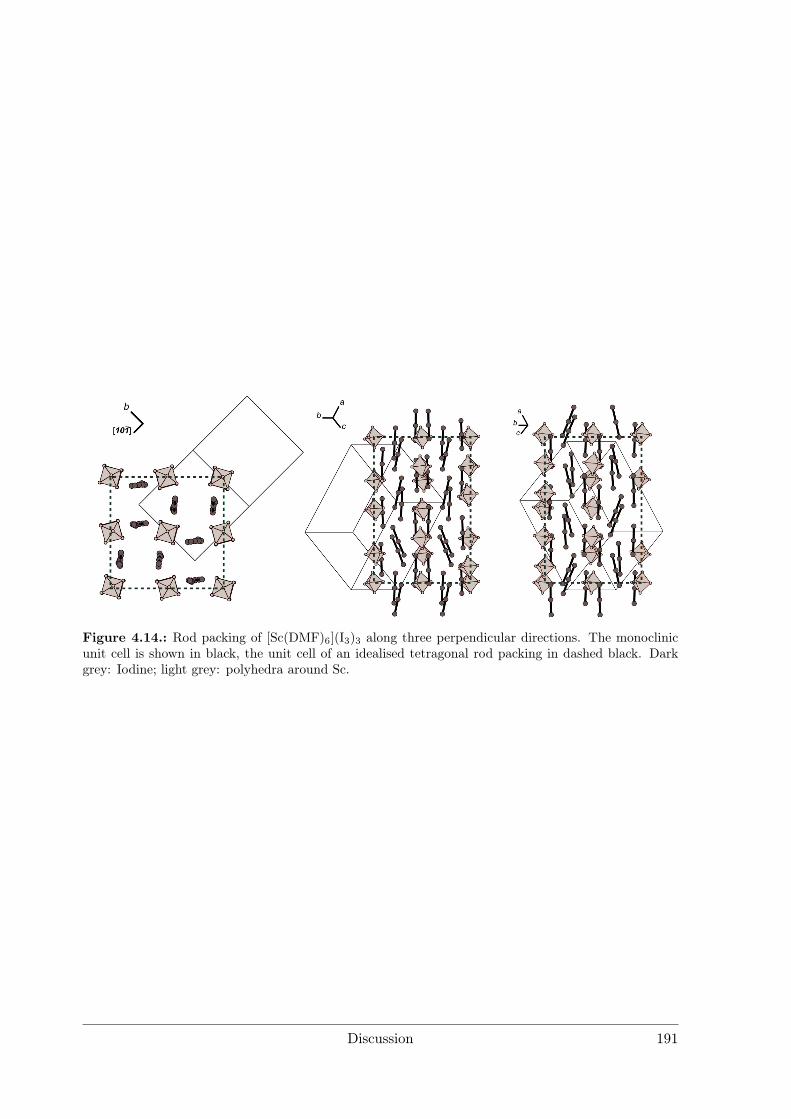
Figure 4.14.: Rod packing of [Sc(DMF)6](I3)3 along three perpendicular directions. The monoclinicunit cell is shown in black, the unit cell of an idealised tetragonal rod packing in dashed black. Darkgrey: Iodine; light grey: polyhedra around Sc.
Discussion 191
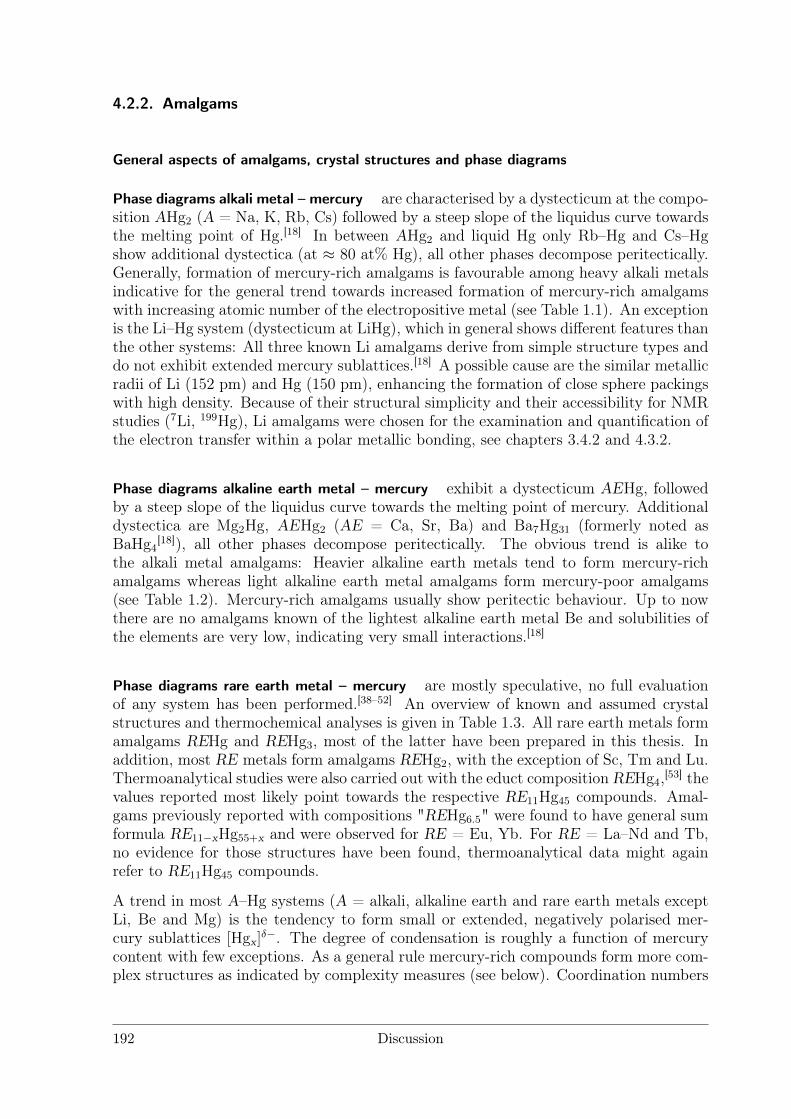
4.2.2. Amalgams
General aspects of amalgams, crystal structures and phase diagrams
Phase diagrams alkali metal – mercury are characterised by a dystecticum at the compo-sition AHg2 (A = Na, K, Rb, Cs) followed by a steep slope of the liquidus curve towardsthe melting point of Hg.[18] In between AHg2 and liquid Hg only Rb–Hg and Cs–Hgshow additional dystectica (at ≈ 80 at% Hg), all other phases decompose peritectically.Generally, formation of mercury-rich amalgams is favourable among heavy alkali metalsindicative for the general trend towards increased formation of mercury-rich amalgamswith increasing atomic number of the electropositive metal (see Table 1.1). An exceptionis the Li–Hg system (dystecticum at LiHg), which in general shows different features thanthe other systems: All three known Li amalgams derive from simple structure types anddo not exhibit extended mercury sublattices.[18] A possible cause are the similar metallicradii of Li (152 pm) and Hg (150 pm), enhancing the formation of close sphere packingswith high density. Because of their structural simplicity and their accessibility for NMRstudies (7Li, 199Hg), Li amalgams were chosen for the examination and quantification ofthe electron transfer within a polar metallic bonding, see chapters 3.4.2 and 4.3.2.
Phase diagrams alkaline earth metal – mercury exhibit a dystecticum AEHg, followedby a steep slope of the liquidus curve towards the melting point of mercury. Additionaldystectica are Mg2Hg, AEHg2 (AE = Ca, Sr, Ba) and Ba7Hg31 (formerly noted asBaHg4
[18]), all other phases decompose peritectically. The obvious trend is alike tothe alkali metal amalgams: Heavier alkaline earth metals tend to form mercury-richamalgams whereas light alkaline earth metal amalgams form mercury-poor amalgams(see Table 1.2). Mercury-rich amalgams usually show peritectic behaviour. Up to nowthere are no amalgams known of the lightest alkaline earth metal Be and solubilities ofthe elements are very low, indicating very small interactions.[18]
Phase diagrams rare earth metal – mercury are mostly speculative, no full evaluationof any system has been performed.[38–52] An overview of known and assumed crystalstructures and thermochemical analyses is given in Table 1.3. All rare earth metals formamalgams REHg and REHg3, most of the latter have been prepared in this thesis. Inaddition, most RE metals form amalgams REHg2, with the exception of Sc, Tm and Lu.Thermoanalytical studies were also carried out with the educt composition REHg4,[53] thevalues reported most likely point towards the respective RE11Hg45 compounds. Amal-gams previously reported with compositions "REHg6.5" were found to have general sumformula RE11−xHg55+x and were observed for RE = Eu, Yb. For RE = La–Nd and Tb,no evidence for those structures have been found, thermoanalytical data might againrefer to RE11Hg45 compounds.
A trend in most A–Hg systems (A = alkali, alkaline earth and rare earth metals exceptLi, Be and Mg) is the tendency to form small or extended, negatively polarised mer-cury sublattices [Hgx]
δ−. The degree of condensation is roughly a function of mercurycontent with few exceptions. As a general rule mercury-rich compounds form more com-plex structures as indicated by complexity measures (see below). Coordination numbers
192 Discussion
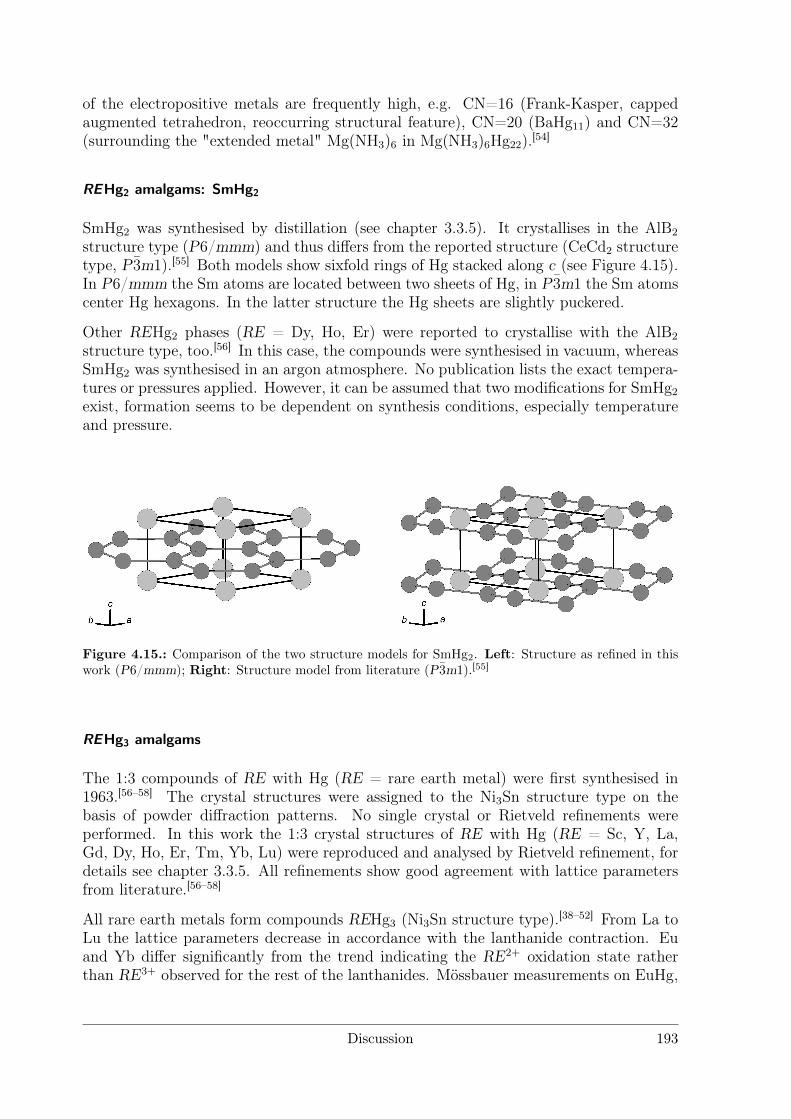
of the electropositive metals are frequently high, e.g. CN=16 (Frank-Kasper, cappedaugmented tetrahedron, reoccurring structural feature), CN=20 (BaHg11) and CN=32(surrounding the "extended metal" Mg(NH3)6 in Mg(NH3)6Hg22).[54]
REHg2 amalgams: SmHg2
SmHg2 was synthesised by distillation (see chapter 3.3.5). It crystallises in the AlB2
structure type (P6/mmm) and thus differs from the reported structure (CeCd2 structuretype, P3m1).[55] Both models show sixfold rings of Hg stacked along c (see Figure 4.15).In P6/mmm the Sm atoms are located between two sheets of Hg, in P3m1 the Sm atomscenter Hg hexagons. In the latter structure the Hg sheets are slightly puckered.
Other REHg2 phases (RE = Dy, Ho, Er) were reported to crystallise with the AlB2
structure type, too.[56] In this case, the compounds were synthesised in vacuum, whereasSmHg2 was synthesised in an argon atmosphere. No publication lists the exact tempera-tures or pressures applied. However, it can be assumed that two modifications for SmHg2
exist, formation seems to be dependent on synthesis conditions, especially temperatureand pressure.
Figure 4.15.: Comparison of the two structure models for SmHg2. Left: Structure as refined in thiswork (P6/mmm); Right: Structure model from literature (P3m1).[55]
REHg3 amalgams
The 1:3 compounds of RE with Hg (RE = rare earth metal) were first synthesised in1963.[56–58] The crystal structures were assigned to the Ni3Sn structure type on thebasis of powder diffraction patterns. No single crystal or Rietveld refinements wereperformed. In this work the 1:3 crystal structures of RE with Hg (RE = Sc, Y, La,Gd, Dy, Ho, Er, Tm, Yb, Lu) were reproduced and analysed by Rietveld refinement, fordetails see chapter 3.3.5. All refinements show good agreement with lattice parametersfrom literature.[56–58]
All rare earth metals form compounds REHg3 (Ni3Sn structure type).[38–52] From La toLu the lattice parameters decrease in accordance with the lanthanide contraction. Euand Yb differ significantly from the trend indicating the RE2+ oxidation state ratherthan RE3+ observed for the rest of the lanthanides. Mössbauer measurements on EuHg,
Discussion 193
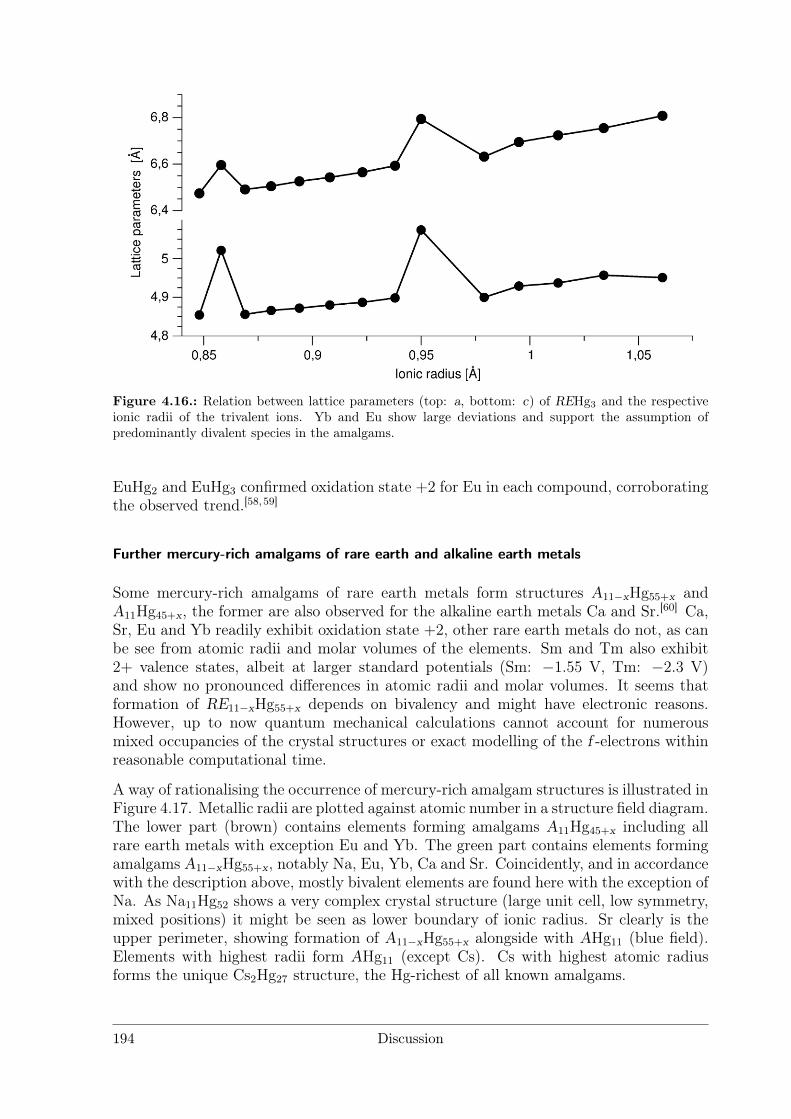
Figure 4.16.: Relation between lattice parameters (top: a, bottom: c) of REHg3 and the respectiveionic radii of the trivalent ions. Yb and Eu show large deviations and support the assumption ofpredominantly divalent species in the amalgams.
EuHg2 and EuHg3 confirmed oxidation state +2 for Eu in each compound, corroboratingthe observed trend.[58, 59]
Further mercury-rich amalgams of rare earth and alkaline earth metals
Some mercury-rich amalgams of rare earth metals form structures A11−xHg55+x andA11Hg45+x, the former are also observed for the alkaline earth metals Ca and Sr.[60] Ca,Sr, Eu and Yb readily exhibit oxidation state +2, other rare earth metals do not, as canbe see from atomic radii and molar volumes of the elements. Sm and Tm also exhibit2+ valence states, albeit at larger standard potentials (Sm: −1.55 V, Tm: −2.3 V)and show no pronounced differences in atomic radii and molar volumes. It seems thatformation of RE11−xHg55+x depends on bivalency and might have electronic reasons.However, up to now quantum mechanical calculations cannot account for numerousmixed occupancies of the crystal structures or exact modelling of the f -electrons withinreasonable computational time.
A way of rationalising the occurrence of mercury-rich amalgam structures is illustrated inFigure 4.17. Metallic radii are plotted against atomic number in a structure field diagram.The lower part (brown) contains elements forming amalgams A11Hg45+x including allrare earth metals with exception Eu and Yb. The green part contains elements formingamalgams A11−xHg55+x, notably Na, Eu, Yb, Ca and Sr. Coincidently, and in accordancewith the description above, mostly bivalent elements are found here with the exception ofNa. As Na11Hg52 shows a very complex crystal structure (large unit cell, low symmetry,mixed positions) it might be seen as lower boundary of ionic radius. Sr clearly is theupper perimeter, showing formation of A11−xHg55+x alongside with AHg11 (blue field).Elements with highest radii form AHg11 (except Cs). Cs with highest atomic radiusforms the unique Cs2Hg27 structure, the Hg-richest of all known amalgams.
194 Discussion
Figure 4.17.: Structure-field diagram for mercury-rich amalgams AHg11, A11−xHg55+x and A11Hg45+x.*: Cs forms an amalgam Cs2Hg27.[14]
The crystal structures of A11−xHg55+x (A = Na, Eu, Yb, Ca, Sr) can be derived from theGd14Ag51 aristotype by lowering the symmetry (from P6/m to P6) and introducing sev-eral disorder phenomena (see chapter 3.3.2). Only Yb shows no disorder phenomena, allatomic positions are fully occupied by one element (see chapter 3.3.4). In Ca11−xHg55+xand Sr11−xHg55+x, the position centring the Frank-Kasper polyhedron is of mixed occu-pancy. In addition to that, Eu10Hg55 shows a Hg chain along the crystallographic c axiswith constrained underoccupation (see chapter 3.3.1). The crystal structure of Na11Hg52
is the most complex. It crystallises in a 3x3x1 superstructure of Gd14Ag51 with 132crystallographically independent positions, one of which shows mixed occupancy.
Complexity measures (see chapter 4.2) for the compounds A11−xHg55+x (A = Na, Eu, Yb,Ca, Sr) are compiled in Table 4.3. The aristotype crystallises with higher symmetry andthus is significantly less complex than the other compounds. Amalgams of Yb, Ca/Sr andEu crystallise with lower symmetry and thus higher complexity than Gd14Ag51. Despitethe differences of their crystal structures and the numerous disorder phenomena, theircomplexities lie in the same order of magnitude (250–275). Next higher in symmetry isa (not yet fully characterised) Na–K amalgam with an estimated complexity of ∼1000.Due to its 2x2x1 superstructure (in comparison to Gd14Ag51), its unit cell content isquadrupled and so is the information content. Highest in complexity is Na11Hg52 witha value close to ∼4000 which is considerably larger than expected even for the 3x3x1supercell with ninefold unit cell content. The difference can be explained by increasedvalue of IG, the information content of each atomic position. Due to its large unit celland low symmetry, each atom can account for more information which then translates
Discussion 195
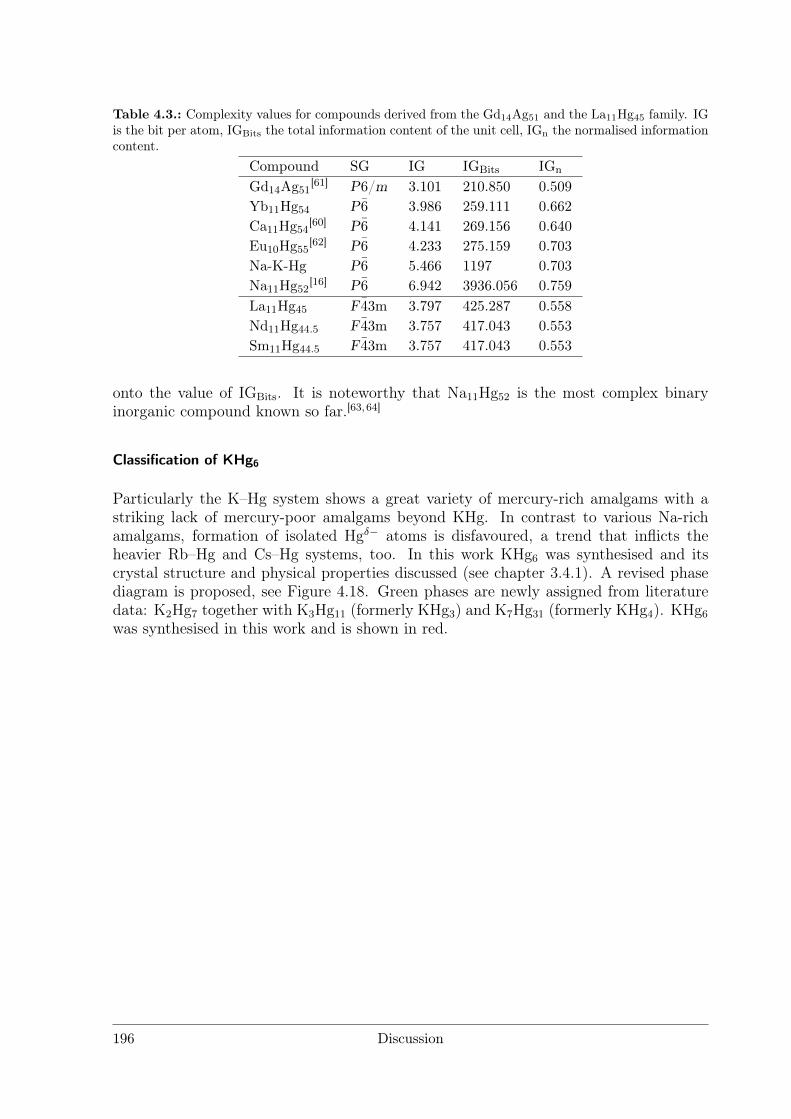
Table 4.3.: Complexity values for compounds derived from the Gd14Ag51 and the La11Hg45 family. IGis the bit per atom, IGBits the total information content of the unit cell, IGn the normalised informationcontent.
Compound SG IG IGBits IGn
Gd14Ag51[61] P6/m 3.101 210.850 0.509
Yb11Hg54 P6 3.986 259.111 0.662Ca11Hg54
[60] P6 4.141 269.156 0.640Eu10Hg55
[62] P6 4.233 275.159 0.703Na-K-Hg P6 5.466 1197 0.703Na11Hg52
[16] P6 6.942 3936.056 0.759La11Hg45 F43m 3.797 425.287 0.558Nd11Hg44.5 F43m 3.757 417.043 0.553Sm11Hg44.5 F43m 3.757 417.043 0.553
onto the value of IGBits. It is noteworthy that Na11Hg52 is the most complex binaryinorganic compound known so far.[63, 64]
Classification of KHg6
Particularly the K–Hg system shows a great variety of mercury-rich amalgams with astriking lack of mercury-poor amalgams beyond KHg. In contrast to various Na-richamalgams, formation of isolated Hgδ− atoms is disfavoured, a trend that inflicts theheavier Rb–Hg and Cs–Hg systems, too. In this work KHg6 was synthesised and itscrystal structure and physical properties discussed (see chapter 3.4.1). A revised phasediagram is proposed, see Figure 4.18. Green phases are newly assigned from literaturedata: K2Hg7 together with K3Hg11 (formerly KHg3) and K7Hg31 (formerly KHg4). KHg6
was synthesised in this work and is shown in red.
196 Discussion
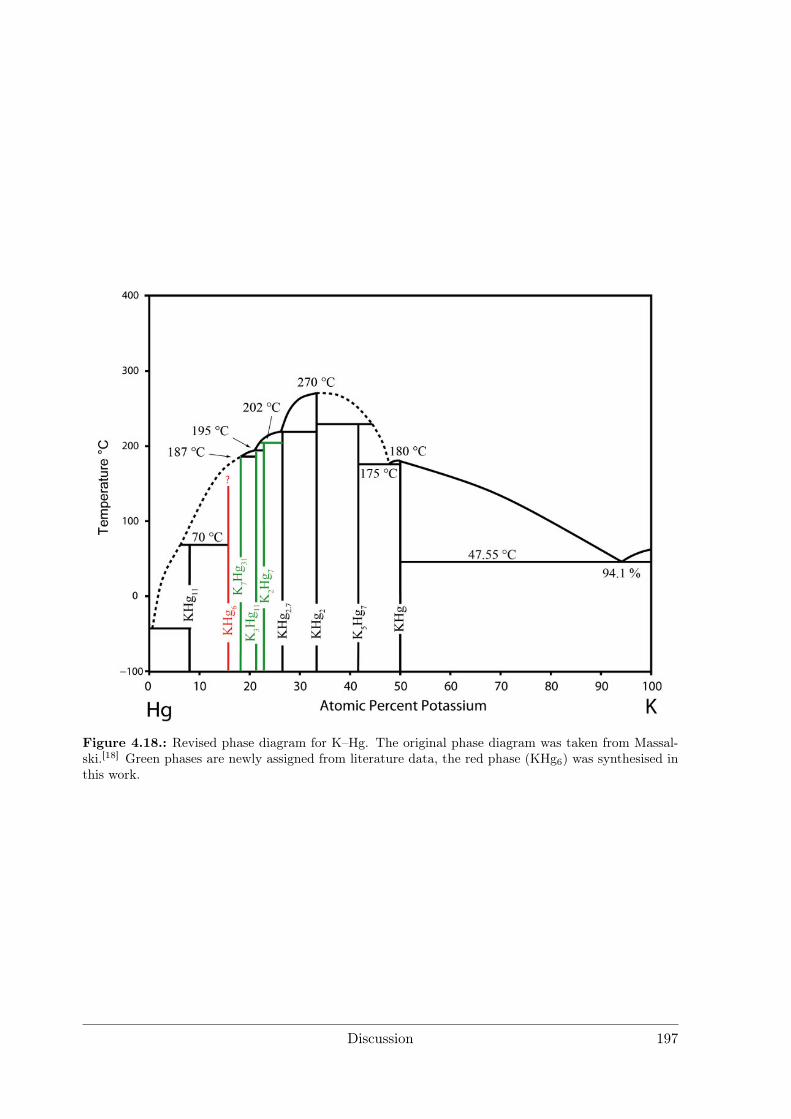
Figure 4.18.: Revised phase diagram for K–Hg. The original phase diagram was taken from Massal-ski.[18] Green phases are newly assigned from literature data, the red phase (KHg6) was synthesised inthis work.
Discussion 197

4.3. Polar Intermetallics – Aspects of Chemical Bonding
4.3.1. What is a Polar Metal?
In this work the term "polar metal" is used to describe the gradual transition froma metallic bond to an ionic bond, equivalent to the "polar covalent bond" in betweencovalent and ionic bonding (see chapter 1.3)
Essential for the formation of a polar metallic bond in the sense of a gradual transitionfrom a metallic bond to an ionic bond is the interplay of a high electronegativity differ-ence (∆EN) of the electropositive partner combined with a high (endothermic) electronaffinity (EA) of the noble partner. In general, there are two extremes which do not resultin a polarised metal-metal bonding: 1) If ∆EN is too low, typical intermetallic phaseswithout pronounced electron transfer will form. The structures are mostly dominated bydense packing of atoms, e.g. Hume-Rothery and Frank-Kasper phases, their propertiesare typically good ductility, opacity and high metallic conductivity. 2) If ∆EN is highand the noble element has a negative (exothermic) electron affinity, Zintl phases willform. They can be rationalised to a great extent with ionic binding concepts and areusually brittle, transparent, semiconducting and dissolve in polar aprotic solvents.
A "polar metallic bonding" forms if ∆EN is high enough for a considerable electrontransfer from the less electronegative to the noble metal, combined with a positive elec-tron affinity of the latter. This does not result in the formation of distinct Zintl anions(which in this case are thermodynamically unstable) but in the formation of extended,negatively polarised networks with embedded cations of the less noble metal. The onlynoble metal with a positive electron affinity is Hg (E = +0.8 V, EA = 1.45 V)[17] andthus amalgams of less noble metals with high Hg content often show metallic conductiv-ity with comparably high resistances and Ioffe-Regel saturation of the specific resistanceat low temperatures. Strong scattering of conduction electrons at the periodic Coulombpotentials lead to typical ”bad metal” behaviour.
Another definition of "polar metals" comes from the combination of ionic and metallicmotifs in the sense of a "chemical twin". In this case a composite structure of ionicoxo(nitrido)metallate ions and excerpts of metal structures is formed, combining prop-erties of classical salts and metals.[65]
4.3.2. Polarity in Amalgams
Structural differences as the result of increasing Hg content lead to severe changes in theband structures of the amalgams (see chapter 1.3 and Figure 4.19). Hg-poor amalgamsshow isolated Hg atoms, Hg states are localised without strong Hg–Hg interactions. Ifsmall Hg clusters form (squares, cubes) observed bond angles are about 90, indicatingmainly σp binding interactions.
Increasing Hg content leads to involvement of Hg6s states into the chemical bonding andthus to dispersion of the respective states. If more Hg–Hg contacts form, Hg5d statesshow increasing dispersion, too. For amalgams crystallising in CsCl structure type it is
Discussion 199
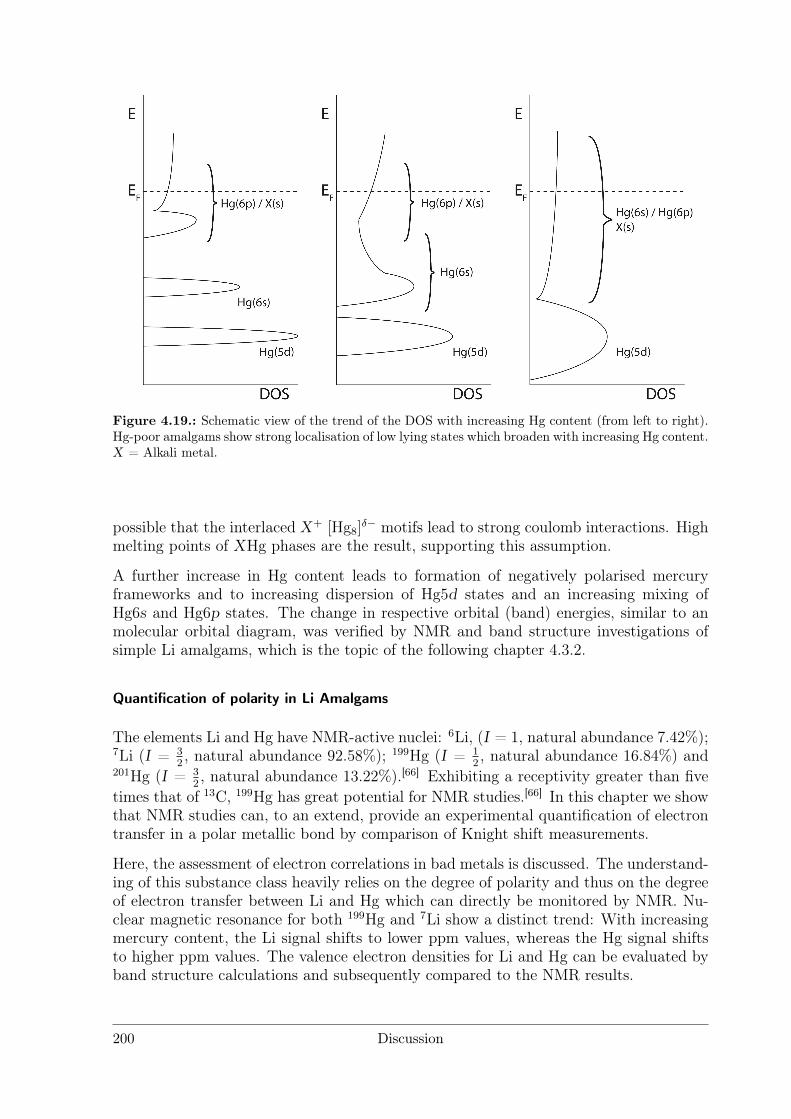
Figure 4.19.: Schematic view of the trend of the DOS with increasing Hg content (from left to right).Hg-poor amalgams show strong localisation of low lying states which broaden with increasing Hg content.X = Alkali metal.
possible that the interlaced X+ [Hg8]δ− motifs lead to strong coulomb interactions. High
melting points of XHg phases are the result, supporting this assumption.
A further increase in Hg content leads to formation of negatively polarised mercuryframeworks and to increasing dispersion of Hg5d states and an increasing mixing ofHg6s and Hg6p states. The change in respective orbital (band) energies, similar to anmolecular orbital diagram, was verified by NMR and band structure investigations ofsimple Li amalgams, which is the topic of the following chapter 4.3.2.
Quantification of polarity in Li Amalgams
The elements Li and Hg have NMR-active nuclei: 6Li, (I = 1, natural abundance 7.42%);7Li (I = 3
2, natural abundance 92.58%); 199Hg (I = 1
2, natural abundance 16.84%) and
201Hg (I = 32, natural abundance 13.22%).[66] Exhibiting a receptivity greater than five
times that of 13C, 199Hg has great potential for NMR studies.[66] In this chapter we showthat NMR studies can, to an extend, provide an experimental quantification of electrontransfer in a polar metallic bond by comparison of Knight shift measurements.
Here, the assessment of electron correlations in bad metals is discussed. The understand-ing of this substance class heavily relies on the degree of polarity and thus on the degreeof electron transfer between Li and Hg which can directly be monitored by NMR. Nu-clear magnetic resonance for both 199Hg and 7Li show a distinct trend: With increasingmercury content, the Li signal shifts to lower ppm values, whereas the Hg signal shiftsto higher ppm values. The valence electron densities for Li and Hg can be evaluated byband structure calculations and subsequently compared to the NMR results.
200 Discussion
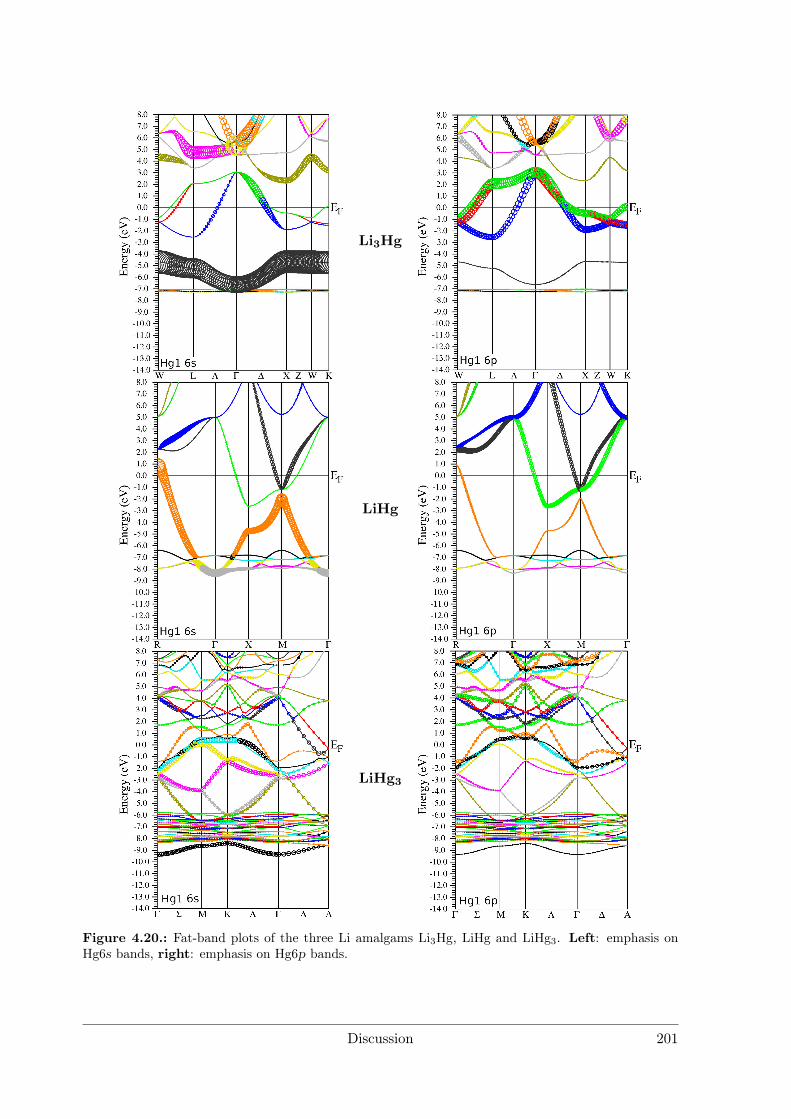
Li3Hg
LiHg
LiHg3
Figure 4.20.: Fat-band plots of the three Li amalgams Li3Hg, LiHg and LiHg3. Left: emphasis onHg6s bands, right: emphasis on Hg6p bands.
Discussion 201
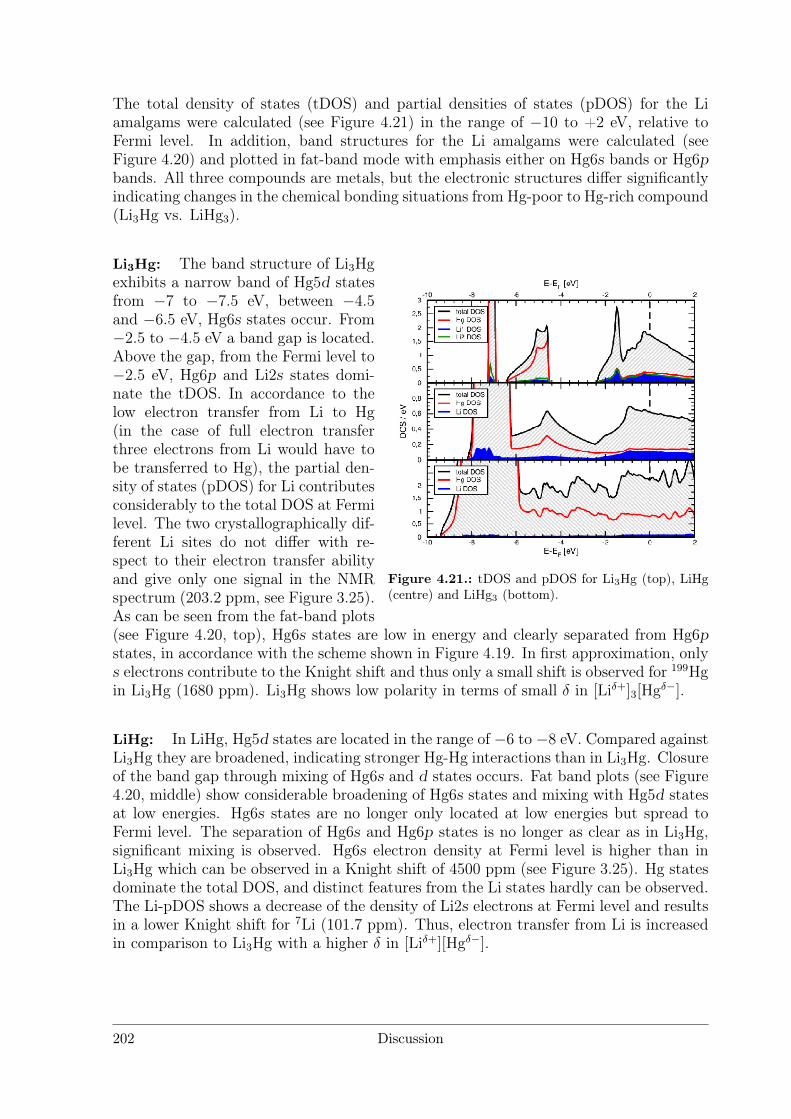
The total density of states (tDOS) and partial densities of states (pDOS) for the Liamalgams were calculated (see Figure 4.21) in the range of −10 to +2 eV, relative toFermi level. In addition, band structures for the Li amalgams were calculated (seeFigure 4.20) and plotted in fat-band mode with emphasis either on Hg6s bands or Hg6pbands. All three compounds are metals, but the electronic structures differ significantlyindicating changes in the chemical bonding situations from Hg-poor to Hg-rich compound(Li3Hg vs. LiHg3).
Figure 4.21.: tDOS and pDOS for Li3Hg (top), LiHg(centre) and LiHg3 (bottom).
Li3Hg: The band structure of Li3Hgexhibits a narrow band of Hg5d statesfrom −7 to −7.5 eV, between −4.5and −6.5 eV, Hg6s states occur. From−2.5 to −4.5 eV a band gap is located.Above the gap, from the Fermi level to−2.5 eV, Hg6p and Li2s states domi-nate the tDOS. In accordance to thelow electron transfer from Li to Hg(in the case of full electron transferthree electrons from Li would have tobe transferred to Hg), the partial den-sity of states (pDOS) for Li contributesconsiderably to the total DOS at Fermilevel. The two crystallographically dif-ferent Li sites do not differ with re-spect to their electron transfer abilityand give only one signal in the NMRspectrum (203.2 ppm, see Figure 3.25).As can be seen from the fat-band plots(see Figure 4.20, top), Hg6s states are low in energy and clearly separated from Hg6pstates, in accordance with the scheme shown in Figure 4.19. In first approximation, onlys electrons contribute to the Knight shift and thus only a small shift is observed for 199Hgin Li3Hg (1680 ppm). Li3Hg shows low polarity in terms of small δ in [Liδ+]3[Hgδ−].
LiHg: In LiHg, Hg5d states are located in the range of −6 to −8 eV. Compared againstLi3Hg they are broadened, indicating stronger Hg-Hg interactions than in Li3Hg. Closureof the band gap through mixing of Hg6s and d states occurs. Fat band plots (see Figure4.20, middle) show considerable broadening of Hg6s states and mixing with Hg5d statesat low energies. Hg6s states are no longer only located at low energies but spread toFermi level. The separation of Hg6s and Hg6p states is no longer as clear as in Li3Hg,significant mixing is observed. Hg6s electron density at Fermi level is higher than inLi3Hg which can be observed in a Knight shift of 4500 ppm (see Figure 3.25). Hg statesdominate the total DOS, and distinct features from the Li states hardly can be observed.The Li-pDOS shows a decrease of the density of Li2s electrons at Fermi level and resultsin a lower Knight shift for 7Li (101.7 ppm). Thus, electron transfer from Li is increasedin comparison to Li3Hg with a higher δ in [Liδ+][Hgδ−].
202 Discussion
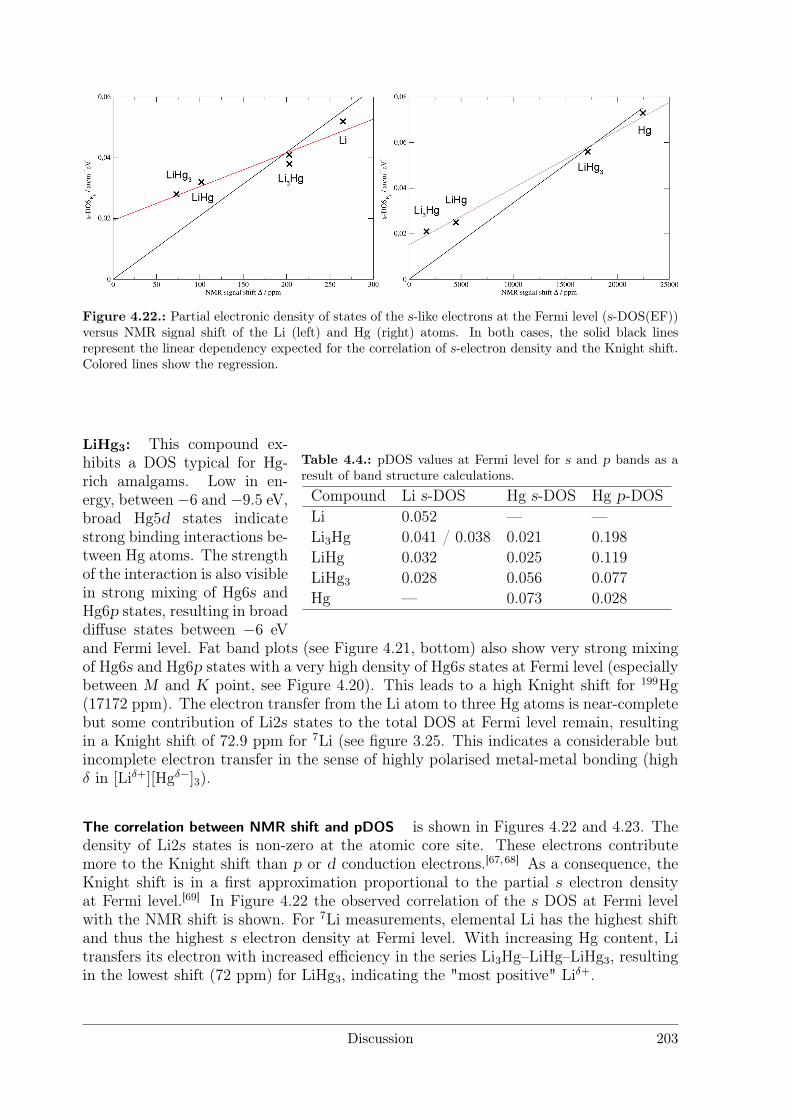
Figure 4.22.: Partial electronic density of states of the s-like electrons at the Fermi level (s-DOS(EF))versus NMR signal shift of the Li (left) and Hg (right) atoms. In both cases, the solid black linesrepresent the linear dependency expected for the correlation of s-electron density and the Knight shift.Colored lines show the regression.
Table 4.4.: pDOS values at Fermi level for s and p bands as aresult of band structure calculations.
Compound Li s-DOS Hg s-DOS Hg p-DOSLi 0.052 — —Li3Hg 0.041 / 0.038 0.021 0.198LiHg 0.032 0.025 0.119LiHg3 0.028 0.056 0.077Hg — 0.073 0.028
LiHg3: This compound ex-hibits a DOS typical for Hg-rich amalgams. Low in en-ergy, between −6 and −9.5 eV,broad Hg5d states indicatestrong binding interactions be-tween Hg atoms. The strengthof the interaction is also visiblein strong mixing of Hg6s andHg6p states, resulting in broaddiffuse states between −6 eVand Fermi level. Fat band plots (see Figure 4.21, bottom) also show very strong mixingof Hg6s and Hg6p states with a very high density of Hg6s states at Fermi level (especiallybetween M and K point, see Figure 4.20). This leads to a high Knight shift for 199Hg(17172 ppm). The electron transfer from the Li atom to three Hg atoms is near-completebut some contribution of Li2s states to the total DOS at Fermi level remain, resultingin a Knight shift of 72.9 ppm for 7Li (see figure 3.25. This indicates a considerable butincomplete electron transfer in the sense of highly polarised metal-metal bonding (highδ in [Liδ+][Hgδ−]3).
The correlation between NMR shift and pDOS is shown in Figures 4.22 and 4.23. Thedensity of Li2s states is non-zero at the atomic core site. These electrons contributemore to the Knight shift than p or d conduction electrons.[67, 68] As a consequence, theKnight shift is in a first approximation proportional to the partial s electron densityat Fermi level.[69] In Figure 4.22 the observed correlation of the s DOS at Fermi levelwith the NMR shift is shown. For 7Li measurements, elemental Li has the highest shiftand thus the highest s electron density at Fermi level. With increasing Hg content, Litransfers its electron with increased efficiency in the series Li3Hg–LiHg–LiHg3, resultingin the lowest shift (72 ppm) for LiHg3, indicating the "most positive" Liδ+.
Discussion 203
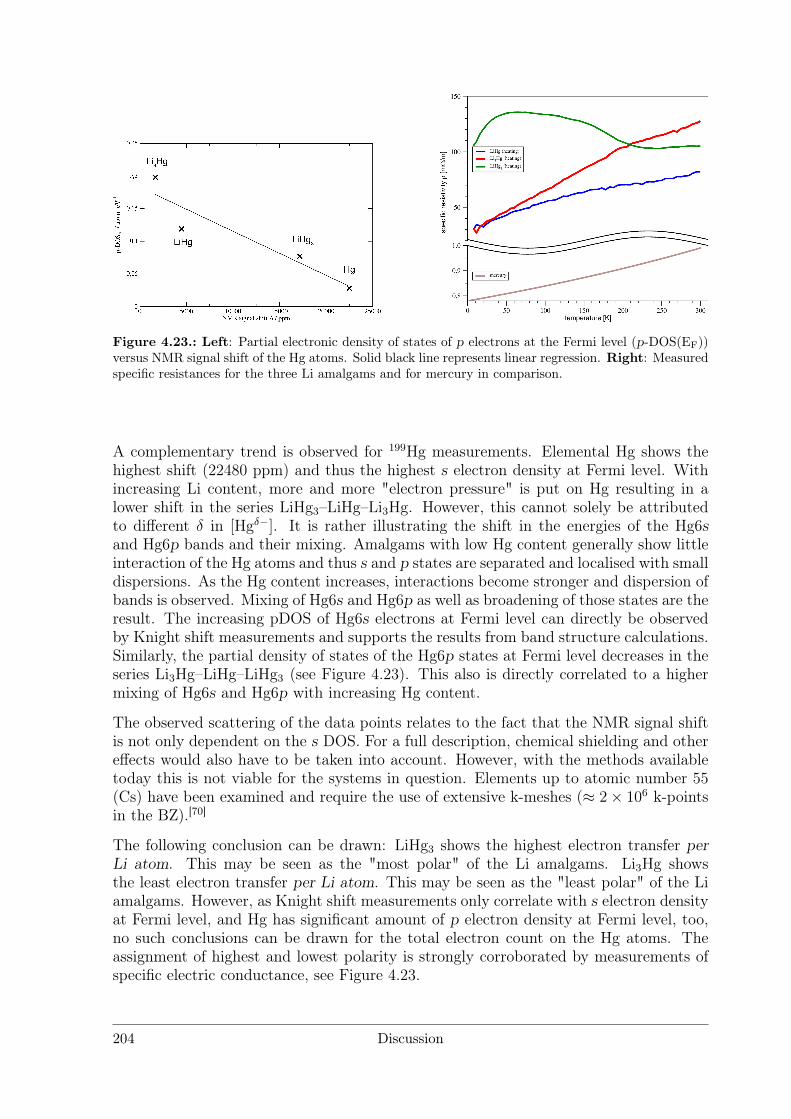
Figure 4.23.: Left: Partial electronic density of states of p electrons at the Fermi level (p-DOS(EF))versus NMR signal shift of the Hg atoms. Solid black line represents linear regression. Right: Measuredspecific resistances for the three Li amalgams and for mercury in comparison.
A complementary trend is observed for 199Hg measurements. Elemental Hg shows thehighest shift (22480 ppm) and thus the highest s electron density at Fermi level. Withincreasing Li content, more and more "electron pressure" is put on Hg resulting in alower shift in the series LiHg3–LiHg–Li3Hg. However, this cannot solely be attributedto different δ in [Hgδ−]. It is rather illustrating the shift in the energies of the Hg6sand Hg6p bands and their mixing. Amalgams with low Hg content generally show littleinteraction of the Hg atoms and thus s and p states are separated and localised with smalldispersions. As the Hg content increases, interactions become stronger and dispersion ofbands is observed. Mixing of Hg6s and Hg6p as well as broadening of those states are theresult. The increasing pDOS of Hg6s electrons at Fermi level can directly be observedby Knight shift measurements and supports the results from band structure calculations.Similarly, the partial density of states of the Hg6p states at Fermi level decreases in theseries Li3Hg–LiHg–LiHg3 (see Figure 4.23). This also is directly correlated to a highermixing of Hg6s and Hg6p with increasing Hg content.
The observed scattering of the data points relates to the fact that the NMR signal shiftis not only dependent on the s DOS. For a full description, chemical shielding and othereffects would also have to be taken into account. However, with the methods availabletoday this is not viable for the systems in question. Elements up to atomic number 55(Cs) have been examined and require the use of extensive k-meshes (≈ 2× 10⁶ k-pointsin the BZ).[70]
The following conclusion can be drawn: LiHg3 shows the highest electron transfer perLi atom. This may be seen as the "most polar" of the Li amalgams. Li3Hg showsthe least electron transfer per Li atom. This may be seen as the "least polar" of the Liamalgams. However, as Knight shift measurements only correlate with s electron densityat Fermi level, and Hg has significant amount of p electron density at Fermi level, too,no such conclusions can be drawn for the total electron count on the Hg atoms. Theassignment of highest and lowest polarity is strongly corroborated by measurements ofspecific electric conductance, see Figure 4.23.
204 Discussion
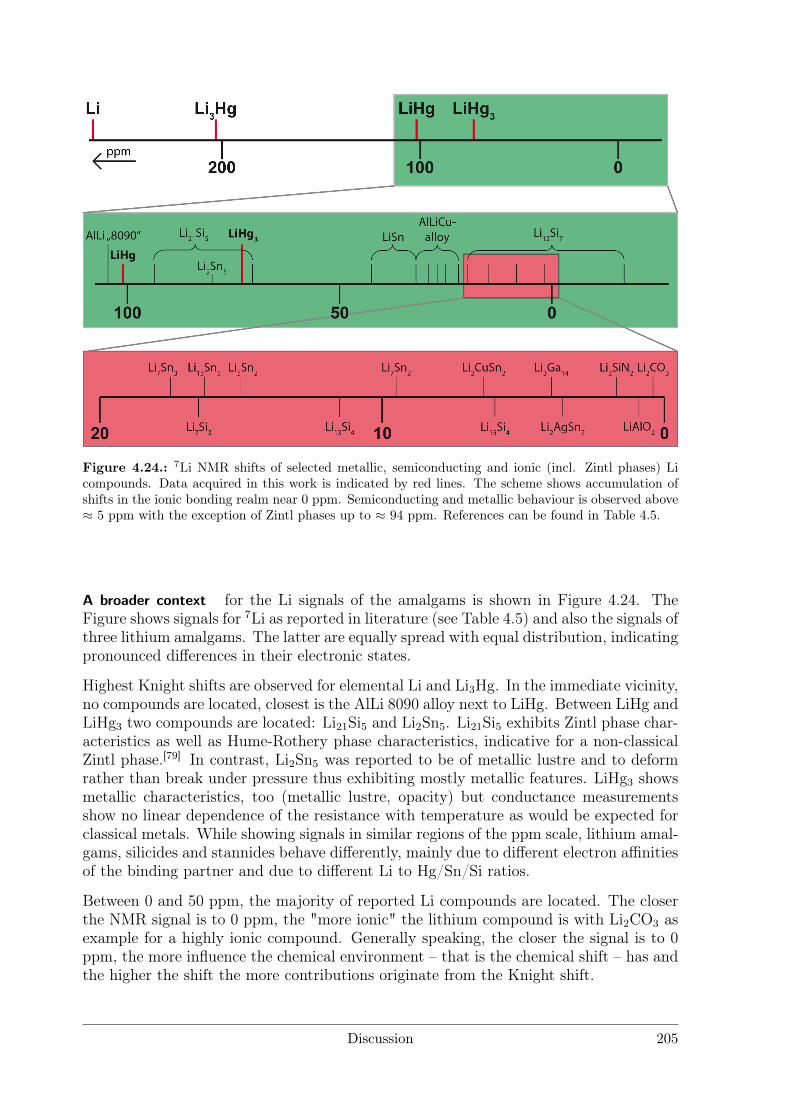
Figure 4.24.: 7Li NMR shifts of selected metallic, semiconducting and ionic (incl. Zintl phases) Licompounds. Data acquired in this work is indicated by red lines. The scheme shows accumulation ofshifts in the ionic bonding realm near 0 ppm. Semiconducting and metallic behaviour is observed above≈ 5 ppm with the exception of Zintl phases up to ≈ 94 ppm. References can be found in Table 4.5.
A broader context for the Li signals of the amalgams is shown in Figure 4.24. TheFigure shows signals for 7Li as reported in literature (see Table 4.5) and also the signals ofthree lithium amalgams. The latter are equally spread with equal distribution, indicatingpronounced differences in their electronic states.
Highest Knight shifts are observed for elemental Li and Li3Hg. In the immediate vicinity,no compounds are located, closest is the AlLi 8090 alloy next to LiHg. Between LiHg andLiHg3 two compounds are located: Li21Si5 and Li2Sn5. Li21Si5 exhibits Zintl phase char-acteristics as well as Hume-Rothery phase characteristics, indicative for a non-classicalZintl phase.[79] In contrast, Li2Sn5 was reported to be of metallic lustre and to deformrather than break under pressure thus exhibiting mostly metallic features. LiHg3 showsmetallic characteristics, too (metallic lustre, opacity) but conductance measurementsshow no linear dependence of the resistance with temperature as would be expected forclassical metals. While showing signals in similar regions of the ppm scale, lithium amal-gams, silicides and stannides behave differently, mainly due to different electron affinitiesof the binding partner and due to different Li to Hg/Sn/Si ratios.
Between 0 and 50 ppm, the majority of reported Li compounds are located. The closerthe NMR signal is to 0 ppm, the "more ionic" the lithium compound is with Li2CO3 asexample for a highly ionic compound. Generally speaking, the closer the signal is to 0ppm, the more influence the chemical environment – that is the chemical shift – has andthe higher the shift the more contributions originate from the Knight shift.
Discussion 205
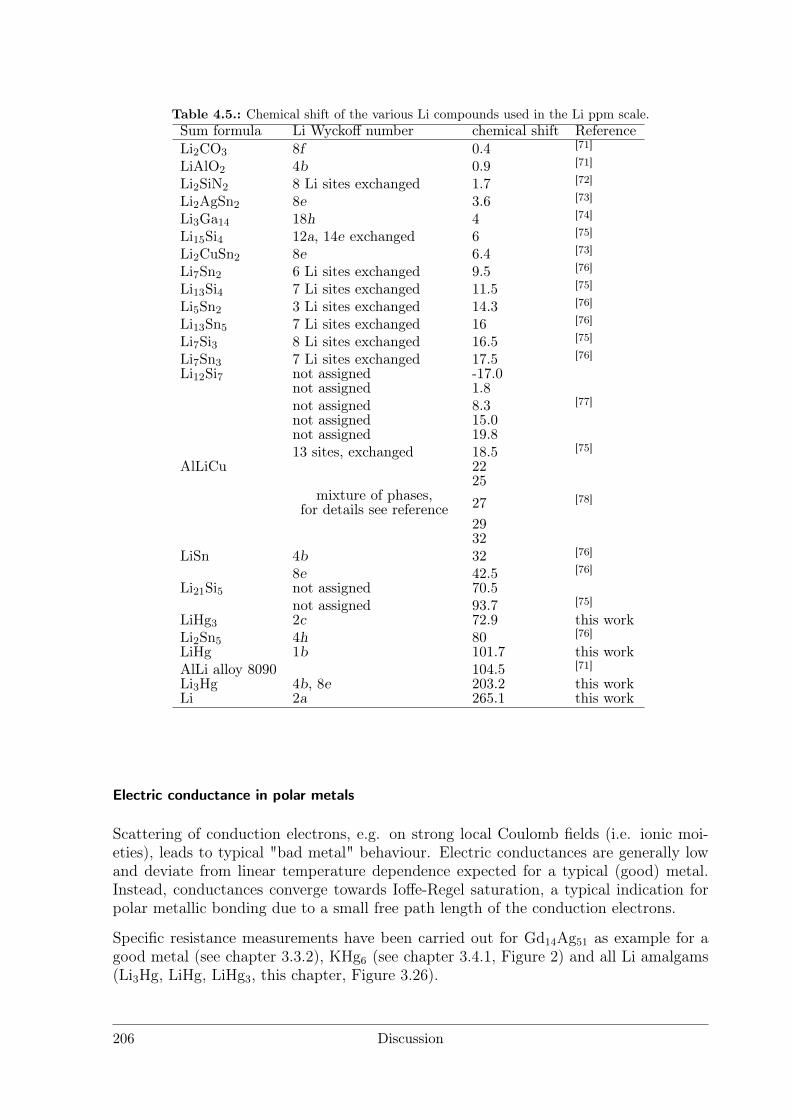
Table 4.5.: Chemical shift of the various Li compounds used in the Li ppm scale.Sum formula Li Wyckoff number chemical shift ReferenceLi2CO3 8f 0.4 [71]
LiAlO2 4b 0.9 [71]
Li2SiN2 8 Li sites exchanged 1.7 [72]
Li2AgSn2 8e 3.6 [73]
Li3Ga14 18h 4 [74]
Li15Si4 12a, 14e exchanged 6 [75]
Li2CuSn2 8e 6.4 [73]
Li7Sn2 6 Li sites exchanged 9.5 [76]
Li13Si4 7 Li sites exchanged 11.5 [75]
Li5Sn2 3 Li sites exchanged 14.3 [76]
Li13Sn5 7 Li sites exchanged 16 [76]
Li7Si3 8 Li sites exchanged 16.5 [75]
Li7Sn3 7 Li sites exchanged 17.5 [76]
Li12Si7 not assigned -17.0not assigned 1.8not assigned 8.3 [77]
not assigned 15.0not assigned 19.813 sites, exchanged 18.5 [75]
AlLiCu 2225
mixture of phases,for details see reference 27 [78]
2932
LiSn 4b 32 [76]
8e 42.5 [76]
Li21Si5 not assigned 70.5not assigned 93.7 [75]
LiHg3 2c 72.9 this workLi2Sn5 4h 80 [76]
LiHg 1b 101.7 this workAlLi alloy 8090 104.5 [71]
Li3Hg 4b, 8e 203.2 this workLi 2a 265.1 this work
Electric conductance in polar metals
Scattering of conduction electrons, e.g. on strong local Coulomb fields (i.e. ionic moi-eties), leads to typical "bad metal" behaviour. Electric conductances are generally lowand deviate from linear temperature dependence expected for a typical (good) metal.Instead, conductances converge towards Ioffe-Regel saturation, a typical indication forpolar metallic bonding due to a small free path length of the conduction electrons.
Specific resistance measurements have been carried out for Gd14Ag51 as example for agood metal (see chapter 3.3.2), KHg6 (see chapter 3.4.1, Figure 2) and all Li amalgams(Li3Hg, LiHg, LiHg3, this chapter, Figure 3.26).
206 Discussion
Gd14Ag51 shows a decrease of specific resistance with decreasing temperature. Therelation is linear in the measured temperature interval. Together with an overall lowresistance, this indicates good metallic behaviour.
KHg6 shows a decrease of specific resistance with decreasing temperature. The overallresistance in comparison to a good metal is high. Furthermore, linear dependence of theresistance with respect to temperature is only given for a small temperature interval(0 to 50 K), at higher temperatures Ioffe-Regel saturation is observed, indicative for atypical "bad metal". The findings are supported by band structure calculations.[80]
The Li amalgams Li3Hg, LiHg and LiHg3 differ in their electric behaviour as a resultof Li content and thus polarity of metal-metal bonding. Li3Hg and LiHg show bad metalbehaviour and exhibit lower specific resistances than LiHg3. At temperatures above20 K, the thermal behaviour of the resistances deviates from linearity and converges in aIoffe-Regel saturation. LiHg3 shows a complicated behaviour even at low temperatures,not indicating typical metallic or "bad metal" behaviour. At temperatures higher than50 K, it follows more or less the signature of a semiconductor, constituing the upperborder of a polar metal-metal bonding.
Discussion 207
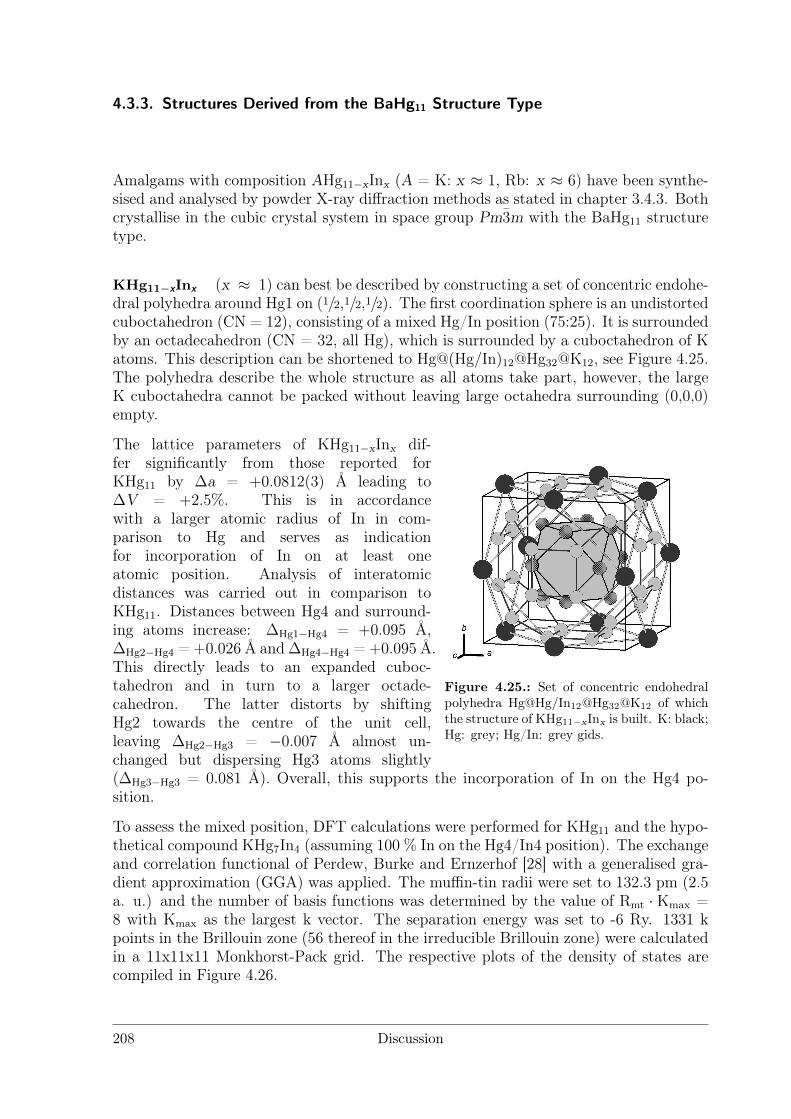
4.3.3. Structures Derived from the BaHg11 Structure Type
Amalgams with composition AHg11−xInx (A = K: x ≈ 1, Rb: x ≈ 6) have been synthe-sised and analysed by powder X-ray diffraction methods as stated in chapter 3.4.3. Bothcrystallise in the cubic crystal system in space group Pm3m with the BaHg11 structuretype.
KHg11−xInx (x ≈ 1) can best be described by constructing a set of concentric endohe-dral polyhedra around Hg1 on (1/2,1/2,1/2). The first coordination sphere is an undistortedcuboctahedron (CN = 12), consisting of a mixed Hg/In position (75:25). It is surroundedby an octadecahedron (CN = 32, all Hg), which is surrounded by a cuboctahedron of Katoms. This description can be shortened to Hg@(Hg/In)12@Hg32@K12, see Figure 4.25.The polyhedra describe the whole structure as all atoms take part, however, the largeK cuboctahedra cannot be packed without leaving large octahedra surrounding (0,0,0)empty.
Figure 4.25.: Set of concentric endohedralpolyhedra Hg@Hg/In12@Hg32@K12 of whichthe structure of KHg11−xInx is built. K: black;Hg: grey; Hg/In: grey gids.
The lattice parameters of KHg11−xInx dif-fer significantly from those reported forKHg11 by ∆a = +0.0812(3) Å leading to∆V = +2.5%. This is in accordancewith a larger atomic radius of In in com-parison to Hg and serves as indicationfor incorporation of In on at least oneatomic position. Analysis of interatomicdistances was carried out in comparison toKHg11. Distances between Hg4 and surround-ing atoms increase: ∆Hg1−Hg4 = +0.095 Å,∆Hg2−Hg4 = +0.026 Å and ∆Hg4−Hg4 = +0.095 Å.This directly leads to an expanded cuboc-tahedron and in turn to a larger octade-cahedron. The latter distorts by shiftingHg2 towards the centre of the unit cell,leaving ∆Hg2−Hg3 = −0.007 Å almost un-changed but dispersing Hg3 atoms slightly(∆Hg3−Hg3 = 0.081 Å). Overall, this supports the incorporation of In on the Hg4 po-sition.
To assess the mixed position, DFT calculations were performed for KHg11 and the hypo-thetical compound KHg7In4 (assuming 100 % In on the Hg4/In4 position). The exchangeand correlation functional of Perdew, Burke and Ernzerhof [28] with a generalised gra-dient approximation (GGA) was applied. The muffin-tin radii were set to 132.3 pm (2.5a. u.) and the number of basis functions was determined by the value of Rmt · Kmax =8 with Kmax as the largest k vector. The separation energy was set to -6 Ry. 1331 kpoints in the Brillouin zone (56 thereof in the irreducible Brillouin zone) were calculatedin a 11x11x11 Monkhorst-Pack grid. The respective plots of the density of states arecompiled in Figure 4.26.
208 Discussion
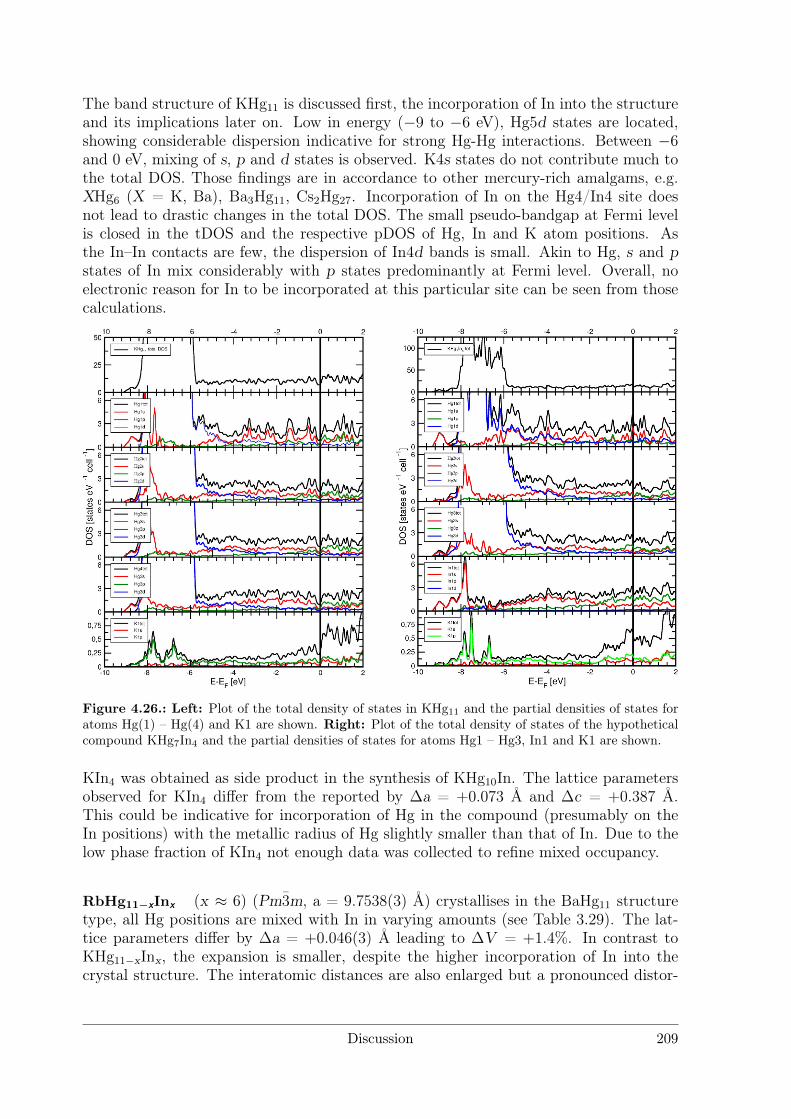
The band structure of KHg11 is discussed first, the incorporation of In into the structureand its implications later on. Low in energy (−9 to −6 eV), Hg5d states are located,showing considerable dispersion indicative for strong Hg-Hg interactions. Between −6and 0 eV, mixing of s, p and d states is observed. K4s states do not contribute much tothe total DOS. Those findings are in accordance to other mercury-rich amalgams, e.g.XHg6 (X = K, Ba), Ba3Hg11, Cs2Hg27. Incorporation of In on the Hg4/In4 site doesnot lead to drastic changes in the total DOS. The small pseudo-bandgap at Fermi levelis closed in the tDOS and the respective pDOS of Hg, In and K atom positions. Asthe In–In contacts are few, the dispersion of In4d bands is small. Akin to Hg, s and pstates of In mix considerably with p states predominantly at Fermi level. Overall, noelectronic reason for In to be incorporated at this particular site can be seen from thosecalculations.
Figure 4.26.: Left: Plot of the total density of states in KHg11 and the partial densities of states foratoms Hg(1) – Hg(4) and K1 are shown. Right: Plot of the total density of states of the hypotheticalcompound KHg7In4 and the partial densities of states for atoms Hg1 – Hg3, In1 and K1 are shown.
KIn4 was obtained as side product in the synthesis of KHg10In. The lattice parametersobserved for KIn4 differ from the reported by ∆a = +0.073 Å and ∆c = +0.387 Å.This could be indicative for incorporation of Hg in the compound (presumably on theIn positions) with the metallic radius of Hg slightly smaller than that of In. Due to thelow phase fraction of KIn4 not enough data was collected to refine mixed occupancy.
RbHg11−xInx (x ≈ 6) (Pm3m, a = 9.7538(3) Å) crystallises in the BaHg11 structuretype, all Hg positions are mixed with In in varying amounts (see Table 3.29). The lat-tice parameters differ by ∆a = +0.046(3) Å leading to ∆V = +1.4%. In contrast toKHg11−xInx, the expansion is smaller, despite the higher incorporation of In into thecrystal structure. The interatomic distances are also enlarged but a pronounced distor-
Discussion 209
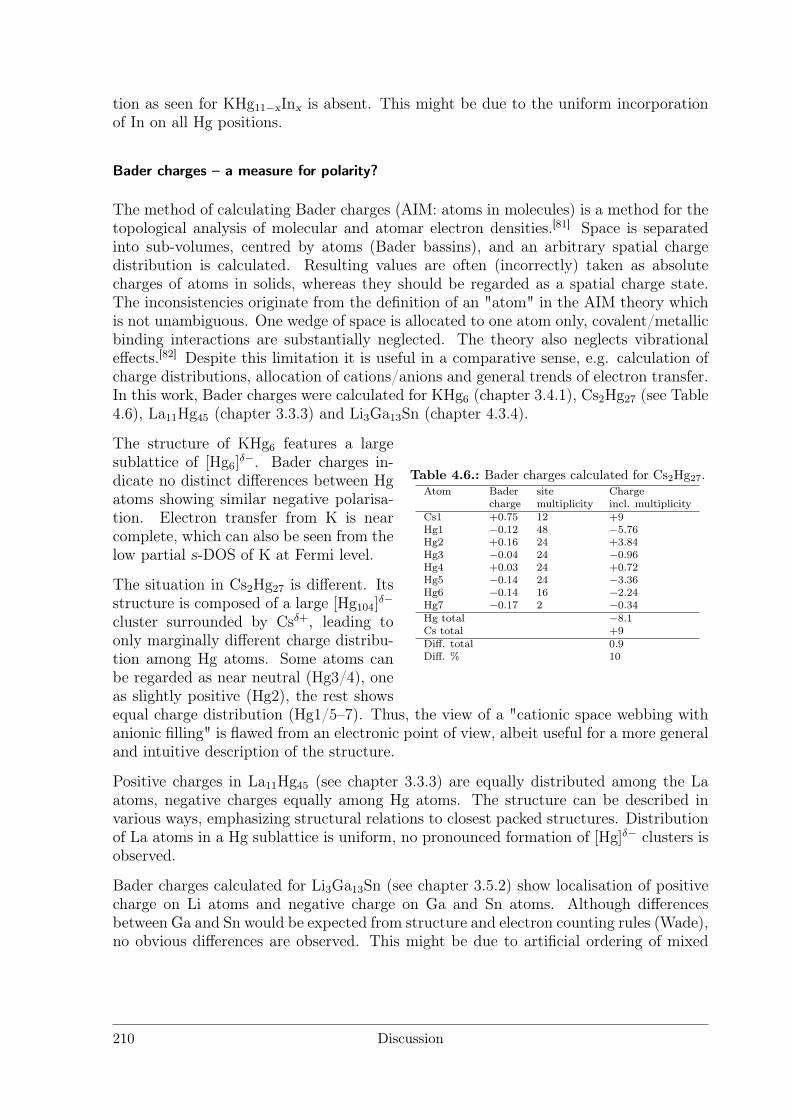
tion as seen for KHg11−xInx is absent. This might be due to the uniform incorporationof In on all Hg positions.
Bader charges – a measure for polarity?
The method of calculating Bader charges (AIM: atoms in molecules) is a method for thetopological analysis of molecular and atomar electron densities.[81] Space is separatedinto sub-volumes, centred by atoms (Bader bassins), and an arbitrary spatial chargedistribution is calculated. Resulting values are often (incorrectly) taken as absolutecharges of atoms in solids, whereas they should be regarded as a spatial charge state.The inconsistencies originate from the definition of an "atom" in the AIM theory whichis not unambiguous. One wedge of space is allocated to one atom only, covalent/metallicbinding interactions are substantially neglected. The theory also neglects vibrationaleffects.[82] Despite this limitation it is useful in a comparative sense, e.g. calculation ofcharge distributions, allocation of cations/anions and general trends of electron transfer.In this work, Bader charges were calculated for KHg6 (chapter 3.4.1), Cs2Hg27 (see Table4.6), La11Hg45 (chapter 3.3.3) and Li3Ga13Sn (chapter 4.3.4).
Table 4.6.: Bader charges calculated for Cs2Hg27.Atom Bader site Charge
charge multiplicity incl. multiplicityCs1 +0.75 12 +9Hg1 −0.12 48 −5.76Hg2 +0.16 24 +3.84Hg3 −0.04 24 −0.96Hg4 +0.03 24 +0.72Hg5 −0.14 24 −3.36Hg6 −0.14 16 −2.24Hg7 −0.17 2 −0.34Hg total −8.1Cs total +9Diff. total 0.9Diff. % 10
The structure of KHg6 features a largesublattice of [Hg6]
δ−. Bader charges in-dicate no distinct differences between Hgatoms showing similar negative polarisa-tion. Electron transfer from K is nearcomplete, which can also be seen from thelow partial s-DOS of K at Fermi level.
The situation in Cs2Hg27 is different. Itsstructure is composed of a large [Hg104]
δ−
cluster surrounded by Csδ+, leading toonly marginally different charge distribu-tion among Hg atoms. Some atoms canbe regarded as near neutral (Hg3/4), oneas slightly positive (Hg2), the rest showsequal charge distribution (Hg1/5–7). Thus, the view of a "cationic space webbing withanionic filling" is flawed from an electronic point of view, albeit useful for a more generaland intuitive description of the structure.
Positive charges in La11Hg45 (see chapter 3.3.3) are equally distributed among the Laatoms, negative charges equally among Hg atoms. The structure can be described invarious ways, emphasizing structural relations to closest packed structures. Distributionof La atoms in a Hg sublattice is uniform, no pronounced formation of [Hg]δ− clusters isobserved.
Bader charges calculated for Li3Ga13Sn (see chapter 3.5.2) show localisation of positivecharge on Li atoms and negative charge on Ga and Sn atoms. Although differencesbetween Ga and Sn would be expected from structure and electron counting rules (Wade),no obvious differences are observed. This might be due to artificial ordering of mixed
210 Discussion
Ga/Sn and underoccupied Li positions for the calculation, necessary because WIEN2kdoes not feature calculations including disorder phenomena.
To conclude, Bader charges serve as comparative values, addressing structural featuresand the trend of electron transfer. Absolute charges cannot be calculated with thismethod, making other experiments (e.g. Knight shift measurements) essential for deeperinsight into polarity of intermetallic phases. In all amalgams for which Bader chargeshave been calculated a clear trend points towards uniform distribution of the negativecharge in the Hg sublattice. No concentration of charge on individual Hg atoms isobserved, corroborating the picture of polar metallic bonding getting more pronouncedin the Hg-rich phases due to more efficient delocalisation of a negative charge on a largerHg sublattice.
Discussion 211
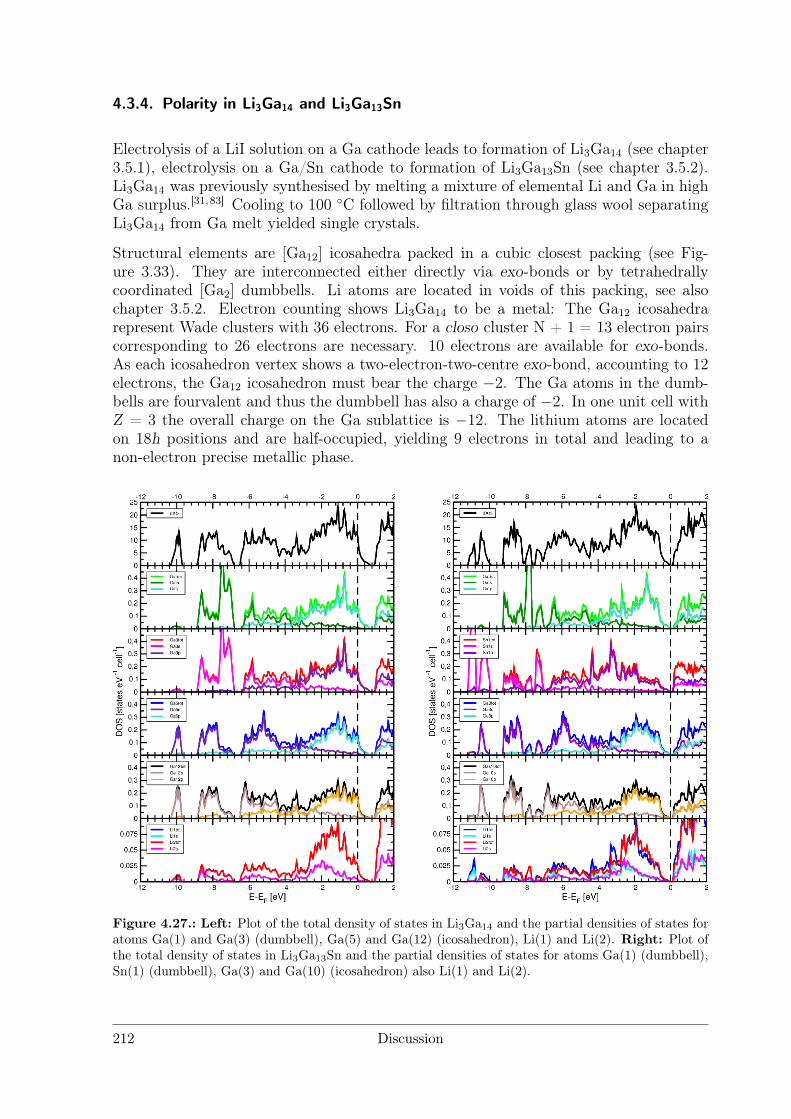
4.3.4. Polarity in Li3Ga14 and Li3Ga13Sn
Electrolysis of a LiI solution on a Ga cathode leads to formation of Li3Ga14 (see chapter3.5.1), electrolysis on a Ga/Sn cathode to formation of Li3Ga13Sn (see chapter 3.5.2).Li3Ga14 was previously synthesised by melting a mixture of elemental Li and Ga in highGa surplus.[31, 83] Cooling to 100 C followed by filtration through glass wool separatingLi3Ga14 from Ga melt yielded single crystals.
Structural elements are [Ga12] icosahedra packed in a cubic closest packing (see Fig-ure 3.33). They are interconnected either directly via exo-bonds or by tetrahedrallycoordinated [Ga2] dumbbells. Li atoms are located in voids of this packing, see alsochapter 3.5.2. Electron counting shows Li3Ga14 to be a metal: The Ga12 icosahedrarepresent Wade clusters with 36 electrons. For a closo cluster N + 1 = 13 electron pairscorresponding to 26 electrons are necessary. 10 electrons are available for exo-bonds.As each icosahedron vertex shows a two-electron-two-centre exo-bond, accounting to 12electrons, the Ga12 icosahedron must bear the charge −2. The Ga atoms in the dumb-bells are fourvalent and thus the dumbbell has also a charge of −2. In one unit cell withZ = 3 the overall charge on the Ga sublattice is −12. The lithium atoms are locatedon 18h positions and are half-occupied, yielding 9 electrons in total and leading to anon-electron precise metallic phase.
Figure 4.27.: Left: Plot of the total density of states in Li3Ga14 and the partial densities of states foratoms Ga(1) and Ga(3) (dumbbell), Ga(5) and Ga(12) (icosahedron), Li(1) and Li(2). Right: Plot ofthe total density of states in Li3Ga13Sn and the partial densities of states for atoms Ga(1) (dumbbell),Sn(1) (dumbbell), Ga(3) and Ga(10) (icosahedron) also Li(1) and Li(2).
212 Discussion
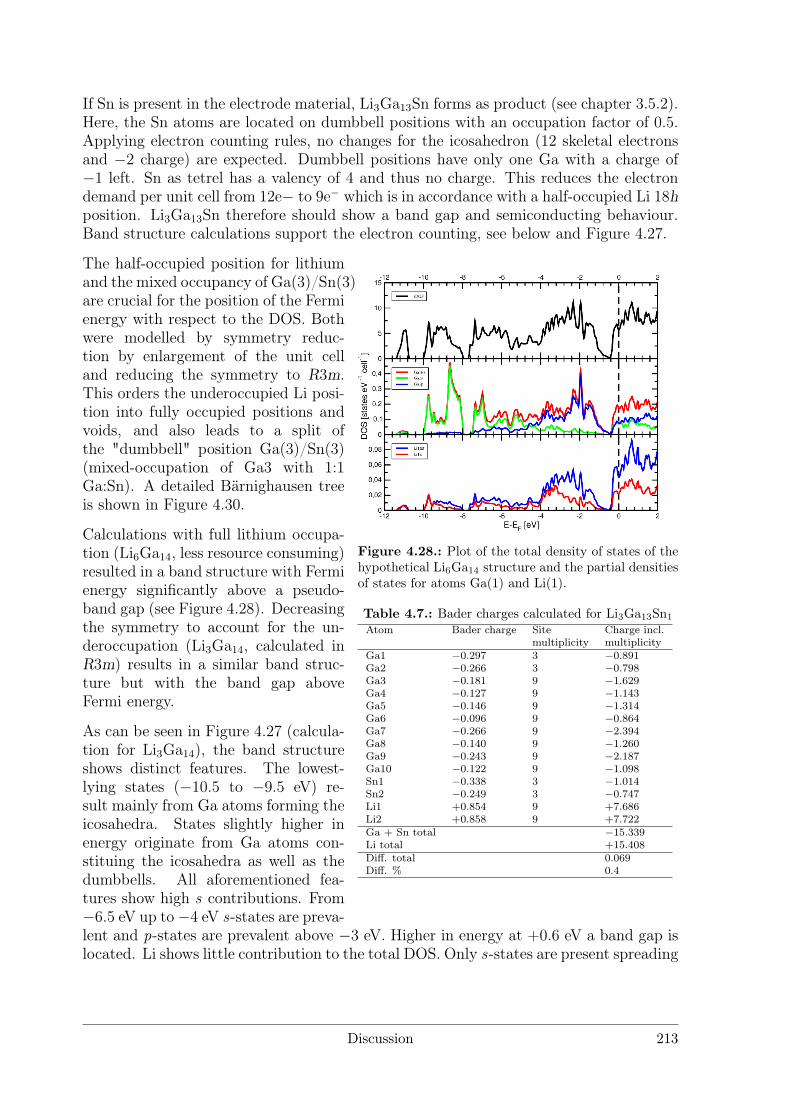
If Sn is present in the electrode material, Li3Ga13Sn forms as product (see chapter 3.5.2).Here, the Sn atoms are located on dumbbell positions with an occupation factor of 0.5.Applying electron counting rules, no changes for the icosahedron (12 skeletal electronsand −2 charge) are expected. Dumbbell positions have only one Ga with a charge of−1 left. Sn as tetrel has a valency of 4 and thus no charge. This reduces the electrondemand per unit cell from 12e− to 9e− which is in accordance with a half-occupied Li 18hposition. Li3Ga13Sn therefore should show a band gap and semiconducting behaviour.Band structure calculations support the electron counting, see below and Figure 4.27.
Figure 4.28.: Plot of the total density of states of thehypothetical Li6Ga14 structure and the partial densitiesof states for atoms Ga(1) and Li(1).
Table 4.7.: Bader charges calculated for Li3Ga13Sn1
Atom Bader charge Site Charge incl.multiplicity multiplicity
Ga1 −0.297 3 −0.891Ga2 −0.266 3 −0.798Ga3 −0.181 9 −1.629Ga4 −0.127 9 −1.143Ga5 −0.146 9 −1.314Ga6 −0.096 9 −0.864Ga7 −0.266 9 −2.394Ga8 −0.140 9 −1.260Ga9 −0.243 9 −2.187Ga10 −0.122 9 −1.098Sn1 −0.338 3 −1.014Sn2 −0.249 3 −0.747Li1 +0.854 9 +7.686Li2 +0.858 9 +7.722Ga + Sn total −15.339Li total +15.408Diff. total 0.069Diff. % 0.4
The half-occupied position for lithiumand the mixed occupancy of Ga(3)/Sn(3)are crucial for the position of the Fermienergy with respect to the DOS. Bothwere modelled by symmetry reduc-tion by enlargement of the unit celland reducing the symmetry to R3m.This orders the underoccupied Li posi-tion into fully occupied positions andvoids, and also leads to a split ofthe "dumbbell" position Ga(3)/Sn(3)(mixed-occupation of Ga3 with 1:1Ga:Sn). A detailed Bärnighausen treeis shown in Figure 4.30.
Calculations with full lithium occupa-tion (Li6Ga14, less resource consuming)resulted in a band structure with Fermienergy significantly above a pseudo-band gap (see Figure 4.28). Decreasingthe symmetry to account for the un-deroccupation (Li3Ga14, calculated inR3m) results in a similar band struc-ture but with the band gap aboveFermi energy.
As can be seen in Figure 4.27 (calcula-tion for Li3Ga14), the band structureshows distinct features. The lowest-lying states (−10.5 to −9.5 eV) re-sult mainly from Ga atoms forming theicosahedra. States slightly higher inenergy originate from Ga atoms con-stituing the icosahedra as well as thedumbbells. All aforementioned fea-tures show high s contributions. From−6.5 eV up to−4 eV s-states are preva-lent and p-states are prevalent above −3 eV. Higher in energy at +0.6 eV a band gap islocated. Li shows little contribution to the total DOS. Only s-states are present spreading
Discussion 213
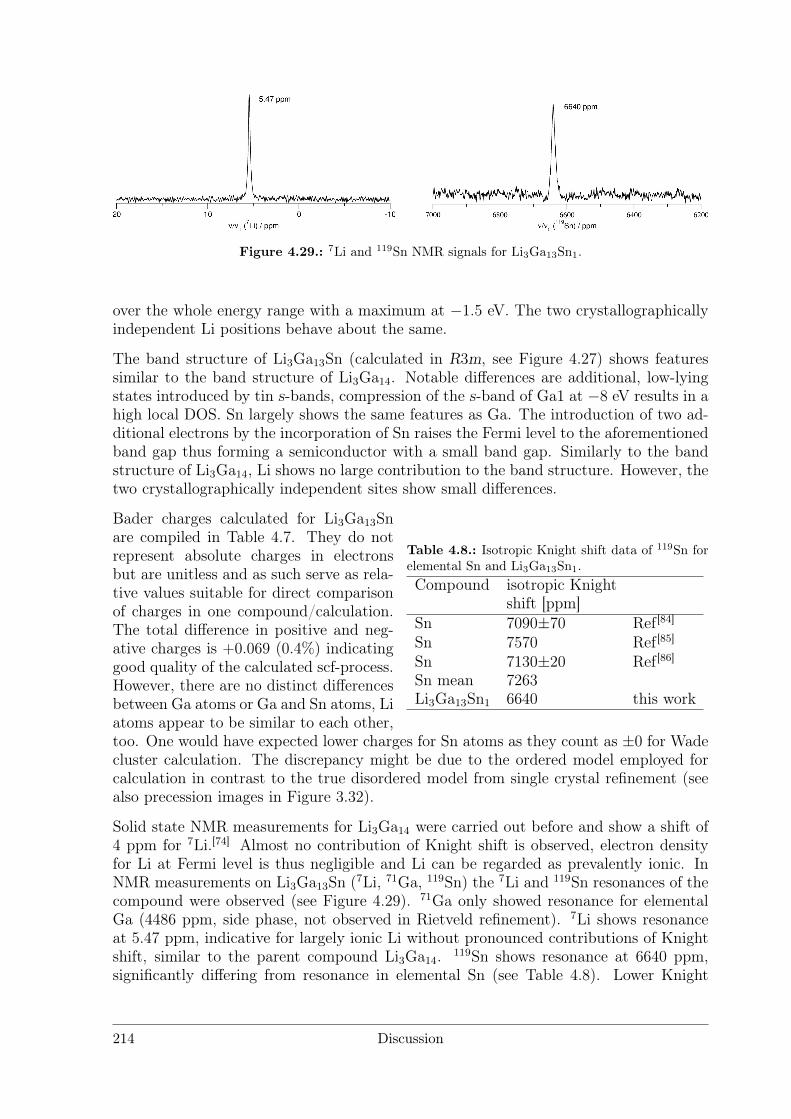
Figure 4.29.: 7Li and 119Sn NMR signals for Li3Ga13Sn1.
over the whole energy range with a maximum at −1.5 eV. The two crystallographicallyindependent Li positions behave about the same.
The band structure of Li3Ga13Sn (calculated in R3m, see Figure 4.27) shows featuressimilar to the band structure of Li3Ga14. Notable differences are additional, low-lyingstates introduced by tin s-bands, compression of the s-band of Ga1 at −8 eV results in ahigh local DOS. Sn largely shows the same features as Ga. The introduction of two ad-ditional electrons by the incorporation of Sn raises the Fermi level to the aforementionedband gap thus forming a semiconductor with a small band gap. Similarly to the bandstructure of Li3Ga14, Li shows no large contribution to the band structure. However, thetwo crystallographically independent sites show small differences.
Table 4.8.: Isotropic Knight shift data of 119Sn forelemental Sn and Li3Ga13Sn1.Compound isotropic Knight
shift [ppm]Sn 7090±70 Ref [84]Sn 7570 Ref [85]Sn 7130±20 Ref [86]Sn mean 7263Li3Ga13Sn1 6640 this work
Bader charges calculated for Li3Ga13Snare compiled in Table 4.7. They do notrepresent absolute charges in electronsbut are unitless and as such serve as rela-tive values suitable for direct comparisonof charges in one compound/calculation.The total difference in positive and neg-ative charges is +0.069 (0.4%) indicatinggood quality of the calculated scf-process.However, there are no distinct differencesbetween Ga atoms or Ga and Sn atoms, Liatoms appear to be similar to each other,too. One would have expected lower charges for Sn atoms as they count as ±0 for Wadecluster calculation. The discrepancy might be due to the ordered model employed forcalculation in contrast to the true disordered model from single crystal refinement (seealso precession images in Figure 3.32).
Solid state NMR measurements for Li3Ga14 were carried out before and show a shift of4 ppm for 7Li.[74] Almost no contribution of Knight shift is observed, electron densityfor Li at Fermi level is thus negligible and Li can be regarded as prevalently ionic. InNMR measurements on Li3Ga13Sn (7Li, 71Ga, 119Sn) the 7Li and 119Sn resonances of thecompound were observed (see Figure 4.29). 71Ga only showed resonance for elementalGa (4486 ppm, side phase, not observed in Rietveld refinement). 7Li shows resonanceat 5.47 ppm, indicative for largely ionic Li without pronounced contributions of Knightshift, similar to the parent compound Li3Ga14. 119Sn shows resonance at 6640 ppm,significantly differing from resonance in elemental Sn (see Table 4.8). Lower Knight
214 Discussion
shift means lower s electron density at Fermi level. From band structure calculationsLi3Ga13Sn is expected to be a semiconductor and thus Knight shift measurements arehighly temperature dependent. At present, no temperature-dependent measurementshave been carried out. Electric resistance measurements are required to confirm semi-conducting behaviour for Li3Ga13Sn.
As can be seen from band structure calculations as well as NMR investigations, Liexhibits a high positive charge in both Li3Ga14 and Li3Ga13Sn. The negative charge isequally distributed between the Ga atoms (and Sn atoms if present). Thus we concludethat these compounds show high polarity in the sense that the electron transfer fromthe Li atoms is near-complete in accordance with the exothermic electron affinities ofGa ans Sn.
References
[1] J. J. Berzelius, Föreläsningar i Djurkemien, Carl Delen, Stockholm (1806).
[2] H. Davy, Philos. Trans. R. Soc. London, 97, 1–56 (1807).
[3] A. Volta, Philos. Trans. R. Soc. London, 90, 403–431 (1800).
[4] H. N. McCoy, H. S. Morris, P. W. Selwood, Inorganic Syntheses, volume 2 of Inor-ganic Syntheses, John Wiley & Sons, Inc., Hoboken, NJ, USA, 2 edition (1946).
[5] T. Moeller, H. E. Kremers, Industrial & Engineering Chemistry Analytical Edition,17(12), 798–800 (1945).
[6] E. E. Jukkola, L. F. Audrieth, B. S. Hopkins, J. Am. Chem. Soc., 56(2), 303–304(1934).
[7] J. W. Neckers, H. C. Kremers, J. Am. Chem. Soc., 50(4), 950–954 (1928).
[8] J. K. Marsh, J. Chem. Soc., 53(9), 398 (1942).
[9] J. K. Marsh, J. Chem. Soc., 53(9), 523 (1942).
[10] J. K. Marsh, J. Chem. Soc., 53(9), 8–10 (1943).
[11] J. K. Marsh, J. Chem. Soc., 53(9), 531–335 (1943).
[12] H. N. McCoy, J. Am. Chem. Soc., 63(2), 7–8 (1937).
[13] H. N. McCoy, R. P. Hammond, J. Am. Chem. Soc., 64(4), 1009–1009 (1942).
[14] C. Hoch, A. Simon, Z. Anorg. Allg. Chem., 634(5), 853–856 (2008).
[15] C. Hoch, A. Simon, Z. Anorg. Allg. Chem., 632(14), 2288–2294 (2006).
[16] C. Hoch, A. Simon, Angew. Chem., 124(13), 3316–3319 (2012); b) C. Hoch, A. Si-mon, Angew. Chem. Int. Ed., 51(13), 3262–3265 (2012).
[17] J. H. Simons, R. P. Seward, J. Chem. Phys., 6(12), 790 (1938).
[18] T. B. Massalski, Binary Alloy Phase Diagrams, ASM International, Materials Park,
Discussion 215
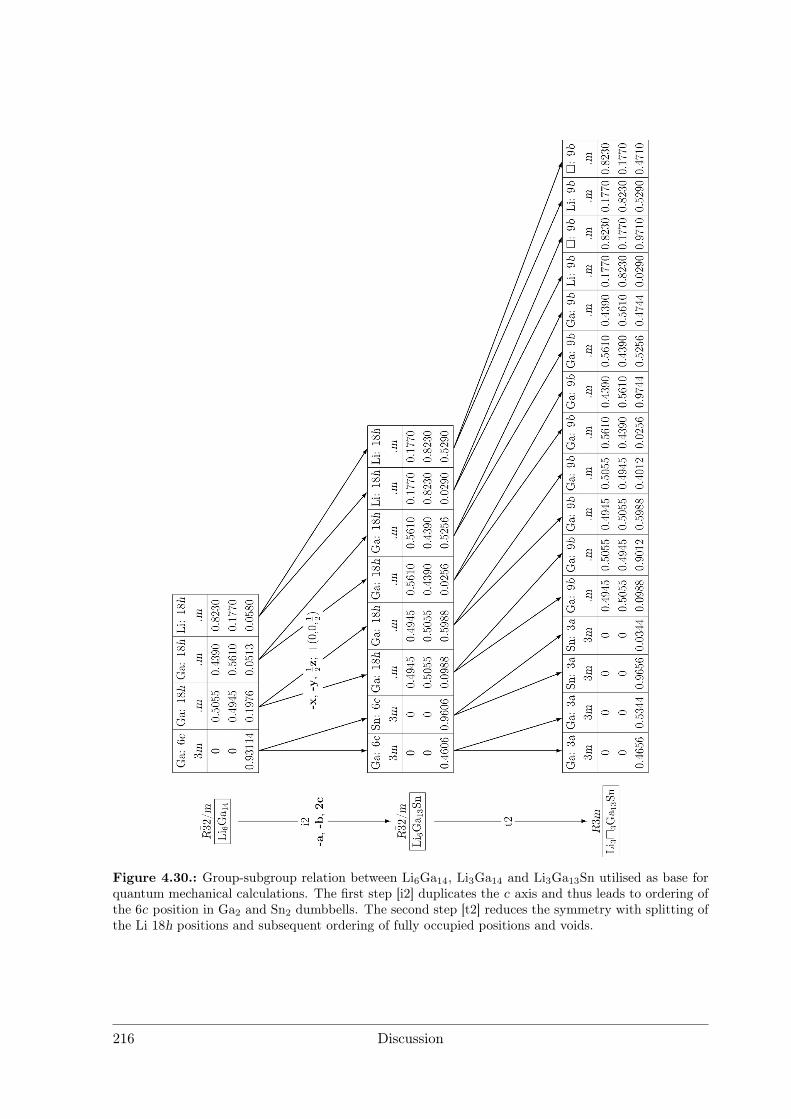
Figure 4.30.: Group-subgroup relation between Li6Ga14, Li3Ga14 and Li3Ga13Sn utilised as base forquantum mechanical calculations. The first step [i2] duplicates the c axis and thus leads to ordering ofthe 6c position in Ga2 and Sn2 dumbbells. The second step [t2] reduces the symmetry with splitting ofthe Li 18h positions and subsequent ordering of fully occupied positions and voids.
216 Discussion
Ohio, USA, 2nd edition (1990).
[19] W. Müller, H. Schäfer, Z. Naturforsch. B, 28(5-6), 246–248 (1973).
[20] G. EI, G. I. Oleksiv, K. PI, Sov. Phys. - Crystallogr., 9(3), 269 (1964).
[21] W. Müller, Z. Naturforsch. B, 29b, 304–307 (1974).
[22] J. Stöhr, H. Schäfer, Z. Anorg. Allg. Chem., 474(3), 221–225 (1981).
[23] J. Blessing, Synthesis and Study of Ternary Phases of Li with Elements of Group 3and 4, Phd-thesis, Cologne (1978).
[24] Corina Lupu, Jiang-Gao Mao, J. Wayne Rabalais, and Arnold M. Guloy, J. JamesW. Richardson, Inorg. Chem., 42(12), 3765–3771 (2003).
[25] G. Jang, J. Crys. Growth, 141(3-4), 399–403 (1994).
[26] O. Genser, J. Hafner, Phys. Rev. B, 63(14), 1–15 (2001).
[27] D. A. Hansen, L. J. Chang, Acta Crystallogr. B, 25(11), 2392–2395 (1969).
[28] W. Blase, G. Cordier, R. Kniep, Z. Anorg. Allg. Chem., 619, 1161–1166 (1993).
[29] U. Frank, W. Müller, Z. Naturforsch. B, 30(5-6), 316–322 (1975).
[30] M. Wiking, J. Stöhr, Z. Naturforsch. B, 32(6), 631–636 (1977).
[31] C. Belin, R. G. Ling, J. Solid State Chem., 45(2), 290–292 (1982).
[32] U. Frank, W. Müller, H. Schäfer, Z. Naturforsch. B, 30(1-2), 1–5 (1975).
[33] M. L. Huber, A. Laesecke, D. G. Friend, NIST Interagency/Internal Report (NIS-TIR) - 6643, pp. 1–56 (2006).
[34] S. Krivovichev, Acta Crystallogr. A, 68, 393–8 (2012).
[35] S. V. Krivovichev, Angew. Chem. Int. Ed., 53(3), 654–61 (2014); b) S. V.Krivovichev, Angew. Chem., 126(3), 666–674 (2014).
[36] J. K. Burdett, C. Marians, J. F. Mitchell, Inorg. Chem., 33(9), 1848–1856 (1994).
[37] S. E. Lister, I. Radosavljevic Evans, J. A. K. Howard, A. Coelho, J. S. O. Evans,Chem. Commun., (22), 2540 (2004).
[38] C. Guminski, J. Phase Equilib., 14(1), 97–99 (1993).
[39] C. Guminski, J. Phase Equilib., 14(3), 382–387 (1993).
[40] C. Guminski, J. Phase Equilib., 16(1), 86–91 (1995).
[41] C. Guminski, J. Phase Equilib., 16(1), 73–76 (1995).
[42] C. Guminski, J. Phase Equilib., 16(2), 181–185 (1995).
[43] C. Guminski, J. Phase Equilib., 16(1), 77–80 (1995).
[44] C. Guminski, J. Phase Equilib., 16(2), 186–192 (1995).
Discussion 217
[45] C. Guminski, J. Phase Equilib., 16(3), 276–276 (1995).
[46] C. Guminski, J. Phase Equilib., 16(5), 448–453 (1995).
[47] C. Guminski, J. Phase Equilib., 16(6), 526–526 (1995).
[48] C. Guminski, J. Phase Equilib., 16(5), 454–458 (1995).
[49] C. Guminski, J. Phase Equilib., 14(3), 391–392 (1993).
[50] C. Guminski, J. Phase Equilib., 16(2), 193–196 (1995).
[51] C. Guminski, J. Phase Equilib., 16(5), 459–459 (1995).
[52] C. Guminski, J. Phase Equilib., 16(4), 348–352 (1995).
[53] W. Lugscheider, H. R. Kirchmayr, Z. Metallkd., 57, 725 – 728 (1966).
[54] I.-C. Hwang, T. Drews, K. Seppelt, J. Am. Chem. Soc., 122, 8486–8489 (2000).
[55] A. Iandelli, A. Palenzona, J. Less-Common Met., 15(3), 273–284 (1968).
[56] H. R. Kirchmayr, Monatsh. Chem., 95(6), 1667–1670 (1964).
[57] E. Laube, H. Nowotny, Monatsh. Chem., 94(5), 851–858 (1963).
[58] A. Palenzona, J. Less-Common Met., 10(4), 290–292 (1966).
[59] S. J. Lyle, W. A. Westall, J. Less-Common Met., 99(2), 265–272 (1984).
[60] A. V. Tkachuk, A. Mar, Inorg. Chem., 47(4), 1313–8 (2008).
[61] D. M. Bailey, G. R. Kline, Acta Crystallogr. B, 27(3), 650–653 (1971).
[62] F. Tambornino, C. Hoch, Z. Anorg. Allg. Chem., 641(3-4), 537–542 (2015).
[63] W. Hornfeck, C. Hoch, Acta Crystallogr. B, 71(6), 752–767 (2015).
[64] S. Krivovichev, Private Communication (2014).
[65] M. Wörsching, F. Tambornino, S. Datz, C. Hoch, Angew. Chem. Int. Ed., 55, 1–5(2016); b) M. Wörsching, F. Tambornino, S. Datz, C. Hoch, Angew. Chem. Int.Ed., 11, 1–6 (2016).
[66] R. K. Harris, E. D. Becker, S. M. Cabral De Menezes, R. Goodfellow, P. Granger,Concepts in Magnetic Resonance Part A: Bridging Education and Research, 14(5),326–346 (2002).
[67] A. Abragam, The Principles of Nuclear Magnetism, International series of mono-graphs on physics, Clarendon Press (1961).
[68] C. P. Slichter, Principles of Magnetic Resonance, Lecture Notes in Computer Sci-ence, Springer (1996).
[69] M. D’Avezac, N. Marzari, F. Mauri, Phys. Rev. B, 76(16), 1–12 (2007).
[70] R. Laskowski, P. Blaha, J. Phys. Chem. C, 119, 19390–19396 (2015).
218 Discussion
[71] Y. Ba, J. A. Ripmeester, Mag. Res. Chem., 40(1), 81–86 (2002).
[72] S. Pagano, M. Zeuner, S. Hug, W. Schnick, Eur. J. Iorg. Chem., 2(12), 1579–1584(2009).
[73] F. Winter, S. Dupke, H. Eckert, U. C. Rodewald, R. Pöttgen, Z. Anorg. Allg. Chem.,639(15), 2790–2795 (2013).
[74] M. Tillard-Charbonnel, C. Belin, M. H. Herzog-Cance, Eur. J. Solid State Inorg.Chem, 25, 329 (1988).
[75] B. Key, R. Bhattacharyya, M. Morcrette, V. Sezne, J.-M. Tarascon, C. P. Grey, J.Am. Chem. Soc., 131, 9239–9249 (2009).
[76] E. Bekaert, F. Robert, P. E. Lippens, M. Ménétrier, J. Phys. Chem. C, 114(14),6749–6754 (2010).
[77] T. K.-J. Köster, E. Salager, A. J. Morris, B. Key, V. Seznec, M. Morcrette, C. J.Pickard, C. P. Grey, Angew. Chem. Int. Ed., 50(52), 12591–12594 (2011).
[78] C. Lee, D. White, B. H. Suits, P. A. Bancel, P. A. Heiney, Phys. Rev. B, 37(15),9053–9056 (1988).
[79] R. Nesper, H. G. von Schnering, J. Solid State Chem., 70(1), 48–57 (1987).
[80] F. Tambornino, C. Hoch, J. Alloys Compd., 618, 299–304 (2015).
[81] R. F. W. Bader, Atoms in Molecules, John Wiley & Sons, Ltd, Chichester, UK(2002).
[82] P. Cassam-Chenai, D. Jayatilaka, Theor. Chem. Acc., 105, 213–218 (2001).
[83] J. Stöhr, H. Schäfer, Rev. Chim. Miner., 19, 122 (1982).
[84] B. R. McGarvey, H. S. Gutowsky, J. Chem. Phys., 21(12), 2114 (1953).
[85] N. Bloembergen, T. Rowland, Acta Metall., 1(6), 731–746 (1953).
[86] E. Jones, D. Llewelyn Williams, Phys. Lett., 1(3), 109–110 (1962).
Discussion 219

5. Conclusion
In this thesis polar intermetallic compounds have been investigated. They are charac-terised by an incomplete electron transfer from an electropositive to an electronegativemetal. On selected examples, the impact of introducing Coulombic contributions in ametallic matrix on the physical properties have been demonstrated. Main objectiveshave been the development of new synthetic methods towards the synthesis of this classof intermetallics with special focus on amalgams as model systems. A plethora of struc-tures of coordination compounds (educts for electrolysis), various amalgams and someselected related Hg-free compounds have been elucidated. Furthermore, DFT calcu-lations have been performed to get insight into bonding modi of the compounds andto better understand fundamental structure-property relations. Additional analyticalmethods (electric conductance, magnetometry) have been employed to characterise theimpact of polarisation of metal-metal bonding on some physical properties.
This chapter gives a brief review of the key results presented in this thesis.
5.1. DMF Solvates of Metal Iodides as Educts forElectrocrystallisation
Solvates of metal iodides with N,N -dimethyl formamide (DMF) as ligand have beenprepared as educts for subsequent preparative electrolysis. Their structures have beenelucidated with single crystal X-ray diffraction. With the concept of hierarchical vari-ants, most of these structures can be rationalised as decorated variants of simple struc-ture types, e.g. hcp, ccp, NiAs, or hexagonal primitive packing. Symmetry reductionsare the result of different spatial demands of iodide ions and DMF ligands, togetherwith the point group of the latter. Group-subgroup relations have been evaluated withBärnighausen trees for selected examples to illustrate the topological relations.
5.2. Electrolysis on Unary, Binary and Ternary Reactive Cathodes
Electrolyses with elemental Hg or Ga cathode materials have been performed and yieldedthe Hg- and Ga-richest phases of the respective intermetallic systems. The amalgamsLiHg3, KHg11, KHg6, Cs3Hg20, Ca11−xHg54+x, Eu10Hg55 and ErHg3 were synthesised.The gallides Li3Ga14 and NaGa4 were synthesised. The principal reaction mechanismshave been evaluated and put into context with an alternative distillation method (yield-ing La11+xHg45−x and RE11Hg45 with RE = Sm, Nd) and classical solid state syntheses.
Conclusion 221
Electrolysis on binary systems as cathode materials can yield a single ternary compound,two binary compounds or one binary compound plus one element. The first case hasbeen observed for the electrolysis of LiI on a GaSn eutectic cathode (yielding Li3Ga13Sn)and NaI on a GaSn eutectic (yielding K8Ga8Sn38). The latter case has been observedfor electrolysis of CsI on a Hg/In (1:1) cathode yielding the new binary main groupelement compound CsIn12 whereas Hg served as inert solvent under the given conditions.Formation of two binary compounds has not been observed on the systems employed,but is likely to occur with other educt materials.
Electrolysis on a ternary cathode materials has been investigated with GalInStan andyielded a mixture of Li3Ga13Sn, LiGa, LiIn and In. Principal reaction pathways havebeen evaluated and a rational pathway for the subsequent formation of the products hasbeen assessed. In principle, formation of a single quaternary product is possible but notin the Li–Ga–Sn–In system for thermodynamic reasons.
The distillation method is complementary to electrocrystallisation at low temperatures.A mercury surplus is distilled off in vacuo after reaction in Hg flux. This method can beperformed in a temperature range of 100 – 300 C and allows for good crystallisation ofthe products as has been shown for La11+xHg45−x and RE11Hg45 (RE = Sm, Nd). Thehorizontal pathway through the x,T-phase diagram is similar to electrocrystallisation,but the mechanism is different: the former relies on stepwise increasing the amount ofthe more electronegative element in the cathode material, whereas the latter relies ondecreasing the mercury surplus in the distillation residue.
5.3. Crystal Structures of Hg-rich Amalgams
Crystal structures of Hg-rich amalgams are complicated and often exhibit mixed and/orunderoccupied positions as shown for RE11+xHg45−x, structures deriving from theGd14Ag51 aristotype and KHg6. Reoccurring motifs are Frank-Kasper polyhedra, clos-est sphere packings and cation-centred polyhedra, the latter emphasising ionic bindingcontributions.
Crystal structures with the common aristotype Gd14Ag51 as well as the aristotype itselfhave been examined. The structures show different disorder phenomena, which have beenevaluated crystallographically and on the basis of complexity measures. We have shownthat the Gd14Ag51 structure type crystallises with space group P6/m by single crystaland powder X-ray structure analysis combined with TEM investigations. Six symmetryequivalent, half-occupied and mutually exclusive Ag positions cannot be resolved bysymmetry reduction and thus are intrinsic to this structure type.
This disorder is resolved in amalgam crystal structures (hettotypes of Gd14Ag51) bysymmetry reduction to P6. However, additional disorder phenomena, mixed and un-deroccupied positions, are introduced in most of them with the exception of Yb14Hg51
crystallising in a fully ordered structure. Quantification of individual disorder phenom-ena has become possible by employing the concept of complexity measures. Singularmixed/underoccupied positions do not greatly increase complexity (e.g. Yb14Hg51 isonly little less complex than Eu10Hg55). A larger effect is observed when superstructureswith longer translation periods form.
222 Conclusion
5.4. Evaluation of Polarity in Amalgams and Related Phases
Polar metals are characterised by an incomplete electron transfer from an electropositivemetal to an electronegative metal. This leads to strong local Coulomb fields from fewcations in an overall metallic lattice. Hg-rich amalgams serve as model systems as fewelectrons from an electropositive element delocalise over a large Hg sublattice.
NMR Knight shift studies have been carried out on the three Li amalgams Li3Hg, LiHgand LiHg3 as both 7Li and 199Hg are NMR-active nuclei. With increasing Hg contentthe electron transfer increases. Thus LiHg3 features the most positive partial chargeon [Liδ+]. In this sense it is the most polar of the Li amalgams, followed by LiHg andLi3Hg as the least polar. These investigations are corroborated by electric conductivitymeasurements of the model compounds Li3Hg, LiHg, LiHg3 and KHg6 with respect to Hgand Gd14Ag51 as metallic references. Polar metals show linear dependence of resistancewith temperature only at low temperatures (LiHg: ≤20 K, KHg6: ≤50 K). Furtherincrease of the polarity leads to complicated behaviour even at low temperatures and tosemiconducting characteristics at only slightly higher temperatures (LiHg3: T ≥ 50 K).
DFT calculations have been performed to monitor the electron transfer ab initio. Badercharges have proven as viable concept but are prone to intrinsic errors as Bader basinsare allocated arbitrarily and the computed charges are not absolute. Better results areobtained by correlation of the partial density of states at Fermi level with observed NMRKnight shift measurements. Knight shifts for both 7Li and 199Hg can be rationalised byshifting the electronic bands in energy to assume energetically more favoured positionsand occupying them.
Conclusion 223

6. Outlook
Electrocrystallisation has proven a promising synthetic method for intermetallic com-pounds, especially polar metals and compounds with low peritectic decomposition tem-peratures. Thus far, only few electrode materials have been tested: Hg, Ga, Ga/Sn andHg/In eutectics and GalInStan. Other viable systems are a great number of multinarysystems compiled in chapter 3.5.1. Depending on the electrolyte, different scenarios forproduct formation can be expected as has been discussed above. For higher melting eu-tectics with melting points close to or above the boiling point of DMF, the solvent wouldhave to be changed. One option consists of ionic liquids as they are thermally stableup to very high temperatures, conduct electricity very well and are commercially avail-able. Preliminary experiments were unsuccessful as many ionic compounds decomposeat higher terminal voltages. In addition, solubility of their iodides is low or the iodidesof the cations of the respective ionic liquid form stable/insoluble salts. An ionic liquidwith a redox-active organic anion instead of iodine has to be developed in combinationwith large cations with low charge (e.g. Cs+) as their polarisability favours low meltingpoints.
An approach complimentary to the use of multinary cathode materials with an electrolytecontaining only one cation would be the use of a unary cathode material together witha multinary mixture of electrolytes containing two or more different cations. Accordingto Nernst equation concentrations would have to be chosen so that the cations presentin this mixture exhibit the same electrochemical potential and hence dissolve simultane-ously in the reactive cathode. Preliminary experiments with a solution of KI and NaI inDMF electrolysed on a Hg cathode show indications of a ternary Na-K amalgam crys-tallising in a hettotype structure of the Ga14Ag51 structure type. However, due to theextreme sensitivity of the systems with respect to reaction conditions and air/moisture incombination with highly anisotropic crystal shape and very high absorption coefficients,up to now no reliable crystal data could be acquired. Use of synchrotron radiation forboth single crystal and powder X-ray measurements are clearly indicated and should becarried out in the future.
Furthermore, the electrolytic process could be used for preparation of metal-rich com-pounds comprising larger, cluster-like ionic units in the metallic matrix. Examples havealready been given by tetramethyl ammonium amalgam and [Mg(NH3)6]Hg22. The re-sulting amalgams share features of intercalation compounds and ordinary intermetallics,and have highest polarity within all metallic compounds. Extension of this interestingfield seems possible in different ways: Cluster compounds like e.g. MoCl2 (Mo6Cl12)are of interest as the four exo-chloride atoms can be exchanged to yield Mo6Cl8I4. ThisDMF-soluble cluster compound might result in incorporation of [Mo6Cl8]
4+ clusters in areactive cathode material. Also conceivable is the use of the isostructural MoI2 (Mo6I12),
Outlook 225
with a [Mo6I8]4+-core. Experiments in this direction are currently being performed in
the group.
The presented apparatus for electrocrystallisation should be modified by adding a refer-ence electrode. This enables direct measurement of electrode potentials in situ, in con-trast to merely adjusting the terminal voltage. Electrochemical decomposition of DMFand onset of electrocrystallisation can thus be determined reliably, and electrochemi-cal quantification of product formation would be possible.. This is especially useful formulti-component electrolytes as the respective potentials have to be equilibrated withgreat precision.
Electrocrystallisation and distillation method for amalgam synthesis yield the mercury-richest amalgams under the respective synthesis conditions. Those amalgams have beenshown to exhibit a plethora of structural features including mixed/ underoccupied posi-tions and superstructures. Numerous amalgams of lanthanide metals with the approxi-mate composition REHg6.5 are reported, mainly on the basis of thermoanalytical data.The structures for RE = Eu and Yb could be determined, it is likely that other structurescan be elucidated by those means, too. Emphasis lies on synthesis at low temperaturesas the compounds are increasingly sensitive.
Combining synthesis, NMR Knight shift measurements and ab initio calculations havebeen proven useful for the quantification of polarity in amalgams and polar intermetallicsin general. This method has yet to be expanded over a lot more exemplary structuresand to be combined with other methods, such as e.g. determination of the molar heat.However, solid state NMR on many metals is difficult due to usually high quadrupolemoments (nuclear spin I ≥ 5/2). Further complication is expected for studies on rareearth metal amalgams. NMR measurements are hampered by electronic and magneticeffects. Those may be overcome by a dilution series of amalgams on an inert substratemaking magic angle spinning available even for metallic compounds, leading to narrowline widths and an overall improved signal-to-noise ratio. The support by ab initio cal-culations is also possible for all alkali and alkaline earth metal amalgams. Necessaryrelativistic corrections for Hg in combination with large unit cells and low symmetrymake the calculations time and recource consuming. Calculations for rare earth metalamalgams are even more complicated. Parallelisation on supercomputing clusters com-bined with modified exchange correlation potentials and Hubbard U correction shouldbe used for accurate modelling of (magnetically active) f electrons. To corroborate bandstructure calculations, a combination of XPS and XAFS is indicated to experimentallyconfirm the calculations.
226 Outlook
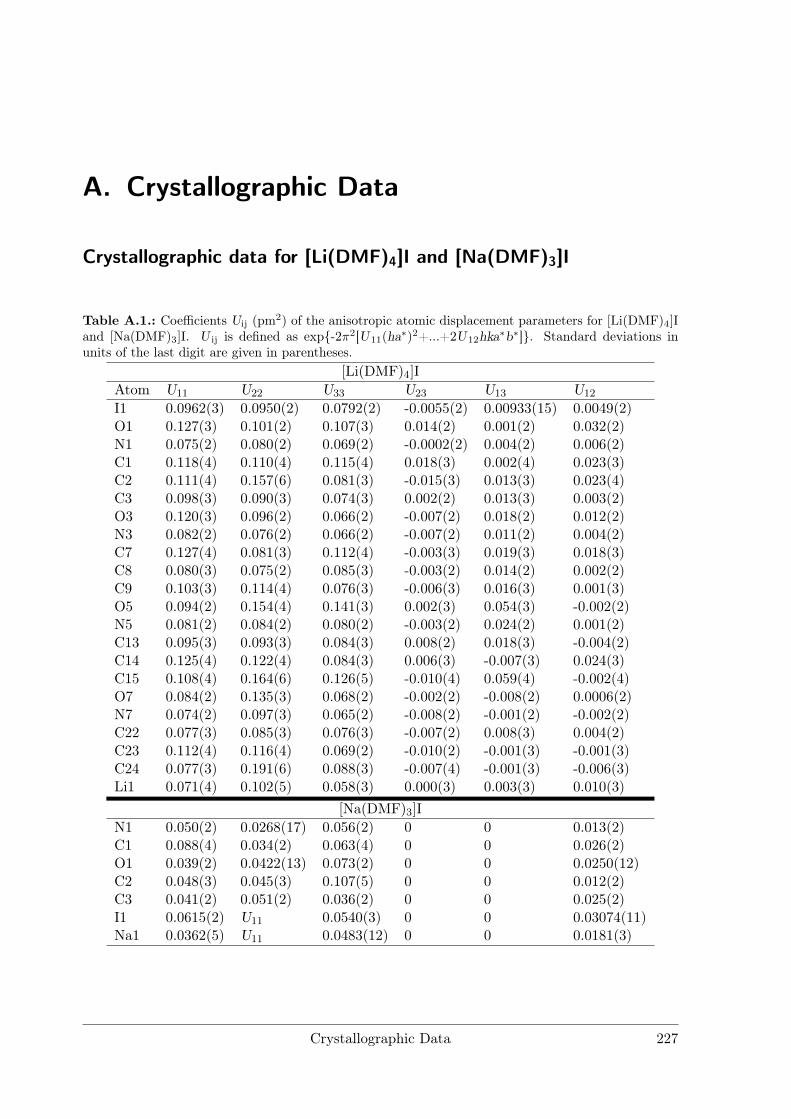
A. Crystallographic Data
Crystallographic data for [Li(DMF)4]I and [Na(DMF)3]I
Table A.1.: Coefficients Uij (pm2) of the anisotropic atomic displacement parameters for [Li(DMF)4]Iand [Na(DMF)3]I. U ij is defined as exp-2π2[U11(ha∗)2+...+2U12hka∗b∗]. Standard deviations inunits of the last digit are given in parentheses.
[Li(DMF)4]I
Atom U11 U22 U33 U23 U13 U12
I1 0.0962(3) 0.0950(2) 0.0792(2) -0.0055(2) 0.00933(15) 0.0049(2)O1 0.127(3) 0.101(2) 0.107(3) 0.014(2) 0.001(2) 0.032(2)N1 0.075(2) 0.080(2) 0.069(2) -0.0002(2) 0.004(2) 0.006(2)C1 0.118(4) 0.110(4) 0.115(4) 0.018(3) 0.002(4) 0.023(3)C2 0.111(4) 0.157(6) 0.081(3) -0.015(3) 0.013(3) 0.023(4)C3 0.098(3) 0.090(3) 0.074(3) 0.002(2) 0.013(3) 0.003(2)O3 0.120(3) 0.096(2) 0.066(2) -0.007(2) 0.018(2) 0.012(2)N3 0.082(2) 0.076(2) 0.066(2) -0.007(2) 0.011(2) 0.004(2)C7 0.127(4) 0.081(3) 0.112(4) -0.003(3) 0.019(3) 0.018(3)C8 0.080(3) 0.075(2) 0.085(3) -0.003(2) 0.014(2) 0.002(2)C9 0.103(3) 0.114(4) 0.076(3) -0.006(3) 0.016(3) 0.001(3)O5 0.094(2) 0.154(4) 0.141(3) 0.002(3) 0.054(3) -0.002(2)N5 0.081(2) 0.084(2) 0.080(2) -0.003(2) 0.024(2) 0.001(2)C13 0.095(3) 0.093(3) 0.084(3) 0.008(2) 0.018(3) -0.004(2)C14 0.125(4) 0.122(4) 0.084(3) 0.006(3) -0.007(3) 0.024(3)C15 0.108(4) 0.164(6) 0.126(5) -0.010(4) 0.059(4) -0.002(4)O7 0.084(2) 0.135(3) 0.068(2) -0.002(2) -0.008(2) 0.0006(2)N7 0.074(2) 0.097(3) 0.065(2) -0.008(2) -0.001(2) -0.002(2)C22 0.077(3) 0.085(3) 0.076(3) -0.007(2) 0.008(3) 0.004(2)C23 0.112(4) 0.116(4) 0.069(2) -0.010(2) -0.001(3) -0.001(3)C24 0.077(3) 0.191(6) 0.088(3) -0.007(4) -0.001(3) -0.006(3)Li1 0.071(4) 0.102(5) 0.058(3) 0.000(3) 0.003(3) 0.010(3)
[Na(DMF)3]I
N1 0.050(2) 0.0268(17) 0.056(2) 0 0 0.013(2)C1 0.088(4) 0.034(2) 0.063(4) 0 0 0.026(2)O1 0.039(2) 0.0422(13) 0.073(2) 0 0 0.0250(12)C2 0.048(3) 0.045(3) 0.107(5) 0 0 0.012(2)C3 0.041(2) 0.051(2) 0.036(2) 0 0 0.025(2)I1 0.0615(2) U11 0.0540(3) 0 0 0.03074(11)Na1 0.0362(5) U11 0.0483(12) 0 0 0.0181(3)
Crystallographic Data 227
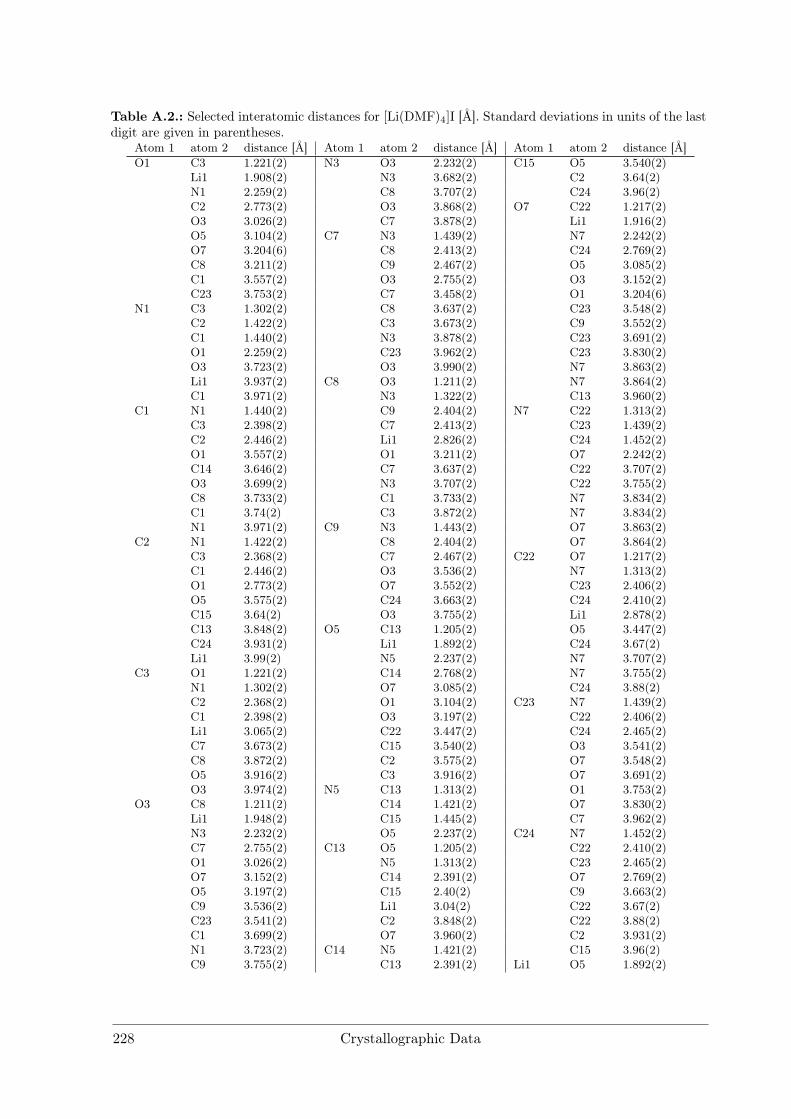
Table A.2.: Selected interatomic distances for [Li(DMF)4]I [Å]. Standard deviations in units of the lastdigit are given in parentheses.
Atom 1 atom 2 distance [Å] Atom 1 atom 2 distance [Å] Atom 1 atom 2 distance [Å]O1 C3 1.221(2) N3 O3 2.232(2) C15 O5 3.540(2)
Li1 1.908(2) N3 3.682(2) C2 3.64(2)N1 2.259(2) C8 3.707(2) C24 3.96(2)C2 2.773(2) O3 3.868(2) O7 C22 1.217(2)O3 3.026(2) C7 3.878(2) Li1 1.916(2)O5 3.104(2) C7 N3 1.439(2) N7 2.242(2)O7 3.204(6) C8 2.413(2) C24 2.769(2)C8 3.211(2) C9 2.467(2) O5 3.085(2)C1 3.557(2) O3 2.755(2) O3 3.152(2)C23 3.753(2) C7 3.458(2) O1 3.204(6)
N1 C3 1.302(2) C8 3.637(2) C23 3.548(2)C2 1.422(2) C3 3.673(2) C9 3.552(2)C1 1.440(2) N3 3.878(2) C23 3.691(2)O1 2.259(2) C23 3.962(2) C23 3.830(2)O3 3.723(2) O3 3.990(2) N7 3.863(2)Li1 3.937(2) C8 O3 1.211(2) N7 3.864(2)C1 3.971(2) N3 1.322(2) C13 3.960(2)
C1 N1 1.440(2) C9 2.404(2) N7 C22 1.313(2)C3 2.398(2) C7 2.413(2) C23 1.439(2)C2 2.446(2) Li1 2.826(2) C24 1.452(2)O1 3.557(2) O1 3.211(2) O7 2.242(2)C14 3.646(2) C7 3.637(2) C22 3.707(2)O3 3.699(2) N3 3.707(2) C22 3.755(2)C8 3.733(2) C1 3.733(2) N7 3.834(2)C1 3.74(2) C3 3.872(2) N7 3.834(2)N1 3.971(2) C9 N3 1.443(2) O7 3.863(2)
C2 N1 1.422(2) C8 2.404(2) O7 3.864(2)C3 2.368(2) C7 2.467(2) C22 O7 1.217(2)C1 2.446(2) O3 3.536(2) N7 1.313(2)O1 2.773(2) O7 3.552(2) C23 2.406(2)O5 3.575(2) C24 3.663(2) C24 2.410(2)C15 3.64(2) O3 3.755(2) Li1 2.878(2)C13 3.848(2) O5 C13 1.205(2) O5 3.447(2)C24 3.931(2) Li1 1.892(2) C24 3.67(2)Li1 3.99(2) N5 2.237(2) N7 3.707(2)
C3 O1 1.221(2) C14 2.768(2) N7 3.755(2)N1 1.302(2) O7 3.085(2) C24 3.88(2)C2 2.368(2) O1 3.104(2) C23 N7 1.439(2)C1 2.398(2) O3 3.197(2) C22 2.406(2)Li1 3.065(2) C22 3.447(2) C24 2.465(2)C7 3.673(2) C15 3.540(2) O3 3.541(2)C8 3.872(2) C2 3.575(2) O7 3.548(2)O5 3.916(2) C3 3.916(2) O7 3.691(2)O3 3.974(2) N5 C13 1.313(2) O1 3.753(2)
O3 C8 1.211(2) C14 1.421(2) O7 3.830(2)Li1 1.948(2) C15 1.445(2) C7 3.962(2)N3 2.232(2) O5 2.237(2) C24 N7 1.452(2)C7 2.755(2) C13 O5 1.205(2) C22 2.410(2)O1 3.026(2) N5 1.313(2) C23 2.465(2)O7 3.152(2) C14 2.391(2) O7 2.769(2)O5 3.197(2) C15 2.40(2) C9 3.663(2)C9 3.536(2) Li1 3.04(2) C22 3.67(2)C23 3.541(2) C2 3.848(2) C22 3.88(2)C1 3.699(2) O7 3.960(2) C2 3.931(2)N1 3.723(2) C14 N5 1.421(2) C15 3.96(2)C9 3.755(2) C13 2.391(2) Li1 O5 1.892(2)
228 Crystallographic Data
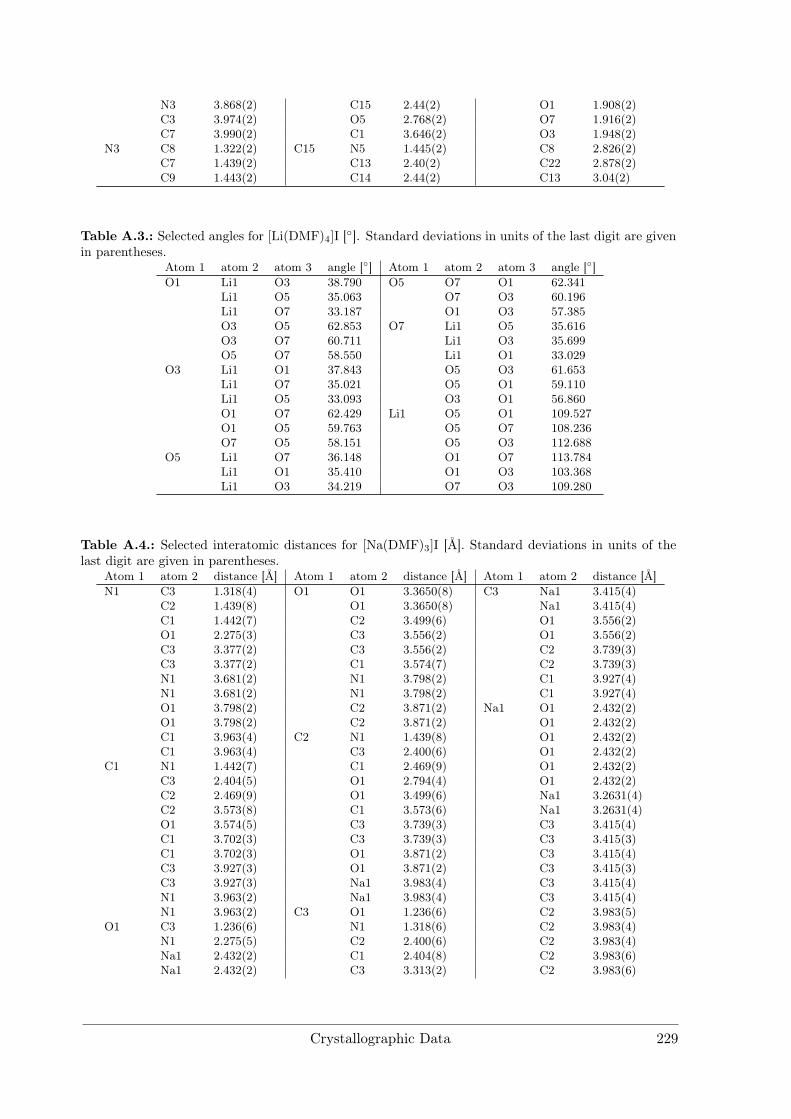
N3 3.868(2) C15 2.44(2) O1 1.908(2)C3 3.974(2) O5 2.768(2) O7 1.916(2)C7 3.990(2) C1 3.646(2) O3 1.948(2)
N3 C8 1.322(2) C15 N5 1.445(2) C8 2.826(2)C7 1.439(2) C13 2.40(2) C22 2.878(2)C9 1.443(2) C14 2.44(2) C13 3.04(2)
Table A.3.: Selected angles for [Li(DMF)4]I []. Standard deviations in units of the last digit are givenin parentheses.
Atom 1 atom 2 atom 3 angle [] Atom 1 atom 2 atom 3 angle []O1 Li1 O3 38.790 O5 O7 O1 62.341
Li1 O5 35.063 O7 O3 60.196Li1 O7 33.187 O1 O3 57.385O3 O5 62.853 O7 Li1 O5 35.616O3 O7 60.711 Li1 O3 35.699O5 O7 58.550 Li1 O1 33.029
O3 Li1 O1 37.843 O5 O3 61.653Li1 O7 35.021 O5 O1 59.110Li1 O5 33.093 O3 O1 56.860O1 O7 62.429 Li1 O5 O1 109.527O1 O5 59.763 O5 O7 108.236O7 O5 58.151 O5 O3 112.688
O5 Li1 O7 36.148 O1 O7 113.784Li1 O1 35.410 O1 O3 103.368Li1 O3 34.219 O7 O3 109.280
Table A.4.: Selected interatomic distances for [Na(DMF)3]I [Å]. Standard deviations in units of thelast digit are given in parentheses.
Atom 1 atom 2 distance [Å] Atom 1 atom 2 distance [Å] Atom 1 atom 2 distance [Å]N1 C3 1.318(4) O1 O1 3.3650(8) C3 Na1 3.415(4)
C2 1.439(8) O1 3.3650(8) Na1 3.415(4)C1 1.442(7) C2 3.499(6) O1 3.556(2)O1 2.275(3) C3 3.556(2) O1 3.556(2)C3 3.377(2) C3 3.556(2) C2 3.739(3)C3 3.377(2) C1 3.574(7) C2 3.739(3)N1 3.681(2) N1 3.798(2) C1 3.927(4)N1 3.681(2) N1 3.798(2) C1 3.927(4)O1 3.798(2) C2 3.871(2) Na1 O1 2.432(2)O1 3.798(2) C2 3.871(2) O1 2.432(2)C1 3.963(4) C2 N1 1.439(8) O1 2.432(2)C1 3.963(4) C3 2.400(6) O1 2.432(2)
C1 N1 1.442(7) C1 2.469(9) O1 2.432(2)C3 2.404(5) O1 2.794(4) O1 2.432(2)C2 2.469(9) O1 3.499(6) Na1 3.2631(4)C2 3.573(8) C1 3.573(6) Na1 3.2631(4)O1 3.574(5) C3 3.739(3) C3 3.415(4)C1 3.702(3) C3 3.739(3) C3 3.415(3)C1 3.702(3) O1 3.871(2) C3 3.415(4)C3 3.927(3) O1 3.871(2) C3 3.415(3)C3 3.927(3) Na1 3.983(4) C3 3.415(4)N1 3.963(2) Na1 3.983(4) C3 3.415(4)N1 3.963(2) C3 O1 1.236(6) C2 3.983(5)
O1 C3 1.236(6) N1 1.318(6) C2 3.983(4)N1 2.275(5) C2 2.400(6) C2 3.983(4)Na1 2.432(2) C1 2.404(8) C2 3.983(6)Na1 2.432(2) C3 3.313(2) C2 3.983(6)
Crystallographic Data 229
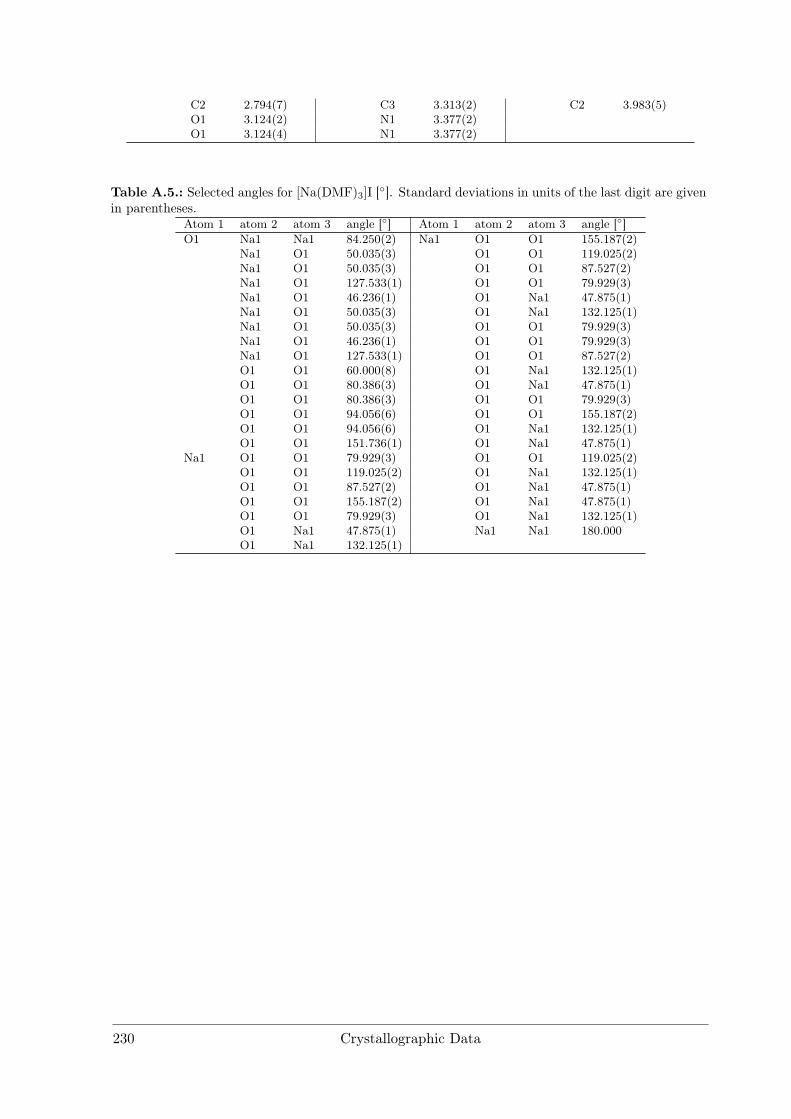
C2 2.794(7) C3 3.313(2) C2 3.983(5)O1 3.124(2) N1 3.377(2)O1 3.124(4) N1 3.377(2)
Table A.5.: Selected angles for [Na(DMF)3]I []. Standard deviations in units of the last digit are givenin parentheses.
Atom 1 atom 2 atom 3 angle [] Atom 1 atom 2 atom 3 angle []O1 Na1 Na1 84.250(2) Na1 O1 O1 155.187(2)
Na1 O1 50.035(3) O1 O1 119.025(2)Na1 O1 50.035(3) O1 O1 87.527(2)Na1 O1 127.533(1) O1 O1 79.929(3)Na1 O1 46.236(1) O1 Na1 47.875(1)Na1 O1 50.035(3) O1 Na1 132.125(1)Na1 O1 50.035(3) O1 O1 79.929(3)Na1 O1 46.236(1) O1 O1 79.929(3)Na1 O1 127.533(1) O1 O1 87.527(2)O1 O1 60.000(8) O1 Na1 132.125(1)O1 O1 80.386(3) O1 Na1 47.875(1)O1 O1 80.386(3) O1 O1 79.929(3)O1 O1 94.056(6) O1 O1 155.187(2)O1 O1 94.056(6) O1 Na1 132.125(1)O1 O1 151.736(1) O1 Na1 47.875(1)
Na1 O1 O1 79.929(3) O1 O1 119.025(2)O1 O1 119.025(2) O1 Na1 132.125(1)O1 O1 87.527(2) O1 Na1 47.875(1)O1 O1 155.187(2) O1 Na1 47.875(1)O1 O1 79.929(3) O1 Na1 132.125(1)O1 Na1 47.875(1) Na1 Na1 180.000O1 Na1 132.125(1)
230 Crystallographic Data
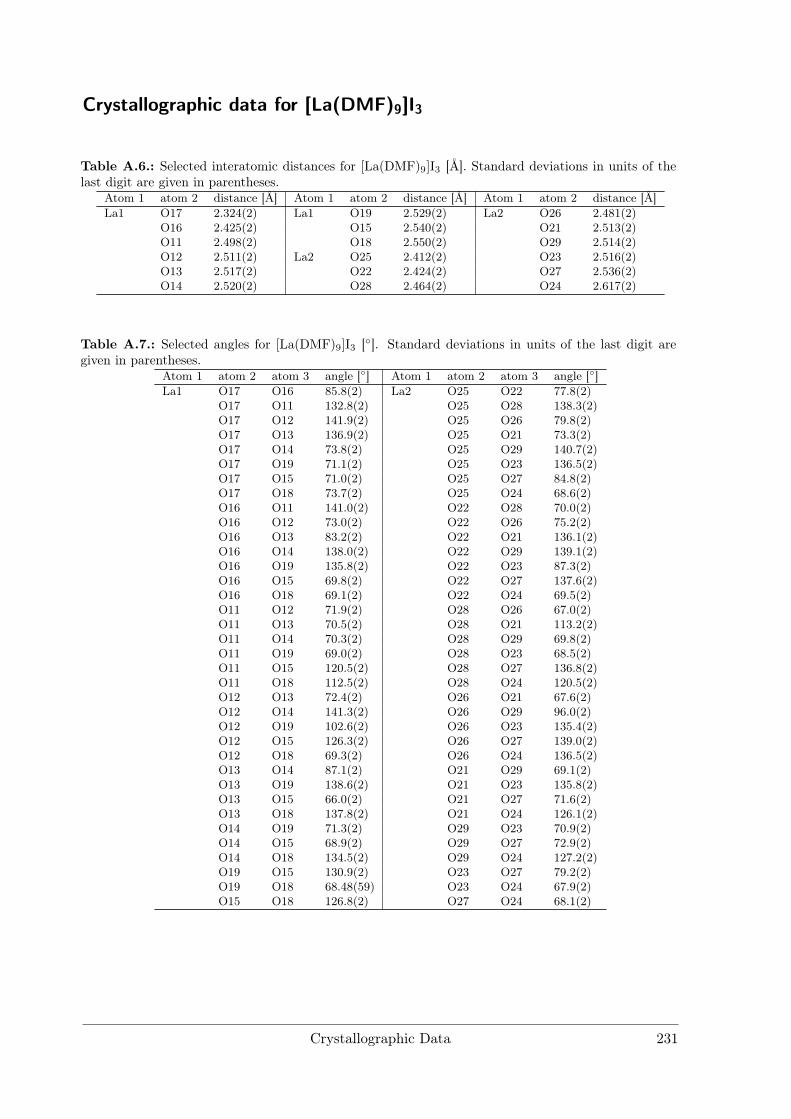
Crystallographic data for [La(DMF)9]I3
Table A.6.: Selected interatomic distances for [La(DMF)9]I3 [Å]. Standard deviations in units of thelast digit are given in parentheses.
Atom 1 atom 2 distance [Å] Atom 1 atom 2 distance [Å] Atom 1 atom 2 distance [Å]La1 O17 2.324(2) La1 O19 2.529(2) La2 O26 2.481(2)
O16 2.425(2) O15 2.540(2) O21 2.513(2)O11 2.498(2) O18 2.550(2) O29 2.514(2)O12 2.511(2) La2 O25 2.412(2) O23 2.516(2)O13 2.517(2) O22 2.424(2) O27 2.536(2)O14 2.520(2) O28 2.464(2) O24 2.617(2)
Table A.7.: Selected angles for [La(DMF)9]I3 []. Standard deviations in units of the last digit aregiven in parentheses.
Atom 1 atom 2 atom 3 angle [] Atom 1 atom 2 atom 3 angle []La1 O17 O16 85.8(2) La2 O25 O22 77.8(2)
O17 O11 132.8(2) O25 O28 138.3(2)O17 O12 141.9(2) O25 O26 79.8(2)O17 O13 136.9(2) O25 O21 73.3(2)O17 O14 73.8(2) O25 O29 140.7(2)O17 O19 71.1(2) O25 O23 136.5(2)O17 O15 71.0(2) O25 O27 84.8(2)O17 O18 73.7(2) O25 O24 68.6(2)O16 O11 141.0(2) O22 O28 70.0(2)O16 O12 73.0(2) O22 O26 75.2(2)O16 O13 83.2(2) O22 O21 136.1(2)O16 O14 138.0(2) O22 O29 139.1(2)O16 O19 135.8(2) O22 O23 87.3(2)O16 O15 69.8(2) O22 O27 137.6(2)O16 O18 69.1(2) O22 O24 69.5(2)O11 O12 71.9(2) O28 O26 67.0(2)O11 O13 70.5(2) O28 O21 113.2(2)O11 O14 70.3(2) O28 O29 69.8(2)O11 O19 69.0(2) O28 O23 68.5(2)O11 O15 120.5(2) O28 O27 136.8(2)O11 O18 112.5(2) O28 O24 120.5(2)O12 O13 72.4(2) O26 O21 67.6(2)O12 O14 141.3(2) O26 O29 96.0(2)O12 O19 102.6(2) O26 O23 135.4(2)O12 O15 126.3(2) O26 O27 139.0(2)O12 O18 69.3(2) O26 O24 136.5(2)O13 O14 87.1(2) O21 O29 69.1(2)O13 O19 138.6(2) O21 O23 135.8(2)O13 O15 66.0(2) O21 O27 71.6(2)O13 O18 137.8(2) O21 O24 126.1(2)O14 O19 71.3(2) O29 O23 70.9(2)O14 O15 68.9(2) O29 O27 72.9(2)O14 O18 134.5(2) O29 O24 127.2(2)O19 O15 130.9(2) O23 O27 79.2(2)O19 O18 68.48(59) O23 O24 67.9(2)O15 O18 126.8(2) O27 O24 68.1(2)
Crystallographic Data 231
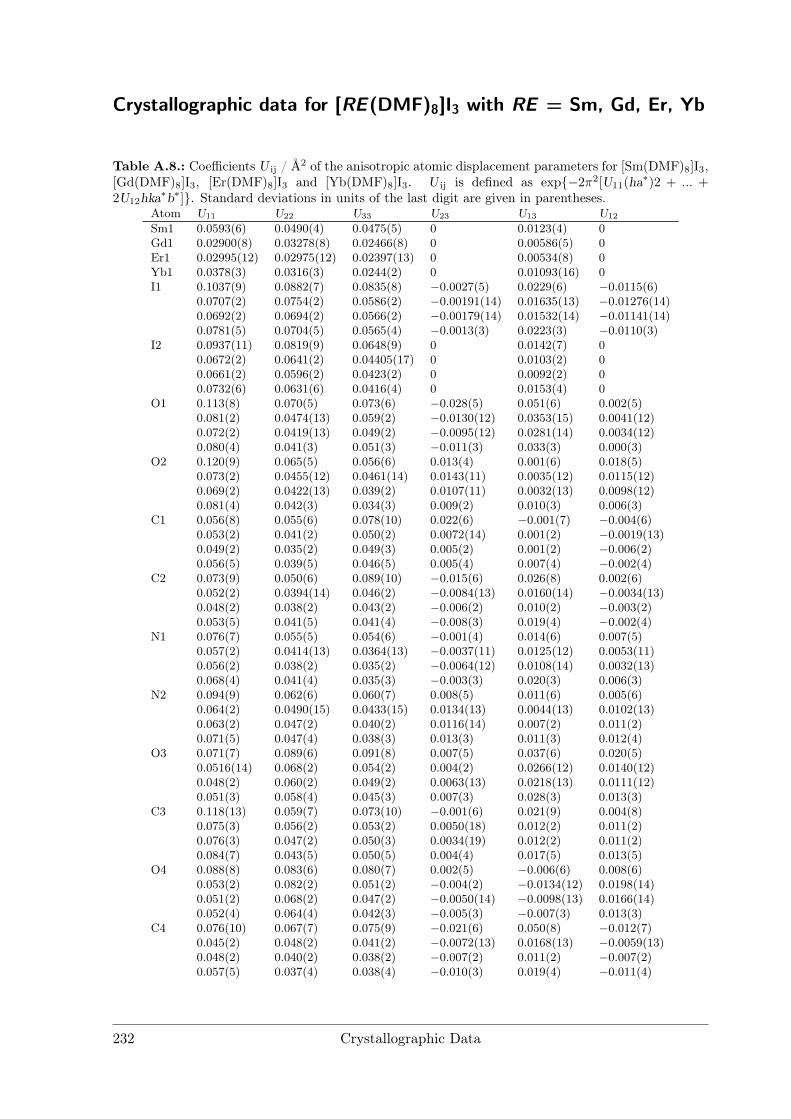
Crystallographic data for [RE(DMF)8]I3 with RE = Sm, Gd, Er, Yb
Table A.8.: Coefficients U ij / Å2 of the anisotropic atomic displacement parameters for [Sm(DMF)8]I3,[Gd(DMF)8]I3, [Er(DMF)8]I3 and [Yb(DMF)8]I3. U ij is defined as exp−2π2[U11(ha∗)2 + ... +2U12hka∗b∗]. Standard deviations in units of the last digit are given in parentheses.
Atom U11 U22 U33 U23 U13 U12
Sm1 0.0593(6) 0.0490(4) 0.0475(5) 0 0.0123(4) 0Gd1 0.02900(8) 0.03278(8) 0.02466(8) 0 0.00586(5) 0Er1 0.02995(12) 0.02975(12) 0.02397(13) 0 0.00534(8) 0Yb1 0.0378(3) 0.0316(3) 0.0244(2) 0 0.01093(16) 0I1 0.1037(9) 0.0882(7) 0.0835(8) −0.0027(5) 0.0229(6) −0.0115(6)
0.0707(2) 0.0754(2) 0.0586(2) −0.00191(14) 0.01635(13) −0.01276(14)0.0692(2) 0.0694(2) 0.0566(2) −0.00179(14) 0.01532(14) −0.01141(14)0.0781(5) 0.0704(5) 0.0565(4) −0.0013(3) 0.0223(3) −0.0110(3)
I2 0.0937(11) 0.0819(9) 0.0648(9) 0 0.0142(7) 00.0672(2) 0.0641(2) 0.04405(17) 0 0.0103(2) 00.0661(2) 0.0596(2) 0.0423(2) 0 0.0092(2) 00.0732(6) 0.0631(6) 0.0416(4) 0 0.0153(4) 0
O1 0.113(8) 0.070(5) 0.073(6) −0.028(5) 0.051(6) 0.002(5)0.081(2) 0.0474(13) 0.059(2) −0.0130(12) 0.0353(15) 0.0041(12)0.072(2) 0.0419(13) 0.049(2) −0.0095(12) 0.0281(14) 0.0034(12)0.080(4) 0.041(3) 0.051(3) −0.011(3) 0.033(3) 0.000(3)
O2 0.120(9) 0.065(5) 0.056(6) 0.013(4) 0.001(6) 0.018(5)0.073(2) 0.0455(12) 0.0461(14) 0.0143(11) 0.0035(12) 0.0115(12)0.069(2) 0.0422(13) 0.039(2) 0.0107(11) 0.0032(13) 0.0098(12)0.081(4) 0.042(3) 0.034(3) 0.009(2) 0.010(3) 0.006(3)
C1 0.056(8) 0.055(6) 0.078(10) 0.022(6) −0.001(7) −0.004(6)0.053(2) 0.041(2) 0.050(2) 0.0072(14) 0.001(2) −0.0019(13)0.049(2) 0.035(2) 0.049(3) 0.005(2) 0.001(2) −0.006(2)0.056(5) 0.039(5) 0.046(5) 0.005(4) 0.007(4) −0.002(4)
C2 0.073(9) 0.050(6) 0.089(10) −0.015(6) 0.026(8) 0.002(6)0.052(2) 0.0394(14) 0.046(2) −0.0084(13) 0.0160(14) −0.0034(13)0.048(2) 0.038(2) 0.043(2) −0.006(2) 0.010(2) −0.003(2)0.053(5) 0.041(5) 0.041(4) −0.008(3) 0.019(4) −0.002(4)
N1 0.076(7) 0.055(5) 0.054(6) −0.001(4) 0.014(6) 0.007(5)0.057(2) 0.0414(13) 0.0364(13) −0.0037(11) 0.0125(12) 0.0053(11)0.056(2) 0.038(2) 0.035(2) −0.0064(12) 0.0108(14) 0.0032(13)0.068(4) 0.041(4) 0.035(3) −0.003(3) 0.020(3) 0.006(3)
N2 0.094(9) 0.062(6) 0.060(7) 0.008(5) 0.011(6) 0.005(6)0.064(2) 0.0490(15) 0.0433(15) 0.0134(13) 0.0044(13) 0.0102(13)0.063(2) 0.047(2) 0.040(2) 0.0116(14) 0.007(2) 0.011(2)0.071(5) 0.047(4) 0.038(3) 0.013(3) 0.011(3) 0.012(4)
O3 0.071(7) 0.089(6) 0.091(8) 0.007(5) 0.037(6) 0.020(5)0.0516(14) 0.068(2) 0.054(2) 0.004(2) 0.0266(12) 0.0140(12)0.048(2) 0.060(2) 0.049(2) 0.0063(13) 0.0218(13) 0.0111(12)0.051(3) 0.058(4) 0.045(3) 0.007(3) 0.028(3) 0.013(3)
C3 0.118(13) 0.059(7) 0.073(10) −0.001(6) 0.021(9) 0.004(8)0.075(3) 0.056(2) 0.053(2) 0.0050(18) 0.012(2) 0.011(2)0.076(3) 0.047(2) 0.050(3) 0.0034(19) 0.012(2) 0.011(2)0.084(7) 0.043(5) 0.050(5) 0.004(4) 0.017(5) 0.013(5)
O4 0.088(8) 0.083(6) 0.080(7) 0.002(5) −0.006(6) 0.008(6)0.053(2) 0.082(2) 0.051(2) −0.004(2) −0.0134(12) 0.0198(14)0.051(2) 0.068(2) 0.047(2) −0.0050(14) −0.0098(13) 0.0166(14)0.052(4) 0.064(4) 0.042(3) −0.005(3) −0.007(3) 0.013(3)
C4 0.076(10) 0.067(7) 0.075(9) −0.021(6) 0.050(8) −0.012(7)0.045(2) 0.048(2) 0.041(2) −0.0072(13) 0.0168(13) −0.0059(13)0.048(2) 0.040(2) 0.038(2) −0.007(2) 0.011(2) −0.007(2)0.057(5) 0.037(4) 0.038(4) −0.010(3) 0.019(4) −0.011(4)
232 Crystallographic Data
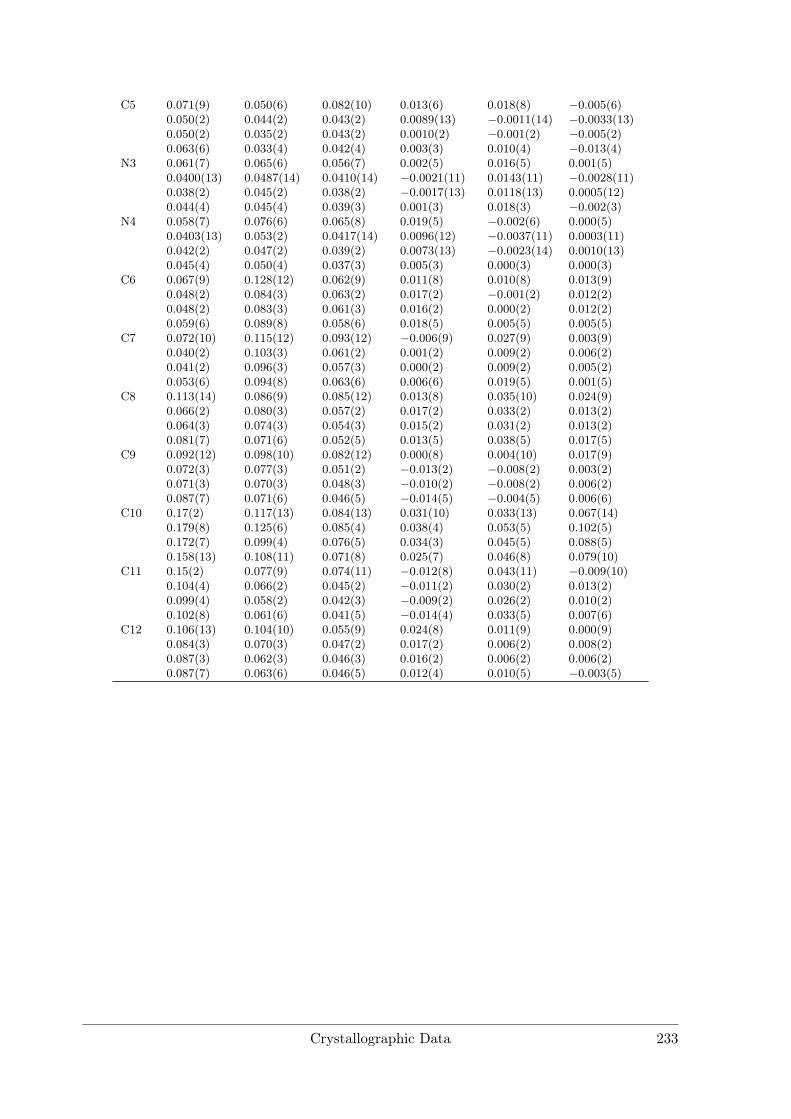
C5 0.071(9) 0.050(6) 0.082(10) 0.013(6) 0.018(8) −0.005(6)0.050(2) 0.044(2) 0.043(2) 0.0089(13) −0.0011(14) −0.0033(13)0.050(2) 0.035(2) 0.043(2) 0.0010(2) −0.001(2) −0.005(2)0.063(6) 0.033(4) 0.042(4) 0.003(3) 0.010(4) −0.013(4)
N3 0.061(7) 0.065(6) 0.056(7) 0.002(5) 0.016(5) 0.001(5)0.0400(13) 0.0487(14) 0.0410(14) −0.0021(11) 0.0143(11) −0.0028(11)0.038(2) 0.045(2) 0.038(2) −0.0017(13) 0.0118(13) 0.0005(12)0.044(4) 0.045(4) 0.039(3) 0.001(3) 0.018(3) −0.002(3)
N4 0.058(7) 0.076(6) 0.065(8) 0.019(5) −0.002(6) 0.000(5)0.0403(13) 0.053(2) 0.0417(14) 0.0096(12) −0.0037(11) 0.0003(11)0.042(2) 0.047(2) 0.039(2) 0.0073(13) −0.0023(14) 0.0010(13)0.045(4) 0.050(4) 0.037(3) 0.005(3) 0.000(3) 0.000(3)
C6 0.067(9) 0.128(12) 0.062(9) 0.011(8) 0.010(8) 0.013(9)0.048(2) 0.084(3) 0.063(2) 0.017(2) −0.001(2) 0.012(2)0.048(2) 0.083(3) 0.061(3) 0.016(2) 0.000(2) 0.012(2)0.059(6) 0.089(8) 0.058(6) 0.018(5) 0.005(5) 0.005(5)
C7 0.072(10) 0.115(12) 0.093(12) −0.006(9) 0.027(9) 0.003(9)0.040(2) 0.103(3) 0.061(2) 0.001(2) 0.009(2) 0.006(2)0.041(2) 0.096(3) 0.057(3) 0.000(2) 0.009(2) 0.005(2)0.053(6) 0.094(8) 0.063(6) 0.006(6) 0.019(5) 0.001(5)
C8 0.113(14) 0.086(9) 0.085(12) 0.013(8) 0.035(10) 0.024(9)0.066(2) 0.080(3) 0.057(2) 0.017(2) 0.033(2) 0.013(2)0.064(3) 0.074(3) 0.054(3) 0.015(2) 0.031(2) 0.013(2)0.081(7) 0.071(6) 0.052(5) 0.013(5) 0.038(5) 0.017(5)
C9 0.092(12) 0.098(10) 0.082(12) 0.000(8) 0.004(10) 0.017(9)0.072(3) 0.077(3) 0.051(2) −0.013(2) −0.008(2) 0.003(2)0.071(3) 0.070(3) 0.048(3) −0.010(2) −0.008(2) 0.006(2)0.087(7) 0.071(6) 0.046(5) −0.014(5) −0.004(5) 0.006(6)
C10 0.17(2) 0.117(13) 0.084(13) 0.031(10) 0.033(13) 0.067(14)0.179(8) 0.125(6) 0.085(4) 0.038(4) 0.053(5) 0.102(5)0.172(7) 0.099(4) 0.076(5) 0.034(3) 0.045(5) 0.088(5)0.158(13) 0.108(11) 0.071(8) 0.025(7) 0.046(8) 0.079(10)
C11 0.15(2) 0.077(9) 0.074(11) −0.012(8) 0.043(11) −0.009(10)0.104(4) 0.066(2) 0.045(2) −0.011(2) 0.030(2) 0.013(2)0.099(4) 0.058(2) 0.042(3) −0.009(2) 0.026(2) 0.010(2)0.102(8) 0.061(6) 0.041(5) −0.014(4) 0.033(5) 0.007(6)
C12 0.106(13) 0.104(10) 0.055(9) 0.024(8) 0.011(9) 0.000(9)0.084(3) 0.070(3) 0.047(2) 0.017(2) 0.006(2) 0.008(2)0.087(3) 0.062(3) 0.046(3) 0.016(2) 0.006(2) 0.006(2)0.087(7) 0.063(6) 0.046(5) 0.012(4) 0.010(5) −0.003(5)
Crystallographic Data 233
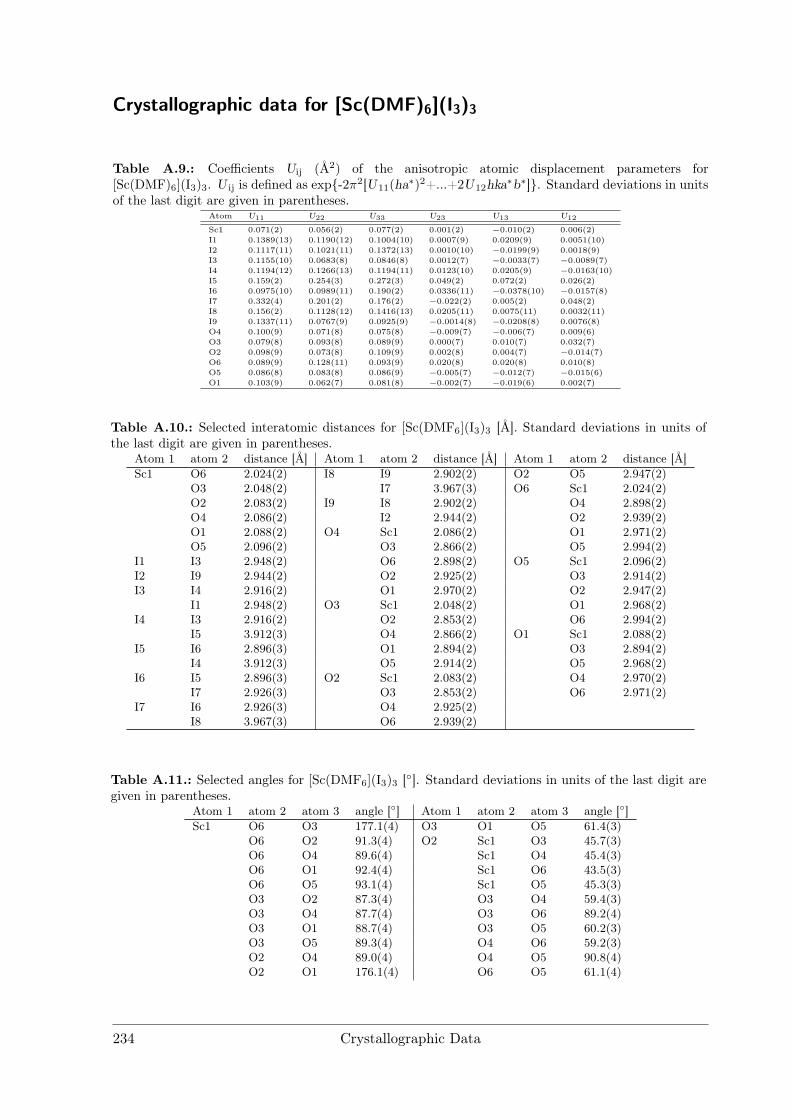
Crystallographic data for [Sc(DMF)6](I3)3
Table A.9.: Coefficients Uij (Å2) of the anisotropic atomic displacement parameters for[Sc(DMF)6](I3)3. U ij is defined as exp-2π2[U11(ha∗)2+...+2U12hka∗b∗]. Standard deviations in unitsof the last digit are given in parentheses.
Atom U11 U22 U33 U23 U13 U12
Sc1 0.071(2) 0.056(2) 0.077(2) 0.001(2) −0.010(2) 0.006(2)I1 0.1389(13) 0.1190(12) 0.1004(10) 0.0007(9) 0.0209(9) 0.0051(10)I2 0.1117(11) 0.1021(11) 0.1372(13) 0.0010(10) −0.0199(9) 0.0018(9)I3 0.1155(10) 0.0683(8) 0.0846(8) 0.0012(7) −0.0033(7) −0.0089(7)I4 0.1194(12) 0.1266(13) 0.1194(11) 0.0123(10) 0.0205(9) −0.0163(10)I5 0.159(2) 0.254(3) 0.272(3) 0.049(2) 0.072(2) 0.026(2)I6 0.0975(10) 0.0989(11) 0.190(2) 0.0336(11) −0.0378(10) −0.0157(8)I7 0.332(4) 0.201(2) 0.176(2) −0.022(2) 0.005(2) 0.048(2)I8 0.156(2) 0.1128(12) 0.1416(13) 0.0205(11) 0.0075(11) 0.0032(11)I9 0.1337(11) 0.0767(9) 0.0925(9) −0.0014(8) −0.0208(8) 0.0076(8)O4 0.100(9) 0.071(8) 0.075(8) −0.009(7) −0.006(7) 0.009(6)O3 0.079(8) 0.093(8) 0.089(9) 0.000(7) 0.010(7) 0.032(7)O2 0.098(9) 0.073(8) 0.109(9) 0.002(8) 0.004(7) −0.014(7)O6 0.089(9) 0.128(11) 0.093(9) 0.020(8) 0.020(8) 0.010(8)O5 0.086(8) 0.083(8) 0.086(9) −0.005(7) −0.012(7) −0.015(6)O1 0.103(9) 0.062(7) 0.081(8) −0.002(7) −0.019(6) 0.002(7)
Table A.10.: Selected interatomic distances for [Sc(DMF6](I3)3 [Å]. Standard deviations in units ofthe last digit are given in parentheses.
Atom 1 atom 2 distance [Å] Atom 1 atom 2 distance [Å] Atom 1 atom 2 distance [Å]Sc1 O6 2.024(2) I8 I9 2.902(2) O2 O5 2.947(2)
O3 2.048(2) I7 3.967(3) O6 Sc1 2.024(2)O2 2.083(2) I9 I8 2.902(2) O4 2.898(2)O4 2.086(2) I2 2.944(2) O2 2.939(2)O1 2.088(2) O4 Sc1 2.086(2) O1 2.971(2)O5 2.096(2) O3 2.866(2) O5 2.994(2)
I1 I3 2.948(2) O6 2.898(2) O5 Sc1 2.096(2)I2 I9 2.944(2) O2 2.925(2) O3 2.914(2)I3 I4 2.916(2) O1 2.970(2) O2 2.947(2)
I1 2.948(2) O3 Sc1 2.048(2) O1 2.968(2)I4 I3 2.916(2) O2 2.853(2) O6 2.994(2)
I5 3.912(3) O4 2.866(2) O1 Sc1 2.088(2)I5 I6 2.896(3) O1 2.894(2) O3 2.894(2)
I4 3.912(3) O5 2.914(2) O5 2.968(2)I6 I5 2.896(3) O2 Sc1 2.083(2) O4 2.970(2)
I7 2.926(3) O3 2.853(2) O6 2.971(2)I7 I6 2.926(3) O4 2.925(2)
I8 3.967(3) O6 2.939(2)
Table A.11.: Selected angles for [Sc(DMF6](I3)3 []. Standard deviations in units of the last digit aregiven in parentheses.
Atom 1 atom 2 atom 3 angle [] Atom 1 atom 2 atom 3 angle []Sc1 O6 O3 177.1(4) O3 O1 O5 61.4(3)
O6 O2 91.3(4) O2 Sc1 O3 45.7(3)O6 O4 89.6(4) Sc1 O4 45.4(3)O6 O1 92.4(4) Sc1 O6 43.5(3)O6 O5 93.1(4) Sc1 O5 45.3(3)O3 O2 87.3(4) O3 O4 59.4(3)O3 O4 87.7(4) O3 O6 89.2(4)O3 O1 88.7(4) O3 O5 60.2(3)O3 O5 89.3(4) O4 O6 59.2(3)O2 O4 89.0(4) O4 O5 90.8(4)O2 O1 176.1(4) O6 O5 61.1(4)
234 Crystallographic Data
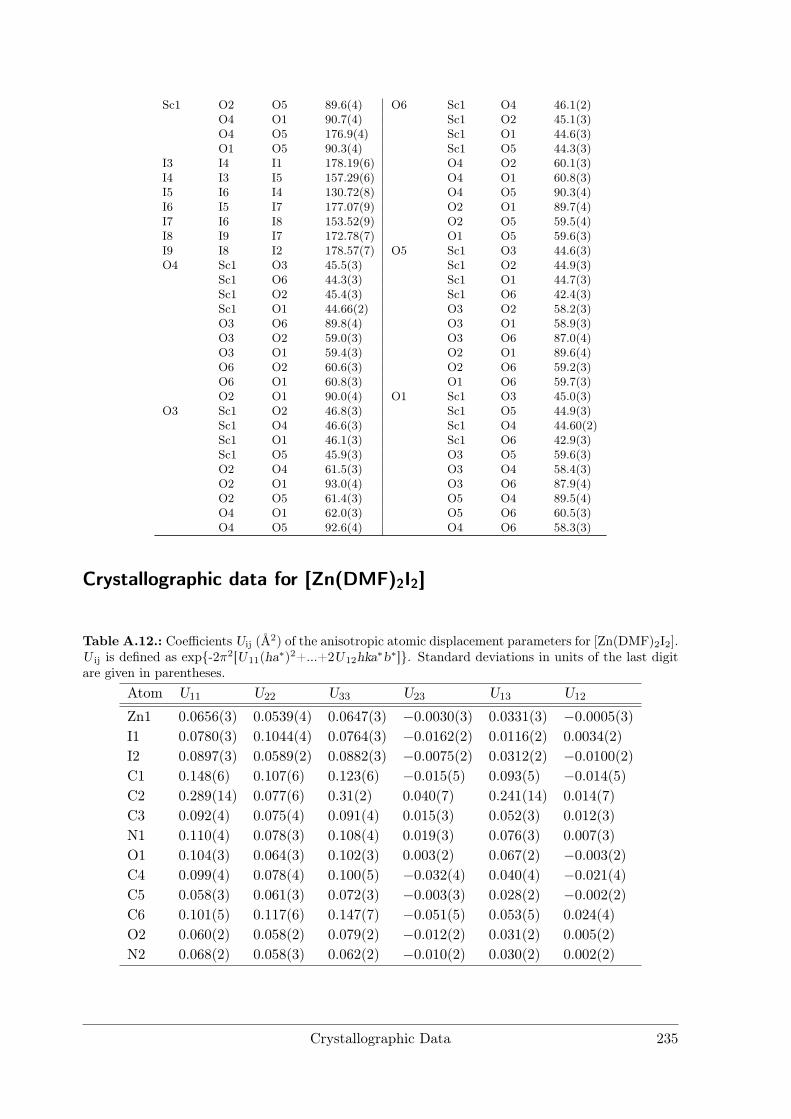
Sc1 O2 O5 89.6(4) O6 Sc1 O4 46.1(2)O4 O1 90.7(4) Sc1 O2 45.1(3)O4 O5 176.9(4) Sc1 O1 44.6(3)O1 O5 90.3(4) Sc1 O5 44.3(3)
I3 I4 I1 178.19(6) O4 O2 60.1(3)I4 I3 I5 157.29(6) O4 O1 60.8(3)I5 I6 I4 130.72(8) O4 O5 90.3(4)I6 I5 I7 177.07(9) O2 O1 89.7(4)I7 I6 I8 153.52(9) O2 O5 59.5(4)I8 I9 I7 172.78(7) O1 O5 59.6(3)I9 I8 I2 178.57(7) O5 Sc1 O3 44.6(3)O4 Sc1 O3 45.5(3) Sc1 O2 44.9(3)
Sc1 O6 44.3(3) Sc1 O1 44.7(3)Sc1 O2 45.4(3) Sc1 O6 42.4(3)Sc1 O1 44.66(2) O3 O2 58.2(3)O3 O6 89.8(4) O3 O1 58.9(3)O3 O2 59.0(3) O3 O6 87.0(4)O3 O1 59.4(3) O2 O1 89.6(4)O6 O2 60.6(3) O2 O6 59.2(3)O6 O1 60.8(3) O1 O6 59.7(3)O2 O1 90.0(4) O1 Sc1 O3 45.0(3)
O3 Sc1 O2 46.8(3) Sc1 O5 44.9(3)Sc1 O4 46.6(3) Sc1 O4 44.60(2)Sc1 O1 46.1(3) Sc1 O6 42.9(3)Sc1 O5 45.9(3) O3 O5 59.6(3)O2 O4 61.5(3) O3 O4 58.4(3)O2 O1 93.0(4) O3 O6 87.9(4)O2 O5 61.4(3) O5 O4 89.5(4)O4 O1 62.0(3) O5 O6 60.5(3)O4 O5 92.6(4) O4 O6 58.3(3)
Crystallographic data for [Zn(DMF)2I2]
Table A.12.: Coefficients Uij (Å2) of the anisotropic atomic displacement parameters for [Zn(DMF)2I2].U ij is defined as exp-2π2[U11(ha∗)2+...+2U12hka∗b∗]. Standard deviations in units of the last digitare given in parentheses.
Atom U11 U22 U33 U23 U13 U12
Zn1 0.0656(3) 0.0539(4) 0.0647(3) −0.0030(3) 0.0331(3) −0.0005(3)I1 0.0780(3) 0.1044(4) 0.0764(3) −0.0162(2) 0.0116(2) 0.0034(2)I2 0.0897(3) 0.0589(2) 0.0882(3) −0.0075(2) 0.0312(2) −0.0100(2)C1 0.148(6) 0.107(6) 0.123(6) −0.015(5) 0.093(5) −0.014(5)C2 0.289(14) 0.077(6) 0.31(2) 0.040(7) 0.241(14) 0.014(7)C3 0.092(4) 0.075(4) 0.091(4) 0.015(3) 0.052(3) 0.012(3)N1 0.110(4) 0.078(3) 0.108(4) 0.019(3) 0.076(3) 0.007(3)O1 0.104(3) 0.064(3) 0.102(3) 0.003(2) 0.067(2) −0.003(2)C4 0.099(4) 0.078(4) 0.100(5) −0.032(4) 0.040(4) −0.021(4)C5 0.058(3) 0.061(3) 0.072(3) −0.003(3) 0.028(2) −0.002(2)C6 0.101(5) 0.117(6) 0.147(7) −0.051(5) 0.053(5) 0.024(4)O2 0.060(2) 0.058(2) 0.079(2) −0.012(2) 0.031(2) 0.005(2)N2 0.068(2) 0.058(3) 0.062(2) −0.010(2) 0.030(2) 0.002(2)
Crystallographic Data 235
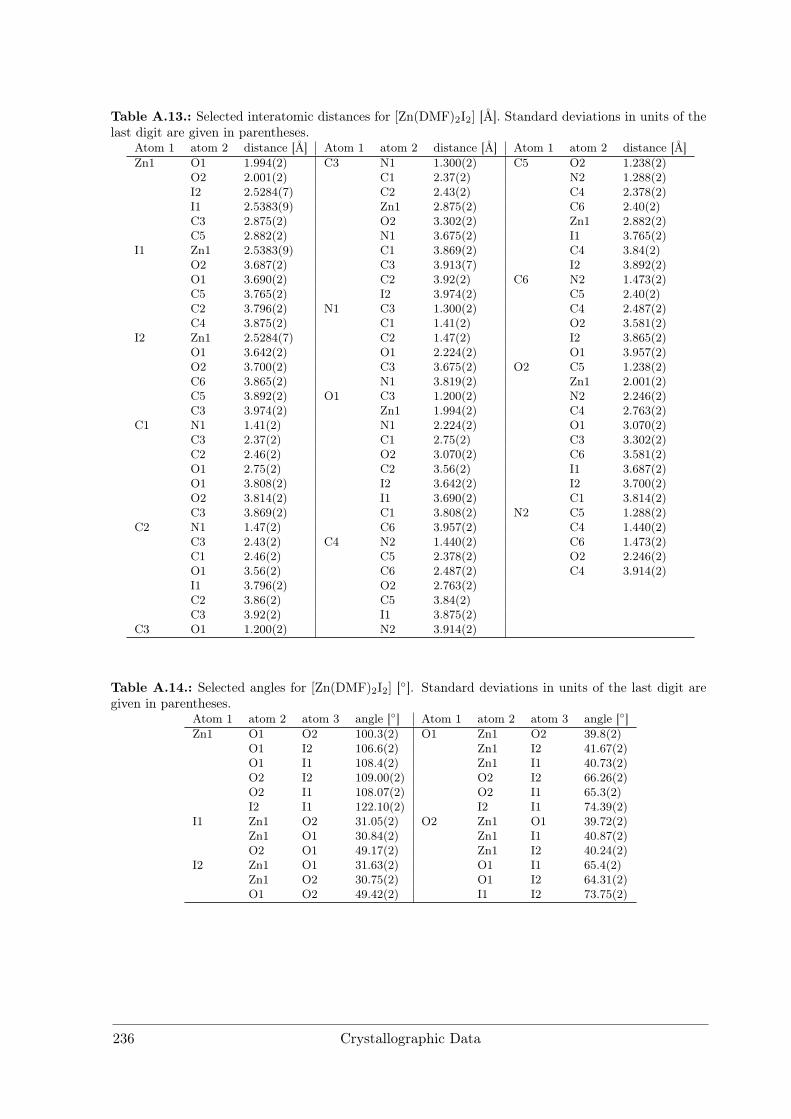
Table A.13.: Selected interatomic distances for [Zn(DMF)2I2] [Å]. Standard deviations in units of thelast digit are given in parentheses.
Atom 1 atom 2 distance [Å] Atom 1 atom 2 distance [Å] Atom 1 atom 2 distance [Å]Zn1 O1 1.994(2) C3 N1 1.300(2) C5 O2 1.238(2)
O2 2.001(2) C1 2.37(2) N2 1.288(2)I2 2.5284(7) C2 2.43(2) C4 2.378(2)I1 2.5383(9) Zn1 2.875(2) C6 2.40(2)C3 2.875(2) O2 3.302(2) Zn1 2.882(2)C5 2.882(2) N1 3.675(2) I1 3.765(2)
I1 Zn1 2.5383(9) C1 3.869(2) C4 3.84(2)O2 3.687(2) C3 3.913(7) I2 3.892(2)O1 3.690(2) C2 3.92(2) C6 N2 1.473(2)C5 3.765(2) I2 3.974(2) C5 2.40(2)C2 3.796(2) N1 C3 1.300(2) C4 2.487(2)C4 3.875(2) C1 1.41(2) O2 3.581(2)
I2 Zn1 2.5284(7) C2 1.47(2) I2 3.865(2)O1 3.642(2) O1 2.224(2) O1 3.957(2)O2 3.700(2) C3 3.675(2) O2 C5 1.238(2)C6 3.865(2) N1 3.819(2) Zn1 2.001(2)C5 3.892(2) O1 C3 1.200(2) N2 2.246(2)C3 3.974(2) Zn1 1.994(2) C4 2.763(2)
C1 N1 1.41(2) N1 2.224(2) O1 3.070(2)C3 2.37(2) C1 2.75(2) C3 3.302(2)C2 2.46(2) O2 3.070(2) C6 3.581(2)O1 2.75(2) C2 3.56(2) I1 3.687(2)O1 3.808(2) I2 3.642(2) I2 3.700(2)O2 3.814(2) I1 3.690(2) C1 3.814(2)C3 3.869(2) C1 3.808(2) N2 C5 1.288(2)
C2 N1 1.47(2) C6 3.957(2) C4 1.440(2)C3 2.43(2) C4 N2 1.440(2) C6 1.473(2)C1 2.46(2) C5 2.378(2) O2 2.246(2)O1 3.56(2) C6 2.487(2) C4 3.914(2)I1 3.796(2) O2 2.763(2)C2 3.86(2) C5 3.84(2)C3 3.92(2) I1 3.875(2)
C3 O1 1.200(2) N2 3.914(2)
Table A.14.: Selected angles for [Zn(DMF)2I2] []. Standard deviations in units of the last digit aregiven in parentheses.
Atom 1 atom 2 atom 3 angle [] Atom 1 atom 2 atom 3 angle []Zn1 O1 O2 100.3(2) O1 Zn1 O2 39.8(2)
O1 I2 106.6(2) Zn1 I2 41.67(2)O1 I1 108.4(2) Zn1 I1 40.73(2)O2 I2 109.00(2) O2 I2 66.26(2)O2 I1 108.07(2) O2 I1 65.3(2)I2 I1 122.10(2) I2 I1 74.39(2)
I1 Zn1 O2 31.05(2) O2 Zn1 O1 39.72(2)Zn1 O1 30.84(2) Zn1 I1 40.87(2)O2 O1 49.17(2) Zn1 I2 40.24(2)
I2 Zn1 O1 31.63(2) O1 I1 65.4(2)Zn1 O2 30.75(2) O1 I2 64.31(2)O1 O2 49.42(2) I1 I2 73.75(2)
236 Crystallographic Data
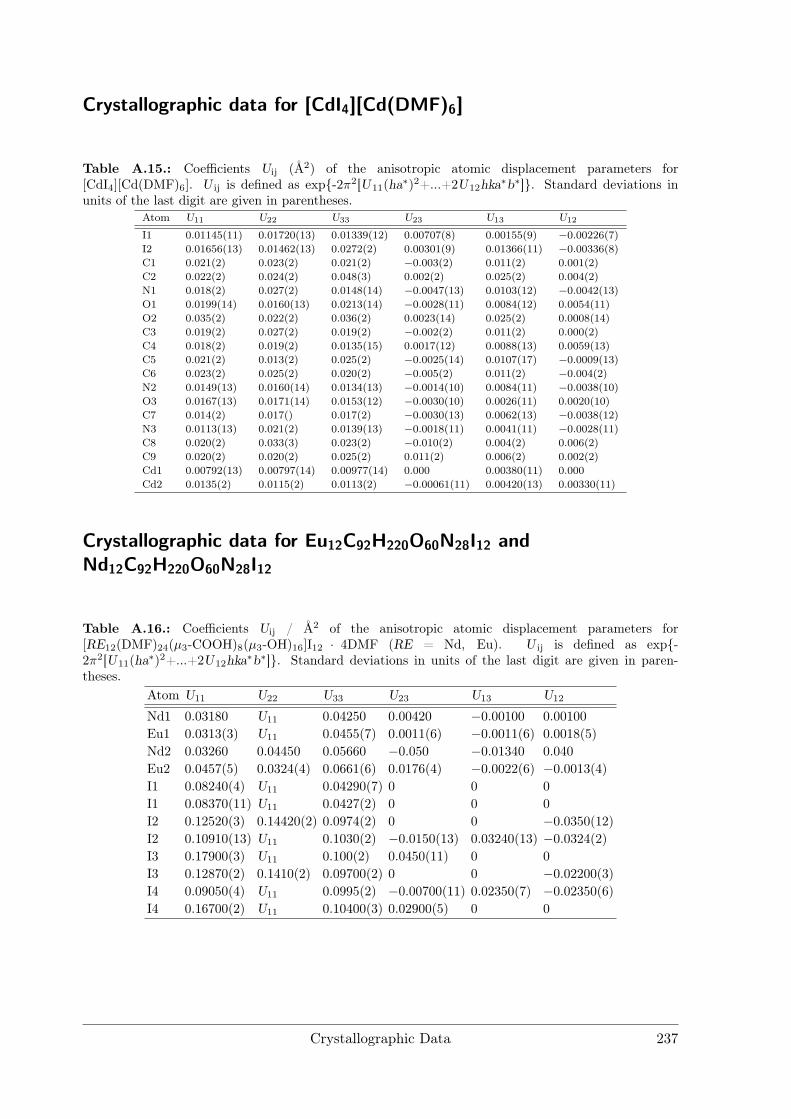
Crystallographic data for [CdI4][Cd(DMF)6]
Table A.15.: Coefficients Uij (Å2) of the anisotropic atomic displacement parameters for[CdI4][Cd(DMF)6]. U ij is defined as exp-2π2[U11(ha∗)2+...+2U12hka∗b∗]. Standard deviations inunits of the last digit are given in parentheses.
Atom U11 U22 U33 U23 U13 U12
I1 0.01145(11) 0.01720(13) 0.01339(12) 0.00707(8) 0.00155(9) −0.00226(7)I2 0.01656(13) 0.01462(13) 0.0272(2) 0.00301(9) 0.01366(11) −0.00336(8)C1 0.021(2) 0.023(2) 0.021(2) −0.003(2) 0.011(2) 0.001(2)C2 0.022(2) 0.024(2) 0.048(3) 0.002(2) 0.025(2) 0.004(2)N1 0.018(2) 0.027(2) 0.0148(14) −0.0047(13) 0.0103(12) −0.0042(13)O1 0.0199(14) 0.0160(13) 0.0213(14) −0.0028(11) 0.0084(12) 0.0054(11)O2 0.035(2) 0.022(2) 0.036(2) 0.0023(14) 0.025(2) 0.0008(14)C3 0.019(2) 0.027(2) 0.019(2) −0.002(2) 0.011(2) 0.000(2)C4 0.018(2) 0.019(2) 0.0135(15) 0.0017(12) 0.0088(13) 0.0059(13)C5 0.021(2) 0.013(2) 0.025(2) −0.0025(14) 0.0107(17) −0.0009(13)C6 0.023(2) 0.025(2) 0.020(2) −0.005(2) 0.011(2) −0.004(2)N2 0.0149(13) 0.0160(14) 0.0134(13) −0.0014(10) 0.0084(11) −0.0038(10)O3 0.0167(13) 0.0171(14) 0.0153(12) −0.0030(10) 0.0026(11) 0.0020(10)C7 0.014(2) 0.017() 0.017(2) −0.0030(13) 0.0062(13) −0.0038(12)N3 0.0113(13) 0.021(2) 0.0139(13) −0.0018(11) 0.0041(11) −0.0028(11)C8 0.020(2) 0.033(3) 0.023(2) −0.010(2) 0.004(2) 0.006(2)C9 0.020(2) 0.020(2) 0.025(2) 0.011(2) 0.006(2) 0.002(2)Cd1 0.00792(13) 0.00797(14) 0.00977(14) 0.000 0.00380(11) 0.000Cd2 0.0135(2) 0.0115(2) 0.0113(2) −0.00061(11) 0.00420(13) 0.00330(11)
Crystallographic data for Eu12C92H220O60N28I12 andNd12C92H220O60N28I12
Table A.16.: Coefficients Uij / Å2 of the anisotropic atomic displacement parameters for[RE12(DMF)24(µ3-COOH)8(µ3-OH)16]I12 · 4DMF (RE = Nd, Eu). U ij is defined as exp-2π2[U11(ha∗)2+...+2U12hka∗b∗]. Standard deviations in units of the last digit are given in paren-theses.
Atom U11 U22 U33 U23 U13 U12
Nd1 0.03180 U11 0.04250 0.00420 −0.00100 0.00100Eu1 0.0313(3) U11 0.0455(7) 0.0011(6) −0.0011(6) 0.0018(5)Nd2 0.03260 0.04450 0.05660 −0.050 −0.01340 0.040Eu2 0.0457(5) 0.0324(4) 0.0661(6) 0.0176(4) −0.0022(6) −0.0013(4)I1 0.08240(4) U11 0.04290(7) 0 0 0I1 0.08370(11) U11 0.0427(2) 0 0 0I2 0.12520(3) 0.14420(2) 0.0974(2) 0 0 −0.0350(12)I2 0.10910(13) U11 0.1030(2) −0.0150(13) 0.03240(13) −0.0324(2)I3 0.17900(3) U11 0.100(2) 0.0450(11) 0 0I3 0.12870(2) 0.1410(2) 0.09700(2) 0 0 −0.02200(3)I4 0.09050(4) U11 0.0995(2) −0.00700(11) 0.02350(7) −0.02350(6)I4 0.16700(2) U11 0.10400(3) 0.02900(5) 0 0
Crystallographic Data 237
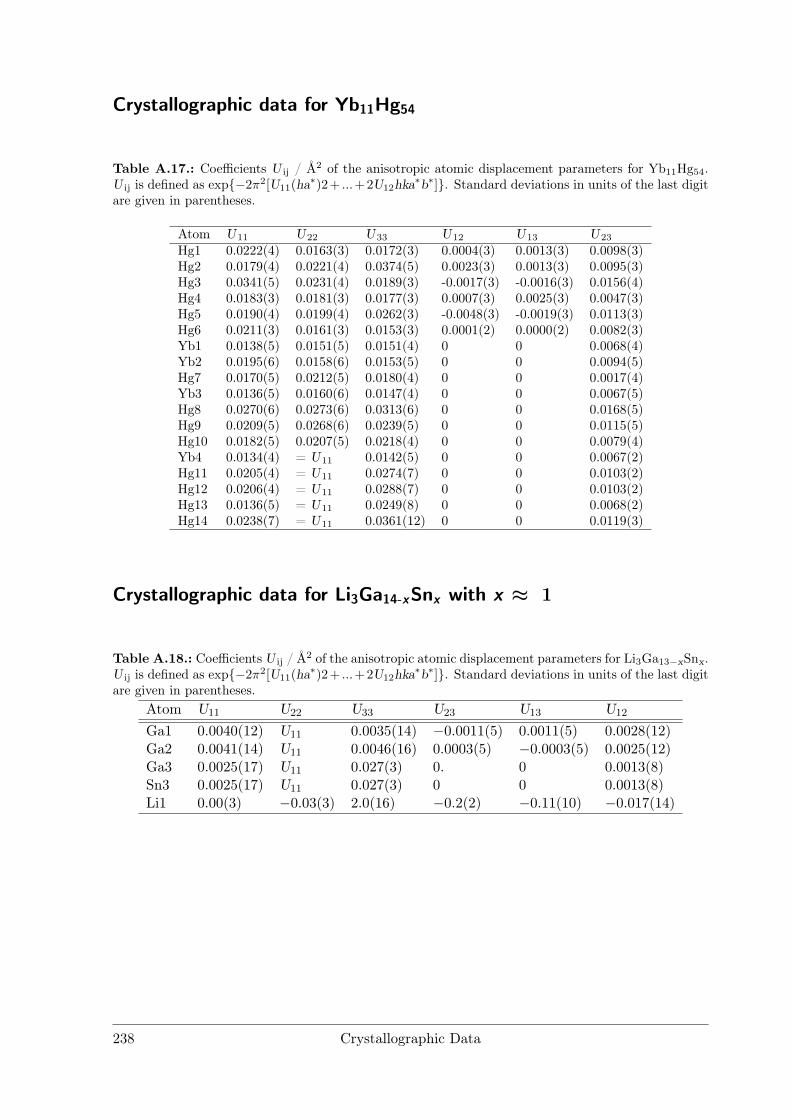
Crystallographic data for Yb11Hg54
Table A.17.: Coefficients U ij / Å2 of the anisotropic atomic displacement parameters for Yb11Hg54.U ij is defined as exp−2π2[U11(ha∗)2+ ...+2U12hka∗b∗]. Standard deviations in units of the last digitare given in parentheses.
Atom U11 U22 U33 U12 U13 U23
Hg1 0.0222(4) 0.0163(3) 0.0172(3) 0.0004(3) 0.0013(3) 0.0098(3)Hg2 0.0179(4) 0.0221(4) 0.0374(5) 0.0023(3) 0.0013(3) 0.0095(3)Hg3 0.0341(5) 0.0231(4) 0.0189(3) -0.0017(3) -0.0016(3) 0.0156(4)Hg4 0.0183(3) 0.0181(3) 0.0177(3) 0.0007(3) 0.0025(3) 0.0047(3)Hg5 0.0190(4) 0.0199(4) 0.0262(3) -0.0048(3) -0.0019(3) 0.0113(3)Hg6 0.0211(3) 0.0161(3) 0.0153(3) 0.0001(2) 0.0000(2) 0.0082(3)Yb1 0.0138(5) 0.0151(5) 0.0151(4) 0 0 0.0068(4)Yb2 0.0195(6) 0.0158(6) 0.0153(5) 0 0 0.0094(5)Hg7 0.0170(5) 0.0212(5) 0.0180(4) 0 0 0.0017(4)Yb3 0.0136(5) 0.0160(6) 0.0147(4) 0 0 0.0067(5)Hg8 0.0270(6) 0.0273(6) 0.0313(6) 0 0 0.0168(5)Hg9 0.0209(5) 0.0268(6) 0.0239(5) 0 0 0.0115(5)Hg10 0.0182(5) 0.0207(5) 0.0218(4) 0 0 0.0079(4)Yb4 0.0134(4) = U11 0.0142(5) 0 0 0.0067(2)Hg11 0.0205(4) = U11 0.0274(7) 0 0 0.0103(2)Hg12 0.0206(4) = U11 0.0288(7) 0 0 0.0103(2)Hg13 0.0136(5) = U11 0.0249(8) 0 0 0.0068(2)Hg14 0.0238(7) = U11 0.0361(12) 0 0 0.0119(3)
Crystallographic data for Li3Ga14-xSnx with x ≈ 1
Table A.18.: Coefficients U ij / Å2 of the anisotropic atomic displacement parameters for Li3Ga13−xSnx.U ij is defined as exp−2π2[U11(ha∗)2+ ...+2U12hka∗b∗]. Standard deviations in units of the last digitare given in parentheses.
Atom U11 U22 U33 U23 U13 U12
Ga1 0.0040(12) U11 0.0035(14) −0.0011(5) 0.0011(5) 0.0028(12)Ga2 0.0041(14) U11 0.0046(16) 0.0003(5) −0.0003(5) 0.0025(12)Ga3 0.0025(17) U11 0.027(3) 0. 0 0.0013(8)Sn3 0.0025(17) U11 0.027(3) 0 0 0.0013(8)Li1 0.00(3) −0.03(3) 2.0(16) −0.2(2) −0.11(10) −0.017(14)
238 Crystallographic Data
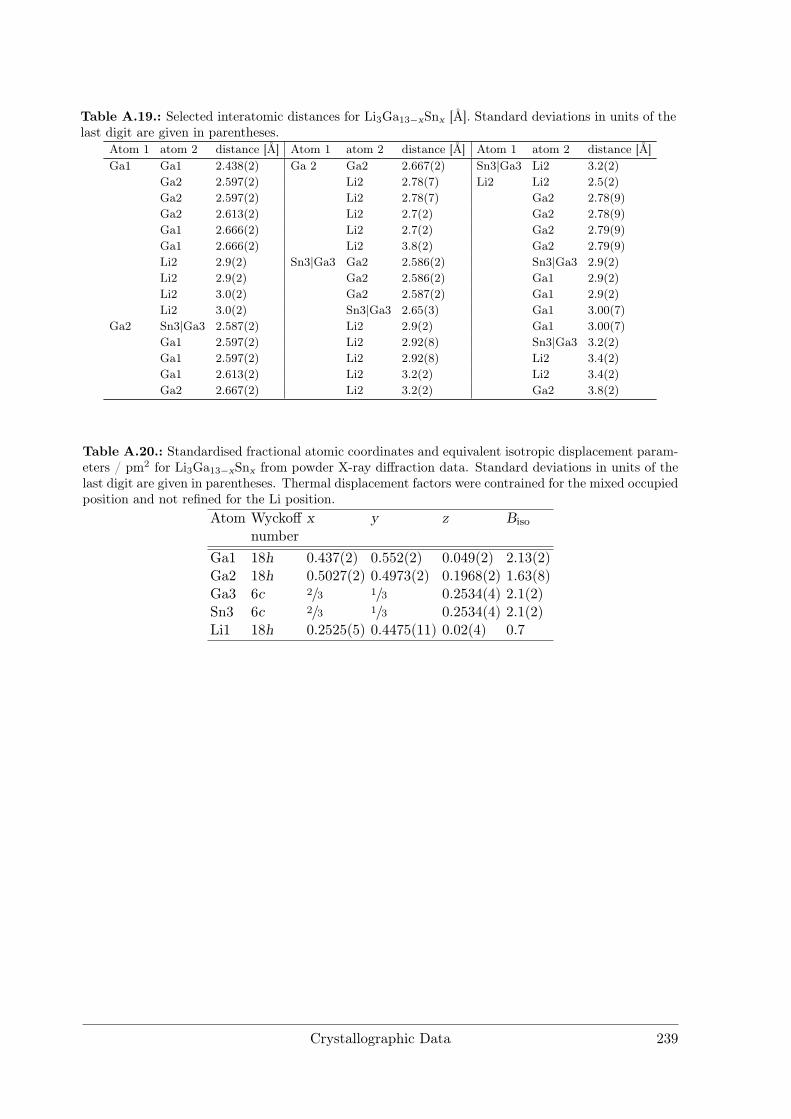
Table A.19.: Selected interatomic distances for Li3Ga13−xSnx [Å]. Standard deviations in units of thelast digit are given in parentheses.
Atom 1 atom 2 distance [Å] Atom 1 atom 2 distance [Å] Atom 1 atom 2 distance [Å]Ga1 Ga1 2.438(2) Ga 2 Ga2 2.667(2) Sn3|Ga3 Li2 3.2(2)
Ga2 2.597(2) Li2 2.78(7) Li2 Li2 2.5(2)Ga2 2.597(2) Li2 2.78(7) Ga2 2.78(9)Ga2 2.613(2) Li2 2.7(2) Ga2 2.78(9)Ga1 2.666(2) Li2 2.7(2) Ga2 2.79(9)Ga1 2.666(2) Li2 3.8(2) Ga2 2.79(9)Li2 2.9(2) Sn3|Ga3 Ga2 2.586(2) Sn3|Ga3 2.9(2)Li2 2.9(2) Ga2 2.586(2) Ga1 2.9(2)Li2 3.0(2) Ga2 2.587(2) Ga1 2.9(2)Li2 3.0(2) Sn3|Ga3 2.65(3) Ga1 3.00(7)
Ga2 Sn3|Ga3 2.587(2) Li2 2.9(2) Ga1 3.00(7)Ga1 2.597(2) Li2 2.92(8) Sn3|Ga3 3.2(2)Ga1 2.597(2) Li2 2.92(8) Li2 3.4(2)Ga1 2.613(2) Li2 3.2(2) Li2 3.4(2)Ga2 2.667(2) Li2 3.2(2) Ga2 3.8(2)
Table A.20.: Standardised fractional atomic coordinates and equivalent isotropic displacement param-eters / pm2 for Li3Ga13−xSnx from powder X-ray diffraction data. Standard deviations in units of thelast digit are given in parentheses. Thermal displacement factors were contrained for the mixed occupiedposition and not refined for the Li position.
Atom Wyckoff x y z Biso
numberGa1 18h 0.437(2) 0.552(2) 0.049(2) 2.13(2)Ga2 18h 0.5027(2) 0.4973(2) 0.1968(2) 1.63(8)Ga3 6c 2/3 1/3 0.2534(4) 2.1(2)Sn3 6c 2/3 1/3 0.2534(4) 2.1(2)Li1 18h 0.2525(5) 0.4475(11) 0.02(4) 0.7
Crystallographic Data 239

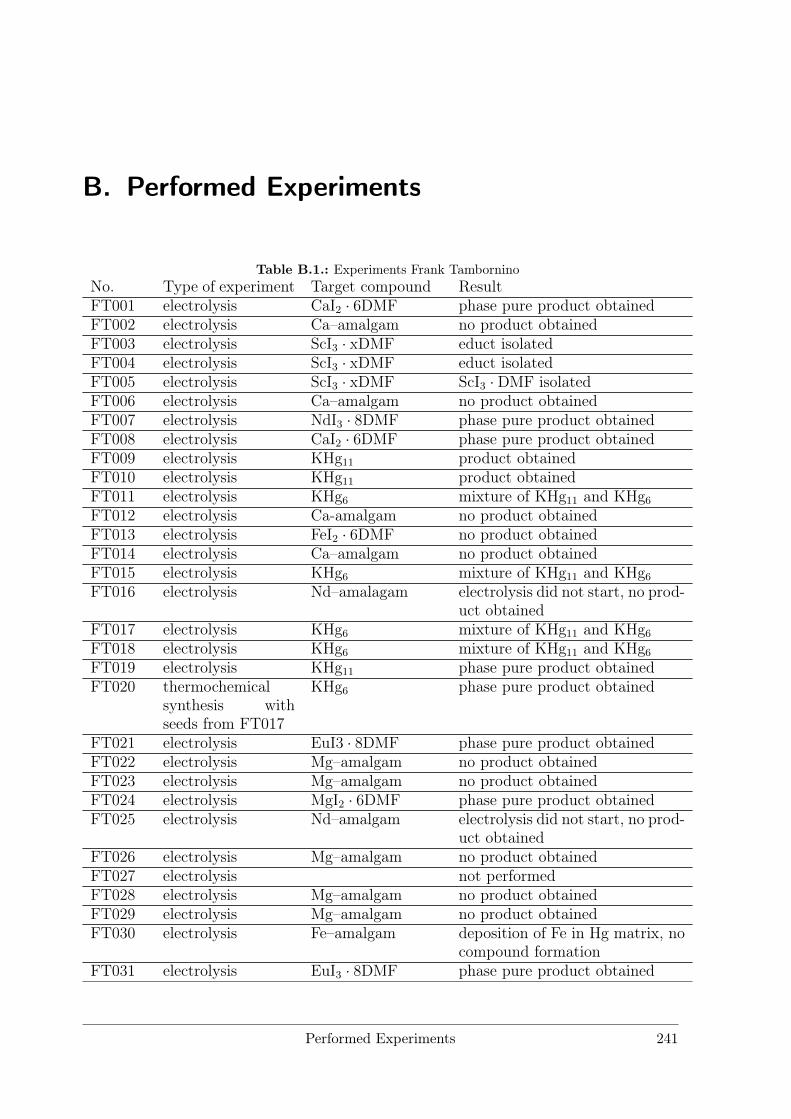
B. Performed Experiments
Table B.1.: Experiments Frank TamborninoNo. Type of experiment Target compound ResultFT001 electrolysis CaI2 · 6DMF phase pure product obtainedFT002 electrolysis Ca–amalgam no product obtainedFT003 electrolysis ScI3 · xDMF educt isolatedFT004 electrolysis ScI3 · xDMF educt isolatedFT005 electrolysis ScI3 · xDMF ScI3 ·DMF isolatedFT006 electrolysis Ca–amalgam no product obtainedFT007 electrolysis NdI3 · 8DMF phase pure product obtainedFT008 electrolysis CaI2 · 6DMF phase pure product obtainedFT009 electrolysis KHg11 product obtainedFT010 electrolysis KHg11 product obtainedFT011 electrolysis KHg6 mixture of KHg11 and KHg6
FT012 electrolysis Ca-amalgam no product obtainedFT013 electrolysis FeI2 · 6DMF no product obtainedFT014 electrolysis Ca–amalgam no product obtainedFT015 electrolysis KHg6 mixture of KHg11 and KHg6
FT016 electrolysis Nd–amalagam electrolysis did not start, no prod-uct obtained
FT017 electrolysis KHg6 mixture of KHg11 and KHg6
FT018 electrolysis KHg6 mixture of KHg11 and KHg6
FT019 electrolysis KHg11 phase pure product obtainedFT020 thermochemical
synthesis withseeds from FT017
KHg6 phase pure product obtained
FT021 electrolysis EuI3 · 8DMF phase pure product obtainedFT022 electrolysis Mg–amalgam no product obtainedFT023 electrolysis Mg–amalgam no product obtainedFT024 electrolysis MgI2 · 6DMF phase pure product obtainedFT025 electrolysis Nd–amalgam electrolysis did not start, no prod-
uct obtainedFT026 electrolysis Mg–amalgam no product obtainedFT027 electrolysis not performedFT028 electrolysis Mg–amalgam no product obtainedFT029 electrolysis Mg–amalgam no product obtainedFT030 electrolysis Fe–amalgam deposition of Fe in Hg matrix, no
compound formationFT031 electrolysis EuI3 · 8DMF phase pure product obtained
Performed Experiments 241
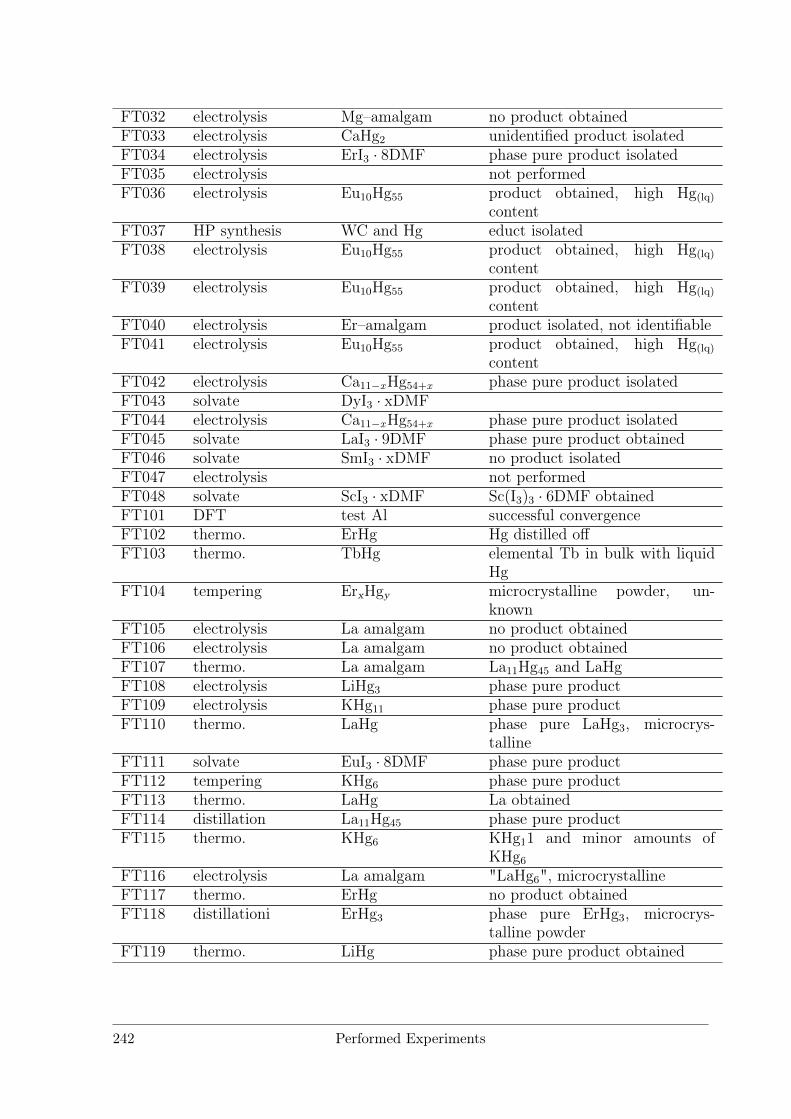
FT032 electrolysis Mg–amalgam no product obtainedFT033 electrolysis CaHg2 unidentified product isolatedFT034 electrolysis ErI3 · 8DMF phase pure product isolatedFT035 electrolysis not performedFT036 electrolysis Eu10Hg55 product obtained, high Hg(lq)
contentFT037 HP synthesis WC and Hg educt isolatedFT038 electrolysis Eu10Hg55 product obtained, high Hg(lq)
contentFT039 electrolysis Eu10Hg55 product obtained, high Hg(lq)
contentFT040 electrolysis Er–amalgam product isolated, not identifiableFT041 electrolysis Eu10Hg55 product obtained, high Hg(lq)
contentFT042 electrolysis Ca11−xHg54+x phase pure product isolatedFT043 solvate DyI3 · xDMFFT044 electrolysis Ca11−xHg54+x phase pure product isolatedFT045 solvate LaI3 · 9DMF phase pure product obtainedFT046 solvate SmI3 · xDMF no product isolatedFT047 electrolysis not performedFT048 solvate ScI3 · xDMF Sc(I3)3 · 6DMF obtainedFT101 DFT test Al successful convergenceFT102 thermo. ErHg Hg distilled offFT103 thermo. TbHg elemental Tb in bulk with liquid
HgFT104 tempering ErxHgy microcrystalline powder, un-
knownFT105 electrolysis La amalgam no product obtainedFT106 electrolysis La amalgam no product obtainedFT107 thermo. La amalgam La11Hg45 and LaHgFT108 electrolysis LiHg3 phase pure productFT109 electrolysis KHg11 phase pure productFT110 thermo. LaHg phase pure LaHg3, microcrys-
tallineFT111 solvate EuI3 · 8DMF phase pure productFT112 tempering KHg6 phase pure productFT113 thermo. LaHg La obtainedFT114 distillation La11Hg45 phase pure productFT115 thermo. KHg6 KHg11 and minor amounts of
KHg6
FT116 electrolysis La amalgam "LaHg6", microcrystallineFT117 thermo. ErHg no product obtainedFT118 distillationi ErHg3 phase pure ErHg3, microcrys-
talline powderFT119 thermo. LiHg phase pure product obtained
242 Performed Experiments
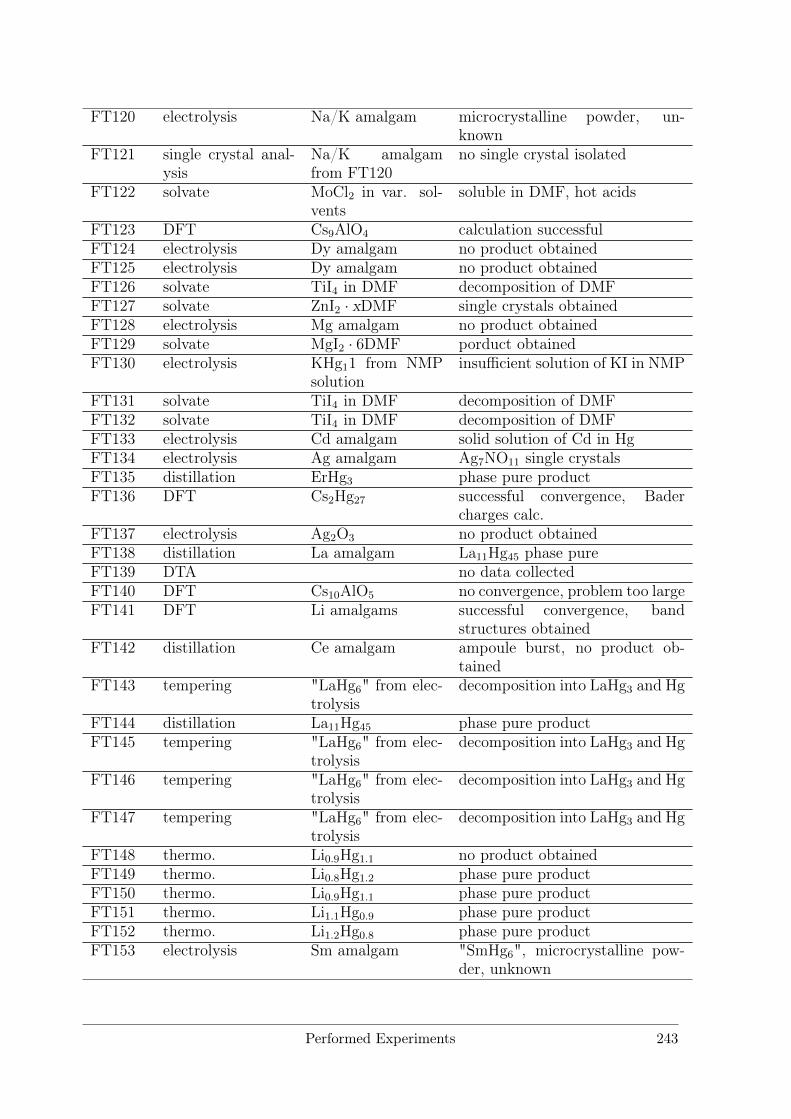
FT120 electrolysis Na/K amalgam microcrystalline powder, un-known
FT121 single crystal anal-ysis
Na/K amalgamfrom FT120
no single crystal isolated
FT122 solvate MoCl2 in var. sol-vents
soluble in DMF, hot acids
FT123 DFT Cs9AlO4 calculation successfulFT124 electrolysis Dy amalgam no product obtainedFT125 electrolysis Dy amalgam no product obtainedFT126 solvate TiI4 in DMF decomposition of DMFFT127 solvate ZnI2 · xDMF single crystals obtainedFT128 electrolysis Mg amalgam no product obtainedFT129 solvate MgI2 · 6DMF porduct obtainedFT130 electrolysis KHg11 from NMP
solutioninsufficient solution of KI in NMP
FT131 solvate TiI4 in DMF decomposition of DMFFT132 solvate TiI4 in DMF decomposition of DMFFT133 electrolysis Cd amalgam solid solution of Cd in HgFT134 electrolysis Ag amalgam Ag7NO11 single crystalsFT135 distillation ErHg3 phase pure productFT136 DFT Cs2Hg27 successful convergence, Bader
charges calc.FT137 electrolysis Ag2O3 no product obtainedFT138 distillation La amalgam La11Hg45 phase pureFT139 DTA no data collectedFT140 DFT Cs10AlO5 no convergence, problem too largeFT141 DFT Li amalgams successful convergence, band
structures obtainedFT142 distillation Ce amalgam ampoule burst, no product ob-
tainedFT143 tempering "LaHg6" from elec-
trolysisdecomposition into LaHg3 and Hg
FT144 distillation La11Hg45 phase pure productFT145 tempering "LaHg6" from elec-
trolysisdecomposition into LaHg3 and Hg
FT146 tempering "LaHg6" from elec-trolysis
decomposition into LaHg3 and Hg
FT147 tempering "LaHg6" from elec-trolysis
decomposition into LaHg3 and Hg
FT148 thermo. Li0.9Hg1.1 no product obtainedFT149 thermo. Li0.8Hg1.2 phase pure productFT150 thermo. Li0.9Hg1.1 phase pure productFT151 thermo. Li1.1Hg0.9 phase pure productFT152 thermo. Li1.2Hg0.8 phase pure productFT153 electrolysis Sm amalgam "SmHg6", microcrystalline pow-
der, unknown
Performed Experiments 243
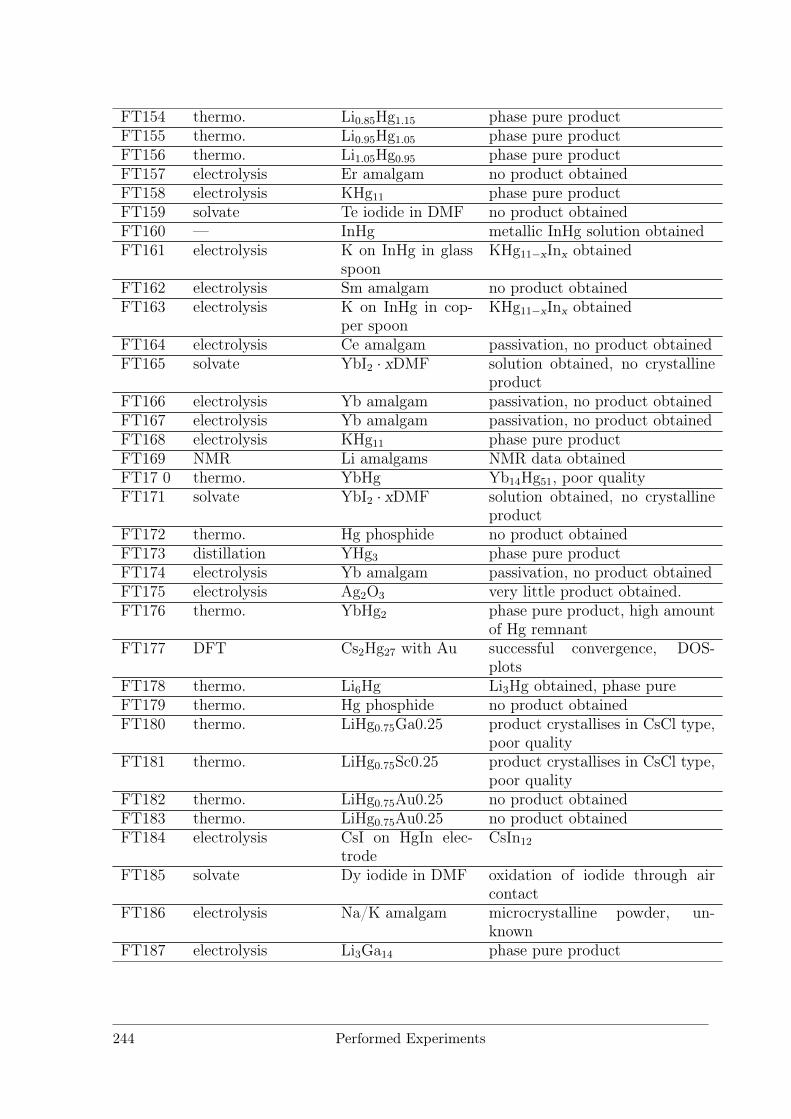
FT154 thermo. Li0.85Hg1.15 phase pure productFT155 thermo. Li0.95Hg1.05 phase pure productFT156 thermo. Li1.05Hg0.95 phase pure productFT157 electrolysis Er amalgam no product obtainedFT158 electrolysis KHg11 phase pure productFT159 solvate Te iodide in DMF no product obtainedFT160 — InHg metallic InHg solution obtainedFT161 electrolysis K on InHg in glass
spoonKHg11−xInx obtained
FT162 electrolysis Sm amalgam no product obtainedFT163 electrolysis K on InHg in cop-
per spoonKHg11−xInx obtained
FT164 electrolysis Ce amalgam passivation, no product obtainedFT165 solvate YbI2 · xDMF solution obtained, no crystalline
productFT166 electrolysis Yb amalgam passivation, no product obtainedFT167 electrolysis Yb amalgam passivation, no product obtainedFT168 electrolysis KHg11 phase pure productFT169 NMR Li amalgams NMR data obtainedFT17 0 thermo. YbHg Yb14Hg51, poor qualityFT171 solvate YbI2 · xDMF solution obtained, no crystalline
productFT172 thermo. Hg phosphide no product obtainedFT173 distillation YHg3 phase pure productFT174 electrolysis Yb amalgam passivation, no product obtainedFT175 electrolysis Ag2O3 very little product obtained.FT176 thermo. YbHg2 phase pure product, high amount
of Hg remnantFT177 DFT Cs2Hg27 with Au successful convergence, DOS-
plotsFT178 thermo. Li6Hg Li3Hg obtained, phase pureFT179 thermo. Hg phosphide no product obtainedFT180 thermo. LiHg0.75Ga0.25 product crystallises in CsCl type,
poor qualityFT181 thermo. LiHg0.75Sc0.25 product crystallises in CsCl type,
poor qualityFT182 thermo. LiHg0.75Au0.25 no product obtainedFT183 thermo. LiHg0.75Au0.25 no product obtainedFT184 electrolysis CsI on HgIn elec-
trodeCsIn12
FT185 solvate Dy iodide in DMF oxidation of iodide through aircontact
FT186 electrolysis Na/K amalgam microcrystalline powder, un-known
FT187 electrolysis Li3Ga14 phase pure product
244 Performed Experiments
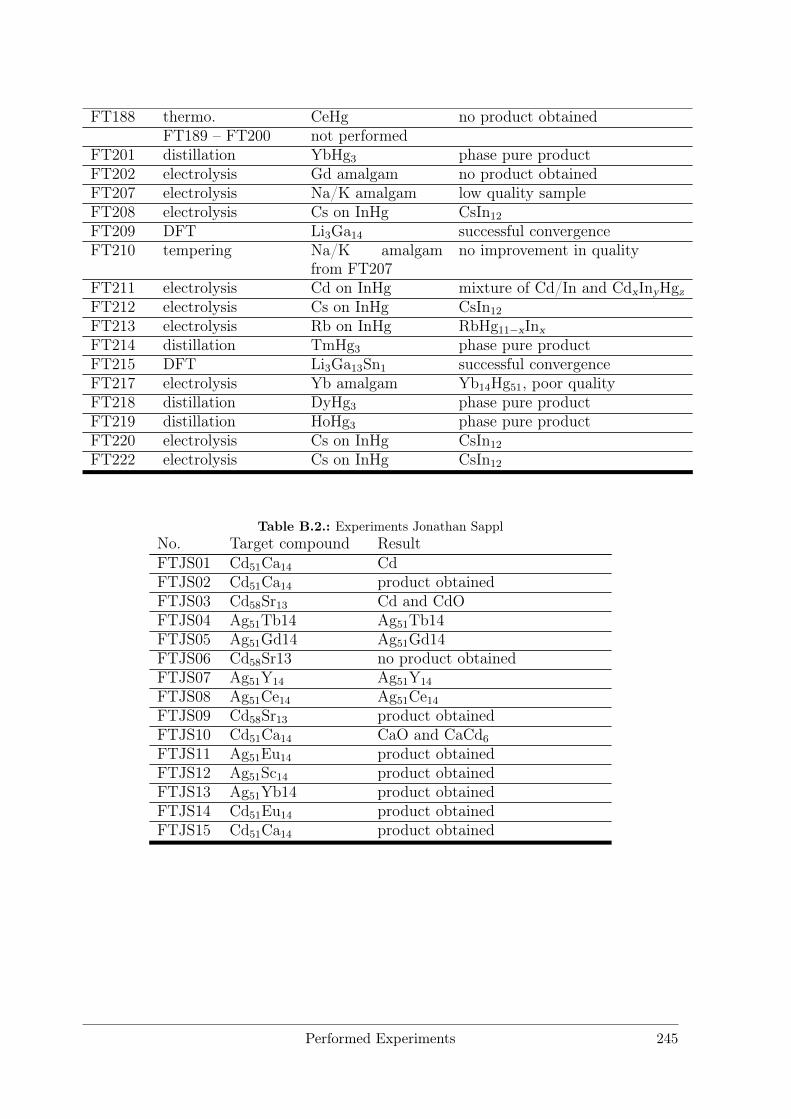
FT188 thermo. CeHg no product obtainedFT189 – FT200 not performed
FT201 distillation YbHg3 phase pure productFT202 electrolysis Gd amalgam no product obtainedFT207 electrolysis Na/K amalgam low quality sampleFT208 electrolysis Cs on InHg CsIn12
FT209 DFT Li3Ga14 successful convergenceFT210 tempering Na/K amalgam
from FT207no improvement in quality
FT211 electrolysis Cd on InHg mixture of Cd/In and CdxInyHgzFT212 electrolysis Cs on InHg CsIn12
FT213 electrolysis Rb on InHg RbHg11−xInxFT214 distillation TmHg3 phase pure productFT215 DFT Li3Ga13Sn1 successful convergenceFT217 electrolysis Yb amalgam Yb14Hg51, poor qualityFT218 distillation DyHg3 phase pure productFT219 distillation HoHg3 phase pure productFT220 electrolysis Cs on InHg CsIn12
FT222 electrolysis Cs on InHg CsIn12
Table B.2.: Experiments Jonathan SapplNo. Target compound ResultFTJS01 Cd51Ca14 CdFTJS02 Cd51Ca14 product obtainedFTJS03 Cd58Sr13 Cd and CdOFTJS04 Ag51Tb14 Ag51Tb14FTJS05 Ag51Gd14 Ag51Gd14FTJS06 Cd58Sr13 no product obtainedFTJS07 Ag51Y14 Ag51Y14
FTJS08 Ag51Ce14 Ag51Ce14FTJS09 Cd58Sr13 product obtainedFTJS10 Cd51Ca14 CaO and CaCd6
FTJS11 Ag51Eu14 product obtainedFTJS12 Ag51Sc14 product obtainedFTJS13 Ag51Yb14 product obtainedFTJS14 Cd51Eu14 product obtainedFTJS15 Cd51Ca14 product obtained
Performed Experiments 245
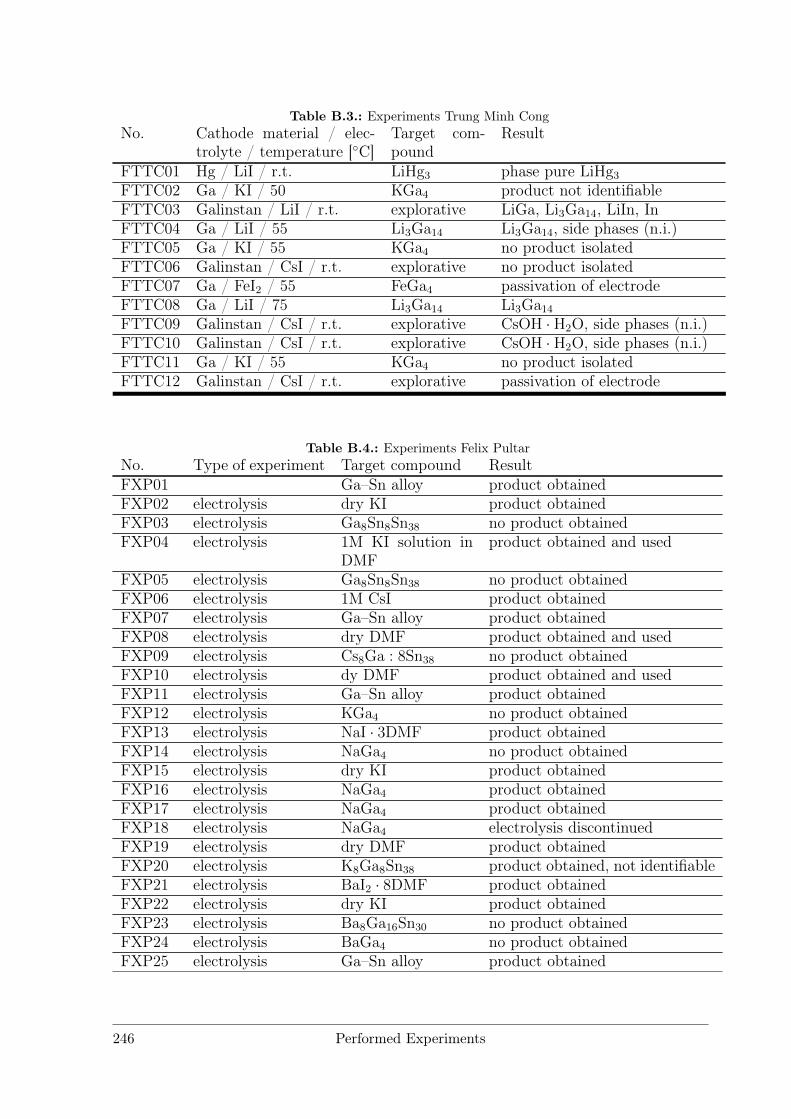
Table B.3.: Experiments Trung Minh CongNo. Cathode material / elec-
trolyte / temperature [C]Target com-pound
Result
FTTC01 Hg / LiI / r.t. LiHg3 phase pure LiHg3
FTTC02 Ga / KI / 50 KGa4 product not identifiableFTTC03 Galinstan / LiI / r.t. explorative LiGa, Li3Ga14, LiIn, InFTTC04 Ga / LiI / 55 Li3Ga14 Li3Ga14, side phases (n.i.)FTTC05 Ga / KI / 55 KGa4 no product isolatedFTTC06 Galinstan / CsI / r.t. explorative no product isolatedFTTC07 Ga / FeI2 / 55 FeGa4 passivation of electrodeFTTC08 Ga / LiI / 75 Li3Ga14 Li3Ga14
FTTC09 Galinstan / CsI / r.t. explorative CsOH · H2O, side phases (n.i.)FTTC10 Galinstan / CsI / r.t. explorative CsOH · H2O, side phases (n.i.)FTTC11 Ga / KI / 55 KGa4 no product isolatedFTTC12 Galinstan / CsI / r.t. explorative passivation of electrode
Table B.4.: Experiments Felix PultarNo. Type of experiment Target compound ResultFXP01 Ga–Sn alloy product obtainedFXP02 electrolysis dry KI product obtainedFXP03 electrolysis Ga8Sn8Sn38 no product obtainedFXP04 electrolysis 1M KI solution in
DMFproduct obtained and used
FXP05 electrolysis Ga8Sn8Sn38 no product obtainedFXP06 electrolysis 1M CsI product obtainedFXP07 electrolysis Ga–Sn alloy product obtainedFXP08 electrolysis dry DMF product obtained and usedFXP09 electrolysis Cs8Ga : 8Sn38 no product obtainedFXP10 electrolysis dy DMF product obtained and usedFXP11 electrolysis Ga–Sn alloy product obtainedFXP12 electrolysis KGa4 no product obtainedFXP13 electrolysis NaI · 3DMF product obtainedFXP14 electrolysis NaGa4 no product obtainedFXP15 electrolysis dry KI product obtainedFXP16 electrolysis NaGa4 product obtainedFXP17 electrolysis NaGa4 product obtainedFXP18 electrolysis NaGa4 electrolysis discontinuedFXP19 electrolysis dry DMF product obtainedFXP20 electrolysis K8Ga8Sn38 product obtained, not identifiableFXP21 electrolysis BaI2 · 8DMF product obtainedFXP22 electrolysis dry KI product obtainedFXP23 electrolysis Ba8Ga16Sn30 no product obtainedFXP24 electrolysis BaGa4 no product obtainedFXP25 electrolysis Ga–Sn alloy product obtained
246 Performed Experiments
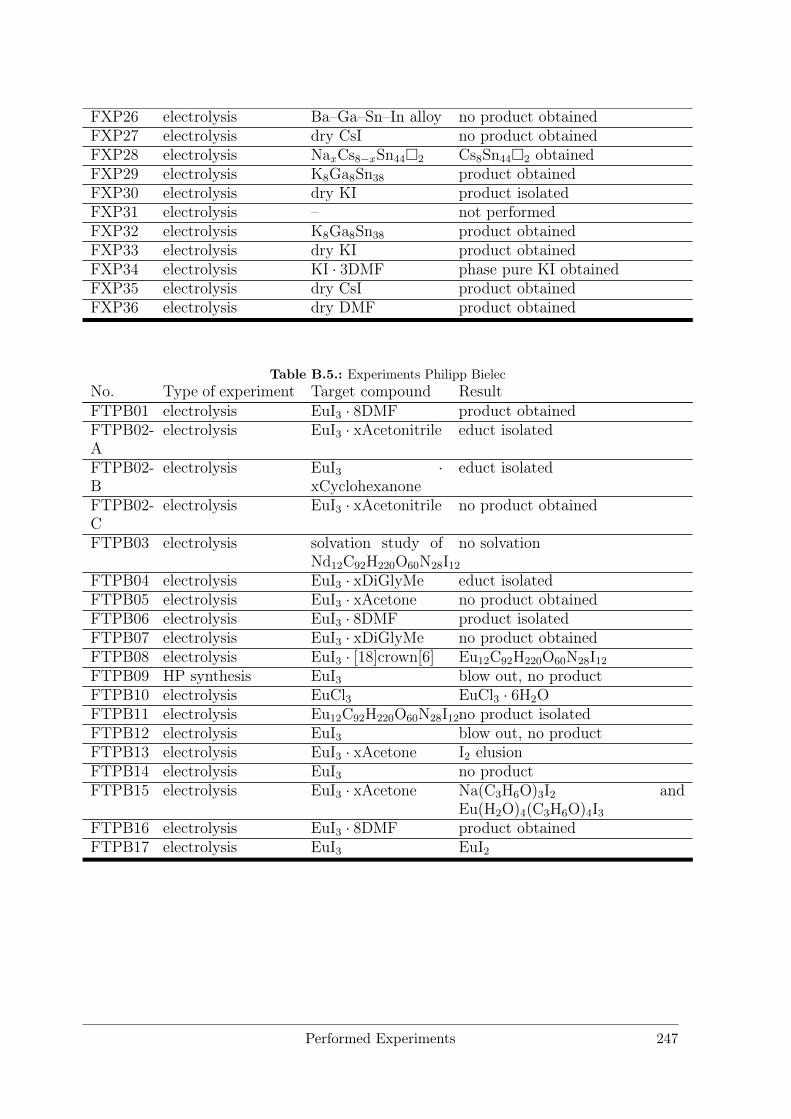
FXP26 electrolysis Ba–Ga–Sn–In alloy no product obtainedFXP27 electrolysis dry CsI no product obtainedFXP28 electrolysis NaxCs8−xSn442 Cs8Sn442 obtainedFXP29 electrolysis K8Ga8Sn38 product obtainedFXP30 electrolysis dry KI product isolatedFXP31 electrolysis – not performedFXP32 electrolysis K8Ga8Sn38 product obtainedFXP33 electrolysis dry KI product obtainedFXP34 electrolysis KI · 3DMF phase pure KI obtainedFXP35 electrolysis dry CsI product obtainedFXP36 electrolysis dry DMF product obtained
Table B.5.: Experiments Philipp BielecNo. Type of experiment Target compound ResultFTPB01 electrolysis EuI3 · 8DMF product obtainedFTPB02-A
electrolysis EuI3 · xAcetonitrile educt isolated
FTPB02-B
electrolysis EuI3 ·xCyclohexanone
educt isolated
FTPB02-C
electrolysis EuI3 · xAcetonitrile no product obtained
FTPB03 electrolysis solvation study ofNd12C92H220O60N28I12
no solvation
FTPB04 electrolysis EuI3 · xDiGlyMe educt isolatedFTPB05 electrolysis EuI3 · xAcetone no product obtainedFTPB06 electrolysis EuI3 · 8DMF product isolatedFTPB07 electrolysis EuI3 · xDiGlyMe no product obtainedFTPB08 electrolysis EuI3 · [18]crown[6] Eu12C92H220O60N28I12FTPB09 HP synthesis EuI3 blow out, no productFTPB10 electrolysis EuCl3 EuCl3 · 6H2OFTPB11 electrolysis Eu12C92H220O60N28I12no product isolatedFTPB12 electrolysis EuI3 blow out, no productFTPB13 electrolysis EuI3 · xAcetone I2 elusionFTPB14 electrolysis EuI3 no productFTPB15 electrolysis EuI3 · xAcetone Na(C3H6O)3I2 and
Eu(H2O)4(C3H6O)4I3FTPB16 electrolysis EuI3 · 8DMF product obtainedFTPB17 electrolysis EuI3 EuI2
Performed Experiments 247
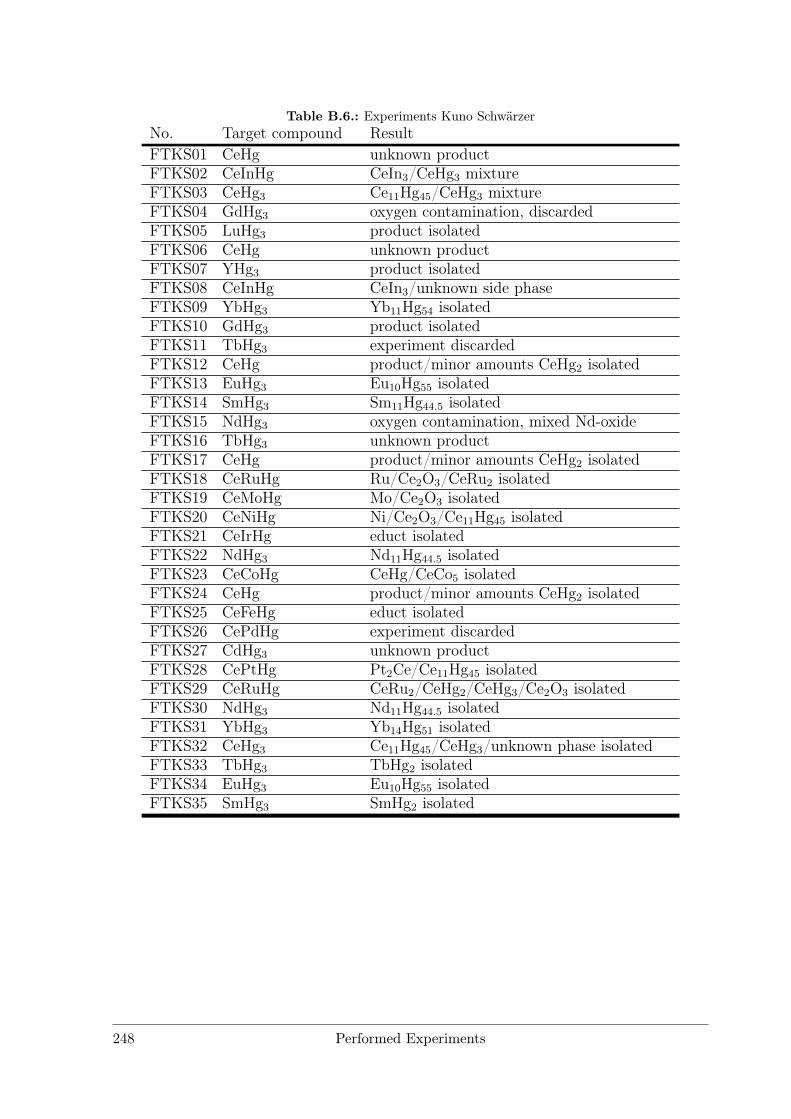
Table B.6.: Experiments Kuno SchwärzerNo. Target compound ResultFTKS01 CeHg unknown productFTKS02 CeInHg CeIn3/CeHg3 mixtureFTKS03 CeHg3 Ce11Hg45/CeHg3 mixtureFTKS04 GdHg3 oxygen contamination, discardedFTKS05 LuHg3 product isolatedFTKS06 CeHg unknown productFTKS07 YHg3 product isolatedFTKS08 CeInHg CeIn3/unknown side phaseFTKS09 YbHg3 Yb11Hg54 isolatedFTKS10 GdHg3 product isolatedFTKS11 TbHg3 experiment discardedFTKS12 CeHg product/minor amounts CeHg2 isolatedFTKS13 EuHg3 Eu10Hg55 isolatedFTKS14 SmHg3 Sm11Hg44.5 isolatedFTKS15 NdHg3 oxygen contamination, mixed Nd-oxideFTKS16 TbHg3 unknown productFTKS17 CeHg product/minor amounts CeHg2 isolatedFTKS18 CeRuHg Ru/Ce2O3/CeRu2 isolatedFTKS19 CeMoHg Mo/Ce2O3 isolatedFTKS20 CeNiHg Ni/Ce2O3/Ce11Hg45 isolatedFTKS21 CeIrHg educt isolatedFTKS22 NdHg3 Nd11Hg44.5 isolatedFTKS23 CeCoHg CeHg/CeCo5 isolatedFTKS24 CeHg product/minor amounts CeHg2 isolatedFTKS25 CeFeHg educt isolatedFTKS26 CePdHg experiment discardedFTKS27 CdHg3 unknown productFTKS28 CePtHg Pt2Ce/Ce11Hg45 isolatedFTKS29 CeRuHg CeRu2/CeHg2/CeHg3/Ce2O3 isolatedFTKS30 NdHg3 Nd11Hg44.5 isolatedFTKS31 YbHg3 Yb14Hg51 isolatedFTKS32 CeHg3 Ce11Hg45/CeHg3/unknown phase isolatedFTKS33 TbHg3 TbHg2 isolatedFTKS34 EuHg3 Eu10Hg55 isolatedFTKS35 SmHg3 SmHg2 isolated
248 Performed Experiments
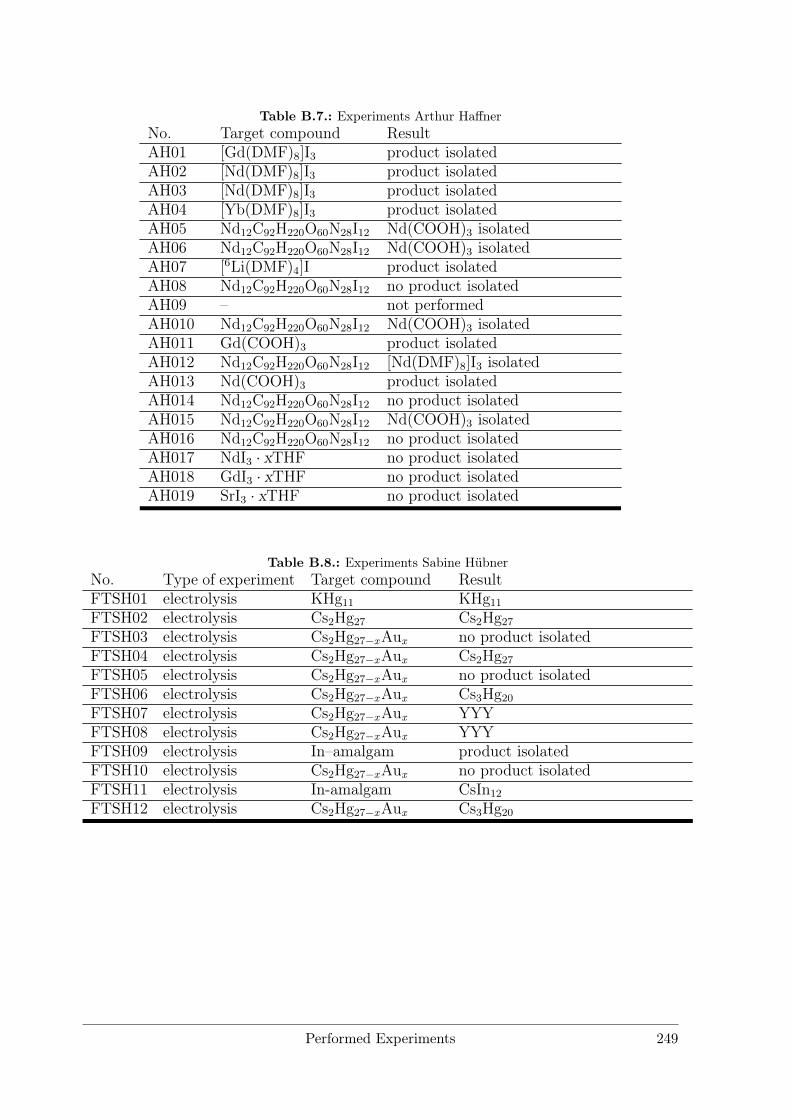
Table B.7.: Experiments Arthur HaffnerNo. Target compound ResultAH01 [Gd(DMF)8]I3 product isolatedAH02 [Nd(DMF)8]I3 product isolatedAH03 [Nd(DMF)8]I3 product isolatedAH04 [Yb(DMF)8]I3 product isolatedAH05 Nd12C92H220O60N28I12 Nd(COOH)3 isolatedAH06 Nd12C92H220O60N28I12 Nd(COOH)3 isolatedAH07 [6Li(DMF)4]I product isolatedAH08 Nd12C92H220O60N28I12 no product isolatedAH09 – not performedAH010 Nd12C92H220O60N28I12 Nd(COOH)3 isolatedAH011 Gd(COOH)3 product isolatedAH012 Nd12C92H220O60N28I12 [Nd(DMF)8]I3 isolatedAH013 Nd(COOH)3 product isolatedAH014 Nd12C92H220O60N28I12 no product isolatedAH015 Nd12C92H220O60N28I12 Nd(COOH)3 isolatedAH016 Nd12C92H220O60N28I12 no product isolatedAH017 NdI3 · xTHF no product isolatedAH018 GdI3 · xTHF no product isolatedAH019 SrI3 · xTHF no product isolated
Table B.8.: Experiments Sabine HübnerNo. Type of experiment Target compound ResultFTSH01 electrolysis KHg11 KHg11
FTSH02 electrolysis Cs2Hg27 Cs2Hg27
FTSH03 electrolysis Cs2Hg27−xAux no product isolatedFTSH04 electrolysis Cs2Hg27−xAux Cs2Hg27
FTSH05 electrolysis Cs2Hg27−xAux no product isolatedFTSH06 electrolysis Cs2Hg27−xAux Cs3Hg20
FTSH07 electrolysis Cs2Hg27−xAux YYYFTSH08 electrolysis Cs2Hg27−xAux YYYFTSH09 electrolysis In–amalgam product isolatedFTSH10 electrolysis Cs2Hg27−xAux no product isolatedFTSH11 electrolysis In-amalgam CsIn12
FTSH12 electrolysis Cs2Hg27−xAux Cs3Hg20
Performed Experiments 249
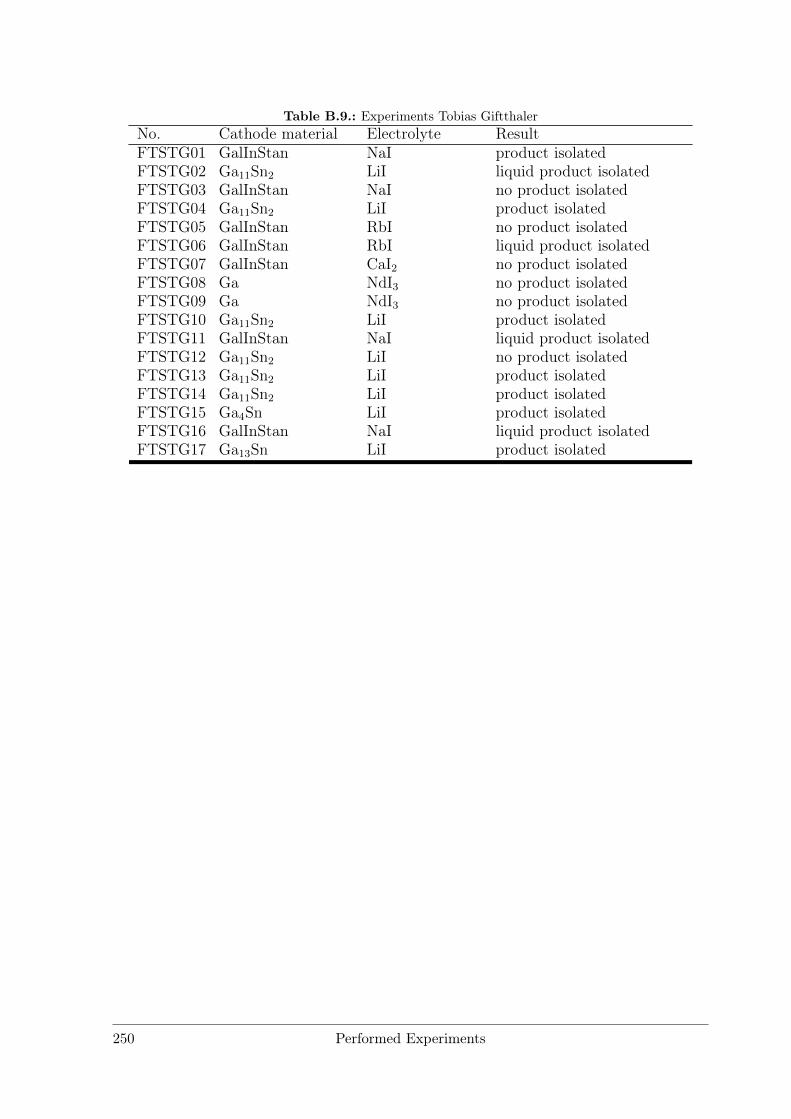
Table B.9.: Experiments Tobias GiftthalerNo. Cathode material Electrolyte ResultFTSTG01 GalInStan NaI product isolatedFTSTG02 Ga11Sn2 LiI liquid product isolatedFTSTG03 GalInStan NaI no product isolatedFTSTG04 Ga11Sn2 LiI product isolatedFTSTG05 GalInStan RbI no product isolatedFTSTG06 GalInStan RbI liquid product isolatedFTSTG07 GalInStan CaI2 no product isolatedFTSTG08 Ga NdI3 no product isolatedFTSTG09 Ga NdI3 no product isolatedFTSTG10 Ga11Sn2 LiI product isolatedFTSTG11 GalInStan NaI liquid product isolatedFTSTG12 Ga11Sn2 LiI no product isolatedFTSTG13 Ga11Sn2 LiI product isolatedFTSTG14 Ga11Sn2 LiI product isolatedFTSTG15 Ga4Sn LiI product isolatedFTSTG16 GalInStan NaI liquid product isolatedFTSTG17 Ga13Sn LiI product isolated
250 Performed Experiments
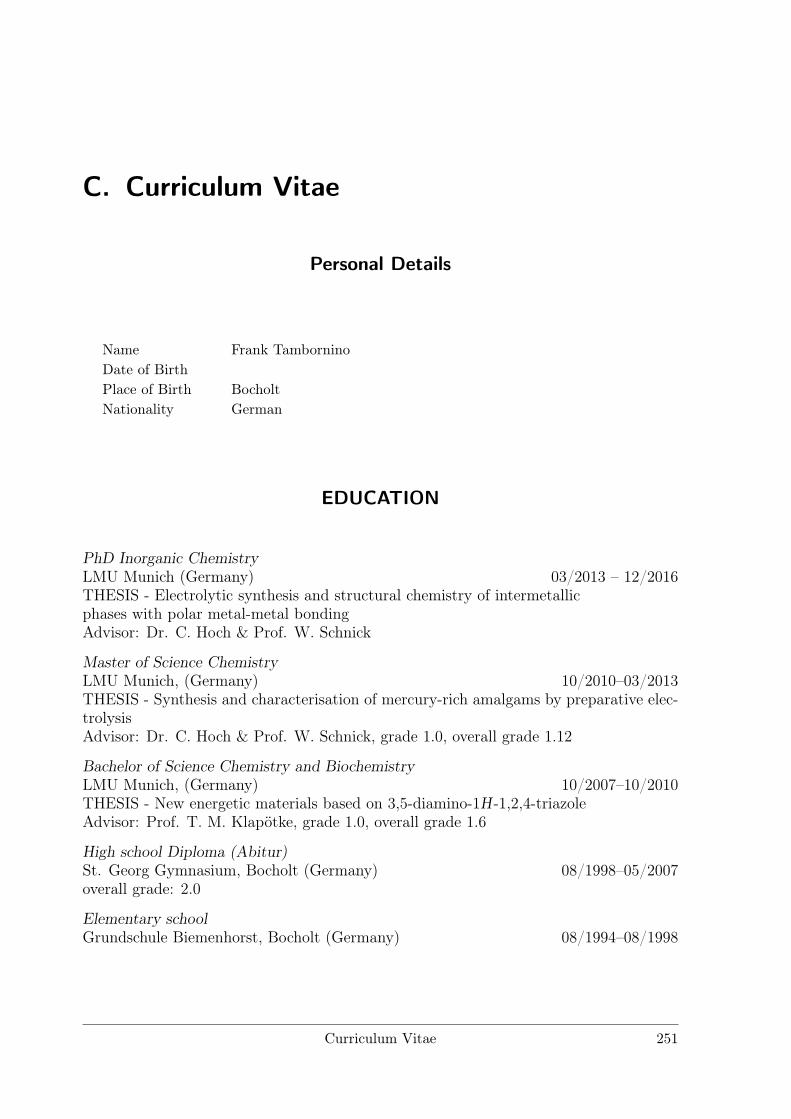
C. Curriculum Vitae
Personal Details
Name Frank TamborninoDate of BirthPlace of Birth BocholtNationality German
EDUCATION
PhD Inorganic ChemistryLMU Munich (Germany) 03/2013 – 12/2016THESIS - Electrolytic synthesis and structural chemistry of intermetallicphases with polar metal-metal bondingAdvisor: Dr. C. Hoch & Prof. W. Schnick
Master of Science ChemistryLMU Munich, (Germany) 10/2010–03/2013THESIS - Synthesis and characterisation of mercury-rich amalgams by preparative elec-trolysisAdvisor: Dr. C. Hoch & Prof. W. Schnick, grade 1.0, overall grade 1.12
Bachelor of Science Chemistry and BiochemistryLMU Munich, (Germany) 10/2007–10/2010THESIS - New energetic materials based on 3,5-diamino-1H -1,2,4-triazoleAdvisor: Prof. T. M. Klapötke, grade 1.0, overall grade 1.6
High school Diploma (Abitur)St. Georg Gymnasium, Bocholt (Germany) 08/1998–05/2007overall grade: 2.0
Elementary schoolGrundschule Biemenhorst, Bocholt (Germany) 08/1994–08/1998
Curriculum Vitae 251
PROFESSIONAL EXPERIENCE
Research Assistant 05/2013 – NowDepartment of Chemistry, LMU Munich
• Synthesis and structural investigations on mercury-rich amalgams of alkali, alkalineearth and lanthanide metals.
• Development of isothermal preparative electrolysis methods on reactive (inter)me-tallic cathode materials including mercury, gallium, indium, tin.
• Structural elucidation (single crystal/powder X-ray diffraction) and characterisa-tion (conductivity, band-structure calculation with WIEN2k, magnetic properties,ss-NMR) of intermetallic compounds.
Assistant Lecturer 10/2013 – 10/2015Department of Chemistry, LMU Munich, Munich
• Planning, preparation and co-conduction of the lecture "Introduction to generaland inorganic chemistry" (first semester lecture, 6h/week) with Prof. W. Schnick.
• Design and execution of educational experiments for this lecture with >600 stu-dents.
252 Curriculum Vitae
Jr. Supervisor Various courses 2009 – NowDepartment of Chemistry, LMU Munich
• Supervisor for advanced students (6-8th semester students, 8 in total, 1on1 super-vision, 40h/week for 8 weeks), 2013–Now.
• Advanced inorganic synthesis lab course (4th semester students, 27h/week for 4weeks), summer terms 2010–13.
• Basic lab course (1st semester students, 15h/week for 10 weeks), 2009.
Research InternshipsProf. U. Wille, University of Melbourne (Australia) 09 – 12/2011
• Synthesis and characterization of DiMeCSTMIO as a potential fluorophore for poly-mer degradation studies
Prof. T. Bein, LMU Munich (Germany) 06 – 08/2011
• Organometallic functionalization and post-synthesis modification of mesoporousMCM-41
Prof. D. Johrendt, LMU Munich (Germany) 02 – 06/2011
• Synthesis and structure of layered iron arsenides and LaSSb
Jr. researcher 03 – 04/2008Ab-solut chemistry GmbH, Rhede
• Development of decoating technologies through plasma (CO, N2, CO2 plasma) andchemical etching
Alternative civilian service 08 – 10/2007Fraunhofer-Institute UMSICHT, Oberhausen, Department: Materials and interaction
• Dispersion of carbon nanotubes in supercritical CO2 for insertion into polymermaterials
HONORS and AWARDS
GDCh travel scholarship (2016)Römer Prize for outstanding research (Master’s thesis) 2013.
Best Poster Presentation (Terrae Rarae 2013).Best Chemistry Abitur Prize, Fonds der Chemischen Industrie (2007).Best Biology Abitur Prize, Fonds der Chemischen Industrie (2007).
Curriculum Vitae 253
PUBLICATIONS
12. F. Tambornino, J. Sappl, F. Pultar, T. M. Cong, S. Hübner, T. Giftthaler, C.Hoch, "Electrocrystallization – a synthetic method for new intermetallic phaseswith polar metal-metal bonding", Inorg. Chem. (2016), in print.doi: 10.1021/acs.inorgchem.6b02068.
11. M. Wörsching, F. Tambornino, S. Datz, C. Hoch, "Chemical Twinning of Salt andMetal in the Subnitridometalates Ba23Na11(MN4)4 with M = V, Nb, Ta", Angew.Chem. 128, 11026–11030 (2016), doi:10.1002/ange.201605113; Angew. Chem. Int.Ed. 55 (2016), 10868-10871, doi:10.1002/anie.201605113.
10. F. Tambornino, K. Schwärzer and C. Hoch, "Synthesis and characterization ofLa11+xHg45−x and RE 11Hg44.5 (RE=Nd, Sm) as hettotypes of the Sm11Cd45 struc-ture type", J. Solid State Chem., 242, 162–169 (2016).doi:10.1016/j.jssc.2016.07.001.
9. A. Schmidt, P. Köstler, F. Tambornino and T. Bein, "Efficient Functionaliza-tion of Mesoporous MCM-41 with Aromatic Organo-Lithium Reagents", Micropor.Mesopor. Mat. 223, 219–224 (2016). doi:10.1016/j.micromeso.2015.10.015.
8. A. Marchuk, S. Wendl, N. Imamovic, F. Tambornino, D. Wiechert, P.J. Schmidt,W. Schnick, "Nontypical Luminescence Properties and Structural Relation ofBa3P5N10X : Eu2+ (X = Cl, I): Nitridophosphate Halides with Zeolite-like Struc-ture", Chem. Mater. 27, 6432–6441 (2015). doi:10.1021/acs.chemmater.5b02668.
7. F. Tambornino, C. Hoch, "The Mercury-richest Europium Amalgam, Eu10Hg55",Z. Anorg. Allg. Chem. 641, 537–542 (2015). doi:10.1002/zaac.201400561.
6. F. Tambornino, C. Hoch, "Bad metal behaviour in the new Hg-rich amalgamKHg6 with polar metallic bonding", J. Alloys Compd. 618 , 299–304 (2015).doi:10.1016/j.jallcom.2014.08.173.
5. F. Tambornino, J. Sappl, C. Hoch, "The Gd14Ag51 structure type and its relationto some complex amalgam structures", J. Alloys Compd. 618, 326–335 (2015).doi:10.1016/j.jallcom.2014.08.017.
4. F. Tambornino, P. Bielec, C. Hoch, "Redetermination of [EuCl2(H2O)6]Cl", ActaCryst. E70, i27 (2014). doi:10.1107/S1600536814010307.
3. F. Tambornino, C. Hoch, "The new potassium amalgam KHg6", Z. Kristallogr.Suppl. 32 (2013).
2. F. Tambornino, C. Hoch, "The Hg-richest europium amalgam, Eu10Hg55", Z.Kristallogr. Suppl. 32 (2013).
1. R. Frankovsky, H. Luetkens, F. Tambornino, A. Marchuk, G. Pascua, A. Amato,H.-H. Klauss, D. Johrendt, "Short-range magnetic order and effective suppressionof superconductivity by manganese doping in LaFe1−xMnxAsO1−yFy", Phys. Rev.B 87, 174515 (2013). doi:10.1103/PhysRevB.87.174515.
254 Curriculum Vitae
PRESENTATIONS
17. "Unexpected complexity in polar metals: Amalgams", Poster, Antwerp summerschool on aperiodic crystals, 07/2016.
16. "Aktuelle Forschung" (Recent research), oral presentation, Group Seminar AKSchnick 12/2015.
15. "The Ag51Gd14 structure type and its relation to some amalgam structures", Posterand oral presentation, Young crystallographers meeting at STOE, Darmstadt, 09/2015.
14. "Probing the electronic structures of lithium amalgams with solid-state NMR",Poster, ECSSC - 15th European Conference on Solid State Chemistry, Vienna (Aus-tria), 08/2015.
13. "Synthese und Struktur von La11Hg45" (Synthesis and structure of La11Hg45), oralpresentation, Hirschegg-Seminar on solid state chemistry 06/2015.
12. "Demixing of multinary metallic liquids during electrolysis - synthesis of CsIn12",Poster, Annual Meeting of the German Crystallographic Society, Göttingen (Ger-many) 2015.
11. "Vergälltes Gallium" (Spoilt Gallium), oral presentation, "Hemdsärmelkolloquium"inorganic chemistry (Munich), 02/2015.
10. "Komplex-Chemie" (Complex-Chemistry), oral presentation, Group Seminar AKSchnick 11/2014.
9. "Festkörper-NMR an Li-Amalgamen" (Solid state NMR on Li-amalgams), oral pre-sentation, Hirschegg-Seminar on solid state chemistry 06/2014.
8. "NMR-Untersuchungen an Lithium-Amalgamen" (NMR-Investigations on Lithium-amalgams), oral presentation, Obergurgl-Seminar on inorganic chemistry, Ober-gurgl (Austria) 01/2014.
7. "Metalliodid-Solvate: Nebenprodukte mit Eigenleben" (Metaliodide-solvates: sideproducts with independent existence), oral presentation, Group Seminar AK Schnick01/2014.
6. "Structural investigation of a dodeca-nuclear Neodymium complex", Poster, XXV.Tage der Seltenen Erden - Terrae Rarae, Stuttgart (Germany) 12/2013.
5. "The Ag51Gd14 structure type and its relation to some amalgam structures", Poster,XII international conference on crystal chemistry of intermetallic compounds, Lviv(Ukraine) 09/2013.
4. "Quecksilberreiche Amalgame von unedlen Metallen" (Mercury-rich amalgams ofnon-precious metals), oral presentation, Group Seminar AK Schnick 07/2013.
3. "Quecksilberreiche Amalgame von unedlen Metallen" (Mercury-rich amalgams ofnon-precious metals), oral presentation, Hirschegg-Seminar on solid state chemistry,Hirschegg (Austria) 05/2013.
2. "The New Potassium Amalgam KHg6", Poster, Annual Meeting of the GermanCrystallographic Society, Freiberg (Germany) 03/2013.
1. "The Hg-Richest Europium Amalgam, Eu10Hg55", Poster, Annual Meeting of theGerman Crystallographic Society, Freiberg (Germany) 03/2013.
Curriculum Vitae 255