
Biological ecofriendly synthesis if nanoparticles and their applications
215
See discussions, stats, and author profiles for this publication at: https://www.researchgate.net/publication/332752071 Biological ecofriendly synthesis if nanoparticles and their applications Article in Bioscience Biotechnology Research Communications · April 2019 DOI: 10.21786/bbrc/12.1/17 CITATIONS 0 READS 427 4 authors, including: Some of the authors of this publication are also working on these related projects: Extracellular biosynthesis and characterization of silver nanoparticles View project Divya Bhatia University Institute of Engineering & Technology 13 PUBLICATIONS 77 CITATIONS SEE PROFILE All content following this page was uploaded by Sunita Khatak on 22 January 2020. The user has requested enhancement of the downloaded file.
-
Upload
khangminh22 -
Category
Documents
-
view
0 -
download
0
Transcript of Biological ecofriendly synthesis if nanoparticles and their applications

See discussions, stats, and author profiles for this publication at: https://www.researchgate.net/publication/332752071
Biological ecofriendly synthesis if nanoparticles and their applications
Article in Bioscience Biotechnology Research Communications · April 2019
DOI: 10.21786/bbrc/12.1/17
CITATIONS
0READS
427
4 authors, including:
Some of the authors of this publication are also working on these related projects:
Extracellular biosynthesis and characterization of silver nanoparticles View project
Divya Bhatia
University Institute of Engineering & Technology
13 PUBLICATIONS 77 CITATIONS
SEE PROFILE
All content following this page was uploaded by Sunita Khatak on 22 January 2020.
The user has requested enhancement of the downloaded file.

An International Peer Reviewed Open AccessJournal For Rapid Publication
VOLUME-12 NUMBER-1 (Jan-Mar 2019)
Print ISSN: 0974-6455
Online ISSN: 2321-4007
CODEN: BBRCBA
www.bbrc.in
University Grants Commission (UGC) New Delhi, India Approved Journal
Published By:Society for Science & Nature (SSN)Bhopal IndiaIndexed by Thomson Reuters, Now Clarivate Analytics USA ISI ESCI SJIF 2017=4.186Online Content Available: Every 3 Months at www.bbrc.in

Registered with the Registrar of Newspapers for India under Reg. No. 498/2007Bioscience Biotechnology Research Communications
VOLUME-12 NUMBER-1 (Jan-Mar 2019)
A study on awareness and practices of physicians about diabetic retinopathy in primary-care centers Hail, Saudi Arabia
Abdulsalam Eisa Mazyad Alshammari, Eman Murdi Abdullah Alshammari, Abdulaziz Moqbel Fale Alshammari, Mohd. Saleem
and Md. Jahoor Alam 1-6
Evaluation of soil biological activity by a vertical profile and erosion catena
Fedor Lisetskii, Denis Vladimirov and Vladimir Cherniavskih 7-16
Experimental protection of ESBL producing Salmonella typhi bacteremic induced mice model by ϕGRCST; a therapeutic approach
Rahul Narasanna, Manjunath Chavadi, Liyakat Ahmed, Syed Sannauallah and Kelmani Chandrakanth 17-25
Anticancer and antibacterial potential of MDR Staphylococcus aureus mediated synthesized silver nanoparticles
Mohd Haseeb, Mohd Sajid Khan, Abu baker, Imran Khan, Iram Wahid and M.S. Mohamed Jaabir 26-35
Investigations on the development of biodegradable nanoparticles for anti-cancer drug
Seyed Goodarz Fallah Vahdati 36-45
Overlap extension PCR to anneal multiple DNA fragments for high-throughput double stranded RNAi vector construction
K. Prasad Babu, M. Manamohan and M. Krishna Reddy 46-53
Prevalence and pathogenesis of otosclerosis: A review
Rania Abdulfattah Sharaf 54-59
Mitigation of radiation-induced pneumonitis in mice using alpha-tocopherol and nano-micelle curcumin
Piman Ameni Asl, Hana Saffar, Masoud Najafi , Ramezan Ali Taheri, Ali Qazvini and Mohammad Reza Nourani 60-65
Isolation, phenotypic and molecular characterization of Burkholderia sp. (strain, PCS1) from maize fields exhibiting starch
hydrolysis ability
Priya Chatterjee, Paromita Roy, Paramita Mandal and Soumendranath Chatterjee 66-72
Improved production of withanolides in adventitious root cultures of Withania somnifera by suspension culture method
Sindhu Rangaraju, A.N. Lokesha and Chenna Reddy Aswath 73-79
Molecular characterization and genetic diversity of Indian potato, Solanum tuberosum germplasms using microsatellite
and RAPD markers
Manthan Kapuria, Darshan Dharajiya, Karen Pachchigar and R. M. Chauhan 80-89
Histobiochemical and physicochemical characterization of mutant jute Corchorus capsularis CMU 013 with poorly developed fibre
Sanjoy Sadhukhan 90-98
Bacteriological profiling of toys and clothes of children from children’s day care centre of Tarakeswar, Hooghly West Bengal, India
Raktima Bandyopadhyay, Sucharita Ghosh, Soumendranath Chatterjee and Shyamapada Mandal 99-107
Application of Langmuir and Freundlich adsorption isotherms in screening suitable adsorbents and the role of FTIR in confi rmation of
C-Phycocyanin purification
Kethineni Chandrika Sunkara Deviprasanth, Daram Pavan Kumar Reddy, Firdous Sultana and Charishma Mandava 108-113
Upgradation of tannase production by Klebsiella pneumoniae KP715242 through heat, UV, NTG and MMS induced mutagenesis for
enhanced tannase activity
Mukesh Kumar, Rajesh, Vivek Srivastava and Raj Kumar Salar 114-123
Synteny analysis of Glycine max and Phaseolus vulgaris revealing conserved regions of NBS-LRR coding genes
Gaurav Singh and Anil Kumar 124-133
Biological eco-friendly synthesis of nanoparticles and their applications
Vivek Singh, Divya Bhatia, Sunita Khatak, Tarun Kumar and Deepak Kumar Malik 134-139
Printed By:Society For Science & Nature Bhopal IndiaC-52, HB Colony, Koh-e-FizaBhopal - 462001, INDIA
Continued Inside Cover

Biotechnological management of water quality: A mini review
Lakhan Kumar, Rajkumar Bidlan, Jaigopal Sharma and Navneeta Bharadvaja 140-146
Bile salt hydrolase, a potent enzyme capable of removing cholesterol present in bacteria: A review
Akhila. B. Rajan, Abhini K N and Fathimathu Zuhara K 147-155
Detection of poly cystic ovarian syndrome (PCOS) using follicle recognition techniques
T. Abirami and S. Palanivel Rajan 156-161
Annexin A2 mediated posttranscriptional destabilization of BRCA1 mRNA in sporadic breast cancer
Anil Bapu Bargale, Jayarama Shetty K, Suchetha Kumari N, Vidya S Patil, R D Kulkarni, Rajesh kumar Manne, Sarathkumar E,
and Praveenkumar Shetty 162-168
A low energy based event driven and secure node deployment protocol for Wireless Medical Sensor Network
Sandip Mandal and Rama Sushil 169-173
Proposed model for the detection of breast cancer using mammogram images
M. Manikandan and A. Nithya 174-180
Studies of geo-gravimetric properties of polished rice, Oryza sativus, (Pusa Sugandha-1)
V.K. Tiwari, Nikhat Parveen Ansari, Astha Asati and Madhusudhan 181-185
Distribution of nitrogen fractions under long term fertilizer and manure application in a vertisol
A. Khandagle, B. S. Dwivedi, S. B. Aher, A. K. Dwivedi, D. S. Yashona, S. Mohbe and S. Panwar 186-193
Biological monitoring of riverine ecosystem and its correlation with water quality
D. D. Bhutekar and S. B. Aher 194-202
Continued From Back Cover
Registered with the Registrar of Newspapers for India under Reg. No. 498/2007Bioscience Biotechnology Research Communications
VOLUME-12 NUMBER-1 (Jan-Mar 2019)

About the Journal
Bioscience Biotechnology Research Communications, BBRC is a broad based internationally indexed offi cial publication of Society for Science & Nature (SSN) since 2008. The international journal publishes peer reviewed original research papers, exciting reviews and short communica-tions in basic and applied areas of life sciences and the upcoming state of the art technologies, including Biology and Medicine on a fast track. The young editorial team of BBRC tries hard to provide a high quality fl awless format of scientifi c communication for the popularization and advancement of science, worldwide. During these years hundreds of peer reviewed research papers of very high quality have been published in BBRC and authors like Kiran Shaw Majumdar of Biocon, Bangalore have contributed to BBRC helping it achieve high readership in a short span of time. Reviewing the published research articles, it becomes evident that on an average, about 7 papers out of 10 are subjected to healthy revisions in BBRC making quality reading. We owe this achievement to our reverend reviewers! We hope the standards set by BBRC will improve further making this international journal unique and easily accessible to the scientifi c fraternity across the globe. In its tenth year of successful existence as a scholarly publication, BBRC has now become an open access Thomson Reuters ISI ESC/Clarivate Analytics USA Indexed journal also approved by University Grants Commission (UGC) Ministry of Human Resource Development, Government of India, New Delhi and has a NAAS-2018, Government of India, Indian Council of Agricultural Research (ICAR) New Delhi rating of 4.38 and SJIF 4.196.
Scope of the Journal
The journal offers an international peer reviewed fast track platform, encouraging contributions from research students, faculty members and academicians from developing countries. Manuscripts in the following areas of Bioscience and Biotechnology are considered for rapid publication:
• Biology, Botany, Zoology, Ecology and Aquaculture• Biophysics, Molecular Biology, Genetics and Genetic Engineering• Biotechnology, Bioinformatics, Proteomics and Nanotechnology• Microbiology, Pathology, Immunology and Diagnostics• Physiology, Endocrinology, Biochemistry and Biochemical Engineering• Environmental Sciences, Toxicology & Environmental Engineering• Biology and Medicine including Nutrition.• Diseases, Pharmaceutical Sciences and Public Health.
On Piracy, Pilferage and Other Human Academic Malpractice
Bioscience Biotechnology Research Communications strongly advocates the policy of outrightly condemning and reporting of any academic mal-practice with regard to manipulation, copying, pilfering or pirating of any research material or data in practice and writing thereof. It is the duty of all our revered contributors of BBRC to kindly verify the authenticity of their scientifi c text in all of their manuscripts with regard to standard of scientifi c research done worldwide. Our reviewers are also being requested to report any of such discrepancies immediately so as to curb this malady. Any case of any kind of piracy detected, will be liable for legal action as per prevailing laws. Articles found with any form of plagiarism will be liable for immediate retraction from the issue after proper confi rmation, following standard publication norms.
On Ethical and Animal Welfare Issues
Bioscience Biotechnology Research Communications requires that the experimental conditions under which human and animal assays and tests are performed are as per standard protocols used worldwide. Studies on animals must comply with the prevailing standards of animal welfare according to Indian Council of Medical Research Guidelines in India and likewise following similar condition following elsewhere. Authors must make it clear that the procedures they used were as humane as possible and have been complied with the guidelines. Studies involving human subjects must be carried out with the formal approval of the relevant Ethical Committee and evidence of such approval must be provided along with the submission.
Editor, Editorial Board and the Publisher of Bioscience Biotechnology Research Communications take no responsibility for inaccurate, mislead-ing data, opinion and statements appeared in the articles and advertisements published in this journal. It is sole responsibility of the contribu-tors and advertisers. No part of the journal can be reproduced without the written permission of the Editor, who also holds the copyright of the Bioscience Biotechnology Research Communications. It is also notifi ed that if any dispute arises regarding the journal, the matter will come within the jurisdiction of Bhopal.
Bioscience Biotechnology Research Communications(Abbreviation: Biosc. Biotech. Res. Comm.)
University Grants Commission (UGC) Ministry of HRD Government of India approved Journal.
Published by: Society For Science & Nature (SSN)Bhopal, India.

Patrons: Prof. Mir Athar Ali (MA Eng., Urdu & Persian, BT, LLB) Retired Professor of English, Senior Advocate High Court and Founder President, Athar Institute of Health and Management Studies, New Delhi, IndiaEr. Zainuddin Shah, Secretary Saifi a Educational Society, Bhopal, India
Honorary Editors: Dr. Sharique A. Ali, Ph.D., FLS (London), FRSB (UK)DAE-BARC Fellow (UNESCO Awardee)Dr. Sharique Ali has published more than 150 research papers in applied areas of Bioscience and Biotechnology and has completed about several projects, guided more than 40 Ph.D. students in Animal Sciences, with 100 % placement. He has also been conferred with several awards and citation, including the prestigious UNESCO Award. He has also taught at many foreign universities as a visiting professor. Dr. Ali has the distinction of being one of the youngest principal investiga-tors of US PL-480 International Research Project, at the age of 28. Presently, he is a Professor of Physiology and heads the Post Graduate Department of Biotech-nology, at Saifi a Science College, Bhopal. He has publications in high impact factor journals like: Comparative Physiology Biochemistry, Phytochemistry, Food & Chemical Toxicology, Cytokine, Viral Immunology, Viral Epidemiology (Elsevier) Environmental Conservation, Journal of Experimental Botany (Cambridge), Bul-letin Contamination Toxicology, Cell & Mol Biol Letters (Perga- mon), Cell Receptors & Signal Transduction, Journal of Pharmacy & Pharmacology, British Journal of Pharmacology (Wiley), Natural Product Res, Pharmacologia (Blackwell), Planta Medica (Verlag), In vitro Biology (Springer), Current Science and many others. Dr. Sharique A. Ali’s personal web-page can also be accessed at: http://www.drshariqali.com
Dr. Ayesha Ali, Ph.D., FSSN., (CSIR Fellow) [email protected]. Ayesha Ali, Professor of Zoology and Animal Biotechnology, Saifi a Science College, Bhopal, did her Ph.D. in Biochemical Toxicology as a UGC and CSIR National Fellow, having an outstanding academic career. She has published more than 100 research papers in National and International journals, visited many countries on academic assignments, completed several research projects and has guided more than 25 Ph.D. students in applied areas of Bioscences and Biotechnology. Dr Ali has also guided more than 100 Masters students for their dissertations in Zoology and Biotechnology. She has been teaching Bioscience to post graduate students since last four decades. She has been on the academic and Ph.D. examination boards of Bioscience of several colleges and universities in India and abroad.
Associate Foreign Editors:Dr S. Salim, PhD., 21925 Manor Crest Ln, Boyds, MD, United States of America – 20841
Dr JM Galgut, PhD.,671, Asprior Avenue, Mississauga, Ontario, Canada
Managing Editor: Dr. Mohd. Miraj, MPTh (Ortho) PhD Riyadh Saudi Arabia and New Delhi [email protected] young dynamic orthopedic and biomechanics specialist from AIIMS, New Delhi with several research papers in National and International journals. Presently, he is the Director of Athar’s Institute of Health & Management Studies, New Delhi (AIHMS - http://www.aihms.in/).
Technical Consultant: Er. Faraz Ali BE (Printing & Communication Graphics) [email protected]
Assistant Editor, Foreign Affairs: Dr. J. Peter Ph.D [email protected] and Dr. K. V. Metei Ph.D [email protected]. Peter has won the Young Scientist Award of MPCST, she is an outstanding young pigment cell researcher, has been to various countries like the US, UK, France, Germany, Japan, Austria, Holland, among many others on academic assignments. She has more than 30 publications to her credit and is looking after the foreign affairs of BBRC.
Dr. Vivek Metei Vivek has done his Ph.D. in Bioscience and has excellent high impact factor journal publications to his credit.
Assistant Editors: Ram Kumar Choudhary [email protected] and Ishrat Naaz [email protected] Choudhary, is a young hard working researcher, who is registered for his Ph.D. in Biotechnology. Ishrat Naaz as a MAN Fellow (UGC) has done her M.Sc. in Biotechnol-ogy. They have published many research papers in applied areas of Bioscience and Biotechnology and are sincere young scientists with great zeal and enthusiasm.
Editorial Secretaries: Nargis Khan, Naima Parveen and Gajendra Mahor are all young scientists, doing their research in Biosciences and Biotechnology at the Post graduate Department of Bio-technology, Saifi a Science College, Bhopal. These ambitious young sincere hardworking researchers are editorial members of BBRC.
Honorary Advisory and Editorial Board:
Bioscience Biotechnology Research Communications International Open Access Peer Reviewed Journal For Rapid Publication
(Indexed in Leading National and International Scientifi c Citation Agencies Approved by University Grants Commission (UGC) New Delhi)
(NAAS 2018 Journal Score — 4.31 SJIF 2017 4.196)Visit us at: http://www.bbrc.in
Dr. Absar Ahmad, National Chemical Laboratories, Pune, India, Prof. Asif A. Ali, Seed Technologist Govt of Maharashtra, Amravati, India, Dr. MS Baig, University of Flor-ida, USA, Dr. RR Bhonde, National Centre Cell Science Pune, India, Dr. Alex Eberle, University of Basel Switzerland, Switzerland, Dr. Idris Khan, Professor of Cardiology, Bombay Hospital Indore, India, Dr. KM Kulkarni, Ex Vice Chancellor Kolhapur University, Kolhapur Pune, India, Dr. Ashok Kumar, Professor of Biotechnology, Institute of Genomics & Integrative Biology New Delhi, India, Dr. Maxime Merheb, American University of Ras Al-Khaimah UAE, Dr. N Nandanwar, Humboldt Fellow, Berlin, Germany, Dr. Anil Prakash, Dean Life Sciences Barkatullah University Bhopal, India, Dr. Bashar Saad, American University, Palestine, Dr. Vinoy Shrivastava, Professor Chairman Bio-sciences Bhopal, India, Dr. Virendra Singh Mullana, Professor and Department of Virology, Medical College India, Dr. ON Tiwari, Institute of Bioresources and Sustainable Development (IBSD), Takyelpat, Imphal, Imphal, India, Dr. HA Akinnibosun, FLS London University of Benin Nigeria, UK, Dr. DK Belsare, DSc, FNASc Professor of Biosci-ence Bhopal, India, Dr. R Chandrashek-har, National Health Research Centre UK, Dr. Khalid Al Ghamdi, King Abdul Aziz University Jeddah, KSA, Dr. Sabir Hussain, City of Hope Hospital & Research Center, Califonia, USA, Prof. Sanat Mohanty Indian Institute of Technology, New Delhi, India, Dr. KS Sachdeva, National Institute of Family & Health New Delhi, India, Prof. Sukh M. Singh Professor and Head Department of Biotechnology BHU, Varanasi, India, Dr. Suhas Bhand, Environmentalist Mumbai, India, Dr. Zhiyang Chen Shanghai Medical University Shanghai, China, Dr. Supriya Ghosh, All India Institute of Medical Sciences New Delhi, India, Dr. FA Kabbinwar, Professor of Oncology, UCLA California, USA, Dr. Scott Newton Virginia State University USA, Dr. S Shah, Memorial Sloan Kettering Cancer Center New York, USA, Dr. Salman Syed, Sydney, Australia, Dr Maulin Shah Head Microbiology,Enviro Technology Ltd, Gujrat, India, Dr. Ranjana Trivedi, Michigan, USA.
CONTENTSVOLUME 12 • NUMBER 1 • JAN-MAR 2019
MEDICAL COMMUNICATION A study on awareness and practices of physicians about diabetic retinopathy in primary-care centers Hail, Saudi Arabia
Abdulsalam Eisa Mazyad Alshammari, Eman Murdi Abdullah Alshammari, Abdulaziz Moqbel Fale Alshammari, Mohd. Saleem and Md. Jahoor Alam........................1-6
ECOLOGICAL COMMUNICATION Evaluation of soil biological activity by a vertical profi le and erosion catena
Fedor Lisetskii, Denis Vladimirov and Vladimir Cherniavskih.......................................................................................................................................................7-16
BIOTECHNOLOGICAL COMMUNICATION Experimental protection of ESBL producing Salmonella typhi bacteremic induced mice model by GRCST; a therapeutic approach
Rahul Narasanna, Manjunath Chavadi, Liyakat Ahmed, Syed Sannauallah and Kelmani Chandrakanth........................................................................................17-25
MEDICAL COMMUNICATION Anticancer and antibacterial potential of MDR Staphylococcus aureus mediated synthesized silver nanoparticles
Mohd Haseeb, Mohd Sajid Khan, Abu baker, Imran Khan, Iram Wahid and M.S. Mohamed Jaabir...............................................................................................26-35
MEDICAL COMMUNICATION Investigations on the development of biodegradable nanoparticles for anti-cancer drug
Seyed Goodarz Fallah Vahdati...................................................................................................................................................................................................36-45
BIOTECHNOLOGICAL COMMUNICATION Overlap extension PCR to anneal multiple DNA fragments for high-throughput double stranded RNAi vector construction
K. Prasad Babu, M. Manamohan and M. Krishna Reddy.............................................................................................................................................................46-53
MEDICAL COMMUNICATION Prevalence and pathogenesis of otosclerosis: A review
Rania Abdulfattah Sharaf.........................................................................................................................................................................................................54-59
MEDICAL COMMUNICATION Mitigation of radiation-induced pneumonitis in mice using alpha-tocopherol and nano-micelle curcumin
Piman Ameni Asl, Hana Saffar, Masoud Najafi , Ramezan Ali Taheri, Ali Qazvini and Mohammad Reza Nourani......................................................................60-65
BIOTECHNOLOGICAL COMMUNICATION Isolation, phenotypic and molecular characterization of Burkholderia sp. (strain, PCS1) from maize fi elds exhibiting starch hydrolysis ability
Priya Chatterjee, Paromita Roy, Paramita Mandal and Soumendranath Chatterjee.........................................................................................................................66-72
PHARMACEUTICAL COMMUNICATION Improved production of withanolides in adventitious root cultures of Withania somnifera by suspension culture method
Sindhu Rangaraju, A.N. Lokesha and Chenna Reddy Aswath......................................................................................................................................................73-79
BIOTECHNOLOGICAL COMMUNICATION Molecular characterization and genetic diversity of Indian potato, Solanum tuberosum germplasms using microsatellite and RAPD markers
Manthan Kapuria, Darshan Dharajiya, Karen Pachchigar and R. M. Chauhan.............................................................................................................................80-89
BIOTECHNOLOGICAL COMMUNICATION Histobiochemical and physicochemical characterization of mutant jute Corchorus capsularis CMU 013 with poorly developed fi bre
Sanjoy Sadhukhan...................................................................................................................................................................................................................90-98
MICROBIOLOGICAL COMMUNICATION Bacteriological profi ling of toys and clothes of children from children’s day care centre of Tarakeswar, Hooghly West Bengal, India
Raktima Bandyopadhyay, Sucharita Ghosh, Soumendranath Chatterjee and Shyamapada Mandal............................................................................................99-107
BIOTECHNOLOGICAL COMMUNICATION Application of Langmuir and Freundlich adsorption isotherms in screening suitable adsorbents and the role of FTIR in confi rmation of
C-Phycocyanin purifi cation
Kethineni Chandrika Sunkara Deviprasanth, Daram Pavan Kumar Reddy, Firdous Sultana and Charishma Mandava...............................................................108-113
BIOTECHNOLOGICAL COMMUNICATION Upgradation of tannase production by Klebsiella pneumoniae KP715242 through heat, UV, NTG and MMS induced mutagenesis for
enhanced tannase activity
Mukesh Kumar, Rajesh, Vivek Srivastava and Raj Kumar Salar..............................................................................................................................................114-123

BIOTECHNOLOGICAL COMMUNICATION Synteny analysis of Glycine max and Phaseolus vulgaris revealing conserved regions of NBS-LRR coding genes
Gaurav Singh and Anil Kumar..............................................................................................................................................................................................124-133
BIOTECHNOLOGICAL COMMUNICATION Biological eco-friendly synthesis of nanoparticles and their applications
Vivek Singh, Divya Bhatia, Sunita Khatak, Tarun Kumar and Deepak Kumar Malik................................................................................................................134-139
BIOTECHNOLOGICAL COMMUNICATION Biotechnological management of water quality: A mini review
Lakhan Kumar, Rajkumar Bidlan, Jaigopal Sharma and Navneeta Bharadvaja........................................................................................................................140-146
BIOCHEMICAL COMMUNICATION Bile salt hydrolase, a potent enzyme capable of removing cholesterol present in bacteria: A review
Akhila. B. Rajan, Abhini K N and Fathimathu Zuhara K........................................................................................................................................................147-155
MEDICAL COMMUNICATION Detection of poly cystic ovarian syndrome (PCOS) using follicle recognition techniques
T. Abirami and S. Palanivel Rajan.........................................................................................................................................................................................156-161
MEDICAL COMMUNICATION Annexin A2 mediated posttranscriptional destabilization of BRCA1 mRNA in sporadic breast cancer
Anil Bapu Bargale, Jayarama Shetty K, Suchetha Kumari N, Vidya S Patil, R D Kulkarni, Rajesh kumar Manne, Sarathkumar E, and Praveenkumar Shetty............162-168
BIOTECHNOLOGICAL COMMUNICATION A low energy based event driven and secure node deployment protocol for Wireless Medical Sensor Network
Sandip Mandal and Rama Sushil..........................................................................................................................................................................................169-173
MEDICAL COMMUNICATION Proposed model for the detection of breast cancer using mammogram images
M. Manikandan and A. Nithya.............................................................................................................................................................................................174-180
AGRICULTURAL COMMUNICATION Studies of geo-gravimetric properties of polished rice, Oryza sativus, (Pusa Sugandha-1)
V.K. Tiwari, Nikhat Parveen Ansari, Astha Asati and Madhusudhan......................................................................................................................................181-185
SOIL SCIENCE COMMUNICATION Distribution of nitrogen fractions under long term fertilizer and manure application in a vertisol
A. Khandagle, B. S. Dwivedi, S. B. Aher, A. K. Dwivedi, D. S. Yashona, S. Mohbe and S. Panwar......................................................................................................186-193
ENVIRONMENTAL COMMUNICATION Biological monitoring of riverine ecosystem and its correlation with water quality
D. D. Bhutekar and S. B. Aher..............................................................................................................................................................................................194-202

A study on awareness and practices of physicians about
diabetic retinopathy in primary-care centers Hail, Saudi
Arabia
Abdulsalam Eisa Mazyad Alshammari, Eman Murdi Abdullah Alshammari, Abdulaziz
Moqbel Fale Alshammari, Mohd. Saleem and Md. Jahoor Alam*
College of Medicine, University of Hail, Hail, KSA, 2College of Applied Medical Sciences, University of Hail, Hail, Kingdom of Saudi Arabia
ABSTRACT
The present study was aimed to assess the level of awareness of knowledge, awareness and practices of physicians in Primary-Care Centers Hail, Saudi Arabia. Cross-sectional and descriptive responses were obtained by using a semi-structured multi-point questionnaire that was prepared in English as well as in Arabic. It consisted of open and closed-ended questions. The data were analyzed using SPSS tool. A total of 62 subjects were included in the study. More than one third of subjects were <40 years of age with mean age of 44.26±11.00 ranging from 26-72 years. Majority viewed that diabetic type 1 patient should visit an ophthalmologist after diagnosis (82.3%). Retinal vascular disease was reported as the most common eye disease associated with diabetic retinopathy (66.1%). About one third of the subjects adapted direct (hand-held) ophthalmoscope and a dilated fundus exam for evaluating diabetic retinopathy each consti-tuting 33.9% and 32.3% respectively. Journals were the main source of knowledge about diabetic retinopathy (72.6%). This study displays the need for hands on training of physicians about detection of diabetic retinopathy by direct use of ophthalmoscopes. Barriers for ophthalmoscope examination as perceived need to be further addressed and evaluated.
KEY WORDS: DIABETIC RETINOPATHY, KNOWLEDGE, AWARENESS, PRACTICES, PHYSICIANS
1
Medical CommunicationBiosci. Biotech. Res. Comm. 12(1): 1-6 (2019)
ARTICLE INFORMATION:
Corresponding Author: [email protected] 12th Jan, 2019Accepted after revision 12th March, 2019BBRC Print ISSN: 0974-6455Online ISSN: 2321-4007 CODEN: USA BBRCBA Thomson Reuters ISI ESC / Clarivate
Analytics USAMono of Clarivate Analytics and Crossref Indexed Journal Mono of CR
NAAS Journal Score 2019: 4.31 SJIF: 4.196© A Society of Science and Nature Publication, Bhopal India 2019. All rights reserved.Online Contents Available at: http//www.bbrc.in/DOI: 10.21786/bbrc/12.1/1

Abdulsalam Eisa Mazyad Alshammari et al.
2 A STUDY ON AWARENESS AND PRACTICES OF PHYSICIANS ABOUT DIABETIC RETINOPATHY BIOSCIENCE BIOTECHNOLOGY RESEARCH COMMUNICATIONS
INTRODUCTION
The prevalence of diabetes mellitus (DM) is increasing globally in both developed and developing countries (Rani et al., 2008). It is estimated that the number of patients with DM will be doubled by 2025 (Rathmann and Giani, 2004). It has been reported that Saudi Arabia with a high prevalence of 24% was ranked 7th out of the top 10 countries for the prevalence of DM among people aged 20-79 years. Worldwide, DM being a lead-ing cause of blindness due to its ocular complications (Sami et al, 2018). Diabetic retinopathy (DR) is the most common microvascular complication of diabetes. It is the foremost cause of blindness in working aged people as well as patients aged 55 years or older (Bunce and Wormald, 2006). DR is considered a signifi cant blinding disease. It is included in the disease control strategy of the VISION 2020 initiative. It has been estimated that 84.5% of people with DM who have had the disease for >20 years will develop DR (UKPDS, 1998; Fong et al, 2004). In a national study in Saudi Arabia, the preva-lence of DR was found to be 19.7%,whereas other stud-ies suggested a prevalence ranging from 16.7% to 31%.Both type 1 and type 2 DM can lead to DR. DR is clas-sifi ed into two types: nonproliferative and proliferative. The former type may cause impaired vision if the macula is affected. Proliferative DR can also result in blindness, and it is more serious (Sami et al, 2018).
Knowledge about DM and DR along with their health impacts and treatments may be considered vital in motivating people to pursue appropriate eye care. Therefore, it may assist in dealing with visual impair-ment (Huang et al, 2013; Wang et al, 2008; Muecke et al, 2008). Despite the well-documented importance and magnitude of the issue in the literature, limited stud-ies have explored the knowledge about DR among the patients with DM. Worldwide, studies have focused on prevalence, screening and the effects of DR. DM and DR are continuously growing problems in the Saudi popula-tion and cause socioeconomic burdens for the healthcare system (Çetin et al, 2013; Seneviratne and Prathapan, 2016).
The health burden due to DM in Saudi Arabia is predicted to rise to catastrophic levels, unless a wide-ranging epidemic control program/multidisciplinary approach is incorporated, with great emphasis laid on advocating a healthy diet, including exercise and active lifestyles, and weight control. To properly manage DM in Saudi Arabia, a multidisciplinary approach is required in which the general health practitioners play an impor-tant role (Al Ghamdi et al, 2017). The present study was aimed to assess the level of awareness of knowledge, awareness and practices of physicians in Primary-Care Centers Hail, Saudi Arabia.
MATERIAL AND METHODS
The study was a cross-sectional and descriptive. This study was conducted to assess the KAP of practitioners toward DR in Primary-Care Centers Hail, Saudi Arabia. Responses were obtained by using a semi-structured multi-point questionnaire that was prepared in Eng-lish and Arabic. It consisted of open and closed-ended questions. To ensure clarity of the fi nal questionnaire, a pilot study was conducted. The fi nal questionnaires were consisted demographic data and general questions about the respondents as well as questions on knowledge & awareness levels. It did not include personal details of the respondent. The written consent from respondent is taken before handover the survey questionnaire. Also an ethical committee approval was taken from the ethical committee of the institute before starting this work.The collected data were coded and entered on a spreadsheet. Statistical analysis was performed using version 16.0. version (SPSS Inc., Chicago) statistical software.
RESULTS
A total of 62 subjects were included in the study. More than one third of subjects were <40 years of age with mean age of 44.26±11.00 ranging from 26-72 years. About half of the subjects were males (51.6%). More than half of the subjects were Sudanese (54.8%). Major-ity of the subjects were general practitioner (72.6%). More than one third of subjects were practicing for 10-20 years (46.8%) (Table 1).
Table 2 depicts the distribution of subjects accord-ing to knowledge about diabetic retinopathy. Major-ity viewed that diabetic type 1 patient should visit an ophthalmologist after diagnosis (82.3%). About one third of the subjects opined that patient should visit an ophthalmologist immediately after diagnosis and every year (33.9%). Majority of the subjects viewed that type 2 patient should visit an ophthalmologist following diagnosis (98.4%). Majority of the subjects also viewed that after type 2 diabetes diagnosis, patient should visit an ophthalmologist immediately after diagnosis (79%). More than half of subjects viewed that type 2 diabetic patient should visit an ophthalmologist every one year (58.1%).
Retinal vascular disease was reported as the most common eye disease associated with diabetic retinopa-thy (66.1%). Cataract was reported as the second most common eye disease associated with diabetic retinopa-thy (53.2%). Retinal detachment was reported as the third most common eye disease associated with diabetic retin-opathy (45.2%). Uncontrolled diabetes was reported as the most common risk for diabetic retinopathy (58.1%). Long duration of diabetes was reported as the second most

Abdulsalam Eisa Mazyad Alshammari et al.
BIOSCIENCE BIOTECHNOLOGY RESEARCH COMMUNICATIONS A STUDY ON AWARENESS AND PRACTICES OF PHYSICIANS ABOUT DIABETIC RETINOPATHY 3
Table 1. Demographic profi le of subjects
Demographic profi le No. (n=62) %Age in years
<40 24 38.7
41-50 19 30.6
>50 19 30.6
Mean±SD (Range) 44.26±11.00 (26-72)
Gender
Male 32 51.6
Female 30 48.4
Nationality
Saudi 4 6.5
Egyptian 13 21.0
Sudanese 34 54.8
Syrian 4 6.5
Jordanian 1 1.6
Indian 2 3.2
Pakistani 4 6.5
Medical specialty
Family medicine 15 24.2
General Practitioner 45 72.6
Others 2 3.2
Experience in years
<10 17 27.4
10-20 29 46.8
21-30 10 16.1
>30 6 9.7
Mean ±SD (Median) 15.84±9.68 (15.00)
Table 2. Distribution of subjects according to knowledge about diabetic retinopathy
Knowledge about No. (n=62) %Diabetic type 1 patient should visit an ophthalmologist after diagnosis
Yes 51 82.3
No 9 14.5
Do not know 2 3.2
How soon after type 1 diabetes diagnosis should a patient visit an ophthalmologist?
Immediately after diagnosis 21 33.9
One year after diagnosis 15 24.2
Two years after diagnosis 2 3.2
Five years after diagnosis 20 32.3
Do not know 4 6.5
How regular should a type 1 diabetic patient visit an ophthalmologist?
Every 5 years 15 24.2
Every 2 years 4 6.5
Every year 21 33.9
Based on ophthalmologist screening assessment
20 32.3
Do not know 2 3.2
Should a diabetic type 2 patient visit an ophthalmologist following diagnosis
Yes 61 98.4
No 1 1.6
How soon after type 2 diabetes diagnosis should a patient visit an ophthalmologist?
Immediately after diagnosis 49 79.0
One year after diagnosis 8 12.9
Two years after diagnosis 2 3.2
Five years after diagnosis 2 3.2
Do not know 1 1.6
How regular should a type 2 diabetic patient visit an ophthalmologist
Every 5 years 4 6.5
Every 2 years 1 1.6
Every 1 year 36 58.1
Based on ophthalmologist screening assessment
20 32.3
Do not know 1 1.6
common risk for diabetic retinopathy (43.5%). Diabetic with HTN was reported as the third most common risk for diabetic retinopathy (37.1%). Decrease visual acuity was the most common symptom of diabetic retinopathy (62.9%) (Table 3). About one third of the subjects adapted direct (hand-held) ophthalmoscope and a dilated fundus exam for evaluating diabetic retinopathy each constitut-ing 33.9% and 32.3% respectively. The percentage of the other methods was less than 10% (Fig. 1).
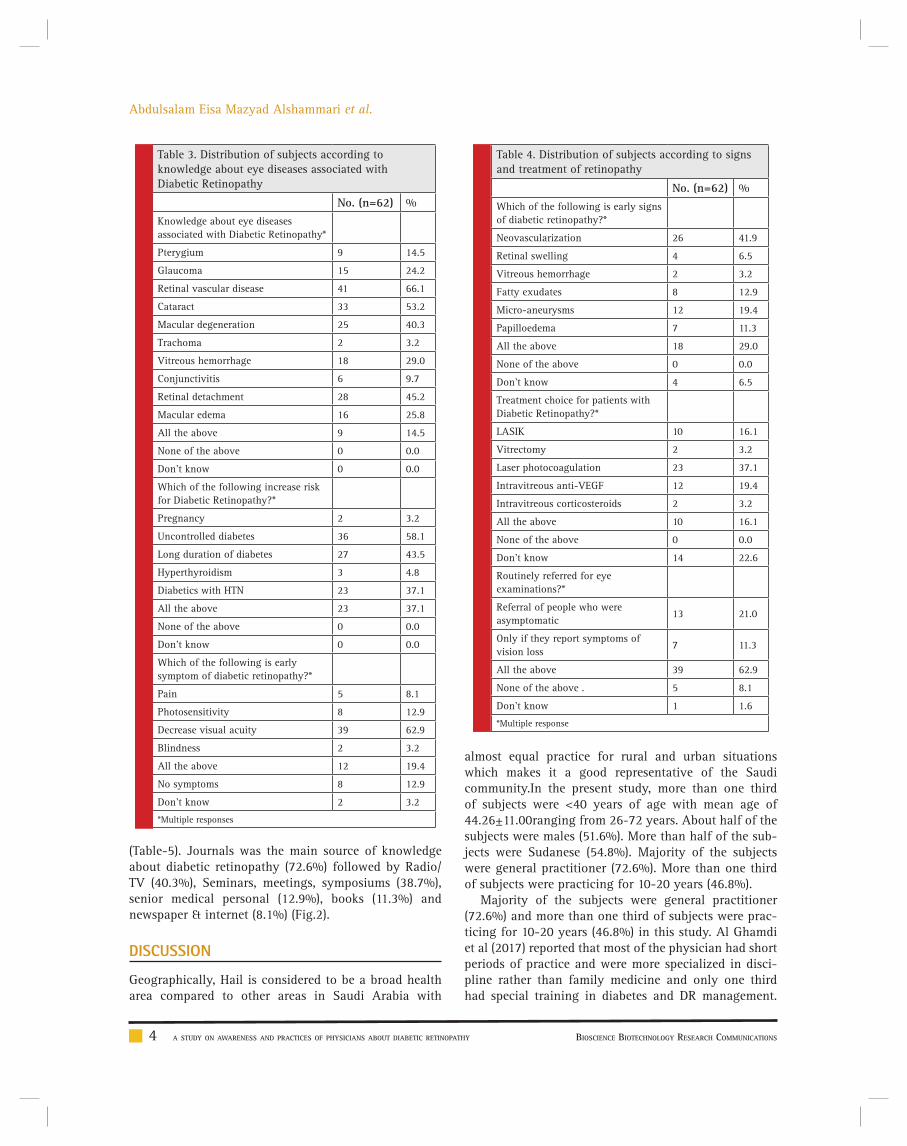
Table 4 shows the distribution of subjects according to signs and treatment of retinopathy. Neovascularization was reported as the most common early signs of diabetic retinopathy (41.9%). Micro-aneurysms was reported as the second most common early signs of diabetic retin-opathy (19.4%). Intra vitreous anti-VEGF (37.1%) was the most common treatment choice among the subjects. More than half of subjects referred both people who were asymptomatic and only if they reported symptoms of vision loss (62.9%) (Table 4).
Majority of the subjects had knowledge about using ophthalmoscope (77.4%) and 46.8% did eye examina-
tion to a diabetic patient. Majority of subjects referred all diabetic patients to an ophthalmologist (75.8%). More than half of subjects followed-up referred patients (64.5%). More than one third of patients were involved in the diabetic retinopathy public awareness programs to educate the public in the past one-year (40.3%)
Abdulsalam Eisa Mazyad Alshammari et al.
4 A STUDY ON AWARENESS AND PRACTICES OF PHYSICIANS ABOUT DIABETIC RETINOPATHY BIOSCIENCE BIOTECHNOLOGY RESEARCH COMMUNICATIONS
Table 3. Distribution of subjects according to knowledge about eye diseases associated with Diabetic Retinopathy
No. (n=62) %Knowledge about eye diseases associated with Diabetic Retinopathy*
Pterygium 9 14.5
Glaucoma 15 24.2
Retinal vascular disease 41 66.1
Cataract 33 53.2
Macular degeneration 25 40.3
Trachoma 2 3.2
Vitreous hemorrhage 18 29.0
Conjunctivitis 6 9.7
Retinal detachment 28 45.2
Macular edema 16 25.8
All the above 9 14.5
None of the above 0 0.0
Don’t know 0 0.0
Which of the following increase risk for Diabetic Retinopathy?*
Pregnancy 2 3.2
Uncontrolled diabetes 36 58.1
Long duration of diabetes 27 43.5
Hyperthyroidism 3 4.8
Diabetics with HTN 23 37.1
All the above 23 37.1
None of the above 0 0.0
Don’t know 0 0.0
Which of the following is early symptom of diabetic retinopathy?*
Pain 5 8.1
Photosensitivity 8 12.9
Decrease visual acuity 39 62.9
Blindness 2 3.2
All the above 12 19.4
No symptoms 8 12.9
Don’t know 2 3.2
*Multiple responses
Table 4. Distribution of subjects according to signs and treatment of retinopathy
No. (n=62) %Which of the following is early signs of diabetic retinopathy?*
Neovascularization 26 41.9
Retinal swelling 4 6.5
Vitreous hemorrhage 2 3.2
Fatty exudates 8 12.9
Micro-aneurysms 12 19.4
Papilloedema 7 11.3
All the above 18 29.0
None of the above 0 0.0
Don’t know 4 6.5
Treatment choice for patients with Diabetic Retinopathy?*
LASIK 10 16.1
Vitrectomy 2 3.2
Laser photocoagulation 23 37.1
Intravitreous anti-VEGF 12 19.4
Intravitreous corticosteroids 2 3.2
All the above 10 16.1
None of the above 0 0.0
Don’t know 14 22.6
Routinely referred for eye examinations?*
Referral of people who were asymptomatic
13 21.0
Only if they report symptoms of vision loss
7 11.3
All the above 39 62.9
None of the above . 5 8.1
Don’t know 1 1.6
*Multiple response
(Table-5). Journals was the main source of knowledge about diabetic retinopathy (72.6%) followed by Radio/TV (40.3%), Seminars, meetings, symposiums (38.7%), senior medical personal (12.9%), books (11.3%) and newspaper & internet (8.1%) (Fig.2).
DISCUSSION
Geographically, Hail is considered to be a broad health area compared to other areas in Saudi Arabia with
almost equal practice for rural and urban situations which makes it a good representative of the Saudi community.In the present study, more than one third of subjects were <40 years of age with mean age of 44.26±11.00ranging from 26-72 years. About half of the subjects were males (51.6%). More than half of the sub-jects were Sudanese (54.8%). Majority of the subjects were general practitioner (72.6%). More than one third of subjects were practicing for 10-20 years (46.8%).
Majority of the subjects were general practitioner (72.6%) and more than one third of subjects were prac-ticing for 10-20 years (46.8%) in this study. Al Ghamdi et al (2017) reported that most of the physician had short periods of practice and were more specialized in disci-pline rather than family medicine and only one third had special training in diabetes and DR management.

Abdulsalam Eisa Mazyad Alshammari et al.
BIOSCIENCE BIOTECHNOLOGY RESEARCH COMMUNICATIONS A STUDY ON AWARENESS AND PRACTICES OF PHYSICIANS ABOUT DIABETIC RETINOPATHY 5
FIGURE 1. Distribution of subjects according to the best method for evaluating diabetic retinopathy
FIGURE 2. Source of knowledge about diabetic retinopathy
The majority of the physicians had adequate knowledge about DR and followed national and international guide-lines for its management. Most of the physician were well aware about consequences of DR. They knew that the ideal method of examination was ophthalmoscopy.
However, this was not practiced by many. Here, there was a disparity between knowledge level and practice pattern. The gap between knowledge and practice in DR screening has been reported (Sparrow et al, 1993). This study neither elucidated the barriers that block the phy-

Abdulsalam Eisa Mazyad Alshammari et al.
6 A STUDY ON AWARENESS AND PRACTICES OF PHYSICIANS ABOUT DIABETIC RETINOPATHY BIOSCIENCE BIOTECHNOLOGY RESEARCH COMMUNICATIONS
Table 5. Distribution of subjects according to practices of retinopathy patients
No. (n=62) %
Knowledge about how to use the ophthalmoscope?
Yes 48 77.4
No 14 22.6
Did eye examination to a diabetic patient?
Yes 29 46.8
No 33 53.2
Type of diabetic patients referred to an ophthalmologist?
Type 1 5 8.1
Type 2 2 3.2
Long duration diabetics 5 8.1
All diabetics 47 75.8
If they develop any eye problem 3 4.8
Followed-up the patients referred to the specialists?
Yes 40 64.5
No 22 35.5
Involved in diabetic retinopathy public awareness programs to educate the public in the past one-year?
Yes 25 40.3
No 37 59.7
sician from putting their knowledge into practice, or the ways to close this evidence-practice gap.
Although a signifi cant percentage of the physician had limited knowledge about the importance of dia-betic retinopathy risk factors. Lack of hands on training courses could be an important reason and that needs to be investigated. Ophthalmoscopes are considered basic equipment that is regularly supplied by the Min-istry of Health to primary health care practice. Shortage in ophthalmoscopes in PHCs refl ects some lacunae in health care system. Individual practitioners can consider getting their own ophthalmoscope, which will greatly improve the quality of their work. Once the infrastruc-ture is available, it need not be a problem for the physi-cian to put their knowledge into practice.
CONCLUSION
This study displays the need for hands on training of physician about detection of DR by direct use of oph-thalmoscopes. Barriers for ophthalmoscope examination as perceived need to be further addressed and evaluated. Furthermore, It is of great importance to improve the
screening facilities at the primary health care setting. This study also suggested that all stakeholders including policymakers and especially health providers should pri-oritize building awareness. In addition, all available and feasible resources should be channeled towards reducing the burden of diabetic retinopathy.
REFERENCES
Rani, P, Raman, R, Subramani, S. (2008) Knowledge of diabe-tes and diabetic retinopathy among rural populations in India, and the infl uence of knowledge of diabetic retinopathy on atti-tude and practice. Rural Remote Health; 8: 838.
Rathmann, W, Giani, G. (2004) Global prevalence of diabetes: estimates for the year 2000 and projections for 2030. Diabetes Care; 27: 2568–2569.
Sami H. Alzahrani, Marwan A. Bakarman, Saleh M. Alqahtani et al. (2018) Awareness of diabetic retinopathy among people with diabetes in Jeddah, Saudi Arabia. TAEM; 9 (4).
Bunce, C, Wormald, R. (2006) Leading causes of certifi cation for blindness and partial sight in England & Wales. BMC Public Health; 6: 58.et
UK Prospective Diabetes Study (UKPDS) Group. (1998) Effect of intensive blood-glucose control with metformin on com-plications in overweight patients with type 2 diabetes (UKPDS 34). Lancet; 352: 854–865.
Fong, DS, Aiello, L, Gardner, TW. (2004) Retinopathy in diabe-tes. Diabetes Care; 27(Suppl. 1): S84–S87.
Huang, OS, Zheng, Y, Tay, WT. (2013) Lack of awareness of common eye conditions in the community. Ophthalmic Epide-miol; 20: 52–60.
Wang, S, Tikellis, G, Wong, N. (2008) Lack of knowledge of glycosylated hemoglobin in patients with diabetic retinopathy. Diabetes Res Clin Pract ; 81: e15–e17.
Muecke, JS, Newland, HS, Ryan, P. (2008) Awareness of diabetic eye disease among general practitioners and diabetic patients in Yangon, Myanmar. Clin Exp Ophthalmol; 36: 265–273.
Çetin, EN, Zencir, M, Fenkçi, S. (2013) Assessment of aware-ness of diabetic retinopathy and utilization of eye care ser-vices among Turkish diabetic patients. Prim Care Diabetes; 7: 297–302.
Seneviratne, B, Prathapan, S. (2016) Knowledge on diabetic retinopathy among diabetes mellitus patients attending the Colombo South Teaching Hospital, Sri Lanka. J US China Med Sci; 13: 35–46.
Al Ghamdi A, Rabiu M, Al Qurashi AM, Al Zaydi M, Al Ghamdi AH, Gumaa SA, Althomali TA, Al Ghamdi AN. (2017) Knowl-edge, attitude and practice pattern among general health prac-titioners regarding diabetic retinopathy Taif, Kingdom of Saudi Arabia. Saudi J Health Sci; 6:44-51
Sparrow JM, McLeod BK, Smith TD, Birch MK, Rosenthal AR. (1993) The prevalence of diabetic retinopathy and maculopa-thy and their risk factors in the non-insulin-treated diabetic patients of an English town. Eye (Lond); 7(Pt 1):158-63.

Evaluation of soil biological activity by a vertical
profi le and erosion catena
Fedor Lisetskii1*, Denis Vladimirov2 and Vladimir Cherniavskih3
1Federal and Regional Centre for Aerospace and Surface Monitoring of the Objects and Natural Resources, Belgorod State National Research University, Belgorod, Russian Federation2Institute of Earth Sciences, Belgorod State National Research University, Belgorod, Russian Federation3Department of Biology, Belgorod State National Research University, Belgorod, Russian Federation
ABSTRACT
The differentiation of soil fertility vertically and its territorial distribution on the slopes have a genetic origin. The main aim of the study was to establish a link between the level of effective soil fertility and its biological activity in two dimensions. The degree interaction between the cellulose decomposition activity and the yield of barley on separate layers of the southern Chernozem was established. The erosion catena demonstrates that the cellulose decomposition intensity in non-eroded and moderately eroded soils was determined by the differences in magnitude and variation soil water reserves in individual soil layers. The results showed that the microbiological activity of the soil refl ecting the intensity of the transformation process of organic matter and the degree of nutrients availability in the yield is likely to act as the sensitive indicator of hydrothermal conditions. In addition, according to the research results, the effective fertility of individual soil layers both in the vertical dimension and in the topographic gradient was evident.
KEY WORDS: CELLULOSE-DECOMPOSING MICROORGANISMS, SOIL FERTILITY, CATENA, SOIL EROSION
7
Ecological CommunicationBiosci. Biotech. Res. Comm. 12(1): 7-16 (2019)
INTRODUCTION
Most abiotic factors and, particularly, air and soil humidity and temperature, concentration and migra-tion of chemical elements and compounds in the soil and ultimately soil fertility tends to change regularly
along hillslope gradient. Studies of vegetation patterns along a vertical gradient have shown that microtopog-raphy driven soil moisture has an important role in the formation of vegetation patterns (Deák et al., 2014) and soil-plant cover (Lisetskii et al., 2014a). Effective fertility is mostly materialized through microorganism activity;
ARTICLE INFORMATION:
Corresponding Author: [email protected] 10th Dec 2018Accepted after revision 21st Feb 2019BBRC Print ISSN: 0974-6455Online ISSN: 2321-4007 CODEN: USA BBRCBA Thomson Reuters ISI ESC / Clarivate
Analytics USAMono of Clarivate Analytics and Crossref Indexed Journal Mono of CR
NAAS Journal Score 2019: 4.31 SJIF: 4.196© A Society of Science and Nature Publication, Bhopal India 2019. All rights reserved.Online Contents Available at: http//www.bbrc.in/DOI: 10.21786/bbrc/12.1/2

Fedor Lisetskii et al.
8 EVALUATION OF SOIL BIOLOGICAL ACTIVITY BY A VERTICAL PROFILE AND EROSION CATENA BIOSCIENCE BIOTECHNOLOGY RESEARCH COMMUNICATIONS
therefore, there is a direct link between soil fertility and its biological activity. This applies to natural changes in fertility and microbiota activity conditions both by vertical measurement in profi le and by topographic gra-dient. About 65% of the world’s land is subject to water erosion and 28% – to defl ation (Webb et al., 2006). In intensive agriculture in semi- arid regions the area of eroded soils increased, on the slopes with eroded soils, the humus content decreased (Prudnikova and Savin, 2015, Haddad et al., 2018; Upton et al., 2018).
Erosion on slope soils changes not only soil profi le morphology, the OM content (Lisetskii, 2008), the tex-ture of soils at different degrees of erosion on slopes with free runoff became coarser by one gradation (Gabbasova et al., 2016), but also the complex of physico-chemi-cal properties, (Volungevicius et al., 2018) and content chemical elements useful for plants (Zelenskaya et al., 2018), which ultimately affects soil formation speed and soil loss tolerance value (Shtompel et al., 1998). During prolonged ploughing of chernozems as compared with a pasture or virgin, the number, size, and biomass of bac-terial cells and microfungi biomass decrease (Polyans-kaya et al., 2016). The aim of this study was to determine changes in the morphological, physical and chemical properties of soils caused by their agrogenic transforma-tion.
The main soil fertility factor is the organic matter (OM) contained in it. The intensity of plant residues decom-position OM in the soil can be judged by its biological activity, which refl ects the related complex of biological processes. For the entire life of soil, the main source of energy is cellulose, which, for example, amounts to 57% in winter wheat straw. Cellulose mineralization synthe-sizes compounds, which are essential for plant growth, humifi cation processes and soil microorganism vital activities. The cellulose-decomposing group of bacteria decomposing plant residues release oxidative enzymes into the environment, which causes humus synthesis to run more intensively using decay products of these residues (Zakharov, 1978). It is not always possible to assess the level of fertility of individual layers of soil profi le by number of nutrients available to the plants. Therefore, it is necessary to search for such indicators of soil fertility that correlate with yields. It was previously found (Tikhomirova, 1970; Zakharov, 1978; Yemtsev and Mishustin, 2005; Ulrich et al., 2008; Widhiya et al., 2016; Haddad et al., 2018; Upton et al., 2018), that the complex of soil conditions required for the vital activity of aerobic microorganisms, which decompose cellulose, coincide with the conditions of crop formation.
Cellulolytic soil activity can be used as an indicator of the vital functions of cellulose decomposing micro-organisms, and conditions for formation of cultivated plant yield. It is known that cellulose constitutes the
bulk of plant residues, and the role of cellulose-destroy-ing microorganisms is signifi cant, since they are pro-ducers of biologically active substances, which replen-ish the pool of these compounds in the OM soil. For example, many types of cellulolytic bacteria (genus Cellulomonas, Cellvibrio, Bacillus, Myxococcus, Pseu-domonas, Flavobacterium and others) synthesize amino acids, growth agents, vitamins, pigments and oxida-tive enzymes which are involved in redox processes of plant residue humifi cation (Kozlov et al., 2017). When cellulose is decomposed, the cellulolytic microorgan-isms release a signifi cant amount of mucus involved in soil conditioning as well as pigments of various nature directly involved in humus synthesis (Zavarzin, 2014).
The need for environmental conditions varies in dif-ferent cellulose-destroying microorganisms; therefore, it is common for different types of soils to have certain groups of cellulose-destroying microorganisms (Yemt-sev and Mishustin, 2005). Semiarid regions with obvious shortage of sediments are characterized by formation of soil conditions in the presence of moisture redistribu-tion along hillslope gradient, and they are signifi cantly changed when using irrigation. The aims of the study were to establish a link between the level of effective fertility based on irrigation soils profi le and cellulolytic activity and to identify differences in the rate of organic matter destruction in soils with varying erosion index on erosion catena.
MATERIALS AND METHODS
Study area: The study area is a part of the southern steppe subzone located seaside and characterized by a weakly dissected surface. Here landscapes are formed in the conditions of hot summer, dry warm autumn and moderately warm wet winter. Average annual air tem-perature (at the nearest weather station (Odessa)) is10.2 °C. The average air temperature in summer varies from 19.4 °C (June) to 22.2 °C (July). The average annual amount of precipitation (since 1894) was 386 mm. Evaporation value is 800 mm, humidity factor is 0.48 and i.e. the correction exceeds precipitation 1.5–2 times. The century-old precipitation trend is characterized by alternation of wet and dry periods (with a reduction to 310–320 mm per year). Heliothermal cycles with major periods of 11 and 10 years which are part of a lower-fre-quency natural periodicity (Ivanov and Lisetskii, 1995), consist in the region covered by our study of 3–4 year phases of change in the amount of heat and moisture.
The studies were carried out on the following two test areas: irrigation land on a relatively fl at watershed (Pir) and non-irrigated agrolandscapes (boghara) with slopes characterized by active soil erosion (Pboh). The Pir test area is a Loess Plateau with a slight eastward slope.

Fedor Lisetskii et al.
BIOSCIENCE BIOTECHNOLOGY RESEARCH COMMUNICATIONS EVALUATION OF SOIL BIOLOGICAL ACTIVITY BY A VERTICAL PROFILE AND EROSION CATENA 9
Belyaevka region (Ukraine). Medium-steppe subzone. Lower Dniester irrigation system (Shkodogorsky array). It was built in 1964. The irrigation area exceeds 37 thou. ha. Groundwater occurs at a depth of 2–5 m. The source of irrigation is the water of the Dniester River. Dominat-ing soils are Southern heavy loam solonetz Chernozem. Humus horizon thickness is 55 cm. Corg is 1.79%. It boils from HCl starting with 70 cm and demonstrates vigorous boiling from 78 cm.
The Pboh test area is a gently undulating loess plain (slopes of steepness<2� occupy 39%) which belongs to a very dry and moderately hot agro-climatic zone. Share of eroded soils (Southern heavy loam Chernozem) is 28%, including moderately eroded soils, which occupy 29% of the total area of eroded soils. We examined the erosion catena on the slope of western exposition with average slope of 2° (experience 3).
Data used: Problem-solving was based on the research program, which included four experiments.
Experiments 1A and 1B included a fi eld experiment on assessment of biological activity with southern irri-gation (1A) Chernozem layers (within the genetic hori-zons) and a vegetation experiment with the same layers to assess the level of effective fertility (1B). The results of these experiments complemented each other. Experi-ment 1A was carried out in the fi eld to determine dif-ferences in the rate of cellulose (%) decomposition in individual layers of irrigated southern Chernozem. Oats and peas planting. Oat phase gives rise to booting (fi fth sheet, height 47 cm). A cellophane fi lm of 3x6 cm in size was put into a nylon mesh with mesh size of 0.25 mm and vertically attached to the soil (3-fold repeat-ability). Experiment 1B was conducted in a phytotron with separate soil layers. We cultivated Odessa-82, a rec-ognized spring barley variety, by 14 plants per a vessel with capacity of 2520 cm3. Since individual soil layers had different moisture content (from 43 to 62%), the moisture in the soil was maintained using gravimetric method at from 25.9% to 37.4%.
The phytotron-maintained average temperature and relative humidity values (according to thermograph and hygrograph records) were 21–25 and 55–65% respec-tively between seeding and barley earing periods (90 days). We equalized the illumination conditions by peri-odic vessel rearrangement. For the vegetation experi-ment, we followed the previous recommendation that for options with transitional horizons (AB, BC) a suf-fi cient number of repetitions at a probability level of 0.95 should be considered as 4–6-fold repeatability, and for options with other horizons reliable results can be obtained when using 3–4 vessels. This made it possi-ble to conduct more reasonable analysis of the mean options with due account for marginal error of differ-
ence of the means. Due to different option repeatability in the experiments, the non-equivalence of contrast of means was taken into account when assessing signifi -cance of particular differences.
Experiment 2 was carried out in the fi eld to assess differences in linen fabric decomposition for 2 periods of biotest exposure in layers 0–10 and 10–20 cm under fallow conditions. As for the experiment location, it was the western exposure ravine slope near water divide, where the southern unwashed Chernozem (depth of horizon A is 32 cm, humus horizon thickness is (A+AB) 50 cm) was present. Experiment 3 was conducted in the fi eld on the erosion catena. Objects under study: 1) Medium loamy non-eroded at the water divide Southern Chernozem, depth of horizon A is 32 cm, humus horizon thickness is (A+AB) is 53 cm; 2) Medium-eroded Cher-nozem 270 m down the slope. Soil moisture and bulk density were monitored at the depths of 10 and 20 cm for 459 days using 22 observation periods. The experi-ment was carried out for two calendar years in the same periods of exposure (August – October). The initial phase of the experiment ran under the stubble of winter wheat (minor cultivation), and since September processes took place in winter wheat rhizosphere, then after the wheat was plowed in May corn was sown and harvested for silage, and in September the plowing was done.
Methods: Activity of microfl ora destroying cellulose in individual layers of the ploughing horizon was deter-mined by the rate of pure linen fabric decomposition since fl ax fi bers consist of cellulose for 80% and impuri-ties in the form of minerals and lignin for 20%. Decom-posing cellulose with simple communities of microor-ganisms (1–2 species) is signifi cantly more sensitive to the soil conditions than plant residues, and its usage pro-vides more accurate results due to uniformity of chemi-cal composition of biotests. The method of “applications” is objective enough to assess the intensity of microbio-logical activity in different layers of the soil profi le and to compare agricultural technologies, including the use of irrigation. The method of applications use is modifi ed (Mirchink, 1988), but it is based on the assessment of intensity of linen fabric decomposition by the difference in dry weight before and after exposure. Biotesting was carried out using squares of linen fabric size 1010 cm, which was covered with a nylon mesh with mesh size of 0.25 mm and laid horizontally in the soil at depths of 10 and 20 cm in order to preserve defragmented mate-rial after decomposition. In addition, we used chemi-cally pure cellulose fi lm in the applications method. The bags removed with fi lms were washed from soil parti-cles fi rst with tap water and then with distilled water. The loss of fi lm weight was determined using analyti-cal scales, and then we calculated the average percent-

Fedor Lisetskii et al.
10 EVALUATION OF SOIL BIOLOGICAL ACTIVITY BY A VERTICAL PROFILE AND EROSION CATENA BIOSCIENCE BIOTECHNOLOGY RESEARCH COMMUNICATIONS
age (%) of decomposition for each examined layer and computed the average percentage for examined layers in each option of the experiment. We used the Euclidean distance calculation to make cumulative comparison of soil layers by parameters, such as humidity (%), bulk density (t m-3) and soil moisture reserve (mm). Chemi-cal analyses of soils included the following standard procedures: Corg content, by Tyurin’s method and CO2 by acidometry. The determination of cation exchange capacity (CEC) in calcareous soils was performed using EDTA–Na2.
RESULTS AND DISCUSSION
Microbiological activity of irrigation soil
Soil irrigation results in increased number of certain groups of microorganisms: algae, nitrifi ers, denitrifi -ers, but less actinomycetes, aerobic organisms, which decompose cellulose (Table 1).
An increase in erosion resistance of steppe soils during irrigation is explained largely due to growth by higher numbers of algae, fungi, aerobic cellulose-degrading microorganisms, and oligonitrophiles, in particular (Lisetskii et. al., 2018). Our results (Table 1) showed that irrigation had maximum effect on the number of groups, such as denitrifi ers, eutrophic plants, anaerobic bacteria and nitrifi ers. Under comparable conditions, sunfl ower and wheat have no advantages due to irrigation in terms of the number of microorganisms (with the exception of algae).
During three periods of vegetation it was natural in May–June for biological activity to show a decrease within meter-deep layer in certain layers of irrigation Chernozem, except for the upper part of carbonate hori-zon B1 (Table 2), which is associated with its chemical properties.
Due to increased duration of irrigation reclamation in seven arid zones of Ukraine, it becomes relevant to study transformation tendencies in soil fertility profi le distribution under irrigation impact. In response to 35 years of irrigation the soil is reported to have humus profi le extension by 9 cm as compared to bogharic soil (Lisetskii, 1988), and increased humus reserve within one meter thick layer. The experiment revealed the existence of more clear horizon-oriented differences in effective fertility than in the non-irrigated Southern Chernozem. For example, the subsurface layer fertil-ity decreased dramatically (F20-34 is 0.49). The results of dispersion analysis of barley grain yield obtained from individual layers of Southern Chernozem in experiment 1B showed that at the level F01 there were proven dif-ferences of effective fertility between all layers, except for layers to 50–64 and 64–75 cm that can be combined (Table 3). The relative (%) evaluation of effective fertility is determined by the ratio of grain yield for each tested layer (i) to ploughing layer yield (denoted by Fi).
Features of effective fertility profi le distribution in irrigated soil are closely interrelated with microbiologi-cal activity. As shown by our two-year observations in the most important vegetation period (May-July), this is facilitated by absence of signifi cant horizon-oriented differences in the moisture content of a meter-thick layer of soil. On average, over three periods of microbiological tests exposure (May-June), the subsurface and underly-ing horizons of irrigated Chernozem showed decreased cellulolytic activity of soils in proportion to the reduced level of effective fertility (Figure 1). It is noteworthy that as for potential fertility (Table 3), the 75–100 cm layer is less fertile than layers to 50–64 and 64–75 cm, but it appeared that this layer demonstrated higher cellulolytic activity and yield.
The results in Figure 1 show that the statistical dependence is virtually proportional: cellulolytic activ-
Table 1. The change in the number of microorganisms in the soil with irrigation in a layer of 0-20 cm
Indicators Units of measureWith irrigation No irrigation
sunfl ower winter wheat sunfl ower winter wheatSoil moisture % 20.53 18.32 15.21 17.72
Eutrophic plants, total million /1 g. soil 12.30 13.80 13.20 13.5
Actinomycetes million /1 g. soil 3.50 4.80 5.40 5.50
Fungi thousand / 1 g. soil 57.80 68.90 54.30 70.40
Nitrifi ers million /1 g. soil 2.46 2.07 2.26 1.70
Denitrifi ers million /1 g. soil 0.85 1.30 0.64 1.05
Decompose cellulose:
thousand / 1 g. soil – aerobic 1.93 2.85 3.46 3.13
– anaerobic 1.33 0.93 1.00 0.92
Algae thousand / 1 g. soil 98.40 S N/F N/F
Note: N/F, Not Found; S, Sporadic.

BIOSCIENCE BIOTECHNOLOGY RESEARCH COMMUNICATIONS EVALUATION OF SOIL BIOLOGICAL ACTIVITY BY A VERTICAL PROFILE AND EROSION CATENA 11
Fedor Lisetskii et al.
Table 2. The degree of transformation of cellulose (%) in separate layers of southern (irrigated) Chernozem (experiments 1A)
Horizon Layers, cmPeriods of transformation of cellulose*
1 2 3 Average
Aar 0–20 24.01±1.66 32.38±3.13 40.37±4.65 32.26±5.03
A 20–34 23.19±1.07 29.16±2.67 35.12±2.72 29.16±3.58
AB1 34–50 20.45±0.80 22.51±1.09 21.59±0.54 21.52±0.89
B1ca 50–75 9.27±0.28 18.74±1.02 19.60±0.78 15.87±2.94
B2 ca. C ca 75–100 15.05±0.25 21.74±1.08 17.38±0.92 18.06±1.84
Note: * Periods: 1 – 14.05–29.05 (the beginning of tubulation heading stage, fruiting peas); 2 – 29.05–13.06 (heading-fl owering stage, fruiting peas); 3 – 13.06–28.06 (fl owering-kernel milk stage, fruiting- wither peas).
Table 3. Chemical properties of individual layers of irrigation Southern Chernozem and the results of vegetation experience (1B)
Horizon Layers, cm Humus,% CEC, cmol kg-1 share Ca in CEC,%
Grain harvest (G), g/vessela
Fi,%
Aar 0–20 2.86 25.77 85.8 1.677±0.05 100
A 20–34 2.03 25.27 87.1 0.827±0.17* 49
AB1 34–50 2.15 24.27 84.9 0.448±0.15* 27
B1ca 50–64 1.62 22.45 87.0 0.148±0.06*5
B1ca 64–75 1.51 21.15 86.5 0.089±0.02
B2ca, Cca 75–100 1.15 20.57 84.1 0.277±0.06* 17
Note: aAn asterisk indicates signifi cant differences in grain yield between two adjacent variants (* P <0.01).
FIGURE 1. The dependence of the normalized values of cellulolytic activity (CA) on the yield of barley (Y) on separate layers of the southern Chernozem (fi gures are relative to the arable horizon). The numbers 1, 2, 3, 4, 5 denote layers 0–20, 20–34, 34–50, 50–75, 75–100 cm, respectively
CA=0.9873Y0.2513
R2=0.918

12 EVALUATION OF SOIL BIOLOGICAL ACTIVITY BY A VERTICAL PROFILE AND EROSION CATENA BIOSCIENCE BIOTECHNOLOGY RESEARCH COMMUNICATIONS
Fedor Lisetskii et al.
ity tends to grow by 18% with increased yield by each 20%. Therefore, microbiological soil activity can act as an indicator of effective fertility of individual layers of soil profi le. It shows the intensity of organic matter transformation process and the degree of possible mate-rialization of available nutrients in the crop. However, the microbiota activity is ahead of those pedogenesis processes, which determine effective soil fertility.
Biotesting of in layer 0–20 cm fallow land
Fallow lands can signifi cantly restore the lost soil fertil-ity even for a short period. The results of experiment 2 showed that in fallow condition the chemical parameters of virgin soil were virtually achieved, except for carbonate content, which obviously requires longer time (Table 4).
In the 0 to 20 cm layer of the Chernozems the basal respiration rate and the content of the microbial bio-mass were minimal in the soil irrigated for 40 years without fertilizer and maximal in the fallow ones (120 yrs) (Prikhod’ko et al., 2013).Our results (Table 5) show that the intensity of microbiological processes can vary vertically under the infl uence of differences in moisture content even in 10 centimeter soil layers.
The experiments demonstrated that the differentia-tion of the ploughing horizon into different in terms of effective fertility parts occurred after 2.5–3 months (Il’ina, 1980). And as for fallow land, as in our experi-ment, any change in hydrothermal conditions (decrease in average soil moisture from 23 to 14% and in-layer to 0–20 cm soil moisture reserve on 17 mm in the second month as compared to the fi rst month) is followed by multidirectional biological activity, when maintaining minor differences in humus and carbonates content and
the composition of cation exchange (Table 5). In the fi rst month, the linen fabric decomposition proportion was slightly higher in the upper 10 cm layers as compared to the lower ones, but in two months, vice versa, cellulose destruction processes were more intense in 10–20 cm layer than in the upper 10 cm soil layers. This is due to the more soil moisture in the 10–20 cm layer as com-pared with the upper 10 cm during the second period of exposure (from 32 to 62 days).
Dynamics of moisture content and microbiota activity in
erosion catena soils
Experiment 3 was conducted on the erosion catena in agrolandscape, which distinguishes this experiment from experiment 2. With the research territory, being signifi cantly eroded (about 60%), the percentage of moderately eroded soils is 13–14% (Lisetskii et al., 2014 b). Due to erosion, the slope soils lose OM and become less fertile (Table 6). The content of available cellulose in the form of surface residues on any moderately eroded soil is 55–60% of its amount on any non-eroded soil (Lisetskii, 1992).
The variability of indicators of microbocenosis con-ditions of steppe soils correlated with the dynamics of the climate (Kashirskaya et al., 2018). During the fi rst year of experiment the climatic conditions changed as follows: during the second period (30–60 days) the air temperature was 2.3°C higher than the long-term aver-age annual normal temperature, and it corresponded to the normal value at the beginning and at the end of the experiment; the precipitation was lower than the nor-mal level in the fi rst and second 30 days on 10 and 22.4 mm respectively, but in the third month precipita-
Table 4. Chemical properties of individual layers of fallow southern Chernozem
Layers, cmHumus CaCO3 CEC, cmol kg-1
% Ca Mg K Na0–10 2.59 4.63 21.70 4.0 0.09 0.07
10–20 2.56 5.93 19.80 3.6 0.10 0.07
Table 5. Changing the conditions of moisture and the results of the decomposition of linen fabric for two periods of biotest exposure in fallow southern Chernozem
Indicators Layers, cm 32 days (Aug. Sept) 62 days (Aug. Sept)
Soil moisture,%0–10 24.68 12.04
10–20 22.45 14.05
Soil moisture reserve, mm0–10 28.88 16.01
10–20 27.84 17.00
Deal decomposition (%) in the layer
0–10 30.31±2.55 46.82±3.12
10–20 28.44±2.39 56.76±3.30
0–20 29.38±2.47 51.79±2.19

BIOSCIENCE BIOTECHNOLOGY RESEARCH COMMUNICATIONS EVALUATION OF SOIL BIOLOGICAL ACTIVITY BY A VERTICAL PROFILE AND EROSION CATENA 13
Fedor Lisetskii et al.
tion indicator was by 30.8 mm more. The second year (starting from the eighth observation period) was very dry: if temperatures were close to the normal range, the moisture defi cit increased from 18.8 and 28.8 to 36 mm in each of three months (August – October, 16–21 tim-ing of observations). Naturally, this was mostly repeated in soil moisture dynamics (Figure 2). Moderately eroded soil had more severe moisture defi cit.
On average, during the observation period (1 year and 3 months), the soil moisture reserve in the 0-20 cm layer was by 4 mm higher in unwashed soil as com-pared to the moderately washed soil. However, these soils (0–10 and 10–20 cm) have different layer-by-layer moisture characteristics. If the second layer of unwashed soil was more compacted than the upper one and had more moisture content and reserves, the lower layer of the moderately washed soil had lower moisture con-tent, density and soil moisture reserve than the 0–10 cm layer. The Euclidean distance calculations make it possible for separate soil layer parameters to be consid-ered as individual ones, and based on that to determine resulting differences of the investigated soil layers. The results obtained show that the unwashed and moder-ately washed soils have the greatest differences in terms of amount and variations of soil moisture reserves in individual soil layers. On average, during 22 observation periods (for 459 days) the soil moisture reserves were by 10% more in non-eroded Chernozem as compared to the moderately eroded one (Figure 2).
Table 6. Chemical properties of soil erosion catena
Depth,cm
Humus CaCO3 CEC, cmol kg-1
% Ca Mg K NaUnwashed soil
10 2.46 6.13 23.70 4.40 0.12 0.08
20 2.52 5.75 23.50 4.00 0.09 0.08
Moderately washed soil
10 2.24 2.68 20.60 4.00 0.09 0.07
20 2.22 6.82 19.90 3.60 0.09 0.07
FIGURE 2. Dynamics of soil moisture reserves (mm) for 22 periods of observations every 21 days in the layers of southern Chernozem not eroded (A) and moderately eroded (B)

14 EVALUATION OF SOIL BIOLOGICAL ACTIVITY BY A VERTICAL PROFILE AND EROSION CATENA BIOSCIENCE BIOTECHNOLOGY RESEARCH COMMUNICATIONS
Fedor Lisetskii et al.
The results of two-year experiment on cellulose (Table 7) decomposition showed that in the fi rst year the rate of cellulose decomposition was more often higher in the ploughing horizon of the moderately washed soil than in the unwashed one. Therefore, over 3 months of decom-position this difference reached 5%, although the total amount of cellulose destruction became almost the same in the ploughing horizons in both soils: 60–61%. However, decomposition that is more active occurred at a depth of 20 cm in moderately washed soil rather than at a depth of 10 cm, and in the unwashed soil — vice versa. During the second year of the experiment, we could observe similar situation as in the previous year only at the beginning of the decomposition process, then the decomposition rate was higher in unwashed soil, which ultimately resulted in higher transformation rate. In addition, after 3 months the degree of organic matter decomposition in the 0–20 cm layer of moderately washed soil was inferior to that of unwashed one by 11%.
For two years of experiments, during the biotest expo-sure periods the soil moisture reserve differences were greater between non-eroded and moderately eroded soils in the second year rather than in the fi rst one: 28 and
11% respectively. This refl ected in the differences in cel-lulose decomposition rate (Table 7).
Comparison of data on rate of decomposition in the fallow land (Table 5) and in winter wheat sowing (Table 7) showed that over 60 days the biological activity of the unwashed soil (0–20 cm) was higher by 13% in the fallow land than in the agrocenosis. These features are confi rmed by earlier studies as well. The rate of OM destruction is lower in winter wheat due to the less favorable moisture conditions for development and functioning of cellulose-destroying microorganisms (Val’kov and Kargaltsev, 1982).
Earlier (Mirchink, 1988) it was suggested that one can judge about “the total intensity of microbiological processes in general” by the degree of biotests decay. Indeed, our results have shown that in agricultural land-scapes the degree of cellulose microorganism activity depends on differences in hydrothermal conditions as well as the entire set of soil fertility resources.
CONCLUSION
Distribution of soil fertility by vertical profi le and based on erosion catena is genetically related, since long-
Table 7. The intensity of the decomposition of cellulose, depending on the duration of exposure, the degree of erosion of the soil and its depth
Exposure time, days Depth, cmSoil erosion
Difference (H–Cp)Unwashed soil Moderately washed soil
1st year
30
10 25.85 23.75 2.1
20 6.06 14.77 -8.7
difference 15.96 19.26 -3.3
60
10 53.90 58.63 -4.7
20 24.32 42.56 -18.2
average 39.11 50.60 -11.5
91
10 74.94 64.55 10.4
20 45.25 57.80 -12.6
average 60.10 61.18 -1.1
difference -5.3
2nd year
30
10 24.08 26.52 -2.4
20 21.56 25.63 -4.1
average 22.82 26.08 -3.3
60
10 26.44 34.52 -8.1
20 51.55 39.68 11.9
average 39.00 37.10 1.9
90
10 64.11 54.35 9.8
20 55.72 42.03 13.7
average 59.92 48.19 11.7
difference 3.5

BIOSCIENCE BIOTECHNOLOGY RESEARCH COMMUNICATIONS EVALUATION OF SOIL BIOLOGICAL ACTIVITY BY A VERTICAL PROFILE AND EROSION CATENA 15
Fedor Lisetskii et al.
term erosion action involves lower soil layers into the ploughing horizon. However, anthropogenic pedogen-esis changes the living conditions of microorganisms in the processed horizon. It turned out that the size and variation of soil moisture reserve in individual layers of non-eroded and moderately eroded soil on erosion catena were the most important parameters for micro-biological activity among the hydrothermal param-eters. Soil conditions, which are essential for the vital activities of cellulose-decomposing microorganisms, are largely similar to the conditions that ensure crop forma-tion. The study results have shown that microbiological soil activity, which refl ects the intensity of organic mat-ter transformation process and the degree of possible materialization of available nutrients in the crop can act as a sensitive indicator of hydrothermal conditions and effective fertility of individual soil layers both in vertical measurement and by topographic gradient.
We associate prospects for further studies with an increase in the number of soil objects on the erosion catena (from weakly to highly eroded) and evaluation of the transformation of microbiological activity due to differences in the hydrothermal regime, which are caused by the exposure of the slopes, especially for the northern and southern slopes.
ACKNOWLEDGEMENTS
The work was done in the framework of the implementa-tion of the base part of the state assignment of the Min-istry of Education and Science of the Russian Federation for the Belgorod State National Research University on 2017–2019 years (Project No. 5.4711.2017/6.7).
REFERENCES
Deák, B., Valkó, O., Alexander, C., Mücke, W., Kania, A., Tamás, J. and Heilmeier H. (2014). Fine-scale vertical position as an indicator of vegetation in alkali grasslands – case study based on remotely sensed data. Flora, 209: 693–697. https://doi.org/10.1016/j.fl ora.2014.09.005
Gabbasova, I.M., Suleimanov, R.R., Komissarov, M.A., Garipov, T.T., Sidorova, L.V., Khaziev, F.K., Khabirov, I.K., Fruehauf, M. and Liebelt P. (2016). Temporal changes of eroded soils depend-ing on their agricultural use in the southern Cis–Ural region. Eurasian Soil Sci., 49(10): 1204–1210. https://doi.org/10.1134/S1064229316100070
Haddad, S.A., Lemanowicz, J. and Abd El-Azeim, M.M. (2018). Cellulose decomposition in clay and sandy soils contami-nated with heavy metals. Int. J Env Sci and Technology: 1–16. https://doi.org/10.1007/s13762-018-1918-1
Il’ina, L.V. (1980). Differentiation of the arable layer of gray forest soil and the ways of its regulation. Proceedings of the Gorky Agricultural Institute, 142: 16–23. (in Russian)
Ivanov, I.V. and Lisetskii, F.N. (1995). Manycentury periodicity of solar-activity and soil formation. Biofi zika, 40(4): 905–910.
Kashirskaya, N.N., Khomutova, T.E., Kuznetsova, T.V., Shish-lina, N.I. and Borisov, A.V. (2018). Dynamics of Chemical and Microbiological Soil Properties in the Desert-Steppe Zone of the Southeast Russian Plain during the Second Part of the Holocene (4000 BC-XIII century AC). Arid Ecosystems, 8(1): 38–46. https://doi.org/10.1134/S2079096118010055
Kozlov, A.V., Kulikova, A.H. and Uromova, I.P. (2017). Bio-logical activity of the cespitose-podsolic soil and productiv-ity agrophytocenosis in dependence from use of high-siliceous breeds as soil conditioners. NAUCH VED BELGORO EN, 39(11): 155–166.
Lisetskii, F.N. (1988). Profi le distribution of fertility in soils of the Ukrainian steppe and changes in it as a result of erosion processes. Pochvovedenie, 4: 68–76.
Lisetskii, F.N. (1992). Periodization of antropogenically determined evolution of steppe ecosystems. SOV J ECOL, 23(5): 281–287.
Lisetskii, F.N. (2008). Agrogenic transformation of soils in the dry steppe zone under the impact of antique and recent land management practices. Eurasian Soil Sci., 41(8): 805–817.
Lisetskii, F.N., Goleusov, P.V., Moysiyenko, I.I. and Sudnik-Wojcikowska, B. (2014 a). Microzonal distribution of soils and plants along the catenas of mound structures. CON-TEMP PROBL ECOL, 7(3): 282–293. https://doi.org/10.1134/s1995425514030111
Lisetskii, F.N., Pavlyuk, Ya.V., Kirilenko, Zh.A. and Pichura, V.I. (2014 b). Basin organization of nature management for solving hydroecological problems. RUSS METEOROL HYDRO, 39(8): 550–557. https://doi.org/10.3103/s106837391408007x
Lisetskii, F.N., Zemlyakova, A.V. and Kirichenko, A.D. (2018). Variability of microbiota under diverse conditions of soil mois-tening. BIOL BULL, 45(4): 337–344. https://doi.org/10.1134/S106235901804009X
Mirchink, T.G. (1988). Soil microbiology. Moscow: MGU. 220 p. (in Russian)
Polyanskaya, L.M., Prikhod’ko, V.E., Lomakin, D.G. and Cher-nov, I.Yu. (2016). The number and biomass of microorgan-isms in ancient buried and recent chernozems under differ-ent land uses. Eurasian Soil Sci., 49(10): 1122–113. https://doi.org/10.1134/S1064229316100100
Prikhod’ko, V.E., Cheverdin, Yu.I. and Titova, T.V. (2013). Changes in the organic matter forms in chernozems of the Kamennaya Steppe under Different Land Uses, Locations,and Hydromorphism Degrees. Eurasian Soil Sci., 46(12): 1166–1176. https://doi.org/10.1134/S1064229313120065
Prudnikova, E.Y. and Savin, I.Y. (2015). Satellite assess-ment of dehumifi cation of arable soils in Saratov region. Eurasian Soil Sci., 48(5): 533–539. https://doi.org/10.1134/S1064229315050075
Shtompel, Y.A., Lisetskii, F.N., Sukhanovskii, Y.P. and Srtel-nikova, A.V. (1998). Soil loss tolerance of brown forest soils of northwestern Caucasus under intensive agriculture. Eurasian Soil Sci., 31(2): 185–190.

16 EVALUATION OF SOIL BIOLOGICAL ACTIVITY BY A VERTICAL PROFILE AND EROSION CATENA BIOSCIENCE BIOTECHNOLOGY RESEARCH COMMUNICATIONS
Fedor Lisetskii et al.
Tikhomirova, L.D. 1970. A method for determining effective soil fertility. Patent number: 338196. Patent Assignee: Experi-mental Design Bureau of the Siberian Scientifi c Research Insti-tute of Agriculture. Inventor: Tikhomirova, L.D. http://www.fi ndpatent.ru/patent/33/338196.html
Ulrich, A., Klimke, G. and Wirth, S. (2008). Diversity and activ-ity of cellulose-decomposing bacteria, isolated from a sandy and a loamy soil after long-term manure application. Micro-bial Ecology, 55(3): 512–522. https://doi.org/10.1007/s00248-007-9296-0
Upton, R.N., Bach, E.M. and Hofmockel, K.S. (2018). Below-ground response of prairie restoration and resiliency to drought. Agriculture Ecosystems & Environment, 266: 122–132. https://doi.org/10.1016/j.agee.2018.07.021
Val’kov, V.F. and Kargaltsev, V.I. (1982). Biological activity of typical chernozem and its change under the infl uence of fer-tilizers in crop rotation. Agrochemistry, 4: 64–69. (in Russian)
Volungevicius, J., Amaleviciute, K., Feiziene, D., Feiza, V., Slepetiene, A., Liaudanskiené, I., Versuliene, A. and Vaisva-lavicius, R. (2018). The effects of agrogenic transformation on soil profi le morphology, organic carbon and physico-chemical properties in Retisols of Western Lithuania. ARCH AGRON
SOIL SCI, 64(13): 1910–1923. https://doi.org/10.1080/03650340.2018.1467006
Webb, N.P., McGowan, H.A., Phinn, S.R. and McTainsh G.H. (2006). AUSLEM (Australian Land Erodibility Model): a tool for identifying wind erosion hazard in Australia. Geomorphology, 78(3-4): 179–200. https://doi.org/10.1016/j.geomorph.2006. 01.012
Widhiya, E.W. and Suharjono Ardiyati, T. (2016). Potency of bacterial consortium from apple crops as production of indole acetic acid (IAA). Int. J. ChemTech Res., 9(6): 718–724.
Yemtsev, V.T. and Mishustin, E.N. (2005). Microbiology. 5th ed. Moscow: Drofa. 445 p. (in Russian)
Zakharov, I.S. (1978). Formation of humus substances by cel-lulose-destroying microorganisms. Chisinau: Shtiintsa. 115 p. (in Russian)
Zavarzin, G.A. (2014). Lectures on naturalists’ microbiology. Moscow: Nauka. 348 p. (in Russian)
Zelenskaya, E., Pichura, V. and Domaratsky, Y. (2018). Priori-ties of agroecological monitoring of the composition of soil trace elements taking into account the peculiarities of its for-mation over time. J ENG APPL SCI, 13(14): 5807–5813. https://doi.org/10.3923/jeasci.2018.5807.5813

Experimental protection of ESBL producing Salmonella
typhi bacteremic induced mice model by GRCST; a
therapeutic approach
Rahul Narasanna,1 Manjunath Chavadi,1 Liyakat Ahmed,2 Syed Sannauallah2 and Kelmani
Chandrakanth1*1Department of Biotechnology Gulbarga University Kalaburagi2Luqman College of Pharmacy, Gulbarga, Karnataka 585101, India
ABSTRACT
Salmonella typhi specifi c bacteriophage i.e. GRCST exhibited potential bacteriolytic activity against n=4, ESBL produc-ing S. typhi isolates in vitro. The GRCST possesses an icosahedral head with 50 nm size and contractile tail belongs to Myoviridae Vi01-like family. The experimental outcome of in vivo studies in BALB/c mice induced with S. typhi bacteraemia treated with 1.5×10⁷ PFU GRCST showed 100% survival with zero causality was recorded. On contrary, only 67% and 83% survival rate was observed in the group of mice which received standard antibiotic ciprofl oxacin. The IgG and IgM titres of anti-phage GRCST antibodies were detected, with increased 4100 fold, 600 fold respectively. This result demonstrates that the antibodies elicited by GRCST are non-neutralizing.
KEY WORDS: BALB/C MICE, ESBL, GRCST, IN VIVO, IGG, IGM, SALMONELLA TYPHI
17
Biotechnological CommunicationBiosci. Biotech. Res. Comm. 12(1): 17-25 (2019)
INTRODUCTION
The Viruses or Bacteriophage which infects bacteria were discovered in 1915 by Frederick Twort. The era of “bacteriophage” was begun with the seminal publication by Felix D’Herelle in 1917, demonstrating “un bacterio-phage obligatoire” means “a bacteriophage mandatory”.
Total of 13 microbiologists worked together integrate the applications of phages in the fi eld of medicine. Till date, over 6000 various bacteriophages were discovered, which includes 6196 bacterial and 88 archaeal viruses, identifi ed morphologically and classifi cation was accomplished (Ackermann et al., 2012). Morphologically, the majority of these phages consisting contractile tail
ARTICLE INFORMATION:
Corresponding Author: [email protected] 4th Jan, 2019Accepted after revision 20th March, 2019 BBRC Print ISSN: 0974-6455Online ISSN: 2321-4007 CODEN: USA BBRCBA Thomson Reuters ISI ESC / Clarivate
Analytics USAMono of Clarivate Analytics and Crossref Indexed Journal Mono of CR
NAAS Journal Score 2019: 4.31 SJIF: 4.196© A Society of Science and Nature Publication, Bhopal India 2019. All rights reserved.Online Contents Available at: http//www.bbrc.in/DOI: 10.21786/bbrc/12.1/3

Rahul Narasanna et al.
18 EXPERIMENTAL PROTECTION OF ESBL PRODUCING SALMONELLA TYPHI BACTEREMIC INDUCED MICE MODEL BIOSCIENCE BIOTECHNOLOGY RESEARCH COMMUNICATIONS
with polyhedral, fi lamentous or pleomorphic head types. The classifi cation of phages so far has been achieved signifi cantly based on their genetic content (DNA vs. RNA), their morphology, and their limited host range i.e. specifi c host (Deghorain et al., 2012).
Increasing case studies of antimicrobial resistance and relented discoveries and development have propelled the researchers to search for an alternative therapy has led to the revitalization of bacteriophage (phage) studies in the Western world. Recently, WHO Listed, a global pri-ority pathogens consist of 12 bacterial species catego-rized into critical, high and medium priority based on their level of resistance and availability of therapeutics pathogens (Tacconelli et al., 2018). While this is a con-tentious fi gure (De Kraker et al., 2016), it nonetheless highlights the serious problem we face regarding thera-peutic options for multi-drug resistant (MDR) bacterial infections (Bassetti et al., 2017).
Phage therapy; obligatory lytic phages were employed to kill the specifi c bacterial hosts, without causing dam-age to human host cells and nullifying the impact on commensal bacteria. Rapid evolving of phage therapy has resulted in resolving life-threatening clinical cases. Currently, antibiotic alternative facing the regulations and policies surrounding clinical use and application beyond compassionate cases (Furfaro et al., 2018).
In the year 1919, phage therapy was the fi rst time practiced in human beings at the hospital des Enfants Malades in Paris, France, when D’Herelle successfully treated many children’s who were suffering from severe dysentery by using phages as a therapeutics, he has iso-lated these infective phages in Pasteur Institute, from stools of soldiers (Sulakvelidze et al., 2005).
Salmonella bacteria are often health hazards, asso-ciated with a million food borne illnesses per year in the US. Bacteriophages have been specifi cally used to identify Salmonella species and may also be useful in therapy and prophylaxis of Salmonella infections. The phage FelixO1 was fi rst used in 1943 by Felix and Cal-low as part of a “phage-typing” system for the identifi -cation Salmonella typhi (Anderson et al., 1953).
First commercial phage produced by Theodore Mazure, in which contains, cocktails—Bacté-Coli-Phage, Bacté-Intesti-Phage, Bacté-Dysentérie-Phage, Bacté-Pyo-Phage and Bacté-Rhino-Phage (Abedon et al., 2011). Henri de Montclos, chief clinical microbiologist at Pasteur Institute of Lyon, for 10 years, his research team has produced fi rst anti-staphylococcal vaccines and therapeutic phages in the year early 1990s. The bacterio-phages were administered to treat the “acute colitis” due to infections of Shigella or Salmonella in Georgia (Mike-ladze et al., 1936). Potential administration of Bacté-Pyo-Phage and Bacté-Intesti-Phage, undiluted resulted in drastic reduction of mortality rate from 85% to 20%.
Therapeutic application of bacteriophage started in Eastern Europe and the former Soviet Union, currently it’s been applied widespread as a part of health care systems. However, the effi ciency of phage therapy is investigated according to rigorous scientifi c standards and presented a list of key criteria for consideration and reporting of phage therapy studies (Kutter et al., 2010; Abedon, 2017; Villarroel et al., 2017). Information criti-cal to the success of clinical trials includes the adequate characterization and selection of phages as well as of the subjects (humans) and the target bacteria., in addition to that, the choice of appropriate disease targets for phage therapy (Harper, 2018). On the other hand, it may be that broad-host range phages are more common than is cur-rently believed, due in part to biases in phage isolation methods (De Jonge et al., 2018); this disparity deserves much further research.
However, recent research and its outcomes suggest that bacteriophage therapy is the appropriate treatment to cure Salmonella associated infections. Majorly typhoid fever was treated with bacteriophages by Tsouloukidze et al., 1936 (Tsulukidze et al., 1936); who successfully treated twenty patients suffering from peritonitis due to intestinal perforations in typhoid fever (Abedon et al., 2011). There are some published reports of success-ful treatment against Salmonella-associated disease with prophylactic phage therapy in treating Russian soldiers suffering from dysentery during and after World War II (Kutter et al., 2009). The reports suggest that, it has been already practiced in broiler chickens. The bacteriophages were able to reduce S. enteritidis counts on chicken skin at refrigeration temperature and short contact time (Atterbury et al., 2007). In addition, the decrease of S. enteritidis count on artifi cially-contaminated chicken skin after phage treatment corresponded to the reduc-tion achieved by chemical agents commonly used in the poultry industry. A signifi cant breakthrough is, bacte-riophages were used as biocontrol agents in Pigs to con-trol the infection, according to the study conducted by Albino et al., 2014; and the outcome of the study was a signifi cant reduction in the colonization of Salmonella in pigs administered with pool of bacteriophages (Albino et al., 2014)
MATERIALS AND METHODS
Phage Isolation, Production, and Titration
ESBL resistant strain S. typhi BST 51 was used to specifi c host isolate bacteriophage from raw sewage samples. The sewage sample was collected from various places of Kalaburagi. The sample was fi ltered with sewage was fi ltered with fi lter paper, and subsequently 40 ml of sew-age was added to the 10 ml of 10X LB broth, inoculated

Rahul Narasanna et al.
BIOSCIENCE BIOTECHNOLOGY RESEARCH COMMUNICATIONS EXPERIMENTAL PROTECTION OF ESBL PRODUCING SALMONELLA TYPHI BACTEREMIC INDUCED MICE MODEL 19
with S. typhi BST 51 strain and incubated for 18-24 hr. The media was centrifuged at 10000 rpm for 10 min and the supernatant was collected and subsequently fi ltered using a 0.2 μm syringe fi lter (Melo et al., 2014b).
Screening of GRCST (G: Gulbarga, R: Rahul, C: Chandrakanth Kelmani, S: Salmonella, T: Typhi) bacte-riophage was accomplished by plaque assay method i.e. agar overlay technique. The LB agar plates were pre-pared, 0.1 ml of supernatant was serially diluted in 0.9 ml of LB media from 101 -1010 in 1.5 ml eppendorf tubes 0.5 ml of test culture S. typhi BST 51 with 0.1 O. D was equally distributed to another set of 10 eppendorf and labelled for each dilution tubes subsequently 0.1 ml seri-ally diluted fi ltrate was added to the respective tubes containing 0.5 ml of S. typhi BST51 bacterial culture labelled with respective dilution, incubated for 10-15 min. Each labelled tube was taken and uniformly mixed with LB soft agar containing 0.6% agar in a molten state at a temperature of 40 0C- 45 0C. Thereafter soft agar was overlaid on LB hard agar plates containing 2% agar and kept for incubation at 18-24 hr. Plaque formation on agar plates indicates bacteriophage positive (Mazzocco et al., 2009; Kropinski et al., 2009).
Phage purifi cation and storage
An isolated colony of S. typhi BST 51 strain was inocu-lated into the LB broth, the culture was allowed to attain an OD of 0.1, and then infected with GRCST of 2X10⁷ PFU, the culture was co-cultivated for 18 hr at 37 0C in a shaking incubator (240 rpm). Polyethylene glycol-8000 (PEG) or NaCl was added to the lysate to a fi nal concen-tration of 20% or 0.5 M respectively and incubated at 1 hr at 4 0C. After centrifugation at 10,000 rpm (16 min at 4 0C) in a sorvall RC5B centrifuge, polyethylene glycol (PEG-8000) was added to the supernatant to a fi nal con-centration of 10%. The lysate was incubated overnight at 4 0C with gentle stirring. Polyethylene glycol-precip-itated phage was collected by centrifugation at 15,000 rpm for 20 min. The resulting pellets were resuspended in 3 ml of SM phage buffer (20 mM Tris-HCL [PH 7.4], 100 mM NaCl, 10 mM MgSO4), fi ltered through 0.2 μm bacterial fi lters and phage fi ltrate was recovered and dialyzed against phage buffer. Purifi ed phage GRCST was stored in aliquots of phage buffer at- 20 0C (Sam-brook and Russell, 2001)).
Transmission Electron Microscopy
The morphology of GRCST particles was observed by transmission electron microscopy, as previously described (Melo et al., 2014b). A drop of Purifi ed phage GRCST suspension was fi xed with fi xative. Samples were dehydrated with series of ethanol series, passed through a “transition solvent” such as propylene oxide and then infi ltrated and embedded in a liquid resin such
as epoxy and LR White resin. The processed suspension was applied to a Farmvar carbon coated grid for 5 min; subsequently stained with 2% uranyl acetate. The grids were examined in a Transmission Electron Microscope at 200kv (2000X – 1500000 X) (Ayache et al., 2010).
ANIMAL EXPERIMENT
Selection of Animals
Disease free, healthy and active BALB/c mice breed were selected for in vivo studies. Both female and male mice were chosen for the experimental purpose with ani-mals weighing in the range of 20-30 gm. Animals were obtained from Sri Venkateswara Enterprises, Bangalore, approved by the institute of Animal Ethics Committee (237/99/CPCSEA). Animals were nourished under con-trolled climate conditions and fed with standard pel-let (VRK Nutrition and Solutions, Sangli, Maharashtra, India Ltd.), and provided suffi cient amount of potable water for drinking. Animals were kept for 10 days before experimentation to acclimatize for laboratory condi-tions. The animals were housed and the entire experi-ment was carried out in Luqman Pharmacy College, Kalaburagi).
Selection of pathogen and induction of bacteraemia
Salmonella typhi BST 51 (Blood Salmonella typhi 51) selected for induction of typhoid fever in experimental mice. S. typhi BST 51 strain has been chosen based on its resistance power to n=7, antibiotics and exhibited a high range of MIC to cefetoxime and also capable of producing ESBL. The selected pathogen was inoculated in LB broth, after 8-12 hr incubation, growth reached 0.2 O.D. Thereafter it was serially diluted in 0.1M PBS and CFU (Colony forming units) was calculated. Subse-quently, 107-109 CFU was administered to experimental mice intraperitoneal to determine the MLD (Minimum Lethal Dose).
Effi cacy of bacteriophage in challenged BALB/c mice
Experimental animals (BALB/c) mice were divided into six groups and each group consist of 6 animals each. The doses were fi xed and prepared in PBS and administered intraperitoneal (i.p). Mice from the group I received only PBS as a control, Group II animals administered with S. typhi BST 51 (2×10⁹ CFU) diluted in PBS, Group III ani-mals administered with only GRCST phage (1.5×10⁷ PFU) to check the lethality of phage on Mice. Group IV ani-mals (Mice) represents (Test group), Group V and VI ani-mals represent (Standard) challenged with S. typhi BST 51 (2×10⁹ CFU) by intraperitoneal injection to induce typhoid. Thereafter, 20 mins induction, Group IV (Test) Mice received a GRCST (1.5×10⁷ PFU), and similarly Group V and VI animals received standard ciprofl oxacin

Rahul Narasanna et al.
20 EXPERIMENTAL PROTECTION OF ESBL PRODUCING SALMONELLA TYPHI BACTEREMIC INDUCED MICE MODEL BIOSCIENCE BIOTECHNOLOGY RESEARCH COMMUNICATIONS
antibiotic substituting bacteriophage. In Group VI cip-rofl oxacin were administered in multiple doses, daily up to 7 days. All the six groups were kept in hygienic con-dition with a continuous supply of food and water for 14 days. The signifi cant observation made and results were recorded (Table 1).
Determination of immunologic response against GRCST
in mice
Introduction of bacteriophage in human body as a ther-apeutic agent cause signifi cant stimulation of humoral immunity subsequently leads to production of antibod-ies. According to previous reports it is a potent anti-gen causes no toxic effect on health of humans. Dur-ing experiment BALB/c mice were treated with GRCST (1.5×10⁷ PFU) through i.p injection. At various time point, mice blood was collected from optic vein and sub-sequently subjected for ELISA (Enzyme Linked Immu-nosorbent Assay) for the detection of antibody titres of IgG and IgM antibody in serum of experimental mice described by Biswas et al., 2002.
ELISA is a semi-quantitative method used to determine the concentration of primary antibody in serum in antigen coated wells. In ELISA detection was done based on posi-tive enzyme-substrate reaction makes change in colour.
RESULTS
Isolation and Morphology of Salmonella typhi specifi c
GRCST
The plaque formation indicates the presence of S. typhi specifi c bacteriophage i.e. GRCST (Fig 1). TEM results revealed that GRCST (G: Gulbarga, R: Rahul, C: Chan-drakanth Kelmani, S: Salmonella, T: Typhi) possesses an icosahedral head with 50 nm size and contractile tail as shown in fi gure belongs to Myoviridae Vi01-like family (Fig 2).
Broad Host Range Screening
In order to investigate the broad host specifi city of GRCST exhibited potential bacteriolytic activity against n=4 (BST 43, BST 94, BST 130, BST 141), ESBL
producing S. typhi isolates among n=9 selected isolates. The plaque formation was observed against (n=4) tested isolates (Fig 3 and Table 2)
ANIMAL EXPERIMENTS
Experimental induction of S. typhi BST 51 strain in
BALB/c mice and determination of Minimum Lethal dose
(MLD)
No causality was reported in the fi rst group mice, which received 1XPBS and were proactive and healthy. Con-sequently, only 83 % of mice survived in group II mice which received until the 7th day of experimentation. However, we observed the 100% mortality in III group on day 7 but in contrast, 100% mortality was recorded on 4th day itself in group IV. Based on the observation 2×10⁹ CFU was determined as MLD (Fig 4)
Treatment and rescue of experimentally challenged
BALB/c mice with GRCST
The comparative study was carried out to evaluate the effi cacy of phage GRCST with Standard antibiotic (cip-
Table 1. Group wise distribution of mice with intraperitoneal administration with various inducing agents
Groups
Control Group I Mice+PBS
Control GroupII Mice + S. typhi BST 51 (2×10⁹ CFU )
Control Group III Mice + phage GRCST (1.5×10⁷ PFU)
Test Group IV Mice + S. typhi BST 51 (2×10⁹ CFU) + GRCST (1.5×10⁷ PFU)
Standard Group V Mice + S. typhi BST 51 (2×10⁹ CFU) + Ciprofl oxacin (1mg/ml)
Standard (Multiple doses) Group VI Mice + S. typhi BST 51 (2×10⁹ CFU) + Ciprofl oxacin (1mg/ml)
FIGURE 1. Plaques of GRCST against S. typhi BST 51 isolate

Rahul Narasanna et al.
BIOSCIENCE BIOTECHNOLOGY RESEARCH COMMUNICATIONS EXPERIMENTAL PROTECTION OF ESBL PRODUCING SALMONELLA TYPHI BACTEREMIC INDUCED MICE MODEL 21
FIGURE 2. Transmission Electron Microscopic images of GRCST Scale bars represent 50 nm.
FIGURE 3. Plates showing the clear lysis of MDR S. typhi BST 94 isolate by GRCST
Table 2. Bacteriolytic activity of GRCST against MDR S. typhi isolates
S. typhi isolates Bacteriophage Plaque formation Growth inhibition
BST 42 GRCST Negative Negative
BST 43 GRCST Positive Positive
BST 48 GRCST Negative Negative
BST 51 GRCST Positive Positive
BST 72 GRCST Negative Negative
BST 94 GRCST Positive Positive
BST 103 GRCST Negative Negative
BST 107 GRCST Negative Negative
BST 130 GRCST Positive Positive
BST 141 GRCST Positive Positive
rofl oxacin). The observation made on daily basis up to 14 days and data was recorded and represented in the graph. According to the observation made, there was 100% rescue was accomplished challenged BALB/c mice treated with 1.5×10⁷ PFU GRCST, comparatively
67% and 83% survival rate was observed in the group of mice which received standard antibiotic ciprofl oxa-cin in a single dose and in multiple doses for treatment. The multiple doses were given on daily basis and results obtained were represented in statistical graph (Fig 5).
The host immune response against phage GRCST in
BALB/c mice
The blood was collected from the optical vein of BALB/c mice (n=6) and serum was separated, both IgG, IgM titres of anti-phage GRCST antibodies were detected, subsequently increased with 4100 fold, 600 fold respec-tively in both the cases (Fig 6 and Fig 7). Incubation of phage GRCST with an excess of mice anti-phage GRCST antibodies did not interfere with phage’s capacity to lyse susceptible bacteria. This result demonstrates that the antibodies elicited by GRCST are non-neutralizing.

Rahul Narasanna et al.
22 EXPERIMENTAL PROTECTION OF ESBL PRODUCING SALMONELLA TYPHI BACTEREMIC INDUCED MICE MODEL BIOSCIENCE BIOTECHNOLOGY RESEARCH COMMUNICATIONS
FIGURE 4. Determination of the MLD of S. typhi BST 51 in BALB/c mice n=6 in each group were infected intraperitoneal (I.p) with serially diluted bacterial suspensions of S. typhi BST 51. The percentage Survival was determined upto 7 days.
No signifi cant difference was found in BALB/c mice IgG and IgM titres against GRCST. The anaphylactic reac-tions were negative, and no changes in animal behav-iour, no signifi cant changes in the body temperature or no other side effects were observed in both the groups.
DISCUSSION
Over the years, application of phages as therapeutic alternatives or complements to antibiotic therapy has been evaluated extensively (Viertel et al., 2014) and has even been listed by the US National Institute of Allergy and Infectious Diseases as one important approach to combat antibiotic resistance (Reardon, 2014)
In the present study, the isolated GRCST effectively infective to MDR S. typhi BST 51 strain (ESBL producing isolate) from sewage sample. In vitro experiments showed remarkable antibacterial activity against the S. typhi BST 51; plaque formation indicates the presence of bacteriophage. The broad host range study of GRCST, demonstrated the effi ciency of GRCST potentially lysed n=4 (44.44%), ESBL producing S. typhi isolates (Table 2). The positive plaque formation was observed in all (n=4) S. typhi strains (Fig 2). Similarly, host range screening was carried out by Wang et al., 2016; with Phage 5460 potentially lysed 12 out of 18 P. mirabilis strains (67%), three out of six P. vulgaris strains and one tested P. penneri strain; while phage 5461 killed all (100%) of the Proteus spp. tested.
Transmission Electron Microscopic (TEM) study of GRCST revealed that our phage belongs to Myoviridae family. The phages which exhibit tail were classifi ed in the order Caudavirales (dsDNA) (Ackermann et al., 2006). This study was concentrated on the bacteriophage in the fi eld of therapeutics, which act against MDR S. typhi,
the characteristic feature GRCST possesses an icosahe-dral head with size 50 nm with contractile tails consist-ing of a sheath with a central tube (Fig 2); it belongs to Myoviridae Vi01-like family of phages containing S. typhi-specifi c Vi01 (Hooton et al., 2011).
In vivo studies conducted in the BALB/c mice model (weighing from 20-30 gms) for the experimental exami-nation of the effi cacy of GRCST. The mice models were showed the effective of prevention of infection caused by antibiotic-resistant bacteria (Wang et al., 2006; Cap-parelli et al., 2007; Vinodkumar et al., 2008). In the pre-sent study, successfully experimented the in vivo effi -cacy of GRCST against S. typhi BST 51 infected mice model and obtained moderate results.
The minimum lethal dose (MLD) was determined by intraperitoneal administration of 2×10⁷ CFU, 2×10⁸ CFU and 2×10⁹ CFU bacterial dose. Total of 100% survival rate was recorded in 1X PBS induced mice. Only 83% survival rate was observed in mice received 2×10⁷ CFU bacterial dosage. The comparative study was carried out to evaluate the effi cacy of GRCST with standard antibi-otic (ciprofl oxacin). The 100% rescue was accomplished in challenged BALB/c mice treated with 1.5×10⁷ PFU phage GRCST, comparatively, 67% and 83% survival rate was observed in the group of mice which received standard antibiotic ciprofl oxacin in a single dose and in multiple doses for treatment. The multiple doses were given on daily basis (Fig 4). Relatively, the similar kind of experiment was conducted on S. paratyphi B infected mice and successfully rescued by treating with phage 1 (Wang et al., 2006).
The therapeutic effect of GRCST was successfully achieved in vivo, the given phage (1.5×10⁷ PFU) adminis-tered along with saline showed no side effects on health

Rahul Narasanna et al.
BIOSCIENCE BIOTECHNOLOGY RESEARCH COMMUNICATIONS EXPERIMENTAL PROTECTION OF ESBL PRODUCING SALMONELLA TYPHI BACTEREMIC INDUCED MICE MODEL 23
FIGURE 7. The raised antibody titre level (IgG and IgM) against GRCST in BALB/c mice
FIGURE 5. The protection effi cacy of phage therapy with ciprofl oxacin (single and multiple doses) treatment of BALB/c mice.
FIGURE 6. ELISA of IgG antibody titre in GRCST immunized mice from S. typhi. A: Serum sam-ple taken from control induced with 1X PBS B-F: Serum of mice treated with phage GRCST
and behavior of the experimental animals. Thus, phage rescue experiments could be conducted by without bias (Uchiyama et al., 2008).
The immunology of phages has been a subject debate over the years. The potential induced phages in; in vivo, subsequently lead to the humoral immune responses ulti-mately results in the inactivation of phage virion parti-cles. There were some early assumptions; Kucharewica-Krukowska and Slopek, 1987, phage therapy in both animals and patients subsequently affect the patients immunity, by stimulating the immune system and sub-sequent production of anti-phage antibodies production of neutralizing antibodies, rapid emergence of phage-resistant bacterial strains (Stent, 1963; Lederberg, 1996; Cairns et al., 2009) and effi cacy of phages only when

Rahul Narasanna et al.
24 EXPERIMENTAL PROTECTION OF ESBL PRODUCING SALMONELLA TYPHI BACTEREMIC INDUCED MICE MODEL BIOSCIENCE BIOTECHNOLOGY RESEARCH COMMUNICATIONS
administered shortly after bacterial infection (Bull et al., 2002); are the most frequent criticisms of the clini-cal use of phages. Recently, similar kind of studies were conducted by Wang et al., (2016); comparatively results obtained were very much similar to the activity of Phage SLPW showed a broad host range and high effi ciency of plating against various types of S. aureus. Phage SLPW remained stable under a various temperatures or pH range. Further, it effi ciently lysed MRSA strains in vitro and in vivo. Intraperitoneal phage administration at 1 h post-infection cured the mice and reduced the bacterial expression of infl ammatory cytokines in mice (Wang et al., 2016).
Titre of IgG and IgM was well measured BALB/c mice after a single dose of GRCST induction, the background titre was increased signifi cantly with 4100 fold, and 600 fold respectively (Fig 6 and Fig 7). Incubation of phage GRCST with an excess of mice anti-phage GRCST anti-bodies did not interfere with phage’s capacity to lyse susceptible bacteria. This result demonstrates that the antibodies elicited by phage GRCST are non-neutral-izing. The similar kind of immune response study was conducted in phage1 against Salp572 (S. paratyphi B) with an elevated level of mice anti-1 antibodies did not interfere with phage’s capacity to lyse phage-suscepti-ble bacteria. This result demonstrates that the antibod-ies elicited by phage1 are non-neutralizing (Capparelli et al., 2010). This study clearly emphasizes that mice does produce antibodies against induced phages but they are non-neutralizing. Indeed, Gorski et al., 2006 (Górski, et al., 2007); have provided enough evidence of a positive impact of phages on immune system func-tioning and have explored potential phage anti-tumour properties mediated through observed shifts in levels of various cytokines as a consequence of interactions between extra decorative head proteins with surface proteins of certain immune-system cells (Budynek et al., 2010). The immune response to GRCST was not associ-ated with anaphylaxis or other adverse immunological reactions. The anaphylactic reactions were negative, and no changes in animal behavior, no signifi cant changes in the body temperature or no other side effects were observed in both the group
CONCLUSION
The bacteriophage therapy will serve for better perspec-tive, with minimum side effects. The present investiga-tion attempted to fi nd and characterize a bacteriophage infective against the multidrug resistant and ESBL pro-ducing S. typhi. Our explored phage was lytic against many MDR S. typhi isolates, it’s in vivo effi cacy proved as an excellent therapeutic agent. The signifi cant out-come of our conducted study a single dose of 1.5×10⁷
PFU of phage GRCST successfully eliminated bacteria from mice circulatory system without infl uencing the host immune system and rescued infected mice, compare to antibiotics failed to rescue all infected mice. Hence, we conclude that our explored GRCST is clinically more effi cient than earlier reported; further characteri-zation like whole genome sequencing and identifi cation and cloning of genes coding for bacterial lysis of the GRCST may prove as an excellent alternative therapeu-tic agent. Based on our observations of this study, phage therapy can be used as an alternative therapy for those patients not responding to antibiotic treatment.
CONFLICT OF INTEREST
The authors declare of no confl ict of interest in conduct-ing this study.
REFERENCES
Abedon, S. T., Kuhl, S. J., Blasdel, B. G., & Kutter, E. M. (2011). Phage treatment of human infections. Bacteriophage, 1(2), 66-85.
Ackermann, H. W. (2012). Bacteriophage electron micros-copy. Adv. Virus Res, 82, 1-32.
Ackermann, H.W. (2006). Classifi cation of bacteriophages. In The Bacteriophages, Ed.Calendar R, Oxford University Press, ISBN 0-19-514850-9, New York, USA, pp. 8–16
Albino, L. A., Rostagno, M. H., Húngaro, H. M., & Mendonça, R. C. (2014). Isolation, characterization, and application of bacteriophages for Salmonella spp. biocontrol in pigs. Food-borne pathogens and disease, 11(8), 602-609.
Anderson, E. S., & Felix, A. (1953). The Vi type-determining phages carried by Salmonella typhi. Microbiology, 9(1), 65-88.
Atterbury, R. J., Van Bergen, M. A. P., Ortiz, F., Lovell, M. A., Harris, J. A., De Boer, A., & Barrow, P. A. (2007). Bacteriophage therapy to reduce Salmonella colonization of broiler chickens. Applied and environmental microbiology, 73(14), 4543-4549.
Ayache, J., Beaunier, L., Boumendil, J., Ehret, G., & Laub, D. (2010). Sample preparation handbook for transmission electron microscopy: techniques (Vol. 2). Springer Science & Business Media.
Bassetti, M., Poulakou, G., Ruppe, E., Bouza, E., Van Hal, S. J., and Brink,A. (2017). Antimicrobial resistance in the next 30 years, humankind,bugs and drugs: a visionary approach. Intensive Care Med. 43, 1464–1475. doi: 10.1007/s00134-017-4878-x
Biswas, B., Adhya, S., Washart, P., Paul, B., Trostel, A. N., Pow-ell, B., ... & Merril, C. R. (2002). Bacteriophage therapy res-cues mice bacteremic from a clinical isolate of vancomycin-resistant Enterococcus faecium. Infection and immunity, 70(1), 204-210.
Budynek, P., Dabrowska, K., Skaradzinski, G., Górski, A. (2010). Bacteriophages and cancer. Arch.Microbiol. 192:315–320.
Bull, J. J., Levin, B. R., DeRouin, T., Walker, N., & Bloch, C. A. (2002). Dynamics of success and failure in phage and anti-

Rahul Narasanna et al.
BIOSCIENCE BIOTECHNOLOGY RESEARCH COMMUNICATIONS EXPERIMENTAL PROTECTION OF ESBL PRODUCING SALMONELLA TYPHI BACTEREMIC INDUCED MICE MODEL 25
biotic therapy in experimental infections. BMC microbiology, 2(1), 1.
Cairns, B. J., Timms, A. R., Jansen, V. A., Connerton, I. F., & Payne, R. J. (2009). Quantitative models of in vitro bacteri-ophage–host dynamics and their application to phage ther-apy. PLoS Pathog, 5(1), e1000253.
Capparelli, R., Nocerino, N., Iannaccone, M., Ercolini, D., Par-lato, M., Chiara, M., & Iannelli, D. (2010). Bacteriophage ther-apy of Salmonella enterica: a fresh appraisal of bacteriophage therapy. Journal of Infectious Diseases, 2011(1), 52-61.
Capparelli, R., Parlato, M., Borriello, G., Salvatore, P., & Ian-nelli, D. (2007). Experimental phage therapy against Staphylo-coccus aureus in mice. Antimicrobial agents and chemother-apy, 51(8), 2765-2773.
Chanishvili, N., Sharp, R.A. (2009). Literature Review of the Practical Application of Bacteriophage Research. Tbilisi, Geor-gia: Eliava Institute.
De Jonge, P. A., Nobrega, F. L., Brouns, S. J. J., and Dutilh, B. E. (2018). Molecular and evolutionary determinants of bacte-riophage host range. Trends Microbiol.7:1352. doi: 10.1016/j.tim.2018.08.006
De Kraker,M. E., Stewardson, A. J., and Harbarth, S. (2016).Will 10 million people die a year due to antimicrobial resist-ance by 2050? PLoS Med. 13:e1002184. doi: 10.1371/journal.pmed.1002184
Deghorain M, Bobay LM, Smeesters PR, Bousbata S, Ver-meersch M, Perez-Morga D, Drèze PA, Rocha EP, Touchon M, Van Melderen L (2012) Characterization of novel phages isolated in coagulase-negative staphylococci reveals evolu-tionary relationships with Staphylococcus aureus phages. J Bacteriol 194:5829–5839
Furfaro, L.L., Payne, M.S. and Chang, B.J., 2018. Bacteriophage therapy: Clinical trials and regulatory hurdles. Frontiers in cel-lular and infection microbiology, 8.
Górski, A., Borysowski, J., Miedzybrodzki, R., & Weber-Dab-rowska, B. (2007). Bacteriophages in medicine (pp. 125-158). Caister Academic Press.
Harper, D. R. (2018). Criteria for selecting suitable infectious diseases for phage therapy. Viruses 10:E177. doi: 10.3390/v10040177
Hooton, S. P., Timms, A. R., Rowsell, J., Wilson, R., & Con-nerton, I. F. (2011). Salmonella Typhimurium-specifi c bacte-riophage SH19 and the origins of species specifi city in the Vi01-like phage family. Virology journal, 8(1), 1.
Kropinski, A. M., Mazzocco, A., Waddell, T. E., Lingohr, E., and Johnson, R. P. (2009). Enumeration of bacteriophages by dou-ble agar overlay plaque assay. Methods Mol. Biol. 501, 69–76. doi: 10.1007/978-1-60327-164-6_7
Kutter EM. Bacteriophage therapy: past and present. In: Schae-cter M, editor. Encyclopedia of Microbiology. Oxford: Elsevier; 2009. pp. 258–266.
Lederberg, J. (1996). Smaller fl eas... ad infi nitum: therapeutic bacteriophage redux. Proceedings of the National Academy of Sciences, 93(8), 3167-3168.
Mazzocco, A., Waddell, T. E., Lingohr, E., & Johnson, R. P. (2009). Enumeration of bacteriophages by the direct plating plaque assay. Bacteriophages: Methods and Protocols, Volume 1: Isolation, Characterization, and Interactions, 77-80.
Melo, L. D., Sillankorva, S., Ackermann, H. W., Kropinski, A. M., Azeredo, J., and Cerca, N. (2014b). Isolation and characteri-zation of a new Staphylococcus epidermidis broad-spectrum bacteriophage. J. Gen. Virol. 95(Pt 2), 506–515. doi: 10.1099/vir.0.060590-0
Mikeladze, C., Nemsadze, E., Alexidze, N., Assanichvili, T. (1936). On the treatment of typhoid fever and acute colitis by d’Herelle bacteriophage. La Médecine. 1936; 17:33–38. (Fre).
Reardon, S. (2014). Phage therapy gets revitalized. Nature 510, 15–16. doi: 10.1038/510015a
Sambrook, J., and Russell, D. W. (2001). Molecular Cloning: A Laboratory Manual, 3rd Edn. New York, NY: Cold Spring Harbor Laboratory Press
Stent, G. S. (1963). Molecular biology of bacterial viruses. Molecular biology of bacterial viruses.
Sulakvelidze, A., Barrow, P. (2005). Phage therapy in animals and agribusiness. In: Kutter E, Sulakvelidze A, eds. Bacterio-phages: Biology and Application. Boca Raton, FL: CRC Press, 335-80.
Tacconelli, E., Carrara, E., Savoldi, A., Harbarth, S., Mendel-son, M., Monnet, D.L., et al. (2018). Discovery, research, and development of new antibiotics: the WHO priority list of anti-biotic-resistant bacteria and tuberculosis. Lancet Infect Dis. 18, 318–327. doi: 10.1016/S1473-3099(17)30753-3
Tsulukidze, A. (1936). Sur l’application du bacteriophage dans la peritonite par perforation au cours de la fi evre typhoide. La Médecine, 17(Suppl), 41-2.
Uchiyama, J., Rashel, M., Maeda, Y., Takemura, I., Sugihara, S., Akechi, K., ... & Matsuzaki, S. (2008). Isolation and characteri-zation of a novel Enterococcus faecalis bacteriophage EF24C as a therapeutic candidate. FEMS Microbiology letters, 278(2), 200-206.
Vinodkumar, C. S., Kalsurmath, S., & Neelagund, Y. F. (2008). Utility of lytic bacteriophage in the treatment of multidrug-resistant Pseudomonas aeruginosa septicemia in mice. Indian Journal of Pathology and Microbiology, 51(3), 360.
Vinogradov, E., and Perry, M. B. (2000). Structural analysis of the core region of lipopolysaccharides from Proteus mira-bilis serotypes O6, O48 and O57. Eur. J. Biochem. 267, 2439–2446. doi: 10.1046/j.1432-1327.2000. 01262.x
Wang, J., Hu, B., Xu, M., Yan, Q., Liu, S., Zhu, X., & Li, Q. Q. (2006). Use of bacteriophage in the treatment of experimen-tal animal bacteremia from imipenem-resistant Pseudomonas aeruginosa. International journal of molecular medicine, 17(2), 309-318.
Wang, Z., Zheng, P., Ji, W., Fu, Q., Wang, H., Yan, Y., & Sun, J. (2016). SLPW: A virulent bacteriophage targeting methicillin-resistant Staphylococcus aureus in vitro and in vivo. Frontiers in microbiology, 7, 934.

Anticancer and antibacterial potential of MDR
Staphylococcus aureus mediated synthesized silver
nanoparticles
Mohd Haseeb1, Mohd Sajid Khan2, Abu baker2, Imran Khan2, Iram Wahid2 and
M.S. Mohamed Jaabir*1Department of Biotechnology, National College, (Autonomous), Tiruchirappalli, Tamil Nadu, India2Department of Biosciences, Integral University Lucknow, Uttar Pradesh India
ABSTRACT
The increasing cases of resistance, low effi cacy and high toxicity of antibiotics and anticancer agents have led to the discovery of nanoparticles as potent antimicrobial and anticancer agents to combat the threat of Multi Drug Resistance (MDR) and to minimize the side effects of drugs. The synthesized silver nanoparticles (SAgNPs) (synthesized using MDR Staphylococcus aureus) were characterized to confi rm synthesis, shape, size, hydrodynamic diameter, colloidal stability and surface functionalization, by UV-visible spectroscopy, TEM, DLS, zeta potential test and FTIR respectively. SAgNPs were found to have spherical shape with a size of 15 nm. Hydrodynamic diameter of nanoparticles was found to be 88.65 nm and the value of zeta potential was recorded to be -24.03 mV. The antimicrobial and anticancer potential of SAgNPs was performed against normal & MDR strains of S. aureus and human colon cancer cell line (HCT-116), respectively.. The MICs of SAgNPs against normal and MDR S. aureus strains were found to be 0.025 μg/ml & 0.053 μg/ml, respectively. Similarly, IC50 against HCT-116 cell line was found to be 0.069 μg/ml by MTT Assay. DAPI analysis confi rmed the interaction of SAgNPs with DNA in order to initiate apoptosis for killing cancer cells.
KEY WORDS: ANTICANCER; DAPI; DLS; MDR; MTT; SAGNPS
26
Medical CommunicationBiosci. Biotech. Res. Comm. 12(1): 26-35 (2019)
ARTICLE INFORMATION:
Corresponding Author: [email protected] 2nd Jan, 2019Accepted after revision 7th March, 2019 BBRC Print ISSN: 0974-6455Online ISSN: 2321-4007 CODEN: USA BBRCBA Thomson Reuters ISI ESC / Clarivate
Analytics USAMono of Clarivate Analytics and Crossref Indexed Journal Mono of CR
NAAS Journal Score 2019: 4.31 SJIF: 4.196© A Society of Science and Nature Publication, Bhopal India 2019. All rights reserved.Online Contents Available at: http//www.bbrc.in/DOI: 10.21786/bbrc/12.1/4
Mohd Haseeb et al.
BIOSCIENCE BIOTECHNOLOGY RESEARCH COMMUNICATIONS ANTICANCER AND ANTIBACTERIAL POTENTIAL OF MDR 27
INTRODUCTION
Toxicity, high cost of the drugs used in the treatment of cancer and microbial diseases, rise in the cases of anti-biotic resistance due to frequent use of antibiotics have forced researchers to look for alternatives in medicine and therapeutics. Side effects of chemotherapeutic drugs due to poor specifi city towards targets and high dose requirements have also made it necessary for nano-med-icine to address the issue and look for other effi cient and cost effective molecules bearing high degree of effi cacy for the target cells (Riehemann et al., 2009).
Inorganic nanoparticles are being widely used throughout the world due to their incredible yet, potential applications. Among the metal NPs, Silver nanoparticles (AgNPs) in particular have attracted considerable atten-tion in various fi elds and have been used as therapeutic agent (Shrivastava et al., 2009), as catalyst (Christopher et al., 2011) antimicrobial and anti-infl ammatory agents (El-Chaghaby, and Ahmad, 2011; Veerasamy et al., 2011), as a strong cytotoxic agent against cancer cell lines (Jacob et al., 2012) . Silver and silver ions have been used since a long time as strong antimicrobial and anti-infl ammatory agents. Nano-silver or silver nanoparticles (AgNPs) have shown promising results against the antibiotic resistant bacteria (Yah and Simate, 2015). AgNPs have also been investigated for their antimicrobial potential against Multi Drug Resistant MDR strains of several pathogenic microbes (Alshaye et al., 2017). The role of AgNPs in diagnostic and probing of cancer has also been reported earlier in a research study (Huang et al., 2017).
In literature, several chemical and physical methods have been used for the synthesis of AgNPs, but these methods utilize large amount of toxic chemicals and extreme conditions like high temperature and are not economical. The green synthesis approaches are a solu-tion to this problem and are more ecofriendly, simple, reliable, reproducible and non-toxic. Recently, research-ers have exploited microorganism as a production tool for the biosynthesis of inorganic metallic nanoparticles, such as silver, cadmium, gold and sulfi de (Hassaan et al., 2018; Elsalam et al., 2018).
The bacterial synthesis seems to be advantageous because of minimal utilization of toxic chemicals and sustainability of large scale production. Many reports have shown that numerous bacterial strains of Staphylo-coccus aureus, Bacillus cereus, Bacillus subtilis, Escheri-chia coli, Bacillus licheniformis, Enterobacter cloacae, Klebsiella pneumonia, Lactobacillus acidophilus, and Pseudomonas aeroginosa, are capable of synthesizing nanoparticles (NPs) (Ghiua et al., 2018; Muthulakshmi et al. 2018; Fatemi et al., 2018).
Biosynthetic methods can be categorized into two groups, on the basis of location of synthesis i.e. intracel-
lular and extracellular synthesis. The extracellular syn-thesis of nanoparticles is simple and economical because of the simplicity in its procedure for not only synthesis but also of recovery and purifi cation as well, under large scale production (Singh et al., 2018). All these reasons make the bacteria a potential source for the extracellular synthesis of AgNPs avoiding the use of toxic and haz-ardous chemicals.
Novel technologies are being developed to overcome the challenges imposed by bacteria and cancer cells, the resistance associated with the regular use of antibiot-ics through MDR phenomenon and to minimize the side effects of the drugs used in chemotherapy (Mohammed et al., 2018).
The current study aims to address the issues of MDR resistance of bacteria S. aureus an uses AgNPs as a tool against cancer cells. Here, AgNPs were synthesized extracellularly from bacteria MDR S. aureus, charac-terized by UV-vis spectroscopy, Transmission Electron Microscopy (TEM), Zeta potential value, Dynamic Light Scattering (DLS), Fourier Transformed Infra Red (FTIR), and subsequently tested against normal and MDR S. aureus as well as against cancer cell lines HCT-116
MATERIALS & METHODS
All the chemicals and media were purchased from Sigma Aldrich (St. Louis, USA) and HiMedia, India. The multi-drug resistant (MDR) and normal strain of Staphylo-coccus aureus (NCIM 2079) were obtained from NCIM, Pune, India.
Synthesis of AgNPs
The MDR strain of S. aureus (NCIM 2079) was used for the synthesis of AgNPs. Bacterial strain was main-tained on nutrient agar at 37o C. The bacterial cultures (OD600- 0.60) were transferred to Erlenmeyer fl asks containing 250 ml nutrient broth and incubated at 37oC on a rotary shaker (180 rpm) for 6-8 hrs. The bacterial cells were collected by centrifugation (6000 g, 10 min at 10°C), washed extensively with sterile distilled water under aseptic conditions and used for further studies.Two different reactions were carried out by incubating S. aureus (NCIM 2079) cells (wet weight-5gm) in 100ml sterile distilled water containing 1mM AgNO3 in two different 500ml Erlenmeyer fl asks for 6-8 hrs at rotatory shaker (180 rpm) at 37°C. The monitoring of the bacteria mediated reduction of silver ions was accomplished by the visual color change and UV–visible spectrum analy-sis for the reaction mixture.
At the end of synthesis, the unbound proteins were removed by Precipitation with 100% (v/v) volumes of absolute ethanol and the AgNPs were collected for fur-ther characterization.
Mohd Haseeb et al.
28 ANTICANCER AND ANTIBACTERIAL POTENTIAL OF MDR BIOSCIENCE BIOTECHNOLOGY RESEARCH COMMUNICATIONS
Characterization Of AgNPs
The AgNPs synthesized using S.aureus (NCIM 2079) were characterized by UV-Vis Spectroscopy, Dynamic Light Scattering, Zeta potential analysis, TEM and FTIR for the confi rmation of synthesis, size, shape, stability, surface functionalization and identifi cation.UV-Vis spectropho-tometer measurements were performed on a Shimadzu dual-beam spectrophotometer (model UV-1601 PC) operated at a resolution of 1nm.
Transmission Electron Microscopy (TEM) measure-ments were performed to analyze the size and morphol-ogy. Samples were prepared by drying a drop of AgNPs solution on carbon coated TEM copper grids followed by measurements on (TEM) FEI Company, TecnaiTM G2 Spirit BioTWIN operated at an accelerating voltage of 80kV. The study was done Indian Institute of Toxico-logical Research (IITR), Lucknow, India. Dynamic Light Scattering (DLS) was used to analyze the mean parti-cle size (MPS) of biosynthesized AgNPs using dynamic light scattering particle size analyzer (Zetasizer Nano-ZS, Model ZEN3600, Malvern Instrument Ltd, Malvern, UK). The samples were taken in a DTS0112-low volume disposable sizing cuvette of 1.5 ml capacity. The sample powder was dissolved to a concentration of 0.5% (w/v) in deionised water and sonicated for 1 min before analy-sis. After fi ltering through a syringe fi lter of 0.4μm pore size, solution was centrifuged at 5000 rpm for 30min and measured for its particle size. Mean particle size was the average of triplicate measurements for a single sample.Zeta potential of AgNPs was determined to measure the charge, as the metal nanoparticles are normally charged or carry charge of capping agents. This analysis was done in Zetasizer Nano-ZS, (Malvern Instrument Ltd. and Malvern, UK).Fourier-transform infrared spectros-copy analysis (FTIR) was used to identify capped bio-molecules over the surface of as synthesized AgNPs was done by FT-IR (Perkin Elmer Spectrum, Jasco- 6100). For the analysis, silver nanoparticles were dried, grounded with KBr pellets and analyzed in the wavelength range of 4000 to 400 cm–1.
The antibacterial activity of AgNPs was determined against MDR strain of Staphylococcus aureus (NICM 2079), and Normal Strains of Staphylococcus aureus (NICM 2079). The bacterial cells (OD600-0.60) were allowed to grow in nutrient broth for 24 hours and kept in a shaker incubator at 180 rpm for 24 hrs at 37�C. Bac-terial lawns were prepared using 100 ml of cultured broth. Agar well diffusion method (Khan et al., 2011) was used to determine preliminary antibacterial activity of biosynthesized AgNPs. Plates were prepared by pour-ing around 25 ml of sterile Mueller Hinton Agar (MHA) media in sterilized petridishes. Different strains of bac-terial culture chosen for the study was swabbed using sterilized cotton swab. Sterilized gel puncture was used
to make wells of 5 mm diameter. Two wells were made in each plate, with each one containing distilled water (for control) and the other was loaded with synthesized silver nanoparticles. The plates were left for 24 hr incubation at 37�C. The inhibition was examined by identifying the clear zone around the well.
The minimum inhibitory concentration (MIC) of the synthesized AgNPs was determined by double diffusion method (Sarker et al., 2007). The MIC50 was determined by broth dilution, performed on a 96 fl at-bottom well plate. The medium used in the plates were prepared at double the fi nal strength to allow for a 50% dilution once the inoculum is added. This approach allowed the inoculum to be prepared in distilled water, which per-mitted the absorbance to be determined using a spec-trophotometer without interference from colored media. All the bacterial strains were allowed to grow till mid-logrithmic phase. Culture was subsequently harvested by centrifugation, washed with 1mM sodium Phosphate buffer (SPB) at pH 7.4, and diluted to 2 × 10⁵ colony forming units (CFU)/ml in Saline phosphate buffer. About 90 μL of Mueller-Hinton broth was used in 96 well- microtitre plates to serially dilute the silver nano-particles in desired concentrations. Bacterial suspension of 95×104 CFU/ well was used as inoculum. Inoculated Microtitre wells were incubated overnight at 37o C. The MIC50 was determined by taking lowest concentration of AgNPs at which the bacterial growth was inhibited. The numbers of colonies were determined by agar plate count method as discussed by Morones et al., (2005).The minimum bactericidal concentration (MBC) is the lowest concentration of an antibacterial agent required to kill a particular bacterium. It can be determined from broth dilution minimum inhibitory concentration (MIC) tests by sub culturing to agar plates that do not contain the test agent.
Cell viability and IC50
value determination of AgNPs
against cancer line HCT-116
The biosynthesized silver nanoparticles were tested against the Human colon cancer cell line HCT-116. The anticancer activity of synthesized silver NPs was deter-mined by MTT (3-[4, 5-dimethylthiazol-2-yl]-2, 5-diphe-nyltetrazolium bromide) assay and nuclear degradation was checked by DAPI (4’, 6-diamino-2-phenylindiole) toxicology assays. For this, the cells were treated with varying concentration of AgNPs and the effect was ana-lyzed by MTT assay and DAPI.
To determine the effect of Ag nanoparticles on cancer cells, MTT assay was performed. For this the HCT 116 cells were plated in 96 well plate with each well seeded with 1 X 10⁴ cells. The plate was incubated for 24 hours in CO2 incubator. After incubation, cells were treated with Ag NP of various concentrations in triplicate with
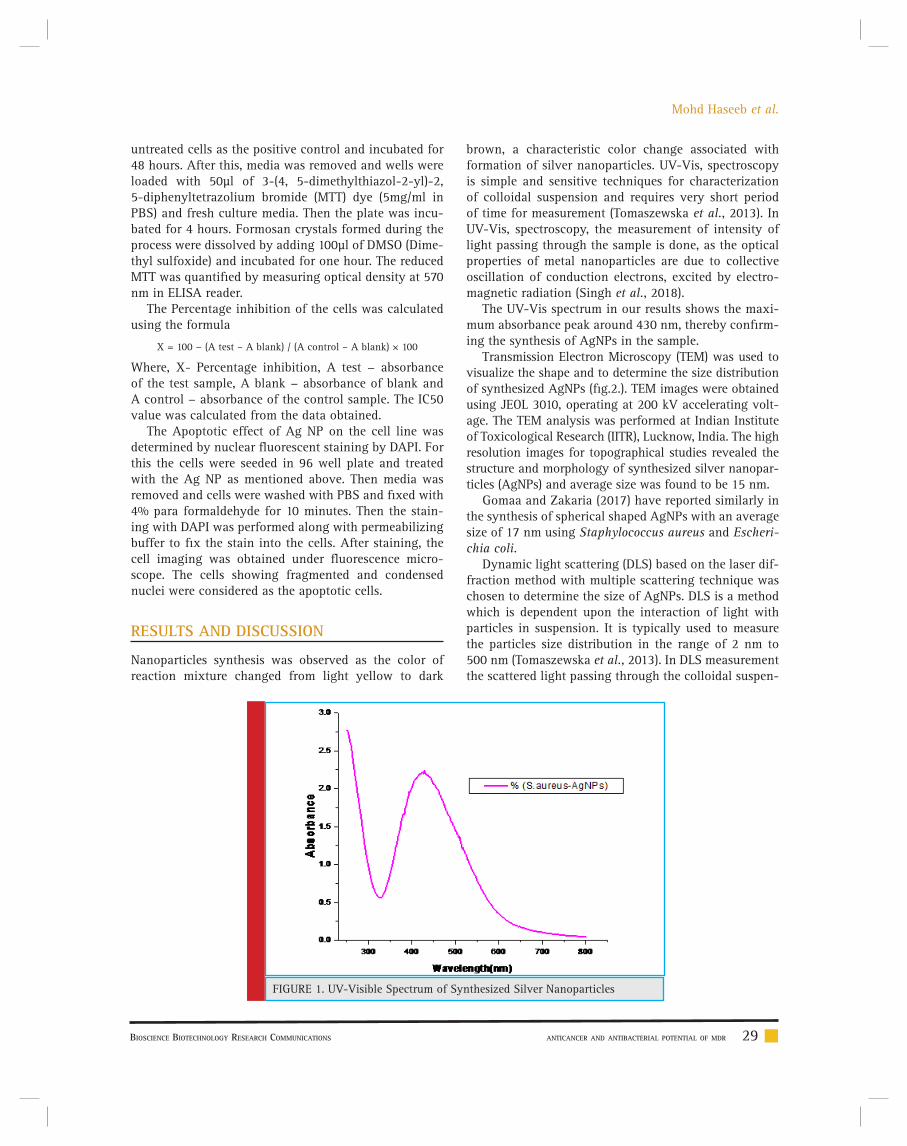
Mohd Haseeb et al.
BIOSCIENCE BIOTECHNOLOGY RESEARCH COMMUNICATIONS ANTICANCER AND ANTIBACTERIAL POTENTIAL OF MDR 29
untreated cells as the positive control and incubated for 48 hours. After this, media was removed and wells were loaded with 50μl of 3-(4, 5-dimethylthiazol-2-yl)-2, 5-diphenyltetrazolium bromide (MTT) dye (5mg/ml in PBS) and fresh culture media. Then the plate was incu-bated for 4 hours. Formosan crystals formed during the process were dissolved by adding 100μl of DMSO (Dime-thyl sulfoxide) and incubated for one hour. The reduced MTT was quantifi ed by measuring optical density at 570 nm in ELISA reader.
The Percentage inhibition of the cells was calculated using the formula
X = 100 − (A test – A blank) / (A control – A blank) × 100
Where, X- Percentage inhibition, A test − absorbance of the test sample, A blank − absorbance of blank and A control − absorbance of the control sample. The IC50 value was calculated from the data obtained.
The Apoptotic effect of Ag NP on the cell line was determined by nuclear fl uorescent staining by DAPI. For this the cells were seeded in 96 well plate and treated with the Ag NP as mentioned above. Then media was removed and cells were washed with PBS and fi xed with 4% para formaldehyde for 10 minutes. Then the stain-ing with DAPI was performed along with permeabilizing buffer to fi x the stain into the cells. After staining, the cell imaging was obtained under fl uorescence micro-scope. The cells showing fragmented and condensed nuclei were considered as the apoptotic cells.
RESULTS AND DISCUSSION
Nanoparticles synthesis was observed as the color of reaction mixture changed from light yellow to dark
brown, a characteristic color change associated with formation of silver nanoparticles. UV-Vis, spectroscopy is simple and sensitive techniques for characterization of colloidal suspension and requires very short period of time for measurement (Tomaszewska et al., 2013). In UV-Vis, spectroscopy, the measurement of intensity of light passing through the sample is done, as the optical properties of metal nanoparticles are due to collective oscillation of conduction electrons, excited by electro-magnetic radiation (Singh et al., 2018).
The UV-Vis spectrum in our results shows the maxi-mum absorbance peak around 430 nm, thereby confi rm-ing the synthesis of AgNPs in the sample.
Transmission Electron Microscopy (TEM) was used to visualize the shape and to determine the size distribution of synthesized AgNPs (fi g.2.). TEM images were obtained using JEOL 3010, operating at 200 kV accelerating volt-age. The TEM analysis was performed at Indian Institute of Toxicological Research (IITR), Lucknow, India. The high resolution images for topographical studies revealed the structure and morphology of synthesized silver nanopar-ticles (AgNPs) and average size was found to be 15 nm.
Gomaa and Zakaria (2017) have reported similarly in the synthesis of spherical shaped AgNPs with an average size of 17 nm using Staphylococcus aureus and Escheri-chia coli.
Dynamic light scattering (DLS) based on the laser dif-fraction method with multiple scattering technique was chosen to determine the size of AgNPs. DLS is a method which is dependent upon the interaction of light with particles in suspension. It is typically used to measure the particles size distribution in the range of 2 nm to 500 nm (Tomaszewska et al., 2013). In DLS measurement the scattered light passing through the colloidal suspen-
FIGURE 1. UV-Visible Spectrum of Synthesized Silver Nanoparticles

Mohd Haseeb et al.
30 ANTICANCER AND ANTIBACTERIAL POTENTIAL OF MDR BIOSCIENCE BIOTECHNOLOGY RESEARCH COMMUNICATIONS
sion relies on Rayleigh scattering from the particles in suspension (Fissan et al., 2014). Next, the hydrodynamic size of the particles is determined by analyzing the mod-ulation of intensity of scattered light as function of time (Dieckmann et al., 2009). DLS revealed the Z-average value to be 88.65 nm. Similar results were obtained in another research in which average diameter silver NPs was found to be 87.46 nm in the aqueous colloidal sus-pension of AgNPs. (Singh et al., 2018).
The determination of Zeta potential is considered as an effective simplest, and most straight forward method to predict the stability and understand surface proper-ties of the nanoparticles. Zeta potential is a measure of the colloidal stability of the nanoparticles in a solution (Saeb et al., 2014). The shielding or exposure of charged groups or concentration, distribution, ionization and adsorption of nano-particles can also be estimated from zeta potential (Guilatt et al., 2004).
Information with reference to the concentration, distribution, exposure or shielding of charged moie-ties; ionization and adsorption could be inferred from the analysis of zeta potential. In the present study, the zeta potential of the synthesized AgNPs was found to be -24.3 mV, which confi rmed that the AgNPs were highly stable in colloidal suspension. Similar observation were also recorded in which zeta potential value was meas-ured to be -25.5 mV (Singh et al., 2018).
FTIR of the synthesized AgNPs is performed to spot the position of various functional groups of the cap-ping agent and their vibration patterns. The FTIR results of the sample states that the position of Amide I(C=O) bond is 1637 cm-1 with transmittance of 10.75%, O-H(Stretch) is 3583.13 cm-1 with transmittance of 9.19%, C-O(Stretch) is 1082.41 cm-1 with transmittance of 16.19% and Alkyne (Stretch) bond 2097.88 cm-1 with transmittance of 33.17%.
FIGURE 2. TEM image (taken at magnifi cation of 110000x) Showing the Shape, Internal Structure and Size of AgNPs
FIGURE 3. DLS Curve (Z-value-88.65 nm) of the AgNPs synthesized using MDR S.aureus bacteria.

Mohd Haseeb et al.
BIOSCIENCE BIOTECHNOLOGY RESEARCH COMMUNICATIONS ANTICANCER AND ANTIBACTERIAL POTENTIAL OF MDR 31
FIGURE 4. Curve representing the Zeta potential (-24.3 mV) of the AgNPs synthesized
FIGURE 5. The FTIR Spectraof the AgNPs synthesized using MDR S.aureus bacteria.
FIGURE 6. Plates showing the zone of inhibition of AgNPs against- a) Normal strain of S.aureus, b) MDR S. aureus
Antibacterial activity of AgNPs against normal and MDR
strains
The AgNPs synthesized using MDR S.aureus was tested for its antibacterial potential, against normal strains of S.aureus. The same was tested against strains of MDR S.aureus as well. The antimicrobial potential was tested by agar well diffusion method, MIC and MBC.
In general MIC is defi ned as the minimum amount of drug required to inhibit the growth of bacteria to 70%-80%. MIC50 is defi ned as the minimum amount of drug required to inhibit the growth of bacteria to 50%. The clear zone of inhibition around the inoculated area con-fi rmed the antibacterial potential of as the synthesized AgNPs. MIC and MBC concentrations were calculated

Mohd Haseeb et al.
32 ANTICANCER AND ANTIBACTERIAL POTENTIAL OF MDR BIOSCIENCE BIOTECHNOLOGY RESEARCH COMMUNICATIONS
FIGURE 7. Curve representing the MIC of AgNPs against a) Normal strain of S.aureus. b) MDR S.aureus
FIGURE 8. Plates showing MBC of AgNPs against: a) MDR strain of S.aureus and b: S.aureus (Normal strain)
FIGURE 9. Imagesof human colon cancer cell line HCT-116 (Taken at mag-nifi cation of 10x): a) untreated cells b) cells treated with AgNPs.
under varying concentrations of the AgNPs synthesized using MDR S.aureus. The Zone of inhibition of AgNPs against normal strain and MDR strains of S.aureus were found to be 2.8 cm and 2.5 cm respectively (fi g-ure no. 6a and 6b). The Minimum inhibitory concentra-tion of AgNPs against normal strain and MDR strains of S.aureus were found to be 0.025 μg/ml and 0.053 μg/ml for respectively. The lowest concentration with no
visible growth indicating 99.5% killing of the inoculum was found to be double the value of MIC, (see fi gure 8 a and b).
Anticancer activity against HCT-116
To evaluate the sensitivity of colon cancer cells to the AgNPs, human colon cancer cell line HCT-116 was treated with different doses (0.01–10 μg/ml) of AgNPs

Mohd Haseeb et al.
BIOSCIENCE BIOTECHNOLOGY RESEARCH COMMUNICATIONS ANTICANCER AND ANTIBACTERIAL POTENTIAL OF MDR 33
FIGURE 10. Graph showing the IC50 of AgNPs against Human coloncancer cell lines HCT-116
FIGURE 11. Representing DAPI Images of Human Colon cancer cell line HCT-116 (taken at a magnifi cation of 20x): Control cells, on left and Cells treated with AgNPs, on right.
synthesized using MDR S.aureus for 24 and 48 h fol-lowed by MTT assay (Fig. 9 a and 9b). MTT is a dye which is reduced to formazon crystals during metab-olism, cellular mechanism of MTT reduction into formazan is understood, involving reaction with NADH or similar reducing molecules that transfer electrons to MTT Viable cells with active metabolism convert MTT into a purple colored formazan product with an absorb-ance maximum near 570 nm. When cells die, they lose the ability to convert MTT into formazan, thus color for-mation serves as a useful and convenient marker of only the viable cells. So, the intensity of the colored product is measured which is directly proportional to the number of viable cells in the culture (Präbst et al., 2017). The MTT analysis was done to assess the activity of mito-chondrial succinate dehydrogenase (Singh et al., 2018).
Here, the decrease in the MTT reduction could be due to decrease in cell viability which in turn can be attrib-
uted to cytotoxic activity of silver nanoparticles. Our results shows that AgNPs at a concentration of 0.069 μg/ml reduced growth of human colon cancer cells by 50%, after 24 h of treatment. Similar pattern of results with more pronounced cytotoxic effect was observed after 48 h of treatment thus proving AgNPs to be more anti-proliferative and cytotoxic for colon cancer cells. Similar fi ndings have been reported in earlier studies, (Singh et al., 2018; Patra et al., 2018).
AgNPs induced nuclear condensation in HCT-116 cells: Apoptosis is characterized by changes in cellular morphology such nuclear fragmentation, degradation of DNA, condensation of chromatin, apoptotic body for-mation and membrane blabbing (Sheikh et al., 2018). In order to confi rm apoptosis in AgNPs treated colon cancer cells, DAPI nuclear staining was performed. DAPI (4’, 6-diamidino-2-phenylindole) is a fl uorescent stain which preferably binds to AT rich regions of DNA.

Mohd Haseeb et al.
34 ANTICANCER AND ANTIBACTERIAL POTENTIAL OF MDR BIOSCIENCE BIOTECHNOLOGY RESEARCH COMMUNICATIONS
The fl uorescence intensity of DAPI increases to approxi-mately 20 times when DAPI is bound to DNA. As the ell permeability is compromised due to apoptosis; DAPI enters easily inside the cell where its binding to DNA produces a strong blue color (Baharara et al., 2018).
After treatment with AgNPs for 24 h, signifi cant nuclear changes in colon cancer cells were observed via DAPI staining. As apparent from photomicrographs, AgNPs induced nuclear condensation and fragmenta-tion in colon cancer cells in a dose dependent manner, whereas the control cells exhibited normal cell morphol-ogy. The results were evident that AgNPs induced apop-tosis in colon cancer cells in a time and dose-dependent manner. Our results are in agreement with several other researches published earlier (Gurunathan et al., 2018; Baharara et al., 2018; Kishore et al., 2018).
CONCLUSION
In this study, MDR strain of S. aureus was used to syn-thesize silver NPs, with the goal to inhibit the MDR strains of S.aureus as well as normal strain of S.aureus to assess its anticancer potential.The synthesized NPs were found to be spherical in shape and approximately 15 nm in size. The NPs were found to form a stable sus-pension with a zeta potential value of -24.03 m. These particles were found to be capped by extracellular bacte-rial proteins (confi rmed by FTIR). The minimum inhibi-tory concentrations were found to be 0.025 μg/ml for S.aureus (normal) and 0.053 μg/ml for S.aureus (MDR), respectively. These nanoparticles were also found to be substantially effective against human colon cancer cell lines HCT-116, with an IC50 value of 0.069 μg/ml. Fur-ther optimization is needed in order to assess the anti-cancer properties of as synthesized AgNPs.
ACKNOWLEDGEMENTS
Authors acknowledge the support of National College (Autonomous) for providing all the necessary facilities to carry out this research work.
REFERENCESAlshaye, N.A., Elobeid, M.M., Alkhalifah, D.H. and Moham-med, A.E., (2017). Characterization of Biogenic Silver Nanopar-ticles by Salvadora persica Leaves Extract and its Application Against Some MDR Pathogens E. coli and S. aureus. Research Journal of Microbiology, 12, pp.74-81.
Baharara, J., Ramezani, T., Hosseini, N. and Mousavi, M., (2018). Silver Nanoparticles Synthesized Coating with Zataria multifl ora Leaves Extract Induced Apoptosis in HeLa Cells Through p53 Activation. Iranian journal of pharmaceutical research: IJPR, 17(2), p.627.
Christopher, P., Xin, H. and Linic, S., (2011). Visible-light-enhanced catalytic oxidation reactions on plasmonic silver nanostructures. Nature chemistry, 3(6), p.467.
Dieckmann, Y., Cö lfen, H., Hofmann, H. and Petri-Fink, A., (2009). Particle size distribution measurements of manga-nese-doped ZnS nanoparticles. Analytical chemistry, 81(10), pp.3889-3895.
Elsalam, S.S.A., Taha, R.H., Tawfeik, A.M., El-Monem, M.O.A. and Mahmoud, H.A., (2018). Antimicrobial Activity of Bio and Chemical Synthesized Cadmium Sulfi de Nanoparticles. Egyp-tian Journal of Hospital Medicine, 70(9).
El-Chaghaby, G.A. and Ahmad, A.F., (2011). Biosynthesis of silver nanoparticles using Pistacia lentiscus leaves extract and investigation of their antimicrobial effect. Oriental Journal of Chemistry, 27(3), p.929.
Fatemi, M., Mollania, N., Momeni-Moghaddam, M. and Sad-eghifar, F., (2018). Extracellular biosynthesis of magnetic iron oxide nanoparticles by Bacillus cereus strain HMH1: Charac-terization and in vitro cytotoxicity analysis on MCF-7 and 3T3 cell lines. Journal of biotechnology, 270, pp.1-11.
Fissan, H., Ristig, S., Kaminski, H., Asbach, C. and Epple, M., (2014). Comparison of different characterization methods for nanoparticle dispersions before and after aerosolization. Ana-lytical Methods, 6(18), pp.7324-7334.
Ghiua, I., Cristea, D., Croitoru, C., Kost, J., Wenkert, R., Vyrides, I., Anayiotos, A. and Munteanu, D., (2018). Characterization and antimicrobial activity of silver nanoparticles, biosynthe-sized using Bacillus species. Applied Surface Science, 438, pp.66-73.
Gomaa, E.Z., (2017). Silver nanoparticles as an antimicrobial agent: A case study on Staphylococcus aureus and Escherichia coli as models for Gram-positive and Gram-negative bacte-ria. The Journal of general and applied microbiology, 63(1), pp.36-43.
Gurunathan, S., Qasim, M., Park, C., Yoo, H., Kim, J.H. and Hong, K., (2018). Cytotoxic Potential and Molecular Pathway Analysis of Silver Nanoparticles in Human Colon Cancer Cells HCT116. International journal of molecular sciences, 19(8), p.2269.
Hassaan, M.A. and Hosny, S., (2018). Green Synthesis of Ag and Au Nanoparticles from Micro and Macro Algae-Review. Inter-national Journal of Atmospheric and Oceanic Sciences, 2(1), p.10.
Huang, Y., Fan, C.Q., Dong, H., Wang, S.M., Yang, X.C. and Yang, S.M., (2017). Current applications and future prospects of nanomaterials in tumor therapy. International journal of nanomedicine, 12, p.1815.
Jacob, S.J.P., Finub, J.S. and Narayanan, A., (2012). Synthesis of silver nanoparticles using Piper longum leaf extracts and its cytotoxic activity against Hep-2 cell line. Colloids and Sur-faces B: Biointerfaces, 91, pp.212-214.
Kishore, M., Abdulqader, A.T., Ahmad, H.S. and Hanuman-tharao, Y., (2018). Anticancer and antibacterial potential of green silver nanoparticles synthesized from Maytenus senega-

Mohd Haseeb et al.
BIOSCIENCE BIOTECHNOLOGY RESEARCH COMMUNICATIONS ANTICANCER AND ANTIBACTERIAL POTENTIAL OF MDR 35
lensis (L.) leaf extract and their characterization. Drug Inven-tion Today, 10(4).
Mohammed, A.E., Al-Qahtani, A., Al-Mutairi, A., Al-Shamri, B. and Aabed, K.F., (2018). Antibacterial and Cytotoxic Poten-tial of Biosynthesized Silver Nanoparticles by Some Plant Extracts. Nanomaterials (Basel, Switzerland), 8(6).
Morones, J.R., Elechiguerra, J.L., Camacho, A., Holt, K., Kouri, J.B., Ramírez, J.T. and Yacaman, M.J., (2005). The bacteri-cidal effect of silver nanoparticles. Nanotechnology, 16(10), p. 2346.
Muthulakshmi, K., Uma, C., Sivagurunathan, P., Yoganathan, K. and Satheeshkumar, S., (2018). Extracellular, biosynthesis of silver nanoparticles using Enterobacter cloacae (mk163462) and their antibacterial activity against certain multidrug resist-ant pathogens. Journal of Pharmacognosy and Phytochemis-try, 7(6), pp.741-747.
Patra, N., Kar, D., Pal, A. and Behera, A., 2018. Antibacterial, anticancer, anti-diabetic and catalytic activity of bio-con-jugated metal nanoparticles. Advances in Natural Sciences: Nanoscience and Nanotechnology, 9(3), p.035001.
Präbst, K., Engelhardt, H., Ringgeler, S. and Hübner, H., (2017). Basic colorimetric proliferation assays: MTT, WST, and resa-zurin. Cell Viability Assays: Methods and Protocols, pp.1-17.
Rabinovich-Guilatt, L., Couvreur, P., Lambert, G., Goldstein, D., Benita, S. and Dubernet, C., (2004). Extensive surface studies help to analyse zeta potential data: the case of cationic emul-sions. Chemistry and Physics of Lipids, 131(1), pp.1-13.
Riehemann, K., Schneider, S.W., Luger, T.A., Godin, B., Fer-rari, M. and Fuchs, H., (2009). Nanomedicine—challenge and perspectives. Angewandte Chemie International Edition, 48(5), pp.872-897.
Saeb, A., Alshammari, A.S., Al-Brahim, H. and Al-Rubeaan, K.A., (2014). Production of silver nanoparticles with strong and stable antimicrobial activity against highly pathogenic and multidrug resistant bacteria. The Scientifi c World Jour-nal, 2014.
Sarker, S.D., Nahar, L. and Kumarasamy, Y., (2007). Microtitre plate-based antibacterial assay incorporating resazurin as an indicator of cell growth, and its application in the in vitro antibacterial screening of phytochemicals. Methods, 42(4), pp.321-324.
Sheikh, E., Bhatt, M.B. and Tripathi, M., (2018). Bio-based syn-thesised and characterized monodispersed Curcuma longa sil-ver nanoparticles induce targeted anticancer activity in breast cancer cells. Pharmacognosy Magazine, 14(57), p.340.
Shrivastava, S., Bera, T., Singh, S.K., Singh, G., Ramachand-rarao, P. and Dash, D., (2009). Characterization of antiplatelet properties of silver nanoparticles. ACS nano, 3(6), pp.1357-1364.
Singh, H., Du, J., Singh, P. and Yi, T.H., (2018). Ecofriendly synthesis of silver and gold nanoparticles by Euphrasia offi ci-nalis leaf extract and its biomedical applications. Artifi cial cells, nanomedicine, and biotechnology, 46(6), pp.1163-1170.
Singh, H., Du, J., Singh, P. and Yi, T.H., (2018). Extracellular synthesis of silver nanoparticles by Pseudomonas sp. THG-LS1. 4 and their antimicrobial application. Journal of pharmaceuti-cal analysis, 8(4), pp.258-264.
Singh, H., Du, J., Singh, P. and Yi, T.H., (2018). Role of green silver nanoparticles synthesized from Symphytum offi cinale leaf extract in protection against UVB-induced photoag-ing. Journal of Nanostructure in Chemistry, 8(3), pp.359-368.
Sudheer Khan, S., Bharath Kumar, E., Mukherjee, A. and Chan-drasekaran, N., (2011). Bacterial tolerance to silver nanoparti-cles (SNPs): Aeromonas punctata isolated from sewage envi-ronment. Journal of basic microbiology, 51(2), pp.183-190.
Tomaszewska, E., Soliwoda, K., Kadziola, K., Tkacz-Szczesna, B., Celichowski, G., Cichomski, M., Szmaja, W. and Grobelny, J., (2013). Detection limits of DLS and UV-Vis spectroscopy in characterization of polydisperse nanoparticles colloids. Jour-nal of Nanomaterials 13, p.60.
Veerasamy, R., Xin, T.Z., Gunasagaran, S., Xiang, T.F.W., Yang, E.F.C., Jeyakumar, N. and Dhanaraj, S.A., 2011. Biosynthesis of silver nanoparticles using mangosteen leaf extract and evalua-tion of their antimicrobial activities. Journal of Saudi Chemical Society, 15(2), pp.113-120.
Yah, C.S. and Simate, G.S., 2015. Nanoparticles as potential new generation broad spectrum antimicrobial agents. DARU Journal of Pharmaceutical Sciences, 23(1), p.43.
Zweifel, U.L. and Hagstrom, A., 1995. Total counts of marine bacteria include a large fraction of non-nucleoid-containing bacteria (ghosts). Applied and Environmental Microbiol-ogy, 61(6), pp.2180-2185.

Investigations on the development of biodegradable
nanoparticles for anti-cancer drug
Seyed Goodarz Fallah Vahdati
Department of Doctoral Pharmacy, Mazandaran University of Medical Sciences (Mazums) Sari, Iran
ABSTRACT
In this research study, it has been attempted to synthesize mPEG-PCL dual copolymers and use their nanoparticles for tamoxifen anticancer drug delivery. Tamoxifen is a non-steroidal anti-estrogen that also has weak estrogenic effects. Tamoxifen is used to treat breast cancer and infertility dependent on oligomenorrhea or secondary amenorrhea. This drug inhibits estradiol receptors and, using it, ovulation involves the occupation of estrogen receptors and eliminates the inhibitory effect of the hormone and thereby stimulates the release of the gonadotrophin-releasing hormone from the hypothalamus. In order to increase the local concentration of tamoxifen in Estrogen Receptor (ER) positive breast cancer, we have prepared and characterized nanoparticle formulation using methoxy poly (ethylene glycol) –Poly (-caprolactone) (mPEG-PCL). In this study, PEG-PCL copolymers were synthesized from mPEG and -caprolactone (-CL) using Sn(oct)2 as catalyst by ring opening polymerization. The copolymers were prepared and characterized by 1H-NMR, FTIR, DSC and GPC. From the results, it was clear that nanoparticles showed sustained release behavior for a long period of time. These results suggest that the nanostructure of mPEG-PCL nanoparticles can be used as a promising candidate for sustained release of tamoxifen.
KEY WORDS: NANOPARTICLES, MPEG-PCL, TAMOXIFEN, CONTROLLED DRUG DELIVERY
36
Medical CommunicationBiosci. Biotech. Res. Comm. 12(1): 36-45 (2019)
INTRODUCTION
Nanotechnology has enormous potential in various fi elds, used in the development of insecticides, pharma-ceuticals (Manjili et al, 2018), and electronics. Nowa-days, nanoparticles have found widespread use that
can be mentioned in several ways: dermal delivery, as antimicrobial and anticancer agents, carries peptide and protein medications such as insulin, as well as carriers of anti-infl ammatory and respiratory drugs. Also, some biodegradable polymer-derived drug delivery systems, such as nanoparticles delivering anticancer agents, are
ARTICLE INFORMATION:
Corresponding Author: [email protected] 27th Dec 2018Accepted after revision 25th March 2019BBRC Print ISSN: 0974-6455Online ISSN: 2321-4007 CODEN: USA BBRCBA Thomson Reuters ISI ESC / Clarivate
Analytics USAMono of Clarivate Analytics and Crossref Indexed Journal Mono of CR
NAAS Journal Score 2019: 4.31 SJIF: 4.196© A Society of Science and Nature Publication, Bhopal India 2019. All rights reserved.Online Contents Available at: http//www.bbrc.in/DOI: 10.21786/bbrc/12.1/5
BIOSCIENCE BIOTECHNOLOGY RESEARCH COMMUNICATIONS INVESTIGATIONS ON THE DEVELOPMENT OF BIODEGRADABLE NANOPARTICLES FOR ANTI-CANCER DRUG 37
Seyed Goodarz Fallah Vahdati
commercially available (Sajadi Tabassi, 2012). PCL-PEG-PCL is a thermo- sensitive copolymer which is more fl ex-ible than PCL-PEG diblock copolymer for drug loading and drug delivery, (Kesente, 2017, Zamani et al, 2018).
Biodegradable polymeric materials are ideal car-rier systems for biomedical applications. Features like controlled and sustained delivery, improved drug phar-macokinetics, reduced side effects and safe degradation make the use of these materials very attractive in a lot of medical fi elds, with dermatology included (Bunker, 2012). Biodegradable polymers have several advantages over non-biodegradable polymers for controlled drug delivery. It does not require surgical use after use, which is the most important advantage in a drug that has no surgical complications. Natural and synthetic biodegrad-able polymers have good properties, such as biocompat-ibility, biodegradability and high mechanical resistance. They have a negligible toxicity, and their destruction is non-toxic. Due to their mechanical properties, they are suitable for a wide range of specifi cations. Natural bio-degradable polymers such as gelatin, albumin, chitosan, hyaluronic acid, and biodegradable synthetic polymers such as Poly(-caprolactone) PCL, PEO, and aliphatic thermoplastic polyester, such as Poly(lactic acid) and poly(lactid-co-glycolid), are fully investigated for drug delivery systems, (Verhoef, 2013).
Polyethylene glycol is a non-ionic polyether that has excellent biocompatibility. Ethylene oxide is non-toxic and approved by the FDA. Polyethylene glycol is a neu-tral polymer with end hydroxyl groups that has poor hydrogen bands, PEG molecules can be added to drug carriers through a number of different routes, including covalently.When PEG is covalently attached to the pro-tein, it is biologically stored, and when linked to cova-lently, PEG can help solubilize other molecules. PEG is soluble in water and a few organic solvents. One of the biggest benefi ts of PEG for drug delivery systems is its ability to stay long in the body (Jenkins et al, 2016). Poly (ethylene glycol) (PEG) has been used on the outer surface of polymeric micelles, due to its benefi cial char-acteristics of pharmacokinetic of the micelles; i.e., long-circulating characteristics and signifi cant tumor accu-mulation. Considering its properties such as nontoxicity, hydrophilicity, solubility in water and organic solvents, and absence of antigenicity and immunogenicity, PEG could be used for many clinical applications (Kelley et al, 2016).
Polycaprolactone is an aliphatic polyester and its monomeric form -caprolactone is a biodegradable and biodegradable, non-toxic polymer having a semi-crys-talline structure and a melting point of about 59-64° C, hydrophobic, as well as a low glass transition tem-perature of about -60 °C, is also synthesized by loop polymerization, (Danafar et al, 2012).
Copolymers are in fact polymers that are polymerized by two or more different monomers and have differ-ent properties of homopolymers. Today, due to the vari-ous properties of copolymers, attention has been paid to their application in various fi elds, especially drug delivery. Among these copolymers, it can be noted that mPEG-PCL copolymers can, due to the duality, create a variety of polymer particles by varying the proportion of hydrophobic to hydrophilic. The obvious properties of these copolymers are their biodegradability, which in the body turns into nontoxic absorbent metabolites. These properties have made these polymers a lot of potential for applications in areas of nanotechnology, tissue engi-neering and drug chemistry. The nanoparticles obtained by these copolymers, due to their core-shell property, have the potential to store the drug in the nucleolar nucleus (PCL) and the shell (PEG) has a dual role in par-ticle stabilization and bioassay distribution. This copoly-mer is used to create drug carrier systems, slow release. Copper mPEG-PCL is used with dual-mode behavior to form core-shell core membranes. This polymer carrier, as a carrier of hydrophobic drugs, increases circulation time in the blood and reduces the absorption of nano-particles by the liver, (Rychter et al, 2018).
Copolymer PCL-PEG-PCL was synthesized by loop polymerization method at 120 ° C and 24 hours by Keng-Lun Chang et al (Rychter et al, 2018). Then, the copolymer nanoparticles were used as a lauric acid carrier for the treatment of acne vulgaris. The size of the nanoparticles was about 24-24 nm. Hiremath in a research paper, prepared polyacroclactone injectable microspheres loaded with tamoxifen by solvent evapo-ration and in the presence of surfactant (PVA) for the treatment of breast cancer. They produced microspheres with a percentage of surfactant 0.4% and 0.8% with var-ying levels of tamoxifen and pcl. When 0.4% PVA was used, the mean size of 44-48 nm and the loading rate of the drug in microspheres were higher compared with 0.8% PVA was used, the size of the microspheres was 26-28 nm and the drug loading was lower than the fi rst one. This is due to the reduction in the tension between the organic phase and the blue phase during the fabrica-tion of nanoparticles and the increase in viscosity in the fi nal blue phase.
Copolymer mPEM-PCL was synthesized by Wichuda et al (2011) using methoxypoly (ethylene glycol) and poly (caprolactone) and the Sn (Oct) 2 catalyst, and the nano-particles of this copolymer were prepared using nano-tube and without any surfactant preparation. Became According to TEM analysis, spherical nanoparticles have a smooth surface. The mean particle size and glass tran-sition temperature decreased and the melting tempera-ture signifi cantly increased with increasing mPEG / PCL ratio. Authors have reviewed the two drugs Ibuprofen

38 INVESTIGATIONS ON THE DEVELOPMENT OF BIODEGRADABLE NANOPARTICLES FOR ANTI-CANCER DRUG BIOSCIENCE BIOTECHNOLOGY RESEARCH COMMUNICATIONS
Seyed Goodarz Fallah Vahdati
and Indomethacin in PCL-PEG-PCL triloclopropylmer nanoparticles and the effect of nicotinic acid on the pro-duction of nanoparticles. Increasing the amount of nico-tinic acid increases the particle size and increases the hydrophobicity of the polymer, increasing drug loading for both drugs compared to nicotine-free nanoparticles. Shakiba et al (2017) in a study to achieve the controlled release of ATRA, PCL-PEG-PCL copolymer with aver-age molecular weight of 5.34 kDa was synthesized. The nanosized micelles were prepared from copolymer by nano-precipitation method. In the case of 10% drug to polymer ratio, more than 80% of the drug was released within 3 days, whereas for ratio of 2% more than 90% of the drug was released within 3 h. The cytotoxic study performed by MTT assay showed that H1299 survival percent decreased signifi cantly (P≤0.05) after exposure to drug-loaded micelles, while no proliferation inhibi-tion effect was observed by either free ATRA or blank PCL-PEG-PCL micelles.
Gavasane and Pawar (2014) believed that polymers are becoming increasingly important in the fi eld of drug delivery. The pharmaceutical applications of polymers range from their use as binders in tablets to viscosity and fl ow controlling agents in liquids, suspensions and emulsions. Polymers are classifi ed as biodegradable and nonbiodegradable. Biodegradable polymers have been widely used in biomedical applications because of their known biocompatibility and biodegradability. The pre-sent communication gives an overview of the different biodegradable polymers that are currently being used in the development of controlled drug delivery system.
MATERIALS AND METHODS
Stannous 2-ethyl-hexanoate [Sn (Oct) 2], Dichlorometh-ane, Petroleum ether, Chloroform, Ethanol, Methanol, Acetone, -Caprolactone, Methoxyethylene glycol, Tet-rahydrofuran, Methoxyethylene oxide, Calcium Hydride, PVA, all of which were used with high purity from Merck and Sigma, and also tamoxifen citrate from Iran Hor-mone Inc. The copolymer of mPEG-PCL was synthesized by loop-polymerization of caproclactone-free monomer in the presence of dry methoxy-polyethylene glycol as a primer and catalysts of tinctanate (reaction 1).
In this way, the amount of 3 g of mPEG (MW = 5000) is introduced into a balloon of a span and dried under vacuum and at a temperature of 80 ° C for 24 hours.
The 6 g is taken from a monomeraproclactone in a balloon for 1 week in its calcium hydrogen hydride after the end of the desired period by the Buchner funnel and the vacuum pump. mPEG and caprolactone in a spatula, then add the Sn (oct)2 catalyst at 0.01 milloles per mMEG of mPEG hydroxyl group to the contents of the balloon. Then the vacuum balloon is placed in the bath of oil.
Under nitrogen atmosphere and magnetic stirring, the reaction temperature was adjusted to 150 ° C and the reaction time was allowed for 12 hours. Then cool the system, dissolve the copolymer into chloroform, and dissolve in cold ether. Collect the precipitate with fi lter paper and dry it.
Reaction (1) mPEG-PCL Copolymer Synthesis Route
Analysis of copolymers mPEG-PCL
1HNMR has been used to determine the copolymer structure of mPEG-PCL. 1HNMR spectra were taken with Bruker 400MHz device at 25 ° C. Dieter chloro-form (CDCL3) has been used as solvent and tri-methyl ketone (TMS) as the internal standard. The spectra taken in (CDCL3) were used to determine the molecular weight of synthetic copolymers by using sub-surface integra-tion of various chemical groups. The ratio of lactone to ethylene glycol in synthetic copolymer can be calculated using Equation 1.
(1)
In this equation, Ia is the integral of the subliminal sur-face associated with PCL, which appears in the range of 1.5-1.6 ppm in the spectrum, and Ie is the integral of the PEG methylene group substrate, which is about 3.6-3.7 ppm, is observed.
When the PCL / EO ratio is synthesized in copolymer, PCL polymerization degree is calculated by consider-ing the degree of polymerization of PEG starting from Equation 2. Finally, the molecular mass of copolymer is obtained using equation 3.
(2)
(3)
FT-IR Infrared Spectroscopy
To confi rm the mPEG-PCL copolymer formation, the FT -IR spectrum has been used. The FT-IR spectra of various specimens were recorded using a Bruker spectrometer (FT-IR).
Gel Permeation Chromatography (GPC)
The average molecular mass and mPEG-PCL copolymer molecular mass distribution are analyzed by chroma-tographic gel analysis. For the GPC analysis, the Ger-man Knauer machine was used. The sample was com-pletely dissolved in pure tetrahydrofuran and, after

BIOSCIENCE BIOTECHNOLOGY RESEARCH COMMUNICATIONS INVESTIGATIONS ON THE DEVELOPMENT OF BIODEGRADABLE NANOPARTICLES FOR ANTI-CANCER DRUG 39
Seyed Goodarz Fallah Vahdati
being injected into the column, and compared with the calibration graph, drawn using standard polystyrene; the molecular mass and the synthesized PolyDispersity copolymer were calculated.
Differential Scaling Calorimeter (DSC)
DSC analysis was used to study the thermal behavior of mPEG-PCL copolymers and their nanoparticles. The samples were heated at a temperature of 10 °C / min and measured in a range of 25-200 °C using a Mettler Toledo, Star SW 9.30, manufactured by England.
Analysis of the morphology of nanoparticles by Scanning
Electron Microscopy (SEM)
SEM (Scanning Electron Miroscopy) is used to capture specimens. In this way, a layer of gold is placed on the sample and the electron beam is emitted. Then, they shrink two or three electron beam concentrating lenses so that when they come in contact with the specimen diameter it is between 10-2 nm. Then several pictures are taken from the sample. For SEM imaging, the XL30 was used as an XL series manufactured by Philips and Hitachi S4160 Cold Field Emission.
Study of drug release in vitro at pH = 40.5
To study drug release, place 10 mg of suspension of nanoparticles in 2 ml of buffer and place in a 12000 cut off bag and place it in a container containing 13 ml phosphate buffer (pH = 4.50). Place the bag containing
the dialysis bag in a 37-°C chiccroncobacterial device and remove 1 ml from the outer solution of the dialysis bag at specifi ed times, and replaced with fresh buffer, and the amount of drug released by the UV spectropho-tometer measured at 250 nm wavelengths. Each of the measurements is repeated three times, and the average of these three data is used to calculate the amount of drug released.
RESULTS AND DISCUSSION:
Investigating the FT-IR spectrum of the mPEG-PCL
copolymer
In Fig. 1, the FT-IR spectrum of mPEG-PCL is shown. From the mPEG-PCL Copolymer FT-IR spectrum, it can be seen that the absorption band at the frequency of 1108 cm-1 and 1240 is related to the tensile bond (C-O). The sharp and severe absorbing strip at a frequency of 1722 cm-1 shows the existence of steric carbonyl groups (C = O), indicating the formation of mPEG-PCL copoly-mer. Methylene hydrone (-CH2-) adsorb two C-H adsor-bents, which are related to the symmetric and asymmet-ric adsorbent adsorption, which absorbs the fi rst in 2869 cm-1 and the second in 2943 cm-1
Investigating the 1HNMR spectrum of mPEG-PCL
copolymer
After reviewing the raw materials used in synthesis to confi rm the synthesis of copolymer, the structure. As
FIGURE 1. FT-IR spectrum of mPEG-PCL copolymer

40 INVESTIGATIONS ON THE DEVELOPMENT OF BIODEGRADABLE NANOPARTICLES FOR ANTI-CANCER DRUG BIOSCIENCE BIOTECHNOLOGY RESEARCH COMMUNICATIONS
Seyed Goodarz Fallah Vahdati
FIGURE 2. The DSC Spectrum of Mpeg-PCL copolymer, it appears in the peak temperature range at 40.3 °C, which can be attributed to the crystallization temperature of PEG.
can be seen, the peak in the area of 3.38 ppm and 3.64 is related to the methoxy group and the methyl group PEG. Peak 1.3 ppm (2H, g), 1.6 ppm (4H, f), 2.2 ppm (2H, e), ppm 4.06 (2H, h) 3.4 ppm (3H,a) respectively cor-responding to group -(CH2) 3 -,(- (CH2) 2-OCCH2-) - and (-CH2OOC-) caprolactone. The weight of the molecular weight calculated with 1HNMR is 21000 g / mol.
Investigating the Differential scanning calorimeter
(DSC) spectrum of mPEG-PCL copolymer
Thermal analysis can be defi ned as measuring the prop-erties of a polymer sample against temperature varia-tions. The most important and fi nal factor in the study of polymers is to measure and measure their thermal stability. Usually weight loss is used to measure thermal stability. Weight variations are recorded against a rise in temperature or against a rise in time at constant tem-perature. Differential Schematic Thermometry (DSC) is a method in which the difference in thermal energy input to the sample and reference material is measured as a function of temperature. The mPEG-PCL copolymer DSC shows in Fig. 2, the peak of the sample is in the range of 67.42 °C, which is a thermoforming courier. Previous studies have shown that PEG and PCL hemopolymers, both of which are semi-crystalline polymers, have a melting point of 62 °C and 60 °C, respectively. However, in the copolymer spectrum, the thermal event belongs to the melting point of PEG and PCL. In addition, it appears in the peak temperature range at 40.3 °C, which can be attributed to the crystallization temperature of PEG.
Investigating the GPC spectrum associated with mPEG-
PCL copolymer
The molecular mass of the weighted mass and molecular weight distribution of mPEG-PCL copolymer is investi-gated by analysis of gel chromatography. The sample is dissolved in the tetrahydrofuran and, after being injected into the column, and compared to the calibration graph compiled using standard polystyrene, the molecular mass and the synthesized poly-dispersed copolymer are calculated. The molecular mass distribution diagram is indicated in Fig. 3, which represents a peak at 7.02 sec-onds after sampling. After placing this time on the Exell chart, the value of mPEG = 5000 g / mol is the mass of the molecular weight of 24663 g/ mol.
Analysis and measuring the size of the nanoparticles
At this stage, after preparing the nanoparticles, the size of the nanoparticles prepared from the DLS sam-ple was taken. According to the measurement of the size of the nanoparticles (Fig. 4), the mean particle size without drug loading was 184.4 nm with PDI = 0.418 obtained.
The average size of the polymer nanoparticles that was loaded onto the drug was investigated by the par-ticle size chart, shown in Fig. 5. According to the size chart of nanoparticles, the average nanoparticle size of 151.7% was obtained with PDI = 0.328. Due to the lack of drug-loading nanoparticles at 184.4 nm, drug loading has not signifi cantly changed the size of the nanoparti-cles, which can be a reason for absorbing the drug into nanoparticles.

BIOSCIENCE BIOTECHNOLOGY RESEARCH COMMUNICATIONS INVESTIGATIONS ON THE DEVELOPMENT OF BIODEGRADABLE NANOPARTICLES FOR ANTI-CANCER DRUG 41
Seyed Goodarz Fallah Vahdati
FIGURE 3. GPC Spectra of Mpeg-PCL copolymer, which represents a peak at 7.02 seconds after sampling.
FIGURE 4. The curve of the size of polymerized nanoparticles synthesized without loading the drug, a) numerically, b) in intensity
SEM Analysis of Polymer Nanoparticles Loaded with
Tamoxifen
The morphology of nanoparticles was investigated using SEM and its images are depicted in Fig. 6.After the prep-aration of nanoparticles loaded with tamoxifen, a SEM
photo was taken, depicted in Figure 6. The SEM image shows that nanoparticles have a spherical shape and approximately one shape with a size of 234 nm. As can be seen, the average size of nanoparticles from a photo-graphed image is well-matched with the size of the DLS.

42 INVESTIGATIONS ON THE DEVELOPMENT OF BIODEGRADABLE NANOPARTICLES FOR ANTI-CANCER DRUG BIOSCIENCE BIOTECHNOLOGY RESEARCH COMMUNICATIONS
Seyed Goodarz Fallah Vahdati
FIGURE 6.
FIGURE 5. The size of nanoparticles loaded with tamox-ifen (a) in numerical order b) in intensity
FT-IR spectra of polymeric nanoparticles mPE-PCL
loaded with tamoxifen
Regarding the structure of tamoxifen citrate (Fig. 7) and the FT-IR spectrum, the average absorption bands in 1590 cm-1 and 1471 cm-1 are related to the aromatic ring group. Absorption band in 2828 cm-1 of the unsaturated stretch C-H3 group, absorption band of 2960 cm-1 of the CH3 group. The 1217 cm-1 band represents the tensile C-O group, and the 1300 cm-1 band represents the C-N stretching group. The band in the 703 cm-1 region of the
FIGURE 7. The structure of tamoxifen citrate
FIGURE 8. FT-IR spectrum of tamoxifen citrate
Ortho substrate and the 3010 cm-1 band represents the OH strain group (Fig. 8)
Comparison of the range of nanoparticles loaded with the mPEG-PCL copolymer spectrum and tamoxifen spec-trum showed drug loading in nanoparticles. The existence of a band of 1602 cm -1 shows the aromatic ring in both of the two spectra of tamoxifen and nanoparticles. The 1728 cm-1 band in two spectra of copolymer and nanoparticles represents the carbonyl tensile group. The 1300 cm-1 band is available in two spectra of tamoxifen and nanoparticles that specify the C-N group. The C = O group has a tensile strength of 1217 cm -1 in two spectra of tamoxifen and nanoparticles. The presence of bands of 2868 cm-1 and 2940 cm-1 in two spectra of copolymers and nanoparticles, indicating methylene tensile CH groups. The results from the following spectrum (Figure 9) showed that tamoxifen drug was loaded onto polymer nanoparticles.
DSC spectrum of tamoxifen citrate
The DSC for tamoxifen shows that the peak from the specimen is in the range of 145.43 °C, which is a ther-mosetting peak and represents the melting point of tamoxifen citrate (Figure 10).
Tamoxifen measurement
Figure 11 shows the tamoxifen curve at a maximum wavelength of 250 nm. Which shows very good linear citizenship of the concentration of tamoxifen with its adsorption in an organic environment. The linear equa-

BIOSCIENCE BIOTECHNOLOGY RESEARCH COMMUNICATIONS INVESTIGATIONS ON THE DEVELOPMENT OF BIODEGRADABLE NANOPARTICLES FOR ANTI-CANCER DRUG 43
Seyed Goodarz Fallah Vahdati
FIGURE 9. FT-IR Spectrum of Nanoparticles
FIGURE 10. DSC spectrum of tamoxifen citrate
FIGURE 11. Calibration curve for tamoxifen citrate at = 250 nm
tion obtained from this graph has been used to estimate the concentration of tamoxifen in assessing the drug loading rate in the drug release analysis.
Determination of tamoxifen loading and encapsulation
in mPEG-PCL copolymer micelles according to the
calcifi cation curve of tamoxifen
According to the following calculations, the amount of drug loaded and encapsulated was 12.909% and 70.025%,
respectively. The reason for loading the drug in tamoxifen in the hydrophobic nucleus of the nanoparticles (the PCL portion) is the hydrophobic nature of the drug.
According to the following calculations, if the per-centage of precipitation of nanoparticles loaded with

44 INVESTIGATIONS ON THE DEVELOPMENT OF BIODEGRADABLE NANOPARTICLES FOR ANTI-CANCER DRUG BIOSCIENCE BIOTECHNOLOGY RESEARCH COMMUNICATIONS
Seyed Goodarz Fallah Vahdati
tamoxifen is 100%, the theoretical loading of the drug should be about 16.66%.
in 2963 cm-1 representing ethylene groups of PEG that can confi rm copolymer synthesis. The results of mPEG-PCL copolymer synthesis showed that the copolymer was completely synthesized. The DSC of mPEG-PCL copoly-mer indicates that the sample courtesy is in the range of 67.42 ° C, which is a thermosetting peak and represents the melting point of PCL and PEG.
The polymer was used to make biodegradable nano-particles based on polyethylene glycol and polycaprol-actone. Copolymer micelles mPEG-PCL were prepared by single emulsion method and tamoxifen drug was loaded. The particle size was about 151.7 nm and particle zeta potential was 13.9 mv. The drug loading effi ciency in nanoparticles and the drug release profi le in vitro were measured by UV spectroscopy.
The results showed that the loading and encapsu-lated drug was 12% and 70%, respectively, indicating high drug loading in nanoparticles. Data from drug release from nanoparticles in different environments also showed that the drug was controlled and released from nanoparticles over a long period of time. Over-all, it can be concluded from the current research that pharmaceutical-containing mPEG-PCL nanoparti-cles can be considered as a good option for controlled release and tamoxifen in the treatment of cancer. Gener-ally, the results of this research work provide valuable information for the development of new pharmaceuti-cal systems and the production of high-strength poly-mers and a higher volume-to-volume ratio in the struc-ture of nano-materials, especially mPEG-PCL-based nanoparticles.
REFERENCES
Alex Bunker (2012). Poly (Ethylene Glycol) in Drug Delivery, Why Does it Work, and Can We do Better? All Atom Molecular Dynamics Simulation Provides Some Answers. Physics Proce-dia. Volume 34, 2012, Pages 24-33.
Chao. C, Ming. H, Chun. H. (2011) The Nanoparticles for Com-bating Acne Vulgairs: In-vitro Effi cacy of Lauric Acid- Loaded PCL-PEG-PCL on Propion bactrium acne, International Con-ference on Nanotechnology and Biosensors, IPCBEE 2 (2011) IACSIT Press, Singapore.
Chen, Y., Chen, X., Chen, Y., Wei, H., Lin, S., Tian, H. Gu, X. (2018). Preparation, characterisation, and controlled release of sex pheromone-loaded MPEG-PCL diblock copolymer micelles for Spodoptera litura (Lepidoptera: Noctuidae). PLoS ONE, 13(9), e0203062. http://doi.org/10.1371/journal.pone.0203062
Danafar H, Rostamizadeh K, Davaran S, Hamidi M. Prepara-tion and characterization of PLA-PEG-PLA tri-block copoly-mer polymersomes as a novel carrier for lisinopril. Res Pharm Sci. 2012;7(5):S398.
Ebrahim Shakiba, Saeedeh Khazaei, Marziyeh Hajialyani, Bandar Astinchap, Ali Fattahi (2017). Preparation and in vitro characterization of retinoic acid-loaded poly(-caprolactone)-
FIGURE 12. The graph of drug release from nanoparti-cles at pH = 7.40 contains tween 80
Based on the results obtained and the proximity of theoretical and empirical results, the degree of encap-sulation of the drug in nanoparticles is determined. The mPEG-PCL nanoparticles show a high ability to encap-sulate tamoxifen.
Reviewing the drug release pattern from nanoparticles
synthesized at pH = 7.40
Figure 13 shows the release of tamoxifen from nano-particles of mPEG-PCL in a phosphate buffer with pH = 7.40 contain thiamine. Tamoxifen citrate is a highly hydrophobic drug. Therefore, phosphate buffer contain-ing 0.01 (w / v) Tween 80 was used to increase the solu-bility of the drug. According to the chart, in the fi rst 72 hours, 9.82% of the tamoxifen drug was released from the nanoparticles.
In this research work, it was fi rst mPEG-PCL polymer in the laboratory synthesized. Subsequently, nanoparticles containing tamoxifen were prepared by a single emulsion method, after which the size and surface profi le of them were evaluated. Finally, drug release from nanoparticles was investigated at various pH levels. In this collaborative research, mPEG-PCL copolymer was synthesized with a mPEG / PCL ratio of 1.3, and its structure and composi-tion were confi rmed by 1HNMR and FT-IR. The thermal behavior of copolymer synthesized by DSC was investi-gated and the molecular mass of the copolymer synthe-sized by GPC was determined. In the FT-IR spectrum, the mPEG-PCL copolymer exhibits a sharp absorption band at a frequency of 1722 cm-1, which confi rms the presence of carbonyl steary groups (C = O) and shows a severe peak

BIOSCIENCE BIOTECHNOLOGY RESEARCH COMMUNICATIONS INVESTIGATIONS ON THE DEVELOPMENT OF BIODEGRADABLE NANOPARTICLES FOR ANTI-CANCER DRUG 45
Seyed Goodarz Fallah Vahdati
poly(ethylene glycol)-poly(-caprolactone) micelles . Research in Pharmaceutical Sciences, December 2017; 12(6): 465-478
Gavasane AJ, Pawar HA (2014) Synthetic Biodegradable Poly-mers Used in Controlled Drug Delivery System: An Overview. Clin Pharmacol Biopharm 3:121.doi:10.4172/2167-065X. 1000121
Hiremath. G.J, kusm. D.V. Tamoxifev. Loaded poly(-caprolactone) based injectable microspheres for breast cancer, International Journal of Pharmacy and Pharmaceutical Sci-ences. 2 (2010) 0975-1491.
Jenkins SI, Weinberg D, Al-Shakli AF, Fernandes AR, Yiu HHP, Telling ND, Roach P, Chari DM (2016). ‘Stealth’ nanoparticles evade neural immune cells but also evade major brain cell populations: Implications for PEG-based neurotherapeutics. J Control Release. 2016 Feb 28;224:136-145. doi: 10.1016/j.jconrel.2016.01.013. Epub 2016 Jan 11.
Kesente, M., Kavetsou, E., Roussaki, M., Blidi, S., Loupas-saki, S., Chanioti, S., Detsi, A. (2017). Encapsulation of Olive Leaves Extracts in Biodegradable PLA Nanoparticles for Use in Cosmetic Formulation. Bioengineering, 4(3), 75. http://doi.org/10.3390/bioengineering4030075
Manjili H K, Malvandi H, Mousavi M S, Attari E, Danafar H. In vitro and in vivo delivery of artemisinin loaded PCL–PEG–PCL micelles and its pharmacokinetic study. Artifi cial cells, nanomedicine, and biotechnology. 2018; 46(5), 926–936. 10.1080/21691401.2017.1347880
Gou M, Wei X, Men K, Wang B, Luo F, Zhao X, Wei Y, Qian Z PCL/PEG copolymeric nanoparticles: potential nanoplatforms for anticancer agent delivery. Curr Drug Targets. 2011 Jul 1; 12(8):1131-50.
Rancan, F., Blume-Peytavi, U., & Vogt, A. (2014). Utilization of biodegradable polymeric materials as delivery agents in der-matology. Clinical, Cosmetic and Investigational Dermatology, 7, 23–34. http://doi.org/10.2147/CCID.S39559
Rychter M, Baranowska-Korczyc A, Milanowski B, Jarek M, Maciejewska BM, Coy EL, Lulek J (2018). Cilostazol-Loaded Poly(-Caprolactone) Electrospun Drug Delivery System for Cardiovascular Applications. Pharm Res. 2018 Jan 16;35(2):32. doi: 10.1007/s11095-017-2314-0.
Sajadi Tabassi SA, Khodaverdi E, Hadizadeh F, Rashid R. Preparation of hydrogels based on inclusion complexes of the triblock copolymer PCL-PEG-PCL with -cyclodextrin (-CD). Res Pharm Sci. 2012;7(5):S975.
Syed A.A. Rizvia Ayman M. Saleh (2016). Applications of nanoparticle systems in drug delivery technology. Saudi Phar-maceutical Journal. Volume 26, Issue 1, January 2018, Pages 64-70
Suksiriworaponga. J, Sriphab. K, Kreuterc. J, Junyapraserta. V.B, (2012) Functionalized (poly(-caprolactone))2-poly(ethylene glycol) nanoparticles with grafting nicotinic acid as drug carriers, International Journal of Pharmaceutics. 423 562-570.
Verhoef, J. J. F., & Anchordoquy, T. J. (2013). Questioning the Use of PEGylation for Drug Delivery. Drug Delivery and Trans-lational Research, 3(6), 499–503.
Wichuda. N, Mangkorn. S-A, Yodthong. B. (2011) Biodegrad-able Blend Nanoparticles of Amphiphilic Diblock Copolymers Prepared by Nano-Precipitation Method, Journal of Biomateri-als and Nanobiotechnology. 2 561-566.

Overlap extension PCR to anneal multiple DNA
fragments for high-throughput double stranded RNAi
vector construction
K. Prasad Babu1,3*, M. Manamohan3 and M. Krishna Reddy2
1Division of Biotechnology, IIHR-ICAR, Hessaraghatta Lake Post, Hessaraghatta, Bangalore, India-5600892Division of Plant Pathology, IIHR-ICAR, Hessaraghatta Lake Post, Hessaraghatta, Bangalore, India-5600893Department of Biotechnology, Centre for post-graduate studies, Jain university, Bangalore, India
ABSTRACT
RNA interference is a sequence dependent gene silencing mechanism with huge potential in agriculture. Virus disease management has become a daunting task due to the lack of availability of resistant cultivars. In this scenario, RNAi mediated viral resistance has acquired importance. RNAi can be employed to silence the viral genes conferring virus resistance. Transformation of the host with an RNAi vector synthesizing hairpin RNA is a prerequisite. It is highly desir-able to develop multiple virus resistance due to the fact that, viruses counter the host RNAi by employing silencing sup-pressors there by leading to resistance breakdown. This can be addressed by targeting all the commonly infecting viruses along with viral slicing suppressors. This increases the complexity of RNAi vector construction as multiple fragments are involved to develop an ihp construct. OE(Overlap-Extension)-PCR is the method of choice due to its several advantages such as no extraneous sequences are incorporated unlike as in restriction based fragment joining and it is also simple and economical compared to other methods. In this experiment, we demonstrate the use of OE-PCR in the construction of an intron containing hairpin RNA synthesizing vector targeting seven genes from four viruses viz. that commonly to tomato and chilli for imparting multiple virus resistance viz. capsicum chlorosis virus, groundnut bud necrosis virus, cucumber mosaic virus and chilli veinal mottle virus. Seven viral gene fragments were joined together in to 1.64kb fragment by OE-PCR. The complete stretch was assembled into the pBI121 and mobilized in to Agrobacterium for transformation.
KEY WORDS: OVERLAP PCR, RNA INTERFERENCE, VIRUS RESISTANCE, AGROBACTERIUM
46
Biotechnological CommunicationBiosci. Biotech. Res. Comm. 12(1): 46-53 (2019)
ARTICLE INFORMATION:
Corresponding Author: [email protected] 29th Dec, 2018Accepted after revision 26th March, 2019 BBRC Print ISSN: 0974-6455Online ISSN: 2321-4007 CODEN: USA BBRCBA Thomson Reuters ISI ESC / Clarivate
Analytics USAMono of Clarivate Analytics and Crossref Indexed Journal Mono of CR
NAAS Journal Score 2019: 4.31 SJIF: 4.196© A Society of Science and Nature Publication, Bhopal India 2019. All rights reserved.Online Contents Available at: http//www.bbrc.in/DOI: 10.21786/bbrc/12.1/6

Babu, Reddy and Manamohan
BIOSCIENCE BIOTECHNOLOGY RESEARCH COMMUNICATIONS OVERLAP EXTENSION PCR TO ANNEAL MULTIPLE DNA FRAGMENTS 47
INTRODUCTION
Tomato (Solanum lycopersicum L.) and chilli (Capsi-cum annum) are commercially important vegetable crops grown globally. Virus management in these crops has been challenging in recent years due to intensive cultivation and spurt in the insect vectors population resulting in virus disease outbreak (Sastrosiswojo 1995; Umamaheswaran et al., 2003). Viral diseases caused by some major viruses like Tospovirus, Cucumovirus and Potyvirus results in immense economic loss in these crops productivity. Tospoviruses (capsicum chlorosis virus and groundnut bud necrosis virus) are negative single-stranded RNA virus, belongs to Bunyaviridae family and containing three genomic segments L, M and S, transmitted by thrips (Haan et al., 1990, 1991, Krishna Reddy et al., 2008). Cucumovirus (cucumber mosaic virus-CMV) is a positive sense single-stranded RNA virus belonging to family Bromoviridae (Palukaitis et al., 1992). Potyvirus (ChiVMV-chilli veinal mottle virus), belongs to the family Potyviridae, is a single molecule which is linear, positive-sense, single-stranded RNA (ssRNA). Potyvirus and cucumovirus are transmitted by insect vector aphids in a non-persistent manner (Berger et al., 2005). Current virus disease management involves prophylactics, roguing and insect vector control. Non availability of the resistance gene pools in most of the cultivated crops poses a serious hurdle in resistant breed-ing. In this regard RNA interference is highly promis-ing in imparting virus resistance (Simon-Mateo and García 2011, Duan et al., 2012; Li et al., 2106; Jia et al., 2017).
RNA interference is a natural antiviral defense sys-tem, degrades the RNA molecules in a sequence-specifi c manner and it is activated in response to double-stranded RNA formed during viral replication (Voinnet et al., 2001). RNAi mediated gene silencing involves, forma-tion of double-stranded RNA, so called “hairpin” RNA (hpRNA), formed by annealing of the reverse comple-mentary sequence at one half of the RNA, which is rec-ognized by and activates plant RNAi machinery leading to the degradation the viral RNA, fi nally plants recover-ing from viral infection. The expression of virus-specifi c dsRNA as hairpin structures renders the plants resistant against virus infection (Bonfi m et al., 2007). In plants, intron-mediated hairpin RNA (ihpRNA) by incorporat-ing an intron as a spacer sequence between the sense and antisense fragments results in higher gene silencing effi ciency in the transgenic plants (Wesley et al., 2001). Moreover, fi eld level virus resistance is achieved by tar-geting multiple viruses in a single chimeric construct (Bucher et al., 2006; Zhang et al., 2011; Thu et al., 2016; Hameed et al., 2017).
Therefore, a cost effi cient, high-throughput system for designing and making of ihpRNA constructs is in great demand. To achieve broad spectrum resistance, there is a need to target multiple virus genes, to join these fragments the selection of restriction enzymes may not be possible in case multiple fragment splicing due to the limited choice and incompatibility of restriction enzymes and also the introduction of extraneous non-target sequences might interfere with the silencing effi -ciency. Due to these diffi culties, OE-PCR is the method of choice to join multiple fragments.
OE-PCR is a technique used to synthesize artifi cial genes, joining one or more DNA segments together to form a new genetic combination (Li et al., 2008) The OE-PCR was fi rst described by (Higuchi et al., 1988). The basic principle of OE-PCR is that individual DNA frag-ments are designed to have a short stretch of their 3’ ends to be complimentary and these overlaps are extended in PCR to splice the two fragments in to one (Harton et al., 1989), the initial PCR fragments then generate overlap gene fragments that can be used as new templates for another PCR to form a full length fragment (Heckman et al., 2007; Wäneskog and Bjerling 2014; Hussain and Chong 2016).
Targeting multiple viruses is important in aiming for RNAi based robust and durable resistance. In this study, RNAi gene construct against broad spectrum of viruses was designed based on the conserved sequences from four different viruses commonly infesting tomato and chilli viz., Capsicum chlorosis virus-nucleocapsid (CaCV-N), Groundnut bud necrosis virus-Nucleocapsid and Non-structural proteins (GBNV-N and NSs), Cucum-ber mosaic virus-2b and Coat protein (CMV-2b and CP) and Chilli veinal mottle virus-helper component protein-ase and coat protein (ChiVMV HC-Pro and CP). We used OE-PCR to join all seven fragments in a single stretch to construct hpRNAi-MVR binary vector for plant trans-formation to impart multiple virus resistance in tomato and chilli. This is the fi rst report by using OE-PCR for joining seven gene fragments in ihpRNA construct for plant virus resistance.
MATERIALS AND METHODS
Selection of target gene sequences for dsRNA construct
Based on the literature survey, we have selected major virus diseases affecting tomato and chilli in Southern India, viz. GBNV, CaCV, CMV, ChiVMV diseases have caused a drastic yield loss in India. To develop broad spectrum ihpRNA vector, we have selected the above four viruses, from these 7 crucial genes were selected to express hairpin RNA in transgenic plants. The sequences

Babu, Reddy and Manamohan
48 OVERLAP EXTENSION PCR TO ANNEAL MULTIPLE DNA FRAGMENTS BIOSCIENCE BIOTECHNOLOGY RESEARCH COMMUNICATIONS
of these genes were retrieved from GenBank at the National Center for Biotechnology Information (NCBI) (http://www.ncbi.nlm.nih.gov/BLAST/). BioEdit-multi-ple sequence alignment using Clustal W (Hall 1999) was carried out and highly conserved regions were selected for dsRNA design from the alignment of about 100-150 viral sequences reported. The selected conserved regions of CaCV-N gene (255bp), GBNV-N gene (255bp) and GBNV-NSs gene (261bp) from Tospovirus, CMV 2b (232bp) and CMV CP gene (214bp) from Cucumovirus and ChiVMV HC-Pro (209bp) and ChiVMV-CP (221bp) from Potyvirus respectively. The detailed GenBank accession for the selected genes included in the (table 1). Off-target effect minimization was carried out using dscheck and Genome BLAST analysis to select highly conserved regions.
Overlap Primer designing and amplifi cation of desired
gene fragments
The clones of viral genes were obtained from the Division of Plant pathology, ICAR-IIHR, Bengaluru. The overlap primers were designed for the individual fragments of fragment S1, S2, S3, S4, S5 and S6 and it generates overhang region of 10-15bp to join the next fragment. No restriction enzymes were incorporated between these fragments. Restriction sites of BamH1/Sac1 and SexA1 were added in 5’ region of S1 fragment and 3’ region of S7 fragment to form ihpRNA construct forming sense: Intron: Antisense orientation. All individual fragments were amplifi ed using PCR. All PCR reactions were car-ried out in 25μl reaction contains 50ng of template, the PCR mix contains 1x Phusion HF buffer 3% DMSO, 200 μM DNTPs, 0.5 μM PCR primers and 1U Phusion® High-Fidelity DNA Polymerase (NEB, USA). The PCR condi-tions were as follows: initial denaturation for 30 seconds at 98 °C, followed by 35 cycles of denaturation 10 sec-onds at 98 °C, 30 seconds at 55 °C annealing, 10 seconds at 72 °C extension and the fi nal extension 30 minutes at 72 °C.
The amplifi ed products were purifi ed using Nucle-oSpin® Gel and PCR Clean-up kit (Macherey-Nagel, Germany), and ligated into PTZ57R/T cloning vector by using T4 DNA ligase (Thermo scientifi c, USA). The ligated products were transformed in to E.coli (DH5) using heat shock method. The transformed clones were sequenced by Sanger Sequencing method (Eurofi ns Genomics India Pvt Ltd, Bangalore). The confi rmed clones were used further for overlap PCR.
Joining of fragments by Overlap PCR:
Three rounds of overlap PCR were carried out to join all 7 fragments. The PCR parameters for the modifi ed Overlap PCR is as follows: PCR was carried out in a 50μl
reaction contains 50ng of purifi ed individual fragments, the PCR mix contains 1x Phusion HF buffer 3% DMSO, 200 μM DNTPs, 0.5 μM PCR primers and 1U Phusion® High-Fidelity DNA Polymerase (NEB, USA) the PCR mix contains no primers. The overlap PCR as follows: initial denaturation for 1 minute at 98 °C followed by exten-sion at 72 °C for 15 minutes, pause/hold the programme at 72 °C or place the tubes in ice, then add the end prim-ers and resume the programme followed by 35 cycles of denaturation for 10 seconds at 98 °C, annealing for 30 seconds at 60 °C, extension for 30s/kb at 72 °C and fi nal extension for 30 minutes at 72 °C. The above PCR condi-tions were followed to join all fragments.
In First round of overlap PCR, the fragments of S1+S2 were joined by using F1 and R2 primers, S4+S5 frag-ments were joined by using F4 and R5 primers and the fragments of S6+S7 were joined by using F6 and R7 primers respectively. An aliquot of all post PCR products were confi rmed on agarose gel, the confi rmed products were purifi ed by NucleoSpin® Gel and PCR Clean-up kit (Macherey-Nagel, Germany). The Second round overlap PCR was carried out by joining the fragments of S1+S2 with S3 using F1 and R3 primers and fragments of S4+S5 with S6+S7 were joined using F4 and R7 primers. An aliquot of post PCR products was used for confi rma-tion of amplifi cation and the rest was used for purifi ca-tion. Likewise, the fi nal round PCR was continued by joining the fragments of S1+S2+S3 with S4+S5+S6+S7 using F1 and R7 primers (Fig 1 and 2). The BamH1/Sac1 restriction sites were incorporated in the F1 primer and SexA1 restriction site were incorporated in R7 primer, used to form Sense and Antisense fragments. A com-plete stretch 1.647kb fragment was purifi ed and ligated in to PTZ57R/T cloning vector (Thermo scientifi c, USA) using T4 DNA ligase (Thermo scientifi c, USA) and the ligated product was transformed in E.coli (DH5 cells). Plasmids were isolated using alkaline lysis method and three clones were sequenced for confi rmation of the fragments joined by OE-PCR.
The complete stretch containing all three fragments of 7 genes in sense and antisense orientation inter-spersed by PDS intron was released using BamH1 and SacI restriction sites, this fragment was purifi ed and ligated into the binary vector pBI121 between CaMV 35S promoter and NOS terminator using BamH1 and SacI sites. The ligation of sense-intron-antisense fragments in pBI121 binary vector were confi rmed by restriction digestion using BamHI and SacI. The resulting plasmid was designated as hpRNAi-MVR. The RNAi expression cassette (hpRNAi-MVR) was electroporated into Agro-bacterium tumefaciens strain EHA105, the electropo-rated cells were grown on selectable antibiotics kana-mycin 100mg l-1 and rifampicin 25mg l-1 containing

Babu, Reddy and Manamohan
BIOSCIENCE BIOTECHNOLOGY RESEARCH COMMUNICATIONS OVERLAP EXTENSION PCR TO ANNEAL MULTIPLE DNA FRAGMENTS 49
LB media and the clones were confi rmed by PCR and Restriction digestion. Glycerol stocks were prepared for the confi rmed clones and stored in -80 °C for further use.
RESULTS AND DISCUSSION
PCR amplifi cation of seven individual fragments by using proof reading Phusion DNA Polymerase yielded the expected amplicon sizes as assessed by agarose gel
electrophoresis and sequencing. The expected amplicon sizes were CaCV-N gene 255bp, GBNV-NSs gene 261bp, GBNV-N gene 255bp, CMV-2b gene 232bp, CMV-CP gene 214bp, ChiVMV-HC pro gene 209bp and ChiVMV-CP gene 221bp respectively.
Overlap extension PCR was carried in 3 successive rounds of PCR reactions to effi ciently complete the join-ing of all the seven fragments (Fig. 1).
In fi rst round of OE-PCR, the S1+S2, S4+S5 and S6+S7 fragments were successfully joined separately
Table 1. List of primers used in this study F1 primers containing Bam H1/Sac1 restriction sitesindicated in italics. Overlap regions indicated in bold letters. R7 primer containing SexA1 restriction site indicated in italics.
Primer Name Primer sequence (5’ –> 3’) Segment size in bp
F1 AGTGAggatccAGTGGAAAGTATAAGTTCTGTG
F1 AGTGAgagctcAGTGGAAAGTATAAGTTCTGTG
R1 TTGACACCTTCTCCAGAGAAACCAATACATAACATATCC 255
F2 TTCTCTGGAGAAGGTGTCAA
R2 TGAAGGTCCAGTCATCTGGATTTGGTTATGCATTGTGAA 261
F3 CAGATGACTGGACCTTCAA
R3 CCGTCGATTCTTCTTGTGAGCCAGAGGGAATATAATTGGT 255
F4 CTCACAAGAAGAATCGACGG
R4 GCGACAGGACTCTAATCATTACCAGCGAACCAATCCG 232
F5 TTAGAGTCCTGTCGCAACAG
R5 TGTTGCTCTTCCACCAGCTTCTTATCGAACTCAGTG 214
F6 GGTGGAAGAGCAACAAGCGA
R6 AAGGTTAACAACAGCCCACGCTTTCCCCATATGA 209
F7 GCTGTTGTTAACCTTGAACACCT
R7 AGATaccwggtTCCATCATAACCCAATAACC 221
FIGURE 1. Overview of overlap extension PCR method

Babu, Reddy and Manamohan
50 OVERLAP EXTENSION PCR TO ANNEAL MULTIPLE DNA FRAGMENTS BIOSCIENCE BIOTECHNOLOGY RESEARCH COMMUNICATIONS
with the expected size if about 516bp, 446bp and 430bp. The amplifi ed PCR products were purifi ed and these eluted products were subsequently used for next round of OE-PCR. In second round OE-PCR, S1+S2+S3 and S4+S5+S6+S7 were joined successfully and the frag-ment sizes were 771bp and 876bp. Third round OE-PCR, assembled all seven fragments by combining fragments obtained from the second round OE-PCR. The size of the fi nal fragment was about 1647bp. Sequencing revealed that there were no errors or mutations/ mismatches after at splicing of all the 7 fragments (Fig. 2).
The amplicon represents the results of fi nal round overlap PCR, for sense fragment, BamH1 forward primer
DISCUSSION
Biotic stresses like viral diseases pose serious threat to crop production and estimated economic loss ranks second only to the other pathogens (Simon-Mateo and Garcia 2011). Effi cient virus diseases control measures are not available and current virus management strategy in most cases are limited to insect vector control and roguing. Development of virus disease resistant lines is highly desirable and RNAi has a direct bearing in the development of genetically engineered virus resistant crops (Chicas and Macino 2001). Imparting virus resist-ance has been proven effective in various plant species by using hpRNAi constructs (Ammara et al., 2015; Jia et al., 2017; Kumar et al., 2017).
Towards this, in this experiment we have developed a gene construct targeting multiple viruses commonly infecting two important Solancaeous crops, chilli and tomato by employing OE-PCR. Targeting single virus may not be suffi cient as most often, the viral infec-tions are mixed under fi eld conditions, to overcome this problem, and also to minimize the resistance breakdown by a mechanism employed by viruses to overcome host induced viral gene silencing, known as “suppression of silencing” targeting multiple gene segments of virus including the respective silencing suppressors could therefore result in more durable and robust virus resist-ance to broad spectrum of virus infections under fi eld conditions. In this regard, we have selected viral silenc-ing suppressors like NSs gene for Tospovirus (Goswami
FIGURE 2. Final round of Overlap PCR.
and SexA1 reverse primer (F1+R7) were used and for Antisense fragment Sac1 forward primer and SexA1 reverse primer (F1+R7) were used. The gel picture depicts that the expected amplicons of both sense and antisense fragments. M. HyperLadder 1kb; 1, 2. Final overlap PCR product of Sense fragment of about 1.64kb; 3,5. Final overlap PCR product of Antisense fragment of about 1.64kb; 5. No template control (NTC).
To form dsRNA, the complete stretch of 1.647kb frag-ment in sense and antisense orientation with the inter-vening 0.25kb of pds intron were ligated and cloned, the plasmids were purifi ed and the orientation of sense, intron and antisense fragments was confi rmed by respective restriction digestion and release of fragment of expected size (Fig. 3).
FIGURE 3. Restriction digestion of hpRNAi-MVR binary vector to confi rm the stretch of Sense, Anti-sense and Intron fragments:M : Lambda DNA/EcoRI+HindIII MarkerLane 1,4,7 : Digested the hpRNAi-MVR binary vec-tor with BamH1 and Sac1 restriction enzymes to confi rm the complete stretch of Sense, Antisense and Intron fragments.Lane 2,5,8 : Digestion of hpRNAi-MVR binary vector with BamH1 Lane 3,6,9 : hpRNAi-MVR binary vector un digested

Babu, Reddy and Manamohan
BIOSCIENCE BIOTECHNOLOGY RESEARCH COMMUNICATIONS OVERLAP EXTENSION PCR TO ANNEAL MULTIPLE DNA FRAGMENTS 51
et al., 2012; Zhai et al., 201 4), 2b gene for Cucumovirus (Du et al., 2014; Nemes et al., 2014) a nd HC-Pro gene for Potyvirus (Torres-Barcelo et al., 2010; Sahana et al., 2014) for broad spectrum virus resistance. The viral suppres-sors plays an important role, it protects the viral genome against RNA silencing and acts as RNA silencing sup-pressor (Lakatos et al., 2006). Hc-Pro gene from potyvi-rus blocks PTGS at tissue level, CMV 2b from cucumo-virus prevents systemic silencing (Brigneti et al., 1998). NSs gene from tospovirus regulates the suppression of the viral movement and host defense mechanism (Lokesh et al., 2010). Many researchers have reported resistance to multiple virus infections (Bucher et al., 2006; Zhang et al., 2011; Thu et al., 2016; Hameed et al., 2017). In this experiment, we have selected seven fragments to target seven viral genes, and this renders the develop-ment of gene construct a tedious and complex task as the commonly employed restriction digestion and liga-tion of fragments gets unwieldy as the number of frag-ments to be joined is more. Thus, we have employed OE-PCR successfully to accomplish the assembly of hpRNAi construct.
Splicing of two fragments of DNA, referred as over-lap extension PCR established by (Yolov et al., 1990), this method has many advantages like joining of many fragments of about 10.8kb using pfu proofreading pol-ymerase (Shevchuk et al., 2004). Majority of commer-cial kits and long PCR protocols are mainly based on Taq polymerase thus cannot be used for overlap exten-sion PCR, because Taq leaves a single A-overhang at 3’ region. This leads to disrupt the primer binding at over-lap regions during overlap extension PCR (Sambrook et al., 2001). The overlap extension PCR has many applica-tions like, joining of 26 synthetic oligos of 54nt of about 969bp with 5 rounds of sequential overlap extension PCR (Zhang et al., 2013). Many modifi ed methods of OE-PCR have been applied in many genetic engineer-ing areas, such as fusion of long length DNA fragments (Fujii et al., 2013; Engel et al., 2013), assembly of longer gene fragments (Benders et al., 2010; You et al., 2012).
Here, we developed a broad spectrum, multiple virus resistant hpRNAi-MVR vector by targeting 7 genes from 4 common virus groups for both tomato and chilli crops viz., CaCV N gene, PBNV N and NSs genes from Tospovi-rus, CMV 2b and CP gene from cucumovirus and HC-Pro and Polyprotein from ChiVMV. We have successfully employed the overlap extension PCR method to splice multiple gene fragments without using any restriction sites and adaptors etc. as the addition of non-specifi c sequences in the gene construct would have affected the RNAi effi cacy due to its sequence dependence. The use of OE-PCR is highly desirable in the development of RNAi constructs involving splicing of multiple frag-ments. Simplifi ed and effi cient gene construct assembly
for RNAi would aid in the development of virus resistant crops in avoiding crop yield loss.
CONCLUSION
Seamless joining of multiple fragments to create single fragment without using any restriction sites or ligase is a critical step in RNAi. Here, we demonstrated the applica-tion of overlap extension PCR to join seven viral gene fragments to develop hpRNAi-MVR construct useful for imparting virus disease resistance in both tomato and chilli. Virus diseases drastically reduce the crop yield and quality and are diffi cult to manage and only the long term solution to this is to develop virus resistant crop lines. Development of broad spectrum hpRNAi construct for commonly infecting viruses is one of the important aspects. Here, we developed an hpRNAi-MVR vector that is useful in developing multiple virus resistant tomato and chilli employing OE-PCR. Demonstrate that OE-PCR is a method of choice in RNAi gene construct for virus resistance as it is simple, fast and economical, can join multiple fragments in less time. This approach can be employed in developing gene constructs for durable, multiple virus resistance in other important crops.
ACKNOWLEDGEMENT
We are thankful to ICAR-IIHR, which provided the facility to carry out this research work. This is the part of Ph.D. dissertation work of fi rst author.
REFERENCES
Ammara U., Mansoor S., Saeed M., Amin I., Briddon R.W. and Al-Sadi A.M. (2015). RNA interference-based resistance in transgenic tomato plants against Tomato yellow leaf curl virus-Oman (TYLCV-OM) and its associated betasatellite. Virology journal, 12(1): 38.
Benders G.A., Noskov V.N., Denisova E.A., Lartigue C., Gibson D.G., Assad-Garcia N., Chuang R.Y., Carrera W., Moodie M., Algire M.A., Phan Q., Alperovich N., Vashee S., Merryman C., Venter J.C., Smith H.O., Glass J.I., Hutchison C.A. (2010). Clon-ing whole bacterial genomes in yeast. Nucleic Acids Research, 38 (8): 2558–2569.
Berger P.H., Adams M.J., Barnett O.W., Brunt A.A., Hammond J., Hill J.H., Jordan R.L., Kashiwazaki S., Rybicki E., Spence N., Stenger D.C., Ohki S.T., Uyeda I., van Zaayen A., Valkonen J., Vetten H.J Family potyviridae. In: Fauquet C.M., Mayo M.A., Maniloff J., Dessel Berger U., Ball L. (eds) (2005). Virus taxon-omy eighth report of the international committee on taxonomy of virus. Elsevier, Academic Press, London, 385–396.
Bonfi m K., Faria J.C., Nogueira E.O., Mendes E.A. and Aragao F.J. (2007). RNAi-mediated resistance to Bean golden mosaic

Babu, Reddy and Manamohan
52 OVERLAP EXTENSION PCR TO ANNEAL MULTIPLE DNA FRAGMENTS BIOSCIENCE BIOTECHNOLOGY RESEARCH COMMUNICATIONS
virus in genetically engineered common bean (Phaseolus vul-garis). Molecular Plant-Microbe Interactions, 20 (6): 717-726.
Brigneti G., Voinnet O., Li W.X., Ji L.H., Ding S.H. and Baul-combe D.C. (1998). Viral pathogenicity determinants are sup-pressors of transgene silencing in Nicotiana benthamiana. EMBO Journal, 17: 6739–6746.
Bucher E., Lohuis D., van Poppel P.M., Geerts-Dimitriadou C., Goldbach R. and Prins M. (2006). Multiple virus resistance at a high frequency using a single transgene construct. Journal of General Virology, 87 (12): 3697-3701.
Chicas A. and Macino G. (2001). Characteristics of post tran-scriptional gene silencing. EMBO reports, 2 (11): 992-996.
De Haan P., Kormelink R., de Oliveira Resende R., Van Poelwijk F., Peters D. and Goldbach R. (1991). Tomato spotted wilt virus L RNA encodes a putative RNA polymerase. Journal of General Virology, 72 (9): 2207-2216.
De Haan P., Wagemakers L., Peters D. and Goldbach R. (1990). The S RNA segment of tomato spotted wilt virus has an amb-isense character. Journal of General Virology, 71 (5): 1001-1007.
Du Z., Chen A., Chen W., Liao Q., Zhang H., Bao Y., Roossinck M.J. and Carr J.P. (2014). Nuclear-cytoplasmic partitioning of the Cucumber mosaic virus 2b protein determines the balance between its roles as a virulence determinant and RNA silencing suppressor. Journal of virology, JVI-00284.
Duan C.G., Wang C.H. and Guo H.S. (2012). Application of RNA silencing to plant disease resistance. Silence, 3 (1): 5.
Engel H., Gutiérrez-Fernández J., Flückiger C., Martínez-Rip-oll M., Mühlemann K., Hermoso J.A., Hilty M., Hathaway L.J. (2013) Heteroresistance to fosfomycin is predominant in Strep-tococcus pneumoniae and depends on the murA1 gene. Anti-microbial Agents, 57 (6): 2801–2808.
Fujii W., Kano K., Sugiura K., Naito K. (2013). Repeatable con-struction method for engineered zinc fi nger nuclease based on overlap extension PCR and TA-cloning. PloS one, 8 (3): e59801.
Goswami S., Sahana N., Pandey V., Doblas P., Jain R.K., Palu-kaitis P., Canto T. and Praveen S. (2012). Interference in plant defense and development by non-structural protein NSs of Groundnut bud necrosis virus. Virus research, 163 (1): 368-373.
Hall T.A. (1999). BioEdit: a user-friendly biological sequence alignment editor and analysis program for Windows 95/98/NT. In Nucleic acids symposium series, 41 (41): 95-98.
Hameed A., Tahir M.N., Asad S., Bilal R., Van Eck J., Jander G. and Mansoor S. (2017). RNAi-mediated simultaneous resist-ance against three RNA viruses in potato. Molecular biotech-nology, 59 (2-3): 73-83.
Heckman K.L., Pease L.R. (2007). Gene splicing and mutagen-esis by PCR-driven overlap extension. Nat Protocols, 2: 924–932.
Higuchi R. (1988). A general method of in vitro preparation and specifi c mutagenesis of DNA fragments: study of protein and DNA interactions. Nucleic Acids Research, 16: 7351–7367.
Horton R.M., Hunt H.D., Ho S.N., Pullen J.K. and Pease L.R. (1989). Engineering hybrid genes without the use of restric-tion enzymes: gene splicing by overlap extension. Gene, 77 (1): 61-68.
Hussain H., and Chong N.F.M. (2016). Combined overlap exten-sion PCR method for improved site directed mutagenesis. BioMed research international (doi.org/10.1155/2016/8041532).
Jia R., Zhao H., Huang J., Kong H., Zhang Y., Guo J., Huang Q., Guo Y., Wei Q., Zuo J. and Zhu Y.J. (2017). Use of RNAi technology to develop a PRSV-resistant transgenic papaya. Scientifi c Reports, 7 (1): 12636.
Krishnareddy M., Rani R.U., Kumar K.A., Reddy K.M. and Pappu H.R. (2008). Capsicum chlorosis virus (Genus Tospovi-rus) infecting Chili pepper (Capsicum annuum) in India. Plant disease, 92 (10): 1469-1469.
Kumar S., Tanti B., Patil B.L., Mukherjee S.K., Sahoo L. (2017). RNAi-derived transgenic resistance to Mungbean yellow mosaic India virus in cowpea. PLoS ONE, 12 (10): e0186786.
Lakatos L., Csorba T., Pantaleo V., Chapman E.J., Carrington J.C., Liu Y.P., Dolja V.V., Calvino L.F., Lopez., Moya J.J. and Burgyan J. (2006). Small RNA binding is a common strategy to suppress RNA silencing by several viral suppressors. The EMBO journal, 25 (12): 2768-2780.
Li X., Qiu Y., Shen Y., Ding C., Liu P., Zhou J. and Ma Z. (2008). Splicing together different regions of a gene by modifi ed poly-merase chain reaction-based site-directed mutagenesis. Ana-lytical biochemistry, 373 (2): 398-400.
Li L.I., Cheng G.U., Biao W.A., Tong Z.H., Yang L.E., DAI Y.H., Wen H.E., LIANG C., WANG X.F. (2016). RNAi-mediated trans-genic rice resistance to Rice stripe virus. Journal of integrative agriculture, 15(11):2539-49.
Lokesh B., Rashmi P.R., Amruta B.S., Srisathiyanarayanan D., Murthy M.R. and Savithri H.S. (2010). NSs encoded by ground-nut bud necrosis virus is a bifunctional enzyme. PLoS One, 5 (3): e9757.
Manamohan M., Chandra G.S., Asokan R., Deepa H., Prakash M.N. and Kumar N.K. (2013). One-step DNA fragment assem-bly for expressing intron-containing hairpin RNA in plants for gene silencing. Analytical biochemistry, 433 (2): 189-191.
Nemes K., Gellert A., Balazs E. and Salanki K. (2014). Alanine scanning of Cucumber mosaic virus (CMV) 2B protein iden-tifi es different positions for cell-to-cell movement and gene silencing suppressor activity. PloS one, 9 (11): e112095.
Palukaitis P., Roossinck M.J., Dietzgen R.G. and Francki R.I. (1992). Cucumber mosaic virus. In Advances in virus research. Academic Press, 41: 281-348.
Sahana N., Kaur H., Jain R.K., Palukaitis P., Canto T. and Praveen S. (2014). The asparagine residue in the FRNK box of potyviral helper-component protease is critical for its small RNA binding and subcellular localization. Journal of General Virology, 95 (5): 1167-1177.
Sambrook J. and Russel D.W. (2001). Molecular Cloning: A Laboratory Manual. Cold Spring Harbor Laboratory Press, Cold Spring Harbor, NY.

Babu, Reddy and Manamohan
BIOSCIENCE BIOTECHNOLOGY RESEARCH COMMUNICATIONS OVERLAP EXTENSION PCR TO ANNEAL MULTIPLE DNA FRAGMENTS 53
Simon-Mateo C. and Garcia J.A. (2011). Antiviral strategies in plants based on RNA silencing. Biochimica et Biophysica Acta (BBA)-Gene Regulatory Mechanisms, 1809 (11): 722-731.
Thu L.T.M., Thuy V.T.X., Duc L.H., Son L.V., Ha C.H. and Mau C.H. (2016). RNAi-mediated resistance to SMV and BYMV in transgenic tobacco. Crop Breeding and Applied Biotechnology, 16 (3): 213-218.
Torres-Barcelo C., Daros J.A. and Elena S.F. (2010). HC-Pro hypo-and hyper suppressor mutants: differences in viral siRNA accumulation in vivo and siRNA binding activity in vitro. Archives of virology, 155 (2): 251-254.
Voinnet O. (2001). RNA silencing as a plant immune system against viruses. Trends Genetics, 17: 449–459.
Shevchuk N.A., Bryksin, A.V., Nusinovich, Y.A., Cabello, F.C., Sutherland, M., Ladisch S. (2004). Construction of long DNA molecules using long PCR-based fusion of several fragments simultaneously. Nucleic Acids Research, 32 (12): e19.
Waneskog M and Bjerling P. (2014). Multi-fragment site-directed mutagenic overlap extension polymerase chain reac-tion as a competitive alternative to the enzymatic assembly method. Analytical biochemistry, 444: 32-37.
Wesley S.V., Helliwell, C.A., Smith, N.A., Wang, M.B., Rouse, D.T, et al. (2001). Construct design for effi cient, effective and high-throughput gene silencing in plants. Plant Journal, 27: 581–590.
Yolov AA., Shabarova, ZA. (1990).Constructing DNA by poly-merase recombination. Nucleic Acids Res, 18(13): 3983–3986.
You C, Zhang XZ, Zhang YHP. (2012). Simple cloning via direct transformation of PCR product (DNA Multimer) to Escherichia coli and Bacillus subtilis. Applied and environmental microbi-ology, 78(5): 1593–1595.
Zhai, Y., Bag, S., Mitter, N., Turina, M. and Pappu, H.R. (2014). Mutational analysis of two highly conserved motifs in the silencing suppressor encoded by tomato spotted wilt virus (genus Tospovirus, family Bunyaviridae). Archives of virology, 159(6): 1499-1504.
Zhang, X., Sato, S., Ye, X., Dorrance, A.E., Morris, T.J., Clem-ente, T.E. and Qu, F. (2011). Robust RNAi-based resistance to mixed infection of three viruses in soybean plants expressing separate short hairpins from a single transgene. Phytopathol-ogy, 101(11): 1264-1269.
Sastrosiswojo, S. (1995). Integrated pest management in veg-etable production. Symposium on Small Scale vegetable pro-duction and Horticultural Economics in Developing Countries. ISHS Acta Horticulturae, 369.
Umamaheswaran, K., Jain, R. K., Bhat, A. I. and Ashwai, Y. S.9. (2003). Biological and molecular characterization of Tospovirus isolate from tomato and its relationship with other Tospovirus. Indian Phytopathology, 56: 168-173.

Prevalence and pathogenesis of otosclerosis: A review
Rania Abdulfattah Sharaf
Department of Speech Language Pathology and Audiology, National Guard Health Affairs, Ministry of National Guard, Riyadh Saudi Arabia
ABSTRACT
The current review is aimed to provide an overview of etio-pathogenesis of otosclerosis. Otosclerosis affects bony laby-rinth resulting a progressive conductive hearing loss, a sensorineural hearing loss, or a mixed-type hearing loss. It is a hereditary localized disease of the otic capsule typifi ed by new bone formation that is composed of different fi brillar and cellular pattern. The abnormal new bone produces ankylosis of the stapes footplate resulting in conductive deafness. The onset of the hearing loss due to otosclerosis is usually between 15 and 40 years of age. Otosclerosis is a disease of adult onset affecting more women than men in the world. The previous study also has identifi ed the link of otosclerosis with the family history. Additionally, women at an earlier age reported greater severity of otosclerosis symptoms compared to men. Despite the numerous theories suggested, the etiology of otosclerosis has remained obscure. Since histopathologi-cal inner ear changes due to otosclerosis is important, this review will provide an updated overview of prevalence and etio-pathological changes in otosclerosis.
KEY WORDS: OTOSCLEROSIS, HEARING LOSS, OTOSPONGIOSIS, COCHLEAR LESIONS
54
Medical CommunicationBiosci. Biotech. Res. Comm. 12(1): 54-59 (2019)
INTRODUCTION
Otosclerosis is a disease of the bony labyrinth, which is characterized by fi xation of the footplate of the sta-pes secondary to abnormal bone formation (Quesnel et al., 2018; Guild, 1994; Schuknecht, 1993). The area of the labyrinthine capsule immediately in front of the footplate of the stapes called “fi ssula antefenestrum” is
the site of predilection for otosclerosis. Other frequent sites include the border of the round window and even the footplate of the stapes (Mansour et al., 2018; Guild, 1994; Schuknecht, 1993).
Virolainen (1972) reports that otosclerosis is usually bilateral. It is a hereditary localized disease of the otic capsule typifi ed by new bone formation that is com-posed of different fi brillar and cellular pattern (Sho-
ARTICLE INFORMATION:
Corresponding Author: [email protected] 27th Dec, 2018Accepted after revision 21st Feb, 2019 BBRC Print ISSN: 0974-6455Online ISSN: 2321-4007 CODEN: USA BBRCBA Thomson Reuters ISI ESC / Clarivate
Analytics USAMono of Clarivate Analytics and Crossref Indexed Journal Mono of CR
NAAS Journal Score 2019: 4.31 SJIF: 4.196© A Society of Science and Nature Publication, Bhopal India 2019. All rights reserved.Online Contents Available at: http//www.bbrc.in/DOI: 10.21786/bbrc/12.1/7
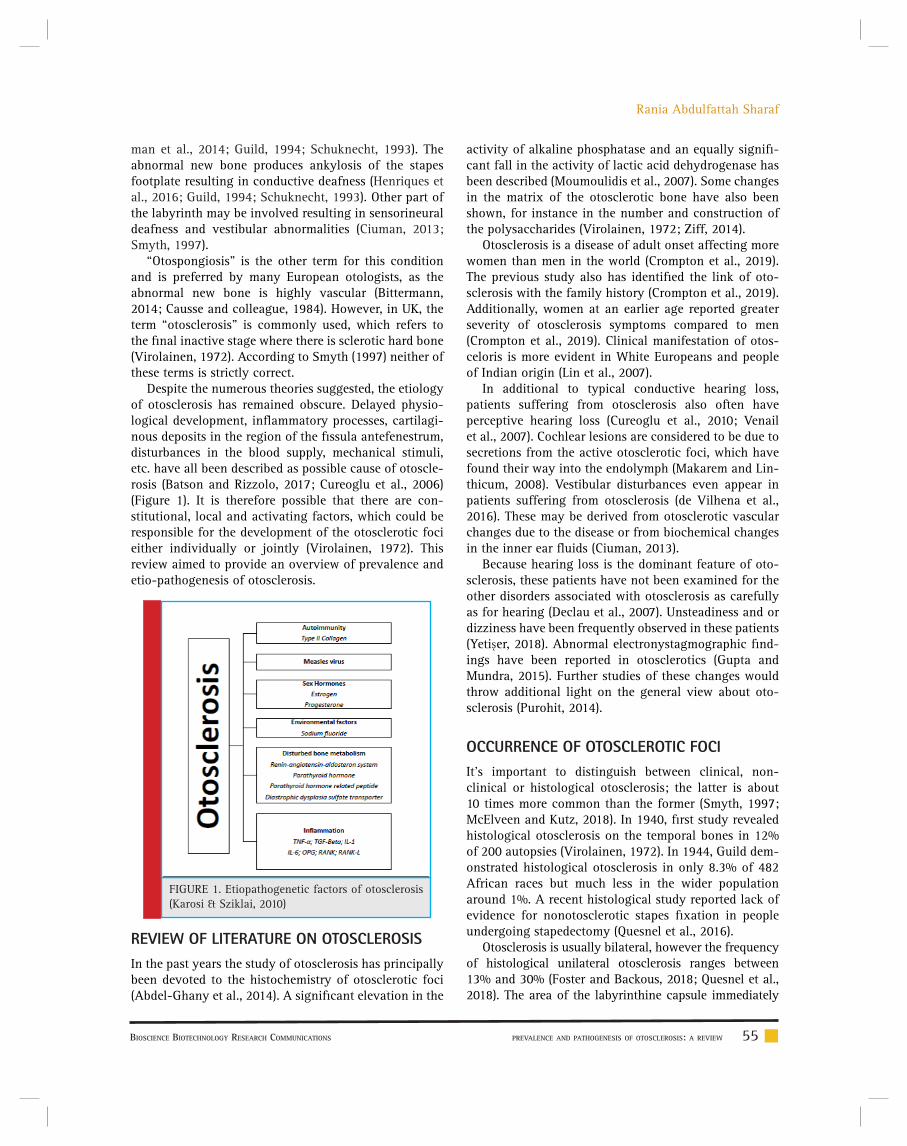
BIOSCIENCE BIOTECHNOLOGY RESEARCH COMMUNICATIONS PREVALENCE AND PATHOGENESIS OF OTOSCLEROSIS: A REVIEW 55
Rania Abdulfattah Sharaf
FIGURE 1. Etiopathogenetic factors of otosclerosis (Karosi & Sziklai, 2010)
man et al., 2014; Guild, 1994; Schuknecht, 1993). The abnormal new bone produces ankylosis of the stapes footplate resulting in conductive deafness (Henriques et al., 2016; Guild, 1994; Schuknecht, 1993). Other part of the labyrinth may be involved resulting in sensorineural deafness and vestibular abnormalities (Ciuman, 2013; Smyth, 1997).
“Otospongiosis” is the other term for this condition and is preferred by many European otologists, as the abnormal new bone is highly vascular (Bittermann, 2014; Causse and colleague, 1984). However, in UK, the term “otosclerosis” is commonly used, which refers to the fi nal inactive stage where there is sclerotic hard bone (Virolainen, 1972). According to Smyth (1997) neither of these terms is strictly correct.
Despite the numerous theories suggested, the etiology of otosclerosis has remained obscure. Delayed physio-logical development, infl ammatory processes, cartilagi-nous deposits in the region of the fi ssula antefenestrum, disturbances in the blood supply, mechanical stimuli, etc. have all been described as possible cause of otoscle-rosis (Batson and Rizzolo, 2017; Cureoglu et al., 2006)(Figure 1). It is therefore possible that there are con-stitutional, local and activating factors, which could be responsible for the development of the otosclerotic foci either individually or jointly (Virolainen, 1972). This review aimed to provide an overview of prevalence and etio-pathogenesis of otosclerosis.
activity of alkaline phosphatase and an equally signifi -cant fall in the activity of lactic acid dehydrogenase has been described (Moumoulidis et al., 2007). Some changes in the matrix of the otosclerotic bone have also been shown, for instance in the number and construction of the polysaccharides (Virolainen, 1972; Ziff, 2014).
Otosclerosis is a disease of adult onset affecting more women than men in the world (Crompton et al., 2019). The previous study also has identifi ed the link of oto-sclerosis with the family history (Crompton et al., 2019). Additionally, women at an earlier age reported greater severity of otosclerosis symptoms compared to men (Crompton et al., 2019). Clinical manifestation of otos-celoris is more evident in White Europeans and people of Indian origin (Lin et al., 2007).
In additional to typical conductive hearing loss, patients suffering from otosclerosis also often have perceptive hearing loss (Cureoglu et al., 2010; Venail et al., 2007). Cochlear lesions are considered to be due to secretions from the active otosclerotic foci, which have found their way into the endolymph (Makarem and Lin-thicum, 2008). Vestibular disturbances even appear in patients suffering from otosclerosis (de Vilhena et al., 2016). These may be derived from otosclerotic vascular changes due to the disease or from biochemical changes in the inner ear fl uids (Ciuman, 2013).
Because hearing loss is the dominant feature of oto-sclerosis, these patients have not been examined for the other disorders associated with otosclerosis as carefully as for hearing (Declau et al., 2007). Unsteadiness and or dizziness have been frequently observed in these patients (Yetiser, 2018). Abnormal electronystagmographic fi nd-ings have been reported in otosclerotics (Gupta and Mundra, 2015). Further studies of these changes would throw additional light on the general view about oto-sclerosis (Purohit, 2014).
OCCURRENCE OF OTOSCLEROTIC FOCI
It’s important to distinguish between clinical, non-clinical or histological otosclerosis; the latter is about 10 times more common than the former (Smyth, 1997; McElveen and Kutz, 2018). In 1940, fi rst study revealed histological otosclerosis on the temporal bones in 12% of 200 autopsies (Virolainen, 1972). In 1944, Guild dem-onstrated histological otosclerosis in only 8.3% of 482 African races but much less in the wider population around 1%. A recent histological study reported lack of evidence for nonotosclerotic stapes fi xation in people undergoing stapedectomy (Quesnel et al., 2016).
Otosclerosis is usually bilateral, however the frequency of histological unilateral otosclerosis ranges between 13% and 30% (Foster and Backous, 2018; Quesnel et al., 2018). The area of the labyrinthine capsule immediately
REVIEW OF LITERATURE ON OTOSCLEROSIS
In the past years the study of otosclerosis has principally been devoted to the histochemistry of otosclerotic foci (Abdel-Ghany et al., 2014). A signifi cant elevation in the

56 PREVALENCE AND PATHOGENESIS OF OTOSCLEROSIS: A REVIEW BIOSCIENCE BIOTECHNOLOGY RESEARCH COMMUNICATIONS
Rania Abdulfattah Sharaf
in front of the footplate of the stapes called ‘fi ssula ante-fenestrum’ is the site of predilection for otosclerosis; other frequent sites may include border of the round window and even the footplate of the stapes around the cochlea, the internal auditory canal or less often around the semi-circular canal (Michaels and Soucek, 2011).
The focus nearly always originates in the endochon-dral layer of the labyrinthine capsule, extending in many cases into the periosteal layer as far as the mucosa of the tympanic cavity, and into the endosteal layer of the labyrinth (Naumann et al., 2005). Where the focus reaches the mucoperiosteum of the tympanum and the endosteum of the labyrinth, these show varying degrees of fi brous thickening and increased vascularity (Maka-rem et al., 2010).
Virolainen (1972) quotes Seligman and Shambaugh (1951) that assessment of 2086 post-operative surgery of ear revealed that cochlear nerve involvement is pre-sent twice as often when otosclerotic foci are situated in the horizontal semicircular canal, compared with the frequency of the involvement when the canal is not affected. Histological otosclerosis is at any rate quite frequently asymptomatic (Declau et al., 2007). In a pre-vious review of Ménière’s disease, the lateral semicircu-lar canal was found at autopsy to be full of otosclerotic bone (Oberman et al., 2017).
PATHOLOGICAL CHANGES IN OTOSCLEROSIS
Otosclerosis is a disease of the bony labyrinthine cap-sule, frequently developing in areas where embryonic cartilage persists (Bloch, 2012; Babcock et al., 2018). The pathological process is characterized by resorption of the normal bone, often around the blood vessels, and by the replacement of normal bone with cellular fi brous connective tissue (Rudic et al., 2015). Areas undergo-ing active resorption are extensively vascularised (Rudic et al., 2015). Focus may contain areas at different stages of activity that can be described as active intermediate and inactive fi nal stage (Karosi & Sziklai, 2010). Karosi et al., (2011) reported that the activity of alkaline phos-phatase increases in the focus.
The term “otospongiosis” refers to the active phase of the disease, which is characterized by the presence of vascular space containing highly cellular fi broses tis-sue, mononuclear histiocytes together with osteocytes and osteoclasts (Parahy and Linthicum, 1984; Uppal et al., 2010). These cells contain many enzymes, which are released in to the surrounding tissues resulting in its absorption (Ziff, 2014). The term “otosclerosis” refers to the fi nal stage of highly mineralized bone with a mosaic appearance (Quesnel et al., 2013). Osteoclasts have dis-appeared but osteocytes and/or osteoblasts may still be seen in the peripheral areas (Quesnel et al., 2013).
Previous study had suggested that some enzyme serve as the initiating factor of decalcifi cation (Puro-hit & Hermans, 2014). Another study suggested that the focus shows alkaline phosphates during the fi rst phase and the whole of secondary phase until the bone is com-pletely calcifi ed, alkaline phosphatase will then disap-pear (Gronowicz et al., 2014). Some studies observed the presence of abnormal accumulation of mucopolysac-charides in to the otosclerosis focus (Ricci, 1962; Ribári et al., 1991). A recent study reported higher level of total oxidant status and oxidative stress index in patients with otosclerosis (Baysal et al., 2017). Additionally, reac-tive oxygen species could be developed in otosclerotic foci (Rudic et al., 2015).
PERILYMPH CHANGES IN OTOSCLEROSIS
The perilymph has an extra-cellular character with low potassium, glucose, amino acid, and high sodium con-centration (Palmer et al., 2016). The blood-labyrinthine barrier permeability has been slightly increased in ears of patients with Ménière’s disease (Tagaya et al., 2011). Additionally, the blood-labyrinthine barrier permeabil-ity is also increased in other diseases, for instance sud-den deafness (Sugiura et al., 2006; Yoshida et al., 2008), labyrinthine invasion of cholesteatoma (Sone et al., 2007; Sone et al., 2012), vestibular schwannoma (Yamazaki et al., 2009), and relapsing polychondritis (Kato et al., 2014). Endolymphatic hydrops (EHs) is often seen in patients with otosclerosis, and preoperative EH was one of the risk factor for inner ear disturbances following stapes surgery (Mukaida et al., 2015). Furthermore, increased perme-ability of the blood-labyrinthine barrier and endolym-phatic hydrops could also causes sensorineural hearing loss in otosclerosis (Mukaida et al., 2015). A recent study assessed and compared cochlear lymph signal intensity in patients with otosclerosis, Ménière’s disease, and healthy individuals (Naganawa et al., 2016). The results of this study indicated an increased cochlear lymph signal inten-sity ratio in patients with otosclerosis than Ménière’s dis-ease or healthy individuals (Naganawa et al., 2016). Many studies has been reported an association of EH with oto-sclerosis (Franklin et al., 1990; Yoon et al., 1990; Shea et al., 1994); however, there is a lack of understanding about the mechanism for the development of EH in patients with otosclerosis (Mukaida et al., 2015).
CONCLUSIONS
The histological and pathological changes of otosclero-sis is still not fully explained. To enhance a better under-standing of the pathogenesis of otosclerosis, it is vital to use modern biologic methods to examine pathological changes in human temporal bones with otosclerosis.

BIOSCIENCE BIOTECHNOLOGY RESEARCH COMMUNICATIONS PREVALENCE AND PATHOGENESIS OF OTOSCLEROSIS: A REVIEW 57
Rania Abdulfattah Sharaf
REFERENCES
Abdel-Ghany, A. F., Osman, N. M., & Botros, S. M. (2014). Cor-relation between the size, CT density of otosclerotic foci, and audiological tests in cases of otosclerosis. The Journal of Inter-national Advanced Otology, 10(2), 156.
Babcock, T. A., & Liu, X. Z. (2018). Otosclerosis: From Genetics to Molecular Biology. Otolaryngologic Clinics of North Amer-ica, 51(2), 305-318.
Batson, L., & Rizzolo, D. (2017). Otosclerosis: an update on diagnosis and treatment. Journal of the American Academy of PAs, 30(2), 17-22.
Baysal, E., Gulsen, S., Aytac, I., Celenk, F., Ensari, N., Taysi, S., ... & Kanlikama, M. (2017). Oxidative stress in otosclerosis. Redox Report, 22(5), 235-239.
Bittermann, A. J. (2014). The treatment of patients with oto-sclerosis. From expert opinion to evidence-based practice (Vol. 67). Utrecht University.
Bloch, S. L. (2012). On the biology of the bony otic capsule and the pathogenesis of otosclerosis. Danish medical journal, 59(10), B4524-B4524.
Bretlau, P., & Jørgensen, M. B. (1968). Otosclerosis in the lat-eral semi-circular canal. The Journal of Laryngology & Otol-ogy, 82(1), 65-67.
Causse, J. R., & Causse, J. B. (1984). Otospongiosis as a genetic disease. Early detection, medical management, and prevention. The American journal of otology, 5(3), 211-223.
Causse, J. R., Uriel, J., Berges, J., Shambaugh, J. G., Bretlau, P., & Causse, J. B. (1982). The enzymatic mechanism of the oto-spongiotic disease and NaF action on the enzymatic balance. The American journal of otology, 3(4), 297-314.
Ciuman, R. R. (2013). Inner ear symptoms and disease: Patho-physiological understanding and therapeutic options. Medical science monitor: international medical journal of experimental and clinical research, 19, 1195.
Crompton, M., Cadge, B. A., Ziff, J. L., Mowat, A. J., Nash, R., Lavy, J. A., ... & Dawson, S. J. (2019). The Epidemiology of Otosclerosis in a British Cohort. Otology & Neurotology, 40(1), 22-30.
Cureoglu, S., Baylan, M. Y., & Paparella, M. M. (2010). Cochlear otosclerosis. Current opinion in otolaryngology & head and neck surgery, 18(5), 357.
Cureoglu, S., Schachern, P. A., Ferlito, A., Rinaldo, A., Tsu-prun, V., & Paparella, M. M. (2006). Otosclerosis: etiopathogen-esis and histopathology. American journal of otolaryngology, 27(5), 334-340.
de Vilhena, D., Gambôa, I., Duarte, D., & Lopes, G. (2016). Ves-tibular disorders after stapedial surgery in patients with oto-sclerosis. International journal of otolaryngology, 2016.
Declau, F., Van Spaendonck, M., Timmermans, J. P., Michaels, L., Liang, J., Qiu, J. P., & Van De Heyning, P. (2007). Prevalence of histologic otosclerosis: an unbiased temporal bone study in Caucasians. In Otosclerosis and Stapes Surgery (Vol. 65, pp. 6-16). Karger Publishers.
Foster, M. F., & Backous, D. D. (2018). Clinical Evaluation of the Patient with Otosclerosis. Otolaryngologic Clinics of North America, 51(2), 319-326.
Franklin, D. J., Pollak, A., & Fisch, U. (1990). Ménière’s symp-toms resulting from bilateral otosclerotic occlusion of the endolymphatic duct: an analysis of a causal relationship between otosclerosis and Ménière’s disease. The American journal of otology, 11(2), 135-140.
Gronowicz, G., Richardson, Y. L., Flynn, J., Kveton, J., Eisen, M., Leonard, G., ... & Parham, K. (2014). Differences in oto-sclerotic and normal human stapedial osteoblast properties are normalized by alendronate in vitro. Otolaryngology–Head and Neck Surgery, 151(4), 657-666.
Guild, S. R. (1944). Histologic otosclerosis. Ann Otol Rhinol Laryngol, 53(1045), 71.
Gupta, S. K., & Mundra, R. K. (2015). Electronystagmography a very useful diagnostic tool in cases of vertigo. Indian Journal of Otolaryngology and Head & Neck Surgery, 67(4), 370-374.
Henriques, V., Teles, R., Sousa, A., Estevão, R., Rodrigues, J., Gomes, A., ... & Fernandes, F. (2016). Abnormal Congenital Location of Stapes’ Superstructure: Clinical and Embryological Implications. Case reports in otolaryngology, 2016.
Karosi, T., & Sziklai, I. (2010). Etiopathogenesis of otosclerosis. European archives of oto-rhino-laryngology, 267(9), 1337-1349.
Karosi, T., Csomor, P., Szalmás, A., Kónya, J., Petkó, M., & Sziklai, I. (2011). Osteoprotegerin expression and sensitivity in otosclerosis with different histological activity. European archives of oto-rhino-laryngology, 268(3), 357-365.
Kato, M., Katayama, N., Naganawa, S., & Nakashima, T. (2014). Three-dimensional fl uid-attenuated inversion recovery mag-netic resonance imaging fi ndings in a patient with relapsing polychondritis. The Journal of Laryngology & Otology, 128(2), 192-194.
Lin, C. Y., Yang, Y. C., Leon Guo, Y., Wu, C. H., Chang, C. J., & Wu, J. L. (2007). Prevalence of hearing impairment in an adult population in southern Taiwan. International journal of audi-ology, 46(12), 732-737.
Makarem, A. O., Hoang, T. A., Lo, W. W., Linthicum, F. H., & Fayad, J. N. (2010). Cavitating otosclerosis: clinical, radiologi-cal and histopathological correlations. Otology & neurotology: offi cial publication of the American Otological Society, Ameri-can Neurotology Society [and] European Academy of Otology and Neurotology, 31(3), 381.
Makarem, A., & Linthicum, F. H. (2008). Cochlear otosclero-sis and endolymphatic hydrops. Otology & neurotology: offi -cial publication of the American Otological Society, American Neurotology Society [and] European Academy of Otology and Neurotology, 29(4), 571.
Mansour, S., Magnan, J., Nicolas, K., & Haidar, H. (2018). Oto-sclerosis. In Middle Ear Diseases (pp. 1-83). Springer, Cham.
McElveen, J. T., & Kutz, J. W. (2018). Controversies in the Eval-uation and Management of Otosclerosis. Otolaryngologic Clin-ics of North America, 51(2), 487-499.

58 PREVALENCE AND PATHOGENESIS OF OTOSCLEROSIS: A REVIEW BIOSCIENCE BIOTECHNOLOGY RESEARCH COMMUNICATIONS
Rania Abdulfattah Sharaf
Michaels, L., & Soucek, S. (2011). Origin and growth of otoscle-rosis. Acta oto-laryngologica, 131(5), 460-468.
Moumoulidis, I., Axon, P., Baguley, D., & Reid, E. (2007). A review on the genetics of otosclerosis. Clinical otolaryngology, 32(4), 239-247.
Mukaida, T., Sone, M., Yoshida, T., Kato, K., Teranishi, M., Naganawa, S., & Nakashima, T. (2015). Magnetic resonance imaging evaluation of endolymphatic hydrops in cases with otosclerosis. Otology & Neurotology, 36(7), 1146-1150.
Naganawa, S., Kawai, H., Taoka, T., Suzuki, K., Iwano, S., Satake, H., ... & Ikeda, M. (2016). Cochlear lymph fl uid signal increase in patients with otosclerosis after intravenous admin-istration of gadodiamide. Magnetic Resonance in Medical Sci-ences, mp-2015.
Naumann, I. C., Porcellini, B., & Fisch, U. (2005). Otosclerosis: incidence of positive fi ndings on high-resolution computed tomography and their correlation to audiological test data. Annals of Otology, Rhinology & Laryngology, 114(9), 709-716.
Oberman, B. S., Patel, V. A., Cureoglu, S., & Isildak, H. (2017). The aetiopathologies of Ménière’s disease: a contemporary review. Acta Otorhinolaryngologica Italica, 37(4), 250.
Palmer, J. C., Lord, M. S., Pinyon, J. L., Wise, A. K., Lovell, N. H., Carter, P. M., ... & Green, R. A. (2016, August). Understand-ing the cochlear implant environment by mapping perilymph proteomes from different species. In 2016 38th Annual Inter-national Conference of the IEEE Engineering in Medicine and Biology Society (EMBC) (pp. 5237-5240). IEEE.
Parahy, C., & Linthicum Jr, F. H. (1984). Otosclerosis and oto-spongiosis: clinical and histological comparisons. The Laryn-goscope, 94(4), 508-512.
Purohit, B., & Hermans, R. (2014). Imaging in otosclerosis: A pictorial review. Insights into imaging, 5(2), 245-252.
Quesnel, A. M., Ishai, R., & McKenna, M. J. (2018). Otosclero-sis: temporal bone pathology. Otolaryngologic Clinics of North America, 51(2), 291-303.
Quesnel, A. M., Ishai, R., Cureoglu, S., Linthicum, F., Lopez, I. A., Nadol Jr, J. B., & McKenna, M. J. (2016). Lack of evidence for nonotosclerotic stapes fi xation in human temporal bone histopathology. Otology & neurotology: offi cial publication of the American Otological Society, American Neurotology Society [and] European Academy of Otology and Neurotology, 37(4), 316.
Quesnel, A. M., Moonis, G., Appel, J., O’malley, J. T., McK-enna, M. J., Curtin, H. D., & Merchant, S. N. (2013). Correlation of computed tomography with histopathology in otosclerosis. Otology & neurotology, 34(1), 22.
Ribári, O., Pereplica, M., & Sziklai, I. (1991). Oversulfated mucopolysaccharides in the otosclerotic bone. Acta oto-laryn-gologica, 111(2), 362-365.
Ricci, V. (1962). Histochemical research on the otosclerotic focus. Considerations on the pathogenesis of otosclerosis and its classifi cation among the” mesenchmopathies”. Minerva otorinolaringologica, 12, 575.
Rudic, M., Keogh, I., Wagner, R., Wilkinson, E., Kiros, N., Fer-rary, E., ... & Zarkovic, N. (2015). The pathophysiology of oto-sclerosis: review of current research. Hearing research, 330, 51-56.
Sakihara, Y., Parving, A. (1999). Clinical otosclerosis, preva-lence estimates and spontaneous progress. Acta oto-laryn-gologica, 119(4), 468-472.
Schuknecht, H.F. (1993). Disorders of bone. In: Schuknecht HF, editor. Pathology of the ear. 2nd ed. Philadelphia7 Lea & Febiger; p. 365- 414.
Seligman, E., & Shambaugh Jr, G. E. (1951). XXXVI Otoscle-rosis of the Osseous Horizontal Semicircular Canal. Annals of Otology, Rhinology & Laryngology, 60(2), 375-381.
Shea, J. J., Ge, X., & Orchik, D. J. (1994). Endolymphatic hydrops associated with otosclerosis. The American journal of otology, 15(3), 348-357.
Shoman, N. M., Samy, R. N., & Choo, D. I. (2014). Congenital Malformations of the Ear. In Congenital Malformations of the Head and Neck (pp. 23-66). Springer, New York, NY.
Smyth, G. D. L. (1997). Otosclerosis. Scott-Brown’s Otolaryn-gology-Otology, London, 1-14.
Sone, M., Mizuno, T., Sugiura, M., Naganawa, S., & Nakashima, T. (2007). Three-dimensional fl uid-attenuated inversion recov-ery magnetic resonance imaging investigation of inner ear dis-turbances in cases of middle ear cholesteatoma with labyrin-thine fi stula. Otology & Neurotology, 28(8), 1029-1033.
Sone, M., Yoshida, T., Naganawa, S., Otake, H., Kato, K., Sano, R., ... & Nakashima, T. (2012). Comparison of computed tomography and magnetic resonance imaging for evaluation of cholesteatoma with labyrinthine fi stulae. The Laryngoscope, 122(5), 1121-1125.
Sugiura, M., Naganawa, S., Teranishi, M., & Nakashima, T. (2006). Three‐dimensional fl uid‐attenuated inversion recovery magnetic resonance imaging fi ndings in patients with sudden sensorineural hearing loss. The Laryngoscope, 116(8), 1451-1454.
Tagaya, M., Yamazaki, M., Teranishi, M., Naganawa, S., Yoshida, T., Otake, H., ... & Nakashima, T. (2011). Endolym-phatic hydrops and blood–labyrinth barrier in Meniere’s dis-ease. Acta oto-laryngologica, 131(5), 474-479.
Uppal, S., Bajaj, Y., & Coatesworth, A. P. (2010). Otosclerosis 2: the medical management of otosclerosis. International journal of clinical practice, 64(2), 256-265.
Venail, F., Lavieille, J. P., Meller, R., Deveze, A., Tardivet, L., & Magnan, J. (2007). New perspectives for middle ear implants: fi rst results in otosclerosis with mixed hearing loss. The Laryn-goscope, 117(3), 552-555.
Virolainen, E. (1972). Vestibular disturbances in clinical oto-sclerosis. Acta Oto-Laryngologica, 74(sup306), 5-34.
Yamazaki, M., Naganawa, S., Kawai, H., Nihashi, T., Fukatsu, H., & Nakashima, T. (2009). Increased signal intensity of the cochlea on pre-and post-contrast enhanced 3D-FLAIR in patients with vestibular schwannoma. Neuroradiology, 51(12), 855.

BIOSCIENCE BIOTECHNOLOGY RESEARCH COMMUNICATIONS PREVALENCE AND PATHOGENESIS OF OTOSCLEROSIS: A REVIEW 59
Rania Abdulfattah Sharaf
Yetiser, S. (2018). Bilateral vestibulopathy due to severe coch-lear otosclerosis: a well-known condition without any favora-ble solution. Turkish archives of otorhinolaryngology, 56(3), 174.
Yoon, T. H., Paparella, M. M., & Schachern, P. A. (1990). Oto-sclerosis involving the vestibular aqueduct and Meniere’s dis-ease. Otolaryngology—Head and Neck Surgery, 103(1), 107-112.
Yoshida, T., Sugiura, M., Naganawa, S., Teranishi, M., Nakata, S., & Nakashima, T. (2008). Three‐dimensional fl uid‐attenu-ated inversion recovery magnetic resonance imaging fi nd-ings and prognosis in sudden sensorineural hearing loss. The Laryngoscope, 118(8), 1433-1437.
Ziff, J. L. (2014). A molecular and genetic analysis of otoscle-rosis [Doctoral dissertation, University College London (Uni-versity of London)].

Mitigation of radiation-induced pneumonitis in mice
using alpha-tocopherol and nano-micelle curcumin
Piman Ameni Asl1, Hana Saffar2, Masoud Najafi 3, Ramezan Ali Taheri1, Ali Qazvini4,5 and
Mohammad Reza Nourani1*1Nanobiotechnology Research Centre, Baqiyatallah University of Medical Sciences, Tehran, Iran2Clinical and Anatomical Pathologist at Tehran University of Medical Sciences, Imam Khomeini Hospital Complex, Tehran, Iran3Radiology and Nuclear Medicine Department, School of Paramedical Sciences, Kermanshah University of Medical Sciences, Kermanshah, Iran4Chemical Injuries Research Center, Baqiatallah University of Medical Sciences, Tehran, Iran5Department of Pulmonology, Faculty of Medicine, Baqiyatallah University of Medical Sciences, Tehran, Iran
ABSTRACT
Pneumonitis is one of the most common consequences of exposure to high doses of ionizing radiation in lung tissue. It is associ-ated with acute infl ammation and infi ltration of infl ammatory cells, leading to massive release of several infl ammatory mediators. Some studies have reported a risk for pneumonitis following exposure to a radiation disaster. In this experimental study, we aimed to evaluate possible mitigatory effect of alpha-tocopherol and nano-micelle curcumin on radiation pneumonitis in mice. 30 male mice were divided into 6 groups, including control, alpha-tocopherol or nano-micelle curcumin treatment, radiation, and radiation plus alpha-tocopherol or nano-micelle curcumin. Treatments were initially performed 1 day after irradiation and continued for 1 month. Irradiation was performed with 18 Gy using a cobalt-60 gamma rays source. After 8 weeks, mice were sacrifi ced and the lung tissues were removed for histopathological evaluation. Our study showed that pneumonitis was associated with was able to reduce infl am-matory cells infi ltration, edema, vascular and alveolar damage. Treatment with alpha-tocopherol could attenuated infl ammation markers, while it could not mitigate vascular and alveolar damage. By contrast, nano-micelle curcumin was able to reduce infl am-mation, and vascular and alveolar damage. This study revealed that treatment with alpha-tocopherol or nano-micelle curcumin can mitigate radiation-induced pneumonitis in mice. These fi ndings may pave the way to mitigation of radiation toxicity after a radiation disaster such as nuclear explosion or radiological events.
KEY WORDS: RADIATION; LUNG; PNEUMONITIS; ALPHA-TOCOPHEROL; NANO-MICELLES CURCUMIN
60
Medical CommunicationBiosci. Biotech. Res. Comm. 12(1): 60-65 (2019)
ARTICLE INFORMATION:
Corresponding Author: [email protected] 27th Dec, 2018Accepted after revision 12th Feb, 2019BBRC Print ISSN: 0974-6455Online ISSN: 2321-4007 CODEN: USA BBRCBA Thomson Reuters ISI ESC / Clarivate
Analytics USAMono of Clarivate Analytics and Crossref Indexed Journal Mono of CR
NAAS Journal Score 2019: 4.31 SJIF: 4.196© A Society of Science and Nature Publication, Bhopal India 2019. All rights reserved.Online Contents Available at: http//www.bbrc.in/DOI: 10.21786/bbrc/12.1/8

Piman Ameni Asl et al.
BIOSCIENCE BIOTECHNOLOGY RESEARCH COMMUNICATIONS MITIGATION OF RADIATION-INDUCED PNEUMONITIS IN MICE 61
INTRODUCTION
Pneumonitis is the most common frequent side effect of high dose ionizing radiation in lung tissue. It is charac-terized by acute infl ammation in the arisen from infl am-matory cells infi ltration and thereby the release of sev-eral infl ammatory mediators. A high dose of ionizing radiation has been shown to induce massive cell death followed by release of cytokines, infl ammatory media-tors, and reactive oxygen and nitrogen species (ROSs and RNSs, respectively). Chronic increased level of cytokines and production of free radicals lead to alveolar, vascu-lar, bronchiolar damage, thereby interrupting normal function of lungs. This phenomenon may be observed in patients with various types of cancer in thoracic area such as non-small cell lung carcinoma (NSCLC), breast cancer, bronchial cancer, and etc. Moreover, mortality has been shown in association with lung injury among radioactive iodine- treated thyroid cancer patients with metastasis in the lungs, (Kwa et al. 1998, Rodrigues et al. 2004, Tsoutsou Koukourakis 2006, Hebestreit et al. 2011 and Najafi et al., 2018 ).
In addition to cancer patients, a body of evidence have suggested that pneumonitis may occur among people who were already exposed to acute ionizing radiation during nuclear or radiological disaster. Although bone marrow and gastrointestinal tract toxicity are the most common culprits for death following a radiation disaster, some stud-ies have proposed that during whole body exposure to ion-izing radiation, lung tissue may receive more than 7-8Gy; while lower parts of body may be affected by non-lethal doses, (Christofi dou-Solomidou et al. 2011; Christofi dou-Solomidou et al. 2017 and Yahyapour et al., 2018a).
Fortunately, stem cell therapy is able to prevent death caused by hematopoietic and gastrointestinal tract tox-icity that occur following exposure to an acute radiation dose greater than 8Gy (Lataillade et al. 2007). Although this worthwhile therapeutic strategy can prevent early death, organ failure in lung following exposure to radia-tion is likely to occur. Additionally, there is piece of evi-dence indicating death caused by lung toxicity among people who were exposed to Chernobyl nuclear station explosion, (Deas et al. 2017; Yahyapour et al. 2018c).
Experimental studies have proposed that treatment with some antioxidants and immunomodulatory agents may mitigate radiation injury in radiosensitive organs. So, identifi cation of mitigatory effect of low toxic anti-oxidants and fl avonoids may be useful for to address the possible radiation disasters. Curcumin is a well-known herbal agent with potent anti-infl ammatory and antiox-idant effects. Previous studies have shown considerable protective effect of curcumin against toxicity of ionizing radiation, (Jurenka 2009, Cho et al. 2013; Patil et al. 2015 Yahyapour et al. 2018b Bagheri et al. 2018).
One of the most important concerns about the cur-cumin is its low absorption in gastric owing to high lipophilicity. This issue has been tackled in nano-micelle form of curcumin (Li et al. 2015). Consequently, more effi ciency can be achieved with the same dose following treatment with nano-micelle form of curcumin. Alpha-tocopherol is another antioxidant that was used for miti-gation of lung pneumonitis in the current study. It has shown a potent antioxidant effect which is able to protect and mitigate radiation toxicity (Ferreira et al. 2004; Singh et al. 2010). In this study, we aimed to illustrate possible mitigatory effect of nano-micelle form of curcumin and alpha-tocopherol on radiation-induced pneumonitis.
MATERIAL AND METHODS
Experimental design
All 30 male mice, purchased from Razi institute, Teh-ran, Iran; were kept under standard condition (tem-perature = 25C, humidity=55%, 12h light/12h dark). Then, they were divided into 6 groups (5mice in each). 1) G1 (control): mice who did not receive any drug or irradiation, and were taken only anesthesia drugs in a similar dose as other groups; 2) G2 (irradiation): mice who were irradiated locally in chest area, 3) G3 (alpha-tocopherol treatment): those received 200mg/kg/day alpha-tocopherol, 4) G4 (curcumin treatment): mice in this group were received 100mg/kg/day nano-micelle form of curcumin, 5) G5 (radiation plus alpha-tocoph-erol): mice were exposed to gamma rays, and after 24h, treatment with alpha-tocopherol was started, and 6) G6 (radiation plus curcumin): mice were exposed to gamma rays, and after 24h, treatment with nano-micelle form of curcumin was started. Finally, all mice were sacrifi ced 8weeks after irradiation and then the lung tissues were removed for histological evaluation.
Irradiation and drug administration
Alpha-tocopherol soft gel capsule was obtained from Nature Made and dissolved in olive oil. Each mouse orally received 1ml containing 6mg alpha-tocopherol (equal 200mg/kg). Then, treatment with alpha-tocoph-erol was started 1day after irradiation with the procedure of 5-time per week for 4 weeks. Nano-micelle form of curcumin was purchased from Exir Nano Sina, Mashahd, Iran, and was dissolved in water at a concentration of 1mg/ml. As mice drink 3 milliliter water daily which was equal to 100mg per kg per day. Treatment was started 24h after irradiation and continued for 1 month. Then, Irradiation was performed using a cobalt-60 source. Before this, mice were anesthetized using a combina-tion of ketamine and xylazine (). After that, they were exposed to gamma rays source at supine position with

Piman Ameni Asl et al.
62 MITIGATION OF RADIATION-INDUCED PNEUMONITIS IN MICE BIOSCIENCE BIOTECHNOLOGY RESEARCH COMMUNICATIONS
a distance of 80cm. subsequently, irradiation of chest was done at a dose of 60cGy/min and other parts of the mice’s body were shielded using lead block.
Histopathological evaluation
Following fi xation of lung tissues, all samples were embedded into a block of paraffi n. Then, they were cut by microtome to pieces with 4-micron thickness. Result-ant lung pieces were located on the slides to be stained. Each slide was stained using hematoxylin and eosin (H&E). The stained slides were evaluated for morpholog-ical changes by a histopathologist. Pneumonitis markers including infi ltration of infl ammatory cells and alveolar and vascular damages were detected. All these proce-dures were performed in the pathology unit of Imam
Khomeini hospital, Tehran University of Medical Sci-ences, Tehran, Iran.
Statically analyses
Results of histopathological evaluation were reported as grade 0 to3. Changes in each groups were calculated as mean ± standard deviation. Mann-Whitney test was used to evaluate the signifi cance in the groups (SPSS V16).
RESULTS
Histopathological evaluations showed a signifi cant increase in pneumonitis markers following exposure to radiation. a drastic increase was also shown in the infi l-tration of infl ammatory cells including macrophages,
Table 1. Histopathological results of pneumonitis incidence following mice lung exposure to ionizing radiation and mitigation by alpha-tocopherol and nano-micelle curcumin.
Macrophage infi ltration
Lymphocyte infi ltration
Neutrophil infi ltration
Vascular thickening
Alveolar thickening
Edema and thrombosis
Control 0±00 0.50±0.50 0±00 0±00 0±00 0±00
Alpha-tocopherol 0±00 0.66±0.47 0±00 0±00 0±00 0±00
Curcumin 0±00 0.33±0.47 0±00 0.66±47 0±00 0±00
Radiation 3.0±00 3.0±00 3.0±00 2.0±00 1.66±47 1±00
Radiation plus Alpha-tocopherol
0.6±0.49 1.2±0.40 0.40±0.48 1.4±0.80 1.4±0.80 0.6±0.49
Radiation plus Curcumin
1.0±1.41 1.0±0.81 0.33±0.47 0.33±0.47 0.33±0.47 0±00
FIGURE 1. Histopathological evaluation of radiomitigatory effects of alpha-tocopherol and nano-micelle curcumin on radiation-induced pneumonitis. Irra-diation cause severe infi ltration of macrophages, neutrophils and lymphocytes; as well as vascular and alveolar thickening, and edema. However, treatment with nano-micelle curcumin or alpha-tocopherol attenuated these markers signifi -cantly. A: Control; B: Nano-micelle curcumin; C: alpha-tocopherol; D: Radiation; E: Radiation + Nano-micelle curcumin; F: Radiation + alpha-tocopherol (H&E staining, ×100).

Piman Ameni Asl et al.
BIOSCIENCE BIOTECHNOLOGY RESEARCH COMMUNICATIONS MITIGATION OF RADIATION-INDUCED PNEUMONITIS IN MICE 63
lymphocytes and neutrophils (p=0.008). Treatment with alpha-tocopherol caused signifi cant amelioration of these infl ammatory cells (p value of 0.018, 0.014, and 0.018 for mitigation of macrophages, lymphocytes, and neutrophils, respectively). When mice were treated with alpha-tocopherol after irradiation, only a low infi ltra-tion of lymphocytes observed, with infi ltration of mac-rophages and neutrophils being similar to that in control group. Irradiation also lead to a moderate vascular thick-ening (p=0.008) and a mild alveolar thickening (p=0.01) and edema (p=0.008). However, treatment with alpha-tocopherol failed mitigate these parameters. Treatment with alpha-tocopherol alone did not cause any toxicity, and lung morphology in this group was similar to that in control group.
Treatment with curcumin nano-micelle has a potent mitigatory effect on radiation-induced pneumonitis. However, treatment with neither nano-micelle cur-cumin nor alpha-tocopherol led to signifi cant change in morphological properties of mice lung tissue. On the other hand, treatment with nano-micelle curcumin after irradiation could signifi cantly attenuate infi ltration of lymphocytes (p=0.037) and neutrophils (p=0.037), however, the difference in infi ltration of macrophages wasn’t signifi cant. administration of this drug also led to a remarkable attenuation of vascular thickening (p=0.037), edema, and thrombosis (p=0.025). However, difference in alveolar thickening between radiation group and radiation plus nano-micelle curcumin was not signifi cant.
DISCUSSION
As previously mentioned, radiation-induced pneumo-nitis is the acute response of lung tissue which leads to respiratory impairments, and also may cause death in a few months. As results of this study showed, lung exposure to ionizing radiation caused severe infi ltra-tion of macrophages, lymphocytes and neutrophils, all of which resulting from massive DNA damage and cell death which in turn lead to the release of chemokines and recruitment of circulatory cells into the injured area (Mukaida et al. 1998). These cells are able to produce massive free radicals via a phenomenon named respira-tory burst. Production of free radicals activates several signaling pathways, including redox reactions by pro-oxidant enzymes, that lead to chronic oxidative stress (Yahyapour et al. 2018d). Also, they are capable of releas-ing several pro-infl ammatory and pro-fi brotic cytokines. Interactions between oxidative stress and infl ammatory cytokines plays a key role in development of late effects of radiotherapy and radiation disaster. targeting these interactions has been proposed as a strategy for miti-gation of radiation injury (Farhood et al. 2018). With
respect to the results, post irradiation-chronic infl am-mation causes alveolar and vascular injury, edema, and thrombosis.
To date, some agents have been proposed for mitiga-tion of radiation-induced lung injury in animal models. Targeting COX-2 by celecoxib has been shown to allevi-ate pneumonitis and increase survival following local chest irradiation (Hunter et al. 2013). renin-angiotensin system also has been proposed as a target for mitiga-tion of lung pneumonitis (Medhora et al. 2012). Ghosh et al. showed that administration of captopril or losar-tan (which are angiotensin inhibitor) mitigates radia-tion pneumonitis and increases survival through the improved breathing, amelioration of vascular injury, and reduction of infi ltration of infl ammatory cells (Ghosh et al. 2009; Molthen et al. 2012). Similar results have been obtained with antioxidants. Mahmood et al. showed that treatment with genistein and/or Eukarion (EUK)-207, which have antioxidant effects, can mitigate the release of infl ammatory cytokines such as IL-1, IL-1, IL-6 and TNF-, and reduce oxidative stress and activity of macrophages (Mahmood et al. 2011). BIO 300, a nanosuspension of genistein has shown similar results (Jackson et al. 2017). These studies show pivotal role of both free radical production and elevated activity of infl ammatory mediators in development of radiation-induced pneumonitis.
In current study we aimed to detect possible miti-gatory effects of two natural anti-infl ammation and antioxidant agents. Curcumin demonstrated potent anti-infl ammatory properties. However, it has low absorb-ance in intestine which may reduce its effi ciency. In recent years, several studies have used other forms of curcumin with high absorbance. For instance, Nano-micelle curcumin is a low cost form of curcumin with easy absorbance. Results of this study showed that treat-ment with nano-micelle curcumin can strongly mitigate infl ammation, infi ltration of infl ammatory cells, throm-bosis, and vascular and alveolar injury. Mitigatory effect of nano-micelle curcumin may be mediated by suppres-sion of infl ammatory mediators such as NF-kB which in turn leads to reduced release of infl ammatory cytokines. Additionally, curcumin has antioxidant properties and is able to reduce activity of pro-oxidant enzymes such as COX-2 and iNOS.
Alpha-tocopherol was another agent we used for mitigation of lung pneumonitis. Treatment with Alpha-tocopherol reduced the serum level of cytokines such as G-CSF, IL-10, IL-6, IL-12, and FLT3 in peripheral blood mononuclear cells (PBMCs) (Singh et al. 2014). Moreover, it was shown to mitigate intestinal injury following expo-sure to radiation through suppression of apoptosis and enhancement of cell proliferation (Singh et al. 2013). This study showed that post-exposure treatment with alpha-

Piman Ameni Asl et al.
64 MITIGATION OF RADIATION-INDUCED PNEUMONITIS IN MICE BIOSCIENCE BIOTECHNOLOGY RESEARCH COMMUNICATIONS
tocopherol can mitigate infi ltration of macrophages, lym-phocytes and neutrophils. However, differences for alveo-lar and vascular was not signifi cant. It is possible that longer follow-up or treatment with higher dose of alpha-tocopherol would be benefi cial for a remarkable mitiga-tion of radiation-induced lung pneumonitis.
CONCLUSION
This study showed that treatment with alpha-tocopherol or nano-micelle curcumin could mitigate radiation-induced pneumonitis in mice. However, alpha-tocoph-erol could not mitigate alveolar and vascular injury. Owing to the low toxicity of these agents, longer treat-ment or higher doses of alpha-tocopherol would be more effective. These fi ndings may pave the way to mitigation of radiation toxicity after a radiation disaster such as nuclear explosion or radiological events.
DECLARATIONS
Acknowledgments
Not Applicable
Funding
Baqiyatallah University of Medical Sciences.
Availability of data and materials
All the relevant data and materials are presented in this article.
Authors’ contributions
All authors were involved in this project.
Ethics approval
This study was approved by the Ethical Committee of the Baqiyatallah University of Medical Sciences on Animal Care.
Consent for publication
Not applicable.
Competing interests
The authors declare that they have no competing inter-ests.
REFERENCES
Bagheri, Hamed, et al. (2018), Protection Against Radiation-Induced Micronuclei in Rat Bone Marrow Erythrocytes by Cur-cumin and Selenium L-Methionine (2018).
Cho, Y. J., et al. (2013), Curcumin attenuates radiation-induced infl ammation and fi brosis in rat lungs, Korean J Physiol Phar-macol, 17 (4), 267-74.
Christofi dou-Solomidou, M., et al. (2017), Radiation Mitigat-ing Properties of Intranasally Administered KL4 Surfactant in a Murine Model of Radiation-Induced Lung Damage’, Radiat Res, 188 (5), 491-504.
Christofi dou-Solomidou, M., et al. (2011), Dietary fl axseed administered post thoracic radiation treatment improves sur-vival and mitigates radiation-induced pneumonopathy in mice, BMC Cancer, 11, 269.
Deas, S. D., Huprikar, N., and Skabelund, A. (2017), Radiation exposure and lung disease in today’s nuclear world, Curr Opin Pulm Med, 23 (2), 167-72.
Farhood, B., et al. (2018), Intercellular communications-redox interactions in radiation toxicity; potential targets for radia-tion mitigation J Cell Commun Signal.
Ferreira, Paulo Renato, et al. (2004), Protective effect of alpha‐tocopherol in head and neck cancer radiation‐induced mucosi-tis: A double‐blind randomized trial, Head & Neck: Journal for the Sciences and Specialties of the Head and Neck, 26 (4), 313-21.
Ghosh, S. N., et al. (2009) Renin-Angiotensin system sup-pression mitigates experimental radiation pneumonitis, Int J Radiat Oncol Biol Phys, 75 (5), 1528-36.
Hebestreit, Helge, et al. (2011) Pulmonary fi brosis in youth treated with radioiodine for juvenile thyroid cancer and lung metastases after Chernobyl’, European journal of nuclear med-icine and molecular imaging, 38 (9), 1683.
Hunter, N. R., et al. (2013) Mitigation and treatment of radia-tion-induced thoracic injury with a cyclooxygenase-2 inhibi-tor, celecoxib Int J Radiat Oncol Biol Phys, 85 (2), 472-6.
Jackson, I. L., et al. (2017) BIO 300, a nanosuspension of gen-istein, mitigates pneumonitis/fi brosis following high-dose radiation exposure in the C57L/J murine model’, Br J Pharma-col, 174 (24), 4738-50.
Jurenka, Julie S (2009) Anti-infl ammatory properties of cur-cumin, a major constituent of Curcuma longa: a review of pre-clinical and clinical research’, Alternative medicine review, 14 (2).
Kwa, Stefan LS, et al. (1998) Radiation pneumonitis as a func-tion of mean lung dose: an analysis of pooled data of 540 patients International Journal of Radiation Oncology* Biology* Physics, 42 (1), 1-9.
Lataillade, JJ, et al. (2007) New approach to radiation burn treatment by dosimetry-guided surgery combined with autolo-gous mesenchymal stem cell therapy’.
Li, Jinglei, et al. (2015) Modifi ed curcumin with hyaluronic acid: combination of pro-drug and nano-micelle strategy to address the curcumin challenge’, Food Research International, 69, 202-08.
Mahmood, J., et al. (2011) Mitigation of radiation-induced lung injury by genistein and EUK-207’, Int J Radiat Biol, 87 (8), 889-901.
Medhora, Meetha, et al. (2012) Radiation damage to the lung: mitigation by angiotensin converting enzyme (ACE) inhibitors Respirology (Carlton, Vic.), 17 (1), 66-71.

Piman Ameni Asl et al.
BIOSCIENCE BIOTECHNOLOGY RESEARCH COMMUNICATIONS MITIGATION OF RADIATION-INDUCED PNEUMONITIS IN MICE 65
Molthen, R. C., et al. (2012) Mitigation of radiation induced pulmonary vascular injury by delayed treatment with captopril Respirology, 17 (8), 1261-8.
Mukaida, Naofumi, Harada, Akihisa, and Matsushima, Kouji (1998) Interleukin-8 (IL-8) and monocyte chemotactic and activating factor (MCAF/MCP-1), chemokines essentially involved in infl ammatory and immune reactions Cytokine & growth factor reviews, 9 (1), 9-23.
Najafi , M., et al. (2018) Mechanisms of infl ammatory responses to radiation and normal tissues toxicity: clinical implications Int J Radiat Biol, 94 (4), 335-56.
Patil, KarthiKeya, et al. (2015) Use of Curcumin Mouthrinse in Radio-Chemotherapy Induced Oral Mucositis Patients: A Pilot Study Journal of clinical and diagnostic research: JCDR, 9 (8), ZC59-62.
Rodrigues, George, et al. (2004) Prediction of radiation pneumo-nitis by dose–volume histogram parameters in lung cancer—a systematic review Radiotherapy and oncology, 71 (2), 127-38.
Singh, V. K., et al. (2013) Alpha-tocopherol succinate-mobi-lized progenitors improve intestinal integrity after whole body irradiation Int J Radiat Biol, 89 (5), 334-45.
Singh, Vijay K, Brown, Darren S, and Kao, Tzu-Cheg (2010) Alpha-tocopherol succinate protects mice from gamma-radi-
ation by induction of granulocyte-colony stimulating factor’, International journal of radiation biology, 86 (1), 12-21.
Singh, Vijay K., et al. (2014) Alpha-tocopherol succinate- and AMD3100-mobilized progenitors mitigate radiation com-bined injury in mice Journal of Radiation Research, 55 (1), 41-53.
Tsoutsou, Pelagia G and Koukourakis, Michael I (2006), ‘Radi-ation pneumonitis and fi brosis: mechanisms underlying its pathogenesis and implications for future research’, Interna-tional Journal of Radiation Oncology Biology Physics, 66 (5), 1281-93.
Yahyapour, R., et al. (2018a) Targeting of Infl ammation for Radiation Protection and Mitigation Curr Mol Pharmacol, 11 (3), 203-10.
Yahyapour, R., et al. (2018b) Radiation protection and mitiga-tion by natural antioxidants and fl avonoids; implications to radiotherapy and radiation disasters, Curr Mol Pharmacol.
Yahyapour, R., et al. (2018c), ‘Radiation-induced infl ammation and autoimmune diseases’, Mil Med Res, 5 (1), 9.
Yahyapour, R., et al. (2018d), Reduction-oxidation (redox) system in radiation-induced normal tissue injury: molecular mechanisms and implications in radiation therapeutics, Clin Transl Oncol, 20 (8), 975-88.

Isolation, phenotypic and molecular characterization
of Burkholderia sp. (strain, PCS1) from maize fi elds
exhibiting starch hydrolysis ability
Priya Chatterjee, Paromita Roy, Paramita Mandal and Soumendranath Chatterjee*
Department of Zoology, The University of Burdwan, Burdwan, 713104, India
ABSTRACT
The starch hydrolysing bacteria have important role in plant nutrient uptake. The aim of the present study is to isolate and characterize bacteria that are able to degrade starch from the rhizospheres of maize plants. Isolation and charac-terization were performed in the laboratory. The bacterial isolate (PCS1) was non-pathogenic and found to be positive for catalase, lipid hydrolysis and nitrogen fi xation. The PCS1 also fermented sucrose, xylose, dextrose, galactose and mannose. The PCS1 strain showed halo-zone on starch medium and starch degrading index was found to be 2.14. The 16S rRNA gene sequence and phylogenetic tree analysis revealed that the PCS1 belonged to one of the strains of Bur-kholderia cepacia complex.
KEY WORDS: AMYLASE; PHYLOGENETIC ANALYSIS; RHIZOSPHERE; STARCH DEGRADING INDEX
66
Biotechnological CommunicationBiosci. Biotech. Res. Comm. 12(1): 66-72 (2019)
INTRODUCTION
A wide range of ecological niches have been occupied by the members of the genus Burkholderia sp. ranging from soils to the respiratory tract of humans (van Elsas et al., 2002; Coenye and Vandamme, 2003; Salles et al., 2002, 2004; Janssen, 2006). Beside free-living rhizospheric association with plants, some of the Burkholderia strains
and species are also epiphytic and endophytic, including obligate endosymbionts and phytopathogen (Coenye and Vandamme, 2003; Janssen, 2006). The research studies on maize rhizosphere have shown that the Burkholderia are the predominant bacterial groups in maize of Italian agricultural fi elds (Hebbar et al., 1992; Ramette et al., 2005). In addition, Viallard et al. (1998) have shown that the species B. graminis and B. cepacia genomovar III are
ARTICLE INFORMATION:
Corresponding Author: [email protected] 2nd Jan 2019Accepted after revision 28th March 2019BBRC Print ISSN: 0974-6455Online ISSN: 2321-4007 CODEN: USA BBRCBA Thomson Reuters ISI ESC / Clarivate
Analytics USAMono of Clarivate Analytics and Crossref Indexed Journal Mono of CR
NAAS Journal Score 2019: 4.31 SJIF: 4.196© A Society of Science and Nature Publication, Bhopal India 2019. All rights reserved.Online Contents Available at: http//www.bbrc.in/DOI: 10.21786/bbrc/12.1/9

Priya Chatterjee et al.
BIOSCIENCE BIOTECHNOLOGY RESEARCH COMMUNICATIONS ISOLATION, PHENOTYPIC AND MOLECULAR CHARACTERIZATION OF BURKHOLDERIA SP. (STRAIN, PCS1) 67
abundant in maize fi elds of France. The most abundant isolates belonged to the genus Burkholderia. Silva et al. (2016) studied the soils of the Amazon basin and found that Burkholderia spp. associated with the maize plants carry nifH genes and able to synthesize indole-3-acetic acid (IAA) and solubilize calcium phosphate. Recently, Correa-Galeote (2018) have shown that the cultivation history is the main driver of endophytic colonization of Burkholderia spp. in maize plants
Bevivino et al. (1998) evaluated the metabolic and molecular profi les for some traits associated with bio-control and plant growth promoting (PGP) activity in Burkholderia cepacia population. They showed that the B. cepacia strains displayed a wide antibiosis against the phytopathogenic fungi. Further studies on maize rhizo-sphere have shown the association of other species such as Burkholderia unamae (Caballero-Mellado et al., 2004) and B. silvatlantica (Perin et al., 2006a). The Burkholde-ria vietnamiensis was first described in the rice rhizo-sphere in Vietnam (Tran Van et al., 1994; Gillis et al., 1995) along with other Burkholderia species from the rhizosphere of maize and coffee in Mexico (Estrada-de Los Santos et al., 2001).
Several novel diazotrophic bacterial species belonging to the genus Burkholderia that may form both epiphytic and endophytic populations with the maize roots are known to be associated with N2 fi xation such as B. viet-namiensis (Estrada-de Los Santos et al., 2001; Estrada et al., 2002), Burkholderia tropica (Reis et al., 2004) and Bur-kholderia cenocepacia (Balandreau et al., 2001). Kost et al. (2014) demonstrated oxalotrophy as one of the vital traits of the genus Burkholderia phytofi rmans. So far, the studies were focused on the diversity of Burkholderia spp. in maize soils, N2 fi xing ability and plant growth promotion traits. The starch solubilising ability of Burkholderia spp. from maize roots is still not reported from any part of India. The objective of the present research work is to identify and characterization of Burkholderia spp. associated with maize rhizosphere capable of starch solubilization.
MATERIALS AND METHODS
The research work was carried out in the Crop Research and Seed Multiplication Farm (CRSMF) of the Univer-sity of Burdwan, West Bengal, located in the eastern part of India (latitude, 87°50’37.35’ E and longitude, 23°15’7.29’N and average altitude of 30m above mean sea level) using one variety of Zea mays L. (var. RE-55, Royal England).The soil samples were collected at the depth of 10 cm using soil auger from the rhizosphere of maize plants in sterile polythene bags and were taken to the Microbiology and Parasitology Laboratory of the University of Burdwan for bacterial analysis. The soil was air-dried and diluted up to 10-3 using sterile distilled
water. From this dilution 100μl portion was mixed with sterile nutrient agar medium (NA) (peptone: beef extract: NaCl: agar at 5:3:3:1 g l-1) and was distributed in 5 steri-lized plates. The plates were incubated at 30 ± 0.1 ºC in the BOD incubator for 24 hours to obtain isolated colo-nies. The colonies were observed on the incubated plates and the most abundant colonies (S1) were purifi ed on NA plates. The bacterial isolate was maintained on the NA slants at 4 ± 0.1º C for subsequent characterization and identifi cation. The morphological characters such as shape, size, colour, margin and opacity of the isolated colonies were determined. The bacteria was streaked on different media including starch (Starch Agar, Himedia, India) and free-living nitrogen-fi xing media (Mannitol, 10 g l-1; K2HPO4, 0.5 g l-1; MgSO4. 7H2O, 0.2 g l-1; NaCl, 0.2 g l-1; MnSO4.4H2O, trace; FeCl3, trace; Agar powder 10 g l-1) and plates were kept at 30 ± 0.1 ºC in the BOD incu-bator. After 24 hours, standard microbiological methods were followed for morphological and biochemical char-acterization of the isolate (Holt et al., 1994; Sneath and Holt, 2001; Forbes et al., 2007).
The Gram staining was performed using Gram stain-ing kit (Himedia, India). Motility test was done by stab-bing the bacteria into SIM agar (Czaban et al., 2007). The biochemical properties such as catalase, citrate utiliza-tion, nitrate reduction, indole production, Methyl-Red (MR), Voges-Proskauer (VP), urease, oxidase, and car-bohydrate metabolism (acid-gas production) tests were performed. The pathogenicity test was done on Blood Agar and by DNase test (Benson et al., 2012). Carbohy-drate fermentation test was performed using the sugar discs of maltose, adonitol, fructose, inositol, mannose sucrose, raffi nose, dextrose, cellobiose, galactose, rham-nose, xylose, melibiose, lactose, salicin, ducitol, sorbitol, mannitol, trehalose and arabinose (Azmi et al., 2014).
In addition, the qualitative determination of enzymes such as starch hydrolysis, lipid hydrolysis, protein hydrolysis (gelatine) tests were also performed. The starch plates were fl ooded with Grams Iodine after 24 hours of incubation. The ability of the bacteria to degrade starch was described by Starch Degrading Index (SDI), which is the ratio of the total diameter of clear zone and colony diameter (Nusrat and Rahman, 2007). The sensitivity analysis of the isolate to the recom-mended doses of antibiotics was done following Brown et al. (2004). The strain was tested for tetracycline (tcn), amoxicillin (amx), gentamycin (gen), ciprofl oxacin (cip), azithromycin (azi), nalidixic acid (nal), ofl oxacin (ofx), neomycin (nm), rifampicin (rif), bacitracin (bac), chlo-ramphenicol (chl), kanamycin (kan), erythromycin (ery), ampicillin (amp), penicillin (pcn) and doxycycline (dox). The zone interpretation was done following CLSI (2011).
Genomic DNA isolation kit was used to isolate the genomic DNA of the bacterial strain from the pure cul-
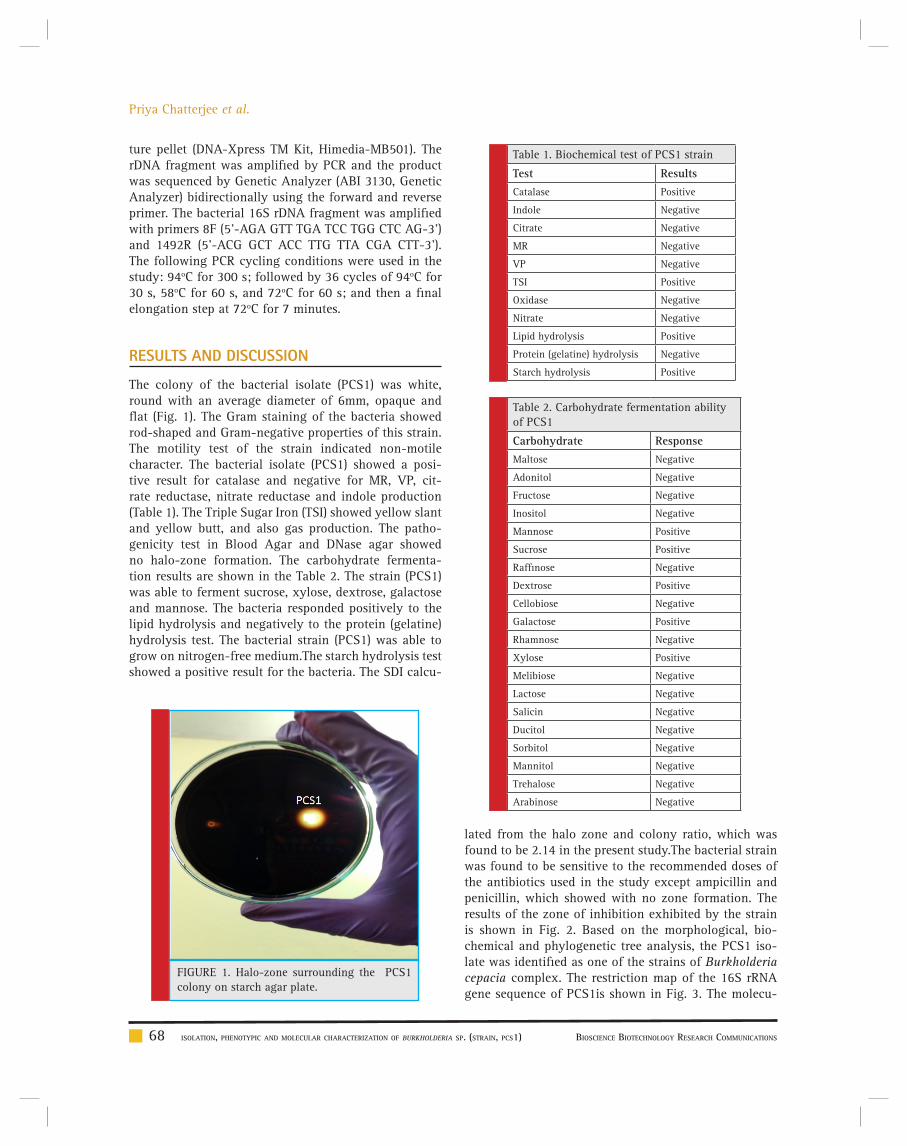
Priya Chatterjee et al.
68 ISOLATION, PHENOTYPIC AND MOLECULAR CHARACTERIZATION OF BURKHOLDERIA SP. (STRAIN, PCS1) BIOSCIENCE BIOTECHNOLOGY RESEARCH COMMUNICATIONS
ture pellet (DNA-Xpress TM Kit, Himedia-MB501). The rDNA fragment was amplifi ed by PCR and the product was sequenced by Genetic Analyzer (ABI 3130, Genetic Analyzer) bidirectionally using the forward and reverse primer. The bacterial 16S rDNA fragment was amplifi ed with primers 8F (5’-AGA GTT TGA TCC TGG CTC AG-3’) and 1492R (5’-ACG GCT ACC TTG TTA CGA CTT-3’). The following PCR cycling conditions were used in the study: 94oC for 300 s; followed by 36 cycles of 94oC for 30 s, 58oC for 60 s, and 72oC for 60 s; and then a fi nal elongation step at 72oC for 7 minutes.
RESULTS AND DISCUSSION
The colony of the bacterial isolate (PCS1) was white, round with an average diameter of 6mm, opaque and fl at (Fig. 1). The Gram staining of the bacteria showed rod-shaped and Gram-negative properties of this strain. The motility test of the strain indicated non-motile character. The bacterial isolate (PCS1) showed a posi-tive result for catalase and negative for MR, VP, cit-rate reductase, nitrate reductase and indole production (Table 1). The Triple Sugar Iron (TSI) showed yellow slant and yellow butt, and also gas production. The patho-genicity test in Blood Agar and DNase agar showed no halo-zone formation. The carbohydrate fermenta-tion results are shown in the Table 2. The strain (PCS1) was able to ferment sucrose, xylose, dextrose, galactose and mannose. The bacteria responded positively to the lipid hydrolysis and negatively to the protein (gelatine) hydrolysis test. The bacterial strain (PCS1) was able to grow on nitrogen-free medium.The starch hydrolysis test showed a positive result for the bacteria. The SDI calcu-
lated from the halo zone and colony ratio, which was found to be 2.14 in the present study.The bacterial strain was found to be sensitive to the recommended doses of the antibiotics used in the study except ampicillin and penicillin, which showed with no zone formation. The results of the zone of inhibition exhibited by the strain is shown in Fig. 2. Based on the morphological, bio-chemical and phylogenetic tree analysis, the PCS1 iso-late was identifi ed as one of the strains of Burkholderia cepacia complex. The restriction map of the 16S rRNA gene sequence of PCS1is shown in Fig. 3. The molecu-
FIGURE 1. Halo-zone surrounding the PCS1 colony on starch agar plate.
Table 1. Biochemical test of PCS1 strain
Test ResultsCatalase Positive
Indole Negative
Citrate Negative
MR Negative
VP Negative
TSI Positive
Oxidase Negative
Nitrate Negative
Lipid hydrolysis Positive
Protein (gelatine) hydrolysis Negative
Starch hydrolysis Positive
Table 2. Carbohydrate fermentation ability of PCS1
Carbohydrate ResponseMaltose Negative
Adonitol Negative
Fructose Negative
Inositol Negative
Mannose Positive
Sucrose Positive
Raffi nose Negative
Dextrose Positive
Cellobiose Negative
Galactose Positive
Rhamnose Negative
Xylose Positive
Melibiose Negative
Lactose Negative
Salicin Negative
Ducitol Negative
Sorbitol Negative
Mannitol Negative
Trehalose Negative
Arabinose Negative
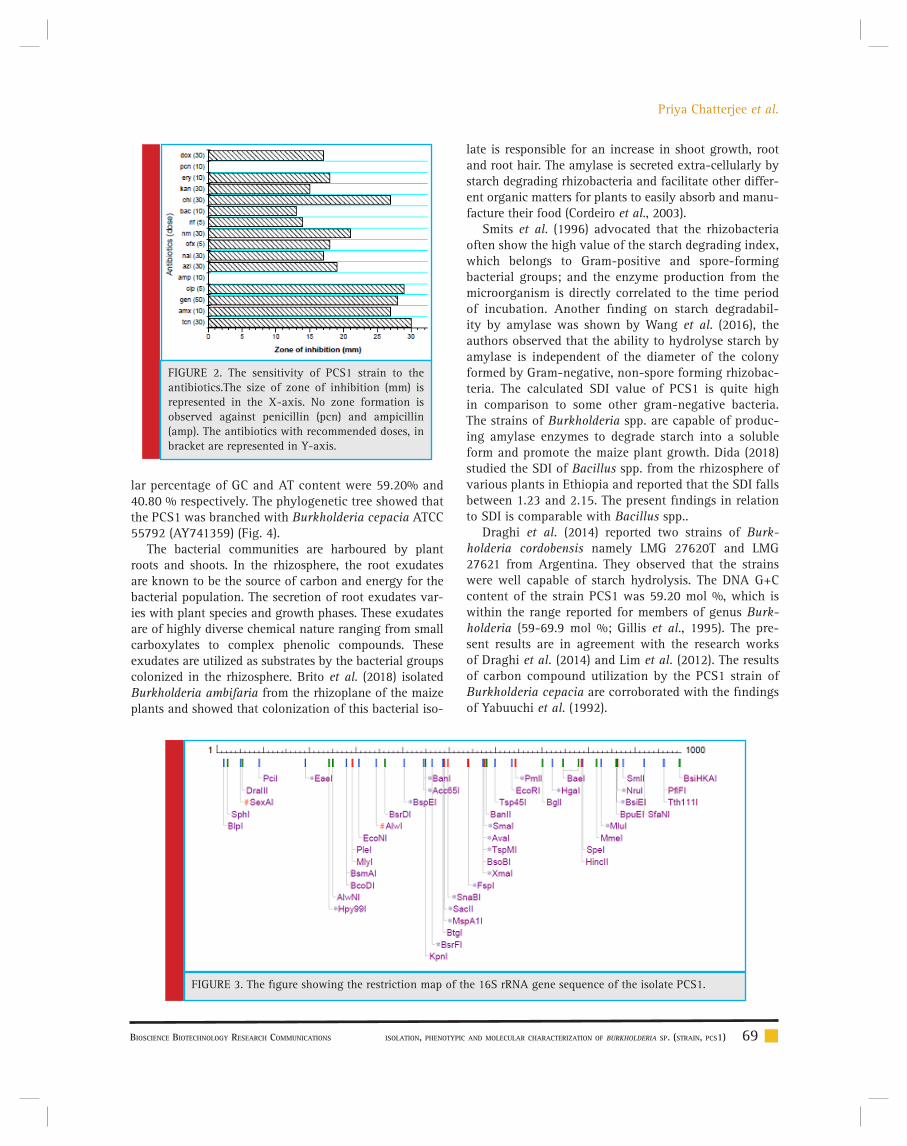
Priya Chatterjee et al.
BIOSCIENCE BIOTECHNOLOGY RESEARCH COMMUNICATIONS ISOLATION, PHENOTYPIC AND MOLECULAR CHARACTERIZATION OF BURKHOLDERIA SP. (STRAIN, PCS1) 69
FIGURE 3. The fi gure showing the restriction map of the 16S rRNA gene sequence of the isolate PCS1.
FIGURE 2. The sensitivity of PCS1 strain to the antibiotics.The size of zone of inhibition (mm) is represented in the X-axis. No zone formation is observed against penicillin (pcn) and ampicillin (amp). The antibiotics with recommended doses, in bracket are represented in Y-axis.
lar percentage of GC and AT content were 59.20% and 40.80 % respectively. The phylogenetic tree showed that the PCS1 was branched with Burkholderia cepacia ATCC 55792 (AY741359) (Fig. 4).
The bacterial communities are harboured by plant roots and shoots. In the rhizosphere, the root exudates are known to be the source of carbon and energy for the bacterial population. The secretion of root exudates var-ies with plant species and growth phases. These exudates are of highly diverse chemical nature ranging from small carboxylates to complex phenolic compounds. These exudates are utilized as substrates by the bacterial groups colonized in the rhizosphere. Brito et al. (2018) isolated Burkholderia ambifaria from the rhizoplane of the maize plants and showed that colonization of this bacterial iso-
late is responsible for an increase in shoot growth, root and root hair. The amylase is secreted extra-cellularly by starch degrading rhizobacteria and facilitate other differ-ent organic matters for plants to easily absorb and manu-facture their food (Cordeiro et al., 2003).
Smits et al. (1996) advocated that the rhizobacteria often show the high value of the starch degrading index, which belongs to Gram-positive and spore-forming bacterial groups; and the enzyme production from the microorganism is directly correlated to the time period of incubation. Another fi nding on starch degradabil-ity by amylase was shown by Wang et al. (2016), the authors observed that the ability to hydrolyse starch by amylase is independent of the diameter of the colony formed by Gram-negative, non-spore forming rhizobac-teria. The calculated SDI value of PCS1 is quite high in comparison to some other gram-negative bacteria. The strains of Burkholderia spp. are capable of produc-ing amylase enzymes to degrade starch into a soluble form and promote the maize plant growth. Dida (2018) studied the SDI of Bacillus spp. from the rhizosphere of various plants in Ethiopia and reported that the SDI falls between 1.23 and 2.15. The present fi ndings in relation to SDI is comparable with Bacillus spp..
Draghi et al. (2014) reported two strains of Burk-holderia cordobensis namely LMG 27620T and LMG 27621 from Argentina. They observed that the strains were well capable of starch hydrolysis. The DNA G+C content of the strain PCS1 was 59.20 mol %, which is within the range reported for members of genus Burk-holderia (59-69.9 mol %; Gillis et al., 1995). The pre-sent results are in agreement with the research works of Draghi et al. (2014) and Lim et al. (2012). The results of carbon compound utilization by the PCS1 strain of Burkholderia cepacia are corroborated with the fi ndings of Yabuuchi et al. (1992).

Priya Chatterjee et al.
70 ISOLATION, PHENOTYPIC AND MOLECULAR CHARACTERIZATION OF BURKHOLDERIA SP. (STRAIN, PCS1) BIOSCIENCE BIOTECHNOLOGY RESEARCH COMMUNICATIONS
Dalmastri et al. (1999) studied the effect of soil type, maize cultivar and root localization on the genetic diver-sity of Burkholderia cepacia populations and found that the degree of genetic diversity was regulated strictly by the soil types. Salles et al. (2004) added that the distribution of Burkholderia spp. in soil is attributed to the land use his-tory of that area beside the maize cultivar and soil type. It is probably due to the soil type and maize cultivar, which were responsible for the deviation of the characteristics of the novel strain, PCS1 from the other strains of Burkholde-ria cepacia, reported from other parts of the world.
CONCLUSION
In addition to nitrogen fi xation in soils, Burkholderia spp. also exhibit starch degrading property that is ben-efi cial to maize plants. The DNA G+C content and the carbohydrate fermentation abilities of the novel strain, PCS1 supports the properties of the genus Burkholde-ria. The phylogenetic tree showed the clustering of PCS1
with Burkholderia cepacia. It can be said that the varia-tion of the strains from the other strains of Burkholderia were due to the type of soil and maize cultivar used in the study.
ACKNOWLEDGEMENTS
The fi rst author is thankful to the Department of Zool-ogy, The University of Burdwan for giving all sorts of laboratory facilities to conduct this research. Thanks are due to the agricultural scientists of the Department of Agriculture, Govt. of West Bengal and scientists of CRSMF, The University of Burdwan for extending the help to carry out the research.
REFERENCES
Azmi, S.A., Catterjee, S.N., Saha, N.C. (2014). Phenotypic and molecular characterization of bubble eye gold fi sh pathogenic ampicillin resistant Bacillus sp(GF1). Int. J. of Pharma. Bio. Sci., 4: 342-351.
FIGURE 4. The neighbourhood joining tree of the PCS1 strain based on 16S rRNA gene sequence

Priya Chatterjee et al.
BIOSCIENCE BIOTECHNOLOGY RESEARCH COMMUNICATIONS ISOLATION, PHENOTYPIC AND MOLECULAR CHARACTERIZATION OF BURKHOLDERIA SP. (STRAIN, PCS1) 71
Balandreau, J., Viallard, V., Cournoyer, B., Coenye, T., Laevens, S., Vandamme, P. (2001). Burkholderia cepacia genomovar III is a common plant-associated bacterium. Appl. Environ. Microbiol., 67: 982–985.
Benson, D.A., Karsch-Mizrachi, I., Clark, K., Lipman, D.J., Ostell, J., Sayers, E.W. (2012). GenBank. Nucleic Acids Res., 40: 48-53.
Bevivino, A., Dalmastri, C., Tabacchioni, S., Chiarini, L., Belli, M.L., Piana, S., Materazzo, A., Vandamme, P., Manno, G. (2002). Burkholderia cepacia complex bacteria from clinical and environmental sources in Italy: genomovar status and dis-tribution of traits related to virulence and transmissibility. J. Clin. Microbiol., 40: 846–851.
Brito, T.S., Buss, R.P.L.A., Carvalho, J.P.F.C., Eberling, T., Mar-tinez, A.S., Vandeir Francisco Guimarães, V.F., Chaves, E.I.D.O. (2018). Growth promotion of Burkholderia ambifaria associ-ated to nitrogen fertilization in the initial development of corn. J. Agric. Sci., 10(6): 123-135.
Brown, A. (2004). Benson’s Microbiological applications: Lab-oratory Manual in General Microbiology. McGraw-Hill Sci-ence/Engineering/Math, New York.
Caballero-Mellado, J., Martinez-Aguilar, L., Paredes-Valdez, G., Estrada-de los Santos, P . (2004). Burkholderia unamae sp. nov, and N2-fixing rhizospheric and endophytic species. Int. J. Syst. Evol. Microbiol., 54: 1165–1172.
CLSI (2011). Clincal Laboratory Standards Institute. Perfor-mance Standards for Antimicrobial Susceptibility Testing; Twenty-First Informational Supplement. Wayne, Pennsylva-nia, USA.
Coenye, T., Vandamme, P., Govan, J.R.W., Li Puma, J.J. (2001d). Taxonomy and identifi cation of the Burkholderia cepacia com-plex. J. Clin. Microbiol., 39: 3427–3436.
Cordeiro, C.A.M., Martinas, M.L.L., Lucaino, A. (2003). Produc-tion and Properties of alpha amylase from thermophylic Bacil-lus species. Brazil J. Microbiol., 33: 1-3.
Correa-Galeote, D., Bedmar, E.J., Arone, G.J. (2018). Maize endophytic bacterial diversity as affected by soil cultivation history. Front. in Microbiol., 9: 484.
Czaban, J., Gajda, A., Wroblewska, B. (2007). The motility of bacteria from rhizosphere and different zones of winter wheat roots. Polish. J. of Environ. Stud., 16 (2): 301-308.
Dalmastri, C., Chiarini, L., Cantale, C., Bevivino, A., Tabac-chioni, S. (1999). Soil type and maize cultivar affect the genetic diversity of maize root-associated Burkholderia cepacia popu-lations. Microb. Ecol., 38: 273-284.
Draghi, W.O., Peeters, C., Cnockaert, M., Snauwaert, C., Wall, L.G., Zorreguieta, A., Vandamme, P. (2014). Burkholderia cor-dobensis sp. nov., from agricultural soils. Int. J. System. Evol. Microbiol., 64: 2003-2008.
Estrada, L.S.P., Bustillos-Cristales, R., Caballero-Mellado, J. (2001). Burkholderia, a genus rich in plant-associated nitrogen fi xers with wide environmental and geographic distribution. Appl. Environ. Microbiol., 67: 2790–2798.
Estrada, L.S.P., Mavingui, P., Cournoyer, B., Fontaine, F., Bal-andreau, J., Caballero-Mellado, J. (2002). A N2 -fixing endo-
phytic Burkholderia sp. associated with maize plants cultivated in Mexico. Can. J. Microbiol., 48: 285–294.
Forbes, B.A., Sahm, D.F., Weissfeld, A.S. 2007. Bailey & Scott’s Diagnostic Microbiology, Elsevier, Inc., St. Louis, MO, USA, 12th edition.
Gillis, M., Van, T., Bardin, R., Goor, M., Hebbar, P., Willems, A., Segers, P., Kersters, K., Heulin, T., Fernandez, M.P. (1995). Polyphasic taxonomy in the genus Burkholderia leading to an amended description of the genus and proposition of Burk-holderia vietnamiensis sp. nov. for N2-fixing isolates from rice in Vietnam. Int. J. Syst. Bacteriol., 4(5): 274–289.
Hebbar, P., Davey, A.G., Merrin, J., Dart, P.J. (1992). Rhizobac-teria of maize antagonistic to Fusarium moniliforme , a soil borne fungal pathogen: colonisation of rhizosphere and roots. Soil Biol. Biochem., 24: 989–997.
Holt, J.G., Krieg, N.R., Sneath, P.H.A., Staley, J.T. and Williams, S.T. (1994). Bergey’s Manual of Determinative Bacteriology (9th Int. ed.), Williams and Wilkins, Maryland, USA, pp. 565-596.
Janssen, P.H. (2006). Identifying the dominant soil bacteria taxa in libraries of 16S rRNA and 16S rRNA genes. Appl. Envi-ron. Microbiol., 72: 1719–1728.
Jukes, T.H., Cantor, C.R. (1969). Evolution of protein molecules. In: Munro, H.N., (ed). Mammalian Protein Metabolism, New York. Academic Press.
Kost, T., Stopnisek, N., Agnoli, K., Eberl, L., Weisskopf, L. (2014). Oxalotrophy, a widespread trait of plant-associated Burkholderia species, is involved in successful root coloni-zation of lupin and maize by Burkholderia phytofi rmans. A Report, University of Zurich.
Krisle da Silva, K., Perin, L., Gomes, M.L., Barauna, A.C., Pereira, G.M.D., Mosqueria, C.A., Costa, I.B., O’hara, G., Zilli, J.E. (2016). Diversity and capacity to promote maize growth of bacteria isolated from the Amazon region. Act. Aamaz., 46(2): 111-118.
Lim, J.S., Choi, B.S., Choi, A.Y., Kim, K.D., Kim, D.I., Choi, I.Y., Ka, J.O. (2012). Complete genome sequence of the fenitrothion-degrading Burkholderia sp. strain YI23. J. Bacteriol., 194: 896.
Nusrat, A., Rahman, S.R. (2007). Comparative studies on the production of extracellular -amylase by three mesophilic Bacillus isolates. Bangladesh J. of Microbiol., 24(2): 129-132.
Perin, L., Martinez-Aguilar, L., Paredes-Valdez, G., Baldani, J.I., Estrada-de Los Santos, P., Reis, V.M., Caballero-Mellado, J. (2006a). Burkholderia silvatlantica sp. nov., a diazotrophic bacterium associated with sugar cane and maize. Int. J. Syst. Evol. Microbiol., 56: 1931–1937.
Ramette, A., LiPuma, J.J., Tiedje, J.M. (2005). Species abun-dance and diversity of Burkholderia complex in the environ-ment. Appl. Environ. Microbiol., 71: 1193–1201.
Reis, V.M., Estrada-de los Santos, P., Tenorio-Salgado, S. (2004). Burkholderia tropica sp. nov, a novel nitrogen-fixing , plant associated bacterium. Int. J. Syst. Evol. Microbiol., 54: 2155–2162.

Priya Chatterjee et al.
72 ISOLATION, PHENOTYPIC AND MOLECULAR CHARACTERIZATION OF BURKHOLDERIA SP. (STRAIN, PCS1) BIOSCIENCE BIOTECHNOLOGY RESEARCH COMMUNICATIONS
Saitou, N., Nei, M. (I987). The neighbor-joining method: a new method for reconstructing phylogenetic trees. Mol. Biol., 4: 406-425.
Salles, J.F., De Souza, F.A., van Elsas, J.D. (2002). Molecular method to assess the diversit y of Burkholderia species in envi-ronmental samples. Appl. Environ. Microbiol., 68: 1595–1603.
Salles, J.F., van Veen, J.A., van Elsas, J.D. (2004). Multivariate analyses of Burkholderia species in soil: effect of crop and land use history. Appl. Environ. Microbiol., 70: 4012–4020.
Smits, J.P., Rinzema, J., Tramper, H., Van, M., Knol, W. (1996). Solid-state fermentation of wheat bran by Trichoderma reesei QM9414: substrate composition changes, C balance, enzyme production, growth and kinetics. Appl. Micro. Biotechnol., 46: 489-496.
Sneath, P.H.A., Holt. J.G. (2001). Bergey’s Manual of System-atic Bacteriology (2nd ed.), Williams & Wilkins, Springer-Ver-lag, NY, USA, 1, pp. 64.
Tran Van, V., Mavingui, P., Berge, O., Balandreau, J., Heulin, T. (1994). Promotion de croissance du riz inocule par une bacteria fixatrice d’azote, Burkholderia vietnamiensis , isolee d’un sol-sulfat e acide du Vietnam Agronomie., 14 : 697–707.
Van Elsas, J.D., Garbeva, P. Salles, J. (2002). Effects of agro-nomical measures on the microbial diversity of soils as related to the suppression of soil-borne plant pathogens. Biodegrada-tion, 13: 29–40.
Viallard, V., Poirier, I., Cournoyer, B., Haurat, J., Wiebkin, S., Ophel-Keller, K., Balandreau, J. (1998). Burkholderia graminis sp. nov.,a rhizospheric Burkholderia species, and reassessment of Pseudomonas phenazinium ,Pseudomonas pyrrocinia and Pseudomonas glathei as Burkholderia. Int. J. Syst. Bacteriol., 48: 549–563.
Wang, S., Lin, C., Liu, Y., Shen, Z., Jeyaseelan, J., Qin, W. (2016). Characterization of a starch-hydrolyzing -amylase produced by Aspergillus niger WLB42 mutated by ethyl methane sulfonate treatment. Int. J. Biochem. Mol. B., 7(1 ): 1-10.
Yabuuchi, E., Kosako, Y., Oyaizu, H., Yano, I., Hotta, H., Hashi-moto, Y., Ezaki, T. & Arakawa, M. (1992). Proposal of Burk-holderia gen. nov. and transfer of seven species of the genus Pseudomonas homology group II to the new genus, with the type species Burkholderia cepacia (Palleroni and Holmes 1981) comb. nov. Microbiol. Immunol., 36: 1251–1275.

Improved production of withanolides in adventitious
root cultures of Withania somnifera by suspension
culture method
Sindhu Rangaraju*, A.N. Lokesha and Chenna Reddy Aswath
Division of Floriculture and Medicinal Crops, ICAR-Indian Institute of Horticultural Research, Hesaraghatta Lake post, Bangalore-89
ABSTRACT
Jawahar Ashwagandha-20 (JA-20) and Arka Ashwagandha (AA) seeds were raised in in vitro conditions and phenotypic differences between the plants was recorded. The adventitious roots were derived from leaves of the two varieties in in vitro conditions. The effects of the strength of media and concentration and the combination of auxins (IAA and IBA) for adventitious roots multiplication using suspension culture were studied. After 30 days of suspension culture, root biomass was measured and HPLC analysis of major withanolides in leaves and adventitious roots was conducted. Arka Ashwagandha variety had higher total withanolide content of 1.621 mg/g, Withaferin A content of 1.362 mg/g and root yield of 4.066 g from 0.1g inoculum in 30 days compared to JA-20 which had total withanolide content of 1.156 mg/g, Withaferin A content of 0.930 mg/g on dry weight basis and root mass of 3.71g from 0.1g of inoculum in 30 days. The present study thus helps in the identifi cation of an elite cultivar of Ashwagandha and development of a standard protocol for mass multiplication of adventitious root in hormone-free media. This is benefi cial in the preparation of health supplements in terms of human health issues due to negligible residual effects of hormones in the fi nal product.
KEY WORDS: ADVENTITIOUS ROOT CULTURE, ASHWAGANDHA, JA 20, IAA- INDOLE ACETIC ACID, IBA- INDOLE-3-BUTYRIC ACID
73
Pharmaceutical CommunicationBiosci. Biotech. Res. Comm. 12(1): 73-79 (2019)
ARTICLE INFORMATION:
Corresponding Author: [email protected] 9th Feb, 2019Accepted after revision 12th March, 2019 BBRC Print ISSN: 0974-6455Online ISSN: 2321-4007 CODEN: USA BBRCBA Thomson Reuters ISI ESC / Clarivate
Analytics USAMono of Clarivate Analytics and Crossref Indexed Journal Mono of CR
NAAS Journal Score 2019: 4.31 SJIF: 4.196© A Society of Science and Nature Publication, Bhopal India 2019. All rights reserved.Online Contents Available at: http//www.bbrc.in/DOI: 10.21786/bbrc/12.1/10

Sindhu Rangaraju, Lokesha and Chenna Reddy Aswath
74 COMPARATIVE ANALYSIS OF PHENOTYPIC TRAITS, ROOT YIELD, AND TOTAL WITHANOLIDES BIOSCIENCE BIOTECHNOLOGY RESEARCH COMMUNICATIONS
INTRODUCTION
Ashwagandha (Withania somnifera Dunal) is a medici-nal crop of commercial importance, belongs to family Solanaceae, and is considered as an alternate to Panax ginseng in its therapeutic values (CSIR.,1976). It is used for curing a wide range of diseases in Ayurveda and other indigenous systems of medicine for over 5000 years (Akram et al., 2011). The herb has the highest value for its pharmacological activity in preparation of vari-ous Ayurvedic formulations. It is anti-stress, anti aging, and aids in recovering from neurodegenerative disorders (Bhattacharya et al., 2002). It is a small, erect, branched, woody shrub that grows up to 1.50m tall. It is cultivated under rainfed condition in marginal soils by small and marginal farmers of Madhya Pradesh, Rajasthan, Guja-rat, Andhra Pradesh, Karnataka, and other states. Apart from chemical constituents like alkaloids and witha-nolides, it also contains a variety of amino acids includ-ing aspartic acid, proline, tryptophan, tyrosine, cysteine, alanine, glycine, and a high amount of iron.
Withanolides are C-28 steroidal lactones (Alfonso et al., 1993). Major withanolides identifi ed include Withanolide A, Withanoside IV and VI (Tohda et al., 2005), Withaferin A (Oh et al., 2008), Withanosides IV and V (Matsuda et al., 2001) and Withanoside B (Pramanick et al., 2008). Ashwagandha is available in the Western world as a die-tary supplement. Its also known as “Indian Ginseng” and “Winter Cherry”. Withanolide A has strong neuro phar-macological properties of promoting outgrowth, synap-tic reconstruction, and a potential to reconstruct neural networks (Kuboyama et al., 2005; Tohda et al., 2005 a,b). Withaferin A inhibits angiogenesis (Mohan et al., 2004), metastasis (Misico et al., 2002). The major pharmacologi-cal activity of Withania somnifera is contributed to two major withanolides, Withaferin and Withaferin D (Gupta et al., 2007, Sindhu et al., 2018).
Arka Ashwagandha is a variety identifi ed at ICAR-Indian Institute of Horticulture Research, for high dry root yield and high total withanolide content. The vari-ety has double the dry root yield (10 q/ha) than JA-20 (5.27q/ha). The other signifi cant features are early vigor, fi eld tolerance to bacterial wilt, late blight, leaf spot dis-eases and pests (Epilachna beetle, mites and aphids). It matures in 180 days and is characterized by desired root thickness and depth. The distinguishing features of the variety are lengthy tertiary branch, thick stem which has dense curved pubescence, lanceolate leaves with obtuse leaf tip, bigger fruit capsules and fruits. JA-20 is a released variety from MPKVV, Mandsaur, Madhya Pradesh used as a check in AICRP National trials and it yields about 5 q/ha.
Recent advances in tissue culture methodologies have improved secondary metabolite production across vari-
ous medicinal plants. Selection of high bioactive produc-ing lines, optimization of culture conditions, metabolic engineering, elicitation strategies and use of bioreac-tor culture systems has made the production of useful metabolites in vitro at a shorter duration of time (Sarin et al., 2005). Plant-specifi c metabolites can be effec-tively obtained from organ and plant culture systems (Verpoorte et al., 2002). Plant cell and organ culture sys-tems are promising methodologies as they aid in rapid proliferation of cells/organs, condensed biosynthetic cycles in comparison to fi eld grown plants (Ramachan-dra Rao and Ravishankar, 2002, Thanh Tam et al., 2019).
Adventitious roots suspension cultures are found to be ideal for biomass accumulation in Echinacea purpurea (Wu et al., 2007) and P. notoginseng (Gao et al., 2005). Recent studies indicate that explant type and genotype affect the accumulation of bioactive compounds in adventitious root cultures of Polygonum multifl orum (Ho et al.,2019) Lack of post-harvest storage technology for roots (Govil et al., 1993; Singh and Kumar., 1998), excessive exploita-tion of natural resources, problems in fi eld cultivation as it is dependent on monsoon, time consuming and labori-ous are reasons enough to multiply adventitious roots of Withania somnifera in suspension culture which meet the global market requirement of Ashwagandha.
MATERIALS AND METHODS
Seeds of Withania somnifera like JA-20 and Arka Ash-wagandha were selected. Seed pretreatment was con-ducted as per our earlier reports (Sindhu et al., 2018), morphological and phenotypic examination of 30-day old plants was done. The adventitious roots were induced in these two varieties, which were then harvested from 10-day old leaf culture bottles supplemented with aux-ins. These roots were washed with sterile distilled water two times to remove the small traces of agar followed by treatment for 1 minute with 3% sodium hypochloride, then the traces of sodium hypochlorite from roots were removed by washing again with sterile distilled water. The roots were dried by blotting with sterile tissue paper. The known quantity of roots (100 mg) were weighed and transferred into 100 ml of full strength MS liquid media supplemented with different concentration and a combi-nation of auxins in conical fl asks with 3% sucrose con-centration under 16 hours of photoperiod and placed in an orbital shaker at 90 rpm at 25°C. The mass of mul-tiplied roots was observed after 30 days of inoculation and was compared with the control.
Extraction of bioactive principles from W. somnifera: The adventitious roots were extracted from the liquid medium and the in vitro leaves were taken washed using distilled water to remove the traces of medium, dried and pow-dered using pestle and mortar. Adventitious roots were

Sindhu Rangaraju, Lokesha and Chenna Reddy Aswath
BIOSCIENCE BIOTECHNOLOGY RESEARCH COMMUNICATIONS COMPARATIVE ANALYSIS OF PHENOTYPIC TRAITS, ROOT YIELD, AND TOTAL WITHANOLIDES 75
assessed for total withanolides and also different com-ponents that contribute to total withanolides whereas the leaves were assessed only for Withaferin A content. The analysis of bio actives was done using High Performance Liquid Chromatography method. One gram of dry root powder was extracted with methanol at 800C on a water bath and the residue was re-extracted twice with metha-nol, till the extract was colorless. The extracts were pooled and fi ltered through sample clarifi cation kit and were subjected to analysis by HPLC with Photo Diode Array. Seven standards such as Withanoside IV, Withanoside V, Withaferin A, Withanolide A, Withanolide B, Witha-none and Withanostramolide from Natural Remedies Pvt. Ltd, Bangalore were used to quantify the total amount of withaferin A present in leaf samples and withanolides in root samples. The chromatogram was recorded at 227 nm and later the contents of various withanolides were added to estimate the total withanolide and expressed as mg/g on a dry weight basis.
Data Analysis:
All experiments were repeated thrice. Mean values of treatments were subjected to ANOVA and signifi cant differences were separated by Duncan’s Multiple Range Test. To determine signifi cance at P<0.05SPSS (Win-dows version 75.1, SPSS Inc., Chicago) was used.
RESULTS AND DISCUSSION
1. Morphological comparison between two varieties of
Ashwagandha.
In vitro plants were assessed for plant height using 1 mm ruler from base of the stem to apical meristem. Leaf shape was also observed.
Table 1. Phenotypic differences between Arka Ashwagandha and JA-20 in in vitro conditions.
Traits Arka Ashwagandha JA -20Plant height (cm) 6.30 5.50
Number of roots 17 16
Leaf shape Lanceolate Ovate
Leaf base Concave Concave
Leaf tip Obtuse Acute
Table 2. Data represent mean ± standard error of fi ve replications in three independent experiments, each with one explant per treatment. Values followed by the different letters are signifi cant P<0.05 according to Duncan’s Range Multiple Test. Data were scored after 30 days of culture. Growth Conditions: Media- Full MS liquid medium supplement with different hormone combinations, 3% sucrose, 16 hours photoperiod at 25±2°C.
TreatmentCombination of auxins
mg/lThe quantity of root obtained in gram/100
ml of media after 30 days of cultureRemarks
IAA IBA AA JA-20Control 0.0 0.0 4.066±0.118f 3.718±0.150f Normal roots
T1 0.25 0.75 8.340±0.098b 7.254±0.135b Fluffy roots
T2 0.50 0.50 6.400±0.139c 6.248±0.072c Fluffy roots
T3 0.75 0.25 5.640±0.083d 5.364±0.068d Fluffy roots
T4 1.0 0.0 4.682±0.086e 4.098±0.114e Fluffy roots
T5 0.0 1.0 9.612±0.088a 8.314±0.138a Fluffy roots
2. Infl uence of hormone supplementation on the
proliferation of Withania somnifera adventitious roots
in suspension culture
For large scale production of useful bioactive metabo-lites, the use of cell suspension cultures is favored due to its rapid growth cycles over other kinds of cell culture methods. Qualitative and quantitative analysis requires a considerable quantity of cells to determine growth responses and metabolism of phytochemicals, for these studies cell suspension cultures are found to be best suited (Vanishree et al., 2004).
In the current study, the establishment of adventi-tious root suspension culture of Withania somnifera was done for two varieties Arka Ashwagandha and JA-20 with different hormone supplementation on media and further the biomass accumulation and total withanolides were estimated. Signifi cant phenotypic differences were recorded in the proliferation of root cultures in MS medium, supplemented with hormones and without hormones. In the hormone supplemented medium, the root biomass was higher, but there was no elongation of lateral roots. The suspension culture media with hor-mones gave rise to fl uffy roots, with callus like exudates formed around the senescent root tissues and subse-quently released into the medium which could not be further multiplied in suspension cultures whereas media without supplementation of hormones had normal roots

Sindhu Rangaraju, Lokesha and Chenna Reddy Aswath
76 COMPARATIVE ANALYSIS OF PHENOTYPIC TRAITS, ROOT YIELD, AND TOTAL WITHANOLIDES BIOSCIENCE BIOTECHNOLOGY RESEARCH COMMUNICATIONS
with important factors of proliferation like lateral root formation, elongation of lateral roots which favored further multiplication of adventitious roots. Lateral root formation was essential for rapid growth and higher biomass production in Rauwolfi a serpentine L (Pandey et al., 2010), thus indicating that phytohormone sup-plementation does not always enhance the regeneration frequency (Roychowdhury et al., 2013).
Genes involved in the synthesis of auxins are expressed in roots, which contribute to normal root growth and maintenance (Petersson et al., 2009). Auxin biosynthesis genes are expressed at root stem cell nice to increase the level of auxins (Stepanova et al., 2008). Signaling pathways for other plant hormones also infl u-ence the auxin response in roots (Kuppusamy et al., 2008). Though there was higher root mass in media supplemented with hormones, considering lateral root formation, proliferation and morphology of roots, MS media without hormone supplementation was consid-ered best.
3. Infl uence of media strength on proliferation of
Withania somnifera adventitious roots in suspension
cultures
Both half strength MS medium and full strength MS medium were found to be suitable for biomass produc-tion of adventitious roots in Panax ginseng, but high-est secondary metabolite content was induced in full strength MS medium (Yu et al., 2000). Full strength MS medium supplemented with 2.0mg/l IBA under contin-uous agitation increased the biomass of root tissue in Vernonia amygdalina (Khalaffala et al., 2009). Several researchers have also reported cell suspension culture studies in Withania somnifera (Sivanandan et al., 2012b and Praveen et al., 2011), hence full strength media without hormone supplementation was considered best suited for adventitious root multiplication in suspension culture as it provides more nutrients and reduces the frequency of subculturing in both varieties of Ashwa-gandha.
Different types of roots obtained by hormone
treatments in Withania somnifera.
Table 3. Data represent mean ± standard error of fi ve replications in three independent experiments, each with one explant per treatment. Values followed by the different letters are signifi cant P<0.05 according to Duncan’s Range Multiple Test. Data were scored after 30 days of culture. Growth Conditions- Media- Full MS liquid medium supplement with different hormone combinations, 3% sucrose, 16 hours photoperiod at 25±2°C.
Treatment Arka Ashwagandha JA-20Half MS 3.684±0.074b 3.520±0.073b
Full MS 4.066±0.066a 3.718±0.054a
FIGURE 1. Different types of roots obtained in Arka Ashwagandha. A-Control, B-Hormone treated roots, C-Normal roots obtained after suspension culture in hormone-free medium, D-Fluffy roots obtained after suspension culture in hormone media.
4. Withanolides identifi ed and total withanolide content
in leaf and adventitious roots by HPLC analysis
HPLC analysis of Withania somnifera using methanolic extraction was reported by many researchers like Ganz-era et al., (2003), Sangwan et al., (2004). The present study indicated that the roots had higher total witha-nolide content i.e., 1.621mg/g on a dry weight basis in Arka ashwagandha, compared to the total withanolide content in JA-20 root was 1.156 mg/g on a dry weight basis. Withanolide A which has a biological activity of sedative and hypnotic was 0.38mg/g on a dry weight basis in Arka Ashwagandha in comparison to JA 20

Sindhu Rangaraju, Lokesha and Chenna Reddy Aswath
BIOSCIENCE BIOTECHNOLOGY RESEARCH COMMUNICATIONS COMPARATIVE ANALYSIS OF PHENOTYPIC TRAITS, ROOT YIELD, AND TOTAL WITHANOLIDES 77
Withaferin A contributes to most of the pharmacologi-cal activity of Withania somnifera with its antibacte-rial, antifungal, antiarthritic, antitumor and antibiotic properties. Dalavayi et al., (2006) identifi ed Withaferin A in roots and leaves of Ashwagandha. The Withaferin A content in Arka Ashwagandha roots was identifi ed to be 1.316mg/g on a dry weight basis compared to JA- 20 with a content of 0.926mg/g on a dry weight basis. The Withaferin A content in Arka Ashwagandha leaves was 0.1733mg/g on a dry weight basis compared to JA-20 leaves 0.116 mg/g on a dry weight basis.
Madhavi et al (2012) reported that Withaferin A was not detected in 120 day old hairy root cultures, whereas it was 136μg /g dry weight in 210 day old hairy root cultures of Withania somnifera, Sivanandan et al (2012) reported 0.85mg/g in 40 day old callus cultures of With-ania somnifera, which is much lesser than the Withaf-erin A content reported in the present study. Dewir et al (2010) reported a Withaferin A content of 0.013 mg/g dry weight in in vitro roots, the present study indicates 100 times increased Withaferin A content.
CONCLUSION
This current study helps in the identifi cation of an elite cultivar of Withania somnifera for mass production of withaferin A and total withanolides. Field cultivation of Withania somnifera is a laborious task, as the crop is prone to diseases like seed rot and blight, harvest-ing of roots is a tedious task. The provision for alterna-tive sources of Ashwagandha through cell cultures and micropropagation must be encouraged as it reduces the heavy dependence on the wild population to fulfi ll the global demand of Withania somnifera. Adventitious root multiplication through suspension cultures in hormone free medium provide an easy way for mass production of useful withanolides and can be used by neutraceuti-cal and pharmaceutical industries as there would not be traces of hormones in the end product.
FIGURE 2. Withaferin A production in leaves and roots of Withania somnifera analyzed by HPLC.
FIGURE 3. Standard HPLC chromatogram of W. som-nifera root extracts. A. Withanoside IV, B. Withano-side V, C. Withaferin A, D. 12-Deoxy Withastramon-olide, E. Withanolide A and F. Withanolide B.
Table 4. Analysis of Withanolides in adventitious roots of Withania somnifera by HPLC Data represents mean ± standard error of three replications. Values followed by the different letters are signifi cant P<0.05 according to Duncan’s Range Multiple Test. Data were scored after 30 days of culture.
Variety
Withanoside IV
Withanoside V
Withaferin A
12-Deoxy withastromalide
Withanolide A
Withanolide B
Total Withanolides
mg/g on dry weight basis
Arka ashwagandha root
0.013±0.000a 0.025±0.001b 1.362±0.032a 0.181±0.004a 0.038±0.001a 0.003±0.000a 1.621±0.069a
JA-20 root 0.011±0.001b 0.037±0.003a 0.930±0.005b 0.173±0.004b 0.028±0.001b 0.002±0.000b 1.1558±0.013b
which has 0.28mg/g on a dry weight basis. Madhavi et al (2012) reported a Withanolide A content of 136 μg/g dry weight in 120 days old hairy root culture and 13μg/g dry weight in 210 days old hairy root culture of Witha-nia somnifera, Dewin et al., (2010) reported Withanolide A content of 0.019 mg/g in in vitro roots of Withania somnifera which is much lesser than the Withanolide A content reported in the present study. The methanolic extract of Withania somnifera has GABA mimetic activ-ity, anti-infl ammatory and anti-stress properties (Mir et al., 2012).
Comparison of Withaferin A content between adventitious roots and in vitro leaves in Withania somnifera.

Sindhu Rangaraju, Lokesha and Chenna Reddy Aswath
78 COMPARATIVE ANALYSIS OF PHENOTYPIC TRAITS, ROOT YIELD, AND TOTAL WITHANOLIDES BIOSCIENCE BIOTECHNOLOGY RESEARCH COMMUNICATIONS
ACKNOWLEDGMENTS
This research was conducted at ICAR- Indian Institute of Horticulture Research and was funded by the Department of Science and Technology through DST Inspire fellowship. The fi rst author also acknowledges Centre for postgradu-ate study, Jain University for conducting this research.
REFERENCES
Akram M, Mohiuddin E, Hannan A and Usmanghani K (2011) Withania somnifera (L.) Dunal (Pharmacology Activity), Phar-macognosy Journal, 2(18):77-78.
Alfonso D, Bernardinelle G and Kapetanidisn I (1993) Witha-nolides from Lochoma coccinaum, Phytochemistry, 34(2):517-521.
Bhattacharya SK, Bhattacharya D, Sairam K and Ghosal S (2002) Effect of Withania somnifera glycol-withanolides on a rat model of tardive dyskinesia, Phytomedicine 9(2):167-170.
Dalavayi S, Kulkarni SM, Itikala RL and Itikala S (2006). Deter-mination of Withaferin A in two Withania species by RP-HPLC method. Indian Journal of Pharmaceutical Sciences. 68:253-256.
Dewir Y.H, Chakrabarty D, Lee S.-H, Hahn E.-J. and Paek K.-Y(2010) Indirect degeneration of Withania somnifera and comparative analysis of Withanolides in in vitro and green house plants. Biologia Plantarum 54(2):357-360,2010.
Sivanandhan G, Arun M, Mayavan S, Rajesh M, Jeyaraj M, Kapil Dev G, Manickavasagam M, Selvaraj N and Ganapathi A (2012b ) Optimization of elicitation conditions with Methyl Jasmonate and Salicylic Acid to improve the productivity of Withanolides in the adventitious root cultures of Withania somnifera(L.)Dunal. Applied Biochem Biotechnol 168:681-696.
Ganzera M, Choudhary MI, Khan IA (2003) Quantitative HPLC analysis of Withanolides in Withania somnifera. Fitoter 74:68-76.
Gao X, Zhu C, Gao W, Jia W, Qui M, Zhang Y and Xiao P (2005) Induction and characterization of adventitious roots directly from the explants of Panax notoginseng, Biotechnol-ogy letters, 27(22):1771-1775.
Gould AR, Everett NP, Wang TL, Street HE (1981) Studies on the control of cell cycle in cultured plant cells: Effects of nutrient limitation and nutrient starvation. Protoplasma, 106 (1-2):1-13.
Govil JN, Singh VK and Shamima H (1993) In: Glimpses in plant research Vol. X medicinal plants: New Vistas of research (Part1) today and tomorrow printers and publishers, New Delhi India. 232-253.
Ho,TT.,Jeonh,CS.,Lee,H. et.al. (2019) Plant Cell Tiss Organ Cult (2019).https://doi.org/10.1007/s11240-018-01556-5.
Kuboyama T, Tohda C, Komastu K (2005)Neuritic regeneration and synaptic reconstruction induced by withanolide A. Br J Pharmacol 144:961-971.
Kuppuswamy KT, Walcher CL and Nemhausar JL (2008) Cross-regulatory mechanisms in hormone signaling. Plant Molecular Biology. 9(4)375-381.
Matsuda H, Murakami T, Kishi A, Yoshikawa M (2001) Struc-tures of Withanolides I, II, III, IV, V, VI and VII, new witha-nolide glycosides from the roots of Indian Withania somnifera Dunal and inhibitory activity of tachyphylaxis to clonidine in isolated guinea pig ileum. Bioorganic and medicinal chemistry, 9(6):1499-1507.
Morano-Risueno MA, Van Norman JM, Moreno A, Zhang J, Ahnert SE and Benfey PN (2010) Oscillating gene expression determines competence for periodic Arabidopsis root branch-ing. Science, 329 (5997): 1306-1311
Oh JH, Lee TJ, Kim SH, Choi YH, Lee SH, Lee JM, Kim YH, Park JW and Kwon TK (2008) Induction of apoptosis by Withaferin A in human leukemia U937 cells through downregulation of AKT phosphorylation. Apoptosis, 13(12):1494-504.
Pandey VP, Cherian E and Pathani G (2010) Effect of Growth Regulators and Culture conditions on Direct Root Induction of Rauwolfi a serpentine L. (Apocynaceae) Benth by leaf explants. Tropical Journal of Pharmaceutical Research, 9(1):2734.
Petersson SV, Johansson AL, Kowalczyk M, Makovychuk A, Wang JY, Moritz T, Grebe M, Benfey PN, Sandberg G and Ljung K(2009) An auxin gradient and maximum in the Arabidopsis root affects shown by high-resolution cell-specifi c analysis of IAA distribution and synthesis. Plant cell 21(6):1659-1668.
Pramanick S, Roy A, Ghosh S, Majumdar HK and Mukhopad-hyay S (2008) Withanolide Z, A new chlorinated withanolide from Withania somnifera, Planta Medica, 74(14):1745-48.
Praveen N and Murthy HN (2010) Production of Withanolide-A from adventitious root cultures of Withania somnifera. Acta Physiology Plantarum. 32(5): 1017-1022
Ramachandra Rao S, Ravishankar GA (2002) Plant cell cul-tures: chemical factories of secondary metabolites. Biotech Adv 20:10-153.
Roy Chowdhary D, Majumdhar A and Jha S (2013) Agrobac-terium rhizogenesis mediated transformation in medicinal plants: Prospects and Challenges in biotechnology for medici-nal plants. Springer Verlag Berlin Heidelberg, 41.
Sarin R (2005) Useful metabolites from plant tissue cultures. Biotechnology 4:79-93.
Sindhu Rangaraju, A.N. Lokesha and Chenna Reddy Aswath (2018) Standardization of various factors for production of adventitious roots in selected varieties of Withania somnif-era and estimation of total withanolides content by High Per-formance Liquid Chromatography, Biosci. Biotech. Res. Comm. 11(3): 451-460.
Singh S and Kumar S (1998) In Withania somnifera: The Indian ginseng, Ashwagandha. Central Institute of medicinal and aromatic plants, Lucknow, India.
Thanh-Tam, Ho Choel-Sueng, Jeong Hyoshin, Lee So-Young Park (2019) Effect of explant- type and genotype on the accu-mulation of bioactive compounds in adventitious root cultures of Polygonum multifl orum, Plant cell tissue and organ culture:
Tohda C, Kuboyama T and Komatsu K (2005) Search for natu-ral products related to regeneration of the neuronal network.Neurosignals, 14(1-2):34-45.

Sindhu Rangaraju, Lokesha and Chenna Reddy Aswath
BIOSCIENCE BIOTECHNOLOGY RESEARCH COMMUNICATIONS COMPARATIVE ANALYSIS OF PHENOTYPIC TRAITS, ROOT YIELD, AND TOTAL WITHANOLIDES 79
Vanisree M, Lee C, Lo S, Nalavade SM, Lin CY and Tsay H (2004) Studies on the production of some important second-ary metabolites from medicinal plants by plant tissue cultures.Botanical buttelin of Academia Sinica, 45:1-22.
Verpoorte R, Contin A, Memelink J (2002). Biotechnology for the production of Plant secondary metabolites. Phytochem Rev 1:13-25.
Wu CH, Dewir YH, Hahn EJ and Peak KY (2006) Optimiza-tion of culturing conditions for the production of biomass and
phenolics from adventitious roots of Echinacea angustifolia. Journal of Plant Biology, 49(3):193-199.
Wu CH, Murthy HN, Hahn EJ and Paek KY (2007) Large-Scale cultivation of adventitious roots of Echinacea purpurea in air lift bioreactors for the production of chichoric acid, chlorogenic acid and caftaric acid. Biotechnology Letters 29(8):1179-1182.
Yu KW, Hahn EJ and Paek KY (2000) Production of adventi-tious ginseng roots using Bioreactor. Korean Journal of Plant Tissue Culture 27:309-315.

Molecular characterization and genetic diversity of
Indian potato, Solanum tuberosum germplasms using
microsatellite and RAPD markers
Manthan Kapuria1,2, Darshan Dharajiya1,3*, Karen Pachchigar1,4 and R. M. Chauhan5
1Department of Plant Molecular Biology and Biotechnology, C. P. College of Agriculture (CPCA), Sardarkrushinagar Dantiwada Agricultural University (SDAU), Sardarkrushinagar-385506, Gujarat, India2Shree P. M. Patel Institute of Integrated M. Sc. in Biotechnology, Anand-388001, Gujarat, India3Department of Biotechnology, Mehsana Urban Institute of Sciences, Ganpat University, Ganpat Vidyanagar–384012, Gujarat, India4College of Basic Science and Humanities, SDAU, Sardarkrushinagar-385506, Gujarat, India5Centre of Seed Technology, S. D. Agricultural University, Sardarkrushinagar-385506, Gujarat, India
ABSTRACT
Potato (Solanum tuberosum L.) is the fourth most important food crop in the world and an important vegetable crop. The genus Solanum consists of 220 tuber containing species of which seven tuber-bearing species is used for commercial cul-tivation. Potato is a self-pollinated crop with cross-pollination up to 2.54 percent. Use of molecular markers to determine genetic variation, genetic diversity and evolutionary relatedness is becoming more popular for the assessment of diversity among cultivars of crop species of from various geographical origins. In the present study, total 42 RAPD markers have been employed, out of which 21 primers were polymorphic with 66.95% average polymorphism and 0.783 average PIC value, indicating higher informativeness of primers. In the present study, total 25 SSR markers have been employed out of these only 4 potent SSR primers were polymorphic. For SSR markers, average polymorphism was 58.33% and mean PIC value was 0.712. The results of current study indicate that RAPD and SSR markers used in the study have very promising polymorphism and PIC values hence, seemed to be good for the molecular characterization and assessing genetic relation-ship among genotypes of potato.
KEY WORDS: POTATO (SOLANUM TUBEROSUM L.), MOLECULAR MARKERS, MICROSATELLITE, RAPD, SSR
80
Biotechnological CommunicationBiosci. Biotech. Res. Comm. 12(1): 80-89 (2019)
ARTICLE INFORMATION:
Corresponding Author: [email protected] 24th Dec, 2018Accepted after revision 1st March, 2019BBRC Print ISSN: 0974-6455Online ISSN: 2321-4007 CODEN: USA BBRCBA Thomson Reuters ISI ESC / Clarivate
Analytics USAMono of Clarivate Analytics and Crossref Indexed Journal Mono of CR
NAAS Journal Score 2019: 4.31 SJIF: 4.196© A Society of Science and Nature Publication, Bhopal India 2019. All rights reserved.Online Contents Available at: http//www.bbrc.in/DOI: 10.21786/bbrc/12.1/11

Kapuria, Dharajiya, Pachchigar and Chauhan
BIOSCIENCE BIOTECHNOLOGY RESEARCH COMMUNICATIONS MOLECULAR CHARACTERIZATION AND GENETIC DIVERSITY OF INDIAN POTATO 81
INTRODUCTION
Potato (Solanum tuberosum L.) originated from South America is one of the major vegetable crops of the world which is also the fourth most important food crop in the world, after maize, wheat, and rice (Ghebreslassie et al., 2016; Majeed and Muhammad, 2018). In India, it was introduced in early seventeenth century possibly by the Portuguese or by the Britishers (Pal and Nath, 1951; Kapuria et al., 2016). It is a source of low cost energy to the human diet hence, it is considered as an economy food (Pandey and Sarkar, 2005). Globally, the major potato growing nations are China, India, Russia, Ukraine and United States of America (Bradshaw, 2019). The genus Solanum consists of 220 tuber-containing spe-cies among which seven tuber bearing species exploited for commercial cultivation (Hawkes and Jackson, 1992). The most important feature in potato taxonomy is the variation in ploidy level. Potato is a self-pollinated crop and the level of cross-pollination is up to 2.54 percent (Kapuria et al., 2016; Wang et al., 2019).
Knowledge of the genetic diversity and relationships among the varieties/cultivars are very benefi cial to rec-ognize the gene pool, to recognize the gaps in germ-plasm collections and to improve effective conservation and management approaches. Use of DNA markers for the identifi cation of genetic variation, genetic diversity and evolutionary relatedness can be useful in identi-fying genetic/population structure as well as diversity among cultivars from various geographical origins. Due to their simplicity, reliability and cost effectiveness, PCR based methods are in demand (Parita et al., 2018).
Different PCR based techniques have been developed during the last two decades, each with specifi c bene-fi ts and drawbacks. The random amplifi ed polymorphic DNA (RAPD) marker system is rapid, simple and requires no prior sequence information in which one random 10-mer primer is used (Welsh and McClelland, 1990; Williams et al., 1990). The dominant nature of inher-itance of RAPD is considered as its drawback. Among different classes of molecular markers, simple sequence repeats (SSR)/microsatellites which are tandem repeats of 1-6 nucleotide long DNA motifs gaining importance in plant breeding and genetics due to their co-dominant inheritance, multi-allelic nature, relative abundance,
hyper variability, reproducibility, good genome cover-age including organellar genomes, chromosome specifi c location, amenability to automation and high through-put genotyping (Oliveira et al., 2006; Walunjkar et al., 2013). The PCR based techniques have been used for DNA fi ngerprinting and genotyping in potato including RAPD (McGregor et al., 2000; Ghislain et al., 2006; Chi-mote et al., 2007; Rocha et al., 2010; Gorji et al., 2011; Onamu et al., 2016; Ayman et al., 2018), SSR (McGregor et al., 2000; Braun and Wenzel, 2004; Feingold et al., 2005; Ghislain et al., 2006; Chimote et al., 2007; Ghis-lain et al., 2009; Rocha et al., 2010; Favoretto et al., 2011; Maras et al., 2017; Ahmed et al., 2018; Tiwari et al., 2019), ISSR (McGregor et al., 2000; Bornet et al., 2002; Gorji et al., 2011; Vanishree et al., 2016) and AFLP (McGregor et al., 2000; Braun and Wenzel, 2004; Solano Solis et al., 2007; Jian et al., 2017). The present work was conducted to evaluate the phylogenetic relatedness of Indian potato genotypes using RAPD and SSR markers.
MATERIALS AND METHODS
Plant material used in the study
Plant material consisted of young leaves sampled from young plants of 15 diverse Indian potato germplasms (Table 1). They were grown in Botanical Garden, C.P. College of Agriculture, SDAU, Sardarkrushinagar, Gujarat, India.
Genomic DNA extraction and quantifi cation
Genomic DNA was extracted from tender fresh leaves of each germplasm by using CTAB (Cetyl Trimethyl Ammo-nium Bromide) method described by Doyle and Doyle, (1990) with minor modifi cations. The quality and integ-rity of DNA were checked by electrophoresis using 0.8% agarose gel. The DNA samples were quantifi ed on UV spectrophotometer (BioSpectrometer, Eppendorf, Ger-many). The stocks were diluted to a fi nal concentration of 30 ng/μl of DNA and used for further work.
PCR amplifi cation
RAPD analysis
Forty two primers were selected and used to ascertain polymorphism among diverse germplasms of potato. The
Table 1. Potato germplasms used in the present study
Sr. No. Germplasm Sr. No. Germplasm Sr. No. Germplasm1 DSP-7 6 DSP-287 11 Kufri Kundan
2 Kufri Chipsona-1 7 Kufri Pushkar 12 Kufri Khyati
3 JX-249 8 Kufri Jyoti 13 Kufri Bahar
4 MF-1 9 Kufri Sutlaj 14 Kufri Anand
5 MS/95-1309 10 Kufri Badshah 15 KCM

Kapuria, Dharajiya, Pachchigar and Chauhan
82 MOLECULAR CHARACTERIZATION AND GENETIC DIVERSITY OF INDIAN POTATO BIOSCIENCE BIOTECHNOLOGY RESEARCH COMMUNICATIONS
RAPD primers used in present study are UBC, OPA, OPB, OPC, OPH, OPG, OPW and OPX series and polymorphic primers used in the analysis are given in Table 2. PCR was carried out as method given by Yasmin et al., (2006) with minor modifi cations in a total reaction volume of 25 μl. The PCR mixture consisted of 1 X PCR buffer, 10 mM dNTPs, 2.0 mM MgCl2, 1 U of Taq DNA polymer-ase, 20 pmol/μl Primer and 30 ng/μl DNA template. All amplifi cations were carried out on a eppendorf thermal cycler using PCR conditions initial denaturation at 94ºC (4 min) one time, denaturation at 94 ºC for 1min, anneal-ing at Tm of primer for 45 sec and extension at 72ºC for 2 min for 35 cycles with fi nal extension of 72ºC for 7 min.
SSR analysis
PCR was carried out as method given by Ghebreslassie et al., (2016) with minor modifi cations in a total reac-tion volume of 25 μl. The PCR mixture consisted of 1 X PCR buffer, 10 mM dNTPs, 2.0 mM MgCl2, 1 U Taq DNA polymerase, 20 pmol/μl of primer pair and 30ng/μl of template DNA. The polymorphic primers used in present study are given in Table 2. PCR conditions con-sisted of initial denaturation at 94ºC (4 min) for fi rst cycle only, denaturation at 94 ºC for 30 sec, anneal-ing at Tm of primer for 1 min and extension at 72ºC for 1 min for 35 cycles with fi nal extension of 72ºC for 6 min.
Resolution of amplifi ed products
The amplifi ed products of RAPD and SSR were resolved on 1.5% and 3.0% agarose gel (Dharajiya et al., 2017). The gel was stained with ethidium bromide (10l/100ml). The standard DNA marker (100 bp) was also run along with the samples. After electrophoresis, the gel was care-fully taken out of the casting tray and photographed using AlphaEaseFC 4.0.0 Gel Documentation system (Alpha Innotech Corporation, USA).
Analysis of RAPD and SSR data
Data were scored for computer analysis on the basis of the presence (1) or absence (0) of the amplifi ed DNA fragments. The data were entered into the binary matrix and subsequently analyzed using PAleontological STa-tistics (PAST) -Version 3.18 (Hammer et al., 2001) was used for genetic diversity evaluation. Coeffi cients of similarity were calculated by using Jaccard’s similar-ity co-effi cient (Jaccard, 1908) and cluster analysis was performed by using the Un-weighted Pair Group Method with Arithmetic Mean (UPGMA) function of PAST ver-sion 3.18. The Relationship between the potato geno-types was graphically represented in the form of den-drograms by using the cluster analysis function of the software. In this method the dendrogram and similarity
matrix were correlated to fi nd the goodness-of-fi t of the dendrogram constructed based on the similarity coeffi -cients. The marker data were then standardized for Prin-cipal Component Analysis (PCA). The software program AlphaEaseFC version 6.0.0 developed by Alpha Innotech Corporation, USA was used for determining the Molec-ular Weight (MW) of bands separated on the gel. The Polymorphism Information Content (PIC) value for each locus was calculated on the basis of allele frequency by the formula given by Anderson et al., (1993). The poly-morphism percentage was calculated as per the method suggested by Smith et al., (1997).
RESULTS AND DISCUSSION
Molecular marker analysis
Total 42 RAPD primers were used for screening of 15 potato germplasms. Out of 42 primers, 21 were polymor-phic which amplifi ed a total of 116 reproducible DNA fragments. Out of total 116 DNA fragments, 79 frag-ments were polymorphic with the mean number of poly-morphic bands per primer was 3.76. The size of ampli-fi ed fragments varied from 140 to 2059 bp. The highest number of amplifi ed bands (8) was exhibited by primer UBC 31 and UBC 34 whereas lowest number of amplifi ed bands (3) was produced by primer OPW 4. The highest polymorphism (100%) was exhibited by two primer OPA 8 and OPB 18, while the lowest polymorphism (20.00 %) was evinced with OPW 8. The average polymorphism detected by the RAPD loci in the present investigation was 66.95 % (Table 2).
Out of 25 SSR primers used in the study, 4 were poly-morphic which amplifi ed a total of 18 reproducible frag-ments among which 11 fragments were polymorphic. The mean number of polymorphic bands was 2.75. The size of PCR amplifi ed fragments varied from 125 to 1899 bp. The highest number of amplifi ed band (6) was exhib-ited by primer STWIN12G and STCPKIN 3 and the lowest number of amplifi ed bands (2) was exhibited by primer STPRINPSG. The highest polymorphism (66.66) was exhibited by two primers viz., STWIN12G and STCPKIN 3, while the lowest polymorphism (50.00%) was evinced with STPRINPSG and STACCS 3. The average polymor-phism detected by the SSR loci in the present investiga-tion was 58.33 % (Table 2).
The distribution of the primers used in the study according to the PIC values and per cent polymorphism is given in the Fig. 1. Most of the RAPD primers (11) have PIC value from 0.7 to 0.8 whereas two SSR prim-ers have PIC value from 0.8 to 0.9. Most of the RAPD primers have per cent polymorphism more than 60 %. It indicates that these primers possess good importance in the diversity analysis in potato.
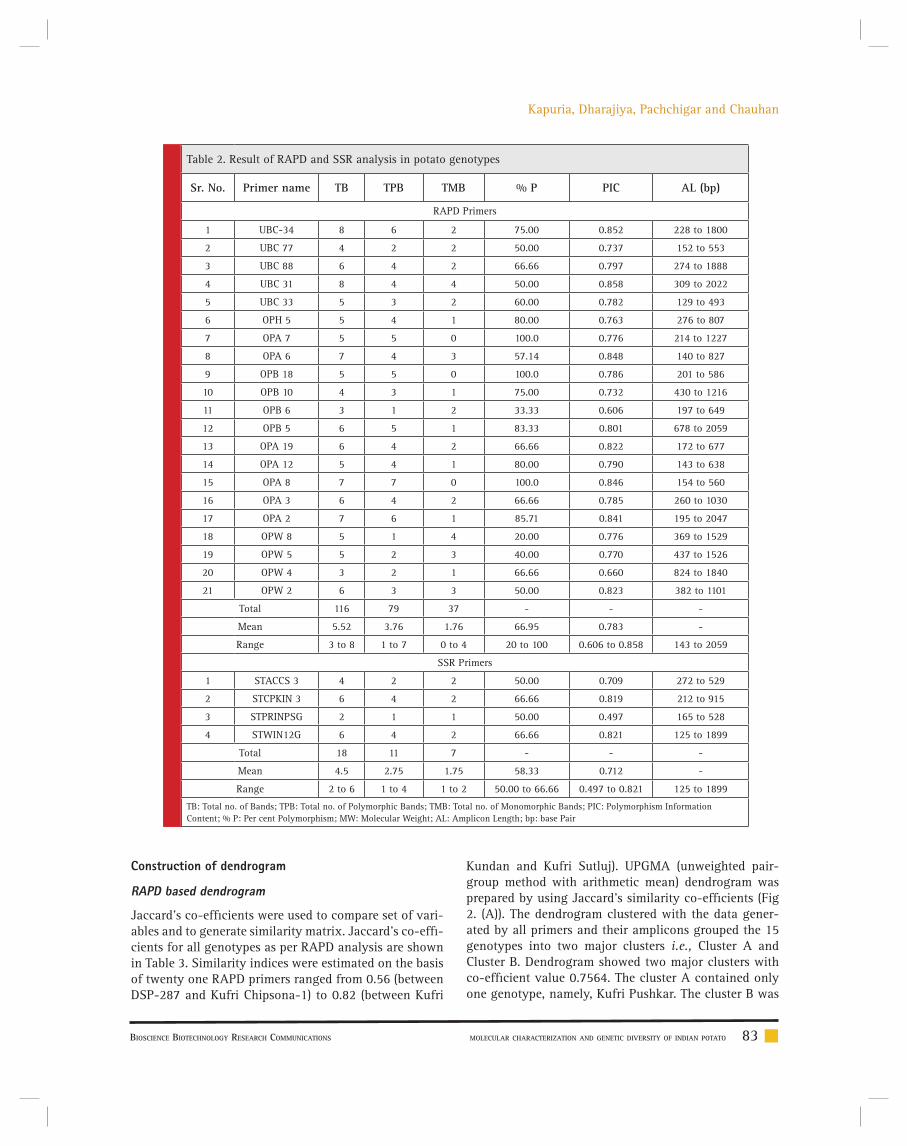
Kapuria, Dharajiya, Pachchigar and Chauhan
BIOSCIENCE BIOTECHNOLOGY RESEARCH COMMUNICATIONS MOLECULAR CHARACTERIZATION AND GENETIC DIVERSITY OF INDIAN POTATO 83
Table 2. Result of RAPD and SSR analysis in potato genotypes
Sr. No. Primer name TB TPB TMB % P PIC AL (bp)
RAPD Primers
1 UBC-34 8 6 2 75.00 0.852 228 to 1800
2 UBC 77 4 2 2 50.00 0.737 152 to 553
3 UBC 88 6 4 2 66.66 0.797 274 to 1888
4 UBC 31 8 4 4 50.00 0.858 309 to 2022
5 UBC 33 5 3 2 60.00 0.782 129 to 493
6 OPH 5 5 4 1 80.00 0.763 276 to 807
7 OPA 7 5 5 0 100.0 0.776 214 to 1227
8 OPA 6 7 4 3 57.14 0.848 140 to 827
9 OPB 18 5 5 0 100.0 0.786 201 to 586
10 OPB 10 4 3 1 75.00 0.732 430 to 1216
11 OPB 6 3 1 2 33.33 0.606 197 to 649
12 OPB 5 6 5 1 83.33 0.801 678 to 2059
13 OPA 19 6 4 2 66.66 0.822 172 to 677
14 OPA 12 5 4 1 80.00 0.790 143 to 638
15 OPA 8 7 7 0 100.0 0.846 154 to 560
16 OPA 3 6 4 2 66.66 0.785 260 to 1030
17 OPA 2 7 6 1 85.71 0.841 195 to 2047
18 OPW 8 5 1 4 20.00 0.776 369 to 1529
19 OPW 5 5 2 3 40.00 0.770 437 to 1526
20 OPW 4 3 2 1 66.66 0.660 824 to 1840
21 OPW 2 6 3 3 50.00 0.823 382 to 1101
Total 116 79 37 - - -
Mean 5.52 3.76 1.76 66.95 0.783 -
Range 3 to 8 1 to 7 0 to 4 20 to 100 0.606 to 0.858 143 to 2059
SSR Primers
1 STACCS 3 4 2 2 50.00 0.709 272 to 529
2 STCPKIN 3 6 4 2 66.66 0.819 212 to 915
3 STPRINPSG 2 1 1 50.00 0.497 165 to 528
4 STWIN12G 6 4 2 66.66 0.821 125 to 1899
Total 18 11 7 - - -
Mean 4.5 2.75 1.75 58.33 0.712 -
Range 2 to 6 1 to 4 1 to 2 50.00 to 66.66 0.497 to 0.821 125 to 1899
TB: Total no. of Bands; TPB: Total no. of Polymorphic Bands; TMB: Total no. of Monomorphic Bands; PIC: Polymorphism Information Content; % P: Per cent Polymorphism; MW: Molecular Weight; AL: Amplicon Length; bp: base Pair
Construction of dendrogram
RAPD based dendrogram
Jaccard’s co-effi cients were used to compare set of vari-ables and to generate similarity matrix. Jaccard’s co-effi -cients for all genotypes as per RAPD analysis are shown in Table 3. Similarity indices were estimated on the basis of twenty one RAPD primers ranged from 0.56 (between DSP-287 and Kufri Chipsona-1) to 0.82 (between Kufri
Kundan and Kufri Sutluj). UPGMA (unweighted pair-group method with arithmetic mean) dendrogram was prepared by using Jaccard’s similarity co-effi cients (Fig 2. (A)). The dendrogram clustered with the data gener-ated by all primers and their amplicons grouped the 15 genotypes into two major clusters i.e., Cluster A and Cluster B. Dendrogram showed two major clusters with co-effi cient value 0.7564. The cluster A contained only one genotype, namely, Kufri Pushkar. The cluster B was
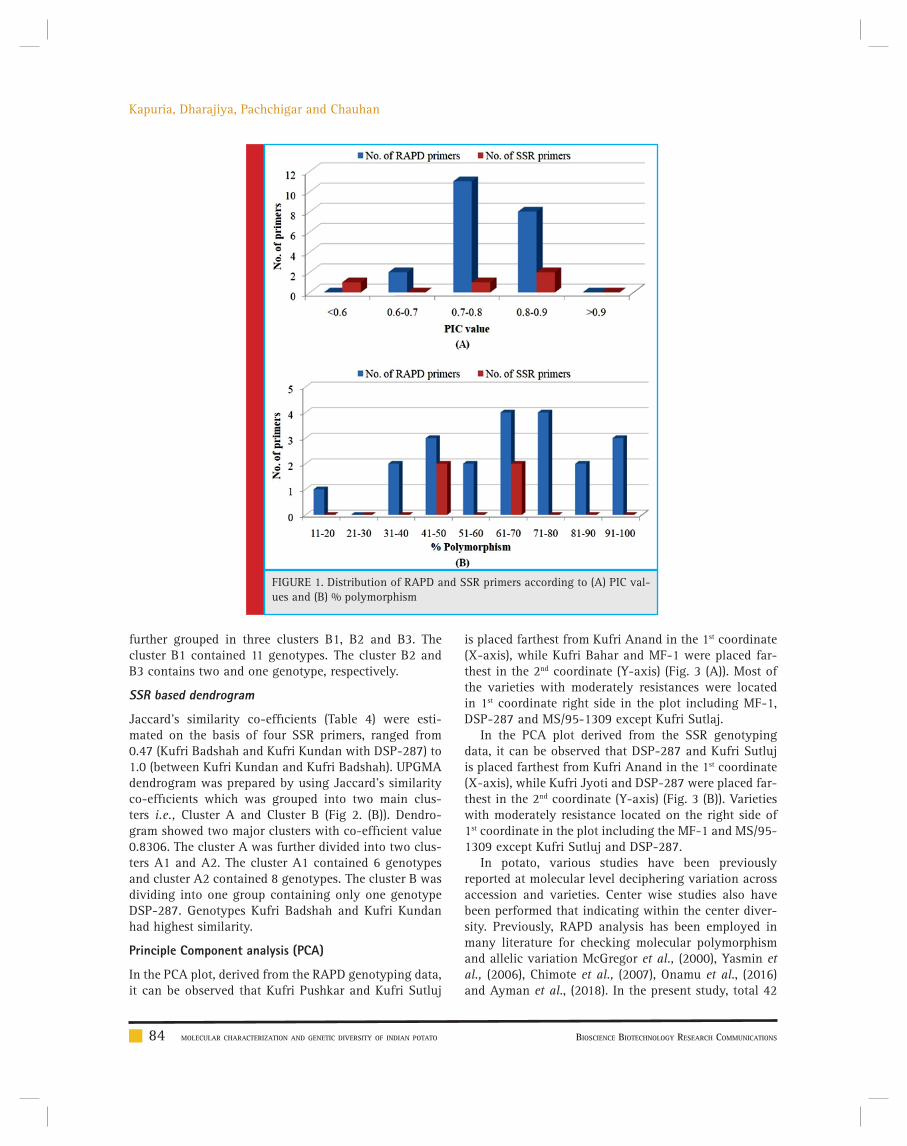
Kapuria, Dharajiya, Pachchigar and Chauhan
84 MOLECULAR CHARACTERIZATION AND GENETIC DIVERSITY OF INDIAN POTATO BIOSCIENCE BIOTECHNOLOGY RESEARCH COMMUNICATIONS
FIGURE 1. Distribution of RAPD and SSR primers according to (A) PIC val-ues and (B) % polymorphism
further grouped in three clusters B1, B2 and B3. The cluster B1 contained 11 genotypes. The cluster B2 and B3 contains two and one genotype, respectively.
SSR based dendrogram
Jaccard’s similarity co-effi cients (Table 4) were esti-mated on the basis of four SSR primers, ranged from 0.47 (Kufri Badshah and Kufri Kundan with DSP-287) to 1.0 (between Kufri Kundan and Kufri Badshah). UPGMA dendrogram was prepared by using Jaccard’s similarity co-effi cients which was grouped into two main clus-ters i.e., Cluster A and Cluster B (Fig 2. (B)). Dendro-gram showed two major clusters with co-effi cient value 0.8306. The cluster A was further divided into two clus-ters A1 and A2. The cluster A1 contained 6 genotypes and cluster A2 contained 8 genotypes. The cluster B was dividing into one group containing only one genotype DSP-287. Genotypes Kufri Badshah and Kufri Kundan had highest similarity.
Principle Component analysis (PCA)
In the PCA plot, derived from the RAPD genotyping data, it can be observed that Kufri Pushkar and Kufri Sutluj
is placed farthest from Kufri Anand in the 1st coordinate (X-axis), while Kufri Bahar and MF-1 were placed far-thest in the 2nd coordinate (Y-axis) (Fig. 3 (A)). Most of the varieties with moderately resistances were located in 1st coordinate right side in the plot including MF-1, DSP-287 and MS/95-1309 except Kufri Sutlaj.
In the PCA plot derived from the SSR genotyping data, it can be observed that DSP-287 and Kufri Sutluj is placed farthest from Kufri Anand in the 1st coordinate (X-axis), while Kufri Jyoti and DSP-287 were placed far-thest in the 2nd coordinate (Y-axis) (Fig. 3 (B)). Varieties with moderately resistance located on the right side of 1st coordinate in the plot including the MF-1 and MS/95-1309 except Kufri Sutluj and DSP-287.
In potato, various studies have been previously reported at molecular level deciphering variation across accession and varieties. Center wise studies also have been performed that indicating within the center diver-sity. Previously, RAPD analysis has been employed in many literature for checking molecular polymorphism and allelic variation McGregor et al., (2000), Yasmin et al., (2006), Chimote et al., (2007), Onamu et al., (2016) and Ayman et al., (2018). In the present study, total 42

Kapuria, Dharajiya, Pachchigar and Chauhan
BIOSCIENCE BIOTECHNOLOGY RESEARCH COMMUNICATIONS MOLECULAR CHARACTERIZATION AND GENETIC DIVERSITY OF INDIAN POTATO 85
Tabl
e 3.
Jac
card
’s c
o-ef
fi ci
ents
for
pot
ato
geno
type
s by
RA
PD a
naly
sis
DSP
-7K.
Chip
-1JX
-249
MF-
1M
S/95
-13
09D
SP-2
87K
. Pu
shka
rK
. Jy
oti
K.
Sutlaj
K.
Bad
shah
K.
Kun
dan
K.
Khy
ati
K.
Bah
arK.
Ana
ndKCM
DSP
-71.
000
K. C
hip-
10.
644
1.00
0
JX-2
490.
677
0.66
71.
000
MF-
10.
663
0.63
40.
616
1.00
0
MS/
95-1
309
0.66
30.
670
0.73
70.
670
1.00
0
DSP
-287
0.67
00.
560
0.70
80.
660
0.72
71.
000
K. P
ushk
ar0.
663
0.59
80.
582
0.58
60.
670
0.62
61.
000
K. J
yoti
0.61
70.
640
0.71
10.
576
0.73
10.
633
0.64
11.
000
K. S
utla
j0.
602
0.65
90.
691
0.57
80.
677
0.66
70.
660
0.76
11.
000
K. B
adsh
ah0.
635
0.64
10.
590
0.67
70.
694
0.70
10.
696
0.66
70.
778
1.00
0
K. K
unda
n0.
674
0.62
80.
643
0.59
80.
663
0.74
00.
663
0.65
30.
820
0.78
01.
000
K. K
hyat
i0.
692
0.66
30.
733
0.68
10.
630
0.65
30.
594
0.65
20.
725
0.68
80.
710
1.00
0
K. B
ahar
0.65
60.
644
0.69
60.
580
0.69
80.
636
0.64
50.
767
0.70
70.
670
0.74
70.
692
1.00
0
K. A
nand
0.69
90.
600
0.70
20.
653
0.68
70.
694
0.57
00.
714
0.64
30.
677
0.69
80.
717
0.81
61.
000
KCM
0.61
90.
624
0.63
90.
643
0.69
40.
650
0.59
20.
685
0.63
30.
684
0.63
60.
688
0.72
50.
769
1.00
0
Tabl
e 4.
Jac
card
’s c
o-ef
fi ci
ents
for
pot
ato
geno
type
s by
SSR
ana
lysi
s
DSP
-7K.
Chip
-1JX
-24
9M
F-1
MS/
95-
1309
DSP
-28
7K
. Pu
shka
rK
. Jy
oti
K.
Sutlaj
K.
Bad
shah
K.
Kun
dan
K.
Khy
ati
K.
Bah
arK.
Ana
ndKCM
DSP
-71.
000
K. C
hip-
10.
882
1.00
0
JX-2
490.
667
0.76
51.
000
MF-
10.
882
0.88
20.
765
1.00
0
MS/
95-1
309
0.82
40.
824
0.70
60.
938
1.00
0
DSP
-287
0.70
60.
611
0.58
80.
706
0.64
71.
000
K. P
ushk
ar0.
588
0.68
80.
786
0.68
80.
625
0.50
01.
000
K. J
yoti
0.82
40.
824
0.81
30.
824
0.76
50.
556
0.73
31.
000
K. S
utla
j0.
647
0.64
70.
857
0.64
70.
588
0.56
30.
769
0.68
81.
000
K. B
adsh
ah0.
647
0.75
00.
857
0.75
00.
688
0.47
10.
917
0.80
00.
846
1.00
0
K. K
unda
n0.
647
0.75
00.
857
0.75
00.
688
0.47
10.
917
0.80
00.
846
1.00
01.
000
K. K
hyat
i0.
722
0.72
20.
813
0.82
40.
765
0.64
70.
733
0.76
50.
800
0.80
00.
800
1.00
0
K. B
ahar
0.68
80.
688
0.78
60.
688
0.62
50.
500
0.83
30.
733
0.91
70.
917
0.91
70.
733
1.00
0
K. A
nand
0.82
40.
722
0.70
60.
824
0.76
50.
750
0.62
50.
667
0.80
00.
688
0.68
80.
875
0.73
31.
000
KCM
0.82
40.
824
0.81
30.
938
0.87
50.
647
0.73
30.
875
0.68
80.
800
0.80
00.
875
0.73
30.
765
1.00
0

Kapuria, Dharajiya, Pachchigar and Chauhan
86 MOLECULAR CHARACTERIZATION AND GENETIC DIVERSITY OF INDIAN POTATO BIOSCIENCE BIOTECHNOLOGY RESEARCH COMMUNICATIONS
FIGURE 2. Dendrogram potato genotypes constructed from (A) RAPD and (B) SSR based Jaccard’s similarity using UPGMA method
RAPD markers have been employed out of which 50% of primers accounts for mean polymorphism greater than 66.95% with PIC 0.783, indicating higher informative-ness of primers. Previously, Chimote et al., (2007), Gorji et al., (2011) and El Komy et al., (2012) found mean pol-ymorphism about 20%, 31% and 57.4% which was less then present result, indicating more superior polymor-phic potential of primers used in the present study and its employment for further research by other in future. Moreover, Gorji et al., (2011) found 0.28 mean PIC value which was very less as compared to the mean PIC value of RAPD (0.78) in the present research. Recently, Onamu et al., (2018) used 19 RAPD markers for the assessment of genetic diversity among 35 potato accessions and reported 81.45% polymorphism which was higher as compare to the current investigation.
Among DNA markers, microsatellites have been cho-sen over RAPD because of their co-dominant behavior, multiallelism, reproducibility, and high level of poly-morphism detected. In potato, few researchers such as Mc Gregor et al., (2000), Feingold et al., (2005), Ghis-lain et al., (2006), Chimote et al., (2007), Sharma and
Nandineni, (2014), Maras et al., (2017), Ahmed et al., (2018) and Tiwari et al., (2019) have successfully used SSR markers. In the present study, total 25 SSR mark-ers have been employed out of these only 4 potent SSR primers were polymorphic. Average polymorphism was 58.33% and mean PIC value was 0.712. Previously, Chimote et al., (2007) work with SSR marker for with general morphological character turns to only mean 19.5% polymorphism with almost same genotype indi-cating more superior polymorphic potential of our SSR marker and its employment for further research by other in future. While, Sharma and Nandineni, (2014) worked with different Kufri varieties by using same set of SSR markers their study revealed more polymorphism (80-90%) then the present study. Biniam et al., (2016) found that 97.8% SSR markers were highly polymorphic with an average PIC value of 0.87 which was very promising for the characterization of potato genotypes. In recent times, Duan et al., (2019) used 20 SSR markers for the analysis of genetic diversity among 217 potato cultivars and reported 97.99% polymorphism and 0.83 PIC value which were higher as compare to the current investiga-

Kapuria, Dharajiya, Pachchigar and Chauhan
BIOSCIENCE BIOTECHNOLOGY RESEARCH COMMUNICATIONS MOLECULAR CHARACTERIZATION AND GENETIC DIVERSITY OF INDIAN POTATO 87
tion. The molecular markers with high PIC values can be utilized for the diversity analysis in potato germplasms.
CONCLUSION
The results of current study indicate that RAPD and SSR markers used in the study seemed to be the good for the molecular assay for fi ngerprinting and assessing genetic relationship among genotypes of potato as they have very promising polymorphism and PIC values. These markers can be utilized for molecular breeding for the improvement of potato.
ACKNOWLEDGEMENT
The authors thank authorities of SDAU and staff of Potato Research Station, Deesa, Gujarat, India, for pro-viding facilities to carry out the research work.
REFERENCES
Ahmed, S., Zhou, X., Pang, Y., Xu, Y., Tong, C., Bao, J. (2018) Genetic diversity of potato genotypes estimated by starch physicochemical properties and microsatellite markers. Food Chemistry 257: 368-375.
Anderson, J.A. (1993) Optimizing parental selection for genetic linkage maps. Genome 36: 181-186.
Ayman, E.F., Zakia, A., Mohamed, T., Sobieh, S., Salah, A. (2018) Molecular diversity analysis of two in vitro and irradi-ated potato varieties expressed by random amplifi ed polymor-phic DNA. Notulae Scientia Biologicae 10(1): 45-51.
Biniam, M.G., Githiri, S.M., Mehari, T., Kasili, R.W., Ghis-lain, M., Magembe, E. (2016) Genetic diversity assessment of farmers’ and improved potato (Solanum tuberosum) cul-tivars from Eritrea using simple sequence repeat (SSR) markers. African Journal of Biotechnology 15(35): 1883-1891.
Bornet, B., Goraguer, F., Joly, G., Branchard, M. (2002) Genetic diversity in European and Argentinian cultivated potatoes
FIGURE 3. PCA analysis of potato genotypes based on (A) RAPD and (B) SSR analysis

Kapuria, Dharajiya, Pachchigar and Chauhan
88 MOLECULAR CHARACTERIZATION AND GENETIC DIVERSITY OF INDIAN POTATO BIOSCIENCE BIOTECHNOLOGY RESEARCH COMMUNICATIONS
(Solanum tuberosum subsp. tuberosum) detected by inter-sim-ple sequence repeats (ISSRs). Genome 45(3): 481-484.
Bradshaw, J.E. (2019) Improving the nutritional value of potatoes by conventional breeding and genetic modifi ca-tion. In Quality Breeding in Field Crops (pp. 41-84). Springer, Cham.
Braun, A., Wenzel, G. (2004) Molecular analysis of genetic var-iation in potato (Solarium tuberosum L.). I. German cultivars and advanced clones. Potato Research 47: 81-92.
Chimote, V.P., Pattanayak, D., Naik, P.S. (2007) Molecular and morphological divergence studies in Indian potato varieties. Indian Journal of Biotechnology 6: 216-223.
Dharajiya, D.T., Khadia, S.M., Pagi, N.K., Khatrani, T.J., Jasani, H.V., Khunt, A.D., Ravindrababu, Y. (2017) Modifi ed method of high quality genomic DNA extraction from mungbean [Vigna radiata (L.) Wilczek] suitable for PCR based amplifi -cation. Indian Journal of Science and Technology 10(20): 1-7.
Doyle, J.J., Doyle, J.L., (1990) Isolation of plant DNA from fresh tissue. Focus 12: 13–15.
Duan, Y., Liu, J., Xu, J., Bian, C., Duan, S., Pang, W., Hu, J., Li, G., Jin, L. (2019) DNA fi ngerprinting and genetic diversity analysis with simple sequence repeat markers of 217 potato cultivars (Solanum tuberosum L.) in China. American Journal of Potato Research 96(1): 21-32.
El Komy, M.H., Saleh, A.A., Molan, Y.Y. (2012) Molecular char-acterization of early blight disease resistant and susceptible potato cultivars using random amplifi ed polymorphic DNA (RAPD) and simple sequence repeats (SSR) markers. African Journal of Biotechnology 11(1): 37-45.
Favoretto, P., Veasey, E.A., Melo, P.C.T.D. (2011) Molecular characterization of potato cultivars using SSR markers. Horti-culture Brasileria 29(4): 542-547.
Feingold, S., Lloyd, J., Norero, N., Bonierbale, M., Lorenzen, J. (2005) Mapping and characterization of new EST-derived microsatellites for potato (Solanum tuberosum L.). Theoretical and Applied Genetics 111(3): 456-466.
Ghebreslassie, B.M., Githiri, S.M., Mehari, T., Kasili, R.W., Ghis-lain, M., Magembe, E. (2016) Genetic diversity assessment of farmers’ and improved potato (Solanum tuberosum) cultivars from Eritrea using simple sequence repeat (SSR) markers. Afri-can Journal of Biotechnology 15(35): 1883-1891.
Ghislain, M., Andrade, D., Rodríguez, F., Hijmans, R.J., Spooner, D.M. (2006) Genetic analysis of the cultivated potato Solanum tuberosum L. Phureja group using RAPDs and nuclear SSRs. Theoretical and Applied Genetics 113(8): 1515-1527.
Ghislain, M., Núnez, J., del Rosario Herrera, M., Pignataro, J., Guzman, F., Bonierbale, M., Spooner, D.M. (2009) Robust and highly informative microsatellite-based genetic identity kit for potato. Molecular Breeding 23(3): 377-388.
Gorji, A.M., Poczai, P., Polgar, Z., Taller, J. (2011) Effi ciency of arbitrarily amplifi ed dominant markers (SCoT, ISSR and RAPD) for diagnostic fi ngerprinting in tetraploid potato. American. Journal of Potato Research 88(3): 226-237.
Hammer, Ø., Harper, D.A.T., Ryan, P.D. (2001) PAST: palaeon-tological statistics software package for education and data analysis. Palaeontologia Electronica 4(1): 9.
Hawkes, J.G., Jackson, M.T. (1992) Taxonomic and evolution-ary implications of the endosperm balance number hypothesis in potatoes. Theoretical and Applied Genetics 84: 180-185.
Jaccard, P. (1908) Nouvelles recherches sur la distribution fl o-rale. Bulletin de la Société vaudoise des sciences naturelles 44: 223-270.
Jian, W., Lu, H., Wang, R.Y., He, M.M., Liu, Q.C. (2017) Genetic diversity and population structure of 288 potato (Solanum tuberosum L.) germplasms revealed by SSR and AFLP markers. Journal of Integrative Agriculture 16(11): 2434-2443.
Kapuria, M., Dharajiya, D., Khatrani, T., Jasani, H., Chaudhari, S.M., Chauhan, R.M. (2016) Evaluation of Indian potato (Sola-num tuberosum L.) germplasms against common scab caused by Streptomyces scabies. International Journal of Agriculture Sciences 8(19): 1336-1338.
Majeed, A., Muhammad, Z. (2018) Potato production in Paki-stan: challenges and prospective management strategies–a review. Pakistan Journal of Botany 50(5): 2077-2084.
Maras, M., Sedlar, A., Reid, A., Božovic, V., Jovovic, Z., Meglic, V., Dolnicar, P. (2017) Genetic diversity and redundancy among potato accessions in the Montenegrin collection as revealed by microsatellite markers. American Journal of Potato Research 94(4): 306-313.
McGregor, C.E., Lambert, C.A., Greyling, M.M., Louw, J.H., Warnich, L. (2000) A comparative assessment of DNA fi nger-printing techniques (RAPD, ISSR, AFLP and SSR) in tetraploid potato (Solanum tuberosum L.) germplasm. Euphytica 113(2): 135-144.
Oliveira, E.J., Pádua, J.G., Zucchi, M.I., Vencovsky, R., Vieira, M.L.C. (2006) Origin, evolution and genome distribution of microsatellites. Genetics and Molecular Biology 29(2): 294-307.
Onamu, R., Legaria, J., Rodríguez, J.L., Sahagùn, J., Pèrez, J. (2016) Molecular characterization of potato (Solanum tubero-sum L.) genotypes using random amplifi ed polymorphic DNA (RAPD) and inter simple sequence repeat (ISSR) markers. Afri-can Journal of Biotechnology 15(22): 1015-1025.
Pal, B.P., Nath, P. (1951) Indian potato varieties. Indian Council Agricultural Research, New Delhi. Miscellaneous Bulletin. 62: 63.
Pandey, S.K., Sarkar, D. (2005) Potato in India: Emerging trends and challenges in the new millennium. Potato Journal 32(3-4): 93-104.
Parita, B., Kumar, S.N., Darshan, D., Karen, P. (2018) Elucida-tion of genetic diversity among ashwagandha [Withania som-nifera (L.) Dunal] genotypes using EST-SSR markers. Research Journal of Biotechnology 13(10): 52-59.
Rocha, E.A., Paiva, L.V., Carvalho, H.H.D., Guimarães, C.T. (2010) Molecular characterization and genetic diversity of potato cultivars using SSR and RAPD markers. Crop Breeding and Applied Biotechnology 10(3): 204-210.

Kapuria, Dharajiya, Pachchigar and Chauhan
BIOSCIENCE BIOTECHNOLOGY RESEARCH COMMUNICATIONS MOLECULAR CHARACTERIZATION AND GENETIC DIVERSITY OF INDIAN POTATO 89
Sharma, V., Nandineni, M.R. (2014) Assessment of genetic diversity among Indian potato (Solanum tuberosum L.) col-lection using microsatellite and retrotransposon based marker systems. Molecular Phylogenetics and Evolution 73: 10-17.
Smith, J.S.C., Chin, E.C.L., Shu, H., Smith, O.S., Wall, S.J., Sen-ior, M.L., Mitchell, S.E., Kresovich, S., Ziegle, J. (1997) An eval-uation of the utility of SSR loci as molecular markers in maize (Zea mays L.): comparisons with data from RFLPs and pedigree Theoretical and Applied Genetics 95: 163-173.
Solano Solis, J., Morales Ulloa, D., Anabalón Rodríguez, L. (2007) Molecular description and similarity relationships among native germplasm potatoes (Solanum tuberosum ssp. tuberosum L.) using morphological data and AFLP markers. Electronic Journal of Biotechnology 10(3): 436-443.
Tiwari, J.K., Ali, N., Devi, S., Kumar, V., Zinta, R., Chakrabarti, S.K. (2018) Development of microsatellite markers set for iden-tifi cation of Indian potato varieties. Scientia Horticulturae 231: 22-30.
Vanishree, G., Patil, V.U., Kardile, H., Bhardwaj, V., Singh, R., Chakrabarti, S.K. (2016) DNA fi ngerprinting of Indian potato cultivars by inter simple sequence repeats (ISSRs) markers. Potato Journal 43(1): 70-77.
Walunjkar, B., Parihar, A., Chaurasia, P., Pachchigar, K., Chau-han, R.M. (2013) Genetic analysis of wild and cultivated germ-plasm of pigeonpea using random amplifi ed polymorphic DNA (RAPD) and simple sequence repeats (SSR) markers. African Journal of Biotechnology 12(40): 5823-5832.
Wang, Y., Rashid, M., Li, X., Yao, C., Lu, L., Bai, J., Li, Y., Xu, N., Yang, Q., Zhang, L., Bryan, G.J. (2019) Collection and eval-uation of genetic diversity and population structure of potato landraces and varieties in China. Frontiers in Plant Science 10: 139.
Yasmin, S., Islam, M.S., Kondoker, M., Nasiruddin, M., Alam, S. (2006) Molecular characterization of potato germplasm by random amplifi ed polymorphic DNA markers. Biotechnology 5(1): 27-31.

Histobiochemical and physicochemical characterization
of mutant jute Corchorus capsularis CMU 013 with
poorly developed fi bre
Sanjoy Sadhukhan
Plant Molecular Biology Laboratory, Department of Botany, Raiganj University, Raiganj – 733134, Uttar Dinajpur, West Bengal, India
ABSTRACT
Jute, an important lingo-cellulosic rich natural bast fi bre, is the second only after cotton in production. It is obtained from the plant belonging to Malvaceae. The advantages of the fi bre lies in its properties i.e. environment-friendly, good insulating, antistatic properties, low thermal conductivity and moderate moisture regain.High lignin content of jute fi bre hinders its utilization in textile industry and diversifi ed value‐added products. To make jute suitable for diverse use, especially in textiles, many efforts were made to modify its chemical composition and physicochemical character-istics. With the aim of developing jute fi bre with reduced lignin content, the comparative histobiochemical and phys-icochemical parameters were studied between normal jute and a stable mutant jute line with decreased lignin content. An x‐ray‐induced mutant line (CMU 013) of jute (Corchorus capsularis) was histobiochemically and physico-chemically evaluated along with its normal parent (JRC 321). The anatomy and morphology of mutant jute differ from normal jute in regard to fi bre formation and deposition of fi bre forming materials. The primary and secondary vascular bundles are normal in both JRC 321 and CMU 013 but bast fi bre formation is less pronounced in mutant jute. The percentage of lignin content is reduced from 19.27% (JRC 321 jute) to 8.627% and cellulose content increased from 48.237% (JRC 321 jute) to 6.397%. X-ray diffraction analysis revealed that the mutant jute has less rigidity and is brittle in nature. Histobiochemical evidence of jute stem of JRC 321 demonstrates that the bast fi bre contains decent amount of cement-ing material, i.e. lignin which is validated by the biochemical analysis of the fi bre. Deposition of the lignin was found to be prerequisite for generation of well-developed fi bre as corroborated by SEM. The fragile nature of the fi bre as seen
90
Biotechnological CommunicationBiosci. Biotech. Res. Comm. 12(1): 90-98 (2019)
ARTICLE INFORMATION:
Corresponding Author: [email protected] 27th Dec, 2018Accepted after revision 21st Feb, 2019BBRC Print ISSN: 0974-6455Online ISSN: 2321-4007 CODEN: USA BBRCBA Thomson Reuters ISI ESC / Clarivate
Analytics USAMono of Clarivate Analytics and Crossref Indexed Journal Mono of CR
NAAS Journal Score 2019: 4.31 SJIF: 4.196© A Society of Science and Nature Publication, Bhopal India 2019. All rights reserved.Online Contents Available at: http//www.bbrc.in/DOI: 10.21786/bbrc/12.1/12

Sanjoy Sadhukhan
BIOSCIENCE BIOTECHNOLOGY RESEARCH COMMUNICATIONS HISTOBIOCHEMICAL AND PHYSICOCHEMICAL CHARACTERIZATION OF MUTANT JUTE 91
in the SEM of CMU 013 jute was validated by the X-ray diffraction analysis and tensile strength. This mutant may serve as a model to understand the molecular mechanism that organizes the development of secondary wall thickening in jute bast fi bre cells.
KEY WORDS: JUTE FIBRE, LIGNIN, MUTANT, SCANNING ELECTRON MICROSCOPY, FTIR SPECTROSCOPY, STRENGTH
INTRODUCTION
Jute, a lignocellulosic natural bast fi bre obtained from the plant Corchorus sp. is a dicotyledonous annual crop belonging to the family Malvaceae. The fi bre originates from the secondary phloem tissue of the stem. It consists of long extraxylary cells which mechanically support the phloem (Guerriero et. al. 2017), also known as bast fi bre. The jute fi bre is one of the most versatile natural fi bres and it has considerable commercial signifi cance for the generation of diversifi ed value-added industrial products i.e. immense potentiality for industrial produc-tion of packaging, textiles, non-textile, construction, and agricultural sectors. Advantages of jute include environment-friendly, renewable resources (Gorshkova 2012), good insulating and antistatic properties, as well as having low thermal conductivity and moderate mois-ture regain. Of late, it has been well established that a score of value-added commercial products of great utility can be produced based on diverse utilization of jute fi bre due to its high strength, high modulus, and high fl exural rigidity. However, some problems have been encountered with the quality of jute fi bre that fi g-ures as critical for their suitability for generation of its value-added textile industrial end products. Utilization of natural fi bres including jute depends on its physi-cal and chemical properties. An extensive comparative study has been made on different physical and chemi-cal properties of different natural fi bres (McGovern et al., 1983 and Young, 1993) and those properties have been found to be the basis of the historical utilization of the natural fi bre. It has also been shown that strength, stiffness, and extensibility of jute fi ber decrease with gradual removal of lignin. The deposition of lignin into cellulose and other cell wall materials might be one of the reasons behind the strength and stiffness of natu-ral fi ber like jute (Roy, 1953; Meredith 1956). Lignin is a secondary plant metabolite which hinders high-end industrial applications of several plant products includ-ing jute (Choudhary et al 2017).
Anatomical studies on jute fi bre showed that the strength and fi neness of the fi bre are correlated with number of cells per bundle, length-breadth ratio of fi bre cells and cross-sectional area of the fi bre cells. The crystallinity of cellulose has a large infl uence on the
mechanical properties of natural fi bres. Jute bast fi bres are composed of xylan with high degree of lignifi ca-tions whereas fl ax, ramie and hemp bast fi bres, have a high abundance of crystalline cellulose (Guerriero et. al. 2017). Fibres like jute, hemp, fl ax, and ramie have their cellulosic chains oriented nearly parallel to the fi bre axis (in the range 7-12°), and they exhibit high strength in contrast to cotton fi bre. Cotton fi bres, with appreciably lower tensile strengths, are characterized by spiraled cellulose chains that are oriented approximately 30° to the fi bre axis (Rials et al., 1997). Moisture content and fi bre purity also infl uence the degree of crystallinity in jute and mesta fi bres (Ray, 1969). X-ray diffraction and Fourier Transformed Infra-Red (FTIR) Spectroscopy are powerful tools to evaluate the structure of jute (Bera et. al. 2002). The bast fibre lignin is significantly different from that of the typical ‘woody plant lignin’ (Day et. al. 2005). Development of bast fi bre in jute (Corchorus spp.) is a complex process involving differentiation of sec-ondary phloem fi bres from the cambium accompanied by lignifi cation of the fi bre cell wall (Kundu et. al. 2012). The formation of secondary phloem fi bres starts long after the initiation of secondary xylem (Snegireva 2015).
In the present study, comparison between an induced mutant (CMU 013) of Corchorus capsularis having an altered form of bast fi bre and a normal jute (JRC 321) plant was performed on the basis of the histobiochemi-cal and physicochemical characters of jute fi bres.
MATERIALS AND METHODS
Transverse sections of jute stems of 45 days after sow-ing (DAS) normal and mutant were prepared, dehy-drated and stained with lignin-specifi c stain phloroglu-cinol-HCl (Srivastava 1966). The stained sections were observed and photographed using Leica DM LS optical microscope.Freehand transverse sections were prepared of jute stems of 60 days old both normal and mutant were prepared and dehydrated. The surface morphology of dry jute fi bers of both cultivated and mutant varieties was evaluated by scanning electron microscopy using JEOL, JSM 5800, at the Central Research Facility, IIT Kharagpur. The images of scanning electron microscopy were taken at electron volt of 20 KeV.

Sanjoy Sadhukhan
92 HISTOBIOCHEMICAL AND PHYSICOCHEMICAL CHARACTERIZATION OF MUTANT JUTE BIOSCIENCE BIOTECHNOLOGY RESEARCH COMMUNICATIONS
Estimation of cellulose, hemicellulose, and lignin
For composition analysis, neutral detergent solution (NDS) and acid detergent solution (ADS) were used. Hemicellulose, cellulose, and lignin were estimated fol-lowing the method (Sadasivam and Manickam 2008). For estimation of these components, the jute fi bers were refl uxed separately with NDS and ADS followed by washing the insoluble part with hot water and acetone in each case. The insoluble parts obtained after treat-ment with NDS and ADS are termed as Neutral Detergent Fiber (NDF) and Acid Detergent Fiber (ADF) respectively. The hemicellulose content of jute fi bers was obtained as a difference of NDF and ADF. The cellulose content of jute fi bers was obtained as the difference of ADF and residue after extraction of ADF with 72% sulphuric acid. The lignin content of jute fi ber was obtained as the dif-ference of residue after extraction of ADF with 72% sul-phuric acid and ash obtained by igniting ADF. In typi-cal procedure hemicellulose, lignin and cellulose of jute fi ber were estimated as follows:
For determination of NDF about 1 g of jute fi ber pow-der was taken in a round bottom fl ask to which 10 ml cold NDS, 2 ml decahydronaphthalene and 0.5 g sodium sulphate were added and refl uxed for 1h. The solid resi-due was fi ltered in a sintered glass crucible (G-2) and washed with hot water followed by washing twice with acetone. The residue was collected, dried at 100°C for 8 h and stored after weighing in a desiccator. This residue was designated as NDF. For determination of ADF about 1g of jute fi ber powder was taken in a round bottom fl ask to which 100ml of ADS were added. The content of the fl ask was heated to boiling in a controlled way to avoid foaming for 5 to 10 min followed by refl uxing for 1h. The residue was fi ltered through sintered glass crucible (G-2), washed with hot water and acetone. The washed residue was then dried at 100°C for overnight. The dried residue was designated as ADF and was stored in a desiccator.
For determination of Acid Detergent Lignin (ADL), weighed amount of ADF was taken in a 100ml beaker to which 25 to 50ml 72% sulphuric acid and 1g asbestos fi bre was added. The content of the beaker was con-tinuously stirred for 3h. Then the content was diluted with distilled water and the residue was fi ltered through a preweighed Whatman No. 1 fi lter paper and washed with water to remove last traces of acid. The residue of the fi lter paper was dried at 100°C for 2 h. The weight of the residue after drying on fi lter paper was taken. The fi lter paper with the residue was transferred on a preweighed silica crucible, which was heated in a muffl e furnace at 550°C for 3 h. The weight of ash was calcu-lated after weighing the cold crucible with the ash. For obtaining % ADL, a blank test was performed by tak-
ing 1 g asbestos fi bre following the same procedure as before. In this blank test, weights of two residues, one weight after drying on fi lter paper at 100°C for 2 h and the other weight after heating at 550°C for 3 h in a muf-fl e furnace in an identical way: (Protocol adopted from, Sadasivam and Manickam 2008)
NDF = Hemicellulose + Cellulose + Lignin + MineralsADF = Cellulose + Lignin + MineralsHemicellulose = NDF - ADFCellulose = ADF - Residue after extraction with 72% H2SO4Lignin = Residue after extraction with 72% H2SO4 - ash
The tensile strength of normal and mutant jute fi b-ers was determined by subjecting the fi bers to Houns-fi eld Universal tensile testing machine with the follow-ing parameters: load range =10.000N, extension range = 3.000mm, speed = 0.0500mm/min, temperature = 25C, relative humidity = 70%. Clean and dry strands col-lected from the middle portion of the fi ber reeds were used for the measurement after proper gripping through paper boards. Before testing, the specimens were kept in desiccators for 2 days. A stress-strain curve of the cultivated and mutant jute fi bers was plotted.IR study of both normal and mutant jute fi bers was done using a Nexus 870 Nicolet FTIR spectrophotometer (Edwards et al., (1997), Samal et al., (1995), Rana et al., (1997), Pan et al., (1999). Jute fi bers were crushed with liquid nitrogen into a fi ne powder and dried in desiccators. An equal weight of both cultivated and mutant fi bers was taken and made pellet with potassium bromide and sub-jected to IR spectrophotometer.
X-ray diffraction (XRD) analysis: XRD of dry jute fi bres were carried out by Philips PW 1729 X-ray gen-erator using Co target (=0.179 nm) at a scanning speed of 2 / min and the data recorded every 0.02 (2) for the angular range of 2 = 10-50 (Varma et al., 1984).
RESULTS
Anatomical study of jute stems
The morphological differences of the mutant (CMU-013) having discontinuous fi bre directed to study the devel-opmental pattern in fi bre formation in its stem compared to cultivated variety JRC 321. Thus, jute stem of 60 days old from both the JRC 321 and CMU 013 was sectioned transversely and stained with phloroglucinol-HCl and analyzed microscopically. It was revealed that the bast fi bre (secondary phloem fi bre) was poorly developed in CMU 013 (Figure 1) indicating a weaker deposition of the fi bre forming components.The comparison was also studied by scanning electron microscopy (SEM) to meas-ure the fi ber-forming zone in both the CMU 013 and JRC

Sanjoy Sadhukhan
BIOSCIENCE BIOTECHNOLOGY RESEARCH COMMUNICATIONS HISTOBIOCHEMICAL AND PHYSICOCHEMICAL CHARACTERIZATION OF MUTANT JUTE 93
FIGURE 1. Anatomical differences of normal and mutant jute stems. Stem sec-tions at 60 days after sowing (DAS) stained with phloroglucinol-HCl and viewed under optical microscope A: JRC 321 (40X magnifi cation), B: CMU 013 (20X magnifi cation). BF – Bast Fibre
FIGURE 2. Anatomical differences of normal and mutant jute stems under SEM. A: JRC 321 and B: CMU 013 at x 40 respectively; C: JRC 321 and D: CMU 013 at x 300 respectively. E and F: Fibre cells of JRC 321 and CMU 013 at x 5000 respectively. BF – Bast Fibre, Xy – Xylem, CW – Cell Wall, L – Lumen of the fi bre cell.
321. It was found that the thickness of the bast cell wall in JRC 321 was 4.5 μm whereas it was 2.2 μm in case of CMU 013. Moreover, the diameter (3.65 μm) of the lumen in jute fi bre of CMU 013 was found to be more
than the JRC 321 (2.25 μm), which indicated further lack of deposition of the fi bre forming components in CMU 013 (Figure 2).

Sanjoy Sadhukhan
94 HISTOBIOCHEMICAL AND PHYSICOCHEMICAL CHARACTERIZATION OF MUTANT JUTE BIOSCIENCE BIOTECHNOLOGY RESEARCH COMMUNICATIONS
FIGURE 3. Surface morphology of the jute fi bres of normal and mutant. A and B: normal JRC 321 at x 400 and x 2000 magni-fi cations respectively. C and D: Mutant CMU 013 at x 400 and x 2000 magnifi cations respectively. S – Smooth surface, RB – Rough surface and Broken fi bres, CL – ‘Crater Like’ Structures.
It was also observed from scanning electron micro-graph that the surface morphology of the jute fi bre iso-lated from CMU 013 was entirely different than that of JRC 321; the fi ber of JRC 321 showed a smooth surface compared to that of the mutant CMU 013 having a rough surface and broken fi bres. At a higher magnifi cation, a crater-like structure was found to be present on the surface of the mutant jute fi ber (Figure 3). Thus, it could be assumed that the fi bre formation in the mutant is underdeveloped due to improper functions of the fi bre forming elements.
The chemical components of cultivated and mutant jute fi bers were estimated by gravimetric method. It was found that cultivated type fi bers have more lignin and less cellulose compared to that of the mutant. Mutant has 28.42 % more cellulose than the cultivated fi ber and whereas the cultivated fi ber has 55 % more lignin than the mutant fi ber.
The jute fi bers of both the cultivated variety (JRC 321) and the mutant (CMU 013) were assessed for its tensile strength. The tensile strength of the jute fi bers was meas-ured by a Universal Tensile Testing Machine (Houns-fi eld) with a load cell 10,000 N, extension range = 30 mm, speed = 0.0500 mm/min, temperature of 25 C and 70 % relative humidity. Clean and dry strands collected from the middle portion of the fi ber reeds were used for the measurement. It was observed that the fi bre of the cultivated variety showed to be stronger (tensile strength of 952.4 MPa) with an elongation percentage at break of 2.51 % than the mutant jute (tensile strength of 600.8
MPa) with an elongation percentage at break of 1.67 %. It was found that the jute fi ber of JRC 321 covered a higher total area under the stress-strain curve compared to that of the mutant CMU 013 (Figure 4). This indicated that the jute fi ber in the cultivated variety was stronger than that of the mutant. From a calculation of the area under the stress-strain plot it was found that the jute of the culti-vated variety needs more energy than that of the mutant for breaking the fi bre under a tensile load.
FTIR vibrational bands of the cultivated and mutant area are shown in Figure 5, and Table 2. In the mutant type of fi bre shifting of H bonded –OH stretching fre-quency value to higher region indicates that intermo-lecular H-bonding decreases and whereas in case of cul-tivated type of fi bre shifting of H bonded –OH stretching frequency value to lower region indicates that intermo-lecular H-bonding increases. Peaks at 2903.76 cm-1 and 2916.84 cm-1 correspond to C-H stretching in methyl and methylene groups (in cellulose and hemicellulose) in jute. Asymmetric C-O-C stretching bands at 1110.67 cm-1 and 1111.85 cm-1 indicates the presence of the chain of anhydroglucose ring, i.e., cellulose. The 1427.11 cm-1 and 1426.78 cm-1 may be due to the presence of lignin on both cultivated and mutant jute fi bres.
The fi bres of both the cultivated and mutant jute were subjected to analyze by X-ray diffraction study within the angular range of 10 - 50 to measure the percent-age crystallinity of the fi bre. It was revealed from fi gure 6 that the percentage crystallinity of the fi bre in cul-tivated variety was found to be 20.53 % whereas that

Sanjoy Sadhukhan
BIOSCIENCE BIOTECHNOLOGY RESEARCH COMMUNICATIONS HISTOBIOCHEMICAL AND PHYSICOCHEMICAL CHARACTERIZATION OF MUTANT JUTE 95
FIGURE 4. Stress-Strain curve of wild and mutant jute fi bers.
FIGURE 5. FTIR spectra of the JRC321 and CMU013 jute fi bers.
of the mutant fi bre was 13.9 % indicating more rigid-ity and brittle nature of the jute fi bre in the cultivated variety.
DISCUSSION
The present study constitutes the fi rst attempt to under-stand the physico-chemical differences between normal jute fi bre and its mutant fi bre. Jute (Corchorus capsu-laris) is the most important fi bre producing crop in the world next to cotton in terms of yield. Anatomically, jute fi bres, also known as bast fi bres, are sclerenchyma
cells with secondary cell wall thickening and are rigid in structure (Kundu, 1944; Fahn, 1990; Evert 2006, Crang et. al. 2018). Proper utilization of this fi bre is hampered due to its coarse nature. Any attempt to improve the quality of the phloem fi bre of jute would be valued for potential diversifi cation of jute usage (Palit, 1999, 2001). Continuous attempts through breeding processes, X-ray induced mutation for generation of improved jute vari-ety and also in improved retting process (Kharkwal et. al. 2004; Das et. al. 2018), to get the improved quality of jute fi bres are being made without any signifi cant out-come. Here, an induced mutant of Corchorus capsularis

Sanjoy Sadhukhan
96 HISTOBIOCHEMICAL AND PHYSICOCHEMICAL CHARACTERIZATION OF MUTANT JUTE BIOSCIENCE BIOTECHNOLOGY RESEARCH COMMUNICATIONS
FIGURE 6. XRD of the wild and mutant jute fi bers.
Table 1. Chemical composition of JRC 321 and CMU 013 jute fi bers
Chemical components Cellulose (%) Hemicellulose (%) Lignin (%)Cultivated (JRC 321) 48.237 28.502 19.273
Mutant (CMU 013) 67.397 20.937 8.672
having an altered bast fi bre was compared with a nor-mal jute plant and identify some of the histobiochemical and physicochemical characters of jute fi bres.
Histobiochemical evidence of jute stem of cultivated variety JRC 321 demonstrates that the development of the secondary cell wall in phloem was initiated at a particular stage of development of jute plant and matured well with deposition of cementing materials, particularly lignin (Figures 1 and 2) as evidenced in our previous studies (Samanta et. al. 2015). This deposition of the cementing materials was found to be prerequisite for generation of well-developed fi bre revealed from the comparative study of the normal with mutant by SEM (Figures 3 and 4).
These data are supported by previous study of Mesh-ram and Palit (2013) where the authors found that the cell wall thickness, strength of fi bre and lignin content goes together and the high cellulose content results fi bre fi neness. Compositional analysis of the fi bre forming components indicated that the fi bre of normal jute con-tains 57% more lignin than mutant. The data are also supported by the earlier evidence that the secondary wall development and formation of compact group of the bast fi bre cells involve deposition of lignin over the cellulose matrix (Priestley and Scott, 1936; Kundu et al., 1959; Preston, 1974; Grabber et al., 1991) though the presence of high amount of lignin was believed to be undesirable for fi bre quality (Harlley, 1987). In contrast, the mutant
fi bre was found to contain a comparatively high amount of cellulose (Table 1) that could be expected to improve the quality and strength of the fi bre. This observation was supported by another study in (Corchorus olitorius L.) mutant with low lignin (7.23%) in phloem fi bre being compared to wild-type JRO 204 (13.7%) was identifi ed and characterized (Choudhary et al 2017).
However, a contrary result was observed in continu-ity and tensile properties of the fi bre. The fi bre generated from mutant on retting was found to be discontinuous or fragmented. It is diffi cult to conclude whether this fragmented nature of fi bre was due to less deposition of lignin or due to poor development of the cell wall. The fi bre of the normal showed to be stronger (tensile strength of 952.4 MPa) with an elongation percentage at break of 2.512 % than the mutant jute (tensile strength of 600.8 MPa) with an elongation percentage at break of 1.676 % (Figure 4). This data was supported by a pre-vious study in which the authors have used different natural fi bres and studied the effect of fi bre morphology on the tensile strength (Fidelisa et. al. 2013).
They found that the increased secondary cell-wall thickness causes increase in both the fi ber strength and Young’s modulus. This observation was further sup-ported by the FTIR analysis and XRD analysis of both normal and mutant fi bres (Figures 5 & 6). The XRD analysis of normal fi bre revealed more crystallinity than

Sanjoy Sadhukhan
BIOSCIENCE BIOTECHNOLOGY RESEARCH COMMUNICATIONS HISTOBIOCHEMICAL AND PHYSICOCHEMICAL CHARACTERIZATION OF MUTANT JUTE 97
that in mutant. Due to higher crystallinity (20.53%) of normal, it is stronger than the mutant jute having lower crystallinity (13.9%), which supports the experimental observation of strength property. This result was sup-ported by a previous study in which the authors found similar result (Saha et. al. 2010). Further to this, the higher crystallinity in JRC 321 fi bre can be ascribed to the presence of more intermolecular H-bonding com-pared to that in mutant jute. FTIR analysis results (Fig-ure 5 and Table 2) indicate the shifting of O-H stretching band from 3382.98 cm-1 in JRC321 to 3415.74 cm-1 in mutant. This confi rms the infl uence of H-bonding on the higher crystalline nature of JRC 321.
CONCLUSION
It could be concluded that the molecular interaction of cellular components determines the fi bre quality in jute in spite of the developmentally regulated synthesis of lignin only as evidenced earlier (Sengupta and Palit, 2004). Moreover, it could be expected that this interac-tion was genetically regulated as it was found to be ham-pered in the mutant. This mutant may serve as a model to understand the molecular mechanism that organizes the development of secondary wall thickening in jute bast fi bre cells. The study will help in the development of desired jute fi bre through genetic modifi cations.
ACKNOWLEDGEMENTS
Financial assistance in the form the grant support from the Department of Biotechnology, Government of India
is acknowledged. Author would like to thank Dr. Jayanta Maity, Polymer and Textile Research Laboratory, Depart-ment of Chemistry, Sidho Kanho Birsha University for interpreting some of the data.
Strain is defi ned as the ratio of change in length to the original length and a ratio do not have any unit. But in the present study it was calculated in “mm/mm”.
REFERENCES
Bera, A.K., Bandyopadhyay, S., Sen, S.K., Ghosh, S., Banerjee, A., (2002). Structural quality assessment of different cellulosic jute fi bres by X-ray diffraction, Indian Journal of Fibre & Tex-tile Research 27: 65-71.
Choudhary, S.B., Chowdhury, I., Singh, R.K., Pandey, S.P., Sharma, H.K., Anil Kumar, A., Karmakar, P.G., Kumari, N., Sou-framanien, J., Jambhulkar, S. J. (2017). Morphological, His-tobiochemical and Molecular Characterisation of Low Lignin Phloem Fibre (llpf) Mutant of Dark Jute (Corchorus olitorius L.), Applied Biochemistry and Biotechnology. 183(3):980–992.
Crang, R., Lyons-Sobaski, S., Wise, R. (2018). Plant Anatomy: A Concept-Based Approach to the Structure of Seed Plants, 1st edn. Chapter 5:155-179. Springer.
Das, S., Majumdar, B., Saha, A.R., Sarkar, S., Jha, S.K. Sarkar, S.K., Saha, R. (2018). Comparative Study of Conventional and Improved Retting of Jute with Microbial Formulation, Pro-ceedings of the National Academy of Sciences, India Section B: Biological Sciences. 88(4):1351–1357.
Day, A., Ruel, K., Neutelings, G., Crônier, D., David, H., Hawk-ins, S., Chabbert, B. (2005). Lignifi cation in the fl ax stem: evidence for an unusual lignin in bast fi bers, Planta. 222(2): 234–245.
Table 2. Assignment of IR vibrational bands in JRC-321 (cultivated variety) and CMU-013 (mutant jute)
JRC 321 CMU 013
Possible assignment of chemical groups cm-1 cm-1
OH Stretching vibrations due to polymeric association 3382.98 3415.74
CH stretching in methyl and methylene groups (in cellulose and hemicellulose) 2903.76 2916.84
CN stretching bond 2360.14 2359.41
C=O stretching (in lignin and sugar aldehydes) 1737.95 1736.61
Aromatic skeletal vibrations 1596.15 1634.92
CC multiple band stretching aromatic 1503.64 1506.21
CH2 bending in lignin 1427.11 1426.78
Unsaturated nitrogen compound C-NO2 nitro compound 1371.89 1374.21
C-N vibrations, aromatic, primary 1321.43 1319.96
Ethers; Sulphur compound 1247.14 1246.08
S=O Stretching vibrations due to sulfonamides 1161.47 1162.63
C-O/C-C stretching 1110.67 1111.85
S=O Stretching vibrations due to sulfoxides 1058.16 1058.68
Alkene, distributed, cis 668.82 668.78

Sanjoy Sadhukhan
98 HISTOBIOCHEMICAL AND PHYSICOCHEMICAL CHARACTERIZATION OF MUTANT JUTE BIOSCIENCE BIOTECHNOLOGY RESEARCH COMMUNICATIONS
Edwards, H.G.M., Farwell, D.W., Webster, D. (1997). FT Raman microscopy of untreated natural plant fi bers, Spectrochimica Acta Part A, 53: 2383-2392.
Evert, R.F. (2006). Esau’s plant anatomy, 3rd edn. John Wiley & Sons, Inc., Publication.
Fahn, A. (1990). Plant anatomy, 4th edn. Oxford: Pergamon Press.
Fidelisa, M.E.A., Pereira, T.V.C., Gomes, O. da Fonseca M., Silva, F. de Andrade., Filho, R.D.T. (2013). The effect of fi ber morphology on the tensile strength of natural fi bers, J Mater Res Technol. 2(2):149–157.
Gorshkova, T., Brutch, N., Chabbert, B., Deyholos, M., Hayashi, T., Lev-Yadun, S., Mellerowicz, E.J., Morvan, C., Neutelings, G., Pilate, G. (2012). Plant fi bre formation: state of the art, recent and expected progress, and open questions, Crit Rev Plant Sci 31:201–228
Grabber, J.H., Jung, G.A., and Hill, R.R.Jr. (1991). Chemical composition of parenchyma and sclerenchyma cell walls iso-lated from orchardgrass and switchgrass, Crop Sci. 31: 1058–1065.
Guerriero, G., Behr, M., Legay, S., Mangeot-Peter, L., Zorzan, S., Ghoniem, M., Hausman, J.F. (2017). Transcriptomic profi l-ing of hemp bast fi bres at different developmental stages, Sci Rep. 7(1):4961.
Harlley, R.D. (1987). The chemistry of lignocellulosic materials from agricultural wastes in relation to processes for increas-ing their biodegradability, In Meer JM, van der Rijkens BA, Ferranti MP, eds. Degradation of lignocellulosics in ruminants and in industrial processes. London and New York: Elsevier Applied Science Publishers.
Kharkwal M.C., Pandey R.N., Pawar S.E. (2004). Mutation Breeding for Crop Improvement, In: Jain H.K., Kharkwal M.C. (eds) Plant Breeding. Springer, Dordrecht
Kundu B.C. (1944). Anatomy of jute stem with special refer-ence to cambial activity and distribution of fi bres in relation to leaf-trace system, Journal of Royal Asiatic Society, Bengal (Science) 10: 27–52.
Kundu, A., Sarkar D., Mandal, N.A., Sinha, M.K., Mahapatra, B.S. (2012) A secondary phloic (bast) fi bre-shy (bfs) mutant of dark jute (Corchorus olitorius L.) develops lignifi ed fi bre cells but is defective in cambial activity, Plant Growth Regulation 67(1):45–55.
Kundu, B.C., Basak, K.C., and Sarkar, P.B. (1959). Jute in India (ed.) M.G. Kamath. The Indian central jute committee, Calcutta.
McGovern, J. N., Coffelt, D. E., Hurter, A. M., Ahuja, N. K., and Weidermann, A, (1983). Other fi bres, in Pulp and Paper Man-ufacture, Vol. 3, Secondary Fibres and Agro-based Pulping, Hamilton F, Leopold B, Eds., TAPPI Press, Atlanta, Chapter IX.
Meredith R. (1956). Mechanical properties of Textile Fibres, Interscience Publisher, Inc., New York, Chaps. VI and VII.
Meshram, J.H., Palit, P. (2013) On the role of cell wall lignin in determining the fi neness of jute fi bre, Acta Physiologiae Plantarum 35(5):1565–1578.
Palit, P. (1999). Jute. In: Smith DL, Hamel C. eds. Crop yield, physiology and processes. Berlin: Springer-Verlag 271–286.
Palit, P., Sengupta, G., Datta, P., and Meshram, J. (2001). Lignin and lignifi cation with special reference to its down regulation for the improvement of wood and bast fi bre quality, Indian Journal of Plant Physiol. 6: 217–228.
Pan, N.C., Dey, A., Mahalanabish, K.K. (1999). Infrared spectra of bleached jute, Colourage 46(1): 15-19.
Preston, R.D. (1974). The physical biology of plant cell walls, London: Chapman and Hall.
Priestley, J.H., and Scott, L.I. (1936). Vascular anatomy of Heli-anthus annus L., Proceedings of the Leeds Philological and Literary Society Science Section 3: 159–173.
Rana, A.K., Basak, R.K., Mitra, B.C., Lawther, M., Banerjee, A.N. (1997). Studies of acetylation of jute using simplifi ed proce-dure and its characterization, Journal Applied Polymer Science 64:1517- 1523.
Ray, P.K. (1969). On the degree of crystallinity in jute and mesta fi bres in different states of purifi cations and moisture conditions, Journal Appl Polym Sci. 13(12): 2593-2600.
Rials T.G. (1997). Wolcott MP in Paper and Composites from Agro-Based Resources, Rowell RM, Young RA, Rowell JK, edi-tors, Lewis Publishers, New York, P.73.
Roy, M.M. (1953). Mechanical properties of jute. II. The study of chemically treated fi bres, Text Inst J. 44:T44.
Sadasivam S, Manickam A. (2008). Biochemical Methods, 3rd Edn., New Age International (P) Ltd. Publishers, New Delhi, pp 12-13, 208.
Saha, P., Manna, S., RoyChowdhury, S., Sen, R., Roy D., Adhi-kari, B. (2010). Enhancement of tensile strength of lignocel-lulosic jute fi bers by alkali-steam treatment, Bioresource Tech-nology. 101(9):3182-3187.
Samal, R.K., Mohanty, M., Panda, B.B. (1995). Effect of chemical modifi cation on FTIR spectra: Physical and chemical behavior of jute-II, Journal of Polymer Materials 12(3): 235-240.
Samanta, P., Sadhukhan, S., Basu, A. (2015). Identifi cation of differentially expressed transcripts associated with bast fi bre development in Corchorus capsularis by suppression subtrac-tive hybridization, Planta. 241(2):371-385.
Sengupta, G., and Palit, P. (2004). Characterization of lignifi ed secondary phloem fi bre-defi cient mutant of jute (Corchorus capsularis), Annals of Botany 93: 211-220.
Snegireva, A., Chernova, T., Ageeva, M., Lev-Yadun, S., Gor-shkova, T. (2015). Intrusive growth of primary and secondary phloem fi bres in hemp stem determines fi bre-bundle formation and structure, AoB Plants. 7: plv061
Srivastava LM. (1966). Histological studies on lignin, Tappi 49:173-183
Varma DS, Varma M, Varma IK. (1984). Coir Fibers: Part I: Effect of Physical and Chemical Treatments on Properties, Journal of Textile Research Inst 54:349.
Young, R. A. (1993). Kirk-Othmer Encyclopedia of Chemical Technology, 4th edition Vol.10, John Wiley and Sons, New York.

Bacteriological profi ling of toys and clothes of children
from children’s day care centre of Tarakeswar, Hooghly
West Bengal, India
Raktima Bandyopadhyay1, Sucharita Ghosh2, Soumendranath Chatterjee2 and
Shyamapada Mandal1*1Laboratory of Microbiology and Experimental Medicine, Department of Zoology, University of Gour Banga, Malda, India and 2Parasitology and Microbiology Research Laboratory, Department of Zoology, University of Burdwan, Burdwan, India
ABSTRACT
The antibiotic resistances of bacterial isolates from various sources have been reported worldwide. The present study stands for the isolation and characterization of the bacteria isolated from the toys and clothes of children collected from children’s day care centre of Tarakeswar, Hooghly (WestBengal, India). Seven bacterial isolates (strain code: GUTY1, GUTY2, GUTY3, GUTY4, GUCL1, GUCL2 and GUCL3) were procured from the samples (toys and clothes) screened. Fol-lowing conventional phenotypic and molecular characterization it was found that the children’s clothes and toys were contaminated with different potential pathogenic bacteria. The isolates GUTY1 and GUCL1 were identifi ed as E. coli, GUTY2 as Aneurinibacillus sp., GUCL3 and GUTY4 as Bacillus cereus where as GUTY3 as Lysinibacillus sp. and GUCL2 as Staphylococcus aureus. The disc diffusion susceptibility test revealed that the bacterial isolates had resistance to ampicillin only, or along with penicillin and/or rifampicin resistances.Thus, regular vigilance of antibiotic resistance of bacteria isolated from children’s toys and clothes is imperatively needed in order to combat the bacterial infection to the children especially in our part of the globe.
KEY WORDS: TOYS AND CLOTHES, PATHOGENIC BACTERIA, 16S RNA GENE, ANTIBIOTIC RESISTANCE, MAR INDEX
99
Microbiological CommunicationBiosci. Biotech. Res. Comm. 12(1): 99-107 (2019)
r
ARTICLE INFORMATION:
Corresponding Author: [email protected] 12th Jan, 2019Accepted after revision 22nd March, 2019BBRC Print ISSN: 0974-6455Online ISSN: 2321-4007 CODEN: USA BBRCBA Thomson Reuters ISI ESC / Clarivate
Analytics USAMono of Clarivate Analytics and Crossref Indexed Journal Mono of CR
NAAS Journal Score 2019: 4.31 SJIF: 4.196© A Society of Science and Nature Publication, Bhopal India 2019. All rights reserved.Online Contents Available at: http//www.bbrc.in/DOI: 10.21786/bbrc/12.1/13

Raktima Bandyopadhyay et al.
100 BACTERIOLOGICAL PROFILING OF TOYS AND CLOTHES OF CHILDREN BIOSCIENCE BIOTECHNOLOGY RESEARCH COMMUNICATIONS
INTRODUCTION
Working family members have to rely on childcare cent-ers for providing a safe, healthy and caring environment for their children. Children are very susceptible to con-tagious diseases as they have not been exposed to many microbial infections and also have no resistance to them, or sometimes have not received required immunizations (ARCH, 1996; Myo clinic, 2006). Children have high hand to mouth activity and obtain infections at an earlier age. Various infections have been documented in children in the childcare centers (Van et al, 1996). They play and eat close together without having proper hygiene habits.Chil-dren having diapers are more susceptible to the spread of diarrheal diseases due to poor or inadequate handwash-ing, diaper changing and environmental sanitation meas-ures (Van et al, 1991). These contributing factors create infections in childcare centers. In children’s day care cen-tre, children are commonly provided with toys and the safeties of these toys are usually not taken. Evidence has shown that belongings such as, toys and school-kits of children may easily be contaminated with microbes. Toys get passed from child to child and become contaminated through handling or by children putting their mouths to them, (Suviste, 1996, Agbulu et al 2015, Ali et al., 2016, Al-Easawi, et al., 2017 Johani et al., 2018).
Children are very much susceptible to microbial dis-eases. Frequently they suffer from bacterial infections like pneumonia, urinary tract infections, diarrhoea, and so many. Most of these diseases occur due to poor hygiene practices. It was noticed that the children at the study areas had been suffering from various types of food-borne and water-borne diseases. There are approx-imately 7000 newborn deaths every day, amounting to 46% of all child deaths under the age of 5-years (WHO, 2016). The current study has been undertaken to deter-mine bacterial contamination of children’s toys and clothes from West Bengal, India and to explore the bac-terial antibiotic resistances.
MATERIALS AND METHODS
MICROBIOLOGICAL ANALYSIS
Ten toys were collected from a children day care centre of Tarakeswar, Hooghly (West Bengal state, India) with which the children seemed to play regularly. Ten cloth samples (socks and shirts) of children were randomly selected for the microbiological examination. Toys were kept in sterile plastic bags. In the laboratory, 0.1% pep-tone broth (suffi cient to cover the toy) was poured into the bag and the toy was then rubbed from the outside of the bag to make sure that organisms were mixed with the broth. The broth was then shaken forcefully in the
bag to make a uniform distribution of organisms, then serially diluted to 10-3 dilution and cultured following standard techniques (Maturin and Peeler, 2001). Ten clothes (socks and shirts) were selected for the microbio-logical examination. The area of clothes was swabbed using a sterile cotton swab, immersed in 0.1% peptone broth and used for culture.
Pour plating was done on nutrient agar for total bac-terial count and on EMB agar for total coliform (TC) count. After pour plating Bacteria were isolated by sterile loop and streaked on nutrient agar plates and incubated at 30±1 oC in a BOD incubator for 24 h to obtain the isolated colonies. Pure culture was maintained on agar slants for further characterization and identifi cation. Three replications were made for each sample tested. Average colony forming unit (CFU) of coliform and total bacteria count per milliliter of broth was recorded for a specifi c toy or specifi c cloth. Total bacterial count and TC count were categorized as ‘none detected’, ‘low’ (between no CFU and ≤103 CFU/mL), ‘moderate’ (>103
CFU/mL and or ‘high’ (105 CFU/mL).
DETERMINATION OF PHENOTYPIC IDENTITY OF
ISOLATED BACTERIA
The shape, size, colour, margin and opacity of the iso-lated bacterial colonies were recorded. Phenotypic and biochemical characterization of the isolates were done following the standard protocol (Holt, 1984; Forbes et al., 2007). To study the bio-chemical properties, catalase, citrate utilization, nitrate reduction, indole production, methyl-red, Voges-Proskauer, urease, oxidase, and fer-mentation tests were done. For qualitative determination of enzymes, starch hydrolysis, lipase, protein hydrolysis, gelatin hydrolysis tests were done.
MOLECULAR CHARACTERIZATION OF
BACTERIAL ISOLATES
The isolated bacteria from toys and clothes were identi-fi ed both on the basis of 16S rRNA gene sequence analy-sis. Fingerprinting of the nucleotide was done following Lou and Golding (2007). The sequence data were aligned using the “ClustalW Submission Form” (http://www.ebi.ac.uk/clustalw) and analyzed by ClustalW (Thompson et al., 1994). Evolutionary distances were calculated using the method of Jukes and Cantor and the phyloge-netic tree was prepared following the neighbor joining method (Saitou and Nei, 1987).
BACTERIAL ANTIBIOTIC SUSCEPTIBILITY AND
MAR INDICES
The sensitivity of the bacterial isolates to antibiotics was tested following disc diffusion method (Bauer et

Raktima Bandyopadhyay et al.
BIOSCIENCE BIOTECHNOLOGY RESEARCH COMMUNICATIONS BACTERIOLOGICAL PROFILING OF TOYS AND CLOTHES OF CHILDREN 101
Table 1. The total bacteria count and total coli form count from children’s toy and cloth samples
Sample Bacterial count Contamination status
Total bacteria count (CFU/mL)
Total coliform count (CFU/mL)
Toy 1 35 × 105 15 × 105 High
Cloth 1 21 × 102 11 × 102 Low
Toy 2 27 × 104 17 × 104 Moderate
Cloth 2 42 × 106 14 × 106 High
Toy 3 55 × 104 15 × 104 Moderate
Cloth 3 15 × 102 03 × 102 Low
Toy 4 12 × 102 07 × 102 Low
Cloth 4 11 × 104 34 × 104 Moderate
Toy 5 65 × 106 23 × 105 High
Cloth 5 5 × 10² 5 × 10² Low
Toy 6 23 × 104 17 × 104 Moderate
Cloth 6 14 × 104 05 × 104 Moderate
Toy 7 14 × 104 05 × 104 Moderate
Cloth 7 22 × 102 16 × 102 Low
Toy 8 17 × 102 13 × 102 Low
Cloth 8 25 × 105 14 × 106 High
Toy 9 17× 102 05 × 102 Moderate
Cloth 9 34× 102 03 × 102 Low
Toy 10 27 × 106 07 × 105 High
Cloth 10 45 × 104 35 × 104 Moderate
al., 1966), as mentioned earlier by Mandal et al (2011) and Mandal et al (2016). The antibiotic discs (Hi-Media, India): ampicillin (10-μg/disc), chloramphenicol (30-μg/disc), doxycycline (30-μg/disc), penicillin G (10 units/disc), levofl oxacin (5 μg/ disc), nalidixic acid (30-μg/disc), and rifampicin (5-μg/disc), were used. Antibiotic susceptibility test results, in terms of zone diameter of inhibition, were interpreted following the criteria of CLSI (2013). The MAR indices for the isolated bacteria were calculated following standard methods (Maloo et al, 2014; Krumperman et al., 1983).
RESULTS AND DISCUSSION
The total bacteria count and TC count from the toys and clothes tested are shown in Table 1. The total bacteria count and TC count were categorized as ‘none detected’, ‘low’ (between no CFU and ≤103 CFU/mL), ‘moderate’ (>103 CFU/mL and or ‘high’ (105 CFU/mL). Out of the 10 toys examined 3 were highly contaminated, 4 were mod-erately contaminated and the rest 3 had low contamina-tion, while among 10 cloth samples tested, 2 were found highly contaminated, 3 were moderately contaminated and the rest 5 showed low bacterial contamination.
A total of 7 bacterial isolates (strain code: GUTY1, GUTY2, GUTY3 and GUTY4 from toy samples, and GUCL1, GUCL2 and GUCL3 from cloth samples) were procured from children’s toys and clothes.The bacte-rial isolates GUTY1 and GUCL1 exhibited almost simi-lar colony morphology and same biochemical proper-ties: GUCL1 showed circular, creamy white and elevated colonies whereas GUTY1 formed spherical fl at whitish colony; both were rod shaped. The bacteria were gram-negative non-spore forming, and were positive for cata-lase, methyl red (MR), indole, nitrate reduction, starch and gelatin hydrolysis but negative for citrate utiliza-tion, oxidase, urease, coagulase and Vogues-Proskauer (VP) test. The bacterial isolates: GUTY2 and GUTY3 formed circular, white and elevated colonies and were gram-positive spore forming rod shaped. The GUTY2 strain was positive for catalase, MR reaction, but nega-tive for VP reaction, indole production, citrate activity, nitrate reduction, H2S production, starch hydrolysis, gelatin hydrolysis, urease test, oxidase, coagulase test, lecithinase test, mannitol methyl red test.
The GUTY3 isolate was positive for catalase, indole, oxidase, nitrate reduction, starch and gelatin hydroly-sis but negative for citrate utilization, methyl red and VP test. The bacterial isolate GUTY4 and GUCL3 showed
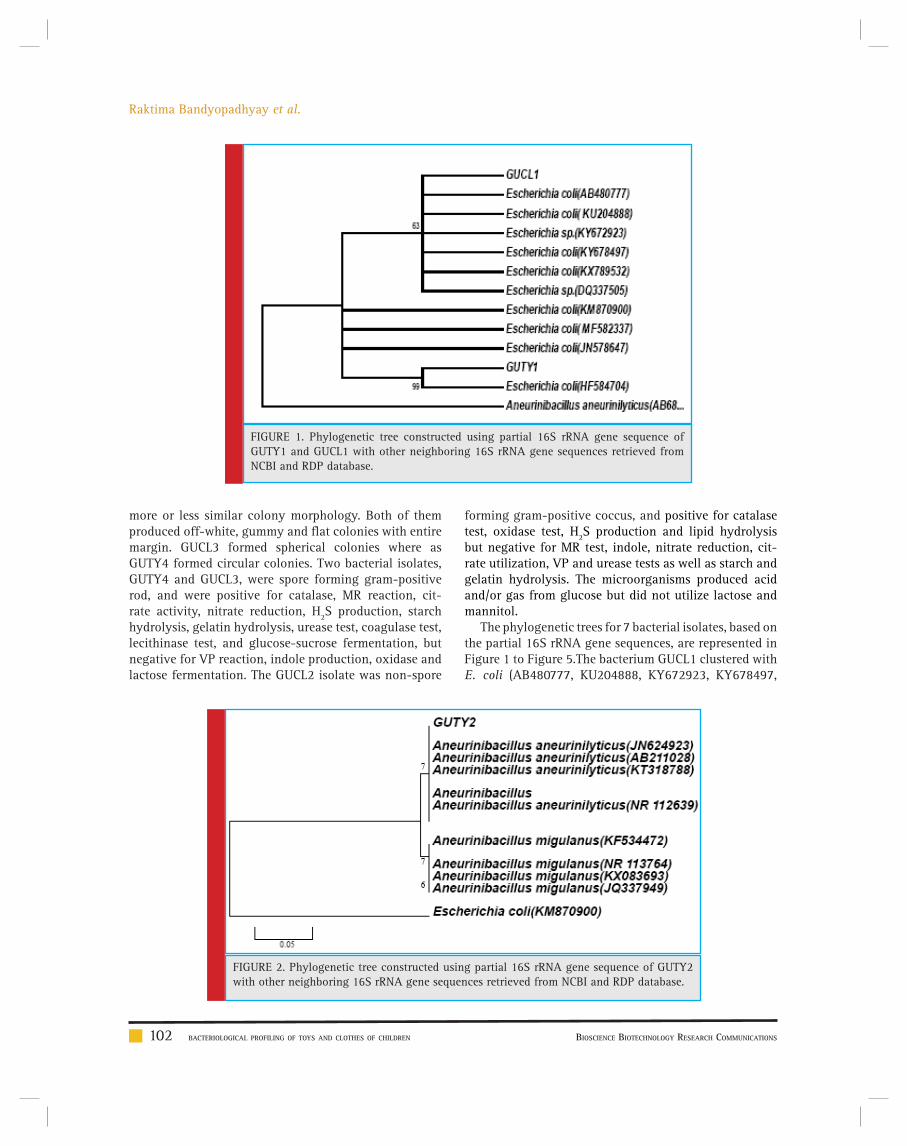
Raktima Bandyopadhyay et al.
102 BACTERIOLOGICAL PROFILING OF TOYS AND CLOTHES OF CHILDREN BIOSCIENCE BIOTECHNOLOGY RESEARCH COMMUNICATIONS
FIGURE 1. Phylogenetic tree constructed using partial 16S rRNA gene sequence of GUTY1 and GUCL1 with other neighboring 16S rRNA gene sequences retrieved from NCBI and RDP database.
FIGURE 2. Phylogenetic tree constructed using partial 16S rRNA gene sequence of GUTY2 with other neighboring 16S rRNA gene sequences retrieved from NCBI and RDP database.
more or less similar colony morphology. Both of them produced off-white, gummy and fl at colonies with entire margin. GUCL3 formed spherical colonies where as GUTY4 formed circular colonies. Two bacterial isolates, GUTY4 and GUCL3, were spore forming gram-positive rod, and were positive for catalase, MR reaction, cit-rate activity, nitrate reduction, H2S production, starch hydrolysis, gelatin hydrolysis, urease test, coagulase test, lecithinase test, and glucose-sucrose fermentation, but negative for VP reaction, indole production, oxidase and lactose fermentation. The GUCL2 isolate was non-spore
forming gram-positive coccus, and positive for catalase test, oxidase test, H2S production and lipid hydrolysis but negative for MR test, indole, nitrate reduction, cit-rate utilization, VP and urease tests as well as starch and gelatin hydrolysis. The microorganisms produced acid and/or gas from glucose but did not utilize lactose and mannitol.
The phylogenetic trees for 7 bacterial isolates, based on the partial 16S rRNA gene sequences, are represented in Figure 1 to Figure 5.The bacterium GUCL1 clustered with E. coli (AB480777, KU204888, KY672923, KY678497,

Raktima Bandyopadhyay et al.
BIOSCIENCE BIOTECHNOLOGY RESEARCH COMMUNICATIONS BACTERIOLOGICAL PROFILING OF TOYS AND CLOTHES OF CHILDREN 103
FIGURE 3. Phylogenetic tree constructed using partial 16S rRNA gene sequence of GUCL3 and GUTY4 with other neighboring 16S rRNA gene sequences retrieved from NCBI and RDP database.
FIGURE 4. Phylogenetic tree constructed using partial 16S rRNA gene sequence of GUTY3 with other neighboring 16S rRNA gene sequences retrieved from NCBI and RDP database.
KX789532, and DQ337505) with 63% bootstrap value and GUTY1 branched with E.coli (HF584704) with 99% bootstrap value (Figure 1).The GUTY2 isolate clus-tered with Aneurinibacillus aneurinilyticus (AB680012,
JN624923, NR112639, AB211028, AB210964, and KT318788) and Aneurinibacillus migulanus (KF534472, NR113764, KX083693, and JQ337949),as represented in Figure 2.

Raktima Bandyopadhyay et al.
104 BACTERIOLOGICAL PROFILING OF TOYS AND CLOTHES OF CHILDREN BIOSCIENCE BIOTECHNOLOGY RESEARCH COMMUNICATIONS
The bacterial isolates GUCL3 and GUTY4 (Figure 3) were clustered with Bacillus cereus (LN890051, KM281941, HQ224510, KF150364, HM771666, LN890245, KF150374, KF150368, LN890064, HM348811, LN890055, KF150410, and LN896325). The GUTY3 isolate branched with Lysini-bacillus sp. (GU288531) with 100% bootstrap value (Fig-ure 4). The GUCL2 strains (Figure 4) has been clustered with Staphylococcus aureus (JX435813). Therefore, on the basis of phenotypic characteristics and phylogenetic tree analysis of bacterial partial 16S rRNA gene sequence, GUTY1 and GUCL1 were identifi ed as E. coli, GUTY2 as Aneurinibacillus sp., GUCL3 and GUTY4 both were iden-tifi ed as Bacillus cereus where as GUTY3 was identifi ed as Lysinibacillus sp. and GUCL2 as Staphylococcus aureus.
The isolates E.coli GUTY1 and E.coli GUCL1 showed sensitivity to chloramphenicol, doxycycline, penicil-lin G, levofl oxacin, nalidixic acid and rifampicin but resistant to ampicillin. The MAR index of E.coli (GUTY1 and GUCL1)isolates was 0.143. Aneurinibacillus sp. the GUTY2 isolate showed sensitivity to chloramphenicol, levofl oxacin,doxycycline, rifampicin,nalidixic acid but resistance to ampicillin and penicillin; the MAR index for the strain was 0.285.The Lysinibacillus sp. GUTY3 isolate and Bacillus cereus GUTY4 and GUCL3 isolates showed resistance to ampicillin with MAR index of 0.143. The Staphylococcus aureus GUCL2 isolate had resistance to ampicillin, penicillin G and rifampicin with MAR index of 0.428.
The bacterial isolates from the toys and clothes were identifi ed on the basis of their phenotypic as well as molecular characters. Phylogenetic studies or culture independent techniques usually provide a better scope
of predictable bacterial diversity in child-care environ-ments (Kelley et al., 2004; McManus and Kelley, 2005). The 16SrRNA gene has been used in phylogenetic studies as it is evolutionary stable and highly conserved (Weis-burg et al., 1991). Besides these highly conserved primer binding sites, the 16S rRNA gene sequences have hyper-variable regions for species-specifi c signature sequences which are very important for the characterization and identifi cation of bacterial strains. The 16S rDNA based identifi cation of bacteria potentially offers a useful alter-native when phenotypic characterization methods fail (Deancourt et al., 2000; Lee et al., 2002). It is scientifi c and objective method of identifi cation of microorgan-isms (Tang et al., 1998). Present investigation revealed the presence of both spore-forming (B.cereus, Lysiniba-cillus sp., Aneurinibacillus sp.) and non-spore forming bacteria (E.coli and Staphylococcus aureus) from toys provided to the children and also from the shirts or socks belonged to the children of the day-care centres.
The isolated bacteria had resistance either to ampicil-lin (Bacillus cereus GUTY4 and GUCL3) or to both the antibiotics: ampicillin and penicillin G (E.coli GUTY1 and E. coli GUCL1). Current study also showed the pres-ence of Staphylococcus aureus GUCL2 which had resist-ance to three antibiotics: ampicillin, penicillin G and rifampicin. The spore-forming bacterial isolates also had resistance to several antibiotics. Present study revealed the presence of gram positive, spore-forming Bacillus cereus GUCL3 and Bacillus cereus GUTY4 having the ability to resist adverse or dry conditions and could be able to grow at a variable range of temperatures (Meer et al. 1991; Von Stetten et al. 1998; Nicholson, 2002;
FIGURE 5. Phylogenetic tree constructed using partial 16S rRNA gene sequence of GUCL2 with other neighboring 16S rRNA gene sequences retrieved from NCBI and RDP database.

Raktima Bandyopadhyay et al.
BIOSCIENCE BIOTECHNOLOGY RESEARCH COMMUNICATIONS BACTERIOLOGICAL PROFILING OF TOYS AND CLOTHES OF CHILDREN 105
Vilain et al, 2006). It has already been established as food-pathogens (Agata et al. 1995; Nester, 2004; Neely and Maley, 2000). The existence of Staphylococcus sp. was probably due to their colonization and survival on human skin and mucosa, without having any adverse effect (Kluytmans et al, 1997).
Similar bacterial diversity was reported by Lee et al. (2007). Microbial survival in clothes is determined by intrinsic factors including cloth properties or microbial features and also extrinsic factors comprising of envi-ronmental temperature, humidity etc. (Agbulu et al., 2010). Ivory and McCollum (1999) made an attempt to evaluate whether the presence of specifi c types of toys had any infl uence on the level of interactive play achieved by young children and concluded that coop-erative play was signifi cantly more common in the presence of social toys. McCrea et al (2000) screened coagulase-negative Staphylococcus, Micrococcus sp, Bacillus sp, methicillin-resistant Staphylococcus aureus, Streptococcus and coliforms from the toys provided to children in neonatal intensive care unit (NICU) cots and reported that toys may be reservoirs for potential infan-tile nosocomial sepsis. Avila-Aguero (2004) isolated coagulase-negative Staphylococcus sp.; Bacillus spp; Staphylococcus aureus; alpha-hemolytic Streptococcus; Pseudomonas spp; Stenotrophomonas maltophilia, and other gram-negative organisms from the toys provided to the children in a children hospital and concluded that toys could be contaminated with hazardous bacteria and afforded unnecessary risks for nosocomial infection.
Merriman et al (2002) reported that hard toys had relatively low levels of contamination in comparison to soft toys. According to Stauber et al., (2013) faecal indicator bacterial levels on toys probably varied in respect to the water and sanitation conditions at home. Buttery et al. (1998) reported that nosocomial outbreak was associated with toys. The current study represents a take-home message that care should be taken for the cleaning and washing of socks and shirts/frocks of chil-dren on a regular basis. Toys in general provided to children in day-care centres pose an infectious risk and effective measures must be implemented to prevent the spread of infections via toys and other belongings, such as clothes.
CONCLUSION
From the present study it was found that the children’s clothes and toys were contaminated with several kinds of bacteria (Staphylococcus aureus, Bacillus cereus and E. coli) having the capacity to cause severe illnesses, and such kinds of children’s belonging might act as the vehicle of pathogenic bacteria in the community. From this point of view it is important to maintain proper
hygiene of children. Parents should be more concern regarding this matter. The toys and clothes must be cleaned properly with disinfectants before everytime use. Overall, regular vigilance of drug resistant bacterial contaminants of children’s belongings is an important and imperative task in order to combat life-threatening infection to children caused with such microbial patho-gens.
AUTHOR CONTRIBUTION
Raktima Bandyopadhyay: performed experimental works and co-wrote the paper; Sucharita Ghosh: per-formed experimental works and co-wrote the paper; Soumendranath Chatterjee: characterized and analyzed the molecular identity of isolated bacteria; Shyamapada Mandal: designed the study and discussed the paper.
CONFLICTS OF INTEREST
There was no confl ict of interest.
REFERENCES
Al-Easawi, N.A.F. and Emran, F.K., (2017). A Microbial Survey of Second Hand Clothe Samples Collected from Baghdad Mar-ket. Journal of Al-Nahrain University-Science, 20(3), pp.127-136.
Ali, S., Al-Harbi, M.M. and Rahman, S.R., (2016) Bacterial Iso-lates, Present On Surface Of Toys In Child Care Centers, In Al-Rass City, Al-Qassim Reigon. KSA.
ARCH National Resource Center for Respite and Crisis Care Services (1996). Preventing the spread of disease: Tips for providers. Retrieved November 10, 2006. From http://www.archrespite.org/ archfs42.htm.
Agata, N., Ohta, M., Mori, M., & Isobe, M. (1995). A novel dodecadepsipeptide, cereulide, is an emetic toxin of Bacillus cereus. FEMS microbiology letters, 129(1), 17-19.
Agbulu, C. O., Gberikon, G. M., & Ajine, B. O. (2015). Isola-tion and characterization of microorganisms associated with second hand female undergarments and children wear sold in Makurdi Metropolis. International Journal of Current Microbi-ology and Applied Sciences, 4(1), 716-724.
Avila-Aguero, M. L., German, G., Paris, M. M., Herrera, J. F., & Safe Toys Study Group. (2004). Toys in a pediatric hospital: Are they a bacterial source?. American journal of infection control, 32(5), 287-290.
Bauer AW, Kirby WMM, Skerris JC, Turuck M. (1966)Antibiotic susceptibility testing by a standard single diffusion method. American Journal of Clinical Pathology 45: 494-496.
Blumenstyk, G., & McCollum, K. (1999). 2 Reports Question Utility and Accessibility in Distance Education. Chronicle of Higher Education, 45(32), A31-A31.
Buttery, J. P., Alabaster, S. J., Heine, R. G., Scott, S. M., Crutch-fi eld, R. A., & Garland, S. M. (1998). Multiresistant Pseu-

Raktima Bandyopadhyay et al.
106 BACTERIOLOGICAL PROFILING OF TOYS AND CLOTHES OF CHILDREN BIOSCIENCE BIOTECHNOLOGY RESEARCH COMMUNICATIONS
domonas aeruginosa outbreak in a pediatric oncology ward related to bath toys. The Pediatric infectious disease journal, 17(6), 509-513.
Drancourt, M., Bollet, C., Carlioz, A., Martelin, R., Gayral, J. P., & Raoult, D. (2000). 16S ribosomal DNA sequence analysis of a large collection of environmental and clinical unidentifi -able bacterial isolates. Journal of clinical microbiology, 38(10), 3623-3630.
Francis, K. P., Mayr, R., von Stetten, F., Stewart, G. S., & Scherer, S. (1998). Discrimination of psychrotrophic and meso-philic strains of the Bacillus cereus group by PCR targeting of major cold shock protein genes. Applied and Environmental Microbiology, 64(9), 3525-3529.
Forbes BA, Sahm DF, Weissfeld AS. (2007) Bailey and Scott’s Diagnostic of Microbiology 2007; 12th Edition, Mosby (Else-vier), USA.
Henze, A S.V., Bockmühl, D. and Höfer, D., (2015.) Fabric-skin models to assess infection transfer for impetigo contagiosa in a kindergarten scenario. European Journal of Clinical Microbiol-ogy & Infectious Diseases, 34(6), pp.1153-1160.
Holt JG. Bergey’s manual of systematic bacteriology, Williams and Wilkins, Baltimore 1984.
Ibfelt, T., Engelund, E.H., Schultz, A.C. and Andersen, L.P., 2015. Effect of cleaning and disinfection of toys on infectious diseases and micro-organisms in daycare nurseries. Journal of Hospital Infection, 89(2), pp.109-115.
Johani, K., Abualsaud, D., Costa, D.M., Hu, H., Whiteley, G., Deva, A. and Vickery, K., (2018). Characterization of microbial community composition, antimicrobial resistance and biofi lm on intensive care surfaces. Journal of infection and public health, 11(3), pp. 418-424.
Jukes TH and Cantor CR. (1969). Evolution of protein mol-ecules. In: Munro HN, editor. Mammalian protein metabolism. New York. Academic Press.
Kelly, D., Campbell, J. I., King, T. P., Grant, G., Jansson, E. A., Coutts, A. G., ... & Conway, S. (2004). Commensal anaerobic gut bacteria attenuate infl ammation by regulating nuclear-cytoplasmic shuttling of PPAR- and RelA. Nature immunol-ogy, 5(1), 104.
Kluytmans, J., Van Belkum, A., & Verbrugh, H. (1997). Nasal carriage of Staphylococcus aureus: epidemiology, underly-ing mechanisms, and associated risks. Clinical microbiology reviews, 10(3), 505-520.
Lee, P., Lee, S., Hong, S., & Chang, H. (2002). Isolation and characterization of a new succinic acid-producing bacte-rium, Mannheimia succiniciproducens MBEL55E, from bovine rumen. Applied microbiology and biotechnology, 58(5), 663-668.
Lee, M. K., Chiu, C. S., Chow, V. C., Lam, R. K., & Lai, R. W. (2007). Prevalence of hospital infection and antibiotic use at a university medical center in Hong Kong. Journal of Hospital Infection, 65(4), 341-347.
Lou M and Golding GB. (2007). Fingerprint: visual depiction of variation in multiple sequence alignments. Mol Ecol Notes, 7:908–914.
Mandal, MD., Mandal, S., and Pal, NK. Antibiotic resistance prevalence and pattern in environmental bacterial isolates. The Open Antimicrobial Agents Journal, 3, (2011), 45-52.
Mandal, S., Das, SN., Mandal, M., Plasmid mediated antibi-otic and heavy metal co-resistance in bacterial isolates from Mahananda river water (Malda, India). Transl Med (Sunny-vale), 6, (2016) ,185. doi:10.4172/21611025.1000185
Maturin, L. J. (2001). Aerobic plate count. In: Bacteriological analytical manual online. http://www.cfsan.fda.gov/~ebam/bam-3.html
McCrea, K. W., Hartford, O., Davis, S., Eidhin, D. N., Lina, G., Speziale, P., & Höök, M. (2000). The serine-aspartate repeat (Sdr) protein family in Staphylococcus epidermidis. Microbiol-ogy, 146(7), 1535-1546.
McManus, C. J., & Kelley, S. T. (2005). Molecular survey of aeroplane bacterial contamination. Journal of applied micro-biology, 99(3), 502-508.
Meer, R. R., Baker, J., Bodyfelt, F. W., & Griffi ths, M. W. (1991). Psychrotrophic bacillus spp. in fl uid milk products: a review. Journal of food protection, 54(12), 969-979.
Merriman, E., Corwin, P., & Ikram, R. (2002). Toys are a poten-tial source of cross-infection in general practitioners’ waiting rooms. Br J Gen Pract, 52(475), 138-140.
Mayo Clinic (2006). Children’s illness: Top 5 causes of missed school. Retrieved December 15. 2006. http://mayoclinic.com/health/childrens-conditions/CC00059
NCCLS. Performance standards for antimicrobial disk suscep-tibility tests. 7th Ed. Approved standard National Committee for Clinical Laboratory Standards document M2- A7, 20(2002), NCCLS, Villanova, PA.
Neely, A. N., & Maley, M. P. (2000). Survival of Enterococci and Staphylococci on hospital fabrics and plastic. Journal of clinical microbiology, 38(2), 724-726.
Nester, Eugene, W., Anderson, DG., Roberts, CE., Pearsall, NN., (2004). Microbiology: A Human Perspective. McGraw-Hill Book Company, Inc., New York, U.S.A.
Nicholson, W. L. (2002). Roles of Bacillus endospores in the environment. Cellular and Molecular Life Sciences CMLS, 59(3), 410-416.
Saitou N and Nei M. (I987). The neighbor-joining method: a new method for reconstructing phylogenetic trees. Mol Biol, 4: 406-425.
Stauber, C. E., Walters, A., de Aceituno, A. M. F., & Sobsey, M. D. (2013). Bacterial contamination on household toys and association with water, sanitation and hygiene conditions in Honduras. International journal of environmental research and public health, 10(4), 1586-1597.
Suviste J. (1996). The toy trap uncovered. Nursing Times. 92(10): 56-60. 3.
Tang, D., Dowell, E. H., & Virgin, L. N. (1998). Limit cycle behavior of an airfoil with a control surface. Journal of Fluids and Structures, 12(7), 839-858.
Thompson JD, Higgins DG, Gibson TJ. (1994). Clustal W: improv-ing the sensitivity of progressive multiple sequence alignment

Raktima Bandyopadhyay et al.
BIOSCIENCE BIOTECHNOLOGY RESEARCH COMMUNICATIONS BACTERIOLOGICAL PROFILING OF TOYS AND CLOTHES OF CHILDREN 107
through sequence weighting, positionspecifi c gap penalties and weight matrix choice. Nucleic Acids Res, 22: 4673-4680.
Van R, Chuan-Chuan W, Morrow A, Pickering L. (1991). The effect of diaper type and overclothing on fecal contamination in day-care centers. JAMA. 265: 1840-1844.
Van R, Morrow A, Reves R, Pickering L. (1996). Environmen-tal contamination in child day-care centers. Am J Epidemiol 1991; 133: 460-470.
Vilain, S., Luo, Y., Hildreth, M. B., & Brözel, V. S. (2006). Analysis of the life cycle of the soil saprophyte Bacillus cereus in liquid soil extract and in soil. Applied and Environmental Microbiology, 72(7), 4970-4977.
Weisburg, W. G., Barns, S. M., Pelletier, D. A., & Lane, D. J. (1991). 16S ribosomal DNA amplifi cation for phylogenetic study. Journal of Bacteriology, 173(2), 697-703.

Application of Langmuir and Freundlich adsorption
isotherms in screening suitable adsorbents and the role
of FTIR in confi rmation of C-Phycocyanin purifi cation
Kethineni Chandrika1, Sunkara Deviprasanth2, Daram Pavan Kumar Reddy2, Firdous
Sultana2 and Charishma Mandava2
1Associate Professor, Department of Biotechnology, Koneru Lakshmaiah Education Foundation, Vaddeswaram, Guntur, AP, India–5225022Department of Biotechnology, Koneru Lakshmaiah Education Foundation, Vaddeswaram, Guntur, AP, India– 522502–522502
ABSTRACT
Adsorption of C-Phycocyaninalong with its recovery and purity was tested with various adsorbents. Evaluation of experimental results shows that activated charcoal has a higher adsorption when compared to Graphite, Chitosan, and Sawdust and fi lter aid. Langmuir and Freundlich adsorption isotherms were taken into consideration to screen the best adsorbent. Although, Langmuir and Freundlich isotherms follow a similar sequence of ranking for adsorbents, Langmuir ranking had shown signifi cant variation in ‘qm’ (Adsorption capacity) over the ‘KF’ (Binding constant) of Freundlich model. Nevertheless, both models predicted activated charcoal as the best adsorbent with the maximum specifi c adsorp-tion. Discrete step optimization for Phycocyanin recovery and purifi cation shows 1% activated charcoal retained 79.3% of CPC while adsorbing 64.8% of contaminant protein with 2.1 purity index. FTIR spectroscopic studies reveal that the C-PC after adsorption with 1% charcoal showed a signifi cant reduction in the concentration of other components char-acteristic of the crude sample. Thus, this work suggests a quick and reliable way to screen adsorbents based on binding constants and FTIR studies.
KEY WORDS: ETHANOL FERMENTATION, MOLASSES, IMMOBILIZATION, ACTIVATORS, REDUCING SUGAR
108
Biotechnological CommunicationBiosci. Biotech. Res. Comm. 12(1): 108-113 (2019)
ARTICLE INFORMATION:
Corresponding Author: [email protected] 2nd Jan, 2019Accepted after revision 22nd March, 2019BBRC Print ISSN: 0974-6455Online ISSN: 2321-4007 CODEN: USA BBRCBA Thomson Reuters ISI ESC / Clarivate
Analytics USAMono of Clarivate Analytics and Crossref Indexed Journal Mono of CR
NAAS Journal Score 2019: 4.31 SJIF: 4.196© A Society of Science and Nature Publication, Bhopal India 2019. All rights reserved.Online Contents Available at: http//www.bbrc.in/DOI: 10.21786/bbrc/12.1/14

Kethineni Chandrika et al.
BIOSCIENCE BIOTECHNOLOGY RESEARCH COMMUNICATIONS APPLICATION OF LANGMUIR AND FREUNDLICH ADSORPTION ISOTHERMS IN SCREENING SUITABLE ADSORBENTS 109
INTRODUCTION
C-Phycocyanin (C-PC), is a water-soluble protein pig-ment derived from the alga Arthrospira platensis. The pigment besides being a natural colorant is known as a potential antioxidant, anti-infl ammatory agent. Studies also show C-PC is known for its platelet aggregation inhibitor. It has also shown to have hepato-protective and neuroprotective properties (Gupta, 2012). In phar-maceutical applications, the purity of C-PC should be (A620/A280) ≥ 4. Cosmetic and food industry requires a purity ratio of A620/A280 ≥ 2. On the other hand the analytical grade (‘Medical’ or ‘Research’ grade) prefers a purity ratio of 2.5-3.5 (Chaiklahan, 2011).
Phycocyanin is a protein complex which can be puri-fi ed by a simple adsorption technique. Adsorption is a physical phenomenon in which one can notice an adhe-sion of atoms, ions and molecules on to a solid surface (Siegbahn, 1990). The adsorbate creates a fi lm on the surface of the adsorbent. The process of adsorption can be explained with classical adsorption models such as the Langmuir and Freundlich isotherms. During a typical adsorption, before equilibrium, the amount of adsorbate on the adsorbent is a function of its pressure (if gas) or concentration (if liquid) at constant temperature. The amount of adsorbed material is the normalization of adsorbent mass, so that a comparison of different adsorbent material can be made during the screening of adsorbents. Freundlich and Langmuir isotherm models are useful tools for comparison of adsorption effi ciency of the adsorbents.
A study (Alves, 2010) shows the adsorption of pro-teins such as bovine serum albumin, human serum albu-min (HSA) and human fi bronectin (HFN). In their study it was shown that albumin adsorption fi ts the Freundlich model. Several studies show enzyme (protein) adsorp-tion onto the polymer particles (Tetsuya Yamamoto, 2017).
The recovery and yield of a desired product is impor-tant during extraction process. At present, several expen-sive unit operations are routinely adopted for purifi ca-tion of C-Phycocyanin. About 50-90% of the production costs are included in the purifi cation steps. Common methods for extraction and purifi cation of phycocyanin involve break up of cells using high pressure homogeni-zation (Moraes, 2011), sonication (Furuki, 2003), freeze thawing, or enzymatic treatment; ammonium sulphate precipitation followed by procedures adopting hydro-phobic (Bracewell, 2011). ion exchange, size exclusion (Jian-Feng, 2007), hydroxyapatite chromatography (Markov, 1974) and aqueous two phase extraction (Patil, 2007). In spite of the increased purity, these methods, however proven to be expensive and time consuming. In addition, some purifi cation techniques may change the
structural and functional properties of proteins, (Bermej, 2008 (Sikarwar, 2017).
Therefore, it is essential to develop a reliable economic process for the separation and purifi cation of phyco-cyanin.The present work aims at process optimization for increased recovery and purity of phycocyanin using various adsorbent materials like Charcoal, Graphite, Chi-tosan, Saw dust and Filter aid in a minimum number of operations. The corresponding affi nity of the adsorbent towards the protein was studied using Langmuir and Fre-undlich isotherm constants. (Finette, 1997)Considering the yield and purity index of the phycocyanin obtained after the each adsorption process with different adsorbent material, a suitable method has been developed which is more effi cient and economically feasible.
MATERIALSAND METHODS
Phycocyanin extraction and estimation
Phycocyanin was extracted from spray dried Spirulina platensis. About 500mg of biomass was dissolved in 500mL of 50mM phosphate buffer (pH 6.8) or equal vol-ume of distilled water in an Erlenmeyer fl ask (Borosil, India). About 20g of 0.65mm glass beads (Merck, India) and 0.25M CaCl2.2H2O were weighed and pre-mixed with the biomass-solvent mixture. The extraction was done using a rotary shaker (Pharmacon, India) at 150 rpm for 30min. The lysed biomass was centrifuged (10,000 rpm, 10min at 10oC) and the supernatant was estimated for recovery and purity of phycocyanin using a double beam UV-Vis spectrophotomeer (Dynamica, Halo DB20). The peak for C-PC was identifi ed at 620nm while the allophycocyanin was identifi ed at 652 nm. The purity of C-PC was estimated by the absorbance index of A620/A280.The conc. of pigment (mg mL-1) was estimated using the following equation adopted by (Moraes., 2011)
ADSORPTION STUDIES
The selected adsorbents for the present study are acti-vated charcoal (Merck, India), Graphite (Ottokemi, India), Chitosan (Ottokemi, India), Hyfl osupercelFilter aid (Ottokemi, India) and Sawdust. The porous sawdust collected was washed with de-ionized water, air dried and sieved to a mesh size of 297 microns.
Batch adsorption experiments were carried out by adding 5% (wt/v) of each adsorbent material to 20mL of crude phycocyanin extract at fi ve different concen-trations (obtained by diluting the original crude extract (20%-100% (v/v)). The crude phycocyanin extract was
(1)
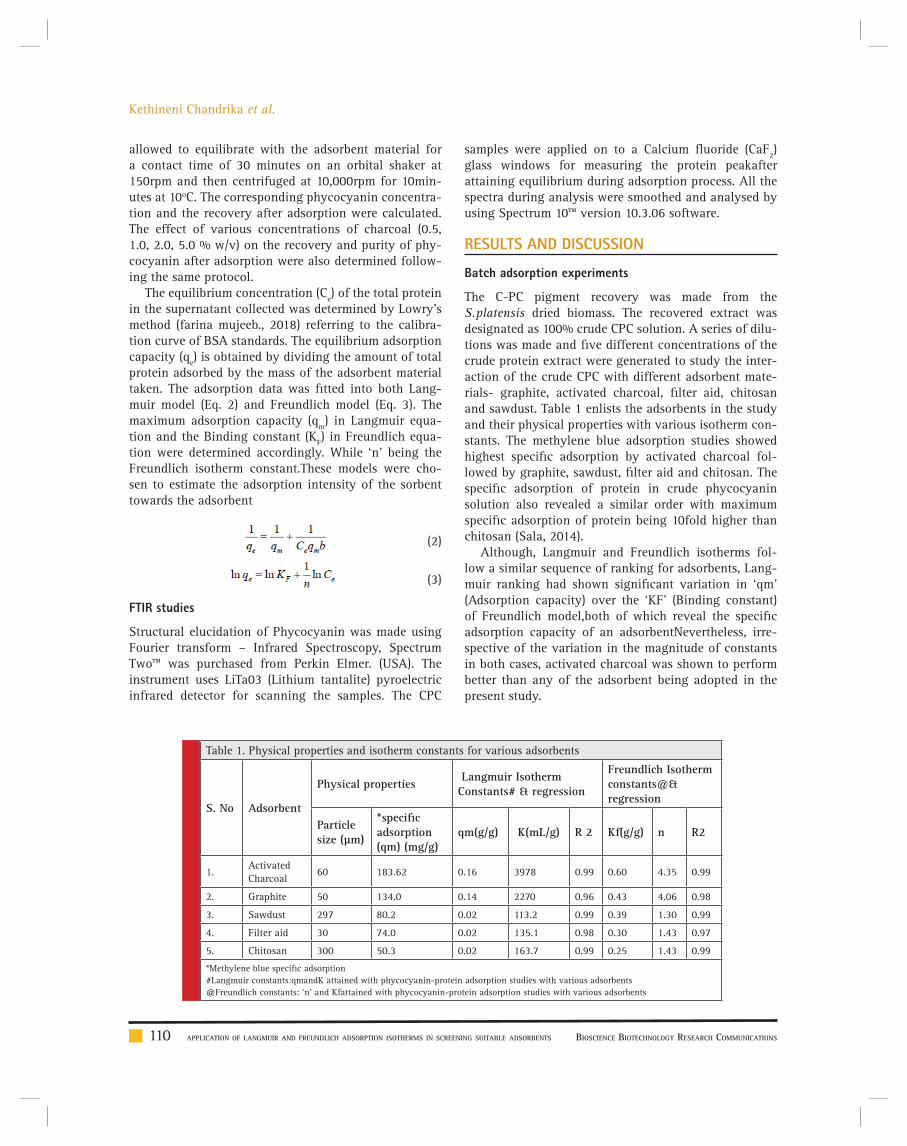
Kethineni Chandrika et al.
110 APPLICATION OF LANGMUIR AND FREUNDLICH ADSORPTION ISOTHERMS IN SCREENING SUITABLE ADSORBENTS BIOSCIENCE BIOTECHNOLOGY RESEARCH COMMUNICATIONS
allowed to equilibrate with the adsorbent material for a contact time of 30 minutes on an orbital shaker at 150rpm and then centrifuged at 10,000rpm for 10min-utes at 10oC. The corresponding phycocyanin concentra-tion and the recovery after adsorption were calculated. The effect of various concentrations of charcoal (0.5, 1.0, 2.0, 5.0 % w/v) on the recovery and purity of phy-cocyanin after adsorption were also determined follow-ing the same protocol.
The equilibrium concentration (Ce) of the total protein in the supernatant collected was determined by Lowry’s method (farina mujeeb., 2018) referring to the calibra-tion curve of BSA standards. The equilibrium adsorption capacity (qe) is obtained by dividing the amount of total protein adsorbed by the mass of the adsorbent material taken. The adsorption data was fi tted into both Lang-muir model (Eq. 2) and Freundlich model (Eq. 3). The maximum adsorption capacity (qm) in Langmuir equa-tion and the Binding constant (KF) in Freundlich equa-tion were determined accordingly. While ‘n’ being the Freundlich isotherm constant.These models were cho-sen to estimate the adsorption intensity of the sorbent towards the adsorbent
samples were applied on to a Calcium fl uoride (CaF2) glass windows for measuring the protein peakafter attaining equilibrium during adsorption process. All the spectra during analysis were smoothed and analysed by using Spectrum 10™ version 10.3.06 software.
RESULTS AND DISCUSSION
Batch adsorption experiments
The C-PC pigment recovery was made from the S.platensis dried biomass. The recovered extract was designated as 100% crude CPC solution. A series of dilu-tions was made and fi ve different concentrations of the crude protein extract were generated to study the inter-action of the crude CPC with different adsorbent mate-rials- graphite, activated charcoal, fi lter aid, chitosan and sawdust. Table 1 enlists the adsorbents in the study and their physical properties with various isotherm con-stants. The methylene blue adsorption studies showed highest specifi c adsorption by activated charcoal fol-lowed by graphite, sawdust, fi lter aid and chitosan. The specifi c adsorption of protein in crude phycocyanin solution also revealed a similar order with maximum specifi c adsorption of protein being 10fold higher than chitosan (Sala, 2014).
Although, Langmuir and Freundlich isotherms fol-low a similar sequence of ranking for adsorbents, Lang-muir ranking had shown signifi cant variation in ‘qm’ (Adsorption capacity) over the ‘KF’ (Binding constant) of Freundlich model,both of which reveal the specifi c adsorption capacity of an adsorbentNevertheless, irre-spective of the variation in the magnitude of constants in both cases, activated charcoal was shown to perform better than any of the adsorbent being adopted in the present study.
(2)
(3)
FTIR studies
Structural elucidation of Phycocyanin was made using Fourier transform – Infrared Spectroscopy, Spectrum Two™ was purchased from Perkin Elmer. (USA). The instrument uses LiTa03 (Lithium tantalite) pyroelectric infrared detector for scanning the samples. The CPC
Table 1. Physical properties and isotherm constants for various adsorbents
S. No Adsorbent
Physical properties Langmuir IsothermConstants# & regression
Freundlich Isotherm constants@& regression
Particle size (μm)
*specifi c adsorption (qm) (mg/g)
qm(g/g) K(mL/g) R 2 Kf(g/g) n R2
1.Activated Charcoal
60 183.62 0.16 3978 0.99 0.60 4.35 0.99
2. Graphite 50 134.0 0.14 2270 0.96 0.43 4.06 0.98
3. Sawdust 297 80.2 0.02 113.2 0.99 0.39 1.30 0.99
4. Filter aid 30 74.0 0.02 135.1 0.98 0.30 1.43 0.97
5. Chitosan 300 50.3 0.02 163.7 0.99 0.25 1.43 0.99
*Methylene blue specifi c adsorption#Langmuir constants:qmandK attained with phycocyanin-protein adsorption studies with various adsorbents @Freundlich constants: ‘n’ and Kfattained with phycocyanin-protein adsorption studies with various adsorbents

Kethineni Chandrika et al.
BIOSCIENCE BIOTECHNOLOGY RESEARCH COMMUNICATIONS APPLICATION OF LANGMUIR AND FREUNDLICH ADSORPTION ISOTHERMS IN SCREENING SUITABLE ADSORBENTS 111
Comparison of the various adsorbent materials for
phycocyanin recovery and yield
Phycocyanin, is essentially a protein –pigment complex. The adsorption of phycocyanin was attributed partly due to the protein complex associated with the pig-ment chromophore. The algal biomass also was shown to comprise 60% of total protein. Hence, during cell lysis and recovery of intracellular pigment-protein complex, supplemental protein contaminant (protein from bio-mass) (Rajakumar, 2015) is anticipated along with the crude total protein extract of phycocyanin.
The relative screening of the effective adsorbent material is based on the amount of adsorbed contami-nant protein; the CPC recovered after adsorption and the purity index. Table 2 shows the total protein par-tition profi le of the crude protein extract and Table 3 details the adsorption effi ciency of the adsorbents dur-ing simultaneous CPC recovery and purifi cation. In the initial batch adsorption studies, a higher purity index of 1.87 was observed with activated charcoal at a crude protein concentration of 100% (Table 4). Crude protein adsorption with activated charcoal exhibited a relatively higher purity index at all the fi ve different concentra-tions when compared to the sorption studies with other adsorbents. Chitosan and Graphite are ranked in the next order for their purity index of the adsorbed phyco-cyanin (Minkova, 2003)
The importance of the current study lies in highlight-ing the proportion of the adsorbed contaminant pro-tein. Data (Table 3) shows a signifi cant proportion of the contaminant protein removal (84.95%) was observed with 5 % (w/v) activated charcoal at 60% concentra-tion of the crude protein. Graphite was found to be next in its adsorption capacity of the contaminant protein (68.88%). Filter aid reported 64.46% contaminant pro-tein removal at 80% crude protein concentration while sawdust reported 61.29% removal effi ciency. Chitosan
Table 2. Partition profi le of various concentrations of Crude Phycocyanin
S. No. Dilution (%)
C-PC*(mg/mL)
Contaminant protein (mg/mL)
Total protein (mg/mL) (by Lowry’s method)
1. 20% 0.074 0.436 0.51
2. 40% 0.144 0.756 0.9
3. 60% 0.199 1.241 1.44
4. 80% 0.266 1.754 2.02
5. 100% 0.33 1.9 2.23
*used in adsorption studies *Crude Phycocyanin (total protein): defi ned by pigment-protein complex +contaminant protein
Tabl
e 3.
Ads
orpt
ion
stud
ies
at v
ario
us c
once
ntra
tions
of
crud
e ph
ycoc
yani
n ex
trac
t fr
om S
. pla
tens
isA
dsor
bent
20%
40%
60%
80%
100%
Cont
amin
ant
prot
ein
abso
rbed
(%
)
C-PC
re
cove
red
afte
r ad
sorp
tion
(%
)
Puri
ty
Inde
x
Cont
amin
ant
prot
ein
abso
rbed
(%
)
C-PC
re
cove
red
afte
r ad
sorp
tion
(%
)
Puri
ty
Inde
x
Cont
amin
ant
prot
ein
abso
rbed
(%
)
C-PC
re
cove
red
afte
r ad
sorp
tion
(%
)
Puri
ty
Inde
x
Cont
amin
ant
prot
ein
abso
rbed
(%
)
C-PC
re
cove
red
afte
r ad
sorp
tion
(%
)
Puri
ty
Inde
x
Cont
amin
ant
prot
ein
abso
rbed
(%
)
C-PC
( %
) re
cove
red
afte
r ad
sorp
tion
Puri
ty
Inde
x
Gra
phite
62.5
283
.78
0.32
54.8
710
.34
0.63
67.3
065
.82
0.74
87.8
876
.24
0.87
68.1
050
.00
0.75
Act
ivat
ed
Char
coal
45.1
73.
301.
6463
.95
2.40
1.60
84.9
52.
731.
8683
.23
4.13
1.76
70.8
06.
401.
87
Chito
san
5.72
43.7
81.
118.
1640
.97
1.02
33.4
536
.63
1.02
70.9
440
.97
1.08
36.4
936
.36
0.99
Filte
r ai
d0.
9078
.37
0.56
0.10
72.2
20.
5831
.24
58.2
90.
5774
.46
82.7
00.
6950
.10
77.8
70.
58
Saw
dust
30.4
740
.54
0.46
60.0
558
.33
0.58
81.2
965
.17
0.71
58.0
033
.40
0.61
58.0
00.
120.
71

Kethineni Chandrika et al.
112 APPLICATION OF LANGMUIR AND FREUNDLICH ADSORPTION ISOTHERMS IN SCREENING SUITABLE ADSORBENTS BIOSCIENCE BIOTECHNOLOGY RESEARCH COMMUNICATIONS
Table 4. Optimization of activated charcoal for selectiveremoval of crude protein from phycocyanin extract
S. No CharcoalConcentration (%)
ContaminantProtein absorbed (%)
C-PC recoveredAfter adsorption (%)
Purity Index
1. 0.5 57.80 87.20 1.62
2. 1.0 64.80 79.30 2.10
3. 2.0 53.50 63.43 2.37
4. 5.0 65.50 5.90 1.87
FIGURE 1. FTIR studies showing the effect of concentrations of activated charcoal adsorp-tionof pigment
reported 42.94% crude protein removal effi ciency at 80% crude protein concentration.
The screening of the effective adsorbent for further study lies in its effi ciency towards its CPC recovery and the relatively higher purity index after the adsorption experi-ment. On an average, the CPC recovery after the adsorp-tion with activated charcoal was about 70%. Hence, the activated charcoal though reported lesser recovery of CPC compared to other adsorbents it was screened for further study due to its increased purity index and a higher per-centage of contaminant protein removal. (Kethineni, 2018)
Discrete step optimization for Phycocyanin recovery and
purifi cation
At high concentration of activated charcoal (5%w/v), indiscriminate adsorption of protein (phycocyanin as well) was observed. However, a supplementary study on optimi-zation of the concentration of activated charcoal for the CPC recovery is performed (Table 4). One percent activated charcoal retained 79.3% of CPC while adsorbing 64.8% of contaminant protein with 2.1 purity index. Nevertheless, a purity index of 2.37 was reported with 2% (w/v) activated charcoal with a CPC recovery of only 63.43%
FTIR spectra analysis of crude and adsorbed C-PC sample
The structural confi guration of the Phycocyanin after adsorption at different concentrations of the charcoal
as adsorbent were confi rmed by FTIR spectra (Fig-ure 1). On the FTIR spectra of crude C-PC, the peaks in the range of 3698.23-3460 cm-1 indicate the pres-ence of O-H stretching vibrations and the peaks at 2932.99-2912.28 cm-1 represent the asymmetrical and symmetrical stretches of aliphatic CH2 groups. The fre-quency range from 1345.07-1250.18 are assigned to the C-O stretching, O-H bending vibrations and C-O asym-metric C-O-C stretching, which represent the presence of alcohols and esters. Peaks of 1133.11 and 1079.64 cm-1 represent symmetric C-H stretching vibration. The peak values of 677.39 and 640.22 cm-1 represent the stretch of S=O and S-O. The peaks at 537.21, 1650.72 and 3440.91 cm-1 in the FTIR spectra of crude C-PC are characteristic of phycocyanin, which are also present in the spectra of C-PC after adsorption with 1% char-coal. However, it can be seen that some peaks of C-PC crude sample disappear in the 1% charcoal adsorbed C-PC sample explaining the phenomena of increased purity index after adsorption. Thus, all the characteristic peaks of Phycocyanin observed in the crude C-PC sam-ple is evident in the FTIR spectra of C-PC after adsorp-tion with 1% charcoal with a signifi cant reduction in the concentration of other components characteristic of the crude sample. Furthermore, the spectra also pro-vide a fi ngerprint of the adsorbed Phycocyanin in the sample.

Kethineni Chandrika et al.
BIOSCIENCE BIOTECHNOLOGY RESEARCH COMMUNICATIONS APPLICATION OF LANGMUIR AND FREUNDLICH ADSORPTION ISOTHERMS IN SCREENING SUITABLE ADSORBENTS 113
CONCLUSION
Process intensifi cation approach in the recovery and purifi cation of phycocyanin in the minimum number of operations is proposed. Basing on the scalability and economic feasibility, the activated charcoal (powder) at 1% was chosen to be the material of choice for simulta-neous recovery and purifi cation of phycocyanin. Amidst the high value and low volume nature of the targeted product, the recovery and specifi c yield of cyanobacte-rial phycocyanin from Spirulina platensis dried biomass showed the suitability of the biomass in various adsorp-tion operations in optimizing the product extraction for maximum pigment recovery. The adsorption phenomena are further confi rmed by the FTIR studies.
REFERENCES
Gupta, N.K., (2012) Effects of C-Phycocyanin on the represent-ative genes of tumor development in mouse skin exposed to 12-O-tetradecanoyl-phorbol-13-acetate. Environmental toxi-cology and pharmacology, vol. 34(3), pages 941-948.
Chaiklahan, R., (2011) Separation and purifi cation of phycocy-anin from Spirulina sp. using a membrane process. Bioresource technology, vol. 102(14), pages 7159-7164.
Siegbahn, K. (1990). From X-ray to electron spectroscopy and new trends. Journal of Electron Spectroscopy and Related Phe-nomena, vol. 51, pages 11–36.
Alves, C., Reis, R. and Hunt, J. (2010). The competitive adsorp-tion of human proteins onto natural-based biomaterials. Jour-nal of The Royal Society Interface, vol. 7(50), pages 1367-1377.
Tetsuya yamamoyo., (2017). In-situ adsorption of polymer par-ticles on multiwall. Carbon nanotubes using Colloidal tech-niques. Colloid and interface ScienceCommunication, vol. 20, pages 1-4.
Sikarwar, V.S., Zhao, M., (2017). Progress in biofuel production from gasifi cation. Progress in Energy and Combustion Science, vol. 61, pages 189–248.
Moraes,C.C., (2011) C-phycocyanin extraction from Spirulina platensis wet biomass. Brazilian Journal of Chemical Engineer-ing, vol. 28(1), pages 45-49.
Furuki (2003) Rapid and selective extraction of phycocyanin from Spirulina platensis adopting with ultrasonic cell disrup-tion. Journal of Applied Phycology, vol. 15(4) pages 319-324.
Bracewell D.G. (2011). Ammonium sulphate precipitation fol-lowed by procedures adopting hydrophobic. Dual salt precipi-tation for the recovery from EscherichiacoliBiotechnical,vol. 27(5), pages 1306-1314.
Jian-Feng, N., (2007). Large-scale recovery of C-phycocyanin from Spirulina platensis using expanded bed adsorption chro-matography. Journal of Chromatography B, vol. 850(1), pages 267-276.
Markov, G. G., & (1974). Hydroxyapatite column chromatog-raphy in procedures for isolation of purifi ed DNA. Analytical Biochemistry, vol. 59(2), pages 555–563.
Patil, G., Raghavarao, K. (2007). Aqueous two-phase extraction for purifi cation of C-phycocyanin. Biochemical Engineering Journal, vol. 34(2), pages 156-164.
Bermejo, P., (2008). Iron-chelating ability and antioxidant properties of phycocyanin isolated from a protean extract of Spirulinaplatensis. Food Chemistry, vol. 110(2), pages 436-445.
Finette, G., (1997). Comparative studies on the isothermal charac-teristics of proteins adsorbed under batch equilibrium conditions to ion-exchange, immobilised metal ion affi nity and dye affi nity matrices with different ionic strength and temperature conditions. Journal of Chromatography, vol. 763(1-2), pages 71–90.
Sala, L., Figueira, F., Cerveira, (2014). Kinetics and adsorption isotherm of C-phycocyanin from Spirulina platensis on ion-exchange resins. Brazilian Journal of Chemical Engineering, vol. 31(4), pages 1013-1022
Gangl, D., Zedler, J., Rajakumar, P., Martinez, E., Riseley, A., Włodarczyk, A., Purton, S., Sakuragi, Y., Howe, C., Jensen, P. and Robinson, C. (2015). Biotechnological exploitation of microalgae. Journal of Experimental Botany, vol. 66(22), pages. 6975-6990.
Minkova, K., Tchernov, A., Tchorbadjieva, M., Fournadjieva, S., Antova, R. and Busheva, M. (2003). Purifi cation of C-phy-cocyanin from Spirulina (Arthrospira) fusiformis. Journal of Biotechnology, vol. 102(1), pages 55-59
Kethineni, C., Choragudi, S., Kokkiligadda, S., Jaswanthi, N. and Ronda, S. (2018). Development of Sequential Processes for Multiple Product Recovery from Microalgae. Industrial Bio-technology, vol 14(2), pages 95-106

Upgradation of tannase production by Klebsiella
pneumoniae KP715242 through heat, UV, NTG and
MMS induced mutagenesis for enhanced tannase
activity
Mukesh Kumar1*, Rajesh2, Vivek Srivastava3 and Raj Kumar Salar4
1Department of Biotechnology, Ambala College of Engineering and Applied Research, Devsthali-133101, Ambala, Haryana, India2Department of Biotechnology, Maharishi Markandeshwar University Sadopur Ambala -134007, Haryana, India3Department of Botany and Biotechnology, Dayanand College, Hisar, 125001, Haryana, India4Department of Biotechnology, Chaudhary Devi Lal University, Sirsa-125055, Haryana, India
ABSTRACT
In the present study, a tannin acyl hydrolase producer bacterium Klebsiella pneumoniae (GenBank Accession Number KP715242) isolated from the soil was used for enhanced tannase production. An attempt was carried out to develop an effi cient tannase producing strain by subjecting this parent strain (K. pneumoniae KP715242) to various mutagenic agents viz. heat, UV irradiations, NTG (N-methyl-N-nitro-N-nitrosoguinidine) and MMS (methyl methane sulfonate). Two most effi ciently growing colonies per treatment were selected at 5–10% survival rate for each treatment. These mutants were assessed for enzyme production under submerged fermentation at preoptimized culture conditions i.e. 5.2 pH, 34.97°C temperature, 103.3 4 rpm agitation speed and 91.34 h of incubation time. Among these, the maxi-mum tannase production (0.075 U/ml) was observed for the mutant U2. The most effi cient mutant strain U2 had nearly 1.15 fold more enzyme activity as compared to the wild type strain (0.065 U/ml) after 90 h of incubation time under similar culture conditions. The maximum enzyme production in this mutant strain was 0.063 U/mL after an incubation time of 75 h as compared to wild type strain that had an incubation period of 90 h for a maximum enzyme activity of 0.065 U/mL. The results indicated that the mutated strain U2 exhibited higher tannase activity as well as less incubation as compared to the wild type strain.
KEY WORDS: KLEBSIELLA PNEUMONIAE, METHYL METHANE SULFONATE, MUTAGENESIS, N-METHYL-N-NITRO-N-NITROSOGUINIDINE, STRAIN IMPROVEMENT, TANNASE
114
Biotechnological CommunicationBiosci. Biotech. Res. Comm. 12(1): 114-123 (2019)
ARTICLE INFORMATION:
Corresponding Author: [email protected] 22nd Dec 2018Accepted after revision 21st March 2019BBRC Print ISSN: 0974-6455Online ISSN: 2321-4007 CODEN: USA BBRCBA Thomson Reuters ISI ESC / Clarivate
Analytics USAMono of Clarivate Analytics and Crossref Indexed Journal Mono of CR
NAAS Journal Score 2019: 4.31 SJIF: 4.196© A Society of Science and Nature Publication, Bhopal India 2019. All rights reserved.Online Contents Available at: http//www.bbrc.in/DOI: 10.21786/bbrc/12.1/15

Mukesh Kumar et al.
BIOSCIENCE BIOTECHNOLOGY RESEARCH COMMUNICATIONS UPGRADATION OF TANNASE PRODUCTION BY KLEBSIELLA PNEUMONIAE 115
INTRODUCTION
Tannins are water soluble polyphenolic compounds of varying molecular weights. These are extensively dis-persed in the plant kingdom and are the fourth most abundant plant component after cellulose, hemicellulose and lignin. Tannins own several imperative biological properties, like defense against fungal, bacterial, and viral diseases. Tannins defend the susceptible parts of the plants from microbial attack by deactivating the attacking microbial extracellular enzymes (Aguilar and Sanchez, 2001). Tannins interact promptly with pro-teins and other molecules to make them indigestible, and adversely affect the nutritive value of animal food (Bhat et al., 1993). High concentration of tannic acid in soil has several detrimental effects like plant vegetation, cropping systems and low production yield. Moreover, tannin also causes various nutritional and processing problems like protein indigestibility, inhibition of enzy-matic reactions and essential microbial processes such as those necessary for beer brewing. These undesirable properties of tannin are responsible for reduced volun-tary feed intake, ineffi cient digestion and low animal productivity (Jana et al., 2014).
Tannin acyl hydrolase (tannase) causes the degrada-tion of hydrolysable tannins because of its hydrolyzing ability for the ester and the depside bond with subse-quent release of glucose, gallic acid and several galloyl esters of glucose (Haslam and Stangroom, 1996; Govin-darajan et al., 2019). Tannase belongs to the esterase superfamily and has been shown to be intracellular as well as extracellular (Aguilar et al., 2007; Banerjee and Mahapatra, 2012). This enzyme has found numerous potential in different industrial aspects like food, brew-ing, beverages and, pharmaceuticals. It has been pro-foundly used for the preparation of instant tea, clarifi -cation of various fruit juices with other beverages and more importantly in the gallic acid production (Belmares et al., 2004; Mohapatra et al., 2009; Madeira et al., 2011; Chavez-Gonzalez et al., 2012, Ghosh and Mandal, 2015; Fathy et al., 2018; Aharwar et al., 2018).
Tannase has been reported to be present in plants, animals and microorganisms, with maximum production from the latter. It is synthesized by various microbes like bacteria, fungi, and yeast. However, maximum research work has been done in case of fungi. Nevertheless, fun-gal applications at commercial level are largely discour-aged owing to its rather low growth rate coupled with relatively complex genome. On the other hand, growth potential of bacteria is very high and are comparatively easier to be handled at the genomic level. Apart from this, the bacteria also owe the ability to endure extreme temperature conditions, thereby exhibiting greater thermo-stability (Kumar et al., 2015). Moreover, bacte-
rial tannase can also degrade and hydrolyze natural tan-nins and tannic acid very effi ciently (Deschamps et al., 1983).
Production of tannase from microorganisms can be achieved through different methods like liquid sur-face, submerged (Smf), solid state fermentation (SSF) and modifi ed solid-state fermentation (Belmares et al., 2004). Submerged fermentation is usually considered as more valuable because of easiness of sterilization, and process control to engineer in these systems (Mahapatra et al., 2005; Jana, 2013; Govindarajan et al., 2019). In view of the immense potential of tannase, large num-ber of efforts have been carried out to make the pro-duction and purifi cation of this enzyme more effi cient. These efforts include the exploration of novel sources of tannase (Mahapatra and Banerjee, 2009; Chhokar et al., 2010; Zakipour et al., 2013) search of new and more effective fermentation systems (Purohit et al., 2006), statistical optimization of different culture conditions (Raaman et al., 2010; Aharwar et al., 2018), develop-ment of more effi cient procedures for purifi cation and recovery of tannase and enhanced tannase production through mutagenesis and recombinant microorganism (Curiel et al., 2009; Liu et al., 2018).
The present study represents a part of these efforts with an aim to produce a more effi cient tannase produc-ing mutant bacterial strain. In this study, we have made an attempt to enhance tannase production by different mutagenic approaches from culture of Klebsiella pneu-moniae KP715242
MATERIALS AND METHODS
ISOLATION AND IDENTIFICATION OF TANNASE
PRODUCING BACTERIAL STRAIN
A number of soil samples collected from different regions of Ambala, India were screened for the isola-tion of tannase positive bacterial strains. Each soil sam-ple (1.0 gm) was suspended in 50 ml minimal medium containing K2HPO4:0.5g/l, KH2PO4:0.5g/l, MgSO4:2.0g/l, CaCl2: 1.0g/l and NH4Cl: 3.0g/l supplemented with 1% tannic acid (pH 5.5) and incubated at 37°C on rotary shaker at 150 rpm for 24 hours (Osawa, 1990). A por-tion of each culture was transferred to fresh medium and cultured again under same conditions until pure cultures were obtained. The strains were maintained on nutrient agar slants in refrigerator at 4°C by regular transfer. All the pure isolates were assessed for tannic acid degrada-tion using through visual reading method and zone of hydrolysis (Kumar et al., 2015a).
Bacterial strain with maximum tannase activity (TAH 10) was identifi ed on the basis of its morphological,

Mukesh Kumar et al.
116 UPGRADATION OF TANNASE PRODUCTION BY KLEBSIELLA PNEUMONIAE BIOSCIENCE BIOTECHNOLOGY RESEARCH COMMUNICATIONS
physiological, biochemical characteristics and 16S rRNA gene sequence.
TANNASE ASSAY
For the tannase assay, 200 μl enzyme solution was mixed with 300μl of 1.0% (w/v) tannic acid prepared in 0.2 M acetate buffer of pH 5.5. The mixture was incubated for 40 minutes at 40°C, thereafter the reaction was stopped by the addition of 3.0 ml bovine serum albumin (1 mg/mL) that caused the precipitation of the residual tannic acid. The heat denatured enzyme was used as a control and was processed in similar way. The reaction mixture containing tubes were centrifuged at 7,000 x g for 10 minutes followed by the dissolution of the precipitates in 3.0 ml of SDS–triethanolamine (1% w/v) solution. Thereafter, 1.0 ml of FeCl3 reagent (0.13 M) was added and the mixture was incubated for 15 minutes to get the color stabilized. The enzyme activity was measured by reading the absorbance of both the sample and control tubes at 530 nm against the blank (without tannic acid). One unit of the tannase was defi ned as the amount of enzyme, which is able to hydrolyze 1 mM of substrate tannic acid in 1 minute under assay conditions (Mondal et al., 2001; Kumar et al., 2016).
FORMULATION OF CELL SUSPENSION
For the preparation of the cell suspension, a small portion of 24 hours grown culture of K. pneumoniae was added in 50 mL nutrient broth followed by subsequent incuba-tion at 37 °C for 12 hours under shaking conditions (110 rpm). A cell biomass pellet was obtained by centrifuging 10 ml inoculated broth at 9000 x g for 10 min at 4°C. The cell suspension (approximately 107-8 cells/ml) was pre-pared by dissolving this pellet in 10 ml sterilized saline and was used for further studies.
HEAT INDUCED MUTAGENESIS
In order to carry out heat induced mutagenesis, 1.0 ml of cell suspension was transferred to a sterilized test tube and was heated at 60 °C for different time inter-vals ranging from 20 to 70 minutes. The cell suspension was serially diluted to obtain a fi nal dilution of 10-6/ml. After the dilution, 100 μl of heat treated cell suspen-sion was laid over the nutrient agar plates supplemented with 2% tannic acid under sterile conditions. All the plates (20, 30, 40, 50, 60 and 70 min) were processed in the same manner. After keeping all the plates in dark for 30 minutes, they were incubated for 48 hours at 37°C. Subsequently, the survival percentage was deter-mined over the control (plate containing unheated cell suspension).
UV INDUCED MUTAGENESIS
For the induction of UV induced mutagenesis, 1.0 ml of the appropriately diluted cell suspension was taken sep-arately in different Petri plates. All of these plates were exposed to UV radiations for different periods ranging from 10 to 60 minutes by maintaining a distance of about 10 cm from the source of UV radiations. After the desired time period, the plates were given dark treatment for 30 minutes, plated on nutrient agar plates provided with 2% tannic acid and incubated for 48 hours at 37°C. The survival percentage of bacterial cells was calculated over the untreated control plate.
NTG (N-METHYL N-NITRO
N-NITROSOGUANIDINE) AND MMS
(METHYL METHANE SULFONATE) INDUCED
MUTAGENESIS
To observe the effect of NTG and MMS mutagens, the bacterial cell suspension and NTG (1 mg/ml) and MMS (100 μl/ml) solutions were mixed separately in a ratio of 1:1 in corresponding test tubes excluding the control tube. This mixture was incubated at 37 ºC for different time periods ranging from 10-60 min. After the desired period of treatment, mixture solution containing treated bacterial cells was centrifuged at 8000 x g for 10 min at 4 ºC. The pellet obtained was washed twice with steri-lized normal saline and plated on nutrient agar plates supplemented with 2% tannic acid. The plates were given dark treatment for 2 hours and then incubated at 37 ºC for 48 hours. The cell survival percentage was determined using the plate containing the untreated cell suspension as control.
COMPARISON OF TANNASE PRODUCTION
BETWEEN MUTANT STRAINS FROM EACH
TREATMENT
For the isolation and identifi cation of hyper tannase producer strain, two colonies from around 5% survival rate were selected for each treatment. The selected iso-lates were used for the production of extracellular tan-nase in submerged conditions. Tannase production was carried out in 250 ml Erlenmeyer’s fl ask with 50 ml of fermentation medium(0.5 g/l K2HPO4, 0.5 g/l KH2PO4, 2.0 g/l MgSO4, 1.0 g/l CaCl2 and 3.0 g/l NH4Cl) enriched with 1% tannic acid under optimized conditions. After regu-lar intervals of 15, 30, 45, 60, 75, 90 and 105 hours, 1.0 ml of the fermented medium was aseptically removed and centrifuged at 10,000 rpm for 20 min at 4°C. The obtained supernatant (crude enzyme) was used for the estimation of tannase activity.

Mukesh Kumar et al.
BIOSCIENCE BIOTECHNOLOGY RESEARCH COMMUNICATIONS UPGRADATION OF TANNASE PRODUCTION BY KLEBSIELLA PNEUMONIAE 117
RESULTS AND DISCUSSION
ISOLATION AND SCREENING OF BACTERIA
A total of 13 pure isolates out of 20 were able to show signifi cant growth on nutrient agar plates supplemented with 1% tannic acid. Out of these 13 isolates, only 6 isolates were found to be positive for visual detection method. However, only TAH 10 was able to exhibit dis-tinct zone of hydrolysis on the agar plates (Fig. 1) with maximum tannase activity of 0.02 U/ml amongst all 6 tested strains (Table 1). Tannase production from this
wild type strain was maximized by optimizing the vari-ous culture conditions. Under these optimum conditions (5.2 pH, 34.97 °C temperature, 103.34 rpm agitation speed and 91.34 hours of incubation time) this strain exhibited 0.065 U/ml of tannase in comparison to 0.025 U/ml obtained under un-optimized conditions (Kumar et al., 2015a).
IDENTIFICATION OF BACTERIAL ISOLATE
On the basis of morphological characterization, the bac-terial strain TAH 10 was found to be a gram negative, non-motile, rod shaped bacterium. Amplifi cation of 16S rDNA and its subsequent gene sequence was used to construct the phylogenetic tree (Fig. 2). The 16S rDNA sequence of the strain TAH 10 has been deposited in the NCBI GeneBank (Accession Number KP715242).
FIGURE 1. Nutrient agar plate show-ing tannase-producing bacterium TAH 10 after 4 days incubation
Table 1. Tannase activity of the positive isolates
Isolate number Enzyme activity (U/ml)*TAH 3 0.015±0.002
TAH 4 0.012±0.003
TAH 7 0.016±0.004
TAH 8 0.015±0.004
TAH 9 0.018±0.006
TAH 10 0.02±0.001
*Values are mean of three replicates; ± Standard deviation
FIGURE 2. Neighbor-joining tree showing the position of isolate Klebsiella pneumoniae KP715242 shown as sample (Kumar et al., 2015a).

Mukesh Kumar et al.
118 UPGRADATION OF TANNASE PRODUCTION BY KLEBSIELLA PNEUMONIAE BIOSCIENCE BIOTECHNOLOGY RESEARCH COMMUNICATIONS
DEVELOPMENT OF EFFICIENT TANNASE
PRODUCING BACTERIAL STRAIN THROUGH
MUTAGENESIS
For the development of hyper tannase producing bac-terial strain, the parental isolate Klebsiella pneumoniae was subjected to various mutagenic treatments like heat treatment, ultra-violet (UV) radiation, N-methyl N-nitro N-nitrosoguanidine (NTG) treatment and methyl meth-ane sulfonate (MMS) treatment. The action of such kind of mutagenic treatments is random in nature that may also lead to mutations in the desired genes resulting in the impairment of essential functions culminating in the death of the cells.
INFLUENCE OF HEAT ON THE SURVIVABILITY
OF KLEBSIELLA PNEUMONIAE
The heat treatment (60°C) associated survival percentage of the bacterial cells is depicted in fi gure 3. The survival percentage declined to 32.20% after initial 20 minutes of heat treatment. There was a progressive decrease in the survival rate with the passage of time and the cul-ture was almost lost after 50 minutes of treatment. The mechanism of heat action involves generation of an oxi-dative stress in the cells and such heat generated stress has been reported to be lethal at 50°C in Saccharomy-ces cerevisiae (Davidson and Schiestl, 2000). The other
heat associated deleterious effects include mutations, recombination, and mitochondrial membrane disrup-tion which are thought to cause decreased sulfhydryl content. Similarly, the co-culture of Aspergillus foetidus and Rhizopus oryzae was completely eliminated after 60 minute exposure of heat treatment (Purohit et al., 2006). Zakipour et al. (2013) reported enhanced production of tannase from Penicillium sp. EZ-ZH190 through induced mutation. It was observed that after 10 minute exposure of heat treatment at 60°C, 8.5×10⁴ colonies (17% of the initial number) were obtained that declined gradually with the increase in exposure time and became nil after exposure of 40, 50, and 60 minutes.
INFLUENCE OF UV RADIATIONS ON THE
SURVIVABILITY OF KLEBSIELLA PNEUMONIAE
Extended exposure to UV radiations can alter the genetic makeup of a cell, resulting in deleterious muta-tions and the possible cell death. Most of the mutations are in the form of thymine dimers produced due to the fusion of two adjacent thymine bases. Thymine dimers negatively infl uence the structural organization of the DNA, subsequently mutating the genetic material of the cell. In the present study, the percent survival of Kleb-siella pneumoniae culture after UV treatment is shown in fi gure 4. A survival rate of 43.1% was obtained after initial 10 minute exposure which declined progressively
FIGURE 3. Effect of heat treatment on the survival percentage of Klebsiella pneumonia

Mukesh Kumar et al.
BIOSCIENCE BIOTECHNOLOGY RESEARCH COMMUNICATIONS UPGRADATION OF TANNASE PRODUCTION BY KLEBSIELLA PNEUMONIAE 119
FIGURE 4. Effect of UV treatment on the survival percentage of Klebsiella pneumoniae
FIGURE 5. Effect of NTG treatment on the survival percentage of Klebsiella pneumoniae
as the exposure time increased. The culture was virtually lost after exposure of 50 minutes. Similar impact of UV radiations has been observed in case of co-culture of Aspergillus foetidus and Rhizopus oryzae (Purohit et al., 2006). Countless colonies were observed after the ini-tial 10 minutes of treatment, however, the cell number decreased with further increase in time and became nil after exposure of 60 minutes.
INFLUENCE OF NTG (N-METHYL N-NITRO
N-NITROSOGUANIDINE) MUTAGENS ON THE
SURVIVABILITY OF KLEBSIELLA PNEUMONIAE
NTG mutagen induces repetitive mutations and strongly increase their frequency. It precisely interacts with DNA and is considered as UV-mimetic agent. In addition, NTG may also form nitrosoguanidine group containing reac-

Mukesh Kumar et al.
120 UPGRADATION OF TANNASE PRODUCTION BY KLEBSIELLA PNEUMONIAE BIOSCIENCE BIOTECHNOLOGY RESEARCH COMMUNICATIONS
FIGURE 6. Effect of MMS treatment on the survival percentage of Klebsiella pneumoniae
FIGURE 7. Effect of incubation period on the enzyme activity of different mutant strains of Klebsiella pneumonia

Mukesh Kumar et al.
BIOSCIENCE BIOTECHNOLOGY RESEARCH COMMUNICATIONS UPGRADATION OF TANNASE PRODUCTION BY KLEBSIELLA PNEUMONIAE 121
tion products upon reaction with organic ions. It may inhibit the synthesis of functional proteins or could affect protein synthesis by causing mistakes during translation (Vorobjeva, 2013). These inhibitory effects of NTG have also been observed in the present study. After initial exposure of 10 minutes, the percent survival rate of Klebsiella pneumoniae was reduced to 56.7%. The survival rate declined steadily with increase in the expo-sure time and the culture was nearly eliminated after 50 minutes of treatment (Fig. 5). A similar trend has been observed in case of co-culture of Aspergillus foeti-dus and Rhizopus oryzae where 60 minute exposure to NTG completely eliminated the culture (Purohit et al., 2006).
EFFECT OF MMS (METHYL METHANE
SULFONATE) TREATMENT ON THE
SURVIVABILITY OF KLEBSIELLA PNEUMONIAE
Methylmethane sulphonate (MMS), is a type of alkylating agent and possess cytotoxic and mutagenic properties. It primarily methylates purine bases leading to various adduct formation in the DNA. Most of the methylated bases are toxic to the cell, hamper DNA replication and can also be a source of base pair substitutions muta-tions. In this report, initial 10 minute exposure to MMS resulted in 43.4% survival rate which declined gradually
as the exposure time increased and was practically lost as the exposure time reached 50 minutes (Fig. 6).
SELECTION OF MOST EFFICIENT TANNASE
PRODUCING MUTANT STRAIN
From each mutagenic treatments, two most effi ciently growing colonies per treatment were selected from 5–10% survival rate from the nutrient agar plates. These bacterial colonies were carefully chosen from the plates having 40-minute exposure to heat (H1 and H2), UV (UV1 and UV2), NTG (N1 and N2) and MMS (M1 and M2) treatments.
For the isolation and selection of most effi cient tan-nase producing mutant strains, these mutants were fur-ther assessed for enzyme production under submerged fermentation at preoptimized culture conditions i.e. 5.2 pH, 34.97°C temperature, 103.34 rpm agitation speed and 91.34 hour of incubation time as reported in our previ-ous study (Kumar et al., 2015a). Among these, the maxi-mum tannase production (0.075 U/ml) was witnessed in mutant U2 followed by U1, H2, and H1, producing 0.065, 0.059 and 0.056 U/ml, respectively (Fig. 7). It was found that the U2 was the most effi cient tannase producing mutant, giving approximately 1.15 fold more enzyme over the wild type strain (0.065 U/ml) after 90 hours of incubation time under similar culture conditions. The maximum tannase in this mutant strain was 0.065 U/mL
FIGURE 8. Stability test of most effi cient mutant strain of Klebsiella pneumoniae for tan-nase production

Mukesh Kumar et al.
122 UPGRADATION OF TANNASE PRODUCTION BY KLEBSIELLA PNEUMONIAE BIOSCIENCE BIOTECHNOLOGY RESEARCH COMMUNICATIONS
with an incubation period of 75 hours as compared to wild strain where the incubation period was 90 hours in order to exhibit the same enzyme activity. Moreover, for the mutant strain U2 generated by 40 minute UV treat-ment, the incubation time lowered from decreased 90 hours to 75 hours to exhibit the same enzyme activity (0.065 U/mL ) as obtained in case of wild culture.
The present results are in accordance to the previ-ous report of enhanced tannase production through mutagenesis highlighting 1.21 fold increase in tan-nase production from mutant SCPR 337, produced by 60-minute heat treatment (Purohit et al., 2006). In addi-tion, the incubation period also decreased to 30 hours from 48 hours for maximum enzyme production as compared to the wild co-culture of Aspergillus foetidus and Rhizopus oryzae. Similarly, Zakipour et al. (2013) also observed that the incubation time of the mutant B named Penicillium sp. EZ-ZH290 (generated by 30 min-ute heat treatment at 60 °C) for maximum tannase pro-duction, decreased from 96 hours to 84 hours retaining the same tannase activity of 4.3 U/ml in comparison to the wild culture.
The best performing mutant strain U2 was assessed for its tannase producing capability for 10 generations. Figure 8 shows that this mutant maintained the produc-tion effi ciency endorsing the stability and heritability of the mutation.
CONCLUSION
The tannase producer bacterium K. pneumoniae (Gen-Bank Accession Number KP715242) used in the present study was isolated from soil and was subsequently iden-tifi ed at the molecular level through 16S ribosomal RNA gene sequence. Induction of mutations through various mutagenic agents and screening of commercially sig-nifi cant microorganisms are crucial processes for the effi cacious development of various microbial strains required for fermentation industry. Enhanced tannase production through mutagenesis has been reported in case of fungi but till date, there is no report on strain improvement in case of bacteria. Therefore, mutagenesis was induced for the fi rst time in the bacterial parent strain Klebsiella pneumoniae through various mutagenic treatments in an attempt for the development of more effi cient tannase producing mutant bacterial strain. Amongst different mutagenic agents, UV-radiations were found to be most effective in generating more effi -cient tannase producer mutant strain. In comparison to the wild type strain, the improved mutated strain deliv-ered enhanced tannase production coupled with reduced incubation period. Moreover, the most effi cient mutant strain retained its tannase production effi cacy for 10 generations refl ecting the stability and inheritability of
the mutation. Such desirable properties of this mutant strain could be exploited for commercial production of tannase at large scale with reduced cost.
ACKNOWLEDGEMENTS
The authors thank Chairperson, Department of Biotech-nology, Chaudhary Devi Lal University, Sirsa, Haryana, India for providing necessary laboratory facilities to carry out this work.
FUNDING
This research did not receive any specifi c grant from funding agencies in the public, commercial, or not-for-profi t sectors.
REFERENCES
Aguilar C.N., Rodríguez R., Gutiérrez-Sánchez G., Augur C., Favela-Torres E., Prado-Barragan L.A., Ramírez-Coronel A., Contreras-Esquivel J.C. (2007) Microbial tannases: advances and perspectives. Applied Microbiology and Biotechnology 6: 47–59.
Aguilar C.N., Sanchez G.G. (2001) Review: Sources properties, applications and potential uses of tannin acyl hydrolase. Inter-national Journal of Food Science & Technology 7(5): 373–382.
Aharwar A., Parihar D.K. (2018) Tannases: Production, Proper-ties, Applications. Biocatalysis and Agricultural Biotechnology 15: 322-334.
Banerjee D., Mahapatra S. (2012) Fungal tannase: a journey from strain isolation to enzyme applications. Dynamic Bio-chemistry, Process Biotechnology and Molecular Biology 6: 49–60.
Belmares R., Contreras-Esquivel J.C., Rodriguez-Herrera R., Coronel A.R., Aguilar C.N. (2004) Microbial production of tan-nase: an enzyme with potential use in food industry. Lebens-mittel-Wissenschaft und -Technologie 37: 857-864.
Bhat T.K., Singh B. Sharma O.P. (1998) Microbial degradation of tannins – a current perspective. Biodegradation 9: 343–57.
Chavez-Gonzalez M., Rodrigues-Durán L.V., Balagurusamy N., PradoBarragán A., Rodrigues R., Conheras J.C., Aguilar G.N. (2012) Biotechnological advances and challenges of tannase: an overview. Food and Bioprocess Technology 5(2): 445-459.
Chhokar V., Seema, Beniwal V., Salar R.K., Nehra K.S., Kumar A., Rana J.S. (2010) Purifi cation and characterization of extra-cellular tannin acylhydrolase from Aspergillus heteromorphus MTCC 8818. Biotechnology and Bioprocess Engineering 15: 793–799.
Curiel J.A., Rodriguez H., Acebron I., Mancheno J.M., Rivas de las B., Munoz R. )2009) Production and physicochemical properties of recombinant Lactobacillus plantarum tannase. Journal of Agricultural and Food Chemistry 57: 6224–6230.

Mukesh Kumar et al.
BIOSCIENCE BIOTECHNOLOGY RESEARCH COMMUNICATIONS UPGRADATION OF TANNASE PRODUCTION BY KLEBSIELLA PNEUMONIAE 123
Davidson J.F., Schiestl R.H. (2000) Mis-targeting of multiple gene disruption constructs containing hisG. Current Genetics 38(4): 188-90.
Deschamps A.M., Otuk G., Lebeault J.M. (1983) Production of tannase and degradation of chestnut tannin by bacteria. Jour-nal of Fermentation Technology, 61: 55–59.
Fathy S.A., Mahmoud A.E., Rashad M.M., Ezz M.K., Moham-med A.T. (2018) Improving the nutritive value of olive pomace by solid state fermentation of Kluyveromyces marxianus with simultaneous production of gallic acid. International Journal of Recycling of Organic Waste in Agriculture 7(2): 135-141.
Ghosh K., Mandal S. (2015) Nutritional evaluation of ground-nut oil cake in formulated diets for rohu, Labeo rohita (Ham-ilton) fi ngerlings after solid state fermentation with a tannase producing yeast, Pichia kudriavzevii (GU939629) isolated from fi sh gut. Aquaculture Reports 2: 82–90.
Govindarajan R.K., Mathivanan K., Rameshkumar N., Shyu D.J.H., Kayalvizhi N. (2019) Purifi cation, structural characteri-zation and biotechnological potential of tannase enzyme pro-duced by Enterobacter cloacae strain 41 Process Biochemistry. 77: 37-47.
Haslam E., Stangroom J.E. (1996) The esterase and depsidase activities of tannase. Journal of Biochemistry 99(1): 28–31.
Jana A, Halder S.K., Banerjee A, Paul T, Pati B.R., Mondal K.C., Mohapatra P.K.D. (2014) Biosynthesis, structural architecture and biotechnological potential of bacterial tannase: A molecu-lar advancement, Bioresource Technology 157: 327–340.
Jana A., Maity C., Halder S.K., Das A., Pati B.R., Mondal K.C., Mohapatra P.K.D. (2013) Structural characterization of thermo-stable, solvent tolerant, cytosafe tannase from Bacillus subtilis PAB2. Biochemical Engineering Journal 77: 161–170.
Kumar M., Amrinder S., Beniwal V., Salar R.K. (2016) Improved production of tannase by Klebsiella pneumoniae using Indian gooseberry leaves under submerged fermentation using Tagu-chi approach. AMB Express 6: 46.
Kumar M., Beniwal V., Salar R.K. (2015) Purifi cation and char-acterization of a thermophilic tannase from Klebsiella pneu-moniae KP715242. Biocatalysis and Agricultural Biotechnol-ogy 4: 745–751.
Kumar M., Rana S., Beniwal V., Salar R.K. (2015a)Optimiza-tion of tannase production by a novel Klebsiella pneumoniae
KP715242 using central composite design. Biotechnology Reports 7: 128–134.
Liu F., Wang B., Ye Y., Pan L. (2018) High level expression and characterization of tannase tan7 using Aspergillus niger SH-2 with low-background endogenous secretory proteins as the host. Protein Expression and Purifi cation 144: 71–75.
Madeira J.J.V., Macedo J.A., Macedo G.A. (2011) Detoxifi cation of castor bean residues and the simultaneous production of tannase and phytase by solid-state fermentation using Paecilo-myces variotii. Bioresource Technology102: 7343–7348.
Mahapatra K., Nanda R.K., Bag S.S., Banerjee R., Pandey A., Szakacs G. (2005) Purifi cation, characterization and some studies on secondary structure of tannase from Aspergillus awamori nakazawaI. Process Biochemistry 40(10): 3251–3254.
Mahapatra S., Banerjee D. (2009) Extracellular tannase pro-duction by endophytic Hyalopus sp. The Journal of General and Applied Microbiology 55(3): 255-259.
Mohapatra P.K.D., Maity C., Rao R.S., Pati B.R., Mondal K.C. (2009) Tannase production by Bacillus licheniformis KBR6: Optimization of submerged culture conditions by Taguchi DOE methodology. Food Research International 42: 430–435.
Mondal K.C., Banerjee D., Jana M., Pati B.R. (2001) Colorimetric assay for determination of tannin acyl hydrolase (E.C.3.1.1.20) activity. Analytical Biochemistry 295: 168–171.
Osawa R. (1990) Formation of a clear zone on tannin-treated brain heart infusion agar by a Streptococcus sp. isolated from feces of koalas. Applied and Environmental Microbiology 56: 829-831.
Purohit J.S., Dutta J.R., Nanda R.K., Banerjee R. (2006) Strain improvement for tannase production from co-culture of Aspergillus foetidus and Rhizopus oryzae. Bioresource Tech-nology 97: 795-801.
Raaman N., Mahendran B., Jaganathan C., Sukumar S., Chan-drasekaran V. (2010) Optimisation of extracellular tannase pro-duction from Paecilomyces variotii. World Journal of Microbi-ology and Biotechnology 26: 1033–1039.
Vorobjeva L. (2013) Propionibacteria. Springer Science & Busi-ness Media.
Zakipour M.E., Hamidi-Esfahani Z., Sahari M.A., Azizi M.H. (2013) Improvement of strain Penicillium sp. EZZH 190 for tannase production by induced mutation. Applied Biochemis-try and Biotechnology 17(6): 1376-1389.

Synteny analysis of Glycine max and Phaseolus vulgaris
revealing conserved regions of NBS-LRR coding genes
Gaurav Singh* and Anil Kumar
School of Biotechnology, Devi Ahilya University, Khandwa Rd., Indore-452001, India
ABSTRACT
Soybean (Glycine max) and common bean (Phaseolus vulgaris) are the two important of the leguminous family, Pha-seoleae. Synteny gives a framework in which preservation of genes and gene order is determine between genomes of various species. The syntenic relationship between G. max and P. vulgaris is important to determine the potential for comparative genomic analysis. Here, synteny analysis has been performed between G. max and P. vulgaris by using the tool ‘SATSUMA’. Genome data of these two legume species were retrieved from NCBI database, gene synteny alignment was then performed and comparatively analysed. Result was visualized by developing custom script in BioPython soft-ware version 3.7. The soybean chromosome 13 was aligned with whole genome of common bean as it contains genes which code for nucleotide binding site and leucine rich repeats (NBS-LRR) protein. The NBS-LRR genes play a major role in defense against pathogens. On alignment, a set of genes linked with disease resistant proteins (NBS-LRR) in G. max showed synteny with the different chromosomes of P. vulgaris. The data supported the theory that in legumes, genes are highly conserved, as extensive regions of synteny exist between these two species. The present study will be helpful to use both genomic resources as well as genetic data for crucial agronomic traits for the improvement of these two species.
KEY WORDS: DISEASE RESISTANCE GENES, GLYCINE MAX, NBS-LRR, PHASEOLUS VULGARIS, SYNTENY
124
Biotechnological CommunicationBiosci. Biotech. Res. Comm. 12(1): 124-133 (2019)
INTRODUCTION
Synteny word came from greek where ‘syn’ means together and ‘taenia’ means ribbon. When gene order is conserved between the organism is commonly refered as Synteny. It is of two different type’s viz. macrosyn-
teny when many genes or large chromosomal segments of different organisms are syntenic; and microsynteny when only few genes are conserved in different species (Zhu et al., 2005 and Passoupathy, 2016). Relationship between plants, pathogens and pests have been cur-rently discussed in different models (Andolfo and Ercol-
ARTICLE INFORMATION:
Corresponding Author: [email protected] 12th Jan, 2019Accepted after revision 2nd March, 2019BBRC Print ISSN: 0974-6455Online ISSN: 2321-4007 CODEN: USA BBRCBA Thomson Reuters ISI ESC / Clarivate
Analytics USAMono of Clarivate Analytics and Crossref Indexed Journal Mono of CR
NAAS Journal Score 2019: 4.31 SJIF: 4.196© A Society of Science and Nature Publication, Bhopal India 2019. All rights reserved.Online Contents Available at: http//www.bbrc.in/DOI: 10.21786/bbrc/12.1/16

Gaurav Singh and Anil Kumar
BIOSCIENCE BIOTECHNOLOGY RESEARCH COMMUNICATIONS SYNTENY ANALYSIS OF GLYCINE MAX AND PHASEOLUS VULGARIS REVEALING CONSERVED REGIONS 125
ano, 2015). This models mainly include proteins which are coded by clustered disease-resistance (R) genes in plant genomes (Hulbert et. al., 2001). In earlier study, the R gene-encoded proteins were divided into eight major group on the basis of amino acid motif organization and localization in the cell (Gururani et. al., 2012). Among these group two main R gene proteins are (CC) NBS-LRR or CNL proteins and TNL proteins. NBS-LRR genes have been grouped into three classes (TNL, CNL and R NLs) (Shao et. al., 2016 Neupane et. al., 2018).
The legumes are extremely diverse and can be dis-tributed into 3 subfamilies viz. Caesalpinioideae, Mimosoideae and Papilionoideae (Doyle and Luckow, 2003). The subfamily, Papilionoideae consists of almost all commercially important legumes like Arachis hypogaea (peanut), Cicer arietinum (chick pea), Glycine max (soybean), Phaseolus vulgaris (common bean), Med-icago sativa (alfalfa), Vigna radiata (mungbean), Lens culinaris (lentil) and Pisum sativum (pea). Although these crop legumes have close phylogenetic relation-ship but differ extremely in their chromosome number, genome size and ploidy level (Table 1). However, previ-ous studies on comparative genetic mapping suggested that the Papilionoideae subfamily members showed broad genome conservation (Weeden et al., 1992; Zhu et al., 2005). Young et al (2003) showed that legumes form a systematic taxonomic group with ubiquitous and prevailing macro- and micro- synteny. There are reports indicating that closely related species contain genomes having various genes with same map positions (Ben-netzen, 2000; Devos and Gale, 2000; Paterson et al., 2000; Schmidt, 2000; Gualtieri et al., 2002).
Earlier, in plants, synteny analyses were aimed only on the species belonging to the families Poaceae and Brassicaceae. In recent time, such studies are being extended on other plants especially legumes (Gualtieri et al., 2002). It has been shown that sequence based tools help to study the evolution, organization and syntenic
relationships of genomes. Macro- and micro- synteny of various species can be compared using linkage maps (Mc Connell et al., 2010). The studies indicated that level of synteny is found high in closely related species, and it decreases with growing phylogenetic distance (Choi et al., 2004). Recently, a linkage map for Apios Ameri-cana (a tuberous perennial legume in phaseolae tribe) has been reported and it showed synteny with selected warm-seasoned legumes. It also revealed a translocation event in Glycine max and common bean against Apios and Vigna species (Singh et al., 2018).
The two most important members of legume family Phaseoleae are soybean and common bean. These two species are commercially valuable legumes, common bean as a nutritional crop for poor population and soy-bean for its various human and animal uses (Mc Clean et al., 2010). Common bean has been diverged from soy-bean 19 million years ago. Considering syntenic rela-tionship between two species is crucial to determine the potential for comparative genomic analysis. Whole genome duplication is one of the most salient character-istics of the soybean genome (Cannon and Shoemaker, 2012).
The RFLP mapping (Shoemaker et al., 1996) and EST Ks analysis have provided substantial evidences that whole genome duplication (WGD) in soybean has occurred about 13 million years ago (Schmutz et al., 2010 and Schlueter et al., 2004). Boutin et al (1995) have reported a number of syntenic linkage blocks between common bean and soybean by exploiting shared RFLP markers. They used using low density RFLP mapping, they showed that these two species share a high degree of homology in sequence, however, synteny has been found over short blocks of genomes. A clear one to two relationship between common bean and soybean genomes was shown by Lee et al (2001). A few synteny analyses have been reported between soybean and com-mon bean. Mc Clean et al., (2010) studied the synteny
Table 1. Genomic information of nine legume species.
Species name Common nameGenome size (Mbp)
Chr. No.Gene number
Remark Reference
Medicago truncatula Barrel medic 470 2n = 2x = 16 50,894 WGS Young et al. 2011
Medicago sativa Alfafa 830–860 2n = 4x = 32 NA – Bauchan and Hossain2001
Pisum sativum Pea 4300 2n = 2x = 14 NA – Franssen et al. 2011
Cicer arietinum Chickpea 864 2n = 2x = 16 28,269 WGS Varshney et al. 2013
Lotus japonicas Bird’s-foot trefoil 471 2n = 2x = 12 39,735 WGS Sato et al. 2008
Vigna radiata Mung bean 333 2n = 2x = 22 22,368 WGS Kang et al. 2014
Glycine max Soybean 1115 2n = 2x = 40 56,044 WGS Schmutz et al. 2010
Phaseolus vulgaris Common bean 625 2n = 2x = 22 38,482 WGS Schmutz et al. 2014
Arachis hypogaea Pea nut, ground nut 2,800 2n = 4x = 40 50,324 WGS Chen et al. 2016
*NA- Not available, WGS - Whole genome sequencing completed.

Gaurav Singh and Anil Kumar
126 SYNTENY ANALYSIS OF GLYCINE MAX AND PHASEOLUS VULGARIS REVEALING CONSERVED REGIONS BIOSCIENCE BIOTECHNOLOGY RESEARCH COMMUNICATIONS
between soybean and common bean on the basis of 300 gene base loci. Synteny blocks of averaging 32 cM in common bean and 4.9 Mb in soybean were found for all 11 common bean linkage groups which were mapped to all soybean linkage groups. A total 55 syntenic blocks each having 7 loci were observed between the common bean and soybean. By analysing the location of these blocks, it was revealed that each locus of common bean genome mapped to two loci of soybean genome (Mc Clean et al., 2010).
In 2014, Schmutz and co-workers observed consid-erable synteny between Phaseolus vulgaris and Glycine max, except in pericentromeric regions, where due to genomic expansion in one or both genomes micro- co-linearity was much extended and due to that was lesser dense. Conservation of genome macrostructure has been reported between the soybean and other legumes includ-ing Phaseolus vulgaris (Lee et al., 2017). Studies showed the correlation between Phaseolus linkage group Pv01 and Glycine max chromosomes Gm06 and Gm04 (Can-non and Shoemaker 2012). It is also reported that Gm5 and Gm8 chromosomes share synteny to common bean Pv2 (Mc Clean et al., 2010). In another study, nearly 63% of common bean unigenes were shown to have homol-ogy to soybean (Kalavacharla et al., 2011). Microsyn-teny analysis was also reported between common bean and soybean where 6 BAC clones were sequenced and analyzed for microsynteny (Yadegari, 2013). Recently the genomes of G.max and P. vulgaris were analyzed for investigating synteny. Syntenic blocks were found between chromosomes Gm03 and Pv10, Gm10 and Pv07 as well as Gm14 and Pv01. A large number of present research make use of whole genome sequences to study R genes in legumes (Anderson 2016, Christie et. al., 2016 and Neupane et. al., 2018).
Earlier many research were done on NBS-LRR genes in Glycine max and other legumes by using bioinformat-ics approach (Benson 2014, Shao et. al., 2016 and Neu-pane et. al., 2018). Nepal and Benson (2015) showed the complete evolutionary relationship of the CNL- R genes in soybean and common bean. In the present study, syn-teny analysis between chromosome 13 of soybean hav-ing NBS-LRR enriched sequences and whole genome of common bean have been carried out since common bean has been reported to have NBS-LRR enriched regions which help in disease resistance. The results from our study will be helpful in understanding evolutionary relationships of NBS-LRR genes with potential implica-tion in crop improvement.
MATERIALS AND METHODS
The gene synteny alignment, and genomic linkage analyses between the chromosome 13 of G. max and
whole genome of P. vulgaris was performed by using ‘SATSUMA version 3.1.0 freely available on the website, http://satsuma.sourceforge.net/. All the data in FASTA and GFF fi les required for genome sequence and anno-tation of soybean and common bean were downloaded from the NCBI database (https://www.ncbi.nlm.nih.gov/genome/). For synteny analysis, only sequence align-ments of more than 200 bp and percent identity of more than 85% were considered and rest were fi ltered out. The results were visualized by developing custom script in Biopython module of BioPython, version 3.7 freely available on the website, http://biopython.org/DIST/docs/install/Installation.html.
RESULTS AND DISCUSSION
Comparison of orthologous regions of soybean and
common bean
The syntenic analysis between soybean and common bean showed many conserved regions between the two as shown in Fig. 1. Twenty one genes mentioned in Table 2, which were screened on the basis of few param-eters of our interest as highest, lowest percent similar-ity, protein kinase, diseases resistance protein, NBS-LRR proteins represent less than 1/4th of the genes we have obtained after synteny mapping. These genes were men-tioned with their gene id, locus tag along with the prod-uct formed as shown in table 2. Soybean chromosome 13 region having start from 22449055 bp and up to 22449570 bp showed gene homology with the sequence starting from 31929662 to 31930177 of Phaseolus vul-garis. This genomic region in both the species codes for guanine nucleotide binding protein subunit gamma 3-like isoform X1. The guanine nucleotide binding pro-tein is important for signalling pathway. It is to be noted that the Rpg1b genes in soybean mainly codes for NB and LRR proteins. Various NB-LRR protein coding genes which are present on chromosome 13 of G. max are also showing synteny with P. vulgaris. For instance, F-box/LRR-repeat protein 4-like (LOC100816140) is located at 27041793 bp to 27042286 bp in Phaseolus vulgaris. A mitogen-activated protein kinase2 (LOC100789734) located on chromosome 13 of Glycine max is showing homology with Phaseolus vulgaris.
A G type lectin S-receptors like serine/threonine-pro-tein kinase coding gene located at chromosome 13 in Gly-cine max is also present in Phaseolus vulgaris genomic region having starts from 30144768 bp to 30146245 bp. It is having several molecular function like ATP binding, Calmodulin binding and protein serine/threonine kinase activity and few biological functions like protein phos-phorylation and recognition of pollen. Glycogen phos-phorylase 1-like isoform X1 coding gene which is present

Gaurav Singh and Anil Kumar
BIOSCIENCE BIOTECHNOLOGY RESEARCH COMMUNICATIONS SYNTENY ANALYSIS OF GLYCINE MAX AND PHASEOLUS VULGARIS REVEALING CONSERVED REGIONS 127
FIGURE 1. Syntenic regions between Glycine max and Phaseolus vulgaris. A synteny region has been amplifi ed where synteny length has been indicated using colors. The colors of the links are based on the magnitude of synteny length (Light grey color indicates minimum synteny length whereas red brick color maximum synteny length).
at locus LOC100779066 on Glycine max chromosome 13 is present in Phaseolus vulgaris. Uncharacterized ATP-dependent helicase C23E6.02-like (LOC100792901) and B3 domain-containing protein Os07g0563300-like both were conserved in these legumes namely Glycine max and Phaseolus vulgaris. Highest synteny was found to be 91.794 % similarity between Glycine max and Phaseo-lus vulgaris for a region which codes for an uncharacter-ized protein LOC100775655 in both the legume. Similarly, lowest synteny was found to be 85.049 % similarity at loci LOC102661544 of Glycine max.
Various syntenic regions were found between the two legumes, which codes for different proteins like MAP Kinase kinase2, Guanine nucleotide binding protein, 1-phosphatidylinositol-3-Phosphate 5-kinase and sev-eral Serine threonine kinases. All the proteins have dif-ferent molecular and biological functions like ATP and ADP binding, Kinase activity, Metal and Calcium Ion binding, signal transduction, defense responses respec-tively. Different gene functions and their position in soybean and common bean are described with details in Table 3.
In the present study, a different approach has been used for comparison of soybean genome with com-mon bean. Advantage of synteny analysis is based on the concept that the species which are evolutionary related are diverged from their common ancestor and conserved genome synteny can be effi ciently interpreted from a well-studied species to another less characterized genomes. Synteny is found to be higher between the closely related species (Lee et. al., 2017) and this concept is confi rmed in this study. The outcome from the analy-sis identifi es the best match to the Glycine max genome. Here focus was done only on chromosome 13 of Glycine max. We selected this chromosome because in Glycine max, diseases resistance coding genes are known to be found mostly on this region (Chr. 13). By the comparison of both the legumes sequences we get NB-LRR protein coding genes, which are responsible for disease resist-ance in Glycine max and Phaseolus vulgaris.
Identifi cation of conserved synteny has noticeable advantage in understanding the legumes genetics. Large region of synteny occurs between Glycine max and Pha-seolus vulgaris (Mc Clean et. al., 2010), our results also

Gaurav Singh and Anil Kumar
128 SYNTENY ANALYSIS OF GLYCINE MAX AND PHASEOLUS VULGARIS REVEALING CONSERVED REGIONS BIOSCIENCE BIOTECHNOLOGY RESEARCH COMMUNICATIONS
Tabl
e 2.
Com
pari
son
of S
oybe
an (G
lyci
ne_m
ax c
ultiv
ar_W
illia
ms_
82 c
hrom
osom
e_13
, Gly
cine
_max
_v2.
0, w
hole
_gen
ome
shot
gun
sequ
ence
) with
Pha
seol
us v
ulga
ris.
Tare
gt_I
DTa
rget
Star
tTa
rget
End
Que
ryID
Que
rySt
art
Que
ryEn
dId
enti
tySt
rand
Synt
eny
Leng
thG
ene
Star
tG
ene
End
Gen
e an
d Lo
cus
tag
Prod
uct
Gly
cine
max
and
Pha
seol
us v
ulga
ris
NC_
0161
00.2
_G
lyci
ne_m
axcu
ltiva
r_W
illia
ms_
82ch
rom
osom
e_13
,G
lyci
ne_m
ax_v
2.0,
who
le_g
enom
esh
otgu
n_se
quen
ce
2212
0404
2212
1394
PhaV
ulg_
232
5022
7532
5032
6086
.363
6-
986
2212
1113
2212
1337
LOC1
0078
9734
GLY
MA
_13G
1069
00m
itoge
n-ac
tivat
ed
prot
ein
kina
se k
inas
e 2
2244
9055
2244
9570
PhaV
ulg_
231
9296
6231
9301
7785
.242
7-
516
2244
9124
2244
9517
LOC1
0078
7066
GLY
MA
_13G
1109
00
guan
ine
nucl
eotid
e-bi
ndin
g pr
otei
n su
buni
t ga
mm
a 3-
like
isof
orm
X
1
2284
7546
2284
9062
PhaV
ulg_
230
9089
8430
9105
0287
.730
9-
1519
2284
8615
2284
8943
LOC1
0081
1146
GLY
MA
_13G
1148
00
1-ph
osph
atid
ylin
osito
l-3-
phos
phat
e 5-
kina
se
FAB1
B-lik
e%2C
tr
ansc
ript
var
iant
X1
2284
7546
2284
9062
PhaV
ulg_
230
9089
8430
9105
0287
.730
9-
1519
2284
7654
2284
8520
LOC1
0081
1146
GLY
MA
_13G
1148
00
1-ph
osph
atid
ylin
osito
l-3-
phos
phat
e 5-
kina
se
FAB1
B-lik
e is
ofor
m X
1
2322
2659
2322
3739
PhaV
ulg_
230
0607
2230
0618
0287
.037
-10
8123
2227
1623
2236
48LO
C100
7780
06G
LYM
A_1
3G11
9600
prob
able
GTP
di
phos
phok
inas
e CR
SH%
2C c
hlor
opla
stic
2211
0388
2211
1570
PhaV
ulg_
232
5140
4832
5152
3391
.794
-11
8622
1104
4522
1111
63LO
C100
7756
55G
LYM
A_1
3G10
6700
unch
arac
teri
zed
prot
ein
LOC1
0077
5655
2411
0505
2411
1213
PhaV
ulg_
637
7930
8237
7937
9287
.005
6+
711
2411
0547
2411
0936
LOC1
0078
4243
GLY
MA
_13G
1282
00
rece
ptor
-lik
e se
rine
/th
reon
ine-
prot
ein
kina
se A
LE2%
2C
tran
scri
pt v
aria
nt X
1
2411
0505
2411
1213
PhaV
ulg_
637
7930
8237
7937
9287
.005
6+
711
2411
0547
2411
0936
LOC1
0078
4243
GLY
MA
_13G
1282
00
rece
ptor
-lik
e se
rine
/th
reon
ine-
prot
ein
kina
se A
LE2
isof
orm
X1
2493
3885
2493
4843
PhaV
ulg_
639
2444
4239
2454
0085
.281
8+
959
2493
4259
2493
4787
LOC1
0079
8007
GLY
MA
_13G
1367
00
prob
able
LRR
rec
epto
r-lik
e se
rine
/thr
eoni
ne-
prot
ein
kina
se
At1
g677
20
2746
6724
2746
7253
PhaV
ulg_
237
7610
2537
7615
5188
.657
8+
527
2746
6879
2746
7198
LOC1
0030
5441
GLY
MA
_13G
1594
00pr
otei
n ki
nase

Gaurav Singh and Anil Kumar
BIOSCIENCE BIOTECHNOLOGY RESEARCH COMMUNICATIONS SYNTENY ANALYSIS OF GLYCINE MAX AND PHASEOLUS VULGARIS REVEALING CONSERVED REGIONS 129
NC_
0161
00.2
_G
lyci
ne_m
axcu
ltiva
r_W
illia
ms_
82ch
rom
osom
e_13
,G
lyci
ne_m
ax_
v2.0
,w
hole
_gen
ome
shot
gun_
sequ
ence
3241
6131
3241
6981
PhaV
ulg_
526
8269
3326
8277
8285
.764
7+
850
3241
6429
3241
6584
LOC1
0081
4013
GLY
MA
_13G
2103
00m
itoge
n-ac
tivat
ed
prot
ein
kina
se 1
5-lik
e
3252
3009
3252
3502
PhaV
ulg_
527
0417
9327
0422
8686
.409
7+
494
3252
3037
3252
3443
LOC1
0081
6140
GLY
MA
_13G
2116
00
F-bo
x/LR
R-re
peat
pr
otei
n 4-
like%
2C
tran
scri
pt v
aria
nt X
1
3277
9883
3278
2745
PhaV
ulg_
527
2465
9327
2494
5789
.447
9+
2865
3277
9922
3278
1577
LOC1
0077
7288
GLY
MA
_13G
2144
00
seri
ne/t
hreo
nine
-pr
otei
n ki
nase
RU
NK
EL-l
ike
3284
8947
3285
0530
PhaV
ulg_
527
2941
6527
2957
4488
.060
6+
1580
3285
0020
3285
0505
LOC1
0077
8885
GLY
MA
_13G
2150
00in
activ
e be
ta-
amyl
ase
9
3455
1754
3455
2841
PhaV
ulg_
529
1045
4929
1056
3087
.396
5+
1082
3455
1796
3455
2806
LOC1
0079
2540
GLY
MA
_13G
2348
00
seri
ne/t
hreo
nine
-pr
otei
n ki
nase
-lik
e pr
otei
n A
CR4
3470
6927
3470
8223
PhaV
ulg_
529
2399
4429
2412
4086
.651
2+
1297
3470
7002
3470
8057
LOC1
0079
8896
GLY
MA
_13G
2367
00
puta
tive
leuc
ine-
rich
re
peat
rec
epto
r-lik
e se
rine
/thr
eoni
ne-
prot
ein
kina
se
At2
g144
40%
2C
tran
scri
pt v
aria
nt X
2
3470
6927
3470
8223
PhaV
ulg_
529
2399
4429
2412
4086
.651
2+
1297
3470
7002
3470
8057
LOC1
0079
8896
GLY
MA
_13G
2367
00
puta
tive
leuc
ine-
rich
repe
at r
ecep
tor-
like
serin
e/th
reon
ine-
prot
ein
kina
se A
t2g
1444
0 is
ofor
m X
1
3558
2629
3558
4126
PhaV
ulg_
530
0278
0830
0293
0590
.314
+14
9835
5826
7735
5840
18LO
C100
7851
28G
LYM
A_1
3G24
7300
prob
able
ser
ine/
thre
onin
e-pr
otei
n ki
nase
abk
C is
ofor
m
X1
3558
2629
3558
4126
PhaV
ulg_
530
0278
0830
0293
0590
.314
+14
9835
5826
7735
5840
18LO
C100
7851
28G
LYM
A_1
3G24
7300
prob
able
ser
ine/
thre
onin
e-pr
otei
n ki
nase
abk
C%2C
tr
ansc
ript
var
iant
X4
3571
2009
3571
3485
PhaV
ulg_
530
1447
6830
1462
4589
.024
4+
1478
3571
2083
3571
3370
LOC1
0080
4024
GLY
MA
_13G
2493
00
G-t
ype
lect
in S
- re
cept
or-l
ike
serin
e/
thre
onin
e-pr
otei
n ki
nase
At4
g272
90
isof
orm
X1
3189
5480
3189
7607
PhaV
ulg_
526
3186
3326
3207
5585
.049
+21
2331
8956
0231
8959
59LO
C102
6615
44G
LYM
A_1
3G20
4900
unch
arac
teri
zed
prot
ein
LOC1
0266
1544

Gaurav Singh and Anil Kumar
130 SYNTENY ANALYSIS OF GLYCINE MAX AND PHASEOLUS VULGARIS REVEALING CONSERVED REGIONS BIOSCIENCE BIOTECHNOLOGY RESEARCH COMMUNICATIONS
Tabl
e 3.
Dif
fere
nt f
unct
ions
of
gene
pro
duct
s of
Gly
cine
max
and
Pha
seol
us v
ulga
ris.
Gen
e Lo
cati
on
in G
lyci
ne m
axG
ene
prod
ucts
Func
tion
s
Mol
ecul
arBio
logi
cal
LOC1
0078
9734
mito
gen-
activ
ated
pro
tein
kin
ase
kina
se 2
ATP
bin
ding
, MA
P ki
nase
kin
ase
activ
ity
and
prot
ein
seri
ne/t
hreo
nine
kin
ase
activ
ity
Act
ivat
ion
of M
APK
act
ivity
, act
ivat
ion
of
prot
ein
kina
se a
ctiv
ity, a
uxin
tra
nspo
rt, c
old
accl
imat
ion,
def
ense
res
pons
e, in
com
patib
le
inte
ract
ion,
res
pons
e to
col
d, r
espo
nse
to
salt
stre
ss, s
igna
l tra
nsdu
ctio
n by
pro
tein
ph
osph
oryl
atio
n, s
tres
s-ac
tivat
ed p
rote
in k
inas
e si
gnal
ling
casc
ade
and
xyle
m a
nd p
hloe
m
patt
ern
form
atio
n
LOC1
0078
7066
guan
ine
nucl
eotid
e-bi
ndin
g pr
otei
n su
buni
t ga
mm
a 3-
like
isof
orm
X1
-G
pro
tein
-cou
pled
rec
epto
r si
gnal
ling
path
way
LOC1
0081
1146
1-ph
osph
atid
ylin
osito
l-3-
phos
phat
e 5-
kina
se
FAB1
B-lik
e%2C
tra
nscr
ipt
vari
ant
X1
ATP
bin
ding
, met
al io
n bi
ndin
g an
d ph
osph
atid
ylin
osito
l pho
spha
te k
inas
e ac
tivity
-
LOC1
0077
8006
prob
able
GTP
dip
hosp
ho k
inas
e CR
SH%
2C
chlo
ropl
astic
Calc
ium
ion
bind
ing
and
kina
se a
ctiv
ityG
uano
sine
tet
ra p
hosp
hate
met
abol
ic p
roce
ss
LOC1
0077
5655
unch
arac
teri
zed
prot
ein
LOC1
0077
5655
LOC1
0078
4243
rece
ptor
-lik
e se
rine
/thr
eoni
ne-p
rote
in k
inas
e A
LE2%
2C t
rans
crip
t va
rian
t X
1A
TP b
indi
ng a
nd p
rote
in k
inas
e ac
tivity
-
LOC1
0079
8007
prob
able
LRR
rec
epto
r-lik
e se
rine
/thr
eoni
ne-
prot
ein
kina
se A
t1g6
7720
ATP
bin
ding
and
pro
tein
kin
ase
activ
ity-
LOC1
0081
4013
mito
gen-
activ
ated
pro
tein
kin
ase
15-l
ike
ATP
bin
ding
and
pro
tein
kin
ase
activ
ity-

Gaurav Singh and Anil Kumar
BIOSCIENCE BIOTECHNOLOGY RESEARCH COMMUNICATIONS SYNTENY ANALYSIS OF GLYCINE MAX AND PHASEOLUS VULGARIS REVEALING CONSERVED REGIONS 131
LOC1
0081
6140
F-bo
x/LR
R-re
peat
pro
tein
4-l
ike%
2C t
rans
crip
t va
rian
t X
1Pe
ptid
yl-p
roly
l cis
-tra
ns is
omer
ase
activ
ity a
nd u
nfol
ded
prot
ein
bind
ing
-
LOC1
0077
7288
seri
ne/t
hreo
nine
-pro
tein
kin
ase
RUN
KEL
-lik
eA
TP b
indi
ng a
nd p
rote
in k
inas
e ac
tivity
-
LOC1
0077
8885
inac
tive
beta
-am
ylas
e 9
Beta
-am
ylas
e ac
tivity
Poly
sacc
hari
de c
atab
olic
pro
cess
LOC1
0079
2540
seri
ne/t
hreo
nine
-pro
tein
kin
ase-
like
prot
ein
ACR
4A
TP b
indi
ng a
nd p
rote
in k
inas
e ac
tivity
-
LOC1
0079
8896
puta
tive
leuc
ine-
rich
rep
eat
rece
ptor
-lik
e se
rine
/th
reon
ine-
prot
ein
kina
se A
t2g1
4440
%2C
tr
ansc
ript
var
iant
X2
Kin
ase
activ
ity-
LOC1
0078
5128
prob
able
ser
ine/
thre
onin
e-pr
otei
n ki
nase
ab
kC%
2C t
rans
crip
t va
rian
t X
4K
inas
e ac
tivity
-
LOC1
0080
9556
hom
eobo
x-le
ucin
e zi
pper
pro
tein
HD
G2
DN
A-b
indi
ng t
rans
crip
tion
fact
or a
ctiv
ity,
lipid
bin
ding
and
seq
uenc
e-sp
ecifi
c D
NA
bi
ndin
g
Mai
nten
ance
of
fl or
al o
rgan
iden
tity
and
tric
hom
e-m
orph
ogen
esis
LOC1
0080
1911
puta
tive
E3 u
biqu
itin-
prot
ein
ligas
e RI
NG
1aM
etal
ion
bind
ing
and
tran
sfer
ase
activ
ity
Cell
fate
det
erm
inat
ion,
chr
omat
in o
rgan
izat
ion,
m
aint
enan
ce o
f fl
oral
mer
iste
m id
entit
y,
mai
nten
ance
of
infl
ores
cenc
e m
eris
tem
iden
tity,
m
aint
enan
ce o
f sh
oot
apic
al m
eris
tem
iden
tity,
ne
gativ
e re
gula
tion
of g
ene
expr
essi
on,
epig
enet
ic, n
egat
ive
regu
latio
n of
tra
nscr
iptio
n,
DN
A-t
empl
ated
and
pro
tein
ubi
quiti
natio
n
LOC1
0077
6037
V-t
ype
prot
on A
TPas
e su
buni
t a1
-lik
e is
ofor
m
X2
ATP
ase
bind
ing,
pro
ton-
tran
spor
ting
ATP
ase
activ
ity a
nd r
otat
iona
l mec
hani
sm
ATP
hyd
roly
sis
coup
led
prot
on t
rans
port
, pr
oton
-tra
nspo
rtin
g V
-typ
e A
TPas
e co
mpl
ex
asse
mbl
y an
d va
cuol
ar a
cidi
fi ca
tion
LOC1
0079
2901
unch
arac
teri
zed
ATP
-dep
ende
nt h
elic
ase
C23E
6.02
-lik
e%2C
tra
nscr
ipt
vari
ant
X2
ATP
bin
ding
, hel
icas
e ac
tivity
and
met
al
ion
bind
ing
-
LOC1
0078
2114
B3 d
omai
n-co
ntai
ning
pro
tein
Os0
7g05
6330
0-lik
eD
NA
bin
ding
and
zin
c io
n bi
ndin
gRe
gula
tion
of t
rans
crip
tion,
DN
A-t
empl
ated
tr
ansc
ript
ion,
and
DN
A-t
empl
ated
Sour
ce: I
nter
Pro,
Uni
Prot
KB-
Uni
Rule
,Uni
Prot
KB-
KW
, GO
_Cen
tral
, TA
IR.

Gaurav Singh and Anil Kumar
132 SYNTENY ANALYSIS OF GLYCINE MAX AND PHASEOLUS VULGARIS REVEALING CONSERVED REGIONS BIOSCIENCE BIOTECHNOLOGY RESEARCH COMMUNICATIONS
showed the gene conservation between both the legumes. Studies of the NBS-LRR gene family in legume plants can provide knowledge on the genomic and molecular mechanism that form the basis of gene regulation and protein functions. In this study, various NBS-LRR pro-teins (as mentioned in table 3 showing different func-tions of gene products) were found to be conserved in Glycine max and Phaseolus vulgaris. Now a day’s gene cloning approach is advancing to make disease resist-ance varieties of legumes as in Medicago sativa clon-ing of a disease resistance gene was done by utilizing Medicago truncatula gene information through synteny (Yang et. at., 2008). In the same way this synteny analy-sis result will be useful for evolutionary studies that help in long term planning, breeding and developing disease resistance varieties of legumes.
ACKNOWLEDGEMENTS
Authors acknowledge the facilities of the Department of Biotechnology, Ministry of Science and Technol-ogy, Government of India, New Delhi (DBT) under the Bioinformatics Sub Centre as well as the golden jubilee research fellowship (GJRF) provided by School of Bio-technology, Devi Ahilya University Indore. M.P. India.
Confl ict of Interest
The authors confi rm that they have no confl ict of inter-est.
REFERENCES
Andersen, E. J., Ali, S., Reese, R. N., Yen, Y., Neupane, S., & Nepal, M. P. (2016). Diversity and evolution of disease resist-ance genes in barley (Hordeum vulgare L.). Evolutionary Bio-informatics, 12, EBO-S38085.
Andolfo, G., & Ercolano, M. R. (2015). Plant innate immunity multicomponent model. Frontiers in plant science, 6, 987.
Bauchan, G. R., & Hossain, M. A. (2001). Distribution and char-acterization of heterochromatic DNA in the tetraploid African population alfalfa genome. Crop science, 41(6), 1921-1926.
Bennetzen, J. L. (2000). Comparative sequence analysis of plant nuclear genomes: microcolinearity and its many excep-tions. The Plant Cell, 12(7), 1021-1029.
Benson, B. V. (2014). Disease resistance genes and their evolu-tionary history in six plant species.
Boutin, S. R., Young, N. D., Olson, T., Yu, Z. H., Vallejos, C. E., & Shoemaker, R. C. (1995). Genome conservation among three legume genera detected with DNA markers. Genome, 38(5), 928-937.
Cannon, S. B., & Shoemaker, R. C. (2012). Evolutionary and comparative analyses of the soybean genome. Breeding sci-ence, 61(5), 437-444.
Chen, X., Li, H., Pandey, M. K., Yang, Q., Wang, X., Garg, V., ... & Upadhyaya, H. (2016). Draft genome of the peanut A-genome progenitor (Arachis duranensis) provides insights into geocarpy, oil biosynthesis, and allergens. Proceedings of the National Academy of Sciences, 113(24), 6785-6790.
Choi, H. K., Mun, J. H., Kim, D. J., Zhu, H., Baek, J. M., Mudge, J., ... & Young, N. D. (2004). Estimating genome conservation between crop and model legume species. Proceedings of the National Academy of Sciences, 101(43), 15289-15294.
Christie, N., Tobias, P. A., Naidoo, S., & Külheim, C. (2016). The Eucalyptus grandis NBS-LRR gene family: physical clustering and expression hotspots. Frontiers in plant science, 6, 1238.
Devos, K. M., & Gale, M. D. (2000). Genome relationships: the grass model in current research. The Plant Cell, 12(5), 637-646.
Doyle, J. J., & Luckow, M. A. (2003). The rest of the ice-berg. Legume diversity and evolution in a phylogenetic con-text. Plant Physiology, 131(3), 900-910.
Franssen, S. U., Shrestha, R. P., Bräutigam, A., Bornberg-Bauer, E., & Weber, A. P. (2011). Comprehensive transcriptome analy-sis of the highly complex Pisum sativum genome using next generation sequencing. BMC genomics, 12(1), 227.
Gualtieri, G., Kulikova, O., Limpens, E., Kim, D. J., Cook, D. R., Bisseling, T., & Geurts, R. (2002). Microsynteny between pea and Medicago truncatula in the SYM2 region. Plant molecular biology, 50(2), 225-235.
Gururani, M. A., Venkatesh, J., Upadhyaya, C. P., Nookaraju, A., Pandey, S. K., & Park, S. W. (2012). Plant disease resistance genes: current status and future directions. Physiological and molecular plant pathology, 78, 51-65.
Hulbert, S. H., Webb, C. A., Smith, S. M., & Sun, Q. (2001). Resistance gene complexes: evolution and utilization. Annual review of phytopathology, 39(1), 285-312.
Kalavacharla, V., Liu, Z., Meyers, B. C., Thimmapuram, J., & Melmaiee, K. (2011). Identifi cation and analysis of common bean (Phaseolus vulgaris L.) transcriptomes by massively par-allel pyrosequencing. BMC plant biology, 11(1), 135.
Kang, Y. J., Kim, S. K., Kim, M. Y., Lestari, P., Kim, K. H., Ha, B. K., ... & Shim, S. (2014). Genome sequence of mungbean and insights into evolution within Vigna species. Nature communi-cations, 5, ncomms6443.
Lee, C., Yu, D., Choi, H. K., & Kim, R. W. (2017). Reconstruc-tion of a composite comparative map composed of ten legume genomes. Genes & Genomics, 39(1), 111-119.
Lee, J. M., Grant, D., Vallejos, C. E., & Shoemaker, R. C. (2001). Genome organization in dicots. II. Arabidopsis as a’bridging species’ to resolve genome evolution events among leg-umes. Theoretical and Applied Genetics, 103(5), 765-773.
McClean, P. E., Mamidi, S., McConnell, M., Chikara, S., & Lee, R. (2010). Synteny mapping between common bean and soy-bean reveals extensive blocks of shared loci. BMC genom-ics, 11(1), 184.
McConnell, M., Mamidi, S., Lee, R., Chikara, S., Rossi, M., Papa, R., & McClean, P. (2010). Syntenic relationships among

Gaurav Singh and Anil Kumar
BIOSCIENCE BIOTECHNOLOGY RESEARCH COMMUNICATIONS SYNTENY ANALYSIS OF GLYCINE MAX AND PHASEOLUS VULGARIS REVEALING CONSERVED REGIONS 133
legumes revealed using a gene-based genetic linkage map of common bean (Phaseolus vulgaris L.). Theoretical and Applied Genetics, 121(6), 1103-1116.
Nepal, M. P., & Benson, B. V. (2015). CNL disease resistance genes in soybean and their evolutionary divergence. Evolu-tionary Bioinformatics, 11, EBO-S21782.
Neupane, S., Ma, Q., Mathew, F. M., Varenhorst, A. J., Andersen, E. J., & Nepal, M. P. (2018). Evolutionary Divergence of TNL Disease-Resistant Proteins in Soybean (Glycine max) and Com-mon Bean (Phaseolus vulgaris). Biochemical genetics, 1-26.
Passoupathy, R. (2016). Synteny with Allied and Model Genomes. 10.1007/978-3-319-47789-3_6.
Paterson, A. H., Bowers, J. E., Burow, M. D., Draye, X., Elsik, C. G., Jiang, C. X., ... & Wright, R. J. (2000). Comparative genom-ics of plant chromosomes. The Plant Cell, 12(9), 1523-1539.
Sato, S., Nakamura, Y., Kaneko, T., Asamizu, E., Kato, T., Nakao, M., & Fujishiro, T. (2008). Genome structure of the leg-ume, Lotus japonicus. DNA research, 15(4), 227-239.
Schlueter, J. A., Dixon, P., Granger, C., & Shoemaker, R. C. (2005). Mining the EST databases to determine evolutionary events in the legumes and grasses. In Genome Exploitation (pp. 163-181). Springer, Boston, MA.
Schmidt, R. (2000). Synteny: recent advances and future pros-pects. Current opinion in plant biology, 3(2), 97-102.
Schmutz, J., Cannon, S. B., Schlueter, J., Ma, J., Mitros, T., Nelson, W., ... & Xu, D. (2010). Genome sequence of the pal-aeopolyploid soybean. Nature, 463(7278), 178.
Schmutz, J., McClean, P. E., Mamidi, S., Wu, G. A., Cannon, S. B., Grimwood, J., ... & Torres-Torres, M. (2014). A reference genome for common bean and genome-wide analysis of dual domestications. Nature genetics, 46(7), 707.
Shao, Z. Q., Xue, J. Y., Wu, P., Zhang, Y. M., Wu, Y., Hang, Y. Y., ... & Chen, J. Q. (2016). Large-scale analyses of angiosperm
nucleotide-binding site-leucine-rich repeat (NBS-LRR) genes reveal three anciently diverged classes with distinct evolution-ary patterns. Plant Physiology, pp-01487.
Shoemaker, R. C., Polzin, K., Labate, J., Specht, J., Brummer, E. C., Olson, T., ... & Kochert, G. (1996). Genome duplication in soybean (Glycine subgenus soja). Genetics, 144(1), 329-338.
Singh, J., Kalberer, S. R., Belamkar, V., Assefa, T., Nelson, M. N., Farmer, A. D., ... & Cannon, S. B. (2018). A transcriptome-SNP-derived linkage map of Apios americana (potato bean) provides insights about genome re-organization and syn-teny conservation in the phaseoloid legumes. Theoretical and Applied Genetics, 131(2), 333-351.
Varshney, R. K., Song, C., Saxena, R. K., Azam, S., Yu, S., Sharpe, A. G., ... & Millan, T. (2013). Draft genome sequence of chickpea (Cicer arietinum) provides a resource for trait improvement. Nature biotechnology, 31(3), 240.
Weeden, N. F., Muehlbauer, F. J., & Ladizinsky, G. (1992). Extensive conservation of linkage relationships between pea and lentil genetic maps. Journal of Heredity, 83(2), 123-129.
Yadegari, Z. (2013). Molecular mapping and characterization of phenylpropanoid pathway genes in common bean (Phaseo-lus vulgaris L.) (Doctoral dissertation).
Young, N. D., Debellé, F., Oldroyd, G. E., Geurts, R., Cannon, S. B., Udvardi, M. K., ... & Van de Peer, Y. (2011). The Medicago genome provides insight into the evolution of rhizobial symbi-oses. Nature, 480(7378), 520.
Young, N. D., Mudge, J., & Ellis, T. N. (2003). Legume genomes: more than peas in a pod. Current opinion in plant biology, 6(2), 199-204.
Zhu, H., Choi, H. K., Cook, D. R., & Shoemaker, R. C. (2005). Bridging model and crop legumes through comparative genomics. Plant physiology, 137(4), 1189-1196.

Biological eco-friendly synthesis of nanoparticles and
their applications
Vivek Singh, Divya Bhatia, Sunita Khatak, Tarun Kumar and Deepak Kumar Malik*
Department of Biotechnology, U.I.E.T, Kurukshetra University Kurukshetra, Kurukshetra, Haryana, India-136119
ABSTRACT
The use, formation and manipulation of materials at nanoscale level is known as Nanotechnology, which change their properties at nanoscale. The nanoscale materials can be synthesized by using physical and chemical processes. Size, shape, morphology, stability and properties of nanoparticles can have direct impact on their potential appli-cations. The design of an eco-friendly, time effective and economic synthesis method with easy control over their essential properties has become a leading area of research. Now a days, the biological entities are employed to improve nanoparticles production without the use of any harsh chemicals. The biological synthesis of nanoparticles is an eco-friendly method. Nanoparticles have broad range of applications such as optical, electronics, electrical, medical, environment, textile, energy science, optoelectronics, catalysis, single electron transistors, light emitters, nonlinear optical devices, photo-electrochemical applications, cosmetics and food industries owing to their unique physiochemical properties. The aim of this critical review is to provide an insight into the ecofriendly synthesis of nanoparticles with signifi cant applications in various fi elds.
134
Biotechnological CommunicationBiosci. Biotech. Res. Comm. 12(1): 134-139 (2019)
INTRODUCTION
The mechanical, magnetic, electrical and optical proper-ties of materials having particle size between 0.1 and 100 nm can be different from the same materials at larger size. Now scientists are changing the form and size of materials at nano scale level to recognize the uncommon properties of the material. Metal nanoparticles like gold,
titanium, titanium oxide, zinc oxide, iron, copper, silver and platinum are widely used in various domestic and commercial products. Silver nanoparticles are of interest owing to the distinctive properties which may be assimi-lated into antimicrobial applications, cosmetic products, biosensor materials, refrigerant super-conducting mate-rials, composite fi bres and electronic components. Gold nanoparticles are presently under intensive study for
ARTICLE INFORMATION:
Corresponding Author: [email protected] 18th Jan, 2019Accepted after revision 20th March, 2019BBRC Print ISSN: 0974-6455Online ISSN: 2321-4007 CODEN: USA BBRCBA Thomson Reuters ISI ESC / Clarivate
Analytics USAMono of Clarivate Analytics and Crossref Indexed Journal Mono of CR
NAAS Journal Score 2019: 4.31 SJIF: 4.196© A Society of Science and Nature Publication, Bhopal India 2019. All rights reserved.Online Contents Available at: http//www.bbrc.in/DOI: 10.21786/bbrc/12.1/17

BIOSCIENCE BIOTECHNOLOGY RESEARCH COMMUNICATIONS BIOLOGICAL ECO-FRIENDLY SYNTHESIS OF NANOPARTICLES AND THEIR APPLICATIONS 135
Vivek Singh et al.
Table 1. Various bacterial entities responsible for the synthesis of nanoparticles
Biological entitySize of nanoparticles
Type of Nanoparticle
Extracellular/ intracellular
References
Bacteria
Pseudomonas aeruginosa 30-40nm Silver Extracellular Jeevan et al., (2012)
Lysinibacillus varians. 10-20nm Silver Extracellular Bhatia et al., (2018)
Burkholderia fungorum 95-100nm Gold Extracellular Khoei et al., (2017)
Lactobacillus casei 50-80nm Silver Intracellular Xu et al., (2018)
Fungi
Aspergillus niger 15-80nm Silver Extracellular Elegbede et al., (2018)
Helminthosporium sp. 15-20nm Silver ExtracellulerLachmapure et al., (2017)
Cladosporium cladosporioides 10-20nm Gold Extracellular Joshi et al.,(2017)
Pestalotiopsis microspora 2-10nm Gold Extracellular Netala et al., (2016)
Plants
Viburnum lantana 2- 80 nm Silver Leaves Shafaghat (2015)
Tinospora cordifolia 60nm Silver Stem Selvam et al., (2017)
Vitis viniera 10-80 nm Silver Fruit Ahmed et al., (2016)
applications in ultrasensitive chemical, optoelectronic devices and biological sensors and as catalysts, (Perez et al., 2012 Khoei et al., 2017 Xu et al., 2018 ).
Evaporation-condensation and optical device abla-tion are the leading physical approaches for the synthe-sis of nanoparticles. However, Physical-chemical tech-niques of synthesis have many diffi culty in scaling-up the process, separation and purifi cation of nanoparti-cles. Microorganisms have been utilized in biotechnol-ogy implementations like bioremediation and bioleach-ing (Stephen et al., 1999). Microorganisms are able to carry out a range of oxidoreduction mechanisms and promote biochemical translation (Sastry et al., 2004). The biological methods are responsible for the synthe-sis of mono-dispersed silver nanoparticles starting from 5 to 15 nm in size (Karthik et al., 2014, Hassan et al., 2018). Now a days, biological methods are used for the synthesis of nanoparticles, to construct the sustainable processes, which do not produce any harmful chemi-cals in to the environment. The plants and microorgan-isms used for the synthesis of nanoparticles are listed in Table 1.
Actinomycetes and Algae
Biogenesis of metal nanoparticles by using actinomy-cetes and algae is seeking attention since decade due to their unique property of intra and extra cellular syn-thesis of nanoparticles (Abdeen et al., 2014). Reduc-tion of metal ions may be due to interacting enzymes being released from the cell membrane and cell wall. Actinomycetes mediated synthesis of copper oxide nanoparticles and study for its antibacterial activity
against selected human and fi sh pathogens was reported by Nabila et al., (2018). In algae mediated synthesized nanoparticles decahedral, polyhedron and tetrahedral structure were observed (Luangpipat et al., 2011). Raja-sulochana et al. (2010) reported the synthesis of silver nanoparticles by using Kappaphycus alvarezii. Senapati et al. (2012) reported the intracellular synthesis of silver nanoparticles via Tetraselmis kochinensis. Castro et al. (2013) reported the use of red Chondrus crispus and green algae Spirogyra insignis for the synthesis of gold and silver nanoparticles.
Bacteria and Fungi
Ability of bacteria to survive in diverse and sometimes extreme environmental situations renders them a suit-able candidate for nanoparticles synthesis. Survival in these harsh conditions ultimately depends on their abil-ity to resist the effects of environmental stresses. Bac-teria are able to synthesize metallic nanoparticles by either intracellular or extracellular mechanisms. The various bacterial species were reported to synthesize the nanoparticles such as Actinobacter sp., Escherichia coli, Klebsiella pneumonia, Lactobacillus sp., Bacillus cereus, Corynebacterium sp. and Pseudomonas sp. (Mohanpuria et al., 2008; Iravani et al., 2014; Sunkar et al., 2014; Tol-lamadugu et al., 2011). The silver nanoparticles were syn-thesized by Pseudomonas stutzeri AG259 by reduction of Ag ions (Ahmad et al., 2003). Husseiny et al. (2007) reported extracellular synthesis of silver nanoparticles by using Pseudomonas. Sneha et al. (2010) reported that Corynebacterium sp. shows a non-enzymatic reduction mechanism in nanoparticle synthesis. The dried biomass

136 BIOLOGICAL ECO-FRIENDLY SYNTHESIS OF NANOPARTICLES AND THEIR APPLICATIONS BIOSCIENCE BIOTECHNOLOGY RESEARCH COMMUNICATIONS
Vivek Singh et al.
of Lactobacillus sp. and Bacillus megaterium reduced silver ions using interaction of molecules present on the cytomembrane to produce silver nanoparticles (Fu et al., 2000).
Fungi being able to secrete large amounts of enzymes and proteins per unit of biomass can be utilized for synthesis of huge amounts of nanoparticles (Naray-anan et al., 2010). The Aspergillus sp., Fusarium sp. and Penicillium sp. have been reported for their biosynthetic ability of silver and gold nanoparticles (Vigneshwaran et al., 2007; Shankar et al., 2003; Philip et al., 2009). The extracellular synthesis of silver nanoparticles by using Aspergillus fumigatus has been reported (Bhainsa and D’Souza, 2006). The biological synthesis of Au nanopar-ticles was carried out by reduction of Au ions by using Trichothecium sp. biomass (Ahmad et al., 2005). The extracellular synthesis of nanoparticles due to its pro-teins discharged by fungal biomass was reported (Mac-donald et al., 1996). Bansal et al. (2007) reported that Fusarium oxysporum synthesized silica and titanium nanoparticles from binary compound solutions of SiO6
2- and TiF6
2- respectively.
Viruses, Yeast and Plants
The virus capsid proteins make an extremely reactive surface able to interact with metallic ions (Makarov et al., 2014). The selection of proteins will act as attach-ment area for the deposition of materials (Kobayashi et al., 2012). In virus mediated synthesis, size was sig-nifi cantly reduced along with increase in their numbers as compared to non viral mediated synthesis (Makarov et al., 2014). The low concentrations of TMV’s were sup-plementary to silver or gold salts before adding plant extracts of Nicotiana benthamiana or Hordeum vulgare.
Yeasts can absorb and accumulate significant amounts of toxic metals from their surrounding environment (Mandel et al., 2006). Due to this property, yeast has been exploited for synthesis of metal nanoparticlesn. Yeasts use different mechanism for the synthesis and stability of nanoparticles which leads to variation in particle size, location and properties (Hulkoti et al., 2014). Dameron et al. (1989) reported Candida glabrata mediated intracel-lular synthesis of CdS quantum dots. Schizosaccharomy-ces pombe cells were used for the synthesis of CdS quan-tum dots (Reese et al., 1998). The intracellular synthesis of PbS quantum dots was carried out by Torulopsis sp. when exposed to Pb2- ions (Kowshik et al., 2002).
Plants mediated synthesis is a relatively simple, less time consuming, cost effective and an ecofriendly pro-cess. The process begins by mixing a sample of plant extract with a metal salt solution. In plants medi-ated synthesis of nanoparticles, metal ions changed from mono or divalent oxidation states to zero-valent states. As growth progresses nanoparticles combine to
form different morphologies (Akhtar et al., 2013; Malik et al., 2014). The plants extract properties and incuba-tion temperature significantly influence the synthesis of nanoparticles (Dwivedi et al., 2010). The plant mediated nanoparticles synthesis are to be safe, less synthesis time and lesser cultivation value as compare to biological systems (Mittal et al., 2013).
Applications of nanoparticles
One of the major applications of nanotechnology is in biology and medicine. Nanoparticles are used for detec-tion of pathogens (Edelstein et al., 2000), detection of proteins (Nam et al., 2003), analysis of DNA structure (Mahtab et al., 1995), Tissue engineering (Ma et al., 20039, de la isla et al., 2003). Now days, superbugs with multi drug resistance are major threat to human being. Nanotechnology can be a solution to combat antimicro-bial drug resistance. Nanotechnology provides synthesis and design strategies to develop antimicrobial nanother-apeutics to fi ght the trouble of antimicrobial resistance. The large surface area-to-volume ratio at nanoscale may be the reason of antimicrobial mechanism against a broad spectrum of microorganisms. Nanoparticles can also be manipulated for effective and targeted delivery of drugs and imaging labels by overcoming the many biological, biophysical, and biomedical barriers. Nano-particles has been also employed for targeted drug deliv-ery at the tumor site or a certain group of cells with-out affecting non target cells (Huang, et al., 2015 Shen et al., 2016, Escarcega et al., 2018).
The silver nanoparticles accumulate in tumours and their distinctive optical and chemical properties may be utilized in thermal treatment procedures (Hirsch et al., 2003). Nanoparticles have been used in anti-odour clothes, furnishings textiles, kitchen cloths, sponges, towels, antibacterial drugs, patient dresses, reusable sur-gical gloves, protecting face masks, suits against biohaz-ards, cosmetic products, toothbrushes, ultra hydrophobic materials with potential applications within the produc-tion of extremely water repellent materials, bactericide material to coat hospital instrumentation, antitumor medication, active wear, food packaging and waste water treatments (Pissuwan et al., 2009, Cheng et al., 2010, Lee et al. 2007, Ramaratnam et al. 2008, Hassan et al., 2012). TiO2 nanoparticles, as a result of their anti-bacterial activity, are utilized in antibacterial coatings and effl uent disinfection processes (Miller et al., 2012).
REFERENCES
Abdeen, S.; Geo, S.; Sukanya, S.; Praseetha, P.K.; Dhanya, R.P. Biosynthesis of Silver nanoparticles from Actinomycetes for therapeutic applications. Int. J. Nano Dimens. 2014, 5, 155–162.

BIOSCIENCE BIOTECHNOLOGY RESEARCH COMMUNICATIONS BIOLOGICAL ECO-FRIENDLY SYNTHESIS OF NANOPARTICLES AND THEIR APPLICATIONS 137
Vivek Singh et al.
Ahmad A., Senapati S., Khan M. I., Kumar R., Ramani R., Srini-vas V., and Sastry M., (2003) Intracellular synthesis of gold nanoparticles by a novel alkalotolerant actinomycete Rhodoc-occus species. Nanotechnology. Vol. 14: Pages 824–828.
Edelstein R. L., Tamanaha C .R., Sheehan P. E., Miller M. M., Baselt D. R., Whit- man L. J., Colton R. J. (2000) The BARC biosensor applied to the detection of biological warfare agents. Biosensors Bioelectron Vol.14: Pages 805-813.
Nam J. M., Thaxton C. C., Mirkin C. A. (2003) Nanoparticles-based bio-bar codes for the ultrasensitive detection of proteins. Science Vol. 301: Pages 1884-1886.
Mahtab R., Rogers J. P., Murphy C. J. (1995) Protein-sized quantum dot luminescence can distinguish between “straight”, “bent”, and “kinked” oligonucleotides. J. Am. Chem. Soc. Vol. 117: Pages9099-9100.
Ma J., Wong H., Kong L. B., Peng K. W. (2003) Biomimetic processing of nanocrystallite bioactive ap atite coating on tita-nium. Nanotechnol. Vol. 14: Pages 619-623.
de la Isla A., Brostow W., Bujard B., Estevez M., Rodriguez J. R., Vargas S., Castano V.M. (2003) Nanohybrid scratch resistant coating for teeth and bone viscoelasticity manifested in tribol-ogy. Mat. Resr. Innovat. Vol. 7: Pages107-114
Ahmad A., Senapati S., Khan M. I., Kumar R., and Sastry M., (2005) Extra-/intracellular, biosynthesis of gold nanoparticles by an alkalotolerant fungus, Trichothecium sp. J. Biomed. Nanotechnol. Vol. 1: Pages 47–53.
Ahmed S. M., Ahmad B. L., Swami., and Ikram S., (2016) A review on plants extract mediated synthesis of silver nanopar-ticles for antimicrobial applications: A green expertise, J. Adv. Res. Vol. 7: Pages 17–28.
Akhtar M. S., Panwar J., and Yun Y. S. (2013) Biogenic syn-thesis of metallic nanoparticles by plant extracts. ACS Sustain. Chem. Eng. Vol. 1: Pages 591–602.
Bansal V., Syed A., Bhargava S. K., Ahmad A., and Sastry M. (2007). Zirconia enrichment in zircon sand by selective fun-gus-mediated bioleaching of silica. Langmuir. Vol. 23(9): Pages 4993-4998.
Bhainsa C.K. and D’Souza, F. S., (2006). Extracellular biosyn-thesis of silver nanoparticles using the fungus Aspergillus fumigatus, Colloids Surfaces B; Biointerfaces. Vol. 47: Pages 160-164.
Shen B., Ma Y., (2016). Smart multifunctional magnetic nano-particle-based drug delivery system for cancer thermo-chem-otherapy and intracellular imaging. (2016) ACS Appl. Mater Interf. Vol. 8(37): Pages 24502–24508.
Huang B., Abraham W. D., et al., (2015) Active targeting of chemotherapy to disseminated tumors using nanoparticle-car-rying T cells. Sci. Trans. Med. 7, 291ra94
Bhatia D., Mittal A., and Malik D. K., (2016). Antimicrobial activity of PVP coated silver nanoparticles synthesized by Lysinibacillus varians. 3 Biotech. Vol. 6(2): Pages 196.
Castro L., Blazquez M. L., Munoz J. A., Gonzalez F., and Bal-lester A., (2013) Biological synthesis of metallic nanoparticles using algae. IET Nanobiotechnol. Vol. 7: Pages 109–116.
Cheng, Y., Samia A. C., Li J., Kenney M E., Resnick A., and Burda C., (2010) Delivery and efficacy of a cancer drug as a function of the bond to the gold nanoparticle surface. Lang-muir. Vol. 26: Pages 2248–2255.
Dwivedi A. D., and Gopal K., (2010) Biosynthesis of silver and gold nanoparticles using Chenopodium album leaf extract. Colloids Surf. A. Vol. 369: Pages 27–33.
Elegbede J. A., Lateef A., Azeez, M. A., Asafa T. B., Yekeen T. A., Oladipo I. C., and Gueguim-Kana E. B. (2018) Fungal xylanases-mediated synthesis of silver nanoparticles for cata-lytic and biomedical applications. IET Nanobiotechnology. Vol.12(6): Pages 857-863.
Escarcega-Gonzaez C. E., Garza-Cervantes J. A., Vazquez-Rod-riguez A., Montelongo-Peralta L. Z., Trevino-Gonzalez M. T., Castro E. D. B., and Rosales J. C. (2018). In vivo antimicrobial activity of silver nanoparticles produced via a green chemis-try synthesis using Acacia rigidula as a reducing and capping agent. International journal of nanomedicine. Vol. 13: Pages 2349.
Fu J. K., Liu Y. Y., Gu P. Y., Liang S. D., Yu L. Z., Xin Y. B., and Zhou W.S., (2000) Spectroscopic characterization on the biosorption and bioreduction of Ag(I) by Lactobacillus sp A09. Acta Phys. Chim. Sin. Vol. 16: Pages 779–782.
Hassan H. S., Elkady M. F., El-Sayed E. M., Hamed A. M., Hus-sein A. M., and Mahmoud I. M., (2018). Synthesis and Char-acterization of Zinc Oxide Nanoparticles using Green and Chemical Synthesis Techniques for phenol decontamination. International Journal of Nanoelectronics and Materials. Vol. 11(2): Pages 179-194.
Hassan M.S., Amna T., Yang O.B., El-Newehy M. H., Al-Deyab S. S., and Khil M. S., (2012) Smart copper oxide nanocrystals: Synthesis, characterization, electrochemical and potent anti-bacterial activity. Colloids Surf. B Biointerfaces. Vol. 97: Pages 201–206.
Hirsch L. R., Stafford R. J., Bankson J. A., Sershen S. R., Rivera B., Price R. E., and West J. L., (2003). Nanoshell-mediated near-infrared thermal therapy of tumours under magnetic resonance guidance. Proceedings of the National Academy of Sciences. Vol. 100 (23): Pages 13549-13554.
Hulkoti N. I., and Taranath T. C., (2014). Biosynthesis of nano-particles using microbes—a review. Colloids and Surfaces B: Biointerfaces. Vol. 121: Pages 474-483.
Husseiny M.I., El-Aziz M.A., Badr Y., and Mahmoud, M. A., (2007) Biosynthesis of gold nanoparticles using Pseudomonas aeruginosa. Spectrochim. Acta A. Vol. 67: Pages 1003–1006.
Iravani S., (2014) Bacteria in nanoparticle synthesis: Current status and future prospects. Int. Sch. Res. Not. Vol. 2014: Pages 359-316.
Jeevan P., Ramya K., and Rena A. E., (2012). Extracellular biosynthesis of silver nanoparticles by culture supernatant of Pseudomonas aeruginosa. Indian Journal of Biotehnology. Vol. 11: Pages 72-76.
Joshi C. G., Danagoudar A., Poyya J., Kudva A. K., and Dhanan-jaya B. L. (2017) Biogenic synthesis of gold nanoparticles by marine endophytic fungus-Cladosporium cladosporioides iso-
138 BIOLOGICAL ECO-FRIENDLY SYNTHESIS OF NANOPARTICLES AND THEIR APPLICATIONS BIOSCIENCE BIOTECHNOLOGY RESEARCH COMMUNICATIONS
Vivek Singh et al.
lated from seaweed and evaluation of their antioxidant and antimicrobial properties. Process Biochemistry. Vol. 63: Pages 137-144.
Karthik L., Kumar G., Vishnu-Kirthi A., Rahuman A. A., Rao V. B., (2014) Streptomyces sp. LK3 mediated synthesis of silver nanoparticles and its biomedical application. Bioprocess. Bio-syst. Eng. Vol. 37: Pages 261–267.
Khoei N. S., Lampis S., Zonaro E., Yrjala K., Bernardi P., and Vallini G., (2017). Insights into selenite reduction and biogen-esis of elemental selenium nanoparticles by two environmen-tal isolates of Burkholderia fungorum. New biotechnology. Vol. 34: Pages 1-11.
Kobayashi M., Tomita S., Sawada K., Shiba K., Yanagi H., Yamashita I., and Uraoka Y., (2012) Chiralmeta-molecules con-sisting of gold nanoparticles and genetically engineered tobacco mosaic virus. Opt. Express. Vol. 20: Pages 24856–24863.
Kowshik M., Vogel W., Urban J., Kulkarni S. K., and Pakni-kar K. M., (2002) Microbial synthesis of semiconductor PbS nanocrystallites. Adv. Mater. Vol. 14: Pages 815–818.
Lachmapure M., Paralikar P., Palanisamy M., Alves M., and Rai, M., (2017). Effi cacy of biogenic silver nanoparticles against clinical isolates of fungi causing mycotic keratitis in humans. IET Nanobiotechnology. Vol. 11(7): Pages 809-814.
Lee H. Y., Park Y. K., Lee Y. M, Kim K., and Park S.B., (2007) A practical procedure for producing silver nanocoated fabric and its antibacterial evaluation for biomedical applications. Chem Commun. Pages 2959–2961.
Luangpipat T., Beattie I.R., Chisti Y., and Haverkamp R.G., (2011) Gold nanoparticles produced in a microalga. J. Nano part. Res. Vol. 13: Pages 6439–6445.
Macdonald I.D.G., and Smith W.E., (1996) Orientation of cytochrome c adsorbed on a citrate-reduced silver colloid sur-face. Langmuir. Vol. 12: Pages 706–713.
Makarov V. V., Love A.J., Sinitsyna O. V., Makarova S. S., Yaminsky I. V., Taliansky M. E., Kalinina, N. O. (2014) Green nanotechnologies: Synthesis of metal nanoparticles using plants. Acta Naturae. Vol. 6: Pages 35–44.
Malik P., Shankar R., Malik V., Sharma N., and Mukherjee T. K, (2014) Green chemistry based benign routes for nanoparticle synthesis. J. Nanopart. Vol. 2014: Pages 302-429.
Miller R. J., Bennett S., Keller, A. A., and Pease, S., Lenihan, H. S., (2012) TiO2 nanoparticles are phototoxic to marine phyto-plankton. PLOS Biol. Vol. 7: Pages 1–7.
Mittal A. K., Chisti Y., and Banerjee U. C., (2013) Synthesis of metallic nanoparticles using plants. Biotechnol. Adv. Vol. 31: Pages 346–356.
Mohanpuria P., Rana N. K., and Yadav S. K., (2008) Biosynthe-sis of nanoparticles: Technological concepts and future appli-cations. J. Nanopart. Res. Vol. 10: Pages 507–517.
Mandel, C. R., Gebauer, D., Zhang, H., & Tong, L. (2006). A serendipitous discovery that in situ proteolysis is essential for the crystallization of yeast CPSF-100 (Ydh1p). Acta Crystal-lographica Section F: Structural Biology and Crystallization Communications, 62(10), 1041-1045.
Nabila M. I., and Kannabiran K., (2018). Biosynthesis, charac-terization and antibacterial activity of copper oxide nanopar-ticles (CuO NPs) from actinomycetes. Biocatalysis and Agricul-tural Biotechnology. Vol. 15: Pages 56-62.
Narayanan K. B., and Sakthivel N., (2010) Biological synthesis of metal nanoparticles by microbes. Adv. Colloid Interface Sci. Vol. 156: Pages 1–13.
Netala V. R., Bethu M. S., Pushpalatha B., Baki V. B., Aishwarya S., Rao J. V., and Tartte V., (2016). Biogenesis of silver nano-particles using endophytic fungus Pestalotiopsis microspora and evaluation of their antioxidant and anticancer activities. International journal of nanomedicine. Vol. 11: Pages 56-83.
Perez-Espitia P.J., Ferreira-Soares N. F., Dos Reis Coimbra J. S., De Andrade N. J., Cruz, R. S., and Medeiros, E. A. A., (2012) Zinc oxide nanoparticles: Synthesis, antimicrobial activity and food packaging applications. Food Bioprocess Technol. Vol. 5: Pages 1447–1464.
Philip, D., (2009) Biosynthesis of Au, Ag and Au-Ag nano-particles using edible mushroom extract. Spectrochim. Acta A. Vol. 73: Pages 374–381.
Pissuwan D., Cortie C. H. Valenzuela S. M., and Cortie M. B., (2009) Functionalised gold nanoparticles for controlling path-ogenic bacteria. Trends Biotechnol. Vol. 28: Pages 207–213.
Rajasulochana P., Dhamotharan R., Murugakoothan P., Murug-esan S., and Krishnamoorthy P., (2010) Biosynthesis and char-acterization of gold nanoparticles using the alga Kappaphycus alvarezii. Int. J. Nanosci. Vol. 9: Pages 511–516.
Ramaratnam K., Iyer S. K., Kinnan M. K., Chumanov G., Brown P. J., and Luzinov I., (2008) Ultra hydrophobic textiles using nanoparticles: lotus approach. J Eng Fibers Fabrics. Vol. 3: Pages 1–14.
Reese R. N., and Winge D. R., (1998) Sulfide stabilization of the cadmium--glutamyl peptide complex of Schizosaccharomyces pombe. J. Biol. Chem. Vol. 263: Pages 12832–12835.
Sastry M., Ahmad A., Khan M. I., and Kumar R., (2004) Micro-bial nanoparticle production. Nanotechnology, (Wiley-VCH, 2004).
Selvam K., (2017) Eco-friendly biosynthesis and characteriza-tion of silver nanoparticles using Tinospora cordifolia (Thunb.) Miers and evaluate its antibacterial, antioxidant potential, J. Radiat. Res. Appl. Sci. Vol. 10: Pages 6–12.
Senapati S., Syed A., Moeez S., Kumar A., and Ahmad, A. (2012) Intracellular synthesis of gold nanoparticles using alga Tetraselmis kochinensis. Mater. Lett. Vol. 79: Pages 116–118.
Shafaghat A., (2015) Synthesis and Characterization of Silver Nanoparticles by Phytosynthesis Method and Their Biological Activity, Synth. React. Inorganic, Met. Nano-Metal Chem. Vol. 45(3): Pages 381–387.
Shankar S. S., Ahmad A., Pasricha R., and Sastry M., (2003) Bio reduction of chloroaurate ions by Geranium leaves and its endophytic fungus yields gold nanoparticles of different shapes. J. Mater. Chem. Vol.13: Pages 1822–1826.
Sneha K., Sathish K. M., Mao J., Kwak I. S., and Yun Y. S., (2010) Corynebacterium glutamicum-mediated crystallization

BIOSCIENCE BIOTECHNOLOGY RESEARCH COMMUNICATIONS BIOLOGICAL ECO-FRIENDLY SYNTHESIS OF NANOPARTICLES AND THEIR APPLICATIONS 139
Vivek Singh et al.
of silver ions through sorption and reduction processes. Chem. Eng. J. Vol. 162: Pages 989–996.
Stephen J. R., and Macnaughton S. J., (1999) Developments in terrestrial bacterial remediation of metals. Curr. Opin. Biotech-nol. Vol. 10: Pages 230–233.
Sunkar S., and Nachiyar C. V., (2014) Biogenesis of antibacte-rial silver nanoparticles using the endophytic bacterium Bacil-lus cereus isolated from Garcinia xanthochymu. Asian Pac. J. Trop. Biomed. Vol. 12: Pages 953–959.
Tollamadugu N. V. K. V., Prasad T., Kambala V. S. R., and Naidu R., (2011) A critical review on biogenic silver nanoparticles
and their antimicrobial activity. Curr. Nanosci. Vol. 7: Pages 531–544.
Vigneshwaran N., Ashtaputre N. M., Varadarajan P.V., Nachane R.P., Paralikar K.M., and Balasubramanya R. H., (2007) Biologi-cal synthesis of silver nanoparticles using the fungus Aspergil-lus flavus. Mater. Lett. Vol. 61: Pages 1413–1418.
Xu C., Guo Y., Qiao L., Ma L., Cheng Y., and Roman, A., (2018). Biogenic synthesis of novel functionalized selenium nanopar-ticles by Lactobacillus casei ATCC 393 and its protective effects on intestinal barrier dysfunction caused by Enterotoxigenic E. coli K88. Frontiers in microbiology. Vol. 9: Pages 11-29.

Biotechnological management of water quality: A mini
review
Lakhan Kumar, Rajkumar Bidlan, Jaigopal Sharma and Navneeta Bharadvaja*
Department of Biotechnology, Delhi Technological University, Shahbad Daulatpur, Delhi-110042, India
ABSTRACT
Since eighteenth century onwards, with the advent of industrial revolution, petrochemical and chemical industries have seen tremendous growth. Wastewater is an essential raw material as well as a by-product of modern day industries and the magnitude of wastewater generation depends upon the level of technological progress of the particular industry of a particular country. It has been observed that least developed and developing countries generate a huge volume of wastewater as compared to the developed ones. This paper discusses the chemistry of water and wastewater, parameters of water for application in drinking water, wildlife and fi sheries, irrigation and industrial cooling purpose. Various methods based on physical, chemical and biological treatment available for treatment of wastewater to make it reusable and less harmful to the environment on discharge. Several biological methods of waste treatment and treatment process including trickling fi lter, activated sludge, aerated lagoon, and waste stabilisation ponds to reduce or degrade some pollutants have been presented in this study. New approaches incorporate natural processes instead of conventional chemical treatment. The role of various microbes has been also discussed to treat various organic pollutants present in wastewater. Applications of genetic engineered microbes as well as certain metabolic engineering mediated interven-tions have shown signifi cant degradation and reduction of pollutants concentration. Research on wastewater treatment suggests treatment of wastewater must be designed specifi cally for the particular type of effl uent produced. Neverthe-less, strategies can be developed for multipollutant targets using biotechnological approaches.
KEY WORDS: BIOLOGICAL TREATMENT, DDT, METABOLIC ENGINEERING, ORGANOCHLORINE, WASTEWATER
140
Biotechnological CommunicationBiosci. Biotech. Res. Comm. 12(1): 140-146 (2019)
ARTICLE INFORMATION:
Corresponding Author: [email protected] 15th Dec, 2018Accepted after revision 21st March, 2019BBRC Print ISSN: 0974-6455Online ISSN: 2321-4007 CODEN: USA BBRCBA Thomson Reuters ISI ESC / Clarivate
Analytics USAMono of Clarivate Analytics and Crossref Indexed Journal Mono of CR
NAAS Journal Score 2019: 4.31 SJIF: 4.196© A Society of Science and Nature Publication, Bhopal India 2019. All rights reserved.Online Contents Available at: http//www.bbrc.in/DOI: 10.21786/bbrc/12.1/18
BIOSCIENCE BIOTECHNOLOGY RESEARCH COMMUNICATIONS BIOTECHNOLOGICAL MANAGEMENT OF WATER QUALITY: A MINI REVIEW 141
Lakhan Kumar et al.
INTRODUCTION
Waste is defi ned as the unwanted or the discarded mate-rial which has no further known application and can be divided into three categories-solid, liquid and gaseous. When any undesired agent mixes with water it makes it impure and unacceptable for further use. Wastewater has been defi ned as water which has some impurities. Generally, it is pure water and various polluting agents in different proportion. Chemistry of pure water elabo-rating the physical and chemical properties of water and how its peculiar structure makes it a universal solvent has been discussed in detail later section. Wastewater is an essential a by-product of modern day industries (Buljan & Kral 2011, Shi Hanchang 2011, Miksch et al., 2015, González-Camejo et al., 2017).
From agriculture to domestic to anindustrial level, water is extensively used as a raw material. Agriculture and public health practices add many pesticides to the water making it unfi t for use. From oil, food, dairy& beverages to textile & leather to pharmaceutical & chemical to paper & pulp to metal and power gener-ating industries, each and every industry needs ahuge amount of water for its operation and is a major con-tributor of wastewater production. Nuclear, mining and quarries also produce agreat volume of wastewater as a by-product. For example, agricultural nitrate is one of the major reasons for groundwater pollution, (Shukla et al. 2013) (Miksch et al., 2015) (González-Camejo et al., 2017). After use of water, it is discharged as wastewater. Composition of wastewater varies to reference to its pro-duction site. Major characteristics include total organic content, solid content present in it, pH, temperature, col-our, presence of heavy metals and their concentration, presence of microbes and their population etc. For reuse of this water, government agencies and various interna-tional bodies dealing with water and health have graded water into different categories. In India, Central Pollu-tion Control Board has classifi ed water into fi ve classes depending upon their end use and passing the stand-ards set by it. It is very important to know the stand-ard parameters of water quality before its application towards human and animal consumption and for water-ing plants. Scientifi c progress in each sector contributed to exhaustion of water resources and waste generation. The amount of wastewater generation depends on the level of technological process development to the par-ticular industry in a particular country and it will be reduced with the improvement of industrial technology. (Hammer 2001, Gogate and Pandit, 2004, Rastogi, 2010 Shi, Hanchang 2011 Rawat et al., 2011, Veerakumari, 2015, Ansari et al., 2017).
It has been observed that least developed and devel-oping countries generate a huge volume of wastewa-
ter as compared to the developed ones. In the present review, a detailed account of water chemistry, waste-water characteristics, and wastewater treatment methods has been summarized. Also, the role of various biologi-cal methods in the treatment of a range of organic pol-lutants has been discussed.
Chemistry of water
Water is composed of one oxygen atom and two hydro-gen atoms that form covalent bonds with the unpaired electrons of oxygen. The hydrogen atoms are placed at 0.958Å from oxygen. The angle between the two hydro-gen (bond angle) is 104.5o making it a bent molecule with partial positive charges on each hydrogen and a partial negative charge on the oxygen atom. Thus, it is a polar molecule. This helps water molecules to form hydrogen bonds with other molecules, including water, (Némethy et al., 1962, Devangee Shukla, et al 2013, Veerakumari, 2015, Emiliano et al. 2017).
It is termed as a universal solvent for the ability to effect many chemical reactions and facilitating the hydrolysis, breaking the bigger molecules into their simpler forms. It possesses certain peculiar and unique physiochemical properties vital for the maintenance of life activities. It solubilises a large number of organic and inorganic compounds. Therefore, it might have been the primary resource for the origin of life. Almost all living organisms possess >70% of their mass comprising water. It is important for many biochemical reactions. It has a high affi nity for salts. Physical properties of water are as follows: heat capacity 1 cal/g, heat of vaporiza-tion 540 cal/g at 0°C, latent heat of fusion 97.7 cal/g at 0°C, surface tension 76 erg/cm2, dielectric constant 79, melting point 0°C, boiling point 100°C and viscosity 1.14 x 10⁻³ g/cm-s (Rastogi Smita, 2010 Devangee Shukla, et al 2013, Veerakumari 2015).
Parameters of water for various uses
Central Pollution Control Board (CPCB) of India has pro-posed various classes of water as ‘A to E’ about their end use. Drinking Water Source without conventional treat-ment but after disinfection has been categorised under Class “A” of water and possess the following character-istics: i) Total Coliforms Organisms MPN/100mL shall be 50 or less ii) pH between 6.5 and 8.5 iii) Dissolved Oxygen 6mg/L or more and iv) Biochemical Oxygen Demand (BOD5
20) of 5 days at 20°C 2mg/L or less. Bureau of Indian Standards has defi ned Indian Standard Speci-fi cations for Drinking Water, under IS: 10500, 1992. This report provides information on the permissible and desirable limits of various parameters in drinking water. Rahmanian et al. (2015) have discussed the determina-tion of parameters for drinking water. Class B water is designated best for organised outdoor bathing. The coli-

142 BIOTECHNOLOGICAL MANAGEMENT OF WATER QUALITY: A MINI REVIEW BIOSCIENCE BIOTECHNOLOGY RESEARCH COMMUNICATIONS
Lakhan Kumar et al.
forms MPN/100 mL in this class is ≤500 and pH 6.5-8.5. The dissolved oxygen and the BOD5
20 levels are set at ≥5 ppm and ≤3 ppm respectively. Class C water is a drinking water source that is available after conventional treat-ment and disinfection process. The MPN for coliforms is set at ≤5000 per mL with pH 6-9 and dissolved oxygen level of ≥ 4 ppm while the BOD5
20 is recommended at ≤ 5 ppm. Class D water is useful for wildlife and fi sheries. Its free ammonia -N is ≤ 1.2 ppm. The pH ranges between 6.5-8.5 while the dissolved oxygen is ≥ 4 ppm. Water for Irrigation, Industrial Cooling, Controlled Waste disposal comes under class “E” of water and it shall have the pH between 6 and 8.5. Additionally, the boron content shall not be more than 2mg/L and maximum Electrical Con-ductivity at 25oC (mhos/cm) is capped on 2250 (Ansari et al., 2009) for the purpose of proper treatment and dilu-tion of effl uent before discharge in water stream or on land. Physico-chemical characteristics of distillery effl u-ent samples such as colour, odour, Total Solids, Total dissolved solids, Total Suspended Solids, pH, Electri-cal Conductivity, Total hardness, Calcium, Magnesium, Alkalinity, Chloride, Dissolved Oxygen, Biological Oxy-gen Demand, Chemical Oxygen Demand, Ammonical Nitrogen, Total Phosphorus, and Total Potassium were analysed and it was observed that the characteristics of spent wash and PTDE (primary treated distillery effl uent.
The composition of wastewater
Wastewater is simply that part of the water supply to the community or to the industry which has been used for different purposes and has been mixed with solids, either suspended or dissolved. Wastewater is 99.9% water and 0.1% solids. The main task of treating the wastewater is to remove most or all of this 0.1% of solids (Spell-man, 2013) toxic chemical products formed as secondary metabolites by a few fungal species that readily colonise crops and contaminate them with toxins in the fi eld or after harvest. Ochratoxins and Afl atoxins are mycotox-ins of major signifi cance and hence there has been sig-nifi cant research on broad range of analytical and detec-tion techniques that could be useful and practical. Due to the variety of structures of these toxins, it is impos-sible to use one standard technique for analysis and/or detection. Practical requirements for high-sensitivity analysis and the need for a specialist laboratory setting create challenges for routine analysis. Several existing analytical techniques, which offer fl exible and broad-based methods of analysis and in some cases detection, have been discussed in this manuscript. There are a number of methods used, of which many are lab-based, but to our knowledge there seems to be no single tech-nique that stands out above the rest, although analyti-cal liquid chromatography, commonly linked with mass spectroscopy is likely to be popular. This review manu-
script discusses (a.The composition of wastewater varies according to the primary use of water. It gives a refl ec-tion of the lifestyle and technologies enjoyed by this progressive world. Two major constituents are organic and inorganic compounds, (Rastogi, 2010, Ansari et al., 2017).
Carbohydrate, protein, fats, amino acids and vola-tile acids etc. come under the organic compounds while sodium, calcium, chlorine, potassium, sulphur, mag-nesium, bicarbonate ammonium salts and heavy met-als etc. are listed as inorganic compounds by various researchers (Abdel-Raouf et al., 2012). Hydrocarbons, fats, oils, waxes and high molecular weight fatty acids are collectively referred to as oil and grease come under organic substances (Hammer 2001). Biological compo-nents constitute bacteria, fungi, virus and algae etc. Eutrophication is a common phenomenon worldwide due to the discharge of industrial wastes into open water resources which includes vast amounts of nitrogen and-phosphorous (Rawat et al., 2011, González-Camejo et al., 2017). Characteristics of wastewater from various indus-tries
Characteristics and compositions of wastewater vary from industry to industry. Wastewater characterisation depends upon changes in colour, odour, total dissolved solids (TDS), total suspended solids (TSS), pH, conduc-tivity, temperature, biochemical oxygen demand (BOD), chemical oxygen demand (COD) and volatile organic compounds (VOCs)etc. The physical characteristics of distillery effl uent samples and observed spent wash colour to be dark brown, odour unpleasant, total sol-ids 42400.2 ± 6.4 (CPCB: 90000-120000), total dissolve solids 38200.2 ± 4.8, total suspended solids 4200.0 ± 0.0, pH 4.2 ± 1.2 (CPCB: 3.7-4.5), electrical conductivity (μmho/cm) 16450.8 ± 8.2, total hardness 2432.4 ± 5.4 calcium 2070.0 ± 2.6 (CPCB: 2000-3500), magnesium 2260.5 ± 6.7, alkalinity 2864.5 ± 8.0, chloride 8530.2 ± 8.3(CPCB: 5000-6000), dissolve oxygen Nil, biochemical oxygen demand 32300.8 ± 10.8 (CPCB: 45000-50000), chemical oxygen demand 57164.6 ± 12.9 (CPCB: 80000-100000), ammonical nitrogen 1254.4 ± 2.4 (CPCB: 1000-2000), total phosphorus 44.4 ± 5.6 (CPCB: 200-300), total potassium 7440.2 ± 3.8 (CPCB: 8000-12000). All values given here are in mg/litre(Central Pollution Control Board, 2008) (Ansari et al., 2009)for the pur-pose of proper treatment and dilution of effl uent before discharge in water stream or on land. Physico-chemi-cal characteristics of distillery effl uent samples such as colour, odour, Total Solids, Total dissolved solids, Total Suspended Solids, pH, Electrical Conductivity, Total hardness, Calcium, Magnesium, Alkalinity, Chloride, Dissolved Oxygen, Biological Oxygen Demand, Chemi-cal Oxygen Demand, Ammonical Nitrogen, Total Phos-phorus, and Total Potassium were analysed and it was

BIOSCIENCE BIOTECHNOLOGY RESEARCH COMMUNICATIONS BIOTECHNOLOGICAL MANAGEMENT OF WATER QUALITY: A MINI REVIEW 143
Lakhan Kumar et al.
observed that the characteristics of spent wash and PTDE (primary treated distillery effl uent (Devangee Shukla, et al. 2013).
Wastewater treatment
Wastewater treatment refers to the application of vari-ous treatment methods on wastewater to make it reusa-ble or less harmful to the environment when discharged. Methods of treatment used for removal of contaminants using physical, chemical and biological reactions are known as unit operations, and they are categorized as primary, secondary and tertiary treatment methods. Pri-mary treatments involve physical operations such as screening and sedimentation for removal of fl oating and settle able solids found in wastewater. Secondary treatments involve chemical and biological processes to remove most of the organic and inorganic matters present in the wastewater. Then comes the tertiary treat-ment methods or advanced techniques. Treatment of wastewater must be designed specifi cally for the specifi c effl uent produced (Gogate and Pandit, 2004, a review of oxidation processes operating at ambient conditions was presented. It has been observed that none of the meth-ods can be used individually in wastewater treatment applications with good economics and high degree of energy effi ciency. Moreover, the knowledge required for the large-scale design and application is perhaps lack-ing. In the present work, an overview of hybrid methods (the majority are a combination of advanced oxidation processes Central Pollution Control Board, 2008, Shi, Hanchang 2011).
Biological treatments of wastewater
Biological treatments of wastewater facilitate the removal of all the settleable colloidal solids and degrade or reduce the present organic as well as inorganic matters (Rawat et al., 2011). Microorganisms utilize the organic/inorganic sources present in the wastewater as a nutrient or food for growth. The process of nutrient utilisation signifi cantly reduces the organic and inorganic loads of the wastewa-
ter. Several microorganisms including bacteria, fungus and algae (Table-2) or symposium of algae and bacteria or fungal and bacterial have been explored for wastewater remediation across the globe, (Cheremisinoff, 1996, Butler et al., 2017). Various methods have been devised to date for remediation of wastewater and they include aerobic, anaerobic and the combination of both. They are further subdivided as per their growth system into attached or suspended growth systems. Some of them are listed in Table 1 & 2.
Metabolic engineering to treat wastewater
Metabolic engineering stands for a branch of molecular biology where alternation in the genome of an organism is carried out to achieve a specifi c purpose of bringing specifi c genotypic or phenotypic changes in the con-cerned microorganism. Metabolic engineering is exer-cised to achieve many objectives such as to reduce or stop the production of by-products to optimise the yield, to increase the rate of thebiochemical process, reduce the energy consumption and ultimately to develop a strain with resistance to biotic as well abiotic stress (Yang & Liu, 2007) (Kumar and Prasad, 2011). The pur-pose of metabolic engineering is to obtain a robust strain of microorganism to gain optimum productivity, in the case of wastewater remediation, optimum nutri-ent removal to decrease the organic and inorganic loads. Mutant bacteria have also been introduced for wastewa-ter treatment (Ostergaard et al., 2000) (Siejen & Macro 2008) (Naidoo & Adimola 2014).
Although for metabolic overproduction, very often the strains of the microorganisms are subjected to muta-tion and selection for yield improvement, the prospect to introduce heterologous genes and regulatory ele-ments makes metabolic engineering, a promising area of research (Soda et al., 1999). The use of a fl oc-forming bacterium as the host for a recombinant plasmid was proposed. The fl oc-forming and phenol-degrading GEM Sphingomonas paucimobilis 551 (pS10-45. Bioaug-mentation engineered bacteria have a unique position
Table 1. Various methods of biological treatment. (Cheremisinoff, 1996) (Hoffmann, 1998) (Tchobanoglous et al., 2003) (Von Sperling, 2007) (Mara, 2009) (Butler et al., 2017)
S. No. Process Treatment Agents Waste treated
1Trickling fi lters (attached growth)
Packed bed covered by the microbial fi lm
Acetaldehyde, benzene, chlorinated hydrocarbons, nylon, rocket fuel
2Activated sludge (suspended growth)
Aerobic microorganisms suspended in wastewater
Refi nery, petrochemical and biodegradable organic wastewaters
3Aerated lagoon Surface impoundment plus mechanical
agitationBiodegradable organic chemicals
4Waste stabilization ponds Shallow surface impoundments plus
aeration to promote the growth of algae and bacteria and algae symbiosis
Biodegradable organic chemicals

144 BIOTECHNOLOGICAL MANAGEMENT OF WATER QUALITY: A MINI REVIEW BIOSCIENCE BIOTECHNOLOGY RESEARCH COMMUNICATIONS
Lakhan Kumar et al.
in the treatment of effl uent from printing and dyeing industries because of its various advantages, includ-ing powerful treatment capability, good decolourisation effect, and modest impact on the surrounding of the original processing system and so on (Xie et al., 2014). McClure et al. discussed the role of genetic engineering in improving wastewater treatment with a focus on the degradation of recalcitrant compounds especially chlo-rinated aromatic compounds. They also investigated the survival and function of natural and genetically modi-fi ed bacteria when inoculated into laboratory-scale acti-vated sludge units, (McClure et al., 1991). Research on wastewater treatment suggests treatment of wastewater must be explicitly designed for the particular type of effl uent produced. Banerjee et al. studied various aspects to increase the lipid accumulation in microalgae Chla-mydomonas reinhardtii and stressed on metabolic engi-neering associated with other factors to get the desired result (Banerjee et al., 2016).
Trained microorganisms to treat wastewater
Raju et al. investigated the role of a consortium of micro-organisms to degrade or reduce the concentration of lin-dane and DDT present in pesticide water. They reported enhanced green gram seed germination upon reduction of Lindane and DDT concentration when the microbial con-sortium was used (Raju et al., 2017). The strain of Serratia marcescens was found to have profound DDT degrading potential Organochlorine which was considered recal-
citrant compounds were shown to degrade at enhanced rates in the presence of non-ionic surfactants such as tweens and specifi cdead-end metabolites of Dichlorodi-phenyltrichloroethane (DDT) like Dichlorodiphenyldichlo-roethylene (DDE) and Dichlorodiphenyldichloroethane (DDD) have also been shown to get metabolised by indeed trained microbes (Bidlan 2007a) (Bidlan 2007b) (Bidlan 2009) (Bharadvaja et al., 2016).
CONCLUSION
Wastewater is generated from various activities in the community and also through natural processes. There are various strategies developed to reduce the levels of vari-ous contaminants in the wastewater. Most of the treat-ment plants use microbial remediation from the microbes already exixtinng in the sludge. Latest trend is to shift from the conventional chemical treatments to the biologi-cal treatments as these are more ecofriendly. Research is being carried out around the globe by various groups and a lot of funds are being pushed into this by many coun-tries so that the best possible treatment methods can be implemented for facilitating clean and healthy water for a better, green and robust environment.
REFERENCES
Abdel-Raouf, N., Al-Homaidan, A.A. and Ibraheem, I.B.M. (2012), Microalgae and wastewater treatment Saudi Journal of Biological Sciences, Elsevier, 1 July.
Table 2. Microbial degradation of various organic pollutants. (Bush et al., 1961) (McCLURE et al., 1991)(Rochkind et al., 1986) (Cheremisinoff, 1996) (Smidt et al., 2000) (Wang et al., 2000) (Tchobanoglous et al., 2003) (Bidlan R, Manonmani H. K., 2007) (Seo et al., 2009) (Mandal and Mallick, 2011) (Renuka et al., 2013) (Saxena et al., 2016) (Gong et al., 2017) (Kumar et al., 2017) (Singh et al., 2017)
S. No. Organic Pollutant Microbes involved
1Petroleum hydrocarbons, Acinetobacter, Arthrobacter, Mycobacteria, Actinomycetes,
Pseudomonas etcamongbacteria; Scolecobasidium and Cladosporium among yeasts.
2Pesticides,herbicides, like Aldrin, Dieldrin and organophosphates like Parathion and Malathion
Zylerionxylestrix (fungus)
3 2, 4-D, 1,2,3-trichloropropane (TCP) Pseudomonas, Arthrobacter
4 Diichlorodiphenyltrichloro ethane( DDT) Penicillium (fungus), Serratia marcescens (Bacteria)
5Kepone, piperonylic acid, Lignocellulosic wastes, Pentachlorophenol
Pseudomonas
6 Ethyl benzene Nocardiatartaricans (Bacteria)
Wastewater Calothrix sp., Lyngbya sp., Ulothrix sp, and Chlorella sp. Chlamydomonasrenhardtii, Parachlorellakessleri-I, NannochloropsisgaditanaScenedesmussp.(Algae)
7 Heavy metals like cadmium Genetically modifi ed E. coli
8 Chlorinated aromatic compounds Desulfomonile tiedjei (bacteria)
9 Lignins from Paper mills Aspergillustrichosporon (Yeast), arthrobacter, Chromobacter, Pseudomonas, Xanthomonas (Bacteria)

BIOSCIENCE BIOTECHNOLOGY RESEARCH COMMUNICATIONS BIOTECHNOLOGICAL MANAGEMENT OF WATER QUALITY: A MINI REVIEW 145
Lakhan Kumar et al.
Ansari, A.A., Khoja, A.H., Nawar, A., Qayyum, M. and Ali, E. (2017), Wastewater treatment by local microalgae strains for CO2 sequestration and biofuel production Applied Water Science, Springer Berlin Heidelberg, Vol. 7 No. 7, pp. 4151–4158.
Ansari, F., Awasthi, A.K. and Srivastava, B.P. (2009), Physico-chemical Characterization of Distillery Effl uent and its Dilution Effect at Different Levels Archives of Applied Science Research, Scholars Research Library, Vol. 4 No. 4, pp. 1705–1715.
Banerjee, C., Dubey, K.K. and Shukla, P. (2016), Metabolic Engineering of Microalgal Based Biofuel Production: Prospects and Challenges, Frontiers in Microbiology, Vol. 7, p. 432.
Bidlan R, Manonmani HK, Kunhi AAM. (2007) Indian Pat-ents. 209454:A Process For Degration Of Dichloro Dipheny Ltrichloro Ethane (Ddt) Using An Improved Strain Of Serratia marcescens.
Bidlan R., Manonmani HK. (2007a), A Process For Enhanced Degradation Of Dichloro-Dip Henyl-Trichloroethane (DDT) Indian patent.
Bidlan R., Manonmani HK. (2007b), A Process For The Prepara-tion Of Biocatalysts Useful For The Degradation Of Dichlorodi-phenyldichloroethylene (Dde) Indian patent.
Bidlan Rajkumar, Manonmani HK. (2009), A Process For The Preparation Of Biocatalysts For The Remediation Of Dichlo-rodiphenyldichlo Roethane (Ddd /Tde) Containing Industrial Effl uents Indian patent.
Brini, Emiliano, Brini, E., Fennell, C.J., Fernandez-Serra, M., Hribar-Lee et al (2017) How water’s properties are encoded in its molecular structure and energies Chemical reviews, Vol. 117, No. 19, pp. 12385-12414.
Buljan J. and I. Kral (2011), Introduction To Treatment of Tan-nery Effl uents United Nations Industrial Development Organi-zation, p. 10.
Bush, A.F., Isherwood, J.D. and Rodgi, S. (1961) Dissolved Sol-ids Removal from Waste Water by Algae Journal of the Sani-tary Engineering Division, ASCE, Vol. 87 No. 3, pp. 39–60.
Butler, E., Hung, Y.-T., Suleiman Al Ahmad, M., Yeh, R.Y.-L., Liu, R.L.-H. and Fu, Y.-P. (2017), Oxidation pond for municipal wastewater treatment Applied Water Science, Springer Berlin Heidelberg, Vol. 7 No. 1, pp. 31–51.
Central Pollution Control Board. (2008), Guidelines for Water Quality Management CPCB, available at:https://doi.org/10.1074/jbc.M002965200.
Cheremisinoff, N.P. (1996), Biotechnology for Waste and Wastewater Treatment, Noyes Publications.
Devangee Shukla, et al (2013) Physicochemical Analysis of Water from Various Sources and Their Comparative Studies IOSR Journal of Environmental Science, Toxicology, and Food Technology , Vol. 5, No. 3, pp. 2319-2402.
Gogate, P.R. and Pandit, A.B. (2004) A review of imperative technologies for wastewater treatment II: hybrid methods Advances in Environmental Research, Pergamon, Vol. 8 No. 3–4, pp. 553–597.
Gong, T., Xu, X., Che, Y., Liu, R., Gao, W., Zhao, F., Yu, H., et al. (2017), Combinatorial metabolic engineering of Pseudomonas putida KT2440 for effi cient mineralization of 1,2,3-trichloro-propane Scientifi c Reports, Vol. 7 No. 1, p. 7064.
González-Camejo, J., Serna-García, R., Viruela, A., Pachés, M., Durán, F., Robles, A., Ruano, M.V., et al. (2017), Short and long-term experiments on the effect of sulphide on microalgae cultivation in tertiary sewage treatment Bioresource Technol-ogy, Vol. 244 No. Pt 1, pp. 15–22.
Hammer MJ, J.H.M. (2001), Water and Wastewater Technol-ogy / Mark J. Hammer, Mark J. Hammer, Jr. - Version Details - Trove.
Hoffmann, J.P. (1998) Wastewater Treatment With Suspended And Nonsuspended Algae Journal of Phycology, Vol. 34 No. 5, pp. 757–763.
Indian Standard Specifi cations for Drinking Water, under IS: 10500, 1992 by Bureau of Indian Standards.
Kumar L, Roy A, Saxena G, Kundu K, Bharadvaja N. (2017) Isolation , Identifi cation and biomass productivity analysis of microalga Scenedesmus rubescens from DTU Lake Vol. 8 No. July, pp. 56–67.
Kumar, R.R. and Prasad, S. (2011) Metabolic Engineering of Bacteria Indian Journal of Microbiology, Springer, July.
Mandal, S. and Mallick, N. (2011) Utilization and biodiesel pro-duction by the green microalga Scenedesmus obliquus Applied and Environmental Microbiology, Vol. 77 No. 1, pp. 374–377.
Mara, D. (2009) Waste stabilization ponds: Past, present and future Desalination and Water Treatment, Taylor & Francis Group, Vol. 4 No. 1–3, pp. 85–88.
McClure, N.C., Fry, J.C. and Weightman, A.J. (1991) Genetic Engineering for Wastewater Treatment Water and Environment Journal, John Wiley & Sons, Ltd, Vol. 5 No. 6, pp. 608–616.
Miksch, K., Cema, G., Corvini, P.F.-X., Felis, E., Sochacki, A., Surmacz-Górska, J., Wiszniowski, J., et al. (2015) R&D priori-ties in the fi eld of sustainable remediation and purifi cation of agro-industrial and municipal wastewater New Biotechnology, Vol. 32 No. 1, pp. 128–132.
Naidoo Shalinee and Ademola Olaniran (2014) Treated waste-water effl uent as a source of microbial pollution of sur-face water resources International journal of environmental research and public health, Vol. 11, No.1, pp. 249-270.
Némethy, George, and Harold A. Scheraga (1962) Structure of water and hydrophobic bonding in proteins. I. A model for the thermodynamic properties of liquid water The Journal of Chemical Physics , Vol. 36, No. 12, pp. 3382-3400.
Ostergaard, S., Olsson, L. and Nielsen, J. (2000) Metabolic engineering of Saccharomyces cerevisiae. Microbiology and Molecular Biology Reviews : MMBR, American Society for Microbiology (ASM), Vol. 64 No. 1, pp. 34–50.
Raju, S.M., Bashambu, D., Bidlan, R., Sharma, J.G. and Kumar, S. (2017), Enhancement In Seed Germination Through Simul-taneous Degradation Of Organochlorine Pesticides (Lindane And Ddt) By A Novel Microbial Consortium International

146 BIOTECHNOLOGICAL MANAGEMENT OF WATER QUALITY: A MINI REVIEW BIOSCIENCE BIOTECHNOLOGY RESEARCH COMMUNICATIONS
Lakhan Kumar et al.
Journal of Advance Research in Science and Engineering, Vol. 6, pp. 707–13.
Rahmanian, Nejat, et al. (2015), Analysis of physiochemical parameters to evaluate the drinking water quality in the State of Perak, Malaysia Journal of Chemistry, Hindawi publications, pp. 1-10.
Rastogi, S.C. (2010), Biochemistry, 3rd ed., Tata McGraw-Hill Education.
Rawat, I., Ranjith Kumar, R., Mutanda, T. and Bux, F. (2011), Dual role of microalgae: Phycoremediation of domestic waste-water and biomass production for sustainable biofuels produc-tion Applied Energy, Elsevier, Vol. 88 No. 10, pp. 3411–3424.
Renuka, N., Sood, A., Ratha, S.K., Prasanna, R. and Ahluwalia, A.S. (2013), “Nutrient Sequestration, Biomass Production By Microalgae And Phytoremediation Of Sewage Water Interna-tional Journal of Phytoremediation, Vol. 15 No. 8, pp. 789–800.
Rochkind, M.L., Blackburn, J.W. and Sayler, G.S. (1986), Micro-bial decomposition of chlorinates aromatic compounds.
Saxena G, Kumar L, Hariri SM, Bhardvaja N (2016) Identifi ca-tion of Potential Culture Conditions for Enhancing the Biomass Production of Microalga Chlorella minutissima Expert Opinion on Environmental Biology, SciTechnol, Vol. s1.
Seo, J.-S., Keum, Y.-S. and Li, Q.X. (2009) Bacterial Degra-dation of Aromatic Hydrocarbons Int. J. Environ. Res. Public Health, Multidisciplinary Digital Publishing Institute (MDPI), Vol. 6 No. 1, pp. 278–309.
Shi, Hanchang (2011) Industrial wastewater-types, amounts and effects Encyclopedia of Life Support Systems, Vol. 1, pp. 191–204.
Siezen, RJ, and Marco Galardini (2008) Genomics of biological wastewater treatment Microbial biotechnology, Vol. 1, No. 5, pp. 333.
Singh, A.K., Sharma, N., Farooqi, H., Abdin, M.Z., Mock, T. and Kumar, S. (2017), Phycoremediation of municipal wastewater
by microalgae to produce biofuel International Journal of Phy-toremediation, Vol. 19 No. 9, pp. 805–812.
Smidt, H., Akkermans, A.D.., Van Der Oost, J. and De Vos, W.M. (2000) Halorespiring bacteria-molecular characterization and detection Enzyme and Microbial Technology, Vol. 27, Elsevier, pp. 812–820.
Soda, S., Uesugi, K., Ike, M. and Fujita, M. (1999) Application of a fl oc-forming genetically engineered microorganism to a sequencing batch reactor for phenolic wastewater treatment Journal of Bioscience and Bioengineering, Elsevier, Vol. 88 No. 1, pp. 85–91.
Spellman, F.R. (2013), Handbook of Water and Wastewater Treatment Plant Operations, Springer, Vol. 23, CRC Press, available at:https://doi.org/10.1007/s13398-014-0173-7.2.
von Sperling, M. (2007), Wastewater Characteristics, Treatment and Disposal, Iwa Publishing. London.
Tchobanoglous, G., Burton, F.L. (Franklin L., Stensel, H.D. and Metcalf & Eddy. (2003), Wastewater Engineering : Treatment and Reuse, McGraw-Hill. Veerakumari, L. (2015), Biochemistry, MJP Publ.
Wang, C.L., Maratukulam, P.D., Lum, A.M., Clark, D.S. and Keasling, J.D. (2000), “Metabolic engineering of an aerobic sulfate reduction pathway and its application to precipitation of cadmium on the cell surface”, Applied and Environmental Microbiology, Vol. 66 No. 10, pp. 4497–4502.
Xie, X.H., Liu, N., Jiang, H. and Zhu, L.Y. (2014) Construction and Application of Engineered Bacteria for Bioaugmentation Decolorization of Dyeing Wastewater: A Review Journal of Geoscience and Environment Protection, Scientifi c Research Publishing, Vol. 02 No. 02, pp. 84–88.
Yang ST, Liu X, Z.Y. (2007) Metabolic Engineering - Applica-tions, Methods, and Challenges Bioprocessing for Value-Added Products from Renewable Resources - New Technologies and Applications - Elsevier Publications.

Bile salt hydrolase, a potent enzyme capable of
removing cholesterol present in bacteria: A review
Akhila. B. Rajan, Abhini K N and Fathimathu Zuhara K*
Department of Life Sciences, University of Calicut, Kerala, India 673635
ABSTRACT
Bile salt hydrolase (BSH) is a highly signifi cant enzyme involved in bile acid alteration in the gastrointestinal tract of humans and animals. Bile salt hydrolase belongs to the chologlycine hydrolase enzyme family and is normally associ-ated with the gastrointestinal bacteria of both human and animals. This enzyme is responsible for the hydrolysis of con-jugated bile acids into free bile acid and amino acid residue. Today, BSH is considered as an upcoming pharmacologi-cally important enzyme since it has the ability to lower cholesterol levels in hypercholesterolemic patients because high cholesterol levels are found as an important reason of atherosclerosis which results in cardiovascular diseases (CVD’s). This review discusses about the incidence of BSH enzyme among bacteria and the role and potential application of this highly signifi cant enzymes on the host.
147
Biochemical CommunicationBiosci. Biotech. Res. Comm. 12(1): 147-155 (2019)
INTODUCTION
Cholesterol, though is regarded as an important sub-stance in human body, high levels of serum cholesterol may lead to atherosclerosis which in turn can end in cardiovascular diseases (CVD’s) ( Jones et al., 2004, Tsai et al., 2014). There is tremendous increase in the number of people suffering from cardiovascular diseases in the developing countries like India. During the past fi ve dec-ades, rate of coronary artery diseases among urban pop-ulation have risen from 4% to 11% due to modernization
and stressful life styles. Many clinical and epidemiologi-cal studies indicate that a correlation exists between the elevated serum cholesterol levels and coronary heart disease (Pereira & Gibson, 2002). According to the recent reports of World Health Organization (WHO), the CVD’s are regarded as number 1 cause of death globally and responsible for 31% of all global deaths (WHO, 2017). On 22 September, 2016 WHO has launched “Global Hearts”, a new initiative to beat back the global threat of cardio-vascular diseases.
ARTICLE INFORMATION:
Corresponding Author: [email protected] 3rd Jan, 2019Accepted after revision 26th March, 2019BBRC Print ISSN: 0974-6455Online ISSN: 2321-4007 CODEN: USA BBRCBA Thomson Reuters ISI ESC / Clarivate
Analytics USAMono of Clarivate Analytics and Crossref Indexed Journal Mono of CR
NAAS Journal Score 2019: 4.31 SJIF: 4.196© A Society of Science and Nature Publication, Bhopal India 2019. All rights reserved.Online Contents Available at: http//www.bbrc.in/DOI: 10.21786/bbrc/12.1/19

Akhila, Abhini and Fathimathu
148 BILE SALT HYDROLASE, A POTENT ENZYME CAPABLE OF REMOVING CHOLESTEROL BIOSCIENCE BIOTECHNOLOGY RESEARCH COMMUNICATIONS
Nowadays, a number of non-pharmacologic meth-odologies such as dietary management, regular exercise and drug therapies are commonly used for lowering cho-lesterol levels (Dunn‐Emke et al., 2001). But most of the drugs in use, though may effectively reduce the choles-terol level, are expensive and known to have side effects (Bliznakov, 2002). Hence the importance of using enzy-matic deconjugation by bile salt hydrolase (BSH), both to lower serum cholesterol levels in hypercholesteremic patients and to prevent hypercholesteremia in normal people is increasing day by day (Sridevi et al., 2009). In this regard, bile salt hydrolase can be considered as an alternative therapy for lowering serum cholesterol lev-els. Bile salt hydrolase, a highly biologically signifi cant enzyme, belongs to the family chologlycine hydrolase (EC 3.5.1.11). This enzyme has been classifi ed as N-ter-minal nucleophilic (Ntn) hydrolase which is involved in the deconjugation of conjugated bile acids resulting in the formation of free bile acids and amino acids (Kumar et al., 2006, Chand et al., 2017).
Bile
Bile is a yellow-green aqueous solution which typically consists of bile acids, cholesterol, phospholipids and the pigment biliverdin. In addition to the trace amounts of mucus, tocopherol and immunoglobulin A (IgA) are also present which prevent the bacterial growth and oxida-tive damage to the epithelium (De Smet et al., 1998, Schiff et al., 2002) . Bile is synthesized in the pericentral hepatocytes of the liver in many mammals and is stored and concentrated in gallbladder followed by the release of this into the duodenum just after the food intake.The bile acids play important role as a biological detergent which emulsifi es and solubilizes lipids, thereby enhanc-ing the absorption and digestion of fats. Under normal conditions, the conservation of bile acids are done by a process called enterohepatic recirculation (Ridlon et al., 2006, Russell, 2009).
Enterohepatic circulation
The cholesterol metabolism, in humans and animals, leads the formation of C24 acid steriods possessing a carboxyl group at the end of the side chain called as bile acids. The synthesis of C24 acid steriods in liver from cholesterol is followed by their conjugation with amino acids such as taurine or glycine at the C24 position of the steroid nucleus, catalysed by the enzyme N-acyl-transferase (Appleby and waters 2014, Schapp et al 2014, Camilleri & Gores 2015). The ratio of conjugation of bile acids with the amino acids glycine or taurine, depends upon the relative abundance of these amino acids, which may not have any functional or regula-tory consequences (Ridlon, 2006). These conjugated bile salts are amphipathic in nature with enhanced solubil-
ity which makes them impermeable to cell membranes. At physiological pH, the carbon at the terminal position of glycocholic acid or oxygen atom of taurocholic acid bonded with sulphur gets ionized. The ionized oxygen atom along with planar structure of bile acids and the hydroxyl groups present in their rings make them highly amphipathic in nature. In the case of glycocholic acid, the conjugation of aminoacid glycine with cholic acid results in the reduction of pKa of cholic acid from 6.4 to 4.4 units thereby enhancing the bile acids to get com-pletely ionized and highly soluble (Alrefai et al., 2007).
The intake of lipids initiates the secretion of bile salts through the common duct into the duodenum, hence results in the association with dietary lipids and vari-ous digestive products (Begley, 2005). The conjugated bile acids are ionized molecules which are resistant to deamidation by pancreatic and mucosal carboxypepti-dases. Instead they move to the distal ileum, where they get absorbed by an active transport system known as ileum bile acid transporter (IBAT) and the members of the ATP binding cassette (ABC) family of transporters (Lack & Weiner, 1966, Nicoloau et al., 2012). About 95% of the bile salt mixture is re-absorbed and returns back to the liver by hepatic portal circulation and this process is known as enterohepatic circulation (fi g.1).
Approximately 600 to 800 ml of bile is being pro-duced daily and the total circulating bile acid pool is about 1.7 to 40 g. The recirculation of entire bile acid pool is about 6 to 15 times per day and a total of 0.2 to 0.5 g is excreted via feces thereby enhancing the synthe-sis of bile acid by de novo pathway (Kumar et al., 2012). The bile acid that eludes the absorption is subjected to bacterial metabolism including reduction and epimer-ization of their OH groups from to conformation (Chiang, 2009). One such important transformation by indigenous intestinal bacteria is deconjugation of bile acids which is catalyzed by the enzyme called bile salt hydrolase (BSH) (Kim and Lee, 2005)
Role of BSH
The function of BSH still remains unclear and several hypotheses have been put forward regarding the expres-sion and function of the BSH gene present in the bacte-ria of the human gastrointestinal tract.
Nutritional role
BSH confer nutritional advantage for the BSH positive strains as they utilize the hydrolysed amino acid moi-eties (Begley et al., 2005). The deconjugation process results in the release of two amino acids such as glycine, which may be further metabolized to ammonia and car-bon dioxide and taurine, which may be metabolized to ammonia, carbon dioxide and sulphate. Evidences sup-porting these hypotheses, proposed by Huijghebaert et

Akhila, Abhini and Fathimathu
BIOSCIENCE BIOTECHNOLOGY RESEARCH COMMUNICATIONS BILE SALT HYDROLASE, A POTENT ENZYME CAPABLE OF REMOVING CHOLESTEROL 149
FIGURE 1. Enterohepatic circulation of Bile acids. (Adapted from http://www.gestaltreality.com/2013/09/21/metabolic-cholestatic-pruritus/)
al. in 1982 and Van Eldere et al. in 1996, stated that certain bile salt deconjugating Clostridium strains were able to utilize the released taurine as an electron accep-tor and the growth rates of these strains were improved in the presence of taurine and taurine-conjugated bile salts (Huijghebaert et al.,1982; Van Eldere et al., 1996).
Modifi cation of Membrane characteristics
Most of the friendly intestinal bacteria play a crucial role in maintaining host gut health. The hydrolytic enzymes, lysozyme, phospholipase A2 and -defensins, produced by these bacteria in host gut provide a defense mech-anism in the intestine. The extent of damage by host defenses on these bacterial membranes is determined by the composition, fl uidity, permeability, hydropho-bicity and net charge of the membrane (Peschel, 2002). Studies have revealed that the cholesterol or bile incor-poration into the bacterial membranes has been facili-tated by BSHs (Dambekodi & Gilliland, 1998; Taranto et al., 2003; Taranto et al., 1997), which may increase the membrane potency by forming BSH- mediated lipid
intermolecular hydrogen bonding (Boggs, 1987) or could change its fl uidity or charge. The resultant cell surface modifi cation by BSH activity could offer safety against perturbation of the structure and bacterial membranes integrity by the immune system and such resistance mechanisms ensures in establishing prolonged persis-tence. This mechanism may strongly confer commen-sals, possessing BSH enzyme, the capacity to dominate over the BSH- negative pathogens or other transients (Patel et al., 2010)
Bile detoxifi cation
BSH activity of microorganisms might be detoxifi cation action and these enzymes make the strains bile toler-ant, thereby making positive environment in the gas-trointestinal tract for survival. Many investigators have disproved this hypothesis of correlation between bile tolerance and BSH activity (Ahn et al, 2003; Moser & Savage, 2001;). Although ambiguity exists between the correlation of bile salt hydrolase and bile tolerance, sev-eral studies have been undertaken to study this relation.

Akhila, Abhini and Fathimathu
150 BILE SALT HYDROLASE, A POTENT ENZYME CAPABLE OF REMOVING CHOLESTEROL BIOSCIENCE BIOTECHNOLOGY RESEARCH COMMUNICATIONS
Studies by four independent groups using wild-type and bsh mutant combinations provide a connection between BSH activity and bile tolerance. The study using Lac-tobacillus amylovorus mutant, with partly reduced BSH activity, displayed reduced growth rates in the presence of bile salts (Grill et al., 2000). Also BSH mutated Lis-teria monocytogenes made the cells more sensitive to bile and bile salts (Begley et al., 2005; Dussurget et al., 2002) and Lactobacillus plantarum (De Smet et al., 1995). The actual mechanism by which BSH positive strains exhibit bile tolerance is not yet fully known. However it was proposed that the toxicity may be exhibited through the intercellular interface by the protonated form of bile salts and BSH positive cells may protect them-selves by the weaker unconjugated counterparts. Hence this mechanism helps in dropping the pH and making suitable environment for bringing back and exporting the co-transported proton (De Smet et al., 1995). The unconjugated bile acids resulting from the enzymatic deconjugation of BSH active strains have an inhibitory effect on bacteria but the study of De Smeth et al sug-gested that the BSH active strains may be capable of detoxifying these effects or they may be associated with 7-dehydroxylating bacteria which will dehydroxylate unconjugated bile acids (De Boever & Verstraete, 1999).
Application of Bile Salt Hydrolase enzyme
Hypocholesterolemic effect
An elevated level of cholesterol in blood can lead to hypercholesterolemia which in turn becomes a threat for the development of coronary heart diseases. Pharmaco-logic agents such as statins, bile acid sequestrants etc. and food products are being formulated continuously to control the serum cholesterol levels in these patients. Recently many studies have shown that probiotics with bile salt hydrolase activity have the ability of cholesterol lowering. These have given much attention of using BSH positive probiotic strains in animal models and human subjects. In 1995 De Smet et al proposed that the BSH active probiotic strains or cultured products containing them result in the reduction of serum cholesterol lev-els by interacting with the bile salt mechanism of the host. The studies of Sukling et al in 1991 revealed that the proposed mechanism of cholesterol lowering effect by De Smet et al (1995) is comparable with pharmaco-logical agents (sequestrants) which prevent the bile salts from being reabsorbed by binding with them (Suckling et al., 1991). In addition to this Liong and shah (2005) and Parvez et al (2005) found that the strains Bifi do-bacterium and Bifi dobacterium bifi dum NRRL 1976 was also able to remove cholesterol by bacterial assimilation and precipitation. Studies of Dong et al (2012) has also demonstrated that bsh positive Lactobacillus plantarum BBE7 was capable of removing cholesterol in vitro.
Human studies
The hypocholesterolemic effects of probiotic strain, fi rst discovered by Mann and Spoerry in 1974, showed that the Maasai tribes in Africa who consumed large amount of milk fermented by Lactobacillus sps resulted in the reduction of serum cholesterol levels (Mann & Spoerry, 1974). In 1979 Hepner reported that the consumption of either pasteurized or non-pasteurized milk showed an effective reduction of serum cholesterol levels which was higher than that expressed by those who consumed 2% butterfat milk after 1 week (Hepner et al.,1979). Moreover, the studies of Sarkar in 2003 revealed that the cholesterol reducing abilities of six strains of L. aci-dophilus was either due to the assimilation of cholesterol or attachment of cholesterol to the surface of L. acido-philus cells. Since this bacterium is a natural inhabit-ant of intestine with bile salt hydrolase activity, they can be utilized for the production of acidophilus milk which can bring out hypocholesterolemic effect. As part of the study he has also proposed that the effi cacy of acidophilus milk to lower serum cholesterol level can be infl uenced by a number factors such as the milk type employed for the manufacture and also the age, sex, food habits and initial cholesterol concentration of the tested subjects (Sarkar, 2003).
Lactobacillus sps have been most widely used since there are several reports supporting the hypocholester-olemic effects of this strain. It was in 1989 Lin et al experimented with 23 human subjects, who received tablets containing 3x10⁷ CFU L. acidophilus (ATCC 4962) and Lactobacillus delbrueckii ssp bulgaricus (ATCC 33409) daily for 16 weeks, which resulted in reduction of serum cholesterol level in an experimental group from 5.7 to 5.4 mmol/L, while the control group remained the same (Lin et al., 1989). Another study with the consump-tion of buffalo milk, fermented with specifi c strain of L. acidophilus, for a month resulted in the reduction of serum cholesterol by 12 to 20% (Khedkar et al.,1993). Even a small reduction in serum cholesterol of 1% can reduce risk of coronary heart disease by 2-3% (Gilliland, Nelson, & Maxwell, 1985; Manson et al., 1992). A num-ber of placebo controlled studies have been carried out to study these effects. In one such study 30 volunteers consumed yoghurt enriched with specifi c strain L. aci-dophilus and it resulted in lowering of cholesterol levels in serum by 0.23 mmol/L (Schaafsma et al, 1998).
Another study with L. Plantarum 229 from the food product Pro-Viva has revealed that the cholesterol lev-els were affected in humans with moderately elevated serum cholesterol. For this study Bukowska et al., 2001 utilized a randomized-placebo design where 30 healthy men who consumed 200 mL/day of Pro-viva for 6 weeks showed a signifi cant decrease in total cholesterol, LDL cholesterol and fi brinogen levels(Bukowska et al.,1998).

Akhila, Abhini and Fathimathu
BIOSCIENCE BIOTECHNOLOGY RESEARCH COMMUNICATIONS BILE SALT HYDROLASE, A POTENT ENZYME CAPABLE OF REMOVING CHOLESTEROL 151
The fi ndings of Harrison and Peat, 1975 stated that a decrease in serum cholesterol level was visible in bot-tle-fed babies whereas the count of L. acidophilus in their stool was increased (Harrison & Peat, 1975). Simi-larly the consumption of yogurt has also resulted in the reduction of serum cholesterol levels in humans (Hepner et al., 1979; Mann, 1977).
Studies with Bifi dobacterium sp have also shown potential hypocholesterolemia effects. Rasic et al in 1992 had found that consumption of B. bifi dum can lead to the assimilation of cholesterol by in vitro experiments (Rašic et al., 1992). It was also able to reduce the serum cholesterol concentration in human subjects with hyper-cholesterolemia. In 2003 Xiao et al proposed that milk fermented with B. longum BL1 resulted in the reduction of serum total cholesterol, LDL cholesterol and triglyc-erides in hypercholesterolemia patients as well as in rats (Xiao et al., 2003).
Animal studies
Animal models such as rats, mice, hamsters, guinea pigs and pigs have been widely used due to their similarities with respect to digestive anatomy and physiology, nutri-tional requirements and various other metabolic pro-cesses including cholesterol and bile acid metabolism, distribution of plasma lipoprotein and regulation of hepatic cholesterol enzymes. Several studies have been conducted to compare the effect of milk and milk prod-ucts on cholesterol concentrations in animal models.
Gilliland et al in 1975 showed that L. acidophilus RP32, capable of assimilating cholesterol in vitro, was able to inhibit the increase of serum cholesterol levels of pigs fed on a high-cholesterol diet (Gilliland, Speck, & Morgan, 1975). In addition, the same author in 1985 had also reported the cholesterol lowering capability of L. casei P47 in pigs (Gilliland et al., 1985). Another study conducted by Mahrous et al., 2011 reported that consumption of yogurt, fermented by L. acidophilus, by mice signifi cantly decreased the cholesterol content in the serum and increased bile acid content in the feces (Mahrous, Shaalan, & Ibrahim, 2011). Chiu et al., 2006 had showed that intake of probiotic fermented foods results in the reduction of total serum cholesterol levels in hamsters with high blood cholesterol levels (Chiu, Lu, Tseng, & Pan, 2006). Moreover, Sindhu and Khetarpaul in 2003 had studied the effect of probiotic fermented foods in 20 young Swiss mice, where there was reduc-tion in the total serum cholesterol (Sindhu & Khetarpaul, 2003).
Studies with L. plantarum PH04 from infant feces showed a signifi cant reduction in the serum cholesterol level and triglycericides when compared with the con-trol (Nguyen, Kang, & Lee, 2007). The effi cacy of buffalo milk-yogurts containing B. longum Bb-46 was deter-
mined by administering it to 48 hypercholesterolemic male albino rats for 35 days and signifi cant reduction of total cholesterol, LDL cholesterol and triglycerides were obtained when compared to the control (El-Gawad et al., 2005). L. acidophilus fermented rice bran showed signifi cant improvement of lipid profi le in hypercho-lesterolemic male Fischer rats (Fukushima et al., 1999). In a study by Lee 2007, on the anti-obesity activity of Trans-10, cis-12 conjugated linoleic acid produced by L. plantarum PL62, an observable reduction was obtained in the weight of epididymal, inguinal, mesenteric and perirenal white adipose tissues in mice (Lee et al., 2007). Similarly the intake of L. gasseri BNR17 also exhibited a reduction in weight, hip and waist circumference with-out any change in behavior or diet (Jung et al., 2013).
Until now, several studies have been conducted to evaluate the effects of consumption of probiotics or fermented products and they have given variable data (Taylor and Williams, 1998). In most of the cases cho-lesterol lowering effect was observed only during the intake of very high doses of the product whereas the normal consumption of probiotics failed to deliver such effects. Such contradictory results obtained may be due to the design of the experiment, lack of statistical power, inadequate sample sizes, improper nutrient intake and expenditure of energy during the experiments and vari-ation in the baseline levels of blood lipids (Pereira & Gibson, 2002).
BSH a desirable trait in probiotics
In 2002 World Health Organization (WHO) has recom-mended BSH activity as one of the main characteristics for considering the strains Lactobacillus and Bifi dobac-teria as probiotics, along with their ability to resist the harsh environment of the gut and to colonize in gastro-intestinal epithelia (WHO, 2002). Overall, several studies have strongly supported the hypothesis that BSH posi-tive strains are capable of detoxifying bile salts there by increasing the intestinal survival. Hence BSH activity can be considered as a desirable factor for the probiotics. The BSH activity may result in the accumulation of large amounts of deconjugated bile salts and hence cause undesirable effects in the human host which may arise concerns over the safety administration of BSH posi-tive strains. However, the probiotic strains Lactobacillius and Bifi dobacterium are not capable of dehydroxylating deconjugated bile salts (Ahn et al., 2003; Gilliland & Speck, 1977; Takahashi & Morotomi, 1994) and hence majority of the breakdown products may be precipitated or excreted through feces which may vary from person to person depending upon the colonic pH and intestinal transit time (Thomas et al., 2000; Thomas et al., 2001).
Studies by two other groups have proposed that the intestinal bacteria, except certain strains of Clostridium
Akhila, Abhini and Fathimathu
152 BILE SALT HYDROLASE, A POTENT ENZYME CAPABLE OF REMOVING CHOLESTEROL BIOSCIENCE BIOTECHNOLOGY RESEARCH COMMUNICATIONS
and Eubacterium, the only strains that possess dehydrox-ylating activity, (Dawson et al., 1996; Doerner et al, 1997) inhibit further modifi cation of deconjugated products. First, Kurdi et al in 2003 proposed that BSH positive pro-biotic strains Lactobacillus and Bifi dobacterium are able to accumulate cholic acid, the main free bile acid produced in the intestine by BSH activity, as long as the bacteria were energized (Kurdi et al., 2003). Second, studies by Jones et al in 2004 revealed that microencapsulated BSH positive L. plantarum can hydrolyze bile salts in vitro and the deconjugated products were trapped within the mem-brane which makes these products less bioavailable. In addition to this the encapsulation of strain would protect them from the harsh gut environment and persistence of the strain (Jones et al., 2004)
Present scenario
Various studies have been carried out with BSH posi-tive probiotics to illustrate the cholesterol lowering capacity with the same concept based on the interrup-tion of enterohepatic circulation. So far the hypocho-lesterolemic effects of probiotics have been confi rmed in both humans (Anderson & Gilliland, 1999) as well as animals(Gilliland et al., 1975; Mahrous et al., 2011; Sridevi et al., 2009). It was observed and reported that Bile salt hydrolase enzyme was associated with only microbiota in gastrointestinal tract and autochthous intestinal bacteria such as Listeria monocytogenes (Dus-surget et al., 2002) and Xanthomonas maltophila (Dean et al., 2002).
Future perspectives
Recently this enzyme is reported to be present in ther-mophilic bacteria, Brevibacillus borstelensis isolated from hot water springs, near Konkan, Maharashtra, India (Sridevi & Prabhune, 2009). Also, a potent producer of BSH, Staphylococcus saprophyticus ZABR2, was isolated from the soil samples collected from the dumping sites of fi sh waste (Rajan & Fathimathu Zuhara, 2018). These fi ndings reveal that microorganisms from other sources may also possess the highly signifi cant enzyme BSH and hence it needs to be explored more for the isolation of the potent producers
REFERENCES
Ahn, Y. T., Kim, G. B., Lim, K. S., Baek, Y. J., & Kim, H. U. (2003). Deconjugation of bile salts by Lactobacillus acidophilus isolates. International Dairy Journal, 13(4), 303–311.
Alrefai, W. A., and R. K. Gill. 2007. Bile acid transporters: structure, function, regulation and pathophysiological impli-cations. Pharmaceutical Research 24: 1803-1823.
Anderson, J. W., & Gilliland, S. E. (1999). Effect of Fermented Milk (Yogurt) Containing Lactobacillus Acidophilus L1 on
Serum Cholesterol in Hypercholesterolemic Humans. Journal of the American College of Nutrition, 18(1), 43–50.
Appleby, RN and Walters, JR (2014). The role of bile acids in functional GI disorders. Neurogastroenterology & Motil-ity 26: 1057–1069
Begley, M., Sleator, R. D., Gahan, C. G. M., & Hill, C. (2005). Contribution of Three Bile-Associated Loci, bsh, pva, and btlB,to Gastrointestinal Persistence and Bile Tolerance of Lis-teria monocytogenes. Infection and Immunity, 73(2), 894–904.
Beher, W. T., Lin, G. J., & Bajraszewski, F. (1984). The deter-mination and excretion of individual human fecal bile acids. Steroids, 44(6), 539–547.
Bliznakov, E. G. (2002). Lipid-lowering drugs (statins), cho-lesterol, and coenzyme Q10. The Baycol case--a modern Pan-dora’s box. Biomedicine & Pharmacotherapy= Biomedecine & Pharmacotherapie, 56(1), 56–59.
Boggs, J. M. (1987). Lipid intermolecular hydrogen bonding: infl uence on structural organization and membrane function. BBA - Reviews on Biomembranes, 906(3), 353–404.
Bortolini, O., Medici, A., & Poli, S. (1997). Biotransformations on steroid nucleus of bile acids. Steroids, 62(8–9), 564–577.
Bukowska, H., Pieczul-Mroz, J., Jastrzebska, M., Chelstowski, K., & Naruszewicz, M. (1998). Decrease in fi brinogen and LDL-cholesterol levels upon supplementation of diet with Lactoba-cillus plantarum in subjects with moderately elevated choles-terol [1]. Atherosclerosis, 137(2), 437–438.
Camilleri, M and Gores, GJ (2015). Therapeutic targeting of bile acids. American Journal of Physiology-Gastrointestinal and Liver Physiology 309:G209–G215
Chand, D., Avinash, V. S., Yadav, Y., Pundle, A. V., Suresh, C. G., & Ramasamy, S. (2017). Molecular features of bile salt hydrolases and relevance in human health. Biochimica et Bio-physica Acta (BBA)-General Subjects, 1861(1), 2981-2991.
Chiu, C. H., Lu, T. Y., Tseng, Y. Y., & Pan, T. M. (2006). The effects of Lactobacillus-fermented milk on lipid metabolism in hamsters fed on high-cholesterol diet. Applied Microbiology and Biotechnology, 71(2), 238–245. https://doi.org/10.1007/s00253-005-0145-0
Dambekodi, P. C., & Gilliland, S. E. (1998). Incorporation of Cholesterol into the Cellular Membrane of Bifi dobacterium longum. Journal of Dairy Science, 81(7), 1818–1824.
Dawson, J. A., Mallonee, D. H., Bjorkhem, I., & B, P. (1996). 4 bile acid 12708 in Escherichia coli k &. Journal Of Lipid Research, 37, 1258–1267.
De Boever, P., & Verstraete, W. (1999). Bile salt deconjugation by Lactobacillus plantarum 80 and its implication for bacterial toxicity. Journal of Applied Microbiology, 87(3), 345–352.
De Smet, I., De Boever, P., & Verstraete, W. (1998). Cholesterol lowering in pigs through enhanced bacterial bile salt hydrolase activity. British Journal of Nutrition, 79, 185–194.
De Smet, I., Van Hoorde, L., Vande Woestyne, M., Christiaens, H., & Verstraete, W. (1995). Signifi cance of bile salt hydro-lytic activities of Lactobacilli. Journal of Applied Bacteriology, 79(3), 292–301.

Akhila, Abhini and Fathimathu
BIOSCIENCE BIOTECHNOLOGY RESEARCH COMMUNICATIONS BILE SALT HYDROLASE, A POTENT ENZYME CAPABLE OF REMOVING CHOLESTEROL 153
Dean, M., Cervellati, C., Casanova, E., Squerzanti, M., Lan-zara, V., Medici, A., … Bergamini, C. M. (2002). Characteriza-tion of cholylglycine hydrolase from a bile-adapted strain of Xanthomonas maltophilia and its application for quantitative hydrolysis of conjugated bile salts. Applied and Environmental Microbiology, 68(6), 3126–3128.
Doerner, K. C., Takamine, F., LaVoie, C. P., Mallonee, D. H., & Hylemon, P. B. (1997). Assessment of fecal bacteria with bile acid 7-dehydroxylating activity for the presence of bai-like genes. Applied and Environmental Microbiology, 63(3), 1185–1188.
Dong, Z., Zhang, J., Lee, B., Li, H., Du, G., & Chen, J. (2012). A bile salt hydrolase gene of Lactobacillus plantarum BBE7 with high cholesterol-removing activity. European Food Research and Technology, 235(3), 419-427.
Dunn‐Emke, S., Weidner, G., & Ornish, D. (2001). Benefi ts of a Low‐Fat Plant‐Based Diet. Obesity Research, 9(11), 731.
Dussurget, O., Cabanes, D., Dehoux, P., Lecuit, M., Buchrieser, C., Glaser, P., & Cossart, P. (2002). Listeria monocytogenes bile salt hydrolase is a PrfA-regulated virulence factor involved in the intestinal and hepatic phases of listeriosis. Molecular Microbiology, 45(4), 1095–1106.
El-Gawad, I. A. A., El-Sayed, E. M., Hafez, S. A., El-Zeini, H. M., & Saleh, F. A. (2005). The hypocholesterolaemic effect of milk yoghurt and soy-yoghurt containing bifi dobacteria in rats fed on a cholesterol-enriched diet. International Dairy Journal, 15(1), 37–44.
Franklund, C. V, de Prada, P., & Hylemon, P. B. (1990). Purifi -cation and characterization of a microbial, NADP-dependent bile acid 7 alpha-hydroxysteroid dehydrogenase. Journal of Biological Chemistry, 265(17), 9842–9849.
Fukushima, M., Yamada, A., Endo, T., & Nakano, M. (1999). Effects of a mixture of organisms, Lactobacillus acidophilus or Streptococcus faecalis on 6-desaturase activity in the livers of rats fed a fat-and cholesterol-enriched diet. Nutrition, 15(5), 373–378.
Gilliland, S. E., Nelson, C. R., & Maxwell, C. (1985). Assimila-tion of cholesterol by Lactobacillus acidophilus. Applied and Environmental Microbiology, 49(2), 377–381.
Gilliland, S. E., & Speck, M. J. (1977). Deconjugation of bile acids by human intestinal bacteria. Applied and Environmen-tal Microbiolog, 33, 15–18.
Gilliland, S. E., Speck, M. L., & Morgan, C. G. (1975). Detec-tion of Lactobacillus acidophilus in feces of humans, pigs, and chickens. Applied Microbiology, 30(4), 541–5.
Grill, J. P., Cayuela, C., Antoine, J. M., & Schneider, F. (2000). Isolation and characterization of a Lactobacillus amylovorus mutant depleted in conjugated bile salt hydrolase activity: Relation between activity and bile salt resistance. Journal of Applied Microbiology, 89(4), 553–563.
Harrison, V. C., & Peat, G. (1975). Serum cholesterol and bowel fl ora in the newborn. The American Journal of Clinical Nutri-tion, 28(12), 1351–1355.
Hepner, G., Fried, R., St Jeor, S., Fusetti, L., & Morin, R. (1979). Hypocholesterolemic effect of yogurt and milk. The American Journal of Clinical Nutrition, 32(1), 19–24. Retrieved from
Huijghebaert, S. M., Mertens, J. a, & Eyssen, H. J. (1982). Isola-tion of a bile salt sulfatase-producing Clostridium strain from rat intestinal microfl ora. Applied and Environmental Microbi-ology, 43(1), 185–192.
Jones, M. L., Chen, H., Ouyang, W., Metz, T., & Prakash, S. (2004). Microencapsulated genetically engineered Lactobacil-lus plantarum 80 (pCBH1) for bile acid deconjugation and its implication in lowering cholesterol. Journal of Biomedicine and Biotechnology, 2004(1), 61–69.
Jung, S. P., Lee, K. M., Kang, J. H., Yun, S. Il, Park, H. O., Moon, Y., & Kim, J. Y. (2013). Effect of Lactobacillus gasseri BNR17 on overweight and obese adults: A randomized, double-blind clinical trial. Korean Journal of Family Medicine, 34(2), 80–89.
Khedkar, C. D., Garge, R. D., Mantri, J. M., Kulkarni, S. A., & Khedkar, G. D. (1993). Effect of feeding acidophilus milk on serum cholesterol in human volunteers. J Dairy Foods Home Sci, 12, 33–38.
Kim, G and Lee, BH (2005) Biochemical and molecular insights into bile salt hydrolase in the gastrointestinal micro-fl ora-a review. Asian Australasian Journal of Animal Sci-ences 18: 1505
Kumar, R. S., Brannigan, J. A., Prabhune, A. A., Pundle, A. V., Dodson, G. G., Dodson, E. J., & Suresh, C. G. (2006). Structural and functional analysis of a conjugated bile salt hydrolase from Bifi dobacterium longum reveals an evolutionary relation-ship with penicillin V acylase. Journal of Biological Chemistry.
M. Kumar, R. Nagpal, R. Kumar (2012). Cholesterol-lowering probiotics as potential biotherapeutics for metabolic dis-eases, Experimental Diabetes Research, vol. 2012, Article ID 902917, 14 pages, 2012.
Kurdi, P., Tanaka, H., van Veen, H. W., Asano, K., Tomita, F., & Yokota, A. (2003). Cholic acid accumulation and its diminu-tion by short-chain fatty acids in bifi dobacteria. Microbiology, 149(8).
Lack, L., & Weiner, I. M. (1966). Intestinal bile salt transport: structure-activity relationships and other properties. American Journal of Physiology-Legacy Content, 210(5), 1142–1152.
Lee, K., Paek, K., Lee, H. Y., Park, J. H., & Lee, Y. (2007). Antiobesity effect of trans‐10, cis‐12‐conjugated linoleic acid‐producing Lactobacillus plantarum PL62 on diet‐induced obese mice. Journal of Applied Microbiology, 103(4), 1140–1146.
Liong, M.T. and Shah, N.P. (2005). Bile salt deconjugation abil-ity, bile salt hydrolase activity and cholesterol co-precipitation ability of lactobacilli strains. International Dairy Journal 15, 391-398
Lin, S. Y., Ayres, J. W., Winkler, W., & Sandine, W. E. (1989). Lactobacillus Effects on Cholesterol: In Vitro and In Vivo Results1. Journal of Dairy Science, 72(11), 2885–2899.
Macdonald, I. A., Bokkenheuser, V. D., Winter, J., McLernon, A. M., & Mosbach, E. H. (1983). Degradation of steroids in the human gut. Journal of Lipid Research, 24(6), 675–700.
Mahrous, H., Shaalan, U. F., & Ibrahim, A. M. (2011b). The role of some probiotic lactic acid bacteria in the reduction of cho-

Akhila, Abhini and Fathimathu
154 BILE SALT HYDROLASE, A POTENT ENZYME CAPABLE OF REMOVING CHOLESTEROL BIOSCIENCE BIOTECHNOLOGY RESEARCH COMMUNICATIONS
lesterol on mice. International Research Journal of Microbiol-ogy, 2(7), 242–248.
Mann, G. V., & Spoerry, A. (1974). Studies of a surfactant and cholesteremia in the Maasai. American Journal of Clinical Nutrition, 27(May), 464–469.
Mann, G. V. (1977). A factor in yogurt which lowers cholester-emia in man. Atherosclerosis, 26(3), 335–340.
Manson, J. E., Tosteson, H., Paul M, R., Satterfi eld, S., Herbert, P., O’Conner, G. T. &Hennekens, C. H. (1992). The Primary pre-vention of Myocardial infraction. The New England Journal of Medicine, 326, 1406–1416.
Moser, S. A., & Savage, D. C. (2001). Bile Salt Hydrolase Activ-ity and Resistance to Toxicity of Conjugated Bile Salts are Unrelated Properties in Lactobacilli. Applied and Environmen-tal Microbiology, 67(8), 3476–3480. https://doi.org/10.1128/AEM.67.8.3476-3480.2001
Nicolaou, M., Andress, E. J., Zolnerciks, J. K., Dixon, P. H., Williamson, C., & Linton, K. J. (2012). Canalicular ABC trans-porters and liver disease. The Journal of pathology, 226(2), 300- 315.
Nguyen, T. D. T., Kang, J. H., & Lee, M. S. (2007). Charac-terization of Lactobacillus plantarum PH04, a potential probi-otic bacterium with cholesterol-lowering effects. International Journal of Food Microbiology, 113(3), 358–361.
Owen, R. W., Thompson, M. H., & Hill, M. J. (1984). Analysis of metabolic profi les of steroids in faeces of healthy subjects undergoing chenodeoxycholic acid treatment by liquid-gel chromatography and gas-liquid chromatography-mass spec-trometry. Journal of Steroid Biochemistry, 21(5), 593–600.
Parvez, S., Malik, K.A., Kang, S.AH. & Kim, H.K. (2005). Pro-biotics and their fermented food products are benefi cial for health. Journal of Applied Microbiology ISSN 1364-5072.
Patel, A. K., Singhania, R. R., Pandey, A., & Chincholkar, S. B. (2010). Probiotic bile salt hydrolase: Current developments and perspectives. Applied Biochemistry and Biotechnology.
Pereira, D. I. A., & Gibson, G. R. (2002). Cholesterol Assimila-tion by Lactic Acid Bacteria and Bifi dobacteria Isolated from the Human Gut. Applied and Environmental Microbiology, 68(9), 4689–4693.
Peschel, A. (2002). How do bacteria resist human antimicrobial peptides? Trends in Microbiology.
Rajan, A. B., & Fathimathu Zuhara, K. (2018). Isolation screen-ing and identifi cation of bile salt hydrolase producing bacteria from waste samples, 11(1), 104–108.
Rašic, J. L., Vujicic, I. F., Škrinjar, M., & Vulic, M. (1992). Assimilation of cholesterol by some cultures of lactic acid bac-teria and bifi dobacteria. Biotechnology Letters, 14(1), 39–44.
Ridlon, JM, Kang, D-J and Hylemon, PB (2006). Bile salt bio-transformations by human intestinal bacteria. Journal of Lipid Research 47: 241–259.
Russell, DW (2009). Fifty years of advances in bile acid synthe-sis and metabolism. Journal of Lipid Research 50: S120–S125
Sarkar, S. (2003). Potential of acidophilus milk to lower choles-terol. Nutrition & Food Science, 33(6), 273–277
Schaafsma, G., Meuling, W. J., van Dokkum, W., & Bouley, C. (1998). Effects of a milk product, fermented by Lactobacillus acidophilus and with fructo-oligosaccharides added, on blood lipids in male volunteers. European Journal of Clinical Nutri-tion, 52(6), 436–40.
Schaap, FG, Trauner, M and Jansen, PL (2014). Bile acid recep-tors as targets for drug development. Nature Reviews Gastro-enterology & Hepatology 11: 55–67
Schiff ER, Sorrell MF, Maddrey WC, editors. Schiff’s Diseases of the Liver. Philadelphia: Lippincott, Williams & Wilkins; 2002. pp. 135–165.
Sindhu, S. C., & Khetarpaul, N. (2003). Effect of feeding probi-otic fermented indigenous food mixture on serum cholesterol levels in mice. Nutrition Research, 23(8), 1071–1080.
Smet, I. De, Hoorde, L. Van, Saeyer, N. De, Woestyne, M. Vande, & Verstraete, W. (1994). in vitro study of bile salt hydro-lase (BSH) activity of BSH isogenic Lactobacillus plantarum 80 strains and estimation of cholesterol lowering through enhanced BSH activity. Microbial Ecology in Health and Dis-ease, 7(6), 315–329.
Sridevi, N., & Prabhune, A. A. (2009). Brevibacillus sp: A novel thermophilic source for the production of bile salt hydrolase. Applied Biochemistry and Biotechnology, 157(2), 254–262.
Sridevi, N., Pradnya, V., & Prabhune, A. (2009). Hypocholester-emic effect of bile salt hydrolase from Lactobacillus buchneri ATCC 4005. Food Research International, (42), 516–520.
Suckling, K. E., Benson, G. M., Bond, B., Gee, A., Glen, A., Haynes, C., & Jackson, B. (1991). Cholesterol lowering and bile acid excretion in the hamster with cholestyramine treatment. Atherosclerosis, 89(2–3), 183–190.
Takahashi, T., & Morotomi, M. (1994). Absence of cholic acid 7 alpha-dehydroxylase activity in the strains of Lactobacillus and Bifi dobacterium. J Dairy Sci, 77(11), 3275–3286.
Taranto, M. P., Fernandez Murga, M. L., Lorca, G., & De Val-dez, G. F. (2003). Bile salts and cholesterol induce changes in the lipid cell membrane of Lactobacillus reuteri. Journal of Applied Microbiology, 95(1), 86–91.
Taranto, M. P., Sesma, F., Pesce De Ruiz Holgado, A., & De Valdez, G. F. (1997). Bile salts hydrolase plays a key role on cholesterol removal by Lactobacillus reuteri. Biotechnology Letters, 19(9), 845–847.
Thomas, L. A., Veysey, M. J., Bathgate, T., King, A., French, G., Smeeton, N. C. & Dowling, R. H. (2000). Mechanism for the transit-induced increase in colonic deoxycholic acid for-mation in cholesterol cholelithiasis. Gastroenterology, 119(3), 806–815.
Thomas, L. A., Veysey, M. J., Murphy, G. M., & Dowling, R. H. (2001). Infl uence of pH on the phase distribution of nascent deoxycholic acid in fresh human cecal aspirates. American Journal of Physiology-Gastrointestinal and Liver Physiology, 281, G371–G374.

Akhila, Abhini and Fathimathu
BIOSCIENCE BIOTECHNOLOGY RESEARCH COMMUNICATIONS BILE SALT HYDROLASE, A POTENT ENZYME CAPABLE OF REMOVING CHOLESTEROL 155
Tsai, C.-C., Lin, P.-P., Hsieh, Y.-M., Zhang, Z., Wu, H.-C., & Huang, C.-C. (2014). Cholesterol-lowering potentials of lactic acid bacteria based on bile-salt hydrolase activity and effect of potent strains on cholesterol metabolism in vitro and in vivo. The Scientifi c World Journal, 2014.
Van Eldere, J., Celis, P., De Pauw, G., Lesaffre, E., & Eyssen, H. (1996). Tauroconjugation of cholic acid stimulates 7 alpha-
dehydroxylation by fecal bacteria. Applied and Environmental Microbiology, 62(2), 656–61.
Xiao, J. Z., Kondo, S., Takahashi, N., Miyaji, K., Oshida, K., Hiramatsu, A &Hosono, A. (2003). Effects of Milk Products Fermented by Bifi dobacterium longum on Blood Lipids in Rats and Healthy Adult Male Volunteers. Journal of Dairy Science, 86(7), 2452–2461.

Detection of poly cystic ovarian syndrome (PCOS)
using follicle recognition techniques
T. Abirami* and S. Palanivel Rajan
Professor, Department of Electronics and Communication Engineering, M. Kumarasamy College of Engineering, Karur, Tamilnadu, India
ABSTRACT
Now a days most of the females are facing the problems of infertility in the age group of 22 to 35. In order to analyze and classify the problems, one can start with making the decision of comparing the normal ovary and affected ovary structurally using advanced techniques. The two images have to be taken and can be compared using the accurate images for detecting the affected ovary or its areas. Using the feature extraction method, the image can be further diag-nostically extracted. Then the image can be processed by segmentation and fi nally it can be detected and subjected to a diseased degree classifi cation. The method used here is Support Vector Machine (SVM) with Fuzzy Logic. SVM algo-rithm is used to classify and regression analysis. It works on the concept of partial truth, where the given value might range between absolutely true and absolutely false. Histogram adjustment calculation is connected to get a complexity improved picture. The wiener channel is the greatest appropriate decision for diminishment of clamor in ovarian using the ultrasound picture. The results are distinguished and then taken for physical request from the experts. Exactness of system can be approximately 95%. Subsequently, this fi guring can be customized by screening of Poly Cystic Ovarian Syndrome problems.
KEY WORDS: POLYCYSTIC OVARIAN DETECTION (PCOD), BODY MASS INDEX (BMI), FOLLICLE-STIMULATING HORMONE (FSH) AND LUTEINIZING HORMONE (LH)
156
Medical CommunicationBiosci. Biotech. Res. Comm. 12(1): 156-161 (2019)
ARTICLE INFORMATION:
Corresponding Author: [email protected] 22nd Dec 2018Accepted after revision 3rd March 2019BBRC Print ISSN: 0974-6455Online ISSN: 2321-4007 CODEN: USA BBRCBA Thomson Reuters ISI ESC / Clarivate
Analytics USAMono of Clarivate Analytics and Crossref Indexed Journal Mono of CR
NAAS Journal Score 2019: 4.31 SJIF: 4.196© A Society of Science and Nature Publication, Bhopal India 2019. All rights reserved.Online Contents Available at: http//www.bbrc.in/DOI: 10.21786/bbrc/12.1/20

BIOSCIENCE BIOTECHNOLOGY RESEARCH COMMUNICATIONS DETECTION OF POLY CYSTIC OVARIAN SYNDROME (PCOS) 157
Abirami and Palanivel Rajan
Many females of reproductive age suffer with the dis-orders Polycystic Ovarion Syndrome commonly known as PCOS. It is a heterogenous endocrine disorder and is most common among the young generation. Though the exact cause for this disorder is unknown factors, like hormonal imbalance, central or overall obesity and hav-ing Body Mass Index greater than 24 can be considered as some of its causes (Abirami et al. 2018). This may result is abnormal ovulation, with absence of or irregu-lar menstrual cycle, infertility conditions called as called as amenorrhea, (Vijayprasath et al. 2015). It also results in release of additional quantity of androgenic hor-mones and it’s effects are frustrating. This leads to acne and insulin resistance which is often accompanied by obesity, high cholesterol levels and type 2 diabetes. The diagnosis procedures usually followed are the ovarian ultrasound images which show ovaries with the disor-der having multiple cysts. But it cannot be stated as the only symptom for the disorder. Huge variety in the side effects and seriousness of the problem has been seen in some females, (Annakamatchi et al. 2018).
Few methodologies are used to identify the PCOD problems. These are medical, biological, and the ovarian ultrasound imaging which are used to fi nd the problem. A patient can be examined as affl iction from PCOD or not, if the any of two from the three situations are given below: (1) Prolonged ovulation or portrayed by sporadic menses series, (2) Additional measures which are caused by mem-brane breakdown, besides raised serum chemicals and (3) Occurrence of polycystic ovaries realized by the image of gynecologic ultrasounds, (Choudhary et al. 2015).
For an ordinary and sound ovary just a single folli-cle develops in a size of 20mm in width, develops and is prepared for ovulation, under right levels of FSH and LH hormones1. But in the case of PCOS affected ovary many small follicles of size 12 or more than that and about 2-9 mm in diameter is found dispersed along the periphery of the ovary which is medically termed as ‘necklace forma-tion’. Hence the volume of ovary will raise above 10 cm3 in PCOS affected patients (Dinesh et al. 2015a). Figure 1 indicates ultrasound picture of typical ovary demonstrat-
ing just a single follicle prepared for ovulation and fi gure 2 depicts the scenario in which various little follicles are found in the edge of ovary (Dinesh et al. 2015b).
In this paper, the images have been tested and affected by PCOS tended to by all the three techniques. Ovarian ultrasound pictures have been gathered for around 20 patients either with or without PCOS side effect alongside values for the measuring parameters of PCOS (Essam et al. 2018). This process is carried out with a 6MHz ultrasound transducer. Techniques such as enhancement of contrast and then fi lters are used to increase the excellence of the images can be obtained. Highlight extraction incorporates were done by remov-ing dull or splendid highlights from the fi rst picture. Divisional identifi cation was carried from which the coveted areas are chosen utilizing qualities such as size, area, compactness and so forth, (Kavitha et al. 2017). The facts were utilized for the compactness which was constructed from the count of follicles acquired in the overhead process and medical and biological informa-tion was gathered from specialists, characterization was completed by the algorithm following the method of Keerthi et al. (2018).The Process Flow of PCOS detection is shown in fi gure.3
FIGURE 1. Normal ovary
FIGURE 2. PCOD affected ovary
FIGURE 3. Process Flow of PCOS detection

158 DETECTION OF POLY CYSTIC OVARIAN SYNDROME (PCOS) BIOSCIENCE BIOTECHNOLOGY RESEARCH COMMUNICATIONS
Abirami and Palanivel Rajan
Table 1. SNR value of different fi ltering techniques
Image/fi ltered image
Signal-to-noise ratio (SNR) in dB
Original image 1.935
Averaging fi lter 4.0058
Median fi lter 4.247
Gaussian fi lter 4.1546
Wiener fi lter 4.2597
The outcomes are noted and it is contrasted with fi nding the manual location with fi gure exactness of the proposed calculation. The stream of process is given beneath in the fi gure.3. Medical ultrasonography pro-duces poor quality images of high noise content and low contrast. For upcoming processes such as feature extraction, segmentation and follicle detection high quality images are required (Vijayprasath et al. 2012). Hence it is necessary to remove the noise and improve the contrast of images (Rajan 2014). The preprocessing technique involves improving the quality of images with the help out of distinction improvement and fi ltering methodologies. Contrast enhancement which was the fi rst step in preprocessing improves the contrast of ovar-ian ultrasound images using different global and local techniques (Rajan 2015). This paper focuses to contrast enhanced image and performances are calculated based on Signal-to-Noise ratio (SNR) given in equation 1 where is the variance of original image and is the vari-ance of enhanced image.
sole picture to become differentiate improved picture on (Sukanesh et al. 2013). In the calculation the change assistances by the extraction of brilliant highlights since the foundation by means of utilizing morphological ini-tial and fi nish task in an organizing component indi-vidually5. The organizing component utilized as a part of this case is a plate organizing component (Ramesh et al. 2018). The splendid best cap change is character-ized as the contrast between the information picture and its opening by the basic component. Then again, dark best cap change is characterized as the contrast between shutting by same basic component and information pic-ture6. On the off chance that is an organizing compo-nent, at that point splendid and dull best cap changes can be given as in equation 2 and 3 individually (Rajan et al. 2013).
(1)
In table 1, the signal to noise ratio of different fi ltering methods are illustrated. From the table original image is a ultrasound image. If processing of original image may give wrong results. So that the original image can be processed for fi ltering to remove the noise and enhance the contrast for further processing. Here different fi lter-ing methods are carried out. Signal to Noise Ratio (SNR) is calculated for various methods of fi ltering. Examples Median Filtering, Averaging Filtering, Gaussian Filter-ing, Wiener Filtering. The output of preprocessing stage is given the fi gure
In the ovarian image using the ultrasound picture, aside since follicles, endometrial veins, lymph hubs, nerve strands and stroma is seen (Ramakrishnan et al. 2018). Hence, it is to be reduced the incorrect discovery, include removals are fi nished through utilizing Multistage mor-phological method, for the situation Top-cap change. White and Dull highlights dismiss be removed after the picture and later the subsequent picture is deducted from
FIGURE 4. Output image of pre-processing stage
(2)
(3)
Picture division is utilized to distinguish wanted highlights with the goal that the consequential pic-ture being less demanding to investigate7 (Ribana et al. 2018). The different methodologies have been suggested and second-hand for picture division like edge area, edge, etc., various edge distinguishing proof practices can be utilized for the division of ovarian picture. In the edge identifi cation method, focuses in picture are documented where picture brilliance changes pointedly or consumes discontinuities, in the picture, get after lin-earization8. In binaries picture, pixel esteems at all the specifi c focuses or the areas alteration all of a sudden from 0 to 255 (i.e. dull to brilliant) and the other way around. Every one of these focuses is sorted out into an arrangement of bended line sections to recognize the edges (Rajan et al. 2012).

BIOSCIENCE BIOTECHNOLOGY RESEARCH COMMUNICATIONS DETECTION OF POLY CYSTIC OVARIAN SYNDROME (PCOS) 159
Abirami and Palanivel Rajan
FIGURE 5. (a) Image obtained after feature extraction(b) Image obtained after linearization (c) Image obtained for important follicle detection (c) Follicular boundaries detected after canny edge detection
Table 2. Parameters taken for classifi cation of PCOS
ParametersPCOS Affected
Normal (Not affected by PCOS)
No. of follicle >8-10 1 Dominant
BMI (kg/mL) > 24 <=24
Menstrual cycle >32 28-32
LH (lU/L) >8 2-8
FSH (lU/L) >5 2-5
FIGURE 6. Plot Vs Density and BMI
Vast number of highlights is recognized after bina-rization what’s more, edge identifi cation (Sivaguruna-than et al. 2018). To isolate out imperative follicles from identifi ed highlights, criterion for example highest and lowest amount of follicles, zone, eroticism as well as smallness must be additionally taken for the calculation. Consider the follicles are round fi t as a fi ddle, isolate locales will associate with 4-80 mm2 for PCOS ovary and around 314 mm2 for common place ovarian follicle. Although it is accredited with the purpose of the follicles are circuitous alive and well, whim is generally compa-rable to 1 (Sivaranjani et al. 2018). Thinking about every one of these qualities for edge, region of each identi-fi ed area or highlight is fi gured and number of essential follicles identifi ed is discovered. In Figure 4, the Image can be obtained after all the process image extraction (Sukanesh et al. 2010a).
The nu mber of ovarian follicles is not an only mat-ter for the problem of PCOS and also it has to measure the parameters of BMI, cycle length, post menstrual FSH and LH10 (Sukanesh et al. 2010b). In every image of the parameter is close at hand of number of follicles is measured and it shown patients are having the problem otherwise it is not showing it to the maximum level14. Here comparing the parameters of Normal Patient with the PCOS affected patients are given in table 1. The parameters were No. of follicle, BMI (kg/mL), Period Cycle, LH (lU/L), FSH (lU/L). The follicle may present in normal patient also but the number should be only one, and value of BMI (Body Mass Index) is about to be less than or equal to 2415. The menstrual cycle also taken as 28 days to 32 days if it is more than 32 days three will be a problem of PCOS. The value of LH and also FSH
FIGURE 7. Kernel Density plot for LH

160 DETECTION OF POLY CYSTIC OVARIAN SYNDROME (PCOS) BIOSCIENCE BIOTECHNOLOGY RESEARCH COMMUNICATIONS
Abirami and Palanivel Rajan
are also compared with PCOs and the Normal patients. With these above parameters are helped to classify the problems to be taken16.
The different set of images are monitored and pre-liminary 15 number of data’s is used for setting up for computation, course of action of subsequently 5 instruc-tive lists is fi nished. The system is frequently for instruc-tive record of the impressive number of patients. It is used for planning the data sets and gathering of all the information. Outcomes acquired be contrasted and indi-viduals gotten by physical grouping and commencing to specialists. In the fi gure 6, it shows the graph between BMI vs density. It is used to predict PCOS ovary or nor-mal ovary.
The both information’s are taken into account and number of follicles are identifi ed and in the above pro-cess are utilized for order utilizing in SVM calculation. Motion to-commotion proportions (SNR) are computed for unique picture and for each separated picture and outcomes are gotten by way of appeared in the table 1. From this, it can be derived that wiener channel is the greatest appropriate decision for diminishment of clamor in ovarian using the ultrasound picture.
In the fi gure 7, it shows the graph between kernel densities with LH. The Wiener sifted picture is utilized for additional processing.
In the given table 3, already the parameter taken for classifi cation of PCOS illustrated in Table 2. 5 different data sets are taken to fi nd the values of BMI, Menstrual Cycle, FSH, LH, No of Follicles. After fi nding the val-ues of all the parameters comparing with the table No:2 and it will help to decide or classify the Normal patient or PCOS affected patients. Training sets are available to make decision of PCOS affected or not.
At last it has been concluded with a robotized proce-dure for Polycystic Ovarian Syndrome area using follicle affi rmation as well as portrayal by means of Support Vector Machine. Picture is to be preprocessed and it is (differentiate upgrade and sifting) utilized for enhancing nature of the picture. Highlights are removed utilizing Multiscale morphological approach and brilliant best cap change. The picture is binarized and portioned utilizing
watchful edge discovery method. Critical follicles are isolated from different areas utilizing region and unpre-dictability limit. Grouping of the considerable number of information is fi nished utilizing the SVM algorithm for calculation. The results have been achieved and the accuracy is about 95%. In the same way, this estimation has been done by enough number of modifi ed screen-ings of PCOS.
REFERENCES
Abirami T,Ramesh L (2018) Bio-Nano Things: Organically stimulated Bio-Cyber Interface Architecture, International Journal of Pure and Applied Mathematics 119(15), 3257-3262
Annakamatchi M, Keralshalini V (2018) Design of Spiral Shaped Patch Antenna for Bio-Medical Applications. Interna-tional Journal of Pure and Applied Mathematics 118(11): Pages 131-135.
Choudhary, J. Chowdhary, M.L. Swarankar, et al., (2015) Predictive value of subendometrial–endometrial blood fl ow assessment by transvaginal 3D power doppler on the day of HCG on clinical outcome of IVF cycles, Int. J. Res. Med. Sci. 3 3114.
Dinesh T, Palanivel S (2015a) Systematic Review on Wear-able Driver Vigilance System with Future Research Directions. International Journal of Applied Engineering Research 2(2): Pages 627-632.
Dinesh T, Palanivel S (2015b) Statistical Investigation of EEG Based Abnormal Fatigue Detection using LabVIEW. Interna-tional Journal of Applied Engineering Research 10(43): Pages 30426-30431
Essam R. Othman, Karim S.Abdullah, Ahmed M.Abbas, Mostafa Hussein(2018), Elwany Elsnosy, Ihab H.EI-Nashar, “Evalua-tion of endometrial and subendrometrial vascularity in obese women with polycystic ovarian disease” Middle East Fertility Society Journal 23, pages 324–330
Kavitha V, Palanivel Rajan S (2017) Diagnosis of Cardiovascu-lar Diseases using Retinal Images through Vessel Segmentation Graph. Current Medical Imaging Reviews 13(4).
Keerthi S, Dhivya S (2017) Comparison of RVM and SVM Clas-sifi er Performance in Analysing the Tuberculosis in Chest X Ray. International Journal of Control theory and Applications 10(36): Pages 269-276.
Table 3. Classifi cation of PCOS and Normal patients
Data Sets BMI Cycle Length FSH LH Follicles Result
Data Set A 25.03-26.87 38 5.76 13.08 7 PCOS
Data Set B 20.47-22.04 26 3.4 4.4 1 Normal
Data Set C 24.67-26.34 32 3.98 3.18 2 Normal
Data Set D 25.09-25.39 36 6.07 15.66 10 PCOS
Data Set E 21.94-22.69 28 1.78 4.28 1 Normal
BIOSCIENCE BIOTECHNOLOGY RESEARCH COMMUNICATIONS DETECTION OF POLY CYSTIC OVARIAN SYNDROME (PCOS) 161
Abirami and Palanivel Rajan
Palanivel Rajan S (2014) A Signifi cant and Vital Glance on “Stress and Fitness Monitoring Embedded on a Modern Telem-atics Platform. Telemedicine and e-Health Journal 20(8): Pages 757-758.
Palanivel Rajan S (2015) Review and Investigations on Future Research Directions of Mobile Based Tele care System for Car-diac Surveillance. Journal of Applied Research and Technology 13(4): Pages 454-460.
Ramakrishnan P, Sivagurunathan P T (2018) Wireless Patient Monitoring systems. International Journal of Pure and Applied Mathematics 118(11): Pages 761- 766.
Ramesh L, Abirami T (2018) Segmentation of Liver Images Based on Optimization Method. International Journal of Pure and Applied Mathematics 118 (8) : Pages 401-405.
Rajan S P, Sukanesh R (2013) Viable Investigations and Real Time Recitation of Enhanced ECG Based Cardiac Tele-Monitor-ing System for Home-Care Applications: A Systematic Evalua-tion. Telemedicine and e-Health Journal 19(4): Pages 278-286.
Rajan S P, Sukanesh R, Vijayprasath S (2012) Performance Evaluation of Mobile Phone Radiation Minimization through Characteristic Impedance Measurement for Health-Care Appli-cations. IEEE Digital Library Xplore.
Ribana K, Pradeep S (2018) Contrast Enhancement Techniques for Medical Images. International Journal of Pure and Applied Mathematics 118: Pages 695-700.
Sivagurunathan P T, Ramakrishnan P (2018) A Survey on Wearable health Sensor– Based System Design. International Journal of Pure and Applied Mathematics 118(08): Pages 383 -385.
Sivaranjani S, Kaarthik K (2018) Medical Imaging Technique to Detect Tumor Cells. International Journal of Pure and Applied Mathematics, 118(11): Pages 399 – 404.
Sukanesh R, Gautham P, Rajan S P, Vijayprasath S (2010a) Cellular Phone based Biomedical System for Health Care. IEEE Digital Library Xplore: Pages 550-553.
Sukanesh R, Palanivel Rajan S (2013) Experimental Studies on Intelligent, Wearable and Automated Wireless Mobile Tele-Alert System for Continuous Cardiac Surveillance. Journal of Applied Research and Technology 11(1): Pages 133-143.
Sukanesh R, Rajan S P, Vijayprasath S (2010b) Intelligent Wire-less Mobile Patient Monitoring System. IEEE Digital Library Xplore: Pages 540-543.
Vijayprasath S, Sukanesh R, Rajan S P (2012) Experimental Explorations on EOG Signal Processing for Real Time Applica-tions in LabVIEW. IEEE Digital Library Xplore.
Vijayprasath S, Rajan S P (2015) Performance Investigation of an Implicit Instrumentation Tool for Deadened Patients Using Common Eye Developments as a Paradigm. International Journal of Applied Engineering Research 10(1): Pages 925-929.

Annexin A2 mediated posttranscriptional destabilization
of BRCA1 mRNA in sporadic breast cancer
Anil Bapu Bargale1,3,4, Jayarama Shetty K2, Suchetha Kumari N5, Vidya S Patil4, R D
Kulkarni6, Rajesh kumar Manne7, Sarathkumar E3 and Praveenkumar Shetty3,4
1Ph D Scholar, K S Hegde Medical Academy, NITTE University, Mangalore, India2Department of Radiotherapy & Oncology, K S Hegde Medical Academy, NITTE University, Mangalore3Central Research Laboratory, SDM College of Medical Sciences & Hospital, Dharwad, India4Dept. of Biochemistry, SDM College of Medical Sciences & Hospital, Dharwad, India. 5Dept. of Biochemistry, K S Hegde Medical Academy, Mangalore, NITTE University, Mangalore6Department of Microbiology, SDM College of Medical Sciences & Hospital, Dharwad, India7Cancer Biology division, National Centre for Cell Science, Pune
ABSTRACT
BRCA1 is a nuclear phosphoprotein involved in genome integrity by regulating cell cycle checkpoints, DNA repair and apoptosis. BRCA1 down regulation occurs in sporadic breast cancer (BC). Posttranscriptional regulation of gene expres-sion has evolved as a means of fi ne-tuning of protein levels. There are several posttranscriptional regulatory motifs, including CU-rich, U-rich and AU-rich elements, which are usually located in the 5’ and 3’ UTR’s. Post-transcriptional regulation of BRCA1 is poorly characterized and underappreciated. To elucidate the molecular mechanism of AnxA2 mediated posttranscriptional regulation of BRCA1 mRNA in sporadic breast cancer. In order to investigate BRCA1 mRNA levels in MDAMB-231 & MCF-7 cells, we conducted DRB chase experiment. The BRCA1 mRNA destabilization is signifi cantly increased upon AnxA2 induction in MCF-7 cells. Further we knocked down AnxA2 in MDAMB-231 cells we found, BRCA1 mRNA stabilization which proves AnxA2 destabilizes BRCA1 mRNA. In RIP-CHIP experiment we found BRCA1 immunoprecipitated with AnxA2. This supports our fi nding that AnxA2 has role in the regulation of BRCA1 at mRNA level. Luciferase reporter assay showed decrease in luciferase activity with BRCA1 3’UTR. On treating with AnxA2 binding oligo from BRCA1 3’UTR showed decrease in cell viability.
KEY WORDS: ANXA2, BRCA1, RNA BINDING PROTEIN, RENILLA LUCIFERASE
162
Medical CommunicationBiosci. Biotech. Res. Comm. 12(1): 162-168 (2019)
ARTICLE INFORMATION:
Corresponding Author: [email protected] 12th Jan 2019Accepted after revision 27th March 2019BBRC Print ISSN: 0974-6455Online ISSN: 2321-4007 CODEN: USA BBRCBA Thomson Reuters ISI ESC / Clarivate
Analytics USAMono of Clarivate Analytics and Crossref Indexed Journal Mono of CR
NAAS Journal Score 2019: 4.31 SJIF: 4.196© A Society of Science and Nature Publication, Bhopal India 2019. All rights reserved.Online Contents Available at: http//www.bbrc.in/DOI: 10.21786/bbrc/12.1/21

Anil Bapu Bargale et al.
BIOSCIENCE BIOTECHNOLOGY RESEARCH COMMUNICATIONS ANNEXIN A2 MEDIATED POSTTRANSCRIPTIONAL DESTABILIZATION 163
INTRODUCTION
Breast Cancer (BC) is one of the leading causes of death among women and has 10% life time risk of developing malignancies in many countries in the western world (Newman 1988). Hereditary BC Syndrome accounts for 5-10% of all BC cases, while the other 90-95% of BC is “Sporadic. According to Population Based Cancer Reg-istry (PBCR); In India, Breast cancer accounts for 25 - 35% of all female cancers in metro cities like; Mumbai, Delhi, Bengaluru, Kolkata, Chennai, Ahmadabad, Bho-pal, etc. and it is second common cancer in rural areas. This implies, practically, one fourth of all female cancer cases are breast cancers, (Adnan 2018). Several studies have been reported the evidences, suggesting involve-ment of BRCA1 in the etiology of sporadic breast and ovarian cancer through reduced expression. Decreased levels of BRCA1 mRNA are frequently observed in breast tumors, (George 1998, Adnan, 2018, Nicolas 2018, Hara-hap 2018, Huszno 2019).
Lower or undetectable levels of expression of the BRCA1 protein have been observed in sporadic BC (McCoy 2003). Different mechanisms have been shown to be responsible for the reduced expression of BRCA1; epigenetic silencing of the BRCA1 gene at the transcrip-tional level by means of promoter methylation is another mechanism involved (Das 2004, Choic 2009, Robertson 2002, Baylin 2006). The BRCA1 gene was identifi ed and cloned in 1994. BRCA1 known for its multiple vital functions such as tumor suppressor activity, including roles in cell cycle progression, DNA damage repair pro-cesses DNA damage responsive cell cycle check point regulation of a set of specifi c transcriptional pathways and apoptosis (Rice 1998). Since, BRCA1 gene is rarely mutated in sporadic breast cancer. It has been suggested that, dysregulation of BRCA1 expression causes reduced mRNA or protein levels in BC (Thompson 2011).
Post-transcriptional regulation of gene expression has evolved as a mean of fi ne tuning protein levels and generating rapid temporal or spatial changes in protein expression following an environmental stimulus (Sau-nus 2008). Regulation of the dynamics of mRNA mol-ecule is a wide spread phenomenon and there are many such examples of genes regulated in this way including tumor suppressor genes (Rosen 2003, Maity 1997). The mechanisms often involve RNA-binding proteins and non-coding RNAs (transacting factors) which recognizes sequence motif in their target transcripts and ‘tag’ them for recognition by macromolecular complexes involved in RNA metabolism such as mRNA transport granules, RNA induced silencing complexes (RISC), the exosome, GW bodies and stress granules(Thanin 2018, Cok 2001, Fu 1997, anderson 2006). There are many examples of post-transcriptional regulatory motifs, including CU-
rich, U-rich and AU-rich elements which are usually located regions of regulated transcripts (Moore 2005, Kedeersha 2002, Engels 2006). It can be diffi cult to pre-dict the regulatory functions of individual motif based on primary sequence alone, as they often associate with multiple transacting factors with different and some-times opposing activities.
BRCA1 is post-transcriptionally regulated by mRNA binding proteins, the identity of which is unknown. HuR is an RNA binding protein already proven to play role in the event of post-transcriptional regulation of BRCA1 by Jodi M Saunus et al. HuR is ubiquitously expressed RNA binding protein that regulates the stability and translation of transcripts that function in multiple cel-lular pathways, such as p21WAFI, COX, TP24, Cyclin A and B and P27. As like HuR other mRNA binding pro-teins like Annexin A2 (AnxA2) expression increases in basal breast cancer where BRCA1 expression is very less or null. AnxA2 is a multifunctional calcium depend-ent phospholipid binding protein. AnxA2 shows func-tional diversity like it regulates membrane traffi c and cytoskeleton organization, extracellular activities and targeted gene disruption (Lopez 2005). AnxA2 is highly expressed in the surface of human tumor cells and pro-motes cell migration and invasion by activating plas-minogen and cleaving extracellular matrix25. AnxA2 stimulates cell proliferation, angiogenesis and invasion (Wein 2003, Wiklund 2002, Maji 2016, Volker 2002).This study demonstrates the hypothesis of AnxA2 medi-ated post-transcriptional regulation of tumor suppressor BRCA1 gene contributes to the development and pro-gression of sporadic breast cancer.
MATERIALS & METHODS
Cell Culture
Human breast cancer cell lines, MDA-MB-231 and MCF-7 were obtained from National Center for cell Sci-ences (NCCS), Pune and grown in respective media as prescribed by the supplier.
Real Time RT-PCR
Total RNA was isolated using TRIZOL (Invitrogen). cDNA was synthesized using RevertAid First strand cDNA syn-thesis kit by Thermo Fischer scientifi c with following primers; For BRCA1 (F: 5’-GGTTCTGATGACTCACAT-GATGGG-3’&R: 5’-TCTGTGGCTCAGTAACAAATGCTC-3’),AnxA2(5’TAACTTTGATGCTGAGCGGG-3’&R:5’-TAATTTCCTGCAGCTCCTGG-3’) and for GAPDH (5’-GAGCGAGATCCCTCCAAA-3’ & R: 5’-ACTGTGGTCAT-GAGTCCTTC-3’. BRCA1, AnxA2 & GAPDH were amplifi ed by DyNAmo Color Flash SYBR Green q-PCR kit (Thermo Fischer scientifi c) on Cepheid Smart cycler. PCR set up for

Anil Bapu Bargale et al.
164 ANNEXIN A2 MEDIATED POSTTRANSCRIPTIONAL DESTABILIZATION BIOSCIENCE BIOTECHNOLOGY RESEARCH COMMUNICATIONS
BRCA1 was 2 minutes for 950 C for one cycle, followed by 30 second 940C, 550C & 720C for 35 cycles. PCR reaction set up for AnxA2 & GAPDH used was 2 minutes at 950C and 40 cycles of 30 s at 950C, 30 s at 540C, and 30 s at 680C. The comparative ΔCt method was used to determine relative BRCA1, AnxA2 mRNA expression.
RNA stability:
RNA stability was analyzed by transcription-chase experiment. The cells were stimulated to over express BRCA1 & AnxA2 by selected agonists respectively and then treated with DRB to inhibit ongoing transcrip-tion, after which total RNA was isolated at selected time points and cDNA was synthesized and amplifi ed as described earlier.
RNA Immunoprecipitation: Formaldehyde was added to cosslink protein-RNAs in MDAMB-231 Cells grown in specifi c medium, at RT after 15 minutes stopped by addition of 2M glycine and incubated for 5 minutes. Cells were collected in 500μl of RIPA lysis buffer con-taining RNase inhibitor. The lysate was centrifuged at 12000g. Annexin A2 specifi c primary antibody added and incubated at 4ºC overnight on shaker. 50 μl of Pro-tein A/G beads added to the lysate and incubated at 4ºC for 4 hours. The lysate was washed twice with RIPA lysis buffer. The crosslinking reversed by 6μl of 5M NaCl and 20 μg of proteinase k added to the lysate and incubated 1 hour at 42ºC and 1 hour at 65ºC. RNA was extracted by following TRIZOL RNA extraction protocol. RNA was reverse transcribed and amplifi ed for BRCA1 by specifi c primers as described earlier. PCR products were resolved on ethidium bromide–stained 1.5% agarose gel.
Luciferase reporter assays
Luciferase reporter used was BRCA1 3’UTR luciferase reporter construct, made by ligating the full-length BRCA1 3’UTR downstream of the luciferase of pLuc. MDAMB-231 cells in 12 well plates were transiently
transfected with equimolar amounts of luciferase reporter constructs. After 24 h of luciferase expression, Firefl y luciferase reporter activity was determined rela-tive to Renilla using a Dual Luciferase Reporter Assay kit (Promega) and Promega Luminometer.
MTT assay:
The MTT (3-(4, 5-dimethyl-2-thiazolyl)-2,5-diphenyl-2H-tetrazolium bromide) assay conducted to check cell proliferation by transfecting the MDAMB-231 cells by 50 oligo nucleotide specifi c binding to BRCA1 3’UTR analyzed by NCBI BLAST software and read by Epoch analyzer.
RESULTS & DISCUSSION
A detailed understanding of the mechanisms regulating BRCA1 expression is very much essential to identify the regulatory abnormalities in breast cancer (Diaz 2004, Blasi 1999). Reduction in BRCA1 expression in sporadic breast cancer is well documented (Tarui 2002). In our earlier data, we have demonstrated that the expressions of BRCA1 and AnxA2 protein are reciprocally regulated, which indicate the possibility of AnxA2 involvement in BRCA1 posttranscriptional regulation. The posttran-scriptional regulation of BRCA1 in the sporadic breast cancer is underappreciated and poorly studied. This study suggests BRCA1 mRNA stability is regulated by AnxA2 in sporadic breast cancer (Wein 2003, Wiklund 2002, Huszno 2019).
BRCA1 & AnxA2 mRNA expression in different cells
Levels of BRCA1 & AnxA2 mRNA were analyzed in BT-549, MCF-7 & MDAMB-231 cells. We found abun-dant AnxA2 mRNA in MDAMB-231 & BT-549 cells than MCF-7. On the other hand MCF-7 cells showed abun-dant BRCA1 mRNA as compared to BT-549 & MDAMB-231 (Figure 1).
FIGURE 1. BRCA1 & AnxA2 mRNA expression in BT-549, MCF-7 & MDAMB-231 cells

Anil Bapu Bargale et al.
BIOSCIENCE BIOTECHNOLOGY RESEARCH COMMUNICATIONS ANNEXIN A2 MEDIATED POSTTRANSCRIPTIONAL DESTABILIZATION 165
FIGURE 2. RNA Immunoprecipitation assay - anti AnxA2 antibody and BRCA1 specifi c primers. AnxA2 coimmunoprecipitates with BRCA1 mRNA in MDAMB-231 breast cancer cells. BRCA1 PCR products were undetectable without anti AnxA2 antibody. Lane -1 without AnxA2 antibody, Lane-2 & 3 with AnxA2 antibody and Lane - 4 Pre-cleared cell lysate.
Endogenous AnxA2 and BRCA1 mRNA are binding
partners
To determine the association between endogenous AnxA2 and BRCA1 mRNA transcripts, we performed an IP-RT-PCR assay using an anti AnxA2 antibody and BRCA1 specifi c primers. We are able to show that AnxA2 coimmunoprecipitates with BRCA1 mRNA in MDAMB-231 breast cancer cells (fi gure 2). Conversely, BRCA1 PCR products were undetectable without anti AnxA2 antibody. The results provide clear evidence that AnxA2 associates with BRCA1 mRNA TNBC cells.
AnxA2 Regulates BRCA1 Post-transcriptionally
To address AnxA2 associated with BRCA1 mRNA, we investigated the effect of AnxA2 over expression on the regulation of BRCA1 mRNA stability. MCF-7 cells were induced to over express AnxA2 and studied the effect on BRCA1 mRNA stability. We observed decreased BRCA1 mRNA stability with time dependent manner, which shows AnxA2 overexpression degrades BRCA1 mRNA. To validate, AnxA2 associated in the regulation
of BRCA1 mRNA. We knocked down AnxA2 by specifi c siRNA in MDAMB-231 cells and analyzed for BRCA1 mRNA stability. We found increase in BRCA1 mRNA sta-bility in time dependent manner (fi gure 3). This shows AnxA2 is involved in regulation of BRCA1 mRNA. To study whether post-transcriptional regulation of BRCA1 occurs in sporadic breast cancer, we investigated BRCA1 expression and mRNA stability by DRB chase experi-ment. BRCA1 mRNA was normalized to control mRNA. We observed decrease in BRCA1 mRNA stability when we over expressed AnxA2 in TNBC cells. Interestingly, when we knocked down AnxA2 by AnxA2 specifi c siRNA we found increase in BRCA1 mRNA stability (fi g-ure 3). This data suggests that AnxA2 may be involved in the post transcriptional processes as well as in the destabilization of BRCA1 mRNA (Tali 2017, Harahap 2018, Zhang 2018).
To investigate, AnxA2 is involved in the regulation of BRCA1 mRNA through the binding of BRCA1 3’UTR region. We designed pLuc vector having multiple clon-ing site downstream to a luciferase reporter gene in the coding region. The cloning of BRCA1 3’UTR construct

Anil Bapu Bargale et al.
166 ANNEXIN A2 MEDIATED POSTTRANSCRIPTIONAL DESTABILIZATION BIOSCIENCE BIOTECHNOLOGY RESEARCH COMMUNICATIONS
FIGURE 3. DRB Chase experiment –a) BRCA1 mRNA stability decreased on EGF induced MCF-7 cells. b) AnxA2 mRNA stability increased on EGF induc-tion in MCF-7 cells. c) BRCA1 mRNA stability increased on AnxA2 knock down. d) AnxA2 knock down caused decrease in AnxA2 mRNA stability.
FIGURE 4. Luciferase Reporter Assay - BRCA1 3’UTR construct allows the luciferase reporter expression that mimic putative AnxA2 target in the 3’ UTR of BRCA1 gene. As a control, fi refl y luciferas construct having targeted sequence. In each well, the transfec-tion mixture included a Renilla luciferase reporter vec-tor, allowing readout for normalizing the transfection effi ciency at 24 hours after transfection in MDAMB-231 cells. The lysate was collected and analyzed fi refl y luciferase activity, which was normalized to Renilla luciferase activity.
allows the luciferase reporter expression that mimic putative AnxA2 target in the 3’ UTR of BRCA1 gene. As a control, fi refl y luciferase construct having targeted sequence was tested. In each well, the transfection mix-ture included a Renilla luciferase reporter vector, allow-ing readout for normalizing the transfection effi ciency at 24 hours after transfection in MDAMB-231 cells. The lysate was collected and analyzed fi refl y luciferase activity, which was normalized to Renilla luciferase activity. We found reduced luciferase expression con-taining BRCA1 3’ UTR as compared to the control and pLuc vector control (fi gure 4). We identifi ed that AnxA2 interacts with BRCA1 3’UTR, leading to decreased lucif-erase activity (Maji 2016).
Effect of AnxA2 putative binding oligo on cell viability
To study the similarity or association of AnxA2 protein sequence with BRCA1 3’UTR, with the help of Vienna RNA web service for secondary structure prediction and BLAST of NCBI software we selected 50 nucleotide oligo having affi nity of AnxA2 to bind BRCA1 3’UTR. We transfected MDAMB-231 cells with 50 oligo nucle-otides and analyzed cell viability by MTT experiment. We found decrease in cell viability of oligo treated cells than without treatment (Figure 5). Finally, putative 50 oligo nucleotide transfected MDAMB-231 cells showed increased apoptosis upon performing cell viability assay. This suggests that, putative oligo nucleotide spares BRCA1 3’UTR from AnxA2 to accelerate tumor suppres-

Anil Bapu Bargale et al.
BIOSCIENCE BIOTECHNOLOGY RESEARCH COMMUNICATIONS ANNEXIN A2 MEDIATED POSTTRANSCRIPTIONAL DESTABILIZATION 167
sor activity in turn promoting the cells to undergo apop-tosis (Shetty 2012).
In summary, we demonstrate that AnxA2 is involved in BRCA1 gene expression at the posttranscriptional level as well as destabilization on BRCA1 in sporadic breast cancer.
CONCLUSION
In the present study, we demonstrate that AnxA2 has a role in posttranscriptional regulation of BRCA1 expres-sion.
ACKNOWLEDGEMENT
The authors would like to acknowledge the help of Harikrishna Ellanki, Avinash Kedari, Clinton D’Souza & Vishwas Kaveeshwar, SDM college of Medical Sciences & Hospital, Dharwad, Karnataka for their help.
RFERENCES
Adnan M, Saldanha E, Palatty PL, Naik T, Monteiro AD, Manjeshwar, et al. (2018) Incidence of Breast Cancer in Women from Agriculture based Areas of Costal Karnataka, India: A Twenty Year Observations from a Tertiary Care Hospital. 3: ClinOncol.; 3: 1437
Anderson, P. and Kedersha, N. (2006). RNA granules. J. Cell. Biol. 172 (6): 803–808.
Baylin SB, Ohm JE. (2006). Epigenetic gene silencing in can-cer-a mechanism for early oncogenic pathway addiction. Nat Rev Cancer. 6:107–116. doi: 10.1038/nrc1799.
Blasi F, Stoppelli MP. (1999).Proteases and cancer invasion: From belief to certainty. AACR meeting on proteases and pro-tease inhibitors in cancer, nyborg, denmark, BiochimBiophys-Acta. 1423(1):R35-44.
Choi JY, James SR, Link PA, et al. (2009). Association between global DNA hypomethylation in leukocytes and risk of breast
cancer. Carcinogenesis. 30:1889–1897. doi: 10.1093/carcin/bgp143.
Cok, S.J. and Morrison, A.R. (2001). The 30-untranslated region of murine cyclooxygenase-2 contains multiple regulatory ele-ments that alter message stability and translational effi ciency. J. Biol. Chem. 276 (25): 23179–23185
Das PM, Singal R. (2004). DNA methylation and cancer. J Clin Oncol., 22: 4632–4642. doi: 10.1200/JCO.2004.07.151.
Diaz VM, Hurtado M, Thomson TM, Reventos J, Paciucci R. (2004).Specifi c interaction of tissue-type plasminogen activa-tor (t-PA) with annexin II on the membrane of pancreatic can-cer cells activates plasminogen and promotes invasion in vitro. Gut.;53(7):993-1000.
Engels, B.M. and Hutvagner, G.(2006). Principles and effects of microRNA-mediated post-transcriptional gene regulation. Oncogene 25 (46): 6163–6169.
Fu, L. and Benchimol, S. (1997). Participation of the human p53 30UTR in translational repression and activation follow-ing gamma-irradiation. EMBO J. 16 (13): 4117–4125
Harahap, W. A., Sudji, I. R., &Nindrea, R. D. (2018). BRCA1 Promoter Methylation and Clinicopathological Characteris-tics in Sporadic Breast Cancer Patients in Indonesia. Asian Pacifi c journal of cancer prevention: APJCP, 19(9), 2643-2649. doi:10.22034/APJCP.2018.19.9.2643
Huszno, J., Kołosza, Z., &Grzybowska, E. (2019). BRCA1 muta-tion in breast cancer patients: Analysis of prognostic factors and survival. Oncology Letters, 17, 1986-1995.
Jodi M Saunus, Juliet D Freanch et al, (2008). post-transcrip-tional regulation of the breast cancer susceptibility gene BRCA1 by the RNA binding protein HuR. Cancer Res; 68(22); 9469-9478
Kedersha, N. and Anderson, P. (2002). Stress granules: sites of mRNA triage that regulate mRNA stability and translatability. Biochem. Soc. Trans. 30 (6): 963–969.
Lopez-de-Silanes, I. et al. (2005).Identifi cation and functional outcome of mRNAs associated with RNA-binding protein TIA-1. Mol. Cell. Biol. 25 (21):9520–9531.
Maity, A., McKenna, W.G. and Muschel, R.J. (1997). Cyclin A message stability varies with the cell cycle. Cell Growth Differ. 8 (3):311–318.
Maji Sayantan, Pankaj Chaudhary, Irina Akopova, et al. (2016). ExosomalAnnexin A2 Promotes Angiogenesis and Breast Can-cer Metastasis. Mol Cancer Res, DOI:101158/1541-7786.MCR-160163.
McCoy, M. L., Mueller, C. R., & Roskelley, C. D. (2003). The role of the breast cancer susceptibility gene 1 (BRCA1) in sporadic epithelial ovarian cancer. Reproductive biology and endocri-nology: RB&E, 1, 72. doi:10.1186/1477-7827-1-72
Moore, M.J. (2005). From birth to death: the complex lives of eukaryotic mRNAs. Science 309 (5740):1514–1518
Newman Beth, A Melissa. Austin, Lee Ming and KingMary-Claire. (1988). Inheritance of human breast cancer: evidence for autosomal dominant transmission in high-risk families. 85(9): 3044-3048
FIGURE 5. MDAMB-231 cells with 50 oligo nucleo-tides putative binding sequence and analyzed the cell viability by MTT.

Anil Bapu Bargale et al.
168 ANNEXIN A2 MEDIATED POSTTRANSCRIPTIONAL DESTABILIZATION BIOSCIENCE BIOTECHNOLOGY RESEARCH COMMUNICATIONS
Nicolas, E., Bertucci, F., Sabatier, R., &Gonçalves, A. (2018). Targeting BRCADefi ciency in Breast Cancer: What are the Clinical Evidences and the Next Perspectives?. Cancers, 10(12), 506. doi:10.3390/cancers10120506
Rice, J. C., Massey-Brown, K. S., and Futscher, B. W. (1998). Oncogene 17: 1807–1812
Robertson KD. (2002). DNA methylation and chromatin-unraveling the tangled web. Oncogene. 21:5361–5379. doi: 10.1038/sj.onc.1205609.
Rosen, E.M., Fan, S.J., Pestell, R.G. and Goldberg, I.D. (2003). BRCA1 gene in breast cancer. J. Cell. Physiol. 196 (1):19–41.
Shetty PK, Thamake SI, Biswas S, Johansson SL, Vishwanatha JK. (2012). Reciprocal regulation of annexin A2 and EGFR with Her-2 in Her-2 negative and herceptin-resistant breast cancer. PLoS ONE. 7(9): e44299. DOI10.1371/journal.pone.0044299
Spiros Miyakis George, Sourvinos Demetrios A. Spandidos. (1998). Differential Expression and Mutation of the ras Family Genes in Human Breast Cancer. Biochem. Biophys. Res. Com-mun, 20(2), Pages 609-612
Tali Cohen Sinai, Zoya Cohen, Haim Werner, Raanan Berger. (2017). Identifi cation of BRCA1 as a potential Biomarker for Insulin like growth factor-1 receptor targeted therapy in breast cancer. Front Endocrinol. 8:10.3389/Fendo.2017.00148
Tarui T, Majumdar M, Miles LA, Ruf W, Takada Y. (2002).Plas-min-induced migration of endothelial cells. A potential tar-
get for the anti-angiogenic action of angiostatin. J Biol Chem. 277(37): 33564-70.
Thanin Chantarachot and Julia Bailey-Serres. (2018). Poly-somes, Stress Granules, and Processing Bodies: A Dynamic Tri-umvirate Controlling Cytoplasmic mRNA Fate and Function. Plant Physiology. Vol. 176, pp. 254–269
Thompson, C., MacDonald, G., & Mueller, C. R. (2011). Decreased expression of BRCA1 in SK-BR-3 cells is the result of aberrant activation of the GABP Beta promoter by an NRF-1-containing complex. Molecular cancer, 10, 62. doi:10.1186/1476-4598-10-62
Volker Gerke, Stephen E, ( 2002).Annexins: From structure to function. Physiol Rev: 82; :331-371.
Wein, G., Rossler, M., Klug, R. and Herget, T. (2003).The 30-UTR of the mRNA coding for the major protein kinase C substrate MARCKS contains a novel CU-rich element interacting with the mRNA stabilizing factors HuD and HuR. Eur. J.Biochem. 270 (2): 350–365.
Wiklund, L., Sokolowski, M., Carlsson, A., Rush, M. and Schwartz, S. (2002).Inhibition of translation by UAUUUAU and UAUUUUUAU motifs of the AU-rich RNA instability element in the HPV-1 late 30 untranslated region. J. Biol. Chem. 277 (43): 40462–40471.
Zhang Y, Meng L, Xiao L, Liu R, Li Z, Wang Y: (2018). The RNA-Binding Protein PCBP1 Functions as a Tumor Suppressor in Prostate Cancer by Inhibiting Mitogen Activated Protein Kinase 1. Cell Physiol Biochem. 48:1747-1754. doi: 10.1159/000492315

A low energy based event driven and secure node
deployment protocol for Wireless Medical Sensor Network
Sandip Mandal and Rama Sushil
DIT University Dehradun, India
ABSTRACT
A wireless sensor network consists of a huge number of sensor nodes associated via wireless medium. Nodes in a WMSN(Wireless Medical Sensor Network) are organized with limited battery energy and thus improvement on network lifetime by reducing energy-usage is of extreme important. One of the solutions to minimize such energy-usage is asso-ciate clustering of network nodes. In this paper an associate clustering scheme in WMSN is proposed where cluster heads are formed by creating a probable associate list is in descending order in which cluster heads are organized according to their residual energy. We have conducted simulation-based evaluations to compare the performance of EEACPSC against Energy Aware Coverage Preservation and Lifetime Enhancement Protocol (EACPLEP) and Enhanced-Energy Effi cient Protocol with Static Clustering (E3PSC). Our experiment results show that the performance of present scheme is much better than the previous one. And it provides better result. 40.3% gain of EEACPSC over E3PSC and 25.3% gain over EACPLEP in terms of number of nodes alive in the network.
KEY WORDS: CLUSTER HEAD, NETWORK LIFETIME, ENERGY EFFICIENCY, WIRELESS MEDICAL SENSOR NETWORK
169
Biotechnological CommunicationBiosci. Biotech. Res. Comm. 12(1): 169-173 (2019)
INTRODUCTION
Innovations in industrial, home and automation in trans-portation represent smart environments. Data for smart environments are obtained through Wireless Medical Sensor Networks (WMSN), where thousands of sensors are deployed at different locations operating in different
modes, (Cook et al, 2004). A sensor network is capable of sensing, processing and communicating which helps the base station or command node to observe and react according to the condition in a particular environment (physical, battle fi eld, biological) (Sohraby et al, 2007). Sensor network protocols have a unique self-organiz-ing capability. Another interesting feature of WMSNs is
ARTICLE INFORMATION:
Corresponding Author: [email protected] 22nd Dec 2018Accepted after revision 27th Feb 2019BBRC Print ISSN: 0974-6455Online ISSN: 2321-4007 CODEN: USA BBRCBA Thomson Reuters ISI ESC / Clarivate
Analytics USAMono of Clarivate Analytics and Crossref Indexed Journal Mono of CR
NAAS Journal Score 2019: 4.31 SJIF: 4.196© A Society of Science and Nature Publication, Bhopal India 2019. All rights reserved.Online Contents Available at: http//www.bbrc.in/DOI: 10.21786/bbrc/12.1/22

Sandip Mandal and Rama Sushil
170 A LOW ENERGY BASED EVENT DRIVEN AND SECURE NODE DEPLOYMENT PROTOCOL BIOSCIENCE BIOTECHNOLOGY RESEARCH COMMUNICATIONS
that the sensor nodes cooperate with each other. Sensor nodes have an in-built processor, using which raw data are processed before transmission. These features facili-tate wide range of applications of WMSNs ranging from biomedical, environmental, military, event detection and vehicular telematics, (Akyildizet al, 2002). In this paper we assume a sensor network model, similar to those used in (Mandal et al, 2018), with the following properties:
• All sensor nodes are immobile and homogeneous with a limited stored energy.
• The nodes are equipped with power control capa-bilities to vary their transmitted power.
• None of the nodes know their location in the net-work.
• Each node senses the environment at a fi xed rate and always has data to send to the base station.
• Base station is fi xed and not located between sen-sor nodes.
In this paper, we propose EEACPSC (An Enhanced Energy Aware Coverage Preservation with Static Clustering), a hierarchical static clustering based protocol, which eliminates the overhead of dynamic clustering and as a result prolongs the network lifetime. In this scheme, cluster heads are selected by creating a probable associ-ate list where cluster heads are organized according to their residual energy and all the rounds are divided into iteration. The rest of paper is organized as follows. Sec-tion 2 describes the proposed scheme followed by the supporting algorithm. Performance-evaluation (Mandal et al, 2019) and simulation results are presented in sec-tion 3. The entire work is concluded in section 4 and 5.
PROPOSED SCHEME
This section contains the proposed scheme, An Enhanced Energy Aware Coverage Preservation with Static Clus-tering (EEACPSC) followed by the algorithm of the pro-posed scheme. The present scheme is a modifi cation of an existing scheme, An Enhanced Energy-Effi cient pro-tocol with Static Clustering (E3PSC) [Loscri V et al, 2005] and Energy Aware Coverage Preservation and Lifetime Enhancement Protocol (EACPLEP) [Junepei et al, 2004]
In the present work, cluster heads are choose by creat-ing a probable associate list for next n number of rounds and the entire cluster heads are organized according to their residual energy.
Algorithm (EEACPSC)
1. BEGIN/* Setup Phase (tasks are performed by the base station) */2. Formk clusters taking n randomly distributednodes based on distance/* Same as EACPLEP*/3. For i 1 to k
4. Compute mean position of node distribution, mean in clusteri
5. for j 1 to mi
/* mi No. of nodes in clusteri */6. Compute distance of nodej from Pmean i, dmean i
7. End For8. Select Temporary Cluster Head (TCHi) randomly for clusteri
9. Create TDMA schedule for the nodes of clusteri
10. for j 1 to mi
11. Send 3-tuple (TCHi, TDMAi, dmean ij) data to nodej
12. End For13. End For/* End of Setup Phase */14. For v 1 to round/* round Total no. of rounds/* Responsible Node Selection Phase */15. For i 1 to k16. For Alive_node 1 to mi
/* Alive_node Nodes whose residual energy is greater than or equal to threshold energy (Eth)17. Send 2-tuple (dmean i
j, Eresidual ij) information to TCHi
18. End For/* TCHi performs the following tasks */ 19. Call Responsible_Node_Selection()/* Select CHi for the current round Select TCHi for the next round */20. End For/* Steady-State Phase */21. For i 1 to k22. For Alive_node 1 to mi
23. Send data to CHi
/*Data transmission by Alive_node(s) */24. End For25. Send aggregated data to the base station /* Data transmis-sion by CHi */26. End For27. End For /* End of rounds */28. END /* End of Algorithm */Responsible_Node_Selection( )1. BEGIN2. For i k /* Creating a list of probable CHi. */ /*k=length (Cluster.nodes)*/3. RGroup=[ ]; /*R denotes Right*/4. LGroup=[ ]; /*L denotes Left*/5. if ~isempty([Cluster.TCH])6. for i=1:k7. if Renergy > Lenergy
8.[C,T]=ISelection(Anode,RGroup,Eth); /* Select the node from right group*/9. else10. [C,T]=ISelection(Anode,LGroup,Eth); /* Select the node from left group*/11. End12. CHi=C;13. TCHi=T;14. Else15. CHi=[ ];16. TCHi=[ ];17. end/*End of Algorithm */

Sandip Mandal and Rama Sushil
BIOSCIENCE BIOTECHNOLOGY RESEARCH COMMUNICATIONS A LOW ENERGY BASED EVENT DRIVEN AND SECURE NODE DEPLOYMENT PROTOCOL 171
PERFORMANCE COMPARISON
Qualitative Analysis
The network lifetime is defi ned in terms of energy-usage. The associate list is determined in such a manner that presence of cluster head within a list is suffi cient and further, to keep the network alive, probable list needs to be associated. To declare the network alive, we can say that for every round the cluster head with maxi-mum energy among all the pre-decided cluster heads within that list should be greater than a threshold energy level Ethreshold beyond which the node is considered as a dead. Since this must hold for every round, we can easily considered that only the minimum of these ener-gies should be above Ethreshold thereby guarantees that each round has suffi cient energy to keep the network alive.
Quantitative Analysis
Simulation Environment
To evaluate the performance of EEACPSC, MATLAB 7.1 is used as a simulation tool. We consider that the sensor nodes are deployed randomly across in plain area of (xm = 100m X ym = 100m) and the base station is located (x=50, y=175). Each node is equipped with equal amount of initial energy (2J) at the beginning of the simulation. Further we assume that WMSN is working in continuous data fl ow application domain. Table 1 represents various parameters and their values used in simulation.
Simulation Metric
The performance of the scheme is evaluated considering network lifetime as a parameter which is defi ned as the
time until the last node dies in the network. Network lifetime is measured using following yard-stick.
• Number of nodes alive in the network : more number of nodes alive involves network lifetime last longer.
• 3D result: results are in 3D format which outper-forms better performance as compare to E3PSC and EACPLEP.
RESULTS AND DISCUSSION
A set of experiments is conducted to compare the per-formance of present scheme EEACPSC with E3PSC (Zah-mati et al, 2007) and EACPLEP (Lindsay et al, 2002).
Fig.1 shows that, after 26 seconds, only 67 nodes are alive over the network.
Fig. 2 shows that, after 26 seconds, only 75 nodes are alive over the network.
Table 1. Parameters and Corresponding Values used in Network Simulation for Medical Sensor Network
Parameter Parameter’s NameNetwork Area 100m X 100m
Base Station’s Position (50m, 175m)
Initial Energy for Nodes 2 Joule
Number of Deployed Nodes 100
Size of Data Message 4000 bits
Energy Consumed in DataAggregation(EDA)
5nJ/bit/signal
Energy Consumed byTransceiver’s Circuitry (Eelec)
50nJ/bit
Energy Expenditure in Transmit-Amplifi cation in free-spacemodel(efs)
10pJ/bit/m2
Energy Expenditure Transmit-Amplifi cation in multipath fading model (Emp)
0.0013pJ/bit/m4
FIGURE 1. Comparison of EEACPSC with E3PSC in terms of number of nodes alive in the network over time
FIGURE 2. Comparison of EEACPSC with EACPLEP in terms of number of nodes alive in the network over time

Sandip Mandal and Rama Sushil
172 A LOW ENERGY BASED EVENT DRIVEN AND SECURE NODE DEPLOYMENT PROTOCOL BIOSCIENCE BIOTECHNOLOGY RESEARCH COMMUNICATIONS
and 3.33% gain over EACPLEP in terms of number of nodes alive in the network.
In this paper an energy-effi cient routing scheme EEACPSC for WMSN is proposed. The EEACPSC is devel-oped by modifying an existing routing scheme E3PSC and EACPLEP with an objective to prolong network life-time further (more number of nodes alive in the net-work). With the results of simulation, we can conclude that in the case of EACPLEP, the intra-cluster communi-cation is increased, which is removed in the EEACPSC, because the cluster head will be choose on the basis of creating a probable list of nodes.
So the energy dissipated in the node to cluster head is less than the EACPLEP. And it organizes by the 3D graph also. So we can say that EEACPSC is more energy effi -cient and coverage preserving as compare to E3PSC and EACPLEP and spatial allocation of nodes plays a vital role in the election of cluster-heads for network opera-
FIGURE 3. Number of nodes alive in the network over time in EEACPSC
FIGURE 4. Number of nodes alive over time in E3PSC (3D)
FIGURE 5. Number of nodes alive over time in EACPLEP (3D)
Fig. 3 shows that, after 26 seconds, 94 nodes are alive over the network.
After comparing these 3 graphs we conclude that the performance of present scheme is much better than the previous one. And it provides better result. 40.3% gain of EEACPSC over E3PSC and 25.3% gain over EACPLEP in terms of number of nodes alive in the network. Fol-lowing are the representation of 3D graphs.
In fi g 4, there is a deployment of 150 nodes instantly and after 460 seconds there are 145 nodes alive in the network.
Fig.5 indicates that, after 460 seconds, there are 150 nodes alive over the network.
Fig.6 shows that, after 460 seconds, 155 nodes are alive over the network.
After comparing these 3D graphs, we conclude that the performance of present scheme is better as compare to previous scheme. 6.89% gain of EEACPSC over E3PSC
FIGURE 6. Number of nodes alive over time in EEACPSC(3D)
Sandip Mandal and Rama Sushil
BIOSCIENCE BIOTECHNOLOGY RESEARCH COMMUNICATIONS A LOW ENERGY BASED EVENT DRIVEN AND SECURE NODE DEPLOYMENT PROTOCOL 173
tion. As per the quantitative results, EEACPSC proves to be better performer than EACPLEP and E3PSC.
As future work, we intend to study more complicated situations, like coverage problems in case of mobile nodes, heterogeneous sensor networks consisting nodes of dif-ferent capabilities, and other non-disk coverage models.
REFERENCES
Akyildiz I.F., Su W, Sankarasubramaniam Y, and Cayirci E (2002), Wireless sensor networks: A survey
Amir SepasiZahmati and Bahman Abolhassani (2007), EPM-PLCS: An Effi cient Power Management Protocol with Limited Cluster Size for Wireless Sensor Networks Proc. 27th Interna-tional Conference on Distributed Computing Systems (ICDCS 2007)Computer Networks, vol. 38, pp. 393-422
Cook D. J. and Das S. K. (2004), Smart environments: tech-nologies, protocols and applications New York:John Wiley, pp. 13-15
Heinzelman W.R. Chandrakasan A.P, and Balakrishnan H. (2000), Energy- Effi cient Communication Protocol for Wireless Microsensor Networks, Proc. 33rd Hawaii Int’l. Conf. Sys. Sci., Jan 2000.
JunpeiKamimura and Naoki Wakamiya and Masayuki Murata (2004)Energy-effi cient clustering method for data gathering in sensor networks,” in Proceedings of First Workshop ON Broad-band Advanced Sensor Networks
Lindsey S, Raghavendra C and Sivalingam K. M (2002), Data-Gathering Algorithms in Sensor Networks using Energy Met-rics, IEEE Trans. Parallel and Distrib. Sys., vol. 13, no. 9, Sept., pp. 924–35.
Loscri’ V. Marano S. ,Morabito G. (2005) A Two-Level Hier-archy for Low-Energy Adaptive Clustering Hierarchy (TL-LEACH). Proceedings VTC2005 Dallas (USA), pp. 1809-1813.
Mandal, Sandip and Sushil, Rama (2018) Adaptive Modelling and Simulation of Wireless Sensor Radio Energy depends On Probabilistic and Stochastic Analysis, Institute of Integra-tive Omics and Applied Biotechnology Vol. 9 No. 2 pp. 129-135
Mandal, Sandip and Sushil, Rama (2018) Detection and Miti-gation from Wormhole Based Protocol Deviation depends on Neighbor Discovery Approach In WSN, International Journal of Engineering and Technology Vol.7 No. 4 pp. 62-65
Mandal, Sandip and Sushil, Rama (2018) Energy Saving Dynamic Clustering Protocol for Wireless Sensor Network , International Journal of Engineering Applied and Manage-ment Sciences Paradigms Vol, 53 No. 03 pp. 25-28
Mandal, Sandip and Sushil, Rama (2018) Enhanced Energy-Balanced Lifetime Enhancing Clustering for WSN (EEBLEC), International Journal of Applied Engineering Research Vol 13 No. 16 pp. 12911—12916
Mandal, Sandip and Sushil, Rama (2018) Real time deploy-ments of sensors and sensing patients vital parameters using secure autonomous WSN for medical applications, Bioscience Biotechnology Research Communications Vol. 11 No. 3 pp. 523-534
Mandal, Sandip and Sushil, Rama (2019) Security Enhance-ment Approach in WSN to Recovering from Various Worm-hole-Based DDoS Attacks, Innovations in Soft Computing and Information Technology pp.179—190, Springer, Singapore
Sohraby K., Minoli D., and Znati T. (2007)Wireless sensor networks: technology, protocols and applications,NewJersey: John Wiley, pp. 38-71
Yongcai Wang, Qianchuan Zhao and Dazhong Zheng (2004), Energy-Driven Adaptive Clustering Data Collection Protocol in Wireless Sensor Networks Proceedings of the 2004 Interna-tional Conference on Intelligent Mechatronics and Automa-tion, Chengdu, China.

Proposed model for the detection of breast cancer
using mammogram images
M. Manikandan* and A. Nithya
Assistant Professor, Department of Electronics and Communication Engineering, M. Kumarasamy College of Engineering, Karur, Tamilnadu, India
ABSTRACT
In the modern world the technology is growing day by day and at the same time the biological pathology is also grow-ing in a proportional rate, wherewomen are diagnosed more than men for various types of dreadful cancers like the breast and ovarian. The technology will never fail to address the biomedical aspects including a specifi c diagnosis. In this communication, we have tried to present our approach towards a possible early detection of breast cancer using mammogram image in 3 dimensional views. The purpose of the presentlyproposed analysis is to recognize the level of calcifi cation or calcifi cation deposits in breast tissues. Usual method for the image analysis is preprocessing followed by segmented results. In this paper we propose to develop the traditional mechanisms with Graphical User Interface, in order to estimate the level of the calcifi cation formed in the breast tissuecontent, which can become an easy way of diagnosis, thus using a 3D analysis as one of the easiest ways for precise future analysis and early treatment of breast cancer, whichcan save the lives of many women.
KEY WORDS: MAMMOGRAM, PREPROCESSING, 3D, CALCIFICATION, GUI, CANNY EDGE DETECTOR
174
Medical CommunicationBiosci. Biotech. Res. Comm. 12(1): 174-180 (2019)
Bosom Tomosynthesis or 3D mammography is the most recent development in advanced mammography (Mohanapriya et al. 2013). The favorable circumstances over customary mammography comprise of better tumor location at a prior arena and less go back break for
extra pictures and consequently less nervousness and more noteworthy practicality for ladies experiencing mammography (Sukanesh et al. 2010b). 3D mammog-raphy is basically like conventional 2D mammography from various perspective (Vijayprasath et al. 2012). The
ARTICLE INFORMATION:
Corresponding Author: [email protected] 19th Dec 2018Accepted after revision 22nd Feb 2019BBRC Print ISSN: 0974-6455Online ISSN: 2321-4007 CODEN: USA BBRCBA Thomson Reuters ISI ESC / Clarivate
Analytics USAMono of Clarivate Analytics and Crossref Indexed Journal Mono of CR
NAAS Journal Score 2019: 4.31 SJIF: 4.196© A Society of Science and Nature Publication, Bhopal India 2019. All rights reserved.Online Contents Available at: http//www.bbrc.in/DOI: 10.21786/bbrc/12.1/23
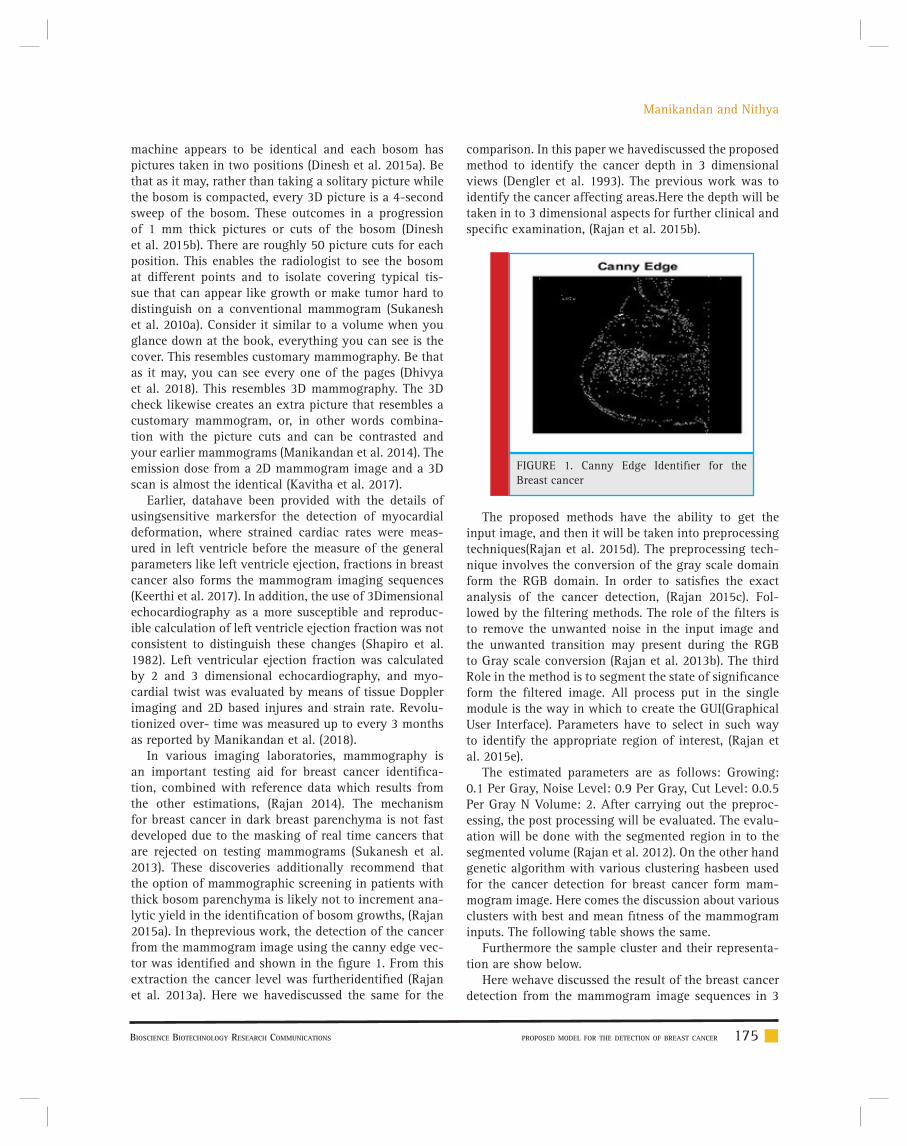
BIOSCIENCE BIOTECHNOLOGY RESEARCH COMMUNICATIONS PROPOSED MODEL FOR THE DETECTION OF BREAST CANCER 175
Manikandan and Nithya
machine appears to be identical and each bosom has pictures taken in two positions (Dinesh et al. 2015a). Be that as it may, rather than taking a solitary picture while the bosom is compacted, every 3D picture is a 4-second sweep of the bosom. These outcomes in a progression of 1 mm thick pictures or cuts of the bosom (Dinesh et al. 2015b). There are roughly 50 picture cuts for each position. This enables the radiologist to see the bosom at different points and to isolate covering typical tis-sue that can appear like growth or make tumor hard to distinguish on a conventional mammogram (Sukanesh et al. 2010a). Consider it similar to a volume when you glance down at the book, everything you can see is the cover. This resembles customary mammography. Be that as it may, you can see every one of the pages (Dhivya et al. 2018). This resembles 3D mammography. The 3D check likewise creates an extra picture that resembles a customary mammogram, or, in other words combina-tion with the picture cuts and can be contrasted and your earlier mammograms (Manikandan et al. 2014). The emission dose from a 2D mammogram image and a 3D scan is almost the identical (Kavitha et al. 2017).
Earlier, datahave been provided with the details of usingsensitive markersfor the detection of myocardial deformation, where strained cardiac rates were meas-ured in left ventricle before the measure of the general parameters like left ventricle ejection, fractions in breast cancer also forms the mammogram imaging sequences (Keerthi et al. 2017). In addition, the use of 3Dimensional echocardiography as a more susceptible and reproduc-ible calculation of left ventricle ejection fraction was not consistent to distinguish these changes (Shapiro et al. 1982). Left ventricular ejection fraction was calculated by 2 and 3 dimensional echocardiography, and myo-cardial twist was evaluated by means of tissue Doppler imaging and 2D based injures and strain rate. Revolu-tionized over- time was measured up to every 3 months as reported by Manikandan et al. (2018).
In various imaging laboratories, mammography is an important testing aid for breast cancer identifi ca-tion, combined with reference data which results from the other estimations, (Rajan 2014). The mechanism for breast cancer in dark breast parenchyma is not fast developed due to the masking of real time cancers that are rejected on testing mammograms (Sukanesh et al. 2013). These discoveries additionally recommend that the option of mammographic screening in patients with thick bosom parenchyma is likely not to increment ana-lytic yield in the identifi cation of bosom growths, (Rajan 2015a). In theprevious work, the detection of the cancer from the mammogram image using the canny edge vec-tor was identifi ed and shown in the fi gure 1. From this extraction the cancer level was furtheridentifi ed (Rajan et al. 2013a). Here we havediscussed the same for the
comparison. In this paper we havediscussed the proposed method to identify the cancer depth in 3 dimensional views (Dengler et al. 1993). The previous work was to identify the cancer affecting areas.Here the depth will be taken in to 3 dimensional aspects for further clinical and specifi c examination, (Rajan et al. 2015b).
FIGURE 1. Canny Edge Identifi er for the Breast cancer
The proposed methods have the ability to get the input image, and then it will be taken into preprocessing techniques(Rajan et al. 2015d). The preprocessing tech-nique involves the conversion of the gray scale domain form the RGB domain. In order to satisfi es the exact analysis of the cancer detection, (Rajan 2015c). Fol-lowed by the fi ltering methods. The role of the fi lters is to remove the unwanted noise in the input image and the unwanted transition may present during the RGB to Gray scale conversion (Rajan et al. 2013b). The third Role in the method is to segment the state of signifi cance form the fi ltered image. All process put in the single module is the way in which to create the GUI(Graphical User Interface). Parameters have to select in such way to identify the appropriate region of interest, (Rajan et al. 2015e).
The estimated parameters are as follows: Growing: 0.1 Per Gray, Noise Level: 0.9 Per Gray, Cut Level: 0.0.5 Per Gray N Volume: 2. After carrying out the preproc-essing, the post processing will be evaluated. The evalu-ation will be done with the segmented region in to the segmented volume (Rajan et al. 2012). On the other hand genetic algorithm with various clustering hasbeen used for the cancer detection for breast cancer form mam-mogram image. Here comes the discussion about various clusters with best and mean fi tness of the mammogram inputs. The following table shows the same.
Furthermore the sample cluster and their representa-tion are show below.
Here wehave discussed the result of the breast cancer detection from the mammogram image sequences in 3

176 PROPOSED MODEL FOR THE DETECTION OF BREAST CANCER BIOSCIENCE BIOTECHNOLOGY RESEARCH COMMUNICATIONS
Manikandan and Nithya
Table 1. Comparison of Various clusters with fi tness values
No of Clusters Best Fitness Mean Fitness
1 3821.97 3821.97
2 1037.34 1037.34
3 377.21 377.405
4 211.563 216.063
5 116.189 116.208
6 118.19 118.218
7 55.8693 55.8693
8 45.3636 45.3788
9 54.5532 56.0221
10 29.7613 29.7769
FIGURE 2. Cluster Number=6 and associated extracted image with fi tness values
FIGURE 3. Best fi tness Values Vs No of Clusters
dimensional views. The GUI was loaded to observe the input sequence and the input image was displayed in the input panel.
After displaying the input mammogram image in the GUI tool, then set the parameters have been discussed in the section II. Select the region which will cover the region of the interest.
Selection of ROI is done then the segmentation will be estimated. Segmented ROI is evaluated in two ways.
The extracted areas are needed to be highlighted with the help of GUI for the accurate computation of cancer cell,as well as estimation of distribution of cancer cells in mammogram.
Finally with the help of all relevant source and fi nd-ings to develop the 3 dimensional projections the cancer

BIOSCIENCE BIOTECHNOLOGY RESEARCH COMMUNICATIONS PROPOSED MODEL FOR THE DETECTION OF BREAST CANCER 177
Manikandan and Nithya
FIGURE 4. Mean fi tness Values Vs No of Clusters
FIGURE 5. GUI front look
FIGURE 6. Input image of the Breast mammogram image Sequence
FIGURE 7. Loading of input image
affected areas. That will help to the doctors to examina-tion the root and cause of the cancer in breast.
In existing systems there are more complex math-ematical calculationsthat are used and it is very dif-fi cult to understand for the users. There is more com-plexity to provide the accurate results in the specifi ed areas and also there may be chance to show many false images which may not be actually affected by cancer cells. Canny edge detector can estimate the amount of affected cells. These algorithms are used to fi nd the seg-mented regions accurately and it is very useful to fi nd the different stages of patients. Early stage of a person can be cured easily and if a patient is affected severely immediate action should be needed. Another method for estimation of the breast cancer is Genetic Algorithm with suitable fi tness values, population identity, stand-

178 PROPOSED MODEL FOR THE DETECTION OF BREAST CANCER BIOSCIENCE BIOTECHNOLOGY RESEARCH COMMUNICATIONS
Manikandan and Nithya
FIGURE 8. (a) Selection of ROI (b) Segmented ROI
FIGURE 9. Segmented ROI (a) Volume 1 (b) Volume 2
FIGURE 10. Highlighted Segmented ROI (a) Volume 1 (b) Volume 2
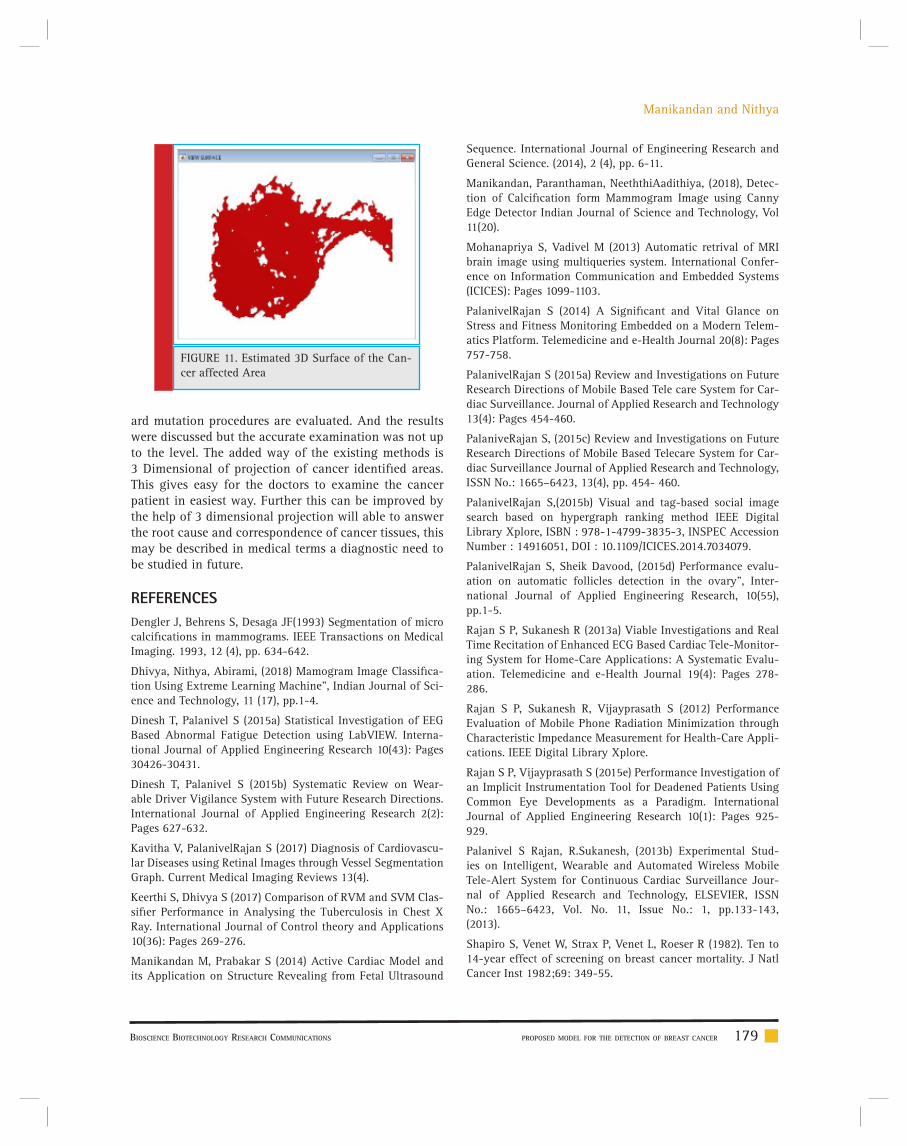
BIOSCIENCE BIOTECHNOLOGY RESEARCH COMMUNICATIONS PROPOSED MODEL FOR THE DETECTION OF BREAST CANCER 179
Manikandan and Nithya
FIGURE 11. Estimated 3D Surface of the Can-cer affected Area
ard mutation procedures are evaluated. And the results were discussed but the accurate examination was not up to the level. The added way of the existing methods is 3 Dimensional of projection of cancer identifi ed areas. This gives easy for the doctors to examine the cancer patient in easiest way. Further this can be improved by the help of 3 dimensional projection will able to answer the root cause and correspondence of cancer tissues, this may be d escribed in medical terms a diagnostic need to be studied in future.
REFERENCES
Dengler J, Behrens S, Desaga JF(1993) Segmentation of micro calcifi cations in mammograms. IEEE Transactions on Medical Imaging. 1993, 12 (4), pp. 634-642.
Dhivya, Nithya, Abirami, (2018) Mamogram Image Classifi ca-tion Using Extreme Learning Machine”, Indian Journal of Sci-ence and Technology, 11 (17), pp.1-4.
Dinesh T, Palanivel S (2015a) Statistical Investigation of EEG Based Abnormal Fatigue Detection using LabVIEW. Interna-tional Journal of Applied Engineering Research 10(43): Pages 30426-30431.
Dinesh T, Palanivel S (2015b) Systematic Review on Wear-able Driver Vigilance System with Future Research Directions. International Journal of Applied Engineering Research 2(2): Pages 627-632.
Kavitha V, PalanivelRajan S (2017) Diagnosis of Cardiovascu-lar Diseases using Retinal Images through Vessel Segmentation Graph. Current Medical Imaging Reviews 13(4).
Keerthi S, Dhivya S (2017) Comparison of RVM and SVM Clas-sifi er Performance in Analysing the Tuberculosis in Chest X Ray. International Journal of Control theory and Applications 10(36): Pages 269-276.
Manikandan M, Prabakar S (2014) Active Cardiac Model and its Application on Structure Revealing from Fetal Ultrasound
Sequence. International Journal of Engineering Research and General Science. (2014), 2 (4), pp. 6-11.
Manikandan, Paranthaman, NeeththiAadithiya, (2018), Detec-tion of Calcifi cation form Mammogram Image using Canny Edge Detector Indian Journal of Science and Technology, Vol 11(20).
Mohanapriya S, Vadivel M (2013) Automatic retrival of MRI brain image using multiqueries system. International Confer-ence on Information Communication and Embedded Systems (ICICES): Pages 1099-1103.
PalanivelRajan S (2014) A Signifi cant and Vital Glance on Stress and Fitness Monitoring Embedded on a Modern Telem-atics Platform. Telemedicine and e-Health Journal 20(8): Pages 757-758.
PalanivelRajan S (2015a) Review and Investigations on Future Research Directions of Mobile Based Tele care System for Car-diac Surveillance. Journal of Applied Research and Technology 13(4): Pages 454-460.
PalaniveRajan S, (2015c) Review and Investigations on Future Research Directions of Mobile Based Telecare System for Car-diac Surveillance Journal of Applied Research and Technology, ISSN No.: 1665–6423, 13(4), pp. 454- 460.
PalanivelRajan S,(2015b) Visual and tag-based social image search based on hypergraph ranking method IEEE Digital Library Xplore, ISBN : 978-1-4799-3835-3, INSPEC Accession Number : 14916051, DOI : 10.1109/ICICES.2014.7034079.
PalanivelRajan S, Sheik Davood, (2015d) Performance evalu-ation on automatic follicles detection in the ovary”, Inter-national Journal of Applied Engineering Research, 10(55), pp.1-5.
Rajan S P, Sukanesh R (2013a) Viable Investigations and Real Time Recitation of Enhanced ECG Based Cardiac Tele-Monitor-ing System for Home-Care Applications: A Systematic Evalu-ation. Telemedicine and e-Health Journal 19(4): Pages 278-286.
Rajan S P, Sukanesh R, Vijayprasath S (2012) Performance Evaluation of Mobile Phone Radiation Minimization through Characteristic Impedance Measurement for Health-Care Appli-cations. IEEE Digital Library Xplore.
Rajan S P, Vijayprasath S (2015e) Performance Investigation of an Implicit Instrumentation Tool for Deadened Patients Using Common Eye Developments as a Paradigm. International Journal of Applied Engineering Research 10(1): Pages 925-929.
Palanivel S Rajan, R.Sukanesh, (2013b) Experimental Stud-ies on Intelligent, Wearable and Automated Wireless Mobile Tele-Alert System for Continuous Cardiac Surveillance Jour-nal of Applied Research and Technology, ELSEVIER, ISSN No.: 1665–6423, Vol. No. 11, Issue No.: 1, pp.133-143, (2013).
Shapiro S, Venet W, Strax P, Venet L, Roeser R (1982). Ten to 14-year effect of screening on breast cancer mortality. J Natl Cancer Inst 1982;69: 349-55.

180 PROPOSED MODEL FOR THE DETECTION OF BREAST CANCER BIOSCIENCE BIOTECHNOLOGY RESEARCH COMMUNICATIONS
Manikandan and Nithya
Sukanesh R, Gautham P, Rajan S P, Vijayprasath S (2010a) Cellular Phone based Biomedical System for Health Care. IEEE Digital Library Xplore: Pages 550-553.
Sukanesh R, PalanivelRajan S (2013) Experimental Studies on Intelligent, Wearable and Automated Wireless Mobile Tele-Alert System for Continuous Cardiac Surveillance. Journal of Applied Research and Technology 11(1): Pages 133-143.
Sukanesh R, Rajan S P, Vijayprasath S (2010b) Intelligent Wire-less Mobile Patient Monitoring System. IEEE Digital Library Xplore: Pages 540-543.
Vijayprasath S, Sukanesh R, Rajan S P (2012) Experimental Explorations on EOG Signal Processing for Real Time Applica-tions in LabVIEW. IEEE Digital Library Xplore.

Studies of geo-gravimetric properties of polished rice,
Oryza sativus, (Pusa Sugandha-1)
V.K. Tiwari*, Nikhat Parveen Ansari, Astha Asati and Madhusudhan
Department of Post-Harvest Process and Food Engineering, Jawaharlal Nehru Krishi Vishawa Vidhyalaya, Jabalpur (M.P.) India
ABSTRACT
Geometric and gravimetric properties of grain are necessary for designing the equipment for processing, sorting, sizing and other post-harvest operations. The aim of this study is to determine the geometric and gravimetric properties of polished rice, (Pusa Sugandha-1).The geometric properties i.e. length, breadth, thickness, sphericity, size, L/B ratio and the gravimetric properties i.e. bulk density, true density, porosity and test weight were measured. The experiments were conducted at fourteen percent moisture content (wb). The average kernel length, breadth and thickness were observed as 8.17, 1.60 and 1.54 mm respectively. The size and volume were recorded as 2.77 mm and 10.53 mm3 respectively. The sphericity was found 33.90. Bulk density, true density and porosity were observed as 798 kg/m3, 1412.56 kg/m3 and 43.4 percent respectively. Test weight of polished rice was recorded as 16.82 grams. The L/B ratio was found 5.10. This rice will be characterized as extra-long (>7 mm), slender shape (L/B> 3) in an international market.
KEY WORDS: POLISHED RICE, GEOMETRIC, GRAVIMETRIC, AND DEHUSKING
181
Agricultural CommunicationBiosci. Biotech. Res. Comm. 12(1): 181-185 (2019)
INTRODUCTION
Rice (Oryzasativa L.) is the most important and exten-sively grown food crop in the world (Agriculture Statis-tics 2016). As a cereal grains, it is the most widely con-sumed staple food for a large part of the world’s human population, especially in Asia. India is the second largest rice producer, exporter and consumer after China. Rice
is the main food approximately for sixty per cent of the Indian population. Milling consists of the removal of husk and bran to obtain the edible portion (endosperm) to a level that is acceptable and _t for human consump-tion (Singh et al., 2015). Determining geo-gravimetric properties of rice can facilitate design of machinery for planting, harvesting, storing and processing operations such as threshing, handling, cleaning and drying (Ash-
ARTICLE INFORMATION:
Corresponding Author: [email protected] 22nd Jan 2019Accepted after revision 24th March 2019BBRC Print ISSN: 0974-6455Online ISSN: 2321-4007 CODEN: USA BBRCBA Thomson Reuters ISI ESC / Clarivate
Analytics USAMono of Clarivate Analytics and Crossref Indexed Journal Mono of CR
NAAS Journal Score 2019: 4.31 SJIF: 4.196© A Society of Science and Nature Publication, Bhopal India 2019. All rights reserved.Online Contents Available at: http//www.bbrc.in/DOI: 10.21786/bbrc/12.1/24
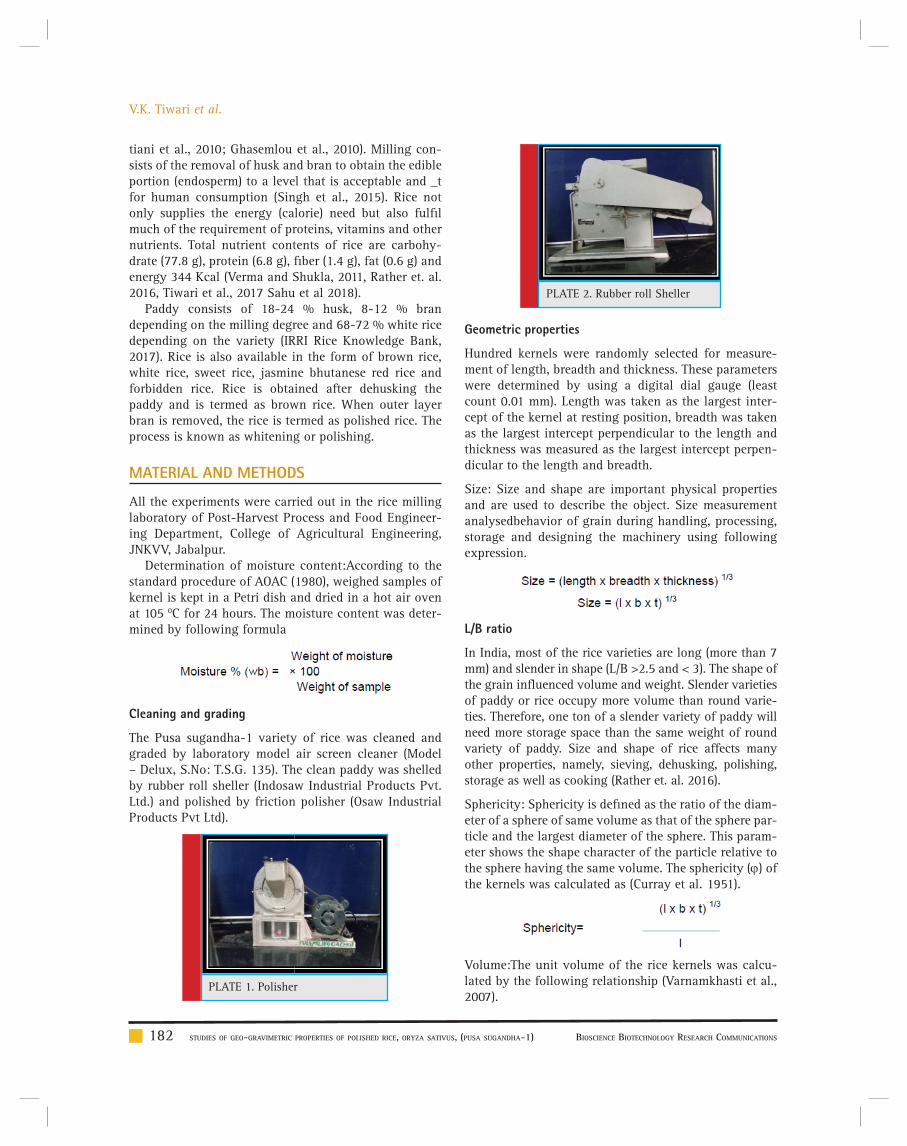
V.K. Tiwari et al.
182 STUDIES OF GEO-GRAVIMETRIC PROPERTIES OF POLISHED RICE, ORYZA SATIVUS, (PUSA SUGANDHA-1) BIOSCIENCE BIOTECHNOLOGY RESEARCH COMMUNICATIONS
tiani et al., 2010; Ghasemlou et al., 2010). Milling con-sists of the removal of husk and bran to obtain the edible portion (endosperm) to a level that is acceptable and _t for human consumption (Singh et al., 2015). Rice not only supplies the energy (calorie) need but also fulfi l much of the requirement of proteins, vitamins and other nutrients. Total nutrient contents of rice are carbohy-drate (77.8 g), protein (6.8 g), fi ber (1.4 g), fat (0.6 g) and energy 344 Kcal (Verma and Shukla, 2011, Rather et. al. 2016, Tiwari et al., 2017 Sahu et al 2018).
Paddy consists of 18-24 % husk, 8-12 % bran depending on the milling degree and 68-72 % white rice depending on the variety (IRRI Rice Knowledge Bank, 2017). Rice is also available in the form of brown rice, white rice, sweet rice, jasmine bhutanese red rice and forbidden rice. Rice is obtained after dehusking the paddy and is termed as brown rice. When outer layer bran is removed, the rice is termed as polished rice. The process is known as whitening or polishing.
MATERIAL AND METHODS
All the experiments were carried out in the rice milling laboratory of Post-Harvest Process and Food Engineer-ing Department, College of Agricultural Engineering, JNKVV, Jabalpur.
Determination of moisture content:According to the standard procedure of AOAC (1980), weighed samples of kernel is kept in a Petri dish and dried in a hot air oven at 105 0C for 24 hours. The moisture content was deter-mined by following formula
Geometric properties
Hundred kernels were randomly selected for measure-ment of length, breadth and thickness. These parameters were determined by using a digital dial gauge (least count 0.01 mm). Length was taken as the largest inter-cept of the kernel at resting position, breadth was taken as the largest intercept perpendicular to the length and thickness was measured as the largest intercept perpen-dicular to the length and breadth.
Size: Size and shape are important physical properties and are used to describe the object. Size measurement analysedbehavior of grain during handling, processing, storage and designing the machinery using following expression.
Cleaning and grading
The Pusa sugandha-1 variety of rice was cleaned and graded by laboratory model air screen cleaner (Model – Delux, S.No: T.S.G. 135). The clean paddy was shelled by rubber roll sheller (Indosaw Industrial Products Pvt. Ltd.) and polished by friction polisher (Osaw Industrial Products Pvt Ltd).
PLATE 1. Polisher
PLATE 2. Rubber roll Sheller
L/B ratio
In India, most of the rice varieties are long (more than 7 mm) and slender in shape (L/B >2.5 and < 3). The shape of the grain infl uenced volume and weight. Slender varieties of paddy or rice occupy more volume than round varie-ties. Therefore, one ton of a slender variety of paddy will need more storage space than the same weight of round variety of paddy. Size and shape of rice affects many other properties, namely, sieving, dehusking, polishing, storage as well as cooking (Rather et. al. 2016).
Sphericity: Sphericity is defi ned as the ratio of the diam-eter of a sphere of same volume as that of the sphere par-ticle and the largest diameter of the sphere. This param-eter shows the shape character of the particle relative to the sphere having the same volume. The sphericity () of the kernels was calculated as (Curray et al. 1951).
Volume:The unit volume of the rice kernels was calcu-lated by the following relationship (Varnamkhasti et al., 2007).

V.K. Tiwari et al.
BIOSCIENCE BIOTECHNOLOGY RESEARCH COMMUNICATIONS STUDIES OF GEO-GRAVIMETRIC PROPERTIES OF POLISHED RICE, ORYZA SATIVUS, (PUSA SUGANDHA-1) 183
Where,
V = unit volume (mm3). l, b and t = length, breadth and thickness of grain (mm)
Gravimetric properties: Bulk Density: The density of the grains is used in the design of storage bins and silos, separation of desirable materials from impurities, clean-ing and grading, evaluation of the grain maturity etc.The bulk density of the rice kernels is the density of whole grains (including the voids). It was determined by fi lling a 100 ml cylindrical vessel with rice kernels, tap-ping it twice to cover the extra space between the ker-nels and then weighing the contents of the vessel using a weighing balance. The volume of the vessel taken as the volume of the rice kernels. Bulk density is the ratio of the mass of the sample to its total volume.
RESULTS AND DISCUSSION
The length, breadth and thickness are very important geometric characteristics for deciding the size of open-ing of air screen cleaners. A summary of the results of the geogravimetric properties of polished rice (Pusa Sugandha-1) is shown in Table 1 and 2. The average length, breadth and thickness were 8.17, 1.60 and 1.64 mm respectively. The ratio of length and breadth was obtained as 5.10. Tiwari et al. (2017) conducted a study to evaluate of physical properties of brown rice (MTU 1010) and reported average values of length, breadth and thickness as 6.39, 2.14 and 1.9 mm. Similar results were observed by Sahu et. al (2018) while studying some physical properties of Madhuraj, Hanthipanjra and Mahamayavarieties.The shape and L/B ratio are very important for designing the indents of disc and cylin-drical separator. Shape is very important for design of helices of spiral separator also. Extra-long (> 7 mm) rice gets high price in national and international market. Rice is also grouped in three grades i.e. super fi ne (L/B >3), fi ne (L/B > 2.5) and common (L/B<2.5) on the basis of above ratio, (Araullo et al., 1985).
Size of polished rice was observed in the range of 2.52-2.89 mm. The size of the grain is useful in estimation of the projected area of a particle moving in the turbulent or near- turbulent region of an air steam (Omobuwajo et al., 1999). The sphericity of polished rice was observed as 33.9, which indicates elongated shape of the grains and makes it diffi cult to roll on surface. This was lower than corresponding value of sphericity (35.72) reported by Tiwari et al (2010) for Sugandha-3 variety of rice. While the value of sphericity of paddy (var. Sazandegi) was 39.88% (Varnamkhasti et al., 2007). Paddy grains with lower sphericity will likely be more diffi culty to roll freely on a fl at surface, Sanusiet. al (2017). The ability to either roll or slide is necessary in the design of hoppers for milling process. Sphericity values (44.36, 38.82, and 41.47 %) were reported bySahuet.al (2018) for Madhuraj, Hanthipanjra and Mahamaya varieties respectively.
The bulk density, true density, and porosity of pol-ished rice were observed as 798.60 kg/m3, 1412.56 kg/m3, and 43.4 percent respectively. Varnamkhasti et al. (2007) studied true density, bulk density, and porosity of rough rice (Sazandegi) and reported the values as 798.60 kg/m3,1193.38 kg/m3 and 60.3 percent respec-tively. The similar results 592.50 kg/m3, 1145.88 kg/m3 and 48.09 percent respectively, were also observed by Tiwari and Sharma (2012) for brown rice (WGL 32100). These properties are used for designing the size of open-ing of screen.Thousand grain weight is commercially very important as it characterized various grades like extra heavy, heavy and moderately heavy, which decides the export price. Thousand-grain weight of polished rice
True Density: The true density of the rice kernels is the density of grains excluding the voids. This was deter-mined by the toluene (C6H5CH3) displacement method. In this method, toluene was fi lled in a 100 ml measuring cylinder and then same mass of sample that was taken for bulk density was put into the vessel containing tolu-ene. The displacement of toluene level in the vessel on putting rice kernels was noted down. The ratio of the mass of rice kernels to the volume of displaced toluene gave the true density.
Porosity: The porosity of rice grains refers to the fraction of the pore spaces in the bulk grain that is not occupied by the grain. It is calculated from the values of true den-sity and bulk density by the following relationship
Test weight: Thousand grain weights of different rice samples was determined by counting one hundred rice kernels, weighing them on a weighing balance and then multiplying it with the factor of 10 (Varnamkhasti et al., 2008).

V.K. Tiwari et al.
184 STUDIES OF GEO-GRAVIMETRIC PROPERTIES OF POLISHED RICE, ORYZA SATIVUS, (PUSA SUGANDHA-1) BIOSCIENCE BIOTECHNOLOGY RESEARCH COMMUNICATIONS
PLATE 3. PaddyPLATE 4. Polished rice
Table 1. Geometric properties of polished rice (Pusa Sugandha-1)
Properties Number of observations
Mean value Minimum value Maximum value
Length (mm) 100 8.17 7.43 8.24
Breadth (mm) 100 1.60 1.59 1.76
Thickness (mm) 100 1.54 1.36 1.68
Size (mm) 100 2.77 2.52 2.89
L/B ratio 100 5.10 4.67 5.29
Volume (mm3) 100 10.53 8.40 12.75
Sphericity 100 33.90 33.64 35.18
Table 2. Gravi metric properties of polished rice (Pusa Sugandha -1)
Properties Number of observations Mean value Minimum value Maximum value
True density (Kg/m3) Bulk density (Kg/m3)
55
1412.56 798.60
1289.14 756.43
1506.23 812.12
Porosity (%) 5 43.46 41.32 46.08
Test weight (g) 5 16.82 15.58 17.43
FIGURE 1. Geometric properties of polished rice FIGURE 2. Gravimetric properties of polished rice
was recorded as 16.82 grams. Since the weight of pol-ished rice is less than 20 grams it will be characterized in moderately heavy group.
CONCLUSION
The results of geometric and gravimetric properties of Pusa Sugandha-1 at fourteen percent moisture content (wb) are shown in Table 1 and 2 respectively. The average

BIOSCIENCE BIOTECHNOLOGY RESEARCH COMMUNICATIONS STUDIES OF GEO-GRAVIMETRIC PROPERTIES OF POLISHED RICE, ORYZA SATIVUS, (PUSA SUGANDHA-1) 185
V.K. Tiwari et al.
length, breadth and thickness were observed as 8.17, 1.60 and 1.54 mm respectively. The average size, L/B ratio and volume were determined 2.77 mm, 5.10 and 10.53 mm3. The bulk density true density, and porosity were observed 798.6 kg/m3, 1412.56 kg/m3 and 43.46 percent. The sphe-ricity of rice was 33.90 percent which shows that rice is elongated and will create friction in rolling.
REFERENCES
Agriculture Statistics at a Glance, http://eands.dacnet.nic.in/PDF/Glance-2016.pdf, (2016).
AOAC. 1980. Association of Analytical Chemists, Offi cial methods of analysis, 13th Edition, Washington, D.C
Araullo EU, Padua DBD and Graham M. 1985. Rice post-har-vest technology. International Development Research Centre.
Ashtiani AH, Sadeghi M, Hemmat A. 2010. Physical properties of two rough rice varieties affected by moisture content. Inter-national Agrophysics 24: 205-207.
BhupendraSahu, D. Khokhar, S. Patel, N. K. Mishra and Girish Chandel (2018). Some Engineering Properties of Selected Paddy Varieties.
Department of the Agricultural Processing and Food Engineer-ing, Faculty of Agricultural Engineering, IGKV, Raipur, Chhat-tisgarh. Int. J. Pure App. Biosci.6 (2): 1337-1342 (2018).
Curray JR. 1951. Analysis of sphericity drying of food grains. Int Res Journal 22 15-20.
Dipti, S. S., Bari, M. N., &Kabir, K. A. (2003). Grain quality characteristics of some beruin rice varieties of Bangladesh. Pakistan Journal Nutrition, 2 (4), 242-245.
Ghasemlou M, Khodaiyan F, Gharibzahedi SMT, Moayedi A, Kes-havarz B. 2010. Study on postharvest physico-mechanical and aerodynamic properties of mungbean [Vigna radiate (L.) Wilc-zek] seeds. International Journal of Food Engineering 6: 122.
IRRI Rice Knowledge Bank. 2017. (www.knowledgebank.irri.org/.../postharvest/milling).
IRRI, 2013. Trends in global rice consumption: Rice Today. International Rice Research Institute, Manila, Philippines.12:1.
Mayowa S. Sanusia, Rahman Akinosoa, and NahemiahDan-babab (2017). Evaluation of Physical, Milling and Cooking Properties of Four New Rice (Oryzasativa L.)
Varieties in Nigeria). International Journal of Food Studies.
Department of Food Technology, Faculty of Technology, Uni-versity of Ibadan, Nigeria. October 2017 Volume 6 page 245-
256.
Omobuwajo TO, Akanda EA and Sanni LA. 1999. Selected physical, mechanical and aerodynamic properties of African breadfruit (Treculla Africana) seeds. J. Food Engg 40: 241–4.
Rather, T. A., Malik, M. A., & Dar, A. H. (2016). Physical, mill-ing, cooking, and pasting characteristics of different rice vari-eties grown in the valley of Kashmir india. Cogent Food & Agriculture, 2 (1), 1178694.
Tiwari VK and Sharma N. 2012. Varietal infl uence on physical characteristics of brown rice. JNKVV Res J 46(1): 90-93.
Tiwari VK, Dayma V, and Sharma HL note on the studies of physical properties of brown rice. International Journal of Sci-entifi c Development and Research 2.
Tiwari VK. 2010. Investigations on physical and engineering properties of rice variety Sugandha-3 grain at Jabalpur, Mad-hya Pradesh. JNKVV Res J 44(2): 213-216.
Varnamkhasti MG, Mobli H, Jafari A, Rafi ee S, Heidarysoltan-abadi M and KheiralipouR K..2007. Some Engineering Proper-ties of Paddy (var. Sazandegi).International Journal of Agricul-ture & Biology 5:763–766.
Varnamkhasti MG, Mobli H, Jafari A, Key-hani AR, Soltan-abadi MH, Raee S and Kheiralipour, K. 2008. Some physical properties of rough rice (Oryzasativa.) grain. Journal of Cereal Science 47 (3):496.
Verma DK, and Shukla K. 2011. Nutritional value of rice and their importance. Indian Farmers’ Digest.

Distribution of nitrogen fractions under long term
fertilizer and manure application in a vertisol
A. Khandagle1,2*, B. S. Dwivedi1, S. B. Aher2, A. K. Dwivedi1, D. S. Yashona2, S. Mohbe2 and
S. Panwar2
1Jawaharlal Nehru Krishi Vishwa Vidyalaya, Jabalpur 482004, Madhya Pradesh, India2ICAR-Indian Institute of Soil Science, Bhopal 462038, Madhya Pradesh, India
ABSTRACT
A fi eld experiment was conducted under Long Term Fertilizer Experiment during 2016-17 at Research Farm, College of Agriculture, JNKVV, Jabalpur. The eight treatments were applied in comprising of different doses of fertilizers viz. 50% NPK, 100% NPK, 150% NPK, 100% NP, 100% N, 100% NPK+FYM, 100% NPK-S and Control, replicated four times in a randomized block design. The application of 100% NPK+FYM showed higher content of all the fractions of N viz. Total hydrolysable-N, Hydrolysable ammonical-N, inorganic–N, hexose amine & hydro.ammo.-N, hexose amine-N, amino acid-N, unidentifi ed hydrolysable-N, non-hydrolysable-N and total N and lower content was recorded in treatment 50%NPK followed by 100% N. The result also revealed that the N fractions were signifi cantly decreased with increasing depth of soil.
KEY WORDS: LONG TERM FERTILIZER ADDITION, ASSESSMENT OF SOIL FERTILITY, NITROGEN FRACTIONS
186
Soil Science CommunicationBiosci. Biotech. Res. Comm. 12(1): 186-193 (2019)
INTRODUCTION
Nitrogen is the key element among the major nutri-ents and without N plant can neither complete a nor-mal reproductive process nor reach its yield potential. It is a constituent of ADP and ATP to most substance in life process, thereby, N nutrient play key role in protein synthesis, oxidation reduction and energy transfer reac-
tion of cell metabolism. It has been established that there are two major sources accounts for the availability viz. inherently from soil source and secondly supplementa-tion through fertilizers and manures. Prolonged appli-cation of fertilizers and organic manures differentially infl uenced mineral N (NO3
–-N and NH4+-N), organic N
fractions, and total N in soils. Organic N fractions con-stituted about 94.2% of total N as compared with 5.8%
ARTICLE INFORMATION:
Corresponding Author: [email protected] 27th Dec 2018Accepted after revision 23rd March 2019BBRC Print ISSN: 0974-6455Online ISSN: 2321-4007 CODEN: USA BBRCBA Thomson Reuters ISI ESC / Clarivate
Analytics USAMono of Clarivate Analytics and Crossref Indexed Journal Mono of CR
NAAS Journal Score 2019: 4.31 SJIF: 4.196© A Society of Science and Nature Publication, Bhopal India 2019. All rights reserved.Online Contents Available at: http//www.bbrc.in/DOI: 10.21786/bbrc/12.1/25

A. Khandagle et al.
BIOSCIENCE BIOTECHNOLOGY RESEARCH COMMUNICATIONS DISTRIBUTION OF NITROGEN FRACTIONS UNDER LONG TERM FERTILIZER 187
share of mineral N. Nitrate N was the dominant mineral N fraction in the soil, which was 4.4 times higher than NH4
+-N fractions. Application of fertilizers improved available N in soil. Hydrolyzable-N increased with the application of organic manures. Of the total hydrolyz-able-N fractions in soils, ammonia-N was 25%, amino sugar-N 9.9%, amino acid-N 25.2%, and hydrolyzable unknown-N 39.8%. A signifi cant positive correlation was recorded between crop yield and N uptake. Amino acid-N and amino sugar-N explained 82.9% of the vari-ation in rice yield and 73.4% of the variation in wheat yield. Integrated use of organic manures and inorganic fertilizers improved the N fractions in the soil, which should help increase rice and wheat production (Durani et al. 2016).
Mineralization of organic nitrogen fraction may play a major role in the N supply of plants. Nitrogen min-eralization is of great importance because it converts organic N into NH4
+ which is available for plant uptake and microbial processes, Mineralization of soil organic N must be taken in to account if N fertilizers are to be used effi ciently, Unfortunately, little progress has been made in identifying and measuring an easily mineraliz-able fraction, or dealing with year to year variability in net mineralization under fi eld conditions, which arises from the effects of temperature and moisture supply on N-cycle process Hence N-fertilizer recommendations have often been made on the basis of cropping or eco-nomics factor rather than soil testing (Mulvaney et al., 2001) However, N mineralization studies have largely been confi ned to the top soil, although plants also uti-lize N from deeper horizons. The topsoil has the largest contents of crop residues, easily decomposable organic matter, the greatest microbial biomass and activity, and therefore N Mineralization (Soudi et al., 1990). However, other studies have shown that a signifi cant proportion of N mineralization occurs in sub soil (Patra et al., 1999).
MATERIALS AND METHODS
Experimental site, climate and soil characteris-tics: Present investigation was conducted in an ongoing scheme All India Coordinated Research Project (AICRP) on Long Term Fertilizers Experiment (LTFE) of Indian Council of Agricultural Research (ICAR). The LTFE is laid out on a permanent site at the Experimental fi eld Department of Soil Science and Agricultural Chemistry, Jawaharlal Nehru Krishi Vishwa Vidyalaya. Jabalpur (M.P.). The experimental site is situated in ‘Kymore Pla-teau and Satpura Hills’ agro climatic region of M.P. It falls on 23.9° N latitude and 79.6° E longitudes with an altitude of 411.8 m above the mean sea level. Jabalpur is situated in the semi-arid region having sub-tropical cli-mate with hot dry summer, and cold winter. The average
rainfall is about 1350 mm, which is mainly distributed from mid June to October. The maximum and minimum temperature ranges between 35.1°C and 5.3°C. The aver-age annual relative humidity is 62%.
The experiment was started with maize fodder as the fi rst crop in summer season of 1972; since then Soy-bean (Kharif)-Wheat (Rabi)-Maize fodder (summer) crop rotation was adopted till 1994.However, since 1994 the cultivation of maize fodder was left and presently the cropping sequence being followed is soybean (Kharif) and wheat (Rabi). The soil of the experimental fi eld is medium black belonging to Kheri series of fi ne montmo-rillonitic hyperthermic family of Typic Haplustert. At the beginning of this experiment in 1972, initial soil sam-ples was collected before application of the treatments and analyzed for different soil properties (Table 1).
Treatments detail: The experiment has been in con-tinuance since 1972 with 10 different treatments, how-ever in present experiment following 8 set of treatments was selected. The selected treatments involve 50% NPK; 100% NPK; 150% NPK; 100% NP; 100% N; 100% NPK+FYM; 100% NPK-S and Control. The 100% opti-mal NPK doses based on initial (1972) soil test values were 120:80:40 and 20:80:20 (N:P2O5:K2O) for wheat and soybean respectively. Nitrogen was applied through urea, phosphorus through single super phosphate and potassium was applied through murate of potash. The farm yard manure in FYM treatment was applied @ 5 ton ha-1 year-1 to soybean crop only. Due to build of Zn content in soil. The application of Zn as ZnSO4@ 20 Kg ha-1 in alternate year to wheat crop was discontinued since, 1987.
Soil sampling and analysis : The representative soil samples were collected from two depths viz. 0-15 and 15-30 cm from each plot with the help of soil auger after
Table 1. Initial characteristics of experimental soil
Soil properties ValueSand (%) 25.5
Silt (%) 17.6
Clay (%) 56.9
Texture class Clay
Bulk density (Mg m-3) 1.30
pH (1:2.5) 7.60
EC (1:2.5) (dSm-1) 0.18
OC (%) 0.57
Available nitrogen (kg ha-1) 193
Available phosphorus (kg ha-1) 7.60
Available potassium (kg ha-1) 370
Available sulphur (mg kg-1) 7.80

A. Khandagle et al.
188 DISTRIBUTION OF NITROGEN FRACTIONS UNDER LONG TERM FERTILIZER BIOSCIENCE BIOTECHNOLOGY RESEARCH COMMUNICATIONS
44 year of continuous cropping. The composite soil sam-ples were prepared by quartering technique. The com-posite soil samples were air dried, crushed by wooden pestle and mortar then passed through 2 mm sieve and fi nally the processed samples were used for analysis of different physical and chemical properties.
The soil pH and electrical conductivity (EC) was measured by glass electrode pH meter and EC meter in 1:2.5 soil: water suspension (Piper, 1950). For determi-nation of the soil organic carbon, a suitable quantity of the soil was digested with chromic acid and sulphuric acid. Excess of chromic acid left over unreduced by the organic matter of the soil was determined by a titration with Ferrous Ammonium Sulphate solution using diphe-nylamine indicator (Walkley and Black, 1934). Available nitrogen in soil sample was determined by using alka-line permanganate method (Subbiah and Asija, 1956) in which soil was mixed with excess of alkaline perman-ganate and distilled. Organic matter present in soils was oxidized by the nascent oxygen liberated by KMnO4 in the presence of NaOH and thus ammonia was released. The released ammonia was absorbed in the boric acid (2%) containing mixed indicator and converted to ammonium borate. The formed ammonium borate was back titrated with standard sulphuric acid. The soil avail-able phosphorus content was estimated by extracting the soil with 0.5 M NaHCO3 (pH 8.5) and determination was done by ascorbic acid method on spectrophotometer (Olsen et al., 1954). The available potassium in soil was extracted by neutral 1N ammonium acetate and it was estimated using fl ame photometer (Muhr et al., 1963). Soil available sulphur was extracted with 0.15% solu-tion of CaCl2 and determined by turbidimetric method (Chesin and Yien, 1951). The total nitrogen and various nitrogen fractions were determined by following stand-ard methods (Table 2).
Statistical analysis: The data obtained was compiled and analyzed for its signifi cance (p=0.05) by statistical procedure appropriate for randomized block design as outlined by Gomez and Gomez (1985).
RESULTS AND DISCUSSION
Distribution of total nitrogen and nitrogen fractions:
Total N
The total N content in soil (0-15 cm) increased succes-sively from 1463 to 1621 and 1723 kg ha-1 as the dose of fertilizer increased from 50%, 100% and 150% NPK, respectively. The highest value of total N was 1818 kg ha-1 recorded with 100% NPK+FYM treatment. While, the lowest value of total N was observed in control (1306 kg ha-1). It is equal to sum of total hydrolysable-N and non-hydrolysable-N (Table 3). The total N content
in soil decreased with depth. The highest total N content 1687 kg ha-1 in 15-30 cm soil depth was recorded in 100% NPK+FYM, whereas the lowest value was noticed as 1132 kg ha-1 in control followed by 50% NPK (1437 kg ha-1). Slightly higher value of total N content was noticed in 150% NPK (1572 kg ha-1) as compared to 100% NPK (Table 4).
The total N content as infl uenced by various treat-ments indicated that higher values of N content was obtained from surface soil could be due to the pres-ence of residues after the harvest of crop as suggested by Meints and Peterson, (1977). The total N in soils at various depths differed signifi cantly by application of manure and fertilizer with respect soil depths. Interac-tion of treatment levels with soil depth was found to be signifi cant on total N. These fi nding are in accord-ance with those of Aggarwal et at. (1990) and Singh and Singh (2007). It has also been noted that higher status of total N was obtained on the surface while it progressively declined with depth (Kushwaha, 2011). The increase in fertilizer application rate, the amount of total nitrogen was also found increased signifi cantly. The pre-sent results are also in conformity with the fi ndings of Babita (2010) and Nayak et al. (2013).
Inorganic N: The inorganic N content in soil (0-15 cm) increased successively from 141 to 152 and 173 kg ha-1 as the dose of fertilizer increased from 50%, 100% and 150% NPK, respectively. The lowest value of inorganic-N was observed in control (122 kg ha-1). While, the high-
Table 2. Standard methods employed for determination of different soil parameters
Soil properties
Standard method Reference
pH(1:2.5)Glass electrode pH meter
Piper (1967).
Electrical conductivity (1:2.5)
Conductivity meter Black (1965).
Organic carbon Dichromate oxidationWalkley and Black (1934)
Available Nitrogen
Alkaline potassium permanganate method
Subbiah and Asija (1956)
Available Phosphorus
Spectrophotometer Olsen et al (1954)
Available Potassium
Flame photometer Muhr et al (1965)
Available Sulphur
SpectrophotometerChesin and Yien (1951)
Total NitrogenSteam distillation method
Page and Bremmer (1965)
Nitrogen fractions
Steam distillation method
Bremmer (1965)

A. Khandagle et al.
BIOSCIENCE BIOTECHNOLOGY RESEARCH COMMUNICATIONS DISTRIBUTION OF NITROGEN FRACTIONS UNDER LONG TERM FERTILIZER 189
Table 3. Effect of long term application of fertilizers and manure on total nitrogen and nitrogen fractions in 0-15 cm soil depth
Treatments Total NInorganic-N(NH4-N+NO3-N)
Total Hydrolysable-N
Hydrolysable Ammonical-N
50 % NPK 1463.4 141.8 1010.8 274.4
100% NPK 1621.3 152.0 1208.0 293.4
150% NPK 1723.4 173.8 1288.4 307.4
100 %NP 1540.1 148.3 1131.3 288.0
100 % N 1513.3 142.6 1087.9 281.4
100% NPK+FYM 1818.6 188.5 1371.4 341.1
100 % NPK-S 1568.2 150.8 1164.7 290.9
Control 1306.1 122.2 939.2 259.0
SEm± 55.6 3.2 38.0 14.4
CD (5%) 181.2 10.5 123.8 46.9
(Values in kg ha-1)
Table 4. Effect of long term application of fertilizers and manure on total nitrogen and nitrogen fractions in 15-30 cm soil depth
Treatments Total NInorganic-N(NH4-N+NO3-N)
Total Hydrolysable-N
Hydrolysable Ammonical-N
50 % NPK 1437.0 130.2 913.4 259.6
100% NPK 1519.6 143.5 1048.5 285.1
150% NPK 1572.5 163.0 1132.0 297.5
100 %NP 1449.7 138.3 1005.4 279.8
100 % N 1439.3 131.0 998.3 271.7
100% NPK+FYM 1687.3 172.8 1215.2 332.6
100 % NPK-S 1510.8 141.3 1020.4 282.3
Control 1132.9 109.4 712.5 227.8
SEm± 46.8 2.9 28.7 10.7
CD (5%) 152.5 9.5 92.3 34.9
(Values in kg ha-1)
est value of inorganic-N 188 kg ha-1 was recorded with 100% NPK+FYM treatment (Table 3). The inorganic N content of soil decreased with soil depth (Table 4). Sig-nifi cantly higher value of inorganic-N content in 15-30 cm soil depth was noticed in 150% NPK (163 kg ha-1) as compared to 100% NPK (143 kg ha-1). The highest inor-ganic N content of 172 kg ha-1 was recorded in 100% NPK+FYM whereas the lowest value was noticed as 109 kg ha-1 in control followed by 50% NPK (130 kg ha-1). The inorganic N content was signifi cantly infl uenced by various treatments due to addition of fertilizer doses suboptimal, optimal and super optimal, N content was correspondingly improved enrichment in Inorganic-N as a result of fertilizer application in these treatments in surface and subsurface soil positive effect of FYM (Kushwaha, 2011). Application of FYM also increased NH4
+ - N and NO3- N content in soil over the control
throughout the incubation period and this was attrib-
uted to increase microbial population and N content (Duhan et al. 2005).
Total hydrolysable N: The highest value of total hydro-lysable-N in 0-15 cm soil depth was recorded with 100% NPK+FYM treatment (Table 3). While, the lowest value 939 kg ha-1 of total hydrolysable-N was noticed in con-trol. Total hydrolysable-N content in soil increased suc-cessively from 1010 to 1208 and 1288 kg ha-1 as the dose of fertilizer increased from 50%, 100% and 150% NPK, respectively. The data presented in Table 4 showed that the total hydrolysable N content of soil decreased with soil depth. The highest total hydrolysable N content 1215 kg ha-1 was recorded in 100% NPK+FYM, whereas the lowest value was noticed as 712 kg ha-1 in control fol-lowed by 50% NPK (913 kg ha-1). Slightly higher value of total hydrolysable N content was obtained in 150% NPK (1132 kg ha-1) as compared to 100% NPK (1048 kg ha-1).

A. Khandagle et al.
190 DISTRIBUTION OF NITROGEN FRACTIONS UNDER LONG TERM FERTILIZER BIOSCIENCE BIOTECHNOLOGY RESEARCH COMMUNICATIONS
It has been observed that higher status of total hydrolys-able N was obtained on the surface while progressively decreased with depth but the rate of depletion was more apparent from surface to subsurface soil. This could be attributed to higher root biomass in the rhizospheric upper soil layer and which decreased with increasing soil depth. It supports the view that total hydrolysable N is more susceptible to mineralization than non-hydro-lysable N (Rao and Ghosh, 1981; Reddy et al., 2003). The content of the total hydrolysable N were maximum in surface soil and thereafter decreased with the depth reported by Reddy et al. (2003), Kushwaha (2011) and Rai (2013).
Hydrolysable ammonical N: The Hydrolysable ammon-ical-N content in soil (0-15 cm) increased successively from 274 to 293 and 307 kg ha-1 as the dose of fertilizer increased from 50%, 100% and 150% NPK, respectively. The lowest value of hydrolysable ammonical-N was noticed in control 259 kg ha-1.While, the highest value of hydrolysable ammonical-N 341 kg ha-1 was recorded with 100% NPK+FYM treatment (Table 3). The hydro-lysable ammonical N content of soil decreased with soil depth (Table 4). The higher value of hydrolysable ammonical-N content was noticed in 150% NPK (297 kg ha-1) as compared to 100% NPK (285 kg ha-1). Maxi-mum hydrolysable ammonical-N content 332 kg ha-1 was recorded in 100% NPK+FYM, whereas the minimum value was noticed as 227 kg ha-1 in control followed by 50% NPK (259 kg ha-1). The highest hydrolysable ammonical N content was found with 100% NPK+FYM (341 kg ha-1), which could be due to organic matter build up which facilitates N accumulation in soil. Rai (2013) reported that hydrolysable ammonium N content was highest in the surface soil and decreased down the profi le. Sub surface soil layer recorded 5% reduction
in hydrolysable ammonical–N as compared to surface layer in all the treatment, the increase in hydrolysable ammonical–N in surface layer might be due to carry over effect of continuous use of organic residue (Sep-ehya et al., 2012).
Hexose amine and hydrolysable ammonical-N: The maximum value of hexose amine and hydrolysable ammonical-N 378 kg ha-1 in 0-15 cm soil depth was recorded with 100% NPK+FYM treatment (Table 5). While, the minimum value of hexose amine and hydro-lysable ammonical-N 277 kg ha-1 was observed in con-trol. Hexose amine and hydrolysable ammonical N con-tent in soil increased successively from 297 to 323 and 341 kg ha-1 as the dose of fertilizer increased from 50%, 100% and 150% NPK, respectively. The highest hex-ose amine and hydrolysable ammonical-N content in 15-30 cm soil depth (366 kg ha-1) was recorded in 100% NPK+FYM, whereas the lowest value 240 kg ha-1 was noticed in control followed by 50% NPK (278 kg ha-1). Slightly higher value of hexose amine and hydrolysable ammonical-N content was recorded in 150% NPK (327 kg ha-1) as compared to 100% NPK (305 kg ha-1) (Table 6). The data showed that higher values of Hexose amine and hydrolysable ammonical-N content were recorded at surface soil as compare to sub surface soil which could be resulted due to FYM build up hydrolysable ammonical and hexose amine and chemical fertilizers may enhance hexose amine + hydrolysable ammonical-N content in soil (Broabdent 1965). Similar results have been reported by Kushwaha (2011).
Hexose amine-N: Hexose amine-N content in soil (0-15 cm) increased successively from 23.0 to 29.6 and 34.5 kg ha-1 as the dose of fertilizer increased from 50%, 100% and 150% NPK, respectively. The highest value of
Table 5. Effect of long term of fertilizers and manure on N-fractions in 0-15 cm soil depth
TreatmentsHexose amine and hydrolysable Ammonical N
Hexose amine N
Amino acid N
Unidentifi ed Hydrolysable N
Non-hydrolysable N
50 % NPK 297.3 23.0 279.0 434.5 452.7
100 % NPK 323.1 29.6 295.7 589.3 413.3
150% NPK 341.5 34.6 328.5 618.0 435.0
100 %NP 315.3 27.4 294.8 521.1 408.8
100 % N 310.3 29.1 288.5 488.9 425.5
100 % NPK+FYM 378.3 37.2 356.5 636.6 447.3
100 % NPK-S 319.3 29.3 299.7 544.9 403.5
Control 277.0 18.2 241.0 420.4 367.0
SEm± 13.9 1.7 13.8 15.8 44.9
CD (5%) 45.2 5.5 44.3 45.7 NS
(Values in kg ha-1)

A. Khandagle et al.
BIOSCIENCE BIOTECHNOLOGY RESEARCH COMMUNICATIONS DISTRIBUTION OF NITROGEN FRACTIONS UNDER LONG TERM FERTILIZER 191
hexose amine-N 37.2 kg ha-1 was recorded with 100% NPK+FYM treatment. While, the lowest value of hex-ose amine-N was observed in control 18.2 kg ha-1 (Table 5). The data in Table 6 showed that the hexose amine N content of soil decreased with soil depth. Slightly higher value of hexose amine-N content (15-30 cm) was obtained in 150% NPK (29.5 kg ha-1) than 100% NPK (20.0 kg ha-1). The maximum hexose amine N content 32.7 kg ha-1 was recorded in 100% NPK+FYM, whereas minimum value was noticed as 13.0 kg ha-1 in control followed by 50% NPK (18.4 kg ha-1). The continuous addition of nitrogen through organic and inorganic sources contributed directly to the enrichment of this pool of organic nitrogen, similar build up in this frac-tion under same set of agro climatic condition has been reported by Kumar (2003) and Kushwaha (2011). Similar results have also been reported by Swapana et al. (2012).
Amino acid-N: Amino acid-N content in soil (0-15 cm) increased successively from 279 to 295 and 328 kg ha-1 as the dose of fertilizer increased from 50%, 100% and 150% NPK, respectively. The minimum value of amino acid-N was observed in control 241 kg ha-1. While, the maximum value of amino acid-N 356 kg ha-1 was recorded with 100% NPK+FYM treatment (Table 5). The highest amino acid-N content (15-30 cm soil depth) of 326 kg ha-1 was recorded in 100% NPK+FYM, whereas the lowest value was noticed as 223 kg ha-1 in control followed by 50% NPK (261 kg ha-1). Non-signifi cantly higher value of amino acid-N content was obtained in 150% NPK (316 kg ha-1) than 100% NPK (Table 6).
The content of the amino acid N was maximum in surface soil and thereafter decreased with the depth reported by Reddy et al. (2003), Sammy et al. (2003) and Sepehya et al (2012). However, due to addition of
fertilizer doses suboptimal, optimal and super optimal, Amino acid N content was correspondingly improved indicating an impact of fertilizer application on enrich-ment of N pools (Keeney and Bremner 1964). The small decrease in amino acid-N fraction as compared to Hex-ose amine N and Hydrolysable ammonica-N in control plot could be due to inclusion of legume crop (soybean) in the rotation which has been found to promote the buildup of amino acid-N (Stevension, 1956).
Unidentifi ed hydrolysable-N: Unidentifi ed hydrolys-able-N content in 0-15 cm soil increased successively from 434 to 589 and 617 kg ha-1 as the dose of fertilizer increased from 50%, 100% and 150% NPK, respectively. The value of unidentifi ed hydrolysable-N was slightly higher in 100% NP than 100% N. The highest value of unidentifi ed hydrolysable-N 636 kg ha-1 was recorded with 100% NPK+FYM treatment. While, the lowest value of unidentifi ed hydrolysable-N was observed in control 421 kg ha-1 (Table 5). The data further showed that the unidentifi ed hydrolysable-N content of soil (15-30 cm) decreased with soil depth (Table 6). Higher value of uni-dentifi ed hydrolysable-N content was observed in 150% NPK (489 kg ha-1) as compared to 100% NPK (463 kg ha-1). The highest unidentifi ed hydrolysable-N content 522 kg ha-1 was recorded in 100%NPK+FYM, whereas the lowest value was noticed as 216 kg ha-1 in control followed by 50% NPK (373 kg ha-1).
The higher value of unidentifi ed hydrolysable-N content was obtained from surface soil compare to sub surface soil. Highest Unidentifi ed hydrolysable N con-tent was registered with 100% NPK+FYM (636 kg ha-1). Further lower content was found in control (421 kg ha-1) attributed due to no fertilizers application which directly or indirectly affected normal biological activi-
Table 6. Effect of long term of fertilizers and manure on N-fractions in 15-30 cm soil depth
TreatmentsHexose amine and hydrolysable Ammonical N
Hexose amine N
Amino acid N
Unidentifi ed Hydrolysable N
Non-hydrolysable N
50 % NPK 278.1 18.5 261.6 373.8 523.6
100 % NPK 305.1 20.0 280.0 463.4 471.2
150% NPK 327.1 29.6 316.2 488.7 440.5
100 %NP 301.3 21.5 278.8 425.4 444.2
100 % N 297.8 26.2 273.1 427.3 441.0
100 % NPK+FYM
366.3 32.8 326.8 522.1 472.1
100 % NPK-S 307.3 25.0 280.1 433.0 490.4
Control 240.8 13.0 223.6 248.1 420.4
SEm± 11.3 1.1 10.7 14.8 20.8
CD (5%) 36.8 3.6 34.8 43.0 60.4
(Values in kg ha-1)

A. Khandagle et al.
192 DISTRIBUTION OF NITROGEN FRACTIONS UNDER LONG TERM FERTILIZER BIOSCIENCE BIOTECHNOLOGY RESEARCH COMMUNICATIONS
ties Rao and Ghosh, (1981). The treatment wise pattern was almost same as that was observed in case of surface soil. Positive effect on build up of unidentifi ed-N frac-tion with the application of organic along with chemi-cal fertilizers might be attributed to the movement of applied nitrogen from upper layer been reported Sep-ehya et al. (2012). It has also been noted that higher status of Unidentifi ed hydrolysable N was obtained on the surface while progressively declined with depth but the rate of depletion was more apparent from surface to subsurface soil while, it was stabilized below 30 cm. Thus, it could be attributed to higher root biomass in the rhizospheric upper soil layer and which declined with increasing soil depth (Kushwaha, 2011).
Non-hydrolysable-N: Non-hydrolysable-N content in 0-15 cm soil depth varied from 452, 414 and 436 kg ha-1 as levels of fertilizer increased from 50%, 100% and 150% NPK, respectively (Table 5). The maximum value of non-hydrolysable N 458 kg ha-1 was recorded with 100% NPK+FYM treatment. While, the lowest value of non- hydrolysable-N was observed control 366 kg ha-1. Similarly, the highest non-hydrolysable N content (15-30 cm soil depth) of 524 kg ha-1 was recorded with 50% NPK, whereas the lowest value was noticed as 420 kg ha-1 in control followed by 100% NP (428 kg ha-1) (Table 6).
The data indicated lower values of Non-hydrolysable-N content in surface soil. The addition of fertilizer doses suboptimal, optimal and super optimal did not showed any signifi cant improvement in N-pool. The application of fertilizers N even up to its highest level did not show any improvement in non hydrolysable N content in soil. Further, it has also been noted that lower status of Non-hydrolysable N was obtained on the surface while pro-gressively increased with depth. The similar results have been reported by Reddy et al. (2003) and Kushwaha (2011).
CONCLUSION
The results from Long Term Fertilizer Experiment revealed that the application of 100% NPK+FYM showed higher content of studied N-fractions viz. Total hydrolysable-N, Hydrolysable ammonical-N, inorganic–N, hexose amine & hydro.ammo.-N, hexose amine-N, amino acid-N, uni-dentifi ed hydrolysable-N, non-hydrolysable-N and total N, whereas lower content was recorded in treatment 50%NPK followed by 100% N. The result also revealed that the N fractions were signifi cantly decreased with increasing depth of soil.
REFERENCES
Aggarwal, R. K., Kumar, P. and Sharma, B. K. 1990. Distribu-tion of nitrogen in some arid soils. J. Indian Soc. Soil Sci., 38: 430-433.
Babita B. 2013. Dynamics of organic and inorganic fractions of nitrogen in an acid alfi sol after long-term addition of chemical fertilizers and amendments in maize-wheat cropping system. International Journal of Agricultural Science and Research, 3(3): 179-184.
Black, C. A., 1965, Methods of Soil Analysis – Part II, Agron-omy Monograph, American Society of Agronomy Madison, Wisconsin, USA.
Bremner J.M. (1965a). Total nitrogen. In ‘Methods of Soil Analysis, Part 2, (Ed CA Black) Am. Soc. Agron Madison, WI pp. 1149-1178.
Bremner JM. 1965b. Organic forms of nitrogen. In ‘Methods of Soil Analysis, Part 2 (Ed CA Black) Am. Soc. Agron. Madison, WI pp. 1238-1255.
Broadbent FE. 1965. Effect of fertilizer nitrogen on the release of soil nitrogen. Soil Sc. Soc. Am. Proc. 29: 692-696.
Chesin, L. and C. H. Yien, 1951. Turbidmetric determination of available sulphur in soil. Soil. Sci. Soc. Am. Proc. 15: 149-157.
Duhan BS, Katarai D, Singh JP, Kuhad MS and Dahiya SS. 2005. Effect of nitrogen, FYM and metribuzin on nitrogen transformation. J. Indian Soc. Soil Sci., 53(2): 184-187.
Durani A, Brar BS and Dheri GS. 2016. Soil Nitrogen Fractions in Relation to Rice-Wheat Productivity: Effects of Long-Term Application of Mineral Fertilizers and Organic Manures. Jour-nal of Crop Improvement, 30 (4): 399–420.
Gomez, K. A. and A. Gomez, 1984. Statistical Procedures for Agricultural Research (2nd edition), John Willey and Sons, New York, 1-680.
Keeney DR and Bremner JM. 1964. Effect of cultivation on the nitrogen distribution in soils. Proc., Soil Sci. Soc. Am. J. 28: 653-656.
Kumar V. 2003. Integrated effect of chemical fertilizers and green manure on forms of nitrogen and their availability under rice-wheat cropping system in Calciorthents. Journal of the Indian Society of Soil Science 51:561-564.
Kushwaha satybhan. 2011. Effect of long term application of fertilizers and manure on nitrogen fractions in a Vertisol. M.Sc. thesis JNKVV, Jabalpur.
Muhr, G. R., N. P. Datta, H. S. Subrsmany, V. K. Leley and R. L. Dunahue, 1965. Soil testing in India. Asia Press, New Delhi.
Mulvaney, R.L. , S.A. Khan, R.G.Hoeft, and H.M. Brown 2001. A soil organic nitrogen fraction that reduce the need for nitro-gen fertilization. Soil Science Society of American Journals 65:1164-1172
Nayak VN, Gatav GK and Bhagat RK. 2013. Different N frac-tions and their relationship with available Nitrogen, yield and nutrient uptake in saffl ower, (Carthanmus tinctoroius) in ver-tisol. Current Advances in Agriculture Science 5(1): 135-137
Olsen, S. R., C. V. Cole, F. S. Watanbe and L. A. Dean, 1954. Estimation of available phosphorus in soils by extraction with sodium bicarbonate. USDA circ. 939: 19-33.
Patra A, Jarvis SC and Hatch DJ. 1999. Nitrogen mineraliza-tion in soil layers, soil particles and macro-organic matter under grassland. Bio. Fertil. Soils 29: 38-45.

A. Khandagle et al.
BIOSCIENCE BIOTECHNOLOGY RESEARCH COMMUNICATIONS DISTRIBUTION OF NITROGEN FRACTIONS UNDER LONG TERM FERTILIZER 193
Piper, C. S. 1966. Soil and Plant Analysis. Hans Publisher, Bombay. 85-102.
Rai Suraj Kumar 2013. Infl uence of long term use of fertilizers and manure on nitrogen dynamics in a Vertisol in wheat under rice-wheat cropping system. Msc. Thesis IGKVV, Raipur
Rao SA and Ghosh AB. 1981. Effect of continuous cropping and fertilizer use on the organic nitrogen fractions in a Typic Ustochepret Soil. Plant and Soil, 62:377-383.
Reddy SK, Singh M, Tripathi AK. Singh MV and Saha MN. 2003. Changes in amount of organic and inorganic fractions of nitrogen in an Eutrochrept soil after long-term cropping with different fertilizer and organic manure inputs. J. Plant Nutri. Soil Sci. 166: 232-¬238.
Sepehya S and Subehia SK 2012, Nitrogen dynamic as infl u-enced by long- term fertilization and amendments under rice – wheat system in a north- western Himalaya soil. Depatment of Soil Science CSK Himalaya Pradesh Krishi Vishvavidyalaya, Palampur
Singh, K. K., and Singh, R. 2007. Distribution of nitrogen and sulphur forms in profi les of mid-western Utter Pradesh. J. Indian Soc. Soil Sci., 55 (4): 476-480
Soudi BA, Sbai and Chiang CN. 1990. Nitrogen mineraliza-tion in semi arid soils of Morocco: rate constant variation with depth. Soil Sci. Soc. Am. J. 54: 756-761.
Stevenson FJ. 1956. Effect of some long time rotations of the amino acid composition of the soil. Proc, Soil Sci. Soc. Am. J. 20: 204-208.
Subbiah, B. V. and G. L. Asija, 1956. A rapid procedure for esti-mation of available nitrogen in soils. Curr. Sci. 25: 259-260.
Swapana S. and Subehia SK. 2012. Nitrogen dynamic as infl u-enced by long term fertilization and amendments under rice wheat system in a North- western Himalayan soil. CSK Himachal Pradesh Krishi Vishvavidyalaya, Palampur – 176062 (H.P.),India
Swapana S. and Subehia SK. 2012. Nitrogen dynamic as infl uenced by long term fertilization and amendments under rice wheat system in a North- western Himalayan soil. CSK Himachal Pradesh Krishi Vishvavidyalaya, Palampur – 176062 (H.P.), India
Walkley, I. A. and C. A. Black, 1934. An examination of the Degtozeff methods for determining the soil organic matter and nitrogen in the soil and a proposed modifi cation of the chro-mic acid titration method. Soil Sci. 37: 29-38.

Biological monitoring of riverine ecosystem and its
correlation with water quality D. D. Bhutekar1 and S. B. Aher2*1Department of Environmental Science, Arts, Commerce and Science College, Ambad, Maharashtra-431204, India2ICAR-Indian Institute of Soil Science, Bhopal, Madhya Pradesh–462038, India
ABSTRACT
The River Godavari serves as a source of water for drinking and domestic use, agricultural irrigation and industries in Ambad stretch. The anthropogenic activities in the stretch caused ecological disturbance through water pollution. In present study, the spatial variation in water quality parameters was studied with respect to the fi sh population and diversity. The fi sh diversity and water quality of Godavari River at Ambad Stretch (16 km length) was studied at fi ve identifi ed sampling sites viz. Paithan (R), Balegaon (A), Gandhari (B), Shahagad-A (C) and Shahagad-B (D). The results revealed that the water quality followed the trend: R>D>B>A>C. The fi sh diversity index was observed between 2.35 and 3.03 among different sampling sites with highest at site R. The correlation study showed signifi cant correlation between water quality parameters viz. total dissolved solids, phosphate, nitrate, dissolved oxygen, biological oxygen demand and chemical oxygen demand and fi sh population and diversity. The pollution tolerant fi sh species Oreochro-mic mossumbicus population showed signifi cant positive correlation with water quality parameters except dissolved oxygen where it was found negatively correlated.
KEY WORDS: GODAVARI RIVER, FISH DIVERSITY, WATER QUALITY, SHANNON DIVERSITY INDEX, AMBAD STRETCH
194
Environmental CommunicationBiosci. Biotech. Res. Comm. 12(1): 194-202 (2019)
INTRODUCTION
The water is the most essential and precious resource and is the elixir of life. Water resources comprising of surface water (river and lakes), ground water, and marine and coastal waters support all living things including human beings. Surface Rivers have always been the lifelines of
development but the freshwater habitats receiving the highest levels of human disturbance. Recent studies on the status of inland water ecosystems showed that the river catchments in the Indian subcontinent are glob-ally most threatened. Therefore, it is essential to identify, monitor and conserve the riverine ecosystems. Biologi-cal assessment of the freshwater habitats aims at char-
ARTICLE INFORMATION:
Corresponding Author: [email protected] 10th Dec, 2018Accepted after revision 25th Feb, 2019BBRC Print ISSN: 0974-6455Online ISSN: 2321-4007 CODEN: USA BBRCBA Thomson Reuters ISI ESC / Clarivate
Analytics USAMono of Clarivate Analytics and Crossref Indexed Journal Mono of CR
NAAS Journal Score 2019: 4.31 SJIF: 4.196© A Society of Science and Nature Publication, Bhopal India 2019. All rights reserved.Online Contents Available at: http//www.bbrc.in/DOI: 10.21786/bbrc/12.1/26

BIOSCIENCE BIOTECHNOLOGY RESEARCH COMMUNICATIONS BIOLOGICAL MONITORING OF RIVERINE ECOSYSTEM AND ITS CORRELATION WITH WATER QUALITY 195
Bhutekar and Aher
acterizing and monitoring the conditions of the aquatic resources. The assessments are commonly associated with human impact (Saunders et al., 2002; Resh, 2008; Bhutekar et al., 2015, Bhutekar et al., 2018a).
In India various studies have presented spatial and temporal trends in diversity or biotic index of streams, rivers and lakes (Bhat, 2002). But still relatively little information is available on the correlation between water quality parameters and population and diversity of the aquatic animals (Rai et al., 2013). The river Goda-vari is considered to be one of the very sacred rivers of India. But being the ultimate sink of anything and every-thing drained through surface runoff, the river has been subjected to considerable stress. As a result, the ecology and water quality has suffered. In India some studies have presented spatial and temporal trends in diversity or biotic index of streams, rivers and lakes (Bhat, 2002). The biomonitoring system developed for the temperate streams was tested and found useful. However, biomoni-toring can not entirely replace standard physic-chemical water quality methods. Standard physico-chemical water quality measures provide information on water quality at a particular spatial unit during the time of sampling. It cannot provide historical information on water quality (Bhutekar et al., 2018b). On the other hand, by knowing the ecology of aquatic insect community, biomonitor-ing tools provide some historic insights into the water quality. Standard physico-chemical water quality meth-ods need to be carried out in conjunction with biomoni-toring tools to comprehensively evaluate the health of freshwater ecosystems (Glorian et al., 2018).
River Godavari serves as a source of water for drinking and domestic use, agricultural irrigation and industries in Ambad stretch. Therefore, it was felt appropriate to evalu-ate, monitor and improve water quality and ecological conditions of river Godavari at Ambad stretch. The attempt was made to study the correlation between the water qual-ity parameters and fi sh population and diversity.
MATERIALS AND METHODS
Sampling site
Present work was carried out on Godavari River water at Ambad Stretch. The total length of the study stretch was around 16 km. The fi ve different locations were
identifi ed and fi sh diversity was studied by conducting seasonal fi sh sampling. Fishes of this river system were sampled seasonally over a period of two years i.e. July 2012 to May 2014 at 5 sampling sites. The sites were selected on the basis of depth and availability of water. The distance between two sampling sites was approxi-mately 3 km. The fi ve sampling sites were Paithan, Bale-gaon, Gandhari, Shahagad-A and Shahagad-B (Table 1).
Fish sampling, identifi cation and diversity computation
Before starting the sampling, a thematic map was devel-oped denoting the sampling sites where GIS based infor-mation was used. On basis of the map a pilot survey was carried out prior to actual sampling. Depending on the suitability and participatory appraisal with local fi sh-erman community the sampling station were decided.Sampling efforts i.e. a single gill net operation or cast net operation for one hour was conducted and a spe-cies accumulation curve was obtained which was used to calculate the minimum sampling efforts vs. sampling effort plot.Based on such pilot survey carried out at many sampling sites, a sampling effort for 3 hours by gill net and drag net operation was used as standard for the sampling of fi shes at all sites under this study.Fish samples were collected seasonally viz. monsoon, win-ter and summer for both years at each sampling station using different nets and gears of local fi sherman. Sam-pling was carried out using a variety of fi shing nets tra-ditionally used by local fi sherman comprising varying mesh sizes of gill, cast nets and drag nets.The fi shes were identifi ed and some representative specimens were col-lected and preserved in (4% formaldehyde solution) in glass jars. The identifi cation of the fi sh specimens from various stations of the river Godavari was carried out with standard methods given by Mishra (1962), Jayaram (1981; 1999; 2006), Fischer and Bianchi (1984) and Jhin-gran (1997). In addition to this, electronic database like catalogue of life (2005), fi shebase (2004) and FAO fi sh identifi cation sheets were also used during fi sh identifi -cation.The identifi ed fi shes were grouped as per stand-ard chronology of standard classifi cation and Shannon Index was computed (Shannon, 1948) as follows:
Table 1. Details of sampling sites
Sampling site Code Geographical Position Water depth (m) River width (m)Paithan R 19°29’083” N, 75°22’408” E 6-7 700-900
Balegaon A 19°23’17.5”N,75°36’54.0”E 2-3 600-650
Gandhari B 19°22’05.4”N,75°40’21.5”E 2-4 550-650
Shahagad-A C 19°22’32.3”N,75°43’21.0”E 3-4 600-700
Shahagad-B D 19°22’35.4”N,75°43’29.5”E 6-8 550-600

196 BIOLOGICAL MONITORING OF RIVERINE ECOSYSTEM AND ITS CORRELATION WITH WATER QUALITY BIOSCIENCE BIOTECHNOLOGY RESEARCH COMMUNICATIONS
Bhutekar and Aher
WhereH’- Shannon Indexi - proportion of individuals belonging to the ith spe-
cies in the dataset of interest.
Water sampling and analysis
Water samples were collected from each sampling sta-tions (Table 1) in fi rst week of every month during June 2012 to May 2014 in morning hours (between 7.00 to 10.00 am). Water temperature was recorded and dis-solved oxygen was fi xed at sampling site. The collected water samples were analyzed in laboratory for differ-ent physical and chemical parameters as per the stand-ard methods (APHA, 2005; Trivedi and Goel, 1984). The parameters studied were temperature, turbidity, pH, total dissolved solids, total alkalinity, total hardness, phos-phate, nitrate, chlorides, dissolved oxygen, biological oxygen demand and chemical oxygen demand.
Statistical analysis
The collected data was compiled and subjected to statis-tical analysis for computation ofcoeffi cient of determi-nation (r2) and correlation coeffi cient (r) as follows and the relationship between two parameters was studied.
Table 2. Spatial variation in occurrence of fi sh species of Godavari River at Ambad stretch
Family Name of species (CODE)Sampling site
R A B C D
NotopteridaeNotopterus notopterus (NN) 43 21 21 15 26
Chitala chitala (CH) 36 23 26 19 31
Cyprinidae
Hypothalmicthys molitrix (HM) 17 4 2 0 13
Salmostoma navacula (SN) 51 16 32 12 34
Chela laubuca (CL) 24 0 7 0 13
Cyprinus carpio carpio (CY) 17 13 13 3 24
Thynicthys sandkhol (TS) 11 0 0 0 5
Osteobrama vigorsii (OV) 45 0 9 0 41
Puntius ticto (PT) 49 0 7 0 30
Cirrhinus mirgala (CM) 15 0 10 5 14
Catla catla (CC) 29 3 22 0 26
Labeo rohita (LR) 28 5 17 0 23
Garra mullya (GM) 10 0 0 0 0
Bagridae Mystus aor =Sperata aor (SA) 64 22 36 11 43
SiluridaeOmpak bimaculatus(OB) 32 15 20 9 20
Wallago attu (WA) 21 6 16 0 13
Heteropneustidae Heteropneustes fossilis (HF) 25 0 23 0 19
Mugilidae Rhinomugil carsula (RC) 66 0 52 0 48
Beonidae Xanthodon cansula (ST) 88 0 64 0 70
MastacembelidaeMastacembelus armatus(MA) 55 8 24 15 33
Mascrognathus pancalus (MP) 74 0 47 0 54
Cichlidae Oreochromis mossambicus (OM) 4 15 13 22 7
Channidae
Channa muralius(MU) 30 10 13 7 25
Channa straita (CS) 16 12 20 6 20
Chanda nama (CN) 38 15 16 12 24
(R- Paithan; A- Balegaon; B- Gandhari; C- Shahagad A and D- Shahagad B).
RESULTS AND DISCUSSION
Fish diversity and population
During the study period, the fi shes belonging to ten dif-ferent families viz. Notopteridae, Cyprinidae, Bagridae, Siluridae, Heteropneustidae, Mugilidae, Beonidae, Mas-tacembelidae, Cichlidae and Channidae were observed

BIOSCIENCE BIOTECHNOLOGY RESEARCH COMMUNICATIONS BIOLOGICAL MONITORING OF RIVERINE ECOSYSTEM AND ITS CORRELATION WITH WATER QUALITY 197
Bhutekar and Aher
in Godavari River at Ambad stretch (Table 2). Similarly, during the study period, total 25 fi sh species were iden-tifi ed in River Godavari at Ambad stretch at different sampling sites viz., R- Paithan, A-Balegaon, B-Gan-dhari, C-Sahagad A and D-Sahagad B. The identifi ed fi sh species were Notopterus notopterus, Chitala chitala, Hypothalmicthys molitrix, Salmostoma novacula, Chela laubuca, Cyprinus carpio carpio, Thynicthys sandkhol, Osteobrama vigorsii, Puntius ticto, Cirrhinus mirgala, Catla catla, Labeo rohita, Garra mullya, Aorichthys aor, Ompak bimaculatus, Wallago attu, Heteropneustes fossilis, Rhinomugil corsula Xanthodon cansula, Mas-tacembelus armatus, Mascrognathus pancalus, Oreo-chromis mossambicus, Channa muralius, Channa straita and Chanda nama. (Table 2)
The fi sh population at different sampling sites ranged 133-881 individuals. The highest and lowest fi sh pop-ulation was found at site R and site C, respectively. The fi sh population at study sites followed the trend: R>D>B>A>C (Table 3). The family wise distribution of fi sh population at different sites revealed that, species from all families were observed at all sites except the species of family Heteropneustidae, Mugilidae and Beo-nidae which was not observed at site A and site C (Table 2). The total fi sh families and species reported at sam-pling sites R, A, B, C and D was 10 and 25, 7 and 15, 10 and 23, 7 and 12; and 10 and 24, respectively (Table 3). The pollution tolerant fi sh species Oreochromis mos-sambicus was found dominant at site C followed by site A and B. The species was least dominant at site R and D.
The Shannon diversity index value observed between 2.35 and 3.03 among different sampling sites of Goda-vari River at Ambad stretch. The lowest value of 2.35 was observed at site C.The results clearly indicated that the maximum Shannon Index value was found at ref-erence and at site D (3.03). The diversity index of site A and B were 2.56 and 2.93 respectively. The higher diversity index at site R might be due to the undisturbed habitat whereas the dilution and self purifi cation process of the river water resulted in higher value of fi sh diver-sityat site D. The water quality at site R and D was found
suitable for fi sh growth. The higher degree of the pol-lution and habitat disturbance made the water quality unsuitable for the growth of the fi sh community which can be evidenced from lower diversity index value at site C (2.35) and site A (2.56).
Physico-chemical properties of Godavari River water
Temperature, turbidity and pH
The spatial variation in water quality of the Godavari River is presented in Table 4. The average water tem-perature was observed between 23.3 and 23.6°C among different sampling locations. Temperature plays very important role in the physiological behavior and distri-bution of aquatic organisms. The variation in river water temperature usually depends on the season, geographic location, ambient air temperature and chemical reaction in a water body (Ahipathi and Puttaiah, 2006). However, no signifi cant difference in site specifi c temperature was observed during the investigation.
Turbidity measures water clarity or the ability of light to pass through water. In present investigation water turbidity was observed between 7.0 and 23.4 NTU among different sampling sites (Table 4). The low-est average turbidity was observed at reference location (R) followed by B and D site. The highest turbidity was recorded for site C (23.4 NTU) followed by site A (17.1 NTU). Surface-runoff, stream fl ow and overland fl ow in natural waters increase the turbidity levels in water. The higher level of pollutants in water also imparts turbid-ity to water. Yadav and Kumar (2011); Medudhula et al. (2012); Dhawde et al. (2018) and Bhutekar et al. (2018a) reported the similar observations.
The pH of the water was found slightly basic at all the sampling sites during the study period (Table 4). The mild alkaline nature of river water attributed to the pres-ence of CO2 in water as bicarbonate (Azeez et al., 2000). The leaching of basic rock material by rainwater and carried by surface runoff to river stream attributed to the higher values of water pH during rainy season (Lal-parmawii, 2007).
Table 3. Fish population and diversity of Godavari River at various sites
Sampling site
No. of fi sh families observed
No. of fi sh species observed
Total fi sh individuals observed
Oreochromis mossambicus population
Shannon Diversity Index
R 10 25 881 4 3.03
A 7 15 184 15 2.56
B 10 23 505 13 2.93
C 5 12 133 22 2.35
D 10 24 652 7 3.03
(R- Paithan; A- Balegaon; B- Gandhari; C- Shahagad A and D- Shahagad B).

198 BIOLOGICAL MONITORING OF RIVERINE ECOSYSTEM AND ITS CORRELATION WITH WATER QUALITY BIOSCIENCE BIOTECHNOLOGY RESEARCH COMMUNICATIONS
Bhutekar and Aher
Dissolved solids, alkalinity and hardness
In the present investigation TDS showed variation at all the sites during study period. The TDS ranged between 288.7 mg l-1 and 674.4 mg l-1 among different sam-pling locations (Table 4). The highest value of TDS was observed at site C followed by site A (622.8 mg l-1). Total dissolved solids (TDS) are a measure, of the amount of dissolved materials in the water and are mainly contains minerals (Senthilnathan et al., 2011).
Alkalinity is the measure of buffering capacity of the water. It is generally imparted by the salts of carbonates, bicarbonates, phosphate, nitrates etc. (Yellavarthi, 2002). In present investigation the TA ranged from 201.0 mg l-1 (site D) to 485.9 mg l-1 (site C) among different sam-pling sites (Table 4). The increase in total alkalinity due to various religious activities, domestic waste and espe-cially due to soaps and detergents was earlier reported by Patil (2003); Mithani et al. (2012) and Dhawde et al. (2018).
The total hardness ranged from 133.6 mg l-1 at site R to 316.2 mg l-1 at site C (Table 4). Hardness of water is a measure of its capacity to produce lather with soap (Garnaik et al., 2013). Total Hardness is an important parameter of water quality whether it is used for domes-tic, industrial or agricultural purposes (Jothivenkatacha-lam et al., 2010). The cations of calcium, magnesium, iron and manganese contribute to the hardness of water (Shrivastava and Patil, 2002). The widespread abun-dance of these metals in rock formations leads often to very considerable hardness levels in surface and ground waters (EPA, 2001). Similarly, the Ca and Mg that enter
the water bodies through residues of soaps, detergents and parent bed rock materials made up of Ca, Mg and other metal ions also signifi cantly contributes to total hardness of water (Nanda, 2005).
Phosphate, nitrate and chlorides
The phosphate concentration in Godavari River water at different sampling location was ranged between 0.19 mg l-1 and 4.67 mg l-1 (Table 4). The highest phosphate con-centration was found at site C followed by site A and site B. The animal waste, agriculture waste and detergent in domestic wastewater may have contributed towards the observed increment in phosphates (Anda et al., 2001). Sinha et al. (1998) have also reported higher phosphate content in lower stretch of Ganga River.
Nitrate concentration in Godavari River water sam-pled at different locations was ranged between 3.35 mg l-1 and 39.1 mg l-1 with mean value of 17.3 mg l-1 (Table 4). The highest concentration of nitrate was found at site C followed by site A and B (19.5 mg l-1). The lowest concentration of nitrate was observed at site D (3.35 mg l-1). Nitrate in surface water is an important factor for water quality assessment (Jhones and Burt, 1993) which is mainly contributed waste discharges and artifi cial nitrogenous fertilizers.
The chloride in Godavari River water was ranged from 60.6 mg l-1 to 109.2 mg l-1 at various sampling locations (Table 4). The highest concentration of chlo-rides was observed at site C followed by site A and site B. Venkatesharaju et al. (2010) and Bhutekar et al. (2018a) also observed similar results with respect to chloride contents of the river water.
Table 4. Physico-chemical properties of Godavari River water at different sampling site
ParameterSampling site
R A B C DTemperature (°C) 23.3 23.5 23.4 23.6 23.6
Turbidity (NTU) 7 17.1 9.6 23.4 9.6
pH 7.55 7.77 7.64 7.85 7.53
Total dissolved solids (mg lit-1) 288.7 622.8 434.9 674.4 305.9
Total alkalinity (mg lit-1) 202.9 300.2 231.7 485.9 201
Total hardness (mg lit-1) 133.6 194 185.9 316.2 167.4
Phosphate (PO4-3) (mg lit-1) 0.19 3.12 3.1 4.67 0.49
Nitrate (NO3-) (mg lit-1) 5.31 19.5 19.5 39.1 3.35
Chlorides (Cl-) (mg lit-1) 27.1 92.4 45.7 109.2 28.6
Dissolved oxygen (mg lit-1) 6.7 4.9 5.8 4.2 6.4
Biological oxygen demand (mg lit-1) 4.3 20.9 12.3 37.8 4.4
Chemical oxygen demand (mg lit-1) 12.2 136.9 108.5 215.0 20.1
(R- Paithan; A- Balegaon; B- Gandhari; C- Shahagad A and D- Shahagad B).

BIOSCIENCE BIOTECHNOLOGY RESEARCH COMMUNICATIONS BIOLOGICAL MONITORING OF RIVERINE ECOSYSTEM AND ITS CORRELATION WITH WATER QUALITY 199
Bhutekar and Aher
Dissolved oxygen, Biological oxygen demand and
Chemical oxygen demand
The sampling station wise mean dissolved oxygen data showed that, DO ranged between 4.2 mg l-1 to 6.7 mg l-1. The highest DO values was recorded for sampling site R followed by D and B. The mean monthly DO concen-tration showed that, it was ranged between 4.7 mg l-1 and 7.0 mg l-1 (Table 4). Dissolved oxygen is one of the important parameter in water quality assessment as it regulates and governs metabolic activities and metabo-lism of the biological community as a whole, respec-tively and also acts as an indicator of trophic status of the water body (Saksena and Kaushik, 1994). Its pres-ence is essential to maintain variety of forms of biologi-cal life in water. Similar observations were also recorded by Singh and Gupta (2010) and Bhutekar et al. (2018a).
The biological oxygen demand of Godavari River water was observed between 4.3 mg l-1 and 37.8 mg l-1 among different sampling sites (Table 4). The highest BOD was observed at site C followed by site A (20.9 mg l-1). The lowest BOD was observed at site R (4.3 mg l-1) followed by site D (4.4 mg l-1). Biodegradation of organic materials exerts oxygen tension in the water and increases the biochemical oxygen demand (Abida, 2008). BOD increases with organic matter addition, wastewater or urban storm water runoff took place at the river water. The higher BOD in polluted water was reported earlier by Garg et al. (2006); Zainudin et al. (2010); Glorian et al. (2018).
The COD is a measure of oxygen equivalent to the organic matter content of the water susceptible to oxi-dation and thus is an index of organic pollution in river (Khaiwal and Anubha, 2003).In present investigation the COD was observed 12.2 and 215.0 mg l-1 among differ-ent sampling sites (Table 4). The highest value of COD was observed at site C followed by site A (136.9 mg l-1) and site B (108.5 mg l-1). The lowest value of COD
was observed for site R (12.2 mg l-1) followed by site D (20.1 mg l-1). Highest COD at site C indicated the higher pollution of water while lower level of COD indicated low level of pollution of water at the study area (Waziri and Ogugbuaja, 2010).Similar result was also reported by Bamniya et al. (2011); Bhutekar et al. (2018b) and Dhawde et al. (2018).
Correlation between water quality and fi sh population
and diversity
The water quality of a water body is determined by measuring the physic-chemical properties of the water. Among the criteria parameters, dissolved oxygen, bio-logical oxygen demand, total dissolved solids, chemi-cal oxygen demand, nitrate and phosphate are consid-ered as key parameters. The correlation between these parameters and fi sh diversity/population was studied and its signifi cance was interpreted using Student’s T Test (Table 5).
The fi sh population, fi sh diversity, number of fi sh families observed, number of fi sh species observed and the population of pollution tolerant fi sh species Oreo-chromis mossumbicus was studied in relation with the water quality parameters. The data showed signifi cant negative correlation between total fi sh families observed and total dissolved solids (r=-0.928), biological oxygen demand (r= -0.963) and chemical oxygen demand (r= -0.893) whereas signifi cant positive correlation with dissolved oxygen (r=0.949). The similar type of relation-ship was also existed with total fi sh species observed and total fi sh population recorded. The total fi sh population showed signifi cant positive correlation with dissolved oxygen (r= 0.971; Fig. 1-A) and signifi cant negative correlation with biological oxygen demand (r= -0.893) and chemical oxygen demand (r= -0.993; Fig. 1-B). The nitrate content did not show signifi cant correlation with total fi sh families, species and population. The phos-phate content also did not shown correlation with TFF and TFS but showed signifi cant negative correlation with total fi sh population. It is interesting to note that, the pollution tolerant fi sh species Oreochromis mossum-bicus showed signifi cant positive correlation with TDS (r= 0.947); phosphate (r= 0.980); nitrate (r= 0.970); BOD (r= 0.964) (Fig. 1-F) and COD (r= 0.993). The Oreo-chromis mossumbicus showed signifi cant negative cor-relation with dissolved oxygen (r= -0.977) (Fig.1-E). The Shannon diversity index showed signifi cant positive correlation with dissolved oxygen (r= 0.981; Fig. 1- C) whereas signifi cant negative correlation with TDS (r= -0.973); nitrate (r= -0.904); BOD (r= -0.974; Fig. 1-D) and COD (r= -0.939).
The aquatic biodiversity of world is changing and get-ting depleted alarmingly fast as a result of extinctions caused by habitat loss, pollution, introduction of exotic
Table 5. Correlation between water quality parameters and fi sh population and diversity
Parameter TFF TFS TFP OMP SDITDS -0.928* -0.974* -0.973* 0.947* -0.973*
PO4-3 -0.805 -0.852 -0.911* 0.980* -0.872
NO-3 -0.872 -0.871 -0.848 0.970* -0.904*
DO 0.949* 0.978* 0.971* -0.977* 0.981*
BOD -0.963* -0.955* -0.893* 0.964* -0.974*
COD -0.893* -0.921* -0.931* 0.993* -0.939*
(TFF-Total fi sh family; TFS-Total fi sh species; TFP-Total fi sh population; OMP-Oreochrimos mossumbicus population; TDS-Total dissolved solids; SDI-Shannon diversity index; PO4
3-Phosphates; NO3-Nitrates; DO-Dissolved oxygen; BOD-Biological oxygen demand; COD-Chemical oxygen demand;*Signifi cant at 5% level as per Students T test; T table value – 3.182)

200 BIOLOGICAL MONITORING OF RIVERINE ECOSYSTEM AND ITS CORRELATION WITH WATER QUALITY BIOSCIENCE BIOTECHNOLOGY RESEARCH COMMUNICATIONS
Bhutekar and Aher
FIGURE 1. Linear regression coeffi cient between water quality parameters and fi sh population and diver-sity (A-Fish population Vs Dissolved oxygen; B- Fish population Vs Chemical oxygen demand; C- Shan-non diversity index Vs Dissolved oxygen; D- Shan-non diversity index Vs Biological oxygen demand; E- Oreochronis mossumbicus population Vs Dissolved oxygen; F- Oreochronis mossumbicus population Vs Biological oxygen demand).
species, over exploitation and other anthropogenic activities. Fishes are the keystone species which deter-mine the distribution and abundance of other organisms in the ecosystem they represent and are good indicators of water quality and aquatic ecosystem. The fresh water fi shes are one of the most threatened taxonomic groups (Darwall and Vie 2005) because of their high sensitivity to the quantitative and qualitative alteration of aquatic habits (Laffaille et al., 2005; Kang et al., 2009; Sarkar et al., 2008). Therefore, fi shes are often used as bioindicator for the assessment of water quality, river network con-nectivity or flow regime (Chovance et al., 2003; Matta et al., 2018). Present investigation, clearly indicated a signifi cant correlation of water quality parameters and fi sh diversity. The higher population of Oreochromis mossambicus at site C and B indicated it is a pollution tolerant species and favors such habitat (Murugan and Prabaharan, 2012). The healthy population of remaining species at site R, site D and site B may be attributed to the favorable water quality as evidenced from the data on water quality parameters (Table 4). The observed
dominant species at site R and D are fresh water fi shes (Munshi and Srivastava, 2006; Teta et al., 2017).
CONCLUSION
The results of the present investigation revealed that, the water quality followed the trend: R>D>B>A>C. The fi sh diversity index was observed between 2.35 and 3.03 among different sampling sites with highest at site R. The correlation study showed signifi cant correlation between water quality parameters viz. total dissolved solids, phosphate, nitrate, dissolved oxygen, biologi-cal oxygen demand and chemical oxygen demand and fi sh population and diversity. The pollution tolerant fi sh species Oreochromic mossumbicus population showed signifi cant positive correlation with water quality parameters except dissolved oxygen where it was found negatively correlated.
REFERENCES
Abida, B. (2008). Study on the quality of water in some streams of Cauvery River. e-Journal of Chemistry, 5(2): 377-384.
Ahipathi, M.V. and Puttaiah, E.T. (2006). Ecological character-istics of Vrishabhavathi river in Bangalore (India). Environ-mental Geology, 49: 1217-1222.
Anda, J., Shear, H., Maniak, U. and Riedel, G. (2001). Lakes & Reservoirs: Research and Management, 6: 313–321.
APHA. (2005). Standard Methods of Water and Wastewater. 21st Edn., American Public Health Association, Washington, DC. 2-61.
Azeez, P.A., Nadarajan, N.R. and Mittal, D.D. (2000). The impact of monsoonal wetland on ground water chemistry. Pol-lution Research, 19(2): 249–255.
Bamniya, B.R., Mahecha, G.S., Kapoor, C.S. and Kapasya, V. (2011). Water quality status of two water reservoirs of Thar desert city, Jaisalmer. Indian Journal Environment and Eco planning , 18(1): 113-116.
Bhat, A. (2002). A study of the diversity and ecology of the freshwater fi shes of four river systems of Uttara Kannada Dis-trict, Karnataka, India. Ph.D. Thesis submitted to Indian Insti-tute of Science, Bangalore, Pp. 178.
Bhutekar, D.D., Aher, S.B. and Babare, M.G. (2018a) Spatial and seasonal variation in physico-chemical properties of Godavari River water at Ambad region, Maharashtra. Journal of Envi-ronment and Biosciences, 32(1):15-23.
Bhutekar, D.D., Aher, S.B. and Babare, M.G. (2018b) Status of water quality and strategies for conservation of Pushkarni reservoir, Ambad. International Journal of Recent Trends in Science and Technology, Special Issue, ACAEE: 2018, 110-113.
Chovance, A., Hoffer, R. and Schiemer, F. (2003). Fish as bioin-dicators. In: Market, B.A., Breure, A.M. and Zechmeiser, H.G. (eds) Bioindicatos and biomonitors, Pp. 639–675.

BIOSCIENCE BIOTECHNOLOGY RESEARCH COMMUNICATIONS BIOLOGICAL MONITORING OF RIVERINE ECOSYSTEM AND ITS CORRELATION WITH WATER QUALITY 201
Bhutekar and Aher
Darwall, W.R.T. and Vie, J.C. (2005). Identifying important sites for conservation of freshwater biodiversity: extending the species- based approach. Fisheries Management Ecology, 12: 287-293.
Dhawde, R., Surve, N., Macaden, R., Wennberg, A., Seifert-Dähnn, I., Ghadge, A. and Birdi, T. (2018). Physicochemical and Bacteriological Analysis of Water Quality in Drought Prone Areas of Pune and Satara Districts of Maharashtra., India. Environments, 5(61): 1-20.
EPA (2001). Parameters of Water Quality, Interpretation and Standards, Environmental Protection Agency, Ireland.
Fischer, W. and Bianchi, G. (1984). FAO Species Identifi ca-tion Sheets for Fishery Purposes: Western Indian Ocean Fish-ing Area. Food and Agriculture Organisation of the United Nations, Rome. Pp. 51
Garg, R.K., Saksena, D.N. and Rao, R.J. (2006). Assessment of physic-chemical water quality of Harsi Reservoir, district Gwalior, Madhya Pradesh. Journal of Ecophysiology and Occupational Health, 6: 33-40.
Garnaik, B., Panda, S., Tripathy, S. and Tripathy, U. (2013). Seasonal Variation of Nagavali River Water Quality at the Vicinity of Paper Mill near Jaykaypur, Odisha, India. Interna-tional Research Journal of Environment Sciences, 2(5): 46-52.
Glorian, H., Börnick, H., Sandhu, C. and Grischek, T. (2018). Water Quality Monitoring in Northern India for an Evaluation of the Effi ciency of Bank Filtration Sites. Water, 10 (1804): 1-15.
Jayaram, K.C. (1981). The freshwater Fishes of India, Pakistan, Bangladesh, Burma and Sri Lanka. Hand Book of Zoological Survey of India, Calcutta, Pp. 475.
Jayaram, K.C. (1999). The fresh water fi shes of the Indian region. Narendra Publishing House, Delhi, Pp. 551.
Jayaram, K.C. (2006). Catfi shes of India. Narendra Publishing House, Delhi, Pp.386.
Jhingran, V.G. (1997). Fish and Fisheries of India, 3rd edition, corrected reprint. Hindustan Publishing Corporation, Delhi, India. Pp. 727.
Jones, P.J. and Burt, P.T. (1993). Nitrate in Surface Waters. In: Burt, T.P., Heathwaite, A.L. and Trudgill, S.T. eds. Nitrate: Pro-cesses, Patterns and Management. John Wiley & Sons, Chich-ester, 269-317.
Jothivenkatachalam, K., Nithya, A. and Chandra, M.S. (2010). Correlation analysis of drinking water quality in and around Perur block of Coimbatore district, Tamil Nadu, India. Rasayan Journal of Chemistry, 3(4): 649-654.
Kang, B., He, D., Perrett, L., Wang, H., Hu, W., Deng, W. and Wu, Y. (2009). Fish and fisheries in the Upper Mekong: current assessment of the fish community, threats and conservation. Reviews in Fish Biology and Fisheries, 19: 465–480.
Khaiwal, R. and Anubha, K. (2003). Seasonal variations in physicochemical characteristics of River Yamuna in Haryana and its ecological best-designated use. Journal of Environmen-tal Monitoring, 5: 419-426.
Laffaille, P., Acou, A., Guillouet, J. and Legult, A. (2005). Tem-poral change in European eel, Anguilla anguilla, stock in a small catchment after installation of fish passes. Fisheries Management Ecology, 12: 123–129.
Lalparmawii, S. (2007). Analysis of water quality and Biomoni-toring of Tuirial River in vicinity of the Hydel Project in Mizo-ram. Ph.D Thesis. Mizoram University, Aizawl.
Matta, G., Gjyli, L., Kumar, A. and Machel, J. (2018). Hydro-chemical characteristics and planktonic composition assess-ment of River Henwal in Himalayan Region of Uttarakhand using CPI, Simpson’s and Shannon-Weaver Index. Journal of Chemical and Pharmaceutical Sciences, 11(1): 122-130.
Medudhula, T., Samatha, C. and Sammaiah, C. (2012). Analysis of water quality using physico-chemical parameters in lower manair reservoir of Karimnagar district, Andhra Pradesh. International Journal of Environmental Sciences, 3(1): 22-25.
Mishra, K.S. (1962). An aid to the identifi cation of the common commercial fi shes of India and Pakistan. Records of the Indian Museum, 57(1-4): 320.
Mithani, I., Dahegaonkar, N.R., Shinde, J.S. and Tummawar, S.D. (2012). Preliminary studies on physico-chemical param-eters of river Wardha, District Chandrapur, Maharashtra. Jour-nal of Research in Ecology, 1: 14-18.
Munshi, D. and Srivastava, J.S. (2006). Natural History of Fishes and Systematics of Freshwater Fishes of India. Narandra Publishing House, Delhi. Pp. 423.
Nanda, S.P. (2005). Environmental management plan (EMP) for Bhubaneswar, India.
Patil, D.S. (2003). Ecological studies in some lentic water bod-ies of Kolhapur city. Ph.D. Thesis, Shivaji University, Kolhapur.
Rai, A.K., Diba, F. and Paul, B. (2013). A study on the seasonal variations of different physic-chemical water quality param-eters of Indrapuri Dam Rohtas District Bihar. International Journal of Environmental Sciences, 2(3): 125-129.
Resh, V.H. (2008). Which group is best? Attributes of differ-ent biological assemblages used in freshwater biomonitoring programs. Environmental Monitoring and Assessment, 138: 131-138.
Saksena, D.N. and Kaushik, S. (1994). Trophic status and habi-tat ecology of entomo fauna of three water bodies at Gwalior, Madhya Pradesh. In: Agrawal, O.P. Eds, Perspective in entomo-logical research Scientifi c Publishers, Jodhpur.
Sarkar, U.K., Pathak, A.K. and Lakra, W.S. (2008). Conserva-tion of freshwater fish resources of India: new approaches, assessment and challenges. Biodiversity Conservation, 17: 2495–2511.
Saunders, D.L., Meeuwig, J.J. and Vincent, A.C.J. (2002). Freshwater protected areas: Strategies for Conservation. Con-servation Biology, 16(1): 30-41.
Senthilnathan, T., Parvathavarthini, K.V. and George, S.M. (2011). Assessment of ground water quality of Maraimalai Nagar town near Chennai, India. Journal of Environmental Research and Development, 5(4): 943-955.

202 BIOLOGICAL MONITORING OF RIVERINE ECOSYSTEM AND ITS CORRELATION WITH WATER QUALITY BIOSCIENCE BIOTECHNOLOGY RESEARCH COMMUNICATIONS
Bhutekar and Aher
Shannon, C.E. (1948). A mathematical theory of communica-tion. The Bell System Technical Journal, 27: 379–423.
Shrivastava, V.S. and Patil, P.R. (2002). Tapti river water pollu-tion by industrial wastes: A statistical approach. Nature, Envi-ronment, Pollution and Technology, 1: 279-283.
Singh, M.R. and Gupta, A. (2010). Seasonal variation in certain physicochemical parameters of Imphal, Iril and Thoubal rivers from Manipur river system, India. Ecology, Environment and Conservation, 16(2): 197-207.
Sinha, M., De, D.K. and Jha, B.C. (1998). The Ganga environ-ment and fi sheries. Central Inland fi sheries Institute, Barrack-pore. pp.142
Teta, C., Ncube, M. and Naik, Y. S. (2017). Heavy metal contami-nation of water and fi sh in peri-urban dams around Bulawayo, Zimbabwe. African Journal of Aquatic Science, 42(4): 351-358.
Trivedy, R.K. and Goel, P.K. (1984). Chemical and biological methods for water pollution studies, Environmental publica-tion Media, Karad, India. 1-251.
Venkatesharaju, K., Ravikumar, P., Somashekar, R.K. and Prakash, K.L. (2010). Physicochemical and bacteriological investigation on the river Cauvery of Kollegal stretch in Kar-nataka. Karnataka University Journal of Science, Engineering and Technology, 6(1): 50-59.
Waziri, M. and Ogugbuaja, V.O. (2010). Interrelationship between physicochemical water pollution indicators: A case study of River Yobe-Nigeria. American Journal of Science and Industrial Research,1: 76-80.
Yadav, S.S. and Kumar, R. (2011). Monitoring Water quality of Kosi River in Rampur District, Uttar Pradesh, India. Advances in Applied Science Research, 2(2): 197-201.
Yellavarthi, E. (2002). Hydrobiological studies of Red hills Res-ervoir, North Chennai, Tamilnadu. Journal of Aquatic Biology, 17(1): 13-16.
Zainudin, Z., Rahman, N.A., Abdullah, N. and Mazlan, N.F. (2010). Development of water quality model for Sungai tebrau using QUAL2K. Journal of Applied Sciences, 10: 2748-2750.

Join Society For Science & Nature and Avail Multiple Benefi ts
1. Life members of Society of Science & Nature (MSSN), Bhopal, India will be entitled to receive free early on line issues of BBRC for life.
2. Selected life members on the basis of their academic and research contributions will be conferred with Honorary Fellowship of SSN (FSSN), who will be instrumental in scientifi c awareness programmes particularly encouragement and popularisa-tion of Science.
3. Life members will be invited to attend society sponsored conferences and seminars on invitation.
Subscription Form For MSSN Life (Fellow Member Society For Science & Nature, along with BBRC):Kindly complete the form and send it, together with the necessary payment to the Secretary of the Society on the address below (Photocopies will be accepted). Forms can also be downloaded from our website (http://www.bbrc.in/subscriptions.html).
(Crossed DD in favor of Treasurer, Society for Science and Nature, C-52, Housing Board Colony, Kohe-Fiza, Bhopal-462001, India, to be sent by Speed/Regd. Post.) Life Membership One Time Subscription (MSSN) including Life Member-ship of BBRC is Rs. 5000/- Direct NEFT can be also made on contacting the Managing Editor. Foreign Members will have to obtain separate invoices for mak-ing payment to the Society for Fellowship.
Name: Dr./Prof. (In capital letters):
Designation & Organization:
Qualifi cation & Specialization of Research:
Present and Past Academic Positions:
Research Publications Experience Enclose Biodata with full publications list:
Academic Achievements Memberships of Societies etc.:
Mailing Address (With tel./Mob./Email id):
I wish to become life Member / Fellow of Science And Nature. I have read the details and agree to abide by them.
SignatureDetails of Accompanying Payment DD No. Date
................................................................................................................................................
JOIN AS LIFE MEMBER BIOSCIENCE BIOTECHNOLOGY RESEARCH COMMUNICATIONS
SUBSCRIPTION FORM FOR BBRC (Only Journal)
Kindly complete this form if you want to become life member/annual member of BBRC only (Individual Life Member BBRC Rs. 4000/-)
I wish to subscribe to Bioscience Biotechnology Research Communications.
Name:
Address:
E-mail: Signature: Date:
Subscription: Annual/Life......................... Amount Rs.
*DD No. enclosed.
All payments by Demand draft should be made in favour of Treasurer, Bioscience Biotechnology Research Communications and sent to: Treasurer, C-52, Housing Board Colony, Kohe-Fiza, Bhopal-462001, India, by registered Post. Direct NEFT can be also made on contacting the Managing EditorE-mail: [email protected] or [email protected] Telephone No. +91-0755-4241662, +919893015818Website: www.bbrc.in
BBRC SUBCRIPTION RATES (INR)1. Life Member (BBRC) INR 4000/-2. Individual Annual Member INR 2000/-3. Institutional Annual Member Libraries INR 3000/-

Declaration about the ownership ofBioscience Biotechnology Research Communications
Form (IV) [See Rule 3]
1. Place of Publication : Bhopal, India
2. Periodicity of its Publication : Six Monthly
3. Printer’s Name : Ayesha S. Ali On behalf of SocietyFor Science & Nature
(Whether Citizen of India) : Yes
Address : H. No. C-52, H.B. Colony, Kohefi zaBhopal-462001, India
4. Publisher’s Name : Ayesha S. Ali on Behalf of SocietyFor Science & Nature
(Whether Citizen of India) : Yes
Address : H. No. C-52, H.B. Colony, Kohefi zaBhopal-462001, India
5. Editor’s Name : Dr. Sharique Ali
(Whether Citizen of India) : Yes
Address : H. No. C-52, H.B. Colony, Kohefi zaBhopal-462001, India
6. Name & Address of the individual/
: Ayesha S. Ali
who own the newspaper & partners or share holders holding more than one percent of the total capital
: H. No. C-52, H.B.Colony, Kohefi za,Bhopal-462001, India
(Whether Citizen of India) : Yes
I, Ayesha S. Ali hereby declare that the particulars given above are true to the best of my knowledge and belief.
Date : 31st Mar 2019 Place : Bhopal

Detailed instructions to authors for preparing and submitting manuscripts to Bioscience Biotechnology Research Communications (BBRC) Please see journal sample manuscript
Bioscience Biotechnology Research Communications (BBRC) is a broad based peer reviewed international open access journal that publishes original research papers, short communications and exciting reviews in all basic and applied fi elds of Life Sciences, including Biology & Medicine on a fast track. The journal is indexed in leading citation agencies of the world such as Thomson Reuters, Research Gate, CAS (USA), Uhrlich, Biobase, EBSCO, Copernicus Indicus, NISCAIR, NAAS, and many others and has a NAAS 2017 journal score of 4.31. It has recently got an Impact Factor of 4.006 and has been approved by University Grants Commission (UGC New Delhi) Ministry of HRD, Government of India, Journal No. 42929 www.ugc.ac.in.
On Ethical and Animal Welfare Issues: Bioscience Biotechnology Research Communications requires that the experimental conditions under which human and animal assays and tests are performed are as per standard protocols used worldwide. Studies on animals must comply with the prevailing standards of animal welfare according to Indian Council of Medical Research Guidelines in India and likewise following similar conditions elsewhere. Authors must make it clear that the procedures they used were as humane as possible and have been complied with the guidelines for animal care of their institutions or with national/ international guidelines. Studies involving human subjects/animals must be carried out with the formal approval of the relevant Ethical Committee and evidence of such approval must be provided as and when needed.
Submission Of Manuscript: Manuscripts should be in 12 point size, Times New Roman Font with one and half space on A4 size paper in MS Word in the given format and must be sent by e-mail as attachment to the editor ([email protected] and a copy to [email protected]). A cover letter signed by author(s) must be enclosed with the manuscript stating that the work is their own and has not been published earlier. Only online MS should be sent by email
Length of contributions: Papers should be ideally be no longer than 08 pages for short communications and 20 pages for full length papers, although we can publish longer papers.
SUBMISSION GUIDELINES: PLEASE PREPARE YOUR MS AS BELOW PLEASE SEE THE JOURNALS ANY SAMPLE MANUSCRIPT• Abstract: All Manuscripts should have an abstract and keywords with the following in the mind but without any sub heads: Objectives, Methods, Results and Conclusion of no more than 200 words. Key words: Up to fi ve key words should be included in italics in alphabetical order.
• Introduction: It should be concise, with what has been done and why, giving in brief the background, latest work done in the area with existing lacunae /controversies/contradictions and valid reasons for taking up the research problem. Review of literature should be brief pertinent and up-to-date. Recent references till-date be added. All references should be checked minutely, for their appearance in text as well as in References/Bibliography section. MS with incomplete references will not be accepted. Reference style of BBRC is Harvard Style ie author last name with year in bracket in the text.
• Material & Methods: Brief description of standard procedures adopted worldwide with standard references.
• Results & Discussion: Should be combined to avoid repetition. Sub-headings may be provided in this section if they improve the clarity. Latest references are a must with interpretational signifi cance in introduction and discussion.
• References: All references used in the text must be arranged alphabetically in the last section of References. Last names of authors with initials should be written with year of publication in bracket ( ) followed by full title of the article, the name of the journal, volume number, and the fi rst and last page numbers (see 1 below). Journal title should be given in full, or abbreviated according to the style of Index Medicus. Title of book should be followed by author(s), year of publication, the publisher and place. THERE SHOULD BE NO USE OF ITALICS IN THE REFERENCE, IE LAST SECTION EXCEPT FOR SCIENTIFIC/ZOOLOGI-CAL/BOTANICAL NAMES Examples of References in BBRC are as:
(1) Ali S.A., S. Salim, T. Sahni, Peter J. and Ali A. S. (2012c). Serotinergic receptors as novel target for optimizing skin pigmentary responses in Indian bull frog Hoplobatrachus tigerinus. British J. of Pharmacol. John Wiley The British Pharmacological Society Vol. 165, Issue 5, 1515-1525.(2) Book: Falconer DC (1960) Introduction to Quantitative Genetics. Oliver & Boyd, Edinburgh 165-185.(3) References to article in book: Simonsen B. (1989). In: Processing of poultry. Pp 221 250 (Ed) G. C. Mead, Elsevier Applied Science, London.(6) Tables and illustrations: Tables and fi gures should be numbered in Arabic numerals and given in separate pages with due reference in the text. Units of measurement should be metric units. Graphs and other line drawings should be drawn in India ink and individually identifi ed by Arabic numerals. Pho-tographs should have good contrast with numbers and explanation of fi gures. Please note that the fi gures/illustrations should be of minimum 300dpi (printable resolution with inside letters or captions clear in reproducible size.).
Peer review: All papers submitted to BBRC undergo a quick internal and external double blind peer review process. On the basis of the referees’ responses, papers will be rejected, accepted subject to minor or major revisions, or accepted unconditionally.
Acceptance of submission: On acceptance, the editors retain the right to make stylistic changes, decide on the date of publication and shorten material, as necessary.
Proofs: Authors will be sent an online copy of the galley on request. Corrections should be confi ned to typographical errors or matters of accuracy. Authors should return proofs within two days of receipt, along with a signed copy-right form downloaded from journals website.
Article Processing Charges (APC): Indian authors will have to bear the article processing cost of INR 4000/- per manuscript submitted, (US$ 300 per man-uscript submitted for foreign authors). In order to meet the rigorous academic standards on a fast track, the journal has some expenses, and for these reasons we charge a very modest article processing fee. Nevertheless, as we believe that lack of funds should not be a barrier to open access publication, Biosc.Biotech Res.Comm. has a policy to provide some waivers to deserving authors from middle and low income countries. Authors can request for a waiver in such cases.
Note: For any hard copies of journals and reprints additional amount will be charged. Please contact the Managing Editor for details.
Copyright: All materials received by BBRC are assumed to be submitted exclusively. It is understood that contributions have not been and will not be published elsewhere. A copy right letter downloaded from journals website duly, signed by all authors is to be submitted after acceptance of the MS.
Accuracy and liability: A contribution is accepted on the strict understanding that its author(s) is/are responsible for accuracy of all information contained in it. BBRC condemns the malice of plagiarism and strongly advocates the policy of out rightly condemning and reporting of any academic malpractice with regard to manipulation, copying, pilfering or pirating of any research material or data in practice and writing thereof.
On Plagiarism and Retraction Policy: Articles found with plagiarized material will be liable for immediate retraction from the issue and action will be taken against such authors as per standard norms.
For any information please contact: Managing Editor, BBRC, C-52, HOUSING BOARD COLONY, KOHE FIZA, Bhopal, (MP) 462001, India. Tel: +91-755-4241662 Mob: +919893015818
A soft copy (MS Word fi le) of the manuscript as attachment with a cover letter declaring originality of the research work and statement of no confl ict of the authors, should be sent to: [email protected] with a copy to [email protected] Journals Website: www.bbrc.in
New Delhi Offi ce: Dr. Mohd. Miraj, AIHMSGautam Nagar, Behind AIIMS New Delhi , LL: +91-11-41030907 Mob: +09560407405, Website: www.aihms.in

Name of Fellow/Member
Life Member, Fellow Society Science & Nature and Member BBRC Designation and Address
Dr. Sharique A. Ali SSN and BBRC Professor and Head, Department of Biotechnology Saifi a Science College, Bhopal
Dr. Ayesha S. Ali SSN and BBRC Professor, Department of Biotechnology & Zoology Saifi a Science College, Bhopal
Dr. J. Peter SSN and BBRC Associate Professor, RKDF University, Bhopal
Dr. M. Miraj SSN and BBRC Director, Institute of Health & Management Studies, New Delhi
Dr. Z.H. Khan SSN and BBRC Professor & Head Department of Biochemistry Shri Shivaji College of Science, Akola
Dr. G.N. Wankhede SSN and BBRC Professor & Head, Department of Zoology, SGB UniversityAmrawati (MS)
Dr. S. Shrivastava BBRC Professor of Chemistry, MVM, Bhopal
Dr. P.M. Makode BBRC Associate Professor of Zoology, Venue, Park, Shegaon Naka VMV Road, Amravati (MS)
Dr. S. Yadav BBRC Assistant Department of Zoology, Satya Sai College for Women BHEL, Bhopal
Dr. R. Singh BBRC Associate Professor,Department of Zoology, MLB Girls College, Bhopal
Dr. A. D. Lakha BBRC Associate Professor of Zoology, Nagazari Area, MIT Road, Ambajogai, Beed (MS) 431517
Dr. R. S. Virani BBRC Associate Professor Karimabad Society, Pandhar Kawada, District, Yeobtmal (MS)
Dr. M. Pal BBRC Assistant Professor, Department of Biotechnology Sadhu Vaswani College Bhopal
Dr. V.R. Wankhede BBRC Assistant Professor, Department of Zoology, Deccan College, Pune
Dr. Mrs. V. Ingole BBRC Department of Zoology Vidya Bharti Mahavidyalaya, Amravati
Dr. U.N. Bhale BBRC Associate Professor RTM University, Nagpur
Dr. A.P. Sawane BBRC Associate Professor RTM University, Nagpur
Dr. A.D. Bobde BBRC Associate Professor RTM University, Nagpur
Dr. R.G. Jadhaw BBRC SGB University, Amravati
Dr. O.N. Tiwari FSSN DBT Imphal, Manipur
Dr. R. K. Singh BBRC USDA Washington, USA
Dr. V. Meitei BBRC Jaipur University, Jaipur
Dr. T. Sultan BBRC Medical Genetics Department, Riyadh University, KSA
Dr. N. Qayyumi BBRC Assistant Professor of Zoology, Bhopal
Dr. M. Sajid BBRC Head Department of Biotechnology Bonnifi e College, Bhopal
Dr. L. Jakkala BBRC Director Macrocare, Macrocare Towers, Hyderabad, AP
Dr. V. Jaiswal BBRC Research Scholar, SGB University, Amravati
Dr. A. Kumar BBRC Associate Professor, Department of Biotechnology, SMD Teerth University, Haryana
Dr. A.S. Dighde BBRC SGB University, Amravati
Dr. P Babu BBRC Professor of Pomology, Horticulture University of Horticulture Science, Bagalkot
Dr. (Smt) S. Sinha BBRC Plot-18, Street-1, Ashish Nagar (East) Risalt, Bhilai, Durg, CG
Dr. R. Khalique BBRC Department of Zoology, University of Kashmir, Srinagar
Dr. A. Siddiqui FSSN Department of Zoology Holkar Science Colege, Indore
Dr. MM. Shrivastava FSSN Department of Biotechnology Holkar Science College, Indore
Dr. A. Eberle FSSN Basel Switzerland
Dr. S. Newton FSSN University of Virginia, USA
Dr. J Galgut BBRC Department of Biomedicine, Qatar
Dr. S. Salim BBRC Maryland, USA
Dr. Ruchi Shivle MSSN DAVV, Indore
Dr. Kirti Dubey MSSN DAVV, Indore
Dr. AT Kalse FSSN NEM University, Jalgaon (MS)
Dr. F Kabinwar FSSN University of California, Los Angeles, USA
Dr. Arjun Deb FSSN Professor of Zoology Lumding College Lumding Assam
Dr. Z.Pir FSSN University of Kashmir, Srinagar
Dr. Razia Sultan FSSN DAVV, Indore
Dr. Thingujam I. Devi FSSN Institute of Bioresources and Sustainable Development, Imphal, Manipur
Dr. I Onyesom
Dr. K. Sudhakar
FSSN
FSSN
Professor Abraska, Delta State Nigeria
Assistant Professor Energy Centre,Maulana Azad National Institute of Technology Bhopal, India.

Bioscience Biotechnology Research CommunicationsSociety For Science & Nature Bhopal, C-52 Housing Board Colony, Kohe – Fiza,
Bhopal 462001 INDIA, Phone no.: +91-755-4241662Website:www.bbrc.in Email:[email protected]
COPYRIGHT TRANSFER FORM:(This form is signed by all the authors or by the corresponding author on behalf of all of them)
1) I / (We) confi rm that the enclosed article entitled:
Authored by: 1. 2.
3. 4.
has not previously been published in whole or in part, is not currently being considered elsewhere for publication, and, if accepted for publication in the above Journal, will not be published elsewhere in any language, without the consent of the editor and the publisher.
2) I/We acknowledge that it is a condition of acceptance by the editor that the publisher, Society for Science & Nature/Biosc. Biotech.Res.Comm. acquires automatically the copyright in the manuscript throughout the world.3) I/We confi rm that I have obtained all the necessary permissions to include in the paper items such as quotations, fi gures, and the results of government sponsored research.4) I/We enclose where necessary written permission of authors and publishers to use any copyright material (e.g.previously published fi gures and tables).
We also certify that the research work carried out is original, and does not contain any plagiarized material. All due permis-sions / ethical clearances have been taken from concerned authorities.
We also understand that if our article is found with plagiarized material, it will be liable for immediate retraction from the issue and due action can be taken as per standard norms.
Author 1
Signature: Name: Date:Institution: Dept: Street: City: State:Zip: Country: Country Code:Phone: Fax: Email:
Author 2
Signature: Name: Date:Institution: Dept: Street: City: State:Zip: Country: Country Code:Phone: Fax: Email:
Author 3
Signature: Name: Date:Institution: Dept: Street: City: State:Zip: Country: Country Code:Phone: Fax: Email:
Author 4
Signature: Name: Date:Institution: Dept: Street: City: State:Zip: Country: Country Code:Phone: Fax: Email:
View publication statsView publication stats


![ChemInform Abstract: Ecofriendly Synthesis of Thieno[2,3-b]pyridines Derivatives](https://static.fdokumen.com/doc/165x107/632083a318429976e4063ccf/cheminform-abstract-ecofriendly-synthesis-of-thieno23-bpyridines-derivatives.jpg)