Susceptibility assessment of rainfall induced debris flow zones ...
20
Susceptibility assessment of rainfall induced debris flow zones in Ladakh–Nubra region, Indian Himalaya HSNEGI*, ANANT KUMAR,NNARASIMHA RAO,NKTHAKUR, MSSHEKHAR and SNEHMANI Snow and Avalanche Study Establishment, Him-Parisar, Sector-37A, Chandigarh 16036, India. *Corresponding author. e-mail: [email protected] MS received 17 April 2019; revised 29 July 2019; accepted 4 August 2019 In recent past, rainfall-induced debris flow events in Ladakh–Nubra region have caused loss of lives and damages to civil infrastructures and army locations. Therefore, there is a need of high spatial and temporal monitoring of precipitation, and further to assess susceptible rainfall-induced debris flow zones in the area. We assessed the rainfall data collected at two gauge stations and observed a significant increase in the rainfall amount over the study region during summer-monsoonal period 1997–2017. Increasing trend was also observed from CRU gridded precipitation dataset. A GIS-based multi-criteria evaluation (MCE) method was performed by combining topographical, environmental and hydrological parameters for mapping of rainfall-induced susceptible zones. Suitability analysis of precipitation fore- casts from WRF model at higher resolution (3 km) was also performed. A good agreement (r = 0.76) was observed between 4-day model forecast and field observed rainfall. Further, the simulated precipitation from WRF was incorporated into GIS model for assessment of debris flow susceptible zones for two cases of heavy precipitation events. The modelled high, medium, low and very low risk susceptible zones identified for the year 2015 events are validated with field survey and pre-post satellite imageries, and found in good agreement (ROC = 76.6%). The model was able to identify affected areas during the Leh cloud burst event in year 2010. In addition, a threshold value of rainfall for initiation of debris flow in the region was also reported. Keywords. Debris flow; Karakoram–Himalaya; rainfall; WRF; CRU; weighted overlay. 1. Introduction Debris flow and landslide triggered due to heavy or prolonged rainfall are amongst the most dev- astating hazards over the Himalayan region as these are responsible for economic loss, injuries and loss of lives during the monsoon season (Bookhagen and Burbank 2010; Bhan et al. 2015). In recent past during first week of August 2010, Leh district experienced 2 hrs of concentrated rainfall reaching a peak intensity of *75 mm over a 30-min period (Hobley et al. 2012), which triggered various mass movement events in the region and caused large scale destruction and several deaths (Juyal 2010). Similarly, during 15–17 June 2013, torrential rainfall triggered numerous landslides and debris flows in and around Uttarkashi districts, claimed lives of more than 5700 people (Martha et al. 2015). In another event, heavy rainfall triggered debris flows at numerous places of Darjeeling Himalaya in June–July month of 2015 and claimed lives of 38 people (Biswas and Pal 2016). More recently in July 2019, landslide events triggered by incessant J. Earth Syst. Sci. (2020)129 30 Ó Indian Academy of Sciences https://doi.org/10.1007/s12040-019-1277-4
-
Upload
khangminh22 -
Category
Documents
-
view
3 -
download
0
Transcript of Susceptibility assessment of rainfall induced debris flow zones ...
Susceptibility assessment of rainfall induced debris flowzones in Ladakh–Nubra region, Indian Himalaya
H S NEGI*, ANANT KUMAR, N NARASIMHA RAO, N K THAKUR,M S SHEKHAR and SNEHMANI
Snow and Avalanche Study Establishment, Him-Parisar, Sector-37A, Chandigarh 16036, India.*Corresponding author. e-mail: [email protected]
MS received 17 April 2019; revised 29 July 2019; accepted 4 August 2019
In recent past, rainfall-induced debris flow events in Ladakh–Nubra region have caused loss of lives anddamages to civil infrastructures and army locations. Therefore, there is a need of high spatial andtemporal monitoring of precipitation, and further to assess susceptible rainfall-induced debris flow zonesin the area. We assessed the rainfall data collected at two gauge stations and observed a significantincrease in the rainfall amount over the study region during summer-monsoonal period 1997–2017.Increasing trend was also observed from CRU gridded precipitation dataset. A GIS-based multi-criteriaevaluation (MCE) method was performed by combining topographical, environmental and hydrologicalparameters for mapping of rainfall-induced susceptible zones. Suitability analysis of precipitation fore-casts from WRF model at higher resolution (3 km) was also performed. A good agreement (r = 0.76) wasobserved between 4-day model forecast and field observed rainfall. Further, the simulated precipitationfrom WRF was incorporated into GIS model for assessment of debris flow susceptible zones for two casesof heavy precipitation events. The modelled high, medium, low and very low risk susceptible zonesidentified for the year 2015 events are validated with field survey and pre-post satellite imageries, andfound in good agreement (ROC = 76.6%). The model was able to identify affected areas during the Lehcloud burst event in year 2010. In addition, a threshold value of rainfall for initiation of debris flow in theregion was also reported.
Keywords. Debris flow; Karakoram–Himalaya; rainfall; WRF; CRU; weighted overlay.
1. Introduction
Debris flow and landslide triggered due to heavyor prolonged rainfall are amongst the most dev-astating hazards over the Himalayan region asthese are responsible for economic loss, injuriesand loss of lives during the monsoon season(Bookhagen and Burbank 2010; Bhan et al. 2015).In recent past during first week of August 2010,Leh district experienced 2 hrs of concentratedrainfall reaching a peak intensity of *75 mm overa 30-min period (Hobley et al. 2012), which
triggered various mass movement events in theregion and caused large scale destruction andseveral deaths (Juyal 2010). Similarly, during15–17 June 2013, torrential rainfall triggerednumerous landslides and debris flows in andaround Uttarkashi districts, claimed lives of morethan 5700 people (Martha et al. 2015). In anotherevent, heavy rainfall triggered debris flows atnumerous places of Darjeeling Himalaya inJune–July month of 2015 and claimed lives of 38people (Biswas and Pal 2016). More recently inJuly 2019, landslide events triggered by incessant
J. Earth Syst. Sci. (2020) 129 30 � Indian Academy of Scienceshttps://doi.org/10.1007/s12040-019-1277-4 (0123456789().,-volV)(0123456789().,-volV)
monsoonal rains across Nepal have claimed 78lives and displaced 17,500 others in the year 2019(‘Nepal floods’: Pradhan 2019). Above-mentionedstudies and reports suggest dominant role playedby rainfall in triggering debris flow and landslideevents. In addition, a few such activities may alsoget induced by tectonic activities (Adhikari andKoshimizu 2005) and lake/stream burst (Owenet al. 2008). Under on-going climate change, anypossible shift in the rainfall pattern over theHimalayas may lead to upsurge in frequency andintensity of these hazardous events (Bhutiyaniet al. 2010). Thus, it becomes imperative tounderstand the threat posed by heavy or pro-longed rainfall, especially for the region under lowrainfall zone, where level of preparedness may notbe high by weather forecasters or disaster man-agement authorities (Ziegler et al. 2016). Onesuch area situated in Nubra–Ladakh region, whichis currently facing increased vulnerability to cli-mate hazards and related risks (Barrett andBosak 2018). After deadlier 2010 event in Leh,another heavy rainfall event occurred during firstweek of August 2015 in Nubra region, wherecontinuous rainfall caused series of debris move-ment at various places of the valley. Both of theseevents have damaged various civil infrastructuresand army locations in the region. Despite threat-ening debris flow events in the region, the sus-ceptibility maps are not available for most of thearea, which can be used for hazard assessmentand mitigation.Different studies suggest that debris flows
susceptibility depends on several causative factors,which include environmental, hydrology, topogra-phy, geology, etc. (Ventra and Clarke 2018; Crostaand Frattini 2003). The causative factors are usu-ally selected based on the analysis of debris flowtypes and the characteristics of the study area(Wang et al. 2019). These factors may be furthercategorized into various levels (primary, sec-ondary, etc.) as per their potentiality in triggeringdebris flow events (Dou et al. 2015). Prime trig-gering factor, i.e., rainfall facilitates the downwardmovement of the solids (boulders, rocks, etc.) orsoils on steep slopes by increasing pore waterpressure, seepage force and reducing effectivestress of the soils (Lu et al. 2012). Consequently,real-time tracking of rainfall observations is criticalfor assessment and early monitoring of rainfall-in-duced hazards (Huffman et al. 2007; Gebremichaeland Hossain 2010). Yet, many parts in high-riskarea of Himalayas lack resources to maintain the
extensive weather networks required to successfullyobserve these conditions. In recent years,space-borne platforms and computing technologiesare effectively employed for hazard detection,monitoring and susceptibility assessment overcomplex terrain (Pardeshi et al. 2013). Remotelysensed gridded precipitation datasets such as Glo-bal Precipitation Measurements (GPM) andTropical Rainfall Measuring Mission (TRMM)offer high temporal and spatial scales to improvethe understanding of landsliding and debris flowevents (Nikolopoulos et al. 2014; Kirschbaum andStanley 2018). Apart from rainfall measurements,optical remote sensing imageries such as Landsat,Advanced Space-borne Thermal Emission andReflection Radiometer (ASTER), Sentinel-2, etc.,and digital elevation models (DEMs) such asShuttle Radar Topographic Mission (SRTM),ASTER GDEM, etc., are widely adopted toretrieve aforementioned factors like land use/landcover (LU/LC), drainage, slope, curvature, vege-tation, etc. (Elkadiri et al. 2014).Blais-Stevens and Behnia (2016) suggested the
quantitative and qualitative techniques to developdebris flow susceptibility map. Quantitative tech-niques such as logistic regression model (Chauhanet al. 2010), frequency-ratio model (Khan et al.2019), fuzzy logic (Kayastha et al. 2013), etc.,depend on probability of sliding by studying therelationship between causative factors and pastdebris flow events. Qualitative techniques such asanalytical hierarchical process (AHP) and weigh-ted overlay analysis (WOA) are mostly employedfor regional scale assessment (Kayastha et al.2013). These techniques consider ranking andweighting of various causative factors based onexpert opinion about an area (Saaty 1990). Quali-tative techniques have been extensively studied forhazard susceptibility mapping over the Himalayanregion (Basharat et al. 2016; Shit et al. 2016;Kanwal et al. 2017). However, most of these studieshave utilized static predictors to generate hazardsusceptibility maps. In order to reduce the impactof rainfall-induced hazards, there is a need todevelop linking the above qualitative GIS modeloutput with operational weather forecasts (Liaoet al. 2010). To quantify the spatial and temporalvariability in rainfall at regional scales, NumericalWeather Prediction (NWP) models have the addedadvantage of weather forecasting and thus can helpin debris flow and landslide hazard predictions(Ochoa et al. 2014). Weather Research and Fore-casting (WRF), a numerical mesoscale model
30 Page 2 of 20 J. Earth Syst. Sci. (2020) 129 30

(Mourre et al. 2016) has the potential to simulateheavy rainfall events. Over Himalayan region,Kumar et al. (2012) simulated 2010 ‘Leh cloudburst event’ using WRF model and observed thatchanging the microphysics schemes inside themodel could result into better simulation. Later on,Thayyen et al. (2013) studied this cloud burstevent using atmospheric modelling and hydrologi-cal analysis to re-establish rainfall estimates duringthe event.The present study thus focuses on susceptibility
assessment of debris flow zones in Ladakh–Nubraregion. We studied summer precipitation patternover this region using ground observatories as wellas gridded precipitation data from ClimateResearch Unit (CRU) for a common period1997–2017. GIS based multi-criteria evaluation(MCE) technique has been performed based onstatic as well as dynamic predict or to identifydebris flow susceptible zones. WRF forecasts havebeen incorporated into GIS model for two cases ofheavy precipitation events. Modeled high, medium,low and very low risk susceptible zones were eval-uated and validated during field visit and satelliteimageries.
2. Study area
The study focuses on Ladakh–Nubra region ofIndian part of Karakoram Himalaya (KH), havingthe geographical extension between latitude34.00�–35.25�N and longitude 76.75�–78.00�E(figure 1) and covers an area of *4895 km2. Thevalley originates from south-western part of TibetanPlateau and runs over major thrust zone formedbetween Karakoram and Zanskar ranges, thusstretching throughKargil, Zanskar, Leh and Nubra.Physiography of the terrain is harnessed with snow-covered peaks, glaciers and non-glaciated valleys.Lying on the rain shadow area of Himalayas, theNubra region combines the condition of both arcticand desert climate (Chundawat and Rawat 1994;Negi 1995). There is a wide diurnal and seasonalfluctuation in temperature with �40�C in winter to+35�C in summer with relative humidity rangingbetween 6% and 24% (Raj 2013). Precipitationoccurs mainly under the influence of westerly dis-turbances in winter and due to induced south-westmonsoon during summer in lower reaches of valley(Bhutiyani et al. 2010). Being in the rain shadowregion, devoid of vegetation and full of sedimentsdue to glaciated valley, during the abnormal
monsoon years, the southwest summer monsoonpenetrate into this region and mobilize large scalesediments in the form of debris flow from unpro-tected mountain slopes (Juyal 2010). The variationin slope alongside road (between 22� and 50�), makethis region highly sensitive and vulnerable tovarious mass movements.
2.1 Leh–Nubra valley road connectivity
The main road access to Nubra Valley is throughKhardung-La pass (figure 1b) which is alsoamongst one of the highest motorable roads in theworld. The road connectivity has a huge impact forlocals residing in the Nubra valley and has helpedin bringing changes in socio-economic condition.The road to Nubra via Khardung-La does notprovide all weather connectivity as it gets closedduring heavy snowfall in winter months and thusthe region is completely cut off for some period.Also various rainfall-induced debris movement,landslides and rock falls during summer causesfrequent road blockage.
3. Data used
3.1 Precipitation dataset
3.1.1 In-situ rain gauge observations
Snow and Avalanche Study Establishment(SASE), India has a snow-meteorological observa-tory in this region at Sasoma. Rainfall data is beingmeasured using accumulation rain gauge at thisobservatory since year 2000. The rainfall datacollected on daily scale was analysed for the sum-mer months (June–September). In addition, rain-fall information available from Indian Air Force(IAF) station at Thoise was also utilised.
3.1.2 Gridded precipitation from CRU
The most recent version of the CRU-TS ver. 4.02precipitation data available from University ofEast-Anglia has been utilized in this study (https://crudata.uea.ac.uk/cru/data/hrg/). The data isentirely based on gauge information and consist ofmonthly gridded fields of precipitation at 0.5� gridspacing over land areas. The CRU dataset is pop-ular because of its relatively long history and finespatial resolution of 0.5�. These datasets are con-tinuously updated through support from World
J. Earth Syst. Sci. (2020) 129 30 Page 3 of 20 30

Meteorological Organization (WMO) in collabora-tion with the US National Oceanographic andAtmospheric Administration (NOAA) (Harris et al.2014). The suitability of this dataset over North-West Himalaya has recently been carried out byNegi and Kanda (2019). Thus, the dataset wasextracted for Nubra region to study summer pre-cipitation climate variability.
3.1.3 WRF simulation
The high resolution non-hydrostatic AdvancedResearch WRF (ARW; Skamarock et al. 2008)mesoscale model (version 3.9) developed at NationalCentre for Atmospheric Research (NCAR) is used tosimulate the heavy rainfall cases. In the presentstudy, double two-way nested domains with hori-zontal resolution 09 and 03 km, keeping study areaand its adjoining areas as the center has been used.The configuration used to run the model is depictedin table 1. The initial and lateral boundary condi-tions were obtained from final reanalysis data (FNL)at 1� 9 1� of National Center for EnvironmentalPrediction (NCEP) Global Forecast System (GFS;https://doi.org/10.5065/D6M043C6).
3.2 Causes and associated factors
Different causative factors for debris flow movementcan be divided into three groups consisting topo-graphical, environmental and hydrological (figure 2).The final susceptibility map involves the generationof thematic maps of various causative factors.
3.2.1 Topographical
Topographical factors include slope, aspect andcurvature derived using Advanced Space-borne
(a)
Karakoram range
Ladakh rangeZanskar rangeThe Great HimalayaPir Panjal range
34°3
0’0’
’N35
°0’0
’’N
TibetianPlateau
( )(b)77°30’0’’E
Figure 1. (a) Location of the study area on Google Earth Imagery. (b) Ladakh–Nubra region shown on Landsat 8 imagery withroad connectivity from Leh to Nubra via Khardungla. Important places of this region are shown by red circles and star shows raingauge stations RG1 (Thoise) and RG2 (Sasoma).
Table 1. WRF model configurations used in the study.
Options WRF v3.9
Horizontal resolution 9 and 3 km
Microphysics WSM6
Long wave radiation RRTM
Shortwave radiation Dhudhia
PBL physics YSU
Land surface model Noah land-surface model
Cumulus parameterizations Kain–Fritsch
Vertical levels 40
Model static fields USGS
IC and BC NCEP GFS (0.25� 9 0.25�)
30 Page 4 of 20 J. Earth Syst. Sci. (2020) 129 30
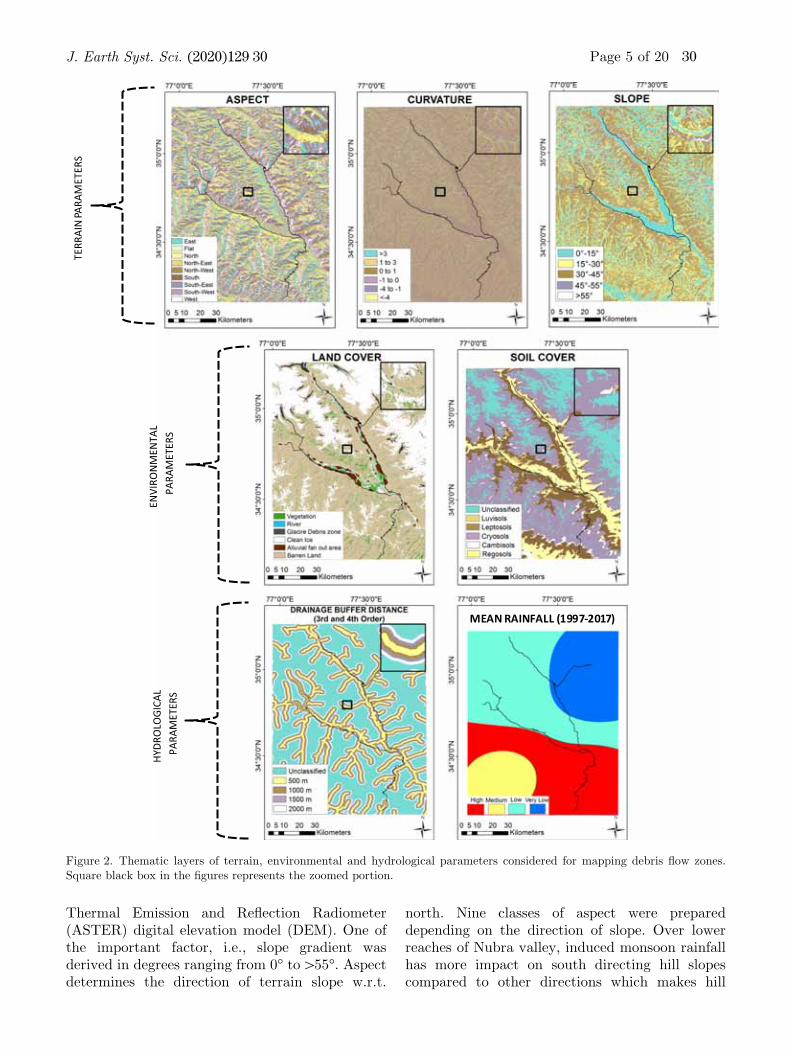
Thermal Emission and Reflection Radiometer(ASTER) digital elevation model (DEM). One ofthe important factor, i.e., slope gradient wasderived in degrees ranging from 0� to[55�. Aspectdetermines the direction of terrain slope w.r.t.
north. Nine classes of aspect were prepareddepending on the direction of slope. Over lowerreaches of Nubra valley, induced monsoon rainfallhas more impact on south directing hill slopescompared to other directions which makes hill
TERR
AIN
PARA
MET
ERS
ENVI
RON
MEN
TAL
PARA
MET
ERS
HYDR
OLO
GICA
L PA
RAM
ETER
S
MEAN RAINFALL (1997-2017)
Figure 2. Thematic layers of terrain, environmental and hydrological parameters considered for mapping debris flow zones.Square black box in the figures represents the zoomed portion.
J. Earth Syst. Sci. (2020) 129 30 Page 5 of 20 30
slopes facing south-east or south-west more proneto debris flows (Riaz et al. 2018). Curvature ofslope is responsible for controlling the flow of waterduring rainfall. It is one of the prime contributingfactors for slope failure during shallow landslidingevent. During analysis, curvature was classified asconcavity and convexity based on planar profiles.Concave slopes with high negative values tend toretain water for a longer period of time after rain-fall and this causes loosening of top layer soil(Vijith et al. 2013).
3.2.2 Environmental
Land cover and soil classes were considered underenvironmental factors. Landsat-8 surface reflec-tance imagery acquired on 30th August, 2015 withcloud coverage less than 10% was downloaded fromUSGS Earth explorer (https://earthexplorer.usgs.gov). The freely available Landsat-8 surfacereflectance (SR) products are atmospherically andradiometrically corrected using Landsat SurfaceReflectance Code (LaSRC) (Dwyer et al. 2018).Employing unsupervised classification technique,major land cover zones were mapped inLadakh–Nubra region and following categorieswere generated: barren land, alluvial fan out area,clean ice, glacier debris zone, vegetation and river.Debris flow is an outcome of large quantities of ice-cored glacial sediments which gets easily activatedfrom heavy precipitation, snowmelt and glaciallake outbursts (Haeberli et al. 1997). Since itoriginates mainly from the lower ablation region ofglaciers, debris zone of glaciers was considered asseparate land cover class. In addition, alluvial fanareas, which are triangle-shaped deposit of gravel,sand/silt, and sediment are usually created byflowing water interaction with mountains, areconsidered as another class. Road connectivity todifferent places mainly passes through these fansout areas which frequently get affected duringsummer rainfall period (figure 3). Other classessuch as barren land, vegetation and water bodiesare well defined land cover classes (Congalton et al.2014). Slope variation over barren land was foundvarying between 36� and 55�, which makes it sus-ceptible to various landsliding events as it cannothold the soil firmly. Vegetation areas are consid-ered under less susceptible class as it reduces theimpact of landslide events by providing necessarystability through their roots.Soil cover information was taken from global soil
information system called ‘‘Soil Grids’’ released by
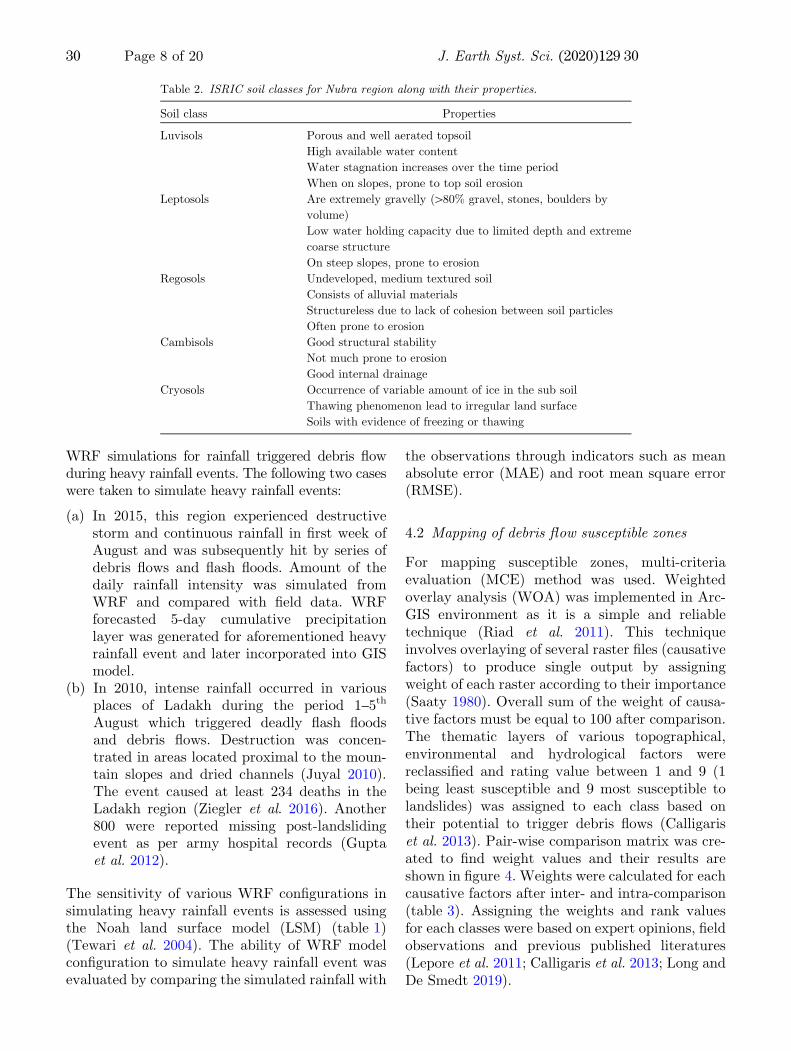
International Soil Reference Information Centre(ISRIC) (https://www.isric.org/explore/soilgrids).The Soil Grids at 250 m spatial resolution areoutputs of a system for automated global soilmapping based on state-of-the-art spatial predic-tion methods (Hengl et al. 2017). It provides globalpredictions for standard soil properties such asorganic carbon, bulk density, cation exchangecapacity (CEC), pH, soil texture fractions andcoarse fragments at seven standard depths alongwith predictions of depth to bedrock and distribu-tion of soil classes based on World Reference Base(WRB) and United States Department of Agri-culture (USDA) classification systems. For thestudy region, soil type consists of five main classes:Luvisols, Leptosols, Regosols, Cambisols, andCryosols. Properties of these soil classes were col-lected from various literatures and have been dis-cussed in table 2, which were also validated duringfield survey in the study region. From figure 3, wecan see the soil class Leptosols and Regosols alongroad connectivity to Sasoma. Compared to thesetwo classes, other classes such as Luvisols, Cryosolsand Cambisols are less susceptible to debrismovement.
3.2.3 Hydrological
Intensive as well as short duration continuous rainhas caused various debris flow events in Ladakhregion during recent past. Therefore, long-termand short-term period thematic summer precipi-tation information was produced from CRU andWRF model respectively.Stream networks are considered another
important factor during debris flow events as theycontribute towards erosion of the slope and alsosaturate the underwater section of the materials(Miller and Burnett 2008). The stream network ofthe study area was computed using ASTER DEM.Four buffer zones with 500 m intervals were pro-duced from the stream networks to see the impactof distance. It was observed that the stream orderthird and fourth contributes maximum to erosionon roadside slopes ranging 30�–45�.
3.3 Field survey and validation
Field survey was carried out in the study regionduring September 2015 (post-debris flow events)and locations were captured using Trimble JunoGPS. Further, Optical Land Imager (OLI) sensor
30 Page 6 of 20 J. Earth Syst. Sci. (2020) 129 30

data from Landsat 8 was also utilized to observepre- and post-debris flow changes.
4. Methods
4.1 Precipitation analysis
To assess the influence of summer precipitation ondebris flows, it is important to study climatic pat-tern over the region. Field observational study onprecipitation for Nubra region is rather limited(Chevuturi et al. 2015). Therefore in the present
study, the summer precipitation informationavailable from two stations was analysed. Further,gridded precipitation data from CRU was alsostudied for the summer periods. The NetCDF dataformat of CRU was converted into Geo-TIFF for-mat before analysis. The trend for cumulativesummer precipitation from CRU data in the studyregion was analysed for the similar period1997–2017.The early-warning for debris flow events can be
generated based on the temporal aspects of slopefailures (Liao et al. 2010). Thus, an effort has beenmade in the present study to assess the suitability of
Alluvial fan
Debris filled valley
River terraceRiver terrace
Ladakh hill slopes
Palaeo river terraces
Screes accompanied by fracture valley
Talus fan
Debris covered valley
River channel
Flood plain
Sandbars
Mudflow along debris covered valley
Cone of Talus
Cone of Talus
Boulders deposited during peak flow in summers
(a)
(b)
(c)
(d)
Figure 3. (a) Debris field valley comprising mostly rock pieces mixed with clayey and sandy soil. (b) Older, well compacted,naturally formed alluvial filled fan out area (Talus fan). (c) Mud flow in the lower part of the debris covered valley. (d) Bouldersdeposition during period of peak discharge.
J. Earth Syst. Sci. (2020) 129 30 Page 7 of 20 30
WRF simulations for rainfall triggered debris flowduring heavy rainfall events. The following two caseswere taken to simulate heavy rainfall events:
(a) In 2015, this region experienced destructivestorm and continuous rainfall in first week ofAugust and was subsequently hit by series ofdebris flows and flash floods. Amount of thedaily rainfall intensity was simulated fromWRF and compared with field data. WRFforecasted 5-day cumulative precipitationlayer was generated for aforementioned heavyrainfall event and later incorporated into GISmodel.
(b) In 2010, intense rainfall occurred in variousplaces of Ladakh during the period 1–5th
August which triggered deadly flash floodsand debris flows. Destruction was concen-trated in areas located proximal to the moun-tain slopes and dried channels (Juyal 2010).The event caused at least 234 deaths in theLadakh region (Ziegler et al. 2016). Another800 were reported missing post-landslidingevent as per army hospital records (Guptaet al. 2012).
The sensitivity of various WRF configurations insimulating heavy rainfall events is assessed usingthe Noah land surface model (LSM) (table 1)(Tewari et al. 2004). The ability of WRF modelconfiguration to simulate heavy rainfall event wasevaluated by comparing the simulated rainfall with
the observations through indicators such as meanabsolute error (MAE) and root mean square error(RMSE).
4.2 Mapping of debris flow susceptible zones
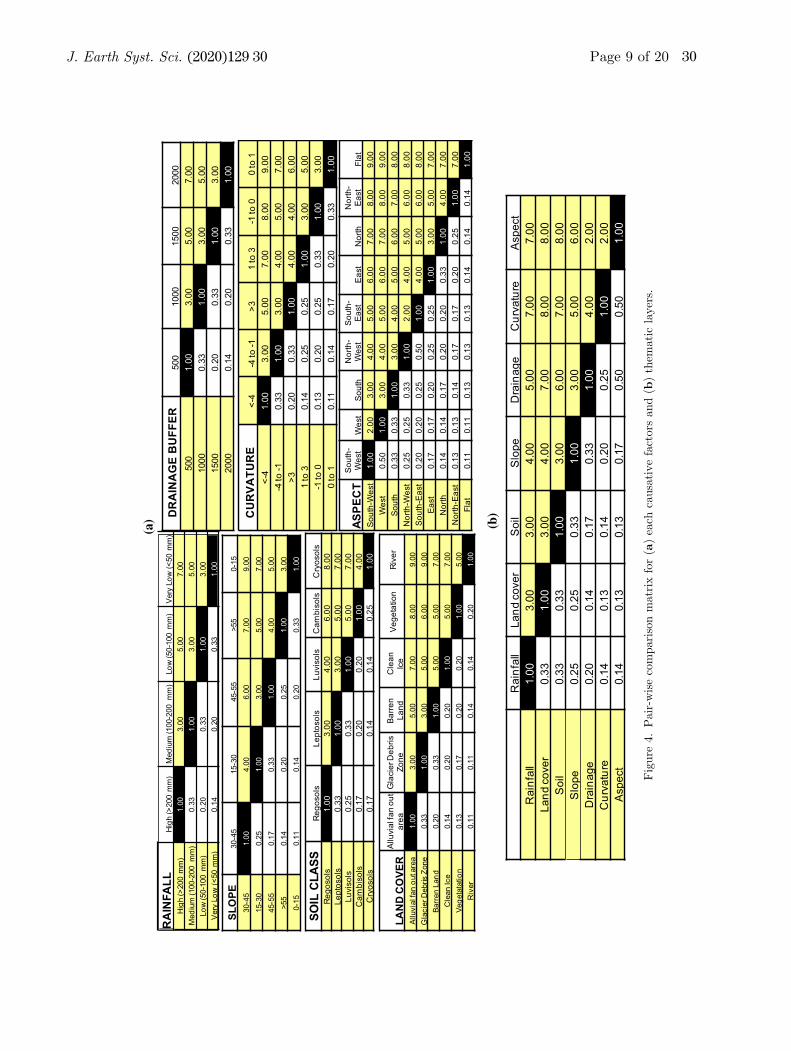
For mapping susceptible zones, multi-criteriaevaluation (MCE) method was used. Weightedoverlay analysis (WOA) was implemented in Arc-GIS environment as it is a simple and reliabletechnique (Riad et al. 2011). This techniqueinvolves overlaying of several raster files (causativefactors) to produce single output by assigningweight of each raster according to their importance(Saaty 1980). Overall sum of the weight of causa-tive factors must be equal to 100 after comparison.The thematic layers of various topographical,environmental and hydrological factors werereclassified and rating value between 1 and 9 (1being least susceptible and 9 most susceptible tolandslides) was assigned to each class based ontheir potential to trigger debris flows (Calligariset al. 2013). Pair-wise comparison matrix was cre-ated to find weight values and their results areshown in figure 4. Weights were calculated for eachcausative factors after inter- and intra-comparison(table 3). Assigning the weights and rank valuesfor each classes were based on expert opinions, fieldobservations and previous published literatures(Lepore et al. 2011; Calligaris et al. 2013; Long andDe Smedt 2019).
Table 2. ISRIC soil classes for Nubra region along with their properties.
Soil class Properties
Luvisols Porous and well aerated topsoil
High available water content
Water stagnation increases over the time period
When on slopes, prone to top soil erosion
Leptosols Are extremely gravelly ([80% gravel, stones, boulders by
volume)
Low water holding capacity due to limited depth and extreme
coarse structure
On steep slopes, prone to erosion
Regosols Undeveloped, medium textured soil
Consists of alluvial materials
Structureless due to lack of cohesion between soil particles
Often prone to erosion
Cambisols Good structural stability
Not much prone to erosion
Good internal drainage
Cryosols Occurrence of variable amount of ice in the sub soil
Thawing phenomenon lead to irregular land surface
Soils with evidence of freezing or thawing
30 Page 8 of 20 J. Earth Syst. Sci. (2020) 129 30
RA
INFA
LLH
igh
(>20
0 m
m)
Med
ium
(100
-200
mm
)Lo
w (5
0-10
0 m
m)
Ver
y Lo
w (<
50 m
m)
Hig
h (>
200
mm
)1.
003.
005.
007.
00M
ediu
m (1
00-2
00 m
m)
0.33
1.00
3.00
5.00
Low
(50-
100
mm
)0.
200.
331.
003.
00V
ery
Low
(<50
mm
)0.
140.
200.
331.
00
SLO
PE30
-45
15-3
045
-55
>55
0-15
30-4
51.
004.
006.
007.
009.
0015
-30
0.25
1.00
3.00
5.00
7.00
45-5
50.
170.
331.
004.
005.
00>5
50.
140.
200.
251.
003.
000-
150.
110.
140.
200.
331.
00
LAN
D C
OVE
RA
lluvi
al fa
n ou
t ar
eaG
laci
er D
ebris
Zo
neB
arre
n La
ndC
lean
Ic
eV
eget
atio
nR
iver
Allu
vial
fan
out a
rea
1.00
3.00
5.00
7.00
8.00
9.00
Gla
cier
Deb
ris Z
one
0.33
1.00
3.00
5.00
6.00
9.00
Barr
en L
and
0.20
0.33
1.00
5.00
5.00
7.00
Cle
an Ic
e0.
140.
200.
201.
005.
007.
00Ve
geta
tatio
n0.
130.
170.
200.
201.
005.
00R
iver
0.11
0.11
0.14
0.14
0.20
1.00
SOIL
CLA
SSR
egos
ols
Lept
osol
sLu
viso
lsC
ambi
sols
Cry
osol
sR
egos
ols
1.00
3.00
4.00
6.00
8.00
Lept
osol
s0.
331.
003.
005.
007.
00Lu
viso
ls0.
250.
331.
005.
007.
00C
ambi
sols
0.17
0.20
0.20
1.00
4.00
Cry
osol
s0.
170.
140.
140.
251.
00
(b)
(a)
Rai
nfal
lLa
nd c
over
Soi
lS
lope
Dra
inag
eC
urva
ture
Asp
ect
Rai
nfal
l1.
003.
003.
004.
005.
007.
007.
00La
nd c
over
0.33
1.00
3.00
4.00
7.00
8.00
8.00
Soi
l0.
330.
331.
003.
006.
007.
008.
00S
lope
0.25
0.25
0.33
1.00
3.00
5.00
6.00
Dra
inag
e0.
200.
140.
170.
331.
004.
002.
00C
urva
ture
0.14
0.13
0.14
0.20
0.25
1.00
2.00
Asp
ect
0.14
0.13
0.13
0.17
0.50
0.50
1.00
DR
AIN
AG
E B
UFF
ER50
010
0015
0020
0050
01.
003.
005.
007.
0010
000.
331.
003.
005.
0015
000.
200.
331.
003.
0020
000.
140.
200.
331.
00
ASPE
CT
Sou
th-
Wes
tW
est
Sou
thN
orth
-W
est
Sou
th-
Eas
tE
ast
Nor
thN
orth
-E
ast
Flat
Sou
th-W
est
1.00
2.00
3.00
4.00
5.00
6.00
7.00
8.00
9.00
Wes
t0.
501.
003.
004.
005.
006.
007.
008.
009.
00S
outh
0.33
0.33
1.00
3.00
4.00
5.00
6.00
7.00
8.00
Nor
th-W
est
0.25
0.25
0.33
1.00
2.00
4.00
5.00
6.00
8.00
Sou
th-E
ast
0.20
0.20
0.25
0.50
1.00
4.00
5.00
6.00
8.00
Eas
t0.
170.
170.
200.
250.
251.
003.
005.
007.
00N
orth
0.14
0.14
0.17
0.20
0.20
0.33
1.00
4.00
7.00
Nor
th-E
ast
0.13
0.13
0.14
0.17
0.17
0.20
0.25
1.00
7.00
Flat
0.11
0.11
0.13
0.13
0.13
0.14
0.14
0.14
1.00
CU
RVA
TUR
E<-
4-4
to -1
>31
to 3
-1 to
00
to 1
<-4
1.00
3.00
5.00
7.00
8.00
9.00
-4 to
-10.
331.
003.
004.
005.
007.
00>3
0.20
0.33
1.00
4.00
4.00
6.00
1 to
30.
140.
250.
251.
003.
005.
00-1
to 0
0.13
0.20
0.25
0.33
1.00
3.00
0 to
10.
110.
140.
170.
200.
331.
00
Figure
4.Pair-w
isecomparisonmatrix
for(a)each
causativefactors
and(b
)them
aticlayers.
J. Earth Syst. Sci. (2020) 129 30 Page 9 of 20 30
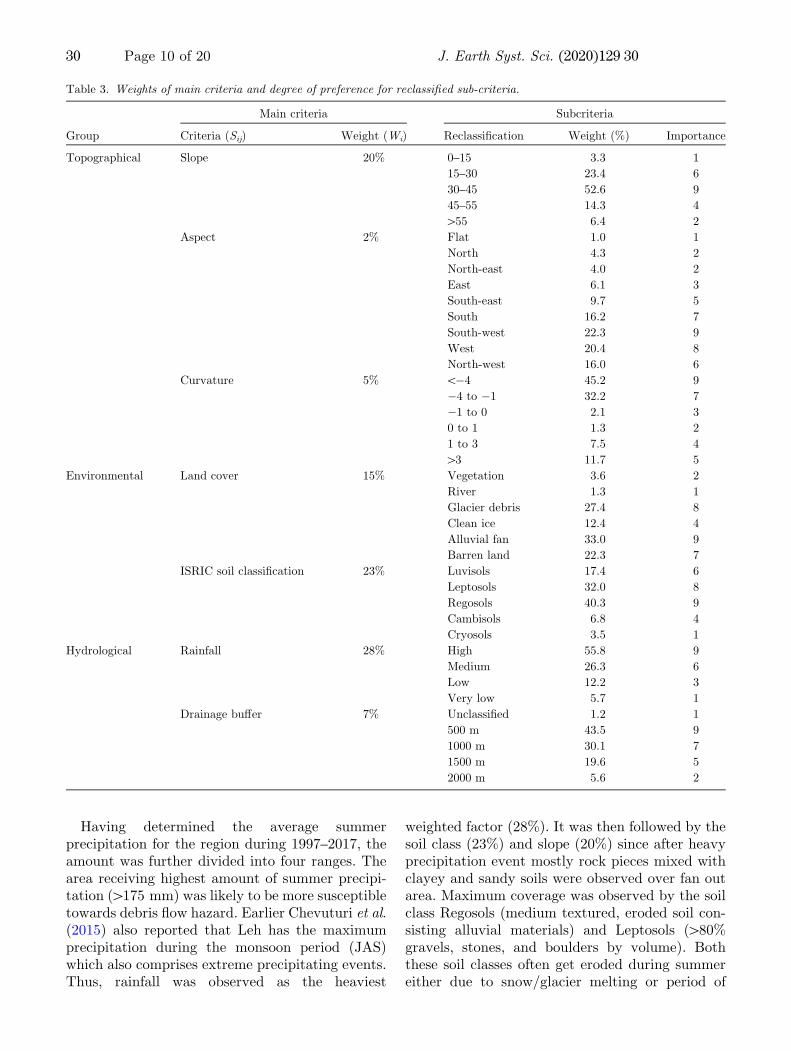
Having determined the average summerprecipitation for the region during 1997–2017, theamount was further divided into four ranges. Thearea receiving highest amount of summer precipi-tation ([175 mm) was likely to be more susceptibletowards debris flow hazard. Earlier Chevuturi et al.(2015) also reported that Leh has the maximumprecipitation during the monsoon period (JAS)which also comprises extreme precipitating events.Thus, rainfall was observed as the heaviest
weighted factor (28%). It was then followed by thesoil class (23%) and slope (20%) since after heavyprecipitation event mostly rock pieces mixed withclayey and sandy soils were observed over fan outarea. Maximum coverage was observed by the soilclass Regosols (medium textured, eroded soil con-sisting alluvial materials) and Leptosols ([80%gravels, stones, and boulders by volume). Boththese soil classes often get eroded during summereither due to snow/glacier melting or period of
Table 3. Weights of main criteria and degree of preference for reclassified sub-criteria.
Group
Main criteria Subcriteria
Criteria (Sij) Weight (Wi) Reclassification Weight (%) Importance
Topographical Slope 20% 0–15 3.3 1
15–30 23.4 6
30–45 52.6 9
45–55 14.3 4
[55 6.4 2
Aspect 2% Flat 1.0 1
North 4.3 2
North-east 4.0 2
East 6.1 3
South-east 9.7 5
South 16.2 7
South-west 22.3 9
West 20.4 8
North-west 16.0 6
Curvature 5% \�4 45.2 9
�4 to �1 32.2 7
�1 to 0 2.1 3
0 to 1 1.3 2
1 to 3 7.5 4
[3 11.7 5
Environmental Land cover 15% Vegetation 3.6 2
River 1.3 1
Glacier debris 27.4 8
Clean ice 12.4 4
Alluvial fan 33.0 9
Barren land 22.3 7
ISRIC soil classification 23% Luvisols 17.4 6
Leptosols 32.0 8
Regosols 40.3 9
Cambisols 6.8 4
Cryosols 3.5 1
Hydrological Rainfall 28% High 55.8 9
Medium 26.3 6
Low 12.2 3
Very low 5.7 1
Drainage buffer 7% Unclassified 1.2 1
500 m 43.5 9
1000 m 30.1 7
1500 m 19.6 5
2000 m 5.6 2
30 Page 10 of 20 J. Earth Syst. Sci. (2020) 129 30
heavy rainfall. Slope gradient influences soil watercontent, formation and potential for the erosion.Generally, slopes with high gradient are expectedto have more influence on debris movements. Onthe gentle slopes where shear stress is also low,debris movements are not expected (Basharat et al.2016). Curvature and aspect were seen amongstthe least weighted factor. Once the above compu-tation was achieved, final landslide susceptibilityindex map was produced using the followingequation (equation 1).
WOA ¼P
WiSijPWi
ð1Þ
where Wi is the raster weight of importance givento each factor, Sij is the reclassified raster in com-mon criteria scale and WOA represents landslidesusceptibility index map.
4.3 Precipitation threshold estimation for debrisflow event
Precipitation thresholds for a region may indicatethe value which when reached is likely to triggerdebris flow events. These thresholds can be estab-lished using historical data on landslide causingrainfall events and corresponding landslide records.The precipitation threshold value can be estimatedusing following categorized parameters:
(i) intensity and duration (I–D)(ii) total rainfall(iii) rainfall event-duration and(iv) rainfall event-intensity (Mathew et al. 2014).
Our approach to estimate threshold value duringheavy rainfall event was based on 5-day total rainfallinformation estimated using WRF and ground sta-tion. Cumulative rainfall (mm/day) was calculatedtill event occurrence day fromWRFand station data.
5. Results and discussion
5.1 Climatological analysis of rainfall
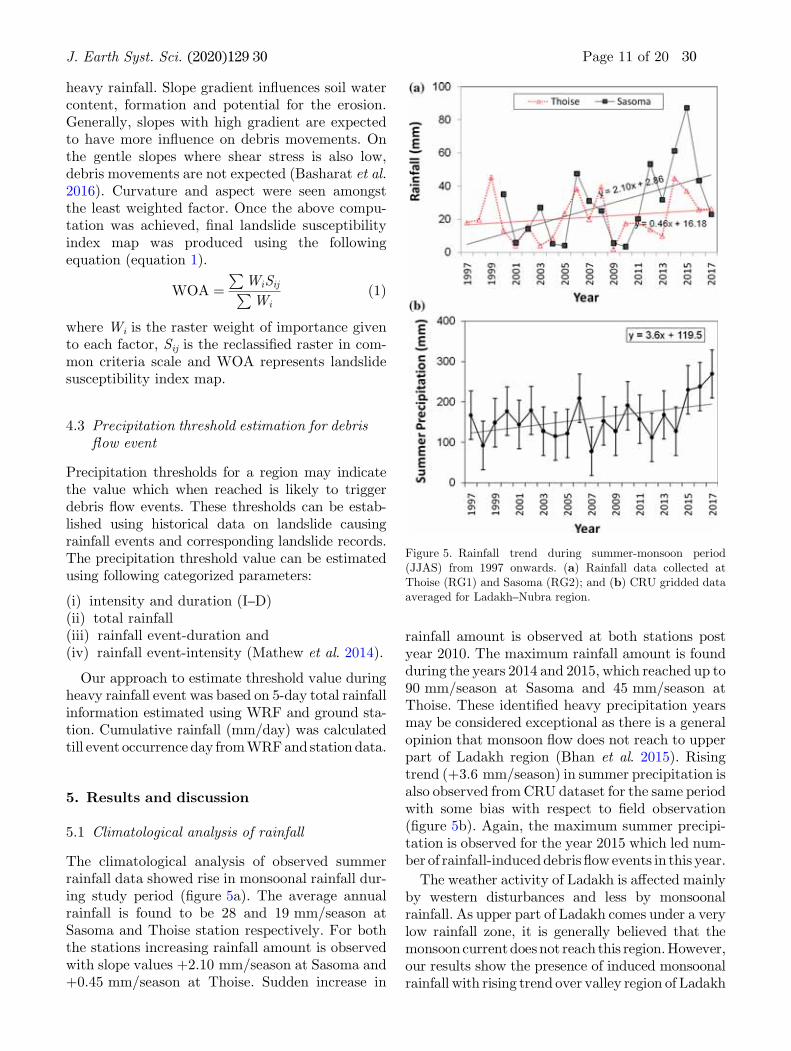
The climatological analysis of observed summerrainfall data showed rise in monsoonal rainfall dur-ing study period (figure 5a). The average annualrainfall is found to be 28 and 19 mm/season atSasoma and Thoise station respectively. For boththe stations increasing rainfall amount is observedwith slope values +2.10 mm/season at Sasoma and+0.45 mm/season at Thoise. Sudden increase in
rainfall amount is observed at both stations postyear 2010. The maximum rainfall amount is foundduring the years 2014 and 2015, which reached up to90 mm/season at Sasoma and 45 mm/season atThoise. These identified heavy precipitation yearsmay be considered exceptional as there is a generalopinion that monsoon flow does not reach to upperpart of Ladakh region (Bhan et al. 2015). Risingtrend (+3.6 mm/season) in summer precipitation isalso observed fromCRU dataset for the same periodwith some bias with respect to field observation(figure 5b). Again, the maximum summer precipi-tation is observed for the year 2015 which led num-ber of rainfall-induceddebris flowevents in this year.
The weather activity of Ladakh is affected mainlyby western disturbances and less by monsoonalrainfall. As upper part of Ladakh comes under a verylow rainfall zone, it is generally believed that themonsooncurrentdoesnot reach this region.However,our results show the presence of induced monsoonalrainfall with rising trend over valley region of Ladakh
Figure 5. Rainfall trend during summer-monsoon period(JJAS) from 1997 onwards. (a) Rainfall data collected atThoise (RG1) and Sasoma (RG2); and (b) CRU gridded dataaveraged for Ladakh–Nubra region.
J. Earth Syst. Sci. (2020) 129 30 Page 11 of 20 30
and Nubra. Houze et al. (2007) and Medina et al.(2010) have examined the rainfall over north-westHimalaya and reported that the region is prone todeep convection during the period of monsoon. Lateron,Ray et al. (2001) also reported that the interactionof the monsoon trough with western disturbancesmay occasionally cause dense clouding and heavyprecipitation in themonthsof JulyandAugust,whichmightbe the reason forunusual heavyrainfall in 2015.Bhan et al. (2015) analysed the Leh cloud burst eventin 2010 and discussed the increasing impact of south-westmonsoon in this region.More importantly, thesestudies also highlighted the orography factor in cre-ating heavy rainfall events over a small and compactregion surrounded by mountains. Thus, increasedprecipitation amount in this region has led to hazardvulnerability, mainly in terms of transportation ofdebris along with the rain water running down-stream.This has been further discussed in succeedingsections.
5.2 Debris flow susceptible zones
A weighted overlay hazard rating methodology wasemployed integrating remote sensing, GIS andNWP technique. All raster datasets of terrainparameters such as slope, aspect, curvature, etc.,were resampled using bilinear interpolation tech-nique. Nearest neighbour technique was employedfor categorical data such as soil and land coverraster before WOA. As dynamic rainfall intensitywas considered as a triggering parameter for vari-ous debris flow events in the region, the model wasrun in following two phases:
5.2.1 Phase 1: Susceptible zones identified basedon mean summer precipitation
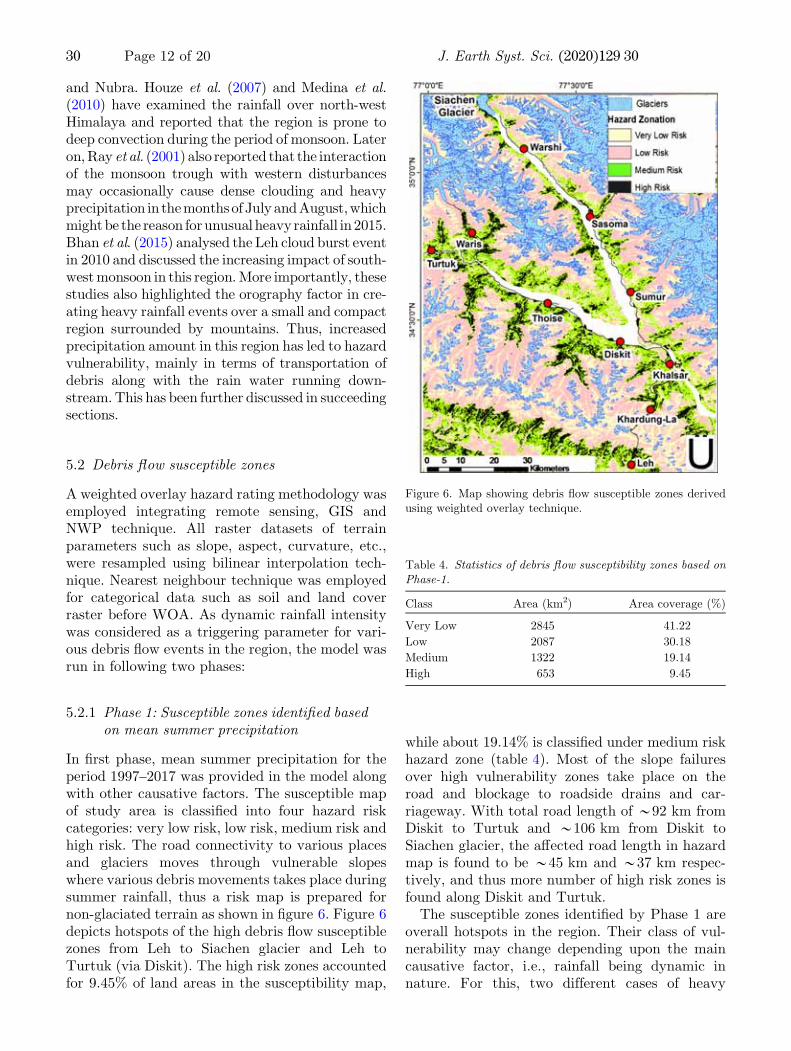
In first phase, mean summer precipitation for theperiod 1997–2017 was provided in the model alongwith other causative factors. The susceptible mapof study area is classified into four hazard riskcategories: very low risk, low risk, medium risk andhigh risk. The road connectivity to various placesand glaciers moves through vulnerable slopeswhere various debris movements takes place duringsummer rainfall, thus a risk map is prepared fornon-glaciated terrain as shown in figure 6. Figure 6depicts hotspots of the high debris flow susceptiblezones from Leh to Siachen glacier and Leh toTurtuk (via Diskit). The high risk zones accountedfor 9.45% of land areas in the susceptibility map,
while about 19.14% is classified under medium riskhazard zone (table 4). Most of the slope failuresover high vulnerability zones take place on theroad and blockage to roadside drains and car-riageway. With total road length of *92 km fromDiskit to Turtuk and *106 km from Diskit toSiachen glacier, the affected road length in hazardmap is found to be *45 km and *37 km respec-tively, and thus more number of high risk zones isfound along Diskit and Turtuk.The susceptible zones identified by Phase 1 are
overall hotspots in the region. Their class of vul-nerability may change depending upon the maincausative factor, i.e., rainfall being dynamic innature. For this, two different cases of heavy
Figure 6. Map showing debris flow susceptible zones derivedusing weighted overlay technique.
Table 4. Statistics of debris flow susceptibility zones based onPhase-1.
Class Area (km2) Area coverage (%)
Very Low 2845 41.22
Low 2087 30.18
Medium 1322 19.14
High 653 9.45
30 Page 12 of 20 J. Earth Syst. Sci. (2020) 129 30
rainfall events simulated by WRF were incorporatedinto GIS model as discussed in the next section.
5.2.2 Phase 2: Based on WRF simulationfor heavy rainfall events
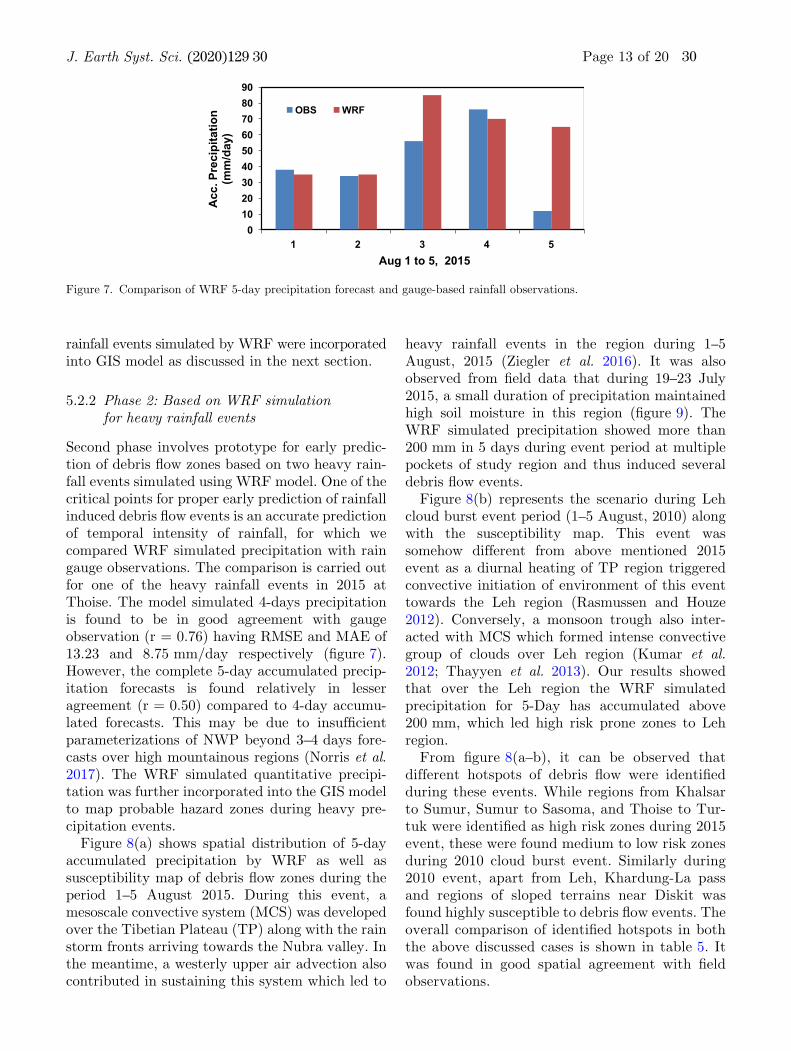
Second phase involves prototype for early predic-tion of debris flow zones based on two heavy rain-fall events simulated using WRF model. One of thecritical points for proper early prediction of rainfallinduced debris flow events is an accurate predictionof temporal intensity of rainfall, for which wecompared WRF simulated precipitation with raingauge observations. The comparison is carried outfor one of the heavy rainfall events in 2015 atThoise. The model simulated 4-days precipitationis found to be in good agreement with gaugeobservation (r = 0.76) having RMSE and MAE of13.23 and 8.75 mm/day respectively (figure 7).However, the complete 5-day accumulated precip-itation forecasts is found relatively in lesseragreement (r = 0.50) compared to 4-day accumu-lated forecasts. This may be due to insufficientparameterizations of NWP beyond 3–4 days fore-casts over high mountainous regions (Norris et al.2017). The WRF simulated quantitative precipi-tation was further incorporated into the GIS modelto map probable hazard zones during heavy pre-cipitation events.Figure 8(a) shows spatial distribution of 5-day
accumulated precipitation by WRF as well assusceptibility map of debris flow zones during theperiod 1–5 August 2015. During this event, amesoscale convective system (MCS) was developedover the Tibetian Plateau (TP) along with the rainstorm fronts arriving towards the Nubra valley. Inthe meantime, a westerly upper air advection alsocontributed in sustaining this system which led to
heavy rainfall events in the region during 1–5August, 2015 (Ziegler et al. 2016). It was alsoobserved from field data that during 19–23 July2015, a small duration of precipitation maintainedhigh soil moisture in this region (figure 9). TheWRF simulated precipitation showed more than200 mm in 5 days during event period at multiplepockets of study region and thus induced severaldebris flow events.Figure 8(b) represents the scenario during Leh
cloud burst event period (1–5 August, 2010) alongwith the susceptibility map. This event wassomehow different from above mentioned 2015event as a diurnal heating of TP region triggeredconvective initiation of environment of this eventtowards the Leh region (Rasmussen and Houze2012). Conversely, a monsoon trough also inter-acted with MCS which formed intense convectivegroup of clouds over Leh region (Kumar et al.2012; Thayyen et al. 2013). Our results showedthat over the Leh region the WRF simulatedprecipitation for 5-Day has accumulated above200 mm, which led high risk prone zones to Lehregion.From figure 8(a–b), it can be observed that
different hotspots of debris flow were identifiedduring these events. While regions from Khalsarto Sumur, Sumur to Sasoma, and Thoise to Tur-tuk were identified as high risk zones during 2015event, these were found medium to low risk zonesduring 2010 cloud burst event. Similarly during2010 event, apart from Leh, Khardung-La passand regions of sloped terrains near Diskit wasfound highly susceptible to debris flow events. Theoverall comparison of identified hotspots in boththe above discussed cases is shown in table 5. Itwas found in good spatial agreement with fieldobservations.
0102030405060708090
1 2 3 4 5
Acc
. Pre
cipi
tatio
n (m
m/d
ay)
Aug 1 to 5, 2015
OBS WRF
Figure 7. Comparison of WRF 5-day precipitation forecast and gauge-based rainfall observations.
J. Earth Syst. Sci. (2020) 129 30 Page 13 of 20 30

5.3 Model validation
Field survey was conducted in the September
month in Nubra after the debris flow events of
2015. Field identified hazard locations were col-
lected using GPS. Later these hazard locations
were overlaid on modelled susceptible classes, i.e.,very low risk, low risk, medium risk and high risk
and the comparison was made. Besides, Landsatimage of period 10th May and 14th October, 2015was also analysed. For better detection of pre andpost changes, image pan sharpening technique wasemployed using OLI multispectral (30 m) andpanchromatic band (15 m), and debris flow zoneswere identified. It was observed that most of theidentified field events occurred over the sloped
Figure 8. Two cases studies of debris flow events: (a) WRF simulation for period 1st to 5th August 2015 and correspondingsusceptibility debris flow zonation; (b) WRF simulation for period 1–5th August 2010 and corresponding susceptibility debrisflow zonation.
30 Page 14 of 20 J. Earth Syst. Sci. (2020) 129 30

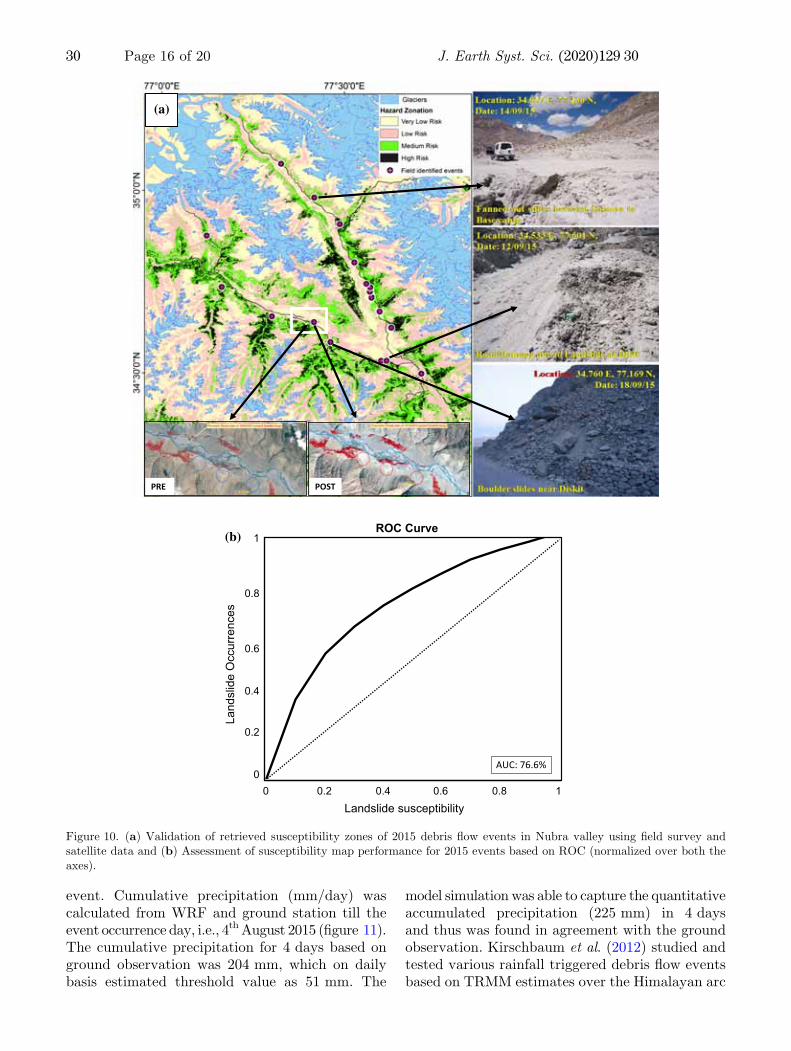
terrains alongside the road which subsequentlyhampered the connectivity over Ladakh–Nubraregion. For instance, we can see from figure 10 thatthe debris (mostly boulders and alluvial fannedmaterials) sliding have occurred near Diskit townand regions between Sasoma and Siachen glacierafter heavy rainfall events of 2015. These aremainly the habitat areas. The observed debris flowlocations were compared with WRF based hazardrisk zones for the 2015 event (figure 10a). Landsat-8imageries were also utilized to infer changes causeddue to debris flow at Thoise. The post event imageclearly showed changes like disconnection of roadsand flow of debris materials.After visual based validation, the model
performance was checked for 2015 events usingstatistical predictive Receiver Operating Charac-teristics (ROC) curve. ROC is widely populartechnique for evaluating the accuracy and effec-tiveness of the susceptibility model (Lee 2005).ROC curve shows model performance based on thetrue positive rate (TPR) and false positive rate(FPR) (Pradhan 2010). An important measure of
the accuracy of the analysis under this predictivecurve is the area under curve (AUC). The mostideal model will have the largest area under thecurve. An AUC value close to 1.0 presents an idealmodel whereas AUC value close to 0.5 indicatesinaccuracy of the model. The ROC was thus pro-duced by plotting landslide occurrences (TPR) aty-axis and landslide susceptibility index (FPR).With limited field identified landslide evidences,the collected points were compared with 4 classesof susceptibility map and the curve generatedprovides rate of success in the model. The com-puted area under the curve is 0.76, which showedan accuracy of 76.6% for the final susceptibilitymap (figure 10b).
5.4 Critical rainfall thresholds
An analysis on the critical threshold value to inducedebris flows was carried out for the study regionusing ground rainfall observations and WRF esti-mates. This was evaluated over Thoise for 2015
0
0.1
0.2
0.3
0.4
0.5
0
10
20
30
40
50
60
70
80
01-Ju
l-15
04-Ju
l-15
07-Ju
l-15
10-Ju
l-15
13-Ju
l-15
16- Ju
l-15
19-Ju
l-15
22-Ju
l-15
25-Ju
l-15
28-Ju
l-15
31-Ju
l-15
03-A
ug- 1
5
06-A
ug- 1
5
09-A
ug-1
5
SOIL
MO
SITU
RE
RAIN
DATE
SOIL MOISTURE (m3/m3)RAIN (mm)
Figure 9. Observational data from Thoise station for July-Aug period. Short duration of rain was observed between 19th Julyand 23rd July 2015 which maintained high soil moisture (source: SMAP L-Band radiometer data; https://www.mosdac.gov.in/soil-moisture-0) in the region.
Table 5. An overall comparison of identified hotspots in two cases studied.
Class Area (km2) Area coverage (%) High risk zones
Case I (2015 event)
Very Low 2839.22 41.13 Khalsar–Sumur, Sumur–Sasoma, Thoise–Turtuk
Low 2407.78 34.88
Medium 1212.17 17.56
High 443.86 6.43
Case II (2010 event)
Very Low 3152.61 45.67 Leh, Khardung-La, Nearby Diskit region
Low 2790.89 40.43
Medium 728.96 10.56
High 301.66 4.37
J. Earth Syst. Sci. (2020) 129 30 Page 15 of 20 30
event. Cumulative precipitation (mm/day) wascalculated from WRF and ground station till theevent occurrence day, i.e., 4th August 2015 (figure 11).The cumulative precipitation for 4 days based onground observation was 204 mm, which on dailybasis estimated threshold value as 51 mm. The
model simulation was able to capture the quantitativeaccumulated precipitation (225 mm) in 4 daysand thus was found in agreement with the groundobservation. Kirschbaum et al. (2012) studied andtested various rainfall triggered debris flow eventsbased on TRMM estimates over the Himalayan arc
PRE POST
(a)
(b)ROC Curve
Landslide susceptibility10.80.60.40.20
Land
slid
e O
ccur
renc
es
1
0.8
0.6
0.4
0.2
0AUC: 76.6%
Figure 10. (a) Validation of retrieved susceptibility zones of 2015 debris flow events in Nubra valley using field survey andsatellite data and (b) Assessment of susceptibility map performance for 2015 events based on ROC (normalized over both theaxes).
30 Page 16 of 20 J. Earth Syst. Sci. (2020) 129 30
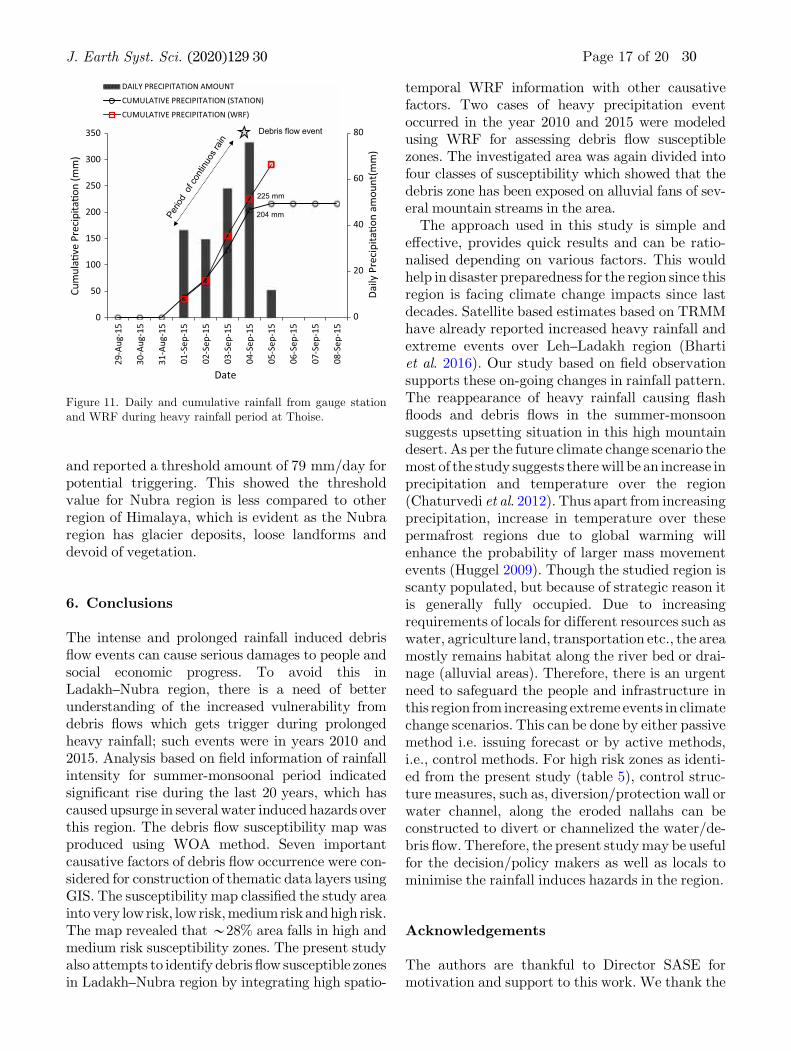
and reported a threshold amount of 79 mm/day forpotential triggering. This showed the thresholdvalue for Nubra region is less compared to otherregion of Himalaya, which is evident as the Nubraregion has glacier deposits, loose landforms anddevoid of vegetation.
6. Conclusions
The intense and prolonged rainfall induced debrisflow events can cause serious damages to people andsocial economic progress. To avoid this inLadakh–Nubra region, there is a need of betterunderstanding of the increased vulnerability fromdebris flows which gets trigger during prolongedheavy rainfall; such events were in years 2010 and2015. Analysis based on field information of rainfallintensity for summer-monsoonal period indicatedsignificant rise during the last 20 years, which hascaused upsurge in several water induced hazards overthis region. The debris flow susceptibility map wasproduced using WOA method. Seven importantcausative factors of debris flow occurrence were con-sidered for construction of thematic data layers usingGIS. The susceptibility map classified the study areainto very lowrisk, low risk,mediumriskandhigh risk.The map revealed that *28% area falls in high andmedium risk susceptibility zones. The present studyalso attempts to identify debris flow susceptible zonesin Ladakh–Nubra region by integrating high spatio-
temporal WRF information with other causativefactors. Two cases of heavy precipitation eventoccurred in the year 2010 and 2015 were modeledusing WRF for assessing debris flow susceptiblezones. The investigated area was again divided intofour classes of susceptibility which showed that thedebris zone has been exposed on alluvial fans of sev-eral mountain streams in the area.The approach used in this study is simple and
effective, provides quick results and can be ratio-nalised depending on various factors. This wouldhelp in disaster preparedness for the region since thisregion is facing climate change impacts since lastdecades. Satellite based estimates based on TRMMhave already reported increased heavy rainfall andextreme events over Leh–Ladakh region (Bhartiet al. 2016). Our study based on field observationsupports these on-going changes in rainfall pattern.The reappearance of heavy rainfall causing flashfloods and debris flows in the summer-monsoonsuggests upsetting situation in this high mountaindesert. As per the future climate change scenario themost of the study suggests therewill be an increase inprecipitation and temperature over the region(Chaturvedi et al. 2012). Thus apart from increasingprecipitation, increase in temperature over thesepermafrost regions due to global warming willenhance the probability of larger mass movementevents (Huggel 2009). Though the studied region isscanty populated, but because of strategic reason itis generally fully occupied. Due to increasingrequirements of locals for different resources such aswater, agriculture land, transportation etc., the areamostly remains habitat along the river bed or drai-nage (alluvial areas). Therefore, there is an urgentneed to safeguard the people and infrastructure inthis region from increasing extreme events in climatechange scenarios. This can be done by either passivemethod i.e. issuing forecast or by active methods,i.e., control methods. For high risk zones as identi-ed from the present study (table 5), control struc-ture measures, such as, diversion/protection wall orwater channel, along the eroded nallahs can beconstructed to divert or channelized the water/de-bris flow. Therefore, the present studymay be usefulfor the decision/policy makers as well as locals tominimise the rainfall induces hazards in the region.
Acknowledgements
The authors are thankful to Director SASE formotivation and support to this work. We thank the
204 mm
225 mm
0
20
40
60
80
0
50
100
150
200
250
300
350
29-A
ug-1
5
30-A
ug-1
5
31-A
ug-1
5
01-S
ep-1
5
02-S
ep-1
5
03-S
ep-1
5
04-S
ep-1
5
05-S
ep-1
5
06-S
ep-1
5
07-S
ep-1
5
08-S
ep-1
5
Daily
Pre
cipi
ta�o
n am
ount
(mm
)
Cum
ula�
ve P
reci
pita
�on
(mm
)
Date
DAILY PRECIPITATION AMOUNT
CUMULATIVE PRECIPITATION (STATION)
CUMULATIVE PRECIPITATION (WRF)
Debris flow event
Figure 11. Daily and cumulative rainfall from gauge stationand WRF during heavy rainfall period at Thoise.
J. Earth Syst. Sci. (2020) 129 30 Page 17 of 20 30

technical persons of SASE Roshan Tamang, GArun, Ritesh Mujawdiya, and Bhupinder Kumarfor field data collection. We are grateful toAir Force Station, Thoise for providing themeteorological data. We would like to acknowledgevarious institutions for providing gridded CRUprecipitation products, ASTER DEM andLandsat-8 data. This work was carried out underDRDO project ‘Him-Parivartan’.
References
Adhikari D P and Koshimizu S 2005 Debris flow disaster atLarcha, upper Bhotekoshi Valley, central Nepal; IslandArc. 14 410–423.
Barrett K and Bosak K 2018 The role of place in adapting toclimate change: A case study from Ladakh, westernHimalayas; Sustainability 10 898.
Basharat M, Shah H R and Hameed N 2016 Landslidesusceptibility mapping using GIS and weighted overlaymethod: A case study from NW Himalayas, Pakistan; Arab.J. Geosci. 9 292.
Bhan S C, Devrani A K and Sinha V 2015 An analysis ofmonthly rainfall and the meteorological conditions associ-ated with cloudburst over the dry region of Leh (Ladakh),India; Mausam 66(1) 107–122.
Bharti V, Singh C, Ettema J and Turkington T A R 2016Spatiotemporal characteristics of extreme rainfall eventsover the Northwest Himalaya using satellite data; Int.J. Climatol. 36 3949–3962.
Bhutiyani M R, Kale V S and Pawar N J 2010 Climate changeand the precipitation variations in the north-westernHimalaya: 1866–2006; Int. J. Climatol. 30(4) 535–548.
Biswas S S and Pal R 2016 Causes of landslides in DarjeelingHimalayas during June–July, 2015; J. Geogr. Nat. Disast. 6173.
Blais-Stevens A and Behnia P 2016 Debris flow susceptibilitymapping using a qualitative heuristic method and flow-Ralong the Yukon Alaska Highway Corridor, Canada; Nat.Hazards Earth Syst. Sci. 16 449–462.
Bookhagen B and Burbank D W 2010 Toward a completeHimalayan hydrological budget: Spatiotemporal distribu-tion of snowmelt and rainfall and their impact on riverdischarge; J. Geophys. Res. 115 F03019.
Calligaris C, Poretti G, Tariq S and Melis M T 2013 First stepstowards a landslide inventory map of the Central KarakoramNational Park; Eur. J. Remote Sens. 46 272–287.
Chaturvedi R K, Joshi J and Jayaraman M 2012 Multi-model climate change projections for India under repre-sentative concentration pathways; Curr. Sci. 103(7)791–802.
Chauhan S, Sharma M, Arora M K and Gupta N K 2010Landslide susceptibility zonation through ratings derivedfrom artificial neural network; Int. J. Appl. Earth Obs. 12340–350.
Chevuturi A, Dimri A P, Das S, Kumar A and Niyogi D2015 Numerical simulation of an intense precipitationevent over Rudraprayag in the central Himalayas during13–14 September 2012; J. Earth Syst. Sci. 124(7)1545–1561.
Chundawat R S and Rawat G S 1994 In: Proceedings of theSeventh International Snow Leopard Symposium; Interna-tional Snow Leopard Trust, Seattle, pp. 127–132.
Congalton R G, Gu J, Yadav K, Thenkabail P and Ozdogan M2014 Global land cover mapping: A review and uncertaintyanalysis; Remote Sens. 6 12,070–12,093.
Crosta G B and Frattini P 2003 Distributed modelling ofshallow landslides triggered by intense rainfall; Nat.Hazards Earth Syst. Sci. 3 81–93.
Dou J, Bui D T, Yunus A P, Jia K, Song X, Revhaug I, Xia Hand Zhu Z 2015 Optimization of Causative Factors forLandslide Susceptibility Evaluation Using Remote Sensingand GIS Data in Parts of Niigata, Japan; PLOS ONE 10(7)e0133262.
Dwyer J, Roy D, Sauer B, Jenkerson C, Zhang H andLymburner L 2018 Analysis ready data: Enabling analysisof the Landsat archive; Remote Sens. 10(9) 1363.
Elkadiri R, Sultan M, Youssef A M, Elbayoumi T, Chase R,Bulkhi A B and Al-Katheeri M M 2014 A remote sensing-based approach for debris-flow susceptibility assessmentusing artificial neural networks and logistic regressionmodeling; IEEE J. Sel. Top. Appl. Earth Observ Rem.Sens. 7(12) 4818–4835.
Gebremichael M and Hossain F 2010 Satellite rainfall appli-cations for surface hydrology; Dordrecht: Springer Nether-lands 3 22.
Gupta P, Khanna A and Majumdar S 2012 Disaster manage-ment in flash floods in Leh (Ladakh): A case study; IndianJ. Comm. Med. 37(3) 185–190.
Haeberli W, Wegmann M and MUhll D V 1997 Slope stabilityproblems related to glacier shrinkage and permafrostdegradation in the Alps; Eclogae Geol. Helv. 90 407–414.
Harris I, Jones P D, Osborn T J and Lister D H 2014 Updatedhigh-resolution grids of monthly climatic observations – theCRU TS3.10 Dataset; Int. J. Climatol. 34 623–642.
Hengl T, Mendes J J, Heuvelink G B M, Ruiperez G M andKilibarda M et al. 2017 Soil Grids 250 m: Global griddedsoil information based on machine learning; PLOS ONE12(2) e0169748.
Hobley D E J, Sinclair H D and Mudd S M 2012 Reconstruc-tion of a major storm event from its geomorphic signature:The Ladakh floods, 6 August 2010; Geology 40 483–486.
Houze R A Jr, Darren C W and Smull B F 2007 Monsoonconvection in the Himalayan region as seen by the TRMMPrecipitation Radar; Quart. J. Roy. Meteorol. Soc. 1331389–1411.
Huffman G J, Adler R F, Bolvin D T, Gu G, Nelkin E J andBowman K P 2007 The TRMM multi-satellite precipitationanalysis: Quasi-global, multi-year, combined-sensor precip-itation estimates at fine scale; J. Hydrometeorol. 8(1) 38–55.
Huggel C 2009 Recent extreme slope failures in glacialenvironments: Effects of thermal perturbation; Quat. Sci.Rev. 28 1119–1130.
Juyal N 2010 Cloud-burst triggered debris flows around Leh;Curr. Sci. 99(9) 1166–1167.
Kanwal S, Atif S and Shafiq M 2017 GIS based landslidesusceptibility mapping of northern areas of Pakistan, a casestudy of Shigar and Shyok Basins; Geomat. Nat. Haz. Risk8(2) 348–366.
Kayastha P, Bijukchhen S M, Dhital M R and De Smedt F2013 GIS based landslide susceptibility mapping using afuzzy logic approach: A case study from Ghurmi-Dhad
30 Page 18 of 20 J. Earth Syst. Sci. (2020) 129 30
Khola area, Eastern Nepal; J. Geol. Soc. India 82(3)249–261.
Khan H, Shafique M, Khan M A, Bacha M A, Shah S U andCalligaris C 2019 Landslide susceptibility assessment usingFrequency Ratio, a case study of northern Pakistan; Egypt.J. Remote Sens. Space Sci. 22 11–24.
Kirschbaum D and Stanley T 2018 Satellite-based assessmentof rainfall-triggered landslide hazard for situational aware-ness; Earth’s Future 6 505–523.
Kirschbaum D, Adler R, Adler D, Peters-Lidard C andHuffman G 2012 Global Distribution of Extreme Precipi-tation and High-Impact Landslides in 2010 Relative toPrevious Years; J. Hydrometeor. 13 1536–1551.
Kumar M S, Shekhar M S, Rama Krishna S S V S, BhutiyaniM R and Ganju A 2012 Numerical simulation of cloud burstevent on August 05, 2010, over Leh using WRF mesoscalemodel; Nat. Hazards 62(3) 1261–1271.
Lee S 2005 Application of logistic regression model and itsvalidation for landslide susceptibility mapping using GIS andremote sensingdata; Int. J.RemoteSensing26(7) 1477–1491.
Lepore C, Kamal S A, Shanahan P and Bras R L 2011Rainfall-induced landslide susceptibility zonation of PuertoRico; Environ. Earth Sci. 66(6) 1667–1681.
Liao Z, Hong Y, Wang J, Fukuoka H, Sassa K, Karnawati Dand Fathani F 2010 Prototyping an experimental earlywarning system for rainfall-induced landslides in Indonesiausing satellite remote sensing and geospatial datasets;Landslides 7(3) 317–324.
Long N T and De Smedt F 2019 Analysis and mapping ofrainfall-induced landslide susceptibility in a Luoi district,Thua Thien Hue province, Vietnam; Water 11(1) 51.
Lu N, Sener-Kaya B, Wayllace A and Godt J W 2012 Analysisof rainfall induced slope instability using a field of localfactor of safety; Water Resour. Res. 48(9) W09524.
Martha T R, Roy P, Govindharaj K B, Kumar V K, DiwakarP G and Dadhwal V K 2015 Landslides triggered by theJune 2013 extreme rainfall event in parts of Uttarakhandstate, India; Landslides 12 135–136.
Mathew J, Babu D G, Kundu S, Kumar V K and Pant C C2014 Integrating intensity-duration-based rainfall thresh-old and antecedent rainfall-based probability estimatetowards generating early warning for rainfall-inducedlandslides in parts of the Garhwal Himalaya, India;Landslides 11(4) 575–588.
Medina S, Houze R A Jr, Kumar A and Niyogi D 2010Summer monsoon convection in the Himalayan region:Terrain and land cover effects; Quart. J. Roy. Meteor. Soc.136 593–616.
Miller D J and Burnett K M 2008 A probabilistic model ofdebris-flowdelivery to streamchannels, demonstrated for theCoast Range of Oregon, USA; Geomorphology 94 184–205.
Mourre L, Condom T, Junquas C, Lebel T, Sicart J E,Figueroa R and Cochachin A 2016 Spatio-temporal assess-ment of WRF, TRMM and in situ precipitation data ina tropical mountain environment (Cordillera Blanca, -Peru); Hydrol. Earth Syst. Sci. 20 125–141.
Negi S S 1995 Cold deserts of India; Indus PublishingCompany, New Delhi.
Negi H S and Kanda N 2019 An appraisal of spatio-temporalcharacteristics of temperature and precipitation usinggridded datasets over NW Himalaya; Climate Change andthe White World; Springer (in press).
Nikolopoulos E I, Crema S, Marchi L, Marra F, GuzzettiF and Borga M 2014 Impact of uncertainty in rainfallestimation on the identification of rainfall thresholds fordebris flow occurrence; Geomorphology 221 286–297.
Norris J, Carvalho LMV and Co-authors 2017 The spatiotempo-ral variability of precipitation over the Himalaya: Evaluationof one-year WRF model simulation; Clim. Dyn. 49 2179.
Ochoa A, Pineda L, Crespo P and Willems P 2014 Evaluationof TRMM 3B42 precipitation estimates and WRF retro-spective precipitation simulation over the Pacific–Andeanregion of Ecuador and Peru; Hydrol. Earth Syst. Sci. 183179–3193.
Owen L A, Kamp U, Khattak G A, Harp E, Keefer D K andBauer M 2008 Landslides triggered by the 8 October 2005Kashmir earthquake; Geomorphology 94(1–2) 1–9.
Pardeshi S D, Autade S E and Pardeshi S S 2013 Landslidehazard assessment: Recent trends and techniques; Spring-erPlus 2 523.
Pradhan B 2010 Application of an advanced fuzzy logic modelfor landslide susceptibility analysis; Int. J. Comput. Int.Syst. 3(3) 370–381.
Pradhan S B 2019 July 16 Nepal floods Death toll touches 78over 17 500 displaced; The Wire, https://www.theweek.in/wire-updates/international/2019/07/16/fgn24-nepal-floods-toll.html.
Raj A 2013 Is Ladakh a ‘cold desert’?Curr. Sci.104(6) 687–688.Rasmussen K L and Houze R A Jr 2012 A flash-flooding storm
at the steep edge of high terrain: Disaster in the Himalayas;Bull. Am. Meteorol. Soc. 93 1713–1724.
Ray T K, Sinha D and Guhathakurta P 2001 Landslides inIndia; India Meteorological Department Pune, pre-pub-lished scientific report No. 1/2001 20.
Riad PH, Billib M, Hassan A A, Salam M A and El DinMN 2011 Application of the overlay weighted model andBoolean logic to determine the best locations for artificialrecharge of groundwater; J. Urban Environ. Eng. 5(2) 57–66.
Riaz M T, Basharat M, Hameed, N, Shafique M and Luo J 2018A data-driven approach to landslide-susceptibility mapping inmountainous terrain: Case study from the northwest Hima-layas, Pakistan; Nat. Hazards Rev. 19 05018007.
Saaty TL 1980 The Analytical Hierarchy Process: Planning,Priority Setting, Resource Allocation; 1st edn, McGraw-HillNew York, ISBN: 0070543712.
Saaty T L 1990 An exposition of the AHP in reply to the paper‘‘remarks on the analytic hierarchy process; Manag. Sci.36(3) 259–268.
Shit P K, Bhunia G S and Maiti R 2016 Potential landslidesusceptibility mapping using weighted overlay model(WOM); Model. Earth Syst. Environ. 2 21.
Skamarock W C and Co-authors 2008 A description of theAdvanced Research WRF version 3; NCAR Tech. NoteNCAR/TN-475 + STR 113.
Tewari M, Chen F, Wang W, Dudhia J, LeMone M A,Mitchell K, Ek M, Gayno G, Wegiel J and Cuenca R H 2004Implementation and verification of the unified NOAH landsurface model in the WRF model (Formerly Paper Number17.5), In: 20th Conference on Weather Analysis andForecasting/16th Conference on Numerical Weather Pre-diction; Am. Meteor. Soc., pp. 11–15.
Thayyen R J, Dimri A P, Kumar P and Agnihotri G 2013Study of cloudburst and flash floods around Leh, Indiaduring August 4–6, 2010; Nat. Hazards 65 2175–2204.
J. Earth Syst. Sci. (2020) 129 30 Page 19 of 20 30

Ventra D and Clarke L E (eds) 2018 Geology andGeomorphology of Alluvial and Fluvial Fans: Terrestrialand Planetary Perspective; Geological Society, London440.
Vijith H, Krishnakumar K N, Pradeep G S, Ninu KrishnanM V and Madhu G 2013 Shallow landslide initiationsusceptibility mapping by GIS-based weights-of-evi-dence analysis of multi-class spatial data-sets: A casestudy from the natural sloping terrain of Western
Ghats, India; Georisk: Ass. Manag. Risk Eng. Syst.Geohazards 8 48–62.
Wang Y Q, Ma C B and Wang Z F 2019 Prediction ofLandslide Position of Loose Rock Mass at Mountain TunnelExit; Adv. Civ. Eng. 2019 3535606.
Ziegler A D, Cantarero S I, Wasson R J, Srivastava P,Spalzin S, Chow W T L and Gillen J 2016 A clear andpresent danger: Ladakh’s increasing vulnerability to flashfloods and debris flows; Hydrol. Process. 30 4214–4223.
Corresponding editor: NAVIN JUYAL
30 Page 20 of 20 J. Earth Syst. Sci. (2020) 129 30