SURVEY OF - Data Tools
62
FEBRUARY 1943 SURVEY OF UNITED STATES DEPARTMENT OF COMMERCE BUREAU OF FOREIGN AND DOMESTIC COMMERCE
-
Upload
khangminh22 -
Category
Documents
-
view
3 -
download
0
Transcript of SURVEY OF - Data Tools
FEBRUARY 1943
SURVEY OF
UNITED STATES DEPARTMENT OF COMMERCE
BUREAU OF FOREIGN AND DOMESTIC COMMERCE

Volume23
SURVEY OF CURRENT BUSINESS
FEBRUARY 1943
ECONOMIC HIGHLIGHTS........ . . . . . . . . . . • • . . . . . . . . . . . . . . . . . . . . 2
THE BUSINESS SITUATION..................................... 3 The Budget Message...................................................... 4
Curtailment of the Civilian Economy. . . . . . . . . • • • . . • . . . . . . . . . . . . . . . . . . . . . . . 5
Foreign Trade............................................................ 9
THE EFFECTIVENESS OF PRICE CONTROL. . . . . . . . . . . . . . . . . . . . 10
BRITISH MANPOWER CONTROL EXPERIENCE. . . . . . . . . . . . . . . . 16
STATISTICAL DATA: Monthly Business Statistics............................................... s-1 General Index .................................................. Inside back cover
Published by the Department of Commerce, JESSE H. JoNES, Secretary, and issued through the Bureau of Foreign and Domestic Commerce, GRosvENOR M. JoNEs, Acting Director
Number 2
Subscription price of the monthly and weekly issues of the SURVEY oF CuRRENT BusiNESS, $2 a year. Single-copy price: Monthly, 15 cents; weekly, 5 cents.
508256-43-1
Foreign subscriptions, $3.50. Price of the 1942 Supplement is 50 cents. Make remittances only to Superintendent of Documents, Washington, D. C.

2 SURVEY OF CURRENT BUSINESS February 1943
Economic Highlights Anthracite Production Reflects Labor Troubles
Production of Pennsylvania anthracite coal during 1942 aggregated nearly 60 million tons, 3 million tons more than 1941 output, but well below the peak reached by the industry in 1917, when nearly 100 million tons were produced. For the past several decades anthracite has been steadily declining in relative
MILLIONS OF SHORT TONS 8
Production and Stocks of Pennsylvania Anthracite.
importance as a source of energy. Thus in 1940 it represented only 5 percent of all energy in the United States, as against 12 percent during the period of the last war, 1916-20. The secular decline in anthracite production has been accompanied by a movement of workers away from the industry, but inN ovember 1942 an estimated 66,000 wage earners still remained. During January labor difficulties, affecting at least 15 thousand workers, cut production appreciably, and threatened to produce serious local shortages of this fuel. For the past several months stocks of anthracite have been growing according to the usual seasonal pattern but have been well below prior year levels. Settlement of the labor difficulties means that production can be expanded rapidly to make up any deficiency incurred in January.
Living Costs Advancing More Rapidly in U.S. Than in Canada
Comparison between indexes of Canadian and American living costs since the outbreak of war reveals some significant differences in behavior. Living costs in Canada felt the impact of the war somewhat earlier, a result primarily of greater relative
INDEX, 1935-39 •100 13 0
Cost of Living in the United States and Canada.
participation in the war by that country. During most of 1941 living costs rose about equally in the two countries, but late in the year the Canadian economic stabilization program went into effect. The comprehensive character of this program, which brought wages and food prices underlcontrol, is reflected in the comparatively modest advance in the index during 1942. In contrast, our own price control program was generalized only in May 1942, while wages were not brought under control until October. Farm product and food prices have been perhaps least effectively controlled and this fact has contributed heavily to the rising cost of living in this country. Both the indexes probably understate the true rise in living costs because of quality deterioration, illegal price advances, and changes in consumption patterns.
Sales of War Savings Bonds Lagging
Sales of war savings bonds,
which reached a peak of more than 1 billion dollars during January 1942, have failed to maintain that high level dur
ing recent months. December was the first month since Jan
uary in which s~les again
topped the 1 billion mark.
This lag in sales has occurred
despite the increasing partici
pation of individuals in pay
roll deduction plans which now
account for roughly 400 mil
lion dollars per month in sales.
For the entire year 1942, sales
of war-savings bonds amounted to more than 9 billion dollar~,
MILLIONS OF DOLLARS 1200
20
REDEMPTIONS (ORIGINAL PURCHASE PRICE
AND ACCRUED INTERES~
0~~~~~~~~~~~~~~~ 1941 1942 D. D . •• -U
Sales, Redemptions, and Pay-roll Deductions for U. S. Savings Bonds. Series E, F, and G.
of which an estimated 6 billions
represented net sales to inrli
viduals. This latter figure is
only about 5 percent of 1942
income payments and accounts
for less than 30 percent of the
increase in income paymentE
during the year. In terms of
the estimated net savings of
individuals, savings bond pur
chases represented slightly
more than one-fifth of the total
savings in 1942. Much larger
bond sales are required if a
substantial alleviation of in
flationary pressure is to result
from this program.
February 1943 SURVEY OF CURRENT BUSINESS 3
The Business Situation
BUSINESS developments in January conformed closely to a wartime pattern whose dominant
feature is scarcity of resources relative to needs. Although the Nation's resources are· larger than ever before, war-stimulated demands surpass them. Requests for productive capital, materials, and men for one vital purpose are therefore weighed carefully against demands based on other vital needs.
From this angle, it is clear that the Casablanca conference of President Roosevelt, Prime Minister Churchill, and other United Nation leaders must have a deep economic as well as military and political significance. The plans for world-wide assault in 1943 against the Axis nations necessarily must rest upon extensive American participation. Hence the strategy
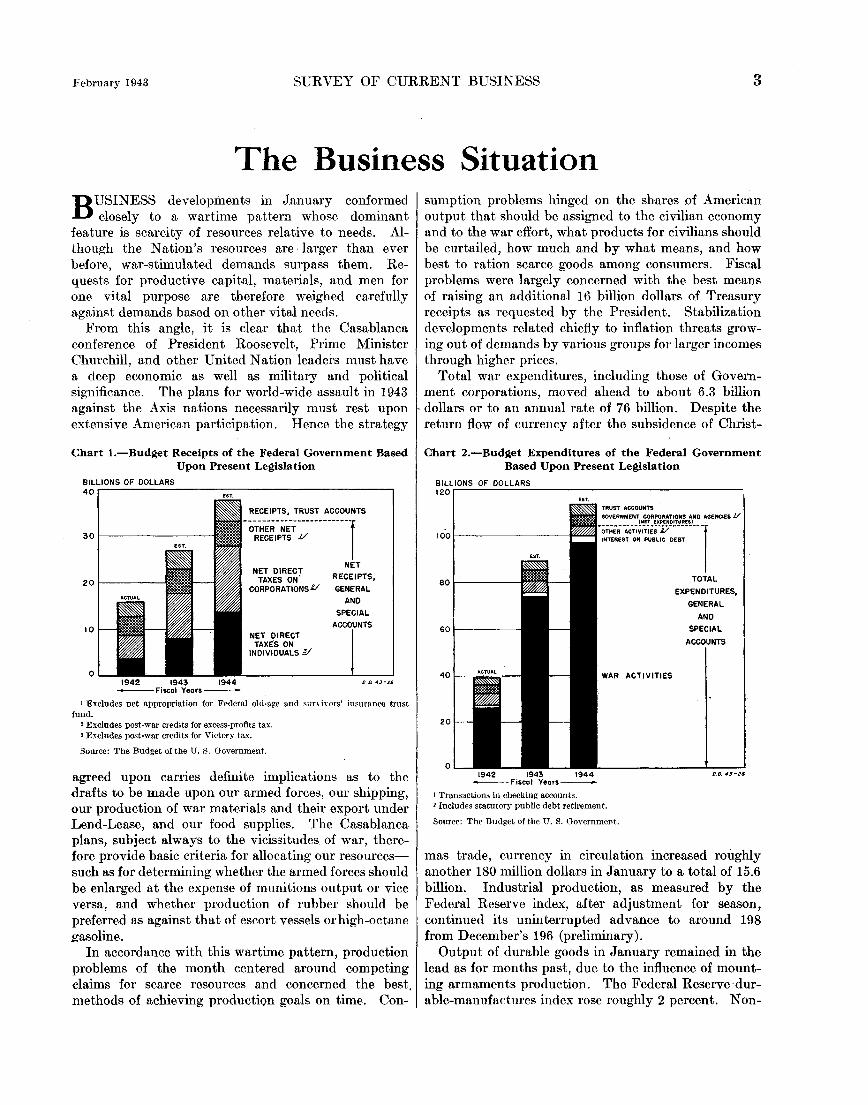
Chart 1.-Budget Receipts of the Federal Government Based Upon Present Legislation
BILLIONS OF. DOLLARS 40
10
0 1942 1943 1944
----.Fiscal Years---
RECEIPTS, TRUST ACCOUNTS
o~~¥:~~~ir;---------i
NET DIRECT NET TAXES ON' RECEIPTS,
CORPORATIONSV GENERAL
NET DIRECT TAXES ON
INDIVIDUALS Y
AND
SPECIAL
ACCOUNTS
D. 0. <#3-25
1 Excludes net appropriation for Federal old-age and sun iYors' insurance trust fund.
' Excludes post-war credits for excess-profits tax. ' Excludes post-war credits for Victory tax.
Source: The Budget of the U. S, Government.
agreed upon carries definite implications as to the drafts to be made upon our armed forces, our shipping, our production of war materials and their export under Lend-Lease, and our food supplies. The Casablanca plans, subject always to the vicissitudes of war, therefore provide basic criteria for allocating our resourcessuch as for determining whether the armed forces should be enlarged at the expense of munitions output or vice versa, and whether production of rubber should be preferred as against that of escort vessels or high-octnne gasoline.
In accordance with this wartime pattern, production problems of the month centered around competing claims for scarce resources and concerned the best. methods of achieving production goals on time. Con-
sumption problems hinged on the shares of American output that should be assigned to the civilian economy and to the war effort, what products for civilians should be curtailed, how much and by what means, and how best to ration scarce goods among consumers. Fiscal problems were largely concerned with the best means of raising an additional 16 billion dollars of Treasury receipts as requested by the President. Stabilization developments related chiefly to inflation threats growing out of demands by various groups for larger incomes through higher prices.
Total war expenditures, including those of Government corporations, moved ahead to about 6.3 billion
· dollars or to an annual rate of 76 billion. Despite the return flow of currency after the subsidence of Christ-
Chart 2.-Budget Expenditures of the Federal Government Based Upon Present Legislation
BILLIONS OF DOLLARS 120
1001--------
801------
601------
40
0 1942 1943 1944
---Fiscal Years~
t Transactions in checking accounts. 'Includes statutory public debt retirement.
Source: The Budget of the U. S. Government.
TOTAL
EXPENDITURES,
GENERAL
AND
SPECIAL
ACCOUNTS
mas trade, currency in circulation increased roughly another 180 million dollars in January to a total of 15.6 billion. Industrial production, as measured by the Federal Reserve index, after adjustment for season, continued its uninterrupted advance to around 198 from December's 196 (preliminary).
Output of durable goods in January remained in the lead as for months past, due to the influence of mounting armaments production. The Federal Reserve ·durable-manufa.ctures index rose roughly 2 percent. Non-

4 SURVEY OF CURRENT BUSINESS February 1943
durable goods output increased only slightly. Minerals output, seasonally adjusted, also increased somewhat, despite declines in anthracite coal and crude petroleum production.
There were indications that employment and the flow of materials through the war industries moved to higher levels during the month. The wholesale-price level again forged ahead by approximately 1 percent. Farm product prices, as usual, led the advance with a gain of 3 percent. Food prices rose about one-half of 1 percent further. If this rate of price-level advance should continue for the entire year, wholesale prices would end the year 7 percent higher than at its beginning. The obvious conclusion is that inflationary pressures during the month were still more powerful than the stabilizing factors.
The Budget Message
The President's budget message, calling for a war outlay of 100 billion dollars during the fiscal year beginning July 1, serves as an economic blueprint of the future. Aside from its implications with respect to civilian supply, the budget message and accompanying estimates have other significant economic implications. It pointed out that under existing revenue legislation probable expenditures during the next fiscal year will be only one-third covered by receipts from current taxes and other sources. To raise this cover toward one-half of expected outlay, the President called for new legislation to yield 16 billion dollars of additional current revenue from taxes or forced savings or both.
The fiscal problem thus assumed renewed prominence and is certain to bulk large in coming legislative deliberations. Finding the additional revenue in ways which will involve an equitable distribution of sacrifice and at the same time make a maximum contribution to the checking of existing inflationary pressures will be a difficult but necessary assignment. Proposals for current collection of taxes, for forced savings in addition to those provided for in the Revenue Act of 1942, and for revenue measures designed to cut deeply and directly into the spendable incomes of individuals are bound to receive consideration.
Budget Recommendations Not Unexpected.
The size of the budget brought no important immediate economic repercussions, since the financial magnitude of the "maximum program for waging war" has been widely appreciated for some time. While the actual budget estimates, like those of a year ago, are naturally subject to revision with the progress of military developments, these revisions probably will not alter, except in degree, the character of the contemplated Government outlays or of the fiscal problems arising from the war program.
Table 1.-Federal Government Receipts, Expenditures, and Debt Under Present Legislation
[;vfilJions of dollars]
Fiscal years
Item Actual, Estimated, Forecast,
1942 1943 1944
Total receipts ....... ------------------------------ 15,990
Net receipts to general and special accounts... 12, 799 Direct taxes on individuals_______________ 3, o95
Personal income tax__________________ 3, 263 Victory tax, less post-war credit_ _____ ----------Estate tax·--------------------------- 340 Gift tax_______________________________ 92
Direct taxes on corporations______________ 5, 022 Corporate income tax_________________ 3, 069 Excess profits tax, less post-war credit_ 1, 618 Declared value excess profits tax______ 52 Capital stock tax_____________________ 282
Employment taxes, less net appropriation to trust funds .. _________________________ 325 Other receipts____________________________ 3, 757
Receipts to trust accounts____________________ 3,191
Total expenditures, excluding public debt retire-ment. _________ .... ---- ...... -----.--------- ....
Expenditures from general and special ac-counts .. _____ . ________________ .. _____ -------
War activities.---------------------------Interest on the public debt ______________ _ Other activities ... ------------------------
Net expenditures of Government corporations and agencies ........ ______________________ __ R. F. C. and subsidiaries ________________ _ Other Government corporations and
agencies ....... _ .. _____________ . ___ .. __ _ Trust account expenditures ___ .. _. _______ ._ .. .
Public debt, beginning of year .................. .. Factors of change in public debt during year:
Deficit in venera! and special accounts .... __ _ Net expenditures of Government corporations and agencies _______________________________ _ Net transfers to trust accounts .............. . Statutory public debt retirements ___________ _ Net change in Treasury balance--------------
Net change in public debt during year __ _ Public debt, end of year _________________________ _
39,093
32,397 26,011
I, 260 5,125
3,625 2,458
1, 167 3,072
. 48,961
19,692
3, 625 -119 -95 358
23,461 72,422
26,804 37,747
22,976 33.081 8,139 13,741 7,263 10,286
335 2, 791 500 609 41 55
9, 770 14,125 4, 015 4,195 5,370 9,480
85 90 300 360
396 457 4, 671 4, 759 3, 828 4,666
89,314 113,529
80,432 104.124 74,000 97,000
1, 850 3,000 4,582 4,124
5,042 4, 774 3, 802 3, 812
1, 240 962 3,840 4,631
72,422 134,830
57,461 71,048
5,042 4, 774 11 -35
-5 -5 -102 -63
62,408 75,719 134,830 210,549
Source: The Budget of the United States Government for fiscal year 1944.
The detailed budget estimates of receipts and expenditures, which are summarized in table 1, show that unless additional current revenue is forthcoming, the public debt, both direct and guaranteed, will rise to 135 billion dollars by next July and to 210 billions by July 1944. Such a volume of public indebtedness implies a considerable transfer outlay for interest and statutory amortization payments, and raises interesting questions about the sort of ownership distribution of Government securities which will develop out of the Treasury's coming financing activities. Latest available data on the ownership of Government securities, shown in table 2, reveal the marked concentration of these securities in financial institutions, and the uneven pattern in which Government securities have been absorbed by classes of holders during a recent period. It is, of course, not possible accurately to predict the manner in which the large increases in public debt contemplated by the budget will be distributed among investing groups. However, unless the forced-savings features of existing revenue legislation are expanded, or unless new impetus can be given to the Treasury's voluntary-savings drive, large blocks of Government securities must be taken by the commercial banking system, thus adding further to the already large growth of bank deposits.
February 1943 SURVEY OF CURRENT BUSINESS 5
Table 2.-0wnership of Securities Issued or Guaranteed by the United States: Public Marketable Interest-Beari~g Securities
[Par values in millions of dollars]
Item
December 31, 1941, par
value
November 30, 1942 Percent _______ increase
Dec. 31, Par Percent 1941• to
value of total N 1~4:f0 · ----·------------- ----------- ---·--Total amount outstanding ______________ _
Held by banks and insurance companies <'Overed in Treasury Survey_
Banks ___ ------------------------_ Commercial banks __________ _ Mutual savings banks ______ _
Insurance companies ____________ _ IAfe insurance~--------------· Fire, casualty, and marine __
Held by U.S. Government agencies and trust funds, and Federal Re-serve banks _______________________ _
IIcld by all other investors _________ _
Source: U.S. Treasury Department.
47,878 70,750
32,088 47,922 24, 230• 38, 571 20, 589 34,480 3, 641 4, 091 7,858 9, 3.11 6, 377 7, 605 1,482 1, 746
4, 801 8, 317 10,990 14,510
Budget Reflects Realinement of War Program.
100.0
67.7 54.5 48.7 5.8
13.2 10.7 2.5
11.8 20.5
47.8
49.3 59.2 67.5 12.4 19.0 19.3 17.8
73.2 32.0
The budget estimates also drew attention to the change which is occurring in the character of the warproduction program as economic mobilization proceeds. It is plain from the break-down of war expenditures given in the budget message that the period of providing facilities to produce armament, and of establishing bases for future offensive operations, is rapidly drawing to a close. Thus the military construction outlays planned for the next fiscal year are only one-half those estimated for the current fiscal period. With the program for facilities expansion thus tapering off, efforts can be concentrated upon securing the maximum volume of war material for immediate use and thus upon pursuing a more aggressive strategy at an early date.
Economic Stabilization Problems to Increase.
The budget also made plain that the magnitude of ~he financial outlays required for a maximum war program will add greatly to the difficulties of securing effective economic stabilization during the rest of the war period. Income payments, which totaled 114 billion dollars during calendar year 1942, have been forecast above 130 billions for the current year and may rise considerably higher unless wage controls are effective and price ceilings generally maintained.
In effect, the 16 billion dollars of additional revenue requested by the President are just about equal to the rise in income payments which has been forecast for this calendar year. Since civilian supplies are being reduced, it is plain that even if fiscal measures sufficient to absorb all the increase in consumer income were to be adopted, inflationary pressures might still grow. The broad-scale extension of rationing scheduled for the near future will, of course, operate to limit further the consumption of individuals and thus will add to the already large volume of liquid savings which may be tapped by new fiscal measures.
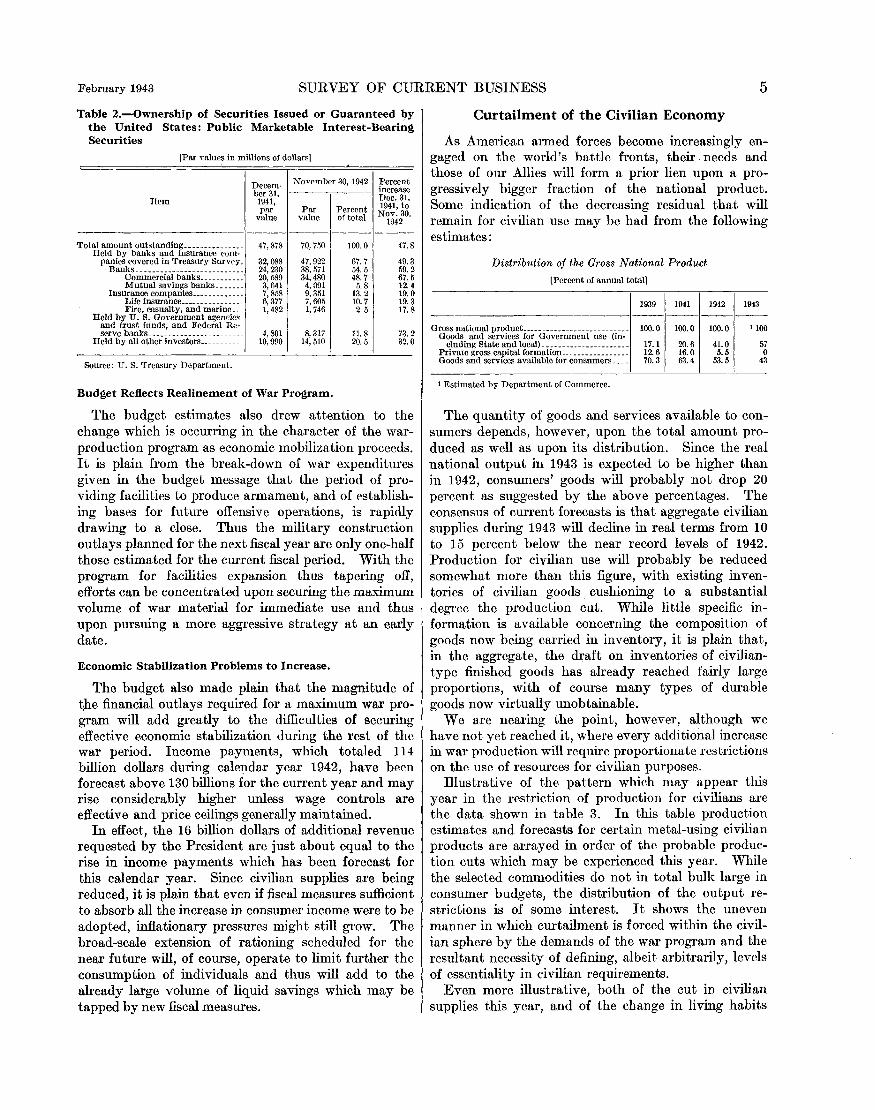
Curtailment of the Civilian Economy
As American armed forces become increasingly engaged on the world's battle fronts, their . needs and those of our Allies will form a prior lien upon a progressively bigger fraction of the national product. Some indication of the decreasing residual that will remain for civilian use may be had from the following estimates:
Distribution of the Gross National Product
[Percent of annual total]
1939 1941 1942 ------
Gross national product ___________________________ Goods and services for Government use (in-
100.0 100.0 100.0
eluding State and local) ______________________ 17.1 20.6 41.0 Private gross capital formation _________________ 12.6 16.0 5.5 Goods and services available for consumers ____ 70.3 63.4 53.5
t Estimated by Department of Commerce.
1943 ---
!JOO
57 0
43
The quantity of goods and services available to consumers depends, however, upon the total amount produced as well as upon its distribution. Since the real national output in 1943 is expected to be higher than in 1942, consumers' goods will probably not drop 20 percent as suggested by the above percentages. The consensus of current forecasts is that aggregate civilian supplies during 1943 will decline in real terms from 10 to 15 percent below the near record levels of 1942. Production for civilian use will probably be reduced somewhat more than this figure, with existing inventories of civilian goods cushioning to a substantial degree the production cut. While little specific information is available concerning the composition of goods now being carried in inventory, it is plain that, in the aggregate, the draft on inventories of civiliantype finished goods has already reached fairly large proportions, with of course many types of durable goods now virtually unobtainable.
We are nearing the point, however, although we have not yet reached it, where every additional increase in war production will require proportionate restrictions on the use of resources for civilian purposes.
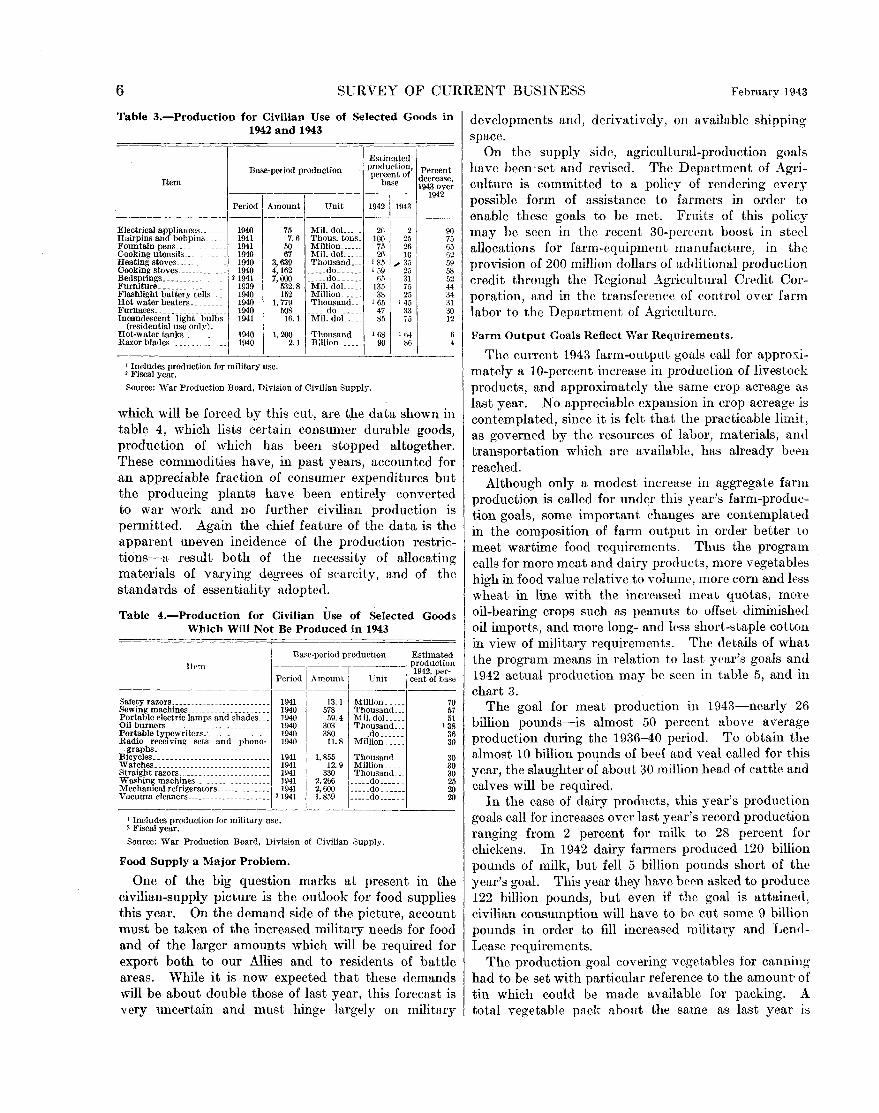
Dlustrative of the pattern which may appear this year in the restriction of production for civilians are the data shown in table 3. In this table production estimates and forecasts for certain metal-using civilian products are arrayed in order of the probable production cuts which may be experienced this year. While the selected commodities do not in total bulk large in consumer budgets, the distribution of the output restrictions is of some interest. It shows the uneven manner in which curtailment is forced within the civilian sphere by the demands of the war program and the resultant necessity of defining, albeit arbitrarily, levels of essentiality in civilian requirements.
Even more illustrative, both of the cut in civilian supplies this year, and of the change in living habits
6 SURVEY OF CURRENT BUSINESS February 194:3
Table 3.-Production for Civilian Use of Selected Goods in 1942 and 1943
Estimated Base-period production production, Percent
percent of decrease Item base 1943 ovef
----------------- 1942
Period Amount Unit 194211943
;;ectrical a;;~:ce:~~~ -1940- ---;- Mi;.~o~~~---;, ---;~----~ Hairpins and bobpins_ _ _ _ _ 1941 7. 6 Thons. tons. 100 25 75 Fountain pens _____________ 1941 50 Million______ 75 261 65 Cooking utensils____ 1940 67 Mil. doL___ 26 JG 62 Heating stoves _____________ 1940 3,639 Thousand ... 135 ; 35 59 Cooking stoves_____________ 1940 4,162 _____ do______ 1 59 25 58 Bedsprings ________________ 21941 7,000 _____ do______ 651 31 52 Furniture_________________ 1939 532.8 Mil. doL___ 135 75 44 Flashlight battery cells .. _ 1940 152 Million_____ 38 25 31 Hotwaterheaters _________ 1940 1,779 Thousand ... 165, 145 ~I Furnaces__________________ 1940 508 _____ do______ 47j 33 30 Incandescent light bulbs 1941 16.1 Mil. doL___ 85 75 12
(residential use only). [
Razor blades______________ 1940 2.1 B;Jiion__ ____ 90 86 Hot-water tanks____________ 1940 1. 200 Thousand... 168
1
1 64
I Includes production for military use. ' l<'iscal year. Source: War Production Board, Division of Civilian Supply.
which will be forced by this cut, are the data shown in table 4, which lists certain consumer durable goods, production of which has been stopped altogether. These commodities have, in past years, accounted for an appre0iable fraction of consumer expenditures but the producing plants have been entirely converted to war work and no further civilian production is permitted. Again the chief feature of the data is the apparent uneven incidence of the production restrictions-a result both of the necessity of allocating materials of varying degrees of scarcity, and of the standards of essentiality adopted.
Table 4.-Production for Civilian Use of Selected Goods Which Will Not Be Produced in 1943
I Base-period production j Estirnat_ed
1
------___________ 1 productiOn Item
j I 1942, per-Period j_A~~~~~--_:~~- ~nt of ba'e
Safety razors_________________________ 1941 Sewing machines_____________________ 1940 Portable electric lamps and shades.__ 1940 Oil burners__________________________ 1940 Portable typewriters.~--------------- 1940 Radio receiving sets and phono- 1940
graphs. Bicycles .. --------------------------- 1941 Watches_____________________________ 1941 Straight razors_______________________ 1941 Washing machines.__________________ 1941 Mechanical refrigerators ... ___________ 1941 Vacuum cleaners _____________________ '1941
I Includes production for military use. 2 Fiscal year.
13.1 Million ____ _ 578 Thousand __ _ 59.4 Mil. doL __ _
303 Thousand .. _ 380 _____ do _____ _ 11.8 Million ____ _
1, 855 Thousand __ 12. 9 Million. __ _
330 Thousand ... 2, 266 , _____ do _____ _ 2,600 ~-----dO.-----1,859 ..... do ____ __
Source: War Production Board, Division of Civilian Supply.
Food Supply a Major Problem.
70 57 51
138 36 30
30 30 30 25 20 20
One of the big question marks at present in the civilian-supply picture is the outlook for food supplies this year. On the demand side of the picture, account must be taken of the increased military needs for food and of the larger amounts which will be required for export both to our Allies and to residents of battle areas. While it is now expected that these demands will be about double those of last year, this forecast is very uncertain and must hinge largely on military
developments and, derivatively, on available shipping space.
On the supply side, agricultural-production goals have been ·set and revised. The Department of Agriculture is committed to a policy of rendering every possible form of assistance to farmers in order to enable these goals to be met. Fruits of this policy may be seen in the recent 30-percent boost in steel allocations for farm-equipment manufacture, in the provision of 200 million dollars of additional production credit through the Regional Agricultural Credit Corporation, and in the transference of control over farm labor to the Department of Agriculture.
Farm Output Goals Reflect V.'ar Requirements.
The current 1943 farm-output goals call for approximately a 10-percent increase in production of livestock products, and approximately the same crop acreage as last year. No appreciable expansion in crop acreage is contemplated, since it is felt that the practicable limit, as governed by the resources of labor, materials, and transportation which are available, has already been reached.
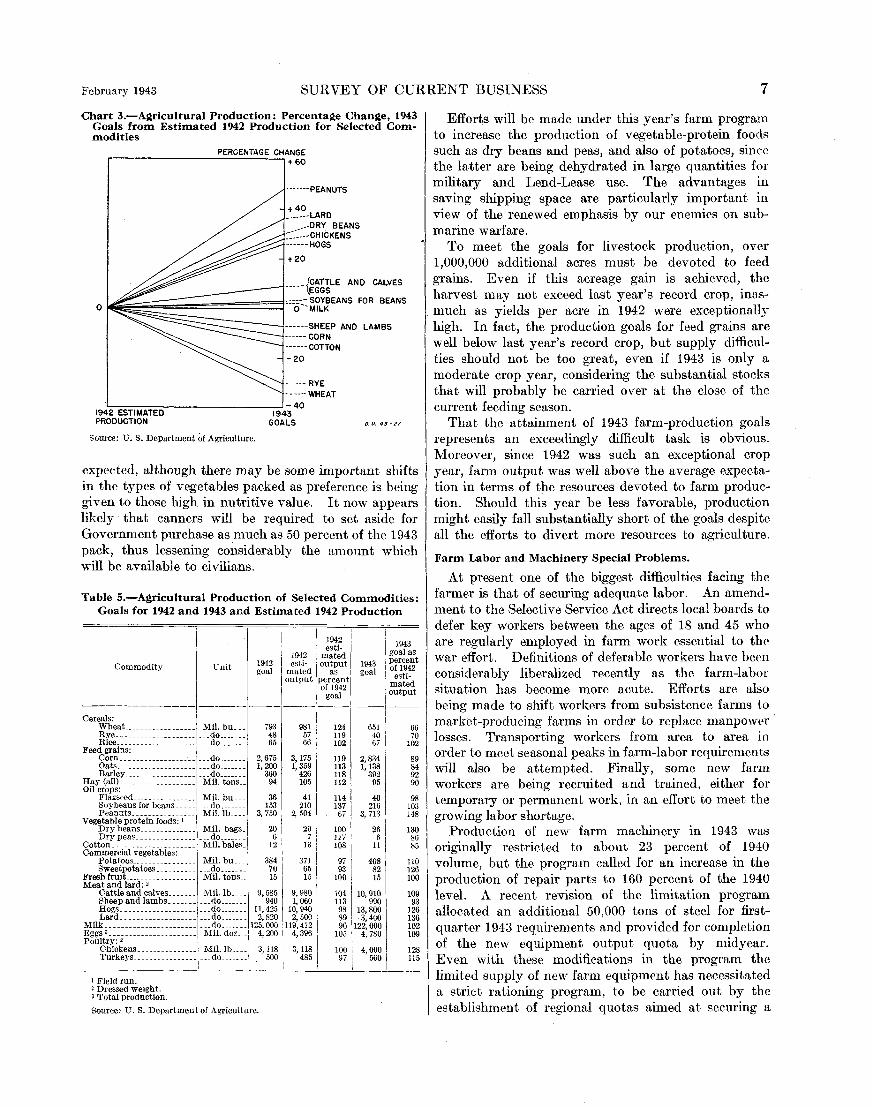
Although only a modest increase in aggregate farm production is called for und~r this year's farm-production goals, some important changes are contemplated in the composition of farm output in order better to meet wartime food requirements. Thus the program calls for more meat and dairy products, more vegetables high in food value relative to volume, more corn and less wheat in line with the increased meat quotas, more oil-bearing crops such as peanuts to offset diminished oil imports, and more long- and less short-staple cotton in view of military requirements. The details of what the program means in relation to last year's goals and 1942 actual production may be seen in table 5, and in chart 3.
The goal for meat production in 1 943-nearly 26 billion pounds-is almost 50 percent above average production during the 1936-40 period. To obtain the almost 10 billion pounds of beef and veal called for this year, the slaughter of about 30 million head of cattle and calves will be required.
In the case of dairy products, this year's production goals call for increases over last year's record production ranging from 2 percent for milk to 28 percent for chickens. In 1942 dairy farmers produced 120 billion pounds of milk, but fell 5 billion pounds short of the year's goal. This year they have been asked to produce 122 billion pounds, but even if the goal is attained, civilian consumption will have to be cut some 9 billion pounds in order to fill increased military and LendLease requirements.
The production goal covering vegetables tor canning had to be set with particular reference to the amount· of tin which could be made available for packing. A total vegetable pack about the same as last year is
February 1943 SURVEY OF CURRENT BUSINESS 7
Chart 3.-Agricultural Production: Percentage Change, 1943 Goals from Estimated 1942 Production for Selected Commodities
PERCENTAGE CHANGE + 60
-------PEANUTS
t 40 -------LARD
---DRY BEANS ::-:~---CHICKENS ------HOGS
t20
-----]CATTLE AND CALVES --- \.EGGS
~~~~~~~~~~~~~~::::-SOYBEANS FOR BEANS 0 I o--MILK
------SHEEP AND LAMBS ------CORN ------COTTON
-20
------RYE -----WHEAT
194'';:;2:-;E:;:S:::T:-::IM;-:A:=T=:ED;:----------I-,-J943 40
PRODUCTION GOALS o.o. 43-27
Source: U.S. Department of Agriculture.
expected, although there may be some important shifts in the types of vegetables packed as preference is being given to those high in nutritive value. It now appears likely that canners will be required to set aside for Government purchase as much as 50 percent of the 1943 pack, thus lessening considerably the amount which will be available to civilians.
Table 5.-Agricultural Production of Selected Commodities: Goals for 1942 and 1943 and Estimated 1942 Production
Commodity Unit
I 1942 I I esti- I I 1942 mated I
1942 I esti- output I 1943 goal mated as goal
output percent[
I of 1942
1943 goal as percent of 1942
estimated output goal I
~~~~;~~i~ --i'- :nrm_'--,~1~--~~ Feed grains: Corn ______________________ do _______ 2,675 3,175 U9 2,834 89 Oats _______________________ do _______ 1,200 1,359 113 1,138 84 Barley __________________ ... do_______ 360 426 118 392
1
, 92 Hay (all) ___________________ Mil. tons__ 94 105 112
4
9
0
5 90 Oil crops:
Flaxseed ________________ Mil. bu... 36 41 114 98 Soybeans for beans _____ ... do_______ 153 210 137 216 103 Peanuts ________________ Mil.lb____ 3, 750 2, 504 67 3, 7131 148
Vegetable protein foods: 1 100
! g? ~;:~s ------------- Mj~ bags_ 28 2~ m 1 2~ 1~~
g~}!~:reiai~~~i~i~~;~;,::::: ·M:il.bales:l 12 13 10
9
8
7
,i u 1 85 Potatoes ________________ Mil. bu... 384 371 408 1 110 Sweetpotatoes _____________ do_______ 70 65 93 1 82 126
Fresh fruit __________________ Mil. tons.. 15 15 100 I 15 100 Meat and lard: ' I Cattleandcalves _______ Mil.lb ____ 9,585 9,980 104 10,910 109
Sheep and lambs _________ do_______ 940 1,060 113 990 93
f~!L::::::::::::::::: :::~~::::::: 1~:~~g 1g:~6g ~~ 1~:~8 ~~~ Milk·----------------------1---rto _______ 125,000 119,412 96 [122,000 102 Eggsa ______________________ .
1
1\Iil. dot .. 4,200 1
4,396 105! 4, 780 109 Poultr)_': ' . 1 [ I
Chickens _______________ Mll.lb____ 3,118 [ 3,118 100 I 4,000 I 128 Turkeys ________________ l ___ do __ . ____ • 500, 485 97 560 115
I • I I
1 Field run. ' Dressed weight. a Total production.
Source: U.S. Department of Agriculture.
Efforts will be made under this year's farm program to increase the production of vegetable-protein foods such as dry beans and peas, and also of potatoes, since the latter are being dehydrated in large quantities for military and Lend-Lease use. The advantages in saving shipping space are particularly important in view of the renewed emphasis by our enemies on submarine warfare.
To meet the goals for livestock production, over 1,000,000 additional acres must be devoted to feed grains. Even if this acreage gain is achieved, the harvest may not exceed last year's record crop, inasmuch as yields per acre in 1942 were exceptionally high. In fact, the production goals for feed grains are well below last year's record crop, but supply difficulties should not be too great, even if 1943 is only a moderate crop year, considering the substantial stocks that will probably be carried over at the close of the current feeding season.
That the attainment of 1943 farm-production goals represents an exceedingly difficult task is obvious. Moreover, since 1942 was such an exceptional crop year, farm output was well above the average expectation in terms of the resources devoted to farm production. Should this year be less favorable, production might easily fall substantially short of the goals despite all the efforts to divert more resources to agriculture.
Farm Labor and Machinery Special Problems.
At present one of the biggest difficulties facing the farmer is that of securing adequate labor. An amendment to the Selective Service Act directs local boards to defer key workers between the ages of 18 and 45 who are regularly employed in farm work essential to the war effort. Definitions of deferable workers have been considerably liberalized recently as the farm-labor situation has become more acute. Efforts are also being made to shift workers from subsistence farms to market-producing farms in order to replace manpower losses. Transporting workers from area to area in order to meet seasonal peaks in farm-labor requirements will also be attempted. Finally, some new farm workers are being recruited and trained, either for temporary or permanent work, in an effort to meet the growing labor shortage.
Production of new farm machinery in 1943 was originally restricted to about 23 percent of 1940 volume, but the program called for an increase in the production of repair parts to 160 percent of the 1940 level. A recent revision of the limitation program allocated an additional 50,000 tons of steel for firstquarter 1943 requirements and provided for completion of the new equipment output quota by midyear. Even with these modifications in the program the limited supply of new farm equipment has necessitated a strict rationing program, to be carried out by the establishment of regional quotas aimed at securing a
8 SURVEY OF CURRENT BUSINESS February 1943
proper geographical distribution of the new equipment. Although an intensive repair program was carried out at the instigation of the Department of Agriculture last year, wi~h the result that the condition of machinery on farms was generally improved, considerably more cooperative pooling of equipment will be required in order to meet minimum needs.
Offsetting these problems of labor and equipment supply are certain favorable factors in the agricultural outlook. Reserves in the Ever-Normal Granary help to· provide the largest feed supplies on record. Animal populations at the beginning of the year were the largest in our agricultural history. Through the soil-conservation program of the past several years the fertility of the soil has been developed in many areas. Price supports assure producers of attractive returns for the desired production of essential commodities.
Chief uncertainty in connection with the achievement of 1943 farm-production goals is, of course, the weather. Crop yields last year averaged 12 percent above previous records, yet acreage this year cannot feasibly be increased. Should yields in 1943 be about average those of the period 1937-41, instead of exceptional as they were last year, this year's goals might be missed by from 10 to 15 percent. The serious implications of this possibliity are obvious.
Food Supplies May Be Seriously Short.
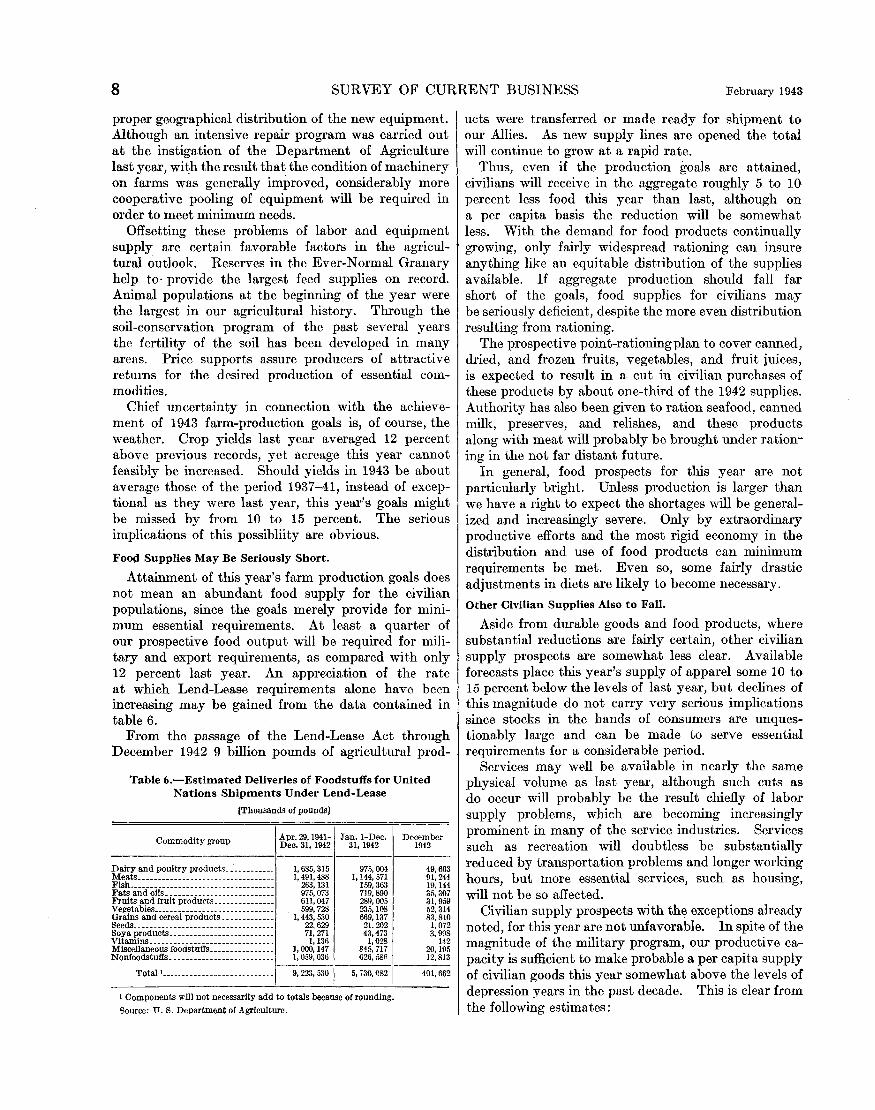
Attainment of this year's farm production goals does not mean an abundant food supply for the civilian populations, since the goals merely provide for minimum essential requirements. At least a quarter of our prospective food output will be required for military and export requirements, as compared with only 12 percent last year. An appreciation of the rate at which Lend-Lease requirements alone have been increasing may be gained from the data contained in table 6.
From the passage of the Lend-Lease Act through December 1942 9 billion pounds of agricultural prod-
Table 6.-Estimated Deliveries of Foodstuffs for United Nations Shipments Under Lend-Lease
[Thousands of pounds]
Commodity group Apr. 29, 1941- Jan. 1-Dec. December Dec. 31, 1942 31, 1942 1942
--------------1----------------· Dairy and poultry products _ _-_________ _ Meats_.--------- ___ . ____ . _____________ _ Fish. _________________________ ----------Fats and oils.-------------------------Fruits antl. fruit produrts_ --------------Vegetables __________________ ------------Grains and cereal products._-----------Seeds ..... ____ --------------------------Soya products __ ------------------------Vitamins _____________ -----------------. Miscellaneous foodstuffs _______________ _ Nonfoodstuffs __ ---------------. ______ _
1, 685, 315 97.5, 004 49,663 1, 491,488 1, 144, 571 91, 241
263, 131 159, 363 19. 144 975,073 719,890 3fi, 307 611,047 289,005 31, 959 599, 728 235, 108 52, 314
I, 443, 530 669, 137 83. 810 22, 629 21. 202 1, 072 71, 271 43,473 3, 998
1, 136 1, 028 142 1, 000,147 84.5, 717 20,195 I, 059,036 626, 586 12,813
---------1-----Totall. __________________________ . 9, 223,530 5, 730,0821 401,662
1 Components will not necessarily add to totals because of rounding.
'>ource: U. S. Department of Agriculture.
nets were transferred or made ready for shipment to our Allies. As new supply lines are opened the total will continue to grow at a rapid rate.
Thus, even if the production goals are attained, civilians will receive in the aggregate roughly 5 to 10 percent less food this year than last, although on a per capita basis the reduction will be somewhat less. With the demand for food products continually growing, only fairly widespread rationing can insure anything like an equitable distribution of the supplies available. If aggregate production should fall far short of the goals, food supplies for civilians may be seriously deficient, despite the more even distribution resulting from rationing.
The prospective point-rationingplan to cover canned, dried, and frozen fruits, vegetables, and fruit juices, is expected to result in a cut in civilian purchases of these products by about one-third of the 1942 supplies. Authority has also been given to ration seafood, canned milk, preserves, and relishes, and these products along with meat will probably be brought under rationing in the not far distant future.
In general, food prospects for this year are not particularly bright. Unless production is larger than we have a right to expect the shortages will be generalized and increasingly severe. Only by extraordinary productive efforts and the most rigid economy in the distribution and use of food products can minimum requirements be met. Even so, some fairly drastic adjustments in diets are likely to become necessary.
Other Civilian Supplies Also to Fall.
Aside from durable goods and food products, where substantial reductions are fairly certain, other civilian supply prospects are somewhat less clear. Available forecasts place this year's supply of apparel some 10 to 15 percent below the levels of last year, but declines of this magnitude do not carry very serious implications since stocks in the bands of consumers are unquestionably large and can be made to serve essential requirements for a considerable period.
Services may well be available in nearly the same physical volume as last year, although such cuts as do occur will probably be the result chiefly of labor supply problems, which are becoming increasingly prominent in many of the service industries. Services such as recreation will doubtless be substantially reduced by transportation problems and longer working hours, but more essential services, such as housing, will not be so affected.
Civilian supply prospects with the exceptions already noted, for this year are not unfavorable. In spite of the magnitude of the military program, our productive capacity is sufficient to make probable a per capita supply of civilian goods this year somewhat above the levels of depression years in the past decade. This is clear from the following estimates:

February 1943 SURVEY OF CURRENT BUSINESS 9
Index Numbers of Physical Volume of Civilian Purchases per Head of Civilian Population
(1941=100)
Year
1932 ______ : ___________________________________________ _ 1933 __________________________________________________ _ 1938 __________________________________________________ _ 1939 __________________________________________________ _ 1940 __________________________________________________ _
mi:(i~~~~~;ij~::::: :::::::::::::::::::::::::::::::: ~:: 1
Commodities Commodities and services only
65 68 82 87 92
100 98 88
58 60 76 85 90
100 95 80
The estimates are necessarily very rough and merely indicate approximate changes from year to year on the basis of the best data at present available. Changes in the types and quality of consumer goods and services purchased render exact comparison with former years virtually impossible. However, under the widespread rationing which IS contemplated for the balance of the war period, supplies of consumer goods will undoubtedly be much more nearly equally distributed than they were during the depression years.
Foreign Trade
Exports in 1942, exclusive of shipments to our armed forces overseas, reached the all-time high of 7.8 billion dollars, or about 5 percent of last year's gross national product. The shipment of this dollar volume of exports, 50 percent greater than ~n 1941, was made possible largely by the Nation's Lend-Lease policy. The LendLease component of 1942 exports accounts for over 60 percent of the total, and in October, November, and December over two-thirds of our shipments to allied and friendly powers were so constituted.
Not only did Lend-Lease exports register a striking mcrease in quantity, but they also changed materially m composition, as shown by the following data, during the past year.
Composition of Lend-Lease Exports
[Percent]
Total Agricul- Indus-tural trial
1 941. _____________________________ 100 44 21 19 42 (11 months) _________________ 100 22 28
Military
35 50
Their geographic distribution also· changed. For reasons of security, the geographic distribution of American foreign trade, other than Lend-Lease, is not revealed. In this connection, however, smce LendLease exports form such a large proportion of total exports, analysis of their geographic destinations is of some interest. Up until December of _last year shipments to the Soviet Union were largely composed of military and industrial goods, but there are indications
508256-43--2
Distribution of Lend-Lease Exports [Percent of total]
1941 ___ ---------------------------1942 (11 months) ___ --------------
Total
100 100
United Middle and Kingdom U.S.S.R. ;;;~ro~h~
76 41
0 28
24 31
that food shipments will increase in importance in the future.
Nominally the Nation had an export balance of over 5 billion dollars in 1942-higher than at any time in the history of the country. If Lend-Lease exports are excluded as falling outside the limits of ordinary balance-of-payments accounting, however, the 1942 export balance is still about one-half a billion dollars. Non-Lend-Lease exports, in value terms, in 1942 were almost as large as in pre-war 1939.
Table 7.-United States Foreign-Trade Summary [Millions of Dollars)
Total Balance Total Lend- exports, General of exports,
Year and month exports I,ease excluding imports excluding Lend- Lend-Lease Lease
---1939 _________________ 3,177 ------------ 3,177 2,318 859 1940 _________________ 4,021 ------------ 4,021 2,625 1,396 194J. ________________ 5,147 741 4,406 3,345 1,061 1942_ ---------------- • 7, 826 • 4, 668 • 3,158 • 2, 743 • 415
January _________ 479 176 303 254 50 February ________ 478 194 234 254 30 March __________ 611 310 301 272 29 ApriL __________ 695 403 292 234 58 May. ___________ 525 295 230 191 39 June __ ---------- 618 374 244 215 29 July _____________ 629 397 232 214 18 August __________ 694 423 271 184 87 September ______ 718 453 265 196 69 October_-------- 776 537 239 199 40 November ______ 750 524 226 174 52 December'------ • 853 • 582 • 271 • 356 •-85
• Preliminary. 1 December figures include some exports and imports actually made but not
tabulated in prior months._ Sources: U.S. Department of Commerce and the Office of Lend-Lease Adminis
tration.
Because of the acute shipping shortage and the loss through enemy action of major sources of supply for several commodities which normally constitute a large part of the goods received from abroad, the dollar volume of imports in 1942 fell below the level of 1941. They were, however, larger than in 1939 and 1940.
The emphasis now is upon importing those commodities which are essential to the prosecution of the war. The Import problem is thus to maintain or to increase Imports of graphite, industrial diamonds, jute, mica splittings, beryllium, tungsten, bauxite, and other strategic commodities that play vital parts in our war effort. The' importance of these imports to a nation fighting for existence can scarcely be measured m dollar terms. Currently, approximately one-half of the total volume of imports consists of commodities such as these which are classified by the Government as strategic and criticaL
10 SURVEY OF CURRENT BUSINESS February 1943
The Effectiveness of Price Control By Don D. Humphrey, Office of Price Administration
Formal price control began in the spring of 1941 and was extended step by step to cover industrial materials basic to the war effort. Retail prices, on the other hand, remained uncontrolled until more than a year later when the General Maximum Price Regulation was made effective in May 1942.
Throughout 1941, price control was based upon Executive Authority. Hearings on a bill were begun in mid-summer. But it was not until February 1942, a full year after the first formal price schedule, that the act to control prices finally became effective. 1
Wholesale Prices
Nearly nine-tenths of the rise in wholesale prices between August 1939, when war in Europe became imminent, and October 1942 occurred before statutory authority to control prices was provided. This is evident from the data contained in table 1.
Table !.-Percentage Changes in Wholesale Prices 1
Commodity group August 19391 February to October 1942 to
1942 October 1942
All commodities ______________________________________ _ 33.3 3.4 Farm products ___________________________________ _ Foods ____________ --- ________ ---------- ___________ -
78.7 7.6 53.9 9. 3
All industrial products __ ----------------------- __ _ 19.2 .6 Hides and leather products __________________ _ 27.1 2.2 Textile products _____ ---------------------- ___ _ Fuel and lighting materials __________________ _ Metals and metal products _____________ _
43.2 2.0 8.8 1.3
11.5 . 3 Building materials ___________________________ _ 23.2 .2 Chemicals and allied products _______________ . 29.6 -.8 Housefurnishing goods __ ---------- __________ _ 19.7 .0 Miscellaneous ________________________________ _ 20.9 -.7
I Pr;ce increases unless otherw;se indicated by a minus sign.
Source: U. 8. Department of Labor and Office of Price Administration.
Industrial prices (all prices other than those-·of farm products and foods) had risen 19 percent by October 1942. But the rise after February 1942, when the Emergency Price Control Act became effective, was negligible. Prices of farm products had risen nearly 79 percent by October 1942-or over 4 times as much as industrial prices. Food prices had risen 54 percent, or almost 3 times as much as industrial prices. But it should not be forgotten that faim prices were a) normally low in August 1939.
Only the prices of farm product~ and foods (and
1 The price control bill became"law on January 30, 1942, but did not become actually effective until early in February. ln this case as well as in others where price changes are measured from a specific event the price indexes for the month nearest the date of the event have been employed. The Bureau of Labor Statistics price indexes used throughout the discussion generally represent, in the case of wholesale prices, monthly averages of weekly price data, although certain stable price items are computed as of the first of the month. In the case of cost of living the price index is as of the !.5th of the month.
those of certain other processed farm commodities) eontinued to rise signifieantly after passage of the Price Control Act.
During 1941, the control of industrial prices was extended to about half of the economy at the manufacturing and wholesale levels. In June of that year, 10 percent of industrial products were under control. The extension of price ceilings to hides, pig iron, fine cotton goods, raw silk, copper, raw cane sugar, Douglas fir plywood, formaldehyde, rayon, and other products brought the controlled fraction to 35 percent in September.
In the final quarter of the year, control over prices of additional chemicals, of textiles and leather prodnets, and, following Pearl Harbor, of a number of imports (such as green eoffee, eocoa beans, pepper, fats and oils) brought the eontrolled frac'tion of the industrial price structure to about 50 percent by the end of the year.
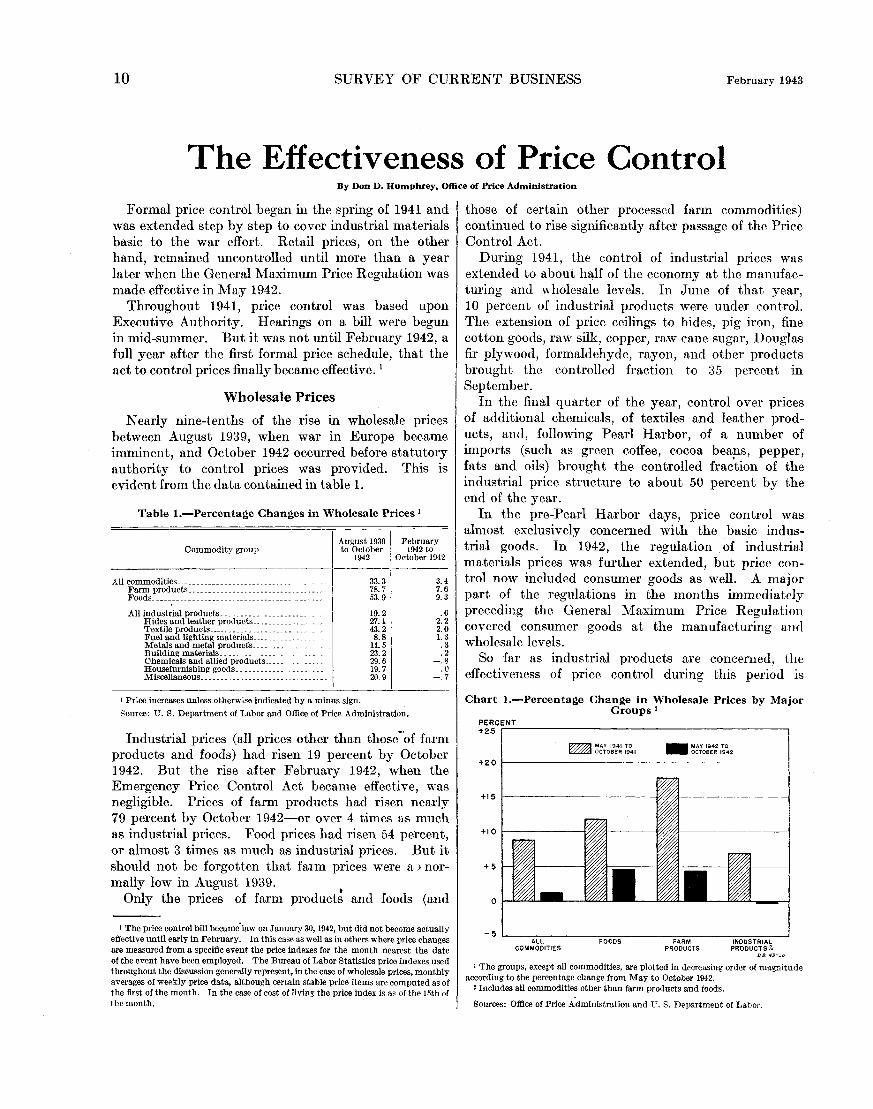
In the pre-Pearl Harbor days, price control was almost exclusively concerned with the basic industrial goods. In 1942, the regulation of industrial materials prices was further extended, but price control now included consumer goods as well. A major part of the regulations in the months immediately preceding the General Maximum Price Regulation covered consumer goods at the manufaeturing and wholesale levels .
So far as industrial products are concerned, the effectiveness of price control during this period is
Chart 1.-Percentage Change in Wholesale Prices by Major Groups 1
~~~CErN~T--------------------,
+20 r----------------------~
+15 r---------------f;
+5
- 5 ~--A~LL---------F~OO~D~S--------F-AR_M _____ IN-D-US~T~RI-AL--~ COMMODITIES PRODUCTS PRODUCTS&'
I The groups, except all commodities, are plotted in decreasing order of magnitude according to the percentage change from May to October 1942.
' Includes all commodities other than farm products and foods. -
Sources: Office of Price Administration and U. S. Department of Labor.
February 1943 SURVEY OF CURRENT BUSINESS 11
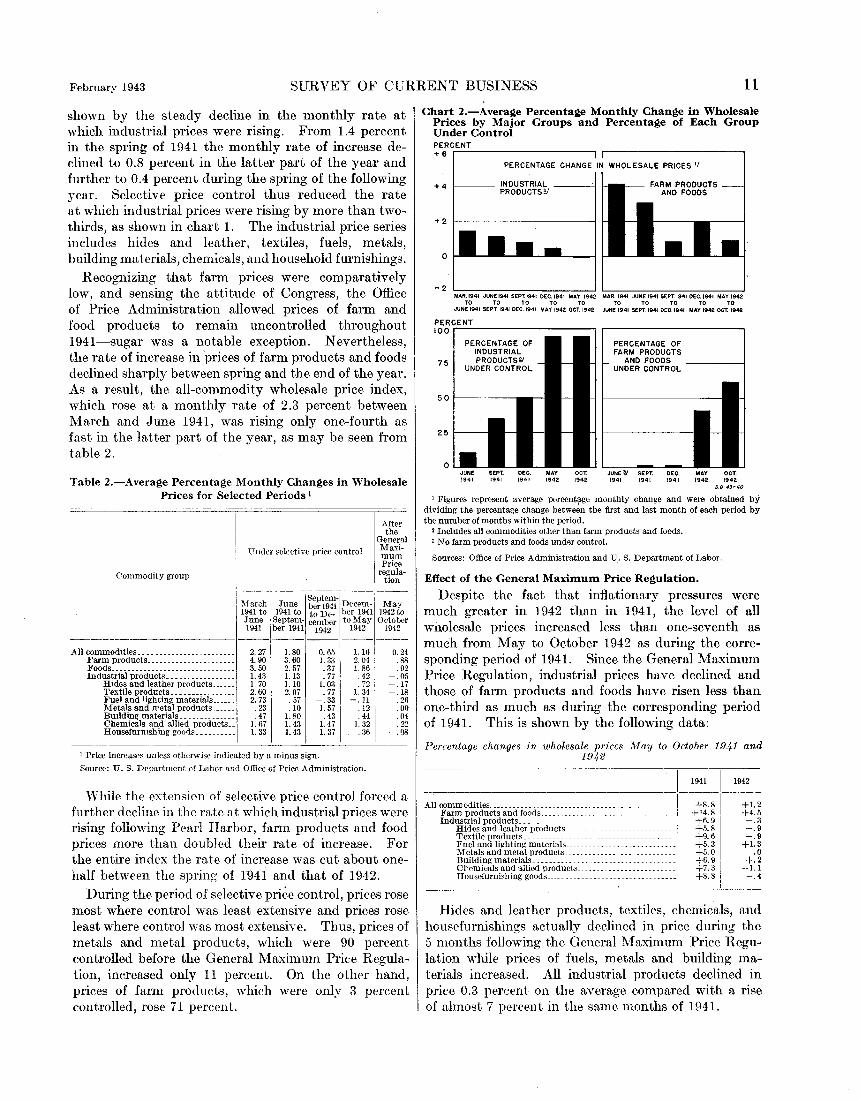
shown by the steady decline in the monthly rate at which industrial prices were rising. From 1.4 percent in the spring of 1941 the monthly rate of increase declined to 0.8 percent in the latter part of the year and further to 0.4 percent during the spring of the following year. Selective price control thus reduced the rate at which industrial prices were rising by more than twothirds, as shown in chart 1. The industrial price series includes hides and leather, textiles, fuels, metals, building materials, chemicals, and household furnishings.
Recognizing that farm prices were comparatively low, and sensing the attitude of Congress, the Office of Pric~ Administration allowed prices of farm and food products to remain uncontrolled throughout 1941-sugar was a notable exception. Nevertheless, the rate of increase in ·prices of farm products and foods declined sharply between spring and the end of the year. As a result, the all-commodity wholesale price index, which rose at a monthly rate of 2.3 percent between March and June 1941, was rising only one-fourth as fast in the latter part of the year, as may be seen from table 2.
Table 2.-Average Percentage Monthly Changes in Wholesale Prices for Selected Periods 1
Under selective price control
Commodity group
After the
General Maximum Price
regulation
~~~~:~~~:~-~~~\~~~::: -May 1941 to 1941 to to De- her 1941 1942 to June Septem- cember to May October 1941 ber 1941 1942 1942 1942
All commodities._______________________ 2. 27 I. 80 0. 6.) Farm products______________________ 4.90 3. 60 1. 33 Foods_____________________ 3. 50 2. 57 0 37 Industrial products. ___ .. ___________ 1. 4~
Hides and leather products______ 1. 70 Textile products .. ______________ 2. 60
1.13 . 77 1.10 1. 03 2.07 .77
Fuel and lighting materials______ 2. 73 .57 -.33 Metals and II' eta! products _ _ _ _ _ . 23 BUilding materials______________ .47
. 10 1. 57 1.80 .43
Chemicals and allied products.. 1. 67 1.43 1.47 Housefurmshing goods__________ 1. 33 1. 43 1. 37
I Price increases unless otherwise indicated by a minus sign.
1.10 2. 04 1. 86 .42 . 72
1. 34 -.11
.12
. 44 1. 32 . 36
Source: U. S. Dcpart.ment of Labor and Office of Prico Administration.
0. 24 . 88 . 92
-.05 -.17 -.18
.26
. 00
. 04 -. 22 -.08
'\Vhile the extension of selective price control forced a further decline in the rate at which industrial prices were rising following Pearl Harbor, farm products and food prices more than doubled their rate of increase. For the entire index the rate of increase was cut about onehalf between the spring of 194l and that of 1942.
During the period o£ selective price control, prices rose most where control was least extensive and prices rose least where control was most extensive. Thus, prices of metals and metal products, which were 90 percent controlled before the General Maximum Price Regulation, increased only 11 percent. On the other hand, prices of farm products, which were onl;.' 3 percent controlled, rose 71 percent.
Chart 2.-Average Percentage Monthly Change in Wholesale Prices by Major Groups and Percentage of Each Group Under Control PERCENT +6
0
-2
75
25
0
MAR.I941 JUNE 1941 SEPt 1941 DEC. 1941 MAY 1942 MAR. 1941 JUNE 1941 SEPT.1941 DEC. 1941 MAY 1942 M M M M M M M M M M
JUNE 1941 SEPT. 1941 DEC. 1941 MAY 1942 OCT. 1942 JUNE 1941 SEPT. 1941 DEC.I941 MAY 1942 OCT. 1942
JUNE SEPT. DEC. MAY OCT. 1941 1941 1941 1942 1942
PERCENTAGE OF FARM PRODUCTS
AND FOODS UNDER CONTROL
JUNE~ SEPT. DEC. MAY OCT. 1941 1941 1941 1942 1942
' Figures represent average percent~tge monthly change and were obtained by dividing the percentage change between the first and last month of each period by the number of months within the period.
' Includes all commodities other than farm products and foods. ' No farm products and foods under control.
Sources: Office of Price Administration and U. S. Department of I,abor.
Effect of the General Maximum Price Regulation.
Despite the fact that inflationary pressures were much greater in 1942 than in 1941, the level of all wholesale prices increased less than one-seventh as much from May to October 1942 as during the corresponding period of 1941. Since the General Maxinmm Price Regulation, industrial prices have declined and those of farm products and foods have risen less than one-third as much as during the corresponding period of 1941. This is shown by the following data:
Percentage changes in wholesale prices l<1ay to October 1941 and 1942
- - 1 1941 1 1942
All com:~~~;:~~~~~~~~~~~~~~~-~~~~~~~-~--~--~;.;r~ Farm products and foods____ ------- i +14. 81 +4. 5 Industrial products ____________________________________ i +6. 9 -. 3
Hidesandleatherproducts ____________________ ------1 +5.8 -.9 Textile products.________________ ____ __ _ ! +9. 6 -. 9 Fnel and lighting materials _________________________ ..
1
+5. 3 +L 3 Metals and metal products _ _ _ _ _ _ _ _ _ _ _ _ _ _ _ _ _ ' +5. 0 I . 0
~~~gHci~~J~r~\i.;.I iii0<ii1cts-:: _::::::::::::: _: ' +U 1 -t i Housefurnishing goods _________________________ ------, +8.8 : -.4
I I
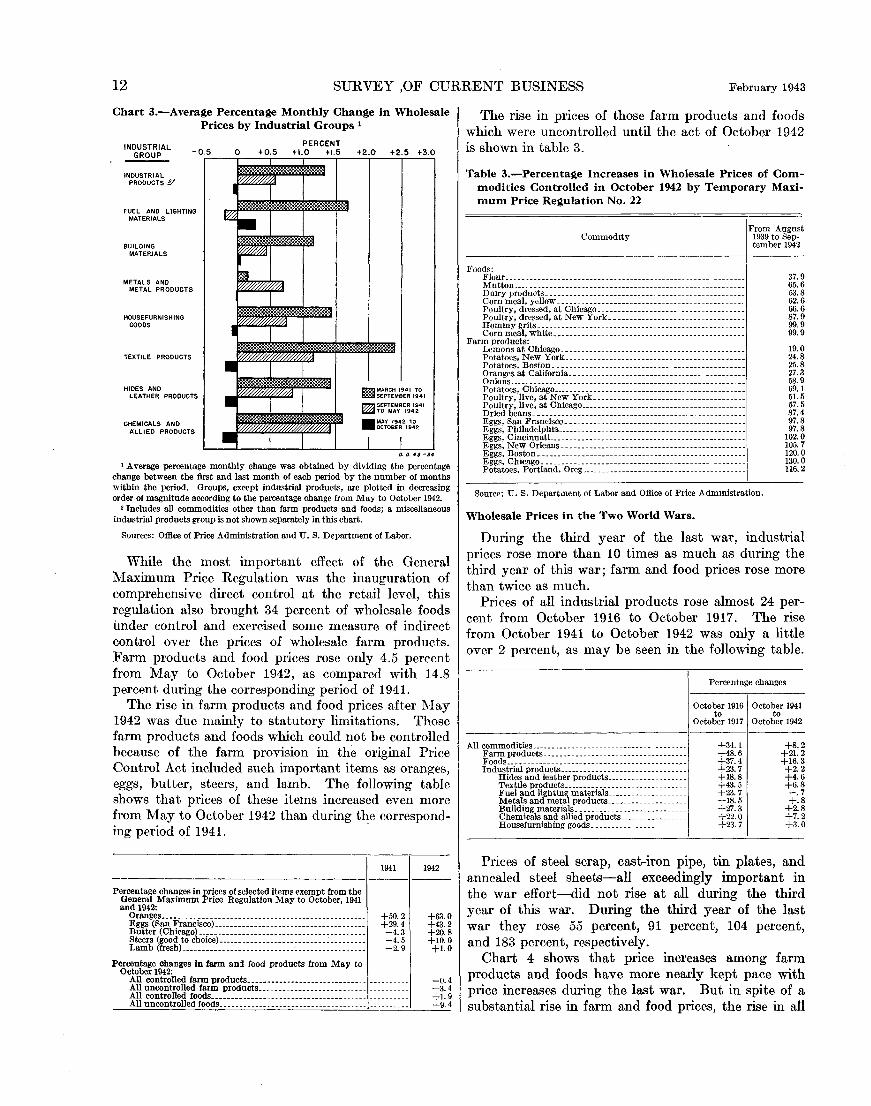
Hides and leather products, textiles, chemicals, and housefurnishings actually declined in price during the 5 months following the General Maximum Price Regulation while prices of fuels, metals and building materials increased. All industrial products declined in price 0.3 percent on the average compared with a nse of almost 7 percent in the same months of 1941.
12 SURVEY ,OF CURRENT BUSINESS February 1943
Chart 3.-Average Percentage Monthly Change in Wholesale Prices by Industrial Groups 1
PERCENT INDUSTRIAL GROUP -0 5 0 +0 5 +I 0 +I 5 +2 0 +2 5 +3 0
INDUSTRIAL PRODUCTS Y
FUEL AND LIGHTING MATERIALS
BUILDING MATERJALS
METALS AND METAL PRODUCTS
HOUSEFURNISHING GOODS
TEXTILE PRODUCTS
HIDES AND LEATHER PRODUCTS
CHEMICALS AND ALLIED PRODUCTS
ro::m I
r.z:::: • -~ ~ ~
I
~ ~ 0/.1
• l'l"/////~~A m~:~;~M~E~ ,;~I • ~SEPTEMBER 1941
TO MAY 1942
~ Ill ~t~o~~~2 1 :~2
~ I I o. 0. 43 ~34
1 Average percentage monthly change was obtained by dividing the percentage change between the first and last month of each period by the number of months within the period. Groups, except industrial products, are plotted in decreasing order of magnitude according to the percentage change from May to October 1942.
' Includes all commodities other than farm products and foods; a miscellaneous industrial products group is not shown separately in this char!.
Sources: Office of Price Administration and U. S. Department of Labor.
While the most important effect of the General Maximum Price Regulation was the inauguration of comprehensive direct control at the retail level, this regulation also brought 34 percent of wholesale foods under control and exercised some measure of indirect control over the prices of wholesale farm products. Farm products and food prices rose only 4.5 percent from May to October 1942, as compared with 14.8 percent during the corresponding period of 1941.
The rise in farm products and food prices after l\Iay 1942 was due mainly to statutory limitations. Those farm products and foods which could not be controlled because of the farm provision in the original Price Control Act included such important items as oranges, eggs, butter, steers, and lamb. The following table shows that prices of these items increased even more from May to October 1942 than during the corresponding period of 1941.
Percentage changes in prices of selected items exempt from the General Maximum Price Regulation May to October, 1941 and 1942: Oranges _________________________________________________ --
~~it-~8(ch1~,:~~~:~~============== == =: ==== = = =::::::::::: Steers (good to choice)-------------------------------------Lamb (fresh)----------- ________ ---------~---- ____ ---------
Percentage changes in farm and food products from May to October 1942:
1941 1942
+50.2 +29.4 -4.3 -4.5 -2.9
+63.0 +43.2 +20.8 +10.0 +LO
All controlled farm products ______________________________ ---------- -0.4 All uncontrolled farm products___________________________ __________ +3. 4 All controlled foods.-------------------------------------- __________ +1. 9 All uncontrolled foods .. ___________________________________ __ __ _ __ _ __ +9. 4
The rise in prices of those farm products and foods which were uncontrolled until the act of October 1942 is shown in table 3.
Table 3.-Percentage Increases in Wholesale Prices of Commodities Controlled in October 1942 by Temporary Maximum Price Regulation No. 22
Commodity
Foods: Flour--------------------------------------------------- --------Mutton .... ------- __ -----------_-------- __ -----------------------
gg::;J~~e~:l~ow~:=::::::=====:=::=:::::.:::::::::::::::::::::~ Poultry, dressed, at Chicago ____________________ ----------------Poultry, dressed, at New York._--------------------------------
~g~~~:C~ilite==:=:=:==:::::=:=::::::::::::::::::::::::::::::: Farm products:
Lemons at Chicago_------------------ _________________________ __ Potatoes, New York _______________________________________ --- __ _ Potatoes, Boston._---------- _____ ------------ ------------------
g~~~~~~-~~-~-~~~~~~~~: == := =: :==:::::::::::::::::::::::-:::::::-:: Potatoes, Chicago ______________________________ ---- ___ -----------Poultry,live, at New York _____________________________________ _ Poultry,live, at Chicago _________________ ------------------------Dned beans_--------------------- __ --------------- . ------------
~~~~; ~t~l~J:l~~~~---=======::::=:::::::::::::::::::::::::::=:::: ~~~~; ~~~io~r:!;;s~ == ==== === === =: = := = = :=: := =: =::::: = =:::::::: :::
i!i:io~~~wii~~~; =6i~~=-~~===== == == == = == = = = = = =::: =::::::: =: =::::
From August 1939 to September 1942
37.9 65.6 53.8 62.6 66.6 87.9 99.9 99.9
19.0 24.8 25.8 27.3 .58. 9 69.1 51.5 57.5 87.4 97.8 97.8
102.0 105.7 120.0 130.0 116.2
Source: U. S. Depart,nent of Labor and Office of Price Administration.
Wholesale Prices in the Two World Wars.
During the third year of the last war, industrial prices rose more than 10 times as much as during the third year of this war; farm and food prices rose more than twice as much.
Prices of all industrial products rose almost 24 percent from October 1916 to October 1917. The rise from October 1941 to October 1942 was only a little over 2 percent, as may be seen in the following table.
Percentage changes
October 1916 October 1941 to to
October 1917 October 1942 ---------------------------------All commodities ...... ------------------------ -------
Farm products------------------------------------Foods .... ____ -- ___ . __ .--_-- __ -- .. --.---.-- _______ _ Industrial products------------------------- ______ _
Hides and leather productS--------------------Textile products .. _______ ----------------------Fuel and lighting materials __________________ __ Metals and metal products ___________________ _ Building materials .. ------------------------ __ Chemical~ and allied products ________________ _ Housefurnishing goods_. ___ . _____ ... _________ _
+34.1 +48.6 +37.4 +23.7 +18.8 +43.5 +23. 7 +18.5 +27.3 +22.0 +23. 7
+8.2 +21.2 +16.3 +2.2 +4.6 +6.8 -.7 +.8
+2.8 +7.2 +3.0
Prices of steel scrap, cast-iron pipe, tin plates, and annealed steel sheets-all exceedingly important in the war effort-did not rise at all during the third year of this war. During the third year of the last war they rose 55 percent, 91 percent, 104 percent, and 183 percent, respectively.
Chart 4 shows that price increases among farm products and foods have more nearly kept pace with price increases during the last war. But in spite of a substantial rise in farm and food prices, the rise in an

February 1943 SURVEY OF CURRENT BUSINESS 13
wholesale prices during the third year of this war has been only one-fourth as great as during the corresponding period of the last war.
Price pressures increase with the size of the war. effort. Last time, war production apparently never exceeded one-third of total output. This time, the
-proportion may be approximately twice as great. Already war production is engaging almost half our resources.
Chart 4.-Percentage Increase in Wholesale Prices by Major Groups, World Wars I and II 1
PERCENT 60
20
10
ALL COMMODITIES
~ gg~g=~~ :::~TO
- g~~g=~= ::~~TO
D.O. 4:S-S5
' Groups, except all commodities, are plotted in decreasing order of magnitude according to the percentage change from October 1941 to October 1942.
J Includes all commodities other than farm products and foods. -
Sources: Office of Price Administration and U. S. Department of Labor.
Adjustments That Follow a Price Freeze
A broad freeze of ceiling prices such as that embodied in the General Maximum Price Regulation is only a stop-gap for holding inflation.2 It was regarded at the outset as a temporary measure to be replaced by specific regulations as rapidly as was feasible. This program of replacing the General Maximum Price Regulation has already made considerable headway and is now being pushed to completion. In the interim, however, it has been necessary to provide relief for gross inequities not only by exceptions in individual hardship cases but also by more general price regulations involving a variety of base dates and formula methods of pricing. An additional need for granting relief from ceiling prices based on March 1942 has arisen in the case of those foods which were uncontrolled at the farm level. The rise of these farm prices since the base date has created a squeeze on processors or distributors.
The regulations employing price formulae in the food and clothing fields must be regarded as temporary expedients. Nevertheless, the complexity of these regulations has impaired voluntary compliance and has
' Direct price control also requires the support of other anti-inflation measures. At the time the General Maximum Price Regulation was announced, the President sent to Congress a 7-point program including heavier taxes, reduced spending and the stabilization of !arm wages and income.
created a serious obstacle in the path of enforcement. It should be recognized that the complexity of the regulations has grown out of the effort to provide price ceilings that were equitable.
Roll-Backs to Relieve Inequities.
It has also been the policy of the Office of Price Administration to relieve squeezes by rolling back cost prices which had been frozen at inequitably high levels. The principal roll-backs, of course, have been to provide relief for retailers, although some have also been made to help wholesalers and processors. Some examples of the roll-back technique are treated briefly in the following paragraphs:
Milled rice.-Prices of milled rice at the processor level bad risen substantially during March 1942. This increase was not reflected in the March prices of wholesalers and retailers so that the General Maximum Price Regulation effected a severe squeeze on them at these levels. To permit wholesalers and retailers to continue sales at March highs, prices of milled rice at the processor level were rolled back roughly 65 cents per hundred pounds or about 8 percent.
Beef and veal carcasses and wholesale cuts.-March highs for these products at the packers' and wholesalers' levels resulted in a squeeze on retailers. To relieve this squeeze, the Office of Price Administration has, in cases of packers and wholesalers, set maximum prices for each grade no higher than the lowest price at which each individual merchandiser sold at least 30 percent of his total quantity of that grade during the period March 18 to 28, 1942. Retailers are allowed to continue to price at their March highs. By this action, packers and wholesalers were prevented from charging their March highs which were considerably above the average prices at which they had been selling during March.
Soap.-Manufacturers of soap had increased their prices in January and February 1942. Increases had not been reflected in prices charged by retailers by March so that the General Maximum Price Regulation resulted in a severe squeeze at the manufacturing level. In order to relieve these squeezes, the Office of Price Administration asked soap manufacturers to roll back their prices from March highs and the manufacturers voluntarily agreed to do so in June 1942. On the other hand, prices of fats and oils had increased substantially so that reductions in manufacturers' prices threatened to effect a squeeze at this level. In order to relieve any possible squeeze on manufacturers, it was necessary to roll back prices of inedible tallow and grease, the major soap-making fats, by 1 cent per pound.
Men's and boys' tailored clothing.-The General Maximum Price Regulation froze clothing prices at March highs. By March, however, retailers had not adjusted their prices to the higher prices charged by manufacturers and wholesalers. In order to relieve a squeeze at
14 SURVEY OF CURRENT BUSINESS February 194:3
the retail level, it was required that manufacturers and wholesalers price on the basis of sales made during the period July to November 1941, when prices were considerably under March highs. Retailers were permitted to maintain their March highs as their maximum prices.
Cost of Living
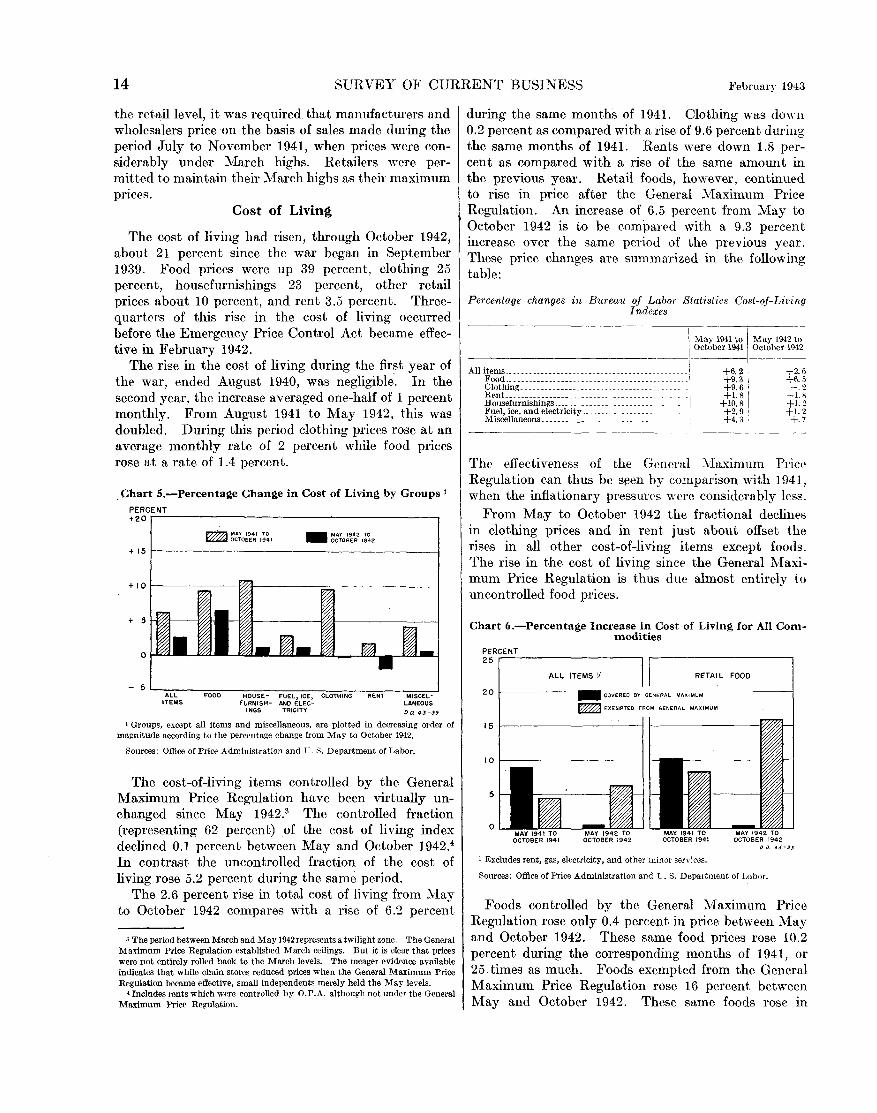
The cost of living had risen, through October 1942, about 21 percent since the war began in September 1939. Food prices were up 39 percent, clothing 25 percent, housefurnishings 23 percent, other retail prices about 10 percent, and rent 3.5 percent. Threequarters of this rise in the cost of living occurred before the Emergency Price Control Act became effective in February 1942.
The rise in the cost of living during the first year of the war, ended August 1940, was negligible. In the second year, the increase averaged one-half of 1 percent monthly. From August 1941 to May 1942, this was doubled. During this period clothing prices rose at an average monthly rate of 2 percent while food prices rose at a rate of 1.4 percent.
. Chart 5.-Percentage Change in Cost of Living by Groups 1
PERCENT +2or-----------------------------------------,
- 5 ~~----~~--~~~~~~~~~~~--~~~ ALL FOOD HOUSE- FUEL, ICE) CLOTHING RENT MISCEL-
ITEMS FURNISH- AND ELEC- LANEOUS INGS TRICITY o.a 4 3-39
during the same months of 1941. Clothing was down 0.2 percent as compared with a rise of 9.6 percent during the same months of 1941. Rents were down 1.8 percent as compared with a rise of the same amount in the previous year. Retail foods, however, continued to rise in price after the General Maximum Price Regulation. An increase of 6.5 percent from May to October 1942 is to be compared with a 9.3 percent increase over the same period of the previous year. These price changes are summnTized in the following table:
Percentage changes in Bureau of Labor Statistics Cost-of-Living Indexes
The effectiveness of the General ?vlaximum Price Regulation can thus be seen by comparison with 1941, when the inflationary pressun•s were considerably less.
From May to October 1942 the fractional declines in clothing prices and in rent just about offset the rises in all other cost-of-living items except foods. The rise in the cost of living since the General Maximum Price Regulation is thus due almost entirely to uncontrolled food prices.
Chart 6.-Percentage Increase in Cost of Living for All Commodities
PERCENT 25
ALL ITEMS.!! RETAIL FOOD
201------- -COVERED 8': GENERAL MAXIMUM
~ EXEMPTED FROM GENERAL MAXIMUM
1 Groups, except all items and miscellaneous, are plotted in decreasing order of 15 1-------------J t---------t% magnitude according to the percentage change from May to October 1942.
Sources: Office of Price Administration and U.S. Department of Labor.
The cost-of-living items controlled by the General Maximum Price Regulation have been virtually unchanged since May 1942.3 The controlled fraction (representing 62 percent) of the cost of living index declined 0.1 percent between May and October 1942.4
In contrast the uncontrolled fraction of the cost of living rose 5.2 percent during the same period.
The 2.6 percent rise in total cost of living from May to October 1942 compares with a rise of 6.2 percent
' The period between March and May 1942 represents a twilight zone. The General Maximum Price Regulation established March ceilings. But it is clear that prices were not entirely rolled back to the March levels. The meager evidence available indicates that while chain stores reduced prices when the General Maximum Price Regulation became effective, small independents merely held the May levels.
• Includes rents which were controlled by O.P.A. although not under the General Maximum Price Re~ulation.
5
0
0 D . .f.1-3J
1 Excludes rent, gas, electricity, and other minor services.
Sources: Office of Price Administration and U. S. Department of Labor.
Foods controlled by the General :Maximum Price Regulation rose only 0.4 percent in price between May and October 1942. These same food prices rose 10.2 percent during the corresponding months of 1941, or 25 times as much. Foods exempted from the General Maximum Price Regulation rose 16 percent between May and October 1942. These same foods rose in

February 1943 SURVEY OF CURRENT BUSINESS 15
price about half as much during the same period of last year, as shown by the following data:
Percentage increase in cost of living, May to October 1941 and 1942
Covered by the Gen- Exempted from the era! Maximum General Maximum Price Regulation Price Regulation
---- -------------1------:----------------
All items'-----------------------------Foods ______ . __________ - ------------
1941
9.0 10.2
1942
0. 5 .4
' Excluding rent, electricity, gas, and other minor services.
1941
4.4 8. 3
1942
6. 2 15.9
Because of statutory limitations and also because of the administrative difficulty of controlling the prices of such foods as leafy vegetables about 40 percent of the urban workers' food budget was excluded from control under the General Maximum Price Regulation. It is these foods which are mainly responsible for the continued rise in the cost of living.
. Since foods represent about one-third of the cost of living index, the 16 percent rise in uncontrolled food prices is responsible for almost the entire 2.6 percent rise in the cost of living since May. Tea, coffee, and sugar, all controlled, declined slightly. Lamb and egg prices, uncontrolled by the May 1942 regulation, rose:12 and 43 percent respectively. Further contrasts are shown in the following table:
Percentage Changes in Retail Prices of Selected Items from May to October, 1941 and 1942
Controlled by General Maximum Price Regulation: Pork chops ____________________ ----------------------------Pink salmon _____________________________________________ _
~a~~i.i-Iieas~ =: :::: :::~:::: :::::::::::::::::::::::::::::::I Exempt from Gen~ral Maximum Price Regulation:
Oranges •--------------------------------------------------
~!t:!~~ ~= ::::::::::::::::::::::::::::::::::::::::::::::::I
1941 1942
+19.4 +18.5 +11.5 +3.0
+32.5 +5.3 -4.1 +7.9
-.2 +.9 +.7
-7.6
+41. 7 +18.2 +51.1 +32.9
1 Controlled after passage of the act of Oct. 2, 1942 amending tbe Price Control Act.
With the passage of the Act of!October 2, amending the first Price Control Act, ceilings were promptly placed over most of the foods exempted from the General Maximum Price Regulation. Since August 1939 these foods have risen 55 percent.
The Cost of Living in Two Wars.
The effectiveness of price control in this war is further shown by a comparison with the last war. During a period corresponding roughly to the third year of World War !-October 1916 to October 1917-the cost of living rose almost 20 percent. During the third year of this war-October 1941 to October 1942-the rise was about 9 percent, or less than half as much. And most of this increase occurred before the General Maximum Price Regulation went into effect in May.
Chart 7.-Percentage Increase in Cost of Living by Selected Groups, World Wars I and II 1
PERCENT 50
~ OGTOB£R 1916 TO ~ OCTOBER 1917
-
OCTOBER 1941 TO OCTOBER 1942.
40r-------------~------~
D.O. •U-J6
' Groups, except all items, are plotted in decreasing order of magnitude according to the percentage change from October 1941 to October 1942.
' Includes rent, fuel, electricity and ice, aud miscellaneous groups not shown separately in this chart.
Sources: Office of Price Administration and U.S. Department of Labor.
Trend of Recent Regulations
There were inevitably some price disparities and inequities in March 1942 when ceiling prices were frozen. In the foods field, where the problem was most acute, the so-called retail squeeze has :r;tow been eliminated. Food prices have risen even faster at the retail than at the processor level in recent months with the result that dollar margins of food distributors have increased very substantially. This increase in distributors' margins is in part due to violations and in part a result of adjustments to the margins prevailing in March. Among the regulations which attempted to correct-inequities were No. 237 and No. 238 which provided relief margins on a number of commodities such as coffee, sugar, canned vegetables, shortening, and cereals. Others such as No. 236 permitted retailers to add the exact amount of the increase in cost to March ceiling prices for such commodities as canned fruits and berries, jams, jellies, etc.
A major change in the method of establishing ceiling prices is now in process for food stores. Uniform mark-ups are being established by classes of stores. On the basis of these uniform mark-ups, OP A field offices will, as far as possible, establish dollars and cents prices in each city and community. Some little time will be required to complete the program because of the difference in transportation costs and methods of distribution which must be dealt with in establishing dollars and cents ceiling prices.
The main purpose of this development is, of course, to simplify retail regulations and to provide more enforceable price ceilings. Uniform mark-ups are second choice, but are now regarded as far more enforceable than March prices.
In the 3 months' period ending February 1942, 58 (Continued on p. 24-)
16 SURVEY OF CURRENT BUSINESS February 194;5
British Manpower-Control Experience By Thomas K. Hitch
The extent of a nation's war effort depends, in the last analysis, upon the degree to which it utilizes its manpower resources. The formula for victory includes other ingredients-such as proper use of scarce materials, effective conversion of industrial facilities, and sound strategy-but the basic ingredient is a maximum contribution by every able person in his most useful capacity. Until the manpower program of the United States succeeds .in supplying that ingredient, we cannot be said to be putting forth a total effort.
For several reasons-late entry into the war, incomparably rich resources, distance from the fighting fronts-this country has not yet encountered the acute manpower shortages that have been among the chief wartime problems of Britain, Germany, and the Soviet Union. We have been able to select our army while in the main keeping family units intact; we have been able largely to disregard the contribution that the female half of the population can make; we have been able to maintain many of our civilian industries at close to maximum production. In short, as far as manpower is concerned, we have not yet mobilized for a total war.
It is now obvious that these easy days are ending. Critical shortages of particular types of labor are developing. General shortages of labor are also developing in some war-production areas. The Army's demand for recruits is growing, yet must be balanced against the need for workers at home. In more and more respects we are coming face to face with the critical manpower problems that have long plagued both our allies and our enemies. Manpower, it is now evident, will be one of our basic problems for the rest of the war.
Since we are only in the first stages of spelling out a solution to this problem, it may be useful to give a short account of Britain's experience with manpower policy and administration. Any manpower program for the United States must, of course, be framed in terms of America's specific needs, conditions, and attitudes. But, as in so many other instances-for example, rationing, price controls, concentration of production, and control of materials-we can profit by the prior experience of Britain in solving a somewhat comparable problem. The fact that Britain's war economy was introduced some 2 years before ours makes her a laboratory where we can see the testing of certain policies and programs designed to solve the problems with which we are now faced. Moreover, the basic similarity of attitudes and institutions in the two countries gives to her experience a relevancy which German or Russian experience does not have.
The British have, moreover, traveled the full length of the road that lies in front of us. While they have made mistakes, they have nonetheless put forth a tremendous effort to achieve two major manpower objectives:
(1) A complete mobilization of manpower resourcesthat is, getting every able person to contribute his full effort with full efficiency.
(2) A proper balance in the apportionment of manpower among the armed forces, the armament industries, and essential civilian production, and at the same time an allocation of skills so that each person is placed in the job where he or she can make the greatest possible contribution to the war effort.
The achievement of these objectives has called for a sustained and systematic program of positive activities on a scale never before approached in British-or American-history.
Legal Basis.
The British never questioned the proposition that every able person in the country would have to make a maximum contribution-either working or fightingif the war is to be won. Consequently, the Emergency Powers (Defense) Act of August 24, 1939, empowered the Government to take any measures necessary to secure the public safety, the defense of the realm, the maintenance of public order, and the efficient prosecution of the war. The precarious military situation which developed in the late spring of 1940 dictated extension of the act (in May) so as to require all persons in Britain to place themselves, their services, and their property at the disposal of the Government.
A regulation issued under the act on the day of its passage granted the Ministry of Labour and National Service power to direct any person in Great Britain to perform any service of which he is capable, provided that working standards-as determined by collective agreements, joint councils, or arbitration or conciliation agencies-be observed. Failing such specific determination, standards generally observed "among good employers in that trade in the district" are to be observed.
This act is the basis of the Government's authority to control and direct labor, and the regulation issued under it constitutes a basic protection to labor standards. Other acts have of course empowered the Government to call men (ages 18 to 50) and women (ages 20 to 30) for military service. In addition, everyone is required (as of January 15, 1941) to register for defense
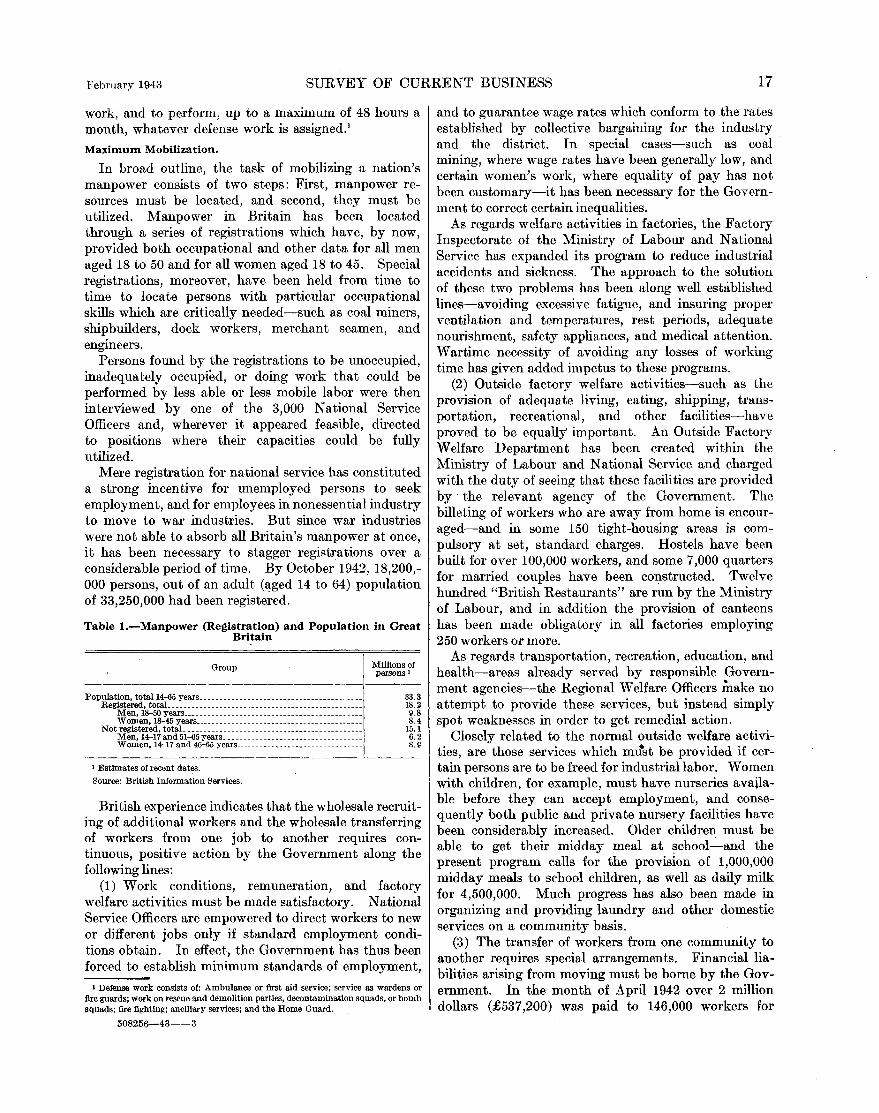
February 1943 SURVEY OF CURRENT BUSINESS 17
work, and to perform, up to a maximum of 48 hours a month, whatever defense work is assigned.1
Maximum Mobilization.
In broad outline, the task of mobilizing a nation's manpower consists of two steps: First, manpower resources must be located, and second, they must be utilized. Manpower in Britain has been located thro~gh a series of registrations which have, by now, provided both occupational and other data for all men age.d 18 ~o 50 and for all women aged 18 to 45. Special regrstratwns, moreover, have been held from time to time to locate persons with particular occupational skills which are critically needed-such as coal miners shipbuilders, dock workers, merchant seamen and . ' engmeers. . Persons found by .. the registrations to be unoccupied, madequately occupred, or doing work that could be performed by less able or less mobile labor were then interviewed by one of the 3,000 National Service Officers and, wherever it appeared feasible directed . . ' to positiOns where their capacities could be fully utilized.
Mere registration for national service has constituted a strong incentive for unemployed persons to seek employment, and for employees ill nonessential industry to move to war industries. But since war industries ~ere not able to absorb all Britain's manpower at once, It has been necessary to stagger registrations over a considerable period of time. By October 1942, 18,200,-000 persons, out of an adult (~ged 14 to 64) population of 33,250,000 had been registered.
Table 1.-Manpower (Registration) and Population in Great Britain
Group
Population, total14-65 years _______________ _
:~~~~~\ m:: \!~ ::::: 1 Estimates of recent dates. Source: British Information Services.
Millions of persons 1
33.3 18.2 9.8 8.4
15.1 6.2 8.9
British experience indicates that the wholesale recruiting of additional workers and the wholesale transferring of workers from one job to another requires continuous, positive action by the Government along the following lines:
(1) Work conditions, remuneration, and factory welf~re activities must be made satisfactory. Nation~l Servwe Officers are empowered to direct workers to new or different jobs only if standard employment conditions obtain. In effect, the Government has thus been forced to establish minimum standards of employment,
1 Defense work consists of: Ambulance or first aid service; service as wardens or fire guards; work on rescue and demolition parties, decontamination squads, or bomb squads; fire fighting; ancillary services; and the Home Guard.
508256-43--3
and to guarantee wage rates which conform to the rates established by collective bargaining for the industry and the district. In special cases-such as coal mini~g, where wage rates have been generally low, and certam women's work, where equality of pay has not been customary-it has been necessary for the Government to correct certain inequalities.
As regards welfare activities in factories, the Factory Inspectorate of the Ministry of Labour and National Service has expanded its program to reduce industrial accidents and sickness. The approach to the solution of these two problems has been along well established lines:-a_voiding excessive fatigue, and insuring proper vent~at10n and temperatures, rest periods, adequate nounshment, safety appliances, and medical attention. vy artime ~ecessity of avoiding any losses of working tnne has g1ven added impetus to these programs.
(2) Outside factory welfare activities-such as the provision of adequate living, eating, shipping, transportation, recreational, and other facilities-have proved to be equally' important. An Outside Factorv Welfare Department has been created within tl;e ~inistry of Labour and National Service and charged With the duty of seeing that these facilities are provided by the relevant agency of the Government. The billeting of workers who are away from home is encouraged-and in some 150 tight-housing areas is compulsory at set, standard charges. Hostels have been built for ?ver 100,000 workers, and some 7,000 quarters for marned couples have been constructed. Twelve hundred "British Restaurants" are r~n by the Ministry of Labour, and in addition the provision of canteens has been made obligatory in all factories employing 250 workers or more.
As regards transportation, recreation, education, and health-areas already served by responsible Government agencies-the Regional Welfare Officers make no attempt to provide these services, but instead simply spot weaknesses in order to get remedial action.
Closely related to the normal outside welfare activities, are those services which mJ'st be provided if certain persons are to be freed for industrial labor. Women with children, for example, must have nurseries available before they can accept employment, and consequently both public and private nursery facilities have been considerably increased. Older children must be able to get their midday meal at school_:_and the present program calls for the provision of 1 000 000 midday meals to school children, as well as d~ily ~ilk for 4,500,000. Much progress has also been made in organizing and providing laundry and other domestic services on a community basis.
(3) The transfer of workers from one community to another requires special arrangements. Financial liabilities arising from moving must be borne by the Government. In the month of April 1942 over 2 million dollars (£537,200) was paid to 146,000 workers for

18 SURVEY OF CURRENT BUSINESS February 1943
traveling warrants, lodging allowances, household removals, clothing and emergency allowances, settling-in grants, and for continuing liabilities (such as maintaining another household in the home community).
(4) Extensive training programs are necessary if former nonworkers are to be made fit for employment and if workers are to be upgraded in such manner as to make full use of their potentialities. It has been the policy of the British Government · to encourage training in factories, rather than to set up special training facilities. Nonetheless, considerable training of war workers is done in 24 Government Training Centers (long course) and in 150 emergency training establishments (short course). Altogether, it is estimated that some 300,000 trainees are being turned out each year. Trainees receive regular entering wages, and are, in all respects, considered employed-that is, they are covered by health- and social-insurance plans and are eligible for lodging and travel allowances.
(5) In addition to increasing the supply of skills in the country by training, other sources of manpower have been located and utilized. Workers have been brought in from Eire. Soldiers temporarily released have been drawn upon. Large numbers of aliens in Britain have been brought into useful employment by means of an International Labour Branch in the Ministry of Labour, by special alien employment exchanges, and by the use of a special register for aliens with special qualifications.
(6) The British have discovered that much potential manpower must, for personal reasons, such as age, infirmities, or domestic responsibilities, be used in its home locality. Such people, when they can prove in their interviews with the National Service Officer that undue hardship would result from their being transferred, ~re classified as "immobile." To bring the vast body of immobile labor into productive employment requires taking the job to the worker. For this reason, production and supply agencies are required to consult with the Ministry of ~abour about the labor:.supply situation in any area where a draft on labor-such as construction of plants or the letting of contracts-is contemplated. In late 1942 a program of shifting plants to areas of immobile labor supply was announced.
The same criterion is followed in the program of concentrating essential civilian production in nucleus plants. Not only are the nucleus plants selected largely in accordance with local labor conditions, but the nucleus plant is generally required to release for war work all "mobile" labor it formerly employed. Immobile labor which would otherwise be unemployable can then replace the released employees.
In other instances, certain less essential firms are required to release all mobile labor in their employ and to draw on immobile labor available in the community. The chief remaining body of mobile labor now consists largely of young women, and a series of orders issued
under the Registration for Employment Order of 1941 has removed women between the ages of 20 and 25 from employment in the retail distributive trades, certain parts of the clothing industry, certain Postal Service occupations, and local government. The mobile workers thus released are then transferred to areas of acute shortage of labor. For this purpose, each of the several hundred employment exchange areas is ranked (or colored) on a four-point scale to indicate the acuteness of its labor supply situation.
(7) Much labor, particularly female, is available only for part-time employment. Calling on this group has involved an intensive program designed to persuade employers to provide part-time work and to organize short shifts, and to persuade individuals to accept work by appeals, by income-tax concessions, exclusion of part-time work from Unemployment Insurance Acts and Essential Work Orders, and assurance of leaves of absence when husbands are home on leave.
(8) Much labor can be saved by efficient organization and management of production. As a stimulus to efficient management the profit motive has not been abandoned in Britain but has, since the early days of the war when conversion and full employment were more important than the conservation of men and materials, been increasingly relied upon. Parliamentary committees have stressed the desirability of fixed contracts with prices set low enough to enforce maxi~um efficiency and saving on the part of contractors.
Inspectors of Labour Supply provide a further eheck on the efficient use of labor. Some of these inspectors are nontechnical, but most (over 500) are specialists in some industrial field and are therefore qualified to go into faetories to see if requests for additional labor are justified, or if further savings in labor can be effected by better organization, more training, upgrading, use of better techniques, or use of less skilled available labor.2
If the inspector discovers possibilities of saving labor, he arranges for that saving either by persuasion or by direction.
Other schemes for saving labor are worthy of note. The simplification of products and their packing has been carried to considerable lengths, mainly to save materials but also to release labor for more essential duties. This principle has been applied in sueh industries as chocolate and sugar confectionary, biseuits, bacon curing, aerated waters, processed cheese, and clothing. Also" shock brigades" -highly mobile groups of specialized workers able to move rapidly into an area where additional labor is temporarily needed-have been organized in the case of dock labor, shipbuilders and repairers, construction workers, and others. Such mobile groups obviate the necessity of maintaining in each area a labor force adequate to fill peak demands.
1 Of the more than 500 technical labor-supply inspectors 419 are for munitions, 73 for building trades, 24 for shipyards, 11 for the iron and steel industry, and 13 for the chemical industry.
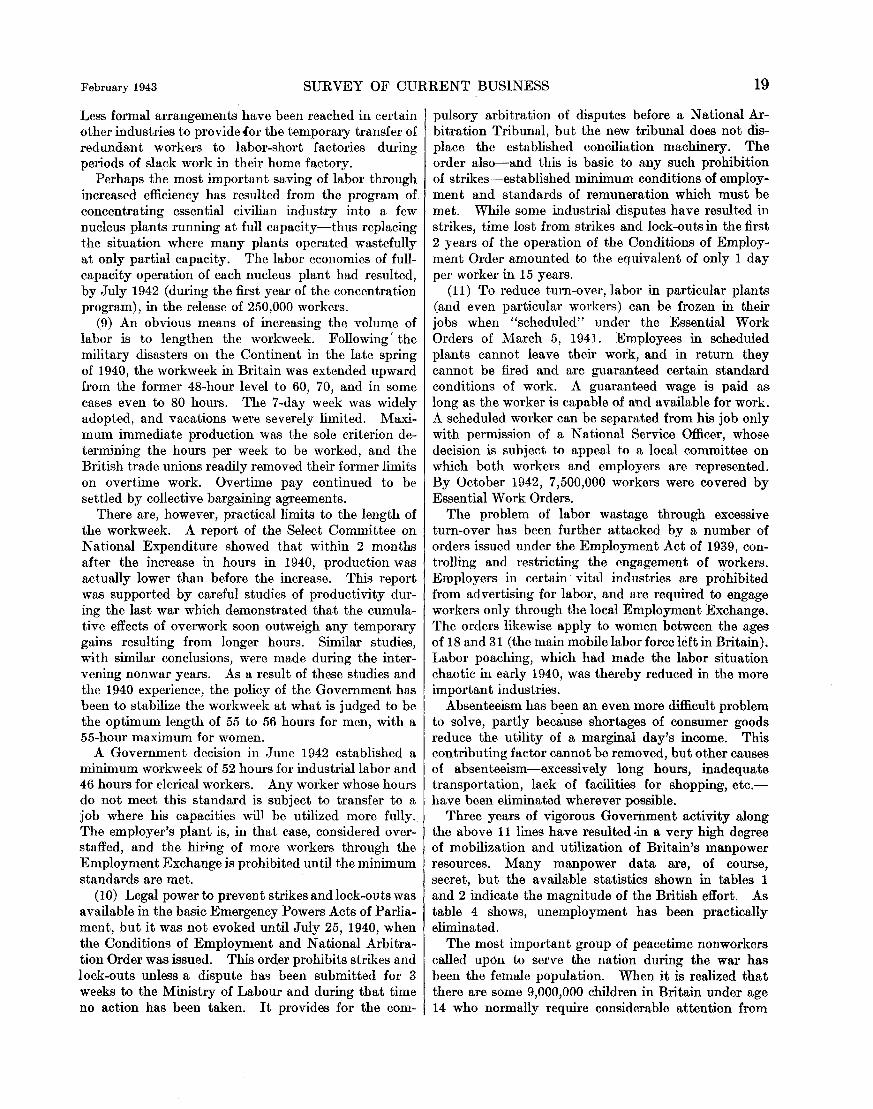
February 1943 SURVEY OF CURRENT BUSINESS 19
Less formal arrangements have been reached in certain other industries to provide !or the temporary transfer of redundant workers to labor-short factories during periods of slack work in their home factory.
Perhaps the most important saving of labor through increased efficiency has resulted from the program of. concentrating essential civilian industry into a few nucleus plants running at full capacity-thus replacing the situation where many plants operated wastefully at only partial capacity. The labor economies of fullcapacity operation of each nucleus plant had resulted, by July 1942 (during the first year of the concentration program), in the release of 250,000 workers.
(9) An obvious means of increasing the volume of labor is to lengthen the workweek. Following' the military disasters on the Continent in the late spring of 1940, the workweek in Britain was extended upward from the former 48-hour level to 60, 70, and in some cases even to 80 hours. The 7 -day week was widely adopted, and vacations were severely limited. Maximum immediate production was the sole criterion determining the hours per week to be worked, and the British trade unions readily removed their former limits on overtime work. Overtime pay continued to be settled by collective bargaining agreements.
There are, however, practical limits to the length of the workweek. A report of the Select Committee on National Expenditure showed that within 2 months after the increase in hours in 1940, production was actually lower than before the increase. This report was supported by careful studies of productivity during the last war which demonstrated that the cumulative effects of overwork soon outweigh any temporary gains resulting from longer hours. Similar studies, with similar conclusions, were made during the intervening nonwar years. As a result of these studies and the 1940 experience, the policy of the Government has been to stabilize the workweek at what is judged to be the optimum length of 55 to 56 hours for men, with a 55-hour maximum for women.
A Government decision in June 1942 established a minimum workweek of 52 hours for industrial labor and 46 hours for clerical workers. Any worker whose hours do not meet this standard is subject to transfer to a job where his capacities will be utilized more fully. The employer's plant is, in that case, considered overstaffed, and the hi~ng of more workers through the Employment Exchange is prohibited until the minimum standards are met.
(10) Legal power to prevent strikes and lock-outs was available in the basic Emergency Powers Acts of Parliament, but it was not evoked until July 25, 1940, when the Conditions of Employment and National Arbitration Order was issued. This order prohibits strikes and lock-outs unless a dispute has been submitted for 3 weeks to the Ministry of Labour and during that time no action has been taken. It provides for the com-
pulsory arbitration of disputes before a National Arbitration Tribunal, but the new tribunal does not displace the established conciliation machinery. The order also-and this is basic to any such prohibition of strikes-established minimum conditions of employment and standards of remuneration which must be met. While some industrial disputes have resulted in strikes, time lost from strikes and lock-outs in the first 2 years of the operation of the Conditions of Employment Order amounted to the equivalent of only 1 day per worker in 15 years.
(11) To reduce turn-over, labor in particular plants (and even particular workers) can be frozen in their jobs when "scheduled" under the Essential Work Orders of March 5, 1941. Employees in scheduled plants cannot leave their work, and in return they cannot be fired and are guaranteed certain standard conditions of work. A guaranteed wage is paid as long as the worker is capable of and available for work. A scheduled worker can be separated from his job only with permission of a National Service Officer, whose decision is subject to appeal to a local committee on which both workers and employers are represented. By October 1942, 7,500,000 workers were covered by Essential Work Orders.
The problem of labor wastage through excessive turn-over has been further attacked by a number of orders issued under the Employment Act of 1939, controlling and restricting the engagement of workers. Employers in certain· vital industries are prohibited from advertising for labor, and a.re required to engage workers only through the local Employment Exchange. The orders likewise apply to women between the ages of 18 and 31 (the main mobile labor force left in Britain). Labor poaching, which had made the labor situation chaotic in early 1940, was thereby reduced in the more important industries.
Absenteeism has been an even more difficult problem to solve, partly because shortages of consumer goods reduce the utility of a marginal day's income. This contributing factor cannot be removed, but other causes of absenteeism-excessively long hours, inadequate transportation, lack of facilities for shopping, etc.have been eliminated wherever possible.
Three years of vigorous Government activity along the above 11 lines have resulted ·in a very high degree of mobilization and utilization of Britain's manpower resources. Many manpower data are, of course, secret, but the available statistics shown in tables 1 and 2 indicate the magnitude of the British effort. As table 4 shows, unemployment has been practically eliminated.
The most important group of peacetime nonworkers called upon to serve the nation during the war has been the female population. When it is realized that there are some 9,000,000 children in Britain under age 14 who normally require considerable attention from
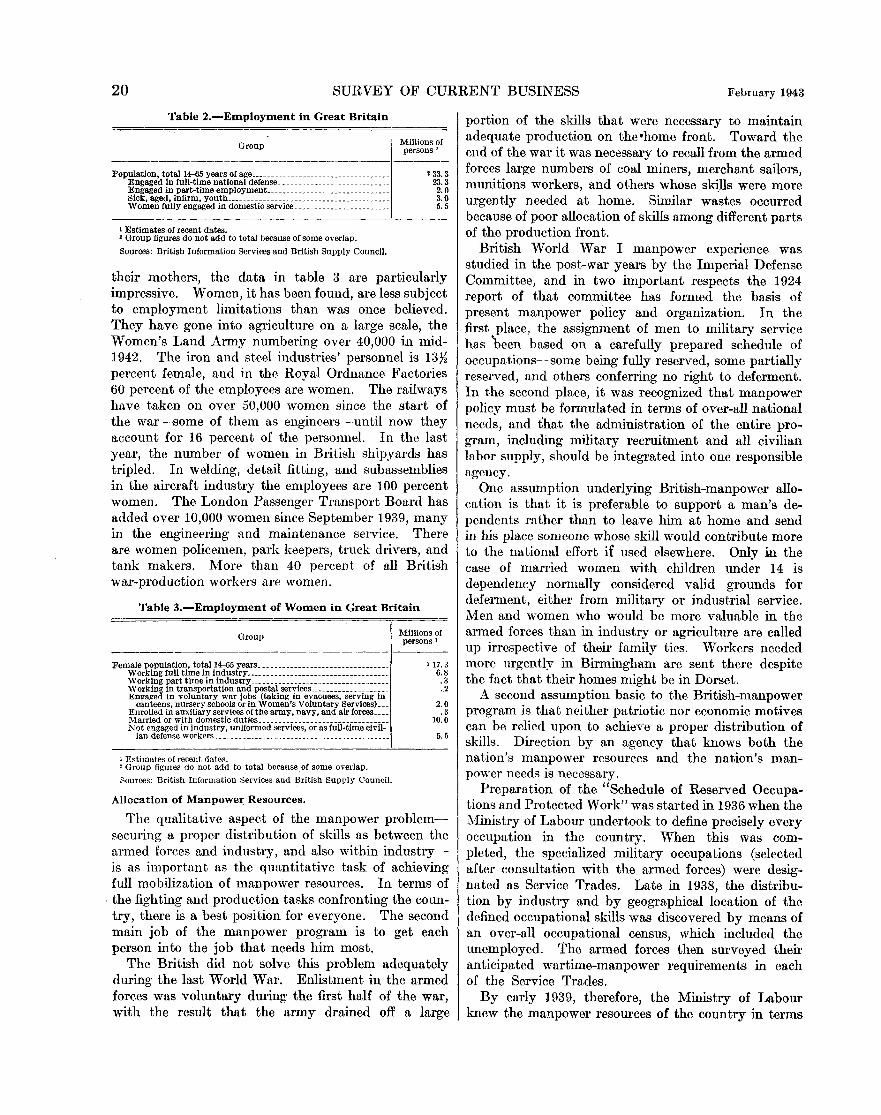
20 SURVEY OF CURRENT BUSINESS February 1943
Table 2.-Employment in Great Britain
Group Millions of persons 1
Population, total14-65 years of age _________ -------------------------- • 33.3 Engaged in full-time national defense____________________________ 23.3 Engaged in part-time employment_______________________________ 2.0 Sick, aged, infirm, youth_________________________________________ 3. 0 Women fully engaged in domestic service________________________ 5. 5
1 Estimates of recent dates. • Group figures do not add to total because of some overlap.
Sources: British Information Services and British Supply Council.
their mothers, the data in table 3 are particularly impressive. Women, it has been found, are less subject to employment limitations than was once believed. They have gone into agriculture on a large scale, the Women's Land Army numbering over 40,000 in mid-1942. The iron and steel i.p.dustries' personnel is 13Yz percent female, and in the Royal Ordnance Factories 60 percent of the employees are women. The railways have taken on over 50,000 women since the start of the war-some of them as engineers-until now they account for 16 percent of the personnel. In the last year, the number of women in British shipyards has tripled. In welding, detail fitting, and subassemblies in the aircraft industry the employees are 100 percent women. The London Passenger Transport Board has added over 10,000 women since September 1939, many in the engineering and maintenance service. There are women policemen, park keepers, truck drivers, and tank makers. More than 40 percent of all British war-production workers are women.
Table 3.-Employment of Women in Great Britain
Group Millions of persons 1
Female population, totall4-{)5 years_________________________________ '17.3 Working full time in industrY------····-·······················-· 6.8 Working part time in industrY----------------------------------- .3 Working in transportation and postal services____________________ . 2 Engaged in voluntary war jobs (taking in evacuees, serving in
canteens, nursery schools or in Women's Voluntary Services).__ 2. 0 Enrolled in auxiliary services of the army, navy, and air forces.... . 3 Married or with domestic duties_________________________________ 10.0 Not engaged in industry, uniformed services, or as full-time civil-
ian defense workers __ ------------------------------------------ 5. 5
1 Estimates of recent dates. ' Group figures do not add to total because of some overlap.
Sources: British Information Services and British Supply Council.
Allocation of Manpower Resources.
The qualitative aspect of the manpower problemsecuring a proper distribution of skills as between the armed forces and industry, and also within industryis as important as the quantitative task of achieving full mobilization of manpower resources. In terms of
. the fighting and production tasks confronting the country, there is a best position for everyone. The second main job of the manpower program is to get each person into the job that needs him most.
The British did not solve this problem adequately during the last World War. Enlistment in the armed forces was voluntary during the first half of the war, with the result that the army drained off a large
portion of the skills that were necessary to maintain adequate production on the•home front. Toward the end of the war it was necessary to recall from the armed forces large numbers of coal miners, merchant sailors, munitions workers, and ot.hers whose skills were more urgently needed at home. Similar wastes occurred because of poor allocation of skills among different parts of the production front.
British World War I manpower experience was studied in the post-war years by the Imperial Defense Committee, and in two important respects the 1924 report of that committee has formed the basis of present manpower policy and organization. In the first place, the assignment of men to military service has been based on a carefully prepared schedule of occupations-some being fully reserved, some partially reserved, and others conferring no right to deferment. In the second place, it was recognized that manpower policy must be formulated in terms of over-all national needs, and that the administration of the entire program, including military recruitment and all civilian labor supply, should be integrated into one responsible agency.
One assumption underlying British-manpower allocation is that it is preferable to support a man's dependents rather than to leave him at home and send in his place someone whose skill would contribute more to the national effort if used elsewhere. Only i.n the case of married women with children under 14 is dependency normally considered valid grounds for deferment, either from military or industrial service. Men and women who would be more valuable in the armed forces than in industry or agriculture are called up irrespective of their family ties. Workers needed more mgently in Birmingham are sent there despite the fact that their homes might be in Dorset.
A second assumption basic to the British-manpower program is that neither patriotic nor economic motives can be relied upon to achieve a proper distribution of skills. Direction by a.n agency that knows both the nation's manpower resources and the nation's manpower needs is necessary.
Preparation of the "Schedule of Reserved Occupations and Protected Work" was started in 1936 when the Ministry of Labour undertook to define precisely every occupation in the country. When this was completed, the specialized military occupations (selected after consultation with the armed forces) were designated as Service Trades. Late in 1938, the distribution by industry and by geographical location of the defined occupational skills was discovered by means of an over-all occupational census, which included the unemployed. The armed forces then surveyed their anticipated wartime-manpower requirements in each of the Service Trades.
By early 1939, therefore, the Ministry of Labour knew the manpower resources of the country in terms

February 1943 SURVEY· OF CURRENT BUSINESS 21
of each occupational skill, and it also had information which would enable it to allot a correct proportion of each skill to the armed forces. It did this by assigning an age limit to each occupational skill above which the members would not be subject to military service.
Aircraft joiners, for example, were absolutely essential to war production, so the age limit for military service was placed at the minimum of 18 years. Architects, on the other hand, were of very slight value to war production; the age limit in their case was the maximum so that none were deferred. Other skilled workers were divided into two groups on an age basis, the younger group being called into the armed forces and the older group being reserved for essential production.
The reservation applied, at first, to skills rather than to employment. Chemists were reserved above a sPlected age irrespective of whether they were working in armament factories or in perfumeries. It was known that in time a large number of chemists would be needed, so the reserved age was set at the point that would rt>serve the needed number.
The Schedule of Reserved Occupations was designed not only to insure that critical skills would not be dissipated in the armed forces, but also to insure that those persons possessing critical skills would be used in their occupational capacity if they were below the age of reservation and therefore subject to military service. Draftees in such reserved occupations had to be put into their respective Service Trade if taken into the army, and, in order to check on the armed forces' conservation of critical skills, the Ministry of Labour appointed in the summer of 1941 a "Committee on Skilled Men in the Services" under the chairmanship of Sir William Beveridge. This committee surveyed the practices of the armed forces in this respect and initiated any needed reforms.
The Schedule of Reserved Occupations has undergone two important revisions since it was first published--other than the periodic changes in ages of reservation as labor supply and demand factors changed or as successive registrations of workers provided better data on which to base the age of reservation. The first change, in April 1941, was designed to encourage workers in nondefense industries to transfer to war industries. The Minister of Labour, reluctant to force such transfers, applied two ages of reservation to many occupations-a higher age for workers in nondefense industries, and a lower age for workers in essential war industries. This change naturally encouraged transfers.
The second change, which in time will abolish the Schedule of Reserved Occupations, was initiated January 1, 1942, when the system of block reservations above a specified age was replaced by a system of individual deferment. The block reservations had served their original purpose of avoiding a dissipation of
critical skills while Britain was building a large army and converting to all-out war production. But by 1942 the general distribution of skilled manpower between the armed forces and industry had become so well stabilized, and manpower shortages had become so severe, that it was decided to review the case of each individual who had formerly been reserved in order to decide whether he should be left in his present employment, transferred to a more essential industry, or called for military service. The supply of skills was still allocated on national standards, but 44 District Manpower Offices were created to review the cases.
Depletion of the ranks of skilled women in industry by call-ups into the Forces has not, for many reasons, been severe enough to merit their inclusion in the Schedule of Reserved Occupations. Only single women (and widows without children) aged 20 to 30 are subject to compulsory enlistment, and so far only the 20- to 24-age group has been called. Furthermore, the women who are called are free to choose between the services and industry, with the result that out of the 1,620,000 in the 20- to 24-age group, only some 332,000 have been directed into one of the Service Forces. Furthermore, women are not called up from some 20 different types of work unless they are sin1ply ancillary workers such as timekeepers, clerks, etc.3
The second aspect of the problem of achieving a proper allocation of manpower-after insuring a satisfactory distribution between the armed forces and industry-is to work out an optimum balance among the competing demands of different industries and different firms. As noted earlier, the bulk of this work has been done by the National Service Officers of the Ministry of Labour (3,000 in number) who have interviewed, from the lists of over 18,000,000 registered workers, those whom they suspect might serve the nation better in some other capacity, and who, as a result, have suggested and effected the transfer of between 4,000,000 and 5,000,000 persons to new jobs in different localities. Aside from this individual work, however, there has been a tremendous patriotic incentive for workers to transfer to war work. This incentive has be@ reinforced by the fact that war work is normally more remunerative than civilian employment. ·
In addition, two specific governmental policies have forced many workers to transfer from nonessential civilian production to war work. In the first place, limitation of civilian production-either by direct order or by scarcity of materials-has severely restricted the employment opportunities in nonessential industry and forced hundreds of thousands of transfers to war work.
a These types of work are Agriculture and Forestry, including the Women's Land Army; Canteen and Hostel Work; Civil Defense; Cotton spinning, doubling and weaving; Dentists and Doctors; Flax fibre; Government work; Hospital work; Laundry; Munitions; Navy, Army and Air Force Institutes (similar to U.S. 0.); Public Utility Services; Radio work; Religious Sisters, ·etc.; Rubber; Teachers; Timber production; Transport services; Veterinary Surgeons; Women's Auxiliary Police Corps.
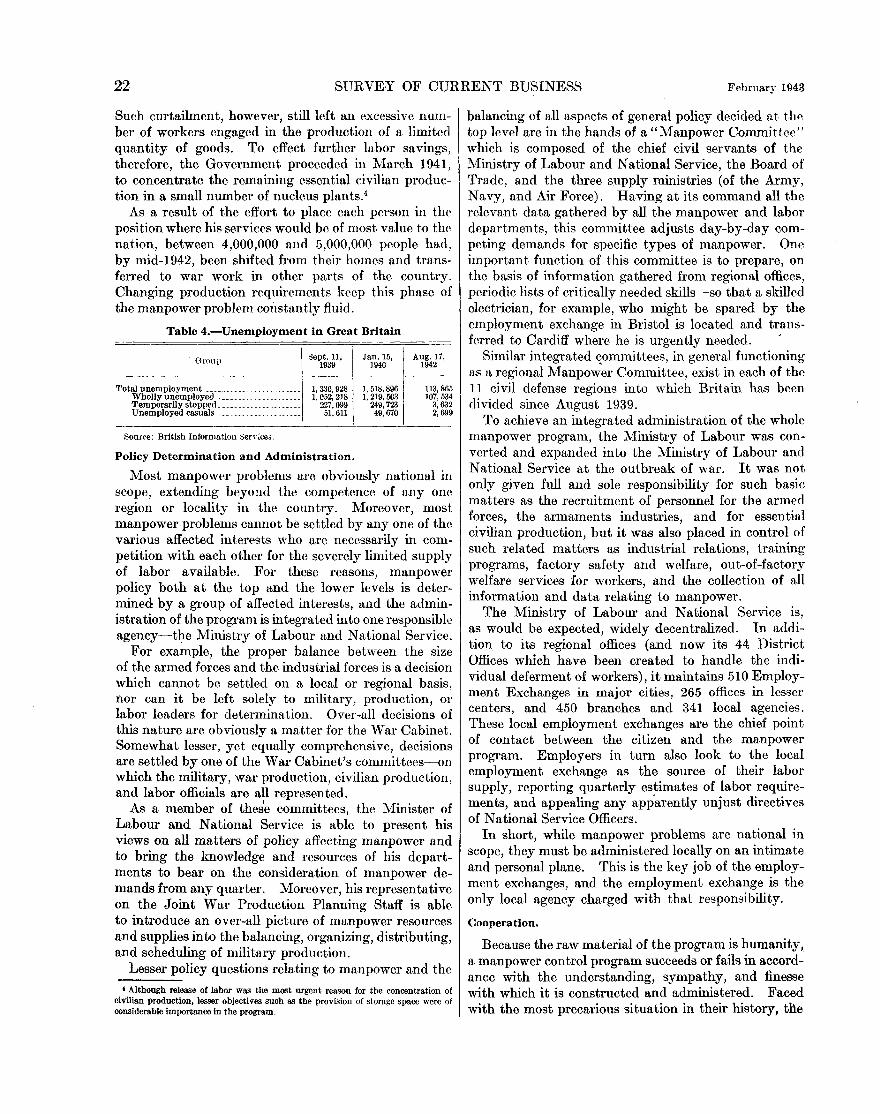
22 SURVEY OF CURRENT BUSINESS February 1943
Such curtailment, however, still left an excessive number of workers engaged in the production of a limited quantity of goods. To effect further labor savings, therefore, the Government proceeded in March 1941, to concentrate the remaining essential civilian production in a small number of nucleus plants.4
As a result of the effort to place each person in the position where his services would be of most value to thP nation, between 4,000,000 and 5,000,000 people had, by mid-1942, been shifted from their homes and transferred to war work in other parts of the country. Changing production requirements keep this phase of the manpower problem coz1stnntly fluid.
Table 4.-Unemployment in Great Britain
Grou-,> I Sept. 11, Jan. 15, Aug. 17, 1939 1940 1942
Tot~~~~i~~~Ji~;~;~-~~-- ~- ~:-;]~u~gi~ ~t~~:~~ ~--iM~~ Temporarily stopped ______________ -----~ 227,099 249,723 3, 632 Unemployed casuals_.__________________ 51.611 49,670 2,699
Source: British Information Sen·iceo.
Policy Determination and Administration.
Most manpower problems are obviously national in scope, extending beyond the competence of any one region or locality in the country. Moreover, most manpower problems cannot be settled by any one of the various affected interests who are necessarily in competition with each other for the severely limited supply of labor available. For these reasons, manpower policy both at the top and the lower levels is determined by a group of affected interests, and the administration of the program is integTated into one responsible agency-the Ministry of Labour and National Service.
For example, the proper balance between the size of the armed forces and the industrial forces is a decision which cannot be settled on a local or regional basis, nor can it be left solely to military, production, or labor leaders for determination. Over-all decisions of this nature are obviously a matter for the War Cabinet. Somewhat lesser, yet equally comprehensive, decisions are settled by one of the War Cabinet's committees-on which the military, wal' production, civilian production, and labor officials are all represented.
As a member of these committees, the Minister of Labour and National Service is able to present his views on all matters of policy affecting manpower and to bring the knowledge and resources of his departments to bear on the consideration of manpower demands from any quarter. Moreover, his representative on the Joint War Production Planning Staff is able to introduce an over-all picture of manpower resources and supplies into the balancing, organizing, distributing, and scheduling of military production.
Lesser policy questions relating to manpower and the
' Although release of labor was the most urgent reason for the concentration of civilian production, lesser objectives such as the provision of storage space were of considerable importance in the program.
balancing of all aspects of general policy decided at the top level are in the hands of a "Manpower Committee" which is composed of the chief civil servants of the Ministry of Labour and National Service, the Board of Trade, and the three supply ministries (of the Army, Navy, and Air Force). Having at its command all the relevant data gathered by all the manpower and labor departments, this committee adjusts day-by-day competing demands for specific types of manpower. One important function of this committee is to prepare, on the basis of information gathered from regional offices, periodic lists of critically needed skills-so that a skilled electrician, for example, who might be spared by the employment exchange in Bristol is located and trans-ferred to Cardiff where he is urgently needed. ··
Similar integrated qommittees, in general functioning as a regional Manpower Committee, exist in each of the 11 civil defense regions into which Britain has been divided since August 1939.
To achieve an integrated administration of the whole manpower program, the Ministry of Labour was converted and expanded into the Ministry of Labour and National Service at the outbreak of war. It was not only given full and sole responsibility for such basic matters as the recruitment of personnel for the armed forces, the armaments industries, and for essential civilian production, but it was also placed in control of such related matters as industrial relations, training programs, factory safety and welfare, out-of-factory welfare services for workers, and the collection of all information and data relating to manpower.
The Ministry of Labour and National Service is, as would be expected, widely decentralized. In addition to its regional offices (and now its 44 District Offices which have been created to handle the individual deferment of workers), it maintains 510 Employment Exchanges in major cities, 265 offices in lesser centers, and 450 branches and 341 local agencies. These local employment exchanges are the chief point of contact between the citizen and the manpower program. Employers in turn also look to the local employment exchange as the source of their labor supply, reporting quarterly estimates of labor requirements, and appealing any apparently unjust directives of National Service Officers.
In short, while manpower problems are national in scope, they must be administered locally on an intimate and personal plane. This is the key job of the employment exchanges, and the employment exchange is the only local agency charged with that responsibility.
Cooperation.
Because the raw material of the program is humanity, a manpower control program succeeds or fails in accordance with the understanding, sympathy, and finesse with which it is constructed and administered. Faced with the most precarious situation in their history, the

February 1943 SURVEY OF CURRENT BUSINESS 23
British people have asked of their Government guidance and direction .in assisting them to find the most useful national service of which they are capable. They have not asked to be driven.,
A manpower program based on this understanding has certain inevitable attributes and characteristics which are worth noting.
In the first place, policy and administrative practices are widely discussed with affected groups before adoption. For this purpose the Minister of Labour and National Service has created four major consultative committees which are in a position to put forward-though not to force-the views of the trade unions, employers' federations, and other groups which they represent.5 Similar committees form an integral adjunct to the regional and local offices of the Ministry of Labour and National Service, and special consultati.ve committees are convened from time to time in connection with a great variety of special problems relating to particular industries or particular types of labor. Each regional board contains three employee and three employer representatives.
The usefulness of these committees naturally depends upon the willingness of the Minister of Labour and National Service (and his regional and local assistants) to turn to them for consultation. Clothed with widespread power to force compliance with whatever program he devises, he could largely disregard them. But in actual practice, it appears that action on any manpower problem has not been taken until after full consultation with the affected parties.
Extensive consultation before policy and general administrative arrangements are decided upon, plus the responsibility of the Minister of Labour and Nati.onal Service to Parliament, constitute adequate safeguards against uninformed, badly designed, or unfair orders. At the personal level, however, each individual needs protection against unfair and arbitrary application and administration of manpower orders, and to this end a comprehensive system of appeals machinery has been established. An appeals committee composed of one man selected from an employees' panel and one from an employers' panel plus a neutral chairman is attached to· each Employment Exchange. This committee hears appeals against any decision affecting a person's industrial service, and although the National Service Officer may, with the approval of the regional office, reject the appeal board's decision, in actual practice he never does unless it clearly runs counter to essential national policy. A similar appeals committee attached to the local exchange hears appeals against military service based on hardship. There is likewise a similar women's panel for women who appeal on these grounds.
• One large advisory fomm on policy, one consultative labor-management committee, one committee for the engineering (roughly munitions) Industry, and a
women's consultative panel.
Appeals against military service based on the essentiality of one's work go to 1 of the 44 District Manpower Offices which were created to handle the whole~ question of review of deferment when block deferments were abandoned in January 1942.
, The Minister of Labour and National Service has ample power to force compliance with the manpower program. While he has not hesitated to use this power when necessary, he has realized that compliance can best be secured by enlisting voluntary cooperation through demonstrating the need of each item in the program, persuading each of the affected parties of its necessity to the national welfare, and enlisting their understanding, acceptance, and participation. For this reason, the full program has developed slowly, for, as Mr. Bevin has e)l:plained, "If . . . we moved a month or 2 months too soon and produced disputes and troubles, the loss of production would have been immense if not irrecoverable."
The line between voluntary compliance and compulsion is difficult to draw. However, the mere fact that compulsion may be used as a last resort immensely wide~s the field of possible action through voluntary agreement and indirect pressure. The policy of the Government, as summed up by one observer, has been that of relying first and foremost on joint action by employers and workers in the industries concerned and "to cast itself in the role of directive agent, using persuasion where possible, pressure where advisable, and compulsion only where necessary." 6
The power of compulsion has been voted the Government only in return for certain definite safeguards to worker status. Orders forbidding workers to leave their jobs or to strike likewise forbid employers to discharge them or lock them out. Also, orders stabilizing employment carry a Government guarantee that wages and conditions will be at least equal to those set by collective agreements or by the National Arbitration Tribunal for the industry and district.
Moreover, compulsive power specifically over labor was not granted until the Government had been reorgani~ed to include a considerable representation of Labour Party and Trade Union leaders. Mr. Ernest Bevin, leader of the largest trade union in Britain, was selected as Minister of Labour and National Service. Not only at the national political level, but at the local production level as well, labor has been brought into active partnership in the prosecution of a war that obviously cannot be fought for the benefit of any one group. Joint-production committees of labor and management have been created on a wide scale and in one instance (coal mining) an entire industry has been reorganized in an effort to secure better labor morale and cooperation. Of particular importance has been a wide-
• Johnstone, Elizabeth Mayer, Wartime Transference of Labour in Great Britain, International Labour Office Series C, Number 24, Montreal, Canada, 1942, p. 21.
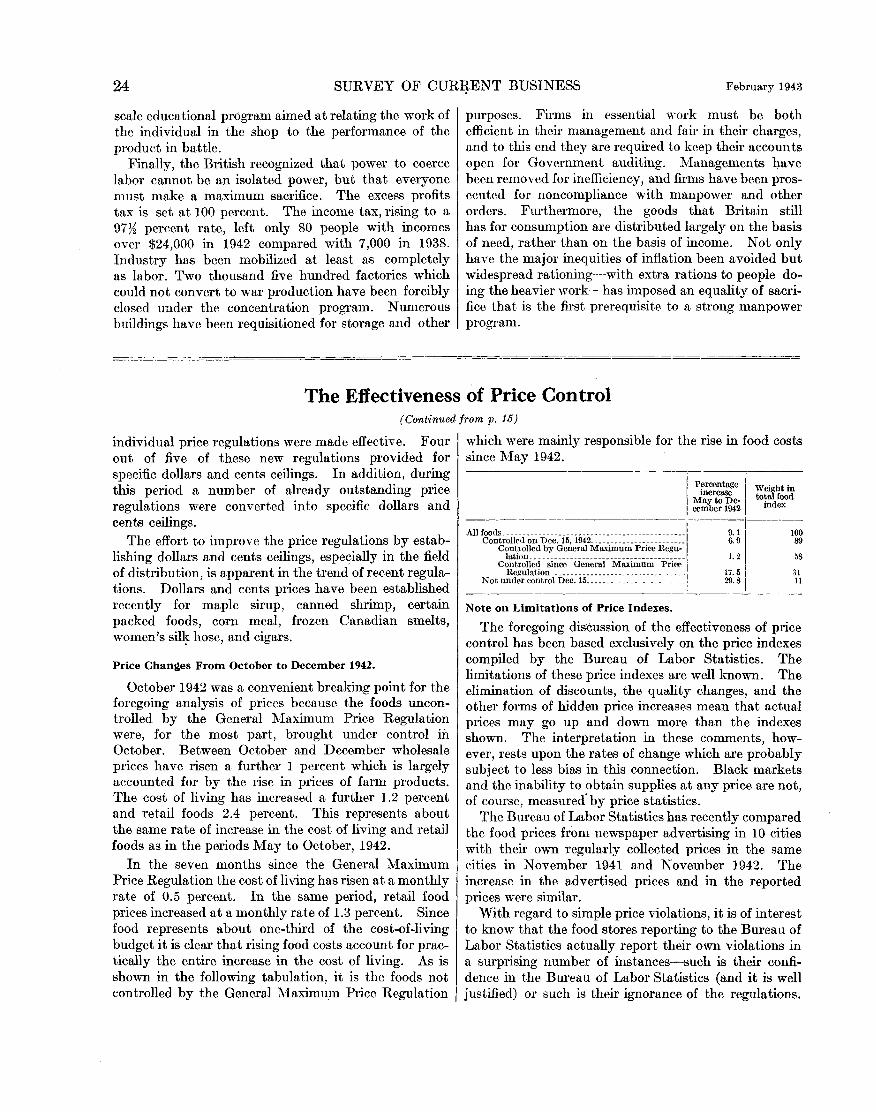
24 SURVEY OF CUR~ENT BUSINESS February 1943
scale educational program aimed at relating the work of the individual in the shop to the performance of the product in battle.
Finally, the British recognized that power to coerce labor cannot be an isolated power, but that everyone must make a maximum sacrifice. The excess profits tax is set at 100 percent. The income tax, rising to a 977f percent rate, left only 80 people with incomes over $24,000 in 1942 compared with 7,000 in 1938. Industry has been mobilized at least as completely as labor. Two thousand five hundred factories which could not convert to war production have been forcibly closed under the concentration program. Numerous buildings have been requisitioned for storage and other
purposes. Firms in essential work must be both efficient in their management and fair in their charges, and to this end they are required to keep their accounts open for Government auditing. :Managements "Q.ave been removed for inefficiency, and firms have been prosecuted for noncompliance with manpower and other orders. Furthermore, the goods that Britain still has for consumption are distributed largely on the basis of need, rather than on the basis of income. Not only have the major inequities of inflation been avoided but widespread rationing-with extra rations to people doing the heavier work-has imposed an equality of sacrifice that is the first prerequisite to a strong manpower program.
The Effectiveness of Price Control (Continued from p. 15)
individual price regulations were made effective. Four which were mainly responsible for the rise in food costs out of five of these new regulations provided for since May 1942. specific dollars and cents ceilings. In addition, during ---------------,~----,----this period a number of already outstanding price P~rcentage Weight In
M~;rt~~e- total food regulations were converted into specific dollars and cember 1942 Index
cents ceilings. The effort to improve the price regulations by estab
lishing dollars and cents ceilings, especially in the field of distribution, is apparent in the trend of recent regulations. Dollars and cents prices have been established
------------------------'----------All foods._-----------------·--------------------------Controlled on Dec. 15, 1942 _______________________ _
ContiOIIed by General Ma:'<imum Price Regu-lation ______________________________________ _ Controlled since General Maximum Price Re!(U\ation _________________________________ _
Not under control Dec. 15 _____________________ _
9.1 6. 9
1.2
17.5 29.8
100 89
58
31 11
recently for maple sirup, canned shrimp, certain Note on Limitations of Price Indexes. packed foods, corn meal, frozen Canadian smelts, women's sil~ hose, and cigars.
Price Changes From October to December 1942.
October 1942 was a convenient breaking point for the foregoing analysis of prices because the foods uncontrolled by the General Maximum Price Regulation were, for the most part, brought under control in October. Between October and December wholesale prices have risen a further 1 percent which is largely accounted for by the rise in prices of farm products. The cost of living has increased a further 1.2 percent and retail foods 2.4 percent. This represents about the same rate of increase in the cost of living and retail foods as in the periods May to October, 1942.
In the seven months since the General Maximum Price Regulation the cost of living has risen at a monthly rate of 0.5 percent. In the same period, retail food prices increased at a monthly rate of 1.3 percent. Since food represents about one-third of the cost-of-living budget it is clear that rising food costs account for practically the entire increase in the cost of living. As is shown in the following tabulation, it is the foods not controlled by the General Maximum Price Regulation
The foregoing discussion of the effectiveness of price control has been based exclusively on the price indexes compiled by the Bureau of Labor Statistics. The limitations of these price indexes are well known. The elimination of discounts, the quality changes, and the other forms of hidden price increases mean that actual prices may go up and down more than the indexes shown. The interpretation in these comments, however, rests upon the rates of change which are probably subject to less bias in this connection. Black markets and the inability to obtain supplies at any price are not, of course, measured· by price statistics.
The Bureau of Labor Statistics has recently compared the food prices from newspaper advertising in 10 cities with their own regularly collected prices in the same cities in November 1941 and November 1942. The increase in the advertised prices and in the reported prices were similar.
With regard to simple price violations, it is of interest to know that the food store:s reporting to the Bureau of Labor Statistics actually report their own violations in a surprising number of instances-such is their confidence in the Bureau of Labor Statistics (and it is well justified) or such is their ignorance of the regulations.
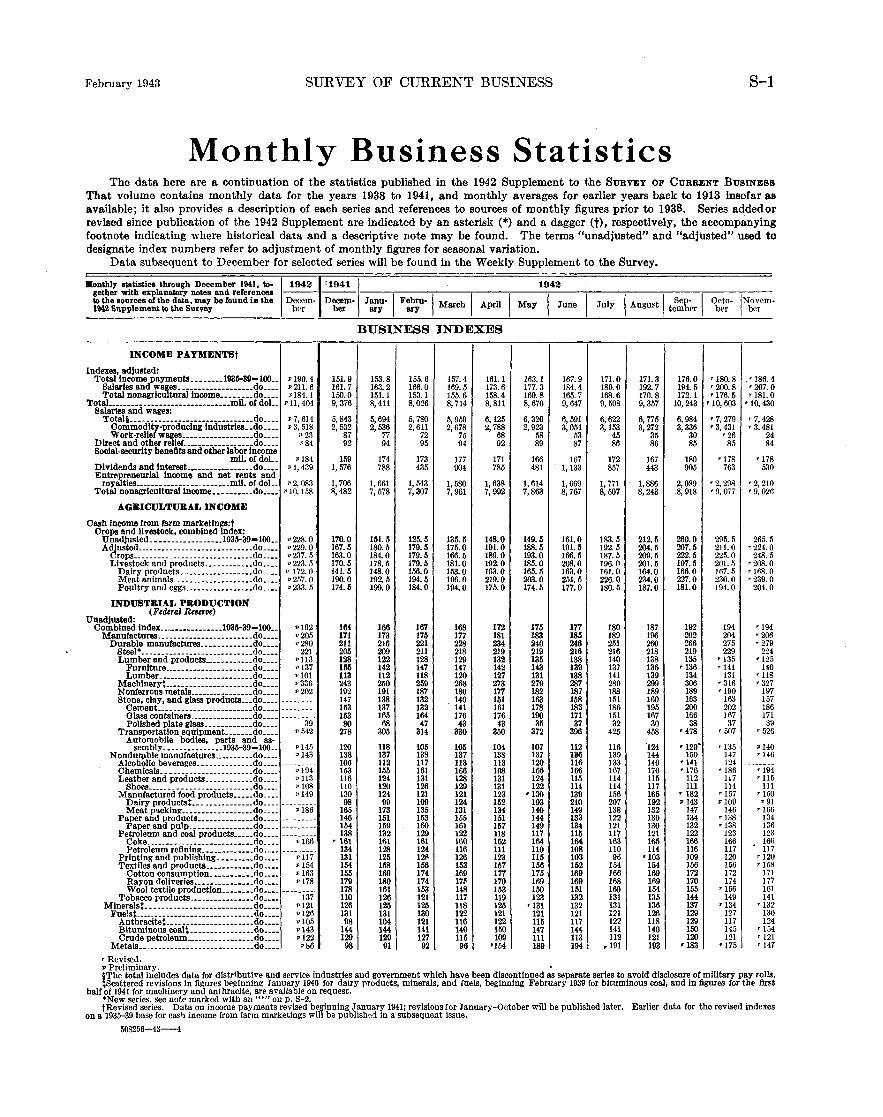
February 1943 SURVEY OF CURRENT BUSINESS 8-1
Monthly Business Statistics The data here are a continuation of the statistics published in the 1942 Supplement to the SuRV5Y OF CuRRENT BusiNESS
That volume contains monthly data for the years 1938 to 1941, and monthly averages for earlier years back to 1913 insofar as available; it also provides a description of each series and references to sources of monthly figures prior to 1938. Series addedor revised since publication of the 1942 Supplement are indicated by an asterisk (*) and a dagger (t), respectively, the accompanying footnote indicating where historical data and a descriptive note may be found. The terms "unadjusted" and "adjusted" used to designate index numbers refer to adjustment of monthly figures for seasonal variation.
Data subsequent to December for selected series will be found in the Weekly Supplement to the Survey.
Monthly statistics through December 1941, to• gether with explanatory notes and references to the sources ofthe data, may be found in the 1942 Supplement to the Survey
INCOME PAYMENTSt
Indexes, adjusted: Total !nrome payments •••••••• 1935-39•l(KL
Salaries and wages. ·-----------------do ..•. Total nonagrlculturallncome •••••••. do ..••
TotaL--------·---·--·---------·---mll. of doL. Salaries and wages:
Total§_ ••••••• __ •••••••• ------••••••• do. ___ Commodity-producing Industries •• do----Work-relief wages •••• ·-------------do •••. Direct and other rellef __________________ do .••.
Social-security benefits and other labor Income mil. of doL.
Dividends and lnterest .••••••••••••••.. do •••• Entrepreneurial Income and net rents and
royalties •••.••••••.••.••.••••••• mil. of doL Total nonagrlculturallncome •••••••••. do ••••
AGRICULTURAL INCOME
Cash Income from farm marketlngs:t Crops and livestock, combined Index:
Unadjusted .••• ______ ••. ____ .1935-39•100. _ Adjusted ...• _ •• ________ ._ ••••• _._ •••• do __ ••
Crops ......... _ .................... do ..•• Livestock and products .•.....•.••• do •..•
Dairy products. --·-···----------do .... Meat animals ____________________ do .... Poultry and eggs ................. do ....
INDUSTRIAL PRODUCTION (Federal Rererfe)
Unadjusted: Combined !ndex ________________ l935-39=100 •• Manuractures ....•••.•••••••••••••••. do ••••
Durable manufactures .•••••••••••• do .••• Steel* •.••• _._ .......... ___ •• __ ._. do .... Lumber and products ............ do ____
Furniture .... ___ •••••••• _ •••••. do. ___ Lumber .• ------ _ •••• _._. ____ ••. do._ ..
Machlneryt.-------·-------------do •••• Nonferrous metals ................ do •••• Stone, clay, and glass prodncts ... do ....
Cement •••.••••••.••••••••••••• do ____ Glass containers ...... ----------do •••• Polished plate glass ............ do ••••
Transportation equipment .... _ •. do ... _ Automobile bodies, parts and as-
semb1y _ ...... ------ •• 1935-39= 100 .. Nondurllble manufactures .......... do ....
Alcoholic beverages .•.••.••.••••• do .••. Chemicals._ ....... ----·· ........ do .... Leather and products •••.•.•••••• do ....
Shoe.s ....... _ .................. do .... Manufactured food products ••••• do ....
Dairy products: •. _. -----------do .... Meat p'\cking ••••••••••••.••.•• do .•••
Paper and products •••••.•••.•••. do .... Paper and pu1p ________________ do .... Petroleum and coal products •••.• do ....
Coke ..... __ ...... ___ ••• __ • _____ do._._ Petroleum reflnlng •••..••.••••• do ....
Printing and publlshlng •••.••••• do .... Textiles and products ............ do ....
Cotton consumption. ·--·------do •••• Rayon deliveries •.•••.. ________ do .••• Wool textile productlon •••••••• do ••••
Tobacco products .••.•••••••••••• do •••• Minerals: •• ·--------· ---·----------·do ••••
Fuelst ............. ___ ------•••••••• do •••• A nthracltet •.• _ ••••. ----- __ •••••• do •••• Bituminous coalt. --------- •.•••• do •••• Crude petroleum ••••••••••.•••••• do ....
Metals ..... __ •••••.• ·-·-·-··----· •. do ....
'Revised.
1
1942 r1941 I
Decem· Decem· Janu·i Febm·i March I April ber ber ary ary
BUSINESS INDEXES
•190. 4 151.9 153.8 155.6 157.4 161.1 •211. 6 161.7 163.2 166.0 169.5 173.6 •184.1 150.0 151.1 153.1 155.6 158.4
•11, 404 9,376 8,411 8,026 8, 714 8, 811
•7, 614 5,843 5,694 5, 780 5, 959 6,125 •3, 518 2,532 2, 536 2,611 2,678 2, 788
• 23 87 77 72 75 68 >84 92 94 95 94 92
•184 159 174 173 177 171 •1, 439 1, 576 788 435 904 785
• 2, 083 1, 706 1. 661 1, 543 1,580 1, 638 p 10, 158 8,482 7,578 7,807 7, 961 7,992
• 228.0 170.0 151.5 125.5 135.5 148.0 • 229.0 167.5 180.5 179.5 175.0 191.0 • 237. 5 163.0 184.0 179.5 166.5 189.0 •223. 5 170.5 178.5 179.5 181.0 192.0 • 172.0 141.5 148.0 156.0 153.0 163.0 •257. 0 190.0 192.5 194./i 196.0 219.0 >233. 5 174.5 199.0 184.0 194.0 175.0
•192 164 166 167 168 172 •205 111 173 175 177 181 •280 211 216 221 228 234
221 205 209 211 218 219 •113 128 122 128 129 132 p 137 156 142 147 147 142 •101 113 112 118 120 127 •336 243 250 259 268 273 •202 192 191 187 180 177
-------- 147 138 132 140 151 153 137 132 141 161
--------- 153 165 164 176 176 39 80 68 47 43 43
• 542 278 305 314 330 350
•145 120 118 105 105 104 p 143 138 137 138 137 138
----.-194' 100 112 117 113 113 153 155 161 166 168
•113 116 124 131 128 131 •108 110 120 126 129 131 •149 130 124 121 121 123
98 99 109 124 152 •186 165 173 135 131 134
146 151 153 155 151 154 159 160 161 157 138 132 129 122 118
•166 ' l61 161 161 160 162
----.-ii7 134 128 124 116 111 131 125 121' 126 123
•154 154 158 156 153 157 •163 155 169 174 169 177 •178 179 180 174 17~ 170
-----137 178 161 153 148 153 110 126 121 117 119
•121 126 125 125 118 125 •126 131 131 130 122 121 •105 98 104 121 116 122 •143 144 144 141 140 150 •122 129 129 127 115 109 •86 98 91 92 96 •154
1942
163.1 167.9 171.0 171.3 177.3 184.4 189.0 192.7 160.8 165.7 168.6 170.8 8,670 9,647 9, 508 9,357
6,320 6, 591 6, 622 6, 775 2,923 3,054 3,153 3,272
58 53 45 35 89 87 86 86
166 167 172 167 481 1, 133 857 443
1, 614 1,669 1, 771 1,886 7,863 8, 767 8,507 8, 243
149.5 161.0 183.5 212.5 188.5 191.5 192.5 204.5 193.0 166.5 187.5 209.5 185.0 208.0 196.0 201.5 165.5 163.0 161.0 164.0 203.0 251.5 226.0 234.0 174.5 177.0 180.5 187.0
175 177 180 187 183 185 189 196 240 246 251 260 219 216 216 218 135 138 140 138 143 139 137 136 131 138 141 139 279 287 289 299 182 187 188 189 163 158 151 160 178 183 186 195 190 171 !51 167 3.~ 37 32 30
372 396 425 458
107 112 116 '124 137 136 139 144 120 116 133 140 166 166 167 170 124 115 114 115 122 114 114 117
'130 139 156 165 193 210 207 192 140 149 138 132 144 133 122 130 149 134 121 130 117 115 117 121 164 164 163 165 110 108 110 114 115 103 96 '103 156 152 154 154 175 169 166 169 169 169 168 169 150 151 160 154 123 132 131 135
•131 132 131 136 121 121 121 126 115 117 122 118 147 144 141 140 111 113 112 121 189 194 '191 193
176.0 194.5 172.1
10,243
6,984 3,336
30 85
180 905
2,089 8, 918
260.0 207.5 222.5 197.5 166.0 227.0 181.0
192 202 266 219 135
r136 134 306 189 163 200 166 38
'478
'129' 150
'141 rl76
112 Ill
' 182 •143
147 134 132 122 166 116 109 156 172 170 155 144 137 129 129 150 120
'183
'180. 8 '200.8 '176.5
'10,603
'7, 279 '3, 431
'26 85
'1781 763
'2, 298 '9, 077
295.5 211.0 225.0 201.5 167.5 230.0 194.0
194 204 275 229
'135 '141
131 '316 '190
163 202 167 37
'507
'135 147 124
'186 117 114
'157 •109
146 '138 '138
123 166 117 120 156 172 174
'!56 149
'134 127 117 145 121
'175
. '186.4 '207.0 '181.0
'10, 430
'7,428 '3,481
24 84
'178 530
'2, 210 '9, 026
265.5 '224.0
248.5 '208.0 '168. 0 '239. 0
204.0
'194 '206 '279
224 '125
140 '118 '327
197 !57 186 171 39
'526
•140 '146
'194 '115
111 '!50
p 91 '166
134 136 123 166 117
'120 '!58
171 177 161 141
'132 130 124
'!54 '121 '147
• Preliminary. , §The total includes data for distributive and service Industries and governmeiJt which have been discontinued as separate series to avoid disclosure or military pay rolls. :scattered revisions in figures bPginning 1 anuary 1940 for dairy products, minerals, and fuels, beginning February 1939 for bituminous coal, and in figures for the first
half of 1941 for machinery and anthracite, are available on request. •New series. see notP marked with an ... , on p. S-2. tRevised series. Data on income payments revised beginning January 1941; revisions for January-October will be published later. Earlier data for the revised indexes
on a 1935-39 base for cas'l income from farm marketings will be published in a subsequent issue.
508256-43-4

8-2 SURVEY OF CURRENT BUSINESS February 1943
llonthly statistics through December 1941, to-~1942,1941 I 1942 ce&her with explanatory noles and references ------
1 1 1o the sources oflhe dais, may be found in &he Decem· Decem- Janu- I Febru·i M h I A iJ M I J I Jul A I Sep-1942 Supplemenllo the Survey bcr ber ary ary arc pr ay , unc Y ugust tember Octo- 'Novem-
ber ber
BUSINESS INDEXES-Continued
INDUSTRIAL PRODUCTION-Con. AdJusted:
172 176 Combined In de>§ .••.•••••••••• 1935-39-100 .• •196 r 167 rt71 172 rt73 r 174 '178 183 186 r 190 rt94 Manufactures§ •••••• ---------•••••••• do •••• • 208 r 173 rt78 '179 180 r 182 183 184 188 r 193 196 •201 •206 Durable manuractum§ •••••••••••• do •••• • 283 r 213 r 221 r 225 r 230 234 239 244 249 r 258 •264 r 273 r 279 Steel*····------- ..••.•••••••.•.•• do •••. 221 205 209 211 218 219 219 216 216 218 219 229 224 Lumber and products§ .•••••••••• do •••. • 125 138 143 144 1:H r 132 r 130 rt31 '133 rt29 r125 rt29 '128 Furnlturet---------------------do •••. •137 149 153 147 r 147 r 142 r 143 r 139 '137 r136 rt36 rt41 rt40 Lum her.----.---- •••••• ----- ••• do •• __ •119 132 138 143 128 127 124 127 130 125 119 123 rl22 M achlnery ----·------------------do •.•• • 336 243 250 259 268 273 279 287 289 299 306 •316 '327 Nonferrous metals ••••.••••••••... do •.•• • 202 193 191 187 180 177 182 188 188 189 r 189 r 190 197 Stone, clay, and glass products§ .• do •••• --------- r 157 r 165 '158 r 158 r 154 rt55 r 147 r 140 r 145 rt52 rt52 '153 Cement' •• ___ ._. __ ---- __ •••••• _ do •• __ r 162 r 167 r 162 r 161 '167 r 172 rt7l r 169 r 177 rt82 r 184 rt80 0 lass containers •••.• ---------· do •.•• 165 184 178 187 176 178 163 145 153 163 162 169 Polished plate vla.'!!<t ••••••••••• do •••• 39 •SO •68 r 47 •43 43 35 37 r 32 •30 38 r 37 •39 Transportation eQulpment ••••••• do •••• •542 278 305 314 330 350 372 396 425 458 •478 •507 r 526 Automobile bodies, parts and assem-120 ll8 105 104 107 112 bly -------------------1936-39-100 •• 105 116 124 r 129 r 135 •140
Nondurable manufactures§ •••••••• do •••• •147 141 143 142 139 139 138 136 138 140 rt42 143 •146 Alcobollc beverages§ ••••••••••.•• do •••• --·-;;iw· r 114 r 137 '130 r 119 r 111 111 104 '122 r 136 '140 r 126 --------Cbemicahl ••• _ ••• ----------------do .••• 152 156 161 161 165 167 172 174 173 r 174 r 182 '192 Leather and products§ ••••••••••. do •.•• • 115 r 124 rl211 '124 r 123 r 130 rt25 r 120 r 116 '112 r 111 r 117 r 116 Sh-§ ------------------------do •••• •114 r 124 r 126 '123 r 121 r 129 r 124 r !20 r 114 r l.t.O r 108 r 114 •115 Manufactured food products§ •••• do •••• • 156 137 r 139 '139 136 136 134 138 143 !43 149 •146 •151 Dairy products§. --------------do •••• ---;,-i58- r 147 rt48 '146 r 145 rt50 142 138 r 143 143 •140 •139 •136 Meat packlng •••••••••••••••••• do •••• 142 148 141 144 142 140 153 146 153 159 145 •147 Paper and products§ ............. do •••• r 150 rt53 '151 r 1.52 148 r 143 134 '125 131 rt32 rt35 135 Paper and pulp§ .•••••••••••••• do •••• r 156 r 159 '157 r 158 r 154 rt47 r 135 '125 132 r 133 •137 137 Petroleum and coal products§ ___ do •••• ···;·j66- r 137 r 133 '129 r 122 r 118 117 r 115 r 118 r 121 r 122 rt23 123 Coke. ____ ------- ·-----·-·------do •••• r 161 161, 161 160 162 164 164 163 165 166 166 '166 Petroleum retlnlnl!~---·--------do •••• --·-;;ii6. rt34 r 129 '124 r 116 r 111 109 •108 '111 r 114 '116 •117 117 Printing Bod publish ng ••••••••• do •••• 130 !28 125 121 117 112 104 106 r 111 109 116 '118 Textiles and products .••••••••••. do .••• •154 154 158 15~ 153 157 156 152 154 154 156 156 r 158 Cotton consumptlon .•••••••••• do •••• 163 155 1~9 174 169 177 175 169 166 169 172 172 171 Rayon deliveries. __ ---·--------do •••• 178 179 180 174 175 170 1~9 169 168 169 170 174 177 Wool textile productlon •••••••• do •••• 178 161 153 148 1!\3 150 151 160 154 155 rt56 161 Tobacco productsf---------------do •••• ---·-iilii. 129 r !34 130 125 127 '120 122 r 126 130 133 r 141 '136 Mlnerals§ ............................ do •••• •128 r 134 r 134 '133 r 126 r 125 rt26 r 127 '125 r 130 131 r 129 '131 Fuelst .•• -------·------------------do •••• •126 rt31 '131 '130 122 r 121 r 121 r 121 '121 r 126 r 129 rt27 '130 A nthracltet •••••• -------- __ ---- •• do •••• •105 r 98 r 104 rJI2 r 116 r 122 r 115 r 117 r 122 r 118 r 129 rtl7 '124 Jlltumlnous eoalt----------------do •••• • 143 rt44 r 144 r 141 r 140 r 150 r 147 r 144 '141 r 140 '150 '145 r 154 Crnde petroleumt----------------do •••• • 122 rt29 rt29 '127 '115 r 109 r 111 113 112 r 121 120 '121 '121 MetB11-----------------------------do •••• •140 rt52 r 150 '153 rt52 151 r 156 158 154 r 151 r 144 r 138 '137
MANUFACTURF.R!'I' ORDF.RS, !'IIDP-MENTS, AND INVENTORIF.S
New ordera, totaL ••.•••••••••. Jan. 1939-too •• --------- 232 268 292 274 292 270 314 256 233 264 266 •279 Durable ~toods. _-----------------------do .... 332 414 4113 427 449 432 545 399 334 390 387 r 415
Iron and steel and their products .••.. do •••• 248 245 256 256 274 216 29n 254 222 250 223 '264 Electrical mBchlnery -----------------do .••• 396 347 452 477 548 648 570 699 491 411 413 •586 Other machinery---- •••••••••• ---- ••• do •••• 367 414 648 442 467 669 578 411 421 358 387 r 381 Other durable goods •••••••••••••••••• do •••• 413 719 645 673 677 490 913 504 377 636 643 '619 Nondurable goods •••••••••••••••••••••. do •••• --------· 167 174 182 176 192 167 166 163 167 183 '188 '192
Shlpments,total. •••. average n;~onth 1939-100 •• --------· 1811 184 199 199 200 203 202 207 212 224 228 r 232 Durable goods ••• ----------------------do •• __ 228 214 232 235 239 254 256 264 270 283 289 • 300
Automobiles and eQulpment. ••.••••. do ..•. 174 152 133 131 131 129 161 172 184 194 207 '223 Iron and steel Bnd their products ••••• do .••• 208 200 208 211 207 216 211 210 215 216 212 214 Electrical machinery ----------------.do .••. 200 211 249 257 259 270 249 267 268 286 317 r 351 Other machinery ---------------------do .••• 247 229 260 270 279 297 306 311 312 322 333 r337 Transportation equipment (except
803 829 1,004 1,018 1,108 1,~ 1,271 1, 362 1,46~ 1, 579 1,578 '1,692 automobiles) •..•.•• __ •• --••••.• __ •• do. ___ Other durable goods ••••••••••••••••.. do •.•• 186 176 194 196 196 199 203 197 211 213 213
Nondurable goods •...•••••••••••••••••. do •••• --------· 157 161 173 171 168 164 160 163 167 177 181 179 Chemicals and allied producta ••••••. do •••• 163 170 181 176 173 170 168 169 171 187 182 rt83 Food and kindred producta •••••••••• do •••• 151 160 171 162 159 164 164 171 178 187 190 '185 Paper and allied products •••••.•••••• do •••• 171 171 173 173 165 154 139 126 131 136 146 143 Petroleum refining ____ --------------.do •••• 139 141 133 130 132 139 136 142 135 140 138 '154 Rubber products •••.. __ --------------do .••• 149 131 144 147 159 171 171 18a 179 205 •207 --------Textile-mill products ...•••••••••••••• do •.•• 183 184 204 206 213 189 186 187 191 197 203 •202 Other nondurable goods •••••••••••••• do •••• 149 150 172 180 172 156 147 146 154 165 173 171 Inventories, totaL ••• ------•••.• _ ••• _ ••• _ do ••• - --------- 158.4 161.9 163.0 165.6 167.0 170.4 172.9 171.2 175.0 175.4 rt76. 5 r 177.8 Durable goods.---- •••. ---------------.do •••• 175.6 179.2 180.8 183.4 186.6 190.2 193.2 195.8 198.0 200.9 204.1 •207. 7 Automobiles and eQulpment ••••••••. do .... 193.3 190.~ 190.0 103.6 202.5 217.9 222.7 22fl.l 229.9 241.4 243.3 r 244.1 Iron and steel and their products •.••. do •••• 129.2 127.2 125.5 125.7 127.6 130. 1 132.3 1:l3. 9 134.3 134. 1 135.7 r 137.4 Electrical machinery----- ------------do •••. 234.1 243.9 250.3 2n5.5 264.2 270.0 277.8 290.3 299.9 307.1 320.6 r 326.1 Other machinery----.-------- ..•••••• do ••• ---------- 1&0.0 187.6 191.4 195.0 100.1 202.9 203.1 204.8 204.6 207.2 210.4 r 213.0 Transportation eQUipment (exoept auto-
6113.9 709.1 742.8 mobiles) •.••• average month 1939clOO. - --------- 863.4 732.5 756.2 802.3 824. p 852.8 890.3 924.2 •975.0 Other durable goods ••••••••••.•••••• do •.• - --------· 136.4 Ul9.5 140.6 141.3 141.5 140.6 139.0 137.6 137.5 135.9 134.0 r 134.2 Non durable goods •• ___ ••••• __ •••••• _. __ do ••• - --------- 143.5 !46.9 147.4 150.1 149.9 153.1 155.1 155.3 154.8 153.1 r 152.4 '151.6 Ohemlcals and allied products ••••••• do •.• 143.7 147.8 150.9 155.6 157.7 159.9 162.7 16~. 3 164.4 161.0 156.5 r 155.1 Food and kindred products. ---------do ••• 162.0 163.~ 158.9 156.8 157.9 160.0 160.3 159.8 159.2 158.0 161.2 r 160.1 Paper and allied products ............ do ••• - --------- 135.1 134,. 137.8 140.0 141.1 145.9 149.7 152. 7 154.6 154.6 149.8 r 146.5 Petroleum refining ____ -------------.do •••• --------- 113.2 113.4 115.5 115.0 114.5 113.0 111.5 110.3 111.2 109.6 109.3 r 107.2 Rubber products .•••.•.•.••.••.•••••• do •••. --------- 143.6 149.7 149.6 155.4 154.3 161.2 165.4 170.2 174.8 173.5 rt72. 7 --------Textile-mill products ••.•.•••••••••••• do •••• --------- 147.3 161.5 154.1 156.2 155.8 162.0 165.1 165.0 159.5 156.2 155.1 r 153.1 Other nondurable e:ood•-------- __ ...• <lo ..•. ________ 138.7 145 4 147.3 155.6 152.8 157.3 160.7 161. 3 161.3 160.R 159.1 r 161.5
r Revl~ed. • Preliminary. *New series. The new index of steel production has been substituted for the combined index for Iron and steel as publication of the latter Index was suspended after
March 1942 until recently. Earlier data are shown in note marked with an "*" on p. S-2 of the December 1942 Survey. §Revisions have been made in seasonal adjustment allowances for recent periods; for total industrial production, total manufactures, durable manufactures, and non
durable manufactures, the resulting changes in the indexes do not exceed 1 point for any month before December 1941. Revisions are available on request. tSeasonal adjustment factors have been revised to 100 beginning as follows: Furniture, February 1942; polished plate glass, December 1941; bituminous coal, May 1941;
anthracite, January 1940; crude petrolem, October 1941. See also note marked ":" on p. S-1 with regard to additional revisions in the fuel series.
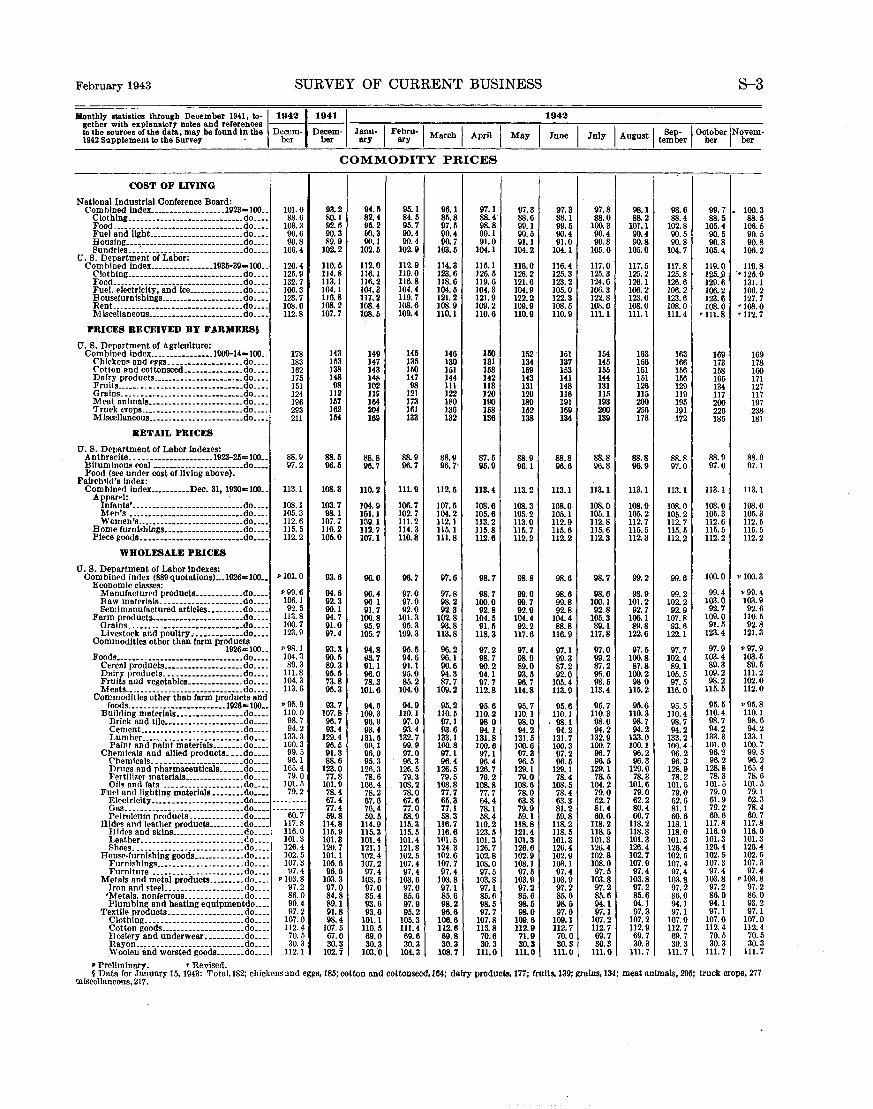
February 1943 SURVEY OF CURRENT BUSINESS S-3
gether with explanatory notes and references ------ ---,. --~~---;------;----,----;----;--------;-------;----Monthly statistics through December 1941, to-,194211941 I 1942
to the sources of the data, may be found in the Decem- Decem- Janu- I Febru-~ March I April I May I June I July I August I tesmep-er I Ocbtoerber INobeverm-1942 Sapp1ement to the Survey · ber ber ary ary b
COMMODITY PRICES
COST OF LIVING
National ~ndustrlal Conference Board: Com blned lndex •••. ---------------1923-100 •. 101.0 93.2 94.fi 95.1 96.1 97.1 97.3 97.3 97.8 98.1 98.6 Clothlng _____________________________ do ..•• 88.6 80.1 82.4 84.5 85.8 88.4 88.6 88.1 88.0 88.2 88.4
Food. ___ ._._----------------------- •. do ____ 108.3 92.6 95.2 95.7 97.5 98.8 99.1 99.5 100.3 101.1 102.8 Fuel and llght.-----------------------do .... 90.6 90.3 li0.3 90.4 90.4 90.1 90.5 90.4 90.4 90.4 90.5
~~~J~~fs-_-:_':.-::::::::::::::::::::::::~~:::: 90.8 89.9 on.1 90.4 90.7 91.0 91.1 91.0 90.8 90.8 90.8 106.4 102.2 102.6 102.9 103.5 104.1 104.2 104.1 105.0 105.0 104.7
U.S. Department of Labor: Com hi ned index ________________ 1935-39= 100 •. 120.4 110.5 112.0 112.9 114.3 115.1 116.0 116.4 117.0 117.5 117.8 Clothing. __________ • _____ • ___ ._. ____ . do ___ . 125.9 114.8 ll6.1 ll9.0 123.6 126.5 126.2 125.3 125.3 125.2 125.8
Food. __ .. _ ... ------ ------------------do •.•. 132.7 ll3.1 ]]6.2 116.8 118.6 ll9. 6 121.6 123.2 124.6 126.1 126.6 Fuel. electricity, and lce ______________ do •.•• 106.3 104. I 104.3 104.4 104.5 104.3 104.9 105.0 106.3 106.2 106.2 B ousefurn lshings. ------. _. _____ ._. __ .do. __ • 123.7 ll6. 8 117.2 ll9. 7 121.2 121.9 122.2 122.3 122.8 123.0 123.6 Rent .•..• _._.----------------------- .do •••• 108.0 108.2 108.4 108.6 108.9 109.2 109.9 108.5 108.0 108.0 108.0 M lscellaneous •••••.•••.• _____________ do ____ 112.8 107.7 108.5 109.4 110.1 110.6 110.9 110.9 111.1 111.1 111.4
PRICES RECEIVED BY FARMERSi
U. S. Department of Agriculture: Com blned index ..•. ------------ 1~09-14-100 .. 178 143 149 145 146 150 152 151 154 163 163 Chicken~ and P!!I!S-------------------do .... 183 153 147 135 130 131 134 137 145 156 166 Cotton and cottonseed.--------------do ____ 162 138 143 150 151 168 159 153 155 151 156 Dairy products. ______________________ do .••• 175 148 148 147 144 142 143 141 144 151 156 Fruits ........ _.----------------------do ____ !51 98 102 98 111 118 131 148 131 126 129 0 rains .•.• ----··----------------------do ____ 124 112 llG 121 122 120 120 116 1Jli 115 119 Meat anlmals ________________________ do ____
196 157 1M 173 180 190 189 191 193 200 195 Truck crops __________________________ do ..•. 293 162 204 1fl1 136 168 152 169 200 256 191 Mlscellaneous ... _____________________ do ____ 211 154 169 133 132 136 138 134 139 173 172
RETAIL PRICES
U. S. Department of Labor Indexes: Anthracite .• __ -----------------1923-211=100 •• 88.9 88.5 88.8 88.9 88.9 87.5 88.9 88.8 88.8 88.8 88.8 Bltnmlnou~ coal -----------------------do •••• 97.2 96.5 96.7 96.7 96.7· 95.9 96.1 96.6 96.8 96.9 97.0 Food (see under cost of living above).
Falrchtld's index: Comhln•d index __________ Dec. 31, 1930-100 •• 113.1 108.3 110.2 111.9 112.5 113.4 113.2 113.1 ll3.1 113.1 ll3.1
A f~r:~~~· --. _____ ....... _ --------~--.do.--- 108.1 103.7 104.9 106.7 107.5 108.6 108.3 108.0 108.0 108.0 108.0 M •n's .. ---------------------------do .••. 105.3 98.1 161.1 102.7 104.2 105.6 105.2 105.1 105.1 105.2 105.2 Women's ...... ---- ___ • _ •• __ -------.do._ •• 112.6 107.7 109.1 111.2 112.1 113.2 JJ3.0 112.9 112.8 112.7 JJ2. 7 B ome furnlshlngs ____________________ do ..•. 115.5 110.2 112.7 114.3 115. 1 115.8 '115. 7 115.6 115.6 115.5 115./i
Piece goods._ ------------------------do •••• 112.2 105.0 107.1 110.8 111.8 112.6 112.2 112.2 112.3 112.3 ll2.2
WHOLESALE PRICES
U. S. Department of Labor Indexes: Combined Index (889 quotatlons)-.1926=100 ••
Economic clMses: ~ 101.0 93.6 96.0 96.7 97.6 98.7 98.8 98.6 98.7 99.2 99.6
M anufacturcd productS------------do •••• ~99.6 94.6 96.4 97.0 97.8 98.7 99.0 98.6 98.6 98.9 99.2 Raw materials ... ------------------do •••• 106. I 92.3 96 1 97.0 98.2 100.0 99.7 99.8 100.1 101.2 102.2 Semlmanufactured articles _______ •• do .••• 92.5 90.1 91.7 92.0 92.3 92.8 92.9 92.8 92.8 92.7 92.9
Farm products ••••••• __ •• --- ••• ____ •• do __ ._ 113.8 94.7 100.8 101.3 102.8 104.5 104.4 104.4 105.3 106.1 107.8 Grains ... __ ... ---------------------do .... 100.7 91.0 95.9 95.3 93.8 91.5 92.2 88.8 89.1 89.8 93.6 Livestock and poultry "------------do ____ 123.9 97.4 105.7 109.3 113.8 118.3 117.6 116.9 117.8 122.6 122.1
Commodities other than farm products • 98.1 1926ml00 •. 93.3 94.8 95.5 96.2 97.2 97.4 97.1 97.0 97.5 97.7 Foods ___ • ___ .• ___ ----- __________ • ___ • do. __ • 104.3 90.5 93.7 94.6 96.1 98.7 98.9 99.3 99.2 100.8 102.4
Cereal products •••. ___ ._. ___ ••• ____ do ___ . 89.3 89.3 91. I 91.1 90.6 90.2 89.0 87.2 87.2 87.8 89.1 Dairy products .•• -----------------do •••• 111.8 95.5 96.0 95.0 94.3 94.1 93.5 92.0 96.0 100.2 105.5 Fruits and vegetables ______________ do ____ 104.3 73.8 78.3 85.2 87.7 97.7 96.7 105.4 98.5 980 97.5 Meats .......... _____ •••••••• ------. do. ___ 113.6 95.3 101.6 104.0 109.2 ll2.8 114.8 113.9 113.4 115.2 116.0
Commodities other than farm products and ~ 95.9 foods .•.• _ •.•. _ .• ___ --------- .1926-100 •• 93.7 94.6 94.9 95.2 95.6 95.7 95.6 95.7 95.6 95.5
B ulld In g materials. ____ -----••••• _. do •••. 110.0 107.8 109.3 110.1 110.5 110.2 110.1 110.1 110.3 Jl0.3 110.4 Brick and tile ____________________ do .••• 98.7 96.7 96.9 97.0 07.1 98.0 98.0 98.1 98.0 98.7 98.7 Cement __________________________ do ____ 94.2 93.4 93.4 93.4 93.6 94.1 94.2 94.2 94.2 94.2 94.2 Lum her------- ______ ._ .• _________ do .... 133.3 129.4 131.6 132.7 133.1 131.8 131.5 131.7 132.9 133.0 133.2 Paint and paint materials ________ do .... 100.3 96.5 9P.1 99.9 100.8 100.6 !00.6 100.3 100.7 100.1 100.4
Ch•mlcols and allled products •••. do •.•• 99.5 91.3 96.0 97.0 97.1 97.1 97.3 97.2 96.7 96.2 96.2 {'hemlcals ...• -----------------·-do ____ 96.1 88.6 95.3 96.3 96.4 96.4 96.5 96.5 96.5 96.3 96.3 Drn!!s and pharmaceut!cals .••••. do ____ 165.4 123.0 126.3 126.5 126.5 126.7 129.1 129. 1 129.1 129.0 128.9 Fertilizer rnaterlals. ______________ do •.•. 79.0 77.8 78.6 79.3 79.5 79.2 79.0 78.4 78.5 78.3 78.2 Oils and fats --------------------do ____ 101.5 101.9 106.4 108.2 108.8 108.8 108.6 108.5 104.2 101.6 101.5
Fupl and lighting materials ________ do ____ 79.2 78.4 78.2 78.0 77.7 77.7 78.0 78.4 79.0 79.0 79.0 Rlectrlclty ..... __________________ do ____ --------· 67.4 67.6 67.6 65.3 64.4 63.8 63.3 62.7 62.2 62.6 ORS ....... ------.----------------do ____ 77.4 76.4 77.0 77.1 78.1 79.9 81.2 81.4 80.4 81.1 Petroleum products ______________ do •••• 60.7 59.8 59.5 58.9 58.3 68.4 59.1 59.8 60.6 60.7 60.6
llidPs and leather products ......... do •••• 117.8 114.8 114.9 115.3 116.7 119.2 118.8 118.2 118.2 118.2 118.1 Tildes and sklns __________________ do ____ 116.0 115.9 115.3 115.5 116.6 123.5 121.4 118.5 118.5 118.8 118.0 Leather-------------------- ______ do .••. 101.3 101.3 101.4 101.4 1n1. 5 101.3 101.3 101.3 101.3 101.3 101.3 Shoes ...... ----- ... ------ ________ do •.•• 126.4 120.7 121~ I 121.8 124.3 126.7 126.6 126.4 126.4 126.4 126.4
llousP-fnrnishing goods _____________ do •••• 102.5 101.1 102,4 102.5 102.6 102.8 102.9 102.9 102.8 102.7 102.5 Furnish logs ___________ ._. _______ . do. __ • 107.3 105.6 107.2 107.4 107.7 108.0 108.1 108.1 108.0 107.9 107.4 Furniture ·----------------------do •.•• 97.4 96.6 97.4 97.4 97.4 97.5 97.5 97.4 97.5 97.4 97.4
Metals and metal products ......... do •••. •103. 8 103.3 103.5 103.6 103.8 103.8 103.9 103.9 103.8 103.8 103.8 Iron ond stPeL ___________________ do ____ 97.2 97.0 97.0 97.0 97.1 97.1 97.2 97.2 97.2 97.2 97.2 •Metals, nonferrous _______________ do .... 8~. 0 84.8 85.4 85.6 85.6 85.6 85.6 85.6 85.6 85.6 86.0 Plumbing and heating equ!pmentdo ..•. 90.4 89.1 93.6 97.9 98.2 98.5 98.5 98.5 94.1 94.1 94.1
Textile products •• --------------- __ do .... 97.2 91.8 93.6 95.2 96.6 97.7 98.0 97.6 97.1 97.3 97.1 Clothing_ ... ------------------·-- do .... 107.0 98.4 101.1 105.3 106.6 107.8 109.6 109.1 107.2 107.2 107.0 Cotton goods __________ --------- __ do .... 112.4 107.5 llO. 5 111.4 112.6 113.8 112.9 112.7 112.7 112.9 112.7 Hosiery and underwear __________ do .... 70.5 67.0 69.0 69.6 69.8 70.6 71.9 70.0 69.7 69.7 69.7 Rayon .... _. _______ ------ __ •• __ •. do .... 30.3 30.3 30.3 30.3 30.3 30.3 30.3 30.8 so.s 30.3 30.3 Woolen and worsted goods _______ do ____ 112.1 102.7 103.0 104.3 108.7 111.0 111.0 111.0 111.0 111.7 l11.7
99.7 . 88.5
105.4 90.5 90.8
105.4
119.0 125 . .9 129.6 106.2 123.6 108.0
r 111.8
169 173 158 165 134 117 200 226 185
88.9 97.0
Jl3.1
108.0 105.3 112.6 115.5 112.2
100.0
99.4 103.0 92.7
109.0 91.5
123.4
97.9 103.4 89.3
109.2 98.2
115.5
95.5 110.4 98.7 94.2
133.3 101.0 96.2 96.2
128.8 78.3
101.5 79.0 61.9 79.2 60.6
117.8 116.0 101.3 126.4 102.5 107.3 97.4
103.8 97.2 86.0 94.1 97.1
107.0 112.4 70.5 30.3
111.7
100.3 88.5
106.5 90.5 90.8
106.2
119.8 r 125.9
131.1 106.2 127.7
r 108.0 r 112.7
169 178 160 171 127 117 197 238 181
88.9 97.1
113.1
108.0 105.3 112.5 115.5 112.2
•100. 3
•99. 4 103.9 92.6
110.5 92.8
121.3
•97.9 103.5 89.5
111.2 102.0 112.0
• 95.8 110.1 98. 6 94.2
133.1 100.7 99. 96.
5 2
165.4 78. 6
101.5 79.1 62.3 78.4 00.7
117.8 116.0 101.3 126.4 102.5 107.3 97.4
•103.8 97.2 86. 0 93.2 97.1
107. 112. 70. 30.
111.
0 4 5 3 7
• Preliminary. • Revised. § Data for January 15, 1943: 'l'otal, 182; chickens and eggs, 185; cotton and cottonseed, 164; dairy products, 177; fruits, 139; grains, 134; meat animals, 205; truck crops, 277
miscellaneous, 217.
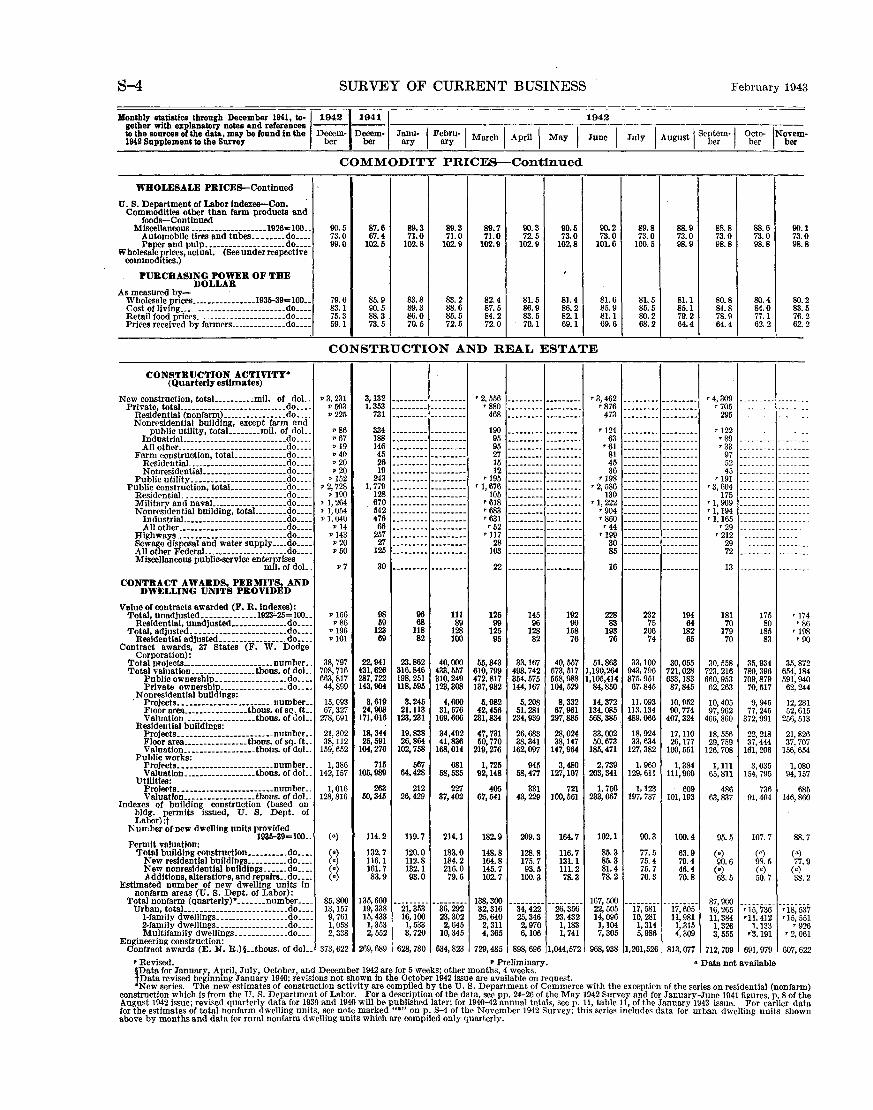
S-4 SURVEY OF CURRENT BUSINESS
:Monthly statistics through December 1941, to-,1942 1941 I 1942 gether with explanatory notes and references ---to the sources of the data, may be found in the Decem- Decem- Janu- I Febru·l March I April I May I June 1942 Supplement to the Sune:r ber ber ary ary
COMMODITY PRICES-Continued
WHOLESALE PRICEs-Continued
U. S. Department of Labor indexes-Con. Commodities other than farm products and
foods-Continued Miscellaneous •.•••.•.•••.•.•.••• 1926~100 •. 90.5 87.6 89.3 89.3 89.7 90.3 90.5 90.2
Automobile tires and tubes •••••.•. do •••. 73.0 67.4 71.0 71.0 71.0 72.5 73.0 73.0
whol!:FeRr!~~.~~i~ai:··(seeiiti<iei-res'Pe~7ive· 99.0 102.5 102.8 102.9 102.9 102.9 102.8 101.6
commod ties.)
PURCHASING POWER OF THE ' DOLLAR
As measured by-85.9 83.8 83.2 82.4 81.6 Wholesale prices •.•••••••••.•••• 1935-39~ 100 •. 79.6 81.5 81.4
Cost or living ........................... do •.•• 83.1 90.5 89.3 88.6 87.5 86.9 86.2 85.9 Retail food prices ....................... do .... 75.3 88.3 86.0 85.5 84.2 83.5 82.1 81.1 Prices received by farmers ......•••.•••• do ..•. 59.1 73.5 70.5 72.5 72.0 70.1 69.1 69.6
CONSTRUCTION AND REAl, ESTATE
CONSTRUCTION ACTIVITY• (Quarterly estimates)
New construction, total. ••••••••. mil. of doL • 3, 231 3,132 --------- --------- '2. 556 -----·--- --·------ •3,462 Private, total. .••.•••...•••••.•.••...••. do •.•. • 503 1, 353 --------- --------- •880 --------- --------- '876
Residential (nonfarm) ..•...•.•.•.•.•. do •... • 225 731 --------- --------- 468 --------- --------- 473 Nonresidential building, except farm and
public utility, total.. •.•••• mil. of doL • 86 334 --------- --------- 190 ---·----- --------- '124 IndustriaL ••••••••..••••.•••••.•••• do .... p 67 188 --------- --------- 95 --------- --------- 63 All other ...•.•••.•••••••••••••••.•. do ..•. •19 146 .................. --------- 95 --------- --------- '61
Farm construction, totaL •••••••.•.•. do .... • 40 45 --------- --------- 27 --------- -----·--- 81 ResidentiaL ....•.•••••••••••••.•••. do ..•. • 20 26 --------- --------- 15 --------- --------- 45 NonresidentiaL •••••••••.•••••.•.•. do ..•. •20 19 --------- --------- 12 --------- --------- 36
Public utility ........................ do .... p 152 243 --------- --------- '195 --------- --------- '198 Public construction, totaL ............. do .... • 2, 728 1, 779 --------- --------- '1,676 --------- --------- •2,586
ResidPntial. ......................... do .... •190 128 --------- --------- 105 --------- --------- 130 Military and navaL. .•.•••••••••••.•. do .... • 1, 264 670 --------- --------- '618 -·------- --------- '1, 222 NonrPsidential building, totaL •••••• do .... • 1,054 542 --------- --------- •683 --------- --------- '904
Industrlal. .•••••.•••••••••••...•••. do ••.. •1, 040 476 --------- ------·-- '631 --------- --------- '860 All other .•.•••••••.•.•••••••.•.•••. do ..•. •14 66 --------- --------- •52 --------- --------- •44
Highways ............................ do •.•• •143 257 --------- --------- '117 -·------- --------- '199 Sew~~ disposal and water supply ••.. do •••. •20 27 --------- --------- 28 --------- --------- 30 Allot Jpr FederaL. ................... do .... • 50 125 --------- --------- 103 --------- --------- 85 Miscellaneous public-service ent~iB~~;~oL .
•7 30 --------- --------- 22 --------- --------- 16
CONTRACT AWARDS, PEBMI'I'S, AND DWELLING UNITS PROVIDED
Value of contracts awarded (F. R. indexes): 98 96 Total, unadjusted •.•.•.•.•.•.•• 1923'-25= 100 •• • 156 111 125 145 192 228
Residential, unadjusted •••••••••••••• do •••. • 86 59 68 89 ll9 96 00 83 Total, adjusted ..••....•••••••••••••••. do •.•. • 196 123 118 128 125 128 158 193
Residenti&ladjusted ................. do .... • 101 69 82 100 95 82 76 76 Contraet awards, 37 States (F. W. Dodge
Corporation): 22,941 23.862 Total projeets ....................... num ber •. 38,797 40,000 55,843 33,1~7 40,557 51,863
Total valuation ..•••••••••••••• thous. or doL 708,716 431,626 316,846 433,557 610,799 498,742 673,517 1,190,264 Public ownership .••••••••.•••.•.•. do •.•. 663,817 287.722 198,251 310,249 472.817 354,575 568,988 1,105,414 Private ownershi&·--·····---------do •.•. 44,899 143,904 118,595 123,308 137,982 144,167 104,529 84,850
Nonresidential bull lngs: 3,619 3,245 Projects ....................... number •. 15,093 4,600 5,982 5,208 8,332 14,372
Floor area .••••.•.•••.•••• thous. or sQ. ft .. 67,327 24,908 21,113 31,576 42,456 51,281 67,961 134,085 Valuation .................. thous. of clol.. 278,091 171,016 123,231 169.606 231,834 234,939 297,885 568,385'
Residential buildings: 18,344 19,838 Projects .••••••...•••••••.•.•.•. number .. 21,302 34,492 47,731 26,683 28,024 33,002
Floor area •••••.•••.•.•.•. thous. of sq. ft •. 38, 112 25,591 26,864 41,836 50,770 38,341 38,147 50,673 Valuation .••••.•.•.•.•••••• thous. of doL 159,652 104,276 102,758 168,014 219,276 162,097 147,964 185,471
Public works: Projects ........................ number .. 1, 386 715 567 681 1, 725 945 3,480 2, 739 Valuation .................. thous. or doL. 142, 157 105,989 64,428 58,535 92,148 58,477 127,107 203,341
Utilities: Prolerts .••••••••••••••••••.•••. number .. 1, 016 263 212 227 405 331 721 1. 750 Valuatlon .••••.•••.•••••.•. tbons. of doL 128,816 50,345 26,429 37,402 67,541 43,229 100,561 233,067
Indexes of building construction (based on bldg. permits issued, U. S. Dept. of Labor):t
1'\ umber of new dwelling units provided (•) 1935-39~ 100 .. 114.2 119.7 214.1 182.9 209.3 164.7 102.1
Permit valuation: Total building eonstruetlon .......... do .... (•) 132.7 120.0 183.0 148.8 128.8 116.7 85.3
New residential buildlngs .......... do •••. (•) 116.1 112.8 184.2 164.8 175.7 131.1 85.3 New nonres!rlential bu!ldlngs ...... do .... (•) 161.7 132.1 216.0 145.7 93.5 111.2 81.4 Additions, alteratlofls, and repairs .. do .... (•) 83.9 93.0 79.6 102.7 100.3 78.3 78.2
Estimated number of new dwelling units in nonfarm areas (U. S. Dept. of Labor):
Total nonfarm (quarterly)• ••••..• number •... 85,800 135,600 "'2i;353' --------- 138,300
'"34;422' "26;356' 167,500
Urban, totaL •..•...•••••.•••••••••••• do .... 13, 157 19,338 36,292 32,316 22,505 1-family dwellings .................. do .... 9, 761 15,433 16,100 23,302 25,640 25,346 23,432 14,096 2-family dwPllings .................. do .... 1, 058 1,353 1, 533 2,645 2,311 2,970 1, 183 1,104 Multifamily dwellings ............. do •.•. 2,338 2, 552 3, 720 10,345 4, 365 6,106 1, 741 7,305
Engineering construction: Contract awards (E. :W. R.)§ •. thous. of doL 373,622 269,689 628,780 634,823 729,485 898,696 1,044,572 968,938
89.8 88.9 73.0 73.0
100.5 98.9
81.5 81.1 85.5 85.1 80.2 79.2 68.2 64.4
--------- ------------------ ------------------ ---------_____ ,. ___ ------------------ ------------------ ------------------ ------------------ ------------------ ------------------ ------------------ ------------------ ·----------------- ------------------ ------------------ ------------------ ------------------ -----·------------ ---------................... ------------------ -------·-
232 194 75 64
206 182 74 65
33,100 30,055 943,796 721,028 875.951 633, 183 67,845 87,845
11,093 10,952 11~. 134 90,774 489,066 407,324
18,924 17,110 33,634 26,177
127,382 100,551
1, 960 1,384 129,611 111,960
1, 123 609 197, 737 101, 193
90.3 100.4
77.5 63.9 75.4 79.4 75.7 46.4 70.3 70.8
"i7;58i- ---------17,605
10,281 11,981 1, 314 1,.315 5,986 4,309
1,201,526 813,077
February 1943
88.8 88.6 73.0 73.0 98.8 98.8
80.8 80.4 84.8 84.0 78.9 77.1 64.4 62.2
'4, 309 ---------'705 ---------
295 ---------
'122 ---------'89 ---------'33 ---------
97 ---------52 ---------45 ---------
'191 ---------•3,604 ---------
175 ---------'1,909 ---------'1, 194 ---------'1, 165 ---------
'29 ---------'212 ---------
29 ---------72 ---------13 ---------
181 175 70 80
179 185 70 83
30,558 35,934 723,216 780,396 660,953 709,879 62,263 70,517
10,405 9,945 97,962 77,245
466,860 372,991
18,556 22,218 29,759 37,444
126,708 151, 206
1, Ill 3,035 65,811 154,795
486 736 63,837 91,404
95.5 107.7
(•) (•) 90.6 98.5
(•) (•) 63.5 50.7
87,900 ---------16,265 •15, 736 11,384 •11.412 1,326 1.133 3,555 i3.191
712,709 691,979
90. 73. 98.
80. 83. 76. 62.
1 0 8
2 5 2 2
----------------------------------------------------------------------------------------------------------------------------------------------------------------
'174 '86
'198 '90
35,872 654, 184 591,940 62,244
12,281 52,615
256,513
21,826 37,707
156,654
1,080 94,157
685 146,860
88.7
(•) 77.9
(•) 38.2
--------'18, 537 '15, 551
'926 '2,061
607,622
• Revised. • Preliminary. • Data not available ~Data for January1 April, July, October, and December 1942 are for 5 weeks; other months, 4 weeks. Data revised begmnmg January 1940; revisions not shown in the OctobPr 1942 issue are available ou request.
•New series. The new estimates of construction aetivity are compiled by the U. S. DP.partment of Commerce with the exception of the series on residential (nonfarm) construction which is from the U.S. Department of Labor. For a description of the data, see pp. 24-26 or the May 1942 Survey and for January-June 1941 figures, p. 8 of the August 1942 issue; revised quarterly data for 1939 and 1940 will be published later; for 194042 annual totals, seep. 11, table 11, of the January 1943 issue. For earlier data for the estimates of total nonfarm dwelling units, see note marked "•" on p. S-4 of the November 1942 Survey; this series includes data for urban dwelling units shown above by months and data for rural noufarm dwelling units which are compiled only quarterly.

February 1943 SURVEY OF CURRENT BUSINESS
Monthly statistics through December 1941, to-~1942 1941 I 1942 gether with explanatory notes and references ---to the sources of the data, may be found in the Decem- Decem- Janu- I Febru-1 March I April I May I June 1942 Supplement to the Survey ber her ary ary
CONSTRUCTION AND REAL ESTATE-Continued
HIGHWAY CONSTRUCTION
Concrete pavement contract awards: 4, 726 7,091 TotaL •••.•••••.•.•••••••••••• thous. sq. yd •• 7, 734 8,176 3,484 8,914 14,462 15,268 14,947
A !rports •••••••• _ •••••••• _ •••.••••• _ •. do •.•• 5,074 2, 984 2,490 I, 451 3,972 5,416 9,800 11,038 11,300 Roads •••••••. --------··-- ·-·---------do •••. 1, 488 3,197 1,139 1,110 I, 727 2,061 3,267 2,060 I,927 ~treets and alleys ..•••.••.•••••.•.•••. do .••. 1,17I 2,015 I,098 903 1,3U2 I, 437 1,394 2,I67 1,655
Status of hi~hway and l!rade crossinl! project~ administered by Public Roads Admn.:
Highways: Approved for construction:
M lleage .•.•••••••••••••••••• no. of miles •• 1, 404 2,259 I, 967 I, 796 1,562 I, 431 1,455 1,654 1, 718 Fe<lcral funds ..•••••••.•••• thous. of doL. 29,634 34,014 30,789 28,844 24,612 24,0L5 27,968 32,808 36, 170
Under construction: Mlleage .•..••••••••••••••••. no. or miles .. 2, 955 7,417 7,044 6,802 6, 778 6,817 6,672 6,071 5,483 Federal funds •••••••••••••• thous. of doL 88,028 121,384 117,009 119,233 123,405 127,195 127,511 122,402 114,997 Estimated cost ••••••••••••••••••••• do •••• 143,983 239,336 228,623 225,527 226,543 231,620 228,535 217,200 200,868
Grade crossings: A~roved for construction:
cderal funds •••. ···-·-·-······ •••• do •••• 6,821 10,005 8,542 8,047 7,490 7,806 8,201 7,108 6, 696 Estimat•d cost. -------------------do •••• 7,484 11,810 9,314 8, 761 8,210 8,503 8,893 7,843 7,358
Under construction: Federal funds •• ______ ---·-----------do •••. 22,242 37,742 35,928 34,754 34,576 34,467 33,658 33,413 31,299 Estimated cost •.• __ •••••••••••••.•• do •.•. 23,853 39,323 38,300 37,140 36,913 36,814 35,838 35,409 33,279
CONSTRUCTION COST INDEXES
Aberthaw (industrial bulldlng) .••.•. 1914=100 •• American Appraisal Co.:
225 215 --~----·- ------·-- 218 -------·- --------- 223 ..................... Average, 30 cltles ..••••••••••••••.. l913=100 •• 248 225 229 231 237 238 241 242 244
Atlanta •. -·-···-------·-··--·· .•••••• do •••. 250 222 224 225 232 232 233 242 245 New York ..••.••••••••••••••••.•••.•• do •••• 251 238 240 241 247 248 250 250 250 San Fr&nclsco •••••••••••••••••••••.•. do •••• 230 212 215 215 221 221 224 228 229 St. Louis _______________________ •.•.•. do •••• 242 226 230 230 236 237 238 238 240
Associated General Contractors (all types) 203.3 203.3 206.5 207.8 1913=100 •• 213.5 204.0 207.3 207.3 209.9 E. B. Boeckh and As•ociates Inc.:
Apartments, hotel•, and office buildings: Brick and concrete:
Atlanta .••••••••. U. S. av., 1926-29-100 •• 107.2 100.2 101,4 101.4 101.9 105.4 105.6 105.6 106.1 New York. ___ ••••••••••••••••••••• do •••• 139.8 136.0 137.0 137.0 137.5 137.7 138.2 138.2 138.2 San Francisco .••••.•••••••••••••••• do •••• 132.0 123.2 124.2 124.2 125.6 125.7 126.6 126.6 130.0 St. Louis •••••.••••• ____ -----------.do •••• 130.6 122.5 123.8 123.9 124.4 124.4 124.8 129.6 129.6
Commercial and factory buildings: Brick and concrete:
Atlanta. ---···--···············----do •••• lOP.. 9 102.1 102.9 102.9 103.2 105.7 106.0 106.0 106.0 New York •• --•--------··----····-.do •••• 141.0 137.7 138.4 138.4 138.8 139.0 139.6 139.6 139.6 San Francisco ••••••••••••••.••••••• do •••• 134.4 126.0 125.3 125.3 126.6 126.7 127.2 127.2 132.3 St. Louis ••.•.• ------_ •••••••• ______ do •••• 133.4 123.4 124.4 124.5 124.9 124.9 125.3 132.6 132.6
Brick and steel: Atlanta ••••••••••• _ •••••••••••••••• do •••• 107.6 101.3 102.5 102.5 102.8 106.4 106. 5 106.5 106. 5 New York • ········---------------do •••• 138.5 135.3 136.2 136.2 136.8 137.1 137.4 137.4 137.4 San Francisco ••••••••••• _ •• __ •••••• do •••• 135.3 128.3 127.1 127.1 128.5 128.6 130.4 130.4 133.1 St. Louis •••••••••••••••.••••••••••• do •••• 130.2 123.1 124.1 124.3 124.7 124.8 125.3 129.4 129.4
Residences: Brick:
Atlanta. __ ····-·· •••••••••••••••••• do._._ 106.7 97.1 99.9 99.9 100.3 103.7 103.8 103.8 104.1 New York. -·······--·······--·····do ____ 140.9 136.1 137.9 137.9 138.3 139.3 139.7 139.7 139.7 San Francisco •••••••••• ······-··---do __ •• 127.6 117.6 120.0 120.0 121.9 122.3 124.8 124.8 125.8 St. Louis ..••••••••• ---------- .•.... do .••• 126.7 120.4 121.4 122.1 122.5 122.8 123.5 126.9 126.9
Frame: Atlanta •• ___ •••••••• ___ •••• __ •••••• do •••• 106.8 95.1 98.5 98.6 98.8 103.2 103.3 103.3 103.6 New York.-------------------- •••• do •••• 142.5 137.2 139.4 139.4 139.8 141.1 141.4 141.4 141.4 San Francisco .•••••.• __ ••••••..•••• do •••• 123.3 114 9 117.7 117.7 118.9 119.5 120.2 120.2 122.0 St. Louis ...•• __ ------_ .•••.••..•••• do •••• 125.6 119.8 120.8 121.7 122.1 122.5 122.9 124.8 124.8
Engineering News Record (all types) 1913=100 ••
Federal Home Loan Bank Administration: Standard 6-room frame house:
283.5 267.6 269.4 269.7 271.8 272.3 274.2 ·277. 7 281.6
Corn hi ned Jndex •••••••••••••• 1935·39-IOO .. 124.5 119.9 120.6 121.2 122.0 122.3 122.8 123.5 123.7 Materials •••••••••••••••••••••.•••. do __ •. 121.4 117.7 118.6 119.3 120.0 120.5 121.0 121.3 121.2 Labor •••••••• ---------- .•••••.•••. do •••. 130.7 124.2 124.5 125.0 126.0 125.9 126.4 127.8 128.5
REAL ESTATE
Fed. Hous. Admn., borne mortgage Insurance: Gross mortgages accepted for Insurance
thous. of doL 54,086 75,435 66,952 104,588 141,443 69,225 53,488 98,800 109,350 Premium-paying mortgages (cumulative)
thous. or <loL .. 4,554,952 1,596,491 3,600,214 a,769,496 3,849,549 3,916,421 3,900,152 4,071,838 4,155,187 Estimated total nonfarm mortgages recorded
($20,000and under)* ••••.•••••.. tbous. of doL 265,406 392,355 321, 396 296, 041 335,636 359,968 350,187 342,250 353.511 Est1m1>ted new mortgage loans by all sa vin~s
and loan associations, totaL._ thous. of do _. 70,628 100,208 79,533 70,756 87,367 99,047 95,009 94,095 95,797 Class!Hed according to purpose:
Mortgage loans on homes: Construction •••••.••• __ ----- .•••••• do .• __ 8,472 30,200 22,791 20,799 21,775 20,488 17,610 15,930 17,709 Home purchase_ -------------------do .•.. 41,440 43,145 34,127 33, 769 40,930 52,196 53,095 52,112 52, !90 Refinancing ___ ••••.•••••• __ --·-•••• do ___ . 12,768 14,424 12,854 12,325 13,225 14,508 13,607 15,184 16,097 Repairs and reconditlonlng~ •••••••. do •.•. 2,J99 4,170 3,190 3,138 3,547 4,083 3,800 3,500 3,671
Loans for all other purpo~es .••..•••. do .••. 5, 749 8,179 6, 571 6, 725 7,800 7,772 6,831 7,303 6,130 Classllled according to type of association:
FederaL--·---------·-·· ..•. thous. of dol ••• 27,381 41,182 31,142 3!,919 36,325 38,484 36,966 35,279 37,007 State members ••••••••• ·---···· •.•••• do .••. 32,751 43,960 35,312 33,939 38,030 43,937 43,005 44.265 43,665 Nonmembers ••• -------- ...••..•••.•. do .• __ 10,496 15,066 13,079 10,898 13,012 16,626 15,038 14, 55! l'i, 125 'Revised
13,947 20,090 10,091 I6, 935 2,653 I, 518 I,202 1,637
1,606 1,534 37,059 35,534
4,954 4,262 109,549 102,419 189,077 174,898
6,665 6, 797 7,327 7,458
29,412 26,417 31,296 28,231
........................ 225
245 246 248 249 250 251 229 229 241 242
213.3 2!3.3
106.1 106.1 138.2 138.2 130.0 130.0 129.6 129.6
106.0 106.0 139.6 139.6 132.3 132.3 132.6 132.6
106.5 106.5 137.4 137.4 133.1 133.1 129.4 129.4
104.1 104.1 139,7 !39.7 125.8 125.8 126.9 126.9
103.6 103.6 141.4 141.4 122.0 !22.0 124.8 124.8
281.6 282.4
124.0 124.4 121.2 121.5 129.4 130.2
109,660 l00,456
4,232,030 4,311,126
336,850 345,964
92,583 94,055
12,568 12,449 55,301 58,060 14,019 14, 063 4,126 3,804 6,549 5, 679
36, 620 37, 987 41,549 42,249 14,394 I , 13,819
12,453 7,600 2,806 2,047
1,524 34,968
3, 714 98,230
165,052
5,852 6,512
24,608 26,387
---------246 249 251 229 242
213.5
106.1 138.5 131.3 129.6
106.0 140.0 134.6 132.6
106.5 137.5 134.5 129.4
104.1 139.9 126.8 126.9
103.6 141.5 122.5 124.8
283.6
124.5 121.6 130.2
'99,833
4,393,862
357,083
91,672
10,572 56,528 14,694 3,498 6,380
35,555 41,937 14,180
S-5
8,67 1 I 6 4
5,82 I,40 1,44
1,53 I 5 33,43
3,3 29 9 1
91,83 153,22
5,00 4 4 6,56
23,1 90 5 24,83
-------2 25
47 0 1 25
229 42 2
213.
107. 139. 132. 130.
106. 141. 134. 133.
107. 138. 135. 130.
105. 140. 127. 126.
105. 142. 123. 125.
283.
124. 121. 130.
0 8 0 6
7 0 4 4
2 5 3 2
3 9 6 7
0 5 3 6
7
4 5 2
73,7 68
21
21
79
4,473,0
278,3
73,9
9,2 75 43, 12,4
984 72 07 41
3,0 5, 2
28,1 35,4
63 41 75 10,3
• Th~ new SP-ries on nonfArm mortva!!es recorded. compiled by the Federal Rome Loan Bank Administration, represents total mortgage Jeg!strations durin!! the month, based on reports covering approximately 600 counties and siruilor political subdivisions, which contain almost two-thirds of the total nonfarm population. To relate mortgage recordings as closely as possible to llnancing of I· to 4-family homes, only instruments with a face amount of $20,000 or less on properties in nonfarm areas are included. For data for January 1939 to August 1941 see note marked "*" on p. 8 5 of the November 1942 Survey,
508256-43--5

S-6 SURVEY OF CURRENT BUSINESS
gether with explanatory note• aod references ------Monthly statistics through December 1941, to-~194211941 I 1942
to the sources of the data, may be round in the Decem- De~em-1 J anu-1 Fcbru-~ March I }.prll I May I June 19U Supplement to the Survey bcr ber ary -ary ·
CONSTRUCTION AND REAL ESTATE-Continued
REAL ESTATE-Continued
Loans outstanding or agencies under the Fed· eral Home Loan Bank Administration:
Federal Savings and Loan Ass'ns, estimated mortgages outstandingt ...... thous. of doL.
Fed. Home Loan ilks., outstanding advances to member instltutionR ....... thous. or doL
Home Owners' Loan Corporation, balan"e of loans outstanding ........... thous. of doL ..
Foreclosures, nonfarm: Index, adjusted ................ 1935-39= 100 ...
Fire losses ........................ thous. of doL.
ADVERTISING
Advertising indexes, adjusted: Printers' Ink, combined index .. 1928-32= 100 ..
~~i~~!;~~-:-:~~~~~~~~~~~~~~~~~~~~~j~::~: Tide, combined index• ......... 1935-39=100 ..
~:;~~~;~;s··-~:::::::::::::::::::::::~~==== Radio advertising:
Cost of facilities, totaL ........ thous. of doL Automobiles and accessories .......... do ___ _ Clothing._ ... __ .... -----.-- .......... do ... . Electrieal household equlpment ______ do ... . FinanciaL .................. _ ........ do ... . Foods. food hev~rages, confectlons .... do __ __ Gasoline and oiL ____________________ do .. .. House furnishings, etc ............... do ... . Soap, cl~ansers, etc .. _ ............... do .. .. Smoking materials ................... do. ---Toilet goods, medical supplles ....... do .. .. All other _____ ... _____________________ do .. ..
Magazine ad vertlsing: Cost, total. ______ .. - -------------------do .. ..
Automobiles and accessorles ......... do ... . Clothing .. ___ .......... -.--- ......... do.---Electric household equlpment ........ do .. .. Financial ••.• ------ ..... ----- ........ do ... . Foods, food beverages, confections .... do .. .. Gasoline and oiL ____________________ do .. .. House furnishings, eto ................ do .. .. Soap, cleansers, etc ................. .do .. .. Office furnishings and supplles ....... do ... . Smoking materials. ------------------do .. .. Toilet goods, medical supplies ....... do ... . All othcr ............................. do .. ..
Linage, totRL ................ thous. of lines .. Newspaper advertising:
Linage, total (52 cities) ................. do .. .. Cla!!!!ifled ....... __ .... ----_ .. ____ .... do. __ _ Display, totaL ______________________ do .. ..
Automotive.------ ....... _ ........ do .. .. FinanciaL ......................... do .. .. Genera!. ....... _ ................ _ •. do ... . Retail •• _ ...... __ .... --- •••• _ ...... do .. ..
GOODS IN WAREHOUSES
Space occupied in public-merchandise ware-
1,853,868
129, 213
1,567,748
21.9 36, f49
96.8 82.7
101.3 87.6 77.5
I18. 6 146.1 97.1
11, 284 361 125 54 60
3,180 609
49 904
1,606 3, 275 1, 061
16,940 607 870 401 336
2, 608 187 735 270 328 781
2, 6R2 7,134 ?, 033
120,332 21, 756 98, 575
2, 581 1, 467
19,147 75,381
houses§ ..................... percent of totaL •. -· ____ ..
POSTAL BUSINESS
Air mail: Pound-mile performance ... rnllllons .. ________ _ Money orders.
Domestic, Issued (50 cities): Number __ --------------------- thousands .. _______ .. Value ........................ thous. of doL. _______ __
Dom~sti~, paid (50 cities): Number. ----------------------thousands .. _______ __ Value ........................ tbous. of dol.. ____ .. ..
CONSUMER EXPENDITrRES
Expenditures for goods and services:• TotaL: __________________________ mil. of doL ____ ... _
Goods _____________________________ ... do ........ .. Services ..... __ • __ ..... __ ..... ___ ..... do._._
Indexes: Unadjusted, totaL~--------1935-39-100 .... _______ _
Goods ______________________________ do ___________ _ Services __________ .---- ............. do ... _
Adjusted, totaL. _____________________ do .... ______ __ Goods ....... ---------------------- do .......... .. Services.-----------------_ .. ___ .... do ...... _ .. __
• Revised.
1,824,646
219,446
1,777,110
32.4 31,261
99.4 67.4 92.8 91.3
112.3 120.5 131.2 101.2
10,412 283
61 44 41
2, 936 666
58 1,157 1, 351 3, 218
597
15,928 898 880 476 355
2,555 219 756 331 329 705
2, 679 5. 744 1,937
12.<;, 484 20,534
104,950 3,291 1, 702
17,047 82,910
82.8
2,675
5,826 67,537
17,557 149,204
7,484 5.274 2, 210
15.'1.6 172.8 12fi. 0 133.7 138.3 125.9
1,824,376 1,829,218 1,832,341 1,842,422
206,068 197,432 191,505 185,298
1,758,213 1,742,116 1,724,220 1,709,064
32.1 30.9 29.5 29.1 35,565 30,819 30,505 27,960
DOMESTIC TRADE
80.5 51.5 72.3 74.5 80.6
117.5 134.5 97.3
10,285 251 87 45 41
3,102 567 66
1,118 1, 356 3,094
728
10,486 580 383 103 318
1, 937 80
318 242 177 na
1,8.<;3 3, 763 1, 940
89,341 19,064 70,277 1, 320 2. 204
13,076 53,677
83.4
2,594
5, 743 58,379
15. 707 135,685
6, 335 4,097 2, 238
131.1 133.2 127.6 141.9 151.1 126.3
81.0 49 3 72.7 75.3 83.1
112.0 120.1 95.0
9,382 210 84 45 41
2,845 502 59
998 1. 215 2,846
537
13,044 473 6b0 227 357
2.648 168 417 515 237 673
2.675 3, 992 2,130
87,944 18,192 69,752
1, 560 1.339
14,662 52, 191
83.9
2,553
5, 317 59,823
14,525 138,264
5,856 3,649 2, 207
130.4 131.5 128.6 138.9 146.0 126.6
80.4 47.5 69.4 74.8 94.2
108.5 110.9 91.9
10,282 176 83 56 54
3,112 470 67
I, 125 1, 298 3,122
551
15,811 481
1, 242 237 390
2, 941 277 798 763 242 790
2, 922 4. 728 2, 331
106.908 21,975 84,932
1,938 1,849
16,268 64,878
85.0
3,019
6, 997 87,793
19,134 210,702
6, 446 4, 207 2,239
134.8 1~9.0 127.6 138.9 145.3 128.0
79.1 52.6 67.9 74.7 77.7
109.2 100.9 92.8
9,372 !52 115 45 44
2, 785 380
52 1,058 1,293 2,843
605
' 14,848 710 905 244 402
2,466 385 Rl5 593 205 736
2, 771 4,615 2,168
107,055 21,649 85,406 2,416 1, 704
17,821 63,464
85.2
2,996
5, 673 59,746
17,093 164,302
6, 560 4,290 2, 270
138.4 143.1 130.3 138.6 143.9 129.5
1,846,790
1~1,165
1,692,197
27.2 23,233
78.0 53.8 67.9 72.8 78.0
107.9 98.9 88.2
9,199 138 108 56 52
2. 543 431
52 1,005 1, 316 2,856
643
15,421 772 968 161 403
2,352 542 851 640 257 809
2,883 4, 783 2,064
107,044 22,326 84,718
2, 334 1,248
16,529 64,608
84.5
3,156
5,411 59,542
15,256 137,629
6, 544 4,287 2, 277
138.4 143.4 129.9 139.1 143,9 131.0
1,849,400
192,645
1,675,888
28.0 22,410
80.9 51.7 77.6 74.2 69-2
112.2 104.6 91.2
8, 989 265 62 45 41
2,473 367 42
1,050 1,299 2, 792
553
13,932 796 735 213 304
2,043 392 536 477 171 732
2,928 4,604 1, 769
97,663 20,608 77,055 2,541 1,370
14,841 58,303
85.4
3,130
6,312 73,783
16,865 162,616
6,509 4, 229 2, 279
137.4 141.2 130.8 138. 1 142. 1 131.3
1,852,972
173,593
1,657,256
27.4 21,000
88.0 61.9 90.3 79.0 75.9
123.4 126.5 100.5
8,500 367
55 45 41
2,162 349 42
1,013 1, 329 2,571
527
11,109 631 250 213 257,
1, 738 306 208 320 170 6(19
2,406 4,001 1, 700
89,411 20,085 69,326
2, 316 1, 616
13,987 51, 407
84.1
3,443
5.573 65,221
16,071 152,047
6, 458 4,178 2, 281
134.0 136.4 130.0 142.0 148.3 131.3
1,856,269
160,201
1,640,119
24.1 19,680
88.2 63.2 8~.2 81.3 72.5
122.6 134.9 101.2
8,186 448 45 57 53
2,051 342
51 928
1, 252 2,337
623
12,415 765 724 126 280
1, 785 405 266 378 193 671
2,268 4, 554 2,072
94,963 21,931 73,032 2,146 1,022
13,195 56,669
83.2
3, 661
5,495 68,098
14,582 142,851
6, 678 4. 392 2,286
139. 2 144.3 130.4 146.1 154.0 132.5 I
February 1943
1,861,062
144,752
1,622,087
25.3 20,443
87.6 69.4 81.5 79.4 86.9
122.5 140.0 96.5
8,878 429
70 47 49
2,336 346 43
929 1, 347 2,659
622
15,394 754
1,208 232 425
2,307 422 275 350 275 741
2,4r.a 5, 593 2,344
104,506 22,658 81,847 2,481 1,099
15,572 62,695
81.0
3,870
5,952 78,701
16,308 174,772
6,945 4, 646 2, 300
148.2 157.6 132.0 144.5 151.6 132.2
1,862,593
131,377
1,603,106
24.4 22,621
84.2 69.8 82.0 77.9 65.6
113.3 127.9 95.8
10,332 339 94 53 49
3, 027 480
0 853
I, 485 3, 081
815
'18, IE9 1, 143 1, 381
443 441
2, 947 415 882 445 298 831
'2,865 6,099 2, 528
117,442 24,071 93,371 2, 404 1, 233
19,781 69,953
'82.1
1,862,79 6
121,88
1,586,7
'23. 24,14
00
4 4
~8.'4 73.9 91.7 82.1 55.6
117. I 1R4. 4 100. I
10,716 362 115 67 57
3, 027 532 54
799 1,497 3.136 1,069
'19, 450 979
1,144 52Z 466
3, 377 367 757 479 322 983
'3, 075 6, 979 2,650
II9. 063 22,996 96,067
2, 787 I, 470
Zl,775 70,035
8?.5
6,022 7, as 78, 748 75,474
17,386 15,649 180, 535 162, 162
7,413 5,120 2,293
151.5 163.7 130.7 147.4 157.3 130.5
4, 823
168.5
162.8
t Minor revisions have hern marle in the data beginning Jan nary 1939; data are available on request. § The num~er of reporting ~n'!s was ~reatly _increa~ed in E~rteml:er and Octoter 1942 and data are now based on reports from over700 warehousing firm& operating nearly
2.000 ~erchandise warehO!JSe bmldmgs: Companson of the revised August figure above based on the enlarged sample with the previous figures for Augl!St 83.6 Indicates that the ratws were not matenal!y affected by the change m the coverage of the reports. ' '
• N~w series. '!'he new lndex.r~ of ad\~erl!slng !Ire compill'd by J. K. Las,er & Co. for "Tide"ll?•.gazine; the combined index includes radio (network only prior to July )941 and. network an~ spot advert1sm~ hegmninl( With that month) farm p_ap~rs, and ou_tdoor adv~rt!Slf!g, for which sep~rate indexes arc computed by the compiling agency, m additiOn to magazmc and newspaper ad,-ertl,ing shown above; data be~mnmg 193!\ will be puhhshed m a subsequent Issue. For data beginning 1929 for the series on consumer expenditures and a description or the data, see pp. 8-14 of the October 1942 Survey. Minor revisions in data for January through September 1941 are available on request.

February 1943 SURVEY OF CURRENT BUSINESS 8-7
Monthly stalislics through December 1941, to-~ '942,1941 I 1942 gether with explanatory notes and references ------
1 1 1
I
1
I I I I to the sources of the data, may be found in the Decem- Debcem- Janu- I Febru- March April May June July August teSmepb-er Obcetro· Nobverem-1942 Supplement to the Survey ber er ary ary
DOMESTIC TRADE-Continued
RETAIL TRADE
All retail stores, total salest .•.••••. mil. of doL. 5, 981 5, 585 4, 355 3,843 4,474 4,592 4,569 Durable !!OOds stores ________ -------~do ..•• 944 I, 237 793 694 ~04 860 856 Nondurable goods storesf ·-----------do •.•. 5,037 4, 348 3, 562 3,149 3,670 3, 733 3, 712
By kinds of business: AppareL ___ • _____ • _____ • ___ ._._._. ___ do. __ . 701 557 376 290 440 406 363 A utomotlve .•. ___ ---------- ____ •••••• do._ •. 215 522 321 240 248 240 247 Bulkling materials and hardware ••. .do .••• 300 331 266 240 316 373 370 Drug ________________________________ .do •.••
279 211 163 152 167 170 182 Eating and drlnklngf ________________ do .••. 5C9 428 3£9 381 431 446 473 Food stores .• ------------------------do ••• 1, 421 1,218 1, 216 1,090 1,172 1,220 1,237 Fillln!! stations ...•• ____ ---------- •• _ .do •... 221 290 268 240 270 273 288 General merchRnillse _________________ do •••. 1, 214 1,106 613 541 ~0 700 659 Household furnishings •.•..•.••••••.•• do .••• 261 261 170 171 203 206 192 Other retail storest -----·--··-·-------do ..•. 800 662 563 489 548 558 557
All retail stores, Indexes of sales: Unadjusted, combined lndext •• 1935-39-100 .. 183.5 169.8 131.4 128.5 137.2 142.0 142.8
Durable ~oods storos .....•.•.•••••••• do •••• 117.7 153.9 97.9 94.3 100.1 108.1 109.7 Nondurable goods storest _-------- .•. do •••. 204.8 174.9 142.3 139.6 149.3 153.0 153.5
Adjusted, combined indext. ---·-------do •••• 146.6 138.3 149.7 144.3 142.8 141.5 141.9 Dural;lle ~oods stores ...•.•••••••••••• do •••. 95.4 135.4 119.6 113.6 111.6 107.3 100.6 Nondurable goods storest. -------·---do •••• 163.2 139.3 159.5 154.3 152.9 152.6 155.3
By kinds of business, adjusted: A ppnrel .. __ ------ __ ----------·--- •••• do •••. 166.2 132.1 176.9 157.9 171.4 152.5 146.8 Automotive i. ___ ...... __ .. ___ ......... do •••• 49.1 119.2 73.2 60.6 56.5 56.6 56.4 Building materials and hardware •• _ .do •••• 149.0 164.0 178.1 179.8 174.7 175.4 162.0 Drug ____ . ------------·---------------do •••• 180.0 135.8 141.7 138.7 141.7 146.5 151.7 ERling and drinklngt. -------·-------do •••. ~18.0 164.().. 175.8 183.7 175.0 179.0 181.0 Food stores. ---------·---------------do •••• 170.6 140.8 155.3 150.4 150.9 153.1 155.8 Fillinl)' stations _____________ ------ __ •. do •••• !07. 4 141.0 155.4 152.9 138.9 134.3 129.6 General merchandise _________________ do .• __ 135.6 123.5 148.5 139.8 138.4 136.2 130.7 Household furnishlngs .•••••••••••••.. do •• __ 138.6 138.6 168.2 167.0 176.0 149.8 132.5 Other retail storesf-------------------do .••. 179.8 150.0 172.5 173.0 167.1 175.8 202.6
Chain-store sales, indexes: Chain-store Age, t'ombined index (20 chains)
average same month 1929-31=100 •. 175.0 157.0 164.0 165.0 169.0 164.0 170.0 Apparel chains _______________________ do •••. 216.0 178.0 188.0 178.0 208.0 174.0 181.0 Drug chain-store sales:
Unadjusted ..•••••• _. ___ •• __ •. 1935-39= 100. _ --------- 164.9 120.7 110.8 124.4 124.6 129.3 Adjusted. ______ •.....•...•••••••••••• do ••• _ 121.3 126.0 118.5 125.0 128.9 133.4
Grooor.r; chain-store sales: Una justed.------------------1935-39=100 •. • 166.7 164.7 170.4 170.0 170.0 175.2 170.7 Adjusted _____________________________ do .••.
•161. 9 159.9 175.7 169.1 168.3 170.1 168.2 Variety-store sales, combined sales. 7 chains:
Unadjusted ______________ ----. 1935-39= 100 •. • 263.0 249.6 97.0 108.1 116.1 123.1 130.2 Adjusted_--- __ .----••••..••..•••.• __ .do. __ . • 120.1 113.9 132.3 136. I 133.6 127.1 135.1
Chain-store sales and stores operated: Variety chains: ·
S. fl. Kresge Co.: Sales _______________________ thous. or doL 28,667 27,515 11,854 11,750 13.174 14,437 14,219 Stores operated ••••••••••••••••• number __ 671 675 673 671 671 672 674
B. lJ. Kress & Co.: Sales ....... ------------···-thous. or doL 18,397 rl7,383 7, 274 7,203 8,503 8,640 8,573 Stores operated. ----------·-----num her __ 244 242 242 242 243 244 244
McCrory Stores Corp.: SRles .....•.....•••••••••••• thous. or doL 10,464 0,398 3,819 3, 739 4, 373 4,: 4, 749 Stor~s operated. __ ----------·- •. nnmber __ 203 202 202 203 203 203
0. C. Murphy Co.: Sales _______________________ thous. or doL 12,269 10,898 4,804 4,469 5,091 5,934 6,136 Stores operated _________________ nnmber __ 207 207 206 206 206 207 207
F. W. Woolworth Co.: Sales. ----------------------thous. of doL 64,240 62,498 28,345 27,466 30,266 33,136 32,660 Stores operated.------------ __ •• number __ 2,015 2,024 2, 021 2,019 2,017 2,013 2,011
Oth~r c.hRin~: · W. T. Grant Co.: Sales _______________________ thous. of doL 25,138 23,518 8,983 8,417 10,470 12,363 12,200
Stores operated •.••••••••••••••• number __ 493 495 496 496 495 494 493 1. C. Penney Co.: Sales. ______________________ thous. of doL. 63,320 59,520 30,589 25.407 32,348 36,531 37,170
Stores operated ...•••••••••••••• number __ 1,611 rJ,606 1, 606 1, 607 1,608 1,609 1,609 Department stores;
Accounts receivable: Instalm~nt accountst .... Dec. 31, 1939=100 .. --------- 115 108 104 102 99 91 Ope.n accountst-------------------- •. do .•.. 116 99 87 88 89 83
Coll~ctions: Instalment aooountst
percent or accounts receivable •• --------- 20 20 19 22 21 22 Open accountst. ------ ___ . __ . _._._._.do .... 46 50 45 46 47 50
Sales, total U. B., unadjusted ••• 1923-25= 100 .. 222 197 108 99 118 115 108 A tlantat --------·-·-----------1935-39- IIXL 286 253 127 127 151 149 144 Boston .• ---------·------c----1923-25-100 •• 177 165 99 74 94 93 89 Chlongo. __ ------------------- 1935-39= 100 •• 246 r2J2 121 114 136 133 124 Cleveland f-----··-------------- _. __ .do .••• 252 232 130 120 147 153 137 Dallas ... ------------------- .192.1-25-IOIL 280 222 122 108 129 127 126 Kansas City-------------------- .1925= 100 •• 231 '182 100 85 110 111 101 Minneapolis •••••••••••••••••• 1935-39= 100 .. 198 122 95 125 130 111 New York ..•...•••••••••••••• l923-25= 100 .. 216 194 104 94 106 106 99 Philadelphia ••• ______ .. ----_ .1935-39= 100 .. 26~ •237 115 )]7 140 132 128 Richmond _______________________ .... do •... 304 265 128 114 161 155 147 St. Louis, •. ------------------1923-25-100 •. 212 190 110 101 125 120 108 Ban Francisco._ --------------1935-39-100 •. ____ . ____ 235 129 132 148 149 142
' Revlood. • Preliminary.
4,503 4,433 4,615 837 813 846
3,666 3,620 3, 769
352 302 365 260 269 269 354 336 336 181 190 195 468 495 525
1,248 1, 285 1,274 286 317 280 648 583 662 174 162 187 532 493 522
139.4 134.5 140.7 105.4 101.2 104.4 150.5 145.3 l.i2. 5 140.4 146.2 149.6 '99.5 103.9 105.1 153.7 160.0 164.1
142.3 . 163. I 180.7 61.2 61.4 61.5
153.4 157.0 156.9 155.6 162.2 168.7 181.0 188.3 190.3 156.3 159.3 166.5 124.6 141.4 115.3 127.2 139.0 147.1 123.4 136.7 138.2 200.6 188.8 189.9
171.0 177.0 182.0 172.0 200.0 212.0
129.5 132.3 135.2 137.0 138.8 142.3
173.4 169.0 167.3 170.8 172.4 174.3
129.1 132.2 124.8 136.2 143.4 142.3
14,536 13,565 14,181 673 672 671
9,105 8, 733 9,607 246 246 246
4,833 4,504 5,017 203 203 203
6,205 5, 775 6, 156 207 207 207
33,025 31,705 33,675 2,011 2,011 2,012
12,222 10,441 11,442 494 494 494
38,457 34,683 40,523 1,609 1,610 1, 611
81 74 71 69 53 53
22 23 24 56 60 59
100 83 103 124 116 144 85 67 75
121 97 117 128 105 134 109 100 127 98 88 114
117 94 115 92 81 94
116 92 112 137 120 147 99 87 114
137 138 158
4,840 r5,284 838 •872
4,003 4,413
456 528 247 '238 342 351 194 207 529 576
1,275 1, 377 280 282 765 880 193 2;9 558 628
152.5 '156.6 108.3 '104. 7 166.9 173.4 146.1 '150.1 103.2 , 100.5 160.0 166.2
163.5 166.0 58.3 , 54.2
153.1 147.0 163.9 174.0 201.0 220.9 160.4 166.7 124.8 128.1 142.0 144.3 142.3 145.7 183.6 189.3
183.0 181.0 220.0 218.0
132.7 147.4 138.2 i45.2
168.9 170.9 172.4 170.0
137.9 140.9 143.4 143.2
14,997 17,237 671 671
9,599 10,278 245 245
5,023 5,656 203 203
6,094 7,335 207 207
33,847 38,475 2,015 2,017
12,648 15,111 494 493
47,467 54,294 1, 611 1, 611
67 65 63 69
25 2ll 60 65
133 137 171 183 105 117 155 154 161 165 171 170 133 l40 145 156 120 130 143 160 174 211 131 145 184 191
r4,89 3 6 6
, 77 '4, 11
47 7 5 9 0 2 7 1 6 1 5
'21 •28
20 '53
, I, 27 •29 r84 r20 , 56
, 159. , 103. , 177. , 154. , 101. , 171.
'182. '50.
'147. , 174. , 221. '167. '143. '155. , 157. , 182.
187. 228.
•140. •140.
170. 170.
161. 157 .
0 4 0 0 2 1
1 8 5 9 8 8 3 0 6 8
0 0
7 1
0 0
6 0
16,61 0 1 67
ll,O 46 5 24
5,6 48 3 20
6, 71 20
9 7
36,37 6 8 2,01
14,38 2 3 49
49,42 1, 51
6
6 1
6 0 7
15
29 63 7 6 6 8 7 I 7 4
20 11 16 18 19 14 14 1
, 18 44 2 3 8 9
r20 15
• 21
§Beginning Decem her 1941, seasonal adjustm~nt factors of 100 are being med for this group. ,The index on a 1935-39 base shown in the 1942 Supplement is in process of revision; pending completion of the revision, the index on a 1923-25 base is being continued. tRevised series. Data for sales of "eating and ilrinking places," "other retail stor~s." and the totals for nondurable goods stores and all retail stores. have been revised
beginning 1935; revised !lata beginning An!!USt 1941 are shown in the October 1942 Survey; earlier data will be published in a subsequent issue. For revised data beginning 1935 for the ind~x of department store sales for the Atlanta district seep. 22, table 19, of the December 1942 Survey. The index for the Cleveland district has been completely revised; data beginning 1919 will be published in a subsequent issue. ·
tData revised slightly and rounded to nearest percent; revisions prior to November 1941 are available on request.

S-8 SURVEY OF CURRENT BUSINESS February 1943
gether with explanatory notes and references --- ------..,.-----,----,----:----:----,----.-----,---..,.---..,.---Monthly statistics through December 1941, lo-~194211941 I 1942
lo the sources of the data, may be found in the Decem- Decem- hnu- I Febru· I March I April I May June I July I August I Sep- I Octo-INovem-1942 Supplement to the Survey ber ber ary ary tember her ber
DOMESTIC TRADE-Continued
RETAIL TRADE-Continued Department stores-Continued.
125 Bales, total U. B., adjusted .•••• 1923-25=100 •• 111 138 126 124 117 108 104 121 Atlantat --···-···-·····-·----1935-39= 100 •• lf>6 14(1 164 144 150 153 147 143 162 Chicago •• ---------------------------do •••• 146 126 154 135 141 134 123 125 139 Cleveland t .•• ·----------------------do .••• 146 135 177 150 161 151 134 134 143 Dallas ____ ------·- __ ----···- •• 1923-25= 100 .. 162 128 161 127 133 131 126 123 143 Minneapolis ••••.••• __ ••••.••• 1935-39= 100 .. -----ii9" 127 152 134 124 129 112 117 133 New York t----·--·- ·----·--.. 1923-25= 100 .. 107 132 116 120 110 105 97 114 Philadelphia ••• __ -------··----1935-39-100 •. 139 127 161 157 149 147 130 122 139 Richmond ••• --··-----····--·-·--·---do_--- 164 142 182 165 165 156 147 144 170 St. Louls,--------------------1923-25= 100 •• 129 115 138 117 130 120 108 lOll 12ft San Francisco •• --------------1935-39= 100 •. --------- 138 167 166 161 167 147 149 166
Instalment sales, New England dept. stores percent of total sales •• --------- 6.3 10.6 11.4 9.2 8.4 6.9 5.4 6.2
Stocks, total U.S., end of month: U nartjusted •••••• __ •••••••••• 1923-25-100 •• • 96 86 83 97 111 122 129 128 126 Adjusted·----·--·--------------------do •••• •102 92 93 102 108 117 126 134 140
Other stores, Instalment accounts and collec-tlons: •
Instalment accounts outstanding, end or mo: Furniture storcs ..••.•• Dec. 31, 1939-100 •• --------- 110 105 102 101 100 97 91 85 Household appliance stores ••••••.•••• do •••• 110 103 100 96 91 P5 77 71 Jewelry stores •... --·------------- __ •• do •••• 123 111 102 98 93 87 81 72
Ratio or collections to accounts at beginning or month:
Furniture stores.-. ·--·-----------Percent •• --------- 11 12 11 13 13 13 14 14 Household appliance stores ••••••••••• do •••• 12 11 11 13 13 13 13 13 Jewelry stores ____ -- ------------------do •••• 21 19 18 19 19 20 22 22
Mall-order and store sales: Total sales, 2 companles .••••••• thous. or dol.. 193,412 204,339 ttl, 481 99,640 131.894 133.905 119,117 117,597 104.118
Montgomery Ward & Co •••••••••••• do .••. 86,472 85,269 41,854 37,969 55,856 57,604 50,762 48,476 42. 521 Soars, Roebuck & Co _________________ do •••• 106,941 '119, 069 69,627 61,671 76,038 76, 301 68,356 69,121 61,597
Rural sales of general merchandise: Total u.S., unadjusted ••••••• 1929-31-100 •. 272.7 287.9 151.5 151.1 185.6 175.6 164.8 160.3 137.3
East .• ----------- ----·---·----·------clo •.•• 273.2 320.3 162.8 161.0 204.9 183.3 171.7 162.9 128.1 South •• _. __ .--- __ ----··------•• -- __ --do .••• 325.8 341.1 173.~ 199.3 224 0 202.0 188.0 179.4 158.6 Middle WesL ••• ----··-··---·-------do .••• 243.0 254.9 136.6 129.6 165.2 155.9 146.6 144.0 118.9 Far West. ___ ------·-··--·-·------·-.do .••• 324.5 319.9 166.6 135.9 194.5 200.1 188.8 203.6 193.8
Total U. S.,adjusted ••••• --------------do •••• 170.5 180.1 199.0 186.8 211.4 191. 1 179.5 176.0 188.1 East •• --··---·--··----·--··-·-------.do •••• 164.1 192.4 214.2 196.9 228.2 192.4 186.6 177.4 179.9 South ___ -------··------------•--·----do •••• 216.9 227.1 219.3 218.5 248.1 229.3 221.7 223.1 233.5 Middle WesL ••• ·-------·--------·--do •••• 155.8 ~3.4 17~. 6 163.0 186.4 167.0 154.8 152.5 161.2 Far West. -·-------------------------do •••• 298.8 96.0 226.7 183.6 236.3 224.0 210.0 213.7 238.3
EMPLOYMENT CONDITIONS AND WAGES
EMPLOYMENT
Estimated civilian labor force, employment, and unemployment:
Labor forO!' (Bureau of the Census)• millions_ 53.4 54.0 53.2 53.4 54.5 53.7 54.2 56.1 56.8 Employment• __ --·------------------do •••• 51.9 50.2 48.9 49.4 50.9 50.7 51.6 53.3 54.0 Agricultural• ___________________ •••• do ____ 8.9 8. 3 8. 2 8.4 8.9 9.3 10.2 11.5 11.7
N onagricultural• ------·------·-----do ____ 43.0 41.9 40.7 41.0 42.0 41.4 41.4 41.8 42.3 Unemployment• __ ---------------do .•••
Employees in nonagricultural establish· 1.5 3.8 4.3 4.0 3.6 3.0 2.6 2.8 2.8
ments:t Unadjusted (U.s. Department of Labor):
TotaL _______ -----------------thousands .• 38,9.16 36,088 34,876 35,062 35,411 35,998 36,346 36,665 37,234 M anufacturlng •••••••••••••••••• _do ____ 15,669 13,566 1q,~~ 13,693 13,81\9 14,109 14,133 14,302 14, 641 Mining ____ --···········-··----· .do •••• 887 976 947 933 929 928 921 923 Construction .• --- ••• ___ ---- ___ •• _ do ____ 1, 726 1.880 1,002 1,594 1,625 1. 771 1.909 1, 991 2,108 Transportation and pub. utllltles.do ..•• 3,497 3,~44 3, 288 3. 270 3, 295 3,389 3.442 3,484 3,519 Trade .. _. __________________ ---· __ do •••• 7,112 7, 511 6, 756 6,686 6, 711 6,679 6,667 6,606 6. 504 Financial, service, and misc •••••• do •••• 4,281 4, 227 4.179 4,180 4,19! 4, 265 4,309 4,324 4,355 Government ______ ---------·-··· .do •••• 5, 784 4, 584 4, 558 4,692 4, 794 4,856 4,958 6,037 5,184
Adjusted (Federal Reserve): TotaL ..... _ -----------------------do ____ 38,745 35,868 35,887 35.933 35.895 36,040 36,200 36,440 37,169
Mannfacturing ___________________ do ____ 15, 665 13,621 13, 72.5 13,794 13,832 14,058 14,146 14,361 14,758 Mining ______ ----- ____ --··-- ______ do .• __ 884 973 970 953 936 938 933 929 929 Construction ___________________ •. do.·-- 1,955 2, Of\7 2.044 1,991 1,886 1,826 I, 791 I. 768 1,851 Transportation and pub. utllltles.do ____ 3,531 3,377 3,365 3;351 3,366 3,408 3,435 3,446 3,471 Trade ___________________________ .do .... 6,641 7,017 6, 907 6,862 6,812 6,690 6,695 6,610 6,609
Estimated wa!(e earners in manufacturing in· dustrles, total (U. S. Dept. of Labor) •
thousands._ 13,023 11,327 11, 185 11,363 Il. 515 11,645 11,751 Il,884 12,153 Durable goods _________________________ .do. ___ 7,455 5, 940 5, 928 6,034 6.154 6,274 6, 395 6,546 6, 712 Iron and steel and their products ..... do ____ 1,679 1, 506 1, 516 1, 537 1, 554 1,568 1,578 1, 596 1, 609
Blast furnaces, steel works, and rolling mills_---------------------- thousa.nds •. 520 543 542 543 544 546 548 549 546
Electrical machinery_---- ____________ do ____ 631 485 4HO 489 498 506 509 514 527 Machinery, except electricaL ________ do ____ 1,159 937 953 978 1,001 1,020 1,030 1,050 1,065
Machinery and machine shop products thousands._ 467 M7 374 383 391 400 409 418 425
Automobiles._----- __________________ do ____ 511 517 445 395 383 373 389 407 428 Transportation equipment, except automo·
biles __________________________ thousands •. 1, 923 845 933 1,030 1, no 1,208 1, 296 1,388 1, 600 Nonferrous metals and products ______ do ____ 380 357 355 358 362 358 359 361 363 Lumber and timber basic products ... do ____ 467 509 494 495 495 498 499 502 506
Sawmills •••• ____ •• __ ._ •••• _. _______ do. ___ 284 3Il 304 305 306 308 309 312 313
r Revised. • Preliminary. 1 See note marked "1" on p. S-7.
130 123 169 161 148 141 157 146 165 154 131 126 123 112 152 133 194 170 152 122 172 176
9.1 7.0
130 •131 135 •126
80 76 64 59 69 65
16 16 13 14 25 26
113,447 142,022 48,741 61,495 64,706 80,527
160.8 214.2 153.3 201.2 178.0 262.8 135.5 185.7 207.8 272.2 196.6 202.6 192.4 204.6 246.9 238.0 164.3 181.1 225.6 232.6
56.2 54.1 54.0 52.4 11.2 10.2 42.8 42.2 2.2 I. 7
37,802 38,348 14,980 15, 233 . 918 910 2,181 2,I85 3,533 3, 542 6,496 6,561 4,371 4,397 5,323 5,520
37,525 37,618 14,911 14,979
918 •900 1, 916 1, 959 3,490 3,482 6,607 6,523
12,442 12,630 6,885 6, 993 1, 617 I, 616
540 532 548 569
1,084 I, 096
435 440 443 462
1,604 1. 677 368 369 508 494 313 303
128 173 147 158 150 131 115 139 170 129 182
7.8
128 115
73 • 54
63
18 15 30
174,045 76,068 97,977
250.5 245.4 362.2 210.8 276.2 192.8 190.7 244.4 166.0 230.0
54.0 52.4 10.5 41.9 1.6
38,478 15,313
902 2,028 3,539 6,697 4, 327 5,672
37,964 15,164
888 1,902 3,466 6,619
12,721 7,153 1,636
525 594
1,119
449 478
I, 768 371 484 295
138 186 153 170 171 144 121 142
r 193 135
• 209
7.8
r 122 rl06
70 50 62
17 15 30
153,406 68,396 85,010
253.6 266.2 334.6 216.5 298.6 194. 206. 243. 165. 246.
54. 52. 9.
43. 1.
9 5 7 2 2
5 8 8 0 7
'38,53 3 4 4
r 15,43 •89
r 1, 8 r 3, 5 r 6, 77
96 20 1 5 3
4,29 r 5, 72
•38,32 •15,34
5 9
r
•1,88 883
9 508
73 •3, r 6,6
r 12,82 "7,28
7 1
1,6 44
r 51 r 61
7 3 7 r 1,13
• 45 7 2 •49
•1,83 9 6 6
• 37 r 47
290
:A few revisions in data for 1938--41, resulting from chang-es in the seasonal adjustment factors, are shown on p. S-8 of the November 1942 Survey. tRevi~ed series. In<lcxes of <lepartment store sales for Atlanta district revised beginning 1935, seep. 22, table 19, of the December 1942 Survey. Revised data beginnin~t
1919 for the Clcvelanrt district will be published in a subsequent issue. The estimates of employees in nonagricultural establishments and In 011ch or the component groups, with the exception of the trade group and the financial, service, and miscellaneous group, have been revised beginning 1939 and revisions of the earlier data are In progress; the revised data will be published when revisions are completed (data beginning August 1941 are in tbe October 1942 Survey).
• New series. Indexes of instqJment accounts and collertion rntios for furniture, jewelry, and household appliance stores beginning January 1940 will be shown In a subsequent issue (a new series on amount of Instalment acnounts outstanding is included on p. S-15). The estimates of civilian labor force, employTl'ent, and unemployment relate to persons 14 years or age and over, excluding institutional population and the estimated number of persons In the armed forces; persons on public emergency projects are Included with the unemployed; data beginning April1940 will be shown in a subsequent issue. Data beginning 1939 for the new series on wage earners to manufacturing Industries will also be shown in a later issue.

February 1943 SURVEY OF CURRENT BUSINESS S-9
gether with explanatory notes and references --- ---- -----;----:-----;---~:----7-::__:_..:..__--;-----;----.,.-----,----:----Monthly statistics through December 1941, to-~194211941 I 1942
to1 thesourcesofthedata,maybefoundinthe Decem- Decem- Janu- I Febru-~ March I April I May I June I July I August I temSebpe-r I octoberiNobveerm· 042 Supplement to the Survey ber ber ary ary
EMPLOYMENT CONDITIONS AND WAGES-Continued
EMPLOYMENT-Continued
Wage earners, manufacturing lndustries*-Con. Durable goods-Continued.
Furniture and finished lumber products thousands •• 351 401 386 390 388 377
Fumlture .....•.••.•.•.••...••••.•. do .••. 169 197 187 189 186 179 Stone, clay, and glass products ..•..• do .••. 354 382 367 363 363 367
N ~~Wi~~:ilfo;~sc:iiiciS.Siici-oiilei-. fiiiei'!::ar,:· 5,568 5,387 5,257 5,330 5,361 5,371
uractures .....• -········-····thousands .. I, 267 1, 299 1,283 1, 283 1,284 1,287 Cotton manufactures, except small wares
thousands •. 510 497 499 502 503 507 Silk and rayon goods ......••.••.... do .... 99 101 100 102 103 105 Woolen and worsted manufactures (ex-
177 cept dyeing and finishing) ... thousands. 192 188 180 179 181 Apparel and otber finished textile products
826 877 850 897 896 thousands •. 906 Men's clothing .••••••••••.•••••• ,...do ..•. 237 253 247 256 259 259 Women's clothing ____ ------·-······do ..•. 248 266 256 275 277 272
Leather and leather products ..•.•••. do .••. 356 378 373 380 387 381 · Boots and shoes ..••........•.•..•.. do •.•. 203 217 217 •222 225 222 Food ana kindred products ....•...•. do .•.. 1,039 966 926 914 899 906
Baking_ ••.. _.--··-· ___ •• _____ •• _. __ do •••. 264 240 237 238 239 237 Canning and preservlug .•..•••..•. do ...• 115 111 100 99 87 92 Slaughtering and meat packlug .•.. do •.•. 183 165 171 164 160 160
Tobacco manufactures •....•.•.•.••.. do •••• 99 97 92 95 95 93 Paper and allied products .••.•••••... do ...• 304 330 323 321 321 320
pJ:f~~~~~EN~hig; ·Bfi<i iiiifeJ ·!Dc:in~rrles- 151 164 165 165 165 165
thousands .. 332 354 342 335 329 325 Chemicals and allled products •••.•••• do .••. 702 476 494 520 547 571
Cbemicals .......•...•......•.•.•••. do .... 113 105 106 107 110 110 Products or petroleum and coal.. ...•. do •••. 123 123 122 122 124 124
Petroleum refinlng .....•..........• do ••.. 78 78 78 78 79 79 Rub her products .....•.•.......••••.• do •••. 173 161 145 144 144 138
Rubber tires and Inner tubes ....... do •.•• 80 67 59 58 58 58 Wage earners, all manufacturing Industries, un-
138.3 136.5 140.6 142.1 adjusted (U. S. Dept. or Labor)t .1939= 100 .. 159.0 138.7 Durable goods .•. -------------····-----do •... 206.5 164.5 164.2 167.1 170.4 173.7
Iron and steel and their products ..... do .... 169.4 151.9 152.9 155.0 156.8 158.2 Bla~t furnaces, steel works, and rolling
139.9 139.6 139.8 140.0 140.6 mills •.. ····-·-- ••..•.••..••. 1939= 100 .. 133.9 Ele<'trlcal machinery .•.......•....... do •... 243.6 187.3 185.1 188.8 192.0 195.2 Machinery, except electricaL ...•..... do .... 219.3 177.3 180.3 185.1 189.5 193.0
Machinery and machine shop products 230.6 181.3 185.0 189.1 193.3 197.9 1939=100 ..
Automoblles •.••.....•..•...••.•...•. do •... 127.1 128.5 110.6 98.1 95.2 92.8 Transportation equipment, except auto-
532.6 587.7 648.8 699.2 761.1 mobiles ..•...•.••..•..••..•.... 1939= 100 .. 1, 211.4 Nonferrous metsls and products ....•. do ..•. 165.8 155.6 154.7 156.0 157.9 156.0 Lumber and timber basic products .. do .... 111.1 121.0 117.6 117.7 117.8 118.4
Sawmills ...........••..........•... do .... 98.5 108.1 105.5 105.9 106.2 107.0 Furniture and finished lumber products
1939=100 .. 107.0 122.4 117.6 118.7 118.2 114.7 Fumlture ............•...•...••.••. do .... 106. 1 123.6 117.7 118.4 116.9 112.4
Stone, clay, and glass products ....... do .... 120.4 130.2 125.1 123.5 123.8 124.9 Nondurable goods ....• _ .•... ___ ........ do._._ 121.5 117.6 114.8 116.3 117.0 117.2
Textile-mill products and other fiber 110.8 113.6 manufactures .•............•. 1939= 100 .. 112.1 112.2 112.2 112.5
Cotton manufactures, except small wares 128.9 125.6 126.0 126.7 127.0 128.1 1939=100 ..
Silk and rayon goods ...........•... do .... 82.6 84.5 83.4 85.3 86.3 87.2 Woolen and worsted manufactures (ex-
118.7 cept dyeing and finishing) ... 1939= 100_. 128.6 125.7 120.3 119. 7 120.9 Apparel and other finished textile products
111.1 107.7 113.6 114.8 113.5 1939=100. 104.7 Men's clothing .••.•. : .............. do .... 108.4 115.8 113.0 116.9 118.6 118.5 Women's clothing ..............•... do .•.. 91.1 98.1 94.1 101.4 102.0 100.0
Leather and leather products ......... do .... 102.7 109.0 107.6 109.5 111.5 109.7 Boots and sboes .................... do .... 93.0 99.4 99.6 100.9 103.0 101.7
Food and kindred products ..•••.••.. do •... 121. 6 113.0 108.3 107.0 105.2 106.0 Baklug ..•.•...•.....•...•.•.•...... do .... 114.4 104.2 102.8 103.1 103.4 102.9 Canning and preserving ..........•. do ..•. 85.6 82.3 74.1 73.9 64.4 68.6 Slaughtering and meat packlug •.... do .... 151.9 136.7 142.3 136.4 132.6 132.6
Tobacco manuractures .•.•..•........ do ..•. 106.1 104.4 98.4 101.4 101.3 99.7 Paper and allied products ......•.•... do ... _ 114.4 124.3 121.8 121.1 121.0 120.5
p~f~~~~~g~hhig-iillc:i.ailie<i.illdii~fri;s- 110.0 119.5 119.9 119.9 120.1 120.2
372 368 361 177 174 172 364 362 355
5,356 5,338 5,441
1, 280 1,278 1,273
508 509 509 105 106 105
183 183 183
874 813 807 256 248 241 263 229 231 375 370 368 218 214 213 924 970 1,077 239 245 254 95 120 191
165 174 180 91 92 94
314 307 296 163 160 155
322 318 319 582 593 606 110 112 112 124 126 127 79 80 80
137 141 148 59 62 66
143.4 145.1 148.3 177.1 181.3 185.9 159.1 160.9 162.2
141.0 141.3 140.4 196.3 198.2 203.2 194.9 198.6 201.5
202.2 206.6 209.9 96.7 101.1 106.3
816.8 874.5 944.8 156.5 157.3 158.3 118.7 119.4 120.3 107.4 108.2 108.7
113.4 112.0 109.9 111.3 109.6 107.9 123.8 123.5 121.1 116.9 116.5 118.8
111.9 111.7 111.3
128.3 128.5 128.5 87.9 88.4 87.8
122.6 122.7 122. 5
110.7 103.0 102.2 117.2 113.4 110.1 96.9 84.3 85.0
108.1 106.7 105.9 99.9 98.2 97.6
108.1 113.5 126.1 103.8 106.0 110.0 70.6 89.1 142.3
136.9 144.0 149.1 97.2 99.0 100.2
118.3 115.6 111.6 118.9 116.6 112.5
1939=100 .. 101.3 108.0 104.1 102.2 100.2 99.2 Chemicals and allied products .•••.... do ... _ 243.5 165.2 171.4 180.3 189.7 198.0
Chemicals .••....•................. do •... 162.6 151.6 152.8 154.2 157.4 158.1 Products of petroleum and coaL ....•. do ..•. 116.4 116.3 114.8 115.5 116.6 117.4 Petroleum retlnlug _________________ do •.•. 107.1 106.5 106.3 106.8 107.8 108.4 Rubber products ..................... do .... 143.4 133.1 120.1 119.0 118.8 114.2
Rubber tires and Inner tubes ....... do. ___ 147.0 123.5 109.3 106.4 107.0 106.5 Manufacturing, adjusted (Fed. Res.)§ 1923-25= 100 -·--·---· 134.9 135.7 135.1 134.7 136.0
Durable goods .•.•...•.•.•..••..••..•.. do. _. 144.3 146.7 146.8 146.9 149.2 Iron and steel and their products, not in-
eluding machlnery •••••.•. 1923-25=100 •. 138.9 139.0 136.6 134.7 134.2 Blast furnaces, steel works, and rolling
mills ••••••..•.•••••••.•... 1923-25= 100 .. 149 150 149 148 149 Bardware •••.•.••..•.•.•.•.....•.•. do .... --------- 104 110 94 94 91 Structural and ornamental metal work
98.2 97.0 97.3 201.9 205.8 210.3 158.8 160.7 160.2 117.5 119.2 120.0 108.7 110.1 110.3 113.5 116.6 122.0 108.9 113.8 121.2 137.7 140.1 143.9 151.7 156.3 162.1
134.1 135.5 136.3
151 153 153 90 93 96
1923-25=100 •. --------- 107 108 112 113 116 Tin cans and other tlnware ••••••••. do •••• --------- 141 147 141 122 115
Lumber and allied products •••.•••••• do .•.. --------- 78.1 79.2 77.9 75.4 73.8 Furniture •••••.•.••••••••••••.•.••• do •.•• 105 106 104 103 101 Lumber, sawmllls. •••••.•••.•••.•.• do •.•• ·-----·-- 68 70 68 66 64
116 117 119 110 105 101
73.2 72.4 72.7 100 97 95 64 63 64
'Revised.
356 354 170 170 357 356
5,557 5,638
1, 263 1, 252
507 505 103 98
181 180
852 846 247 246 253 252 361 350 209 200
1,152 1, 239 258 263 248 322 179 178 97 98
293 292 152 151
319 316 616 631 111 111 127 127 81 81
153 158 68 70
152.1 '154.6 191.1 '194.2 163.7 '163.8
138.9 137.0 212.0 220.3 205.2 207.4
214.9 217.5 110.1 114.8
1, 015.0 1, 062.9 161.1 161.5 120.8 117.5
•108.5 105.0
108.4 •108.0 107.0 107.2 121.5 121.2 121.3 •123.3
110.5 109.5
128.0 '127. 7 86.0 81.9
121.3 120.3
107.9 •107.0 113.1 112.5 '92.9 '92.1 104.0 ' 101. 1 95.6 91.7
134.9 '145.1 111.8 113.6 184.5 239.7 148.6 147.3 103.5 105.2 110.3 •109. 9 110.6 109.7
97.1 96.6 213.8 '222.4 158.9 159.2 120.1 119.4 110.8 110.3 126.3 '130. 7 125.5 '130.5 145.0 145.0 165.7 167.2
135.3 133.7
151 149 99 98
121 122 99 96
71.2 69.4 91 88 63 61
350 173 354
5,569
1, 255
505 100
177
843 242 253 350 199
1,125 265 197 174 99
295 151
324 655 111 125
79 162
73
'155. 5 '198. 2 '165. 1
135.2 '229.0 '211. 6
222.0 '118. 8
'1,113. 7 162.0 115. 1 102.5
'108.3 •,108.3
120.7 '121. 8
109.7
'127. 7 83.2
118.7
106.7 '111. 0 '92. 5
'101. 2 91.3
'131. 7 114.7 146.4
'144.6 '106.4 '111.1
109.5
98.9 '230. 5
158.9 117. 9 108.4
'135. 2 '136. 7
---------------------------------------------
------------------------------------
r 35 0 8
54 6
16 3
r 5,54
'1, 25 7
6 9
50 9
17 6
6 5 8 7
82 23
•24 35 2
'1,06 04 3 3 0 6 0
26 •14
17 10
' 299 0 '15
33 1 4 I 3 8 8 9
•68 11
'12 7
'16 '7
156. '201. '165.
'133. '236. '215.
'226. '122.
'1,158. '163. '118. '100.
'106. '105.
120. '121.
'109.
'127. 82.
'118.
104. 107. •91.
'103. '93.
'124. '114. '103. '145. '106. '112. '109.
100. '237. '159. '116. '107. '138. '141.
------------·--
---------------------
----------------------------
6 6 8
0 4 1
0 2
3 8 2 6
6 8 7 1
9
7 7
6 6 4 0 4 4 1 9 8 7 6 3
8 4 5 4 0 9 5
----------------
§Adjusted indexes of manufacturing employment have not as yet been computed on a revised basis corresponding to the unadjusted Indexes on a 1939 base which have been substituted for the Indexes on a 1923-25 base formerly shown. The adjusted Indexes on the old base shown above will be replaced by revised series when available.
*New series. Data beginning 1939 for the estimates or number of wage earners in manufacturing industries will be published in a subsequent issue. tRevised series. The Department or Labor's indexes or wage earner employment in manufacturing industries have been completely revised; for data beginning January
1939, see l'P· 23 and 24 or the December 1942 Survey.

S-10 SURVEY OF CURRENT BUSINESS February 1943
Monthly statistics through December 1941, locether wUh explanatory noteo and references 1o the 1ources of the data, may be found in the 1942 Supplement to the Suney I
1942!1941 I Decem- Decem- Janu- I Febru·l March I April I
ber ber ary ary
1942
I I I I Sep I Octo- INovem-May June July August temb~r ber ber
EMPLOYMENT CONDITIONS AND WAGES-Continued
EMPLOYMENT-Continued
M anufacturlng, adjusted (Fed. Res.)§-Con. Durable ~:oods-Contlnued.
Machinery, excluding transportation equip-189.4 193.1 ment. ___________________ .1923-25= 100. _ --------- 185.2 197.0
Agricultural implements (Including trac· tors) .•••••••. _ •.• _.------ .1923-25= 100 •• --------- 167 161 161 160
Foundry and machlne-sbop prod ••. do .••• --------- 11\0 153 161i 157 Radios and phonographs ••.•..••••. do •.•. 206 2li0 235 250
Metals, nonferrous, and products ••••• do •••. 143.4 147. 1 146. 7 146.8 Stone, clay, and glass products ••••.•. do .••• ------'--- 101.6 105.0 100.1 96.9
Brick, tile, and terra cotta •••••••••. do .••• 77 81 78 75 Glass .•••••. ------ •. _____ ........... do •.•• 132 136 126 124
Transportation equlpment •••••.••••• do •.•. --------- 205.8 211.0 216.2 220.7 A utomohlles. ----------------------do •.•. 111 90 84 81
N ondurahle goods ••••••••••••••.•.••.•• do.--- --------- 126.0 125.2 123.8 123,1 Chemical, petroleum, and coal prod •• do ____ 149.2 151.8 154.7 155.9
C hem lcals •.•••• _ ..• __ ••.•• _________ do •••. 187 190 192 195 Paints and varnlshes •••••••••.••••• do •.•. --------- 144 145 142 141 Petroleum refining __ .------------- .do •.•. --------- 129 130 131 132 Rayon and allied products ••••.•.•• rlo •••• 320 313 308 309
Food and kindred products •••.•.•.•. do ..•. 147.5 148.4 147.6 144.4 Baking_ ••••. __ ._. ______ ._ •.•• _ .••• _ do •.• _ 152 163 152 152 Slaughtering and meat packing •••. do •.•. 133 139 138 137
Leather and Its manufactures •••••••. do •.•. 103.1 98.8 96.3 97.4 Boots and shoes •••••••.•••••.•.•.•. do .••• --------- 100 95 92 93
Paper and printing ................... do .••. -------~- 125.9 125.2 123.4 122.0 Paper and pulp ____________________ do •.•. 129 130 130 130
Rubber products .•.•••••.•...•••••••. do ..•. 109.4 99.6 98.3 97.5 Rubber tires and Inner tubes ••••.•. do .••. 85 75 73 73
Textiles and their products .•••••.•••. do •.•. --------- 113.2 112.0 1!0.0 109.4 Fabrics._ ••.. --------------------- .do •.•. 104.4 104.1 102.2 102.6 Wearing appareL ------------------do •••. --------- 128.2 125.1 122.8 120.0
Tobacco manufactures. --------------do .... 66.5 69.2 66.7 66.1 Manufacturing, unadjusted, by States and cities:
State: Delawate •.• _ •• _. _. _ •.•••••••• 1923-25 c 100. _ 179. 5 137.1 137.8 138.1 138.7 Illinois •.• ---------- ..•.•.•••• 1935-39= 100 .. 145.4 139.1 137.2 137.7 136.9 Iowa ••. ----------------------1923-25c 100 •. 173.8 162.8 158.2 153.3 154.5 Maryland .. ------------------1929· 31 = 100 •• 180.2 •147.1 149.5 153.4 157.4 M assachusetts .•.••••.•••••••• 1925-27= 100 •. 108.3 100.4 99.2 100.5 101.5 New Jer!!l'y -------------------1923-25=100 •. 164.2 145.7 145.8 148.3 150.1 N PW York, ••••••••••••••••••• 1935-39= 100 .. 155.8 141.2 138.9 143.4 145.4 Ohio._ ••••• ------------------------ .. do •••• 136.9 135.d 135.4 140.9 Pennsylvania ••••••••••••••••. 1923-25= 100 __ 116.8 •111.6 110.3 111.8 112.5 W iseonsln •• __ •••••. ----•••••. 1925-27 -100. _ 126.6 124.9 125.7 127.4
City or Industrial area: Bal tlmore ••• ----- __ •••• ---- •• 1929-31-100 .. 174.1 146.9 149.8 154.1 157.7 Chlcl\go_. --------------------1935-39= 100 .. 149.0 140.6 1311.1 139.0 137.9 Cleveland •••. __ ••••• _ •••• _______ . __ ._ do •... 151.8 151.5 152.8 155.6 Detroit .•••••.•••••••••.•••.•. 1923-25= 100 •• 150.3 97.4 102.7 104.6 111.0 M II waukee .... __ ••. __ ._ •••••• 1925-27 = 100 •• --------· 135.8 '134.3 135. 1 137.6 New Yorkt ------------------1935-39=100 •. 134.6 126.7 121.9 129.8 132.4 Philad~lphla •• _ •• _ -----. _. __ .1923-25= 100. _ 138.2 '118.9 117.6 120.3 1~.8 Pittsburgh----------- ••.••... ______ •.. do •. 124.3 119.3 118.5 118.8 118.5 St. Louis .••.. ----------------- .. 1937= 100 •. --------- 120.9 121.2 124.3 126.6 Wilmln!!'ton .•.••.•. __ •••.•.•. 1923-25= 100. _ 177. 9 125.7 127.7 127.5 127.8
Nonmanufacturlng, unadjusted (U.S. Depart-ment of Labor):
Mining: A ntbraclte. _ ----------------- .•• 1929= 100 .. 45.7 49.1 49.0 48.8 48.4 Bituminous coal .• ____ • __ ..... _ ..•. _ •. do._._ 88.6 95.5 95.1 94.6 93.8 Metalliferous_ ... ------····· •.....•.. do .••. 79.6 80.2 80.7 81.0 81.9 Crude petroleum produclng ...•.•••.• do •.•• 54.7 61.1 61.3 60.6 59.7 Quarryin!!' and nonmetallic._ ••••.•.. do •.•. 46.4 50.9 46.8 (6. 7 47.7
Public utilities: Electric li~ht and power •.••••••.•.•. do .••. 80.3 93.1 92.0 90.5 89.6 StrPet railways and busses ••....•.... do .... 77.6 70.6 70.4 70.7 71.2 Telephone and telegraph •••.•...•.••• do •••. 92.6 90.0 90.4 90.3 90.5
Services: Dyeing and cleanlng •..•.••..•..••.•. do .••. 115.5 113.3 109.8 109.5 113.8 Laundries. ___ -----------------------do ..•. ]]3, 3 108.4 108.8 107.6 107.9 Year-round hotels .••.••••••••..•.•.•. do •... 95.1 95.3 94.2 94.1 93.6
Trade: Retail, totaL .....•.• _------------ •... do. ___ 106.2 113.0 95.4 94.0 94.4
General merchandislng ••••........ do •.•. 166.4 161.5 105.1 103.2 105.9 Wholesale ... __ ....•..••.•.•• ----- __ ._ do ..• _ 89.1 96.3 94.9 94.3 93.9
Miscellaneous employment data: Construction. Ohio •.... ________ 1935-39= 100 .. --------- 146.4 125.6 125.1 131.9 Federal and State highways:
Totalt .. ____ . ___ . __ . _____ ... ------number._ --------- 224,762 194,092 183,559 191,444 Construction (Federal and State) •• do .••. -------- 75,131 49,113 44,852 52.975 M alntenance (State) __________ : .•.. do .... 110,311 105,920 101,087 102.023
Federal civilian employees: United States .... _. ------------------do .... 1,670,922 1,703,09P 1,805,186 1,926,074
District of Columbia ...•.••••••.... do .•.. ~-------- 207,214 223,483 233,403 238,801 Railway employees (class I steam railways):
TotaL. ___ --------------------- thousands .. --------- 1, 211 1,192 1,193 1, 215 Indexes: Unadjusted. ________ 1923-25= 100 .. 73.9 66.3 65.4 65.4 66.6
AdJusted ••• _._ •.•••• _ •••• _ .do. ___ 75.8 68.0 68.2 68.0 68.f
LABOR CONDITIONS
Average weekly hours per worker In factories: Nat!. Ind. Con. Bd. (25 lndustri~sl. hours .. --------- 41.6 42.4 42.4 42.7 U.S. Dept. of Labor, all manufacturing.do _____________ 41.2 41. ~ 42.2 42.5
Durable goods* -----------------------do .. --j-- ------- 42.8 43.7 44.4 44.7 Nondurable goods*----------------- .. do. ___ ··------- 39.4 39.1 39.7 39.8
I 200.4 202.7 206.9 212.3
157 162 166 169 160 161 165 168 249 223 195 199
145.8 146.6 147.8 150.3 94.7 90.9 90.8 91.0
71 67 65 65 124 122 119 118
230.9 246.2 268.4 295.2 79 83 89 96
123.3 124.3 124.7 126.6 157.4 159.1 161.7 162.4
194 195 197 1~3 137 131 127 I 6 132 133 133 133 317 318 324 311
142.3 143.7 143.8 149.2 151 151 153 . 159 138 141 146 151
98.1 100.0 100. 1 95.3 95 97 98 92
121.3 119.5 118.5 117.3 130 128 126 122
93.7 04.5 98.1 103.4 73 75 78 83
110.9 112.3 112.2 114.6 104.8 105,5 107.2 108.1 119.7 122.7 118.5 123.8 65.8 63.6 64.1 64.8
139.9 145.2 151.4 153 . .5 136.4 136.3 136.0 137.5 153.4 156.0 158.5 159.8 160.7 164.0 165.3 171.6 102.0 101.8 101.5 101.8 151.6 153.3 153.1 153.3 145.2 144.0 139.4 142.3 142.8 143.7 146.2 148.4 113.0 112.2 113.6 114.1 129.6 131.2 133.2 135.5
161.2 164.2 165.5 170.4 137.6 136.6 136.1 138.7 157.3 159.3 162.7 165.0 115.7 118.6 127.1 133.5 141.8 144.9 147.8 152.2 131.9 128.3 116.5 119.5 123.8 125.4 127.1 128.7 119.4 119.3 119.8 119.9 128.7 132.0 135.4 139.0 128.1 130.8 137.U 138.1
47.8 48.2 45.5 46.8 93.5 92.9 92.7 93.0 81.9 82.2 81.8 81.5 58.8 58.1 57.6 • 57.1 50.3 51.7 51.9 51.6
88.9 88.0 •87. 7 86.9 72.1 72.9 74.0 74.8 91.2 91.7 92.5 93.5
121.3 127.6 130.1 120.9 110.3 113.7 114.8 119. I 95.2 96.1 95.5 94.4
94.3 94.0 92.8 90.3 108.6 109.5 108.4 103.6 92.7 91.2 90.4 89.7
137.7 142.8 137.5 124.8
218,037 236,929 2.~6. 102 240,633 72,420 90,103 89,999 94,191
105,441 107,804 112,000 ll4, 361
1,970,969 2,066,873 2.206,970 2,327,932 248,100 256,457 268,383 274,001
1,266 1,296 1,319 1,343 69.4 71.1 72.4 73.7 70.0 70.3 70.8 71.8
42.8 42.7 42.7 42.6 42.4 42.6 42.6 42.4 44.7 45.0 45.1 44.7 39.7 39.7 39.6 39.6
I
218.6 219.7
173 168 172 171 196 193
151.3 149.0 89.9 89.5
63 62 118 119
314.4 329.1 99 103
125.2 123.8 163.0 161.2
193 190 128 127 134 132 306 308
150.4 152.2 162 163 152 151
91.2 go.s 88 87
116.1 114.4 120 119
106.4 101.4 86 88
111.4 108.2 106.2 103.5 118.2 114.1 64.7 64.9
166.7 168.7 141.5 141.2 162.0 163.6 175.9 177.2 102.7 103.3 158.4 161.7 146.4 149.7 151.5 155.4 114.7 114.7 136.9 138.8
174.5 174.8 142.3 142.9 167.0 168.7 137.9 143.1 155.4 157.6 130.0 133.2 131.4 132.5 120.4 120.4 138.9 138.6 150.2 155.0
46.7 46.7 92.3 91.6 80.3 78.6 56.7 55.8 51.5 50.7
85.9 84.2 75.0 75.7 93.8 93.6
123.7 123.0 117.4 ll6.4 93.4 93.9
89.4 91.7 103.9 ll2. 0 90.3 89.4
122.5 ]]6, 5
238,722 219,047 90,022 80,836
117,972 109,076
2,450,759 2,549,474 275,362 281,423
1,349 1, 349 74.0 74.0 72.2 72.5
43.2 43.4 42.8 42.3 45.2 44.6 89.9 39.5
--------- ---------------- ---------------- ---------------- ---------------- ---------------- ---------------- ---------------- --------------·- -------~-------- ---------------- ---------~---- -- ---------------- -------~------ -- --------~~-~---- ---------~------ ---------------- -------~---- ---- ----------------- -----------------------------------------------------------------------------------------------
166.0 142.9 167.2 176.5 105.1 161.9 152.1
• 157. 5 •115. 5
141.1
173.4 145.8
'171.6 146.9 160.0 135.5 134.5 122.5
'141.4 162.6
• 46.2 90.6 77.7 55.4 50.0
82.6 75.9 93.3
124.8 115.9 95.6
94.6 121. 1
9C.O
•112.8
211. 751 78,031
1C5, 701
2,687,093 283,692
1,348 74.0 72.0
43.6 "43.6 45.7 40.6
----------------------------------------------------------------------
174. 142. 167.
•178. 106.
•163. 153. 159 . 115. 143.
172. 146. 175. 149. 163. 134.
'136. '122.
143. 172.
•46 . • 89. • 79.
55. 48.
•81. • 75. • 93.
•119. '114.
95.
•96. '131. '89.
108.
1 8 0 4 4 2 6 3 9 5
3 5 4 5 6 2 8 7 1 0
2 3 1 0 5
2 9 I
7 2 3
8 8 3
0
2 7 8
186,94 58,94
100,89
2,75(),10 1 8 284,15
1,34 73. 73.
43. 44. 46. 41.
3 8 3
7 0 0 1
• Revised. § See n9te marked "§" on p. S-9.. l ~otal incl)ldes State enJZinee!ing, supervisory, and administrative employees not shown separatPly. , Data for YP;ars prwr to 1940, comparab)e With data begmning with that year J?Ubhshed In tl!e 1942 Supplement and currently, will he shown in a subsequent issue. t Revlserl ~enes. E~rller data. for the re~1sed ~mployment ind~x for New York City not shown m the July 1942 Survey and subsequent Issues will be published later. • New series. Earlier data will be published m a subsequent Issue.
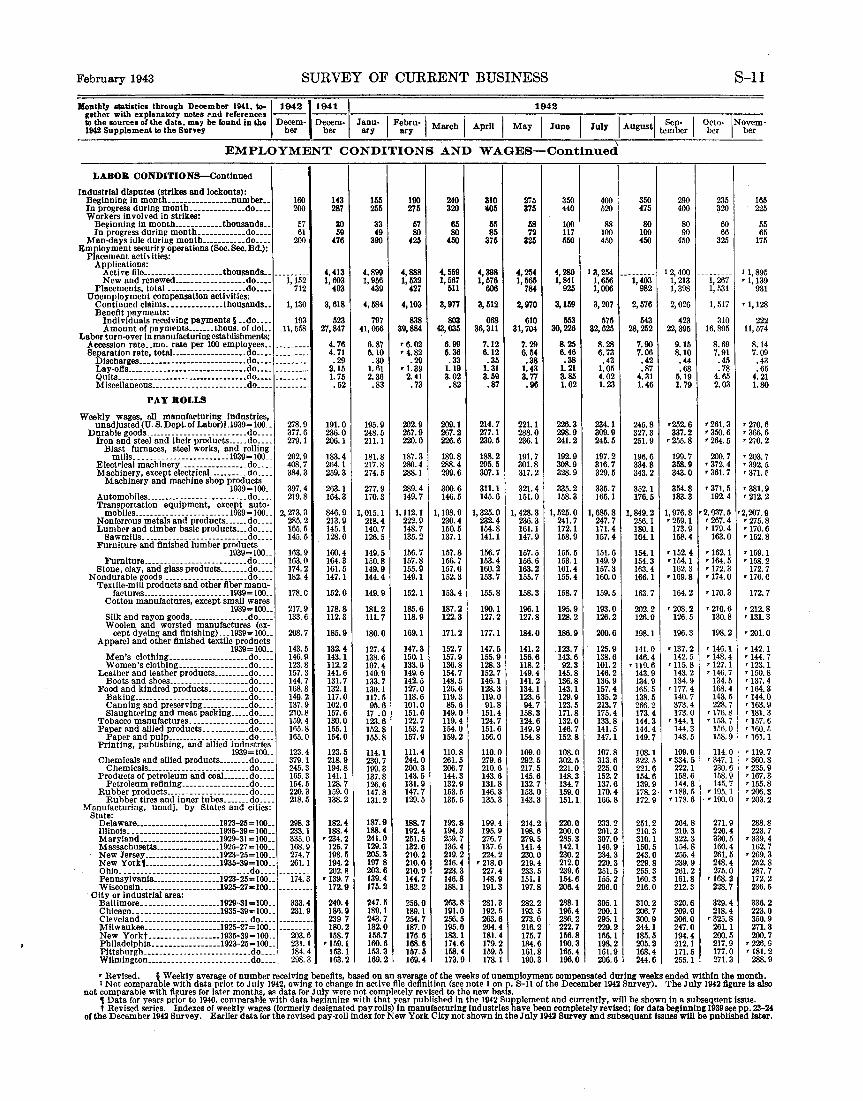
February 1943 SURVEY OF CURRENT BUSINESS
Monthly statistics through December 1941. to-~1942 1941 I 1942 gether with explanatory notes r,nd references ---to the sources of the data, may be found in t.he Decem- Decem- Janu- I Febru-1 March I April I May I June 1942 Supplement to the Survey ber ber ary ary I July I August! te~~~r I
EMPLOYMENT CONDITIONS AND
LABOR CONDITION8-Contlnued
ndustrial disputes (strikes and lockouts): Beginning in month ••.•..•••••••••• number •• 160 143 155 190 240 In progress during month •••••••••••••. do •••• 200 287 255 275 320 Workers involved in strikes:
Beginning In month ••...••••••• thousands •. 57 30 33 57 65 In progress during month .••••••••••. do ____ 61 511 49 80 80
Man-days hJle duriug month .....••••.• do •••• 200 476 390 425 450 mployment security operations (Soc. Sec.Bd.): Placement activities:
E
Applications: Acti ~e file--------------------thousands •• --------- 4,413 4,899 4,888 4, 559 New and renewed __________________ do ..•. 1,152 1,603 1,956 1,532 1,007
Placements, total --------------------do •••. 712 493 439 427 511 Unemployment compensation actlviUes:
Continued claims •• ------------thousands •• 1,130 3, 618 4,584 4,103 3,977 Benefit payments:
Individuals receiving payments§ •. do ..•. 193 523 797 838 803 Amount of payments ..•••.. thous. of doL. 11,558 27,847 41,056 311,884 43,035
Labor turn-over In manufacturing estahlishments: Accession rate .. mo. rate per 100 employees •. --------- 4. 76 6.87 '6.02 6.99 Separation rate, totaL-----------------do ..•. --------- 4. 71 5.10 r 4.82 5.36
Dlscharges .•• ------------------------do •.•. .29 .30 .29 .33 Lay -otis •••• ____ • __ • ___ -------- •• _._ •• do._ •• 2.15 1. 61 r 1. 39 1. 19 Quits. _______ --------- ----------------do •••• 1. 75 2.36 2.41 3.02 Miscellaneous .. _._ •• ____ " ___________ .do .• __ --------· .52 . 83 • 73 .82
PAY BOLLS
Weekly wages, all mnnufa<'turing Industries, unadjusted (U.S. Dept. or Labor)t .1939= 100. _ 278.9 191.0 195.9 202.9 209.1
Durabl~ goods,---------------- _________ do ____ 377.6 236.0 248.5 257.9 267.2 Iron and steel and their produ~ts ..•.. do ____ 279.1 206.1 211.1 220.0 226.6
Blast furnaces, steel works, and rolling mills._._ --------------------1939=100 .. 202.9 183.4 181.8 187.3 189.8
Electrical machinery _________________ do ____ 408.7 2fl4. I 217.8 280.4 288.4 Machinery, except electricaL .••••... do ____ 384.3 259.3 274.5 288.1 299.6
Machinery and machine shop products 1939=100 .. 397.4 263.1 277.9 289.4 300.6
Automobiles __________ ----_--------_ .. do. ___ 219.8 164.3 170.3 149.7 146.5 Transportation equipment, except auto-
mobiles ____ • _________________ .. 1939= 100. _ 2, 273.3 846.9 1,015.1 1, 112.1 1,198. 9 Nonferrous metals and products ....•• do ____ 285.2 213.9 218.4 222.9 230.4 Lumb~r and timber basic products ••. do ____ 165.5 145.1 140.7 148.7 150.5
Sawmills.------- _______ .-------- ___ do ____ 145.5 128.0 126.5 135.2 137.1 Furniture and finished lumber products
1939=100 .. 163.9 160.4 149.5 156.7 157.8 Furniture ___________ -- __ ----- ______ do ____ 163.0 164.3 150.8 157.8 156.7
Stone, clay, and glass products _______ do ____ 174.2 161.5 149.9 155.9 157.6 Nondurable goods,-·--------- __________ do ____ 182.4 147.1 144.4 149.1 152.3
Textile-mill products and other fiber manu-factures ______________________ l939= 100 .. 178.C 152.0 149.9 152.1 153.4
Cotton manufactures, except small wares 1939=100 .. 217.9 178.8 181.2 185.6 187.2
Silk and rayon goods _______________ do ____ Woolen and worsted manufactures (ex-
133.6 112.3 111.7 118.9 122.3
cept dyeing and finishing),_ .1939= 100 .. 208.7 185.9 180.0 169.1 171.2 Apparel and other finished textile products
1939=100 .. 143.5 132.4 127.4 147.3 152.7 Men's clothing ___________ --- _____ .do. ___ 146.9 143.1 138.6 150.1 157.9 Women's clothing __________________ do ____ 123.8 112.2 107.4 133.6 136.8
Leather and leather products _________ do ____ 157.3 141.6 140.9 149.6 154.7 Boots and shoes ____________________ do ____ 144.7 131.7 133.7 142.5 148.5 Food and kindred products __________ do ____ 168.8 132.1 130.1 127.0 126.6 Baking ___________________________ •• do. ___ 149.2 117.0 117.5 118.6 119.3
Canning and preserving ____________ do ____ 137.9 102.0 95.6 101.0 85.6 Slaught~ring and meat packing ..••• do ____ 210.8 157.6 17 .o 151.6 149.0
Tobacco manufactures _______________ do ..•• 159.4 130.0 123.6 122.7 119.4 Paper and allied products ____________ do ____ 165.8 155.1 152.8 153.2 154.0 Paper ani! pu)p _____________________ do ____ 165.0 154.0 155.8 157.9 159.2 Printing, publishing, and allied industries
1939=100 .. 123.4 123.5 114.1 111.4 110.8 Chemicals and allied products ________ do ____ 379.1 218.9 230.7 :l44.0 261.5
Chemicals ____ .. _____________ ------ .do .. __ 245.3 194.8 199.3 200.3 206.7 Products of petroleum and coal _______ do ____ 165.3 141.1 137.8 143.5 144.3
Petroleum refining _________________ do ____ 154.5 128.7 126.6 131.9 132.9 Rubber products _____________________ do ____ 220.3 159.0 147.8 147.7 153.5
Ruhber tires and inner tubes _______ do .... 218.5 138.2 131.2 129.5 135.5 Manufacturing, unadj. by States and cities:
State: Delaware ___ •• _ •• ___ ••• _____ •• 1923-25 = 100 .• 298.3 182.4 187.9 188.7 193.8 Illinois •• _. -------------------1935-39= 100 •• 233.1 188.4 188.4 192.4 194.3 Maryland .• ------------------1929-31 = 100 .. 335.0 '234. 2 241.0 251.5 259.7 Msssachusetts----------------1925-27 = 100 .. 168.9 125.7 12!1. 3 132.6 136.4 New Jersey -------------------11123-25= 100 .. 274.7 198.5 205.3 210.2 219.2 New York, ___________________ 1935-39= 100. _ 261.1 194.2 197 8 210.0 216.4 Ohio. __ ---------------------- _______ .do ____ 202. R 203.6 210.9 223.3 Pennsylvania _________________ l923-25= 100 .. 174.3 r 139.7 139.4 144.7 146.8 Wisconsin. ________ • ________ •• 1925-27-100. _ --------- 172.9 175.2 182.2 188.1
City or industrial ares: Baltimore. ___________ ------- .1929-31 = 100. _ 333.4 240.4 247.5 256.0 263.8 Chicago ___________ ---- ___ ..•. 1935-39-100 .. 231.9 18~.9 189.1 189.1 191.0 Cleveland_ ••• _._ •••• _______ -- _______ . do. ___ --------· 239,7 243.7 254.7 256.5 Milwaukee ..••.••.•. ---------1925-27= 100. _ -------- 180.2 182.0 187.0 195.0 New Yorkt ------------------1935-39-100 .. 203.6 158.7 156.7 176.6 183.1 Philadelphia •• _------ ••• _____ 1923-25= 100 •. 231.1 r 159.1 160.6 168,6 174.6 PittshurJ!'h_ ------ __ • _ •• ____ ----- _____ do. ___ 184.4 153.1 1113.3 157.5 158.4 W limington ••.• ________ • __________ ._ .do. ___ 298.3 163.2 169.2 169.4 173.9
\ WAGES-Continued
310 275 350 400 t05 375 440 520
65 58 100 88 85 72 117 100
375 325 550 450
4,39S 4,254 4,280 I 3,254 1, 576 1,565 1, 841 1,656
606 784 925 1,006
3,512 2,970 3,159 3,207
668 610 553 575 36,311 31,704 30,226 32,625
7.12 7. 2!1 8.25 8.28 6.12 6.54 6.46 6. 73 .35 .38 .38 .43
1.31 1.43 1. 21 1.05 3.59 3. 77 3. 85 4.02 .87 .96 1.02 1. 23
214.7 221.1 226.3 234.1 277.1 288.0 298.9 309.9 230.5 236.1 241.2 245.5
188.2 191.7 192.9 197.2 2\15.5 301.8 308.9 316.7 307.1 317.2 328.9 329.5
311.1 321.4 335.2 335.7 145.6 151.0 158.3 165.1
1, 325.0 1, 428.3 1, 525.0 1, 685.8 232.4 236.3 241.7 247.7 154.8 161.1 172.1 171.4 141.1 147.9 158.9 157.4
156.7 157.5 155.5 151.6 153.4 156.6 153. 1 149.9 160.2 163.2 161.4 157.3 153.7 155.7 155.4 160.0
155.8 158.3 158.7 159.5
190.1 196.1 195.9 193.0 127.2 127.8 128.2 126.2
177.1 184.0 186.9 200.6
147.5 141.2 .123. 7 125.9 155.9 156.6 143.6 138.6 128.3 118.2 92.3 101.2 152.7 149.4 145.8 146.2 146.1 141.2 136.8 136.9 128.3 134.1 143.1 157.4 119.0 123.6 129.9 135.2 91.8 94.7 123.5 213.7
151.4 158.3 171.8 175.4 124.7 124.6 132.0 133.8 151.6 149.9 146.7 141.5 156.0 154.8 152.8 147.1
110.0 109.0 108.0 107.8 279.6 292.5 302.5 313.6 210.6 217.5 221.0 225.0 143.6 145.6 148.3 152.2 131.8 132.7 134.7 137.6 146.3 153.0 159.0 170.4 135.3 143.3 151.1 166.8
199.4 214.2 220,0 233.2 195.9 198.6 200.0 201.2 276.7 279.5 285.3 307.0 137.6 141.4 142.1 146.9 224.2 230.0 230.2 234.3
r 218.0 219.4 212.0 220.3 227.4 233.5 239.6 251.5 148.9 151.1 154.6 155.2 191.3 197.8 206.4 206.0
281.3 282.2 288.1 305.1 192.5 193.5 196.4 200.1 263.6 273.6 286.2 295.1 204.4 216.2 222.7 229.2 181.4 175.7 156.8 166.1 179.2 1!!4.6 190.3 198.2 159.5 161.8 165.4 161.9 178.1 190.3 196.0 206.6
350 290 475 400
80 80 100 90 450 4'50
---i;4ii3" 12,400 1, 213
982 1,398
2,576 2,026
543 423 28,252 22,395
7.90 9.15 7.06 8.10 .42 .44 .87 .68
4. 31 5.19 1. 46 1. 79
245.8 •252. 6 327.3 337.2 251.9 '255. 8
196.6 199.7 334.8 358.9 343.2 343.0
352.1 354.8 176.5 183.3
1, 849.2 1, 976.8 256.1 r 259. 1 180.1 173.9 164.1 158.4
154.1 r 152.4 154.3 r 154.1 163.4 162.3 166.1 r 169.8
163.7 164.2
202.2 , 208.2 126.9 126.5
198.1 196.3
141.0 r 137.2 146.4 142.5
r 119.6 '115. 8 143.9 143.2 134.9 134.9 165. 5 rt77. 4 138.5 140.7 266.2 373.4 173.4 173.0 144.3 r 144.1 144.4 144.3 149.7 148.5
108.1 109.0 322.5 r334. 5 221.6 222.1 154.6 158.6 139.9 144.3 178. 2, '183. 5 172.9 rt78. 6
251.2 264.8 210.3 210.3 310.1 322.3 150.5 154.8 243.0 255.4 229.8 239.9 255.3 261.2 160.3 161.8 216.0 212.3
310.2 320.6 206.7 209.0 300.9 306.0 244.1 247.0 185.5 194.4 205.2 212.1 168.4 171.5 244.6 255.1
S-11
Oeto- ~Novem-ber ber
235 ~20
60 66
325
---------1, 267 1, 531
1, 517
310 16,895
8.69 7.91 .45 . 78
4.65 2.03
•261.3 '350.6 •264.5
200.7 '372.4 '361. 7
r 371.5 192.4
•2,037.5 , 267.4 r 179.4
163.0
r 162.1 rt64. 5 r 172.3 r 174.0
r 170.3
'210.6 130.8
198.2
'146.1 '148.4 '127.1 '146. 7
134.5 168.4 143.5 228.7
, 176.8 '153. 7
lf6.0 158.9
114.0 '347.1
230.6 158.9 145.7
'195. 1 , '190.0
271.9 220.4 330.5 160.4 261.5 248.4 275.0
r 168.2 228.7
329.4 218.4
r 325.8 261.1 200.5 217.9 177.0 271.3
165 225
55 65
175
ll,89t '1,13 9
931
r 1,1 28
22 4
2 11,57
8.1 7.0
4 9 3 5 1
.4
.6 4.2 1 . 80
'270. '366. '270.
6 6 2
'203. '392.
7 5
'371.
'381. , 212.
9 2
•2,207. '275. '170. '152.
9 8 6 8
'159. '158.
172. , 176.
1 2 7 e
172.
r 212. r 131.
'201.
, 142. '144. , 123. '150. '137. '164. '144. r 163. '181. '157. '160. , 161.
'119. '360. '235. '167. , 155. '206. r 203.
288. 223.
'339. 162.
'269. 252. 287. 172. 236.
336. 223. 350. 271.
7
8 3
0
1 7 1 8 4 3 0 9 3 6
7 8 9 3 8 3 2
8 7 4 7 3 8 7 2 5
200.
2 0 9 3 7 g '226.
'181. 288.
2 9
'Revised. §Weekly average of number receiving benefits, based on an average of the weeks of unemployment compensated during weeks ended within the month. I Not comparable with data prior to July 1942, owin~t to change In active file definition (see note I on p. S-11 of the December 1942 Survey). The July 1942 figure is also
not comparable with fi~ures for later months, "-' data for July were not completely revised to the new bMis. , Data for years prior to 1940, comparable with data heginnin~ with that year pubiish•d in the 1942 Supplement and currently, will be shown in a subsequrnt issue. t Revised series. Indexes of weekly wages (formerly designated pay rolls) in manufacturing industries have been completely revised; for data beginninc: 1939 see pp. 23-24
of the December 1942 Survey. Earlier data for the revised pay-rolllndex for New York City not shown In the July 1942 Survey and subsequent Issues will be published later.

S-12 SURVEY OF CURRENT BUSINESS
Monthly statistics through December 1941, to-~1942,1941 \ 1942 gether with explanatory notes and references --- ---
1 1 tothesourcesofthedata,maybefoundinthe Decem- Decem-~ Janu- I Febru·l March I April May June I 1942 Supplement to the Survey ber ber sry ary July
EMPLOYMENT CONDITIONS AND WAGES-Continued
PAY BOLLS-Continued
Nonmfg., nnadj. (U. S. Dept. of Labor): Mining:
Anthracite •• __ ------------------1929= 100 .• 50.1 35.9 39.4 49.6 50.9 44.7 51.5 56.0 45.9 Bituminous coaL_ -------------------do ..•• 129.5 119.9 117.1 118.2 116.9 118.3 122.1 140.3 112.7 Metalliferous ..•••••. __ ••• _. ___ ••••• _. do •••• 104.8 93.7 94.3 98.4 99.1 99.1 100.8 102.0 101.6 Crude petroleum producing __________ do .••• 63.8 64.6 64.8 64.8 62.6 63.2 62.0 63.1 62.4 Quarrying and nonmetslllc. .......... do .... 60.4 55.8 48.9 52.0 54.4 58.1 63.0 65.1 65.9
Public utilities: Electric light and power ............. do .••• 108.6 115.2 114.6 113.7 113.5 113.5 113.6 113.6 113.4 Street railways and busses ........... do .... 102.2 80.0 80.5 83.7 84.7 84.4 86.8 89.4 91.0 Telephone and telegraph ............. do •.•. 128.0 122.9 120.9 120.9 121.8 122.2 125.0 125.3 126.0
Services: Dyeing and cleaning _________________ do ...• 104.2 88.6 86.5 85.6 92.7 105.7 113.1 117.7 109.2 Laundries ••••• __ •••••••• __ ._ •••• __ • __ do._ •• 120.2 102.6 103.8 102.5 104.3 108.6 113.8 115.2 117.8 Year-round hotels •••••• ------------ •• do •.•• 105.9 93.3 91.5 92.6 91.6 93.5 95.4 96.6 96.5
Trade: Retail, totaL ..... ·-------------·----do •.•. 107.5 107.8 94.6 93.9 93.7 93.6 94.0 93.4 91.8 General merchandising _______ • ____ .do .. _. 165.3 151.1 105.7 104.1 105.2 108.0 108.5 109.0 105.1 Wholesale ...... ____ •. _ .. _____ ._ ...... do .. __ 9.1. 8 92.8 91.8 93.7 93.9 92.2 91.7 91.0 91.3
WAGES
Factory aver~e weekly earnings: 36.08 37.47 Nat!. Ind. on. Bd. (25 indnstrles) •• dollars •• --------- 37.53 38.14 38.68 39.00 39.52 39.80
U. S. Dept. of Labor (00 Industries)§ ... do •••• 33.70 35.11 35.71 36.11 36.63 37.46 37.99 136.43 Durable goods. __ ------------------ .. do ..•• 38.62 40.91 41.53 41.94 42.57 43.41 44.02 I 42.51
Iron and steel and their products, not In-36.99 37.31 38.89 39.84 eluding machinery ........... dollars .. ... 38.32 38.99 39.68 40.46
Blast furnaces, steel works, and rolling ml!ls ......................... dollars •• --- 39.26 39.13 40.23 40.67 40.22 40.91 40.85 41.77
Hardware ••.•••• -----------------do ____ ---- ---- 31.90 32.94 33.67 34.66 35.84 37.22 37.77 38.40 Structural and ornamental metal work
dollars .. ----- --- 36.89 38.00 39.95 40.65 40.85 41.14 41.63 41.51 Tin cans and othertinwsre ...... do ____ --------- 28.89 29.64 28.16 28.97 29.21 29.26 29.77 30.52
Lumber and allied products •••••••• do •••• --------- 24.30 23.80 24.94 25.33 25.71 26.66 27.34 27.26 Furniture •• __ .... ------ __ .------. do ____ 26.61 25.47 26.46 26.75 27.26 28.05 27.91 27.84 Lumber, sawmllls ................ do ____ --------" 21.48 21.77 23.20 23.47 23.97 25.05 26.26 26.14
Machinery, excl. transp. equip •••.. do •••. 40.67 43.00 43.49 44.34 44.56 45.41 46.16 46.04 Agricultural Implements (Including
tractors) ••••• _ •••• ------••• _. dollars .. --------- 35.96 38.28 39.82 40.61 40.93 42.55 43.07 42.36 Electrical machinery, apparatus, and
E~~PJ'~:~tnrbiiies;·w-a'ter··-wliee~~~~<i- --------- 38.90 40.68 41.10 41.52 41.80 42.21 42.62 42.57
windmills. ___ ........ ______ •. dollars •• 52.71 57.75 55.59 57.49 56.48 56.48 56.15 56.91 Foundry and machine-shop products
dollars •• --------- 39.86 41.09 41.98 42.00 43.49 43.91 44.71 44.46 Machine tools ____________________ do .... --------- 48.82 50.81 50.87 51.43 50.79 52.24 52.47 51.41 Radios and phonographs _________ do ____ --------- 32.01 32.17 32.84 3.~. 88 34.31 35.33 36.32 36.59 Metals, nonferrous, and products ... do ••.• --------- 36.72 38.19 38.47 39.16 40.01 40.39 41.23 42.03
Brass, bronz~ and copper prod ... do .••• 40.81 43.54 43.62 43.77 44.56 44.73 45.81 46.79 Stone, clar.. an glass products ..... do .... 29.21 28.04 29.77 30.02 30.00 30.59 30.31 29.90
Brick, t1le, and terra cotta ....... do .... 25.72 24.62 26.10 26.52 26.71 27.07 27.56 27.38 Glass. _____ .••• _____ ._ ••• __ ._ .• _ •. do .• _. 31.75 30.80 32.15 32.10 32.08 32.99 31.49 30.83
Transportation equipment .••..••.. do ..•. --------- 43.74 49.29 49.31 48.95 49.71 50.06 50.10 50.93 Aircraft. ... _ .• _ .. _. ___ .•••• _ .•• _. do. __ . 42.50 46.78 44.97 45.24 45.90 46.22 46.67 46.01 Automobiles._ ••. ____ •• _ ••• _ .•... do. __ . --------- 40.97 49.36 48.92 49.34 50.29 50.08 50.20 49.79 Shipbuilding. __ •.. _ •• _ •• __ •• ____ . do._._ --------- 49.19 52.42 53.38 52.28 53.28 53.27 52.73 55.11 Nondurable goods ______________ .. ____ do .... 26.91 26.95 27.35 27.68 27.78 28.26 28.32 128.94
Chemical, petroleum, and coal products 36.17 36.64 37.04 37.93 dollars .. 36.14 36.45 38.03 38.80 Chemicals _____ • ___ •• __ • ___ •• __ •. do._._ --------- 38.74 39.18 39.02 39.52 39.97 41.06 41.21 42.01
Paints and vamlshes ............. do .... --------- 34.13 33.88 34.66 35.25 35.34 35.96 35.78 35.47 Petroleum refining _______________ do .... --------- 41.74 41.09 42.64 42.67 41.97 42.07 42.18 43.00 Rayon and allied products ....... do .... ------- 31.13 31.71 31.95 32.15 32.05 32.13 32.07 32.20
Food and kindred products ........ do .... --------- 28.28 29.06 28.56 28.94 29.18 29.90 30.30 30.21 Baking ________ • ____ . __ ...... _ .... do •• _. 28.84 29.30 29.41 29.48 29.52 30.45 31.34 31.43 Slaughtering and meat packing .. do .... 31.82 33.02 30.70 31.04 31.49 31.87 32.86 32.61
Leather and Its manufactures ...... do .... 24.87 25.08 26.16 26.55 26.57 26.35 26.09 26.46 Boots and shoes .................. do .... --------- 23.36 23.64 24.86 25.32 25.21 24.84 24.48 24.71
Paper and printing ................. do .... --------- 34.02 33.34 33.45 33.68 33.45 33.59 33.76 33. 7.1 Pag:r and pulp __________________ do .... 32.40 32.82 33.28 33.50 32.84 32.94 33.14 33.09 Rub er products ................... do .... 33.50 34.55 34.88 36.32 35.91 37.80 38.24 38.88
Rubber tires and Inner tubes ..... do .... ------·--- 37.35 40.05 40.62 42.27 42.55 44.05 44.42 46.08 Textiles and their products.· ........ do .... --------- 22.29 22.14 22.94 23.25 23.37 23.70 23.45 23.73
Fabrics .•• ______ .------ ______ .... do. ___ 22.46 22.32 22.73 22 90 23.20 23.70 23.79 24.01 Wearing appareL ................ do .... --------- 21.79 21.59 23.52 24.23 23.85 23.72 22.47 22.88
Tobacco manufactures. ____________ do .... 20.65 20.76 20.05 19.72 20.82 21.25 22.16 22.10 Factory average hourly earnings:§
Nat!. Ind. Con. Bd. (2~ indu~triesl. •.. do .... --------- .868 .878 .880 .888 .896 .906 .917 .928 U.S. Dept. of Labor, all manufacturing.do .••. ---- --- . 787 .801 .803 .809 .819 . 831 .840 .850 Durable goods _______________________ do .... 871 .889 .893 .89!1 .910 .923 .933 . 946
Iron anti steel and their products, not . 904 .909 .916 .926 including machinery ......... dollars .. --------- .894 • 933 . 937 .943
Blast furnaces, steel works, and rolling .986 .990 mills __________ . ______ .••••..• dollars .. .983 .988 .996 1. 000 .999 1. 004
Hardware ______________ .......... do .... --------- • 741 . 750 . 746 . 764 • 790 .812 .827 .852 Structural and ornamental metal worU
.875 dollars .. --------- .856 .892 .899 .891 .900 .905 .908 Tin cans and other tinware ...... do .••. ----·----- . 703 • 713 . 709 • 720 .738 • 736 • 742 . 749
Lumber and silled products ........ do .... .. _ -- .602 .607 . 613 .620 .632 .644 .659 .660 Furniture .•.••• __ ---- •• ____ ...... do .... --- .638 .641 .649 . 655 .667 .677 .673 .672 Lumber, sawmllls ................ do .... --------- .572 . 576 .584 .594 .606 .620 .646 .646
Machinery, excl. transp. equip ... do .... -------- .884 .906 . 910 .918 .932 .945 .955 • 961 Agricultural implements (including
.926 tractors) .. ___ --------. _____ .. dollars._ .922 .938 .950 .955 .986 1.002 1.000 Electrical machinery, apparatus, and
supplies ..••. _._._ ••• _. ____ ••. dollars •. -----·--- .878 .898 .903 .906 • 913 .918 .926 . 932
48.2 118.6 106.5 62.4 67.4
112.8 93.8
127.4
106.4 116.8 96.6
91.4 104.9 91.8
40.87 137.38 143.84
41.29
42.22 39.61
44.37 31.41 28.54 28.95 27.33 46.38
43.72
43.31
54.00
45.74 52.12 36.38 43.00 48.02 31.10 27.99 32.55 52.16 46.24 51.76 56.82
129.36
39.35 41.73 35.92 43.58 32.85 29.61 31.69 32.40 26. 3_7 24.89 34.50 34.18 39.46 46.10 24.65 24.79 24.~ 23.09
.940
.864
.966
.967
1.030 .871
.944 • 757 .677 .682 .663 .964
1.014
.938
February 1943
'50.2 122.2 103.0 '64. 9
67.5
112.5 93.6
130.5
107.9 117.3 98.5
93.1 112.4 '92.3
41.79 r1 37.80
I 44.45
---------------------------
'44.92 '31.50
---------'28.90
27.22 ---------------------------------------------
50.72 37.28
-----------------------------·ai:28· ---------
46.55 ---------
58.60 129.53
---------41.70 36.11 45.19 33.38
---------31.72 32.62
---25:93' ---------
34.10 ---------
'45.80 ------------------------------------
. 957 '· 886 . 995
.997
1. 065 (•)
•.966 '· 776 .686 • 700 . 671 .998
(•)
.968
'48. 3 124.8 104.5 '64.1
68.9
111.1 95.3
128.4
112.5 118.9 103.2
96.4 121.6 94.6
42.10 "38. 89 '145. 31
---------------------------
•46.43 '33.09
---------•30.50
28.69 ---------
---------
---------
•49. '123. '104.
62. '66.
'109. 97.
129.
'107. '118. •103.
'99. '130. •96.
2 9 1 6 4
1 8 0
9 5 9
2 8 1
42.4 9 8 7
139.7 146.2
-------
--------------
45.4 33.1
-------30.0
4 2
27.4 -------
-------
-------
---------- --------------
52.32 '38. 25
------------------------------------
'35. 40 ---------
45.77 ---------
'57.53 "30.66
---------43.38
'36. 79 46.56 32.96
--·ai:oo· •34.02
---------26.03
---36:59' ---------
'46. 55 ------------------------------------
. 958 '.887 . 988
'· 994
1. 058 (•)
r. 976 '· 793 .697
'· 707 . 684 .996
(•)
. 951
-------53.1 8
3 38.5 ----------------------------
34.7 -------
46. -------
3 44
5 5
60.7 131.2
-------44.3 2
6 4
68
37.8 50.5 32.
32.3 34.5
-------25.9
2 2
37.1 8 -------
47.6 ----------------------------
.9 66 9 3
.89 1.00
l.O
1.0
00
60 (•)
. 9t
.7
.6
. 70
.6
6 97 92 3
7C 1. 00 I
(•)
.9 55 ' Revised. • Comparable data not available. t Weekly earnings for July-November are weighted averages and are not comparable with earlier data; percentage increases November 1941 to November 1942 are as
follows: All manufacturing, 29.2; durable goods, 30.9; nondurable goods, 20.4. t Hourly earnings for structural and ornamental metal work revised beginning April1942 on the basis of more complete reports. §The Department of Labor has published avera~e weekly and hourly earnings for July-November 1942 for the revised Industry classifications shown for wage earners
and weekly wages on pp. S-9 and S-11; pending revisiOns of earlier figures, hourly earnings are shown here on the old basis in order to have comparable figures for the entire period covered; November weekly earnings, comparable with earlier data, are available only as shown.

February 1943 SURVEY OF CURRENT BUSINESS S-13
gether with explanatory notes and references ----------:-----;-----,----,----,-------,----.,----.---,----.,---Monthly statistics through December 1941, to-~1942 1941 I 1942
tothesourcesofthedata,maybefoundinthe Decem- Decem· JanuaryiFebru·/Marchl Aprt'l I May I June I July /August/ Sep·i Octo-~Novem-1942 Supplement to the Survey her ber ary tern her her her
EMPLOYMENT CONDITIONS AND WAGES-Continued
WAGEs-Continued
Factory average hourly earnings §-Continued. U.S. Department of Labor-Continued.
Durable goods-Continued. Machinery, etc.-Continued.
Engines, turbines, etc ..•...•.• dollars •. --------- 1. 094 1.152 1.126 1.153 1.155 1.158 1.154 I. 175 Foundry and machine-shop products
.881 .900 .921 dollars .. .858 .874 .879 . 910 . 924 Machine tools ........•.••......•. do ..•. -~------- .908 .926 .928 .943 .944 .965 .974 . 975 Radios and phonographst ........ do .... --------- . 726 . 739 . 754 • 757 • 770 • 785 • 799 . 810
Metals, nonferrous, and products •• do .... .848 . 865 .872 .884 .897 .908 .920 . 935 Brass, bronze, and copper prod ... do .... .918 . 948 .957 . 970 .981 .993 1.000 1. 027
Stone, clay, and glass product ...... do .... • 753 . 751 . 759 . 762 . 767 . 771 . 780 . 787 Brick, tile, and terra cotta ........ do .... .666 .669 .675 .685 .689 . 700 • 708 . 714 Glass ............................ do .... .836 .825 .830 .826 .834 .835 .834 .842
Transportation eQuipment .. _._ .... do .... --------- 1.035 1.069 1.061 1.052 1.057 1.069 1.071 1. 091 Aircraft .......................... do .... .918 . 963 . 951 .956 .971 .983 ' .993 . 991 Automobiles ..................... do .... --------- 1.107 1.168 1.158 1.136 1.133 1.142 1.137 1.144 Shipbulldingt .................... do .... --------- 1.063 1.085 1.091 1.078 1.083 1.091 1.088 1.138
Nondurable goods. __ ................ do .... .695 • 701 • 702 • 707 .714 • 722 • 727 . 732 Chemical, petroleum, and coal products
.886 .889 dollars .. .881 .881 .900 .917 .930 . 941 Chemicals .............. ___ ...... do .... --------- .943 .949 .. 950 .962 .973 .990 .990 1. 003 Paints and varnishes ............. do .... -------- .822 .824 .831 .839 .847 .856 .862 .864 Petroleum refining __________ ..... do .... --------- 1.106 1.107 1.104 1.104 1.103 1.098 1.102 1.114 Rayon and allied products ....... do .... --------- • 797 .800 .812 .812 .812 .808 .808 .824
Food and kindred products ........ do .... • 703 .718 . 718 • 723 .732 . 741 • 743 . 735 Baking. _____ .... -------------- .. do .... .695 .697 .696 .698 • 706 .717 • 731 . 738 Slaughtering and meat pscking .. do .... --------- .782 .791 .786 . 791 .800 .800 .806 .801
Leather and its manufactures ...... do .... .649 .649 .658 .663 .678 .682 .685 .687 Boots and shoes .................. do .... --------- .618 .616 .629 .633 .649 .650 .652 . 654
Paper and printing ................ do .... --------- .855 .852 .854 .862 .868 .876 .886 .893 Pa~er and pulp .................. do .... • 747 .760 .764 • 769 • 769 • 777 • 797 .809
Rub er productst .................. do .... .875 .887 .882 .901 .902 .916 .926 . 933 Rubber tires and inner tubest .... do .... 1.058 1.085 1.074 1.093 1.084 1.096 1.103 1.107
Textiles and their products ........ do .... .583 .589 .592 .596 .599 .604 .603 .611 Fabrics.------ ................... do .... .571 .574 .574 .576 .583 .592 .595 .604 Wearing apparel. ............... do .... --------- .609 .620 .629 .635 .632 .627 .616 .628
Tobacco manufacturM ............. do .... .530 .549 .544 • 537 .564 . 565 .575 . 575 Factory average weekly earnings, by States:
Delaware .... _._._ .•..•••..••. _ .1923-25= 100 .. 159.7 128.3 131.5 131.6 134.6 137.2 142.0 139.9 146.3 illinois. ____ •.. _ ................ 1935-39= 100 •. 163.3 135.5 137.3 140.3 141.8 144.0 147.9 148.9 148.4 Massachusetts.----------- .. __ •. 1925-27=100 .. 156.0 125.2 130.3 131.9 134.4 134.9 138.9 140.0 144.3 New 1ersey ----------- .......... 1923-25= 100 .. 201.6 163.9 169.3 170.3 175.4 177.7 180.5 180.9 184.0 New York ...................... 1936-39=100 •. 167.6 137.5 142.4 146.4 148.8 150.1 152.4 152.1 154.8 Pennsylvania. __ ............... 1923-25-100 •• 171.1 143.0 144.6 148.9 150.2 151.3 153.6 155.4 155.4 Wisconsin ..... __ ............... 1925-27 -too .. --------- 136.6 140.3 145.0 147.7 147.7 150.8 154.9 152.1
Miscellaneous wage data: Construction wage rates (E. N. R.) :,
Common labor .............. dol. per hour .. .832 • 769 • 776 .780 • 780 • 788 . 788 • 796 .803 Skilled labor ....... --------------- ... do .... 1.60 1.52 1.53 1.64 1.54 1.54 1.54 1.55 1.56
Farm wages without board (Quarterly) dol. per month. -------- --------- 47.77 ----:860' ----:840' 50.54 ----:835' ----:826' 56.97
Railway wages (avg., class l)_dol. per hour .. .836 .841 .834 .825 Road-building wages, common labor:
United States, average ............... do .... .67 .49 .45 .43 .47 .49 .53 .56 . 59 East North Central. ............... do ..•• .88 .67 .65 .69 .68 .65 .67 .71 . 75 East South Central ................ do •.•. .46 .37 .36 .37 .37 .37 • 41 .42 . 41 Middle Atlantic .... ----------------do •••• .82 .59 .63 .59 .57 .64 .60 .61 .69 Mountain ......... _._ ••.••• _ ••••••• do .... .88 .61 .63 .62 .62 .63 .68 .68 .71 New England ....................... do .... .80 .59 .57 .52 .52 .62 .65 .64 .69 Pacific ..• ----. ___ • __ ........... _ ••• do •••• 1. 02 .81 • 85 .82 .82 .89 .90 .92 .95 South Atlantic •••.• _ ......... ____ •. do .••• . 56 .35 .35 .36 .37 .40 .43 .46 .48 West North CentraL .............. do .... . 69 .50 .55 . 51 .52 .52 .55 .57 .60 West South CentraL. .............. do .... . 48 . 41 .40 .43 .42 .44 .42 .43 . 41
PUBUC ASSISTANCE
Total public assistance and earnings of persons employed under Federal work programs
mil. of doL. --------- 170 162 157 159 150 141 135 120 Assistance to recipients:
Special types of public assistance ... ~. do .... --------- 63 63 64 64 64 64 •65 65 Old-age assistance .... ____ ._ ..... __ . do .... 48 48 49 48 48 49 49 50
General relief..-------------- ........ do .... --------- 19 20 19 19 17 15 14 14 Earnings of persons employed under Federal
work programs: Civilian Conservation Corps ... mll. of doL. --------- 8 8 7 6 5 4 4 (2) National Youth Administrationci' .... do ... --------- 9 8 7 7 7 6 6 0 Work Projects Administration ........ do ... --------- 69 62 58 62 56 51 47 42
Earnings on regular Federal construction projects ........................... m!l. of doL • 432 167 166 186 194 237 287 314 368
FINANCE
BANKING
Acceptances and com'! paper outstanding: Bankers' acceptances, total. ..... mil. of dol.. 118 194 197 190 183 177 Ii4 163 156
Held by accepting banks, total.. ..... do .... 93 146 154 144 146 139 133 122 119 Own bills.----------- .............. do .••• 60 92 103 92 89 86 82 78 77 Bills bought. --------------·-------do .... 34 54 52 53 57 53 51 44 42
Held by others• ·--------------------do .... 25 49 43 46 37 38 4.1 41 38 Commercial paper outstanding ......... do .... 230 375 381 388 384 373 354 315 305
1.104 (1)
.942 . 967
. 987 .990
.811 .830
.954 .979 1.047 (1) . 798 .810 . 727 (1) .842 .854
1.114 1.148 .993 1.011
1.145 1.167 1.193 1,247 . 738 '· 750
.944 .950 1.001 1. 014 .870 .879
1.130 1.165 .827 .845 . 732 • 728 . 732 • 733 .807 .813 .687 .705 .657 .677 .896 .908 .814 .825 .936 .948
1.105 •1.114 .627 .641 . 619 .636 .642 .652 .587 .591
145.0 150.9 150.9 151.3 146.5 •150.0 184.7 190.1 157.0 160.3 159.8 161.9 157.8 153.1
.823 .823 1.59 1.59
---------.828 ---------
.839
. 61 .63
. 76 .77
. 43 .46
.66 .64
. 77 . 74
.65 .66
.97 1.08
.50 . 50
.60 .66
.46 .44
110 106
65 65 50 50 13 13
(') (') 0 (•)
31 26
423 426
139 123 108 97 71 64 37 33 31 26
297 282
(1)
.972
.998 •.830 •.979 (1) .823
(1) •.889 1.122 .991
1.151 '1.208
. 757
'· 937 1.019 •.883 1.160 .834 . 757 . 741
•.821 '· 710 .683 . 915. .828
'· 949 '1.115
.647
.642 '· 659 . 596
157.4 156.7 152.6 194.5 163.3 166.9 162.0
.826 1. 59
59.25 . 832
. 66
.83
.48
. 72
.82
. 70 1.04 . 52 .72 . 47
104
66 51 13
(2) (•)
25
439
119 94 63 31 25
271
(1)
. 97 5 7 0 0
1.00 .83 .98
(1) .82
(1) .87 8
94
3 3
1.151 .9
1.181 1.26 . 76
. 94 0 27 90 4
1.0 .8
1.17 .8 29
3 6
. 76
. 74
.8 23 5 3 8
.71
.68
.91
.831
.9 56
7 4
54 5
1.121 . 64 . 64 • R .60
1111: 4 159.
159.8 152. 9
7 7 9
'198.8 164.
'169. 164.
.83 2 0 1. 6
--------.85 0
66
7 .83 .4 . 75 .87 . 75
1.06 .54 • 77 .46
101
66 52 12
(2) 1
22
'435
11 9 6
6 0 1
2 26
29 6 1
• Revised. • Preliminary. •None held by Federal Reserve banks. • Less than $500,000. I Comparable data not available. 2 No data available for small amounts expended after June 1942 for the CCC now in process of liQuidation as directed by Congress. t Data for shipbuilding revised beginning December 1941, for radios and phonographs beginning February 1942, and for rubber products and rubber tires and inner tubes
beginning March 1942, on the basis of more complete reports. ci'Beginning with July 1942 ouly amounts expended for the student work program are included; need is no longer a criterion for enrollment in the out-of-school work
program, which Is focused on training inexperienced youths for war industries, and the program is therefore droppea from this series. ,construction wage rates as of Jan. I, 1943: common labor, $0.832; skilled labor, $1.61. §See note marked"§" on p. S-12.
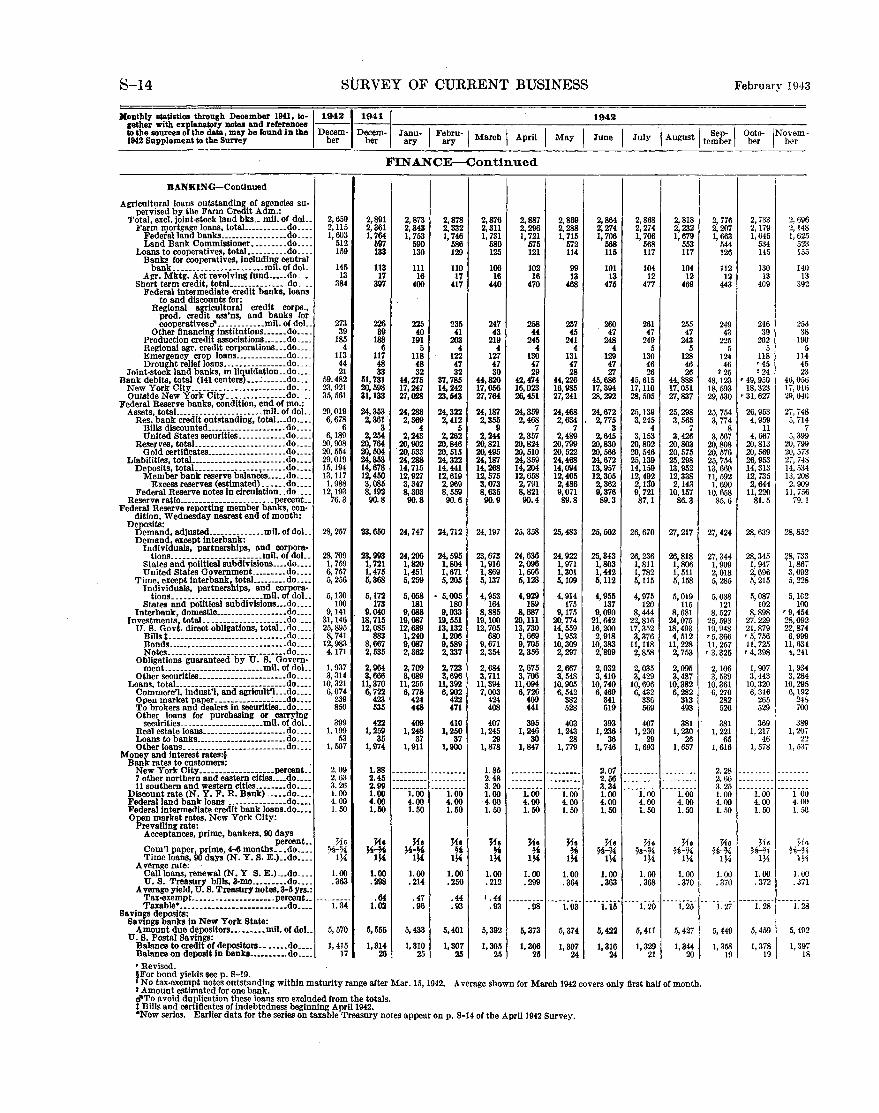
S-14 SURVEY OF CURRENT BUSINESS February 1943
gether with explanatory notes and references ----------,-----------,----,-------.,.------,------,-------Monthly statistics through December 1941, to-~194211941 I 1942
tothesourcesofthedato,maybefoundinthe Decem· Decem- 1anu- I Febru·\ M b I A .1 I M 1 1 I 11 ., A t I Sep·i Octo· \Novem· 1942 Supplement to the Survey ber ber ary ary arc Prt ay une u Y ugus tember ber ber
FINANCE-Continued
BANKING-Continued I Agricultural loans outstandln~ of agencies su·
pervised by the Farm Cre It Adm.: Total, excl. joint-stock land bks .. mil. or dol.. 2,659 2,891 2,873 2,878 2,876 2,887 2,869 2,864 2,868 2,818
Farm mortgage loans, total. .•••••.... do .... 2,115 2,361 2,343 2,332 2,311 2,296 2, 288 2,274 2,274 2,232 Federal land banks ...•••••••••.•••• do ..•. 1,603 1, 764 1, 753 1, 746 1, 731 1, 721 1, 715 1,706 1, 706 1,679 Land Bank Commlssloner •••.••••. do ••.. 512 697 590 586 680 575 572 568 568 553
Loans to cooperatives, total ••••.••... do .... 159 133 130 129 125 121 114 115 117 117 Banks for cooperatives, Including central
bank ••••..•.....•••..•.•••• mll. of doL 145 113 111 110 106 102 99 101 104 104 A gr. Mktg. Act revolving fund .••.. do ..•. 13 17 16 17 16 16 13 13 12 12
Short term credit, total •..•...•..••••. do ... 384 397 400 417 440 470 468 475 477 469 Federal intermediate credit banks, loans
to and discounts for: Regional agricultural credit corps.,
prod. credit ass'ns, and banks for cooperativesci'------------mll. of doL 273 226 225 235 247 268 257 260 261 255
Other financing lnstitutlons •••••• do •••. 39 39 40 41 43 44 45 47 47 47 Production credit assoclations .••••• do .... 185 188 191 203 219 245 241 248 249 243 Regional agr. credit corporations ..• do .... 4 6 5 4 4 4 4 4 5 5 Emergency crop loans .••.....•..•. do ..•. 113 117 118 122 127 130 131 129 130 123 Drought relief loans •.•.••...•....•. do ..•. 44 48 48 47 47 47 47 47 46 46
Joint-stock land banks, in Jl~uldatlon .. do .••. 21 33 32 32 30 29 28 27 26 26 Bank debits, total (141 centers ·--~------do .••. 59,482 51,731 44,275 37,785 44,820 42,474 44,226 45,686 45, 615 44,888
New York CltY---------·---·--------·-do .... 23,921 20,598 17,247 14,242 17,056 16,023 16,985 17,394 17,110 17,051 Outside New York City -------·-------do .. __ 35,561 31,133 27,028 23,543 27,764 26,451 27,241 28,292 28,505 27,837
Federal Reserve banks, condition, end of mo.: Assets, totaL ____________________ mll. of doL 29,019 24,353 24,288 24,322 24,187 24,359 24,468 24,672 25,139 25,298
Res. bank credit outstanding, total ... do •••. 6,678 2, 361 2,369 2,412 2,355 2,468 2,634 2, 775 3, 245 3,565 Bills dlscounted ____________________ do ..•. 6 3 4 5 9 7 7 3 4 7 United States securltles ••..•...••.. do .... 6,189 2,254 2,243 2,262 2,244 2,357 2,489 2,645 3,153 3,426
Reserves, totaL. ____ .•• ______________ do. ___ 20,908 20,764 ~~ 20,846 20,821 20,824 20,799 20,830 20,802 20,803 Gold certificates •..•••.• -·----------do ••.• 20,554 20,504 20,515 20,495 20,510 20,522 20,566 20,546 20,575
Liabilities, totaL----------------------do .••• 29,019 24,353 24,288 24,322 24,187 24,359 24,468 24,672 25,139 25,298 Deposits, total. ____ ------ _____ , ______ do ..•• 15, 194 14,678 14,715 14,441 14,268 14,204 14,094 13,957 14,159 13,952
Member bank reserve balances ••••• do .... 13,117 12,450 12,927 12,619 12,575 12,668 12,405 12,305 12,492 12,338 Excess reserves (estlmated) ...... do .... 1,988 3,085 3,347 2,969 3,073 2, 791 2,486 2,362 2,1:!0 2,143
Federal Reserve notes in circulation .. do .. _. 12,193 8,192 8,303 8,559 8,635 8,821 9,071 9,376 9, 721 10,157 Reserve ratio __________ .............. percent •• 76.3 90.8 90.8 90.6 90.9 90.4 89.8 89.3 87.1 86.3
Federal Reserve reporting member banks, con· dltlon, Wednesday nearest end of month:
Deposits: Demand, adjusted .••••••.••.••. mll. of doL. 28,257 23,650 24,747 24,712 24,197 25.358 25,483 25,502 26,670 27,217 Demand, except Interbank:
Individuals, partnerships, and corpora-tions _______________________ mll. of doL 28,709 23,993 24,206 24,595 23,673 24,636 24,922 25,343 26,236 26,818 States and political subdlvlslons ..•• do .••• 1, 759 1, 721 1,820 1,804 1,916 2,096 1, 971 1,803 1, 811 1,806 United States Government .•••••••• do. ___ 6, 757 1,475 1,451 1,671 1,869 1,506 1, 301 1,442 1, 782 1, 511
Time, except Interbank, totaL •••.••. do .••• 5,256 5,368 5,259 5,205 5,137 5,128 5,109 5,112 5,115 5,168 Individuals, partnerships, and corpora-tions _______________________ mll. of doL. 5,130 5,172 5,058 • 5,005 4,953 4,929 4, 914 4,955 4,975 5,019 States and political subdlvlslons ••• do .... 100 173 181 180 164 189 175 137 120 115
Interbank, domestic .•••.• _. ___ ------. do--._ 9,141 9,040 9,088 9,033 8,885 8,687 9,175 9,090 8,444 8,681 Investments, totaL. -------··--·------·do .... 31,146 18,715 19,087 19,551 19,100 20,111 20,774 21,642 22,816 24,075
U. 8. Govt. direct obligations, total .• do .... 25,895 12,085 12,689 13,132 12,705 13,730 14,559 16,200 17,352 18,493
~~~d~--===::::::::::::==============a~==== 8, 741 883 1,240 1,206 680 1,669 1,953 2, 918 3, 376 4,512
12,983 8,667 9,087 9,589 9,671 9, 705 10,309 10,383 11,118 11,228 Notes ...•• _ .•••• __ ------.--•• --.---do .•.• 4,171 2, 535 2,362 2,337 2,354 2,356 2,297 2,'899 2, 858 2, 753
Obligations guarantesd by U. S. Govern· ment .. ----------·-----·------mll. of doL. 1, 937 2,964 2, 709 2,723 2,684 2,675 2,667 2, 032 2,035 2,095
Other securities._-·---·-· ·----·------do .••. 3,314 3,666 3,689 3,696 3, 711 3, 706 3,548 3,410 3,429 3,487 Loans, totaL ......... ____ .•.• --- •....•. do •••. 10,321 11,370 11,255 11,392 11,394 11,094 10,905 10,740 10,696 10,382
Commerc'l. lndust'l, and agrlcult'L .. do ____ 6,074 6, 722 6, 778 6,902 7,003 6, 726 6,542 6,469 6,432 6,282
¥ge~r~:~~~~aS!~ier'iliii-Siciuritie8==~~=:== 239 423 424 422 424 409 382 341 336 313 850 535 448 471 408 441 528 5!9 569 493
Other loans for purchaslng or carrying secdrities .. ___________________ mll. of doL 399 422 409 410 407 395 403 393 407 381 Real estate loans ......... ------··----do .... 1, 199 1,259 1,248 1,250 1,245 1,246 1, 243 1,236 1,230 1, 230 Loans to banks.---·------------·-----do ..•. 53 35 37 37 29 30 28 36 29 26 Other loans.----------· --··----------do .••• 1, 507
Money and Interest rates:§ 1,974 1,911 1,900 1,878 1,847 1, 779 1, 746 1, 693 1, 657
Bank rates to customers: New York City_. _________________ percent.: 2.09 1.88 -~------- --------- 1. 85 --------- --------- 2.07 --------- ---------
7 other northern and eastern citles •••• do .••. 2. 63 2.45 --------- ·-------- 2.48 --------- --------- 2.56 --------- ---------11 southern and western cltles .••••••• do •••. 3.26 2.99 ----i~o<> ----i~o<i
3.20 ----i~oo- --------- 3.34 --------- ---------
Discount rate (N.Y. F. R. Bank) ..... do .••• 1.00 1.00 1.00 1.00 1.00 1. 00 1.00 Federal land bank loans ... ---~---------do •••• 4.00 4.00 4.00 4.00 ·4.00 4.00 4.00 4.00 4.00 4.00 Federal intermediate credit bank loans.do .••• 1.50 1.50 1. 50 1.50 Open market rates, New York City:
1.50 1.50 1.50 1.50 1. 50 1. 50
Prevailing rate: Acceptances, prime, bankers, 90 days
Yi• tie tio percent •• Uo tio Uo Uo Uo Yi• u. Com'! paper, prime, 4-6 months ..• do •••. %-% ~-% ~-~' ~' % ~' % %-% ~a-% %-% Time loans, 90 days (N.Y. 8. E.) .• do •••• 1)4 IW 1W 1W 1W 1~ tW 1W 1}4 1}4
Average rate: Call loans, renewal (N. Y 8. E.) ..• do ...• 1.00 1.00 1.00 1.00 1.00 1.00 1.00 1.00 1.00 1.00 U.S. Treasury bills, 3-mo .•••••••• do •••. .363 .298 .214 .250 .212 .299 .364 .363 • 368 .370
.Average yield, U.S. Treasury notes, 3-5 yrs.: Tax-exempt •. __ ·-._·-----------. percent •• .64 .47 .44 •.44
-----~98' ----i~oa· --·-i~i5" ----i:2o· ---T25-Taxable• ·----------·------------·--do. ___ 1. 34 1.02 .96 .93 .93 Bavl~s de~sits:
Sa ngs anks In New York State: Amount due deposltors ••••••••• mll. of doL 5,570 5,555 5,433 5,401 5,392 5, 373 5,374 5,422 5,411 5,427
U. 8. Postal Savings: Balance to credit of def::ltors .•••••• do ____ 1, 415 1,314 1,310 1,307 1,305 1,306 1, 307 1,316 1,329 1,344 Balance on deposit In anks .••••••••• do •••. 17 26 25 25 25 25 24 24 21 20 r Revised. fFor bond yields seep. S-19.
No tax-exempt notes outstanding within maturity range after Mar. 15,1942. Average shown for March 1942 covers only first half of month. • Amount estimated for one bank. <i'To avoid duplication these loans are excluded from the totals. ~ Bills and certificates of Indebtedness beginning April1942. •New series. Earlier data for the series on taxable Treasury notes appear on p. S-14 of tbe Apri11942 Survey.
2, 776 2, 733 2,207 2,179 1, 663 1, 645
544 5.34 126 145
112 130 1~ 13
443 409
249 246 43 39
225 202 5 5
124 118 46 •45
• 25 '24 48,123 r 49,950 18, 593 18,323 29, 530 '31, 627
25, 754 26,953 3, 774 4,959
8 11 3, 567 4, 667
20,808 20,813 20,576 20,569 25,754 26,953 13,660 14,313 11,592 12,735 1,690 2,644
10,658 11,220 85.6 81.5
27,424 28,639
27, 344 28,345 1,909 1, 947 2, 018 2,696 5,285 5,215
5,038 5,087 121 102
8.527 8,898 25,593 27,229 19,948 21,879 •5, 366 • 5, 756 11,257 11,725 • 3,325 '4,398
2,106 1, 907 3, 539 3,443
10.361 10,320 6,270 6,316
282 265 526 529
381 369 1, 221 1, 217
65 46 1, 616 1, 578
2. 28 ---------2.66 ---------3. 25 ---------1.00 1.00 4.00 4.00 1. 50 1.50
Uo %-%
H6 78-%
1)4 1}4
1.00 1.00 . 370 . 372
--------- ---T28-1. 27
5, 449 5,459
1,358 1,378 19 19
I
2,69 6 8 5
2,14 1,62.
5 23 5 15
14 0 3 I
:m·
25: 3 8 3
I
11 4. 2'
90 5 4 !\ 3 6 6 0
46,05 17,01 2q,o4
27,74 8 4 5, 71 I
5, 3 99 99 73 8
20,7 20, 5t 27,74 H,:;a 4
s 9 6
13.20 2,90
11,75 79.1
28,85 2
:?8, 733 1,861 3,09 2
28 5, 2.
5, lG 2 100
r9,4 54 2 4
28,09 22,87 6,999
11,63 4 4, 241
1, 934 3,
10,29 284
5 2 8
6,19 24. 700
38 1, 204
2-1, 5:3,
------------------------
1.0 0 00 50
4. !."
H ~-a-:v
IV
!. 00 1 . 37
1.2
5,49 2
1,39 ' 1 8
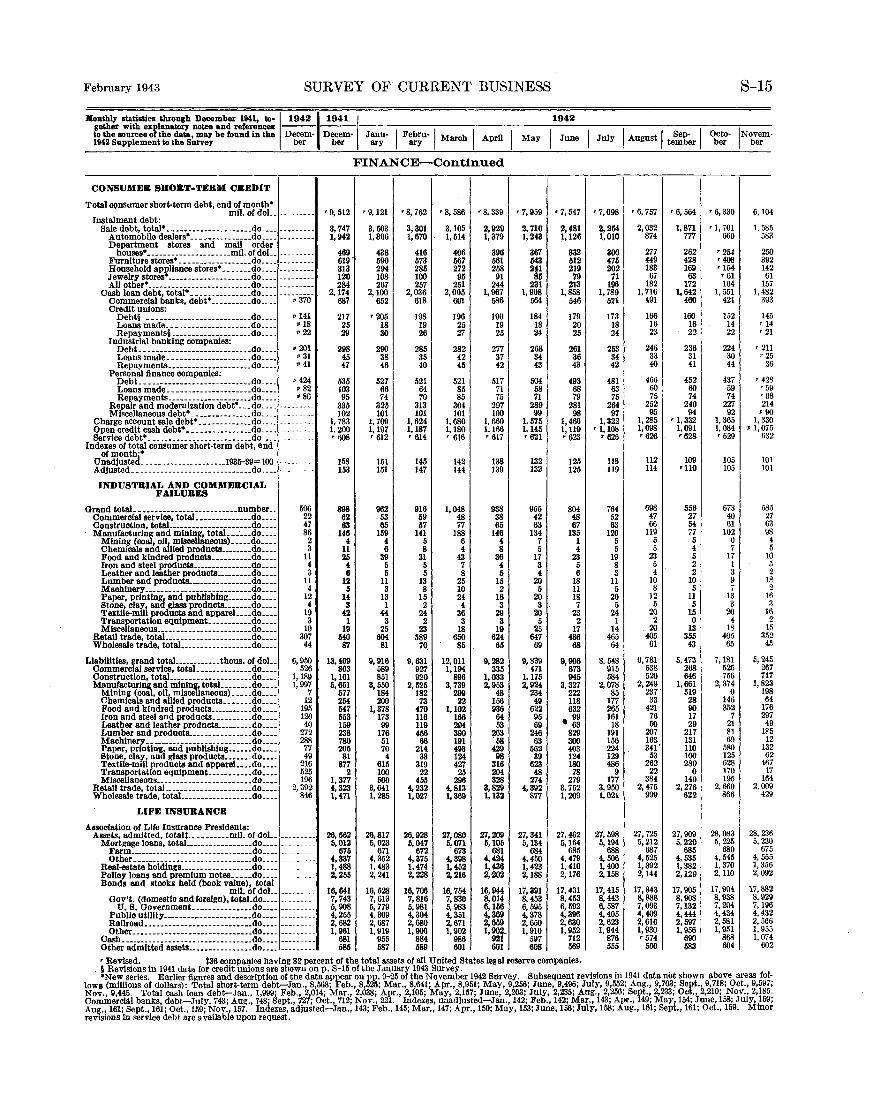
February 1943 SURVEY OF CURRENT BUSINESS S-15
lltonlhly statistics lhrough December 1941, to-,1942,1941 j,~---;----;-----;------~-=19.::4.::2:.:..__-;----;----.,------,-------;--gether with explaustory uctea and referencea --- ---~,-to the sources of the data, ma:y be found in lhe Decem- Decem- Janu- I Febm-1 March I April I M I June I J 1 I Au t I Sep- I Octo- INovem-1942 Supplement to the Surve:y ber ber ary ary ay u Y gus tember ber ber
FINANCE-Continued
CONSUMER SHORT-TERM CREDIT
Total oonsdmer short-term debt, end of month• mil. of doL
Instalment debt: ------~-- r 9, 512 r 9,121 rS, 762 r 8, 586 '8, 339 •7,959 r 7, 547
Sale debt, total* ---------------------do ••.. --------- 3, 747 3, 503 3,301 3,105 2,929 2, 710 2,481 Automobile dealers• ___ ------------do .... --------- 1,942 1,806 1,670 1, 514 1,379 1,243 1,126 Department stores and mail order
houses• ---------------------mil. of doL. --------- 46\l 438 416 406 39tl 367 332 Furniture stores• _.----------------do .•.. --------- 619 590 573 !i67 !i6I M3 5I2 Household ap£liance stores• _______ do .•.. --------- 3I3 294 285 272 258 2:~ 219 Jewelry stores ---------------------do .... 120 108 100 95 91 79 All other• --------------------------do .... 284 267 257 25I 244 231 213
Cash loan debt, total* ---------------do .•.. -··-;,·37() 2,174 2,IOO 2,036 2,005 1,967 1,908 I,858 Commercial banks, debt* __________ do .... 687 652 618 601 586 564 546 Credit unions:
Debt§. __ ------------------------do .... • 141 217 r 205 I98 196 190 184 I79 Loans made. --------------------do .... •IS 25 18 I9 25 I9 18 20 Repayments§ --------------------do ••.. p 22 29 30 26 27 25 24 25
Industrial banking companies: • 201 Debt._. __ .•.• ------------ .•••.•. do •• __ 298 290 285 282 277 268 261
Loans made. --------------------do •..• p 31 45 38 35 42 37 34 36 Repayments _____________________ do .... • 41 47 46 40 45 42 43 43
Personal finance companies: •424 Debt._. ___ --------------- ...•••. do ••.. 535 527 521 521 517 504 493
Loans made._ -------------------do .••. • 82 I03 66 64 85 71 58 68 Repayments._. __ •..• ___ • _____ .•• do .• _. •86 95 74 70 85 75 71 79
Repair and modernization debt* .•. do .... --------- 335 325 3I3 304 297 289 281 Miscellaneous debt* ---------------do .... I02 101 101 101 100 99 98
Charge account sale debt* _____________ do .... --------- I, 783 l, 709 1,624 1,680 1,660 1,575 I,466 Open credit cash debt* ----------------do •..• ---- 1, 200 1,197 1,187 I,lSO l,I66 1,I45 1,119 Service debt• _-------------------------do .••. ---- r 608 '6I2 r 6I4 r 616 '6I7 '62I '623
Indexes of total consumer short-term debt, end of month·*
Unadjusted._. ------------------1935-39= 100 --------- 158 I5I 145 142 138 132 I25 Adjusted .. ----------------------------do ...• --------- I 53 151 I47 144 I39 132 125
INDUSTRIAL AND COMMERCIAL FAILURES
Grand totaL_ ------------------------number __ 506 898 962 9I6 1,048 938 955 804 Commercial service, total •••••••••••••• do •••. 22 62 53 59 48 38 42 48 Constmctlon, totaJ _____________________ do .••. 47 63 65 57 77 65 63 67 Manufacturi~ and mini~, total. _____ do .••. 86 146 I 59 141 188 146 134 135
Mining (co , o~ misce aneous) ••••. do •••• 2 4 4 6 6 4 7 I Chemicals and !led products •••••••• do .••. 3 11 6 8 4 8 5 4 Food and kindred products __________ do ..•. 11 26 39 31 4.3 36 17 23 Iron and steel products _______________ do .••• 4 4 5 5 7 4 3 5 Leather and leather products •••••..•• do ..•• 3 6 5 6 8 5 4 6 Lumber and products ________________ do •.•• 11 12 11 I3 25 15 20 18 Machinery ••• ____ .• __ .---- __ •••••••.. do .••• 4 5 3 8 10 2 5 11 Paper, printin'if and publlshing ••.... do .••• I2 14 13 16 24 18 20 18 Stone, clay, an gi8SS products •.•.••• do ..•• 4 3 I 2 4 3 3 7 Textlle-mUJ roroducts and appareL ••• do ..•. 19 42 44 24 36 29 20 23 Transflortat on equipment ___________ do .••. 3 1 3 2 3 3 5 2 Misce laneous ••••. -------------------do ..•. IO 19 25 23 I8 19 26 I7 Retail trade, totaJ.. ____________________ do •••• 307 MO 604 589 650 624 647 486
Wholesale trade, totaL •••••••.•.••.••.. do .••. 44 87 81 7Q 85 65 69 68
Liabilities, faand totaL ..•..•.•.. thous. of doL 6,950 13,469 9,9I6 9,631 12,011 9,282 9,839 9,906 Commerc al service, totaL .•••••••••••• do •.•• 526 863 589 927 I,I94 335 471 673 Construction, totaJ. ____________________ do ..•• I, I89 1,161 85I 920 896 1,033 1,175 945 Manufacturing and mini~ totaL •••••• do •• __ 1, 997 5,65I 3,550 2,525 3, 739 2,953 2,924 3,327
Mining (coal, o~ misoe aneous) ••••• do •.•• 7 577 184 182 299 48 234 222 Chemicals and !led products ••••••• do •.•• 12 254 200 73 22 156 49 118 Food and kindred products ••••••••... do •••• I95 547 1,378 470 1,102 936 622 632 Iron and steel and products ••••••.••. do .••. I20 553 173 116 166 64 96 • 99 Leather and leather products •••• _____ do •.•. 40 169 99 119 204 53 6\l 63 Lumber and products •••...•••••••••• do •••. 272 238 176 4!i6 390 263 246 829 Machinery------------------- ________ do •.•. 288 780 51 66 19I .58 63 300 Paper, prlntln'if and publlshing ______ do •••. 77 206 70 214 493 429 562 403 Stone, clay, an glass products ••••••. do •••. 49 81 4 33 124 98 39 124 Textile-mill products and appareL ••• do •••• 2I6 877 616 319 427 3I6 623 180 Transportation equlpment ••••••••.•• do •.•. 525 2 100 22 25 204 48 78 Miscellaneous .• _ .•• _ ••••..•••• __ • ___ • do •••. I96 1,377 500 455 296 328 274 279
Retall trade, total----------------------do •• __ 2,392 4,323 3,641 4,232 4. 813 3,829 4, 392 3, 752 Wholesale trade, total ••••••••••••••••.• do •••• 846 1,471 1.285 1,027 1,369 l,I32 877 I,209
LIFE INSURANCE
AssoCiation of Life Insurance Presidents: Assets, admitted, total: .• ________ mil. of doL. --------- 26,662 26,817 26,928 27,080 27,209 27,341 27,462
Mortgage loans, totaL ________________ do •••• 5,012 5,023 5,047 5,071 5,105 5, I34 5,164 Farm •••• ----------- ••••••.••..•••.. do •••• 675 671 672 673 68I 684 685 Other.-·------------- ••.•...••••.•. do •.•. --------- 4,337 4, 352 4, 375 4,398 4,424 4,450 4,479
Real-estate holdings ••••••.• -------- .. do .• __ --------- 1,488 I.483 1,474 1,452 1,436 I, 423 1, 410 Polley loans and premium notes. __ .• do .•.. 2,255 2, 241 2,228 2,216 2,002 2,188 2,176 Bonds and stocks held (book value), total
16,641 16,706 16,944 17,431 mil. of doL 16,528 16,754 17,391 Gov't. (domestic and foreign), totaJ_do •••• --------- 7, 743 7,613 7,816 7,830 8,014 8,453 8,453
U. S. Government. --------------do •••• 5,908 5, 779 6,981 5, 983 6,156 6, 595 6,592 Public utility •• _______________ • ____ do •••. --------- 4,255 4, 309 4,304 4, 35I 4,36\l 4, 378 4,396 Railroad ••••• -------····· •. ________ do •••. 2,682 2,687 2,680 2,671 2,659 2,650 2,630 Other---- •..•.• ---- __ •••.. --- •••••• do •••. --------- I,961 1, 919 I,906 1,902 I,902_ 1,910 1,952
Cash.------------------ .• ____________ do .••. --------- 681 955 884 986 921 597 712 Other admitted assets ________________ do •••• --------- 585 587 589 601 601 608 569
r Revised. t36 companiQS having 82 percent of the total assets of all United States legal reserve companies •
'7,098 r 6, 757
2,254 2,032 1,010 874
300 277 475 449 202 I83
71 67 196 182
1, 789 1, 716 521 491
I73 166 18 I6 24 23
253 246 34 33 42 40
48I 466 63 60 75 75
264 252 97 95
1,322 I, 285 r 1,108 1,098
r 625 '626
118 112 119 114
764 698 52 47 63 66
120 119 5 5 5 5
I9 23 8 5 3 4
11 10 5 8
20 I2 5 5
24 20 I 2
14 20 465 405
64 61
8, 548 6, 781 9I5 538 584 520
2,078 2,249 85 237
177 33 265 42I 161 76 IS 50
19I 207 156 I63 224 341' 129 53 486 262
9 22 I77 384
3,950 2,475 1,021 999
27,598 27,725 5,I94 5,2I2
688 687 4, 506 4,525 1,400 I,392 2,I58 2,144
I7, 4I5 17,843 8,443 8,888 6, 587 7,093 4,405 4,409 2,623 2,616 1,944 1,930
876 r 574 555 560
r 6,564
I,871 777
262 428 169 63
172 1, 642
460
I60 16 22
236 31 4I
452 60 74
240 94
r 1,332 1,09I •628
109 •110
556 27 54 77 5 4 5 2 2
10 5
11 5
15 0
I3 355 43
5,473 268 646
1,66I 519 28 90 17 29
217 131 110 100 280
0 140
2,276 622
27,909 5,220
685 4, 535 I,382 2,I29
17,905 8,908 7,I32 4,444 2,597 1, 9!i6
690 583 '
f' 6,33 0 6, I04
r 1, 70 I 1. 585 66 0 583
'2 54 250 r 408 392 rt 54 I42 •6 I 6I I 64 157
1,55 1 1, 482 42 1 393
I5 2 145 1 4 '14 2 2 '2I
22 4 '211 3 0 '25 4 4 36
43 7 ,. 428 5 9 '59 7 4 '68
22 7 214 9 2 p 90
1, 3 65 I, 330 I,08 4 • 1, 075
29 632 r 6•
10 5 101 IO 5 101
67 3 585 4 0 27 6 1 63
10 2 98 0 4 7 5
1 7 IO I 5 3 2 9 IE 7 2
I 3 16 3 3
20 16 4 2
I 8 I5 40 5 352 6 5 45
7,18 52
I 5, 245 5 267
75 6 717 4 1, 823 2,37 0 198
14 6 64 35 2 I76
7 297 2 I 49 8 I 1~5 9 I2 6
5 80 132 1 25 62 6 28 467 I7 0 I7 I9 5 I64
2,66 0 2, 009 86 6 429
28,08 3 28, 236 5,
68 225 5, 230
0 675 5 "· 555 4,54 0 1, 356 1, 37
2,11 0 2, 092
17,90 8, 93 7, 4,43 2,58
4 17,882 8 8, 929
204 7,I96 4 4, 432 1 2, 566
I, 95 8
I 1, 955 68 1, 074
60 4 602
. § Revisions in 194I data for credit unions are shown on p. S-15 of the January I943 Survey. · *New series. Earlier figures and description of tb.e data appear on pp. 9-25 of the November I942 Survey. Subsequent revisions in 1941 data not shown above areas fol
lows (millions of dollars): Total short-term debt-Jan., 8,568; Feb., 8,525; Mar., 8,641; Apr., 8,951; May, 9,256; June, 9,496; July, 9,552; Aug., 9,703; Sept., 9,718; Oct., 9,597; Nov., 9,445. Total cash loan debt-Jan., 1,999; Feb., 2,014; Mar., 2,038; Apr., 2,105; May, 2,I57; June, 2,203; July, 2,235; Aug., 2,256; Sept., 2,233; Oct., 2,210; Nov., 2,185. Commercilll banks, debt-July, 743; Aug., 748; Sept., 727; Oct., 712; Nov., 221. Indexes, unadjusted-Jan.,l42; Feb., I42; Mar., 143; Apr., I49; May,I54; June,I58; July, 159; Au~.1 161; Sept.,161; Oct., 159; Nov.,157. Indexes, adjusted-Jan., 143; Feb., 145; Mar., 147; Apr., 150; May, I53; June, 156; July, 158; Aug., 16I; Sept., 16I; Oct., 159. Minor reviSions In service debt are available upon request.

.S-16 SURVEY OF CURRENT BUSINESS February 1943
Monthly statistics through December 1941, to-,194211941 I 1942 gether with explanatory notes and references ------
Janu- I Febru·l March I I I I I August I te~~~r I Octo· INovem-to the sources of the data, may be found in the Decem- Decem· April May June July 1942 Supplement to the Survey ber ber ary ary ber ber
FIN ANCF..-Continued
LIFE INSURANCE-Continued
Association of Life Insurance Presidents-Con. insurance written:®
Policies and certificates, totaJ number 1,193 677 721 705 710 630 592 594 thousands .. 679 770 724 679 628
Group ••••••••.••....•••...•••••••• do .••• 165 246 33 32 55 68 48 87 66 42 55 46 72 IndustriaL •••.•••.•••.•.•••.•••••. do ..•. 315 598 404 418 456 454 461 425 366 364 356 428 358 Ordinary ..••.•••••••••••••••••••••• do .... 200 349 334 227 213 200 196 198 199 186 184 204 197
VaJue, totaL ..•••••••••••.•. thous. of doL 811,710 1,141,316 955,414 652,434 657,327 632, t\47 589,564 657,597 631,391 529,525 527,168 582,688 577,536
&r3~fti-iac:::::::::::::::::::::::a~:::: 317,372 298,817 49,07G 50,231 97,826 124,823 87,773 161,061 151,343 83,304 84,799 78,094 114, 180 97,863 186,190 119,820 126,492 140,735 139,021 141,378 129,863 112,917 112,240 111,795 135,727 111,801
Ordinary •.•• ---------- •••••••••••. do ..•• 396,475 656,309 786,518 475,711 418,766 368,503 360,413 366,673 367, 131 333,981 330,574 368,867 351, 555 Premium collections, totaJ® .•••••.•••• do ..•. 414,137 295,827 272,778 291,538 276,007 270,516 277,578 278,011 247,852 253,735 262,368 260,427
Annuities •.••••••••••••.••••••••.•.•• do •••. 90,148 38,921 25,378 24, 130 23,113 25,363 25,654 30,999 18,935 20,092 21,753 22,128 Group ••••.•••.••••••••••.•.••••.•.•• do_ .•• --------- 24,757 17,842 15,040 18,789 14,968 14, 496 15,783 16,297 14,291 15,382 16,073 16,857 IndustriaJ ••••••••.••.•••••••.• _ •••••. do ..•. 84,397 61,281 57,578 64,257 66,272 59, 133 64,014 56,368 58,855 58,805 56,836 58,539 Ordinary •••••••..•.••••.•••••••••••. do •••. --------- 214,835 177,783 174,782 184,362 171,654 171,524 172,127 174,347 155,771 159,456 167,706 162, 903
Institute of Life Insurance:• Payments to policyholders and beneficiaries,
239,681 215,949 186,505 222,927 227,512 188,894 203,882 204,396 165,866 189,326 totaL ...........•.......•.. thous. of doL --------- 176, 104 176,247 Death claim payments ••••••••••..... do .... --------- 91,949 87,464 74,057 92,558 92,409 75,533 80,702 89,707 71,785 76,726 84, 114 80, 109 Matured endowments •.•••..••.•..•.. do .... 20,470 24,427 21,061 23,931 23,404 21,644 22,478 20,444 17,449 20,283 22,464 22,132 Disability payments .•.•.••.•...•.•.. do .... --------- 10,604 8,878 7, 581 8,489 7, 943 7,600 8,823 8, 360 7, 930 7,021 8,053 7,218 Annuity payments .•.•....•..•.•••••• do .... 12,365 16,367 12,664 13,759 13,694 12,727 14, 173 14,549 10,607 12,978 13,968 12, 763 Dividends ...• _______ ...•.•.•...•.•.. do .... 56,601 40,419 34,286 38,891 46,647 31, 187 37,221 32,252 24,851 27,510 27,258 25,880 Surrender values, premium notes, etc. do .•.. --------- 47,692 38,394 36,856 45, 299 43,415 40,203 40,485 39,084 33,244 31,586 33,469 28,145
Lite Insurance Sales Research Bureau: Insurance written, ordinary, totaL •.••• do •••. 521,524 879,492 1,001,653 634,538 552,044 462,761 457,926 463,325 459,499 430,297 432,679 467,814 447,749
New England •.•••.•.•.••.•..•.•••••• do •••. 36,426 66,292 83,056 51,310 42,030 37,131 36,248 37,029 37,051 34,983 33,590 37,408 34,767 Middle Atlantlo ....••••••••.•••••••• do ..•. 143,961 251,633 309,292 175,355 138,708 118,591 114, 230 117,577 115,844 100,695 101,125 118,351 119,590 East North CentraL ••••••••.••.•••. do •••. 114,554 196,569 220,739 141,939 126,330 106,487 106,445 106,796 105,599 97,929 96,148 106,057 100,774 West North CentraJ ••••••....•••.••. do .••. 52,563 79,864 87,332 60,218 53,182 44,931 48,833 47,660 46,746 44,693 45,203 47,518 44,357 South Atlantlc ••...••••••.•••.••.•.•• do •••• 50,307 90,218 91,272 60,754 52,173 45,968 44,679 44,407 44,696 44,285 46,426 47,720 45,188 East South Central. ••••••••••••••••. do •••. 20,220 34,154 38,273 24,742 24,960 18,950 17,758 19,182 18,549 17, 515 18,413 18,867 17,410 West Sooth CentraJ ••••.•••••.•••••.• do •••• 38, 142 64,976 67,602 44,577 46, 534 32,604 31,825 32,247 32,199 32,785 35,445 32,234 30,565 Mountain •••••••.•••.•.•••••••.• _ •••• do •.•. 16,069 20,480 21,694 15,345 14,533 11,998 12,188 12,288 13, 165 12,123 12,390 13,059 12,703 Pacific .•••••.•••.•••••••••••••.•.•••. do .••. 49,282 75,306 82,393 60,298 53,594 46,101 45,720 46,139 45,650 45,289 43,939 46,600 42,395.
Lapse rates .•.•.•.•••••••••••.•• 1925-26-100 •• -·------- 87 --------- --------- --------- --------- --------- 80 --------- --------- ---------.., ________
--------MONETARY STATISTICS
Foreign exchange rates: .298 .298 .298 .298 .298 .298 .298 .298 .298 .298 Argentlna ..••••••••••••• dol. per paper y,eso •. . 298 .298 .298
Brazil, oflielaJ ••••••••••••••• dol. per ml rels •• .061 .061 .061 .061 .061 .061 .061 .061 .061 .061 .061 .061 .061 British India .•.•••••••••••••. dol. per rupee •• .301 .301 .301 .301 .301 .301 . 301 .301 .301 .301 . 301 . 301 . 301 Canada, free rate ....•• dol. per Canadian doL. .879 .874 .878 .884 .877 .872 .886 .900 .899 .895 .878 .876 . 881 Colombla ...•..••••••••••••.••. dol. per peso •. .572 .5711 .570 .570 .570 .570 . 57() .570 .571 .572 . 571 . 570 .570 Mexico_.-·------·····- __ .•.••••••.•• do •••.•. .206 .206 .206 .206 .206 .206 .206 .206 .206 .206 .206 .206 .206
a!I3:ted Kingdom, free rate ........ dol. per£ .. 4.035 4.035 4.035 4.035 4.035 4.035 4. 035 4.035 4.035 4.035 4.035 4.035 4.035
Monetary stock, U. S .••••••••••• mil. of doL. 22,726 22,737 22,747 22,705 22,687 22,691 22,714 22,737 22,744 22,756 22, 754 22,740 22,743 Movement, foreign:
-65,525 -20,068 -14.792 -27,759 -56,440 Net release from earmark• ••• thous. of doL -30,974 -99,705 -38,506 -109,277 -38,196 -24,383 -21,763 -10,752 Production, estimated world total, outside
105,035 104,370 90,335 100,485 (1) U.S. S. R ••.•••••.•••••••• thons. of doL -·so:ooa· ·,;78;454" ">82;858" ---------Reported monthly, totaJ; •••••••••••• do •••• --------- 88,884 88,598 75,653 85,031 79,926 • 77,553 • 76,949 • 77,431 • 70,696 Africa .•••••••••••••••••••••••••••• do •••• 47,328 47,533 44,462 47,518 46,366 47,347 •46,666 • 47,461 '46,053 •45, (144 • 45,459 • 43,580 Canada .••••••••••.•.•••••••••••••• do •••• --------- 14,746 14, 198 13,147 15,372 14,728 14,881 14,852 14,864 14, 100 '13, 212 13,365 12,693 United ·states •••••••.••••••••••••• .do •••• --------- 16,761 14,982 10,034 10,959 11.058 10,807 10,147 12,396 9,806 11,479 11,656 7,471
Currency in circulation, totaJ ..•••.. mil. of doL 15, 412 11, 160 11, 175 11,485 11,566 ]], 767 12,074 12,383 12,739 13,200 13,703 14,210 14,805 Silver:
Price at New York ........•.. dol. per fine oz .. .448 . 351 Production:
. 351 . 351 .351 . 351 . 351 . 351 • 351 . 351 .448 .448 .448
Canada ........•.......... thous. of fine oz .. --------- 1, 722 1, 538 1,478 1, 606 1, 613 1,624 1, 537 1, 966 I, 505 1, 758 1,870 United States •..• ___________ .. _____ .. do .... --------- 5, 661 4,844 4, 470 5,285 5,606 4,948 4,528 5,048 4,412 4, 561 3,819 3, 292 Stocks, refinery, end of month:
3, ll)!t 2, 922 United States .•.•...... ------------- .do •..• --•------ 1. 947 4, 382 3, 224 2,930 3, 270 2, 685 3, 744 4, 510 3,505 3,128
BUSINESS INCORPORATIONS New incorporations (4 States) .•.••••.• number .• 939 1, 414 1, 353 1, 172 1, 279 1,194 1,094 889 889 832 818 890 784
PROFITS AND DIVIDENDS lndustrlaJ corporations {FederaJ Reserve):
Net profits, totaJ {629 cos.) .••. _ .. mil. of doL_ --------- 550 --------- --------- 423 --------- --------- 369 460 --------- --------Iron and steel (47 cos.). ______________ do .... 72 --------- --------- 52 --------- --------- 52 --------- ---- 50 --------- --------Machinery (69 cos.) •..•............. .do .... 55 --------- --------- 38 --------- --------- 35 --------- ---- 38 ---------- ------Automobiles (15 cos.) ________________ do .... 61 --------- --------- 46 --------- --------- 25 --------- --------- 46 --------- --------Other transportation equip. (68cos.) .. do .... --------- 62 --------- --------- '55 --------- --------- t 53 --------- --------- 2 61 Nonferrous metals and prod. (77 cos.).do .... 40 --------- --------- 36 --------- --------- 32 --------- --------- 34 Other durable goods (75 cos.) •........ do .... 32 --------- --------- 19 --------- --------- 18 --------- ------·-- 21 Foods, beverages, and tobacco (49cos.).do. ___ 37 --------- --------- 32 --------- --------- 32 --------- --------- 41 ··---------Oil producing and refining (45 cos.) •. do .... 46 --------- --------- 35 --------- --------- 27 --------- --------- 41 --------- ---Industrial chemicals {30 cos.) .....•••. do .... 52 --------- --------- 39 --------- --------- 35 --------- --------- 43 --------- ---Other nondurable goods (80 cos.) ....• do .... 46 --------- --------- 39 --------- --------- 27 --------- --------- 32 ------- ---Miscellaneous services (74 cos.) ....... do .... 48 --------- --------- 32 --------- --------- 34 --------- --------- 52 --------- ----Profits and dividends (152 cos.) :• Net profits .. -------------------------do. ___ 276 --------- --------- 204 --------- --------· 174 215 --------- --------Dividends:
Preferred ..•••••.•• __ ._ .. ____ . ___ .•. do_ •. _ --------- 24 --------- --------- 21 23 --------- --------- 21 --------- -----Common_ ..•.• ___ • ___ .... _______ .. do_ .. _ ------ 221 134 136 --------- --------- 127 ---·----- -----Electric power companies, net income (28 cos.) (Federal Reserve)• _______________ mil. of doL --------- 34 33 --------- --------· 25 --------- --------- 28 --------- -----Railways, class I, net income (Interstate Com-merce Commlssion) .....•.....••. mil. of doL. 138.4 --------- --------- 96.7 --------- --------- 199.2 --------- --------- 284.1 --------- -------Telephones, net operating Income (Federal Communlr.ations Commission) .•. mil. of doL 72.3 ---- ~---- --------- 64.1 --------- --------- 66.0 --------- --------- 66.8 --------- --------
'Revised. ' Preliminary. 1 Discontinued by compiling source. 2 Partly estimated. • Or increase in earmarked gold (-). ® 39 companies having 81 percent of the totaJ life Insurance outstanding in all United States legal reserve companies. fMexico not included beginning April1942 as data are not available. Figures for Mexico included for earlier months are as follows (thousands of dollars): 1941-December
1,832; 1942-January, 3,790; February, 563; March, 3,457. •New series. The series on payments to /solicyholders and beneficiaries, compiled by the Institute of Life Insurance, represents total payments in the United States in-
eluding payments by Canadian companies; ata are based on reports covering 90 to 95 percent of the total and are adjusted to allow for companies not reporting; data De· ginning September 1941 are available in the November 1942 Survey; earlier data will be shown In a subsequent issue. For data beginning 1929 for profits and dividends for 152 companies, seep. 21, table 10, of the April 1942 Survey. Earlier data for net income of electric power companies will be published in a subsequent Issue.
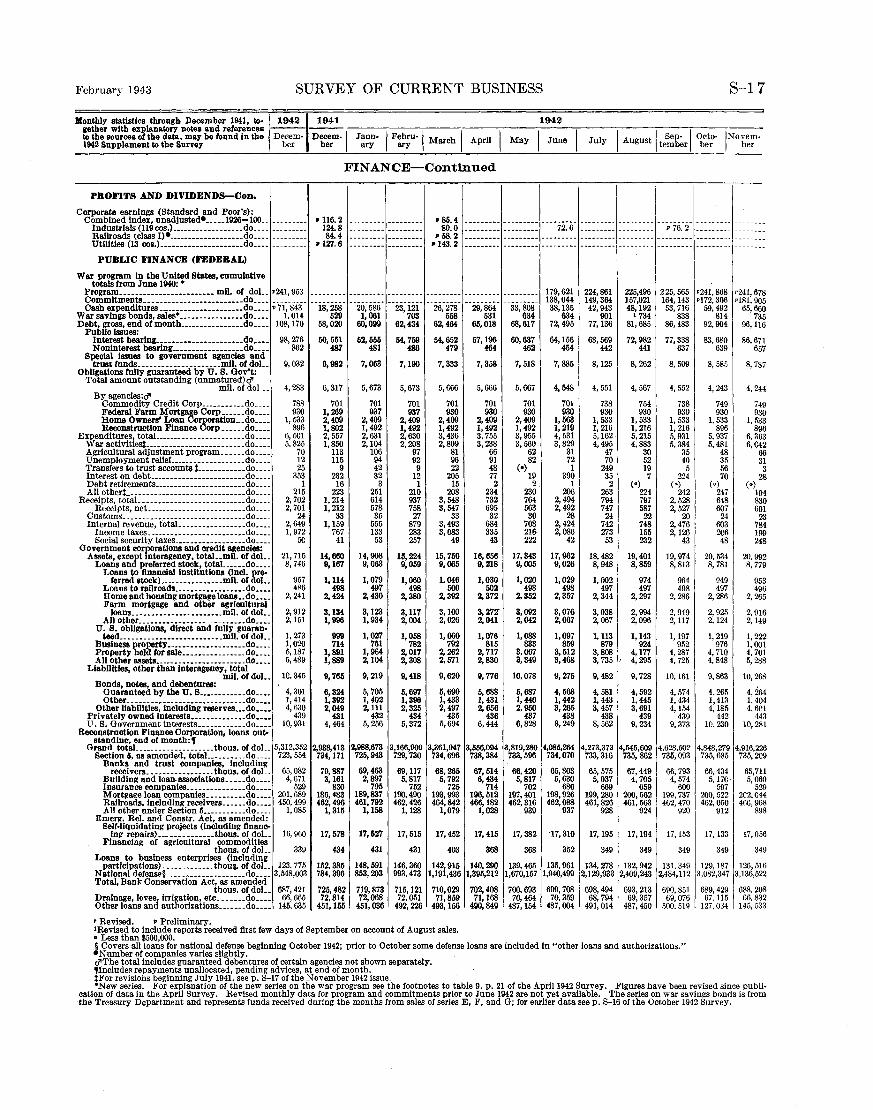
February 1943 SURVEY OF CURRENT BUSINESS S-17
gether with explanatory notes and references ------ ----,----,-----,----,----..----;----.----;----;----;---Monthly statistics through December 1941, to-~194211941 I 1942
lothesourcesofthedata,ma;vbefoundinthe Decem- Decem- Janu-,Febru·jMarchl April! May I June I July IAugustl Sep-,Octo-,Novem· 1942 Supplement to the Surve:v ber ber ary ary tember ber ber
FINANCE-Continued
PROFITS AND DIVIDENDs-Con.
Corporate earnings (Standard and Poor's): Combined index, unadjusted• ..... 1926-10(L --------- • 116.2 --------- --------- •85.4
Industrials (119 cos.)------------ ______ do •. __ 124.8 --------- --------- 80.0 Railroads (class I)•-------------------do .... 84.4 --------- --------- • 58.2 Utllltles (13 cos.) _____________________ do ____
------ •127. 6 --------- --------- •143. 2
PUBLIC FINANCE CI'EDEBAL)
War program In the United States, cumulative totals from June 1940: •
Program·----------------------- mil. of dol.. Commitments .. ____ ---- _________ ---- __ .do ___ • •241, 953 --------- --------- --------- ---------
Cash expenditures ----------------------do ____ • 71, 843 18,258 20,586 23,121 26,278 War savings bonds, aaJes•----------------do .... 1,014 529 1,061 703 558 Debt, gross, end of month ________________ do ____ 108,170 58,020
Public issues: 60,099 62,434 62,464
Interest bearing_. __ -- __ ---_. __ ----- •• do.--- 98,276 50,551 52,555 54,759 54,652 N onlnterest bearing ••• ________ --- __ •• do ____ 862 487 481 486 479
Special Issues to government agencies and trust funds _____________________ mil. of doL 9,032 6,982 7,063 7,190 7,333 Obligations fully guaranteed by U.S. Oov't:
Total amount outstanding (unmatured) a" mil. of dol __ 4, 283 6,317 5,673 5,673 5,666
By agencies:o" Commodity Credit Corp ___________ do ____ 788 701 701 701 701 Federal Farm Mortgage Corp ______ do ____ 930 1,269 937 937 930 Home Owners' Loan Co~ratlon ... do ____ 1, 533 2,409 2,409 2,409 2,409 Reconstruction Finance orp ______ do ____ 896 1,802 1,492 1,492 1,492
Expenditures, total ________________ . ______ do. ___ 6, 5C1 2, 557 2,631 2,630 3,436 War activlties~-------------------------do .... 5,825 1,850 2,104 2,208 2,809 Agricultural adjustment program ____ .. do ____ 70 113 106 97 81 Unemployment relieL _________________ do .... 12 115 94 92 96 Transfers to trust accounts ~------------do ____ 25 9 42 9 22 Interest on debt. .. _____________________ do .... 353 232 32 12 205 Debt retirements _______________________ do .... 1 16 3 1 15 All otherL-----------------------------do .... 215 223 251 210 208
Receipts, totaL __________________________ do ____ 2, 702 1,214 614 937 3,548 Receipts, net. ........................ do .... 2, 701 1,212 578 758 3,547 Customs _______________________________ do ___ , 24 33 35 27 33
Internal revenue, total _________________ do .... 2,649 1,159 555 879 3,493 Income taxes. ________ ------- _____ .... do ____ 1, 972 767 133 283 3,083 Social security taxes __________________ do ____ 5() 41 53 257 49
Government corporations and credit agencies: 21,715 Assets, exc1t Interagency, total .. mil. of dol.. 14,660 14,908 15,224 15,750
Loans an preferred stock, totaL .... do .... 8, 746 9,167 9,063 9,059 9,065 Loans to financial Institutions (Incl. pre-
1,079 ferred stock) ________________ mil. of doL 957 1,114 1,060 1,046 Loans to rallroads __________________ do ____ 486 498 497 498 500 Home and housing mortgage loans __ do ____ 2, 241 2,424 2, 430 2,380 2,392 Farm mortgage and other agricultural
3,123 loans _______________________ mil. of doL. 2, 912 3,134 3,117 3,100 All other _________________ .. __ ...... do ____ 2,151 1,996 1,934 2,004 2,026
U. S. obligations, diract and fuUy guaran· 1,027 teed __________________________ mil. of doL. 1, 273 999 1,058 1,060
Business property---------------- ____ do ____ 1,020 714 751 782 792 Property held for aaJe ________________ do ____ 5,187 1,891 1,964 2,017 2,262 All other assets _______________________ do .... 5,489 1,889 2,104 2,308 2,571
Llablllties, other than Interagency, total 10.345 9,219 9,620 mil. of doL 9, 765 9,418
Bonds, notes, and debentures: Guaranteed by the U. s ____________ do .... 4,301 6,324 5, 705 5,697 5,690 Other_ .. __ . _____ . ____ • ___________ .• do ____ 1,414 1,392 1,402 1,396 1,433
Other liabilities, Including reserves ••• do ____ 4, 630 2,049 2,111 2,325 2,497 Privately owned lnterests ______________ do ____ 439 431 432 434 435 U.S. Government interests ____________ do ____ 10,931 4,464 5,256 5,372 5,694
Reconstruction Finance Corporation, loans out-stand in!!', end of month: f
5,312,352 2,988,673 Orand total ____________________ tbous. or doL 2,938,413 3,166,909 3,361,947 Section 5, as amended, totaL _________ do ____ 723,554 734,171 725,943 729,730 734,696
Banks and trust companies, Including 69,463 receivers. ________________ thous. or doL 65,082 79,887 69,117 68,265
Bulldln~~: and loan.assoclatlons ••••• do .... 4, 671 3,161 2,897 5,817 5, 792 Insurance companies._._. ________ •. do. ___ 529 830 795 752 725 Mortgage loan companies .......... do .... 201,689 186,483 189,837 190,490 193,993 Railroads. including receivers ______ do .... 450,499 462,496 461,792 462,426 464,842 All other under Section 5 ___________ do .... 1, 085 1, 315 1,158 1,128 1,079
EmeJ1?. Rei. and Constr. Act, as amended: Self-liquidating projects (Including ftnanc-
lng repairs) ______________ thous. or doL 16,960 17,578 17,527 17,515 17,452 Financing of agricultural commodities
431 thous. or doL 339 434 431 403 Loans to business enterprises (including
participations). ____________ thou!!- of doL 123. 775 152,385 148,591 146,360 142,915 National defense§ __ .. ________________ do .... 3,548,003 784,396 853,203 993,473 1,191,436 Total, Bank Conservation Act, as amended
thous. or doL 687,421 725,482 719,873 715,121 710,029
8~~~~~~n~e:~~ :~t~~\~~ti~~s_'_~::::~~:::: 66,665 72,814 72,068 72,051 71,859 145,635 451,155 451,036 492,226 493, 156
• Revised. • Preliminary. 'Revised to include reports received first few days of September on account of August sales. • Less than $500,000.
------------------------------------
---------29,864
531 611,018
57,196 464
7,358
5,666
701 930
2,409 1,492 3, 755 3,238
66 91 48 77 2
234 732 695 32
684 335
43
16,656 9,218
1,030 502
2,372
3,272' 2, 041
1,076 815
2, 717 2,830
9, 776
5,688 1, 431 2,656
436 6,444
3,556,094 738,384
67,514 6,434
714 196,512 466,182
1,028
17,415
368
140,290 1,395,212
702,408 71,168
490,849
--------- ------------------ 72.6 ------------------ --------- ------------------ --------- ---------
--------- 179,621 224,861 138,044 149,364
33, 80S 38,135 42,943 634 634 901
68,617 72,495 77, 136
60,637 64,156 68,569 462 454 442
7, 518 7,885 8,125
5,667 4,548 4, 551
701 701 738 930 930 930
2,409 1, 563 1, 533 1,492 1,219 1, 216 3,955 4, 531 5,162 3,560 3,829 4,495
62 31 47 82 72 70
(•) 1 249 19 390 35 2 1 2
230 206 263 764 2,494 794 563 2,492 747 30 28 24
708 2,424 742 216 2,086 273 222 42 53
17,343 17,962 18,482 9,005 9,026 8,948
1,020 1,029 1,002 498 498 497
2,352 2,357 2, 344
3,002 3,076 3,038 2,042 2,067 2, 067
1,088 1,097 1,113 833 859 879
3,067 3,512 3,808 3,349 3,468 3, 735
10,078 9,275 9,482
5,687 4,568 4, 581 1,440 1,442 1, 443 2,950 3,265 3,457
437 438 438 6,828 8,249 8,562
3,819,280 4,085,264 4,273,373 733,596 734,070 733,316
66,420 65,803 65,575 5,817 5,630 5,037
702 686 669 197,401 198,926 199,280 462,316 462,088 461,826
939 937 928
17,382 '17, 310 17, 195
368 352 349
139.465 135,961 134.278 1,670,157 1,940,499 2,129,933
700.693 699,708 698,494 70,464 70,359 68,794
487,154 487,004 491, 014
----------------------------------·-
225,496 157,021 48,192
1734 81,685
72,982 441
8,262
4, 567
754 930
1, 533 1,216 5,215 4,883
30 52 19 7
(•) 224 797 587 22
748 155 232
19,401 8,859
974 497
2,297
2,994 2, 0!16
1,143 924
4,177 4,295
9, 728
4,592 1,445 3,691
439 9, 234
4,545,609 735, 862
67,449 4, 705
659 200,562 461,563
924
17,194
349
132,942 2,409,243
693,213 69,357
487,450
---.-76.-2- ------------------
--------- ------------------ ---------
225,565 •241, 868 164,143 •172, 306 53,716 59,492
838 814 86,483 92,904
77,338 83,680 637 639
8,509 8, 585
4, 552 4, 243
738 749 930 930
1,533 1, 533 1, 216 8!16 5,931 5. 937 5,384 5,481
35 48 40 35 5 56
224 70 (•) (•)
242 247 2,528 648 2, 527 607
20 24 2,476 603 2,126 2C6
43 48
19,974 20,534 8,813 8, 781
964 949 498 497
2,286 2, 286
2, 949 2, 925 2,117 2, 124
1,197 1, 219 952 976
4, 287 4, 710 4, 725 4,848
10, 161 9,863
4,574 4.265 1,434 1,413 4,154 4,185
439 442 9, 373 10.230
4,628,50? 4,848,279 735,093 735,685
66,793 66,434 4,574 5, 17C
600 597 199,737 200,522 462,470 462,050
920 912
17, 153 17, 133
349 349
131.349 129, 187
----------------------------
•241, 67 •181, 90
8 5 0 5 6
65,66 73
96,11
86,67 65
8, 78
4, 24 4
9 0 3
96
74 93
1, 53 8
6,36 6,C4
3 2
66 3
2 (•)
19 83 60
1 3 8
4 0 1
7 23 84 9 8
19 24
20.99 8, 77
95 49
2, 26
2,91 2,14
2 9
6 9
1,2 22 1 1
88
1,00 4, 70 5, 2
10,26
d 8
64 4 1 3 I
1, 40 4,6C
44 10,28
4,916, 226 9 735,20
65,71 1 0 9 4 8 8
5,06 52
2C2.C4 460,96
89
17,05
34
126,51 2,484.112 r·082.347 3,136.52
690, 851 689, 429 688. 2 69, 076 67. 115 66.83
.JOO. 519 127,034 145,53
08 2 3
§ Covers all loans for national defense beginning October 1942; prior to October some defense loans are included In "other loans and authorizations." •Number of companies varies slightly. cf'The total includes guaranteed debentures of certain agencies not shown separately. fincludes repayments unallocated, pending ad vices, at end of month. ~For revisiohs beginning July 1941, seep. S-17 of the November 1942 issue. •New series. For explanation of the new series on the war program see the footnotes to table 9, p. 21 of the April1942 Survey. Figures have been revised since publi
cation of data in the April Survey. Revised monthly data for program and commitments prior to June 1942 are not yet available. The series on war savings bonds is from ·the Treasury Department and represents funds received during the months from sales of series E, F, and G; for earlier data seep. S-16 or the October 1942 SurYey.

S-18 SURVEY OF CURRENT BUSINESS February 1943
1942 llonth17 statistics through December 1841, to-~1942 gether with explsnatoey notes and references to the sources of the data, may be found in the Decem-1842 Supplement to the Suney ber
1941 I D:m· J:;·l F~-~ March I April I May I June I July I August I Se~~~m-1 ob'et;>· I v~er
SECURITIES ISSUED
(Securltle• and E:rtllange Commiallon) t tlmated gross proceeds, total.. .•• mll. ot doL_ Es
B ~types of security: onds, notes, and debentures, totaL.do .... Corporate •...•.........•...••...•.. do ..•.
Preferred stock ••••.•..•..••.••••.•••. do .••. Common stock ••••••..••••••.••..••.• do ••.. y types of Issuers: Corporate, totaL .................... do .••.
B
IndustriaL ••••••••.•••.•••••••••.•• do •••. Public utility ----------------------do •••. RaiL •• ----------------------------do ...• Other------------------------ •••••• do •. __
Non-corporate. totaL •••••.••• ___ .••• do •.•. U. a. Government and agencles ..•• do •••. State and munlcipaL •.•••.••••••.. do •••. -Foreign Oovernment ••••••••••••••• do •••. Non-profit agencies ... ------- ....... do .. __
w corporate security Issues: stlmated net proceeds, totaL ......... do .••.
Ne E
Proposed uses of proceeds: New money, totaL ................. do ....
Plant and equipment. ........... do .... Working capltal ................. do ....
Repayment of debt and retirement of stock, total ............... mll. of dol..
Funded debt. ................... do •••• Other debt ....................... do •••• Preferred stock ................... do ....
Other purposes. .................... do .... Proposed uses of ~roceeds by major groups:
Industrial, tots net proceeds .• mll. of dol.. New money ..................... do .... Repayment of debt and retirement of
stock ..................... mil. of doL Public utility, total net proceeds ... do ....
New money ...................... do .... Repayment of debt and retirement of
stock ..................... mll. of doL Railroad, total net proceeds ........ do .••.
New money ...................... do ____ Repayment of debt and retirement of
stock ..................... mil. of doL Other corporate, total net proceeds.do ....
New money ..................... do .... Repayment of debt and retirement of
stock ..................... mll. of doL
(Commercial and Finantlal Chronicle)
uritles Issued, by type of securlth, total (new capital andrefundlng) ••••••. t ous. of <ioL
Sec
ew capital, totaL .................... do .... Domestic, totaL ..................... do ••••
Corporate, totaL ................... do .••• Federal agencies .................... do ____ Municipal, State, etc ______________ <lo ....
Foreign ...................... ______ .. do .... efundlng, totaL --·-------------------do .... Domestic, total ...................... do ....
N
R
CorPorate .......................... do .... Federal agencies .................... do .... Municipal, State, etc .............. do ____ Forelgn ______________________________ do ....
mestlc Issues for productive uses (Moody's): Do T otaL ............................. mil. of doL
Corporate ............................ do .•• Municipal, State, etc •.••.•••••••••.• do ....
(Bond Buver) te and municipal issues: ata
p ermanent (long term) ....••••• thous. of doL. T emporary (short term) ................ do .•••
COMMODITY MARKETS lume of trading In grain futures: Vo w c
heat ............................ mll. of bu •• om ................................... do ....
SECURITY MARKETS 8 rokers' Balances (N.Y. S. E. members
carrying mar~ln aceounts)f
stomers' debit balances (net) •.•. mil. of doL Cu Cas Mo Cus
h on hand and In banks .............. do .... ney borrowed •..••...•.•••••••••..••.. do .... tomers' free credit balances •••.•...••. do ....
Bonds ces: Prl
A verageprlceofallllsted bonds (N.Y. a. E.) dollars ..
Domestic ............................ _ do •••. Forelgn .••.•••••••••••••••••••••••..•. do .... • Revised. • Less than $500,000.
6,951 2,336
6,951 2,302 26 no 0 20 0 13
26 144 3 48
20 62 4 28 0 6
6,925 2,192 6,9C6 2,131
18 60 0 0
(•) (•)
26 142
8 57 7 36 1 21
17 79 13 52
(•) 17 4 10
(•) 6
3 46 2 25
1 16 19 62 3 3
17 58 4 28 4 28
0 0 0 6 0 (•)
0 5
144,808 •244, 942 36,696 '142, 346 36,696 •142, 346 10,621 '80,003 16,720 19,520 9, 355 42,823
0 0 108,113 102,596 108,113 102,596 64.829 59,062 34. 245 25,100 9,039 18,435
0 0
14 71 7 34 7 37
29, 190 90,578 45,144 99,988
224 294 125 89
543 600 160 211 378 368 270 289
96.70 94.50 98.04 96.69 66.11 66.27
FINANCE--Continued
1,345 2,335 709 708
1,290 2,315 693 701 110 58 86 115 37 19 1G 4 17 0 (•) 2
164 78 102 121 44 39 47 110
109 35 49 11 10 4 6 0
1 0 0 0 1,181 2,257 607 587 1,061 2, 216 558 631
118 41 49 66 0 0 0 0 2 (•) 1 0
161 76 100 us n 40 39 70 38 34 35 15 33 5 4 55
89 26 61 48 80 12 41 12
9 2 15 36 0 11 5 0
(•) 11 (•) (•)
43 38 46 107 43 11 25 59
(•) 16 21 48 107 34 48 11 18 25 8 11
89 10 40 0 10 4 6 0 10 4 6 0
0 0 0 0 1 0 0 0 1 0 0 0
0 0 0 0
'197, 359 •320, 240 '180, 282 •265, 603 '168, 053 •!23, 775 '109, 749 '158, 579 '168, 053 •123, 775 •!09, 749 •!58, 579 '72, 920 ' 56, 709 '79, 085 97, 114
11,175 36,890 8,860 9, 720 '83, 958 '30, 176 '21,804 r 51, 745
0 0 0 0 •!52, 187 56,508 '87, 610 •107, 025 •152,187 56,508 '87, 610 •107, 025
82,846 18,901 39,209 18,527 33,775 26,580 21,315 80.540
'3.1, 566 11,027 '27,085 '7, 958 0 0 0 0
137 47 78 50 67 33 58 10 70 14 20 40
51,235 61,308 118,470 46,564 I19, 070 38,277 183,744 113,745
253 140 178 249 154 77 Ill 148
547 534 631 515 219 203 195 195 308 307 306 300 274 262 249 247
95.24 95.13 95.97 95.63 97.31 97.18 97.98 97.54 58.45 57.40 58.95 60.29
2,965 809 3,099 2,068 2, 631 4, 975
2,952 792 3,099 2,066 2,519 4,973 113 126 52 - 87 50 15 10 9 0 2 9 3
3 7 (•) 0 3 (•)
126 142 53 89 62 18 104 63 47 19 16 6
21 70 3 68 45 3 0 9 2 2 1 9 1 1 0 0 0 0
2,839 666 3,046 1,979 2,469 4,958 2,809 634 2,998 1,932 2,444 4,919
30 32 47 47 24 38 0 0 0 0 0 0
(•) 0 1 0 1 0
124 139 52 88 60 17
59 72 14 39 23 2 27 57 11 33 s 2 33 15 3 6 15 1
64 66 37 37 29 15 11 55 29 34 26 15 53 5 8 3 1 0 0 5 ~=~ 0 2 (•) 1 2 12 8 0
102 61 46 18 15 5 49 51 9 4 14 2
53 (•) 8 37 3 3 21 69 3 68 44 3 10 17 2 34 7 (•)
11 51 1 34 28 2 0 9 2 2 1 9 0 3 2 2 1 c 0 6 0 0 0 9 1 1 0 0 0 0
(•) 1 0 0 0 0
(•) 0 0 0 .o 0
'181, 961 •201, 422 •142, 322 '161, 739 100,977 '115, 001 •129, 500 '96, 516 '40, 750 •103, 133 45,085 '28, 145 '129, 500 '96, 516 '40, 750 •103, 133 45,085 '28, 145 •!03, 842 76,827 27,510 58,600 28,446 2, 434
2, 715 2,060 2. 515 0 0 0 '22, 944 '17, 628 'lO, 725 '44, 533 16,639 ' 25, 711
0 0 0 0 0 0 52,461 '104, 906 '101, 572 '58, 606 55,893 86,856 52,461 •104, 906 '101, 572 '58, 606 55,393 86,856 5,807 61,686 32,719 6,018 30,437 43,846
38,800 28,455 32,260 49,925 18,400 30,645 7, 855 '14, 766 '36, 593 '2,663 6,556 12,365
0 0 0 0 500 0
35 66 28 26 7 26 20 55 18 17 4 1 Ill 11 10 9 3 25
28,759 36,723 48,096 60,862 28,811 36,036 59,916 75,400 133,630 53,672 203,704 79,815
226 267 390 257 261 190 126 145 104 141 85 81
502 496 491 490 500 510 177 180 172 -·------- -------- --------300 309 307 300 310 310 238 240 238 240 240 260
95.64 95.50 95.76 96.08 96.18 96.48 97.46 97.28 97.49 97.75 97.83 98.08 61.16 61.72 61.68 62.51 62.97 63.16
tFcr revised data for August-December 1941 seep. S-17 of the October 1942 Survey. Revisions for January-July 1941 are available upon request. fComplete reports are now collected semiannually; data shown for August-November 1942 are estimated on basis of reports for a small number of large firms
779
778 27 0
(•)
27 12 15 0 0
752 735
17 0 0
27
2 (•)
2
24 24
(•) (•) (•)
12 2
10 15
(•)
14 c 0
0 0 0
0
97,871 29,029 29,029 4, 679
17,12 7, 225
0 68,842 68,842
'13, 531 45,520 9, 792
0
5 2 3
'24, 188 '6,905
146 g4
520 --------
320 270
96.11 97.59 65.24
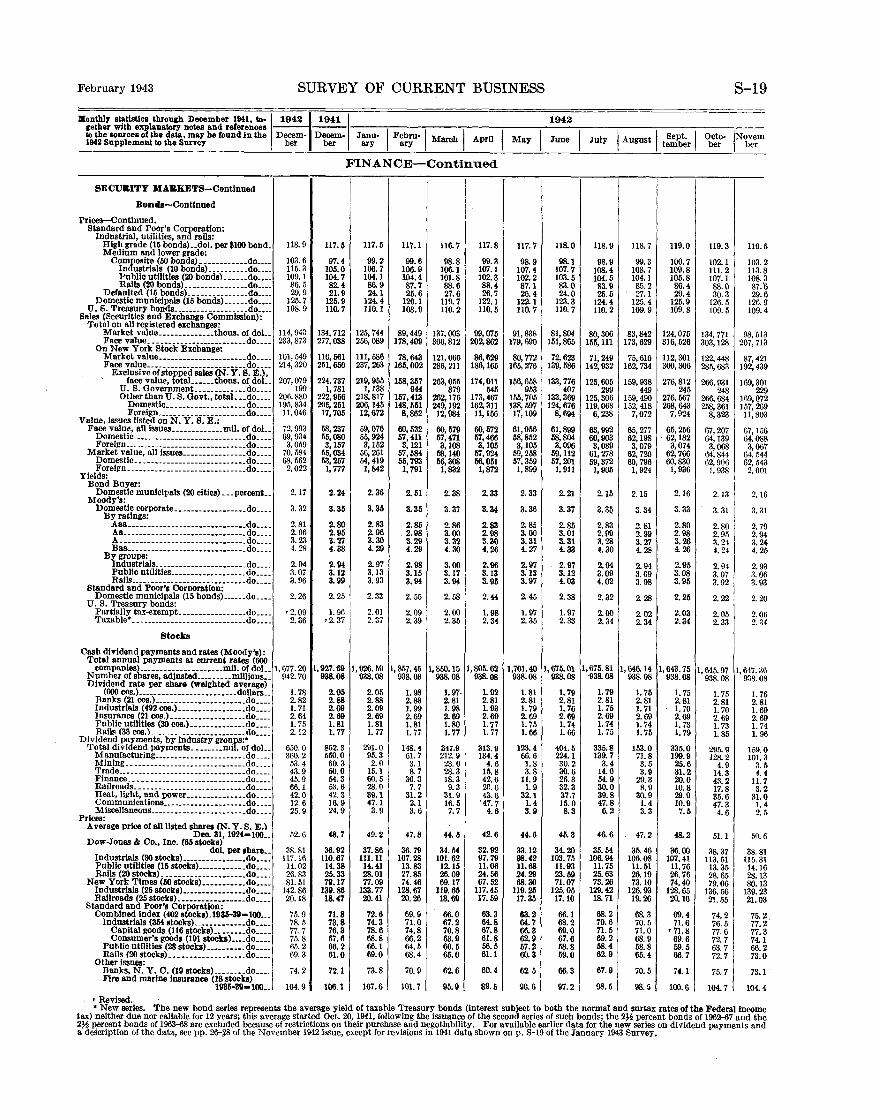
February 1943 SURVEY OF CURRENT BUSINESS
lllonthl;v statistics through December 1841, to-,1942 gether with explanatoey notes and references to the sources of the data, ma;v be found in the Decem-1842 Supplement to the Surve:r ber
SECURITY H.&RKET8-Contlnued
Bonds-Continued
Prices-Continued. Standard and Poor's Corporation:
Industrial, utilities, and mils: High grade (16 bonds) .• dol. per $100 bond. 118.9 Medium snd lower ~(fade:
Composite (60 bonds) ____________ do •••• 103.6 Industrials (10 bonds) __________ do •.•• 115.3 l'u blic utilities (20 bonds)_ • __ •• do .••• 109.1 Ralls (20 bonds>----------------do ..•• 86.5 Defaulted (15 bonds) _______________ do ____ 29.9
Domestic municipals (15 bonds) ______ do ____ 125.7 U.S. Tre88ury bonds-------------------do ____ 108.9
Sales (Securities and Exchange Commission): To tel on all registered exchanges:
Market value ______________ thous. or doL 114,943 Face value •• _ ----------------------do. ___ 233,873
On New York Stock Exchange: Market value ______________________ do •.•• 101,549 Face value ___________ -------- ______ do ____ 214,320
' Exclusive of stopped sales (N.Y. S. E.),
face value, totaL ••••. thous. of doL. 207,079 U.S. Govemment _____________ do ____ 199 Other than U.S. Govt., total ••. do ____ 206,880
Domestic. _______________ ---- do. ___ 195,834 Foreign ________ --------------do ..•. 11,046
Value, Issues listed on N.Y. S. E.: Face value, all lssues _____________ mil. of doL 72,993
Domestic·-------------------- ________ do. ___ 69,934 Foreign ____________________________ • __ do. ___ 3,059 Market value, alllssues ________________ do ____ 70,584 Domestic._------ ____ ---------------.do ____ 68,562 Foreign __________ ---------------- ____ do ____ 2,022
Yields: Bond Buyer:
Domestic municipals (20 cities) •.. percent •. 2.17 Moody's:
Domestic corporate._ ----------------do ____ 3. 32 By ratings:
Aaa ••• _____ •• ______ --- _ ---- ____ •• do. ___ 2.81 A a._----. __ --- ___________ .--- __ •• do. ___ 2. 96 A ________________ ---- __ ------ ____ do •.• _ 3.23 Baa •. __________ --- _______________ do. ___ 4.28
B fJ'cl~frT~Js. __________ ----- __ ----_do __ -- 2.94 Public utilities ___________________ do ____ 3.07 Rails ___________ ------------------do ____ 3.96
Standard and Poor's Comomtlon: Domestic municipals (15 bonds) .••... do ____ 2. 26
U.S. Treasury bonds: Partially tax-exempt_ ----------------do ____ • 2.09 Taxable* ___ -------_-------------- __ .. do ____ 2.36
Stocks
Cash di?idend payments and rates (Moody's): Total annual payments at current rates (600 companles) _____________________ m!J. or doL. 1, 677.20 Number or shares, adjusted _________ mi!Jions •• 942.70 Dividend rate per share (welihted average) (600 cos.) _________________________ dollars. _ 1. 78 Banks (21 cos.) _______________________ do ____ 2.82 Industrials (492 cos.) _________________ do ____ 1.71 Insurance (21 cos.) ___________________ do ____ 2.64
Public ut!J!t!es (30 cos.) ______________ do ____ 1. 75 Ran .. (36 cos.) .. ----------------do ____ 2. 12
Dividend paymentS; by Industry groups:• Total dividend payments ________ miJ. or doL. 650.0 Manufacturing _______________________ do ____ 360.2
Mining ________________ ------------ .. do. ___ 53.4 Trade .. ______________________________ do ____ 43.9
Finance _____ ----------- ____ ---------do ____ 45.9 Railroads. __ --------------· ----------do ____ 66.1 Heat, light, and power _______________ do ____ 42.0 Communications _____________________ do ____ 12.6 Miscellaneons ________________________ do ____ 25.9
Prices: Average price of all listed shares (N. Y. s. E.)
Dec. 31, 1924-100 •. 52.6 Dow-Jones & Co., Inc. (66 stocks)
dol. per share •• 38.81 Industrials (30 stocks) ________________ do ____ 117.16 Public ut!Jitles (15 stocks) ____________ do ____ 14.02 Ralls (20 stocks) ___ ------------------do ____ 26.83
New York Times (fiG stocks) ••••••••••• do ____ 81.51 Industrials (25 stocks) ________________ do ____ 142.86 Railroads (25 stocks) _________________ do ____ 20.18 Standard and Poor's Corporation:
Combined Index (402 stocks).1935-39-1()() ___ 75.9 Industrials (354 stocks) _____________ do •••. 78.5
Capital goods (116 stocks) ________ do ____ 77.7 Consumer's goods (191 stocks) •••. do ____ 75.8
Public ut!J!ties (28 stocks) __________ do ____ f>ii. 2 Ralls (20 stocksl-------------------do •.•. 69.3
Other Issues: Banks, N.Y. C. (19 stocks) ________ do ___ 74.2 Fire and marine !usurance (18 stocks)
1935-311-100 •. 104.9
• Revised.
1941 I Decem
ber
FINANCE-Continued
I I
117.5 117.5 117.1 116.7 117.8
97.4 99.2 99.6 98.8 99.3 105.0 106.7 106.9 106.1 107.1 104.7 104.1 104.4 101.8 102.3 82.4 86.9 87.7 88.6 88.4 21.9 24.1 25.6 27.6 26.7
125.9 124.4 120.1 119.7 122.1 110.7 110.1 108.9 110.2 110.5
134,712 125,744 89;449 137,003 99,075 277,038 256,089 178,409 306,812 202,862
116,561 111,586 78,643 121,066 86,629 251,660 237,263 165,002 286,211 186,165
224,737 219,955 158,357 263,055 174,011 1, 781 1,188 944 879 545
222,956 218.817 157,413 262,176 173,467 205,251 206, 145 148,551 249,192 162,311 17,705 12,672 8,862 12,984 11,156
58,237 59,076 60,532 60,579 60,572 55,080 55,924 57,411 57,471 57,466 3,157 3,152 3,121 3,108 3,105
55,034 56,261 57,584 58,140 57,924 5.1,257 54,419 55,793 56,308 56,051 1, 777 1,842 1, 791 1,832 1,872
2.24 2.36 2.51 2.38 2.33
3.35 3.35 3.35 3.37 3.34
2.80 2.83 2.85 2.86 2.83 2. 95 2.96 2.98 3.00 2.98 3.27 3.30 3.29 3.32 3.30 4. 88 4_29 4.29 4.30 4.26
2.94 2.97 2.98 3.00 2.96 3.12 3.13 3.15 3.17 3.13 3.99 3. 93 3.94 3.94 3.95
2.25 2. 33 2.55 2.58 2.44
1. 96 2.01 2.09 2.00 1.98 •2. 37 2.37 2.39 2.35 2.34
I, 927.69 1, 926.59 1, 857.45 1,850.15 1,805.62 988.08 988.08 938.08 988.08 988.08
2.05 2.05 1. 98 1.97- 1.92 2.88 2.88 2.88 2.81 2.81 2.09 2.09 1. 99 1. 98 1. 93 2.69 2.69 2.69 2.69 2.69 1. 81 1. 81 1. 81 1.80 1. 77 1. 77 1. 77 1. 77 1. 77 1.77
852.3 291.0 148.4 347.9 313.9 550.0 95.3 61.7 212.9 134.4 60.3 2.0 3.1 23.0 4.6 50.0 15.1 8. 7 28.3 15.8 54.3 60.5 30.3 18.3 42.6 53.6 28.0 7. 7 3i:~' 20.6 42.3 39.1 31.2 43.6 16.9 47.1 2.1 16.5 '47. 7 24.9 3.9 3.6 7. 7 4.6
48.7 49.2 47.8 44.3 42.6
36.92 37.86 36.79 34.54 32.92 110.67 111.11 107.28 101.62 97.79 14.38 14.41 13.83 12.15 11.06 25.33 28.01 27.85 26.09 24.56 711.17 77.09 74.46 69.17 67.52
139.86 133.77 128.67 119.65 117.45 18.47 20.41 20.26 18.69 17.59
71.8 72.6 69.9 66.0 63.3 73.8 74.3 71.0 67.2 64.8 76.3 78.6 74.8 70.8 67.8 67.6 68.8 66.2 63.9 61.8 66.2 66.1 64.5 60.5 56.5 61.0 69.0 58.4 65.0 61.1
72.1 73.8 70.9 62.6 60.4
106.1 107.6 101.7 95.9 89.5
1942
117.7 118.0
98.9 98.1 107.4 107.7 102.2 103.5 87.1 83.0 26.4 24.0
122. 1 123.3 110.7 110.7
91,838 81,804 179,690 151,865
80,772 72,623 165,276 139,586
156,658 133,776 953 407
155,705 133,369 138, 597 124, 676 17,109 8,694
61,956 61,899 58,852 58,804 3,105 3,096
59,258 59,112 57,359 57,201 1,899 1, 911
2.33 2.21
3.36 3.37
2.85 2.85 3.00 3.01 3.31 3.31 4.27 4-33
2.97 2.97 3;13 3.12 3.97 4.03
2.45 2.88
1.97 1. 97 2.35 2.33
1,701.40 I, 675.01 988.08 938.08
1.81 1. 79 2.81 2. 81 1. 79 1. 76 2.69 2.69 I. 75 1. 74 1.66 1.66
123.4 404.5 66.6 224.1 1.8 30.2 3.8 30.6
11.9 26.3 1.9 32.3
32.1 37.7 1.4 15.0 3.9 8.3
44.6 45.3
33.12 34.20 98.42 103.75 11.68 11.93 24.29 23.59 68.30 71.07
119.25 125.05 17.35 17.10
63.2 66.1 64.7 68.2 66.3 69.0 62.9 67.6 57.2 58.8 60.3 59.0
62.5 66.3
90.6 97.2
118.9 118.7 119.0
98.9 99.3 100.7 108.4 108.7 109.8 104.5 104.1 105.8 83.9 85.2 86.4 25.5 27.1 29.4
124.4 125.4 125.9 110.2 109.9 109.8
80,306 83,842 124,075 155,111 173,629 316,526
71,249 75,610 112,301 142,932 162,734 300,306
125,605 159,938 276,812 299 449 245
125,306 159,490 276,567 119,068 152, 418 268,643
6,288 7,072 7,924
63,992 65,277 65,256 60,903 62,198 62,182 3,089 3,079 3,074
61,278 62,720 62,766 59,372 60,796 60,830 1,905 1, 924 I, 936
2.15 2.15 2.16
3.3/i 3.34 3.33
2.83 2. 81 2.80 2.99 2.99 2.98 3.28 3.27 3.26 4.30 4.28 4-26
2.94 2.94 2.95 3.09 3.09 3.08 4.02 3.98 3.95
2.32 2.28 2.25
2.00 2.02 2.03 2.34 2.34 2.34
1,675. 81 1, 646.14 1,643. 75 ·938.08 938.08 938.08
1. 79 1. 75 I. 75 2.81 2. 81 2.81 1. 75 1. 71 1. 70 2.69 2.69 2.69 1. 74 I. 74 1.73 1. 75 1. 75 1. 79
335.8 153.0 335.0 139.7 71.8 199.9
3.4 3.5 25.6 14.0 3.9 31.2 54.9 29.3 20.0 30.0 8.9 10.8 39.8 30.9 29.9 47.8 1. 4 10.9 6.2 3.3 7.5
46.6 47.2 48.2
35.54 35.46 36.00 106.94 106.08 107.41 11.75 11.51 11.76 25.63 26.19 26.76 73.26 73.10 74.40
129.42 126.93 128.65 18.71 19.26 20.16
68.2 68.3 69.4 70.6 70.5 71.6 71.5 71.0 '71.8 69.2 68.9 69.6 68.4 58.8 59.5 62.9 65.4 66.7
67.9 70.5 74.1
98.5 98.5 100.6
119.3
102.1 111.2 107.1 88.0 30.3
126.5 109./i
134,771 303,128
122,448 285,683
266,931 248
266,684 258, 361
8,323
67,207 64,139 3,058
64,841 62,906 1,938
2.13
3. 31
2.80 2.95 3. 21 4. 24
2.lH 3.07 3.92
2.22
2.05 2.33
1, 645.97 938.08
1. 75 2.81 1. 70 2.69 1. 73 1. 85
295.9 128.2
4.9 14.3 4.~. 2 17.8 35.6 47.3
4.6
M.1
38.37 113.51 13.35 28.65 79.06
136.56 21.55
74.2 76.5 77.6 72.7 63.7 72.7
75.7
104.7
S-19
\
119.
103. 113. 108. 8". ..
5
2 8 3 6 6 9 4
29. 126. 109.
98,51 207,71
3 3
87,42 1 9 192,43
169,30 1
169,07 229
2 9 3
157,26 11,80
67,15 6 64.0 3,06
88 7 4 3 1
64,54 62,54 2,00
2.1 6
3. 3
2. 7 2.9
9 4 4 5
3.2 4. 2
2.9 3 6 3
3.0 3.9
2.2
2.0 2. 3
0
6 4
1, 647.3 (\ 8 938.0
1.7 2.8
6 1 9 9 4
1.6 2.6 1.7 1. 96
159. 101.
3. 4_
11. 3.
31. 1. 2.
50.
0 3 5 4 7 2 0 4 5
6
38.8 1 1 6 3 3
23
115.3 14. 1 28.1 80.1
139. 21.0 3
75. 77. 77. 74-66. 73.
73.
104-
2 2 3 1 2 0
4
• New series. The new bond series represents the average yield of taxable Treasury bonds (interest subject to both the normal and surtax rates of the Federal Income tax) neither due nor callable for 12 years; this average started Oct. 20, 1941, following the issuance of the second series of such bonds; the 2~~ percent bonds of 1962-67 and the 2).2 percent bonds of 1963-68 are excluded because of restrictions on their purchase and negotiability. For available earlier data for the new series on dividend payments and a description of the data, see pp. 26--:18 of the November 1942 issue, except for revisions in 1941 data shown on p. S-19 of the January 1943 Survey.

8-20 SURVEY OF CURRENT BUSINESS February 1943
Monthly statistics through December 1941, to-~194211941 I 1942 gether with explanatory notes and references ------· I I tothesourcesofthedata,maybefoundinthe Decem- Decem-~ Janu-1 Febru-~ March I April I May I June I July I August! tesmepb-er Obcetro- Nob'e~erm-1942 Supplement to the Survey ber ber ary ary
FINANCE-Continued
SECURITY MARKETs-Continued Stocks-Continued
Bales (Securities and Exchange Commission): Total on all registered exchanges:
272,889 Market value ..•••.•.•••.•. thous. of dol 629,403 1,085,599 512,503 296,408 341,230 Shares sold .• -----------------thousands.: 33,651 62,676 28,359 14,018 16,391 13,613
On New York Stock Exchange: 226,187 Market value ..•••••••.•••• thous. of doL. 536,509 929,046 466,932 251,187 287,785
Shares sold.---------------- •. thousands .• 25,160 46,891 22,236 10,610 12, 175 10,079 Exclusive of odd lot and stopped sales
8,580 7,589 (N.Y. Times) ..•••....•.•• thousands. 19, 313 36,387 12,994 7,926 Shares listed, N.Y. B. E.:
32,844 31,449 Market value, all listed shares .•.. mll. of doL. 38,812 35,786 36,228 35,234 Number of shares listed.--------- .•• millions .• 1, 471 1,463 1,467 1,467 1,469 1,469
Yields: Common stocks (200), Moody's ..... pereent .. 5, 7 7.3 7.2 7.1 7. 7 7.8
Banks (15 stocks) .......... ·----------do ..•• 5.0 5.4 5.3 5.6 6.0 6.1 Industrials (125 stocks) •••.••.•••••••• do .•.. 5.3 7.3 7.4 7.2 7. 7 7. 7 Insurance (10 stocks) ................. do .... 4.2 4.5 4.5 4.6 5.0 5.3 Public utilities (25 stocks) ............ do .... 7.2 7.6 7.6 7. 7 8.5 8.9 Rails (25 stocks) ..................... do .... 8.6 8.2 7.2 7.4 8.2 8.3
Preferred stocksp hlgh{f.rade (1~ stocks), 4.19 4.15 4.38 4. 52 Standard and oor's orp ........ pereent .. 4.21 4.24
Stockholders (Common Stock) American Tel. & Tel. Co., total ...... numher __ 642,631 633,588 --------- --------- 637,020 ---------Foreign ................................ do .... 5,159 5,281 --------- --------- 5,230 ---------PennsylvanlaR. R. Co., totaL ........... do ____ 205,965 205,012 --------- --------- 205,304 ---------
Foreign ................................ do •.•• 1,360 1,447 --------- --------- 1,409 ---------U.S. Steel Corporation, total ............ do .... 163,296 163,732 --------- --------- 164,013 ---------Foreign ____ .• ___ ... _.--------, ......... do ..• _ 2. 577 2,584 -----·--- --------- 2,596 .................. Shares held by brokers ..... pereent of totaL 25.45 25.40 --------- --------- 24.90 ---------
FOREIGN TRADE
INDEXES Exports of U. B. merchandise:
1214 148 190 205 Quantity .... -------- .......... 1923-24-100 ... --------- 145 V slue .................................. do .... II71 127 128 162 185 Unit value ............................. do .... ~ ------- 80 86 88 85 90
Imports for consumption:
273,279 265,455 12,625 12,838
226,102 232,947 9,685 9,932
7,229 7,466
33,419 32,914 1,469 1,470
6.9 6.6 5. 7 5.6 6. 7 6.4 4.9 4.8 8.2 8.4 7.8 7.8
4.48 4.40
--------- 639,152 --------- 5,214 --------- 205,259 --------- 1,374 --------- 164,039 --------- 2.580 --------- 24.90
153 183 139 165 91 89
253,211 302,181 14,033 12,553
214,217 258,535 10,964 9,489
8,374 7,387
34,444 34,872 1,471 1,471
6.4 6.3 5.5 5.1 6.1 6.0 4. 7 4. 7 8.2 8.0 7. 7 7.5
4.32 4.27
--------- ------------------ ---------------.--- ------------------ ------------------ ------------------ ------------------ ---------
195 167 86
I
284,995 465,937 411,312 15,381 24,753 22,053
241,517 400,475 352,283 11,903 19,610 17,310
9,450 15,933 13,437
35,605 37,738 37,374 1,471 1, 471 I, 471
6.1 5.8 5.9 4.9 5,0 5.2 5.8 5.5 5. 5 4.5 4.4 4. 5 7.9 7.2 7.1 7.3 7.0 8.0
4. 27 4. 23 4. 23
641,301 --------- --------5,184 --------- --------
205,405 --------- --------1,367 --------- --------
163,754 --------- --------2, 577 --------- --------24.88 --------- --------
~~~':,t!~~---:============================a~==== 156 117 107 110 95 78 86 86 --------- --------- --------- --------106 80
Unit value ............................. do .... --------- 68 69
VALUE
75 79 70 70 72 73
58 63 75 73
66 76
Exports, total Incl. reexports .... thous. of doL ____ ~ __ .. '651, 555 479, 464 478, 355 610, 973 695, 355 525, 116 618, 965 628, 681 <694, 466 718, 187 776, 036 r 749, 623 ExportsofU.B.merch!IDdise .......... do .... _________ '635,179 473,521 474,720 604,945 687,658 519,168 613.572 623,801 <688,124 712,135 768,912 <743,806
Generallmports ......................... do .... ____ _____ 343,794 253,522 2G3, 546 272,111 234,085 190, 609,•214, 919
1
214,384 184,432 195,689 199,392 •173, 745 lmportsforconsumption ................. do .... _________ 388,272 255,996 239,529 252,050 222,819 186,159 205,024 210,257 191,759 199,221 •224,012 •193,555
TRANSPORTATION AND COMMUNICATIONS
TRANSPORTATION I Commodity and Passenger•
Unadjusted indexes: Combined index, all typest ..... 1935--39-100.- --------- 146 149 152 158 169 176 182 189 196 201
Excluding local transit linest. ---- .. do. ___ 149 152 156 162 174 183 189 197 205 210 CommoditYt-------------------------do .... 147 151 155 161 172 179 182 188 194 198 Passengert ................. __ ........ do. ___ -------- 143 141 143 148 163 169 181 193 203 208
Excluding local transit linest ........ do .... -------- 166 163 161 169 197 210 233 264 284 289 By types of transportation:
Air, combined index ................. do .... 260 261 270 311 349 326 287 302 326 '343 Commodity ____ ... ______________ ... do .... 261 258 273 292 303 311 324 349 372 '406 Passenger. . __ . _ .... _____ .. ________ do ____ 258 263 268 324 380 337 263 270 296 301 Intercity motor bus and truck, combined
indext ..... _ ... __ ...... __ .1935-39= 100. _ --------- 172 170 163 164 171 169 184 209 215 215 Commodity, motor truckt ......... do .... --------- 177 178 178 165 160 154 166 180 191 196 Passenger, motor bust_ ............ do. ___ 159 149 127 159 199 206 228 280 273 259
Local transit Jines, passenger __ . __ .. __ do .... 123 124 128 131 136 135 137 134 136 142 Oil and gas pipe lines, commodity .... do .... 136 140 142 130 126 123 123 122 129 131 Railroads, combined index ..... __ . ___ do ____ 151 157 164 173 185 197 202 209 218 224 Commodity ___________ ._. __ .... __ .. do. ___ --------· 149 156 163 174 185 196 198 203 209 214 Passenger ... __________ ............. do .... -------- 164 164 173 165 184 205 234 256 289 304 Waterborne (domestic), commodityf do .... ----- 87 64 53 59 92 108 113 114 113 110
Adjusted indexes: Combined index, all typesf ____________ do .... --------- 149 153 158 163 '173 '179 '180 '187 •WI '193
Excluding local transit linest ....... do ____ 154 158- 163 169 '180 '186 '187 rt93 '197 '200 Commodityf ____ ....... __ ............ do .... 153 156 160 166 176 181 182 1S7 189 190 Passengert .. -------------- ........... do ... _ --------- 137 146 149 154 '165 rt74 '176 '186 '195 '204
Excluding local transit linest ....... do .... --------- 161 175 180 189 '207 '222 '222 '232 '249 '272 By type of transportation:
Air, combined iudex ........ ~--------do .... 292 332 321 336 353 316 261 286 296 '313 Commodity ____ ... ______ ..... __ .... do. ___ 250 279 276 282 298 308 316 363 372 '407 Passenger .. ---------- .............. do ... --------- 320 367 350 372 388 321 225 236 245 251
Intercity motor bus and truck, combined indext .................. 1935--39=100 .. 166 172 169 176 182 183 184 195 201 202
Commodity, motor truckt ......... do .... --------- 170 171 175 173 172 167 172 184 193 190 Passenger, motor bust ............. do .... _________ 156 173 156 184 206 222 215 221
220 I 233 Local transit lines, passenger ......... do .... ________ 116 122 124 125 130 134 139 148 151 147 Oil and gas pipe lines, commodity .... do .... ________ . 135 137 133 125 123 123 128 128 132 135 'Revised. 1 Figures overstated owing to inclusion in the December export statistics of an unusually large volume of shipments actually exported in earlier months. • New series. For a description of the transportation indexes and earlier data, except as noted, see pp. 20-28 of the September 1942 Survey. t Revised or added since publication of data in the Seotember Survey; earlier indexes will be published in a subsequent issue.
'204 '213
203 '203 '276
'343 '412
298
210 200 234 151 135 230 ?21
'296 '103
r 197 205 193
'211 '286
'315 •403
258
205 187 248 149 140
19 2
7 04
194 205 276
321 398 27 0
204 196 223 147 142 220
9 20 304 8 7
195 203 189 215 300
339 409 293
204 187 244 144 142

February 1943 SURVEY OF CURRENT BUSINESS S-21
1942 Monthly 11\atialics through December 1941, to• rether with explanatory notes and references to the sources of the data, may be found in the 1942 Supplement to the Suney I
1942 I 1941 I Decem- Decem-
ber ber 1:~:- I F~;u-1 March I April I May I June I July I August I te~~er I o~:~- IN'l:m-
TRANSPORTATION AND COMMUNICATIONS-Continued
TRANSPORTATION
Commodity and Passenger•-Con.
Adjusted indexes-Continued. By type or transportation-Continued.
155 160 Railroads .•....••.•••..••.•.•. 1935-39-100 .• -----·--- 168 177 Commodity ..••••.••••••••••••••••• do .••. --------- 155 159 167 176 Passenger .......•••••.••••••••..... do .•.. 154 165 182 181
Waterborne (domestic), commodity:.do .... 116 112 101 99 Espreas Operations
Operating revenue ••••••••••••••• thous. or doL. --------- 14,051 11,809 11,582 11,976 Operating lncome •••••••••••••••••••••••• do •••• 131 79 90 77
Loeal Transit Unes Fares, average, cash rate ••••••••••••..••. cents .• 7.8060 7.8005 7.8005 7.8033 7.8033 Passen~ers carried ••••••••••••••••• _ thousands._ 1,222,617 941,924 946,315 885,128 1,003,196 Operat ng revenues •••••••••••••• thous. of doL. 68,133 68,637 65,004 72,561
Clan I Steam Ralwaya Freight carloadlngs (Federal Reserve Indexes):
Combined Index, unadjusted ••• 1935-39= 100 •. 126 128 129 129 129 Coal ••••••••••••••.•.•.•••••••••••••• do .... 132 125 136 132 125 Coke •••••••.••••••••••••••••••••••••• do ..•. 193 182 184 184 175 Forest products •••••••••.•.•••••••••. do •••• 122 129 140 153 149 Grains and grain products ••••••••••. do ..•. 130 113 125 110 102 Llvestock ..•.•••••.•••••••••••••••••• do ..•. 113 97 95 76 77 Merchandise, I. c. L ......•.......... do •••• 56 96 93 96 92 Ore •••••••.•••••••••••••••••••••••••• do •••• 59 69 46 47 73 Mlscellaneous ••••.••••••••••••••••••• do •••• 135 138 134 135 139
Combined Index, adjusted ••••••••••••. do .••. 134 137 140 139 136 Coal •••••••••••.•••.•••••••••••••••.•. do •.•. 116 111 119 116 122 Coke ••••••...•.•••••••••••••••••••••• !lo. • . 177 167 153 150 168 Forest products •.•.•••••.•••••••••••• do •.•. 137 146 156 169 149 Grains and grain products ••••••••••• do •••• 143 124 142 131 119 Livestock ••••••.•.••••••••••••••••••. do •••. 117 101 99 95 97 Merchandise, I. c.l.. .••...•.•••••..•. do •.•. 59 100 97 100 92 Ore ••..•••••••••••••••••••••••••••••• do ••• _ 210 246 186 187 282 Miscellaneous •••••••••••••••••••••••• do ••• _ 146 149 152 151 143
Freight-car loadings (A. A. R.):, Total cars •••••••••••••••••• __ •••• thousands .. 2,834 8,046 3,858 3,123 3,171
Coal •••••••••••••••••••••••••••••••••• do ••.. 612 675 797 629 610 Coke ..•.•.•••••••••••••••••••••••••. do .•.. 57 54 71 57 55 Forest products •••••••••.•••••••••••• do •••• 148 153 208 185 184 Grains and grain prodncts •••• ~-------do ••.• 176 155 212 154 146 Livestock •.•••••••••••••••••••••••••• do .•.. 63 53 65 42 43 Merchandise, 1. c. L •••••••••••••••••• do •••. 340 582 711 697 584 Ore ••.•••••••••••••••••••••••••••••••• do .••. 66 77 65 52 72 Miscellaneous •••.•••••••••••••••••••. do ..•. 1,371 1,396 1,729 1,407 1,477
Freight-car surplus, total ••••••••••••••••• do •.•. 68 711 60 69 68 Box cars ••••••••••••••••••••••••••••••. do •.•. 35 27 22 22 23 Coal cars .•••••••••••••••••••••••••••••• do ••• 20 32 22 20 17
Financial operations: 0~e,~tgt_~~~~~~~:-~~~~::::::~~~~~-~~~~~: 702,995 479,560 480,691 462,486 640, 118
531,918 389,223 392,571 377,593 445,490 Passenger ..••••••••••••••••••••••••••• do .•.. 119,151 53,868 55,697 54.746 59,106
Operating expenses .••••.••••••••••.•••• do ..•. 431,873 352,532 348,781 327,653 360,011 Taxes, Joint facility and equip. rente ••• do ••.. 170,851 46,480 62,944 68,347 87,749 Net railway operating lncome •••••••••• do •.•. 100,271 80,549 68,966 66,486 92,359 Net Income ..•.••••.•.•••••••••••••••••. do ••.. 55,492 26,130 23,716 46,888 Operating results:
Freight carried 1 mlle ...•••••.• mll. oftons .. --------- 44,545 46,666 44,109 61,853 Revenue per ton-mlle ...••••••.••••. cents .. .943 .914 .926 .924 Passengers carried 1 mile ..••••.•••. milllons .. 8,055 3,078 2,895 3,070
Flnanclal operations, adJusted:
o~e{e,~{;[~~~~~~~:~~~:::::::::~~~-~rd~~~:: 486.2 495.3 518.9 541.7 403.2 406.6 423.9 443.0
Passenger ...•.•••••.••••.•.•••.•.•••. do •••. 49.4 53.6 60.1 63.0 Railway expenses ..•.••••••...•.•.•.•••• do .•.. 409.8 413.1 420.3 445.7 Net railway operating lncome •••••••••• do .•.. 76.4 82.3 98.6 96.1 Net income ..•.••.•.•.•••••••••••••••••• do ••.. 36.6 40.0 57.7 52.4
Waterway Trame Canals, New York State •. thous. of short Ions .. --------·· 0 0 0 0 Rivers, Mississippi (Gov. barges only) ..• do ..•. 119 81 65 100
Travel O~atlons on scheduled air Jines:
lies 11.own •.•.••••.•••••.•••• thous. of miles .. --------- 10,855 11,127 9,979 11,352 Express carried ....••.••••.•.•••• thous. of lb .. --------- 2,386 2,531 2,170 2,560 Passengers csrrled .•..•••••••..••.... number .. 298,680 800,900 286,435 371,398 Passenger-miles 11.own ..•.••• thous. of mlles .. 111,077 113,135 104,220 139,061
Hotels: Average sale r.:;r occupied room ...... dollars .. 3. 56 3.39 3.40 a. 39 3.30 Rooms occup ed •.•.•...•.••• percent of totaL 74 61 71 70 70 Restaurant sales lndex •.••••••••••• 1929-100. 132 103 107 101 100
Foreign travel: U. 8. citizens, arrlvals ..••••••••.••. number .. --------- 10,799 9,456 11,723 8, 745 U.S. citizens, departures ••••••••••••••• do .... --------- 11,316 7,871 5,754 .10, 222 Emigrants .•..•••••••••••••.•.••••• _ ••• do .•.. 686 408 448 532 Immigrants ..•••• _ ••••.•••••••••••••... do .... --·8;247" 2, 581 1,1154 1,924 1,560 Passports issuedo" ---------------------.do .. _ 4,549 5,145 6,020 G,881
National parks: Visitors .•••••••.•..••••.••••.••..•••••. do .•. _ --------- 59,812 60,767 59,338 60,808 Automobiles •••••...•.•.•••.••.•••••••• do .• __ --------- 18, 152 17,477 16,821 17,760
Pullman Co.: Revenue pas!enger·miles ••••••••• thousands .. --------· 1,017,616 1,273,822 1,208,162 1,288,858 Passengerrevenues .•.•.•.••••. thous. of doL. 5,608 6,929 6,421 6,935
• Revised. ~See note marked "t" on p. S-20. 'f])ata for January, May, August, and October 1942 are for 5 weeks; other months, 4 weeks, ci'Beginning February 1942 data include passports Issued to American seamen. •Aee note marked with an ... , on p. S-20.
•192 •201 •202 •208 •211 191 199 199 204 205
•197 •216 •25 •238 •264 •87 84 84 84 84
12,134 12.312 12,168 12,]70 12,106 79 61 72 76 77
7.8060 7.8060 7.8060 7.8060 7.8060 1,004,698 1,034,361 1,015,722 1,023,167 1,038,784
72,668 75,512 76,494 77.400 78,399
136 138 139 142 144 135 139 135 132 136 176 181 179 177 175 159 161 165 173 173 100 99 111 138 129 90 89 81 76 100 81 62 60 57 57
218 303 318 325 308 142 144 145 148 152 143 143 141 142 143 160 164 160 155 154 200 197 199 205 208 169 155 159 172 165 117 115 113 95 106 101 98 103 90 106 80 62 60 57 57
267 289 183 180 176 141 142 144 1411 152
3, 322 3,351 4,171 3,386 4,351 645 830 661 605 825 66 70 57 54 69
196 246 204 203 270 141 174 154 194 228 50 62 45 40 68
525 492 378 346 449 235 420 369 363 440
1,503 1,878 1,1128 1. 517 2,001 56 70 82 67 59 28 42 55 43 40 12 10 9 6 5
672,531 601,002 623,687 665.182 683,807 468,007 487,982 501,343 533,086 537,412 66,116 74,3(5 82,268 91,939 103,463
366,756 375,440 378,472 390.477 399,.292 103,741 115,933 126,484 141.703 149,250 102,034 109,628 118,731 133.001 135,264 57,890 63,668 77,691 89,632 89,243
53,631 58,517 57,304 6(), 713 62,405 .937 .900 • 931 .936 .917
3,427 3,822 4,238 4. 765 5,395
584.2 617.8 627.4 642.8 668.9 474.8 499.4 508.6 519.4 534.2 71.3 81.0 79.4 82.0 92.3
471.5 486.5 499.6 518.7 539.3 112.7 131.2 127.9 124.0 129.5 70.3 87.9 84.2 79.2 84.6
201 401 462 584 461 206 251 225 257 247
11,340 10,847 7,353 8,079 8,451 2,884 3,076 3,097 3,534 3,927
428,153 369,776 240,916 262, 715 283,145 158,218 144,947 109,253 116, 104 127,393
3.54 3.26 3.43 3.45 3. 74 71 72 71 69 75
121 121 128 125 143
7,298 7,569 7,459 9,263 7,031 6,807 11,145 5,147 4. 935 5,005
462 389 585 419 344 1,699 1, 673 2, 593 2,195 1,932 7,923 7,880 16,244 15,042 11,635
94,192 137, 187 221,697 342, 043 330,540 28,203 41, 196 67,454 98, 147 94, 102
1;380,255 1,445,506 1,496,048 1,471,500 1,843,326 7, 784 8, 092 8,509 8,9()3 9,638
•216 r 222 206 210
•294 r 307 84 80
12,922 13,319 88 56
7.8060 7.8060 1,048,977 1,157,621
78,782 85,257
152 150 142 138 184 180 167 158 139 139 135 169 57 58
304 260 162 163 136 133 135 121 188 180 154 149 126 130 102 110 55 56
174 221 146 144
3,504 4, 512 661 837 56 71
199 244 188 247
71 118 347 460 336 373
1,647 2,162 89 30 25 17 5 5
697,792 745,584 546,791 587,612 104,971 108,322 399,706 416,430 143,455 144,439 154,632 184,715 105,190 135,538
61,934 66,019 .941 .946
5,500 5,508
662.6 660.8 517.9 501.9 100.4 113.0 534.7 533.3 127.9 127.5 81.8 80.9
544 436 196 222
8, 099 8,408 4, 375 4, 341
273,022 273, 162 125,327 128,329
3. 70 3. 73 78 80
134 135
10,393 7,902 4,400 5,190
423 463 2, 336 2,147
19,128 14,667
210,020 76,659 62,910 24,178
1,925,459 1,961,986 10,169 10,444
21 9 5
29 1
20 3 8
14, 77 3 53 1
7.806 0 88 6
1,086,3 81,35
14 0 9 6
38
13 18 1 12 3 1 5
20
44 9 6 0 4 5 6 0
15 13 12 17 14 1 11 26 4
58 22 1
4 14
3,23 6 9 7
64 5
1 1 7
35
64 68 8 6 0 4
53
23 1,53
28 4 1
690,10 8 2
60 534,76 108,0 406,38 9
0 9
134,77 148,94
--------60,4
--- ------------
722. 553.5
5·
4 2 3
120. 563. 159.
--------
. -------14 0
7, 77 3, 974
240,70 5 112,4 88
3. 7 7
13
9 9 7
7,474 4, 904
563 1, 915
11,173
51,976 --------1,906,71
10,05 4 2

S-22
llllonthly statistics through December 1941, to• gether with explanatory notes and references to the sources of the data, may be found in the 1942 Supplement to the Survey
SURVEY OF CURRENT BUSINESS
1942 I 1941 I 1942
Decem- Decem- Janu- I Febru·j March I April I May I Jun her her ary ary e
TRANSPORTATION AND COMMUNICATIONS-Continued
COMMUNICATIONS Telephone carriers:
Operating revenues ••.•......•. thous. of doL. --------- 128,993 128,257 123,860 130,347 131,727 133,076 134,216 135,652 135,328 Station revenues ....... --------- __ .•. do .... 80,229 79,974 77,771 79,698 80,264 80,070 80,078 79,415 78,897 Tolls, message __ ------------ _________ do.--- --------- 37, 782 37,441 34,961 39,471 40,207 41,616 42,379 44,579 44,666 Operating expenses _____________________ do .... 87,307 82,935 79,414 84,365 84,372 85,655 85,542 89,370 86,439
Net operating Income _________ ......... do .... 32,532 21,166 21,307 21,647 21,596 22,264 22,167 21,339 22,632 Phones In service, end of month. thousands .. 21,206 21,362 21,481 21,595 21,702 21,815 21,888 21,941 22,048
Telegraph and cable carriers: Operating revenues, totaL ..... thous. of doL. 15,448 12,732 11,697 13,074 13,587 13,877 14,398 14,375 14,282
Telegraph carriers, totaL .. --------~-do .... 14,089 11,563 10,724 11,940 12,563 12,824 13,151 13,296 13,254 Western Union Telegraph Co., revenues
from cable operations. ___ thous. of dol.. 734 620 565 663 661 658 678 709 712 Cable carriers ______ •••• ______________ do .... 1,359 1,169 972 1,134 1,035 1,053 1,248 1,080 1,028 Operating expenses.----- ... ____________ do .... --------- 12,003 11,054 10,246 10,889 11,188 11,639 11,718 11,967 11,932 Operating income·--------------~------do .. -- 2,215 585 465 918 1,088 905 1,216 958 1, 031 Net income .. --------------------------do .... 1,488 61 •65 480 572 380 787 454 501
Radiotelegraph carriers, operating revenues
February 1943
138,015 142,864 140,447 80,413 82,507 81,576 45,680 48,161 46,566 87,832 89,260 87,940 22,846 20,337 24,310 22, 146 22,284 22,400
14, 617 14,956 --------13,600 13,875 --------
755 819 --------1,018 1,082 --------
11,912 12, 179 --------1, 384 1,336 --------
946 812 --------thous. of doL. 1,442 1,163 1,092 915 1,032 1,108 1,204 993 999 961 I 998 1,007
CHEMICALS AND ALLIED PRODUCTS
CHEMICALS Methanol:
Prices, wholesale: 0. 58 Wood, refined (N. Y.) ...... dol. per gallon .. O.DS O.DS 0.58 0.58 0.58 0.58 0.58 0.58 0.58 0.58 0.58 0.58
snrthetlc, pure, f. o. b. works ........ do .... .28 .28 .28 .28 .28 .28 .28 ,28 .28 .28 .28 .28 .28 Explos ves, shipments ... _________ thous. of lb •. 30,626 38,879 36,720 37,681 36,453 41,045 40,545 42,101 40,409 41,709 42,571 41,407 41,477 Sulphur production (quarterly):
147,850 135,285 163,810 Louisiana .•. ------------------ .... Jon~ tons .. --------- --------- 110,115 --------- --------- --------- --------- 148,570 --------- --------Texas .•.••• _ •••• _. ___ •.• __ .• _ .. _______ .do •. __ --------- 802,576 --------- --------- 725,679 --------- --------- 774,706 --------- 739,665 --------- --------Sulfuric acid:
Price, wholesale, oo•, at works dol. per short ton •• 16.50 16.150 16.50 16.50 16.50 16.50 16.50 16.150 16.50 16.50 16.50 16.50 16.50
FERTILIZERS Consumption, Southern States
thous. of short tens •• 340 '265 1,030 '1,170 '1, 061 678 287 148 70 66 169 200 , 221 PrlcA, wholes•lP, nltr11te of soda, crude
f. o. b. cars, port warehouses• •• dol. per cwt .. 1. 650 1. 6150 1.650 1.650 1.650 1.650 1.650 1.650 1.650 1.650 1. 650 1.650 1. 650 Potash deliveries. ------------------short tons •• 59,897 57,113 51,402 56,386 44,994 29,714 62,959 59,224 59,371 56,439 59,846 54,855 Superphosphate (bulk): II
Produetlon ..... -----. __ ----------------do •••• --------- 487,558 487,164 457,302 480,018 431,634 440,685 453,095 445,603 501,592 '520, 558 504,852 525,960 Shipments to consumers .. -------------do .... --------- 80, 113 77,725 146,846 204,855 254,239 147,473 78,577 72,332 98,287 '150. 599 179,252 160,799 Stocks, end of montb ___________________ do .... 1,049,268 1,082,860 1,017,847 911,507 730,135 760,761 915,172 1,067,747 1,070,7851'1,175,835 1,158,092 1,120,646
NAVAL STORES Rosin, gum:
Price, wholesale "H" (Savannah), bulk 3.22 3.(16 2.89 2.82 dol. per cwt .. 3.43 2.89 3,16 2.95 3.10 2. 91 3.30 3.50 3.46
Receipts, net, 3 ports .......... bhl. (500 lb.) .. 20,108 34,637 30,2U 19,862 3, 733 16,353 18,449 21,686 26,872 35,415 24,713 18,922 19,432 Stocks, 3 ports, end of month ........... do .... 277,546 270,383 269,496 257,926 250;110 239,817 245.086 237,420 229,436 245,937 250,079 263,434 267,144
Turpentine, gum, spirits of: . 73 . 76 . 73 .65 . 61 Price. wholesale (Savannah) ..... dol. per gal.. . 70 . 76 .63 .64 • 61 .66 . 70 . 70
Receipts, net, 3 ports .......... bbl. (50 gal.) .. 6,806 12,231 6,357 1,127 784 4,550 6, 554 8,021 11,466 10,421 9,290 6, 474 6,047 Stocks, 3 ports. end of month __________ .. do .. __ 55,900 1~. 676 26,594 20,496 16,675 17,010 17,758 22,817 32,164 39,821 45,705 49,525 51,913
OILS, FATS, A.ND BYPRODUCTS Animal, Including fish oils:
Animal fats: Consumption, factory ......... thous. of lb .. 114,436 1350,722
-~------- --------- 1395,967 --------- --------- 1379,256 104,890 120,265 137,997 136,624 108,682 Production ........... _______ ..... ___ .do .. __ 290,597 1761,446 --------- --------- 1776,542 --------- --------- 1699,673 247.889 213,963 220,217 223,747 255,989 Stocks, end of month ................. do .... 306,055 1461,497 --------- --------- 1440,114 --------- --------- 1365,870 393,452 368,527 311,526 289,743 286,358
Greases: Consumption. factory ................ do .. __ 44,716 1118,673 --------- --------- 1125,047 --------- --------- 1]35,020 39,94~ 46,245 42,549 51,239 41,333 Production ........................... do .... 50,942 1140,991 --------- --------- 1140, 105 --------- --------- 1141,187 46, 2~9 41,313 42,086 45,084 45,693 Stocks, end of month ................. do .•.. 108,570 110~. 81~ --------- --------- •100,330 --------- --------- 1102,044 106,004 107,787 104,028 96,432 104,916
Fish oils: Consumption, factory ................ do .... 16,549 I 54,613 --------- --------- I 60,176 --------- --------- 142,798 16,067 14,570 15, 319 14,496 11,568 Production ..... ____ . ____ ...... ___ .... do ••.. 15,373 1 81, 68~ --------- --------- 17,128 --------- --------- I 11,713 10,342 27,575 27,291 20,895 23,845 Stocks, end of month ................. do .... 215,619 1189,916 1171,398 1160,540 162,869 178,219 178,247 207,131 208,237
Ve!(etable oils, total: 11,048 Consumption, crude, factory ...... mil. oflh .. 362 11,106 --------- --------- --------- --------- 1744 210 212 266 342 355
Production ....... __ .... __ .............. do .... 416 11,206 -----·---- --------- 11,018 --------- --------- 1710 214 212 333 432 419 Stocks, end of month:
Crude ..... _. __ •. _ ... _._._._ .•. __ . ___ .do ••.. 914 1902 --------- --------- 1895 --------- --------- I 761 729 726 764 834 884 Refined .. ___ ._. ____ .... __ ._ ...• _____ • do._ •• 407 1450 --------- --------- I 513 --------- --------- 1521 458 373 312 299 354
Coconut or copra oil: Consumption, factory:
1113,643 Crude _________________________ thous. of lb._ 7, 442 1184, 737 --------- --------- --------- --------- 135,085 9,316 10,026 7, 352 8,058 7,639 Refined .... __ ------- .... _____ ........ do ... _ 3, 900 I 79,028 _.., _______ --------- 149,437 --------- --------- 112,995 3,294 5,218 2, 742 2,259 2,151
Production: Crude.------ •. __ ....... __ ........ __ .. do. __ . 7,472 I R0,366 --------- --------- I 45,392 --------- --------- t 17,740 (•) (•} (•) 9,111 5,208 Refined .... ____ ... ____ ... ____ --------do .. __ 4, 293 I 97,464 --------- --------- I 65,072 --------- --------- I 13,612 3, 715 4, 289 1, 822 2,370 2,684
Stocks, end of month: Crude ............... _________________ do_. __ 134,971 '178, 463 --------- --------- 1135,790 --------- --------- 1126,087 129, ?03 128,602 121,262 126,739 138,142 Refined ____ ------- ....... ---------- .. do._ .• 6, 415 I 16,248 --------- --------- 115,131 --------- --------- 110,017 9,325 6,988 8,141 7,243 7,243
Cottonseed: Consumption (crush) ... thous. of short tons .. 652 '5031 474 413 317 224 144 88 62 93 529 738 714 Receipts at mills-----------------------do .... 340 '355 218 144 52 22 21 27 27 157 1,085 1,635 ,'!33 Stocks at mills, end of month ........... do .... 1, 401 '1, 291 1,037 768 503 301 177 116 81 145 701 1,598 1, 714
• Not available. • Deficit. ' Revised. 1 Quarterly data. Data compiled monthly beginning July 1942. J Data beginning September 1942 include a certain amount of superphosphate formerly reported in dry and mixed base goods not previously included with bulk super
phosphate. The stock figure as of August 31, comparable with September data is 1,129,790 tons; no other data are available for comparison. Data are currently reported on an 18% A. P. A. basis and are here converted to a 16% basis so that they are comparable with prior figures.
•This price has been substituted beginning 1935 for the one shown in the 1942 Supplement. Revisions for Jannary 1935-July 1937 will be shown in a subsequent issue. There has been no change in data beginning with August 1937. Prices are quoted per ton, in 100-lb. bags, and have been converted to price per bag,

February 1943 SURVEY OF GCRRENT BUSINESS S-23
Monthly sta~istios through December 1941, ~-I 1942,1941 I 1942 gether with explana~ry no~a and referenc.es ~------ . ~the sources of~he da~a. may be found in~he Decem- Decem- Janu- J Febru-1 March J April I May I June 1942 Supplemeru ~~he Survey her ber ary ary I July I A I Sep- I ugust tember
Octo- November 1 ber
CHEMICALS AND ALLIED PRODUCTS-Continued
OILS, FATS, AND BYPRODUCTS-Con.
Cottonseed cake and meal: Production ......................... short tons.. 291,922 '221. 360 Stocks at mills, end of month .. ____ .... do ... __ 92,672 ':;80. 593
Cottonseed oil, crude: Productlon •.•••••.....•......... thous. of lb .• 200,882 '153 i84 Stocks, end of month .•.••........•..... do_ ___ !5i, 212 'I~Y. i42
Cottonseerl oil, refined: Consumption. factory •..• _ -------------do____ 13i. -169 1 28i. 061
In oleomargarine ____________________ do .... ______ ___ 14,129 Price, wholesale, summer. yellow, prime
(N. Y.L ...••••.•...•.......•.. rlol per lb .. Production .•. -------------------thous. of lb .. Stocks, end of month ___________________ do ___ _
Flaxseed: Duluth:
.140 -131 185, 433 '132 797 300,519 '315.134
Receipts. --------------------thous. of htL. ________ _ ISO 4117
I, .j/J4 ~~~gb~~~~== =:: := :===:=::: :===: =::::- ~~: =:-Minneapolis:
~~f;!l:~is=== :=: =:=====:===: :======= :~~:::: I i~ ~62 101
3. 897 Stocks _______________________________ do.... 2. 269
Oil mills: Consumption .•••. -------------------do ___ _ Stocks1 end of month ------------ __ .. rlo .....
Price, wnolesale, No.1 (Mpla.) .. dol. per hu .. Production (crop estlmate) ..... thous .. of bu ..
Linseed cake and meal:
3, 8!7 I 13.0116 11_682 112. !i57
2. 56 2 .. 00 ' 40, 660 z 32, 285
Shipments from Mlnneapolls .... thous. of lb.. 64. i40 53.760 Linseed oil:
Consumption, factory-------------- .... do ...• Price, wholesale (N. Y.) •.•.•••.•. dol. per lb .. Production ......... _______________ thous. of lb •. Shipments from Minneapolis ........... do .••. Stocks at factory, end of montb •.•...... do .••.
40,879 .129
i3, 569 27, i80
29i, 244
I J46, !47 .. 108
'251, 723 17,950
I 198,579 Soybeans:
Consumption .... -______________ thous. or bu.. 10,058 I 19,232 Price, wholesale, No.2, yellow (Chicago}
dol. per bu •• _________ 1..67 Production (crop estlmate) •.•.. thous. of bu .. '209, 559 '105, 587 Stocks, end of month ___________________ do.... 34,938 '19,431
Soybean oil: Consumption, refined ___________ thous. oflb.. 53,608 198,20~ Price. wholesale. refined, domestic (N. Y .)
Production: dol. per lb •• _______ __ .126
('ntde _________________________ thous. oflb.. 92,326 '177 .. 217 Refined .... ________ ------------------do.... 65,414 IJ08, 850
Stocks, end of month: Crude ______________ ---------- •• ____ .. do.... 83,416 '68, 400 Refined ______________________________ do.... 57,080 141,846
Oleomargarine: Consumption (tax-paid withdrawals) t __ do .••. _________ • 33,764 Price, wholesale, standard, uneolored (Chi·
cago) _________________________ . dol. per lb •. Production t ________ . ____ .• _ .. thous. of lb ....
Shortenings and compounds:
. 150 .. 145 '34, 687
Production ___________ .. ____ ------ thous. of lb.. lli, 91.5 '31!i, 707 Stocks,endofmonth ______________ . do ___ 42,648 153,351 Vegetable price, wholesale, tierc~• l<'hlcago)
dol. p~rlb .... . 16.o
PAINT SALES
Calcimines, plastic and cold-water pa!nts: Calcimlnes ____________________ thnus .. of dol. ___ _ Plastic paints .. ____________________ ... __ do .... ___ . __ _ Cold-water paints:
rn dry form ......... ________________ do ____ -In paste form, for interior use .......... do ___
Paint, varnish. lacquer, aud fillt'rs: Total .... --------- ----------------------do .....
Classified, total. __________ ------- .... do ..•. __ _ IndustriaL .. ______ ------ __________ do .••. _. Trade _____________________________ do ... __
Unclassiflerl ______ ------- .... ________ do... _
'!17 47
17fi 496
41,708 17. Sf\ I ~~~. 200 IS.I\61
:1. X-\~
zor,, 817 176,833 139, 742 97, 180 62,361 38,269 31,384 40,845 224,921 330,025 317,338 370. 564 372, 208 338, 711 311, «13 286, 844 250, 715 192, 910 133, 495 146, 533 134, 136 117, i78
1411. 676 128,843 101, 526 72.671 47,058 27,534 20,996 28, 233 161, 748 232,888 217, 103 !81, 533 170,913 137,975 105,714 80,989 51,291 34, 167 27,907 90,601 133,726 157,849
- ----------1292.882 -232,482 90,054 99,522 129,952 135,3i7 119,3<74 t4, 427 14,738 13,837 11,883 10, 235 10,352 10, .. 400 11,312 13, 487 15,612 19, 126
137 ~~~- 457 322.972
17 36
I. 386
I, 292 311
3. 430
2. 23
51,840
- 113
22. ()00
1.83
. 132
.139 .140 .140 .14! .138 .140 .139 130,622 127.442 100,548 71,502 52,807 36,661 32,942 351,683 389,010 402,540 394, 580 369,745 310,433 230, 569
3 249
1,067
704 141
3,105
2 .. 33
5 46
1,026
708 154
2,634
'13, 425 •8, 4i7
2 .. 60
'153, 620 .119 . 133
--------- '258. 720 22, 250 22, 400
-------- 1235,897
1.95
I 20, 500
1.86
119,907
4 105 925
490 144
2,120
56 455 527
585 90
1,078
2.62 2 .. 58
129 233 423
633 130 826
'12,526 '3,965
2 .. 54
-------- ------ --1151,183 . 141 . 141 - 139
--- ----- --------- 1241,015 23, 600 30, 000 22, 100
--------- ---------1 225,615
'18,497
1.83 1.80 1. 72
241 566 98
447 164 468
3, 981 4,197 2.46
46,826 .137
76,782 27,900
211,087
6,595
I. 72
•11, 624 10, 244
517 236 379
5,438 483 835
3,899 5,467 2.40
44,407 .136
76,308 21,850
230,252
6,218
1.71
5, 931
. 136 . 137 . 140 80, 512 169, 490 181, 960
199, 396 201, 427 254, 713
2,438 750
2,066
5, 678 465
2, 734
3, 778 10,347
2.43
46,726 .134
72,023 22,750
242,879
6,081
I. 71
2. 646 2,398 2,304
5, 564 554
2. 780
4, 445 11,938
2 .. 46
44,383 ' .. 131
84,785 24,8.50
273, 101
6, 983
(')
828 1,695 1, 437
1,320 252
2, 535
3, 993 11,254
2. 43
40,198 ' .127 77,045 25,560
291.212
8,145
1, 120 25,213 35, 356
-------- '118,285 --------- --------- 1123,400 42,629 58.478 63,940 60,393 49,691
.135 .135 .135 . 135 .135 .135 . 135 .137 .. 138 . 138
---------'188,805 --------- --------- '167,945 59,843 57.413 55,389 1)1,451 i5.393 -------- '151,998 --------- ---------'147,269 48,061 62,40i 60,879 55,435 58,061
186.231 '56, 639
'78, 719 '76,098
78,350 73,099
68,896 67,761
52,456 55,134
51,364 51, 234
62,268 51,4i6
' :t>, 864 '31, 800 ' 29, 679 '26. 760 ' 23, 081 ' 23, 099 22, 535 24, 379 29, 537 35, 403 39, 371
IM .1~ .!50 .150 .150 .~0 .150 .~0 .150 .. 1->0 .~0 '15, 109 '33. 015 '30, 700 '28, 659 '27, 611 '27, 143 29,383 38,495 39,604 46,283 47,635
• 11)4
l!lO 46
185 428
47.044 42.0:!2 Ill. 1~0 2'2. Sl2
.>.012
--------- '329,867 ------------------ 124tl,304 95,477 125,918 158,107 ):)0,336 96,229
,}t),l)
1i'2 311
190 323
45 .. 176 39, 745 17,619 22, 126
5. 431
lf.O,i90 ------------------ 163 .. 208 56,823 50,953 43,583 41.142 37,853
-165
lf\2 43
18~ 412
48, OiO 42.617 18.. 898 23,719 5, 453
. 170
161 51
261 466
so. 530 44, S49 19,009 2.). 840 5,681
.liO
193 49
260 594
49,204 44,141 18,140 26,000 5,064
• 165
173 32
26il 517
43,982 39,513 17,0821 22,430 4. 469
.165
103 29
235 406
42,221 37,987 17, 173 20.813 4, 234
.165
117 36
219 385
41,106 36,935 16, i48 20,187 4,170
.165
147 33
196 410
43,028 37,782 17,243 20,540 5,246
.165
100 45
190 481
44, 122 39.186 li, 906 21,280 4, 935
.165
ii 37
177 456
38,122 34.315 16,221 18,094
3, 80i
ELECTIUC POWER AND GAS
EI,ECTRIC POWER
Product.lon.totaL .............. mll.ofkw.-hr. •• 17.672 15,651 15,646 14,102 15,053 14,588 14,YY1 15,182 16,005 16,262 16,114 16,753 •16.459 By souree:
FueL .• -----------------------------do ..... ll,564 11.156 11,050 9,664 9,43~ ~.979 9.632 9,8.31 10,877 IC,!\46 10,895 11,244 '10,i26 Waterpower ________________________ do •... 6,109 4,495 4,595 4,438 5,615 1\,609 5.3m 5,352 5,128 5,315 5,219 5.509 '5,733
By typP of prodncl'r: l'rlvately and municipally owned electric
utilitle•-------------------miLofkw.-hr •. 15,237 14,224 14,110 12 .. 612 13,322 12,949 13,326 13.394 14,047 14.047 13,804 14,282 14,086 Other prodtwers.. ..................... do.... 2,435 1,427 1.531\ 1,491 1. 731 1.639 1.u:l• t. i8b 1,958 2,214 2,310 2.470 '2,373
'Revised. ' Quarterly data. Data compiled monthly beginning July 1942. ' Revised estimate. • December 1 estimate. 'Superseded effective October 1942, by regulated price paid by crushers under Government program, operated by Commodity Credit Corporation. The October price
was $LAO .. t Data revised beginning July 1?41. Revisions not shown above are as follows (thous. of lb.): Consumption, July, 25,911; August, 25,179; September, 33,097; October,
33,933; November, 32,148. Productwn, July, 27,367; Au!ffist, 24,808; September, 33,129; October, 34,064; November, 32,513.
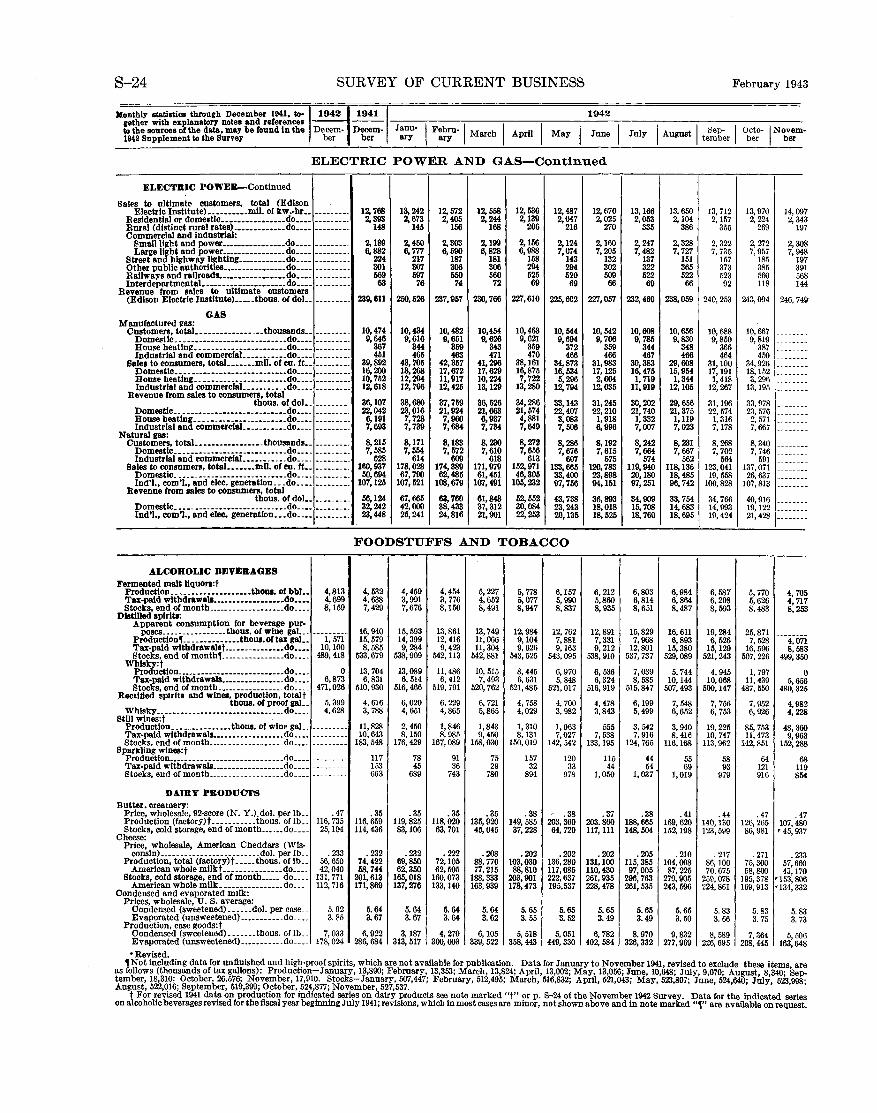
S-24 SURVEY OF CURRENT BUSINESS
lllonlhly slatislica lhrough December 1941, to-,194211941 I 1942 gelher wilh explanatory nolea and references --- ---lo lhe sources of the do.la, mo.y be found in lhe Decem- Decem- Janu- I Febru-1 March I April I May I June 1942 Supplemenllo the Survey ber ber ary 1 ary
ELECTRIC POWER AND GAS-Continued
ELECTRIC POWER-Continued
Sales to ultimate customers, total (Edison Electric Institute) •••••••••. mil. of kw -·hr •• --------- 12,768 13,242 12,572 12,558 12,536 12,487 12,670
Residential or domeetlc •••••••••••••••• do •••• 2,393 2,673 2,405 2,244 2,139 2,047 2,025 Rural (distinct rural rales) .•••••••••••• do •••• 148 145 156 168 206 216 270 Commercial and Industrial:
2,189 2,199 2,156 2,124 2,160 Pmall li~tht and power •••••••••••••••• do .••. 2,450 2,303 J,arge light and power •••••••••••••••. do •••• 6,882 6, 777 6,590 6,828 6,988 7,074 7,205
Street and highway ll~btlng •••••••••••• do •••• 224 217 187 181 158 143 132 Other public autborlt es •••••••••••••••• do •••• 301 307 306 306 294 294 302 Railways and rallroads. •••••••••••••••• do •••• 569 597 550 560 525 520 509 Interdepartmental ••••••••••••••••••••• do •••• 63 76 74 72 69 69 66
Revenue from sales to ultimate customers (Edison Electric InsUtute} ••••• tbous. of doL 239,611 250,526 237,957 230,766 227,610 225,602 227,057
GAS Manufactured I!'BS:
10,474 10,434 10,454 10,463 Customers, totaL •••.•••.•.•••.•. thousands •• --------- 10,482 10,544 10,542 Domestic ............................ do •••• 9,646 9,616 9,651 9,626 9,621 9,694 9, 706 House beatln~t •••• -·-·-·-·-·-·-···---do •.•• --------- 367 344 359 343 359 372 359 Industrial and commerclaL •.•.•.•.•. do •.•• 451 465 463 471 470 466 466
Sales to consumers, totaL •••.•. mll. of cu. ft.. 39,892 48,705 42,357 41,296 38,161 34,873 31,983 Domestic •••.•.•••••••••••••••••••••• do •••• --------- 16,200 18,268 17,672 17,629 16,875 16,534 17,125 House beating .• ------------·-···----do •••• --------- 10,752 12,294 11,917 10,224 7,722 5,296 2,604 Industrial and commerclal ........... do •.•. 12,618 12,796 12,425 13, 129 13,280 12,794 12,035
Revenue from sales to consumers, total tbous. of dol •. --------- 36,107 38,680 37,759 36,526 34,286 33,143 31,245
Domestic •.. -------------------------do •••. --------- 22,042 23,016 21,924 21,663 21,574 22,407 22,210 House beating .•• -------------·--·-·-do •••• --------- 6,191 7,728 7,960 6,937 4,881 3,083 1,918 Industrial and commerclal ••.•.•••.•. do •••. 7,693 7, 739 7,684 1, 734 7,649 1,506 6,996
Natural gas: 8,215 8,171 8,183 8,230 8,272 8,192 Customers, totaL •••••••••••••••• tbousands •. --------- 8,286
Domestic ••. ----------- .............. do •••. --------- 7,585 1,554 7,572 7,610 1,656 7,676 7,615 Industrial and commerclal ••••••.•.•. do ..•. --------- 628 614 609 618 613 607 575
Sales to consumers, total ••••••• mll. of en. ft •• --------- 160,937 178,028 174,389 171,979 152,971 133,665 120,783 Domestic .. ---- ------------------···-do •.•• --------- 50,694 67,790 62,485 61,451 46,305 33,400 23,898 lnd'l., com')., and elec. generatlon ... do •••• --------- 107,125 107,521 108,679 107,491 105,232 97,756 94,11i1
Revenue from sales to consumers, total tbous. of dol •• 56,124 67,665 63,760 61,848 52,552 43,738 36,893
Domestic ••••. ____ ---------· •.•.•. · ••. do •.•• 32,242 42,000 38,433 37,312 30,084 23,243 18,018 lnd'l., com'!., and elec. generatlon ••• do •.•• --------- 23,448 25,241 24,816 21,901 22,253 20,135 18,525
FOODSTUFFS AND TOBACCO
ALCOHOLIC BEVERAGES Fermented malt Uquon:t
Production. ------------··-----thous. or bbl •• 4,813 4,532 4,459 4,454 5,227 5, 778 6,157 6, 212 Tax-paid wltbdrawals •••••••••••••••••• do •••• 4,699 4,638 3,991 3, 776 4,652 5,077 5,990 5,860 Stocks, end of montb ••..•...•..•.••••.. do .••. 8,159 7,429 7,676 8,150 8,491 8,947 8,837 8,935
Distilled spirits: Apparent consumption for beverage pur-
16,940 15,593 13,861 13,749 12,984 poses .••...•.••...•.• tbous. of wine gaL. ---i~57i"
12,762 12,891 Production, ___ -----------tbous.oftax gaL 15,579 14,399 12,416 11,066 9,104 7,881 7,331 Tax-paid wltbdrawalat ••.••..•••••••• do •••• 10,100 8,585 9,284 9,423 11,304 9,626 9,163 9,212 Stocks, end of month,_ ---------------do •••. 489,418 533,679 538,909 542,113 542,881 543,525 543,095 538,910
Wblaky:t 0 Production ........................... do •••. 13,704 13,089 11,486 10,515 8,445 6,970 6,536
Tax-paid withdrawals •••••••••••••••. do .••• 6,873 6,831 6, 514 6,412 7,493 6, 631 5,848 6,324 Stocks, end of month ................. do .... 471,026 510,930 516,466 519,791 520,762 521,485 521,017 516,919
Reclitled spirits and wines, grodnctlon, totalt 5,399 6, 721 t oua. of proof gaL 4, 616 6,020 6,229 4, 758 4, 700 4,478
Whisky •.•.•••••.•••••••••••••••••••••. do ••• _ 4,628 3, 788 4,651 4,865 5,865 4,029 3,982 3,843 Still wlnes:t
Prodnctlon ..••.•••.•••••• tbous. or wine gaL_ --------- 11,828 2, 450 1,846 1,843 1, 310 1,063 555 Tax-paid wltbdrawals •••••••••.•••••••• do •••• --------- 10,643 8,150 8,985 9,450 8,131 7,027 7,538 Stocks. end of montb ................... do .••. 183,548 176,429 167,089 158,030 150,019 142,542 133,195
Sparkling wlnes:t 117 78 91 75 157 Production .•...••••.•••••.••••• __ •.•.•. do •••• --------- 120 115
Tax-paid wltbdrawals .••••.••.•...••.•. do •••• --------- 153 45 36 29 32 33 44 Stocks, end ofmonth ................... do .... 663 689 743 780 894 978 1,050
DAIRY PRODUCTS Butter. creamery:
Price, wholesale, 92--score (N. Y.)_dol. per lb •. .47 .35 .35 .35 .35 . 38 .38 .37 Production (factory) t ....... __ .. thons. oflb •. 116,735 116, 659 119,825 118,020 135,920 149,585 203,360 203,860 Stocks, cold storage, end of montb •.•.•• do ..•. 25,104 114,436 83, 106 63,701 45, 045 37,228 64,720 117, 111
Cheese: Price, wholesale, American Cheddars (Wis· consin) _________________________ dol. per lb .. . 233 .232 .232 .222 .208 .202 .202 .202 Production, total (factory)t ••••. tbous. of lb .. 56,650 74,422 69,850 72,105 88,770 103,030 136,280 131,100
American whole mllkt. •••••....•.... do ____ 42,040 68,744 62,350 62,505 77,215 88,810 117,085 110,430 Stocks, cold storage, end of month .••.. do .... 131,771 201,613 165,018 160,073 188,333 203,901 222,637 261,935
American whole mllk ••••.•...••••••. do ... 112,716 171,869 137,276 133, 140 163,939 178,473 195,537 228,478 Condensed and evaporated milk:
Prices, wholesale, U. S. average: Condensed (sweetened) ...... dol. per case._ 5. 92 5.64 5.64 5.64 5.64 5.65 5.65 5. 65 Evaporated (unsweetened) ..•........ do ..•. 3. 85 3.67 3.67 3.64 3.62 3.55 3. 52 3.49
Production, case goods:t Condensed (sweetened) ....... tbous. oflb __ 7, 033 6,922 3,187 4, 270 6,105 5, 518 5, 051 6, 782 Evaporated (unsweetened) .••.••.•..• do ... _ 178,024 286,684 313,517 300,003 339, 522 358,443 449,330 402,584
•Revised.
13, 166 13,650 2,053 2,104
335 386
2,247 2,328 7,482 7, 727
137 151 322 365 522 522 69 66
232,460 238,059
10,656 10,608 9, 785 9,830
344 348 467 466
30,383 29,608 16,475 15,954 1, 719 1,344
11,919 12,105
30,202 29,656 21,740 21,375 1,332 1,119 7,007 7,023
8,242 8,231 7,664 7,667
574 562 119,940 118,136 20,180 18,485 97,251 96,742
34,909 33,754 15,708 14,683 18,760 18,695
6,803 6,984 6,814 6,864 8,651 8,487
15,829 16,611 7,968 6,893
12,801 15,380 537,737 529,089
7,039 5, 744 8, 585 10, 144
515,847 507,493
6,199 7,548 5,499 6,652
3, 542 3, 940 7, 916 8, 416
124,765 116,168
44 55 54 69
1,037 1,019
.38 . 41 188,665 169,620 148,504 152,198
.205 .210 115,385 104,008 97,005 87,225
296,763 279,905 261,535 243,596
5. 65 5.65 3.49 3. 50
8.970 9,832 326,332 277,969
February 1943
13,712 13,970 2,157 2,224
355 269
2, 322 2, 272 7, 735 7, 957
157 185 373 385 523 560 92 118
240,253 243,094
10,688 10,667 9,850 9,819
366 387 464 450
31,100 34,926 17, 191 18, 152 1,418 3,296
12,267 13,195
31, 196 33,978 22,574 23,576
1, 316 2,571 7,178 7,667
8,268 8,340 7, 702 7, 746
564 59! 123,041 137,071 19,558 26,637
100,828 107,813
34,766 40,916 14,993 19,122 19,424 21,428
6,587 5, 770 6,208 5,626 8,593 8,483
19,284 25,871 6,526 7,528
15,129 16,596 521,243 507,226
4,945 I, 797 10,068 11,439
500,147 487,550
7, 756 7, 952 6, 753 6,926
19,225 85,753 10,747 11,473
113,962 142,851
58 64 93 121
979 916
. 44 . 47 140,130 126,265 123,599 86,981
. 217 -271 86,100 75,300 70,675 58,800
259,078 195,378 224,861 169,913
5.83 5. 83 3. 66 3. 75
8,589 7,364 226,695 208,445
14,09 7 3 7
2, 34 19
8 2, 30 7,
19 39 56
948 7 I 8
1 44
246,74 9
---------------------------------------------------------------------------------------------------------------------------------------------------
4, 70 5 7
53 4, 71 8,2
-------4,07 1
3 350
8,58 499,
5, 0
656 5 480,32
4,98 2 228 4,
48, 360 3
88 9,96
152,2
11 68 9
54 8
.4 107,48
7 0 7 • 45,93
. 2 33 60 0
57,6 43,17
'153, 806 2 •134, 33
5.8 3 3 3. 7
5, 50 6 8 163,64
'Not including data for unfinished and high-proof spirits, which are not available for publication. Data for January to November 1941, revised to exclude these Items are as follows (thousands of tax gallons): Production-January, 13,890; February, 13,353; March, 13,824; April, 13,002; May, 13,056; June, 10,648; July, 9,070; August, 8,340; September, 18,310; October, 26,576; November, 17,910. Stocks-January, 507,447; February, 512,495; March, 516,832; April, 521,043; May, 523,807; June, 524,640; July, 523,998; August, 522,016; September, 519,399; October, 524,877; November, 527,537.
t For revised 1941 data on production for indicated series on dairy products see note marked "t" or p. S-24 of the November 1942 Survey. Data for the indicated series on alcoholic beverages revised fortbe fiscal year beginning July 1941; revisions, which in most cases are minor, not shown above and in note marked .. , .. are avB!Iable on request.

February 1943 SURVEY OF CURRENT BUSINESS S-25
Monthly statistics through December 1941, to-~194211941 I 1942 gether with e:rplanatory notes and references ------- ----,---,---,------,------,----.----.----,----.,-----,---to the sources of the d&ts, m117 be found in the Decem- Decem- Janu- I Febru- I M h I Ap .1 I M I J I I Sep- I Octo I Novem 1942 Supplement to the Suney ber ber ary ary arc n ay nne July August tember ber- ber •
FOODSTUFFS AND TOBACCO-Continued
DAIRY PRODUCTs-Continued.
Condensed and evaporated milk-Continued. Stocks, manufacturers', case goods, end of mo:
Condensed (sweetened) _______ thous. of lb .. Evaporated (unsweetened) ___________ do .••.
Fluid milk: Price, dealers', standard grade. dol. per 100 lb •. Production _____________________ mil. of lb .... Utilization in manufactured dairy productst
mil. of lb .. Dry skim milk:
Price, wholesale, for human consumption, U.S. average ___________________ dol. per lb .•
Production, total t ______________ thous. of lb .. For human consumption t ___________ do .•..
Stocks, manufacturers', end of month, .total thous. of lb ..
For human consumptlon _____________ do ___ _
FRmTS AND VEGETABLES
4,226 82.672
2.95 8, 519
3,478
.134 32,000 30,000
27,060 25,728
Apples: Production (crop estlmate) .•••. thous. or bu •• 2127,655 Shipments, carlot ••••.••••••• no. of carloads.. 4, 744 Stocks, cold storage, end of mo •• thous. or bu.. 30,590
Citrus fruits, carlot shipments .•• no. of carloads. 19,231 Frozen fruits, stocks, cold storage, end of month
thous. of lb._ 187, 929 Frozen vegetables, stocks, cold storage, end of
month __________________________ thous. of lb .. 103, 176 Potatoes, white:
Price, wholesale (N. Y.) .• : ••• dol. per 100lb.. 2.275 Production (crop estlmate) ••••• thous. of bu •• '371,150 Shipments, carlot •.•••••••••• no. of carloads.. 15,564
GRAINS AND GRAIN PRODUCTS Barley:
Prices, wholesale (Minneapolis): No.3, straight _________________ dol. per bu.. . 74 No.2, malting _________________________ do.. . 95
Production (crop estimate) ••••. thous. of bu .• 2 426,150 Receipts, principal markets •••.•.••.••. do.... 9, 967 Stocks, commercial, end of month .•••.• do.... 10,743
Corn: Grindings, wet pro.:esst ................ do.... 10,922 Prices, wholesale:
No.3, yellow (Chicago} •••••••. dol. per bu.. .89 No. 31 white (Chlcago) •.••.•.•.•••.•• do.... 1. 08 Welgnted avg., 5 markets, all grades .do.... . 85
Production (crop estlmate) ••••. thous of bu ••• '3,175,154 Receipts, principal markets ______________ do.. 41,389
~~ ~ooo ~m ~- ~- ~m ~w ~m 328,475 252,532 218,410 213,550 222,485 294, 579 330,810 292,911
5,412 211,001
4,124 136,985
2.445 97.706
2,586 90,678
2. 70 8,466
3,876
.128 31,253 27,525
20,156 18,565
177,948
92,929
.68
. 82 I 362,082
12,190 10,002
2. 73 8, 726
4,007
.131 40,000 35,800
22,931 21,068
157,973
82,638
. 76
.87
2. 74 8,288
3,934
.131 41,800 37,164
28,789 26,102
142,192
73,245
2.044
.13
.87
2. 75 9,626
4,589
.128 54,000 48,470
38,482 34,988
2. 75 10,290
5,036
.127 61,400 55,780
47,459 42,378
2. 75 12,136
6,694
.126 78,100 70,500
60,595 54,305
2. 75 12,570
6,546
.126 79,600 74,200
61,604 54,855
119, 982 101, 810 106, 538 129, 334
61, 781 53, 416 49, 548 65, 358
1. 920 1. 894 2. 581 2. 883
. 70
.86 .71 .88
. 76
.92 .68 .89
2. 75 11,780
5,894
.127 61,000 56,300
48,597 42,822
2. 76 10,788
5,280
.129 55,100 51,400
41,160 36,331
2.82 9,525
4,367
.131 44,000 40,600
32,017 28,084
2.85 8, 944
3, 933
.133 36,000 34,000
19,063 16,847
2.93 8,220
3,240
.132 29,000 27,300
17,567 16,066
186, 003 207, 767 . 225, 104 221, 727 ' 206,396
88, 248 102, 186 117, 796 115, 810 ' 115,845
2. Q19
.65
.80
2.150
.64
.82
1.615
.64
.85
1. 950
.61
.88
2.206
.65
.90
9, 795 10,849 9, 968 11, 228 11.023 11,067 10, 752 10.679 10, 749 10,642 11,276 11, 175
.H .~ .~ .~ .~ .M .M .86 .84 .84 .n .U :~~ :~ :~ :~ :~i :~ :~~ 1:~ 1J~ 1:~ -~~ 1:~~
'2,677,517 --------- --------- --------- --------- --------- --------- --------- --------- --------- --------- --------~w ~~ ~w ~- ~~ ~w -~ •m -~ •oo ~~ ~~
Stocks, domestic, end of month: Commercfal ____________________________ do.. 43,407 47,946 50,311 59,884 60,973 63,363 64,408 57,012 51,774 43,697 38,641 40.112 40,834 On farms _______________________________ do .. 2,277,332 2,016,404 --------- --------- •1,289,588 --------- •761,363 •1423,758 --------- --------
Oats: Price, wholesale, No.3, white (Chicago)
dol. per bu.. . 54 • 53 .58 . 56 .54 .55 .55 .49 .48 .49 .49 .47 . 50 Production (crop estimate) ...•. thous. of bu .. 21,358,730 11,180,663 --------- --------- ------1-- --------- --------- --------- --------- --------Receipts, principal markets •.•.•.•••••... do.. 6, 783 7, 947 8, 519 5, 670 5, 253 5, 614 5, 8 3 3, 671 6, 642 16,918 17,414 13, 125 6, 209 Stocks, domestic, end of month:
Commercial.--------------------------.do.. 9, 534 9, 473 8, 625 7, 483 5, 893 4, 642 3, 776 2,109 2,191 5,132 10,123 12,106 10.451 Rice?n farms _____ --------------------------do.. 887,575 •751, 428 --------- •432, 020 --------- --------- ''192,398 --------- --------- •1,132,933 --------- _______ _
Price, wholesale, head, clean (New Orleans) dol. per lb.. .067 .064 .068 .068 .070 .080 .073 .070 .070 .069 .067 .062 .067
Production (crop estimate) .••.. thous. of bu .. 2 66,363 1 51,323 --------- --------- --------- --------- --------- --------- --------- --------- --------- --------- -------California:
Receipts, domestic,rough ••. bags UOOlb.) __ 543,339 378,554 465,182 229,404 278,245 499,885 422,998 469,837 194,148 40,293 493 394,062 531,917 Shipments from mills, milled rice ••.. do ____ 383,414 260,941 137,749 97,631 162,316 420,205 195,996 392,090 166.373 69,944 36,666 60,150 111,630 Stocks, rough and cleaned (In terms of
cleaned rice), end of mo .. bags (100 lb.)-- 428,358 210, 534 343,001 374,565 364,795 242,690 290,831 187,381 152.048 107,281 70,919 247,027 457,565 Southern States (La., Te:r., Ark., and Tenn.}:
Receipts, rough, at mills thous. of bbl. (1621b.} -- 2, 293
Shipments from mills, milled rice thous. or pockets (100 lb.)__ 2, 091
Stocks, domestic, rough and cleaned (In terms of cleaned rice}, end of month
thous. of pockets (100 lb.}._ 3, 100 Rye:
Price, wholesale, No.2 (Mpls.) •. dol. per bu.. . 70 Production (crop estimate) ...•• thous. of bu •. ' 57,341 Receipts, principal markets ..•••••.••••• do.... 1, 061 Stocks, commercial, end of month ••••• do.... 19,889
Wheat:
2,113
1, 785
3,007
.68 '45,364
2,475 17,474
Disappearance, domestic ..••••••••••••. do •••. --------- 179,227 · Prices, wholesale:
No.1, Dark Northern Spring (Minneapolis) dol. per bu.. 1. 32
No.2, Red Winter (St. Louls) ••••••• do.... 1.48 No. 21 Hard Winter (K. C.) .••••••••• do.... 1.31 Welgnted av., 6 markets, all grades •. do.... 1. 28
Prot!uctlon (crop est.). total •.•. thous. of bn .. 2981.327 Spring wheat.-----------------------do .••. ,2278, 074 Winter wheat •••••••••••••••••••••.•• do •••. 2703,253
1.23 1.27 1.20 1.15
'943,127 1272,418 '670, 709
1,231 1,342 664 198 70 105 14 298 1, 295 2, 902 2, 717
1, 766 1,323 1,397 1,256 471 253 187 253 781 1, 764 1, 947
2,508 2,598 1,885 844 43\1 282 109 158 677 1,908 2, 787
.so .78 .75 .72 .69 .60 .61 .59 . 65 .59 .59
---2~iis· --T9ia· ---i;o9i- ---··soo· ---i~iaa· --·--s6i" ---i;269- ---2~508- ---2;393· ---3;846- --"1:577 16,785 17,029 17,651 17,333 17,240 17,034 17, 212 17,288 18, 477 19,295 19, 761
------------------ 185,815 --------- --------- 169,181 --------- --------- 237,305 --------- --------
1.28 1.34 1.26 1.20
L26 1.31 L23 1.21
1.24 1.30 1. 21 1.19
1.19 1.21 1.15 1.14
1.20 1.20 1.15 1.16
1.14 1.19 1.11 1.11
1.14 1.22 1.08 1.10
1.13 1. 26 1.11 1.11
1.19 1. 33 1.20 1.18
1.19 1. 38 1. 21 1.15
1. 20 1.32 1. 23 1.17
• Revised. ' Revised estimate. • December 1 estimate. 3 Includes old crop only. . t Data for the utilization of llnid milk in manulactured dairy products have been revised beginning 1920 to Include the milk equivalent of dry whole milk; revisions are
minor throughout. For revised 1941 data for production of dry skim milk see note marked "t" on p. S-25 of the November 1942 Survey. Data for com grindings revised beginning October 1941 to Include grindings for export. Revisions for 1941 not shown above are as follows: October, 10,473,000; November, 9,826,000.
508256-43--4
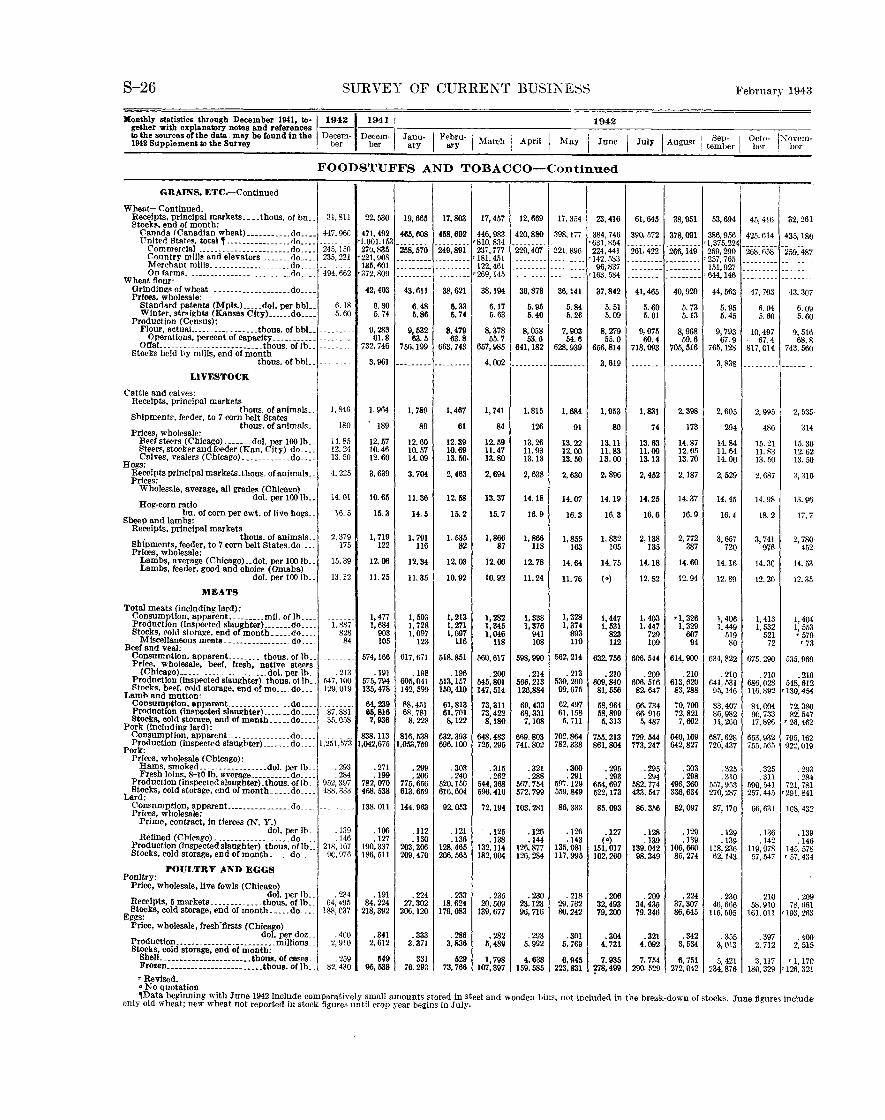
S-26 SURVEY OF CURRENT BUSI~ESS February 1943
Mon~hly statistics through December 1941, ~-~1942,1941 I 1942 ge~her wi~h explana~ry notes and references --- ---~'-----------------_::_::_::__:__ _____________ ~--~the sou':ces ofthe data, may be found in the Decem- Decem- Janu- I Febru-~ Mar ·h I Apr'l I May I June j July I Augu.<t I Sep-
1
. Octo- '!11\ovem-
1942 Supp,emenl ~ ~he Survey ber her 1 ary ISry c 1 ' j i tember ber , ber
FOODSTUFFS AND TOBACCO-Continued
GRAINS, ETC.-Continued
I Wheat-Continued. Receipts. principal markets .... thous. of bu .. 31,811 22,530 19,665 17,803 17,457 12,669 17, 354 23,416 Stocks, end of month:
Canada (Canadian wbeat) ........... do .... 447, 96C 471,492 465,008 458,692 446,983 420,880 398, m 384,746 Unlte<l Statf•s. total, ................ <ln .... •1,001,153 ----- ~- --------- •810, &14 --------- •631, 854
Commercial ....... __ .............. do .... 245, 150 27(), 835 258,570 249,891 237,777 229,407 221.896 224,441 Country mll1s and elevators ....... do .... 235, 221 •221, 908 --------- --------- •181, 451 --------- --------- '142, 583 Merchant mllls ____________________ do _____ 135,fi01 --------- --------- 122,461 --------- --------- 96,837 On farms ----- ... -...... _ .... _._ .. do .... 494,662 •372, 809 •269, 145 --------- --------·· •1fi3. 584
Wheat flour: Grindings of wheat .......... --------- .do .... ---··---- 42,403 43,611 38,621 38, 194 36,878 36, 141 37.842 Prices, wholesale:
Standard patents (Mpl!.) ..... dol. per bbl.. 6. 18 6. 30 6.48 6.33 6.17 5.95 5.84 5. 51 Winter, str•ights (Kansas Clty) ...... do .... 5.60 5. 74 6.86 5. 74 5. 63 5.40 r..26 5.09
Production (Censns): Flour, actual.. .. ., ........... thons. of bbL. --------- 9, 283 9,532 8,479 8, 378 8,058 7,903 8,279 Operations, percent of capacity ___________ --------- 61.8 63.5 63.8 55.7 53.6 54.6 55.0 OffaL. .... -------------------_ thous. of lb .. 732,746 756,199 663,743 657,985 641, 182 628,939 656, 8!4
Stocks held by mills, end of month thous. of bbl.. -------- 3,961 --------- --------- 4,002 --------- --------- 3,619
UVESTOCK
Cattle and calves: Receipts, principal markets
thous. of animals_. Shipments, feeder, to i corn belt States
1, 846 I, 964 1, 789 1, 467 1, 741 1, 815 1,684 1,953
thous. of animals._ 180 Prices, wholesale:
!89 89 61 84 126 91 80
Beef steers (Chicago) ....... dol. per 100 lb .. ~~- 85 12.57 12.60 12.39 12.59 13.26 13.22 13.11 Steers, stocker and feeder (Kan. City) do .... 12.24 10.46 10.57 10.69 11.47 11.93 12.00 11.83 Calves, vealers (Chicago). ___________ do .... 13. 50 12.60 14.09 13.50- 13.80 13.13 13.50 13.00
Hogs: Receipts principal markets.thous. of animals .. Prices:
4, 225 3,639 3, 704 2, 463 2,694 2,638 2, fi30 2,896
Wholesale, average, all grades (Chicago) dol. per 100 lb .. 14.01
Hog-corn ratio 10.65 11.36 12.58 13.37 14.18 14.07 14.19
bu. of corn per cwt. of live hogs_. 16.5 Sheep and lambs:
15.3 14.5 15.2 15.7 !6.9 16.3 !6. 3
Receipts, principal markets . thous. of animals __ 2, 379 1, 719 1, 791 I, 535 1,866 1,866 1,855 1. 832
Shipments, feeder, to 7 corn belt States. do .... 175 122 116 82 87 118 1fi3 105 Prices, wholesale:
Lambs, average (Chicago)..dol. per 100 lb .. 15.39 !2.06 12.34 12.03 12.00 12.78 14.64 14.75 Lambs, feeder, good and choice (Omaha)
dol. per 100 lb .. !3.12 11.25 11.35 10.92 10.92 11.24 11.76 (•)
MEATS
Total meats (including lard): 1,328 Consumption. apparent. ________ mll. of lh _____ ----- 1,477 1, 503 1, 213 1,282 1,338 1,447
ProductiOn (inspe<•ted slaughter) ....... do .... I. R87 I, 684 I, 728 1, 271 1,345 1,376 1,374 1, 531 Stocks, rold storage. end or month _____ do ___ 828 903 1,097 1,097 1,046 941 893 823 Miscellaneous meats ________________ do .... 84 105 123 116 118 108 110 112 Beer and veal:
Consumption. apparent ________ thons. of lb .. ----· 574,166 617,671 518.851 560,617 598,990 562,214 632, 756 Price. wholesale, beef, fresh, native steers
(Chlca!(o). ____ ... . .. .. .... dol. per lb . 213 .191 .198 .196 .200 . 214 . 213 • 210 Production (lnsp~cted slan!lhter) _ thons. of lh .. 547. 100 575,794 605,041 513, 157 545,801 566,213 530,200 609,840 Rtocks. b~~f. rold storage, end of mo ... do .. _ 129,019 135,478 142,599 150,410 147,514 126,884 99.075 81,556
Laml> and mutton: Consumption, apparent ... _________ • _ •. do .... 64,239 ~8. 451 61,813 73,311 69,433 62,497 58,964 Prodnct!on (Inspected slanghter) __ ._ ... do .... 87.881 66,816 68.781 61.701 73,422 68,331 61, ISS 58,899 Stocks, cold storal!e, end or month_ .... do .... 35,058 7,936 8. 228 8,122 8,180 7,108 5, 711 5,313
Pork (including lard): Consumption, apparent .... ____________ do. ___ 838, 113 816,538 632,393 648,483 669.803 702.864 755,213 Production (inspected slau!lhter) _______ do ____ 1,251,573 1,042,675 1,053,759 696,100 725,295 741,802 782,338 861,804 Pork: Prices, wholesale (Chicago):
Hams, smoked ................. doL per lb .. . 293 .271 .299 . 303 .315 . 321 .300 • 295 Fresh lnlns, 8-10 lb. avcrage .......... do .... . 284 .199 .206 . 240 .262 .288 . 291 .293
Production (inspected slaughter). thous. of lb. 952,397 782,070 775,656 520, !56 544,368 567.754 5!17. 129 654,697 L~~:cks, cold storage, end of month __ ... do .... 488.333 468.538 613.659 616,604 590.416 572.799 559,849 522,173
Consumption, apparent. ............... do. ___ ---------Prices, wholesale:
138.011 144, 9fi3 92,053 72,194 103, 281 86,333 85.093
Prime, contract, In tierces (N. Y.) dol. per lb. . 139 . 106 .112 .121 .125 .126 '12f\ .127
Refined (Chicago).------------- ___ .. do._ .. .146 .127 .130 .136 .138 .144 -143 (•) Production (Inspected slaughter) thous. of lb __ 218.107 190.337 203,306 128.465 132.114 126,877 135,081 151,017 Stocks, cold storage, end of month ..... do ____ 9C, 976 186, 511 209,470 206,565 182,004 126,284 117,995 102,260
POULTRY AND EGGS Poultry:
Price, wholesale, live fowls (Chicago) dol. per lb .. . 234 .191 . 224 -233 . 235 . 230 . 2!8 .206 Receipts, 5 markets _____________ thous. of lb .. fi4,495 84,224 27,302 18.624 20.509 23.123 29. 762 32,493
Stocks, cold storage, end of month ..... do .... 188, C37 218,392 206,120 179,083 139,677 96,716 80,242 79,200 f;!(~tS:
Price, wholesale, fresh"firsts (Chicago) dol. per doz._ . 4DO .341 .333 . 286 .282 . 293 . 301 .304
Production ......................... millions .. 2, 910 2, 612 3.371 3,836 5,489 5, 992 5, 769 4, 731 Stocks, cold storage. end of month:
SheiL ..................... thous. of cases .. . 259 649 331 529 1, 798 4. 638 6,945 7.935 Frozen ........................ thons. of lb._ 82,430 95,538 76.293 73,766 107,397 159,585 223,831 278,499 • Revised. • No quotation
61,645 38,951 53,694
390, 572 378,091 386,956 •1,375,224
261. 422 266,149 269,290 --------- --------. •257, 765 -------- --------- 151,927
-------- •644, 146
41,465 40,920 44,563
5. 60 5. 73 5.95 5.01 5.13 5.45
9, 075 8, 968 9, 793 00.4 59.6 67.9
718,093 705,516 765, 128
--------- --------- 3,838
1,831 2,398 2,605
74 173 294
13. 6.1 14.87 14.84 11.09 12.05 11.64 13.13 13.70 14.00
2,452 2,187 2, 529
14.25 14.37 14.45
16.6 16.9 16.4
2, 138 2, 772 3,657 135 387 720
14.18 14.60 14.16
12.52 12.94 12.89
!. 403 '1, 326 1,406 1, 447 1.329 1, 449
729 607 519 109 94 so
606, 544 614,900 634,822
.209 . 210 . 210 606. 5!6 613,620 641, 53! 82.647 83,288 95, 146
66. n4 70,700 83,407 66. 9!6 72,821 86,982
5, 487 7,602 11,260
729.544 640,169 687,628 773,247 642,827 720,437
.295 .303 .325
.294 .298 .310 582,774 496,360 557,953 433.547 336,634 270,287
86,356 82,097 87, 170
.128 .129 .129
.139 .139 .139 139,042 106,660 118,236 98,349 85,274 62, 143
. 209 .224 . 230 34,435 37,307 46,666 79,346 86,645 115,505
.321 .342 • 355 4.092 3, 534 3, 013
7. 754 6, 751 5, 421 290-529 272,042 234,876
45,416
425.614
268.658 ------------- --. ------
47, 703
6.04 5.60
10,497 67.4
817, C14
--- ----
2, 995
486
15.21 11. ~3 13. 50
2.687
14.98
18.2
3, 741 976
14. 3C
12.20
1. 413 I, 532
521 72
675. 290
. 210 686,028 116,892
84,004 9~. 733 17,896
653,932 755,565
.325
. 311 590, 541 257,445
32, ~61
435, 18 0
259,48 --- -------- -----------
43,30
6.0 5.6
9 0
9,51 6 8
60 68.
743,5
-------
2,53
3! 4
0 2
15.3 12.6 13. 50
3, 31 0
13.9
17.
2, 7 80 45
3 14.5
12.3
1,4 I, 55
04 3 9 3
• 57 •7
535,96 9
0 2
54
.21 548,61
•130,4
72,3 80 7 2
82,54 • 26,46
795,16 2 9 922,01
. 29
721, 78 •291, 84
3 284
1 1
66, 631 1108, 43
. 136 .13 9 6 8 4
.142 119,978 57,547
. 210 58.910
161,011
. 397 2, 712
3,117 180,329
.14 145. 57 • 57,43
209 1 3
78,66 '193, 26
. 4 00 5 2, 51
• I, 17 0 I •126, 32
,Data beginning with June 1942 include comparatively small amounts stored in steel and wooden bins, not included in the break-down of stocks. June figures includeonly old wheat; new wheat not reported in stock figures until crop year begins in July.

February 1943 SURVEY OF CURRENT BUSINESS
1\lonthly statistics through December 1941, to· 1942 I 1941 I 1942
gether wilh explanatory notes and references Decem- Decem- 1anuaryl Febru·i March I I I to lhe sources of the dala, may be found in lhe April May June 1942 Supplement to the Survey ber ber ary
FOODSTUFFS AND TOBACCO-Continued
TROPICAL PRODllCTS
Cocoa, price, spot, Accra (N. Y .) . dol. !l4)r lb .... Coffee:
0.890
Clearances from Brazil, totaL thous. of bags .. 506 To United States ..•.•................ do ..•. 378
Price, wholesale, Santos, No.4 (N.Y.) dol. per lb .. . 134
VIsible supply, United States.thous. of bags._ 703 Sugar, United States:
Raw sugar: Price, wholesale, 96° centrifugal (N.Y.)
dol. per lb .. . 037 Refined sugar, granulated:
Price, retail (N. Y.) .................. do .... .068 Price, wholesale (N. Y.) .............. do ..•. . 055
MISCELLANEOUS FOOD PRODUCTS
Candy sales by manufacturers .... thous. of doL 32,741 Fish:
Landings, fresh fish, prin. ports •• thous. oflb .. --------Stocks, cold storage, 15th of month ..••• do.... 105, 699
Gelatin, edible: · Monthly report for 7 companies:
Production. _____ ----------------- __ .do ... _ 2, 014 Shipments ........... ----------------do.... 2, 054 Stocks._. ______ ------------------ .... do... 2, 504
QuartPrly report for 11 companies: Production ............... ·-----------do •••. __ ----- __ Stocks._--------------·--- ............ do ... .
TOBACCO Leaf:
Production (orop fstlmate) ........ mil. oflb.. '1,417 Stocks, dealers and manufacturers, total, end
of Quarter .................... mil. of lb •• ---------Dome.«tlc:
Cigar leaf.. ________________________ do •.•. ----- __ .. Fire-cured and dark alr-cured •...•. do •••. --------Flue-cured and light air-cured ...••. do •.•. ---------Miscellaneous domestic •• __________ do .... ---------
Foreign grown: Cigar leaL -------------------------do •.•. ------- .. Cigarette tobacco._ ----------------do .... ________ _
Manufactured products: Consumption (tax-paid withdrawals):
Small cigarettes .... __ ..•• ------ __ millions •. Large cigars ............ ------- thousands •. Mfd. tobacco and snutJ •...•. thous. of lb •.
19,716 685,002 24,082
Prices, wholesale (list price composite): Cigarettes, f.o.b. destlnaUon .. dol. per 1,000.. 6. C06 Cigars, delivered .................... do.... (')
Production, manufactured tobacco: Total.------------ ______________ thous. of lb •. ________ _
~~~~-c-~~_"~~~!~~~~::::::::::::::::::~~:::: ::::::::: Scrap chewing •.••.••••••..•••.•.•.•. do ..•. ________ _ Smoking _________________________ , __ .do •... ---------Snuff .......•. ______ ---------- ....... do .... ___ . ___ .. Twist •. ------------------------------do ...... _____ ..
BIDES AND SKINS
Livestock slaughter (Federally Inspected): Calves .•.•......••..•••.•. thous. of animals .. 476 Cattle .••••••.•. ___ ----- •••.•••.......•. do .. __ 982 Hogs .••..•...•...•.•.•...•.•.•.. ___ ••.. do .. __ 6, 778 Sheep and Jamb •.•.•...•...•.•...•.•.•. do ..•. 2,175
Prices, wholesale (Chicago): Hides, packers•, heavy, native steers
dol. per lb •. .1f5 Calfskins, packers•, 8 to 15lb •••.•••••. do .... .218
LEATHER Production:
Calf and kip .. ---------------thous. of skins •. Cattle hides .................. thous. of hides ..
1, 041
Goat and kid ................. thous. of skins •• 3,169 Sheep and Jamb ________________________ do •.•. ________ Prices, wholesale:
Bole, oak, bends (Boston)t •..•.•. dol. per lb .. . 440 Chrome, calf, B grade, black composite
dol. per sq. ft.. .529 Stocks of cattle hides and leather, end of month:
TotaL ............... thous. of equiv. hides •. _________ Leather, in process and tlnlshed •••••• do .... ---------Hides, raw--------------------· ..•.•. do .... _________
• Revised. • Revised estimate. • December 1 estimate.
0. 0935 0.0950 0. 0892 0. 0890 0. 0890 0. 0890
1,008 1,073 766 680 I, 006 773 970 I, 001 665 609 842 635
.1:13 .134 . 134 .134 .134 .134 1, 327 I, 471 1,102 850 852 825
. 035 . 037 .037 . 037 .037 . 037
.060 . 064 .066 .066 .066 .065
.052 .053 -053 .053 • G55 .055
31,043 27,007 27,277 28,914 27,179 22,830
•29,'132 16,355 13,853 39,153 42,493 48,879 117,805 99,979 82,677 62,160 49,079 55,036
2,081 2,245 2.102 2,269 2,164 2,116 2,121 2,094 2.126 2,147 2,162 1,940 3, 392 3, 542 3, 518 3,640 3,642 3,819
8,314 --------- --------- 8,549 --------- ---------5,026 --------- --------- 5,139 --------- ---------
I I, 263 --------- --------· --------- --------- ---------3,492 --------- --------- 3, 510 --------- ---------
340 --------- --------- 437 --------- ---------251 --------- --------- 303 --------- ---------
2, 784 --------- --------- 2, 663 --------- ---------4 --------- --------- 4 -------- ---------
21 --------- --------- 21 --------- ---------Ill --------- --------- 81 --------- ---------
16,201 19,503 16,628 17,016 17,380 18,455 474,913 458,277 441.805 489,727 503,536 457,767 24,265 27,938 24,426 27,919 27,825 25,181
5. 760 5. 760 5. 760 5. 760 5. 760 5. 760 46.056 46.056 46.190 46.592 46.592 46.592
25,521 27,365 25,072 28,656 27,745 25,950 415 415 358 411 398 420
3, 769 4,045 3, 697 4,445 4,347 4, 297 3, 410 3,673 3,411 4.117 3, 913 3, 768
14,070 14,990 13,854 15,240 14,782 13,705 3. 392 3, 763 3, 265 3, 916 3,827 3, 302
465 479 486 528 478 459
LEATHER AND PRODUCTS
457 440 392 491 502 471 1,004 1,057 891 929 956 885 5, 767 5, 831 3,892 4,134 4,196 4,320 I, 571 1,611 1,407 1,669 I, 570 1, 475
.155 .lob .155 .155 .155 .155
.218 . 218 .218 . 218 .218 .218
1,048 ~22 974 1,040 1,006 989 2,572. 2, 666 2, 502 2,629 2,684 2,577 4, 441 4,226 4,005 4,414 4., 320 3,631 4,303 4,163 4, 555 4,462 4,552 4,998
.440 .440 . 440 .440 .440 .440
.629 . 531 .531 .531 .529 .529
14,021 14,223 14,052 13,413 12,747 12,389 8,691 s, 958 8,923 8,900 8,879 8,898 5, 330 5, 265 5,129 4,513 3,868 3,4g1
• No quotation. tRevised series; revised data beginning July 1933 will be shown in a •ubsequent issue.
0.0890
453 348
.134 1, 079
. 037
. 066
. 055
19,177
49,195 63,411
1,860 2,151 3,528
8,035 4,782
---------3,177
426 280
2,366 4
22 78
20,004 532,390 27,807
5. 760 46.592
28,207 481
4,878 4,047
14,912 3,366
522
475 1,039 4,554 1,481
.155
.218
1,031 2,534 3,490 4,614
.440
.529
12,139 8,925 3,214
1uly I August I Seb~~m-1
'0. 0890 0.0890 0. 0890
560 269 519 418 136 366
.134 .134 .134 973 795 539
. 037 .037 . 037
.066 .066 .068
. 055 .055 .055
20, 136 23,962 29,234
48,887 49,307 40,021 81,496 100,088 109,428
I, 962 1, 715 I, 712 2. 292 2,130 1, 907 3, 198 2, 783 2, 588
6, 861 --- ----- --------- 3, 301
--------- --------- ---------
--------- --------- 3, 252
--------- --------- 380 --------- --------- 240 --------- --------- 2,520 --------- --------- 3
--------- --------- 25 ------ ----------- 84
20,875 20,941 21,978 510,823 498,872 519,976 27.013 25,329 27,329
5. 760 5. 760 5. 760 46.592 46.592 (')
29,443 26,475 27,535 446 437 437
4, 933 4, 749 5,128 5, 24& 4, 724 4,260
15,02/i 13,259 14,035 3, 264 ' 2, 799 3,169
534 506 507
461 460 513 I. 048 1,103 1,159 3, 886 3,223 3,843 1. 705 1,840 2,223
. J.o5 .155 .155 -218 . 218 . 218
1. 053 1,093 1,029 2.601 2,364 2,384 3, (137 2,423 2, 728 4. 147 4,287 4,150
.440 ,440 .440
. 529 .529 .529
11,622 11,706 11,809 8, 7(2 8,679 8,691 2. ~60 3,027 3,118
Octo-ber
0.8090
716 508
.134 381
. 037
.058
. 055
35,665
38,659 115,128
2,128 1,050 2,666
---------
---------
-------------------------------------
------------------
23,075 633, 3EO 30,956
5. 760 (3)
29,845 426
5,036 4,624
15,980 3, 252
526
572 1, 280 4, 218 2, 344
. 155
. 218
1,073 2, 642 2, 929 4,462
.440
. 529
'11, 861 '8,811 '3,050
S-27
iNovem-ber
0.890
510 384
.134 361
.037
.068
. 055
32,099
28,449 '114, 19&
2, 217 2,339 2,544
--------
--------
--------------------------------
----------------
20,447 474,348 25,882
'6.006 (3)
50 ! 8
23 1, 01 5,0 2, 12 6
- 15 . 21
r 1,00
5 8
2,44 9 1 iS 9
2, 65 4, 8E
.44 0
9 .52
11, 8, 2.
804 904 900

S-28 SURVEY OF CURRENT BUSINESS February 1943
gether with explanatory notes e.nd references ------ ----,-----,-,-----,---,-------,-----,------,-----,------------~ Monthly statistics through December 1941, lo·,l94211941 I '1942
lothesourcesofthedata,maybefoundinthe Decem- Decem· Jaarnyu- I Feabryru-~ March I April I May I June I July I August I teSmepb-er I Obcetro- INob'e'erm-1942 Supplement to the Survey her her I
LEATHER AND PRODUCTS-Continued
LEATHER MANUFACTURES Gloves and mittens:
Production (cut), totaL __________ dozen pairs .. 270,905 216,623 207,169 252,904 283,112 296,359 313,805 289,8&1 Dress and semldress .. ________________ do ...•. 153,671 120,228 122,262 158,253 180,237 183,210 198,458 178,452 Work .••. _______ •• _ •.•.••• ___ .•• _ •• __ do._. __ 117,234 96,395 84,907 94,651 102,875 113,149 115,347 111,398
Boots, aboes, and slippers: Prices, wholesale, factory:
Men's black calf blucher •••••. dol. per g.air __ 6. 75 6.40 8.40 6.40 6.40 6. 75 6. 75 6. 75 Men's black calf oxford\ corded tip ••• o .... 4.60 4.40 4.65 4.60 4.60 4.65 4.61 4.60 Women's colored, elk b ucber ..•.•.•. do ____ 3. 60 IJ.56 8.58 3.60 3.60 3.60 3.60 3.60
Production, boots, shoes, and slippers: TotaL. --------·-·-··-··---thous. or pairs •. 38, 182 38,451 311,828 40,006 45,106 45,590 40,771 39,643
A tbletlc. _. ___ • _ ••• ___ •••••.••••• _._do. ___ 453 442 358 377 572 620 504 481 All fabric (satin, canvas, etc.) •••••• do •.•. 317 337 ~36 454 643 535 478 39S Part fabric and part leather __ ..•••. do •••. 1, 003 1,052 1,352 1,356 1,247 1,056 883 555 High and low cut, leather, totaL ••. do ..•. 32,058 32,654 34,899 34,110 38,220 38,362 34,046 33,416
Government shoes .••••..•.••.••. do ____ 3, 715 1, 737 2,223 2,336 2,954 3,858 3,614 3,675 Civilian shoes:
Boys' and youths' •••.••••.•••. do ____ 1, 316 1, 535 1,~93 1,410 1, 513 1,526 1,412 1,4W Infants' •• ____ ._._._._._ •• _ •.•• _ do ____ 2,101 2,296 2,146 2,029 2,340 2,372 2,187 2,124 Misses' and chlldren's ••.••••••. do ..•. 3, 236 3,888 3,805 3,659 3,760 3, 751 . 3,344 3,603 Men's .. __ ••• _______ • ____ ••• __ •. do ____ 7, 732 10,410 9,871 9,368 9,640 9, 730 8,557 8,311 Women's •• __ --·- __ ------·-···-do .... 13, 958 12,789 15,461 15,308 18,013 17,127 14,932 14,245
SUppers and moccasins for housewear tbous. of pairs .• 3, 663 3, 509 l, i)56 2,674 3,297 3,607 3,577 3, 777
All other footwear .•••.•••..•••.•.•. do ____ 687 459 827 1,036 1,127 1,410 1, 283 1,018 '
LUMBER AND MANUFACTURES
LUl\IBER-ALL TYPES National Lumber Manufacturers Assn.:t
Production, totaL. _______________ mn. btl.rt •• --------- 2,445 '2, 385 '2,335 '2,494 '2, 768 r 2, 763 '2,921 Hardwoods._ ---------·-··-·-···-···-·do .••• 464 454 450 440 473 431 423 Softwoods ..• ___ .• __ •••••••• -._.-•.•••. do •••• --------- 1,981 rJ,931 '1, 885 '2,054 '2,295 '2, 332 r 2,498
Sb~ments, totaL •••••••••••••••••.•••• do ____ --------- 2,433 r 2, 552 '2, 537 r 2,801 '3, 186 '3,033 '3, 106 ardwoods •• _ •••••••••••••••••••.•••. do ..•• 450 458 443 458 470 496 501
Softwoods ••.• ____ •• _ ••••••••.•• -..•••. do ..• _ --------- 1,983 '2,094 '2,094 '2, 343 r 2, 716 '2, 537 '2, 605
stnct!':d!~~~-e~~-~:~~~t~:-~~~~~::::::~~:::: --------- 6, 976 6,802 6, 599 6, 308 5, 958 5, 717 5, 534 2,002 1,998 2,004 1, 986 1, 991 1,925 1, 846
Softwoods ____ ._ ••• __ ••••••••••...• _ •. d<> .••• --------- 4, 974 4,804 4, 595 4,322 3, 967 3, 792 3, 688 FLOORING
Maple, beech, and blreh: 7,225 7, 775 7,150 7,300 7,200 7,875 Orders, new __________ ----·--------M bd. ft.. --------- 8,575
Orders, unfilled, end of month ••••.•••• do .•.. 9,050 11,975 9,600 10,550 10, 125 8, 750 8,950 Production._.-----------. _____________ do .• __ 8.075 7,175 7,550 7,275 7,500 7,150 7,625 Shipments._ .. _. ____ ---._-·- -----------do .• __ --------- 7,350 7,075 7,100 7,500 7,700 8,850 7,675 Stocks, end of month .•••••••••.•.•••••• do .•.• 13,626 14,075 14,250 14,000 13,850 12,000 12,100
Oak: Orders, new----·- ______ ----- __ -·-··-·- .do. ___ 17,641 34,286 40,749 39,369 34,972 32,560 27,732 17,911 Orders, unfilled, end or month •••••••.. do ____ 20,053 42,035 46,235 48,097 45,481 42,673 37,488 30,479 Production ____ •••.••••••.• __ ._ ••••• ____ do._._ 18,007 42,697 41,647 36,719 38,691 40,656 36,283 30,062 Shipments.-- __ .----·------- ··--···----do •••. 17,064 35,100 86,549 37,788 37,588 37,027 32,917 24,920 Stocks, end of month .••..•..•.••••••••. do •••. 64,506 55,875 60,673 58,601 59,704 63,333 06,699 72,341
Douglas fir: SOFTWOODS Prices, wholesale:
Dimension, No. I, common, 2 x 4-16. 29.498 32.340 32.340 32.340 dol. perM bd. ft •• 32.340 32.095 32.340 32.340
Flooring, Band better, F. G., I x 4, R. L. 42.336 44.100 44.100 dol. per M bd. ft.. 44.100 44.100 44.100 44.100 44.100
Southern pine: Orders, newt---------------------mil. bd. ft .• --------- 761 1, 010 832 936 957 758 794 Orders, unfilled, end of montb ..•••..•. do .••• --------- 621 796 858 940 943 887 871 Prices, wholesale:
Boards, No.2 common, 1 x 8 30.804 30.000 dol. perM bd. ft •• 30. coo 30.620 30.663 3(l. 770 30.000 30.000
Flooring, Band better, F. G., 1 x 4 ••. do ..•. 55.000 53.596 54.330 54.708 53.798 55.000 55.000 55.000 Productlont ••••••• ----·-··-------mll. bd. ft •• 770 785 702 749 759 745 753 Sb!pmentst •. _____ .---·-··-·····--····-do ____ --------- 743 835 770 854 954 814 810 Stocks, end of month ••••••••••••••.•••. do .. __ 1,425 1, 375 1,307 1, 202 1,007 938 881
Western pine: Orders, new-··--·-- __ ------ ______ .••••• do •••. --------- 491 519 352 482 684 575 664 Orders, unfilled, end or month •.••..•.. do ____ 421 520 465 473 614 635 671 Price, wholesale, Ponderosa, boards, No. 3
common, I x 8 ••••••••••.• dol. perM bd. ft._ 31.83 30.42 30.73 31.46 31.52 31.04 31.35 31.51 Productlont --··---------------··-mil. bd. ft.. 368 266 292 374 484 522 691 Shlpmentst __ .--------·--·-·······-----do ••.. 426 421 407 474 543 553 628 Stocks, end of montht .••••••••••••.•••• do ••.• 1, 681 '1, 526 1,411 1, 311 1, 252 1, 221 1, 284
West coast woods: Orders, newt--···-··----- ____ ------- __ .do. ___ 580 868 '747 '680 '765 '1,062 '977 '867 Orders, unfilled, end of month •••••••.• do ..•• 1,057 827 929 897 891 1,029 1,097 I,067 Production t ••• _. _ •••• _ ••••••• __________ do._._ 524 642 '668 '690 '717 '819 '825 '806 Shipmentst _______ ------··-···- ___ ••••. do. ___ 624 626 '642 '713 '771 '939 '893 •887 Stocks, end ormonth ••••••••.••••••••.• do ____ 497 971 991 968 929 875 835 756
Redwood, California: Orders, new_ -·--------------------M bd. ft.. 38,864 29,688 41,252 40,942 55,566 39,407 39,445 44,631 Orders, unfilled, end or month •••.••.•. do ..•• 85,128 41,696 49,873 61,104 75,009 66,073 64,152 65,359 Production •.•• _._. _____ •••••••• __ ••••• _ do ••• _ 33,571 30,698 35,642 33,I28 38,808 37,960 37,397 41,666 Shipments .•. ------------··------------do •••. 38,830 22,877 32,292 30,208 43,560 46,562 41,205 43,307 Stocks, end ofmontb •••.••••••....••... do ..... 158, 153 253,061 249,176 249,377 240,342 228,068 220,602 213,124
r Revised.
295,243 272,256 268,191 177,707 159,056 150,656 117,636 113,200 117,535
6. 75 6. 75 6. 75 4.60 4.60 4.60 3.60 3.60 3.60
41,689 38,796 37,094 459 424 452 147 175 237 671 611 716
35.912 33,046 31,089 3,678 3,879 3,333
1, 562 1,392 1, 419 2.151 2,125 2,074 3.602 3, 224 3,055 s. 578 7,446 7, 560
16, 341 14,980 - 13,648
3, 850 4,080 4,219 650 460 381
'3,047 '2,936 '2,842 465 471 451
'2,582 '2,465 '2, 391 '3, 293 '3,057 '2,971
638 510 523 '2, 755 '2,547 '2,348
5,280 5,148 5,046 1, 773 1, 734 1, 662 3, 507 3,414 3, 384
7.S25 6,950 5,900 8,650 8,100 7,200 7, 500 6, 850 8,000 7,675 7,500 6,950
12,000 11,500 12,500
17,616 22,720 22,609 24.957 27,771 22,631 25. 491 19,288 18,633 21,071 18,906 21,214 76, 763 76,422 73,841
32.340 32.340 32.340
44.100 44.100 44.100
826 731 740 840 793 794
30.000 30.000 30.000 55.000 55.000 f5.000
807 738 706 857 778 739 831 791 758
597 564 586 626 578 562
31.36 31.53 31.53 695 666 637 642 612 602
1, 337 1, 391 1, 426
'1,075 '842 '847 1. 171 1,145 1, 150 '818 '820 '812 '945 '858 '830
622 572 578
50,047 44,983 58,135 73, I37 87,154 88,086 42.008 38,790 38,462 46. 673 48,647 48,738
207,.588 195,721 182,697
'295, 715 '166, 831 128,884
6. 75 4.60 3.60
39,842 460 361 992
32,929 3,920
1,580 2,042 3, 239 8,282
13,865
4,430 6il
'2, 782 442
'2,340 '2, 941
541 , 2,400
4,898 1, 563 3,335
6,COO 5, 700 6, 500 7, 500
11, 500
23,249 19,1C1 20,174 26,779 65,236
32.340
44.100
755 818
30. coo 55.000
705 731 732
640 578
32.Cl 641 624
1, 443
'711 1,095 '757 '768
578
58,278 90,997 41,I63 51,567
170,197
257.13 9 3 6
142,82 114,31
6. 7 5 0
60 4.6 3.
'35, 22 7 5 5 1 4
24
41 30
'90 '28, 96 r3,4
'1,16 4 3 3 9 1
'2,00 2, 74
'7,10 '12, 52
'3,98 5 58 '6
2,39 5 0 5 2 0 2 9 5 4
41 1,98
,. 2,56 49
'2,07 4, 75 1, 48 3, 27
5, 85 0 0 0 0 5
5, 50 6, 25 6,30
11,27
18,6 19,47
26 6 0 1 3
18,40 18,25 63,56
32.34 0
0
0 6
44.10
60 73
30.00 0 0 5 2 5
55.00 67 68 72
47 4 6 56
31.3 8 2 6 9
43 48
1, 38
'68 4 6 9 3 6
1,10 66 67 59
44,86 91,54
8 2 9 9 7
35,39 40,97
163,45
t Lumber statistics for 1941 and 1942 have been revised to data from the 1941 Census of Forest Products. RPv!sions have been made also in earlier figures beginning 1937 for hardwood stocks and total lumber stocks, and beginning 1939 for softwood stocks and new orders, production, and shipments of west coast woods, on the basis of additional Information now available. Revisions for all months of 1941 and earlier figures affected by the revisions will be published later.

February 1943 SURVEY OF CURRENT BUSINESS S-29
gether with explanatory notes and references --- ---1------,---,----,----,,---..,...::~=-.-----,----;----.----,---lrt:onlhly statistics through December 1941, to-,1942,1941 I 1942
to the sources of the data, may be found in the Decem- Decem- .Tanu- I Febru-1 March I April I M I ;r Jul I A t I Sep- I Octo- INovem-1942 Supplement to the Survey ber ber ary ary ay une Y ugus tember b~r ber
LUMBER AND MANUFACTURES-Continued
FURNITURE All districts:
Plant operations _______ percent of normaL 67.0 82.0 79.0 83.0 79.0 79.0 78.0 78.0 74.0 72.0 72.0 74.0 i3.0 Grand Rapids district:
Orders: Canceled._._ ••••. percent of new orders_ . 7.0 15.0 8.0 7.0 8.0 5.0 10.0 8.0 5.0 4.0 5.0 2.0 8.0 New ....•.....•. no. of days' production .. 22 15 22 20 18 29 23 21 23 25 30 25 24 Unfilled, end o! month _____________ do ____ 46 59 59 58 50 58 53 50 52 55 63 58 51
Plant operatlons •.•.•.•• percent of normaL_ 73.0 86.0 81.0 82.0 75.0 79.0 78.0 75.0 73.0 60.0 51.0 58.0 69.0 Shipments ..•••••• no. of days• production •. 25 28 24 22 25 21 22 20 19 18 20 26 26
Prices, wholesale: Beds, wooden._ -------------------1926= 100 .. 101.0 101.2 101.2 101.0 101.0 101.0 101.0 101.0 101.0 101.0 101.0 101.0 101.0 Dining-room chairs, set of 6 .•• _________ do ____ 118.9 115.0 118.9 118.9 118.9 118.9 118.9 118.9 118.9 118.9 118.9 118.9 118.9 Kitchen cabinets __________ ------------ .do ____ 102.6 102.0 102.6 102.6 102.6 102.6 102.6 102.6 102.6 102.6 102.6 102.6 102.6 Living-room davenports ________________ do •••• 104.2 104.2 104.2 104.2 104.2 104.2 104.2 104.2 104.2 104.2 104.2 104.2 104.
Steel furniture (see Iron and Steel Section). 2
METALS AND MANUFACTURES
IRON AND STEEL I Iron and Steel Serap
Consumption, total* ..... thous. of short tons .. --------- 5,078 4,956 4,708 5, 221 5,156 5,225 5,000 5,006 5,015 4, 955 5,342 4,930 Home scrap•. -----------------------do •••. --·------ 2,873 2,822 2,643 2,956 2,919 2,932 2, 763 2, 792 2,812 2,846 3,034 2, 796 Purchased scrap• •. ---------------- ..• do .... 2,205 2,134 2,065 2,265 2,237 2,293 2,237 2,214 2,203 2,109 2,308 2,134
Stock. consumers', end of mo., total* ••• do .... --------- 3,802 3,503 3,455 3,460 3,682 3,972 4,297 4,579 4, 780 4,993 5, 530 6.078 Home scrap• _--··--------------------do •••• 1,167 1,145 1,170 1,114 1, 105 1,077 1,185 1,286 1,337 1,388 1,460 I, 544 Purchased scrap•. ------- __ ----------.do .••• --------- 2,635 2,358 2,285 2,346 2. 577 2, 895 3,112 3, 293 3,443 3,605 4,070 4, 534
Iron Ore
Lake Superior district: Consumption by furnaces
thous. of long tons._ 7, 759 7,062 7,158 6,403 7,109 7,007 7,230 7,034 7,176 7,155 7,140 7, 599 7,456 Shipments from upper lake ports ••.•• do ____ 636 835 0 0 793 7,857 12,677 12,625 13,405 13,236 11,848 11,417 7,582 Stocks, end of month, total ........... do .... 47,424 40,457 33,919 27,526 20,100 20,065 25,199 30,931 37,327 43,236 48,422 52,667 53,708
At furnaces •• ____ ------------------do •.•• 40,603 35,563 29,627 23,835 17.561 17,536 22,310 27,664 33,289 38,124 42,548 45,883 46,552 On Lake Erie docks ................ do .... 6, 821 4,894 4,292 3,691 2,629 2,529 2,889 3,267 4,038 5,112 5,874 6, 784 7, 151
Pig Iron and Iron Manufactures
Castings, malleable: Orders, new,net .................. short tons __ 93,824 56,587 '106, 045 66,292 62,979 60,398 54,219 55,032 63,651 63,978 r 87,697 70,907 '74, 080 Productlon ••••••••••••••.•••••••••••••• do ____ 66,177 71,311 '69,203 65, 140 69.737 71,256 60,696 59,990 61,434 56,304 r 61,021 68,251 '59, 287 Shipments ............... _--------- .. __ do .... 63,703 70,744 '65,640 62,724 65,866 68,459 61,783 59,144 59,120 56,651 '58, 977 65,457 '58,484
Pig iron: Consumptlon• __________ thous. of short tons •. --- ~----- 5,020 4,997 4,554 5,100 4,944 5,030 4, 869 4,959 4,935 4,836 5,145 4,883 Prices, wholesale:
Basic (valley furnace) •••• dol. per long ton __ 23.50 23.50 23.50 23.50 23.60 23.50 23.50 23.50 23.50 23.50 23.50 23.50 23.50 Composite.---------- ____ -------- .... do .... 24.23 24.15 24.15 24.15 24.17 24.20 24.20 24.20 24.20 24.20 24.20 24.20 24.20 Foundry, No.2, northern (Pitts) .... do ____ 25.89 25.89 25.89 25.89 25.89 25.89 25.89 25.89 25.89 25.89 25.89 25.89 2.5. 89
Stocks, consumers', ena or montn• thous. of short tons •. ------ ~-- 1,581 1,473 1,400 1,286 1,232 1,221 1,257 1.296 1,272 1,284 1, 266 1,334
Boilers and radiators, cast-Iron: Boilers, round:
Productlon ____________________ thous. of lb •• --------- 1,115 732 754 1,012 1,071 905 504 690 976 (') --------- --------Shipments ••• __ ••• ___ •••• __ ••••••••• _ do ••• _ --------- 1,448 1,484 1,408 1,083 938 539 842 1,479 2,094 (2) --------- --------Stocks, end of month. ---------------do .••• 11,182 10.146 9,493 9,421 9,554 9,673 9,325 8,546 7,428 (') --------- --------
Boilers, square: Production •• ------------------------do •••• --------- 19,642 18,756 17,773 16,214 15,026 11,494 10,532 9,924 11,312 (2) --------- -----··--Shipments ••••• _. ___ ••••• __ ..... __ ••• do ... _ --------- 17,380 17,044 19,081 15,789 16,301 8,546 12,474 16.644 18,702 (2) --------- --·------Stocks, end of month •• ______________ do .... --------- 92,998 94,832 93,625 93,950 92,675 93,749 91,807 85,090 77,700 (2) --------- --------
Radiators and convectors: Production. tho us. of sq. ft. heating surface._ --------· 6, 763 6, 717 6,199 6,445 5,399 4,317 4,333 4, 457 4,384 (2) --------- ·-------Shipments •• _ •••• _ ••••••••••• _ •• __ ••. do ••• _ 7,390 6,175 6, 781 5,656 6,384 4,131 5,168 6, 284 6,291 (') --------- --------Stocks, end of month ________________ do .... 17,567 18,106 17,524 18,313 17,328 17,062 16,149 14,322 12,414 (2) --------- --------
Boilers, range, galvanized: Orders, new, net .......... number of boilers •. 33,700 41,343 42,781 53,809 62,010 38,014 31,458 30,481 22,955 46,025 41,779 43,829 40, 130 Orders, unfilled, end of month ••••••••• do .... 36,474 80,844 72,366 77,190 76,750 68,884 62,709 62,652 34,672 39,324 35,879 42,597 45,737 Production ••• ---------------------- ... do .... 42,913 55,856 50,557 49,217 64,847 42,427 33,627 39,171 40,181 40,454 43,410 35,681 37,353 Shipments. _______ ------------------ ••. do ... _ 42,963 54,465 51,259 48,985 62,450 45,880 37,633 40,538 40,935 41,373 45,224 37, 111 36,990 Stocks, end of month .................. do ..•. 6, 715 17,785 17,212 17,444 19,841 16,388 12,382 11,015 10,561 9,646 7,832 6,402 6, 765
Steel, Crude and Semlmanuractured
Castings, steel, commercial: 179,880 171,265 Orders, new, total, neL .......... short tons .. --------- 113,034 150,551 211,081 191, 195 199,619 208,243 202,334 140,673 '175, 484 !69,S62
Railway specialties •••••• -----·-------do ••.. 26,839 35,723 54,409 43,997 26,558 11,025 11, 218 3,610 1-13,480 13,546 '7, 708 9, 278 Production, total _____ ----·-------------do .... 131, 518 134,778 133,726 146,507 149,625 131,492 131,458 134,461 139,059 135,823 '149, 268 137,428
Railway specialties. __________________ do •••• --------- 45,640 46,357 45,013 48,335 45,158 25,644 21,658 111,251 12,988 12,051 '13, 979 10,744 Steel ingots and steel for castings:
6,521 7,122 7,022 7,149 7,233 7,067 Production ______________ thous. of short tons.. 7, 303 7,150 7,125 7,393 7,387 7, 585 7,185 Percent of capacity------------------------- 97 98 95 96 98 98 98 96 95 95 97 100 98
Prices, wholesale: .0265 .0265 .0265 Composite, finished steeL ....... dol. per lb .• .0265 .0265 .0265 .0265 .0265 .0265 .0265 .0265 . 0265 .0265
Steel billet!, rerolling (Pittsburgh) 34.00 34.00 34.00 34.00 34.00 dol. per long ton .• 34.00 34.00 34.00 34.00 34.00 34.00 34.00 34.00
Structural steel (Pittsburgh) ..... dol. per lb •• .0210 .0210 .0210 .0210 .0210 .0210 .0210 .0210 • 0210 .0210 .0210 . 0210 . 0210 Steel scrap (Chicago) ______ dol. per long ton •• 18.75 18.75 18.75 18.75 18.75 18.75 18.75 18.75 18.75 18.75 18.75 18.75 18.75
U. 8. Steel Corporation, shipments of fin-1, 759 1, 704 !shed steel products ....... tnoua. or abort tons •. 1,850 1,846 1, 739 1,617 1, 781 1,834 1, 774 1, 766 1, 789 1, 788 1, 666
'Revised. t Cancelatlons exceeded orders booked during the month by 13,480 short tons. t Figures previously shown for September were found to be incomplete and are omitted In this Issue. *New series. The data on scrap Iron and steel and pig Iron consumption and stocks are estimated industry totals compiled by the U. 8. Department of Interior, Bureau
of Mine8, based on reports from consumers accounting for 96 to 99 percent of the Industry total beginning In the latter half of 1941 and 93 to 95 percent In the earlier period. Data for January-October 1941 are shown on p. S-30 of the April1942 Survey. Prior to 1941 data were collected only for the last month of each quarter. For a\•ailable 1939 and 1940 data, see note marked"*" on p. S-29 of the November 19421ssue. Consumers' stocks of pig iron include suppliers' and producers' stocks.
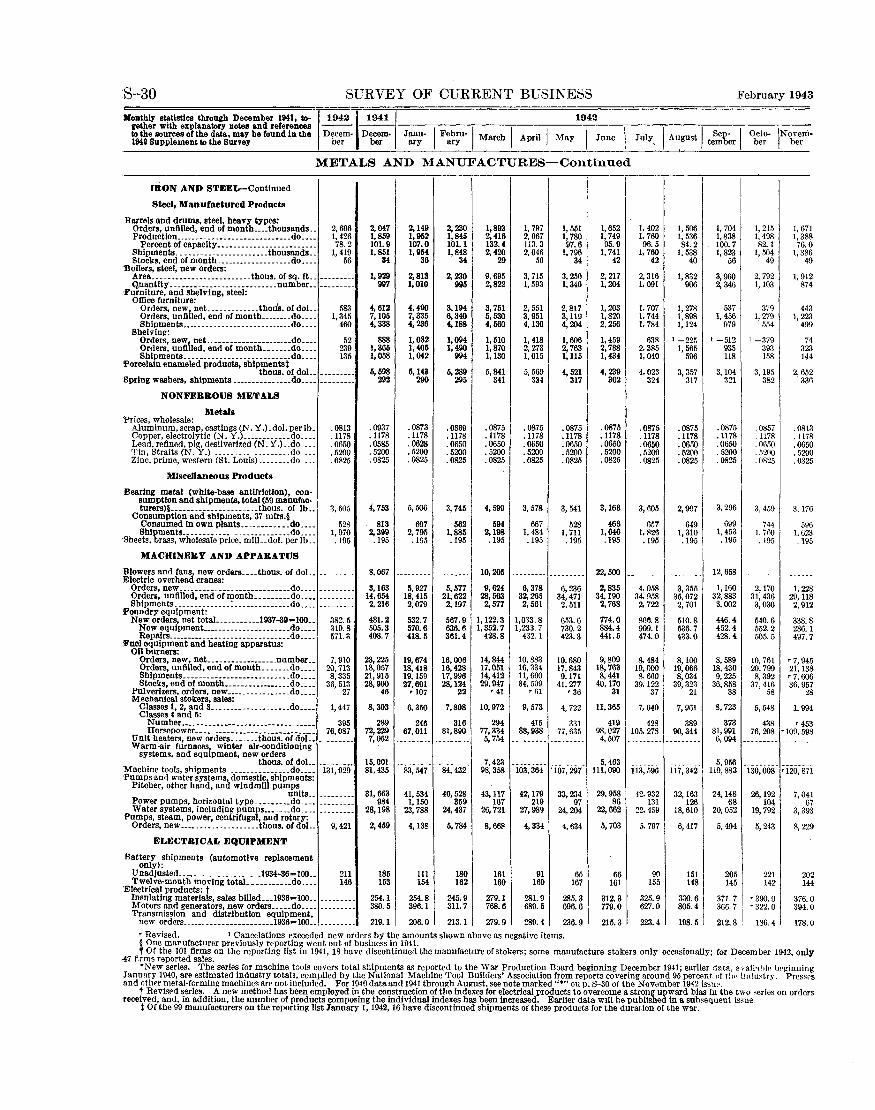
S-30 SURVEY OF CURRENT BUSIKESS
Monthly statistics through Decembez 1941, to-,194211941 I 1942 gether with explanatory notes and references --- ----
1 to the sources of the data, may be found in the Decem- Decem· Janu- I Febru- March I April J May I June 1942 Supplement to the Survey ber ber ary ary ,
METALS AND MANUFACTURES-Continued
IRON AND STEEL-Continued
Steel, Manufactured Products
Barrels and drums, steel, heavy types: Orders, unfilled, end of month .•.• thousands .. 2,696 2,047 2,149 2,230 1,893 1, 797 1, 551 1,652 ], 402 Production .....•. _ .•. ------------- .••.. do .••. 1,426 1,859 1,952 1,845 2,416 2,067 1, 780 1, 749 1. 760
Percent of capacitY------------------------- 78.2 101.9 107.0 101.1 132.4 113.3 97.6 95.9 96.5 Shipments ... --------------------thousands .. 1,419 1. 851 1,Q54 1,848 2,420 2.046 1, 796 1, 741 1. 760 Stocks, end of month ......•..•......... do .... 56 34 36 34 29 50 34 42 42
"Boilers, steel, new orders: 1,929 2,813 Area ..•...•••.•.••.••.••••... thous. of sq. ft .. --------- 2,230 9,695 3, 715 3,250 2, 217 2, 316
Quantity •..••••.•.......•.•••...•.. number •. --------- 997 1,010 995 2,822 1, 593 1,340 1,204 1. 091 ·Furniture, and shelving, steel:
Office furniture: Orders, new! net .••......•... thou8. of doL 583 4, 612 4,490 3,194 3, 751 2, 551 2,817 1, 203 1. 707 Orders, unfi led, end of month ...••••. do ..•. 1,345 7,105 7,335 6,340 5,530 3. 951 3,119 1,820 1, 744 Shipments ••.......... --------- .....•. do .... 460 4,338 4,236 4,188 4,560 4,130 4,204 2,256 1, 784
Shelving: Orders, new! net ...•.•.•••..••••.••••• do .•.. 52 888 1,082 1,094 1,510 1, 418 1,606 1,459 63R Orders, unfi led, end of month .••.•.• do .•.. 239 1, 365 1,405 1,490 1,870 2,273 2,763 2,788 2, 385 Shipments ... ·"-. __ ·-------- ......... do .... 135 1,058 1,042 994 1,130 1, 015 1,115 1,434 1, 040
i'orcelain enameled products, shlpmentst thous. of doL 5,598 5,143 6,289 5,841 5, 560 4, 521 4,239 4,023
Spring washers, shipments----------- .••. do .••• --------- 292 290 295 341 334 317 302 324
NONFERROUS MET A.LS
Metals Prices, wholesale:
Aluminum, scrap, castings (N.Y.) .dol. per lb. .0813 .0937 .0873 .0869 .0875 .0875 .0875 .0875 .0875 Copper, electrolytic (N. Y.) .. __________ do .... .1178 .1178 .1178 .1178 .1178 .1178 .1178 .1178 .1178 Lead, refined, pig, desilverized (N. Y.) .. do .... .0650 .0585 .0628 .0650 .0650 .0650 .0650 .0650 .0650 1'in, Straits (N. Y.) .................... do .... .5200 . 5200 .5200 . 5200 . 5200 .5200 .5200 .5200 .5200 Zinc, prime, western (St. Louis) ........ do .... .0825 .0825 .0825 .0825 .0825 .0825 .0825 .0825 .0825
Miscellaneous Products
Bearing metal (white-base antifrlctlon), con-aumpt!on and shipments, total (59 manufac.
4, 753 turers)§ ...................... thous. of lb •• 3, 605 5,506 3, 745 4,599 3, 578 3, 541 3,163 3,805 Consumption and shipments, 37 mfrs.§
Consumed in own plants ............ do .•.. 528 813 697 562 594 667 528 463 657 Shipments .......•...• __ ............ do .... 1,970 2,399 2, 795 1,885 2,198 I, 484 1, 711 1,646 I, 826
Sheets, brass, wholesale price, mi!L.dol. per lb .. .195 .195 .195 .195 .195 .195 .195 .195 .195
MACHINERY AND APPARATUS
Blowers and fans, new orders .... thous. of doL. Electric overhead cranes:
--------- 8,067 --------- --------- 10,205 -------- --------- 22,500 --------Orders, new-------------- --------------do .... --------- 3,163 5,927 5,577 9,624 6, 378 0,2'36 2,835 4,058 Orders, unfilled, end of month ••.....•. do ____ 14,654 18,415 21,622 28,563 32,265 34,471 34,190 34. 9.58 Shipments .............. : .............. do .•.. 2, 216 2,079 2,197 2,577 2,561 2,511 2,768 2. 722
Foundry equipment: New orders, net totaL. ......... 1937-39=100 .. 382.5 481.2 532.7 567.9 I, 122.3 1,033.8 653.6 774.0 so~. 8
New equipment ..••.•.•.•. ----- .•••.. do .•. _ 319.8 505.3 570.6 636.6 1, 352.7 1,233. 7 730.2 884.4 909.1 Repairs ............... ----------------do .•.. 571.3 408.7 418.5 361.4 428.8 432.1 423.3 441.5 474.0
Fuel equipment and heating apparatus: on burners:
Orders, new, net ..•.•••.•.•••.•... number .. 7, 910 23,225 19,674 16,006 14,844 10,883 10,680 9,809 8. 484 Orders, unfilled, end oCmonth ..•.... do .•.. 20,713 18,057 18,418 16,428 17,051 16,334 17,843 18,763 19,000 Shipments ....•.. --------------- .•.•. do .... 8,335 21,915 19,159 17,996 14,412 11,600 9,171 8,441 g, 660 Stocks, end of month_ ....•••••••••... do .... 36,513 28,900 27,601 28,124 29,947 34,509 41,277 40,170 39.122
Pulverizers, orders, new ................ do .... 27 46 r 107 22 '41 r 61 '36 31 37 Mechanical stokers, sales:
7,8081 Classes I, 2, and 3 .................... do .... 1,447 8, 303 6,350 10,972 9, 573 4, 722 ll, 365 7, 040 Classes 4 and 5:
Number ................... ----- •••.....•. 395 289 246 316 294 415 331 419 428 Horsepower .......... ---------------- _____ 76,087 72,229 67, on 81,890 77,334 88,938 77,635 98,027 105, 278
Unit heaters, new orders •...... thous. of doL. 7,062 --------- --------- 5, 754 --------- --------- 4, 507 ---------Warm-air furnaces! winter air-conditioning systems, and equ pment, new orders
thous. oC doL. 15,001 -------- -- ----- 7,423 --------- --- ----- 5, 463 --------Machine tools, shipments ·--------------do .... 131,929 81,435 83,547 84,432 98,358 103,364 '107, 297 111,090 ll3, 596 Pumps and water systems, domestic, shipments:
Pitcher, other hand, and windmill pumps units .. --------- 31,663 41,534 40,528 43, 117 42,179 33,234 29,958 42.932
Power pumps, horizontal type ......... do .... --------- 984 1,150 359 167 219 97 86 131 Water systems, including pumps •••... do .... 28,198 23,788 24,437 26,721 27,989 24,204 22,662 22. 459
Pumps, steam, power, centrifugal, and rotary: Orders, new .................... thous. of doL. 9,421 2,459 4,138 5, 784 8,66~ 4,334 4, 634 5, 703 5, 797
ELECTRICAL EQUIPMENT
Battery shipments (automotive replacement only):
Unadjusted ... _ ............. 1934-36=100 .. 21l 185 111 180 161 91 65 66 90 Twelve-month moving totaL .......... do .•.. 146 153 154 162 169 169 167 161 155
'Electrical products: t Insulating materials, sales billed ... 1936=100 .. --------- 254.1 254.8 245.9 279.1 281.9 285.3 312.3 325.9 Motors and generators, new orders ..... do .... 380.5 396.1 311.7 768.6 689.5 696.6 779.0 627.0 Transmission and distribution equipment,
new orders ........ ---------- ••.•• 1936=100 .. 219.1 206.0 213.1 279.9 289.4 236.9 215.3 223.4
' Revised. ' Cancelations exceeded new orders by the amounts shown above as negative items.
1,506 1, 536 84.2
1.538 40
1, 832 906
1, 278 1, 898 1,124
1 -225 1, 565
596
3,357 317
.0875
.1178
.0650
.5200
.0825
2,907
649 1,310 .195
- -------·· 3,355
35,072 2, 701
510.8 536.7 433.0
8,100 19,066 8,034
39,323 21
7, 961
389 90,344
---------
--------117,342
32,163 126
18,610
6,417
!51 148
330.6 805.4
198.5
February 1943
1, 704 1,838 100.7 1, 823
56
3,960 2, 346
537 1, 456
979
1-512 935 118
3,104 321
.0875
.1178
.0650 . 5200 . 0825
3, 296
699 1, 453 .195
12,658
1,160 32,883 3,002
446.4 452.4 428.4
8, 589 18,430 9,225
36,858 38
8, 723
373 81,991 6,094
5, 956 119,883
24,148 68
20,052
5,494
205 145
371.7 366,7
212.8
1, 215 1, 498 82.1
1, 504 49
2, 792 1, 103
379 1, 279
554
I -379 393 158
3,195 382
. 0857
. 1178 '0650 .5200 '0825
3, 459
744 I, 760 .195
1, 67 1 88 0 6 9
1, 3 76.
1, 38 4
1, 91 87
44 1, 22
2 4
3 3 9 49.
3 7 4 23
14
2, 65 33
.081
4
2 fi
.117 3 8 0 .065
. 5 200 5 .082
3, 17
59 1, 62 .19
6
6 3 5
------ -----
2,170 31,436
3,030
540.6 552.2 505.5
10,761 20,799 8,392
37, 416 58
5,548
438 76,208
---------
---------130,008
26,192 104
19,792
5, 243
221 142
'390, 0 '322.0
186.4
1, 2 28 8 2
29,11 2,91
338. 286. 497.
8 1 7
'7, 94 21,13 '7,60 36,95
2
5 8 6 7 8
1, 99 4
3 8
'45 '109, 59 -------
------•120, 87
7,04 6
3,39
8,2
20 2 4 14
376. 394.
178.
0 0
0
§ One manufacturer previously reporting went out of business in 1941. , Of the 101 firms ou the reporting list in 1941, 18 have discontinued the manufacture of stokers; some manufacture stokers only occasionally; for December 1942, only
·47 Arms reported sales. *New series. The series for machine tools covers total shipments as reported to the War Production Board beginning December 1941; earlier data, svaihhli· twginning
January 1940, are estimated industry totals, compiled by the National Machine Tool Builders' Association from reports covering around 95 percent of tlu· ira!ustrv. Pressrs and othrr metal-forming machines are not included. For 1940 data and 1941 through August, see note marked"*" on p. S-30 of the November 1942 issue. ·
t Revised series. A new method has been employed in the construction of the indexes for electrical products to overcome a strong upward bias In the two series on orders Teceived, and, in addition, the number of products composing the individual indexes has beeu increased. Earlier data w11l be published in a subsequent isme.
t Of the 99 manufacturers on the reporting list January 1, 1942, 16 have discontinued shipments of these products for the duration of the war.

February 1943 SURVEY OF CURRENT BUSINESS S-31
gether with explanatory notes and references ----------,----,----,----.,----.,..---.,----.,----.,----,----,---Monthly statistics through December 1941, to- ! 194211941 I 1942
to the sources oflhe data, may be found in the Decem- Decem- Janu- I Febru-1 Mar h I April I May I June July I August I Sepbteerm·l Obcet,o_- INobveerm-1942 Supplement to the Survey ber ber ary ary c •
METALS AND MANUFACTURES-Continued
ELECTRICAL EQUIPMENT-Con.
I Furnaces, electric, Industrial, sales: 23,961 {;nit. •• ___ •. __________ • ________ ._. kilowatts. ---- 12,298 21,520 45,674 148,556 34.210 70. 507
Value. _____ -----·-------------- thous. of dol.. - ---- 1,149 1,882 2,491 4, 551 10,367 3,177 5,100 Electrical goods, new orders (quarterly)
1,057,954 thous. of dol.. --------· 583,214 -··a;s7ii- --------- 759,063 ---3;699" ---------Laminated fiber products, shlpments •.•. do .... 5. 302 3, 151 3,151 3,641 3, 722 4,116 Motors (1-200 hp.):
6,061 Polyphase Induction, bllllngs __________ do ... ---- -- 6, 957 6,417 6, 743 7,604 7, 471 7,855 Polyphase Induction, new orders ______ .do ... ---- -- 8,176 7,086 7,469 13,189 12,697 11,174 11,932 Direct current, blllings _________________ do ..•. --------· 2,552 2,140 2,294 3,097 4, 418 3, 395 3, 225 Direct current, n~w orders. ____________ do ..• --- ----- 4,602 3, 974 3,056 8,313 10,196 12,761 13,494
Pow•r cable, paper insulated, shipments: 958 Unit .••.... __ ------------------ .. tho us. of ft.. --- _( ____ 1,054 928 605 578 576 1, 375
Value ... ------------------------ thous. of doL --- ----- 1,694 1, 475 1,119 1,062 934 978 1, 716 Rigid steel rondult and flttings, shipments
. short tons __ - -------- 28,840 22,834 22,838 25,572 26,499 22,987 22,656 Vulcanlted fiber: I
Consumption of fiber paper ..... thous. oflb •. 4, 7(i7 8, 738 3,454 3,681 3,987 3,900 4,228 4,303 Shipments .......... __________ thous. of dol.. 1, 595 1,107 1,024 956 1,107 1,145 1, 215 1,378
PAPER AND PRINTING
-,
I WOOD PULP
Production: Total, all grades .................. short tons ..
Chemical: 726,772 867,738 939,719 848,380 967,031 933,764 925,230 854,880
Sulphate, totaL ... ------- _______ ... do .••. 320,751 373,737 405,729 371,572 425,643 412,155 428,479 394,702 Unbleached .. ____________________ do .... 266. 138 324,942 350,651 318,629 370,357 358,804 874,412 342,983
Sulphite, total ....... ------------- .do .... 207,841 253,004 274,355 246,792 277,408 265, 63ll 259,072 253,057 Bleached ••.. _____________________ do.--· 127,146 145,138 156,252 141,544 158,440 150,657 147, 791 148,767
Soda __________ .• ___________________ do .... 46,572 53,413 56,505 52,124 57,120 54,368 52,461 45,484 Ground wood ...... _ ......... _______ •. do_ .. _ 134,667 167,578 181,127 157,185 184,039 179,643 166,037 147,325
Stocks, enli of month: Total, all grades ________________________ do .... 146,300 96,600 111,300
Chemical: 112,600 136,400 132,400 163,600 170,000
Sulphate, total -----·--------------do .... 61.700 13,900 16,700 14,900 19,700 16,200 23,500 29,700 Unbleached ............. __ ....... do .... 52,800 9,600 11,100 10,600 14,600 12,100 17,700 23,300
Sulphite, totaL ......... ------·-·- do .... 33,600 36,100 39,700 37,800 42,800 29,400 41,800 40,100 Bleached ...... --------- .......... do ... 14.800 21,600 23,900 24,600 28,200 16,100 25,700 23,700
Soda._ ... ______ .. -------------------do. ___ 4, 000 3,400 3,400 3,600 3,600 3, 300 4,400 14,600 Ground wood .. --------- ______________ do .... 44,300 42,200 50,300 55,100 69,100 82,100 92.300 94,200
l!'rlces, wholesale: Sulphate, Kraft No.1, unbleached
dol. per 100 lb .. __ ----- 3.625 3.625 3.625 3. 625 (•) --------- ---------Sulphite, unbleached .. ____ ---------- .. do .... ---- 3. 713 3. 713 3. 713 3. 713 (•) --------- ---------
PAPER
Total paper1 Incl. newsprint and paperboard: I 1,~23,019 1,407,718 1,267,666 1,372,28R 1,321,529 1,223,478 1,088,755 ProductiOn ___________ .• ________ short tons .. -----
Paper, excl. newsprint and paperboard: ' Orders, new .................... short tons .. _ --- --- 523,096 570,366 490,358 535,913 480,905 435, 152 424. 740 Production_ •.... ____ ---------- ...... do ... --- --- 550,696 584,728 525,743 565,900 561,402 li33,859 485, 561 Shipments.------ ____ ------ .......... do ... 557,951 579,162 524,645 549,851 544,116 5lli, 417 473.482
'Fig~fe~~~~~w _ .......... ________________ do--··,.::::-::: 61,948 66,766 53,211 55,029 46,505 40,339 35,479 Orders, unfilled, end of montb ________ _cto _____________ 119,847 115,708 112,775 104,915 79,757 64,360 49,485 Production_.! •.... ---------------------do .... _________ 60,176 61,766 55,699 62,468 62,167 58,953 52,850 Shipments. __ ._ .... _.--------- __ •. __ . ___ do .. __ --------- tiO, 881 62,792 57,926 61,052 59,693 56,505 50,403 Stocks, end o! month _________________ _cto ____ -------- 41,318 39,674 37,024 38,120 40,529 43.205 46,064
.Printing paper: 177,083 Orders, new ___ . -----------------------do .... -- ----- 202,304 166,106 176,103 151,901 130,506 137,689
Orders, unfilled, end of month ________ do .... __ 1fi0, 710 145, 159 133,418 124,637 101,239 85,432 87,107 Production __ ···-·---------------------do ______ 188.532 205,556 182,115 190,265 184,042 165,640 141,414 Shipments ..................... _ .. ___ .. do ... ___ -- -- 195,251 203,954 180, 555 183,473 173,373 157,244 139,881 Stocks, end of month._ ------·-·----···do ...... --- 72.664 72,359 72,891 79,897 90,258 99,299 100,832
Wrapping paper: Orders, new ...... ------------- ......... do .... 195,773 205,436 181, 150 203,361 199,272 187,460 167,470 Orders, untilled, end of month ......... do .... --------- 172,528 167.838 161,842 160.881 151,056 131,933 111,161 Production. __ .. __ ........ ____ ... ___ ... do_ ... 197,408 211,630 187,990 208,188 210,318 207,863 191,899 Shipments.-------------------- ........ do. ___ --------- 196,880 211,880 185,348 203,323 209.120 204,402 187,537 Stocks, end of month. -----------------do .•.. 70,422 70,689 70,039 74,091 75,598 79,244 81,080
Book paper: Coated paper:
Orrlers, new .... percent of standard capacity 55.3 69.0 73.5 57.2 49.0 47.9 31.8 30.2 Production. __ .. --------- ____________ do .... 52.6 91.3 87.6 76.2 61.5 55.3 40.1 37.0 Shipments .. _ .. ---------------------do .... 53.0 91.0 87.4 77.3 60.9 55.1 39.9 35.1
Uncoated paper: Orders, new._ ... ____________________ do .... 97.5 93.1 104.4 93.5 94.0 84.1 69.7 71.1 Price, wholesale, "B" grade, English finish,
white, f. o. b. mill. ...•... dol. per 100 lb .. 7. 30 7. 30 7.30 7.30 7.30 7. 30 7.30 7.30 Production __ percent of standard capacity .. 86.1 102.0 108.8 109.3 105.0 98.2 811.4 73.9 Shipments ........ _________ . ______ ... do .... 91.4 103.0 107.5 108.7 102.6 96.1 87.0 74.7
Newsprint: Canada:
Production. _____ .. _--------- .. short tons .. 244, 191 300.823 311,904 278,101 295,835,277,741 251,831 242,762 Shipments from mUJs. _______________ do.... 243,530 319. <!82 291,998 264,621 308, !66 238, 346 266,443 253,288 Stocks, at mills, end or month ........ do .... t 91,986 123.571 143,477 156.957 144,626 184. 021 1f>9,409 158,888
• No comparable d~tta. 'Revised.
24, 796 31, 310 2.133 2.378
--------- ---------4, 557 4,475
8, 052 7, 710 10,949 9, 272 3,413 3,857 8,407 10,377
1, 549 899 2,050 I, 123
21, 449 21, 420
4,067 4, 219 1, 204 1, 351
I \
769,364 813,237
361,272 385,750 310,525 328, 767 225.818 241, 701 132, 6S1 145,693
41- 5~4 44,651 124- 955 123,968
175, 400 192,500
41,300 64,900 37.400 60,300 42. 300 48,600 27.300 32,400 4, 300 5,000
85,800 72,200
--------- ------------------ ---------·
992, 225 '1,078,823
404,474 426,672 4:l6, 465 465,571 431,633 438,299
39, 486 40,805 40,782 36,354 46,763 45,917 45,071 44,285 47,002 48,775
135,468 143,837 78,511 80,572
133,608 143,658 141,166 141,889 92,740 94,690
160,105 158,618 100,290 93,863 176.864 184, 113 167,497 164,092 88, 239 105,018
32.3 36.4 30.7 34.0 32.7 35.8
74.9 78.6
7.30 7.30 72.7 79.2 76.7 79.5
241,178 253,239 243,620 255,563 Iff• 446 154,122
26,528 20,297 2,237 1, 534
965,120 -------5,028 5, 279
8,088 8, 287 8,257 7, 291 4,584 4,433 4,341 3,614
1,074 942 1,435 1,269
17,452 14,509
4,364 4,832 1, 581 I 1,614
771,499 834,604
363,177 303, 155
383,037 321,417
227,033 241,687 133, 135 148, 231 44,562 51,025
119,270 137, 761
182,400 166,400
76, 100 75,900 69,400 70,000 42,000 26,400
36,400 21,700
5,100 57,200
5,000 45,400
-------------------
--------------
- -------63 84 8 0 6
5,1
7,4 6,09 5, 3C 6, 94
88 97
8 8
12,38 9
4 5
4, 31 1,46
•758, 326
r336, 174 •278, 510 •216, 797 '134, 469 '48, 544 136,023
157,200
'68, 100 '59, 400
37,600 20,300 '4,500
' 44,400
•1,067,366' 1,210,488 1,095,815
'452, 930 ' 555, 334 507, !53 '457, 707 ' 518,846 465.460
452,597 ' 511, 572 472,575
43,612 64,588 52,397 35,657 44,983 48, 6C3 45,360 52,787 48,136 44,448 53,935 47,671 49,553 48,768 49,074
152, 709 192,509 171, C48 81,449 99,025 110,631
148,520 177,924 157,743 151,884 175, 121 162,048 91,502 90,829 85,651
165,768 195, 215 187,773 99,334
•169, 643 ' 161,266
116,100 138, 215 183,488 163,393 180,037 164,521
>111, 204 ' 116,007 118,742
47.4 59.7 62.7 45.2 51.3 50.3 48.8 51.8 54.0
88.1 105.3 97.5
7.30 7.30 7.30 85.3 96.3 90.7 86.6 95.0 92.9
257,618 271,555 251,147 292,405 295,625 255,087 119,335 95,265 91,325
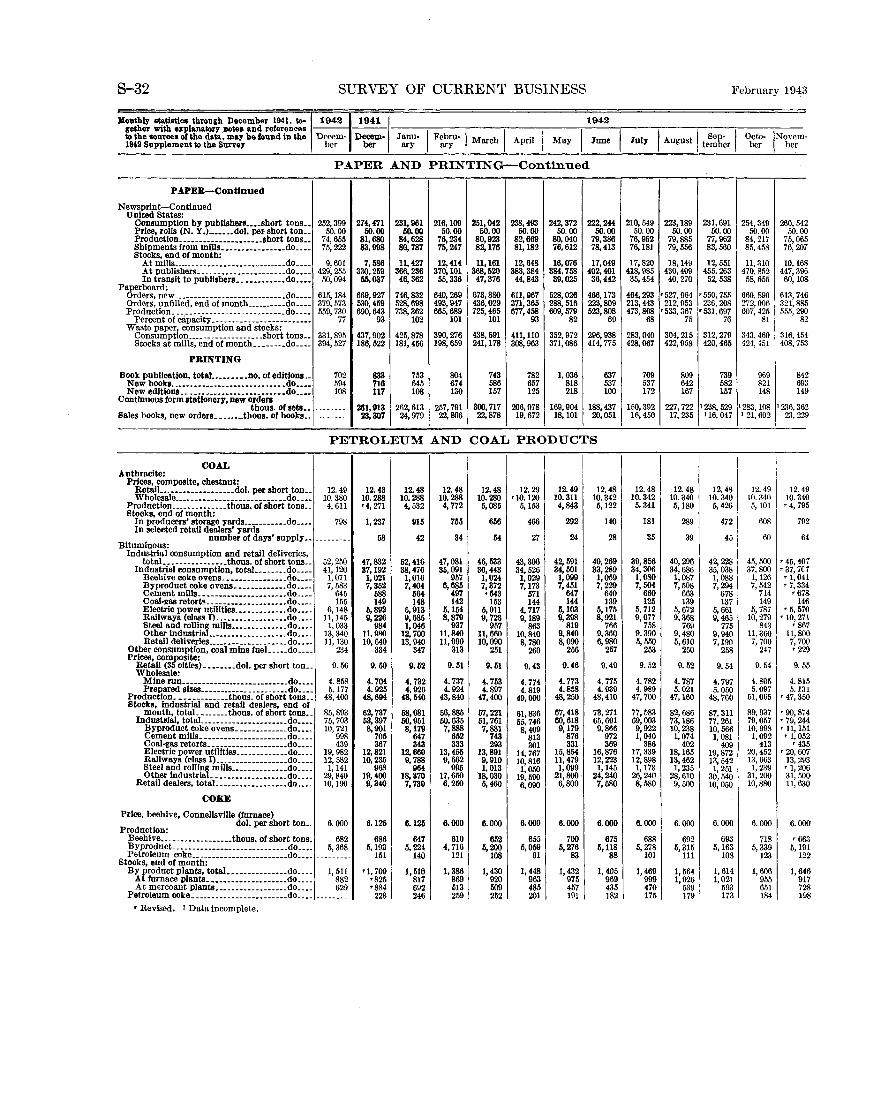
8-32 SURVEY OF CURRENT BUSINESS
J[onthly statistics through December 1941, to-~1942 1941 I gether with explanatory .notes and references 1----1 to the sources of the data, may be found in the Decem- Decem· 1942 Supplement to the Survey ber ber
1942
J~;- I F~~-~ March I April I May I June
PAPER AND PRINTING-Continued
PAPER-Continued
Newsprint-Continued United States:
Consumption by publ!shers •••• short tons •• 252,399 274,471 231,961 216,109 251,042 238,493 242,372 222,244 Price, rolls (N. Y,) _______ dol. per short ton __ 50.00 00.00 00.00 50.00 50.00 00.00 00. 00 00.00 Production. --------------------short tons •• 74,655 81,680 84,628 76,234 80,923 82,669 80,040 79,386 Shipments from mUls ________________ do ____ 75,222 83,998 80,787 75,247 82,176 81,182 76,612 78,413 Stocks, end of month: At mills _____________________________ do ____ 9,601 7,586 11,427 12,414 11,161 12,648 16,076 17,049
At publishers. ---------------------do ____ 429,255 330,259 366,286 370,101 368,520 383,384 384,758 402,401 In transit to publishers ____________ do ____ 50,094 55,037 46,362 55,336 47,376 44,843 39,025 36,442
Paperboard: Orders, new ____ ----------- ____ ---------do ____ 615,184 669,927 746,832 640,269 673,880 611,967 528,026 466,173 Orders, unfilled, end of month __________ do ____ 379,573 530,459 528,698 493,947 436,029 371,365 288,516 223,809 Production. _______ ------ _______ -------dO---- 559,730 690,643 738,362 665,689 725,465 677,458 609,579 523,808
Percent of capacitY------------------------- 77 93 102 101 101 93 82 69 Waste paper, consumption and stocks:
390,276 438,591 352,972 296,938 Consumption ................... short tons •• 331,895 437,902 425,878 411,110 Stocks at mills, end of month ........ do .... 394,527 186,522 181,456 198,659 241,178 308,963 371,086 414,775
PRINTING
Book publication, totaL ••••••• no. of editions •• 702 833 753 804 743 782 1,036 637 New books ________ -------------------- .do ____ 594 716 645 674 586 657 818 537 New editions. _____ ------------------_ .do ____ 108 117 108 130 157 125 218 100
Contlnuous form stationery, new orders 300,717 206,078 169,904 188,437 thous. of sets •• --------- 261,913 262,613 257,791
Bales books, new orders ________ thous. of books .. --------- 23,307 24,979 22,806 22,878 19,672 18, 101 20,051
PETROLEUM AND COAL PRODUCTS
COAL Anthracite:
Prices, composite, chestnut: RetaiL-----------------dol. per short ton •. 12.49 12.43 12.48 12.48 12.48 12.29 12.49 12.48 Wholesale ____________________________ do ..•• 10.380 10.288 10.288 10.288 10.280 •10.120 10.311 10.342
Production ______________ thous. of abort tons .. 4, 611 •4, 271 4,532 Stocks, end of month:
4, 772 5,085 5,153 4,843 6,122
In producers' storage yards __________ .do .••• 798 1, 237 916 765 656 466 292 140 In selected retail dealers' yards
number of days' supply •• --------- 58 42 34 54 27 24 28 Bituminous:
Industrial consumption and retail deliveries, totaL •• -------------thous. of short tons .. 52,250 47,832 52,416 47,081 46,533 43,306 42, 591 40,269
Industrial consumption, totaL ....... do .••. 41, 120 37,192 38,476 35,091 36,443 34,526 34,501 33,289 Beehive coke ovens. _______________ do ____ 1,071 1,021 1,016 957 1,024 1,029 1,099 1,059 Byproduct coke ovens _____________ do ____ 7, 583 7,352 7,404 6,685 7,372 7,173 7,451 7,229 Cement mills._ --------------------do .... 645 588 664 497 •543 571 647 640 Coal-gas retorts .. ------------------do .... 155 149 148 142 153 144 144 139 Electric power utilities _____________ do ____ 6,148 &,892 5,913 5,154 5,011 4, 717 5,103 5,175 Railways (class I) __________________ do ____ 11, 145 9,226 9,685 8,879 9, 723 9,189 9,398 8,921 Steel and roll!ng mills ______________ do •••. I, 033 984 1,046 937 957 863 819 766 Other IndustriaL ________________ •. do •••. 13,340 11, 9RO 12,700 11,840 11,66(1 10,840 9,840 9,360 Retail deliveries ___________ .... ___ .. do •••. 11, 130 10,640 13,940 11,990 10,090 8, 780 8,090 6,980
Other consumption, coal mine fueL .... do ..•. 234 334 347 313 251 260 256 257 Prices, com poslte:
Retail (35 cities) ________ dol. per short ton .. 9. 56 9.00 9.52 9.51 9.51 9.43 9.46 9.49 Wholesale:
Mine run-------------- _____________ do •••• 4.858 4. 704 4. 732 4. 737 4. 753 4. 774 4. 773 4. 775 Prepared sizes _________________ ._ .•• do •.•. 5.177 4.925 4.926 4.924 4.897 4.819 4.858 4.939 Production. ------------thous. or short tons .. 48,400 48,694 48,540 43,840 47,400 49,000 48,250 48,410 Stocks, Industrial and retail dealers, end or
month, totaL _______ thous. of short tons .. 85,893 62,737 58,681 56,885 57,221 61,836 67,418 73,271 Indust~ial, totaL ___ . __ ----- ____ ---- .do ••• _ 75,703 63,397 50,951 00,635 51, 761 55,746 60,618 65,691
Byproduct coke ovens _____________ do .... 10,721 8,901 8,179 7,888 7,881 8,409 9,179 9,866 Cement mills. ---------------------do ___ . 998 705 647 652 743 813 876 972 Coal-gas retorts. -------------------do .... 439 367 343 333 293 301 331 369 Electric power ut!llties _____________ do .... 19,982 12,821 12,660 13,455 13,891 14,767 15,854 16,876 Railways (class I) __________________ do .... 12,582 10,235 9, 788 9,662 9,910 10,816 11,479 12,223 Steel and rolling m!lls .............. do •••• 1, 141 968 964 995 1,013 1,050 1,099 I, 145 Other industriaL __________________ do .... 29,840 19,400 18,370 17,650 18,030 19,590 21,800· 24,240 Retail dealers, totaL _________________ do .... 10, 190 9,340 7,730 6,250 5,460 6,090 6,800 7,580
COKE
Price, beehive, Connellsville (furnace)
Production: dol. per short ton .. 6.000 6.125 6.125 6.000 6.000 6.000 6.000 6.000
Beeh!ve __________________ thous. of short tons 682 686 647 610 652 655 700 675 Byproduct_. ______ ------- ________ ._ •• _ .do._.: 5, 368 5,193 5, 224 4, 716 5,200 5,059 5,276 5, ll8 Petroleum coke .. ------- ---------------do .... 151 140 121 108 91 83 88
Stocks, end of month: By product plants, totaL •• ------------do .... 1, 511 '1, 709 1, 516 1,386 1,430 1,448 1,432 1,405 At furnace plants ____________________ do .... 882 •825 817 869 920 963 975 969 At mercoant Plants __________________ do ____ 629 •884 692 613 509 485 457 435 Petroleum coke ________________________ do. ___ --------- 228 246 259 252 201 191 182
• Revised. 1 Data incomplete.
210,549 223,189 50.00 50.00
76,952 79,885 76, 181 79,556
17,820 18,149 418,985 430,409 35,454 40,270
464,293 •527, 964 213,443 212,953 473,808 •533, 367
68 75
283,040 304,215 428,067 422,958
709 809 537 642 172 167
150,392 227,722 16,450 17,235
12.48 12.48 10.342 10.340
5, 341 5,180
181 289
35 39
39,856 40,296 34,300 34,686
1,080 1,087 7,504 7,508
660 663 125 139
5, 712 5,672 9,077 9,368
758 769 9.390 9,480 5,500 5,610
253 250
9.52 9.52
4. 782 4. 787 4. 989 5.021
47,700 47,160
77,583 82,686 69,003 73, 186 9,922 10,238 I, 040 1,074
386 402 17,339 18,165 12,898 13,462
I, 178 1, 235 26,240 28,610 8,580 9,500
6.000 6.000
688 692 5,278 5,315
101 111
1,469 1,564 999 1,026 470 539 175 179
February 1943
231,691 254,349 50.00 50.00
77,962 84,217 83,560 85,458
12,551 11,310 455,263 470,852
52,538 58,655
•550, 755 660,890 236,208 272,006
• 531,697 607,425 76 81
312,279 343,460 420,465 424, 451
739 969 582 821 157 148
1238,529 1283,108 116,047 I 21,602
I 12.48 12.49
10.340 10.340 5,426 5, 101
472 608
45 60
42,228 45,500 35,038 37,800
1, 088 1, 126 7,294 7, 542
678 714 137 149
5, 661 5, 787 9,465 10,279
775 843 9,940 11,360 7,190 7, 700
258 247
9.54 9.54
4. 797 4. 805 5.050 5.097
48,760 51,065
87,311 89,937 77,261 79,057 10,566 10,998 I, 081 1,092
409 413 19,872 20,452 13,542 13,663
I, 251 I, 239 30,540 31,200 10,050 10,880
6.000 6.000
693 718 5,163 5,339
108 123
1, 614 1, 606 1,021 955
593 651 173 184
260,54 2 50.00
75,065 76,207
10,168 447,39 6
8 60,10
613,746 321,885 555,290
8
316, 45
2
4 408,753
84 693 14
2
9
2 '236, 36 23, 229
12.49 10.340 r 4, 795
792
64
'45, 407 '37, 7C1 '1, 041 •7,334
•678 146
'5, 570 '10,271
'867 11,800 7, 700 '229
9. 55
4. 81& 5.131
'47, 350
r 90,874 '79, 244 ' 11, 151 '1,052
'435 '20,607
13,293 'I, 206 31,500 11,630
6.000
'663 5,191
122
1,64 917 728 19 8

February 1943 SURVEY OF CURRENT BUSINESS S-33
Monthly statistics through December 1941, lo-~1942 1941 I 1942 gether with explanatory notes and references ---
1 1o the sources of the data, may be found in the Decem- Decem- 1anu· I Febru-1 March I April I May IIune Iuly I August I temSepb-er I Obcetro· INobveerm· 1942 Supplement 1o the Surve7 ber ber ary ary
PETROLEUM AND COAL PRODUCTS-Continued
PETROLEUM AND PRODUCTS
Crude petroleum: Consumption (runs to stllls) .•• thous. of bbL. ···i:iio· 124,986 119,032 105,776 110,565 104,882 1011,883 105,376 Price (Kansas-Okla.) at wells ••• dol. per bbl .. 1.110 1.110 1.110 1.110 1.110 1.110 1.110 Production .................... thous. of bbL. 128,2113 128,262 113,961 114,473 105, Oli3 110,192 108,1i95 Refinery operatlons ......... pct. of capacity •• ~-------- 88 82 81 76 75 74 77 Stocks, end of month:
Refinable In U. S .......... thous. of bbL 246,884 253, li31 260,844 261,832 257,761 254,577 251,421 At refineries ________________________ do .... 51, 319 53,208 51,821 50,050 49,525 48,454 47,551 At tank farms and in pipe lines .... do .... --------- 183,992 188, 437 196,728 199,240 195,937 193,334 191,353 On leases .... ------------------·---.do ____ --------- 11,573 11,886 12, 295 12,542 12, 299 12,789 12,517
Heavy In Callfornia .................. do .... 10, 179 10,543 11,229 11,737 11,434 11,168 10,892 Wells completed .................... number •. !,458 1,373 953 778 825 847 726
Refined petroleum products: Gas and fuel oils:
Consumption: 1, 284 946 923 Electric power plants ••••. thous. of bbL. 1, 960 1,867 1, 532 1,304 1,012
Railways (class I). _________________ do ____ --··:o5ii 6,328 6, 495 6,949 6,595 6,399 6,624 6,427
Price, fuel oil (Pennsylvanla) .. dol. per gaL .051 .050 .062 .055 .057 .058 .059 Production:
Gas, oil and distillate fuel o!l thous. of bbL --------- 17,142 16,902 15,194 16,214 14,002 13,436 15,210
Residual fuel oil ____________________ do .... --------- 31, 127 29,405 27,254 28,095 29,440 30,971 28, 352 Stocks, end of month:
Gas{ o!l and distillate fuel oiL ...... do ____ _., _______ 49,926 40,801 33,711 30,205 28,792 30,281 32, 501
Res dual fuel oll ................... do .... 83,195 78,386 75,386 70,098 67,658 68,388 66,341 Motor fuel:
Prices, gasoline: .060 .056 Wholesale, refinery (Okla.).dol per gal .. .059 .060 .060 .055 .054 .055
Wholesale, tank wagon, (N.Y.) •••• do •••• .161 .U9 .150 .162 .153 .167 .161 .166 Reta!llservlce stations 60 cltles •••• do .... - 145 .139 .1.1 .141 .143 .144 .144 .154
Product on, totalt ........... thous. of bbL 63,673 60,035 61,612 52,902 .7,528 48,938 45,887 Benzol.----------------- -----------do •••• 323 208 189 200 0 0 0 Straight run I!BSOline ............... do .... --------- 24. Q13 22,725 19,226 20,609 18,339 19,573 17,404 Cracked gasoline. __ ........ ____ •••• do ••• _ 32,255 30,324 26,006 25,629 23,504 23,130 22,423 N atura:..aasollnet •••• --.... ---..... do---- 6,082 7,488 6, 768 7,020 6,257 6, 718 6,558
Natu gasoline blended ......... do .... .,622 5,351 4,456 4, 414 4,046 4,272 4,423 Retail dlstrlbutfon ............. mil. of gaL 2,246 1,982 1, 739 1,979 2,015 2,092 2,079 Stocks, gasoline end of month:
Finished gasoline, total .... thous. of bbL 86,413 93,489 100,186 99,184 94,127 87,461 80,080 At refinerles ...................... do .... --------- 56,325 64,996 72,990 73,556 67,182 62,597 li5,213
Unfinished gasollne ................ do .... --------- 7,685 7, 724 8,111 7,549 7,695 7,220 7,437 Natural gasollne .................... do .... 4,275 4,802 15,209 5,620 6,043 6,568 6,671
Kerosene: Price, wholesale, water white, 47", refinery
(Pennsylvanla) .............. dol. per taL .063 .064 .064 .063 .063 .063 .064 .064 Productlon ___________________ thous. of bL 6,682 6,634 6,133 6,035 5,529 5, 302 4,929 Stocks, refinery, end of month ........ do .... --------- 9,599 6,987 6,193 5,460 5,630 6,411. 6,940
Lubricants: Price, wholesale, cylinder, refinery (Penn·
.160 .160 .160 sylvanla) .................... dol. per taL .160 .160 .160 .160 .160 Prodnctlon ................... thous. of bl. 3,654 3,497 3,174 3,533 3,438 3,439 3,231 Stocks, refinery, end of month ........ do .... --------- 8,127 8,266 8,429 8,470 8,470 8, 768 8,756
Asphalt: Production .• _______ .•..• ____ ••• ----- .do .••. 466,600 382,000 382,700 428,200 452,900 600,500 517,800 Stocks, refinery, end of month ........ do .••. --------· 604,000 695,000 765,400 740,700 719,400 617,800 513,800
Wax: Productlon .................... thous. of lb •• --------- 60,200 55,160 52,920 61,600 52,080 51,800 57,960 Stocks, refinery, end of month ........ do .•.. --------- 74,814 72,800 75,600 75,040 69,720 69,160 69,720
Asphalt prepared roofing, shipments: 2,743 TotaL ___________________ thous. of squares .. --------- 3,033 3,085 3,692 4,198 4, 391 4,397
Grit surfaced .•. ___ -------- ________ .do .. __ --------- 813 675 782 969 1,178 1, 227 1, 286 Ready roofing ______________________ do. ___ -·------- 1,265 1, 307 1, 441 1, 592 1, 509 1, 467 1, 528 Shingles, all types ................... do .... 955 761 862 1,132 1, 511 1,697 1, 582
STONE, CLAY, AND GLASS PRODUCTS
ABRASIVE PRODUCTS
Coated abrasive paper and cloth: Shipments .••• _ ••••••••••••••••• _ ••••• reams •• ---------
PORTLAND CEMENT
Production ...................... thous. of bbL. 14,090 Percent of capacity--------------------------- 67 Shlpments _______________________ thous. of bbL. 8, 923
Stocke, finished, end of month ........... do .... 17, 401 Stocks, clinker, end of month ............. do .... 3,450
CLAY PRODUCTS
Common brick, price, wholesale, composite f. o. b. plant .................. dol. per thous ... 13, 236
Floor and wall tile, shipments: Quantity ..................... thous. of sq. ft .• Value .......................... thous. of doL
VItrified paving brick: Shipments ................... thous. of brick .. ---------Stocks, end of month ................... do ..•. ---------
'DisconUuued by compiling agency. 'Revised.
199,373 111,700
13,810 12,360 65 59
11,511 9,115 19,925 23,168 .,575 1,020
12.936 •13.070
5,029 8,584 1,432 1,077
1, 735 1,040 17,122 17,948
130,525 109,568 105,808 110,645 115,910
10,797 12,733 14,067 16,119 16,022 57 61 69 77 79
8,293 12,663 14,774 16,349 18,250 25,668 25,832 25,112 24,886 22,609 5,840 6,571 6,656 6, 241 6,809
r 13.115 '13.187 •13. 249 13.216 r 13.224
3,689 3,944 3,905 3,290 2, 792 1,047 1,119 1,147 939 773
785 2,075 1,983 2,680 3,682 18,823 18,992 19,615 19,647 19,461
111,1i55 1.110
111,782 78
245,026 46,919
185,797 12,310 10,950
833
1,211 6, 747 .059
16, 149 30,096
37,729 66,935
.058
.186
.153 49,302
0 19,088 23,946 6,804 4,577 2,202
71,657 48,585
7, 789 6,588
.063 5,134 7,480
.160 3,133 8,945
629,300 436,000
50,680 68,040
4,908 1, 726 1, 751 1, 431
121,187
16,833 so
20,601 18,979 5,528
'13. 263
2,589 667
3, 711 18,760
114,135 113,474 1.110 1.110
120,429 80
115,801 83
244,125 240,043 46,435 44,569
184,757 182,825 12,933 12,649 10,706 10,167
745 836
1,349 1,431 6,985 7,131
.059 .059
17,052 18,062 30,446 30,402
42,918 45,817 67,613 69,264
.059 .059
.166 .161
.144 .144 51,105 49,289
0 0 19,192 19,088 25,387 23,882 7,028 6,998 4,909 5,108
, 1, 998 2,015
71,403 69,293 47,924 46,736 8,123 8,853 6,405 6,056
.063 .063 5,340 5,421 8, 261 8,203
.160 .!60 3,141 2,951 9,301 9,278
619,500 396,500
631,800 366,900
61,040 57,120 77,000 77,840
5,152 5,440 1,823 1,802 1, 918 2,091 1,411 1,547
135,030 142,985
17,605 , 17,527 85 87
21,282 20,145 15,268 '12, 697 4,493 3,595
'13.265 r 13.255
(1~ 2,558 675 (I
3,682 ---------19, 215 ---------
116,381 1.110
120,311 82
237,361 43,552
181,203 12,606 10,868
817
1, 331 7, 798 -059
18,858 31,239
r 49,701 r 68,873
.059
.161
.144 51,495
0 19,977 24,905
7, 256 5, 455 2,037
67,669 46, 158 8, 953 5,424
.063 5,907 8, 599
.160 3,057 9,421
656,900 343,100
75,320 86,240
5, 774 1, 847 2,283 1,644
120,953
18,258 87
20,345 10, 617 2, 723
r 13. 213
------------------------------------
112,368 1.110
116,101 82
234, 100 42,699
178,405 12,996 10,724
765
'1, 112 --------
.059
17,562 31,311
50,709 66,664
.059
.161
.144 50,018
0 19,11 6 24,433 7,156 4,989
--------64, 224 44,623 8,992 4,996
.063 5, 759 8, 770
.160 2,983 9,336
549,100 340,200
59,9 86,5
20 20
4, 926 1, 555 2,0 60
l 1, 31
126,87 4
16,241 8
14,6 '12, 23
0 27 4
'2,831
' 13. 215
----------------
----------------
$Beginning 1anuary 1942 figures for tbe production of natural gasoline include total sales of liquefied petroleum gas as follows (thous. of barrels): Jan., 710; Feb., 577; Mar., 556; Apr .. 572; May, 483; June, 498; July, 536; Aug., 502; Sept. 579; Oct. 663; Nov. 687; data for such sales have not been included in the total for motor fuel. Prior to 1942 an indeterminable amount of liquefied petroleum gas has been included in total motor fuel and natural gasoline production.

S-34 SURVEY OF CURRENT BUSINESS February 1943
gether with explanatory notes and references ------ ---.,-----;-------;---,----,----,-----,-----,------c,-----;---Monthly statistics through December 1941, to-~194211941 I 1942
to the sources of the data, may be found in the Decem- Decem- Janu- I Fearbyru-1 March I April I May I June I July I August I teSmepb-er I Obcetro- INobveerm· 1942 Supplement to the Survey. ber her ary
STONE, CLAY, AND GLASS PRODUCTS-Continued
GLASS PRODUCTS
Glass containers: Production ••........•..••.••• thous. of gross .. 6, 268 n.M3 6, 755 5,965 6, 935 6,921 7,192 6, 723 5,946
Percent of capacity--------------------- .... 93.2 90.4 96.6 96.1 103.1 102.9 111.2 99.9 88.4 Shipments, totaL .• --------- .thous. of gross •. 6,528 4, 965 6,877 6,141 7,073 6,830 6,997 6,356 6,333
Narrow neck, food •• -----------------do •.•. 418 214 271 352 588 454 419 331 383 Wide mouth, food •••••••••••••••.••.. do ..•. 1, 715 862 1,191 1, 319 1, 517 1,554 1,489 1,405 1,577 Pressed food ware •.•.•..••....•...... do .•• 39 39 4~ 37 49 51 49 43 40 Pressure and non-pressure •••••••••••• do ..•• 362 332 352 408 503 479 508 451 416 Beer bottles •• ------------------------do ..•. 814 395 624 601 737 868 1, 158 1,065 837 Liquor ware .•..••.. -------- ..•.••.•.. do ..•. 862 843 905 917 983 838 814 759 853 Medicine and tollet. •••••••••••.••••.. do .... 1, 491 1,640 1,884 1, 741 1,806 1, 757 1, 733 1,482 1,379 General purpose .•••••••..•••••••••.•. do ..•. 516 374 399 429 514 448 441 433 328 Milk bottles •.••.••••.••..•••... __ •.•• do •••• 272 245 257 224 243 234 259 272 295 Fruit Jars and Je1lh glasses •••••••••••• do •••• 16 4 29 97 106 125 1M 90 195
Stocks, end of mont -------------------do ..•• 7, 774 9,610 10,228 9,950 9,450 9,417 9,489 10,008 9,528 Other glassware, machine-made:
Tumblers: Production .• ------- •.•••.... thous. of doz •• 3, 837 4,346 6,350 4,595 4,804 4,558 4, 134 3, 779 3,183 Shipments ••• ------- ••• ------------- .do •••• 3, 746 '3,426 4,143 3,921 4,482 4,610 4,315 3,845 3, 915 Stocks ... ___ . -------------------------do •••• 7,177 8,936 8, 797 9,376 9,260 9,156 8,879 9,140 8,411
Table, kitchen, and householdware, shipments 3, 744 3,112 3,278 2,927 2,494 thous. of doz .. 2,553 2, 587 2,876 2,397
Plate glass, polished, production . 5,001 5,600 4,310 4, 726 thous. of sq. ft •. 10,311 9,143 5,565 5,570 4,194
Window glass, product!On ••••• thous. of boxes •• '1, 297 1,696 1,639 1,457 1,583 1,644 1, 557 1,223 1, 274 Percent of capacitY--------------------------- 79.9 104.6 100.9 89.7 97.6 101.3 95.9 75.3 78.5
GYPSUM AND PRODUCTS
Gypsum, production: 1,006,362 1,234,293 Crude.---------------- ......••... short tons .• --------- 1,361,034 --------- --------- ·-------- --------- ---------
Calcined .... __ ..........•....•..•...... do ..•• 1,()88,745 --------- --------- 817,8-56 --------- --------- 829,201! ---------Gypsum products sold or used:
Uncalcined ..... __ ......•.. _ ........... do .••• --------- 317,781 --------- --------- 28-5,755 --------- --------- 399,192 ---------Calcined:
For building uses: Base-coat plasters .... __ ..•.. ____ ... do. __ . --------- 345,697 --------- --------- 275,886 --------- --------- 252,8-60 ---------Keene's cement. _______ ..••• __ •..•. do .. __ --------- 6,841 --------- --------- 5,904 --------- --------- 3, 781 ---------All other building plasters .......... do ..... --------- 90,558 --··----- --------- 76,430 --------- --------- 80,320 ---------Lath .................•... thous. of sq. ft •. 567,393 --------- 348,061 -------·- --------- 254,690 ---------Tile ............... __ .........••..•. do. ___ 7,398 --------- --------- 6,490 --------- --------- 7,523 ---------Wallboard ........... ----------- ..... do ..•. --------- 269,129 --------- --------- 256,755 --------- --------- 365,166 ---------
Industrial plasters .............. short tons .. -------- 36, 130 --------- --------- 34,114 --------- --------- 35,736 ---------
TEXTILE PRODUCTS
CLOTHING Hosiery:
Productlon .....••....•. thous. or dnz~n pairs ... 12, 178 12,555 13,147 12,204 12,951 12,729 11,913 12,033 12,067 Shipments •.• _ .•••..••.. ---------------do ..•. 12, 441 11,938 12,869 12,759 13,506 13,533 11,600 10,990 11,251 Stocks. end of month .• , ................. do ..•. 21, 175 22,026 22,292 21,726 21,169 20,346 20,748 21,781 22,598
COTTON
Cotton (exclusive of linters): Consumption __________________________ bales •. 935,511 8-88,379 947,539 892,288 967,406 999,749 957,864 967,523 994,552 Prices received by farmers ........ dol. per lb .. .196 .162 .169 .178 .181 .190 .192 .18-3 .18-6 Prices, wholesale, middling, •~a", average,
10 markets ..................... dol. per lb .. . 197 .173 ,190 .192 .196 .202 .200 .189 .194 Production:
Ginnings (running bales)§ .. thous. of bales ... 11,743 9,915 10,225 --------- 110,495 --------- --------- --------- 49 Crop estimate, equivalent 500-lb. bales
thous. or bal011 .• 2 12,982 --------- --------- --------- "110, 742 -------·- --------- --------- ---------Stocks, domestic cotton In the United States,
end of month:t 9,463 Warehouses ................ thous. of bales .. 13,576 13, 710 12,857 12,212 11,349 10,491 8,457 7,633
Mllls ...••................•.••.••..•. do .... 2, 567 2,395 2,498 2,582 2,654 2,631 2,585 2,443 2,252 Cotton linters:
~~~J~:fo~~~=: :::::::::::::::::::::: ::~g:::: 108 110 116 108 132 131 132 127 122 200 149 143 124 97 67 41 26 22
Stocks, end of monthJ .................. do .... 810 807 8-66 886 S54 806 732 653 577
COTTON MANUFACTURES
Cotton cloth: Prices, wholesale:
Mill margins .................. cents per lb .. 2!.08 20.31 20.26 20.27 20.25 20.28 20.95 21.82 21.27 Denims, 28-inch ............... dol. per yd .. .192 .180 .190 .190 .193 .196 .196 .196 .196 Print cloth, 64x 60 .................... do ••.• .090 .083 .086 .087 .088 .089 .090 .090 .090 Sheeting, unbleached, 4 x 4 ........... do ..•. .108 .098 .103 .104 .105 .107 .108 .108 .108
Ffnl!hed cotton cloth, production: Bleached, plain .•. --------------thous. of yd .• --------- 180, 7D2 192,229 176,227 191,654 194,328 192,142 192,091 189,214 Dyed, colors ••••.•..••••••.•..•....•..•. do ..•• 126. 677 133,624 126,465 145,169 \48,023 145,423 147.654 150,8-32 Dyed, black •.•... --------------- ..•••• do .••• 6, 750 8,547 6,553 6, 010 5,338 5,573 5,196 5, 730 Printed •.•...••.•••••••••••. , •..•..•••• do •••. 91,674 82, 267 8-3,791 88,674 75,962 72,813 61,287 55,732
• Revised. ' Total ginnings of 1941 crop. • December 1 estimate of 1942 crop, • Partially estimated. §Total glnnings to end of month Indicated.
6,585 6, 297 97.9 97.3
6,902 6,879 546 815
1,828 1, 629 33 31
320 315 723 636
1,164 1,095 1, 253 1, 286
329 361 270 286 401 395
9,139 8,490
4, 498 3, 880 4,532 3,829 8,196 8, 239
3,048 3,606
3,863 4, 741 1,075 1.097 66.2 67.6
--------- 1,213,817 --------- 754,911
--------- 384,730
--------- 199,061 --------- 2, 905 --------- 77, 4S3 --------- 197,845 --------- 11,577 --------- 404,896 --------- 36,399
11,982 12,335 12,118 12,649 22,462 22,148
925,089 966,149 .180 .18-6
.186 .187
738 5,009
--------- ---------
7,502 9,676 1,848 1, 711
122 115 27 154
490 505
22.17 22.03 .193 .192 .090 .090 .108 .108
178,185 179,363 149,159 157,074
5,121 5,472 60,073 65,606
6, 837 97.9
6, 975 505
1, 830 49
350 618
1, 171 1, 662
455 276 29
8,299
4, 500 4,8-88 7,8-37
4,608
4,924 3 960 59.2
--------------------------·
-----------------------------·------------------------------·--
12,650 13,012 21,786
972,490 .189
.189
9, 726
---------
12:674 2,118
116 221 588
21.85 .192 .090 .108
182,176 167,390
5,503 70,935
I
6,20& 99.9
6,252 449
1, 645 39
331 672 816
1, 508 520 236 13
8,119
3, iTS 3, 535 8, 076-
3,909
4,612" 3 984 60.&
----------------
--------
---------------------------------------------------------
11, 7n 12,059-21,438-
913,038 .192'
. 193
11, 539•
13, 637" 2,441
114 215 698
21.47 .192' .090 .108
168, 349· 143,165
5,8-60• 63, 144
tFor revised figures for all months of th~ cotton year 1941-42, seep. S-34 of the l\'ovember 194Z Survey. 'The total ~toeks of American cotton in the .United States o"' July 31, 1942,includfng stocks on farms and in transit, was 10,455,000 bales.
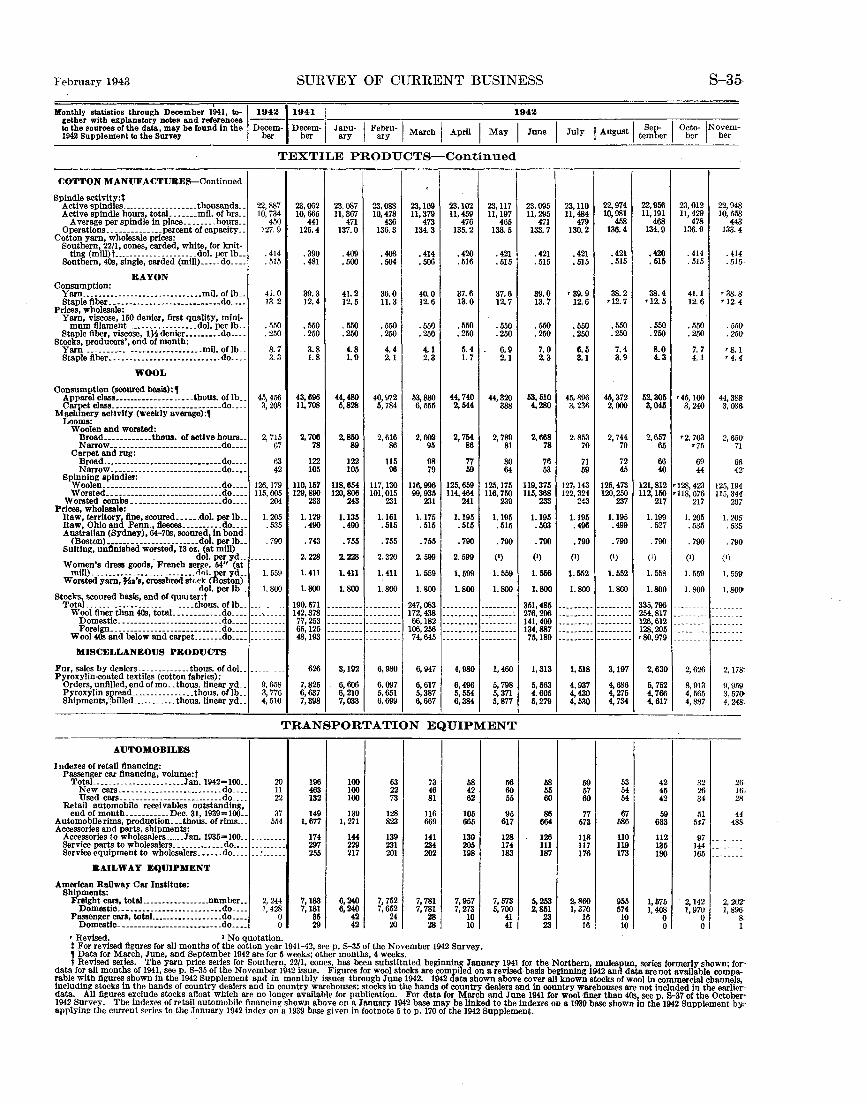
February 1943 SURVEY OF CURRENT BUSINESS S-35-
Monthly statistics through December 1941, to-,1942 gether with explanatory notes and references --. -to the sources of the data, may be found in the Decem-
1941 ~---,----..,.------,-----,----1~9=-4~2=----;---:-----;------,---;---D~:rm-l J:~;- j F:~~u-1 March I April I May I June I July I August I t:~~~r I 0g~~-~No;:rm-1942 Supplem:ent to the Survey ber
TEXTILE PRODUCTS-Continued
COTTON MANUFACTURES-Continued
Spindle actlvity:t Active spindles ..............••.•. thousands •. 22,887 23,062 23.087 23.088 23,109 23,102 23,117 Active spindle hours, totaL .•••.. mil. of brs .. 10,734 10,665 ll, 367 10,478 11,379 11,459 11,197
Average per spindle in place ........ hours .. 450 441 471 436 473 476 465 Operations ______________ percent of capacity __ 127.9 125.4 137.0 136.3 134.3 135.2 138.5
Cotton yarn, wholesale prices: Southern, 22/1, cones, carded, white, for knit-
.421 ting (mi1J)t _____________________ dol. per lb .. .414 . 390 .409 .408 .414 .420 Southern, 40s, single, carded (miJJ) _____ do ____ . 515 . 481 .500 .504 .506 .516 . 515
RAYON Consumption:
Yarn ______________________________ miJ. of lb •. 41.0 39.3 41.2 36.0 40.0 37.6 37.6 Staple fiber __ --------------------------do ____ 13.2 12.4 12.5 11.3 12.6 13.0 12.7
Prices, wholesale: Yarn, viscose, 150 denier, first quality, mini-
. 550 .550 .550 .MO .550 mum filament __________________ dol. per lb .. . 550 • 550 Staple fiber, viscose, 1J.i denier _________ do ____ .250 .250 .250 .250 .250 .250 .250
Stocks, producers', end of month: 6.9 Yarn ___________ ------------------mil. of lb .. 8. 7 3.8 4.8 4.4 4.1 5.4
Staple fiber ___ -------------------------do ____ 3. 3 1.8 1.9 2.1 2.3 1.7 2.1
WOOL
Consumption (scoured basis):, 44,480 44,740 Apparel class _______________ .. __ .thous. of lb __ 45,456 43,696 40,972 53,880 44,320
M ~:~:!~'!::itvit:Y-<weeiriy-iiviriii8):f __ do __ --3,208 11,708 5,828 5, 784 6, 555 2,544 388
Looms: Woolen and worsted:
Broad ____________ tbons. of active hours .. 2, 715 2, 706 2,850 2,616 2,602 2, 754 2, 789 Narrow __________________________ •• do. ___ 67 78 89 86 95 86 81 Carpet and rug:
Broad ______________________ ----- ___ do. ___ 63 122 122 115 98 77 80 Narrow ____ --- _______ ------------- .do ____ 42 105 105 96 79 59 64
Spinning spindles: Woolen. _____ -------- ________________ do. ___ 126,179 110,157 118,654 117,130 116,996 125,659 125,175 Worsted _________________ ----- ______ .do ____ 115,005 129,890 120,806 101,015 99,935 114,464 116,750
Wol'llted combs __ ---------------------do ____ 204 233 243 231 231 241 239 Prices, wholesale:
Raw, territory, tine, scoured _____ .dol. per lb •• ]. 205 1.129 1.135 1.161 1.175 1.195 1.195 Raw, Oblo and Penn., fieeces __________ do ____ . 535 .490 .490 .515 . 515 .515 .515 Australian (Sydney), 64--70s, scoured, in bond
(Bostonl-----------------------dol. per lb .. . 790 • 743 • 755 . 755 . 755 • 790 . 790 Suiting, unfinished worsted, 13 oz. (at mill)
. dol. peryd __ -- 2.228 2.228 2. 320 2.599 2.599 (I) Women's dress goods, Freneb serl!'~. 54" (at
w~~reiiriii-ii;;i;·&:crossbredstr.~k1 (~~t~~)- 1. 559 1.411 1.411 1.411 1.559 1.599 1.559
dol. per lb _ 1.800 1.800 1.800 1.800 1.800 1.800 1.800 Stocks, scoured basis, end of quarter:t
TotaL_--------------------- ____ thous. of lb •. 190.571 --------- --------- 247,083 --------- ---------Wool finer than 40s, totaJ. ___________ do ____ ___ ... _____ 142,378 --------- --------- 172,438 ---------Domestic._--------- ___ ----------_ .do ____ 77,253 --------- --------- 66,182 --------- ---------Foreign ____________________________ do. ___ --------- 65,125 --------- --------- 106,256 --------- ---------Wool40s and below and carpet _______ do •••• 48,193 --------- --------- 74.645 --------- ---------MISCELLANEOUS PRODUCTS
Fur, sales by dealers-------------tbous. of doL. --------- 626 3,192 6,980 6,947 4,980 1,460 Pyroxylin-coated textiles (cotton fabrics):
Orders, unfilled, end of mo._ tbous. linear yd .. 9, 658 7,825 6,606 6,097 6,617 6,496 5, 798 Pyroxylin s~read ________________ tbous. of lb .. 3, 776 6,637 6,210 5,651 5,387 5,554 5, 371 Shipments;, llled ___________ tbous.linear yd __ 4, 510 7,398 7,033 6,699 6,667 6,384 5,877
TRANSPORTATION EQUIPMENT
AUTOMOBILES
Indexes of retail financing: Passenger car financing, volume:t
TotaL _____________________ Jan. 1942-100. _ 20 196 100 63 73 58 New cars .•• ___ --------------------do ____ 11 463 100 22 46 42 Used cars __________________________ do ____ 22 132 100 73 81 62
Retail automobile receivables outstanding, end of month ___________ Dec. 31, 1939=100-- 37 149 139 128 ll6 105
Automobile rims, production ... tbous. of rims.__ 554 1, 677 1, 271 823 669 665 Accessories and parts, shipments:
Accessories to wbolesalers ...... Jan. 1935-100 .• 174 144 139 141 130 Service parts to wbolesalers _____________ do .... --------- 297 229 231 234 205 Service equipment to wholesalers •••.•. do ____ 255 217 201 202 198
RAILWAY EQUIPMENT
American Railway Car Institute: Shipments:
Freight cars, total _________________ number __ 2, 244 7,183 6,240 7, 752 7, 781 7,957 Domestic. __ --- --------------------do. ___ 1, 428 7,181 6,240 7,652 7, 781 7,273 Passenger cars, total __________________ do ____ 0 35 42 24 28 10 Domestic.--------------- __ ----- ••. do •• __ 0 29 42 20 28 10
• Revised. I No quotation. t For revised figures for all months of tbe cotton year 1941-42, seep. S-35 of the November 1942 Survey. , Data for March, June, and September 1942 are for 5 weeks; other months, 4 weeks.
56 60 55
95 617
128 174 183
7, 573 5,700
41 41
23,095 23,110 22,974 11,295 11,484 10,981
471 479 458 133.7 130.2 136.4
.421 .421 .421
.515 . 515 .515
39.0 '39.9 38.2 13.7 12.6 •12. 7
.550 .550 .550
.250 .250 .250
7.0 6.5 7.4 2.3 3.1 3.9
53,510 45, 896 45,372 4,280 3, 23~ 2,000
2,668 2.853 2, 744 78 70 70
76 71 72 53 59 45
119,375 127. 143 125,473 115,368 122,324 120,250
233 243 237
1.195 1.195 1.195 .503 .496 .499
• 790 • 790 • 790
(1) (1) (1)
1.556 1.552 1. 552
1.800 1.800 1.800
351,485 --------- ---------276,296 --------- ---------141,409 --------- ---------134,887 --------- ---------75,189 --------- ---------
1,313 1,518 3,197
5,563 4,937 4,686 4,605 4,430 4,275 5,279 4,530 4, 734
58 59 53 55 57 54 60 60 54
86 77 67 664 573 586
126 118 110 111 117 119 187 176 173
5,253 2.ll60 955 2, 851 1, 370 574
23 16 10 23 16 10
22,956 11,191
468 134.9
.420 • 515
38.4 •12. 5
.550
.250
8.0 4.3
52,305 3,045
2,657 65
66 40
121,812 112, 150
217
1.199 . 527
. 790
(')
1. 558
1.800
335,796 254,817 126,612 128,205 •80.979
2,630
5, 752 4, 766 4, 617
42 45 42
59 633
112 135 180
1,575 1, 408
0 0
23,012 11,429
478 136.9
.414
. 515
41.1 12.6
.550
.250
7. 7 4.1
•45,100 3,240
•2. 703 •75
69 44
•128, 423 •118, 676
217
1. 205 .535
. 790
(')
1.559
1.800
------------------------------- ---
22,9 48 58 10,5
44 • 4 133.
. 41
.51
•38. '12.
4 5
s 4
. 55 (} (} .25
•8. '4.
44,3 3,03
2, 65
1 4
(}
1 7
6 4
125,19 ll5, 34
20
6 2'
4 4 7
1. 20 5 5 . 53
. 79 (}
(I\
1. 55 \}
00 1.8
--------------------------
------- . -------
2,626
8, 913 4, 565 4,887
32 26 34
51 547
97 144 165
2,142 1,970
0 0
2,17
9, 9.1
g-
9 (} g_
3, 57 4, 24
2 1 28
44 48
------------------------
2. 20 1,89
1
t Revised series. Tbe yarn price series for Southern, 22/1, cones, has been substituted beginning January 1941 for the Northern, mulespun, series formerly sbown; for data for all months of 1941, seep. S-35 of tbe November 1942 issue. Figures for wool stocks are compiled on a revised basis beginning 1942 and data are not available comparable with figures shown in tbe 1942 Supplement apd in monthly issues through June 1942. 1942 data sbown above cover all known stocks of wool in commercial channels, Including stocks in the bands of country dealers and in country warehouses: stocks In tbe bands of country dealers and in country warehouses are not included In tbe earlierdata. All fi!(ures exclude stocks afloat which are no longer available for publication. For data for Marcb and June 1941 for wool finer tban 40s, seep. 8-37 of the October· 1942 Survey. Tbe Indexes of retail automobile financing shown above en a January 1942 base may be linked to tbe indexes on a 1939 base sbown In tbe 1942 Supplement bye applying tbe current serie.s to the January 1942 index on a 1939 base given in footnote 5 top. 170 of the 1942 Supplement.
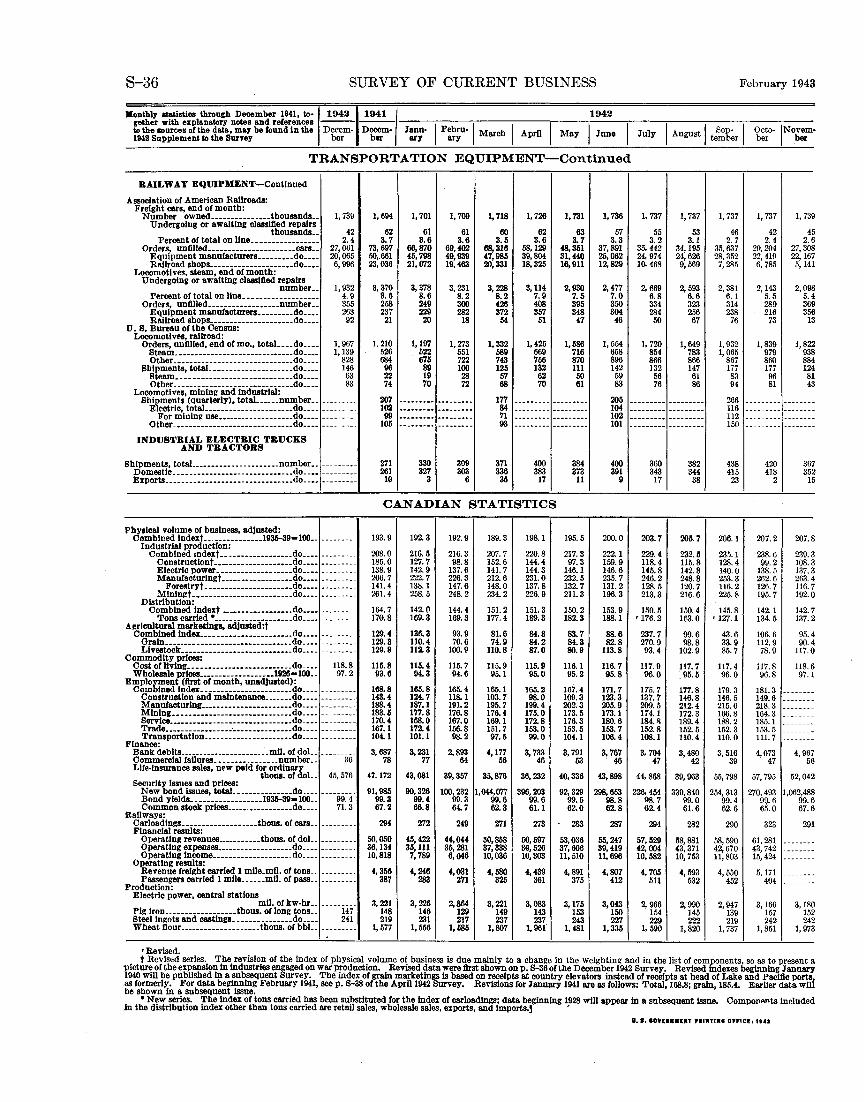
S-36
Monthly statistics through December 1941, to• gether with explanatory notes and references to the sources of the data, may be found in the 1942 Supplement to the Suryey
SURVEY OF CURRENT BUSINESS February 1943
1942!1941 I Decem- Decem• Janu· I Febru-1 March I April I May
ber ber ary ary
1942
I June
TRANSPORTATION EQUIPMENT-Continued
RAILWAY EQUIPMENT-Continued
Aasoclatlon of American Railroads: Freight cers, end of month:
Number owned ..•.•••••••.•.• thousands •. Undergoing or awaiting classified repairs
thousands •. Percent or total on line _________________ Orders, unfilled ..•••••••••••••••••••• cars ••
Equipment manufacturers ••••••••• do •••• Railroad shops •••• -----••••• ----- •• do ••• _
Locomotives, steam, end of month: Undergoln& or awaiting claaslfied repairs
number •. Percent of total on line ___________________ Orders, unfilled __ • __ ._ •• ___ •••••• number ••
Equipment manufactarers ••••••••• do •••. Railroad shops ___________________ •. do ..•.
U. B. Bureau of the Census: Locomotives, railroad:
Orders, unfilled, end of mo., totaL ••. do •••• Steam ••• -- •• ---- ••• --.-----•• ---- •• do •••• Other __ ••• _____ •••••. __ •••••••• __ •• do ••••
Shipments, totaL----------------- ••• do •••. Steam •••••• --- •• -- ••• --------- __ •. do.---Other----- .• -----•••• --------•••.•. do •• __
Locomotives, mlnln& and Industrial: Shipments (quarterly), total •••••. number ••
Electric, totaL ---------------------do •••• For mining ullll •• -----------------do •••.
Other_ •• _.--"- •••• -- ••• --.---.----•• do •• --
INDUSTRIAL ELECTRIC TRUCKS AND TRACTORS
1, 739
42 2.4
27,061 20,065 6, 996
1, 932 4.9 355 263 92
1. 967 1,139
828 146 63 83
---------
Shipments, total ______________________ number •• ---------Domestic •• ----------------------------do ..•• -------.-Exports ..•• ____ ------------------------do ..••• -.------
Physical volume or business, adjusted: Combined lndext .• ·-----------1935-39-100 •• ---------
Industrial production: Combined mdext •• ----------------do •••• ------ ·--
Constructlont ---- •••••••• -----·--do •••• Electric power.------------- ••••• do •••• Manufacturlngt ----- •••• ------- •• do ••••
Fore~~tryt. ----------------- •.•• do •••• Mlnln!!t _ •• __ --------------------do ••••
Distribution: Combined lndext ------------------do •••• ----·----
Tons carried • --------------------do •••• ---------Agricultural marketings, adjusted:t
Combined Index ••••• ------------------do •••• ---------Grain .• -----••• __ •• -------- __ ------- .do .••• ---------Llvestock ____________________________ do .••.
---------Commodity prices:
Cost of Jiving ••• -----------------------do ____ 118.8 Wholesale prices .• -----------------llm-100 •• 97.2
Employment (first of month, unadjusted): Combined Index._ ---------------------do .•.. ---------
Construction and maintenance •.••••• do •••• ---------Manufacturing ____ ••••••••••••••••••• do •••. ---------re~l~:.:::::::::::::::::::::::::::::~~==== Trade. _______ ••••••••• · ••••••••••••••• do .... ---------Transportation .•....•••••• --•.•••••. do .••• ---------
Finance: Bank deblts. ____________________ _._mu. of doL ---------Commercial failures •• ------------ .. number •. 36 Life-Insurance sales, new paid for ordinary
thous. of doL 45,576 Securltb Issues and prices:
New ond issues, total •.••••••••••••• do ..•. ----99:4· Bond yields._ ----------------1935-39-100 .. Commo~ stock prlces •••••.•.••••••••• do .••• 71.3
•Railways: Carloadlngs ___________________ thous. of cars •. Financial results:
Operating revenues .••••••.••• thous. of doL. ---------Operating expenses •••••...• __________ do ..•. Operating Income ______________ -----. do.---
Operating results: Revenue freight carried 1 mlle.mll. of tons_. Paasengerscarried 1 mlle .••••• mll. ofpaas ••
Production: Electric power, central stations
mU.ofkw-br •• ---------Pig lron __________________ thous. of long tons .. 147 Bteelln!!ots and castings. --------------do .... 241 Wheat flour ____________________ thous. of bbL.
•Revised.
1,694
62 3. 7
73,697 50,.661 23.036
3, 370 8.6 258 237
21
I. 210 526 684 96 22 74
207 102 99
105
271 261
10
1, 701
61 3.6
66,870 45,798 21,072
3,378 8.6 249 229 20
1,197 522 675 89 19 70
------------------------------------
330 327
3
1, 709
61 3.6
69,402 49,939 19,463
3,231 8.2 300 282
18
1,273 551 722 100
28 72
---------....................... ------------------
309 303
6
1, 718
60 3.5
68,316 47,985 20,331
3,228 8.2 426 372
54
1,332 589 743 125 57 68
177 84 71 93
371 336 35
1, 726
62 3.6
58,129 39,894 18,325
3,114 7.9 408 357
51
1,(25 669 756 132 62 70
------------------------------------
400 383
17
1, 731
63 3. 7
48,351 31,«0 16,911
2,930 7.5 395 348
47
1,586 716 870 111 50 61
-----------------~ ------------------
384 373 11
CANADIAN STATISTICS
193.9 192.3 192.9 189.3 198.1 195.5
208.0 216.5 216.3 207.7 220.8 217.3 185.0 127.7 98.8 152.6 144.4 97.3 138.9 142.9 137.6 141.7 144.3 146.1 206.7 222.7 226.3 212.6 231.0 232.5 141.4 138.1 147.6 148.0 137.8 132.7 261.4 258.5 248.2 234.2 226.9 211.3
164.7 142.0 144.4 151.2 151.3 150.2 17~.8 169.3 169.3 177.4 189.3 182.3
129.4 136.3 93.9 81.6 84.8 83.7 129.3 110.4 70.6 74.9 84.2 84.3 129.8 112.3 100.9 110.8 87.0 80.9
115.8 115.4 115.7 115.9 115.9 116.1 93.6 94.3 94.6 95.1 95.0 95.2
168.8 166.8 165.4 166.1 165.2 167.4 H3.4 12t. 7 118.1 103.7 98.0 109.3 188.4 187.1 191.2 195.7 199.4 202.3 183.5 177.8 176.8 176.4 175.0 173.5 170.( 168.0 167.0 169.1 172.8 176.3 167.1 172.4 156.8 151.7 153.0 153.5 104.1 101.1 98.2 97.5 99.0 104.1
3,687 3,231 2,893 (,177 3, 733 3, 791 78 77 64 56 46 53
47. 172 43,081 39,357 35,876 36,232 40,336
91,985 90,326 100,232 1,044,077 396,203 92,329 99.3 99.4 99.3 99.6 99.6 99.5 67.2 66.8 64.7 62.3 61.1 62.0
294 272 249 271 273 283
50.050 45,422 44,0« ~0,858 50,597 53,036 36.134 35,111 35,281 37,338 36,526 37,606 10,818 7, 789 6,046 10,036 10,303 11,510
4,35& (,246 4,031 4,580 4,439 4,891 387 283 271 325 361 375
3, 221 3,226 2,864 3,221 3,083 3,175 148 146 129 119 143 153 219 231 217 237 237 243
1, 577 1,556 1,585 1,807 1,96f 1,481
1, 736
57 3.3
37,891 25,062 12,829
2,477 7.0 350 394 46
1,554 658 896 142 59 83
205 104 102 101
400 391
9
200.0
222.1 159.9 146.6 235.7 131.2 196.3
153.9 188.1
88.6 82.8
113.8
116.7 95.8
171.7 123.3 205.9 173.1 180.6 153.7 106.4
a, 767 46
43,898
298,663 98.8 62.8
287
55,247 39,419 11,696
4,807 412
3,043 150 227
1,335
1, 737
55 3.2
35, 442 24, 974 10. 468
2, 669 6.8 334 284 50
1, 720 854 866 132 56 76
------------------------------------
360 343
17
203.7
229.4 118.4 145.8 246.2 128.5 213.3
150.5 '176.2
237.7 270.9 93.4
117.9 96.0
175.7 137.7 209.5 174.1 184.11 152.8 108.1
3, 704 47
44, 868
226. 454 98.7 62.4
294
57,529 42,094 10,582
4, 705 511
2, 966 154 229
1, 590
1, 737
53 3.1
34,195 24,626 9, 569
2, 593 6.6 323 256 67
1,649 783 866 147
61 86
------------------------------------
382 344 38
205.7
232.5 115.8 142.8 248.8 120.7 216.6
150.4 163.0
99.6 98.8
102.9
117.7 :95.5
177.8 146.8 212.4 172.3 189.4 152.5 110.4
3,480 42
39,963
339,840 99.0 61.6
282
58,881 43,371 10,753
4,593 532
2,990 145 222
1,820
1, 737
46 2. 7
35,637 28,352 7,285
2, 381 6. 1 314 238
76
1, 932 1, 065
867 177 83 94
266 116 112 150
438 415
23
206.1
231.1 128.4 140.0 253.3 116.2 225.8
145.8 '127.1
43.6 33.9 85.7
117.4 96.0
179.3 146.5 215.6 166.8 188.2 152.3 110.0
3, 516 39
55,798
254,313 99.4 62.6
290
58,590 42,670 11,803
4, 550 452
2,947 139 219
1, 737
1, 737
42 2.4
29,204 22,419 6, 785
2,143 5.5 289 216
73
1,839 979 860 177 96 81
------------------------------------
420 418
2
207.2
238.6 99.2
138.5 262.6 126.7 195.7
142.1 134.5
106.6 112.9 78.9
117.8 96.8
181.3 149.6 218.3 164.3 185.1 153.5 111.7
4,073 47
57,795
270,493 9~. 6 65.0
323
61, 281 43,742 15,424
5,171 404
3,166 157 242
1,851
1, 739
45 2.6
27,308 22,167 5,141
2,098 5.4 369 356 13
1,822 938 884 124 81 43
--------------------------------
367 352
15
207.8
239.3 108.3 137.3 263.4 116.7 192.0
142.7 137.2
95.4 90.4
117.0
118.6 97.1
--------------------------------------------------------
4, 967 56
52,042
1,062,488 99.6 67.6
291
----------------------------------------
3,180 152 242
1, 973
t Revised series. The revision of the index of physical volume of business is due mainly to a change in the weighting and in the Jist of components, so as to present 8 picture of the expansion In Industries engaged on war production. Revised data were first shown on p. S-36 of the December 1942 Survey. Revised Indexes beginning January 1940 will be published in 8 subsequent Survey. The index of grain marketings Is based on receipts at country elevators Instead of receipts at head of Lake and Pacific ports{ as formerly. For data beginning February 1941, seep. 8-38 of the Aprl11942 Survey. Revisions for January 1941 are as follows: Total,168.8; grain, 185.4. Earlier data wil be shown In a subsequent issue.
• New series. The Index of tons carried has been substituted for the Index of carloadlngs; data beginning 1928 will appear In a subsequent issue. CompopAnts Included Jn the distribution Index other than tons carried are retail sales, wholesale sales, exports, and Imports.~ •
W. I. eOYIIH.IIIT PIIRTI.I OPFIC!: UU

INDEX TO MONTHLY BUSINESS STATISTIC
CLASSIFICATION, BY SECTIONS
Monthly business statiatia: Business indexes_--------------Commodity prices ••••...••••••• Construction and real estate ••••• Domestic trade .•••...•.••.•.••• Employment conditions and waQ;ea. Finance .. __ .. ---------- .. ___ ........... Foreign trade ••••.•.......•..•• Transportation and communica·
tiona ..... ------------- ------Statistics on indi,;dual industries:
Chemicals and allied products •• Electri<" power and gas •.•••••• Foodstuffs and tobacco •••.•••• Leather and products .••••••••• Lumber and manufactures ••••• Metals and manufactures:
Iron and steeL •.....••••••• Nonferrous metals and prod·
ucts .. --- ---- .. _ .... _ .......... ---Machinery and apparatus .•••
Paper and printinQ;.-- •.. _ .•••• Petroleum and coal products ••. Stone, clay, and glass products •• Textile products •...•.•••••••• Transportation equipment •••••
Canadian statistia .•••.•.•••••••
Page S-1 S-3 S-4 8-6 S-8
8-13 S-20
8-20
S-22 S-23 8-24 S-27 8-28
8-29
8-30 8-30 8-31 S-32 S-33 S-34 S-35 8-36
CLASSIFICATION, BY INDIVIDUAL SERIES
PaQ;es marked S Abrasive paper and doth (coated)......... 33 Acceptances, bankers'.................... 13 Advertising........ ..••••••••••.••••••• 6 Agricultural cash income................. 1 Agricultural wages, loans ••.••.••••••••••• 13,14 Air mail and air-line operations........... 6. 21 Aircraft- ........••..•••.•••••••••••••••• 12, 13 Alcohol, methyL........................ 22 Alcoholic beveraQ;e•---···-·-·----------· 1, 2, 24 Aluminum ..•• _ •• ·······-·----·---·----- 30 Animal fats, greases..................... 22 Anthracite •••••..••••••..•••••• 1,2,3,10,12,32 Apparel, wearing .••.•• 3, 6, 7, 9,10,11,12, 13,34,35 Asphalt................................ 33 Automobiles •.••• 1. 2, 6, 7, 8,9, 10, 11,12,13,16,35 Automobile accessories and parts.......... 35 Banking •..•••••.•••• ···--------···· ••• 13,14 Barley •....• ----------·-·------------·· 25 Bearing metal •••. ---------------------·- 30 Beef and veaL.------------·······------ 26 Beverages, alcoholic •• ---·-·------· ••.•• 1, 2, 24 Bituminous coaL ••••••••••••••• 1,2,3,10,12,32 Boilers ...••...•. ----·----------·-· ••••• 29.30 Bonds. issues. prices, sales, yields .•••.••••• 18, 19 Book publication........................ 32 Brass, bronze, and copper products ..•••• 12, 13,10 Brick ...•• -- •.••••••••••••••• 3, 9,10,12,13, 33 Brokers' loans .......................... 14,18 Building contracts awarded............... 4 Building costa ..... --------------··-···- 5 Buil<lin& expenditures (indexes)........... 4 Buildin&-material prices, retail trade....... 3, 7 Butter .... ___ ------------ ••• --·-·-··- 24 Canadian statistics •••••••• ----····--·· •• 16,36 Canal traffic •••. ·········-·····-------·- 21 Candy ......... -·----·····--·--··------ 27 Capttal ftotationa........................ 18
For productive use&------·-------··-··· 18 Carloadings •.•. --------------··--·-·-·· 21 Cattle and calves........................ 26 Cement .............. ----------····· 1, 2, 3, 33 Chain-store sales........................ 7 Cheese................................. 24 Chemicals _ . . . 1, 2, 3, 9, 10,11, 12, 13,15, 16, 22 Cigarsandcigarettes...... •..••.••••••• 27 Civil-service employees.............. . . • . 10 Clay products ......... 1, 2, 9,10,11,12.13,15,33 Clothing (see also hosiery). --------- . . 3,
6, 7, 9,10,11, 12, 13,34.35 CoaL .......... ·····------ 1,2,3,10,12,32 Cocoa .................. ··-·-·-------·· 27 Coffee ••• _ •..• ----·-··---------·-·-···· 27 Coke ..................... ···-·-·-···-· 1, 2, 32 Commercial failures..................... 15 Commerdal paper....................... 13 Construction:
Construction estimates................. 4 Contracts awarded.................... 4 Casu ........... ------- ------------- 5 Highways and grade crossingo........... 5 Wage rates ... __ ....... .. • . ••••••••••• 13
Consumer cr~dit............. .• ••••••••• 15 Consumer expenditures ......... ---------------· 6 Copper ... ------------- ---·-·········- 30 Copra or coconut oiL.................... 22 Com. ..• . .. . . • . • . . ................... 25 Coat or-living index. .. . . . . . . .. _..... . 3, 4 Cotton. raw. and manufactures. 1,2.3,9.10,11,34 Cottonseed. cak~ and meal, oiL.. . .. . • _ 22. 23 Crops ...................... 1,23,25.27,34 Currency in circulation • .. .. .. • . • • . . • _ . 16 Dairy products ................... 1, 2 3, 24,25 D~bits, bank........................... t4 Debt. United States Government.. . . . . 17 Delaware. employment, pay rolls. wages. 10,11,13 Denartment stores; Sales. stocks. collec·
tions .... __ ...... __ ----·--· ••••••••• 7, 8
Pages marked S
g!'posits, '!>ank •• :······ .. --------------- 1141 tsputes. tnduatrtal -------------------Dividend payments and rates .. _-------··· 1,19 Earnings, factory, weekly and hourly ........ 12, 13 Eggs and chickens ...................... 1,3, 26 Electri<·al equipment-------------- 2,6,12,30.31 Electric power production, sales, revenues •. 23,24 Employment, estimated ••. ··-----------··· 8 Employment indexes:
Factory, by cities and States............ 10 Factory, by induotrie.. --------------- 8,9,10 Nonmanufacturing •.••. -------------- 10
Employment, security operations.......... 11 Emigration and immigration.............. 21 Engineeoring construction _ _ ...... _ ... _......... ... ... ... ... ... ... ... 4 Exchange rates, foreign. -·-------------- 16 Expenditures, United States Government.. 17 Explosives ......... _ ••••••••.•••••• ---·- 22 Exports. ....•.•••••••••••••••••••••••• 20 Factory employment, pay rolla, hours, wages. 8,
9,10,11,12,13 Fairchild's retail price index.............. 3 Farm wages............................ 13 Farm pric.-s, index....................... 3,4 Fats and oil•---------------------------- 3 Federal Government, finance. • • • . • • • • • . • • 17 Federal Reserve banks, condition of. • • . • • • 14 Federal Reserve reporting member banks... 14
~f::::~~==-========~=========:::::::: 3, 2~ Fish oils and fish •••••••••••••••••••••••• 22,27 Flaxseed •• -------------·-···-·········· 23
~~~~;t:::::::::::::::::::::::::::: ~: Food product•. ·······--------·········· 1,
2. 3, 4, 6, 7. 9,10,11,12,13,15,16, 24, 25, 26,27 Footwear .•..•.. ------ 1,2,3,9,10,11,12,13,28 Foreclosures, real estate.................. 6 Foundry equipment.. .•.••••••••••••••. 30 Freight cars (equipment) ••.•.•••.•••••••• 35,36 Freight carloadings, carat indexes............................ 21 Freight-car surplus...................... 21 Fruit• and vegetables.-------.-·····--··- 3, 25 Fuel equipment and heating apparatus..... 30 Fuels ••.••..•••••••••••••••••••••• 1, 2, 3,32, 33 Furniture.--·------------ 1, 2,3, 9,11,12, 29,30 Gas, customers. sales, revenues------------ 24 Gas and fuel oil•----·-----------------·· 33 Gasoline .••.•••• ·---------------------- 33 Gelatin, edible •••••••••. --------·-··---- 27 Glass and glassware •.•.• 1, 2, 9, 10,11,12,13,15, 34 Gloves and mittens.-------------···-·-·· 28 Gold ........... --------------·-----···- 16 Goods in warehouse&-----------------·-·· 6 Grains •.••.• ------------------- 3,17,18, 25,26 Gypsum •••••• --------···-------------- 34 Hides and akina ••••••••• ------------·--· 3,27 Highways, and grade crossinp, Federal aid.. 5 Hogs ..••.•.•.• ·----------------------- 26 Home-loan banks, loans outstanding....... 6 Home mortgages .•••••• -----·········--- 5 Hosiery •••••••••••••••••••• --·-····-··- 3,34 Hotel•--------------·-··-··········· 10,12, 21 Housefurniahings •••••••••••••••••••••••• 3, 6, 7 Housing................................ 3, 4 Illinois, employment, pay rolla, waQ;ea •• - 10,11,13 Immigration and emigration.............. 21 Imports ......... ················-··---- 20 Income paYments ••••••• ----·····------- 1 Income-tax receipts...................... 17 Incorporations, business, neW------------- 16 Industrial production, indexes............. 1. 2 Instalment loans ......... --------------- 15 Instalment sales, department stores........ 8 Insurance, life ........ ----------------- 15,16 Interest and money rates................. 14 Inventories, manufacturers'~-------------- 2 Iron and steel, crude. manufactures........ 2,
3,8,9,11,12,15,16,29,30 Kerosene ••••••••••• ----········-------- 33 Labor, turn-over, disputes................ 11 Lamb and mutton._..................... 26 Lard ..................... -------------· 26 Lead .......... ----·-···········-······- 30 Leather ......... 1,2,3,9,10,11,12,13,15,27,28 Linseed oil, cake, and meaL.............. 23 Livestock ....................... _.... 1, 3, 26 Loans, real·estate, agricultural, bank. broken'
(see also Consumer credit) ........ 5,6,14,17.18 Locomotives ..... _...................... 36 Looms. woolen, acti,;ty •••••••••••• ---·- 35 Lubricants............................. 33 Lumber __ ._ ............ 1, 2, 3,8, 9, 11, U ,15, 28 Machine acti,;ty, cotton, woo'--------·· .. 35 Machine tools ...................... 12,13,30 Machinery .. _ .. 1,2,8.9.10.11,12,13 15,16,30 Magazine advertising ....... ------------ 6 Manufacturers' orders, shipment&. inven•
tories ........... ---------·- ---------Manufacturing production indexes..... .. . Maryland, employment, pay rolls. ____ ..
2 1,2
10,11 Massachusetts, employm~nt, pay rolls,
wages .......................... --·- 10, 11. 13 Meatoand meat packing. 1, 2,3, 9,10, 11,12,13, 26 Metals. ___________ 1,2,3,8,9,10,11,12,13 16,29
Methanol •• _-----------·-···----------- 22 Milk .. ----------------·--·---------·--· 24,25 Minerals........................... 1, 2,10, 12 Naval stores ••••••••• -------·--......... 22 New Jersey, employment, pay rolls, wages_ 10,
11,13 Newspaper advertising .•••••••.•. ._........ 6 Newsprint ....••.•••...••••.•.•.••.•..•. 31,32