
A Survey on Pre-Processing Educational Data
36
Chapter 2 A Survey on Pre-Processing Educational Data Cristóbal Romero, José Raúl Romero and Sebastián Ventura Abstract Data pre-processing is the first step in any data mining process, being one of the most important but less studied tasks in educational data mining research. Pre-processing allows transforming the available raw educational data into a suitable format ready to be used by a data mining algorithm for solving a specific educational problem. However, most of the authors rarely describe this important step or only provide a few works focused on the pre-processing of data. In order to solve the lack of specific references about this topic, this paper specifically surveys the task of preparing educational data. Firstly, it describes different types of educational environments and the data they provide. Then, it shows the main tasks and issues in the pre-processing of educational data, Moodle data being mainly used in the examples. Next, it describes some general and specific pre-processing tools and finally, some conclusions and future research lines are outlined. Keywords Educational data mining process Data pre-processing Data prep- aration Data transformation Abbreviations AIHS Adaptive and intelligent hypermedia system ARFF Attribute-relation File Format CBE Computer-based education CSV Comma-separated values C. Romero (&) J. R. Romero S. Ventura Department of Computer Science and Numerical Analysis, University of Córdoba Campus de Rabanales, Edificio C2-Albert Einstein, Córdoba, Spain e-mail: [email protected] J. R. Romero e-mail: [email protected] S. Ventura e-mail: [email protected] A. Peña-Ayala (ed.), Educational Data Mining, Studies in Computational Intelligence 524, DOI: 10.1007/978-3-319-02738-8_2, ȑ Springer International Publishing Switzerland 2014 29
Transcript of A Survey on Pre-Processing Educational Data

Chapter 2A Survey on Pre-ProcessingEducational Data
Cristóbal Romero, José Raúl Romero and Sebastián Ventura
Abstract Data pre-processing is the first step in any data mining process, beingone of the most important but less studied tasks in educational data miningresearch. Pre-processing allows transforming the available raw educational datainto a suitable format ready to be used by a data mining algorithm for solving aspecific educational problem. However, most of the authors rarely describe thisimportant step or only provide a few works focused on the pre-processing of data.In order to solve the lack of specific references about this topic, this paperspecifically surveys the task of preparing educational data. Firstly, it describesdifferent types of educational environments and the data they provide. Then, itshows the main tasks and issues in the pre-processing of educational data, Moodledata being mainly used in the examples. Next, it describes some general andspecific pre-processing tools and finally, some conclusions and future researchlines are outlined.
Keywords Educational data mining process � Data pre-processing � Data prep-aration � Data transformation
Abbreviations
AIHS Adaptive and intelligent hypermedia systemARFF Attribute-relation File FormatCBE Computer-based educationCSV Comma-separated values
C. Romero (&) � J. R. Romero � S. VenturaDepartment of Computer Science and Numerical Analysis, University of CórdobaCampus de Rabanales, Edificio C2-Albert Einstein, Córdoba, Spaine-mail: [email protected]
J. R. Romeroe-mail: [email protected]
S. Venturae-mail: [email protected]
A. Peña-Ayala (ed.), Educational Data Mining,Studies in Computational Intelligence 524, DOI: 10.1007/978-3-319-02738-8_2,� Springer International Publishing Switzerland 2014
29

DM Data miningEDM Educational data miningHTML Hypertext Markup languageID IdentifierIP Internet ProtocolITS Intelligent tutoring systemKDD Knowledge discovery in databasesLMS Learning management systemMCQ Multiple choice questionMIS Management information systemMOOC Massive Open Online CourseOLAP Online Analytical ProcessingSQL Structured Query LanguageWUM Web Usage MiningWWW World Wide WebXML Extensible Markup Language
2.1 Introduction
Educational Data Mining (EDM) is a field that exploits Data Mining (DM)algorithms in different types of educational data in order to resolve educationalresearch issues [1]. Data mining or Knowledge Discovery in Data-bases (KDD) isthe automatic extraction of implicit and interesting patterns from large datacollections [2]. The first step in the KDD process is the transformation of data intoan appropriate form for the mining process, which is usually called data pre-processing in data mining systems [3]. It allows raw data to be transformed into ashape suitable for resolving a problem using a specific mining method, techniqueor algorithm [4]. In fact, the better raw data are pre-processed, the more usefulinformation is possible to discover. However, the data pre-processing phase typ-ically requires a significant amount of manual work, this phase coming to consume60–90 % of the time, efforts and resources employed in the whole knowledgediscovery process [5]. In particular, educational environments store a huge amountof potential mining data (raw, original or primary data) but often the data availableto solve a problem are not in the most appropriate form (or abstraction), that is, thediscovered models are not useful.
For example, obtaining a model with too many rules only containing very lowlevel attributes would not be of interest to the instructor since it would not indicatehow to improve the course. To resolve this difficulty it is necessary to pre-processdata. It is often considered that once you have the correct transformation of thedata (modified data), the problem is almost solved [6] and it is well known that the
30 C. Romero et al.

success of every data mining algorithm/technique and the resulting or discoveredmodel/pattern are strongly dependent on the quality of the data used.
Data pre-processing in educational context is considered the most crucial phasein the whole educational data mining process [7], and it can take more than half ofthe total time spent in solving the data mining problem [3]. EDM users (such as aninstructor, teacher, course administrator, academic staff, etc.) have to apply themost appropriate data pre-processing techniques for a particular data set andpurpose. Thus, it is necessary that EDM users actively participate in the whole pre-processing process in order to select the pre-processing steps/tasks to be done andto decide how they should be ordered. Classical Web Usage Mining (WUM) pre-processing techniques, originally targeted at e-commerce, can be used in mostcases, but new approaches more related to learning environments are required toreach interesting results [8].
There are some other special issues concerning educational data, e.g. dataintegration from multiple sources, integration of data with different granularities,etc. Thus, in the specific case of educational data, for example, the large number ofattributes collected with information about each student can be reduced andsummarized in a table for a better analysis with multi-relational analysis methods;attributes can be re-represented in binary representation whenever it is appropriateto allow association rule analysis; continuous attributes can be discretized tocategorical attributes to improve the comprehensibility of data, etc. However, toour knowledge there are very few previous works exclusively focused on the pre-processing of educational data [7, 9, 10]. Therefore, in order to fill the gap ofspecific references about this important topic, this paper surveys the pre-processingtask of educational data.
Our main goal is to survey different issues on data pre-processing to provide aguide or tutorial for educators and EDM practitioners.
Throughout this paper, Moodle is used as a coherent framework of pre-processing, and data extracted from Moodle learning management system [11] haveserved as case under study in most examples. The paper is organized as follows:Sect. 2.2 shows the different types of educational environments, whilst Sect. 2.3discusses the different type of data they provide. Section 2.4 describes the maintasks and issues involved in the pre-processing of educational data. Section 2.5 listsmost of the currently existing general and specific data pre-processing tools.Finally, some conclusions and further research are outlined in Sect. 2.6.
2.2 Types of Educational Environments
Traditional education or back-to-basics refers to long-established customs found inschools that society has traditionally deemed to be appropriate.
These environments are the most widely-used educational system, based mainlyon face-to-face contact between educators and students that is organized throughlectures, class discussion, small groups, individual seat work, etc. These systems
2 A Survey on Pre-Processing Educational Data 31

gather information on student attendance, marks, curriculum goals, and individ-ualized plan data. Also, educational institutions store many diverse and variedsources of information [12] such as administrative data in traditional databases(student’s information, educator’s information, class and schedule information,etc.). In conventional face-to-face classrooms, educators may attempt to enhanceinstruction by monitoring students’ learning processes and analyzing their per-formance on paper and through observation. But with the increasing use ofcomputers as educational tools, it is much easier for instructors to monitor andanalyze students’ behavior starting from their usage information.
Computer-Based Education (CBE) means using computers in education to pro-vide guidance, to instruct or to manage instructions to the student. CBE systems wereoriginally stand-alone educational applications that ran on a local computer withoutusing artificial intelligence techniques. However, both the global use of Internet hasled to today’s plethora of new Web-based educational systems, together with arti-ficial intelligence techniques has induced the emergence of new educational systemssuch as: learning management systems, intelligent tutoring systems, massive openonline courses, etc. Each one of them provides very different data sources that have tobe pre-processed in different ways depending on both the nature of available data andthe specific problems and tasks to be resolved by DM techniques.
2.2.1 Learning Management Systems
Learning Management Systems (LMS) are a special type of Web-based educa-tional platform for the administration, documentation, tracking, and reporting oftraining programs, classroom and online events, e-learning programs, and trainingcontent. They also offer a great variety of channels and workspaces to facilitateinformation-sharing and communication among all the participants in a course.Some examples of commercial LMSs are Blackboard and Virtual-U, while someexamples of free LMS are Moodle, Ilias, Sakai and Claroline.
These systems accumulate massive log data with respect to students’ activitiesand usually have built-in student tracking tools that enable the instructor to viewstatistical data [13]. They can record any student activities involved, such as reading,writing, taking tests, performing various tasks in real or virtual environments, andcommenting on events with peers. LMSs normally also provide a relational databasethat stores all student information in different tables such as: personal user infor-mation (profile), academic results (grades), and the user’s interaction data (reports).
2.2.2 Massive Open Online Courses
Massive Open Online Courses (MOOC) are growing substantially in numbers, andalso in interest from the educational community [14]. MOOC is an online course
32 C. Romero et al.

aimed at large-scale interactive participation and open access via the Web that madeit possible for anyone with an internet connection to enroll in free, university levelcourses. Some examples of MOOCs are Udacity, MITx, EdX, Coursera and Udemy.MOOCs store very similar student’s usage information than LMSs but from thou-sands or hundreds of students. Thus, they also generate large amounts of data thatmakes necessary the use of data mining techniques to process and analyze it.
2.2.3 Intelligent Tutoring Systems
Intelligent Tutoring Systems (ITS) are systems that provide direct customizedinstruction or feedback to students. An ITS models student behavior and changes itsmode of interaction with each student based on its individual model [15]. The abilityof ITS to log and pool detailed, longitudinal interactions with large numbers ofstudents can create huge educational data sets [16]. Although ITSs record all student-tutor interaction in log files or databases, there are some other data stores availablewithin an ITS, for example, a domain model that incorporates a set of constraintsrelevant to the tutor’s domain, a pedagogical data set that contains a set of problemsand their answers, and a student model that stores information about each studentwith respect to all the constraints, satisfactions, and violations recorded.
2.2.4 Adaptive and Intelligent Hypermedia Systems
Adaptive and Intelligent Hypermedia Systems (AIHS) are one of the first and mostpopular kinds of adaptive hypermedia and provide an alternative to the traditionaljust-put-it-on-the-Web approach in the development of educational courseware[17]. They attempt to be more adaptive by building a model of the goals, pref-erences, and knowledge of each individual student and using this modelthroughout the interaction with the student in order to adapt to the needs of thatstudent. The data coming from these systems is semantically richer and can lead toa more diagnostic analysis than data from traditional Web-based education sys-tems [18]. In fact, the data available from AIHs are similar to ITS data; that is,AIHs store data about the domain model, student model and interaction log files(traditional Web log files or specific log files).
2.2.5 Test and Quiz Systems
Test and quiz systems are among the most widely used and well-developed tools ineducation. A test is an instrument consisting of a series of questions/items andother prompts for the purpose of gathering information from respondents.
2 A Survey on Pre-Processing Educational Data 33

The main goal of these systems is to measure the students’ level of knowledgewith respect to one or more concepts or subjects. There are different types ofquestions/items [19] such as: yes/no questions, multiple choice questions (MCQ),fill-in questions, open-ended answered questions, etc. Test systems store a greatdeal of information, such as questions, students’ answers, calculated scores, andstatistics.
2.2.6 Other Types of Educational Systems
There are also other types of educational environments, such as: educational gameenvironments, virtual reality environments, ubiquitous computing environments,learning object repositories, wikis, forums, blogs, etc.
2.3 Types of Data
Most of the data provided by each of the above-mentioned educational environ-ments are different, thus enabling different educational problems to be resolvedusing data mining techniques. In fact, they have conceptually different types ofdata that can be grouped in the next main types showed in Table 2.1.
2.3.1 Relational Data
Relational databases/data sets are one of the most commonly available and richestinformation repositories. A relational database is a collection of tables, and each isassigned a unique name. Each table consists of a set of attributes (columns orfields) and usually stores a large set of tuples (records or rows). Each tuple in arelational table represents an object identified by a unique key and described by aset of attribute values [2]. Relational data can be accessed by database queries
Table 2.1 Different types of data and DM techniques
Type of data DM technique
Relational data Relational data miningTransactional data Classification, clustering, association rule mining, etc.Temporal, sequence and time series data Sequential data miningText data Text miningMultimedia data Multimedia data miningWorld Wide Web data Web content/structure/usage mining
34 C. Romero et al.
written in a relational query language, such as Structured Query Language (SQL),or with the assistance of graphical user interfaces.
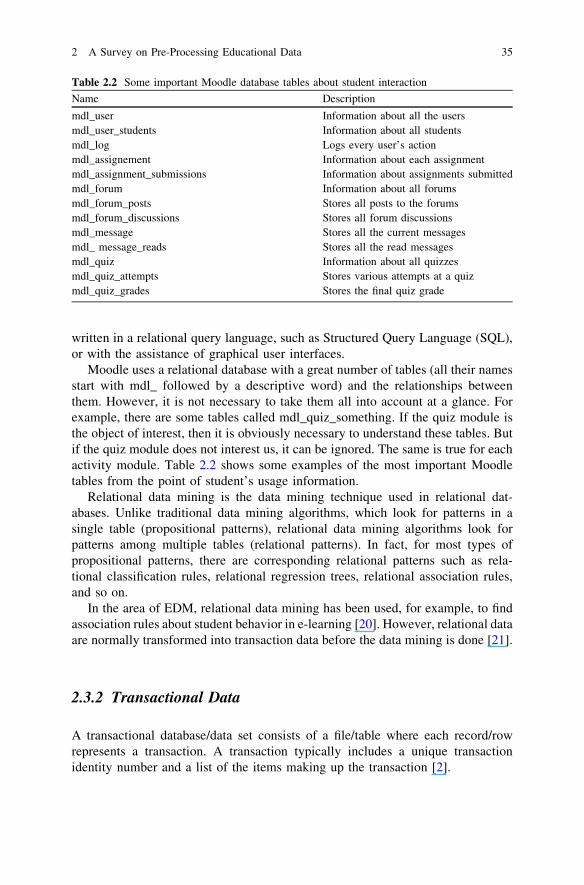
Moodle uses a relational database with a great number of tables (all their namesstart with mdl_ followed by a descriptive word) and the relationships betweenthem. However, it is not necessary to take them all into account at a glance. Forexample, there are some tables called mdl_quiz_something. If the quiz module isthe object of interest, then it is obviously necessary to understand these tables. Butif the quiz module does not interest us, it can be ignored. The same is true for eachactivity module. Table 2.2 shows some examples of the most important Moodletables from the point of student’s usage information.
Relational data mining is the data mining technique used in relational dat-abases. Unlike traditional data mining algorithms, which look for patterns in asingle table (propositional patterns), relational data mining algorithms look forpatterns among multiple tables (relational patterns). In fact, for most types ofpropositional patterns, there are corresponding relational patterns such as rela-tional classification rules, relational regression trees, relational association rules,and so on.
In the area of EDM, relational data mining has been used, for example, to findassociation rules about student behavior in e-learning [20]. However, relational dataare normally transformed into transaction data before the data mining is done [21].
2.3.2 Transactional Data
A transactional database/data set consists of a file/table where each record/rowrepresents a transaction. A transaction typically includes a unique transactionidentity number and a list of the items making up the transaction [2].
Table 2.2 Some important Moodle database tables about student interaction
Name Description
mdl_user Information about all the usersmdl_user_students Information about all studentsmdl_log Logs every user’s actionmdl_assignement Information about each assignmentmdl_assignment_submissions Information about assignments submittedmdl_forum Information about all forumsmdl_forum_posts Stores all posts to the forumsmdl_forum_discussions Stores all forum discussionsmdl_message Stores all the current messagesmdl_ message_reads Stores all the read messagesmdl_quiz Information about all quizzesmdl_quiz_attempts Stores various attempts at a quizmdl_quiz_grades Stores the final quiz grade
2 A Survey on Pre-Processing Educational Data 35

In our case, Moodle does not provide directly any transactional database or dataset in itself. However, transactional data can be derived in Moodle, though it is notexplicitly stored in its database. In fact, this chapter explains how to create atransactional summary table (Table 2.5 and Fig. 2.10) starting from some rela-tional database tables (see Table 2.2) which contain student usage information onMoodle activities.
A great number of data mining methods can be applied over this type of data. Infact, most of the well-known and traditional data mining techniques, such asclassification, clustering and association rule mining, work with this type of data.In fact, in the area of EDM, all these data mining techniques have been applied toMoodle student usage data to provide feedback to the instructor about how toimprove both courses and student learning [21].
2.3.3 Temporal, Sequence and Time Series Data
Temporal, sequence and time series data consists of sequences of values or eventschanging with time [2]. A temporal database typically stores relational data thatinclude time-related attributes. These attributes may involve several time-stamps,each one involving different semantics. A sequence database stores sequences ofordered events, with or without a concrete notion of time. A time-series databasestores sequences of values or events obtained over repeated measurements of time(e.g., hourly, daily, weekly).
An example of a sequential database used by Moodle is a student’s log. A logcan be thought of as a list of a student’s events, in which each line or recordcontains a time-stamp plus one or more fields that holds information about anactivity at that instant. In particular, a Moodle log (see Fig. 2.1) 1 consists of thetime and date it was accessed, the Internet Protocol (IP) address accessed from, the
Fig. 2.1 Example of Moodle log file
1 The full name column covers the identification of subjects.
36 C. Romero et al.

name of the student, each action (view, add, update and delete) performed in thedifferent modules (forum, resource, assignment, etc.) and additional informationabout the action.
Sequential data mining, also known as sequential pattern mining, addresses theproblem of discovering all frequent sequences in a given sequential database ordata set [22]. In the area of EDM, sequential data mining algorithms can be used,for example, to recommend to a student which links are more appropriate to visitwithin an adaptive educational hypermedia system based on previous trails ofstudents with similar characteristics [23].
2.3.4 Text Data
Text databases or document databases consist of large collections of documentsfrom various sources, such as news articles, research papers, books, digitallibraries, e-mail messages, chat and forum messages, and Web pages. Text dat-abases may be highly unstructured, such as some Hypertext Markup Language(HTML) Web pages, or may be somewhat structured, that is, semi-structured, suchas e-mail messages and eXtensible Markup Language (XML) Web pages.
Moodle provides a great amount of information in text format, such as: stu-dents’ messages to forums, messages to chats and e-mails, and anything thatstudents can read or write within the system.
Text mining or text data mining is roughly equivalent to text analytics [24], andcan be defined as the application of data mining techniques to unstructured textualdata. Typical text mining tasks include text categorization, text clustering, concept/entity extraction, production of granular taxonomies, sentiment analysis, documentsummarization, and entity relation modeling (i.e., learning relations betweennamed entities). In the area of EDM, text data mining has been used, for example,to assess asynchronous discussion forums in order to evaluate the progress of athread discussion [25].
2.3.5 Multimedia Data
Multimedia databases store image, audio and video data. Multimedia databasesmust support large objects, because data objects such as video can require giga-bytes of storage. Specialized storage and search techniques are also required.Because video and audio data require real-time retrieval at a steady and prede-termined rate in order to avoid picture or sound gaps and system buffer overflows,such data are referred to as continuous-media data. Multimedia information isubiquitous and essential in many applications, and repositories of multimedia arenumerous and extremely large.
Moodle also stores a great amount of multimedia data, for example, all the filesuploaded by the instructors and the students. These files can be, for example, an
2 A Survey on Pre-Processing Educational Data 37
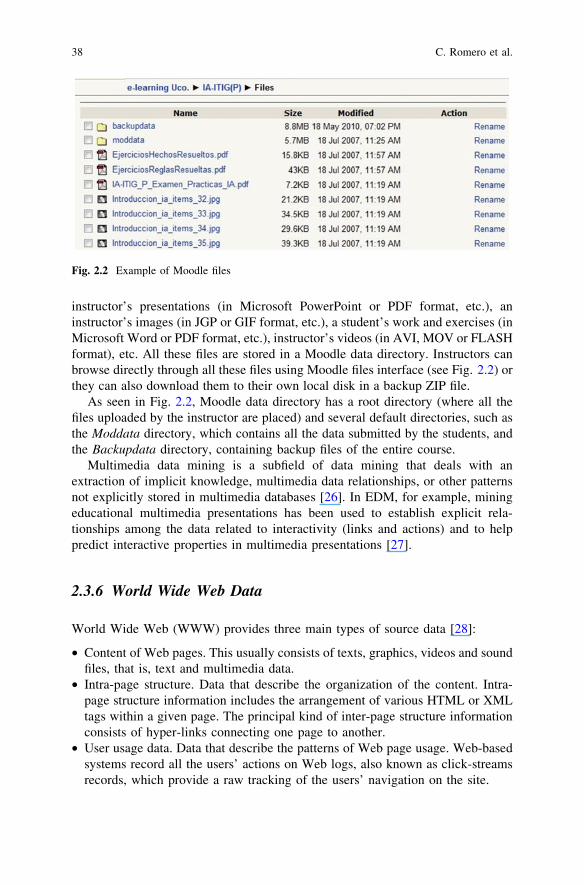
instructor’s presentations (in Microsoft PowerPoint or PDF format, etc.), aninstructor’s images (in JGP or GIF format, etc.), a student’s work and exercises (inMicrosoft Word or PDF format, etc.), instructor’s videos (in AVI, MOV or FLASHformat), etc. All these files are stored in a Moodle data directory. Instructors canbrowse directly through all these files using Moodle files interface (see Fig. 2.2) orthey can also download them to their own local disk in a backup ZIP file.
As seen in Fig. 2.2, Moodle data directory has a root directory (where all thefiles uploaded by the instructor are placed) and several default directories, such asthe Moddata directory, which contains all the data submitted by the students, andthe Backupdata directory, containing backup files of the entire course.
Multimedia data mining is a subfield of data mining that deals with anextraction of implicit knowledge, multimedia data relationships, or other patternsnot explicitly stored in multimedia databases [26]. In EDM, for example, miningeducational multimedia presentations has been used to establish explicit rela-tionships among the data related to interactivity (links and actions) and to helppredict interactive properties in multimedia presentations [27].
2.3.6 World Wide Web Data
World Wide Web (WWW) provides three main types of source data [28]:
• Content of Web pages. This usually consists of texts, graphics, videos and soundfiles, that is, text and multimedia data.
• Intra-page structure. Data that describe the organization of the content. Intra-page structure information includes the arrangement of various HTML or XMLtags within a given page. The principal kind of inter-page structure informationconsists of hyper-links connecting one page to another.
• User usage data. Data that describe the patterns of Web page usage. Web-basedsystems record all the users’ actions on Web logs, also known as click-streamsrecords, which provide a raw tracking of the users’ navigation on the site.
Fig. 2.2 Example of Moodle files
38 C. Romero et al.
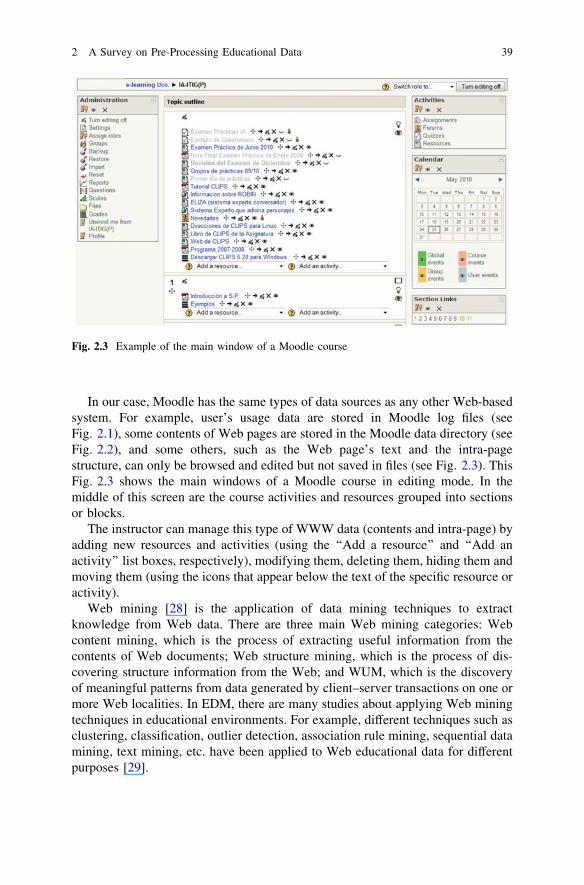
In our case, Moodle has the same types of data sources as any other Web-basedsystem. For example, user’s usage data are stored in Moodle log files (seeFig. 2.1), some contents of Web pages are stored in the Moodle data directory (seeFig. 2.2), and some others, such as the Web page’s text and the intra-pagestructure, can only be browsed and edited but not saved in files (see Fig. 2.3). ThisFig. 2.3 shows the main windows of a Moodle course in editing mode. In themiddle of this screen are the course activities and resources grouped into sectionsor blocks.
The instructor can manage this type of WWW data (contents and intra-page) byadding new resources and activities (using the ‘‘Add a resource’’ and ‘‘Add anactivity’’ list boxes, respectively), modifying them, deleting them, hiding them andmoving them (using the icons that appear below the text of the specific resource oractivity).
Web mining [28] is the application of data mining techniques to extractknowledge from Web data. There are three main Web mining categories: Webcontent mining, which is the process of extracting useful information from thecontents of Web documents; Web structure mining, which is the process of dis-covering structure information from the Web; and WUM, which is the discoveryof meaningful patterns from data generated by client–server transactions on one ormore Web localities. In EDM, there are many studies about applying Web miningtechniques in educational environments. For example, different techniques such asclustering, classification, outlier detection, association rule mining, sequential datamining, text mining, etc. have been applied to Web educational data for differentpurposes [29].
Fig. 2.3 Example of the main window of a Moodle course
2 A Survey on Pre-Processing Educational Data 39
2.4 Pre-Processing Tasks
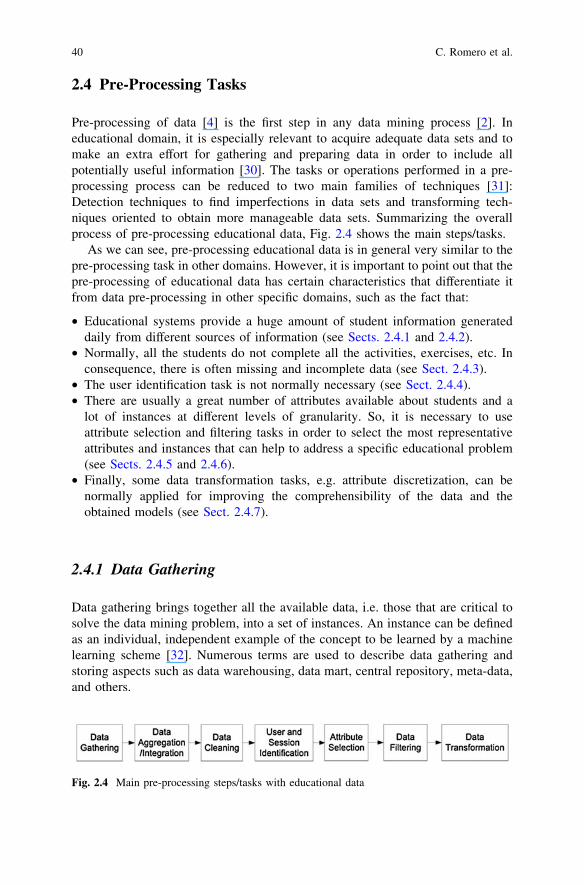
Pre-processing of data [4] is the first step in any data mining process [2]. Ineducational domain, it is especially relevant to acquire adequate data sets and tomake an extra effort for gathering and preparing data in order to include allpotentially useful information [30]. The tasks or operations performed in a pre-processing process can be reduced to two main families of techniques [31]:Detection techniques to find imperfections in data sets and transforming tech-niques oriented to obtain more manageable data sets. Summarizing the overallprocess of pre-processing educational data, Fig. 2.4 shows the main steps/tasks.
As we can see, pre-processing educational data is in general very similar to thepre-processing task in other domains. However, it is important to point out that thepre-processing of educational data has certain characteristics that differentiate itfrom data pre-processing in other specific domains, such as the fact that:
• Educational systems provide a huge amount of student information generateddaily from different sources of information (see Sects. 2.4.1 and 2.4.2).
• Normally, all the students do not complete all the activities, exercises, etc. Inconsequence, there is often missing and incomplete data (see Sect. 2.4.3).
• The user identification task is not normally necessary (see Sect. 2.4.4).• There are usually a great number of attributes available about students and a
lot of instances at different levels of granularity. So, it is necessary to useattribute selection and filtering tasks in order to select the most representativeattributes and instances that can help to address a specific educational problem(see Sects. 2.4.5 and 2.4.6).
• Finally, some data transformation tasks, e.g. attribute discretization, can benormally applied for improving the comprehensibility of the data and theobtained models (see Sect. 2.4.7).
2.4.1 Data Gathering
Data gathering brings together all the available data, i.e. those that are critical tosolve the data mining problem, into a set of instances. An instance can be definedas an individual, independent example of the concept to be learned by a machinelearning scheme [32]. Numerous terms are used to describe data gathering andstoring aspects such as data warehousing, data mart, central repository, meta-data,and others.
Fig. 2.4 Main pre-processing steps/tasks with educational data
40 C. Romero et al.
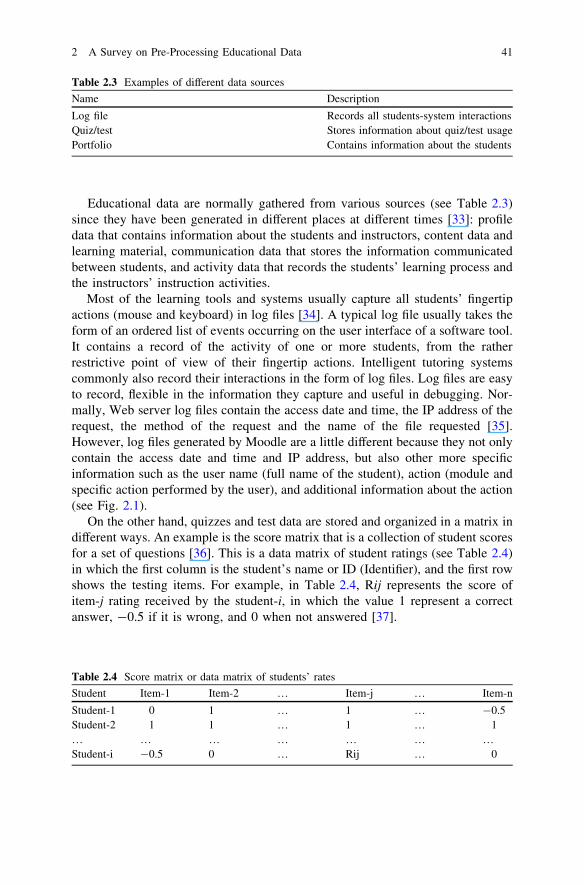
Educational data are normally gathered from various sources (see Table 2.3)since they have been generated in different places at different times [33]: profiledata that contains information about the students and instructors, content data andlearning material, communication data that stores the information communicatedbetween students, and activity data that records the students’ learning process andthe instructors’ instruction activities.
Most of the learning tools and systems usually capture all students’ fingertipactions (mouse and keyboard) in log files [34]. A typical log file usually takes theform of an ordered list of events occurring on the user interface of a software tool.It contains a record of the activity of one or more students, from the ratherrestrictive point of view of their fingertip actions. Intelligent tutoring systemscommonly also record their interactions in the form of log files. Log files are easyto record, flexible in the information they capture and useful in debugging. Nor-mally, Web server log files contain the access date and time, the IP address of therequest, the method of the request and the name of the file requested [35].However, log files generated by Moodle are a little different because they not onlycontain the access date and time and IP address, but also other more specificinformation such as the user name (full name of the student), action (module andspecific action performed by the user), and additional information about the action(see Fig. 2.1).
On the other hand, quizzes and test data are stored and organized in a matrix indifferent ways. An example is the score matrix that is a collection of student scoresfor a set of questions [36]. This is a data matrix of student ratings (see Table 2.4)in which the first column is the student’s name or ID (Identifier), and the first rowshows the testing items. For example, in Table 2.4, Rij represents the score ofitem-j rating received by the student-i, in which the value 1 represent a correctanswer, -0.5 if it is wrong, and 0 when not answered [37].
Table 2.4 Score matrix or data matrix of students’ rates
Student Item-1 Item-2 … Item-j … Item-n
Student-1 0 1 … 1 … -0.5Student-2 1 1 … 1 … 1… … … … … … …Student-i -0.5 0 … Rij … 0
Table 2.3 Examples of different data sources
Name Description
Log file Records all students-system interactionsQuiz/test Stores information about quiz/test usagePortfolio Contains information about the students
2 A Survey on Pre-Processing Educational Data 41

In our case, Moodle provides the score matrix when mark details are selected inthe quiz results panel. Moodle also shows the full names of the students, andinformation about when they started and when they completed the quiz, the totaltime taken, as well as the final grade obtained together with the score for eachquestion (score matrix). Quizzes can provide much more information, for example,the students’ knowledge state can be determined from test question responsesusing a q-matrix. A q-matrix is the one that shows relationships between a set ofobserved variables (e.g. questions), and latent variables (concepts) that relate theseobservations [38]. In the context of education, for a given q-matrix Q, the value ofQ (concept, question) represents the probability a student has of incorrectlyanswering the question due to the fact that he/she does not understand the conceptinvolved. Learning management systems also provide some statistical informationabout quizzes. For example, Moodle has statistical quiz reports which provide itemanalysis (see Fig. 2.5). This table presents processed quiz data in a way suitable foranalyzing and judging the performance of each question by way of assessment.
The statistical parameters used are calculated as explained by classical testtheory (Facility Index or % Correct, Standard Deviation, Discrimination Index,Discrimination Coefficient). The teacher can see the most difficult and easiestquestions for the students (% Correct Facility) as well as the most discriminatingones (Disc. Index and Disc. Coeff.). This information can also be downloaded intext-only or Excel formats in order to use a spreadsheet to chart and analyze it.
Another important educational data source is the portfolio. An e-portfolio canbe seen as a type of learning record that provides actual evidence of achievement.An e-portfolio is a complete profile of a student that includes raw logged data and/or filled (predefined) templates; like traditional portfolios, it can facilitate theanalysis of student learning behavior.
Fig. 2.5 Example of Moodle item analysis
42 C. Romero et al.

Portfolios can include all the records of students’ activities during the learningprocess, such as their interaction with others, notes, assignments, test papers, per-sonal work collections, their discussion content, online learning records and reports,etc. [39]. Learning portfolios can also include the students’ learning path (routesused by students throughout the courses), preferred learning styles (approaches orways of learning preferred by such groups as visual learners, auditory learners,kinesthetic learners, etc.), students’ learning time (time used by students in eachactivity and/or the full course), course grade and difficulty, etc. [40].
Finally, it is important to highlight that software agents have been used toautomatically capture students’ interaction data. Although in general there are nodifferences between using an agent-based architecture or another type of archi-tecture for logging, gathering and data analysis, agents can provide modularity,autonomy, persistence and social ability. A software agent or intelligent agent is acomplex software entity capable of acting with a certain degree of autonomy inorder to accomplish tasks on behalf of its user.
They have been used for extracting and evaluating log data from e-learningsoftware and organizing that data in intelligent ways [41] to capture ITS data basedon an agent communication standard [42], and for automatically recording usefulinformation and organizing it into its corresponding tables in the database [43].
2.4.2 Data Aggregation/Integration
The goal of data aggregation/integration is to group together all the data fromdifferent sources [44]. The data can come from various sources, and so can bestored in different formats [30]. After the previous step of gathering all therequired/desired data, the process of aggregation/integration can begin for com-bining data from multiple sources into a coherent recompilation, normally into adatabase. Aggregation and integration are different terms used to distinguishbetween the aggregations of the same type of data over multiple problems/sessions/students/classes/schools from the integration of different types of dataabout the same problem/session/student/class/school.
Educational systems normally provide several data sources that can be aggre-gated and/or integrated into one single database. Some of these data can beavailable for read in form of files, even when a certain part has to be transcribedmanually from paper documents, because not all the useful information has beenstored digitally [30]; this is the case of the attendance paper, in which all studentssign at in-person classes. For example, Web log information can be used inconjunction with data from surveys, usability studies and other sources [45]; logfiles can be mixed with other inputs, such as student demographics and perfor-mance data and survey results [46].
Online learning environments normally store all the students’ interactions notonly in log files but also directly in databases [46]. And if this is not the case,during the pre-processing process, data for each individual student (profiles, logs,
2 A Survey on Pre-Processing Educational Data 43
etc.) can be aggregated into a database [47, 48]. In a similar way, although ITSsuse log files, it has been found that storing logging tutorial interactions directlyinto a properly designed and indexed database instead of using log files eliminatesthe need to parse them [49]. So, relational databases are more powerful than usuallog text files and provide easier, more flexible and less bug-prone analyses [49].
In fact, most universities today have large and complex structure and activities(Multiversity) that are collected into one or several databases [50]. An example ofa relational database is the Moodle database, which stores all the Moodle courseinformation [11]. Moodle also provides different types of reports accessible fromthe Moodle interface. These reports are available to the course’s instructor/s as anoption in the Administration block and in some activities. All these reports canalso be saved into files with .TXT, .ODS or.XLS format. Excel Pivot Tables havebeen also proposed to conduct a flexible analytical processing of Moodle usagedata and gain valuable information [51]. A Pivot Table is a highly flexible con-tingency table that can be created from a large data set and offers the possibility tolook at one section at a time.
Data warehouses have also been proposed for data gathering and integration [13].A data warehouse schema can represent information about the structure and usage ofthe courses and can include several data sources, for example, the universityManagement Information System (MIS), Web server log files and LMS databases[52]. Data warehouses and data marts require concise, subject-oriented schemas thatfacilitate the analysis of data. For example, a star model (a modeling paradigm ofeducational data) of a data mart for a course of a LMS can contain a central accessfact table that contains keys for each of the other tables, such as a time-dimensiontable, a user-dimension table and a learning-resource dimension table [53].
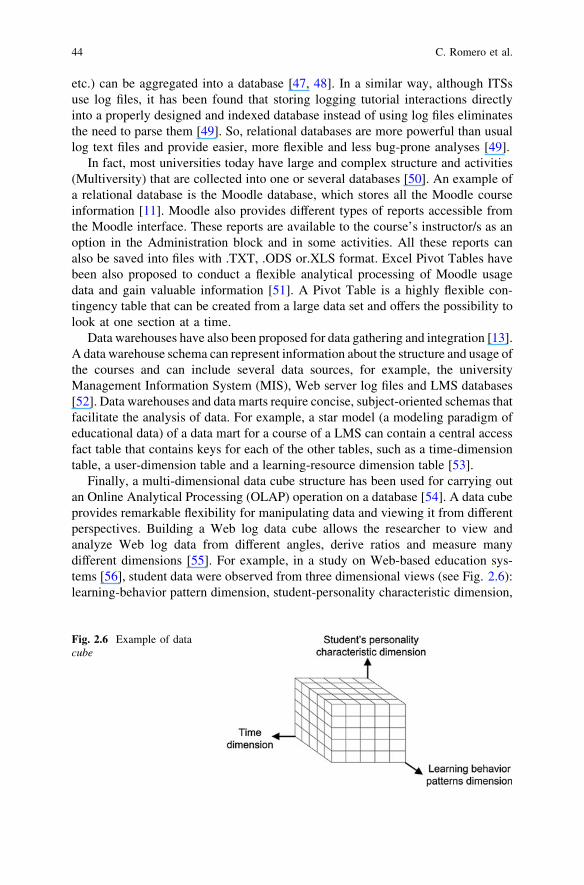
Finally, a multi-dimensional data cube structure has been used for carrying outan Online Analytical Processing (OLAP) operation on a database [54]. A data cubeprovides remarkable flexibility for manipulating data and viewing it from differentperspectives. Building a Web log data cube allows the researcher to view andanalyze Web log data from different angles, derive ratios and measure manydifferent dimensions [55]. For example, in a study on Web-based education sys-tems [56], student data were observed from three dimensional views (see Fig. 2.6):learning-behavior pattern dimension, student-personality characteristic dimension,
Fig. 2.6 Example of datacube
44 C. Romero et al.

and time dimension. Each dimension was related to the so-called dimension table.One dimension may also describe a different level, for example, a time dimensionmay describe a level from a year, quarter, month, date and so on [56]. So, OLAPprovides us with the possibility of analyzing different levels of aggregation, e.g.per day, per month, per duration of the course, or per student, per group, or thewhole population, etc.
2.4.3 Data Cleaning
The data cleaning task consists of detecting erroneous or irrelevant data anddiscarding it [2]. The most common type of inaccuracies, such as missing data,outliers and inconsistent data [57], are described below.
Missing data are a common issue in the application of data analysis methods. Instatistics, missing values occur when no value is stored for the variable in thecurrent observation [58].
Some possible solutions are to use a global constant to fill in the missing valueor to use a substitute value, like the attribute mean or the mode. For example,missing values have been replaced using linear interpolation of the previous andposterior 4 values for emotion detection in an educational scenario [59], or bydetermining what is the most probable value to fill in the missing value usingregression [60]? A different and simple approach is to codify missing/unspecifiedvalues by mapping incomplete values [9], using for example the labels ‘‘?’’(Missing) and ‘‘null’’ (unspecified).
In educational data, missing values usually appear when students have notcompleted or done all the activities in the course, or when we combine data fromdifferent sources and students have skipped some tasks [61]. For example, studentswho enroll in a course but do not actually participate, or those whose informationor data are incomplete (missing data) [62]. In some extreme cases, in order to cleandata and ensure their completeness, students who have all or almost all their valuesmissed can be removed from data. For example, in e-learning courses some usersonly enter to a specific course one time (by error or in order to see one specificresource or to do an activity) but later they never come back to the course [21]. Butnormally, in the case that students show some missing values, whenever possible,these specific students may be contacted and asked (by the instructor) to completethe course, so that their information can be used and/or evaluated. When this is notpossible, the missing information regarding students could be replaced by apredetermined value or label [9].
The elimination of noisy instances is one of the most difficult problems in datapre-processing. Frequently, there are samples in large data sets that do not complywith the general behavior of the data [63]. Such samples, which are significantlydifferent from or inconsistent with the remaining set of data, are called outliers.Outliers can be caused by measurement error or they may be the result of inherentdata variability, in which case the term ‘‘outlier’’ just refers to unlikely or
2 A Survey on Pre-Processing Educational Data 45

unexpected distribution, rather than outside a limit. For example, the value couldbe a typographical error, or it could be correct and represent real variability for thegiven attribute.
Many data mining algorithms try to minimize the influence of outliers in thefinal model, or eliminate them in the pre-processing phases. For example, in a1-dimensional value a simple way to keep outliers from distorting results is to usemedians instead of means [64]. This method has the added advantage of solvingthe prickly problem of distinguishing outliers from real values. It is also importantto highlight that although outliers normally can be due to noise, in educational datathey can be often true observations. For example, there are always exceptionalstudents, who succeed with little effort or fail against all expectations. However,making the distinction between the outliers that should be accepted and those thatshould be rejected is not always easy. This requires knowledge of the domain inwhich the data was collected and depends on the aims of the analysis [65]. In thiscase, a relatively simple technique that can help to detect outliers is by visualizingdata clusters, where values that fall outside the set of clusters may be consideredoutliers (see Fig. 2.7).
An example of data cleaning in a Web-based educational system [48] is todetect and eliminate both long periods of time between two actions carried out bythe same student (longer than 10 min) and incomplete data (incompletely visitedchapters, and unfinished tests and activities). Another similar example [61] showsthat very high values were often recorded for attribute time because the studenthad left the computer without first exiting the exercise, concept or section. In orderto address this problem, any times that exceeded a maximum established value(between 20 and 30 min is a common criterion) are considered noisy data, and thismaximum value is assigned to any apparently erroneous data. A different approachis to use association rule mining for filtering data that match a predefined type ofrule [66]. In this case, if results have the rule containing the conclusion NO, which
Fig. 2.7 Plot of three dataclusters and some outliers
46 C. Romero et al.

indicates that students are not interested in the course, then the courses with thelowest students count are removed, as well as those students having the lowestcourse count.
Finally, inconsistent data appear when a data set or group of data is dramati-cally different from a similar data set (conflicting data set) for no apparent reason.In fact, some incorrect data may also result from inconsistencies in naming theconventions or data codes in use, or inconsistent formats for input fields, such as adate. For example, duplicate tuples can require data cleaning, e.g. Age = ‘‘42’’and Birthday = ‘‘03/07/1997’’, shows discrepancy between duplicate records oroxymoron (self-contradiction).
2.4.4 User and Session Identification
One of the key issues in the pre-processing phase is to identify users. This stepdistinguishes the users as individuals, and as a result, different users are identified.This can generally be done in various ways, like through the use of IP addresses,cookies, and/or direct authentication (login/password).
Identifying users based on Web log files is not a straightforward problem, andso various methods have been developed [67]. On the other hand, user sessionsalso have to be identified. A session is a semi-permanent interactive informationinterchange between two or more communicating devices, for example, a loginsession is the period of activity between a user logging in and logging out.
Although user and session identification is not specific to education, it isespecially relevant due to the longitudinal nature of student usage data. However,computer-based educational systems provide user authentication (identification bylogin and password). These logs include entries that identify the students/userswho have logged on, thus identifying sessions a priori since users may also have tolog out [68].
So it is not necessary to do the typical user identification task to identifysessions from logs, and session determination ceases to be a problem. In fact, allrecords can be sorted in an ascending order with the user ID as the primary key,and the event time as a secondary key [69]. After this sorting step, it is easy toidentify user sessions by grouping contiguous records from one login record to thenext one. Specifically, browsing records picked out between two successive loginrecords are grouped into a browsing session, and an upper limit of the time intervalbetween two successive clicks has to be set (from 15 to 45 min) in order to breakthe sequence of one student’s click stream into sessions [35]. This value may resultin increasing or decreasing the total number of identified sessions.
However, to our knowledge, there is no research on the relation betweentimeout of user session and its impact on quality of discovered knowledge [70]. Itis also important to construct not only learning sessions but also learning episodesfrom logs [71] and tasks and activities [72]. A learning episode is a high levelmodel of the student’s learning task with information about the system situation at
2 A Survey on Pre-Processing Educational Data 47
the beginning of the episode, the actions performed by the student, and the systemsituation at the end of the episode. A task is defined as a sequence of user inter-actions within one resource that ranging from passive reproductions of paper-based documents to sophisticated interactive resources [72]. An activity is definedas an interaction within the site and categorized to indicate whether the activityinvolved browsing or reading, or more interactive use.
Another noteworthy aspect to consider is that accessing to some informationabout users/students can be restricted due to privacy issues and special measuresand permission may be required. It is also necessary to preserve student dataanonymity/privacy but enabling that different pieces of information are linked tothe same person without explicitly identifying but making sure that users can bede-coupled from their sessions if local, state or federal laws require it. Petersen[73] points to the importance of the de-identification of data before the data ismade available for institutional use, including the option to retain unique identi-fiers for individuals in the data set, without identifying the actual identity of theindividuals. A common solution for it consists in using a number randomly orincrementally generated, like a user ID or other kind of personal information, suchas e-mail or an identification card instead of using someone’s real name (seeid_student attribute in Fig. 2.10). But, a better mechanism for assigning unique,disassociated IDs (from a specific name), may be required in some systems.
A different approach to protecting student identity consists in not revealing anyprivate information in reports, tables, figures, etc. For example, notice that in somefigures shown in this chapter (see Figs. 2.1 and 2.9), student names were blurred toprotect their identity. Finally, whereas educational institutions have always hadrequirements to protect student and teacher privacy, new amendments to theexisting regulations increase access to data for research and evaluation (includingsharing across levels, such as from high school to college) while maintainingstudent privacy and parents’ rights [74].
2.4.5 Attribute/Variable Selection
Feature selection and extraction chooses a subset of relevant attributes from all theavailable attributes [75]. This is also known as variable selection, feature reduc-tion, attribute selection or variable subset selection. Choosing the right variables isone of the main tasks before applying data mining techniques [76], because thevariables can be correlated or redundant. Consequently, the data must be pre-processed to select an appropriate subset of attributes and ignore irrelevant andredundant ones. An attribute may be redundant if it can be derived from anotherattribute or set of attributes. There may be redundancy, where certain features arecorrelated so that it is not necessary to include all of them in modeling; andinterdependence, where two (or more) features together convey important infor-mation that is obscure if either of them is included on its own [77].
48 C. Romero et al.

Attribute selection is very important in education because there could be a largenumber of attributes for learning schemes to handle in many practical situations[78] and this number of attributes can result in reducing the accuracy of a learningmodel due to overfitting problems. One solution to this issue is to select only themost important attributes/variables. For example, a ranking of several featureselection algorithms has been used for identifying which features or attributes havethe greatest effect for predicting school failure [79]. A decision tree technique hasbeen also used to choose the right variables (relevance analysis or feature selec-tion) in educational data [76]. This method is used to obtain the most consistentvariables by presenting them at various tree levels. Another solution is not to useirrelevant data that do not really provide any useful information to solve theproblem. Some examples of well-known attributes that can be irrelevant are userpassword, student’s e-mail, student’s phone number, student’s address, student’spicture, etc.
Learning management systems, such as Moodle, store a huge amount of attri-butes/variables about courses, students and activities. So it is really relevant toselect only a representative group of attributes in order to reduce the dimension-ality of data. There are some proposals of indexes and metrics [80] in order toproperly facilitate the evaluation of the course usage. However, even when thereare many of these metrics in Web usage analysis for e-commerce, it is not the samesituation in the case of e-learning. Then, these selected attributes can be stored alltogether in a new table comprising all the relevant information related to thestudents enrolled in the course [21].
For example, in the problem/case of predicting what it is the students’ finalperformance in a course, starting from the usage information with Moodle, there isa lot of variables about the interaction between the students and Moodle system.Thus, it is necessary to select only the most related attributes with the studentperformance. Table 2.5 shows a list of the selected features/attributes for eachstudent in a Moodle course, i.e. the fields of each summary record.
Table 2.5 Example of list of attributes selected per student in Moodle courses
Name Description
id_student Identification number of the studentid_course Identification number of the coursenum_sessions Number of sessionsnum_assigment Number of assignments donenum_quiz Number of quizzes takena_scr_quiz Average score on quizzesnum_posts Number of messages sent to the forumnum_read Number of messages read on the forumt_time Total time used on Moodlet_assignment Total time used on assignmentst_quiz Total time used on quizzest_forum Total time used on forumf_scr_course Final score of the student obtained in the course
2 A Survey on Pre-Processing Educational Data 49

Finally, notice that some student-related variables or attributes might introducea great degree of variance and this instability could represent a non-trait measure(i.e. a non- specific trait that a student has), denoting that this variable does not andshould not describe the student [81]; for example, the consistency of students’behavior regarding the pace (also referred as speed or rate) of their actions (i.e. thenumber of logged actions divided by the session length in minutes) along thesessions of an online course. Nevertheless, some other variables (e.g. sessionlength, response time, intensity of activity, preferred tasks) might have a greatvariance when they are repeatedly measured for the same student: this instabilitymay also represent a non-trait measure.
2.4.6 Data Filtering
Data filtering selects a subset of representative data in order to convert large datasets into manageable (smaller) data sets [2]. Data filtering allows the huge amountof information available to be reduced. Data sets for analysis may contain hun-dreds of attributes, many of which may be irrelevant to the mining task orredundant. Some of the most common types of filtering techniques for educationaldata are the selection of data subsets relevant to the expected purpose, and theselection of the most convenient grain size to the research at hand.
Educational systems provide a huge quantity of information about all the eventsand activities performed by the students enrolled in courses. However, theinstructor or educational research can be only interested on a certain subset ofevents, students or courses depending on the specific problem or task to be solved.For this reason filtering can be used to select only a specific subset of desired data[82]. These data can be filtered by defining the conditions of one or more attributesand removing the instances that violate them [83]. For example, Moodle allows logfiles to be filtered by course, participant, day, and activity.
A novel data preparation approach uses activity theory, which considers threelevels of human activity, has been also used to pre-process data in order to getmore interesting results to study what happens in a collaborative learning platform[10]. They propose to map the original data to a higher level, analysis-orientedrepresentation by using activity theory.
A specific characteristic of data collection from the educational system is thatthere are different levels of granularity such as: keystroke level, answer level,session level, student level, classroom level, and school level [84]. Therefore, it isnecessary to choose an appropriate level of granularity in order to only identify thevariables that can be recorded at that specific level of granularity [83]. Loggingdata with multiple grain size facilitates viewing and analyzing data at differentlevels of detail [16]. Figure 2.8 shows various levels of granularity and amounts ofdata related to each level. It can be observed that a higher grain is related to asmaller amount of data and, on the other hand, a lower grain is related to a largeramount of data.
50 C. Romero et al.

The level at which events are logged constrains their analysis. For example,logging a mouse click by its x and y coordinates may help to analyze the student’smotor skills. In contrast, logging the menu item selected may allow a student’sreply to a multiple choice question to be scored. So, the level of granularity affectsanalysis, that is, the granularity of data should fit its intended analysis because theresulting temporary table would only contain attributes and transactions fromstudents with respect to the level selected [61].
Sometimes, the raw learning logs collected by computer systems may beexcessively detailed. To analyze these logs at the behavioral unit or grain sizerequired by the educational research, we need to reformat the raw learning logs bysystematically aggregating them and pass from low level events to high levellearning actions [85]. Thus, it is necessary to define different abstractions of the logfile data, such as:
• Event. It is a single action or interaction recorded on the log file.• Session. It is a sequence of interactions of a user from a login to the last
interaction.• Task. A sequence of interactions of a user within one resource.• Activity. A series of one or more interactions to achieve a particular outcome.
Moodle also provides several levels of data granularity. For example, as pre-viously described, Moodle log reports provide fine grain information about allstudents’ actions (see Fig. 2.1). In this case, there can be hundreds of instances orrecords or rows in the log file belonging to each student. However, Moodle alsoprovides coarse grain information about students, for example by grades. Moodlegrades show the grades of quizzes and other activities that students have done. Inthis case, there is only one instance or row for each student with columns for eachactivity. For example, Fig. 2.92 shows the grades of a course that has two quizzes(Examen Practicas IA and Ejemplo de Cuestionario) and two assignments(Entrega de Relacción de Ejercicios de Hechos and de Ejercicios de Reglas)evaluated using a scale from 0 to 10. The instructor can download the entire gradebook as an .ODS, .XLS or .TXT file.
Fig. 2.8 Different levels ofgranularity and theirrelationship to the amount ofdata
2 The student column covers the identification of subjects.
2 A Survey on Pre-Processing Educational Data 51

2.4.7 Data Transformation
Data transformation derives in new attributes from already available attributes [2].Data transformation can facilitate a better interpretation of information. Someexamples of transformation such as normalization, discretization, derivation, andformat conversion, are described next.
Normalization is a data transformation technique where the attribute values arescaled within a specified range, usually from -1.0 to 1.0, or between 0.0 and 1.0.Within one feature there is often a great difference between maximum and min-imum values, e.g. 0.01 and 1,000. Hence, normalization can be performed to scalethe value magnitudes to low values. In this way, normalization may improve theaccuracy and efficiency of the mining algorithms involving distance measurements[2].
Normalization also helps to prevent attributes with initially large ranges fromoutweighing attributes with initially smaller ranges. For example, one of the mostimportant steps in data pre-processing for clustering is to standardize or normalizedata in order to avoid obtaining clusters that are dominated by attributes with thelargest amounts of variation [86].
There are many other methods for data normalization. However, in education,the most commonly used method is the Min–max normalization, which performs alinear transformation of the original data [87]. Suppose that minA and maxA are theminimum and maximum values of an attribute A, respectively. Then, the Min–max
Fig. 2.9 Example of Moodle grades
52 C. Romero et al.

normalization maps a value, v, of A to v’ in the range (new minA, new maxA) usingthe Eq. (2.1):
v0 ¼ v�minA
maxA�minAðnew max
A�new min
AÞ þ new min
Að2:1Þ
Discretization divides the numerical data into categorical classes that are moreuser-friendly than precise magnitudes and ranges. It reduces the number of pos-sible values of the continuous feature and it provides a much more comprehensibleview of the data. Generally, discretization smooths out the effect of noise andenables simpler models, which are less prone to overfitting. It can be included as areduction method that uses some data mining algorithms that do not work wellwith continuous attributes. For example, association rule mining algorithms usu-ally work only with categorical data. A special type of discretization is thetransformation of ordinal to binary representation, that is, from numbers denoting aposition in a sequence to 0 or 1 value. This type of codification is used for examplein frequent pattern mining research. Some discretization methods [2] are thefollowing:
• Equal-width binning divides the range of possible values into N sub-ranges ofthe same size in which (2.2) For example, if our values are all between 0 and100, 5 bins could be created as follows: [0–20], [20–40], [40–60], [60–80] and[80–100].
bin width ¼ ðmaxvalue�minvalueÞ=N ð2:2Þ
• Equal-frequency or equal-height binning divides the range of possible valuesinto N bins, each of which holding the same number of instances.
• For example, there are the following 10 values: 5, 7, 12, 35, 65, 82, 84, 88, 90and 95. Now, in order to create 5 bins, the range of values would be divided upso that each bin holds 2 values in the following way: [5, 7], [12, 35], [65, 82],[84, 88] and [90, 95].
• Manual discretization lets the user directly specify the cut-off points. A typicaleducational example of a manual discretization method is normally done withmarks/scores. For example, if a range of values between 0.0 and 10.0 is applied,they could be transformed into the next four intervals and labels [21]:
mark =
FAIL : if value is \ 5PASS : if value is � 5 and \ 7GOOD : if value is � 7 and \ 9EXCELLENT : if value is � 9
8>><
>>:
ð2:3Þ
Another example is the grade point average (normally a value between 0.0 and4.0), which can also be translated into a letter grade, e.g. A, B+, B, C+ and C [88].A different approach is to use fuzzy intervals, in which fuzzy sets for grading are
2 A Survey on Pre-Processing Educational Data 53

used instead of crisp intervals [89]. Finally, the most extreme but simplest dis-cretization case is when attributes are binarized (0 or 1). Here, even if someinformation is lost, the resulting model can produce, for example, a more accurateclassification [90].
Another technique of data transformation is the derivation, which enables tocreate new attributes starting from the previous ones. So, new attributes can beoffshoots of other current attributes in a specific attribute derivation. In manycases, a new attribute needs to be derived from one (or more) of the attributes in adata set. The new attribute may result from a mathematical transformation ofanother attribute [83], such as the time difference attribute that could be convertedto minutes instead of seconds. The most commonly used type of derivation per-forms some kinds of aggregation on another attribute. For example, when theconstraints related to each attempt are grouped into an attribute of the attempt dataset, then a ‘‘violated count’’ attribute is included as an attribute of the analysis dataset. This attribute identifies the total number of violated constraints in each attempt[83].
A hash code has been also used as the encoding scheme for combining studentinformation into a single hash number [9]. This hash number was simply createdby multiplying each field with a distinct power of ten, in descendant order. Someother examples of attributes [91] derived from the information provided by an e-learning system is shown in Table 2.6.
A different approach is to enrich data (normally log files) by using expressions,annotations, labels, text replays, etc. However, it is important to note that dataannotations and labeling are very labor-intensive tasks. Some other authors [92]propose making log files more expressive by overcoming a historical tendency tomake log files cryptic in order to save file space. This change involves altering therepresentation of events in the log file and enriching the logged expressions so thatmore inferences can be drawn more easily. Other approach is to completely rep-resent each event using English words, using English grammar and using standardlog file forms [92].
Other authors [84] have also proposed using text replays as a method forgenerating labels or tags. Text replays produce data that can be more easily usedby data mining algorithms. It is an example of distillation for human judgment that
Table 2.6 Example of derived attributes
Attribute Description
UserId A unique identifier per userPerformance Percentage of correctly answered tests calculated as the number of correct tests
divided by the total number of tests performed)TimeReading Time spent on pages (calculated as the total time spent on each page accessed) in
a sessionNoPages The number of accessed pagesTimeTests The time spent performing tests (calculated as the total time spent on each test)Motivation Engaged/disengaged
54 C. Romero et al.

tries to make complex data understandable by humans to leverage their judgment.Text replays represent a segment of the student’s behavior from the log files in atextual ‘‘prettily-printed’’ form. For example, the coder can see the time when eachaction has taken place, as well as the problem context, the input entered, therelevant skill and how the system assessed the action. Then the coder can chooseone among a set of behavior categories and tags or can indicate that something hasgone wrong. Other authors propose the use of hand-labeled data and the mappingof events to variables through intelligent tutors’ data [16]. In this case, annotationsabout the level of students’ engagement were made by an expert with tutoringexperience to annotate sequences of students’ actions with the label engaged ordisengaged. A current approach proposes to create a grammar (i.e., a set of rules)to unambiguously combine some low-level entries into high level actions thatcorrespond to functions provided at the user interface level of the Alice pro-gramming environment [93].
Finally, pre-processed data have to be transformed into the format required bythe data mining algorithm or framework that will be used later. Therefore, datahave to be exported to a specific format, such as the Weka’s ARFF format(Attribute-Relation File Format) [32], Keel DAT format [94], Comma-separatedvalues (CSV), XML, etc. Fig. 2.10 shows an example of a summary file in theARFF format. Either the WekaTransform tool (http://sourceforge.net/projects/wekatransform/) or the Open DB Preprocess task in Weka Explorer (http://www.cs.waikato.ac.nz/ml/weka/) can be used in order to transform data directlyfrom a database into ARFF format. Datapro4j (http://www.uco.es/grupos/kdis/datapro4j) can also be used to programmatically transform multiple data formats
Fig. 2.10 Example of Moodle summary ARFF file
2 A Survey on Pre-Processing Educational Data 55
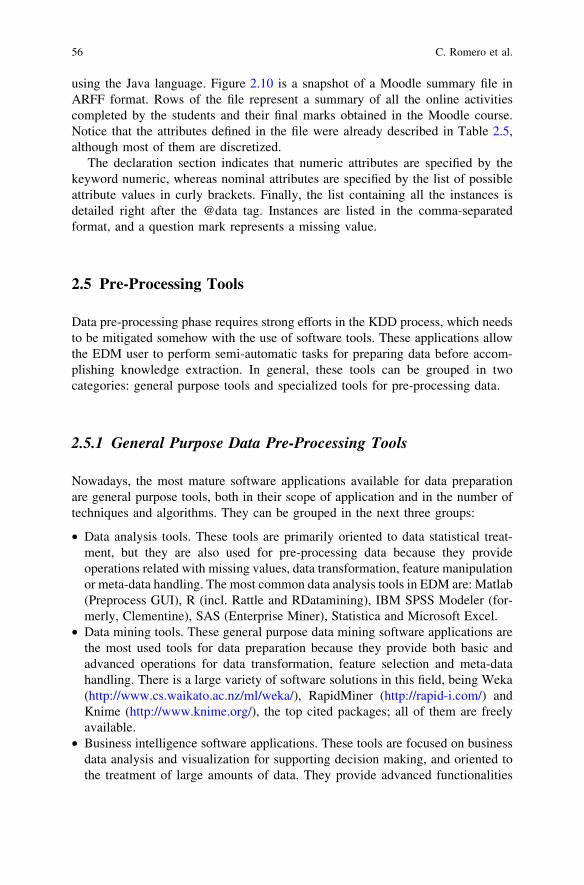
using the Java language. Figure 2.10 is a snapshot of a Moodle summary file inARFF format. Rows of the file represent a summary of all the online activitiescompleted by the students and their final marks obtained in the Moodle course.Notice that the attributes defined in the file were already described in Table 2.5,although most of them are discretized.
The declaration section indicates that numeric attributes are specified by thekeyword numeric, whereas nominal attributes are specified by the list of possibleattribute values in curly brackets. Finally, the list containing all the instances isdetailed right after the @data tag. Instances are listed in the comma-separatedformat, and a question mark represents a missing value.
2.5 Pre-Processing Tools
Data pre-processing phase requires strong efforts in the KDD process, which needsto be mitigated somehow with the use of software tools. These applications allowthe EDM user to perform semi-automatic tasks for preparing data before accom-plishing knowledge extraction. In general, these tools can be grouped in twocategories: general purpose tools and specialized tools for pre-processing data.
2.5.1 General Purpose Data Pre-Processing Tools
Nowadays, the most mature software applications available for data preparationare general purpose tools, both in their scope of application and in the number oftechniques and algorithms. They can be grouped in the next three groups:
• Data analysis tools. These tools are primarily oriented to data statistical treat-ment, but they are also used for pre-processing data because they provideoperations related with missing values, data transformation, feature manipulationor meta-data handling. The most common data analysis tools in EDM are: Matlab(Preprocess GUI), R (incl. Rattle and RDatamining), IBM SPSS Modeler (for-merly, Clementine), SAS (Enterprise Miner), Statistica and Microsoft Excel.
• Data mining tools. These general purpose data mining software applications arethe most used tools for data preparation because they provide both basic andadvanced operations for data transformation, feature selection and meta-datahandling. There is a large variety of software solutions in this field, being Weka(http://www.cs.waikato.ac.nz/ml/weka/), RapidMiner (http://rapid-i.com/) andKnime (http://www.knime.org/), the top cited packages; all of them are freelyavailable.
• Business intelligence software applications. These tools are focused on businessdata analysis and visualization for supporting decision making, and oriented tothe treatment of large amounts of data. They provide advanced functionalities
56 C. Romero et al.
for data exploration and transformation. Some examples are: Orange (http://orange.biolab.si), Angoss (http://www.angoss.com) and Amadea (http://alice-soft.com/html/prod_amadea_en.htm).
2.5.2 Specific Purpose Data Pre-Processing Tools
The number of tools exclusively devoted to data pre-processing is marginal.Although some specific tools have been developed for preparing data in anydomain, as well as others especially well-suited for educational data, most of thecurrently existing tools are just prototypes providing restricted features or they areoriented to work only with a very specific type of data.
A sample of specific tool for data pre-processing is DataPreparator (http://www.datapreparator.com), a freely available proprietary and multi-platform soft-ware tool, that provides functionalities for data load (text files, relational dat-abases, excel), data reduction (including attribute selection), data transformation(discretization, missing values, scaling, sorting) and outlier handling. In contrast toprior approaches, DMPML-TS [95] is a visual tool founded on the use of DataMining Preparation Markup Language (DMPML), an XML notation designed torepresent the data preparation phase of the KDD process in general domains. Itsauthors stand for the use of this type of representation, and claim that it facilitatesdata codification, cleaning and data transformation using XSLT transformations.
As for data pre-processing solutions in the field of EDM, we can also find someprototypical proposals in the literature. These tools are mainly oriented to thepreparation of data extracted from log files in Web learning environments. A firstproposal in the field of WUM was presented by Zaïne and Luo [96]. They high-lighted the variety of Web log analysis tools available but specially tailored for e-business and, consequently, difficult to use by educators. Therefore, they proposed anovel tool based on a three-tier architecture for data gathering and pre-processing.
Its constraint-based approach allowed the educators to express restrictions andfilters during the preparation phase, the patterns discovery phase, or the patternsevaluation phase. Having domain-specific filters during the first stages consider-ably reduces the search space and controls the performance and accuracy of thepattern extraction.
Similarly, Marquardt et al. [8] proposed an early tool prototype for the auto-mation of the most typical tasks performed by the instructor in the pre-processingphase for the mining of data extracted from Web courses. Their tool, called WUMPrep, offered a set of scripts implementing classical WUM pre-processingtechniques, i.e. data cleaning and filtering, user and session identification, pathcompletion, data enrichment, and transaction identification.
Ceddia et al. [97] proposed Web Analysis Tool (WAT) to allow the educator todescribe activities from sequences of Web site interactions that could be meaningfulin the course context. The aim of this approach is to provide the teacher with anindication of how successful the educational Web course has been in assisting thestudents meet their objectives, based on the navigation path recorded. Even when it is
2 A Survey on Pre-Processing Educational Data 57
also a prototype application, WAT provides a usable GUI and defines a process intwo phases: activity definition, where the log files are preprocessed extracting thosefields that are valuable for the activity and imposing some meaning to the selectedinteraction attributes; and activity extraction, where the file is processed according tothe previous configuration, and the information about activities is extracted andshown to the educator.
More recently, Sael et al. [7] have proposed a specific pre-processing tool fore-learning platform using Moodle logs. It uses not only access log information butalso SCORM activities in order to identify different levels of access to a courseand thus to define episodes according to these levels.
Finally, EDM Workbench [98] is a specific tool that helps educationalresearchers with processing data from various sources (PLC shop, SQL tutor,Collaborative Learning System Database and Streamed Log Files). Though still inbeta version, this application provides a GUI with some basic operations andalgorithms specialized for EDM. It provides operations for collaborative labelingof log files, extraction of information for its subsequent use in machine learningand data transformation (e.g. random sampling, clipping, and a few others).
2.6 Conclusions
Nowadays, there are very few specific data pre-processing tools and so, EDM usersnormally use general software and DM tools for pre-processing. For example,database GUI administrator tools are used to data aggregation/integration, texteditors or spreadsheets are used to manually eliminate some incomplete students’data, and DM tool are used for automatic attribute selection and filtering. How-ever, most of the current data mining tools and general pre-processing tools arenormally designed more for power and flexibility than for simplicity and thus, theydo not suitably support pre-processing activities in the educational domain.
Most of the currently existing tools can be too complex for educators, EDMresearchers and users who are not expert in data mining, since their features gowell beyond the scope of what an educator may want to do. So, a very importantfuture development will be the appearance of free EDM pre-processing tools andwizards in order to automate and facilitate all the pre-processing functions in aneasy-to-use framework. In this way, the typical workload of the pre-processingphase could be significantly reduced by the automation of the most usual tasks.
On the other hand, there is currently only one public educational data reposi-tory, the PSLC DataShop [99] that provides a great number of educational datasets about ongoing courses. However, all this log data comes from ITSs, so it willbe also useful to have in the future more public data sets available from otherdifferent types of educational environments such as AIHS, LMSs, MOOCs, etc. Inthis way, a wide range of educational benchmark data sets could be used directlywithout need to be pre-processed. Finally, the following main lessons have beenlearned with respect to the pre-processing of educational data:
58 C. Romero et al.

• Pre-processing is always the necessary first step in any data mining process/application. This task is very important because the interestingness, usefulnessand applicability of the obtained DM models highly depend on the quality of theused data.
• There are different types of educational environments that provide different typeof data, and several pre-processing tasks can be applied. Although, this paperrecommends the use of a specific flow or sequence in applying differentpre-processing tasks/steps, some variations in the order of some tasks can alsobe possible. For example, data cleaning can be done later; attribute selection,data filtering and data transformation can be mixed or put in different order.
• Not all these pre-processing tasks/steps have to be applied in all the cases. Thatis, depending on the data and the specific issue to address, it might or might notbe necessary to apply some of them. Examples are aggregation/integration (onlyif there are multiple sources), cleaning (only if there are erroneous, missing orincomplete data), user identification (only if the educational system does notprovide user identification), data filtration and attribute selection (only if there isa huge amount of data and/or attributes respectively).
• Different types of techniques have also been used in each task/step, althoughthere is no recipe or rule about which specific technique should be used in eachpre-processing task. Therefore, the user will be the one in charge of selectingwhich one to apply each time depending on several issues, such as the specificcharacteristics of the data, the tools and algorithms available, and the finalobjective or data mining problem to be solved.
Acknowledgments This research is supported by projects of the Regional Government ofAndalucía and the Ministry of Science and Technology, P08-TIC-3720 and TIN-2011-22408,respectively, and FEDER funds.
References
1. Romero, C., Ventura, S.: Data mining in education. WIREs Data Min. Knowl. Disc. 1(3),12–27 (2013)
2. Han, J., Kamber, M.: Data Mining: Concepts and Techniques. Morgan Kaufmann Publishers,San Francisco (2006)
3. Miksovsky, P., Matousek, K., Kouba, Z.: Data Pre-processing support for data mining. In:IEEE International Conference on Systems, Man and Cybernetics, pp. 208–212, Hammamet,Tunisia (2002)
4. Pyle, D.: Data Preparation for Data Mining. Morgan Kaufmann, San Francisco (1999)5. Gonçalves, P.M., Barros, R.S.M., Vieria, D.C.L: On the use of data mining tools for data
preparation in classification problems. In: 11th International Conference on Computer andInformation Science, pp. 173–178, IEEE, Washington (2012)
6. Bohanec, M., Moyle, S., Wettschereck, D., Miksovsk, P.: A software architecture for datapre-processing using data mining and decision support models. In: ECML/PKDD’01Workshop on Integrating Aspects of Data Mining, Decision Support and Meta-Learning,pp. 13–24 (2001)
2 A Survey on Pre-Processing Educational Data 59
7. Sael, N., Abdelaziz, A., Behja, H.: Investigating and advanced approach to data pre-processing in Moodle platform. Int. Rev. Comput. Softw. 7(3), 977–982 (2012)
8. Marquardt, C.G., Becker, K., Ruiz, D.D.: A Pre-processing tool for web usage mining in thedistance education Domain. In: International Database Engineering and ApplicationsSymposium, pp. 78–87. IEEE Computer Society, Washington (2004)
9. Wettschereck, D.: Educational data pre-processing. In: ECML’02 Discovery ChallengeWorkshop, pp. 1–6. University of Helsinki, Helsinki (2002)
10. Simon, J.: Data preprocessing using a priori knowledge. In: D’Mello, S.K., Calvo, R.A.,Olney, A. (eds.) 6th International Conference on Educational Data Mining, pp. 352–353.International Educational Data Mining Society, Memphis (2013)
11. Rice, W.H.: Moodle E-learning Course Development. A Complete Guide to SuccessfulLearning Using Moodle. Packt publishing, Birmingham (2006)
12. Ma, Y., Liu, B., Wong, C., Yu, P., Lee, S.: Targeting the right students using data mining. In:Sixth ACM SIGKDD International Conference on Knowledge Discovery and Data mining,pp. 457–464. ACM, New York (2000)
13. Silva, D., Vieira, M.: Using data warehouse and data mining resources for ongoingassessment in distance learning. In: IEEE International Conference on Advanced LearningTechnologies, pp. 40–45. IEEE Computer Society, Kazan (2002)
14. Clow, D.: MOOCs and the funnel of participation. In: Suthers, D., Verbert, K., Duval, E.,Ochoa, X. (eds.) International Conference on Learning Analytics and Knowledge,pp. 185–189. ACM New York, NY (2013)
15. Anderson, J., Corbett, A., Koedinger, K.: Cognitive tutors. J. Learn. Sci. 4(2), 67–207 (1995)16. Mostow, J., Beck, J.: Some useful tactics to modify, map and mine data from intelligent
tutors. J. Nat. Lang. Eng. 12(2), 95–208 (2006)17. Brusilovsky, P., Peylo, C.: Adaptive and intelligent web-based educational systems. Int.
J. Artif. Intell. Educ. 13(2–4), 159–172 (2003)18. Merceron, A., Yacef, K.: Mining student data captured from a web-based tutoring tool: initial
exploration and results. J. Interact. Learn. Res. 15(4), 319–346 (2004)19. Brusilovsky, P., Miller, P.: Web-based testing for distance education. In: De Bra, P., Leggett,
J. (eds.) WebNet’99, World Conference of the WWW and Internet, pp. 149–154. AACE,Honolulu (1999)
20. Hanna, M.: Data mining in the e-learning domain. Campus-Wide Inf. Syst. 21(1), 29–34(2004)
21. Romero, C., Ventura, S., Salcines, E.: Data mining in course management systems: moodlecase study and tutorial. Comput. Educ. 51(1), 368–384 (2008)
22. Agrawal, R., Srikant, R.: Mining sequential patterns. In: Eleventh International Conferenceon Data Engineering, pp. 3–4. IEEE, Washington (1995)
23. Romero, C., Ventura, S., Zafra, A., De Bra, P.: Applying web usage mining for personalizinghyperlinks in web-based adaptive educational systems. Comput. Educ. 53(3), 828–840 (2009)
24. Feldman, R., Sanger, J.: The Text Mining Handbook: Advanced Approaches in AnalyzingUnstructured Data. Cambridge University Press, Cambridge (2006)
25. Dringus, L.P., Ellis, T.: Using data mining as a strategy for assessing asynchronousdiscussion forums. Comput. Educ. J. 45(1), 141–160 (2005)
26. Petrushin, V., Khan, L. (eds.): Multimedia Data Mining and Knowledge Discovery. Springer,London (2007)
27. Bari, M., Lavoie, B.: Predicting interactive properties by mining educational multimediapresentations. In: International Conference on Information and Communications Technology,pp. 231–234. Bangladesh University of Engineering and Technology, Dhaka (2007)
28. Srivastava, J., Cooley, R., Deshpande, M., Tan, P.: Web usage mining: discovery andapplications of usage patterns from web data. SIGKDD Explor. 1(2), 12–23 (2000)
29. Romero, C., Ventura, S.: Educational data mining: a survey from 1995 to 2005. Expert Syst.Appl. 33(1), 135–146 (2007)
30. Vranic, M., Pintar, D., Skocir, Z.: The use of data mining in education environment. In: 9thInternational Conference on Telecommunications, pp. 243–250. IEEE, Zagreb (2007)
60 C. Romero et al.

31. Gibert, K., Izquierdo, J., Holmes, G., Athanasiadis, I., Comas, J., Sanchez, M.: On the role ofpre and post processing in environmental data mining. In: Sánchez-Marré, M., Béjar, J.,Comas, J., Rizzoli, A. E., Guariso, G. (eds.) iEMSs Fourth Biennial Meeting: InternationalCongress on Environmental Modelling and Software (iEMSs 2008), pp. 1937–1958.International Environmental Modelling and Software Society, Barcelona (2008)
32. Witten, I.H., Frank, E.: Data Mining: Practical Machine Learning Tools and Techniques.Morgan Kaufmann, San Francisco (2005)
33. Zhu, F., Ip, H., Fok, A., Cao, J.: PeRES: A Personalized Recommendation Education SystemBased on Multi-Agents & SCORM. In: Leung, H., Li, F., Lau, R., Li, Q. (eds.) Advances inWeb Based Learning—ICWL 2007. LNCS, vol. 4823, pp. 31–42. Springer, Heidelberg(2007)
34. Avouris, N., Komis, V., Fiotakis, G., Margaritis, M., Voyiatzaki, E.: Why logging of fingertipactions is not enough for analysis of learning activities. In: Workshop on Usage Analysis inLearning Systems, pp. 1–8. AIED Conference, Amsterdam (2005)
35. Chanchary, F.H., Haque, I., Khalid, M.S.: Web usage mining to evaluate the transfer oflearning in a web-based learning environment. In: International Workshop on KnowledgeDiscovery and Data Mining, pp. 249–253. IEEE, Washington (2008)
36. Spacco, J., Winters, T., Payne, T.: Inferring use cases from unit testing. In: AAAI Workshopon Educational Data Mining, pp. 1–7, AAAI Press, New York (2006)
37. Zhang, L, Liu, X., Liu, X.: Personalized instructing recommendation system based on webmining. In: International Conference for Young Computer Scientists, pp. 2517–2521. IEEEComputer Society Washington (2008)
38. Barnes, T.: The Q-matrix method: mining student response data for knowledge. In: AAAI-2005 Workshop on Educational Data Mining, pp. 1–8, AAAI Press, Pittsburgh (2005)
39. Chen, C., Chen, M., Li, Y.: Mining key formative assessment rules based on learner profilesfor web-based learning systems. In: Spector, J.M., Sampson D.G., Okamoto, T., Kinshuk,Cerri, S.A., Ueno, M., Kashihara, A. (eds.) IEEE International Conference on AdvancedLearning Technologies, pp. 1–5. IEEE Computer Society, Los Alamitos (2007)
40. Wang, F.H.: A fuzzy neural network for item sequencing in personalized cognitivescaffolding with adaptive formative assessment. Expert Syst. Appl. J. 27(1), 11–25 (2004)
41. Markham, S., Ceddia, J., Sheard, J., Burvill, C., Weir, J., Field, B.: Applying agenttechnology to evaluation tasks in e-learning environments. In: International Conference of theExploring Educational Technologies, pp. 1–7. Monash University, Melbourne (2003)
42. Medvedeva, O., Chavan, G., Crowley, R.: A data collection framework for capturing its databased on an agent communication standard. In: 20th Annual Meeting of the AmericanAssociation for Artificial Intelligence, pp. 23–30, AAAI, Pittsburgh (2005)
43. Shen, R., Han, P., Yang, F., Yang, Q., Huang, J.: Data mining and case-based reasoning fordistance learning. J. Distance Educ. Technol. 1(3), 46–58 (2003)
44. Lenzerini, M.: Data integration: a theoretical perspective. In: International Conference onACM SIGMOD/PODS, pp. 233–246. ACM, New York (2002)
45. Ingram, A.: Using web server logs in evaluating instructional web sites. J. Educ. Technol.Syst. 28(2), 137–157 (1999)
46. Peled, A., Rashty, D.: Logging for success: advancing the use of WWW logs to improvecomputer mediated distance learning. J. Educ. Comput. Res. 21(4), 413–431 (1999)
47. Talavera, L., Gaudioso, E.: Mining student data to characterize similar behavior groups inunstructured collaboration spaces. In: Workshop on Artificial Intelligence in CSCL,pp. 17–23. Valencia (2004)
48. Romero, C., Ventura, S., Bra, P.D.: Knowledge discovery with genetic programming forproviding feedback to courseware author. User modeling and user-adapted interaction.J. Personalization Res. 14(5), 425–464 (2004)
49. Mostow, J., Beck, J.E.: Why, what, and how to log? Lessons from LISTEN. In: Barnes, T.,Desmarais, M., Romero, R., Ventura, S. (eds.) 2nd International Conference on EducationalData Mining, pp. 269–278. International Educational Data Mining Society, Cordoba (2009)
2 A Survey on Pre-Processing Educational Data 61

50. Binli, S.: Research on data-preprocessing for construction of university information systems.In: International Conference on Computer Application and System Modeling, pp. 459–462.IEEE, Taiyuan (2010)
51. Dierenfeld, H., Merceron, A.: Learning analytics with excel pivot tables. In: MoodleResearch Conference, pp. 115–121. University of Piraeus, Heraklion (2012)
52. Solodovnikova, D., Niedrite, L.: Using data warehouse resources for assessment of e-earninginfluence on university processes. In: Eder, J., Haav, H.M., Kalja, A., Penjam, J. (eds.) 9thEast European Conference, ADBIS 2005. Advances in Databases and Information Systems.LNCS, vol. 3631, pp. 233-248. Springer, Heidelberg (2005)
53. Merceron, A., Yacef, K.: Directions to Enhance Learning Management Systems for BetterData Mining. Personal Communication (2010)
54. Yan, S., Li, Z.: Commercial decision system based on data warehouse and OLAP.Microelectron. Comput. 2, 64–67 (2006)
55. Zorrilla, M.E., Menasalvas, E., Marin, D., Mora, E., Segovia, J.: Web usage mining projectfor improving web-based learning sites. In: Moreno-Díaz, R., Pichler, F., Quesada-Arencibia,A. (eds.) Computer Aided Systems Theory—EUROCAST 2005. LNCS, vol. 3643,pp. 205–210. Springer, Heidelberg (2005)
56. Yin, C., Luo, Q.: Personality mining system in e-learning by using improved associationrules. In: International Conference on Machine Learning and Cybernetics, pp. 4130–4134.IEEE, Hong Kong (2007)
57. Heiner, C., Beck, J.E., Mostow, J.: Lessons on using ITS data to answer educational researchquestions. In: Lester, J.C., Vicari, R.S., Paraguaçu, F. (eds.) Intelligent Tutoring Systems, 7thInternational Conference, ITS 2004. LNCS, vol. 3220, pp. 1–9. Springer, Heidelberg (2004)
58. Rubin, D.B., Little, R.J.A.: Statistical Analysis with Missing Data. Wiley, New York (2002)59. Salmeron-Majadas, S., Santos, O., Boticario, J.G., Cabestrero, R., Quiros, P.: Gathering
emotional data from multiple sources. In: D’Mello, S.K., Calvo, R.A., Olney, A. (eds.) 6thInternational Conference on Educational Data Mining, pp. 404–405. InternationalEducational Data Mining Society, Memphis (2013)
60. Shuangcheng, L., Ping, W.: Study on the data preprocessing of the questionarie based on thecombined classification data mining model. In: International Conference on e-Learning,Enterprise Information Systems and E-Goverment, pp. 217–220. Las Vegas (2009)
61. García, E., Romero, C., Ventura, S., Castro, C.: An architecture for making recommendationsto courseware authors using association rule mining and collaborative filtering. User Model.User-Adap. Inter. 19(1–2), 99–132 (2009)
62. Huang, C., Lin, W., Wang, S., Wang, W.: Planning of educational training courses by datamining: using China Motor Corporation as an example. Expert Syst. Appl. J. 36(3),7199–7209 (2009)
63. Kantardzic, M.: Data Mining: Concepts, Models, Methods, and Algorithms. Wiley,New York (2003)
64. Beck, J.E.: Using learning decomposition to analyze student fluency development. In:Workshop on Educational Data Mining at the 8th International Conference on IntelligentTutoring Systems, pp. 21–28. Jhongli (2006)
65. Redpath, R., Sheard, J.: Domain knowledge to support understanding and treatment ofoutliers. In: International Conference on Information and Automation, pp. 398–403. IEEE,Colombo (2005)
66. Sunita, S.B., Lobo, L.M.: Data preparation strategy in e-learning system using associationrule algorithm. Int. J. Comput. Appl. 41(3), 35–40 (2012)
67. Ivancsy, R., Juhasz, S.: Analysis of web user identification methods. World Acad. Sci. Eng.Technol. J. 34, 338–345 (2007)
68. Rahkila, M., Karjalainen, M.: Evaluation of learning in computer based education using logsystems. In: ASEE/IEEE Frontiers in Education Conference, pp. 16–21. IEEE, San Juan(1999)
69. Wang, F.H.: Content recommendation based on education-contextualized browsing eventsfor web-based personalized learning. Educ. Technol. Soc. 11(4), 94–112 (2008)
62 C. Romero et al.
70. Munk, M., Drlík, M.: Impact of Different pre-processing tasks on effective identification ofusers’ behavioral patterns in web-based educational system. Procedia Comput. Sci. 4,1640–1649 (2011)
71. Heraud, J.M., France, L., Mille, A.: Pixed: an ITS that guides students with the help oflearners’ interaction log. In: Lester, J.C., Vicari, R.S., Paraguaçu, F. (eds.) IntelligentTutoring Systems, 7th International Conference, ITS 2004. LNCS, vol. 3220, pp. 57–64.Springer, Heidelberg (2004)
72. Sheard, J., Ceddia, J., Hurst, J., Tuovinen, J.: Inferring student learning behaviour fromwebsite interactions: a usage analysis. J. Educ. Inf. Technol. 8(3), 245–266 (2003)
73. Petersen, R.J.: Policy dimensions of analytics in higher education. Educause Rev. 47, 44–49(2012)
74. Bienkowski, M., Feng, M., Means, B.: Enhancing Teaching and Learning ThroughEducational Data Mining and Learning Analytics: An Issue Brief. U.S. Department ofEducation, Office of Educational Technology, pp. 1–57 (2012)
75. Liu, H., Motoda, H.: Computational Methods of Feature Selection. Chapman & Hall/CRC,Boca Raton (2007)
76. Delavari, N., Phon-Amnuaisuk, S., Beikzadeh, M.: Data mining application in higherlearning institutions. Inf. Educ. J. 7(1), 31–54 (2008)
77. Kotsiantis, B., Kanellopoulos, D., Pintelas, P.: Data pre-processing for supervised learning.Int. J. Comput. Sci. 1(2), 111–117 (2006)
78. Mihaescu, C., Burdescu, D.: Testing attribute selection algorithms for classificationperformance on real data. In: International IEEE Conference Intelligent Systems,pp. 581–586. IEEE, London (2006)
79. Márquez-Vera, C., Cano, A., Romero, C., Ventura, S.: Predicting student failure at schoolusing genetic programming and different data mining approaches with high dimensional andimbalanced data. Appl. Intell. 38(3), 315–330 (2013)
80. Wong, S.K., Nguyen, T.T., Chang, E., Jayaratnal, N.: Usability metrics for e-learning. In:Meersman, R., Tari, Z. (eds.) On the Move to Meaningful Internet Systems 2003: OTM 2003Workshops, LNCS, vol. 2889, pp. 235–252. Springer, Heidelberg (2003)
81. Hershkovitz, A. Nachmias, R.: Consistency of students’ pace in online learning. In: Barnes,T., Desmarais, M., Romero, R., Ventura, S. (eds.) 2nd International Conference onEducational Data Mining, pp. 71–80. International Educational Data Mining Society,Cordoba (2009)
82. Mor, E., Minguillón, J.: E-learning personalization based on itineraries and long-termnavigational behavior. In: Thirteenth World Wide Web Conference, pp. 264–265. ACM, NewYork (2004)
83. Nilakant, K., Mitrovic, A.: Application of data mining in constraint based intelligent tutoringsystems. In: International Conference on Artificial Intelligence in Education, pp. 896–898.Amsterdam (2005)
84. Baker, R., Carvalho, M.: A labeling student behavior faster and more precisely with textreplays. In: Baker, R.S.J.d, Barnes, T., Beck, J.E. (eds.) 1st International Conference onEducational Data Mining, pp. 38–47. International Educational Data Mining Society,Montreal (2008)
85. Zhou, M., Xu, Y., Nesbit., J.C., Winne, P.H.: Sequential pattern analysis of learning logs:methodology and applications. In: Romero, C., Ventura, S., Pechenizkiy, M., Baker, R.S. J.D.(eds.) Handbook of Educational Data Mining, Chapman & Hall/CRC Data Mining andKnowledge Discovery Series, pp. 107–120. CRC Press, Boca Raton (2010)
86. Liu, B.: Web Data Mining: Exploring Hyperlinks, Contents and Usage Data. Springer,Heidelberg (2011)
87. Thai, D., Wu, H., Li, P.: A hybrid system: neural network with data mining in an e-learningenvironment. In: Jain, L., Howlett, R.J., Apolloni, B. (eds.) Knowledge-Based IntelligentInformation and Engineering Systems, 11th International Conference, KES 2007, XVIIItalian Workshop on Neural Networks. LNCS, vol. 4693, pp. 42–49. Springer, Heidelberg(2007)
2 A Survey on Pre-Processing Educational Data 63
88. Hien, N.T.N., Haddawy, P.: A decision support system for evaluating international studentapplications. In: Frontiers in Education Conference, pp. 1–6. IEEE, Piscataway (2007)
89. Kosheleva, O., Kreinovich, V., Longrpre, L.: Towards interval techniques for processingeducational data. In: International Symposium on Scientific Computing, ComputerArithmetic and Validated Numerics, pp. 1–28. IEEE Computer Society, Washington (2006)
90. Hämäläinen, W., Vinni, M.: Classifiers for educational data mining. In: Romero, C., Ventura,S., Pechenizkiy, M., Baker, R.S.J.d. (eds.) Handbook of Educational Data Mining, Chapman& Hall/CRC Data Mining and Knowledge Discovery Series, pp. 57–71. CRC Press, BocaRaton (2010)
91. Cocea, M., Weibelzahl, S.: Can log files analysis estimate learners’ level of motivation? In:Workshop week Lernen—Wissensentdeckung—Adaptivität, pp. 32–35. Hildesheim (2006)
92. Tanimoto, S.L.: Improving the prospects for educational data mining. In: Track onEducational Data Mining, at the Workshop on Data Mining for User Modeling, at the 11thInternational Conference on User Modeling, pp. 1–6. User Modeling Inc., Corfu (2007)
93. Werner, L., McDowell, C., Denner, J.: A first step in learning analytics: pre-processing low-level Alice logging data of middle school students. J. Educ. Data Min. (2013, in press)
94. Alcalá, J., Sanchez, L., García, S., Del Jesus, M.J., Ventura, S., Garrell, J.M., Otero, J.,Romero, C., Bacardit, J., Rivas, V., Fernández, J.C., Herrera, F.: KEEL: a software tool toassess evolutionary algorithms to data mining problems. Soft. Comput. 13(3), 307–318(2009)
95. Gonçalves, P.M., Barros, R.S.M.: Automating data preprocessing with DMPML andKDDML. In: 10th IEEE/ACIS International Conference on Computer and InformationScience, pp. 97–103. IEEE, Washington (2011)
96. Zaïne, O.R., Luo, J.: Towards evaluating learners’ behaviour in a web-based distancelearning environment. In: IEEE International Conference on Advanced LearningTechnologies, pp. 357–360. Madison, WI (2001)
97. Ceddia, J., Sheard, J., Tibbery, G.: WAT: a tool for classifying learning activities from a logfile. In: Ninth Australasian Computing Education Conference, pp. 11–17. AustralianComputer Society, Darlinghurst (2007)
98. Rodrigo, M.T., Baker, R., McLaren, B.M., Jayme, A., Dy, T. : Development of a workbenchto address the educational data mining bottleneck. In: Yacef, K., Zaïane, O., Hershkovitz, A.,Yudelson, M., Stamper, J. (eds.) 5th International Conference on Educational Data Mining,pp. 152–155. International Educational Data Mining Society, Chania (2012)
99. Koedinger, K., Cunningham, K., Skogsholm, A., LEBER, B.: An open repository andanalysis tools for fine-grained, longitudinal learner data. In: Baker, R.S.J.d, Barnes, T., Beck,J.E. (eds.) 1st International Conference on Educational Data Mining, pp. 157–166.International Educational Data Mining Society, Montreal (2008)
64 C. Romero et al.