DATA COLLECTION SURVEY ON BUILDING CLIMATE ...
352
JR GE 21-044 REPUBLIC OF MALDIVES MINISTRY OF ENVIRONMENT DATA COLLECTION SURVEY ON BUILDING CLIMATE RESILIENT SAFER CITIES FINAL REPORT October 2021 JAPAN INTERNATIONAL COOPERATION AGENCY NIPPON KOEI CO., LTD. MIZUHO RESEARCH & TECHNOLOGIES, LTD.
-
Upload
khangminh22 -
Category
Documents
-
view
0 -
download
0
Transcript of DATA COLLECTION SURVEY ON BUILDING CLIMATE ...

←文字上 /上から 70mm
←文字上 /下から 70mm
←文字上 /下から 95mm
←文字上 /上から 75mm
JRGE
21-044
REPUBLIC OF MALDIVESMINISTRY OF ENVIRONMENT
DATA COLLECTION SURVEYON BUILDING CLIMATE RESILIENT
SAFER CITIES
FINAL REPORT
October 2021
JAPAN INTERNATIONAL COOPERATION AGENCY
NIPPON KOEI CO., LTD.MIZUHO RESEARCH & TECHNOLOGIES, LTD.

←文字上 /上から 70mm
←文字上 /下から 70mm
←文字上 /下から 95mm
←文字上 / 上から 75mm
REPUBLIC OF MALDIVESMINISTRY OF ENVIRONMENT
DATA COLLECTION SURVEYON BUILDING CLIMATE RESILIENT
SAFER CITIES
FINAL REPORT
October 2021
JAPAN INTERNATIONAL COOPERATION AGENCY
NIPPON KOEI CO., LTD.MIZUHO RESEARCH & TECHNOLOGIES, LTD.

Data Collection Survey on Building Climate Resilient Safer Cities Final Report
i
Table of Contents
EXECUTIVE SUMMARY .................................................................................................................... ES-1
CHAPTER 1 INTRODUCTION.......................................................................................................... 1-1 1.1 Background .................................................................................................................................. 1-1 1.2 Outline of the Survey .................................................................................................................... 1-2 1.3 Structure of This Report ............................................................................................................... 1-2
CHAPTER 2 BASIC INFORMATION ............................................................................................... 2-1 2.1 Topographic Characteristics, Climate and Hydraulic Trend ......................................................... 2-1
2.1.1 Topographic Characteristics ................................................................................................. 2-1 2.1.2 Climate and Hydraulic Trend ............................................................................................... 2-3 2.1.3 Wave ..................................................................................................................................... 2-7
2.2 Coral Habitat Environment and Water Quality ........................................................................... 2-16 2.2.1 Coral Habitat Environment ................................................................................................. 2-16 2.2.2 Water Quality...................................................................................................................... 2-18
2.3 Basic Information on Socio-economic Conditions ..................................................................... 2-20 2.3.1 The Maldives ...................................................................................................................... 2-20 2.3.2 Laamu Atoll ........................................................................................................................ 2-22
2.4 Current Conditions of Land Use, Developments, Critical Infrastructure .................................... 2-23 2.4.1 Current Conditions of Land Use, Developments ................................................................ 2-23 2.4.2 Current Conditions of Critical Infrastructure and Disaster Risk ......................................... 2-24
2.5 Sand Source and Mechanism of Sediment movement on Coral Reef Beach ............................. 2-30 2.5.1 Type of Sandy Beach and its Sand Source.......................................................................... 2-30 2.5.2 Mechanism of Sediment Transport on Coral Reef Beach ................................................... 2-30 2.5.3 Fundamental Mechanism for Cause of Coastal Erosion ..................................................... 2-31 2.5.4 Basic Idea of Adaptation Measures against Costal Erosion ................................................ 2-32
2.6 Coastal Erosion ........................................................................................................................... 2-33 2.6.1 Outline of Coastal Erosion in the Maldives ........................................................................ 2-33 2.6.2 Examples of Coastal Erosion Caused in Addu and Laamu Atoll ........................................ 2-33
2.7 Current Condition for Coastal Protection Measures and Coastal Management .......................... 2-37 2.7.1 Coastal Protection Measures .............................................................................................. 2-37 2.7.2 Coastal Management .......................................................................................................... 2-38
2.8 Analysis on Current Situation and Issues of Disaster Information Transmission ....................... 2-40 2.8.1 Current Situation and Issues of Disaster Prevention Information ....................................... 2-40
2.9 Review of Related Projects by Other Donors ............................................................................. 2-41 2.9.1 Outline of Related Climate Change Projects and Relationship with This Project............... 2-41

Data Collection Survey on Building Climate Resilient Safer Cities Final Report
ii
CHAPTER 3 REGIONAL CLIMATE OVERVIEW, FUTURE CLIMATE PROJECTION AND NATURAL HAZARD .......................................................................................... 3-1
3.1 Regional Climate Overview ......................................................................................................... 3-1 3.2 Future Climate Projection ............................................................................................................. 3-4
3.2.1 Rainfall and Temperature ..................................................................................................... 3-4 3.2.2 Sea Level .............................................................................................................................. 3-5 3.2.3 Sea Surface Temperature (SST) ............................................................................................ 3-6
3.3 Natural Hazard ............................................................................................................................. 3-7 3.3.1 Storm Surge .......................................................................................................................... 3-7 3.3.2 Swell Wave ........................................................................................................................... 3-8 3.3.3 Heavy Rainfall ...................................................................................................................... 3-9 3.3.4 Drought ................................................................................................................................ 3-9 3.3.5 Tsunami .............................................................................................................................. 3-10 3.3.6 Summary ............................................................................................................................ 3-11
3.4 Conclusion .................................................................................................................................. 3-12
CHAPTER 4 VULNERABILITY TO CLIMATE CHANGE HAZARD ........................................ 4-1 4.1 Outline .......................................................................................................................................... 4-1 4.2 Land and Coastal Geology ........................................................................................................... 4-1
4.2.1 Natural Vulnerability ............................................................................................................ 4-1 4.2.2 Human-induced Vulnerability .............................................................................................. 4-3
4.3 Human Settlement and Critical Infrastructure .............................................................................. 4-4 4.4 Economy ...................................................................................................................................... 4-5
4.4.1 Tourism................................................................................................................................. 4-5 4.4.2 Fisheries................................................................................................................................ 4-7 4.4.3 Agriculture and Food Security............................................................................................ 4-10
4.5 Human Health ............................................................................................................................ 4-10 4.6 Water Resources ......................................................................................................................... 4-14 4.7 Coral Reef Biodiversity .............................................................................................................. 4-18 4.8 Policy and Governance ............................................................................................................... 4-22 4.9 Gender and Locality ................................................................................................................... 4-24 4.10 Conclusion .................................................................................................................................. 4-24
CHAPTER 5 DENTIFICATION OF CLIMATE CHANGE HAZARD TO BE ADDRESSED IN THE PROJECT AND SELECTION OF TARGET AREA ........ 5-1
5.1 Target Climate Hazards and Idea for Selection of Target Area ..................................................... 5-1 5.2 Item 1: Impact of Climate Hazard and Vulnerability .................................................................... 5-2 5.3 Item 2: Effect of the Project .......................................................................................................... 5-4 5.4 Item 3: Similarity to Coastal Conditions and Coastal Problems on Many Inhabited Islands,
and Validity as Model Cases ......................................................................................................... 5-7

Data Collection Survey on Building Climate Resilient Safer Cities Final Report
iii
5.4.1 Gan in Laamu Atoll .............................................................................................................. 5-7 5.4.2 Fonadhoo in Laamu Atoll ..................................................................................................... 5-8 5.4.3 Maamendhoo in Laamu Atoll ............................................................................................... 5-8 5.4.4 Isdhoo in Laamu Atoll .......................................................................................................... 5-9 5.4.5 Hithadhoo in Addu Atoll ...................................................................................................... 5-9 5.4.6 Maradhoo/Maradhoo-Feydhoo in Addu Atoll ...................................................................... 5-9 5.4.7 Feydhoo in Addu Atoll ....................................................................................................... 5-10 5.4.8 Meedhoo/Hulhdhoo in Addu Atoll ..................................................................................... 5-10
5.5 Conclusion .................................................................................................................................. 5-13
CHAPTER 6 STUDY ON RISK ASSESSMENT DUE TO CLIMATE IMPACT AT TARGET ISLAND ......................................................................................................... 6-1
6.1 Outline .......................................................................................................................................... 6-1 6.2 Impact Assessment for Climate Hazard ........................................................................................ 6-1
6.2.1 Future Scenario of SLR and Wave Height ............................................................................ 6-1 6.2.2 Assessment of Topographic Characteristics and Vulnerability in the Target
Two Islands and Identification of Project Sites ..................................................................... 6-5 6.2.3 Impact Assessment on Coastal Erosion and Flooding Due to High Waves ........................ 6-19
6.3 Risk Assessment on the Compound Damage by Coastal Erosion and Flooding ........................ 6-33 6.3.1 Overview of the Compound Damage by Coastal Erosion and Flooding ............................ 6-33 6.3.2 Classification and Calculation of the Compound Damage ................................................. 6-37
6.4 Study for climate impact on beach erosion which has been already observed at target area ...... 6-45 6.4.1 Outline ................................................................................................................................ 6-45 6.4.2 Analysis .............................................................................................................................. 6-45
CHAPTER 7 THEORY OF CHANGE ............................................................................................... 7-1 7.1 Summary of Coastal Issues at the Target Area .............................................................................. 7-1 7.2 Categorization .............................................................................................................................. 7-1
7.2.1 Developmental Issues ........................................................................................................... 7-1 7.2.2 Climate Related Issues.......................................................................................................... 7-2
7.3 Policy to Address Issues ............................................................................................................. 7-3 7.3.1 Reducing Hazard .................................................................................................................. 7-3 7.3.2 Overcoming Vulnerability and Reducing Exposure ............................................................. 7-4
7.4 Barriers to Address Issues ............................................................................................................. 7-5 7.4.1 Lack of regulatory system .................................................................................................... 7-5 7.4.2 Insufficient technical expertise and experience..................................................................... 7-6 7.4.3 Insufficient skill to implement a solution .............................................................................. 7-6
7.5 Goal Statement and Expected Outcomes and Project Results ...................................................... 7-7 7.6 Necessary Activities to Achieve the Project Results ..................................................................... 7-8
7.6.1 Component 1: Establishment of Integrated Coastal Zone Management (ICZM) ................. 7-8
Data Collection Survey on Building Climate Resilient Safer Cities Final Report
iv
7.6.2 Component 2: Implementation of Coastal Conservation/Protection Measures against Coastal Erosion ..................................................................................................................... 7-9
7.6.3 Component 3: Development of Disaster Warning and Information Dissemination .............. 7-9 7.6.4 Component 4: Development of Basic Data Collection and Sharing System Related to
Climate Change .................................................................................................................. 7-10
CHAPTER 8 STUDY ON PROJECT COMPONENT ...................................................................... 8-1 8.1 Outline of Project Component ...................................................................................................... 8-1 8.2 Component 1: Establishment of the Integrated Coastal Zone Management (ICZM) ................... 8-2
8.2.1 Outline .................................................................................................................................. 8-2 8.2.2 Activity 1.1: Inventory Study for Risk Assessment on Present Coastal and Coral Reef
Conditions ............................................................................................................................ 8-3 8.2.3 Activity 1.2: Preparation of basic policy of ICZM at the national level ............................... 8-4 8.2.4 Activity 1.3: Preparation of concrete ICZM Plan at representative inhabitant island as
case study ............................................................................................................................. 8-5 8.2.5 Activity 1.4: Capacity development and information sharing between the relevant
organizations for the establishment of the ICZM ................................................................. 8-7 8.3 Component 2: Implementation of Coastal Conservation/Protection Measures against
Coastal Disasters (Addu and Laamu Atolls) ................................................................................. 8-9 8.3.1 Outline .................................................................................................................................. 8-9 8.3.2 Activity 2.1: Detailed design of coastal conservation measures and the capacity
development of stakeholders .............................................................................................. 8-10 8.3.3 Activity 2.2: Implementation of coastal conservation/protection measures ........................ 8-11 8.3.4 Sub-activity 2.3: Implementation of beach maintenance, establishment of structure
and capacity development of stakeholders ......................................................................... 8-27 8.4 Component 3: Development of Disaster Wrning and Information Dissemination ..................... 8-31
8.4.1 Background ........................................................................................................................ 8-31 8.4.2 Outline ................................................................................................................................ 8-34 8.4.3 Activity 3.1: Installment of terrestrial digital broadcasting system ..................................... 8-34 8.4.4 Activity 3.2: Establishment of Disaster Early Warning and Information Broadcasting
System ................................................................................................................................ 8-34 8.5 Study for the Contents of Component 4 ..................................................................................... 8-37
8.5.1 Component 4: Development of Basic Data Collection and Sharing System Related to Climate Change .................................................................................................................. 8-37
8.5.2 Activity 4.1: Development of Wave and Sea Level Monitoring System ............................ 8-37 8.5.3 Sub-activity 4.1.2: Technical transfer on data processing, analysis and operation .............. 8-39 8.5.4 Activity 4.2: Development of Beach, Coral Reef and Land Use Monitoring System ........ 8-42

Data Collection Survey on Building Climate Resilient Safer Cities Final Report
v
CHAPTER 9 BASIC POLICY AND DESIGN OF PROPOSED COASTAL ADAPTATION MEASURE ..................................................................................................................... 9-1
9.1 Coastal Adaptation Measure ......................................................................................................... 9-1 9.1.1 Basic Policy .......................................................................................................................... 9-1 9.1.2 Basic Policy for Target Beaches ........................................................................................... 9-2
9.2 Outline Design .............................................................................................................................. 9-6 9.2.1 Specifications of Proposed Adaptation Measure and its Concept ......................................... 9-6 9.2.2 Layout Plan .......................................................................................................................... 9-7 9.2.3 Typical Cross Section ........................................................................................................... 9-8 9.2.4 Validation for Dimensions of Proposed Measures .............................................................. 9-10
9.3 Outline Construction Plan and Cost Estimates ........................................................................... 9-14 9.3.1 Outline Construction Plan .................................................................................................. 9-14 9.3.2 Outline Construction Schedule ........................................................................................... 9-15 9.3.3 Outline Cost Estimate ......................................................................................................... 9-16
CHAPTER 10 DISCUSSION ON UTILIZING FINANCIAL RESOURCES FROM EXTERNAL ORGANIZATIONS .............................................................................. 10-1
10.1 Outlining External Resource Schemes ....................................................................................... 10-1 10.2 Analyzing External Resource Schemes (Focusing on the GCF) ................................................ 10-2 10.3 Specific Ways of Application of GCF Resources in MD .......................................................... 10-18
CHAPTER 11 ENVIRONMENTAL AND SOCIAL CONSIDERATION/ PUBLIC CONSULTATION/ GENDER .................................................................................... 11-1
11.1 Relevant Regulations and Guidelines (GCF, JICA and Maldives) ............................................. 11-1 11.1.1 Legal and Institutional Framework for Natural and Social Consideration, including
EIA and Gender .................................................................................................................. 11-1 11.1.2 Protected Areas and Sensitive Areas ................................................................................... 11-2 11.1.3 Dredging and Reclamation Regulation (Regulation 2013/R-15) ........................................ 11-5 11.1.4 Cultural and Historical Places and Objects Act (Act No.27/79) ......................................... 11-6 11.1.5 Regulation on Cutting Down and Export of Trees and Coconut Palms (Regulation No.
7-R/2014) ........................................................................................................................... 11-6 11.1.6 Coral and Sand Mining Regulation .................................................................................... 11-7
11.2 Relevant Policies of the Maldives .............................................................................................. 11-7 11.2.1 National Biodiversity Strategy and Action Plan (2016-2025)............................................. 11-7 11.2.2 National Framework for Development 2009-2013/ 2014-2020 ......................................... 11-8 11.2.3 3rd National Environmental Action Plan, 2009-2013 ......................................................... 11-8 11.2.4 National Solid Waste Management Policy, 2007 ................................................................ 11-9 11.2.5 Waste Management Regulations ........................................................................................ 11-9 11.2.6 Decentralization Act ........................................................................................................... 11-9

Data Collection Survey on Building Climate Resilient Safer Cities Final Report
vi
11.3 Multilateral Agreements ........................................................................................................... 11-10 11.3.1 United Nations Framework Convention on Climate Change (UNFCCC) and the
Kyoto Protocol ................................................................................................................. 11-10 11.3.2 United Nations Convention on Biological Diversity (UNCBD) ...................................... 11-11 11.3.3 United Nations Convention to Combat Desertification (UNCCD) .................................. 11-11 11.3.4 United Nations Convention on the Law of the Sea (UNCLOS) ....................................... 11-11
11.4 EIA Procedures of Maldives ..................................................................................................... 11-11 11.4.1 Project Subject to EIA ...................................................................................................... 11-11 11.4.2 Procedures of Environmental Impact Assessment ............................................................ 11-13 11.4.3 EIA Procedures of GCF and JICA .................................................................................... 11-14
11.5 Environmental and Social Impact Evaluation for each Component ......................................... 11-17 11.5.1 Issues to be considered as the Environmental and Social Consideration and Tentative
Countermeasures .............................................................................................................. 11-17 11.5.2 Proposed Activities that have potential Environmental and Social Impacts ..................... 11-19 11.5.3 Evaluation Results ............................................................................................................ 11-25 11.5.4 Generic Environmental and Social Management Plan (ESMP) ....................................... 11-36
11.6 Activity/Site-Specific Assessments, Mitigation Planning and Implementation ........................ 11-36 11.6.1 Component 1: Establishment of Integrated Coastal Zone Management (ICZM) ............. 11-36 11.6.2 Component 2: Implementation of coastal conservation/protection measures against
coastal disasters ................................................................................................................ 11-38 11.6.3 Component 3: Development of disaster warning and information dissemination ............ 11-41 11.6.4 Component 4: Development of basic data collection and sharing system related to
climate change .................................................................................................................. 11-43 11.6.5 Capacity building and training .......................................................................................... 11-43
11.7 Summary of Consultation and Stakeholder Engagement Plan ................................................. 11-44 11.7.1 Stakeholder Engagement .................................................................................................. 11-44 11.7.2 Previous Stakeholder Engagement ................................................................................... 11-44 11.7.3 Stakeholder Engagement Plan .......................................................................................... 11-46 11.7.4 Grievance Mechanism ...................................................................................................... 11-48
11.8 Gender Assessment................................................................................................................... 11-51 11.8.1 Gender assessment ........................................................................................................... 11-51 11.8.2 Legal and Administrative Framework Protecting Women and Protecting Gender
Equality ............................................................................................................................ 11-51 11.8.3 Results of Qualitative Assessments .................................................................................. 11-54
CHAPTER 12 CONSIDERATIONS FOR THE PROJECT IMPLEMENTATION ...................... 12-1 12.1 Considerations for the Implementation Arrangement ................................................................. 12-1
12.1.1 Project Steering Committee (PSC) ..................................................................................... 12-1 12.1.2 Project Management Unit (PMU) ...................................................................................... 12-5

Data Collection Survey on Building Climate Resilient Safer Cities Final Report
vii
12.1.3 Capacity Development through Detailed Design/Construction Supervision Consultant ........................................................................................................................... 12-7
12.1.4 Procurement System for Consultant and Contractor........................................................... 12-8 12.1.5 Management of the Fund .................................................................................................... 12-9 12.1.6 Project Reporting to GCF ................................................................................................. 12-10
12.2 Considerations for the Project Schedule ................................................................................... 12-11 12.3 Considerations for the Project Cost .......................................................................................... 12-12
12.3.1 Precondition...................................................................................................................... 12-12 12.3.2 Project Cost for GCF Fund ............................................................................................... 12-13 12.3.3 Project Cost for All Components ...................................................................................... 12-13
12.4 Project Evaluation by Economic Analysis ................................................................................ 12-14
CHAPTER 13 SUMMARY OF RESULTS AND ISSUES FOR FUTURE STUDIES .................... 13-1 13.1 Summary .................................................................................................................................... 13-1
13.1.1 Basic Information for Topographic, Hydrological, Environmental and Socio-economic Conditions ................................................................................................ 13-1
13.1.2 Coastal Hazard ................................................................................................................... 13-2 13.1.3 Vulnerability against Coastal Disaster ................................................................................ 13-2 13.1.4 Coastal Risk Assessment .................................................................................................... 13-3 13.1.5 Basic Policy for Coastal Adaptation Measures ................................................................... 13-3 13.1.6 Proposed Project Component ............................................................................................. 13-4
13.2 Issues for Future Studies ............................................................................................................. 13-4 13.2.1 Necessity of Detailed Layout Planning based on Appropriate Numerical Analysis ........... 13-4 13.2.2 Necessity of Continuous Coastal Management after the Project Implementation .............. 13-4 13.2.3 Necessity to Improve Repeatability of Numerical Model at Detailed Design Stage .......... 13-5 13.2.4 Necessity of Project Evaluation based on Accurate Prediction of Inundation Damage ...... 13-5 13.2.5 Necessity of Precise Cost Estimation based on Characteristics of Beach Nourishment ..... 13-5
Appendix A: Institutional Arrangement for Using External Fund Appendix B: Economic Analysis Supportive Appendix: Relevant Material for the Funding Proposal

Data Collection Survey on Building Climate Resilient Safer Cities Final Report
viii
List of Figures Figure 2.1.1 Land Area and Reef Area in each Atoll ................................................................................. 2-1 Figure 2.1.2 Vertical Topography in the Gan of Laamu Atoll .................................................................... 2-2 Figure 2.1.3 Geographical map of Maldives ............................................................................................. 2-3 Figure 2.1.4 Accumulated rainfall during various seasons for Male and Gan (1975 to 2010) ...................... 2-4 Figure 2.1.5 Variations in annual mean maximum and minimum temperature for Male and Gan
(1975 to 2010) .......................................................................................................... 2-4 Figure 2.1.6 Seasonal climate cycles ......................................................................................................... 2-5 Figure 2.1.7 Distribution and Wind Rose (1979-2008) ............................................................................. 2-6 Figure 2.1.8 Wind Rose for Two Periods at Three Measuring Points ........................................................ 2-6 Figure 2.1.9 Observed sea level in Gan, Addu Atoll for the past 33 years ................................................. 2-7 Figure 2.1.10 Variation of annual mean sea surface temperature fluctuation for four zones in
Maldives (1982 to 2009)........................................................................................... 2-7 Figure 2.1.11 Time Series Variation of Reanalysis Data (ERA5) and Observation Data of H1/3 ............. 2-8 Figure 2.1.12 Correlation of Reanalysis Data (ERA5) and Observation Data ........................................... 2-8 Figure 2.1.13 Distribution and Rose for Significant Wave (1979-2008) ................................................... 2-9 Figure 2.1.14 Variation of Maximum Value of Monthly Average Wave Height (H1/3 and Hmax)
(1978 - 2018) ............................................................................................................ 2-9 Figure 2.1.15 Location of the Hydraulic Wave Height Meter ................................................................. 2-10 Figure 2.1.16 Time Series Variation of Significant Wave Height (H1/3) ................................................ 2-11 Figure 2.1.17 Sample of the Variation of Water Level obtained at Lagoon Side ..................................... 2-11 Figure 2.1.18 Power Spectrum of Wave .................................................................................................. 2-12 Figure 2.1.19 Relation between the Wave Height and Period (①out of the reef at ocean side) .............. 2-13 Figure 2.1.20 Frequency Distribution of Wave Direction (①out of the reef at ocean side) ..................... 2-13 Figure 2.1.21 Time Series Variation of Significant Wave Height (H1/3) and Significant Wave
Period (T1/3) (④out of the reef at lagoon side) ...................................................... 2-13 Figure 2.1.22 Time Series Variation of H1/3 at the Inside and Outside of the Reef (Ocean Side) ........... 2-14 Figure 2.1.23 Relation of Wave Height of Inside and Outside of the Reef .............................................. 2-15 Figure 2.1.24 Relation of Wave Height and Water Level at Inside of the Reef ....................................... 2-15 Figure 2.1.25 Sample of Surf Beat Observed at Inside of Reef ............................................................... 2-16 Figure 2.4.1 Residential Area with Inadequate Setback (Ocean Side of Hithadhoo, Addu Atoll) ........... 2-23 Figure 2.4.2 Land Use Map of Gan ......................................................................................................... 2-24 Figure 2.4.3 Kadhdhoo Airport ............................................................................................................... 2-27 Figure 2.4.4 Seaports of Maamendhoo (Left) and Southern Part of Gan (Right) .................................... 2-27 Figure 2.4.5 Main Road in Fonadhoo (Left) Island Road in Maamendhoo (Right) ............................. 2-28 Figure 2.4.6 FENAKA Building for Power Generation (Gan) ................................................................ 2-28 Figure 2.4.7 Rain Water Storage Tank in Maabaidhoo ............................................................................ 2-29 Figure 2.4.8 Sewerage Facility (Left) and Discharge Pipe to the Sea (Right) at Gan .............................. 2-29 Figure 2.4.9 Recycling Facility (Left) and Dump Site (Right) at Fonadhoo ........................................... 2-30

Data Collection Survey on Building Climate Resilient Safer Cities Final Report
ix
Figure 2.5.1 Sediment Movement on Coral Reef Beach ......................................................................... 2-31 Figure 2.5.2 Image of Sediment Budget at Beach ................................................................................... 2-32 Figure 2.6.1 Coastal Erosion at the Down Drift Side due to Port Construction ....................................... 2-34 Figure 2.6.2 Beach Condition at Down Drift (North) Side (Feb. 2019) .................................................. 2-34 Figure 2.6.3 Construction of Navigation Channel (Gan Island in Laamu Atoll) ..................................... 2-34 Figure 2.6.4 Mining of Coral Sand and Gravel on Coral Reef (Fonadhoo Island(Left), Gan
Island(right) in Laamu Atoll) ............................................................................... 2-35 Figure 2.6.5 Mining of Coral Sand and Gravel from Foreshore Area (Gan in Laamu Atoll) .................. 2-35 Figure 2.6.6 Construction of Revetment on Foreshore Area (Meedhoo in Addu Atoll) .......................... 2-36 Figure 2.6.7 Change of Coral Environment (Growth of Seaweed) (Fonadhoo Island in Laamu) ........... 2-36 Figure 2.7.1 Impermeable Type of Seawall using Mixed Cement and Sand Bag .................................... 2-37 Figure 2.7.2 Rubble Type Impermeable Revetment ................................................................................ 2-37 Figure 2.7.3 Feydhoo Reclamation Project ............................................................................................. 2-38 Figure 2.7.4 Rubbish Disposal on the Beach (Gan at Laamu Atoll) ........................................................ 2-39 Figure 2.7.5 Dairy Beach Cleaning and Public Area (Fonadhoo at Laamu Atoll) ................................... 2-39 Figure 2.7.6 Illegal Coral Sand and Gravel Mining from Foreshore (Gan at Addu Atoll) ....................... 2-39 Figure 3.1.1 Variability of Sea Surface Temperature1) .............................................................................. 3-1 Figure 3.1.2 Variability of Sea Surface Temperature in EEIO under GM and LGM Conditions1) ........... 3-2 Figure 3.1.3 Relation between Change in SD of SST and Zonal Wind Stress in the EIO1) ...................... 3-2 Figure 3.1.4 Rainfall impacts of current and future modes of climate variability in the IO1) ................... 3-3 Figure 3.2.1 IPRC RegCM annual mean temperature projection for Maldives ......................................... 3-4 Figure 3.2.2 IPRC RegCM annual daily rainfall projection for Maldives ................................................. 3-4 Figure 3.2.3 Temperature and rainfall changes over Maldives domain from IPRC RegCM scenario
time slices (2021-2050) and (2082-2100) from baseline (1980-2000) ..................... 3-5 Figure 3.2.4 Observed Sea Level in Gan, Addu Atoll for the Past 33 Years .............................................. 3-5 Figure 3.2.5 Estimated Sea Level Rise by RCP Scenarios ........................................................................ 3-6 Figure 3.2.6 RCP Scenario of SLR (based on 2019) .............................................................................. 3-6 Figure 3.2.7 Changes in Sea Surface Temperature 1951-2011 .................................................................. 3-7 Figure 3.2.8 Estimated Sea Surface Temperature Rise .............................................................................. 3-7 Figure 3.3.1 Cyclones Pathways (1877-2004) ........................................................................................... 3-8 Figure 3.3.2 Frequency of Inundation Caused by Swell Wave and Number of Islands Affected .............. 3-9 Figure 3.3.3 Trend in Consecutive Days of Drought by Island ............................................................... 3-10 Figure 3.3.4 Run Up Height of Tsunami in 2004 .................................................................................... 3-10 Figure 4.2.1 Example of Inhabited Island in Maldives .............................................................................. 4-1 Figure 4.2.2 Examples of Coastal Erosion at Inhabited Island .................................................................. 4-2 Figure 4.2.3 Example of Cross Section of Inhabited Island (Hankede Area in Addu Atoll) ...................... 4-2 Figure 4.2.4 Examples of Artificial Modification ...................................................................................... 4-3 Figure 4.2.5 Encroachment of Housing ..................................................................................................... 4-4 Figure 4.4.1 Yellow Fin Catch per Unit Effort (CPUE) from 1997 to 2012 .............................................. 4-8 Figure 4.4.2 Skipjack Tuna Catch per Unit Effort (CPUE) from 1997 to 2012 ......................................... 4-9

Data Collection Survey on Building Climate Resilient Safer Cities Final Report
x
Figure 4.5.1 Total number of reported cases ............................................................................................ 4-12 Figure 4.5.2 Reported dengue cases and long term mean rainfall (2005- 2013) ...................................... 4-12 Figure 4.5.3 Scrub Typhus cases reported monthly from 2011-2013 ...................................................... 4-13 Figure 4.5.4 Reported Chikungunya cases .............................................................................................. 4-13 Figure 4.6.1 Rainwater storage capacity by atolls ................................................................................... 4-16 Figure 4.6.2 Deficit water storage with respect to current storage capacity ............................................. 4-17 Figure 4.6.3 Number of requests made for emergency water during the dry period
from 2005-2014. ..................................................................................................... 4-17 Figure 4.6.4 Summary by month of measured pH of water quality from MCOH ................................... 4-18 Figure 4.7.1 Monthly variation of SST across Maldives ......................................................................... 4-19 Figure 4.7.2 Atoll specific pattern of recovery of coral sites ................................................................... 4-20 Figure 4.7.3 Projected impacts of coral bleaching ................................................................................... 4-21 Figure 4.8.1 New Residential Area for Migrants (Fonadhoo in Laamu Atoll) ........................................ 4-22 Figure 6.2.1 RCP Scenario of SLR (based on 2019) .............................................................................. 6-1 Figure 6.2.2 Relation Between SLR and Tide Deviation........................................................................... 6-2 Figure 6.2.3 Encounter Probability of Extreme Tide with 50-year Return Period for Each RCP
Scenario .................................................................................................................... 6-2 Figure 6.2.4 Increase of Wave Height Rate on Coral Reef for Each RCP Scenario .................................. 6-3 Figure 6.2.5 Sample of Surf Beat Observed Inside of the Reef ................................................................. 6-3 Figure 6.2.6 Relation Between Run-up Height and Wave Height at the Outer Reef ................................. 6-4 Figure 6.2.7 Relation Between Run-up Height and SLR .......................................................................... 6-4 Figure 6.2.8 Target Islands (Left: Maamendhoo Island, Right: Fonadhoo Island in Laamu Atoll) ........... 6-5 Figure 6.2.9 Change in Condition of Maamendhoo Island in Laamu Atoll ............................................... 6-6 Figure 6.2.10 Elevation Distribution of Maamendhoo .............................................................................. 6-7 Figure 6.2.11 Cross Section of Topographic Profile at the Four Representative Lines in
Maamendhoo ............................................................................................................ 6-8 Figure 6.2.12 Change in Beach Condition Between February and September 2019 ................................. 6-9 Figure 6.2.13 Beach Condition at Maamendhoo (March 2019) ................................................................ 6-9 Figure 6.2.14 Flooding Due to High Wave (2019) .................................................................................... 6-9 Figure 6.2.15 Coordinate to be Used for the Analysis of Shoreline Change............................................ 6-10 Figure 6.2.16 Shoreline Change at the West Side ................................................................................. 6-11 Figure 6.2.17 Shoreline Change at the East Side ..................................................................................... 6-11 Figure 6.2.18 Overview of Fonadhoo Island in Laamu Atoll .................................................................. 6-12 Figure 6.2.19 Cross Section in the Four Representative Lines of Fonadhoo Island ................................ 6-14 Figure 6.2.20 Coastal Erosion at Residential Area .................................................................................. 6-15 Figure 6.2.21 Simple Sand Embankment ................................................................................................ 6-15 Figure 6.2.22 Houses Just behind the Coast ............................................................................................ 6-15 Figure 6.2.23 Mined Coral Sand and Gravel ........................................................................................... 6-15 Figure 6.2.24 Aerial Photos Taken in 1969 and 1999 and Satellite Images in 2005 and 2018 ................ 6-16 Figure 6.2.25 Shoreline Change Based on 1969 ...................................................................................... 6-17

Data Collection Survey on Building Climate Resilient Safer Cities Final Report
xi
Figure 6.2.26 Change of Sand Deposition on Coral Reef Between 2005 and 2018 ................................ 6-17 Figure 6.2.27 Change of Coastal Area at the Central Residential Area of the Ocean Side ................... 6-18 Figure 6.2.28 Definition of Each Specification Presented in the Report ................................................. 6-20 Figure 6.2.29 Approach of Proposed Calculation Method on Beach Retreat for Coral Reef Beach .... 6-20 Figure 6.2.30 Comparison of Calculated Beach Retreat using Proposed Formula6) and
Experiment7) .......................................................................................................... 6-21 Figure 6.2.31 Example of Calculation (Maamendhoo, RCP 8.5) ............................................................ 6-22 Figure 6.2.32 Predicted Beach Retreat (Fonadhoo, RCP 4.5 and 8.5) ..................................................... 6-22 Figure 6.2.33 Predicted Beach Retreat (Maamendhoo, RCP 4.5 and 8.5) ............................................... 6-23 Figure 6.2.34 Estimated Land Loss Due to Coastal Erosion for Three Islands for Each RCP
scenario ................................................................................................................... 6-23 Figure 6.2.35 Shoreline Change Due to Interruption of Littoral Drift by Groin ...................................... 6-24 Figure 6.2.36 Further Expansion of Beach Retreat at Down-drift Side Due to Impact of Climate
Change .................................................................................................................... 6-24 Figure 6.2.37 Estimated Beach Retreat at Down-drift Side of Groin With and Without the Impact
of Climate Change (Hankede at Addu Atoll) .......................................................... 6-25 Figure 6.2.38 Extreme Statistical Analysis of the Offshore Wave Height in Maamendhoo .................... 6-26 Figure 6.2.39 Extreme Statistical Analysis of the Offshore Wave Height in Fonadhoo .......................... 6-27 Figure 6.2.40 Image of Wave Propagation Analysis Using Boussinesq Model ....................................... 6-28 Figure 6.2.41 Assumed Flood Area for Maamendhoo (with the Project Implementation Area) ............. 6-28 Figure 6.2.42 Flood Map of Maamendhoo (No Erosion Impact Considered) ......................................... 6-30 Figure 6.2.43 Assumed Flood Area for Fonadhoo (with Project Implementation Area) ......................... 6-31 Figure 6.2.44 Flood Map at Target Coast of Fonadhoo (No Erosion Impact Considered) ...................... 6-32 Figure 6.3.1 Compound Damage Map Due to Erosion and Flooding with SLR for Maamendhoo ........ 6-35 Figure 6.3.2 Compound Damage Map Due to Erosion and Flooding with SLR for Fonadhoo .............. 6-36 Figure 6.3.3 Comparison of Damage Amount for Maamendhoo Case: Flooding (USD/year) VS
Coastal Erosion (USD, Accumulative) ................................................................... 6-39 Figure 6.4.1 Coastal Erosion at down-drift side of Port Construction ..................................................... 6-45 Figure 6.4.2 Target Area at Maamendhool .............................................................................................. 6-46 Figure 6.4.3 Long-Term Shoreline Change at Maamendhoo from 1969 ................................................. 6-46 Figure 6.4.4 Target Area at Fonadhool .................................................................................................... 6-47 Figure 6.4.5 Long-Term Shoreline Change at Fonadhoo from 1969 ....................................................... 6-47 Figure 6.4.6 Variability of Sea Surface Temperature in EEIO under GM and LGM Conditions ............ 6-48 Figure 6.4.7 Variation of annual mean sea surface temperature fluctuation for zone 3 in Maldives
(1982 to 2009) ........................................................................................................ 6-48 Figure 6.4.8 Observed sea level in Gan, Addu Atoll for the past 33 years ............................................... 6-49 Figure 6.4.9 SLR for each RCP Scenario ................................................................................................ 6-49 Figure 6.4.10 Estimated Beach Retreat due to SLR at Fonadhoo and East Side of Maamendhoo .......... 6-50 Figure 6.4.11 Estimated Beach Retreat due to SLR at West Side of Maamendhoo ................................. 6-50 Figure 6.4.12 Increment of Beach Retreat between Actual and Estimated since 1969 to 2018 ............... 6-50

Data Collection Survey on Building Climate Resilient Safer Cities Final Report
xii
Figure 7.6.1 Relation of Activities 1 to 3 against Coastal Disaster .......................................................... 7-11 Figure 7.6.2 Relation of Activities 1 to 3 against Coastal Disaster Theory of Change ............................ 7-12 Figure 8.3.1 Location of Proposed Intervention ...................................................................................... 8-12 Figure 8.3.2 Long-term Beach Change after the Project (Bali Beach Conservation Project) ............... 8-15 Figure 8.3.3 Cost comparison of soft engineering solutions for coastal adaptation ................................. 8-18 Figure 8.3.4 Coastal Conservation Measures and Evacuation Area at Maamendhoo Island in
Laamu Atoll ............................................................................................................ 8-23 Figure 8.3.5 Coastal Conservation Measure at Fonadhoo Island in Laamu Atoll .................................... 8-24 Figure 8.3.6 Coastal Conservation Measure at Medhoo Island in Addu Atoll ......................................... 8-25 Figure 8.3.7 Coastal Protection Measure at Gan Island in Laamu Atoll .................................................. 8-26 Figure 8.3.8 Coastal Protection Measure at Ishdhoo Island in Laamu Atoll ............................................ 8-26 Figure 8.3.9 Image of Beach Maintenance After the Beach Nourishment .............................................. 8-28 Figure 8.3.10 Image of Adaptation Management System to be Applied to the Maintenance Work
after Beach Nourishment ........................................................................................ 8-29 Figure 8.5.1 Image of Wave Observation System ................................................................................... 8-38 Figure 8.5.2 Image of Monitoring System Using Satellite Image ........................................................... 8-43 Figure 8.5.3 Image of Monitoring System using UAV Technology ........................................................ 8-44 Figure 9.1.1 Beach Condition at Maamendhoo (March 2019) .................................................................. 9-3 Figure 9.1.2 Flooding Due to High Wave .................................................................................................. 9-4 Figure 9.1.3 Proposed Area for Adaptation Measures in Maamendhoo .................................................... 9-4 Figure 9.1.4 Resident Area at Ocean Side ................................................................................................. 9-5 Figure 9.1.5 Coastal Erosion at Ocean Side .............................................................................................. 9-5 Figure 9.1.6 Proposed Area for Adaptation Measures in Fonadhoo .......................................................... 9-5 Figure 9.1.7 Public Area Maintained by Resident ..................................................................................... 9-6 Figure 9.2.1 Layout Plan in Maamendhoo ................................................................................................ 9-8 Figure 9.2.2 Layout Plan in Fonadhoo ...................................................................................................... 9-8 Figure 9.2.3 Reductive Rate of Wave Overtopping by Beach Nourishment Width for H1:10 ................ 9-11 Figure 9.2.4 Expected Wave Overtopping for Without/ with the Beach Nourishment
(Maamendhoo) ....................................................................................................... 9-12 Figure 9.2.5 Calculation of Required Crest Height against H1:50 (Maamendhoo) ................................. 9-13 Figure 9.2.6 Expected Wave Overtopping for without/ with the Beach Nourishment (Fonadhoo) ...... 9-14 Figure 10.1.1 Scale of Major International Funds Applicable to Climate Change Activities .................. 10-2 Figure 10.3.1 No Objection Letter ......................................................................................................... 10-20 Figure 10.3.2 Process for Issuance of the No Objection Letter (after the new rule is applied) .............. 10-21 Figure 11.4.1 EIA Process in the Maldives ............................................................................................ 11-14 Figure 11.5.1 Cross Section View of Beach and Groin at the Maamendhoo East Coast, Laamu
Atoll under Component 2 ..................................................................................... 11-21 Figure 11.5.2 Cross Section View of Perimeter Revetment at the Maamendhoo North Coast,
Laamu Atoll under Component 2 ......................................................................... 11-21

Data Collection Survey on Building Climate Resilient Safer Cities Final Report
xiii
Figure 11.5.3 Cross Section View of Beach and Groin at the Fonadhoo East Coast, Laamu Atoll under Component 2 .............................................................................................. 11-22
Figure 11.5.4 Cross Section View of Coastal Protection Measure at Gan Island in Laamu Atoll under Component 2 (Maldives’s co-finance) ........................................................ 11-22
Figure 11.5.5 Cross Section View of Coastal Protection Measure at Ishdhoo Island in Laamu Atoll under Component 2 (Maldives’s co-finance) ........................................................ 11-22
Figure 11.5.6 Cross Section View of Coastal Conservation Measure at Meedhoo Island in Addu Atoll under Component 2 (Maldives’s co-finance) ............................................... 11-23
Figure 11.5.7 Combination type tower and station for Component 3 .................................................... 11-24 Figure 12.1.1 Implementation Arrangement of the GCF Project ............................................................. 12-2 Figure 12.1.2 PSC Operation Arrangement ............................................................................................. 12-3 Figure 12.1.3 Operation Arrangement of PMU ....................................................................................... 12-7 Figure 12.1.4 GCF Fund Flow .............................................................................................................. 12-10 Figure 12.2.1 Overall Schedule of this Project ...................................................................................... 12-12 Figure 12.2.2 Reporting Schedule to the GCF Secretariat ..................................................................... 12-12
Data Collection Survey on Building Climate Resilient Safer Cities Final Report
xiv
List of Tables Table 1.1.1 Representative Indexes Related to Coastal Vulnerability in Several Atoll Countries .............. 1-1 Table 2.2.1 Sediment Conditions in the Target Islands in Laamu and Addu Atolls .............................. 2-18 Table 2.2.2 Optimum Conditions of Water Quality Parameters for the Coral Growth ............................ 2-19 Table 2.2.3 Water Quality of the Sea Water in Addu City ....................................................................... 2-19 Table 2.2.4 Water Quality of the Sea Water at Laamu Atoll .................................................................... 2-20 Table 2.2.5 Water Quality of the Land Water in Addu City ..................................................................... 2-20 Table 2.2.6 Water Quality of the Land Water in Laamu Atoll ................................................................. 2-20 Table 2.3.1 Population of the Maldives by Gender as of 2014 ................................................................ 2-21 Table 2.3.2 Population of the Maldivians including Non-Residents as of 1967, 1990, and 2014 ............ 2-21 Table 2.3.3 Population Projection ............................................................................................................ 2-21 Table 2.3.4 Population in Laamu Atoll by Gender as of 2014 ................................................................. 2-22 Table 2.3.5 Population Projection of the Maldivians (Residents) in Laamu Atoll ................................... 2-22 Table 2.3.6 Residents Population, Land Area, and Population Density at each Locality
in Laamu Atoll ........................................................................................................ 2-22 Table 2.4.1 List of Airports in the Maldives ............................................................................................ 2-24 Table 2.4.2 Main Roads in the Maldives ................................................................................................. 2-25 Table 2.8.1 Current Situation and Issues of Disaster Information Transmission ..................................... 2-40 Table 2.9.1 Current Situation and Issues of Disaster Information Transmission ..................................... 2-41 Table 3.2.1 RCP Scenario of SLR (based on 2019) ................................................................................ 3-6 Table 3.3.1 Maximum Sea Level by Island ............................................................................................... 3-8 Table 3.3.2 Maximum Precipitation by Island ........................................................................................... 3-9 Table 3.3.3 Severity, Frequency and Impact Potential of Natural Hazards by Climate Projection .......... 3-11 Table 3.3.4 Impact Potential of Natural Hazard by Region ..................................................................... 3-11 Table 4.4.1 Major climate change impacts on the Maldives tourism sector .............................................. 4-5 Table 4.5.1 Summary findings of health related impacts ......................................................................... 4-11 Table 4.6.1 Indicators of groundwater quality in study islands ................................................................ 4-15 Table 4.7.1 Rate of reef recovery from 1998-2012 .................................................................................. 4-20 Table 5.2.1 Total Numbers of Reported Cases of Coastal Erosions on Each Atoll .................................... 5-3 Table 5.2.2 The Gender Inequality Index (GII) ......................................................................................... 5-3 Table 5.2.3 The Human Development Index (HDI, IHDI) ........................................................................ 5-4 Table 5.2.4 The Composite Human Vulnerability Index (HVI) ................................................................ 5-4 Table 5.3.1 The Hierarchy of Each Atoll by the National Spatial Plan ...................................................... 5-5 Table 5.3.2 The Numbers of Airline Passengers of Each Atoll .................................................................. 5-5 Table 5.3.3 Present Population and Future Population of Each Atoll ........................................................ 5-5 Table 5.3.4 Agriculture Production of Each Atoll ..................................................................................... 5-6 Table 5.3.5 Fishery Production of Each Atoll ............................................................................................ 5-6 Table 5.3.6 The Numbers of Beds in the Resorts of Each Atoll ................................................................ 5-6 Table 5.3.7 The Ranking of Each Indicator ............................................................................................... 5-6

Data Collection Survey on Building Climate Resilient Safer Cities Final Report
xv
Table 5.4.1 Areas, Population and Density of the Main Inhabited Islands in Laamu and Addu Atolls ........................................................................................................................ 5-7
Table 5.4.2 Evaluation Results of Main Islands in Laamu and Addu Atolls ............................................ 5-11 Table 5.4.3 Quantitative Criteria for Evaluation ...................................................................................... 5-11 Table 5.4.4 Results of Scoring and Prioritization .................................................................................... 5-12 Table 6.2.1 RCP Scenario of SLR (based on 2019) ................................................................................ 6-1 Table 6.2.2 Cases for Flood Evaluation for Maamendhoo ...................................................................... 6-29 Table 6.2.3 Cases for Flood Evaluation for Fonadhoo ............................................................................ 6-31 Table 6.3.1 Schematic Figure of the Compound Damage of Coastal Erosion and Flooding ...................... 6-33 Table 6.3.2 Evaluation Condition for the Compound Damage of Erosion and Flooding ........................... 6-34 Table 6.3.3 Classification of the Compound Damage ................................................................................ 6-37 Table 6.3.4 Items Used for the Calculation of Damage ........................................................................... 6-37 Table 6.3.5 Damage Rate of Property by Inundation Depth .................................................................... 6-38 Table 6.3.6 Probability of Occurrence and Damage ................................................................................ 6-38 Table 6.3.7 Estimated Damage for Maamendhoo (RCP 8.5, H1/10) ....................................................... 6-39 Table 6.3.8 Estimated Damage for Fonadhoo (RCP 8.5, H1/10) ............................................................. 6-39 Table 6.3.9 Estimated Damage on People’s Lives (RCP 8.5, H1/10) ...................................................... 6-40 Table 6.3.10 Estimated Damage on Economy (RCP 8.5, H1/10) ............................................................ 6-40 Table 6.3.11 Estimated Annual Damage for Maamendhoo (USD/year) .................................................. 6-41 Table 6.3.12 Estimated Annual Damage for Fonadhoo (USD/year) ....................................................... 6-41 Table 6.3.13 Estimated Annual Damage with Countermeasures for Maamendhoo (USD/year) ............. 6-42 Table 6.3.14 Estimated Annual Damage with Countermeasures for Fonadhoo (USD/year) ................... 6-42 Table 6.3.15 Comparison of Flood Depths With and Without Countermeasure (RCP 8.5) ..................... 6-43 Table 6.3.16 Damage Reduction Effect of the Proposed Countermeasures (Maamendhoo) ................... 6-44 Table 6.3.17 Damage Reduction Effect of the Proposed Countermeasures (Fonadhoo) ......................... 6-44 Table 6.4.1 Estimated SLR for the past 50 years since 1969 ...................................................................... 6-49 Table 6.4.2 Comparison of Beach Retreat between Observed and Estimated One due to Climate
Impact ..................................................................................................................... 6-50 Table 8.1.1 Proposed Project Components and Activities ......................................................................... 8-1 Table 8.2.1 Assumed Main OJT Target Organizations for Each Activity .................................................. 8-8 Table 8.2.2 Details of Assumed Workshop and Seminar ........................................................................... 8-8 Table 8.3.1 Proposed intervention for each site, its background, reason .................................................. 8-12 Table 8.3.2 Concrete Measures in Each Category ................................................................................... 8-17 Table 8.3.3 Roles and Purpose of Maintenance ..................................................................................... 8-30 Table 8.3.4 Outline of Each Item and Related Organization ................................................................... 8-30 Table 8.3.5 Role and responsibility of Executing Entities (EE) for Activity 2.3 ...................................... 8-31 Table 8.4.1 The Construction Facilities and Quantity of Target Atoll ...................................................... 8-34 Table 8.4.2 The Facilities and Equipment to Be Introduced .................................................................... 8-34 Table 8.5.1 Comparison of Wave Measurement Equipment ................................................................... 8-40 Table 8.5.2 Necessary Technology Transfer for Wave Observation System............................................ 8-42
Data Collection Survey on Building Climate Resilient Safer Cities Final Report
xvi
Table 8.5.3 Necessary Technology Transfer for Monitoring System using UAV Technology ................ 8-44 Table 9.1.1 Comparison between Revetment (as Hard Structure Measure) and Beach
Nourishment (as Soft Measures) .............................................................................. 9-2 Table 9.2.1 Adaptation Measures in Target Beaches ................................................................................. 9-6 Table 9.2.2 Cross Section View of Beach and Groin at Maamendhoo East Coast .................................... 9-9 Table 9.2.3 Cross Section View of Perimeter Revetment at Maamendhoo North Coast ........................... 9-9 Table 9.2.4 Cross Section View of Beach and Groin at Fonadhoo East Coast ........................................ 9-10 Table 9.2.5 Reference Values for Allowable Overtopping Rate .............................................................. 9-11 Table 9.3.1 Construction Schedule .......................................................................................................... 9-16 Table 9.3.2 Assumed Specification and Charter Cost of TSHD .............................................................. 9-17 Table 9.3.3 Unit Price of Rock ................................................................................................................ 9-17 Table 9.3.4 Construction Cost of Beach Fill Works per m3 .................................................................... 9-17 Table 9.3.5 Construction Cost of Groin and Revetment Works ............................................................... 9-17 Table 9.3.6 Outline Construction Cost .................................................................................................... 9-18 Table 10.1.1 Scale of Major International Funds Applicable to Climate Change Activities .................... 10-1 Table 10.2.1 GCF’s Criteria for Project Approval ................................................................................... 10-2 Table 10.2.2 Descriptions on “Logical Framework” in Funding Proposals of the Similar Projects ........ 10-4 Table 10.2.3 Expected Results and Fund-Level Impact Indicators provided by the GCF ....................... 10-6 Table 10.2.4 Expected Outcome and Fund-Level Outcome Indicators provided by the GCF ................. 10-7 Table 10.2.5 Descriptions on “Risk Assessment and Management” in the FP160 .................................. 10-8 Table 10.2.6 Descriptions on “Risk Assessment and Management” in the FP066 ................................ 10-13 Table 10.2.7 Descriptions on “Risk Assessment and Management” in the FP053 ................................ 10-16 Table 10.3.1 Actions and Measures described in Maldives’ NDC ........................................................ 10-19 Table 11.1.1 Regulations related to Natural and Social Environment of the Maldives ............................ 11-1 Table 11.4.1 Projects Subject to EIA ..................................................................................................... 11-12 Table 11.4.2 Performance Standards of IFC .......................................................................................... 11-15 Table 11.4.3 Comparison of Environmental and Social Performance Standards of IFC and GCF ........ 11-15 Table 11.4.4 Engagement Areas to apply GCF’s Environmental and Social Policy .............................. 11-15 Table 11.4.5 Necessary Items to accomplish ESMS of GCF ................................................................. 11-16 Table 11.4.6 Risk Category ................................................................................................................... 11-16 Table 11.4.7 Definitions of the Risks ..................................................................................................... 11-17 Table 11.4.8 Applied Areas by Levels of GCF’s Gender Equality Policy ............................................. 11-17 Table 11.5.1 Project Components .......................................................................................................... 11-17 Table 11.5.2 Project Components at Each Island under Component 1 .................................................. 11-18 Table 11.5.3 Project Components at Each Island under Component 2 .................................................. 11-18 Table 11.5.4 Project Components at Each Island under Component 3 .................................................. 11-19 Table 11.5.5 Project Components at Each Island under Component 4 .................................................. 11-19 Table 11.5.6 Adaptation Measures in Target Coasts under Component 2 ............................................. 11-20 Table 11.5.7 Measures on establishment of disaster warning and information dissemination system,
which will be co-financed by JICA under Component 3 ...................................... 11-23

Data Collection Survey on Building Climate Resilient Safer Cities Final Report
xvii
Table 11.5.8 Planned number of facilities, which will be co-financed by JICA under Component 3 .... 11-24 Table 11.5.9 Evaluation results per Component .................................................................................... 11-25 Table 11.5.10 Impacts and Mitigation Measures per Environmental Item for Component 1 ................ 11-26 Table 11.5.11 Impacts and Mitigation Measures per Environmental Item for Component 2 ................ 11-28 Table 11.5.12 Impacts and Mitigation Measures per Environmental Item for Component 3 ................ 11-33 Table 11.6.1 Necessary assessments for activities under Component 1 ................................................. 11-37 Table 11.6.2 Project Components required for ESS under Component 1 .............................................. 11-37 Table 11.6.3 Institutional arrangements for preparation of the ESIA for Component 1 ......................... 11-37 Table 11.6.4 Summary of the Impacts and Mitigation Measures for Component 1 .............................. 11-38 Table 11.6.5 Necessary assessments for activities under Component 2 ................................................. 11-38 Table 11.6.6 Project Components required for ESS under Component 2 .............................................. 11-39 Table 11.6.7 Institutional arrangements for preparation of the ESIA for Component 2 ......................... 11-40 Table 11.6.8 Summary of the Impacts and Mitigation Measures for Component 2 .............................. 11-40 Table 11.6.9 Necessary assessments for activities under Component 3 ................................................. 11-41 Table 11.6.10 List of Islands for which EIAs were conducted for Component 3 .................................. 11-42 Table 11.6.11 Institutional arrangements for preparation of the ESIA for Component 3 ....................... 11-43 Table 11.6.12 Necessary assessments for activities under Component 4 ............................................... 11-43 Table 11.7.1 Schedules of the Public Consultation Meetings ................................................................ 11-45 Table 11.7.2 Main Discussion Points at each Public Consultation Meeting .......................................... 11-45 Table 11.7.3 Three-tier Grievance Redress Mechanism ........................................................................ 11-49 Table 11.8.1 Schedules of the Gender Assessment Consultation Meetings ........................................... 11-54 Table 12.1.1 PSC Members and Roles .................................................................................................... 12-3 Table 12.1.2 PSC Meeting Holding Guidelines ....................................................................................... 12-5 Table 12.1.3 Roles of PMU Members ..................................................................................................... 12-6 Table 12.1.4 Procurement Rules of the GoM (Extracted)........................................................................ 12-9 Table 12.1.5 Documents of the GCF Project Submitted to the GCF Secretariat ................................... 12-11 Table 12.3.1 Consultant and Staff Fee per M/M .................................................................................... 12-13 Table 12.3.2 Project Cost for GCF Fund (Million USD) ....................................................................... 12-13 Table 12.3.3 Breakdown of Project Cost ............................................................................................... 12-14

Data Collection Survey on Building Climate Resilient Safer Cities Final Report
xviii
Abbreviation Table
AE Accredited Entity AFD Agence Française de Développement
CATV Cable TV COD Chemical Oxygen Demand DO Dissolved Oxygen
EAD Expected Annual Damage EC Electrical Conductivity
ECMWF European Centre for Medium-Range Weather Forecasts EE Executing Entity
EIRR Economic Internal Rate of Return EPA Environmental Protection Agency
EWBS Early Warning Broadcasting System F/S Feasibility Study
GCF Green Climate Fund GDP Gross Domestic Product GII Gender Inequality Index GPS Global Positioning System
H.W.L. High Water Level HDI Human Development Index HVI Human Vulnerability Index
ICZM Integrated Coastal Zone Management IHDI Inequality-adjusted Human Development Index IPCC Intergovernmental Panel on Climate Change
ISDB-T Integrated Service Digital Broadcasting - Terrestrial JICA Japan International Cooperation Agency
KOICA Korea International Cooperation Agency LGA Local Government Authority
M.S.L. Mean Sea level MBC Maldives Broadcasting Corporation ME Ministry of Environment, Climate Change and Technology
MEE Ministry of Environment and Energy MEEW Ministry of Environment, Energy and Water
MHAHE Ministry of Home Affairs, Housing and Environment MMS Maldives Meteorological Service
MNBC Maldives National Broadcasting Corporation MNDF Maldives National Defense Force MNPI Ministry of National Planning MPS Maldives Police Service
NAPA National Adaptation Programme of Action NDMA National Disaster Management Authority NDMC National Disaster Management Centre NGO Non Governmental Organization NPO Nonprofit Organization OJT On-the-Job Training PMU Project Management Unit PSC Project Steering Committee PSM Public Service Media SLR Sea Level Rise SST Sea Surface Temperature
TETRA Terrestrial Trunked Radio TSHD Trailing Suction Hopper Dredger UNDP United Nations Development Programme UNFPA United Nations Population Fund

Data Collection Survey on Building Climate Resilient Safer Cities Final Report
ES-1
EXECUTIVE SUMMARY Background
Small and low-lying island countries in the world have been under threat of more and more frequent coastal disasters such as sea level rise (SLR), high wave, storm surge, flooding and coastal erosion. Impacts of such disasters are expected to be rather stronger due to the impact of climate change. Among these, the small island countries in the Indian Ocean and the Oceania region are considered more vulnerable to climate change and natural disasters, which are more apparent in atoll countries with low elevated and narrow land.
The ratio of coastline to land area is high in the Maldives. Over 80 % of the land is narrow and has low elevation of less than MSL (mean sea level) + 1.0 m, while about half of residential area and infrastructure facilities are located within 100 m from the coastal line. Compared to other atoll countries, the Maldives is higher in population density, ratio of coastline to land area, GDP per capita. That is, the Maldives is one of the most vulnerable countries among the atoll countries which are extremely vulnerable to climate change.
It was reported that coastal erosion has been the most serious environmental issue in the Maldives (State of Environment, 2016) especially in inhabited islands. The SLR and induced increase of waves and change of meteorology will accelerate further coastal erosion resulting in the acceleration of land loss and serious impact on the life of the people and economy. In such situation, the Maldives is facing an urgent need to take proper coastal adaptation measures.
In this context, the formulation of a cooperative project conducive for building climate resilient safer island in Maldives has been required. Japan International Cooperation Agency (JICA) started the survey for Building Climate Resilient Safer Islands in Maldives from January 2019, in order to support the Maldives government to submit the funding proposal to GCF.
Outline of Survey
Objectives: This survey has the following three objectives.
providing basic information for examining project options that will contribute to building climate resilient safer islands in countries vulnerable to disasters,
collecting information on possibility of utilizing external fund for more effective project implementation, and
recommending necessary system design of utilizing GCF within JICA
Target Area of Survey: The target area of the literature survey on similar cases is the entire globe. The target area of the field study and examination of project options is Maldives. The specific sites of the field study are islands of Addu atoll and Laamu atoll.
Concerned Government Organizations: Ministry of Environment, Climate Change and Technology (ME); Ministry of National Planning and Infrastructure (MNPI); National Disaster Management Authority (NDMA); Ministry of Defense & National Security (MDNS); Environmental Protection

Data Collection Survey on Building Climate Resilient Safer Cities Final Report
ES-2
Agency (EPA); Maldives Meteorological Service (MMS); Maldives Land Survey Authority (MLSA); Local Government Authority (LGA); Marine Research Center (MRC)
Basic Information for Topographic, Hydrological, Environmental and Socio-economic Conditions
Maldives, located in Indian Ocean, consists of 26 coral atolls and about 1,200 islands with various island shape and area. The land was formed at the edge of atolls by accumulated coral sand and gravel due to wave action. Therefore, land area is too small with 298 km2 in total and the elevation is low about 1 to 2 m from the seawater level.
The coast area exists both sides of outer ocean side and inner lagoon side. Coral reef exists at the ocean side and the coral reef flat with shallow water and certain width of several ten meter to several kilo-meter spreads at offshore side of coast area. The reef edge exists at the offshore end of reef flat and incident waves from offshore break at this point. The reef slope exists at the offshore side from the reef edge to the deep-sea area.
The Maldives is tropical climate with high temperature and humidity. The average temperature is about 26 to 33 degree. There are two seasons, which are northeast monsoon season (November to April) and southwest monsoon season (May to October). The characteristics of winds and waves in Maldives change due to two different seasons.
The tidal range in Maldives is about 1m, it is not so high tide range comparing to other countries.
The condition of coral habitat in Maldives is not so good as the same as that in other tropical island countries. The coral breaching due to high seawater temperature by El Niño, and the damage of corals due to artificial construction and activities, such as port construction, dredging, coral mining, etc. has been seen in Maldives. On the other hand, the damage of corals due to Indian Ocean Tsunami in 2004 was not so significant.
The islands in Maldives divided into three categories, which are inhabitant island (188 islands), resort island (111 islands) and industrial island. Based on Census in 2014, the population in Maldives is about 400 thousand peoples and the population density is 13.49 person/ha, which is sixth highest in the world. The population density at Male Island, the capital island in Maldives, is about 786.9 person/ha, which is very high population density city in the world.
Main industry of Maldives is tourism and fisheries. About 25.3 % of GDP and 39.8 % of government income are occupied by tourism in Maldives. Total number of tourists who visited in Maldives in 2014 was about 1.2 million visitors, and the annual rate for increase of tourism is about 7.6 %.
The main important infrastructures in Maldives are 1) airport, 2) harbor, 3) main road, 4) utility facilities (electricity, water and sewage), 5) waste treatment.
There is no specific coastal law or regulation for coastal management and utilization, however, EPZ (Environmental Protection Zone) is defined in land use plan at some inhabitant islands. The condition of coastal management and maintenance at inhabitant islands is different for each island. Some islands seem to be well-managed the community-based beach cleaning. On the other hand,

Data Collection Survey on Building Climate Resilient Safer Cities Final Report
ES-3
significant household rubbishes identified on the beach at some islands. Furthermore, the illegal mining of coral sand and gravel has been continued by local peoples at some islands.
Coastal Hazard
As the coastal hazard in Maldives related to the climate change, the following four hazards were selected, which were 1) seawater level, 2) waves (especially waves on coral reef), 3) coastal erosion and 4) impact of climate change. Tsunami is also possibility to become one of coastal hazards. Even though the Indian Ocean Tsunami was attached to the Maldives in 2004 and serious damage occurred, the encounter probability for occurring such like Indian Ocean Tsunami is quite low comparing to other coastal hazards mentioned above. Thus, the tsunami was not considered as coastal hazard in this study.
The maximum meteorological tide (tide deviation) for past 33 years in Maldives was not so high about 0.17 m in maximum and 0.14 m in average. This meteorological tide (tide deviation) is not due to the storm surge, but the effect of swell waves transmitted from long way.
The increase of tide level for past 33 years, which was observed at Gan Island in Addu Atoll, was 10.6 cm (3.2 mm/year) for average tide and 7.5 cm (2.3 mm/year) for maximum tide. This value is higher than the global average for 110 years (from 1901 to 2010), which is presented in IPCC 5th report in 2013.
The waves, which transmitted on coral reef and reached to the beach, is influenced by offshore wave characteristics and topography condition of coral reef, and the wave height on coral reef is mostly proportional to the water depth on coral reef flat. Further, the wave height and energy decrease due to wave breaking at reef edge and wave dissipation on coral reef due to bottom friction.
Impact of sea level rise due to climate change will cause not only the increase of seawater level, but also significant increase of wave height on coral reef, and therefore more serious impact might occur to coral reef coast comparing to general sandy coast.
Vulnerability against Coastal Disaster
The most serious coastal issue in Maldives is “coastal erosion”. Coastal erosion identified at more than 60 % among 188 inhabitant islands in Maldives. Main cause of coastal erosion is artificial construction and activities, which are port construction, coral dredging for navigation channel, reclamation, inadequate construction of coastal facilities, coral sand and gravel mining from both coral reef and foreshore area, etc.
Some inhabitant island has been defined the “EPZ (Environmental Protection Zone)” in land use plan, which are functioned as buffer zone from the coastal line. On the other hand, there are many inhabitant islands, in which the residential and other commercial areas are located close to the nearshore area without enough buffer zone. In such area, there are high possibility to suffer the coastal disaster such as wave run-up and flooding.

Data Collection Survey on Building Climate Resilient Safer Cities Final Report
ES-4
Coastal Risk Assessment
Sea level rise due to climate change will cause the change in beach profile due to increase of wave height on coral reef, and this will cause significant retreat of the beach, even though costal erosion has not been identified in this time. The coastal erosion at the coast, where the coastal erosion already in progress, will accelerate due to both impacts of artificial and climate change.
Coastal erosion will cause not only the increase of coastal disaster, but also the significant loss of land area, especially for island countries which consists of small islands such as Maldives.
The annual damage by inundation is roughly estimated around six- to seven- million USD year at the maximum for both Maamendhoo and Fonadhoo in 2100 with RCP 8.5 scenario. This damage amount is more than eight times larger than that of 2019.
It was estimated that inundation damage will be prevented by the countermeasure proposed in this study (i.e. beach nourishment with groins) in 2030 as a middle-term perspective and will be much reduced even after 2050 as a long-term view.
Basic Policy for Coastal Adaptation Measures
The hard structure measures such as revetment as coastal adaptation measures against coastal erosion might not be the permanent measures, but temporary measures as protection of land side. Because the hard structure measures cannot improve the fundamental cause of coastal erosion, which is “decrease (or disappear) of sand supply. In order to maintain the original functioned beach until the next generation with sustainability, the long-term process for forming of natural beaches, maintaining of sand supply from coral reef and natural protection function due to existing of coral reef shall be fully considered as the basic policy.
The proposed coastal adaptation measures shall be also considered to maintain the human activities at coastal area (beach use) since before. Also, the proposed measures shall leave the door open to deal with uncertain factor of future scenario for climate change.
From above mentioned basic policies, it is proposed to apply the beach nourishment as soft measures considering not only protection function but also beach use and coastal environment.
The Fonadhoo and Maamendhoo islands in the Laamu Atoll are proposed as physical project site. Coastal erosion is high priority issue in both islands. The Fonadhoo Island is one of high potential islands in the Laamu Atoll on economic development, however, the main residential area is located nearby the coastal area of ocean side and wave run-up and flooding has occurred when storm waves attached during the high tide. The Maamendhoo Island is one of high population density islands in Maldives with small land area, and most land elevation is less than 1 m from mean seawater level. The land area was fully occupied and there is no space for future development. On the other hand, the productivity of island is high comparing to other inhabitant islands in the Laamu Atoll. Considering the limited land area and no enough space in land area, it is proposed to secure the new evacuation area in the island by land reclamation together with beach nourishment.
As the nourished sand is always faced on wave action as the same condition as natural beaches, one of technical issues is how to minimize the sand discharge after the initial filling of sand. To

Data Collection Survey on Building Climate Resilient Safer Cities Final Report
ES-5
minimize the sand discharge due to wave action after the beach nourishment, the “static stable method” by using the groins together with the beach nourishment will be applied. The maintenance work, which is to fill the sand additionally, is basically required for beach nourishment. Thus, it is proposed to stock the sand for future maintenance in order to make easy for the maintenance work by each island.
It was estimated by numerical analysis that proposed dimensions of the countermeasures are sufficient to have required protection function against target wave.
Proposed Project Component
The combination of soft and hard approach is proposed as project component in order to achieve the resilience of islands with maintaining the relation between human life and beaches. From this point, the following two goals are set as; 1) Maintaining of natural function of beach and relation between human life and beaches, 2) Human resource development on coastal management though the Project
Based on above mentioned principles, the following 4 components are proposed in the Project.
Component 1: Establishment of the Integrated Coastal Zone Management (ICZM)
Component 2: Implementation of Coastal Conservation/Protection Measures against Coastal Disasters
Component 3: Development of Disaster Warning and Information Dissemination
Component 4: Development of Basic Data Collection and Sharing System Related to Climate Change
Economic analysis was conducted for the Component 2 by calculating the cost-benefit ratio and the economic internal rate of return (EIRR). As a result of the analysis, it was confirmed that the Project is feasible in terms of implementation as public works.
Recommendations
The following five actions were recommended for future implementation of the proposed project.
Detailed Layout Planning based on Appropriate Numerical Analysis
Continuous Coastal Management after the Project Implementation
Improving Repeatability of Numerical Model at Detailed Design Stage
Project Evaluation based on Accurate Prediction of Inundation Damage
Precise Cost Estimation based on Characteristics of Beach Nourishment
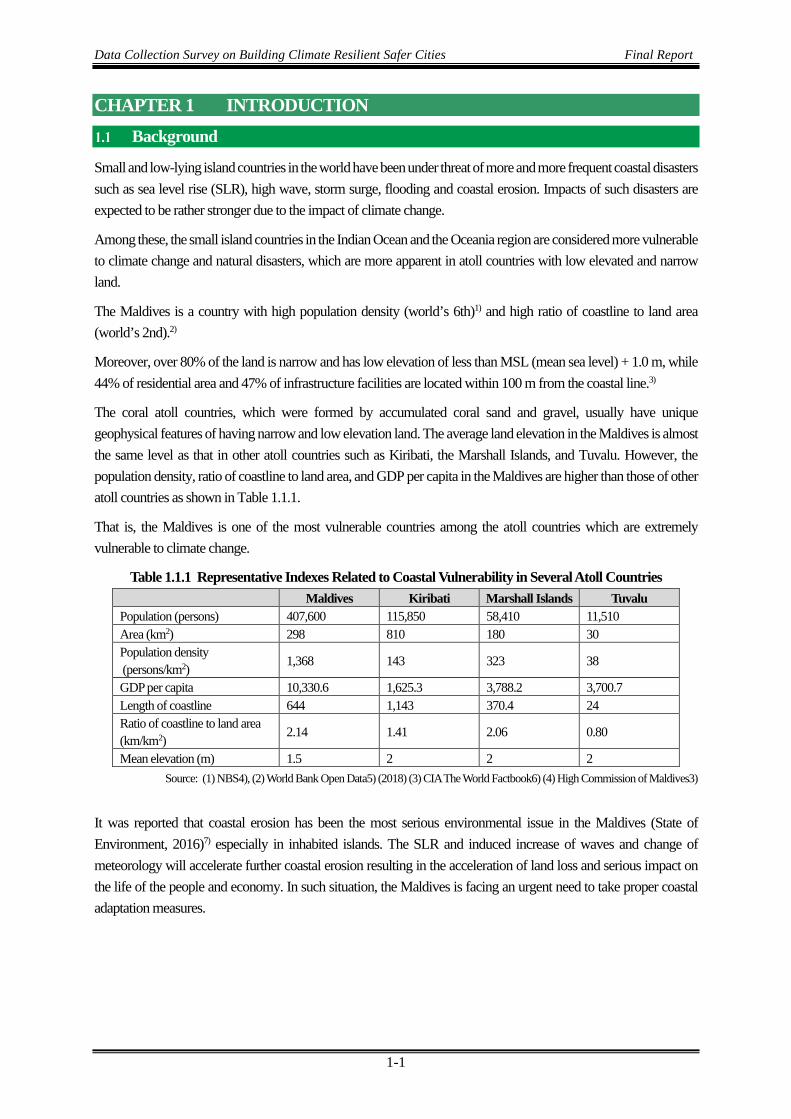
Data Collection Survey on Building Climate Resilient Safer Cities Final Report
1-1
CHAPTER 1 INTRODUCTION
Background
Small and low-lying island countries in the world have been under threat of more and more frequent coastal disasters such as sea level rise (SLR), high wave, storm surge, flooding and coastal erosion. Impacts of such disasters are expected to be rather stronger due to the impact of climate change.
Among these, the small island countries in the Indian Ocean and the Oceania region are considered more vulnerable to climate change and natural disasters, which are more apparent in atoll countries with low elevated and narrow land.
The Maldives is a country with high population density (world’s 6th)1) and high ratio of coastline to land area (world’s 2nd).2)
Moreover, over 80% of the land is narrow and has low elevation of less than MSL (mean sea level) + 1.0 m, while 44% of residential area and 47% of infrastructure facilities are located within 100 m from the coastal line.3)
The coral atoll countries, which were formed by accumulated coral sand and gravel, usually have unique geophysical features of having narrow and low elevation land. The average land elevation in the Maldives is almost the same level as that in other atoll countries such as Kiribati, the Marshall Islands, and Tuvalu. However, the population density, ratio of coastline to land area, and GDP per capita in the Maldives are higher than those of other atoll countries as shown in Table 1.1.1.
That is, the Maldives is one of the most vulnerable countries among the atoll countries which are extremely vulnerable to climate change.
Table 1.1.1 Representative Indexes Related to Coastal Vulnerability in Several Atoll Countries Maldives Kiribati Marshall Islands Tuvalu
Population (persons) 407,600 115,850 58,410 11,510 Area (km2) 298 810 180 30 Population density (persons/km2) 1,368 143 323 38
GDP per capita 10,330.6 1,625.3 3,788.2 3,700.7 Length of coastline 644 1,143 370.4 24 Ratio of coastline to land area (km/km2)
2.14 1.41 2.06 0.80
Mean elevation (m) 1.5 2 2 2 Source: (1) NBS4), (2) World Bank Open Data5) (2018) (3) CIA The World Factbook6) (4) High Commission of Maldives3)
It was reported that coastal erosion has been the most serious environmental issue in the Maldives (State of Environment, 2016)7) especially in inhabited islands. The SLR and induced increase of waves and change of meteorology will accelerate further coastal erosion resulting in the acceleration of land loss and serious impact on the life of the people and economy. In such situation, the Maldives is facing an urgent need to take proper coastal adaptation measures.

Data Collection Survey on Building Climate Resilient Safer Cities Final Report
1-2
In this context, the formulation of a cooperative project conducive for building climate resilient safer island in Maldives has been required. Japan International Cooperation Agency (JICA) was accredited as the first certification body of the Green Climate Fund (GCF) in Japan on July 2017. GCF is an international fund to support mitigation of greenhouse gas in developing countries and adaptation to the impacts of climate change. In 2017, JICA set the directions of cooperation with the Fund for the time being including three points: 1) choosing a project that is expected to have synergistic effects in cooperation with the existing and planned ODA projects as well as having consistency with the cooperation policy between Japan and the relevant country, 2) giving priority to projects that meet the priority areas of the Japanese government including disaster risk reduction, assistance to Small Island Developing States (SIDS), utilization of advanced technology, 3) aiming for submission and approval of one or two proposals to the GCF secretariat during FY 2018.
To support the Maldives government to submit the funding proposal to GCF, JICA started the survey for Building Climate Resilient Safer Islands in Maldives from January 2019.
Outline of the Survey
(1) Objective of Survey
This survey has the following objectives.
providing basic information for examining project options that will contribute to building climate resilient safer islands in countries vulnerable to disasters,
collecting information on possibility of utilizing external fund for more effective project implementation, and
recommending necessary system design of utilizing GCF within JICA
(2) Target Area of Survey
The target area of the literature survey on similar cases is the entire globe. The target area of the field study and examination of project options is Maldives. The specific sites of the field study are islands of Addu atoll and Laamu atoll.
(3) Concerned Government Organizations
Ministry of Environment, Climate Change and Technology (ME); Ministry of National Planning and Infrastructure (MNPI); National Disaster Management Authority (NDMA); Ministry of Defense & National Security (MDNS); Environmental Protection Agency (EPA); Maldives Meteorological Service (MMS); Maldives Land Survey Authority (MLSA); Local Government Authority (LGA); Marine Research Center (MRC)
Structure of This Report
Based on Section 1.1, the chapters of this report are as follows. The structure of this report basically follows the logical structure required by the funding proposal for Green Climate Fund (GCF) project as shown in Chapters 3 to 9 and Chapter 12. Chapter 2 summarizes the basic information required for the study of these Chapters. Chapter 10 considers utilization of financial resources and Chapter 11 discusses environmental and social aspects of the proposed GCF project. Lastly, Chapter 13 gives the conclusions and recommendations.
Chapter 1 INTRODUCTION
Chapter 2 BASIC INFORMATION
Chapter 3 CLIMATE HAZARD AND NATURAL HAZARD

Data Collection Survey on Building Climate Resilient Safer Cities Final Report
1-3
Chapter 4 VULNERABILITY TO CLIMATE HAZARD
Chapter 5 IDENTIFICATION OF CLIMATE CHANGE HAZARD TO BE ADDRESSED IN THE PROJECT AND SELECTION OF TARGET AREA INTRODUCTION
Chapter 6 STUDY ON RISK ASSESSMENT DUE TO CLIMATE IMAPACT AT TARGET ISLAND
Chapter 7 THEORY OF CHANGE
Chapter 8 STUDY ON PROJECT COMPONENT
Chapter 9 BASIC POLICY AND DESIGN OF PROPOSED COASTAL ADAPTATION MEASURE
Chapter 10 DISCUSSION ON UTILIZING FINANCIAL RESOURCES FROM EXTERNAL ORGANIZATIONS
Chapter 11 ENVIRONMENTAL AND SOCIAL CONSIDERATION/ PUBLIC CONSULTATION / GENDER
Chapter 12 CONSIDERATION FOR THE PROJECT IMPLEMENTATION
Chapter 13 SUMMARY OF RESULTS AND ISSUES FOR FUTURE STUDIES

Data Collection Survey on Building Climate Resilient Safer Cities Final Report
1-4
<References>
1) The World Bank (2018): World Bank Open Data, https://data.worldbank.org/
2) Central Intelligence Agency: The World Factbook, https://www.cia.gov/library/publications/the-world-factbook (ranking was analyzed by JICA Expert Team with the data of the World Factbook)
3) Ministry of Environment Energy and Water (2006): National Adaptation Programme of Action
4) National Bureau of Statistics (2014): Population & Housing Census 2014
5) Central Intelligence Agency: The World Facebook, https://www.cia.gov/library/publications/the-world-factbook/
6) High Commission of Maldives Kuala Lumpur, Malaysia: https://maldives.org.my/about-maldives
7) Ministry of Environment and Energy Republic of Maldives (2016): State of Environment, 216p.

Data Collection Survey on Building Climate Resilient Safer Cities Final Report
2-1
BASIC INFORMATION
Topographic Characteristics, Climate and Hydraulic Trend Topographic Characteristics
Atoll Characteristics
The Maldives is formed from 26 atolls and about 1,200 islands of different shapes and sizes in the Indian Ocean. Figure 2.1.1 shows the land area, reef area, and number of islands in each atoll. Atoll and reef characteristics vary greatly from north to south depending on latitude. The atolls located in the north are not composed of continuous edge of the atolls, but are composed of a large number of ring-shaped coral reefs which is called faro. The atolls located in the south tend to have fewer islands and fewer Faro.
Source:STATE OF THE ENVIRONMENT (2016)1)
Figure 2.1.1 Land Area and Reef Area in each Atoll
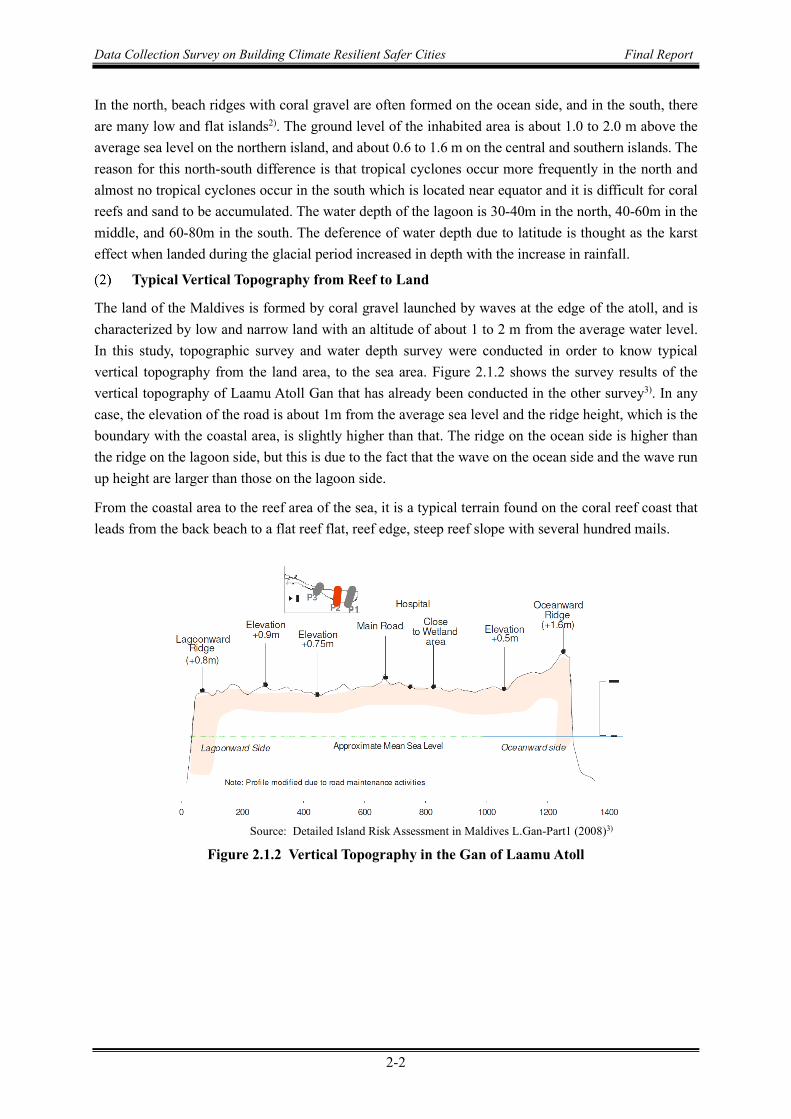
Data Collection Survey on Building Climate Resilient Safer Cities Final Report
2-2
In the north, beach ridges with coral gravel are often formed on the ocean side, and in the south, there are many low and flat islands2). The ground level of the inhabited area is about 1.0 to 2.0 m above the average sea level on the northern island, and about 0.6 to 1.6 m on the central and southern islands. The reason for this north-south difference is that tropical cyclones occur more frequently in the north and almost no tropical cyclones occur in the south which is located near equator and it is difficult for coral reefs and sand to be accumulated. The water depth of the lagoon is 30-40m in the north, 40-60m in the middle, and 60-80m in the south. The deference of water depth due to latitude is thought as the karst effect when landed during the glacial period increased in depth with the increase in rainfall.
Typical Vertical Topography from Reef to Land
The land of the Maldives is formed by coral gravel launched by waves at the edge of the atoll, and is characterized by low and narrow land with an altitude of about 1 to 2 m from the average water level. In this study, topographic survey and water depth survey were conducted in order to know typical vertical topography from the land area, to the sea area. Figure 2.1.2 shows the survey results of the vertical topography of Laamu Atoll Gan that has already been conducted in the other survey3). In any case, the elevation of the road is about 1m from the average sea level and the ridge height, which is the boundary with the coastal area, is slightly higher than that. The ridge on the ocean side is higher than the ridge on the lagoon side, but this is due to the fact that the wave on the ocean side and the wave run up height are larger than those on the lagoon side.
From the coastal area to the reef area of the sea, it is a typical terrain found on the coral reef coast that leads from the back beach to a flat reef flat, reef edge, steep reef slope with several hundred mails.
Source: Detailed Island Risk Assessment in Maldives L.Gan-Part1 (2008)3)
Figure 2.1.2 Vertical Topography in the Gan of Laamu Atoll

Data Collection Survey on Building Climate Resilient Safer Cities Final Report
2-3
Climate and Hydraulic Trend Rainfall
The islands stretch 860km from latitude 7°6’35”N, crossing the Equator to 0°42’24”S, and lying between 72°33’19”E and 73°46’13”E longitude, and is demarcated into four zones in north-south direction as shown in Figure 2.1.3.
Annual and monthly climatology in Maldives for rainfall and temperatures have been presented using observed climate data by Maldives Meteorological Services for the period 1975 to 2010. The seasonal rainfall time series trend at Male’ and Gan in Addu Atoll are presented in Figure 2.1.4. From the present analysis of rainfall trends, indicates overall positive trend in all the seasons except rainy season in Gan (May to October). Rainfall during the core southwest monsoon months (JJAS) and northeast monsoon months (DJ) shows increasing trend for both the locations. The rainfall trend of Gan for rainy season is decreasing but has increasing trend during core southwest monsoon season. Annual Tropical Rainfall Measuring Mission (TRMM) rainfall analysis from 1998 to 2007 shows that zone4 receives more rainfall than other three zones (1, 2 & 3). Also, the fluctuation of annual rainfall is inferred between 1162 to 2503mm. It is observed that monthly rainfall amounts range from -200mm to 300mm, with very few anomalies that are greater than 400mm.
Temperature
In terms of long-term annual maximum and minimum temperature analysis, the result shows rising trend for both Male and Gan station. Figure 2.1.5 shows trend plot of maximum and minimum temperatures in both northern (Hulhule) and southern (Gan) parts of the Maldives. Maximum temperature shows an increasing trend in the northern part of the Maldives (0.21°C/decade), but a decreasing trend in the southern part (- 0.06°C/). Looking at the minimum temperature, there is an increase trend observed in northern parts (0.25°C/) and steep increase in southern part (0.4°C/). However Gan’s maximum temperature decreasing trend is overcome by higher rise of minimum temperature.
Source: Arranged by JICA Expert Team based on
Zen Tech
Figure 2.1.3 Geographical map of Maldives
Hanimaadhoo
Male
Gan
Zone1
Zone2
Zone3
Zone4

Data Collection Survey on Building Climate Resilient Safer Cities Final Report
2-4
Source: Climate change scenarios and their interpretation for Maldives (2012)4)
Figure 2.1.4 Accumulated rainfall during various seasons for Male and Gan (1975 to 2010)
Source: Climate change scenarios and their interpretation for Maldives (2012)4)
Figure 2.1.5 Variations in annual mean maximum and minimum temperature for Male and Gan (1975 to 2010)

Data Collection Survey on Building Climate Resilient Safer Cities Final Report
2-5
Monthly climatology from the observed datasets (1975 to 2010) has been shown in Figure 2.1.6. The main rainfall months as well as peaks are the months May and September. These peaks have been well marked in other stations also, illustrating the strong signal of the two monsoon seasons in the rainfall climatology of the islands. Rainfall in Maldives varies from north to south, with the amount of rainfall increasing towards the south. This difference in rainfall pattern is primarily due to the northeast monsoon, and April being much drier in the north than in the south.
Source: Climate change scenarios and their interpretation for Maldives (2012)4)
Figure 2.1.6 Seasonal climate cycles
Wind Condition
Figure 2.1.7 shows distribution and rose of wind speed by reanalysis data by WavewatchⅢ from 1979 to 2008. The most common wind speed is around 6 m/s, with a maximum observed value of 18 m/s. In terms of directionality, the wind is predominantly coming from the western. 6) North

Data Collection Survey on Building Climate Resilient Safer Cities Final Report
2-6
Source: Assessment of extreme and metocean conditions in the Maldives for OTEC applications (2019)
5)
Figure 2.1.7 Distribution and Wind Rose (1979-2008)
In addition, in order to show the seasonal change of wind direction, Figure 2.1.8 shows the wind rose for two periods (northeast monsoon period and southwest monsoon period) at three measuring points in the Maldives. In the Maldives, as shown in Figure 2.1.8, winds in the northeast direction are dominant in the dry season, December to April, and winds in the southwest direction are dominant in the rainy season, May to November. This tendency applies throughout the Maldives regardless of the north-south position.
Dec.2017 (Northeast Monsoon Season)
Hanimaadhoo
Hulhule
Gan
Aug.2017(Southwest Monsoon Season)
Hanimaadhoo
Hulhule
Gan
Source: MMS weather report (2017)6) Figure 2.1.8 Wind Rose for Two Periods at Three Measuring Points

Data Collection Survey on Building Climate Resilient Safer Cities Final Report
2-7
Sea Level
Figure 2.1.9 shows the observed sea level for the past 33 years from 1986 to 2018 which was observed in Gan, Addu Atoll. The blue and red lines in the figure show the maximum and average values for each year, respectively. Sea level was observed at 10.6 cm for 33 years (3.2 mm/year) for the average tide. On the other hand, the global average value for SLR, which was reported in the IPCC 5th Report 2013, was 19 cm from 1901 to 2010, or for 110 years (1.7 mm/year).
Source: Arranged by the JICA Expert Team Based on Data for Maldives Meteorological Service
Figure 2.1.9 Observed sea level in Gan, Addu Atoll for the past 33 years
Sea Surface Temperature (SST)
SST is an important parameter because of its change might affect Maldives’ coral reefs (coastal eco system) and fisheries sector. Understanding SST historical change and projection is, therefore, essential for coastal ecosystem impact assessment. NOAA Global Optimum Interpolation (OI) Sea Surface Temperature (SST) Analysis dataset is available for the period 1982 to 2010.
Figure 2.1.10 shows four different zones of Maldives. The SST has the same increasing tendency as that of the air temperature recorded at two meteorological stations of Maldives. Average monthly Sea Surface Temperature (SST) ranges from 28.2ºC to 29.3ºC.
Wave Approach
The wave observation for long periods has not been implemented in the Maldives. So, the reliable information does not exist. Therefore, in
Source: Climate change scenarios and their interpretation for
Maldives (2012)4)
Figure 2.1.10 Variation of annual mean sea surface temperature fluctuation for four zones
in Maldives (1982 to 2009)

Data Collection Survey on Building Climate Resilient Safer Cities Final Report
2-8
this study, ERA5 which is reanalysis data base of the global climate model provided by ECMWF (European Centre for Medium-Range Weather Forecasts) was adopted. So, the offshore wave height was set by the significant wave height data for long periods obtained from ERA5. However, the spatial resolution of ERA5 is about 31 km. So, the result of reanalysis data is not considered to the wave condition at the coral reef coast with reef edges, and reef flats common in the Maldives. So, the wave observation by the hydraulic wave height meter was implemented in the Maldives for a year addition to the reanalysis data in order to know the wave condition in the lagoon, reef flats and out of the reef edges.
Study of Offshore Wave Condition by the Reanalysis Data (ERA5)
Reliability of Reanalysis Data comparing to the Observation Data
Firstly, the reliability of reanalysis data by ERA5 should be confirmed comparing to the observation data carried out in this survey. The following graphs show the comparison of both data from the 9th February 2019 to 28th February 2019 at the ocean side in Addu. The reanalysis data of this comparison is obtained the data at the nearest point from the wave observation site. However, the distance of both is about tens of kilometers. The figure on the left shows the time series variation of the significant wave height (H1/3) and the figure on the right shows the correlation of the significant wave height.
From these results, the wave height of the reanalysis data is bigger than the one of the observation, the both are correlated highly. This is because the analysis data is the offshore wave, but the observation data is the wave at the point of -17 m water depth. So, the wave height of the observation data may be influenced in the seabed topography. From the above, the wave height of both is different. But the both are correlated highly. So, the reanalysis data can be adopted to the study of offshore wave condition.
Source: JICA Expert Team
Figure 2.1.11 Time Series Variation of Reanalysis Data (ERA5) and Observation Data of H1/3
(Vertical : H1/3 (m), Horizontal : Date)
Source: JICA Expert Team
Figure 2.1.12 Correlation of Reanalysis Data (ERA5) and Observation Data
(Vertical : H1/3 (m), Horizontal : ERA5 H1/3 (m))
Wave Condition for Long Periods in the Maldives
Figure 2.1.13 shows distribution and rose of significant wave by WavewatchⅢ from 1979 to 2008. The significant wave height varies between 0.1 and 5 m, with the most frequently occurring value around 1.2 m. Most of the wave resource comes from the southeast. Figure 2.1.14 shows the
0
0.5
1
1.5
2
2.5
2019
/2/9
2019
/2/1
0
2019
/2/1
1
2019
/2/1
2
2019
/2/1
3
2019
/2/1
4
2019
/2/1
5
2019
/2/1
6
2019
/2/1
7
2019
/2/1
8
2019
/2/1
9
2019
/2/2
0
2019
/2/2
1
2019
/2/2
2
2019
/2/2
3
2019
/2/2
4
2019
/2/2
5
2019
/2/2
6
2019
/2/2
7
2019
/2/2
8
H1/3
(m)
日付
H1/3(obsevation) H1/3(ERA5)
y = 0.6513x - 0.1189
R² = 0.6862
0
0.5
1
1.5
2
0 0.5 1 1.5 2 2.5
Obs
erva
tion
H1/
3(m
)
ERA5 H1/3(m)

Data Collection Survey on Building Climate Resilient Safer Cities Final Report
2-9
variation of maximum value of monthly average wave height (H1/3 and Hmax) near the Addu atoll for about 40 years from 1978 to 2018 obtained from the reanalysis data of ERA5. This figure shows the increasing trend of H1/3 and Hmax. Hmax increases by about 1 cm/yr, and H1/3 increases by about 0.6 cm/yr. However, the increasing rates are too small that their rates are less than 1 % of the both of monthly average wave height
Source: JICA Expert Team
Figure 2.1.13 Distribution and Rose for Significant Wave (1979-2008)
Source: JICA Expert Team
Figure 2.1.14 Variation of Maximum Value of Monthly Average Wave Height (H1/3 and Hmax) (1978 - 2018)
Study of Wave Condition at the Coral Reef Coast by the Wave Observation
Outline of the Wave Observation
Coral reef enclosed the coastline in the Maldives and offshore waves propagate through coral reef. The propagate waves on coral reef is greatly influenced by wave deformation on coral reef such as wave breaking and split at reef edge, dissipation on reef flat, and wave set up on coral reef. Thus, it is important to know the characteristics of waves on coral reef to discuss vulnerability of coastal area. The characteristics of waves on coral reef are discussed based on the wave observation data, which was obtained by preliminary survey of JICA study in 2019. Further, the wave conditions at the ocean and lagoon side are different because the islands in the Maldives are located the edge of the atoll.
y = 0.010 x - 16.426
y = 0.006 x - 9.444
1.0
1.5
2.0
2.5
3.0
3.5
4.0
1975 1980 1985 1990 1995 2000 2005 2010 2015 2020
Year
Hmax
H1/3
線形 (Hmax)
線形 (H1/3)

Data Collection Survey on Building Climate Resilient Safer Cities Final Report
2-10
In the Maldives, there are 2 seasons, north east monsoon season and south west monsoon season. The wave conditions also are changed by the seasons. So, the wave conditions out of the reef edge were observed for 1 year to know the influence of season change. On the other hand, the wave conditions in the reef edge were replaced as appropriate because they are affected the reef topography.
The locations of this observation are 4 places, Hankede、Meedhoo (Addu atoll), Fonadhoo and Maamendhoo (Laamu atoll).
Location of the Wave Observation
The consideration of the observation results in this report is based on the data obtained at Hankede in Addu atoll for February 2019 to August 2019 because the data collection was completed. In Hankede, the observations were carried out 5 sites, inside (2 sites) and outside of the reef edge at the ocean side, and inside and outside of the reef edge at the lagoon side. The location and the topographic feature are shown in Figure 2.1.15.
Source: JICA Expert Team
Figure 2.1.15 Location of the Hydraulic Wave Height Meter
Consideration of the Observation Result
i) Difference of Wave Condition between the Ocean Side and Lagoon Side
The time series variations of the significant wave height (H1/3) and significant wave period (T1/3) for February 2019 to May 2019 out of the reef edge at the ocean side and lagoon side are shown in Figure 2.1.16.
① Ocean Side (d = -16.9 m)
+1.2m+2.5m
Reef Flat 150m
-0.5m -0.1m
+1.5m
Reef Flat 800m
-2.0m
Ocean side
0.0m
Land side
Lagoon side
Reef Slope Reef Slope
Reef Edge
Reef Edge
-16.9m
-5.2m
-15.7m
0
5
10
15
20
25
0.00.20.40.60.81.01.21.41.61.82.0
2019
/2/8
2019
/2/1
5
2019
/2/2
2
2019
/3/1
2019
/3/8
2019
/3/1
5
2019
/3/2
2
2019
/3/2
9
2019
/4/5
2019
/4/1
2
2019
/4/1
9
2019
/4/2
6
2019
/5/3
2019
/5/1
0
T1/3
(s)
H1/3
(m)
H1/3(m)
T1/3(s)
④ in the Reef at the Lagoon
⑤ out of the Reef at the Lagoon
① in the Reef near Shore at the Ocean
② in the Reef near Edge at the Ocean
③ out of the Reef at the Ocean

Data Collection Survey on Building Climate Resilient Safer Cities Final Report
2-11
④ Lagoon Side (d = -15.7 m)
Source: JICA Expert Team
Figure 2.1.16 Time Series Variation of Significant Wave Height (H1/3)
and Significant Wave Period (T1/3)
From the above results, the wave height at the ocean side changed in response to the weather disturbance. The wave height in the calm time was about 0.5 m, and in bad weather was about 2 m. The wave period in the calm time was about 6 - 8 s, and in bad weather was about 15 s, which may be one of the swell. On the other hand, the wave height and period at lagoon side was almost calm, and H1/3 was about 0.4 m and T1/3 was about 2, 3 s.
As shown in Figure 2.1.17, the wave at the lagoon side may be influenced by the wind wave generated in the lagoon and the wave propagating from the ocean through the channels of the atoll. This figure shows the variation of water level obtained from the outside of the reef edge at the lagoon side. In calm time, the small wave which is about 10 -20 cm for a short period, and may be the wind wave was observed. On the other hand, when the high wave occurs, the small wave overlapped the long-period wave of which the period is about 12 s.
a) Calm (28th February 2019)
b) High Wave (11th June 2019)
Source: JICA Expert Team
Figure 2.1.17 Sample of the Variation of Water Level obtained at Lagoon Side
0
5
10
15
20
25
0.00.20.40.60.81.01.21.41.61.82.0
2019
/2/8
2019
/2/1
5
2019
/2/2
2
2019
/3/1
2019
/3/8
2019
/3/1
5
2019
/3/2
2
2019
/3/2
9
2019
/4/5
2019
/4/1
2
2019
/4/1
9
2019
/4/2
6
2019
/5/3
2019
/5/1
0
T1/3
(s)
H1/3
(m)
H1/3(m)
T1/3(s)

Data Collection Survey on Building Climate Resilient Safer Cities Final Report
2-12
To investigate the wave condition more clearly, the power spectrum at the ocean side and lagoon side when the wave at the ocean side was calm and significant are shown in Figure 2.1.18.
The spectrum at lagoon side shows the peek was around the 0.1 Hz (T = 10 s) at calm case and high wave case, which was the same as the spectrum at ocean side. And the spectrum at lagoon side also shows the peek was around 0.2 - 0.3 Hz (T = 3 - 5 s), which may be generated by the wind waves. These result shows that the wave at the lagoon side mixed the wind wave generated in the lagoon and the long-period wave propagating from the ocean through the channels of the atoll.
And the 2 peeks of spectrum in calm case were almost same. However, for the peak in high wave case, the peak of 0.1 Hz was stronger than the one of 0.2 – 0.3 Hz. Therefore, the high wave observed in lagoon side was affected by the long-period wave propagating from the ocean.
a) Calm
b) High Wave
Source: JICA Expert Team
Figure 2.1.18 Power Spectrum of Wave
(Vertical : Spectrum Density (m2s), Horizontal : Frequency (Hz))
ii) Difference of Wave Condition by Seasons
A) Ocean Side
The relation between the wave height and period at the outside of the reef in ocean side is shown in Figure 2.1.19. In this figure, the data observed in north east monsoon season are shown by blue dots, in south west monsoon season are by orange dots.
Lagoon
Ocean
Lagoon
Ocean
Long-period wave propagates to the lagoon
Wind wave
Long-Period wave
Long-period wave stronger than wind
wave

Data Collection Survey on Building Climate Resilient Safer Cities Final Report
2-13
At the outside of the reef in ocean side, the wind wave and long-period wave were propagated and mixed. So, the high wave due to the wind wave and long-period wave were also observed. Because the coastline of ocean side is faced to the south west, the high waves have occurred in south west monsoon season more than north east monsoon season.
Figure 2.1.20 shows frequency distribution of wave direction at the outside of the reef in ocean side. Basically, the long-period waves propagated from west to south west every season. Though the wave direction is affected by the seasonal change of the monsoon in general, the wave direction observed by this survey was not so affected by it. This is because the wave direction at the shallow area like the wave observed point in this survey which was -17 m depth, changed to the perpendicular to the coast line due to the refraction. However, the wave direction was slightly shifted from south west and west south west to west at the south west monsoon season.
B) Lagoon Side
The time series variation of significant wave height and period at the outside of the reef in lagoon side from February to August is shown in Figure 2.1.21. as mentioned above, the wave height and period in lagoon side is almost stable. However, high waves have occurred a few times in south west monsoon season.
Source: JICA Expert Team
Figure 2.1.21 Time Series Variation of Significant Wave Height (H1/3) and Significant Wave Period (T1/3) (④out of the reef at lagoon side)
0
4
8
12
16
20
0.0
0.2
0.4
0.6
0.8
1.0
2019
/1/2
6
2019
/2/2
2019
/2/9
2019
/2/1
6
2019
/2/2
3
2019
/3/2
2019
/3/9
2019
/3/1
6
2019
/3/2
3
2019
/3/3
0
2019
/4/6
2019
/4/1
3
2019
/4/2
0
2019
/4/2
7
2019
/5/4
2019
/5/1
1
2019
/5/1
8
2019
/5/2
5
2019
/6/1
2019
/6/8
2019
/6/1
5
2019
/6/2
2
2019
/6/2
9
2019
/7/6
2019
/7/1
3
2019
/7/2
0
2019
/7/2
7
2019
/8/3
2019
/8/1
0
2019
/8/1
7
2019
/8/2
4
2019
/8/3
1
2019
/9/7
T1/3
(s)
H1/3
(m)
H1/3(m)
T1/3(s)
Source: JICA Expert Team
Figure 2.1.19 Relation between the Wave Height and Period (①out of the reef at ocean side)
Source: JICA Expert Team
Figure 2.1.20 Frequency Distribution of Wave Direction (①out of the reef at ocean side)
y = 0.3074e0.1419x
R² = 0.5817
0.00.20.40.60.81.01.21.41.61.82.02.22.42.62.83.03.23.4
0 1 2 3 4 5 6 7 8 9 10 11 12 13 14 15 16 17 18 19 20T1/3 (s)
H1/3
(m)
OS
4-8月2-4月
0%
10%
20%
30%
40%
50%
60%
70%
80%
90%
N NNW NW WNW W WSW SW SSW S
割合
波向
2月~4月4月~8月
Feb-Apr Apr-Aug
South West Monsoon
North East Monsoon
SW,WSW →W
Wind wave
Long-period wave
Feb-Apr Apr-Aug

Data Collection Survey on Building Climate Resilient Safer Cities Final Report
2-14
iii) Difference of Wave Condition between Inside and Outside of Reef
As Figure 2.1.22 shown, the reef edge exists at the both side of ocean and lagoon. However, the reef flat and edge in lagoon side are deeper than in ocean side, and it is about -2 m at the MSL even the highest point of reef edge. So, the wave in lagoon side does not break at the reef edge. On the other hand, the elevation of the reef edge is -0.1 m at MSL, and the reef flat is -0.5 m at MSL in ocean side. So, the wave propagating from the out of the reef edge breaks at the reef edge. For these reasons, the difference of wave condition between inside and outside of reef was considered by the data observed in ocean side.
A) Wave Height
The time series variation of the wave height at the inside and outside of the reef is shown in Figure 2.1.22. On the reef flat, the surf beat due to the breaking wave at the reef edge occurred (please refer to 2 Surf Beat on the Reef Flat). So, it is not applicable to calculate the wave height by the wave analysis methods such as zero crossing method. Therefore, the wave height of inside of the reef was calculated by the following formula of the relation of the spectrum and the significant wave height.
H1/3 ≓ Hm0 = 4.004 �m0 m0 = ∫ s(f) df∞0
S(f) …Spectrum Density of Frequency
From the results of Figure 2.1.22, the wave height of inside of the reef showed the different trend of the outside of the reef, and correlated with the water level on the reef flat. However, when the high wave occurred at the outside, the wave height of inside of the reef was also affected, and the high wave occurs at the inside of the reef too.
① Outside of the Reef (d = -16.9 m)
② Inside of the Reef (d = -0.5 m)
Source: JICA Expert Team
Figure 2.1.22 Time Series Variation of H1/3 at the Inside and Outside of the Reef (Ocean Side)
0.00.20.40.60.81.01.21.41.61.82.0
2019
/2/8
2019
/2/1
5
2019
/2/2
2
2019
/3/1
2019
/3/8
2019
/3/1
5
2019
/3/2
2
2019
/3/2
9
2019
/4/5
2019
/4/1
2
2019
/4/1
9
2019
/4/2
6
2019
/5/3
2019
/5/1
0
H1/3
(m)
Ocean Side (offshore)
H1/3(m)
00.20.40.60.8
11.21.41.61.8
2
2019
/2/8
2019
/2/1
5
2019
/2/2
2
2019
/3/1
2019
/3/8
2019
/3/1
5
2019
/3/2
2
2019
/3/2
9
2019
/4/5
2019
/4/1
2
2019
/4/1
9
2019
/4/2
6
2019
/5/3
2019
/5/1
0
H1/3
(m)
Ocean Side (Inner Reef)
H1/3 (m)

Data Collection Survey on Building Climate Resilient Safer Cities Final Report
2-15
The relation of the wave height of inside and outside of the reef is shown in Figure 2.1.23. And the relation of wave height and water level at inside of the reef is shown in Figure 2.1.24. These figure shows that the wave heights of inside and outside of the reef were correlated. Especially, as Figure 2.1.243 shown, the wave height of inside of the reef was not only correlated with the water level but also the wave height of outside of the reef. However, it is suggested that the SLR due to the climate change should cause to increase the wave overtopped to the coast because the scale of the wave stipulated in the water level on the reef flat. The impact of climate change for wave height is described in section 6.2.
Figure 2.1.24 shows the observation data at the 2 points at different distances from the reef edge, and the blue dots shows the data at the point 50 m away from the reef edge, and the orange dots shows the data at the point 120 m away. This figure shows the wave height decreased by 20 % on propagating on the reef flat. This is because the wave energy decayed due to the roughness of the coral on the reef flat mainly.
In this way, the coral reef has 2 wave reduction effects which are the breaking the wave at the reef edge and the decreasing the wave on the reef flat.
B) Surf Beat on the Reef Flat
Figure 2.1.25 shows the samples of water level observed at the inside of the reef in calm case and in high wave case. In high wave case, the long-period wave can be seen, which was the surf beat due to the breaking the wave. At the coral reef coast, because the long-period waves resonate between the coast and the reef edge, the surf beat is more significant than the general sand coast. It is known that the surf beat becomes strong depending on the wave energy of outside of the reef edge, and this results also show it.
Source: JICA Expert Team
Figure 2.1.23 Relation of Wave Height of Inside and Outside of the Reef
Source: JICA Expert Team
Figure 2.1.24 Relation of Wave Height and Water Level at Inside of the Reef
0
0.2
0.4
0.6
0.8
1
1.2
1.4
1.6
0 0.5 1 1.5 2 2.5 3
H1/3
(m)
(Inne
r Re
ef)
H1/3 (m) (Outer Reef)
0
0.2
0.4
0.6
0.8
1
1.2
1.4
1.6
0 0.25 0.5 0.75 1 1.25 1.5
H1/3
(m) (
Inne
r Re
ef)
Water Level (m)
エッジ側 海岸側50 m 120m

Data Collection Survey on Building Climate Resilient Safer Cities Final Report
2-16
a) Calm
b) High Wave
Source: JICA Expert Team
Figure 2.1.25 Sample of Surf Beat Observed at Inside of Reef
Conclusion of the Wave Condition in the Maldives
Based on the reanalysis data for 40 years, the offshore wave height in the Maldives becomes bigger. However, it is about 0.6 cm / year of H1/3, which is too small.
On the other hand, at the coral reef coast like the islands in the Maldives, the wave overtopped to the coast is strongly affected by the reef topography, and stipulated in the water level on the reef flat.
The wave conditions are different between the lagoon side and ocean side. The wave condition at the ocean side depends on the weather disturbance. On the other hand, the wave condition at the lagoon side constitutes of the wind wave generated in the lagoon and the long-period wave propagated from the ocean through the channel. Especially, when the high wave occurs at the ocean side, the wave at the lagoon side is strongly affected by the wave from ocean side.
The natural coral reef has 2 wave reduction effects which are the breaking the wave at the reef edge and the decreasing the wave on the reef flat.
Coral Habitat Environment and Water Quality
Coral Habitat Environment Coral Habitat Environment in the Maldives
Coral reefs are the physical basis of the Maldives, and they also provide the resource base for the two essential pillars of the Maldivian economy: tourism and fisheries8). Coral reefs are subjected to increasing stresses from developmental activities for the Maldives and also from climate induced warming of the seas. Prior to 1998, an isolated bleaching event was reported to have occurred in the

Data Collection Survey on Building Climate Resilient Safer Cities Final Report
2-17
three central atolls in the Maldives. The first known recorded mass bleaching event was occurred in 1998, and around 80 % of corals completely or partially bleached on the back reef, and 60-100 % coral mortality was reported depending on species and location. Based on the results, the coral covers in the Maldives decreased from 50 % to 10 % as a whole. The mortality and survival rates differ for each coral species. For instance, while Acropora cover declined, whilst massive (i.e. Porites) and encrusting (i.e. Pavona, Leptastrea etc.) coral species were the main survivors.
After 1998, recovery to pre-1998 average live coral cover levels was observed by 2013, in spite of a subsequent moderate bleaching event in 2010, the 2004 tsunami, and the Crown-of-Thorns Starfish (Acanthaster planci) outbreaks.
The damage from the 2004 tsunami was far less than the mortality resulting from the 1998 bleaching event and the on-going development-related activities, such as coral rock and sand collection/ mining from reef flats and the dredge and fill operations associated with coastal development facilitate damage to the corals9).
The 2015-2016 El Niño and associated 2016 sea surface temperature anomalies in the Maldives caused the largest coral bleaching event in the country since 1998. Corals experience thermal stress, which is the main cause of bleaching, and coral bleaching has accelerated because of the long-term increment of sea water temperature. The survey results in 2017 shows that around 73% of the 71 survey sites recorded bleached corals in the Maldives. The bleaching severity at 7 to 13 m depth was significantly higher than the bleaching severity at <7 m depth. However, the survey results showed no significant difference in the bleaching response to exposed sites (i.e. sites which are found on the ocean ward rim of the atoll and exposed to oceanic currents and wave action).
Coral Habitat Environment in Addu City and Laamu Atoll
As the proposed projects are planned to be implemented along the coastal lines and to the areas between coastal lines to the coral reefs, the coral habitat environment around the proposed project sites were conducted by the line transect survey, along with the water quality survey, at Lammu Atoll and Addu City in February and December 2019.
The survey results for four islands in Laamu Atoll and one island in Addu Atoll are shown in the following tables. The live corals are observed only in three lines in Maamendhoo island, Laamu, with 19% coverage areas, and two lines in Meedhoo island, Addu, with 13% coverage areas, while 10% to 79% areas are covered by coral rock and coral pebbles, 21% to 77% by seaweed (with coral rock/ sand). Massive-type and plate-type corals are inhabiting along three lines in Maamendhoo island.
Massive- and plate-type corals, such as Favites, Platygyra species, are inhabiting in the sea at Maradhoo, near to Hithadhoo island 10), and several coral species, such as Acroporidae, Faviidae, Poritidae, etc., exist inside the reef at the southwestern part of Fonadhoo Harbor at Laamu Atoll.

Data Collection Survey on Building Climate Resilient Safer Cities Final Report
2-18
Table 2.2.1 Sediment Conditions in the Target Islands in Laamu and Addu Atolls Laamu Laamu Laamu
Sediment condition
Maamendhoo Fonadhoo Ishdhoo Survey lines: 9 Survey lines: 9 Survey lines: 3
Total Length (m)* % Total Length
(m)* % Total Length (m)* %
1 Coral 130 19% 0 0% 0 0% 2 Coral rock 162 23% 180 21% 99 79% 3 Sand + Seaweed 240 35% 344 40% 0 0% 4 Coral rock + Seaweed 0 0% 0 0% 26 21% 5 Seaweed 58 8% 0 0% 0 0% Sand 103 15% 326 38% 0 0% 6 Rock 0 0% 0 0% 0 0% Total 693 100% 850 100% 125 100%
Laamu Addu
Sediment condition
Gan Meedhoo Survey lines: 2 Survey lines: 4
Total Length (m)* % Total Length
(m)* %
1 Coral 0 0% 50 13% 2 Coral rock 155 72% 40 10% 3 Sand + Seaweed 60 28% 165 41% 4 Coral rock + Seaweed 0 0% 145 36% 5 Seaweed 0 0% 0 0% Sand 0 0% 0 0% 6 Rock 0 0% 0 0% Total 215 100% 400 100%
* Total length of each conditions in line with the surveyed line transect. Source: JICA Expert Team
Corals of Laamu Atoll and Addu City were tremendously affected by the coral bleaching of 1998, and the coral cover at the lagoon side of Gan island, Addu, decreased significantly. After the coral bleaching of 1998, the coral covers have increased to 20 % in 20099), even after the coral bleaching of 2016. The coral cover data of Meedhoo island, Addu City, in the above table shows 13 %, assuming the recovery of coral growth has not been seen.
Water Quality
As the proposed projects are planned to be implemented along the coastal lines and to the areas between coastal lines to the coral reefs, the water qualities of the sea waters were measured by using the multi-item water quality meter at two different periods: i) north-west monsoon (February 2019) and ii) south-west monsoon (August to September 2019). The following items were measured: i.e. pH, Dissolved Oxygen (DO), Electrical Conductivity (EC), turbidity, water temperature and salinity. The water quality of groundwater (water wells) and tap water were also measured.
The optimum conditions of water quality parameters for the coral growth are shown as follows12):

Data Collection Survey on Building Climate Resilient Safer Cities Final Report
2-19
Table 2.2.2 Optimum Conditions of Water Quality Parameters for the Coral Growth Parameter Optimum range Remarks
1 Temperature 18 oC ~ 32 oC 2 Salinity 3.2% ~ 4.2% 3 pH 8.0 ~ 8.3 Levels below 7.4 pH cause stress for the coral growth. 4 Turbidity 3 ~ 5 NTU >5NTU cause stress for the coral growth. 5 COD <20 mg/L
Source: EIA Data Collection Guidelines
The survey results are shown in the following table. As shown in the table below , most of the data show quite low pH levels for the sea water at the upper, middle and lower parts of the sea level. As pH level below 7.4 may cause stress for coral growth as shown in the table above, assuming the effects of the ocean acidification, the growth and calcification of the marine organisms with calcium carbonate (CaCO3) skeletons, such as coral, seashells, and sea urchins, etc. might be hampered13).
Regarding the turbidity, the measured data for Addu along the coast show relatively high level, but lower than the range, which will cause stress to the coral growth. However, for the sea bottom areas, some data show levels higher than the optimum range. Data for water far from the coast inside the reef show quite low range, resulting in the adequate turbidity conditions for the coral growth. Any significant differences are shown for the salinity between the water nearby the coast and far from the coast.
At Laamu Atoll, the water qualities were measured particularly at sand dredging areas nearby the coasts, and most of data show low turbidity, while, DO level is low at the sand dredging areas and is relatively high at the shallow reef.
Table 2.2.3 Water Quality of the Sea Water in Addu City
Point Measurement Date pH
DO Electrical Conductivit
y Turbidity Temperatur
e Salt
(mg/L) (S/m) (NTU) (oC) (‰)
Upper level of water
February 7, 2019 5.92+0.41 4.89+2.36 5.24+0.79 0.42+0.65 29.79+0.59 35.24+5.75
August 25, 2019 5.44+0.01 4.45+0.03 37.00+1.09 0.75+0.87 30.90+0.43 34.99+0.20
Middle level of water
February 7, 2019 5.54+0.60 2.26+2.46 4.25+1.40 0.73+1.62 29.56+0.50 27.96+10.21
August 25, 2019
5.47+0.00 7.08+0.00 5.20+1.49 1.34+0.44 30.26+0.06 34.99+0.00
Lower level of water
February 7, 2019 5.69+0.73 2.84+3.04 4.31+1.35 3.64+6.48 29.54+0.41 28.39+9.85
August 25, 2019 5.44+0.02 6.63+0.01 5.21+2.46 2.00+2.34 29.83+0.43 35.00+0.09
Source: JICA Expert Team

Data Collection Survey on Building Climate Resilient Safer Cities Final Report
2-20
Table 2.2.4 Water Quality of the Sea Water at Laamu Atoll
Point Measurement Date pH
DO Electrical Conductivit
y Turbidity Temperatur
e Salt
(mg/L) (S/m) (NTU) (oC) (‰) Northern part of Gan
February 28, 2019 6.25+0.03 7.75+0.75 5.31+0.05 1.97+2.00 29.90+1.30 35.67+0.55
Southern part of Fonadhoo
February 28, 2019 6.17+0.02 11.00+2.77 5.40+0.09 10.79+26.23 30.71+0.87 36.44+0.69
Southern part of Fonadhoo
February 28, 2019
6.16+0.00 9.03+1.18 5.34+0.08 1.58+2.83 32.50+1.16 36.15+0.58
Source: JICA Expert Team
The water quality of the land water at both atolls is shown in the following table. The data shows the low salinity, and low pH value (acid). The existing information shows that pH level of the groundwater were between 7.5 to 7.9 at Feydhoo island 14), and the measured data show quite low pH levels, assuming the effect of the ocean acidification.
Table 2.2.5 Water Quality of the Land Water in Addu City
Point Measurement Date pH
DO Electrical Conductivity Turbidity Temperatur
e Salt
(mg/L) (S/m) (NTU) (oC) (‰)
Tap water February 7, 2019 5.83+0.01 5.69+3.32 35.07+55.29 4.60+4.68 28.30+1.11 0.10+0.17
August 31, 2019 5.44+0.03 4.45+2.50 37.00+44.97 0.75+1.06 30.90+2.40 0.05+0.07
Source: JICA Expert Team
Table 2.2.6 Water Quality of the Land Water in Laamu Atoll
Point Measurement date pH
DO Electrical Conductivity Turbidity Temperatur
e Salt
(mg/L) (S/m) (NTU) (oC) (‰)
Water well March 2, 2019 6.25+0.04 3.89+1.51 71.67+13.64 3.05+5.07 29.23+0.82 0.15+0.08
August 31, 2019 5.28+0.00 3.13+1.74 46.54+41.27 0.47+0.81 28.67+0.71 0.23+0.15
Source: JICA Expert Team
Basic Information on Socio-economic Conditions The Maldives
Population
Population of the Maldives is about 400,000 persons according to Population and Housing Census 2014. About 60,000 out of 400,000 is foreigners, and the remaining is the Maldivians. The share of male and female in the Maldivian population is nearly equivalent. The share of male population in the Maldivian population is 51 %, and the share of female population is 49 %. For foreigner population share, the share of male is 88 % and much higher than the share of female of 12 %. The land area of the Maldives is 298km2 or 29,800 ha. The population density of residential population including foreigners as of 2014 is 13.49 persons/ha.

Data Collection Survey on Building Climate Resilient Safer Cities Final Report
2-21
Table 2.3.1 Population of the Maldives by Gender as of 2014 Type of Population Total Male Female
Total 407,660 230,453 177,207 Residents 402,071 227,749 174,322 Maldivians (Residents) 338,434 171,962 166,472 Foreigners 63,637 55,787 7,850 Non-residents 5,589 2,704 2,885
Source: Population & Housing Census 201415)
The population of the Maldivians including non-residents was about 100,000 in 1967. The population in 2014 was about 340,000. It had grown three times for about 50 years.
Table 2.3.2 Population of the Maldivians including Non-Residents as of 1967, 1990, and 2014 1967 1990 2014
Maldivians (including Non-residents) 103,381 213,215 344,023
Source: Population & Housing Census 201415)
National Bureau of Statistics, the Maldives, released “Maldives Population Projections 2014-2054” with the assistance by UNFPA in 2018. The population of the Maldives will grow as shown in Table below, according to the projection. The population of Maldivian (Residents) was about 340,000 in 2014. It will be double, about 660,000 in 2030. It is also expected that the share of foreigners’ population in residents population will increase.
Table 2.3.3 Population Projection 2020 2030 2040 2050 2054 Residents 557,426 665,256 784,780 916,951 974,359 Maldivians 379,270 438,245 491,051 539,795 557,537 Foreigners 178,156 227,011 293,729 377,156 416,822 Maldivians/ Residents
68% 66% 63% 59% 57%
Foreigners/ Residents 32% 34% 37% 41% 43%
Source: Maldives Population Projections 2014-2054, National Bureau of Statistics7)
Main Industry
The main industry in the Maldives is tourism and fisheries. Tourism occupies 25.3 % of Gross Domestic Product (GDP) and is main source of acquiring foreign currency. Tourism also accounts for 39.8 % of government revenue. The annual growth rate of tourism is 7.58 % at price level of 2003 for five years between 2010 and 2014. Based on the plan of one island one resort, 111 islands out of 1,192 islands are resort islands. The number of tourists in 2014 was 1.2 million. The tourists from China is the highest (363,000) followed by Germany (98,000), United Kingdom (88,000). Bonito accounts for 53 % of volume of landings, which is the largest, followed by tuna (38 %). Bonito flakes are produced as special product in the Maldives.

Data Collection Survey on Building Climate Resilient Safer Cities Final Report
2-22
Laamu Atoll Population
Residents population in Laamu Atoll was 12,676 in 2014. The Maldivians population out of the residents population was 11,795. The Maldivians population in 2006 was 11,743, so the population had increased by only 100 persons for eight years. The share of male in Residents is higher than that of female, but the share of female in the Maldivian (Residents) is higher than that of male.
Table 2.3.4 Population in Laamu Atoll by Gender as of 2014 Type of Population Total Male Female
Residents 12,676 6,648 6,028 Maldivians (Residents) 11,795 5,859 5,936 Foreigners 881 789 92
Source: Population & Housing Census 201415)
According to “Maldives Population Projections 2014-2054”, population of the Maldivian (Residents) will slightly decrease for 40 years between 2014 and 2054 as shown in Table below. This projection does not mention the population projection of foreigners in Laamu Atoll, but it is considered that foreign population in Laamu Atoll will increase judging from the tendency of increasing the population share of foreigners in total population in the Maldives.
Table 2.3.5 Population Projection of the Maldivians (Residents) in Laamu Atoll Type of Population 2014 2054
Maldivians (Residents) 11,795 11,279 Source: Maldives Population Projections 2014-2054, National Bureau of Statistics7)
Laamu Atoll has 12 localities. Population of Gan is 3,080 and the highest, followed by 2,226 of Fonadhoo. Maamendhoo has the highest population density of 47.9 persons/ha. Gan has the largest population and land area, but the population density is 4.6 persons/ha and smaller than the other localities.
Table 2.3.6 Residents Population, Land Area, and Population Density at each Locality in Laamu Atoll
Residents Population Land Area (ha) Population Density (persons/ha) Isdhoo 958 145.5 6.6 Dhanbidhoo 647 53.2 12.2 Maabaidhoo 649 59.2 11.0 Mundoo 236 23.6 10.0 Gan 3,080 663.0 4.6 Maavah 1,530 38.4 39.9 Fonadhoo 2,266 162.6 13.9 Gaadhoo 178 69.1 2.6 Maamendhoo 896 18.7 47.9 Hithadhoo 1,007 112.6 8.9 Kunahandhoo 650 91.7 7.1 Kalhaidhoo 579 27.1 21.3
Source: Population & Housing Census 201415)

Data Collection Survey on Building Climate Resilient Safer Cities Final Report
2-23
Industry
Main industry of Laamu atoll is tourism and fisheries. The atoll has a resort island, which name is Six Senses, and hotels in inhabited islands. There are one hotel in Fonadhoo and three hotels in Gan. Isdhoo, Gan, and Fonadhoo have Buddhist ruins. These islands are promoting the tourism by utilizing the historical heritages in recent years.
For fisheries, there is a fisheries processing factory of Horizon Fisheries in Maandhoo island. About 1,000 employee work during the busy season. The factory has the processing capacity of 100 ton/day for tuna processing at maximum. Other than the Horizon Fisheries factory, there are small scale bonito flakes factory at coastal area of each island.
Current Conditions of Land Use, Developments, Critical Infrastructure
Current Conditions of Land Use, Developments The Maldives
Islands of the Maldives are classified into three: inhabited island, resort island, and industrial island. Large scale industrial estates such as cement factories and beverage factories are located in industrial islands. Mixed land use between residential and mid-large scale industry is not observed in inhabited islands, so land use harmful to living environment is also not seen in inhabited islands.
Ministry of National Planning, Housing and Infrastructure formulates regulation for preparation of land use plan. Local government prepares land use plan based on the regulation. The regulation specifies the set back at coastal areas and advises securing at least 20m from the coastal line for residential area. On the other hand, “Survey of Climate Change Adaptation Measures in the Maldives” mentions that each island decides the set back with their own in spite of the regulation. In fact, setback from the coastal line is less than 20m at the coasts such as the northern part of ocean side at Hithadhoo of Addu Atoll, the ocean side of Fonadhoo of Laamu Atoll, the western part of Maamendhoo of Laamu Atoll.
Source: Processed by JICA Expert Team based on Google Map
Figure 2.4.1 Residential Area with Inadequate Setback (Ocean Side of Hithadhoo, Addu Atoll)

Data Collection Survey on Building Climate Resilient Safer Cities Final Report
2-24
Laamu Atoll
Large scale industry in Laamu Atoll is a fishery processing factory in Maandhoo. Small scale bonito flakes factories can be seen at coastal area of the other inhabited islands, but the impact of the bonito flakes factories to living environment at residential areas is not significant.
Setback from the coastal line is less than 20 m at the ocean side of Fonadhoo and the western part of Maamendhoo. These islands have fairly higher population density and residential areas have expanded from land side to sea side. The other islands such as Gan and Isdhoo secure set back more than 20 m.
The following figure shows land use map of Gan. The green color part of the map is set back part and designated at protected area.
Source: Gan Island Council
Figure 2.4.2 Land Use Map of Gan
Current Conditions of Critical Infrastructure and Disaster Risk
National Adaptation Programme of Action (NAPA) and Climate Change Policy Framework in the Maldives specifies that critical infrastructures are the five types: 1) airport, 2) seaport, 3) main road, 4) utility (power supply, water supply and sewerage), 5) solid waste management facilities.
The Maldives
Airport
The Maldives has 14 airports as shown in Table below. Four airports out of 14 airports are international airport. The largest airport in the Maldives is Velana International Airport, which is located in Hulhule island of Male City and the gateway of the Maldives. The airport has a runway with 3,200m length and 45m width.
Table 2.4.1 List of Airports in the Maldives Airport Atoll Island
International Airport Gan International Airport Addu City Gan
Hanimaadhoo International Airport Haa Dhaalu Hanimaadhoo Velana International Airport Malé Hulhulé
Maafaru International Airport Noonu Maafaru Dharavandhoo Airport Baa Dharavandhoo

Data Collection Survey on Building Climate Resilient Safer Cities Final Report
2-25
Airport Atoll Island International Airport
Fuvahmulah Airport Gnaviyani Fuvahmulah Ifuru Airport Raa, Noonu Ifuru
Kaadedhdhoo Airport Gaafu Dhaalu Kaadedhdhoo Kadhdhoo Airport Laamu Kadhdhoo Kooddoo Airport Gaafu Alifu Kooddoo Dhaalu Airport Dhaalu Kudahuvadhoo
Villa International Airport Alifu Dhaalu Maamingili Thimarafushi Airport Thaa Thimarafushi
Kulhudhuffushi Airport Haa Dhaalu Kulhudhuffushi Source: Wikipedia
Seaport
Seaport in the Maldives are classified into four: international and regional port, proprietary terminals, private jetty, and public jetty. Proprietary terminals are mainly used for transporting cement and oils, and private jetty was used for resorts. The sea routes exist between Male and the main islands of each atoll, but the routes are limited among the main islands of each atoll.
Main Road
The Maldives consist of many small islands with tiny land area. The number of the main roads is limited, so the main roads are seen in the islands connecting with bridges and causeways as showing in Table below.
Table 2.4.2 Main Roads in the Maldives
Atoll Section Length of Road Connection
Kaafu Atoll Male-Hulhule-Hulhumale 9km Bridge, Causeway Laamu Atoll Fonadhoo-Kadhdhoo-Maandhoo-Gan 15 km Causeway Addu Atoll Gan-Feydhoo-Maradhoo-Hithadhoo 15km Causeway, Bridge
Source: JICA Expert Team
Many islands has one traversing road and some roads, which cross the traversing road and stretching to the coast. The road network is fish-bone shape with bird’s eye view.
Utility (Power Supply, Water Supply and Sewerage)
i) Power Supply
Electrification rate in the Maldives is 100 %, which is the highest electrification rate in South Asia as of 2014. Only six islands had a 24-hour power supply in 1990, but all islands had equipped a 24-hour power supply by 2011. The nationwide power generation amounted to 245 MW in 2012, with a breakdown of 120 MW for the inhabited islands, 105 MW for the resort islands, and 20 MW for the industrial islands. In Male and North Central regions, the State Electric Company, Limited (STELCO) supplies electricity, and in other regions, FENAKA, established in 2012, supplies electricity on 149 islands. Most of the power generation is diesel power generation. In recent years, the government has sought to introduce solar power generation because of the government plans

Data Collection Survey on Building Climate Resilient Safer Cities Final Report
2-26
to increase renewables in the energy mix and to reduce greenhouse gases and the pressure on finances due to soaring fuel costs.
ii) Water Supply and Sewerage
Water supply and sewerage in the Maldives are administrated by Water and Sanitation Department, Ministry of Environment, Climate Change and Technology. The department plays a role in providing safe water and developing eco-friendly sewerage system.
Water Supply
In the past, the water from the freshwater lens was being pumped. As the amount of pumped water increased, salt water and water pollution progressed, and the number of residents using the water from the freshwater lens has decreased in the recent years. According to a 2016 survey by the Ministry of the Environment, about 90 % of the Maldives residents use rainwater as their water source.
Sewerage
Sewerage development has been in progress since 1985 in Male City, and it has been in progress on other inhabited islands after 1992. The sewerage penetration rate is 48 % as of 2016. In areas where sewerage is not widespread, traditional pothole toilets are used. According to the National Water and Sewerage Policy formulated by the Ministry of the Environment in 2017, the target of sewerage development is to increase the sewerage penetration rate to 76 % by the end of 2019.
Solid Waste Management Facilities
Waste Management and Pollution Control Department of the Ministry of the Environment, Climate Change and Technology. is responsible for solid waste management in the Maldives. Solid waste management differs in urban areas such as Male City, other inhabited islands, and resort islands, respectively.
i) Urban Areas
In Male City and Addu City, Waste Management Corporation Ltd (WAMCO), which is a public corporation in charge of solid waste management wholly owned by the Maldives government, is responsible for solid waste management. WAMCO was established in January 2016. There are three offices in the Maldives, and WAMCO operates in the Greater Male area (Male Island, Hulhumale, Villingili), Addu City and Fuvahmulah. WAMCO is responsible for the collection and disposal of waste from households and offices.
ii) Other Inhabited Islands
Solid waste on inhabited islands is managed by the island council as a general rule, but the management situation varies greatly from island to island. Some islands have begun collecting like Fonadhoo on Laamu Atoll, while others like Gan where residents go to dump sites.
iii) Resort Islands
Resort islands are obliged to install incinerators for waste treatment. When a resort island is newly opened, business license from the Ministry of Tourism, Arts and Culture will not be granted unless an incinerator is installed. The food residue is currently allowed to be dumped into the ocean. The

Data Collection Survey on Building Climate Resilient Safer Cities Final Report
2-27
Ministry also has specific regulations on how to manage their waste by not only incinerator but also other measures such as bottle crushers and compactors, etc.
Laamu Atoll
Airport
The airport of Laamu Atoll is Kadhdhoo Airport on Kadhdhoo Island. It is operated by the Kahdhoo Airport Company Limited. There is a paved runway with a length of 1,220 m and a width of 30m, and propeller aircraft of Maldivian Airlines and Flyme Airlines are in service directly to the capital, Male. Some flights pass through other atolls. The distance from the runway to the coast is about 200 m at the shortest point, and there is enough setback. The altitude of the airport is 1.2 m above sea level.
Source: JICA Expert Team
Figure 2.4.3 Kadhdhoo Airport
Seaport
There are small seaports on each island except for uninhabited islands, and fishing boats are mainly moored. Maandhoo also has a fishery processing factory and its own fishing port. Many islands have harbors on the lagoon side where the waves are calm.
Source: JICA Expert Team
Figure 2.4.4 Seaports of Maamendhoo (Left) and Southern Part of Gan (Right)

Data Collection Survey on Building Climate Resilient Safer Cities Final Report
2-28
Main Road
Fonadhoo, Kadhdhoo, Maandhoo and Gan are connected by a causeway. The main road including a causeway is about 15 km long with two lanes on each side, and was constructed in 2016 with support from China. On Fonadhoo and Gan, there is a road that connects the ocean side and the lagoon side across the main road, forming a block. Maamendhoo is a small 18.7 ha island, but its population density is high, so roads are formed in a grid over almost the entire island.
Source: JICA Expert Team
Figure 2.4.5 Main Road in Fonadhoo (Left) Island Road in Maamendhoo (Right)
Utility (Power Supply, Water Supply and Sewerage)
i) Power Supply
FENAKA supplies power to Laamu Atoll, and diesel power generation is performed on all inhabited islands. Fonadhoo and Gan were updated with new generators in August 2019, and 1 MW capacity generators were introduced on Fonadhoo and 800 kW capacity on Gan.
Source: JICA Expert Team
Figure 2.4.6 FENAKA Building for Power Generation (Gan)
ii) Water Supply and Sewerage
Water Supply
In many households and facilities, rainwater is the source of water. Rainwater that falls on the roof is stored in a large storage tank.

Data Collection Survey on Building Climate Resilient Safer Cities Final Report
2-29
Source: JICA Expert Team
Figure 2.4.7 Rain Water Storage Tank in Maabaidhoo
Sewerage
Gan has three primary waste water treatment plant. The treated water is discharged from the plant to the reef edge at the ocean side through a pipe. Fonadhoo has one primary treatment plant and the treated water is discharged to the sea likewise.
Source: JICA Expert Team
Figure 2.4.8 Sewerage Facility (Left) and Discharge Pipe to the Sea (Right) at Gan
Solid Waste Management Facility
Fonadhoo has a recycling facility, but most of the islands has open dumps at ocean side where the garbage are burned. Garbage collection started from 2019 in Fonadhoo, but the residents bring the garbage by their own to the dump sites. The dump sites are located at ocean side, so it is concerned that the garbage will be outflown to the sea when either storm surge or tsunami attacks.

Data Collection Survey on Building Climate Resilient Safer Cities Final Report
2-30
Source: JICA Expert Team
Figure 2.4.9 Recycling Facility (Left) and Dump Site (Right) at Fonadhoo
Sand Source and Mechanism of Sediment movement on Coral Reef Beach Type of Sandy Beach and its Sand Source
There are two type of sandy beaches, which are common sandy beach and coral reef beach. For common type of sandy beaches, the sand is supplied from the river and/or sea cliff and transported by wave and current action, and finally run-up to the beach. On the other hand, for coral reef beaches, sand is supplied from coral debris, shells and Foraminifera which are origin of marine organism on coral reef and transported from coral reef to the beach by wave and current action on coral reef.
Mechanism of Sediment Transport on Coral Reef Beach
Coral gravel and sand, which are produced around reef edge and coral reef by crushing and abrasion of corals and coral rock due to wave action, are transported from coral reef to the beach by onshore-ward current which is produced by wave breaking at reef edge. This transported sand is shifting to nearshore direction in total due to differences of incident wave direction and/or topographic condition of coral reef (Figure 2.5.1). Furthermore, it is known that the emission from the Parrotfish is also contributed as another major sand source for coral reef beach.

Data Collection Survey on Building Climate Resilient Safer Cities Final Report
2-31
Fundamental Mechanism for Cause of Coastal Erosion
Sandy beach is basically maintained on balance of both sand inflow and outflow. Namely, the sand volume is balanced between inflow and outflow for stable beaches and the position of shoreline can be maintained. On the other hand, when the volume of sand inflow is relatively decreased comparing to that of sand outflow, beach retreat (coastal erosion) occurs as shown in Figure 2.5.2.
Source: JICA Expert Team
Figure 2.5.1 Sediment Movement on Coral Reef Beach
Incident Wave
Wav
e Br
eakin
g
Onshore Sediment Transport
Ons
hore
Sedi
men
t Tr
ansp
ort
Shor
elin
e
Ree
f Fla
tR
eef S
lope
Ree
f Fla
tR
eef S
lope
Land
Ree
fEdg
e
Land

Data Collection Survey on Building Climate Resilient Safer Cities Final Report
2-32
Following reasons why coastal erosion occurs at coral reef beaches such as the Maldives case are identified.
Decrease of sand source due to deterioration of coral habitat and its environment Decrease of sand inflow from up-drift side due to artificial construction such as construction of port,
jetty, etc. Decrease of sand inflow from offshore side due to artificial mining of corals on coral reef Removal of accumulated coral sand and gravel on foreshore area Increase for quantity of outflow by increase of wave and current action due to climate change
Basic Idea of Adaptation Measures against Costal Erosion
Based on basic mechanism of coastal erosion as presented before, it is required to consider the following two approaches as adaptation measures against coastal erosion.
To increase sand supply or inflow, or To decrease sand outflow
Source: JICA Expert Team
Figure 2.5.2 Image of Sediment Budget at Beach
Shoreline
Target Beach Area
① Inflow from Reef
② Outflow to Outer Area
Incident Wave
③ Inflow due to Littoral Drift ④ Outflow
(1) ①+③ = ②+④→ Balanced→ Stable
Shoreline
Target Beach Area
① Inflow from Reef
② Outflow to Outer Area
Incident Wave
③ Inflow due to Littoral Drift ④ Outflow
(2) ①+③ < ②+④→ Unbalanced→ Erosion
(ex) Jetty
retreat

Data Collection Survey on Building Climate Resilient Safer Cities Final Report
2-33
One of the ideas to increase sand supply for long term measures is to improve the coral environment and habitat. On the other hand, the prevention of artificial modification of the beach which will cause the decrease of sand inflow from up-drift side, or the artificial sand filling by beach nourishment are realistic idea as short and middle term measures. And the hard structure measures such as just construction of revetment, seawall, groins, etc. are not as the solution against coastal erosion.
As the measures to decrease of sand outflow, there is an idea to construct of groin, headland, etc. together with beach nourishment as supplementary measures to minimize the sand outflow after the nourishment.
Coastal Erosion
Outline of Coastal Erosion in the Maldives
Coastal erosion in the Maldives has been actualized since 1980s, mainly at inhabitant islands. The number of inhabitant islands is 188 among total 1200 islands in the Maldives. Among this, the number of 116 inhabitant islands has been under condition of coastal erosion and 38 % is under serious coastal erosion16). Most of coastal erosion at inhabitant islands has been caused by artificial construction and human activities, such as construction of port and navigation channel, reclamation on coral reef, construction of coastal facilities, coral sand and gravel mining from coral reef and shore area, etc.
On the other hand, over 80 % of the total land area of the Maldives is less than 1 m above mean sea water level (MSL)1). Even if there is no issue on coastal erosion for this moment, it is anticipated to cause the coastal erosion near future due to sea level rise and increase of waves at shore for the impact of climate change. At the existing coasts which have been already suffered by coastal erosion will accelerate further erosion.
Examples of Coastal Erosion Caused in Addu and Laamu Atoll Interruption of Littoral Drift due to Port Construction
Figure 2.6.1 and Figure 2.6.2 shows the satellite image before and after the port construction at the north side of Gan in Laamu Atoll and existing beach condition at down drift side (north side from the port), respectively. The port was constructed from 2005 to 2006. As northward littoral drift exists in this coast, the beach erosion with about 50 m for 13 years after the completion of port construction causes at the north side of port due to interruption of northward littoral drift.
Dredging for Construction of Navigation Channel
Most of inhabitant islands in the Maldives are faced on both ocean and lagoon side, and the coral reef exists near the coasts. Due to this topographic condition with shallow water area, it is common to construct the navigation channel by dredging on coral reef. Construction of navigation channel causes the trap of sediment transport from reef edge to shore and decrease of sand supply to the shore. As the result, coastal erosion will be induced (Figure 2.6.3).
Mining of Coral Sand and Gravel on Coral Reef to Secure Construction Material (Borrow Pit)
Mining of coral sand and gravel on coral reef (borrow pit) has been carried out at inhabitant islands, frequently to secure construction materials for houses and infrastructure facilities as shown in Figure

Data Collection Survey on Building Climate Resilient Safer Cities Final Report
2-34
2.6.4. Such large-scale coral mining on the reef has induced the change in wave and current condition nearby, decrease of sand supply from coral reef, trap and intercept of sediment transport and deterioration of water quality and coral condition.
Source: Processed by JICA Expert Team based on QuickBird in 2003
and WorldView in 2018 procured by JICA Expert Team (1) Before (Jan. 2003) (2) After (Jul. 2018)
Figure 2.6.3 Construction of Navigation Channel (Gan Island in Laamu Atoll)
Sep. 2003 Aug. 2018
Source: Processed by JICA Expert Team based on QuickBird in 2003
and WorldView in 2018 procured by JICA Expert Team (1) Before Construction (Jan. 2003) (2) After Construction (Jul. 2018)
Figure 2.6.1 Coastal Erosion at the Down Drift Side due to Port Construction
Source: JICA Expert Team
Figure 2.6.2 Beach Condition at Down Drift (North) Side (Feb. 2019)
Jan. 2003 Jul. 2018

Data Collection Survey on Building Climate Resilient Safer Cities Final Report
2-35
Mining of Coral Sand and Gravel from Foreshore Area
Although the mining of coral sand and gravel from foreshore and coral reef was prohibited from several years ago, such activities continue illegally at some areas as shown in Figure 2.6.5. Even though the study on supply of sand from coral reef is very limited, there is a report to study the quantity of sand supply on coral reef17). According to this report, expected quantity of sand supply to the beach was estimated to 0.5~1.5 m3/m/year. Under such limited quantity of sand supply, if coral sand and gravel are taken from the beach by peoples continuously for a long period, it will cause the decrease of sand supply and induces coastal erosion.
Inadequate Construction of Coastal Facility
Coastal protection measures have been carried out by both central and local governments in accordance with actualization of coastal erosion. Hard structure measures such as seawall, revetment, etc. are common protection measures at inhabitant islands in the Maldives. However, some of revetment are
Source: (Left) Processed by JICA Expert Team based on WorldView in 2018 procured by JICA Expert Team
(Right) JICA Expert Team
Figure 2.6.4 Mining of Coral Sand and Gravel on Coral Reef (Fonadhoo Island(Left), Gan Island(right) in Laamu Atoll)
Source: JICA Expert Team
Figure 2.6.5 Mining of Coral Sand and Gravel from Foreshore Area (Gan in Laamu Atoll)

Data Collection Survey on Building Climate Resilient Safer Cities Final Report
2-36
constructed on foreshore area. This will induce the loss of sandy beach, increase of wave energy due to reflection waves, forming of scouring and resulting coastal erosion (Figure 2.6.6).
Inadequate Construction of Coastal Facility
Increase of economic development and human activities due to increase of population will greatly affect to the coral environment at inhabitant islands in the Maldives. Figure 2.6.7 shows the change in condition of coral reef based on the aerial photo and satellite image for different 3 periods. In 1969, growth of seaweed on the reef was not significant and it seems active sand supply from the reef was identified. On the other hand, the growth of seaweed seems to be significant in 2005. In 2018, most of the coral reef area was covered by seaweed. Significant increase of seaweed in recent might be caused by decrease of exchange function for seawater between ocean and lagoon side due to construction of causeway, etc. and eutrophication of seawater due to increase of human activities. Increase of seaweed will induce trapping effect on coral reef. On the other hand, it will decrease supply of sand to the beach.
Source: JICA Expert Team
Figure 2.6.6 Construction of Revetment on Foreshore Area (Meedhoo in Addu Atoll)
Source: Processed by JICA Expert Team based on aerial photos in 1969 provided by Land & Survey
and QuickBird in 2005 and WorldView in 2018 procured by JICA Expert Team
Figure 2.6.7 Change of Coral Environment (Growth of Seaweed) (Fonadhoo Island in Laamu)

Data Collection Survey on Building Climate Resilient Safer Cities Final Report
2-37
Current Condition for Coastal Protection Measures and Coastal Management
Coastal Protection Measures
It is common to employ the seawall or revetment as coastal protection measures at inhabitant islands in the Maldives. Although it was common to employ the impermeable type revetment using sand bags filled with coral sands or gravels in the past, it was easy to damage due to wave action. Instead of this, the rubble type permeable revetment has been commonly adopted in recent. However, the alignment for most of the revetments is positioned on foreshore area, and it is causing the scoring at toe part of the revetment.
Furthermore, the reclamation was also conducted on the coral reef as coastal protection measures in recent. Figure 2.7.3 shows the one of examples to carry out the large-scale reclamation at Feydhoo in Addu Atoll, which was completed in 2018. 1.3 million m3 of coral sand was dredged from the seabed in the lagoon and filled on the coral reef surrounding at Feydhoo after the construction of perimeter revetment. Same type of reclamation project is planned at the ocean side of Maradhoo in Addu Atoll. On the other hand, small scale of reclamation near the beach was carried out as secondary project for port project and dredged sand from the port area or navigation channel was reused for reclamation material.
Source: JICA Expert Team
(1) Meedhoo (Addu Atoll) (2) Gan (Laamu Atoll)
Figure 2.7.1 Impermeable Type of Seawall using Mixed Cement and Sand Bag
Source: JICA Expert Team
(1) Meedhoo (Addu Atoll) (2) Gan (Laamu Atoll)
Figure 2.7.2 Rubble Type Impermeable Revetment

Data Collection Survey on Building Climate Resilient Safer Cities Final Report
2-38
Coastal Management
Coastal Law
Although there is no specific coastal law regarding coastal management in the Maldives, two acts which are related to coastal management exist, (1) Land Use Planning and (2) Reclamation and Dredging Regulation (2014).
The concept of “Setback” was mentioned in the Land Use Planning and it was recommended to secure 20 m from the vegetation area at foreshore side. However, this rule is not clearly imposed at inhabitant islands, and it is identified that houses and facilities are located within 20 m buffer area. In this way, the “Setback” rule is entrusted by each opinion for island council.
Dairy Maintenance (Beach Cleaning)
Beach cleaning is one of common dairy maintenance in the coastal management. Although the effort of beach cleaning is different for each island, it is common to conduct by voluntary activity or cooperation together with NGO (ex. Meedhoo at Addu Atoll).
Performance for beach cleaning seems to be closely related to the condition of beach use by residents. Dumping of rubbish on the beach is usually identified at the beach where the peoples don’t use so actively as shown in Figure 2.7.4. On the other hand, Figure 2.7.5 shows the beach where active beach cleaning has been conducted by residents. In this beach, dairy beach cleaning was conducted by the residents as voluntary activity, and the public area on the beach is well maintained by the residents.
(1) Before (Sep. 2003) (2) After (Aug. 2018)
(3) Reclaimed Land (Feb. 2019) (4) Perimeter Revetment (Feb. 2019)
Source: (1), (2): Processed by JICA Expert Team based on QuickBird in 2003 and WorldView in 2018 procured by JICA Expert Team
(3), (4): JICA Expert Team
Figure 2.7.3 Feydhoo Reclamation Project
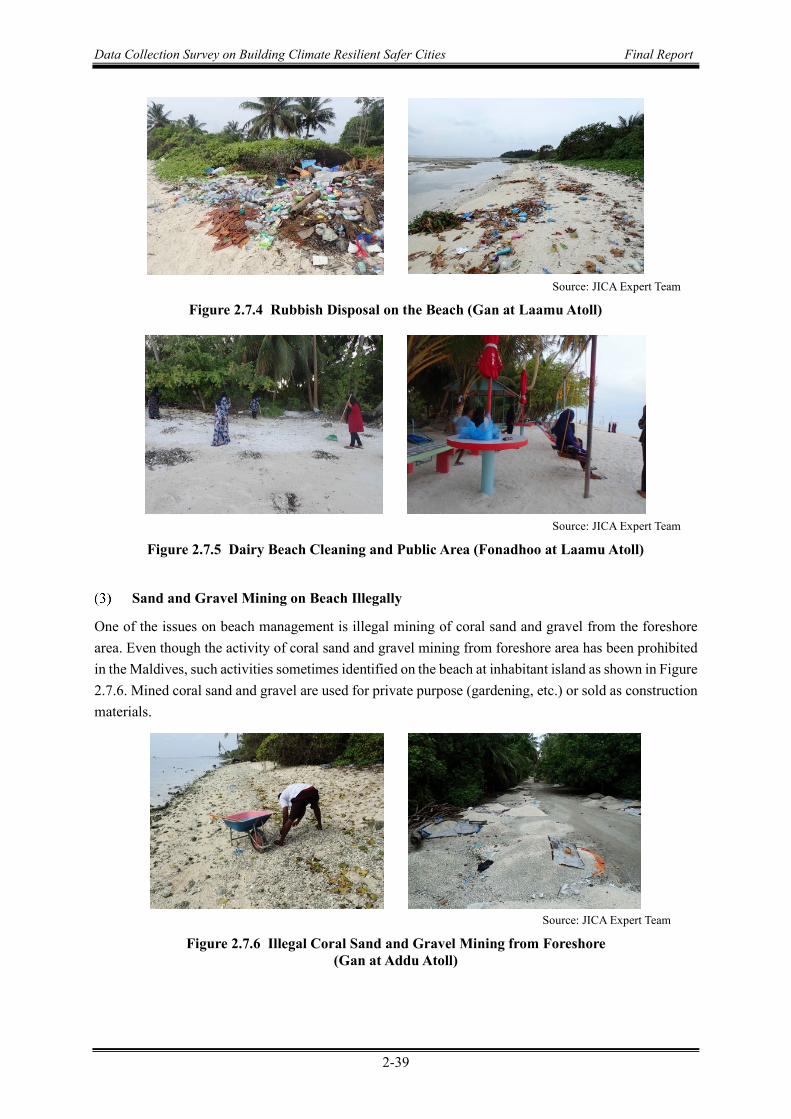
Data Collection Survey on Building Climate Resilient Safer Cities Final Report
2-39
Sand and Gravel Mining on Beach Illegally
One of the issues on beach management is illegal mining of coral sand and gravel from the foreshore area. Even though the activity of coral sand and gravel mining from foreshore area has been prohibited in the Maldives, such activities sometimes identified on the beach at inhabitant island as shown in Figure 2.7.6. Mined coral sand and gravel are used for private purpose (gardening, etc.) or sold as construction materials.
Source: JICA Expert Team
Figure 2.7.4 Rubbish Disposal on the Beach (Gan at Laamu Atoll)
Source: JICA Expert Team
Figure 2.7.5 Dairy Beach Cleaning and Public Area (Fonadhoo at Laamu Atoll)
Source: JICA Expert Team
Figure 2.7.6 Illegal Coral Sand and Gravel Mining from Foreshore (Gan at Addu Atoll)

Data Collection Survey on Building Climate Resilient Safer Cities Final Report
2-40
Analysis on Current Situation and Issues of Disaster Information Transmission
In this survey, investigations and analyzes were conducted on disaster information management, warnings transmissions, and transmission method by government agencies for disasters such as storm surges, high waves, and tsunami.
Current Situation and Issues of Disaster Prevention Information
In addition to providing information directly from MMS using a broadcast network, disaster prevention weather information in the Maldives is transmitted from various organizations such as NDMA, and information transmission method is made redundant. As a means of transmitting information, beside of using broadcasting, free Internet services such as SNS that are widely used. On the other hand, since SNS is a private free service using the Internet, there are concerns about congestion due to simultaneous use of residents and sustainability of service use. The present situation on disaster information transmission is classified and organized into the items of “communication methods”, “transmission system”, and “information.” And problems assumed for disaster information transmission are shown below.
Table 2.8.1 Current Situation and Issues of Disaster Information Transmission Items Current Situation Issues
Communication Methods
Communications between atolls and islands use private telecommunications companies
Disaster prevention agencies use telephone, fax, e-mail, SMS, SNS
In case that the private operator line is not available, radio from the national army, police, and coast guard are used.
Use TV, radio, WEB, SNS for general residents
EWBS is being introduced recently. Speakers are installed in the Council office
on Maamendoo in LAAMU Speakers installed in the mosque are not
used for disaster prevention purposes
In order to make information transmission redundant, it is necessary to develop not only private communication lines but also administrative dedicated lines and networks that can be used for disaster prevention purposes.
It is necessary to develop push-type communication system that can transmit information, no matter if it’s indoors or outdoors.
Requires development of EWBS-compatible equipment and set-top boxes
It is necessary to develop the reliable internet network.
Transmission System
MMS delivers weather warnings MMS delivers information via SNS to
schools and municipalities, called Focal Point
NDMA, as a coordinating and advising organization when issuing warnings happen, provide information to support the activities of residents to related organizations
Each Council has formulated a Disaster Management Plan, stipulates role sharing and information transmission methods in the event of a disaster.
There is no systematic program for evacuation
Evacuation information is transmitted from the local government to residents
NPOs are also active during a disaster
NDMA staff are not assigned to each atoll. The assignment of disaster prevention specialists to each atoll is expected.
Because administrative staff are assigned for input and redistribution to SNS, relying on humans for such task mean that the speed and certainty of information transmission is not guaranteed.
There is a shortage of personnel instructing preparing of disaster prevention training program.

Data Collection Survey on Building Climate Resilient Safer Cities Final Report
2-41
Items Current Situation Issues Information Regular weather forecasts are conducted
twice a day. color code is introduced to make ease of
understanding of alarm Send both text and images by using SMS.
Forecasts are issued at each atoll, therefore information with high spatial accuracy is required.
Provision of easy-to-understand information to residents who do not have mobile devices
Urgent provision of information to residents living outdoors or at sea is required.
Source: JICA Expert Team
Review of Related Projects by Other Donors Outline of Related Climate Change Projects and Relationship with This Project
So far, climate change projects in Maldives have been implemented by various international organizations and other donors. After the related projects shown in Table 2.9.1 and the related fields of this project are analyzed, the study on this project in the following chapters will proceed.
Table 2.9.1 Current Situation and Issues of Disaster Information Transmission No. Project Donor Related Field to the Project 1 Climate Change Adaptation Project
(CCAP) (2015) World Bank ・ Coral reef monitoring
・ Building awareness and strengthening local government capacity to address climate change adaptation issues
2 UNDP country program on enhancing national capacity for DRRM in Maldives a. Scaling up the National Capacity for
Disaster Risk Reduction and Management in the Maldives (2016-2018)
b. Enhance National Capacity for Disaster Risk Reduction and Management in Maldives (2011-2015)
UNDP ・ Strengthen the early warning systems
・ Enhancement of community capacity for disaster response
3 Supporting vulnerable communities in Maldives to manage climate change-induced water shortages, GCF (2016-2021)
GCF Early warning system established on the basis of forecasted meteorological information
4 Integrating Climate Change Risks into Resilient Island Planning in the Maldives (2008-2010)
GEF Enhanced capacity of national, provincial, atoll and island authorities and civil society leaders to integrate climate risk information into policy, planning and investment decisions
5 Enhancing National Development through Environmentally Resilient Islands (ENDhERI) (2018-2020)
GEF ・ Integrated coastal zone management (ICZM)
・ Marine management area (MMA)

Data Collection Survey on Building Climate Resilient Safer Cities Final Report
2-42
No. Project Donor Related Field to the Project 6 Present cost-effective, locally
appropriate coastal management and drainage management options contributing to climate change resilience of communities in Fares-Maathoda (2010-2015)
Government of Denmark
・ Identifying and developing locally appropriate adaptation options on coastal management
・ Implementation of locally appropriate adaptation options
7 Coastal protection project of Fuvahmulah City (2017-2018)
Netherlands Enterprise Agency, Kuwait Fund
Coastal protection
8 IMPACT2C project (2012-2016) IMPACT2C (Research project)
Sea level rise in Maldives for future coastal design
9 Integrating Sea-level Projections in climate services for coastal adaptation (INSeaPTION) (2017-2020)
European Research Area for Climate Services (ERA4CS) (Research project)
Information with extreme wave condition and future climate change scenarios
Source: JICA Expert Team

Data Collection Survey on Building Climate Resilient Safer Cities Final Report
2-43
<References>
1) Ministry of Environment and Energy (2016): State of Environment 2016 2) The Association of Japanese Geographers (2009): Global Warming and Natural Disasters 3) UNDP (2007): Detailed Island Risk Assessment in Maldives, Vol.Ⅲ Detailed Island Reports L.
Gan-Part 1, 72p. 4) RIMES, Regional Integrated Multi-Hazard Early Warning System for Africa and Asia (2012): Climate
change scenarios and their interpretation for Maldives, 47p. 5) Giovanni Rinaldi, et al (2019): Assessment of extreme and metocean conditions in the Maldives for
OTEC applications, Int J. Energy Res., pp. 7316-7335 6) Maldives Meteorological Service (2017): Weather Report 7) National Bureau of Statistics (2018):
http://statisticsmaldives.gov.mv/yearbook/2019/http:/statisticsmaldives.gov.mv/yearbook/2019/ 8) Ibrahim, N., Mohamed, M., Basheer, A., Ismail, H., Nistharan, F., Schmidt, A., Naeem, R., Abdulla, A.,
and Grimsditch, G (2017), Status of Coral Bleaching in the Maldives in 2016, Marine Research Centre 9) Zahir, H; N. Quinn and N. Cargilia (2010), Assessment of Maldivian Coral Reefs in 2009 after Natural
Disasters. Marine Research Centre 10) CDE (2018-1), Environment Impact Assessment for the Proposed harbour Redevelopment at Maradhoo
Island, Addu City 11) CDE (2018-2), EIA for the proposed Harbour Redevelopment Project at Laamu Fonadhoo 12) Environmental Protection Agency: EIA Data Collection Guidelines 13) Kaoru Kubota, Yusuke Yokoyama, Tsuyoshi Ishikawa, Atsushi Suzuki, Masao Ishii (2017): Rapid
decline in pH of coral calcification fluid due to incorporation of anthropogenic CO2. 14) Water Solutions (2018), Environmental Impact Assessment: The Flood Mitigation Project at Feydhoo,
Addu City 15) National Bureu of Statics (2014): Population & Housing Census 2014, 105p 16) Ministry of Environment and Energy (2016): Second National Communication of Maldives, 142p. 17) Baird (2003): Study on Coastal Erosion in Mauritius, 462p.

Data Collection Survey on Building Climate Resilient Safer Cities Final Report
3-1
REGIONAL CLIMATE OVERVIEW, FUTURE CLIMATE PROJECTION AND NATURAL HAZARD
In this chapter, (1) Regional Climate Overview, (2) Climate Projection and (3) Natural Hazard in the Maldives which are considered to have high impact, are summarized.
Regional Climate Overview
Regional Climate Overview is summarized based on the technical paper, “Emergence of an equatorial mode of climate variability in the Indian Ocean1)
Predicting changes in the pattern and magnitude of sea surface temperature (SST) fluctuations over the tropical oceans is critical for attributing changing climate variability and extreme weather over large parts of the world2). Observations show that the tropical Indian Ocean has been considered as a minor driver of climate variability relative to the Pacific or the Atlantic oceans for a long period3).
Source: Emergence of an equatorial mode of climate variability in the Indian Ocean (2020)1)
Figure 3.1.1 Variability of Sea Surface Temperature1)
The tropical Indian Ocean exhibits much weaker SST variability than the tropical Pacific and Atlantic oceans as shown in Figure 3.1.1. Unlike these oceans, where the El Niño Southern Oscillation (ENSO) phenomenon and the Atlantic Niño drive pronounced basin-wide SST anomalies (SSTAs), variability in the Indian Ocean is restricted to the western side of the basin and along the coast of Sumatra and Java4). Large SSTAs spanning the equatorial Indian Ocean are extremely rare.
However, the model simulations of CMIP5 (Coupled Model Inter-comparison Project 5) show that continued greenhouse warming could alter these features, and the Indian Ocean could evolve into a mean state similar to the Pacific or Atlantic oceans5),6),7). The CMIP5 models show a direct link between the changes in mean climate and the increase in variability under greenhouse warming. Historical observations support this prediction, showing a tendency for easterly winds along the equator, an eastward shoaling thermocline, and a reversal of the east-west SST gradient since the 1950s8)-11). These changes should be accompanied by increased SST variability along the equatorial Indian Ocean12).

Data Collection Survey on Building Climate Resilient Safer Cities Final Report
3-2
Source: Emergence of an equatorial mode of climate variability in the Indian Ocean (2020)1)
Figure 3.1.2 Variability of Sea Surface Temperature in EEIO under GM and LGM Conditions1)
Eastern equatorial Indian ocean (EEIO) is one of the most climatically sensitive regions in the global ocean, which plays a vital role in modulating Indian ocean dipole (IOD) and El Niño southern oscillation (ENSO). The simulation results indicate that under greenhouse warming (GM) and Last Glacial Maximum (LGM) conditions, the Indian Ocean can exhibit increased SST variability in the eastern equatorial Indian Ocean (EEIO) as shown in Figure 3.1.2. The magnitude of the increase in SST variability, measured by the change in the Standard Deviation (SD) of SSTAs averaged over the EEIO, is strongly anti-correlated with the changes in zonal wind stress along the equator as shown in Figure 3.1.3. Most of CMIP5 models predict increases in variability and more easterly winds for the second half of the century. These seasonal variations are similar to those occurring in the modern Pacific and Atlantic oceans. The simulated changes in the Indian Ocean give rise to its own El Niño like variability.
Figure 3.1.4 shows the rainfall impacts of current and future modes of climate variability in the Indian Ocean. Composite rainfall anomalies (shading) during (A, B) observed Dipole Mode events and (C, D) simulated Equatorial Mode events active in the Indian Ocean under greenhouse warming. In both cases, warm (A, C) and cold (B, D) events are, respectively, characterized by positive or negative SST anomalies (contours) over the eastern Indian Ocean. The emergence of the equatorial mode could drive rainfall variability with stronger amplitude and altered patterns over the Indian Ocean and surrounding
Source: Emergence of an equatorial mode of climate
variability in the Indian Ocean (2020)1)
Figure 3.1.3 Relation between Change in SD of SST and Zonal Wind Stress in the EIO1)

Data Collection Survey on Building Climate Resilient Safer Cities Final Report
3-3
land masses relative to currently experienced. Warm vents, with their positive SSTAs spanning much of the equatorial Indian Ocean, could drive rainfall deficits over the Horn of Africa as well as over Southern
India, in addition to increased rainfall over Indonesia and Northern Australia (Figure 3.1.4 C). On the other hand, cold events associated with the equatorial mode could drive rainfall anomalies with a similar spatial pattern and magnitude as the warm events, but with opposite polarity and subtle, yet important differences for terrestrial precipitation as shown in Figure 3.1.4 D.
Source: Emergence of an equatorial mode of climate variability in the Indian Ocean (2020)1)
Figure 3.1.4 Rainfall impacts of current and future modes of climate variability in the IO1)
In summary, it is demonstrated that the Indian Ocean can sustain an equatorial mode of climate variability under altered mean states predicted for the second half of the 21st century. This mode manifests as cold and warm interannual events with large-scale SSTAs spanning the central and EEIO. These events, particularly warm ones, represent a marked departure from current variability, characterized by weaker and more spatially confined warm Indian Ocean Dipole (IOD) events. Because of their basin wide and stronger SSTAs, future warm events could drive unprecedented hydrological extremes across the basin. They could bring more frequent droughts to East Africa and southern India, in addition to increased rainfall over Indonesia, exacerbating the effect of a warmer climate on these hydrological extremes13). A potential activation under greenhouse warming, however, could lead to record-breaking SST and rainfall fluctuations, rendering the emergence of the mode a main factor determining future climate risks, including more frequent and devastating wildfires, flooding, and droughts.

Data Collection Survey on Building Climate Resilient Safer Cities Final Report
3-4
Future Climate Projection Rainfall and Temperature
Future projection of Maldives climate is described by using the regional dynamical downscaling climate model provided by the International Pacific Research Center (IPRC), University of Hawaii, which calls “IPRC RegCM”.
Mean Temperature plot over Maldives for time slices 1981- 2000, 2021-2050, 2082-2100 are presented in Figure 3.2.1. Surface temperature has an increasing trend as seen from the time slices experiments (2021- 2050) and (2082-2100) scenario over the different zones of Maldives. The regional model could simulate the rainfall characteristics over different zones as shown in Figure 3.2.2. These results show an increase in rainfall over most of the zones.
Figure 3.2.3 shows the simulated rainfall changes through the Special Report on Emission Scenarios, IPCC (SRES) A1B scenarios from 20th Century Climate in Coupled Models (20C3M) for the rainy season. The time slice of 2082-2100 shows increased rainfall overall. A greater increase in the rainfall from the north to south during the rainy season is observed encompassing zones 1, 2 and 3.
Source: Climate change scenarios and their interpretation for Maldives (2012)14)
Figure 3.2.1 IPRC RegCM annual mean temperature projection for Maldives
Source: Climate change scenarios and their interpretation for Maldives (2012) 14)
Figure 3.2.2 IPRC RegCM annual daily rainfall projection for Maldives

Data Collection Survey on Building Climate Resilient Safer Cities Final Report
3-5
Source: Climate change scenarios and their interpretation for Maldives (2012) 14)
Figure 3.2.3 Temperature and rainfall changes over Maldives domain from IPRC RegCM scenario time slices (2021-2050) and (2082-2100) from baseline (1980-2000)
Sea Level
Figure 3.2.4 shows the observed sea level for the past 33 years which was observed in Gan, Addu Atoll. The blue and red lines in the figure show the maximum and average values for each year, respectively. Sea level was observed at 10.6 cm for 33 years (3.2 mm/year) for the average tide. On the other hand, the global average value for SLR, which was reported in the IPCC 5th Report 201315), was 19 cm from 1901 to 2010, or for 110 years (1.7 mm/year).
Sea Level Rise (SLR) is a type of hazard which affects all the coastal zones and contributes to intensifying impacts of other natural disasters. Therefore, SLR can be considered as the most serious hazard for the future in the Maldives which consists of low-lying, narrow islands and long coastlines (See Chapter 5 for details).
Source: Arranged by the JICA Based on Data for Maldives Meteorological Service
Figure 3.2.4 Observed Sea Level in Gan, Addu Atoll for the Past 33 Years
y = 0.22716 x - 454.89342
y = 0.3219x - 644.68
-20
-15
-10
-5
0
5
10
15
20
1985 1990 1995 2000 2005 2010 2015 2020
Sea
Leve
l (cm
)
year
Max Average 線形 (Max) 線形 (Average) 線形 (Average)
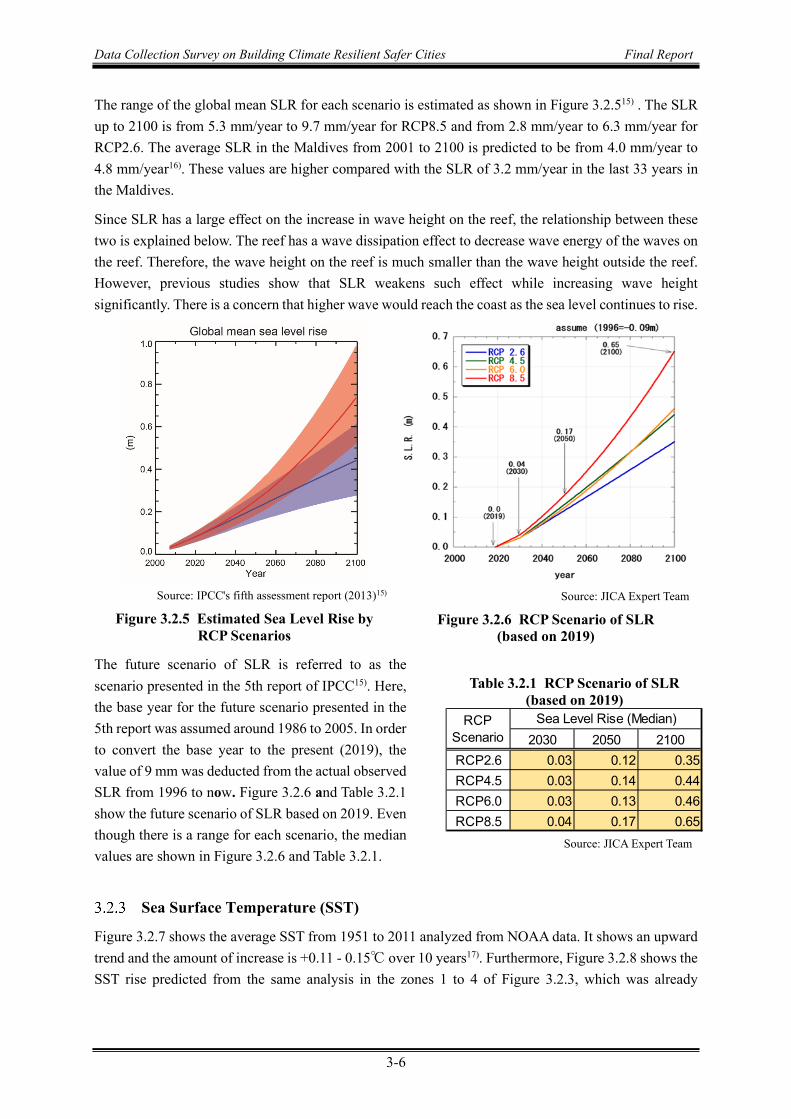
Data Collection Survey on Building Climate Resilient Safer Cities Final Report
3-6
The range of the global mean SLR for each scenario is estimated as shown in Figure 3.2.515) . The SLR up to 2100 is from 5.3 mm/year to 9.7 mm/year for RCP8.5 and from 2.8 mm/year to 6.3 mm/year for RCP2.6. The average SLR in the Maldives from 2001 to 2100 is predicted to be from 4.0 mm/year to 4.8 mm/year16). These values are higher compared with the SLR of 3.2 mm/year in the last 33 years in the Maldives.
Since SLR has a large effect on the increase in wave height on the reef, the relationship between these two is explained below. The reef has a wave dissipation effect to decrease wave energy of the waves on the reef. Therefore, the wave height on the reef is much smaller than the wave height outside the reef. However, previous studies show that SLR weakens such effect while increasing wave height significantly. There is a concern that higher wave would reach the coast as the sea level continues to rise.
Source: IPCC's fifth assessment report (2013)15)
Figure 3.2.5 Estimated Sea Level Rise by RCP Scenarios
Source: JICA Expert Team
Figure 3.2.6 RCP Scenario of SLR (based on 2019)
The future scenario of SLR is referred to as the scenario presented in the 5th report of IPCC15). Here, the base year for the future scenario presented in the 5th report was assumed around 1986 to 2005. In order to convert the base year to the present (2019), the value of 9 mm was deducted from the actual observed SLR from 1996 to now. Figure 3.2.6 and Table 3.2.1 show the future scenario of SLR based on 2019. Even though there is a range for each scenario, the median values are shown in Figure 3.2.6 and Table 3.2.1.
Sea Surface Temperature (SST)
Figure 3.2.7 shows the average SST from 1951 to 2011 analyzed from NOAA data. It shows an upward trend and the amount of increase is +0.11 - 0.15℃ over 10 years17). Furthermore, Figure 3.2.8 shows the SST rise predicted from the same analysis in the zones 1 to 4 of Figure 3.2.3, which was already
Table 3.2.1 RCP Scenario of SLR (based on 2019)
Source: JICA Expert Team
2030 2050 2100RCP2.6 0.03 0.12 0.35RCP4.5 0.03 0.14 0.44RCP6.0 0.03 0.13 0.46RCP8.5 0.04 0.17 0.65
Sea Level Rise (Median)RCPScenario

Data Collection Survey on Building Climate Resilient Safer Cities Final Report
3-7
mentioned. Although an increase is expected in all areas, it is confirmed that the amount of increase is larger in the north than in the central or south.
Source: Rayner et al. (2003)18)
Figure 3.2.7 Changes in Sea Surface Temperature 1951-2011
Source: Second National Communication of Maldives (2016)17)
Figure 3.2.8 Estimated Sea Surface Temperature Rise
Natural Hazard
The natural hazards in the Maldives are stated in this section including the severity, frequency, and regional characteristics of the damage and also climate projection that have a high impact on each natural hazard.
Storm Surge
There are very few cases of cyclones occurring in the sea area near the Maldives. As shown in Figure 3.3.1, only 11 cyclones passed through the Maldives for 117 years from 1877 to 2004. Regarding the influence range of storm surge, the southern parts in the Maldives, as located near the equator, are off the pathways of cyclones and tropical depressions in general. Therefore, the impacts of storm surge are more significant in the northern side from the Laamu Atoll. Maximum seawater level by island is as shown in Table 3.3.1. It is confirmed that the northern part is more affected than the central or southern
27.027.528.028.529.029.530.030.531.0
1951
1956
1961
1966
1971
1976
1981
1986
1991
1996
2001
2006
2011
Mon
thly
mea
n SS
T (℃
)
Figure 2.9 Changes in Sea Surface Temperature 1951 2011

Data Collection Survey on Building Climate Resilient Safer Cities Final Report
3-8
parts from the table. One of the examples in recent years, i.e., Cyclone Nilam, hit the northern parts and caused severe damage and flooding in 28 islands or so19).
Moreover, SST rise is considered as a climate projection that has a large impact on storm surges. When the seawater temperature rises, cyclones and tropical cyclones become stronger and then the scale of storm surges becomes larger. In addition, when the sea level rises, the land ground height is relatively lowered and the water level reaching the coast becomes higher, but the external force of storm surge itself is hardly affected by the SLR.
Table 3.3.1 Maximum Sea Level by Island Island (from north to south)
Maximum Sea level (+M.S.L.))
H.Dh Kulhudhuffushi +2.9 m Sh. Funadhoo +2.9 m K. Thulusdhoo +2.23 m Dh. Kudahuvadhoo +2.23 m Th. Vilufushi +2.23 m L. Gan +2.23 m GA. Viligilli 0 G.dh Thinadhoo 0 S. Feydhoo 0 S. Hithadhoo 0
Source: Detailed Island Risk Assessment in Maldives (2008)20)
Source: National Adaptation Plan of Action (NAPA) (2006)21)
Figure 3.3.1 Cyclones Pathways (1877-2004)
Swell Wave
Based on the frequency of flooding damage due to swell waves and the number of affected islands as shown in Figure 3.3.2, the flooding from swell waves occurred two to three times a year on average except in 2017. At the extreme event in recent years (May 15th – 18th, 2007), a tropical depression emerged in the southwest about 5,630 km off the Maldivian islands and brought swell waves to cause flooding in 68 islands in 18 atolls22). In some islands, flooding by swell waves reached 600 m inside from the coast. More serious damages were reported in the south, including Gaafu, Dhaalu, Thaa, and Laamu atolls.
Moreover, there are two climate projections that have a large impact on swell waves: SLR and SST rise. Regarding SLR, the depth of water inside the reef is shallower than that outside the reef, so the relative increase in water depth due to SLR is large. Since the wave height on the reef is defined by the water depth, if waves reaching the coast becomes large due to the effect of SLR, it is assumed that the scale of swell wave will increase. Meanwhile, when SST rises, it is assumed that the scale of the swell wave will increase as the monsoon intensifies.
.

Data Collection Survey on Building Climate Resilient Safer Cities Final Report
3-9
Source: Second National Communication of Maldives (2016)17)
Figure 3.3.2 Frequency of Inundation Caused by Swell Wave and Number of Islands Affected
Heavy Rainfall
Actual event of flooding by heavy rainfall in the Maldives is not known, as there is no monitoring system established in the country. It can be presumed that there have been no severe damages reported comparable to those by high tide or swell waves since there is no damage on houses and infrastructure from the remaining records. It is considered that flooding damage caused by heavy rain is not so large but the frequency is relatively high due to the monsoon. Table 3.3.2 shows the maximum precipitation by island. It is noted that actual values of the maximum precipitation per day for southern regions are larger than those in the table. Therefore, it can be expected that flooding may cause more damages in the south.
Moreover, increase in rainfall is considered as a climate projection that has a large impact on flooding by heavy rainfall. When rainfall increases, the scale of flooding is expected to increase.
Drought
In the Maldives, as with the case of flooding by heavy rainfall, there are no reliable records and no significant drought damage that has been reported in the past. According to the analysis of rainfall data, the number of consecutive days of drought in the northern, central, and southern regions is shown in Figure 3.3.3. It can be confirmed that the number of consecutive days in the northern and central parts is larger than in the southern part. Even though, drought was not so significant in the past, it is expected to increase due to climate change based on the result of grovel climate model.
0102030405060708090100
02468
10121416
1991
1993
1995
1997
1999
2001
2003
2005
2007
2009
2011
2013
No.
of i
slan
ds
No.
of E
vent
s
Non of EventsNo of islands
Table 3.3.2 Maximum Precipitation by Island Island
(from north to south) Maximum Precipitation
(mm/24hr) H.Dh Kulhudhuffushi 176 Sh. Funadhoo 176 K. Thulusdhoo 176 Dh. Kudahuvadhoo 241 Th. Vilufushi 241 L. Gan 241 GA. Viligilli 248 G.dh Thinadhoo 248 S. Feydhoo 248 S. Hithadhoo 248
Source: Detailed Island Risk Assessment in Maldives (2008)20)

Data Collection Survey on Building Climate Resilient Safer Cities Final Report
3-10
Tsunami
Tsunamis caused by earthquakes in the fault zone around the Maldives have been observed 80 times since 1816, and damages were not seen except for those caused by the Indian Ocean Tsunami that occurred in 2004. In the Indian Ocean Tsunami, 82 people were killed and 26 were missing, and 3,997 houses and buildings were damaged. About one-third of the population was severely affected. Figure 3.3.4 shows the results of the tsunami run-up height survey over the country. Based on the survey result, it tends to be lower in the north and higher in the south due to the difference of height of coral ridge and grand level that is higher at northern area than that at southern area. Once huge tsunami attacks to the Maldives, it is caused serious damage to the Maldives because of low elevation and small area of land. However, the frequency of occurrence is very rare comparing to other natural hazard, and it is considered that there is no climate projection that has a large impact on Tsunami.
Source: Second National Communication of Maldives (2016)17)
Figure 3.3.3 Trend in Consecutive Days of Drought by Island
0
20
40
60
1992
1994
1996
1998
2000
2002
2004
2006
2008
2010
2012
Max
imum
con
vecu
tive
dry
days
(C
CD
) North
y=-0.52x+1070
0
20
40
60
1992
1994
1996
1998
2000
2002
2004
2006
2008
2010
2012
Max
imum
con
vecu
tive
dry
days
(C
CD
)
Central
y=0.15x-270
0
20
40
60
1992
1994
1996
1998
2000
2002
2004
2006
2008
2010
2012
Max
imum
con
vecu
tive
dry
days
(C
CD
)
Sourth
y=0.32x-650
Source: Global Warming and Natural Disasters
(2009)22)
Figure 3.3.4 Run Up Height of Tsunami in 2004

Data Collection Survey on Building Climate Resilient Safer Cities Final Report
3-11
Summary
Impact potentials and regional differences by natural hazard, as described in this chapter, are summarized in Table 3.3.3 and Table 3.3.4, respectively. See the next page for an overall conclusion.
Table 3.3.3 Severity, Frequency and Impact Potential of Natural Hazards by Climate Projection
Source: JICA Expert Team
Table 3.3.4 Impact Potential of Natural Hazard by Region 1) Storm
Surge 2) Swell
Wave 3) Flooding 4) Drought 5) Tsunami
Regional Trend
High
High
Low
Mod.
High
Low
High
High
Mod.
High
High
Source: JICA Expert Team
5) Tsunami

Data Collection Survey on Building Climate Resilient Safer Cities Final Report
3-12
Conclusion
Climate projection that should be focused on: SLR
Major natural hazards for the Maldives include precipitation increase, SLR, and atmospheric and SST rise. Among these, SLR is the biggest concern that results in adverse impacts to the country that has long coastlines as well as narrow and low-lying land. Moreover, as shown in Table 3.3.3, SLR may intensify impacts of other natural hazards (swell waves and storm surges in particular), which should be addressed with the highest priority.
Climate projection that should be focused on: Swell waves
Among major natural hazards as shown in Table 3.3.3, 3) flooding and 4) drought are relatively small in terms of magnitude of disaster, as previously described. 5) tsunami brings massive damages but occurs quite rarely (once in 200 years or so), with less impacts of climate change. Meanwhile, 1) storm surge and 2) swell waves are the hazards that result to massive damage and are more sensitive to climate change. In particular, 2) swell waves occur more frequently than other hazards, which should be addressed with highest priority.
Regions that should be focused on: Islands in the south
Looking at hazards from swell waves and climate projections as previously described, the southern regions in the Maldives tend to be affected more than others as shown in Table 3.3.4. From natural and climate projections viewpoints, the islands in the south of the Maldives should be taken as the most important region to be addressed.

Data Collection Survey on Building Climate Resilient Safer Cities Final Report
3-13
<Reference>
1) P. N. DiNezio, M. Puy, K. Thirumalai, F.F. Jin, J. E. Tierney: Emergence of an equatorial mode of climate variability in the Indian Ocean: Science Advances, Vol. 6, no. 19, eaay7684 (2020)
2) J. H. Christensen, K. Krishna Kumar, E. Aldrian, S.-I. An, I. F. A. Cavalcanti, M. de Castro, W. Dong, P. Goswami, A. Hall, J. K. Kanyanga, A. Kitoh, J. Kossin, N.-C. Lau, J. Renwick, D. B. Stephenson, S.-P. Xie, T. Zhou, Climate Phenomena and their Relevance for Future Regional Climate Change (Cambridge Univ. Press, 2013), chap. 14, pp. 1217–1308.
3) J. M. Wallace, E. M. Rasmusson, T. P. Mitchell, V. E. Kousky, E. S. Sarachik, H. von Storch, On the structure and evolution of enso-related climate variability in the tropical pacific: Lessons from toga. J. Geophys. Res. Oceans 103, 14241–14259 (1998).
4) N. H. Saji, B. N. Goswami, P. N. Vinayachandran, T. Yamagata, A dipole mode in the tropical Indian Ocean. Nature 401, 360–363 (1999).
5) M. K. Roxy, K. Ritika, P. Terray, S. Masson, The curious case of Indian ocean warming. J. Clim. 27, 8501–8509 (2014).
6) X.-T. Zheng, S.-P. Xie, G. A. Vecchi, Q. Liu, J. Hafner, Indian ocean dipole response to global warming: Analysis of ocean–atmospheric feedbacks in a coupled model. J. Clim. 23, 1240–1253 (2010).
7) W. Cai, X.-T. Zheng, E. Weller, M. Collins, T. Cowan, M. Lengaigne, W. Yu, T. Yamagata, Projected response of the Indian Ocean Dipole to greenhouse warming. Nat. Geosci. 6, 999–1007 (2013).
8) G. Alory, S. Wijffels, G. Meyers, Observed temperature trends in the Indian Ocean over 1960?1999 and associated mechanisms. Geophys. Res. Lett. 34, L02606 (2007).
9) H. Tokinaga, S. Xie, A. Timmermann, S. McGregor, T. Ogata, H. Kubota, Y. M. Okumura, Regional patterns of tropical indo-pacific climate change: Evidence of the walker circulation weakening. J. Clim. 25, 1689–1710 (2012).
10) M. K. Roxy, K. Ritika, P. Terray, S. Masson, The curious case of Indian ocean warming. J. Clim. 27, 8501–8509 (2014).
11) Y. Du, S.-P. Xie, Role of atmospheric adjustments in the tropical Indian Ocean warming during the 20th century in climate models. Geophys. Res. Lett. 35, L08712 (2008).
12) F.-F. Jin, Tropical ocean-atmosphere interaction, the pacific cold tongue, and the el niño-southern oscillation. Science 274, 76–78 (1996).
13) W. Cai, A. Santoso, G. Wang, E. Weller, L. Wu, K. Ashok, Y. Masumoto, T. Yamagata, Increased frequency of extreme Indian Ocean Dipole events due to greenhouse warming. Nature 510, 254–258 (2014).
14) RIMES, Regional Integrated Multi-Hazard Early Warning System for Africa and Asia (2012): Climate change scenarios and their interpretation for Maldives, 47p.
15) IPCC (2014): Climate Change 2014 Synthesis Report, Intergovernmental Panel on Climatec Change, 151p.
16) Ministry of Environment and Energy Republic of Maldives (2016): State of Environment, 216p.
17) Ministry of Environment and Energy (2016): Second National Communication of Maldives, 142p.
18) Rayner, N., Parker, D. E., Horton, E., Folland, C., Alexander, L., Rowell, D., Kent, E. and Kaplan, A. (2003): Global analyses of sea surface temperature, sea ice, and night marine air temperature since the late nineteenth century. Journal of Geophysical Research: Atmospheres, p108.

Data Collection Survey on Building Climate Resilient Safer Cities Final Report
3-14
19) Asian Disaster Reduction Center (2018): Republic of Maldives Country Report, 38p
20) UNDP (2008): Detailed Island Risk Assessment in Maldives, Natural Hazard and Physical Vulnerability Assessment Report, Vol.1, Executive Summary, 35p.
21) Ministry of Environment, Energy and Water, Republic of Maldives (2006): National adaptation plan for action – NAPA, 98p.
22) The Association of Japanese Geographers (2009): Global Warming and Natural Disasters.

Data Collection Survey on Building Climate Resilient Safer Cities Final Report
4-1
VULNERABILITY TO CLIMATE CHANGE HAZARD Outline
The vulnerability assessment shown in the National Adaptation Plan for Action1) defined eight high-risk sectors which interact with the climate hazards, i.e.:
1) Land, Beach and Human Settlement 2) Critical Infrastructure 3) Tourism 4) Fisheries 5) Human Health 6) Water Resources 7) Agriculture and Food Security 8) Coral Reef Biodiversity
In addition, this Feasibility Study (F/S) will refer to vulnerabilities on policy and governance, gender and locality, together with the abovementioned eight sectors. In this chapter, the vulnerabilities to the climate change hazards under the eight sectors will be described.
1) Land and Coastal Geology (Natural Vulnerability and Human-induced Vulnerability) 2) Human Settlement and Critical Infrastructure 3) Economy (Tourism, Fisheries, Agriculture and Food Security) 4) Human Health 5) Water Resources 6) Coral Reef Biodiversity 7) Policy, Governance 8) Gender, Locality
In this chapter, “1) Land and Coastal Geology” will be described from the viewpoints of i) natural vulnerability based on the Maldives-specific natural and geological characteristics, and ii) human-induced vulnerability based on human factors.
Land and Coastal Geology
Natural Vulnerability
Natural vulnerability is susceptible to the impacts on the geological characteristics, e.g., land areas, land elevation, width of islands, and berm height. The land area of the Maldives is 298 km2, which is ranked as the 6th smallest country in the world. In terms of coastal line, the total length of the costal lines in the country is 644 km, and the ratio of the length of coastal lines to the land area is ranked 3rd in the world. There are 1,192 coral islands, and 96 % of the islands have less than 1 km2 in area, and only ten islands have areas more than 2.5 km2. The average width of 188 islands with inhabitants is just 500 m (Figure 4.2.1)2). As most of the islands are
Source: JICA Expert Team
Figure 4.2.1 Example of Inhabited Island in Maldives (Fonadhoo in Laamu Atoll)

Data Collection Survey on Building Climate Resilient Safer Cities Final Report
4-2
small and narrow, most of the residential areas and important facilities and infrastructures are located along and nearby the coastal lines, resulting in high vulnerability to natural hazards.
More than 80 % of the country's land is composed of coral islands with less than MSL (Mean Sea level) +1 m3). Islands in the Maldives are scattered throughout the 800 km long areas from the north to the south, and the average land elevation becomes low gradually from the north to the south4). For example, the average land elevation of the inhabited islands in the northern area ranges from MSL +1.0 m to 1.4 m, while the average land elevation at Gan Island in Laamu Atoll is just MSL +0.9 m. The lower land elevation makes it extremely vulnerable to SLR and coastal erosion.
Coastal erosion is considered as the most serious environmental problem in the Maldives2) as more than 97 % of inhabited islands reported coastal erosion in 2004, of which 64 % reported severe coastal erosion1) (Figure 4.2.2). The SLR will induce the increment of waves which reach to the beach. Due to the geographical characteristics of coral reefs, coastal erosion will be accelerating. Because of this, i) increment of damage to the facilities at the hinterland due to intrusion of high waves and resulting flooding, and ii) acceleration of the land loss of the country, will be induced. As mentioned above, because the Maldives has a high ratio of coastal lines to land areas, and small and flat lands, the acceleration of coastal erosion and weakening of the land due to future climate change will be much higher than in other countries.
Source: JICA Expert Team
Figure 4.2.3 Example of Cross Section of Inhabited Island (Hankede Area in Addu Atoll))
+1.2m+2.5m
Coral reef 150m
-0.5m 1:3 ~1:4
-0.1m
50m100m
+1.5m
Coral reef 800m
-5.0m
-2.0m
200m 100m 500m
1:8 ~1:10
Lagoon side Ocean side
0.0m1:8 ~1:10
Land area 150m
Reef edge
Storm ridge Storm ridge
(1) Meedhoo Island in Addu Atoll
(2) Maamendhoo Island in Laamu Atoll
Source: JICA Expert Team
Figure 4.2.2 Examples of Coastal Erosion at Inhabited Island

Data Collection Survey on Building Climate Resilient Safer Cities Final Report
4-3
The storm ridge (refer to Figure 4.2.3) has a natural protection function against intrusion of waves and sea waters into the land. Since the storm ridge is formed by wave action, the height of the storm ridge depends on the wave height. Therefore, the height of the storm ridge at the ocean side ranges from MSL +1.5 m to 2.5 m and higher than that of the lagoon side which ranges from MSL +0.7 m to 1.4 m4). The loss of sandy beach due to SLR, coast erosion, and the artificial modification on the beach will decrease the natural protection functions against waves.
Islands in the Maldives are scattered within an 860 km distance from the north down to the south. Vulnerabilities against each hazard differ from each other depending on the location. The northern parts of the Maldives have vulnerabilities against cyclones and extreme waves, and causing strong winds and storm surges, while the southern parts of the Maldives have higher vulnerabilities against swell waves, which would occur during the southwestern monsoon, as the many islands in the south are prone to be hit by such swell waves. Tsunami waves used to hit from the eastern side, and the islands located in the eastern sides are prone to be damaged compared with those in the western sides.
Human-induced Vulnerability
In addition to the abovementioned natural vulnerabilities, the physical and biological changes due to the human-induced vulnerability are accelerating the further deterioration of the natural vulnerabilities. The most severe impact is derived from the artificial modifications of coastal geography and environment, and inadequate utilization of the lands.
(1)Coastal Erosion due to Harbor Construction (Gan in Laamu Atoll)
(2) Loss of Coral Reef due to Large-scale Reclamation (Feydhoo in Addu Atoll)
Source: Processed by JICA based on QuickBird in 2003 and WorldView in 2018 procured by JICA
Figure 4.2.4 Examples of Artificial Modification
Gan島Feydhoo島Feydhoo島

Data Collection Survey on Building Climate Resilient Safer Cities Final Report
4-4
The artificial modifications at the coral reef and the coastal line due to construction of harbor, reclamation, and coastal protection facilities are causing the acceleration of coastal erosion and decrease of natural protection function of coral reef and beach against coastal-induced hazard (Figure 4.2.4). Furthermore, the encroachment of housing to the coastal area induces the decrease of coastal vegetation area and loss of storm ridge, which have also important natural protection function against coastal hazard (Figure 4.2.5). Decrease of coastal vegetation area leads to further exposure of housing and other land facilities against coastal-induced and other hazards, such as strong winds.
The development and expansion of the residential area due to the increase of residents in the inhabited islands induce the deterioration of coastal and coral environments, especially for coral habitat.
Human Settlement and Critical Infrastructure
Due to the natural setting in the Maldives, small size of the coral islands has very little or no option, rather build critical infrastructure in close proximity to the shoreline, hence makes it extremely vulnerable to adverse impacts of climate change. 3)
About 44 % of the settlement footprints of all islands are within 100 m of the coastal line. This translates to 42 % of the population and 47 % of all housing structures being within 100 m of the coastal line. Over the last six years since 2006, more than 90 inhabited islands have been flooded at least once, and 37 islands have been flooded regularly or at least once a year5). The weak structure of the houses combined with their poor protection makes the houses of these islands especially vulnerable to flooding events. Building setback is not a common option in areas with limited space available. Meanwhile, overpopulation is another factor to extend vulnerability. Already 34 of the inhabited islands do not have additional land for new housing in 20065).
More than 97 % of inhabited islands reported beach erosion in 2004, of which 64 % reported severe beach erosion. More than 45 % of the country’s 87 tourist resorts have also reported severe erosion (Shaig 2006). Acceleration of coastal erosion due to SLR and high waves will result in huge loss of land for both residential and tourism areas and damage to critical infrastructure facilities.
Significant investments have been made to develop the country’s infrastructure, which is highly vulnerable to sea level rise and storm conditions. The transport infrastructure, for example, includes three major commercial seaports, more than 128 island harbors, and five airports, of which two are international. The infrastructure of the two international airports is within 50 m of the coastal line.
Other critical infrastructure includes utilities and environmental services. The average width of inhabited islands is 566 m, and on both inhabited islands and resorts, 80 % of the powerhouses and 75 % of communications infrastructure are located within 100 m of the coastline. Also, 90 % of the islands have their waste disposal sites within 100 m of coastline and on the oceanward side of the island5).
Source: JICA Expert Team
Figure 4.2.5 Encroachment of Housing (Hithadhoo Island in Addu Atoll)

Data Collection Survey on Building Climate Resilient Safer Cities Final Report
4-5
If appropriate adaptation measures are not taken, frequent flooding could virtually obliterate the critical infrastructure, severely damaging the economy and threatening the safety and security of the people. The scale and magnitude of potential damage can be deduced from historical records. The flooding of 1987 caused damages of USD 4.5 million to the Male’ International Airport alone (MHAHE 2001). During the tsunami of 2004, damage to transport and communications infrastructures was estimated to be USD 73 million, with some 4,200 m of quay wall and 15,000 m of harbor/sea walls and breakwaters damaged or destroyed6).
Economy
Tourism
Naturally beautiful beaches and the presence of island resorts make tourism the main economic sector in Maldives. Tourists can choose to visit one of the 120 islands with operating resorts, ranging from small resorts with only 14 beds to larger ones with more than 900 beds.
About 70 % of tourists visit the Maldives primarily for beach holidays, which would be severely disrupted because of the loss of beaches. Already 45 % of tourist resorts have reported varying degrees of beach erosion7).
In addition to attracting tourists to its beaches, the Maldives is the “world’s leading dive destination” and the “Indian Ocean’s leading destination” 8). The area’s coral reefs thrive in a narrow temperature range and are highly sensitive to changes in temperature. Given the current predictions for an increase in the sea surface temperature (SST) and the observed relatively more frequent or persistent El Niño episodes, coral bleaching is expected to rise rapidly and significantly.
The major climate change impacts on the Maldives tourism sector are identified as shown in Table 4.4.1.9)
Table 4.4.1 Major climate change impacts on the Maldives tourism sector Major Climate Change Identified Impact
Increase in temperatures. Change and unpredictability in seasons, increase in cooling costs, heat stress for tourists, infectious disease increases.
Increasing frequency and intensity of extreme events.
Increased insurance costs/loss of insurability, business interruption costs.
Sea level rise Coastal erosion, loss of beach area, loss of coastal infrastructure, higher costs to protect and maintain beaches.
Sea surface temperatures rise Increased coral bleaching and marine resource and aesthetics degradation in dive and snorkel destinations
Changes in marine biodiversity Loss of natural marine attractions and species. Source: Second National Communication of Maldives October 2016
MINISTRY OF ENVIRONMENT AND ENERGY to the United Nations Framework Convention on Climate Change
Increase in Temperature
Sea-Sand-and–Sun is the main tourist product that the Maldives promotes for visitors. Increased global temperatures mean tourists from the colder climates would not need to travel as far to enjoy the warmer climate. This poses the risk of lowering number of visitors to the Maldives. Furthermore, as the temperatures increase, air conditioning costs would increase, hence increasing the operational costs of the tourism sector. Additional taxes on any aviation will further makes the industry vulnerable. Another

Data Collection Survey on Building Climate Resilient Safer Cities Final Report
4-6
threat posed by the increase in temperature is the spread of infectious diseases. Small temperature increases can greatly affect transmission potential. Resort operators as well as live aboard vessels in Maldives indicates that an outbreak of vector borne diseases (e.g. dengue) in nearby community could affect the staff turnover as well as tourist excursions.
Increase in Extreme Events
Storms and associated rain induced flooding and swell waves are the most common type of climate related extreme events experienced in Maldives. Increasing frequency and intensity of extreme events due to climate change increase the risks for tourism facilities and services. As Maldives tourism sector is slowly evolving from the seasonal destination to a year around destination, these seasonal climate events are likely to have more impact on tourism activities. The disruption to transport services, loss of property is likely to increase with the current climate trends/ projections10).The low elevation and near shore infrastructure at resorts makes it also very vulnerable to swell waves that are generated in the tropical and extra-tropical regions. In addition to flooding, swell waves also contaminate the groundwater of the islands leaving a lasting damage on the vegetation that is used for either aesthetical or agricultural purposes on the resorts. Another increased risk due to climate change is the increased insurance costs for Maldives.
Sea Level Rise
One of the most important and critical assets of a tourist resort islands in Maldives is the beach. Currently 60% of beaches are already facing varying degrees of erosion and encroachment 9). Rise in sea level aggravates the erosion issue as well as increase the risk of salt water intrusion into aquifers to a higher degree of risk from sea level rise and extreme events. The maintenance of natural beach is of paramount importance to attract tourists to the resorts and the construction of artificial structures designed to control and limit beach erosion are not aesthetically pleasing and also expensive. A modern resort with a bed capacity of 200 beds would cost a capital investment of more than 43 million dollars 1). This indicates that a risk of higher economic loss due to sea level rise in resort islands compared to other islands. Due to the small size of the islands, the infrastructures on the resort islands are in close proximity to the shore. In addition, in many resorts water bungalows and underwater infrastructures in the shallow lagoons are commonly seen. This subjects the resort infrastructure
Increase in Sea Surface Temperatures
Westmacott & Rijsberman 11) estimates 25% to 35% of the tourists visit Maldives for snorkeling and diving. Due to increase in sea surface temperatures, bleaching of coral reefs in the diving destinations are known to be the most eminent threats in the tourism dependent small low-lying destinations 12). The bleaching event of the 1997/1998 El-Nino caused more than 80% coral bleaching in Maldives 13).
In a perception study it has indicated that 68% of the tourist who visited Maldives in 1998-99 were unaware of coral bleaching event in Maldives that season 11). The estimated economic loss was around USD 3 million for that year. Thus the immediate impacts of coral bleaching due to short episodic events would not affect the industry on a noticeable scale 11).
However, higher mortality of corals due to increased SST is likely to impact larger and higher profile marine animals which depend on coral reefs (e.g. turtle, sharks and rays). Martin & Hakeem14) values the shark based diving industry in Maldives at USD 38.6 million. Anderson et al.15) estimated Manta-

Data Collection Survey on Building Climate Resilient Safer Cities Final Report
4-7
watching in Maldives to be worth about USD 8.1 million per year in direct revenue. Hence, the long term increase of SST due to climate change is likely to have a higher economic impact.
Fisheries
Predominant proportion of the fishery captures is tuna and tuna related species. Dynamics of marine fish stocks including tuna are linked to the climate variability. As the fishery of Maldives is entirely dependent on coral reef ecosystems, any impacts on these ecosystems will have a direct impact on fisheries sector. For example, tuna fishery is dependent on live bait which is caught from the reefs. In addition, a number of reef fish is extract for the export market and the resorts. The two main factors related to climate change that will impact fisheries are the changes in sea surface temperature and ocean pH.
The fisheries industry is highly vulnerable to climate change. For example, the migration of tuna fish, which may affect catches, is highly relevant to climate-related aquatic products, and vulnerable to sea surface temperature (SST) and other climate-induced factors in particular.
The waning tuna-fishing industry will directly affect the Maldives’ food security, as tuna fish is a major source of protein and essential item in every meal for the Maldivian. Meanwhile, declining fishes living in coral reefs will affect the residents who rely on the tourism and fisheries industries.
Acceleration of coastal disaster and coastal erosion due to SLR will cause damage to the fishery’s facilities and ports which are located at the coastal area and resulting in the decrease of catch and production.
Impact of Increased SST on Fisheries
Changes in ocean climate manifested through variation in sea surface temperature can affect the distribution, migration patterns of tuna and other pelagic fish species. Temperature is also likely to influence the survival of larvae and subsequent recruitment of fish. Large-scale distribution and displacement of skipjack tuna in the equatorial Pacific are well correlated with El-Nino Southern Oscillation (ENSO) events 16). Similarly, variability in the distribution and catch rates of tuna species has also been observed in association with the Indian Ocean Dipole (IOD). IOD is a basin-scale pattern of sea surface and subsurface temperatures that affect climate in the Indian Ocean. The environmental processes associated with the IOD that drive variability in tuna populations, however, are largely unexplored 17).
Therefore, better understanding of ocean variables that influence tuna will help to understand the changes in the distribution and abundance of tuna in the Maldives. Tuna catch statistics show spatial variations in the abundance and distribution of tuna in relation to north to south of Maldives. This variation distribution and abundance along the atoll chain and around seamounts has been reported in First National Communication (MHAHE, 2001)7). It is well documented that ocean upwelling’s (nutrient enrichment) associated with seamounts encourage productivity 18). Although few seamounts are associated with in the Maldives atoll chain, ‘Deraha’ and ‘Sato Raha’ both in one and half degree channel north of equator influencing this productivity, the oceanic ridge that form the basis for the atoll chain also create a barrier across the central Indian Ocean creating an upwelling in the leeward side of the ridge based on the monsoonal winds. In the northeast monsoon when the wind blows from east, there is

Data Collection Survey on Building Climate Resilient Safer Cities Final Report
4-8
high concentration of chlorophyll on the west side of the ridge and vice versa during southwest monsoon when the wind blows from west. This near-shore productivity is however, not reflected by tuna catch. Tuna catches are more prevalent on the eastern side of Maldives during northeast monsoon and western side during southwest monsoon.
It has been reported in FNC that tuna fishery of the Maldives is affected by the seasonal monsoon and other oceanographic variations along the long chain of atolls in the archipelago. Anderson19) reports that the tuna abundance are also affected by El Nino events. During the El Nino years of 1972-73, 1976, 1982-83, 1987 and 1992-94, the skipjack catch rates noticeably decreased, while the yellow fin and other tuna species increased. During La Niña years, the skipjack catch rates increased while those of the other major tuna species decreased.
Analysis of tuna catch for the two main species, yellow fin and skipjack tuna from 1971 -2012 based on adjusted effort are shown in Figure 4.4.1 and Figure 4.4.2 respectively.
Source: Second National Communication of Maldives October 2016
MINISTRY OF ENVIRONMENT AND ENERGY to the United Nations Framework Convention on Climate Change
Figure 4.4.1 Yellow Fin Catch per Unit Effort (CPUE) from 1997 to 2012
CPUE of skipjack tuna over 43 years was assessed to show whether the abundance of skipjack tuna for the years that have shown strong El Nino signals were same as that of the rest within this time frame. Skipjack tuna abundance during El Nino years was found to be lower compared to other years. Although the mean abundance of skipjack were low in El Nino years compared to non El Nino years, the difference was statistically not significant. Similar results were seen with Yellow fin tuna abundance during La Nina years compare to the normal years. Consolidation of the data on tuna abundance since the 2001 reporting based on the prior to 1990s and current assessment (1971-2012) support the general observation on the availability of abundance of tuna and its interaction with large scale climate variables, e.g. ENSO and IOD events. The severity of such impacts on tuna and related species is perhaps largely unknown with current knowledge in this field. For Maldives, where over 90% of export is marine products, especially tuna any significant change in the abundance and catch-ability of tuna will have economic consequences. As one of the highest consumer of fish per capita as their default protein source,

Data Collection Survey on Building Climate Resilient Safer Cities Final Report
4-9
decrease in abundance of seafood will not only affect the health but also change food security aspects of the economy.
Source: Second National Communication of Maldives October 2016
MINISTRY OF ENVIRONMENT AND ENERGY to the United Nations Framework Convention on Climate Change
Figure 4.4.2 Skipjack Tuna Catch per Unit Effort (CPUE) from 1997 to 2012
The oceanographic processes that depicts these decadal scale variations in tuna abundance in the Maldivian waters are not yet known. Also the stock structure of the skipjack and yellow fin in the Indian Ocean is not well known. More research needs to be undertaken in order to find any direct effects of climate change onto the fishery sector.
Impact of Ocean acidification on fisheries
As a result of CO2 exchange with seawater 21), pH and concentrations of carbonate in seawater will change. The relationship for the absorption of CO2 in seawater is also influenced by temperature 22) and there is the potential for calcification to facilitate a negative feedback on atmospheric levels 23). A drop of 0.5 pH units over the next 50 to 100 years is predicted. This has the potential to affect intracellular processes and the physiology of organisms such as coral development and physical development of planktons, molluscs, crustaceans and fishes. All of these organisms therefore, are at risk from ocean acidification 21). This will have an impact on the food production and availability in the food chain.
Literature, on likely impact of change in ocean chemistry on tuna has identified four ways. These include in change in pH would increase change carbonic acid in body fluids that is likely to lower blood pH, a likely factor to change physiology resulting various energy costs. Additional ways that would affect tuna include, effects on growth and formation of ear bones (otholiths) may be susceptible to lower pH because they are aragonite based 24). Otoliths are important for orientation and hearing. Reduced availability of calcium carbonate is also likely to cause indirect effect on the distribution and abundance of tuna by changing availability of species of calcifying planktons within the lower trophic level of the food web that support tuna. Tuna is also likely to be affected by change in acoustics due to change pH.

Data Collection Survey on Building Climate Resilient Safer Cities Final Report
4-10
Agriculture and Food Security
Agriculture is extremely important for the Maldives in terms of food security, nutrition, and income, which accounts for 1.2 % of its GDP in 2019.44) Small size of coral islands with porous sand, makes production of agricultural products extremely challenging. According to Shabau 25) only 30 km2 of cultivable land available throughout the archipelago. This is further exacerbated with limited fresh water available for irrigation on these small islands. Hence, agriculture is limited, making food availability a major concern for the Maldives.
Impacts of climate-induced hazards are huge and emerge in various ways: heat stress to plants, changes in moisture and temperature of soil, loss of fertile soil from surface erosion, water shortage for growing crops, changes in underground water level, water salination, land loss due to sea level rise, and so on. These impacts will worsen the current situation of the Maldives’ agriculture which has already been under stress from poor soil, limited land area, and water shortage.
The agricultural production and trading faces risk from damages from extreme events. Particularly from storms and its associated winds, rains and surges. Effects of flooding due to sea swell are much long lasting due to salt contamination of ground water. In 2007, 12 out of 20 atolls reported varying levels of agricultural damages due to strong wind felling fruit bearing trees (papaya, breadfruit, banana and palms).
Moreover, if extreme weather events hit the Maldives more frequently due to climate change, they will stop food transportation by sea to small islands (other than the major inhabited islands), which will worsen the food storage issues that each island faces, both in the long term and in urgent time. Airports and seaports are the main gateways for importing food into the country. These facilities or critical infrastructures are identified as being very vulnerable to impacts of climate change. Any damages to the critical infrastructure or climate events that inhibits the operation/use of any of these structures could impact importation of food into the country. Increase in extreme events due to climate change further impacts the supply and distribution and hence food security in Maldives. In addition to these facilities the entire supply chain from loading ports to the transport routes are also exposed to the direct impacts of climate change and extreme events.
Human Health
Climate change can modify ecosystems in ways that not only increase physical disease but also create health burdens that affect mental and social well-being (Comrie, 2007)3). The dispersed nature of the islands poses a special challenge in accessing health facilities around Maldives. Although each island has primary health facilities, higher tiered facilities are limited to atoll capitals and population centres.
Direct health impacts
There has not been an assessment done in the Maldives to find the exact relationship between climate change and health impacts. The anticipated climatic factors that have direct health impacts in Maldives are heat and extreme events. The climate model downscaling exercise predicts an increase of 1.67-3.72°C in temperature by the end of 21st century which could lead to an increase in frequency and intensity of heat waves in the future3). IPCC concludes heat-related mortality increases in countries with limited adaptive capacities and large exposed populations26). A semi-structured interviews conducted under SNC in selected islands to outline their perception on climate change impacts. Table 4.5.1

Data Collection Survey on Building Climate Resilient Safer Cities Final Report
4-11
summarizes the issues highlighted by the respondents as major concerns and emerging issues facing the islands. Participants raised concerns over increasing temperatures and related health impacts such as skin irritation and dehydration particularly among labourers was also highlighted by many participants. Some participants believe that deaths in elderly populations may have been due to heat.
Table 4.5.1 Summary findings of health related impacts Location (Atoll/Island) Main Concerns
HDh. Kulhudhuffushi hotter days dehydration skin irritation Urinary Tract Infections Eye irritation Respiratory diseases Increase in dust accumulation.
AA. Rasdhoo Skin diseases (Itchiness, rashes), Hotter days
AA. Thoddoo Respiratory diseases Dehydration.
Addu City Hotter days Dehydration, Dryness due to loss of green vegetation is the reason. Source: Second National Communication of Maldives October 2016
MINISTRY OF ENVIRONMENT AND ENERGY to the United Nations Framework Convention on Climate Change
There is an increase in the extreme events in Maldives. Future climate predictions indicate that frequency and intensity of these events will increase as mentioned earlier. The relation of health impacts, such as physical injury and mortality from these events have not been studied in the Maldivian context. Lack of information on direct health impacts are hindering factors for such an analysis. In the qualitative survey, participants highlighted disruption of transport and reduced accessibility to health facilities due to extreme events.
Indirect Impacts
Indirect health effects of climate change include secondary effects caused by changes in ecology and social systems. One of the most prominent indirect impacts is the impacts due to vector borne diseases. Vector borne diseases such as Malaria and Filaria has been eradicated in Maldives. Dengue, Chikungunya and Scrub-typhus are the main vector borne diseases of concern.
Dengue has been endemic in the Maldives since 1979. Since then outbreaks have been recorded almost every year with significant out breaks in some of the years. Historical outbreaks were recorded in 1988, 1998 and 1999 and more recently in 2006, 2007, 2011 and 2015 as seen in Figure 4.5.1. Relations with dengue outbreaks and ENSO events have been established in various regions. Depending on the severity of the ENSO event, the outbreaks have occurred with a time lag after the actual ENSO event 27). A similar result is seen in Figure 4.5.1 indicating that there is close relationship between dengue outbreaks and El- Nino events in Maldives.

Data Collection Survey on Building Climate Resilient Safer Cities Final Report
4-12
Source: Second National Communication of Maldives October 2016
MINISTRY OF ENVIRONMENT AND ENERGY to the United Nations Framework Convention on Climate Change
Figure 4.5.1 Total number of reported cases
In addition to the inter-annual variations such as the El- Nino events, seasonal variations of dengue episodes are observed in Figure 4.5.2. A lagged correlation between the rainfall episodes and the dengue outbreaks are evident in the central Maldives. Due to poor quality of data available, this relationship was difficult to establish in the northern and southern regions of Maldives. The results strongly suggest the epidemic dynamics of dengue fever is influenced by climate variability.
Source: Second National Communication of Maldives October 2016
MINISTRY OF ENVIRONMENT AND ENERGY to the United Nations Framework Convention on Climate Change
Figure 4.5.2 Reported dengue cases and long term mean rainfall (2005- 2013)
Other vector borne diseases that are re-emerging in the Maldives are scrub typhus and chikungunya. The scrub typhus data (Figure 4.5.3) indicates that cases increases in the Maldives during the monsoon.

Data Collection Survey on Building Climate Resilient Safer Cities Final Report
4-13
Chikungunya was first diagnosed in 2006. The most recent outbreaks of Chikungunya was observed in 2009 and 2010 after which it has been drastically reduced as seen in Figure 4.5.4 indicating that solid measures have been taken to control the outbreak of the disease.
Source: Second National Communication of Maldives October 2016
MINISTRY OF ENVIRONMENT AND ENERGY to the United Nations Framework Convention on Climate Change
Figure 4.5.3 Scrub Typhus cases reported monthly from 2011-2013
Source: Second National Communication of Maldives October 2016
MINISTRY OF ENVIRONMENT AND ENERGY to the United Nations Framework Convention on Climate Change
Figure 4.5.4 Reported Chikungunya cases
Food and Waterborne Infections
Food and water borne diseases are not commonly seen in Maldives. Heavy rainfall with flooding promotes the transmission of pathogens when there is no secure disposal of faecal waste. Due to the

Data Collection Survey on Building Climate Resilient Safer Cities Final Report
4-14
poor sanitation systems and pollution of the groundwater, the chances of spreading water borne diseases would be high.
Acute Gastroenteritis is the main food and water borne disease reported in Maldives. It is a bacterial disease transmitted through the ingestion of food or drink contaminated by the faeces or urine of infected people. Acute Gastroenteritis was also expressed as a concern during flood events among the surveyed population.
Air Quality
The most comprehensive air quality assessment was the Comparative Risk Assessment carried out as part of the 2010 Global Burden of Disease Project. It found that the combined health impact of the household exposures to particle air pollution from poor combustion of solid cooking fuels, plus general ambient pollution, was about 6.8 million premature deaths annually, with about 5% overlapping globally. However, in Maldives the main source of cooking fuel is LPG with very limited use of kerosene. The main source of air pollution in Maldives is mobile fuel combustion and open burning of waste in most outer islands, where as in the capital city Malé, it’s mainly from vehicle emissions and cement duct from construction. This pollution is amplified with congestion and high population density.
The poor air quality and the acute respiratory diseases (ARI) is a well-established link globally. Given the small and clustered space available in the Maldives, the chances of exposure to air pollution is high and thus to respiratory diseases.
Water Resources
Freshwater resources would be directly impacted by the predicted rise in global temperatures, sea level and also possible decrease in rainfall. For small islands like the Maldives, with limited fresh water it is important to realize the possible impacts on water resources from the impacts of climate change. This assessment, using a desk review and field work at selected islands looks at the vulnerability of water resources in the Maldives. Quality of groundwater and availability of rainwater are used as the main indicators for assessing the vulnerability of the case study islands to the impacts of climate change.
Groundwater
The groundwater, deposited in the freshwater lenses, located 1 m to 1.5 m underground, used to be the drinking water of the people in the past, and now around 90 % of people use rainwater for drinking and cooking. In addition to the over-pumping of water from the freshwater lenses, there will be possibilities for such water to be exhausted due to the prolonged dry seasons.
Saltwater intrusion to the freshwater lenses could occur due to the assumed floods caused by sea level rise and swell waves. Saltwater intrusion will affect the soil condition, vegetation and terrestrial ecosystem, resulting in severe losses in the agriculture sector.
Samples taken in the study islands show that groundwater from all four islands were contaminated with faecal coliforms (Table 4.6.1). According to the surveys conducted none of the islands have a proper sanitation system in place. All households practice onsite sewage and wastewater disposal through septic tanks systems. Studies conducted by Falkland28) confirmed wide spread groundwater contamination with domestic sewage due to absence of appropriate sanitation system and uncontrolled pumping of groundwater from wells across Maldives.

Data Collection Survey on Building Climate Resilient Safer Cities Final Report
4-15
Table 4.6.1 Indicators of groundwater quality in study islands Water quality
parameters (averages) B. Hithaadhoo Hithadhoo, Addu city Gn. Fuvahmulah Ga. Dhekanbaa
pH 8.0 7.5 7.6 8.8 Electrical Conductivity
(μS/cm) 1108.3 824.7 687.8 1725.6
Salinity (‰) 0.9 0.5 0.3 12.6 Percentage of samples
positive with faecal coliforms (%)
100.0 60.0 100.0 100.0
Faecal Coliform counts (CFU/100ml)
97.0 59 54.0 45.5
Source: Second National Communication of Maldives October 2016 MINISTRY OF ENVIRONMENT AND ENERGY
to the United Nations Framework Convention on Climate Change
Rainwater
Future regional climate change scenario shows that though the Maldives would experience high intensity monsoonal rainfall events, the number of rainy days are likely to decrease. This would have an impact on availability of rainwater for communities as a source of water.
Rainwater is harvested over the roof top via the domestic houses and public buildings. Figure 4.6.1 shows the total rainwater storage capacity in the atolls and the per capita storage. It is noted that more storage space is available in the north and the south of Maldives compared to the central Maldives.
Analysis of the dry period showed that the maximum number of observed consecutive dry days are 56, 38 and 32 in the north, central and southern atolls of Maldives respectively. Considering a water consumption of 10 L/ capita/day 29) and the maximum number of consecutive dry days, the required amount of storage to cater the dry period was compared against the current available storage. Figure 4.6.2 shows that northern and central are more vulnerable to elongated dry periods. These regions with low per capita storage as in Figure 4.6.1 and the most number of requests made for water during the dry periods as shown in Figure 4.6.3.

Data Collection Survey on Building Climate Resilient Safer Cities Final Report
4-16
Source: Second National Communication of Maldives October 2016
MINISTRY OF ENVIRONMENT AND ENERGY to the United Nations Framework Convention on Climate Change
Figure 4.6.1 Rainwater storage capacity by atolls
During the field investigations, it was found that some of the storage tanks provided were not connected due to capacity constraints and lack of awareness. In addition to the climatic factors, these constraints would further increase the vulnerability of water sector.
While the issue of sufficient availability remains, another important consideration is the quality of rainwater collected. Testing for faecal coliforms was carried out from 10 and 4 well respectively from Hithadhoo and Fuvahmulah. All samples tested showed contamination level of 43 CFU/100 ml and 55 CFU/100 ml in Hithadhoo and Fuvahmulah, respectively. In previous studies, it was found that there were instances where rainwater quality was not at acceptable level, for instance studies conducted by Maldives Water and Sanitation Authority (MWSA) in Laamu Gan Island found that 45% of the samples tested were positive for faecal coliforms 30). Similar studies conducted in Addu Atoll recently, found that rainwater collected in community tanks were contaminated with E.coli bacteria, which the local health authorities believed are due to unsafe harvesting 31). It is important that safe methods are used in rainwater harvesting and storage and rooftops are thoroughly cleaned prior to use.

Data Collection Survey on Building Climate Resilient Safer Cities Final Report
4-17
Source: Second National Communication of Maldives October 2016 MINISTRY OF ENVIRONMENT AND ENERGY
to the United Nations Framework Convention on Climate Change
Figure 4.6.2 Deficit water storage with respect to current storage capacity
Source: Second National Communication of Maldives October 2016 MINISTRY OF ENVIRONMENT AND ENERGY
to the United Nations Framework Convention on Climate Change
Figure 4.6.3 Number of requests made for emergency water during the dry period from 2005-2014.
Such on-site contamination is cause for alarm and there is further concern of rainwater contamination by air pollutants. Trans-boundary air pollution, known as the Asian Brown Cloud, from the Indian sub-continent is of concern to the rainwater quality in the Maldives. Das et al. 32) shows an increase of

Data Collection Survey on Building Climate Resilient Safer Cities Final Report
4-18
pollutants (SOx, NOx and Ammonium) and an overall decrease in pH during the months of December and January in rain water during using Maldives Climate Observatory in Hanimaadhoo (MCOH) as seen in Figure 4.6.4. It is important that mechanisms are established to monitor impacts of such pollution on local rainwater and take appropriate measures.
Source: Second National Communication of Maldives October 2016
MINISTRY OF ENVIRONMENT AND ENERGY to the United Nations Framework Convention on Climate Change
Figure 4.6.4 Summary by month of measured pH of water quality from MCOH
Coral Reef Biodiversity
The Maldives has a diverse coral ecosystem and considered to have the 7th widest coral reef in the world. As of the outstanding biodiversity, the Maldives houses more than 1,090 species of fish, 36 species of sponges, 180 species of hermatypic corals, and 250 species of ahermatypic corals, in addition to nine species of whales, seven species of dolphins, 15-20 species of sharks, and five species of sea turtles.
Corals are very sensitive to sea water temperature rise, and sea water temperature has already been higher than the threshold temperature that is optimal for the better growth of some coral species. The sea surface temperature (SST) anomalies cause coral bleaching. Coral reefs are also vulnerable to sea level rise, and the coral reefs found in the Maldives have already grown to reach the upper limit of the sea surface level, and there is no more room for the corals to grow further upward. Although the sea level rise may give opportunities to the corals to grow upward, it would be difficult for the corals to apply the sea level rise naturally, as the coral growth rate cannot keep up with the pace of sea level rise, accompanied with SST.
Impact of Sea Surface Temperature (SST) on coral reef
Increase in SST has been documented as one of the major factors causing death of corals and other zooxanthelate animals in tropical coral reefs 33). The Maldive-Chagos archipelago is historically the warmest region in the Indian Ocean 34). Coral bleaching has been observed in the Maldives in 1977, 1983, 1987, 1991, 1995, 1997 and 1998. The 1998 event was the most severe causing unprecedented damage to coral reefs , with more than 90% of corals wholly or partially bleached (Ali & Manik, 198935); MRC, 199836); Riyaz et al., 199837)). In recent times similar warm episodes with coral bleaching have

Data Collection Survey on Building Climate Resilient Safer Cities Final Report
4-19
been observed in 2005 and 2010 deviating significantly from the long-term (1951- 2010) SST mean (Figure 4.7.1). These recurring events hindered the recovery process from the 1998 bleaching event.
Source: Second National Communication of Maldives October 2016
MINISTRY OF ENVIRONMENT AND ENERGY to the United Nations Framework Convention on Climate Change
Figure 4.7.1 Monthly variation of SST across Maldives
Large parts of coral community in shallow reef areas across the Maldives was intensely bleached due to the 1998 event causing heavy mortality. Comparison of available data from various sources showed that pre bleaching status of the reefs has 40-60% live coral cover in terms of health of the reefs and plummeted to less than 3% after a bleaching event 38). Since the event, Maldives Marine Research Centre (MRC) started national coral reef monitoring program by continued monitoring of the 15 reefs that were assessed to study impact of bleaching in 1998.
Significant increase in coral cover has been observed since the 1998 bleaching event. Coral cover in the northern atolls has increased from 1% in year 2000 to over 36% in 2012. Similar recovery patterns are observed in other atolls. (Figure 4.7.2).

Data Collection Survey on Building Climate Resilient Safer Cities Final Report
4-20
Source: Second National Communication of Maldives October 2016
MINISTRY OF ENVIRONMENT AND ENERGY to the United Nations Framework Convention on Climate Change
Figure 4.7.2 Atoll specific pattern of recovery of coral sites
However, this variation in reef recovery rates reduced over a longer span of time. Recovery rates from 1998 to 2012 showed rates ranging between 2.1 and 3.5% per year at atoll scale and 2.4 to 2.8 at regional scale (Figure 4.7.2 and Table 4.7.1). The data showed that it takes over a decade or perhaps a couple of decades for reefs to attain their former status (40-60% of live coral coverage).
It is apparent that the reefs are in state of recovery. Any other natural or anthropogenic pressure on the reefs will impede this. Increase in SST is likely to escalate recurrence of bleaching.
Table 4.7.1 Rate of reef recovery from 1998-2012 Region Rate of recovery (% per year)
Haa dhaal atoll 2.41 Kaafu atoll 2.14 Ari atoll 3.54 Vaavu atoll 3.18 Addu City 3.04 North region (6 °-7 ° N; 73 °-74 ° E) 2.41 Central region (3°-5 ° N; 73 °-74 ° E) 2.86 South region (1 ° N-1 ° S; 73 °-74 ° E) 2.78
Source: Second National Communication of Maldives October 2016 MINISTRY OF ENVIRONMENT AND ENERGY
to the United Nations Framework Convention on Climate Change

Data Collection Survey on Building Climate Resilient Safer Cities Final Report
4-21
Future climate projections of the SST shows and increase over all regions of the Maldives as seen earlier. With the historic threshold of SST reaching 33°C for coral bleaching and using the baseline SST and the projected SST, it was found that the severity of bleaching will get higher with change of climate as seen in Figure 4.7.3 (MEE, 2015a)39).
Source: Second National Communication of Maldives October 2016
MINISTRY OF ENVIRONMENT AND ENERGY to the United Nations Framework Convention on Climate Change
Figure 4.7.3 Projected impacts of coral bleaching
Impact of Ocean Acidification on Coral Reef
Ocean acidification is a consequence of absorption of carbon dioxide and is described as the “other impact of high emissions”. Ocean acidification is not a symptom of climate change, rather, it is a threat concurrent with climate change and caused by a common root problem of ongoing anthropogenic CO2 emissions.

Data Collection Survey on Building Climate Resilient Safer Cities Final Report
4-22
Oceans have absorbed at least 30-40% of the excess CO2 produced by human activities22) and 40). Over the past 250 years surface ocean pH is estimated to have decreased from approximately 8.25 to 8.14 41). This decreased pH in combination with other ocean biogeochemical changes could undermine the functioning of marine ecosystems and disrupt the provision of many goods and services associated with the ocean. In particular, it decreases the saturation states of carbonate minerals. It is important to note that most tropical reef building corals are aragonite based which is more susceptible to dissolution than calcite21). The reduced saturation states of carbonate significantly reduce the ability of reef-building corals and hence affect reef structures that house hundreds of thousands of marine species.
Several controlled experiments in Great Barrier Reef (GBR) of calcification rates under elevated CO2 levels confirm that calcification rates decrease with increasing CO2 levels 42). These measurements suggest that calcification rates may decrease by up to 60% with a doubling of atmospheric CO2 concentrations by end of 21st century. This may put reef structures into net erosion with long-term implications for coastal protection, degradation of reef framework that provides habitats for several organisms that form part of the overall ecosystem 43). In light of these findings in GBR and elsewhere where coral reefs are exposed to similar condition in the Maldives it is expected that similar suit is likely to follow. Such projected impacts are of a serious concern for the reefs of Maldives where they are already exposed elevated sea surface temperatures.
Policy and Governance
After the Indian Ocean Earthquake and Tsunami in 2004, the “Safer Island Policy” was shown by the Maldivian government to actively promote the concentration of people and resources to the main islands in each atoll. While this policy is currently not actively in place due to practical difficulties with limited resources and administrative capacities, the movement and migration of the people from the surrounding islets to the base and main islands of each atoll are being carried out, due to the specific conditions and reasons of each atoll and islet/ island. In case of Gan and Fonadhoo, which are the base islands in Laamu Atoll, the residential areas for the migrants from the surrounding islets are actively being constructed Figure 4.8.1). The population density of the inhabited islands in the Maldives is quite high compared with other countries. Some of the main islands have already become more densely populated. The concentration of the population may lead to the disappearance of the natural idle lands and acceleration of vulnerabilities due to the expansion and exposure of the residential areas to the coastal areas.
In the Maldives, the Ministry of National Planning, Housing and Infrastructure (MNPI) is responsible for planning the infrastructure development projects along the coastal areas, such as harbor construction and land reclamation, while the Ministry of Environment, Climate Change and Technology (ME) is
Source: JICA Expert Team
Figure 4.8.1 New Residential Area for Migrants (Fonadhoo in Laamu Atoll)

Data Collection Survey on Building Climate Resilient Safer Cities Final Report
4-23
responsible for planning and implementing coastal protection projects. In the coastal areas, as the coastal lines are being deformed due to sand movement in response to changes of external forces such as waves and currents, coastal development projects have larger impacts on wider coastal areas compared with the development projects on lands. Therefore, it is necessary to examine the pros and cons of the projects, by considering the appropriate impacts on the development projects, to formulate the action plans and implement adequate monitoring and maintenance after the project completion. However, at this moment, due to the shortage of sufficient information sharing and mutual and common understanding among the related authorities and organizations, the systems and structures for planning, designing, and management necessary for co-existing and co-prospering with the coast development policy and coastal economic infrastructure development are inadequate, and the capacity of the stakeholders to implement is also insufficient. As a result, the function of natural infrastructure of the coastal areas is deteriorating due to the inadequate development and modification of the coastal areas. The development and modification of the coastal areas due to weak organization structure and shortage of capacity of stakeholders have become one of the factors that increase vulnerability of the coastal areas.
As coastal erosion and high wave and flooding damage due to coastal erosion have become apparent, especially for the inhabited islands in the Maldives, the budgets of USD 0.65 million to USD 10 million per year are being used for the implementation of coastal protection measures. However, as more than 80 % of nearly 200 inhabited islands are suffering from coastal erosion, the budgets are completely inadequate in order to cover costs in implementing coastal protection measures for all the inhabited islands. As a result, the comprehensive measures to improve the target coastal areas cannot be implemented, and most of the measures which have been taken so far are coastal revetment measures, which are locally and uniformly implemented, resulting in the further deterioration of the coastal environment and coastal erosion.
At the time of the 2004 Indian Ocean tsunami, 108 deaths and missing persons were recorded, and the lack of systematic efforts and measures related to early warning, information transmission and evacuation during the event is said to be one of the reasons of the deaths and missing persons. In order to enhance the measures and response before and right after disaster events and to secure the safety and security of the people during disasters, some issues have been identified. Based on the recognition of the possibilities of coastal disaster, the following issues could be obstacles to solve such problems: i) lack of systems for early warning and information transmission on the coastal disaster in order for the administrations and local people to recognize and understand the possibilities of coastal disaster, and ii) insufficient capacity building and budget for such early warning and information transmission.
In order to tackle the problems related to future climate change, based on the understanding of phenomena related to the external forces and topographic changes, the following tasks should be secured: i) acquisition of necessary data related to climate change in the Maldives, ii) securing of human resources to evaluate and judge appropriately based on the gathered data, and iii) appropriate operation of such data acquisition and evaluation/judgement. However, the systems and human resources necessary for the abovementioned tasks are lacking in the Maldives. In addition, in order to secure long-term and sustainable maintenance of the coastal areas, not only the administrative interventions, but also the involvement and participation of the local people who use the coastal areas are required for the sustainable coast management. While the Maldives has much more beautiful and richer seas and coasts compared with other countries, the people inhabiting the islands are not conscious enough of the

Data Collection Survey on Building Climate Resilient Safer Cities Final Report
4-24
conservation of coastal and reef environments, and as a result, in many inhabited islands, those actions and measures are not being conducted sufficiently to connect with the community-based actions related to coastal environment conservation and maintenance and management of the coastal areas.
Gender and Locality
The Maldives has the highest divorce rates in the world, and 10.97 divorces out of each 1000 persons in 2012 and 8.0 divorces in 2015 occurred, respectively. It is also reported that the average 30-year-old Maldivian females divorced three times. Therefore, more than 40 % of registered households are headed by women, and many households are those without adult men. The poverty rates of the female-headed household (8.8 %) are slightly higher than those of male-headed household (7.8 %), and these higher poverty rates are most likely associated with differences in labor market characteristics for females: only 43 % of Maldivian women are engaged in the labor market compared with 79 % of Maldivian men45). Even in the male-headed household, the women in the household have much responsibilities to take care of children, elders and disabilities in their houses. Therefore, in the case of disaster such as heavy rain and flooding, it is said to be difficult for the women to get necessary evacuation information and evacuate from their houses together with their children, elders and those with disabilities.
In the Maldives, both major employment sectors, tourism and fishing, are dominated by men, and most of the vessels and boats, which are used for both sectors, are owned by men and not by women. They are often bound by duties related to household maintenance, and are employed in low paid fields which are deemed “unworthy” for men, which contributes to women’s increased vulnerability, especially during the disaster, as they lack access to resources and movement between islands46).
Conclusion
The Maldives is composed of 1,192 flat and narrow coral islands, which are formed by coral sand and gravel, deposited by wave action over the years. There are 188 inhabited islands, in which residential areas and important infrastructures are located inside the flat and narrow islands. Most of the residential areas and important infrastructures are located within 100 m from the coastal lines. According to the specific geological features and high exposure situations of the residential areas and important infrastructures, which are located nearby the coasts, the Maldives are more vulnerable to natural hazards, such as high waves, storm surge and flooding, compared with other island countries. The SLR due to climate change in the future will accelerate the occurrence of natural hazards such as increment of wave height, which will reach the coast, together with SLR.
Recently, the most serious environmental problems in the Maldives are the increment of flooding due to high wave and the impact on the loss of lands due to the revealed coastal erosion. The SLR and heightening of wave height, associated with SLR due to climate change, accelerate the coastal erosion, resulting in the increase of pace of the loss of national lands, increasing exposure risks to the coastal residential areas and important infrastructure, and making the damages by high waves and flooding great and severe in terms of scale and frequency.
The centralization of human and resources to the coastal areas in the inhabited islands and artificialization of the coastal lines by constructing harbors, reclamation, and other coastal protection facilities cause the decrement of protection functions and drainage functions, most of which are natural

Data Collection Survey on Building Climate Resilient Safer Cities Final Report
4-25
sandy beaches and coral reefs that the Maldives used to have. This results to the acceleration of coastal line changes and coast erosion, and to the increase of the vulnerabilities against the climate change hazards in the future.
Due to the shortage of sufficient information sharing and basic mutual understanding among the relevant authorities related to the development of off-shore and coastal areas, necessary coast policies have not been prepared for maintaining the natural protection functions. In addition, the appropriate planning, designing, and management systems are insufficient for coexistence and coprosperity with nature. Development of economical infrastructures in the coastal areas, and capacities for the abovementioned tasks are also insufficient. As the results suggest, the natural infrastructure functions are deteriorating due to inadequate development and modification of coastal areas.
There are many inhabited islands where necessary measures to lead the community-level actions related to conservation and maintenance/management of coastal environment have not been taken due to the low awareness concerning the conservation of coastal areas and reef environment by the local residents who actually utilize the areas.
The labor force rate of women is lower than that of men in the Maldives. Basically, women have the responsibility to take care of children and elderly in their houses as the Maldives’ general family style. Because of this, information acquisition and communication during a disaster event, and evacuation are limited and insufficient for women compared with men.
As the results of the study show, the vulnerabilities against climate change will further increase because of the following reasons:1) natural characteristics specific to the Maldives, especially geological features, 2) enlargement of climate change hazards, especially increment of hazards on SLR and increase of wave height reaching to the coastal areas, 3) further loss of national lands accelerating coastal erosion due to SLR, enlargement of exposure risks of residential areas and important infrastructure along the coastal areas, and increment of damage due to high waves and flooding, 4) increment of exposure risks for the residential areas and important infrastructure due to further development of and centralization to the coastal areas in accordance with economic development, 5) inadequate development and modification of the coastal areas due to the shortage of implementation structures and capacities to conduct coastal development and protection, associated with the decrement of natural infrastructure functions, 6) decrement of awareness of the residents for the coastal areas, and lack of management and maintenance of the coastal areas by the local communities, and 7) limitation on information sharing/communication and evacuation means for the women, elderly, and children during a disaster event.

Data Collection Survey on Building Climate Resilient Safer Cities Final Report
4-26
<References> 1) Ministry of Environment, Energy and Water, Republic of Maldives (2006): National adaptation plan
for action – NAPA, 25p, 26p, 98p. 2) Ministry of Environment and Energy Republic of Maldives (2016): State of Environment, 216p. 3) Ministry of Environment and Energy Republic of Maldives (2016): Second National
Communication of Maldives, 142p. 4) UNDP (2008): Detailed Island Risk Assessment in Maldives, Natural Hazard and Physical
Vulnerability Assessment Report, Vol.1, Executive Summary, 35p. 5) Shaig, A. (2006): Climate change vulnerability and adaptation assessment of the land and beaches
of Maldives, technical papers to Maldives national adaptation plan of action for climate change 6) World Bank (2005): National Recovery and Reconstruction Plan 7) MHAHE (Ministry of Home Affairs, Housing and Environment) (2002): First National Report of
the Maldives to the Convention on Biological Diversity. Male’, Maldives 8) World Travel Awards (2006) 9) Scott, D., Amelung, B., Becken, S., Ceron, J.-P., Dubois, G., Gössling, S., Peeters, P. and Simpson,
M. C. (2008). Climate change and tourism: Responding to global challenges. Madrid, Spain: World Tourism Organization and the United Nations Environment Programme.
10) Solomon, S., Qin, D., Manning, M., Chen, Z., Marquis, M., Averyt, K., Tignor, M. M. B. and Miller, H. L. (2007). Climate Change 2007-the physical science basis: Contribution of Working Group I to the Fourth Assessment Report of the Intergovernmental Panel on Climate Change. Cambridge University Press.
11) Westmacott, S. and Rijsberman, F. (2000). Cost-effectiveness analysis of coral reef management and protection: a case study of the republic of the Maldives. In: Integrated coastal zone management of coral reefs: decision support modeling (Kent Gustavson, Richard M. Huber, H. Jack Ruitenbeek). World Bank Publications. pp.67–81.
12) Perch-Nielsen, S. L. (2008). Climate change and tourism intertwined. 13) Edwards, A. J., Clark, S., Zahir, H., Rajasuriya, A., Naseer, A. and Rubens, J. (2001). Coral
bleaching and mortality on artificial and natural reefs in Maldives in 1998, sea surface temperature anomalies and initial recovery. Marine Pollution Bulletin, 42: 7–15.
14) Martin, R. A. and Hakeem, A. A. A. (2006). Development of a sustainable shark diving ecotourism industry in the Maldives: Challenges and opportunities. Maldives Marine Research Bulletin, 8: 1–53.
15) Anderson, R. C., Adam, M. S., Kitchen-Wheeler, A.-M. and Stevens, G. (2011). Extent and economic value of manta ray watching in Maldives. Tourism in Marine Environments, 7: 15–27.
16) Lehodey, P., Bertignac, M., Hampton, J., Lewis, A. and Picaut, J. (1997). El Nino Southern Oscillation and tuna in the western Pacific. Nature, 389: 715–718.
17) Lan, K.-W., Evans, K. and Lee, M.-A. (2012). Effects of climate variability on the distribution and fishing conditions of yellowfin tuna (Thunnus albacares) in the western Indian Ocean. Climatic Change, 119: 63–77.
18) Boehlert, G. and Genin, A. (1987). A review of the effects of seamounts on biological processes. In: Seamounts, Islands and Atolls. Geophysical Monograph (Keating, B., Fryer, P., Batiza, R., Boehlert, G. (Eds.),). American Geophysical Union, Washington. pp.319–344.
19) Anderson, R. C. (1992). North-south variation in the distribution of fishes in the Maldives. Rasain, 12: 210–226.
20) IPCC (2001). Climate Change 2001, The Scientific Basis. In: Contribution of Working Group I to the Third Assessment Report of the Intergovernmental Panel on Climate Change (JT Houghton, Y Ding, DJ Griggs, N Noguer, PJ van der Linden, X Dai, K Maskell, and CA Johnson (eds)). Cambridge University Press, Cambridge United Kingdom and New York, NY, USA.
21) Orr, J., Fabry VJ, Aumont O, Bopp L, Doney SC, Feely RA, Gnanadesikan A, Gruber N, Ishida A, Joos F, Key RM, Lindsay K, Maier-Reimer E, Matear R, Monfray P, Mouchet A, Najjar RG, Plattner

Data Collection Survey on Building Climate Resilient Safer Cities Final Report
4-27
G-K, Rodgers KB, Sabine CL, Sarmiento JL, Schlitzer R, Slater RD, Totterdall IJ, Weirig M-F, Yamanaka Y and Yool A (2005). Anthropogenic ocean acidification over the twenty-first century and its impact on calcifying organisms. Nature, 437: 681–686
22) Kleypas, J. A., Buddemeier, R. W., Eakin, C. M., Gattuso, J. P., Guinotte, J., Hoegh‐Guldberg, O., Iglesias‐Prieto, R., Jokiel, P. L., Langdon, C. and Skirving, W. (2005). Comment on ‘Coral reef calcification and climate change: the effect of ocean warming’. Geophysical Research Letters, 32.
23) Riebesell, U., Zondervan, I., Bost, B., Tortell, P. D., Zeebe, R. E. and Morel, M. M. (2000). Reduced calcification of marine plankton in response to increased atmospheric CO2. Nature, 407: 364–367.
24) Fabry, V. J., Seibel, B. A., Feely, R. A. and Orr, J. C. (2008). Impacts of ocean acidification on marine fauna and ecosystem processes. ICES Journal of Marine Science: Journal du Conseil, 65: 414–432.
25) Shabau, I. (2006). Food fuel crisis and climate change in the Maldives, A small Island State Perspective. Ministry of Fisheries and Agriculture, Government of Maldives.
26) Bernstein, L., Peter Bosch, Osvaldo Canziani, Zhenlin Chen, Renate Christ, Ogunlade Davidson, William Har, Saleemul Huq, David Karoly, Vladimir Kattsov, Zbigniew Kundzewicz, Jian Liu, Ulrike Lohman, Martin Manning, Taroh Matsuno, Bettina Menne, Bert Metz, Monirul Mirza, Neville Nicholls, Leonard Nurse, Rajendra Pachauri, Jean Palutikof, Martin Parry, Dahe Qin, Nijavalli Ravindranath, Andy Reisinger, Jiawen Ren, Keywan Riahi, Cynthia Rosenzweig, Matilde Rusticucci, Stephen Schneider, Youba Sokona, Susan Solomon, Peter Stott, Ronald Stouffer, Taishi Sugiyama, Rob Swart, Dennis Tirpak, Coleen Vogel, Gary Yohe and Lenny Bernstein (2007). Climate Change 2007: Sythensis Report. Contribution of Working Groups I, II and III to the Fourth Assessment Report of the Intergovernmental Panel on Climate Change. In: Climate Change 2007 Synthesis Report 2007. p.104 pp.
27) Gagnon, A. S., Bush, A. B. G. and Smoyer-Tomic, K. E. (2001). Dengue epidemics and the El Niño Southern Oscillation. , 39: 35–43.
28) Falkland, T. (2001). Integrated Water Resources Management and Sustainable Sanitation for Four Islands, Republic of Maldives. Maldives Water and Sanitation Authority (MWSA) and UNICEF.
29) Falkland, T. (2002). Tropical island hydrology and water resources: current knowledge and future needs. In: Hydrology and water resources management in the humid tropics. March 1992. In: UNESCO-IHP-V technical documents in hydrology no. 52. Paris: UNESCO. p.239.
30) MWSA (2005). Rainwater harvesting and its safety in Maldives: A pilot study conducted in Laamu atoll Gan, Maldives-2005, Male’: Maldives Water and Sanitation Authority Maldives. Maldives Water and Sanitation Authority.
31) Haveeru (2011). E-coli found in water tanks in Maldives. 2011. <http://www.haveeru.com.mv/english/ details/36817. Accessed 22 August 2011.
32) Das, R., Granat, L., Leck, C., Praveen, P. and Rodhe, H. (2011). Chemical composition of rainwater at Maldives Climate Observatory at Hanimaadhoo (MCOH). Atmospheric Chemistry and Physics, 11: 3743–3755.
33) Wilkinson, C. (1998). Status of the coral reefs of the world: 1998. 34) Rosen, B. R. (1971). The distribution of reef coral genera in the Indian Ocean. In: pp.263–300. 35) Ali, M. and Manik, M. H. (1989). Sea Level Rise: A Coral Atoll Perspective on Terrestrial
Environment and Marine Resources. 36) MRC (1998). Coral Bleaching in the Maldives - survey carried out in the North and South Malé
Atolls. Marine Research Section and Environment Research Unit. 37) Riyaz, M., Shareef, M. and Elder, D. (1998). Coral Bleaching Event: Republic of Maldives, May
1998. 38) Edwards, A. J., Clark, S., Zahir, H., Rajasuriya, A., Naseer, A. and Rubens, J. (2001). Coral
bleaching and mortality on artificial and natural reefs in Maldives in 1998, sea surface temperature anomalies and initial recovery. Marine Pollution Bulletin, 42: 7–15.

Data Collection Survey on Building Climate Resilient Safer Cities Final Report
4-28
39) MEE (2015a). Development of high-resolution regional climate model for the Maldives: Intergrating climate change risk into resilient island planning in the Maldives project. Ministry of Environment and Energy.
40) Raven, J., Caldeira, K., Elderfield, H., Hoegh-Guldberg, O., Liss, P., Riebesell, U., Shepherd, J., Turley, C. and Watson, A. (2005). Ocean acidification due to increasing atmospheric carbon dioxide. The Royal Society.
41) Jacobson, M. Z. (2005). Studying ocean acidification with conservative, stable numerical schemes for nonequilibrium air‐ocean exchange and ocean equilibrium chemistry. Journal of Geophysical Research: Atmospheres, 110.
42) De’ath, G., Lough, J. M. and Fabricius, K. E. (2009). Declining coral calcification on the Great Barrier Reef. Science, 323: 116–119.
43) Hoegh-Guldberg (2005). Low coral cover in a high-CO2 world. Journal Of Geophysical Research 110, C09S06.
44) National Bureau of Statistics (2020): National Summary Data Page (NSDP)- Maldives 45) National Bureau of Statistics (2016): Household Income & Expenditure Survey, 52p. 46) UNDRR (United Nations Office for Disaster Risk Reduction) (2019): Disaster Risk Reduction in
the Republic of Maldives, Status Report 2019, 31p.

Data Collection Survey on Building Climate Resilient Safer Cities Final Report
5-1
DENTIFICATION OF CLIMATE CHANGE HAZARD TO BE ADDRESSED IN THE PROJECT AND SELECTION OF TARGET AREA
Target Climate Hazards and Idea for Selection of Target Area
As mentioned in the previous chapter, the Maldives is one of the extremely vulnerable countries in the world against climate hazards such as sea level rise (SLR), as the Maldives has very specific geographical characteristics, such as low-elevation and narrow islands, and as most residential areas and critical infrastructures are located nearby the coastal area.
The impact of SLR is not limited to direct phenomena such as rising of the seawater level. It also contributes to the enormous damage and frequent occurrence of high waves and flooding, and acceleration of the national land losses caused by the significant increase of wave heights to reach to the shoreline especially at the coral reef coasts experiencing coastal erosion.
Therefore, the Maldives has the highest impact on SLR among the climate hazards, and the impact on SLR is positioned as the most important climate hazard for the Maldives.
The Maldives is required to increase the resilience of the national lands to maintain the national land conservation and secure the safe, secure and comfortable livelihood of the people for the next generation under the expected increase of vulnerabilities due to SLR in the future.
The basic concept of the proposed climate adaptation project is to achieve the sustainability of the national resilience and maintaining of the long-term relation between people’s livelihood and coasts which has been continued since before. In other words, the proposed climate adaptation project is to implement the necessary (or supplementary) coastal measures to protect and conserve the national land for a long period and to enhance the national resilience under the economic development, together with maintaining and utilizing the natural protection function of coral reef and sandy beaches as “natural infrastructure”, which has been naturally formed for several thousand years.
For example, in Male , which is the central economic island in the Maldives, the hard-structure protection measures such as large-scale reclamation on the coral reef and concrete seawall have been employed to protect the island against the narrow area and the extreme high population density due to rapid concentration of people brought about by economic development. On such islands, it is not realistic to enhance the national resilience in combination with co-existence with nature, but realistic to continue in strengthening national land by means of artificial hard protection measures.
On the other hand, most of the islands among the 188 inhabited islands in the Maldives have natural sandy beaches and coral reefs, and the people’s livelihood has continued coexisting with nature. Under such conditions, coastal erosion, intrusion of high waves, flooding, and climate risks are now increasing.
Among many islands scattered over wide areas, the target islands and areas proposed in the Project will be selected by considering the current vulnerability against coastal disasters, the future impacts on the climate risks, as well as the effectiveness for expansion of the project achievement to other inhabited islands based on the understanding of the current beach condition and beach use by the locals in the inhabited islands in the Maldives.

Data Collection Survey on Building Climate Resilient Safer Cities Final Report
5-2
The following three points were considered for the selection of target atolls and islands: Item 1) impact of climate hazard and vulnerability; item 2) effect of the Project; and item 3) similarity to coastal conditions and coastal problems on many other inhabited islands, and validity of the Project as model cases.
Item 1: Impact of climate hazard and vulnerability
Whether the atolls are those where the impact of climate hazard will be significant or not. That is, whether the atolls are those that have already been seriously affected by coastal erosion, high waves, and flooding, and whether the atolls are likely to be even more vulnerable in the future due to climate change or not.
Item 2: Effect of the Project
Whether the atolls are those expected to receive high effectiveness of the Project in terms of economic and social environment, such as atolls’ position, economy, development, locality, and public awareness, and so on.
Item 3: Similarity to coastal conditions and coastal problems on many inhabited islands, and validity as model cases
Whether the islands are those with existing natural coasts and coral reefs found in many inhabited islands in the Maldives, and whether they are suffering from similar coastal problems, which are coastal erosion, high waves, and flooding, or not. And whether the selected islands become the model case for expansion of knowledge to the other islands with similar situations and problems, or not.
Based on the three abovementioned items, the procedures to select the target atolls and islands are described below.
Item 1: Impact of Climate Hazard and Vulnerability
As presented in Chapters 3 and 4, the SLR will induce the increment of waves reaching to the shore and resulting coastal erosion, enlargement and frequent occurrence of high wave and flooding, and acceleration of national land loss.
Since the damage due to high waves and flooding occurs several times in a year, and the coastal erosion occurs gradually as a result of accumulated continuous wave action, the increase of swell waves which occur frequently due to SLR will give a significant impact to such phenomena. This is different point from the other extreme events such as tsunami, which will provide serious damage but very low occurrence frequency.
High waves due to swell waves commonly occur especially during the southwestern monsoon season, and the influence due to swell waves becomes larger in the southern areas in the Maldives. Waves propagate from offshore and reach to the shore through the coral reef. The wave height on coral reef increases in accordance with the water depth on the coral reef, so that the wave height at the shore will significantly increase due to SLR. As a result, the intrusion of high waves and flooding will be more serious with high frequency and will accelerate the coastal erosion.
Influence of swell waves is much higher in the southern areas in the Maldives as explained in Chapter 2, so that the impact of the increase of swell waves due to SLR will also be larger in the southern area.

Data Collection Survey on Building Climate Resilient Safer Cities Final Report
5-3
On the other hand, since the ground elevation of islands tends to be lower toward the southern areas, the southern areas in the Maldives will be more vulnerable to high waves and flooding, and coastal erosion due to climate impacts compared with the northern areas in the Maldives.
Based on the abovementioned points of view, the southern areas in the Maldives will be focused as the target areas for the Project. The impact assessment due to SLR and the risk assessment of the target area will be described in Chapter 6 in detail.
Regarding the gender- and poverty-related indices, focusing on the southern area, such indicators as the numbers of reported cases of coastal erosion, Gender Inequality Index (GII), Human Development Index (HDI), and Composite Human Vulnerability Index (HVI) are compared for each atoll in the southern area, as climate vulnerability.
Laamu Atoll has the highest reported cases of coastal erosions, based on the national statistics.
Table 5.2.1 Total Numbers of Reported Cases of Coastal Erosions on Each Atoll Laamu North
Huvadhu South
Huvadhu Fuvahmulah Addu
Total numbers of reported cases between 2012 and 2018
33 11 20 3 25
Source: JET processed based on Statistical Yearbook of Maldives 2019, National Bureau of Statistics1)
The Gender Inequality Index (GII) reflects women’s disadvantage in three dimensions mainly reproductive health, empowerment and the labor market. The index shows the loss in human development due to inequality between female and male achievements in these dimensions. Region 5, which is composed of the Kolhumadulu (Thaa: Th) and the Hadhdhunmathi (Laamu: L) atolls, shows the highest value (0.741) among the other regions, resulting in the most inequality in the country.
Table 5.2.2 The Gender Inequality Index (GII) Locality Gender Inequality Index (Value)
Region 5 (Th, L) 0.741 Region 6 (GA, GDh) 0.723 Region 7 (Gn, S) 0.696
Source: Maldives Human Development Report 2014 (UNDP 2014)2)
The Human Development Index (HDI) is an index to measure and rank countries’ levels of social and economic development based on three basic dimensions of human development: a long and healthy life, access to knowledge, and a decent standard of living. The Inequality-adjusted Human Development Index (IHDI) adjusts the Human Development Index (HDI) for inequality in the three basic dimensions of human development (income, life expectancy, and education). The HDI and IHDI indices for Region 5, which include Laamu Atoll, show relatively low values: 0.622 for HDI and 0.450 for IHDI, respectively, while those for Region 7, which consists of Addu City, show relatively high value: 0.647 for HDI and 0.482 for IHDI, respectively.

Data Collection Survey on Building Climate Resilient Safer Cities Final Report
5-4
Table 5.2.3 The Human Development Index (HDI, IHDI)
Locality Inequality- adjusted
Human Development Index
(IHDI) (Value)
Human Development Index (HDI) (Value)
Loss Due to Inequality (%)
Gini Coefficient
Region 5 (Th, L) 0.450 0.622 27.60 0.33 Region 6 (GA, GDh) 0.432 0.594 27.40 0.37 Region 7 (Gn, S) 0.482 0.647 25.60 0.34
Source: Maldives Human Development Report 2014 (UNDP 2014)2)
The Composite Human Vulnerability Index (HVI) is a composite value formulated by combining 12 indicators from many dimensions of poverty and vulnerability, such as poverty, electricity network, transportation, education, environment, and employment1 . All of the islands in all the atolls of the Maldives were evaluated based on this index. Laamu Atoll showed the lowest value (3.4) among the five atolls in the southern area, meaning that Laamu Atoll is the most vulnerable atoll.
Table 5.2.4 The Composite Human Vulnerability Index (HVI)
Atoll name Composite HVI 2004–
Female Priorities Composite HVI 2004 – Male
Priorities (Value) (Rank in all
the Atolls) (Value) (Rank in all the Atolls)
181 Laamu Atoll 3.4 3 3.4 3 194 Gaafu Alifu Atoll (Northern
Huvadhu Atoll) 3.2 9 3.2 8 205 Gaafu Dhaalu Atoll
(Southern Huvadhu Atoll) 2.6 18 2.6 18 216 Gnaviyani Atoll
(Fuvahmulah Atoll) 1.5 20 1.5 20 218 Seenu Atoll (Addu City) 2.1 19 2.1 19
Source: Vulnerability and Poverty Assessment 2004 (UNDP 2004)3)
Regarding the vulnerability towards climate change, Laamu Atoll is the most vulnerable atoll in the southern area, based on the numbers of reported cases of coastal erosion, Gender Inequality Index (GII), Human Development Index (HDI), and Composite Human Vulnerability Index (HVI).
Item 2: Effect of the Project
The target atolls will be selected based on the point of view that the atolls are those expected to receive high effectiveness of the Project in terms of economic and social environment, such as atolls’ position, economy, development, locality, public awareness, and so on.
Pertaining to the atoll’s social and economic position, such indicators as the importance in the National Spatial Plan, numbers of airline passengers, future population, scale of tourism, scale of agriculture production, and scale of fisheries were compared.
Importance in the National Spatial Plan
1 Composite HVI is calculated by using the following indexes: Income Poverty Index, Electricity Index, Transport Index, Communication Index, Education Index, Health Index, Drinking Water Index, Consumer Goods Index, Housing Index, Environment Index, Food Security Index, Employment Index, and Recreation Index.

Data Collection Survey on Building Climate Resilient Safer Cities Final Report
5-5
The National Spatial Plan specifies the Male metropolitan area as the central region. The regional center with the population of 50,000 and Sub-regional center with population of 25,000, are based on the population size, economic strategy and future potential growth. Laamu, South Huvadhu and Addu are specified as the regional centers in the southern area.
Table 5.3.1 The Hierarchy of Each Atoll by the National Spatial Plan Laamu North Huvadhu South Huvadhu Fuvahmulah Addu
Hierarchy Regional Center Sub-Regional Center
Regional Center Sub-Regional Center
Regional Center
Source: National Spatial Plan4)
Numbers of Airline Passengers in 2018
Table 5.3.2 The Numbers of Airline Passengers of Each Atoll Laamu
(Kadhoo) North Huvadhu
(Koodoo) South Huvadhu
(Kaadedhoo) Fuvahmulah Addu (Gan)
Arrivals 74,660 42,546 35,462 20,244 19,076 (58,882)
Departures 75,166 42,625 35,534 20,569 18,975 (59,164)
Note: ( ) shows international passengers Source: Statistical Pocketbook of Maldives 20195)
Present Population and Future Population
According to the 2014 census, Laamu Atoll has the second largest population after Addu City. The ranking may not change in the future projection; however, the population of Laamu Atoll will decrease significantly, and the balance between Addu City will be reduced, while population of other atolls will decrease significantly. The future population projection is calculated based on the scenario that most population will move to the Male metropolitan area and other regional centers, such as Laamu and Addu Atolls. Under this forecast, the few population of Laamu Atoll will move to the Male metropolitan area.
Table 5.3.3 Present Population and Future Population of Each Atoll Laamu North
Huvadhu South
Huvadhu Fuvahmulah Addu
2014 11,795 8,334 11,587 7,984 19,329 2054 11,279 2,722 3,313 8,604 13,339
Source: Maldives Population Projections 2014-2054, National Bureau of Statistics1)
Agriculture Production
Laamu Atoll has the largest agriculture production compared with other atolls. Their production is 1.7 times of the production of South Huvadhu (ranked in 2nd), and 27 times of that of Addu City, which is ranked 3rd in this area.

Data Collection Survey on Building Climate Resilient Safer Cities Final Report
5-6
Table 5.3.4 Agriculture Production of Each Atoll Laamu North
Huvadhu South Huvadhu Fuvahmulah Addu
Agriculture production in 2028 (MVR) 4,336,156 56,260 2,651,855 0 161,490
Source: Statistical Yearbook of Maldives 2019, National Bureau of Statistics1)
Fishery Production
Laamu Atoll is ranked 3rd among five atolls, after North Huvadhu and South Huvadhu Atolls.
Table 5.3.5 Fishery Production of Each Atoll Laamu North
Huvadhu South
Huvadhu Fuvahmulah Addu
Fishery production (1,000 ton) 11.6 25.1 14.6 4.8 9.4
Source: Statistical Yearbook of Maldives 2019, National Bureau of Statistics1)
Scale of Tourism
Addu City has the highest potential and scale in tourism, followed by North Huvadhu and South Huvadhu, and the scale of tourism in Laamu Atoll is relatively small.
Table 5.3.6 The Numbers of Beds in the Resorts of Each Atoll Laamu North
Huvadhu South
Huvadhu Fuvahmulah Addu
Numbers of beds in the reports (2018) 194 616 550 0 826
Source: Statistical Yearbook of Maldives 2019, National Bureau of Statistics1)
The table below shows the rankings of each indicator.
The Laamu Atoll has a smaller value in the tourism indicator compared with other atolls, however, it has larger values on agriculture and fishery production. The number of airline passengers is more than other atolls, and is ranked in 2nd after Addu City. Laamu Atoll is also positioned as the Regional Center in the National Spatial Plan. Therefore, although the economic importance of Laamu Atoll is relatively lower than the 2nd largest city in the Maldives, i.e., Addu City, it is expected that importance of Laamu Atoll will become larger in the future, and it is considered to have the highest potential in the region.
Table 5.3.7 The Ranking of Each Indicator
Laamu North Huvadhu
South Huvadhu Fuvahmulah Addu
Importance in the National Spatial Plan 1 4 1 4 1
Number of airline passengers 2 3 4 5 1
Present population and 2 4 3 5 1 Future population 2 5 4 3 1 Agriculture production 1 4 2 5 3 Fishery production 3 1 2 5 4 Scale of tourism 4 2 3 5 1 Average ranking 2.14 3.28 2.71 4.57 1.71
Source: Processed based on the National Spatial Plan4); Statistical Yearbook of Maldives 2019, National Bureau of Statistics1)

Data Collection Survey on Building Climate Resilient Safer Cities Final Report
5-7
Item 3: Similarity to Coastal Conditions and Coastal Problems on Many Inhabited Islands, and Validity as Model Cases
As mentioned above, many of the 188 inhabited islands in the Maldives are facing coastal problems such as flooding due to high waves and coastal erosion with existing coral reefs and sandy beaches. The target islands shall be selected as the model case for other inhabited islands with similar topographical conditions (existence of sandy beach and coral reef) and similar coastal problems (flooding, coastal erosion). In addition, in order to achieve an effective horizontal expansion of the Project effectiveness and outcomes, it is desirable that the selected target islands are located in the main atolls in the Maldives, and are representative islands in the atoll as the model case under several different conditions on economic and natural points of view.
From items 1 and 2 mentioned above, Laamu and Addu atolls are selected as the target atolls. The target islands will be selected among the main inhabited islands of two atolls, based on the following viewpoints: 1) vulnerability, 2) current condition of coral reef and beaches, and degree of request from residents for coastal measures, and 3) importance of the islands on economic point of view and the potential for future development. It is noted that the islands, in which no enthusiastic requests were received from the central, atoll, and island governments during the site survey, were eliminated. Furthermore, the inhabited islands with low population and population density were also eliminated as they are not suitable for the model case. As a result of the preliminary evaluation, the four islands in each atoll were listed for evaluation, i.e.: Gan, Fonadhoo, Maamendhoo, and Isdhoo in Laamu Atoll, and Hithadhoo, Maradhoo/Maradhoo-Feydhoo, Feydhoo and Meedhoo/Hulhudhoo in Addu Atoll.
The characteristics of each island are explained below.
Gan in Laamu Atoll
Gan in Laamu Atoll is the largest inhabited island in the Maldives with area of approximately 633 ha and with 3,080 residents. Average land elevation is M.S.L + 0.9 m. The population density is the lowest in Laamu Atoll with 4.6 persons/ha. Even though the land elevation is lower than the average elevation in the Maldives, the exposure condition to coastal disasters is relatively lower compared with other populated islands as there are still undeveloped areas in the island. At this moment, only limited areas in the island are suffering from the risk of flooding due to high waves. However, coastal erosion, which is caused by artificial modification at the coastal area such as construction of harbor and blockage of inlet between each island by construction of causeway, is increasing. However, since the natural coastlines and coral reefs are still well-maintained compared with other inhabited islands, tourism development will be actively planned in this island. In addition, historical and cultural heritage site exists just behind the
Table 5.4.1 Areas, Population and Density of the Main Inhabited Islands in Laamu and Addu Atolls
Source: Population & Housing Census 20146)
Atoll No. IslandArea(ha)
personsdensity
(person/ha)
1 Gan 663 3,080 4.62 Fonadhoo 163 2,266 13.93 Maamendhoo 19 896 47.94 Isdhoo 146 958 6.65 Hithadhoo 498 11,129 22.4
6Maradhoo/Maradhoo-feydhoo 91 3,602 39.6
7 Feydhoo 74 3,431 46.68 Meedhoo/Hulhudhoo 315 3,113 9.9
Laamu
Addu

Data Collection Survey on Building Climate Resilient Safer Cities Final Report
5-8
ocean side. The revetment was constructed ten years ago but is already damaged by wave action and has collapsed. The island council is highly concerned about coastal erosion and deterioration of the coastal and reef environment so as to be highly conscious of the conservation of the coastal environment for the coastal areas and coral reef.
Fonadhoo in Laamu Atoll
Fonadhoo is the second largest inhabited island in Laamu Atoll, next to Gan, with an area of approximately 163 ha and with 2,266 residents. Average elevation is MSL + 0.9 m. As the atoll capital island, the population density is relatively high (13.9 persons/ha) and it is ranked in 3rd place in Laamu Atoll. In addition, the population is increasing due to migration from adjacent inhabited islands, such as Gaadhoo Island, for the purpose of employment opportunities and integration of social infrastructure. Active land use development such as construction of residential areas along the coastal areas are being promoted in the island. Based on the field survey results, the residential areas are extended to the vicinity of the coastal areas and flooding due to intrusion of high waves has occurred frequently at this residential area. The artificial modifications on the coral reef at several points of the lagoon side were observed such as harbor construction and coral mining on the reef to obtain construction material. On the other hand, natural sandy beaches and coral reefs still exist along the ocean-side coastal areas. According to the interview survey to the island council and residents, the coast at the ocean side is suffering from serious coastal erosion; however, coastal protection measures, except the embankment made by coral sand nearby the residential areas, have not been implemented so far. As the coastal areas nearby the residential areas are being used for recreational purposes by the residents, it is assumed that these people have high awareness on coastal environment conservation, so that these residents conduct beach cleaning activities at the regional level from 2019. Since further migration from adjacent islands to the atoll capital island is expected, further development of residential area is planned in Fonadhoo.
Maamendhoo in Laamu Atoll
Maamendhoo is the smallest inhabited island in Laamu Atoll with an area of 19 ha and having 896 residents. The island has the highest population density in the atoll with 47.9 persons/ha. As Maamendhoo is located at a nearby atoll channel, this island has an important role as the logistic base for traveling from Laamu Atoll to other atolls. Furthermore, this island also has a role of providing the human resources and goods to a world-famous resort island, the Six Senses, which is located next to this island. Since most of the residential areas and important infrastructure facilities are located very close to the coast, the island has extremely high exposure to coastal hazards compared with the other islands. The land elevation of the island is lower (M.S.L+ 0.7~0.8 m in average) than other inhabited islands. Such geographical characteristics together with extremely narrow area and high population density will induce high vulnerability compared with other inhabited islands. Coastal erosion has been a serious problem in the island and retreat of the shoreline at 0.6 m per year from 1999 was reported7). Since the land area is very small, the issue of coastal erosion becomes more serious on both impacts of land loss and flooding due to high waves. The island council and residents are very concerned about the coastal erosion and induced coastal disaster. Because of this, they have strongly requested the implementation of coastal protection. Within the limited island areas, as the coastal areas are closely associated with

Data Collection Survey on Building Climate Resilient Safer Cities Final Report
5-9
peoples’ lives as places for recreation and playing sports, the people’s awareness on coastal environment conservation is relatively higher than in the other inhabited islands.
Isdhoo in Laamu Atoll
Isdhoo has an area of 146 ha and 958 residents, and the population density is the third lowest in the atoll at 6.6 persons/ha. The residential areas are located behind the two main harbors, and as the roads run inland in the island, the exposure to the coastal hazards is not so high compared with other islands. As the island is in the northernmost area in the atoll, the damage due to coastal erosion has been reported especially at the northern part of the island, where the offshore waves directly hit the area. As there exist historical and cultural heritages behind this coast, the island council has raised strong requests to conserve the cultural heritage sites.
Hithadhoo in Addu Atoll
Hithadhoo, located in the northwestern side of Addu Atoll, is the central island in the atoll in terms of administration and economy as the atoll capital island. The area of the island is 498 ha (with average elevation of M.S.L+1.0 m) and this island is the second largest inhabited island in the Maldives, after Gan in Laamu Atoll. Hithadhoo is one of the highly dense populated islands among inhabited islands in the Maldives, with a population of 11,129 and a density of 22.4 persons/ha. Since Hithadhoo is the second largest economic zone after Male Island, many kinds of critical infrastructures, such as large-scale harbors, link roads, communication infrastructure, and equatorial hospital, exist together with the residential areas. The link roads are constructed to connect with Hithadhoo and Maradhoo and Heydhoo, and Gan which is the international airport island. The lagoon side of the island has already been developed by constructing harbors and land reclamation. Further reclamation projects at the lagoon side are also planned in the near future. As the width of coral reef at the ocean side is relatively narrow at 100 m to 200 m, high waves are occurring especially during the southwestern monsoon season. The buffer zone is basically considered to protect the residential area at the nearby ocean coast against wave intrusion with the exception of some limited houses. Coastal erosion is one of the issues on the ocean side of the island, and protection measures at some beachfront houses have been conducted by the island/atoll council.
Maradhoo/Maradhoo-Feydhoo in Addu Atoll
The Maradhoo/Maradhoo-Feydhoo, located in the south of Hithadhoo, has a land area of 91 ha (average elevation M.S.L +1.0 m), population of 3,602 people, and a high population density of 39.6 persons/ha. In the same economic zone which continues from Hithadhoo, critical infrastructures such as harbors and its facilities, commercial facilities, and residential areas densely exist in the island. As the link roads combined with a rubble type material to connect the four main islands are constructed along the lagoon side coast, the original natural beaches have already disappeared. As the coral reef at the ocean side is wider with 400 m to 700 m width, the waves that reach to the coast are smaller than those of Hithadhoo. Because of this, there were no reports and requests on coastal erosion and high wave damages through the field survey. On the other hand, large-scale land reclamation project is planned on the coral reef at

Data Collection Survey on Building Climate Resilient Safer Cities Final Report
5-10
the ocean side in order to improve the social conditions of the island, such as small and narrow spaces and population density.
Feydhoo in Addu Atoll
Feydhoo, located at the south of Maradhoo, has a land area of 74 ha (average elevation of M.S.L +1.0 m), population of 3,431 people, and high population density of 46.4 persons/ha, which is the densest population in the atoll. To solve this dense situation, a total of 50 ha area of land reclamation was constructed in 2018 on the coral reef along both the lagoon and ocean sides of the island. This reclaimed area is almost 70 % of the original island area. As a result, Feydhoo has become an island completely surrounded by revetments and land reclamation, and all of the natural beaches have completely disappeared on both the lagoon and ocean sides of the island.
Meedhoo/Hulhdhoo in Addu Atoll
Meedhoo/Hulhdhoo are located on the northeastern top of the atoll, far from the abovementioned four connected islands. The land area is 315 ha in total, with a population of 3,113, and a population density of 9.9 persons/ha. The residential areas are mainly located at the lagoon side, and the natural sandy beaches exist along the ocean side coast where the offshore waves occur directly. Several public beach parks are maintained through the support of NGOs, and these parks are used for the recreation of the residents. Tourism development is very active in Meedhoo/Hulhudhoo, and new resort development is currently ongoing at the northwestern area of the island. It has been reported that coastal erosion has become serious along the northern and eastern sides of the coastal areas which face the open ocean. Even though no residential area exists near the northern coast, there exists the oldest graveyards in the Maldives, which is an important historical and cultural heritage site. Furthermore, a plantation land that utilizes freshwater located nearby the coast also exists. Although a seawall has been constructed to prevent shoreline retreat and seawater intrusion caused by coastal erosion, most of the sections have already been damaged. At the eastern side of the island, a rubble-type revetment, with an approximate length of 1.1 km, was newly constructed in 2018. However, this has caused the decrement of the sandy beaches and interference to utilize the coastal areas. Under such situations, the requests from the residents on maintenance of the natural sandy beaches, but not hard-type protection measures, are collected through the hearing survey. Residents in the island have high awareness and consciousness regarding coastal conservation, and are also keen on coast maintenance activities in collaboration with NGOs.
Based on the current situations mentioned above, Table 5.4.2 shows the results of the evaluation on the three items. Here, evaluation was basically examined by employing quantitative criteria for each item as shown in Table5.4.3. Table 5.4.4 explains the prioritized islands based on the scoring.
As a result, two islands, namely Maamendhoo and Fonadhoo in Laamu Atoll, are prioritized to be the target islands for the climate change adaptation project. Thus, conducting the coastal adaptation measures to maintain and enhance the natural protection function of the beach financed by GCF will be proposed at the certain area of these two islands.

Data Collection Survey on Building Climate Resilient Safer Cities Final Report
5-11
Table 5.4.2 Evaluation Results of Main Islands in Laamu and Addu Atolls
Source: JICA Expert Team
Table 5.4.3 Quantitative Criteria for Evaluation
Source: JICA Expert Team
Hithadhoo Maradhoo Feydhoo Meedhoo Gan Fonadhoo Isdhoo Maamendhoo
High(small) High(small) High(small)Medium(middle)
Low(large)Medium(middle)
Medium(middle)
Very high(very small)
High Very highmidium(afterreclamation)
Low Low High Low Very high
High Highmidium(afterreclamation)
Low Low High Low Very high
Medium Low Low High High Medium High Medium
High Medium - High Medium High Medium High
Medium(partially)
Low Low HighMedium
(partially)High
Medium(partially)
Very high
Medium Medium Medium High High High High High
Medium Medium Medium High High High High High
High High High Low Medium Medium Low Low
High Medium Low High High High High High
High High High Medium High High Medium High
High Medium Medium High High High Medium MediumFuture development
Importance of the Island interms of economy andfuture development
Evaluation Category Evaluation Items
Current situations and severity ofcoastal erosionCurrent situations and severity ofhigh wave and flooding dameges
Awareness and gender gap
Awareness and efforts of islandcouncils
Vulnerability
Current situations of the artificationof the coasts and reefs, and futuredevelopment plans
Geographical features (elevation,areas, etc.)Dense situation (infrastructure,residential areas,populationExposure situations of resudentialareas and infrastructureExposure situations of otherelements, such as histrical and
Addu Atoll Laamu Atoll
Requests from the local on thecoastal protection measures
Coastal development,request on coastal
protection
Future economy
Very High High Medium Low Remark
E < 0.8 m 0.8 < E < 1.0 m 1.0 < E < 1.2 m E > 1.2 m
A < 50 ha 50 < A <100 ha 100 < A <500 ha A > 500 ha
D > 40 person/ha 40 > D > 15person/ha
15 > D > 10person/ha D < 10 person/ha
L (Av.) < 5 ~10m
L (Av.) < 10 ~15m
L (Av.) < 15 ~20m
L (Av.) > 20 m
Exist near shoreand important Exist near shore Exist Nothing
R > 20 m 10 < R < 20 m 5 < R < 10 m R < 5 m
F > 2 F > 1 F > 0 not observed Based oninterview result
N > 80 % 50 < N < 80 % 20 < N < 50 % N < 20 %
very high high medium less interest Based oninterview result
Very High High Medium Low Based oninterview result
Evaluation Category Evaluation Items
Geographical features (elevation): E
Dense situation (population density) : D
Exposure situations of resudential areas andinfrastructure (Distance from shore) : L
Geographical features (area) : A
Severity of coastal erosion (Retreat width) : R
Current situations and severity of high wave andflooding dameges (Frequency/year) :F
Awareness and gender gapAwareness and efforts of island councils
VulnerabilityExposure situations of other elements (histrical
and cultural heritages, inland ecosystems) :
Requests from the local on the coastalprotection measures
Coastal development,request on coastal
protection
Future economy
Future development
Importance of the Islandin terms of economy and
future development
Current situations of the artification of thecoasts (Rate of natural beach) : N

Data Collection Survey on Building Climate Resilient Safer Cities Final Report
5-12
Table 5.4.4 Results of Scoring and Prioritization
Note: the scores range from 1: low, 2: medium, 3: high, and 4: very high, while for the items with *), the s
core will be vice versa. Source: JICA Expert Team
Meedhoo in Addu Atoll is the third priority in the result of evaluation. The similar coastal adaptation measures will be proposed as sub-set activity financed by GoE.
Even though, the total scoring in Gan and Isdhoo Islands in Laamu Atoll is not so high, there are important historical and cultural heritages behind the coast, and the island council has raised strong request to conserve the cultural heritage sites in Gan and Ishdoo Islands. Taking into account such conditions, it is also proposed to include the coastal protection measures at both islands.
Hithadhoo Maradhoo Feydhoo Meedhoo Gan Fonadhoo Isdhoo Maamendhoo
3 3 3 2 1 2 2 4
3 4 2 1 1 3 1 4
3 3 2 1 1 3 1 4
2 1 1 3 3 2 3 2
3 2 0 3 2 3 2 3
2 1 1 3 2 3 2 4
2 2 2 3 3 3 3 3
2 2 2 3 3 3 3 3
1 1 1 3 2 2 3 3
3 2 1 3 3 3 3 3
3 3 3 2 3 3 2 3
3 2 2 3 3 3 2 2
2.5 2.2 1.7 2.5 2.3 2.8 2.3 3.2
3 7 8 3 5 2 5 1Overall ezaluation
Score
Priority
Coastal development,request on coastal
protection
Current situations of the artificationof the coasts and reefs, and futuredevelopment plans*)
Requests from the local on thecoastal protection measures
Importance of the Island interms of economy andfuture development
Future economy
Future development
Evaluation Category Evaluation ItemsAddu Atoll Laamu Atoll
Vulnerability
Geographical features (elevation,areas, etc.)Dense situation (infrastructure,residential areas,populationExposure situations of resudentialareas and infrastructureExposure situations of otherelements, such as histrical andCurrent situations and severity ofcoastal erosionCurrent situations and severity ofhigh wave and flooding dameges
Awareness and gender gap
Awareness and efforts of islandcouncils

Data Collection Survey on Building Climate Resilient Safer Cities Final Report
5-13
Conclusion
As presented in Chapters 3 and 4, the risk for SLR in the Maldives is higher than that in other countries among the other kinds of climate hazards. Therefore, SLR is positioned as the most critical climate hazard that should be addressed with top priority. The vulnerability of the land due to SLR is expected to increase.
The impact of SLR is not limited to the direct physical phenomena such as the rising seawater level. SLR will cause a significant increase of wave energy and height reaching the coast and would eventually result to coastal erosion. This will lead to serious and frequent damage caused by high waves and flooding, and acceleration of the loss of national land.
Under such situations, it is required to build the resilience of the national land in order to conserve the land and maintain a safe, secure, and comfortable life for the people in order for them to hand over the land to the next generation and beyond.
In order to achieve this purpose, it is reasonable and realistic to consider both natural and project effects; that is to maintain the protection function of natural sandy beach and coral reef as “natural infrastructure” as much as possible, and to supplement the required or insufficient function by the implementation of climate adaptive measures.
In the 188 inhabited islands of the Maldives, many natural beaches and coral reefs still exist, and people have been living for a long time coexisting with the beaches and coral reefs. Under such situation, coastal erosion and risk for the damages by high waves and flooding have occurred and expected to increase because of climate impact.
The target atolls and islands were selected among the many inhabited islands scattered over a wide area in the Maldives; in consideration of the achievement of effective horizontal expansion of the outputs of the proposed project to other islands, and the current vulnerability of coastal disasters and the impacts of future climate risks, based on the current coastal situations as well as the current land use and activities along the coast in the inhabited islands.
There are three points for selecting the target atolls and islands: item 1) impact of climate hazard and vulnerability, item 2) project effects, and item 3) similarity to coastal conditions and coastal problems on many inhabited islands, and validity as model cases.
The results of examining each item are as follows:
Item 1): The impacts of climate hazard and vulnerability in the southern area are higher than in any other areas in the Maldives. The number of reported cases of coastal erosion, gender inequality index, human development index, and composite human vulnerability index show that Laamu Atoll has the highest climate impact and vulnerability among the southern atolls.
Item 2): Atolls in the southern part of the Maldives were compared in terms of socio-economic status. It includes the importance in the National Spatial Plan, the size of air passengers, current and future population, scale of tourism, scale of agriculture, and scale of fisheries. Addu Atoll is the most important in the southern area, followed by Laamu Atoll in terms of socio-economic activity.
Item 3): From the results of items 1) and 2), it was confirmed that Laamu Atoll and Addu Atoll have higher climate impact and vulnerability in the southern area, and project implementation effects can be

Data Collection Survey on Building Climate Resilient Safer Cities Final Report
5-14
expected. In the selected two atolls, the main inhabited islands were compared for selecting target islands in terms of 1) vulnerability, 2) current condition and future development plan for coral reef and natural coasts, and request by residents on coastal measures, and 3) the importance of the islands on both economic and development potential. Eight inhabited islands were listed for the comparison from each atoll, which were Gan, Fonadhoo, Maamendhoo, and Isdhoo in Laamu Atoll and Hithadhoo, Maradhoo/Maradhoo-feydhoo, Feydhoo and Meedhoo/Hulhudhoo in Addu Atoll. The priority of eight listed islands in total were evaluated by giving a score for each. As a result, the Maamendhoo of Laamu Atoll marked the highest, followed by Fonadhoo of Laamu Atoll.
Based on the results of the examination of items 1, 2, and 3, the Fonadhoo of Laamu Atoll and Maamendhoo were selected as the target islands of the proposed projects. Fonadhoo is to be selected as a model island and is expected to increase future population and housings, as the atoll capital which is an economic and administrative center of the atoll. Maamendhoo is to be selected as another model island representing a small isolated island with overpopulation and away from the atoll capital. In the succeeding chapter, the proposed adaptation measures for climate change will be examined by conducting the evaluation of coastal erosion, vulnerability of high-wave and resulting flooding, and exposure to the disaster.

Data Collection Survey on Building Climate Resilient Safer Cities Final Report
5-15
<References>
1) Julia Borgudd (2014): Reducing risk for erosion in Maldives comparative case study of local people’s and resort’s adaptive capacity in Laamu atoll, 66p
2) UNDP (2014): Maldives Human Development Report 2014, 125p. 3) MPND (2004): Vulnerability and Poverty Assessment 4) MNPI (2019): National Spatial Plan 5) National Bureau of Statistics (2019): Statistical Pocketbook of Maldives 2019 6) National Bureau of Statics (2014): Population & Housing Census 2014, 105p. 7) Bodil Englund (2014): Reducing risk of beach erosion in Maldives Comparative case study of
authority´s adaptive capacity in Laamu atoll, 64p
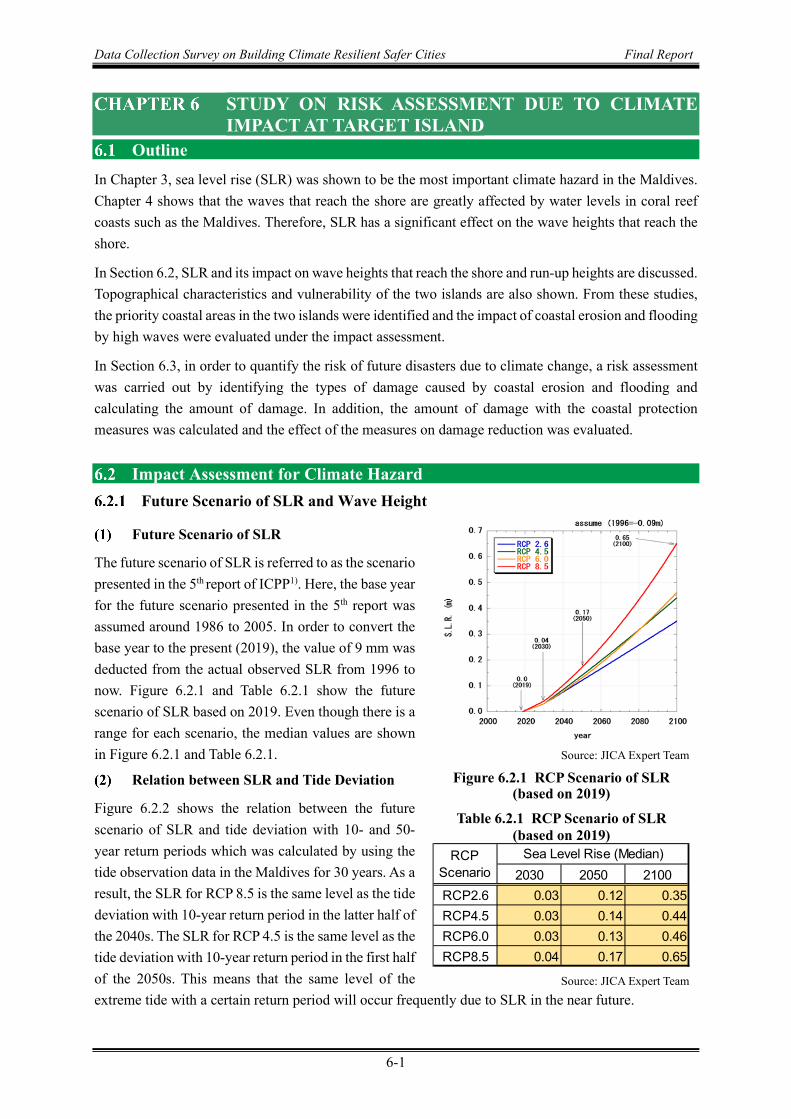
Data Collection Survey on Building Climate Resilient Safer Cities Final Report
6-1
STUDY ON RISK ASSESSMENT DUE TO CLIMATE IMPACT AT TARGET ISLAND
Outline
In Chapter 3, sea level rise (SLR) was shown to be the most important climate hazard in the Maldives. Chapter 4 shows that the waves that reach the shore are greatly affected by water levels in coral reef coasts such as the Maldives. Therefore, SLR has a significant effect on the wave heights that reach the shore.
In Section 6.2, SLR and its impact on wave heights that reach the shore and run-up heights are discussed. Topographical characteristics and vulnerability of the two islands are also shown. From these studies, the priority coastal areas in the two islands were identified and the impact of coastal erosion and flooding by high waves were evaluated under the impact assessment.
In Section 6.3, in order to quantify the risk of future disasters due to climate change, a risk assessment was carried out by identifying the types of damage caused by coastal erosion and flooding and calculating the amount of damage. In addition, the amount of damage with the coastal protection measures was calculated and the effect of the measures on damage reduction was evaluated.
Impact Assessment for Climate Hazard
Future Scenario of SLR and Wave Height
Future Scenario of SLR
The future scenario of SLR is referred to as the scenario presented in the 5th report of ICPP1). Here, the base year for the future scenario presented in the 5th report was assumed around 1986 to 2005. In order to convert the base year to the present (2019), the value of 9 mm was deducted from the actual observed SLR from 1996 to now. Figure 6.2.1 and Table 6.2.1 show the future scenario of SLR based on 2019. Even though there is a range for each scenario, the median values are shown in Figure 6.2.1 and Table 6.2.1.
Relation between SLR and Tide Deviation
Figure 6.2.2 shows the relation between the future scenario of SLR and tide deviation with 10- and 50-year return periods which was calculated by using the tide observation data in the Maldives for 30 years. As a result, the SLR for RCP 8.5 is the same level as the tide deviation with 10-year return period in the latter half of the 2040s. The SLR for RCP 4.5 is the same level as the tide deviation with 10-year return period in the first half of the 2050s. This means that the same level of the extreme tide with a certain return period will occur frequently due to SLR in the near future.
Source: JICA Expert Team
Figure 6.2.1 RCP Scenario of SLR (based on 2019)
Table 6.2.1 RCP Scenario of SLR (based on 2019)
Source: JICA Expert Team
2030 2050 2100RCP2.6 0.03 0.12 0.35RCP4.5 0.03 0.14 0.44RCP6.0 0.03 0.13 0.46RCP8.5 0.04 0.17 0.65
Sea Level Rise (Median)RCPScenario

Data Collection Survey on Building Climate Resilient Safer Cities Final Report
6-2
Source: JICA Expert Team
Figure 6.2.2 Relation Between SLR and Tide Deviation
Source: JICA Expert Team
Figure 6.2.3 Encounter Probability of Extreme Tide with 50-year Return Period for Each RCP Scenario
To be clear quantitatively, the encounter probability for the tide level which will exceed the tide with a certain return period to occur is presented. Figure 6.2.3 shows the encounter probability for the tide level that will exceed the tide with 50-year return period for each RCP scenario to occur. The encounter probability is increased significantly because of the SLR.
Impact on Wave Height on Coral Reef
The waves on the coral reef are generally smaller than those for common sandy beaches with uniform slope due to wave breaking at the reef edge and wave dissipation on coral reef due to the effect of seabed friction. The coral oriented beach was formed by the action of such waves over a long period. It is known that the wave height on the coral reef is almost proportional to the water depth on coral reef (H =γh、H: Wave height, h: water depth on coral reef, γ: constant). This means that SLR due to climate change will induce significant increase of wave height on the coral reef. Based on the past study results, it was known that the constant value γ was 0.35 ~ 0.42). Here, the value of γ was set to 0.4 and the wave height on coral reef for each RCP scenario will be examined. Figure 6.2.4 shows the calculated rate of wave height on the coral reef between that with and without SLR for each RCP

Data Collection Survey on Building Climate Resilient Safer Cities Final Report
6-3
scenario with the topographic condition assuming the values of Fonadhoo Island in Laamu Atoll (h = MSL -0.2 m). From the result, it shows that the SLR will induce a significant increase of wave height on the coral reef compared to the common sandy beach. Such increase of wave height will also induce the increase of wave run-up for the coral beach.
Impact on Run-up Height
Flooding because of high wave occurs when the waves reached the shore and the water level is high. As mentioned above, long-term SLR causes not only the rising of the water level but also the increase of wave height on coral reef. Furthermore, the long-period components, which are included in the incident waves (defined as “surf beats”), are amplified by reflections and resonances in the coral reef, which have a significant impact on the damage caused by flooding.
As shown in Figure 6.2.5, there are significant water level fluctuations (surf beat) within few minutes during high wave condition. When such fluctuations of water level are combined with high waves, the run-up height and wave overtopping become significant and will cause flooding at the hinterland. Figure 6.2.6 shows an example of the relation between run-up height and incident wave height at the outer reef area, obtained using a nonlinear numerical wave model (called “Boussinesq Equation”) for three different water level conditions. The run-up height increases in accordance with the increase of incident wave height. Figure 6.2.7 shows the future prediction of run-up height for two different scenarios, RCP 4.5 and RCP 8.5 at two islands, using the same wave model.
a) Calm (H1/3 (Outer reef) = 1.06 m)
b) High Wave (H1/3 (Outer reef) = 2.25 m)
Source: JICA Expert Team
Figure 6.2.5 Sample of Surf Beat Observed Inside of the Reef
Source: JICA Expert Team
Figure 6.2.4 Increase of Wave Height Rate on Coral Reef for Each RCP Scenario
0.8
1.0
1.2
1.4
1.6
1.8
2.0
2000 2020 2040 2060 2080 2100
H ree
f (w
ith S
LR)/H
reef
(with
out
SLR)
Year
RCP8.5RCP6.0RCP4.5RCP2.6

Data Collection Survey on Building Climate Resilient Safer Cities Final Report
6-4
*Values on the vertical axis are the run-up heights of the top 2% of all waves and obtained by dividing the
significant wave height at the outer reef. Source: JICA Expert Team
Figure 6.2.6 Relation Between Run-up Height and Wave Height at the Outer Reef
Source: JICA Expert Team
Figure 6.2.7 Relation Between Run-up Height and SLR
The run-up height increases with the increasing SLR. The different trend of increase between Maamendhoo Island and Fonadhoo Island is mainly due to the difference of reef topography such as the difference of water depth on the reef.
As mentioned above, the increasing trend of the water level and wave height due to SLR, together with the water level fluctuations due to surf beats, will increase the frequency of high waves on the shore and flooding in the hinterland. It will induce more severe coastal erosion and flooding damage.
1.0
2.0
3.0
4.0
5.0
1 2 3 4 5 6
WAV
E R
UN
UP
(2%
) /H 1
/3(O
UTE
R RE
EF)
H1/3 (OUTER REEF) (M)
WL=0.79mWL=0.39mWL=0.00m
0.3
0.4
0.5
0.6
0.7
0.8
0.9
1.0
2020 2040 2060 2080 2100
Wav
e Ru
n-up
(2%
) /H 1
/3(a
t out
er re
ef)
Fonadhoo
RCP4.5 RCP8.0
0.3
0.4
0.5
0.6
0.7
0.8
0.9
1.0
2020 2040 2060 2080 2100
Wav
e Ru
n-up
/H1/
3(a
t Out
er R
eef)
Maamendhoo
RCP4.5 RCP8.0

Data Collection Survey on Building Climate Resilient Safer Cities Final Report
6-5
Assessment of Topographic Characteristics and Vulnerability in the Target Two Islands and Identification of Project Sites
Location of Two Islands
Figure 6.2.8 shows the location of the two target islands, namely, Maamendhoo Island and Fonadhoo Island in Laamu Atoll.
Maamendhoo Island is located at the almost southern end of Laamu Atoll. Since this island is located near the largest open channel in Laamu Atoll, swell wave is propagated from the outer atoll from the southeast side of the island. The coral reef, about 200 m wide, has formed along the western coast of the island, and is about 500 m along the shore. The water depth on the coral reef is about mean sea level (MSL) -2 m. Therefore, the coral reef does not dry up even during low tide and the seabed surface is covered by seagrass. There is no significant coral reef at the other coast and no coral reef exists at the southwestern part of the island.
Fonadhoo Island is located in the southeast side of Laamu Atoll. The west side of the island faces the ocean side and the east side is the lagoon side. At the west side of the island (ocean side), the coral reef with about 300-500 m width has formed, and it dries up during low tide. On the other hand, at the east side of the island (lagoon side), the coral reef with about 400-700 m width has formed. The depth on the coral reef is about 0.5 m lower than that at the ocean side and therefore, most of the seabed surface on the coral reef is significantly covered by seagrass.
Source:Processed by JICA Expert Team based on Google Earth
Figure 6.2.8 Target Islands (Left: Maamendhoo Island, Right: Fonadhoo Island in Laamu Atoll)
Maamendhoo Island
Outline Figure 6.2.9 shows the satellite images from 1969 until now for three periods. Land development has
been active since 1969 and there is no space for further development in the area now. Maamendhoo Island is located nearby the open channel of Laamu Atoll. The island area is 18.7 ha and it is the smallest inhabited island in Laamu Atoll. According to the Census in 20143), the registered population is 1,335 and the resident population is 896. This is the 5th biggest populated island among the 12 inhabited islands in Laamu Atoll. On the other hand, due to the small area of the island, the population density is

Data Collection Survey on Building Climate Resilient Safer Cities Final Report
6-6
the highest in Laamu Atoll with 48 persons/ha. This is also the 4th highest in all of the inhabited islands in the Maldives. Maamendhoo Island is located close to the channel of Laamu Atoll, making it a logistical key point both in and out of the atoll. Besides, due to a prominent resort island (Six Senses), its per capita output is higher than that of other islands as a base for labour and supplies. In the northeastern part of the island, a harbour was constructed between 2007 and 2008, and the dredged material from the navigation and anchorage was placed as reclamation material on the north and south sides of the harbour.
Source: Processed by JICA Expert Team based on aerial photos in 1969 and satellite image in 1999
provided by Land & Survey and WorldView in 2019 procured by JICA Expert Team
Figure 6.2.9 Change in Condition of Maamendhoo Island in Laamu Atoll
Port Construction (2007-2008)Pavement Improvement in 2014
Reclamed areausing dredged
sand in port project
High dencity in Land
①
②③

Data Collection Survey on Building Climate Resilient Safer Cities Final Report
6-7
Topographic Characteristics A map of the island's elevation distribution, obtained from the previous survey results4), is shown in Figure 6.2.10 and the ground elevation in the four representative lines is shown in Figure 6.2.11.
The average elevation of the main area of the island is about MSL +0.7 - 0.8 m, which is lower than the other islands in the Maldives (about MSL +1.0 m). However, near the southern coast of the island, the elevation is higher at about MSL +1.2 to 1.4 m. This is due to the formation of the beach ridge, which is a response to the high waves on the south side of the island where the waves enter directly from the ocean side.
Source: LeCred Survey4) processed
by JICA Expert Team Figure 6.2.10 Elevation Distribution of
Maamendhoo
(a) Line M1
(b) Line M2
M1
M2
M3
M4
-0.50.00.51.01.52.02.5
0 50 100 150 200 250 300 350 400 450 500 550 600 650
Elev
atio
nfr
omM
SL(m
)
Distance (m)
South Side ← M1 → North Side
-0.50.00.51.01.52.02.5
0 50 100 150 200 250 300 350 400 450 500 550 600 650
Elev
atio
nfr
omM
SL(m
)
Distance (m)
South Side ← M2 → North Side

Data Collection Survey on Building Climate Resilient Safer Cities Final Report
6-8
Conditions of Beach, Coastal Erosion and Flooding Seasonal change of the beach due to change of waves for each season is significant, especially for small islands like Maamendhoo Island. Figure 6.2.12 shows the change in beach condition between two different seasons during the northeast (February 2019) and southwest (September 2019) monsoon seasons. Here, (1) shows the photo at position ① in Figure 6.2.9, (2) at position ②, and (3) at position ③. The upper photos were taken in February 2019 during the northeast monsoon season where the southward littoral drift might be significant. On the other hand, the lower photos were taken in September 2019 during the southwest monsoon season where the northward littoral drift might be significant. Due to such seasonal change, the beach at position ① changed from retreat during the northeast monsoon season to accumulation during the southwest monsoon season. Also, the northward littoral drift from position ② to ③ was identified during the southwest monsoon season. The beach will change in the long term through the repetition of such seasonal change.
From the result of the interview survey with the residents, the issues of coastal erosion, wave run-up, and flooding have been occurring at the southeast side of the port for approximately 300 m, and the west side for 600 m as shown in the lower figure in Figure 6.2.9. Figure 6.2.13 shows the current condition of coastal erosion at these two sites, and Figure 6.2.14 shows the condition after flooding occurred in 2019. Coral sand and gravel mining, which still continue at other inhabited islands, have
(c) Line M3
(d) Line M4
Source: Processed by JICA Expert Team based on Google Earth and LeCred survey4)
Figure 6.2.11 Cross Section of Topographic Profile at the Four Representative Lines in Maamendhoo
-0.50.00.51.01.52.02.5
0 50 100 150 200 250 300 350 400 450 500 550 600 650
Elev
atio
nfr
omM
SL(m
)
Distance (m)
West Side ← M3 → East Side
-0.50.00.51.01.52.02.5
0 50 100 150 200 250 300 350 400 450 500 550 600 650
Elev
atio
nfr
omM
SL(m
)
Distance (m)
West Side ← M4 → East Side

Data Collection Survey on Building Climate Resilient Safer Cities Final Report
6-9
(1) Position ① (2) Position ② (3) Position ③
Source: JICA Expert Team
Figure 6.2.12 Change in Beach Condition Between February and September 2019
(1) West Side (2) East Side
Source: JICA Expert Team
Figure 6.2.13 Beach Condition at Maamendhoo (March 2019)
(1) Around Beach Area (2) Residential Area at Hinterland
Source: Maamendhoo Island Council
Figure 6.2.14 Flooding Due to High Wave (2019)
2019.2
2019.9
2019.2
2019.9 2019.9
2019.2

Data Collection Survey on Building Climate Resilient Safer Cities Final Report
6-10
Long Term Shoreline Change Long term shoreline change was analyzed based on the old aerial photos and satellite image for five periods since 1969 up to now (1969, 1999, 2005, 2007 and 2019). Figure 6.2.16 shows the shoreline change at the west side of the island with 1,300 m while Figure 6.2.17 shows that on the east side with 600 m, as also shown in Figure 6.2.15. The shoreline change shown in (1) in the figures is based on 1969. On the other hand, the shoreline change based on 2005 is also shown in (2) to know the influence of the port construction. The “+” in the vertical axis means an advance of shoreline and the “-” means retreat.
At the west side, the beach at the convex area shows retreat and advance in the surrounding area. A beach retreat of approximately 5 m to 10 m was observed at the northwest side of the beach (X= 300 m to 650 m), which is the same tendency based on the result of the interview survey. On the other hand, the beach on the east side was eroded by approximately 10 m to 15 m before construction of the port. After the reclamation that was implemented from 2007 to 2008, the shoreline at the south side of the port (X= 0 m to 300 m) advanced by approximately 35 m. After that, from 2017 to 2019, no significant change of shoreline in this area was identified. On the other hand, beach erosion has continued to occur at X= 300 m to 600 m since 1969 by about 15 m to 20 m.
According to these results, the average erosion rates were estimated to be about 0.4 m/year on the southeast coast side and 0.7 m/year on the west coast, based on the year 2005.
Source: Processed by JICA Expert Team based on WorldView in 2019
procured by JICA Expert Team
Figure 6.2.15 Coordinate to be Used for the Analysis of Shoreline Change
(1) Based on 1969

Data Collection Survey on Building Climate Resilient Safer Cities Final Report
6-11
(2) Based on 2005
Source: JICA Expert Team
Figure 6.2.16 Shoreline Change at the West Side
(1) Based on 1969
(2) Based on 2005
Source: JICA Expert Team
Figure 6.2.17 Shoreline Change at the East Side

Data Collection Survey on Building Climate Resilient Safer Cities Final Report
6-12
Summary and Identification of the Project Sites Active land development at Maamendhoo Island has been identified since 1969, and currently,
there is very little undeveloped land on the island. As a result, Maamendhoo Island became the fourth most densely populated island in the Maldives. The average elevation, MSL +0.7 m to 0.8 m, is lower than the average elevation of the other inhabited islands.
The coast shows an overall erosion trend over the long term, with repeating seasonal changes on topography which are commonly seen in small islands. Especially at the southeast coast side, erosion is approximately 300 m alongshore, and at the west side coast, it is approximately 600 m. The average erosion rates are about 0.4 m/year on the southeast coast side and 0.7 m/year on the west coast since 2005.
Because of the particular conditions of this island such as low average elevation, high population density, and almost no vacant land space, there is a concern that the combined effects of SLR and high waves and rising seawater levels on the coral reefs due to surf beat may cause further coastal erosion and flooding. Thus, coastal adaptation measures, together with securing of the area for evacuation during coastal disaster, are required.
As a result, it was proposed to conduct beach conservation measures at the southeast side beach for 300 m alongshore, and at the west side beach for 600 m alongshore, where coastal erosion and flooding are currently occurring. Also, it was proposed to create a secured space to serve as the temporary evacuation area for residents at the north area of the island (see Chapter 9 for details of the measures).
Fonadhoo Island
Outline An overview of the Fonadhoo Island is shown in Figure 6.2.18. Fonadhoo Island is located in the east side of Laamu Atoll. This island is the second biggest populated island next to the Gan Island 3) with a population of 2,266. The area of the island is 162.6 ha (Gan Island is 663 ha) and the population density is about 14 persons/ha, which is the fourth highest population density in Laamu Atoll. The coastal area is divided into two sides, the “lagoon side” and “ocean side”, and the coastlines are 4.0 km and 4.5 km, respectively.
Source: Processed by JICA Expert Team based on WorldView in 2019 procured by JICA Expert Team
Figure 6.2.18 Overview of Fonadhoo Island in Laamu Atoll
Jetty for sea cucumber farmnew houses for
migrated families from Gaadhoo
Ongoing mining area(digging depth is about 3 m, plan to stop)
sea cucumber farm
New houses for migrated families
from Gaadhoo
Port Construction(1993-2008)
Sand mining pit for link road (already stopped) Channel & basin
dredgingLink Road

Data Collection Survey on Building Climate Resilient Safer Cities Final Report
6-13
The coral reef at the lagoon side is 350 m to 700 m wide (average 600 m), and 250 m to 500 m wide (average 300 m) at the ocean side. Since the ocean waves do not affect the lagoon side, the wave condition at the lagoon side is relatively calm throughout the year and it is very rare for high waves to occur.
On the other hand, at the ocean side, high waves hit the coast especially during the southwest monsoon season and flooding at the residential area occurs frequently.
The residential area is mainly located at the center of Fonadhoo Island, behind the port at the lagoon side. Also, new residential area and houses for families that migrated from Gaadhoo Island in the same atoll in 2018, were developed at both the north and south sides of the central residential area.
Topographic Characteristics The cross section of the topographic profile of Fonadhoo Island is shown in Figure 6.2.19. The average elevation is about MSL +1.0 m, which is slightly higher than the average elevation of Maamendhoo (MSL +0.7 - 0.8 m) and almost the same as the average elevation of the inhabited islands in the Maldives. The elevation from the top of the ocean side is about MSL +1.5 m due to the formation of the beach ridge by wave action and is the same as that for Maamendhoo Island. The reason why the berm height at the top of the ocean side in line F2 is MSL +2.0 m, which is about 0.5 m higher than the other lines, is that the Island Council has used artificially filled sand to prevent wave intrusion towards the residential area.
(a) Line F1
F1
F2F3F4
-0.50.00.51.01.52.02.5
0 100 200 300 400 500 600
Elev
atio
nfr
omM
SL(m
)
Distance (m)
Lagoon ← F1 → Ocean
-0.50.00.51.01.52.02.5
0 100 200 300 400 500 600
Elev
atio
nfr
omM
SL(m
)
Distance (m)
Lagoon ← F2 → Ocean

Data Collection Survey on Building Climate Resilient Safer Cities Final Report
6-14
(b) Line F2
(c) Line F3
(d) Line F4
Source: Processed by JCIA based on Google Earth and LeCred survey4)
Figure 6.2.19 Cross Section in the Four Representative Lines of Fonadhoo Island
Conditions of Beach, Coastal Erosion and Flooding The Fonadhoo Port was constructed at the center area of the lagoon side from 1993 to 1995 and was further expanded in 2008. In order to secure the construction material for the projects of the port and rink road in the island, coral sand and gravel were excavated from the three borrow pits on the coral reef at the lagoon side. Currently, coral sand mining continues only in the biggest borrow pit located at the south end of the island. However, this mining activity will end from now on. Such artificial modifications of the coast might cause coastal erosion at the lagoon side. On the other hand, the alignment of the rink road is positioned at the lagoon side and the area between the coastline and the rink road with 30 m to 100 m width is secured as a “buffer zone”.
Flooding has occurred frequently at the ocean side of the coastal area due to the storm waves during high tide. Also, when the Indian Ocean Tsunami occurred in 2004 and hit the east side of the Maldives, significant flooding with approximately 2 m to 3 m height occurred at the ocean side of the coastal area. As the residential area exists nearby the ocean side of the coastal area, it is identified as a high-risk area for coastal disaster. Coastal erosion, which was identified in this coastal area (as shown in Figure 6.2.20, has increased the vulnerability for coastal disaster. A simple sand embankment was constructed at the central coastal area by the Island Council, as shown in Figure 6.2.21, in order to protect the hinter residential area against flooding.
According to the land use plan which was recently prepared by the Island Council, a buffer zone with 30 m was planned along the coastline in order to protect the land against coastal erosion and flooding due to storm wave. However, some houses at the residential area are located within 30 m from the coast (Figure 6.2.22) and are sometimes affected by the flooding.
Illegal mining of coral sand and gravel has been continued by the local people, and mined sand and gravel are temporarily placed at the coastal area (Figure 6.2.23).
-0.50.00.51.01.52.02.5
0 100 200 300 400 500 600
Elev
atio
nfr
omM
SL(m
)
Distance (m)
Lagoon ← F3 → Ocean
-0.50.00.51.01.52.02.5
0 100 200 300 400 500 600
Elev
atio
nfr
omM
SL(m
)
Distance (m)
Lagoon ← F4 → Ocean

Data Collection Survey on Building Climate Resilient Safer Cities Final Report
6-15
Source: JICA Expert Team Source: JICA Expert Team
Figure 6.2.20 Coastal Erosion at Residential Area
Figure 6.2.21 Simple Sand Embankment
Source: JICA Expert Team Source: JICA Expert Team
Figure 6.2.22 Houses Just behind the Coast Figure 6.2.23 Mined Coral Sand and Gravel
Long Term Shoreline Change Long term shoreline change was analyzed based on the old aerial photos taken in 1969 and 1999 and satellite images in 2005 and 2018 shown in Figure 6.2.24. The satellite image in 2018 shown in Figure 6.2.24 also describes the coordinates of the shoreline for the ocean and lagoon side, which will be used for the figures for shoreline change. Figure 6.2.25 shows the shoreline change in each period based on the shoreline position in 1969. The “+” in the vertical axis means advance of shoreline and the “-” means retreat from the shoreline position in 1969. The beach retreat was identified from 1969 to 1999 at 5 m to 10 m for 30 years. No significant change in the shoreline was observed from 1999 to 2005. From 2005 to 2018, the tendency for the advance of the shoreline was slightly identified. In contrast, at the lagoon side, significant beach retreat from 1969 to 1999 at 20 m for 30 years was observed at the north side of the port. This might be caused by the interruption of the northward littoral drift due to the port construction which was carried out from 1993 to 1995.
From the result of the interview survey, flooding during a high wave attack has occurred frequently in the residential areas (X= 2060 m to 3260 m) of the ocean side. Therefore, the simple sand embankment was constructed by the Island Council to prevent wave intrusion (Figure 6.2.21). On the other hand, according to the shoreline change map traced from the images shown in Figure 6.2.25, the shoreline at the above-mentioned area seems to advance from 2005 to 2018. In order to check the condition at this area in detail, the zoom-up satellite images between 2005 and 2018 are shown in Figure 6.2.26.

Data Collection Survey on Building Climate Resilient Safer Cities Final Report
6-16
Source: Processed by JICA based on aerial photos in 1969 and satellite image in 1999
provided by Land & Survey and QuickBird in 2005 and WorldView in 2018 procured by JICA
Figure 6.2.24 Aerial Photos Taken in 1969 and 1999 and Satellite Images in 2005 and 2018
at Fonadhoo Island

Data Collection Survey on Building Climate Resilient Safer Cities Final Report
6-17
(1) Ocean Side
(2) Lagoon Side
Source: JICA Expert Team
Figure 6.2.25 Shoreline Change Based on 1969
Source: Processed by JICA Expert Team based on QuickBird in 2005 and WorldView in 2018
procured by JICA Expert Team
Figure 6.2.26 Change of Sand Deposition on Coral Reef Between 2005 and 2018

Data Collection Survey on Building Climate Resilient Safer Cities Final Report
6-18
Source: JICA Expert Team
Figure 6.2.27 Change of Coastal Area at the Central Residential Area of the Ocean Side
From Figure 6.2.26, sand depositions on the coral reef are identified at around X= 2100 m to 2300 m in 2018, which were not seen in 2005. Some of the sand seems to reach the shore. This adds to the difficulty in tracing the shoreline position from the satellite image accurately and may result in some errors. As shown in Figure 6.2.25, significant variation on the position of shoreline change was identified and this makes it difficult to evaluate the trend of shoreline change in this area. Therefore, to identity the average shoreline change and to know the tendency of the shoreline process, the change in area at the specific coastal area from X= 2060 m to 3260 m was calculated as shown in Figure 6.2.27. Here, the change in area from 1969 to 2005 is presented and the data of 2018 is eliminated because of the difficulty to trace the shoreline position. The area decreased by approximately 6,000 m2 over 30 years from 1969 to 1999 and was almost kept constant from 1999 to 2005. From the result, the average beach retreat was estimated to be about 5 m (0.17 m/year) over 30 years from 1969 to 1999. The continuous monitoring of the process of beach change in this area is still required to clarify the impact and effect of sand deposition on the coral reef.
Summary and Identification of the Project Sites Fonadhoo Island is about 4.5 km long and 500 m wide and is surrounded by coral reef. It is one of
the main islands in Laamu Atoll with a population of over 2,000 people. The residential area is concentrated at the central area of the island up to the nearby coastal area at the ocean side, even though the coastal area at the ocean side remains undeveloped. As a result, flooding by high waves frequently occurs at the residential areas located at the central area of the ocean side. The Island Council has constructed a simple embankment at the coastline by filling with sand to prevent high waves.
As a result of the long-term shoreline analysis based on the satellite image from 1969 to 2005, coastal erosion is identified at the coast surrounding this residential area at the ocean side for 1.2 km alongshore. The beach retreat was estimated to be about 5 m for 30 years (0.17 m/year). On the other hand, sand accumulation nearby the shore on the coral reef was identified in the satellite image in 2018, and this makes it difficult to trace the position of the shoreline.
In Fonadhoo Island, there is a concern that the combined effects of SLR and the increase of swell waves and resulting rising seawater levels on the coral reefs due to surf beat may cause further coastal erosion and flooding. It is required to prevent further coastal erosion to protect the residential areas at the hinterland against flooding particularly at the central area of the ocean side where the residential area spreads to the nearby coast of the ocean side,.
In the other areas of Fonadhoo Island, except the above-mentioned central area at the ocean side, further land development such as the expansion of residential area is planned in the future, even though undeveloped area still exists. In such areas, it is recommended to consider the effort for resiliency of national land into the land use plan (e.g., securing of buffer zone against coastal disaster) as the first priority.

Data Collection Survey on Building Climate Resilient Safer Cities Final Report
6-19
As a result, coastal adaptation measures shall be implemented in Fonadhoo Island to address further coastal problems caused by SLR at the central area of the ocean side for 850 m, where the residential area spreads nearby the coast and coastal erosion and flooding due to high wave have already been occurring.
Impact Assessment on Coastal Erosion and Flooding Due to High Waves Outline
In this section, the effects of climate hazards (SLR and resulting increase of wave height on coral reef and run-up height at shore) on coastal erosion and flooding, which are the two major causes of coastal disasters, in the potential project sites of the two islands shall be investigated.
It is important to note that although coastal erosion and flooding are different events, they interfere with each other in reality. Therefore, the progress of coastal erosion can cause not only the loss of land and the collapse of houses and infrastructures but also the increase of vulnerability to climate hazards and will induce the increase of flooding damage. Based on the individual impact studies discussed in this section, the next section (6.3) assumes a case where erosion and flooding are linked and evaluates the impact and damage costs.
Impact Assessment on Coastal Erosion
Approaching Method It is common to apply the Bruun Theory5) to estimate the beach retreat due to SLR for sandy beaches. This is a simple estimation method by assuming a two-dimensional equilibrium coastal topographic profile which can be determined by the grain size of seabed sand and the wave condition. However, there are some differences of coastal topographic profile between the coral reef beaches and the equilibrium profile for sandy beaches assumed by the Bruun Theory. Also, significant changes in profile for coral reef beaches will occur only at nearby shore due to existence of coral reef. Therefore, it is problematic to estimate the beach retreat due to SLR for coral reef beaches using the Bruun Theory.
In order to estimate the beach retreat due to SLR for coral reef beaches, a simple calculation method is newly developed by using basic specification related to the coastal topographic profile for coral reef beaches which has been obtained by previous field and experimental study6). Figure 6.2.28 shows the definition of each parameter used in this method, and Figure 6.2.29 shows the image of the method. The following preconditions i) and ii), and the assumption iii) were employed for deriving the new method.
i) Profile change due to wave action occurs only nearby the shore at the end of the reef flat7).
ii) Regarding profile changes, foreshore slope (β) roughly depends on the difference of grain size of foreshore bed material. Berm height (hR) at the foreshore increases with the transmitted wave height (H) to the beach8).
iii) The rate between the foreshore slope (tan β) and the backshore slope (tan β2) is assumed to be almost constant regardless of the changes in wave heights due to rising water levels. The results of the field surveys at several coasts in the Maldives gave this ratio as nearly 1/3.
In addition to these conditions, the following relational equations, which have been obtained from previous studies, were used:
i) Wave height (H) on coral reef is almost proportional to the water depth on coral reef and is defined as 0.4 times of the water depth (h) 2)
ii) Beach ridge height (berm height (hR)) at foreshore is almost proportional to the transmitted wave height (H) to the beach9). That is,

Data Collection Survey on Building Climate Resilient Safer Cities Final Report
6-20
𝛼𝛼 = ℎ𝑅𝑅/𝐻𝐻 = ℎ′𝑅𝑅/𝐻𝐻′ (𝛼𝛼 ≈ 1.0)
Source: JICA Expert Team
Figure 6.2.28 Definition of Each Specification Presented in the Report
Source: JICA Expert Team
Figure 6.2.29 Approach of Proposed Calculation Method on Beach Retreat for Coral Reef Beach
𝛼𝛼 = ℎ𝑅𝑅/𝐻𝐻 = ℎ′𝑅𝑅/𝐻𝐻′ (𝛼𝛼 ≈ 1.0)
Using these conditions, the beach retreat after SLR, ΔY0, can be calculated from the relationship in which the area of sedimentation equals the area of erosion (𝐴𝐴𝑎𝑎 = 𝐴𝐴𝑒𝑒), assuming that the volume of sand is still conserved during SLR (Figure 6.2.29).

Data Collection Survey on Building Climate Resilient Safer Cities Final Report
6-21
Source: JICA Expert Team
Figure 6.2.30 Comparison of Calculated Beach Retreat using Proposed Formula6) and Experiment7)
The calculated result6) is compared to the experimental result7) presented in Figure 6.2.30 in order to verify the validity of the proposed method. The calculated beach profile well agrees with the experimental one and the validity of the proposed method for coral reef beach was proved. Using this method, the beach retreat under different SLR for each RCP scenario (as shown in Figure 6.2.1) and the impact on the loss of island area are examined in the next step.
This method is to predict the amount of beach retreat only due to SLR. However, in addition to this, coastal erosion is often caused by human-induced activities such as construction of ports, navigation channels, coastal protection structures, etc. In the following study, the amount of beach retreat caused by SLR is firstly examined, and then the case of additional beach retreat caused by the combination of SLR and human-induced activity is examined.
Prediction of Beach Retreat and Rate of Land Loss by SLR Figure 6.2.31 shows the calculated change in beach profile and resulting beach retreat due to SLR for RCP 8.5 in case of Maamendhoo. This figure shows the beach retreat with the change of beach profile in response to rising water levels. In this case, the retreat length due to SLR is 21 m in 2100.
Figure 6.2.32 and Figure 6.2.33 show the predicted beach retreat due to SLR (ΔY0) for RCP 4.5 and RCP 8.5 by using the representative topographic profile of coral reef beach at both Fonadhoo and Maamendhoo Islands in Laamu Atoll. For reference, the beach retreat only due to the rising of seawater level without consideration on the change in beach profile due to SLR is also presented in the figure as ΔYs. From this, it can be seen that significant beach retreat occurs when the changes in beach profile caused by SLR are considered.
Figure 6.2.34 shows the rate of land loss for three islands (Gan, Fonadhoo, Maamendhoo) due to coastal erosion. Here, the total land area of Gan is 663 ha, Fonadhoo is 163 ha, and Maamendhoo is 19 ha. As a result, the smaller the island, the rate of land loss becomes more significant. For example, about 26% of land loss at Maamendhoo was predicted by 2100 in the case of RCP 8.5.
The results of this study indicate that the acceleration of coastal erosion by SLR will have a more significant impact as the island becomes smaller. Therefore, climate change adaptation measures should be able to deal with both flooding and coastal erosion.

Data Collection Survey on Building Climate Resilient Safer Cities Final Report
6-22
Source: JICA Expert Team
Figure 6.2.31 Example of Calculation (Maamendhoo, RCP 8.5)
(1) In case of RCP 4.5 (2) In case of RCP 8.5
Source: JICA Expert Team
Figure 6.2.32 Predicted Beach Retreat (Fonadhoo, RCP 4.5 and 8.5)

Data Collection Survey on Building Climate Resilient Safer Cities Final Report
6-23
(1) In case of RCP4.5 (2) In case of RCP8.5
Source: JICA Expert Team
Figure 6.2.33 Predicted Beach Retreat (Maamendhoo, RCP 4.5 and 8.5)
(1) In case of RCP 4.5 (2) In case of RCP 8.5
Source: JICA Expert Team
Figure 6.2.34 Estimated Land Loss Due to Coastal Erosion for Three Islands for Each RCP scenario
Impact of SLR on Coastal Erosion Due to Artificial Construction In the previous section, the impact on coastal erosion due to SLR only was examined. On the other hand, most of the coastal erosion at inhabited islands in the Maldives have been caused by artificial means. Therefore, the impact on coastal erosion due to both climate change and artificial impact is examined in this section.
Figure 6.2.35 shows the image of artificial impact due to construction of a groin (jetty). When the groin is constructed at the littoral coast with littoral drift (Q), the shoreline will advance at the up-drift side and retreat at the down-drift side due to interruption of littoral movement as shown in Figure 6.2.35.
When the SLR and the increase of wave height on the coral reef due to climate change occur, the magnitude of littoral drift will increase (from Q to Q’) as shown in Figure 6.2.36. In addition to the beach retreat caused by the impact of the jetty (Case 1), the shoreline on the down-drift side of the jetty will further retreat due to the increase in littoral drift by climate change (Case 2).
In addition, due to the beach retreat caused by the above-mentioned beach profile changes due to SLR, the shoreline will further retreat. As a result, the final position of the shoreline will change from Case 1 to Case 3.
0
10
20
30
40
50
1 2 3 4 5
Rate
of A
rea
Loss
(%)
Time Horizon (Year)
Gan (L)
Fonadhoo (M)
Maamendhoo (S)
0
10
20
30
40
50
1 2 3 4 5
Rate
of A
rea
Loss
(%)
Time Horizon (Year)
Gan (L)
Fonadhoo (M)
Maamendhoo (S)
RCP 4.5 RCP 8.5

Data Collection Survey on Building Climate Resilient Safer Cities Final Report
6-24
Figure 6.2.37 shows the predicted beach retreat at the down-drift side of the groin considering the impact of climate change at the area in Addu Atoll. It indicates that the beach retreat becomes more serious due to the additional impact of the groin on climate change. For example, amounts of beach retreat in 2050 and 2100 are 14 m and 29 m, respectively, for the case without considering the impact of climate change. After considering the impact of climate change, the degrees of beach retreat became quite large, i.e., 20 m and 69 m. Thus, the impact of SLR will further accelerate coastal erosion where the erosion due to human-induced activity has already occurred.
Source: JICA Expert Team
Figure 6.2.35 Shoreline Change Due to Interruption of Littoral Drift by Groin
Source: JICA Expert Team
Figure 6.2.36 Further Expansion of Beach Retreat at Down-drift Side Due to Impact of Climate Change
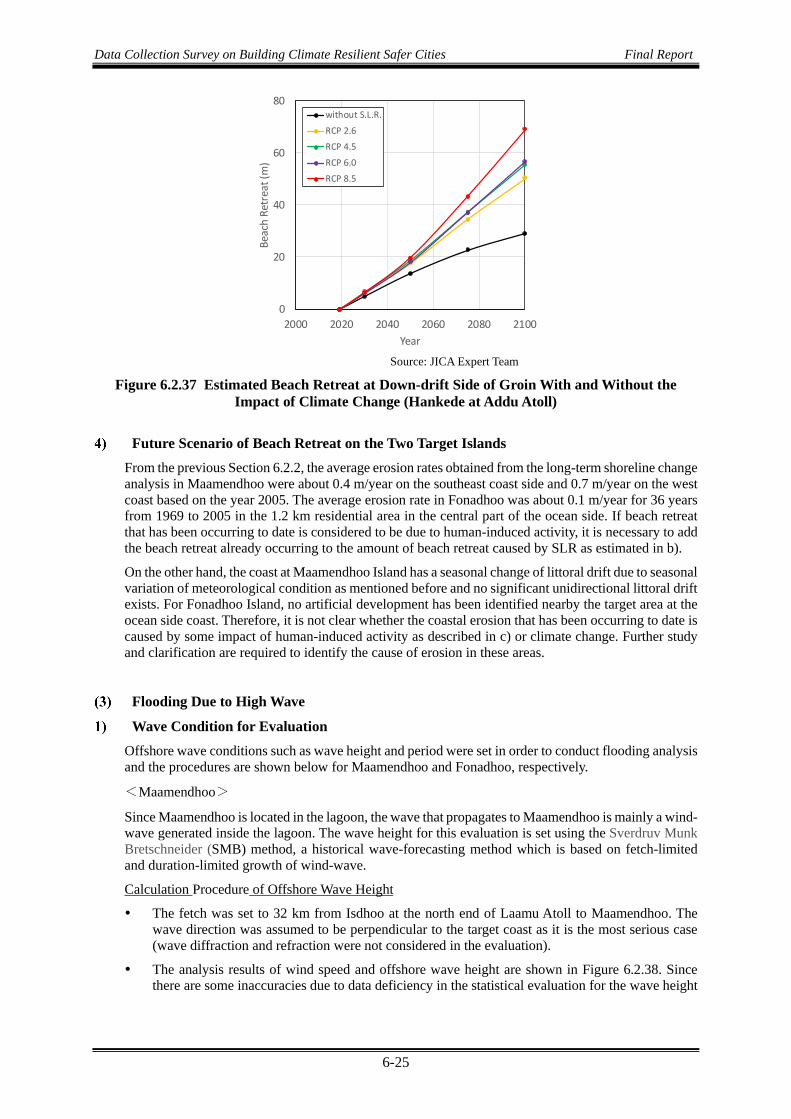
Data Collection Survey on Building Climate Resilient Safer Cities Final Report
6-25
Source: JICA Expert Team
Figure 6.2.37 Estimated Beach Retreat at Down-drift Side of Groin With and Without the Impact of Climate Change (Hankede at Addu Atoll)
Future Scenario of Beach Retreat on the Two Target Islands From the previous Section 6.2.2, the average erosion rates obtained from the long-term shoreline change analysis in Maamendhoo were about 0.4 m/year on the southeast coast side and 0.7 m/year on the west coast based on the year 2005. The average erosion rate in Fonadhoo was about 0.1 m/year for 36 years from 1969 to 2005 in the 1.2 km residential area in the central part of the ocean side. If beach retreat that has been occurring to date is considered to be due to human-induced activity, it is necessary to add the beach retreat already occurring to the amount of beach retreat caused by SLR as estimated in b).
On the other hand, the coast at Maamendhoo Island has a seasonal change of littoral drift due to seasonal variation of meteorological condition as mentioned before and no significant unidirectional littoral drift exists. For Fonadhoo Island, no artificial development has been identified nearby the target area at the ocean side coast. Therefore, it is not clear whether the coastal erosion that has been occurring to date is caused by some impact of human-induced activity as described in c) or climate change. Further study and clarification are required to identify the cause of erosion in these areas.
Flooding Due to High Wave
Wave Condition for Evaluation Offshore wave conditions such as wave height and period were set in order to conduct flooding analysis and the procedures are shown below for Maamendhoo and Fonadhoo, respectively.
<Maamendhoo>
Since Maamendhoo is located in the lagoon, the wave that propagates to Maamendhoo is mainly a wind-wave generated inside the lagoon. The wave height for this evaluation is set using the Sverdruv Munk Bretschneider (SMB) method, a historical wave-forecasting method which is based on fetch-limited and duration-limited growth of wind-wave.
Calculation Procedure of Offshore Wave Height
The fetch was set to 32 km from Isdhoo at the north end of Laamu Atoll to Maamendhoo. The wave direction was assumed to be perpendicular to the target coast as it is the most serious case (wave diffraction and refraction were not considered in the evaluation).
The analysis results of wind speed and offshore wave height are shown in Figure 6.2.38. Since there are some inaccuracies due to data deficiency in the statistical evaluation for the wave height
0
20
40
60
80
2000 2020 2040 2060 2080 2100
Beac
h Re
trea
t (m
)
Year
without S.L.R.
RCP 2.6
RCP 4.5
RCP 6.0
RCP 8.5

Data Collection Survey on Building Climate Resilient Safer Cities Final Report
6-26
of 1-year and 50-year return periods, the wave heights were set at bigger figures than the statistics results referring to the distribution of the actual wave height data.
Return Period (Year)
maximum wind speed
(m/s)
Significant Wave height H1/3 (m)
100 23.09 2.76 50 21.18 2.50 30 19.77 2.31 20 18.64 2.16 10 16.68 1.90 5 14.64 1.63 4 13.94 1.53 3 13.01 1.41 2 11.55 1.22 1 5.12 0.41
→Referring to the result in the table, wave height for evaluation was set as follows:
H1:1=1.0 m H1:10=2.0 m H1:50=3.0 m.
* Wave Period, T1/3 was set to 10 sec based on the result of wave observation at the lagoon side in Addu Atoll
Source: JICA Expert Team
Figure 6.2.38 Extreme Statistical Analysis of the Offshore Wave Height in Maamendhoo
<Fonadhoo>
Since the priority coast in Fonadhoo is facing the outer ocean, the wave height for this evaluation should be adopted based on the waves from the outer ocean. The wave height was calculated using extreme statistical analysis using the significant wave height data at the point near Laamu Atoll obtained from ERA5 provided by the European Centre for Medium-Range Weather Forecasts (ECMWF).
Calculation Procedure of Offshore Wave Height
(1) Obtain the annual maximum significant wave height for 31 years from 1979 to 2009 from ERA5
(2) Calculate the offshore wave height for some return periods (1 – 100 years) by extreme statistical analysis
The analysis results of the offshore wave height are shown in Figure 6.2.39. Since there are some inaccuracies due to data deficiency in the statistical evaluation for the wave height for the one-year return period, the wave height was set at a bigger figure than the statistical result referring to the distribution of the actual wave height data.
100503020105432
Return Period(Year)
-2.0-1.5-1.0-0.50.0 0.5 1.0 1.5 2.0 2.5 3.0 3.5 4.0 4.5 5.0
Standardized Variables
1.0
3.0
5.0
7.0
9.0
11.0
13.0
15.0
17.0
19.0
21.0
23.0
25.0
Wind
Speed
(m/s)
Gumbell

Data Collection Survey on Building Climate Resilient Safer Cities Final Report
6-27
Return Period (Year)
Significant Wave height H1/3 (m)
100 5.24 50 4.84 30 4.57 20 4.38 10 4.08 5 3.81 2 3.48 1 2.16
→Referring to the result in the table, wave height for the evaluation was set as follows: H1:1 = 3.0 m H1:10= 4.0 m H1:50= 4.8 m *Wave Period, T1/3 was set to 16 sec based on the result of wave observation at the outside of the reef edge in Addu
Source: JICA Expert Team
Figure 6.2.39 Extreme Statistical Analysis of the Offshore Wave Height in Fonadhoo
Flooding Due to High Wave The flooding due to high wave under climate change effect was evaluated at the priority coasts of Maamendhoo and Fonadhoo.
<Maamendhoo>
Flooding due to high wave was evaluated by the following procedure:
Evaluation Procedure of Flooding Due to High Wave
Background: Wave propagates in a complicated manner on the reef bathymetry, which is composed of the reef slope, the reef edge where the wave once breaks, and the reef flat where the wave propagates and develops due to wave setup by wave breaking.
(1) The Boussinesq Model, which can evaluate wave propagation on such complicated bathymetry and situation, was selected for the numerical analysis.
(2) Results of the wave measurement at the reef slope and the reef flat were applied to improve the repeatability of the numerical model.
(3) Calculate the wave overtopping rate, q (m3/s/m), at the hinterland (see Section 9.2.4 for threshold value of wave overtopping)
q ≧ 0.02 (m3/s/m) → Evaluated such that major wave overtopping occurs, proceed to next step (4)
q < 0.02 (m3/s/m) → Evaluated such that no major wave overtopping occurs
2.0
2.5
3.0
3.5
4.0
4.5
5.0
5.5
6.0-2.0 0.0 2.0 4.0 6.0 8.0
Wav
e He
ight
(m)
Stat
istic
s
Standardized variable
2 5 10 20 50 100
Return Period(year)30

Data Collection Survey on Building Climate Resilient Safer Cities Final Report
6-28
Source: JICA Expert Team
Figure 6.2.40 Image of Wave Propagation Analysis Using Boussinesq Model
Calculate the flooding depth based on the amount of wave overtopping and hinterland elevation It should be noted that inundation depth is just a criteria to show the degree of risk and does not
necessarily represent actual phenomenon to occur in the future.
Figure 6.2.41 shows the flood area assumed in the analysis. The project implementation area is also indicated in the figure for reference (see Chapter. 9.2 for details).
*1 Counted from local residential map
Source: Processed by JICA Expert Team based on Google Earth
Figure 6.2.41 Assumed Flood Area for Maamendhoo (with the Project Implementation Area)
Cases for evaluation are summarized in Table 6.2.2. High waves with 1-year, 10-year, and 50-year return periods were used for the current evaluation of 2019. Future evaluation with SLR on the RCP scenarios was carried out using a wave with a 10-year return period to avoid extreme overestimation.
Ho(Offshore wave) Wave breaking @reef edge Wave at shore
Wave and current meter@ reef slope
Wave and current meter@ reef flat
Assumed Flooding Area
Beach Nourishment with Groins L= 600 m Reclamation at North Tip of
V= 70,000 m3
Target Wave direction (W)
Project Affected Area (whole Island) ・Population: 1,335 ・Houses*1: 261
Beach Nourishment with Groins L= 300 m

Data Collection Survey on Building Climate Resilient Safer Cities Final Report
6-29
Figure 6.2.42 shows the flood map that corresponds with the red circle cases in Table 6.2.2. It is noted that the impact caused by the coastal erosion presented in Section 6.2.3.(2) is not included in this evaluation. From the results in the table, it was inferred that:
Flooding with about 50 cm depth may occur even at present (2019) at the lower land area if extreme wave (10-year return period) and high tide concurrently occur.
In 2100 and with an SLR of 65 cm, flooding above 1 m may occur across the whole island if extreme wave (10-year return period) and high tide concurrently occur.
Table 6.2.2 Cases for Flood Evaluation for Maamendhoo
Tide Ho
Present RCP 4.5 RCP 8.5 2019
H.W.L= +0.64 m
2030 SLR= 0.03
m
2050 SLR= 0.14
m
2100 SLR= 0.44
m
2030 SLR= 0.04
m
2050 SLR= 0.04
m
2100 SLR= 0.65
m H1:1= 1.0 m ● - - - - - - H1:10= 2.0 m ● ● ● ● ● ● ● H1:50= 3.0 m ● - - - - - -
Source: JICA Expert Team

Data Collection Survey on Building Climate Resilient Safer Cities Final Report
6-30
2019
2030 (RCP 8.5)
2050 (RCP 8.5)
2100 (RCP 8.5) Source: JICA Expert Team
Figure 6.2.42 Flood Map of Maamendhoo (No Erosion Impact Considered)

Data Collection Survey on Building Climate Resilient Safer Cities Final Report
6-31
<Fonadhoo>
Flood evaluation was carried out using the same procedure applied for Maamendhoo.
The cases considered in the evaluation are summarized in Table 6.2.3, and Figure 6.2.43 shows the flood area assumed in the analysis. It is noted that the impact caused by coastal erosion presented in Section 6.2.3.(2) is not included in the evaluation. Figure 6.2.44 shows the flood map that corresponds with the red circle cases in Table 6.2.3. From the results in the table, it was inferred that:
Flooding with about 50 cm depth may occur even at present (2019) at the lower land area if extreme wave (10-year return period) and high tide concurrently occur.
In 2100 and with an SLR of 65 cm, flooding above 1.5 m may occur across the whole area if extreme wave (10-year return period) and high tide concurrently occur.
Table 6.2.3 Cases for Flood Evaluation for Fonadhoo Tide
Ho
Present RCP 4.5 RCP 8.5 2019
H.W.L= +0.64 m
2030 SLR= 0.03
m
2050 SLR= 0.14
m
2100 SLR= 0.44
m
2030 SLR= 0.04
m
2050 SLR= 0.44
m
2100 SLR= 0.65
m H1:1= 3.0 m ● - - - - - - H1:10= 4.0 m ● ● ● ● ● ● ● H1:50= 4.8 m ● - - - - - -
Source: JICA Expert Team
*1 Counted from residential map
*2 Calculated by multiplying the no. of houses by the no. of people per house (5 people/house) Source: Processed by JICA Expert Team based on Google Earth
Figure 6.2.43 Assumed Flood Area for Fonadhoo (with Project Implementation Area)
Project Area L= 850 m
Assumed Flood Area
Whole Island ・Population: 2,101 Project Affected Area ・Houses*1: 199 ・Population*2: 990

Data Collection Survey on Building Climate Resilient Safer Cities Final Report
6-32
2019
2030(RCP 8.5)
2050 (RCP 8.5)
2100 (RCP 8.5)
Source: JICA Expert Team
Figure 6.2.44 Flood Map at Target Coast of Fonadhoo (No Erosion Impact Considered)

Data Collection Survey on Building Climate Resilient Safer Cities Final Report
6-33
Risk Assessment on the Compound Damage by Coastal Erosion and Flooding
The impact caused by coastal erosion and flooding due to SLR was respectively evaluated in the previous Section. 6.3.2. In the actual phenomenon, however, coastal erosion and flooding are closely related to each other. For example, the progress of coastal erosion reduces the protection function that the coast originally has and consequently, the wave overtopping and flooding amount due to high wave increases at the hinterland. In this section, the risk assessment on the compound damage caused by coastal erosion and flooding was conducted by classifying the types of damage and calculating these in monetary value.
Overview of the Compound Damage by Coastal Erosion and Flooding
The schematic figure for the compound damage of coastal erosion and flooding is shown in Table 6.3.1. The following impacts are expected to accelerate due to this phenomenon:
The beach ridge, which is a wave-deposited ridge parallel to the shoreline, is generally formed and developed after experiencing high waves. However, once the beach ridge erodes and disappears due to coastal erosion, the protection function of the beach would be reduced.
The beach scarp, which is a steep slope or miniature cliff formed by wave action, will develop as coastal erosion progresses, and this will increase the wave overtopping at the hinterland.
In addition to the abovementioned phenomenon, the wave force acting on the shore will increase and would further accelerate coastal erosion.
Table 6.3.1 Schematic Figure of the Compound Damage of Coastal Erosion and Flooding Schematic Figure of the Compound Damage Description
Damage Solely by Coastal Erosion
National land will be lost due to coastal erosion. In case there are properties such as houses, their value will
also be lost due to erosion.
Damage Solely by Flooding
Flooding will occur at the hinterland due to severe wave overtopping at the shore.
Properties located inside the flood area will suffer damage depending on the degree of flood depth.
Compound Damage Caused by Both Erosion and Flooding
The beach ridge will be lost, and the beach slope will become steeper as coastal erosion progresses.
This will weaken the protection function that the beach used to have and will increase wave overtopping at the hinterland.
The wave force acting on the shore will increase and will increase the rate of coastal erosion.
Source: JICA Expert Team
Beach ridge
Increase of flooding depth Loss of beach ridge, steeper slope
Loss of properties
Loss of properties
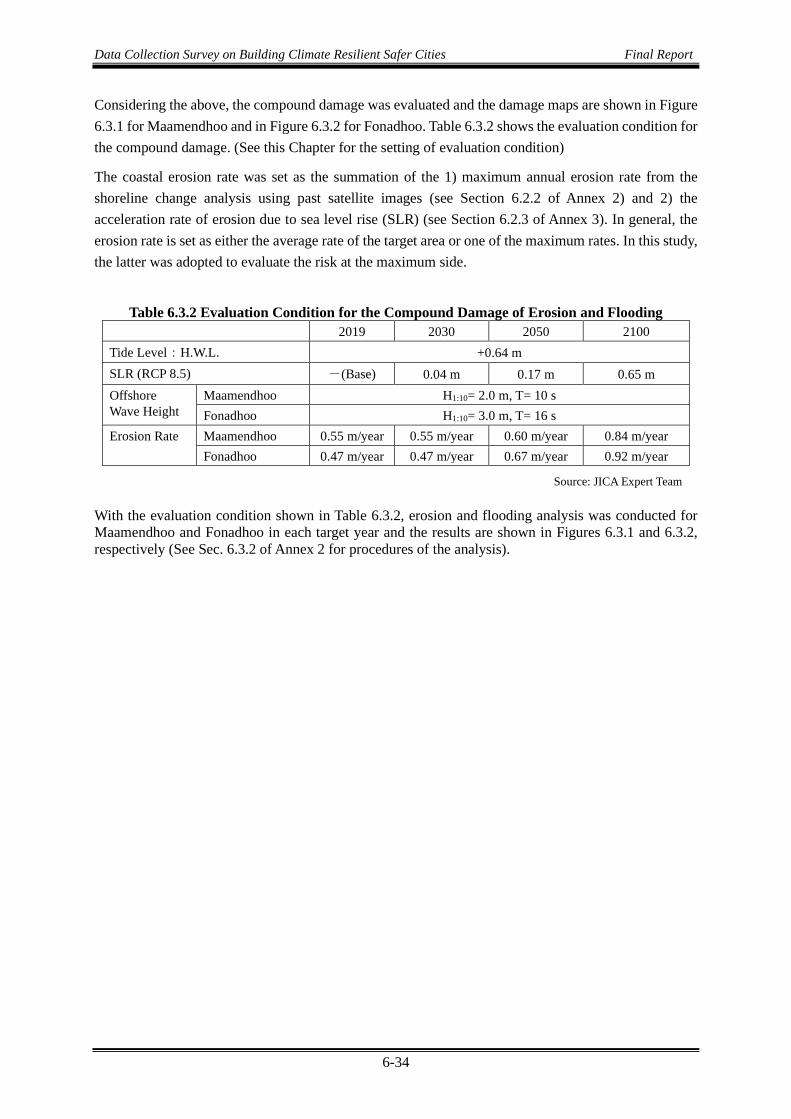
Data Collection Survey on Building Climate Resilient Safer Cities Final Report
6-34
Considering the above, the compound damage was evaluated and the damage maps are shown in Figure 6.3.1 for Maamendhoo and in Figure 6.3.2 for Fonadhoo. Table 6.3.2 shows the evaluation condition for the compound damage. (See this Chapter for the setting of evaluation condition)
The coastal erosion rate was set as the summation of the 1) maximum annual erosion rate from the shoreline change analysis using past satellite images (see Section 6.2.2 of Annex 2) and 2) the acceleration rate of erosion due to sea level rise (SLR) (see Section 6.2.3 of Annex 3). In general, the erosion rate is set as either the average rate of the target area or one of the maximum rates. In this study, the latter was adopted to evaluate the risk at the maximum side.
Table 6.3.2 Evaluation Condition for the Compound Damage of Erosion and Flooding 2019 2030 2050 2100 Tide Level:H.W.L. +0.64 m SLR (RCP 8.5) -(Base) 0.04 m 0.17 m 0.65 m Offshore Wave Height
Maamendhoo H1:10= 2.0 m, T= 10 s Fonadhoo H1:10= 3.0 m, T= 16 s
Erosion Rate Maamendhoo 0.55 m/year 0.55 m/year 0.60 m/year 0.84 m/year Fonadhoo 0.47 m/year 0.47 m/year 0.67 m/year 0.92 m/year
Source: JICA Expert Team With the evaluation condition shown in Table 6.3.2, erosion and flooding analysis was conducted for Maamendhoo and Fonadhoo in each target year and the results are shown in Figures 6.3.1 and 6.3.2, respectively (See Sec. 6.3.2 of Annex 2 for procedures of the analysis).

Data Collection Survey on Building Climate Resilient Safer Cities Final Report
6-35
2019 (Base Year)
No. of Housing Unit Loss (Total):2
2030(RCP 8.5)
No. of Housing Unit Loss (Total) :28
2050 (RCP 8.5)
No. of Housing Unit Loss (Total): 138
2100 (RCP 8.5)
*Black dotted line: Eroded shoreline, Gray highlighted: Houses lost Source: JICA Expert Team
Figure 6.3.1 Compound Damage Map Due to Erosion and Flooding with SLR for Maamendhoo

Data Collection Survey on Building Climate Resilient Safer Cities Final Report
6-36
2019 (Base Year)
No. of Housing Unit Loss (total):1
2030(RCP 8.5)
No. of Housing Unit Loss (total) :4
2050 (RCP 8.5)
No. of Housing Unit Loss (total) :49
2100 (RCP 8.5)
*Black dotted line: Eroded shoreline, Gray highlighted: Houses lost Source: JICA Expert Team
Figure 6.3.2 Compound Damage Map Due to Erosion and Flooding with SLR for Fonadhoo

Data Collection Survey on Building Climate Resilient Safer Cities Final Report
6-37
Classification and Calculation of the Compound Damage Classification of the Compound Damage
The compound damage caused by coastal disasters (coastal erosion and flooding due to high wave) was classified into the four groups listed in Table 6.3.3. In the study, items marked with “Y” in the table were evaluated in monetary value while items marked with “–” were not evaluated quantitatively due to difficulties in assuming the primary unit required for calculation.
Table 6.3.3 Classification of the Compound Damage
Damage Type Item Quantitative Evaluation
1) Physical Damage Flooding damage on properties (houses) Y Erosion damage on properties (loss of houses) Y Erosion damage on national land (loss of land) Y
2) Damage on People’s Lives
Resettlement forced due to loss of houses Y Difficulties and inconvenience on beach use -
3) Economic Damage Loss of work opportunities due to business suspension Y Damage on island’s economic function such as logistics and tourism -
4) Environmental Damage Damage on biological environment - Y: Calculated in this study
- : Not calculated Source: JICA Expert Team
Calculation of Damage Amount
Physical Damage As shown in Table 6.3.4, the physical damages were classified into damage due to coastal erosion (properties and national land) and flooding.
i) Flood Damage
Assumption:It was assumed that the hinterland was flooded due to high wave under extreme weather condition and properties (houses and household commodities) would be affected in accordance with the degree of flood depth.
Calculation Overview:Flood damage was calculated based on the assumed flood area and flood depth (see Figure 6.3.1 for Maamendhoo and Figure 6.3.2 for Fonadhoo), with mainly three items listed in Table 6.3.4
Table 6.3.4 Items Used for the Calculation of Damage Item Description
a) Value of asset (house) Interview survey results were used to determine value of houses as there was no statistical data available. → USD 30,000/house (Since no official construction cost per house available, this figure was set based on average construction cost per house from the interview survey results by the JICA Expert Team)
b) Damage rate by inundation depth
Cited from the Guideline for Cost and Benefit Analysis (Refer to Table 6.3.5)
c) Probability of occurrence (flooding)
Cited from the Guideline for Cost and Benefit Analysis (Refer to Table 6.3.6)
Source: JICA Expert Team

Data Collection Survey on Building Climate Resilient Safer Cities Final Report
6-38
Table 6.3.5 Damage Rate of Property by Inundation Depth Degree of Flooding
Property Below Floor Level
Above Floor Level Below 50 cm 50-99 cm 100-199
cm 200-299
cm Above 300
cm House 0.045 0.151 0.229 0.480 1.000 1.000 Household Product 0.021 0.189 0.489 0.889 1.000 1.000
Source:The Guideline for Cost and Benefit Analysis of Coastal Protection (Japanese, June 2004, Ministry of Agriculture, Forestry and Fisheries, and Ministry of Land, Infrastructure, Transport and Tourism)10)
Table 6.3.6 Probability of Occurrence and Damage
Return Period Probability
of Exceedance
Expected Damage
(1) Annual Ave. of Occurrence
Probability
(2) Annual Ave. of Expected
Damage
Expected Annual Damage With the Probability
(1) × (2) 1-year return
period N1=1 L1(=0) N1-N10
(=1-1/10) (L1+L10 )/ 2 ((N1-N10)×(L1+L10))/2
10-year return
period N10=1/10 L10
Source:The Guideline for Cost and Benefit Analysis of Coastal Protection10)
ii) Coastal Erosion Damage
A) Loss of Properties (Houses)
Assumption:It was assumed that property (house) will be lost due to coastal erosion as the basement of the house would be affected by erosion. Once lost, the property will be eliminated from the damage evaluation to avoid overestimation.
Calculation Overview:Prosperity was counted as lost when the eroded shoreline reaches the property. The damage amount due to loss was calculated based on the value of the assets shown in Table 6.3.4.
B) Loss of National Land
Assumption:It was assumed that the land area inside the present shoreline is all national land, and coastal erosion across this border was evaluated as loss of national land. Once lost, the land will be eliminated from the damage evaluation to avoid overestimation.
Calculation Overview:The damage amount was calculated using the formula below. Land unit value was set at USD 5/m2 referring to the guidelines* as a reliable statistical value was not available in the Maldives.
* The Guidelines for Cost and Benefit Analysis of Coastal Protection (Japanese, June 2004, Ministry of Agriculture, Forestry and Fisheries, and Ministry of Land, Infrastructure, Transport and Tourism)
<Calculation Formula>
Damage of loss of national land (USD/year) = Annual erosion rate (m/year) × Shoreline distance (m) × Land unit value (USD/m2)
iii) Calculation Results of the Compound Damage The calculation results are shown in Table 6.3.7 for Maamendhoo and Table 6.3.8 for Fonadhoo.
Although the damage amount is generally presented on an annual basis, the accumulative damage over the years was also presented for coastal erosion as reference. Even though the damage due to erosion is much smaller than that of flooding on an annual basis, it should be noted that coastal erosion is a type of irreversible disaster that progresses slowly. In fact, if evaluated as accumulated damage, as shown in Figure 6.3.3, the damage due to erosion is not negligible even compared with

Data Collection Survey on Building Climate Resilient Safer Cities Final Report
6-39
the damage due to flooding. Thus, it is indicated that taking specific countermeasures against coastal erosion is essential especially in the long term.
In Figure 6.3.3, a slight decrease of damage due to flooding is observed from 2050 to 2100. This is because the number of properties affected by flooding decreased during the period due to coastal erosion. On the other hand, damage due to erosion increased during the same period.
Table 6.3.7 Estimated Damage for Maamendhoo (RCP 8.5, H1/10) Damage Unit 2019 2030 2050 2100
Flooding USD/year 564,084 855,900 4,017,074 2,273,225 Erosion USD/year 7,909 7,909 41,700 69,794
USD (Accumulative) 7,909 94,909 928,909 4,418,615
Source: JICA Expert Team
Table 6.3.8 Estimated Damage for Fonadhoo (RCP 8.5, H1/10) Damage Unit 2019 2030 2050 2100
Flooding USD/year 555,498 664,686 1,568,133 2,753,744 Erosion USD/year 4,736 4,736 7,348 31,550
Source: JICA Expert Team
Source: JICA Expert Team
Figure 6.3.3 Comparison of Damage Amount for Maamendhoo Case: Flooding (USD/year) VS Coastal Erosion (USD, Accumulative)
Damage on People’s Lives Assumption: In case houses and housing land would be lost due to coastal erosion, the owner would be obliged to resettle to other areas or island because reconstruction of the house at the original area would not be realistic in terms of the physical and safety aspects.
Calculation Overview: The damage was estimated using the equation below considering the reconstruction cost required for the number of lost properties (houses).
<Calculation Formula>
B=A×C
B: Annual damage (USD/year) A: Number of affected properties C: Value of asset (USD 30,000/house, cited in Table 6.3.4)
0
1,000,000
2,000,000
3,000,000
4,000,000
5,000,000
6,000,000
0
1,000,000
2,000,000
3,000,000
4,000,000
5,000,000
2019
2021
2023
2025
2027
2029
2031
2033
2035
2037
2039
2041
2043
2045
2047
2049
2051
2053
2055
2057
2059
2061
2063
2065
2067
2069
2071
2073
2075
2077
2079
2081
2083
2085
2087
2089
2091
2093
2095
2097
2099
Accu
mul
ativ
e Da
mag
e du
e to
Coa
stal
Er
osio
n(U
SD)
Annu
al D
amag
e du
e to
Flo
odin
g (U
SD/y
ear)
Flooding
Coastal Erosion(Accumulative)

Data Collection Survey on Building Climate Resilient Safer Cities Final Report
6-40
Table 6.3.9 Estimated Damage on People’s Lives (RCP 8.5, H1/10) Target Unit 2019 2030 2050 2100
Maamendhoo USD/year 5,455 5,455 39,000 66,000 Fonadhoo USD/year 2,727 2,727 4,500 27,600
Source: JICA Expert Team
Economic Damage Assumption: If a house was affected by flooding, this will affect the resident’s work environment and force residents to spend a certain period of time before getting back to work as usual. The lack of work opportunities during this period was evaluated as the damage to the economy.
Calculation Overview: The damage was estimated using the formula below. In the formula, income per capita was used as the unit to estimate economic loss. Thus, it is interpreted that the damage contains losses on industries such as fishery and tourism.
<Calculation Formula>
B=A×C×D×R×P
B: Annual damage (USD/year) A: Income per capita, USD 10,626/person (National Accounts (Maldives) - Analysis of Main
Aggregates, United Nations, 2019) C: Number of affected people (number of people inside the flooding area) D: Period for loss of work opportunities (assumed to be six months at the maximum, classified
by flooding depth) R: Damage rate by flooding depth (The Guidelines for Cost and Benefit Analysis of Coastal
Protection (Japanese, June 2004, MAFF and MLTI)) P: Probability of occurrence (associated with return period of offshore wave)
Table 6.3.10 Estimated Damage on Economy (RCP 8.5, H1/10) Target Unit 2019 2030 2050 2100
Maamendhoo USD/year 254,936 363,834 1,170,850 723,207 Fonadhoo USD/year 234,748 273,776 422,446 858,411
Source: JICA Expert Team
Summary of Estimated Annual Damage and Damage Reduction Effect by Countermeasure
Table 6.3.11 and Table 6.3.12 show the summation of the damage for Maamendhoo and Fonadhoo, respectively. The estimated damage amount rapidly increases due to SLR. The annual damage is estimated to be about USD 5 million/year from 2050 to 2100 for each island.
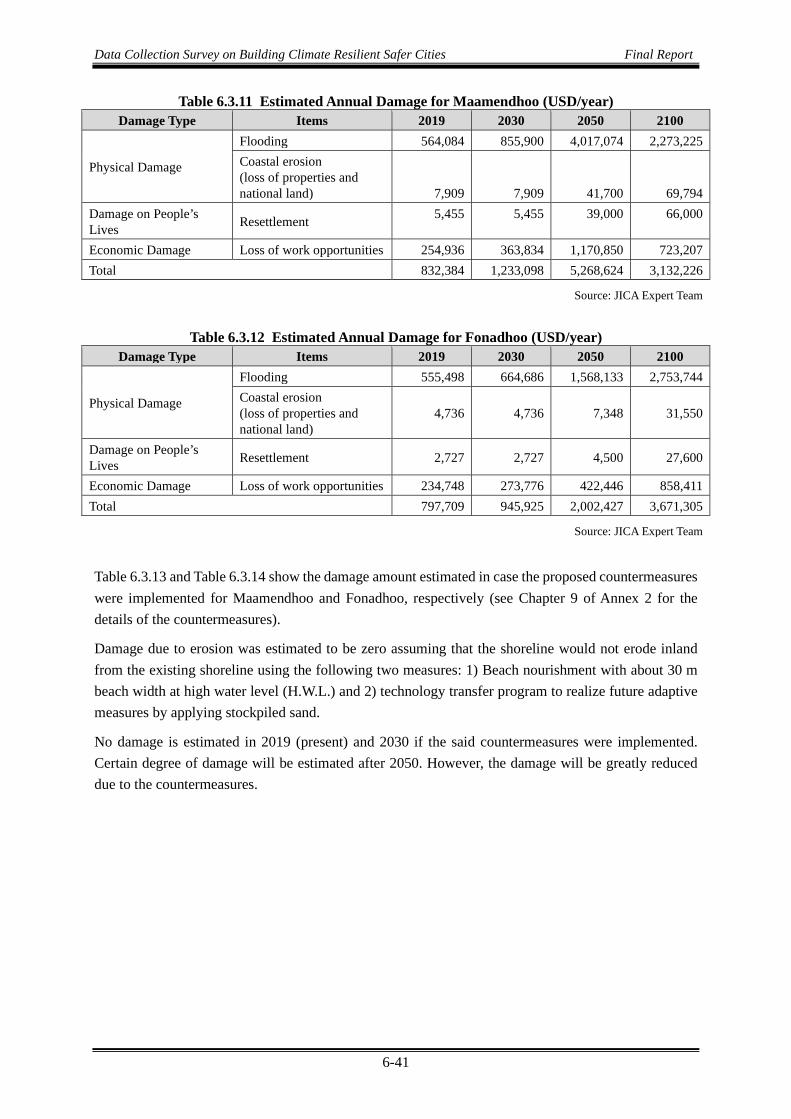
Data Collection Survey on Building Climate Resilient Safer Cities Final Report
6-41
Table 6.3.11 Estimated Annual Damage for Maamendhoo (USD/year) Damage Type Items 2019 2030 2050 2100
Physical Damage
Flooding 564,084 855,900 4,017,074 2,273,225 Coastal erosion (loss of properties and national land) 7,909 7,909 41,700 69,794
Damage on People’s Lives Resettlement 5,455 5,455 39,000 66,000
Economic Damage Loss of work opportunities 254,936 363,834 1,170,850 723,207 Total 832,384 1,233,098 5,268,624 3,132,226
Source: JICA Expert Team
Table 6.3.12 Estimated Annual Damage for Fonadhoo (USD/year) Damage Type Items 2019 2030 2050 2100
Physical Damage
Flooding 555,498 664,686 1,568,133 2,753,744 Coastal erosion (loss of properties and national land)
4,736 4,736 7,348 31,550
Damage on People’s Lives Resettlement 2,727 2,727 4,500 27,600
Economic Damage Loss of work opportunities 234,748 273,776 422,446 858,411 Total 797,709 945,925 2,002,427 3,671,305
Source: JICA Expert Team
Table 6.3.13 and Table 6.3.14 show the damage amount estimated in case the proposed countermeasures were implemented for Maamendhoo and Fonadhoo, respectively (see Chapter 9 of Annex 2 for the details of the countermeasures).
Damage due to erosion was estimated to be zero assuming that the shoreline would not erode inland from the existing shoreline using the following two measures: 1) Beach nourishment with about 30 m beach width at high water level (H.W.L.) and 2) technology transfer program to realize future adaptive measures by applying stockpiled sand.
No damage is estimated in 2019 (present) and 2030 if the said countermeasures were implemented. Certain degree of damage will be estimated after 2050. However, the damage will be greatly reduced due to the countermeasures.
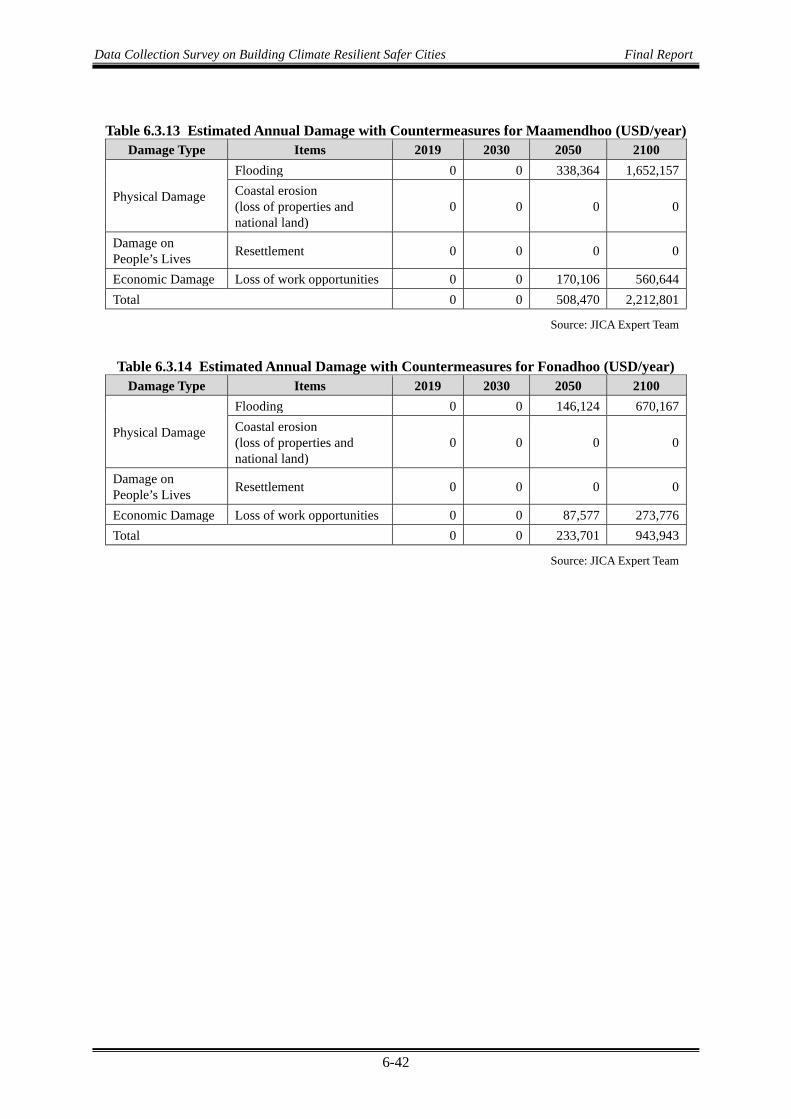
Data Collection Survey on Building Climate Resilient Safer Cities Final Report
6-42
Table 6.3.13 Estimated Annual Damage with Countermeasures for Maamendhoo (USD/year) Damage Type Items 2019 2030 2050 2100
Physical Damage
Flooding 0 0 338,364 1,652,157 Coastal erosion (loss of properties and national land)
0 0 0 0
Damage on People’s Lives Resettlement 0 0 0 0
Economic Damage Loss of work opportunities 0 0 170,106 560,644 Total 0 0 508,470 2,212,801
Source: JICA Expert Team
Table 6.3.14 Estimated Annual Damage with Countermeasures for Fonadhoo (USD/year) Damage Type Items 2019 2030 2050 2100
Physical Damage
Flooding 0 0 146,124 670,167 Coastal erosion (loss of properties and national land)
0 0 0 0
Damage on People’s Lives Resettlement 0 0 0 0
Economic Damage Loss of work opportunities 0 0 87,577 273,776 Total 0 0 233,701 943,943
Source: JICA Expert Team

Data Collection Survey on Building Climate Resilient Safer Cities Final Report
6-43
Table 6.3.15 Comparison of Flood Depths With and Without Countermeasure (RCP 8.5) Year Target Without Countermeasures With Countermeasures
2050
Maamendhoo
Fonadhoo
2100
Maamendhoo
Fonadhoo
Source: JICA Expert Team

Data Collection Survey on Building Climate Resilient Safer Cities Final Report
6-44
Table 6.3.16 (Maamendhoo) and Table 6.3.17 (Fonadhoo), which illustrate the damage reduction effect through the implementation of the proposed countermeasure, were derived from the difference of Table 6.3.11 and Table 6.3.13, and Table 6.3.12 and Table 6.3.14, respectively. These values were used as benefit for the cost-benefit analysis. It is noted that the effect for Maamendhoo used for the cost-benefit analysis was evaluated considering the coverage ratio of the coastal protection measure to avoid overestimation of the benefit. The ratio was calculated to be 72% based on the length of coastal conservation measures (1,440 m) out of total coastline distance (2,000 m).
Table 6.3.16 Damage Reduction Effect of the Proposed Countermeasures (Maamendhoo) Damage Type Items 2019 2030 2050 2100
Physical Damage
Flooding 564,084 855,900 3,678,710 621,068 Coastal erosion (loss of properties and national land)
7,909 7,909 41,700 69,794
Damage on People’s Lives Resettlement 5,455 5,455 39,000 66,000
Economic Damage Loss of work opportunities 254,936 363,834 1,000,743 162,563
(1) Total 832,384 1,233,098 4,760,153 919,425 (2 ) Total (Applied in cost-benefit analysis) (1) X 72% 599,316 887,831 3,427,310 661,986
Source: JICA Expert Team
Table 6.3.17 Damage Reduction Effect of the Proposed Countermeasures (Fonadhoo) Damage Type Items 2019 2030 2050 2100
Physical Damage
Flooding 555,498 664,686 1,422,009 2,083,577 Coastal erosion (loss of properties and national land)
4,736 4,736 7,348 31,550
Damage on People’s Lives Resettlement 2,727 2,727 4,500 27,600
Economic Damage Loss of work opportunities 234,748 273,776 334,870 584,635
Total 797,709 945,925 1,768,727 2,727,362
Source: JICA Expert Team
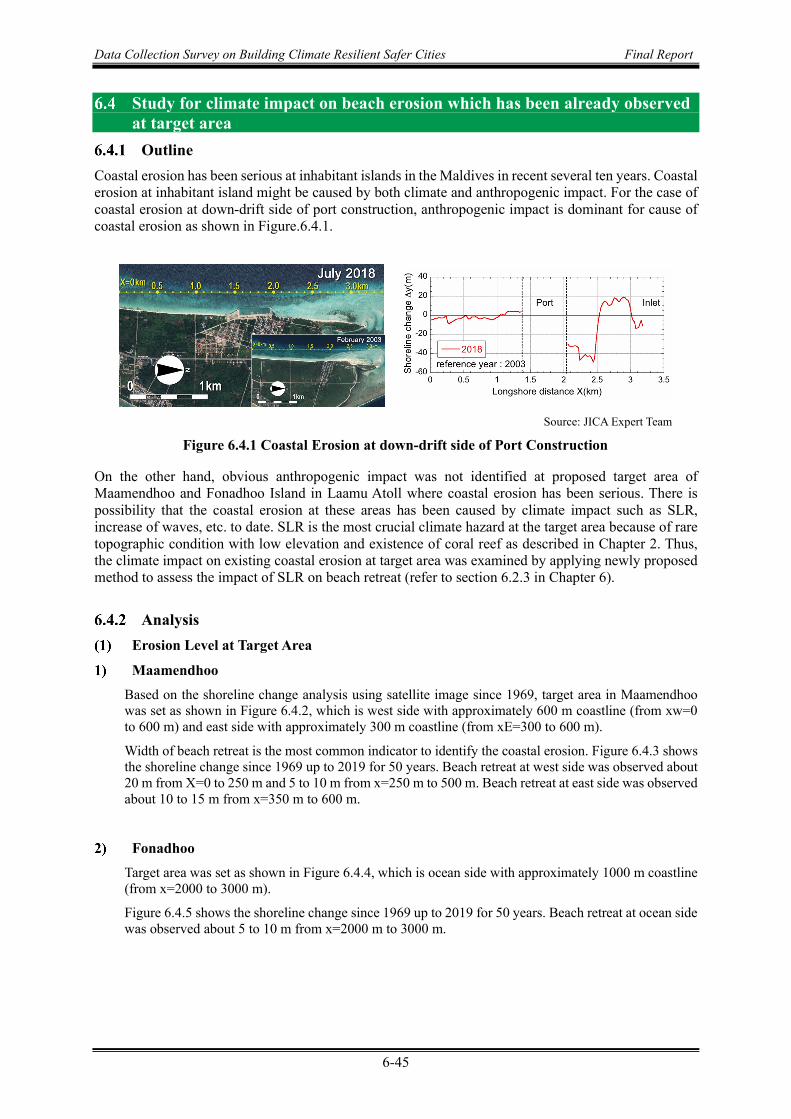
Data Collection Survey on Building Climate Resilient Safer Cities Final Report
6-45
Study for climate impact on beach erosion which has been already observed at target area
Outline Coastal erosion has been serious at inhabitant islands in the Maldives in recent several ten years. Coastal erosion at inhabitant island might be caused by both climate and anthropogenic impact. For the case of coastal erosion at down-drift side of port construction, anthropogenic impact is dominant for cause of coastal erosion as shown in Figure.6.4.1.
On the other hand, obvious anthropogenic impact was not identified at proposed target area of Maamendhoo and Fonadhoo Island in Laamu Atoll where coastal erosion has been serious. There is possibility that the coastal erosion at these areas has been caused by climate impact such as SLR, increase of waves, etc. to date. SLR is the most crucial climate hazard at the target area because of rare topographic condition with low elevation and existence of coral reef as described in Chapter 2. Thus, the climate impact on existing coastal erosion at target area was examined by applying newly proposed method to assess the impact of SLR on beach retreat (refer to section 6.2.3 in Chapter 6).
Analysis Erosion Level at Target Area
Maamendhoo Based on the shoreline change analysis using satellite image since 1969, target area in Maamendhoo was set as shown in Figure 6.4.2, which is west side with approximately 600 m coastline (from xw=0 to 600 m) and east side with approximately 300 m coastline (from xE=300 to 600 m).
Width of beach retreat is the most common indicator to identify the coastal erosion. Figure 6.4.3 shows the shoreline change since 1969 up to 2019 for 50 years. Beach retreat at west side was observed about 20 m from X=0 to 250 m and 5 to 10 m from x=250 m to 500 m. Beach retreat at east side was observed about 10 to 15 m from x=350 m to 600 m.
Fonadhoo Target area was set as shown in Figure 6.4.4, which is ocean side with approximately 1000 m coastline (from x=2000 to 3000 m).
Figure 6.4.5 shows the shoreline change since 1969 up to 2019 for 50 years. Beach retreat at ocean side was observed about 5 to 10 m from x=2000 m to 3000 m.
Source: JICA Expert Team
Figure 6.4.1 Coastal Erosion at down-drift side of Port Construction

Data Collection Survey on Building Climate Resilient Safer Cities Final Report
6-46
Source: JICA Expert Team
Figure 6.4.2 Target Area at Maamendhool
Erosion at east side (L= 300 m)
(1) West Side
(2) East Side
Source: JICA Expert Team
Figure 6.4.3 Long-Term Shoreline Change at Maamendhoo from 1969
Target Area
Target Area

Data Collection Survey on Building Climate Resilient Safer Cities Final Report
6-47
Impact of Climate Change to Oceanographic Condition and Marine Ecosystem
Regional climate overview in the Indian Ocean was presented in Chapter 3.1 in F/S report. The tropical Indian Ocean has been considered as a minor driver of climate variability relative to the Pacific or the Atlantic oceans for a long period. However, the model simulations of CMIP5 (Coupled Model Inter-comparison Project 5) show that continued greenhouse warming could alter these features, and the Indian Ocean could evolve into a mean state similar to the Pacific or Atlantic oceans. The CMIP5 (Coupled Model Inter-comparison Project 5) show a direct link between the changes in mean climate and the increase in variability of sea surface temperature (SST) under greenhouse warming as shown in Figure 6.4.6. Historical observations support this prediction, showing a tendency for easterly winds along the equator, an eastward shoaling thermocline, and a reversal of the east-west SST (sea surface temperature) gradient since the 1950s. The increase in variability under greenhouse warming will drive increase of hydrological extreme events, such as increase of magnitude of swell waves, increase of peak value of SLR due to increase of variability of SLR. Also, increase of SST will drive the increase of average value of SLR, increase of magnitude and frequency of cyclone and tropical depression, storm surge, change in their track pattern. Furthermore, the increase of SST will correlate coral breaching and it results the decrease of coral sand which is source to formulate sandy beaches in Maldives.
Source: JICA Expert Team
Figure 6.4.4 Target Area at Fonadhool
Erosion (L= 1000 m)
Source: JICA Expert Team
Figure 6.4.5 Long-Term Shoreline Change at Fonadhoo from 1969
Target Area

Data Collection Survey on Building Climate Resilient Safer Cities Final Report
6-48
Source: JICA Expert Team
Figure 6.4.6 Variability of Sea Surface Temperature in EEIO under GM and LGM Conditions
Increment of SST since 1982
As presented in section 2.1 in Chapter 2, the dataset of SST, which is “NOAA Global Optimum Interpolation (OI) Sea Surface Temperature (SST) Analysis” is available for the period 1982 to 2010. Figure 6.4.7 shows the variation of annual mean sea surface temperature fluctuation for zone 3 (zone for Laamu Atoll) in the Maldives. The SST has the same increasing tendency as that of the air temperature recorded at two meteorological stations of Maldives. Monthly SST ranges from 28.2ºC to 29.3ºC and average increase of SST/decade is 0.14 °C.
Source: Climate change scenarios and their interpretation for Maldives (2012)4)
Figure 6.4.7 Variation of annual mean sea surface temperature fluctuation for zone 3 in Maldives (1982 to 2009)
Increment of SLR since 1969
Long term tide observation has been carried out at 3 stations in Maldives, which are Hanimaadhoo (zone 1), Male (Zone 2) and Gan in Addu Atoll (Zone 3). Tide observation data at Gan in Addu Atoll has been accumulated since 1986 as shown in Figure 6.4.8. Based on this observed data, increment of SLR was extrapolated from 1969 to 2018 for 50 year as shown in Table 6.4.1. From the result, SLR with 16.1 cm increment for 50 years since 1969 was obtained.

Data Collection Survey on Building Climate Resilient Safer Cities Final Report
6-49
Source: Arranged by the JICA Based on Data for Maldives Meteorological Service
Figure 6.4.8 Observed sea level in Gan, Addu Atoll for the past 33 years
Table 6.4.1 Estimated SLR for the past 50 years since 1969
Source: JICA Expert Team
Estimation of Beach Retreat for past 50 years
Beach retreat due to SLR for past 50 years was estimated by using proposed method for coral reef coast described in F/S report in Chap. 6.
By applying the assumed SLR for each RCP scenario as shown in Figure 6.4.9, elapsed year to reach the increment of SLR for past 50 years (16.1 cm) was found. From the result, increment of SLR with 16.1 cm is found in 2060 for the case of RCP 2.6, or 2050 for the case of RCP 8.6.
The width of beach retreat due to SLR depends on site specific topography condition. Figure 6.4.10 shows the estimated beach retreat at Fonadhoo and east side of Maamendhoo due to each RCP scenario of SLR. And Figure 6.4.11 for west side of Maamendhoo. From the result, beach retreat with 5.8 m was estimated at Fonadhoo and east side of Maamendhoo, and 3.2 m was estimated at west side of Maamendhoo.
Comparison between Observed and Estimated Beach Retreat due to Past SLR
Finally, the estimated beach retreat due to past SLR is compared with observed one as shown in Table 6.4.2. Figure 6.4.12 shows beach retreat since 1969 to 2018 for actual range (red line: maximum, blue line: minimum) and estimated one due to SLR (gray line) .
The portion of beach retreat due to past SLR is about 30 to 60 % at west side of Maamendhoo, 40 to 60 % at east side of Maamendhoo, and 60 to 100 % at Fonadoo.
1986-2018 33 10.61969-2018 50 16.1
observed data in Gan, Laamuextrapolation from observed data
PeriodDuration (year)
SLR(Av.)(cm)
Remark
Source: JICA Expert Team
Figure 6.4.9 SLR for each RCP Scenario (based on 2019, average value)
16.1cm

Data Collection Survey on Building Climate Resilient Safer Cities Final Report
6-50
Source: JICA Expert Team
Figure 6.4.10 Estimated Beach Retreat due to SLR at Fonadhoo and East Side of Maamendhoo
Source: JICA Expert Team
Figure 6.4.11 Estimated Beach Retreat due to SLR at West Side of Maamendhoo
Table 6.4.2 Comparison of Beach Retreat between Observed and Estimated One due to Climate Impact
Source: JICA Expert Team
Source: JICA Expert Team
Figure 6.4.12 Increment of Beach Retreat between Actual and Estimated since 1969 to 2018
5.8m 5.8m
Fonadhoo (Ocean side), Maamendhoo (East side) Fonadhoo (Ocean side), Maamendhoo (East side)
3.2m 3.2m
Maamendhoo (Wast side) Maamendhoo (Wast side)
Observed EstimatedWest side 5~10 3.2 30~60 %East side 10~15 5.8 40~60 %
Fonadhoo Ocean side 5~10 5.8 60~100%
Mamendhoo
Island Area PeriodDuration
(year)
1969-2018 50
Retreat (m)Portion
0
5
10
15
1960 1980 2000 2020
Beac
h R
etre
at (m
)
Year
Maamendho (West)
min max SLR
0
5
10
15
1960 1980 2000 2020
Beac
h R
etre
at (m
)
Year
Maamendho (East)
min max SLR
0
5
10
15
1960 1980 2000 2020
Beac
h R
etre
at (m
)
Year
Fonadhoo (Ocean)
min max SLR
Data Collection Survey on Building Climate Resilient Safer Cities Final Report
6-51
Conclusion
Based on the analysis to estimate the beach retreat due to past SLR, it is concluded as follows.
Beach retreat due to past SLR for 50 years is the major part for observed beach retreat for both Fonadhoo and Maamendhoo.
As the other part for causing the past breach retreat, it might be pointed out the influence of anthropogenic impact which is port construction at surrounding coast even if the project site is not located at down-drift side from the port, and deterioration of coral condition due to increase of SST which will cause the decrease of sand source, etc.

Data Collection Survey on Building Climate Resilient Safer Cities Final Report
6-52
<References>
1) IPCC: Climate Change 2014 Synthesis Report, Intergovernmental Panel on Climatec Change, 151pp.
2) Dean, R. G. and Dalrymple R. A. (200): Coastal Processes with Engineering Applications, Cambridge University Press, 488p.
3) National Bureau of Statistics (2994), the Population and Housing Census. 2014, 105P.
4) Land and Marine Environmental Resource Group Pvt Ltd, Maldives (2018): LeCred Survey Report
5) Bruun, P.(1962): Sea-level rise as a cause of shore erosion, J. Waterways and Harbors Div., ASCE, 88 (WW1), pp.117-130.
6) Onaka S., M. Serizawa, T. Uda, et.al (2020): A method to predict shoreline recession due to sea level rise on coral reef beaches and its impact in small island country, Proceeding of Coastal Engineering B2, Vol.76, No.2, JSCE, (in press).
7) Masselink, G., Beetham, E. and Kench, P. (2019): Modeling Response of Coral Reef Islands to Sea-Level Rise, Coastal Sediments ’19, pp.930-944.
8) Uda T., S. Kosuge, et.al (1992): Study on formation and dissipation of coral reef island, Proceeding of Coastal Engineering, Vol.39, pp. 376-380.
9) JSCE (2004): Design Manual for Coastal Facilities, 577p.
10) Ministry of Agriculture, Forestry and Fisheries, and Ministry of Land, Infrastructure, Transport and Tourism (2004): The Guideline for Cost and Benefit Analysis of Coastal Protection (Japanese)

Data Collection Survey on Building Climate Resilient Safer Cities Final Report
7-1
THEORY OF CHANGE
Summary of Coastal Issues at the Target Area
The coastal issues at the target areas, which were selected based on the evaluation of climate hazards and vulnerabilities, are summarized in the following six items:
1) Increasing hydraulic external forces due to sea level rise (SLR) and increasing coastal erosion, occurrence frequency, and severity of the damage due to high wave attack and flooding, and acceleration of national land loss as a result.
2) Increasing exposure of residential areas due to the concentration of people, and critical infrastructures due to further coastal developments.
3) Declining natural protection function of coral reef and sandy beach due to artificial modifications at the coastal areas associated with economic development and inadequate construction of coastal protection measures, and severity of coastal erosion as a result.
4) Lack of basic information and data which are required for studying climate impact and measures against it, and information sharing among relevant organizations, induces delay and misleading risk at taking necessary actions against climate issues.
5) Deterioration of the coastal environment due to declining awareness of residents on coast and coastal conservation, and then resulting to lack of community-based beach maintenance and management activities.
6) Increasing disaster risk due to insufficient access, communication, and sharing of disaster information by the island people, and uniqueness of evacuation way as the Maldives composed of individually isolated islands.
The abovementioned six issues will be categorized into “developmental issues” and “climate related issues”.
Categorization
Developmental Issues
The following two items are categorized under the developmental issues:
1) Increasing exposure of residential areas due to the concentration of people, and critical infrastructures due to further coastal developments.Since the residential areas and critical infrastructures are located nearby coastal area due to narrow land area in the Maldives, the exposure risk is higher than in the other countries. Fonadhoo, which is one of the target islands in the Project, is the capital and economic center of Laamu Atoll, and further development of residential area and infrastructures is planned in the limited land area. This will induce the increase of exposure risk against coastal disasters.
2) Declining natural protection function of coral reef and sandy beach due to artificial modifications at the coastal areas associated with economic developments and inadequate construction of coastal protection measures, and severity of coastal erosion as a result.

Data Collection Survey on Building Climate Resilient Safer Cities Final Report
7-2
It has been pointed out that the artificial modifications at the coastal areas, such as port construction, reclamation, coastal road, and hard measures for coastal protection such as seawall and revetment, were accelerating the decline of coral reef and sandy beach. As a result, it caused the decline of their natural protection function and increase the vulnerability against coastal disasters. Furthermore, artificial modification along the coastline without sufficient understanding on the mechanism of waves, currents, and littoral drift induces serious problems of coastal erosion especially at the inhabited islands.
Climate Related Issues
The following four items are categorized under climate related issues.
1) Increasing hydraulic external forces due to SLR and increasing coastal erosion, occurrence frequency, and severity of the damage due to high wave attack and flooding, and acceleration of national land loss as a result.
As presented in Chapter 5, SLR will induce not only the physical phenomena to increase the seawater level, but also the increase of wave height on shore. Due to such impacts, the increase of coastal erosion, and the occurrence frequency and severity of the damage due to high wave attack and flooding, and acceleration of national land loss are expected. This is a fundamental climate related issue. The smaller the land area is, the more significant impact on the loss of land area is due to coastal erosion. Maamendhoo, which is one of the target islands in the Project and where the land area is extremely narrow and population density is high, is facing a high risk against SLR.
2) Lack of basic information and data which are required for studying climate impact and measures against it, and information sharing among relevant organizations, induces delay and misleading risk at taking necessary actions against climate issues.
Since there is an uncertainty in the future prediction of climate hazards, it is important to clarify the future scenario on the change of SLR, waves and so on based on the actual observed data in order to study and implement the climate change adaptation measures in the Maldives. However, no continuous and long-term wave observation has been conducted yet and this is causing the insufficiency of correct understanding of the hydraulic phenomena. Furthermore, sufficient information and data sharing and its effective usage have also not been performed among the relevant government organizations. The necessity to obtain correct information and data and to share the information to study and implement the appropriate measures for climate change is increasing.
3) Deterioration of the coastal environment due to declining awareness of residents on coast and coastal conservation, and then resulting to lack of community-based beach maintenance and management activities.
The residents’ awareness on coast and coastal conservation seem to be declining in accordance with progressing artificial modifications at the coastline and people’s in and outflow. Such change of coastal condition and lifestyle may cause the deterioration of the coastal environment, such as dumping garbage at the beach, illegal mining of coral gravel and sand from the beach. Up to the past level of coastal disaster, it did not make much problem to increase the risk for coastal disaster, even though the community-based beach maintenance and management was not carried out actively. On the other hand, under the condition to expect the increasing occurrence frequency of high wave and flooding and acceleration of coastal erosion, the degree of damage due to coastal disaster will be dependent on the maintenance condition of the beach. Because the residents have the closest relation with the beach through their daily livelihood, maintaining the beach in a good condition through community-based

Data Collection Survey on Building Climate Resilient Safer Cities Final Report
7-3
activities will become more important and necessary. The relation between residents and the beaches at Fonadhoo, which is one of the target islands, seems high based on the identification during the field survey in which carrying out the community-based daily beach cleaning and creating a hand-made beach park by themselves are found. The potential of the island to perform the community-based beach maintenance and management seems high.
4) Increasing disaster risk due to insufficient access, communication and sharing of disaster information by the island people, and uniqueness of evacuation way as the Maldives composed of individually isolated island
The SLR will induce the increase of occurrence frequency and severity of high wave attack and flooding to residential area nearby the coast. A tsunami is a representative of a severe coastal disaster which requires proper evacuation. However, the occurrence frequency is rare and basically there is no way to evacuate when a big-scale tsunami occurs. On the other hand, the occurrence frequency and magnitude of the coastal disaster caused by high wave attack and flooding will gradually increase due to climate change; therefore, the degree of damage will significantly depend on the access, communication and sharing of disaster information, and the existence of evacuation. Therefore, the necessity and importance to maintain such a system will become high. Generally, the system of disaster information as well as early warning is not sufficient at each inhabited island in the Maldives. One of the target islands of the Project, Maamendhoo, is the most densely populated island with limited narrow land area in Laamu Atoll, where no evacuation area is available for extreme disaster events.
Policy to Address Issues
The abovementioned coastal issues are dependent on the scale of hazard, vulnerability, and exposure. Methods to address the issues may be divided into 7.3.1 reducing hazard and 7.3.2 overcoming vulnerability and reducing exposure. In the following section, feasibility and validity of these two methods are examined and the most appropriate direction for the Maldives to solve the coastal issues will be shown.
Reducing Hazard
1) The most critical climate hazards in the Maldives are SLR and swell wave as explained in Chapter 2. However, controlling the hazard or the external forces itself may not be a scope of the Project which is for climate adaptation.
2) As a measure to reduce or eliminate external forces that directly impact on the coasts, the construction of breakwater at the reef edge or reclamation of the reef with revetment that covers the whole island area could be considered. However, this kind of measure does not utilize the natural protection function nurtured in the Maldives over a long period of time; rather, it forcibly and artificially protects the islands which breaks coexistence of the island people with the natural environment and at least disconnects the relationship of the people with the coast and coral reefs. Further, as it will be a large-scale construction project, it requires enormous construction cost. Thus, this method will be excluded from the Project proposal.

Data Collection Survey on Building Climate Resilient Safer Cities Final Report
7-4
Overcoming Vulnerability and Reducing Exposure
1) Measures to overcome vulnerability and to reduce exposure by improving administrative functions on land use are the following; i) setback of residential area and critical infrastructure from the coastal area to the inland area, ii) lifting island ground up to the height with no risk of swell wave, iii) relocation of residents to the other islands, iv) establishment and operation of coastal area land use plan so that development of these in coastal area will not be planned, and v) implementation of physical protection measures at the coastal area is considered.
i) Setback of residential area and critical infrastructure from the coastal area to the inland area: Due to the limited land areas of most of the inhabited islands including the target islands of the Project and the lack of sufficient space, introducing a setback is hardly possible in the Maldives.
ii) Lifting island ground up to the height with no risk of swell wave:
The construction work requires the residents’ temporary relocation. Since securing the relocation space is difficult and the construction cost is enormous, the lifting island ground measure is not feasible.
iii) Relocation of residents to the other islands:
The relocation of residents generally occurs from depopulated islands to the main islands in the atoll but not the other way around. Because the target islands of the Project are main islands, relocation to depopulated islands seems impossible.
iv) Establishment and operation of coastal area land use plan:
Land use planning considers coastal disasters that have not been developed or operated in the Maldives so far. This then allows encroachment of residential areas and infrastructures into the coastal areas at some islands and some areas in the other islands. The establishment and operation of a coastal area land use plan, which considers coastal disaster including climate impact and covers the whole area of the target island, will be effective for maintaining sustainable resilience over the island.
v) A) Structural protection measure such as revetment:
This measure is possible if only land side protection is considered. However, it induces loss of sandy beach that has been nurtured and maintained over thousands of years. This will also cause the disconnection of people’ relation with the coast, the decrease of the coastal use for fishing and recreation, and the deterioration of the coastal landscape. Further, the adequate protection measure for future climate risk expected at present could be excessive or insufficient in the future due to the uncertainty that climate risk contains, thus the validity of the structural protection measure cannot be judged clearly.
B) Protection measure by using natural protection function of reef and sandy beach:
Sustainably maintained reef and sandy beach will fulfill the protection function which is required for the frequently occurring climate events. However, such maintenance itself becomes a challenge recently due to coastal erosion, artificial modifications along the coastline, and the deterioration of reef environment. Once the challenge is overcome, a sustainably maintained sandy beach that has flexibility to change its form according to the ever increasing and changing external forces induced by climate change, will be very effective against the uncertain climate risk.

Data Collection Survey on Building Climate Resilient Safer Cities Final Report
7-5
2) The measures described above are aimed at the reduction of coastal issues inducing disaster risk; however, fully controlling the risks is impossible. In the case in which adequate measures for the Maldives have been taken but extreme events that exceed expectation of the measures have still occurred, evacuation measures will be required to minimize disaster damage (reducing damage at disaster).
From the examination above, under the geological characteristics unique to the Maldives, the protection measures for inhabited islands by which the relations between residents and the beaches are maintained and the measures with flexibility for adaptively coping with uncertainty-filled climate risk are required. Further, in order to handle the damage caused by high wave attack and flooding with different occurrence frequency and severity and to have a balance in keeping people’s daily lifestyle and protecting them from disaster risk, preparing a phased measure (not a single measure) for risk reduction according to the severity of the climate event will be considered as the most appropriate way.
Therefore, the Project policy is set out as follows.
In order to enhance the economic development of the islands while maintaining the relations between residents and the beaches, the Project will maintain a natural protection function composed of the coral reef and sandy beach, and will implement necessary hard (physical) and soft (non-physical) measures and appropriately manage the measures. This is to ensure that the long-term and sustainable resilience of the national land against climate change will be strengthened.
Barriers to Address Issues
On the coastal issues described in Section 7.2, climate impact was recognized as phenomena such as coastal erosion, but the background and root cause of the phenomena have not been analyzed and sufficiently understood in the Maldives. Therefore, the government officials with technical expertise and experience were not able to plan and formulate necessary projects to address climate impact (insufficient technical expertise and experience). Since such expertise and experiences were not available in the country, a regulatory system to pursue coexistence and co-prosperity of development and coastal conservation projects which consider climate impact have not been established (lack of regulatory system) and the policies and measures to support and facilitate formulation and implementation of such projects have not been presented (insufficient skill to implement a solution). These are the barriers to address the coastal issues and are identified to be the bottlenecks in the implementation of projects according to the Project policy shown in Section 7.3. The barriers are the major issues for public sector rather than private sector. How the private sector deal with the barriers and what experiences of the private sector can be utilized for public sector are mentioned in 6. of Supporting Document.
Lack of regulatory system
The lack of regulatory systems to pursue coexistence and co-prosperity of development and coastal conservation projects which consider climate impact
1) In terms of the land use plan of the Maldives, the concept to secure a buffer zone at coastal area is shown in the Regulation for Preparation of Land Use Plan. However, formulation of the actual plan including the rules for coastal management and utilization of the coast is left open for the interpretation of the local governments, and the appropriate plan is not formulated in some cases.

Data Collection Survey on Building Climate Resilient Safer Cities Final Report
7-6
While insufficient availability of the government officials who can start and prepare such plans is one of the bottlenecks explained above, no provision of clear standards and guiding approaches based on the actual cases is another bottleneck. In the circumstances where coastal development projects and conventional coastal measures are preceded, the establishment of an inclusive regulatory system is required. In the regulatory system, certain standards and points to note shall be described for adequate coastal conservation/protection measures, which consider climate impact, in order for such measures to coexist with the preceding projects and measures (for the coastal issues No. 2 and 3).
Insufficient technical expertise and experience
Insufficient technical expertise and experience to plan and formulate necessary projects to address climate impact
1) In the Maldives, many of the inhabited islands are affected by coastal erosion where physical (hard) protection measures such as revetment have mainly been implemented. These measures were done for a speedy response that is feasible within the limited budget of the country. Under the current situation where the increase of coastal erosion due to climate impact is expected, it is essential to implement the best-mixed approach by selecting from the various physical (hard) measures and the measures including soft approaches such as land use and beach maintenance in order to strengthen long-term and sustainable resilience of the national land. However, government officials with technical expertise and experience who can plan and formulate such projects from a long-term and multifaceted perspective are not sufficiently available. (for the coastal issues No. 1, 2, 3 and 5)
2) Also, development activities associated with the country’s economic development have progressed in the narrow land area including the coastal area where the coastal disaster risk is high. There is also a case in which inadequate coastal measures, which do not examine the impact of waves, currents, and littoral drift, induces the decline of natural protection function and occurrence of coastal erosion. While the formulation of the land use plan, including the rules for coastal and sediment management and utilization, is left to the local governments, there are some cases in which the local government faces difficulties in applying the plan into the existing situation and end up needing to formulate a new plan in the first place. It is necessary to formulate a coastal management plan which is based on the individual local conditions, minimizes exposure of residential areas and critical infrastructure, and maintains natural protection function. However, the government officials that have the technical expertise and experience to originate and prepare such plans are not sufficiently available. (for the coastal issues No. 2 and 3)
Insufficient skill to implement a solution
Insufficient expertise and skill to implement solutions (policies and measures) to support/facilitate formulation/implementation of projects /that address climate impact
1) In the circumstances where increase of coastal erosion, occurrence frequency and severity of the damage due to high wave attack and flooding and acceleration of national land loss induced by climate impact are a concern in the Maldives; broad policies to address climate change are set out. However, the measures for adequate coastal conservation/protection measures which consider
Data Collection Survey on Building Climate Resilient Safer Cities Final Report
7-7
climate impact to coexist with coastal development are not shown. Thus, detailed activities for realizing the policies are not sufficiently studied (for the coastal issues No. 1, 2 and 3).
2) In terms of coastal disaster, the approach of protecting the assets by using only the physical protection measures at coastal areas is taken at present based on the past disaster record. However, considering the increasing occurrence frequency and severity of the damages caused by high wave attack and flooding due to climate impact, it will be necessary to formulate plans including access, communication and sharing of disaster information and evacuation way (for the coastal issues No. 1 and 6).
3) Also, progressing artificial modifications at the coastline such as the construction of ports and revetments turns out to change people’s lifestyle and move them away from the coast, lowering people’s awareness on coast and coastal conservation. For gradually deteriorating coastal environment and coastal erosion, it is important to notice the abnormal change of a coast as early as possible, and hence daily monitoring by the community people, who live near the beach and traditionally recognize its importance, will be the most feasible and effective method. Under the current condition where people’s awareness on the coast is declining, an active approach of the local government to the community people is required. However, the policy and outline of community-based beach maintenance have not been presented (for the coastal issue No. 5).
4) Further, in order to examine the long-term and sustainable measures for resilience against climate change, the Maldivian government would have to take action to understand the detailed picture, history and factors of the phenomena such as coastal erosion and deterioration of the coastal environment and to share common understanding among the relevant government agencies. However, the system to continuously obtain basic information and data essential for such common understanding and the system to share the information have not been established (for the coastal issue No. 4).
Goal Statement and Expected Outcomes and Project Results
The goal statement for the Project is set as follows.
“IF Integrated Coastal Zone Management (ICZM) and appropriate coastal conservation/protection are implemented while disaster early warning/information is delivered to residents, THEN loss of the national land is alleviated and safe and secure livelihood is maintained, especially in islands with high population density, BECAUSE beach and coral reef are conserved with natural resilience and residents' capacity of protective actions in case of disaster is enhanced.”
The outcome 1 in Figure 7.6.2 will see “Strengthened institutional and regulatory framework for climate responsive ICZM”, as a results of Result 1 and 4, which are “Institutional capacity building and policy support for realization and enforcement of ICZM” and “Improved observations and monitoring of long-term wave, sea level, coastline, coral reef and land use”.
The outcome 2 in Figure 7.6.2 will see “Reduced exposure to coastal erosion for coastal communities and infrastructures”, as a results of Result 1and 2, which are “Institutional capacity building and policy support for realization and enforcement of ICZM” and “Protection of coastal communities and infrastructure exposed to coastal erosion caused by SLR”.

Data Collection Survey on Building Climate Resilient Safer Cities Final Report
7-8
The outcome 3 in Figure 7.6.2 will see “Integrated climate information and early warning systems able to instantly inform public to facilitate quick evacuation and protective actions”, as a results of Result 3 and 4, which are “ Strengthened multi hazard early warning system services” and “Improved observations and monitoring of long-term wave, sea level, coastline, coral reef and land use”.
Project interventions aim to shift the paradigm away from current common understanding and action on coastal protection in the Maldives by modification of natural beaches artificially using hard structure measures without sufficient climate data and consideration for impact due to artificial modification towards a new paradigm to maintain the natural resilience of sandy beach and coral reef that the islands of the Maldives originally owned and has a potential to adapt to uncertain climate impact by realization of Integrated Coastal Zone Management (ICZM) and to implement the coastal conservation measures at some of densely populated area together with delivery of disaster early warning/information, by transferring knowledge and expertise on the proper implementation of soft (nature based) measures for coastal zone and beach protection and long-term sustainable management, to alleviate the loss of national land and to maintain safe and secure livelihood. This approach should ensure the maximum mitigation of maladaptation cases experienced by the country.
Due to the negative experience of Maldives regarding the effectiveness of soft measures for coastal zone and beach protection, these measures are not popular at this stage. Unpopularity of soft measures is mainly related to difficulties as shown in the above key barriers to be implemented effectively due their high sensitivity to the local environmental conditions such as geomorphology, hydrology and climate leading finally to maladaptation. In addition to knowledge and experience, the soft measures also require frequent and long-term commitment and significant financial resources to maintain their effectiveness.
AE submitting this funding proposal on behalf of Maldives’ Government have successful experience in implementation of soft measures for coastal zone protection in the countries from the same region and offers to the government of Maldives to transfer the technology related knowledge and provide on job training of coastal zone engineers for sustainable and cost-effective management of coastal zone with soft measures.
Necessary Activities to Achieve the Project Results
In line with the Project policy shown in Section 7.3 and to address issues by removing the three barriers that prevent the achievement of the Project, the following four components including each activity are proposed to be implemented:
Component 1: Establishment of Integrated Coastal Zone Management (ICZM)
1) Due to climate impact, the increase in exposure of residential areas and critical infrastructures, the decline in natural protection function of coral reef and sandy beach, and the increase occurrence frequency and severity of the damage due to high wave attack and flooding are expected.
2) In this activity, the integrated coastal zone management (ICZM), which includes the land use of coastal areas, hinterland and sediment management of the coastal areas, and will be established as a non-physical (soft) measure. The capacity development of the government officials to be responsible for the operation of the ICZM will be supported (as output) for the GoM in order to maintain the

Data Collection Survey on Building Climate Resilient Safer Cities Final Report
7-9
people’s safe and secure livelihood and natural protection function of coral reefs and sandy beaches and to have a balance of coastal development and conservation/protection (as outcome).
3) The detailed activities are as follows.
Activity 1.1: Inventory study for risk assessment on present coastal and coral reef conditions
Activity 1.2: Preparation of basic policy of ICZM at the national level
Activity 1.3: Preparation of concrete ICZM Plan at representative inhabitant island as case study
Activity 1.4: Capacity development and information sharing of the relevant organizations for establishment of the ICZM
Component 2: Implementation of Coastal Conservation/Protection Measures against Coastal Erosion
1) Due to climate impact, the increase of coastal erosion, occurrence frequency and severity of the damages due to high wave attack and flooding and acceleration of national land loss are expected hereafter.
2) In this activity, coastal conservation/protection measures to the coastal areas already exposed to the coastal disaster risk and further increase of the risk is expected will be prioritized. This is done for long-term and sustainable resilience of national land and will be implemented as a physical (hard) measure. The capacity development of government officials to be responsible for the maintenance and management of the areas will be supported (as output) for the GoM in order to maintain the people’s safe and secure livelihood and natural protection function of coral reefs and sandy beaches and to have a balance of coastal development and conservation/protection (as outcome).
3) The detailed activities are as follows.
Activity 2.1: Detailed design of coastal conservation measures and capacity development of stakeholders
Activity 2.2: Implementation of coastal conservation/protection measures of stakeholders
Activity 2.3: Implementation of beach maintenance, establishment of structure and capacity development of stakeholders
Component 3: Development of Disaster Warning and Information Dissemination
1) Due to climate impact, the increase of the occurrence frequency and severity of the damage due to high wave attack and flooding is expected.
2) In this activity, a system for access, communication and sharing of disaster information that widely covers residents will be developed and capacity development of government officials to be responsible for operating the system will be supported (as output) for protecting residents lives through the appropriate evacuation activities to be taken by residents themselves (as outcome).

Data Collection Survey on Building Climate Resilient Safer Cities Final Report
7-10
3) The detailed activities are as follows.
Activity 3.1: Installment of terrestrial digital broadcasting system
Activity 3.2: Establishment of Disaster Early Warning and Information Broadcasting System
Component 4: Development of Basic Data Collection and Sharing System Related to Climate Change
1) The validity of the abovementioned measures for climate change (physical, non-physical, and evacuation measures) will be influenced by a climate impact assessment which is used as a precondition for the planning and implementation of each measure and forms a consistency among different measures.
2) In this activity, a system for obtaining and sharing basic data related to climate change will be established and the capacity development of the government officials to be responsible for operating the system will be supported by transferring technical skills (as output) for the government agencies to sufficiently share the understanding and recognition of the actual situation and the impact of climate change and thereby help in the implementation of the most appropriate measure (as outcome).
3) The detailed activities are as follows.
Activity 4.1: Development of wave and sea level monitoring system
Activity 4.2: Development of beach, coral reef and land use monitoring system
Activity 4.1 and 4.2 will be utilized to Activity 3.1 and 3.2 as input data for early warning system, and Activity 1.1 to 1.4 and Activity 2.1 to 2.3 for establishment of ICZM plan and planning and design of coastal conservation measures which will be examined by GoM hereafter.
Figure 7.6.1 shows the relation between Activity 1.1 to 1.4, Activity 2.1 to 2.3 and Activity 3.1 and 3.2 for the image of prevention measures against coastal disasters. Physical intervention utilizing natural protection function and coastal conservation/protection measures as required (Activity 1.1 to 1.4 and Activity 2.1 to 2.3) are expected to control low- to middle- intensity coastal disasters, which frequently occur and constantly require public expenditure for recovery and rehabilitation. Disasters of low frequency with high intensity, including distant tsunami, may exceed the design scale of those measures against disaster, but investment on physical measures to stand the level of extreme disaster is not financially viable for countries with small financial resource such as the Maldives. To address these remaining risks of rare but extreme disasters, promotion of appropriate evacuation by residents involving early warning (Activity 3.1 and 3.2) is essential for minimizing damages.

Data Collection Survey on Building Climate Resilient Safer Cities Final Report
7-11
Source: JICA Expert Team
Figure 7.6.1 Relation of Activities 1 to 3 against Coastal Disaster
Frequency
Dam
age
Extensive event(High frequency / small damage)
Prevent and/or reducedamages with naturalprotection function &
Hard (physical) measures
Mitigate damages with soft (non-physical) measures
for evacuation
Extreme event(Low frequency / large damage)
<Activity 1.1 to 1.4>(ICZM including to conserve natural protection function)
<Activity 2.1 to 2.3>Coastal conservation/ protection measures
<Activity 3.1 and 3.2> Early Warning System

Data Collection Survey on Building Climate Resilient Safer Cities Final Report
7-12
Source: JICA Expert Team
Figure 7.6.2 Relation of Activities 1 to 3 against Coastal Disaster Theory of Change
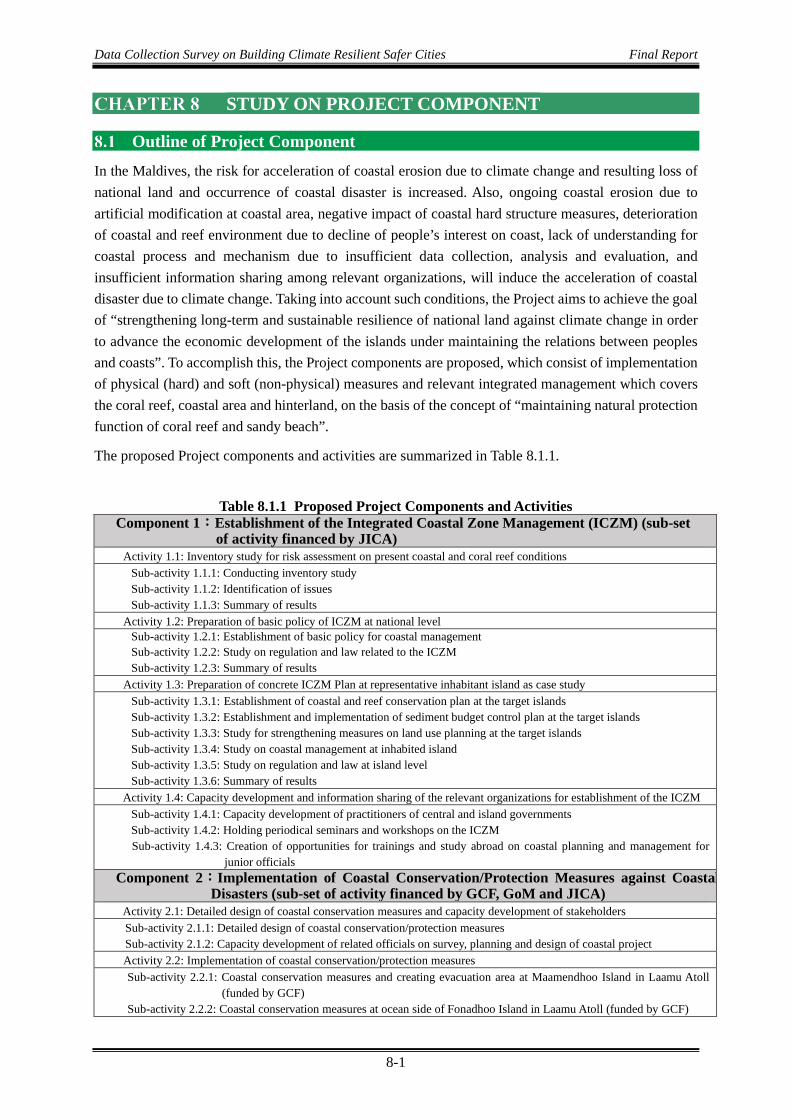
Data Collection Survey on Building Climate Resilient Safer Cities Final Report
8-1
STUDY ON PROJECT COMPONENT
Outline of Project Component
In the Maldives, the risk for acceleration of coastal erosion due to climate change and resulting loss of national land and occurrence of coastal disaster is increased. Also, ongoing coastal erosion due to artificial modification at coastal area, negative impact of coastal hard structure measures, deterioration of coastal and reef environment due to decline of people’s interest on coast, lack of understanding for coastal process and mechanism due to insufficient data collection, analysis and evaluation, and insufficient information sharing among relevant organizations, will induce the acceleration of coastal disaster due to climate change. Taking into account such conditions, the Project aims to achieve the goal of “strengthening long-term and sustainable resilience of national land against climate change in order to advance the economic development of the islands under maintaining the relations between peoples and coasts”. To accomplish this, the Project components are proposed, which consist of implementation of physical (hard) and soft (non-physical) measures and relevant integrated management which covers the coral reef, coastal area and hinterland, on the basis of the concept of “maintaining natural protection function of coral reef and sandy beach”.
The proposed Project components and activities are summarized in Table 8.1.1.
Table 8.1.1 Proposed Project Components and Activities Component 1:Establishment of the Integrated Coastal Zone Management (ICZM) (sub-set
of activity financed by JICA) Activity 1.1: Inventory study for risk assessment on present coastal and coral reef conditions
Sub-activity 1.1.1: Conducting inventory study Sub-activity 1.1.2: Identification of issues Sub-activity 1.1.3: Summary of results
Activity 1.2: Preparation of basic policy of ICZM at national level Sub-activity 1.2.1: Establishment of basic policy for coastal management Sub-activity 1.2.2: Study on regulation and law related to the ICZM Sub-activity 1.2.3: Summary of results
Activity 1.3: Preparation of concrete ICZM Plan at representative inhabitant island as case study Sub-activity 1.3.1: Establishment of coastal and reef conservation plan at the target islands Sub-activity 1.3.2: Establishment and implementation of sediment budget control plan at the target islands Sub-activity 1.3.3: Study for strengthening measures on land use planning at the target islands Sub-activity 1.3.4: Study on coastal management at inhabited island Sub-activity 1.3.5: Study on regulation and law at island level Sub-activity 1.3.6: Summary of results
Activity 1.4: Capacity development and information sharing of the relevant organizations for establishment of the ICZM Sub-activity 1.4.1: Capacity development of practitioners of central and island governments Sub-activity 1.4.2: Holding periodical seminars and workshops on the ICZM Sub-activity 1.4.3: Creation of opportunities for trainings and study abroad on coastal planning and management for
junior officials Component 2:Implementation of Coastal Conservation/Protection Measures against Coastal
Disasters (sub-set of activity financed by GCF, GoM and JICA) Activity 2.1: Detailed design of coastal conservation measures and capacity development of stakeholders Sub-activity 2.1.1: Detailed design of coastal conservation/protection measures Sub-activity 2.1.2: Capacity development of related officials on survey, planning and design of coastal project Activity 2.2: Implementation of coastal conservation/protection measures Sub-activity 2.2.1: Coastal conservation measures and creating evacuation area at Maamendhoo Island in Laamu Atoll
(funded by GCF) Sub-activity 2.2.2: Coastal conservation measures at ocean side of Fonadhoo Island in Laamu Atoll (funded by GCF)
Data Collection Survey on Building Climate Resilient Safer Cities Final Report
8-2
Sub-activity 2.2.3: Coastal conservation measures at Meedhoo Island in Addu Atoll (Sub-set of activity financed by GoM) Sub-activity 2.2.4: Coastal protection measure at Gan Island in Laamu Atoll (Sub-set of activity financed by GoM) Sub-activity 2.2.5: Coastal protection measure at Ishdhoo Island in Laamu Atoll (Sub-set of activity financed by GoM)
Activity 2.3: Implementation of beach maintenance, establishment of structure and capacity development of stakeholders Sub-activity 2.3.1: Implementation and establishment of adaptive management Sub-activity 2.3.2: Implementation of community-based beach maintenance for comfortable beach use and environment Sub-activity 2.3.3: Public education, enlightenment, public relations to residents and capacity development on beach
maintenance and management Component 3:Development of Disaster Warning and Information Dissemination (sub-set of
activity financed by JICA) Activity 3.1: Installment of terrestrial digital broadcasting system
Sub-activity 3.1.1: Standardization of disaster warning and information dissemination system Sub-activity 3.1.2: Awareness raising on disaster warning and information dissemination
Activity 3.2: Establishment of Disaster Early Warning and Information Broadcasting System Sub-activity 3.2.1: Examination of operational system for disaster warning and information dissemination Sub-activity 3.2.2: Establishment of the structure to operate disaster warning and information dissemination through the
terrestrial digital broadcasting system Component 4:Development of Basic Data Collection and Sharing System Related to Climate
Change (sub-set of activity financed by JICA) Activity 4.1: Development of wave and sea level monitoring system
Sub-activity 4.1.1: Development of wave and sea level monitoring system (three representative locations) Sub-activity 4.1.2: Technical transfer on data processing, analysis, and operation
Activity 4.2: Development of beach, coral reef, and land use monitoring system Sub-activity 4.2.1: Development of wide-area monitoring system applying satellite images and GIS system, and capacity
development Sub-activity 4.2.2: Development of monitoring system utilizing the UAV technology at specific area, and capacity
development Source: JICA Expert Team
Component 1: Establishment of the Integrated Coastal Zone Management
(ICZM) Outline
The coastal development on the inhabited islands in the Maldives has been accomplished without sufficient understanding of its impact on the coastal environment and without a concept of development that harmonizes with the coastal environment. In addition, there are no proper policies related to coastal zone management and institutional development necessary to sustainably maintain the natural protection functions of the coral reef and sandy beach that have been maintained for many years. There are also no proper basic policies to build resilient hinterland against coastal disasters. In order to build climate-resilient safer islands, the decline of natural protection functions of coastal areas and islands due to developments and human activities has to be prevented and the protection functions have to be maintained and facilitated on a long-term basis in addition to the implementation of resilient measures at the coastal area. To achieve this, government officials both from the national and island level need to understand the current state of the coast and the future climate risk. They should formulate the ICZM plan including the coral reef, coastal area, and hinterland, and implement specific activities based on the plan. This component fulfills the output of the ICZM, which includes the land use of coastal areas, hinterland and sediment budget control of the coastal areas, and will be established along with the capacity development of government officials who will be responsible for the operation of the ICZM. Component 1 consists of the following four activities to achieve the outcome of “the GoM to maintain people’s safe and secure livelihood and natural protection function of coral reef and sandy beach and to

Data Collection Survey on Building Climate Resilient Safer Cities Final Report
8-3
have balance of coastal development and conservation/protection”, which will be implemented as a Sub-set of activity financed by JICA.
Activity 1.1: Inventory Study for Risk Assessment on Present Coastal and Coral Reef Conditions
Activity 1.2: Preparation of basic policy of ICZM at the national level Activity 1.3: Preparation of concrete ICZM Plan at representative inhabitant island as case study
Activity 1.4: Capacity development and information sharing between the relevant organizations for the establishment of the ICZM
Activity 1.1: Inventory Study for Risk Assessment on Present Coastal and Coral Reef Conditions
Sub-activity 1.1.1: Conducting inventory study
It is unrealistic to make all of the nearly 200 inhabited islands resilient to climate change risks. Therefore, about 200 inhabited islands are categorized by different topographical characteristics, hazard characteristics, socio-economic characteristics, and living environment. Then, some islands are selected from each categorized island and a field survey is conducted there. The current problems, issues, and climate change risks in the different types of islands are sorted out. By doing this, the basic conditions such as the present conditions of coastal areas and coastal disaster risk for climate change necessary for establishing the ICZM will be understood. The detailed procedure is as follows:
Categorization from existing materials/information
Basic information on all inhabited islands is collected from existing materials and satellite images. The present status of topographical characteristics, hazard characteristics, socio-economic characteristics, living environment, etc. is understood.
Basic classification of the island based on the collected information is made. At the present stage, categorization from the following viewpoints is assumed, but it will be examined again during the implementation stage.
Categorization based on the difference in coastal conditions (islands with advanced artificialization, islands with both natural and artificial coasts, islands with natural coasts being maintained)
Categorization based on the difference in exposure (differences in population density, island size, coastal use, etc.)
Categorization based on the socioeconomic aspect of islands
Understanding of the actual condition by field survey
Several islands are extracted from each category and a field survey is conducted in order to understand the actual condition. The field survey will be carried out by extracting about two to three islands in each categorization. The main survey items are to study the present condition of the coast and risk of coastal disasters by doing mainly field survey and simple topographic surveys and to study the condition of coastal use and the state of local and administrative efforts on coastal management by doing mainly interview surveys.

Data Collection Survey on Building Climate Resilient Safer Cities Final Report
8-4
Sub-activity1.1.2: Identification of issues
Regarding the categorized islands in Sub-activity 1.1.1, the characteristics of the islands, the risk of coastal disasters against climate change, and the current situation and challenges for resilience will be summarized based on past materials, satellite images, and field survey results.
Sub-activity1.1.3: Summary of results
The obtained results will be summarized as the Inventory Survey Report.
Activity 1.2: Preparation of basic policy of ICZM at the national level
In Activity 1.2, the ICZM at the national level for categorized inhabited islands will be established. The detailed activities are shown below.
Sub-activity1.2.1: Establishment of basic policy for coastal management
The basic policy for Integrated Coastal Zone Management (ICZM) at the national level will be examined, based on the current problems, issues, and climate change risks in the different types of islands, which are exposed as the results of activity 1.1. For the purpose of realization of coastal management based on the ICZM policy, basic plans for strengthening governance of coastal administration of the GoM and coastal management on each inhabited island will also be developed. Regulations and legal systems necessary for realization of ICZM are also examined, and the support for their enforcement is provided. The ICZM Guideline (Policy phase) will be prepared as the result of this activity.
Strengthening governance on coastal management
It is required to take action to decrease the negative impact due to artificial modifications at the coastal area caused by infrastructure development such as construction of ports, coastal roads, etc., while fully understanding the influence of these activities to coasts due to artificial modifications together with conducting the climate adaptation measures.
To achieve this, it is essential to enhance the sharing of information and promote the basic understanding between the infrastructure developers and the coastal management bodies who are in charge of planning, implementation, and management of the coastal projects. Currently, the infrastructure developments at the coastal area and the projects for coastal protection are treated individually. The procedure of Environmental Impact Assessment (EIA), which is required by the developers, is the only way to share the information. The first step to improve the current insufficient information sharing between both parties is to ensure that the developers should have an interest and understanding on the predicted influence and impact due to the development at the coastal area from the initial planning stage. This activity is done to promote such enhancement of cooperation and support for the establishment of a coastal management system between the developers and the coastal management body.
As one of the concrete ideas, the coordination opportunity for information sharing will be established among MNPI, who is in charge of development projects and coastal projects, ME, who is in charge of climate adaptation/mitigation measures, and the island governments at the project implementation site from the initial planning stage. In addition, the new system to review the proposed project plan with certain forces should be examined when the proposed project is expected to cause serious impact on the surrounding coastal area. Furthermore, establishment of the system to monitor and evaluate the impact of the project together with the developer side after the implementation should be examined.

Data Collection Survey on Building Climate Resilient Safer Cities Final Report
8-5
Promotion to enhance information sharing and clarification of roles on planning and management of coastal projects in inhabited islands
The policy to enhance the island autonomy was newly set after the regime change of the GoM in 2019. Due to this policy change, the opportunity for implementation and management of the projects controlled by the island governments might increase. On the other hand, since the full understanding of the impact of coastal projects is required in the planning and management of coastal projects, information sharing and common understanding between the island governments and national government are more important for coastal projects than other landside projects.
This activity aims to examine the system to enhance information sharing and common understanding between the national and the island governments of the inhabited island.
Sub-activity1.2.2: Study on regulation and law related to the ICZM
The regulations and legal systems that are necessary for the realization of coastal management based on the above three basic plans are examined, and the support for their enforcement is provided. Since the three basic plans cover a wide range of related fields, a review of existing laws and regulations will be conducted and if new clauses are determined to be necessary, it will be added after consultations have been made with related organizations.
Sub-activity1.2.3: Summary of results
The results of these examinations will be summarized as the ICZM Guideline (Policy part) and a visual material which is easy to understand will be made to promote understanding.
Activity 1.3: Preparation of concrete ICZM Plan at representative inhabitant island as case study
So far, various studies regarding the ICZM have been conducted in other countries. However, there are only few cases where concrete efforts have been conducted based on an established ICZM idea. That is, most cases were just at the conceptual level. In the Maldives where many inhabited islands are scattered, it is required that the coexistence of both coastal development and coastal conservation under the unified ICZM basic policy should be considered taking into account the characteristics and situation of each island in order to strengthen long-term resilience against coastal disasters in the future. To promote such concrete efforts based on the national level of the ICZM concept, Gan and Fonadhoo islands in Laamu Atoll are selected as the example of representative inhabited islands, and the concrete action for the island level of the ICZM will be examined based on the national level of the ICZM as a case study. The detailed activities are shown below.
Sub-activity1.3.1: Establishment of coastal and reef conservation plan at the target islands
The coastal conservation plan and reef environmental conservation plan at the target islands of Gan and Fonadhoo will be established, taking into account the characteristics of waves and topography, current condition of beach and coral reef, future development plan, etc. in order to maintain the existing beach and coral reef and relation with people’s livelihood against the future risk of climate change.

Data Collection Survey on Building Climate Resilient Safer Cities Final Report
8-6
In the Maldives, the road projects that connect the main islands of each atoll have been actively promoted and most of the cases were using causeways for connection. On the other hand, the closure of the original natural open channel between the islands due to construction of causeways, together with the impact of interruption of continuity of drift sand due to large-scale ports, etc., has caused the drastic change in beach topography and deterioration of water quality (refer to Chapter 2). In the coastal conservation/reef environmental conservation plan that will be established, the effects of such artificial alterations shall be taken into account and the study of the contribution to coexistence with future coastal development and conservation will be conducted.
Sub-activity1.3.2: Establishment and implementation of sediment budget control plan at the target islands
In Gan and Fonadhoo islands, a large amount of coral sand and gravel was taken from the coral reef to obtain building materials for infrastructure development and housing construction in recent years. The total amount was almost the same order of supply of sand to the coast for decades (refer to Chapter 2). On the other hand, coral sand and gravel are still required for future infrastructure development in the island, coastal conservation measures, and maintenance of sandy beach. This activity aims to establish the sediment budget control plan for the target islands in terms of technical aspect, which can show the securing of future required sand and gravel for development and coastal conservation without any negative impact on the surrounding coast and its environment.
In this activity, the field survey regarding waves and sediment transport, etc., will be planned in order to understand the mechanism of sediment budget and transport, as required.
Sub-activity1.3.3: Study for strengthening measures on land use planning at the target islands
The existing land use plan at Gan and Fonadhoo islands shows the buffer zone along the shore called the Environment Protected Zone (EPZ). However, it was not defined on a technical basis for consideration of future climate risk. There are some areas that do not comply with this rule. The important thing is the realization and operation to comply with such rule. In this activity, the EPZ at the two target islands will be reviewed and examined from a technical perspective that are based on future predictions and measures for improvement for its implementation and operation. In addition to EPZ, measures for strengthening land use will be considered in order to carry out stepwise protection according to the risk level.
Sub-activity1.3.4: Study on coastal management at inhabited island
In order to maintain the good condition of the beach in the inhabited islands, cooperation between the island governments and residents who are the main beach users is needed based on sharing information and common understanding. In this activity, the island government's approach to coastal management, its system, and the basic policy regarding the participation and cooperation of residents and NGOs during the coastal maintenance activities will be examined as a case study in Gan and Fonadhoo. In particular, beach nourishment is essential for proper coastal maintenance after the implementation in order to maintain the project beach for long-term sustainability. Concrete maintenance activities on the islands based on the basic policy established in this activity will be carried out at the nourished beaches

Data Collection Survey on Building Climate Resilient Safer Cities Final Report
8-7
in the three islands (Fonadhoo, Meemndhoo, and Meedhoo) that will be implemented in Activity 2.3 of Component 2.
Sub-activity1.3.5: Study on regulation and law at island level
The island-level systems and regulations necessary for implementing the activities above will be examined, and support for their implementation will be conducted in cooperation with the island governments.
Sub-activity1.3.6: Summary of results
These results will be summarized as the ICZM Guideline (Practice part) and visual material that is easy to understand will be created to promote wide adoption. In addition, in order to horizontally spread the knowledge to other inhabited islands that have the same problem and to share information with related organizations on other islands, workshops and site visits will be conducted regularly during the implementation period.
Activity 1.4: Capacity development and information sharing between the relevant organizations for the establishment of the ICZM
For basic common understanding between the relevant agencies at the central and island levels on the above activities, as well as cooperation between the island councils and residents who are the main users of the coastal area. This activity will carry out capacity building, education and public relation programs for the practitioners of the relevant organizations of the central ministries and agencies and island councils, island community, NGO, schools and educational institutions, etc. Assumed related organization are Ministry of Environment, Climate Change and Technology (ME), Ministry of National Planning and Infrastructure (MNPI), Local Government Authority (LGA), National Disaster Management Authority (NDMA), Maldives Meteorological Service (MMS) as relevant agencies at central revel.
Capacity development at the relevant agencies will be conducted mainly through the on the job training (OJT) during the implementation period. To share and expand the understanding and knowledge to other inhabited islands, ICZM Guidelines, which are prepared as the results of Activity 1.2 and 1.3, will be utilized through conducting seminar and workshop in several times at other inhabited islands. The purpose of seminar and workshop is; 1) to share the outcomes of the Activity 1.2 and 1.3 examining the basic policy of ICZM in the Maldives and necessary planning for implementing the ICZM in other inhabited islands; and 2) to support the GoM to replicate it to other islands. Through these activities, the development impact on the coastal environment, the concept of development that harmonizes with the coastal environment, and its priority will be understood at the national as well as island level, facilitating multi-stakeholder engagement in monitoring and maintenance of the functional yet environmentally sustainable environment.

Data Collection Survey on Building Climate Resilient Safer Cities Final Report
8-8
Sub-activity1.4.1: Capacity development of practitioners of central and island governments
Capacity development to enhance the understanding of the concept and operation for the ICZM is conducted through the inventory survey in Activity 1.1, the establishment of the ICZM in Activity 1.2, and the case study in Activity 1.3 as on-the-job training (OJT) involving the relevant organizations. Table 8.2.1 shows the assumed main OJT target organizations for each activity.
Table 8.2.1 Assumed Main OJT Target Organizations for Each Activity Activity Target Organization
1.1 Inventory study ME, EPA 1.2 Establishment of the ICZM ME, MNPI, EPA 1.3 Case study Island Council, ME
Source: JICA Expert Team
Sub-activity 1.4.2: Holding periodical seminars and workshops on the ICZM
A workshop to promote the exchange of opinions among related organizations involved in the ICZM establishment will be regularly held. Also, a seminar to promote information sharing and basic understanding will be regularly held in order to horizontally develop the ICZM at the national and island level. The assumed workshop and seminar purpose, target, and frequency are shown in Table 8.2.2.
Table 8.2.2 Details of Assumed Workshop and Seminar Name Main Purpose Target Organization
WS-A Sharing opinions related to the establishment of the ICZM at national level
ME, MNPI, LGA, NDMA, MMS, EPA
WS-B Sharing opinions related to the establishment of the ICZM at island level
Island Council, NGO, Community, Community based organizations
SE-A Sharing of established ICZM among central government and promotion of basic understanding
ME, MNPI, LGA, NDMA, MMS, EPA
SE-B Sharing of established ICZM among local government and promotion of basic understanding
Island Council, NGO, Community, Community based organizations
Source: JICA Expert Team
Sub-activity 1.4.3: Creation of opportunities for trainings and study abroad on coastal planning and management for junior officials
Participation in external training and seminars for young practitioners of relevant national and local organizations involved in coastal project establishment and coastal management will be supported. By doing this, getting basic knowledge related to coastal engineering and coastal projects necessary for implementation, sharing information with engineers from other countries who have similar problems through presentations and consultations, and creating opportunities for exchange are expected. The creation of study abroad opportunities using the scholarship system will also be supported. As an example of external training, it is assumed that they will participate in the JICA knowledge co-creation program related to this field.
Data Collection Survey on Building Climate Resilient Safer Cities Final Report
8-9
Component 2: Implementation of Coastal Conservation/Protection Measures against Coastal Disasters (Addu and Laamu Atolls)
Outline
The exposure of residential areas and critical infrastructure at nearshore area has been significant in the Maldives because the development activities associated with economic development have been executed near the coastal areas and coastal erosion has been serious in the inhabited islands. Artificial modifications of coast line due to construction of coastal infrastructures such as port construction, reclamation, etc., and some of hard structure coastal protection measures such as revetment, seawall, etc. have also accelerated the decline of natural protection function for original sandy beaches and coral reefs, and induced further coastal erosion. Under the current situation where the increase of coastal erosion due to climate impact is expected, it is essential to implement the best-mixed approach by selection and/or combination of various physical coastal conservation/protection measures, depending on the condition of usage of hinterland and beach. This component, as a sub-set of activity financed by GCF, partially by GoM in Activity 2.2 and by JICA in Activity 2.1 and 2.3, aims to implement and maintain sustainably the coastal conservation/protection measures in order to protect the communities and infrastructures at hinterland exposed to coastal erosion. In this component, coastal conservation/protection measures, including environmental and social impact assessment, will be implemented in the five selected coasts that have been already exposed to coastal disaster risk where another approach to enhance resilience at the hinterlands are difficult to implement and further increase of coastal disaster risk is expected due to climate impact.
Coastal conservation measures by applying beach nourishment will be implemented at three selected sites to protect the residential area at the hinterland considering the usage and current condition of the beach. And coastal protection measures with hard structure measures will be implemented at two sites to protect the historical heritage sites. In the planning and design for these coastal measures, it is essential that the related officers in the Maldives will obtain the required knowledge on coastal engineering, planning and design skills for future implementation of appropriate coastal measures by the Maldives autonomously against predicted climate risks. Realization of appropriate beach maintenance and management at project beaches are also strongly required to maintain beaches with good condition and sustainability. Necessary activities on capacity development, public education and public relation will be also conducted in this component. Also, the countermeasures will be designed in line with the relevant existing regulations such as Land Use Planning of the Maldives.
Strategic Action Plan for 2019-2023 of the Maldives aims to develop localized coastal protection and flood mitigation mechanisms, and infrastructure in the islands identified as most vulnerable to disaster and climate risk, and this component is expected to contribute to the achievement of this goal.
The outcome of “the GoM to maintain people’s safe and secure livelihood and natural protection function of coral reef and sandy beach and to have balance of coastal development and conservation/protection” is achieved by implementing the three activities below.
Activity 2.1: Detailed design of coastal conservation measures and the capacity development of stakeholders
Activity 2.2: Implementation of coastal conservation/protection measures Activity 2.3: Implementation of beach maintenance, establishment of structure and capacity
development of stakeholders

Data Collection Survey on Building Climate Resilient Safer Cities Final Report
8-10
A part of this component will be implemented as a sub-set of activity financed by JICA and Government of Maldives.
Activity 2.1: Detailed design of coastal conservation measures and the capacity development of stakeholders
The detailed activities of Activity 2.1 are shown below.
Sub-activity 2.1.1: Detailed design of coastal conservation/protection measures
Detailed design of the proposed coastal protection/protection measures is conducted in Activity 2.1. The detailed design includes the coastal conservation measures at two target islands in Laamu Atoll, namely, Maamendhoo and Fonadhoo islands, which are funded by GCF, as well as coastal conservation measures at Meedhoo Island in Addu Atoll, which are implemented as a sub-set of activity financed by the Government of the Maldives (GoM). It also includes the detailed design of coastal protection measures at Gan and Isdhoo islands in Laamu Atoll. In addition, as pointed out in the previous chapter, capacity development to obtain knowledge of coastal engineering, planning and design skills that are required for the planning and design of appropriate coastal measures autonomously against future climate risks will be carried out through OJT. The detailed study items for this activity are as follows:
i) Conducting detailed survey
ii) Conducting detailed design (including construction plan and cost estimate)
iii) ESIA support
iv) Preparation of bid document and support for bidding
i) Conducting detailed survey
As shown in Chapter 9, beach nourishment is planned to be implemented at three target beaches. It is important to understand the external force and the characteristics of sand drift in order to examine the appropriate layout plan and design of beach nourishment, and to predict the beach change after the implementation. Wave observation, survey of beach and coral reef (including topographic surveys), etc., are expected as main survey items.
However, the survey result which will be obtained in this limited period might be insufficient for fully understanding the coastal process and phenomena including the seasonal change of waves and beach topography. Considering this point of view, the data of wave observation and beach monitoring that have been continuously undertaken by JICA since the preliminary survey, as well as the data and information obtained from the output of Component 1 by the sub-set of activity financed by JICA, which will be implemented in advance, will be effectively utilized.
ii) Implementation of detailed design (including construction method and cost estimate)
The detailed layout planning and cross section design for each facility will be conducted based on the results obtained from the detailed survey and satellite image analysis. In addition, the construction method and the cost estimate will be prepared, and the packaging of the construction will be finalized.
iii) Assistance in ESIA (funded by JICA)
The Project will assist in reviewing the existing documents and on-going procedures related to ESIA for Component 2, which will be implemented by GoM, confirming whether the ESIA-related

Data Collection Survey on Building Climate Resilient Safer Cities Final Report
8-11
documents and procedures would be in line with the guidelines of JICA, which is AE, and assisting in updating and revising the documents and procedures if deemed necessary.
iv) Preparation of bid document and support for bidding
Based on the results of i) to iii), the bid documents will be prepared and the bidding process for the construction of each package, which will be mainly processed by the PMU, will be supported based on international procurement guidelines (FIDIC) and procurement procedure in the Maldives.
Sub-activity 2.1.2: Capacity development of related officials on survey, planning and design of coastal project
The above-mentioned activities will be carried out by an international consultant team selected through international procurement. The most effective way for the capacity development on survey, planning and design for the implementation of coastal project is for the related officers in the Maldives to work together with the consultant team under OJT. Therefore, the Maldivian engineers who will be engaged in the government coastal project in the future will be assigned into the consultant team.
The items of capacity development expected through this activity are as follows:
Enhancement of the understanding of coastal process and characteristics including waves and littoral drift
Acquisition of knowledge on each field survey method and analysis necessary to consider the above analysis
Acquisition of techniques on planning, design and construction method related to coastal conservation and protection measures
Acquisition of knowledge of international procurement rules and procedures
Activity 2.2: Implementation of coastal conservation/protection measures
The coastal conservation measures funded by GCF at the two target islands of Maamendhoo and Fonadhoo islands in Laamu Atoll, the coastal conservation measures at Meedhoo Island in Addu Atoll by the GoM, and the coastal protection measures at Gan and Isdhoo islands in Laamu Atoll will be implemented as shown in Figure 8.3.1 and Table 8.3.1.
The basic design, construction method and cost estimate for the coastal conservation measures at Maamendhoo and Fonadhoo islands funded by GCF are shown in Chapter 9.

Data Collection Survey on Building Climate Resilient Safer Cities Final Report
8-12
Table 8.3.1 Proposed intervention for each site, its background, reason
Source: JICA Expert Team
ProjectSite
ObjectiveCoastline Objective Beach
TopographyLand Use atHinterland
Considerationon Planning
ProposedMeasure
Maamendhoo 900 m
Fonadhoo 850 m
Meedhoo 1400 m Residential andAgricultural area
Gan 270 m
Isdhoo 270 m
Beachnourishment withsupplementary
groins (to reducesand discharge)
Rubble typerevetment
-Protection-Beach use
-Environment
-Protection
- To protect residential areaagainst climate change- To maintain resident'slivelihood and culture onbeach use and environment
- To protect historicalheritage
coral sandybeach
Natural emptyarea
coral rock,gravel, slightsandy part
Residential area
Source: JICA Expert Team
Figure 8.3.1 Location of Proposed Intervention
0 100 km
Fonadhoo
Maamendhoo
0 20 km
Gan
Isdhoo
0 10 km
Meedhoo
Funded by GCF
Funded by GOEAddu Atoll
Laamu Atoll
Laamu Atoll
Addu Atoll

Data Collection Survey on Building Climate Resilient Safer Cities Final Report
8-13
The Reason why beach nourishment method is proposed at above presented three sites as climate adaptation measures on coastal erosion is as follows.
1) Only the method to solve fundamentally for coastal erosion
There are mainly two type of measures for coastal erosion, which are “hard structure measures such as revetment, seawall, groin, detached breakwater, etc., and “soft measures” such as beach nourishment. Basically, coastal erosion causes decrease of sand supply or unbalance of sediment transport. This means hard structure measures which is just protect land side and not to improve the decrease of sand supply. To solve coastal erosion problem fundamentally, improvement or recovery of sand supply is only the method to solve.
2) Multi-functions of sandy beach
Beach nourishment has multi-functions not only “protection” (which is only function for structure measures), but also “beach use” and “environment”. Selection of method (hard or soft) is mainly depending on 1) what is original and current coastal topography, 2) what is condition of hinterland especially for the point of land use and 3) how is realization to maintain for long-term. For 1): originally sandy beach and still exists, for 2) residential area (for high consideration on beach use and environment) and for 3) expect not so significant sand discharge, are the basic requirements to select beach nourishment method.
Natural sandy beach has been formed through several thousand years, however, once natural beach take place to artificial beach with hard structure measures, coastal protection using hard structure measures shall be maintained continuously instead of natural beaches which has been maintained for long centuries.
3) Similarity of formation, flexibility, and adaptability of sandy beach
Impact of climate change will occur gradually year by year, and this is different phenomena such as big Tsunami which causes destructively. Combination of coral reef and natural sandy beach has been formed through several thousand year and beach profile has been flexibly maintained by series historical wave action (e.g. berm height increases due to increase of wave action). Such flexibility is one of strong advantages of sandy beach, and which is not obtained by hard structure measures. This flexibility is expected to contribute to climate adaptation measures with uncertain factors. Also, appropriate measures can be considered adaptively depending to the actual future condition (not finalize the adaptation measures now for 50 or 100 advanced target year)
4) Applicability to coral reef coast
Magnitude of littoral drift for coral reef coast is significantly smaller to order than that for general sandy beach which is facing to offshore waves directly. This means, sand movement and discharge of sand after beach nourishment will be also small and it is easy and low cost for sand replenishment as maintenance work.
5) Transformation of opinion in developed countries for coastal measures
As coastal conservation/protection measures in developed countries, beach nourishment as soft measures have become mainstream as coastal protection/conservation measures, based on lessons and learnt for previous hard structure measures.

Data Collection Survey on Building Climate Resilient Safer Cities Final Report
8-14
6) Experience of similar Projects by JICA
JICA has experienced to execute several similar projects applying beach nourishment from pilot-scale to large-scale in tropical island countries with coral reef coasts. One of large-scale projects is “Bali Beach Conservation Project”, in which nourished beach has been maintained about 20 years with no sufficient periodical sand replenishment. As the other project, “Technical cooperation project on coastal conservation in Mauritius” is the one of success project to scale up the beach nourishment method by strong ownership of Mauritian Governments and communities after the pilot-scale Project.
Introduction of Similar Projects and Relation to this Project
Here introduces Bali Beach Conservation Project (JICA Loan), in which nourished beach has been maintained about 20 years with no sufficient periodical sand replenishment, as one of the similar projects.
1) Outline
Beach nourishment (with groins, headlands and detached breakwaters) was undertaken at three sites to recover the coral sandy beach against coastal erosion. Further, protection of sea cliff was carried out to protect the historical heritage temples faced on the sea.
Quantity of sand for beach nourishment is about 300,000 m3 at Sanur, 340,000 m3 at Nusa Dua and 530, 000 m3 at Kuta Beach. Sand stock was also secured as sand for maintenance with 150,000 m3 in the stockpile.
20 years has already passed since initial beach nourishment at Sanur and Nusa Dua, and 14 years at Kuta.
Discharge rate after the nourishment was taken as the index to evaluate the effectiveness of beach nourishment (about less than 20 %/ year was expected in planning and design stage, except extreme storm event).
2) Actual Condition after the Project
Nourished beach has been well maintained for 20 years at Sanur and Nusa Dua without sufficient maintenance (periodical sand replenishment). This means it was proved that nourished sand could be well controlled by conducting appropriate planning and design.
On the other hand, undesirable issues on coastal management has been currently observed, which are illegal construction of building on the beach, individual construction of revetment at the retreat area, etc. Now, Bali Beach Conservation Project has been ongoing since this year, and “establishment of coastal management system” is one of the project components.
3) Similarity to this Project, Reference Outcome
The similarity between BBCP and the proposed project for the Maldives in the funding proposal is as follows.
BBCP was the first experience to employ beach nourishment method to wide public coastline as “coastal conservation” (not “commercial purpose for private sectors).
Government of Indonesia as well as communities had no experience for maintaining of beach when the BBCP was completed. Thus, they were very worry about the possibility of significant sand discharge and increase of maintenance cost after the initial nourishment.

Data Collection Survey on Building Climate Resilient Safer Cities Final Report
8-15
There are two type of beach nourishment method, which are “dynamically stable beach” and “statically stable beach”. Dynamically stable beach is just to replenish sand without any kinds of supplementary coastal structures and this method has been common to employ as coastal conservation measures in the United States or some of European countries. On the other hand, statically stable beach is to replenish sand with some supplementary coastal structures such as groins, headlands etc. in order to reduce the expected sand discharge after the initial nourishment. The method to be employed in BBCP was statically stable beach, and this method is also recommended in the proposed project for the Maldives in the funding proposal.
As beach nourishment is to recover sandy beach like original natural beaches, it is not avoidable to expect some amount of sand discharge in post project period and periodical maintenance is required to maintain recovered sandy beach with good condition. If sand for maintenance is procured at every periodical maintenance period, it causes high cost (almost same cost of initial nourishment). To minimize the cost for maintenance, it is desirable to dredge and maintain sand stock for targeted certain period together. In BBCP, sand for future maintenance was stocked with about 150,000 m3 at the sand stockpile. Same idea is employed to the proposed project for the Maldives in the funding proposal.
Source: JICA Expert Team
Figure 8.3.2 Long-term Beach Change after the Project (Bali Beach Conservation Project)

Data Collection Survey on Building Climate Resilient Safer Cities Final Report
8-16
Based on the monitoring result for about 20 years, most parts of sandy beaches recovered by the BBCP still well maintained. Sand replenishment using stocked sand has been carried out at some limited part of deteriorated area by the government once or twice for 20 years. This means the maintenance effort and its cost can be minimized by provision of proper planning and design of beach nourishment (especially layout design) with deep understanding of site-specific condition for beach process and mechanism of sand movement.
After the BBCP, the government of Indonesia, communities, and related stakeholders have well understand that the contribution of recovered sandy beach on points not only for protection function but also for beach use (recovered beach has been highly used as tourism, recreation and cultural events are).
To accelerate and achieve proper beach management by the government, communities and other stakeholders, the technical support has been continued through the second similar project (BBCP2).
Understanding of Beach Nourishment in Inhabitant Island of Maldives Described in Previous Report
The Second National Communication (SNC) Maldives updated in 2018 gives the following information.
Soft measures are difficult to implement effectively due its high sensitivity to the local environmental conditions such as geomorphology, hydrology and climate. The measures also require frequent and long-term commitment to maintain the effectiveness. These measures are not popular in inhabited islands due to low visibility but preferred by resorts in the Maldives that has high priority of maintaining a larger beach and to preserve the aesthetics of the natural coast.”
There are mainly two categories as coastal measures, which are “hard measures” and “soft measures”. Concrete measures in each category are shown in Table 8.3.2.
There are several different categories for “soft measures” and “hard (structure) measures” for coastal conservation/protection measures. If we focus on coastal protection facilities, “hard (structure) measures” is to protect coasts by structures only, such as seawall, revetment, groins, breakwaters, submerged breakwaters (artificial reef). Other measures are basically categorized as “soft measures”. In other words, “soft measures” is to protect coasts by not only hard structures, but also by enhancement of nature protection function, such as beach nourishment (including combination of nourishment and supplementary structures), artificial sand dune recovery, sand engine (sand motor), coral reef restoration (coral transplantation), mangrove plantation, etc. or by other methods to reduce coastal vulnerability such as land use control (set-back, securing of buffer zone), evacuation system, etc. Some of measures categorized as soft measures in the SNC are different from above categorization, such as temporary seawalls/revetments, artificial reefs (same as submerged breakwater).
As beach nourishment method, there are mainly two methods, which are “dynamically stable beach” and “statically stable beach”. The former is just to replenish sand on beaches without any coastal structures. This method is common as coastal protection measures against coastal erosion mainly in the United States, Australia and some of European countries. On the other hand, “statically stable beach” is to replenish sand by combination of with some supplementary coastal structures such as groins, headlands, breakwaters, etc. in order to reduce sand discharge after initial beach nourishment.

Data Collection Survey on Building Climate Resilient Safer Cities Final Report
8-17
Private sectors not only in the Maldives but also in other countries have commonly applied “statically stable beach method “to maintain their beach locally in order to reduce sand discharge after the initial nourishment. On the other hand, in inhabitant islands in the Maldives, beach nourishment has not been common method as coastal protection measures. They have experiences only to dump by-product sand which was obtained from port (navigation channel) construction. This is almost same method as that for “dynamically stable beach”, just filling sand without any structures.
Table 8.3.2 Concrete Measures in Each Category
Source: JICA Expert Team
SNC mentioned that though the initial cost of beach nourishment is cheaper than other hard structure measures, the maintenance cost of beach nourishment for assumed 20 years is significantly high and about four times as much as initial cost (see Figure 8.3.3). This means all quantity of nourished sand will be disappeared in every 5 years and periodical sand replenishment with same quantity of initial beach nourishment is required in every 5 years. Even though the assumption or evidence for this estimation is unclear, our targeted sand discharge and required frequency and quantity of sand for maintenance will be lees than this estimation by conducting proper planning and design and considering sand stock for future maintenance.
As explained below, we proposed to employ special dredger (Trailor Suction Hopper Dredger, TSHD) and dredge sand from offshore seabed with certain depth to minimize adverse effect to surrounding coastal topography.
There are mainly two items which is related to sand dredging using TSHD, which are 1) mobi- and demobilization cost for TSHD and 2) cost for sand dredging. TSHD with sufficient capacity is very special dredger, and source for procurement of TSHD is very limited, only from Europe. That is why, the item 1) costs about 3 million U$ more or less. Furthermore, the cost for item 2) is mainly for equipment ownership cost (equipment rental cost) during the mobilization duration. This means the cost for dredging work is greatly influenced by the scale merit (amount of sand). Thus, if we dredge and maintain sand stock for targeted certain period together, the total cost can be reduced.
Even though the amount of sand will be significantly increased, adverse effect on environment is not expected because we have already considered the expected impact to the beach (further coastal erosion
Hard (Structure) Measures Soft Measures - Seawall (mainly by concrete) - Revetment (by concrete,
concrete block or rubble) - Groins (by concrete , concrete
block or rubble) - Breakwaters (by concrete,
concrete block or rubble) - Submerged breakwaters
(artificial reef) (by concrete block or rubble), etc.
- Beach nourishment a) dynamically stable beach ( only sand
replenishment) b) statically stable beach (sand replenishment with
supplementary facilities by groins, headlands, etc.)
- Artificial sand dune (similar to nourishment) - Sand engine (sand motor) (similar to
nourishment) - Coral reef restoration (coral transplantation) - Mangrove plantation - Land use control (setback, securing of buffer
zone) - Evacuation system, EWS, etc.

Data Collection Survey on Building Climate Resilient Safer Cities Final Report
8-18
due to sand dredging) and not recommended to take sand nearby coastal area, but from the appropriate borrowing sites, e.g. several km far from the coral reef at least more than 20 m in depth, sea bottom is manly composed of coral sand. That is why we need to employ such special dredger (TSHD) with sufficient capacity.
Regarding necessity of sand stockpile, if sand stock is not considered together with initial sand nourishment, it is very difficult for Maldives Gov. to obtain sand for maintenance from the appropriate borrowing sites by using special dredgers, TSHD, and this will cause the unsuccess of maintenance of projected beach with sustainability. That is why we recommend to prepare the sand stock for first 25 to 30 years maintenance period. Another possibility for unsuccess maintenance might be by misunderstanding on beach conservation and environment, and this will cause to accelerate illegal sand mining, deterioration of coastal environment, etc.
As sand stockpile area, we are planning to keep certain area with about 1.5 – 2.0 ha with 1.5 to 2.0 m height for Fonadhoo and Meedhoo on land side because there are many un-used areas for both islands. On the other hand in Maamendhoo, as land area is very limited and no empty space in the island, we are planning to use newly constructed evacuation area as sand stockpile by increase of land elevation about +1 m from required grand elevation for evacuation.
Sand stockpile will be prepared by local government as “government property”, and just stock sand without maintenance (same as Bali Beach Project case). So, it will not cost for sand stock.
Source: JICA Expert Team
Figure 8.3.3 Cost comparison of soft engineering solutions for coastal adaptation
Reason why SNC Stated that Soft Measure (Beach Nourishment) was “Inappropriate” in the Maldives
1) Misunderstanding for image of beach nourishment method because of limited experiences of beach nourishment in inhabitant islands
As mentioned above, there are several options for beach nourishment method. However, the understanding of beach nourishment stated in SNC seems just one pattern, maybe for dynamically beach (Because beach replenishment at inhabitant island in the Maldives has been implemented to just replenish of dredged sand at some area, which was obtained as by-product material for construction of port/navigation channel). If proper method of beach nourishment is employed while taking into account of site-specific conditions, maintenance issues, etc., it becomes more realistic and easy method.

Data Collection Survey on Building Climate Resilient Safer Cities Final Report
8-19
2) No consideration how to reduce maintenance activities and its cost
Basically, there is no consideration to reduce maintenance activities and its cost (for example, preparation of sand stockpile in initial nourishment).
3) Lack of technical skill for coastal engineering, especially for understanding of coastal process, mechanism of sediment transport and experience for implementation of beach nourishment.
In order to conduct proper planning and layout design for beach nourishment, sufficient understanding for site-specific coastal process, mechanism of sediment transport and know-how for beach nourishment based on actual implementation, etc. is strongly required. However, there is barrier for lack of technical skill, knowledge and experiences for executed officers of government of Maldives, related stakeholders.
Differences of Beach Nourishment between by the Government and by Private Sectors
Purpose of beach nourishment is different between the government and private sectors. Government projects are for the purpose of coastal protection/conservation which is conducive to protect natural land, public property, and facilities, people’s livelihood, culture etc. basically for whole coastal area in an island. On the other hand, projects by private sectors are implemented to maintain just their local private property for commercial purpose and coastal conservation point of view, which the government has, is not considered.
Basically, private sectors do not have views on coastal conservation in which impact of the other islands and national land loss is taken into account. On the other hand, the government considers protecting natural land, public property, and facilities, people’s livelihood, culture etc. basically for whole coastal area in an island.
Commercial purpose for private sectors is for tourism contribution from foreign and domestic tourists. However, if we expand the meaning of “commercial purpose” more widely for inhabitant islands, there is possibility to contribute to bring income to local residents and local governments due to enhancing beach amenity using financial resources (for example, income from small shop for food and drinking, collection of entrance fee, etc.). Also, several kinds of beach activities can be promoted such as beach sport event (AE have an experience to promote and carry out such events using recovered sandy beach in the Tuvalu).
Due to difference of above-mentioned purpose, private sectors dredge sand for maintenance from nearby project site (sometimes from foreshore area or coral reef) using sand pump and barge to minimize the maintenance cost. Due to this, there is possibility to cause adverse effect to surrounding coasts. On the other hand, from the coastal conservation point of view, it is required to take sand with high consideration not to cause adverse effect to surrounding beach. To achieve this, it is common understanding to dredge sand far from the coast with certain depth using special dredger (Trailor Suction Hopper Dredger, TSHD) even though cost is significantly higher than that for sand dredging using sand pump.
Applicability of Beah Nourishment in the Maldives
1) Proposed beach nourishment method
As beach nourishment method, we have proposed to employ “statically stable beach” using supplementary coastal structures such as groins together with beach nourishment to reduce the

Data Collection Survey on Building Climate Resilient Safer Cities Final Report
8-20
possibility of sand discharge after the initial nourishment. We understood that this method is realistic and appropriate method to apply to developing countries considering the reduction of maintenance period and its cost.
2) From the Point of Predicted Sand Discharge
As mentioned in 2, the magnitude of littoral drift for coral reef coast is significantly smaller than that for common open sandy beach. Furthermore, proposed beach nourishment is not to apply the dynamically stable beach without any supplementary coastal structure such as groins, but the statically stable beach with combination of groins (same method of Bali Beach Conservation Project). Thus, it is expected to further reduce the sand discharge after the nourishment due to both effect of coral reef and planning of statistically stable beach.
The estimated sand discharge (loss) for Bali Beach Project was 6,000 to 8,000 m3/year based on long-term satellite image analysis. On the other hand for proposed two beaches, Maamendhoo and Fonadhoo in the Maldives, estimated beach retreat with considering the effect of SLR was 0.6m/year at Maamendhoo and 0.67m/year at Fonadhoo in 2050 (as shown in Table 6.3.2 in Chapter 6, Appendix2). Assuming 2 m as the height of sediment movement from the result of field survey, annual sand loss was estimated 720m3/year at west side coast in Maamendhoo with 600 m objective coastline, 360m3/year at east side coast with 300 m objective coastline. At Fonadhoo, 1160m3/year at 850 m objective coastline. This quantity for sand loss is quite smaller than that for Bali Beach.
In the proposed design for intervention, 20 m is assumed as the nourished beach width as the result of analysis for flooding due to SLR and high waves. Also, it is proposed to prepare sand stock with same amount of initial volume of sand about 33,000 m3 for each island. From above mentioned result, this volume is equivalent to the volume of sand discharge for 30 years at Maamendhoo and 28 years at Fonadhoo. Furthermore, the proposed method can further reduce sand discharge due to the effect of supplementary structure such as groins to form statically stable beach.
Actual phenomena depend on unpredictable wave condition. If unexpected extreme event (strong storm) occurs with high frequency, further sand replenishment will be required. However, based on rough analysis mentioned above, the applicability of beach nourishment in the Maldive coast seems high from the point of expected sand discharge after beach nourishment.
3) Consideration to reserve sand stock
To minimize the maintenance cost, it is recommended to reserve the sand for maintenance together with sand for initial nourishment at the same time. We propose to stock sand with the same amount of initial nourishment, which will be secured for 25 years maintenance work.
4) Planning and design based on sufficient analysis for the process of beach change and mechanism of sediment movement and capacity development for related governments officials
Detailed analysis for the process of beach change and mechanism of sediment movement will be conducted based on combination of satellite image analysis, field investigation and numerical approach to achieve appropriate planning and design of beach nourishment. Technology transfer and capacity development to related governments officials will be conducted through each activity by OJT.

Data Collection Survey on Building Climate Resilient Safer Cities Final Report
8-21
5) Establishment of beach management system and capacity development for both government officers and communities
Through the sub-activity 2.3 of the proposed project, beach maintenance system will be established for both government officials (adaptive management to maintain project beaches) and community (dairy maintenance). In the sub-activity 2.3, it is also planned to promote and conduct several recreation events using recovered sandy beach area, such as beach sports event, open market, environment educational open school, etc. to increase the function of projected beach on commercialization point of view. Furthermore, possibility to increase the income of community or local governments will be examined, e.g. to collect entrance fee (or parking fee) to install attractive beach amenities, etc.
These events, program will be planned and executed local Gov. and community by AE support during the project period based on the experience from other projects by AE, and finally expect to conduct and manage by local Gov. and community in the Maldives.
Evaluation on Effect against Climate Change and Maladaptation Risk due to Intervention
The effect against climate change is evaluated as follows.
Proposed intervention will have effect against climate change by reducing damage due to flooding and erosion.
Magnitude of littoral drift due to intervention is small.
Adverse effect of erosion and flooding at adjacent coast due to Intervention is not so significant.
Regarding adverse effect by flooding, intervention was designed to minimize the adverse effect by flooding. The similar project by JICA in Tuvalu shows that no significant wave flooding and adverse effect was observed at beach and even around groin area.
Points to be addressed in the Detailed Design Stage
In detailed design, measures to mitigate out flow of sand will be elaborated by addressing the following two points.
1) Finalization of Detailed Layout Planning based on Appropriate Numerical Analysis
The layout plan will be finalized with accurate understanding and evaluation on expected sediment transport and beach changes after the implementation. In the detailed design stage, therefore, the numerical model needs to be developed to improve its repeatability of actual phenomenon of beach change then to be applied to optimize the detailed layout of beach nourishment and groins.
2) Improve Repeatability of Numerical Model at Detailed Design Stage
Wave data recorded in the site study was applied in order to improve the repeatability of the numerical model, however, it allows further improvement as the record period was only several months. Since the wave data will be accumulated for more than one year at the detailed design stage, these data should be analyzed in terms of annual variability (offshore wave height, wave height on reef, water level, wave direction, etc.) and be applied to improve the repeatability of numerical model.

Data Collection Survey on Building Climate Resilient Safer Cities Final Report
8-22
Contribution of Paradigm Shift
Activity 2.2 Implementation of coastal conservation/protection measures is critical to realize enhancing resiliency against climate change by utilizing the natural protective functions of coasts and reefs. This activity is actual practice of implementing coastal conservation/protection measure and the central activities among the activities in the proposed project of all components. Through the implementation by organizing Project Management Unit, PMU will conduct monitoring and evaluation of the implementation and extract good practices and lessons learned which are conducive to bring the paradigm shift. The good practices and lessons learned will be obtained from the experiences of project management, procurement, construction, construction supervision. The impact is also high, since the stakeholders in Maldives would like to prevent coastal erosion and loss of beach.
“Activity 2.1 Detailed design of coastal conservation measures and capacity development of stakeholders” is necessary activity to prepare for Activity 2.2. “Activity 2.3 Implementation of beach maintenance, establishment of structure and capacity development of stakeholders” is also necessary activity to maintain the beach to be nourished in Activity 2.3. In Activities 2.1 and 2.3 as mentioned in C.3.2 of FP, capacity building and technology transfer through on-the-job training will be conducted. The trained personnel will be transferred to ME or MNPI, island councils to disseminate and share experience and knowledge learned through the activities in Component 2.
Activity 2.3 includes real maintenance activities by local community. Through the activity, the ownership by local community is fostered through deepening understating of local community on their maintenance and how the maintenance connects coastal environment and their benefits for community as mentioned in Support Document 1.
These activities in Component 2 will make the base of sustainable beach nourishment and contribute paradigm shift and impact of resilience in conjunction with the activities of other components.
Proposed Intervention for Each Site
The following two adaptation measures will be implemented at Maamendhoo Island: 1) Coastal conservation measures by employing beach nourishment (L=900m) with supplementary groins; and 2) Creating evacuation area by partial reclamation (2.2ha). As coastal conservation measures at Fonadhoo and Meedhoo islands, beach nourishment (L=850m and 1400m, respectively) with supplementary groins is employed as the appropriate coastal conservation measure. The construction of rubble type revetment with L=270m each is proposed as coastal protection measures at Gan and Isdhoo islands to protect the historical heritage area at hinterland (Figure 8.3.7 and 8.3.8).
GoM will also make in-kind contribution for procurement of sand to be used for beach nourishment at three sites and for reclamation material in both GCF- and GoM-funded construction sites.
Sub-activity 2.2.1: Coastal conservation measures and creation of evacuation area at Maamendhoo Island in Laamu Atoll (funded by GCF)
The following two adaptation measures will be implemented at Maamendhoo Island (Figure 8.3.4):
Coastal conservation measures against coastal erosion and flooding due to high wave at two sites
Creating evacuation area

Data Collection Survey on Building Climate Resilient Safer Cities Final Report
8-23
Beach nourishment is employed as the appropriate coastal conservation measure at the two targeted sites, at the southeast side beach for about 300 m alongshore, and at the west side beach for about 600 m alongshore. This is done in order to achieve the coexistence between maintaining the protection function against coastal erosion and flooding due to high wave, and the beach use and environment.
About 20 m to 25 m width will be secured as the target width of the nourished beach following the technical study shown in Chapter 9. Setting of groins is also considered together with beach nourishment as supplementary facilities in order to minimize the sand outflow after the nourishment and to achieve the maintenance of sandy beach for long term. Even though the above-mentioned consideration will take place, some amount of nourished sand will be moved by wave action and gradually flow out. Therefore, certain amount of sand (approximately the same amount for the initial beach nourishment) will be stocked to secure the sand for periodic maintenance of the nourished beach.
Furthermore, the evacuation area against extreme weather and wave event will be secured by employing partial reclamation of the island because there is no empty space for evacuation of residents in Maamendhoo Island due to the particular condition of the island with extremely high density and low elevation land. The required area of the evacuation area will be set to approximately 2.2 ha based on the consideration of total number of residents (about 1,000 people) and the area for the required adjoining
Source: JICA Expert Team
Figure 8.3.4 Coastal Conservation Measures and Evacuation Area at Maamendhoo Island
400 m
Typical Cross-Section Image for Beach
Typical Cross-Section Image for Groins Typical Cross-Section Image for Reclamation Area

Data Collection Survey on Building Climate Resilient Safer Cities Final Report
8-24
utilities (e.g., storage warehouse). The ground elevation at the evacuation area will be set to +1.0 m from the average land elevation to avoid flooding during the evacuation.
Sub-activity 2.2.2: Coastal conservation measures at the ocean side of Fonadhoo Island in Laamu Atoll (funded by GCF)
Beach nourishment is employed as the appropriate coastal conservation measure at the central area of ocean side for about 850 m alongshore, where the residential area has expanded nearby the ocean coast under the condition that coastal erosion has been progressing and flooding due to high wave has occurred frequently, in order to achieve the coexistence between maintaining the protection function against coastal erosion and flooding due to high wave, and the beach use and environment (Figure 8.3.5). The planned beach width is the same as that for Maamendhoo, i.e., about 20 m to 25 m width. The setting of groins and preparation of sand stockpile have the same concept as in Maamendhoo.
Sub-activity 2.2.3: Coastal conservation measures at Meedhoo Island in Addu Atoll (sub-set of activity financed by GOM)
Beach nourishment is employed as the appropriate coastal conservation measure at the northern side for about 1.4 km alongshore where coastal erosion has been progressing and flooding due to high wave has occurred frequently, in order to achieve the coexistence between maintaining the protection function against coastal erosion and flooding due to high wave, and the beach use and the environment (Figure
Source: JICA Expert Team
Figure 8.3.5 Coastal Conservation Measure at Fonadhoo Island in Laamu Atoll
(2) Typical Cross-Section Image for Groins(1) Typical Cross-Section Image for Beach (with refrained revetment)

Data Collection Survey on Building Climate Resilient Safer Cities Final Report
8-25
8.3.6). Since the project beach is facing the open sea with narrow coral reef width, the wave conditions are more severe than those of the above two sites. Therefore, the target beach width is set to about 15 m to 20 m to consider the stability of the beach after the nourishment. The setting of groins and preparation of sand stockpile have the same concept as in the above two sites.
Source: JICA Expert Team
Figure 8.3.6 Coastal Conservation Measure at Medhoo Island in Addu Atoll
700 m
Image of Proposed Beach Conservation Measure (Just Image)
Beach nourishment with Groins

Data Collection Survey on Building Climate Resilient Safer Cities Final Report
8-26
Sub-activity 2.2.4: Coastal protection measure at Gan Island in Laamu Atoll (sub-set of activity financed by GoM)
There is a historical heritage site at the hinterland of the ocean coast at Gan Island in Laamu Atoll where the width of the coral reef is narrow. Here, there is a risk to damage the heritage site due to high wave overtopping from the ocean. The protection measure using seawall has been undertaken by the GoM before, but it collapsed frequently, and it is requested to protect the heritage site by using stronger protection measures against high waves. Therefore, the rubble type revetment with approximately 270 m length is proposed as the coastal protection measure for the purpose of protecting the hinterland including historical heritage site (Figure 8.3.7).
Sub-activity 2.2.5: Coastal protection measure at Ishdhoo Island in Laamu Atoll (co-
financed project by the GoM)
There is also a historical heritage site at the hinterland of the northern coast at Ishdhoo Island in Laamu Atoll. This site experiences the most severe wave condition in the island due to the narrowness of the coral width in the island where the ocean waves propagate directly. There is a concern that the heritage
Source: JICA Expert Team
Figure 8.3.7 Coastal Protection Measure at Gan Island in Laamu Atoll
Rubble-type Revetment(L=270m)
Heritage
200 m
Image of Typical Cross Section
Source: JICA Expert Team
Figure 8.3.8 Coastal Protection Measure at Ishdhoo Island in Laamu Atoll
Rubble-type Revetment(L=270m)
Heritage
200 m
Image of Typical Cross Section

Data Collection Survey on Building Climate Resilient Safer Cities Final Report
8-27
site will be damaged by wave overtopping in the near future. Even though a poor seawall was constructed by the GoM as a measure against high-wave protection, most of the section has already collapsed. There is a strong demand from the island council to protect the site using strong protection measures. Therefore, the rubble type revetment with approximately 270 m length is proposed as the coastal protection measure for the purpose of protecting the hinterland including historical heritage site (Figure 8.3.8).
GoM will also make in-kind contribution for procurement of sand to be used for beach nourishment at three sites and for reclamation material in both GCF- and GoM-funded construction sites.
Sub-activity 2.3: Implementation of beach maintenance, establishment of structure and capacity development of stakeholders
Appropriate coastal maintenance in accordance with actual changes in coastal conditions is essential in order to sustainably maintain the project beaches after the beach nourishment carried out in Activity 2.2. The required coastal maintenance after the beach nourishment is mainly divided into two items, which are a) adaptive management aimed to maintain the beaches in accordance with the change of beach profile due to wave action, and 2) daily maintenance aimed to maintain the good condition of the beach for the beach use and environment as shown in Figure 8.3.9. The actual activities for a) will mainly be undertaken by the island governments, since construction work (e.g., supplementary sand filling) is required. However, some of the activities for a) will be conducted in collaboration with the residents as volunteer’s basis. Self-management by the residents who are the main users of the beach is strongly required for b). Therefore, cooperation between the island governments and communities in cooperate with NGOs is essential for the sustainable maintenance of the beach. Activity 2.3 is aimed to establish the beach maintenance system and develop the capacity of both island governments officers and residents for beach maintenance by conducting the actual beach maintenance activities after the beach nourishment in Activity 2.2 in collaboration with the island governments and residents.
The image of beach maintenance after the implementation of beach nourishment is shown in Figure 8.3.9. Even though the actual activities in Activity 2.3 will be carried out by GCF, the basic policy of beach maintenance and management will come from the result of Activity 1.2 “Establishment of the ICZM” which will be implemented as a subset of activity financed by JICA. Thus, collaboration with the consultant for the sub-set of activities financed by JICA and by GCF is essential to proceed smoothly.
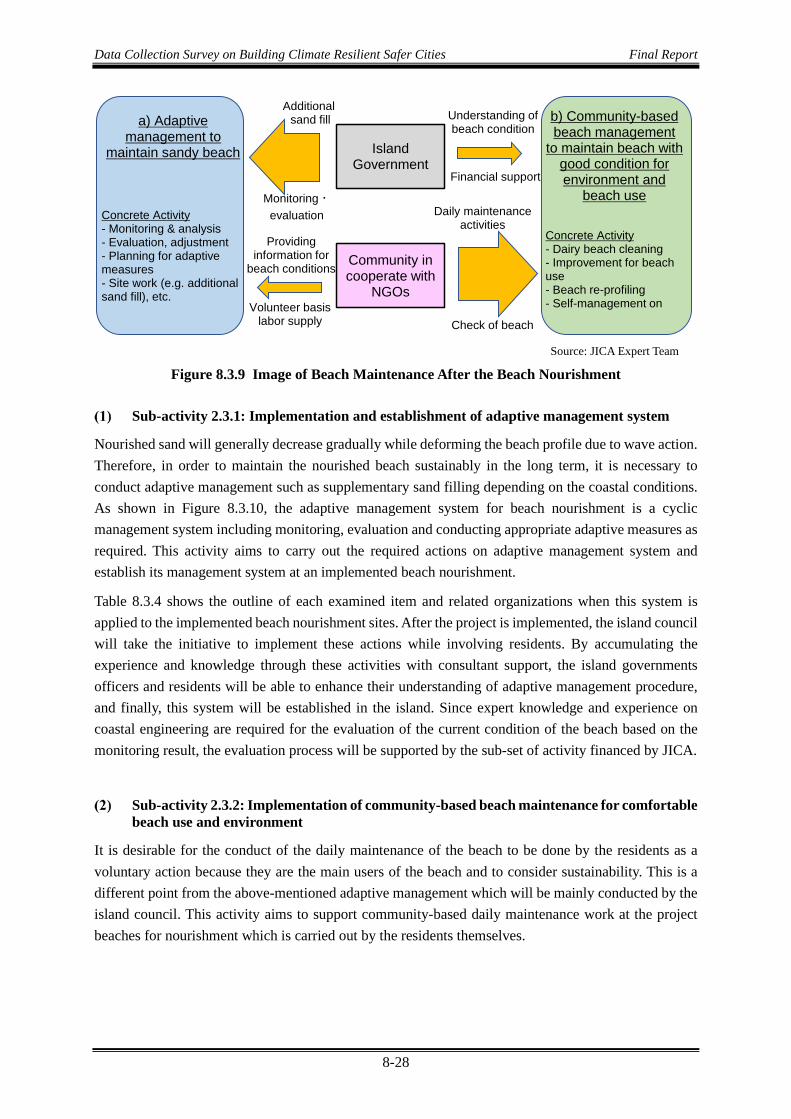
Data Collection Survey on Building Climate Resilient Safer Cities Final Report
8-28
Source: JICA Expert Team
Figure 8.3.9 Image of Beach Maintenance After the Beach Nourishment
Sub-activity 2.3.1: Implementation and establishment of adaptive management system
Nourished sand will generally decrease gradually while deforming the beach profile due to wave action. Therefore, in order to maintain the nourished beach sustainably in the long term, it is necessary to conduct adaptive management such as supplementary sand filling depending on the coastal conditions. As shown in Figure 8.3.10, the adaptive management system for beach nourishment is a cyclic management system including monitoring, evaluation and conducting appropriate adaptive measures as required. This activity aims to carry out the required actions on adaptive management system and establish its management system at an implemented beach nourishment.
Table 8.3.4 shows the outline of each examined item and related organizations when this system is applied to the implemented beach nourishment sites. After the project is implemented, the island council will take the initiative to implement these actions while involving residents. By accumulating the experience and knowledge through these activities with consultant support, the island governments officers and residents will be able to enhance their understanding of adaptive management procedure, and finally, this system will be established in the island. Since expert knowledge and experience on coastal engineering are required for the evaluation of the current condition of the beach based on the monitoring result, the evaluation process will be supported by the sub-set of activity financed by JICA.
Sub-activity 2.3.2: Implementation of community-based beach maintenance for comfortable beach use and environment
It is desirable for the conduct of the daily maintenance of the beach to be done by the residents as a voluntary action because they are the main users of the beach and to consider sustainability. This is a different point from the above-mentioned adaptive management which will be mainly conducted by the island council. This activity aims to support community-based daily maintenance work at the project beaches for nourishment which is carried out by the residents themselves.
a) Adaptive management to
maintain sandy beach
b) Community-based beach management
to maintain beach with good condition forenvironment and
beach useConcrete Activity- Monitoring & analysis- Evaluation, adjustment- Planning for adaptive measures - Site work (e.g. additionalsand fill), etc.
Concrete Activity- Dairy beach cleaning- Improvement for beachuse- Beach re-profiling- Self-management on
Island Government
Community in cooperate with
NGOs
Additionalsand fill
Providing information for
beach conditions
Volunteer basis labor supply
Understanding of beach condition
Monitoring・evaluation
Financial support
Daily maintenance activities
Check of beach

Data Collection Survey on Building Climate Resilient Safer Cities Final Report
8-29
Source:NOAA Coastal Services Center 20061)
Figure 8.3.10 Image of Adaptation Management System to be Applied to the Maintenance Work after Beach Nourishment
The following activities are assumed as the daily maintenance of the beach by the residents:
Beach cleaning Self-management and compliance of beach use Enhancement of beach amenity Monitoring of beach condition and information sharing with related organizations of the island
governments Beach re-profiling that can be done by manpower level (if necessary)
Implementation bodies of maintenance are local government and local community. Island government will allocate the budget for maintaining the beach to be nourished in the proposed project and conduct activities for the maintenance.
On the other hand, local community will conduct activities such as daily beach cleaning, self-control on beach use, check beach condition and information sharing to island government, to bring paradigm shift of coastal conservation and environment.
The maintenance of the beach by local community aims at not only maintaining protection function but also maintain good condition for each use and environment. Since local people are the main users of the beach, they also have roles in maintenance to enhance awareness on coastal conservation and environment as mentioned in Table below.
It is considered that local people have little interest in coastal protection and environment in Maldives. On the other hand, local people proactively conduct daily cleaning and beach is the place for recreation and relax at a part of coastal areas of Fonadhoo island. The active involvement and fostering ownership by local community will be encouraged in the proposed project.

Data Collection Survey on Building Climate Resilient Safer Cities Final Report
8-30
Table 8.3.3 Roles and Purpose of Maintenance Implementation body Main Roles Purpose
Island Government (Atoll council and Island council)
Monitoring and evaluation Implement adaptive measure (if
needed) including sand replenishment
Maintain function (especially for protection function) of the intervention (i.e. beach nourishment)
Maintain coastal condition (for beach use and environment) and foster ownership based on paradigm shift of coastal conservation and environment
Local community with NGOs and Women Development Committee (WDC)
Daily beach cleaning Self-control on beach use (to
avoid illegal activities (e.g. private sand taking, encroachment of property, etc.)
Check beach condition and information sharing to Island Gov.
Source: JICA Expert Team
The Possibility to Realize Sustainable Beach Cleaning Structure and Benefits for Community due to Maintenance are shown in 4. and 5. of Supporting Document of Annex 2 as feasibility of this Sub-activity.
Sub-activity 2.3.3: Public education, enlightenment, public relations for residents and capacity development on beach maintenance and management
Full understanding of beach maintenance activities and its system is required for the realization and sustainable operation of adaptive management (Sub-activity 2.3.1) and community-based daily maintenance (Sub-activity 2.3.2). This activity aims to conduct several programs to enhance the understanding of adaptive management and community-based beach maintenance for both island officers and residents, and to expand this knowledge to other inhabited islands.
The capacity development of the island governments officers on adaptive management system will be carried out through the actual activities in Sub-activity 2.3.1 as OJT.
Table 8.3.4 Outline of Each Item and Related Organization Item Summary Related organization
Implementation Additional sand supply to maintain the beach Island governments, Inhabitants (Labor supply)
Monitoring Regular coastal monitoring (change in beach profile, etc.)
Island governments, Inhabitants (Providing information)
Evaluation - Evaluation based on monitoring results - Understanding of the condition of beach changes
Island governments
Adaptation or planning
Determination of the necessity for adaptive measures and planning
Island governments, inhabitants (Information sharing)
Source: JICA Expert Team
The programs for education, enlightenment, public relations for the residents are assumed as follows:
Continuous coastal environmental education at elementary and junior high schools in collaboration with educational institutions
Holding of various educational events related to the conservation of coastal environment

Data Collection Survey on Building Climate Resilient Safer Cities Final Report
8-31
Holding regular information exchange meetings on coastal conditions to promote better understanding
In addition, the following efforts will be carried out in order to expand the knowledge on the coastal maintenance activities to other islands:
Holding of site tours and seminars with the participation of local government officials, residents and NGO representatives in other islands
Creation of brochures that introduce the activities and their distribution to other islands Production of short video stories of success stories from target islands to disseminate the success
stories with larger audience
Table 8.3.5 shows the role and responsibility of ME and JICA as Executing Entities (EE) for Activity 2.3.
Table 8.3.5 Role and responsibility of Executing Entities (EE) for Activity 2.3
Source: JICA Expert Team
Component 3: Development of Disaster Wrning and Information Dissemination
Background Component 3: Development of Disaster Warning and Information Dissemination
The coastal disaster measures in the Maldives are mainly implemented with physical protection measures at the coastal areas. However, considering the increasing occurrence frequency and severity of the damage due to high wave attack and flooding, the emergency plan, including access, communication and sharing of disaster information with the island people, is required. In the Maldives, a relatively large number of households are women-headed, and the gender disparity is seen in the poverty ratio. Also, women tend to take care of elders, children, and people with disabilities at home and they are supposed to accompany them all the time. Comparing with men, who mostly work outside home and have various access to information, women have less opportunity to promptly obtain information. Due to such environment, the delaying risk of women’s evacuation is high. In this component, a system for disaster warning and information dissemination that widely covers the residents for protecting their lives will be developed and operated as a sub-set of activity financed by JICA. In
ME JICA
Sub-activity2.3.1
Implementation and establishmentof adaptive management
1) Monitoring survey after the construction2) Implementation of adaptive measures3) Coordination and follow up of island governmenton operation of adaptive management
1) Technical evaluation based on monitoringresults2) Planning of adaptive measures3) Support for capacity development foradaptive management system through eachactivity on site by OJT
Sub-activity2.3.2
Implementation of community-based beach maintenance forcomfortable beach use andenvironment
1) Coordination and follow up of community onoperation of community-based beach maintenance2) Coordination and follow up of island governmenton operation of community-based beachmaintenance
1) Support for capacity development forcommunity-based beach maintenance trougheach activity on site by OJT
Sub-activity2.3.3
Public education, enlightenment,public relations to residents andcapacity development on beachmaintenance and management
1) Organizing coastal environmental education atelementary and junior high schools2) Organizing of various educational events
1) Action for expanding knowledge (site tours,preparation of brochures, video for PR, etc.)2) Support for educational program and event
Role and Responsibility of Executing Entities (EE)Sub-activity

Data Collection Survey on Building Climate Resilient Safer Cities Final Report
8-32
addition to the development of a hard system, the component also includes a soft system, such as capacity development of relevant organization on system operation, public education and awareness raising activities. This component fulfills the output of “a system for access, communication and sharing of disaster information that widely covers residents will be developed and capacity development of government officials to be responsible for operating the system will be supported”, and the outcome of “protecting residents’ lives through the appropriate evacuation activities to be taken by the residents themselves”.
Activity 3.1: Installment of terrestrial digital broadcasting system Activity 3.2: Establishment of Disaster Early Warning and Information Broadcasting System
Establishment of the Disaster Warning and Information Dissemination System in Maldives
The various projects and activities related to disaster warning and information dissemination systems are being conducted by the Maldivian government and donor organizations, especially after the 2004 Indian Ocean Tsunami disaster.
Assistance to Terrestrial Trunked Radio (TETRA) Project
After the hit by the 2004 Indian Ocean tsunami, the Korea International Cooperation Agency (KOICA) and the Agence Française de Développement (AFD) assisted the Maldives Police Service (MPS) by providing financial support and upgrading the equipment for establishment of the emergency communication network between islands/atolls. The TETRA system is a closed network and can allow communication among closely related stakeholders, such as police, army, etc. Soon after, the TETRA system was installed for the Maldives National Defense Force (MNDF). The MPS was then able to communicate with MNDF through the TETRA system.
Enhance National Capacity for Disaster Risk Reduction and Management in the Maldives
The National Disaster Management Centre and the United Nations Development Programme (UNDP) commenced the project “Enhance National Capacity for Disaster Risk Reduction and Management in Maldives” in 2013. This project supported the following: i) establishment of the institutional and legal systems for disaster risk reduction and effective disaster risk reduction organizations/institutions, ii) strengthening of the end-to-end early warning systems and implementation of public awareness campaigns and knowledge building on disaster risk reduction and climate change adaptation, iii) increase of community capacities for disaster preparedness for effective response, iv) establishment of a flood response mechanism, v) involvement of multi-stakeholder engagement, and iv) assessment and strengthening of the capacities of the National Disaster Management Centre (NDMC) as the lead national institution on disaster risk reduction and disaster risk management and coordination.
Scaling Up the National Capacity for Disaster Risk Reduction and Management in the Maldives
The National Disaster Management Centre and the United Nations Development Programme (UNDP) have commenced the project “Scaling up the National Capacity for Disaster Risk Reduction and Management in the Maldives” in 2016, and the project duration is from February 2016 to January 2018. The amount of the project is USD 380,000. In line with the Sendai Framework for Disaster Risk Reduction in coherence with the 2030 Agenda for Sustainable Development, and the Paris Agreement of Climate Change, the objectives of this project are to build on the achievements of the government on disaster management, to scale up, and to ensure continuity and enhancement of the current policies and programs. The main activities are the following: i) enhancement of community capacity for disaster response, ii) strengthening of the early warning systems, and iii) enhancement of capacity in disaster statistics. Through the activity ii) above, the National Disaster Management Centre and other response

Data Collection Survey on Building Climate Resilient Safer Cities Final Report
8-33
bodies will be able to maintain uninterrupted communication across all atolls in the Maldives in case of localized and/or national emergencies.
Television/Radio Networks in the Maldives
The television and radio networks are used as the fundamental systems to disseminate information on the weather forecast and natural disasters. The Maldives introduced radio services in 1962, while the TV service began in 1978 and was introduced by the State Radio and Television. The services continued until 2008 separately. Broadcasting was under the umbrella of the Maldives National Broadcasting Corporation (MNBC) from 2008 to 2012 and was continued by the Maldives Broadcasting Corporation (MBC) from 2012 to 2015. The Public Service Media (PSM) had been formed as a public service company under the Public Service Media Act (9/2015) in 2015. PSM is the official state media in the Maldives.
The diffusion rates of television sets in the Maldives have increased from 85% in 2006 to 88.4% in 2014 (Census 2006 and 2014 Census, National Bureau of Statistics). However, there are only three terrestrial TV broadcasting stations in the country. Two stations, except for PSM, have limited-area terrestrial broadcasting service and are only located around the Male Island areas. On the other hand, satellite television/cable television (CATV) is becoming more widespread especially in the rural areas due to the under development of terrestrial broadcasting services. The penetration rate of CATV is 6% in 2000, 50.3% in 2006, and has increased to 73.9% in 2014 (Census 2006 and 2014, National Bureau of Statistics). The CATV is more popular in rural inhabited islands than in Male Island, i.e., penetration rate in Male: 71.2%, and rural inhabited islands: 75.7%. This is, because it is essential for the rural inhabited island residents to subscribe to CATV companies in order to watch various TV programs. However, because paid foreign television programs broadcasted through CATV have become more popular, it would be difficult for CATV companies to produce programs and contents specialized in information necessary for living in the Maldives and in the rural areas.
Necessity to Establish the Disaster Warning and Information Dissemination System
Through the above-mentioned UNDP project to strengthen the early warning systems, the communication network can be sustained during emergency; however, the national-level disaster warning and information dissemination system has not yet been established. Because more than 1,300 islands are scattered across an 800 km length in the Maldives, the necessary information may differ depending on the areas in the case of disaster events making it necessary to establish the systems to organize the necessary specific information and disseminate to the specific areas. Therefore, it is necessary to develop a nationwide broadcasting network using digital communication, and to improve the technology of the organizations that implement the operation and management of the constructed broadcasting network. Furthermore, it is necessary to improve the capacity to produce the necessary contents and programs to disseminate appropriate and necessary information, and to develop the system for transmitting disaster alert information using a nationwide digital broadcasting network.

Data Collection Survey on Building Climate Resilient Safer Cities Final Report
8-34
Outline
Component 3: Development of Disaster Warning and Information Dissemination
As mentioned in Section 7.6 of Chapter 7, the activities under Component 3 will be implemented as a sub-set of activity financed by JICA and is composed of the following two activities: Activity 3.1: Installment of terrestrial digital broadcasting system Activity 3.2: Establishment of Disaster Early Warning and Information Broadcasting System
Activity 3.1: Installment of terrestrial digital broadcasting system Brief Explanation of Activity 3.1
ISDB-T television network will be installed, with network operation center (in Male) and transmitting station equipment (in nationwide level), to allow broadcasting digital television broadcasts throughout the Maldives. Due to the installment of ISDB-T television network under the Project, the coverage corresponds to 91.23% of the total population of the Maldives, and this system, implemented through a co-financed grant aid project by JICA, will serve as a platform of EWBS.
Sub-activity 3.1.1: Standardization of Disaster Warning and Information Dissemination System
Sub-activity 3.1.1 includes the facilities necessary for obtaining and disseminating necessary information related to coastal and ocean disaster for the central- and atoll-level concerned authorities. Based on the request from the Maldivian government, the facilities listed in the following table are being constructed nationwide which includes Gan Island, Laamu Atoll.
Table 8.4.1 The Construction Facilities and Quantity of Target Atoll Facility Quantity Remarks
Network operation center 1 atoll Villingili (Male) (K) Microwave relay stations 3 atolls Maafushi (K), Feeali (F), Fiyoari (GDh) Digital transmitting stations 18 atolls Dhidhdhoo (Ha), Kulhudhuffushi (HDH), Funadhoo
(Sh)*1, Manadhoo (N), Ungoofaaru (R), Eydhafushi (B), Naifaru (Lh)*2, Villingili (Male) (K), Felidhoo (V), Dhangethi (ADh), Nilandhoo (F), Gan (L), Guraidhoo (Th), Gadhadhoo (GDh), Thinadhoo (GDh)*3, Villigili (Ga), Fovammulah (Gn), Hithadhoo (S) Note: *1: Funadhoo (Sh) was replaced with Maaungdhoo (Sh), *2: Naifaru (Lh) was replaced with Hinnavaru (Lh), *3: Thinadhoo (GDh) was cancelled.
Source: JICA Expert Team
Table 8.4.2 The Facilities and Equipment to Be Introduced Item Detail Remarks
Facility Antenna tower, transmission center building, etc. Equipment Digital transmission system, equipment for network
operation center, PSM equipment, etc.
Source: JICA Expert Team

Data Collection Survey on Building Climate Resilient Safer Cities Final Report
8-35
Sub-activity 3.1.2: Awareness Raising on Disaster Warning and Information Dissemination
For practical disaster information transmission, pilot evacuation drills with test transmission of EWBS will be organized in selected towns, with participation of municipalities and local residents so that they familiarize themselves with, as well as raise awareness of, the categories and contents of warning/information and appropriate responsive actions. Lesson learned from the pilot evacuation drills will be reviewed for further improvement of EWBS.
Activity 3.2: Establishment of Disaster Early Warning and Information Broadcasting System
Brief Explanation of Activity 3.2
In the Maldives, including Laamu Atoll, the information disparity especially the disparity of information on natural disasters should be corrected by improving the access to weather/disaster information through a digital terrestrial television broadcasting system. To achieve this, it is necessary to implement digital broadcasting that takes advantage of its features and is suited to the situation of the Maldives. Therefore, Sub-activity 3.2.1 will assist in the proper installation and operation of the emergency alert broadcasting system (EWBS), while Sub-activity 3.2.2 will assist in the promotion of the terrestrial digital broadcasting system, the proper operation and maintenance of the terrestrial digital broadcasting system, and the production of appropriate data broadcasting programs through the sub-set of activity financed by JICA as technical cooperation. These activities will be carried out by JICA's technical cooperation projects while keeping it in line with the progress of the grant aid project of Sub-activity 3.1.1.
Sub-activity 3.2.1: Examination of Operational System for Disaster Warning and Information Dissemination
In order to transmit the necessary information properly in the event of a disaster, it is necessary to develop the appropriate disaster alert information dissemination system and to operate it appropriately. For these to be achieved, the following activities will be implemented under Sub-activity 3.2.1:
Establishment of Early Warning Broadcasting System (EWBS)
The Early Warning Broadcasting System (EWBS) will be established. The EWBS is the most important characteristic of the Japanese-standard terrestrial digital broadcasting system or the Integrated Services Digital Broadcasting - Terrestrial (ISDB-T). Real-time warnings can be provided through the EWBS and can be received even for vessels under sea navigation which is expected to result to prompt and appropriate evacuation behavior. At the same time, the equipment such as digital signages, etc., will be procured for EWBS, as well as necessary equipment for production of appropriate data broadcasting programs.
Assistance in Operation of the Early Warning Broadcasting System (EWBS)
For the proper operation of the EWBS, the mechanism of the disaster broadcast should be clarified, and then the EWBS will be operated as a part of the disaster broadcast. The operation of EWBS will be carried out by PSM, Maldives Meteorological Service (MMS), and NDMC, whose roles are as follows:
PSM: Announce the alarm through the EWBS
MMS: Announce weather warnings/advisories and send the information to PSM
NDMC: Announce evacuation information/disaster information in response to an alarm

Data Collection Survey on Building Climate Resilient Safer Cities Final Report
8-36
In order to operate EWBS properly, a working group including the above three organizations, in which PSM is the group leader, will be established to support the operations. The technology transfer on the operation of EWBS will be conducted through on-the-job training (OJT) during actual operation and training, and through the preparation of various manuals. When issuing an alarm through EWBS, real-time wave information obtained from the wave observation system proposed in Component 4 of this FP will be utilized.
Sub-activity 3.2.2: Establishment of the Structure to Operate Disaster Warning and Information Dissemination through the Terrestrial Digital Broadcasting System
The terrestrial digital broadcasting technology is a completely new technology that will be introduced to the Maldives. As a first step to implement the terrestrial digital broadcasting system in the Maldives, a system for promoting and spreading terrestrial digital broadcasting system will be established. Technical transfer to improve the capacity to operate and maintain the equipment and facilities to the staff and engineers on broadcasting should be done in order to operate the equipment and facilities properly.
The assistance for the production of data broadcasting program in consideration of regional characteristics and the program-unlinked data broadcasting program, the creation of the program scheduling plan, and the preparation of program production manuals will be conducted.

Data Collection Survey on Building Climate Resilient Safer Cities Final Report
8-37
Study for the Contents of Component 4 Component 4: Development of Basic Data Collection and Sharing System Related
to Climate Change
In the Maldives, the detailed recognition and understanding of the impact of hydraulic external forces and SLR due to climate change, and the detailed picture, history and factors of the phenomena, such as coastal erosion and deteriorating reef environment, are not sufficient. One of the main causes of this is that the concerned stakeholders have not had the chance to understand each phenomenon based on data and have not discussed the countermeasures based on accurate information. In this sense, observation of the climate impact and the data of external force on wave and sea levels, which are the most relevant data to the coastal disaster risk increased by climate impact, regular examination of their impact to the coastal area, analysis of the climate impact based on the quantitative information and continuous study of the countermeasures against future climate impact, are expected for the GoM. This component fulfills the output of “a system for obtaining and sharing basic data related to climate change will be established and capacity development of the government officials to be responsible for operating the system will be supported by transferring technical skills”, and the outcome of “the government agencies to sufficiently and commonly share the understanding of actual situation and impact of climate change and thereby to implement most appropriate measures” by implementing the following two activities. This component will be implemented as a sub-set of activity financed by JICA. Sub-activity 4.1: Development of wave and sea level monitoring system Sub-activity 4.2: Development of beach, coral reef and land use monitoring system
Activity 4.1: Development of Wave and Sea Level Monitoring System
In Activity 4.1, a long-term wave and sea level monitoring system, which has not been developed in the Maldives until now, will be developed and necessary technical transfer will be provided in order to obtain the long-term external forces related to climate change. The details of the activities are shown below.
Sub-activity 4.1.1: Development of wave and sea level monitoring systems (three representative locations)
Assumed Observation Sites
Since each atoll and inhabited island in the Maldives is distributed over a range of approximately 820 km from north to south, the characteristics of waves and sea level that cause coastal disasters also differ greatly between the north and the south (see Chapter 2). For this reason, a long-term observation system at a fixed point for waves and water levels will be developed at three representative sites in the north, central, and south areas of the Project. The three representative sites are assumed in Hanimadhoo, Male, and Gan in Addu Atoll, where the Maldives Meteorological Service (MMS) has been executing the sea level observation and its management.
Assumed Wave Observation Equipment
The wave height and period, wave direction, wave spectrum (if required), sea level, water temperature, and so on are pointed out as required information on long-term wave observation. There are several options for wave observation equipment that have been commonly applied in the world. It is important to consider the reliability and durability of the observation system for long-term measurement as well as the reliability of obtained data for selecting the wave equipment. It is also important to consider the feasibility and simplicity of the operation and maintenance of the system because such observation

Data Collection Survey on Building Climate Resilient Safer Cities Final Report
8-38
system is a first in the Maldives and will be operated and maintained by the Maldivians themselves. There are two main data record systems in the wave observation system, namely, “real-time data transmission type” and “recorded type into the internal memory”. The former can obtain wave data from time to time using a data transmission system. The latter can obtain wave data from the memory mounted in the wave recorder and the recorded data can be obtained when the wave recorder is removed from the sea. Considering the expanded usage for the disaster warning and information dissemination proposed in Component 3, the real-time system is desirable.
Table 8.5.1 shows the comparison of different types of major wave observation systems. Particularly in recent years, the real-time wave observation system using a GPS sensor has been commonly used in Japan and other countries in accordance with the improvement of accuracy for GPS positioning and the development of data transmission technology via satellites. Recently, miniaturized GPS wave measurement equipment that can easily be installed and moored on site and the one with solar panels installed in order to avoid underwater work such as change of battery in the recorder have been proposed.
Based on the results of the comparison shown in Table 8.5.2, the wave observation system with the application of a small type of GPS wave measurement equipment is currently recommended for the Project. After Project implementation, a detailed examination such as test observation on site will be conducted to finalize the recommended wave observation system.
Assumed System for Wave Monitoring
Figure 8.5.1 shows the image of the entire system using the GPS wave measurement equipment on site including the data acquisition, transmission, and accumulation.
Source: JICA Expert Team
Figure 8.5.1 Image of Wave Observation System

Data Collection Survey on Building Climate Resilient Safer Cities Final Report
8-39
Utilization of Obtained Data
The accumulated data is expected to be utilized as shown below.
Understanding of long-term wave characteristics and seawater levels as climate hazards
Utilization for preparation of basic policy on climate change and for planning and design of adaptation measures for climate change, and other coastal projects based on the above
Utilization for post analysis of extreme events such as analysis of high swell waves, storm surges, flooding, and other coastal disasters
Understanding of wave characteristics in other areas in the Maldives by combining with reanalysis data (ERA5) which is open sourced data on the web
Utilization for wave prediction on early warning system by combining the data with numerical model for wave prediction
Sub-activity 4.1.2: Technical transfer on data processing, analysis and operation
Necessary technology transfer items related to the development of this system and assumed target organization are shown in Table 8.5.1.

Data Collection Survey on Building Climate Resilient Safer Cities Final Report
8-40
Table 8.5.1 Comparison of Wave Measurement Equipment No. 1 2 3 4
Type Sea bottom setting type (Ultrasonic/water pressure)
Wave rider buoy GPS type (Large buoy)
GPS type (Small buoy)
Principle for Measurement Ultrasonic type:Ultrasonic sensor directly measures the fluctuation of water level Water pressure type:Converts the pressure fluctuation measured by the water pressure sensor into the fluctuation of water level
Converts the acceleration measured by the acceleration sensor in the buoy into the fluctuation of water level
Calculate wave height by filtering the position of GPS attached to the buoy
Same as the left
Accuracy Degree High Medium Low High Reason for above Ultrasonic sensors have the highest
accuracy because they can measure waves directly. However, in case of high waves, data will be missed due to the inclusion of bubbles in the wave therefore it is often used with a water pressure sensor that is not affected by bubbles.
The accuracy is lower than that of sea bottom setting type because the acceleration is converted into wave height. Since it is small and the followability of wave is high, the accuracy is relatively high.
The accuracy is lower than others. First, when the position of GPS is converted into wave height, error occurs. Secondly, since it is large, the followability of wave is low.
The accuracy is higher than that of No. 3 (GPS type, large buoy), because the error that occurs when the position of GPS is converted into wave height is removed. Because it is small, the followability is high.

Data Collection Survey on Building Climate Resilient Safer Cities Final Report
8-41
No. 1 2 3 4 Simplicity of Work
Degree Low Medium Medium High Reason for above Dive work is required to install it
and replace internal memory and battery every few months.
Dive work is not required. Since it is small, a large mooring system is not required, and maintenance work is simple.
Dive work is not required. However, a large mooring system is required, and maintenance work requires much time and cost.
Dive work is not required. A large mooring system is not required. Furthermore, because the power source is a solar panel, battery replacement work is not required, and frequency of maintenance work is less than the other alternatives.
Battery Alkaline battery or lithium battery(storage battery) Solar battery (or storage battery)
Data Storage Format Built-in data on SD card Built-in data on SD card Data transmission in real time
Data transmission in real time
Cost
Measuring equipment
Medium (USD 30,000/unit)
Low (under USD 10,000/unit)
High(USD 100,000/unit )
Medium (USD 60,000/unit)
Mooring/installation system
Unnecessary (Sea bottom setting type)
Low (Small size)
High (Large size)
Low (Small size)
Data transfer system Basically none (Because the data is stored on SD card. However, it is possible to measure in real time by using a transmission buoy.)
Basically none (Because the data is stored on SD card.)
Medium (JPY 1 million/year for receiving PC and communication satellite usage)
Same as the left
Field work High (Diving work by diver)
Low (Use of small vessels)
High (Use of vessels for special work)
Low (Use of small vessels )
Total High Low High Low Limitation of Installation Site Since dive work is required for
installation/replacement work, the site is limited to shallow water areas (water depth is limited up to about 30 m where it is possible to do dive work.)
Basically, dive work is not required, so there is no limitation on the site selection and installation.
Same as the left Same as the left
Source: JICA Expert Team

Data Collection Survey on Building Climate Resilient Safer Cities Final Report
8-42
Table 8.5.2 Necessary Technology Transfer for Wave Observation System Work Necessary Technology Transfer Items Target Organization
Data Acquisition (Field work)
・GPS wave meter handling method ・Installation/mooring methods and contents of the field work ・Work related to data transmission
MMS, Land and Survey Authority, EPA
Data Analysis ・Calculation of wave statistics value ・Spectral analysis ・Comparison with open data (reanalysis data in ERA5)
MMS, EPA
Data Utilization ・Database compilation ・Networking for sharing ・Building a wave prediction model ・Building an early warning system
MMS, ME, EPA
Source: JICA Expert Team
Activity 4.2: Development of Beach, Coral Reef and Land Use Monitoring System
Beach, coral reef, and land use monitoring system will be developed in Activity 4.2. This component is divided into two types of monitoring systems, namely, long-term monitoring for coastline, coral reef, and land use for a wide area, and detailed monitoring for change in beach profile and coral reefs at a specific area. Details of each activity are shown below.
Sub-activity 4.2.1: Development of wide-area monitoring system applying satellite images and GIS system, and its capacity development
Outline of System
The monitoring system applying satellite images and GIS system will be developed in order to monitor the long-term change in coastline, coral reefs, and land use for a wide area. The overview of the assumed system is as follows, and the system image is shown in Figure 8.5.2.
Collecting the satellite images for inhabited islands every few years, and extracting the required information such as change in coastline, condition of coral reef and land development situation. The interval for collecting the satellite images is assumed every several years. The target islands for the monitoring will be decided based on the topographical characteristics, the importance and status of island on socioeconomic point of view, and the budget for purchasing satellite images.
Extracted information from the satellite image will be unified on a GIS system for common data format.
Accumulated data and information will be shared to the related organizations.
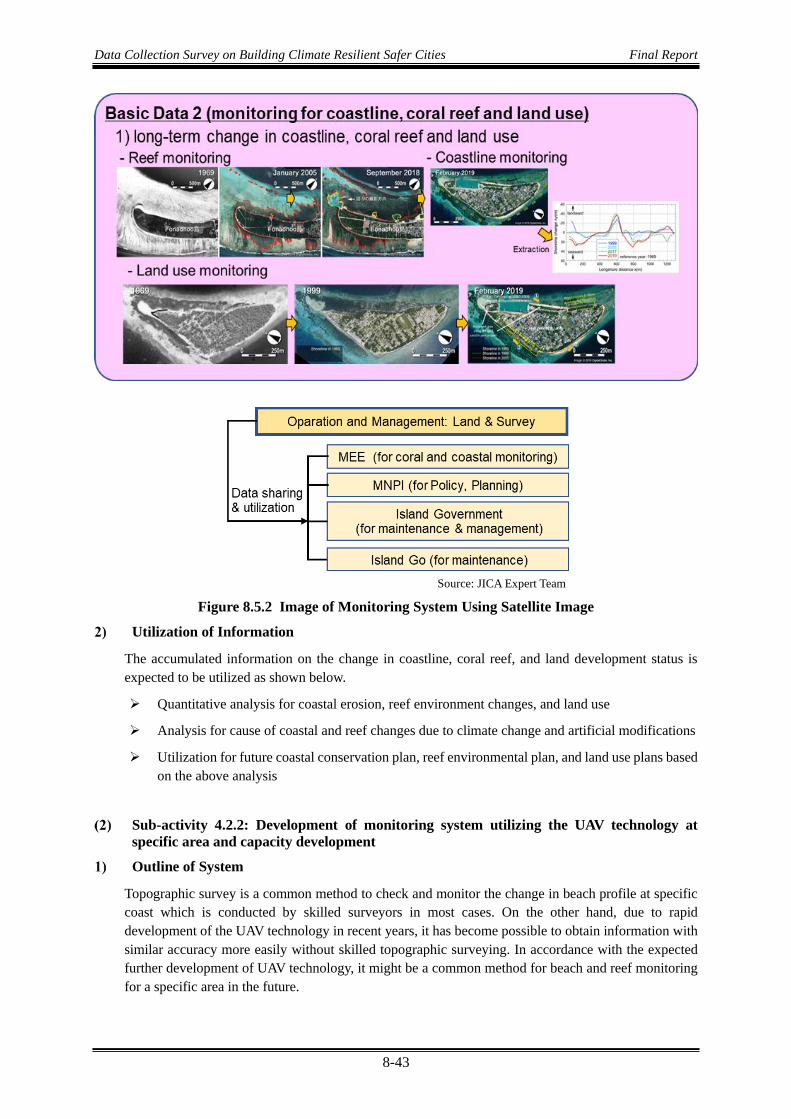
Data Collection Survey on Building Climate Resilient Safer Cities Final Report
8-43
Source: JICA Expert Team
Figure 8.5.2 Image of Monitoring System Using Satellite Image
Utilization of Information
The accumulated information on the change in coastline, coral reef, and land development status is expected to be utilized as shown below.
Quantitative analysis for coastal erosion, reef environment changes, and land use
Analysis for cause of coastal and reef changes due to climate change and artificial modifications
Utilization for future coastal conservation plan, reef environmental plan, and land use plans based on the above analysis
Sub-activity 4.2.2: Development of monitoring system utilizing the UAV technology at specific area and capacity development
Outline of System
Topographic survey is a common method to check and monitor the change in beach profile at specific coast which is conducted by skilled surveyors in most cases. On the other hand, due to rapid development of the UAV technology in recent years, it has become possible to obtain information with similar accuracy more easily without skilled topographic surveying. In accordance with the expected further development of UAV technology, it might be a common method for beach and reef monitoring for a specific area in the future.

Data Collection Survey on Building Climate Resilient Safer Cities Final Report
8-44
The system image is shown in Figure 8.5.3. The first step is to take aerial images of coasts and reefs using the UAV equipment (drone). The next step is to convert the obtained images to 3D point group data which has RGB values and position coordinates (X, Y, Z) at all points. Finally, the necessary information is extracted from the 3D point group data for each purpose.
Source: JICA Expert Team
Figure 8.5.3 Image of Monitoring System using UAV Technology
The necessary technology transfer items related to the introduction of this system and assumed target organization are shown in Table 8.5.3.
Table 8.5.3 Necessary Technology Transfer for Monitoring System using UAV Technology Work Necessary Technology Transfer Items Target Organization
Field work ・Making flight plan ・Drone operation ・Technology support related to site
work
Land and Survey
Analysis (Making a 3D model)
・How to utilize analysis software Land and Survey
Extraction of necessary information
・How to process the data for coastal and reef change monitoring
・How to evaluate the result ・How to store the data
Land and Survey ME MNPI
Source: JICA Expert Team
<References>
1) NOAA Coastal Services Center (2006): Coastal Ecosystem Restoration. http://www.csc.noaa.gov/coastal/management/management.htm.
Understanding the coordinate position
-0.50
0.00
0.50
1.00
1.50
2.00
0 5 10 15 20 25
標高(m)
距離(m)
3次元モデル横断測量
UAV Shooting
Example of flight route
Preparation for flight plan according to local condition ・Shooting altitude・Shooting block・Shooting time・Flight route
3D modeling with point group data
Flight plan Field work 3D modeling Extraction information
Elevation data of thecoast from 3Dmodeling and cross-sectional surveying
Line of cross-sectional surveying
Required equipment:・UAV(with RTK)・D-RTK2
(as a base station to improve position accuracy of UAV)
Required software:SfM(Structure fromMotion)ー Reconstruct 3D shape from some images with different viewpoints
Data sharing and utilization by ME, MNPI, etc.
Assumed responsible organization:Land & Survey

Data Collection Survey on Building Climate Resilient Safer Cities Final Report
9-1
BASIC POLICY AND DESIGN OF PROPOSED COASTAL ADAPTATION MEASURE
Coastal Adaptation Measure
Basic Policy Basic Policy for Coastal Adaptation
It was common to apply the hard structure measures such as revetment, reclamation, etc. as coastal protection measures in the Maldives. On the other hand, there are issues for hard structure measures as follows.
The islands in the Maldives were formed by coral sand and gravel which were supplied from coral reef by wave action. Hard structure measures are not to consider such mechanism for sand supply from coral reef and formation of islands.
Coastal erosion in the Maldives was mainly caused by decrease or disappearing of sand supply to the beach which has been continued in the balance of natural mechanism, by artificial construction and human activities. Even though hard structure measure is applied at the beach where coastal erosion continues, this measure is just “temporary protection”, not “permanent protection” with consideration of fundamental phenomena of coastal erosion that is “to improve the decrease of sand supply to the beach”. This means hard structure measures are not sustainable and permanent solution as measures for coastal erosion under the condition of climate change in long term with uncertainty.
The proposed sites for physical measures, Fonadhoo and Maamendhoo are faced on serious coastal erosion and flooding due to high wave. On the other hand, natural sandy beach still exists, and beach is utilized as recreation area of the residents. Construction of hard structure measures will induce the disturbance of such beach use forever. Once natural beach is lost by construction of hard structure measures, it is basically difficult to recover the lost natural sandy beach.
Based on above mentioned issues, the following points shall be considered for proposed coastal adaptation measure as basic policy.
Proposed adaptation measure shall consider not only to enhance the protection function, but also to maintain the relationship between people’s livelihood and beach (to maintain beach use)
In order to maintain the beach to next generation, proposed adaptation measure shall consider the natural mechanism on formation of coral beach, maintaining of supply of sand on coral reef and its natural protection function.
As future scenario for the impact of climate change has uncertainty, proposed adaptation measure is to have a flexibility for actual causing phenomena for climate change.
There is another approach as coastal protection measures, not to use the hard structure measures but to use “beach nourishment” as one of soft protection measures. Table 9.1.1 shows the comparison between revetment as structure measures and beach nourishment as soft measures.

Data Collection Survey on Building Climate Resilient Safer Cities Final Report
9-2
Resident area exists at the hinter area of the beach at proposed sites, Fonadhoo and Maamendhoo, and beach area is highly utilized as recreation area for local peoples. Considering such present condition on beach use, beach nourishment is basically proposed as coastal protection measures in the Project.
Table 9.1.1 Comparison between Revetment (as Hard Structure Measure) and Beach Nourishment (as Soft Measures)
Measures Revetment (Hard Structure Measures) Beach Nourishment (Soft Measures)
Protection Function
Hinter area will be protected as far as revetment is damaged
Hinter area will be protected as far as nourished beach is maintained
Relation for Forming of beach, natural protection function, supply of sand
No relation (Sand supply will be disturbed due to construction)
To enhance such natural mechanism and function
Beach Use Basically, difficult at every implemented coast Maintain same function on beach use Environment and Land Scape
Artificial view image Maintain natural view image and possibility to enhance habitat of marine biota
Adaptability for uncertain factor for climate change
Basically difficult (as far as to consider improvement of design for future risk such as increase of crown height, enhancement of stability, etc.)
Possible in nourishment area flexibly (as buffer zone)
Sustainability of function
Maintained as far as no damage of revetment. However, some improvement (or maintenance) will be required under progress of coastal erosion (30yrs are applied as life cycle for coastal hard structures)
Maintained as far as beach is well maintained. On the other hand, difficult in case of no maintenance)
Initial cost Construction cost in the Maldives is about 1,000~2,000 U$/m (ex.) 2~4 million U$ (for 2 km)
About 10~15 U$/m3 (excluded mobi- and demobi-cost for dredger) (ex.) 2km, 20m0.6~1 million U$ (for 2km, 20m wide) (Assuming 2.6 million U$ for mobi- and demobi-cost for dredger, total3.2~3.6 million U$)
Maintenance cost
Basically, it takes same cost after 30yrs If so, 33,000~66,000 U$/yr
Periodical maintenance is required. If assumed 20 % of initial sand volume in every 3yrs, maintenance cost is 21,000~64,000 U$/yr
Source: JICA Expert Team
Basic Policy for Target Beaches Proposed Adaptation Measures at Maamendhoo
Maamendhoo has the highest population density in the Laamu Atoll with about 900 residents in the small island area of 18.7 ha. Most of land area was occupied as resident area and there is no empty space in the island. The land elevation is quite low with MSL +0.6 ~ +0.8 m, and coastal erosion is one of serious issues in the Island (Figure 9.1.1). Flooding sometimes occurred during high wave and high tide conditions (Figure 9.1.2). As presented in Chapter 3, the impact on the loss of land by decrease of sandy beach due to coastal erosion becomes bigger for small island. The impact of sea level rise and progress of coastal erosion will cause further increase of coastal disaster and acceleration of land loss. Based on

Data Collection Survey on Building Climate Resilient Safer Cities Final Report
9-3
such conditions, the coastal adaptation measures are proposed to implement in this island. The basic policy for proposed measures is as follows.
The purpose to implement the coastal adaptation measures in this island is 1) To protect the land against flooding due to wave run-up during high tide and high waves, and to minimize land loss due to coastal erosion, 2) To secure the evacuation area during the extreme condition (hitting cyclone, Tsunami).
Based on the result of field investigation, the serious beach area for coastal erosion and flooding is the beach at west side with approximately 600 m and east side with 300 m. These two locations are proposed as implementation of physical measures. Sandy beach still exists at these two beaches, even though coastal erosion is in progress, and the beach area is utilized as recreation zone for the residents. Therefore, beach nourishment is proposed as coastal adaptation measures taking into account not only protection function but also beach use and coastal environment. To enhance the stability of sandy beach after the nourishment against wave action, groins are also planned to construct as supplementary coastal facilities.
It is also proposed to conduct the reclamation to secure the evacuation area against extreme events such as hitting of cyclone and Tsunami. However, it is proposed to minimize the space of reclamation as far as securing enough evacuation area in order to avoid the artificial of natural beach and coral reef. The reclamation area is proposed to set at the north side of existing port considering present land use condition at hinter area (not so utilized as resident area). Furthermore, the land elevation at this reclamation area is planned to increase in order to ensure safety and security as evacuation area.
(1) West Side (2) East Side
Source: JICA Expert Team
Figure 9.1.1 Beach Condition at Maamendhoo (March 2019)

Data Collection Survey on Building Climate Resilient Safer Cities Final Report
9-4
Proposed Adaptation Measures at Fonadhoo
Fonadhoo is the middle size of island in the Laamu Atoll with about 2,200 residents in the area of 163 ha. The main residential and commercial area are located at the hinterland of the Fonadhoo port located at central area of lagoon side. Undeveloped areas still exist except this central area. However, development as residential area is planned at these areas. Flooding has sometimes occurred at the ocean side of central residential area (shown in Figure 9.1.4) during high wave and high tide condition, and sand embankment was constructed by the island council. Even though the beach erosion is not so significant, the tendency of beach retreat has been identified (Figure 9.1.5). Coastal erosion and increase of wave height on coral reef due to climate change will increase the vulnerability for coastal disaster. From such condition, it is proposed to implement the coastal adaptation measures at the central area of ocean side with approximately 850 m. Basic policy for proposed measures are as follows.
The purpose for proposed measures is to ensure the safety and security at the residential area faced on the ocean side against coastal erosion and intrusion of high wave.
Sandy beach exists at the proposed area and the beach is utilized as recreation area for the residents (Figure 9.1.7). Therefore, beach nourishment is proposed as coastal adaptation measures taking into account not only protection function but also beach use and coastal
(1) Around Beach Area (2) Resident Area at hinterland
Source: Maamendhoo Island Council
Figure 9.1.2 Flooding Due to High Wave
Source: Processed by JICA based on World View in 2019 procured by JICA
Figure 9.1.3 Proposed Area for Adaptation Measures in Maamendhoo
Reclamation
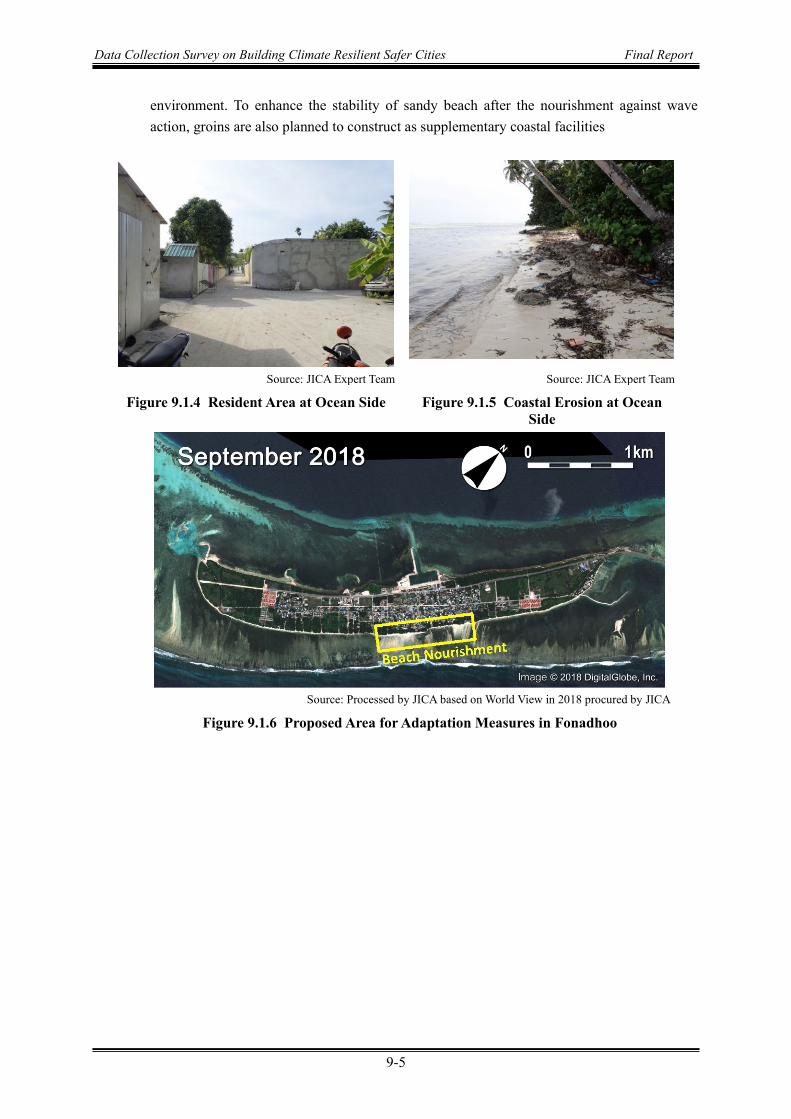
Data Collection Survey on Building Climate Resilient Safer Cities Final Report
9-5
environment. To enhance the stability of sandy beach after the nourishment against wave action, groins are also planned to construct as supplementary coastal facilities
Source: JICA Expert Team Source: JICA Expert Team
Figure 9.1.4 Resident Area at Ocean Side Figure 9.1.5 Coastal Erosion at Ocean Side
Source: Processed by JICA based on World View in 2018 procured by JICA
Figure 9.1.6 Proposed Area for Adaptation Measures in Fonadhoo

Data Collection Survey on Building Climate Resilient Safer Cities Final Report
9-6
Outline Design
Specifications of Proposed Adaptation Measure and its Concept
Adaptation measures in target beaches are shown in Table 9.2.1. The concept of specification of each facility are shown as follows.
Table 9.2.1 Adaptation Measures in Target Beaches Target islands Location Coastal adaptation measure
Maamendhoo East coast (300 m) Beach nourishment+Groin West coast (600 m) Beach nourishment+Groin North coast Reclamation+Perimeter revetment
Fonadhoo East coast (850 m) Beach nourishment+Groin Source: JICA Expert Team
Beach Nourishment
The backshore berm heights which is one of the main specifications are set to the same as the berm height of natural beaches obtained by the field surveys because the berm height of natural beaches is formed by the action of the wave and flow for long period.
It is known that the foreshore slope depends on the grain size of the sand which constitutes of the beach. The grain size of the sand for beach nourishment is set to the same size as near natural beaches. For these reasons, the foreshore slope is also set to the same as the one of natural beaches obtained by the field survey.
The berm width is set to about 20 m considering to the location of original coastline, the buffer zone for protection of backward, the beach usage for residents, etc. (refer to Section 5.2.4 Validation for Dimensions of Proposed Measures for its technical validity)
The cross section of the beach is changed by the wave action every time, and the beach sand may discharge significantly when the storm wave occurs. So, it is necessary that the periodic maintenances such as the additional nourishment should be carried out, and the sand stock for additional nourishment will be procured by this project.
Source: JICA Expert Team
Figure 9.1.7 Public Area Maintained by Resident

Data Collection Survey on Building Climate Resilient Safer Cities Final Report
9-7
The volume of the sand stock is set as the volume to maintain for 30 years considering to the basic service life for the civil structures. Though it is necessary to evaluate the volume and frequency of the additional nourishment quantitatively by the detailed prediction study of future trend of the coast line, the volume of the sand stock is set to almost the same as the volume of the initial beach nourishment in this study assuming that about 20 % of discharges occur in 5-6 years.
Groin
The structure type of the groin adopts the rubble mound groin which was constructed in the Maldives recently considering to the workability and scoring by reflected waves.
The interval of groins, which depends on the length of the groin, is set to 200-300 m considering to the landscape and usability in this study by reference to the similar coastal protection project.
Though the length of groin depends on the berm width, the interval of groins and stable coastline condition after nourishment, it is basically set to the length with a certain margin (about 10-20 m) from the coastline after nourishment.
The crown height is set to the berm height + 0.3 m in terms of protection of the discharging the beach sand.
The crown width is set to 2 m as the minimum length to ensure the stability of armored stones.
The crown slope is set to 1:3 as the gently slope enough to climb easily considering the usability.
Reclamation, Perimeter Revetment
The elevation of reclamation area is set to existing ground elevation + 1.0 m in terms of the evacuation area in storm wave and surge.
The area of reclamation area is set to about 2 ha (about 10 % of the area of Maamendhoo) considering to number of the residents of Maamendhoo (about 900 people), required evacuation facility space and percentage of total island area, etc.
The crown height of perimeter revetment is set to the same as the elevation of reclamation area. (refer to Section 5.2.4 Validation for Dimensions of Proposed Measures for its technical validity considering to runup height)
The structure type of perimeter revetment adopts the rubble mound for the same reasons of the groin. The cross section is trapezoidal considering to the reclamation works after constructing the revetment. The slope for the fore side is set to 1:3 for the same reasons of the groin, and for the back side is set to 1:1 considering to the stability of the rubble mound.
Layout Plan
The layout plans of the adaptation measures in Maamendhoo and Fonadhoo are shown in Figure 9.2.1. and Figure 9.2.2. However, the following layout plan is preliminary one because the layout of beach nourishment and groin should be finalized by the detailed future prediction study of stable beach after the project.

Data Collection Survey on Building Climate Resilient Safer Cities Final Report
9-8
Source: Processed by JICA based on Google Earth
Figure 9.2.1 Layout Plan in Maamendhoo
Source: Processed by JICA based on Google Earth
Figure 9.2.2 Layout Plan in Fonadhoo
Typical Cross Section Maamendhoo East Coast (300 m), West Coast (600 m)
The typical cross sections of the beach and groin at the East coast and West coast in Maamendhoo are shown as follows.

Data Collection Survey on Building Climate Resilient Safer Cities Final Report
9-9
Table 9.2.2 Cross Section View of Beach and Groin at Maamendhoo East Coast
Typical Cross
Section View of the
Beach
Typical Cross
Section View of the
Groin
Standard Profile of the Groin
Source: JICA Expert Team
Maamendhoo North Coast (2.2 ha)
The typical cross section of the perimeter revetment at the north coast in Maamendhoo is shown as follows.
Table 9.2.3 Cross Section View of Perimeter Revetment at Maamendhoo North Coast
Typical Cross Section View of the
Revetment
Source: JICA Expert Team

Data Collection Survey on Building Climate Resilient Safer Cities Final Report
9-10
Fonadhoo East Coast (850 m)
The typical cross sections of the beach and groin at the East coast in Fonadhoo are shown as follows.
Table 9.2.4 Cross Section View of Beach and Groin at Fonadhoo East Coast
Typical Cross
Section View of
the Beach
Typical Cross
Section View of the
Groin
Standard Profile of the Groin
Source: JICA Expert Team
Validation for Dimensions of Proposed Measures East Coast (L=300 m) and West Coast (L=600 m) of Maamendhoo
Validation of Beach Nourishment
A general design code is not sufficiently developed for beach nourishment while that for hard structures such as sea wall was well developed. Therefore, dimensions of beach nourishment were preliminary designed based on detailed observation of natural beach conditions of the region then were validated by the numerical analysis.
i) Estimation of Reductive Rate of Wave Overtopping by Beach Nourishment
The Bousinesque model aforementioned was applied for the wave propagation analysis to estimate the reductive rate of wave overtopping by implementation of beach nourishment. Figure 9.2.3 shows the calculation results of the rates with wave of 10 years return period. It was observed from the Figure that the wave overtopping rate can be reduced to 10 % if the beach nourishment width is 20 m.
→ The reductive rate of wave overtopping was set as 0.1 in case of beach nourishment width of 20m.

Data Collection Survey on Building Climate Resilient Safer Cities Final Report
9-11
Source: JICA Expert Team
Figure 9.2.3 Reductive Rate of Wave Overtopping by Beach Nourishment Width for H1:10
ii) Allowable Overtopping Rate
There are some reference values for allowable overtopping rate as shown in Table 9.2.5 and mostly are ranging between 0.01 and 0.05 (m3/s/m). In this study, the value of 0.02 (m3/s/m) was selected with consideration both of economic efficiency and safety side of design concept.
Table 9.2.5 Reference Values for Allowable Overtopping Rate Allowable overtopping
rate (m3/s/m) Target Source
0.01~0.05 Driving Limit Allsop et al. (2007)1) 0.01 Region where houses and important public facilities
are densely located, and severe damage is expected due to wave overtopping and inundation.
The Technical Standard for Shore Protection Facilities (Japanese, Aug. 2019) 0.02 The important region other than above
0.02~0.06 The region other than above Source: JICA Expert Team
iii) Calculation of Overtopping Rate
Dimensions of beach nourishment was evaluated with the following wave and tide conditions.
Wave height for validation:Hs=2.0 m (equivalent to H1:10)、Ts=10s
Tide level for validation: +0.64 m (H.W.L.)
Figure 9.2.4 shows the calculation results of overtopping rate for the beach nourishment (referred as BN in the Figure). Since the calculated rate satisfied the allowable overtopping rate, the effectiveness of beach width of 20 m was confirmed against the target wave.
0.00
0.10
0.20
0.30
0.40
0.50
0.60
0.70
0.80
0.90
1.00
0m 10m 20m 30mRedu
ctio
n ra
te o
f wav
e ov
erto
ppin
g
Beach Nourishment Width

Data Collection Survey on Building Climate Resilient Safer Cities Final Report
9-12
Source: JICA Expert Team
Figure 9.2.4 Expected Wave Overtopping for Without/ with the Beach Nourishment (Maamendhoo)
Crest Height of Perimeter Revetment
In this study, the perimeter revetment was planned to protect the reclamation area (i.e. evacuation area) at north tip of Maamendhoo. The crest height was evaluated using the Technical Standard aforementioned and a wave of 50 years return period was used considering the purpose of the measure. The evaluation details are shown as followings and the crest height required was calculated as M.S.L+1.8 m.
Wave height for validation:Hs=3.0 m(equivalent to H1:50)、Ts=10s
Tide level for validation:+0.64 m (H.W.L.)
0.0001
0.001
0.01
0.1
1
H1:1 H1:10 H1:50
Expected Wave Overtopping Rate (m3/s/m)
Without BN With BN
Allowable overtopping rate 0.02m3/s/m

Data Collection Survey on Building Climate Resilient Safer Cities Final Report
9-13
<Procedures> Offshore wave height H1:50=3.0 m Wave height on reef flat Ho’=1.64 m (Analyzed by Boussinesq model) Wave period To=10s Wave length Lo=1.56×T2=156 m Wave steepness Ho’/Lo=1.64/156=0.011≒0.012 Tide level H.W.L=M.S.L+0.64 m Setup due to wave breaking η=0.16m (Analyzed by Boussinesq model) Design water level: H.W.L+η=M.S.L+0.80 m Water depth in front of structure h=1.40 m (Survey result) From the figure with values above, h/Ho’=0.85 hc/Ho’=0.60 hc=1.00 m Therefore, Required crest height =M.S.L+1.8 m
Source: JICA Expert Team and Technical Standard for Share Protection Facilities (Japanese, P.2-66)2)
Figure 9.2.5 Calculation of Required Crest Height against H1:50 (Maamendhoo)
Fonadhoo (L=850 m)
The beach nourishment dimension at Fonadhoo was validated with the same procedure of that of Maamendhoo. Wave and tide conditions used for validation are listed below. Figure 9.2.6 shows the calculation results of the rates with wave of 10 years return period. It was confirmed from the Figure that the wave overtopping can be reduced to 10 % if the beach nourishment width is 20 m.
Wave for validation:Hs=4.0 m (H1:10)、Ts=16s
Tide level for validation:+0.64 m (H.W.L.)

Data Collection Survey on Building Climate Resilient Safer Cities Final Report
9-14
Source: JICA Expert Team
Figure 9.2.6 Expected Wave Overtopping for without/ with the Beach Nourishment (Fonadhoo)
Outline Construction Plan and Cost Estimates
Outline Construction Plan Construction Package
Regarding the procurement of contractors, it is assumed that the adaptation projects in Maamendhoo and Fonadhoo will be procured as a one package considering to the location of two islands which are in the same atoll, and the efficiency of transporting the construction equipment.
Construction Materials and Equipment
Rock
Many of the rock materials used for the coastal protection in the Maldives are procured from south India. So, it is assumed that the rock materials used for the groin and revetment in this project will be also procured from south India.
Sand
It is preferable that the sand materials for beach nourishment are the coral sand same as the sand constitutes of natural beach. In order to procure the coral sand without further coastal erosion, it is necessary to pick up the sand from the sea bed at a distance site from the coast. And it is preferable to pick up at calm sea in the terms of workability. For these reasons, it is assumed that the coral sand will be pick up from the sea bed (more than 20 m depth) at the point few km away from coast of lagoon side. In this case, trailer suction hopper dredger (TSHD) will be used for dredging and transport.
Dredger (TSHD)
It is necessary to procure the TSHD with enough pump capacity in order to pick up the coral sand efficiently. I n this project, it is assumed that the TSHD of which the pump capacity is 10,000 m3 is procured from India because it is difficult to procure the special vessel in the Maldives.
Other Heavy Equipment, Work Vessels
Other heavy equipment (excavators, dump trucks, etc.) and work vessels (barges, tug boats, etc.) will be procured from the Maldives.
0.0001
0.001
0.01
0.1
1
10
H1:1 H1:10 H1:50
Expected Wave Overtopping Rate (m3/s/m)
Without BN With BN
Allowable overtopping rate 0.02m3/s/m

Data Collection Survey on Building Climate Resilient Safer Cities Final Report
9-15
Outline of Each Works
General Preparatory Works
General preparatory works includes the mobilization and demobilization of construction equipment, the surveys such as environmental survey, topographic survey, construction of ancillary facilities such as site offices.
Groin Works
The rock materials from south India will be unloaded at the port near the site once. Then, they will be transported by the barge or dump truck to each construction site. The rock layers of the groin will constitute of 3 layers, core layer, under layer and armor layer. For each layer, the installation and leveling work will be carried out.
Beach Fill Works
The coral sand and gravel dredged in the lagoon will be transported to the site by the TSHD and discharged to the beach directly through the sand discharge pipe which will be constructed in advance, and connect to the TSHD. After discharge, the beach shape will be formed and leveled by the excavators.
Perimeter Revetment Works, Reclamation Works
Firstly, the perimeter revetment will be constructed around the reclamation area by the same way of groin works. Then, geotextile sheet will be overlaid in the revetment. Then, the sand will be discharged through the sand discharge pipe in the revetment by the same way of beach fill works. Finally, the leveling work by the bulldozers will be carried out at the area where the sand fill will be completed.
Outline Construction Schedule
The construction period is assumed for 2.5 years from 2024.4 to 2026.9. The construction schedule is shown in Table 9.3.1. Because the charter period of TSHD will be the shortest, the construction work of this project will be carried out in order of groin works and perimeter revetment works at Maamendhoo, groin works at Fonadhoo, beach fill and reclamation works at each island.

Data Collection Survey on Building Climate Resilient Safer Cities Final Report
9-16
Table 9.3.1 Construction Schedule
Source: JICA Expert Team
Outline Cost Estimate Preconditions
Exchange rate is shown as follows.
1 USD = 105.013 JPY 1 MVR = 6.90739 JPY (August 2020)
Construction cost described in this chapter is not included the physical contingency price escalation and VAT because they are described in Section 10.3 Consideration to Outline Project Cost. The base year is 2019.
Concept for Cost Estimate of Construction and Material
Charter Cost of the TSHD
The TSHD used for dredging the coral sand will be chartered from India, and the amortization and fuel cost from India to the Maldives are included in the cost of preparation works. The assumed specification and charter cost of TSHD is shown in Table 9.3.2 based on the interview to marine contractor in Europe which owns the TSHD.
1 2 3 4 5 6 7 8 9 10 11 12 1 2 3 4 5 6 7 8 9 10 11 12 1 2 3 4 5 6 7 8 9 10 11 12 1 2 3 4 5 6 7 8 9 10 11 12 1 2 3 4 5 6 7 8 9 10 11 12
1 1 1 1 1 1 1 1 1 1 1 1 1 1 1 1 1 1 1 1 1 1 1 1 1 1 1 1 1 1
1 1
1 1 1 1
1 1 1 1
1 1 1 1 1 1 1 1 1 1 1 1 1 1 1 1 1 1 1 1 1 1 1 1 1 1 1 1 1
1 1 1 1 1 1 1 1 1 1 1 1 1 1 1 1 1 1 1 1 1 1 1 1 1 1 1 1 1
1 1 1 1 1 1 1 1
1 1 1 1 1 1
1 1 1 1 1 1 1 1
1 1 1 1 1
1 1 1 1 1
1 1 1 1 1 1 1 1
1 1 1 1 1
1 1 1 1 1 1 1
1 1 1 1 1
1 1 1 1
1 1 1 1
1 1
1
1
1
1 1
1
1
1 1
1 1
1 1 1 1 1 1
1 1 1
1 1 1 1 1 1
1 1 1
1 1 1
1 1 1
1
1
1
1
30.01 1 1 1 1 1 1 1 1 1 1 1 1 1 1 1 1 1 1 1 1 1 1 1 1 1 1 1 1 1
203
0.0
301 Excavation works for perimeter revetment 5.0
3A
204 Installation and leveling of armor layer
0.0
PK1 (Maamendhoo, Fonadhoo)0 9 12 9 0
6B Other Work 1.0
303 Installation and leveling of under layer for perimeter revetment 5.0
304 Installation and leveling of armor layer for perimeter revetment 4.0
502 Leveling 2.0
501B Supply, transport and filling of sand (including sand stock) 1.0
305 Supply and installation of geotextile sheet 4.0
5A Reclamation Works ( 2.2 ha, +1m up from Existing Land) 2.0
0.0
0.0
203
Perimeter Revetment Works (L= 540 m) 8.0
302 Supply of rock material for perimeter revetment 7.0
0.0
402 Supply, transport and filling to sand stock pile 1.0
3.0
0.0
(Site A) Maamendhoo 0.0
4A Beach Fill Works (L=600 m (west) + 300m (east)) 2.0
401A Arrangement of Discharge Pipe 1.0
6A Other Work 2.0
202 Supply of rock material 6.0
2B
2A Groin Works (L=70 m, 4 units (west) + L=70 m, 3 units (east)) 8.0
201
Groin Works (L=70 m, 5 units) 6.0
201 Excavation works 3.0
402 Supply, transport and filling to sand stock pile 1.0
0.0
4B Beach Fill Works (L=850 m) 3.0
401B Supply, transport, filling and forming of beach 1.0
401A Arrangement of Discharge Pipe 1.0
Installation and leveling of under layer 3.0
204 Installation and leveling of armor layer
0.0
(Site B) Fonadhoo 0.0
105 Preparation of report, drawings, photo, video and others 29.0
401B Supply, transport, filling and forming of beach 1.0
501A Arrangement of Discharge Pipe 1.0
Installation and leveling of under layer 5.0
5.0
0.0
Excavation works 6.0
202 Supply of rock material 8.0
103 Common Temporary Works 4.0
104 Survey and monitoring works before, during and after construction 29.0
101 Mobilization and demobilization (for TSHD) 2.0
102 Mobilization and demobilization 4.0
1 General Preparatory Works 30.0
2026Work Item 2023 2024 2025 Month2027
Defect Liability Period

Data Collection Survey on Building Climate Resilient Safer Cities Final Report
9-17
Table 9.3.2 Assumed Specification and Charter Cost of TSHD Item Qty Remarks
Dredging capacity of TSHD 10,000 m3/hour Maximum depth for dredging by TSHD 35 m Trailing distance to the Maldives 1,900 km From India Trailing period (return trip) 10.2 days Vessel speed :10 knot Fuel cost (return trip) 800,000 USD Amortization (including work boat, labor cost) 1,260,000 USD/week by interview survey for Van Oord Total (amortization + fuel cost, return trip) 2,992,000 USD
Source: JICA Expert Team
Material Cost of Rock (Import)
Material cost of rock used for the groin and revetment is shown in Table 9.3.3 in reference to the quoted prices by major import company in the Maldives. This quoted price includes the transportation cost from India to the port near the construction site.
Table 9.3.3 Unit Price of Rock Item Unit Rate Remarks
Rock (unload at Laamu atoll) 116 USD/m3 Estimated by the import company’s quotation Source: JICA Expert Team
Construction Cost of Beach Fill Works
Construction cost of beach fill works constitutes of 2 items, 1) Dredge, transport and fill the sand by the TSHD, and 2) Forming the cross section of the beach. For 1), the cost can be estimated by the cycle time of a series of works, charter cost of the TSHD and construction cost of sand discharge pipe.
In this study, the construction cost of beach fill works per m3 is estimated in reference to the beach nourishment project in other countries and the reclamation works by dredging sand from the inside of the lagoon in the Maldives. The dredged sand mixes the sea water in slurry when transporting and filling through the sand discharge pipe. So, the loss factor of the sand generated during the construction (set as 20 %) is considered in this cost.
The construction cost of beach fill works per m3 is shown in Table 9.3.4. And the extra rate for the sand volume is set to 20 % for beach nourishment works and 10 % for sand stockpile considering to the loss by the wave action and the consolidation during the construction.
Table 9.3.4 Construction Cost of Beach Fill Works per m3 Item Unit rate Remarks
Beach fill works (for Beach nourishment)
13 USD/m3 Cycle time of TSHD:5.1 hours Dredging volume per time :6,000 m3
Beach fill works (for Sand stock pile) 10 USD/m3 Source: JICA Expert Team
Construction Cost of Groin and Revetment Works
The construction cost of groin and revetment works constitutes of 3 items, 1) Excavating works, 2) Procurement of the rock, and 3) Installation and leveling (in case of revetment works, 4) Overlaying the geotextile sheets). For 3), because the construction methods and working times of the installation and leveling of the armor layer is different from others, the cost is estimated 2 types for under, core layer and for armor layer in reference to the coastal protection project in the Maldives and other countries. And the extra rate for the rock volume is set to 5 %.
Table 9.3.5 Construction Cost of Groin and Revetment Works Item Unit rate Remarks
Installation, leveling (under, core layer)
51 USD/m3 reference to the coastal protection project in other countries
Installation, leveling (armor layer) 72 USD/m3 Source: JICA Expert Team

Data Collection Survey on Building Climate Resilient Safer Cities Final Report
9-18
Construction Cost of Other Works
Construction cost of other works is estimated as 10 % of the total cost of construction cost.
Total Construction Cost
Outline construction cost is shown in Table 9.3.6. The total construction cost of adaptation measures in Laamu atoll is 19.2 million USD.
Table 9.3.6 Outline Construction Cost
Source: JICA Expert Team
<References> 1) Allsop, A., Bruce, T., Pullen, T., Van der Meer, J. (2008): Direct hazards from wave overtopping –
the forgotton aspect of coastal risk assessment 2) Coastal Development Institute of Technology (2018): Technical Standard for Shore Protection
Facilities, pp.2-66 (Japanese)
PKG1(Maamendhoo, Fonadhoo)
Foreign Local Foreign LocalUSD MVR USD MVR USD
Area A Maamendhoo
1A General Preparatory Works ls 1 3,683,400 0 3,683,400 0 3,683,400
2A Groin Works (L=70 m, 4 units(west) +L=70 m, 3 units(east)) ls 1 2,301,329 0 2,301,329 0 2,301,329
3A Perimeter Revetment Works (L = 540 m) ls 1 2,019,515 0 2,019,515 0 2,019,515
4A Beach Fill Works (L=600 m (west) + 300m (east)) ls 1 901,440 0 901,440 0 901,440
5A Reclamation Work (2.2ha, +1m up fromExisting land) ls 1 1,344,000 0 1,344,000 0 1,344,000
6A Other Works ls 1 1,138,800 0 1,138,800 0 1,138,800
Area B Fonadhoo
1B General Preparatory Works ls 1 2,904,000 0 2,904,000 0 2,904,000
2B Groin Works (L=70 m, 5 units) ls 1 1,766,005 0 1,766,005 0 1,766,005
4B Beach Fill Works (L=850 m) ls 1 905,184 0 905,184 0 905,184
6B Other Work ls 1 619,200 0 619,200 0 619,200
Area C Meedhoo
1B Preparation of report, drawings, photo,video and others ls 1 564,960 0 564,960 0 564,960
2B Beach Fill Work ls 1 1,046,400 0 1,046,400 0 1,046,400
USD JPY
Grand Total 19,194,233 2,015,643,969
*Exclude VAT
No. item unit QuantityUnit Price Cost
Total
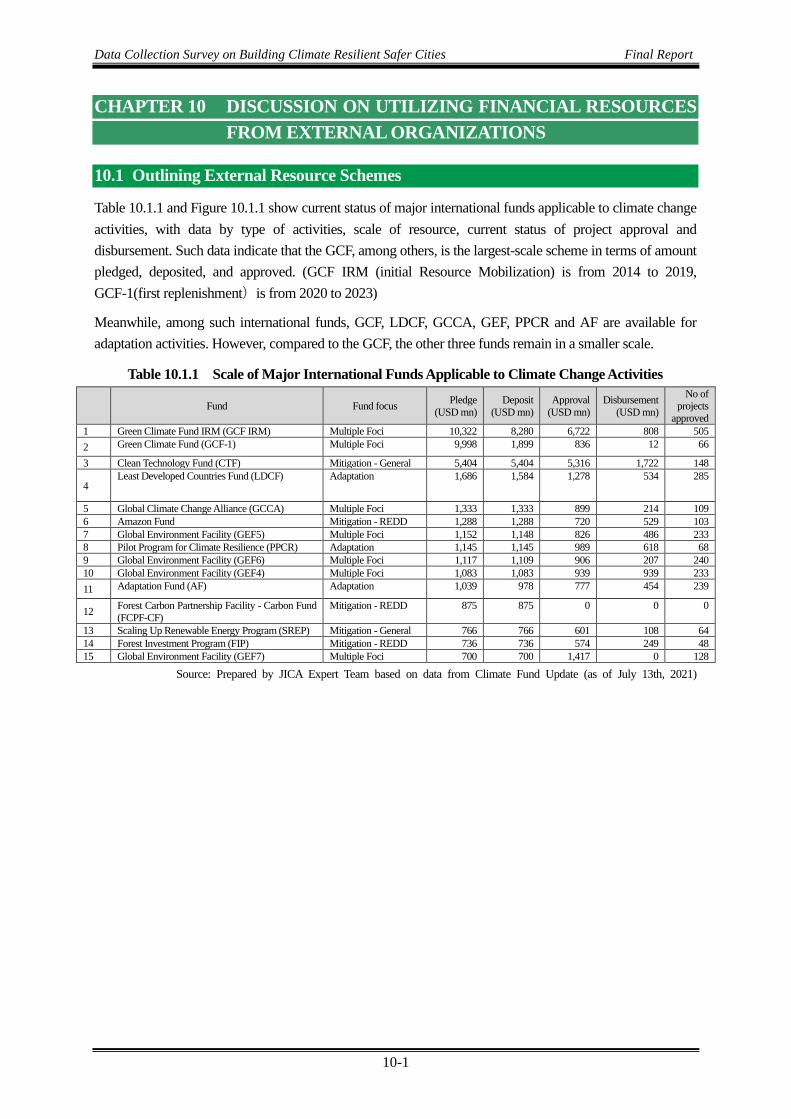
Data Collection Survey on Building Climate Resilient Safer Cities Final Report
10-1
CHAPTER 10 DISCUSSION ON UTILIZING FINANCIAL RESOURCES FROM EXTERNAL ORGANIZATIONS
10.1 Outlining External Resource Schemes
Table 10.1.1 and Figure 10.1.1 show current status of major international funds applicable to climate change activities, with data by type of activities, scale of resource, current status of project approval and disbursement. Such data indicate that the GCF, among others, is the largest-scale scheme in terms of amount pledged, deposited, and approved. (GCF IRM (initial Resource Mobilization) is from 2014 to 2019, GCF-1(first replenishment)is from 2020 to 2023)
Meanwhile, among such international funds, GCF, LDCF, GCCA, GEF, PPCR and AF are available for adaptation activities. However, compared to the GCF, the other three funds remain in a smaller scale.
Table 10.1.1 Scale of Major International Funds Applicable to Climate Change Activities
Fund Fund focus Pledge (USD mn)
Deposit (USD mn)
Approval (USD mn)
Disbursement (USD mn)
No of projects
approved 1 Green Climate Fund IRM (GCF IRM) Multiple Foci 10,322 8,280 6,722 808 505 2 Green Climate Fund (GCF-1) Multiple Foci 9,998 1,899 836 12 66
3 Clean Technology Fund (CTF) Mitigation - General 5,404 5,404 5,316 1,722 148
4 Least Developed Countries Fund (LDCF) Adaptation 1,686 1,584 1,278 534 285
5 Global Climate Change Alliance (GCCA) Multiple Foci 1,333 1,333 899 214 109 6 Amazon Fund Mitigation - REDD 1,288 1,288 720 529 103 7 Global Environment Facility (GEF5) Multiple Foci 1,152 1,148 826 486 233 8 Pilot Program for Climate Resilience (PPCR) Adaptation 1,145 1,145 989 618 68 9 Global Environment Facility (GEF6) Multiple Foci 1,117 1,109 906 207 240 10 Global Environment Facility (GEF4) Multiple Foci 1,083 1,083 939 939 233 11 Adaptation Fund (AF) Adaptation 1,039 978 777 454 239
12 Forest Carbon Partnership Facility - Carbon Fund (FCPF-CF)
Mitigation - REDD 875 875 0 0 0
13 Scaling Up Renewable Energy Program (SREP) Mitigation - General 766 766 601 108 64 14 Forest Investment Program (FIP) Mitigation - REDD 736 736 574 249 48 15 Global Environment Facility (GEF7) Multiple Foci 700 700 1,417 0 128
Source: Prepared by JICA Expert Team based on data from Climate Fund Update (as of July 13th, 2021)

Data Collection Survey on Building Climate Resilient Safer Cities Final Report
10-2
Source: Prepared by JICA Expert Team based on data from Climate Fund Update (as of July 13th, 2021)
Figure 10.1.1 Scale of Major International Funds Applicable to Climate Change Activities 10.2 Analyzing External Resource Schemes (Focusing on the GCF)
As a first step for creating a funding proposal to the GCF, we conducted some preparatory works by referring to existing GCF projects to sort out relevant information, such as requirements for project formulation, investment criteria, funding proposals of similar project activities, etc.
For creating a funding proposal, it would be worth to understand GCF’s criteria for project approval, and therefore we conducted a research to outline such criteria as shown in Table 10.2.1.
Table 10.2.1 GCF’s Criteria for Project Approval Criterion Definition Coverage area Activity-specific sub-criteria
Impact potential
Potential of the programme / project to contribute to the achievement of the Fund’s objectives and result areas
Mitigation impact Contribution to the shift to low- emission sustainable development pathways
Adaptation impact Contribution to increased climate resilient sustainable development
Paradigm shift potential
Degree to which the proposed activity can catalyse impact beyond a one-off project or programme investment
Potential for scaling up and replication, and its overall contribution to global low – carbon development pathways being consistent with a temperature increase of less than 2 degrees Celsius (mitigation only)
Innovation Level of contributions to global low-carbon development pathways, consistent with a temperature increase of less than 2 degrees Celsius Potential for expanding the scale and impact of the proposed programme or project (scalability)

Data Collection Survey on Building Climate Resilient Safer Cities Final Report
10-3
Criterion Definition Coverage area Activity-specific sub-criteria Potential for exporting key structural elements of the proposed programme or project elsewhere within the same sector as well as to other sectors, regions or countries (replicability)
Potential for knowledge and learning
Contribution to the creation or strengthening of knowledge, collective learning processes, or institutions
Contribution to the creation of an ,enabling environment
Sustainability of outcomes and results beyond completion of the intervention Market development and transformation
Contribution to the regulatory frameworks and policies
Potential for strengthened regulatory framework and policies to drive investment in low-emission technologies and activities, promote development of additional low-emission policies, and/ or improve climate-responsive planning and development
Overall contribution climate-resilient development pathways consistent with a country's climate change adaptation strategies and plans ( adaptation only)
Potential for expanding the proposal's impact without equally increasing its cost base (scalability) Potential for exporting key structural elements of the proposal to other sectors, regions or countries (replicability)
Sustainable development potential
Wider benefits and priorities
Environmental co- benefits Expected positive environmental impacts, including in other result areas of the Fund, and / or in line with the priorities set at the national, local or sectoral level, as appropriate
Social co- benefits Expected positive social and health impacts, including in other result areas of the Fund, and /or in line with the priorities set at the national, local or sectorial level, as appropriate
Economic co- benefits Expected positive economic impacts, including in other result areas of the Fund, and /or in line with the priorities set at the national, local or sectorial level, as appropriate
Gender- sensitive development impact
Potential for reduced gender inequalities in climate change impacts and / or equal participation by gender groups in contributing to expected outcomes
Needs of the recipient
Vulnerability and financing needs of the beneficiary country and population
Vulnerability of the country (adaptation only)
Scale and intensity of exposure of people, and / or social or economic assets or capital, to risks derived from climate change
Vulnerable groups and gender aspects (adaptation only)
Comparably high vulnerability of the beneficiary groups
Economic and social development level of the country and the affected population
Level of social and economic development of the country and target population
Absence of alternative sources of financing
Opportunities for the Fund to overcome specific barriers to financing
Need for strengthening institutions and implementation capacity
Opportunities to strengthen institutional and implementation capacity in relevant institutions in the context of proposal

Data Collection Survey on Building Climate Resilient Safer Cities Final Report
10-4
Criterion Definition Coverage area Activity-specific sub-criteria Country ownership
Beneficiary country ownership of, and capacity to implement, a funded project or programme (policies, climate strategies and institutions)
Existence of a national climate strategy
Objectives are in line with priorities in the country’s national climate strategy Proposed activity is designed in cognizance of other country policies
Coherence with Existing policies
Capacity of accredited entities or executing entities to deliver
Experience and track record of the Accredited Entity or executing entities in key elements of the proposed activity
Engagement with civil society organizations and other relevant stakeholders
Stakeholder consultations and engagement
Efficiency and effectiveness
Economic and, if appropriate, financial soundness of the programme / project
Cost-effectiveness and efficiency regarding financial and non-financial aspects
Financial adequacy and appropriateness of concessionality Cost-effectiveness (mitigation only)
Amount of co- financing Protentional to catalyse and / or leverage investment (mitigation only)
Programme / project financial viability and other financial indicators
Expected economic and financial internal rate of return Financial viability in the long run
Industry best practices Application of best practices and degree of innovation
Source: GCF
“E. Logical Framework” and “F. Risk Assessment and Management” in the template are the sections not required at the concept note stage but required for creating a funding proposal. We looked into two funding proposals of projects with similar activities to ours: one is in Marshall Islands (FP66) and the other in Egypt (FP53), for studying what are described in the sections E and F.
First of all, we conducted a study on “Logical Framework” in each Funding Proposal and sorted out descriptions as shown in Table 10.2.2.
Table 10.2.2 Descriptions on “Logical Framework” in Funding Proposals of the Similar Projects
FP066: Pacific Resilience Project Phase II for RMI(World Bank)
FP053: Enhancing Climate Change Adaptation in the North Coast and Nile
Delta Regions in Egypt (UNDP)
Fund-level impact ・ Reduced expected annual damage due to coastal protection works Means of Verification (MoV): Coastal
risk assessment Modeling End target: 700,000USD/year
・ Length of coast with reduced vulnerability to flooding and storm surges Means of Verification (MoV): Project
reports End target: 1,500m
・ Number of people with reduced risks to coastal hazards and the effects of climate change Means of Verification (MoV): Annual
survey End target: 10,000
・ Number of new infrastructure constructed to withstand condition from climate variability and change Means of Verification (MoV): Annual
progress report; mid-term review; terminal evaluation
Mid-term target: 15-20km Final target: 69km
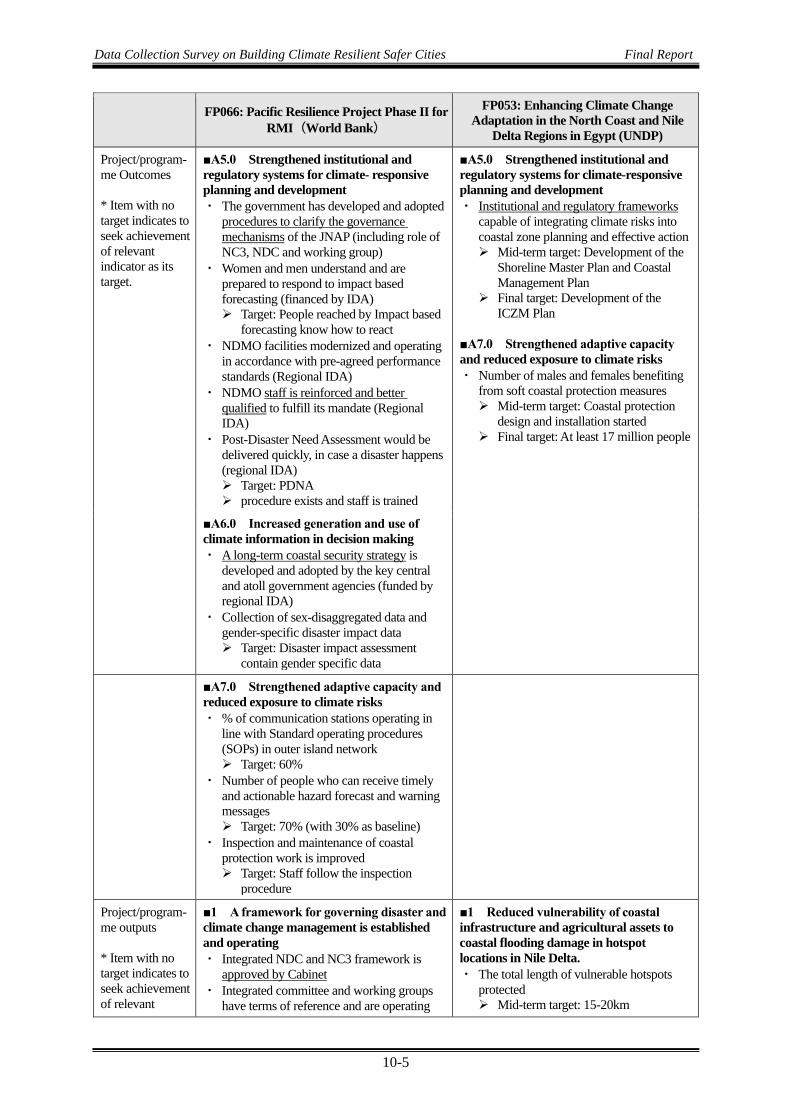
Data Collection Survey on Building Climate Resilient Safer Cities Final Report
10-5
FP066: Pacific Resilience Project Phase II for RMI(World Bank)
FP053: Enhancing Climate Change Adaptation in the North Coast and Nile
Delta Regions in Egypt (UNDP)
Project/program-me Outcomes * Item with no target indicates to seek achievement of relevant indicator as its target.
■A5.0 Strengthened institutional and regulatory systems for climate- responsive planning and development ・ The government has developed and adopted
procedures to clarify the governance mechanisms of the JNAP (including role of NC3, NDC and working group)
・ Women and men understand and are prepared to respond to impact based forecasting (financed by IDA) Target: People reached by Impact based
forecasting know how to react ・ NDMO facilities modernized and operating
in accordance with pre-agreed performance standards (Regional IDA)
・ NDMO staff is reinforced and better qualified to fulfill its mandate (Regional IDA)
・ Post-Disaster Need Assessment would be delivered quickly, in case a disaster happens (regional IDA) Target: PDNA procedure exists and staff is trained
■A5.0 Strengthened institutional and regulatory systems for climate-responsive planning and development ・ Institutional and regulatory frameworks
capable of integrating climate risks into coastal zone planning and effective action Mid-term target: Development of the
Shoreline Master Plan and Coastal Management Plan
Final target: Development of the ICZM Plan
■A7.0 Strengthened adaptive capacity and reduced exposure to climate risks ・ Number of males and females benefiting
from soft coastal protection measures Mid-term target: Coastal protection
design and installation started Final target: At least 17 million people
■A6.0 Increased generation and use of climate information in decision making ・ A long-term coastal security strategy is
developed and adopted by the key central and atoll government agencies (funded by regional IDA)
・ Collection of sex-disaggregated data and gender-specific disaster impact data Target: Disaster impact assessment
contain gender specific data
■A7.0 Strengthened adaptive capacity and reduced exposure to climate risks ・ % of communication stations operating in
line with Standard operating procedures (SOPs) in outer island network Target: 60%
・ Number of people who can receive timely and actionable hazard forecast and warning messages Target: 70% (with 30% as baseline)
・ Inspection and maintenance of coastal protection work is improved Target: Staff follow the inspection
procedure
Project/program-me outputs * Item with no target indicates to seek achievement of relevant
■1 A framework for governing disaster and climate change management is established and operating ・ Integrated NDC and NC3 framework is
approved by Cabinet ・ Integrated committee and working groups
have terms of reference and are operating
■1 Reduced vulnerability of coastal infrastructure and agricultural assets to coastal flooding damage in hotspot locations in Nile Delta. ・ The total length of vulnerable hotspots
protected Mid-term target: 15-20km

Data Collection Survey on Building Climate Resilient Safer Cities Final Report
10-6
FP066: Pacific Resilience Project Phase II for RMI(World Bank)
FP053: Enhancing Climate Change Adaptation in the North Coast and Nile
Delta Regions in Egypt (UNDP)
indicator as its target.
・ Annual government activities are overseen by the committee and working groups under the framework
■2 Increased coverage of forecast and warning messages to Outer Island populations at risk ・ Communications roadmap is prepared and
adopted ・ Communications equipment is procured and
operating, with maintenance arrangements in place, and users are trained
・ User communities receive timely early warning messages and advice
■3 Sources of aggregates are identified (financed by IDA) ・ Sustainable sources of aggregate, and
methods of extraction, are identified and quantified in Kwajalein and Majuro atolls Target: Potential sources are studied and
sustainability is assessed ■4 Project management and governance is effective ・ The National Steering Committee (NSC)
meetings and provides effective oversight and governance.
・ Target: 1 per year
Final target: 69km ■2 Development and implementation of an integrated coastal zone management plan (ICZM) for the entire North Coast of Egypt ・ Assessment of the capacity needs of
institutions and individuals (women and men) for ICZM planning Mid-term target: Assessment under
development Final target: At least 1 Capacity Needs
Assessment Report indicating the capacity needs of women and men
・ Number of technical officers (men and women) trained on modeling and other skills associated with ICZM Mid-term target: At least 50 technical
government staff exposed to hands-on trainings on the three areas
Final target: At least 20 technical government staff exposed to hands-on trainings
・ Setup of monitoring equipment for national observation system Mid-term target: All monitoring
equipment procured Final target: System is operational
・ GoE has adopted ICZM Plan Mid-term target: Development of the
ICZM Plan Final target: Adoption of the ICZM
・ Initiate implementation of the coastal protection measures generated from the ICZM plan Mid-term target: NA Final target: Implementatio n initiated
Source: Prepared by JICA Expert Team based on the Funding Proposals
In “Fund level impact” as the top item of the section E, project entities are required to provide explanation in line with the Fund-level impact indicator corresponding to Expected Results as provided by the GCF. Table 10.2.3 shows indicators for adaptation activities.
Table 10.2.3 Expected Results and Fund-Level Impact Indicators provided by the GCF Expected Results
(Adaptation) Fund-level impact indicator
A1: Most vulnerable people, communities and regions
・ A1.1 Change in expected losses of lives and economic assets (US$) due to the impact of extreme climate-related disasters
・ A1.2 Number of males and females benefiting from the adoption of diversified, climate resilient livelihood options (including fisheries, agriculture, tourism, etc.)
・ A1.3 Number of Fund funded projects/programmes that supports effective adaptation to fish stock migration and depletion to climate change

Data Collection Survey on Building Climate Resilient Safer Cities Final Report
10-7
Expected Results (Adaptation) Fund-level impact indicator
A2: Health and well-being, and food and water security
・ A2.1 Number of males and females benefiting from introduced health measures to respond to climate-sensitive diseases due to the impact of extreme climate-related disasters
・ A2.2 Number of food secure households (in areas/periods at risk of climate change impacts)
・ A2.3 Number of males and females with year-round access to reliable and safe water supply despite climate shocks and stresses
A3: Infrastructure and built environment
・ A3.1 Number of physical assets made more resilient to climate variability and change, considering human benefits
A4: Ecosystem and ecosystem services
・ A4.1 Coverage/scale of ecosystems protected and strengthened in response to climate variability and change
・ A4.2 Value (US$) of ecosystem services generated or protected in response to climate change
Source: Prepared by JICA Expert Team based on GCF documents.
Among indicators, FP66 gives explanation on A1.1, A1.2 and A3.1, while FP53 does A3.1 only. Considering such examples observed in these projects, it would be preferable for the project in Maldives to adopt at least A3.1, and then to add A1.1 and A1.2 if possible, in explaining the fund-level impact.
In “Fund level outcome” as the second item of the section E, project entities are required to provide explanation in line with the Fund-level impact indicator corresponding to Expected Outcome as provided by the GCF. Table 10.2.4 shows indicators for adaptation activities.
Table 10.2.4 Expected Outcome and Fund-Level Outcome Indicators provided by the GCF Expected Outcome
(Adaptation) Fund-level outcome indicator
A5.0 Strengthened institutional and regulatory systems for climate-responsive planning and development
・ A5.1 Institutional and regulatory systems that improve incentives for climate resilience and their effective implementation
・ A5.2 Number and level of effective coordination mechanisms A6.0 Increased generation and use of climate information in decision-making
・ A6.1 Use of climate information products/services in decision-making in climate sensitive sectors
A7.0 Strengthened adaptive capacity and reduced exposure to climate risks
・ A7.1 Use by vulnerable households, communities, businesses and public-sector services of Fund-supported tools instruments, strategies and activities to respond to climate change and variability
・ A7.2 Number of males and females reached by [or total geographic coverage of] climate-related early warning systems and other risk reduction measures established/strengthened
A8.0 Strengthened awareness of climate threats and risk-reduction processes
・ A8.1 Number of males and females made aware of climate threats and related appropriate responses
Source: Prepared by JICA Expert Team based on GCF documents.
It should be noted that contents of this section are not symmetrical between the similar projects and this project due to version updates of the Funding Proposal template, and therefore the numbering of the predecessors cannot be used in this project without adjustment. Nevertheless, taking into consideration project similarity, we assume that indicators of A5.2, A6.1, A7.1, A7.2 and A8.1 would be suitable to this project.

Data Collection Survey on Building Climate Resilient Safer Cities Final Report
10-8
The third indicator is supposed to be developed for each project. We conducted indicator setting based on actual components of the project, while referring to those in the similar projects.
As the next step, for a study on “F. Risk Assessment and Management,” we looked into each Funding Proposal and sorted out descriptions, as outlined in Table 10.2.5, Table 10.2.6 and Table 10.2.7, along with risk implication for this project in Maldives. In the section F, project entities are required to describe various risks that may hinder target achievement of the project/program, as well as countermeasures for lowering such risks.
Table 10.2.5 Descriptions on “Risk Assessment and Management” in the FP160
No. Risk factor Risk mitigation measure Risk implication for
this project in Maldives
1 Inadequate engagement with local-level stakeholders and project partners. This may occur as a result of insufficient coordination between implementing agencies during project implementation and/or limited integration of local knowledge into project activities.
・ The project design has involved extensive engagement with local stakeholders to ensure support for project activities.
・ Extensive engagements with project partners, other agencies operating in the area and stakeholders will continue during project implementation.
・ Project implementation activities will build on and/or draw from existing local committees, groups, systems and procedures to ensure local stakeholder participation.
These risks may be posed by inadequate coordination among implementing agencies or limited integration of local knowledge into project activities.
2 Inadequate incorporation of gender sensitivity as well as social safeguards considerations and livelihoods into the implementation of the project activities. The management structures and systems may have adverse impacts on gender equality and may reproduce discrimination based on gender.
・ A Gender Assessment and Action Plan (Annex 8) has been developed and will be implemented to ensure that gender equality is central to all interventions.
・ Activity design will include the full participation of women in consultations and capacity development and be sensitive to gender vulnerability disparities in all decision-making. The project design will consider the livelihood capacity development of women in the fishing industry and in the local communities.
・ A Social Management Plan as part of the ESMP has been designed based on a detailed screening process. The ESMP provides a framework for ensuring that project activities do not have a negative impact on the environment or local communities (Annex 6).
These risks may be posed if gender considerations, social safeguards and livelihoods are not fully incorporated in the implementation of project activities.
3 The failure to commit and provide the co-financing commitment from "new money" or sustainable “payment-in-kind”for project development resulting in funds from other fundamental services/development being compromised
・ UNDP has committed to providing co-financing for the project and has worked with the GoL to identify further sources of co-financing and in-kind activities. The availability of in-kind co-finance for Activity 1.2 in the form of rock materials has been verified by the GoL and UNDP.
Since the implementation of co-financing is officially planned by JICA and is an additional fund, the risk of reducing other funds may be low.

Data Collection Survey on Building Climate Resilient Safer Cities Final Report
10-9
No. Risk factor Risk mitigation measure Risk implication for
this project in Maldives
4 The long-term project success requires a commitment to coastal and land-use planning policies and actions to safeguard communities/infrastructure. It is also necessary to ensure that there is no overlap and/or misalignment between project activities and other actions in the MMA.
・ The project has been designed with extensive stakeholder engagement at all levels of government and affected parties to ensure that there is synergy between project activities and any past and ongoing initiatives in the MMA.
・ Regular meetings will be held between the GoL and relevant individuals/organisations responsible for the management of the project. This will ensure that future projects or initiatives are aligned with the project’s interventions.
・ Government commitment to address land tenure arrangements during project implementation in coastal and tidal areas agreed as a condition of the project. This will include a commitment to new legal instruments and enforcement where necessary.
These risks may be posed if the effectiveness of the project may not be maintained in the long term due to insufficient involvement of the Maldives government and local stakeholders.
5 Changes in political leadership or focus could result in delays in project implementation or even abandonment of some activities. Additionally, turnover of government staff may impede capacity building, the retention of skills and knowledge, and knowledge management across the relevant institutions to ensure coastal and land use policy and actions are aligned with sustainable practices.
・ Regular engagement with non-political actors – such as government agency officials, staff and local community members – will be prioritised during project implementation. In so doing, knowledge regarding the project planning and implementation processes will be shared amongst a number of individuals who can hold the implementing agencies accountable for delivery in the case of key individuals leaving their respective organisations.
・ The formulation of local ordinances, mainstreaming of project interventions into local planning and budgeting systems and establishment of accountable centres/offices will ensure that political changes will have negligible impact on the sustainability of project interventions.
These risks may be posed if the involvement of decision-making authorities in each organization is insufficient, or if the formulation of local ordinances, etc. is insufficient.
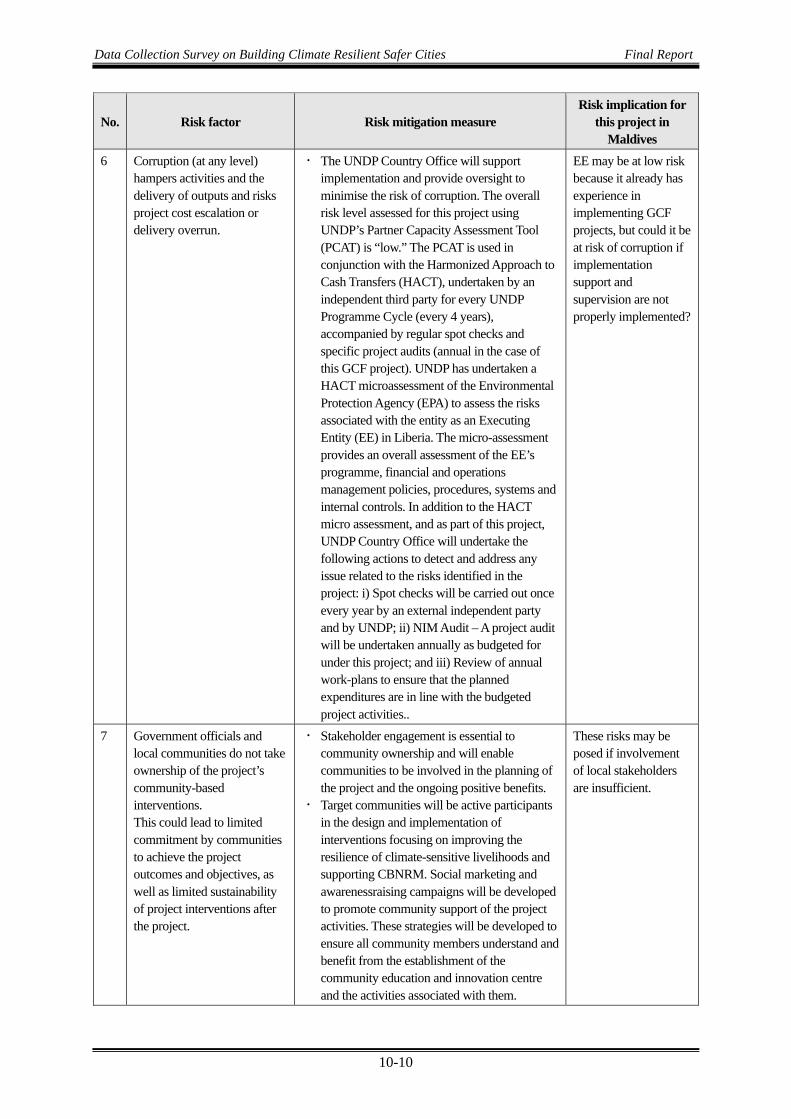
Data Collection Survey on Building Climate Resilient Safer Cities Final Report
10-10
No. Risk factor Risk mitigation measure Risk implication for
this project in Maldives
6 Corruption (at any level) hampers activities and the delivery of outputs and risks project cost escalation or delivery overrun.
・ The UNDP Country Office will support implementation and provide oversight to minimise the risk of corruption. The overall risk level assessed for this project using UNDP’s Partner Capacity Assessment Tool (PCAT) is “low.” The PCAT is used in conjunction with the Harmonized Approach to Cash Transfers (HACT), undertaken by an independent third party for every UNDP Programme Cycle (every 4 years), accompanied by regular spot checks and specific project audits (annual in the case of this GCF project). UNDP has undertaken a HACT microassessment of the Environmental Protection Agency (EPA) to assess the risks associated with the entity as an Executing Entity (EE) in Liberia. The micro-assessment provides an overall assessment of the EE’s programme, financial and operations management policies, procedures, systems and internal controls. In addition to the HACT micro assessment, and as part of this project, UNDP Country Office will undertake the following actions to detect and address any issue related to the risks identified in the project: i) Spot checks will be carried out once every year by an external independent party and by UNDP; ii) NIM Audit – A project audit will be undertaken annually as budgeted for under this project; and iii) Review of annual work-plans to ensure that the planned expenditures are in line with the budgeted project activities..
EE may be at low risk because it already has experience in implementing GCF projects, but could it be at risk of corruption if implementation support and supervision are not properly implemented?
7 Government officials and local communities do not take ownership of the project’s community-based interventions. This could lead to limited commitment by communities to achieve the project outcomes and objectives, as well as limited sustainability of project interventions after the project.
・ Stakeholder engagement is essential to community ownership and will enable communities to be involved in the planning of the project and the ongoing positive benefits.
・ Target communities will be active participants in the design and implementation of interventions focusing on improving the resilience of climate-sensitive livelihoods and supporting CBNRM. Social marketing and awarenessraising campaigns will be developed to promote community support of the project activities. These strategies will be developed to ensure all community members understand and benefit from the establishment of the community education and innovation centre and the activities associated with them.
These risks may be posed if involvement of local stakeholders are insufficient.

Data Collection Survey on Building Climate Resilient Safer Cities Final Report
10-11
No. Risk factor Risk mitigation measure Risk implication for
this project in Maldives
8 International experts/consultants/developers do not perform according to expectations
・ The services of consultants and contractors will be procured as per the guidelines in the UNDP manual. This will ensure that only suitably qualified applicants are contracted for project activities.
・ The UNDP Country Office will have an active role in project oversight ensuring that standards are not compromised in any aspect of the project.
The same risk may be low when procurement and supervision are conducted according to JICA rules.
9 Limited long-term operations and maintenance of hard interventions to effectively combat coastal erosion
・ Initial local consultations concluded that maintenance of hard structure interventions was unlikely to be undertaken regularly or appropriately given budget and capacity constraints of local authorities. The designs of the revetments and groyne were done with this limitation in mind and are intended to function as designed for a minimum of 50 years.
・ Operations and Maintenance costs are estimated to average ~USD50,000 per year (Annex 21: Operations and Maintenance Plan). The ICZMP process is intended to address the institutional responsibilities and budgets for its implementation, including the maintenance of the coastal defence structures. The ICZMP itself and the institutional responsibilities associated will be endorsed at the highest level of government as part of the government policy processes.
These risks may be posed.
10 Extreme ocean weather events/hazards could negatively affect or delay project on-the-ground project interventions.
・ The revetment and groyne material will be resilient to most weather and ocean conditions.
・ The final construction plan will incorporate careful planning of activities informed by ocean conditions, weather and climate briefs. Interventions will be scheduled in conjunction with this forecasting information to reduce the potential for extreme weather events to negatively affect the implementation project interventions.
These risks may be posed.
11 The potential unintended environmental and dynamic changes to shore and nearshore sediment erosion and deposition as a result of physical coastal interventions.
・ An Environmental and Social Assessment Report (Annex 6) has been developed to specifically mitigate the potential changes that may result from the implementation of coastal physical interventions.
It is important to take measures based on the Environmental and Social Assessment Report.

Data Collection Survey on Building Climate Resilient Safer Cities Final Report
10-12
No. Risk factor Risk mitigation measure Risk implication for
this project in Maldives
12 Inadequate incorporation of environmental safeguard considerations into the implementation of the project activities as well as its management structures and systems. The scale of pollution in the creeks, estuaries and mangrove swamps around Monrovia proves too extensive for control by existing agencies.
・ An Environmental Management Plan has been designed based on a detailed screening process. This will provide a framework for ensuring that project activities do not have a negative impact on the environment.
・ Project design will include surveys of drainage and pollution sources, focussed on identifying curable problems to be addressed by the project, with others raised for longer-term action by the authorities.
It is important to take measures based on the Environmental Management Plan.
13 Project might involve temporary or permanent and full or partial physical displacement
・ The project has been designed to avoid physical displacement.
・ Should it prove to be necessary for a small number of people, then a full UNDP- (and IFC-) compliant resettlement approach will be used.
If it becomes necessary to relocate residents, measures need to be taken.
14 Project development may infringe on land tenure arrangements in marginal coastal areas.
・ The GoL has committed to address land tenure arrangements in coastal and tidal areas. This will include a commitment to new legal instruments and enforcement where necessary. Adopting the ICZM approach and developing the ICZMP with a specific section dedicated to coastal land tenure regulation in high-risk areas will serve to mitigate this risk. The above-mentioned component of the ICZMP will be fully aligned with the World Bankfunded land use masterplan for Monrovia currently under development
・ Project design will support government actions by including messages on land tenure in its community awareness raising programmes.
・ Project design will also include support to government agencies through its capacity strengthening programme.
Cooperation with the Government of the Maldives is important
15 Construction of coastal protection measures has the unintended consequence of exacerbating existing flood risk in West Point
・ The revetment at West Point has been designed to armour the vulnerable shoreline and fix it in place. The revetment will use porous materials, a permeable design and include a drainage system to enable water to drain through the structure into the sea, rather than creating a levee which would contain flood water.
・ During the development of the detailed design and construction plan, a site-specific hydrological model of West Point will also be used to assess the impact of the revetment on existing localised flooding and mitigate this risk by enabling the design of adequate drainage capacity.
These risks may be posed.
Source: Prepared by JICA Research Team based on Funding Proposals.

Data Collection Survey on Building Climate Resilient Safer Cities Final Report
10-13
Table 10.2.6 Descriptions on “Risk Assessment and Management” in the FP066
No. Risk factor Risk mitigation measure Risk implication for this project in Maldives
1 Reluctance from sectors to integrate disaster risk and climate change adaptation approaches into their sector development
・ The Office of the Chief Secretary has been recognized as a key supporter to move this agenda forward, and will act as the interface between the key ministries and agencies (e.g: Ministry of Finance, Ministry of Public Work and the agencies in charge of Disaster risk reduction and climate change adaptation) in support to the objective of the JNAP.
Management plans for coastal zone and outer areas would not be legislated nor implemented.
2 The project will be complex both from a technical and operational perspective, with involvement of multiple stakeholders, and might cause difficulties during implementation.
・ To manage this risk, technical support will be provided at a regional level by SPC, and will focus on a core set of activities that will include: (i) institutional and systems strengthening for early
warning and preparedness; and (ii) technical assistance in coastal resilience planning.
In addition, the consulting firm Deltares was hired to conduct a Coastal Vulnerability Assessment of Ebeye which will contribute to coastal planning and future investments based on a good understanding of risks.
・ Where possible, activities will draw from lessons and experience from PREP Phase I, and activities will be packaged together in larger contracts wherever it is feasible to do so.
As the project is implemented by picking up a specific needs as a co-finance projects of GCF, JICA and MD government, there would be complaints on the selection even after the project is launched.
3 Limited capacity of DIDA and MPW for implementation
・ This risk will be mitigated through the recruitment of a full time Project Manager by MoF/DIDA, who will manage the day-to-day implementation, including procurement activities for Component 1, 3 and 4.
・ The Project Manager will also be supported by the PSU, and significant training and capacity development will be provided to relevant staff through various aspects of the project.
・ Technical staff will also be recruited to support implementation of Components 1 and 3. A consulting firm will be recruited by the MPW to implement Component 2.
・ The World Bank will maintain a close dialogue with the PSU and Project Manager, and will conduct regular implementation support missions to oversee progress.
There may be the same risks as long as ME faces manpower shortage.
4 Limited capacity of local market for the design and construction of coastal protection works
・ The project will target international consultants and contractors so as to achieve an acceptable quality of investment.
・ The national contractors can also participate in bidding (as contractor or sub-contractor subject to meeting the qualification requirements) so that their capacity will also be strengthened.
Lack of knowledges and expertise on beach nourishment in companies in Maldives.

Data Collection Survey on Building Climate Resilient Safer Cities Final Report
10-14
No. Risk factor Risk mitigation measure Risk implication for this project in Maldives
5 Weak coordination between DIDA and MPW.
・ The Office of the Chief Secretary will act as the interface between DIDA and Public Work and the agencies in charge of Disaster risk reduction and climate change adaptation.
・ In addition, the project manager in DIDA will coordinate and monitor all the procurement activities under the whole project, including consolidation of the procurement plans and using the Systematic Tracking of Exchanges in Procurement (STEP). Selected Risk
In the government of Maldives, there was a case that a project planned by the Ministry of Infrastructure was not recognized by the Ministry of the environment. Weakness in cooperation between ministries can be a risk.
6 Uncertainty regarding source of construction materials and design
・ Clear specifications in line with the recommendation of the ESMF/ESIA will be included in the bidding document regarding technical requirements of aggregates so that bidders can be involved in the procurement process to propose technical solutions.
・ In addition, SPC will undertake a study to identify appropriate and sustainable sources of aggregate for future works.
Uncertainty risks such as where sands and pebbles used for beach nourishment would have come from.
7 Weak fiduciary capacity in RMI
・ Mitigation measures agreed as a result of financial management (FM) and procurement assessments will be implemented, including provision of technical assistance, and compliance with World Bank Procurement and FM requirements, including strong internal financial controls and regular independent audits.
・ The World Bank will monitor this through implementation support missions which will include reviewing the effectiveness and compliance with internal financial controls, reviewing interim financial reports for accuracy, and following up on issues raised in audit reports. The World Bank Procurement Regulations for IPF Borrowers and related guidance notes will be disseminated to concerned agencies early on in project preparation.
・ One full-time Project Manager (with procurement experience) will be hired under the Project Preparation Advance, who will work with DIDA to: - conduct procurement processes under Components
1, 3 and 4 as well as procurement of consulting services (including those under PPA);
- update the PPSD and procurement plan when necessary;
- provide procurement training to DIDA staff; - prepare a detailed procurement manual as a part of
the POM; and - Provide support to MPW when necessary.
・ A procurement expert will be included in the team of consultants selected to work with the MPW of Public Works, and the main tasks are the same as above.
Risks would be relatively low in this case, as the NDA has already had a certain experience in implementation of GCF projects.

Data Collection Survey on Building Climate Resilient Safer Cities Final Report
10-15
No. Risk factor Risk mitigation measure Risk implication for this project in Maldives
8 Difficulties to secure the rights to occupy land or create encumbrances or easements and potential adverse effects of protection works on the coastal environment
・ To mitigate this the Ministry of Finance and PWD will engage with land owners early in the process, including them in the assessment of priority areas for development and concept design. Coastal protection works can be prioritized in areas where land owner agreements are secured. The land owners will receive clear benefits from the coastal protection works, and this is another mitigating factor.
・ Coastal protection works will have potential negative impacts on the foreshore and marine environments of Ebeye and Majuro which will be carefully assessed as part of the ESMF/EIA process and appropriate mitigation measures included in the design and construction phase.
There may be the same risks.
9 A significant disaster event occurs during implementation of the PREP Phase II, diverting attention and resources of the implementing agencies to the immediate disaster response and recovery needs of the country
・ In order to mitigate this, a Contingency Emergency Response Component (CERC) has been incorporated into the Project in addition to the ex-ante disaster risk financing and insurance mechanism supported by the PREP Phase I. This should provide flexibility and minimize disruption to the Project in the event of a disaster occurring, by providing funds to assist the government with their response and recovery needs.
There may be the same risks.
Source: Prepared by JICA Expert Team based on Funding Proposals.

Data Collection Survey on Building Climate Resilient Safer Cities Final Report
10-16
Table 10.2.7 Descriptions on “Risk Assessment and Management” in the FP053
No. Risk factor Risk mitigation measure Risk implication for this project in Maldives
1 Implementing a new planning framework within an existing planning context with sharply delineated lines of responsibility could create resistance
・ The mitigation of this risks will benefit from the action over the past decades to create buy-in and institutional momentum to integrate climate change into a comprehensive and integrated planning framework. Reasons for resistance will be analyzed and appropriate approaches to eliminate them will be identified and applied.
Would it not be risks of inconsistency with existing policies and programs.
2 Lack of agreement among key stakeholders on the developed ICZM Plan
・ The project will employ experts in participatory approaches.
・ In addition, international expertise will be sought for this component, as needed, to ensure the utilization of highest level of available modelling techniques and to provide evidence based proposals to achieve the best possible interest of all stakeholders.
・ Experts will be selected based on competitive selection process starting from the identification if the assignment can be conducted by an individual expert or needs company with multi-disciplinary team. Market assessments will be done prior to procurement on whether there is local capacity in-country for the work at hand or whether it would be necessary to procure from the international market place. Terms of References will then be advertised and the selection panel including UNDP and the Government will evaluate the proposals received and decide on the appointment based on the combination of financial and technical proposals. EOIs and RFPs may be used as well.
For legislation and implementation of management plans for coastal zones and outer areas, it may result in resistances from other ministries and local governments.
3 Low skills and staff limitations could impede the monitoring and follow-up of implementation
・ Capacity needs assessments will be undertaken to identify any specific needs and gaps.
・ The proposed project is building on significant activities to strengthen capacities of staff in key national institutions and local governments, considered the needs for follow up and implementation after the project is finalized.
・ UNDP will ensure that a long term M&E plan will be an output of the project for the sustainability of operations after end of the GCF project including needed financial and human resources.
There may be the same risks as long as ME faces manpower shortage.

Data Collection Survey on Building Climate Resilient Safer Cities Final Report
10-17
No. Risk factor Risk mitigation measure Risk implication for this project in Maldives
4 Long term sustainability of investments (e.g. information systems, coastal protection measures) if project interventions do not prevent the ongoing coastal flooding, and vulnerabilities in urban and agricultural areas increase
・ The project interventions will be integrated into the planning and budgeting processes of key national agencies and local governments.
・ Implementation will actively engage local community groups to ensure greater ownership and thus long term sustainability.
・ Project interventions will be decided during the development of the ICZM plan. The interventions that will be included in the ICZM plan will be limited to those that have been tested and subject to a thorough cost-effectiveness analysis.
・ Extensive studies and thorough design will be conducted using international expertise, as needed, to reduce any chances of faulty design.
・ A strong M&E programme will be put in place and field officers will be recruited through the project to ensure local government staff and communities have access to technical advice, and opportunities to express concerns as necessary. Through regular monitoring, success of interventions will be measured and communicated to provide assurance, as well as to inspire behavior change. The M&E plan will be prepared by the project team according to the UNDP standard format and will be discussed with the government and endorsed by the project board. The project M&E plan includes among other measures inception workshop, project board meetings, preparation of project progress reports, measurements of means verification of the progress, independent Mid Term and Final Evaluations, field visits, and project annual and terminal reports.
There may be risks in which regular maintenance for beach nourished is implemented less frequently over time.
5 Extreme climatic events disrupt implementation or damages investments, resulting in delays and additional costs. Egypt is at increased risk of climate-related natural hazards, such as storm surges and flashfloods which could impact implementation as well as long term sustainability of investments.
・ Timing of fieldworks and construction activities during implementation will be scheduled to minimize risk, to the extent possible (e.g. planning around storm periods). Design of investment projects will be following the results of a thorough risk assessment to ensure long term resilience. Selected Risk
It needs to check if any extreme climate events would occur in Maldives enough to hamper project implementations.

Data Collection Survey on Building Climate Resilient Safer Cities Final Report
10-18
No. Risk factor Risk mitigation measure Risk implication for this project in Maldives
6 Sediment movement during construction works
・ There is the likelihood for sediment movement during the construction of coastal infrastructure.
・ To ensure that the sediment is not mobilised that will result in environmental impacts, it will be necessary to prepare an Erosion, Drainage and Sediment Control Plan (EDSCP) and install silt curtains to restrict sediment movement from the site. Further, any earthworks should be undertaken during the dry season and compacted sufficiently to reduce sediment movement. The EDSCP should contain aspects including but not limited to the installation of sediment curtains to reduce sediment movement and the quick placement of footing material. These impacts will be spatially and temporally restricted to works periods.
There may be the same risks.
7 Construction Noise ・ The construction contractor should consider any sensitive receptors including communities.
・ Noise will be limited to excavators removing sediment from the water course. It is likely that more noise will be generated through the use of excavators and trucks moving sediment.
・ Where necessary, noise shields should be constructed to reduce the potential for noise to reach these communities if an impact occurs.
・ The noise will have very limited temporal scales
There may be the same risks.
Other ・ While there exists a strong commitment from the Egyptian government that limits many risks, there is a possibility that this commitment is not carried through because of different perceptions of key decision makers, or because project activities begin to be perceived as not sufficiently contributing to an effective long-term strategy to address climate change adaptation in the Nile Delta.
・ However, the commitment to baseline development activities implemented by government, as well as its efforts to secure the necessary co-financing, has served to minimize these risks.
・ The risk mitigation strategies will focus on strengthening communication with national counterparts; enhancing national and UNDP capacities to rapidly respond to political changes.
There may be the same risks.
Source: Prepared by JICA Expert Team based on Funding Proposals.
10.3 Specific Ways of Application of GCF Resources in MD
For utilizing GCF resources in Maldives, we conducted a research on MD’s policy to utilize GCF and on whether there would be any other candidate GCF projects under development. Through hearing surveys to the ME, we learned that MD government puts priority on those projects described in its NDC (Nationally Determined Contribution) under the Paris Agreement and the Second National Communications, both

Data Collection Survey on Building Climate Resilient Safer Cities Final Report
10-19
submitted to the UNFCCC. (Table 10.3.1 shows actions listed in updated Maldives’ NDC, which indicates such actions of coastal protection, early warning and climate observation systems as adaptation.)
As for project approved by the GCF, there are one on-going project (AE: UNDP) and four under consideration (including this project). Activity areas of the latter projects are, in order of progress of consideration, coastal prevention (AE: JICA), energy efficiency (AE: UNEP), conservation of ecosystems (AE: FAO) and water-induced health problems in remote areas (AE: WHO). Meanwhile, although no direct access entity exists within the country so far, Bank of Maldives is under consideration for application.
Table 10.3.1 Actions and Measures described in Maldives’ NDC Mitigation ■ Target
・ Reduce 26% of its GHG below BAU for the year 2030 in a conditional manner, in the context of sustainable development, supported and enabled by availability of financial resources, technology transfer and capacity building.
・ it has a responsibility to take a transformational economic and environmental path to development and aims to reach net-zero by 2030 provided on condition that it gets the extensive support and assistance from the international community
■ Sectors
・ Energy
・ Waste ■ Gases
・ CO2
・ CH4
・ N2O Adaptation ■Sector
・ Enhancing Agriculture and Food Security
・ Infrastructure Resilience
・ Public Health
・ Enhancing Water Security
・ Coastal Protection
・ Safeguarding coral reef biodiversity
・ Tourism
・ Fisheries
・ Early warning and Systematic Observation
・ Disaster risk reduction and management
・ Cross Cutting Issues (Finance, Climate governance and capacity building) Source: Prepared by JICA Expert Team based on Update of NDC of Maldives.
For submission of the funding proposal to the GCF, a No Objection Letter (NOL) needs to be attached as an annex. In order to obtain such NOL from the ME (the NDA in Maldives), we checked up relevant procedure by looking into ME’s publication and conducting hearings surveys. Moreover, we also checked the contents of “GCF NDA Manual of the Republic of the Maldives Draft Final Report (v2)” which was released during the research period (in February 2019). Consequently, we requested the government of Maldives for the NOL, which was issued as shown in Figure 10.3.1. The issuance process for the NOL, as indicated in the aforementioned NDA Manual, is as shown in Figure 10.3.2 for reference. In the meantime, the NOL for this project was issued by not taking the process because this project proceeded for the NOL before the process came into effect in August 2019.

Data Collection Survey on Building Climate Resilient Safer Cities Final Report
10-20
Source: The Government of Maldives
Figure 10.3.1 No Objection Letter

Data Collection Survey on Building Climate Resilient Safer Cities Final Report
10-21
Source:GCF NDA Manual of the Republic of the Maldives Draft Final Report (v2)
Figure 10.3.2 Process for Issuance of the No Objection Letter (after the new rule is applied)

Data Collection Survey on Building Climate Resilient Safer Cities Final Report
11-1
CHAPTER 11 ENVIRONMENTAL AND SOCIAL CONSIDERATION/ PUBLIC CONSULTATION/ GENDER
In this chapter, outline of environmental and social consideration/public consultation/ gender are mentioned. See Annex 6~8 in Supportive Appendix for the details. 11.1 Relevant Regulations and Guidelines (GCF, JICA and Maldives)
11.1.1 Legal and Institutional Framework for Natural and Social Consideration, including EIA and Gender
(1) Relevant Regulations of the Maldives
The following regulations are listed as the policy and regulations related to natural and social environment.
Table 11.1.1 Regulations related to Natural and Social Environment of the Maldives Regulations Remarks
Environmental Protection and Preservation Act (Act No. 4/93)
Environmental Impact Assessment Regulation (2012) First amendment (2013), Second amendment (2015), Third amendment (2016), Fourth amendment (2017), Fifth amendment (2018)
Dredging and Reclamation Regulation (Regulation 2013/R-15)
First amendment (2014)
Cultural and Historical Places and Objects Act (Act No.27/79)
Regulation on Cutting down and Export of Trees and Coconut Palms (Regulation No. 7-R/2014)
Coral and Sand Mining Regulation (1990) Gender Equality Act (Act No. 18/2016)
Source: JICA Expert Team (2019)
(2) Environmental Protection and Preservation Act (Act No. 4/93)
The Environmental Protection and Preservation Act of the Maldives, EPPA (Law No. 4/93), provides the basic framework for environmental management including the Environmental Impact Assessment (EIA) process in the Maldives, which is currently being implemented by the Environmental Protection Agency (EPA) on behalf of the former Ministry of Planning, Human Resources and Environment (currently known as the Ministry of Environment, Climate Change and Technology (ME)).
The project conforms to the requirements of EPPA. The EIA should be undertaken in accordance with the EIA Regulation 2012 of Maldives, together with the succeeding amendments, by registered consultants. Furthermore, it adheres to the principles underlined in the regulations, action plans, programmes, and policies of the ME, Ministry of Planning and Infrastructure (MPI), and relevant local councils.
Articles 2, 4, 5, 6, 7, and 8 of the law are relevant to the coastal protection projects in Addu City and Laamu Atoll.
Clause 2 of the EPPA mandates the ME to formulate policies, rules, and regulations regarding the environment.
Clause 5 of the EPPA specifically provides for an environmental impact assessment (EIA), a tool implemented to attempt to integrate environmental issues into development decisions. According to

Data Collection Survey on Building Climate Resilient Safer Cities Final Report
11-2
Clause 5 (a) of the Act, an Environmental Impact Assessment study shall be submitted to the ME before implementing any development project that may have a potential impact on the environment. According to Clause 5 (b), the ME shall formulate the guidelines for the EIA and shall determine the projects that need such assessment as mentioned in paragraph (a) of this clause.
Clause 6 of the EPPA gives the ME the authority to terminate any project that has an undesirable impact on the environment.
Clause 7 of the EPPA refers to the disposal of oil, waste, and poisonous substances in the Maldivian territory. According to this clause, any type of waste, oil, toxic gas, or any substance that may have harmful effects on the environment should not be disposed within the Maldivian territory. If, however, the disposals of such substances become absolutely necessary, the clause states that they should be disposed only within the areas designated for that purpose and if incinerated, appropriate precautions should be taken to avoid harm on the health of the population.
Clause 8 of the EPPA (4/93) states that Hazardous, Toxic, or Nuclear Waste that is harmful to human health and the environment shall not be disposed anywhere within the territory of the country.
Furthermore, Clause 9 sets a fine form MVR 5 to MVR 500 for minor offenses in breach of this law and a fine of not more than MVR 100 million for major offenses. The fine shall be levied by the ME or by other government authorities designated by the ME in case of minor offenses.
Finally, Clause 10 of the EPPA gives the Government of the Maldives the right to claim compensation for all damages caused by activities that are detrimental to the environment. The Clause 3 of the Environment Act has been amended by Law No. 12/2014, which now states that environmental protection, including conservation of biological diversity, protection of groundwater resources and related environments including mangroves, swamps found in the islands, protection of the environment from waste and hazardous gases as well as to formulate relevant policies, regulations, standards, and implementation of such in consultation with other government agencies shall be a responsibility of the ME assigned for implementing environmental policies.
The proposed project will fully abide to the Environmental Preservation and Protection Act. All mitigation measures will be implemented in the interest of the environment
(3) Employment Act (Act No. 2/2008)
The Employment Act, the legal framework to govern the rights and responsibilities of the migrant workers in the Maldives, is included in the Employment Act (2/2008). The Employment Act provides for the creation of a Labour Relations Authority, an Employment Tribunal and an Advisory Board on wages. To date, four amendments have been brought to the Employment Act (2/2008). All contractors shall be required to undertake ethical recruitment and responsible employment of workers during the construction stage of the project. During the operation stage, an ethical recruitment and responsible employment policy and system will be developed and implemented and amendments were made through the following Acts: 14/2008; 12/2010; 3/2014; 14/2015.
11.1.2 Protected Areas and Sensitive Areas
Under Article 4 of the Environment Protection and Preservation Act, the ME is vested with the responsibility of identifying and registering protected areas and natural reserves and drawing up of rules and

Data Collection Survey on Building Climate Resilient Safer Cities Final Report
11-3
regulations for their protection and preservation. For the target areas for Component 2 in Addu City and Laamu Atoll, there are no protected areas nearby the target areas. For Component 3, all the target areas are not located in the sensitive areas.
As part of the Environmental Regulation, EPA has established a list of ‘sensitive sites’ in the Maldives. Although not formalized as a regulation, the sensitive list is mentioned in the recent Regulation on Dredging and Reclamation (Regulation number 2014/R-13). The sensitive sites, according to EPA are sites in the Maldives (islands, reefs, mangroves, inter-tidal areas) where developments ought to be restricted, regulated, or controlled. Some view those sites mentioned in the sensitive list have no meaning because there is no evidence to show any ‘sensitive features’ of the areas.
(1) Environmental Impact Assessment Regulation 2012
1) Environmental Impact Assessment Regulation 2012
The former Ministry of Housing and Environment (currently known as the ME) issued the EIA regulation in May 2012, which guides the process of undertaking the Environmental Impact Assessment in the Maldives. This guideline also provides a comprehensive outline of the EIA process, including the roles and responsibilities of the consultants and the proponents. This regulation outlines every step of the EIA process beginning from the application to undertake an EIA, details on the contents, minimum requirements for consultants undertaking the EIA, format of the EIA/IEE report, and many more. The guidance provided in this Regulation was followed in the preparation of this EIA report. The EIA has also been prepared by registered consultants.
2) First Addendum to the Environmental Impact Assessment Regulation 2012 (Regulation 2013/ R-18)
This first addendum was gazetted on 9th April 2013. This amendment stipulates that the responsible authority has to check the submitted EIA report for everything mentioned in the Regulation’s article (Kaafu) and inform the proponent whether the EIA Report has been accepted or rejected within two working days. The penalty for repetitive offenses has also been updated in this amendment of the regulation.
3) Second Addendum to Environmental Impact Assessment Regulation 2012 (Regulation 2015/R-174)
The second amendment gazetted on 30th August 2015 includes the following important points:
- Some procedural changes have been made to the EIA process: e.g., shifting the tourism related developmental project EIAs to the Ministry of Tourism, ii) changes in the process like finalization of the Terms of Reference during the scoping meeting, and iii) changes in the fees structure for the review process have been made to include three different categories.
- Article 8 (a) of the amendment of the decision for the screening form is as follows:
a) Environmental Management Plan
b) Initial Environmental Examination
c) Environmental Impact Assessment
d) Approval to go forward with the screened project

Data Collection Survey on Building Climate Resilient Safer Cities Final Report
11-4
e) Approval to go forward with the project with as per the mitigation measures proposed by EPA.
- Article 9(b) of the amendment for the decision for IEE is as follows:
a) Environmental Impact Assessment Report if the project anticipated to have major environmental impacts
b) Environmental Management Plan
c) Approval to go forward with the project if the project is not anticipated to occur major environmental impacts
4) Third Addendum to the Environmental Impact Assessment Regulation 2012 (Regulation 2016/R-66)
The third amendment gazetted on 11th August 2016 includes the following important points:
- The point system for consultants, categories of the consultants, and amendment of the penalties to consultants and proponents who fail to follow the regulation. This EIA report was prepared by a Category A registered EIA consultant
5) Fourth Addendum to the Environmental Impact Assessment Regulation 2012 (Regulation 2017/R-7)
The fourth Amendment gazetted on 19th January 2017 includes the following points:
- The projects that can be preceded without an Environmental Impact Assessment when the proponent requests to the former Ministry of Environment and Energy (currently known as the ME) in writing along with commitments or guarantee that the Proponent will carry out the mitigation measures that may impact the Environment due to such projects. A list of such projects given in the amendment is as follows:
a) Removal of deposited sand inside the harbor
b) Trees and palms present on lands left for the purpose of building houses need to be taken by the owner of the land.
c) If trees/palms present on lands left for building purposes obstruct the roads need to be removed. (Such cases will be handled by the council of the island).
d) Creating boreholes on land for the uptake of water.
e) On lands, which are connected to naturally formed islands, projects that are carried out before three years since the reclamation of land.
f) On lands, which are newly reclaimed in the middle of a lagoon, projects which are carried out for before five years since the reclamation.
Even on the lands mentioned in numbers 5 and 6 of clause a) of this regulation, if people habituate, development projects should be carried out under EIA regulation (2012). It can only be carried out after submitting an EIA and with the permission of the ME.
- Even on the lands mentioned in numbers 5 and 6 of clause a) of this regulation, the projects listed down below can only be carried out under the EIA regulation (2012) with the approval of the ME.

Data Collection Survey on Building Climate Resilient Safer Cities Final Report
11-5
a) Projects involving hazardous/toxic chemicals
b) Projects involving the storage of oil
c) Projects involving the usage of incinerators
d) Projects which would release any kind of toxic fumes into the atmosphere
6) Fifth Addendum to Environmental Impact Assessment Regulation 2012 (Regulation 2018/R-131)
The fifth amendment gazetted in 2018 includes the following points:
- Some procedural changes have been made to the EIA process. The main change is the re-inclusion of the tourism related developmental project EIAs to the ME from the Ministry of Tourism: i.e., 36) Development of tourist resorts, and 37) development of tourist guesthouse.
11.1.3 Dredging and Reclamation Regulation (Regulation 2013/R-15)
(1) Dredging and Reclamation Regulation (Regulation 2013/R-15)
The regulation of Dredging and Land Reclamation was published on 2 April 2013 with the aim of minimizing environmental impacts associated with dredging activities in islands and reefs across the Maldives. This regulation explains in detail about the situation of dredging and reclamation. The followings are the outlines of the regulation:
- The regulation defines the rationales acceptable for dredging as those related to the approved development activities on inhabited islands and economic islands. It defines that those activities should be of utmost necessity for dredging to be considered.
- All dredging and reclamation activities must be approved by EPA in writing. The process includes the submission of project information to EPA along with a scaled before and after map. The regulation defines rationales for reclamation as those absolutely necessary for social, economic, or safety purposes.
- Dredging is restricted in the following areas:
a) 500 m from the ocean side reef edge;
b) 50 m from any island vegetation line;
c) An environmentally sensitive site;
d) Land reclamation is restricted within 200 m of a sensitive area; and
e) Land reclamation cannot exceed 30% of the house reef area.
- The regulation requires producing scaled-maps of the island before and after the proposed intervention. Land use plan and the details of essential requirement should be submitted to the Implementation Agency. Along with these details, a geo-referenced scale map (1:10,000) should be submitted and permission should be obtained from the Implementation Agency.
- Special provisions have been made on protected and sensitive area restricting changes to the environment of the islands.

Data Collection Survey on Building Climate Resilient Safer Cities Final Report
11-6
(2) First Amendment to the Dredging and Reclamation Regulation
This amendment to the regulation came into force on 9 February 2014 and has brought changes to Clause 13 (d) of the Dredging Regulation. The amendment explains that the developmental projects planned under the cabinet decision or run under government developmental projects can be preceded even after it falls under Clause 13 (d) number 4 along with the conditions given in the First Amendment. The proponent shall apply to the Implementation Agency for such activities like sand mining, while dredging and reclamation and shall be carried out only after obtaining permission from the Implementation Agency. The conditions given in the amendment are as follows:
a) Carry out a study on the existence of living flora, fauna, and threatened species.
b) Submit a plan and obtain permission for such plans on how to transfer, shift, and farm the threatened species.
c) Develop a natural area not smaller than the existing area with the existing characteristics or develop an area with such characteristics that are instructed by the Implementation Agency as per the policy, regulation, and standards and set arrangements to protect, manage, and monitor such areas.
d) Carry out a study to monitor the impact on the existing aquifer and to take mitigation measures to prevent the occurrence of likely impacts. Additionally, these activities should be monitored by the implementation Agency.
e) Carry out a study on possible flooding and implement a suitable drainage system as a mitigation measure. This project can be preceded as per the regulations and its amendments where mitigation and monitoring are explained in relevant sections.
11.1.4 Cultural and Historical Places and Objects Act (Act No.27/79)
The Law on Cultural and Historical Places and Objects of the Maldives (27/79) prohibits destroying or damaging any historical and cultural places, sites, objects, and artifacts belonging to the sovereign area of the Maldives.
a) The cultural sites mentioned in this regulation are things or places used by locals or foreign ancestors who had resided in the Maldives. These things reflect the lifestyles of the ancestors of the locals.
b) Monuments or idols, which have been created in honor of certain personalities or idols that people used to worship in the past, are also protected under this regulation.
c) However, with the permission from the relevant authorities of the government, cultural sites are allowed to be touched and studied in such a way that their original identity is not lost.
11.1.5 Regulation on Cutting Down and Export of Trees and Coconut Palms (Regulation No. 7-R/2014)
The Regulation on Cutting Down and Export of Trees and Palms (Regulation No. 7-R/2014) specifies that the cutting down, uprooting, digging out, and export of trees and palms from one island to another can only

Data Collection Survey on Building Climate Resilient Safer Cities Final Report
11-7
be done if it is absolutely necessary and if there is no other alternative. It further states that for every tree or palm removed in the Maldives two more should be planted and grown in the island.
The regulation prohibits the removal of the following tree types;
- The coastal vegetation growing around the islands extending to about 15 meters into the island;
- All the trees and palms growing in mangrove and wetlands spreading to 15 meters of land area;
- All the trees that are in a government designated protected areas;
- Trees that are being protected by the government in order to protect species of animal/organisms that live in such trees; and
- Trees/palms that are abnormal in structure.
11.1.6 Coral and Sand Mining Regulation
Coral mining from house reef and atoll rim has been banned through a directive from the President’s Office dated 26 September 1990. Additionally, the Regulation on Sand and Coral Mining was issued by the Ministry of Fisheries, Agriculture, and Marine Resources (MOFA) on 13 March 2000.
This regulation covers sand mining from uninhabited islands that have been leased; sand mining from the coastal zone of other uninhabited islands; and aggregate mining from uninhabited islands that have been leased and from the coastal zone of other uninhabited islands. Sand should not be mined from any parts of the existing island, beach, or the newly reclaimed island beach. Sand should also not be mined from within 100 feet of the shoreline.
11.2 Relevant Policies of the Maldives
The following policies are listed as the policy and regulations related to natural and social environment.
- National Biodiversity Strategy and Action Plan (2016-2025)
- National Framework for Development 2009-2013/ 2014-2020
- 3rd National Environmental Action Plan, 2009-2013
- National Solid Waste Management Policy, 2007
11.2.1 National Biodiversity Strategy and Action Plan (2016-2025)
One of the most recent policy documents, which are connected with the proposed projects, is the National Biodiversity and Strategy and Action Plan (NBSAP 2016-2025). This seeks to ensure that threats to biodiversity are addressed, biodiversity is conserved, sustainably used and benefits arising from them are shared equitably. It also encompasses ways of addressing gaps, challenges, and constraints highlighted in earlier sections. The proponent has committed on conservation and protection of the environment while undertaking this proposed project.
Data Collection Survey on Building Climate Resilient Safer Cities Final Report
11-8
11.2.2 National Framework for Development 2009-2013/ 2014-2020
The National Framework for Development 2009-2013 consists of ten policies. It is the important environmental policy guidance given in the Strategic Action Plan (SAP). The environmental policies outlined in the SAP include the following:
- Policy 1: Strengthen EIA process with an emphasis on EIA monitoring.
- Policy 2: Conserve and sustainably use biological diversity and ensure maximum ecosystem benefits.
- Policy 3: Develop resilient communities addressing impacts of climate change, disaster mitigation and coastal protection.
- Policy 4: Strengthen adaptation and mitigation responses for beach erosion and develop a system to assist communities where livelihood and property are affected by beach erosion.
- Policy 5: Ensure management of solid waste to prevent impact on human health and environment through approaches that are economically viable and locally appropriate.
- Policy 6: Ensure protection of people and the environment from hazardous waste and chemicals.
- Policy 7: Improve air quality to safeguard human health.
- Policy 8: Enable a fully functional decentralized environmental governance system.
- Policy 9: Develop a low carbon economy to achieve carbon neutrality by 2019.
- Policy 10: Inculcate environmental values in the society and enable environmentally friendly lifestyle.
This policy encourages strengthening EIA process and EIA monitoring including conservation and sustainability of biological diversity. Based on this plan, relevant laws, regulations, and amendments to such regulations have been done to improve the processes and the relevant laws and regulations are covered under the Policy, Legal, and Administrative Framework of this report.
11.2.3 3rd National Environmental Action Plan, 2009-2013
The 3rd National Environmental Action Plan (NEAP 3) sets out the agenda for environmental protection and management in the Maldives for the five-year period of 2009 – 2013. This plan is targeted to achieve measurable environmental results that matter to the people of the Maldives. The aim of developing NEAP 3 is to protect and preserve country’s environment and properly manage natural resources for the sustainable development of the country. This should encompass the ten principles with six strategic results with targeted goals to be achieved under each result. The key principles of the NEAP 3 are as follows:
- Principle 1: Environmental protection is the responsibility of every individual
- Principle 2: Achieve results
- Principle 3: Promote and practice sustainable development
- Principle 4: Ensure local democracy
- Principle 5: Inter-sectoral coordination and cooperation
Data Collection Survey on Building Climate Resilient Safer Cities Final Report
11-9
- Principle 6: Informed decision making
- Principle 7: Precaution first
- Principle 8: Continuous learning and improvement
- Principle 9: Right to information and participation
- Principle 10: Environmental protection complements development
11.2.4 National Solid Waste Management Policy, 2007
As waste management has been identified as a key environmental issue in the Maldives, a National Solid Waste Management for the Republic of Maldives was developed in 2007 as an important step towards mainstreaming waste management in the country. The aim of the waste management policy is to formulate and implement guidelines and means for solid waste management in order to maintain a healthy environment. Accordingly, the key elements of the policy include: i) ensuring a safe disposal of solid waste and encouraging the recycling and reduction of waste generated; ii) developing guidelines on waste management and disposal and advocating to enforce such guidelines through inter-sectorial collaboration; and iii) ensuring the safe disposal of chemical, hazardous, and industrial waste.
The proponents of this project must be aware of the policy and all solid and hazardous waste produced in this project should be disposed according to the Environmental Management Plan for the project, which reflects the principles of the Waste Management Policy
11.2.5 Waste Management Regulations
Waste Management Regulation (No. 2013/R-58) put on gazette in August 2013 came into force in February 2014. The regulation provides a set of comprehensive guidelines on collecting, storing, transporting, and managing waste as well as the management of hazardous waste. The aim of Waste Management Regulation is to implement the national waste policy that contains specific provisions to (a) implement measures to minimize impacts on human health; (b) formulate and implement waste management standards; (c) implement an integrated framework for sustainable waste management (d) encourage waste minimization, reuse, and recycling (e) implement Polluter Pays Principle; and (f) introduce Extended Producer Responsibility.
The Waste Management Regulation identifies the areas prohibited from the dumping of waste; protected areas under the Environmental Protection and Preservation Act, mangroves, lagoons of islands, coral reefs, sand banks, beaches of islands, coastal vegetated areas of islands, harbors, parks, and roads. Additionally, the Waste Management Regulation states that those involved in waste management must be permitted by the Environmental Protection Agency.
11.2.6 Decentralization Act
The main objectives of decentralizing the Administrative Divisions of the Maldives is to allow the island communities to make their own decisions in a democratic and accountable manner. These include the improvement of people’s living standards through social, economic, and cultural development, the

Data Collection Survey on Building Climate Resilient Safer Cities Final Report
11-10
emancipation of the people, the increase in scope that will bring the services closer to the people, and the creation of an environment conducive for peace and prosperity.
In order to provide for decentralized administration, Atoll Councils, Island Councils, and City Councils are established. This project will be monitored and overlooked by PMU, in close relationship with the representatives of councils in Addu City and Laamu Atoll. The project was also formulated and finalized together with inputs from the local councils.
11.3 Multilateral Agreements
The following are the multilateral agreements and international treaties listed as the policy and regulations related to natural and social environment.
- United Nations Framework Convention on Climate Change (UNFCCC) and the Kyoto Protocol
- United Nations Convention on Biological Diversity (UNCBD)
- United Nations Convention to Combat Desertification (UNCCD)
- United Nations Convention on the Law of the Sea (UNCLOS)
11.3.1 United Nations Framework Convention on Climate Change (UNFCCC) and the Kyoto Protocol
The Maldives is a party to the United Nations Framework Convention on Climate Change (UNFCCC) and the Kyoto Protocol to the UNFCCC. The objective of the convention is to achieve, in accordance with the relevant provisions of the convention, the stabilization of greenhouse gas concentrations in the atmosphere at a level that would prevent dangerous anthropogenic interference with the climate system. Such a level should be achieved within a time frame sufficient to allow ecosystems to adapt naturally to climate change, to ensure that food production is not threatened and to enable economic development to proceed in a sustainable manner.
The IPCC defines mitigation “as an anthropogenic intervention to reduce the sources or enhance the sinks of greenhouse gases.” The greenhouse gas inventory of the Maldives forms an integral part of the First National Communication of the Maldives to the UNFCCC. In March 2009, the President of the Maldives announced the target to make Maldives carbon neutral by 2020. Hence, in the implementation of the project, careful attention needs to be given to ensure energy efficiency and reduce transport related fuel consumption. Furthermore, planting of beach vegetation would help in mitigation of greenhouse gas emissions from the project.
The IPCC defines adaptation “as an adjustment in natural or human systems in response to actual or expected climatic stimuli or their effects.” Various types of adaptation include anticipatory and reactive adaptation, private and public adaptation, and autonomous and planned adaptation. The adaptation policies and strategies of the Maldives are given in the Maldives National Adaptation Programme of Action (NAPA). The replenishment of the beach can be considered as a long-term adaptation measure against beach erosion caused by rising sea levels.
Data Collection Survey on Building Climate Resilient Safer Cities Final Report
11-11
11.3.2 United Nations Convention on Biological Diversity (UNCBD)
The Maldives is a party to the United Nations Convention on Biological Diversity and has prepared the National Biodiversity Strategy and Action Plan in 2002. The objectives of the UNCBD are “the conservation of biological diversity, the sustainable use of its components, and the fair and equitable sharing of the benefits arising out of the utilization of genetic resources.” The Convention entered into force on 29 December 1993.
The proposed projects in this funding proposal do not fall on any areas recognized for its ecological value, even when there are some coral inhabiting areas. However, it is unlikely that there will be a significant loss of biodiversity. Therefore, it is recommended that the project ensures that mitigation measures are followed while executing works on land and in the marine environment to protect the marine biodiversity.
11.3.3 United Nations Convention to Combat Desertification (UNCCD)
The objective of the UNCCD is to “combat desertification and mitigate the effects of drought in countries experiencing serious drought and/or desertification, particularly in Africa, through effective action at all levels, supported by international cooperation and partnership arrangements, in the framework of an integrated approach, which is consistent with Agenda 21, with a view to contributing to the achievement of sustainable development in affected areas (Article 2).” To achieve this goal, the Convention focuses on improving land productivity, rehabilitation of land, and the conservation and sustainable management of land and water resources. The Convention was adopted in Paris on 17 June 1994 and entered into force on 26 December 1996. The Maldives has acceded to the Convention in 2002.
11.3.4 United Nations Convention on the Law of the Sea (UNCLOS)
UNCLOS refers to several United Nations events and one treaty. This treaty provided new universal legal controls for the management of marine natural resources and the control of marine pollution. UNCLOS provides a legal order for the seas and oceans that will facilitate international communication, and will promote the peaceful uses of the seas and oceans, the equitable and efficient utilization of their resources, the conservation of their living resources, and the study, protection, and preservation of the marine environment
11.4 EIA Procedures of Maldives
11.4.1 Project Subject to EIA
All the development projects in the Maldives shall proceed the EIA in accordance with the Environmental Impact Assessment Regulation (2012) of the Maldives. According to the regulation, the EIA surveys shall be conducted by the registered consultants, who are listed by EPA. The projects subject to EIA are listed in the following table.

Data Collection Survey on Building Climate Resilient Safer Cities Final Report
11-12
Table 11.4.1 Projects Subject to EIA No. Target Project 1 Commercial aquaculture projects 2 Fish processing facilities 3 Artificial reefs 4 Agriculture projects 5 Livestock and animal husbandry 6 Large scale deforestation 7 Construction and dredging of Harbours 8 Cutting, dredging and maintenance of channels 9 Construction of Jetties (without water channel) 10 Development of Yacht Marinas 11 Land Reclamation projects 12 Sea defence structures (such as seawalls, revetments, marine installation, offshore breakwaters, groynes) 13 Beach nourishment 14 Sand mining using machinery 15 Construction of Major roads 16 Development of Airports 17 Helipads and Seaplane hubs 18 Major housing projects
19 Building structures, with more than ten (10) storeys (excluding the foundation raft) or higher than thirty one (31) metres.
20 Buildings with foundation structures that cater for more than ten (10) storeys 21 Buildings with basements 22 Buildings with foundations deeper than five (5) feet or a foundation of a unique structure
23 Development of Factories (with initial investments more than Rf. 100,000 (one hundred thousand Rufiyaa), and those registered with the relevant government authorities)
24 Waste incinerators 25 Landfills 26 Unofficial Translation 27 Large-scale Waste storage and separation facilities 28 Bottling plants 29 Drinking water supply network systems 30 Sewerage projects 31 Marine outfall pipes 32 Power plants 33 Oil, fuel and gas storage, handling and refining facilities 34 Desalination plants of capacity larger than hundred and fifty (150) tonnes 35 Hospitals 36 Development of new tourist hotel or resort 37 Additions and large-scale developments to tourist hotels and resorts
Sources: modified by the JICA Expert Team, based on the Environmental Impact Assessment Regulation (2012), the second amendment (2015) and the fifth amendment (2018)
Note: The tourism related developmental projects: i.e. No. 36 and No. 37 in the above table, were listed as target projects No. 1 and No. 2 in the Environmental Impact Assessment Regulation in 2012, however, those two projects were shifted to the Ministry of Tourism through the second amendment (2015). Through the Fifth Amendment (2018), those two tourism related projects have been re-added to the projects under managing of EPA.

Data Collection Survey on Building Climate Resilient Safer Cities Final Report
11-13
11.4.2 Procedures of Environmental Impact Assessment
The followings are the brief procedures of the environmental impact assessment in Maldives.
1) Screening 2) Initial Environmental Examination (IEE) 3) Environmental Impact Assessment (EIA) 4) Environmental Permits
Under Article 5 (a) of the EPPA, an Environmental Impact Assessment (EIA) has to be prepared and submitted by the developer of a project which may have potential impacts on the environment, to ME for approval before commencement of the project. The EIA process is coordinated by the Environment Protection Agency of ME with consultation from other relevant government agencies and the National Commission for the Protection of the Environment (NCPE).
The EIA process is initiated when the proponent submits a Screening Form to ME. By this stage, ME identifies if the project requires an Initial Environmental Examination (IEE) or a full Environmental Impact Assessment (EIA). Subsequently, the scope of the EIA will be discussed in a Scoping Meeting attended by representatives from ME and the proponent. Once the scope is identified, baseline surveys will be carried out and a report submitted to the ME according to the guidelines provided in the EIA Regulation. The main components of the report are project description, existing environment, public consultation, impact assessment, alternatives, mitigation and monitoring. A decision statement is then issued by the ME stating whether the project is approved, needs further information or is rejected. The EIA process is schematically shown on the following table.

Data Collection Survey on Building Climate Resilient Safer Cities Final Report
11-14
Source: Environmental Impact Assessment Regulation 2012
Figure 11.4.1 EIA Process in the Maldives
11.4.3 EIA Procedures of GCF and JICA
(1) EIA-related Guidelines of GCF
The GCF adopted the International Finance Corporation (IFC) Performance Standards as its safeguard standards on an interim basis until 2017. In addition, it adopted requirements related to gender. After that,

Data Collection Survey on Building Climate Resilient Safer Cities Final Report
11-15
the GCF created its own safeguard standards, namely Environmental and social policy in 2018. The following table gives an overview of the topics covered in IFC’s Performance Standards 1-8.
Table 11.4.2 Performance Standards of IFC
OVERARCHING (ESMS) SUBJECT SPECIFIC
PS1: Assessment and Management of Environmental and Social Risks and Impacts
- Policy (or equivalent documents) - Process for identifying risks & impacts - Management program - Organizational capacity & competency - Process for monitoring & evaluation - External communications
PS2: Labor and Working Conditions PS3: Resource Efficiency and Pollution Prevention PS4: Community Health, Safety, and Security PS5: Land Acquisition and Involuntary Resettlement PS6: Biodiversity Conservation and Sustainable
Management of Living Natural Resources PS7: Indigenous Peoples PS8: Cultural Heritage
Source: GCF/B.07/11
Based on the Performance Standards of IFC, the GCF sets its own safeguard standards as follows:
Table 11.4.3 Comparison of Environmental and Social Performance Standards of IFC and GCF
IFC’s Performance Standards (PS) GCF’s Environmental and Social Standards (ESS)
PS1: Assessment and Management of Environmental and Social Risks and Impacts
PS2: Labor and Working Conditions PS3: Resource Efficiency and Pollution Prevention PS4: Community Health, Safety, and Security PS5: Land Acquisition and Involuntary Resettlement PS6: Biodiversity Conservation and Sustainable
Management of Living Natural Resources PS7: Indigenous Peoples PS8: Cultural Heritage
ESS1: Assessment and Management of Environmental and Social Risks and Impacts
ESS2: Labor and Working Conditions ESS3: Resource Efficiency and Pollution Prevention ESS4: Community Health, Safety, and Security ESS5: Land Acquisition and Involuntary Resettlement ESS6: Biodiversity Conservation and Sustainable
Management of Living Natural Resources ESS7: Indigenous Peoples ESS8: Cultural Heritage
Source: JICA Expert Team (2021)
The GCF’s Environmental and social policy applies to all GCF-financed activities and to both public and private sector entities. The activities which will be supported by GCF may include programmes, projects and subprojects. The financial instruments may vary and may include grants, concessional loans, guarantees and equity investments. The Environment and Social Policy applies to three engagement areas
Table 11.4.4 Engagement Areas to apply GCF’s Environmental and Social Policy Engagement Areas
(a) At the strategic and institutional level, the policy responds to the mandate expressed in the Governing Instrument and links to other operational strategies and policies including internal structures and governance frameworks of GCF;
(b) At the entities level, the policy sets out the requirements for accredited entities working with GCF to establish and maintain robust, systematic, accountable, inclusive, gender responsive, participatory and transparent systems to manage risks and impacts from GCF-financed activities, pursuant to this policy and the ESS standards adopted by GCF. These requirements complement the accreditation framework and are considered in the accreditation and reaccreditation processes; and
(c) At the activity level, the policy establishes the requirements for environmental and social risk assessment and management to be aligned to GCF ESS standards ensuring that due diligence is undertaken for all GCF-financed activities, including subprojects financed from GCF-funded programmes or through financial intermediaries, regardless of the financial instruments used or whether these are solely supported by GCF or cofinanced by other institutions.
Source: Environmental and social policy (2018)
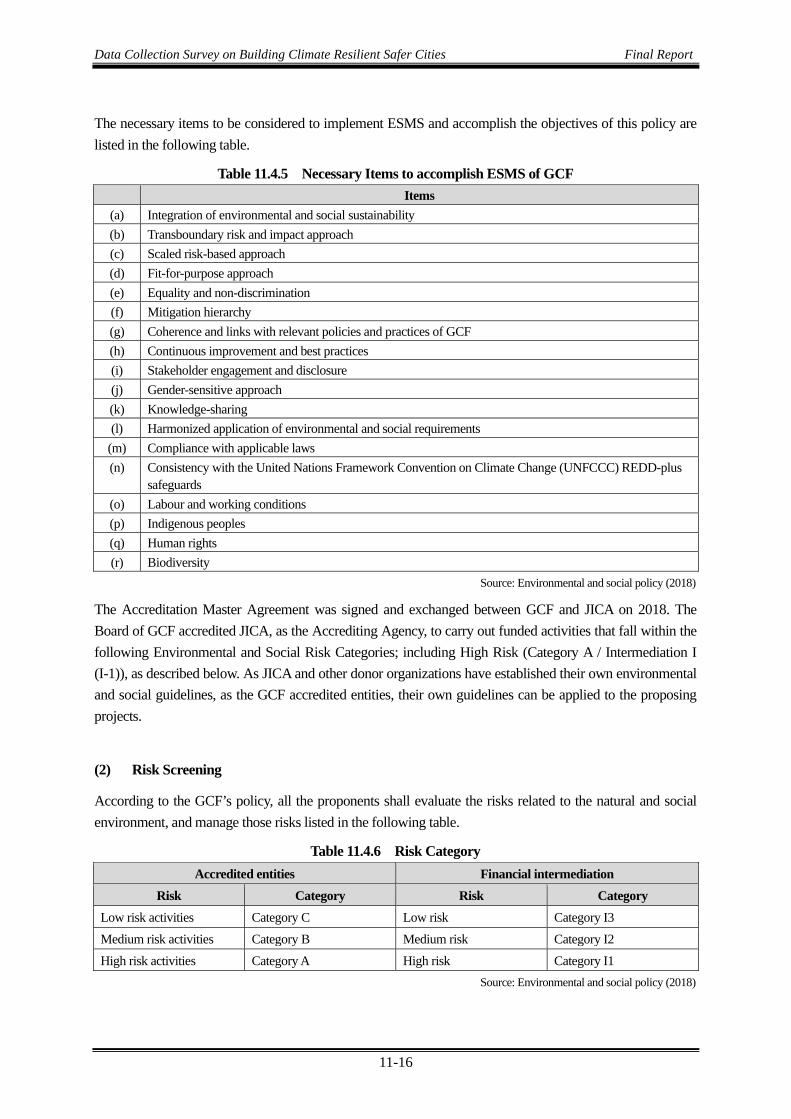
Data Collection Survey on Building Climate Resilient Safer Cities Final Report
11-16
The necessary items to be considered to implement ESMS and accomplish the objectives of this policy are listed in the following table.
Table 11.4.5 Necessary Items to accomplish ESMS of GCF Items
(a) Integration of environmental and social sustainability (b) Transboundary risk and impact approach (c) Scaled risk-based approach (d) Fit-for-purpose approach (e) Equality and non-discrimination (f) Mitigation hierarchy (g) Coherence and links with relevant policies and practices of GCF (h) Continuous improvement and best practices (i) Stakeholder engagement and disclosure (j) Gender-sensitive approach (k) Knowledge-sharing (l) Harmonized application of environmental and social requirements
(m) Compliance with applicable laws (n) Consistency with the United Nations Framework Convention on Climate Change (UNFCCC) REDD-plus
safeguards (o) Labour and working conditions (p) Indigenous peoples (q) Human rights (r) Biodiversity
Source: Environmental and social policy (2018)
The Accreditation Master Agreement was signed and exchanged between GCF and JICA on 2018. The Board of GCF accredited JICA, as the Accrediting Agency, to carry out funded activities that fall within the following Environmental and Social Risk Categories; including High Risk (Category A / Intermediation I (I-1)), as described below. As JICA and other donor organizations have established their own environmental and social guidelines, as the GCF accredited entities, their own guidelines can be applied to the proposing projects.
(2) Risk Screening
According to the GCF’s policy, all the proponents shall evaluate the risks related to the natural and social environment, and manage those risks listed in the following table.
Table 11.4.6 Risk Category Accredited entities Financial intermediation
Risk Category Risk Category Low risk activities Category C Low risk Category I3 Medium risk activities Category B Medium risk Category I2 High risk activities Category A High risk Category I1
Source: Environmental and social policy (2018)

Data Collection Survey on Building Climate Resilient Safer Cities Final Report
11-17
The definitions of each risk are as follows:
Table 11.4.7 Definitions of the Risks Category Definitions of the Risks
Category A / I1 Activities with potential significant adverse environmental or social risks and/or impacts that are diverse, irreversible, or unprecedented.
CategoryーB / I2 Activities with potential limited adverse environmental or social risks and/or impacts that are few in number, generally site-specific, largely reversible, and readily addressed through mitigation measures.
CategoryーC / I3 Activities with minimal or no adverse environmental or social risks and/or impacts Source: Environmental and social policy (2018)
(3) Gender related Guideline of GCF
GCF established the Gender Equality Policy1) as his gender-related policy of GCF and its scope and applied areas are quite comprehensive, then all the mitigation and adaptation measures/ projects which are planned to be implemented wither public and private entities need to apply this policy. The Gender Equality Policy is applied to the following four (4) levels.
Table 11.4.8 Applied Areas by Levels of GCF’s Gender Equality Policy Applied Areas
(a) At the GCF institutional level: to adopt, implement and document the GCF gender-responsive approach in its day-to-day governance, operations and procedures, and its performance measurement frameworks while committing the necessary resources, financial and human, to make this approach robust and effective
(b) At the project/portfolio level: to address and reduce gender inequality gaps, minimize social risks, deepen stakeholder engagement and deliver better accountability to men and women to generate sustainable livelihood opportunities, health and well-being and resilience against climate-induced shocks and risks
(c) At the regional and national level: to support and sustain an enabling environment among GCF stakeholders – including NDAs/focal points, AEs, and delivery partners – that builds on existing policy commitments, environmental and social standards, and redress mechanisms to achieve gender equality
(d) At the sector level: to contribute to high-quality, more comprehensive and systematic sex-disaggregated data collection, qualitative and quantifiable gender analysis and action plans, and a knowledge base that supports gender-responsive learning outcomes.
Source: Gender Equality Policy (2018) 11.5 Environmental and Social Impact Evaluation for each Component
11.5.1 Issues to be considered as the Environmental and Social Consideration and Tentative Countermeasures
The proposed project is composed of four (4) components as shown below:
Table 11.5.1 Project Components Component Funded by
Component 1: Establishment of Integrated Coastal Zone Management (ICZM) Activity 1.1: Inventory study and risk assessment on present coastal and coral reef
conditions JICA
Activity 1.2: Preparation of basic policy of ICZM at the national level JICA Activity 1.3: Preparation of concrete ICZM Plan at representative inhabitant island as
case study JICA

Data Collection Survey on Building Climate Resilient Safer Cities Final Report
11-18
Component Funded by Activity 1.4: Capacity development and information sharing of the relevant
organizations for establishment of the ICZM JICA
Component 2: Implementation of coastal conservation/protection measures against coastal disasters
Activity 2.1: Detailed design of coastal conservation measures and capacity development of stakeholders
GCF, Maldives’s co-finance
Activity 2.2: Implementation of coastal conservation/ protection measures GCF, Maldives’s co-finance
Activity 2.3: Implementation of beach maintenance, establishment of structure and capacity development of stakeholders
JICA
Component 3: Development of disaster warning and information dissemination Activity 3.1: Installment of terrestrial digital broadcasting system JICA Activity 3.2: Establishment of disaster early warning and information broadcasting
system JICA
Component 4: Development of basic data collection and sharing system related to climate change
Activity 4.1: Development of wave and sea level monitoring system JICA Activity 4.2: Development of beach, coral reef, and land use monitoring system JICA
Source: JICA Expert Team (2019)
The proposed activities at each target area in the four components are shown below:
Table 11.5.2 Project Components at Each Island under Component 1 Atoll Island Project component Funding source Abb.
All For all inhabited islands
Categorization into pattern by existing information and extraction of issues (Activity 1.1) Formulation of national-level ICZM (Activity 1.2)
JICA’s co-finance
6-9 islands (2-3 islands per pattern x 2-3 patterns)
Field surveys to grasp and confirm the current situations (Activity 1.1)
JICA’s co-finance -
Laamu Fonadhoo Preparation of island-level concrete ICZM as the case studies (Activity 1.3)
JICA’s co-finance L-FND
Gan ditto JICA’s co-finance L-GAN Source: JICA Expert Team (2019)
Table 11.5.3 Project Components at Each Island under Component 2 Atoll/ City Island Project Component Funding Source Abbreviation Laamu Fonadhoo Beach nourishment and groins for the eastern
coast (ocean side) GCF fund L-FND
Maamendhoo Beach nourishment and groins for the eastern and western side coast, and reclamation for evacuation place at the north-western top
GCF fund L-MMD
Ishdhoo Sea walls to protect historical sites at the ocean side coast at the north top
Maldives’s co-finance
L-ISD
Gan Sea walls to protect the historical sites at the ocean side at the middle of the island
Maldives’s co-finance
L-GAN
Addu Meedhoo Beach nourishment and groins for the eastern coast (northern coast)
Maldives’s co-finance
S-MED
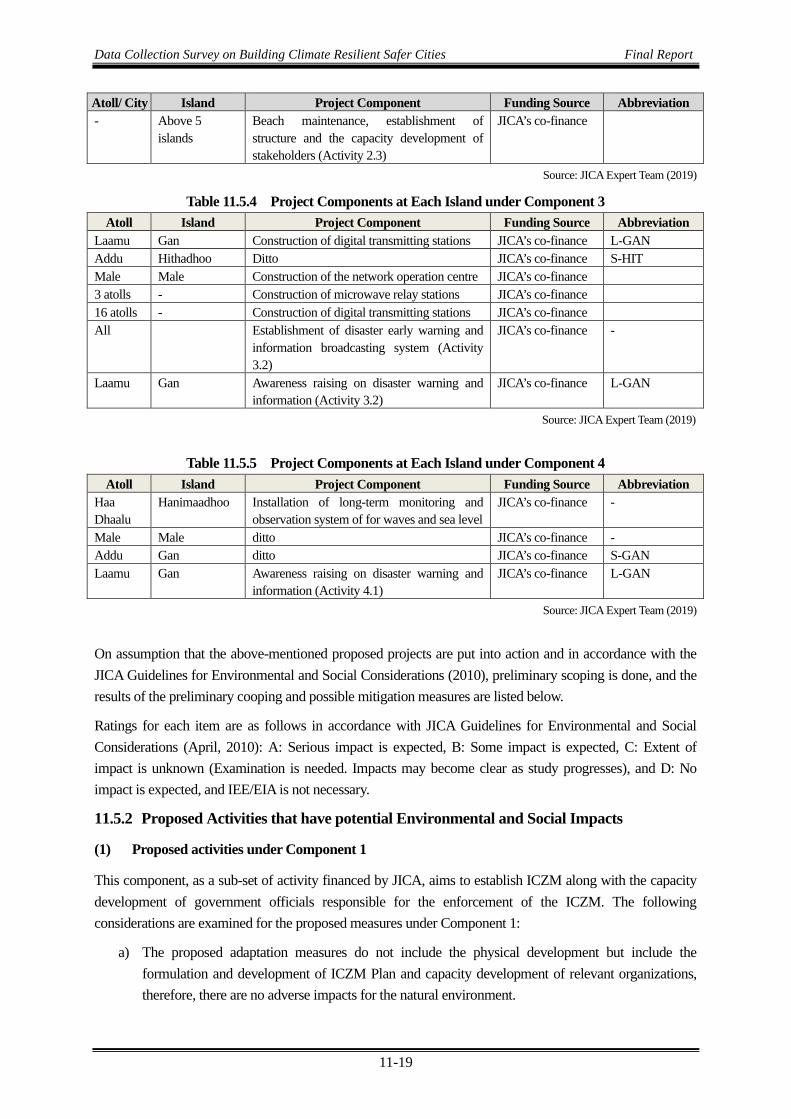
Data Collection Survey on Building Climate Resilient Safer Cities Final Report
11-19
Atoll/ City Island Project Component Funding Source Abbreviation - Above 5
islands Beach maintenance, establishment of structure and the capacity development of stakeholders (Activity 2.3)
JICA’s co-finance
Source: JICA Expert Team (2019)
Table 11.5.4 Project Components at Each Island under Component 3 Atoll Island Project Component Funding Source Abbreviation
Laamu Gan Construction of digital transmitting stations JICA’s co-finance L-GAN Addu Hithadhoo Ditto JICA’s co-finance S-HIT Male Male Construction of the network operation centre JICA’s co-finance 3 atolls - Construction of microwave relay stations JICA’s co-finance 16 atolls - Construction of digital transmitting stations JICA’s co-finance All Establishment of disaster early warning and
information broadcasting system (Activity 3.2)
JICA’s co-finance -
Laamu Gan Awareness raising on disaster warning and information (Activity 3.2)
JICA’s co-finance L-GAN
Source: JICA Expert Team (2019)
Table 11.5.5 Project Components at Each Island under Component 4 Atoll Island Project Component Funding Source Abbreviation
Haa Dhaalu
Hanimaadhoo Installation of long-term monitoring and observation system of for waves and sea level
JICA’s co-finance -
Male Male ditto JICA’s co-finance - Addu Gan ditto JICA’s co-finance S-GAN Laamu Gan Awareness raising on disaster warning and
information (Activity 4.1) JICA’s co-finance L-GAN
Source: JICA Expert Team (2019)
On assumption that the above-mentioned proposed projects are put into action and in accordance with the JICA Guidelines for Environmental and Social Considerations (2010), preliminary scoping is done, and the results of the preliminary cooping and possible mitigation measures are listed below.
Ratings for each item are as follows in accordance with JICA Guidelines for Environmental and Social Considerations (April, 2010): A: Serious impact is expected, B: Some impact is expected, C: Extent of impact is unknown (Examination is needed. Impacts may become clear as study progresses), and D: No impact is expected, and IEE/EIA is not necessary.
11.5.2 Proposed Activities that have potential Environmental and Social Impacts
(1) Proposed activities under Component 1
This component, as a sub-set of activity financed by JICA, aims to establish ICZM along with the capacity development of government officials responsible for the enforcement of the ICZM. The following considerations are examined for the proposed measures under Component 1:
a) The proposed adaptation measures do not include the physical development but include the formulation and development of ICZM Plan and capacity development of relevant organizations, therefore, there are no adverse impacts for the natural environment.

Data Collection Survey on Building Climate Resilient Safer Cities Final Report
11-20
b) The concrete action for the island level of the ICZM will be examined based on the national level of the ICZM as a case study at two islands in Laamu Atoll.
c) The to-be-developed ICZM Plan as case studies may include 1) establishment of coastal and reef conservation plan, 2) establishment and implementation of sediment budget control plan, 3) review of EPZ (Environment Protected Zone), 4) examination of the island government's approach to coastal management, and 5) examination of the island-level systems and regulations necessary for implementing the activities above as well as support for their implementation. However, the details of coastal and reef conservation plan have not yet decided.
More detail information of measures are shown in another Annex (Annex-2) under this Funding Proposal.
(2) Proposed activities under Component 2
Among all the activities under four components, the Component 2 has the physical measures. The following considerations are examined for the proposed adaptation measures under Component 2:
a) The proposed adaptation measure is to enforce the protection function and to maintain the relationship between the local people and coasts.
b) In order to provide a sustainable coast management, the proposed measures are to maintain the sand supply for the reef coast and to keep the natural protection function as much as possible.
c) By referring the uncertainty of the climate change scenario, the proposed adaptation measures are to be flexible against the future climate change.
The proposed adaptation measures under Component 2, which are funded by the GCF fund and co-financed by GOM, and the typical cross sections of the proposed adaptation measures are shown in the following tables. More detail specifications and information of proposed adaptation measures are shown in another Annex (Annex-2) under this Funding Proposal.
Table 11.5.6 Adaptation Measures in Target Coasts under Component 2 a) Adaptation measures to be funded by GCF fund
Atoll Target Islands Location Coastal Adaptation Measure Laamu Maamendhoo East coast (300 m) Beach nourishment+Groin West coast (600 m) Beach nourishment+Groin North coast Reclamation+Perimeter revetment Fonadhoo East coast (850 m) Beach nourishment+Groin
b) Adaptation measures to be co-financed by GOM Atoll Target Islands Location Coastal Adaptation Measure Laamu Gan East coast (270 m) Rubble type revetment Ishdhoo Northern coast (270 m) Rubble type revetment Addu Meedhoo North coast (1,500 m) Beach nourishment+Groin
Source: JICA Expert Team (2019)

Data Collection Survey on Building Climate Resilient Safer Cities Final Report
11-21
Measure Typical Cross Section Typical Cross Section View of the Beach
Typical Cross Section View of the Groin
Standard Profile of the Groin
Source: JICA Expert Team (2019)
Figure 11.5.1 Cross Section View of Beach and Groin at the Maamendhoo East Coast, Laamu Atoll under Component 2
Measure Typical Cross Section
Typical Cross Section View of the Revetment
Source: JICA Expert Team (2019) Figure 11.5.2 Cross Section View of Perimeter Revetment at the Maamendhoo North Coast, Laamu
Atoll under Component 2

Data Collection Survey on Building Climate Resilient Safer Cities Final Report
11-22
Measure Typical Cross Section Typical Cross Section View of the Beach
Typical Cross Section View of the Groin
Standard Profile of the Groin
Source: JICA Expert Team (2019) Figure 11.5.3 Cross Section View of Beach and Groin at the Fonadhoo East Coast, Laamu Atoll
under Component 2
Measure Typical Cross Section Typical Cross Section View of the Revetment
Source: JICA Expert Team (2019)
Figure 11.5.4 Cross Section View of Coastal Protection Measure at Gan Island in Laamu Atoll under Component 2 (Maldives’s co-finance)
Measure Typical Cross Section
Typical Cross Section View of the Revetment
Source: JICA Expert Team (2019)
Figure 11.5.5 Cross Section View of Coastal Protection Measure at Ishdhoo Island in Laamu Atoll under Component 2 (Maldives’s co-finance)

Data Collection Survey on Building Climate Resilient Safer Cities Final Report
11-23
Measure Typical Cross Section Typical Cross Section View of the beach conservation measure
Source: JICA Expert Team (2019)
Figure 11.5.6 Cross Section View of Coastal Conservation Measure at Meedhoo Island in Addu Atoll under Component 2 (Maldives’s co-finance)
(3) Proposed measures under Component 3
The objective of the Component 3 is to enhance the accessibility to information and to alleviate information disparities among islands in the Maldives through the development of the digital terrestrial television broadcasting network, thereby contributing to the mitigation of vulnerability and further social-economic development in Maldives. The following considerations are examined for the proposed measures under Component 3:
a) The proposed measures are not located in sensitive areas in the Maldives.
b) The proposed measures do not have sensitive characteristics nor fail into sensitive sectors.
The proposed measures under Component 3, which are co-financed by JICA are shown in the following tables.
Table 11.5.7 Measures on establishment of disaster warning and information dissemination system, which will be co-financed by JICA under Component 3
Atoll Target Islands Measure Laamu Gan Construction of digital transmitting stations Addu Hithadhoo ditto Male Male Construction of the network operation centre 3 atolls Construction of microwave relay stations 16 atolls Construction of digital transmitting stations
Source: JICA Expert Team (2019)

Data Collection Survey on Building Climate Resilient Safer Cities Final Report
11-24
Type Typical Cross Section Tentative Location A
1 2 3 4 6 7 8 10 11 13 14 15 16 17 19 20 21
Ha. Dhidhdhoo HDh. Kulhudhufushi Sh. Funadhoo N. Manadhoo B. Eydhafushi Lh. Naifaru K. Vilingili (Male) V. Felidhoo ADh. Dhangethi Nilandhoo L. Gan Th. Guraidhoo Ga. Viligili GDh. Gadhdhoo GDh. Thinadhoo Gn. Foammulah S. Hithadhoo
B
6 R. Ungoofaaho
C
11 12 18
K. Maafushi F. Feeali GDh. Fiyoari
Source: EIA for the Proposed Digital Terrestrial Television Broadcasting Network Development Project, Energy Consultancy Pvt. Ltd. (2018)
Figure 11.5.7 Combination type tower and station for Component 3
Table 11.5.8 Planned number of facilities, which will be co-financed by JICA under Component 3 Facilities to be constructed Quantities
(1) 90-meter antenna tower 1 set (2) 80-meter antenna tower 7 sets (3) 70-meter antenna tower 5 sets (4) 60-meter antenna tower 3 sets (5) 50-meter antenna tower 3 sets (6) 30-meter antenna pole 1 set (7) 20-meter antenna pole 1 set Total 21 sets
Source: JICA Expert Team (2017)

Data Collection Survey on Building Climate Resilient Safer Cities Final Report
11-25
(4) Proposed measures under Component 4
The proposed measures under Component 4, which are co-financed by JICA, are the technical cooperation, and the main objectives for Component 4 are observation of ocean characteristics, such as waves and sea level, by installing the observation equipment, and trainings to monitor and analyze the obtained data. There are no considerations to be examined for Component 4.
11.5.3 Evaluation Results
(1) General
As this project is supported by JICA in its role as a GCF Accredited Entity, the project has been screened against JICA’s Environmental and Social Consideration Procedure. The Environmental and Social Screening Template was prepared and the project deemed to be a Category B (medium risk) project, as their potential adverse impacts on the environment and society are less adverse than those of Category A (high risk) projects. Discussions on the impact assessment are provided in the Environmental and Social Screening Template, which provided the rationale for the project being classified as a moderate risk. The results of evaluation of each component are shown in the following table, and this ESMF provides further discussion below, especially for the Component 2.
Table 11.5.9 Evaluation results per Component Component Evaluation Remarks
Component 1 Category B Planning of ICZM will be conducted as the case study, and no actual (physical) implementation will be included.
Component 2 Category B Dredging sand for beach nourishment shall be considered. Component 3 Category B JICA has conducted screening and GoM has conducted screening
and EIA Component 4 Category C
Source: JICA Expert Team (2019)
An impact risk assessment was undertaken using JICA’s Environmental and Social Screening Procedure to assess the impact of the risk (critical, severe, moderate, minor, and negligible). From this, a significance value was attributed to the potential impact (negligible, low, medium, high, and extreme).
(2) Evaluation results of Component 1
All the activities under Component 1 are implemented by JICA as the co-financed project, and the activities will be screened against JICA’s Environmental and Social Consideration Procedure. The Environmental and Social Screening Template is tentatively prepared and the activities deem to be a Category B (medium risk) project, as all the project sites are not located in sensitive areas, nor sensitive characteristics, nor fall into sensitive sectors under the JICA guidelines for Environmental and Social Considerations, and potential adverse impacts on the environment are not likely to be significant.

Data Collection Survey on Building Climate Resilient Safer Cities Final Report
11-26
Table 11.5.10 Impacts and Mitigation Measures per Environmental Item for Component 1
1) Pollution Control
Environmental Item Issues Measures Evaluation Objective
projects BC/DC OP 1 Air Quality No adverse effects to the air quality at the target sites
would be occurred, as there are no sources by the activities.
D D
2 Water Pollution For the implementation of sediment budget control plan, the water quality may be affected in some extent, due to the improper implementation.
Proper implementation of sediment budget control plan and adequate management of the sediment may be necessary.
C C
3 Soil Pollution No adverse effects to the soil pollution at the target sites would be occurred, as there are no sources by the activities.
D D
4 Waste Management
No adverse effects to the waste management at the target sites would be occurred, as there are no sources by the activities.
D D
5 Noise and Vibration
No adverse effects to the noise and vibration at the target sites would be occurred, as there are no sources by the activities.
D D
6 Subsidence No adverse effects to the subsidence at the target sites would be occurred, as there are no sources by the activities.
D D
7 Odor No adverse effects to the odor at the target sites would be occurred, as there are no odor sources by the activities
D D
8 Sediment For the implementation of sediment budget control plan, the sediment may occur in some extent, due to the improper implementation.
Proper implementation of sediment budget control plan and adequate management of the sediment may be necessary.
C C
9 Accidents No adverse effects to the accidents at the target sites would be occurred, as there are no sources by the activities.
D- D
2) Natural Environment Environmental
Item Issues Measures Evaluation Objective projects BC/DC OP
1 Protected Areas There are no protected areas and Marine Protected Areas (MPA) around the proposed project sites.
D D
2 Ecosystem and Fauna/Flora
No adverse effects to the ecosystem and fauna/ flora at the target sites would be occurred, as there are no activities which affect to ecosystem and fauna/ flora.
D D
3 Geology and Geomorphology
No adverse effects to the accidents at the target sites would be occurred, as there are no activities which affect to geology and geomorphology.
D D
4 Soil Erosion For the implementation of sediment budget control plan, the soil erosion may occur in some extent, due to the improper implementation.
Proper implementation of sediment budget control plan and adequate management of the sediment may be necessary.
C- C

Data Collection Survey on Building Climate Resilient Safer Cities Final Report
11-27
Environmental Item Issues Measures Evaluation Objective
projects BC/DC OP 5 Groundwater No adverse effects to the groundwater at the target
sites would be occurred, as there are no extraction of a large volume of groundwater by the activities.
D D
6 Hydrology No adverse effects to the hydrology at the target sites would be occurred, as there are no activities which affect to the hydrology.
D D
7 Coastal Areas For the establishment of coastal and reef conservation plan and implementation of sediment budget control plan, the marine system in the coastal areas may be affected in some extent, due to the improper implementation.
Proper establishment coastal and reef conservation plan, implementation of sediment budget control plan and adequate management of the sediment may be necessary.
C C
8 Climate No adverse effects to the climate at the target sites would be occurred, as there are no activities which affect to the climate.
D D
9 Climate Change No adverse effects to the climate change at the target sites would be occurred, as there are no activities which affect to the climate.
D D
3) Social Environment
Environmental Item Issues Measures Evaluation Objective
projects BC/DC OP 1 Resettlement No involuntary resettlement will be occurred by
implementing any proposed projects, as there are no residents and residential areas at all the project sites.
D D
2 Living and Livelihood
If the target areas are used by the local people regularly, there will be possibilities for the local people not to be able to use the areas for their livelihood activities due to the coastal and reef conservation plan.
Proper arrangement and management of the areas under the coastal and reef conservation plan is necessary to mitigate and reduce unfairness to their livelihood activities.
C C
3 Heritage There will be no adverse effects for the heritage sits, as there are no heritages at all the project sites.
D D
4 Landscape No adverse effects to the landscapes at the target sites would be occurred, as all the projects are in small scale.
D D
5 Ethnic Minorities and Indigenous Peoples
If the target areas are used by the local people regularly, there will be possibilities for the local people not to be able to use the areas for their livelihood activities due to the coastal and reed conservation plan.
Proper arrangement and management of the areas under the coastal and reed conservation plan is necessary to mitigate and reduce unfairness to their livelihood activities.
C C
Source: JICA Expert Team (2019) A+/-: Significant positive/negative impact is expected, B+/-: Positive/negative impact is expected to some extent, C: Extent of impact is unknown. (A further examination is needed, and the impact could be clarified as the study progresses) and D: No impact is expected. Note: BC: Before Construction, DC: During Construction, OP: Operation Phase

Data Collection Survey on Building Climate Resilient Safer Cities Final Report
11-28
(3) Evaluation results of Component 2
Detailed design of coastal conservation measures and capacity development of stakeholders (Activity 2.1) and implementation of beach maintenance, establishment of structure and capacity development of stakeholders (Activity 2.3) will be implemented by JICA as the co-financed project, and implementation of coastal conservation/protection measures (Activity 2.2) will be implemented by GoM as GCF-funded project and Maldives’ co-financed projects.
The activities have been screened against JICA’s Environmental and Social Consideration Procedure. The Environmental and Social Screening Template was prepared and the project deemed to be a Category B (medium risk) project, as all the project sites are not located in sensitive areas, nor sensitive characteristics, nor fall into sensitive sectors under the JICA guidelines for Environmental and Social Considerations , and potential adverse impacts on the environment are not likely to be significant.
Table 11.5.11 Impacts and Mitigation Measures per Environmental Item for Component 2
1) Pollution Control
Environmental Item Issues Measures
Evaluation Objective projects BC/DC OP
1 Air Quality During the construction stage, the adverse effects would be occurred to the air quality by using the large machineries, i.e. dredging machine.
Large machineries to be used shall be maintained properly, in order not to emit the unnecessary exhaust gas.
C C L-FND, L-MMD, S-MED
2 Water Pollution During the construction stage, the adverse effects would be occurred to the water quality by using the large machineries, i.e. dredging machine, backhoes, etc.
Large machineries to be used shall be maintained properly, in order to prevent the water pollution.
B- C L-FND, L-MMD, L-ISD, L-GAN, S-MED
During the construction stage, the adverse effects would be occurred to the water quality by inadequate water drainage and soil spill into the sea.
During the construction stage, the adequate drainage water treatment shall be done, i.e. installing silt protectors and sand bunds.
B- C L-FND, L-MMD, L-ISD, L-GAN, S-MED
For the beach nourishment and land reclamation, the adverse effects would be occurred to the water quality by inadequate soil spill into the sea, during the operation stage.
During the operation stage, the community-based maintenance and monitoring will be done through the project.
B- C L-FND, L-MMD, L-ISD, L-GAN, S-MED

Data Collection Survey on Building Climate Resilient Safer Cities Final Report
11-29
Environmental Item Issues Measures
Evaluation Objective projects BC/DC OP
3 Soil Pollution During the construction stage, the adverse effects would be occurred to the soil quality, by oil leaking from the large machineries.
During the construction stage, such measures as preparation of the construction accident prevention manual, installation of oil treatment mat, shall be conducted.
C C L-FND, L-MMD, L-ISD, L-GAN, S-MED
4 Waste Management
During the construction stage, there will be possibility to appear garbage and harmful waste.
During the construction stage, the adequate waste management shall be conducted.
C C L-FND, L-MMD, L-ISD, L-GAN, S-MED
5 Noise and Vibration
During the construction stage, the noise and vibration would be occurred by using the large machineries, i.e. dredging machine, backhoes, etc.
During the construction stage, the noise-cut large machineries and generators shall be used. During the construction stage, the large machineries shall not be used during the night time nearby the residential areas.
C C L-FND, L-MMD, L-ISD, L-GAN, S-MED
6 Subsidence No adverse effects to the subsidence at the target sites would be occurred, as there are no extraction of a large volume of groundwater by the project.
D D -
7 Odor No adverse effects to the odor at the target sites would be occurred, as there are no odor sources by the projects.
D D -
8 Sediment For the beach nourishment and land reclamation, the adverse impact may occur for the subsistence (sea bed) during the construction and operation.
For the beach nourishment and land reclamation, the existing situations/ conditions of the sediment shall be confirmed before construction. During the construction stage, such measures to prevent from the adverse effects, shall be considered, i.e. installing silt protectors and sand bunds.
B- B- L-FND, L-MMD, S-MED
During the operation stage, the community-based maintenance and monitoring will be done through the project.
C C L-FND, L-MMD, S-MED
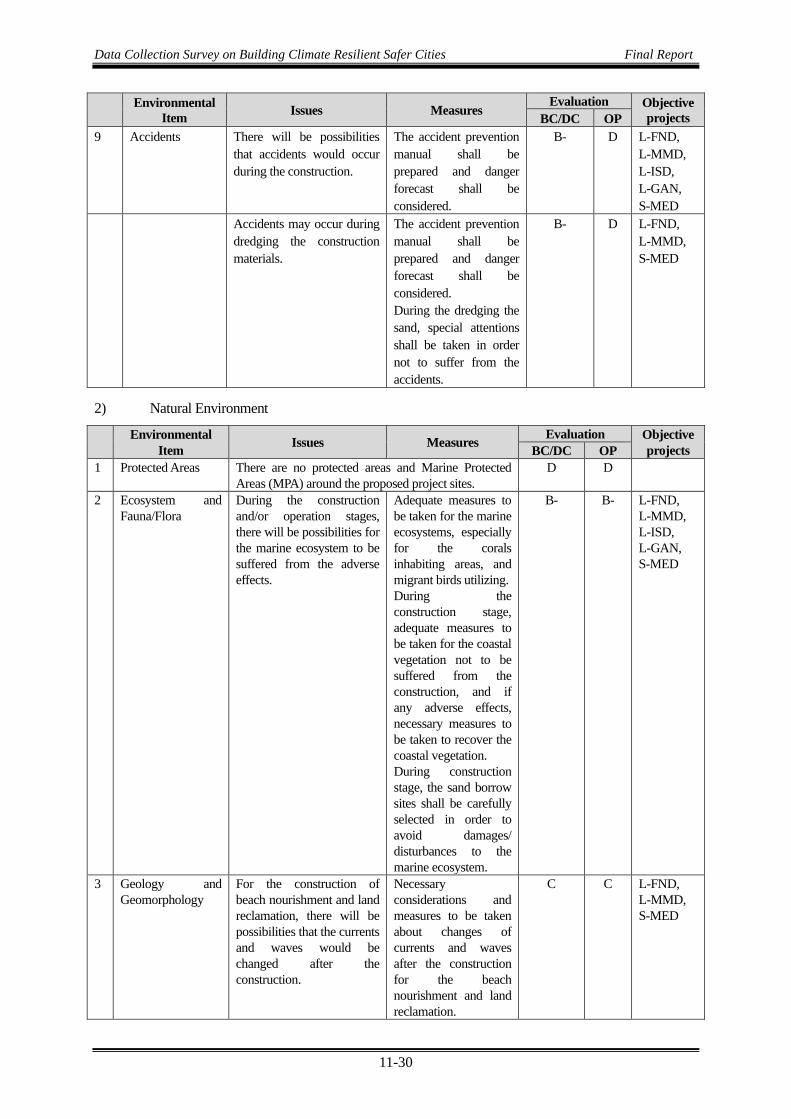
Data Collection Survey on Building Climate Resilient Safer Cities Final Report
11-30
Environmental Item Issues Measures
Evaluation Objective projects BC/DC OP
9 Accidents There will be possibilities that accidents would occur during the construction.
The accident prevention manual shall be prepared and danger forecast shall be considered.
B- D L-FND, L-MMD, L-ISD, L-GAN, S-MED
Accidents may occur during dredging the construction materials.
The accident prevention manual shall be prepared and danger forecast shall be considered. During the dredging the sand, special attentions shall be taken in order not to suffer from the accidents.
B- D L-FND, L-MMD, S-MED
2) Natural Environment
Environmental Item Issues Measures Evaluation Objective
projects BC/DC OP 1 Protected Areas There are no protected areas and Marine Protected
Areas (MPA) around the proposed project sites. D D
2 Ecosystem and Fauna/Flora
During the construction and/or operation stages, there will be possibilities for the marine ecosystem to be suffered from the adverse effects.
Adequate measures to be taken for the marine ecosystems, especially for the corals inhabiting areas, and migrant birds utilizing. During the construction stage, adequate measures to be taken for the coastal vegetation not to be suffered from the construction, and if any adverse effects, necessary measures to be taken to recover the coastal vegetation. During construction stage, the sand borrow sites shall be carefully selected in order to avoid damages/ disturbances to the marine ecosystem.
B- B- L-FND, L-MMD, L-ISD, L-GAN, S-MED
3 Geology and Geomorphology
For the construction of beach nourishment and land reclamation, there will be possibilities that the currents and waves would be changed after the construction.
Necessary considerations and measures to be taken about changes of currents and waves after the construction for the beach nourishment and land reclamation.
C C L-FND, L-MMD, S-MED
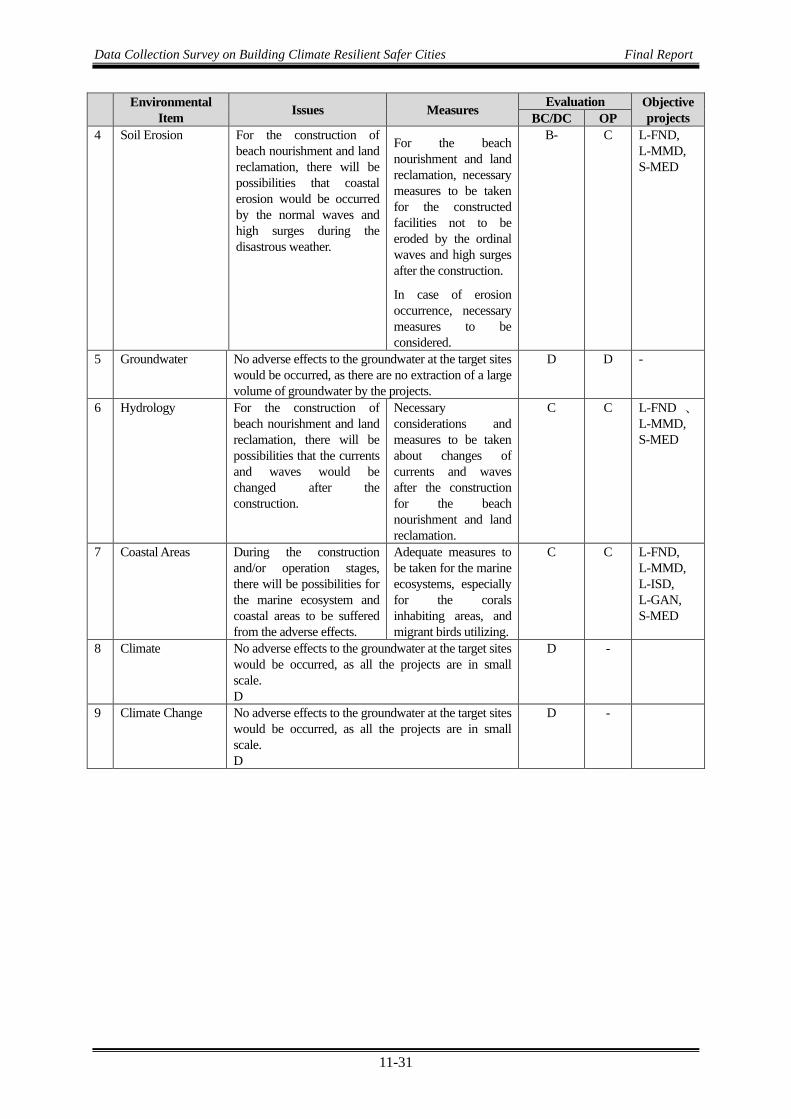
Data Collection Survey on Building Climate Resilient Safer Cities Final Report
11-31
Environmental Item Issues Measures Evaluation Objective
projects BC/DC OP 4 Soil Erosion For the construction of
beach nourishment and land reclamation, there will be possibilities that coastal erosion would be occurred by the normal waves and high surges during the disastrous weather.
For the beach nourishment and land reclamation, necessary measures to be taken for the constructed facilities not to be eroded by the ordinal waves and high surges after the construction.
In case of erosion occurrence, necessary measures to be considered.
B- C L-FND, L-MMD, S-MED
5 Groundwater No adverse effects to the groundwater at the target sites would be occurred, as there are no extraction of a large volume of groundwater by the projects.
D D -
6 Hydrology For the construction of beach nourishment and land reclamation, there will be possibilities that the currents and waves would be changed after the construction.
Necessary considerations and measures to be taken about changes of currents and waves after the construction for the beach nourishment and land reclamation.
C C L-FND 、L-MMD, S-MED
7 Coastal Areas During the construction and/or operation stages, there will be possibilities for the marine ecosystem and coastal areas to be suffered from the adverse effects.
Adequate measures to be taken for the marine ecosystems, especially for the corals inhabiting areas, and migrant birds utilizing.
C C L-FND, L-MMD, L-ISD, L-GAN, S-MED
8 Climate No adverse effects to the groundwater at the target sites would be occurred, as all the projects are in small scale. D
D -
9 Climate Change No adverse effects to the groundwater at the target sites would be occurred, as all the projects are in small scale. D
D -

Data Collection Survey on Building Climate Resilient Safer Cities Final Report
11-32
3) Social Environment
Environmental
Item Issues Measures Evaluation Objective
projects BC/DC OP 1 Resettlement No involuntary resettlement will be occurred by
implementing any proposed projects, as there are no residents and residential areas at all the project sites.
D D -
2 Living and Livelihood
If the target areas are used by the local people regularly, there will be possibilities for the local people not to be able to use the areas during construction.
Dissemination of the objectives and contents of the proposed projects to the local people shall be done before commencement of the construction, and their understandings shall be secured.
C C L-FND, L-MMD, S-MED
3 Heritage There will be no adverse effects for the heritage sits, as there are no heritages at all the project sites and all the concerned projects (L-ISD and L-GAN) would be the facilities to protect such heritage sites nearby the project sites.
D B+ L-GAN, L-ISD
4 Landscape No adverse effects to the landscapes at the target sites would be occurred, as all the projects are in small scale.
D D -
5 Ethnic Minorities and Indigenous Peoples
If the target areas are used by the local people regularly, there will be possibilities for the local people not to be able to use the areas during construction.
Dissemination of the objectives and contents of the proposed projects to the local people shall be done before commencement of the construction, and their understandings shall be secured.
C C L-FND 、
L-MMD, S-MED
Source: JICA Expert Team (2019) A+/-: Significant positive/negative impact is expected, B+/-: Positive/negative impact is expected to some extent, C: Extent of impact is unknown. (A further examination is needed, and the impact could be clarified as the study progresses) and D: No impact is expected. Note: BC: Before Construction, DC: During Construction, OP: Operation Phase
(4) Evaluation results of Component 3
The Installment of terrestrial digital broadcasting system (Activity 3.1) is implemented by JICA as the co-financed project, the project has been screened against JICA’s Environmental and Social Consideration Procedure. The Environmental and Social Screening Template was prepared and the project deemed to be a Category B (medium risk) project, as all the project sites are not located in sensitive areas, nor sensitive characteristics, nor fall into sensitive sectors under the JICA guidelines for Environmental and Social Considerations , and potential adverse impacts on the environment are not likely to be significant.
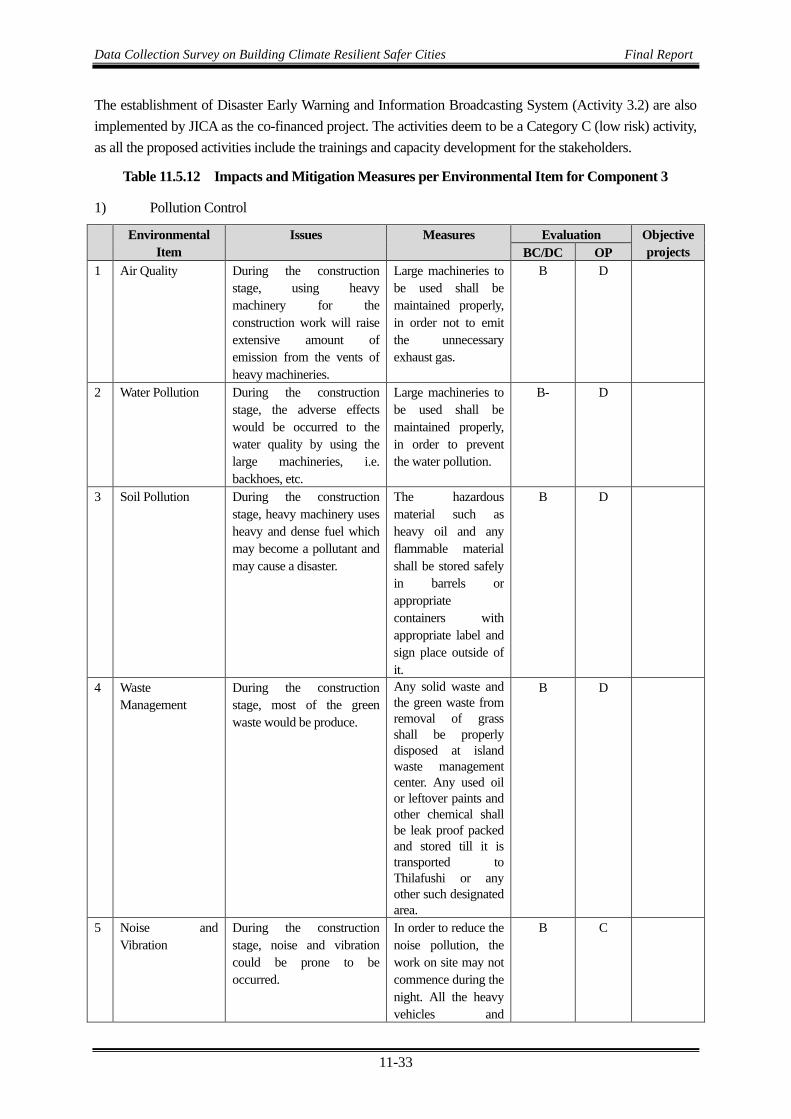
Data Collection Survey on Building Climate Resilient Safer Cities Final Report
11-33
The establishment of Disaster Early Warning and Information Broadcasting System (Activity 3.2) are also implemented by JICA as the co-financed project. The activities deem to be a Category C (low risk) activity, as all the proposed activities include the trainings and capacity development for the stakeholders.
Table 11.5.12 Impacts and Mitigation Measures per Environmental Item for Component 3
1) Pollution Control
Environmental Item
Issues Measures Evaluation Objective projects BC/DC OP
1 Air Quality During the construction stage, using heavy machinery for the construction work will raise extensive amount of emission from the vents of heavy machineries.
Large machineries to be used shall be maintained properly, in order not to emit the unnecessary exhaust gas.
B D
2 Water Pollution During the construction stage, the adverse effects would be occurred to the water quality by using the large machineries, i.e. backhoes, etc.
Large machineries to be used shall be maintained properly, in order to prevent the water pollution.
B- D
3 Soil Pollution During the construction stage, heavy machinery uses heavy and dense fuel which may become a pollutant and may cause a disaster.
The hazardous material such as heavy oil and any flammable material shall be stored safely in barrels or appropriate containers with appropriate label and sign place outside of it.
B D
4 Waste Management
During the construction stage, most of the green waste would be produce.
Any solid waste and the green waste from removal of grass shall be properly disposed at island waste management center. Any used oil or leftover paints and other chemical shall be leak proof packed and stored till it is transported to Thilafushi or any other such designated area.
B D
5 Noise and Vibration
During the construction stage, noise and vibration could be prone to be occurred.
In order to reduce the noise pollution, the work on site may not commence during the night. All the heavy vehicles and
B C

Data Collection Survey on Building Climate Resilient Safer Cities Final Report
11-34
Environmental Item
Issues Measures Evaluation Objective projects BC/DC OP
equipment’s shall be well serviced and maintained to reduce the unnecessary emission and incomplete combustion of the fuel.
6 Subsidence During the construction stage, the dewatering would accelerate the horizontal flow of the groundwater. This will have an impact on the groundwater depletion and subsidence of the ground.
In case surface soil subsiding occurs, the depth of the steal pile needed to be adjusted before commencing the dewatering.
B D
7 Odor No adverse effects to the odor at the target sites would be occurred, as there are no odor sources by the projects.
D D
8 Sediment No adverse effects to the sediment at the target sites would be occurred, as there are no sediment sources by the projects.
D D
9 Accidents There will be possibilities that accidents would occur during the construction.
The accident prevention manual shall be prepared and danger forecast shall be considered. When the workers present at the construction site, the safety helmet and safety shoes needed to be wrorn at all time.
B- D
2) Natural Environment
Environmental Item Issues Measures Evaluation Objective
projects BC/DC OP 1 Protected Areas There are no protected areas and Marine Protected
Areas (MPA) around the proposed project sites. D D -
2 Ecosystem and Fauna/Flora
During the construction stage, most of the vegetation would be cleared and an immediate and most adverse environmental impact on the vegetation will arise.
Adequate measures to be taken for the ecosystem and fauna/ flora; i.e. any tree that could be replanted, shall be replanted in a different location, try to avoid cutting
B- D-
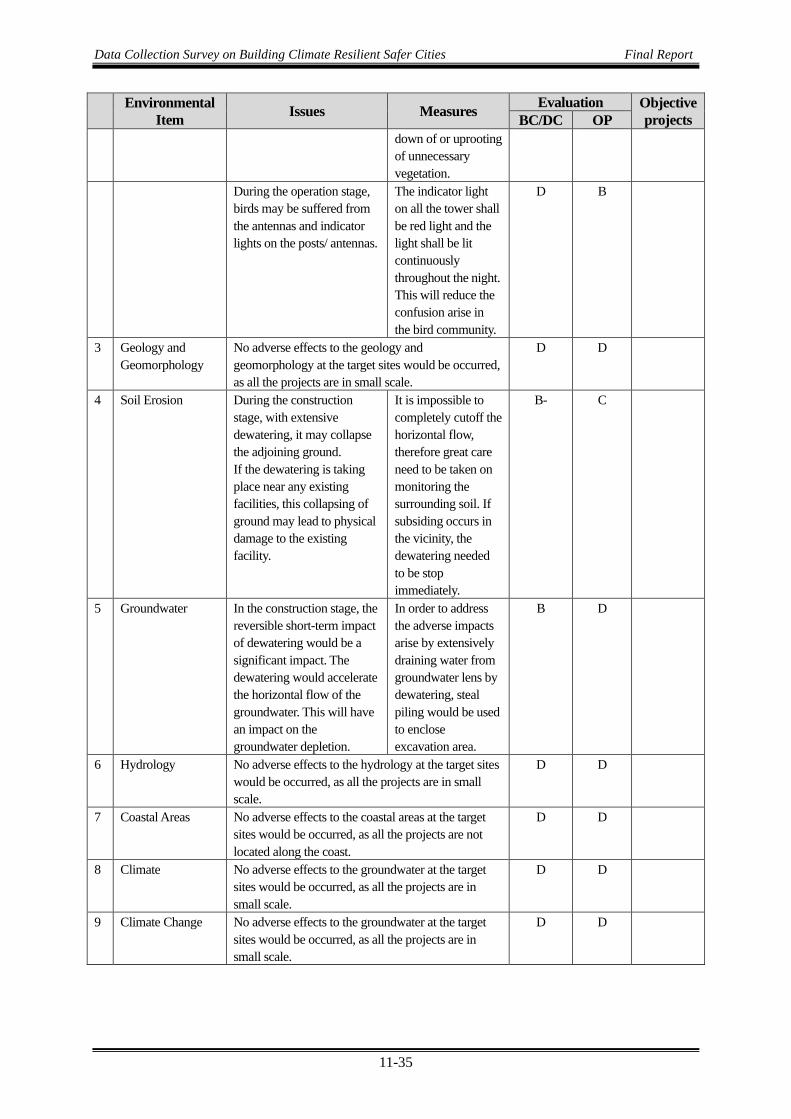
Data Collection Survey on Building Climate Resilient Safer Cities Final Report
11-35
Environmental Item Issues Measures Evaluation Objective
projects BC/DC OP down of or uprooting of unnecessary vegetation.
During the operation stage, birds may be suffered from the antennas and indicator lights on the posts/ antennas.
The indicator light on all the tower shall be red light and the light shall be lit continuously throughout the night. This will reduce the confusion arise in the bird community.
D B
3 Geology and Geomorphology
No adverse effects to the geology and geomorphology at the target sites would be occurred, as all the projects are in small scale.
D D
4 Soil Erosion During the construction stage, with extensive dewatering, it may collapse the adjoining ground. If the dewatering is taking place near any existing facilities, this collapsing of ground may lead to physical damage to the existing facility.
It is impossible to completely cutoff the horizontal flow, therefore great care need to be taken on monitoring the surrounding soil. If subsiding occurs in the vicinity, the dewatering needed to be stop immediately.
B- C
5 Groundwater In the construction stage, the reversible short-term impact of dewatering would be a significant impact. The dewatering would accelerate the horizontal flow of the groundwater. This will have an impact on the groundwater depletion.
In order to address the adverse impacts arise by extensively draining water from groundwater lens by dewatering, steal piling would be used to enclose excavation area.
B D
6 Hydrology No adverse effects to the hydrology at the target sites would be occurred, as all the projects are in small scale.
D D
7 Coastal Areas No adverse effects to the coastal areas at the target sites would be occurred, as all the projects are not located along the coast.
D D
8 Climate No adverse effects to the groundwater at the target sites would be occurred, as all the projects are in small scale.
D D
9 Climate Change No adverse effects to the groundwater at the target sites would be occurred, as all the projects are in small scale.
D D

Data Collection Survey on Building Climate Resilient Safer Cities Final Report
11-36
3) Social Environment
Environmental Item
Issues Measures Evaluation Objective projects BC/DC OP
1 Resettlement No involuntary resettlement will be occurred by implementing any proposed projects, as there are no residents and residential areas at all the project sites.
D D
2 Living and Livelihood
No adverse effects to the living and livelihood at the target sites would be occurred, as all the projects are in small scale.
D D
3 Heritage There will be no adverse effects for the heritage sites, as there are no heritages at all the project sites
D D
4 Landscape No adverse effects to the landscapes at the target sites would be occurred, as all the projects are in small scale.
D D
5 Ethnic Minorities and Indigenous Peoples
No adverse effects to the ethnic minorities and indigenous peoples at the target sites would be occurred, as all the projects are in small scale.
D D
Source: EIA for the Proposed Digital Terrestrial Television Broadcasting Network Development Project, Energy Consultancy Pvt. Ltd. (2018a, 2018b), compiled by JICA (2020)
A+/-: Significant positive/negative impact is expected, B+/-: Positive/negative impact is expected to some extent, C: Extent of impact is unknown. (A further examination is needed, and the impact could be clarified as the study progresses) and D: No impact is expected.
Note: BC: Before Construction, DC: During Construction, OP: Operation Phase
(5) Evaluation results of Component 4
All the activities under Component 4 are implemented by JICA as the co-financed project, and the activities will be screened against JICA’s Environmental and Social Consideration Procedure. The Environmental and Social Screening Template is tentatively prepared and the activities deem to be a Category C (low risk) project, as the proposed activities include the observation of the environmental data and information, and information sharing.
11.5.4 Generic Environmental and Social Management Plan (ESMP)
Based on the preliminary assessments of environmental and social risks and potential impacts relating to GCF's ESS from ESS1 to ESS9, the Generic Environmental and Social Management Plan is examined for each component activity.
11.6 Activity/Site-Specific Assessments, Mitigation Planning and Implementation
11.6.1 Component 1: Establishment of Integrated Coastal Zone Management (ICZM)
(1) Project activities that will be subject to assessments
For the sub-activities under Component 1, there are no activities, that will be subject to assessments.

Data Collection Survey on Building Climate Resilient Safer Cities Final Report
11-37
Table 11.6.1 Necessary assessments for activities under Component 1 Activity Necessary Assessment
Activity 1.1 Inventory study for risk assessment on present coastal and coral reef conditions
No need
Activity 1.2 Preparation of basic policy of ICZM at the national level No need Activity 1.3 Preparation of concrete ICZM Plan at representative
inhabitant island as case study IEE (including screening)
Activity 1.4 Capacity development and information sharing of the relevant organizations for establishment of the ICZM
No need
Source: JICA Expert Team (2020)
(2) Government Permitting requirements
There are no government permitting requirements required for all the activities under Component 1.
(3) The scope of the assessments
According to the Environmental and Social Management Plan (ESMP) in the Clause 11.5.4, the necessary actions should be arranged and conducted for GCF’s ESS 3 under environmental profiles, and ESS 2 under social profiles.
The target areas to be assessed are as follows:
Table 11.6.2 Project Components required for ESS under Component 1 Atoll/ City Island Project Component Funding Source Laamu Fonadhoo Preparation of concrete ICZM plan as
case study under Activity 1.3 JICA co-finance
Gan Preparation of concrete ICZM plan as case study under Activity 1.3
JICA co-finance
Source: JICA Expert Team (2020)
(4) Institutional Arrangements for the preparation of the ESIA and for implementing and monitoring the site-specific mitigation/management plans
The necessary institutional arrangement for the preparation of the ESIA shall be arranged as below, and the site-specific mitigation/ management plans shall be implemented and monitored according to the following table.
Table 11.6.3 Institutional arrangements for preparation of the ESIA for Component 1 Item Maldives side Japan side
Proponent MPI JICA (AE) Environmental assessment (IEE/ ESIA)
Will be conducted by MPI/ME through consulting company.
Will be reviewed by JICA (AE), and necessary assistances will be done by JICA (AE), if necessary.
Approval of ESIA Will be approved by EPA, and EIA Decision Statement will be issued by EPA.
Necessary assistances will be done by JICA (AE).
Monitoring Monitoring will be conducted by PMU.
Monitoring will be assisted and monitored by JICA (AE).
Source: JICA Expert Team (2020)

Data Collection Survey on Building Climate Resilient Safer Cities Final Report
11-38
(5) Activity/Site-Specific Assessments and Mitigation Planning
According to the consideration through the analysis in the above table, the impacts and mitigation measures for each proposed activity are summarized in the following table.
Table 11.6.4 Summary of the Impacts and Mitigation Measures for Component 1 Proposed Activity
Impact Mitigation Measures Rank
(1) Establishment of coastal and reef conservation plan at Gan and Fonadhoo Islands, Laamu Atoll (Activity 1.3)
Inadequate arrangement and management of coastal and reef conservation plan may facilitate the unfairness on utilization of the coastal and reef areas for the livelihood activities by the local people.
In order to prevent/ mitigate such adverse effects on the livelihood, adequate measures should be done to reduce assumed unfairness on utilization.
Rank: B
(2) Establishment and implementation of sediment budget control plan at Gan and Fonadhoo Islands, Laamu Atoll (Activity 1.3)
Inadequate arrangement and management of sediment budget control plan may facilitate inadequate sand quarry and sediment, decrease in water quality, and adverse effect to marine ecosystem and coastal areas.
In order to prevent/ mitigate such adverse effects on the water quality, marine ecosystem and coastal areas, adequate measures; such as establishment of regulations and management structures, examination of alternative quarry sites, etc., should be done to reduce inadequate sediment control.
Rank: B
Source: JICA Expert Team (2020)
11.6.2 Component 2: Implementation of coastal conservation/protection measures against coastal disasters
(1) Project activities that will be subject to assessments
For the activities under Component 2, those activities will be subject to assessments.
Table 11.6.5 Necessary assessments for activities under Component 2 Activity Necessary Assessment
Activity 2.1 Detailed design of coastal conservation measures and capacity development of stakeholders
ESIA
Activity 2.2 Implementation of coastal conservation/ protection measures
ESIA
Activity 2.3 Implementation of beach maintenance, establishment of structure and capacity development of stakeholders
No need
Source: JICA Expert Team (2020)
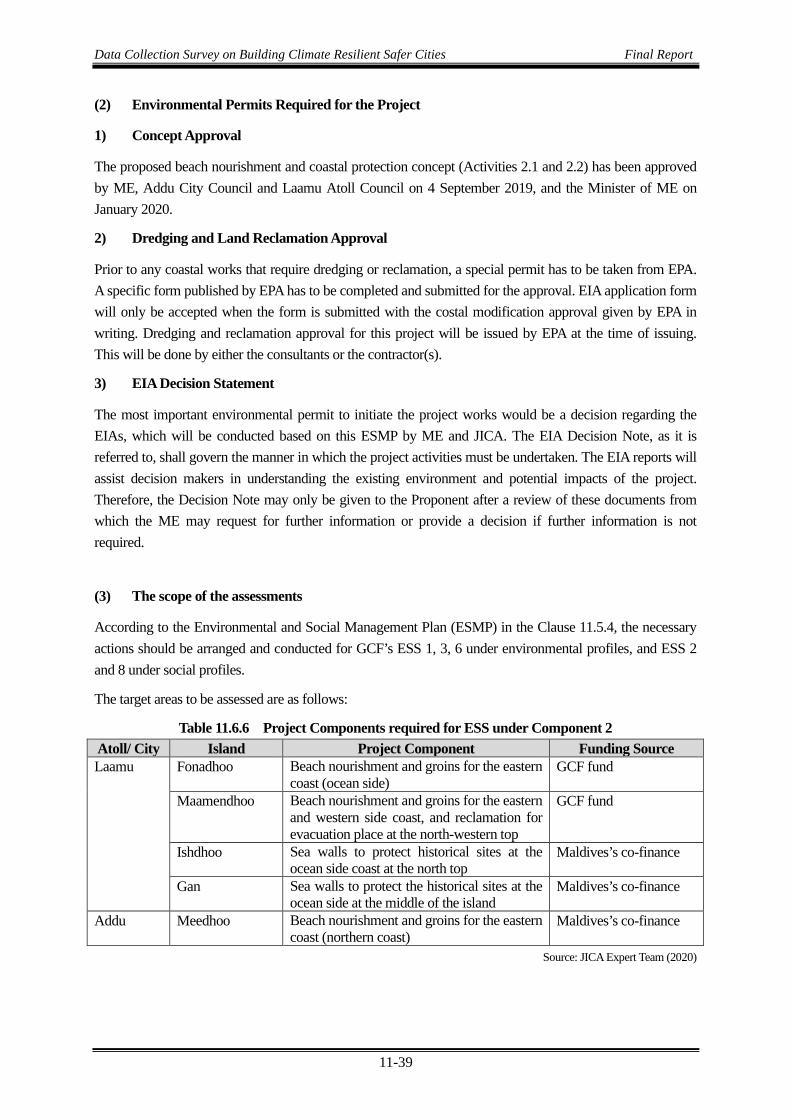
Data Collection Survey on Building Climate Resilient Safer Cities Final Report
11-39
(2) Environmental Permits Required for the Project
1) Concept Approval
The proposed beach nourishment and coastal protection concept (Activities 2.1 and 2.2) has been approved by ME, Addu City Council and Laamu Atoll Council on 4 September 2019, and the Minister of ME on January 2020.
2) Dredging and Land Reclamation Approval
Prior to any coastal works that require dredging or reclamation, a special permit has to be taken from EPA. A specific form published by EPA has to be completed and submitted for the approval. EIA application form will only be accepted when the form is submitted with the costal modification approval given by EPA in writing. Dredging and reclamation approval for this project will be issued by EPA at the time of issuing. This will be done by either the consultants or the contractor(s).
3) EIA Decision Statement
The most important environmental permit to initiate the project works would be a decision regarding the EIAs, which will be conducted based on this ESMP by ME and JICA. The EIA Decision Note, as it is referred to, shall govern the manner in which the project activities must be undertaken. The EIA reports will assist decision makers in understanding the existing environment and potential impacts of the project. Therefore, the Decision Note may only be given to the Proponent after a review of these documents from which the ME may request for further information or provide a decision if further information is not required.
(3) The scope of the assessments
According to the Environmental and Social Management Plan (ESMP) in the Clause 11.5.4, the necessary actions should be arranged and conducted for GCF’s ESS 1, 3, 6 under environmental profiles, and ESS 2 and 8 under social profiles.
The target areas to be assessed are as follows:
Table 11.6.6 Project Components required for ESS under Component 2 Atoll/ City Island Project Component Funding Source Laamu Fonadhoo Beach nourishment and groins for the eastern
coast (ocean side) GCF fund
Maamendhoo Beach nourishment and groins for the eastern and western side coast, and reclamation for evacuation place at the north-western top
GCF fund
Ishdhoo Sea walls to protect historical sites at the ocean side coast at the north top
Maldives’s co-finance
Gan Sea walls to protect the historical sites at the ocean side at the middle of the island
Maldives’s co-finance
Addu Meedhoo Beach nourishment and groins for the eastern coast (northern coast)
Maldives’s co-finance
Source: JICA Expert Team (2020)
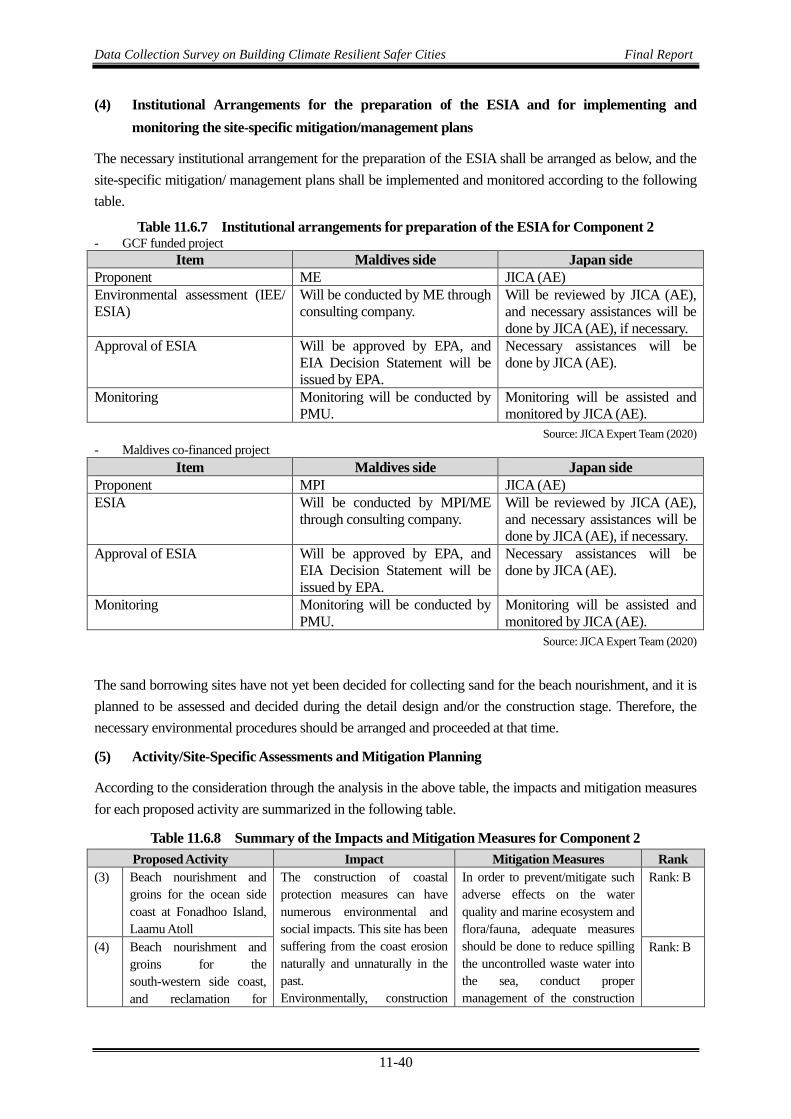
Data Collection Survey on Building Climate Resilient Safer Cities Final Report
11-40
(4) Institutional Arrangements for the preparation of the ESIA and for implementing and monitoring the site-specific mitigation/management plans
The necessary institutional arrangement for the preparation of the ESIA shall be arranged as below, and the site-specific mitigation/ management plans shall be implemented and monitored according to the following table.
Table 11.6.7 Institutional arrangements for preparation of the ESIA for Component 2 - GCF funded project
Item Maldives side Japan side Proponent ME JICA (AE) Environmental assessment (IEE/ ESIA)
Will be conducted by ME through consulting company.
Will be reviewed by JICA (AE), and necessary assistances will be done by JICA (AE), if necessary.
Approval of ESIA Will be approved by EPA, and EIA Decision Statement will be issued by EPA.
Necessary assistances will be done by JICA (AE).
Monitoring Monitoring will be conducted by PMU.
Monitoring will be assisted and monitored by JICA (AE).
Source: JICA Expert Team (2020) - Maldives co-financed project
Item Maldives side Japan side Proponent MPI JICA (AE) ESIA Will be conducted by MPI/ME
through consulting company. Will be reviewed by JICA (AE), and necessary assistances will be done by JICA (AE), if necessary.
Approval of ESIA Will be approved by EPA, and EIA Decision Statement will be issued by EPA.
Necessary assistances will be done by JICA (AE).
Monitoring Monitoring will be conducted by PMU.
Monitoring will be assisted and monitored by JICA (AE).
Source: JICA Expert Team (2020)
The sand borrowing sites have not yet been decided for collecting sand for the beach nourishment, and it is planned to be assessed and decided during the detail design and/or the construction stage. Therefore, the necessary environmental procedures should be arranged and proceeded at that time.
(5) Activity/Site-Specific Assessments and Mitigation Planning
According to the consideration through the analysis in the above table, the impacts and mitigation measures for each proposed activity are summarized in the following table.
Table 11.6.8 Summary of the Impacts and Mitigation Measures for Component 2 Proposed Activity Impact Mitigation Measures Rank
(3) Beach nourishment and groins for the ocean side coast at Fonadhoo Island, Laamu Atoll
The construction of coastal protection measures can have numerous environmental and social impacts. This site has been suffering from the coast erosion naturally and unnaturally in the past. Environmentally, construction
In order to prevent/mitigate such adverse effects on the water quality and marine ecosystem and flora/fauna, adequate measures should be done to reduce spilling the uncontrolled waste water into the sea, conduct proper management of the construction
Rank: B
(4) Beach nourishment and groins for the south-western side coast, and reclamation for
Rank: B

Data Collection Survey on Building Climate Resilient Safer Cities Final Report
11-41
Proposed Activity Impact Mitigation Measures Rank evacuation place at the north-western top at Maamendhoo Island, Laamu Atoll
includes the movement of sediment into the marine environment which could result in smothering of any corals and seagrasses. Socially, construction is likely to hamper the accessibility to the beach for the ordinal users during the construction.
materials (sands for nourishment). Socially and regarding pollution, proper management and arrangement of wastes derived from the construction should be properly implemented.
(5) Sea walls to protect historical sites at the ocean side coast at the north top at Ishdhoo Island, Laamu Atoll
The construction of coastal protection measures can have some environmental and social impacts. These sites have been suffering from the coast erosion naturally and unnaturally in the past. Environmentally, construction includes the revetment wall along the coasts, which could result in changing the marine and coastal ecosystem.
In order to prevent/mitigate such adverse effects on the ecosystem and flora/fauna, adequate measures should be done to decrease such damages through the proper management of the construction.
Rank: C
(6) Sea walls to protect the historical sites at the ocean side at the middle of the island at Gan Island, Laamu Atoll
Rank: C
Beach nourishment and groins for the norther coast at Meedhoo Island, Addu City
The construction of coastal protection measures can have numerous environmental and social impacts. This site has been suffering from the coast erosion naturally and unnaturally in the past. Environmentally, construction includes the movement of sediment into the marine environment which could result in smothering of any corals and seagrasses. Socially, construction is likely to hamper the accessibility to the beach for the ordinal users during the construction.
In order to prevent/mitigate such adverse effects on the water quality and marine ecosystem and flora/fauna, adequate measures should be done to reduce spilling the uncontrolled waste water into the sea, conduct proper management of the construction materials (sands for nourishment). Socially and regarding pollution, proper management and arrangement of wastes derived from the construction should be properly implemented.
Rank: B
Source: JICA Expert Team (2019)
11.6.3 Component 3: Development of disaster warning and information dissemination
(1) Project activities that will be subject to assessments
For the activities under Component 3, those activities will be subject to assessments.
Table 11.6.9 Necessary assessments for activities under Component 3 Activity Necessary Assessment
Activity 3.1 Installment of terrestrial digital broadcasting system ESIA Activity 3.2 Establishment of disaster early warning and
information broadcasting system IEE
Source: JICA Expert Team (2020)

Data Collection Survey on Building Climate Resilient Safer Cities Final Report
11-42
(2) Environmental Permits Required for the Project
1) Environmental screening procedures conducted by JICA (EE)
The facilities under Component 3 are constructed by JICA through its Grant Aid as the co-financed project. The project has been screened against JICA’s Environmental and Social Consideration Procedure. The Environmental and Social Screening Template was prepared and the project deemed to be a Category B (medium risk) project, as all the project sites are not located in sensitive areas, nor sensitive characteristics, nor fall into sensitive sectors under the JICA guidelines for Environmental and Social Considerations (April 10), and potential adverse impacts on the environment are not likely to be significant. The result of the screening has been disclosed in the website of JICA .
2) ESIAs conducted by the proponent
Based on the results of JICA’s Environmental screening, GoM conducted the Screening procedures in 2017, and nine (9) sites, out of 22 candidate sites, were screened out for the further procedure: i.e. conducting EIA.
Based on the results of the screening by GoM, the EIAs were conducted by the EIA consultant in 2018. In addition, three (3) sites are additionally selected for further procedures.
Table 11.6.10 List of Islands for which EIAs were conducted for Component 3 Atoll Island Remarks
1 Ha Dhidhdhoo EIA: Energy Consultancy Pvt. Ltd. (2018a ) Decision Statement (Approval of Environmental Impact Assessment): No. 203-EIARES/PSM/2018/3 (date of issue: 9 May 2018)
2 HDH Kulhudhuffushi 3 Sh Funadhoo 4 N Manadhoo 10 V Felidhoo 11 ADh Dhangethi 14 L Gan 15 Th Guraidhoo 17 GDh Fiyoari 18 GDh Thinadhoo Additionally selected.
EIA: Energy Consultancy Pvt. Ltd. (2018b ) Decision Statement (Approval of Environmental Impact Assessment): No. 203-EIARES/PSM/2018/4 (date of issue: 4 June 2018)
21 S Hithadhoo Ga Nilandhoo
Source: JICA Expert Team (2020)
(3) The scope of the assessments (GCF's ESS2 to ESS8)
According to the Environmental and Social Management Plan (ESMP) in the Clause 11.5.4, the necessary actions should be arranged and conducted for GCF’s ESS 3 under environmental profiles and ESS 2 and 8 under social profiles.

Data Collection Survey on Building Climate Resilient Safer Cities Final Report
11-43
(4) Institutional Arrangements for the preparation of the ESIA and for implementing and monitoring the site-specific mitigation/management plans
The necessary institutional arrangement for the preparation of the ESIA shall be arranged as below, and the site-specific mitigation/ management plans shall be implemented and monitored according to the following table.
Table 11.6.11 Institutional arrangements for preparation of the ESIA for Component 3 Item Maldives side Japan side
Proponent PMS JICA (EE) Environmental assessment (IEE/ ESIA)
Have been conducted by PMS through consulting company.
Have been reviewed by JICA (EE).
Approval of ESIA Have been approved by EPA, and EIA Decision Statements have been issued by EPA.
Have been monitored JICA (EE).
Monitoring Monitoring will be conducted by PMS. Monitoring will be assisted and monitored by JICA (EE).
Source: JICA Expert Team (2020)
11.6.4 Component 4: Development of basic data collection and sharing system related to climate change
(1) Project activities that will be subject to assessments
For the sub-activities under Component 4, there are no activities, that will be subject to assessments.
Table 11.6.12 Necessary assessments for activities under Component 4 Activity Necessary Assessment
Activity 4.1 Development of wave and sea level monitoring system No need Activity 4.2 Development of beach, coral reef, and land use monitoring system No need
Source: JICA Expert Team (2020)
(2) Government Permitting requirements
There are no government permitting requirements required for all the activities under Component 4.
(3) The scope of the assessments
There are no assessments required for all the activities under Component 4.
(4) Institutional Arrangements for the preparation of the ESIA and for implementing and monitoring the site-specific mitigation/management plans
There are no institutional arrangement required for all the activities under Component 4.
11.6.5 Capacity building and training
In the Component 2, the consultant for the detailed design/construction supervision, procured by PMU, will play an important role for the capacity development of the human resources of the Maldives. Those national consultants are to be trained through on-the-job trainings, while working with technical international consultants.

Data Collection Survey on Building Climate Resilient Safer Cities Final Report
11-44
If the human resources in the government agencies in the Maldives are sufficient, it is desirable to target the officials of MEE, MNPI and the local council being dispatched to the Project as full-time PMU members, however, the government agencies are constantly understaffed, they may be dispatched as part-time basis.
In order for that purpose, all project staff, especially the PMU, and members of the Project Board will be required to attend an induction training that: (i) covers substantive matters relevant to the ESMF requirements, (ii) explains the responsibilities of all the relevant parties for matters of monitoring, reporting and assurance related to social and environmental impacts and mitigation measures; and (iii) covers the operational mechanisms related to public transparency and accountability as well as those mechanisms to be used for ensuring coordination and information sharing among ME, JICA and GCF as well as with local councils, private sector actors and other partners with contract responsibilities 11.7 Summary of Consultation and Stakeholder Engagement Plan
11.7.1 Stakeholder Engagement
This stakeholder engagement plan will apply to all components of the proposed project and all third parties are expected to adhere to this as they execute their assigned activities.
Objectives
The objectives of the stakeholder engagement plan are;
- To identify all project stakeholders including their priorities and concerns;
- To identify strategies for information sharing and communication to stakeholders as well as consultation of stakeholders in ways that are meaningful and accessible throughout the project cycle;
- To specify procedures and methodologies for stakeholder consultations, documentation of the proceedings and strategies for feedback;
- To establish an accessible, culturally appropriate, transparent and responsive grievance mechanism for the project; and
- To develop a strategy for stakeholder participation in the monitoring of project impacts and reporting or sharing of results among the different stakeholder groups.
11.7.2 Previous Stakeholder Engagement
During the preparation of the feasibility study, many kinds of stakeholders were consulted through coordination meetings, public consultation meetings, gender assessment consultation meetings, and individual meetings in order to discuss the design and scope of the Project and in order to collect their opinions.
During the various consultations, the project objective and activities were briefly explained by the study team, and the following topics were addressed by the participants and the findings incorporated into the feasibility study:
- Situations: coastal erosion, disappearance of sandy beach, vulnerability to climate change, inadequate waste management, necessity of capacity development on coastal management,

Data Collection Survey on Building Climate Resilient Safer Cities Final Report
11-45
- Measures: desire to recover the sandy beaches (beach nourishment), unnecessity of revetment along the coasts, land reclamation for evacuation
- Gender: voluntary coast cleaning (by women), involvement of women development group to the coastal monitoring and cleaning, inequity on access to the coasts (to vulnerable persons).
- Disaster prevention: insufficient information dissemination system on the disaster, difficulties to evacuate for the vulnerable persons (women, children, disables).
Table 11.7.1 Schedules of the Public Consultation Meetings Atoll/ Island
No. Venue Date No. Participants
Laamu Public consultation meeting Fonadhoo Island Council February 25, 2019 15 Fonadhoo Island Council May 15, 2019 15 Laamu Atoll Education Centre September 10, 2019 16 Ishdhoo - -
Gender assessment Consultation meeting
Fonadhoo (Female) 10/Sep/2019 13 Fonadhoo (Male) 27/May/2019 7 Maamendhoo (Female) 28/May/2019 13 Maamendhoo (Male) 28/May/2019 7 Ishdhoo (Female) 10/Sep/2019 12 Ishdhoo (Male) 10/Sep/2019 7
Addu
Public consultation meeting Hithadhoo February 14, 2019 13 Hithadhoo May 15, 2019 8 Hithadhoo August 29, 2019 31 Meedhoo August 29, 2019 11
Gender assessment consultation meeting
Hithadhoo (Female) 20/May/2019 6 Hithadhoo (Male) 21/May/2019 12
Source: JICA Expert Team (2019)
Main discussion points at each public consultation meeting are as follows:
Table 11.7.2 Main Discussion Points at each Public Consultation Meeting Atoll No. Main Discussions Remarks
Laamu First ・ Present concerned areas are 1) northern-side coast from the harbor at lagoon side of northern Gan Island, 2) northern-side coast from the harbor at lagoon side of central part of Gan Island, 3) northern-side coast from the harbor at lagoon side of south of Gan Island
・ As Gan Island is most populated island in this atoll, there is necessary to conduct the hard (physical) measures. However, no desire to be as same as Male’ Island.
・ Necessity to conduct the concrete type walls at the ocean side, and rock revetments at the lagoon side.
All participants come from Gan Island, including the President of the Atoll, and Atoll Council members.
Second ・ Explained the proposed measures examined by the JICA Expert Team.
・ Inquiries on the size of beach nourishment. ・ Necessity to expand the residential areas and construct the
evacuation areas by land reclamation at Maamendhoo island ・ Community-based monitoring system can be managed if
necessary equipment would be supplied.
Residents from Maamendhoo and Fonadhoo islands also attended.
Third ・ Explained the proposing measures through the FP Residents from

Data Collection Survey on Building Climate Resilient Safer Cities Final Report
11-46
Atoll No. Main Discussions Remarks ・ Importance to protect the historic sites at Ishdhoo Island ・ Necessity to utilize the external funds to the adequate ways in
order not to be utilized to the unplanned measures. ・ Island Council should be included into the members of PMU
Isdhoo Island also attended.
Addu/ Hithadhoo
First ・ Severe coastal erosion at lagoon side of Hankede areas, where are utilized as the swimming areas. Resort development plan at Hankede areas have been cancelled.
・ Illegal sand mining is one of the main causes for the coastal erosion. Sand dredging for the land reclamation at Feydhoo island and construction of the new jetty at lagoon side are also main causes for the coastal erosion.
・ Coastal protection measures are necessary, but no need to be developed as Male’ Island
・ Beach nourishment is the best measures to be conducted.
Fishermen group members shall be attended at the next meeting.
Second ・ As there is the resort development plan for Hankede areas, this area was excluded from the target area.
・ Inquiries from the participants on the size of beach nourishment
・ Necessity to include the ocean side of Hankede area, as one of the co-financed projects by the Maldives government.
Third ・ Explanation on the proposing projects through FP ・ Through the development of the Link Roads, the people’s
livelihood have been improved, however, coastal erosion have been facilitated.
・ The JICA Expert Team understood that the benefit to the residents increased through the development of the Link Roads. Best solutions would be considered.
Addu/ Meedhoo
First ・ Explanation on the proposing projects through FP ・ Divergent views on the proposing beach nourishment
together with groins were raised by the participants for the northern top of Meedhoo Island. Recovery of the sandy beach is desirable, however, unsure if beach would be recovered by the beach nourishment with groins.
・ Sands for the beach nourishment are planned to be dredged at the points far from the islands with more than 30m deep.
・ Unsure whether effective maintenance would be possible after implementation, because the Maldives Government does not fund for the maintenance of nourished beach.
・ JICA Expert Team explained the additional wave measurement by the wave hunter at Meedhoo Island.
Source: JICA Expert Team (2019)
11.7.3 Stakeholder Engagement Plan
(1) Stakeholder Engagement Plan (SEP)
The stakeholder engagement plan (SEP) for directly financed projects should have:
- A detailed process for effective engagement with communities and individuals, including vulnerable and marginalized groups and individuals, who are affected or potentially affected by proposed GCF-supported activities, including co-financed activities;
Data Collection Survey on Building Climate Resilient Safer Cities Final Report
11-47
- A description of how information will be disclosed; the process by which meaningful consultation and informed participation will occur in a culturally appropriate and gender responsive manner; and, in certain circumstances, steps that will be taken to obtain the fee, prior and informed consent of indigenous peoples; and
- A process for receiving and managing concerns and grievances at the project level that has been designed in consultation with stakeholders and complements the AE’s grievance redress mechanism and GCF Independent Redress Mechanism.
The stakeholder engagement plan will focus on through the project period, from the feasibility study of the project through implementation phase. The SEP should be confirmed together with the feasibility study, the Environmental and Social Management Framework (ESMF) and Gender Assessment/Gender Action Plan, which elaborate on the interaction between the different institutions during the implementation phase. The SEP will mainly focus on project engagement with lower level stakeholders that are not part of the project organization; i.e., PSC and PMU. The main activities include the following:
- Mobilization of beneficiaries from the project commencement to implementation (information, sensitization, participation);
- Identification of critical issues (erosion, land, vulnerable groups);
- Grievance management;
- Supervision and monitoring during implementation stage; and
- Implementation of the Environmental and Social Management Framework.
Engaging relevant stakeholders increases their ownership of the project, and can contribute to replicating and/or transferring actions, methodologies or technologies that are employed in the activity. From the proposal preparation stage, efforts are undertaken to engage stakeholders during project preparation and how engagement should continue during implementation. In order to achieve such continued engagement, feedback mechanisms can be built into the project design. In addition, ME can play an important role in facilitating stakeholder engagement from an early stage.
Engagement of relevant stakeholders in all stages is key to successful design and implementation of activities.
(2) Objectives of the SEP
The objectives of the SEP are:
- To offer opportunities for stakeholders to raise their concerns and submit their opinions. - To create avenues for complaints handling and grievance management. - To create opportunities for information sharing and disclosure. - To create a mechanism for giving feedback to the stakeholders. - To create an avenue for participatory project impacts monitoring. - To foster strong project community relationships. - To promote social acceptability of the project. - To ensure meaningful consultation and the consideration of expectations and concerns into the
implementation arrangements for the project.

Data Collection Survey on Building Climate Resilient Safer Cities Final Report
11-48
(3) Stakeholder Engagement Process
In order to conduct more meaningful stakeholder engagement, the following points are to be considered.
- Processes are designed to be flexible, adapting and responding to national and local conditions and activity requirements;
- Project budgets include resources for stakeholder engagement activities, including salaries or fees for qualified staff and/or consultancy expertise to carry them out;
- Engagement begins early enough to identify key issues and influence related decisions; - Communication flows two ways, allowing all sides an opportunity to listen, exchange views and have
their concerns addressed; - Processes are inclusive; and should take into account that women, men and members of different ethnic
groups may have different needs and perspectives, as well as different approaches to engaging and decision-making;
- Engagement activities are free from coercion or manipulation; - Meetings are well documented to keep track of the information disclosed, the groups and individuals
who have been engaged, when and where meetings took place, key issues raised, commitments and agreements, and how stakeholder concerns have been addressed; and
- Clear and mutually agreed processes are well prepared for timely reporting of actions taken, with clarification regarding upcoming steps.
11.7.4 Grievance Mechanism
(1) Grievance Mechanism
A grievance redress mechanism becomes integral part of stakeholder engagement process. The mechanism needs to take into special consideration vulnerable groups and how easy access to the grievance mechanism is ensured to such parties. Handling of grievance is the responsibility of PMU, EEs (JICA-1&4 and JICA-3) and the local councils.
The objectives of the grievance mechanism will be:
- To create a mechanism where affected people can address their grievances or complaints; and
- To create a mechanism through which the project will be able to pick-up all the complaints and grievances. The project will systematically, promptly and exhaustively respond to the peoples’ complaints.
A three-tier system will be established under the project to ensure a fair process for addressing grievances. This Grievance Redress Mechanism (GRM) is developed based on the experience of ME and JICA.
(2) Complaints Handling Process (Project Management and Implementation)
Grievances related to project implementation should be resolved within the project implementation structure through a three-tier system. All affected stakeholders will be expected to submit their complaints to either of the following collection points as of Tier 1:
- Community leader
- Local councils (atoll/ island)

Data Collection Survey on Building Climate Resilient Safer Cities Final Report
11-49
All the grievances or complaints by a group of people who have been directly affected by the adverse impacts through the failure of the project will be filed and registered in the PMU’s database by the LGA officer. The concerned officers will then investigate the validity of the grievance and plan the way forward. A factfinding mission will be conducted together with the complainant, community leader and a PMU officer (Atoll based officer/ SEO). Proposals on how the grievance can be resolved will be discussed and the complainant will be advised accordingly. The GRM information will be given to the stakeholders during the project consultative meetings. Furthermore, the GRM will be displayed in council notice board, website and a notice board highlighting the process will be installed in each project site.
Table 11.7.3 Three-tier Grievance Redress Mechanism Tiers of
Grievance Mechanism
Nodal Person for Contact Communication and other facilitation by the project
Timeframe to address
grievance First Tier (Tier 1): (Atoll/City Council/ Island Council/ Community Advisory board)
Atoll Councils/ City Council will be the first point of contact for any grievances. Once the community advisory board is formed, complaints received by the Atoll/ City council will be sent to the community advisory board for advice.
- In the Council Offices and at the project locations, there will be an Information Board listing the names and contact telephones/emails.
- Grievances can be addressed informally by contacting the Councils.
- If the grievance cannot be resolved informally, an aggrieved party must submit a complaint on the Tier 1 Complaint Form. A copy of the form should be provided to the aggrieved party as evidence of receipt. The complaint form should be available from the website of MEE and from the Atoll/ City Councils.
- For those who cannot write, a council staff will assist them to fill the form.
- The council may pass the grievance to the Community Advisory Board for comments and input.
- A meeting (if required, a public meeting) must be held by the Community Advisory Board to discuss a complaint submitted on a Complaint Form.
- If the complaint is resolved within 15 days, the Atoll/ City Council must communicate the decision to the aggrieved party in writing.
- The aggrieved party must acknowledge the receipt of decision and submit their agreement or disagreement with the decision within 10 days.
- If no acknowledgement is submitted from the aggrieved party, then the decision will be considered as accepted.
- If a complaint requires more time to address, this requirement must be communicated to the aggrieved party in writing and the aggrieved party must consent and sign-off the request for the extension to take effect. An extension can be made to an additional 15 days.
15 days
Second Tier (Tier 2): (Ministry of Environment, Climate Change and Technology
Ministry of Environment, Climate Change and Technology (ME), Social Environmental and
- If the grievance cannot be resolved through Tier 1, an aggrieved party must submit a complaint on the Tier 2 Complaint Form. A copy of the form should be provided to the aggrieved party as evidence of receipt. The complaint form should be available from the website of ME and the Atoll/ City Councils and from city council office.
15 days

Data Collection Survey on Building Climate Resilient Safer Cities Final Report
11-50
Tiers of Grievance
Mechanism
Nodal Person for Contact Communication and other facilitation by the project
Timeframe to address
grievance (ME))
Gender Officer (SEGO) at the Project Management Unit (PMU) will be the focal point.
- ME will forward the grievance to PMU. - PMU will screen the grievance to determine if it is
related to the GCF project. If it is unrelated, the aggrieved party must be notified in writing and the way forwarded must be outlined to them including the necessary government institutions to follow up, like the Police.
- Social Environmental and Gender Officer at the PMU will be the contact person in processing a grievance through the Tier 2.
- If required, the ME must arrange a public meeting to address the Tier 2 grievance and notify the nature of the grievance and the meeting venue to the aggrieved party.
- ME may also visit the site and hold onsite discussions and meetings.
- The PMU will be responsible to ensure that there is no cost imposed on the aggrieved person, due to the grievance mechanism at the second tier.
- If the complaint is resolved within 15 working days, the PMU must communicate the decision to the aggrieved party in writing.
- The aggrieved party must acknowledge the receipt of decision and submit their agreement or disagreement with the decision within 10 days.
- If no acknowledgement is submitted from the aggrieved party, then the decision will be considered as accepted.
- If the grievance is not resolved to the satisfaction of the aggrieved party within 15 working days of submission of the grievance to Tier 2 then the aggrieved party may notify the ME, in writing, of the intention to move to Tier 3.
Third Tier (Tier 3): Judiciary Power / Assistance to Vulnerable Persons beyond the Project’s Grievance Redress Mechanism
An individual has the option of going to established judiciary system of the country
- The legal system is accessible to all aggrieved persons.
- Assistance from the GCF project is available only for vulnerable person(s) as per this grievance mechanism.
- In cases where vulnerable person(s) are unable to access the legal system, the Attorney General´s office will provide legal support to the vulnerable person(s). The PMU must assist the vulnerable person(s) in getting this support from Attorney General´s Office. PMU must also ensure that there is no cost imposed on the aggrieved person if the person belongs to the vulnerable groups. The list of vulnerable groups is as defined in the footnote but may be further defined by ME.
- The verdict of the Courts will be final.
As per the judicial procedure of the Maldives.
Source: JICA Expert Team (2019)

Data Collection Survey on Building Climate Resilient Safer Cities Final Report
11-51
11.8 Gender Assessment
11.8.1 Gender assessment
This gender assessment aims to provide an overview of the gender situation in the Maldives, with a specific focus on protecting and increasing the resilience of groups in vulnerable situations, particularly women and children from the adverse impact of climate change on rising sea levels and coastal erosion in Addu and Laamu Atolls, which are main atolls for the project “Building Climate Resilient Safer Islands in the Maldives (hereinafter referred to as “the Project””. The assessment will highlight gender issues that have a bearing on the Project, as well as opportunities to empower women through gender responsive adaptation, mitigation, and risk reduction measures. The assessment is based on both primary and secondary sources. Primary sources include information collected from the implementation of gender assessment consultation meetings. Secondary sources include research and studies conducted by the Government of the Maldives, donor agencies, multilateral development banks, academia, and civil society. Data gathering activities will focus on:
a) Aligning the proposed project approach with the Maldives’s national priorities as reflected in the Seventh National Development Plan 2006-2010 and the Manifesto of the Maldivian Democratic Party – Alliance 2008-2013.
b) Synthesizing and building on information obtained and lessons learned from past interventions and gender assessments.
c) Engaging women who might be potentially affected by project activities which includes their voice into this assessment, as well as that of other vulnerable groups (the elderly, disabled persons, and the children).
d) Formulating gender sensitive project output and outcome indicators.
e) Designing mainstreaming and equity activities targeting women which promotes their agency and leadership.
11.8.2 Legal and Administrative Framework Protecting Women and Protecting Gender Equality
(1) International Gender Framework
1) International Commitments to Gender Equality
The Maldives became a signatory to the UN Convention on the Elimination of All Forms of Discrimination (CEDAW) in 1993 and in 2005, the Maldives ratified the Optional Protocol to CEDAW (OP-CEDAW).
The Maldives is signatory to a number of international instruments addressing gender equality and a party to all major human rights treaties: i.e., International Covenant on Civil and Political Rights (ICCPR) 1966 (signatory 2006), ICCPR Optional Protocol 1966 (signatory 2006), International Covenant on Economic, and Social and Cultural Rights (ICESCR 1966) (signatory 2006).
The Maldives is also a party to the Commonwealth Action Plans on Gender Equality and regional initiatives such as SAARC Convention on Preventing and Combating Trafficking in Women and Children for Prostitution and SAARC-UNIFEM Project on the Gender Infobase.

Data Collection Survey on Building Climate Resilient Safer Cities Final Report
11-52
2) The Millennium Development Goals (MDGs)
The Maldives is committed to the achievement of the MDGs by 2015 and the Maldives achieved five of the eight MDGs before 2015, making it the first ‘MDG plus (+) country in the South-Asia region. However, MDG Goal 3: Promote Gender Equality and Empower Women was not achieved and additional efforts and emphasis needs to be placed on SDG Goal 5.
3) Sustainable Development Goals (SDGs)
A new global developmental agenda, known as the 2030 Agenda of Sustainable Development, was adopted on 25 September 2015. A Sustainable Development Goals Division has been established at the Ministry of Environment and Energy in May 2016. The division is mandated to coordinate, monitor, and report the implementation process of SDGs in the Maldives. In order to facilitate the implementation of the SDGs in the Maldives, a National Ministerial Coordination Committee (NMCC) was formed to provide policy guidance and feedback from their respective agencies and other areas of knowledge and ensure the integration of economic, environmental, governance, and social aspects in the implementation.
One of the main tasks for the year 2018/2019 includes integration of the SDGs into the budgetary process through program budgeting. Some sectors, namely; education, health, energy, waste management, fisheries, water and sanitation, and local governance, have incorporated the SDGs into respective policy documents and action plans. In local governance, the Local Government Authority has aligned its Five-year Development Plan (2017-2021) with SDGs, which will be implemented by the island councils.
(2) National Gender Frameworks
1) Government Structures to Address the Gender Issues
The government structures to address gender issues have shifted multiple times over the last 25 years. A Gender Committee formed in 1979 was declared a Gender Department in 1989 and it grew to be the Gender Ministry in 1993. However, since then, the name of the Gender Ministry, its mandate and its work portfolios have continued to shift (Department of National Planning 2012; Hope for Women 2012). The Ministry of Law and Gender was established in 2014 to be responsible for gender policy, and renamed to Ministry of Gender and Family. When the new (current) government formed its cabinet on November 2018, they reformed it to the Ministry of Gender, Family and Social Services.
2) National Commitments to Gender Equality
All persons are guaranteed the same rights and freedoms under the Constitution of the Republic of Maldives (2008).
Economic empowerment of women, women and environment, special needs and concerns of women, women’s participation in development, temporary special measures/ affirmative action to facilitate women’s equal access to available opportunities, harassment of women and gender-based violence, women and non-traditional non-stereotypical work, women in politics and decision-making, and fundamental freedoms were emphasized as the government’s policy on women and gender equality.
3) National Gender Equality Policy
The National Gender Equality Policy and Framework for Action (Draft 1) consolidates President Mohamed Nasheed’s women’s policy framework which was announced in the International Women’s Day (2009) statement into public policy. The draft includes recommendations for an effective NWM/ Lead Agency for
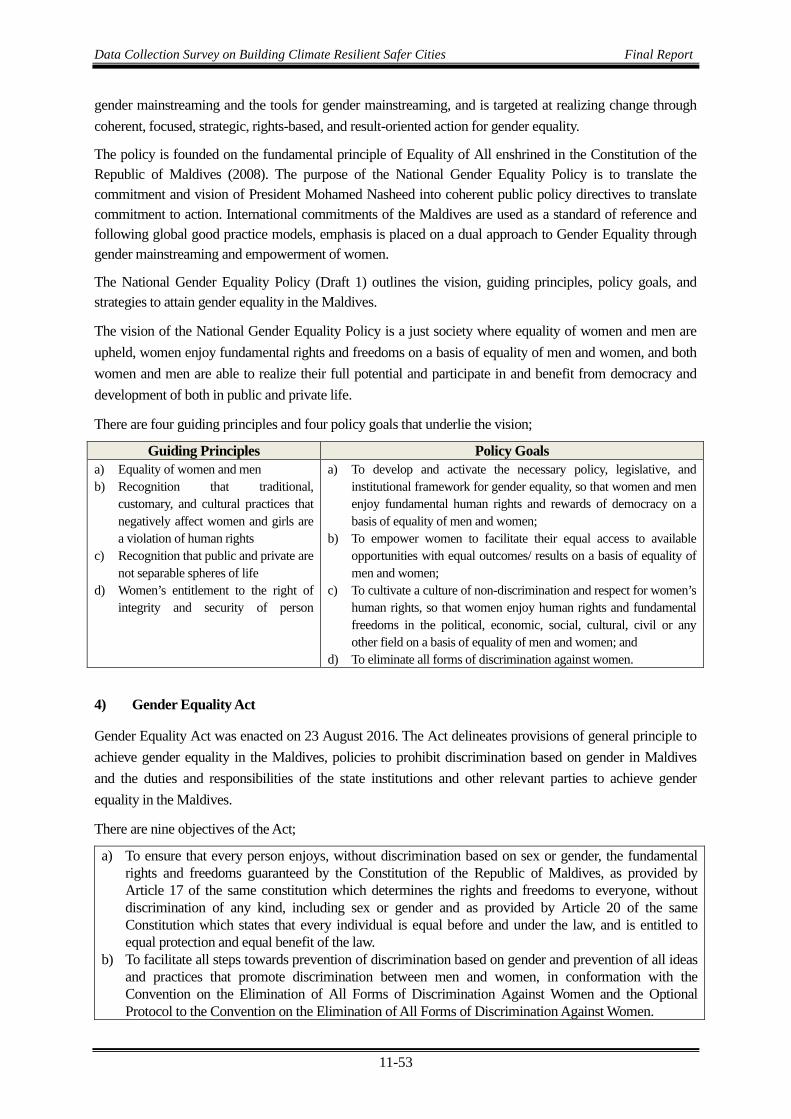
Data Collection Survey on Building Climate Resilient Safer Cities Final Report
11-53
gender mainstreaming and the tools for gender mainstreaming, and is targeted at realizing change through coherent, focused, strategic, rights-based, and result-oriented action for gender equality.
The policy is founded on the fundamental principle of Equality of All enshrined in the Constitution of the Republic of Maldives (2008). The purpose of the National Gender Equality Policy is to translate the commitment and vision of President Mohamed Nasheed into coherent public policy directives to translate commitment to action. International commitments of the Maldives are used as a standard of reference and following global good practice models, emphasis is placed on a dual approach to Gender Equality through gender mainstreaming and empowerment of women.
The National Gender Equality Policy (Draft 1) outlines the vision, guiding principles, policy goals, and strategies to attain gender equality in the Maldives.
The vision of the National Gender Equality Policy is a just society where equality of women and men are upheld, women enjoy fundamental rights and freedoms on a basis of equality of men and women, and both women and men are able to realize their full potential and participate in and benefit from democracy and development of both in public and private life.
There are four guiding principles and four policy goals that underlie the vision;
Guiding Principles Policy Goals a) Equality of women and men b) Recognition that traditional,
customary, and cultural practices that negatively affect women and girls are a violation of human rights
c) Recognition that public and private are not separable spheres of life
d) Women’s entitlement to the right of integrity and security of person
a) To develop and activate the necessary policy, legislative, and institutional framework for gender equality, so that women and men enjoy fundamental human rights and rewards of democracy on a basis of equality of men and women;
b) To empower women to facilitate their equal access to available opportunities with equal outcomes/ results on a basis of equality of men and women;
c) To cultivate a culture of non-discrimination and respect for women’s human rights, so that women enjoy human rights and fundamental freedoms in the political, economic, social, cultural, civil or any other field on a basis of equality of men and women; and
d) To eliminate all forms of discrimination against women.
4) Gender Equality Act
Gender Equality Act was enacted on 23 August 2016. The Act delineates provisions of general principle to achieve gender equality in the Maldives, policies to prohibit discrimination based on gender in Maldives and the duties and responsibilities of the state institutions and other relevant parties to achieve gender equality in the Maldives.
There are nine objectives of the Act;
a) To ensure that every person enjoys, without discrimination based on sex or gender, the fundamental rights and freedoms guaranteed by the Constitution of the Republic of Maldives, as provided by Article 17 of the same constitution which determines the rights and freedoms to everyone, without discrimination of any kind, including sex or gender and as provided by Article 20 of the same Constitution which states that every individual is equal before and under the law, and is entitled to equal protection and equal benefit of the law.
b) To facilitate all steps towards prevention of discrimination based on gender and prevention of all ideas and practices that promote discrimination between men and women, in conformation with the Convention on the Elimination of All Forms of Discrimination Against Women and the Optional Protocol to the Convention on the Elimination of All Forms of Discrimination Against Women.

Data Collection Survey on Building Climate Resilient Safer Cities Final Report
11-54
c) To ensure that women enjoy equal terms with men, human rights, fundamental rights, and equal opportunities in their economic, social, cultural, civil, and political life in the Maldives. In conformation with the Convention on the Elimination of All Forms of Discrimination Against Women and the Optional Protocol to the Convention on the Elimination of All Forms of Discrimination Against Women.
d) To protect human dignity. e) To establish principles of gender equality in the conduct of state institutions, businesses, civil society
organizations, employers, other legal entities, and individuals. f) To establish gender equality principles in making social, economic, political and cultural policies. g) To end all forms of violence against women and girls. h) To take special steps to establish gender equality. i) To establish a culture of empowerment, provide equal opportunities, and an enabling environment to
achieve results on gender equality.
5) Decentralization Act (7/2010)
the Decentralization Act (7/2010) was enacted on 2010. The Act and its subsequent amendments ensures the participation of women in decision making in the local islands. Under the Act, local level decision making is delegated to City Councils, Atoll Councils and Island Councils, in which one third of seats are allocated for women following its amendment in 2019.
In addition, the Women’s Development Committees (WDCs) of each island established under the Act will be engaged in project decision making processes to ensure that women’s concerns and priorities are taken onboard. The Act also stipulates WDCs shall be consulted by the local councils in the formulation of local regulations.
11.8.3 Results of Qualitative Assessments
(1) Stakeholder Engagement
The gender assessments were conducted in order to understand any possible effects by implementing the proposed projects at each target island, according to the following schedules. The gender assessment consultation meetings were held separately by gender (female and male) through the individual meetings and questionnaire surveys.
Table 11.8.1 Schedules of the Gender Assessment Consultation Meetings Atoll Island Target (gender) Implementation date No. of Participants
Laamu Fonadhoo Female September 10, 2019 13 Male May 27, 2019 7
Maamendhoo Female May 28, 2019 13 Male May 28, 2019 7
Isdhoo Female September 10, 2019 13 Male September 10, 2019 6
Addu Hithadhoo Female May 20, 2019 6 Male May 21, 2019 12
Source: JICA Survey Team (2019)

Data Collection Survey on Building Climate Resilient Safer Cities Final Report
11-55
(2) Specific issues raised include:
The followings are the issues raised during the meetings, per project component and/or per mutual issues:
1) Issues related to all/ several component:
Even in economic organizations, the involvement of men is greater than that of women. It was suggested that the reason could be that women are the primary caregivers in households.
Women are provided the opportunity legally, but there are barriers which they have to overcome in terms of proving themselves worthy to the public compared with men.
2) Issues related to Component 1:
Regarding the community-based management of the site, many females and males mentioned that the workload would increase for women in terms of maintaining the cleanliness of the area. The Women’s Development Committee (WDC) would be most likely to do the work as men would not be interested in doing such work voluntarily.
Box: Main comments from the participants (Female: Maamendhoo) The overall workload of women would increase with the development of the
area in terms of managing the cleanliness of the area as women are the people who are actively working in the NGOs responsible for maintaining the cleanliness of the entire island.
(Male: Ishdhoo) The workload for women will be increased due to the proposed interventions. (Male: Fonadhoo) The Women's Development Committee (WDC) would be most likely to do the work
as men would not be interested in doing such work voluntarily, unless it comes in the form of job opportunities. Another suggested solution was that to find interested youth from the island to work on the community-based management of the area.
(Male: Fonadhoo) When it comes to the community-based management of the site, the workload would increase for women in terms of maintaining the cleanliness of the area. Moreover, should the area be appropriate, there would be business opportunities which men would grab. The area could be used for volunteerism and other social work.
(Female: Ishdhoo) Woman will take care of the place (coastal area) more (Female: Maamendhoo) The coastal area was previously used as a defecating site, prior to toilets
being established at homes. Women are the people who mostly utilize the area to spend time with kids on the beach, but if there is a boat being harbored for maintenance or building, then men would also use the area. So it was agreed that the overall use is equal among men and women.
(Male: Maamendhoo) The political decisions are majorly made by men but that women also have the opportunity and there are some active women in the field.
3) Issues related to Component 2:
Due to the coastal erosion, most participants, regardless gender, think that many sandy beaches, coastal roads, and coastal vegetation were eroded away, and now it is difficult for them to go to the coastal areas easily for many purposes: e.g. for men to do fishing and surfing, and for women to walk with children, collect coconuts, and also for conduct traditional medical treatment.

Data Collection Survey on Building Climate Resilient Safer Cities Final Report
11-56
Women worry about inequality in access to the eroded sites because people with disabilities and people of old age have difficulties accessing the area due to the erosion that has taken place in the area, whilst men think that there are no inequalities in social group accessibility except for people with disabilities.
Box: Main comments from the participants (Female: Meedhoo) Many roads have eroded away. Within the past three years, roads in close
proximity have been repaired due to erosion. (Male: Fonadhoo) The erosion process has been accelerated and that people have only started to care
now, and the concern was not observed previously, which resulted in the soil eventually eroding. The people are a lot more aware of the situation that they were years back.
(Male: Fonadhoo) The islanders are faced with many difficulties, mainly due to rain which leads to flooding, erosion and falling of trees in the area as a result.
(Female: Addu): Pebble mining is also a huge reason of the current coastal situation and there still is a huge demand and market for pebbles for the home yards.
(Male: Meedhoo) Due to climate change both gender have had impact from sea bounty such as reef gaining and fishing.
(Female: Ishdhoo) Now we are not able to come from the beach area due to the erosion. (Male: Maamendhoo) There are no inequalities when it comes to different social groups and all have
equal access to the area.
4) Issues related to Component 3:
Overall, it is difficult for women to evacuate from the home in case of disaster, because they would not be able to move due to the fear, and also they need to take care of children and elders in their houses. On the contrary, it is much easier for men to evacuate from the home even in case of disaster.
The evacuation plans are not planned, or even planned, they are not well disseminated to the participants. Most of participants indicated that the island councils/ disaster management committees are those who would decide how to manage (evacuate) in case of disaster. However, for some islands, information dissemination methods used by the council is not effective.
Box: Main comments from the participants (Male: Maamendhoo) The authorities, council, disaster management center as well as the government
work together in instructing the civilians on how to act during a disastrous situation. (Female: Maamendhoo) Overall, in the case of a disaster, which can as be as much as king surges
which might flood a home, women would find it most difficult to deal with the situation due to the difficulty in managing the fear. Men would find it more easy to deal with the situation and find a way to salvage the belongings and people in the event of a natural disaster.
(Male: Fonadhoo): Regarding the way to set the evacuation procedures of the island, there is no existing evacuation plan, but announcements on how to act are made when the disaster takes place. However, there are some trained personnel in the island.
(Female: Addu) Trainings for disaster management are to be conducted by the Disaster Management Centre of the Maldives. However, despite conducting different training programmes in various islands each week, Addu has never been part of any trainings conducted. The early warning systems were not implemented and utilized properly and the public has no knowledge of how to prepare for bad weather at the least, except for small directions provided by MNDF.

Data Collection Survey on Building Climate Resilient Safer Cities Final Report
11-57
5) Issues related to Component 4:
There are no specific issues raised during the consultation meetings for the activities under Component 4.

Data Collection Survey on Building Climate Resilient Safer Cities Final Report
12-1
CONSIDERATIONS FOR THE PROJECT IMPLEMENTATION
Considerations for the Implementation Arrangement
Project Steering Committee (PSC)
In the Project, the Maldives’ technical and engineering foundation for responding to the climate events with increasing occurrence frequency due to climate change will be strengthened through Component 1: Establishment of the Integrated Coastal Zone Management (ICZM) (non-physical (soft) measure) and Component 2: Implementation of Coastal Conservation/Protection Measures against Coastal Erosion (physical (hard) measure). At the same time, Component 3: Development of Disaster Warning and Information Dissemination (evacuation measure) will be implemented for the extreme events that are not protected by the physical (hard) / non-physical (soft) measures. Further, Component 4: Development of Basic Data Collection and Sharing System Related to Climate Change will be implemented to obtain the essential basic data necessary as precondition for the planning and implementation of each of the measures and the establishment of a sharing system of such data among relevant agencies. In order for various agencies to share the Project information and cooperate to strengthen the long-term and sustainable resilience of the national land against climate change, the Project Steering Committee (PSC) will be established thereby effectively implementing the components and facilitating discussions towards replication in the country. Under the oversight of PSC, the Component 1, 3, 4 and a part of Activity 2.3 of Component 2 will be financed and implemented by the Japan International Cooperation Agency (JICA) as the Executing Entity (EE). For Component 2, the Green Climate Fund (GCF) financing activities and the Maldives financing activities will be implemented by the Ministry of Environment, Climate Change and Technology (ME) as EE, in cooperation with Ministry of National Planning and Infrastructure (MNPI). For the efficient implementation of the activities, the project management unit (PMU) will be established for Component 2. The JICA financing activities are grouped into Components 1, 4 and a part of Activity 2.3 (EE will be called as JICA-1&4) and Component 3 (EE will be called as JICA-3), and a JICA Expert Team will be formed for each of the groups to implement the activities. The implementation arrangement of the Project will be as shown in Figure 12.1.1, in which the PMU and JICA Expert Teams report to the PSC via the EEs such as ME, JICA-1&4 and JICA-3.
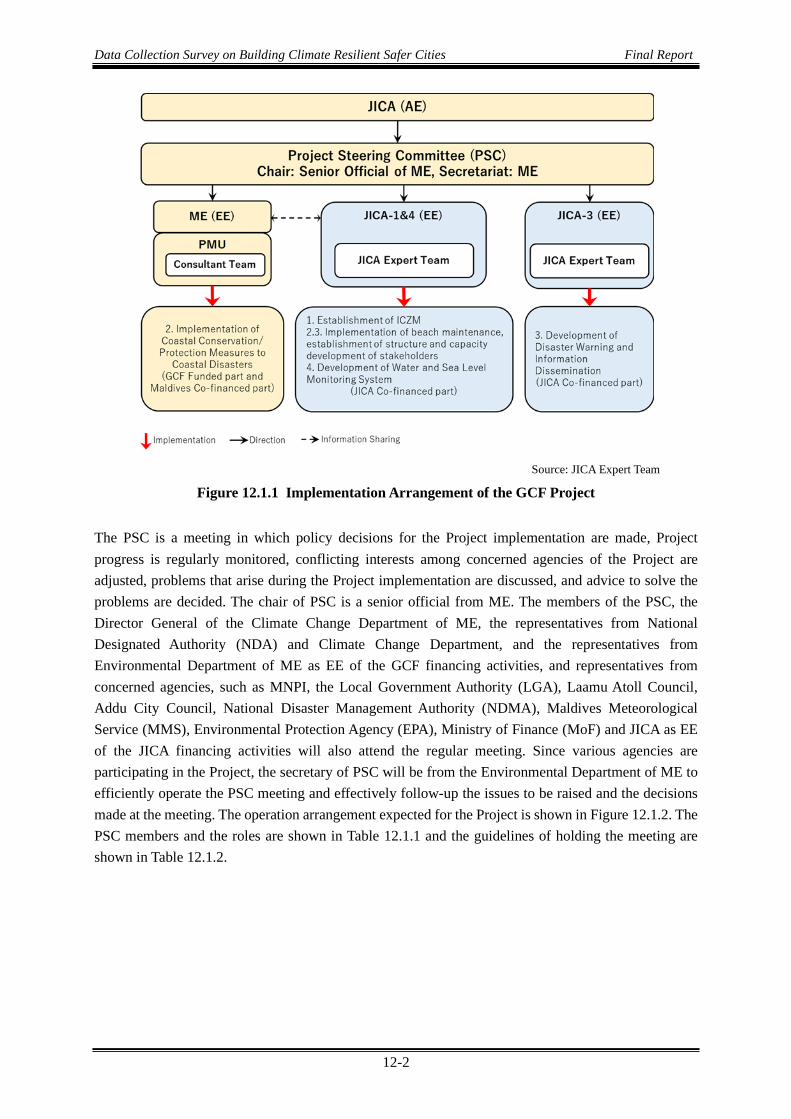
Data Collection Survey on Building Climate Resilient Safer Cities Final Report
12-2
Source: JICA Expert Team
Figure 12.1.1 Implementation Arrangement of the GCF Project
The PSC is a meeting in which policy decisions for the Project implementation are made, Project progress is regularly monitored, conflicting interests among concerned agencies of the Project are adjusted, problems that arise during the Project implementation are discussed, and advice to solve the problems are decided. The chair of PSC is a senior official from ME. The members of the PSC, the Director General of the Climate Change Department of ME, the representatives from National Designated Authority (NDA) and Climate Change Department, and the representatives from Environmental Department of ME as EE of the GCF financing activities, and representatives from concerned agencies, such as MNPI, the Local Government Authority (LGA), Laamu Atoll Council, Addu City Council, National Disaster Management Authority (NDMA), Maldives Meteorological Service (MMS), Environmental Protection Agency (EPA), Ministry of Finance (MoF) and JICA as EE of the JICA financing activities will also attend the regular meeting. Since various agencies are participating in the Project, the secretary of PSC will be from the Environmental Department of ME to efficiently operate the PSC meeting and effectively follow-up the issues to be raised and the decisions made at the meeting. The operation arrangement expected for the Project is shown in Figure 12.1.2. The PSC members and the roles are shown in Table 12.1.1 and the guidelines of holding the meeting are shown in Table 12.1.2.
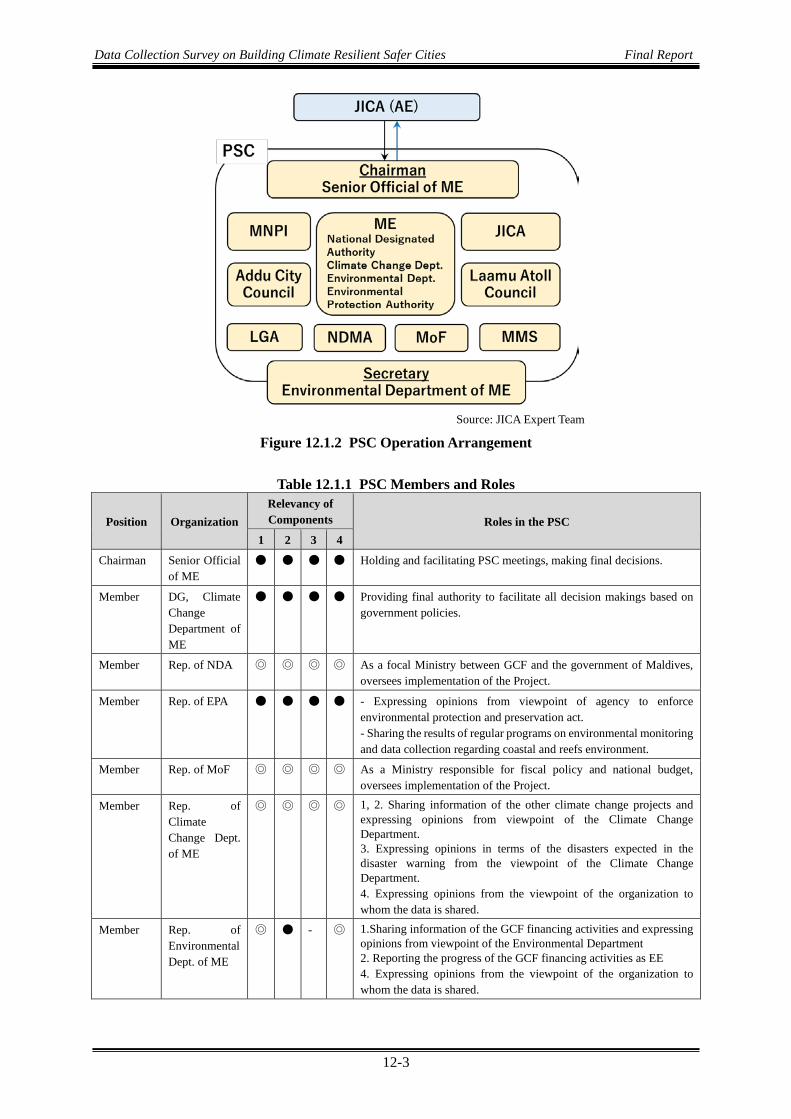
Data Collection Survey on Building Climate Resilient Safer Cities Final Report
12-3
Source: JICA Expert Team
Figure 12.1.2 PSC Operation Arrangement
Table 12.1.1 PSC Members and Roles
Position Organization Relevancy of Components Roles in the PSC
1 2 3 4
Chairman Senior Official of ME
● ● ● ● Holding and facilitating PSC meetings, making final decisions.
Member DG, Climate Change Department of ME
● ● ● ● Providing final authority to facilitate all decision makings based on government policies.
Member Rep. of NDA ◎ ◎ ◎ ◎ As a focal Ministry between GCF and the government of Maldives, oversees implementation of the Project.
Member Rep. of EPA ● ● ● ● - Expressing opinions from viewpoint of agency to enforce environmental protection and preservation act. - Sharing the results of regular programs on environmental monitoring and data collection regarding coastal and reefs environment.
Member Rep. of MoF ◎ ◎ ◎ ◎ As a Ministry responsible for fiscal policy and national budget, oversees implementation of the Project.
Member Rep. of Climate Change Dept. of ME
◎ ◎ ◎ ◎ 1, 2. Sharing information of the other climate change projects and expressing opinions from viewpoint of the Climate Change Department. 3. Expressing opinions in terms of the disasters expected in the disaster warning from the viewpoint of the Climate Change Department. 4. Expressing opinions from the viewpoint of the organization to whom the data is shared.
Member Rep. of Environmental Dept. of ME
◎ ● - ◎ 1.Sharing information of the GCF financing activities and expressing opinions from viewpoint of the Environmental Department 2. Reporting the progress of the GCF financing activities as EE 4. Expressing opinions from the viewpoint of the organization to whom the data is shared.

Data Collection Survey on Building Climate Resilient Safer Cities Final Report
12-4
Position Organization Relevancy of Components Roles in the PSC
1 2 3 4
Member Rep. of MNPI ◎ ● - ● 1. Sharing information of the other infrastructure projects and expressing opinions from infrastructure developer’s viewpoint. 2. Providing cooperation to ME by discussing and understanding the concept and process of Maldives financing activities. 4. Reporting the progress of JICA financing activities together with JICA as counterpart of the activities (Land and Survey Dept) and expressing opinions from the viewpoint of the organization (Coastal Protection and Disaster Risk Reduction Unit) to whom the data is shared.
Member Rep. of LGA ◎ ◎ ◎ 〇 1, 2, 3. Expressing opinions in terms of replication of the activities to the inhabited islands other than the target islands of the activities. 4. Expressing opinions from the viewpoint of the organization to whom the data is shared.
Member Rep. of Addu City Council
● ● ◎ 〇 1. Reporting the progress of the JICA financing activities as the target atoll of the case study. 2. Reporting the progress of the GCF financing activities together with ME and MNPI as the atoll council of the target islands of the activities. 3. Reporting the progress of the JICA financing activities together with NDMA and MMS as the target atoll of the activities. 4. Expressing opinions from the viewpoint of the atoll council of the target islands of the activities and organization to whom the data is shared.
Member Rep. of Laamu Atoll Council
● ● ◎ 〇 1. Reporting the progress of the JICA financing activities as the target atoll of the case study. 2. Reporting the progress of the GCF financing activities together with ME and MNPI as the atoll council of the target islands of the activities. 3. Reporting the progress of the JICA financing activities together with NDMA and MMS as the target atoll of the activities. 4. Expressing opinions from the viewpoint of the organization to whom the data is shared.
Member Rep. of NDMA
◎ ◎ ● 〇 1. Expressing opinions in terms of disaster management at the national level. 2. Expressing opinions in terms of protecting people during disasters. 3. Reporting the progress of the JICA financing activities together with JICA and MMS as the counterpart of the activities. 4. Expressing opinions from the viewpoint of the organization to whom the data is shared.
Member Rep. of MMS 〇 - ● ● 1. Expressing opinions from the MMS viewpoint in terms of ICZM at the national level. 3. Reporting the progress of the JICA financing activities together with JICA and NDMS. 4. Reporting the progress of the JICA financing activities together with JICA as the counterpart of the activities.
Member Rep. of JICA ● ● ● ● 1,3,4. Reporting the progress of the JICA financing activities as EE 2. Reporting the progress of JICA part of Activity 2.3.
Secretary Environmental Dept of ME
● ● ● ● Preparing for holding PSC meetings, preparing and sharing meeting minutes, following up of the decisions made at the PSC.
Note: ●: For the component, the member is actively involved in and reporting the progress of the activities. ◎: For the component, the member expresses its opinion to accomplish the objectives of the organization. 〇: For the component, the member expresses its opinion as a beneficiary organization.
Source: JICA Expert Team

Data Collection Survey on Building Climate Resilient Safer Cities Final Report
12-5
Table 12.1.2 PSC Meeting Holding Guidelines Item Contents Notes
Frequency Semi-annual base Special meeting to be held on an ad hoc basis as necessary
Attendees PSC member PSC Secretary sits for the preparation of the meeting and preparation of the minutes of the meeting. When necessary, concerned PMU member will attend.
Agenda Following issues on all components - Implementation policies - Progress of the Project - Adjustment of conflicting
interests among concerned agencies
- Issues raised by EE/PMU
Meeting Documents
Progress report of the Project (updating of the previous meeting)
For Component 2, the consultant reports confirmed by PMU are approved by EE (ME). For the Component 1,3, 4, and JICA part of Activity 2.3, the reports prepared by the JICA Expert Teams are confirmed by EE (JICA-1&4/JICA-3) and then approved by the Chairman of PSC. Thereafter, they are submitted to JICA (AE). Copies are distributed to the PSC members at the same time.
Financial information and APR to be submitted to GCF
Reports are drafted by PMU for Component 2 and by the JICA Expert Teams for the Component 1, 3, 4 and JICA part of Activity 2.3 and are submitted to EE (ME / JICA-1&4/ JICA-3). EE-approved reports are submitted to the Chairman of PSC. Upon his approval, the reports are submitted to JICA (AE) for approval. The approved copies of the reports are distributed to the PSC members.
Papers on the issues raised by EE/PMU
Necessary papers are drafted by PMU for Component 2 based on the consultant reports and by the JICA Expert Teams for the Component 1, 3, 4 and JICA part of Activity 2.3 on unexpected issues which occurred during the Project implementation and submitted to EE for approval. Upon approval by EE, the Chairman of PSC confirms and provides approval as well. Thereafter, the papers are shared with JICA (AE) and copies are distributed to the PSC members at the same time.
Minutes of the meeting The minutes is drafted by the PSC Secretary, confirmed with the attendees, and then submitted to the Chairman of PSC. Upon approval of the Chairman, it is shared with JICA (AE). A copy is distributed to the PSC members at the same time.
Source: JICA Expert Team
Project Management Unit (PMU)
The PMU, established on behalf of the EE for Component 2, are responsible for the procurement of consultant for detail design/construction supervision and contractors and the day-to-day project management including design, construction, monitoring of defect liability period and commencement of beach monitoring and management activities. The members of PMU are composed of various experts such as project manager, technical adviser, social environmental and gender officer, knowledge management officer, procurement/contract manager, senior procurement adviser, and supporting staffs,

Data Collection Survey on Building Climate Resilient Safer Cities Final Report
12-6
such as office administrator, accountant, document controller and secretary; all of them are employed from external sources outside of ME. The function of PMU will end when the final performance report of the Project is submitted, and the final administration of the Project expenses is settled. The roles of the PMU members are shown in Table 12.1.3.
Table 12.1.3 Roles of PMU Members (1/2) Position Roles
Project Manager Overall supervision, technical supervision and daily activity management, report preparation - As a leader of PMU, responsible for daily management of the activities based on the
plan, ensure the activities to be completed within the period and expenses as planned and fulfill the required quality.
- In case unexpected situation arises, consult with PSC for policy guidance and advice so that the activities will continue to achieve the objectives.
- When necessary, attend the PSC meeting together with the representative of ME. Technical Adviser
Providing technical advice, quality assurance (reviewing bidding documents, evaluation, checking consultant report, etc.), safety management of construction - Support PMU work by providing technical expertise on coastal
protection/conservation in reviewing and evaluating bidding documents, scrutinizing reports of detailed design/construction supervision consultant regarding civil work and maintenance work and other matters from the technical engineering aspect.
- Since it works most closely with the activities implementation and assures quality of the activities, the procurement and contract of the technical adviser are carried out by JICA using the GCF fund.
- The reporting lines of the technical adviser are JICA as employer and the Project Manager as the leader of PMU.
Social Environmental and Gender Officer
Environmental and social and gender consideration (necessary administration, coordination with concerned agencies, monitoring) - Responsible for the administration necessary for confirming the approval of the
Environmental Social Impact Assessment and coordination with concerned agencies for smooth implementation of the activities according to the plan, stakeholder engagement plan and gender action plan.
- Review the consultant’s environmental, social and gender monitoring report and confirm necessary measures are taken.
- In case unexpected situation is foreseen, report to the project manager with possible countermeasures and implement the measures.
- When necessary, attend the PSC meeting together with the project manager. Knowledge Management Officer
- Communication of the activities, promotion of the activities among stakeholders including preparation of awareness materials, media engagement, and writing update reports etc.
- Collecting and organizing knowledge and lessons learned from the project activities to improve the activities and reflect to activities to other projects in Maldives and other countries.
Procurement /Contract Manager
Procurement administration (reviewing and preparing draft bidding documents, announcement, evaluation, contract negotiation, management of procurement and contract related documents) - Lead the procurement of the consultant for detailed design and construction
supervision, and the contractors for civil work according to the procurement policy of JICA as AE.
- Review the draft bidding documents prepared by the ME for the selection of the consultant, review the documents prepared by the consultant for the selection of the contractor, finalize and announce bidding documents, evaluate bidders, request PSC approval for evaluation report, discuss contract conditions during contract negotiation and conclude contract with successful bidder, and file documents regarding procurement and contracts.

Data Collection Survey on Building Climate Resilient Safer Cities Final Report
12-7
Position Roles Senior Procurement Adviser
Procurement supervision - Confirm that the activities led by the procurement/contract manager comply with
procurement policy of AE, by providing technical expertise on AE’s procurement system.
- Since it works as a double check function within PMU, the procurement and contract of the technical adviser are carried out by JICA using the GCF fund.
- The reporting lines of the senior procurement adviser are JICA as employer and the project manager as the leader of PMU.
Office Administrator
Logistics arrangement
Accountant Management of project budget and project management budget, disbursement request, management of accounting documents - Manage project budget and Maldives co-financed activity budget including project
management budget, preparing the disbursement request, file accounting records and documents throughout the project period under the supervision of the project manager
Document Controller
Support day-to-day documentation work of Procurement/Contract Manager in preparation of bidding documents, reports, and contract related documents
Secretary Administration work other than above Source: JICA Expert Team
Figure 12.1.3 shows the operation arrangement of PMU expected in the Project.
Source: JICA Expert Team
Figure 12.1.3 Operation Arrangement of PMU
Capacity Development through Detailed Design/Construction Supervision Consultant
In the Component 2, the consultant for the detailed design/construction supervision, procured by PMU, will play an important role for the capacity development of the human resources of the Maldives. The consultant is expected to be procured through international competitive bidding and is required to form a team with Maldivian consultants. The capacity development of the Maldivian human resources will be expected through the co-work of Maldivian consultants with international consultants, active coaching by international consultants and active learning by the Maldivian consultants by utilizing the

Data Collection Survey on Building Climate Resilient Safer Cities Final Report
12-8
actual cases during the activities implementation. If the human resources in the government agencies in the Maldives are sufficient, it is desirable to target the officials of ME, MNPI and the local council being dispatched to the Project as full-time members. However, the government agencies are constantly understaffed. For example, the number of vacant positions in ME is 111 against the approved positions of 217 as of February 2019. According to the interviews with MNPI and the local council, dispatching the existing officials to the new project is difficult due to the work load currently handled by each official, and new recruitment for the vacant posts is also difficult because of the budget deficiency. On the other hand, ME already started employing local consultants, who worked for donor funded project on a contract basis, as the civil servants after completion of the project so that the project impact is sustained. During the interview, ME and MNPI officials expressed their view that the employment of human resources whose ability and experiences are confirmed in the donor funded projects is relatively acceptable within the government. In a similar way, it is expected in the project that the government agencies such as ME, MNPI and local council will employ the Maldivian resources who gained experience and performed well in the Project after completion of their contracts. This should be done in order to utilize them as the core resource to spread learnings and experiences from the Project out to the organization. The consultant team procured by PMU will be composed of international consultants and local consultants. The local consultants will obtain technical and practical expertise from international consultants by working together for the Component 2. Some of the local consultant positions, such as co-team leader and site engineers, are expected to be employed as contract staffs as per government after the completion of the contracts. Those consultants would play a role to disseminate his/her learnings and experiences gained in the project to the government organizations. Especially, the personnel who play a role as site engineers and learn much about beach nourishment are expected to be employed at the island councils after completion of the construction supervision for utilizing his/her first-hand experiences gained in the consultant team to beach maintenance work implemented through the Activity 2.3 at the site.
Procurement System for Consultant and Contractor
Procurements in Component 2 that will be implemented using the fund from GCF and GoM are carried out in accordance with the procurement policy of JICA as AE. The contract, with procurement value up to MVR 5,000,000, will be approved by the Secretary of ME based on the decisions made at the bid committee formed in ME. A procurement value more than that will be approved by the Secretary of ME based on the decisions made at the National Tender Board, chaired by the Ministry of Finance. The procedure of procurement and announcement, and the participants and approvers depending on the ranges of procurement values are shown in Table 12.1.4.

Data Collection Survey on Building Climate Resilient Safer Cities Final Report
12-9
Table 12.1.4 Procurement Rules of the GoM (Extracted) (1/2) Procurement Value (*1) Procedure Announcement Participants Approvers
Less than MVR 2,000 (Less than USD 133)
Shopping NA NA Procurement officer of the government agency in charge
MVR 2,000 ~ MVR 35,000 (USD 133 ~ USD 2,333)
Financial Executive of the government agency
MVR 35,000 ~ MVR 100,000 (USD 2,333 ~ USD 6,667)
Open Tender
Government procurement notices website, government gazette, public notice board of the agency, newspaper, or magazine (*4)
Can be restricted to Maldivian firms
Head of the government agency as per the decision of the bid committee (*2) or a person approved by the head of the agency MVR 100,000 ~ MVR
250,000 (USD 6,667 ~ USD 16,667)
In addition to the above, public notice board of the local council MVR 250,000 ~
MVR 5,000,000 (USD 16,667 ~ USD 333,333)
Invite international firms
MVR5,000,000 ~ MVR15,000,000 (USD333,333 ~ USD1,000,000)
Head of the government agency as per the decision of the national tender board (*3) upon submission
Over MVR15,000,000 (Over USD 1,000,000)
In addition to above, at least 2 international magazines and newspapers published and circulated internationally
*1 Amount in USD is for reference only. Exchange rate applied is 1 USD = 15 MVR as tentative. *2 The bid committee is a procurement committee formed within the government agency in charge of the procurement
(comprised of 7 members including the Chairman). Committee members are selected based on head of agency review (any person who doe procurement works cannot be a member).
*3 The national tender board is a procurement board comprised of seven members including the chairman. The president of the Republic of Maldives, with the advice of the Minister of Finance, shall decide and appoint the members to the board. As of November 2019, it is composed of the chairman and secretary from the Ministry of Finance, and the other members from the president’s office, Ministry of National Planning and Infrastructure (MNPI), Attorney General Office, Ministry of Environment, Climate Change and Technology (ME), Ministry of Economic Development and the private sector.
*4 Announcement by newspaper or magazine is done if there is not enough competition is expected. Approval by MoF is required to publish.
(http://www.finance.gov.mv/ministry/statutory-boards/national-tender-board) Source: Chapter 10 of Public Finance Regulation (Unofficial Translation) received from ME
Management of the Fund
The Project will be implemented with the fund from JICA for Components 1, 3, 4 and a part of Activity 2.3. The funds from GCF and GoM will be used for Component 2 other than a part of Activity 2.3 that JICA will finance.
In terms of the Component 2 GCF financing activities, the GCF’s fund will be disbursed to the designated account of JICA as AE based on the annual Project cost estimation. After the second disbursement, the timing will be decided based on the actual expenditure ratio. The disbursement of GCF’s fund from JICA (AE) to the designated account of the GoM will be made by disbursement request
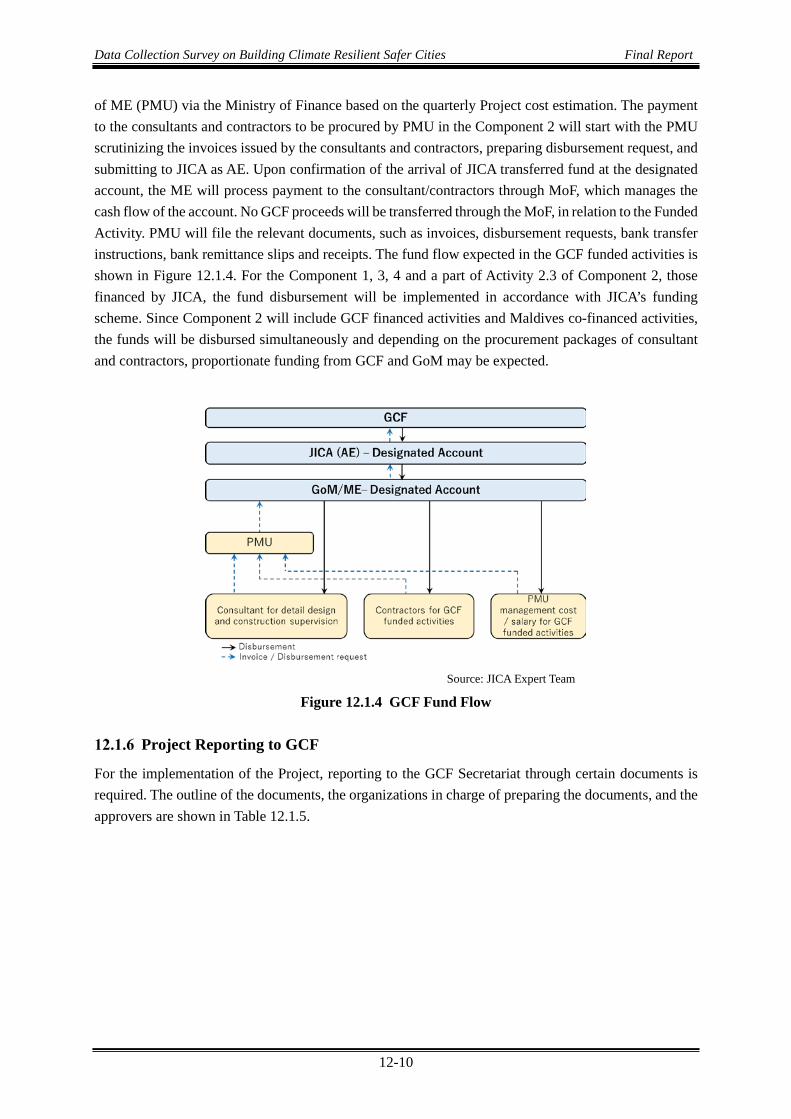
Data Collection Survey on Building Climate Resilient Safer Cities Final Report
12-10
of ME (PMU) via the Ministry of Finance based on the quarterly Project cost estimation. The payment to the consultants and contractors to be procured by PMU in the Component 2 will start with the PMU scrutinizing the invoices issued by the consultants and contractors, preparing disbursement request, and submitting to JICA as AE. Upon confirmation of the arrival of JICA transferred fund at the designated account, the ME will process payment to the consultant/contractors through MoF, which manages the cash flow of the account. No GCF proceeds will be transferred through the MoF, in relation to the Funded Activity. PMU will file the relevant documents, such as invoices, disbursement requests, bank transfer instructions, bank remittance slips and receipts. The fund flow expected in the GCF funded activities is shown in Figure 12.1.4. For the Component 1, 3, 4 and a part of Activity 2.3 of Component 2, those financed by JICA, the fund disbursement will be implemented in accordance with JICA’s funding scheme. Since Component 2 will include GCF financed activities and Maldives co-financed activities, the funds will be disbursed simultaneously and depending on the procurement packages of consultant and contractors, proportionate funding from GCF and GoM may be expected.
Source: JICA Expert Team
Figure 12.1.4 GCF Fund Flow
Project Reporting to GCF
For the implementation of the Project, reporting to the GCF Secretariat through certain documents is required. The outline of the documents, the organizations in charge of preparing the documents, and the approvers are shown in Table 12.1.5.

Data Collection Survey on Building Climate Resilient Safer Cities Final Report
12-11
Table 12.1.5 Documents of the GCF Project Submitted to the GCF Secretariat Type of
Documents Outline Organizations in Charge of Preparation Approvers
Annual Performance Report
Project information, Project cost, progress, performance against GCF investment criteria, progress updates of the indicators of logical framework, changes, issues and lessons learned after commencement of the Project, environmental, social and gender impact, compliance status with the rules and regulations, implementation status of environmental and social management plans, monitoring and gender action plans and planned activities, updated project schedule, financial information and evaluation report.
PMU, JICA Expert Team, EE (ME/ JICA-1&4/ JICA-3)
Chairman of PSC, JICA (AE)
Evaluation Reports
Evaluation of the Project (mid-term and final) Evaluator JICA
Financial Information
Financial information of each component PMU, JICA Expert Team, EE (ME/ JICA-1&4/ JICA-3)
Chairman of PSC, JICA (AE)
External Audit Report
Audit of financial information Independent auditor selected by JICA
JICA (AE)
Source: JICA Expert Team
Considerations for the Project Schedule
The overall schedule of the GCF project is shown in Figure 12.2.1. The project schedule below is tentative and subject to change due to unforeseen situations such as the coronavirus pandemic. After the funded activity agreement (FAA) negotiation, the project will start in November 2021. The PMU and PSC will be established in June 2022 and will carry out the management of each component and the procurement of the consultant and contractor.
The JICA technical cooperation project, which constitutes Components 1 and 4 will start in October 2021 and will continue for about three years. For Component 2, the procurement of the consultant will start in October 2022 after the establishment of the PMU. The construction will start in April 2024. After 30 months of construction period and 18 months of coastal monitoring period, Component 2 will be finished in June 2028. Component 2 includes the assistance project for coastal monitoring by JICA and coastal protection measures by the Maldivian government. Component 3 will be finished in June 2023.
From April 2028 to June 2028, the completion report will be prepared. Then, the GCF project will be finished after the final external audit issued within six months upon the submission of the completion report.
The reporting schedule to the GCF Secretariat is shown in Figure 12.2.2. The documents described in this figure is referred to in Section 10.1.6 Project Reporting to GCF.

Data Collection Survey on Building Climate Resilient Safer Cities Final Report
12-12
Source: JICA Expert Team
Figure 12.2.1 Overall Schedule of this Project
Source: JICA Expert Team
Figure 12.2.2 Reporting Schedule to the GCF Secretariat
Considerations for the Project Cost Precondition
Exchange Rate, Base Year
The exchange rate is shown as follows:
USD 1 = JPY 105.013 MVR 1 = JPY 6.90739 (August 2020)
The base year is 2019.
Comp Activity
FAA Negotiation
Environmental andSocial Consideration
Subsidiary Agreement
Establishment of PSC
Establishment of PMU,Management eachcomponent
Comp 1 ICZM
Procurement of DDCSConsultant
Detaile Design
Procurement ofContractor
Construction Period,Defect Liability Period
Comp 3 Disaster Warning
Comp 4 Monitoring System
Final FinancialInformation, CompletionReport
Final Evaluation Rerort
2025 2026 2027 2028
-
2020 2021 2022 2023 2024
-
Comp 2
Monitoring, CapasiryDevelopment(by JICA)
Activity for All ComponentsActivity covered by GCF FundActivity covered by JICA
Project Start
Reporting, Accounting management, etc.
D.L.P
Month1 2 3 4 5 6 7 8 9 10 11 1 2 3 4 5 6 7 8 9 10 11 12 1 2 3 4 5 6 7 8 9 10 11 12 1 2 3 4 5 6 7 8 9 10 11 12 1 2 3 4 5 6 7 8 9 10 11 12 1 2 3 4 5 6 7 8 9 10 11 12 1 2 3 4 5 6 7 8 9 10 11 12 1 2 3 4 5 6
1 1 1 1 1 1 1 1 1 1 1 1 1 1 1 1 1 1 1 1 1 1 1 1 1 1 1 1 1 1 1 1 1 1 1 1 1 1 1 1 1 1 1 1 1 1 1 1
1 1 1 1
1 1 1 1 1 1 1 1 1 1 1 1 1 1 1 1 1 1 1 1 1 1 1 1 1 1 1 1 1 1 1 1 1 1 1 1 1 1 1
1 1 1 1
1 1 1 1
1 1 1 1
1 1 1 1
1 1 1 1
1 1 1
1 1 1
1
Project Term 2024 20252022 2023 2026 2027 20282019
Return Unsed Fund
External Audit
3rd APR
2nd APR
5th APR
10% Fee
Final APR (Completion Report)
Final Independent Evaluation Report Up to Dec.2028
1st Annual Perfprmance Report (APR)
Interim Independent Evaluation Report
Inception Report
Semi-Annual Financial Information
Final Financial Information
4th APR
issue the report
make out the report
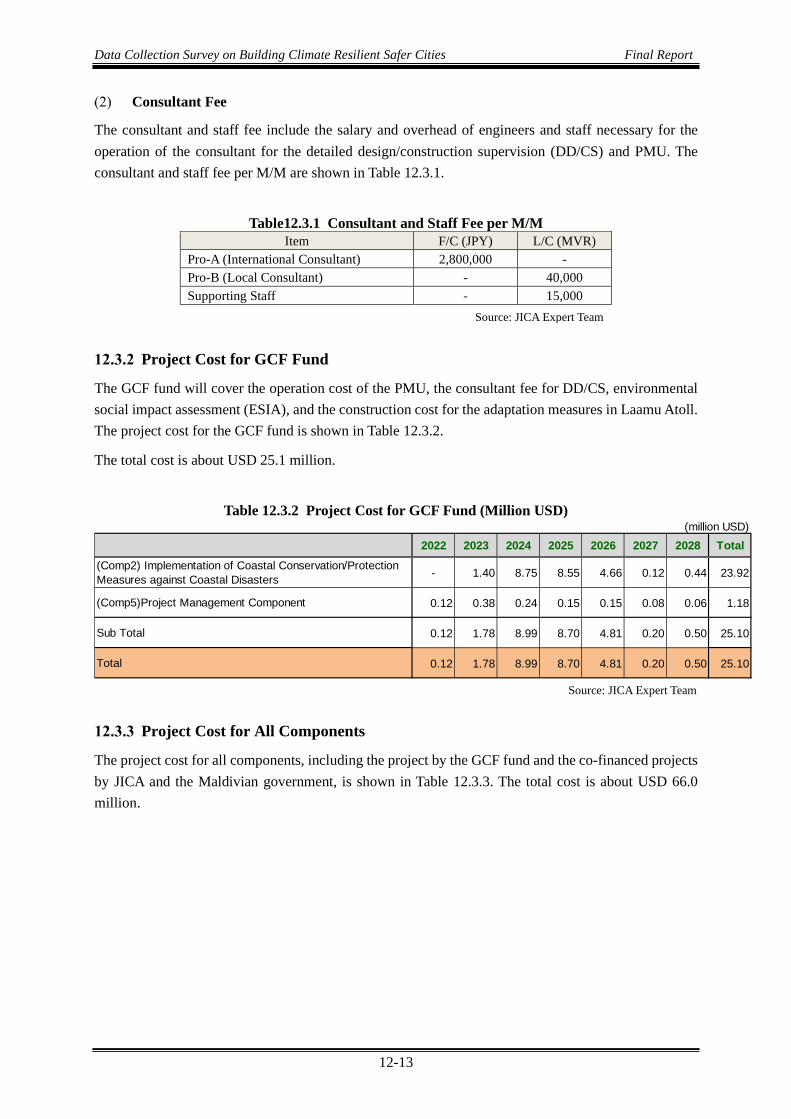
Data Collection Survey on Building Climate Resilient Safer Cities Final Report
12-13
Consultant Fee
The consultant and staff fee include the salary and overhead of engineers and staff necessary for the operation of the consultant for the detailed design/construction supervision (DD/CS) and PMU. The consultant and staff fee per M/M are shown in Table 12.3.1.
Table12.3.1 Consultant and Staff Fee per M/M Item F/C (JPY) L/C (MVR)
Pro-A (International Consultant) 2,800,000 - Pro-B (Local Consultant) - 40,000 Supporting Staff - 15,000 Source: JICA Expert Team
Project Cost for GCF Fund
The GCF fund will cover the operation cost of the PMU, the consultant fee for DD/CS, environmental social impact assessment (ESIA), and the construction cost for the adaptation measures in Laamu Atoll. The project cost for the GCF fund is shown in Table 12.3.2.
The total cost is about USD 25.1 million.
Table 12.3.2 Project Cost for GCF Fund (Million USD)
Source: JICA Expert Team
Project Cost for All Components
The project cost for all components, including the project by the GCF fund and the co-financed projects by JICA and the Maldivian government, is shown in Table 12.3.3. The total cost is about USD 66.0 million.
(million USD)2022 2023 2024 2025 2026 2027 2028 Total
- 1.40 8.75 8.55 4.66 0.12 0.44 23.92
0.12 0.38 0.24 0.15 0.15 0.08 0.06 1.18
0.12 1.78 8.99 8.70 4.81 0.20 0.50 25.10
0.12 1.78 8.99 8.70 4.81 0.20 0.50 25.10
(Comp2) Implementation of Coastal Conservation/ProtectionMeasures against Coastal Disasters
(Comp5)Project Management Component
Sub Total
Total

Data Collection Survey on Building Climate Resilient Safer Cities Final Report
12-14
Table 12.3.3 Breakdown of Project Cost
Source: JICA Expert Team
Project Evaluation by Economic Analysis
See "Appendix B Economic Analysis" for details.
Totall Cost GCFfinancing
Amount Amount Amountmillion USD
($)million USD
($)million USD
($)
Component 1: Establishment of the Integrated Coastal Zone Management (ICZM) 2.3 2.3 JICA
5.3 GoM0.8 JICA
Component 3: Development of Disaster Warning and Information Dissemination 29.5 29.5 JICA
Component 4: Development of Basic Data Collection and Sharing System Related to Climate Change 0.8 0.8 JICA
2.0 JICA0.2 GoM
66.0 25.1
1.2
40.9
Component
Indicative total cost
Co-financing
FinancialInstrument
Component 2: Implementation of Coastal Conservation/Protection Measures against Coastal Disasters 30.0 23.9
Component 5: Project Management Component 3.4

Data Collection Survey on Building Climate Resilient Safer Cities Final Report
13-1
SUMMARY OF RESULTS AND ISSUES FOR FUTURE STUDIES
Summary
Basic Information for Topographic, Hydrological, Environmental and Socio-economic Conditions
Maldives, located in Indian Ocean, consists of 26 coral atolls and about 1,200 islands with various island shape and area. The land was formed at the edge of atolls by accumulated coral sand and gravel due to wave action. Therefore, land area is too small with 298 km2 in total and the elevation is low about 1 to 2 m from the seawater level.
The coast area exists both sides of outer ocean side and inner lagoon side. Coral reef exists at the ocean side and the coral reef flat with shallow water and certain width of several ten meter to several kilo-meter spreads at offshore side of coast area. The reef edge exists at the offshore end of reef flat and incident waves from offshore break at this point. The reef slope exists at the offshore side from the reef edge to the deep-sea area.
The Maldives is tropical climate with high temperature and humidity. The average temperature is about 26 to 33 degree. There are two seasons, which are northeast monsoon season (November to April) and southwest monsoon season (May to October). The characteristics of winds and waves in Maldives change due to two different seasons.
The tidal range in Maldives is about 1m, it is not so high tide range comparing to other countries.
The condition of coral habitat in Maldives is not so good as the same as that in other tropical island countries. The coral breaching due to high seawater temperature by El Niño, and the damage of corals due to artificial construction and activities, such as port construction, dredging, coral mining, etc. has been seen in Maldives. On the other hand, the damage of corals due to Indian Ocean Tsunami in 2004 was not so significant.
The islands in Maldives divided into three categories, which are inhabitant island (188 islands), resort island (111 islands) and industrial island. Based on Census in 2014, the population in Maldives is about 400 thousand peoples and the population density is 13.49 person/ha, which is sixth highest in the world. The population density at Male Island, the capital island in Maldives, is about 786.9 person/ha, which is very high population density city in the world.
Main industry of Maldives is tourism and fisheries. About 25.3 % of GDP and 39.8% of government income are occupied by tourism in Maldives. Total number of tourists who visited in Maldives in 2014 was about 1.2 million visitors, and the annual rate for increase of tourism is about 7.6%.
The main important infrastructures in Maldives are 1) airport, 2) harbor, 3) main road, 4) utility facilities (electricity, water and sewage), 5) waste treatment.
There is no specific coastal law or regulation for coastal management and utilization, however, EPZ (Environmental Protection Zone) is defined in land use plan at some inhabitant islands. The condition of coastal management and maintenance at inhabitant islands is different for each island. Some islands seem to be well-managed the community-based beach cleaning. On the other hand,

Data Collection Survey on Building Climate Resilient Safer Cities Final Report
13-2
significant household rubbishes identified on the beach at some islands. Furthermore, the illegal mining of coral sand and gravel has been continued by local peoples at some islands.
Coastal Hazard
As the coastal hazard in Maldives related to the climate change, the following four hazards were selected, which were 1) seawater level, 2) waves (especially waves on coral reef), 3) coastal erosion and 4) impact of climate change. Tsunami is also possibility to become one of coastal hazards. Even though the Indian Ocean Tsunami was attached to the Maldives in 2004 and serious damage occurred, the encounter probability for occurring such like Indian Ocean Tsunami is quite low comparing to other coastal hazards mentioned above. Thus, the tsunami was not considered as coastal hazard in this study.
The maximum meteorological tide (tide deviation) for past 33 years in Maldives was not so high about 0.17 m in maximum and 0.14 m in average. This meteorological tide (tide deviation) is not due to the storm surge, but the effect of swell waves transmitted from long way.
The increase of tide level for past 33 years, which was observed at Gan Island in Addu Atoll, was 10.6 cm (3.2 mm/year) for average tide and 7.5 cm (2.3 mm/year) for maximum tide. This value is higher than the global average for 110 years (from 1901 to 2010), which is presented in IPCC 5th report in 2013.
The waves, which transmitted on coral reef and reached to the beach, is influenced by offshore wave characteristics and topography condition of coral reef, and the wave height on coral reef is mostly proportional to the water depth on coral reef flat. Further, the wave height and energy decrease due to wave breaking at reef edge and wave dissipation on coral reef due to bottom friction.
Impact of sea level rise due to climate change will cause not only the increase of seawater level, but also significant increase of wave height on coral reef, and therefore more serious impact might occur to coral reef coast comparing to general sandy coast.
Vulnerability against Coastal Disaster
The most serious coastal issue in Maldives is “coastal erosion”. Coastal erosion identified at more than 60% among 188 inhabitant islands in Maldives. Main cause of coastal erosion is artificial construction and activities, which are port construction, coral dredging for navigation channel, reclamation, inadequate construction of coastal facilities, coral sand and gravel mining from both coral reef and foreshore area, etc.
Some inhabitant island has been defined the “EPZ (Environmental Protection Zone)” in land use plan, which are functioned as buffer zone from the coastal line. On the other hand, there are many inhabitant islands, in which the residential and other commercial areas are located close to the nearshore area without enough buffer zone. In such area, there are high possibility to suffer the coastal disaster such as wave run-up and flooding.

Data Collection Survey on Building Climate Resilient Safer Cities Final Report
13-3
Coastal Risk Assessment
Sea level rise due to climate change will cause the change in beach profile due to increase of wave height on coral reef, and this will cause significant retreat of the beach, even though costal erosion has not been identified in this time. The coastal erosion at the coast, where the coastal erosion already in progress, will accelerate due to both impacts of artificial and climate change.
Coastal erosion will cause not only the increase of coastal disaster, but also the significant loss of land area, especially for island countries which consists of small islands such as Maldives.
The annual damage by inundation is roughly estimated around six- to seven- million USD year at the maximum for both Maamendhoo and Fonadhoo in 2100 with RCP 8.5 scenario. This damage amount is more than eight times larger than that of 2019.
It was estimated that inundation damage will be prevented by the countermeasure proposed in this study (i.e. beach nourishment with groins) in 2030 as a middle-term perspective and will be much reduced even after 2050 as a long-term view.
Basic Policy for Coastal Adaptation Measures
The hard structure measures such as revetment as coastal adaptation measures against coastal erosion might not be the permanent measures, but temporary measures as protection of land side. Because the hard structure measures cannot improve the fundamental cause of coastal erosion, which is “decrease (or disappear) of sand supply. In order to maintain the original functioned beach until the next generation with sustainability, the long-term process for forming of natural beaches, maintaining of sand supply from coral reef and natural protection function due to existing of coral reef shall be fully considered as the basic policy.
The proposed coastal adaptation measures shall be also considered to maintain the human activities at coastal area (beach use) since before. Also, the proposed measures shall leave the door open to deal with uncertain factor of future scenario for climate change.
From above mentioned basic policies, it is proposed to apply the beach nourishment as soft measures considering not only protection function but also beach use and coastal environment.
The Fonadhoo and Maamendhoo islands in the Laamu Atoll are proposed as physical project site. Coastal erosion is high priority issue in both islands. The Fonadhoo Island is one of high potential islands in the Laamu Atoll on economic development, however, the main residential area is located nearby the coastal area of ocean side and wave run-up and flooding has occurred when storm waves attached during the high tide. The Maamendhoo Island is one of high population density islands in Maldives with small land area, and most land elevation is less than 1 m from mean seawater level. The land area was fully occupied and there is no space for future development. On the other hand, the productivity of island is high comparing to other inhabitant islands in the Laamu Atoll. Considering the limited land area and no enough space in land area, it is proposed to secure the new evacuation area in the island by land reclamation together with beach nourishment.
As the nourished sand is always faced on wave action as the same condition as natural beaches, one of technical issues is how to minimize the sand discharge after the initial filling of sand. To

Data Collection Survey on Building Climate Resilient Safer Cities Final Report
13-4
minimize the sand discharge due to wave action after the beach nourishment, the “static stable method” by using the groins together with the beach nourishment will be applied. The maintenance work, which is to fill the sand additionally, is basically required for beach nourishment. Thus, it is proposed to stock the sand for future maintenance in order to make easy for the maintenance work by each island.
It was estimated by numerical analysis that proposed dimensions of the countermeasures are sufficient to have required protection function against target wave.
Proposed Project Component
The combination of soft and hard approach is proposed as project component in order to achieve the resilience of islands with maintaining the relation between human life and beaches. From this point, the following two goals are set as; 1) Maintaining of natural function of beach and relation between human life and beaches, 2) Human resource development on coastal management though the Project
Based on above mentioned principles, the following 4 components are proposed in the Project.
Component 1: Establishment of the Integrated Coastal Zone Management (ICZM)
Component 2: Implementation of Coastal Conservation/Protection Measures against Coastal Disasters
Component 3: Development of Disaster Warning and Information Dissemination
Component 4: Development of Basic Data Collection and Sharing System Related to Climate Change
Economic analysis was conducted for the Component 2 by calculating the cost-benefit ratio and the economic internal rate of return (EIRR). As a result of the analysis, it was confirmed that the Project is feasible in terms of implementation as public works.
Issues for Future Studies
Necessity of Detailed Layout Planning based on Appropriate Numerical Analysis
The layout plan of beach nourishment and groins proposed in this study is a preliminary plan without a detailed prediction on beach changes by numerical analysis. The layout plan must be finalized with accurate understanding and evaluation on expected sediment transport and beach changes after the implementation. In the detailed design stage, therefore, the numerical model needs to be developed to improve its repeatability of actual phenomenon of beach change then to be applied to optimize the detailed layout of beach nourishment and groins.
Necessity of Continuous Coastal Management after the Project Implementation
The beach nourishment proposed for the Project is a multifunctional measure to improve not only protection function but also beach use and environment. In this point, the measure is superior to hard structure measures such as revetment and seawall. However, the measure, similar to natural beach, is

Data Collection Survey on Building Climate Resilient Safer Cities Final Report
13-5
subject to sand outflow due to wave action and significant beach change during extreme weather condition. Therefore, adaptive management and establishment of its structure are required for beach nourishment project after the implementation. In addition, the participatory coastal management system by local community is necessary to maintain beach with healthy condition as community people will be the main users of Project beach. The central government is strongly encouraged to support these management activities from both hard and soft aspects. Educational training, PR and information sharing will be required for both the coastal management body and beach users to improve their ownership and awareness to realize sustainable coastal conservation.
Necessity to Improve Repeatability of Numerical Model at Detailed Design Stage
Wave propagates in complicated manner on the reef bathymetry which is composed of reef slope, reef edge where wave once breaks, and reef flat where wave propagates and developed due to wave setup by wave breaking. In this study, the validation of proposed design was conducted using the numerical model called Boussinesq model, which can evaluate wave propagation on such complicated bathymetry and situation. Wave data recorded in this study was applied in order to improve the repeatability of the numerical model, however, it allows further improvement as the record period was only several months. Since the wave data will be accumulated for more than one year at the detailed design stage, these data should be analyzed in terms of annual variability (offshore wave height, wave height on reef, water level, wave direction, etc.) and be applied to improve the repeatability of numerical model. If necessary, application of a physical model will also be effective to improve the repeatability of the model.
Necessity of Project Evaluation based on Accurate Prediction of Inundation Damage
Damage prediction is one of the most important data for Project evaluation. In this study, the damage by inundation was estimated by setting inundation area and depth. The inundation depth was simply set by wave overtopping amount at a representative cross section using the wave condition analyzed in this study. The property values used for Project evaluation were set based on interview survey as no static data was obtained. In the detailed design stage, it is recommended to apply followings to realize more accurate project evaluation: 1) the inundation simulation model to obtain more realistic inundation damage, and 2) detailed survey on property values which is statically reliable.
Necessity of Precise Cost Estimation based on Characteristics of Beach Nourishment
Beach nourishment with groins was proposed as physical measure for priority coasts. Armor rocks for groins and dredger for sand must be procured from foreign countries. In this study, cost related this procurement was simply evaluated referring to similar projects’ example at overseas. In the detailed design stage, detailed study on the procurement plan and cost is required in the target country to conduct precise cost estimation for the Project. Since beach nourishment requires adaptive management, it is important to include future maintenance cost for the Project. The maintenance cost must be evaluated accurately based on the prediction of sand outflow described in item (1) Chapter 10.