
Research Collection
191
Research Collection Doctoral Thesis On Biotransformation of Polar Organic Micropollutants in Phytoplankton Author(s): Stravs, Michael A. Publication Date: 2017 Permanent Link: https://doi.org/10.3929/ethz-b-000212315 Rights / License: In Copyright - Non-Commercial Use Permitted This page was generated automatically upon download from the ETH Zurich Research Collection . For more information please consult the Terms of use . ETH Library
-
Upload
khangminh22 -
Category
Documents
-
view
3 -
download
0
Transcript of Research Collection

Research Collection
Doctoral Thesis
On Biotransformation of Polar Organic Micropollutants inPhytoplankton
Author(s): Stravs, Michael A.
Publication Date: 2017
Permanent Link: https://doi.org/10.3929/ethz-b-000212315
Rights / License: In Copyright - Non-Commercial Use Permitted
This page was generated automatically upon download from the ETH Zurich Research Collection. For moreinformation please consult the Terms of use.
ETH Library

DISS. ETH NO. 24236
ON BIOTRANSFORMATION OF POLAR ORGANIC MICROPOLLUTANTS IN PHYTOPLANKTON
A thesis submitted to attain the degree of
DOCTOR OF SCIENCES of ETH ZURICH
(Dr. sc. ETH Zurich)
presented by
MICHAEL ANDREJ STRAVS
MSc Biology, ETH Zürich
born on 21.01.1986
citizen of Zürich, ZH
accepted on the recommendation of
Prof. Dr. Juliane Hollender
Dr. Francesco Pomati
Prof. Dr. Bernhard Wehrli
Dr. Emmanuelle Vulliet
2017


i Contents
Contents
Summary .................................................................................................................................. v
Zusammenfassung ................................................................................................................. vii
Chapter 1. Introduction ......................................................................................................... 1
1.1 Micropollutants in the aquatic environment ................................................................ 3
1.2 Biotransformation of micropollutants .......................................................................... 4
1.3 Freshwater phytoplankton .......................................................................................... 5
1.4 Liquid chromatography – mass spectrometry in environmental analysis ................... 6
1.5 Objectives and contents of the thesis ........................................................................ 8
References ........................................................................................................................... 9
Chapter 2. Microvolume trace environmental analysis using peak-focusing online solid-phase extraction – nano-liquid chromatography – high-resolution mass spectrometry ........ 15
Abstract ............................................................................................................................... 17
2.1 Introduction .............................................................................................................. 17
2.2 Materials and methods ............................................................................................. 18
2.3 Results and discussion ............................................................................................ 22
2.4 Conclusions and Outlook ......................................................................................... 28
2.5 Acknowledgements .................................................................................................. 28
Compliance with ethical standards ..................................................................................... 28
References ......................................................................................................................... 30
Chapter S2. Supporting Information: Microvolume trace environmental analysis using peak-focusing online solid-phase extraction – nano-liquid chromatography – high-resolution mass spectrometry .......................................................................................................................... 35
S2.1 Supplementary Materials and Methods ................................................................... 37
S2.2 Supplementary Results ............................................................................................ 43
References ......................................................................................................................... 58
Chapter 3. Exploring micropollutant biotransformation in three freshwater phytoplankton species .......................................................................................................................... 61
Graphical Abstract .............................................................................................................. 63
Abstract ............................................................................................................................... 63
Environmental impact ......................................................................................................... 63
3.1 Introduction .............................................................................................................. 63
3.2 Materials and Methods ............................................................................................. 65
3.3 Results and Discussion ............................................................................................ 68
3.4 Conclusion ............................................................................................................... 75
3.5 Acknowledgements .................................................................................................. 75
References ......................................................................................................................... 76

ii Contents
Chapter S3. Supporting Information: Exploring micropollutant biotransformation in three freshwater phytoplankton species .......................................................................................... 83
S3.1 Supplementary Materials and Methods ................................................................... 85
S3.2 Supplementary Results ............................................................................................ 92
S3.3 Spectra and Data for Transformation Products ..................................................... 102
References ....................................................................................................................... 116
Chapter 4. Functional and taxonomic diversity drive micropollutant biotransformation in phytoplankton assemblages ................................................................................................. 119
Abstract ............................................................................................................................. 121
4.1 Introduction ............................................................................................................ 121
4.2 Results and Discussion .......................................................................................... 123
4.3 Conclusions ........................................................................................................... 130
4.4 Materials and Methods ........................................................................................... 131
4.5 Acknowledgements ................................................................................................ 134
References ....................................................................................................................... 135
Chapter S4. Supporting Information: Functional and taxonomic diversity drive micropollutant biotransformation in phytoplankton assemblages ................................................................ 139
S4.1 Supplementary Methods ........................................................................................ 141
S4.2 Supplementary Results .......................................................................................... 156
References ....................................................................................................................... 164
Chapter 5. Conclusions and Outlook ................................................................................ 167
5.1 General summary .................................................................................................. 169
5.2 Analytical methodology .......................................................................................... 169
5.3 Biotransformation in phytoplankton ........................................................................ 171
References ....................................................................................................................... 173
Acknowledgements .............................................................................................................. 177
Curriculum Vitae ................................................................................................................... 179

iii

iv

v Summary
Summary Organic micropollutants from agricultural use (e.g., pesticides) and from urban discharge (e.g., pharmaceuticals, personal care products) are released into natural waterways, where they pose a potential hazard to aquatic ecosystems and undergo fate processes, e.g., can be sorbed to solids, taken up by organisms, or be transformed via abiotic and biotic processes, forming transformation products (TPs). TPs have toxic and physico-chemical properties distinct from their parent compounds, and understanding the extent of transformation and the formation of TPs is essential for proper understanding of environmental fate and risk of micropollutants.
Phytoplankton forms the base of the aquatic food web and provides considerable biomass to the ecosystem, yet the contribution of phytoplankton to biotransformation processes is not well understood, as they are photosynthetic organisms, and do not rely on organic carbon fixation. Studies point to enhanced degradation of some micropollutants in the presence of phytoplankton, however there is no comprehensive overview of the range of compounds biotransformed by algae, the biotransformation pathways that are active, and the TPs that are formed.
In this PhD thesis, laboratory studies were conducted to investigate the biotransformation and bioconcentration of a variety of structurally different relevant polar organic micropollutants by single phytoplankton species and their assemblages using high-resolution tandem mass spectrometry (HRMS) for quantification and TP identification.
First, an analytical method was developed, coupling automated (online) solid-phase extraction of water samples or algal lysates, with nano-liquid chromatography (nano-LC) and HRMS. This method allowed to quantify 41 analytes with octanol-water distribution ratios (log Dow) from -0.8 to 4.8, and a m/z range of 134 to 748 in three different sample matrices. From only 88 µL of sample, sub-ng/L detection levels could be achieved for 14 analytes in each of the three matrices. The method was exemplarily applied to a bioconcentration and biotransformation experiment using the alga Microcystis aeruginosa (Cyanobacteria) as a model system, where internal concentrations of trifloxystrobin and atrazine of 9.1 and 9.3 µg/g dry weight, respectively, were found. In addition, the trifloxystrobin TP trifloxystrobin acid could be detected and identified.
Second, laboratory batch biotransformation and bioconcentration experiments were conducted with two cyanobacterial species, Microcystis aeruginosa and Synechococcus sp., and with one green alga, Chlamydomonas reinhardtii, using a set of 24 micropollutants, thereof 9 pharmaceuticals and 15 fungicides. Samples taken at different time points were analyzed by LC-HRMS. TPs were detected with suspect and nontarget screening, and their structures elucidated by HRMS/MS interpretation. For 9 substances, 14 TPs were observed, formed by hydrolysis reactions (3), likely cytochrome P450-catalyzed oxidation (5), methylation or conjugation reactions (4), and further modifications of conjugated products (3). Found reactions were the hydrolysis of strobilurin fungicides trifloxystrobin and kresoxim-methyl, a glutamic acid conjugation of mefenamic acid, the transformation of metoprolol and atenolol to the common product atenolol/metoprolol acid, the conjugation of the antibiotic sulfamethoxazole to endogenous dihydropterin and subsequent formation of sulfamethoxazole-pterin and sulfamethoxazole-oxopterin, the dealkylation of ranitidin, verapamil and bezafibrate, and the methylation of bezafibrate. For 15 micropollutants, including all studied azole fungicides (9), no TPs were observed. Bioconcentration was

vi Summary
highest for difenoconazole, trifloxystrobin and pyraclostrobin (log BCF ~ 3), and followed trends in log Kow.
Finally, the influence of phytoplankton functional group (FG) richness and species richness on the biotransformation potential of laboratory assembled communities was studied. 22 phytoplankton species from five FG (cyanobacteria, chlorophytes, chrysophytes, cryptophytes and diatoms) were assembled in 27 combinations, with a FG richness gradient at fixed species, and a species richness gradient with representation of all FG. The assembled communities were incubated with a mixture of 37 micropollutants, and the concentrations were monitored over a 6 d period with LC-HRMS. In addition, suspect screening was conducted to characterize the number of TPs formed. For 13 substances, partial or complete transformation was observed. Transformation was quantified as the integral of lost analyte, and as first-order reaction rate constants. FG richness had a net positive average effect on transformation integrals and rates per substance, a positive effect on total number of compounds transformed, and on averaged normalized transformation rate (micropollutant multifunctionality). Species richness was not significantly associated with positive or negative effects on either measure. Both FG and species richness had a positive effect on the total number of TPs formed. FG richness had a positive effect on the number of TPs formed that were not further degraded (“stable” TPs), whereas species richness had a positive effect on the number of observed TPs that were further degraded (“transient” TPs). These results show that increased diversity in phytoplankton leads to more pathways available for micropollutant biotransformation. In addition to the effect of FG richness, species richness still contributes additional pathways that are not directly influencing the biotransformation extent of the studied compounds, but could be important for additional micropollutants.
Overall, this work elucidates analytical, biochemical and ecological aspects of biotransformation in phytoplankton organisms. It was shown that biotransformation in phytoplankton is not universal, but can be a relevant factor for selected compounds. Further, the observed biodiversity effects suggest that biotransformation in natural systems can be dependent on phytoplankton community composition and diversity, which in turn has a seasonal component and is influenced by environmental factors. These laboratory studies prompt verification of the observed phenomena at mesocosm scale or in field studies. In particular, the occurrence of the detected TPs should be further investigated in natural systems in connection with phytoplankton monitoring, and biodiversity effects on biotransformation potential should be evaluated in natural communities in the context of additional factors such as photodegradation and interactions with heterotrophic bacteria.

vii Zusammenfassung
Zusammenfassung
Organische Mikroschadstoffe aus der Landwirtschaft (z.B. Pestizide) und aus dem Abwasser (z.B. Pharmazeutika, Pflegeprodukte) gelangen in natürliche Gewässer, wo sie eine mögliche Gefahr für aquatische Ökosysteme darstellen und können entweder an Feststoffe sorbieren, von Organismen aufgenommen werden oder durch biotische oder abiotische Prozesse transformiert werden. Letzteres führt zur Bildung von Transformationsprodukten (TPs), die sich in Toxizität und in physisch-chemischen Eigenschaften von ihren Vorläufersubstanzen unterscheiden. Um den Verbleib und das Risiko von Mikroverunreinigungen in der Umwelt zu verstehen, ist das Verständnis von Transformationsprozessen, ihren Ausmasses und gebildeten TPs essentiell.
Phytoplankton formt die Basis des aquatischen Nahrungsnetzes und bildet einen wichtigen Teil der aquatischen Biomasse. Allerdings ist die Rolle von Phytoplankton in Biotransformationsprozessen wenig erforscht, da Phytoplankton als phototrophe Organismen nicht von der Assimilation von organischem Kohlenstoff abhängen. Studien weisen auf einen verstärkten Abbau einiger organischer Mikroverunreinigungen in Anwesenheit von Phytoplankton hin, allerdings gibt es keine umfassende Übersicht über die Bandbreite an Substanzen, die von Algen biotransformiert werden können, die aktiven Biotransformationsmechanismen und die dabei gebildeten TPs.
Die vorliegende Arbeit befasst sich mit Laborversuchen zur Biotransformation und Biokonzentration verschiedener, strukturell unterschiedlicher Mikroschadstoffe in einzelnen Phytoplanktonspezies und in Zusammensetzungen verschiedener Spezies, unter der Verwendung hochauflösender Massenspektrometrie (HRMS) für die Quantifizierung von Mikroschadstoffen und die Identifizierung von TPs.
Erstens wurde eine analytische Methode entwickelt, in welcher automatische (online) Festphasenextraktion von Wasserproben oder von Algen-Zelllysaten an nano-Flüssigchromatographie (nano-LC) und HRMS gekoppelt wurde. Dies ermöglichte die Quantifizierung von 41 Analyten mit Oktanol-Wasser-Verteilungskoeffizienten (log Dow) von -0.8 bis 4.8 und eines Massenbereichs von 134 bis 748 Da in drei verschiedenen Matrizen. Mit nur 88 µL Probe wurden Nachweisgrenzen unter 1 ng/L für jeweils 14 Analyten in jeder Matrix erreicht. Die Methode wurde exemplarisch an einem Biokonzentrations- und Biotransformationsexperiment mit dem Cyanobakterium Microcystis aeruginosa als Modellorganismus angewandt. Dabei wurden interne Konzentrationen von 9.1 µg/g Trockengewicht für Trifloxystrobin und 9.3 µg/g Trockengewicht für Atrazin festgestellt. Zusätzlich konnte das Transformationsprodukt Trifloxystrobinsäure nachgewiesen und identifiziert werden.
Zweitens wurden Laborexperimente zu Biotransformation und Biokonzentration mit zwei Spezies der Cyanobacteria, Microcystis aeruginosa und Synechococcus sp., und einer Grünalge, Chlamydomonas reinhardtii, durchgeführt. Dafür wurden 24 Mikroschadstoffe verwendet, davon 9 Pharmazeutika und 15 Fungizide. Zu verschiedenen Zeitpunkten genommene Proben wurden mit LC-HRMS analysiert und TPs wurden mit suspect screening (Suche nach vermuteten möglichen TPs) und nontarget screening (datenbasierte, ungezielte Suche nach möglichen TPs) erkannt. Für 9 Substanzen wurden 14 TPs gefunden, die durch Hydrolyse (3), sehr wahrscheinlich Oxidation via Cytochrom-P450-Enzyme (5), Methylierung oder Konjugation (4) und weiterer Transformation von Konjugaten (3) gebildet wurden. Beobachtet wurden Hydrolyse der Strobilurinfungizide Trifloxystrobin und Kresoxim-methyl, Glutamatkonjugation von Mefenaminsäure, Transformation von Metoprolol und Atenolol zum gemeinsamen TP Atenolol- bzw. Metoprololsäure, Konjugation des Antibiotikums Sulfamethoxazol mit endogenem Dihydropterin und darauffolgende Bildung von

viii Zusammenfassung
Sulfamethoxazol-Pterin und Sulfamethoxazol-Oxopterin, die Dealkylierung von Ranitidin, Verapamil und Bezafibrat und die Methylierung von Bezafibrat. Für 15 Substanzen, einschliesslich der 9 untersuchten Azolfungizide, wurden keine TPs gefunden. Difenoconazol, Trifloxystrobin und Pyraclostrobin wiesen die höchste Biokonzentration auf (ca. log BCF = 3) und Biokonzentration verhielt sich entsprechend der Hydrophobizität der Substanzen (log Kow).
Zum Schluss wurde der Einfluss des Artenreichtums und des Reichtums an funktionellen Gruppen (FG) auf das Biotransformationspotential von künstlich zusammengesetzten Phytoplanktongesellschaften untersucht. 22 Phytoplanktonspezies, die jeweils einer von 5 funktionellen Gruppen (Cyanobakterien, Grünalgen, Goldalgen, Cryptophyten und Kieselalgen) angehörten, wurden in 27 Zusammensetzungen kombiniert: einerseits in Gemeinschaften mit steigendem Reichtum an FG und fixem Artenreichtum und andererseits in Gemeinschaften mit steigendem Artenreichtum bei Vorhandensein aller FG. Die zusammengesetzten Gesellschaften wurden einer Mischung aus 37 Mikroverunreinigungen ausgesetzt und die Konzentrationen wurden über eine Periode von 6 Tagen verfolgt. Zusätzlich wurde mit suspect screening die Zahl entstandener TPs charakterisiert. Für 13 Substanzen wurde teilweise oder vollständige Transformation beobachtet. Transformation wurde als Integral des verlorengegangenen Analyten und als Transformationsrate erster Ordnung quantifiziert. FG-Reichtum hatte einen positiven mittleren Effekt auf Transformationsintegrale und Transformationsraten, einen positiven Effekt auf die Anzahl transformierter Substanzen und auf die normalisierte mittlere Transformationsrate (micropollutant multifunctionality). Artenreichtum war nicht signifikant mit positiven oder negativen Effekten auf diese Parameter verbunden. Sowohl FG-Reichtum als auch Artenreichtum hatten einen positiven Effekt auf die Anzahl gebildeter TPs. FG-Reichtum hatte einen positiven Effekt auf die Anzahl gebildeter stabiler TPs (die nicht weiter abgebaut wurden), während Artenreichtum einen positiven Einfluss auf die Anzahl gebildeter transienter TPs (die weiter abgebaut wurden) zeigte. Diese Resultate zeigen, dass erhöhte Vielfalt in Phytoplankton zur Verfügbarkeit von mehr Mechanismen für Biotransformation führt. Ergänzend zum Effekt des FG-Reichtums führte höheres Artenreichtum zu zusätzlichen verfügbaren Biotransformationswegen, die keinen direkten Einfluss auf die Transformation der untersuchten Verbindungen hatte, aber für zusätzliche Verbindungen relevant sein könnte.
Insgesamt betrachtet die vorliegende Arbeit analytische, biochemische und ökologische Aspekte der Biotransformation in Phytoplankton. Es wurde gezeigt, dass Biotransformation in Phytoplankton nicht universell ist, aber für ausgewählte Verbindungen eine wichtige Rolle spielen kann. Des Weiteren sind die beobachteten Effekte innerhalb der Artenvielfalt ein Hinweis darauf, dass Biotransformation in natürlichen aquatischen Systemen durch die Zusammensetzung und Vielfalt der Phytoplanktongesellschaften beeinflusst werden kann; diese werden wiederum durch Umweltfaktoren beeinflusst und haben saisonale Komponenten. Die Ergebnisse der vorliegenden Laborstudien regen zu einer Bestätigung in Mesokosmenstudien und Feldversuchen an. Das Vorkommen der gefundenen TPs ist von Interesse im Zusammenhang mit der Überwachung von Phytoplanktonzusammensetzungen in natürlichen Gewässern. Darüber hinaus erfordern die beobachteten Effekte der Artenvielfalt auf das Biotransformationspotential eine Bestätigung durch Studien mit natürlichen Phytoplanktongesellschaften, im Zusammenhang mit zusätzlichen Faktoren wie photochemischem Abbau und Interaktion mit heterotrophen Bakterien.

ix

x

1 Chapter 1
Chapter 1. Introduction

2 Introduction

3 Chapter 1
1.1 Micropollutants in the aquatic environment
In the anthropocene, pollution of natural water bodies is ubiquitous. Domestic and industrial wastewater (treated or untreated) and agricultural runoff contain macropollutants (such as salts and inorganic nutrients, at concentrations in the mg/L range), but also a wide variety of organic micropollutants (MPs) [1]. With regards to macropollutants, eutrophication (the excessive nutrient input into receiving waters) has been recognized as a driver of excess primary production, leading to macrophyte growth, algal blooms, and occasionally fish death; wastewater treatment plant upgrades have mitigated the effects [2, 3]. On the other hand, the environmental effects of MPs are much harder to interpret, due to their wide diversity and diverse potential modes of action. Initial research centered on the toxicity, transport and persistence of hydrophobic substances such as dichlordiphenyltrichloethane (DDT) and polychlorinated substances, and has led to bans and mitigation measures [4]. More recently, attention has turned to polar organic contaminants. Domestic wastewater is a major source of pharmaceuticals, hormones and personal care products [5], despite efforts to reduce the MPs load through advanced treatment [6], and agriculture is the principal source of pesticides to receiving waters through diffuse input [5]. These inputs lead to complex mixtures of MPs in rivers and lakes, where single substances concentrations generally are on the ng/L to µg/L range [5]. Through acute and chronic effects, MPs can cause harm to aquatic organisms on the individual level, and exert higher-level effects on the ecosystem [7]. The fate of MPs in water is governed by different physical, chemical and biological processes (Figure 1-1). MPs can be transformed (i.e., chemically modified) by direct and indirect photochemistry [8], or other abiotic processes (e.g., hydrolysis and oxidation-reduction reactions) [9, 10], undergo sorption to organic or inorganic matter [11, 12], or be taken up and/or transformed by organisms.
Figure 1-1 Schematic depicting expected fate processes for micropollutants in the environment, including possible contribution of phytoplankton.

4 Introduction
1.2 Biotransformation of micropollutants
Biodegradation, or mineralization, of a molecule describes the complete biotransformation of a molecule to its inorganic constituents. In contrast, incomplete biotransformation (sometimes “primary transformation” or “primary degradation” [13]) leads to transformation products (TPs) with properties different from their parent compounds. Transformation of bioactive chemicals can modify the active site, often reducing their activity or toxicity. However, in some cases transformation leads to increased activity or toxicity by exposing an active moiety or by modifying an inactive into an active form of a molecule. Further, transformation modifies the physico-chemical properties of a molecule, making it often more but sometimes also lesspolar, and changing its mobility, bioavailability and bioconcentration potential correspondingly. Finally, TPs differ from their parents in persistence, and highly persistent TPs should not be overlooked in environmental monitoring [14]. Understanding biotransformation processes is therefore crucial to proper assessment of environmental fate of MPs. For pesticides, studies on both transformation in the environment and metabolism in non-target animals and plants are prerequisite for regulatory approval [15]. For pharmaceuticals, metabolism in humans and animals, but also environmental fate is studied [16], though the latter studies often remain confidential.
Biotransformation reactions involve oxidations, reductions, hydrolysis, and conjugations. A vast number of oxidations and reductions are catalyzed by enzymes of the cytochrome P450 (CYP450) superfamily, whose principal reaction is monooxygenation [17]:
Typical oxidation reactions catalyzed by CYP450 enzymes include hydroxylation of alipathic and aromatic carbon, heteroatom hydroxylation and oxidation, double bond epoxidation, dehydrogenation, heteroatom dealkylation, ester cleavages, reductive or oxidative dehalogenation, and oxidative group transfers. Other reduction-oxidation (redox) reactions involve reduction and oxidation of alcohols and aldehydes. Hydrolysis reactions of carboxylic esters, amides or peptides are mediated by esterases [17]. Conjugation reactions involve the attachment of a chemical moiety (other than oxygen) to the molecule, and usually increase the hydrophilicity of a molecule. Conjugation reactions include glucuronidation, sulfate conjugation, acetylation and methylation of nucleophiles, amino acid conjugation of carboxylic acids, and glutathione conjugation of electrophiles. They are mediated by corresponding group transfer enzymes, but some can occur also abiotically [17]. While redox and hydrolysis reactions were commonly grouped as “phase I”, and conjugation reactions as “phase II” reactions, it has been suggested to discontinue the use of this terminology [18]. Specific classes of transformation reactions are typical for different organisms and systems, e.g., glucuronidation and sulfation are common for human drug metabolism, but not usually observed in wastewater treatment [19, 20], whereas conjugation to sugars or amino acids common in plants [21]. From known reaction pathways, it is possible to predict comprehensive lists of potential TPs for a parent compound. On the other hand, predicting which of these TPs will actually be formed in human or environmental systems remains challenging, and experimental determination is essential [20, 22]. Also, trivially, predictions are more accurate for well-studied and specific systems, whereas for unknown systems they are inherently vague.

5 Chapter 1
1.3 Freshwater phytoplankton
Phytoplankton is, according to Reynolds [23], “the collective of photosynthetic microorganisms, adapted to live partly or continuously in open water”. In freshwaters, they are the main photosynthetic primary producers, , and form the base of the aquatic food web [23]. Phytoplankton is a complex polyphyletic group, united by the capability of photosynthesis. Evolutionarily, photosynthesis arose initially in cyanobacteria, the only prokaryotic phytoplankton group; all eukaryotic phytoplankton groups acquired photosynthesis by endosymbiosis (engulfment) of a cyanobacterium or of another eukaryotic alga [24]. Therefore, the different eukaryotic groups are not closely related phylogenetically.
The different algal taxonomic groups relevant to freshwater phytoplankton differ in their pigmentation, cell size and morphology, and ecological preferences. While a systematic classification and generalization is useful, exceptions to all general statements are numerous. Cyanobacteria are, as noted above, prokaryotes. They live as single cells or simple filamentous, plate-like or spherical colonies. Cell size ranges from sub-micrometer (picoplankton, e.g., Synechococcus), to 10 µm, and colony size can exceed 100 µm. Cyanobacteria are typically blue-green in appearance, with a large variation depending on the balance of accessory pigments. Most species have relatively broad environmental requirements, but tend to be particularly competitive in eutrophic, low light and high-temperature conditions. Green algae or chlorophytes (Chlorophyta) are a highly diverse eukaryotic group typically fresh green in appearance, due to chlorophyll-a and -b pigmentation. Planktonic green algae are unicellular with or without flagella, or colonial [23, 25]. A notable example of a complex colony is Volvox, which forms a hollow sphere moving in a synchronous rolling motion [26]. Green algae include broadly tolerant species (e.g., Chlamydomonas) as well as species with narrow ecological preferences. As a group, they are prevalent in early-summer conditions before cyanobacteria become dominant, or can form blooms in hypertrophic conditions [25]. Golden algae or chrysophytes (Chrysophyta) are an eukaryotic group notable for their golden-brown color, which is due to the pigment fucoxanthin typically present in high amounts. They include unicellular flagellates and non-flagellates as well as colonial forms (e.g., the branched Dinobryon). Chrysophytes are typical of oligotrophic conditions, and characteristically many species are mixotrophic, i.e., can assimilate carbon both from photosynthesis and from organic sources [23, 25]. The diatoms (Bacillariophyceae) are a highly diverse group of eukaryotic algae easily distinguished by their siliceous cell wall. They are broadly separated in two groups by their symmetry (centric, with a radial symmetry, or pennate, with a longitudinal symmetry) and can occur as single cells or in simple colonies. As a group, diatoms are ubiquitous; however single species often have characteristic ecological preferences, e.g., pennate species are indicative of oligotrophic conditions, whereas centric species are more typical of eutrophication. In bloom phases, diatoms typically become limited by Si availability [25, 27]. The cryptomonads (Cryptophyta) are a poorly understood eukaryotic group with few species. They are unicellular and flagellate, generally green, but can have a reddish or blueish tint depending on pigmentation. Cryptomonads are mixotrophic, with some species of the group (Chilomonas) having lost pigmentation and the ability for photosynthesis. They are typical for colder, oligo- or mesotrophic lakes, and can form populations in deeper layers of lakes [23, 25, 28, 29]. Other groups common in freshwater phytoplankton include the euglenoids, yellow-green algae (xantophytes) and dinoflagellates.
The effects of MPs on phytoplankton organisms and communities have been studied extensively, and basic toxicity studies are part of standardized testing [30]. In environmentally relevant mixtures, herbicides (e.g., diuron, atrazine, irgarol) dominate the risk towards green

6 Introduction
algae and diatoms [31–33], and in particular antimicrobial agents (e.g., triclosan, fluoroquinolone, sulfamethoxazole) exhibit significant toxicity [34, 35]. However, at sublethal concentrations, MPs can enhance algal growth [36]. Shifts in phytoplankton community composition have been shown e.g. for multiple herbicides even at low concentrations [37–39]. Previous work has also shown effects of pharmaceuticals and their mixtures on natural algal communities in environmentally relevant scenarios [40, 41], and influences both species composition and growth of algal assemblages [42–46].
On the other hand, the effect of phytoplankton on the fate of MPs in the environment has only recently been recognized (Figure 1-1). Standardized regulatory testing is designed to assess biodegradability of MPs in aerobic or anaerobic water/sediment systems (OECD 308) or aerobic mineralization in surface water (OECD 309). Such tests are typically performed under dark conditions, or allow diffuse light but do not address the contribution of phototrophic organisms [13, 47]. Under conditions similar to OECD 308, Thomas and Hand showed increased aerobic degradation of six crop protection products for systems containing macrophytes or algae [48]. In further studies, they showed the metabolic competence of one diatom, eight green algal, and four cyanobacterial strains towards the fungicide fludioxonil [49]. Some studies have examined degradation of MPs in algae-containing wastewater treatment systems, which could be reflective of the behavior of algae in natural systems. For example, De Wilt et al. reported the removal of four pharmaceuticals in algal wastewater treatment systems by a combination of photodegradation and biodegradation [50]. In high-rate algal ponds containing algae and bacteria, Matamoros et al, showed moderate to complete removal of 23 out of 28 studied compounds, yet did not differentiate the degradation mechanisms [51]. Zhou et al. incubated wastewater influent with four algal species and observed efficient removal particularly for antibiotics and steroids [52].
While these findings indicate the potential presence of biotransformation in microalgae, they leave open questions regarding mechanisms and pathways of biotransformation. Activity of biotransformation enzymes in algae has been shown early in enzymatic assays. In macroalgae, Pflugmacher et al. demonstrated the hydroxylation of several fatty acids and 3-chlorobiphenyl, as well as glutathione conjugation and glucuronidation of nitrobenzene derivatives [53]. Thies and Grimme showed the dealkylation of coumarin and resorufin methyl, ethyl and pentyl ethers in two Chlorella strains, which was blocked by known P450 inhibitors [54]. Transformation pathway studies have concentrated on estrogens and some herbicides. For estrogens, multiple studies have shown redox and conjugation reactions, but also unusual reactions such as biobromination; differences between individual species were often observed [55–58]. Studies on transformation of substances of industrial or agricultural interest, including the persistent substances DDT, lindane, and endosulfan, by individual microalgae and cyanobacteria strains have been reviewed by Subashchandrabose et al. [59]. Except for estrogens, however, there is little information about algal biotransformation of polar MPs, such as pharmaceuticals or modern pesticides, and no comprehensive overview about the range of compounds amenable to algal biodegradation, or about biotransformation pathways.
1.4 Liquid chromatography – mass spectrometry in environmental analysis
Chemical characterization of MP occurrence and fate is commonly done using mass spectrometry. Historically, gas chromatography-mass spectrometry (GC-MS) was used to identify and quantify organic pollutants, and is still widely used today, particularly for non-polar analytes [60]. With the advent of electrospray ionization [61], liquid chromatography-mass

7 Chapter 1
spectrometry (LC-MS) enabled the analysis of more polar, non-volatile compounds without the need for derivatization and is now the preferred technology for this purpose [62, 63]. For analysis of water samples and biota extracts, typically, solid-phase extraction (SPE) precedes the analysis by LC-MS [64, 65], achieving low ng/L detection limits. A recent trend is the automation of SPE and direct coupling to LC-MS, thereby reducing laboratory work and required sample quantities, and improving reproducibility by reducing operator interference [66, 67]. Established multi-residue methods using LC coupled to triple-quadrupole (QqQ)-MS allow the quantification of typically up to 100 target analytes using multiple reaction monitoring [66, 68]. More recently, high-resolution mass spectrometry (HRMS) has been adopted in environmental analytics. Orbitrap and Time-of-Flight mass spectrometers with mass resolution above 20’000 allow mass determination to part-per-million accuracy and (within limits) the determination of a molecular formula from the recorded exact mass [69]. Over an LC run, full scan HRMS spectra, and optionally data-dependent (selected ion fragmentation) or data-independent (broad-window ion fragmentation) HRMS2 spectra are acquired. This comprehensive dataset simultaneously allows the quantification of a large number target compounds using classical reference standard calibration, and suspect and non-target screening for unknown compounds [70]. In suspect screening, exact mass lists and predicted isotope patterns are generated from the molecular formulae of a list of compounds of potential interest, and screened for in a HRMS dataset. In non-target screening, potentially interesting features are extracted from HRMS data in a data-driven approach, e.g., with statistical methods. For features of interest, a potential structure is elucidated through formula assignment, isotope pattern matching, database searches and (HR)MS2 spectrum interpretation [71, 72]. In either case, reference standards for final confirmation are often not available; a classification system serves to communicate the level of confidence for tentative identifications [73].
LC-HRMS has become a staple technology for TP identification. For known parent compounds, lists of potential TPs can be predicted from expected reactions and/or compiled from literature and tentatively identified via suspect screening in laboratory degradation studies [20]. While commercial software exists for these tasks (e.g., SIEVE, Compound Discoverer; both Thermo Fisher, Bremen), the task can equally be achieved using a combination of open-source tools for HRMS data processing (e.g., enviMass, enviPick, https://www.github.com/blosloos; XCMS [74], RMassBank [75]). HRMS2 databases (e.g., MassBank [76], METLIN [77]) can aid in structure elucidation, though commonly only via extrapolation from similar compounds, since spectra even of previously documented TPs are only scarcely available. In silico MS2 prediction [78, 79], while in its infancy, can provide hints towards TP identification; however manual MS2 interpretation remains crucial for structure elucidation.
8 Introduction
1.5 Objectives and contents of the thesis
In light of the preceding introduction, while the relevance of phytoplankton organisms for the fate of organic MPs has been recognized, there is a lack of knowledge about the extent of their contribution, scope, and the role of phytoplankton composition. The aim of this thesis was to study the role of freshwater phytoplankton in the biotransformation of polar organic MPs.
In Chapter 2, an analytical method to analyze polar organic MPs and their TPs in both water samples and biota extract was developed, requiring small sample quantities and minimal sample work-up. This enabled the analysis of medium and internal concentrations in biotransformation experiments conducted in small volumes. Online solid-phase extraction (SPE) of very small (<100 µL) sample volumes was coupled to nano-liquid chromatography and high-resolution mass spectrometry using peak refocusing on the analytical column, whereby the SPE cartridge is eluted completely with organic solvent and diluted with water before the analytical column. The method was validated on surface water, extract of the cyanobacterium Microcystis aeruginosa, and spent Microcystis growth medium.
In Chapter 3, the biotransformation potential of two cyanobacterial species, Microcystis aeruginosa and Synechococcus sp., and a green microalga, Chlamydomonas reinhardtii, mas investigated with a mixture of 24 polar organic micropollutants. In laboratory batch experiments, the uptake and dissipation of the chemicals were assessed, and the formed TPs were elucidated with tandem high-resolution mass spectrometry and suspect / nontarget screening.
In Chapter 4, the role of phytoplankton diversity on the biotransformation potential of assembled communities was investigated . To this end, 22 species from five phytoplankton functional groups (FG; cyanobacteria, chlorophytes, chrysophytes, diatoms and cryptophytes) were combined into communities of differing species richness and FG richness. The communities were exposed to a mixture of 37 polar organic MPs in batch experiments. The observed removal, as well as the formation of putative TPs, were assessed in dependence of FG and species richness.
In Chapter 5, the findings are discussed in context, and further questions raised by this work are highlighted.

9 Chapter 1
References
1. Schwarzenbach RP, Escher BI, Fenner K, Hofstetter TB, Johnson CA, Gunten U von, Wehrli B (2006) The Challenge of Micropollutants in Aquatic Systems. Science 313:1072–1077. doi: 10.1126/science.1127291
2. Correll DL (1998) The Role of Phosphorus in the Eutrophication of Receiving Waters: A Review. J Environ Qual 27:261–266. doi: 10.2134/jeq1998.00472425002700020004x
3. Schindler DW (2006) Recent advances in the understanding and management of eutrophication. Limnol Oceanogr 51:356–363. doi: 10.4319/lo.2006.51.1_part_2.0356
4. Werner I, Hitzfeld B (2012) 50 Years of Ecotoxicology since Silent Spring - A Review. GAIA - Ecol Perspect Sci Soc 21:217–224.
5. Luo Y, Guo W, Ngo HH, Nghiem LD, Hai FI, Zhang J, Liang S, Wang XC (2014) A review on the occurrence of micropollutants in the aquatic environment and their fate and removal during wastewater treatment. Sci Total Environ 473–474:619–641. doi: 10.1016/j.scitotenv.2013.12.065
6. Eggen RIL, Hollender J, Joss A, Schärer M, Stamm C (2014) Reducing the Discharge of Micropollutants in the Aquatic Environment: The Benefits of Upgrading Wastewater Treatment Plants. Environ Sci Technol 48:7683–7689. doi: 10.1021/es500907n
7. Malaj E, Ohe PC von der, Grote M, Kühne R, Mondy CP, Usseglio-Polatera P, Brack W, Schäfer RB (2014) Organic chemicals jeopardize the health of freshwater ecosystems on the continental scale. Proc Natl Acad Sci 111:9549–9554. doi: 10.1073/pnas.1321082111
8. Boreen AL, Arnold WA, McNeill K (2003) Photodegradation of pharmaceuticals in the aquatic environment: A review. Aquat Sci 65:320–341. doi: 10.1007/s00027-003-0672-7
9. Lee Wolfe N, Jeffers P (2000) Hydrolysis. Handb Prop Estim Methods Chem. doi: 10.1201/9781420026283.ch13
10. Tratnyek P, Macalady D (2000) Oxidation-Reduction Reactions in the Aquatic Environment. Handb Prop Estim Methods Chem. doi: 10.1201/9781420026283.ch16
11. Schwarzenbach RP, Gschwend PM, Imboden DM (2002) Sorption I: General Introduction and Sorption Processes Involving Organic Matter. In: Environ. Org. Chem. John Wiley & Sons, Inc., pp 275–330
12. Schwarzenbach RP, Gschwend PM, Imboden DM (2002) Sorption III: Sorption Processes Involving Inorganic Surfaces. In: Environ. Org. Chem. John Wiley & Sons, Inc., pp 387–458
13. OECD (2004) OECD Guideline for the Testing of Chemicals: Aerobic Mineralisation in Surface Water - Simulation Biodegradation Test.
14. Boxall AB, Sinclair CJ, Fenner K, Kolpin D, Maund SJ (2004) When synthetic chemicals degrade in the environment. Environ Sci Technol 38:368A–375A.
15. OECD (1994) Environment Monograph No. 77. Data Requirements for Pesticide Registration in OECD Member Countries: Survey Results.
16. Committee for Medicinal Products for Human Use (CHMP) (2006) European Medicines Agency Pre-Authorisation Evaluation of Medicines for Human Use (Doc. Ref. EMEA/CHMP/SWP/4447/00) Guideline on the environmental risk assessment of medicinal products for human use.
17. Parkinson A Biotransformation of Xenobiotics. Casarett Doulls Toxicol. Basic Sci. Poisons
18. Josephy PD, Guengerich FP, Miners JO (2005) “Phase I and Phase II” Drug Metabolism: Terminology that we Should Phase Out? Drug Metab Rev 37:575–580. doi: 10.1080/03602530500251220

10 Introduction
19. Stadler LB, Ernstoff AS, Aga DS, Love NG (2012) Micropollutant Fate in Wastewater Treatment: Redefining “Removal.” Environ Sci Technol 46:10485–10486. doi: 10.1021/es303478w
20. Bletsou AA, Jeon J, Hollender J, Archontaki E, Thomaidis NS (2015) Targeted and non-targeted liquid chromatography-mass spectrometric workflows for identification of transformation products of emerging pollutants in the aquatic environment. TrAC Trends Anal Chem 66:32–44. doi: 10.1016/j.trac.2014.11.009
21. Lamoureux GL, Rusness DG (1986) Xenobiotic Conjugation in Higher Plants. In: Xenobiotic Conjug. Chem. American Chemical Society, pp 62–105
22. Rücker C, Kümmerer K (2012) Modeling and predicting aquatic aerobic biodegradation – a review from a user’s perspective. Green Chem 14:875–887. doi: 10.1039/C2GC16267A
23. Reynolds CS (2006) Ecology of phytoplankton. Cambridge University Press, Cambridge; New York
24. Falkowski PG, Katz ME, Knoll AH, Quigg A, Raven JA, Schofield O, Taylor FJR (2004) The Evolution of Modern Eukaryotic Phytoplankton. Science 305:354–360. doi: 10.1126/science.1095964
25. Bellinger EG, Sigee DC (2015) Introduction to Freshwater Algae. In: Freshw. Algae. John Wiley & Sons, Inc., pp 1–42
26. Drescher K, Leptos KC, Tuval I, Ishikawa T, Pedley TJ, Goldstein RE (2009) Dancing Volvox: Hydrodynamic Bound States of Swimming Algae. Phys Rev Lett 102:168101. doi: 10.1103/PhysRevLett.102.168101
27. Bellinger EG, Sigee DC (2015) Algae as Bioindicators. In: Freshw. Algae. John Wiley & Sons, Inc., pp 101–139
28. Cerino F, Zingone A (2007) Decrypting cryptomonads. In: Unravelling Algae. CRC Press, pp 197–214
29. Mieleitner J, Borsuk M, Bürgi H-R, Reichert P (2008) Identifying functional groups of phytoplankton using data from three lakes of different trophic state. Aquat Sci 70:30–46. doi: 10.1007/s00027-007-0940-z
30. Test No. 201: Freshwater Alga and Cyanobacteria, Growth Inhibition Test | OECD READ edition. In: OECD ILibrary. http://www.keepeek.com/Digital-Asset-Management/oecd/environment/test-no-201-alga-growth-inhibition-test_9789264069923-en. Accessed 25 Feb 2017
31. Tang JYM, Escher BI (2014) Realistic environmental mixtures of micropollutants in surface, drinking, and recycled water: Herbicides dominate the mixture toxicity toward algae. Environ Toxicol Chem 33:1427–1436. doi: 10.1002/etc.2580
32. Bérard A, Dorigo U, Mercier I, Becker-van Slooten K, Grandjean D, Leboulanger C (2003) Comparison of the ecotoxicological impact of the triazines Irgarol 1051 and atrazine on microalgal cultures and natural microalgal communities in Lake Geneva. Chemosphere 53:935–944. doi: 10.1016/S0045-6535(03)00674-X
33. Deng X, Gao K, Sun J (2012) Physiological and biochemical responses of Synechococcus sp. PCC7942 to Irgarol 1051 and diuron. Aquat Toxicol 122–123:113–119. doi: 10.1016/j.aquatox.2012.06.004
34. Webb SF (2001) A Data-based Perspective on the Environmental Risk Assessment of Human Pharmaceuticals I — Collation of Available Ecotoxicity Data. In: Kümmerer APDK (ed) Pharm. Environ. Springer Berlin Heidelberg, pp 175–201
35. Crane M, Watts C, Boucard T (2006) Chronic aquatic environmental risks from exposure to human pharmaceuticals. Sci Total Environ 367:23–41. doi: 10.1016/j.scitotenv.2006.04.010

11 Chapter 1
36. Pomati F, Netting AG, Calamari D, Neilan BA (2004) Effects of erythromycin, tetracycline and ibuprofen on the growth of Synechocystis sp. and Lemna minor. Aquat Toxicol 67:387–396. doi: 10.1016/j.aquatox.2004.02.001
37. Pannard A, Rouzic BL, Binet F (2009) Response of Phytoplankton Community to Low-Dose Atrazine Exposure Combined with Phosphorus Fluctuations. Arch Environ Contam Toxicol 57:50–59. doi: 10.1007/s00244-008-9245-z
38. Nyström B, Becker-Van Slooten K, Bérard A, Grandjean D, Druart J-C, Leboulanger C (2002) Toxic effects of Irgarol 1051 on phytoplankton and macrophytes in Lake Geneva. Water Res 36:2020–2028. doi: 10.1016/S0043-1354(01)00404-3
39. Knauert S, Dawo U, Hollender J, Hommen U, Knauer K (2009) Effects of photosystem II inhibitors and their mixture on freshwater phytoplankton succession in outdoor mesocosms. Environ Toxicol Chem 28:836–845. doi: 10.1897/08-135R.1
40. Backhaus T, Arrhenius Å, Blanck H (2004) Toxicity of a Mixture of Dissimilarly Acting Substances to Natural Algal Communities: Predictive Power and Limitations of Independent Action and Concentration Addition. Environ Sci Technol 38:6363–6370. doi: 10.1021/es0497678
41. Backhaus T, Porsbring T, Arrhenius Å, Brosche S, Johansson P, Blanck H (2011) Single-substance and mixture toxicity of five pharmaceuticals and personal care products to marine periphyton communities. Environ Toxicol Chem 30:2030–2040. doi: 10.1002/etc.586
42. Wilson CJ, Brain RA, Sanderson H, Johnson DJ, Bestari KT, Sibley PK, Solomon KR (2004) Structural and Functional Responses of Plankton to a Mixture of Four Tetracyclines in Aquatic Microcosms. Environ Sci Technol 38:6430–6439. doi: 10.1021/es049766f
43. González-Pleiter M, Gonzalo S, Rodea-Palomares I, Leganés F, Rosal R, Boltes K, Marco E, Fernández-Piñas F (2013) Toxicity of five antibiotics and their mixtures towards photosynthetic aquatic organisms: Implications for environmental risk assessment. Water Res 47:2050–2064. doi: 10.1016/j.watres.2013.01.020
44. Lawrence JR, Zhu B, Swerhone GDW, Roy J, Tumber V, Waiser MJ, Topp E, Korber DR (2012) Molecular and microscopic assessment of the effects of caffeine, acetaminophen, diclofenac, and their mixtures on river biofilm communities. Environ Toxicol Chem 31:508–517. doi: 10.1002/etc.1723
45. Rosi-Marshall EJ, Kincaid DW, Bechtold HA, Royer TV, Rojas M, Kelly JJ (2013) Pharmaceuticals suppress algal growth and microbial respiration and alter bacterial communities in stream biofilms. Ecol Appl 23:583–593. doi: 10.1890/12-0491.1
46. Wilson BA, Smith VH, deNoyelles F, Larive CK (2003) Effects of Three Pharmaceutical and Personal Care Products on Natural Freshwater Algal Assemblages. Environ Sci Technol 37:1713–1719. doi: 10.1021/es0259741
47. OECD (2002) OECD Guideline for the Testing of Chemicals: Aerobic and Anaerobic Transformation in Aquatic Sediment Systems.
48. Thomas KA, Hand LH (2011) Assessing the potential for algae and macrophytes to degrade crop protection products in aquatic ecosystems. Environ Toxicol Chem 30:622–31. doi: 10.1002/etc.412
49. Thomas KA, Hand LH (2012) Assessing the metabolic potential of phototrophic communities in surface water environments: fludioxonil as a model compound. Environ Toxicol Chem 31:2138–46. doi: 10.1002/etc.1928
50. de Wilt A, Butkovskyi A, Tuantet K, Hernandez L, Fernandes TV, Langenhoff A, Zeeman G (2016) Micropollutant removal in an algal treatment system fed with source separated wastewater streams. 304:84–92.
12 Introduction
51. Matamoros V, Gutiérrez R, Ferrer I, García J, Bayona JM (2015) Capability of microalgae-based wastewater treatment systems to remove emerging organic contaminants: a pilot-scale study. J Hazard Mater 288:34–42. doi: 10.1016/j.jhazmat.2015.02.002
52. Zhou G-J, Ying G-G, Liu S, Zhou L-J, Chen Z-F, Peng F-Q (2014) Simultaneous removal of inorganic and organic compounds in wastewater by freshwater green microalgae. Environ Sci Process Impacts 16:2018–2027. doi: 10.1039/C4EM00094C
53. Pflugmacher S, Wiencke C, Sandermann H (1999) Activity of phase I and phase II detoxication enzymes in Antarctic and Arctic macroalgae. Mar Environ Res 48:23–36. doi: 10.1016/S0141-1136(99)00030-6
54. Thies F, Grimme LH (1995) O-Dealkylation of coumarin and resorufin ethers by unicellular green algae: kinetic properties of Chlorella fusca and Chlorella sorokiniana. Arch Microbiol 164:203–211.
55. Lai K, Scrimshaw M, Lester J (2002) Biotransformation and bioconcentration of steroid estrogens by Chlorella vulgaris. Appl Environ Microbiol 68:859–864. doi: 10.1128/AEM.68.2.859-864.2002
56. Della Greca M, Pinto G, Pistillo P, Pollio A, Previtera L, Temussi F (2008) Biotransformation of ethinylestradiol by microalgae. Chemosphere 70:2047–53. doi: 10.1016/j.chemosphere.2007.09.011
57. Maes HM, Maletz SX, Ratte HT, Hollender J, Schae A (2014) Uptake, Elimination, and Biotransformation of 17α-Ethinylestradiol by the Freshwater Alga Desmodesmus subspicatus. Environ Sci Technol 48:12354–12361. doi: 10.1021/es503574z
58. Peng F, Ying G, Yang B, Liu S, Lai H, Liu Y, Chen Z, Zhou G (2014) Biotransformation of progesterone and norgestrel by two freshwater microalgae (Scenedesmus obliquus and Chlorella pyrenoidosa): Transformation kinetics and products identification. Chemosphere 95:581–588. doi: 10.1016/j.chemosphere.2013.10.013
59. Subashchandrabose SR, Ramakrishnan B, Megharaj M, Venkateswarlu K, Naidu R (2013) Mixotrophic cyanobacteria and microalgae as distinctive biological agents for organic pollutant degradation. Environ Int 51:59–72. doi: 10.1016/j.envint.2012.10.007
60. Barceló D, Petrovic M (2007) Challenges and achievements of LC-MS in environmental analysis: 25 years on. TrAC Trends Anal Chem 26:2–11. doi: 10.1016/j.trac.2006.11.006
61. Whitehouse C, Dreyer R (1985) Electrospray interface for liquid chromatographs and mass spectrometers. Anal Chem 57:675–679.
62. Alder L, Greulich K, Kempe G, Vieth B (2006) Residue analysis of 500 high priority pesticides: Better by GC–MS or LC–MS/MS? Mass Spectrom Rev 25:838–865. doi: 10.1002/mas.20091
63. Giger W (2009) Hydrophilic and amphiphilic water pollutants: using advanced analytical methods for classic and emerging contaminants. Anal Bioanal Chem 393:37–44. doi: 10.1007/s00216-008-2481-2
64. Gros M, Petrović M, Barceló D (2006) Multi-residue analytical methods using LC-tandem MS for the determination of pharmaceuticals in environmental and wastewater samples: a review. Anal Bioanal Chem 386:941–952. doi: 10.1007/s00216-006-0586-z
65. Huerta B, Rodríguez-Mozaz S, Barceló D (2012) Pharmaceuticals in biota in the aquatic environment: analytical methods and environmental implications. Anal Bioanal Chem 404:2611–24. doi: 10.1007/s00216-012-6144-y
66. Petrovic M, Farré M, de Alda ML, Perez S, Postigo C, Köck M, Radjenovic J, Gros M, Barcelo D (2010) Recent trends in the liquid chromatography-mass spectrometry analysis of organic contaminants in environmental samples. J Chromatogr A 1217:4004–17. doi: 10.1016/j.chroma.2010.02.059

13 Chapter 1
67. Rogeberg M, Malerod H, Roberg-Larsen H, Aass C, Wilson SR (2014) On-line solid phase extraction-liquid chromatography, with emphasis on modern bioanalysis and miniaturized systems. J Pharm Biomed Anal 87:120–129. doi: 10.1016/j.jpba.2013.05.006
68. Lebedev AT (2013) Environmental Mass Spectrometry. Annu Rev Anal Chem Palo Alto Calif. doi: 10.1146/annurev-anchem-062012-092604
69. Kind T, Fiehn O (2010) Advances in structure elucidation of small molecules using mass spectrometry. Bioanal Rev 2:23–60. doi: 10.1007/s12566-010-0015-9
70. Krauss M, Singer H, Hollender J (2010) LC-high resolution MS in environmental analysis: from target screening to the identification of unknowns. Anal Bioanal Chem 397:943–51. doi: 10.1007/s00216-010-3608-9
71. Schymanski EL, Singer HP, Slobodnik J, Ipolyi IM, Oswald P, Krauss M, Schulze T, Haglund P, Letzel T, Grosse S, Thomaidis NS, Bletsou A, Zwiener C, Ibáñez M, Portolés T, de Boer R, Reid MJ, Onghena M, Kunkel U, Schulz W, Guillon A, Noyon N, Leroy G, Bados P, Bogialli S, Stipaničev D, Rostkowski P, Hollender J (2015) Non-target screening with high-resolution mass spectrometry: critical review using a collaborative trial on water analysis. Anal Bioanal Chem 407:6237–6255. doi: 10.1007/s00216-015-8681-7
72. Brack W, Ait-Aissa S, Burgess RM, Busch W, Creusot N, Di Paolo C, Escher BI, Mark Hewitt L, Hilscherova K, Hollender J, Hollert H, Jonker W, Kool J, Lamoree M, Muschket M, Neumann S, Rostkowski P, Ruttkies C, Schollee J, Schymanski EL, Schulze T, Seiler T-B, Tindall AJ, De Aragão Umbuzeiro G, Vrana B, Krauss M (2016) Effect-directed analysis supporting monitoring of aquatic environments — An in-depth overview. Sci Total Environ 544:1073–1118. doi: 10.1016/j.scitotenv.2015.11.102
73. Schymanski EL, Jeon J, Gulde R, Fenner K, Ruff M, Singer HP, Hollender J (2014) Identifying Small Molecules via High Resolution Mass Spectrometry: Communicating Confidence. Environ Sci Technol 48:2097–2098. doi: 10.1021/es5002105
74. Smith CA, Want EJ, O’Maille G, Abagyan R, Siuzdak G (2006) XCMS: processing mass spectrometry data for metabolite profiling using nonlinear peak alignment, matching, and identification. Anal Chem 78:779–87. doi: 10.1021/ac051437y
75. Stravs MA, Schymanski EL, Singer HP, Hollender J (2013) Automatic recalibration and processing of tandem mass spectra using formula annotation. J Mass Spectrom 48:89–99. doi: 10.1002/jms.3131
76. Horai H, Arita M, Kanaya S, Nihei Y, Ikeda T, Suwa K, Ojima Y, Tanaka K, Tanaka S, Aoshima K, Oda Y, Kakazu Y, Kusano M, Tohge T, Matsuda F, Sawada Y, Hirai MY, Nakanishi H, Ikeda K, Akimoto N, Maoka T, Takahashi H, Ara T, Sakurai N, Suzuki H, Shibata D, Neumann S, Iida T, Tanaka K, Funatsu K, Matsuura F, Soga T, Taguchi R, Saito K, Nishioka T (2010) MassBank: a public repository for sharing mass spectral data for life sciences. J Mass Spectrom 45:703–14. doi: 10.1002/jms.1777
77. Smith CA, O’Maille G, Want EJ, Qin C, Trauger SA, Brandon TR, Custodio DE, Abagyan R, Siuzdak G (2005) METLIN: a metabolite mass spectral database. Ther Drug Monit 27:747–51.
78. Allen F, Pon A, Wilson M, Greiner R, Wishart D (2014) CFM-ID: A web server for annotation, spectrum prediction and metabolite identification from tandem mass spectra. Nucleic Acids Res 42:94–99. doi: 10.1093/nar/gku436
79. Allen F, Greiner R, Wishart D (2014) Competitive fragmentation modeling of ESI-MS/MS spectra for putative metabolite identification. Metabolomics 11:98–110. doi: 10.1007/s11306-014-0676-4

14

15 Chapter 2
Chapter 2. Microvolume trace environmental analysis using peak-focusing online solid-phase extraction – nano-liquid chromatography – high-resolution mass spectrometry
Michael A. Stravs1,2, Jonas Mechelke1, P. Lee Ferguson3, Heinz Singer1, Juliane Hollender1,2* 1 Eawag, Swiss Federal Institute of Aquatic Science and Technology, 8600 Dübendorf, Switzerland 2 Institute of Biogeochemistry and Pollutant Dynamics, ETH Zurich, 8092 Zürich, Switzerland 3 Department of Civil and Environmental Engineering, Duke University, Durham, NC 27708, USA
* Corresponding Author
Überlandstrasse 133, 8600 Dübendorf, Switzerland; phone: +41 58 765 5493; fax: +41 58 765 5893; e-mail: [email protected]
Published in Analytical and Bioanalytical Chemistry, DOI: 10.1007/s00216-015-9294-x

16 Microvolume trace environmental analysis

17 Chapter 2
Abstract
Online solid-phase extraction was combined with nano-liquid chromatography coupled to high-resolution mass spectrometry (HRMS) for the analysis of micropollutants in environmental samples from small volumes. The method was validated in surface water, Microcystis aeruginosa cell lysate, and spent Microcystis growth medium. For 41 analytes, quantification limits of 0.1-28 ng/L (surface water) and 0.1-32 ng/L (growth medium) were obtained from only 88 µL of sample. In cell lysate, quantification limits ranged from 0.1-143 ng/L or 0.33-476 ng/g dry weight from a sample of 88 µL, or 26 µg dry weight, respectively. The method matches the sensitivity of established online and offline solid-phase extraction – liquid chromatography – mass spectrometry methods but requires only a fraction of the sample used by those techniques, and is among the first applications of nano-LC-MS for environmental analysis. The method was applied to the determination of bioconcentration in Microcystis aeruginosa in a laboratory experiment, and the benefit of coupling to HRMS was demonstrated in a transformation product screening.
2.1 Introduction
Organic micropollutants in the environment are a central topic of research in environmental analytical chemistry [1, 2]. While classical hydrophobic pollutants have been analyzed with gas chromatography – mass spectrometry (GC-MS) methods, the advent of electrospray ionization (ESI) [3] for the hyphenation of liquid chromatography (LC) with MS has made more hydrophilic micropollutants accessible to mass spectrometric analysis. In combination with sample enrichment techniques, highly sensitive detection can be achieved. Solid-phase extraction (SPE) followed by LC-MS is routinely applied for the analysis of micropollutants in water samples and biota. State-of-the-art methods are able to quantify a wide variety of micropollutants at low nanogram per liter or nanogram per gram levels [4–7]. To increase sample throughput, automated SPE can be employed, where enrichment on a cartridge is performed by the chromatographic system and elution is performed directly onto the chromatographic column (online SPE) [8]. In addition to automating otherwise tedious manual work, online SPE offers higher reproducibility and precision by reducing sample manipulation [9] and is much faster. While in manual (offline) SPE often L quantities of sample are enriched, online SPE can reach ng/L detection limits from sample volumes of typically 1 to 20 mL [10–13] and the technique can be applied to biological material [14] where sample volume is often limited. In the most common setup, after enrichment, the SPE cartridge is switched in line with the analytical column and a gradient elution is performed over both (trap-and-elute). A key challenge in this setup is the choice of an SPE sorbent compatible with the analytical column while preventing analyte breakthrough [15]. A more advanced setup involves dilution of the SPE eluate before the analytical column [10, 16]. This causes refocusing of the analytes on the analytical column and improves multiresidue analytical separation for analytes with a broad range of properties.
Advances in LC instrumentation have enabled the miniaturization of analytical methods. Capillary and nano-LC-MS provide the advantage of high sensitivity with reduced sample volumes, while separation is as efficient as in regular systems. As an additional benefit, solvent usage and waste generation is reduced [17]. Nano-LC typically refers to chromatography at sub-microliter per minute flow rates with capillary columns of up to 150 µm inner diameter (ID) [18]. Since the chromatographic dilution scales with the square of the ID [19], a reduction of e.g., column diameter from 2.1 mm (a typical narrowbore column) to 100 µm (a typical nano-LC column) would lead to a 441-fold increase in mass sensitivity. Since the column capacity,

18 Microvolume trace environmental analysis
and therefore maximum injectable sample amount, is also subject to scaling, nano-LC itself does not inherently confer higher sensitivity except in cases where sample volume is limited (e.g. for biological samples) [19]. However, hyphenation to mass spectrometry with micro- or nanoelectrospray also contributes to enhanced sensitivity, since the smaller emitted initial droplet size leads to more efficient desolvation and thus higher transmittance [20]. In nano-LC setups, the realization of complex setups such as column-switching SPE is dependent on careful consideration of geometry to avoid dead volumes which can impair separation efficiency [21]. Column-switching SPE in nano-LC systems has been realized for proteomics applications [22], or in hyphenation with ICP-MS for the analysis of lanthanide-labeled peptides [23]. However, to our knowledge, no SPE system incorporating pre-column dilution/peak refocusing has yet been described. Nano-LC-MS has gained widespread adoption in the field of proteomics [24], where small sample amounts are an inherent limitation. In environmental analysis, only few applications have been reported. In an early application, Wilson et al. combined online solid-phase extraction with nano-LC-MS for the analysis of perflurooctanoic acid and perfluorooctane sulfate, reaching method detection limits of 0.5 and 1 pg, respectively [25]. Recently, interest in miniaturized applications for multiresidue environmental analytics has resurged. Berlioz-Barbier et al. used miniaturized QuEChERS extraction followed by nano-LC-MS for the analysis of carbamazepine and fluoxetine in benthic invertebrates [26]; a similar setup was applied for 35 micropollutants [27]. David et al. developed a miniaturized extraction on multi-well plates in combination with nano-UHPLC-MS for profiling of the metabolome and xenometabolome in fish plasma, which includes environmentally relevant substances [28]. In a related study, Chetwynd et al. showed a sensitivity increase for metabolites and xenometabolites using nano-LC-nanoESI-MS [29]. Nano-LC was also applied as the first separation dimension in a 2D-LC system with ESI-MS detection for comprehensive screening of a wastewater sample [30]. However, no multiresidue method to date combines nano-LC-MS with automated online SPE, despite the fact that this avoids problematic manual handling of extremely small volumes, and offers automatization and improved reproducibility.
Our aim was to develop a system which could be used for highly sensitive analysis of organic micropollutants in small sample quantities, such as phytoplankton samples from surface water or high-throughput laboratory experiments (e.g. in multi-well plates). To develop a method applicable for a broad range of analytes with very small volumes, we aimed to implement refocusing online SPE combined with nano-LC-MS. Using 59 environmentally relevant substances with a broad range of polarity (octanol-water partitioning coefficient (log Dow) values at pH 7 of -2.1 to 4.8) and molecular weight (119 to 748 Da), the apparatus configuration and analytical method was developed, optimized and finally the capabilities and limitations of the method evaluated. The use of high-resolution mass spectrometry enabled the application not only to multiresidue analysis but also for the identification of transformation products via suspect screening [31].
2.2 Materials and methods
Apparatus The chromatographic system consisted of a Dionex UltiMate TM 3000 RSLCnano (Thermo Scientific, Bremen) with an NCS-3500RS pump module and a WPS-3000 TPS RS autosampler, and a Rheos 2200 quaternary HPLC pump (Flux Instruments, Switzerland) used as an auxiliary pump. The pump module contains a binary micro/nano pump which was equipped with a nano-LC flow selector, and a ternary loading pump. The solvent channels of the loading pump were routed through the built-in four-channel degasser of the chromatographic system. An additional degasser with reduced chamber volume (DEGASi micro, 2 channels, Biotech, Sweden) was used to degas the nano-LC solvent channels. In

19 Chapter 2
addition to the 10-port / 2-position switching valve installed in the column compartment, a second 10-port/2-position switching valve (model C72X-6670D) was operated externally with a microelectric actuator (model ED, both VICI, Schenkon, Switzerland) controlled via relay from the chromatographic system. Online solid-phase extraction was performed using EXP Stem Trap cartridges with an inner diameter of 130 µm and a volume of 170 nL (Optimize Technologies, USA) custom-packed using tools provided by the manufacturer. The cartridges were packed with Oasis HLB (Waters, USA), PolyWAX LP (PolyLC, USA), PolyCAT A (PolyLC, USA) or mixtures thereof, in 5 µm particle size. Chromatography was performed over an Atlantis dc18 nanoACQUITY column (Waters, USA; 100Å, 3µm, 100µm × 150mm). The chromatographic system was coupled to a Q-Exactive Plus (Thermo Scientific, Bremen) single quadrupole-orbitrap mass spectrometer using a Nanospray Flex (Thermo Scientific, Bremen) ion source, with a modified junction for applying high voltage. The ion source was equipped with a TaperTip emitter (New Objective, USA; 360 µm OD, 50 µm ID, uncoated) cut to approximately 5 cm length and voltage was applied at the junction between column outlet and emitter. All connections between components were made with either nanoViper PEEK-coated fused-silica capillaries with built-in zero-dead-volume 1/16” fittings (Thermo Scientific, Bremen) or fused-silica capillaries (360 µm OD, BGB, Switzerland) with two-piece PEEK 360 µm to 1/16” adaptor fittings (VICI, Schenkon, Switzerland). Connections configured for nanoflow rates generally used 20 µm ID capillaries, whereas connections for higher flow rates generally used 75 µm capillaries. A detailed description of the connections is found in Figure S2-1 and Table S2-1 in the Supporting Information (SI).
Solvents The binary nano-LC pump delivered nanopure water with 0.1% formic acid (solvent A) and LC-MS grade methanol with 0.1 % formic acid (solvent B). The auxiliary pump supplied solvent A isocratically and the ternary loading pump 5 mM ammonium acetate in nanopure water (loading solvent), LC-MS grade acetonitrile, and 10%/90% LC-MS grade methanol/nanopure water (solvent C). All solvents were degassed for 30 min in an ultrasonic bath and filtered through 0.2 µm regenerated cellulose membrane filters (Sartorius, Germany). Solvent C was used for the syringe buffer of the autosampler.
Online SPE – nano-LC setup The configuration of the online-SPE – nano-LC coupling is shown in a summary in Figure 2-1 and in more detail in Figure S1-2. A chromatographic run started with a loading step, in which a sample was loaded and concentrated on the SPE cartridge. This was followed by an elution step, where the concentrated sample was eluted from the SPE cartridge and refocused on the chromatographic column. Finally, in the chromatographic step, gradient chromatography over the column took place. The 10-port valve connected to the chromatographic column (the method valve) assumed two positions. Position A was used for the loading and chromatography steps, whereas during elution the valve was switched to position B.
The gradient program and valve positions are listed in Table 2-1. During loading, the loading pump delivered a 10 µL/min flow of 98% loading solvent/2% acetonitrile to the SPE cartridge. The autosampler drew 44 µL sample into the sample loop and then switches it into the loading pump flow. The flow then delivered the sample from the sample loop to the SPE cartridge during ~5 min. Subsequently, the process was repeated, such that finally 88 µL sample were concentrated on the SPE cartridge during ~10 min. The loading process was performed using a custom autosampler program to minimize cross-contamination (see SI for details). During this time, the nano-LC pump conditioned the analytical column to 10% B at a flow of 700 nL/min. The auxiliary pump delivered a flow of 900 nL/min of A against a flow restrictor capillary, which serves to provide backpressure for the pump to ensure a constant flow rate.

20 Microvolume trace environmental analysis
After the second sample plug had passed the SPE cartridge, the nano-LC pump lowered the flow rate to 120 nL/min while simultaneously changing the solvent to 95% B, and the method valve switched to position B. In this position, the flow over the column was composed from 900 nL/min A from the auxiliary pump and 120 nL/min 95% B cartridge eluate from the nano-LC pump. The total elution time was 9.5 min. While still in elution position, the nano-LC pump switched to aqueous (10% B) conditions again.
Subsequently, the chromatographic step was initiated. The valve switched back to position A and flow was quickly raised to 700 nL/min. The nano-LC pump delivered a chromatographic gradient of 1.8 min at 10% B, 6 min from 10% to 50% B, 11.8 min from 50% to 95% B, 3.5 min at 95% B, 0.5 min 95% to 10% B.
During the chromatography step, the loading pump solvent was switched to acetonitrile, and the SPE cartridge was washed for 9.3 min after the chromatography step started. Subsequently, the solvent was changed back to 98% loading solvent / 2% acetonitrile, and the cartridge was reequilibrated for 9 min until the end of the run. Due to a 200-µL gradient delay of the loading pump, purge steps were incorporated for every solvent change using an additional valve (see Table 2-1 for details).
Nano-ESI and detection The use of commercial nanoelectrospray Silica TaperTip emitters was important for achieving good spray conditions reproducibly over multiple months. Stainless steel emitters were also tested, but found to give less reproducible spray conditions and a less stable spray over the chromatographic gradient. Positive mode electrospray mass spectrometry was performed in full scan MS1 with top 3 data dependent MS2 using an inclusion list with the exact masses of analyte ions. The MS1 scan was performed at a resolution of 70,000 with a scan range of 100 to 1500 m/z with a maximum injection time of 50 ms. The MS2 scans were performed with an isolation window of 1.5 m/z at a resolution of 17,500 with an automatically determined scan range and maximum injection time of 50 ms. Collision energies for the analytes (see Table S2-6) were determined using an empirical formula based on molecular weight and adjusted where necessary. When no inclusion list ions were found, top 3 precursor ions were fragmented with a collision energy setting of 50 (NCE, normalized collision energy). Dynamic exclusion was set to 15 s. Spray voltage was set at 2200 V. No sheath, sweep, and auxiliary gas flows were used.
Data processing Quantification of analytes using the internal standard method was performed with TraceFinder EFS (version 3.2 RC, Thermo Scientific, Bremen). A mass tolerance of 5 ppm was used. Analyte peaks were automatically integrated by the ICIS algorithm and reviewed by hand. Confirming fragments (see Table S2-6) were automatically detected. Calibration curves were weighted 1/x over the concentration range.
Sample collection Surface water (SW) was collected at Greifensee, Switzerland, at a depth of 2 m, and stored at 4 °C until usage. For Microcystis cell lysate (MC) and spent Microcystis growth medium (GM), cells of Microcystis aeruginosa PCC7806 were grown in WC medium (see SI) to a concentration of 0.3 g/L as determined via correlation to optical density. Twenty milliliters of the culture was centrifuged at 4000 rpm for 10 min. Supernatant was recovered as GM matrix. Remaining supernatant was removed. Cells were resuspended in 2 mL of nanopure water and cells were lysed by three cycles of freezing in liquid nitrogen and thawing at 37°C in an ultrasonic bath. The suspension was then frozen and freeze-dried. The resulting pellet was resuspended in 4 mL 1:1 ethanol:nanopure water and incubated for 10 min in an ultrasonic bath at 37°C. The suspension was centrifuged and the supernatant was diluted 1:10 with nanopure water, giving MC matrix.

21 Chapter 2
Figure 2-1 Valve configuration of the final online-SPE – nano-LC setup. Left Valve position A, SPE loading (step 1) and chromatography (step 3). The loading pump delivers the sample loop contents to the SPE cartridge, while the nano-LC pump is connected directly to the column. Right Valve position B, elution of SPE cartridge to column (step 2). The nano-LC pump delivers a low flow over the SPE cartridge to elute the analytes, which is diluted by the auxiliary pump flow before it reaches the column (more details in Figure S2-2). See Table 2-1 for the corresponding program.
Table 2-1 Gradient and valve program of the analytical method. Method valve positions refer to the positions shown in Figure 2-1.
Loading pump Purge valve Nanoflow pump Method valve
Comment
Time Flow %A %B Flow %A %B
[min] [µL/min] [nL/min]
0 10 98 2 to autosampler 700 10 90 position A
5.5 700 10 90
SPE cartridge elution
6.15 10 98 2 120 5 95 position B
6.7 0 98 2 to waste Loading pump is purged with acetonitrile
7.2 150 0 100
10.2 150 0 100
10.7 0 0 100 to autosampler
11.7 10 0 100
15.15 120 5 95
15.25 120 90 10
18.2 120 90 10 position A
19 700 90 10 nanoLC gradient: 1.8 min 10% B 6 min 10% to 50% B 11.7 min 50% to 95% B 3.5 min 95% B 0.5 min 95% B to 10% B
20.8 700 90 10
26.8 700 50 50
27 10 0 100
27.5 0 0 100 to waste Loading pump is purged with loading buffer
28 150 98 2
31 150 98 2
31.5 0 98 2 to autosampler
32.5 10 98 2
38.5 700 5 95
40.5 10 98 2
42 700 5 95
42.5 10 98 2 700 90 10
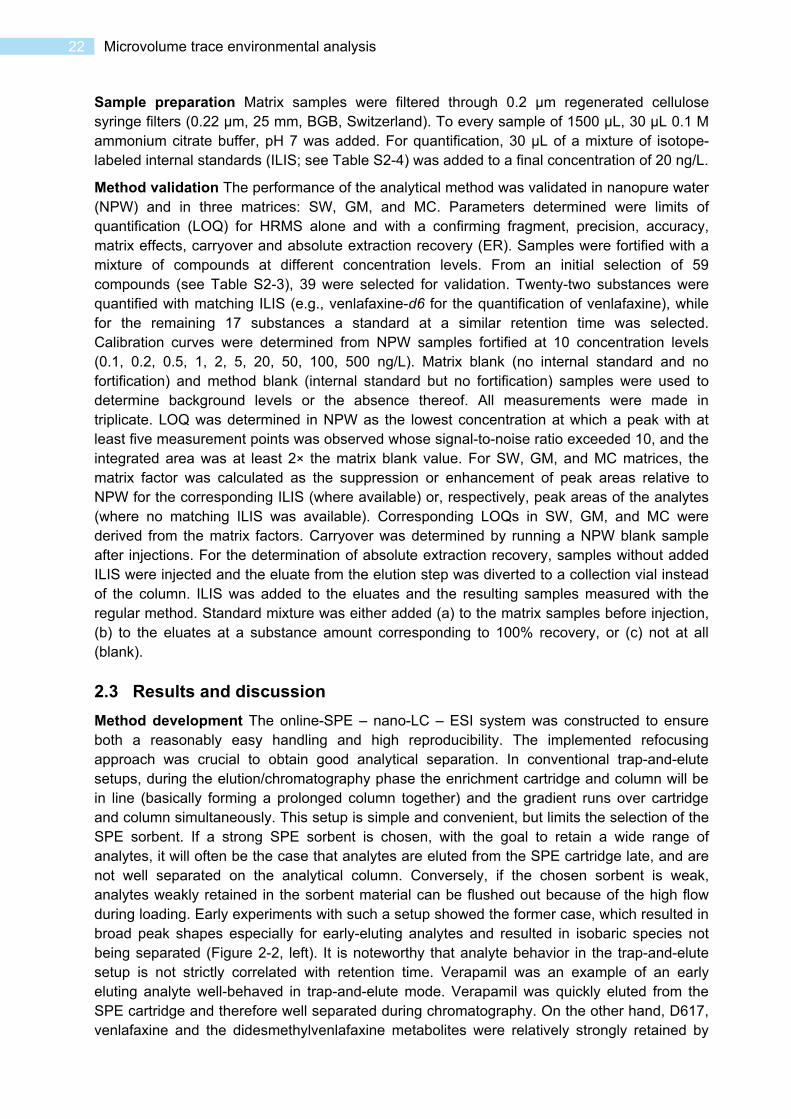
22 Microvolume trace environmental analysis
Sample preparation Matrix samples were filtered through 0.2 µm regenerated cellulose syringe filters (0.22 µm, 25 mm, BGB, Switzerland). To every sample of 1500 µL, 30 µL 0.1 M ammonium citrate buffer, pH 7 was added. For quantification, 30 µL of a mixture of isotope-labeled internal standards (ILIS; see Table S2-4) was added to a final concentration of 20 ng/L.
Method validation The performance of the analytical method was validated in nanopure water (NPW) and in three matrices: SW, GM, and MC. Parameters determined were limits of quantification (LOQ) for HRMS alone and with a confirming fragment, precision, accuracy, matrix effects, carryover and absolute extraction recovery (ER). Samples were fortified with a mixture of compounds at different concentration levels. From an initial selection of 59 compounds (see Table S2-3), 39 were selected for validation. Twenty-two substances were quantified with matching ILIS (e.g., venlafaxine-d6 for the quantification of venlafaxine), while for the remaining 17 substances a standard at a similar retention time was selected. Calibration curves were determined from NPW samples fortified at 10 concentration levels (0.1, 0.2, 0.5, 1, 2, 5, 20, 50, 100, 500 ng/L). Matrix blank (no internal standard and no fortification) and method blank (internal standard but no fortification) samples were used to determine background levels or the absence thereof. All measurements were made in triplicate. LOQ was determined in NPW as the lowest concentration at which a peak with at least five measurement points was observed whose signal-to-noise ratio exceeded 10, and the integrated area was at least 2× the matrix blank value. For SW, GM, and MC matrices, the matrix factor was calculated as the suppression or enhancement of peak areas relative to NPW for the corresponding ILIS (where available) or, respectively, peak areas of the analytes (where no matching ILIS was available). Corresponding LOQs in SW, GM, and MC were derived from the matrix factors. Carryover was determined by running a NPW blank sample after injections. For the determination of absolute extraction recovery, samples without added ILIS were injected and the eluate from the elution step was diverted to a collection vial instead of the column. ILIS was added to the eluates and the resulting samples measured with the regular method. Standard mixture was either added (a) to the matrix samples before injection, (b) to the eluates at a substance amount corresponding to 100% recovery, or (c) not at all (blank).
2.3 Results and discussion
Method development The online-SPE – nano-LC – ESI system was constructed to ensure both a reasonably easy handling and high reproducibility. The implemented refocusing approach was crucial to obtain good analytical separation. In conventional trap-and-elute setups, during the elution/chromatography phase the enrichment cartridge and column will be in line (basically forming a prolonged column together) and the gradient runs over cartridge and column simultaneously. This setup is simple and convenient, but limits the selection of the SPE sorbent. If a strong SPE sorbent is chosen, with the goal to retain a wide range of analytes, it will often be the case that analytes are eluted from the SPE cartridge late, and are not well separated on the analytical column. Conversely, if the chosen sorbent is weak, analytes weakly retained in the sorbent material can be flushed out because of the high flow during loading. Early experiments with such a setup showed the former case, which resulted in broad peak shapes especially for early-eluting analytes and resulted in isobaric species not being separated (Figure 2-2, left). It is noteworthy that analyte behavior in the trap-and-elute setup is not strictly correlated with retention time. Verapamil was an example of an early eluting analyte well-behaved in trap-and-elute mode. Verapamil was quickly eluted from the SPE cartridge and therefore well separated during chromatography. On the other hand, D617, venlafaxine and the didesmethylvenlafaxine metabolites were relatively strongly retained by

23 Chapter 2
the SPE cartridge and therefore were not well resolved on the analytical column subsequently. Ideally, for a trap-and-elute setup, a combination of SPE cartridge and analytical column should be found which results in good separation of all analytes of interest. However, with increasing number of analytes, it becomes increasingly difficult to find a combination suitable for every substance. In the refocusing setup, the cartridge was eluted with 95% organic phase such that elution was exhaustive and fast, and the eluate was diluted online pre-column with nanopure water such that the analytes were focused on the analytical column. This effectively separated SPE elution from chromatography, and resulted in resolution of the didesmethylvenlafaxine isobars and good peak shapes for venlafaxine and D617 verapamil metabolite (Figure 2-2, right). At the same time, previously well-resolved peaks remained unaffected. Refocusing has been shown to be important for good analytical separation over a wide range of compounds in narrowbore and analytical online-SPE-LC-MS systems [10, 16, 32]. The realization of dilution/refocusing presents particular challenges in nanoflow regimes: During elution, the organic solvent delivered by the elution flow should not exceed ~10% of the aqueous dilution flow, to successfully achieve refocusing of the analytes on the column, while the total flow is limited by the pump and column backpressure. These limiting factors dictate the use of a very low elution flow (120 nL/min), which leads to a tradeoff between the elution volume through the SPE cartridge and prolonged elution times. Since the elution flow is one order of magnitude lower than the total flow (1.02 µL/min), considerations of dead volume, e.g., in junctions and capillaries become even more critical. Through the use of a conventional HPLC pump (Rheos 2200) for the dilution flow, a refocusing setup could be realized cost-effectively, avoiding the use of an additional nano-LC pump and therefore feasible with limited investment for most laboratories who already own nano-LC equipment. At 900 nL/min, the pump used operates at the absolute lower limits of its specifications, and can only be used in isocratic mode. Also, it is mandatory to keep a high backpressure on the channel at all times because the pump is not able to build up such a pressure (~300 bar) quickly on demand. To this end, a flow restrictor was created using a capillary packed with 3 µm C18 chromatographic particles, which keeps the pump under backpressure when the dilution flow is not going to the analytical column. Former implementations of peak refocusing in narrowbore and analytical scale systems commonly used two pumps for the formation of a gradient, where the organic solvent pump runs over the cartridge [10, 32]. Therefore, the cartridge is permanently eluted with methanol during the analytical run. In the nano-LC system shown here, a gradient can only be formed by the nano-LC pump; therefore, the elution phase must be separated completely from the gradient chromatography phase.
Figure 2-2 Online SPE-LC-MS in conventional trap-and-elute (left) and refocusing (right) setup. Extracted ion chromatograms of [M+H]+ with 10 ppm mass window. From top to bottom verapamil, azoxystrobin, diclofenac, D617 verapamil metabolite, N,N- and N,O-didesmethylvenlafaxine (Didesme-Vf), venlafaxine.

24 Microvolume trace environmental analysis
Online SPE Sorbents used in offline SPE are often available in large particle sizes (30-100 µm). However, in a miniaturized online system where the cartridge inner diameter is only 130 µm, only chromatography grade material (particle sizes ~5 µm) can be used. Oasis HLB (Waters, USA), a broad-range SPE adsorbent commonly used in environmental chemistry based on vinylpyrrolidone-divinylbenzene copolymer, is available in 5 µm particle size, and was chosen as the basis material for extraction. In both online and offline SPE applications, good results were obtained by using a mixture of sorbents including Oasis HLB, anion and cation exchange sorbents, and Isolute ENV+ (Biotage, Uppsala, SE), a polymeric material which typically shows higher retention for polar analytes [33]. In an attempt to reproduce the broad-range selectivity of the mixed material cartridges, different combinations of materials in the SPE cartridge were screened preliminarily with 45 substances at a concentration of 100 ng/L. The selected substance range included species which are cationic (14) and anionic (3) or exhibit multiple charges (4) at the loading pH of 7. Therefore combinations of Oasis HLB with weak cation and anion exchangers (PolyCAT and PolyWAX, PolyLC, USA) in 5 µm particle size, with a single cartridge or two cartridges in series were tested. During loading at pH 7, both ion exchangers are in charged state. During elution under acidic conditions, WCX and potential anions will be uncharged, whereas WAX and potential cations will stay charged, thus disrupting both types of ionic interactions, such that a single elution condition is sufficient for any combination of sorbents. However, only minor differences in selectivities between the different cartridge types were observed. The fact that the system is to be used for transformation product identification, many of which are anionic, led to the adoption of a HLB/WAX mixture as the final cartridge.
To challenge the final system the screening was expanded to 59 compounds including very hydrophilic substances. At a concentration of 50 ng/L 41 compounds were retained sufficiently for subsequent validation (see Table S2-5). The remaining 18 compounds could either not be recovered at all, or showed very weak peaks suggesting that only a fraction of the compound was retained on the cartridge. As shown in Figure S2-4, the unretained analytes were all in the highly polar range. Recovery was particularly poor for hydroxylated metabolites of pesticides and pharmaceuticals such as atrazine-2-hydroxy and terbuthylazine-2-hydroxy, which are often reported to be not well retained on SPE cartridges. Of the seven non-recovered analytes with log Dow (pH 7) > 0.5, six were hydroxylated metabolites. This shows an obvious limitation of the chosen SPE sorbent system. Combination of the currently used sorbents with stronger hydrophilic SPE materials would likely improve the range of accessible analytes; however, at the time of the study, such sorbents were not available in suitable particle size.
To examine the elution properties and the capacity of the SPE system, analyte recovery was tested with both a single cartridge and two cartridges in series. An elution duration of 9 minutes proved suitable for the elution of the targeted analytes for both cases.
Backflush (shown in Figure 2-1) and forward elution (see Figure S2-3) setups were tested. It is often recommended to set up nanoLC systems in forward elution mode to reduce the risk of clogging [34]. However, backflush elution was selected in this case, since we observed less carryover and better elution of strongly retained analytes (e.g., Diclofenac) in backflush elution. This is likely related to the fact that strongly retained analytes travel a shorter distance in the cartridge during trapping; therefore, in backflush elution they have a shorter elution pathway and can be eluted completely, while in forward elution they might not be fully eluted because of a longer elution pathway. Enrichment flow rates from 2.5 to 10 µL/min were tested, however, no marked influence of flow rate on extraction recovery was noted. Ten microliters per minute was chosen as enrichment flow rate to keep total runtime short. Likely, a drop in efficiency

25 Chapter 2
could have been observed at even higher flow rates. However, the maximal flow rate is limited not by the cartridge itself, but by the backpressure generated by the 20 µm ID capillary which follows the trap.
Chromatography Figure S2-5 shows chromatographic profiles of the quantified analytes in the final method at the validation level of 50 ng/L, including peak width at half-maximum, 10%, and 5%. To evaluate the chromatographic performance, peak tailing factor and peak asymmetry, which both describe the chromatographic suitability of a peak in terms of tailing, were computed (see Supplementary Information, Materials and methods) and are shown in Table S2-2. For comparison, peak width and tailing / asymmetry were also calculated for an established LC – HRMS/MS method [35]. For the same substances, peak widths were in general equal or narrower than in the established method, showing the chromatographic competitiveness of the method. The median of the tailing factors is 1.45, and 90% are below 1.65. The compared LC – HRMS/MS method performs slightly better (median 1.23, 90% below 1.46); the slight tailing is likely a consequence of the transfer from SPE cartridge to analytical column [36]. However, all tailing factors are below 2, which is a typical requirement for routine analysis [37] and is unproblematic for quantification.
Extraction recovery The method was finally validated with a set of 41 substances. An overview of the results is presented in Table 2-2. The observed extraction recoveries for all substances cover a wide range from <10% to complete extraction. The determination of extraction recovery required collection of the eluate from an online SPE run and subsequent reinjection on the online SPE system after addition of an internal standard. Since all compounds therefore underwent extraction losses twice, some extraction recoveries for weakly retained compounds could not be quantified. However it is notable that even for analytes with very low recoveries, detection limits in the low nanogram per liter range were reached (see below, e.g. Trifloxystrobin). This reinforces the finding that nano-LC in combination with nano-ESI can be used for highly sensitive quantitation of small molecules, and in some cases, the already good detection limits could be further improved by a factor of 10 or more with the use of more efficient SPE sorbents.
Carryover The repeated use of the same extraction cartridge, in combination with strongly sorptive compounds, often contributes to carryover in online SPE system. A thorough washing procedure was instated to minimize cross-contamination (see above). Cross-contaminations could not be completely eliminated, however for the majority of substances the carryover was absent or <1%. Exceptions with a higher carryover were the insecticide DEET (up to 15%), the didesmethylvenlafaxine metabolites (N,N- and N,O-, 5-10%), mefenamic acid (2-5%) and metoprolol (1%). For best quantification results, it is advised to insert a blank run or a shortened blank run between two samples.
Sensitivity LOQs in NPW are reported as MS LOQs (where the chromatographic peak in MS reaches acceptance criteria) and MS/MS LOQs (the first concentration where a confirming fragment was observed). For all validated analytes, LOQs of less than 20 ng/L in NPW were obtained, while 14 compounds reached sub-nanogram per liter quantification limits. The median LOQ is at 2 ng/L. A comparison of the different matrices is shown in Figure 2-3. In surface water and growth medium, moderate matrix effects are observed; in both cases, 14 compounds are quantifiable in sub-ng/L concentrations, whereas the highest LOQs are 28 and 31 ng/L and the median LOQs are 2.9 and 3.7 ng/L, respectively, still representing very high sensitivity. In Microcystis lysate, matrix effects were most clearly manifested. Fourteen analytes still exhibit sub-nanogram per liter sensitivity, and median LOQ is 3.6 ng/L, however, specific analytes (tramadol N-oxide, LOQ 52 ng/L; fluconazole, 127 ng/L; diclofenac, 143 ng/L)

26 Microvolume trace environmental analysis
were strongly affected. For diclofenac, this may possibly be caused by a coeluting matrix component observed at high intensity in cell lysate (m/z 535.2148) which dominates the TIC at the corresponding retention time. The SPE extraction recovery is not affected. For fluconazole, the extraction recovery is low in all matrices, but cannot be excluded as a possible cause for low sensitivity in cell lysate. Detection limits in MC matrix are given in ng/L for comparison with other matrices. Since the phytoplankton biomass used in the validation study was 0.3 g dry weight/L, the corresponding detection limits in Microcystis ranged from 0.33 to 476 ng/g dry weight.
Precision and relative recovery Figure 2-4 summarizes precision and relative recovery results over the examined matrices, separating compounds with a matching internal standard from compounds which were quantified using a non-matching internal standard. It should be noted that, when using a non-matching internal standard, relative recoveries in different matrices will not necessarily be close to 100%. If the matrix effect is constant, quantification can still be highly accurate by taking the relative recovery into account. The data in the figure exclude clarithromycin, which showed strong matrix interferences in all cases (see Table 2-2) even though a matching internal standard was used, and could not be quantified satisfactorily. The data shows that relative recovery was generally in the 80-120% range typically required for quantification in environmental analytics, and precision was generally <20%, in many cases <10%. As expected, it was clearly observed that the use of matching internal standards markedly increased the method precision and repeatability. This influence was much stronger for more complex matrices, as seen by the loss in precision for MC matrix. With regards to the use of nano-ESI, the use of matching internal standards becomes even more important because nano-ESI fluctuates more strongly depending on gradient conditions, compared to standard flow ESI [38]. Retention time differences between the analyte and the internal standard will not only change the magnitude of matrix suppression, but will inherently contribute to imprecision because of random differences in the spray conditions. For precise quantification under varying conditions, the use of a matching internal standard is essential. This is true in particular when sample pretreatment is kept minimal and potential matrix components can influence compounds unevenly, as was likely the case in MC matrix.
Figure 2-3 Top Distribution of limits of quantification in different matrices. NPW nanopure water; SW surface water; GM growth medium; MC Microcystis lysate. Bottom Comparison to existing methods for surface water. Quantification limits for a subset of 20 (offline) or 27 (online) of the analyzed substances with offline SPE – LC – HR-MS/MS (Singer et al. [35]) or online SPE – LC – MS/MS (Huntscha et al. [10]).

27 Chapter 2
Figure 2-4 Relative recovery and precision of all analytes in different matrices, separated by matching ILIS (blue, 21 compounds) and non-matching ILIS (red, 17 compounds). Data for MC exclude compounds with strong matrix interference (mefenamic acid, DEET, bezafibrate, N-desmethylclarithromycin) and with detection limits >50 ng/L (fluconazole, diclofenac, tramadol N-oxide).
System performance Attention was paid to keep dead volume low, in particular in low-flow pathways, for example the used Stem Trap cartridge was mounted directly into a valve port, thus minimizing dead volume and avoiding additional junctions which have the potential for imperfect connections. A recurring problem in nano-LC is the clogging of small-ID capillaries and columns due to particles in a sample. Therefore, not only filtered solvents and samples were used but additionally an inline filter (Stem Filter, 0.2 µm) was inserted into the valve after the loading pump port, such that the sample was additionally filtered during extraction.
SPE cartridges were observed to be highly durable; they were able to withstand >100 injections without observed deterioration. The employed commercial LC column was, however, more prone to clogging. Therefore, an inline filter as the one used for filtering the loading pump flow was also mounted before the HPLC column. However, while the swept volume of the filter is small (270 nL), it added significant gradient delay and mixing, leading to problems in chromatography and was subsequently removed from the system. While the validation study was carried out without additional column protection, later a commercially available Stem Trap cartridge (130 µm ID, 1.3 cm length), packed with 3 µm C18 particles, was inserted into the valve port before the column, acting as a guard column. This approach increased column lifetime markedly.
Application: Bioaccumulation in Microcystis aeruginosa In application to a real-world problem, biocaccumulation of organic micropollutants in Microcystis aeruginosa was determined using a mixture of micropollutants (see SI). Microcystis culture was incubated for 24 h with a mixture of micropollutants at 100 µg/L concentration, and the cells lysed and analyzed. While most substances accumulated in negligible amounts, high bioconcentration was found for trifloxystrobin (9.1 ± 1.2 µg/g DW) and atrazine (9.3 ± 2 µg/g DW). In addition, using suspect screening with exact masses and MS/MS interpretation, the putative transformation product trifloxystrobin acid could be identified in Microcystis cells and in the growth medium (see Figure S2-5). This laboratory experiment demonstrates one possible application of the method and its versatility, since the high resolution MS and MS2 data recorded during the quantitation measurement enabled putative identification of a metabolite without additional measurements.

28 Microvolume trace environmental analysis
Comparison to known approaches For 20 and 27 compounds, respectively, performance results were compared with established offline SPE – LC – HRMS/MS [35, 39] and online SPE – LC – MS/MS [10] methods for surface water analysis. Both methods employed two-layer mixed cartridges with Oasis HLB and a mixture of Isolute ENV+, weak anion and weak cation exchangers. The offline SPE method comprises the enrichment of 500 mL to a final volume of 1 mL, wherein 20 µL was injected (i.e., the injected volume equivalent is 10 mL). In the online SPE method, 20 mL sample are injected and enriched. The methods used 2.1 mm and 3.0 mm ID columns for chromatography, respectively. Given that chromatographic dilution scales with the square of column diameter [19], a comparable sensitivity could be expected from 50-100 µL on a 100 µm ID column. Indeed, as shown in Figure 2-3, the detection limits in surface water for analytes present in the offline and normal flow online methods fall in the same range as the values from the developed method. This shows that minimal sample amounts are sufficient to achieve low nanogram per liter detection limits. In some cases (atrazine, carbamazepine, mefenamic acid) the nano-LC method outperformed both online and offline methods. For strongly polar metabolites for which the nano-LC method is less sensitive (e.g., carbendazim), the low extraction recovery likely contributes to the difference.
2.4 Conclusions and Outlook
Herein, we demonstrated for the first time a miniaturized approach for automated online-SPE – nano-LC – HRMS analysis which incorporates peak refocusing. The method is applicable in both water and biological matrices. With a small fraction of the sample amount conventionally used (88 µL for water samples, or 26 µg Microcystis dry weight), detection limits matching classical large- and medium-volume approaches were reached. Since sample preparation required was minimal, the approach is suitable for automated processing. While the method was primarily developed for the analysis of low-volume, high-throughput laboratory experiments in multi-well plates, it shows promise for other applications, such as biomonitoring in phytoplankton from sub-mg samples – the required phytoplankton sample quantity could be retrieved from less than 1 L of lake water. Future applications in combination with miniaturized sampling could be envisioned. Through the hyphenation to HRMS, the system could successfully be used for the tentative identification of a transformation product.
While high sensitivity and good accuracy are reached with many important environmental analytes, currently the most polar analytes (in particular, many hydroxylated transfomation products) are not accessible to the online SPE method via easily available materials. Custom production or modification [40] of existing materials with small particle size would increase the coverage, as it has been shown that the combination of materials in a layered cartridge can provide good coverage of a wide range of substance classes.
2.5 Acknowledgements
This research was supported by the Swiss National Science Foundation, grant number 315230141190.
We acknowledge Thorsten Schmidt as the external supervisor of Jonas Mechelke during his master thesis.
Compliance with ethical standards
Conflicts of Interest
The authors declare that they have no conflict of interest.
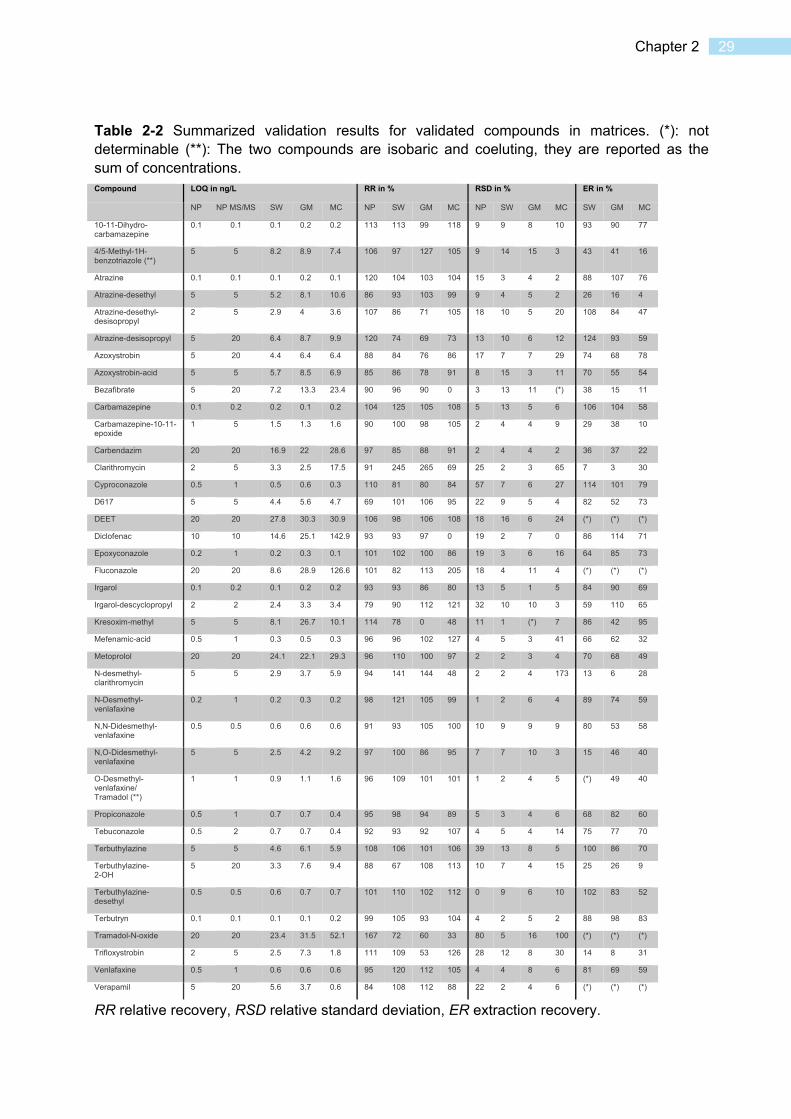
29 Chapter 2
Table 2-2 Summarized validation results for validated compounds in matrices. (*): not determinable (**): The two compounds are isobaric and coeluting, they are reported as the sum of concentrations. Compound LOQ in ng/L RR in % RSD in % ER in %
NP NP MS/MS SW GM MC NP SW GM MC NP SW GM MC SW GM MC
10-11-Dihydro- carbamazepine
0.1 0.1 0.1 0.2 0.2 113 113 99 118 9 9 8 10 93 90 77
4/5-Methyl-1H- benzotriazole (**)
5 5 8.2 8.9 7.4 106 97 127 105 9 14 15 3 43 41 16
Atrazine 0.1 0.1 0.1 0.2 0.1 120 104 103 104 15 3 4 2 88 107 76
Atrazine-desethyl 5 5 5.2 8.1 10.6 86 93 103 99 9 4 5 2 26 16 4
Atrazine-desethyl- desisopropyl
2 5 2.9 4 3.6 107 86 71 105 18 10 5 20 108 84 47
Atrazine-desisopropyl 5 20 6.4 8.7 9.9 120 74 69 73 13 10 6 12 124 93 59
Azoxystrobin 5 20 4.4 6.4 6.4 88 84 76 86 17 7 7 29 74 68 78
Azoxystrobin-acid 5 5 5.7 8.5 6.9 85 86 78 91 8 15 3 11 70 55 54
Bezafibrate 5 20 7.2 13.3 23.4 90 96 90 0 3 13 11 (*) 38 15 11
Carbamazepine 0.1 0.2 0.2 0.1 0.2 104 125 105 108 5 13 5 6 106 104 58
Carbamazepine-10-11- epoxide
1 5 1.5 1.3 1.6 90 100 98 105 2 4 4 9 29 38 10
Carbendazim 20 20 16.9 22 28.6 97 85 88 91 2 4 4 2 36 37 22
Clarithromycin 2 5 3.3 2.5 17.5 91 245 265 69 25 2 3 65 7 3 30
Cyproconazole 0.5 1 0.5 0.6 0.3 110 81 80 84 57 7 6 27 114 101 79
D617 5 5 4.4 5.6 4.7 69 101 106 95 22 9 5 4 82 52 73
DEET 20 20 27.8 30.3 30.9 106 98 106 108 18 16 6 24 (*) (*) (*)
Diclofenac 10 10 14.6 25.1 142.9 93 93 97 0 19 2 7 0 86 114 71
Epoxyconazole 0.2 1 0.2 0.3 0.1 101 102 100 86 19 3 6 16 64 85 73
Fluconazole 20 20 8.6 28.9 126.6 101 82 113 205 18 4 11 4 (*) (*) (*)
Irgarol 0.1 0.2 0.1 0.2 0.2 93 93 86 80 13 5 1 5 84 90 69
Irgarol-descyclopropyl 2 2 2.4 3.3 3.4 79 90 112 121 32 10 10 3 59 110 65
Kresoxim-methyl 5 5 8.1 26.7 10.1 114 78 0 48 11 1 (*) 7 86 42 95
Mefenamic-acid 0.5 1 0.3 0.5 0.3 96 96 102 127 4 5 3 41 66 62 32
Metoprolol 20 20 24.1 22.1 29.3 96 110 100 97 2 2 3 4 70 68 49
N-desmethyl- clarithromycin
5 5 2.9 3.7 5.9 94 141 144 48 2 2 4 173 13 6 28
N-Desmethyl- venlafaxine
0.2 1 0.2 0.3 0.2 98 121 105 99 1 2 6 4 89 74 59
N,N-Didesmethyl- venlafaxine
0.5 0.5 0.6 0.6 0.6 91 93 105 100 10 9 9 9 80 53 58
N,O-Didesmethyl- venlafaxine
5 5 2.5 4.2 9.2 97 100 86 95 7 7 10 3 15 46 40
O-Desmethyl- venlafaxine/ Tramadol (**)
1 1 0.9 1.1 1.6 96 109 101 101 1 2 4 5 (*) 49 40
Propiconazole 0.5 1 0.7 0.7 0.4 95 98 94 89 5 3 4 6 68 82 60
Tebuconazole 0.5 2 0.7 0.7 0.4 92 93 92 107 4 5 4 14 75 77 70
Terbuthylazine 5 5 4.6 6.1 5.9 108 106 101 106 39 13 8 5 100 86 70
Terbuthylazine- 2-OH
5 20 3.3 7.6 9.4 88 67 108 113 10 7 4 15 25 26 9
Terbuthylazine- desethyl
0.5 0.5 0.6 0.7 0.7 101 110 102 112 0 9 6 10 102 83 52
Terbutryn 0.1 0.1 0.1 0.1 0.2 99 105 93 104 4 2 5 2 88 98 83
Tramadol-N-oxide 20 20 23.4 31.5 52.1 167 72 60 33 80 5 16 100 (*) (*) (*)
Trifloxystrobin 2 5 2.5 7.3 1.8 111 109 53 126 28 12 8 30 14 8 31
Venlafaxine 0.5 1 0.6 0.6 0.6 95 120 112 105 4 4 8 6 81 69 59
Verapamil 5 20 5.6 3.7 0.6 84 108 112 88 22 2 4 6 (*) (*) (*)
RR relative recovery, RSD relative standard deviation, ER extraction recovery.

30 Microvolume trace environmental analysis
References
1. Richardson SD (2012) Environmental mass spectrometry: emerging contaminants and current issues. Anal Chem 84:747–78. doi: 10.1021/ac202903d
2. Richardson SD, Ternes TA (2014) Water analysis: emerging contaminants and current issues. Anal Chem 86:2813–48. doi: 10.1021/ac500508t
3. Whitehouse C, Dreyer R (1985) Electrospray interface for liquid chromatographs and mass spectrometers. Anal Chem 57:675–679.
4. Petrovic M, Farré M, Eljarrat E, Díaz-Cruz MS, Barceló D (2013) Environmental Analysis: Emerging Pollutants. In: Liq. Chromatogr. Appl. pp 389–410
5. Huerta B, Rodríguez-Mozaz S, Barceló D (2012) Pharmaceuticals in biota in the aquatic environment: analytical methods and environmental implications. Anal Bioanal Chem 404:2611–24. doi: 10.1007/s00216-012-6144-y
6. Andreu V, Picó Y (2012) Determination of currently used pesticides in biota. Anal Bioanal Chem 404:2659–81. doi: 10.1007/s00216-012-6331-x
7. Bijlsma L, Beltrán E, Boix C, Sancho J V., Hernández F (2014) Improvements in analytical methodology for the determination of frequently consumed illicit drugs in urban wastewater. Anal Bioanal Chem 406:4261–4272. doi: 10.1007/s00216-014-7818-4
8. Rogeberg M, Malerod H, Roberg-Larsen H, Aass C, Wilson SR (2014) On-line solid phase extraction-liquid chromatography, with emphasis on modern bioanalysis and miniaturized systems. J Pharm Biomed Anal 87:120–129. doi: 10.1016/j.jpba.2013.05.006
9. Chen L, Wang H, Zeng Q, Xu Y, Sun L, Xu H, Ding L (2009) On-line coupling of solid-phase extraction to liquid chromatography--a review. J Chromatogr Sci 47:614–623. doi: 10.1093/chromsci/47.8.614
10. Huntscha S, Singer HP, McArdell CS, Frank CE, Hollender J (2012) Multiresidue analysis of 88 polar organic micropollutants in ground, surface and wastewater using online mixed-bed multilayer solid-phase extraction coupled to high performance liquid chromatography-tandem mass spectrometry. J Chromatogr A 1268:74–83. doi: 10.1016/j.chroma.2012.10.032
11. Togola A, Baran N, Coureau C (2014) Advantages of online SPE coupled with UPLC/MS/MS for determining the fate of pesticides and pharmaceutical compounds. Anal Bioanal Chem 406:1181–1191. doi: 10.1007/s00216-013-7248-8
12. Panditi VR, Batchu SR, Gardinali PR (2013) Online solid-phase extraction-liquid chromatography-electrospray-tandem mass spectrometry determination of multiple classes of antibiotics in environmental and treated waters. Anal Bioanal Chem. doi: 10.1007/s00216-013-6863-8
13. Fayad PB, Prévost M, Sauvé S (2013) On-line solid-phase extraction coupled to liquid chromatography tandem mass spectrometry optimized for the analysis of steroid hormones in urban wastewaters. Talanta 115:349–360. doi: 10.1016/j.talanta.2013.05.038
14. Jeon J, Kurth D, Hollender J (2013) Biotransformation pathways of biocides and pharmaceuticals in freshwater crustaceans based on structure elucidation of metabolites using high resolution mass spectrometry. Chem Res Toxicol. doi: 10.1021/tx300457f
15. Hennion MC (1999) Solid-phase extraction: method development, sorbents, and coupling with liquid chromatography. J Chromatogr A 856:3–54. doi: 10.1016/S0021-9673(99)00832-8

31 Chapter 2
16. Ye X, Kuklenyik Z, Needham LL, Calafat AM (2005) Automated On-Line Column-Switching HPLC-MS/MS Method with Peak Focusing for the Determination of Nine Environmental Phenols in Urine. Anal Chem 77:5407–5413. doi: 10.1021/ac050390d
17. Gama MR, Collins CH, Bottoli CBG (2013) Nano-liquid chromatography in pharmaceutical and biomedical research. J Chromatogr Sci 51:694–703. doi: 10.1093/chromsci/bmt023
18. Chervet JP, Ursem M, Salzmann JP (1996) Instrumental requirements for nanoscale liquid chromatography. Anal Chem 68:1507–12. doi: 10.1021/ac9508964
19. Vissers JPC (1999) Recent developments in microcolumn liquid chromatography. J Chromatogr A 856:117–143. doi: 10.1016/S0021-9673(99)00692-5
20. Juraschek R, Dülcks T, Karas M (1999) Nanoelectrospray — More Than Just a Minimized-Flow Electrospray Ionization Source. J Am Soc Mass Spectrom 10:300–308.
21. Shen Y, Moore RJ, Zhao R, Blonder J, Auberry DL, Masselon C, Hixson KK, Auberry KJ, Smith RD (2003) Coupling to 15-150-µm-i.d. Column Liquid Chromatography for Proteomic Analysis. Anal Chem 75:3596–3605.
22. Shen Y, Tolić N, Masselon C, Pasa-Tolić L, Camp DG, Hixson KK, Zhao R, Anderson G a, Smith RD (2004) Ultrasensitive proteomics using high-efficiency on-line micro-SPE-nanoLC-nanoESI MS and MS/MS. Anal Chem 76:144–54. doi: 10.1021/ac030096q
23. Holste A, Tholey A, Hung CW, Schaumlöffel D (2013) Nano-high-performance liquid chromatography with online precleaning coupled to inductively coupled plasma mass spectrometry for the analysis of lanthanide-labeled peptides in tryptic protein digests. Anal Chem 85:3064–3070. doi: 10.1021/ac303618v
24. Zhang Y, Fonslow BR, Shan B, Baek M-C, Yates JR (2013) Protein analysis by shotgun/bottom-up proteomics. Chem Rev 113:2343–94. doi: 10.1021/cr3003533
25. Wilson SR, Malerød H, Holm A, Molander P, Lundanes E, Greibrokk T (2007) On-line SPE-Nano-LC-Nanospray-MS for rapid and sensitive determination of perfluorooctanoic acid and perfluorooctane sulfonate in river water. J Chromatogr Sci 45:146–52.
26. Berlioz-Barbier A, Baudot R, Wiest L, Gust M, Garric J, Cren-Olivé C, Buleté A (2015) MicroQuEChERS-nanoliquid chromatography-nanospray-tandem mass spectrometry for the detection and quantification of trace pharmaceuticals in benthic invertebrates. Talanta 132:796–802. doi: 10.1016/j.talanta.2014.10.030
27. Berlioz-Barbier A, Buleté A, Faburé J, Garric J, Cren-Olivé C, Vulliet E (2014) Multi-residue analysis of emerging pollutants in benthic invertebrates by modified micro-Quick-Easy-Cheap-Efficient-Rugged-Safe extraction and nanoliquid chromatography-nanospray-tandem mass spectrometry analysis. J Chromatogr A 1367:16–32. doi: 10.1016/j.chroma.2014.09.044
28. David A, Abdul-Sada A, Lange A, Tyler CR, Hill EM (2014) A new approach for plasma (xeno)metabolomics based on solid-phase extraction and nanoflow liquid chromatography-nanoelectrospray ionisation mass spectrometry. J Chromatogr A 1365:72–85. doi: 10.1016/j.chroma.2014.09.001
29. Chetwynd AJ, David A, Hill EM, Abdul-Sada A (2014) Evaluation of analytical performance and reliability of direct nanoLC-nanoESI-high resolution mass spectrometry for profiling the (xeno)metabolome. J Mass Spectrom 49:1063–9. doi: 10.1002/jms.3426
30. Haun J, Leonhardt J, Portner C, Hetzel T, Tuerk J, Teutenberg T, Schmidt TC (2013) Online and Splitless NanoLC × CapillaryLC with Quadrupole/Time-of-Flight Mass Spectrometric Detection for Comprehensive Screening Analysis of Complex Samples. Anal Chem 85:10083–10090. doi: 10.1021/ac402002m

32 Microvolume trace environmental analysis
31. Krauss M, Singer H, Hollender J (2010) LC-high resolution MS in environmental analysis: from target screening to the identification of unknowns. Anal Bioanal Chem 397:943–51. doi: 10.1007/s00216-010-3608-9
32. Singer H, Jaus S, Hanke I, Lück A, Hollender J, Alder AC (2010) Determination of biocides and pesticides by on-line solid phase extraction coupled with mass spectrometry and their behaviour in wastewater and surface water. Environ Pollut 158:3054–64. doi: 10.1016/j.envpol.2010.06.013
33. Kovalova L, McArdell CS, Hollender J (2009) Challenge of high polarity and low concentrations in analysis of cytostatics and metabolites in wastewater by hydrophilic interaction chromatography/tandem mass spectrometry. J Chromatogr A 1216:1100–8. doi: 10.1016/j.chroma.2008.12.028
34. Maier-Rosenkranz J (2006) uLC/NanoLC - Optimization and Troubleshooting. In: HPLC Made to Meas. A Pract. Handb. Optim. pp 467–486
35. Singer H, Huntscha S, Hollender J, Mazacek J (2009) Multikomponenten-Screening für den Rhein bei Basel. http://www.eawag.ch/fileadmin/Domain1/Abteilungen/uchem/Analytik/pdf/Multikomponenten-Screening_fuer_den_Rhein.pdf. Accessed 21 Sept 2015
36. Kuklenyik Z, Ye X, Needham LL, Calafat AM (2009) Automated solid-phase extraction approaches for large scale biomonitoring studies. J Chromatogr Sci 47:12–18.
37. Snyder LR, Kirkland JJ, Dolan JW (2010) Basic Concepts and the Control of Separation. In: Introd. to Mod. Liq. Chromatogr. John Wiley & Sons, Inc., Hoboken, NJ, USA, pp 19–86
38. Stewart II, Zhao L, Le Bihan T, Larsen B, Scozzaro S, Figeys D, Mao GD, Ornatsky O, Dharsee M, Orsi C, Ewing R, Goh T (2004) The reproducible acquisition of comparative liquid chromatography/tandem mass spectrometry data from complex biological samples. Rapid Commun Mass Spectrom 18:1697–1710. doi: 10.1002/rcm.1538
39. Kern S, Fenner K, Singer HP, Schwarzenbach RP, Hollender J (2009) Identification of transformation products of organic contaminants in natural waters by computer-aided prediction and high-resolution mass spectrometry. Environ Sci Technol 43:7039–46.
40. Sun JJ, Fritz JS (1992) Chemically modified resins for solid-phase extraction. J Chromatogr 590:197–202.

33

34

35 Chapter 2 – Supporting Information
Chapter S2. Supporting Information: Microvolume trace environmental analysis using peak-focusing online solid-phase extraction – nano-liquid chromatography – high-resolution mass spectrometry

36 Microvolume trace environmental analysis

37 Chapter 2 – Supporting Information
S2.1 Supplementary Materials and Methods
Materials. Oasis HLB (Waters, USA), 5 µm particle size, was obtained by utilizing the material from a 3.9 x 20 mm Oasis HLB online cartridge. PolyCAT and PolyWAX, 5 µm particle size, were purchased from PolyLC (USA). LC-MS grade methanol was obtained from Fisher Scientific (Switzerland), and acetonitrile from Acros Organics (USA). The providers for all used reference standards and isotope-labeled internal standards are listed in Tables S1-1 and S1-2.
Sample injection procedure. The sample injection procedure was designed to minimize cross-contamination and ensure complete injection of the sample. Since the autosampler needle volume is 2.4 µL, first 3 µL are drawn from a vial containing loading solvent (vial 1) to displace previous liquid in the needle while the SL is in the loading pump flow. Subsequently, the autosampler valve switches the SL into the syringe path and 44 µL of sample are drawn into the loop. Since the last 2.4 µL of the sample will still be in the syringe needle, 2.4 loading solvent µL are drawn from an additional vial (vial 3) to displace the final sample into the loop. However, to avoid contaminating vial 3 with sample, the needle is first dipped into a loading solvent vial (vial 2) to dilute potential contamination on the outside of the needle away. Finally, the sample loop is switched into the loading pump flow again, and the syringe / buffer loop undergo the standard autosampler washing procedure. After the former 44 µL sample have been delivered over the cartridge, this injection process is repeated such that the final injection volume is 88 µL. As a second measure to avoid cross-contamination, after every run, the buffer loop connecting the syringe to the autosampler valve and vial needle was washed with acetonitrile drawn from an autosampler vial.
Growth medium. Microcystis aeruginosa was cultured in WC medium (1 mM NaNO3, 250 µM CaCl2, 150 µM MgSO4, 150 µM NaHCO3, 100 µM Na2SiO3, 50 µM K2HPO4, 390 µM H3BO3, 11.7 µM Na2EDTA, 11.7 µM FeCl3, 10 nM CuSO4, 76.5 nM ZnSO4, 42 nM CoCl2, 910 nM MnCl2, 26 nM Na2MoO4, 98 nM Na3VO4, 115 g/L TES buffer in deionized H2O) which was prepared from 1000x stock solutions of constituents in deionized water and subsequently sterilized by autoclaving.
Determination of dry weight. Different dilutions (50 mL each) of a densely grown culture of Microcystis aeruginosa were made. Of every dilution, the OD at 750 nm was determined. Subsequently, the cultures were filtered over pre-weighed pre-dried filters (Whatman GF/F, Sigma Aldrich, USA) and the filters dried at 110°C. The dried filters were weighed. Correlation of measured OD over background to dry cell weight gave c = 1.05 g/L/uOD * A, where c is the cell dry mass concentration in g/L and A is the measured absorbance over background in optical density units (uOD). For further calculation of dry weight, the determined equation was used.
Bioconcentration in Microcystis aeruginosa. 30 mL Microcystis culture were incubated for 24 hours in WC medium with or without a mixture of 26 micropollutants which included azoxystrobin, ranitidin, epoxiconazole, propiconazole, venlafaxine, verapamil, bezafibrate, tramadol, atrazine, mefenamic acid, tebuconazole, cyproconazole, fluconazole, trifloxystrobin, kresoxim-methyl, sulfamethoxazole, benzotriazole, atenolol, metoprolol and carbendazim (20) and additionally fluoxastrobin, pyraclostrobin, penconazole, difenoconazole, metconazole and ketoconazole, at a final concentration of 100 µg/L each. Micropollutant treatments were run in triplicate. 1 mL samples of the medium were taken after addition of the micropollutant mixture and after 24 h. After 24 h, OD at 750 nm was determined. 20 mL of Microcystis culture were taken and treated as described. ILIS mixture was added before freeze-drying for quantification. Cell lysate samples and diluted medium samples were measured using the described method.
Chromatographic performance analysis. Chromatographic performance indicators were determined by converting the raw files to mzXML format using ProteoWizard [1] and processed

38 Microvolume trace environmental analysis
using an in-house R script using the RMassBank package [2]. Chromatographic indicators were computed according to the formulae from Snyder et al. [3]. For comparison, the same procedure was applied to raw data from an offline SPE-LC-HRMS method obtained from Singer et al. [4]. Due to the much higher acquisition rate (~2 Hz vs ~0.3 Hz), but also higher spray fluctuation on the nano-LC-HRMS system versus the offline SPE-LC-HRMS systen, a boxcar smoothing window with n=7 was used in the nano-LC-HRMS system, whereas the offline SPE-LC-HRMS data were smoothed with n=3.

39 Chapter 2 – Supporting Information
Figure S2-1 Connections. Table S2-1 describes the connection types used for each numbered connection (1-12) and union (U1-U3)

40 Microvolume trace environmental analysis
Table S2-1 Tubings and unions used for connections, as referred to in Figure S2-1.
No. Tubing or union
1 nanoViper™, 1/32”, 65 µm ID, 250 mm length, 1/16” OD
2 PFTE tubing, 75 µm ID, 650 mm length
3 nanoViper™, 75 µm ID, 650 mm length, 1/16” OD
4 nanoViper™, 75 µm ID, 550 mm length, 1/16” OD
5 nanoViper™, 20 µm ID, 550 mm length, 1/16” OD
6 nanoViper™, 20 µm ID, 150 mm length, 1/16” OD
7 FS, 20 µm ID, 100 mm length, 363 µm OD
8 FS, 30 µm ID, 150 mm length, 363 µm OD
9 nanoViper™, 250 µm ID, 70 mm L, 1/16” OD
10 FS, 20 µm ID, 700 mm length, 363 µm OD
11 FS, 20 µm ID, 100 mm length, 363 µm OD
12 FS, 20 µm ID, 100 mm length, 363 µm OD
U1 360 µm nanovolume tee piece, 50 µm bore, VICI C360TS6FS2
U2 360 µm nanovolume union, 50 µm bore, VICI C360UFS2
U3 360 µm nanovolume union, 50 µm bore, VICI C360UFS2
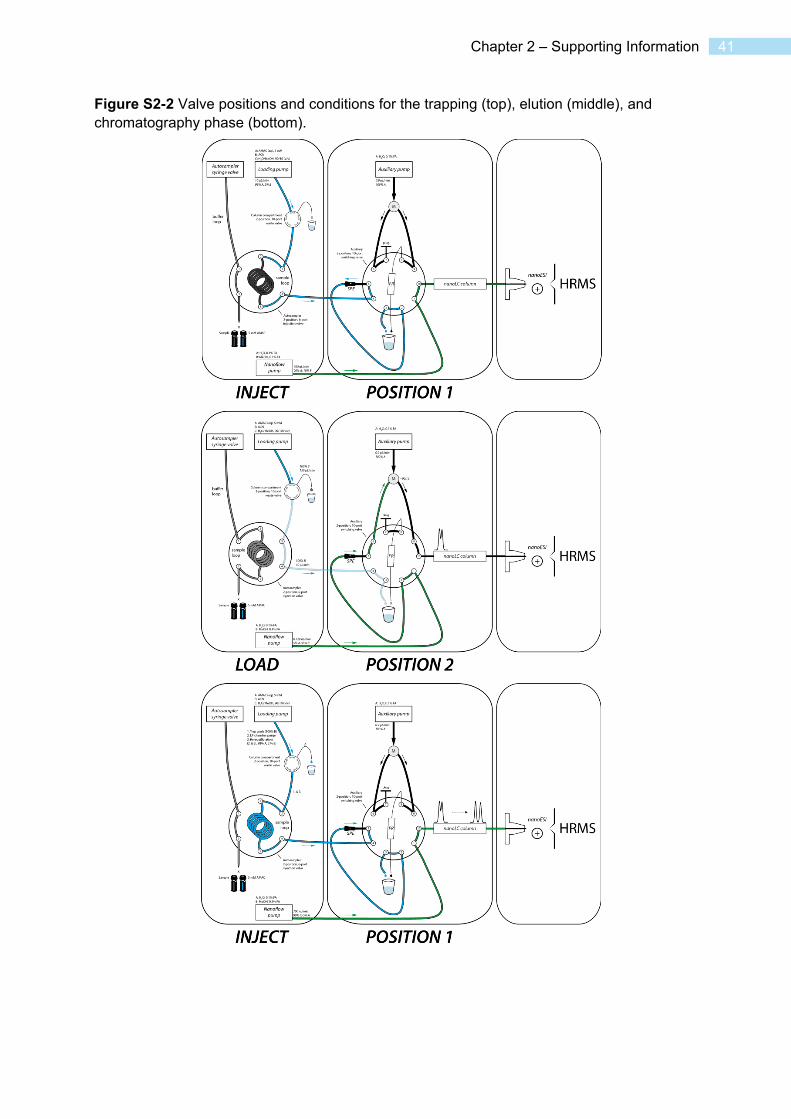
41 Chapter 2 – Supporting Information
Figure S2-2 Valve positions and conditions for the trapping (top), elution (middle), and chromatography phase (bottom).

42 Microvolume trace environmental analysis
Figure S2-3 Method valve in forward elution setup. Left: trapping and chromatography, right: elution.

43 Chapter 2 – Supporting Information
S2.2 Supplementary Results
Figure S2-4 Distribution of calculated octanol-water partition coefficients (logD) at pH 7 for analytes retained (top) or not retained (bottom) on the mixed Oasis HLB/PolyLC WAX SPE cartridge.
Green: retained analytes. Red: non-retained analytes except hydroxylated metabolites. White: non-retained hydroxylated metabolites.
04
81
2
-4 -3 -2 -1 0 1 2 3 4 5
logD (pH 7)
cou
nt
04
81
2
-4 -3 -2 -1 0 1 2 3 4 5
logD (pH 7)
cou
nt

44 M
icrovolume trace environm
ental analysis
Figure S2-5 Chromatographic profiles of all analytes, with parameters used for peak tailing calculations.
Red: maximum; light green horizontal lines: 10% and 5% peak height; orange: FWHM peak width; dark green: left and right limits at 5 and 10% peak height. Note: Cyproconazole is a mixture of diastereomers and therefore elutes in a double peak. The peaks were characterized separately.

Chapter 2 – S
upporting Information
45
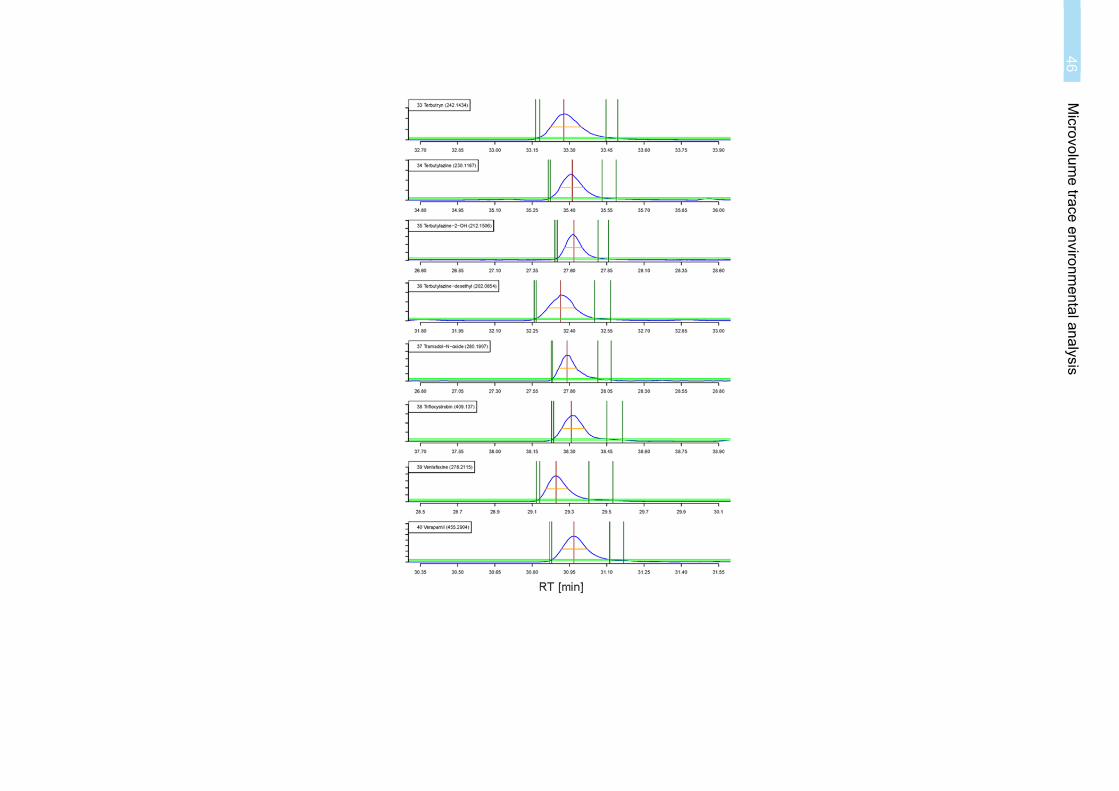
46 M
icrovolume trace environm
ental analysis

47 Chapter 2 – Supporting Information
Table S2-2 Chromatographic performance parameters for this method (left) and, for comparison, of the offline SPE-LC-HRMS/MS method of Singer et al. [4].
T: tailing factor; AS: peak asymmetry; FWHM: full width at half maximum. (see Figure S2-6 for calculation). Note: Cyproconazole is a mixture of diastereomers and therefore elutes in a double peak. The peaks were characterized separately.
Data for this method Data for offline SPE-LC/HRMS
Substance Peak widthFWHM [sec]
T As Peak widthFWHM [sec]
T As
10,11-Dihydrocarbamazepine 6.3 1.50 1.55 4/5-Methyl-1H-benzotriazole 7.7 1.60 1.73 12.3 1.07 0.86 Atrazine 7.3 1.33 1.42 13.8 1.19 1.29 Atrazine-desethyl 9.2 1.18 1.04 12.4 1.33 1.60 Atrazine-desethyl-desisopropyl 6.8 1.39 1.51 Atrazine-desisopropyl 5.8 1.25 1.59 12.4 1.14 1.00 Azoxystrobin 6.2 1.59 1.50 12.3 1.21 1.00 Azoxystrobin-acid 6.8 1.63 1.72 Bezafibrate 6.7 1.68 2.10 13.9 1.43 1.29 Carbamazepine 6.3 1.50 1.64 13.9 1.07 1.00 Carbamazepine-10,11-epoxide 5.8 1.41 1.43 Carbendazim 29.2 1.08 1.11 12.5 1.36 1.29 Clarithromycin 6.3 1.27 1.54 14.0 1.14 1.33 Cyproconazole (isomer 1) 6.3 1.28 1.32 13.1 1.53 1.56 Cyproconazole (isomer 2) 6.2 1.33 1.43 12.9 0.91 0.60 D617 6.3 1.62 1.78 DEET 5.8 1.43 1.47 12.6 1.25 1.17 Diclofenac 5.7 1.51 1.79 12.0 1.29 1.50 Epoxyconazole 6.2 1.42 1.45 12.5 1.36 1.50 Fluconazole 8.8 1.30 1.50 12.3 1.08 1.00 Irgarol 7.8 1.57 1.91 13.7 1.57 1.43 Irgarol-descyclopropyl 7.2 1.64 1.98 12.4 0.89 1.50 Kresoxim-methyl 5.7 1.46 1.89 14.3 1.43 1.33 Mefenamic-acid 7.2 1.42 1.64 14.0 1.36 1.50 Metoprolol 14.5 1.15 0.99 12.3 1.33 1.17 N-Desmethyl-clarithromycin 6.3 1.58 1.70 N-Desmethylvenlafaxine 7.2 1.47 1.66 N,N-Didesmethylvenlafaxine 7.2 1.47 1.68 N,O-Didesmethylvenlafaxine 11.5 0.85 0.89 Tramadol / O-Desmethylvenlafaxine
24.9 0.83 0.56
Propiconazole 10.0 1.20 1.06 19.0 1.33 1.37 Tebuconazole 5.7 1.39 1.37 13.8 1.14 1.00 Terbutryn 7.8 1.46 1.75 15.5 1.44 1.57 Terbutylazine 5.8 1.41 1.36 14.1 0.82 0.56 Terbutylazine-2-OH 7.2 1.41 1.44 12.2 1.12 1.20 Terbutylazine-desethyl 6.3 1.46 1.42 13.7 1.79 0.86 Tramadol-N-oxide 7.3 1.91 2.14 Trifloxystrobin 5.7 1.80 2.00 Venlafaxine 7.2 1.94 1.99 12.3 1.00 1.00 Verapamil 6.3 1.53 1.63 12.5 1.17 1.17

48 Microvolume trace environmental analysis
Figure S2-6 Illustration of the definition and calculation of peak asymmetry (As) and tailing factor (T), as described by Snyder et al. [3].
a5, b5 and a10, b10 denote peak widths to the left and right side of the maximum at 5% peak height or 10% peak height, respectively.

49 Chapter 2 – Supporting Information
Figure S2-7 Extracted ion chromatogram with structure, MS spectrum with predicted isotope pattern, and MS2 spectrum with fragment interpretation of putative metabolite trifloxystrobin acid.

50 M
icrovolume trace environm
ental analysis
Table S2-3 Analyte reference standards with molecular formula and vendor.
Substance name Substance class CAS-No. Vendor Molecular formula
10-11-Dihydrocarbamazepine Pharmaceutical TP 3564-73-6 Sigma-Aldrich C15H14N2O
4-Methyl-1H-benzotriazole Corrosion inhibitor TP 29878-31-7 TRC C7H7N3
4'-OH-diclofenac Pharmaceutical TP 64118-84-9 TRC C14H11Cl2NO3
5-Methyl-1H-benzotriazole Corrosion inhibitor TP 136-85-6 Sigma-Aldrich C7H7N3
5-OH-diclofenac Pharmaceutical TP 69002-84-2 TRC C14H11Cl2NO3
Atenolol Pharmaceutical 29122-68-7 Sigma-Aldrich C14H22N2O3
Atenolol-acid Pharmaceutical TP 56392-14-4 TRC C14H21NO4
Atenolol-desisopropyl Pharmaceutical TP 81346-71-6 TRC C11H16N2O3
Atrazine Pesticide 1912-24-9 Dr. Ehrenstorfer C8H14ClN5
Atrazine-2-OH Pesticide TP 2163-68-0 Sigma-Aldrich C8H15N5O
Atrazine-desethyl Pesticide TP 6190-65-4 Riedel-de-Haën C6H10ClN5
Atrazine-desethyl-2-OH Pesticide TP 19988-24-0 Sigma-Aldrich C3H4ClN5
Atrazine-desethyl-desisopropyl Pesticide TP 3397-62-4 Riedel-de-Haën C6H11N5O
Atrazine-desisopropyl Pesticide TP 1007-28-9 Sigma-Aldrich C5H8ClN5
Atrazine-desisopropyl-2-OH Pesticide TP 7313-54-4 Syngenta C5H9N5O
Azoxystrobin Pesticide 131860-33-8 Dr. Ehrenstorfer C22H17N3O5
Azoxystrobin acid Pesticide TP 1185255
-09-7
Dr. Ehrenstorfer C21H15N3O5
Benzotriazole Corrosion inhibitor 95-14-7 Sigma-Aldrich C6H5N3
Bezafibrate Pharmaceutical 41859-67-0 Sigma-Aldrich C19H20ClNO4
Carbamazepine Pharmaceutical 298-46-4 Sigma-Aldrich C15H12N2O

51 C
hapter 2 – Supporting Inform
ation
Carbamazepine-10-11-dihydro-
10-11-di-OH
Pharmaceutical TP 58955-93-4 TRC C15H14N2O3
Carbamazepine-10-11-epoxide Pharmaceutical TP 36507-30-9 TRC C15H12N2O2
Carbendazim Biocide 10605-21-7 Sigma-Aldrich C9H9N3O2
Clarithromycin Pharmaceutical 81103-11-9 TRC C38H69NO13
Cyproconazole Pesticide 94361-06-5 Dr. Ehrenstorfer C15H18ClN3O
D617 Pharmaceutical TP 34245-14-2 TRC C17H26N2O2
DEET Biocide 134-62-3 Dr. Ehrenstorfer C12H17NO
Diclofenac Pharmaceutical 15307-86-5 Sigma-Aldrich C14H11Cl2NO2
Epoxiconazole Pesticide 133855-98-8 Dr. Ehrenstorfer C17H13ClFN3O
Fluconazole Pharmaceutical 86386-73-4 Dr. Ehrenstorfer C13H12F2N6O
Irgarol Biocide 28159-98-0 Fluka C11H19N5S
Irgarol-descyclopropyl Biocide TP (*) ASCA GmbH C8H15N5S
Kresoxim-methyl Pesticide TP 143390-89-0 Dr. Ehrenstorfer C18H19NO4
Mefenamic-acid Pharmaceutical 61-68-7 Sigma-Aldrich C15H15NO2
Metoprolol Pharmaceutical 37350-58-6 Sigma-Aldrich C15H25NO3
N4-Acetylsulfamethoxazole Pharmaceutical TP 21312-10-7 TRC C12H13N3O4S
N-Desmethyl-clarithromycin Pharmaceutical TP 101666-68-6 TRC C37H67NO13
N-Desmethylvenlafaxine Pharmaceutical TP 149289-30-5 TRC C16H25NO2
N,N-Didesmethylvenlafaxine Pharmaceutical 93413-77-5 TRC C15H23NO2
N,O-Didesmethylvenlafaxine Pharmaceutical 135308-74-6 TRC C15H23NO2
O-Desmethylvenlafaxine Pharmaceutical TP 93413-62-8 TRC C16H25NO2
Propiconazole Pesticide 60207-90-1 Dr. Ehrenstorfer C15H17Cl2N3O2

52 M
icrovolume trace environm
ental analysis
Ranitidine Pharmaceutical 66357-35-5 Sigma-Aldrich C13H22N4O3S
Ranitidine-N-oxide Pharmaceutical TP 738557-20-2 TRC C13H22N4O4S
Ranitidine-S-oxide Pharmaceutical TP 73851-70-4 TRC C13H22N4O4S
Sulfamethoxazole Pharmaceutical 723-46-6 Sigma-Aldrich C10H11N3O3S
Tebuconazole Pesticide 107534-96-3 Dr. Ehrenstorfer C16H22ClN3O
Terbutryn Biocide 886-50-0 Dr. Ehrenstorfer C9H16ClN5
Terbutylazine Pesticide 5915-41-3 Dr. Ehrenstorfer C9H17N5O
Terbutylazine-2-OH Pesticide TP 66753-07-9 Dr. Ehrenstorfer C7H12ClN5
Terbutylazine-desethyl Pesticide TP 30125-63-4 Dr. Ehrenstorfer C7H13N5O
Terbutylazine-desethyl-2-OH Pesticide TP 66753-06-8 Dr. Ehrenstorfer C10H19N5S
Tramadol Pharmaceutical 27203-92-5 Sigma-Aldrich C16H25NO2
Tramadol-N-oxide Pharmaceutical TP 147441-56-3 LGC C16H25NO3
Trifloxystrobin Pesticide 141517-21-7 Dr. Ehrenstorfer C20H19F3N2O4
Valsartan Pharmaceutical 137862-53-4 TRC C24H29N5O3
Valsartan acid Pharmaceutical TP 164265-78-5 Novartis C14H10N4O2
Venlafaxine Pharmaceutical 93413-69-5 AUE-Labor Basel C17H27NO2
Verapamil Pharmaceutical 152-11-4 Sigma-Aldrich C27H38N2O4
(*): Irgarol-descyclopropyl has no CAS number; it denotes the substance N-(2-Methyl-2-propanyl)-6-(methylsulfanyl)-1,3,5-triazine-2,4-diamine.

53 Chapter 2 – Supporting Information
Table S2-4 Used isotope-labeled internal standards with corresponding vendor.
Substance name Vendor
4'-OH-diclofenac-d4 TRC
5-Methyl-benzotriazole-D6 TRC
Atenolol-Acid-D5 TRC
Atenolol-D7 TRC
Atrazine-2OH-D5 Dr. Ehrenstorfer
Atrazine-D5 Dr. Ehrenstorfer
Atrazine-desethyl-15N3 Sigma-Aldrich
Atrazine-desisopropyl-D5 Dr. Ehrenstorfer
Benzotriazole-D4 TRC
Bezafibrate-D4 TRC
Carbamazepine-10-11-epoxide-13C-D2 TRC
Carbamazepine-D8 TRC
Carbendazim-D4 Dr. Ehrenstorfer
Clarithromycin-D3 TRC
DEET-D10 TRC
Diclofenac-D4 TRC
Fluconazole-D4 TRC
Irgarol-D9 TRC
Mefenamic-acid-D3 TRC
Metoprolol-D7 TRC
N-Desmethylvenlafaxine-D3 TRC
N-O-Didesmethylvenlafaxine-D3 TRC
O-Desmethylvenlafaxine-D6 TRC
Propiconazole-D5 Dr. Ehrenstorfer
Sulfamethoxazole-D4 TRC
Tebuconazole-D6 Dr. Ehrenstorfer
Terbuthylazine-D5 Dr. Ehrenstorfer
Terbutryn-D5 Dr. Ehrenstorfer
Tramadol-D6 TRC
Valsartan-13C5-15N Novartis
Valsartan acid-D4 Novartis
Venlafaxine-D6 TRC
Verapamil-D6 TRC

54 Microvolume trace environmental analysis
Table S2-5 Cartridge recovery test on a mixed HLB/WAX cartridge. x: yes, o: no. (*): hydroxylated metabolite
Substance recovered logD (pH 7)
Atenolol-desisopropyl o -3.03
Atenolol o -2.14
Ranitidine-S-oxide o -1.35
Atenolol-acid o -1.24
Atrazine-desisopropyl-2-OH (*) o -1.05
Metoprolol x -0.81
N,O-Didesmethylvenlafaxine (*) x -0.43
N,N-Didesmethylvenlafaxine x -0.41
N-Desmethylvenlafaxine x -0.3
Ranitidine-N-oxide o -0.13
Ranitidine o -0.12
D617 x -0.1
N4-Acetyl-sulfamethoxazole o 0.1
Sulfamethoxazole o 0.14
Valsartan acid o 0.17
Tramadol x 0.24
N-desmethyl-clarithromycin x 0.39
Azoxystrobin acid x 0.42
Valsartan o 0.43
Atrazine-desethyl-desisopropyl x 0.46
Fluconazole x 0.56
O-Desmethylvenlafaxine (*) x 0.69
Carbamazepine-10-11-dihydro-10-11-di-OH (*) o 0.81
Venlafaxine x 0.84
4'-OH-diclofenac (*) o 0.89
5-OH-diclofenac (*) o 0.93
Bezafibrate x 0.97
Atrazine-desethyl-2-OH (*) o 1.01
Atrazine-desisopropyl x 1.12
Benzotriazole o 1.29
Terbutylazine-desethyl-2-OH (*) o 1.29
Tramadol-N-oxide x 1.33

55 Chapter 2 – Supporting Information
Diclofenac x 1.37
Atrazine-desethyl x 1.54
Atrazine-2-OH (*) o 1.66
Carbendazim x 1.8
4-Methyl-benzotriazole x 1.81
5-Methyl-benzotriazole x 1.81
Terbuthylazine-desethyl x 1.82
Clarithromycin x 1.84
Terbuthylazine-2-OH (*) x 1.94
Carbamazepine-10-11-epoxide x 1.97
Irgarol-descyclopropyl x 2.19
Atrazine x 2.2
Mefenamic acid x 2.42
Verapamil x 2.42
Terbuthylazine x 2.48
DEET x 2.5
Carbamazepine x 2.77
Cyproconazole x 2.85
Terbutryn x 2.85
10-11-Dihydrocarbamazepine x 2.96
Irgarol x 2.97
Tebuconazole x 3.69
Epoxyconazole x 3.74
Azoxystrobin x 4.22
Propiconazole x 4.33
Kresoxim-methyl x 4.34
Trifloxystrobin x 4.8

56 M
icrovolume trace environm
ental analysis
Table S2-6 Analytical parameters used in the final method. RT: retention time.
Substance name ILIS for quantification m/z Expected
RT [min] NCE Fragments
10-11-Dihydrocarbamazepine Terbutryn-D5 239.1179 33.1 60 194.0964 180.0808
4-Methyl-1H-benzotriazole 5-Methyl-benzotriazole-D6 134.0713 29.7 105 134.0713 77.0386 79.0542 106.0651
5-Methyl-1H-benzotriazole 5-Methyl-benzotriazole-D6 134.0713 29.7 105 134.0713 77.0386 79.0542 106.0651
Atrazine Atrazine-D5 216.1010 33.5 70 174.0541 104.001 68.0243 132.0325 96.0557
Atrazine-desethyl Atrazine-desethyl-15N3 188.0697 29.1 85 146.0228 104.001
Atrazine-desethyl-desisopropyl Carbamazepine-D8 146.0228 31.9 100 68.0243 104.001
Atrazine-desisopropyl Atrazine-desisopropyl-D5 174.0541 35.4 90 104.001 68.0243
Azoxystrobin 404.1241 35.2 15 372.0979 344.103 329.0793 172.0398 316.1076
Azoxystrobin-acid DEET-D10 390.1084 34.0 15 372.0979 344.103
Bezafibrate Bezafibrate-D4 362.1154 35.6 15 138.9945 316.1099 276.0786 121.0648 362.1154
Carbamazepine Carbamazepine-D8 237.1022 32.6 65 194.0964 192.0808 193.0885 179.073 165.0696
Carbamazepine-10-11-epoxide Carbamazepine-10-11-epoxide-13C-D2 253.0972 30.6 55 210.0913 236.0706 180.0808 253.0972 182.0964
Carbendazim Carbendazim-D4 192.0768 20.3 80 160.0505 132.0556 133.0633 133.0635
Clarithromycin Clarithromycin-D3 748.4842 33.2 15 158.1176 590.3899 116.0706 116.0705 116.1069
Cyproconazole Bezafibrate-D4 292.1211 35.8 40 70.04 125.0153 138.9945 165.0467 155.0264
D617 Venlafaxine-D6 291.2067 29.5 40 248.1519 260.1645 243.1380 177.0910 291.2067
DEET DEET-D10 192.1383 33.5 80 91.0542 119.0491 109.0492 65.03858 109.0648
Diclofenac Diclofenac-D4 296.0240 37.3 40 215.0496 250.0185 214.0418 278.0132 180.0807
Epoxyconazole Propiconazole-D5 330.0804 36.5 25 121.0448 123.0241 141.0103 70.0400 261.0488
Fluconazole Fluconazole-D4 307.1113 28.7 35 169.0460 220.0681 139.0354 70.0400 238.0786
Irgarol Irgarol-D9 254.1434 34.0 55 198.0808 108.0556 91.0325 83.0604
Irgarol-descyclopropyl Carbamazepine-10-11-epoxide-13C-D2 214.1121 30.6 70 158.0495 85.0509
Kresoxim-methyl Tebuconazole-D6 314.1387 37.0 30 267.1016 282.1125 206.0812 222.0913 116.0495
Mefenamic-acid Mefenamic-acid-D3 242.1176 38.6 60 209.0835 180.0808 208.0757 181.0886 224.1070
Metoprolol Metoprolol-D7 268.1907 27.3 50 191.1067 116.107 121.0648 98.0965 133.0648
N-Desmethyl-clarithromycin Clarithromycin-D3 734.4685 33.2 15 144.1019 576.3742
N-Desmethylvenlafaxine N-Desmethylvenlafaxine-D3 264.1958 29.3 50 121.0648 215.1430 147.0804 173.0961

57 C
hapter 2 – Supporting Inform
ation
N,N-Didesmethylvenlafaxine Venlafaxine-D6 250.1802 29.3 55 121.0648 215.1430 147.0804 173.0961 159.0804
N,O-Didesmethylvenlafaxine N-O-Didesmethylvenlafaxine-D3 250.1802 27.0 55 133.0648 107.0491 201.1274 159.0805 145.0648
O-Desmethylvenlafaxine O-Desmethylvenlafaxine-D6 264.1958 27.1 50 107.0491 133.0648
Propiconazole Propiconazole-D5 342.0771 37.6 20 158.9763 69.0699 204.9820 273.0447 186.9713
Tebuconazole Tebuconazole-D6 308.1524 37.3 35 70.04 125.0153 290.1414 151.031 165.0467
Terbutryn Terbutryn-D5 242.1434 33.3 60 186.0808 91.0324 68.0244 96.0557 116.0279
Terbutylazine Terbuthylazine-D5 230.1167 35.4 65 174.0541 104.001 132.0324 68.0244 146.0229
Terbutylazine-2-OH Venlafaxine-D6 212.1506 27.49 75 97.0771 154.0734 210.1360 69.0458
Terbutylazine-desethyl Carbamazepine-D8 202.0854 32.4 75 104.001 68.0243
Tramadol Tramadol-D6 264.1958 26.9 50 58.0651 264.1958 246.1852 56.0494
Tramadol-N-oxide Metoprolol-D7 280.1907 27.7 45 262.1802 135.0441 110.0964
Trifloxystrobin Tebuconazole-D6 409.1370 38.2 15 186.0525 206.0812
Venlafaxine Venlafaxine-D6 278.2115 29.2 45 215.14321 260.2009 121.065 58.0651 147.0806
Verapamil Verapamil-D6 455.2904 30.9 15 150.06753 165.0910 105.0698 134.0726 455.2904

58 Microvolume trace environmental analysis
References
1. Chambers MC, Maclean B, Burke R, Amodei D, Ruderman DL, Neumann S, Gatto L, Fischer B, Pratt B, Egertson J, Hoff K, Kessner D, Tasman N, Shulman N, Frewen B, Baker TA, Brusniak M-Y, Paulse C, Creasy D, Flashner L, Kani K, Moulding C, Seymour SL, Nuwaysir LM, Lefebvre B, Kuhlmann F, Roark J, Rainer P, Detlev S, Hemenway T, Huhmer A, Langridge J, Connolly B, Chadick T, Holly K, Eckels J, Deutsch EW, Moritz RL, Katz JE, Agus DB, MacCoss M, Tabb DL, Mallick P (2012) A cross-platform toolkit for mass spectrometry and proteomics. Nat Biotechnol 30:918–920. doi: 10.1038/nbt.2377
2. Stravs MA, Schymanski EL, Singer HP, Hollender J (2013) Automatic recalibration and processing of tandem mass spectra using formula annotation. J Mass Spectrom 48:89–99. doi: 10.1002/jms.3131
3. Snyder LR, Kirkland JJ, Dolan JW (2010) Basic Concepts and the Control of Separation. In: Introd. to Mod. Liq. Chromatogr. John Wiley & Sons, Inc., Hoboken, NJ, USA, pp 19–86
4. Singer H, Huntscha S, Hollender J, Mazacek J (2009) Multikomponenten-Screening für den Rhein bei Basel. http://www.eawag.ch/fileadmin/Domain1/Abteilungen/uchem/Analytik/pdf/Multikomponenten-Screening_fuer_den_Rhein.pdf. Accessed 21 Sept 2015

59

60

61 Chapter 3
Chapter 3. Exploring micropollutant biotransformation in three freshwater phytoplankton species
Michael A. Stravs†‡, Francesco Pomati†§, Juliane Hollender†‡* †Eawag Swiss Federal Institute of Aquatic Science and Technology, Überlandstrasse 133, 8600 Dübendorf, Switzerland ‡Institute of Biogeochemistry and Pollutant Dynamics, Universitätstrasse 16, ETH Zürich, 8092 Zürich, Switzerland §Institute of Integrative Biology, ETH Zürich, Universitätstrasse 16, 8092 Zürich, Switzerland
* Corresponding Author
Überlandstrasse 133, 8600 Dübendorf, Switzerland
phone: +41 58 765 5493; fax: +41 58 765 5893; e-mail: [email protected]
Published in Environmental Sciences: Processes and Impacts, DOI: 10.1039/C7EM00100B

62 Exploring micropollutant biotransformation in three freshwater phytoplankton species

63 Chapter 3
Graphical Abstract
Abstract
Phytoplankton constitute an important component of surface water ecosystems; however little is known about their contribution to biotransformation of organic micropollutants. To elucidate biotransformation processes, batch experiments with two cyanobacterial species (Microcystis aeruginosa, Synechococcus sp.) and one green algal species (Chlamydomonas reinhardtii) were conducted. Twenty-four micropollutants were studied, including 15 fungicides and 9 pharmaceuticals. Online solid phase extraction (SPE) coupled to liquid chromatography (LC) – high resolution tandem mass spectrometry (HRMS/MS) was used together with suspect and nontarget screening to identify transformation products (TPs). 14 TPs were identified for 9 micropollutants, formed by cytochrome P450-mediated oxidation, conjugation and methylation reactions. The observed transformation pathways included reactions likely mediated by promiscuous enzyme reactions, such as glutamate conjugation to mefenamic acid and pterin conjugation of sulfamethoxazole. For 15 compounds, including all azole fungicides tested, no TPs were identified. Environmentally relevant concentrations of chemical stressors had no influence on the transformation types and rates.
Environmental impact
The persistence, fate and transformation of organic micropollutants in freshwater is frequently studied. However, a potential contribution of phototrophic organisms to micropollutant fate is often disregarded. Phytoplankton is a crucial component in freshwater ecosystems, yet little is known about its role in the fate of organic micropollutants, and formation of potentially unknown transformation products. The present study examines the biotransformation of a set of both wastewater-borne and agricultural micropollutants in three freshwater phytoplankton species, revealing biotransformation by common mechanisms and by promiscuous enzyme reactions. Understanding of biotransformation pathways in phytoplankton adds to the general picture of environmental fate processes, and has potential additional relevance for processes in algae-containing water treatment systems.
3.1 Introduction
Natural water bodies receive inputs of polar organic micropollutants from diffuse and point sources such as agricultural run-off and wastewater treatment plant effluents. The persistence of those micropollutants in the environment varies widely depending on biotic and abiotic processes such as photodegradation, microbial degradation, sorption, and potentially also bioaccumulation and biotransformation in different organisms.
For pesticides in agricultural use, fate studies concerning persistence, degradation, sorption, and other processes in water and sediment, as well as toxicity studies in different freshwater organisms (phytoplankton, invertebrates, fish) are mandatory for registration [1]. Similar tests

64 Exploring micropollutant biotransformation in three freshwater phytoplankton species
are also mandated for pharmaceuticals [2]; however the corresponding data is usually confidential, and only in select cases is their fate known.
Specifically, aerobic and anaerobic transformation in water bodies is examined in Organisation for Economic Co-operation and Development (OECD) tests 308 and 309 [3, 4]. Such tests are typically intended to examine biotransformation by heterotrophic microorganisms. In contrast, very little is known about bioaccumulation, biotransformation, or biodegradation in other aquatic organisms. Thomas and Hand [5] investigated the degradation of pesticides under conditions close to the OECD 308 guidelines, in the presence or absence of phytoplankton or macrophytes. They demonstrated that the presence of phototrophic organisms had significant effect on the degradation of certain pesticides. A closer investigation of the degradation of the fungicide fludioxonil showed metabolic activity of different strains of cyanobacteria, green algae and diatoms [6]. Studies on wastewater treatment in e.g. algal ponds and bioreactors also suggest that some micropollutants can be degraded by algae to different extents [7–10]. As phototrophs, phytoplankton do not rely on organic chemicals as carbon sources, however the presence of biotransformation in algae is potentially a detoxification mechanism, as suggested for dichlorophenol degradation [11], or a consequence of enzyme promiscuity or reactivity with compounds similar to their natural substrates (as suggested e.g. for Arabidopsis [12, 13]).
This highlights the need to study the role of algae in biotransformation, as knowledge about biotransformation processes in phytoplankton is limited. Enzymes active in biotransformation are present in cyanobacteria and other microalgae. Cytochrome P450 enzymes are found in all domains of life [14]. They are widespread in green algae and cyanobacteria [15, 16], and some are known to participate in biological functions, but many remain uncharacterized [15]. The activity of phytoplankton enzymes in biotransformation has been demonstrated; examples include cytochrome P450 (CYP450) monooxygenase, O- and N-glucosyltransferase and glutathione S-transferase activity on a number of substrates in marine macroalgae [17], or CYP450-dependent dealkylation of several ethers in Chlorella strains [18]. On the other hand, no studies to date include or imply the activity of promiscuous enzymes.
Biotransformation in phytoplankton has only been investigated for few compounds so far. For estrogens, glucose conjugation as well as hydroxylation and other oxidation/reduction reactions and hydrolysis have been reported [19–21] but even unusual reactions such as bio-bromination [22] have been observed. In a study with different monoterpenes, various redox reactions were found [23]. Oxidation was also found to be important for the organophosphorus pesticide fenamiphos [24], whereas sulfate and glucose conjugation as well as O-methylation products were observed in the case of tetrabromobisphenol A [25]. O-methylation of the antimicrobial triclosan was also observed [26].
However, so far, no study has attempted to get a more comprehensive picture of the biotransformation potential of algae and cyanobacteria. Therefore, our goal was to investigate biotransformation processes in phytoplankton more closely, to elucidate important types of biotransformation reactions and determine relevant structural moieties susceptible to those reactions. To this end, we performed batch experiments to identify transformation products for 24 micropollutants (9 pharmaceuticals and 15 fungicides) with various functional groups. Within the fungicides, two groups of structurally related compounds (5 strobilurin fungicides and 9 azole fungicides) were selected to investigate commonalities within compound classes. The strobilurin fungicides are synthetic analogs of fungicidal natural products with a β-methoxyacrylate group or analog, acting on the respiratory chain, whereas azole fungicides are synthetic chemicals with an imidazole or triazole ring, which inhibit CYP450 enzymes in fungi [27]. Strobilurins are used only in agriculture, whereas azole fungicides have both agricultural and medicinal uses. We focused on the biotransformation behavior of two
65 Chapter 3
phytoplankton functional groups, the green algae (Chlorophyta) and the Cyanobacteria, which were also the main focus of Thomas and Hand’s studies [6]. As a green alga, Chlamydomonas reinhardtii was studied, which is an important freshwater and soil alga and a well-studied model organism. For cyanobacteria, two related but physiologically different species were chosen: Microcystis aeruginosa and Synechococcus sp. are common freshwater phytoplankton species. Microcystis aeruginosa is a medium-sized (~5 µm cell size) cyanobacterium, forms colonies in natural conditions, and frequently causes harmful algal blooms, while Synechococcus is the most abundant component of the picoplankton (<1 µm) in aquatic ecosystems. Degradation of the substance mixture over time and the formation of transformation products (TPs) was characterized with liquid chromatography – high-resolution tandem mass spectrometry (LC-HRMS/MS). To investigate the induction of biotransformation as a general stress response mechanism, the influence of low-level environmental stressors on the transformation was simulated by three algicides.
3.2 Materials and Methods
Chemicals. All organic micropollutants were obtained in analytical grade (typically 98%+) from Dr. Ehrenstorfer (now LGC Standards, Wesel, Germany), Sigma-Aldrich (St. Louis, MO, USA), Fluka (now Sigma-Aldrich), TRC Canada (Toronto, Canada), Novartis (Basel, Switzerland) or HPC Standards (Cunnersdorf, Germany). A detailed list is attached in Table S3-1. Two mixtures of chemicals were used in experiments (Mix 1, all compounds, and Mix 2, no azoles): atenolol (ATE), bezafibrate (BEZ), carbendazim (CBDZ), mefenamic acid (MEF), metoprolol (MPL), ranitidine (RAN), tramadol (TRA), venlafaxine (VFX), verapamil (VPL), azoxystrobin (AZY), fluoxastrobin (FXS), kresoxim-methyl (KME), pyraclostrobin (PYR) and trifloxystrobin (TFL) were contained in both Mix 1 and Mix 2. Cyproconazole (CYP), difenoconazole (DIF), epoxiconazole (EPO), fluconazole (FLU), ketoconazole (KET), metconazole (MET), penconazole (PEN), propiconazole (PRO), tebuconazole (TEB) and sulfamethoxazole (SMZ) were only contained in Mix 1. Before analysis, samples were fortified with an in-house isotope-labeled internal standard (IS) mixture; the standards used for quantification are listed in Table S3-2.
Cultures. Microcystis aeruginosa, strain PCC7806 (Mcy), Synechococcus sp., natural isolate from a Swiss lake (Syn), and Chlamydomonas reinhardtii, strain CC125 (Chl), were obtained from subsampling of in-house cultures. Cultures were kept at room temperature in 100 mL Erlenmeyer flasks. Mcy and Syn were grown in WC (Woods Hole Combo, see SI) medium, whereas Chl was grown in WC+A+M medium (with ammonia and MOPS, see SI). Cultures were kept under ambient light and room temperature for maintenance. Subculturing was performed under sterile conditions in a clean bench close to a Bunsen burner flame.
Single species experiments. Biotransformation experiments were conducted in an incubation shaker (Multitron II, Infors HT, Bottmingen, Switzerland) at 20°C, 90 rpm at approximately 100 µEinstein of light intensity from fluorescent tubes. To inhibit possible phototransformation, the fluorescent tubes were equipped with UV protection tubes (METOLIGHT ASR-UV-400-60-T8, Asmetec, Germany) and the shaker window was covered with UV protection foil (METOLIGHT SFC-10, Asmetec, Germany). One week before the start of the experiment, maintenance cultures of Mcy, Syn and Chl were transferred into fresh WC medium (Mcy, Syn) or WC+A+M medium (Chl) and incubated under experimental conditions. At the start of the experiment, for each species 6 subcultures of 50 mL were prepared in sterile 100 mL Erlenmeyer flasks. To 3 flasks, Mix 1 (see above and Table S3-1; 1 mg/L per compound in EtOH) was added to a final concentration of 10 µg/L per substance. To one flask, Mix 2 (without azoles, 1 mg/L in EtOH) was added to a final concentration of 10 µg/L per substance. To two control flasks, only solvent (500 µL EtOH) was added. In addition, two flasks were prepared with 50 mL WC or WC+A+M

66 Exploring micropollutant biotransformation in three freshwater phytoplankton species
medium, and chemical mixture 1 was added to a final concentration of 10 µg/L per substance. All samples were then incubated as described above.
Immediately after addition of the chemical mixture (t0), and after 1 (t1) and 4 days (t2), samples were taken for chemical analysis and cell density measurement. After 12 days (t3), an additional sample of only the medium was taken, as algal cultures were in senescent state. For chemical analysis, 10 mL per culture were sampled into a glass centrifuge tube pre-washed with MeOH and centrifuged 2 min at 4000 rpm (Mcy, Chl) or 20 min at 4000 rpm (Syn) (PerfectSpin 24 Plus, Peqlab, Germany). 1 mL of supernatant was transferred into an HPLC vial and stored at -20°C. The remaining supernatant was discarded. As a washing step to remove chemicals from residual medium or weakly adsorbed to cells, the pellet was resuspended in 10 mL WC medium in a fresh tube and centrifuged again for 2 min at 4000 rpm (Mcy, Chl) or 20 min at 4000 rpm (Syn). The supernatant was discarded. The pellet was resuspended in 1 mL nanopure H2O and frozen in liquid N2, then stored at -20°C until analysis. For cell density measurement, 200 µL per culture were sampled into a 96-well plate, and optical density at 680 nm and 750 nm was measured (SpectraMax 190, Molecular Devices, Sunnyvale CA). The biomass per sample was determined from a calibration curve to dry weight, which was previously generated for the three species.
Sample preparation. Concentrations of all chemicals in the growth medium was determined from the supernatant, and internal concentrations were determined from the pellet. For measurement of medium concentration, 100 µL supernatant was diluted to 20 mL with nanopure water and fortified with IS mixture (total final absolute amount 1 ng IS per substance and sample). For measurement of internal concentrations, cells in the pellet were lysed by three cycles of freezing in liquid N2 and thawing at 37°C in an ultrasonic bath, and subsequently frozen in liquid N2 and freeze-dried. The lyophilized samples were redissolved in 1 mL MeOH and 1 mL nanopure H2O, then briefly sonicated in an ultrasonic bath at 37°C. The samples were centrifuged for 1 min at 4000 rpm. 750 µL supernatant was diluted with nanopure H2O to 20 mL and IS was added (total final absolute amount 1 ng IS per substance and sample).
Chemical Analysis. Samples were analyzed by online solid phase extraction coupled to high performance liquid chromatography – high resolution tandem mass spectrometry (online SPE – LC – HRMS/MS) as described previously [28]. To 20 mL sample, 80 µL 0.5M citric acid buffer (pH 7) were added. The entire sample was loaded into a sample loop and enriched on a mixed-bed multilayer online SPE cartridge (see SI, loading solvent: 2 mM ammonium acetate in H2O, pH 7). Separation was performed on an Atlantis T3 column (3 mm × 150 mm; Waters Milford, USA), For chromatography, a gradient was formed by mixing water (A, H2O / 0.1% formic acid (FA)) and organic solvent (B, MeOH / 0.1% FA) delivered by two separate pumps (total flow rate: 300 µL/min, gradient: 13.3% B (0-5 min), 13.3 to 95% B (5-20 min), 95% B (20-29 min), 95 to 13.3% B (29-29.5 min), 13.3% B (29.5-35 min; reconditioning)). For 7 min, solvent B ran over the SPE cartridge (elution of enriched analytes) before mixing with A (dilution before analytical column). During cartridge elution, the sample loop was washed with acetonitrile (1 min, 4 mL/min). During chromatography, the cartridge was washed with acetonitrile (5.1 min, 0.4 mL/min) and reconditioned with loading solvent (5.5 min, 0.4 mL/min), and subsequently the next sample was enriched on the cartridge (16 min, 1.27 mL/min).
Detection was performed using a quadrupole-Orbitrap mass spectrometer (Q-Exactive Plus, Thermo Scientific, Bremen) with a heated electrospray (H-ESI) source. For quantification measurements, data was acquired in polarity switching mode with data-dependent acquisition with an MS2 inclusion list. For the inclusion list, masses of the parent compounds and masses of potential metabolites calculated using mass differences (hydroxylation, demethylation, didemethylation, dehydration) in positive and negative modes were selected. For acquisition of

67 Chapter 3
MS2 spectra for compound identification, selected samples were reanalyzed in targeted MS2 mode. Detailed parameters are listed in the SI.
Quantification of analytes using the internal standard method was performed with TraceFinder EFS (version 3.2.368.22, Thermo Scientific, Bremen). Table S3-2 lists internal standards used for quantification for each analyte. A mass tolerance of 5 ppm was allowed. Analyte peaks were automatically integrated by the ICIS algorithm and reviewed by hand. Where available, the internal standard used for quantification was the isotope-labeled analyte. Otherwise, an internal standard close in retention time and with a similar structure was used. All spiked parent compounds as well as known TPs available in the lab as authentic standards (see Table S3-2) were quantified. In addition, newly identified TPs were added retrospectively to the analysis and quantified as area relative to the parent compound, which disregards differences in ionization and is therefore only an indicative measure. Calibration curves were weighted 1/x over the concentration range. For lysate samples, calculated biomass was used to convert substance amount to dry weight concentrations.
Screening and structure elucidation of transformation products (TPs)
Suspect and nontarget screening of TPs were conducted using the open-source workflow RMassScreening (https://www.github.com/meowcat/RMassScreening). It integrates feature detection using the enviPick R package (https://www.github.com/blosloos/enviPick), and cross-sample feature alignment (profile building) using the enviMass R package (https://www.github.com/blosloos/enviMass). For grouping of isotopes, adducts and in-source fragments (componentization), a customized version of the R package RAMClustR [29] was used (https://www.github.com/meowcat/RAMClust). A list of potential TPs was generated from the parent compounds, using lists of possible modifications that were applied for one or two generations using RMassScreening (see Table S3-3 for lists). Suspect hits were found based on exact mass matches from screening the list on all found profiles.
Time series filtering, implemented in RMassScreening, was applied to the features such that 1) only features not present in the micropollutant-free controls were retained, 2) only features absent or with small intensity at t0 were retained, and 3) only features present in chemical treatment groups, but absent in medium control were retained. The list was ordered by decreasing intensity in the chemical treatment. Typically, filters were set to include features 3x over intensity at t0 and in abiotic and chemical controls. The resulting list was evaluated visually to find products with a trend consistent with TPs. These criteria were applied either to suspect hits (for suspect screening), or to all profiles (for nontarget screening).
For putative TPs, MS2 spectra were initially extracted (if available) from the original measurements, and later acquired with targeted MS2 at multiple collision energies for detailed MS2 analysis. Spectra were extracted using RMassBank [30], and converted to MassBank [31] format version 2 (http://www.massbank.jp). Fragment mass spectra were interpreted manually with help of known fragment mass spectra of parent compounds and in silico methods. MS2 elucidation was aided by the package MassInSpectoR (https://github.com/meowcat/MassInSpectoR). This toolkit interfaces to GenForm [32] (https://sourceforge.net/projects/genform) for parent formula assignment based on MS and MS2 spectra, and fragment/loss annotation, CFM-ID [33, 34] for prediction of MS2 spectra of unknown compounds, and RMassBank [30] and in-house code for spectra comparison and shifting. The mass spectral databases MassBank [31] (http://www.massbank.jp), MoNA (http://mona.fiehnlab.ucdavis.edu), and METLIN [35] (https://metlin.scripps.edu/index.php) were used for similarity searches. Identification confidence was stated according to the guidelines by Schymanski et al. [36].

68 Exploring micropollutant biotransformation in three freshwater phytoplankton species
3.3 Results and Discussion
Overview
A mixture of 24 compounds was used for incubation experiments (Mix 1, see in detail Table S3-1.) The mixture covers a wide range of physicochemical properties, with molecular weight from 191 to 531 Da, and log octanol-water partitioning coefficient (log Kow) values from 0.16 to 5.12. The compounds span a range of functional groups, including secondary and tertiary amines, carboxylic acids, esters and amides, sulfonamides, alcohols, ethers, cyanides, triazoles, epoxides, and compounds with and without halogens. In preliminary tests, it was verified, both as single compounds and in mixtures, that the compounds used do not significantly inhibit growth in single species experiments at concentrations of 10 and 100 µg/L, as reflected in the growth curves for single species and mixture experiments (Figure S3-1). Fourteen of the 24 compounds (Mix 2, excluding azole fungicides and sulfamethoxazole) were tested separately to evaluate a potential inhibitory effect on biotransformation (see below). Strongly algicidal compounds (triclosan, atrazine, irgarol) had been excluded from the mixture after initial tests; these compounds were used as chemical stressors (see below). The mixtures (Mix 1 or Mix 2) were applied to batch cultures of the single species Mcy, Syn and Chl or a Mcy+Syn mixture (see SI) at a concentration of 10 µg/L per compound to study bioaccumulation and biotransformation of the compounds. Cultures grew from 0.07 to 0.25 mg/L dry weight (DW) equivalent (Mcy), 0.06 to 0.21 mg/L DW (Syn) and 0.01 to 0.07 mg/L DW (Chl), respectively, over the course of 4 days in single species experiments, and from 0.04 to 0.15 mg/L DW in Mcy+Syn mixture experiments (Figure S3-1). (Note: Chl was not used in combination experiments, since the strain used needs an adapted growth medium.)
Internal concentrations: fast equilibration and log Kow-dependent accumulation
For all compounds and species, bioconcentration factors (BCFs) were calculated as the mean of all values during apparent equilibrium. Some compounds (CBDZ, FLU, TRA, VFX) did not accumulate in the cells at all (i.e., internal concentrations < LOD), whereas for DIF, PYR and TFL the highest observed BCF values were close to 1000 (see Table S3-5). For all compounds, the observed log BCF factors showed a weak correlation with log Kow. Within the two studied compound classes alone, the correlation was stronger (R2 >0.7 in all cases, see Table S3-6 and Figure S3-2), which is likely because physicochemical properties within the classes are more homogenous, and all compounds are uncharged under experimental conditions. Differences between the studied species were insufficient to warrant any conclusions. Fast equilibration was generally observed: for many compounds, the apparent BCF reached a stable value already at the first sampling point (t0, effectively ca. 30 min). Notably, fast equilibration could lead to BCF underestimation, since compounds could be lost to the medium in the wash step (see Materials and Methods). A summary of the compound mass balances in the three species after four days (Table S3-4) shows that for many compounds the largest fraction remained in the medium.
Fate of strobilurin fungicides
Of the five strobilurin fungicides tested (AZY, FXS, KME, PYR; TFL), fast disappearance was observed for KME and TFL in Mcy, while slower degradation was seen in Syn and Chl (Figure 3-2a, b). AZY was essentially stable in the medium (Figure 3-2c). PYR and FXS, which are the most apolar of the five, showed disappearance from the medium over time in Syn, but not in Mcy or Chl. For both, accumulation in cells could be observed, which could, however, not completely account for the losses in medium (Figure 3-2d-e).
Through suspect screening and MS2 interpretation, the ester hydrolysis products (kresoxim-methyl acid (KME-A, [M+H]+ 300.1234, RT 23.4 min) and trifloxystrobin acid (TFL-A, [M+H]+

69 Chapter 3
395.1213, RT 23.9 min) could be identified as TPs (Figure 3-1a). The identity of KME-A could be confirmed by authentic standard. TFL-A, which had been observed in a preliminary study [37], was later also confirmed with an authentic standard. As shown in Figure 3-2a, the formed KME-A accounts for nearly 100% of KME dissipated; TFL-A (only quantified using relative area since at the time the standard was not available) is also the near-quantitative TP of TFL (Figure 3-2b). For PYR and AZY, the corresponding hydrolysis product was not observed, even though for AZY it is a known microbial metabolite [38]. FXS is not amenable to hydrolysis because of its lack of an ester function.
Small amounts (<10%) of KME-A and TFL-A were also formed in the medium control (see Figure 3-2a-b). Since both can hydrolyze abiotically at basic pH with half-lives of 7 h and 27.1 h at pH 9 [39], their fast formation in biological samples could in principle be due to pH shifts in the medium during growth. Therefore, combination (Mcy+Syn) experiments were performed with medium at pH 7.2 or 7.5 and medium pH was followed during the experiment (see Figure S3-3). As a control, autoclaved phytoplankton mixture was used to include abiotic reactions mediated by dead cyanobacterial cells. While in this experiment, disappearance of KME and TFL was less rapid and did not go to completion, it could be observed that 1) the pH was stable for 3 days during the experiment, and 2) a higher pH did not lead to faster hydrolysis, in fact at pH 7.2 hydrolysis proceeded faster. Biotic transformation at pH 7.2 was 8-fold (TFL-A) or 6-fold (KME-A) higher than abiotic TP formation. Therefore, it appears that the observed hydrolysis is linked to active cyanobacterial metabolism. Two possible alternatives remain to be investigated: 1) the hydrolysis is enzymatic or 2) it is driven by highly local pH changes that occur during photosynthesis, when CO2 is depleted around cells.
With regards to the unexplained losses of PYR and FXS, no additional TPs could be identified. Since the substances are considerably hydrophobic, it is conceivable that the unexplained part of the mass balance indeed represents substance weakly adsorbed to the cells which is lost during the washing step.
Atenolol and metoprolol transformation
The TP atenolol/metoprolol acid (ATE/MPL-A, [M+H]+: 268.1542, RT 13.6 min) was detected in single species experiments with both Syn and Chl species, and confirmed with an authentic standard. ATE/MPL-A is known to be formed from ATE by enzymatic hydrolysis [40], or from MPL by CYP450-mediated dealkylation [41, 42] in human metabolism and microbial biotransformation. The disappearance of ATE in Syn, and of MPL in Chl, support the activity of the respective pathways in the two species (Figure 3-1c, Figure 3-2n,o). While the formation of ATE/MPL-A can fully explain the removal of ATE in Syn, the sum of ATE/MPL-A and MPL in Chl only account for ~80% of the original MPL quantity (Figure 3-2p). In addition to ATE/MPL-A, suspect screening revealed a second putative TP MPL-dm ([M+H]+: 254.1750, RT: 13.1 min) consistent with a demethylation product of MPL (Figure 3-1c), which could be tentatively identified by MS2 interpretation (see Supporting Information (SI) S3.3.10). This product, approximately quantified by area ratio (no authentic standard available), accounts for the remaining 20% of MPL removed (Figure 3-2q). Knowledge from human metabolism [43] suggest that MPL-dm is the precursor of MPL-A and would be degraded further to the latter.

70 Exploring micropollutant biotransformation in three freshwater phytoplankton species
Figure 3-1 Observed biotransformation pathways and products for a) strobilurin fungicides, b) mefenamic acid, c) atenolol and metoprolol, d) sulfamethoxazole, e) bezafibrate, f) ranitidine and g) verapamil. Italic: putative enzyme responsible for reaction. Arrows: species exhibiting the reaction. Blue: Mcy, light blue: Syn, green, Chl, black: only observed in mixture experiments. GH3: Gretchen Hagen 3. DHPS: dihydropteroate synthase. CYP450: cytochrome P450. MT: methyltransferase. Note that transformed functional groups are in red. Dashed arrows: minimal amounts of SMZ-Pt detected in Chl.

71 Chapter 3
Figure 3-2 Biotransformation of micropollutants, time profiles. c/c0 values are concentrations, or transformation product amounts semiquantified via peak area (marked *), relative to average initial parent concentration. a)-e) Strobilurin fungicides in single-species experiments. Bold lines: concentration in medium. Solid lines: a) KME, b) TFL, c) AZY, d) FXS, e) PYR. Dashed lines: a) KME-A, b) TFL-A. f)-g) MEF biotransformation in single-species (f) and Mcy+Syn mixture (g) experiments. Solid lines: MEF, dashed lines: MEF-Glu. h)-i): BEZ biotransformation in single-species (h) and Mcy+Syn mixture (i) experiments. Solid line: BEZ, dashed lines: BEZ-da, dotted line: BEZ-M. j)-m): SMZ biotransformation in single-species experiments. j) SMZ, k) SMZ-DHPt, l) SMZ-Pt, m) SMZ-PtO. n)-q): MPL and ATE biotransformation in single-species experiments. n) ATE, o) MPL, p) ATE/MPL-A, q) MPL-dm. r) Biotransformation of VPL in single-species experiments. Solid line: VPL, dashed line: VPL-da. s) Biotransformation of RAN in single-species experiments. Solid line: RAN, dashed line: RAN-dm. Blue: Mcy, turquoise: Syn, green: Chl. Black: medium control. g), i): Dark blue: Mcy+Syn mixture.

72 Exploring micropollutant biotransformation in three freshwater phytoplankton species
Transformation of sulfamethoxazole
Five TPs of SMZ were identified (Figure 3-1d). A TP with [M+H]+ 430.0930 (RT: 16.2 min) was initially thought to be a glucuronide conjugation product ([M+H]+ 430.0915). However the MS2 spectrum could not be reconciled with a glucuronide conjugation. A second TP with [M+H]+ 429.1086 (RT 16.1 min) was initially matched as a second-generation TP by an amination reaction, and exhibited near-identical losses in the MS2 spectrum. By MS2 interpretation (see SI S3.3.4) and using information from previous studies [44], the latter could be tentatively identified as the TP pterin-sulfamethoxazole (SMZ-Pt). Sulfonamide drugs act as inhibitors of dihydropteroate synthase (DHPS) [45–47] which is expressed in microorganisms and plants, but not in higher eukaryotes [48]. DHPS catalyzes the formation of dihydropteroate from dihydropterin pyrophosphate and p-aminobenzoic acid, and sulfonamide antibiotics can act as an enzyme substrate and form a pterin conjugate [44, 46]. The TP with [M+H]+ 430 can then be explained as a product of SMZ-Pt (SMZ-PtO, see SI S3.3.5), where the primary amine has been transformed to a keto group. Through expanded screening, a third related product was observed, which is the dihydro form of SMZ-Pt (SMZ-DHPt, [M+H]+ 431.1244, RT 15.9 min), whereas the dihydro form of SMZ-PtO was not found. In Mcy single culture experiments, SMZ-DHPt appears before SMZ-Pt and SMZ-PtO but disappears before the final timepoint (Figure 3-2j-m). This supports the formation pathway postulated by Richter et al. [44], which suggest SMZ-Pt as the stable form of SMZ-DHPt, and further the formation of SMZ-PtO from SMZ-Pt (rather than through a parallel pathway).
Additional TPs could be found at [M+H]+ 312.0646 (RT 16.1 min) for single-species and Mcy+Syn combination experiments, and [M+H]+ 296.0700 (RT 16.8 min) only in Mcy+Syn combination experiments (see Figure S3-4). The latter is the known metabolite N4-acetylsulfamethoxazole (SMZ-Ac), as confirmed by authentic standard. The former appeared to be N4-hydroxyacetyl-sulfamethoxazole, earlier observed by Majewsky et al. [49, 50]; however comparison with an authentic standard (a gift of Dr. Marius Majewsky, Heidelberg, Germany, and Rafael Peschke, Karlsruhe, Germany) showed slight differences in retention time and markedly different MS2 spectra in positive and negative mode. Based on MS2
interpretation the compound appears to be sulfamethoxazole-N4-acetic acid (SMZ-AcOH, SI S3.3.6), possibly arising from a degradation of SMZ-Pt/SMZ-PtO. Both compounds reach only low concentrations (<3%), indicating that the products can be formed, but their relative importance is only minor to overall biotransformation.
CYP450 transformation products of pharmaceuticals
For BEZ, VPL and RAN, no significant dissipation was observed; however TPs were found in low concentrations (Figure 3-2h,i,r,s). Dealkylation products were observed that are consistent with CYP450 biotransformation (VPL-da, [M+H]+: 291.2067 RT: 17.2 min, BEZ-da, [M+H]+: 276.0787, RT: 21.39 min, RAN-dm, [M+H]+: 301.1329, RT: 10.6 min; Figure 3-1e,f,g). VPL-da corresponds to the previously known VPL TP D617 [51] and was confirmed with authentic standard. Neither of the demethylation products (norverapamil by N-demethylation, or the O-demethylation products known as D702 and D703 [51]) was observed. BEZ-da was tentatively identified by MS2 interpretation (see SI S3.3.7) and is hypothesized to arise from a decarboxylation followed by CYP450-mediated O-dealkylation. RAN-dm corresponds to the product of a mono-dealkylation on the dimethylamine of RAN (see SI S3.3.9), which is a known minor human RAN metabolite [52] but to our knowledge has not been observed in an environmental context. All three products were formed predominantly in Mcy, and in smaller quantities in Chl and Syn, except for BEZ-da, which was not formed in Syn. BEZ-da and RAN-dm could be observed in Mcy+Syn experiments; VPL-da was also present, but could not be quantified due to matrix interferences. These results suggest the activity of CYP450 enzymes in multiple biotransformation pathways in all three studied species. For further verification of
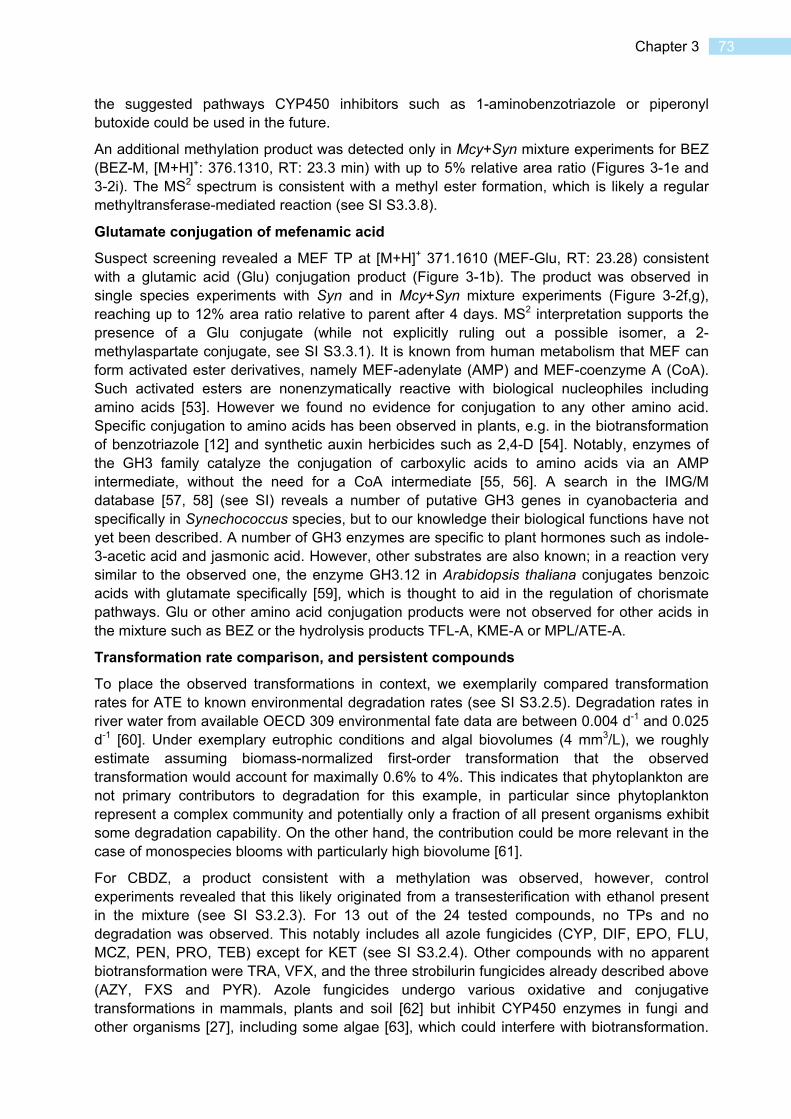
73 Chapter 3
the suggested pathways CYP450 inhibitors such as 1-aminobenzotriazole or piperonyl butoxide could be used in the future.
An additional methylation product was detected only in Mcy+Syn mixture experiments for BEZ (BEZ-M, [M+H]+: 376.1310, RT: 23.3 min) with up to 5% relative area ratio (Figures 3-1e and 3-2i). The MS2 spectrum is consistent with a methyl ester formation, which is likely a regular methyltransferase-mediated reaction (see SI S3.3.8).
Glutamate conjugation of mefenamic acid
Suspect screening revealed a MEF TP at [M+H]+ 371.1610 (MEF-Glu, RT: 23.28) consistent with a glutamic acid (Glu) conjugation product (Figure 3-1b). The product was observed in single species experiments with Syn and in Mcy+Syn mixture experiments (Figure 3-2f,g), reaching up to 12% area ratio relative to parent after 4 days. MS2 interpretation supports the presence of a Glu conjugate (while not explicitly ruling out a possible isomer, a 2-methylaspartate conjugate, see SI S3.3.1). It is known from human metabolism that MEF can form activated ester derivatives, namely MEF-adenylate (AMP) and MEF-coenzyme A (CoA). Such activated esters are nonenzymatically reactive with biological nucleophiles including amino acids [53]. However we found no evidence for conjugation to any other amino acid. Specific conjugation to amino acids has been observed in plants, e.g. in the biotransformation of benzotriazole [12] and synthetic auxin herbicides such as 2,4-D [54]. Notably, enzymes of the GH3 family catalyze the conjugation of carboxylic acids to amino acids via an AMP intermediate, without the need for a CoA intermediate [55, 56]. A search in the IMG/M database [57, 58] (see SI) reveals a number of putative GH3 genes in cyanobacteria and specifically in Synechococcus species, but to our knowledge their biological functions have not yet been described. A number of GH3 enzymes are specific to plant hormones such as indole-3-acetic acid and jasmonic acid. However, other substrates are also known; in a reaction very similar to the observed one, the enzyme GH3.12 in Arabidopsis thaliana conjugates benzoic acids with glutamate specifically [59], which is thought to aid in the regulation of chorismate pathways. Glu or other amino acid conjugation products were not observed for other acids in the mixture such as BEZ or the hydrolysis products TFL-A, KME-A or MPL/ATE-A.
Transformation rate comparison, and persistent compounds
To place the observed transformations in context, we exemplarily compared transformation rates for ATE to known environmental degradation rates (see SI S3.2.5). Degradation rates in river water from available OECD 309 environmental fate data are between 0.004 d-1 and 0.025 d-1 [60]. Under exemplary eutrophic conditions and algal biovolumes (4 mm3/L), we roughly estimate assuming biomass-normalized first-order transformation that the observed transformation would account for maximally 0.6% to 4%. This indicates that phytoplankton are not primary contributors to degradation for this example, in particular since phytoplankton represent a complex community and potentially only a fraction of all present organisms exhibit some degradation capability. On the other hand, the contribution could be more relevant in the case of monospecies blooms with particularly high biovolume [61].
For CBDZ, a product consistent with a methylation was observed, however, control experiments revealed that this likely originated from a transesterification with ethanol present in the mixture (see SI S3.2.3). For 13 out of the 24 tested compounds, no TPs and no degradation was observed. This notably includes all azole fungicides (CYP, DIF, EPO, FLU, MCZ, PEN, PRO, TEB) except for KET (see SI S3.2.4). Other compounds with no apparent biotransformation were TRA, VFX, and the three strobilurin fungicides already described above (AZY, FXS and PYR). Azole fungicides undergo various oxidative and conjugative transformations in mammals, plants and soil [62] but inhibit CYP450 enzymes in fungi and other organisms [27], including some algae [63], which could interfere with biotransformation.

74 Exploring micropollutant biotransformation in three freshwater phytoplankton species
In microbial systems, VFX typically yields demethylation products [41] and N-oxides [64]. However, microbial systems are typically highly diverse, i.e. contain >1000 species [65], with a broad range of biotransformation capabilities.
Influence of chemical stressors
Two antagonistic potential factors that could influence biotransformation were examined. For one, other compounds present in the mixture could inhibit biotransformation, leading to an underestimation of the biotransformation potential. In particular, as azole fungicides are known CYP450 inhibitors, their presence in the mixture could potentially inhibit biotransformation of other compounds [63, 66]. Additionally, sulfamethoxazole is an antibiotic, and likely the most toxic compound in the mixture, with EC50 values reported for some phytoplankton organisms values in the sub-100 µg/L range [67]. On the other hand, toxic chemicals can induce biotransformation enzymes, as is known e.g. for atrazine and triclosan in rat liver [68, 69]. It is possible that such chemical stressors, especially if being specifically toxic against green algae or cyanobacteria, could stimulate biotransformation of other compounds when present in environmentally relevant (but not acutely toxic) concentrations. Triclosan is an antimicrobial highly toxic against cyanobacteria and algae (EC50 for Scenedesmus subsipcatus: 0.7 µg/L, for Anabaena flos-aquae 0.97 µg/L) [70], while atrazine and irgarol are triazine herbicides, and toxic to algae and cyanobacteria as photosystem II inhibitors [71] (EC50 for Synechococcus sp. 45 µg/L [72] and 4.8 µg/L [73], respectively).
To test these hypotheses, incubation experiments with a Mcy+Syn mixture were performed. The culture was incubated with a chemical mixture of 24 (including azoles) or 14 (excluding azoles, see Table S3-1) compounds at 10 µg/L per compound. The experiments with both mixtures were performed in presence or absence of a chemical stressor at realistic environmental concentrations (0, 10 or 100 ng/L of atrazine, irgarol, or triclosan).
Figure 3-3 shows the time profiles of bezafibrate dealkylation (a), bezafibrate methylation (b) and atenolol / metoprolol acid formation (c) with or without azoles and with or without 100 ng/L atrazine. If azoles inhibit biotransformation by CYP450 enzymes on a general scale, a faster formation of bezafibrate would be expected in their absence (while bezafibrate methylation and atenolol acid formation from atenolol can proceed without CYP450 contribution). Stimulation of biotransformation by atrazine would be apparent in faster formation rates of all three products. None of the studied experimental factors resulted in faster formation of observed TPs. Also, all previously stable compounds remained persistent, and no additional TPs were found by screening. The same results were observed for 10 ng/L atrazine and 10 or 100 ng/L irgarol or triclosan (Figure S3-5). The azole-free mixture was also tested in the original single species experiments without resulting in obvious changes. While it cannot be excluded that other conditions could potentially stimulate biotransformation (e.g. at higher concentrations less typically observed in the environment), the observed transformation potential of the tested species is seemingly neither limited by inhibition from azoles, nor enhanced by environmentally relevant concentrations of chemical stressors. Other environmental stressors, such as nutrient limitation and temperature, could potentially affect biotransformation and would be an interesting topic for follow-up studies.

75 Chapter 3
Figure 3-3 Formation of the TPs BEZ-da (a), BEZ-M (b) and ATE/MPL-A (c) under chemical stress. Blue: no atrazine / no azoles; red: azoles only, yellow: atrazine only, light blue: atrazine and azoles. c/c0 values are concentrations, or transformation product amounts semiquantified via peak area (marked *), relative to average initial parent concentration.
3.4 Conclusion
This work provides insight into common and previously unknown transformation processes occurring in phytoplankton. In total, 14 TPs were identified for 9 parent compounds by various reactions. Of these, 3 involved hydrolysis, 5 involved CYP450 oxidation reactions of the parent compound, 4 were methylation or conjugation reactions and 3 involved modifications of a conjugate. Notably, multiple pathways likely result from enzymes reacting with non-natural substrates, such as MEF glutamate conjugation and SMZ pterin conjugation. Such reactions are not commonly studied in environmental biotransformation by microorganisms or in human metabolism, but might contribute to the formation of currently still unknown TPs in the environment. The observed pathways are likely to have broader validity, e.g. pterin formation for sulfonamides in general; and glutamate conjugation for other fenamates, salicylates and benzoates.
3.5 Acknowledgements
We thank Dr. Marius Roos-Majewsky (Heidelberg University Hospital, Dept. of Clinical Pharmacology and Pharmacoepidemiology, Heidelberg, Germany) and Rafael Peschke (Karlsruher Institut für Technologie, Karlsruhe, Germany) for providing authentic standard of N4-hydroxyacetyl-sulfamethoxazole and helpful discussion. We thank Christian Ahrens (Agroscope, Wädenswil, Switzerland) and Cresten Mansfeldt (Eawag, Switzerland) for advice on bioinformatics. Dr. Emma Schymanski and Dr. Jennifer Schollée are acknowledged for helpful comments on the manuscript.
This work was supported by the Swiss National Science Foundation, grant number 315230_141190 and 205320_165935.

76 Exploring micropollutant biotransformation in three freshwater phytoplankton species
References
1. OECD (1994) Environment Monograph No. 77. Data Requirements for Pesticide Registration in OECD Member Countries: Survey Results.
2. Committee for Medicinal Products for Human Use (CHMP) (2006) European Medicines Agency Pre-Authorisation Evaluation of Medicines for Human Use (Doc. Ref. EMEA/CHMP/SWP/4447/00) Guideline on the environmental risk assessment of medicinal products for human use.
3. OECD (2002) OECD Guideline for the Testing of Chemicals: Aerobic and Anaerobic Transformation in Aquatic Sediment Systems.
4. OECD (2004) OECD Guideline for the Testing of Chemicals: Aerobic Mineralisation in Surface Water - Simulation Biodegradation Test.
5. Thomas KA, Hand LH (2011) Assessing the potential for algae and macrophytes to degrade crop protection products in aquatic ecosystems. Environ Toxicol Chem 30:622–31. doi: 10.1002/etc.412
6. Thomas KA, Hand LH (2012) Assessing the metabolic potential of phototrophic communities in surface water environments: fludioxonil as a model compound. Environ Toxicol Chem 31:2138–46. doi: 10.1002/etc.1928
7. Norvill ZN, Shilton A, Guieysse B (2016) Emerging contaminant degradation and removal in algal wastewater treatment ponds : Identifying the research gaps. J Hazard Mater 313:291–309. doi: 10.1016/j.jhazmat.2016.03.085
8. de Godos I, Muñoz R, Guieysse B (2012) Tetracycline removal during wastewater treatment in high-rate algal ponds. J Hazard Mater 229–230:446–449. doi: 10.1016/j.jhazmat.2012.05.106
9. de Wilt A, Butkovskyi A, Tuantet K, Hernandez L, Fernandes TV, Langenhoff A, Zeeman G (2016) Micropollutant removal in an algal treatment system fed with source separated wastewater streams. J Hazard Mater 304:84–92.
10. Zhou G-J, Ying G-G, Liu S, Zhou L-J, Chen Z-F, Peng F-Q (2014) Simultaneous removal of inorganic and organic compounds in wastewater by freshwater green microalgae. Environ Sci Process Impacts 16:2018–2027. doi: 10.1039/C4EM00094C
11. Papazi A, Kotzabasis K (2013) “Rational” Management of Dichlorophenols Biodegradation by the Microalga Scenedesmus obliquus. PLOS ONE 8:e61682. doi: 10.1371/journal.pone.0061682
12. LeFevre GH, Müller CE, Li RJ, Luthy RG, Sattely ES (2015) Rapid Phytotransformation of Benzotriazole Generates Synthetic Tryptophan and Auxin Analogs in Arabidopsis. Environ Sci Technol 49:10959–10968. doi: 10.1021/acs.est.5b02749
13. LeFevre GH, Portmann AC, Müller CE, Sattely ES, Luthy RG (2016) Plant Assimilation Kinetics and Metabolism of 2-Mercaptobenzothiazole Tire Rubber Vulcanizers by Arabidopsis. Environ Sci Technol 50:6762–6771. doi: 10.1021/acs.est.5b04716
14. Nebert DW, Nelson DR, Feyereisen R (1989) Evolution of the cytochrome P450 genes. Xenobiotica 19:1149–1160. doi: 10.3109/00498258909043167
15. Robert FO, Pandhal J, Wright PC (2010) Exploiting cyanobacterial P450 pathways. Curr Opin Microbiol 13:301–306. doi: 10.1016/j.mib.2010.02.007
16. Nelson DR (2006) Plant cytochrome P450s from moss to poplar. Phytochem Rev 5:193–204. doi: 10.1007/s11101-006-9015-3
17. Pflugmacher S, Wiencke C, Sandermann H (1999) Activity of phase I and phase II detoxication enzymes in Antarctic and Arctic macroalgae. Mar Environ Res 48:23–36. doi: 10.1016/S0141-1136(99)00030-6

77 Chapter 3
18. Thies F, Grimme LH (1995) O-Dealkylation of coumarin and resorufin ethers by unicellular green algae: kinetic properties of Chlorella fusca and Chlorella sorokiniana. Arch Microbiol 164:203–211.
19. Della Greca M, Pinto G, Pistillo P, Pollio A, Previtera L, Temussi F (2008) Biotransformation of ethinylestradiol by microalgae. Chemosphere 70:2047–53. doi: 10.1016/j.chemosphere.2007.09.011
20. Lai K, Scrimshaw M, Lester J (2002) Biotransformation and bioconcentration of steroid estrogens by Chlorella vulgaris. Appl Environ Microbiol 68:859–864. doi: 10.1128/AEM.68.2.859-864.2002
21. Peng F, Ying G, Yang B, Liu S, Lai H, Liu Y, Chen Z, Zhou G (2014) Biotransformation of progesterone and norgestrel by two freshwater microalgae (Scenedesmus obliquus and Chlorella pyrenoidosa): Transformation kinetics and products identification. Chemosphere 95:581–588. doi: 10.1016/j.chemosphere.2013.10.013
22. Maes HM, Maletz SX, Ratte HT, Hollender J, Schae A (2014) Uptake, Elimination, and Biotransformation of 17α-Ethinylestradiol by the Freshwater Alga Desmodesmus subspicatus. Environ Sci Technol 48:12354–12361. doi: 10.1021/es503574z
23. Rasoul-Amini S, Fotooh-Abadi E, Ghasemi Y (2010) Biotransformation of monoterpenes by immobilized microalgae. J Appl Phycol 23:975–981. doi: 10.1007/s10811-010-9625-4
24. Cáceres T, Megharaj M, Naidu R (2008) Toxicity and transformation of fenamiphos and its metabolites by two micro algae Pseudokirchneriella subcapitata and Chlorococcum sp. Sci Total Environ 398:53–59. doi: 10.1016/j.scitotenv.2008.03.022
25. Peng F-Q, Ying G-G, Yang B, Liu Y-S, Lai H-J, Zhou G-J, Chen J, Zhao J-L (2014) Biotransformation of the flame retardant tetrabromobisphenol-A (TBBPA) by freshwater microalgae. Environ Toxicol Chem 33:1705–1711. doi: 10.1002/etc.2589
26. Huang X, Tu Y, Song C, Li T, Lin J, Wu Y, Liu J, Wu C (2016) Interactions between the antimicrobial agent triclosan and the bloom-forming cyanobacteria Microcystis aeruginosa. Aquat Toxicol 172:103–110. doi: 10.1016/j.aquatox.2016.01.002
27. Zarn JA, Brüschweiler BJ, Schlatter JR (2003) Azole fungicides affect mammalian steroidogenesis by inhibiting sterol 14α-demethylase and aromatase. Environ Health Perspect 111:255–261. doi: 10.1289/ehp.5785
28. Huntscha S, Singer HP, McArdell CS, Frank CE, Hollender J (2012) Multiresidue analysis of 88 polar organic micropollutants in ground, surface and wastewater using online mixed-bed multilayer solid-phase extraction coupled to high performance liquid chromatography-tandem mass spectrometry. J Chromatogr A 1268:74–83. doi: 10.1016/j.chroma.2012.10.032
29. Broeckling CD, Afsar FA, Neumann S, Ben-Hur A, Prenni JE (2014) RAMClust: A novel feature clustering method enables spectral-matching-based annotation for metabolomics data. Anal Chem 86:6812–7. doi: 10.1021/ac501530d
30. Stravs MA, Schymanski EL, Singer HP, Hollender J (2013) Automatic recalibration and processing of tandem mass spectra using formula annotation. J Mass Spectrom 48:89–99. doi: 10.1002/jms.3131
31. Horai H, Arita M, Kanaya S, Nihei Y, Ikeda T, Suwa K, Ojima Y, Tanaka K, Tanaka S, Aoshima K, Oda Y, Kakazu Y, Kusano M, Tohge T, Matsuda F, Sawada Y, Hirai MY, Nakanishi H, Ikeda K, Akimoto N, Maoka T, Takahashi H, Ara T, Sakurai N, Suzuki H, Shibata D, Neumann S, Iida T, Tanaka K, Funatsu K, Matsuura F, Soga T, Taguchi R, Saito K, Nishioka T (2010) MassBank: a public repository for sharing mass spectral data for life sciences. J Mass Spectrom 45:703–14. doi: 10.1002/jms.1777

78 Exploring micropollutant biotransformation in three freshwater phytoplankton species
32. Meringer M, Reinker S, Zhang J, Muller A (2011) MS / MS Data Improves Automated Determination of Molecular Formulas by Mass Spectrometry. MATCH Commun Math Comput Chem 65:259–290.
33. Allen F, Greiner R, Wishart D (2014) Competitive fragmentation modeling of ESI-MS/MS spectra for putative metabolite identification. Metabolomics 11:98–110. doi: 10.1007/s11306-014-0676-4
34. Allen F, Pon A, Wilson M, Greiner R, Wishart D (2014) CFM-ID: A web server for annotation, spectrum prediction and metabolite identification from tandem mass spectra. Nucleic Acids Res 42:94–99. doi: 10.1093/nar/gku436
35. Smith CA, O’Maille G, Want EJ, Qin C, Trauger SA, Brandon TR, Custodio DE, Abagyan R, Siuzdak G (2005) METLIN: a metabolite mass spectral database. Ther Drug Monit 27:747–51.
36. Schymanski EL, Jeon J, Gulde R, Fenner K, Ruff M, Singer HP, Hollender J (2014) Identifying Small Molecules via High Resolution Mass Spectrometry: Communicating Confidence. Environ Sci Technol 48:2097–2098. doi: 10.1021/es5002105
37. Stravs MA, Mechelke J, Ferguson PL, Singer H, Hollender J (2016) Microvolume trace environmental analysis using peak-focusing online solid-phase extraction–nano-liquid chromatography–high-resolution mass spectrometry. Anal Bioanal Chem 408:1879–1890. doi: 10.1007/s00216-015-9294-x
38. Roberts TR, Hutson DH (1999) Strobilurin analogues. In: Roberts TR, Hutson DH (eds) Metab. Pathw. Agrochem. Part 2 Insectic. Fungic. Royal Society of Chemistry, Cambridge, pp 1327–1342
39. Turner JA (2015) The Pesticide Manual - A World Compendium, 17th Editi. BCPC, Alton
40. Radjenović J, Pérez S, Petrović M, Barceló D (2008) Identification and structural characterization of biodegradation products of atenolol and glibenclamide by liquid chromatography coupled to hybrid quadrupole time-of-flight and quadrupole ion trap mass spectrometry. J Chromatogr A 1210:142–153. doi: 10.1016/j.chroma.2008.09.060
41. Kern S, Baumgartner R, Helbling DE, Hollender J, Singer H, Loos MJ, Schwarzenbach RP, Fenner K (2010) A tiered procedure for assessing the formation of biotransformation products of pharmaceuticals and biocides during activated sludge treatment. J Environ Monit 12:2100–11. doi: 10.1039/c0em00238k
42. Rubirola A, Llorca M, Rodriguez-Mozaz S, Casas N, Rodriguez-Roda I, Barceló D, Buttiglieri G (2014) Characterization of metoprolol biodegradation and its transformation products generated in activated sludge batch experiments and in full scale WWTPs. Water Res 63:21–32. doi: 10.1016/j.watres.2014.05.031
43. McGourty J, Silas J, Lennard M, Tucker G, Woods H (1985) Metoprolol metabolism and debrisoquine oxidation polymorphism - population and family studies. Br J Clin Pharmacol 20:555–566. doi: 10.1111/j.1365-2125.1985.tb05112.x
44. Richter MK, Focks A, Siegfried B, Rentsch D, Krauss M, Schwarzenbach RP, Hollender J (2013) Identification and dynamic modeling of biomarkers for bacterial uptake and effect of sulfonamide antimicrobials. Environ Pollut 172:208–15. doi: 10.1016/j.envpol.2012.09.011
45. Prabhu V, Lui H, King J (1997) Arabidopsis dihydropteroate synthase: General properties and inhibition by reaction product and sulfonamides. Phytochemistry 45:23–27. doi: 10.1016/S0031-9422(96)00793-5
46. Roland S, Ferone R, Harvey RJ, Styles VL, Morrison RW (1979) The characteristics and significance of sulfonamides as substrates for Escherichia coli dihydropteroate synthase. J Biol Chem 254:10337–45.
79 Chapter 3
47. Hong YL, Hossler PA, Calhoun DH, Meshnick SR (1995) Inhibition of recombinant Pneumocystis carinii dihydropteroate synthetase by sulfa drugs. Antimicrob Agents Chemother 39:1756–1763. doi: 10.1128/AAC.39.8.1756
48. Cossins EA (2000) The fascinating world of folate and one-carbon metabolism. Botany 78:691. doi: 10.1139/b00-061
49. Majewsky M, Wagner D, Delay M, Bräse S, Yargeau V, Horn H (2014) Antibacterial activity of sulfamethoxazole transformation products (TPs): General relevance for sulfonamide TPs modified at the para position. Chem Res Toxicol 27:1821–1828. doi: 10.1021/tx500267x
50. Majewsky M, Glauner T, Horn H (2015) Systematic suspect screening and identification of sulfonamide antibiotic transformation products in the aquatic environment. Anal Bioanal Chem 407:5707–5717. doi: 10.1007/s00216-015-8748-5
51. Kroemer HK, Gautier J-C, Beaune P, Henderson C, Wolf CR, Eichelbaum M (1993) Identification of P450 enzymes involved in metabolism of verapamil in humans. Naunyn Schmiedebergs Arch Pharmacol 348:332–337. doi: 10.1007/BF00169164
52. McNeil JJ, Mihaly GW, Anderson A, Marshall AW, Smallwood RA, Louis WJ (1981) Pharmacokinetics of the H2- receptor antagonist ranitidine in man. Br J Clin Pharmacol 12:411–5.
53. Horng H, Benet LZ (2013) The nonenzymatic reactivity of the acyl-linked metabolites of mefenamic acid toward amino and thiol functional group bionucleophiles. Drug Metab Dispos 41:1923–1933. doi: 10.1124/dmd.113.053223
54. Lamoureux GL, Rusness DG (1986) Xenobiotic Conjugation in Higher Plants. In: Xenobiotic Conjug. Chem. American Chemical Society, pp 62–105
55. Staswick PE (2002) Jasmonate Response Locus JAR1 and Several Related Arabidopsis Genes Encode Enzymes of the Firefly Luciferase Superfamily That Show Activity on Jasmonic, Salicylic, and Indole-3-Acetic Acids in an Assay for Adenylation. Plant Cell 14:1405–1415. doi: 10.1105/tpc.000885
56. Staswick PE (2005) Characterization of an Arabidopsis Enzyme Family That Conjugates Amino Acids to Indole-3-Acetic Acid. Plant Cell 17:616–627. doi: 10.1105/tpc.104.026690
57. Markowitz VM, Chen I-MA, Chu K, Szeto E, Palaniappan K, Pillay M, Ratner A, Huang J, Pagani I, Tringe S, Huntemann M, Billis K, Varghese N, Tennessen K, Mavromatis K, Pati A, Ivanova NN, Kyrpides NC (2014) IMG/M 4 version of the integrated metagenome comparative analysis system. Nucleic Acids Res 42:D568–D573. doi: 10.1093/nar/gkt919
58. Markowitz VM, Chen I-MA, Palaniappan K, Chu K, Szeto E, Pillay M, Ratner A, Huang J, Woyke T, Huntemann M, Anderson I, Billis K, Varghese N, Mavromatis K, Pati A, Ivanova NN, Kyrpides NC (2014) IMG 4 version of the integrated microbial genomes comparative analysis system. Nucleic Acids Res 42:D560–D567. doi: 10.1093/nar/gkt963
59. Okrent RA, Brooks MD, Wildermuth MC (2009) Arabidopsis GH3.12 (PBS3) conjugates amino acids to 4-substituted benzoates and is inhibited by salicylate. J Biol Chem 284:9742–9754. doi: 10.1074/jbc.M806662200
60. AstraZeneca (2013) Environmental Risk Assessment Data: Atenolol.
61. Sitoki L, Kurmayer R, Rott E (2012) Spatial variation of phytoplankton composition, biovolume, and resulting microcystin concentrations in the Nyanza Gulf (Lake Victoria, Kenya). Hydrobiologia 691:109–122. doi: 10.1007/s10750-012-1062-8
62. Roberts TR, Hutson DH (1999) Azoles and analogues. In: Roberts TR, Hudson DH (eds) Metab. Pathw. Agrochem. Part 2 Insectic. Fungic. Royal Society of Chemistry, Cambridge, pp 1011–1104

80 Exploring micropollutant biotransformation in three freshwater phytoplankton species
63. Thies F, Grimme LH (1996) Effects of Cytochrome P450-Interacting Plant Growth Retardants, Fungicides and Related Compounds on Cell Development and Phase-I Biotransformation Capacity of Unicellular Photoautotrophic Green Algae. Pestic Sci 47:337–346.
64. Gulde R, Meier U, Schymanski EL, Kohler H-PE, Helbling DE, Derrer S, Rentsch D, Fenner K (2016) Systematic Exploration of Biotransformation Reactions of Amine-Containing Micropollutants in Activated Sludge. Environ Sci Technol 50:2908–2920. doi: 10.1021/acs.est.5b05186
65. Johnson DR, Helbling DE, Lee TK, Park J, Fenner K, Kohler HPE, Ackermann M (2015) Association of biodiversity with the rates of micropollutant biotransformations among full-scale wastewater treatment plant communities. Appl Environ Microbiol 81:666–675. doi: 10.1128/AEM.03286-14
66. Venkatakrishnan K, von Moltke LL, Greenblatt DJ (2000) Effects of the Antifungal Agents on Oxidative Drug Metabolism. Clin Pharmacokinet 38:111–180. doi: 10.2165/00003088-200038020-00002
67. Ferrari B, Mons R, Vollat B, Fraysse B, Paxēaus N, Giudice RL, Pollio A, Garric J (2004) Environmental risk assessment of six human pharmaceuticals: Are the current environmental risk assessment procedures sufficient for the protection of the aquatic environment? Environ Toxicol Chem 23:1344–1354. doi: 10.1897/03-246
68. Islam MO, Hara M, Miyake J (2002) Induction of P-glycoprotein, glutathione-S-transferase and cytochrome P450 in rat liver by atrazine. Environ Toxicol Pharmacol 12:1–6. doi: 10.1016/S1382-6689(01)00121-1
69. Hanioka N, Jinno H, Nishimura T, Ando M (1997) Effect of 2,4,4’-trichloro-2’-hydroxydiphenyl ether on cytochrome P450 enzymes in the rat liver. Chemosphere 34:719–30.
70. Orvos DR, Versteeg DJ, Inauen J, Capdevielle M, Rothenstein A, Cunningham V (2002) Aquatic toxicity of triclosan. Environ Toxicol Chem 21:1338–1349. doi: 10.1002/etc.5620210703
71. Bérard A, Dorigo U, Mercier I, Becker-van Slooten K, Grandjean D, Leboulanger C (2003) Comparison of the ecotoxicological impact of the triazines Irgarol 1051 and atrazine on microalgal cultures and natural microalgal communities in Lake Geneva. Chemosphere 53:935–944. doi: 10.1016/S0045-6535(03)00674-X
72. Weiner JA, DeLorenzo ME, Fulton MH (2004) Relationship between uptake capacity and differential toxicity of the herbicide atrazine in selected microalgal species. Aquat Toxicol 68:121–128. doi: 10.1016/j.aquatox.2004.03.004
73. Deng X, Gao K, Sun J (2012) Physiological and biochemical responses of Synechococcus sp. PCC7942 to Irgarol 1051 and diuron. Aquat Toxicol 122–123:113–119. doi: 10.1016/j.aquatox.2012.06.004

81

82

83 Chapter 3 – Supporting Information
Chapter S3. Supporting Information: Exploring micropollutant biotransformation in three freshwater phytoplankton species

84 Exploring micropollutant biotransformation in three freshwater phytoplankton species

85 Chapter 3 – Supporting Information
S3.1 Supplementary Materials and Methods
Culture medium. Woods Hole Combo (WC) medium (as modified by Guillard and Lorenzen [1]) was prepared as follows: A solution of 1 mM NaNO3, 250 μM CaCl2, 150 μM MgSO4, 150 μM NaHCO3, 50 μM K2HPO4, 390 μM H3BO3, 11.7 μM Na2EDTA, 11.7 μM FeCl3, 10 nM CuSO4, 76.5 nM ZnSO4, 42 nM CoCl2, 910 nM MnCl2, 26 nM Na2MoO4, 98 nM Na3VO4, 0.5 mM TES (2-[[1,3-dihydroxy-2-(hydroxymethyl)propan-2-yl]amino]ethanesulfonic acid) in deionized water was prepared from 115 mg TES and 1000x stock solutions of the remaining constituents. The medium was sterilized by autoclaving (30 min at 121°C). Modified versions were prepared by replacing TES by 100 mL 0.1M MOPS (3-(N-morpholino)propanesulfonic acid) buffer stock solution, pH 7.5, per L of medium (Woods Hole Combo + MOPS, WC+M medium), or by replacing TES by 100 mL 0.1M pH 7.5 per L of medium, and 1 mM NaNO3 by 1 mM NH4Cl (Woods Hole Combo + Ammonia + MOPS, WC+A+M medium).
Experiments – small scale, Mcy/Syn mixtures. Mcy and Syn cultures were sampled at comparable optical densities and mixed 1:1. In 20 mL online vials, 3 mL of Mcy/Syn mixture were diluted with 3 mL fresh WC medium. For control samples, 6 mL of fresh WC or WC+M medium was added to 20 mL online vials. A chemical mixture or solvent control (see below) was added to a final concentration of 10 µg/L per compound and sample. To each sample, a stressor chemical or vector control was added (see below). The vials were capped with a non-fixed crimp cap and a tissue cover, and incubated as for single species experiments..
Immediately after addition of the chemical mixture (t0) and after timepoints up to a week (see below) samples were taken for chemical analysis and cell density measurement. For chemical analysis, 500 or 750 µL of well mixed culture were sampled into a HPLC vial and frozen until measurement. For cell density measurement, 200 uL per culture were sampled into a 96-well plate and optical density at 680 nm and 750 nm was measured (SpectraMax 190, Molecular Devices, Sunnyvale CA).
Experiments – small scale: sample preparation. The frozen samples were thawed and lysed in the ultrasonic bath for 5 min at 37°C. 150 uL of well-mixed sample were added to a 300 uL HPLC insert in an 1.5 mL Eppendorf vial and subsequently centrifuged 5’ at 9000 rpm. 100 uL SN were diluted into 20 mL nanopure H2O and fortified with internal standard (IS) mixture (total final absolute amount 1 ng IS per substance and sample).
pH controlled degradation experiment. Two culture vials were prepared with WC+M medium (pH 7.5), one sample was prepared with WC medium (pH 7.2). As a control, two culture vials with WC+M medium and one with WC medium were prepared and autoclaved. To all samples, chemical mixture 1 was added to a final concentration of 10 µg/L per compound. Samples were taken at 0, 2.5, 4, 24, 32, 50 and 74 hours.
Chemical stressor experiment – 3 stressors. 14 culture vials were prepared with WC medium. To 7 vials, chemical mixture 1 was added to a final concentration of 10 µg/L per compound; to the other 7 vials, chemical mixture 2 was added instead. To 6 of the 7 vials for each mixture, a chemical stressor (atrazine, irgarol or triclosan) was added to a final concentration of 10 ng/L (3 vials, one each, from 1 µg/L in EtOH) or 100 ng/L (3 vials, one each, from 10 µg/L in EtOH).To the last vial, no stressor (only equivalent EtOH) was added. As a control, one vial each was prepared without culture, with WC medium, and either chemical mixture 1 or 2 (medium control); and two vials were prepared with culture and WC medium and no chemical mixture (biological control). Samples were taken after 0, 1, 3, 5 and 7 days.
Chemical stressor experiment – atrazine only. 8 culture vials were prepared with WC medium. To 4 vials each, chemical mixture 1 or 2 was added to a final concentration of 10 µg/L per compound. To 2 vials each, atrazine (final concentration 100 ng/L, from 10 µg/L in EtOH)

86 Exploring micropollutant biotransformation in three freshwater phytoplankton species
was added; to the 2 other vials, no atrazine (only EtOH) was added. As a control, 4 vials were prepared without culture, with WC medium, 100 ng/L atrazine, and either chemical mixture 1 or 2 (two each, medium control); and 4 vials were prepared with culture and WC medium, no chemical mixture, and 100 ng/L atrazine (2 vials) or equivalent EtOH (2 vials) was added. Samples were taken after 0, 1, 3 and 5 days.
CBDZ: solvent exchange experiment. 8 culture vials were prepared with WC medium (5 mL volume, otherwise as above). To 2 vials each, Mix 1 (in EtOH), CBDZ alone in EtOH, CBDZ in isopropanol were added to a final concentration of 10 µg/L per compound (spike volume 50 µL); to two vials, EtOH alone (50 µL) was added (biological control). As a control, 3 vials were prepared with WC medium. To two, Mix 1 was added to a final concentration of 10 µg/L per compound; to one, CBDZ in EtOH was added to a final concentration of 10 µg/L. Samples were taken after 0, 1, 2 and 3 days.
Chemical analysis: Online SPE cartridge. An empty stainless steel SPE cartridge (20 mm x 2.1 mm, BGB) was filled with 9 mg Oasis HLB (15 µm particle diameter; Waters, USA) and a second layer of 9 mg of a 1:1:1.5 mixture of Strata X-AW (33 µm particle diameter), Strata X-CW (25 µm; both Phenomenex, Aschaffenburg, Germany), and Isolute ENV+ (70 µm; Biotage, Uppsala, Sweden).
Chemical analysis: source parameters. Source parameters were as follows: spray voltage: 4 kV (positive mode) or 3 kV (negative mode), capillary temperature: 320 °C, sheath gas: 40, auxiliary gas: 10, spare gas: 0, probe heater temperature: 50 °C, S-Lens RF level: 50. Calibration of the mass spectrometer was performed in positive and negative mode using an in-house amino acid / oligopeptide calibration solution.
Chemical analysis: Quantification and screening, method parameters For initial quantification measurements, data was acquired in polarity switching mode with data-dependent acquisition. Parameters were as follows: MS resolution: 70000, MS AGC target: 1 × 10⁶, MS maximum injection time: 50 ms, mass range: m/z = 100-1500, loop count for MS2 acquisition: 3 (positive), 2 (negative), MS2 resolution: 17500, MS2 AGC target: 1 × 10⁵, MS2 maximum injection time: 50 ms, MS2 isolation window: 1 Da, underfill ratio: 1%, MS2 intensity threshold: 2 × 10⁴, dynamic exclusion: 10 s, “pick others”: enabled.
Chemical Analysis: Spectra acquisition for compound identification, method parameters. Using inclusion lists, putative transformation products were fragmented in positive and negative mode at collision energies of 15, 30, 45, 60, 75, 90, 120, 150, 180 in time windows of 0.8 min around the expected retention time. Parameters were as follows: Full MS (positive and negative): MS resolution: 70000, MS AGC target: 5 × 10⁵, MS maximum injection time: 50 ms, mass range: m/z = 70-1050. DIA (positive and negative): MS2 resolution: 17500, MS2 AGC target: 2 × 10⁵, MS2 maximum injection time: 50 ms, MS2 isolation window: 1 Da, loop count: 9 × number of compounds measured.
Gene family search. Gene sequences associated to a gene family were retrieved from the JGI Integrated Microbial Genomes & Microbiome samples database (https://img.jgi.doe.gov/) [2, 3]. In “Cassette Search”, genomes from domain “Bacteria”, selection “Cyanobacteria” (Finished, Permanent Draft and Draft) were chosen. Using the “Pfam” protein cluster option, genomes were searched for “pfam03321” (GH3 gene family), “pfam04055” (radical SAM gene family) or “pfam02310,pfam04055” (Logical Operator “And”; cobalamin binding domain and radical SAM superfamily, corresponding to radical SAM class B family.)
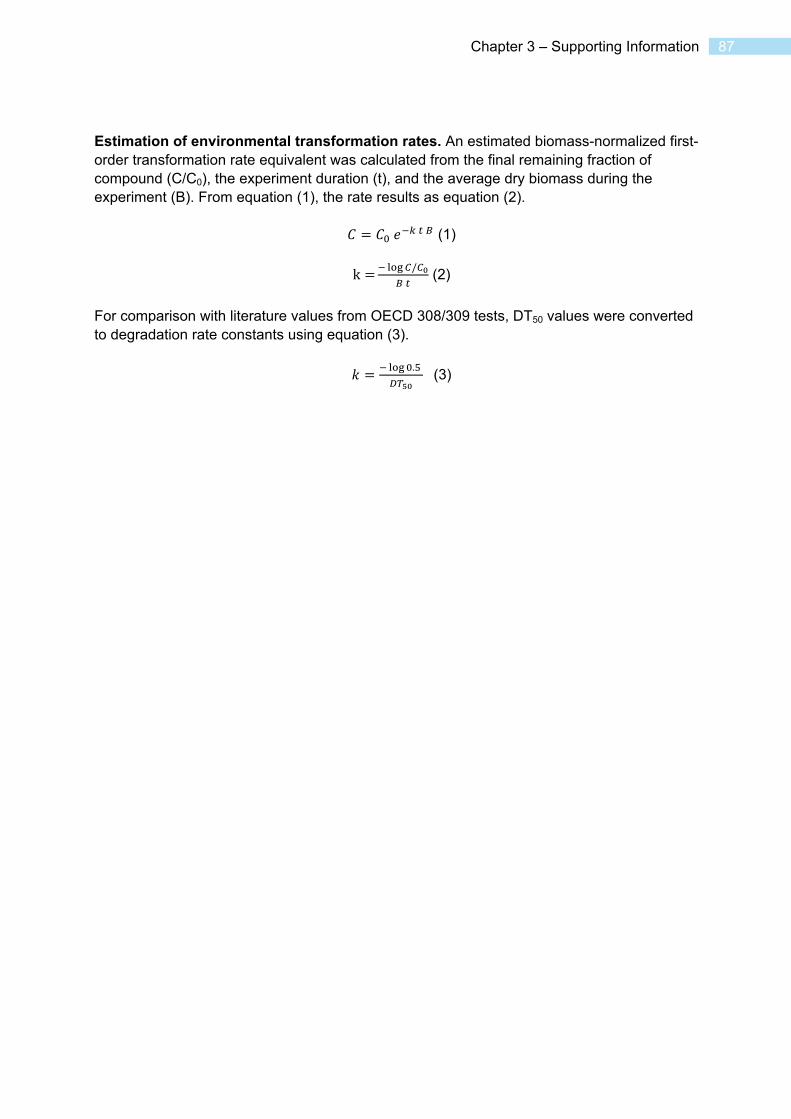
87 Chapter 3 – Supporting Information
Estimation of environmental transformation rates. An estimated biomass-normalized first-order transformation rate equivalent was calculated from the final remaining fraction of compound (C/C0), the experiment duration (t), and the average dry biomass during the experiment (B). From equation (1), the rate results as equation (2).
(1)
k/
(2)
For comparison with literature values from OECD 308/309 tests, DT50 values were converted to degradation rate constants using equation (3).
. (3)

88
Exploring m
icropollutant biotransformation in three freshw
ater phytoplankton species
Table S3-1 Used compounds , chemical formulas, molecular weights, log Kow values, CAS numbers and sources.
Code Name Compound class present in mixes Formula Molecular weight
[Da]
Exact mass log Kow CAS Vendor
1 2
ATE Atenolol Pharmaceutical x x C14H22N2O3 266.3 266.163044 0.16 [2] 29122-68-7 Sigma-Aldrich BEZ Bezafibrate Pharmaceutical x x C19H20ClNO4 361.8 361.108084 4.25 [4] 41859-67-0 Sigma-Aldrich
CBDZ Carbendazim Pharmaceutical x x C9H9N3O2 191.2 191.069474 1.48 [1] 10605-21-7 Dr. Ehrenstorfer MEF Mefenamic acid Pharmaceutical x x C15H15NO2 241.3 241.110284 5.12 [2] 61-68-7 Sigma-Aldrich MPL Metoprolol Pharmaceutical x x C15H25NO3 267.4 267.183444 1.88 [2] 37350-58-6 Sigma-Aldrich RAN Ranitidine Pharmaceutical x x C13H22N4O3S 314.4 314.141262 0.27 [2] 66357-35-5 Sigma-Aldrich TRA Tramadol Pharmaceutical x x C16H25NO2 263.4 263.188534 2.4 [2] 27203-92-5 Fluka VFX Venlafaxine Pharmaceutical x x C17H27NO2 277.4 277.204184 3.28 [3] 93413-69-5 TRC Canada VPL Verapamil Pharmaceutical x x C27H38N2O4 454.6 454.283154 3.79 [2] 52-53-9 Sigma-Aldrich AZY Azoxystrobin Strobilurin fungicide x x C22H17N3O5 403.4 403.116824 2.5 [1] 131860-33-8 Fluka FXS Fluoxastrobin Strobilurin fungicide x x C21H16ClFN4O5 458.8 458.079326 2.86 [1] 361377-29-9 Dr. Ehrenstorfer KME Kresoxim-methyl Strobilurin fungicide x x C18H19NO4 313.3 313.131404 3.4 [1] 143390-89-0 Dr. Ehrenstorfer PYR Pyraclostrobin Strobilurin fungicide x x C19H18ClN3O4 387.8 387.098584 3.99 [1] 175013-18-0 Fluka TFL Trifloxystrobin Strobilurin fungicide x x C20H19F3N2O4 408.4 408.129694 4.5 [1] 141517-21-7 Dr. Ehrenstorfer CYP Cyproconazole Azole fungicide (agric.) x C15H18ClN3O 291.8 291.113844 3.09 [1] 94361-06-5 Dr. Ehrenstorfer DIF Difenoconazole Azole fungicide (agric.) x C19H17Cl2N3O3 406.3 405.064697 4.36 [1] 119446-68-3 Dr. Ehrenstorfer EPO Epoxiconazole Azole fungicide (agric.) x C₁₇H₁₃ClFN₃O 329.8 329.073114 3.3 [1] 106325-08-0 Dr. Ehrenstorfer FLU Fluconazole Azole fungicide (pharm.) x C13H12F2N6O 306.3 306.104064 0.4 [2] 86386-73-4 Dr. Ehrenstorfer KET Ketoconazole Azole fungicide (pharm.) x C26H28Cl2N4O4 531.4 530.148761 4.35 [2] 65277-42-1 Sigma-Aldrich MET Metconazole Azole fungicide (agric.) x C17H22ClN3O 319.8 319.14514 3.85 [1] 125116-23-6 Dr. Ehrenstorfer PEN Penconazole Azole fungicide (agric.) x C13H15Cl2N3 284.2 283.064303 3.72 [1] 66246-88-6 Novartis PRO Propiconazole Azole fungicide (agric.) x C15H17Cl2N3O2 342.2 341.069784 3.72 [1] 60207-90-1 HPC Standards GmbH TEB Tebuconazole Azole fungicide (agric.) x C16H22ClN3O 307.8 307.145144 3.7 [1] 107534-96-3 Dr. Ehrenstorfer SMZ Sulfamethoxazole Pharmaceutical:antibiotic x C10H11N3O3S 253.3 253.052114 0.89 [2] 723-46-6 Sigma-Aldrich
(agric.): in agricultural use, (pharm.) in pharmaceutical use [1]: Data from Pesticide Properties Database [4] [2]: Data from DrugBank [5] [3]: Data from PubChem (CID: 5656) [6] [4]: No experimental value for the log Kow of BEZ could be found; the used value is calculated using EPI-Suite [7]

Chapter 3 – S
upporting Information
89
Table S3-2 Parents and transformation products with internal standards used for quantification
Parent Transformation product CAS No. Formula m/z RT [min]
internal standard
Atenolol ATE C14H22N2O3 267.1703 11.3 Atenolol-D7 ATE Atenolol-desisopropyl 81346-71-6 C11H16N2O3 225.1234 7.9 Carbamazepine-10-11-epoxide-
13C-D2 ATE,
MPL Atenolol/metoprolol acid 56392-14-4 C14H21NO4 268.1543 12.7 Atenolol/metoprolol acid-D5
Azoxystrobin AZY C22H17N3O5 404.1241 22.1 Azoxystrobin-D4 AZY Azoxystrobin acid 1185255-09-7 C21H15N3O5 390.1084 21.3 Azoxystrobin-D4, DEET-D10 Bezafibrate BEZ C19H20ClNO4 362.1154 22.6 Bezafibrate-D4 BEZ 3-[(4-chlorobenzoyl)amino]-
propanoic acid 108462-95-9 C10H10ClNO3 228.0422 19.5 Sulfadimethoxin-D4,
Erythromycin-13C2 Carbendazim CBDZ C9H9N3O2 192.0768 13.9 Carbendazim-D4 Cyproconazole CYP C15H18ClN3O 292.1211 23.1 Epoxiconazole-D4 Difenoconazole DIF C19H17Cl2N3O3 406.0720 24.2 Propiconazole-D5 Epoxiconazole EPO C17H13ClFN3O 330.0804 23.4 Epoxiconazole-D4 Fluconazole FLU C13H12F2N6O 307.1113 17.5 Fluconazole-D4 Fluoxastrobin FXS C21H16ClFN4O5 459.0866 23.0 Epoxiconazole-D4 Ketoconazole KET C26H28Cl2N4O4 531.1560 19.2 Atomoxetin-D3,
Erythromycin-13C2 Kresoxim-methyl KME C18H19NO4 314.1387 23.7 Epoxiconazole-D4 KME Kresoxim-methyl acid 181373-11-5 C17H17NO4 300.1230 23.4 Epoxiconazole-D4 Mefenamic acid MEF C15H15NO2 242.1176 24.7 Mefenamic acid-D3 Metconazole MET C17H22ClN3O 320.1524 24.2 Propiconazole-D5 Metoprolol MPL C15H25NO3 268.1907 15.6 Metoprolol-D7 Penconazole PEN C13H15Cl2N3 284.0716 23.9 Tebuconazole-D6 Propiconazole PRO C15H17Cl2N3O2 342.0771 24.0 Propiconazole-D5 Pyraclostrobin PYR C19H18ClN3O4 388.1059 24.0 Tebuconazole-D6 Ranitidine RAN C13H22N4O3S 315.1485 11.3 Ranitidine-D6 RAN Ranitidine S-oxide 73851-70-4 C13H22N4O4S 331.1435 7.0 Carbendazim-D4 RAN Ranitidine N-oxide 73857-20-2 C13H22N4O4S 331.1435 11.7 Carbendazim-D4 Sulfamethoxazole SMZ C10H11N3O3S1 254.0594 16.3 Sulfamethoxazole-D4 SMZ N-Acetyl-Sulfamethoxazole 21312-10-7 C12H13N3O4S 296.0700 17.9 N-Acetyl-Sulfamethoxazole-D5 Tebuconazole TEB C16H22ClN3O 308.1524 23.9 Tebuconazole-D6

90
Exploring m
icropollutant biotransformation in three freshw
ater phytoplankton species
Trifloxystrobin TFL C20H19F3N2O4 409.1370 24.2 Propiconazole-D5 TFL Trifloxystrobin acid 252913-85-2 C19H17F3N2O4 395.1213 23.9 Tebuconazole-D6 (*) Tramadol TRA C16H25NO2 264.1958 15.5 Tramadol-D6 TRA N,N-didesmethyltramadol 931115-27-4 C14H21NO2 236.1645 16.1 Tramadol-D6 TRA N-desmethyltramadol 73806-55-0 C15H23NO2 250.1802 16.0 Tramadol-D6 TRA Tramadol N-oxide 147441-56-3 C16H25NO3 280.1907 16.0 Atrazine-desethyl-15N3 Venlafaxine VFX C17H27NO2 278.2115 17.2 Venlafaxine-D6 VFX N-desmethylvenlafaxine 149289-30-5 C16H25NO2 264.1958 17.3 Venlafaxine-D6 VFX N,N-didesmethylvenlafaxine 93413-77-5 C15H23NO2 250.1802 17.3 N,O-didesmethylvenlafaxine-D3 VFX N,O-didesmethylvenlafaxine 135308-74-6 C15H23NO2 250.1802 15.3 N,O-didesmethylvenlafaxine-D3 VFX O-desmethylvenlafaxine 93413-62-8 C16H25NO2 264.1958 15.2 O-desmethylvenlafaxine-D6 VFX Venlafaxine N-oxide 1094598-37-4 C17H27NO3 294.2064 17.8 Venlafaxine-D6 Verapamil VPL C27H38N2O4 455.2904 18.2 Verapamil-D6 VPL D617 34245-14-2 C17H26N2O2 291.2067 23.2 Verapamil-D6, Atorvastatin-D5
(*): quantified by relative peak area in single species experiments

91 Chapter 3 – Supporting Information
Table S3-3 Suspect screening lists used for transformation product prediction.
Type Name Mass
difference Loss Gain Formula difference Description
parent 0.0000 no change Reductions, oxidations, skeleton substitutions (CHNO)
oh 15.9949 O O1 Hydroxlation deme -14.0157 CH3 H C-1H-2 Demethylation deet -28.0313 C2H5 H C-2H-4 Deethylation deh2 -2.0157 H2 H-2 General reduction h2 2.0157 H2 H2 General oxidation deh2o -18.0106 H2O H-2O-1 Dehydration h2o 18.0106 H2O H2O1 Hydration deco2 -43.9898 CO2 C-1O-2 Decarboxylation deno2 -44.9851 NO2 H H1N-1O-2 Nitro group loss meoxi 29.9742 H O2H O2 Methyl oxidation to carboxylic acid deamin -15.0109 H NH2 N1H1 Deamination oxicooh 13.9793 H2 O O1H-2 Alcohol oxidation to acid nitrored -29.9742 O2 H2 H2O-2 Nitro reduction disnhox 0.9840 NH2 OH O1N-1H-1 Amine to hydroxy (ipso-)substitution deipr -42.0470 C3H7 H C-3H-6 Isopropyl loss amin -0.9840 OH NH2 N1O-1H1 Hydroxy to amine (ipso-)substitution
Reductions, oxidations (Cl, F) clXh -33.9610 Cl H H1Cl-1 Reductive dechlorination disf -17.9906 F H H1F-1 Reductive defluorination disclox -17.9661 Cl OH O1H1Cl-1 Oxidative dechlorination disfox -1.9957 F OH O1H1F-1 Oxidative defluorination
Conjugation-type reactions: methylation me 14.0157 H CH3 C1H2 Methylation et 28.0313 H C2H5 C2H4 Ethylation / di-methylation
Conjugation-type reactions: amino acid conjugation leu 113.0841 H2O C6N1H13O2 C6N1H11O1 Leucine / isoleucine lys 128.0950 H2O C6N2H14O2 C6N2H12O1 Lysine met 131.0405 H2O C5N1S1H11O2 C5N1S1H9O1 Methionine phe 147.0684 H2O C9N1H11O2 C9N1H9O1 Phenylalanine thr 101.0477 H2O C4N1H9O3 C4N1H7O2 Threonine try 186.0793 H2O C11N2H12O2 C11N2H10O1 Tryptophan val 99.0684 H2O C5N1H11O2 C5N1H9O1 Valine arg 156.1011 H2O C6N4H14O2 C6N4H12O1 Arginine his 137.0589 H2O C6N3H9O2 C6N3H7O1 Histidine ala 71.0371 H2O C3N1H7O2 C3N1H5O1 Alanine asn 114.0429 H2O C4N2H8O3 C4N2H6O2 Asparagine asp 115.0269 H2O C4N1H7O4 C4N1H5O3 Aspartate cys 103.0092 H2O C3N1S1H7O2 C3N1S1H5O1 Cysteine glu 129.0426 H2O C5N1H9O4 C5N1H7O3 Glutamate gln 128.0586 H2O C5N2H10O3 C5N2H8O2 Glutamine gly 57.0215 H2O C2N1H5O2 C2N1H3O1 Glycine pro 97.0528 H2O C5N1H9O2 C5N1H7O1 Proline ser 87.0320 H2O C3N1H7O3 C3N1H5O2 Serine tyr 163.0633 H2O C9N1H11O3 C9N1H9O2 Tyrosine adda 313.2042 H2O C20H29NO3 C20N1H27O2 ADDA [1]
Conjugation-type reactions: other gluc 176.0321 H C6H9O6 C6O6H8 Glucuronidation nac 42.0106 H C2H3O C2O1H2 (N-)acetylation sulf 79.9568 H HSO3 S1O3 Sulfate conjugation gsh 305.0682 H C10H15N3O6S C10H15N3O6S1 Glutathione conjugation naccys 162.0225 H C5H8NO3S C5H8N1O3S1 (N-)acetylcysteine conjugation
[1] ADDA is a non-proteinogenic amino acid found in toxic cyanobacterial peptides, e.g. microcystin.[8]

92 Exploring micropollutant biotransformation in three freshwater phytoplankton species
S3.2 Supplementary Results
S3.2.1 Bioconcentration
Figure S3-1 Growth curves for single culture experiments (a) and mixture experiments (b,c). a) Dark blue: Mcy, light blue: Syn, green: Chl. Solid lines: cultures treated with chemicals, dashed lines: chemical-free control. Note: The lines for Syn overlap completely, which is why the chemical control is not visible. b) Mixture experiments with stressors at 100 ng/L, blue: no stressor, yellow: atrazine, brown: irgarol, olive: triclosan, blue dashed: chemical-free control. c) Mixture experiments with stressors. Blue: no stressor; yellow: atrazine 100 ng/L; red: azoles 10 µg/L, turquoise: atrazine and azoles; blue dashed: chemical-free control.

Chapter 3 – S
upporting Information
93
Table S3-4: Mass balance of studied compounds after 4 days.
Microcystis Synechococcus Chlamydomonas medium cells TPs medium cells TPs medium cells TPs Atenolol 95% 0% 87% 0% ATE/MPL-A: 7% 102% 0% Azoystrobin 102% 0% 95% 0% 107% 0% Bezafibrate 96% 0% BEZ-da: <1%* 93% 100% BEZ-da: <1%* Carbendazim (see S2.3) 99% 94% (CBDZ-M: 1%*) 104% Cyproconazole 101% 0% 95% 0% 102% 0% Difenoconazole 83% 0% 77% 4% 98% 2% Epoxyconazole 97% 0% 92% 1% 100% 0% Fluconazole 97% 94% 101% Fluoxastrobin 103% 0% 90% 2% 108% 0% Ketoconazole (see S2.4) 23% 3% (7%*) 48% 0% (7%*) 75% 1% (8%*) Kresoxim-methyl 1% 0% KME-A: 101% 68% 1% KME-A: 29% 94% 0% KME-A: 14% Mefenamic acid 89% 0% 85% MEF-Glu: 9%* 96% Metconazole 95% 0% 93% 0% 104% 0% Metoprolol 94% 0% 93% 86% ATE/MPL-A:
4% (medium) 2% (cells) MPL-dm: 6%*
Penconazole 96% 0% 94% 0% 102% 0% Propiconazole 96% 0% 95% 0% 102% 0% Pyraclostrobin 85% 2% 61% 12% 96% 1% Ranitidine 84% 0% RAN-dm: 4%* 89% 0% 94% 0% Sulfamethoxazole 66% 0% SMZ-DHPt: 2%*
SMZ-Pt: 3%* SMZ-PtO: 3%*
38% 0% SMZ-AcOH: 2%* 98% 0%
Tebuconazole 96% 93% 102% Tramadol 119% 117% 125% Trifloystrobin 2% 0% TFL-A: 101%* 49% 8% TFL-A: 28%* 96% 1% TFL-A: 7%* Venlafaxine 101% 100% 106% Verapamil 69% 0% VPL-da: 1% 90% 0% VPL-da: <1% 97% 0% VPL-da: <1%
“medium”: parent substance in medium. “cells”: parent substance in cells. “TPs”: transformation products. (*): quantified using peak area ratio. Unless otherwise noted, TPs were only found in medium. Values are the mean of three replicates.

94 Exploring micropollutant biotransformation in three freshwater phytoplankton species
Table S3-5 Individual apparent log bioconcentration factors for each compound in the three species Mcy, Syn and Chl.
Mcy Syn Chl
ATE 2.2 1.4 1.5AZY 0.9 1.5 2.3BEZ 1.1 - - CBDZ - - - CYP 1.3 1.7 1.9DIF 2.5 2.8 3.3EPO 1.4 1.7 2.5FLU - - - FXS 1.7 2.4 2.3KET 2.7 2.5 3.1KME - - 2.7MCZ 1.6 2.0 2.4MEF 2.2 - - MPL 1.4 - - PEN 1.5 - 2.2PRO 1.0 - - PYR 3.2 3.1 2.9RAN 1.3 - 1.9SMZ 1.5 1.9 - TEB - - - TFL - 3.0 2.9TRA - - - VFX - - - VPL 2.1 1.9 1.8
Mean log BCF were calculated from the point of apparent equilibration. No log BCF was calculated for
CBDZ, FLU, TRA, VFX (all species), BEZ, MPL, TEB, MEF (some species) because internal concentrations in cells were negligible
KME for Mcy and Chl, and TFL for Mcy, because degradation was too rapid to reliably determine an (apparent) BCF

95 Chapter 3 – Supporting Information
Figure S3-2 Log bioconcentration factor in dependence of log Kow for a) Mcy, b) Syn and c) Chl. Red filled circles: azole fungicides; blue filled circles: strobilurin fungicides, black open circles: remaining compounds. Red, blue and black line: linear correlation for azole fungicides only (red), strobilurin fungicides only (blue), or all compounds (including azole and strobilurin fungicides; black).
Table S3-6 log Kow correlations to apparent bioconcentration factor.
log BCF = a + b * log Kow adjusted
Species Chem a b R2 R2 p (b ≠ 0)
Mcy all 1.39 0.11 0.06 -0.01 0.39 Syn all 1.23 0.30 0.49 0.43 0.017 (*) Chl all 1.53 0.29 0.53 0.49 0.004 (**) Mcy azoles -2.38 1.09 0.71 0.63 0.036 (*) Syn azoles -0.97 0.83 0.95 0.93 0.024 (*) Chl azoles -0.86 0.92 0.82 0.76 0.035 (*) Mcy strobilurins -2.64 1.47 0.98 0.97 0.083 Syn strobilurins -0.01 0.72 0.80 0.71 0.1 Chl strobilurins 1.47 0.34 0.92 0.90 0.009 (**) p (b ≠ 0): p value for slope of the linear regression log BCD = a + b * log Kow. (*): p < 0.05; (**): p <0.01

96 Exploring micropollutant biotransformation in three freshwater phytoplankton species
S3.2.2 Transformation product identification
Table S3-7 Analytical summary of found transformation products.
Parent m/z Identification level
MS2 spectra (MassBank)
TP Formula [M+H]+ [M‐H]‐ RT (Bold: annotated spectrum in SI)
KME C18H19NO4 314.1386 (312.1240)
KME‐A C17H17NO4 300.1234 (298.1088) 1 23.6
TFL C20H19F3N2O4 409.1368 (407.1222)
TFL‐A C19H17F3N2O4 395.1213 (393.1067) 1 24.1
CBDZ C9H9N3O2 192.0767
CBDZ‐M C10H11N3O2 206.0926 2b 15.6 ET270101..09 (pos) ET270102
MEF C15H15NO2 242.1175 240.1029
MEF‐Glu C20H22N2O5 371.161 369.1464 3 23.3 ET320101..09 (pos) ET320151..59 (neg) ET320152
SMZ C10H11N3O3S 254.0593 252.0447
SMZ‐DHPt C17H18N8O4S 431.1244 429.1098 3 16.6
SMZ‐Pt C17H16N8O4S 429.1090 427.0944 2b 16.7 ET310201..09 (pos) ET310251..59 (neg) ET310201..09 (merged)
SMZ‐PtO C17H14N7O5S 430.0930 428.0784 3 16.8 ET310301..09 (pos) ET310351..59 (neg) ET310201..09 (merged)
SMZ‐Ac C12H13N3O4S 296.0700 294.0554 1
SMZ‐AcOH C12H13N3O5S 312.0649 310.0503 3 16.8 ET310401..09 (pos) ET310451..59 (neg) ET301402
MPL C15H25NO3 268.1906 15.5
ATE C14H22N2O3 267.1702 11.4
MPL/ATE‐A C14H21NO4 268.1542 1 13.6
MPL‐dm C14H23NO3 254.1750 2b 13.1 ET280101..09 (pos)
BEZ C19H20ClNO4 362.1152 360.1006 22.7
BEZ‐da C15H14ClNO2 276.0787 (274.0641) 2b 21.4 ET290101..09 (pos) ET290103
BEZ‐M C20H22ClNO4 376.1310 2b 23.3 ET290201..09 (pos) ET290202
Note: All retention times are given as found in the initial measurement. Retention times in the MassBank spectra may slightly differ if measured on a different chromatographic system, depending on system availability at the time. m/z values in parentheses: weak signal

97 Chapter 3 – Supporting Information
Figure S3-3 pH-controlled experiments for strobilurin fungicides. Top 5 plots, a)-e): KME, TFL, AZY, FXS, PYR; dashed: KME-A, TFL-A. f) pH over time g) biomass (determined from optical density at 750 nm) over time. Blue: nominal pH 7.5, red: nominal pH 7.2, black (narrow): autoclave control pH 7.5, brown (narrow): autoclave control pH 7.2.

98 Exploring micropollutant biotransformation in three freshwater phytoplankton species
Figure S3-4 Sulfamethoxazole and metabolites in mixture experiments. a) SMZ, b) SMZ-Ac, c) SMZ-AcOH, d) SMZ-DHPT, e) SMZ-Pt, f) SMZ-PtO. Red: Mcy+Syn mixture, black: medium control. c/c0 values are concentrations, or transformation product amounts semiquantified via peak area (marked *), relative to average initial parent concentration.

99 Chapter 3 – Supporting Information
Figure S3-5 Formation of BEZ-da (a), BEZ-M (b) and ATE/MPL-A (c) under chemical stress. Blue: no stressor, yellow: atrazine, brown: irgarol, olive: triclosan, black: medium control. Top: 100 ng/L stressor concentration, bottom: 10 ng/L stressor concentration. All experiments without azole mixture. c/c0 values are concentrations, or transformation product amounts semiquantified via peak area (marked *), relative to average initial parent concentration.
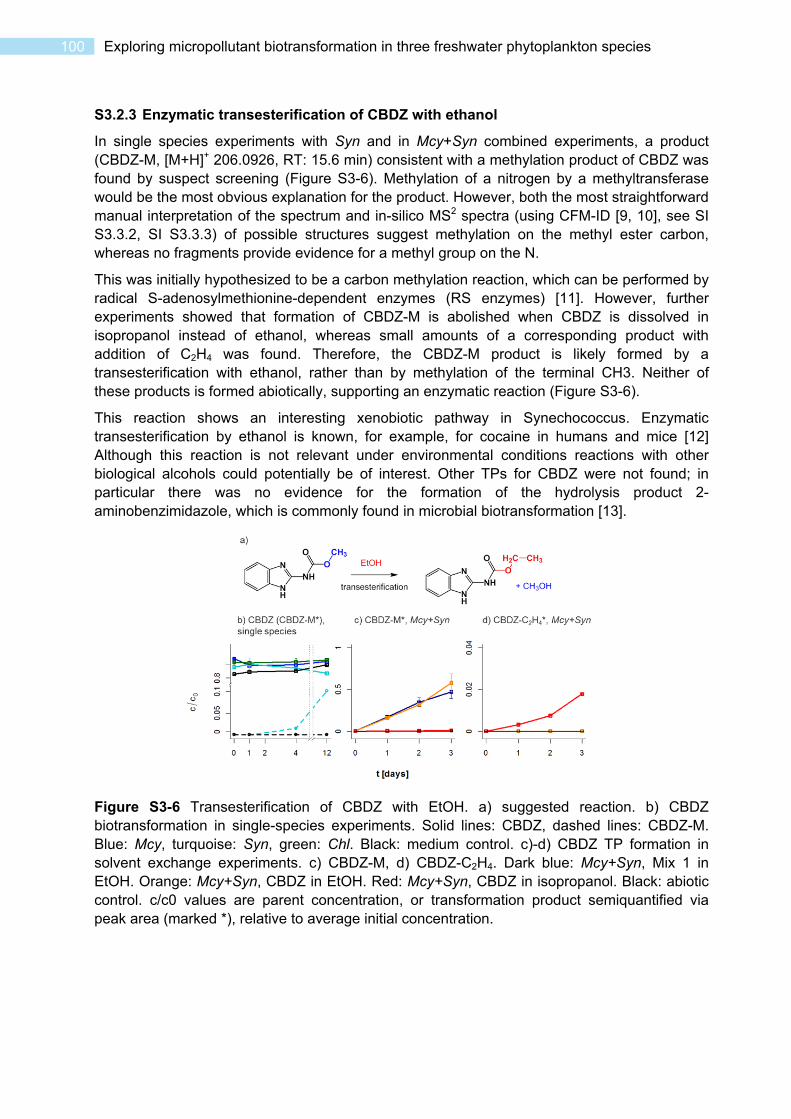
100 Exploring micropollutant biotransformation in three freshwater phytoplankton species
S3.2.3 Enzymatic transesterification of CBDZ with ethanol
In single species experiments with Syn and in Mcy+Syn combined experiments, a product (CBDZ-M, [M+H]+ 206.0926, RT: 15.6 min) consistent with a methylation product of CBDZ was found by suspect screening (Figure S3-6). Methylation of a nitrogen by a methyltransferase would be the most obvious explanation for the product. However, both the most straightforward manual interpretation of the spectrum and in-silico MS2 spectra (using CFM-ID [9, 10], see SI S3.3.2, SI S3.3.3) of possible structures suggest methylation on the methyl ester carbon, whereas no fragments provide evidence for a methyl group on the N.
This was initially hypothesized to be a carbon methylation reaction, which can be performed by radical S-adenosylmethionine-dependent enzymes (RS enzymes) [11]. However, further experiments showed that formation of CBDZ-M is abolished when CBDZ is dissolved in isopropanol instead of ethanol, whereas small amounts of a corresponding product with addition of C2H4 was found. Therefore, the CBDZ-M product is likely formed by a transesterification with ethanol, rather than by methylation of the terminal CH3. Neither of these products is formed abiotically, supporting an enzymatic reaction (Figure S3-6).
This reaction shows an interesting xenobiotic pathway in Synechococcus. Enzymatic transesterification by ethanol is known, for example, for cocaine in humans and mice [12] Although this reaction is not relevant under environmental conditions reactions with other biological alcohols could potentially be of interest. Other TPs for CBDZ were not found; in particular there was no evidence for the formation of the hydrolysis product 2-aminobenzimidazole, which is commonly found in microbial biotransformation [13].
Figure S3-6 Transesterification of CBDZ with EtOH. a) suggested reaction. b) CBDZ biotransformation in single-species experiments. Solid lines: CBDZ, dashed lines: CBDZ-M. Blue: Mcy, turquoise: Syn, green: Chl. Black: medium control. c)-d) CBDZ TP formation in solvent exchange experiments. c) CBDZ-M, d) CBDZ-C2H4. Dark blue: Mcy+Syn, Mix 1 in EtOH. Orange: Mcy+Syn, CBDZ in EtOH. Red: Mcy+Syn, CBDZ in isopropanol. Black: abiotic control. c/c0 values are parent concentration, or transformation product semiquantified via peak area (marked *), relative to average initial concentration.

101 Chapter 3 – Supporting Information
S3.2.4 Abiotic transformation of KET
For KET, 25-75% dissipation after 4 days and >75% dissipation after 12 days was observed in single species experiments and a single TP ([M+H]+ 533.1353) was found. However, the substance was not consistently stable in medium controls, and the TP was found also in controls where KET loss was observed. While KET is documented to be long-term stable in aqueous solutions from pH 5-9 under presence of minimal amounts of antioxidant [14], no information is available on its stability in solutions similar to WC medium; abiotic oxidation, potentially by indirect photochemistry, is a likely source for the TP.
S3.2.5 Estimation of environmental transformation rates
Estimated environmental biomass-normalized transformation rates (Table S3-8) were calculated for ATE as described in Supplementary Materials and Methods. To compare calculated rates with known values, DT50 values from literature were converted to degradation rates as described (Table S3-9). Phytoplankton biomass values for the eutrophic lake Greifensee (Switzerland) in the range of 4 mm3/L were used as a reference [15]. Using 0.47 pg/µm3 as a wet biovolume to dry weight conversion estimate [16], a dry weight equivalent of 2 mg/L can be obtained. The contribution of phytoplankton was then estimated by multiplying the biomass-normalized rate with the biomass, and diving the obtained rate by the rate derived from DT50 values.
It should be noted that the observed data qualitatively do not match neither a first-order decay nor a pure biomass-dependent degradation, but likely involve some regulation dynamics. Therefore these values are to be seen as the roughest of estimates, however they should serve to get an order-of-magnitude estimate of the relevance of the observed reactions to environmental situations.
Table S3-8 Estimation of environmental transformation rates for ATE
% remaining
log degradation
time biomass norm. rate
[days] [g/L] [(d × g/L)-1]
ATE (Syn) 65 -0.19 12 0.2 0.08
ATE (Mcy+Syn) 85 -0.07 5 0.1 0.14
“norm. rate”: estimated dry biomass normalized first order degradation rate.
Table S3-9 Estimation of phytoplankton contribution to environmental transformation rates.
norm. rate biomass env.rate DT50 lit. rate contribution
[(d × g/L)-1] [g/L] [d-1] [d] [d-1] [%]
ATE (Syn) 0.08 0.002
1.6 × 10⁻⁴ 12.8-69.3 [17] 0.004 to 0.025
0.6 to 4
ATE (Mcy+Syn) 0.14 2.8 × 10⁻⁴ 1 to 7
“norm. rate”: estimated dry biomass normalized first order degradation rate. “env.rate”: estimated contribution to environmental first-order degradation with given biomass. “lit. rate”: Literature DT50 converted to first-order degradation rate.
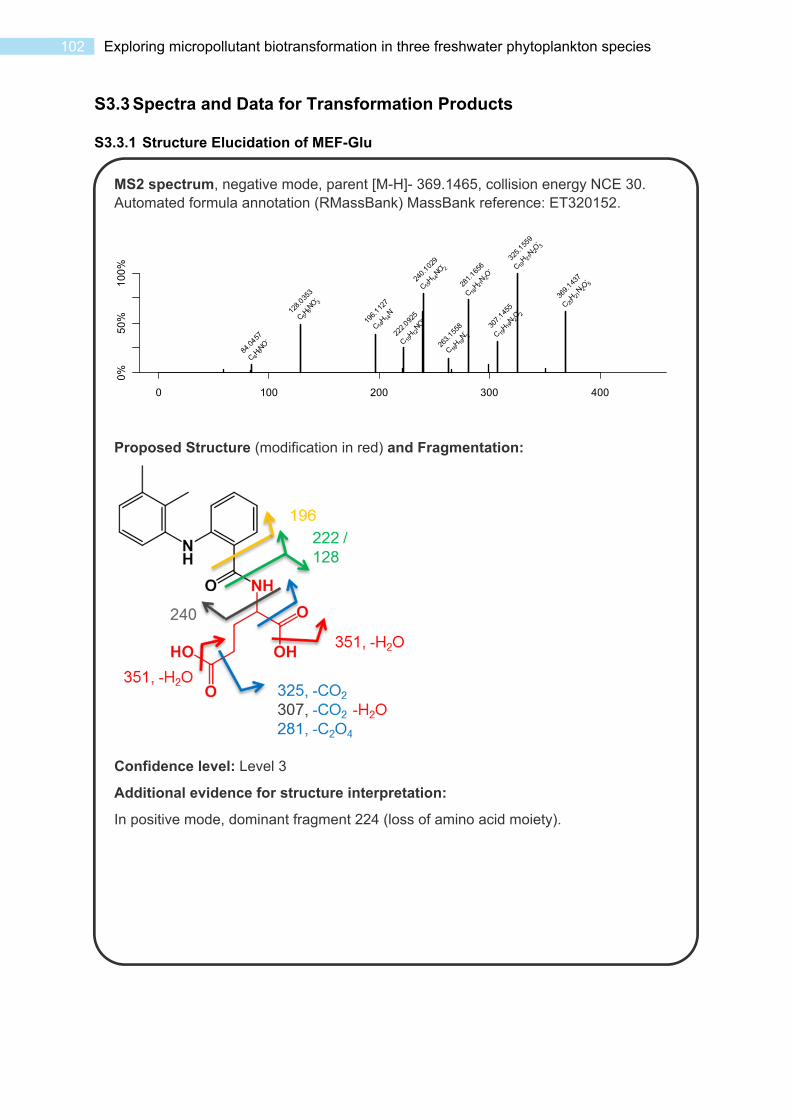
102 Exploring micropollutant biotransformation in three freshwater phytoplankton species
S3.3 Spectra and Data for Transformation Products
S3.3.1 Structure Elucidation of MEF-Glu
MS2 spectrum, negative mode, parent [M-H]- 369.1465, collision energy NCE 30. Automated formula annotation (RMassBank) MassBank reference: ET320152.
Proposed Structure (modification in red) and Fragmentation:
Confidence level: Level 3
Additional evidence for structure interpretation:
In positive mode, dominant fragment 224 (loss of amino acid moiety).
0 100 200 300 400
0%
50
%1
00%
84.0
457
C 4H6N
O-
128.
0353
C 5H6
NO 3-
196.
1127
C14H 14
N-
222.
0925
C 15H12
NO-
240.
1029
C15H 14
NO 2-
263.
1558
C 18H 19
N 2-
281.
1656
C 18H21
N 2O-
307.
1455
C 19H19
N 2O 2-
325.
1559
C19H 21
N 2O3
-
369.
1437
C 20H 21
N 2O5
-

103 Chapter 3 – Supporting Information
S3.3.2 Structure Elucidation of CBDZ-M
MS2 spectrum, positive mode, parent [M+H]+ 206.0924, collision energy NCE 30. Automated formula annotation (RMassBank). MassBank reference: ET270102
Proposed Structure (modification in red) and Fragmentation:
Confidence Level: Level 2b
Additional evidence for structure interpretation:
See SI S3.3.3, comparison with in-silico spectra by CFM-ID
As noted in the main text, this product could in theory be formed by “ethanolysis” of the methyl ester as a possible side reaction to hydrolysis. However, a corresponding hydrolysis product is not observed. For KME and TFL, which show marked hydrolysis, trace quantities of transformation products possibly formed by ethanolysis could be observed ([M+H]+ 328.1543, RT: 24.2 min for the KME product KME-M, 423.1527, RT: 24.6 min for the TFL product TFL-M).
0 50 100 150 200 250
0%
50%
100
%
134.
0713
C7H 8
N 3+
160.
0506
C 8H 6N
3O+
178.
0612
C 8H 8N
3O2
+
206.
0926
C 10H 12
N 3O 2+

104 Exploring micropollutant biotransformation in three freshwater phytoplankton species
S3.3.3 Comparison of CBDZ-M spectrum to predicted CFM-ID spectra.
Top: MS2 spectrum, positive mode, parent [M+H]+ 206.0924, merged spectra (collision energies NCE 15, 30, 45, 60, 75, 90) by absolute intensity. MassBank reference: ET270101-ET270109.
Bottom: In-silico MS2 spectrum, CFM-ID, positive mode, merged spectra (collision energy 10 eV, 20 eV, 40 eV).
0 50 100 150 200 250
0%
50
%1
00
%
65.0
386
C 5H 5+
80.0
494
C 5H 6
N+
92.0
495
C6H6
N+
105.
0447
C 6H 5N
2+
134.
0713
C7H 8
N 3+
160.
0506
C 8H6N
3O+
178.
0612
C 8H8N 3
O 2+
206.
0925
C 10H 12
N 3O 2+
100
%5
0%
0%
29.0
386
47.0
491
73.0
284
134.
0713
160.
0505
178.
0611
206.
0924
Dot product similarity: 0.86

105 Chapter 3 – Supporting Information
Top: MS2 spectrum, positive mode, parent [M+H]+ 206.0924, merged spectra (collision energies NCE 15, 30, 45, 60, 75, 90) by absolute intensity. MassBank reference: ET270101-ET270109.
Bottom: In-silico MS2 spectrum, CFM-ID, positive mode, merged spectra (collision energy 10 eV, 20 eV, 40 eV).
0 50 100 150 200 250
0%
50%
10
0%
65.0
386
C 5H 5+
80.0
494
C 5H 6
N+
92.0
495
C6H6
N+
105.
0447
C 6H 5N
2+
134.
0713
C7H 8
N 3+
160.
0506
C 8H6N
3O+
178.
0612
C 8H8N 3
O 2+
206.
0925
C 10H 12
N 3O 2+
10
0%
50
%0
%
59.0
128
148.
0869
174.
0662
206.
0924
Dot product similarity: 0.22
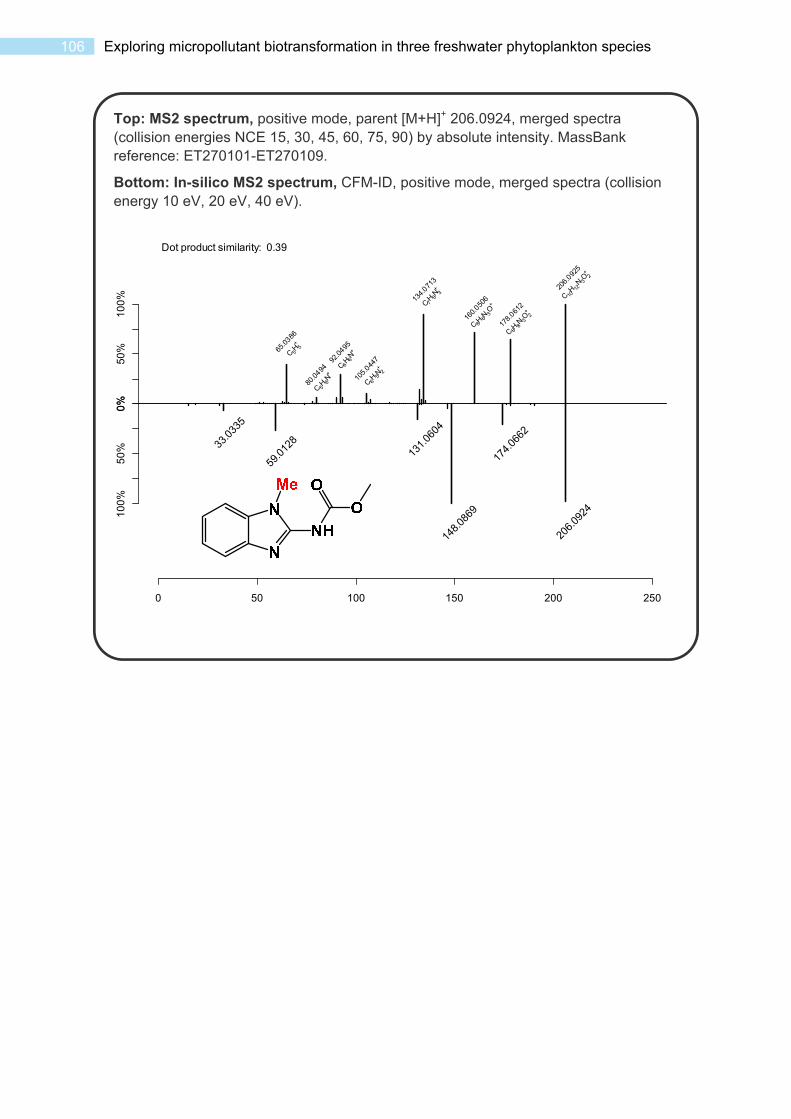
106 Exploring micropollutant biotransformation in three freshwater phytoplankton species
Top: MS2 spectrum, positive mode, parent [M+H]+ 206.0924, merged spectra (collision energies NCE 15, 30, 45, 60, 75, 90) by absolute intensity. MassBank reference: ET270101-ET270109.
Bottom: In-silico MS2 spectrum, CFM-ID, positive mode, merged spectra (collision energy 10 eV, 20 eV, 40 eV).
0 50 100 150 200 250
0%
50%
10
0%
65.0
386
C 5H 5+
80.0
494
C 5H 6
N+
92.0
495
C6H6
N+
105.
0447
C 6H 5N
2+
134.
0713
C7H 8
N 3+
160.
0506
C 8H6N
3O+
178.
0612
C 8H8N 3
O 2+
206.
0925
C 10H 12
N 3O 2+
10
0%
50
%0
%
33.0
335
59.0
128
131.
0604
148.
0869
174.
0662
206.
0924
Dot product similarity: 0.39

107 Chapter 3 – Supporting Information
Top: MS2 spectrum, positive mode, parent [M+H]+ 206.0924, merged spectra (collision energies NCE 15, 30, 45, 60, 75, 90) by absolute intensity. MassBank reference: ET270101-ET270109.
Bottom: In-silico MS2 spectrum, CFM-ID, positive mode, merged spectra (collision energy 10 eV, 20 eV, 40 eV).
0 50 100 150 200 250
0%
50%
10
0%
65.0
386
C 5H 5+
80.0
494
C 5H 6
N+
92.0
495
C6H6
N+
105.
0447
C 6H 5N
2+
134.
0713
C7H 8
N 3+
160.
0506
C 8H6N
3O+
178.
0612
C 8H8N 3
O 2+
206.
0925
C 10H 12
N 3O 2+
10
0%
50
%0
%
132.
0556
174.
0662
206.
0924
Dot product similarity: 0.54

108 Exploring micropollutant biotransformation in three freshwater phytoplankton species
Top: MS2 spectrum, positive mode, parent [M+H]+ 206.0924, merged spectra (collision energies NCE 15, 30, 45, 60, 75, 90) by absolute intensity. MassBank reference: ET270101-ET270109.
Bottom: In-silico MS2 spectrum, CFM-ID, positive mode, merged spectra (collision energy 10 eV, 20 eV, 40 eV).
0 50 100 150 200 250
0%
50%
10
0%
65.0
386
C 5H 5+
80.0
494
C 5H 6
N+
92.0
495
C6H6
N+
105.
0447
C 6H 5N
2+
134.
0713
C7H 8
N 3+
160.
0506
C 8H6N
3O+
178.
0612
C 8H8N 3
O 2+
206.
0925
C 10H 12
N 3O 2+
10
0%
50
%0
%
33.0
335
59.0
128
131.
0604
148.
0869
174.
0662
206.
0924
Dot product similarity: 0.39
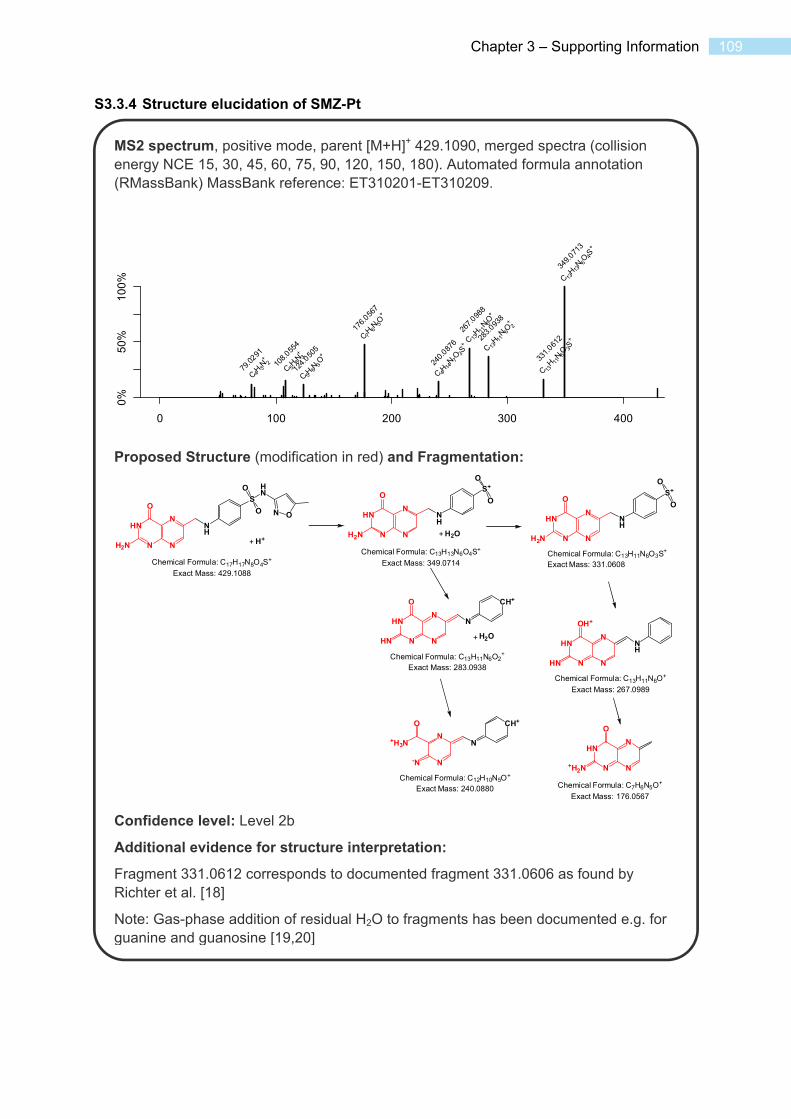
109 Chapter 3 – Supporting Information
S3.3.4 Structure elucidation of SMZ-Pt
[18–20]
MS2 spectrum, positive mode, parent [M+H]+ 429.1090, merged spectra (collision energy NCE 15, 30, 45, 60, 75, 90, 120, 150, 180). Automated formula annotation (RMassBank) MassBank reference: ET310201-ET310209.
Proposed Structure (modification in red) and Fragmentation:
Confidence level: Level 2b
Additional evidence for structure interpretation:
Fragment 331.0612 corresponds to documented fragment 331.0606 as found by Richter et al. [18]
Note: Gas-phase addition of residual H2O to fragments has been documented e.g. for guanine and guanosine [19,20]
0 100 200 300 400
0%
50
%1
00
%
79.0
291
C4H3N 2+
108.
0554
C 5H 6N
3+
124.
0505
C 5H6N
3O+
176.
0567
C7H 6
N 5O+
240.
0876
C 4H14N 7
O3S+
267.
0988
C 13H 11
N6O+
283.
0938
C 13H11
N 6O2
+
331.
0612
C 13H 11
N6O 3S
+
349.
0713
C 13H13
N 6O4S
+
N O
HN
S
O
O
NH
N
NHN
NH2N
O
S+
O
O
NH
N
NHN
NH2N
O
N
NHN
N+H2N
O
Chemical Formula: C7H6N5O+
Exact Mass: 176.0567
S+
O
O
NH
N
NHN
NH2N
O
Chemical Formula: C13H11N6O3S+
Exact Mass: 331.0608
CH+
N
N
NHN
NHN
O
H2O
Chemical Formula: C13H11N6O2+
Exact Mass: 283.0938
H2O
Chemical Formula: C13H13N6O4S+
Exact Mass: 349.0714
N
NHN
NHN
OH+
Chemical Formula: C13H11N6O+
Exact Mass: 267.0989
NH
CH+
N
N
N+H3N
-N
O
+
+H++
Chemical Formula: C17H17N8O4S+
Exact Mass: 429.1088
Chemical Formula: C12H10N5O+
Exact Mass: 240.0880

110 Exploring micropollutant biotransformation in three freshwater phytoplankton species
S3.3.5 Structure elucidation of SMZ-PtO
MS2 spectrum, positive mode, parent [M+H]+ 430.0930, merged spectra (collision energy NCE 15, 30, 45, 60, 75, 90, 120, 150, 180). Automated formula annotation (RMassBank). MassBank reference: ET310301-ET310309.
Proposed Structure (modification in red) and Fragmentation:
Confidence level: Level 3
Additional evidence for structure interpretation:
Compare to SMZ-Pt.
Note: Gas-phase addition of residual H2O to fragments has been documented e.g. for guanine and guanosine [19,20]
0 100 200 300 400
0%
50%
10
0%
52.0
182
C 3H2N+ 79
.0291
C 4H3N
2+
106.
04
C5H4N 3+
124.
0506
C 5H 6N
3O+
177.
0407
C 7H5N
4O 2+
195.
0513
C 7H7N
4O 3+
241.
0719
C 12H9N
4O 2+
268.
0829
C 13H 10
N5O 2+
284.
0778
C 13H 10
N5O 3+
350.
0552
C 13H 12
N 5O 5S
+
N O
HN
S
O
O
NH
N
NHN
NH
O
O
S+
O
O
NH
N
NHN
NH
O
O
N
NHN
NHO
O
Chemical Formula: C7H5N4O2+
Exact Mass: 177.0407
S+
O
O
NH
N
NHN
NH
O
O
Chemical Formula: C13H10N5O4S+
Exact Mass: 332.0448
CH+
N
N
NHN
NO
O
H2O
Chemical Formula: C13H10N5O3+
Exact Mass: 284.0778
H2O
Chemical Formula: C13H12N5O5S+
Exact Mass: 350.0554
N
NHN
NO
OH+
Chemical Formula: C13H10N5O2+
Exact Mass: 268.0829
NH
+
+H++
Chemical Formula: C17H16N7O5S+
Exact Mass: 430.0928
CH+
N
N
NC+
-N
O
H2O+
Chemical Formula: C12H9N4O2+
Exact Mass: 241.0720

111 Chapter 3 – Supporting Information
S3.3.6 Structure elucidation of SMZ-AcOH
MS2 spectrum, positive mode, parent [M+H]+ 312.0649, collision energy NCE 30. Automated formula annotation (RMassBank). MassBank reference: ET310402.
Proposed Structure (modification in red) and Fragmentation:
Confidence level: Level 3
Additional evidence for structure interpretation:
Does not coelute with an authentic standard of N4-hydroxyacetyl-sulfamethoxazole.
Peak 166.0500 corresponds to the peak 108.0444 in SMZ, which arises through rearrangement. SO2 loss rearrangements in analogy to SMZ. Peaks 151, 150 correspond to peaks 93, 92 in SMZ.
0 100 200 300
0%
25
%5
0%
75
%
59.0
491
C 3H 7
O+
89.0
597
C 4H9O
2+
106.
0651
C 7H 8
N+
151.
0628
C8H9NO 2
+
166.
05
C 8H 8
NO 3+
189.
0897
C 10H11
N 3O+
214.
0169
C8H8
NO 4S+
246.
0873
C 12H 12
N3O 3+
312.
0646
C 12H14
N 3O5S+
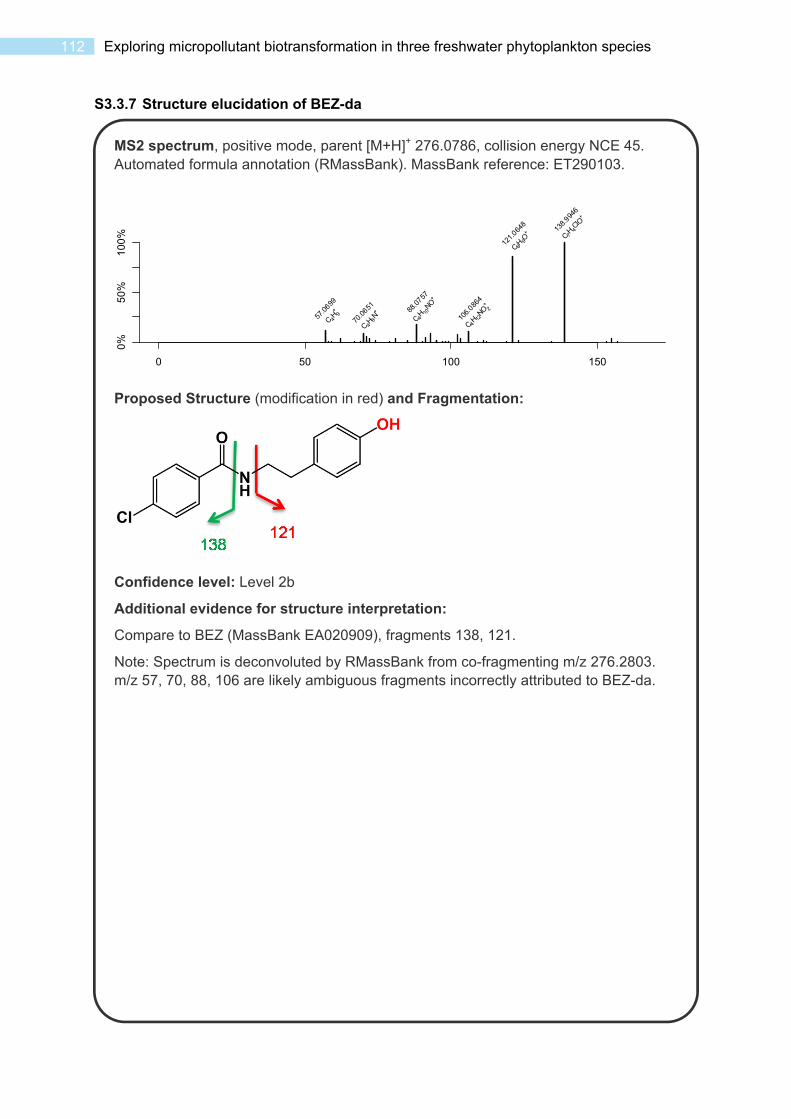
112 Exploring micropollutant biotransformation in three freshwater phytoplankton species
S3.3.7 Structure elucidation of BEZ-da
MS2 spectrum, positive mode, parent [M+H]+ 276.0786, collision energy NCE 45. Automated formula annotation (RMassBank). MassBank reference: ET290103.
Proposed Structure (modification in red) and Fragmentation:
Confidence level: Level 2b
Additional evidence for structure interpretation:
Compare to BEZ (MassBank EA020909), fragments 138, 121.
Note: Spectrum is deconvoluted by RMassBank from co-fragmenting m/z 276.2803. m/z 57, 70, 88, 106 are likely ambiguous fragments incorrectly attributed to BEZ-da.
0 50 100 150
0%5
0%
100
%
57.0
699
C 4H 9+
70.0
651
C 4H8
N+ 88
.0757
C4H 10
NO+
106.
0864
C4H12
NO 2+
121.
0648
C8H9O+ 13
8.994
6
C7H 4
ClO+

113 Chapter 3 – Supporting Information
S3.3.8 Structure elucidation of BEZ-M
MS2 spectrum, positive mode, parent [M+H]+ 376.1310, collision energy NCE 30. Automated formula annotation (RMassBank). MassBank reference: ET290202.
Proposed Structure (modification in red) and Fragmentation:
Confidence level: Level 2b
Additional evidence for structure interpretation:
Compare to BEZ (MassBank EA020909), fragments 316, 276, 161, 138, 121 structurally shared, fragment 101 structurally specific to TP.
0 100 200 300
0%5
0%
100
%
73.0
648
C 4H 9O
+10
1.059
8
C 5H 9O
2+
121.
0649
C8H 9
O+
138.
9946
C 7H 4
ClO+
161.
0962
C 11H 13
O+
204.
1147
C 13H 16
O 2+
222.
1252
C 13H 18
O 3+
276.
0787
C 15H 15
ClNO 2+
316.
1099
C 18H 19
ClNO 2+
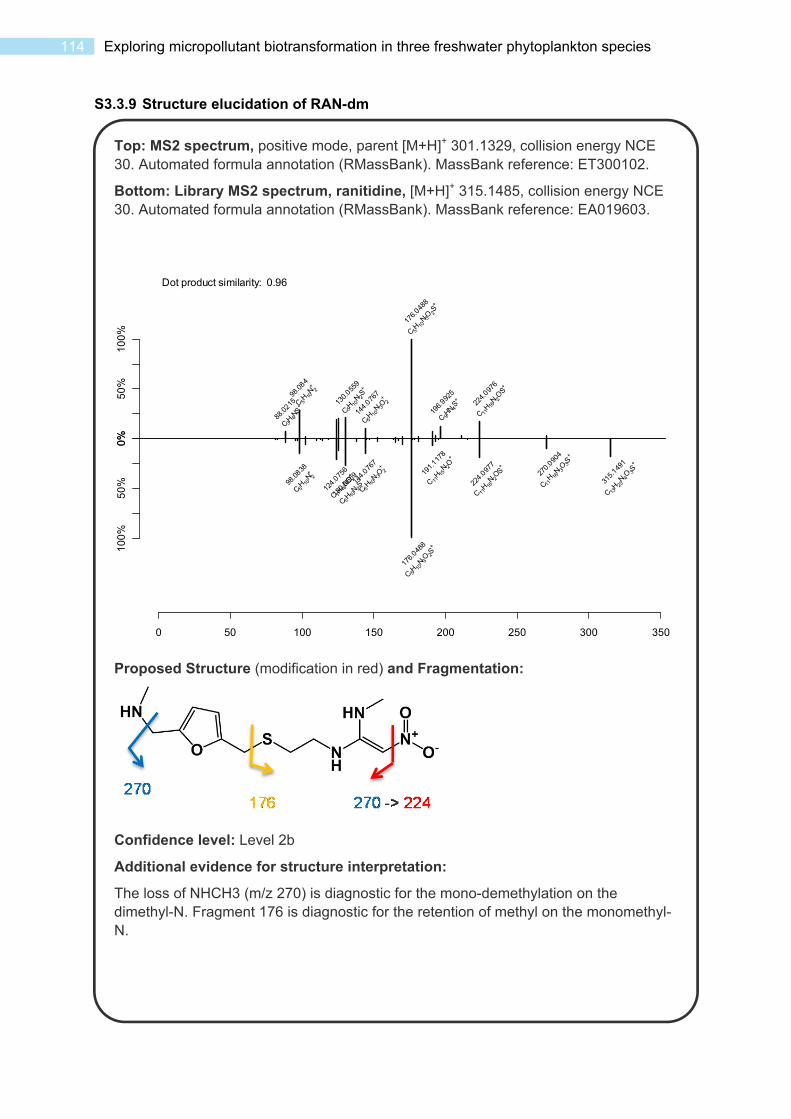
114 Exploring micropollutant biotransformation in three freshwater phytoplankton species
S3.3.9 Structure elucidation of RAN-dm
Top: MS2 spectrum, positive mode, parent [M+H]+ 301.1329, collision energy NCE 30. Automated formula annotation (RMassBank). MassBank reference: ET300102.
Bottom: Library MS2 spectrum, ranitidine, [M+H]+ 315.1485, collision energy NCE 30. Automated formula annotation (RMassBank). MassBank reference: EA019603.
Proposed Structure (modification in red) and Fragmentation:
Confidence level: Level 2b
Additional evidence for structure interpretation:
The loss of NHCH3 (m/z 270) is diagnostic for the mono-demethylation on the dimethyl-N. Fragment 176 is diagnostic for the retention of methyl on the monomethyl-N.
0 50 100 150 200 250 300 350
0%5
0%
100
%
88.0
215
C3H6NS+
98.0
84
C 5H 10
N 2+
130.
0559
C5H10N 2
S+
144.
0767
C5H 10
N 3O2
+
176.
0488
C 5H 10
N3O2S+
196.
9925
C 9HN4
S+ 22
4.097
6
C 11H16
N 2OS
+
100
%5
0%
0%
98.0
838
C5H 10
N 2+
124.
0756
C 7H10NO
+
130.
0559
C5H10
N 2S+144.
0767
C5H10
N 3O2
+
176.
0488
C 5H10N3
O 2S+
191.
1178
C 11H15
N 2O+
224.
0977
C 11H 16
N 2OS
+
270.
0904
C11H 16
N 3O3S
+
315.
1491
C 13H 23
N 4O 3S
+
Dot product similarity: 0.96

115 Chapter 3 – Supporting Information
S3.3.10 Structure elucidation of MPL-dm
Top: MS2 spectrum, positive mode, parent [M+H]+ 254.1750, collision energy NCE 30. Automated formula annotation (RMassBank). MassBank reference: ET280102.
Proposed Structure (modification in red) and Fragmentation:
Confidence level: Level 2b
Additional evidence for structure interpretation:
Compare to MPL (MassBank EA017201..14)
0 50 100 150 200 250 300
0%
50%
10
0%
72.0
806
C 4H10N+
98.0
964
C 6H 12
N+
116.
107
C 6H 14
NO+
177.
0909
C11H 13
O 2+
212.
1282
C 11H 18
NO 3+
254.
1751
C 14H 24
NO 3+

116 Exploring micropollutant biotransformation in three freshwater phytoplankton species
References
1. Guillard RRL, Lorenzen CJ (1972) Yellow-Green Algae with Chlorophyllide C1,2. J Phycol 8:10–14. doi: 10.1111/j.1529-8817.1972.tb03995.x
2. Markowitz VM, Chen I-MA, Palaniappan K, Chu K, Szeto E, Pillay M, Ratner A, Huang J, Woyke T, Huntemann M, Anderson I, Billis K, Varghese N, Mavromatis K, Pati A, Ivanova NN, Kyrpides NC (2014) IMG 4 version of the integrated microbial genomes comparative analysis system. Nucleic Acids Res 42:D560–D567. doi: 10.1093/nar/gkt963
3. Markowitz VM, Chen I-MA, Chu K, Szeto E, Palaniappan K, Pillay M, Ratner A, Huang J, Pagani I, Tringe S, Huntemann M, Billis K, Varghese N, Tennessen K, Mavromatis K, Pati A, Ivanova NN, Kyrpides NC (2014) IMG/M 4 version of the integrated metagenome comparative analysis system. Nucleic Acids Res 42:D568–D573. doi: 10.1093/nar/gkt919
4. Lewis KA, Tzilivakis J, Warner DJ, Green A (2016) An international database for pesticide risk assessments and management. Hum Ecol Risk Assess Int J 22:1050–1064. doi: 10.1080/10807039.2015.1133242
5. Wishart DS (2006) DrugBank: a comprehensive resource for in silico drug discovery and exploration. Nucleic Acids Res 34:D668–D672. doi: 10.1093/nar/gkj067
6. National Center for Biotechnology Information PubChem Compound Database; CID=5656, https://pubchem.ncbi.nlm.nih.gov/summary/summary.cgi?cid=5656.
7. US EPA (2016) Estimation Programs Interface SuiteTM for Microsoft® Windows, v 4.11. United States Environmental Protection Agency, Washington, DC, USA.
8. Harada K, Imanishi S, Kato H, Mizuno M, Ito E, Tsuji K (2004) Isolation of Adda from microcystin-LR by microbial degradation. Toxicon 44:107–109. doi: 10.1016/j.toxicon.2004.04.003
9. Allen F, Greiner R, Wishart D (2014) Competitive fragmentation modeling of ESI-MS/MS spectra for putative metabolite identification. Metabolomics 11:98–110. doi: 10.1007/s11306-014-0676-4
10. Allen F, Pon A, Wilson M, Greiner R, Wishart D (2014) CFM-ID: A web server for annotation, spectrum prediction and metabolite identification from tandem mass spectra. Nucleic Acids Res 42:94–99. doi: 10.1093/nar/gku436
11. Bauerle MR, Schwalm EL, Booker SJ (2015) Mechanistic diversity of radical S-adenosylmethionine (SAM)-dependent methylation. J Biol Chem 290:3995–4002. doi: 10.1074/jbc.R114.607044
12. Boyer CS, Petersen DR (1992) Enzymatic basis for the transesterification of cocaine in the presence of ethanol: evidence for the participation of microsomal carboxylesterases. J Pharmacol Exp Ther 260:939–946.
13. Kern S, Baumgartner R, Helbling DE, Hollender J, Singer H, Loos MJ, Schwarzenbach RP, Fenner K (2010) A tiered procedure for assessing the formation of biotransformation products of pharmaceuticals and biocides during activated sludge treatment. J Environ Monit 12:2100–11. doi: 10.1039/c0em00238k
14. Skiba M, Skiba-Lahiani M, Marchais H, Duclos R, Arnaud P (2000) Stability assessment of ketoconazole in aqueous formulations. Int J Pharm 198:1–6. doi: 10.1016/S0378-5173(99)00279-3
15. Rott E (1981) Some results from phytoplankton counting intercalibrations. Schweiz Z Für Hydrol 43:34–62.
16. Reynolds CS (2006) Ecology of phytoplankton. Cambridge University Press, Cambridge; New York
17. AstraZeneca (2013) Environmental Risk Assessment Data: Atenolol.

117 Chapter 3 – Supporting Information
18. Richter MK, Focks A, Siegfried B, Rentsch D, Krauss M, Schwarzenbach RP, Hollender J (2013) Identification and dynamic modeling of biomarkers for bacterial uptake and effect of sulfonamide antimicrobials. Environ Pollut 172:208–15. doi: 10.1016/j.envpol.2012.09.011
19. Tuytten R, Lemière F, Dongen W, Esmans EL, Witters E, Herrebout W, Veken B, Dudley E, Newton RP (2005) Intriguing Mass Spectrometric Behavior of Guanosine Under Low Energy Collision-Induced Dissociation: H2O Adduct Formation and Gas-Phase Reactions in the Collision Cell. J Am Soc Mass Spectrom 16:1291–1304. doi: 10.1016/j.jasms.2005.03.026
20. Sultan J (2008) Collision induced dissociation of deprotonated guanine: Fragmentation of pyrimidine ring and water adduct formation. Int J Mass Spectrom 273:58–68. doi: 10.1016/j.ijms.2008.03.002

118

119 Chapter 4
Chapter 4. Functional and taxonomic diversity drive micropollutant biotransformation in phytoplankton assemblages
Michael A. Stravs†‡, Francesco Pomati†§*, Juliane Hollender†‡ †Eawag, Swiss Federal Institute of Aquatic Science and Technology, Überlandstrasse 133, 8600 Dübendorf, Switzerland ‡Institute of Biogeochemistry and Pollutant Dynamics, Universitätstrasse 16, ETH Zürich, 8092 Zürich, Switzerland §Institute of Integrative Biology, ETH Zürich, Universitätstrasse 16, 8092 Zürich, Switzerland
* Corresponding Author, [email protected]

120 Functional and taxonomic diversity drive micropollutant biotransformation

121 Chapter 4
Abstract
Biotransformation of chemical pollutants is an ecological process requiring multifunctionality (multiple metabolic pathways) and, potentially, high biodiversity. Phytoplankton communities are highly diverse functionally and taxonomically, and co-occur with complex mixtures of organic pollutants in aquatic environments. Here, we investigated how phytoplankton species richness (SPR) and functional group richness (FGR) determine the biotransformation of a mixture of 37 pollutants using laboratory experiments and analysis of high-resolution mass-spectrometry data. The biotransformation of pollutants over 6 days and the total number of transformed chemicals increased with FGR. The total number of transformation products (TPs) was positively affected by both FGR and SPR: FGR had a positive effect on stable TPs found, SPR led to more transient TPs. Our data indicate that both taxonomic and functional diversity are important for biotransformation of anthropogenic chemicals in freshwater phytoplankton and suggest that plankton biodiversity could play a role in the remediation of pollutant loads in aquatic ecosystems.
4.1 Introduction
The environmental fate of anthropogenic chemical pollutants is of preeminent research interest as they can affect flora and fauna, and ultimately also human health. Surface waters receive inputs of organic pollutants from agricultural sources, e.g., pesticides, as well as from urban areas, e.g., pharmaceuticals and personal care products, which are not degraded in wastewater treatment plants (WWTPs). The fate of these so-called “micropollutants” in aquatic ecosystems is governed by sorption to abiotic material, abiotic transformation, bioconcentration in organisms, and biotransformation. Biotransformation processes can lead to the complete degradation of a compound to CO2 (mineralization) or to the formation of transformation products (TPs). The latter have properties (persistence, toxicity, sorption potential) distinct from their parent compounds, and the study of biotransformation is essential for understanding the environmental fate of micropollutants [1, 2].
Freshwater phytoplankton has recently been studied as a potential driver of biotransformation processes. Thomas and Hand presented evidence that degradation of different micropollutants is influenced by the presence of photoautotrophs [3] and showed that a number of cyanobacteria and green microalgae are competent in the degradation of the fungicide fludioxonil [4]. Further, the biotransformation of selected estrogens, industrial chemicals, and herbicides by phytoplankton has been investigated in different studies [5–8]. We recently elucidated the transformation of 24 micropollutants by two cyanobacterial species and the green alga Chlamydomonas reinhardtii. For 10 micropollutants, we could observe 14 transformation products formed by oxidation, reduction, and conjugation reactions [9]. Phytoplankton is however a highly diverse, polyphyletic group of organisms, spanning the domains of bacteria and eukaryotes, and within the latter, distributed across different phyla [10]. Major groups are the Cyanobacteria (prokaryotic), Chlorophyta, Chrysophyta, the poorly studied Cryptophyta, and the Bacillariophyta (or diatoms; all eukaryotic). Whereas heterotrophic nutrition is observed in isolated cases for all listed groups, mixotrophy is common only in chrysophytes and cryptophytes [11]. The community composition of phytoplankton is very dynamic and continuously driven by fluctuations in water chemistry and physics, e.g. nutrient and light availability, temperature and water column stability [12, 13]. For example, eutrophication is often associated with Cyanobacteria-dominated communities, whereas Chrysophyta are indicators of low nutrient levels [14], and seasonal succession of community composition is typical for specific lake types [12, 13].
Given the breadth of organisms that make up the phytoplankton, it appears to be of immediate interest how biotransformation processes of micropollutants in aquatic ecosystems might

122 Functional and taxonomic diversity drive micropollutant biotransformation
depend on phytoplankton community diversity and composition. The influence of biodiversity of natural communities on ecological function (e.g., nutrient use efficiency) and ecosystem services (e.g., quality of drinking water), in general, has been the subject of extensive research[15]. Higher biodiversity is generally agreed to improve efficiency and stability in performed community functions and can contribute to enhanced provision of services [15]. The relationship between diversity and functioning or (performance of a specific) service is however not trivial. Recent analyses suggest a saturating relationship, as at high diversity new species introduce increasingly redundant functions (but can contribute to stability) [15]. When multiple functions or services are considered, the influence of biodiversity is larger, i.e., higher biodiversity is required to provide multiple functions or services simultaneously (multifunctionality) [15, 16]. In phytoplankton communities, species richness (SPR) has been shown to improve the productivity and resource use efficiency in observational studies [17]. Regarding micropollutant degradation, the effect of the biodiversity of bacteria has been studied in wastewater treatment plants, where a positive effect of microfauna diversity was observed on degradation rates of individual micropollutants, and the highest effect was observed for multifunctionality (i.e., the composite biotransformation of multiple micropollutants) [18].
Ecosystem effects are mediated by functions performed by assemblages of organisms and by the diversity of species and functional groups within; in many cases, functional group richness (FGR) , rather than SPR, is a more powerful measure for diversity when attempting to predict ecosystem processes [19]. Phytoplankton functional groups in ecology are generally defined based on pigmentation and trophic behavior (e.g., mixotrophy), characters that have a strong phylogenetic signal [12]. Therefore, classification in broad functional groups (e.g., green algae, cyanobacteria) allows accounting for important ecological, physiological and genetic differences among phytoplankton species [12]. For example, Behl et al. and Stockenreiter et al. found an influence of phytoplankton FGR on carbon uptake [20] and lipid yield [21]. Here, we assume that phytoplankton functional groups differ in the physiological and genetic basis that determine cometabolic or metabolic biotransformation of micropollutants. Therefore, we hypothesise that both FGR and independently SPR can influence biotransformation processes[22].
To test these hypotheses, we assembled communities from five major functional groups of phytoplankton (Chlorophyceans CHL, Cyanobacteria CYA, Chrysophytes CHR, Cryptophytes CRY, and diatoms DIA). We used cultured phytoplankton and laboratory experiments to manipulate and factor out the effects of FGR and SPR on biotransformation. One set of experiments was conducted with constant SPR (5 species) and varying FGR (1, 3, or 5 functional groups). A second set of experiments was conducted with saturated FGR (all 5 functional groups represented) and 5, 8, or 11 species. Test communities were exposed to a mixture of 37 environmentally relevant micropollutants (16 pharmaceuticals, 10 fungicides, 6 insecticides, and 4 additional chemicals) with a wide range of chemical structural features (therefore potentially subject to different transformation pathways), molecular weight (120 to 792 Da), and hydrophobicity (log Kow -2.5 to 5.8). Transformation of compounds as well as formation of TPs was assessed using liquid chromatography coupled to high resolution mass spectrometry (LC-HRMS).

123 Chapter 4
4.2 Results and Discussion
Overall extent of transformation
Of the 37 tested compounds, 13 showed measureable transformation in polyculture samples (see Table S4-4). Transformation integrals for these compounds ranged from partial (%deg 0.2, or k=0.06 d-1 for venlafaxine) to complete (%deg 1.09, or k=1.37 d-1 for atenolol). From the remaining compounds, sulfamethoxazole also showed fast transformation in a number of samples, but was degraded in one bacterial control (no phytoplankton, BAC 2) for both experimental replicates and therefore discarded from further evaluation.
Thirteen compounds were stable, i.e., were not transformed in any sample, and one (methoxyfenozide) degraded only in medium controls (no phytoplankton or bacteria). For the remaining 9 compounds, quantification was inaccurate because of interferences or too low concentrations; higher concentrations were not used to avoid toxicity. These compounds were not further evaluated, and only a tentative classification of the transformation behaviour was given. Details for all 37 compounds are shown in Table S4-4. For further analysis, the 13 compounds with quantifiable biotransformation were selected.
Influence of functional group and species richness on single compound transformation
In Figure 4-1, the biomass corrected and scaled biotransformation integrals (%deg, see Methods) are shown separated by FGR and SPR for each compound. On top, the Pearson correlation coefficients are shown for each compound for %deg against FGR in all SPR≤5 experiments (influence of FGR, n=34 for each compound), and against SPR in all FGR=5 experiments (influence of SPR, n=30 for each compound). The overall effect is given by the distribution of FGR and SPR effects on each compound (n=13). Figure S4-4 shows the identical metrics calculated on the transformation rate k.
As a general trend, biodiversity had a positive influence on biotransformation (Figure 4-1). The influence of FGR is significant for both %deg and k (%deg: p < 0.001; k: p = 0.015, n=13), whereas the SPR effect is not significant for either measure (%deg: p = 0.25, k: p = 0.35, n=13). It is apparent that different compounds show different trends in their transformation patterns. For example, the transformation of benzotriazole and climbazole depends strongly on the FGR but not on SPR; whereas for azoxystrobin, imidacloprid, or kresoxim-methyl, transformation is more strongly related to SPR and hardly affected by FGR. For all compounds except atenolol, either FGR, SPR, or both effects were positive. If only statistically significant slopes (p < 0.05, one-sided Pearson correlation test) for each compound are considered, then 4 positive FGR effects are observed for %deg (3 positive effects for k) and no significant SPR effect is found.
The same analysis was conducted without biomass correction. For this case, the FGR effect is significant only for %deg (p=0.04) but not for k (p=0.27, both n=13). This is because of a specific FGR=1 experiment (CHR as functional group), which exhibited fast growth and concomitantly fast transformation of multiple compounds (carbendazim, azoxystrobin, cyprodinil, kresoxim-methyl), reducing the net FGR effect as a result. As expected, a model using robust linear regression excludes this effect and gives a stable relationship (p=0.009 for %deg, 0.03 for k, n=13.)

124 Functional and taxonomic diversity drive micropollutant biotransformation
Figure 4-1 Top left Distribution of functional group richness (FGR) effect and species richness (SPR) effect slopes for all compounds for %deg values. Red line indicates the zero effect line. Top right and below Distribution of %deg values, for each compound, separated by FGR and SPR, and Pearson correlation coefficients for FGR and SPR effects (top right, illustrated example for azoxystrobin). On top Pearson correlation coefficient for FGR and SPR effects, respectively. (*): p<0.05; (**): p<0.01; (***): p<0.001. For FGR=1, colors indicate the functional group: green chlorophytes, blue cyanobacteria, golden chrysophytes, brown diatoms, grey cryptomonads. Boxplots represent median and first/third quartile (hinges) and the most extreme datapoints no more than 1.5x the interquartile range from the box (whiskers).
-10
12
34 FGR = -0.008 SPR = -0.170
Atenolol
%de
g
SPR <=5 5 5 8 11FGR 1 3 5 5 5
01
23
45
FGR = 0.022 SPR = 0.242
Azoxystrobin
%d
eg
SPR <=5 5 5 8 11FGR 1 3 5 5 5
-10
12
34
FGR = 0.545 *** SPR = 0.097
Benzotriazole
%de
g
SPR <=5 5 5 8 11FGR 1 3 5 5 5
-10
12
34
FGR = 0.254 SPR = 0.230
Carbendazim
%de
g
SPR <=5 5 5 8 11FGR 1 3 5 5 5
-10
12
34 FGR = 0.567 *** SPR = 0.153
Climbazole
%de
g
SPR <=5 5 5 8 11FGR 1 3 5 5 5
-10
12
34
5
FGR = 0.432 ** SPR = -0.099
Cyprodinil
%de
g
SPR <=5 5 5 8 11FGR 1 3 5 5 5
01
23
4
FGR = 0.137 SPR = 0.218
Kresoxim-methyl
%de
g
SPR <=5 5 5 8 11FGR 1 3 5 5 5
02
46
FGR = 0.161 SPR = 0.046
Mefenamic acid
%de
g
SPR <=5 5 5 8 11FGR 1 3 5 5 5
01
23
4 FGR = 0.122 SPR = -0.307
Metoprolol
%de
g
SPR <=5 5 5 8 11FGR 1 3 5 5 5
-10
12
34
5
FGR = 0.271 SPR = -0.127
Tebuconazole
%d
eg
SPR <=5 5 5 8 11FGR 1 3 5 5 5
-10
12
3
FGR = 0.431 ** SPR = -0.109
Venlafaxine
%d
eg
SPR <=5 5 5 8 11FGR 1 3 5 5 5
-10
12
34
FGR = -0.050 SPR = 0.228
Fipronil
%d
eg
SPR <=5 5 5 8 11FGR 1 3 5 5 5
02
46 FGR = 0.232 SPR = 0.040
Fludioxonil
%d
eg
SPR <=5 5 5 8 11FGR 1 3 5 5 5
FGR effect FGR = 1 to 5 SPR = 5
SPR effect FGR = 5 SPR = 5 to 11
O
NO
O
O
N
O
Cl
O
N
N
NN
OH
Cl
Effect correlation coefficient
-0.50 0.00 0.50 0.75
SPR
FGR

125 Chapter 4
Influence of functional group and species richness on overall compound transformation
To corroborate these findings, the biotransformation potential of communities was also assessed as the number of transformed compounds (#TC). The cutoff value for compound transformation was determined to maximize the range of #TC values over the cultures. We calculated micropollutant multifunctionality (MPMF) using centered, scaled rates of change for all compounds that were averaged per experiment, such that the resulting average represents a normalized relative biotransformation potential for each community, as suggested by Johnson et al.[18]. For both #TC and MPMF, significantly positive effects of FGR and non-significant effects of SPR were found when analyzed with either transformation integrals (Figure 4-2) or rates (Figure S4-5).
This suggests that the overall transformation potential of a phytoplankton community is mainly dependent on the number of functional groups present; whereas once all functional groups are present, additional species have a small effect. This would correspond to what is expected when the metabolic / genetic basis for biotransformation are similar within functional groups. In this case, the diversity of enzymes potentially active in transformation is, as a first approximation, determined by the identity or total number of functional groups present.
Influence of functional group identity
The effect of FGR might, for single compounds, be caused by changes in community composition, rather than the actual number of algal groups present. The community transformation capability for a compound may be driven by the presence of a particularly performant functional group whose presence is by chance more probable under a larger richness (i.e., sampling effect) [23]. The single-group transformation rates (Figure 4-1) suggest the importance of community composition and group identity in cases such as tebuconazole and metoprolol (CHL), mefenamic acid (CYA), azoxystrobin, and carbendazim (CHR). Given the high activity observed for single algal groups and many compounds, we investigated the effect of community composition in more detail. To this end, we studied the effect of presence or absence of each group on %deg of individual compounds, as well as on MPMF and #TC. For all experiments with 1 or 3 FGR, multiple regressions for %deg values, MPMF or TC were conducted against five binary variables encoding presence or absence of CHL, CYA, CHR, CRY, and DIA. The results are shown in Table 4-1.
Five compounds each showed positive effects of CHL, CHR, or CYA presence, respectively, and 2 for CRY presence. By contrast, CHR and CHL presence had a negative effect in one case, CRY presence in two cases and DIA presence in 4 cases. For 5 compounds, significant positive effects were observed for multiple algal groups. In summary, this shows that single functional groups can be significantly important for the transformation of individual compounds but overall there is no single group that dominates the total community effect. DIA presence showed only significant negative effects, suggesting that their presence contributed to a lower fraction of biomass being active in transformation; also, the DIA strains exhibited overall slow growth. Therefore, all examined groups except DIA contribute to the FGR effect on micropollutants biotransformation. This is also reflected in the MPMF, where CHL, CHR, and CYA contribute positively. The same evaluation was conducted including the 5 FGR and 5 SPR experiments, yielding similar results (Table S4-7). Overall, we conclude that multiple algal groups contributed to the overall FGR effect.

126 Functional and taxonomic diversity drive micropollutant biotransformation
Figure 4-2 Influence of FGR and SPR on micropollutant multifunctionality (MPMF, left) and number of transformed compounds (#TC, right). On top Pearson correlation coefficient for FGR and SPR effects, respectively. (*): p<0.05; (**): p < 0.01; (***): p<0.001. Colors for functional groups, and boxplot margins are as specified in Figure 4-1.
Table 4-1 p-values for multiple linear regressions (n=24 for each compound) of %deg values per compound, #TC, and MPMF against presence/absence of the functional groups CHL, CHR, CRY, CYA, DIA in experiments with FGR= 1 or 3. Colors depict the direction of significant effects (i.e. slope of the significant linear regression fits; p < 0.05, green positive effect, red negative effect).
CHL CHR CRY CYA DIA
Atenolol 0.07 0.42 0.85 0.08 0.08 Azoxystrobin 0.02 0.005 0.02 0.35 0.71 Benzotriazole 0.15 0.07 0.05 0.05 0.61 Carbendazim 0.14 <0.0001 0.006 0.56 0.35 Climbazole 0.006 0.0008 0.02 0.008 0.41 Cyprodinil 0.005 0.02 0.96 0.12 0.01 Kresoxim-methyl
0.07 0.64 0.35 0.04 0.001
Mefenamic acid
0.04 0.34 0.24 0.04 0.09
Metoprolol 0.06 0.71 0.30 0.94 0.47 Tebuconazole 0.005 0.22 0.64 0.22 0.46 Venlafaxine 0.69 0.001 0.19 0.29 0.82 Fipronil 0.18 0.0003 0.005 0.14 0.0006 Fludioxonil 0.006 0.76 0.66 0.008 0.02
#TC 0.33 0.01 0.95 0.24 0.03 MPMF 0.05 0.01 0.99 0.006 0.007
-0.5
0.0
0.5
1.0
1.5
2.0
2.5 FGR = 0.418 ** SPR = 0.086
Micropollutant multifunctionality
MP
MF
SPR <=5 5 5 8 11FGR 1 3 5 5 5
02
46
81
01
2 FGR = 0.394 * SPR = 0.147
Number of transformed compounds
#T
CSPR <=5 5 5 8 11FGR 1 3 5 5 5

127 Chapter 4
To compare community composition and FGR effects, an ANOVA was conducted for the individual compound %deg and multifunctionality (MPMF and #TC) measures against FGR and composition. The results (Table S4-8) varied depending on different compounds, showing significance for FGR (2 compounds: climbazole and cyprodinil), community composition (3 compounds: atenolol, azoxystrobin, and carbendazim) or both (2 compounds, benzotriazole and venlafaxine); #TC was affected by both, whereas for MPMF, only by FGR. Overall this supports the conclusions above, that community composition is only part of the explanation for the observed FGR effects.
Transformation patterns of compounds
Given that the biotransformation of each compound was influenced by different functional groups, we further inquired whether there are groups of similarly behaving compounds, whose transformation is performed by similar groups of organisms. Heatmaps (Figure 4-3, Figure S4-6) visualize the correlation matrix of all %deg and k values, respectively, across all selections by compounds, ordered by hierarchical clustering. For each compound, the effects of FGR and SPR, and of individual functional groups presence/absence are also shown, to identify common factors driving the transformation behavior. Considering either k or %deg, three main groups are apparent: The two strobilurin fungicides (kresoxim-methyl and azoxystrobin) and carbendazim fall into group 1, venlafaxine and metoprolol, both rather polar with larger alipathic moieties, build group 2, and a larger cluster with multiple compounds with nitrogen heterocycles (climbazole, tebuconazole, benzotriazole, fipronil, mefenamic acid, and fludioxonil) belong to group 3. Atenolol shows weak correlation to any other compound. Cyprodinil is assigned to group 3, but also shows similarity to group 1. Overall, strongly correlated groups are noted, but little apparent anticorrelation, suggesting that no evident tradeoffs exist between transformations of different compounds.
Figure 4-3 (bottom) shows the compound groups with chemical structures and associated FGR, SPR, and composition effects. Group 1 is characterized by positive (though non-significant) effects of SPR, positive effects of CHR, and negative effects of CRY. Group 2 is associated with positive FGR effects and negative SPR effects, as well as positive CHR and negative CRY effects. For the broad group 3, a FGR effect can be observed best since both FGR and multiple individual functional groups show a positive influence. Whereas these interpretations have anecdotal character, they suggest that transformation mechanisms for different structural features might be unequally common, and differently distributed within algal functional groups.

128 Functional and taxonomic diversity drive micropollutant biotransformation
Figure 4-3 Top left: Hierachical clustering of Pearson correlation coefficients between compound transformation integrals (%deg) across all samples. Blue: positive correlation, white no correlation, yellow: negative correlation. Column names are the compound name abbreviations as specified in rows. Top right: Effect of FGR and SPR (as from Figure 4-1), and effect of presence/absence of individual functional groups in FGR=1 and FGR=3 samples, on %deg. Green positive effect, white no effect, red negative effect. (*): p <0.05; (**): p<0.01; (***): p<0.001. Bottom: Compounds as grouped by hierarchical clustering.
CPD - Cyprodinil
TEB - Tebuconazole
CLI - Climbazole
BTA - Benzotriazole
MEF - Mefenamic acid
FIP - Fipronil
FDX - Fludioxonil
ATE - Atenolol
KME - Kresoxim-methyl
AZY - Azoxystrobin
CBDZ - Carbendazim
VFX - Venlafaxine
MPL - Metoprolol
MP
L
VF
X
CB
DZ
AZ
Y
KM
E
AT
E
FD
X
FIP
ME
F
BT
A
CL
I
TE
B
CP
D
**
***
***
**
FG
R
SP
R
** * *
**
** *** * **
* *
* *
*** ** ***
** ** *
* **
* ** *
*** **
**
CH
L
CH
R
CR
Y
CY
A
DIA

129 Chapter 4
Figure 4-4 Number of observed transformation products dependent on FGR and SPR. Left all TPs, middle transient TPs (see text), right stable TPs (see text). BAC, bacterial control. On top Pearson correlation coefficient for FGR and SPR effects, respectively (n=34 and n=30 for FGR and SPR effect, respectively.) (*): p<0.05; (**): p<0.01; (***): p<0.001. Colors for functional groups, and boxplot margins are as specified in Figure 4-1.
Influence of functional group and species richness on transformation products
TPs observed for micropollutants reflect metabolic pathways active in their respective community, but their relationship with community diversity is non-trivial. On one hand, a higher richness suggests the presence of more transformation pathways, which should lead to a higher variety of observed TPs. On the other hand, high richness can also lead to first-order TPs being (quickly) further transformed into structurally more distant, very small or polar TPs, or even mineralized. This would lead to less apparent/observable TPs (in particular first-generation TPs) detectable with our LC-HRMS analysis. To shed light on this relationship, the entire dataset was screened for masses of >1000 putative TPs of selected compounds for which notable transformation in the assembled communities was observed. The search was limited to expected first-generation TPs and extended to later generations of observed first-generation products (see Supplementary Methods). Whereas the identified chemical features are reasonably likely to be TPs, detailed structure elucidation and confirmation was outside the scope of this study. Forty two TPs were observed in total. Thereof, 15 were attributed to the parent fludioxonil, 12 to metoprolol, and 5 to cyprodinil, whereas 1 to 3 TPs could be found for the remaining compounds. The observed atenolol acid is a well-known TP of both atenolol and metoprolol. To facilitate analysis, it was attributed to atenolol alone. No TPs were observed for benzotriazole, climbazole and venlafaxine.
For each TP and experimental sample, the integral of peak area (total peak area) under the linearly interpolated time trend C(t) was calculated and corrected by biomass. Correlation coefficients for FGR and SPR influence were then calculated as above; the presence of the TPs was also checked in bacterial controls. Individually analyzed, most TPs show uncharacteristic behavior, since they appear only in certain samples (Figure S4-8). However, for selected TPs, a clear trend can be observed, e.g. three putative fludioxonil TPs, four putative metoprolol TPs, and one mefenamic acid TP show a significant positive correlation with increasing FGR.
When considering the entirety of TPs, a count of observed different TPs per sample shows a significant positive slope for FGR and SPR and a net overall positive effect (Figure 4-4). TPs were then separated into “transient” and “stable”: TPs were denoted “transient” when their final peak area was <50% of their maximal peak area, indicating that they are being further transformed to another product. Notably, the count of stable TPs shows a significant positive
510
1520
2530
35FGR = 0.51 ** SPR = 0.41 *
TPs overall#T
P
SPR <=5 5 5 8 11FGR 1 3 5 5 5
BAC
05
1015
20
FGR = 0.02 SPR = 0.34 *
Transient TPs
#TP
SPR <=5 5 5 8 11FGR 1 3 5 5 5
BAC
510
1520
25
FGR = 0.61 *** SPR = 0.15
Stable TPs
#TP
SPR <=5 5 5 8 11FGR 1 3 5 5 5
BAC

130 Functional and taxonomic diversity drive micropollutant biotransformation
slope for FGR and no effect for SPR, whereas the count of transient TPs shows no effect for FGR and a significant positive slope for SPR (Figure 4-4).
The results for stable TPs reflect the general findings above and are expected in light of the observed positive relationship between FGR and number of compounds transformed (#TC, Figure 4-2). By contrast, the positive effect of SPR on transient TPs unravel novel results that were hidden in the parent transformation rate analysis. The increased number of transient TPs represents additional biotransformation mechanisms, leading to further modification of TPs, or formation of the same final TP via different intermediates. These additional biotransformation pathways do not result in enhanced overall transformation of the studied compounds, but instead could contribute to the transformation of other compounds beyond those investigated in this study.
In summary, our data support the hypothesis that increased biodiversity leads to more observable TPs. By contrast, a general trend towards “further biotransformation” (i.e., a shift towards structurally distant or highly polar transformation products not captured by screening, or mineralization), which should result in a negative influence of biodiversity on the number of stable TPs, is not supported by the data. However, trends matching “further biotransformation” can be observed for individual compounds including mefenamic acid and cyprodinil (see Supplementary Note, Figure S4-7). These examples show that the consequences of phytoplankton biodiversity for micropollutants transformation can be more complex than just additive effects, and reinforce the need for additional future studies [15].
4.3 Conclusions
To the best of our knowledge this study reports the first evidence for phytoplankton biodiversity and composition effects on micropollutant biotransformation (37 compounds). Our FGR and SPR treatments embraced both the polyphyletic nature of phytoplankton communities and the diversity within and between the principal functional groups. Our results show the effect of FGR on transformation rates, total transformation, and number of transformed compounds. By contrast, SPR was not a significant explanatory variable of overall biotransformation. FGR was also a positive covariate of the number of total TPs and stable TPs per experiment, while SPR was positively associated to the number of transient TPs. For individual compounds, examples could be found showing evidence for further biotransformation at high SPR levels. Our work highlights the need to address the effects of biodiversity on ecosystem processes, such as the degradation of pollutants, at a comprehensive level. A study on a single compound alone would not have provided the same detailed and convincing data as reported here. In this study, results were facilitated by modern high-resolution mass spectrometry, which can be used to quantify the transformation of a large number of compounds in parallel, and further allowed to investigate TP formation at the community-level in replicated experiments.
In nature, the effects of phytoplankton community composition and richness on micropollutant biotransformation will be dependent on the complex interaction between these organisms and their fluctuating environment. For example, phytoplankton functional groups have different abiotic and biotic environmental preferences and community composition follows a seasonal succession that also depends of the trophic state of the aquatic ecosystem [12, 13]. Our results suggest that meso-oligotrophic environments, generally characterised by higher functional and taxonomic diversity [12, 24], will perform better than eutrophic ecosystems in biotransforming micropollutants. Biotransformation can nevertheless be influenced by the total biomass of communities, which peaks in summertime and in eutrophic ecosystems. These instances, of which an example are cyanobacterial blooms, do not coincide with a high biodiversity of the planktonic community [12, 13]. The importance of phytoplankton total biomass relative to biodiversity on micropollutant biotransformation requires further

131 Chapter 4
investigation. All the above factors influence the importance of phytoplankton in relation to other environmental fate processes of micropollutants, such as photodegradation or heterotrophic biotransformation.
Our results suggest that future studies should investigate directly the effects of phytoplankton community diversity, composition, and biomass on the biotransformation of micropollutants in natural aquatic ecosystems. Rather than preempt a conclusion, therefore, this work prompts for further evaluation of findings in a natural environmental context to assess conclusively the importance of phytoplankton biodiversity for the biotransformation and final fate of water-borne anthropogenic chemicals.
4.4 Materials and Methods
Growth conditions
Twenty-two cultures from five algal functional groups were obtained from different sources (six from the Norwegian Institute for Water Research Culture Collection of Algae (NIVA, Oslo, Norway), four from the Scandinavian Culture Collection of Algae and Protozoa (SCCAP; now NIVA, Oslo, Norway), , five from the Culture Collection of Algae at Göttingen University (SAG, Göttingen, Germany), two from the Culture Collection of Algae at the University of Cologne (CCAC, Cologne, Germany), four in-house) and were maintained in ca. 50 mL volume in WC, WC+Si or WC+Bac medium (see Table S4-1) in 100-mL Erlenmeyer flasks under a 8 h / 16 h day/night cycle in a temperature-controlled room at 20°C. Sub-culturing occurred every 1 to 4 weeks depending on growth.
Chemical mixture
A mixture of 37 compounds was prepared from stock solutions of analytical grade (95%+) reference standards (Table S4-2). Chemicals were obtained from Sigma-Aldrich (St. Louis, USA), Fluka (now Sigma-Aldrich), Dr. Ehrenstorfer (now LGC Standards, Teddington, UK), TRC Canada (Toronto, Canada), Lipomed AG (Arlesheim, Switzerland), or Riedel-de Haën (Seelze, Germany) (see Table S4-2). In preliminary tests, the mixture did not inhibit growth at a concentration of 2.5 µg/L for one species per FG.
Experiment
Twenty-two algal species, belonging to one of 5 functional groups (CHL, CYA, CHR, CRY, DIA) were precultured as described above. From this pool, a list of species selections with specified FGR and SPR was generated randomly with a script in R (version 3.2.2). 5 species selections each were generated for the combinations: FGR 3/SPR 5, FGR 5/SPR 5, FGR 5/SPR 8, and FGR 5/SPR 11. The 5 selections for the special case FGR 1/SPR 5 consisted in all species of each of the 5 functional groups. The selections were arranged such that functional groups were evenly distributed in the FGR 3/SPR 5 experiments and such that species use was approximately even in general. While a number of cultures were examined, 5 species that grew in the selected medium could not be found for all functional groups. Therefore, only 3 species for CHR and 4 species for CRY could be used. In addition, a selection of SPR 3 was performed for the functional groups CHL and CYA. All selections are listed in Table S4-3. In total, this resulted in 5x5 + 2 = 27 selections. See Table 4-2 for the experimental design.

132 Functional and taxonomic diversity drive micropollutant biotransformation
Table 4-2 Experimental design: Number of combinations at each FGR and SPR level.
FGR 1 3 5
SP
R 5 7 × 2 * 5 × 2 5 × 2
8 5 × 2
11 5 × 2
„×2“ indicates duplication for each combination. (*): Not for all functional groups 5 species were available. For CHR, 3 species were used; for CRY, 4 species. In addition, a 3 species combination was added for both CYA and CHL.
One week before the experiment, an aliquot of each species was diluted with fresh medium and incubated in an incubation shaker (Multitron II, Infros HT, Bottmingen, Switzerland) at 20°C, 90 rpm, and approximately 100 µEinstein light irradiation from fluorescent tubes. The fluorescent tubes were shielded by UV protection tubes (METOLIGHT ASR-UV-400-60-T8, Asmetec, Germany), and UV protection foil (METOLIGHT SFC-10, Asmetec, Germany) was used to cover the shaker window, to reduce possible photodegradation of chemicals by UV light during the subsequent experiment.
Before the experiment, the biovolume of each strain was determined from flow cytometry measurements of single cultures (see Supplementary Methods) using a formula for biovolume estimation from Total Forward Scattering per particle [25, 26] . For each selection, volumes of different species were calculated such that the total biovolume of all species combined was constant (3.3 × 10⁵ µg/L). Species evenness was not necessarily constant, since not all species were available in the same density. For each selection, the specified volumes of each species were combined into a sterilized 20-mL glass vial and adjusted with WC+0.5Si medium to a total volume of 6 mL. Additionally, the 5 “FGR 1/SPR 5” selections were prepared in duplicate for use as chemical-negative controls (see below). In addition, two bacterial control selections were prepared: a constant volume of all CHL and CYA species except Synechococus (9 total, BAC 1) and all CHR, CRY, and DIA species (12 total, BAC 2) was pooled and filtered through a 1 µm track-etched polycarbonate filter (Whatman Nuclepore, cat. no. 111110, Sigma-Aldrich, Buchs, Switzerland). The filtrate, which contained only particles <1 µm, represented the bacterial contaminations of all species. Because of their small size, Synechococcus was excluded from this control mixture. The filtrate was collected and adjusted with WC+0.5Si to 6 mL. Two medium controls, consisting of 6 mL only WC+0.5Si, were also prepared. This resulted in 36 total samples (5x5 + 2 selections, 5 chemical-negative controls, 2 bacterial controls, 2 medium controls.) The vials were covered loosely with a plastic cover and incubated as above.
After 1 day of acclimation, 100 µL of spike solution (150 µg/L per compound in 7.5 % EtOH / H2O) was added to each vial except the chemical-negative controls to a final concentration of 2.5 µg/L for each compound. To the chemical-negative controls, 100 µL 7.5% EtOH in H2O was added. Immediately, samples were withdrawn for chemical analysis and growth determination: 200 µL were sampled into a 96-well plate and the optical density at 750 nm (OD750) was determined (Cytation 5, Biotek, Winooski, USA). 550 µL were diluted 1:1 with MeOH in 2 mL HPLC vials, mixed well, and incubated in an ultrasonic bath for 10 minutes at 37°C. Subsequently, 350 µL were transferred into flat-bottom glass inserts (SUPELCO, cat. no. 29441-U, Sigma-Aldrich, Buchs, Switzerland) in Eppendorf tubes and centrifuged for 4 min at 9000 rpm. The supernatant was recovered into a 2 mL HPLC vial and stored at -20°C until analysis. After the initial (t0) sampling, the experimental vials were incubated as above. After 1,

133 Chapter 4
2, 4, and 6 days, samples for chemical analysis and growth determination were taken as described above. The entire experiment was repeated after two weeks for replication, and both experiments were analyzed in common.
Chemical analysis
Compound concentrations were determined using online solid phase extraction coupled to LC-HRMS based on a previously published method [9]. Briefly: 150 µL of supernatant sample was diluted to 20 mL with nanopure water and fortified with internal standard (IS) solution (absolute quantity 187.5 pg per IS compound per sample). The 20 mL sample was enriched on a custom multilayer online SPE cartridge (see Supplementary Methods) and eluted with MeOH / 0.1% formic acid (FA) onto the analytical column (Atlantis T3, 3 µm, 150 mm) after predilution with H2O / 0.1% FA. Chromatography was performed with a 13.3-95% MeOH / 0.1% FA in H2O / 0.1% FA gradient over 32 min. A quadrupole-Orbitrap mass spectrometer (Q-Exactive, Thermo Scientific, Bremen) with a heated-electrospray source was used for detection. Measurements were performed in MS1 and data-independent MS2 in polarity switching mode. Analytes were quantified using the internal standard method with TraceFinder EFS (version 3.2.368.22, Thermo Scientific, Bremen). Details are listed in the Supplementary Methods. The raw calculated amounts were exported in csv format.
Transformation product screening
For 13 compounds, a list of potential TPs was generated. Using the open-source workflow RMassScreening (https://github.org/meowcat/RMassScreening), the sample time series were screened for potential TPs occurring in culture samples, not in bacterial controls,chemical-negative controls, or the t0 samples. Details are listed in the Supplementary Methods.
Data evaluation and transformation assessment
All further data processing and statistical evaluation was performed in R. Three compounds were persistent in all samples (thiamethoxam, hydrochlorothiazide, sucralose), and all concentrations were divided by the mean of these compounds to correct for evaporation in the samples, sampling inaccuracies, etc. This resulted in a time series for 37 compounds in 72 experiments. Values for two missing samples (out of 288 total) were imputed from the preceding time point. Exemplar time series plots are shown in Figure S4-2.
For each compound, two measures of the transformation rate were fitted to each time series (transformation integral %deg and transformation rate k). The transformation integral %deg was determined as the area under the curve of the relative amount of compound removed since the start of the experiment:
%deg 1
6
as described in the Supplementary Methods and illustrated in Figure S4-1. This resulted in a value roughly in the [0,1] range where 0 means no transformation and 1 means total transformation. The transformation rate k (in d-1) was determined by nonlinear fitting of the equation , where C0 was set as the mean of all t0 concentrations for the compound. k is a value roughly in the [0,infinity] range where 0 means no transformation (and 1 corresponds to one natural logarithm unit attenuation per day). Not all compounds showed transformation trends that qualitatively fit first-order kinetics, likely because of community dynamics effects; notwithstanding, the obtained values for k qualitatively appear to describe the extent and speed of transformation well.
In Figure S4-3, %deg and k corresponded well for all compounds, and the relationship was linear except for rare samples for which transformation integrals were near 1, since they

134 Functional and taxonomic diversity drive micropollutant biotransformation
cannot capture differences in extremely fast transformation processes. (e.g. for kresoxim-methyl). For further analysis, compounds were classified as “transforming” when they showed a maximum %deg of 0.2 and above, and significant number of samples with transformation stronger than the bacterial control (see Supplementary Methods). The bacterial control was preferred over medium control since it reflects sample conditions closer; in addition, medium controls without biomass appeared susceptible to abiotic transformation, possibly through indirect photolysis.
OD750 minus background was used as a proxy to correct for biomass effects. All %deg and k values were divided by the biomass integral for each sample, computed from OD750 in analogy to %deg (see Supplementary Methods). For each compound, the corrected rates were centered to zero mean and scaled to unit standard deviation to examine diversity effects on each compound equally, independent of the total average transformation rate of the compound.
Statistical analysis
The #TC was computed for each sample. For #TC determination, biomass-corrected %deg or k were scaled to a maximum of 1, where 0 was the maximal transformation rate observed in a control sample and 1 the maximal overall transformation rate. For each sample, the number of substances exceeding a cutoff relative to the maximal transformation rate were counted.
The MPMF was computed as proposed by Johnson et al. [18]. For each compound, transformation rates were centered and scaled to a mean of zero and a standard deviation of one. For each sample, the normalized transformation rates for all compounds were averaged.
The influence of FGR and SPR on individual compound transformation, #TC, MPMF, or biotransformation products observed was determined with a one-sided Pearson correlation test of FGR or SPR, respectively, to the examined value.
For visualization of compound correlations, the Pearson correlation matrix of k or %deg values was ordered by hierarchical clustering using Euclidean distances and complete cluster linkage.
Data availability
The data sets generated and analyzed for the current study are available from the corresponding author upon reasonable request.
4.5 Acknowledgements
We thank M. K. Thomas (Eawag) for helpful suggestions in experimental design and data analysis. We thank C. B. Mansfeldt for helpful comments on the manuscript. This work was supported by the Swiss National Science Foundation, grant number 315230_141190 and 205320_165935.

135 Chapter 4
References
1. Boxall AB, Sinclair CJ, Fenner K, Kolpin D, Maund SJ (2004) When synthetic chemicals degrade in the environment. Environ Sci Technol 38:368A–375A.
2. Sinclair CJ, Boxall ABA (2003) Assessing the ecotoxicity of pesticide transformation products. Environ Sci Technol 37:4617–25.
3. Thomas KA, Hand LH (2011) Assessing the potential for algae and macrophytes to degrade crop protection products in aquatic ecosystems. Environ Toxicol Chem 30:622–31. doi: 10.1002/etc.412
4. Thomas KA, Hand LH (2012) Assessing the metabolic potential of phototrophic communities in surface water environments: fludioxonil as a model compound. Environ Toxicol Chem 31:2138–46. doi: 10.1002/etc.1928
5. Subashchandrabose SR, Ramakrishnan B, Megharaj M, Venkateswarlu K, Naidu R (2013) Mixotrophic cyanobacteria and microalgae as distinctive biological agents for organic pollutant degradation. Environ Int 51:59–72. doi: 10.1016/j.envint.2012.10.007
6. Della Greca M, Pinto G, Pistillo P, Pollio A, Previtera L, Temussi F (2008) Biotransformation of ethinylestradiol by microalgae. Chemosphere 70:2047–53. doi: 10.1016/j.chemosphere.2007.09.011
7. Lai K, Scrimshaw M, Lester J (2002) Biotransformation and bioconcentration of steroid estrogens by Chlorella vulgaris. Appl Environ Microbiol 68:859–864. doi: 10.1128/AEM.68.2.859-864.2002
8. Maes HM, Maletz SX, Ratte HT, Hollender J, Schae A (2014) Uptake, Elimination, and Biotransformation of 17α-Ethinylestradiol by the Freshwater Alga Desmodesmus subspicatus. Environ Sci Technol 48:12354–12361. doi: 10.1021/es503574z
9. Stravs MA, Pomati F, Hollender J (2017) Exploring micropollutant biotransformation in three freshwater phytoplankton species. Environ Sci Process Impacts 19:822–832. doi: 10.1039/C7EM00100B
10. Falkowski PG, Katz ME, Knoll AH, Quigg A, Raven JA, Schofield O, Taylor FJR (2004) The Evolution of Modern Eukaryotic Phytoplankton. Science 305:354–360. doi: 10.1126/science.1095964
11. Bellinger EG, Sigee DC (2015) Introduction to Freshwater Algae. In: Bellinger EG, Sigee DC (eds) Freshw. Algae. John Wiley & Sons, Inc., pp 1–42
12. Reynolds CS, Huszar V, Kruk C, Naselli-Flores L, Melo S (2002) Towards a functional classification of the freshwater phytoplankton. J Plankton Res 24:417–428. doi: 10.1093/plankt/24.5.417
13. Sommer U, Adrian R, De Senerpont Domis L, Elser JJ, Gaedke U, Ibelings B, Jeppesen E, Lürling M, Molinero JC, Mooij WM, van Donk E, Winder M (2012) Beyond the Plankton Ecology Group (PEG) Model: Mechanisms Driving Plankton Succession. Annu Rev Ecol Evol Syst 43:429–448. doi: 10.1146/annurev-ecolsys-110411-160251
14. Ptacnik R, Lepistö L, Willén E, Brettum P, Andersen T, Rekolainen S, Solheim AL, Carvalho L (2008) Quantitative responses of lake phytoplankton to eutrophication in Northern Europe. Aquat Ecol 42:227–236. doi: 10.1007/s10452-008-9181-z
15. Cardinale BJ, Duffy JE, Gonzalez A, Hooper DU, Perrings C, Venail P, Narwani A, Mace GM, Tilman D, Wardle DA, Kinzig AP, Daily GC, Loreau M, Grace JB, Larigauderie A, Srivastava DS, Naeem S (2012) Biodiversity loss and its impact on humanity. Nature 486:59–67. doi: 10.1038/nature11148
16. Zavaleta ES, Pasari JR, Hulvey KB, Tilman GD (2010) Sustaining multiple ecosystem functions in grassland communities requires higher biodiversity. Proc Natl Acad Sci 107:1443–1446. doi: 10.1073/pnas.0906829107

136 Functional and taxonomic diversity drive micropollutant biotransformation
17. Ptacnik R, Solimini AG, Andersen T, Tamminen T, Brettum P, Lepistö L, Willén E, Rekolainen S (2008) Diversity predicts stability and resource use efficiency in natural phytoplankton communities. Proc Natl Acad Sci 105:5134–5138. doi: 10.1073/pnas.0708328105
18. Johnson DR, Helbling DE, Lee TK, Park J, Fenner K, Kohler HPE, Ackermann M (2015) Association of biodiversity with the rates of micropollutant biotransformations among full-scale wastewater treatment plant communities. Appl Environ Microbiol 81:666–675. doi: 10.1128/AEM.03286-14
19. Dıaz S, Cabido M (2001) Vive la différence: plant functional diversity matters to ecosystem processes. Trends Ecol Evol 16:646–655. doi: 10.1016/S0169-5347(01)02283-2
20. Behl S, Donval A, Stibor H (2011) The relative importance of species diversity and functional group diversity on carbon uptake in phytoplankton communities. Limnol Oceanogr 56:683–694. doi: 10.4319/lo.2011.56.2.0683
21. Stockenreiter M, Haupt F, Graber A-K, Seppälä J, Spilling K, Tamminen T, Stibor H (2013) Functional group richness: implications of biodiversity for light use and lipid yield in microalgae. J Phycol 49:838–847. doi: 10.1111/jpy.12092
22. Lefcheck JS, Byrnes JEK, Isbell F, Gamfeldt L, Griffin JN, Eisenhauer N, Hensel MJS, Hector A, Cardinale BJ, Duffy JE (2015) Biodiversity enhances ecosystem multifunctionality across trophic levels and habitats. Nat Commun 6:6936. doi: 10.1038/ncomms7936
23. Wardle DA (1999) Is “Sampling Effect” a Problem for Experiments Investigating Biodiversity-Ecosystem Function Relationships? Oikos 87:403–407. doi: 10.2307/3546757
24. Mittelbach GG, Steiner CF, Scheiner SM, Gross KL, Reynolds HL, Waide RB, Willig MR, Dodson SI, Gough L (2001) What Is the Observed Relationship Between Species Richness and Productivity? Ecology 82:2381–2396. doi: 10.1890/0012-9658(2001)082[2381:WITORB]2.0.CO;2
25. Pomati F, Nizzetto L (2013) Assessing triclosan-induced ecological and trans-generational effects in natural phytoplankton communities: a trait-based field method. Ecotoxicology 22:779–794. doi: 10.1007/s10646-013-1068-7
26. Foladori P, Quaranta A, Ziglio G (2008) Use of silica microspheres having refractive index similar to bacteria for conversion of flow cytometric forward light scatter into biovolume. Water Res 42:3757–3766. doi: 10.1016/j.watres.2008.06.026

137

138

139 Chapter 4 – Supporting Information
Chapter S4. Supporting Information: Functional and taxonomic diversity drive micropollutant biotransformation in phytoplankton assemblages

140 Functional and taxonomic diversity drive micropollutant biotransformation
141 Chapter 4 – Supporting Information
S4.1 Supplementary Methods
Culture medium.
Growth medium (Woods Hole Combo (WC) medium, modified after Guillard and Lorenzen [1]) was prepared from deionized water, 10x TES (2-[[1,3-dihydroxy-2-(hydroxymethyl)propan-2-yl]amino]ethanesulfonic acid) buffer stock solution, and 1000x stock solutions of all other constituents to a final concentration of 1 mM NaNO3, 250 μM CaCl2, 150 μM MgSO4, 150 μM NaHCO3, 50 μM K2HPO4, 390 μM H3BO3, 11.7 μM Na2EDTA, 11.7 μM FeCl3, 10 nM CuSO4, 76.5 nM ZnSO4, 42 nM CoCl2, 910 nM MnCl2, 26 nM Na2MoO4, 98 nM Na3VO4, 0.5 mM TES. The medium was sterilized by autoclaving (30 min at 121°C). Alternative versions of the growth medium additionally contained 100 µM Na2O3Si (WC+Si medium), 50 µM Na2O3Si (WC+0.5Si medium) or 5% heat-killed bacteria (WC+Bac medium). WC+Bac medium was prepared immediately before use by adding heat-killed bacteria to regular WC medium under the sterile hood. Heat-killed bacteria were prepared as follows: From frozen stock aliquots, 500 µL each of Bacillus subtilis (cat. no. 154865, Carolina, Burlington, NC, USA), Bacillus brevis (cat. no. 154921, ibid.) and Serratia fonticuli (cat. no. DSM 4576, DSMZ, Braunschweig, Germany) were added to 250 mL WC medium in a 500-mL Schott bottle and incubated 48 h at room temperature. The culture was visibly turbid at this point. The culture bottle was incubated for 3 h at 80°C in a heating oven before an aliquot of the heat-killed bacteria culture was added to the WC+Bac medium.
Flow cytometry and data processing.
Culture sample was diluted 1:10 in 0.25% glutaraldehyde / H2O, and particle properties were determined using a scanning flow cytometer (CytoSense, CytoBuoy b.v., Woerden, Netherlands) with a flow velocity of 1 µL/s, and triggering on sideway scattering (SWS) of 32, at a beam width of 5 and core speed of 1.47. Particles were measured for a maximum of 300 s or until ca. 15000 particles were counted. If the particle count exceeded 1000 particles/µL, then the sample was remeasured at higher dilution to avoid instrument saturation. Using the software CytoUSB (CytoBuoy b.v., Woerden, Netherlands), concentration and pressure sensor data and all measured single-particle parameters (Listmode particle parameters) were exported in CSV format. Using the statistical software R, a noise cutoff for total red fluorescence (FL Red Total) was determined, and biovolume per particle (in µm3) was determined from the total forward scattering per particle (FWS Total) with the following equation [2, 3]:
√0.0017 0.0133 [1]
Total biovolume (per culture volume, µg / L) was obtained by summing particle biovolumes and adjusting for measured volume and dilution.
Chemical analysis: Online solid-phase extraction and chromatography
The instrumentation for online solid phase extraction and liquid chromatography and the online solid phase extraction cartridge used for online solid-phase extraction was described previously [4, 5]. For online solid-phase extraction, 80 µL 0.5M citric acid buffer (pH 7) were added to 20 mL sample. The entire sample was loaded into a sample loop and enriched on an online SPE cartridge (loading solvent: 2 mM ammonium acetate in H2O, pH 7). Separation was performed with an Atlantis T3 column (3 µm, 3.0 mm x 150 mm; Waters, Milford, USA). For chromatography, a gradient was formed by mixing water (A, H2O / 0.1% formic acid (FA)) and organic solvent (B, MeOH / 0.1% FA) delivered by two separate pumps (total flow rate: 300 µL/min, gradient: 13.3% B (0-4 min), 13.3 to 95% B (4-20 min), 95% B (20-28 min), 95 to 13.3% B (28-28.2 min), 13.3% B (28.2-32.3 min; reconditioning)). For 5 min, solvent B ran over the SPE cartridge (elution of enriched analytes) before mixing with A (dilution before analytical

142 Functional and taxonomic diversity drive micropollutant biotransformation
column). During cartridge elution, the sample loop was washed with acetonitrile (0.5 min, 2 mL/min). During chromatography, the cartridge was washed with acetonitrile (7.5 min, 0.4 mL/min) and reconditioned with loading solvent (6.5 min, 0.4 mL/min), and subsequently the next sample was enriched on the cartridge (11.5 min, 2 mL/min).
Detection was performed using a quadrupole-Orbitrap mass spectrometer (Q-Exactive, Thermo Scientific, Bremen) with a heated electrospray (H-ESI) source. Data was acquired in polarity-switching mode with data-independent MS2 acquisition. For positive and negative mode each, a full scan (m/z range: 70-1050, resolution: 70’000, maximum injection time: 50 ms, automatic gain control (AGC) target: 1 × 10⁶, profile mode) was followed by three data-independent high-energy collision-induced fragmentation events (resolution: 35’000, maximum injection time: 50 ms, AGC target: 2 × 10⁵, profile mode; isolation windows: m/z range: 70-330, normalized collision energy (NCE): 30; m/z range: 320-680, NCE: 50; m/z range: 670-1030, NCE: 70). Source parameters were set as follows: spray voltage: 4 kV (positive mode), 3 kV (negative mode); capillary temperature: 350 °C, sheath gas: 40; auxiliary gas: 10; spare gas: 0; probe heater temperature; 50 °C.
Quantification of the analytes was performed using the internal standard method with TraceFinder EFS (version 3.2.368.22, Thermo Scientific, Bremen). The mass tolerance was set to 5 ppm. Peak integration was performed with the ICIS algorithm, and integrated peaks were reviewed by hand. If available, the isotope-labeled analyte was used as internal standard; otherwise, an internal standard close in retention time and structure was used.
Data analysis
The degradation integral %deg was determined by 1) determining the average measured starting concentration of the compound C0 across all samples, 2) linearly interpolating compound concentrations C(t) between the five measurement points at t = 0, 1, 2, 4, 6 d; 3) integrating the difference between C0 and C(t), i.e., the amount of compound degraded from 0 to 6 days, and 4) dividing by 6 (the experiment duration). The measure is illustrated in Figure S4-1 and described by equation 2, where C(t) is the piecewise linear approximation function between the measured data points.
%deg
[2]
The biomass integral B was computed in analogy as the area under the curve of the optical density at 750 nm (OD750) corrected by background (OD750,blank). OD750 was interpolated between the five measurement points at t=0, 1, 2, 4, 6 d, integrated over 0 to 6 days, and divided by 6. The measure is described by the equation 3, where OD750(t) is the piecewise linear approximation between the measured data points.
B , [3]

143 Chapter 4 – Supporting Information
Figure S4-1 Determination of %deg, illustrated.
Functional group composition
The influence of specific functional groups on %deg for each compound, #TC and MPMF was analyzed by linear regression of the response variable against 5 dummy variables encoding presence/absence of each functional group (CHL, CHR, CRY, CYA, DIA), using the function lm from the statistical package R. Note that the inclusion of FGR=5 experiments effectively only includes data for one specific combination of functional groups (all functional groups are present).
In analogy to Tilman et al. [6], the explanatory power of community composition versus FGR on %deg for each compound, #DC and MPMF was analyzed with (nested) ANOVA of the response variable against a factor encoding FGR (1, 3 or 5 functional groups) and a factor encoding community composition (11 combinations for presence/absence of each functional group: 5 single-functional group combinations, 5 combinations with FGR=3, one combination with FGR=5.) Note that community composition is nested within FGR.
Transformation product screening
For 13 compounds (atenolol, metoprolol, venlafaxine, mefenamic acid, cyprodinil, carbendazim, tebuconazole, benzotriazole, climbazole, azoxystrobin, fludioxonil, kresoxim-methyl, and sulfamethoxazole), a list of TP candidates was generated from the parent mass and likely modification reactions using the open-source workflow RMassScreening (https://github.com/meowcat/RMassScreening). First, a list of compound-specific reactions (Table S4-5) dependent on the chemical structure (e.g., dechlorination if a chlorine was present in the structure) was applied recursively (i.e., first reactions are applied to the parent, and subsequently follow-up reactions were applied until all reactions were processed. Subsequently a list of general reactions (Table S4-6) was applied on all parents and generated TP candidates as specified by the reaction count (e.g., for hydroxylation with count 3, for every parent and TP candidate three new candidates with 1, 2, or 3 hydroxylations were generated), and all generated products were added to the candidate list for the next reaction. Finally, all reactions specified “F” in Table S4-6 were applied to the parents and candidate list without recursion.

144 Functional and taxonomic diversity drive micropollutant biotransformation
Whereas this generates a large reaction list, during the screening process higher-generation TPs were only considered when the respective precursor was observed and the chemical reaction was plausible.
Table S4-1 Algal strains used in the experiment, with growth media (see text) and source. “WC/WC+Bac”: Medium was cycled between WC and WC+Bac.
Code Species name Strain Source Functional group
Medium
CHL1 Ankistrodesmus bibarianus NIVA 179 NIVA Chlorophyta WC
CHL2 Chlamydomonas reinhardtii in-house Chlorophyta WC
CHL3 Chlorella sp. NIVA 170 NIVA Chlorophyta WC
CHL4 Kirchneriella subcapitata in-house Chlorophyta WC
CHL5 Pediastrum sp. SCCAP K-1033 SCCAP Chlorophyta WC
CHR1 Chrysocapsa epiphytica SAG 20.88 SAG Chrysophyta WC+Si
CHR2 Ochromonas danica SAG 933-7 SAG Chrysophyta WC/WC+Bac
CHR3 Poterioochromonas malhamensis SAG 933-1a SAG Chrysophyta WC/WC+Bac
CRY1 Chroomonas sp. SAG 980-1 SAG Cryptophyta WC
CRY2 Cryptomonas sp. in-house Cryptophyta WC
CRY3 Komma sp. SCCAP K-1622 SCCAP Cryptophyta WC
CRY4 Rhodomonas sp. CCAC 0194 CCAC Cryptophyta WC/WC+Bac
CYA1 Anabaena flos-aquae NIVA 269/6 NIVA Cyanobacteria WC
CYA2 Aphanizomenon flos-aquae NIVA 693 NIVA Cyanobacteria WC
CYA3 Microcystis aeruginosa PCC 7806 PCC Cyanobacteria WC
CYA4 Planktothrix rubescens SCCAP K-0576 SCCAP Cyanobacteria WC
CYA5 Synechococcus sp. in-house Cyanobacteria WC
DIA1 Asterionella formosa NIVA BAC-3 NIVA Diatom WC+Si
DIA2 Fragilaria crotonensis SAG 28.96 SAG Diatom WC+Si
DIA3 Nitzschia sp. SCCAP K-1905 SCCAP Diatom WC+Si
DIA4 Synedra rumpens var. familiaris NIVA BAC-18 NIVA Diatom WC+Si
DIA5 Tabellaria sp. CCAC 3717 B CCAC Diatom WC+Si
SCCAP Scandinavian Culture Collection of Algae and Protozoa, University of Copenhagen, Copenhagen, Denmark, now NIVA, Oslo, Norway; SAG Culture Collection of Algae at Göttingen University, Georg-August-Universität Göttingen, Göttingen, Germany; CCAC Culture Collection of Algae at the University of Cologne, Cologne, Germany; NIVA Norwegian Institute for Water Research Culture Collection of Algae, Oslo, Norway

145 C
hapter 4 – Supporting Inform
ation
Table S4-2 Mixture of micropollutants used in the experiment.
Name Compound class Formula Molecular weight [Da]
Exact mass [Da]
log Kow CAS Vendor Ion m/z Retention time [min]
Amisulpride Pharmaceutical C17H27N3O4S 369.4811 369.1722 1.06 [2] 71675‐85‐9 Sigma‐Aldrich [M+H]+ 370.1795 12.2
Atenolol Pharmaceutical C14H22N2O3 266.3374 266.1630 0.16 [2] 29122‐68‐7 Sigma‐Aldrich [M+H]+ 267.1703 9.9
Azoxystrobin Fungicide C22H17N3O5 403.3894 403.1168 2.5 [1] 131860‐33‐8 Fluka [M+H]+ 404.1241 21.2
Benzotriazole Corrosion inhibitor C6H5N3 119.1246 119.0483 1.44 [5] 95‐14‐7 Fluka [M+H]+ 120.0556 15.4
Bezafibrate Pharmaceutical C19H20ClNO4 361.8213 361.1081 4.25 [4] 41859‐67‐0 Sigma‐Aldrich [M+H]+ 362.1154 21.6
Boscalid Fungicide C18H12Cl2N2O 343.2086 342.0327 2.96 [1] 188425‐85‐6 Dr. Ehrenstorfer [M+H]+ 343.0399 21.7
Caffeine C8H10N4O2 194.1914 194.0804 ‐0.07 [6] 58‐08‐2 Fluka [M+H]+ 195.0877 14.3
Carbamazepine Pharmaceutical C15H12N2O 236.2699 236.0950 2.45 [2] 298‐46‐4 Sigma‐Aldrich [M+H]+ 237.1022 19.9
Carbendazim Fungicide C9H9N3O2 191.1875 191.0695 1.48 [1] 10605‐21‐7 Dr. Ehrenstorfer [M+H]+ 192.0768 12.6
Chlorpyrifos Insecticide C9H11Cl3NO3PS 350.5882 348.9263 4.7 [1] 2921‐88‐2 Dr. Ehrenstorfer [M+H]+ 349.9336 24.9
Citalopram Pharmaceutical C20H21FN2O 324.3937 324.1638 3.5 [2] 59729‐33‐8 TRC Canada [M+H]+ 325.1711 16.8
Climbazole Fungicide / Pharmaceutical
C15H17ClN2O2 292.7622 292.0979 3.76 [1] 38083‐17‐9 Dr. Ehrenstorfer [M+H]+ 293.1051 18.7
Cyprodinil Fungicide C14H15N3 225.2903 225.1266 4 [1] 121552‐61‐2 Dr. Ehrenstorfer [M+H]+ 226.1339 22.2
Dimethoate Insecticide C5H12NO3PS2 229.2589 228.9996 0.7 [1] 60‐51‐5 Riedel‐de Haën [M+H]+ 230.0069 16.5
Fexofenadine Pharmaceutical C32H39NO4 501.6592 501.2879 5.6 [2] 83799‐24‐0 TRC Canada [M+H]+ 502.2952 18.1
Fipronil Insecticide C12H4Cl2F6N4OS 437.1497 435.9387 3.75 [1] 120068‐37‐3 Dr. Ehrenstorfer [M‐H]‐ 434.9314 22.6
Fludioxonil Fungicide C12H6F2N2O2 248.1861 248.0397 4.12 [1] 131341‐86‐1 Fluka [M‐H]‐ 247.0325 21.7
Hydrochlorothiazide Pharmaceutical C7H8ClN3O4S2 297.7410 296.9645 ‐0.07 [2] 58‐93‐5 Sigma‐Aldrich [M‐H]‐ 295.9572 11.5
Imidacloprid Insecticide C9H10ClN5O2 255.6621 255.0523 0.57 [1] 138261‐41‐3 Riedel‐de Haën [M+H]+ 256.0596 15.3
Iopromide X‐ray contrast medium C18H24I3N3O8 791.1135 790.8698 ‐2.49 [4] 73334‐07‐3 Dr. Ehrenstorfer [M+H]+ 791.877 11.3
Ketoconazole Fungicide / Pharmaceutical
C26H28Cl2N4O4 531.4337 530.1488 4.35 [2] 65277‐42‐1 Sigma‐Aldrich [M+H]+ 531.156 18.5

146 F
unctional and taxonomic diversity drive m
icropollutant biotransformation
Kresoxim‐methyl Fungicide C18H19NO4 313.3494 313.1314 3.4 [1] 143390‐89‐0 Dr. Ehrenstorfer [M+H]+ 314.1387 23.0
Lamotrigine Pharmaceutical C9H7Cl2N5 256.0926 255.0079 2.5 [2] 84057‐84‐1 TRC Canada [M+H]+ 256.0151 14.9
Mefenamic acid Pharmaceutical C15H15NO2 241.2864 241.1103 5.12 [2] 61‐68‐7 Sigma‐Aldrich [M+H]+ 242.1176 24.0
Methoxyfenozide Insecticide C22H28N2O3 368.4713 368.2100 3.72 [1] 161050‐58‐4 Dr. Ehrenstorfer [M+H]+ 369.2173 22.0
Metoprolol Pharmaceutical C15H25NO3 267.3653 267.1834 1.88 [2] 37350‐58‐6 Sigma‐Aldrich [M+H]+ 268.1907 14.4
Oxazepam Pharmaceutical C15H11ClN2O2 286.7146 286.0509 2.24 [2] 604‐75‐1 Lipomed AG [M+H]+ 287.0582 20.7
Propamocarb Fungicide C9H20N2O2 188.2682 188.1525 0.84 [1] 24579‐73‐5 Dr. Ehrenstorfer [M+H]+ 189.1598 10.5
Sucralose Artificial sweetener C12H19Cl3O8 397.6352 396.0146 ‐1 [4] 56038‐13‐2 Dr. Ehrenstorfer [M+FA]‐ 441.0128 15.1
Sulfamethoxazole Pharmaceutical C10H11N3O3S 253.2791 253.0521 0.89 [2] 723‐46‐6 Sigma‐Aldrich [M+H]+ 254.0594 14.8
Tebuconazole Fungicide C16H22ClN3O 307.8201 307.1451 3.7 [1] 107534‐96‐3 Dr. Ehrenstorfer [M+H]+ 308.1524 23.2
Thiamethoxam Insecticide C8H10ClN5O3S 291.7162 291.0193 ‐0.13 [1] 153719‐23‐4 Dr. Ehrenstorfer [M+H]+ 292.0266 13.9
Torasemide Pharmaceutical C16H20N4O3S 348.4220 348.1256 2.3 [2] 56211‐40‐6 TRC Canada [M+H]+,[M‐H]‐
349.1329, 347.1183
17.8
Valsartan Pharmaceutical C24H29N5O3 435.5210 435.2270 5.8 [2] 137862‐53‐4 LGC Standards [M+H]+ 436.2343 21.7
Venlafaxine Pharmaceutical C17H27NO2 277.4033 277.2042 3.28 [3] 93413‐69‐5 TRC Canada [M+H]+ 278.2115 16.3
Vildagliptin Pharmaceutical C17H25N3O2 303.4009 303.1947 0.79 [4] 274901‐16‐5 TRC Canada [M+H]+ 304.202 9.9
[1]: Data from Pesticide Properties Database [7] [2]: Data from DrugBank [8] [3]: Data from PubChem (CID: 5656) [9] [4]: No experimental value for the log Kow could be found; the used value is calculated using EPI-Suite [10] [5]: Data from PubChem (CID: 7220) [11] [6]: Data from PubChem (CID: 2519) [12]

147 Chapter 4 – Supporting Information
Table S4-3 Culture selections
Selection 1 FGR = 5 SPR = 3 (CHR)
chemical-negative control
CHR1 Chrysocapsa epiphytica
CHR3 Poterioochromonas malhamensis
CHR2 Ochromonas danica
Selection 2 FGR = 1 SPR = 3 (CHL)
CHL1 Ankistrodesmus bibarianus
CHL5 Pediastrum sp.
CHL2 Chlamydomonas reinhardtii
Selection 3 FGR = 5 SPR = 8
CHL3 Chlorella sp.
CYA5 Synechococcus sp.
CYA4 Planktothrix rubescens
CRY1 Chroomonas sp.
CRY3 Komma sp.
DIA5 Tabellaria sp.
DIA1 Asterionella formosa
CHR1 Chrysocapsa epiphytica
Selection 4 FGR = 5 SPR = 5 (DIA)
chemical-negative control
DIA5 Tabellaria sp.
DIA2 Fragilaria crotonensis
DIA1 Asterionella formosa
DIA3 Nitzschia sp.
DIA4 Synedra rumpens var. familiaris
Selection 5 FGR = 5 SPR = 5 (DIA)
DIA5 Tabellaria sp.
DIA2 Fragilaria crotonensis
DIA1 Asterionella formosa
DIA3 Nitzschia sp.
DIA4 Synedra rumpens var. familiaris
Selection 6 FGR = 5 SPR = 8
CHL5 Pediastrum sp.
CYA1 Anabaena flos-aquae
CRY1 Chroomonas sp.
CRY3 Komma sp.
CRY4 Rhodomonas sp.
DIA3 Nitzschia sp.
DIA4 Synedra rumpens var. familiaris
CHR2 Ochromonas danica
Selection 7 FGR = 5 SPR = 11
CHL3 Chlorella sp.
CHL4 Kirchneriella subcapitata
CYA5 Synechococcus sp.
CYA1 Anabaena flos-aquae
CYA2 Aphanizomenon flos-aquae
CRY2 Cryptomonas sp.
CRY1 Chroomonas sp.
DIA5 Tabellaria sp.
DIA4 Synedra rumpens var. familiaris
CHR3 Poterioochromonas malhamensis
CHR2 Ochromonas danica
Selection 8 FGR = 5 SPR = 4 (CRY)
chemical-negative control
CRY2 Cryptomonas sp.
CRY1 Chroomonas sp.
CRY3 Komma sp.
CRY4 Rhodomonas sp.
Selection 9 FGR = 5 SPR = 5
CHL2 Chlamydomonas reinhardtii
CYA4 Planktothrix rubescens
CRY2 Cryptomonas sp.
DIA5 Tabellaria sp.
CHR2 Ochromonas danica
Selection 10 medium control
Selection 11 FGR = 5 SPR = 11
CHL1 Ankistrodesmus bibarianus
CHL2 Chlamydomonas reinhardtii
CYA3 Microcystis aeruginosa
CRY1 Chroomonas sp.
CRY3 Komma sp.
CRY4 Rhodomonas sp.
DIA5 Tabellaria sp.
DIA1 Asterionella formosa
CHR1 Chrysocapsa epiphytica
CHR3 Poterioochromonas malhamensis
CHR2 Ochromonas danica
Selection 12 FGR = 5 SPR = 5
CHL5 Pediastrum sp.
CYA1 Anabaena flos-aquae
CRY2 Cryptomonas sp.
DIA1 Asterionella formosa
CHR3 Poterioochromonas malhamensis

148 Functional and taxonomic diversity drive micropollutant biotransformation
Table S4-3 (continued)
Selection 13 FGR = 5 SPR = 5
CHL4 Kirchneriella subcapitata
CYA5 Synechococcus sp.
CRY3 Komma sp.
DIA5 Tabellaria sp.
CHR1 Chrysocapsa epiphytica
Selection 14 FGR = 5 SPR = 5 (CYA)
chemical-negative control
CYA5 Synechococcus sp.
CYA1 Anabaena flos-aquae
CYA4 Planktothrix rubescens
CYA3 Microcystis aeruginosa
CYA2 Aphanizomenon flos-aquae
Selection 15 FGR = 5 SPR = 11
CHL1 Ankistrodesmus bibarianus
CHL2 Chlamydomonas reinhardtii
CYA5 Synechococcus sp.
CYA1 Anabaena flos-aquae
CYA4 Planktothrix rubescens
CYA3 Microcystis aeruginosa
CYA2 Aphanizomenon flos-aquae
CRY1 Chroomonas sp.
CRY3 Komma sp.
DIA4 Synedra rumpens var. familiaris
CHR3 Poterioochromonas malhamensis
Selection 16 FGR = 5 SPR = 5 (CHL)
CHL1 Ankistrodesmus bibarianus
CHL3 Chlorella sp.
CHL5 Pediastrum sp.
CHL4 Kirchneriella subcapitata
CHL2 Chlamydomonas reinhardtii
Selection 17 FGR = 5 SPR = 5
CHL1 Ankistrodesmus bibarianus
CYA2 Aphanizomenon flos-aquae
CRY1 Chroomonas sp.
DIA3 Nitzschia sp.
CHR2 Ochromonas danica
Selection 18 FGR = 5 SPR = 8
CHL2 Chlamydomonas reinhardtii
CYA2 Aphanizomenon flos-aquae
CRY3 Komma sp.
DIA1 Asterionella formosa
DIA3 Nitzschia sp.
DIA4 Synedra rumpens var. familiaris
CHR1 Chrysocapsa epiphytica
CHR3 Poterioochromonas malhamensis
Selection 19 FGR = 5 SPR = 8
CHL1 Ankistrodesmus bibarianus
CHL5 Pediastrum sp.
CHL2 Chlamydomonas reinhardtii
CYA1 Anabaena flos-aquae
CRY1 Chroomonas sp.
CRY4 Rhodomonas sp.
DIA2 Fragilaria crotonensis
CHR2 Ochromonas danica
Selection 20 medium control
Selection 21 FGR = 5 SPR = 11
CHL4 Kirchneriella subcapitata
CYA5 Synechococcus sp.
CYA4 Planktothrix rubescens
CRY2 Cryptomonas spec.
CRY3 Komma sp.
CRY4 Rhodomonas sp.
DIA5 Tabellaria sp.
DIA1 Asterionella formosa
DIA4 Synedra rumpens var. familiaris
CHR3 Poterioochromonas malhamensis
CHR2 Ochromonas danica
Selection 22 FGR = 5 SPR = 3 (CHR)
CHR1 Chrysocapsa epiphytica
CHR3 Poterioochromonas malhamensis
CHR2 Ochromonas danica
Selection 23 FGR = 3 SPR = 5
CHL5 Pediastrum sp.
CHL2 Chlamydomonas reinhardtii
CRY3 Komma sp.
CHR3 Poterioochromonas malhamensis
CHR2 Ochromonas danica
Selection 24 FGR = 5 SPR = 5 (CYA)
CYA5 Synechococcus sp.
CYA1 Anabaena flos-aquae
CYA4 Planktothrix rubescens
CYA3 Microcystis aeruginosa
CYA2 Aphanizomenon flos-aquae
Selection 25 FGR = 3 SPR = 5
CHL1 Ankistrodesmus bibarianus
CHL3 Chlorella sp.
CYA4 Planktothrix rubescens
CYA2 Aphanizomenon flos-aquae
CHR3 Poterioochromonas malhamensis

149 Chapter 4 – Supporting Information
Table S4-3 (continued)
Selection 26 FGR = 5 SPR = 8
CHL4 Kirchneriella subcapitata
CHL2 Chlamydomonas reinhardtii
CYA4 Planktothrix rubescens
CYA3 Microcystis aeruginosa
CRY1 Chroomonas sp.
CRY4 Rhodomonas sp.
DIA4 Synedra rumpens var. familiaris
CHR3 Poterioochromonas malhamensis
Selection 27 FGR = 3 SPR = 5
CYA4 Planktothrix rubescens
CYA2 Aphanizomenon flos-aquae
CRY2 Cryptomonas sp.
DIA1 Asterionella formosa
DIA4 Synedra rumpens var. familiaris
Selection 28 FGR = 5 SPR = 5 (CHL)
chemical-negative control
CHL1 Ankistrodesmus bibarianus
CHL3 Chlorella sp.
CHL5 Pediastrum sp.
CHL4 Kirchneriella subcapitata
CHL2 Chlamydomonas reinhardtii
Selection 29 FGR = 5 SPR = 4 (CRY)
CRY2 Cryptomonas sp.
CRY1 Chroomonas sp.
CRY3 Komma sp.
CRY4 Rhodomonas sp.
Selection 30 FGR = 3 SPR = 5
CHL4 Kirchneriella subcapitata
CYA5 Synechococcus sp.
CYA2 Aphanizomenon flos-aquae
DIA5 Tabellaria sp.
DIA3 Nitzschia sp.
Selection 31 FGR = 1 SPR = 3 (CYA)
CYA1 Anabaena flos-aquae
CYA4 Planktothrix rubescens
CYA2 Aphanizomenon flos-aquae
Selection 32 FGR = 3 SPR = 5
CRY1 Chroomonas sp.
CRY3 Komma sp.
DIA2 Fragilaria crotonensis
DIA4 Synedra rumpens var. familiaris
CHR3 Poterioochromonas malhamensis
Selection 33 FGR = 5 SPR = 5
CHL3 Chlorella sp.
CYA3 Microcystis aeruginosa
CRY4 Rhodomonas sp.
DIA5 Tabellaria sp.
CHR3 Poterioochromonas malhamensis
Selection 34 bacterial control 1
CHL1-CHL5 and CYA1-CYA4 filtrate
Selection 35 FGR = 5 SPR = 11
CHL1 Ankistrodesmus bibarianus
CHL4 Kirchneriella subcapitata
CYA1 Anabaena flos-aquae
CYA4 Planktothrix rubescens
CYA3 Microcystis aeruginosa
CRY2 Cryptomonas sp.
CRY3 Komma sp.
DIA2 Fragilaria crotonensis
CHR1 Chrysocapsa epiphytica
CHR3 Poterioochromonas malhamensis
CHR2 Ochromonas danica
Selection 36 bacterial control 2
CHR1-CHR3 filtrate
CRY1-CRY4 filtrate
DIA1-DIA5 filtrate

150 Functional and taxonomic diversity drive micropollutant biotransformation
Degradation assessment
For compounds with a maximal %deg of 0.2 or above in cultures, degradation was compared with bacterial controls to verify that the observed degradation was not primarily bacterial. The mean and standard deviation (SD) of the bacterial control samples were calculated, and a cutoff was set to one SD around the mean. The exceedances in negative and positive directions were compared: a one-sided sign test compared the positive exceedances (degradation) to the total exceedances, and a one-sided t-test compared the absolute deviations from the control mean for positive and negative exceedances (when a sufficient number of negative exceedances was present). A compound was classified as degrading if three out of four statistical tests (t test and sign test for k or %deg) were significant on a p<0.05 level (or no t-tests could be performed for lack of negative exceedances).
Note: the compounds vildagliptin and lamotrigine showed significant numbers of samples with transformation stronger than bacterial control, but very marginal extent of transformation (maximal %deg of <0.1), making their classification uncertain. We excluded them from the final analysis, however the analyses were run also including the two compounds, confirming the results.
Figure S4-2 Examples of corrected concentration time profiles (C/C0 over time) for a compound persistent in the experiment (vildagliptin), degraded in cultures (metoprolol), degraded by cultures and bacteria (sulfamethoxazole), and degraded exclusively in medium controls (methoxyfenozide). Black phytoplankton communities; red bacterial control; blue medium control; green chemical-free control.

151 Chapter 4 – Supporting Information
Figure S4-3 (continued on next page) Plot of degradation rates versus integrals for 27 compounds. a) Kresoxim-methyl (maximal rate: k=4.8), b) compounds with maximal k of 0.5 to 1, c) compounds with maximal k of 0.25 to 0.5. Red bacterial controls; black phytoplankton communities; red solid lines mean of bacterial controls; red dotted lines mean plus/minus one standard deviation of bacterial controls.
0.0 0.2 0.4 0.6 0.8 1.0 1.2
01
23
45
%deg
k
Kresoxim-methyl
0.0 0.2 0.4 0.6 0.8 1.0 1.2
0.0
0.2
0.4
0.6
0.8
1.0
%deg
k
Atenolol
0.0 0.2 0.4 0.6 0.8 1.0 1.2
0.0
0.2
0.4
0.6
0.8
1.0
%deg
k
Azoxystrobin
0.0 0.2 0.4 0.6 0.8 1.0 1.2
0.0
0.2
0.4
0.6
0.8
1.0
%deg
k
Carbendazim
0.0 0.2 0.4 0.6 0.8 1.0 1.2
0.0
0.2
0.4
0.6
0.8
1.0
%deg
k
Cyprodinil
0.0 0.2 0.4 0.6 0.8 1.0 1.2
0.0
0.2
0.4
0.6
0.8
1.0
%deg
k
Fludioxonil
0.0 0.2 0.4 0.6 0.8 1.0 1.2
0.0
0.2
0.4
0.6
0.8
1.0
%deg
k
Sulfamethoxazole
-0.2 0.0 0.2 0.4 0.6
-0.2
0.0
0.1
0.2
0.3
0.4
0.5
%deg
k
Benzotriazole
-0.2 0.0 0.2 0.4 0.6
-0.2
0.0
0.1
0.2
0.3
0.4
0.5
%deg
k
Metoprolol
-0.2 0.0 0.2 0.4 0.6
-0.2
0.0
0.1
0.2
0.3
0.4
0.5
%deg
k
Tebuconazole
-0.2 0.0 0.2 0.4 0.6
-0.2
0.0
0.1
0.2
0.3
0.4
0.5
%deg
k
Fipronil
-0.2 0.0 0.2 0.4 0.6
-0.2
0.0
0.1
0.2
0.3
0.4
0.5
%deg
k
Climbazole
-0.2 0.0 0.2 0.4 0.6
-0.2
0.0
0.1
0.2
0.3
0.4
0.5
%deg
k
Mefenamic acid
a) b)
c)

152 Functional and taxonomic diversity drive micropollutant biotransformation
Figure S4-3 Degradation rates and integrals for 27 compounds. Horizontal axis: degradation integral %deg, vertical axis: degradation rate k. d) Compounds with maximal k < 0.25 . Red bacterial controls; black phytoplankton communities; red solid lines mean of bacterial controls; red dotted lines mean plus/minus one standard deviation of bacterial controls.
-0.2 -0.1 0.0 0.1 0.2
-0.0
50
.00
0.0
50
.10
%deg
kVenlafaxine
-0.2 -0.1 0.0 0.1 0.2
-0.0
50
.00
0.0
50
.10
%deg
k
Methoxyfenozide
-0.2 -0.1 0.0 0.1 0.2
-0.0
50
.00
0.0
50
.10
%deg
k
Bezafibrate
-0.2 -0.1 0.0 0.1 0.2
-0.0
50
.00
0.0
50
.10
%deg
k
Boscalid
-0.2 -0.1 0.0 0.1 0.2
-0.0
50
.00
0.0
50
.10
%deg
k
Carbamazepine
-0.2 -0.1 0.0 0.1 0.2
-0.0
50
.00
0.0
50
.10
%deg
k
Imidacloprid
-0.2 -0.1 0.0 0.1 0.2
-0.0
50
.00
0.0
50
.10
%deg
k
Lamotrigine
-0.2 -0.1 0.0 0.1 0.2
-0.0
50
.00
0.0
50
.10
%deg
k
Oxazepam
-0.2 -0.1 0.0 0.1 0.2
-0.0
50.
00
0.0
50
.10
%deg
k
Thiamethoxam
-0.2 -0.1 0.0 0.1 0.2
-0.0
50.
00
0.0
50
.10
%deg
k
Torasemide
-0.2 -0.1 0.0 0.1 0.2
-0.0
50.
00
0.0
50
.10
%deg
k
Valsartan
-0.2 -0.1 0.0 0.1 0.2
-0.0
50.
00
0.0
50
.10
%deg
k
Vildagliptin
-0.2 -0.1 0.0 0.1 0.2
-0.0
50
.00
0.0
50
.10
%deg
k
Hydrochlorothiazide
-0.2 -0.1 0.0 0.1 0.2
-0.0
50
.00
0.0
50
.10
%deg
k
Sucralose
d)

153 Chapter 4 – Supporting Information
Table S4-4 Transformation/persistence assessment of 37 substances.
Substance Transformation stable unreliable analytics by cultures bacterial control medium
Atenolol X Azoxystrobin X X Benzotriazole X Carbendazim X Cyprodinil X Kresoxim-methyl X X Metoprolol X Tebuconazol X X Venlafaxin X Fipronil X X Fludioxonil X Climbazole X (X)1 X
Mefenamic acid X (X)1
Sulfamethoxazole X X Methoxyfenozide X Bezafibrate X Boscalid X Carbamazepine X Imidacloprid X Lamotrigine X Oxazepam X Thiamethoxam X Torasemide X Valsartan X Vildagliptin X Hydrochlorothiazide X Sucralose X Torasemide X Chlorpyrifos (X)2 (X)2 (X)2 X
Ketoconazole (X)2 (X)2 (X)2 X
Amisulpride (X)2 X
Citalopram (X)2 X
Caffeine (X)2 X
Dimethoate (X)2 X
Propamocarb (X)2 X
Fexofenadine (X)2 X
Iopromide X 1microbial degradation present but to an extent smaller than in culture samples 2analytics are unreliable or not sensitive enough, therefore degradation or stability assessment is tentative.

154 Functional and taxonomic diversity drive micropollutant biotransformation
Table S4-5 Transformation product candidate generation: reactions applied to specific parent compounds.
Parent Reaction Loss Gain
Atenolol (ATE)
ATE deisopropylation C3H7 H
ATE sidechain loss C6ONH14 H
ATE hydrolysis (TP1) NH2 OH
ATE TP1 decarboxylation CO2H H
Metoprolol (MPL)
MPL deme CH3 H
MPL deipr C3H7 H
Venlafaxine (VFX)
VFX deme CH3 H
Mefenamic acid (MEF)
MEF C8H9 aryl loss (TP1) C8H9 H
MEF TP1 deamination NH2 H
MEF decarboxylation CO2H H
MEF C6H5 aryl loss (TP2) C6H5 H
MEF TP2 deamination NH2 H
Cyprodinil (CPD)
CPD decycloproyl C3H5 H
CPD C8H9 aryl loss (TP1) C8H9 H
CPD TP1 deamination NH2 H
Carbendazim (CBDZ)
CBDZ demethylation CH3 H
CBDZ urea hydrolysis C2O2H3 H
Tebuconazole (TEB)
TEB dechlorination (reductive) Cl H
TEB dechlorination (oxidative) Cl OH
TEB demethylation CH3 H
TEB deethylation C2H5 H
TEB depropylation C3H7 H
TEB debutylation C4H9 H
TEB triazole ring loss C2N3H2 NH2
TEB C6H4Cl aryl loss C6H4Cl H
Benzotriazole (BTA)
none (all expected BTA reactions are within the general reactions)
Climbazole (CLI)
CLI demethylation CH3 H
CLI deethylation C2H5 H
CLI depropylation C3H7 H
CLI debutylation C4H9 H
CLI decarbox CO2H H
CLI imidazole ring loss (TP1) C3N2H3 NH2
CLI ether cleavage 1 C8H8N2O
CLI ether cleavage 2 C6H3Cl
CLI TP1 deamination NH2 H CLI and all TP dechlorination (reductive) Cl H CLI and all TP dechlorination (oxidative) Cl OH
Fludioxonil (FDX)
FDX defluorination (reductive) F H
FDX defluorination (oxidative) F OH
FDX didefluorination (reductive) F2 H2
FDX CF2 loss CF2 H2
FDX CN oxidation to COOH (TP1) CN CO2H
FDX TP1 decarboxylation CO2H H

155 Chapter 4 – Supporting Information
Kresoxim‐methyl (KME)
KME demethylation (TP1) CH3 H
KME didemethylation (TP2) C2H6 H2
KME methoxy loss (TP3) CH3O H
KME methoxy loss + demethylation C2H6O H
KME strobilurin moiety loss C4O3NH6 H
KME TP1‐3 decarboxylation CO2H H
KME ether cleavage 1 C7H7 H
KME ether cleavage 1 (incl. O) C7H7O H
KME ether cleavage 2 C11H11NO3
KME ether cleavage 2 (incl. O) C11H11NO4 H
Azoxystrobin (AZY)
AZY demethylation (TP1) CH3 H
AZY didemethylation (TP2) C2H6 H2
AZY methoxy loss (TP3) CH3O H
AZY methoxy loss + demethylation C2H6O H
AZY strobilurin moiety loss (TP4) C5H7O3 H
AZY TP1‐3 decarboxylation CO2H H
AZY TP4 ether cleavage 1 C6H5 H
AZY TP4 ether cleavage 1 (incl. O) C6H5O H
AZY ether cleavage 2 C7H5N H
AZY ether cleavage 2 (incl. O; TP5) C7H5NO H
AZY TP5 ether cleavage 3 C4H2N2 H
AZY CN oxidation to COOH (TP6) CN CO2H
AZY TP6 decarboxylation COOH H
Table S4-6 Transformation product candidate generation: reactions applied to all parent compounds.
Reaction Loss Gain Count
hydroxylation H OH 3
oxidation H2 2
reduction H2 2
methyl to COOH oxidation CH3 CO2H 2
formylation CO F
glucuronidation C6H8O6 F
sulfate conjugation SO3 F
taurine conjugation C2H5NO2S F
glutathione conjugation C10H15N3O6S F
cysteine conjugation C3H5NO2S F
acetylation C2H2O F
acetylcysteine conjugation C5H7NO3S F
glucose conjugation C6H10O5 F
glutamate conjugation H2O C5H9NO4 F
glycine conjugation H2O C2H5NO2 F
aspartate conjugation H2O C4H7NO4 F
methylation H CH3 F
carboxylation H CO2H F
propanoic acid H C3H5O2 F

156 Functional and taxonomic diversity drive micropollutant biotransformation
S4.2 Supplementary Results
Influence of functional group and species richness on single compound transformation.
Figure S4-4 Top left Distribution of functional group richness (FGR) and species richness (SPR) effect slopes for all compounds for degradation rates (k). Red line indicates the zero effect line. Top right and below Distribution of degradation rates (k) for each compound, separated by SPR and FGR, and Pearson correlation coefficients for FGR and SPR effects (top right, illustrated example for azoxystrobin). On top: Pearson correlation coefficient for FGR and SPR effects, respectively. (*): p<0.05; (**): p<0.01; (***): p<0.001. Colors for functional groups, and boxplot margins are as specified in Figure 4-1.
02
46
FGR = -0.143 SPR = -0.235
Atenolol
k [d
1]
SPR <=5 5 5 8 11FGR 1 3 5 5 5
-10
12
34
5
FGR = -0.117 SPR = 0.265
Azoxystrobin
k [d
1]
SPR <=5 5 5 8 11FGR 1 3 5 5 5
-10
12
34 FGR = 0.592 *** SPR = -0.007
Benzotriazole
k [d
1]
SPR <=5 5 5 8 11FGR 1 3 5 5 5
01
23
4 FGR = -0.047 SPR = 0.242
Carbendazim
k [d
1]
SPR <=5 5 5 8 11FGR 1 3 5 5 5
-10
12
34
5 FGR = 0.444 ** SPR = 0.192
Climbazole
k [d
1]
SPR <=5 5 5 8 11FGR 1 3 5 5 5
-10
12
34 FGR = 0.215 SPR = -0.079
Cyprodinil
k [d
1]
SPR <=5 5 5 8 11FGR 1 3 5 5 5
01
23
4 FGR = -0.005 SPR = 0.140
Kresoxim-methyl
k [d
1]
SPR <=5 5 5 8 11FGR 1 3 5 5 5
-10
12
34
5 FGR = 0.090 SPR = 0.082
Mefenamic acid
k [d
1]
SPR <=5 5 5 8 11FGR 1 3 5 5 5
01
23
45 FGR = 0.151 SPR = -0.283
Metoprolol
k [d
1]
SPR <=5 5 5 8 11FGR 1 3 5 5 5
-10
12
34
56 FGR = 0.252 SPR = -0.138
Tebuconazole
k [d
1]
SPR <=5 5 5 8 11FGR 1 3 5 5 5
01
23
4 FGR = 0.369 * SPR = -0.204
Venlafaxine
k [d
1]
SPR <=5 5 5 8 11FGR 1 3 5 5 5
-10
12
34 FGR = -0.049 SPR = 0.232
Fipronil
k [d
1]
SPR <=5 5 5 8 11FGR 1 3 5 5 5
-10
12
34
56
FGR = 0.249 SPR = 0.064
Fludioxonil
k [d
1]
SPR <=5 5 5 8 11FGR 1 3 5 5 5
FGR effect FGR = 1 to 5 SPR = 5
SPR effect FGR = 5 SPR = 5 to 11
O
NO
O
O
N
O
Cl
O
N
N
NN
OH
Cl
Effect correlation coefficient
-0.50 0.00 0.50 0.75
SPR
FGR

157 Chapter 4 – Supporting Information
Influence of functional group and species richness on overall compound transformation.
Figure S4-5 Influence of FGR and SPR on micropollutant multifunctionality (MPMF, left) and number of compounds transformed (#TC, right), determined from transformation rates (k). On top Pearson correlation coefficient for FGR and SPR effects, respectively (n=34 and n=30 for FGR and SPR effect, respectively.). *: p<0.05 **: p < 0.01. Colors for functional groups, and boxplot margins are as specified in Figure 4-1.
-0.5
0.0
0.5
1.0
1.5
2.0 FGR = 0.312 * SPR = 0.070
Micropollutant multifunctionality
MP
MF
SPR <=5 5 5 8 11FGR 1 3 5 5 5
02
46
81
01
2 FGR = 0.291 * SPR = 0.262
Number of transformed compounds
#T
C
SPR <=5 5 5 8 11FGR 1 3 5 5 5

158 Functional and taxonomic diversity drive micropollutant biotransformation
Influence of functional group identity
Table S4-7 p values (n=34 for each compound) for multiple linear regressions of %deg values per compound, #DC, and MPMF against presence/absence of the functional groups CHL, CHR, CRY, CYA, DIA in experiments with FGR 1, 3 or 5 and SPR≤5. Colors depict the direction of significant effects (i.e. slope of the significant linear regression fits; p < 0.05, green positive effect, red negative effect)
CHL CHR CRY CYA DIA
Atenolol 0.18 0.78 0.65 0.006 0.16 Azoxystrobin 0.08 0.001 0.06 0.80 0.86 Benzotriazole 0.35 0.15 0.11 0.11 0.28 Carbendazim 0.20 <0.0001 0.01 0.48 0.46 Climbazole 0.14 0.03 0.23 0.18 0.25 Cyprodinil 0.05 0.14 0.77 0.24 0.27 Kresoxim-methyl
0.52 0.48 0.31 0.06 0.07
Mefenamic acid
0.17 0.52 0.47 0.18 0.25
Metoprolol 0.05 0.63 0.43 0.89 0.62 Tebuconazole 0.03 0.44 0.62 0.44 0.49 Venlafaxine 0.73 0.003 0.22 0.33 0.85 Fipronil 0.19 0.02 0.03 0.16 0.03 Fludioxonil 0.08 0.92 0.76 0.09 0.19
#DC 0.18 0.006 0.85 0.12 0.05 MPMF 0.12 0.06 0.87 0.03 0.08
.
Table S4-8 p values for individual ANOVAs (n=34 for each compound) of %deg values per compound, #DC, and MPMF against FGR (1, 3 or 5 functional groups) and community composition (presence/absence of each functional groups, 11 total combinations: 5 combinations with FGR=1, 5 combinations with FGR=3, one combination with FGR=5)
FGR Community composition
Atenolol 0.10 0.005Azoxystrobin 0.27 0.0004Benzotriazole 0.0002 0.01Carbendazim 0.08 0.0001Climbazole 0.0006 0.18Cyprodinil 0.03 0.43Kresoxim-methyl
0.39 0.54
Mefenamic acid
0.70 0.77
Metoprolol 0.65 0.15Tebuconazole 0.22 0.07Venlafaxine 0.010 0.010Fipronil 0.58 0.11Fludioxonil 0.41 0.47 #DC 0.02 0.03MPMF 0.03 0.10

159 Chapter 4 – Supporting Information
Transformation patterns of compounds
Figure S4-6 Left Hierarchical clustering of Pearson correlation coefficients between compound transformation rates (k) across all samples. Column names are the compound name abbreviations as specified in rows. Blue positive correlation, white no correlation, yellow negative correlation. Right Effect of FGR and SPR (as from Figure 4-1), and effect of presence/absence of individual functional groups in FGR=1 and FGR=3 samples. Green positive effect, white no effect, red negative effect. (*): p<0.05; (**): p<0.01; (***): p<0.001.
Supplementary Note: The influence of biodiversity on transformation products
To examine the behavior of individual parent compounds, the total peak area of all potential TPs for each parent were summed and evaluated for FGR and SPR effects (Figure S4-7). The trends were compared to the parent substance trends (Figure 4-1). For carbendazim and azoxystrobin (with only a single observed TP), as well as for kresoxim-methyl (2 TPs), the observed TPs appear to match the general trend observed for the parent’s transformation. No clear trend is apparent for fludioxonil, metoprolol and tebuconazole. The atenolol (and metoprolol) TP (ATE/MPL acid) shows a moderate negative trend for high SPR, resembling the trend for atenolol parent, but is not clearly interpretable since there is also bacterial formation.
By contrast, the TPs for mefenamic acid and cyprodinil show a strong decrease for high species diversity which is not observed for the parents. These examples show that “further biotransformation” at high diversity levels can occur at the level of individual compounds, and the effects of diversity are more complex than an additive view would suggest.
FDX - Fludioxonil
CLI - Climbazole
TEB - Tebuconazole
BTA - Benzotriazole
FIP - Fipronil
MEF - Mefenamic acid
AZY - Azoxystrobin
CBDZ - Carbendazim
KME - Kresoxim-methyl
CPD - Cyprodinil
MPL - Metoprolol
VFX - Venlafaxine
ATE - Atenolol
AT
E
VF
X
MP
L
CP
D
KM
E
CB
DZ
AZ
Y
ME
F
FIP
BT
A
TE
B
CL
I
FD
X
**
***
*
FG
R
SP
R
** * *
* * * **
*
*
** * **
*
* ** *
* *** **
** ** *
**
*
CH
L
CH
R
CR
Y
CY
A
DIA

160 Functional and taxonomic diversity drive micropollutant biotransformation
Figure S4-7 For 10 parent compounds, sum of total peak areas (TPA) of all observed TP, for assembled communities by FGR and SPR, and for bacterial controls. Atenolol and metoprolol are evaluated in combination, since they share the important TP atenolol acid. BAC, bacterial control. On top: Pearson correlation coefficient for FGR and SPR effects, respectively. (*): p<0.05; (**): p<0.01; (***): p<0.001. Colors for functional groups, and boxplot margins are as specified in Figure 4-1.
0e+0
02e
+07
4e+0
76e
+07
8e+0
7 FGR = -1.4e-01 SPR = -2.6e-01
Atenolol TPs
TP
A
SPR <=5 5 5 8 11FGR 1 3 5 5 5
BAC0.
0e+0
05.
0e+0
61.
0e+0
71.
5e+0
7
FGR = 3.6e-02 SPR = 4.1e-02
Azoxystrobin TPs
TP
A
SPR <=5 5 5 8 11FGR 1 3 5 5 5
BAC
0.0e
+00
1.0e
+07
2.0e
+07
FGR = 2.5e-01 SPR = 2.7e-01
Carbendazim TPs
TP
A
SPR <=5 5 5 8 11FGR 1 3 5 5 5
BAC
0e+0
02e
+07
4e+0
76e
+07
FGR = 1.5e-01 SPR = -1.8e-01
Cyprodinil TPs
TP
A
SPR <=5 5 5 8 11FGR 1 3 5 5 5
BAC
0e+0
02e
+07
4e+0
76e
+07
FGR = 2.4e-01 SPR = -5.9e-03
Fludioxonil TPs
TP
A
SPR <=5 5 5 8 11FGR 1 3 5 5 5
BAC0.
0e+0
05.
0e+0
61.
0e+0
71.
5e+0
72.
0e+0
7
FGR = 1.4e-01 SPR = 4.1e-02
Kresoxim-methyl TPs
TP
A
SPR <=5 5 5 8 11FGR 1 3 5 5 5
BAC
0e+0
02e
+06
4e+0
66e
+06
8e+0
6
FGR = 3.5e-01 * SPR = -3.0e-01
Mefenamic acid TPs
TP
A
SPR <=5 5 5 8 11FGR 1 3 5 5 5
BAC
0.0e
+00
1.0e
+08
2.0e
+08
FGR = 1.1e-01 SPR = -5.1e-02
Metoprolol TPs
TP
A
SPR <=5 5 5 8 11FGR 1 3 5 5 5
BAC
0.0e
+00
1.0e
+07
2.0e
+07 FGR = 1.4e-01 SPR = -1.7e-01
Tebuconazole TPs
TP
A
SPR <=5 5 5 8 11FGR 1 3 5 5 5
BAC

161 Chapter 4 – Supporting Information
Figure S4-8 (continued on next page)
0e+
002e
+07
4e+0
76e
+07
8e+0
7 FGR = -1.4e-01 SPR = -2.6e-01
ATE/MPL acidT
PA
SPR <=5 5 5 8 11FGR 1 3 5 5 5
BAC
0.0e
+00
5.0
e+06
1.0e
+07
1.5e
+07
FGR = 3.6e-02 SPR = 4.1e-02
AZY acid
TP
ASPR <=5 5 5 8 11FGR 1 3 5 5 5
BAC
0.0e
+00
5.0e
+06
1.0e
+07
1.5e
+07
2.0e
+07
2.5e
+07
FGR = 2.5e-01 SPR = 2.7e-01
CBDZ OH1
TP
A
SPR <=5 5 5 8 11FGR 1 3 5 5 5
BAC
0e+
001e
+07
2e+
073e
+07
4e+
075e
+07 FGR = 2.4e-01 SPR = -1.3e-01
CPD OH1-19.1
TP
A
SPR <=5 5 5 8 11FGR 1 3 5 5 5
BAC
050
0000
1500
000
250
0000
3500
000
FGR = -2.6e-02 SPR = -3.1e-02
CPD OH1-20.5
TP
A
SPR <=5 5 5 8 11FGR 1 3 5 5 5
BAC
0e+
002
e+06
4e+0
66e
+06
8e+0
61e
+07
FGR = -1.4e-01 SPR = -2.3e-01
CPD carboxyT
PA
SPR <=5 5 5 8 11FGR 1 3 5 5 5
BAC
0.0e
+00
5.0e
+06
1.0e
+07
1.5e
+07
2.0e
+07
2.5e
+07 FGR = -9.4e-02 SPR = -1.4e-01
CPD OH1-21.1
TP
ASPR <=5 5 5 8 11FGR 1 3 5 5 5
BAC
0e+
001e
+06
2e+0
63e
+06
4e+0
6
FGR = 2.4e-01 SPR = -1.9e-01
CPD OH1-16.3
TP
A
SPR <=5 5 5 8 11FGR 1 3 5 5 5
BAC
0.0e
+00
5.0
e+06
1.0
e+07
1.5e
+07
2.0e
+07
FGR = 2.9e-01 * SPR = -1.6e-02
FDX OH2-18.9
TP
A
SPR <=5 5 5 8 11FGR 1 3 5 5 5
BAC
0.0
e+00
1.0e
+07
2.0e
+07
3.0
e+07
FGR = 1.9e-01 SPR = -2.7e-02
FDX OH2-18.3
TP
A
SPR <=5 5 5 8 11FGR 1 3 5 5 5
BAC
050
000
100
000
1500
0020
000
0
FGR = 1.7e-01 SPR = -3.1e-02
FDX OH2-red-17.9T
PA
SPR <=5 5 5 8 11FGR 1 3 5 5 5
BAC
0e+0
02e
+05
4e+0
56e
+05
8e+0
51e
+06
FGR = -9.4e-02 SPR = 2.2e-01
FDX OH2-ox
TP
ASPR <=5 5 5 8 11FGR 1 3 5 5 5
BAC
05
0000
01
5000
0025
000
0035
000
00
FGR = -1.6e-03 SPR = 1.6e-01
FDX OH2-18.2
TP
A
SPR <=5 5 5 8 11FGR 1 3 5 5 5
BAC
0e+0
02e
+05
4e+0
56e
+05
8e+0
51e
+06
FGR = 1.8e-01 SPR = 3.2e-01 *
FDX didefluoro
TP
A
SPR <=5 5 5 8 11FGR 1 3 5 5 5
BAC
050
0000
150
0000
2500
000
FGR = 9.1e-02 SPR = -2.7e-01
FDX OH1-19.7
TP
A
SPR <=5 5 5 8 11FGR 1 3 5 5 5
BAC
0e+0
02e
+05
4e+0
56e
+05
8e+0
51e
+06 FGR = -1.6e-01 SPR = -6.6e-02
FDX OH1-19.6T
PA
SPR <=5 5 5 8 11FGR 1 3 5 5 5
BAC

162 Functional and taxonomic diversity drive micropollutant biotransformation
Figure S4-8 (continued on next page)
050
0000
1000
000
1500
000
2000
000
250
0000
FGR = 3.5e-01 * SPR = 1.5e-01
FDX OH2-18.7T
PA
SPR <=5 5 5 8 11FGR 1 3 5 5 5
BAC
020
0000
600
000
1000
000
140
0000
FGR = 2.3e-01 SPR = -1.2e-01
FDX OH-sulfate
TP
ASPR <=5 5 5 8 11FGR 1 3 5 5 5
BAC
0e+
002e
+05
4e+0
56
e+05
8e+0
5
FGR = 4.8e-02 SPR = -5.5e-02
FDX OH3
TP
A
SPR <=5 5 5 8 11FGR 1 3 5 5 5
BAC
0e+
002e
+05
4e+0
56e
+05
8e+0
5
FGR = 4.0e-01 ** SPR = -1.2e-01
FDX OH2-red-18.3
TP
A
SPR <=5 5 5 8 11FGR 1 3 5 5 5
BAC
050
0000
1000
000
1500
000
FGR = 3.4e-01 * SPR = 1.8e-01
FDX OH1-carboxy
TP
A
SPR <=5 5 5 8 11FGR 1 3 5 5 5
BAC
0e+
001e
+05
2e+0
53e
+05
4e+0
5
FGR = 1.3e-01 SPR = 1.6e-01
FDX OH2-red-18.4T
PA
SPR <=5 5 5 8 11FGR 1 3 5 5 5
BAC
0e+
001
e+05
2e+0
53e
+05
4e+
055e
+05
FGR = -1.5e-01 SPR = 1.9e-01
FDX OH2-18.0
TP
ASPR <=5 5 5 8 11FGR 1 3 5 5 5
BAC
0.0e
+00
5.0e
+06
1.0
e+07
1.5e
+07
2.0e
+07
FGR = 1.3e-01 SPR = 8.8e-02
KME acid
TP
A
SPR <=5 5 5 8 11FGR 1 3 5 5 5
BAC
0e+0
02e
+06
4e+
066e
+06
8e+0
61e
+07
FGR = 2.1e-03 SPR = -2.1e-01
KME decarboxy-desmethyl
TP
A
SPR <=5 5 5 8 11FGR 1 3 5 5 5
BAC
020
0000
6000
0010
0000
0
FGR = 2.4e-01 SPR = 1.8e-01
KME destrobi
TP
A
SPR <=5 5 5 8 11FGR 1 3 5 5 5
BAC
0e+0
01e
+06
2e+0
63e
+06
4e+
065e
+06
6e+
06
FGR = 3.8e-01 * SPR = -2.6e-01
MEF dearyl glutamic acidT
PA
SPR <=5 5 5 8 11FGR 1 3 5 5 5
BAC
0e+0
02e
+06
4e+0
66e
+06
8e+0
6
FGR = 1.1e-01 SPR = -1.8e-01
MEF glutamic acid
TP
ASPR <=5 5 5 8 11FGR 1 3 5 5 5
BAC
0e+0
01e
+07
2e+0
73e
+07
4e+0
75e
+07
FGR = -1.2e-01 SPR = -1.4e-01
MPL desmethyl
TP
A
SPR <=5 5 5 8 11FGR 1 3 5 5 5
BAC
0.0e
+00
5.0e
+06
1.0e
+07
1.5e
+07
2.0e
+07 FGR = 5.9e-01 *** SPR = 2.3e-02
MPL demethyl-glucoside 13.3
TP
A
SPR <=5 5 5 8 11FGR 1 3 5 5 5
BAC
0e+0
02e
+07
4e+
076e
+07
8e+0
7 FGR = -1.4e-01 SPR = -2.6e-01
MPL demethyl-keto
TP
A
SPR <=5 5 5 8 11FGR 1 3 5 5 5
BAC
0e+0
02e
+07
4e+0
76
e+07
FGR = 5.9e-01 *** SPR = 5.4e-02
MPL demethyl-glucoside 12.3T
PA
SPR <=5 5 5 8 11FGR 1 3 5 5 5
BAC

163 Chapter 4 – Supporting Information
Figure S4-8 (continued) For 46 TP candidates, total peak areas (TPA) for assembled communities by FGR and SPR, and for bacterial controls (BAC). . On top: Pearson correlation coefficient for FGR and SPR effects, respectively. (*): p<0.05; (**): p<0.01; (***): p<0.001. Colors for functional groups, and boxplot margins are as specified in Figure 4-1. ATE atenolol, MPL metoprolol, MEF mefenamic acid, CPD cyprodinil, CBDZ carbendazim, TEB tebuconazole, AZY azoxystrobin, FDX fludioxonil, KME kresoxim-methyl, SMZ sulfamethoxazole. Numbers after TP candidate name indicate the retention time in case of isobaric compounds.
0.0e
+00
5.0e
+06
1.0e
+07
1.5e
+07
2.0e
+07 FGR = 9.1e-02 SPR = -3.5e-01
MPL hydroxyT
PA
SPR <=5 5 5 8 11FGR 1 3 5 5 5
BAC
0.0e
+00
5.0e
+06
1.0e
+07
1.5e
+07 FGR = 1.1e-01 SPR = 2.0e-01
MPL deispropyl-glucoside 10.4
TP
ASPR <=5 5 5 8 11FGR 1 3 5 5 5
BAC
0e+0
01e
+07
2e+0
73e
+07
FGR = 4.6e-01 ** SPR = 1.8e-01
MPL demethyl-glucoside 11.8
TP
A
SPR <=5 5 5 8 11FGR 1 3 5 5 5
BAC
0e+0
01e
+07
2e+0
73e
+07
FGR = 5.1e-01 ** SPR = 1.7e-01
MPL glucuronide 11.6
TP
A
SPR <=5 5 5 8 11FGR 1 3 5 5 5
BAC
0.0e
+00
5.0e
+06
1.0e
+07
1.5e
+07
2.0e
+07
2.5e
+07 FGR = 4.3e-01 ** SPR = 1.9e-01
MPL glucuronide 11.4
TP
A
SPR <=5 5 5 8 11FGR 1 3 5 5 5
BAC
0.0e
+00
4.0e
+06
8.0
e+06
1.2e
+07
FGR = 3.3e-01 * SPR = 1.7e-01
MPL deispropyl-glucoside 11.5T
PA
SPR <=5 5 5 8 11FGR 1 3 5 5 5
BAC
0e+0
01e
+06
2e+0
63e
+06
4e+0
65e
+06
FGR = 3.7e-01 * SPR = -1.7e-01
MPL glucoside
TP
ASPR <=5 5 5 8 11FGR 1 3 5 5 5
BAC
0e+0
01e
+06
2e+0
63e
+06
4e+0
65e
+06 FGR = -1.7e-01 SPR = 0.0e+00
MPL demethyl-hydroxy
TP
A
SPR <=5 5 5 8 11FGR 1 3 5 5 5
BAC
0e+0
01e
+06
2e+0
63e
+06
4e+0
65e
+06
6e+
06
FGR = 1.8e-01 SPR = -1.3e-01
TEB OH2
TP
A
SPR <=5 5 5 8 11FGR 1 3 5 5 5
BAC
0.0e
+00
5.0e
+06
1.0
e+07
1.5e
+07
2.0e
+07
FGR = 1.3e-01 SPR = -1.8e-01
TEB OH1
TP
A
SPR <=5 5 5 8 11FGR 1 3 5 5 5
BAC

164 Functional and taxonomic diversity drive micropollutant biotransformation
References
1. Guillard RRL, Lorenzen CJ (1972) Yellow-Green Algae with Chlorophyllide C1,2. J Phycol 8:10–14. doi: 10.1111/j.1529-8817.1972.tb03995.x
2. Pomati F, Nizzetto L (2013) Assessing triclosan-induced ecological and trans-generational effects in natural phytoplankton communities: a trait-based field method. Ecotoxicology 22:779–794. doi: 10.1007/s10646-013-1068-7
3. Forlani G, Pavan M, Gramek M, Kafarski P, Lipok J (2008) Biochemical bases for a widespread tolerance of cyanobacteria to the phosphonate herbicide glyphosate. Plant Cell Physiol 49:443–56. doi: 10.1093/pcp/pcn021
4. Huntscha S, Singer HP, McArdell CS, Frank CE, Hollender J (2012) Multiresidue analysis of 88 polar organic micropollutants in ground, surface and wastewater using online mixed-bed multilayer solid-phase extraction coupled to high performance liquid chromatography-tandem mass spectrometry. J Chromatogr A 1268:74–83. doi: 10.1016/j.chroma.2012.10.032
5. Stravs MA, Pomati F, Hollender J (2017) Exploring micropollutant biotransformation in three freshwater phytoplankton species. Environ Sci Process Impacts 19:822–832. doi: 10.1039/C7EM00100B
6. Tilman D, Knops J, Wedin D, Reich P, Ritchie M, Siemann E (1997) The Influence of Functional Diversity and Composition on Ecosystem Processes. Science 277:1300–1302. doi: 10.1126/science.277.5330.1300
7. Lewis KA, Tzilivakis J, Warner DJ, Green A (2016) An international database for pesticide risk assessments and management. Hum Ecol Risk Assess Int J 22:1050–1064. doi: 10.1080/10807039.2015.1133242
8. Wishart DS (2006) DrugBank: a comprehensive resource for in silico drug discovery and exploration. Nucleic Acids Res 34:D668–D672. doi: 10.1093/nar/gkj067
9. National Center for Biotechnology Information PubChem Compound Database; CID=5656, https://pubchem.ncbi.nlm.nih.gov/summary/summary.cgi?cid=5656.
10. US EPA (2016) Estimation Programs Interface SuiteTM for Microsoft® Windows, v 4.11. United States Environmental Protection Agency, Washington, DC, USA.
11. National Center for Biotechnology Information PubChem Compound Database; CID=7220, https://pubchem.ncbi.nlm.nih.gov/summary/summary.cgi?cid=7220.
12. National Center for Biotechnology Information PubChem Compound Database; CID=2519, https://pubchem.ncbi.nlm.nih.gov/summary/summary.cgi?cid=2519.

165

166

167 Chapter 5
Chapter 5. Conclusions and Outlook

168 Conclusions and Outlook

169 Chapter 5
5.1 General summary
The present work contributes to extending the knowledge about micropollutant biotransformation in phytoplankton. First, an analytical methodology was developed to quantify micropollutants in sub-100 µL samples in surface water and Microcystis cell lysate. Second, transformation products from hydrolysis, oxidations and conjugations were identified for two cyanobacteria and a green alga. Finally, the positive influence of phytoplankton functional group richness on overall biotransformation, and of functional group and species richness on the variety of formed transformation products was shown.
5.2 Analytical methodology
Chapter 2 shows the development of a microvolume analytical method, coupling online solid-phase extraction (SPE) on a miniature cartridge with nano-liquid chromatography (nano-LC) and high-resolution tandem mass spectrometry (HRMS/MS). In the present work, this method was applied to bioconcentration studies and the elucidation of a transformation product using LC-HRMS/MS. The application of microvolume analytics has additional promise in environmental analytical chemistry; it could facilitate the characterization of detailed time profiles collected with automatic sampling devices, where large numbers of fractions are collected due to the small volumes necessary for this method. For example, Pomati et al. have developed an autonomous monitoring station to characterize time and depth profiles in lakes by automatic sampling [1], currently recording six time profiles per day at six depth levels, and automatically preserving samples for microscopy and chemical analysis. While the collected volumes are likely insufficient for traditional sample preparation and LC-MS quantification, sufficient quantification limits could probably be reached with the presented method. Small-volume analytical methodology also enables a more straightforward automation of sample treatment, e.g., with liquid handling systems on multiwell plates, common in biological and environmental toxicological tests [2].
While the system has a range of promising applications, potential improvements would expand its overall applicability. In particular, for the present study on transformation products, the online-SPE-nano-LC system was limited in the analysis of highly polar analytes, particularly hydroxylated metabolites commonly observed in biotransformation. This limitation was mainly a consequence of the SPE sorbent employed. The retention of highly polar analytes in standard SPE (and also in reverse phase chromatography) is a longstanding problem [3]. In addition, the miniaturization requires sorbents to be available in sub-10 µm particle size, excluding a sorbent successfully used for the retention of polar compounds in other approaches (Isolute ENV+, Biotage, Sweden; [4]). Recently, small-particle polystyrene-divinylbenzene beads with hydrophilic modifications have become available [5], and the use of such material would likely expand the range of analytically accessible compounds for the method.
Transformation product detection and elucidation was performed by LC-HRMS/MS, time series analysis, and MS2 spectra interpretation. Commercial software exists for this purpose [6], which varies in performance and flexibility. Flexible, powerful open-source tools can be used for individual steps LC-HRMS data processing and TP elucidation [6, 7], yet there is no combined workflow generally applicable for TP search, or a useful interface for result visualization and exploration. In the course of the present work, an integrated workflow for TP screening and visual exploration of the results was developed (https://github.com/meowcat/RMassScreening). The workflow (Figure 5-1) applies open-source tools for LC-HRMS preprocessing, i.e., peak picking (enviPick, https://github.com/blosloos/

170 Conclusions and Outlook
enviPick), cross-sample peak alignment and grouping (enviMass, https://github.com/ blosloos/enviMass; XCMS [8]) and componentization (RAMclustR [9]).The workflow then provides functions for combinatorial prediction of TP candidates from parent molecules and reactions, and screens for the occurrence of TP candidates in all samples. The results are combined by sample types in time series, and can be explored visually, with interactive filter criteria based on ratios between sample groups and time points. Multiple open-source workflows exist which cover analysis of LC-HRMS data after preprocessing, e.g., for metabolomics [10–12] or trend detection in environmental time series (https://github.com/blosloos/enviMass) but to our knowledge no other open-source workflow currently implements flexible interactive filtering and visualization. A GUI-based toolbox for MS2 spectrum interpretation was also developed, integrating multiple open-source tools (https://github.com/meowcat/MassInSpectoR). Future optimizations may include automated treatment of MS2 spectra acquired by data-independent acquisition, and more seamless integration of LC-HRMS data evaluation and MS2 elucidation. While fully automated structure elucidation from LC-HRMS/MS data remains the ultimate target, and is the subject of active research, confident compound identification to date still relies on expert knowledge [13].
Figure 5-1 The workflow RMassScreening: Schematic processing (top), annotated exemplary screenshots of interactive filter generation (bottom left) and data exploration (bottom right).
171 Chapter 5
5.3 Biotransformation in phytoplankton
The third chapter was devoted to the elucidation of biotransformation pathways in three phytoplankton species. Transformations of 24 polar organic compounds were studied, and the influence of chemical stressors in low concentrations was investigated. In addition to conventional biotransformation pathways, e.g., cytochrome P450-mediated reactions, products that were formed from enzymatic activity on non-natural substrates (sulfamethoxazole pterin conjugation, mefenamic acid glutamate conjugation) were also observed. The formation of pterin conjugates has been observed previously for sulfonamides in bacteria [14], and reactions on non-natural substrates have been found, e.g., for benzotriazoles in Arabidopsis thaliana [15]. Such products are often not yet predicted by rule-based tools that rely on known biotransformation reactions [16]. One recently published approach uses enzyme reaction rules based on the Enzyme Classification system to predict possible transformation products [17]; however, neither of the studied TPs in question are predicted by the tool as of now. Potentially pathways of this type are responsible for more TPs in the environment. Currently, TP prediction systems usually start with a query compound of interest and predict what reactions are relevant for said compound. To quickly evaluate the potential relevance and scope of newly observed reactions, it would be beneficial to evaluate a reaction against a list of potentially environmentally relevant compounds (e.g., databases by Howard and Muir [18, 19] or suspect lists collected from water research institutes in the NORMAN Network, http://www.normandata.eu/?q=node/236).
In addition, TPs formed via reactions of non-natural enzyme substrates have potential relevance for interfering in the respective pathways. E.g., the amino acid conjugation of benzoates is relevant for phytohormone homeostasis in plants [20], and the effect of corresponding TPs of micropollutants might be worthy of consideration. However, further degradation of these products is also possible in natural systems.
The findings in Chapter 4 additionally suggest an expansion of the research on transformation pathways. In addition to green algae and cyanobacteria, chrysophytes and, to a lesser degree, cryptomonads were shown to be active in the biotransformation of micropollutants. This result suggests that these species are also relevant for the biotransformation of micropollutants and further investigation of biotransformation pathways would be needed. The elucidation of biotransformation pathways (past a simplistic screening of transformation products) was outside of the scope of the study, but may inform future research. In addition to confirming previously observed TPs (e.g., kresoxim-methyl acid, glutamate-mefenamic acid, desmethyl-metoprolol and metoprolol/atenolol acid), a variety of potential new TPs were observed (particularly for metoprolol and fludioxonil). The exact structures of these TPs and the pathways that lead to their formation deserve further investigation. For all of the observed TPs, their occurrence and relevance in the environment are also still unknown; their inclusion in future monitoring studies and suspect screening lists might shed light on this aspect. Particularly the occurrence of phytoplankton-specific TPs in the environment is still uninvestigated and would be needed to understand the importance of phytoplankton in micropollutant environmental fate. While biotransformation in phytoplankton organisms can be postulated as a detoxification mechanism, induction of biotransformation under low-level chemical stress was not observed. This study is, however, not sufficient to conclude that such a mechanism does not generally exist. For example, biotransformation as a stress response could be important specifically for chemical stressors themselves, or only at higher stressor concentrations. Further research is needed in this topic to arrive at firm conclusions, e.g., biotransformation potential should be assessed in scenarios of demonstrated non-lethal environmental stress by micropollutants. Herbicides were excluded from the compound sets studied in both Chapter 3 and 4, since these compounds are often toxic to phytoplankton at

172 Conclusions and Outlook
concentrations typical for biotransformation experiments, which precludes further conclusions about their transformation behavior under stress.
The scope of the compound selection was different between Chapters 3 and 4: in the former, two larger groups of chemically similar compounds were investigated, as well as a broader set to expand the chemical space covered, whereas in the latter, the selection was intended to be both broad and environmentally relevant. Nevertheless, some structure-transformation relationships were anecdotally observed in Chapter 4, e.g., the biotransformation of the polar, structurally similar pharmaceuticals atenolol and venlafaxine was driven by the presence of chrysophytes. Typical reactions and TPs for specific chemical (sub)structures have been studied, e.g., for amines and amides in activated sludge [21, 22], sulfonamides in the environment [23], or azole fungicides in Gammarus pulex [24]. In wastewater treatment, parameters associated with sludge composition has been associated with the degradation of different micropollutant classes [25]. Similarly, if different phytoplankton FGs are associated with transformation of different micropollutant classes, different environmental fate processes may be expected in different ecological conditions; e.g., increased transformation of metoprolol or venlafaxine in oligotrophic lakes compared to eutrophic conditions due to higher chrysophyte abundance. To understand these influencing factors further, it would be of interest to determine if differences in compound specificity of the different FG is a result of physiological features, such as mixotrophy prevalent in chrysophytes.
The contribution of phytoplankton to environmental fate of micropollutants in natural systems can be difficult to disentangle. Field studies to quantify biotransformation by phytoplankton would be crucial, but challenging. For one, additional fate processes, such as degradation by microorganisms, uptake in zooplankton and fish, or direct or indirect photolysis, make it more difficult to understand the role of phytoplankton. In particular, phytoplankton biodegradation and photochemical processes are both supposedly most relevant in the epilimnion, where sunlight additionally influences phytoplankton growth and metabolic activity. While a differentiation between, e.g., phytoplankton contributions and photolysis, could be conceivable via very detailed sampling and modeling, the verification of TPs characteristic for phytoplankton might be a more straightforward way to distinguish phytoplankton contributions from other environmental processes.
In Chapter 4, the effects of species and FG richness on the biotransformation potential of phytoplankton communities has been shown in a laboratory setting. As noted therein, studies investigating this effect in natural environments pose multiple challenges. Phytoplankton community composition is influenced by factors which also influence total phytoplankton biomass (e.g., nutrient availability, sunlight, grazing by zooplankton, etc.), and contribute to other processes (as noted above, photochemistry). In turn organic carbon from phytoplankton primary production promotes the growth of heterotrophic bacteria [26, 27]. Two consequences of this are that 1) the total contribution of phytoplankton to biotransformation is shaped by the same processes that also influence the relative biotransformation potential of a community, possibly in different directions, and 2) phytoplankton community productivity affects micropollutant biotransformation indirectly by shaping the heterotrophic microorganism community, which might be a more important process in the overall biotransformation. These considerations should be part of a more comprehensive view of the role of phytoplankton in environmental fate, and stimulate research in both modelling and experimental directions.

173 Chapter 5
References
1. Pomati F, Jokela J, Simona M, Veronesi M, Ibelings BW (2011) An Automated Platform for Phytoplankton Ecology and Aquatic Ecosystem Monitoring. Environ Sci Technol 45:9658–9665. doi: 10.1021/es201934n
2. Geis SW, Fleming KL, Korthals ET, Searle G, Reynolds L, Karner DA (2000) Modifications to the algal growth inhibition test for use as a regulatory assay. Environ Toxicol Chem 19:36–41. doi: 10.1002/etc.5620190105
3. Rogeberg M, Malerod H, Roberg-Larsen H, Aass C, Wilson SR (2014) On-line solid phase extraction-liquid chromatography, with emphasis on modern bioanalysis and miniaturized systems. J Pharm Biomed Anal 87:120–129. doi: 10.1016/j.jpba.2013.05.006
4. Huntscha S, Singer HP, McArdell CS, Frank CE, Hollender J (2012) Multiresidue analysis of 88 polar organic micropollutants in ground, surface and wastewater using online mixed-bed multilayer solid-phase extraction coupled to high performance liquid chromatography-tandem mass spectrometry. J Chromatogr A 1268:74–83. doi: 10.1016/j.chroma.2012.10.032
5. Lungfiel K, Seubert A (2016) Applying Hydrophilicity to PS/DVB-Beads Via Introduction of Protected Comonomers. Chromatographia 79:5–17. doi: 10.1007/s10337-015-3001-0
6. Bletsou AA, Jeon J, Hollender J, Archontaki E, Thomaidis NS (2015) Targeted and non-targeted liquid chromatography-mass spectrometric workflows for identification of transformation products of emerging pollutants in the aquatic environment. TrAC Trends Anal Chem 66:32–44. doi: 10.1016/j.trac.2014.11.009
7. Schollée JE, Schymanski EL, Avak SE, Loos M, Hollender J (2015) Prioritizing Unknown Transformation Products from Biologically-Treated Wastewater Using High-Resolution Mass Spectrometry, Multivariate Statistics, and Metabolic Logic. Anal Chem 87:12121–12129. doi: 10.1021/acs.analchem.5b02905
8. Smith CA, Want EJ, O’Maille G, Abagyan R, Siuzdak G (2006) XCMS: processing mass spectrometry data for metabolite profiling using nonlinear peak alignment, matching, and identification. Anal Chem 78:779–87. doi: 10.1021/ac051437y
9. Broeckling CD, Afsar FA, Neumann S, Ben-Hur A, Prenni JE (2014) RAMClust: A novel feature clustering method enables spectral-matching-based annotation for metabolomics data. Anal Chem 86:6812–7. doi: 10.1021/ac501530d
10. Uppal K, Soltow QA, Strobel FH, Pittard WS, Gernert KM, Yu T, Jones DP (2013) xMSanalyzer: automated pipeline for improved feature detection and downstream analysis of large-scale, non-targeted metabolomics data. BMC Bioinformatics 14:15. doi: 10.1186/1471-2105-14-15
11. Mak TD, Laiakis EC, Goudarzi M, Fornace AJ (2014) MetaboLyzer: A Novel Statistical Workflow for Analyzing Postprocessed LC − MS Metabolomics Data. Anal Chem 86:506–513.
12. Uppal K, Walker DI, Liu K, Li S, Go Y-M, Jones DP (2016) Computational Metabolomics: A Framework for the Million Metabolome. Chem Res Toxicol 29:1956–1975. doi: 10.1021/acs.chemrestox.6b00179
13. Rathahao-Paris E, Alves S, Junot C, Tabet J-C (2016) High resolution mass spectrometry for structural identification of metabolites in metabolomics. Metabolomics 12:10. doi: 10.1007/s11306-015-0882-8
14. Richter MK, Focks A, Siegfried B, Rentsch D, Krauss M, Schwarzenbach RP, Hollender J (2013) Identification and dynamic modeling of biomarkers for bacterial uptake and effect of sulfonamide antimicrobials. Environ Pollut 172:208–15. doi: 10.1016/j.envpol.2012.09.011

174 Conclusions and Outlook
15. LeFevre GH, Müller CE, Li RJ, Luthy RG, Sattely ES (2015) Rapid Phytotransformation of Benzotriazole Generates Synthetic Tryptophan and Auxin Analogs in Arabidopsis. Environ Sci Technol 150904114153000–150904114153000. doi: 10.1021/acs.est.5b02749
16. Wicker J, Lorsbach T, Gütlein M, Schmid E, Latino D, Kramer S, Fenner K (2016) enviPath – The environmental contaminant biotransformation pathway resource. Nucleic Acids Res 44:D502–D508. doi: 10.1093/nar/gkv1229
17. Jeffryes JG, Colastani RL, Elbadawi-Sidhu M, Kind T, Niehaus TD, Broadbelt LJ, Hanson AD, Fiehn O, Tyo KEJ, Henry CS (2015) MINEs: open access databases of computationally predicted enzyme promiscuity products for untargeted metabolomics. J Cheminformatics 7:44. doi: 10.1186/s13321-015-0087-1
18. Howard PH, Muir DCG (2010) Identifying New Persistent and Bioaccumulative Organics Among Chemicals in Commerce. Environ Sci Technol 44:2277–2285. doi: 10.1021/es903383a
19. Howard PH, Muir DCG (2011) Identifying New Persistent and Bioaccumulative Organics Among Chemicals in Commerce II: Pharmaceuticals. Environ Sci Technol 45:6938–6946. doi: 10.1021/es201196x
20. Okrent RA, Brooks MD, Wildermuth MC (2009) Arabidopsis GH3.12 (PBS3) conjugates amino acids to 4-substituted benzoates and is inhibited by salicylate. J Biol Chem 284:9742–9754. doi: 10.1074/jbc.M806662200
21. Gulde R, Meier U, Schymanski EL, Kohler H-PE, Helbling DE, Derrer S, Rentsch D, Fenner K (2016) Systematic Exploration of Biotransformation Reactions of Amine-Containing Micropollutants in Activated Sludge. Environ Sci Technol 50:2908–2920. doi: 10.1021/acs.est.5b05186
22. Helbling DE, Hollender J, Kohler H-PE, Fenner K (2010) Structure-based interpretation of biotransformation pathways of amide-containing compounds in sludge-seeded bioreactors. Environ Sci Technol 44:6628–35. doi: 10.1021/es101035b
23. Majewsky M, Glauner T, Horn H (2015) Systematic suspect screening and identification of sulfonamide antibiotic transformation products in the aquatic environment. Anal Bioanal Chem. doi: 10.1007/s00216-015-8748-5
24. Rösch A, Anliker S, Hollender J (2016) How Biotransformation Influences Toxicokinetics of Azole Fungicides in the Aquatic Invertebrate Gammarus pulex. Environ Sci Technol 50:7175–7188. doi: 10.1021/acs.est.6b01301
25. Men Y, Achermann S, Helbling DE, Johnson DR, Fenner K (2017) Relative contribution of ammonia oxidizing bacteria and other members of nitrifying activated sludge communities to micropollutant biotransformation. Water Res 109:217–226. doi: 10.1016/j.watres.2016.11.048
26. Sigee DC (2004) Algae: The Major Microbial Biomass in Freshwater Systems. In: Freshw. Microbiol. John Wiley & Sons, Ltd, pp 105–180
27. Azam F, Fenchel T, Field JG, Gray JS, Meyer-Reil LA, Thingstad F (1983) The ecological role of water-column microbes in the sea. Mar Ecol Prog Ser Oldendorf 10:257–263.

175

176
177 Acknowledgements
Acknowledgements
First, I would like to thank Prof. Juliane Hollender for giving me the opportunity to conduct this project. She provided not only an interesting scientific topic, but also gave me the freedom to spend time on methodological aspects I was interested in (analytical method development and computational data processing), perhaps more so than strictly necessary for the progress of the project. She supported and encouraged my independent work style while always providing help and support when I needed it. Thanks also go to Dr. Francesco Pomati, my co-supervisor. I much appreciated his input, which came not only from a different discipline but also from a different viewpoint, and helped to broaden my perspective. Further thanks to my committee members, Dr. Emmanuelle Vulliet and Prof. Bernhard Wehrli. I want to thank Jonas Mechelke, who had the dubious pleasure of working with me for his master thesis on the optimization and validation of the nano-LC method. In this context, I also thank Prof. P. Lee Ferguson, who introduced me to nano-LC-MS. A big thanks goes to Dr. Emma Schymanski, who introduced me to non-target screening and computational mass spectrometry upon my arrival at Eawag. Our project RMassBank, originally a small helper tool for spectra processing, has become an important backbone in my work (particularly for data processing). Both Emma and the RMassBank project were instrumental for me to establish a network in the Computational Mass Spectrometry community. Many thanks go to all the members of the Environmental Chemistry department. This includes particularly Heinz Singer for all analytical input, Prof. Kathrin Fenner for helpful discussions on transformation products, Philipp Longrée and Birgit Beck for their technical support and assistance in the lab, and Dr. Martin Loos for enviEverything which I relied on a lot. I also thank the Phytoplankton Community Ecology group for support, and for the often inspiring discussions at the group meetings. Particular thanks to Hannele Penson and Marta Reyes for their support with algal cultures, and Dr. Mridul Thomas for his input on my biodiversity work. Thanks go to all former and present members of E23, the one and only, who contributed a lot to my PhD experience (and also could witness me insulting my computer more often than not) – with a particular mention of Matze, the veteran, and Stefan, who has been here almost as long as me. Big thanks to Jen, Birgit, Andrea, and Bekka, who enjoyed (or endured) my frequent office visits in better and worse times. I want to extend these thanks to the old guard (Aurea, Baschi, Bernadette, Martin, Nicole, Kov, Fred, Simon, Tobi, Sarah, Stephie, Reto), recurring visitors (Halua, Ewa) and also the new generation (Werni, Christine, Urs, Adi, Cresten, Karin) for the great time at and away from Eawag. Special thanks to Jen for her support, encouragement and of course the sunsets! Thanks go to my friends for their company. Widi, Dalmo, Basil and Daniela with Vanessa, Matthias, Fäbi, Müri, Marin, everyone from DO Karate, thank you. R.L., you are missed. Thanks also to Gotte Nuska and padrino Andrea. Finally, I want to thank my parents, Luisa and Andrej, and my brother Alexander who are always there for me and have supported me throughout my life.

178