Factbook Education Systems: Tanzania - Research Collection
50
ETH Library Factbook Education Systems: Tanzania Report Author(s): Renold, Ursula Publication date: 2020-12 Permanent link: https://doi.org/10.3929/ethz-b-000459427 Rights / license: In Copyright - Non-Commercial Use Permitted Originally published in: CES Factbook Education Systems 2 This page was generated automatically upon download from the ETH Zurich Research Collection . For more information, please consult the Terms of use .
-
Upload
khangminh22 -
Category
Documents
-
view
0 -
download
0
Transcript of Factbook Education Systems: Tanzania - Research Collection
ETH Library
Factbook Education Systems:Tanzania
Report
Author(s):Renold, Ursula
Publication date:2020-12
Permanent link:https://doi.org/10.3929/ethz-b-000459427
Rights / license:In Copyright - Non-Commercial Use Permitted
Originally published in:CES Factbook Education Systems 2
This page was generated automatically upon download from the ETH Zurich Research Collection.For more information, please consult the Terms of use.
Chair of Education Systems
Factbook Education System: Tanzania Ursula Renold CES Factbook Education Systems, No. 2, 2020

Editing and Acknowledgement This Factbook was edited by Ursula Renold. We want to thank Nick Bischofberger for the elaboration of the contents.
Contents Foreword 7
1. Tanzania’s Economy and Political System 9 1.1 Tanzania’s Economy 9 1.2 The Labour Market 13 1.2.1 Overview of the Tanzanian Labour Market 13 1.2.2 The Youth Labour Market 16 1.2.3 The Youth Labour Market Index for Low-Income Countries (YLILI) for Tanzania 17 1.3 Tanzania’s Political System 17 1.3.1 Overview of the Tanzanian Political System 17 1.3.2 Politics and Goals of the Education System 18
2. Formal System of Education 20 2.1 Pre-Primary Education 22 2.2 Primary and Lower Secondary Education 22 2.3 Upper Secondary Education 24 2.4 Postsecondary and Higher Education 24 2.5 Continuing Education (Adult Education) 26 2.6 Teacher Education 26
3. The System of Vocational and Professional Education and Training 29 3.1 Technical and Vocational Education and Training (TVET) 29 3.2 Professional Education and Training (PET; Post-Secondary Level) 33 3.3 Regulatory and Institutional Framework of the TVET System 33 3.3.1 Central Elements of TVET Legislation 33 3.3.2 Key Actors 33 3.4 Educational Finance of the VPET System 34 3.5 Curriculum Development 36 3.5.1 Curriculum Design Phase 36 3.5.2 Curriculum Application Phase 37 3.5.3 Curriculum Feedback Phase 37 3.6 Supplying Personnel for the VPET System (Teacher Education) 37
4. Major Reforms in the Past and Challenges for the Future 39 4.1 Major Reforms 39 4.2 Major Challenges 40
5. References 42
Factbook Education Systems: Tanzania 4
List of Abbreviations
ACSEE Advanced Certificate of Secondary Education Examination
CBET Competence Based Education and Training
CCM Chama Cha Mapinduzi
CES Chair of Education Systems
CIA Central Intelligence Agency
CSEE Certificate of Secondary Education Examination
CVC Curriculum Value Chain
DATS Dual Apprenticeship
DVoET Diploma in Vocational Education and Training
ESPD Education Sector Development Program
GCI Global Competitiveness Index
GER Gross Enrolment Ratio
GII Global Innovation Index
GDP Gross Domestic Product
HDI Human Development Index
IAE Institute of Adult Education
ILO International Labour Organization
ISCED International Standard Classification of Education
KOF Swiss Economic Institute
LFPR Labour Force Participation Rate
MoEST Ministry of Education, Science and Technology
MVTTC Morogoro Vocational Instructors Training College
NACTE National Council for Technical Education
NECTA National Examinations Council of Tanzania
NEET Not in Education, Employment, or Training
NER Net Enrolment Ratio
NGO Non-governmental organization
Factbook Education Systems: Tanzania 5
NQF National Qualifications Framework
NTA National Technical Awards
NVTA National Vocational and Training Awards
OECD Organisation for Economic Co-operation and Development
PEDP Primary Education Development Program
PET Professional Education and Training
PMO-RALG Prime Minister's Office Regional Administration and Local Government
PSLE Primary Leaving School Examination
RPL Recognition for Prior Learning
SDL Skills and Development Levy
TANU Tanganyika African National Union
TCU Tanzania Commission for Universities
TET Technical Education and Training
TIE Tanzania Institute of Education
TTU Tanzania Teachers' Union
TVET Technical and Vocational Education and Training
UIS UNESCO Institute for Statistics
UNESCO United Nations Educational, Scientific and Cultural Organization
UPE Universal Primary Education
VET Vocational Education and Training
VETA Vocational Education and Training Authority
VPET Vocational Professional Education and Training
VTCC Vocational Teachers Certificate Course
WEF World Economic Forum
YLILI Youth Labour Market Index for Low Income Countries
YLMI Youth Labour Market Index
Factbook Education Systems: Tanzania 6
List of Figures
Figure 1: Employment by sector (as % of total employment), 2014 and 2019 ....................... 12
Figure 2: ISCED 2011 mapping Tanzania's education system, 2014 .................................... 20
Figure 3: Tanzanian enrolment ratio for primary education, 1970–2018 ................................ 23
Figure 4: Enrolled students by ISCED programme and gender ............................................. 26
Figure 5: Teachers and enrolment by institution type and education level, 2018 .................. 27
Figure 6: Student-teacher ratio by education level, 1970-2018 .............................................. 28
Figure 7: Distribution of enrolment by programme orientation, 2018 ..................................... 30
Figure 8: Expenditure by education level and country as a percentage of government
expenditure on education, 2014 ............................................................................................. 35
Figure 9: Curriculum Value Chain .......................................................................................... 36
List of Tables
Table 1: Value added and employment by sector, 2019 ........................................................ 11
Table 2: Labour force participation rate and unemployment rate by age in 2018 .................. 14
Table 3: Labour force participation rate and unemployment rate by educational attainment in
2017 (persons aged 25–64) ................................................................................................... 15
Table 4: Net enrolment rate (NER) and gross enrolment ratio (GER), 2018 .......................... 21
Table 5: National Qualifications Framework (NQF), 2014 ...................................................... 32
Table 6: Distribution of TET teachers by qualification (in percentages), 2008/2009 .............. 38
Factbook Education Systems: Tanzania 7
Foreword
The increasing competitiveness of the world economy as well as the high youth unemployment rates after the worldwide economic crises have put pressure on countries to upgrade the skills of their work-forces. Consequently, vocational education and training (VET) has received growing attention in recent years, especially amongst policy-makers. For example, the European Commission defined common objectives and an action plan for the development of VET systems in European countries in the Bruges Communiqué on Enhanced European Cooperation in Vocational Education and Training for 2011-2020 (European Commission, 2010). In addition, a growing number of US states and other industrialized, transition, and developing countries (for example Hong Kong, Singapore, Chile, Costa Rica, Benin and Nepal) are interested in either implementing VET systems or making their VET system more labour-market oriented.
The appealing outcome of the VET system is that it improves the transition of young people into the labour market by simultaneously providing work experience, remuneration and formal education de-grees at the secondary education level. If the VET system is optimally designed, VET providers are in constant dialogue with the demand-side of the labour market, i.e. the companies. This close relationship guarantees that the learned skills are in demand on the labour market. Besides practical skills, VET systems also foster soft-skills such as emotional intelligence, reliability, accuracy, precision, and respon-sibility, which are important attributes for success in the labour market. Depending on the design and permeability of the education system, VET may also provide access to tertiary level education (accord-ing to the ISCED classification): either general education at the tertiary A level or professional education and training (PET) at the tertiary B level. PET provides occupation-specific qualifications that prepare students for highly technical and managerial positions. VET and PET systems are often referred to together as “vocational and professional education training (VPET)” systems.
Few countries have elaborate and efficient VPET systems. Among these is the Swiss VPET system, which is an example of an education system that successfully matches market supply and demand. The Swiss VPET system efficiently introduces adolescents to the labour market, as shown by Switzerland’s 2007-2017 average youth unemployment rate of 8.1 percent compared to 14.8 percent for the OECD average (OECD, 2017).
Though not many countries have VPET systems that are comparable to Switzerland’s in terms of quality, efficiency and permeability, many have education pathways that involve some kind of practical or school-based vocational education. The purpose of the CES Education System Factbook Series1 is to provide information about the education systems of countries across the world, with a special focus on vocational and professional education and training.
In the CES Factbook Education Systems: Tanzania, we describe Tanzania’s vocational system and discuss the characteristics that are crucial to the functioning of the system. Essential components com-prise the regulatory framework and the governance of the VPET system, the involved actors, and their competencies and duties. The Factbook also provides information regarding the financing of the system and describes the process of curriculum development and the involved actors.
The Factbook is structured as follows: First, we provide an overview of Tanzania’s economy, labour market, and political system. The second part is dedicated to the description of the formal education
1 From 2013 to 2019, the Factbooks were produced within the framework of the Education Systems research division at the KOF Swiss Economic Institute. From 2020 they will be produced by the Chair of Education Systems (CES) group.
Factbook Education Systems: Tanzania 8
system. The third section explains Tanzania’s vocational education system. The last section offers a perspective on Tanzania’s recent education reforms and challenges to be faced in the future.
The Factbook Education Systems series have to be regarded as work in progress. The authors do not claim completeness of the information which has been collected carefully and in all conscience. Any suggestions for improvement are highly welcome!
Contact: [email protected]
Suggested citation:
CES Chair of Education Systems (2020). CES Factbook Education Systems: Tanzania. CES Factbook Education Systems, ed. 1. ETH Zurich.
Factbook Education Systems: Tanzania 9
1. Tanzania’s Economy and Political System
One of the main purposes of an education system is to provide the future workforce with the skills needed in the labour market. The particularities of a country’s economy and labour market are important factors determining the current and future demand for skills. Therefore, these are briefly described in the first part of this Factbook. In addition, this part provides an overview of Tanzania’s political system with emphasis on the description of the education policies.
It is important to state that the United Republic of Tanzania consists of two entities: Tanzania Mainland, consisting of the mainland region, and Zanzibar, consisting of the semiautonomous archipelago (Zanzi-bar Island and Pemba). The union is headed by a president, who is also the head of government. Even though Zanzibar is part of the union, it has its own president, court system and legislation. This distinc-tion is important to understand the following chapters.
1.1 Tanzania’s Economy Like many other African countries, Tanzania’s economy has been influenced by German and British colonialism. Germany’s reign began in the late 19th century when the Germans conquered the regions of Tanganyika (known today as Tanzania Mainland) and Zanzibar to form German East Africa. During the First World War, Germany had no capacity to govern its colony, and thus in 1919 the Supreme Council of the Paris Peace Conference awarded German East Africa to Britain. In 1954, after the Second World War ended, the newly founded, politically oriented Tanganyika African National Union (TANU) became the leading political organisation. The TANU was particularly committed to national sovereignty for Tanganyika. Its leader, Julius Nyerere, became Minister of Tanganyika in 1960 and led the country to independence in 1961. Only in 1962 did Tanganyika become a democratic republic. Zanzibar followed one year later after the Zanzibar Revolution, which crushed the Arab Dynasty. Finally, Zanzibar merged with Tanganyika on 26 April 1964 (Union Day). The country was then renamed the United Republic of Tanzania under its first president, Nyerere (Encyclopædia Britannica Online, 2019).
In 1977, a merger of the TANU (the ruling party in Tanzania Mainland) and the Afro-Shirazi Party (the ruling party in Zanzibar) resulted in the current conservative ruling party Chama Cha Mapinduzi (CCM). In the last presidential election in October 2015, the running candidate of the CCM, John Magufuli, was elected as president with a voting majority of 58.46% (election turnout of 67.34%). The general election will be held in October 2020, when the president could be re-elected.
Since its independence, Tanzania has grown substantially with an approximate average yearly popula-tion growth rate of 3%. In 2019, the population was estimated to be 54.6 million. Of these, 33.8% live in urban and 66.2% in rural areas (Encyclopædia Britannica Online, 2019). Dar es Salaam is the commer-cial capital and largest city and is inhabited by 6.7 million people (12.3% of the total population). How-ever, the political capital is Dodoma, which is located in the centre of the country. Furthermore, three official languages are spoken: Swahili (the national language), English, and Arabic (Zanzibar).
In 2018, Tanzania’s GDP per capita (PPP, constant 2011 international $) was $2,875 compared to $3,077 in neighbouring Kenya and $3,536 in sub-Saharan Africa (World Bank Group, 2018a). Between 2010 and 2018, Tanzania’s annual real GDP grew by 6.36% compared to 5.90% in Kenya and 3.64% in sub-Saharan Africa (World Bank Group, 2018b). Thus, the Tanzanian economy grew at a higher rate than the sub-Saharan average.
Factbook Education Systems: Tanzania 10
According to the Human Development Index (HDI), Tanzania is a country with low human development (HDI score of 0.528 in 2018). The HDI is a multidimensional measure used to assess key dimensions of human development based on life expectancy, expected and average years of schooling and income per capita (Gross National Income per capita, PPP$). The final index lies between 0 and 1, where 0 indicates a country with no human development and 1 indicates a country with the best possible human development. Therefore, receiving an index value close to 1 implies a high level of human development, while a value close to 0 represents a low level. Tanzania lags a bit behind Kenya (HDI score of 0.579). In comparison, the second highest score received belongs to Switzerland at 0.946 (UNDP, 2018).
In 2017, Tanzania received a Gini index score of 40.5, compared to Kenya’s 40.8 (2015). The Gini index as a World Bank (2017) estimate indicates income equality (among countries where data was available). A score of 0 indicates perfect equality where every citizen has the same income, and 100 indicates perfect inequality where a single citizen has all the income and all the other citizens have none. South Africa received the lowest score at 63.0 in 2014. According to this inequality index, Tanzania is in the mid-field.
The poverty headcount ratio at Tanzania’s poverty line is 26.4% of the population (World Bank Group, 2018c). This indicates that approximately one quarter of Tanzania’s population lives below the national poverty line of US$1 per capita per day in 2005 PPP, whereas the international poverty line is at US$1.25 per capita per day in 2005 PPP (World Bank Group, 2015). Tanzania’s poverty line is even below the international one. This suggests that poverty is a significant issue in Tanzania.
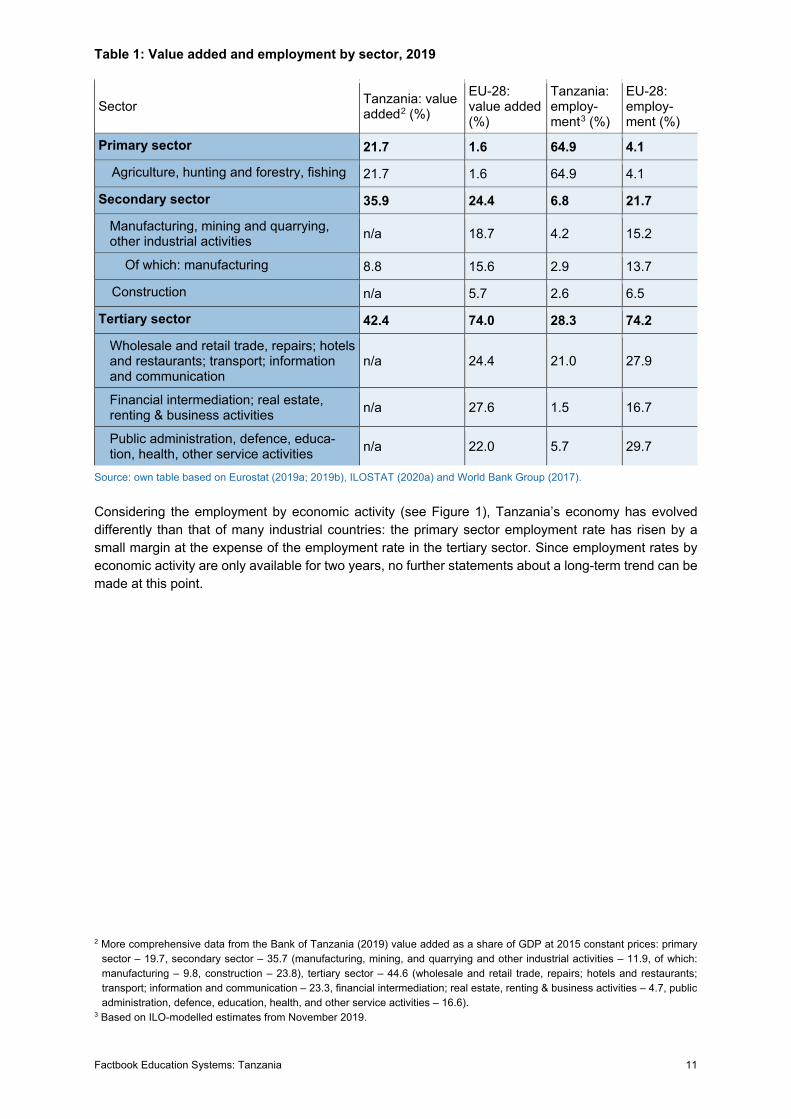
When comparing Tanzania’s added value breakdown to the EU-28 member countries as shown in Table 1, it is apparent that the tertiary sector makes up 74.0% of the value added in the EU-28 countries but only 42.4% in Tanzania. This difference comes from the fact that Tanzania’s economy relies on agricul-ture. The employment in Tanzania’s primary sector is 64.9% compared to 4.1% in EU-28, whereas the value added is only 21.7%. This shows that Tanzania’s labour force is mainly invested in the agricultural business, even though agriculture is a relatively unprofitable business. Furthermore, Tanzania’s econ-omy and farmers are exposed to the risk of seasonality and weather shocks. These phenomena influ-ence yields and thus commodity prices, which have a direct impact on farmers’ wages and the GDP.
Factbook Education Systems: Tanzania 11
Table 1: Value added and employment by sector, 2019
Sector Tanzania: value added2 (%)
EU-28: value added (%)
Tanzania: employ-ment3 (%)
EU-28: employ-ment (%)
Primary sector 21.7 1.6 64.9 4.1
Agriculture, hunting and forestry, fishing 21.7 1.6 64.9 4.1
Secondary sector 35.9 24.4 6.8 21.7
Manufacturing, mining and quarrying, other industrial activities n/a 18.7 4.2 15.2
Of which: manufacturing 8.8 15.6 2.9 13.7
Construction n/a 5.7 2.6 6.5
Tertiary sector 42.4 74.0 28.3 74.2
Wholesale and retail trade, repairs; hotels and restaurants; transport; information and communication
n/a 24.4 21.0 27.9
Financial intermediation; real estate, renting & business activities n/a 27.6 1.5 16.7
Public administration, defence, educa-tion, health, other service activities n/a 22.0 5.7 29.7
Source: own table based on Eurostat (2019a; 2019b), ILOSTAT (2020a) and World Bank Group (2017).
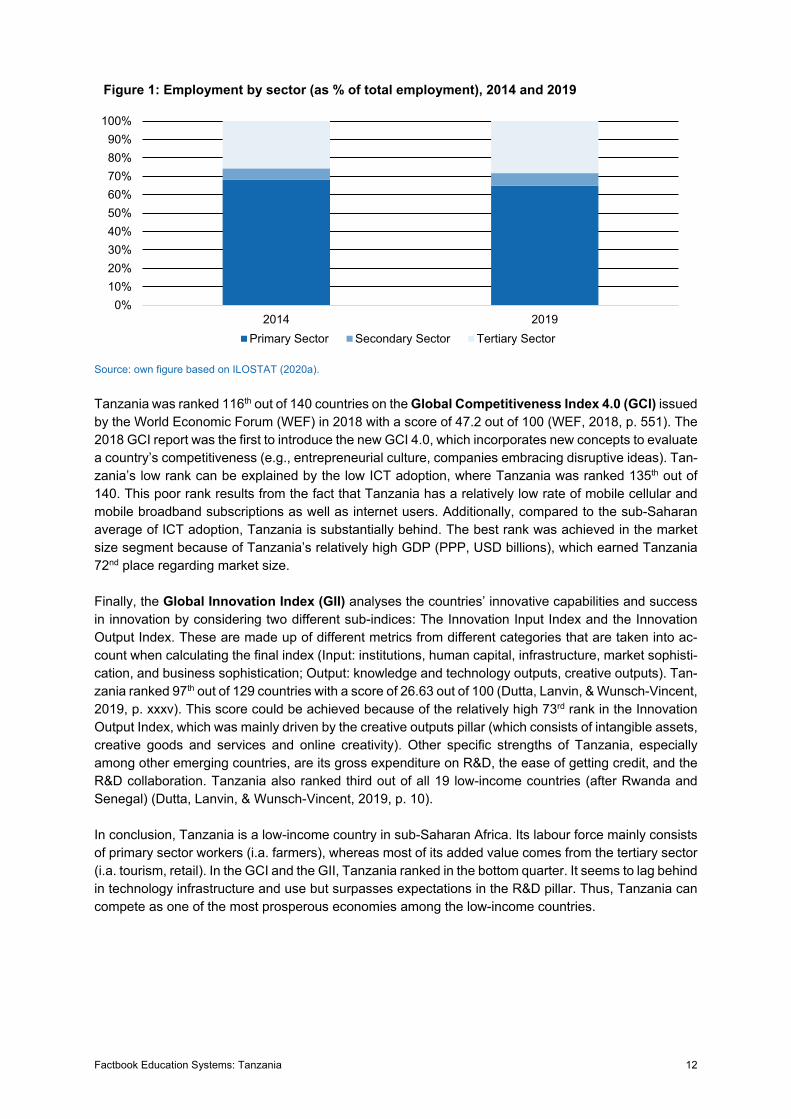
Considering the employment by economic activity (see Figure 1), Tanzania’s economy has evolved differently than that of many industrial countries: the primary sector employment rate has risen by a small margin at the expense of the employment rate in the tertiary sector. Since employment rates by economic activity are only available for two years, no further statements about a long-term trend can be made at this point.
2 More comprehensive data from the Bank of Tanzania (2019) value added as a share of GDP at 2015 constant prices: primary sector – 19.7, secondary sector – 35.7 (manufacturing, mining, and quarrying and other industrial activities – 11.9, of which: manufacturing – 9.8, construction – 23.8), tertiary sector – 44.6 (wholesale and retail trade, repairs; hotels and restaurants; transport; information and communication – 23.3, financial intermediation; real estate, renting & business activities – 4.7, public administration, defence, education, health, and other service activities – 16.6).
3 Based on ILO-modelled estimates from November 2019.
Factbook Education Systems: Tanzania 12
Source: own figure based on ILOSTAT (2020a).
Tanzania was ranked 116th out of 140 countries on the Global Competitiveness Index 4.0 (GCI) issued by the World Economic Forum (WEF) in 2018 with a score of 47.2 out of 100 (WEF, 2018, p. 551). The 2018 GCI report was the first to introduce the new GCI 4.0, which incorporates new concepts to evaluate a country’s competitiveness (e.g., entrepreneurial culture, companies embracing disruptive ideas). Tan-zania’s low rank can be explained by the low ICT adoption, where Tanzania was ranked 135th out of 140. This poor rank results from the fact that Tanzania has a relatively low rate of mobile cellular and mobile broadband subscriptions as well as internet users. Additionally, compared to the sub-Saharan average of ICT adoption, Tanzania is substantially behind. The best rank was achieved in the market size segment because of Tanzania’s relatively high GDP (PPP, USD billions), which earned Tanzania 72nd place regarding market size.
Finally, the Global Innovation Index (GII) analyses the countries’ innovative capabilities and success in innovation by considering two different sub-indices: The Innovation Input Index and the Innovation Output Index. These are made up of different metrics from different categories that are taken into ac-count when calculating the final index (Input: institutions, human capital, infrastructure, market sophisti-cation, and business sophistication; Output: knowledge and technology outputs, creative outputs). Tan-zania ranked 97th out of 129 countries with a score of 26.63 out of 100 (Dutta, Lanvin, & Wunsch-Vincent, 2019, p. xxxv). This score could be achieved because of the relatively high 73rd rank in the Innovation Output Index, which was mainly driven by the creative outputs pillar (which consists of intangible assets, creative goods and services and online creativity). Other specific strengths of Tanzania, especially among other emerging countries, are its gross expenditure on R&D, the ease of getting credit, and the R&D collaboration. Tanzania also ranked third out of all 19 low-income countries (after Rwanda and Senegal) (Dutta, Lanvin, & Wunsch-Vincent, 2019, p. 10).
In conclusion, Tanzania is a low-income country in sub-Saharan Africa. Its labour force mainly consists of primary sector workers (i.a. farmers), whereas most of its added value comes from the tertiary sector (i.a. tourism, retail). In the GCI and the GII, Tanzania ranked in the bottom quarter. It seems to lag behind in technology infrastructure and use but surpasses expectations in the R&D pillar. Thus, Tanzania can compete as one of the most prosperous economies among the low-income countries.
Figure 1: Employment by sector (as % of total employment), 2014 and 2019
0%10%20%30%40%50%60%70%80%90%
100%
2014 2019Primary Sector Secondary Sector Tertiary Sector
Factbook Education Systems: Tanzania 13
1.2 The Labour Market In the first part of this section, we describe the general situation of Tanzania’s labour market. In the second part, we focus on the youth labour market in particular.
1.2.1 Overview of the Tanzanian Labour Market Since Zanzibar is semiautonomous, the Mainland and Zanzibar have separate labour laws in place. Workers on the Mainland can form independent trade unions, bargain collectively and conduct strikes. The law for worker rights officially prohibits discrimination of workers who are part of a union. Neverthe-less, there are some restrictions to this law; for example, a worker who is fired because of his or her union activity has no right of reinstatement (Bureau of Democracy, Human Rights, and Labor, 2020). The union density rate of 24.3% in Tanzania is almost the same as the OECD average of 24.4% (ILO-STAT, 2015; OECD, 2020).
In 2015, the government established an industry-specific minimum wage for workers in public and pri-vate sectors on the Mainland and in Zanzibar. “Industry-specific” means that nine industries were as-signed their own minimum wages due to the differing profit levels in the respective sectors. Even though the minimum wages were above the national poverty line, they were below the World Bank standards for what constitutes extreme poverty. Employers are not allowed to let employees work for more than 54 hours per week (9 hours per day for 6 six days per week) without paying a compensation of one and a half times their salary. Regarding holidays, the laws states that workers with a 12-month contract are entitled to 28 days of paid annual vacation (Bureau of Democracy, Human Rights, and Labor, 2020). Furthermore, there is no unemployment protection law in place (World Bank Group, 2020a).
Tanzania ranked 141st out of 190 countries in the Ease of Doing Business rankings. Among the low-income countries, Tanzania ranked 9th out of 30. This ranking includes several factors related to busi-ness activity and the ease of conducting it (e.g., starting a business, dealing with construction permits, getting credit, trading across borders). Tanzania stands out in the categories of getting credit and en-forcing contracts, while it lags behind in trading across borders and starting a business (World Bank Group, 2020b).
In 2014, Tanzania’s informal employment made up 72% of the total non-agricultural employment com-pared to 83% in neighbouring Uganda in 2012 (World Bank Group, 2014). This leads to the conclusion that a large share of workers in sub-Saharan countries are informally employed.
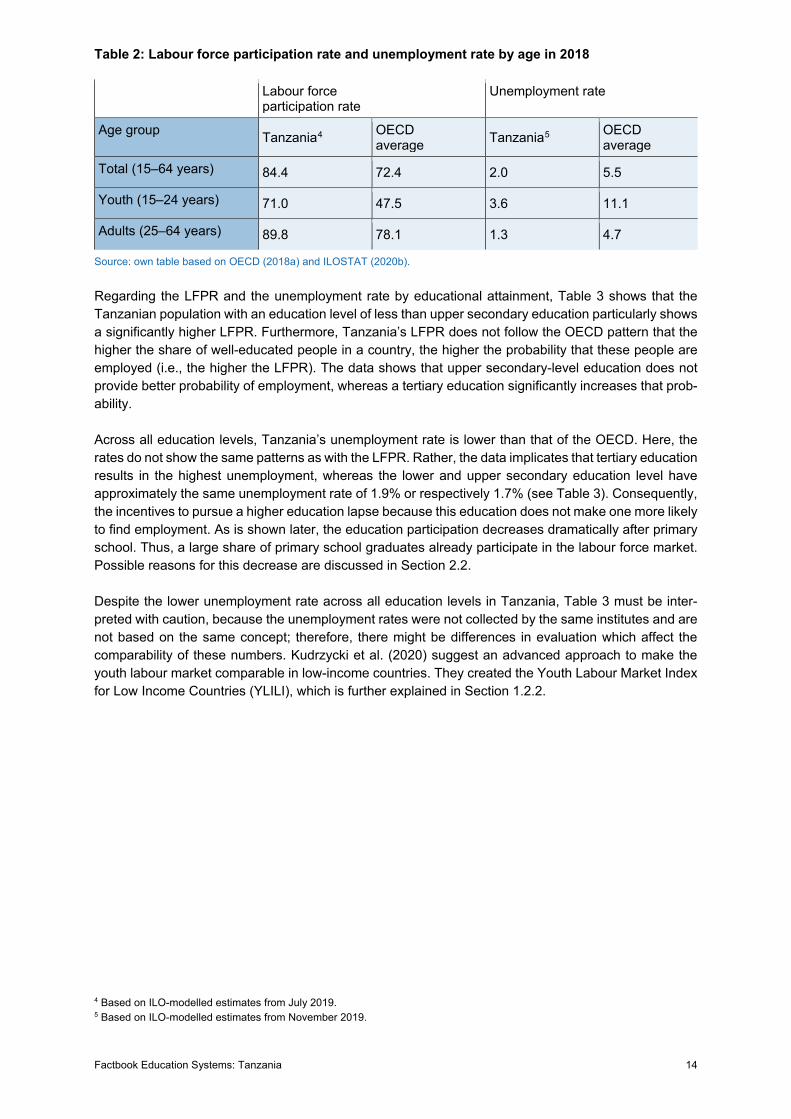
Looking at the Labour Force Participation Rate (LFPR) in Table 2, it is apparent that Tanzania tends to have an especially high youth LFPR of 71% compared to the OECD average. This results in a low youth unemployment rate of only 3.6% compared to 11.1% in OECD countries. This also indicates that the youth (ages 15 to 24) already participate heavily in the labour market. Furthermore, across all age groups the unemployment rate is lower and the LFPR is higher for Tanzania than the OECD average. However, the concept of unemployment can only be compared to a very limited extent between high- and low-income countries. This is shown in Kudrzycki et al.’s (2020) paper about the youth labour market index in low-income countries. Thus, Table 2 must be interpreted with care.
Furthermore, forced or compulsory child labour is a significant issue in Tanzania. The government drafted a child labour strategy in 2018, which is expected to be launched soon (Bureau of Democracy, Human Rights, and Labor, 2020, p. 2). Despite Mainland Tanzania's efforts to take child labour cases to court, Zanzibar has not yet taken any legal action against child labour (minimum age for contractual employment is 14 on the Mainland and 15 in Zanzibar). Nevertheless, the Mainland government still expels pregnant students from public schools and thus exposes them to the worst forms of child labour (Bureau of International Labor Affairs, 2018).
Factbook Education Systems: Tanzania 14
Table 2: Labour force participation rate and unemployment rate by age in 2018
Labour force participation rate
Unemployment rate
Age group Tanzania4 OECD average Tanzania5 OECD
average
Total (15–64 years) 84.4 72.4 2.0 5.5
Youth (15–24 years) 71.0 47.5 3.6 11.1
Adults (25–64 years) 89.8 78.1 1.3 4.7
Source: own table based on OECD (2018a) and ILOSTAT (2020b).
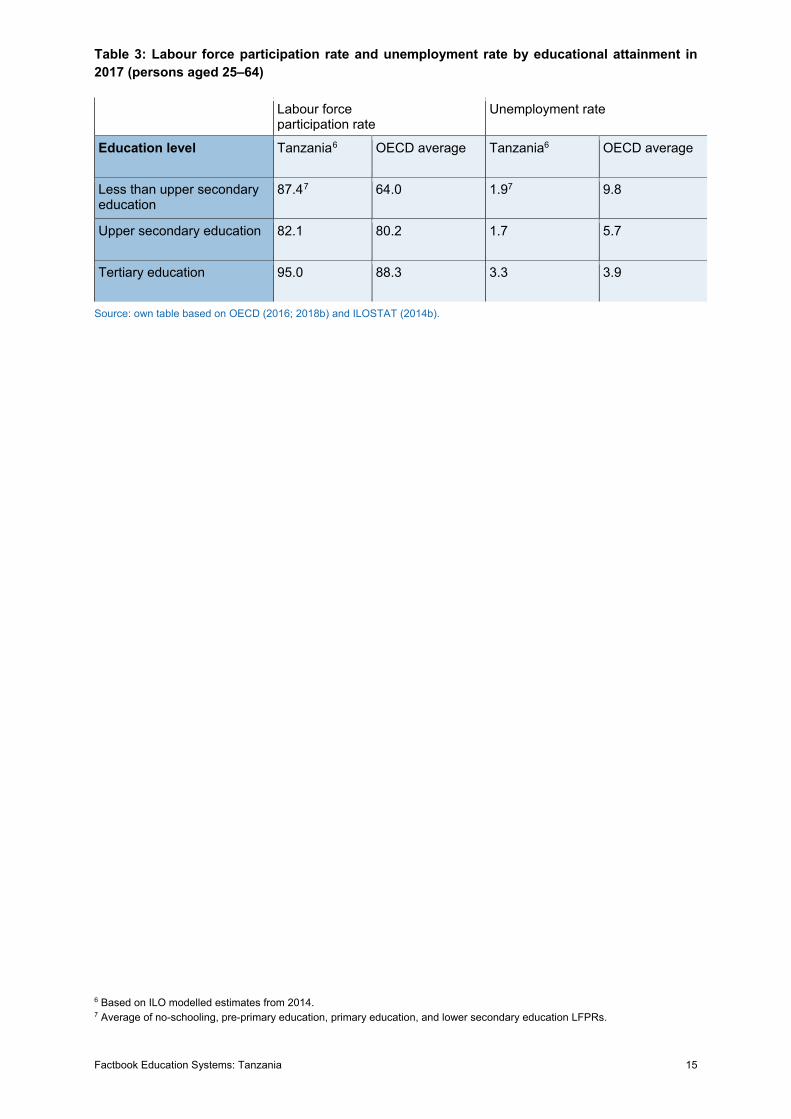
Regarding the LFPR and the unemployment rate by educational attainment, Table 3 shows that the Tanzanian population with an education level of less than upper secondary education particularly shows a significantly higher LFPR. Furthermore, Tanzania’s LFPR does not follow the OECD pattern that the higher the share of well-educated people in a country, the higher the probability that these people are employed (i.e., the higher the LFPR). The data shows that upper secondary-level education does not provide better probability of employment, whereas a tertiary education significantly increases that prob-ability.
Across all education levels, Tanzania’s unemployment rate is lower than that of the OECD. Here, the rates do not show the same patterns as with the LFPR. Rather, the data implicates that tertiary education results in the highest unemployment, whereas the lower and upper secondary education level have approximately the same unemployment rate of 1.9% or respectively 1.7% (see Table 3). Consequently, the incentives to pursue a higher education lapse because this education does not make one more likely to find employment. As is shown later, the education participation decreases dramatically after primary school. Thus, a large share of primary school graduates already participate in the labour force market. Possible reasons for this decrease are discussed in Section 2.2.
Despite the lower unemployment rate across all education levels in Tanzania, Table 3 must be inter-preted with caution, because the unemployment rates were not collected by the same institutes and are not based on the same concept; therefore, there might be differences in evaluation which affect the comparability of these numbers. Kudrzycki et al. (2020) suggest an advanced approach to make the youth labour market comparable in low-income countries. They created the Youth Labour Market Index for Low Income Countries (YLILI), which is further explained in Section 1.2.2.
4 Based on ILO-modelled estimates from July 2019. 5 Based on ILO-modelled estimates from November 2019.
Factbook Education Systems: Tanzania 15
Table 3: Labour force participation rate and unemployment rate by educational attainment in 2017 (persons aged 25–64)
Labour force participation rate
Unemployment rate
Education level Tanzania6 OECD average Tanzania6 OECD average
Less than upper secondary education
87.47 64.0 1.97 9.8
Upper secondary education 82.1 80.2 1.7 5.7
Tertiary education 95.0 88.3 3.3 3.9
Source: own table based on OECD (2016; 2018b) and ILOSTAT (2014b).
6 Based on ILO modelled estimates from 2014. 7 Average of no-schooling, pre-primary education, primary education, and lower secondary education LFPRs.
Factbook Education Systems: Tanzania 16
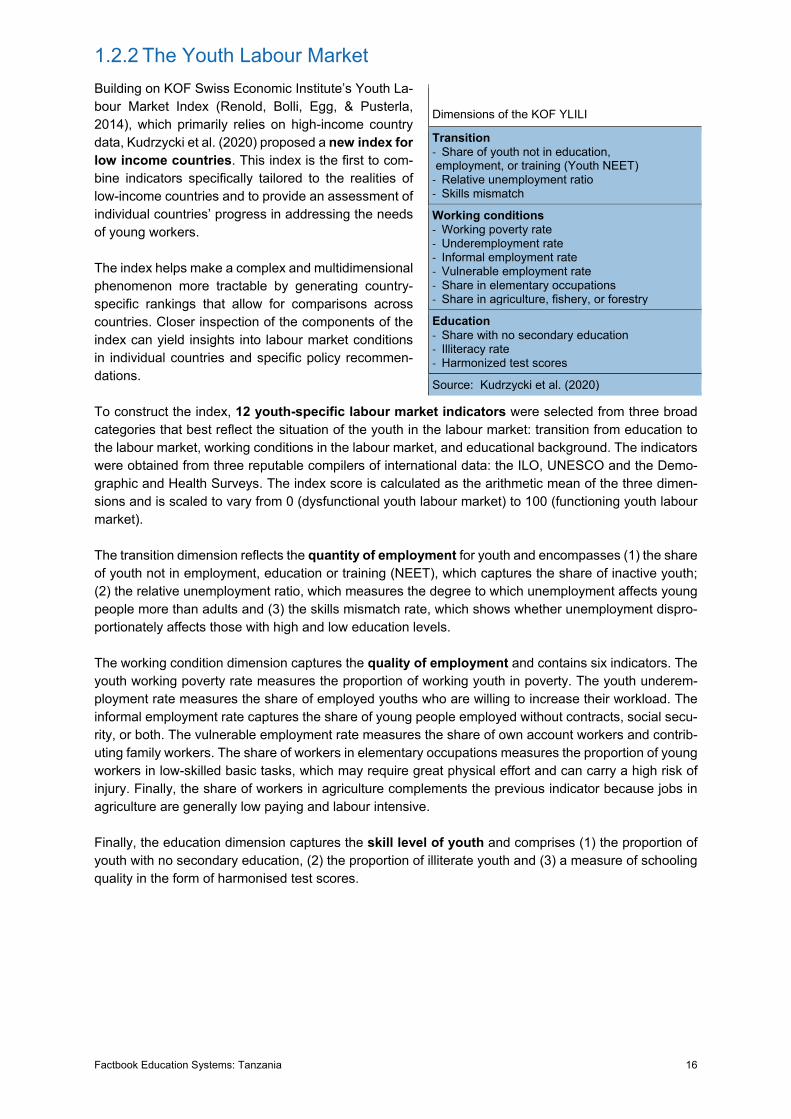
1.2.2 The Youth Labour Market Building on KOF Swiss Economic Institute’s Youth La-bour Market Index (Renold, Bolli, Egg, & Pusterla, 2014), which primarily relies on high-income country data, Kudrzycki et al. (2020) proposed a new index for low income countries. This index is the first to com-bine indicators specifically tailored to the realities of low-income countries and to provide an assessment of individual countries’ progress in addressing the needs of young workers.
The index helps make a complex and multidimensional phenomenon more tractable by generating country-specific rankings that allow for comparisons across countries. Closer inspection of the components of the index can yield insights into labour market conditions in individual countries and specific policy recommen-dations.
To construct the index, 12 youth-specific labour market indicators were selected from three broad categories that best reflect the situation of the youth in the labour market: transition from education to the labour market, working conditions in the labour market, and educational background. The indicators were obtained from three reputable compilers of international data: the ILO, UNESCO and the Demo-graphic and Health Surveys. The index score is calculated as the arithmetic mean of the three dimen-sions and is scaled to vary from 0 (dysfunctional youth labour market) to 100 (functioning youth labour market).
The transition dimension reflects the quantity of employment for youth and encompasses (1) the share of youth not in employment, education or training (NEET), which captures the share of inactive youth; (2) the relative unemployment ratio, which measures the degree to which unemployment affects young people more than adults and (3) the skills mismatch rate, which shows whether unemployment dispro-portionately affects those with high and low education levels.
The working condition dimension captures the quality of employment and contains six indicators. The youth working poverty rate measures the proportion of working youth in poverty. The youth underem-ployment rate measures the share of employed youths who are willing to increase their workload. The informal employment rate captures the share of young people employed without contracts, social secu-rity, or both. The vulnerable employment rate measures the share of own account workers and contrib-uting family workers. The share of workers in elementary occupations measures the proportion of young workers in low-skilled basic tasks, which may require great physical effort and can carry a high risk of injury. Finally, the share of workers in agriculture complements the previous indicator because jobs in agriculture are generally low paying and labour intensive.
Finally, the education dimension captures the skill level of youth and comprises (1) the proportion of youth with no secondary education, (2) the proportion of illiterate youth and (3) a measure of schooling quality in the form of harmonised test scores.
Dimensions of the KOF YLILI
Transition - Share of youth not in education, employment, or training (Youth NEET) - Relative unemployment ratio - Skills mismatch
Working conditions - Working poverty rate - Underemployment rate - Informal employment rate - Vulnerable employment rate - Share in elementary occupations - Share in agriculture, fishery, or forestry
Education - Share with no secondary education - Illiteracy rate - Harmonized test scores
Source: Kudrzycki et al. (2020)
Factbook Education Systems: Tanzania 17
1.2.3 The Youth Labour Market Index for Low-Income Countries
(YLILI) for Tanzania According to the YLILI, Tanzania obtained a score of 56.98 out of 100. This score corresponds to the 34th rank out of 48 lower-middle and low-income countries8 (Kudrzycki, Günther, & Lefoll, 2020). Com-pared to the other countries, Tanzania received an especially high rank in the transition dimension (rank 9 out of 48), which suggests that the quantity of employment is relatively high. In contrast, in the working conditions dimension, Tanzania ranked 48th out of 48, suggesting that the quality of employment is poor. Finally, the education dimension is rather unobtrusive since Tanzania ranked 39th out of 48 countries, which is mostly in line with its overall rank (Kudrzycki, Günther, & Lefoll, 2020). In addition, it must be mentioned that for Tanzania, 10 out of 12 indicators were available, and to calculate the YLILI, data from the most recent year available was taken as input for the index. These results are not perfectly con-sistent, because the year of data obtainment varies. Nonetheless, the YLILI provides a good measure of a low-income country’s youth labour market.
In conclusion, Tanzania's youth employment rate is relatively high, meaning that many young people have a job, but the quality of the jobs is rather low. This also makes sense intuitively since low unem-ployment in low-income countries indicates a low quality of work.
1.3 Tanzania’s Political System Understanding the basics of a country’s political system and getting to know the political goals with respect to its education system are crucial points for the understanding of the education system in a broader sense. In the first part, we explain Tanzania’s political system in general. The policies and goals regarding the education system are referred to in the second part.
1.3.1 Overview of the Tanzanian Political System As of 1964, the United Republic of Tanzania (the former United Republic of Tanganyika and Zanzibar) was created. Since then, the government type has been a presidential republic where Zanzibar is a semiautonomous entity (as mentioned in Chapter 1).
Regarding the executive branch, the current president John Magufuli leads the Mainland. Furthermore, Kassim Majaliwa is the current prime minister and is thus responsible for the day-to-day operations and government business in the National Assembly and is the head of the Cabinet. The Cabinet consists of members of the National Assembly appointed by the president and serves as advisory board. Tanzania is divided into 31 regions for administrative purposes. Each region has a commissioner appointed by the central government. Regions are further divided into districts, divisions and wards, which all have a popularly elected council with appointed executive officers (Encyclopædia Britannica Online, 2019). Zanzibar has a separate executive branch that consists of a majority-elected president (currently Ali Mohamed Shein, CCM) and the Zanzibar Cabinet (Supreme Revolutionary Council).
The purpose of the presidential election is to directly elect the president and vice president by a majority popular vote for a 5-year term (for a maximum of two terms and thus 10 years collectively) (Ency-clopædia Britannica Online, 2019). The last presidential election was held in October 2015, and Magufuli was elected with a 58.5% majority.
8 For the YLILI ranking, a total of 82 lower-middle- and low-income countries were analysed. Only 48 of those were ranked, be-cause the remaining 34 countries had too little data.
Factbook Education Systems: Tanzania 18
In the legislative branch, Tanzania has a unicameral National Assembly with 393 seats. The seats are distributed as follows: 264 directly elected (simple majority vote), 113 women indirectly elected by pro-portional representation vote, five seats indirectly elected by the Zanzibar House of Representatives (parliament), 10 appointed by the president, and one seat for the attorney general. Members of the National Assembly and House of Representatives serve 5-year terms. The National Assembly is re-sponsible for enacting laws for the whole country as well as laws for the Mainland. Zanzibar has its own parliament with 82 seats. The seats are distributed as follows: 50 directly elected (simple majority vote), 20 women directly elected by proportional representation vote, 10 appointed by the Zanzibar president, one seat for the House speaker, and one for the attorney general. The latest elections were held in October 2015. In Zanzibar, the 2015 election was annulled and a repoll was held in March 2016 (CIA, 2020). The women's quota in the National Assembly, which has been in place since the 1980s, is note-worthy, because Tanzania was one of the first African countries to introduce such a measure. Currently, women hold 145 out of 393 seats (38.9%) (Encyclopædia Britannica Online, 2019). The current seat distribution in the National Assembly by party is CCM 55%, CHADEMA 32%, CUF 9% and others 5%.
In the judicial branch there are three main courts: one for the Mainland (High Court for Mainland Tan-zania), one for Zanzibar (High Court of Zanzibar) and one for the union (Court of Appeal of the United Republic of Tanzania, which consists of the chief of justice and 14 other justices). Furthermore, there are several subordinate courts (e.g., Kadhi courts for Islamic family matters) (CIA, 2020).
Regarding political parties, since the creation of the CCM revolutionary party in 1977, a new constitu-tion has been adopted. The CCM dominated Tanzania’s politics until the 1992 amendment. The first multiparty election was held in 1995. Since then, CCM’s involvement in political affairs has begun to wane (Encyclopædia Britannica Online, 2019). In 2014, four opposition parties (CUF, CHADEMA, NCCR and NLD) united to form the Coalition for the People’s Constitution.
1.3.2 Politics and Goals of the Education System Regarding education, the government declared as part of the Musoma Declaration in 1974 that uni-versal primary education (UPE) is mandatory. Following the Arusha Declaration in 1967, this was a huge step which assigned education an essential role in the transformation of the country (World Bank Group, 2010). This plan suffered from the consequences of the external shocks of the 1980s (oil crises, drought, low coffee prices and war between Tanzania and Uganda). This led to a reduction in resources that resulted in a decline of quantity and quality at all education levels (World Bank Group, 2010). De-spite the stagnating social indicators, in 1995 the Tanzanian government decided to prepare an educa-tion and training policy that was embedded in the Education Sector Development Program (ESDP). The ESDP ran from 1998 to 2007 and included a statement which says that Tanzania commits to the aims of the World Declaration on Education for All: Meeting Basic Learning Needs (launched by UNESCO). As part of the ESDP, the government established the Primary Education Development Program (PEDP) in 2002, which ran until 2006. The goals of the PEDP were to (1) expand school access, (2) improve education and (3) increase school retention at the primary level. These objectives should be achieved by (1) Improvement of resource allocation and utilisation, (2) improvement of edu-cational inputs and (3) strengthened institutional arrangements for effective primary education delivery (Government of the United Republic of Tanzania, 2001).
In a second step, as part of the National Strategy for Growth and Reduction of Poverty in 2005, the government focused on social well-being and quality of life improvements. This has been done by intro-ducing special resources for disadvantaged learners and helping families that were traditionally ex-cluded from education opportunities regardless of their social, intellectual or other conditions (Govern-ment of the United Republic of Tanzania, 2005).
Due to UPE, the net enrolment rate (NER) in primary schools rose to 81.3% in 2018 (see Table 4). Nevertheless, secondary education has suffered from popular pressure due to the lack of government finance. This has resulted in an increase in the number of private secondary schools, which are mostly
Factbook Education Systems: Tanzania 19
sponsored by religious institutions and wealthy parents. Because a majority of the population cannot afford private school, the NER in secondary schools is substantially lower (26.5% in 2018; see Table 4) than in primary schools (Encyclopædia Britannica Online, 2019). Furthermore, the language change from Kiswahili to English is a barrier for most students to switch to secondary school because secondary schools are all taught in English, whereas public primary schools are taught in Kiswahili and private ones in English.
In Tanzania, education and training are undertaken by several actors such as governmental ministries, NGOs, communities, religious institutions, and individuals. However, at a national level, the responsibil-ity for the education system (including the technical and vocational education and training) lies with the Ministry of Education, Science and Technology (MoEST, formerly the Ministry of Education and Voca-tional Training). The Ministry’s rights and duties include legal mandates for policy formulation, coordina-tion, monitoring, standard setting, quality assurance and quality control of the entire education system. The local government authorities (districts, towns, municipals, and city councils) have the duty to man-age and deliver both formal and non-formal education within their area and competence (UNESCO-IBE, 2010).
The MoEST is the legal authority responsible for policies, standard setting, quality assurance and control of the whole education system. However, in 1997 as part of the Local Government Reform Programme, all power to make decisions was transferred to the local government authorities (UNESCO-IBE, 2010), which now hold full responsibility for the management and delivery of formal and informal education. Pre-primary, primary and secondary (ordinary and advanced) education are under the supervision of the Prime Minister’s Office Regional Administration and Local Government (PMO-RALG). Since its es-tablishment in 1971, the National Examinations Council of Tanzania (NECTA) has issued the graduation certificates on the levels mentioned.
Factbook Education Systems: Tanzania 20
2. Formal System of Education
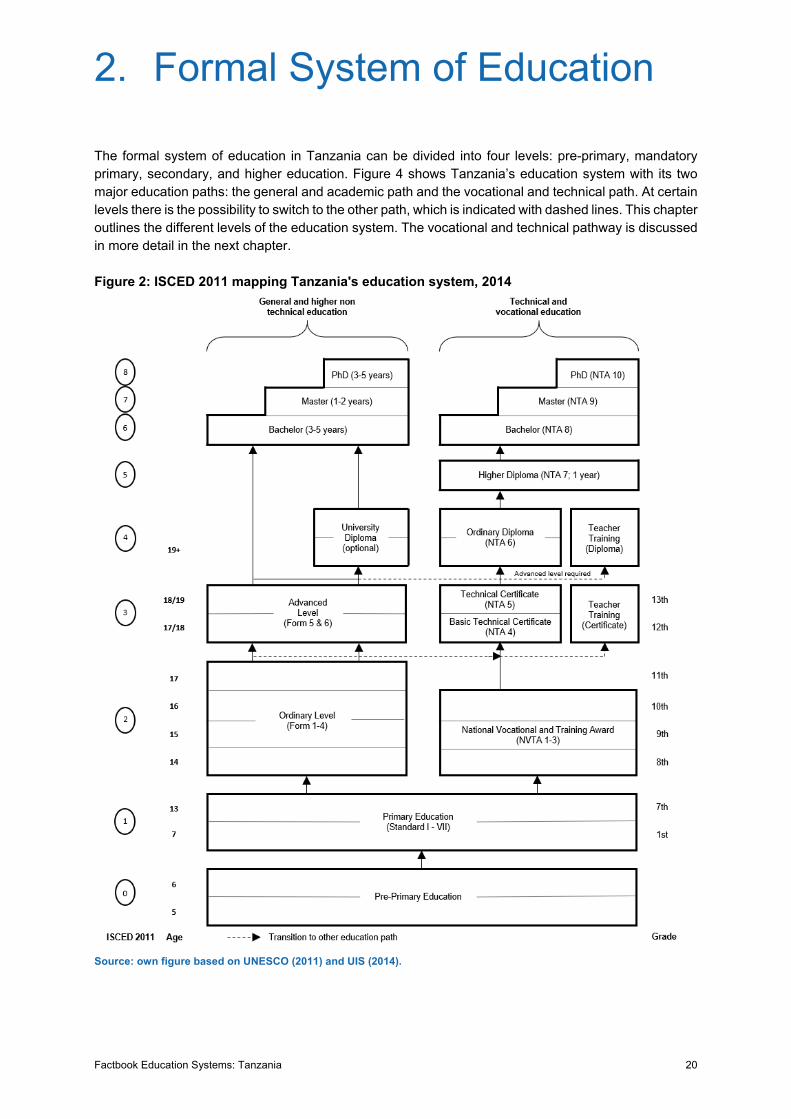
The formal system of education in Tanzania can be divided into four levels: pre-primary, mandatory primary, secondary, and higher education. Figure 4 shows Tanzania’s education system with its two major education paths: the general and academic path and the vocational and technical path. At certain levels there is the possibility to switch to the other path, which is indicated with dashed lines. This chapter outlines the different levels of the education system. The vocational and technical pathway is discussed in more detail in the next chapter.
Figure 2: ISCED 2011 mapping Tanzania's education system, 2014
Source: own figure based on UNESCO (2011) and UIS (2014).
Factbook Education Systems: Tanzania 21
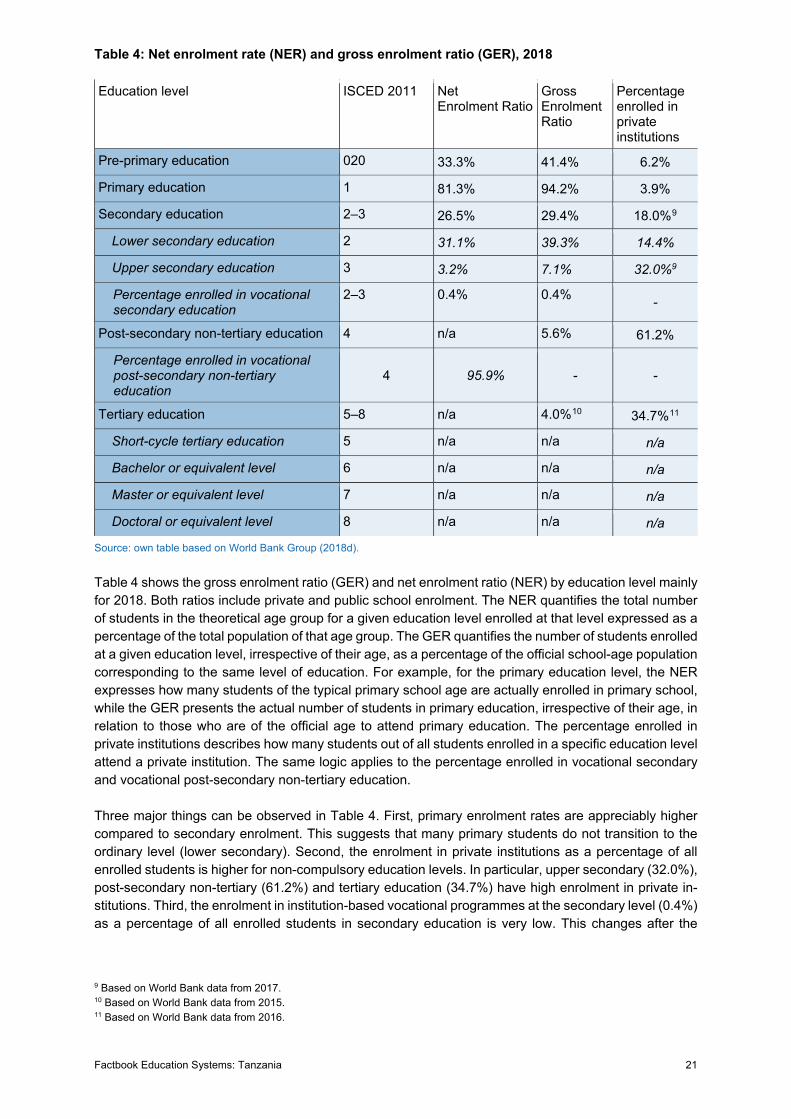
Table 4: Net enrolment rate (NER) and gross enrolment ratio (GER), 2018
Education level ISCED 2011 Net Enrolment Ratio
Gross Enrolment Ratio
Percentage enrolled in private institutions
Pre-primary education 020 33.3% 41.4% 6.2%
Primary education 1 81.3% 94.2% 3.9%
Secondary education 2–3 26.5% 29.4% 18.0%9
Lower secondary education 2 31.1% 39.3% 14.4%
Upper secondary education 3 3.2% 7.1% 32.0%9
Percentage enrolled in vocational secondary education
2–3 0.4% 0.4% -
Post-secondary non-tertiary education 4 n/a 5.6% 61.2%
Percentage enrolled in vocational post-secondary non-tertiary education
4 95.9% - -
Tertiary education 5–8 n/a 4.0%10 34.7%11
Short-cycle tertiary education 5 n/a n/a n/a
Bachelor or equivalent level 6 n/a n/a n/a
Master or equivalent level 7 n/a n/a n/a
Doctoral or equivalent level 8 n/a n/a n/a
Source: own table based on World Bank Group (2018d). Table 4 shows the gross enrolment ratio (GER) and net enrolment ratio (NER) by education level mainly for 2018. Both ratios include private and public school enrolment. The NER quantifies the total number of students in the theoretical age group for a given education level enrolled at that level expressed as a percentage of the total population of that age group. The GER quantifies the number of students enrolled at a given education level, irrespective of their age, as a percentage of the official school-age population corresponding to the same level of education. For example, for the primary education level, the NER expresses how many students of the typical primary school age are actually enrolled in primary school, while the GER presents the actual number of students in primary education, irrespective of their age, in relation to those who are of the official age to attend primary education. The percentage enrolled in private institutions describes how many students out of all students enrolled in a specific education level attend a private institution. The same logic applies to the percentage enrolled in vocational secondary and vocational post-secondary non-tertiary education.
Three major things can be observed in Table 4. First, primary enrolment rates are appreciably higher compared to secondary enrolment. This suggests that many primary students do not transition to the ordinary level (lower secondary). Second, the enrolment in private institutions as a percentage of all enrolled students is higher for non-compulsory education levels. In particular, upper secondary (32.0%), post-secondary non-tertiary (61.2%) and tertiary education (34.7%) have high enrolment in private in-stitutions. Third, the enrolment in institution-based vocational programmes at the secondary level (0.4%) as a percentage of all enrolled students in secondary education is very low. This changes after the
9 Based on World Bank data from 2017. 10 Based on World Bank data from 2015. 11 Based on World Bank data from 2016.
Factbook Education Systems: Tanzania 22
secondary level. Out of all students enrolled in post-secondary non-tertiary education, 95.9% are en-rolled in vocational programmes. This strong increase is due to a substantially larger offer of educational possibilities in the vocational and technical path in post-secondary education (see Figure 4). In the fol-lowing sections, the individual educational levels are discussed in more detail regarding the composition, curriculum, minimum requirements, examinations, and challenges.
2.1 Pre-Primary Education In Tanzania Mainland, the non-compulsory pre-primary education lasts 2 years (children ages 5 and 6). Children under 5 years of age are admitted but not formally registered. In contrast, Zanzibar provides three years of pre-primary education (children ages 4 to 6). Pre-primary education is undertaken by governmental organizations, NGOs, and private individuals, whereby governmental pre-primary educa-tion is the most common. The curriculum mainly focuses on numeracy and literacy. Pre-primary educa-tion in urban areas is far more advanced than in rural areas. Rural classes have less space, larger group sizes, less favourable teacher-student ratios, fewer teaching materials and poorly qualified teachers. These circumstances are similar to those found in other sub-Saharan countries (Mtahabwa & Rao, 2010).
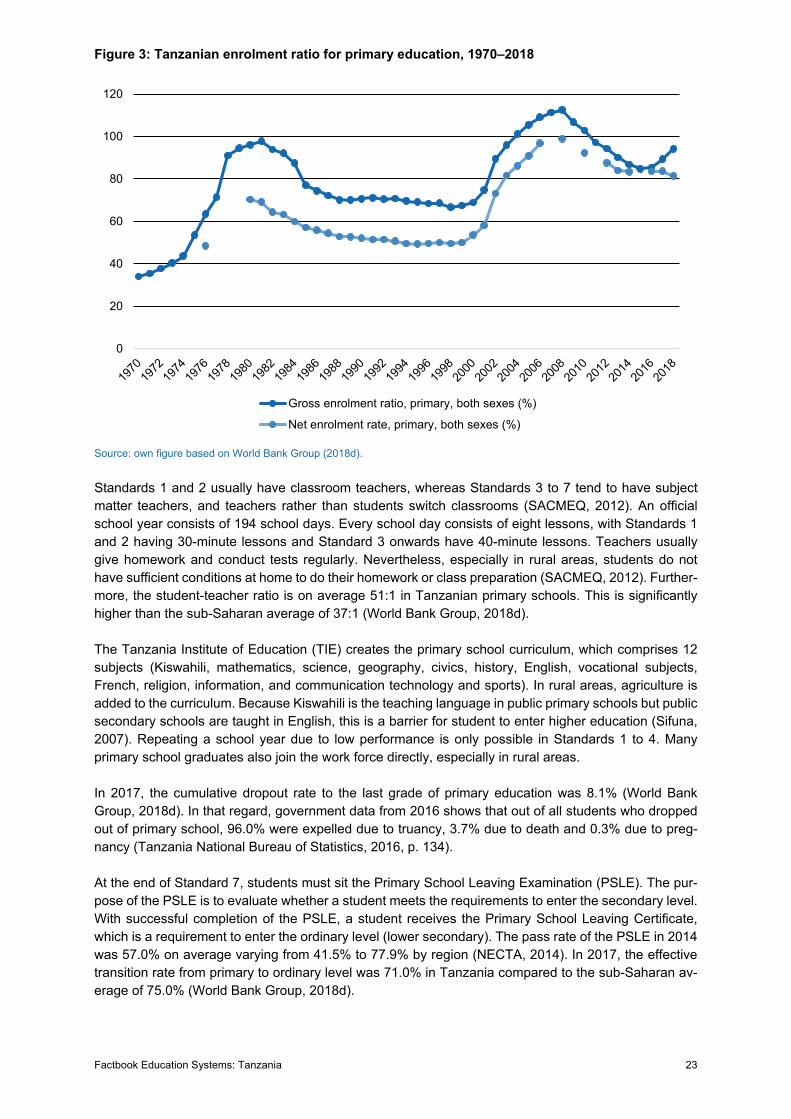
2.2 Primary and Lower Secondary Education Primary schools (Standards 1 to 7) became mandatory in 1974 as part of the Musoma Declaration. Since then, primary schools have been free of charge except for several expenses including school supplies, uniforms, testing fees, and school building repairs. Public schools are taught in Kiswahili, whereas private schools are primarily taught in English. The minimum entry age is 7 years. In 2018, total enrolment in primary education was 10.11 million children, which corresponds to a NER of 81.3% where female students have a 3 percentage points higher NER than male students. 50.1% of students in primary education are female (World Bank Group, 2018d). Figure 7 shows the development of primary school enrolment from 1970 to 2018. There are two peaks in this trajectory. The first one occurred in 1981 and was caused by the Musoma Declaration in 1974, which declared primary schools mandatory. The second peak occurred in 2008. It can be explained by the PEDP (see Section 1.3.2), which ran until 2006. Since then, the primary education enrolment ratios have dropped.
Factbook Education Systems: Tanzania 23
Figure 3: Tanzanian enrolment ratio for primary education, 1970–2018
Source: own figure based on World Bank Group (2018d). Standards 1 and 2 usually have classroom teachers, whereas Standards 3 to 7 tend to have subject matter teachers, and teachers rather than students switch classrooms (SACMEQ, 2012). An official school year consists of 194 school days. Every school day consists of eight lessons, with Standards 1 and 2 having 30-minute lessons and Standard 3 onwards have 40-minute lessons. Teachers usually give homework and conduct tests regularly. Nevertheless, especially in rural areas, students do not have sufficient conditions at home to do their homework or class preparation (SACMEQ, 2012). Further-more, the student-teacher ratio is on average 51:1 in Tanzanian primary schools. This is significantly higher than the sub-Saharan average of 37:1 (World Bank Group, 2018d).
The Tanzania Institute of Education (TIE) creates the primary school curriculum, which comprises 12 subjects (Kiswahili, mathematics, science, geography, civics, history, English, vocational subjects, French, religion, information, and communication technology and sports). In rural areas, agriculture is added to the curriculum. Because Kiswahili is the teaching language in public primary schools but public secondary schools are taught in English, this is a barrier for student to enter higher education (Sifuna, 2007). Repeating a school year due to low performance is only possible in Standards 1 to 4. Many primary school graduates also join the work force directly, especially in rural areas.
In 2017, the cumulative dropout rate to the last grade of primary education was 8.1% (World Bank Group, 2018d). In that regard, government data from 2016 shows that out of all students who dropped out of primary school, 96.0% were expelled due to truancy, 3.7% due to death and 0.3% due to preg-nancy (Tanzania National Bureau of Statistics, 2016, p. 134).
At the end of Standard 7, students must sit the Primary School Leaving Examination (PSLE). The pur-pose of the PSLE is to evaluate whether a student meets the requirements to enter the secondary level. With successful completion of the PSLE, a student receives the Primary School Leaving Certificate, which is a requirement to enter the ordinary level (lower secondary). The pass rate of the PSLE in 2014 was 57.0% on average varying from 41.5% to 77.9% by region (NECTA, 2014). In 2017, the effective transition rate from primary to ordinary level was 71.0% in Tanzania compared to the sub-Saharan av-erage of 75.0% (World Bank Group, 2018d).
0
20
40
60
80
100
120
Gross enrolment ratio, primary, both sexes (%)
Net enrolment rate, primary, both sexes (%)
Factbook Education Systems: Tanzania 24
After having passed the PSLE, a student has finished compulsory schooling and is now eligible for ordinary level (lower secondary) education. Ordinary level (known as Forms 1–4 or O level) consists of 4 years of schooling to prepare for the Certificate of Secondary Education Examination (CSEE) issued by the NECTA, which if passed provides students with the Certificate of Secondary Education that grants access to upper secondary education, technical level (NTA12 4) or pursuit of the teacher training certifi-cate to become a pre-primary or primary school teacher. Most secondary education schools offer both ordinary and advanced education and are separated by gender. In 2018, the 31.1% NER for ordinary level (see Table 4) was 1.9 percentage points higher than the sub-Saharan average of 29.2% (World Bank Group, 2018d).
The curriculum of advanced-level schools consists of core and optional subjects. From the optional subjects, students can choose up to two (a school-specific offer). The core subjects in Forms 1 to 4 include mathematics, English, physics, chemistry, Kiswahili, biology, history, geography, civics, and re-ligion. Optional subjects might include home economics, information and computer studies, additional mathematics, music, fine arts, French, Arabic, Islamic studies, Bible knowledge, or physical education.
Regarding dropouts from ordinary-level schools, in 2017, the cumulative dropout rate to the last grade of ordinary-level education was 22.8% (World Bank Group, 2018d). This is 14.7 percentage points higher than in primary schools. In this regard, government data from 2016 shows that out of all students who dropped out of ordinary-level education, 87.4% were expelled due to truancy, 11.5% due to death and 1.1% due to pregnancy (Tanzania National Bureau of Statistics, 2016, p. 140).
2.3 Upper Secondary Education Advanced-level education (known as Forms 5 and 6 or A level) consists of 2 years of schooling to prepare for the Advanced Certificate of Secondary Education Examination (ACSEE) issued by the NECTA, which if passed provides students with the Advanced Certificate of Secondary Education that grants access to university bachelor’s programs, the technical level (NTA 6) and the teacher training diploma to become a secondary school teacher. In 2018, the 7.1% GER for the advanced level was 27 percentage points higher than the sub-Saharan average of 34.1% (World Bank Group, 2018d).
Secondary schools that show higher pass rates for the ACSEE and CSEE tend to have better-trained teachers, meaning that teachers at schools with high pass rates tend to have higher education levels. This is primarily due to higher salaries and better school management. 58% of all teachers who have graduated from university work in non-government schools. Most of the rest teach in governmental schools; thus, almost no teachers at community-built schools (more frequent in rural areas) have at-tended university (UNESCO-IBE, 2010).
2.4 Postsecondary and Higher Education Higher education and tertiary education in Tanzania can occur in universities, university colleges or tertiary-level institutions (technical higher education). The universities offer bachelor, master, and PhD programmes. Universities also offer shorter programmes which are rewarded with a certificate (7 to 12 months) or diploma (2 years). A university year comprises 40 weeks of studying with two vacations in December and July. The GER for tertiary education for Tanzania was 4.0% in 2015. Compared to Kenya
12 National Technical Awards
Factbook Education Systems: Tanzania 25
(9.2%) and the sub-Saharan average (9.2%), Tanzania shows low enrolment in tertiary education (World Bank Group, 2018d). In total, Tanzania has 54 academic education institutes, which consists of 30% public universities and colleges and 70% private universities. Nonetheless, of all students enrolled in tertiary education, only 34.7% attend a private university or college. This is because the student-teacher ratio is much smaller in private institutions (Tanzania National Bureau of Statistics, 2018). The Tanza-nian universities are supervised by the Tanzania Commission for Universities (TCU).
In the 2015/2016 academic year, out of all students enrolled in a university for tertiary education, 91.3% were enrolled in bachelor (ISCED 5) programmes (MoEST, 2016). Thus, in the general education path, a bachelor is by far the most popular choice.
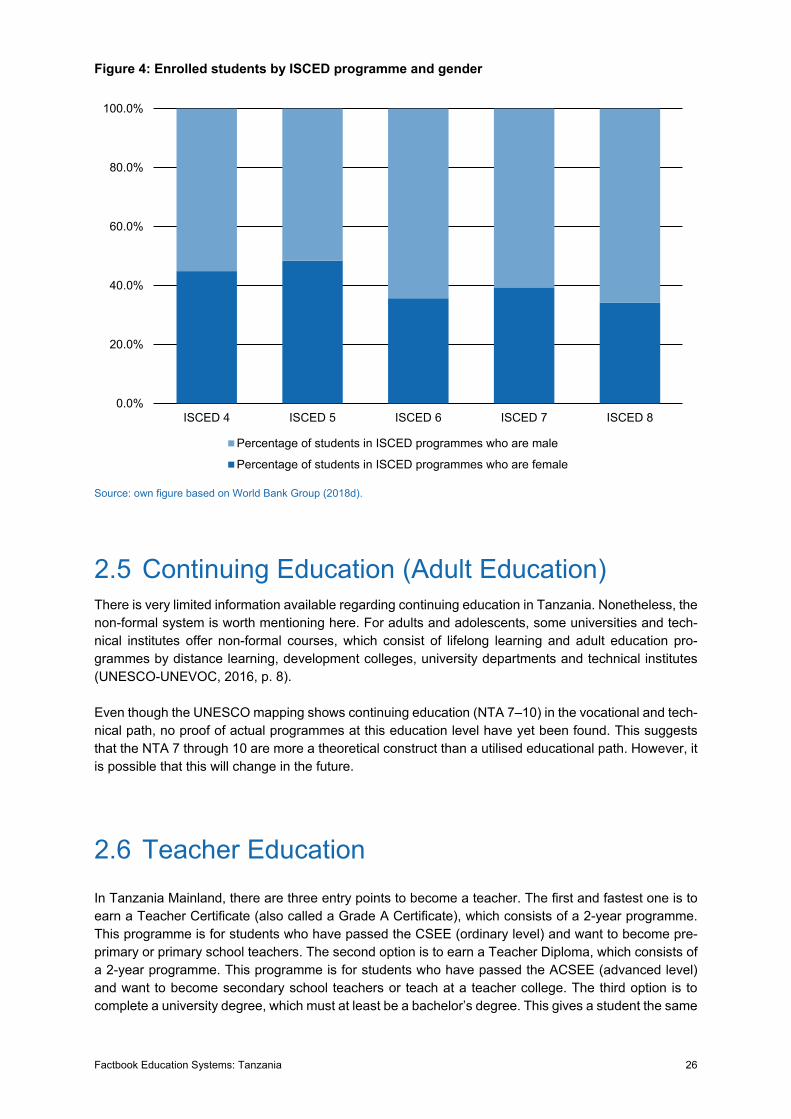
Figure 6 displays enrolled students by ISCED level and gender. From that data, a slight tendency can be observed that the higher the education level, the higher the percentage of male participants in the respective ISCED level. At the highest level, almost two thirds of students are male.
The technical and vocational higher education is further elaborated on in Section 3.2. The National Council for Technical Education (NACTE) is responsible for all technical education at the tertiary non-university level.
Factbook Education Systems: Tanzania 26
Figure 4: Enrolled students by ISCED programme and gender
Source: own figure based on World Bank Group (2018d).
2.5 Continuing Education (Adult Education) There is very limited information available regarding continuing education in Tanzania. Nonetheless, the non-formal system is worth mentioning here. For adults and adolescents, some universities and tech-nical institutes offer non-formal courses, which consist of lifelong learning and adult education pro-grammes by distance learning, development colleges, university departments and technical institutes (UNESCO-UNEVOC, 2016, p. 8).
Even though the UNESCO mapping shows continuing education (NTA 7–10) in the vocational and tech-nical path, no proof of actual programmes at this education level have yet been found. This suggests that the NTA 7 through 10 are more a theoretical construct than a utilised educational path. However, it is possible that this will change in the future.
2.6 Teacher Education In Tanzania Mainland, there are three entry points to become a teacher. The first and fastest one is to earn a Teacher Certificate (also called a Grade A Certificate), which consists of a 2-year programme. This programme is for students who have passed the CSEE (ordinary level) and want to become pre-primary or primary school teachers. The second option is to earn a Teacher Diploma, which consists of a 2-year programme. This programme is for students who have passed the ACSEE (advanced level) and want to become secondary school teachers or teach at a teacher college. The third option is to complete a university degree, which must at least be a bachelor’s degree. This gives a student the same
0.0%
20.0%
40.0%
60.0%
80.0%
100.0%
ISCED 4 ISCED 5 ISCED 6 ISCED 7 ISCED 8
Percentage of students in ISCED programmes who are male
Percentage of students in ISCED programmes who are female
Factbook Education Systems: Tanzania 27
possibilities to become a teacher as a Teacher Diploma does. In 2010, due to a lack of teachers, espe-cially in private secondary schools, there were high numbers of untrained teachers (UNESCO-IBE, 2010). Nonetheless, in 2018, 98.1% of teachers in primary education and 98.5% in secondary education were sufficiently qualified (World Bank Group, 2018d).
The curriculum for the Teacher Certificate and Teacher Diploma programmes consists of educational psychology, educational evaluation (for exams), methods of teaching and content of the curriculum. Because both programmes count as vocational education, they are both under the administration of the Vocational Education and Training Authority (VETA). The examinations at the end of each programme are conducted by the NECTA. After graduating, Tanzanian teachers earn satisfactory wages compared to other professionals (UNESCO-IBE, 2010).
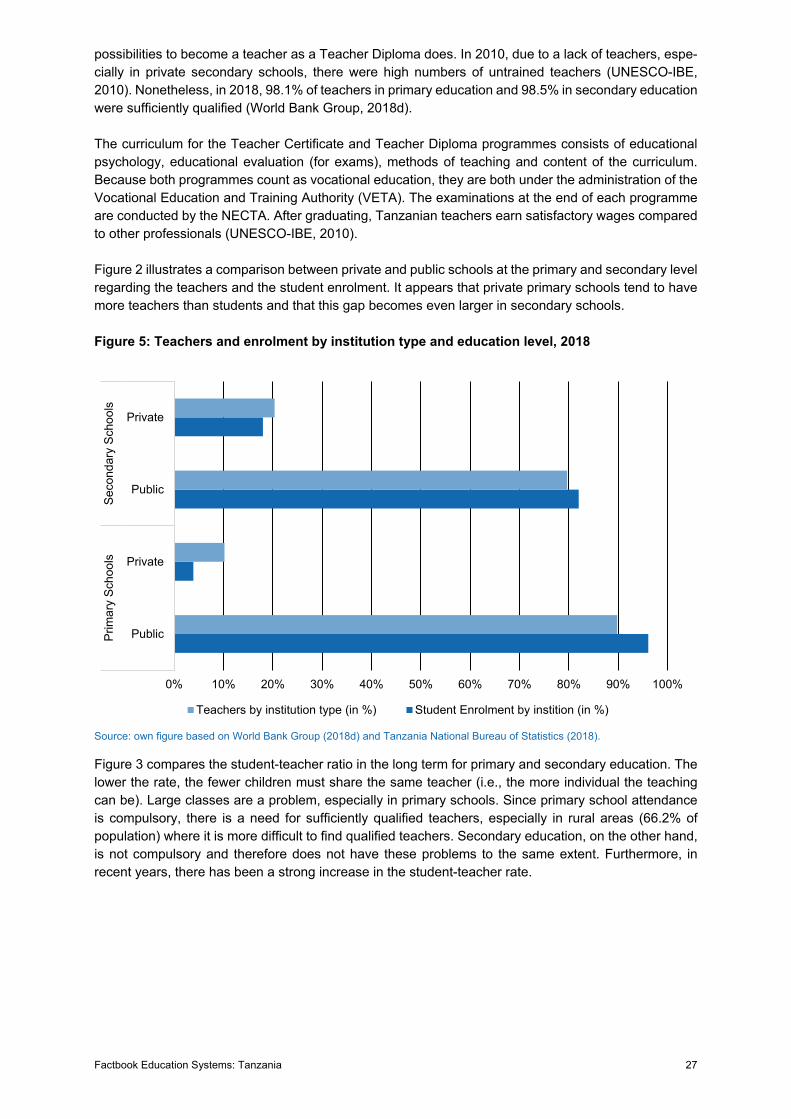
Figure 2 illustrates a comparison between private and public schools at the primary and secondary level regarding the teachers and the student enrolment. It appears that private primary schools tend to have more teachers than students and that this gap becomes even larger in secondary schools.
Figure 5: Teachers and enrolment by institution type and education level, 2018
Source: own figure based on World Bank Group (2018d) and Tanzania National Bureau of Statistics (2018).
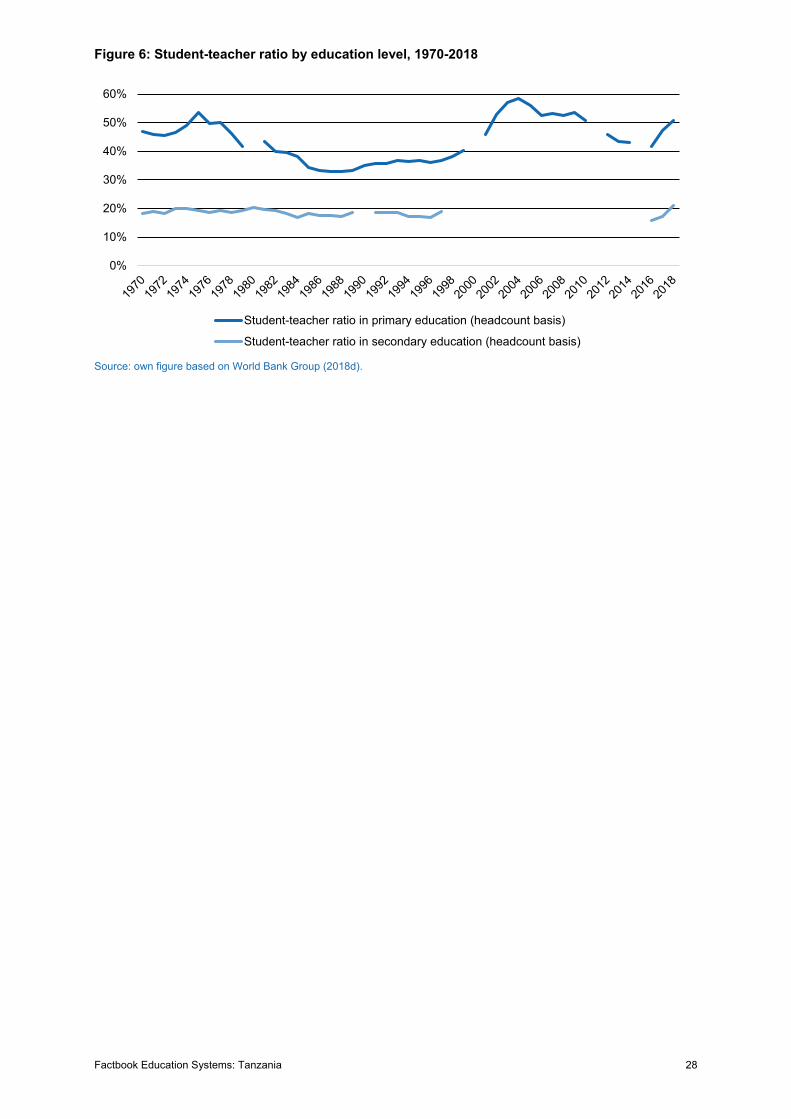
Figure 3 compares the student-teacher ratio in the long term for primary and secondary education. The lower the rate, the fewer children must share the same teacher (i.e., the more individual the teaching can be). Large classes are a problem, especially in primary schools. Since primary school attendance is compulsory, there is a need for sufficiently qualified teachers, especially in rural areas (66.2% of population) where it is more difficult to find qualified teachers. Secondary education, on the other hand, is not compulsory and therefore does not have these problems to the same extent. Furthermore, in recent years, there has been a strong increase in the student-teacher rate.
0% 10% 20% 30% 40% 50% 60% 70% 80% 90% 100%
Public
Private
Public
Private
Prim
ary
Scho
ols
Seco
ndar
y Sc
hool
s
Teachers by institution type (in %) Student Enrolment by instition (in %)
Factbook Education Systems: Tanzania 28
Figure 6: Student-teacher ratio by education level, 1970-2018
Source: own figure based on World Bank Group (2018d).
0%
10%
20%
30%
40%
50%
60%
Student-teacher ratio in primary education (headcount basis)
Student-teacher ratio in secondary education (headcount basis)
Factbook Education Systems: Tanzania 29
3. The System of Vocational and Professional Education and Training
This section of the Factbook describes the vocational education and training (VET) system at the lower secondary level and the technical education and training system (TET) at the upper secondary and tertiary level in more detail. Therefore, the term technical and vocational education and training (TVET) refers to both the VET and the TET systems. A so-called professional education system (PET) as occurs in other countries does not exist in Tanzania.
3.1 Technical and Vocational Education and Train-
ing (TVET) As can be seen in Figure 4, Tanzania’s TVET system consists of institution-based VET at the ordinary level (lower secondary) and TET at the advanced level (upper secondary) and onwards. A feature of Tanzania’s education system is the VET because it starts at the lower instead of upper secondary level. This is very unusual compared to other countries such as South Africa, the Netherlands, and Switzer-land. One possible explanation for this could be the compulsory schooling, which in Tanzania is only straight through to the end of primary school, whereas in the other countries mentioned, up to the lower secondary level of schooling is compulsory. From here on, the term TVET is used when both systems are meant. The entire TVET path runs almost parallel to the general secondary education.
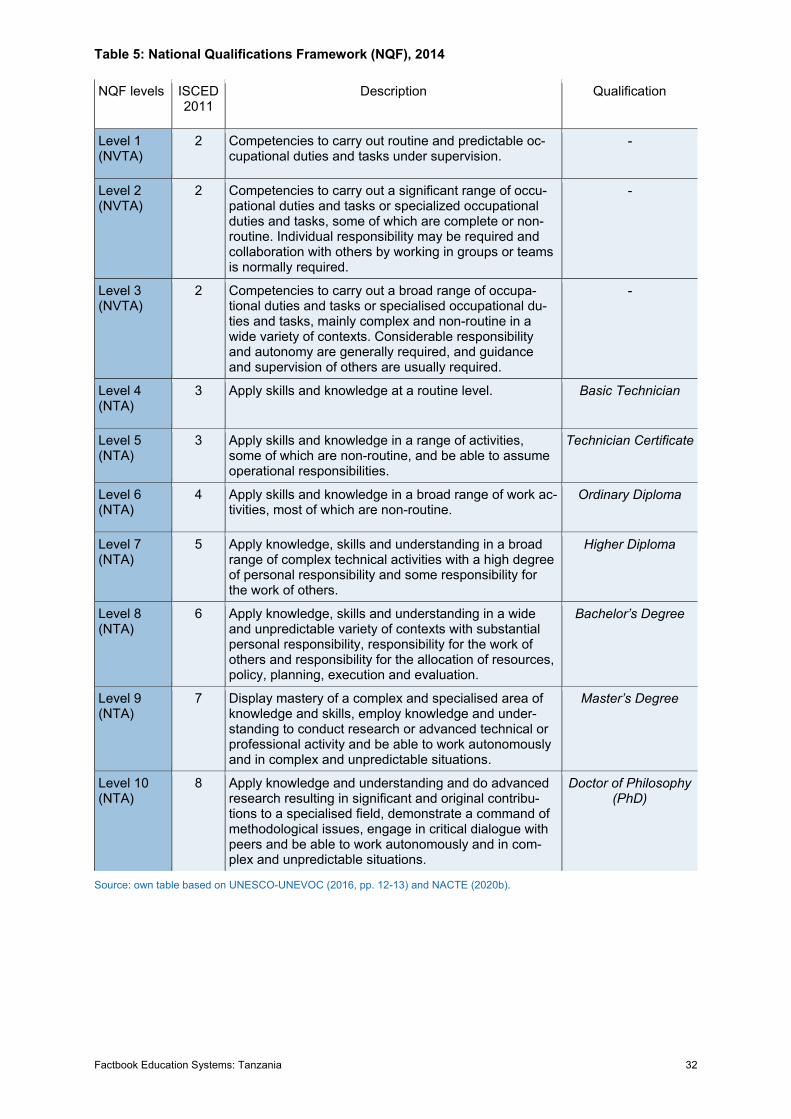
The VETA, which is responsible for the VET programmes, and the NACTE, which is responsible for the TET programmes, established the National Qualifications Framework (NQF). The NQF consists of 10 levels: the National Vocational and Training Awards 1-3 and the NTA 4-10 (see Figure 4 and Table 5). While the VETA coordinates NVTA 1 through 3 (VET) on a national scale, the NACTE does the same for NTA 4 through 10 (TET).
We begin with the VET programmes that can be entered directly after completion of the mandatory primary school. For these institution-based programmes13, the minimum requirement is the PSLE. The VET is offered at regional- or district-level VET institutes and usually lasts 2 to 3 years depending on the programme chosen. In 2020, at the VET level 715 training centres offer school-based pro-grammes in the following 12 categories: mechanical, electrical, civil and building engineering, automo-tive, commercial services and business support, clothing and textile, transport, mining, printing, cos-metology, agriculture and food processing and hospitality, tourism and travel agency (VETA, 2020a; VETA, 2020c). No enrolment numbers by programme or category were found.
13 Institution-based refers to programmes that take place in a school setting. This also includes programmes that have practical courses that take place in the VET institutes.
Factbook Education Systems: Tanzania 30
In addition to the institutional-based programmes, the VETA is currently implementing two work-based apprenticeship modes14: the Recognition of Prior Learning (RPL) and the Dual Apprenticeship (DATS) programme. The RPL programme focuses on informal apprentices that never had the chance to be awarded a certificate. Regardless of when, how, or where the learning occurred, the VETA awards apprentices through the Recognition of Prior Learning Assessment. For this programme, the VETA col-laborates with informal and formal companies and the International Labour Organisation (ILO). The im-plementation plan involves several steps beginning with the completion of a form by informal appren-tices. Candidates who prove to be eligible can then apply for the assessment. The VETA organises training to prepare the candidates for the assessment and tries to fill their educational gaps on an indi-vidual basis. After passing the assessment, the candidates receive a certificate and have improved chances of getting a better job.
On the other hand, the DATS programme, which was established in cooperation with the Federal Min-istry for Economic Cooperation and Development of Germany, was designed as a mixture of on-the-job training and classroom learning. Thus, the programme consists of alternating blocks of weeks between the VETA training centre and the respective workplace. The DATS lasts 3 years with 38% of the time spent at the VETA training centre and 62% on the job. Apprentices can simply sign an apprenticeship contract with a partner company of the DATS and then submit the contract to the VETA centre of regis-tration. The DATS then begins. In 2020, four industries offered DATS programmes (automotive, electri-cal, hospitality and agro mechanics). Several other programmes are expected to be available in the future. Currently, approximately 100 companies are partners of the DATS programme. In June 2019, 200 apprentices finished their training, while 168 are still in the programme (VETA, 2020b).
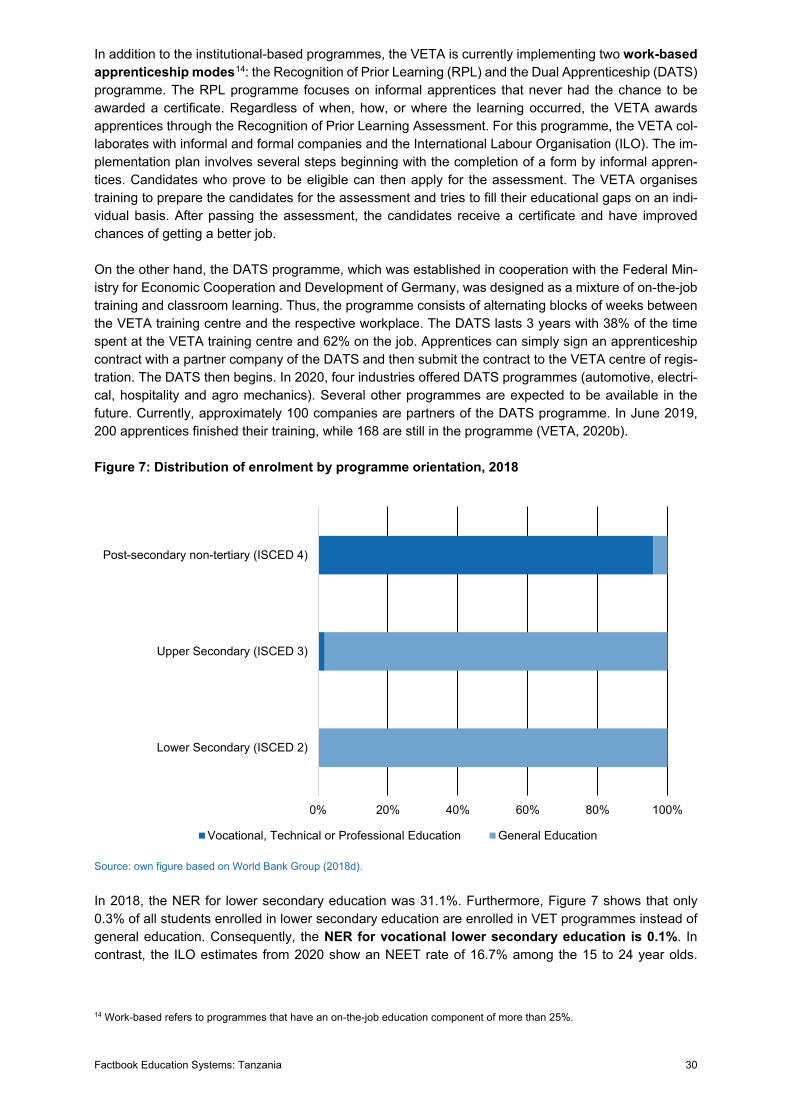
Figure 7: Distribution of enrolment by programme orientation, 2018
Source: own figure based on World Bank Group (2018d).
In 2018, the NER for lower secondary education was 31.1%. Furthermore, Figure 7 shows that only 0.3% of all students enrolled in lower secondary education are enrolled in VET programmes instead of general education. Consequently, the NER for vocational lower secondary education is 0.1%. In contrast, the ILO estimates from 2020 show an NEET rate of 16.7% among the 15 to 24 year olds.
14 Work-based refers to programmes that have an on-the-job education component of more than 25%.
0% 20% 40% 60% 80% 100%
Lower Secondary (ISCED 2)
Upper Secondary (ISCED 3)
Post-secondary non-tertiary (ISCED 4)
Vocational, Technical or Professional Education General Education
Factbook Education Systems: Tanzania 31
Furthermore, the estimates show that this share is 8.1 percentage points higher for women than for men and surprisingly 14.6 percentage points higher for urban than for rural adolescents (ILOSTAT, 2020c). However, these percentages must be analysed carefully since, for example, the quality of the work can be significantly worse in rural areas.
We now consider the TET programmes offered at the upper secondary level in 21 different subjects. The courses are offered in non-university TET institutes and usually last 2 to 3 years depending on the programme chosen (UNESCO-UNEVOC, 2016, p. 8). There are also some rare short-cycle pro-grammes. In 2018, the NER for upper secondary education was 3.2% (see Table 4). Furthermore, Fig-ure 7 shows that only 1.9% of all students enrolled in upper secondary education are enrolled in a TET programme instead of general education. Consequently, the NER for technical upper secondary ed-ucation is 0.1%.
TET is also offered on the post-secondary and tertiary level at non-university tertiary institutions. The coordination of all TET institutes and their programmes on a national level is supervised by the NACTE. In 2020, the total number of centres that offer TET programmes is 559 (NACTE, 2020a). In 2018, the GER for post-secondary non-tertiary education was 5.6%. Furthermore, Figure 7 shows that 95.9% of all students enrolled in post-secondary non-tertiary education are enrolled in a TET programme instead of general education. Consequently, the GER for technical post-secondary non-tertiary education is 5.4%. This is clearly higher than the NER for TVET at the secondary level. However, these figures must be treated with caution, because the GER and NER cannot be directly compared.
The distribution of enrolment in secondary education by programme orientation for sub-Saharan Africa shows that 5.9% of all secondary-level students are enrolled in a vocational programme instead of gen-eral education. For Tanzania, the same number is 0.4%. This indicates that Tanzania’s TVET system is less popular than the general education system compared to the sub-Saharan average.
Regarding the curriculum, NACTE counts on competence-based education and training (CBET) that includes four key points: (1) clear identification of what a student must learn, (2) assessment of progress based on students’ demonstrable achievement, (3) use of multiple instructional and assessment strate-gies to meet each student’s needs and (4) provision of adequate time and assistance so that each learner can reach his or her maximum potential (NACTE, 2020b).
In general, limited information was found regarding NTA 6 through 10. The official website of the NACTE lists all registered and accredited institutions that offer TET programmes (NACTE, 2020c). This website also shows which subjects and NTA levels the respective institutions offer. Based on a random check of 20 institutions’ programmes on this website, most programmes offered are in NTA 4 to 6; NTA 7 to 8 programmes are rarely offered, and no evidence of NTA 9 to 10 programmes could be found. This indicates that the higher the NTA level, the lower the number of programmes offered, with no offers found after NTA 8. The investigation of the higher NTA levels could be subject to a subsequent extended investigation.
One example of an institute that offers TET programmes is the Institute of Adult Education (IAE). It offers a bachelor’s degree (NTA 8; 3 years), an Ordinary Diploma (NTA 6; 2–3 years), a Basic Technician Certificate (NTA 4; 1 year) and short-term courses.
In summary, in Tanzania there are some newer possibilities in the TVET system. However, the TVET system is currently only sparsely used, mainly because of informal education and low enrolment rates in the formal TVET system.
Factbook Education Systems: Tanzania 32
Table 5: National Qualifications Framework (NQF), 2014
NQF levels ISCED 2011
Description Qualification
Level 1 (NVTA)
2 Competencies to carry out routine and predictable oc-cupational duties and tasks under supervision.
-
Level 2 (NVTA)
2 Competencies to carry out a significant range of occu-pational duties and tasks or specialized occupational duties and tasks, some of which are complete or non-routine. Individual responsibility may be required and collaboration with others by working in groups or teams is normally required.
-
Level 3 (NVTA)
2 Competencies to carry out a broad range of occupa-tional duties and tasks or specialised occupational du-ties and tasks, mainly complex and non-routine in a wide variety of contexts. Considerable responsibility and autonomy are generally required, and guidance and supervision of others are usually required.
-
Level 4 (NTA)
3 Apply skills and knowledge at a routine level. Basic Technician
Level 5 (NTA)
3 Apply skills and knowledge in a range of activities, some of which are non-routine, and be able to assume operational responsibilities.
Technician Certificate
Level 6 (NTA)
4 Apply skills and knowledge in a broad range of work ac-tivities, most of which are non-routine.
Ordinary Diploma
Level 7 (NTA)
5 Apply knowledge, skills and understanding in a broad range of complex technical activities with a high degree of personal responsibility and some responsibility for the work of others.
Higher Diploma
Level 8 (NTA)
6 Apply knowledge, skills and understanding in a wide and unpredictable variety of contexts with substantial personal responsibility, responsibility for the work of others and responsibility for the allocation of resources, policy, planning, execution and evaluation.
Bachelor’s Degree
Level 9 (NTA)
7 Display mastery of a complex and specialised area of knowledge and skills, employ knowledge and under-standing to conduct research or advanced technical or professional activity and be able to work autonomously and in complex and unpredictable situations.
Master’s Degree
Level 10 (NTA)
8 Apply knowledge and understanding and do advanced research resulting in significant and original contribu-tions to a specialised field, demonstrate a command of methodological issues, engage in critical dialogue with peers and be able to work autonomously and in com-plex and unpredictable situations.
Doctor of Philosophy (PhD)
Source: own table based on UNESCO-UNEVOC (2016, pp. 12-13) and NACTE (2020b).
Factbook Education Systems: Tanzania 33
3.2 Professional Education and Training (PET; Post-Secondary Level)
As mentioned in Subchapter 2.4, students completing the admission criteria are able to apply for a program at a polytechnic institution.
One could regard the TET at the tertiary education level (NTA 7+) as PET. Nonetheless, there is no such official distinction. TET-accredited institutions offer programmes from NTA 4 to NTA 10; thus, there is no institutional differentiation among TET courses. In addition, no programme offerings were found for NTA 9 to 10. In summary, no evidence of a PET system was found, so it remains unclear whether there is one in Tanzania.
3.3 Regulatory and Institutional Framework of the TVET System
Since no evidence of a PET system in Tanzania was found, this section focuses on the frameworks of the TVET system.
3.3.1 Central Elements of TVET Legislation The regulatory and institutional framework for the TVET system consists of four acts:
• The Education Act No. 21 (1973)
• The Education Act No. 25 (1978)
• The Vocational Education and Training Act (VET Act; 1994)
• The National Council for Technical Education Act (NACTE Act; 1997)
The Education Act No. 25 (amended in 1995 to reinforce the implementation of the education and train-ing policy issued in the same year) defines the legal basis for all education in Tanzania. It states the roles of the national and local education institutions (UNESCO-UNEVOC, 2016). Furthermore, the Ed-ucation Act No. 21 established the NECTA. In addition, the VET Act (amended in 2006) and the NACTE Act established the corresponding national institutions, namely the VETA and the NACTE.
3.3.2 Key Actors Government
The MoEST has the power of policy formulation, coordination, monitoring, standard setting, quality as-surance and quality control for the entire education system. Since 1997, all powers to make and effect decisions have been devolved to lower levels (UNESCO-IBE, 2010, p. 4). Therefore, the local govern-ment authorities (districts, towns, municipals, and city councils) assume full responsibility for manage-ment and delivery of formal and non-formal education. The MoEST consists of six divisions. One of these six is the division for TVET, which in turn consists of three sections: TET, VET and Management Support Services. These sections are primarily responsible for conducting TVET skills audits, promoting the TVET system, monitoring the development plans and evaluating them.
Factbook Education Systems: Tanzania 34
The second of the six divisions, the division for higher education, is responsible for promoting, develop-ing, monitoring, evaluating, and implementing higher education and its policies in Tanzania. Further-more, the division for higher education oversees the NQF and its development.
Other actors are the VETA and NACTE. The VETA’s objectives are coordinating, regulating, financing, promoting, and providing vocational education and training in Tanzania. Currently, they handle all VET programmes in training centres, including regional vocational training and services, vocational training centres, vocational teachers training colleges and district vocational training centres. On the other hand, the NACTE’s objectives include the supervision of all technical education at non-university TET institu-tions. Furthermore, they oversee the coordination, registration and accreditation of technical institutions and their programmes and establish the NQF within those institutions.
Furthermore, other ministries are responsible for the establishment and management of schools and colleges. The respective ministries provide water, sanitation, health services, transport, food, and nutri-tion.
Representation and Advisory Bodies
The minister of national education (head of the MoEST) has his own advisory council that consults with him regarding topics related to the execution of national policies and education. Specifically, the organisation, promotion, and other related matters are the responsibilities of the advisory council. Fur-thermore, the commissioner for national education (head of the Basic Education Development Office within the MoEST) is responsible for the general management and administration of all schools for whose management the government is responsible or to whose maintenance the government makes a contribution (United Republic of Tanzania, 1978).
The Tanzania Teachers’ Union (TTU) has existed since 1993. Its goal is to advocate for and promote the rights of teachers in Tanzania. A teacher strike that led to massive suspensions of over 300 teachers brought this union into existence. In 2012, 200,000 teachers went on strike to push for higher salaries. According to the chairman of the TTU, 95.7% of all union members voted in favour of that strike (Reuters, 2012). Apart from the TTU, no other trade unions or employee associations for teachers were found.
Education and Training Providers
In 2014, out of all VET institutions at that time, 11% were owned by the central government, 11% by civil society organisations, 28% by faith-based organisations, 6% by local government authorities, 12% by private companies, 29% by private individuals and 3% by the VETA (VETA, 2014). This shows that most VET institutions are faith-based or privately owned. Therefore, private institutions are admin-istered and managed by the owners according to the guidelines and regulations issued by the MoEST. VET centres exist at both the regional and district levels. The VETA website provides a list of all 715 currently registered VET centres (VETA, 2020c).
As already mentioned in Section 3.1, according to the NACTE website, there are 559 TET institutions (NACTE, 2020c). TET at the tertiary level (NTA 7+) is offered at universities, university colleges and tertiary-based institutions (UNESCO-UNEVOC, 2016, p. 8).
3.4 Educational Finance of the VPET System Since no information about the PET system was found, this section covers the financing of the VET and TET systems, because they are financed differently. While the VET is mainly funded by the VET Fund, which is administered by the VET board, the TET is financed through cost sharing between the
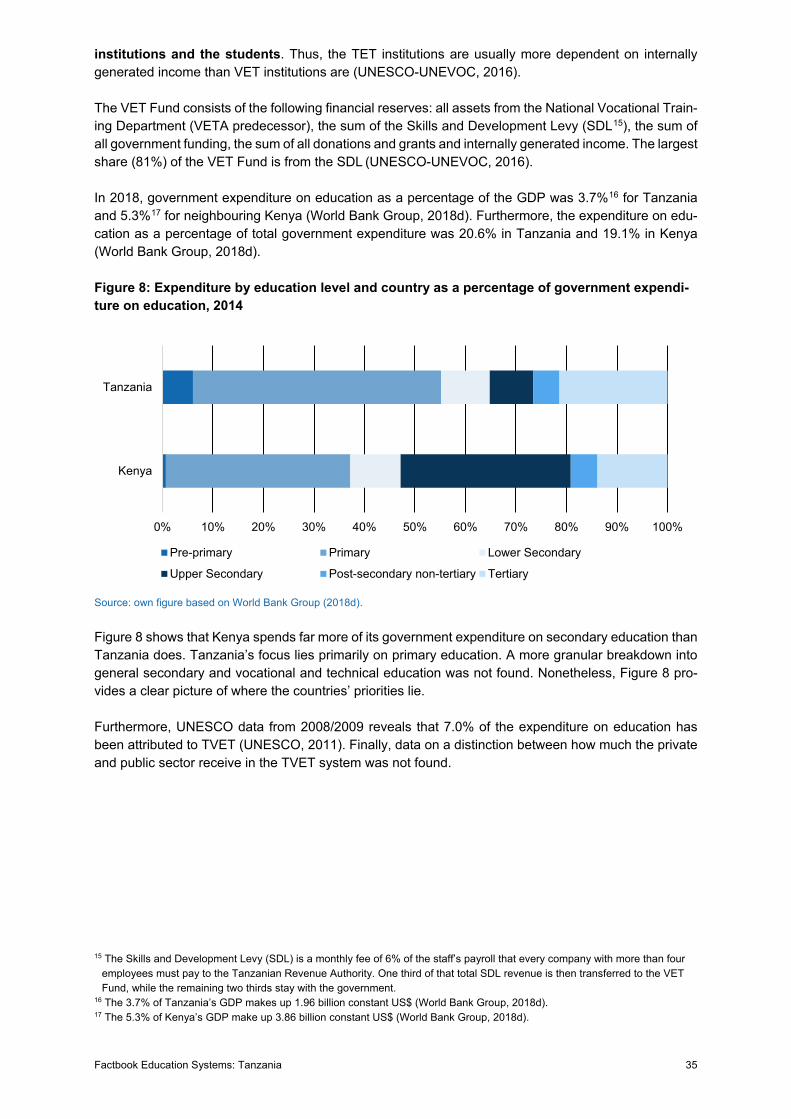
Factbook Education Systems: Tanzania 35
institutions and the students. Thus, the TET institutions are usually more dependent on internally generated income than VET institutions are (UNESCO-UNEVOC, 2016).
The VET Fund consists of the following financial reserves: all assets from the National Vocational Train-ing Department (VETA predecessor), the sum of the Skills and Development Levy (SDL15), the sum of all government funding, the sum of all donations and grants and internally generated income. The largest share (81%) of the VET Fund is from the SDL (UNESCO-UNEVOC, 2016).
In 2018, government expenditure on education as a percentage of the GDP was 3.7%16 for Tanzania and 5.3%17 for neighbouring Kenya (World Bank Group, 2018d). Furthermore, the expenditure on edu-cation as a percentage of total government expenditure was 20.6% in Tanzania and 19.1% in Kenya (World Bank Group, 2018d).
Figure 8: Expenditure by education level and country as a percentage of government expendi-ture on education, 2014
Source: own figure based on World Bank Group (2018d).
Figure 8 shows that Kenya spends far more of its government expenditure on secondary education than Tanzania does. Tanzania’s focus lies primarily on primary education. A more granular breakdown into general secondary and vocational and technical education was not found. Nonetheless, Figure 8 pro-vides a clear picture of where the countries’ priorities lie.
Furthermore, UNESCO data from 2008/2009 reveals that 7.0% of the expenditure on education has been attributed to TVET (UNESCO, 2011). Finally, data on a distinction between how much the private and public sector receive in the TVET system was not found.
15 The Skills and Development Levy (SDL) is a monthly fee of 6% of the staff’s payroll that every company with more than four employees must pay to the Tanzanian Revenue Authority. One third of that total SDL revenue is then transferred to the VET Fund, while the remaining two thirds stay with the government.
16 The 3.7% of Tanzania’s GDP makes up 1.96 billion constant US$ (World Bank Group, 2018d). 17 The 5.3% of Kenya’s GDP make up 3.86 billion constant US$ (World Bank Group, 2018d).
0% 10% 20% 30% 40% 50% 60% 70% 80% 90% 100%
Kenya
Tanzania
Pre-primary Primary Lower Secondary
Upper Secondary Post-secondary non-tertiary Tertiary
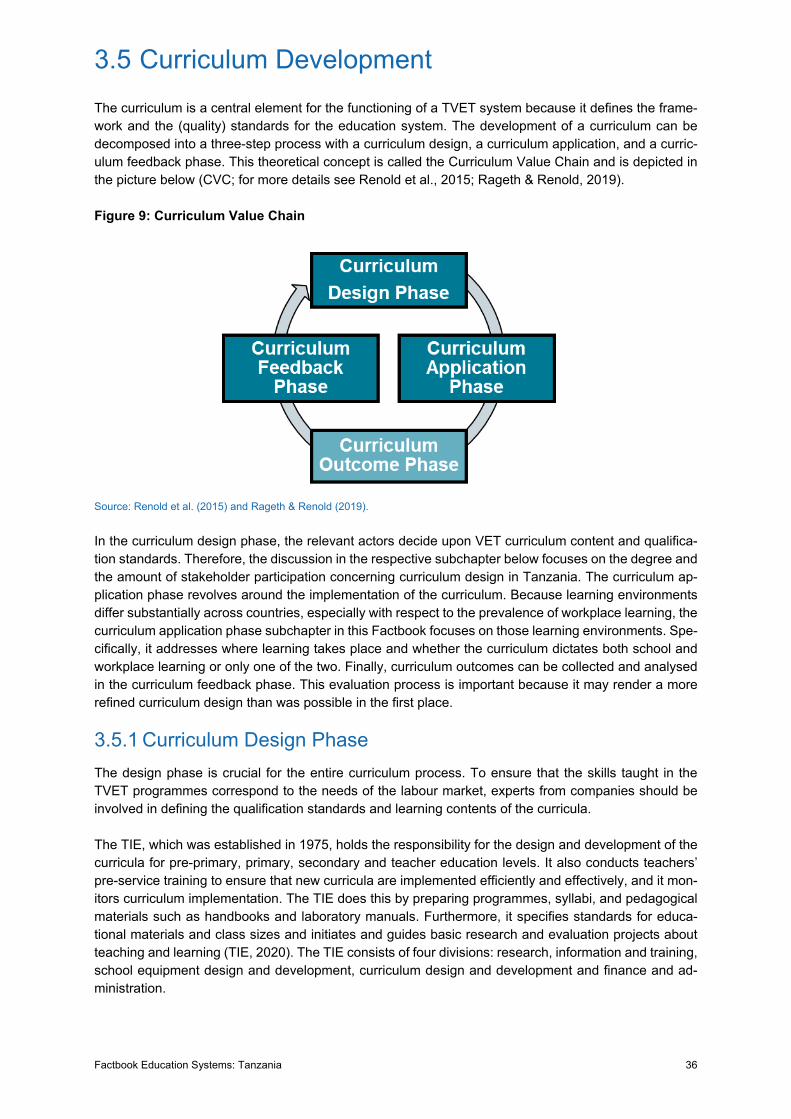
Factbook Education Systems: Tanzania 36
3.5 Curriculum Development The curriculum is a central element for the functioning of a TVET system because it defines the frame-work and the (quality) standards for the education system. The development of a curriculum can be decomposed into a three-step process with a curriculum design, a curriculum application, and a curric-ulum feedback phase. This theoretical concept is called the Curriculum Value Chain and is depicted in the picture below (CVC; for more details see Renold et al., 2015; Rageth & Renold, 2019).
Figure 9: Curriculum Value Chain
Source: Renold et al. (2015) and Rageth & Renold (2019).
In the curriculum design phase, the relevant actors decide upon VET curriculum content and qualifica-tion standards. Therefore, the discussion in the respective subchapter below focuses on the degree and the amount of stakeholder participation concerning curriculum design in Tanzania. The curriculum ap-plication phase revolves around the implementation of the curriculum. Because learning environments differ substantially across countries, especially with respect to the prevalence of workplace learning, the curriculum application phase subchapter in this Factbook focuses on those learning environments. Spe-cifically, it addresses where learning takes place and whether the curriculum dictates both school and workplace learning or only one of the two. Finally, curriculum outcomes can be collected and analysed in the curriculum feedback phase. This evaluation process is important because it may render a more refined curriculum design than was possible in the first place.
3.5.1 Curriculum Design Phase The design phase is crucial for the entire curriculum process. To ensure that the skills taught in the TVET programmes correspond to the needs of the labour market, experts from companies should be involved in defining the qualification standards and learning contents of the curricula.
The TIE, which was established in 1975, holds the responsibility for the design and development of the curricula for pre-primary, primary, secondary and teacher education levels. It also conducts teachers’ pre-service training to ensure that new curricula are implemented efficiently and effectively, and it mon-itors curriculum implementation. The TIE does this by preparing programmes, syllabi, and pedagogical materials such as handbooks and laboratory manuals. Furthermore, it specifies standards for educa-tional materials and class sizes and initiates and guides basic research and evaluation projects about teaching and learning (TIE, 2020). The TIE consists of four divisions: research, information and training, school equipment design and development, curriculum design and development and finance and ad-ministration.

Factbook Education Systems: Tanzania 37
While the TIE designs and develops the curricula for the general education path, the VETA and NACTE do the same for the TVET system by analysing the needs of the labour market and subsequently devel-oping the TVET curricula (UNESCO-UNEVOC, 2016). Regarding the specific curricula of the TVET system, however, no other information was found. For this reason, it remains unclear whether there are standard curricula for all TVET courses and whether the TVET institutions have a say in their develop-ment.
3.5.2 Curriculum Application Phase The way in which a curriculum is implemented, especially with respect to learning environments, is important to achieve the intended learning outcome.
As extensively described in Section 3.1, VET programmes in Tanzania are school-based with the ex-ception of two programmes: the RPL and the DATS. However, the prevalence of those programmes is rather low. The DATS, for example, has an on-the-job education component of 62%.
Regarding the curriculum for TVET courses, the VETA and NACTE establish and implement the curric-ula. Whether these curricula also apply to the RPL and DATS programmes remains unclear.
3.5.3 Curriculum Feedback Phase The curriculum feedback phase deals with the question of whether and how educational outcomes are analysed. Based on this, the curriculum could be re-worked and improved.
In Tanzania, the VETA and NACTE are responsible for evaluation and analysis of their respective cur-ricula. They do this in accordance with the TVET institutions (UNESCO-UNEVOC, 2016).
3.6 Supplying Personnel for the VPET System (Teacher Education)
For VET teachers, the Morogoro Vocational Instructors Training College (MVTTC) provides teacher training courses. The MVTTC operates under the administration of the VETA and was mandated under the VET Act in 1994. The MVTTC’s offerings for future VET teachers consist of two courses: the Voca-tional Teachers Certificate Course (VTCC) and the Diploma in Vocational Education and Training (DVoET).
At the NTA 5 level, the VTCC offers a 2-year programme that aims to develop VET teachers’ pedagog-ical and management skills and help them develop relevant competencies (UNESCO-UNEVOC, 2016, p. 10). To enter the VTCC course, the following criteria must be met: (1) a CSEE with passes in four subjects, (2) an NVTA 3 degree or any equivalent qualification offered by a recognised institution and (3) 2 years of work experience in the industry (MVTTC, 2020).
At the NTA 6 level, the DVoET offers a 2-year programme that aims to enhance existing pedagogical and managerial skills of VET teachers (UNESCO-UNEVOC, 2016, p. 11). To enter the DVoET course, the following criteria must be met: (1) a CSEE with a minimum of four passes, (2) a VTCC degree or any equivalent qualification offered by a recognised institution and (3) 2 years of work experience in the industry (MVTTC, 2020).
Compared to teachers in the general education path, meaning primary and secondary, VET teachers undergo separate training. There are differences especially regarding the admission requirements (e.g.,
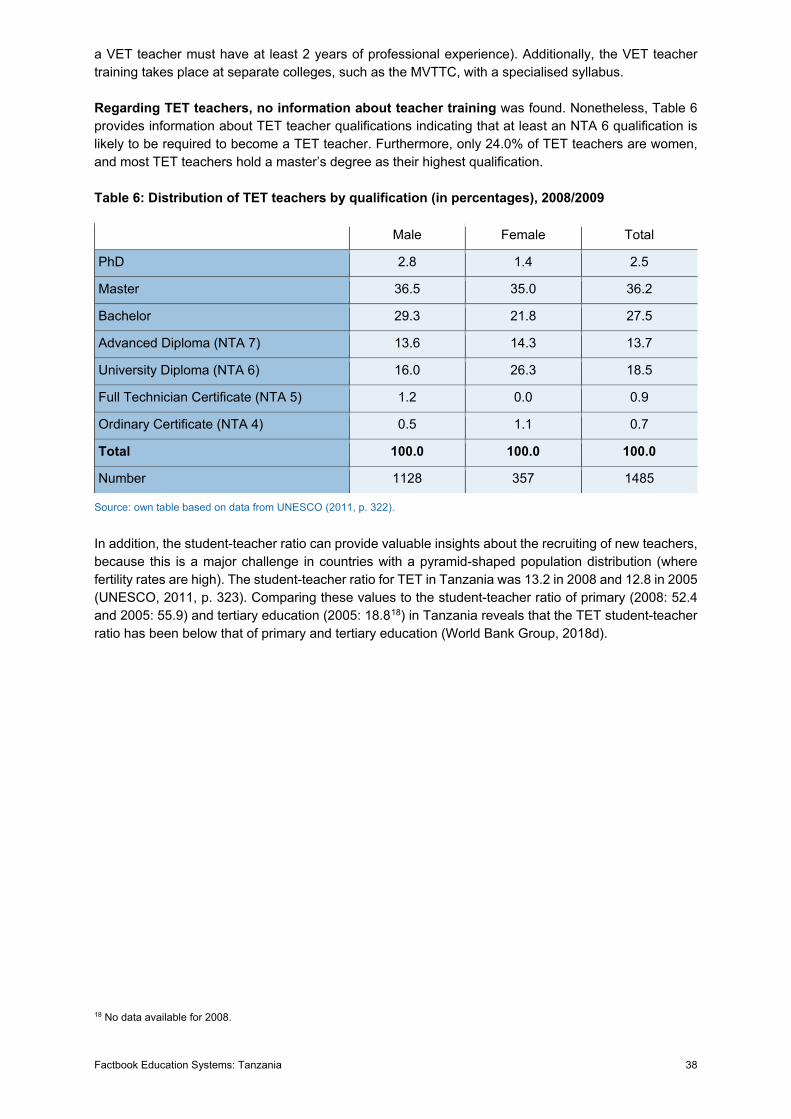
Factbook Education Systems: Tanzania 38
a VET teacher must have at least 2 years of professional experience). Additionally, the VET teacher training takes place at separate colleges, such as the MVTTC, with a specialised syllabus.
Regarding TET teachers, no information about teacher training was found. Nonetheless, Table 6 provides information about TET teacher qualifications indicating that at least an NTA 6 qualification is likely to be required to become a TET teacher. Furthermore, only 24.0% of TET teachers are women, and most TET teachers hold a master’s degree as their highest qualification.
Table 6: Distribution of TET teachers by qualification (in percentages), 2008/2009
Male Female Total
PhD 2.8 1.4 2.5
Master 36.5 35.0 36.2
Bachelor 29.3 21.8 27.5
Advanced Diploma (NTA 7) 13.6 14.3 13.7
University Diploma (NTA 6) 16.0 26.3 18.5
Full Technician Certificate (NTA 5) 1.2 0.0 0.9
Ordinary Certificate (NTA 4) 0.5 1.1 0.7
Total 100.0 100.0 100.0
Number 1128 357 1485
Source: own table based on data from UNESCO (2011, p. 322).
In addition, the student-teacher ratio can provide valuable insights about the recruiting of new teachers, because this is a major challenge in countries with a pyramid-shaped population distribution (where fertility rates are high). The student-teacher ratio for TET in Tanzania was 13.2 in 2008 and 12.8 in 2005 (UNESCO, 2011, p. 323). Comparing these values to the student-teacher ratio of primary (2008: 52.4 and 2005: 55.9) and tertiary education (2005: 18.818) in Tanzania reveals that the TET student-teacher ratio has been below that of primary and tertiary education (World Bank Group, 2018d).
18 No data available for 2008.
Factbook Education Systems: Tanzania 39
4. Major Reforms in the Past and Challenges for the Future
4.1 Major Reforms This section focuses on the major national reforms concerning the TVET system in Tanzania. As also discussed in Section 1.3.2, the national TVET actors VETA and NACTE were established by their re-spective legal frameworks: the VET Act (1994) and NACTE Act (1997). Other than that, the most im-portant reforms of the TVET system are as follows:
• In 1995, the Education and Training Policy summarised the main objective of TVET as the
provision and acquisition of a wider range of employable skills leading to increased productivity
in the economy and better earnings and well-being in all areas of life. The policy also empha-
sises the importance of apprenticeship training as an alternative cost-effective training system
and urges employers to employ a larger proportion of the workforce. The policy also focuses on
increasing the number of applications, ensuring fair access and improving the quality of educa-
tion and training at all levels (United Republic of Tanzania, 1995; Manyaga & Athumani, 2010,
p. 9).
• In 1999, the Tanzania Development Vision 2025 was released. It summarises the country’s
main economic problems as low productivity accompanied by a weak application of science and
technology to productive activities accompanied by a lack of initiative, ingenuity, creativity, and
innovation. On the other hand, it creates a vision for Tanzania’ economical future, which shall
be characterised by (1) macroeconomic stability; (2) accelerated industrialisation that produces
a diverse, semi-industrialised economy; (3) increased average annual growth rates; (4) a world
class infrastructure; (5) interventions that allow the poor to benefit from economic growth and
(6) active and competitive participation in the regional and global markets (United Republic of
Tanzania, 1999; Manyaga & Athumani, 2010, p. 8).
• In 2000, the Education Sector Development Programme was introduced, which addresses
the low enrolment rates and tries to provide equitable access and quality for education and
training. First, it aims to improve provision and equity of TVET by developing facilities, providing
adequate finances, and introducing a student loan system. Second, it tries to enhance the qual-
ity of TVET teachers, the use of ICT, the quality assurance system and the TVET curriculum in
cooperation with key stakeholders. Third, it aims to improve micro- and macro-management
and governance of TVET by developing a 3-year rolling plan for the TVET education sector,
enhancing planning and coordination and promoting and funding consultative dialogue (United
Republic of Tanzania, 2000; UNESCO-UNEVOC, 2016, p. 14).
• In 2003, the Small and Medium Enterprise Development Policy established the role of SMEs
in employment creation, income generation and poverty reduction and as a base for industrial
development. The policy’s goal is to promote entrepreneurship development through facilitating
improved access of SMEs to financial and non-financial services and to enhance the capacity
Factbook Education Systems: Tanzania 40
of institutions providing business training to SMEs (United Republic of Tanzania, 2003; Man-
yaga & Athumani, 2010, p. 9).
• In 2005 and 2010, the National Strategy for Growth and Reduction of Poverty I & II were
introduced as strategies that define ways in which to reduce poverty and unemployment in order
to realise the Tanzania Development Vision 2025. In that context, TVET is required to provide
demand-driven training for formal and self-employment. This gives more school leavers and
other unemployed people access to formal employment or to become self-employed and earn
an adequate income. Furthermore, especially at the rural level, TVET should contribute to im-
proved agricultural production through adequate teaching. Increased food production and in-
come reduces the population living below the national poverty line (United Republic of Tanzania,
2005; United Republic of Tanzania, 2010; Manyaga & Athumani, 2010, pp. 9-10).
• In 2008, the National Employment Policy suggested that TVET should pursue a demand-
driven skills and competencies approach. It calls for the development of mechanisms for devel-
oping skills to be used as guidelines for formal and informal qualification programmes to improve
the employability of the national labour force for both formal and self-employment. Furthermore,
entrepreneurship training shall be part of the training curricula to promote entrepreneurial skills
and self-employment. Lastly, on-the-job training shall be intensified to enhance the employabil-
ity and productivity of the national labour force (United Republic of Tanzania, 2008; Manyaga &
Athumani, 2010, p. 9).
4.2 Major Challenges Tanzania’s TVET system is key to the country’s development. To conclude this factbook, the most im-portant challenges affecting the TVET system are summarised as follows:
• There is difficulty in creating demand-driven TVET programmes for a heterogeneous target pop-
ulation (i.e., school leavers, workers wanting to upgrade their qualifications and low-skilled and
poorly educated people from urban and rural areas) (UNESCO, 2011, p. 330). Although Tanza-
nia’s TVET system relies on a demand-driven approach, the adaptation to the requirements of
the informal sector remain low. There is little attention on courses for workers who want to up-
grade their qualifications. Newer forms of training, such as RPL and DATS, are trying to catch
up, but the enrolment in such programmes is still low.
• Qualifications that are incongruous with the labour market are common. This complicates the
transition from TVET to the labour market for TVET school leavers. The connection to the labour
market is weak and uncoordinated, which results in a mismatch between the supply of jobs and
the demand for qualified workers (Manyaga & Athumani, 2010, pp. 27-33).
• Over-reliance on institutionally based training results in a lack of partnerships with workplaces
to enhance work-based training (formal and informal) (Manyaga & Athumani, 2010, p. 7).
• The variety of TVET stakeholders (ministries, VETA, NACTE, faith-based organisations, NGOs,
private institutions and other individuals) complicates the coordination and harmonisation of
TVET programmes (UNESCO, 2011, p. 330).
• Although theoretical transitions do exist between VET and TET, the practical continuity is still a
major challenge (UNESCO, 2011, p. 331).
Factbook Education Systems: Tanzania 41
• Poor TVET training infrastructures and inadequate TVET teacher training (i.e., teachers re-
cruited directly from training institutions or universities) limits the quality of TVET education
(Manyaga & Athumani, 2010, p. 7).
• There is weak monitoring of trainees to confirm the relevance of TVET offerings through tracer
studies (Manyaga & Athumani, 2010, p. 7).
• It is necessary to limit the variations in the costs of TVET programmes by defining a funding
formula to institutionalise the allocation of resources among TVET institutions (UNESCO-UNE-
VOC, 2016, p. 14).
In summary, Tanzania is well on its way to expanding the TVET system. The NQF and teacher education in particular are already advanced for a developing country. In addition, the TVET system is constantly being expanded, such as by the newer offers of work-based apprenticeship modes. It will be exciting to see how the TVET system in Tanzania develops in the future.
Factbook Education Systems: Tanzania 42
5. References
Bank of Tanzania. (2019). Monetary Policy Statement 2019/20.
Bureau of Democracy, Human Rights, and Labor. (2020). 2019 Country Reports on Human
Rights Practices. Tanzania.
Bureau of International Labor Affairs. (2018). Child Labor and Forced Labor Reports -
Tanzania. Retrieved April 27, 2020, from
https://www.dol.gov/agencies/ilab/resources/reports/child-labor/tanzania
CIA. (2020). The World Factbook - Tanzania. Retrieved April 28, 2020, from
https://www.cia.gov/library/publications/the-world-factbook/geos/tz.html
Dutta, S., Lanvin, B., & Wunsch-Vincent, S. (2019). The Global Innovation Index 2019:
Creating Healthy Lives. Fontainebleau, Ithaca, and Geneva: Cornell University,
INSEAD, and WIPO.
Encyclopædia Britannica Online. (2019). Tanzania. Retrieved April 17, 2020, from
https://www.britannica.com/place/Tanzania
Eurostat. (2019a). Gross Value Added and Income by A*10 Industry Breakdown
(nama_10_a10). Retrieved April 21, 2020, from
https://ec.europa.eu/eurostat/web/products-datasets/product?code=nama_10_a10_e
Eurostat. (2019b). Employment by A*10 Industry Breakdowns (nama_10_a10_e). Retrieved
April 21, 2020, from https://ec.europa.eu/eurostat/web/products-
datasets/product?code=nama_10_a10_e
Government of the United Republic of Tanzania. (2001). Primar Education Devolopment Plan
2002 - 2006. Retrieved April 28, 2020, from
https://www.tanzania.go.tz/egov_uploads/documents/Primary_Education_Developme
nt_Plan-PEDP_I_2000-06_sw.pdf
Government of the United Republic of Tanzania. (2005). National Strategy for Growth and
Reduction of Poverty (NSGRP). Retrieved April 28, 2020, from
https://siteresources.worldbank.org/INTPRS1/Resources/TanzaniaPRSP(June-
2005).pdf

Factbook Education Systems: Tanzania 43
ILOSTAT. (2014b). Annual data: Unemployment rate. International Labour Organization.
Retrieved April 24, 2020, from
https://www.ilo.org/shinyapps/bulkexplorer56/?lang=en&segment=ref_area&id=TZA_
A
ILOSTAT. (2015). Annual data: Trade union density rate. International Labour Organization.
Retrieved April 23, 2020, from
https://www.ilo.org/shinyapps/bulkexplorer2/?lang=en&segment=ref_area&id=TZA_A
ILOSTAT. (2020a). Annual data: Employment by sex and economic activity. International
Labour Organization. Retrieved April 20, 2020, from
https://www.ilo.org/shinyapps/bulkexplorer28/?lang=en&segment=ref_area&id=TZA_
A
ILOSTAT. (2020b). Annual data: Labour force by sex and age - ILO modelled estimates.
International Labour Organization. Retrieved April 24, 2020, from
https://www.ilo.org/shinyapps/bulkexplorer56/?lang=en&segment=ref_area&id=TZA_
A
ILOSTAT. (2020c). Annual data: Share of youth not in employment, education or training
(NEET) - ILO modelled estimates. International Labour Organization. Retrieved May
22, 2020, from
https://www.ilo.org/shinyapps/bulkexplorer53/?lang=en&segment=ref_area&id=TZA_
A
Kudrzycki, B., Günther, I., & Lefoll, E. (2020). Youth Labor Market Index for Low Income
Countries. Zurich: KOF Swiss Economic Institute, ETH Zurich: LELAM Working Papers
No. 13.
Manyaga, T., & Athumani, A. (2010). Relevance of Technical and Vocational Education and
Training to market demands: Skills for Employability. Dar es Salaam: Ministry of
Education and Vocational Training.
MoEST. (2016). Dataset: University Students Enrollment Degree & Non-Degree. Ministry of
Education, Science, and Technology. Retrieved May 14, 2020, from
http://statistics.go.tz/dataset/udahili-wa-wanafunzi-wa-vyuo-vikuu-ngazi-ya-shahada-
na-isiyokuwa-shahada-2015-2016
Mtahabwa, L., & Rao, N. (2010). Pre-primary education in Tanzania: Observations from urban
and rural classrooms. International Journal of Educational Development, 30, 227-235.
MVTTC. (2020). Certificate and Diploma Programmes. Morogoro Vocational Teachers
Training College. Retrieved June 15, 2020, from http://mvttc.ac.tz/index.php
Factbook Education Systems: Tanzania 44
NACTE. (2020a). Institution Registration. Record and Statistics. National Council for Technical
Education. Retrieved May 22, 2020, from
https://www.nacte.go.tz/index.php/registration/record-and-statistics/
NACTE. (2020b). NTA Competence Level Descriptors. National Council for Technical
Education. Retrieved May 20, 2020, from
https://www.nacte.go.tz/index.php/curriculum/competence-descriptor/
NACTE. (2020c). Registered and Accredited Institutions. National Council for Technical
Education. Retrieved June 03, 2020, from
https://www.nacte.go.tz/index.php/registration/registered-institutions/
NECTA. (2014). Dataset: Primary School Leaving Examination Performance by Region.
National Examinations Council of Tanzania. Retrieved May 11, 2020, from
http://statistics.go.tz/dataset/ufaulu-kimkoa-kwa-mtihani-wa-kumaliza-elimu-ya-msingi
OECD. (2016). Labour force participation rates by educational attainment. Retrieved April 27,
2020, from https://www.oecd.org/els/emp/employment-outlook-statistical-annex.htm
OECD. (2018a). LFS by sex and age - indicators. Retrieved April 24, 2020, from
https://stats.oecd.org/Index.aspx?DataSetCode=LFS_SEXAGE_I_R#
OECD. (2018b). OECD Labour Force Statistics. Retrieved April 24, 2020, from
https://data.oecd.org/unemp/unemployment-rates-by-education-level.htm#indicator-
chart
OECD. (2020). Trade Unions: Trade union density. OECD Employment and Labour Market
Statistics. doi:https://doi.org/10.1787/data-00371-en
Rageth, L., & Renold, U. (2019). The Linkage between the Education and Employment
Systems: Ideal Types of Vocational Education and Training Programs. Journal of
Education Policy. doi:10.1080/02680939.2019.1605541
Renold, U., Bolli, T., Caves, K., Rageth, L., Agarwal, V., & Pusterla, F. (2015). Feasibility Study
for a Curriculum Comparison in Vocational Education and Training. Zurich: KOF
Studies. Retrieved from https://doi.org/10.3929/ethz-a-010713492
Renold, U., Bolli, T., Egg, M. E., & Pusterla, F. (2014). On the Multiple Dimensions of Youth
Labour Markets - A Guide to the KOF Youth Labour Market Index. Zurich: KOF Swiss
Economic Institute. Retrieved from https://doi.org/10.3929/ethz-a-010699115
Reuters. (2012). Tanzanian teachers in strike over pay. Dar es Salaam: Reuters. Retrieved
June 08, 2020, from https://www.reuters.com/article/ozatp-tanzania-strike-20120730-
idAFJOE86T05320120730
Factbook Education Systems: Tanzania 45
SACMEQ. (2012). Education in Tanzania. Southern And Eastern Africa Consortium For
Monitoring Educational Quality. Retrieved May 11, 2020, from
https://web.archive.org/web/20130906142845/http://www.sacmeq.org/education-
tanzania.htm
Sifuna, D. N. (2007). The challenge of increasing access and improving quality: An analysis of
universal primary education interventions in Kenya and Tanzania since the 1970s.
International Review of Education, 53, 687-699.
Tanzania National Bureau of Statistics. (2016). Statistical Abstract 2016. Dar es Salaam.
Retrieved May 13, 2020, from https://www.nbs.go.tz/index.php/en/tanzania-statistical-
abstract
Tanzania National Bureau of Statistics. (2018). Tanzania in Figures 2018. Dar es Salaam.
Retrieved May 15, 2020, from https://www.nbs.go.tz/index.php/en/tanzania-in-figures
TIE. (2020). Website: Tanzanian Institute of Education. Tanzania Institute of Education.
Retrieved June 12, 2020, from https://www.tie.go.tz/
UIS. (2014). ISCED Mappings - Tanzania. UNESCO Institute For Statistics. Retrieved May 05,
2020, from http://uis.unesco.org/en/isced-mappings
UNDP. (2018). Human Development Index. United Nations Development Programme.
Retrieved April 17, 2020, from http://hdr.undp.org/en/content/human-development-
index-hdi
UNESCO. (2011). Tanzania - Education Sector Analysis. UNESCO. Retrieved June 15, 2020,
from
https://poledakar.iiep.unesco.org/sites/default/files/fields/publication_files/executive_s
ummary_tanzania.pdf
UNESCO-IBE. (2010). World Data on Education VII Ed. 2010/11. United Republic of Tanzania.
Geneva: UNESCO-IBE. Retrieved April 29, 2020, from
http://www.ibe.unesco.org/fileadmin/user_upload/Publications/WDE/2010/pdf-
versions/United_Republic_of_Tanzania.pdf
UNESCO-UNEVOC. (2016). World TVET Database Tanzania. International Centre for
Technical and Vocational Education and Training. Retrieved April 29, 2020, from
https://unevoc.unesco.org/wtdb/worldtvetdatabase_tza_en.pdf
United Republic of Tanzania. (1978). The National Education Act No. 25. Retrieved June 08,
2020, from
Factbook Education Systems: Tanzania 46
http://www.unesco.org/education/edurights/media/docs/873ae01bc28cf449895950c7
cac2a419d3ede5fd.pdf
United Republic of Tanzania. (1995). Education and Training Policy. Dar es Salaam: Ministry
of Education and Culture. Retrieved June 22, 2020, from
http://www.tzonline.org/pdf/educationandtraining.pdf
United Republic of Tanzania. (1999). The Tanzania Development Vision 2025. Retrieved June
22, 2020, from http://www.tzonline.org/pdf/theTanzaniadevelopmentvision.pdf
United Republic of Tanzania. (2000). The Education Sector Development Programme.
Retrieved June 22, 2020, from
http://www.tzonline.org/pdf/theeducationsectordevelopmentprogramme.pdf
United Republic of Tanzania. (2003). Small and Medium Enterprise Development Policy.
Ministry of Industry and Trade. Retrieved June 22, 2020, from
https://www.tanzania.go.tz/egov_uploads/documents/SME%20-%20Development-
Policy.pdf
United Republic of Tanzania. (2005). National Strategy for Growth and Reduction of Poverty.
Vice President's Office. Retrieved June 22, 2020, from
https://extranet.who.int/nutrition/gina/sites/default/files/Tanzannia-
National%20Strategy%20for%20Growth%20and%20Poverty%20Reduction%20.pdf
United Republic of Tanzania. (2008). National Employment Policy. Ministry of Labour,
Employment and Youth Development. Retrieved June 22, 2020, from
https://www.tanzania.go.tz/egov_uploads/documents/National-Employment-
Policy_sw.pdf
United Republic of Tanzania. (2010). National Strategy for Growth and Reduction of Poverty
II. Ministry of Finance and Economic Affairs. Retrieved June 22, 2020, from
http://www.tzonline.org/pdf/mkukutalldraft.pdf
VETA. (2014). Dataset: Number of Vocational Training Centres. Vocational Education and
Training Authority. Retrieved June 08, 2020, from
http://statistics.go.tz/dataset/veta/resource/b44be49b-f7ed-4767-8e21-8e5c8f455534
VETA. (2020a). Institutional Based Training. Vocational Education and Training Autority.
Retrieved May 20, 2020, from https://www.veta.go.tz/institutional-based-training
VETA. (2020b). Dual Apprenticeship. Vocational Education and Training Autority. Retrieved
May 22, 2020, from https://www.veta.go.tz/dual-apprenticeship
Factbook Education Systems: Tanzania 47
VETA. (2020c). VET Registered Centres. Vocational Education and Training Authority.
Retrieved June 15, 2020, from https://veta.go.tz/vetcat/
WEF. (2018). The Global Competitiveness Report 2018. Geneva: World Economic Forum.
World Bank Group. (2010). Project Performance Assessment Report - Tanzania. The World
Bank. Retrieved April 28, 2020, from
http://documents.worldbank.org/curated/en/340871468174232243/pdf/553830PPAR0
p121ficial0use0only01061.pdf
World Bank Group. (2014). Informal employment (% of total non-agricultural employment). The
World Bank. Retrieved April 27, 2020, from
https://data.worldbank.org/indicator/SL.ISV.IFRM.ZS?locations=TZ
World Bank Group. (2015). Tanzania Mainland Poverty Assessment. The World Bank.
World Bank Group. (2017). GINI index (World Bank estimate). The World Bank. Retrieved April
22, 2020, from https://data.worldbank.org/indicator/SI.POV.GINI
World Bank Group. (2017). World Development Indicatiors. The World Bank. Retrieved April
27, 2020, from
https://databank.worldbank.org/reports.aspx?source=2&country=&series=NY.GDP.M
KTP.KD.ZG&period=
World Bank Group. (2018a). GDP per capita, PPP (constant 2011 international $). The World
Bank. Retrieved April 17, 2020, from
https://data.worldbank.org/indicator/NY.GDP.PCAP.PP.KD
World Bank Group. (2018b). GDP growth (annual %). The World Bank. Retrieved April 22,
2020, from https://data.worldbank.org/indicator/NY.GDP.MKTP.KD.ZG
World Bank Group. (2018c). Poverty headcount ratio at national poverty lines (% of
population). The World Bank. Retrieved April 20, 2020, from
https://data.worldbank.org/indicator/SI.POV.NAHC
World Bank Group. (2018d). Education Statistics - All Indicators. Tanzania. The World Bank.
Retrieved April 30, 2020, from https://databank.worldbank.org/source/education-
statistics-%5E-all-indicators#
World Bank Group. (2020a). Ease of doing Business in Tanzania. The World Bank. IBRD-IDA.
Retrieved April 24, 2020, from
https://www.doingbusiness.org/en/data/labormarketeconomy/tanzania

Factbook Education Systems: Tanzania 48
World Bank Group. (2020b). Ease of Doing Business rankings. The World Bank. IBRD-IDA.
Retrieved April 24, 2020, from https://www.doingbusiness.org/en/rankings
ETH Zürich Chair of Education Systems LEE F 134 Leonhardstrasse 21 8092 Zürich, Switzerland www.ces.ethz.ch Herausgeber: Chair of Education Systems CES Gestaltung: ETH Zürich Fotos: Photo by Jeremy Bishop on Unsplash © ETH Zürich, Dezember 2020
ETH Zürich Chair of Education Systems LEE F 134 Leonhardstrasse 21 8092 Zürich, Switzerland www.ces.ethz.ch Herausgeber: Chair of Education Systems CES Gestaltung: ETH Zürich Fotos: Photo by Jeremy Bishop on Unsplash © ETH Zürich, Dezember 2020