The World Copper Factbook 2019 - Pebble Watch
68
PEBBLE PROJECT RECORD OF DECISION ENVIRONMENTAL IMPACT STATEMENT INTERNATIONAL COPPER STUDY GROUP, THE WORLD COPPER FACTBOOK 2019 (INTERNATIONAL COPPER STUDY GROUP, 2019)
-
Upload
khangminh22 -
Category
Documents
-
view
3 -
download
0
Transcript of The World Copper Factbook 2019 - Pebble Watch
PEBBLE PROJECT RECORD OF DECISION ENVIRONMENTAL IMPACT STATEMENT
INTERNATIONAL COPPER STUDY GROUP, THE WORLD COPPER FACTBOOK 2019
(INTERNATIONAL COPPER STUDY GROUP, 2019)

The World Copper Factbook 2019
International Copper Study Group
THE WORLD COPPER FACTBOOK 2019
INTERNATIONAL COPPER STUDY GROUP

The World Copper Factbook 2019
International Copper Study Group
Table of ContentsAbout ICSG iICSG Officers and Secretariat iiICSG Publications ii i
Chapter 1: Cu Basics 1What is Copper? 1Copper Properties and Benefits 2Selected Copper Definitions 3Copper in History 4Copper Today 5
Chapter 2: Copper Resources and Long‐Term Availability of Copper 6Copper Reserves and Resources 6Are We Going to Run Out of Copper 8
Chapter 3: Copper Production 9How is Copper Produced? 9Copper Mine Production: World Copper Mine Production, 1900‐2018 10Copper Mine Production by Region: 1960 versus 2018 11Copper Mine Production by Country: Top 20 Countries in 2018 12Trends in copper Mining Capacity, 2000‐2023 13Top 20 Copper Mines by Capacity, basis 2019 14Constraints on Copper Supply 15Copper Smelter Production: World Copper Smelter Production 1980‐2018
16
Trends in Copper Smelting Capacity, 2000‐2023 17Copper Smelter Production by Region, 1990‐2018 18Copper Smelter Production by Country: Top 20 Countries in 2018 19Top 20 Copper Smelters by Capacity, basis 2019 20World Refined Copper Production, 1960‐2018 21Trends in Refined Capacity, 2000‐2023 22Refined Copper Production by Region, 1990‐2018 23Refined Copper Production by Country: Top 20 Countries in 2018 24Top 20 Copper Refineries by Capacity, basis 2019 25World Copper & Copper Alloy Semis Production, 1980‐2018 26Copper and Copper Alloy Semis Production by Region, 1980 & 2018 27Copper and Copper Alloy Semis Capacity by Region & Product 2019 28Copper and Copper Alloy Semis Production by Country: Top 20 Countries, 2019 29
Chapter 4: Corporate Social Responsibility (CSR) in Mining 30What is Corporate Social Responsibility? 30Why is CSR Important? 30
Chapter 5: Copper Trade 31Major International Trade Flows of Copper Ores and Concentrates 32Major International Trade Flows of Copper Blister and Anode 33Major International Trade Flows of Refined Copper 34Leading Exporters and Importers of Semi‐Fabricated Copper Products, 2018 35The Global Copper Market and the Commodity "Copper" 36Copper Stocks, Prices and Usage (Jan 2001 ‐ Jun 2019) 37
Chapter 6: Copper Usage 38How is Copper Used? 388World Refined Copper Usage, 1900‐2017 39Refined Copper Usage by Region, 1960, 1980 & 2018 40World Refined Copper Usage per Capita: 1950‐2018 41Intensity of Refined Copper Usage 42Total Copper Usage, Including Copper Scrap, 2006‐2017 43Major Uses of Copper: Electrical 44Major Uses of Copper: Electronics and Communications 45Major Uses of Copper: Construction 46Major Uses of Copper: Industrial Machinery and Equiptment 47Major Uses of Copper: Consumer and General Products 48Major Uses of Copper: Transportation 49Electric Vehicles 49Growth Markets for Copper Usage 50Major Uses of Copper: Usage by End‐Use Sector and Region, 2018 51
Chapter 7: Copper Recycling 52Copper Recycling Rate Definitions 53Global Copper Use (incl. Recycling), 2010‐2017 54ICSG Global Copper Scrap Research Project and recent scrap reports 55Industry Global Flows of Copper (2017) and Derived Recycling Rates 56The Flow of Copper 57
ANNEXWorld Copper Production and Refined Usage, 1960‐2018 59ICSG Publications Order Form 60

The World Copper Factbook 2019
International Copper Study Group
About ICSG
The International Copper Study Group (ICSG) was formally established as an autonomous inter‐governmental organization on 23 January 1992, following a series of Ad Hoc meetings sponsored by the United Nations (UNCTAD) in 1986 and 1987 to review the world situation of copper and discuss the need for such a body. ICSG serves to increase copper market transparency and promote international discussions and cooperation on issues related to copper.
In order to fulfill its mandate, the Study Group has three main objectives:
Increase market transparency by promoting an exchange of information on production, consumption, stocks, trade, and prices of copper, by forecasting production and consumption, and by assessing the present and future capacities of copper mines, plants, smelters and refineries.
Promote international cooperation on matters related to copper, such as health and the environment, research, technology transfer, regulations and trade.
Provide a global forum where industry and governments can meet and discuss common problems/objectives. The ICSG is the only inter‐government forum solely dedicated to copper.
The current members of ICSG are:
Australia
Italy
Belgium
Japan Brazil
Luxembourg
Chile
Mexico
China
Mongolia
DR Congo
Peru European
Union
Poland
Finland
Portugal
France
Russian Federation
Germany Serbia
Greece Spain
India Sweden Iran United States
As part of its mandate to provide a global forum where industry and governments can meet and discuss common problems and objectives, ICSG meetings are held twice per year, typically in the Spring and Fall at ICSG Headquarters in Lisbon, Portugal. The meetings of the Study Group are open to government members, their industry advisors and invited observers.
i

The World Copper Factbook 2019
International Copper Study Group
ICSG Officers and Secretariat
INTERNATIONAL COPPER STUDY GROUP OFFICERS FOR 2019 Chairperson
TBA
Vice Chairperson Mr Li Yusheng (China)
STANDING COMMITTEE
Chairperson TBA Vice Chairperson Mr Mitsunori Fukuda (Japan) Finance Committee Chairman Mr Henrique Santos (Portugal)
ENVIRONMENTAL AND ECONOMIC COMMITTEE
Chairperson Mr Piotr Krawczyck (Poland) Vice Chairperson Mr K D Diwan (India) Vice Chairperson Mr Dieudonné Tambwe (D.R. Congo) Contacts:
International Copper Study Group Rua Almirante Barroso, 38‐6º 1000‐013 Lisbon, Portugal Tel: +351‐21‐351‐3870 Fax: +351‐21‐352‐4035 e‐mail: [email protected] website: www.icsg.org
STATISTICAL COMMITTEE
Chairperson Mr Daniel Flanagan (U.S.A.) Vice Chairperson Ms Manuela Ramirez (Spain) Vice Chairperson Ms Cao Mingyue (China)
INDUSTRY ADVISORY PANEL
Chairperson Mr Mark Loveitt (IWCC)
SECRETARIAT
Secretary-General Mr Paul White Director of Market Research and Statistics Ms Ana Rebelo Director of Economics and Environment Mr Carlos Risopatron Manager of Statistical Analysis Mr Shairaz Ahmed Secretary Ms Ana Paula Calheiros
Acknowledgements and Copyright:
ICSG would like to thank the International Wrought Copper Council, the International Copper Association, the Copper Development Association, the European Copper Institute, the U.S. Geological Survey, the U.S. National Park Service, the British Museum and Mr Luis Hernán Herreros Infante for their contributions to the Factbook. Cover page image of the Escondida mine courtesy of Rio Tinto (Copyright © 2018 Rio Tinto).
The International Copper Study Group's World Copper Factbook © 2019 is published by the ICSG.
ii

The World Copper Factbook 2019
International Copper Study Group
ICSG Publications
COPPER BULLETIN (monthly). The ICSG Copper Bulletin includes annual and monthly statistics on copper and copper products, their production, usage and trade by country, as well as stocks and exchange prices, providing a global view of supply and demand. Subscribers to the Copper Bulletin receive the Yearbook as part of their annual subscription.
ICSG STATISTICAL YEARBOOK. The ICSG Copper Bulletin yearbook includes annual statistics on copper and copper products, their production, usage and trade by country, as well as stocks and exchange prices, providing a global view of supply and demand for the past 10 years. The Yearbook serves as a useful tool for consultations and analysis on the longer term evolution of world copper production, usage, stocks and prices. Subscribers to the Copper Bulletin receive the Yearbook as part of their annual subscription.
DIRECTORY OF COPPER MINES AND PLANTS. The Directory of Copper Mines and Plants highlights current capacity and provides a five year outlook of forecasted capacity for over 1,000 existing and planned copper mines, plants and refineries on a country by country basis, including separate tables for SX‐EW plants. Salient details for each operation are included and the Directory separates operations between Operating & Developing and Exploration & Feasibility stages. The Directory is published twice per year.
ICSG STATISTICAL DATABASE. The ICSG maintains one of the world's most complete historical and current databases with statistics on copper production capacities, data on copper production, consumption, stocks, prices, recycling and trade for copper products. In 2012 ICSG launched its online statistical database that gives subscribers direct access to ICSG historical data. It also provides subscribers with specific extraction tools for downloading the data.
DIRECTORY OF COPPER & COPPER ALLOY FABRICATORS (FIRST USE). This directory provides a global overview of companies and plants involved in the first use of copper.
EUROPEAN SEMI MANUFACTURED COPPER PRODUCTS CAPACITY (2019). A study focusing on providing a complete picture of fabrication and copper use in Europe.
SOLID WASTES IN COPPER, LEAD, ZINC AND NICKEL MINING, SMELTING AND REFINING (2019). The study examines mine, smelter and refinery solid wastes and assesses a range of issues related to these wastes.
SMELTING AND HYDROMETALLURGY TREATMENT FOR COPPER SULPHIDE ORES AND CONCENTRATES (2019). This study focuses on key issues related to plants processing copper sulphide ores and concentrates of different complexity.
COPPER USE IN FABRICATION IN JAPAN, KOREA, TAIWAN (CHINA) AND VIETNAM (2018). A study focusing on providing a complete picture of fabrication and copper use in the Japan, Korea, Taiwan and Vietnam.
INDUSTRIAL USE OF REFINED COPPER AND SCRAP IN FABRICATION IN CHINA (2017). A study focusing on providing a complete picture of fabrication and copper use in China.
MANUFACTURE AND USE OF SEMI‐FABRICATED COPPER IN LATIN AMERICA/CANADA (2017). A study focusing on providing a complete picture of fabrication and copper use in Latin America and Canada.
CHINA COPPER MINING INDUSTRY. A study focusing on providing a complete picture of the copper mining industry in China.
To subscribe to ICSG publications, please see our Order Form on Page 60. Alternatively, please visit our website at www.icsg.org
iii

The World Copper Factbook 2019
International Copper Study Group
1
Chapter 1: Cu Basics What is Copper? Copper is a malleable and ductile metallic element that is an excellent conductor of heat and electricity as well as being corrosion resistant and antimicrobial. Copper occurs naturally in the Earth’s crust in a variety of forms. It can be found in sulfide deposits (as chalcopyrite, bornite, chalcocite, covellite), in carbonate deposits (as azurite and malachite), in silicate deposits (as chrysycolla and dioptase) and as pure "native" copper.
Copper also occurs naturally in humans, animals and plants. Organic life forms have evolved in an environment containing copper. As a nutrient and essential element, copper is vital to maintaining health. Life sustaining functions depend on copper.
Copper and copper‐based alloys are used in a variety of applications that are necessary for a reasonable standard of living. Its continued production and use is essential for society's development. How society exploits and uses its resources, while ensuring that tomorrow's needs are not compromised, is an important factor in ensuring society's sustainable development.
Copper is one of the most recycled of all metals. It is our ability to recycle metals over and over again that makes them a material of choice. Recycled copper (also known as secondary copper) cannot be distinguished from primary copper (copper originating from ores), once reprocessed. Recycling copper extends the efficiency of use of the metal, results in energy savings and contributes to ensuring that we have a sustainable source of metal for future generations.
The demand for copper will continue to be met by the discovery of new deposits, technological improvements, efficient design, and by taking advantage of the renewable nature of copper through reuse and recycling. As well, competition between materials, and supply and demand principles, contribute to ensuring that materials are used efficiently and effectively.
Copper is an important contributor to the national economies of mature, newly developed and developing countries. Mining, processing, recycling and the transformation of metal into a multitude of products creates jobs and generates wealth. These activities contribute to building and maintaining a country's infrastructure, and create trade and investment opportunities. Copper will continue to contribute to society’s development well into the future.
Images courtesy of the Copper Development Association.
1

The World Copper Factbook 2019
International Copper Study Group 2
Copper Properties and Benefits Chemical Symbol Cu Atomic Number 29
Atomic Weight 63.54
Density 8960 kg m-3
Melting point 1356 K
Specific Heat cp (at 293 K) 0.383 kJ kg-1 K-1
Thermal conductivity 394 W m-1 K-1
Coefficient of linear expansion 16.5 x 10⁻⁶ K-1
Young's Modulus of Elasticity 110 x 109 N m-2
Electrical Conductivity (% IACS) 1.673 x 10⁻⁸ ohm-m
Crystal Structure Face-Centered Cubic
Copper makes vital contributions to sustaining and improving society. Copper's chemical, physical and aesthetic properties make it a material of choice in a wide range of domestic, industrial and high technology applications. Alloyed with other metals, such as zinc (to form brass), aluminum or tin (to form bronzes), or nickel, for example, it can acquire new characteristics for use in highly specialized applications. In fact, society's infrastructure is based, in part, on copper.
But copper’s benefits extend beyond mechanical characteristics:
Copper is essential to the health of plants, animal and humans. Deficiencies, as well as excesses, can be detrimental to health.
Antimicrobial Properties. Due to copper’s antimicrobial properties, copper and copper alloy products can be used to eliminate pathogens and reduce the spread of diseases.
Recycling. Copper is one of the most recycled of all metals. Virtually all products made from copper can be recycled and recycled copper loses none of its chemical or physical properties.
Energy Efficiency. Copper can improve the efficiency of energy production and distribution systems.
Key Physical Properties of Copper

The World Copper Factbook 2019
International Copper Study Group 3
Selected Copper Definitions Anode. The positive terminal in an electrolytic cell where
electrons leave a device to enter the external circuit. A copper anode at 99 percent purity will dissolve.
Blister. The product of a converting furnace. It is an intermediate, more concentrated (with respect to the desired metal) material than matte, from which it is made, and is usually transferred to another furnace for further concentration.
Cathode. The negative terminal in an electrolytic cell where copper is plated during electrowinning or electrolytic refining. Copper so plated is referred to as “cathode” and is generally about 99.99 percent pure.
Contained Copper. Contained copper is defined as the analytical amount of copper outputted in concentrates and precipitates.
Copper concentrate. A product of flotation milling. It composes sulfide minerals and entrained material and contains one‐third each copper, iron, and sulfur. It can be processed pyrometallurgically in a smelter to produce matte or hydrometallurgically (pressure leaching) to produce pregnant leach solution, both products requiring further processing to obtain copper metal.
Direct melt scrap. Direct‐melt, or re‐melt scrap is secondary material that can be used directly in a furnace without cleanup through the use of fluxes and poling and re‐refining.
Electrorefining. An electrolytic refining process where less pure copper anode is dissolved and high‐purity copper is plated at the cathode.
Electrowinning. An electrolytic refining process where the anode is inert, and rich (copper‐loaded) electrolyte continually replaces lean (copper‐depleted) electrolyte as copper is plated at the cathode.
Fire‐refined copper. The product of a fire‐refining furnace. It is an intermediate, more concentrated (with respect to the desired metal) material than blister, from which it is made. Fire‐refined copper contains about 99 percent copper, the exact percentage depending on the process parameters.
Primary copper. Copper extracted from ores and recovered as copper metal or copper‐bearing chemicals.
Secondary refined material. Secondary refined material represents scrap that has been fire‐refined, or that has been converted to anode at the smelter level and then electrolytically refined.
Solvent extraction. A method of separating one or more metals from a leach solution by treating with a solvent that will extract the required metal, leaving the others. The metal is recovered from the solvent by further treatment.
Stocks. ICSG reports refined copper stocks as those held by the exchanges, consumers, producers and governments. Merchant stocks are included where it is certain that these are nonduplicative to those already reported. Only refined products at plant sites are included. Items such as wire rod, tube and other semifabricated forms are not included.
Usage. Copper usage represents refined copper used by semifabricators. Usage data is either directly reported, or ICSG estimates an apparent usage using the following formula: Refined copper production + refined imports ‐ refined exports + refined beginning stocks ‐ ending stocks.
Sources: ICSG and USGS.

The World Copper Factbook 2019
International Copper Study Group 4
Images courtesy of the British Museum, the Copper Development Association and ICSG.
Copper in History
Archaeological evidence demonstrates that copper was one of the first metals used by humans and was used at least 10,000 years ago for items such as coins and ornaments in western Asia. During the prehistoric Chalcolithic Period (derived from chalkos, the Greek word for copper), man discovered how to extract and use copper to produce ornaments and implements. As early as the 4th to 3rd millennium BC, workers extracted copper from Spain's Huelva region.
The discovery that copper, when alloyed with tin, produces bronze, led to the Bronze Age, c. 2,500 BC. Israel's Timna Valley provided copper to the Pharaohs (an Egyptian papyrus records the use of copper to treat infections and to sterilize water). Cyprus supplied much of the Phoenician, Greek and Roman needs for copper. "Copper" is derived from the latin Cyprium, literally Cyprian metal. The Greeks of Aristotle's era were familiar with brass as a valued copper alloy. In South America, the pre-Columbian Maya, Aztec and Inca civilizations exploited copper, in addition to gold and silver. During the Middle Ages, copper and bronze works flourished in China, India and Japan.
The discoveries and inventions relating to electricity and magnetism of the late 18th and early 19th centuries by scientists such as Ampere, Faraday and Ohm, and the products manufactured from copper, helped launch the Industrial Revolution and propel copper into a new era. Today, copper continues to serve society's needs. Although copper has been in use for at least 10,000 years, innovative applications for copper are still being developed as evidenced by the development of the copper chip by the semi-conductors industry.
The World Copper Factbook 2019
International Copper Study Group 5
Copper Today
CCooppppeerr PPrroodduuccttiioonn HHiigghhlliigghhttss
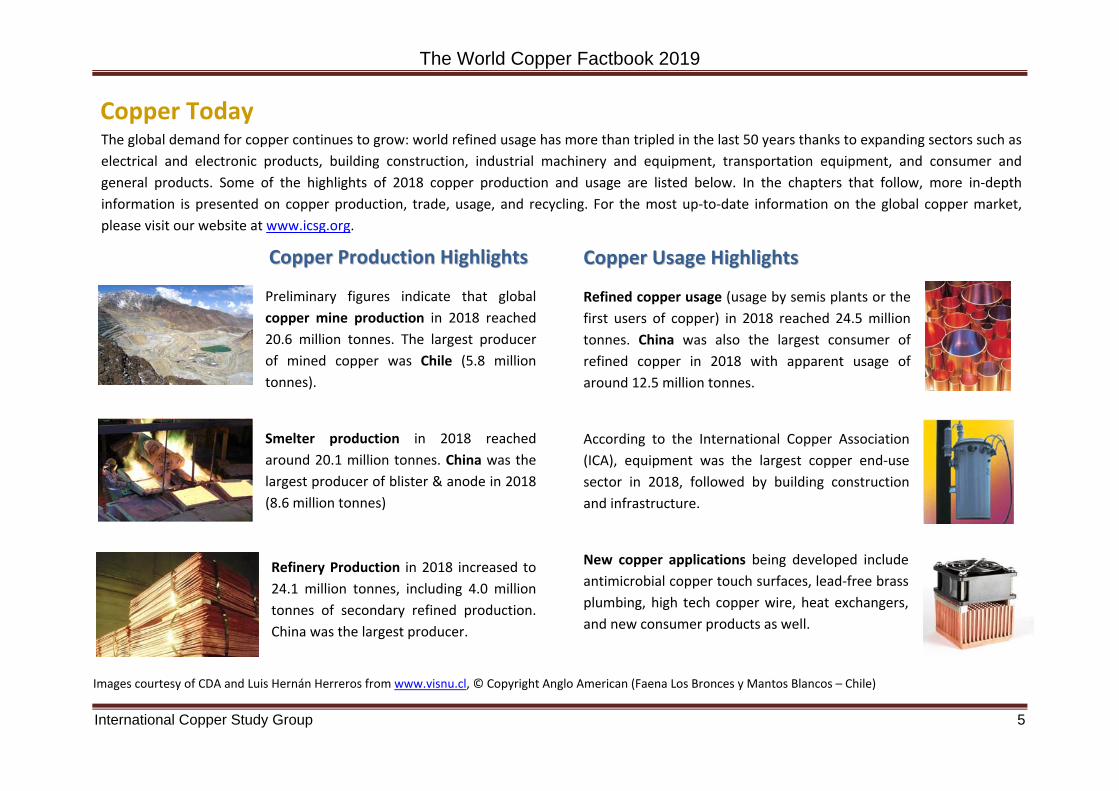
Preliminary figures indicate that global copper mine production in 2018 reached 20.6 million tonnes. The largest producer of mined copper was Chile (5.8 million tonnes).
Smelter production in 2018 reached around 20.1 million tonnes. China was the largest producer of blister & anode in 2018 (8.6 million tonnes) Refinery Production in 2018 increased to 24.1 million tonnes, including 4.0 million tonnes of secondary refined production. China was the largest producer.
CCooppppeerr UUssaaggee HHiigghhlliigghhttss
Refined copper usage (usage by semis plants or the first users of copper) in 2018 reached 24.5 million tonnes. China was also the largest consumer of refined copper in 2018 with apparent usage of around 12.5 million tonnes.
According to the International Copper Association (ICA), equipment was the largest copper end‐use sector in 2018, followed by building construction and infrastructure.
New copper applications being developed include antimicrobial copper touch surfaces, lead‐free brass plumbing, high tech copper wire, heat exchangers, and new consumer products as well.
The global demand for copper continues to grow: world refined usage has more than tripled in the last 50 years thanks to expanding sectors such as electrical and electronic products, building construction, industrial machinery and equipment, transportation equipment, and consumer and general products. Some of the highlights of 2018 copper production and usage are listed below. In the chapters that follow, more in‐depth information is presented on copper production, trade, usage, and recycling. For the most up‐to‐date information on the global copper market, please visit our website at www.icsg.org.
Images courtesy of CDA and Luis Hernán Herreros from www.visnu.cl, © Copyright Anglo American (Faena Los Bronces y Mantos Blancos – Chile)

The World Copper Factbook 2019
International Copper Study Group 6
Chapter 2: Copper Resources and Long‐Term Availability of Copper Copper Reserves and Resources Typically, the future availability of minerals is based on the concept of reserves and resources. Reserves are deposits that have been discovered, evaluated and assessed to be economically profitable to mine. Resources are far bigger and include reserves, discovered deposits that are potentially profitable, and undiscovered deposits that are predicted based on preliminary geological surveys (see definitions below).
According to the United States Geological Survey (USGS), copper reserves currently amount to around 830 million tonnes (Mt) and identified and undiscovered copper resources are estimated to be around 2,100 Mt and 3,500 Mt, respectively. The latter does not take into account the vast amounts of copper found in deep sea nodules and land‐based and submarine massive sulphides. Current and future exploration opportunities will lead to increases in both reserves and known resources.
(undiscovered resources not including deep sea nodules and land‐based and submarine massive sulfides ‐ contained copper)
2018 World Copper Reserves & Mine Production 1/
Reserves 830 Mt
Mine Capacity 24.1 Mt
Mine Production 20.6 Mt
(not to scale)
Total Resources (identified and undiscovered) 5,600 million tonnes (Mt)
1/ Source: USGS (resources/reserves data) and ICSG (capacity/production data)
Identified Resources 2,100 Mt
Definitions (http://minerals.usgs.gov/minerals/pubs/mcs/2014/mcsapp2014.pdf) Resource: A concentration of naturally occurring solid, liquid, or gaseous material in or on the Earth’s crust in such form and amount that economic extraction of a commodity from the concentration is currently or potentially feasible. Identified Resources: Resources whose location, grade, quality, and quantity are known or estimated from specific geologic evidence. Identified resources include economic, marginally economic, and sub‐economic components. Undiscovered Resources: Resources, the existence of which are only postulated, comprising deposits that are separate from identified resources. Undiscovered resources may be postulated in deposits of such grade and physical location as to render them economic, marginally economic, or sub‐economic. Reserves: That part of the reserve base (part of an identified resource that meets specified minimum physical and chemical criteria related to current mining and production practices, including those for grade, quality, thickness, and depth) which could be economically extracted or produced at the time of determination. The term reserves need not signify that extraction facilities are in place and operative.

The World Copper Factbook 2019
International Copper Study Group 7
South America, 39%
Central America and the
Caribbean, 2%North America,
23%
Northeast Asia, 0%
North Central Asia, 8%
South Central Asia and
Indochina, 3%
Southeast Asia Archipelagos, 6%
Australia, 1%
Eastern Europe and
Southwestern Asia, 6%
Western Europe, 4%
Africa and the Middle East, 8%
A. Identified Copper Resources
>1%
South America, 21%
Central America and the
Caribbean, 5%
North America, 13%
Northeast Asia, 7%
North Central Asia, 14%
South Central Asia and
Indochina, 15%
Southeast Asia Archipelagos, 9%
Australia, 1%
Eastern Europe and
Southwestern Asia, 7%
Western Europe, 3%
Africa and the Middle East, 5%
B. Undiscovered Copper Resources
Global Distribution of Identified and Undiscovered Copper Resourcesin Porphyry and Sediment‐hosted Stratabound Copper Deposits 1/
1/ Undiscovered Copper Resources ‐ A Global Assessment, April 2014, Presentation at ICSG meeting, Lisbon, by Mrs Jane M. Hammarstrom (USGS Global Mineral Resource Assessment Team) 2/ Supporting studies, including documentation of the assessment methodology and descriptions of individual tracts, are available on the USGS Mineral Resources Program Web site, at http://minerals.usgs.gov/global/.
In 2013 the U.S. Geological Survey (USGS) completed a geology‐based, cooperative international assessment of copper resources of the world 2/. The USGS assessed undiscovered copper in two deposit types that account for about 80% of the world’s copper supply. Porphyry copper deposits account for about 60% of the world’s copper. In porphyry copper deposits, copper ore minerals are disseminated in igneous intrusions. Sediment‐hosted stratabound copper deposits, in which copper is concentrated in layers in sedimentary rocks, account for about 20% of the world’s identified copper. The mean undiscovered totals for porphyry and sediment‐hosted deposits are 3,100 and 400 Mt respectively, resulting in a global total of 3,500 Mt of copper. With identified copper resources currently estimated at 2,100 Mt, total copper resources (undiscovered + identified) are estimated at 5,600 Mt.

The World Copper Factbook 2019
International Copper Study Group 8
Are We Going to Run Out of Copper1? It is highly improbable. Since 1950, there has always been, on average, 40 years of reserves, and significantly greater amounts of known resources (USGS data). In addition, recycling, innovation and mining exploration continue to contribute to the long‐term availability of copper.
Despite increased demand for copper produced from ore in recent years, increases in reserves have grown, and there is more identified copper available to the world than at any other time in history.
In the period 2008‐2018, 197 million tonnes of copper have been mined. In that same period however, reserves have grown by 280 million tonnes. This reflects additional exploration, technological advances and the evolving economics of mining.
Technology has a key role to play in addressing many of the challenges faced by new copper production. Known and as yet unknown innovations will ensure new mine production continues to provide vital copper supplies.
In addition copper recycling plays an important role in copper availability since today’s primary copper is tomorrow’s recycled material. Unlike other commodities such as energy or food, copper is not “consumed”. Copper is one of the few raw materials which can be recycled repeatedly without any loss of performance, and key stakeholders such as policy‐makers, scrap collectors, copper producers and recyclers must all focus on ensuring that yesterday’s metal is recycled and re‐used.
While this will ensure a progressive move towards a more sustainable economy, the loop cannot be completely closed for two reasons. Firstly, demand will continue to increase due to population growth, product innovation and economic development. Secondly in most applications, copper stays in use for decades.
Consequently, meeting future metals demand will continue to require a combination of primary raw materials, coming from mines, as well as recycled materials, while innovative policies and technology should continue to contribute to improvements in recycling performance and resource efficiency.
Based on the latest knowledge on geological availability and continuous industry innovation there are good reasons to believe that copper will continue to be a vital and positive contributor to society well into the future.
1/ Based on the International Copper Association briefing note on copper’s long‐term availability. See http://copperalliance.org/about‐copper/long‐term‐availability/

The World Copper Factbook 2019
International Copper Study Group 9
Chapter 3: Copper Production
How is Copper Produced? Geologists look for signs and/or anomalies that would indicate the presence of a mineral deposit. Under the right geological, economic, environmental and legal conditions, mining can proceed.
Primary copper production starts with the extraction of copper‐bearing ores. There are three basic ways of copper mining: surface, underground mining and leaching. Open‐pit mining is the predominant mining method in the world.
After the ore has been mined, it is crushed and ground followed by a concentration by flotation. The obtained copper concentrates typically contain around 30% of copper, but grades can range from 20 to 40 per cent. In the following smelting process, sometimes preceded by a roasting step, copper is transformed into a “matte” containing 50‐70% copper. The molten matte is processed in a converter resulting in a so‐called blister copper of 98.5‐99.5% copper content. In the next step, the blister copper is fire refined in the traditional process route, or, increasingly, re‐melted and cast into anodes for electro‐refining.
The output of electro‐refining is refined copper cathodes, assaying over 99.99% of copper.
Alternatively, in the hydrometallurgical route, copper is extracted from mainly low grade oxide ores and also some sulphide ores, through leaching (solvent extraction) and electrowinning (SX‐EW process). The output is the same as through the electro‐refining route ‐ refined copper cathodes. ICSG estimates that in 2018, refined copper production from SX‐EW represented around 16% of total copper refined production.
Refined copper production derived from mine production (either from metallurgical treatment of concentrates or SX‐EW) is referred to as “primary copper production”, as obtainable from a primary raw material source. However, there is another important source of raw material which is scrap. Copper scrap derives from either metals discarded in semis fabrication or finished product manufacturing processes (“new scrap”) or obsolete end‐of‐life products (“old scrap”). Refined copper production attributable to recycled scrap feed is classified as “secondary copper production”. Secondary producers use processes similar to those employed for primary production. ICSG estimates that in 2018, at the refinery level, secondary copper refined production reached 17% of total copper refined production.
The World Copper Factbook 2019
International Copper Study Group 10
0
2,000
4,000
6,000
8,000
10,000
12,000
14,000
16,000
18,000
20,000
22,000
1900 1910 1920 1930 1940 1950 1960 1970 1980 1990 2000 2010
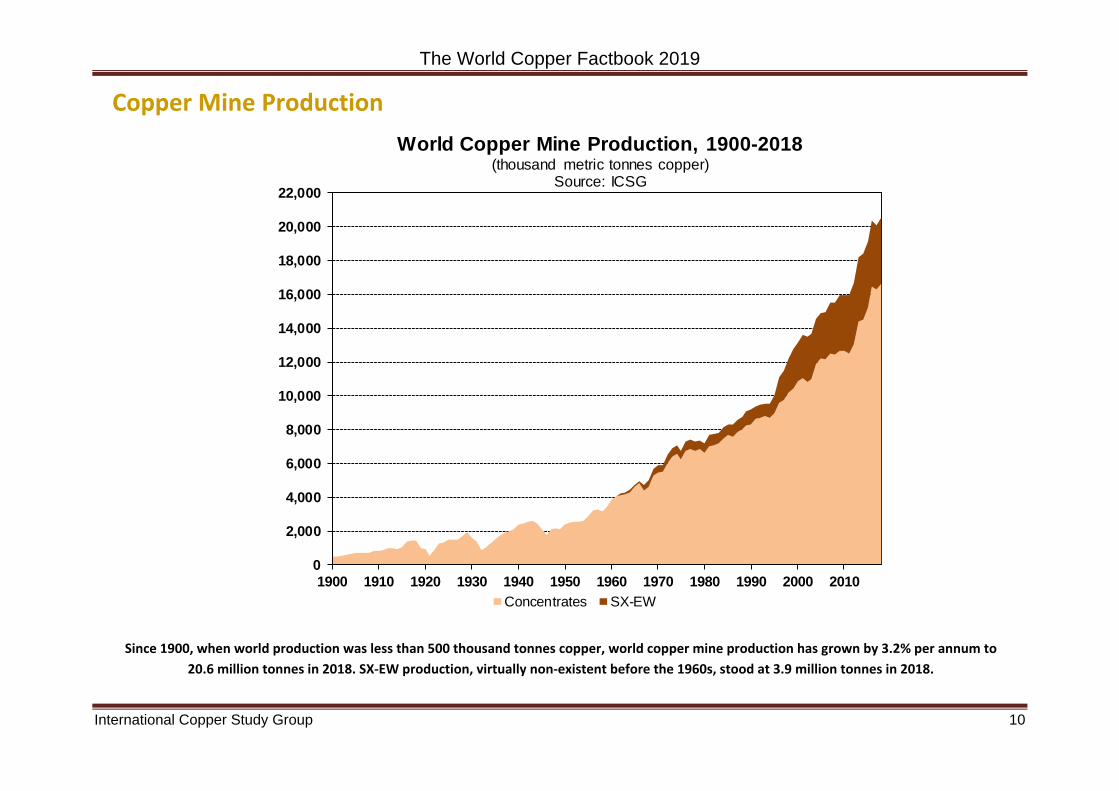
World Copper Mine Production, 1900-2018 (thousand metric tonnes copper)
Source: ICSG
Concentrates SX-EW
Since 1900, when world production was less than 500 thousand tonnes copper, world copper mine production has grown by 3.2% per annum to 20.6 million tonnes in 2018. SX‐EW production, virtually non‐existent before the 1960s, stood at 3.9 million tonnes in 2018.
Copper Mine Production

The World Copper Factbook 2019
International Copper Study Group 11
From less than 750,000 tonnes copper in 1960, copper mine production in Latin America has increased to 8.7 million tonnes in 2018, representing 42% of the global total. Asia has also exhibited significant growth. The region’s share of global production has increased from just 6% to 17% over the respective period. Conversely, North America’s share declined from 36% to 12%.
Copper Mine Production by Region, 1960 versus 2018Thousand metric tonnes copper
Source: ICSG

The World Copper Factbook 2019
International Copper Study Group 12
0 1,000 2,000 3,000 4,000 5,000 6,000
BulgariaLaos
MyanmarSpain
MongoliaIran
BrazilPolandCanada
IndonesiaKazakhstan
Mexicorussian fed.
ZambiaAustralia
CongoUnited States
ChinaPeruChile
Copper Mine Production by Country: Top 20 Countries in 2018 (Thousand metric tonnes copper)
Source: ICSG
Chile accounted for almost a third of world copper mine production in 2018 with mine output of 5.8 million tonnes copper. Peru, which has seen a sharp increase in output since 2015, accounted for 12% of world mine production.

The World Copper Factbook 2019
International Copper Study Group 13
‐
1,000
2,000
3,000
4,000
5,000
6,000
2000 2004 2008 2012 2016 20200.0%
1.0%
2.0%
3.0%
4.0%
5.0%
6.0%
7.0%
8.0%
% growth
SX‐EW
Thousand metrictonnes copper
2000‐2005:+3.7%
2012‐2017:+0.9%
2006‐2011:+6.0%
2018‐2023:+2.5%
‐
3,000
6,000
9,000
12,000
15,000
18,000
21,000
24,000
2000 2004 2008 2012 2016 20200.0%
1.0%
2.0%
3.0%
4.0%
5.0%
6.0%
7.0%
8.0%
Thousand metric tonnes copper
% growth
Concentrates
2000‐2005:+3.1%
2012‐2018:+3.7%2006‐2011:
+2.1%
2019‐2023+5.1%
Copper mining capacity is estimated to reach 28.9 million tonnes copper in 2023, with 18% being SX‐EW production. This will be 20% higher than global capacity of 24.1 million tonnes copper recorded in 2018. Growth in copper mine capacity is expected to average 4.6% per year going forward as new capacity is added at existing and some new operations. The ratio between production and
capacity is called the capacity utilization rate. The world mine capacity utilization rate was around 85% in 2018.
Trends in Copper Mining Capacity, 2000‐2023Thousand metric tonnes copper (Bars) and Annual percentage change (Line)
Source: ICSG Directory of Copper Mines and Plants – H1 2019 Edition
Note: Capacity data reflects production capabilities not necessarily production forecasts

The World Copper Factbook 2019
International Copper Study Group 14
Constraints on Copper Supply
Rank Mine Country Owner(s) Source Capacity1 Escondida Chile BHP Billiton (57.5%), Rio Tinto Corp. (30%), Japan Escondida (12.5%) Concs & SX-EW 1,400
2 Collahuasi Chile Anglo American (44%), Glencore plc (44%), Mitsui (8.4%), JX Holdings (3.6%) Concs & SX-EW 570
3 Buenavista del Cobre (former Cananea)
Mexico Grupo Mexico Concs & SX-EW 525
4 Morenci United States Freeport-McMoRan Inc 72%, 28% affiliates of Sumitomo Corporation Concs & SX-EW 520
5 Cerro Verde II (Sulphide) Peru Freeport-McMoRan Copper & Gold Inc. 54%, Compañia de Minas Buenaventura 19.58%, Sumitomo 21%
Concentrates 500
6 Antamina Peru BHP Billiton (33.75%), Teck (22.5%), Glencore plc (33.75%), Mitsubishi Corp. (10%)
Concentrates 450
7 Polar Division (Norilsk/ Talnakh Mills)
Russia Norilsk Nickel Concentrates 450
7 Las Bambas Peru MMG (62.5%), Guoxin International Investment Corporation Limited (22.5%), CITIC Metal Co., Ltd. (15%)
Concentrates 430
9 El Teniente Chile Codelco Concs & SX-EW 42210 Chuquicamata Chile Codelco Concs & SX-EW 390
11 Los Bronces Chile Anglo Amercian 50.1%, Mitsubishi Corp. 20.4%, Codelco 20%, Mitsui 9.5% Concs & SX-EW 390
12 Los Pelambres Chile Antofagasta Plc (60%), Nippon Mining (25%), Mitsubishi Materials (15%) Concentrates 370
13 Kansanshi Zambia First Quantum Minerals Ltd (80%), ZCCM (20%) Concs & SX-EW 340
14 Radomiro Tomic Chile Codelco Concs & SX-EW 330
15 Grasberg Indonesia PT Freeport Indonesia (PT Inalum and the provincial/regional government 51.2% and Freeport-McMoRan Inc 48.8%)
Concentrates 300
16 Kamoto Congo Katanga Mining Ltd (86.33% Glencore plc) 75%, Gecamines 25% SX-EW 300
17 Bingham Canyon United States Kennecott Concentrates 280
18 Toquepala Peru Southern Copper Corp (Grupo Mexico 88.9%, international investment community 11.1%)
Concs & SX-EW 265
18 Sentinel Zambia First Quantum Minerals Ltd Concentrates 250
20 Olympic Dam Australia BHP Billiton Concs & SX-EW 225
Top 20 Copper Mines by Capacity (basis 2019)Thousand metric tonnes copper
Source: ICSG Directory of Copper Mines and Plants – H1 2019 Edition
Note: Capacity data reflects production capabilities not necessarily production forecasts

The World Copper Factbook 2019
International Copper Study Group 15
Constraints on Copper Supply With copper concentrate in strong demand, there has been growing interest in understanding the obstacles that can prevent copper mine supply from coming on‐stream. Below are some of the operational and financial constraints identified from the study. For more information about ICSG research related to constraints on copper supply, please contact the ICSG Secretariat at [email protected]
Declining ore grades: a serious issue in developed copper areas such as the USA and Chile
Project finance: prolonged economic and price volatility may have significant impact on cost of capital
Tax & investment regimes: recent research indicates these are less important than geological endowments
Other cost issues: lower capital expenditure may have adverse long term effect on copper supply; operating cost escalation
Water supply: a critical issue in dry mining districts
Energy: coal is the fuel chosen to power main copper mines and processes… climate change may increase costs
Other environmental issues: governments are becoming more aware of the impact of mining to the surrounding environment in recent years. In countries like Peru and the Philippines, the relationship with indigenous community is also a key factor.
Resource nationalism: It has become a priority for certain governments to develop their mineral resources that have not been exploited until now. While willing to develop their natural resources, countries might be seeking to extract strong revenue flows from them. It will be important to balance royalty/taxation levels with the need to encourage capital investment to develop their rising industries.
Sulphuric acid supply and price: 16% cost factor for SX‐EW projects Skilled labor: open labor markets would help address this
constraint Labor strikes: tend to increase when refined prices are high and
GDP is growing faster, but tend to be longer and less frequent otherwise
High domestic costs if there is “Dutch disease” (resulting in higher exchange rates due in part to strong exports)
Rate between imported inputs and domestic input costs affected by the currency strength of the producer
Political risks: Security and transport accessibility is crucial to mine operation

The World Copper Factbook 2019
International Copper Study Group 16
Copper Smelter Production
02,500
5,000
7,500
10,000
12,500
15,000
17,500
20,000
22,500
1980 1985 1990 1995 2000 2005 2010 2015
World Copper Smelter Production, 1980-2018Thousand metric tonnes copper
Source: ICSG
Primary Feed Secondary Feed
Smelting is the pyrometallurgical process used to produce copper metal. In 2018, world copper smelter production reached 20.1 million tonnes copper. Recently, the trend to recover copper directly from ores through leaching processes has been on the increase. Primary smelters use mine concentrates as their main source of feed (although some use copper scrap as well). Secondary copper smelters use copper scrap as their feed.

The World Copper Factbook 2019
International Copper Study Group 17
Trends in Copper Smelting Capacity, 2000 and 2023
Percentage share of total capacity, by technology type Source: ICSG Directory of Copper Mines and Plants – H1 2019 Edition
The use of Flash/Continuous technology accounted for 59% in total copper smelting capacity in 2000. This share rose to 69% in 2018. It is expected to remain around this level until 2023. There has also been a rapid expansion of Chinese technology, which first emerged in
2004. It now accounts for around 12% of total copper smelting capacity.
2000 2023
Note: Capacity data reflects production capabilities not necessarily production forecasts

The World Copper Factbook 2019
International Copper Study Group 18
0
2,000
4,000
6,000
8,000
10,000
12,000
14,000
1990 1993 1996 2000 2003 2006 2009 2012 2015 2018
Copper Smelter Production by Region, 1990-2018Thousand metric tonnes copper
Source: ICSG
Africa America Asia Europe Oceania
Asia’s share of world copper smelter output jumped from 27% in 1990 to 62% in 2018 as smelter production in China expanded rapidly.
The World Copper Factbook 2019
International Copper Study Group 19
0 1,000 2,000 3,000 4,000 5,000 6,000 7,000 8,000 9,000 10,000
SwedenIndonesia
MexicoKazakhstan
SpainIran
CanadaPeru
BulgariaAustraliaGermany
IndiaPoland
United StatesKorean Rep.
ZambiaRussian Fed.
ChileJapanChina
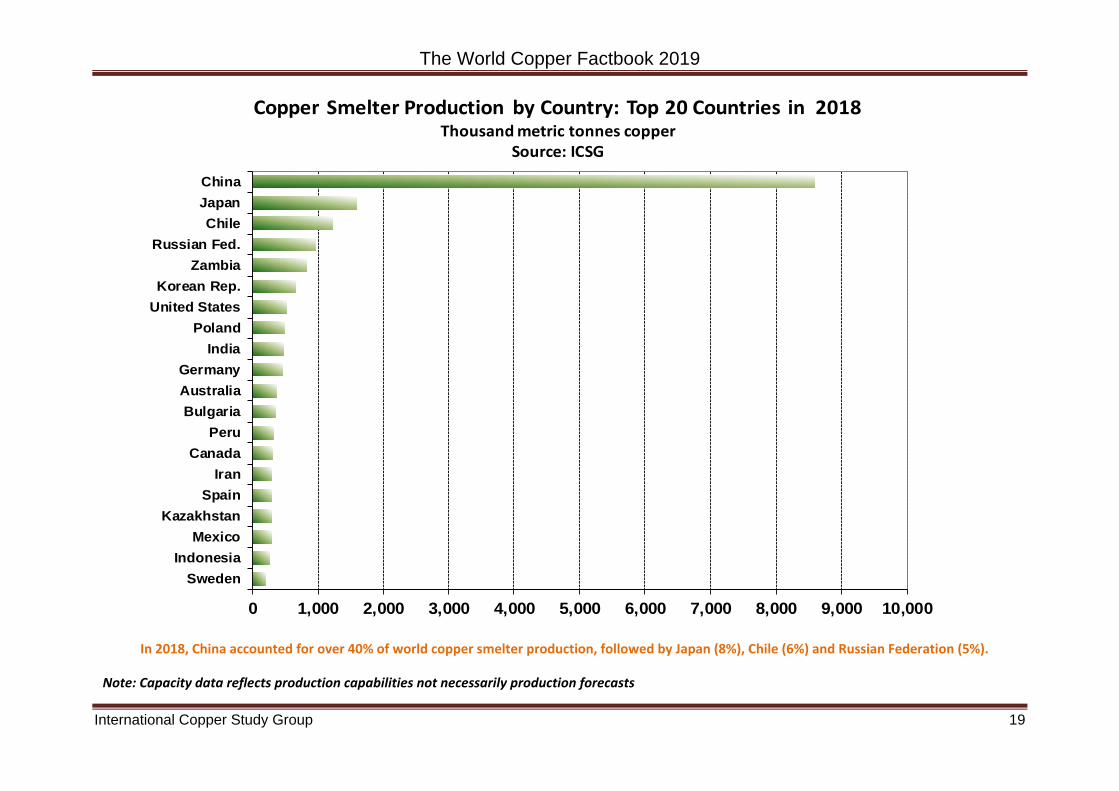
Copper Smelter Production by Country: Top 20 Countries in 2018Thousand metric tonnes copper
Source: ICSG
In 2018, China accounted for over 40% of world copper smelter production, followed by Japan (8%), Chile (6%) and Russian Federation (5%).
Note: Capacity data reflects production capabilities not necessarily production forecasts

The World Copper Factbook 2019
International Copper Study Group 20
Rank Smelter Country Operator/Owner(s) Process Capacity1 Guixi (smelter) China Jiangxi Copper Corp. Outokumpu Flash 900
2 Birla Copper (Dahej) India Birla Group (Hidalco) Outokumpu Flash, Ausmelt, Mitsubishi Continuous 500
3 Chuquicamata (smelter) Chile Codelco Outokumpu/ Teniente Converter 450
3 Jinchuan (Fangchenggang smelter) China Jinchuan Non-Ferrous Metal Co. Flash smelter 450
3 Hamburg Germany Aurubis Outokumpu, Contimelt, Electric 450
3 Besshi/ Ehime (Toyo) Japan Sumitomo Metal Mining Co. Ltd. Outokumpu Flash 450
3 Saganoseki/ Ooita (smelter) Japan Pan Pacific Copper Co. Ltd Outokumpu Flash 450
8 El Teniente (Caletones) Chile Codelco Chile Reverberatory/ Teniente Conv. 400
8 Jinchuan (smelter) China Jinchuan Non- Ferrous Metal Co. Reverberatory/ Kaldo Conv. 400
8 Jinguan (smelter) China Tongling Non-Ferrous Metals Group Flash Smelter 400
8 Jinlong (Tongdu) China Tongling Nonferrous Metals Corp. (57.4%), Sumitomo (35%), Pingguo Aluminium Co. Flash Smelter 400
8 Xiangguang copper (smelter) China Yanggu Xiangguang Copper Co Outokumpu Flash 400
8 Sterlite Smelter (Tuticorin) India Vedanta Isasmelt Process 400
8 Norilsk (Nikelevy, Medny) Russia Norilsk Nickel Reverb, Electric, Vanyukov 400
15 Pirdop (smelter) Bulgaria Aurubis (99.77%) Outokumpu Flash 360
15 Ilo Smelter Peru Southern Copper Corp (Grupo Mexico 88.9%, international investment community 11.1%) Isasmelt Process 360
17 Onahama/ Fukushima JapanMitsubishi Materials Corp. (49.29%), Dowa Metals & Mining Co. Ltd.(31.15%), Furukawa Metals & Resources Co. Ltd. (12.67%)
Mitsubishi/ Reverb. 354
18 Naoshima/ Kagawa (smelter) Japan Mitsubishi Materials Corp. Mitsubishi Continuous 342
19 Isabel/ Leyte (PASAR) Philippines Glencore plc 78.2%, Local investors 21.8% Outokumpu Flash 330
20 Huelva Spain Atlantic Copper S.A. (Freeport McMoran) Outokumpu Flash 320
Top 20 Copper Smelters by Capacity (basis 2019)Thousand metric tonnes copper
Source: ICSG Directory of Copper Mines and Plants – H1 2019 Edition
Note: Capacity data reflects production capabilities not necessarily production forecasts

The World Copper Factbook 2019
International Copper Study Group 21
Refined Copper Production
0
5,000
10,000
15,000
20,000
25,000
1960 1964 1968 1972 1976 1980 1984 1988 1992 1996 2000 2004 2008 2012 2016
World Refined Copper Production, 1960‐2018 Thousand metric tonnes copper
Source: ICSG
Refinery Primary Refinery Secondary Refinery SX-EW
With the emergence of solvent extraction‐electrowinning (SX‐EW) technology, refined copper produced from leaching ores has increased from less than 1% of world refined copper production in the late 1960’s to 16% of world output in 2018.
The World Copper Factbook 2019
International Copper Study Group 22
-
5,000
10,000
15,000
20,000
25,000
30,000
35,000
2000 2002 2004 2006 2008 2010 2012 2014 2016 2018 2020 2022
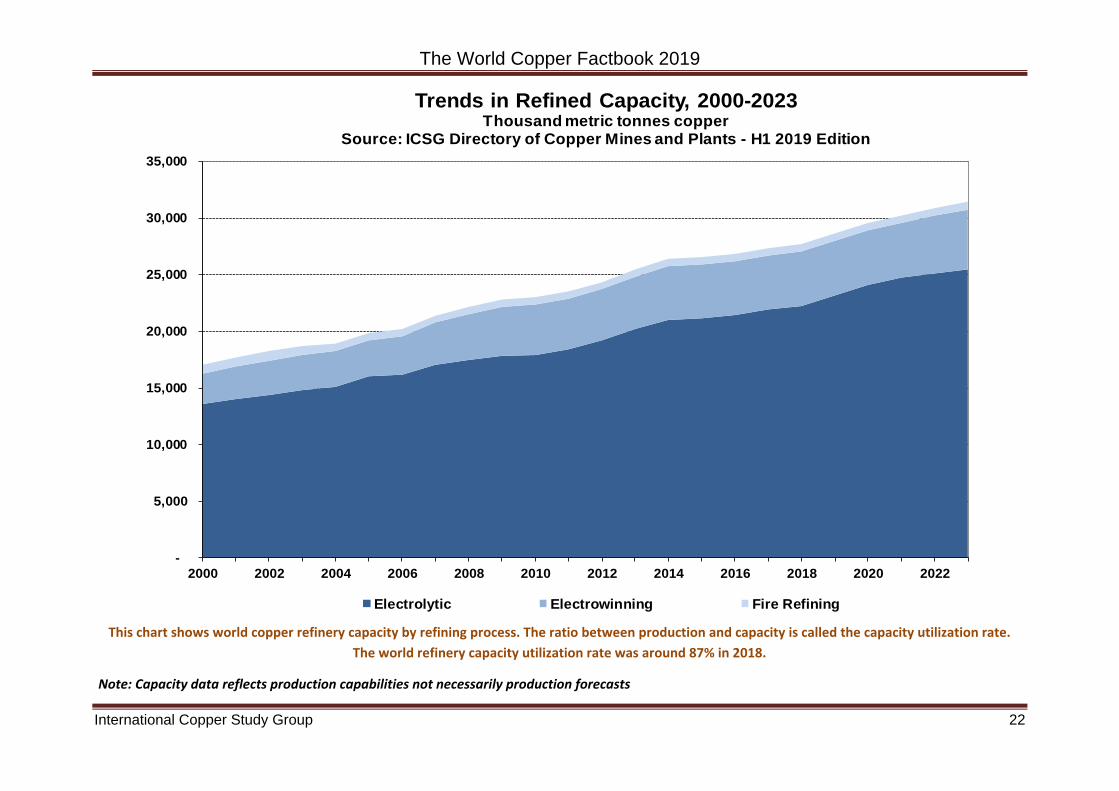
Trends in Refined Capacity, 2000-2023Thousand metric tonnes copper
Source: ICSG Directory of Copper Mines and Plants - H1 2019 Edition
Electrolytic Electrowinning Fire Refining
This chart shows world copper refinery capacity by refining process. The ratio between production and capacity is called the capacity utilization rate. The world refinery capacity utilization rate was around 87% in 2018.
Note: Capacity data reflects production capabilities not necessarily production forecasts

The World Copper Factbook 2019
International Copper Study Group 23
0
5,000
10,000
15,000
20,000
25,000
30,000
1990 1993 1996 2000 2003 2006 2009 2012 2015 2018
Refined Copper Production by Region, 1990-2018Thousand metric tonnes copper
Source: ICSG
Africa America Asia Europe Oceania
Regions with the highest output of refined copper in 1990: the Americas (4,250 kt), followed by Europe (3,004 kt)
Leading region in the world in 2018: Asia (13,504 kt) as compared to 2,505kt in 1990.

The World Copper Factbook 2019
International Copper Study Group 24
0 1,000 2,000 3,000 4,000 5,000 6,000 7,000 8,000 9,000 10,000
IranIndonesia
CanadaPeru
KazakhstanBelgium
AustraliaSpain
MexicoZambiaPoland
IndiaGermany
Korean Rep.Congo
Russian Fed.United States
JapanChile
China
Refined Copper Production by Country: Top 20 Countries in 2018Thousand metric tonnes copper
Source: ICSG
In 2018, China accounted for 39% of world copper refined production, followed by Chile (10%), Japan (7%) and the United States (5%).

The World Copper Factbook 2019
International Copper Study Group 25
Rank Refinery Country Owner(s) Process Capacity1 Guixi China Jiangxi Copper Corporation Electrolytic 1000
2 Jinchuan China Jinchuan Non Ferrous Co. Electrolytic 650
3 Daye/ Hubei (refinery) China Daye Non-Ferrous Metals Co. Electrolytic 600
4 Yunnan Copper China Yunnan Copper Industry Group (64.8%) Electrolytic 500
4 Birla India Birla Group (Hidalco) Electrolytic 500
6 Pyshma Refinery Russia UMMC (Urals Mining & Metallurgical Co.) Electrolytic 400
7 Jinchuan (Fangchenggang fi )
China Jinchuan Non-Ferrous Metal Co. Electrolytic 450
7 Toyo/Niihama (Besshi) Japan Sumitomo Metal Mining Co. Ltd. Electrolytic 450
7 Amarillo United States Grupo Mexico Electrolytic 450
7 Chuquicamata Refinery Chile Codelco Electrolytic 450
11 Onsan Refinery I Korean Republic LS-Nikko Co. (LS, Nippon Mining) Electrolytic 440
12 Hamburg (refinery) Germany Aurubis Electrolytic 416
13 El Paso (refinery) United States Freeport-McMoRan Copper & Gold Inc. Electrolytic 415
14 Las Ventanas Chile Codelco Electrolytic 410
15 Jinguan (refinery) China Tongling Non-Ferrous Metals Group Electrolytic 400
15Jinlong (Tongdu) (refinery) China Tongling NonFerrous Metal Corp. 52 %, Sharpline
International 13%, Sumitomo Corp. 7.5%, Itochu Corp. 7.5%Electrolytic 400
15 Xiangguang Copper ( fi )
China Yanggu Xiangguang Copper Co Electrolytic 400
15 Shandong Fangyuan ( fi )
China Dongying, Shandong Electrolytic 400
15 Sterlite Refinery India Vedanta Electrolytic 400
20 CCR Refinery (Montreal) Canada Glencore plc Electrolytic 370
Top 20 Copper Refineries by Capacity (basis 2019)Thousand metric tonnes copper
Source: ICSG Directory of Copper Mines and Plants – H1 2019 Edition
Note: Capacity data reflects production capabilities not necessarily production forecasts
The World Copper Factbook 2019
International Copper Study Group 26
0
3,000
6,000
9,000
12,000
15,000
18,000
21,000
24,000
27,000
30,000
1980 1985 1990 1995 2000 2005 2010 2015
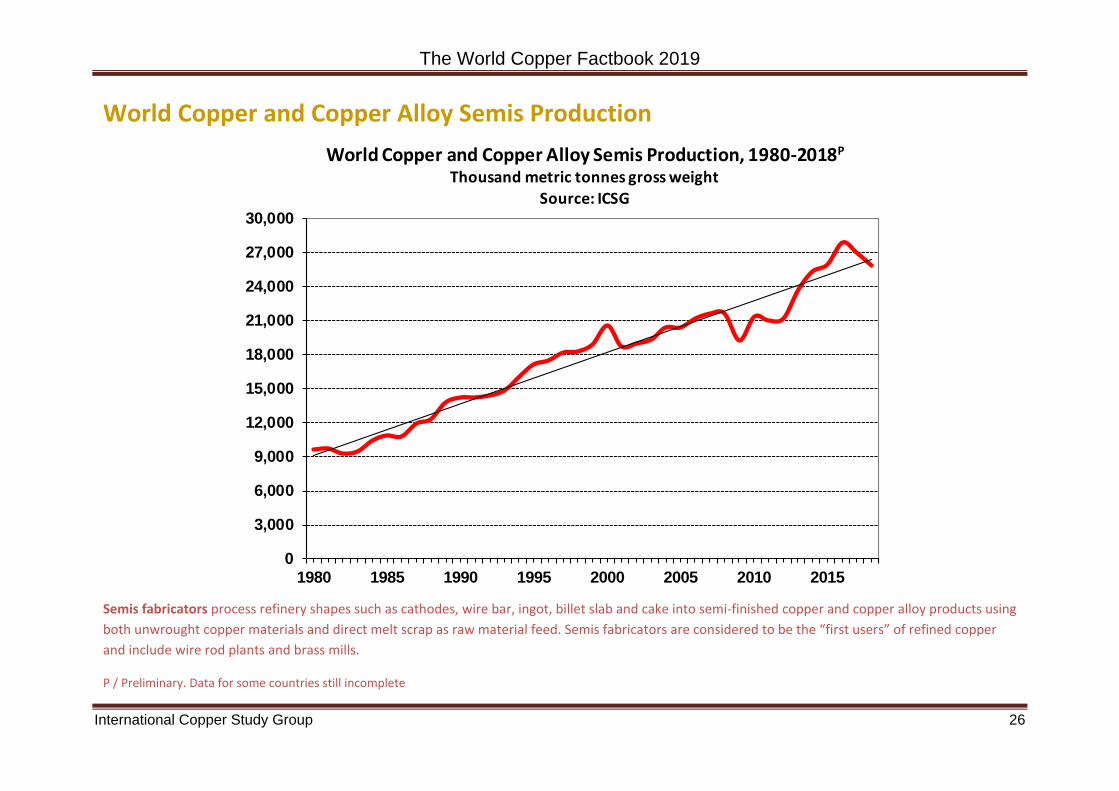
World Copper and Copper Alloy Semis Production, 1980‐2018PThousand metric tonnes gross weight
Source: ICSG
Semis fabricators process refinery shapes such as cathodes, wire bar, ingot, billet slab and cake into semi‐finished copper and copper alloy products using both unwrought copper materials and direct melt scrap as raw material feed. Semis fabricators are considered to be the “first users” of refined copper and include wire rod plants and brass mills.
P / Preliminary. Data for some countries still incomplete
World Copper and Copper Alloy Semis Production

The World Copper Factbook 2019
International Copper Study Group 27
0
5,000
10,000
15,000
20,000
25,000
Africa Asia Europe North America Oceania South America
Copper and Copper Alloy Semis Production by Region, 1980 & 2018PThousand metric tonnes gross weight
Source: ICSG
1980 2018
Asia accounted for 80% (or almost 20.6 million metric tonnes) of semis output in 2018, compared to 23% in 1980.
P / Preliminary. Data for some countries still incomplete

The World Copper Factbook 2019
International Copper Study Group 28
-
10
20
30
40
50
60
2018 2019
Semis Production Capacity by Product, 2018 vs 2019 (million tonnes gross weight)
Source: ICSG
Wire Rod PSS RBSTubes Alloy Wire IngotsFoil Powder Not Classified
In 2019, China will account for the largest share of world semis production capacity (44%).
Wire rod plants are estimated to account for 62% of world first use capacity in 2019.
Copper & Copper Alloy Semis Production Capacity by Region & ProductSource: ICSG Directory of Copper and Copper Alloy Fabricators 2019
Note: Capacity data reflects production capabilities not necessarily production forecasts

The World Copper Factbook 2019
International Copper Study Group 29
0 4,000 8,000 12,000 16,000 20,000 24,000 28,000
MalaysiaVietnam
UAEIndonesia
FranceSpain
ThailandRussian Fed.
IranMexicoTurkey
Taiwan (China)Italy
BrazilGermany
IndiaKorean Republic
JapanUSA
China
Copper and Copper Alloy Semis Production Capacity by Country: Top 20 Countries, 2019
Thousand metric tonnes gross weight Source: ICSG Directory of Copper and Copper Alloy Fabricators 2019
Note: Capacity data reflects production capabilities not necessarily production forecasts

The World Copper Factbook 2019
International Copper Study Group 30
Chapter 4: Corporate Social Responsibility (CSR) in Mining
What is Corporate Social Responsibility? Corporate Social Responsibility refers to the continuing commitment by “the corporation” to behave ethically and contribute to economic development while improving the quality of life of the workforce and their families as well as of the local community and society at large.
The basis of CSR is rooted in Archie Carroll’s “Pyramid of Corporate Social Responsibility.”1 In this Pyramid a corporation has four types of responsibilities. The first and most obvious is the economic responsibility to be profitable. The second is the legal responsibility to obey the laws set forth by society. The third, which is closely linked to the second, is the ethical responsibility. That is to do what is right even when business is not compelled to do so by law. The fourth is the philanthropic responsibility. It is best described by the resources contributed by corporations toward social, educational, recreational and/or cultural purposes.
Why is CSR Important? Corporate Social Responsibility has been around since the 1950s, but its importance and practice took hold much later. With mining activity increasing, CSR is more relevant than ever before.
CSR programs usually invest in infrastructure (potable water, electricity, schools, roads, hospitals, hospital equipment, drainage repairs, etc.), building social capital (providing high‐school and university education, workshops on gender issues, information on family planning, improving hygiene, etc.), and building human capital (training local people to be employed by the mining business or to provide outsourced services, promote and provide skills on microbusiness, aquaculture, etc.).2
Mining companies engage in CSR programs because:
From a community perspective, they provide a mechanism of compensation for the social and environmental costs associated with mining. CSR is also a means through which a mining company can be seen to actively give back to the community.
Mining companies also benefit from CSR programs by building better relations with the local communities in which they operate. The economic risks of not having good community relations include project delays, and even mine closures.
Source: 1/ based on Archie Carroll’s research on The Pyramid of Corporate Social Responsibility: Toward the Moral Management of Organizational Stakeholders (1991) 2/ https://www.miningfacts.org/communities/what‐is‐corporate‐social‐responsibility/

The World Copper Factbook 2019
International Copper Study Group 31
Chapter 5: Copper Trade Copper products across the value chain are traded internationally. Often, countries where upstream copper production capacity exceeds downstream production capacity will import the raw materials needed to meet their production needs, and vice versa. Major product categories of copper traded internationally include:
Copper concentrates Copper blister and anode Copper cathode and ingots Copper scrap and Copper semis
Copper powders and compounds are also traded globally, but typically in much smaller quantities. In additional, copper is contained in end‐use products that are traded globally including automobiles, appliances, electronic equipment and other products. Changes in trade regulations, such as import duties or export quotas, can have significant impacts on the international trade of copper. For more information about the international trade of copper and changes in regulations that can affect the trade of copper, please contact the ICSG Secretariat at [email protected]
1 Gross weight. 2 Exports and Imports might not match due to transit time, under-reporting or product misclassification

The World Copper Factbook 2019
International Copper Study Group 32
Major International Trade Flows of Copper Ores and Concentrates1
1Figure is intended to illustrate trade flows but not actual trade routes.
Major Exporters of Copper Ores and Concentrates, 2018
1. Chile 2. Peru 3. Australia 4. Mexico 5. Indonesia 6. Spain 7. Canada 8. Mongolia 9. Brazil 10. United States
Major Importers of Copper Ores and Concentrates, 2018
1. China 2. Japan 3. Spain 4. Korean Rep. 5. Germany 6. Bulgaria 7. India 8. Russian Fed. 9. Zambia 10. Finland
Major International Trade Flows of Copper Ores and Concentrates1
Detailed trade matrices are available in ICSG Statistical Yearbook.
Image courtesy of the Copper Development Association.

The World Copper Factbook 2019
International Copper Study Group 33
Major International Trade of Copper Blister and Anode1
1Figure is intended to illustrate trade flows but not actual trade routes.
Major Exporters of Copper Blister and Anode, 2018
1. Zambia 2. Chile 3. Bulgaria 4. South Africa 5. Spain 6. Belgium 7. Finland 8. Armenia 9. United States 10. Germany
Major Importers of Copper Blister and Anode, 2018
1. China 2. Belgium 3. India 4. Germany 5. Canada 6. Korean Rep. 7. Austria 8. Japan 9. Sweden 10. Pakistan
Major International Trade Flows of Copper Blister and Anode1
Detailed trade matrices are available in ICSG Statistical Yearbook.
Image courtesy of the Copper Development Association.

The World Copper Factbook 2019
International Copper Study Group 34
Major International Trade Flows of Refined Copper1
1Figure is intended to illustrate trade flows but not actual trade routes.
Major Exporters of Refined Copper, 2018
1. Chile 2. Russian Fed. 3. Japan 4. Kazakhstan 5. Australia 6. Netherlands 7. Zambia 8. Peru 9. China 10. Korean Rep.
Major Importers of Refined Copper, 2018
1. China 2. United States 3. Germany 4. Italy 5. Taiwan (China) 6. Thailand 7. Turkey 8. Netherlands 9. Malaysia 10. Korean Rep.
Major International Trade Flows of Refined Copper1
Detailed trade matrices are available in ICSG Statistical Yearbook.
Image courtesy of the Copper Development Association.

The World Copper Factbook 2019
International Copper Study Group 35
0
200
400
600
800
1,000
1,200
1,400
1,600 Importers
0
200
400
600
800
1,000
1,200Exporters
Leading Exporters and Importers of Semi‐Fabricated Copper Products, 2018Thousand metric tonnes gross weight, Source: ICSG

The World Copper Factbook 2019
International Copper Study Group 36
01,0002,0003,0004,0005,0006,0007,0008,0009,000
10,000
1960 1965 1970 1975 1980 1985 1990 1995 2000 2005 2010 2015
Average Annual Copper Prices (LME, Grade A, Cash), 1960‐2018 US$ per tonne Source: ICSG
Current $ Constant 2012 $
The Global Copper Market and the Commodity “Copper” Copper, as any other good or merchandise, is traded between producers and consumers. Producers sell their present or future production to clients, who transform the metal into shapes or alloys, so that downstream fabricators can transform these into different end‐use products. One of the most important factors in trading a commodity such as copper is the settlement price for the present day (spot price) or for future days.
Exchanges
The role of a commodity exchange is to facilitate and make transparent the process of settling prices. Three commodity exchanges provide the facilities to trade copper: The London Metal Exchange (LME), the Commodity Exchange Division of the New York Mercantile Exchange (COMEX/NYMEX) and the Shanghai Futures Exchange (SHFE). In these exchanges, prices are settled by bid and offer, reflecting the market's perception of supply and demand of a commodity on a particular day. On the LME, copper is traded in 25 tonne lots and quoted in US dollars per tonne; on COMEX, copper is traded in lots of 25,000 pounds and quoted in US cents per pound; and on the SHFE, copper is traded in lots of 5 tonnes and quoted in Renminbi per tonne. More recently, mini contracts of smaller lots sizes have been introduced at the exchanges.
Exchanges also provide for the trading of futures and options contracts. These allow producers and consumers to fix a price in the future, thus providing a hedge against price variations. In this process the participation of speculators, who are ready to buy the risk of price variation in exchange for monetary reward, gives liquidity to the market. A futures or options contract defines the quality of the product, the size of the lot, delivery dates, delivery warehouses and other aspects related to the trading process. Contracts are unique for each exchange. The existence of futures contracts also allows producers and their clients to agree on different price settling schemes to accommodate different interests.
Exchanges also provide for warehousing facilities that enable market participants to make or take physical delivery of copper in accordance with each exchange's criteria.
The World Copper Factbook 2019
International Copper Study Group 37
0
50
100
150
200
250
300
350
400
450
0
375
750
1,125
1,500
1,875
2,250
2,625
3,000
3,375
Jan01
Jul Jan02
Jul Jan03
Jul Jan04
Jul Jan05
Jul Jan06
Jul Jan07
Jul Jan08
Jul Jan09
Jul Jan10
Jul Jan11
Jul Jan12
Jul Jan13
Jul Jan14
Jul Jan15
Jul Jan16
Jul Jan17
Jul Jan18
Jul Jan19
Pric
e LM
E (U
S c
ents
/pou
nd)
Thou
sand
met
ric to
nnes
, co
pper
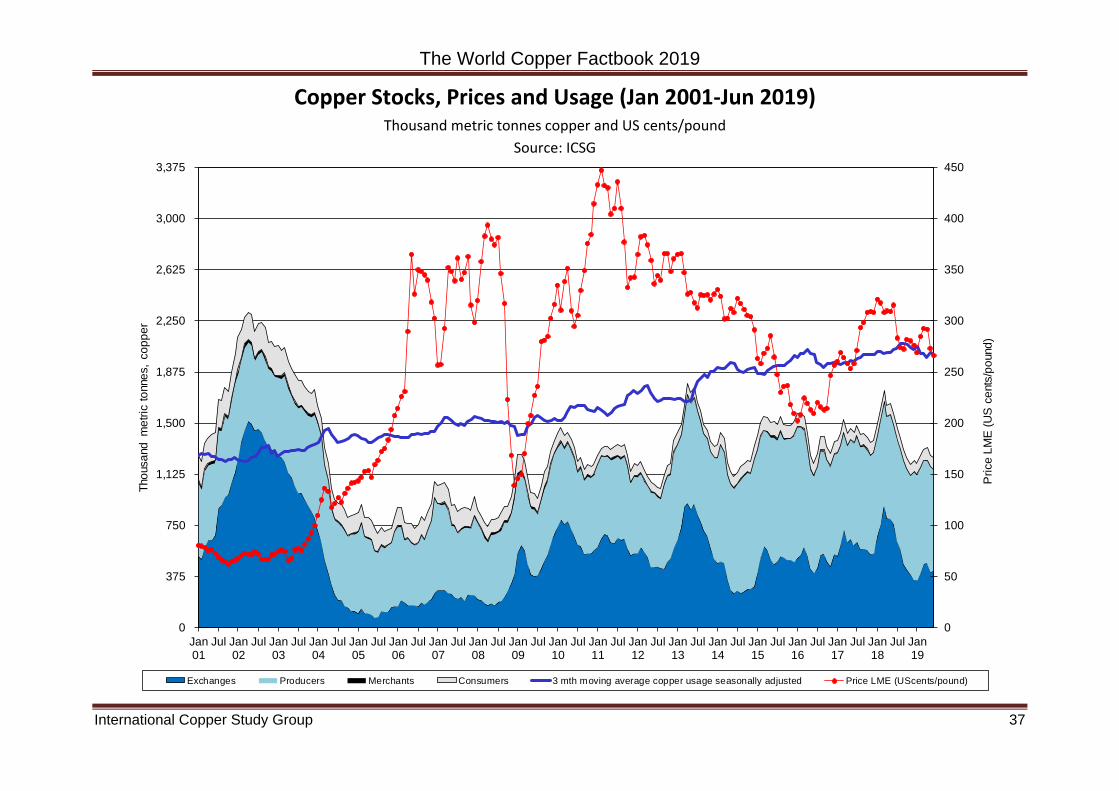
Exchanges Producers Merchants Consumers 3 mth moving average copper usage seasonally adjusted Price LME (UScents/pound)
Copper Stocks, Prices and Usage (Jan 2001‐Jun 2019)Thousand metric tonnes copper and US cents/pound
Source: ICSG

The World Copper Factbook 2019
International Copper Study Group 38
Chapter 6: Copper Usage How Is Copper Used?
Copper is shipped to fabricators mainly as cathode, wire rod, billet, cake (slab) or ingot. Through extrusion, drawing, rolling, forging, melting, electrolysis or atomization, fabricators form wire, rod, tube, sheet, plate, strip, castings, powder and other shapes. The fabricators of these shapes are called the first users of copper. The total use of copper includes copper scrap that is directly melted by the first users of copper to produce copper semis.
Copper and copper alloy semis can be further transformed by downstream industries for use in end use products such as automobiles, appliances, electronics, and a whole range of other copper‐dependent products in order to meet society’s needs. This section provides a range of information about refined copper usage, total use, major uses of copper and end‐use.
For the most up‐to‐date information on refined copper usage, please visit the ICSG website at www.icsg.org

The World Copper Factbook 2019
International Copper Study Group 39
02,0004,0006,0008,00010,00012,00014,00016,00018,00020,00022,00024,00026,000
World Refined Copper Usage, 1900‐2018 Thousand metric tonnes copper
Source: ICSG
Since 1900, apparent usage for refined copper has increased from less than 500 thousand tonnes to 24.5 million metric tonnes in 2018 as usage over the period grew by a compound annual growth rate of 3.4% per year.

The World Copper Factbook 2019
International Copper Study Group 40
57%
0.5%
10%1%
30%
2%
The key driver of global refined copper usage has been Asia, where demand has expanded almost eight‐fold over the past four decades mainly due to China.
Refined Copper Usage by Region, 1960 versus 2018Thousand metric tonnes copper
Source: ICSG
1960 2018

The World Copper Factbook 2019
International Copper Study Group 41
0.0
0.5
1.0
1.5
2.0
2.5
3.0
3.5
0
1
2
3
4
5
6
7
8
1950 1955 1960 1965 1970 1975 1980 1985 1990 1995 2000 2005 2010 2015
kg per personP
opul
atio
n (b
ln)
World Refined Copper Usage* per Capita: 1950‐2018Sources: ICSG and US Census Bureau
World Population Refined Copper Usage per Capita
*Refined copper is typically used by semis fabricators or the “first users” of refined copper, including ingot makers, master alloy plants, wire rod plants, brass mills, alloy wire mills, foundries and foil mills. As a result, per capita usage of refined copper refers to the amount of copper used by industry divided by the total population and does not represent copper used in finished products per person.

The World Copper Factbook 2019
International Copper Study Group 42
2018 data GDP per capita (US$) Intensity (tonnes/US$bln)Australia 56352 7.052 Belgium 46723 522.766 Brazil 8968 162.094 Canada 46261 92.904 Chile 16078 184.457 China 9608 935.561 Egypt 2573 420.642 France 42878 68.465 Germany 48264 299.883 India 2036 183.065 Indonesia 3871 223.032 Iran 5491 315.728 Italy 34260 262.998 Japan 39306 203.173 Korean Rep. 31346 432.470 Malaysia 10942 685.755 Mexico 9807 314.781 Poland 15431 486.342 Russian Fed. 11327 212.512 Saudi Arabia 23567 236.419 Spain 30697 255.978 Sweden 53874 250.383 Taiwan 24971 648.393 Thailand 7187 732.739 Turkey 9346 631.624 United Arab Emirates 40713 1,059.734 United States 62606 88.540 Vietnam 2551 1,276.568 Zambia 1417 1,231.145
Australia
Belgium
BrazilCanada
Chile
China
Egypt
France
Germany
IndiaIndonesia
Iran ItalyJapan
Korean Rep.
Malaysia
Mexico
Poland
Russia Saudi ArabiaSpain Sweden
Taiwan
Thailand
Turkey
United Arab Embirates
United States
VietnamZambia
0
250
500
750
1,000
1,250
1,500
0 10,000 20,000 30,000 40,000 50,000 60,000 70,000
Cop
per u
sage
per
GD
P (to
nnes
/ US$
bln
)
GDP per capita (US$)
Intensity of Copper Usage 2018
Intensity of Refined Copper Usage*Sources: ICSG and International Monetary Fund
*Refined copper is typically used by semis fabricators or the “first users” of refined copper, including ingot makers, master alloy plants, wire rod plants, brass mills, alloy wire mills, foundries and foil mills. As a result, intensity of refined copper usage per GDP refers to the amount of copper used by industry divided by GDP and does not represent copper used in finished products per person.

The World Copper Factbook 2019
International Copper Study Group 43
0
5,000
10,000
15,000
20,000
25,000
30,000
2007 2009 2011 2013 2015 2017
Direct melt scrap Refined Usage
Total Copper Usage, Including Direct Melted Copper Scrap, 2007‐2017Thousand metric tonnes copper
Source: ICSG Recyclables Survey April 2019

The World Copper Factbook 2019
International Copper Study Group 44
Major Uses of Copper: Electrical
Copper is the best non‐precious metal conductor of electricity as it encounters much less resistance compared with other commonly used metals. It sets the standard to which other conductors are compared.
Copper is also used in power cables, either insulated or uninsulated, for high, medium and low voltage applications.
In addition, copper's exceptional strength, ductility and resistance to creeping and corrosion makes it the preferred and safest conductor for commercial and residential building wiring.
Copper is an essential component of energy efficient generators, motors, transformers and renewable energy production systems. Renewable energy
sources such as solar, wind, geothermal, fuel cells and other technologies are all heavily reliant on copper due to its excellent conductivity.
ICSG, in partnership with the Common Fund for Commodities, the International Copper Association and the International Copper Promotion Council (India), undertook the Transfer of Technology for High Pressure Copper Die Casting in India project. The project facilitated the transfer of technology related to the manufacture of rotors, motors and motor systems using more energy efficient high pressure copper die castings.
Images courtesy of the Copper Development Association.

The World Copper Factbook 2019
International Copper Study Group 45
Major Uses of Copper: Electronics and Communications
Copper plays a key role in worldwide information and communications technologies. HDSL (High Digital Subscriber Line) and ADSL (Asymmetrical Digital Subscriber Line) technology allows for high‐speed data transmission, including internet service, through the
existing copper infrastructure of ordinary telephone wire.
Copper and copper alloy products are used in domestic subscriber lines, wide and local area networks, mobile phones and personal computers.
Semiconductor manufacturers have launched a revolutionary "copper chip." By using copper for circuitry in silicon chips, microprocessors are able to operate at higher speeds, using less energy. Copper heat sinks help remove heat from transistors and keep computer processors operating at peak efficiency. Copper is also used extensively in other electronic equipment in the form of wires, transformers, connectors and switches.
Images courtesy of the Copper Development Association and European Copper Institute.

The World Copper Factbook 2019
International Copper Study Group 46
Major Uses of Copper: Construction
Copper and brass are the materials of choice for plumbing, taps, valves and fittings. Thanks in part to its aesthetic appeal, copper and its alloys, such as architectural bronze, is used in a variety of settings to build facades, canopies, doors and window frames.
Unlike plastic tubing, copper does not burn, melt or release noxious or toxic
fumes in the event of a fire. Copper tubes also help protect water systems from potentially lethal bacteria such as legionella. Copper fire sprinkler systems are a valuable safety feature in buildings.
The use of copper doorknobs and plates exploits copper's biostatic properties to
help prevent the transfer of disease and microbes.
Copper roofing, in addition to being attractive, is well known for its resistance to extreme weather conditions. Major public buildings, commercial buildings and homes use copper for their rainwater goods and roofing needs. The telltale green patina finish, that gives copper the classic look of warmth and richness, is the result of natural weathering.
Images courtesy of the Copper Development Association and the International Copper Association.

The World Copper Factbook 2019
International Copper Study Group 47
Major Uses of Copper: Industrial Machinery and Equipment
Wherever industrial machinery and equipment is found, it is a safe bet that copper and its alloys are present. Due to their durability, machinability and ability to be cast with high precision and tolerances, copper alloys are ideal for making products such as gears, bearings and turbine blades.
Copper's superior heat transfer capabilities and ability to withstand extreme environments makes it an ideal choice for heat exchange equipment, pressure vessels and vats.
The corrosion resistant properties of copper and copper alloys (such as brass, bronze, and copper‐nickel) make them especially suitable for use in marine and other demanding environments.
Vessels, tanks, and piping exposed to seawater, propellers, oil platforms and coastal power stations, all depend on copper's corrosion resistance for protection
Images courtesy of the Copper Development Association.

The World Copper Factbook 2019
International Copper Study Group 48
Major Uses of Copper: Consumer and General Products
From the beginning of civilization copper has been used by various societies to make coins for currency.
Today, countries are replacing lower denomination bills with copper‐based coins, as these coins last 10, 20 and even 50 times longer. In the United States, one cent
coins and five cent coins contain 2.5% and 75% copper, respectively, while other U.S. coins contain a pure copper core and 75% copper face.1 In the recently expanded European Union, the Euro coins, first introduced in 2002, also contain copper.
1 Source: U.S. Department of the Treasury.
Copper and copper‐based products are used in offices, households and workplaces. Computers, electrical appliances, cookware, brassware, and locks and keys are just some of the products exploiting copper's advantages.
In addition, in areas known to be copper deficient, copper is used by farmers to supplement livestock and crop feed.
Images courtesy of the International Copper Association and the Copper Development Association.

The World Copper Factbook 2019
International Copper Study Group 49
Major Uses of Copper: Transportation
All major forms of transportation depend on copper to perform critical functions.
Copper‐nickel alloys are used on the hulls of boats and ships to reduce marine befouling, thereby reducing drag and improving fuel consumption.
Automobiles and trucks rely on copper motors, wiring, radiators, connectors, brakes and
bearings. Today, the average internal combustion engine contains about 22.5 kg (50 lbs) of copper, while luxury cars on average contain around 1,500 copper wires totaling about 1.6 km (1 mile) in length.
ELECTRIC VEHICLES
Electric vehicles (EVs) contain approximately four times more copper than conventional cars. It is used in batteries, windings and copper rotors used in electric motors, wiring, busbars and charging infrastructure.
It is estimated that globally over 5 million electric vehicles were on the road in 2018. In an effort to reduce carbon emissions it is expected that the use of EVs will continue to rise. The demand for EVs is also expected to increase as a result of technology improvements, increased affordability and the deployment of
Images courtesy of the Copper Development Association and the European Copper Institute.

The World Copper Factbook 2019
International Copper Study Group 50
more electric chargers (each EV charger will add 0.7 kg of copper. Fast chargers can add up to 8 kg of copper each). This increase will result in greater demand for copper.
Copper’s superior thermal conductivity, strength, corrosion resistance and recyclability also make it ideal for automotive and truck radiators. New manufacturing technologies, processes and innovative designs are resulting in lighter, smaller and more efficient radiators.
Copper is used extensively in new generation airplanes and trains. New high‐speed trains can use anywhere from 2 to 4 tonnes of copper, significantly higher than the 1 to 2 tonnes used in traditional electric trains.
Growth Markets for Copper Usage In the longer term, copper could benefit from use in the following markets: 1
1. Antimicrobial – copper is gaining popularity as an alternative to plastic in medical applications, such as sterile table tops and medical cart handles
2. Aquaculture – marine aquaculture nets and pens made with copper‐alloy mesh are emerging as an effective solution to important problems facing the near‐shore fish farming industry
3. Electrical Propulsion – powering EVs require changes to the electrical infrastructure that will benefit from copper
4. Renewable Energy – copper plays important roles in clean energy systems from wind to solar thermal plants
5. Seismic Energy Dissipation – earthquake damage can be controlled through the use of copper‐based devices that absorb energy to limit building motions
6. Ultra‐conductive Copper Components – progress is being made in the methods of incorporating nanocarbon materials into copper in a way that promises to deliver large efficiency improvements in electrical energy transmission and distribution networks
7. Electrical Vehicles (EVs) – to reduce carbon emissions. Rising number of EVs is expected to result in increased copper usage
Images courtesy of the Copper Development Association and the European Copper Institute. Source: 1/ ICA Annual Reports

The World Copper Factbook 2019
International Copper Study Group 51
Major Uses of Copper: Usage by Region and End Use Sector, 2018 Source: International Wrought Copper Council (IWCC) and International Copper Association (ICA)

The World Copper Factbook 2019
International Copper Study Group 52
Chapter 7: Copper Recycling Copper is among the few materials that do not degrade or lose their chemical or physical properties in the recycling process. Considering this, the existing copper reservoir in use can well be considered a legitimate part of world copper reserves. In the recent decades, an increasing emphasis has been placed on the sustainability of material uses in which the concept of reuse and recycling of metals plays an important role in the material choice and acceptance of products. If appropriately managed, recycling has the potential to extend the use of resources, and to minimize energy use, some emissions, and waste disposal.
Closing metal loops through increased reuse and recycling enhances the overall resource productivity and therefore represents one of the key elements of society’s transition towards more sustainable production and consumption patterns. It is widely recognized that recycling is not in opposition to primary metal production, but is a necessary and beneficial complement.
In 2017, ICSG estimates that 33% of global copper use came from recycled copper. Some countries' copper requirements greatly depend on recycled copper to meet internal demands. However, recycled copper alone cannot meet society's needs, so we also rely on copper produced from the processing of mineral ores.
Images courtesy of the European Copper Institute.

The World Copper Factbook 2019
International Copper Study Group 53
Copper Recycling Rate Definitions The recycling performance of copper-bearing products can be measured and demonstrated in various ways – depending, among other things, on objectives, scope, data availability and target audience. The three International Non-Ferrous Metal Study Groups in conjunction with various metal industry associations agreed on the common definitions of the three following metal recycling rates:
The Recycling Input Rate (RIR) measures the proportion of metal and metal products that are produced from scrap and other metal-bearing low-grade residues. The RIR is mainly a statistical measurement for raw material availability and supply rather than an indicator of recycling efficiency of processes or products. The RIR has been in use in the metals industry for a long time and is widely available from statistical sources. Major target audiences for this type of “metallurgical” indicator are the metal industry, metal traders and resource policy makers. However, given structural and process variables, it may have limited use as a policy tool.
The Overall Recycling Efficiency Rate indicates the efficiency with which end of life (EOL) scrap, new scrap, and other metal-bearing residues are collected and recycled by a network of collectors, processors, and metal recyclers. The key target audiences of this particular indicator are metal industry, scrap processors and scrap generators.
The EOL Recycling Rate indicates the efficiency with which EOL scrap from obsolete products is recycled. This measure focuses on end-of-life management performance of products and provides important information to target audiences such as metal and recycling industries, product designers, life cycle analysts, and environmental policy makers.

The World Copper Factbook 2019
International Copper Study Group 54
0
1,000
2,000
3,000
4,000
5,000
6,000
7,000
8,000
9,000
10,000
2010 2011 2012 2013 2014 2015 2016 2017
('000 t Cu)
Secondary refined production Cu content of Direct Melt
26%
28%
30%
32%
34%
36%
38%
0
5,000
10,000
15,000
20,000
25,000
30,000
2010 2011 2012 2013 2014 2015 2016 2017
RIR %('000 t Cu)
Refined Usage Cu content of Direct Melt Recycling Input Rate (RIR)
ICSG Global Copper Use (incl. Recycling), 2010-2017 Source: ICSG Recyclables Survey April 2019
Global Scrap Use (incl. secondary refined production and scrap direct melt)
Global Copper Use and Recycling Input Rate (incl. refined usage and scrap direct melt)

The World Copper Factbook 2019
International Copper Study Group 55
Key Drivers of the Global Copper Scrap Market
Expanding Copper Mine Production and Refined Copper Substitution
Industrialization and Economic Growth Prices
o Copper Scrap Prices and Spreads o Refined Copper Prices and the Demand for Scrap
Chinese scrap market developments The Shift in Regional Scrap Processing Capacity Regulations on Recycling and Trade Technology
ICSG Global Copper Scrap Project Reports
European Semi Manufactured Copper Products Capacity (2019)
Copper Use in Fabrication in Japan, Korea, Taiwan (China) and Vietnam (2018)
Industrial Use of Refined Copper and Scrap in Fabrication in China (2017)
Manufacture and Use of Semi‐fabricated copper in Latin America/Canada (2017)
Fabrication and Copper Use in Indian Subcontinent, ASEAN and Oceania (2015)
Survey of Brass Mills, Copper Products and Foundries in China (2014)
Middle East and North Africa Copper Use Study (2014)
Copper and Copper Alloy Scrap Supply Survey in EU‐27 (2013)
ICSG Global Copper Scrap Research Project and recent scrap reports Based on interest expressed by member countries, ICSG launched the copper scrap market project in 2007 in order to provide greater transparency on an increasingly vital component of the world copper market at a time when globalization is reshaping the copper scrap and copper alloy recycling business. The final report of the project was published in August 2010. In addition, ICSG has completed a number of new detailed reports on NAFTA, European, Middle Eastern and Chinese scrap recovery and scrap supply in recent years. For more information about ICSG work related to copper scrap, please contact the ICSG Secretariat at [email protected]

The World Copper Factbook 2019
International Copper Study Group 56
Recycling indicator 10‐yr avg
Recycling inputrate 33%
EoL recyclinginput rate 17%
EoL collectionrate 58%
EoL processingrate 70%
EoL recycling rate 41%Overall processing rate 81%
Overall recyclingefficiency rate 56%
Old Scrap Ratio 52%
Industry Global Flows of Copper (2017) and Derived Recycling Rates Figures produced for the International Copper Association by Fraunhofer ISI based on Environ. Sci. Technol. 47 (12), pp. 6564–6572 (freely
available under http://dx.doi.org/10.1021/es400069b).

The World Copper Factbook 2019
International Copper Study Group 57
The Flow of Copper
Concen-trates/ Matte
Trade Blister/ Anode
Refined Copper
Mine Smelter Refinery
Alloy Ingot
Semis Net Trade
Wire rod plant / Wire mill
Brassmill
Foundry
Other Plants
Direct Melt
Hydromet. Plant
Low Grade Residues
Semis Supply
Ingot Maker
Scrap for Smelting
Scrap Recycling
Scrap for Refining
Production Fabrication
Alloy Metals
Refined Usage
incl. low grade scrap
By-products/ slag/ashesTailings
Mining
Chemicals
SX/EW
New Scrap
Wire rod
refined
alloys

The World Copper Factbook 2019
International Copper Study Group 58
Finished Products
Net Trade
EOL Products
New Scrap
Old Scrap
Recycling
Scrap & Low grade Net Trade
Disposal/ Other Uses
Other Metal Loops
Manufacture
Dissipative Uses
Product Use(Lifetime)
End-of-Life Management
Construction
E&E Equipment
Ind. equipment
Transport
Consumer/ Gen.
Other Uses
C&D
INEW
IEW
ELV
WEEE
MSW & Other
Abandoned/ Stored/ Reused
End-of-Life Products
Copper Reservoir
in UseFinished Products
EOL Products
Product Supply
Low grade from Fabr.
Recycling
Recycling losses new
scrap
Semis Import
(EOL Management adjusted for
export/reuse after collection)
The Flow of Copper (cont.)

The World Copper Factbook 2019
International Copper Study Group 59
Mine Production
Refined Production
Refined Usage
Mine Production
Refined Production
Refined Usage
Mine Production
Refined Production
Refined Usage
1960 3,924 4,998 4,738 1980 7,227 9,261 9,396 2000 13,199 14,793 15,1221961 4,081 5,127 5,050 1981 7,721 9,573 9,522 2001 13,636 15,638 14,9381962 4,216 5,296 5,048 1982 7,745 9,319 9,090 2002 13,487 15,354 15,1331963 4,286 5,400 5,500 1983 7,824 9,541 9,510 2003 13,699 15,272 15,6411964 4,443 5,739 5,995 1984 8,135 9,440 9,930 2004 14,594 15,918 16,7431965 4,769 6,059 6,193 1985 8,288 9,616 9,798 2005 14,927 16,572 16,5581966 4,987 6,324 6,445 1986 8,295 9,920 10,112 2006 14,983 17,288 16,9261967 4,743 6,004 6,195 1987 8,620 10,148 10,293 2007 15,508 17,895 18,0361968 5,010 6,653 6,523 1988 8,773 10,512 10,668 2008 15,537 18,191 17,8881969 5,682 7,212 7,137 1989 9,086 10,908 11,081 2009 15,946 18,234 17,8991970 5,900 7,592 7,291 1990 9,227 10,805 10,886 2010 15,992 18,981 19,1411971 5,941 7,404 7,296 1991 9,373 10,686 10,563 2011 15,965 19,601 19,7151972 6,541 8,100 7,942 1992 9,497 11,042 10,866 2012 16,692 20,194 20,4831973 6,915 8,544 8,740 1993 9,571 11,274 10,992 2013 18,190 21,058 21,4171974 7,097 8,759 8,310 1994 9,539 11,118 11,560 2014 18,426 22,490 22,9271975 6,735 8,187 7,445 1995 10,070 11,817 12,043 2015 19,149 22,838 23,0811976 7,289 8,632 8,539 1996 11,084 12,628 12,489 2016 20,386 23,357 23,5121977 7,444 8,884 9,057 1997 11,514 13,425 13,082 2017 20,097 23,548 23,7321978 7,306 9,030 9,527 1998 12,228 14,032 13,440 2018/p 20,557 24,104 24,5111979 7,371 9,200 9,848 1999 12,767 14,576 14,223
p/ preliminary
ANNEX World Copper Production and Refined Usage, 1960-2018
Thousand Metric Tonnes Copper Source: ICSG

The World Copper Factbook 2019
International Copper Study Group 60
PUBLICATION Member Country*
Non‐Member Country Total
The ICSG monthly publication COPPER BULLETIN o One year’s subscription (12 issues + Yearbook) o Single Issue ______(month) ________ (year) o Access to ICSG Online Database for COPPER BULLETIN data (only available to subscribers of COPPER BULLETIN)
€500 €100 €200
€750 €150 €250
The ICSG STATISTICAL YEARBOOK – 2018 (single issue) €200 €300 The ICSG DIRECTORY OF COPPER MINES AND PLANTS o One year’s subscription (2 issues) o Single issue o Access to ICSG Online Database for DIRECTORY data
(only available to subscribers of DIRECTORY OF COPPER MINES AND PLANTS)
€500 €400 €200
€750 €600 €250
The 2019 ICSG DIRECTORY OF COPPER AND COPPER ALLOY FABRICATORS (single issue) €400 €800 NEW European Semi Manufactured Copper Products Capacity (2019) €500 €1,000 NEW Solid Wastes in Base Metal Mining, Smelting and Refining: A Comprehensive Study for the Copper, Lead and Zinc and Nickel Industries (2019) €500 €1,000
NEW Smelting and Hydrometallurgy Treatment for Copper Sulphide Ores and Concentrates (2019) €500 €1,000
Copper Use in Fabrication in Japan, Korea, Taiwan (China) and Vietnam (2018) €500 €1,000 Industrial Use of Refined Copper and Scrap in Fabrication in China (2017) €400 €600 Manufacture and Use of Semi‐Fabricated copper in Latin America/Canada (2017) €400 €600 China Copper Mining Industry (2016) €1,000 €1,500 Social Acceptance for Mineral and Metal Projects (2015) €500 €750 The By‐Products of Lead, Zinc, Copper and Nickel – Updated (2015) €1,000 €1,500 Fabrication and Copper Use in Indian Subcontinent, ASEAN and Oceania (2015) €400 €600 Middle East and North Africa Copper Use Study (2014) €400 €600 Survey of Brass Mills, Copper Products and Foundries in China (2014) €400 €600 Cobalt as a By‐Product of Copper and Nickel (2014) €1,000 €2,000 Taxation, Royalties and Other Fiscal Measures Applied to the Non‐Ferrous MetalsIndustry (2013) €500 €750
Risk Factors in Developing Minerals and Metal Projects (2013) €500 €750
TOTAL ORDER
ICSG Publications Order Form
(*) ICSG Members refers to orders originating from institutions based in ICSG member countries. ICSG member countries are: Australia, Belgium, Brazil, Chile, China, D.R. Congo, Finland, France, Germany, Greece, India, Iran, Italy, Japan, Luxembourg, Mexico, Mongolia, Peru, Poland, Portugal, Russian Fed., Serbia, Spain, Sweden and the U.S.A
Prices are quoted in Euros. For US dollars payments contact ICSG at [email protected] or Tel: 351‐21‐351‐3870 Fax: 351‐21‐352‐4035.
To subscribe to ICSG publications please fill in this form and send to [email protected]
Name _____________________________________________________
Company __________________________________________________
Address ___________________________________________________
________________________________City_______________________
Postal Code______________________ Country___________________
Tel________________________________________________________
Email______________________________________________________
Date______________________________________________________
Signed_____________________________________________________
METHOD OF PAYMENT
□ Bank Transfer: Bank name and address: Millennium BCP, Avenida Republica 59A, Lisbon, Portugal IBAN No.: PT50‐0033‐000000‐191361989‐05 ACCOUNT No.: 19136198905 BIC/SWIFT: BCOMPTPL
□ By Credit Card (VISA or MasterCard) for ___________ Euros
Card number________________________________________________
C.V.V. (Card Value Verification – last three digits of the number on
the back of the card) _________________________________________
Cardholders Name ___________________________________________
Expiry date _________________________________________________
Signature __________________________________________________
Date ______________________________________________________
Cardholders Address_________________________________________
__________________________________________________________

The World Copper Factbook 2019
International Copper Study Group 61
Notes 2019

International Copper Study Group 62
International Copper Study Group Rua Almirante Barroso 38 – 6th
1000-013 Lisbon, Portugal
Tel: +351-21-351-3870 Fax: +351-21-352-4035
e-mail: [email protected]
Web site: www.icsg.org