Emerging marketplace dynamics in Rohingya camps of Cox's ...

cd-manual
www.ercis.org
cd-manual
www.ercis.org
ERCIS – European Research Center for Information Systems
Westfälische Wilhelms-Universität Münster
Leonardo-Campus 3 48149 Münster Germany
Tel: +49 (0)251 83-38100 Fax: +49 (0)251 83-38109
[email protected] http://www.ercis.org/
ERCIS – European Research Center for Information SystemsEditors: J. Becker, K. Backhaus, H. L. Grob, B. Hellingrath, T. Hoeren, S. Klein, H. Kuchen, U. Müller-Funk, U. W. Thonemann, G. Vossen
Working Paper No. 18
The Data Marketplace Survey RevisitedStahl, F. Schomm, F. Vossen, G.
Wor
king
Pap
er N
o. 1
8
The
Dat
a M
arke
tpla
ce S
urve
y Re
visi
ted
ISSN 1614-7448
cd-manual
www.ercis.org

cite as: Florian Stahl, Fabian Schomm, Gottfried Vossen: The Data MarketplaceSurvey Revisited. In: Working Paper No. 18, European Research Center forInformation Systems, Eds.: Becker, J. et al. Munster 2014.
ISSN 1614-7448
Florian Stahl, Fabian Schomm, Gottfried Vossen
The Data Marketplace Survey Revisited
Working Paper No. 18
ERCIS – European Research Center for Information SystemsEditors: J. Becker, K. Backhaus, H. L. Grob, T. Hoeren, S. Klein,
H. Kuchen, U. Muller-Funk, U. W. Thonemann, G. Vossen
Working Papers


�1
Contents1 Introduction . . . . . . . . . . . . . . . . . . . . . . . . . . . . . . . . . . . . . . . . . . . 5
2 Methodology and Approach . . . . . . . . . . . . . . . . . . . . . . . . . . . . . . . . . . 52.1 Similarities and Dissimilarities with the Previous Survey . . . . . . . . . . . . . . . 52.2 Data Acquisition and Approach . . . . . . . . . . . . . . . . . . . . . . . . . . . . . 62.3 Method of Comparative Study . . . . . . . . . . . . . . . . . . . . . . . . . . . . . . 7
3 Findings . . . . . . . . . . . . . . . . . . . . . . . . . . . . . . . . . . . . . . . . . . . . . 73.1 Objective Dimensions . . . . . . . . . . . . . . . . . . . . . . . . . . . . . . . . . . 8
3.1.1 Type . . . . . . . . . . . . . . . . . . . . . . . . . . . . . . . . . . . . . . . . 83.1.2 Time Frame . . . . . . . . . . . . . . . . . . . . . . . . . . . . . . . . . . . . 83.1.3 Domain . . . . . . . . . . . . . . . . . . . . . . . . . . . . . . . . . . . . . . 93.1.4 Data Origin . . . . . . . . . . . . . . . . . . . . . . . . . . . . . . . . . . . . 93.1.5 Pricing Model . . . . . . . . . . . . . . . . . . . . . . . . . . . . . . . . . . . 103.1.6 Data Access . . . . . . . . . . . . . . . . . . . . . . . . . . . . . . . . . . . 103.1.7 Data Output . . . . . . . . . . . . . . . . . . . . . . . . . . . . . . . . . . . . 103.1.8 Language . . . . . . . . . . . . . . . . . . . . . . . . . . . . . . . . . . . . . 113.1.9 Target Audience . . . . . . . . . . . . . . . . . . . . . . . . . . . . . . . . . 113.1.10 Pre-Purchase Testability . . . . . . . . . . . . . . . . . . . . . . . . . . . . . 12
3.2 Subjective Dimensions . . . . . . . . . . . . . . . . . . . . . . . . . . . . . . . . . . 123.2.1 Trustworthiness . . . . . . . . . . . . . . . . . . . . . . . . . . . . . . . . . . 123.2.2 Size of Vendor . . . . . . . . . . . . . . . . . . . . . . . . . . . . . . . . . . 133.2.3 Maturity . . . . . . . . . . . . . . . . . . . . . . . . . . . . . . . . . . . . . . 133.2.4 Pre-Purchase Information . . . . . . . . . . . . . . . . . . . . . . . . . . . . 13
4 Related Work . . . . . . . . . . . . . . . . . . . . . . . . . . . . . . . . . . . . . . . . . . 14
5 Conclusion & future work . . . . . . . . . . . . . . . . . . . . . . . . . . . . . . . . . . . 15
A Glossary . . . . . . . . . . . . . . . . . . . . . . . . . . . . . . . . . . . . . . . . . . . . 17A.1 Objective Dimensions . . . . . . . . . . . . . . . . . . . . . . . . . . . . . . . . . . 17
A.1.1 Type . . . . . . . . . . . . . . . . . . . . . . . . . . . . . . . . . . . . . . . . 17A.1.2 Data Origin . . . . . . . . . . . . . . . . . . . . . . . . . . . . . . . . . . . . 18A.1.3 Pricing Model . . . . . . . . . . . . . . . . . . . . . . . . . . . . . . . . . . . 18A.1.4 Data Access . . . . . . . . . . . . . . . . . . . . . . . . . . . . . . . . . . . 18A.1.5 Data Output . . . . . . . . . . . . . . . . . . . . . . . . . . . . . . . . . . . . 19
A.2 Subjective Dimensions . . . . . . . . . . . . . . . . . . . . . . . . . . . . . . . . . . 19A.2.1 Trustworthiness . . . . . . . . . . . . . . . . . . . . . . . . . . . . . . . . . . 19A.2.2 Size of Vendor . . . . . . . . . . . . . . . . . . . . . . . . . . . . . . . . . . 20A.2.3 Maturity . . . . . . . . . . . . . . . . . . . . . . . . . . . . . . . . . . . . . . 20

� 2
List of FiguresFigure 1: Number of Vendors for each Type. . . . . . . . . . . . . . . . . . . . . . . . . . . 8Figure 2: Number of Vendors for Time Frame. . . . . . . . . . . . . . . . . . . . . . . . . . 9Figure 3: Number of Vendors for each Domain. . . . . . . . . . . . . . . . . . . . . . . . . 9Figure 4: Data Origin Distribution. . . . . . . . . . . . . . . . . . . . . . . . . . . . . . . . 9Figure 5: Number of Vendors for each Pricing Model. . . . . . . . . . . . . . . . . . . . . . 9Figure 6: Data Access Distribution. . . . . . . . . . . . . . . . . . . . . . . . . . . . . . . . 10Figure 7: Number of Vendors per Data Output Category. . . . . . . . . . . . . . . . . . . . 10Figure 8: Language of Web Sites (left) and Data (right). . . . . . . . . . . . . . . . . . . . 11Figure 9: Number of Vendors by Target Audience. . . . . . . . . . . . . . . . . . . . . . . 12Figure 10: Number of Vendors by Pre- Purchase Testability. . . . . . . . . . . . . . . . . . . 12Figure 11: Trustworthiness Distribution. . . . . . . . . . . . . . . . . . . . . . . . . . . . . . 13Figure 12: Number of Vendors by Size. . . . . . . . . . . . . . . . . . . . . . . . . . . . . . 13Figure 13: Maturity of Vendors. . . . . . . . . . . . . . . . . . . . . . . . . . . . . . . . . . . 14Figure 14: Number of Vendors by Pre- Purchase Information. . . . . . . . . . . . . . . . . . 14

�3
List of TablesTable 1: The Set of Dimensions. . . . . . . . . . . . . . . . . . . . . . . . . . . . . . . . . 6

� 4
Type
Research Report
Title
The Data Marketplace Survey Revisited.
Authors
Florian Stahl, Fabian Schomm, Gottfried Vossencontact via: [email protected]
Abstract
Trading data as a commodity is increasingly popular. To get a better understanding of emergingdata marketplaces, we have conducted two surveys to systematically gather and evaluate theircharacteristics. This paper is a continuation of a survey we conducted in 2012; it describes ourfindings from a second round done in 2013. Our study shows that the market is vivid with numerousexits and changes in its core business. We try to identify trends in this young field and explainthem. Notably, there is a definite trend towards high quality data.
Keywords
Data Market Places, Data Marketplaces Survey, Data Marketplaces Development
�5
1 Introduction
In this day and age, information and its underlying data are more important than ever before.Having the right information at the right time is crucial in almost all business areas. However,despite the huge supply of data nowadays, data quality is still an issue in many applications and formany companies. Furthermore, finding a data set that matches someone’s needs with satisfactoryquality is often very challenging, especially so if regular updates to the data set are needed. Aswe have argued in [9, 13, 12], data marketplaces and specialized data vendors may help solvingthis issue. Still, finding a suitable vendor or data market place can be equally challenging. Asdescribed in [12], the market for such providers is relatively young and diverse with a plenitudeof data marketplaces and data vendors around, each with vastly different offerings. We havepresented an initial overview of data vendors and marketplaces for data and have provided aninitial overview of the market for data marketplaces and data vendors in 2012. This
honors our the promise to repeat the study regularly, in order to provide insights into how themarket is developing, where it is heading and which types of vendors and technology survives. Itturns out that already after one year we were able to discover interesting trends.
The task of this second survey has been (a) to refine the framework used in the first survey, (b)to describe the situation as of summer 20131, and (c) to compare the results of both surveysand analyze the changes. To this end, we first describe the approach and discuss differencesbetween both surveys in Section 2. We then present the results of the 2013 survey in Section 3.Finally, Section 5 summarizes our main findings and gives conclusions regarding trends on datamarketplaces.
2 Methodology and Approach
In this section we will first outline the methodological similarities and dissimilarities with our previoussurvey. We will then describe the dimensions of both surveys and the comparative analysis that isnew to the one reported here.
2.1 Similarities and Dissimilarities with the Previous Survey
In order to make this survey comparable to the previous one [12] we did not changed the methodol-ogy significantly. In particular, our definition of data marketplace and data vendor have stayed thesame, and we refrain from extensively reciting it. In short, we are focused on companies offeringeither a platform that allows users to buy and sell (or just offer) data (e. g., datamarket.com),providing raw data in any form (e. g., data.gov), or on companies offering data enrichment tools(e. g., attensity.com). A further selection criterion for the companies surveyed has been that theyoffer their products and services online. For a more comprehensive definition, interested readersare referred to the elaborations in [13, 12, 9].
The general limitations of both our surveys have not changed. They are as follows: (1) We purelyrely on the information that vendors provide on their respective Web site. While we are aware thatevery vendor tries to present himself in the best way, which might lead to a bias in the findings, wesimply do not have the resources needed to evaluate every candidate in thorough details. Thisis, however, inherent to any Web survey. (2) It was not possible to find information about everydimension for every vendor. We intentionally left these fields empty, which could lead to minimally
1The study was conducted in July and August of 2013.

� 6
Table 1: The Set of Dimensions.
Dimension Categories Question to be answered
obje
ctiv
e
Type Web Crawler, Customizable Crawler,Search Engine, Pure Data Vendor,Complex Data Vendor, MatchingVendor, Enrichment –Tagging,Enrichment –Sentiment, EnrichmentAnalysis, Data Market Place
What is the type of the coreoffering?
Time Frame Static/Factual, Up To Date Is the data static or real-time?Domain All, Finance/Economy, Bio Medicine,
Social Media, Geo Data, AddressData
What is the data about?
Data Origin Internet, Self-Generated, User,Community, Government, Authority
Where does the data come from?Who is the author?
Pricing Model Free, Freemium, Pay-Per-Use, FlatRate
Is the offer free, pay-per-use orusable with a flat rate?
Data Access API, Download, SpecializedSoftware, Web Interface
What technical means are offeredto access the data?
Data Output XML, CSV/XLS, JSON, RDF,Report
In what way is the data formattedfor the user?
Language English, German, More What is the language of the Website? Does it differ from thelanguage of the data?
Target Audience Business, Customer Towards whom is the productgeared?
Pre-Purchase Testability None, Restricted Access, CompleteAccess.
Can buyers test if the offermatches their needs?
subj
ectiv
e
Trustworthiness Low, Medium, High How trustworthy is the vendor?Can the original data source betracked or verified?
Size of Vendor Startup, Medium, Big, Global Player How big is the vendor?Maturity Research Project, Beta, Medium,
HighIs the product still in beta oralready established?
Pre-Purchase Information Barely Any, Sparse MedialInformation, Comprehensive MedialInformation
To what degree take vendorsmeasures to reduce informationuncertainty of buyers?
skewed results, as we believe that this approach yields the best overall results. (3) Our surveydoes not claim to be exhaustive, as that would be close to impossible due to the sheer number ofactors in this field. However, we have tried our best to survey the most important vendors as wellas representative niche vendors. We believe that this gives a pretty accurate view of the overallmarket situation.
2.2 Data Acquisition and Approach
Given that this is an extension of our previous study intended to mark the beginning of an ongoingprocess, we have revisited all the vendors we surveyed previously (cf. [12]). The actual dataacquisition was performed through means of an online investigation. In order to speed up thisprocess, the number of surveyors was doubled from last year. Similar to last year’s survey we alsoconducted a broad keyword-based search to find suitable candidates as well as using suggestionsfrom peers with whom we discussed the survey.

�7
For continuity reasons, we have analyzed the data along the same twelve dimensions that weused last time, which are divided into objective and subjective dimensions. During the investigationphase, however, it became clear that these dimensions do not cover every interesting aspect.Therefore, we decided to add two new dimensions, namely Pre-Purchase Information (subjective)and Pre-Purchase Testability (objective).
Table 1 gives an overview over all the dimensions, the categories that constitute a dimension aswell as sample questions we asked to conduct the survey.
As in the previous survey, the values are strictly Boolean. An offering either fulfills the criteria for acertain dimension category or it does not. However, categories are not mutually exclusive in mostcases, e. g., one offering can provide multiple ways of data access. Dimensions that are mutuallyexclusive will be pointed out in the dimension description in Section 3.
2.3 Method of Comparative Study
The market for data vendors and data marketplaces is an emerging and dynamic market. Thus,some offerers leave the market and new providers appear. We observed that out of all companiesthat were surveyed last year, three companies went out of business and one changed their servicesso much that it no longer fits our definition of a data marketplace.
In order to properly capture the changing market, we also looked at new companies to include. Itturned out that 5 companies, which had not been part of the previous survey, fit nicely into ourselection criteria as explained in Section 2.1. This results in 3 groups of companies surveyed whichwe gave the following names:
� Leavers: Companies that no longer exist or have changed business — 4 companies.
� Returners: Companies that are continuously part of the survey — 42 companies.
� Freshmen: Companies new to the survey — 5 companies.
Returners and Freshmen together build the basis for the 2013 data which will be — similar to lastyear — described in the findings section (Section 3). In the same context, we will highlight thedevelopment of the market situation. To this end, we compare the data we gathered in 2012 for theReturners with the 2013 survey data for this group. By doing so we will draw an initial picture ofhow the market has developed. Of course it is still too early to take these two surveys as a basisfor predictions, but as they develop further the picture gets more complete and will allow for moresophisticated analysis in the future.
3 Findings
The results for 2013 will be presented in the same manner as we did in [12]. In contrast to theprevious survey, no in-depth explanation of each category will be given except for the two newdimensions (cf. Section 2.2). However, to assist readers unfamiliar with our previous work, aglossary of important terms can be found in Appendix A. Also, we focus on presenting thedevelopment over the last year rather than solely presenting the figures for 2013. To that end,all figures are split into two parts. The lower bar-chart presents the current market situation in2013. The upper chart illustrates the changes within the group of returners2. This implies that
2The two new dimensions do not show changes because we have no previous data to compare to.

� 8
Figure 1: Number of Vendors for each Type.
the situation of 2013 depicts more than the survey of 2012 plus changes, as also new vendorshave been included in the survey. More concretely, the lower bar chart is based on the two groupsreturners and freshmen which together consist of 47 vendors. The upper chart however onlyrepresent the change in returners which consist of 42 vendors.
3.1 Objective Dimensions
3.1.1 Type
The Type dimension classifies vendors regarding their core product. As can be seen in Figure 1,for this not-mutually exclusive category, most types show a growth in numbers. The strongestincrease (relative and absolute) being Enrichment Tagging. Generally, it can be seen that productsthat offer enhanced data are increasingly common, while the number of services for unprocessedinformation e. g. raw data or non-customized crawling decreases slightly. In light of the fact thatin a growing market stagnation can be seen as a step backwards, it is reasonable to make theassumption that this goes along with an increasing demand for high quality processed data.
3.1.2 Time Frame
Time Frame describes the temporal context of the data. It can be distinguished between data thatis valid and relevant for a long period of time (static/fatual) and data which is only valuable shortlyafter its creation (up to date).

�9
Most strikingly, we found that the percentage of vendors offering both static and up-to-date dataincreased from less than 20% in 2012 to approximately 45% (21 vendors) in 2013 (cf. Figure 2).Also, the gap between both shrank from 9 to 4 vendors in the overall sets. Additionally, this trend isevident by the stronger increase in up-to-date information within the returners group.
Figure 2: Number of Vendorsfor Time Frame. Figure 3: Number of Vendors for each Domain.
3.1.3 Domain
The domain describes from which area of application the data originally stems from. The domainany describes vendors whose offers are not restricted (for instance on a data marketplace). Asin 2012, vendors falling into the any category did not count towards explicit domains. In contrast,other domains were not mutually exclusive, i. e., a vendor may serve more than one domain.Figure 3 shows, that the situation is similar to the previous study. Thus, we did not observe anychange or emerging trend in this dimension.
3.1.4 Data Origin
Data origin describes the type of source from which the data originally comes from.
Figure 4: Data Origin Distribution.Figure 5: Number of Vendors for each
Pricing Model.
In the 2013 survey, Internet and Authority stay the most popular sources with 23 and 20 vendors,respectively. Despite the fact that the main advantage of these offers is that the data is usually
� 10
of high correctness, completeness, and credibility, we observed an increase of more than 80% inorigins self-generated, user, and community within the group of returners. Regarding user, whichconsists mainly of enhancement services, this may point to an increased need in adding value tothe data a company has already at hand. Also, the raise in self-generated and community maysuggest that there is a need for data that cannot be generated or sourced by other means. Thenumbers are illustrated in Figure 4.
3.1.5 Pricing Model
The four pricing models described last year are still those most commonly used. As can be seenin Figure 5, all pricing models except for freemium are about level. Interestingly, freemium has lostimportance while at the same time pay-per-use increased strongly, both within the returners andregarding the overall set. This development could indicate that customers have more trust in thequality of the purchased data sets, and thus a higher willingness to pay.
3.1.6 Data Access
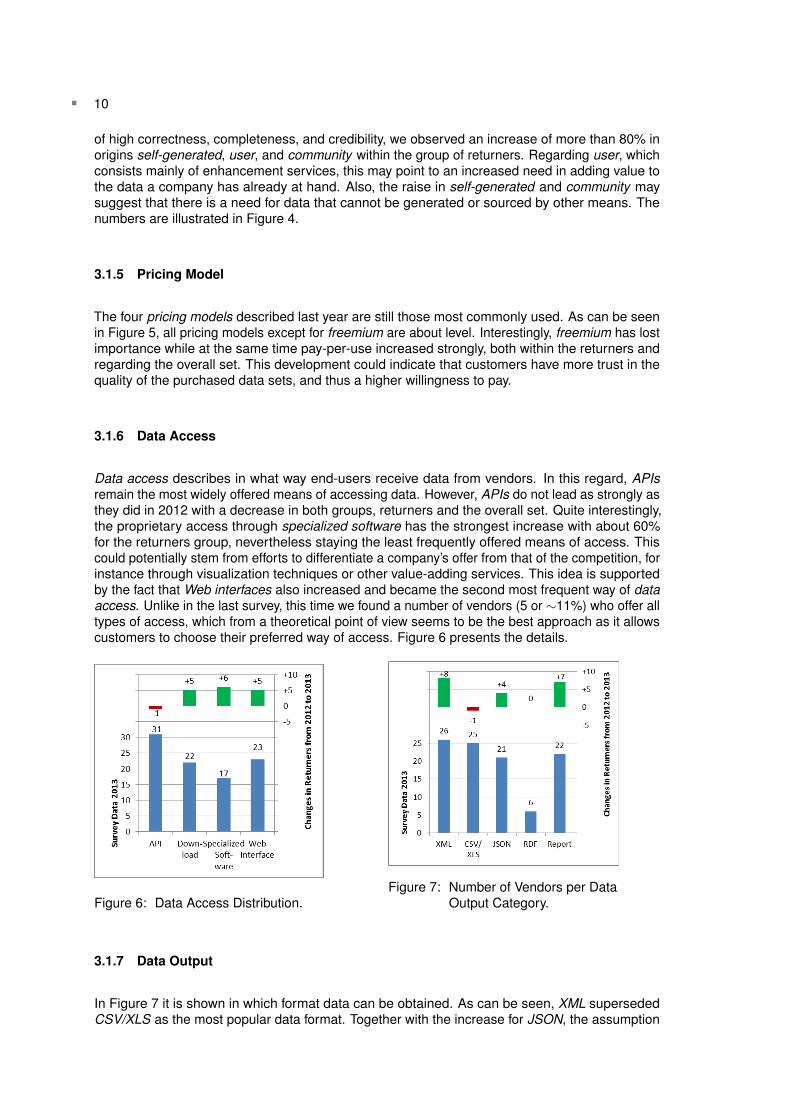
Data access describes in what way end-users receive data from vendors. In this regard, APIsremain the most widely offered means of accessing data. However, APIs do not lead as strongly asthey did in 2012 with a decrease in both groups, returners and the overall set. Quite interestingly,the proprietary access through specialized software has the strongest increase with about 60%for the returners group, nevertheless staying the least frequently offered means of access. Thiscould potentially stem from efforts to differentiate a company’s offer from that of the competition, forinstance through visualization techniques or other value-adding services. This idea is supportedby the fact that Web interfaces also increased and became the second most frequent way of dataaccess. Unlike in the last survey, this time we found a number of vendors (5 or ∼11%) who offer alltypes of access, which from a theoretical point of view seems to be the best approach as it allowscustomers to choose their preferred way of access. Figure 6 presents the details.
Figure 6: Data Access Distribution.Figure 7: Number of Vendors per Data
Output Category.
3.1.7 Data Output
In Figure 7 it is shown in which format data can be obtained. As can be seen, XML supersededCSV/XLS as the most popular data format. Together with the increase for JSON, the assumption
�11
can be made that Web standards are about to replace the traditional exchange formats. Twovendors even offer all data output formats. The increase in pre-formatted reports is feeding theimpression from previous sections that vendors try to individualize themselves as well as simplifydata access for managers and other non-technical personnel.
3.1.8 Language
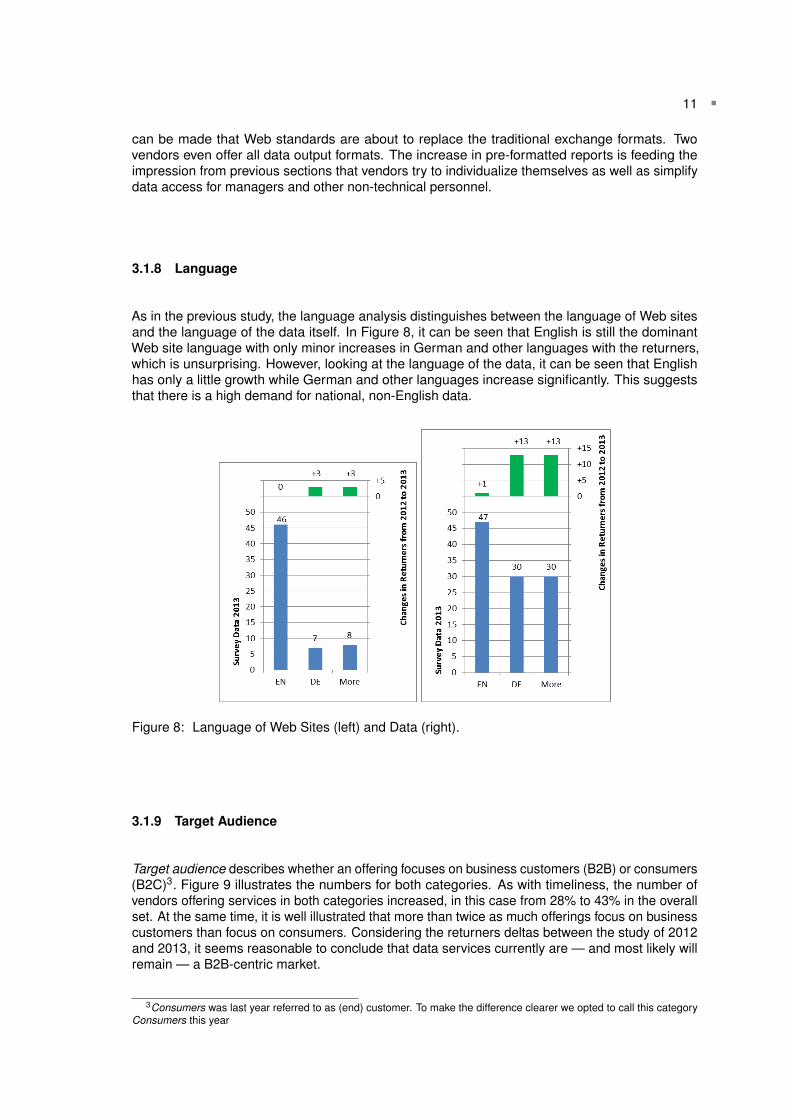
As in the previous study, the language analysis distinguishes between the language of Web sitesand the language of the data itself. In Figure 8, it can be seen that English is still the dominantWeb site language with only minor increases in German and other languages with the returners,which is unsurprising. However, looking at the language of the data, it can be seen that Englishhas only a little growth while German and other languages increase significantly. This suggeststhat there is a high demand for national, non-English data.
Figure 8: Language of Web Sites (left) and Data (right).
3.1.9 Target Audience
Target audience describes whether an offering focuses on business customers (B2B) or consumers(B2C)3. Figure 9 illustrates the numbers for both categories. As with timeliness, the number ofvendors offering services in both categories increased, in this case from 28% to 43% in the overallset. At the same time, it is well illustrated that more than twice as much offerings focus on businesscustomers than focus on consumers. Considering the returners deltas between the study of 2012and 2013, it seems reasonable to conclude that data services currently are — and most likely willremain — a B2B-centric market.
3Consumers was last year referred to as (end) customer. To make the difference clearer we opted to call this categoryConsumers this year

� 12
Figure 9: Number of Vendors by TargetAudience.
Figure 10: Number of Vendors by Pre-Purchase Testability.
3.1.10 Pre-Purchase Testability
This is one of the two new dimensions of this years survey. It describes to what extent data offeringscan be tested before an actual purchase is made. From our survey we derived the three intuitivecategories:
� None: No access is given to the data before purchase, leaving the demanders to buy a pig in apoke.
� Restricted Access: In this category, pre-purchase access to the service is either limited by time(e. g., 30 days trial) or by API calls/data volume (e. g., first 100 calls / 100MB free). The latter is atypical implementation of freemium pricing models.
� Complete Access: Vendors in this category allow a complete access before purchasing
Supposing that most buyers are interested in as much information as possible before they purchasea service, it is little surprising that more than 80% (39 vendors) of the sample vendors offer at leastrestricted access. Even though 17% (8 vendors) seems a rather low figure compared to that, it isan unexpectedly high total number given that these vendors expect their customers to relay on thevendor’s promises and do a blind bargain.
3.2 Subjective Dimensions
3.2.1 Trustworthiness
For this dimension we assessed the trustworthiness of vendors based on the origin of their data aswell as on how it is processed. As in 2012, this dimension is not quantifiable and, thus, the resultsare subjectively biased. Also, we kept the method of allowing multiple entries for one vendor asone vendor can offer multiple services.
As can be seen in Figure 11, there is no clear trend recognizable. While an increase on both ends(i. e., barely and highly trustworthy) can be observed, at the moment any interpretation of thatphenomenon would be sheer speculation.

�13
Figure 11: Trustworthiness Distribution. Figure 12: Number of Vendors by Size.
3.2.2 Size of Vendor
Similar to the previous survey, we used the vendors’ Web presentation as a foundation for aclassification regarding the size of a vendor, which is inherently mutually exclusive.
In Figure 12 it can be seen that the distribution is similar to 2012. Nevertheless, within the returnersgroup an increase in size of vendors can be seen. Also, in the overall result for 2013 the relation ofbig to medium companies favors big companies more than it did in 2012, while the startup andglobal player remain about the same, which suggests that the market is growing and companiesare developing.
3.2.3 Maturity
Similar to Size of Vendor, Maturity has not changed tremendously compared to 2012. Regardingthe overall set a slight increase in medium and high maturity can be observed. This maturing trendis also supported by the deltas for the returners. This is illustrated in Figure 13 and supports thesuggestion made in the previous subsection that the market and companies are not only growingbut also maturing, admittedly at a rather slow pace.
3.2.4 Pre-Purchase Information
Pre-purchase information is the second new dimension. Unlike testability, which classifies hands-on experiences, this dimension evaluates how well and extensive a supplier provides information inadvance to a purchase. This dimension is inherently subjective, as the same information mightbe differently interpreted by different people. For that reason we focused mainly on the extent —rather than the quality — of the information. Nevertheless, the values might be subjectively biased.We observed the following three categories in this dimension:
� Barely Any (Information): The information given on the Web site is only textual and rather sparse.Potential customers are often asked to send their enquiries via e-mail.
� Sparse Medial (Information): This group compromises vendors offering more comprehensivetextual and sparse medial information such as short video demonstrations.

� 14
Figure 13: Maturity of Vendors.Figure 14: Number of Vendors by Pre-
Purchase Information.
� Rich Medial (Information): Besides extensive textual description of their services, these vendorssupply a plenitude of medial information such as screen casts.
Given that more information enables potential customers to evaluate a service more compre-hensively to match it with their needs, it is little surprising that only 3 vendors supply hardly anyinformation beforehand. At the same time it is exemplary that nearly half (23 vendors) of thevendors surveyed in 2013 supply comprehensive medial information to reduce their (potential)customer’s uncertainty and facilitate a purchase decision.
4 Related Work
Among the first to study data marketplaces were GE et al. [3] who researched question and answerWeb sites (e. g., Askjeeves.com). However, they only described five Web sites and focused moreon business models than on surveying marketplace properties.
Regarding data markets as defined in Section 2 the picture has not changed much since [12]. Toour knowledge, there is still no other survey directly comparable in size or method to our work.
Other surveys that have been conducted are on a much smaller scale, not disclosing any methodol-ogy, and only in textual form. For instance, Strata [2] describe characteristics of the four (accordingto them) most mature data markets Factual, Infochimps, DataMarket, and Windows Azure DataMarketplace, which we also examined in this study.
A more organized approach was followed by MILLER who interviewed ten providers of datamarketplaces or data related services in a series of podcasts [6]. However, he only provides theinterviews in a rather unprocessed form, i. e., as audio files, which makes it difficult to access andaggregate the contained information. Later, he published a report [7] on data marketplaces andtheir business models, in which he identified common functionalities that data marketplaces offer,elaborated on potential business models and made some general predictions, such as increasingcompetition and a wider choice of data and sources.
Furthermore, there have been investigations into particular market places, for instance on Kasabi[8], who went out of business in 2012; Freebase, who try to create a ”collaboratively created graphdatabase for structuring human knowledge” [1]; and Microsoft’s Windows Azure Marketplace [5].

�15
While this study is concerned with data markets that provide business data, also works exist thatare concerned with data markets for personal data. For instance [4] describe how facebook datacan be of value to recommender systems or [11] who found that while people generally worry abouttheir personal data, they are not willing to pay in order to protect or control their personal data.
5 Conclusion & future work
This study was the second iteration of an observation and study of the emerging area of datavendors and data marketplaces. Together with its predecessor, this study is intended to form thefoundation of a regular survey of this field, in order to be able to discover new trends quickly andreliably and to identify relevant research questions. In this work, we were able to come one stepcloser to this goal. Besides a description of the market situation in 2013, we were able to identifyinitial trends. However, it remains to be seen how vivid the market really is, when we repeat thestudy for a third time in 2014.
In light of the current debate on surveillance of citizens trough secret services, we feel obliged topoint out that it cannot be guaranteed that data sold on data markets is always legally obtained.Nevertheless, at the same time we do not have any evidence suggesting this is the case — inparticular as many providers mention their sources.
For now, we could identify the following trends: Raw and unstructured data became less fre-quently offered during the past year, while enrichment services and processed data offeringshave increased. This is evident by the numbers of vendors per type, but also by the fact thatreports, specialized software, and Web interfaces were more often provided. Also supporting thisassumption are the facts that data is available in many more languages and that the amount ofup-to-date offerings increased. One reason behind this observation could be the fact that in thisway, information can be used directly without much processing on the customer site and also fromless technical staff. Regarding targeted customers, the figures strongly suggest that data is amarket which mainly focuses on business customers, while consumers are less relevant.
Although the domains in which data is offered have not changed tremendously, the origins of thedata show an over-proportional growth in less established data sources such as self-generated,enhanced customer data, and community data. This may be owing to the fact that these sourcesare becoming more widely accepted (for instance, Wikipedia has become generally more acceptedthan it was years ago) or because these sources are the only way to obtain certain knowledge (forinstance, some data is only of value if it can be well integrated with a company’s existing data).Unfortunately, at this point we cannot say anything about the development of trustworthiness forthe data is too inconclusive.
The shift in pricing models away from freemium was somewhat surprising to us, while the rise inpay-per-use was rather expected. On a technical level, Web technologies overtook more traditionalexchange formats. Whether these two observations are trends or just outliers remains to be seenin subsequent studies.
Regarding the new dimensions pre-purchase testability and pre-purchase information, it can bestated that most vendors provide sufficient information for buyers to make educated decisionswhether or not to buy a product or service.
Looking at the market as a whole, it can be seen that the market is still in motion with fourcompanies leaving the survey. However, at the same time we could observe a positive trend incompany growth as well as a maturing tendency. Similar to the technical standards and the pricingmodels it remains to be seen how this develops further. Also, it should be kept in mind that oneyear is a rather short period in terms of business developments.

� 16
From all that, it can be concluded that the market for data vendors is far from fully mature andleaves vast potential for development, which we plan to monitor futher.
Acknowledgment
We like to thank our students Michael Glahn and Dennis Assenmacher for their support in conduct-ing the survey.
References
[1] K. Bollacker, C. Evans, P. Paritosh, T. Sturge, and J. Taylor. Freebase: a collaborativelycreated graph database for structuring human knowledge. In Proc. 2008 ACM SIGMOD Int.Conf. on Management of Data, pages 1247–1250, New York, NY, USA, 2008. ACM.
[2] E. Dumbill, 2012. http://strata.oreilly.com/2012/03/data-markets-survey.html.
[3] W. Ge, M. Rothenberger, and E. Chen. A Model for an Electronic Information Marketplace.Australasian Journal of Information Systems, 13(1), 2005.
[4] J. Gottschlich, I. Heimbach, and O. Hinz. The Value Of Users’ Facebook Profile Data -Generating Product Recommendations For Online Social Shopping Sites. In ECIS 2013,page 117, 2013.
[5] Microsoft White Paper. Windows Azure Marketplace, 2011. http://go.microsoft.com/
fwlink/?LinkID=201129&clcid=0x409.
[6] P. Miller, 2012. http://cloudofdata.com/category/podcast/data-market-chat/.
[7] P. Miller, 2012. http://pro.gigaom.com/2012/08/data-markets-in-search-of-new-bus
iness-models/.
[8] K. Moller and L. Dodds. The Kasabi Information Marketplace. In 21st World Wide WebConference, Lyon, France, 2012.
[9] A. Muschalle, F. Stahl, Loser, and G. Vossen. Pricing Approaches for Data Markets. In6th International Workshop on Business Intelligence for the Real Time Enterprise (BIRTE),pages 129–144, 2012.
[10] B. Pang and L. Lee. Opinion Mining and Sentiment Analysis. Found. Trends Inf. Retr.,2(1-2):1–135, January 2008.
[11] D. Potoglou, S. Patil, C. Gijon, J. F. Palacios, and C. Feijoo. The value of personal informationonline: Results from three stated preference discrete choice experiments in the uk. In ECIS,page 189, 2013.
[12] F. Schomm, F. Stahl, and G. Vossen. Marketplaces for data: an initial survey. ACM SIGMODRec., 42(1):15–26, May 2013.
[13] F. Stahl, A. Loser, and G. Vossen. Preismodelle fur Datenmarktplatze. Informatik-Spektrum,2014.
�17
A Glossary
In this appendix, we briefly repeat the dimension and category definitions as in [12] to assistreaders not familiar with our previous work. Examples can also be found in [12].
As elaborated in Section 3, the following 14 dimensions have been examined: Type, Time Frame,Domain, Data Origin, Pricing Model, Data Access, Data Output, Language, Target Audience, Pre-Purchase Testability, Trustworthiness, Size of Vendor, Maturity and Pre-Purchase Information. Wehave grouped these dimensions into objective and subjective dimensions.
A.1 Objective Dimensions
Dimensions in this group can be objectively verified.
A.1.1 Type
The Type of a vendor is used to categorize the core offering. This dimension is not mutuallyexclusive. Possible values are:
(Focused) Web Crawlers are designed to crawl a particular website or a number of websites anddeliver the results in a user-friendly format. They are always bound to one domain.
Customizable Crawlers can be set up and configured by customers to crawl arbitrary websites.They are therefore more powerful, but also more expensive to set up, as compared to pre-configuredcrawlers.
Search Engines list results relevant to a specific combination of keywords entered by a customer.
Raw Data Vendors offer raw data, most often in form of tables or lists. Raw in this context meansthat the data is not enriched or analyzed in any way.
Complex Data Vendors offer data that is the result of some form of pre-processing.
Matching Data Vendors offer matching of input data against their databases. They provide valueto customers who wish to have their data (e. g., address data) verified and corrected if need be.
Enrichment – Tagging describes services that enrich a given input (text or less commonly otherformats) through means of tags, which are non-hierarchical keywords or terms assigned to a pieceof information.
Enrichment – Sentiment describes services that specialize in sentiment analysis [10]. Given thename of a brand or a product, these services try to capture and analyze the sentiment of peopletowards that subject, mostly on the basis of social media resources.
Enrichment – Analysis describes services that enrich data through various types of analysis,such as comparisons with historical data, forecasts or other statistical operations.
Data Market Places allow customers to buy and sell data by providing the infrastructure neededfor such transactions.

� 18
A.1.2 Data Origin
Data Origin describes the type of source from which the data originally comes from. Possiblevalues are:
Internet data is pulled directly from a publicly and freely available online resource. The addedvalue for a user consists of the integration and curation of these data sets.
Self-Generated data originates from vendors who have means of generating data on their own,e. g., manual curation of a specific dataset or calculating forecasts based on patented methods.
User data means that users have to provide an input before they can obtain any data, e. g.,address data offerings return the address for a name provided by the customer.
Community data is based on a wiki-like principle. These vendors obtain and maintain their datain a very open fashion. The restrictions as to who can participate and contribute are usually ratherlow.
Government data is a recent development, where governments decide to make the huge amountsof data they capture and process publicly available.
Authority data is data that comes directly from an authority in a given domain, e. g., the stockmarket for stock prices or postal offices for address data.
A.1.3 Pricing Model
Pricing Model describes the model used to price data and data related services. Possible valuesare:
Free services can be used at no charge. Vendors in this category do not count towards any of thefollowing categories.
Freemium is a portmanteau combining free and premium. This pricing model offers a limitedaccess at no cost with the possibility of an update to a fee-based premium access. Freemiummodels are always combined with at least one of the following two payment models.
Pay-Per-Use is used with varying connotations and a clear definition is lacking. [13] proposesa distinction between pure pay-per-use (calculation per GB or per API-call) and tiered pricing(layers of e. g. 10 GB- 20 GB or up to 1000 API calls). For simplicity reasons, we refrain from thisdistinction here, as pure pay-per-use occurs rather seldom in practice.
Flat Rate means that after paying a fixed amount of money, customers can make unlimited use ofthe service for a limited time, mostly a month or a year.
A.1.4 Data Access
Data Access describes in what way data is received from vendors by the end-users. Values weobserved are:
APIs (Application Programming Interfaces) are used to provide language- and platform-independentprogrammatic access to data over the Internet.

�19
Downloads are traditionally the easiest way to access a data set, because anyone can accessthe files with only a Web browser.
Specialized Software clients are usually proprietary and given to the user by the same vendor thatalso offers the data set in question. While this approach does have disadvantages (implementationand maintenance expense, dependency issues, etc.), there are some scenarios in which theconcept is beneficial to the customer, for example, providing an easy-to-use graphical user interfaceas an out-of-the-box solution or granting access to real-time streams of data.
Web Interfaces display the data to customers directly in a browser on a website.
A.1.5 Data Output
Data output describes in which formats data can be obtained. We observed the following:
XML is a widely established standard for data transfer and representation which is human- andmachine-readable.
CSV/XLS Most structured data is laid out in a tabular way, thus it is logical to use a table file format.We do not distinguish between CSV and XLS and other table file formats because they mainlydiffer in implementation details and software support which does not affect the raw data.
JSON is similar to XML but a little more light-weight and also used as a data transfer format. Datais represented as text in key-value pairs.
RDF is a method to describe and model information. It uses subject-predicate-object triplets tomake statements about resources.
Report When data is preprocessed, aggregated and “prettified” in some way, we declared theoutput as a report. The main difference in this category is that the customer does not have insightinto the underlying raw data. Also, visual reports in the form of MS Excel spreadsheets classifiedfor this category.
A.2 Subjective Dimensions
Dimensions in this group are rather subjective and tend to depend on the researcher’s judgement.
A.2.1 Trustworthiness
Trustworthiness indicates how trustworthy the data of a vendor is, depending on the origin of thedata as well as on how it is processed. For instance, data that comes from a community tendentiallyhas a lower trustworthiness than data that is sourced from an authority. In other words, data from apostal operator as offered by, e. g., AddressDoctor is more likely to be correct than an aggregationof online sources. However, there are also other cases where a collective of anonymous authorsproduce data that is verifiably correct and therefore trustworthy, e. g., Wikipedia. Whether moretrust is put in a single authority of a domain or in a crowd of people depends on the applicationcontext and one’s personal attitude. That said we made the attempt to identify vendors with low,medium, and high trustworthiness based on our judgement.

� 20
A.2.2 Size of Vendor
The Size of Vendor classifies how big of a player that vendor is. While one could argue thatthis dimension is quantifiable (e. g., using the number of employees or its revenue), and thus,an objective dimension, it is difficult to find reliable figures that support such an analysis. In oursurveys, the size of a vendor is estimated based on the claims made by that vendor as wellas the general presentation on the respective website. We distinguish 4 categories: Startupswhich are newly created companies and have only a small number of people involved. Theseare often funded by investors, as they do not have a positive cash flow from the very beginning.Medium sized companies left the beta stage, gained experience and maturity, and are no longerdependent on investors. Big companies are well-established and have more than one product intheir portfolio4.Global Players are only the biggest companies such as Yahoo!, Microsoft, IBM,etc.
A.2.3 Maturity
Maturity describes how far a given service or product has come in its development cycle. Thefollowing mutually exclusive categories have been observed: Research Projects are usually notfor profit and can therefore be used free of charge. They are mainly executed as a proof-of-concept.Beta products are still in development and have not been fully launched. Nevertheless, we haveobserved offerings in beta phase that already demanded a usage-fee. Medium mature productswere already out of beta, but still not as highly developed as other products.High maturity productsimplement numerous features and are ready for use in an operational environment.
4While there is no sharp dividing line between medium-sized and big companies, we still felt that separating the two indifferent groups yields more overall accuracy for the analysis.

cd-manual
www.ercis.org
cd-manual
www.ercis.org
ERCIS – European Research Center for Information Systems
Westfälische Wilhelms-Universität Münster
Leonardo-Campus 3 48149 Münster Germany
Tel: +49 (0)251 83-38100 Fax: +49 (0)251 83-38109
[email protected] http://www.ercis.org/
ERCIS – European Research Center for Information SystemsEditors: J. Becker, K. Backhaus, H. L. Grob, B. Hellingrath, T. Hoeren, S. Klein, H. Kuchen, U. Müller-Funk, U. W. Thonemann, G. Vossen
Working Paper No. 18
The Data Marketplace Survey RevisitedStahl, F. Schomm, F. Vossen, G.
Wor
king
Pap
er N
o. 1
8
The
Dat
a M
arke
tpla
ce S
urve
y Re
visi
ted
ISSN 1614-7448
cd-manual
www.ercis.org
Copyright © 2022 FDOKUMEN