PAIN MANAGEMENT MARKETPLACE (CENTERS OF EXCELLENCE MARKETING)
57
Pain Management Marketplace A “Global Marketing Excellence” Strategy Presentation By Andre’ Harrell
Transcript of PAIN MANAGEMENT MARKETPLACE (CENTERS OF EXCELLENCE MARKETING)

Pain Management Marketplace
A “Global Marketing Excellence” Strategy
Presentation By Andre’ Harrell

This slide presentation is for illustration purposes only and to
show how AH2 & Beyond Consulting can help you build your Global
Marketing Excellence Strategy Plan
All content & data is fictitious and is only for illustration
purposes

Objectives
• Market Analysis
• Competitive Analysis
• Buying Process
• Customer Analysis
– Segmentation
• Value Proposition
• Positioning
• SWOT
• Critical Success Factors
• Strategic Priorities
Below are objectives you can utilize to set up your strategy

Regulatory Key Events (2014) US and EU
Jan Feb Mar Apr May Jun Jul Aug Sep Oct Nov Dec // 2015
US Target: NDA Approval June 15
FDA RMP mtg NDA Resubmission
Submit RMP Proposal to FDA
=Corporate regulatory submissions (base case)
=Target regulatory approvals/license
=Key regulatory milestones
Understanding the regulatory process/requirements are critical at the beginning build of your marketing
excellence plan

Acute Pain Market
Overview Establishing a Market Overview in your
plan sets up a strategy of “Where To Play”. The next few slides examine a therapeutic class within the healthcare sector as an
example.
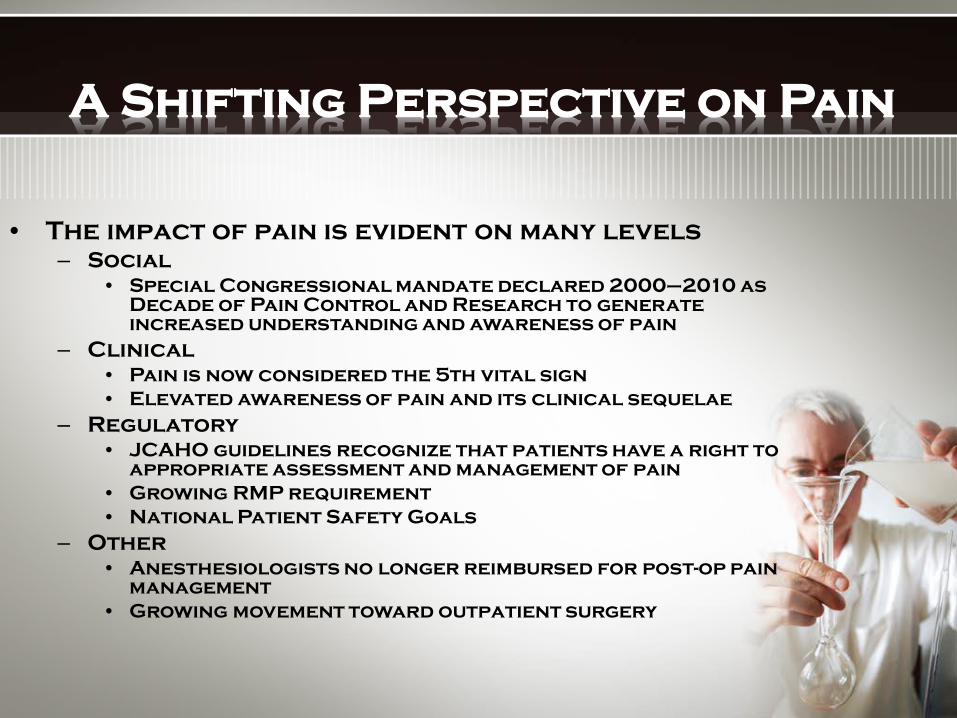
A Shifting Perspective on Pain
• The impact of pain is evident on many levels – Social
• Special Congressional mandate declared 2000–2010 as Decade of Pain Control and Research to generate increased understanding and awareness of pain
– Clinical • Pain is now considered the 5th vital sign • Elevated awareness of pain and its clinical sequelae
– Regulatory • JCAHO guidelines recognize that patients have a right to
appropriate assessment and management of pain • Growing RMP requirement • National Patient Safety Goals
– Other • Anesthesiologists no longer reimbursed for post-op pain
management • Growing movement toward outpatient surgery

Surgical Trends Inpatient
• Complexity of inpatient surgeries growing – Neurologic procedures
(craniotomies) – Transplants – Bone
repair/microsurgery
• Inpatient surgical costs scrutinized for most hospitals – Hospitals focusing on
improving clinical efficiencies to maximize cost recovery
• Increase in minimally invasive surgery
Outpatient • Increasing transition
to outpatient surgeries (OP) – Hysterectomy (either
ambulatory or 23-hour) – Shoulder surgery – Cholecystectomy
• The ability to transition surgeries to OP highly dependent upon pain management – 30% of all readmissions
based on pain issues – Inability to tolerate
orals after anesthesia

Inpatient Acute Pain Landscape
Source: Solucient LLC AC Tracker data, HCUP data
54M+ Inpatient Procedures and Diagnoses
5.8M inpatient surgical procedures
[within key specialties]
6.8M inpatient non surgical
procedures and diagnoses
• Orthopedic • OBGYN • General • Urology
“Non-Surgical Acute Pain”
18M Opioid Requiring Patients
1.8M other surgical procedures
[outside key specialties]
• Cardiovascular • Neurological • Vascular(Micro)
38M Unique Inpatients
14M Patients Requiring “Injectable” Opioid
Segments included in revenue forecast

Acute Pain Primary Stakeholders
• Anesthesiology (32,113)
• Anesthesiologists Role – Responsible for the
post anesthesia care unit (PACU)
– Order all epidurals and some IV PCA
– Key influencers in surgeons decision of post op pain plan
– Often lead acute pain teams
• Surgeons – Orthopedic (24,231) – OB/GYN* (42,912) – General (31,822) – Urology* (11,106) – Other (27,292)
• Surgeons Role – Acute pain management
not primary focus – Order most of the IV
PCA, all IM, all orals • Secondary Targets
include: Pharmacists, PACU Nurses, Floor Nurses

Ambulatory Surgery Center Insights
• ASC’s conduct both surgeries and diagnostic procedures
• There are about 3,000 Ambulatory Surgery Centers (ASC)
• Primary specialties involved in ASC’s are GI, Opth, GYN
• There is some IV opioid use in recovery; low levels of PCA mostly for ORS procedures
• Pharmaceutical spend is low, roughly $25/case
• Reimbursement at ASC’s is typically lower than in hospitals

Competitive Landscape
Establishing a Competitive Landscape in your plan can help you set up a strategy of
“Offense”, in addition, gather an understanding of your products strengths
& weaknesses

IV PCA Overview WHY ACCEPTED • Patient in control of
pain management • Lower opioid
consumption • Removes delay in
analgesic delivery / gaps
• Can be customized for each patient – Flexibility (opioids,
dose, duration, basal, etc.)
• Nursing preference – No repeated needle
sticks – Reduce time
requirements for staff & patients
DOWNSIDES
• Invasive (IV access required)
• Potential for programming errors
• Need qualified personnel to administer
• Involves multiple departments in hospital to coordinate and deliver care
Presenter
Presentation Notes

IV PCA Trends
• Addressing IV PCA Safety Issues – Smart pump technology becoming
more prevalent • Bar-coding to minimize errors
• Pre-filled syringes for multiple opioids
• Wireless communication with hospital IM system

Product X
• Company: Product Pharmaceuticals/Skye
• Indication: Intended for single dose administration by the epidural route for the treatment of pain
following major surgery. Administration is prior to surgery.
• Price: $161-191 for 48 hours
• Forecast: $25-30M (net in 2014)
• Sales Force: 150 Hospital Sales Reps
• Clinical Data: 876 patients
(Hip & knee replacement, Lower Ab, C-Section)
• Advantages: Single shot, no need for indwelling catheter, reduce/eliminate PCA
• Disadvantages: Invasive, long lasting, supplemental analgesic requirements
• Initial feedback: Administration issues with Product X

Acute Pain Market - Conclusions
• Broad audience with differing needs • Several factors effect post-op analgesic
selection • Multiple modalities used based upon patient and
surgical processes • IV PCA is cornerstone of post-op pain
management – highly rated based on patient control, flexibility,
and efficacy – drawbacks based upon invasiveness, administration
error, complexities (logistical) • Increasing scrutiny of IV PCA safety issues • Current pump advancements focused on safety
features • Continual monitoring of Product X impact

The “Buying Cycle”
Understanding the “Buying Process” for any product establishes the buying patterns of your
customer in addition to understanding the various buying personalities of your top
customers. Many marketing plans do not have a “Buying Process” which separates our template
from many.
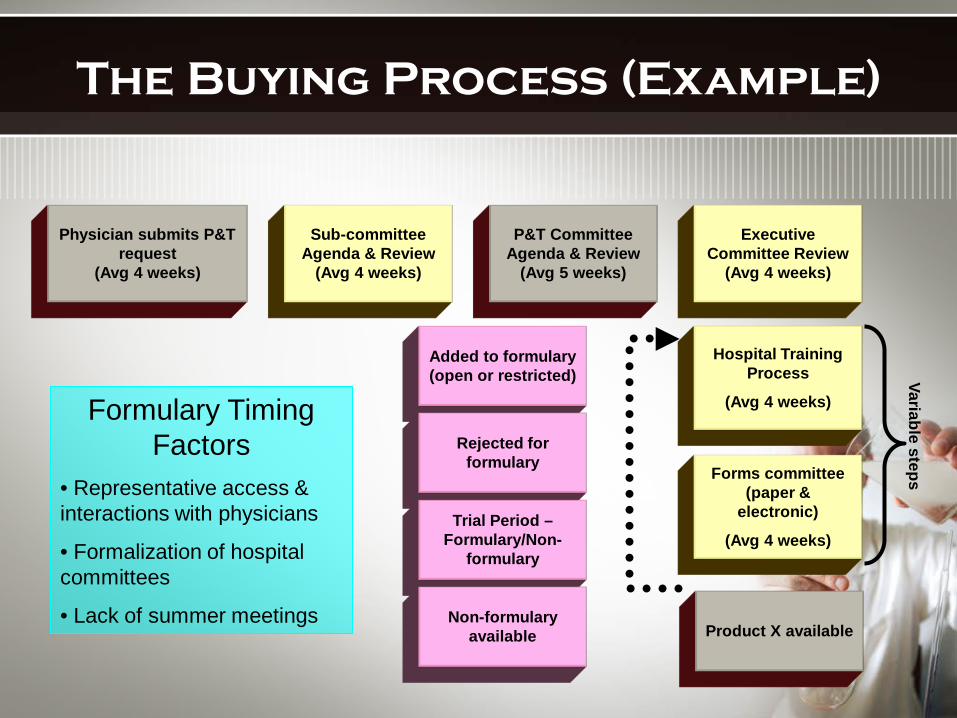
Physician submits P&T request
(Avg 4 weeks)
P&T Committee Agenda & Review
(Avg 5 weeks)
Executive Committee Review
(Avg 4 weeks)
Sub-committee Agenda & Review
(Avg 4 weeks)
Added to formulary (open or restricted)
Rejected for formulary
Trial Period – Formulary/Non-
formulary
Non-formulary available
Hospital Training Process
(Avg 4 weeks)
Forms committee (paper &
electronic)
(Avg 4 weeks)
Variable steps
Product X available
The Buying Process (Example)
Formulary Timing Factors
• Representative access & interactions with physicians
• Formalization of hospital committees
• Lack of summer meetings

Segmentation
Developing a “Segmentation Process” should be a priority of any global
marketing excellence plan. Segmentation provides a microscopic
look at your customers and drives them from a personality and behavior
standpoint.

Initial Segmentation
• Identification of appropriate surgical types
• Patient type segmentation • Institutional segmentation based on IV
opioid use – Led to product positioning – Sales force deployment – Target audience identification – Forecast development
Need further segmentation to allow maximization of sales force direction and marketing spends

Segmentation Deliverables
• Quantify growth opportunities and leverage points
• Identify richest targets – Identify physician characteristics that may
explain likelihood to identify need and advocate for Product X access
– Identify physician characteristics that may explain Product X early adoption
– Identify hospital characteristics that may explain likelihood of Product X access and usage
• Ability to maximize marketing investment by segment – Invest in “richest targets” – Allocations based on launch timing – Institutional targeting plan at a hospital &
physician level

Segmentation “Where to Play”
Which customer segments do we want to target?

Hospital Characteristics
Physician Characteristics 1. Choose the most meaningful and
actionable segmentation variables to put on the axes
2. Put variables 2. Combine variables on each axis in
a way that will further explain differences in behavior(s)
Process for Creating Segmentation Frame
3. Identify, characterize and prioritize the segments within the frame
Presenter
Presentation Notes
Paper
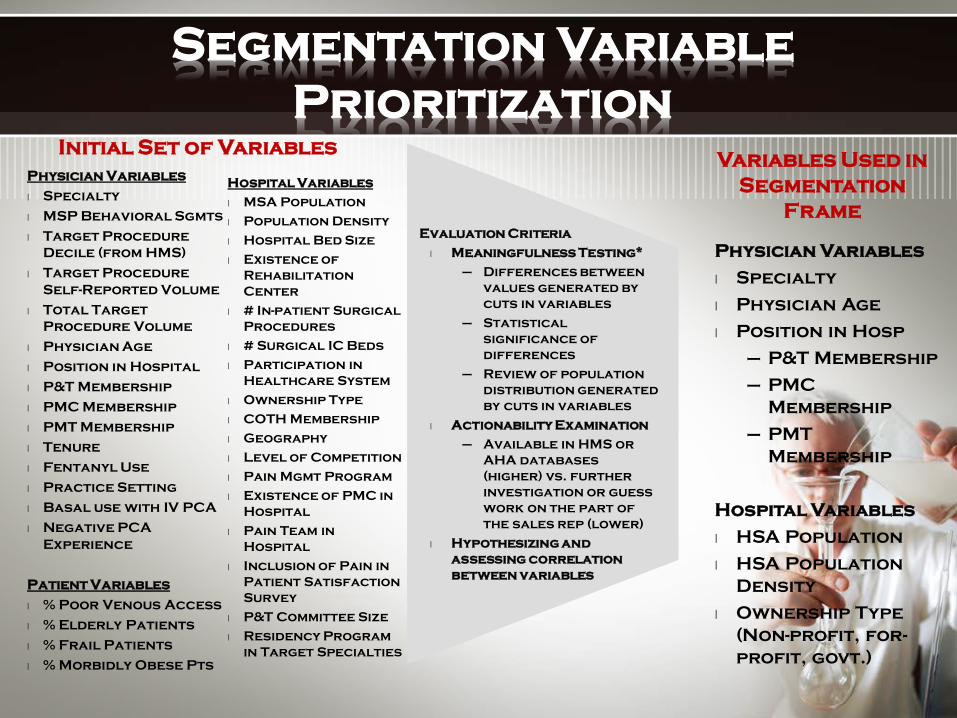
Segmentation Variable Prioritization
Physician Variables
l Specialty
l Physician Age
l Position in Hosp
– P&T Membership
– PMC Membership
– PMT Membership
Hospital Variables
l HSA Population
l HSA Population Density
l Ownership Type (Non-profit, for-profit, govt.)
Variables Used in Segmentation
Frame
Physician Variables
l Specialty
l MSP Behavioral Sgmts
l Target Procedure Decile (from HMS)
l Target Procedure Self-Reported Volume
l Total Target Procedure Volume
l Physician Age
l Position in Hospital
l P&T Membership
l PMC Membership
l PMT Membership
l Tenure
l Fentanyl Use
l Practice Setting
l Basal use with IV PCA
l Negative PCA Experience
Patient Variables
l % Poor Venous Access
l % Elderly Patients
l % Frail Patients
l % Morbidly Obese Pts
Initial Set of Variables
Hospital Variables
l MSA Population
l Population Density
l Hospital Bed Size
l Existence of Rehabilitation Center
l # In-patient Surgical Procedures
l # Surgical IC Beds
l Participation in Healthcare System
l Ownership Type
l COTH Membership
l Geography
l Level of Competition
l Pain Mgmt Program
l Existence of PMC in Hospital
l Pain Team in Hospital
l Inclusion of Pain in Patient Satisfaction Survey
l P&T Committee Size
l Residency Program in Target Specialties
Evaluation Criteria
l Meaningfulness Testing*
– Differences between values generated by cuts in variables
– Statistical significance of differences
– Review of population distribution generated by cuts in variables
l Actionability Examination
– Available in HMS or AHA databases (higher) vs. further investigation or guess work on the part of the sales rep (lower)
l Hypothesizing and assessing correlation between variables

Quantified Action Segmentation®
Note: Target procedures = avg. target procedures per physician in cell. DOT = avg. days of therapy for physicians in cell. Source: Weighted data from IONSYS 2005 Quantitative Segmentation Study, N = 748, AHA data not available for all physicians. Hospital data missing for 3 anesthesiologists, 1 OB/GYN, and 1 general surgeon.
Physician
Hospital
Higher Procedure Volume Surgeons (incl. Gen Surg, Ortho, OB/GYN)
Anesthesiologists
Not Pain Mgmt Team, Committee, P&T or Chief of
Service
Pain Mgmt Team, Committee, P&T or Chief of Service
Not Pain Mgmt Team,
Committee, or P&T Member
Pain Mgmt Team,
Committee, or P&T Member Age <50 Age 50 and
over
HSA Population Less
than 100,000
15% phys (124) 31% launch 54% 6 months 32% ID need 22% advocate
13% phys (117) 35% launch 53% 6 months 46% ID need 42% advocate
13% phys (45) 36% launch 50% 6 months 41% ID need 28% advocate
15% phys (52) 34% launch 47% 6 months 52% ID need 42% advocate
HSA Population 100,000 or
more
Not-for-
profit
Pop Dens <1500 ppl/mi2
24% phys (230) 36% launch 54% 6 months 27% ID need 21% advocate
Pop Dens 1500+ ppl/mi2
10% phys (87) 32% launch 50% 6 months 16% ID need 12% advocate
Other (for profit and govt.)
11% phys (91) 24% launch 42% 6 months 24% ID need 17% advocate
I II III
IVa
V
VI
IVb
34% phys (317) 34% launch 53% 6 months 24% ID need 19% advocate
IV

Overview: Key Insights
•Specialty (surgeon vs. anesthesiologist), the role of the physician in a hospital and hospital context (surrounding population and ownership type) all have a meaningful impact on physician attitudes and behaviors toward Product X
•Anesthesiologists play a central role for product access
and usage as pain and fentanyl experts sitting on influential pain management and P&T committees and participating in 4-5 times as many procedures as surgeons
•Product X is expected to take significant share across all target procedures from multiple pain alternatives, but particularly IV PCA (50-55% share at 6 months post-launch in target segments)
•~ 80% of P&T members expect Product X formulary approval to be likely, if economically comparable to IV PCA. Only 1% of P&T members expect formulary approval to be very unlikely.
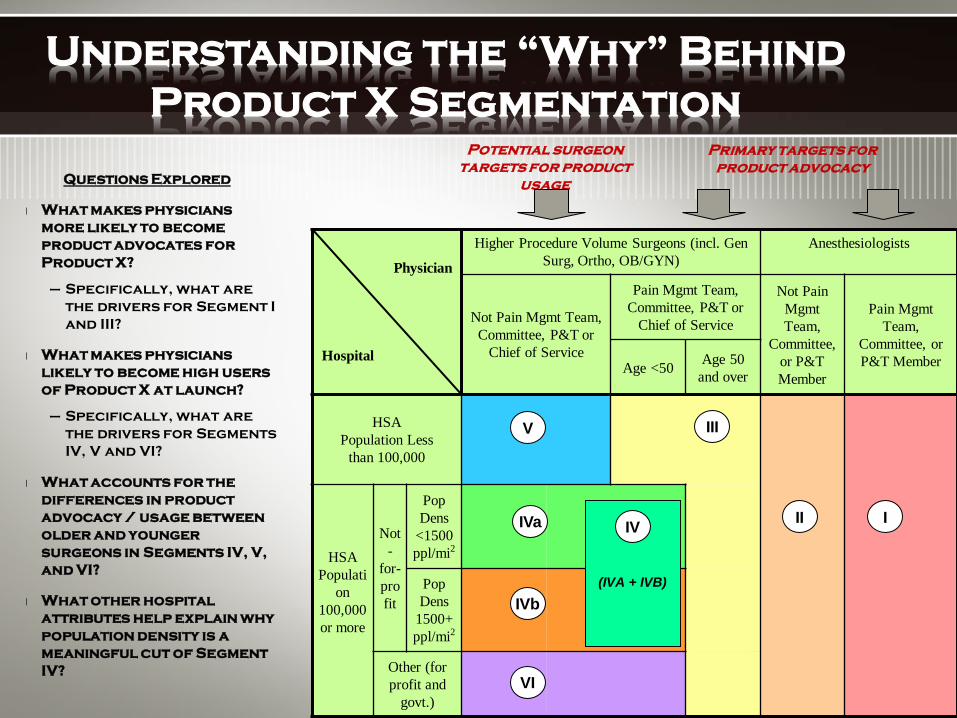
Questions Explored
l What makes physicians more likely to become product advocates for Product X?
– Specifically, what are the drivers for Segment I and III?
l What makes physicians likely to become high users of Product X at launch?
– Specifically, what are the drivers for Segments IV, V and VI?
l What accounts for the differences in product advocacy / usage between older and younger surgeons in Segments IV, V, and VI?
l What other hospital attributes help explain why population density is a meaningful cut of Segment IV?
Understanding the “Why” Behind Product X Segmentation
Physician
Hospital
Higher Procedure Volume Surgeons (incl. Gen Surg, Ortho, OB/GYN)
Anesthesiologists
Not Pain Mgmt Team, Committee, P&T or
Chief of Service
Pain Mgmt Team, Committee, P&T or
Chief of Service
Not Pain Mgmt Team,
Committee, or P&T Member
Pain Mgmt Team,
Committee, or P&T Member Age <50 Age 50
and over
HSA Population Less
than 100,000
HSA Populati
on 100,000 or more
Not-
for-profit
Pop Dens
<1500 ppl/mi2
Pop Dens
1500+ ppl/mi2
Other (for profit and
govt.)
I II
III
IVa
V
VI
IVb
Primary targets for product advocacy
Potential surgeon targets for product
usage
(IVA + IVB)
IV
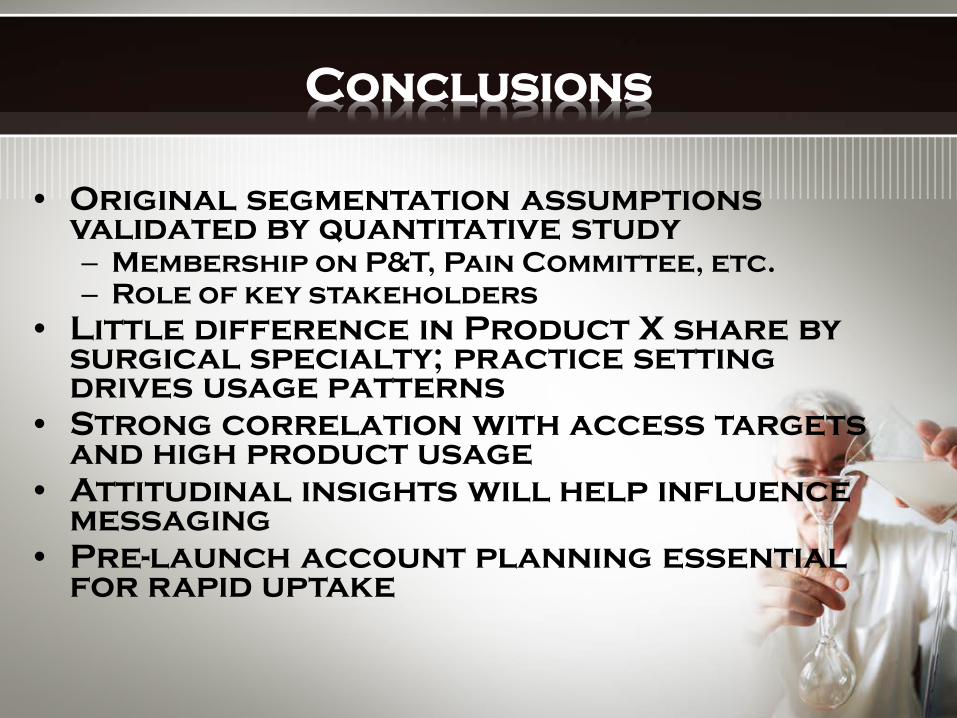
Conclusions
• Original segmentation assumptions validated by quantitative study – Membership on P&T, Pain Committee, etc. – Role of key stakeholders
• Little difference in Product X share by surgical specialty; practice setting drives usage patterns
• Strong correlation with access targets and high product usage
• Attitudinal insights will help influence messaging
• Pre-launch account planning essential for rapid uptake

“Value Proposition”
Every Global Marketing Excellence plan where a product is featured should have a “Value Proposition”
structure. Detailed in the next few slides provide examples of how the
building of a “Value Proposition” statement/structure is built.
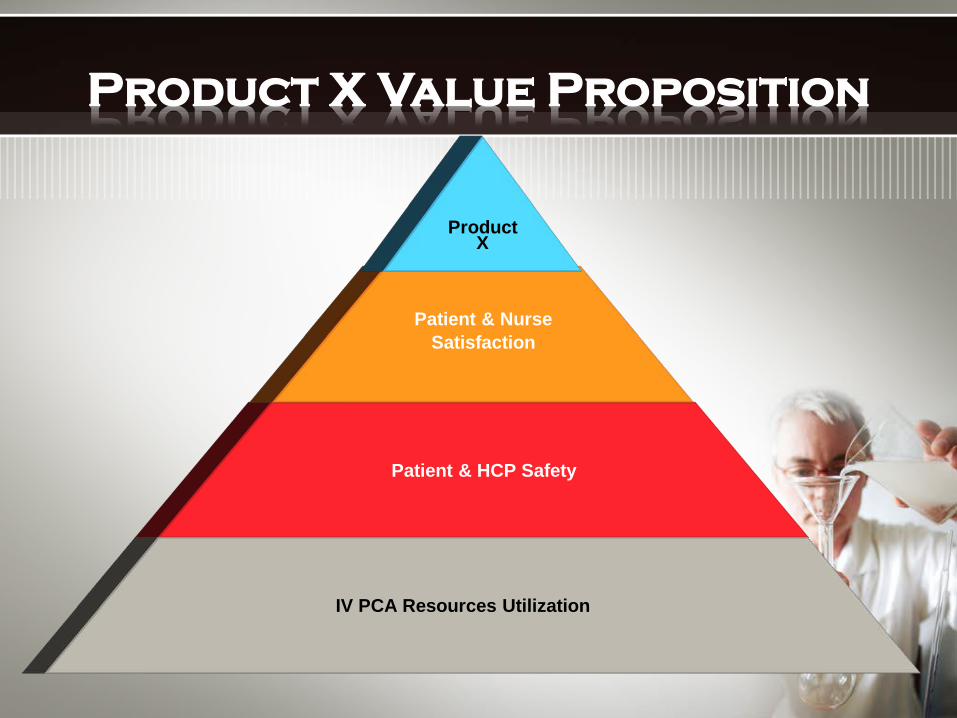
Patient & HCP Safety
Patient & Nurse Satisfaction
Product X
IV PCA Resources Utilization
Product X Value Proposition

Positioning

Who: (target audience) For all healthcare professionals For: (patient types) …..whose patients have acute post op pain and require strong opioids, (competitive framework) patient-controlled Product X is a form of parenteral analgesia which (customer benefit – emotional/end use/functional benefits) is needle-free so it makes my life easier because it is comfortable, safe and easy to use, providing optimal pain relief (reasons to believe –product attributes)
Product X Global Positioning

Emotional benefits
End-use benefits
Functional benefits
Product benefits
Benefit Ladder
Product X Benefit Ladder
Therapeutic equivalence to IV PCA morphine
Similar s/e to IV PCA
Compact, needle free, pre-programmed system
Innovative, single use, off the shelf, disposable system
Comfortable Easy to use, new option Safer Mobility
It makes my life easier
End-use benefits: Anesthesiologist/Surgeon
Quick,safe pain relief
New tool in my armamentarium
Mobility signals recovery

Product X S.W.O.T
Analysis Building a SWOT analysis as part of your
global marketing excellence plan can help you identify where your product can and should receive that best chances to be
successful. Being honest and forthcoming with your SWOT analysis can prepare you
for any market dynamic.

Strengths
• Unique technology • Pre-programmed • Minimizes risk of medication errors • Extensive Health Outcomes platform • Easy to administer • Enhances mobility • Non-invasive technology • Efficacy equivalent to IV PCA morphine • Effective in a broad range of surgical
procedures and patient types • High degree of brand acceptance • Large volume of quality clinical data • Increased nurse and patient satisfaction

Weaknesses
• Perception that one size does not fit all
• Inability to precisely query the system
• Inability to titrate or adjust dosing
• Lack of supplemental dosing recommendations
• No onset of action data
• Challenges to successful implementation of Risk Management Plan (returns & disposal processes)
• Lack of a bolus dosing feature
• Lack of reliability in technical/manufacturing process
• Potential of uncovered accounts in HSA <100k

Opportunities
• Exploit heightened focus on patient safety • Raise noise level on the limitations of
current modalities (IV PCA & IM) • Exploit the growing awareness of safety
concerns with IV PCA • Minimize analgesic gaps through greater
continuity of care • Capitalize on the current nursing shortage • Exploit the fact that our competitors have a
low share of mind among our target audience • Fully prepare the marketplace due to
expected time to launch

Threats
• Lengthy formulary review process • Lack of P&T meetings during summer months
(June launch) • Cost perception may be difficult to overcome • High degree of satisfaction with IV PCA • HCP experience level is low with using
fentanyl in APOPM • Potential for an aggressive competitive
response • Difficulty in accessing customer due to OR
setting • Limited perception of transdermal (patch)
technology

Critical Success Factors
• Establish stronger company presence with key stakeholders pre-launch
• Develop and implement Marketing Mix to strategically target key HCPs
• Gain awareness and acceptance of Product X value proposition
• Accelerate time to formulary approval
• Insure appropriate product procurement and usage

Strategic Priorities
Establishing the Strategic Priorities of your global marketing excellence plan is
probably the most important part of your plan because establishes “goal focus”, “financial focus”, and “Lean Thinking”.

Product X Strategic Priorities
• Disrupt perceived market satisfaction
• Establish leadership presence with target audience
• Exploit uniqueness of the product
• Gain rapid availability and generate positive initial product experience
• Optimize communication of Product X value proposition

Strategic Priorities
• Review brand strategic plan • Gain buy-in on
– Tactical direction – Allocation of funds
• Investment by strategy • Distribution of funds by broad bucket • Pre-launch and Post-launch spends • Spend by key tactic
– Highlight continuing spends from prior year

Critical Success Factors
• Establish stronger company presence with key stakeholders pre-launch
• Develop and implement Marketing Mix to strategically target key HCPs
• Gain awareness and acceptance of Product X value proposition
• Accelerate time to formulary approval
• Insure appropriate product procurement and usage

Product X Strategic Priorities
• Disrupt perceived market satisfaction
• Establish leadership presence with target audience
• Exploit uniqueness of the product • Gain rapid availability and
generate positive initial product experience
• Optimize communication of Product X value proposition

Product X BMEs
Advertising 2,000$ HCP Education 1,160$
Search Program 500$ Speaker Training and Program 4,375$
Marketing Research 1,200$ Promotional Materials 5,250$
Samples 5,300$ Publication Plan 370$
Conventions and Exhibits 2,200$ Internet 600$
Public Relations 870$ Selling Aids 6,335$
Incentive Plan 1,500$ Strategic Customer Marketing 440$
Journal Advertising 2,500$ TOTAL 34,600$

Spend by Strategic Priorities
Establish Leadership Presence With Target
Audience31%
Exploit Uniqueness of Product
19%
Disrupt Perceived Market Satisfaction
14%
Optimize Communication of Value Proposition
2%Gain Rapid Availability and Generate Positive
Initial Product Experience 34%

Critical Success Factors
• Establish stronger company presence with key stakeholders pre-launch
• Develop and implement Marketing Mix to strategically target key HCPs
• Gain awareness and acceptance of Product X value proposition
• Accelerate time to formulary approval
• Insure appropriate product procurement and usage

Forecast
Forecasting your Global Marketing Excellence plan can be a challenging one
because of the unpredictabilities that occur in the marketplace. A solid forecast that’s based on market statistics/dynamics and vision is vital for a product to succeed.

Forecast Architecture
Procedures w.
Injectable Opioid
x Product X
DOT / procedure x
Product X PX
Share
x
Product X Price Per
Day of Therapy
= Product X
Dollars
Step 1 – Product X Days of Therapy
= Product X
Days of Therapy
Product X Total Days of Therapy
Step 2 – Valuation
Assumptions supported by US quant. study and market
analogues From Solucient
Data
Total Surgical
Procedures
Procedures w. Opioid
7.9M

• Total Procedure Growth for Unique Surgical Discharge by Specialty (All Surgical Px Discharges)
• Trending historical Market Unique Discharges and applying findings from market research that overall procedures are moving to outpatient settings (Hysterectomy, Shoulder, Cholecystectomy).
• Penetration of total procedures
• 2012 87.3 %
• 2013 86.3%
• 2014 85.5%
Product X Forecast Assumptions
All Spec Ortho OBGYN General Urology Other2012 -5.6%2013 -4.2%2014 1.5% 2.1% 1.5% -1.5% -4.6% 5.9%YTD 4/12 0.6% 3.9% 1.3% -7.3% 1.1% 3.3%2013 -0.2% 0.7% 0.9% 0.8% -8.8% -1.3%2014 -1.4% 0.2% 0.1% 0.0% -7.3% -3.9%
Shift to outpatient Minimally invasive

• Injectable Opioid Penetration of opioid procedures
• 2012 94.9%
• 2013 95.1%
• 2014 95.9%
• Product X Procedure share of Injectable Opioid
• 2012 Overall Product X Share 1.4% Exit share = 5.4%
• 2013 Overall Product X Share 11.0% Exit share = 14.7%
• Shares calculated from quant study
Product X Forecast Assumptions

• Days of Therapy, Units of Product X per Procedure
2013 2014
• All Specialties 2.1 2.1
• Orthopedics 2.1 2.1
• OBGYN 1.6 1.6
• General Surgery 2.8 2.8
• Urology 2.0 2.0
• Other 2.0 2.0
Results of Quant Study, looked at key procedures with in each above specialty to come up with an overall weighted Days of Therapy per Specialty.
• GTN Rates
• 2012 - 91%
• 2013 - 91%
Product X Forecast Assumptions

• Stocking and Months of Supply
• Currently built into model is a 5% demand stocking call.
• Current Price
2013 2014
• GOP $116.48 $116.48
• NET $106.00 $106.00
•Pricing research under way to determine latest pricing assumptions and strategies.
Product X Forecast Assumptions

Product X Forecast
2013 2014
Injectable Market Px 7.886M 7.830M
Product X Share 1.4% 11.4%
Product X Px 107,796 858,466
Product X Days of Therapy
2.1 2.1
Product X Total Units 228,800 1,822,674
GOP Price per Unit $116.48 $116.48
Pipeline 5% of units 5% of units
GTN Rate 91% 91%
NET Dollars $25.5M $202.9M

Product X P&L Projected Launch 7/2015Product X
$MM'sPreLaunchPost Launch PreLaunch Post Launch
NTS -$ 26.0$
GP -$ 19.9$
Selling 5.0$ -$ -$
Launch Meeting/CD&T 3.8$ 2.5$
Marketing (BME/Mkt Res 10.0$ -$ 16.9$ 11.4$
Clinical 7.7$ -$ 7.3$ -$
Other (dist, net admin, le 2.4$ -$ 4.0$ 7.6$
OI&E -$ -$
Carrying Cost -$ 0.4$
IBT (25.1)$ -$ (32.0)$ (2.0)$
Taxes (8.8)$ -$ (11.2)$ (0.7)$
MNI (16.3)$ -$ (20.8)$ (1.3)$
20152014

This slide presentation is for illustration purposes only and to
show how AH2 & Beyond Consulting can help you build your Global
Marketing Excellence Strategy Plan
All content & data is fictitious and is only for illustration
purposes

Checkout my “Global Sales-Marketing Business Plan” for the Pharma/Med Device Industry featuring Pain Management. http://www.slideshare.net/aharrell2000/example-global-sales-marketing-business-plan You can also checkout my background/work by clicking on the following links: http://www.slideshare.net/aharrell2000 www.linkedin.com/pub/andre-d-harrell/5/13/382/ http://thesalesprofessionalnetwork.blogspot.com/ www.ah2andbeyond.com https://www.facebook.com/pages/Sales-Marketing-Management-Consulting/267898536570725
Contact Us

Andre’ Harrell
AH2 & Beyond Consulting
www.ah2andbeyond.com
267-221-8529
Contact Us