Bursa Mekteb-i Sultanîsi (Bursa Erkek Lisesi) ve Şeref Defteri
Upload
khangminh22Category
view
1download
0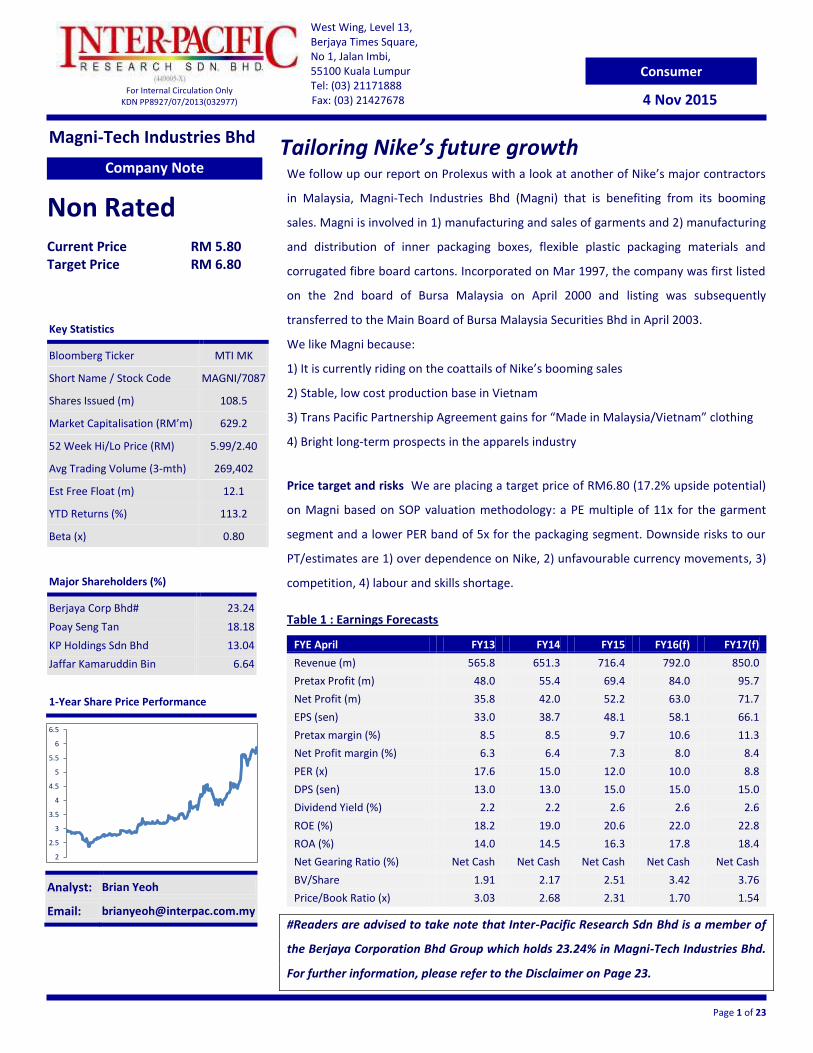
Key Statistics
Bloomberg Ticker MTI MK
Short Name / Stock Code MAGNI/7087
Shares Issued (m) 108.5
Market Capitalisation (RM’m) 629.2
52 Week Hi/Lo Price (RM) 5.99/2.40
Avg Trading Volume (3-mth) 269,402
Est Free Float (m) 12.1
YTD Returns (%) 113.2
Beta (x) 0.80
Major Shareholders (%)
Berjaya Corp Bhd#
Poay Seng Tan
KP Holdings Sdn Bhd
Jaffar Kamaruddin Bin
23.24
18.18
13.04
6.64
Page 1 of 23
West Wing, Level 13, Berjaya Times Square, No 1, Jalan Imbi, 55100 Kuala Lumpur Tel: (03) 21171888 Fax: (03) 21427678
For Internal Circulation Only KDN PP8927/07/2013(032977)
Consumer
4 Nov 2015
Company Note
Non Rated
Current Price RM 5.80 Target Price RM 6.80
Analyst: Brian Yeoh
Email: [email protected]
1-Year Share Price Performance
2
2.5
3
3.5
4
4.5
5
5.5
6
6.5
Magni-Tech Industries Bhd
We follow up our report on Prolexus with a look at another of Nike’s major contractors
in Malaysia, Magni-Tech Industries Bhd (Magni) that is benefiting from its booming
sales. Magni is involved in 1) manufacturing and sales of garments and 2) manufacturing
and distribution of inner packaging boxes, flexible plastic packaging materials and
corrugated fibre board cartons. Incorporated on Mar 1997, the company was first listed
on the 2nd board of Bursa Malaysia on April 2000 and listing was subsequently
transferred to the Main Board of Bursa Malaysia Securities Bhd in April 2003.
We like Magni because:
1) It is currently riding on the coattails of Nike’s booming sales
2) Stable, low cost production base in Vietnam
3) Trans Pacific Partnership Agreement gains for “Made in Malaysia/Vietnam” clothing
4) Bright long-term prospects in the apparels industry
Price target and risks We are placing a target price of RM6.80 (17.2% upside potential)
on Magni based on SOP valuation methodology: a PE multiple of 11x for the garment
segment and a lower PER band of 5x for the packaging segment. Downside risks to our
PT/estimates are 1) over dependence on Nike, 2) unfavourable currency movements, 3)
competition, 4) labour and skills shortage.
Table 1 : Earnings Forecasts
FYE April FY13 FY14 FY15 FY16(f) FY17(f)
Revenue (m) 565.8 651.3 716.4 792.0 850.0
Pretax Profit (m) 48.0 55.4 69.4 84.0 95.7
Net Profit (m) 35.8 42.0 52.2 63.0 71.7
EPS (sen) 33.0 38.7 48.1 58.1 66.1
Pretax margin (%) 8.5 8.5 9.7 10.6 11.3
Net Profit margin (%) 6.3 6.4 7.3 8.0 8.4
PER (x) 17.6 15.0 12.0 10.0 8.8
DPS (sen) 13.0 13.0 15.0 15.0 15.0
Dividend Yield (%) 2.2 2.2 2.6 2.6 2.6
ROE (%) 18.2 19.0 20.6 22.0 22.8
ROA (%) 14.0 14.5 16.3 17.8 18.4
Net Gearing Ratio (%) Net Cash Net Cash Net Cash Net Cash Net Cash
BV/Share 1.91 2.17 2.51 3.42 3.76
Price/Book Ratio (x) 3.03 2.68 2.31 1.70 1.54
#Readers are advised to take note that Inter-Pacific Research Sdn Bhd is a member of
the Berjaya Corporation Bhd Group which holds 23.24% in Magni-Tech Industries Bhd.
For further information, please refer to the Disclaimer on Page 23.
Tailoring Nike’s future growth
Page 2 of 23
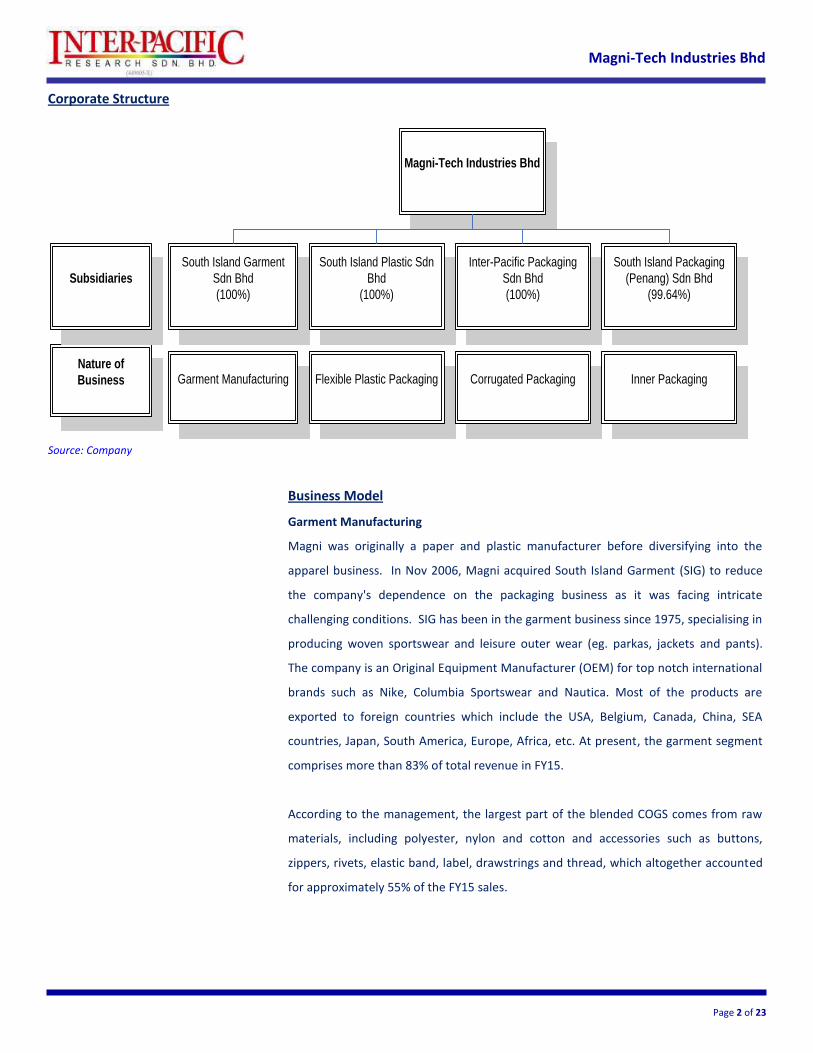
Magni-Tech Industries Bhd
Corporate Structure
Magni-Tech Industries Bhd
South Island Garment
Sdn Bhd
(100%)
South Island Plastic Sdn
Bhd
(100%)
Inter-Pacific Packaging
Sdn Bhd
(100%)
South Island Packaging
(Penang) Sdn Bhd
(99.64%)
Garment Manufacturing
Flexible Plastic Packaging
Corrugated Packaging
Inner Packaging
Nature of
Business
Subsidiaries
Source: Company
Business Model
Garment Manufacturing
Magni was originally a paper and plastic manufacturer before diversifying into the
apparel business. In Nov 2006, Magni acquired South Island Garment (SIG) to reduce
the company's dependence on the packaging business as it was facing intricate
challenging conditions. SIG has been in the garment business since 1975, specialising in
producing woven sportswear and leisure outer wear (eg. parkas, jackets and pants).
The company is an Original Equipment Manufacturer (OEM) for top notch international
brands such as Nike, Columbia Sportswear and Nautica. Most of the products are
exported to foreign countries which include the USA, Belgium, Canada, China, SEA
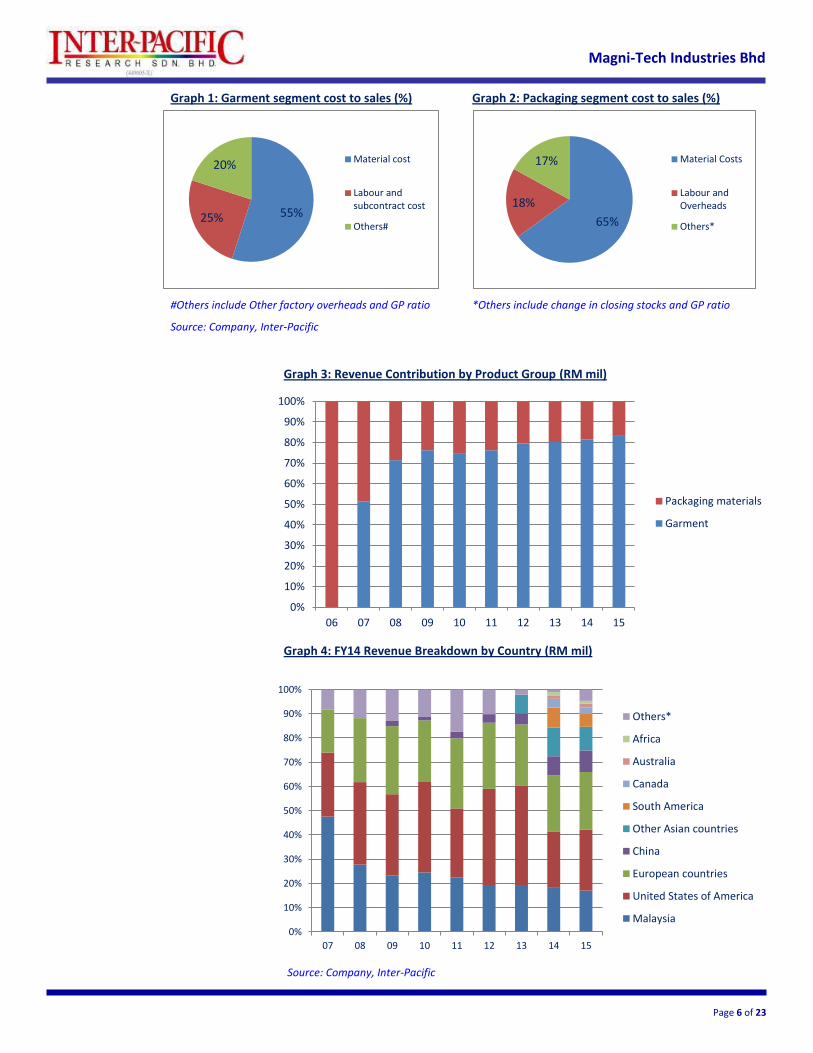
countries, Japan, South America, Europe, Africa, etc. At present, the garment segment
comprises more than 83% of total revenue in FY15.
According to the management, the largest part of the blended COGS comes from raw
materials, including polyester, nylon and cotton and accessories such as buttons,
zippers, rivets, elastic band, label, drawstrings and thread, which altogether accounted
for approximately 55% of the FY15 sales.

Page 3 of 23
Magni-Tech Industries Bhd
Exhibit 1: Corrugated boxes
Source: Boxilimited
Table 2: Breakdown of corrugated packaging products purposes
Corrugated Packaging Product Purpose
Single faced corrugated sheets General-purpose wrapping and scratch prevention Single wall corrugated cartons Used as smaller or inner carton for protective cover
Double wall corrugated cartons Used as outer cartons for storage and distribution
Single wall corrugated fittings Used for nesting or as dividers
Double wall corrugated fittings Used as reinforcement of cartons Source: Company, Inter-Pacific
Packaging Business
The packaging segment's activities are undertaken by Magni-Tech’s 3 subsidiaries'
manufacturing facilities in Malaysia. Packaging products such as corrugated
boards/sheets, fittings and fibreboard cartons and boxes are typically used by the
manufacturing sector. The electronics, food, beverage, healthcare and tobacco sectors
are the company's end-customers. Packaging products manufactured by the group are
sold mainly locally but a sizeable percentage is used in the packaging of manufactured
products that are ultimately exported.
The market for corrugated packaging products can be roughly divided into local users
(65% by turnover) and Licensed Manufacturing Warehouses (35%) (which perform
some light value-added services for manufacturers such as break-bulk and
customisation of packaging for specific markets). The market can also be classified by
way of end-users. These include the Electronics industry, Plastics and Rubber-based
products, Toiletries, Food & Beverage Industry and the Textiles Industry. A final
category of end use customer is the Corrugated Packaging Converter.
The Flexible Plastic Packaging Products and the Inner Packaging Boxes business can
both be classified by the end-market served viz local businesses (72%), the Free Trade
Zones (1.4%), Licensed Manufacturing Warehouses (21.2%) and export destinations
(5.4%). They can also be classified by way of specifying the end users which are mainly
the manufacturing segments identified above.
Corrugated Carton Manufacturing
Corrugated packaging manufacturing involves upstream as well as downstream
processes. In the upstream portion of activities, industrial kraft, testliner and medium
paper is converted into corrugated boards through a process called corrugating. A
subsequent downstream process transforms corrugated boards into corrugated
products in a step called conversion into die cut trays, containers and cartons.
Integrated operations involves sourcing kraftliner, testliner and medium paper which
upon being corrugated, boards are manufactured which are then converted into other
products.

Page 4 of 23
Magni-Tech Industries Bhd
IPP manufactures corrugated boards which are then converted by SIPP into generic final
corrugated cartons and die cut trays customised for end customer needs. They are
mainly sold to customers in the northern Peninsular region due to the bulky nature and
high transport costs that will not justify their being transported over longer distances.
Raw materials used are largely kraftliner and testliners, which are more appropriately
labeled Kraft Paperboard and Recycled Paperboard. "Kraftliner" is defined as "paper or
paperboard whose fibre content has no less than 80% fibre obtained by the chemical
sulfate or soda processes". Semi chemical fluting (medium) paper is defined as
containing no less than 65% unbleached hardwood fibres obtained by a semi-chemical
pulping process. There is no formal definition of "testliner" but the term is used in the
Pacific Rim when referring to papers of different bursting strengths. But because some
grades of testliner have lower burst factors than experienced with Rule 41 of the US
National Railroad Freight Committee’s Uniform Freight Classification compliant boards
that meet edge crush tests, basis weight and combined board burst requirements due
to their containing high amounts of recycled fibres. Lower grades of testliner have
come to be associated with recycled fibres. Many Pacific Rim customers rely on a visual
inspection of any board sheet, and if contaminants are visible on the surface, the board
is judged to be testliner.
Kraftliners involving chemically sourced virgin fibres are always imported, from the US,
Canada and New Zealand. Testliners and corrugating medium paper are available
locally. Other raw materials such as printing ink and glue are also sourced locally.
Manufacturing of corrugated boards and cartons is carried out at Inter-Pacific Packaging
S/B's 27,797 m2 facility in Batu 13, Jalan Kelang Lama, in Puchong which has a built up
area of 15,362m2. Operating on 2 shifts with 167 employees, it has a capacity of 36,000
mt p.a. but currently production is running at 23,822 mt/month or at 66% of capacity.
Flexible Plastic Packaging Materials Manufacturing
The group manufactures a range of flexible plastic packaging materials such as
wrappers, paper bags, stationery and labels for industrial & commercial use e.g.:
Plastic bags for wrapping food products e.g. bread, frozen food, cereals, snacks,
noodles etc.
Plastic sheets used in the agriculture and the construction and building industry.
Laminated plastic products used in high end packaging of products.
Plastic packing used in automated packaging machinery.
Page 5 of 23
Magni-Tech Industries Bhd
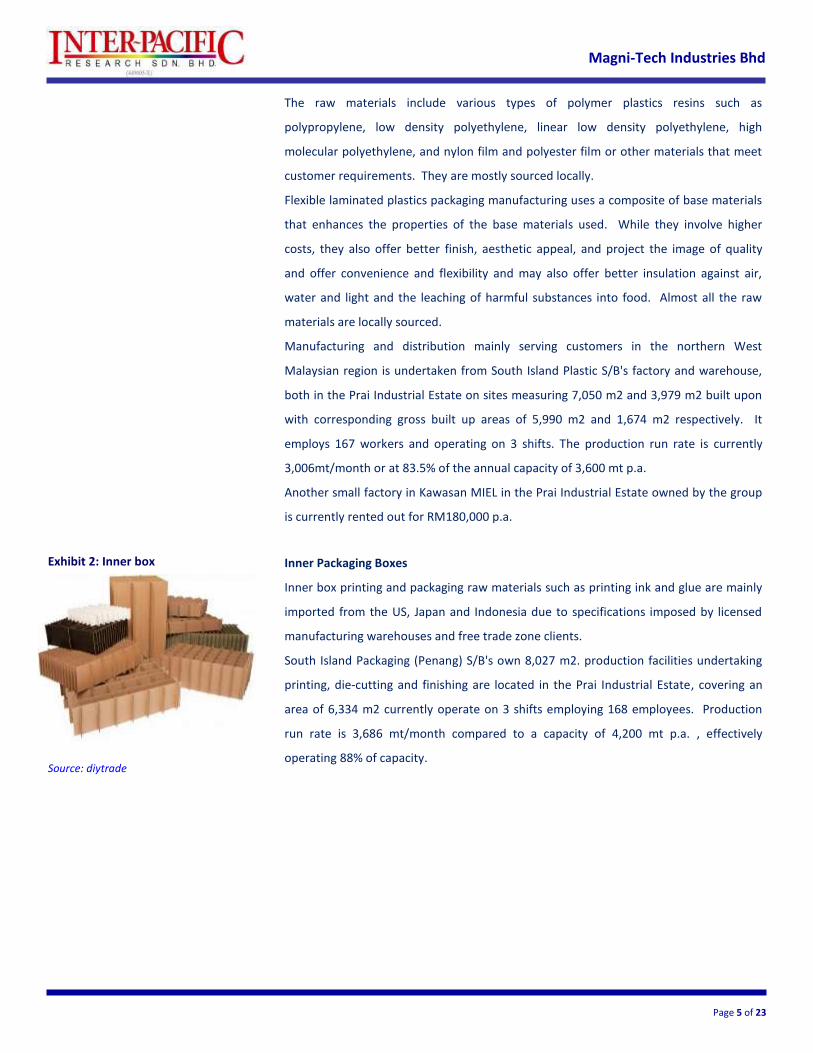
Exhibit 2: Inner box
Source: diytrade
The raw materials include various types of polymer plastics resins such as
polypropylene, low density polyethylene, linear low density polyethylene, high
molecular polyethylene, and nylon film and polyester film or other materials that meet
customer requirements. They are mostly sourced locally.
Flexible laminated plastics packaging manufacturing uses a composite of base materials
that enhances the properties of the base materials used. While they involve higher
costs, they also offer better finish, aesthetic appeal, and project the image of quality
and offer convenience and flexibility and may also offer better insulation against air,
water and light and the leaching of harmful substances into food. Almost all the raw
materials are locally sourced.
Manufacturing and distribution mainly serving customers in the northern West
Malaysian region is undertaken from South Island Plastic S/B's factory and warehouse,
both in the Prai Industrial Estate on sites measuring 7,050 m2 and 3,979 m2 built upon
with corresponding gross built up areas of 5,990 m2 and 1,674 m2 respectively. It
employs 167 workers and operating on 3 shifts. The production run rate is currently
3,006mt/month or at 83.5% of the annual capacity of 3,600 mt p.a.
Another small factory in Kawasan MIEL in the Prai Industrial Estate owned by the group
is currently rented out for RM180,000 p.a.
Inner Packaging Boxes
Inner box printing and packaging raw materials such as printing ink and glue are mainly
imported from the US, Japan and Indonesia due to specifications imposed by licensed
manufacturing warehouses and free trade zone clients.
South Island Packaging (Penang) S/B's own 8,027 m2. production facilities undertaking
printing, die-cutting and finishing are located in the Prai Industrial Estate, covering an
area of 6,334 m2 currently operate on 3 shifts employing 168 employees. Production
run rate is 3,686 mt/month compared to a capacity of 4,200 mt p.a. , effectively
operating 88% of capacity.
Page 6 of 23
Magni-Tech Industries Bhd
Graph 1: Garment segment cost to sales (%) Graph 2: Packaging segment cost to sales (%)
#Others include Other factory overheads and GP ratio *Others include change in closing stocks and GP ratio
Source: Company, Inter-Pacific
Graph 3: Revenue Contribution by Product Group (RM mil)
Graph 4: FY14 Revenue Breakdown by Country (RM mil)
Source: Company, Inter-Pacific
0%
10%
20%
30%
40%
50%
60%
70%
80%
90%
100%
06 07 08 09 10 11 12 13 14 15
Packaging materials
Garment
0%
10%
20%
30%
40%
50%
60%
70%
80%
90%
100%
07 08 09 10 11 12 13 14 15
Others*
Africa
Australia
Canada
South America
Other Asian countries
China
European countries
United States of America
Malaysia
65%
18%
17% Material Costs
Labour andOverheads
Others*55% 25%
20% Material cost
Labour andsubcontract cost
Others#
Page 7 of 23
Magni-Tech Industries Bhd
Investment Merits
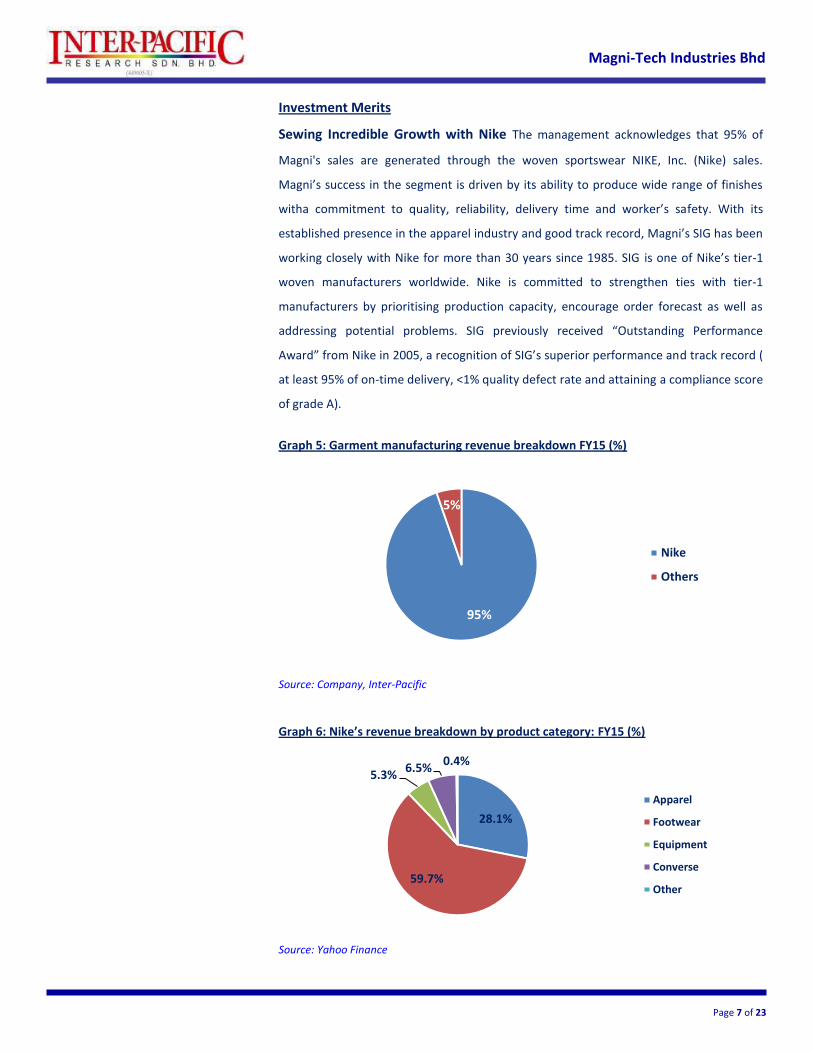
Sewing Incredible Growth with Nike The management acknowledges that 95% of
Magni's sales are generated through the woven sportswear NIKE, Inc. (Nike) sales.
Magni’s success in the segment is driven by its ability to produce wide range of finishes
witha commitment to quality, reliability, delivery time and worker’s safety. With its
established presence in the apparel industry and good track record, Magni’s SIG has been
working closely with Nike for more than 30 years since 1985. SIG is one of Nike’s tier-1
woven manufacturers worldwide. Nike is committed to strengthen ties with tier-1
manufacturers by prioritising production capacity, encourage order forecast as well as
addressing potential problems. SIG previously received “Outstanding Performance
Award” from Nike in 2005, a recognition of SIG’s superior performance and track record (
at least 95% of on-time delivery, <1% quality defect rate and attaining a compliance score
of grade A).
Graph 5: Garment manufacturing revenue breakdown FY15 (%)
Source: Company, Inter-Pacific
Graph 6: Nike’s revenue breakdown by product category: FY15 (%)
Source: Yahoo Finance
95%
5%
Nike
Others
28.1%
59.7%
5.3% 6.5%
0.4%
Apparel
Footwear
Equipment
Converse
Other
Page 8 of 23
Magni-Tech Industries Bhd
Nike aims to generate USD50bil sales by 2020 During the recent Nike’ investor day,
the company set a new target (previous target: USD36bil FY17), expecting to grow to USD
50bil by 2020.This implies sales will expand at a 10% CAGR from 2015-2020. We think this
ambitious goal is attainable because Nike managed to clock in USD30.6bil in FY15 actual
revenue, surpassing its previous revenue target of USD28-30bil. The company’s growth
plans by 2020 as follows add colour to Magni-Tech Industries' growth prospects:
Table 3: Nike's 2020 expected growth plans
2020 growth plans Amount (USD bil)
Integrated marketplace
Direct to consumer (DTC) operations 16.0
e-commerce sales 7.0
Wholesale growth Mid-high single digit
Business & Categories
Women business 11.0
Running category 7.5
Basketball category , Jordan 4.5
Expected total 50.0
Source: Company. Yahoo finance
Overall, we like Nike’s long-term growth record because of:-
1) Plans to hit USD50bil in revenue, as mentioned above
2) Well positioned to take advantage of an expanding global sports apparel industry
and a stable growth of China sales even in the face of slowdown elsewhere
3) Reporting good financial growth, consistently exceeding street views
4) A beneficiary of the gain in popularity of athleisure trends
5) One of the most innovative companies worldwide
6) Ownership of a portfolio of globally recognized brands
7) Strong marketing programmes (endorsement deals with high-profile athletes)
With the above-mentioned key prospects underpinning Nike's growth, we believe Magni
is set to expand, riding on Nike’s success. We note that the local listed Prolexus Bhd's
share price which climbed more than 118.06% over a 1-year span, a share price trend
shared with many of Nike suppliers, climbing in tandem with Nike's own share price. We
also note the terrific year Taiwan listed, Eclat Textile Co Ltd's share price enjoyed as
another major Nike apparel supplier, boasting a 1 year return of 68.85%.
Page 9 of 23
Magni-Tech Industries Bhd
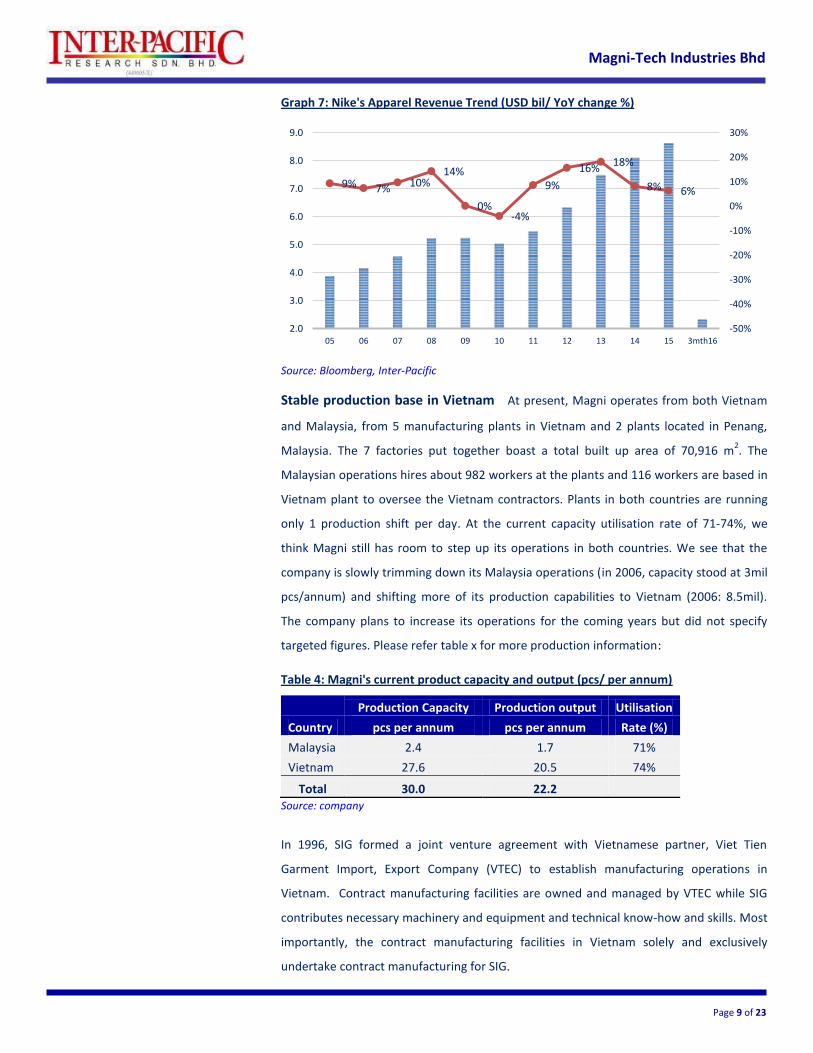
Graph 7: Nike's Apparel Revenue Trend (USD bil/ YoY change %)
Source: Bloomberg, Inter-Pacific
Stable production base in Vietnam At present, Magni operates from both Vietnam
and Malaysia, from 5 manufacturing plants in Vietnam and 2 plants located in Penang,
Malaysia. The 7 factories put together boast a total built up area of 70,916 m2. The
Malaysian operations hires about 982 workers at the plants and 116 workers are based in
Vietnam plant to oversee the Vietnam contractors. Plants in both countries are running
only 1 production shift per day. At the current capacity utilisation rate of 71-74%, we
think Magni still has room to step up its operations in both countries. We see that the
company is slowly trimming down its Malaysia operations (in 2006, capacity stood at 3mil
pcs/annum) and shifting more of its production capabilities to Vietnam (2006: 8.5mil).
The company plans to increase its operations for the coming years but did not specify
targeted figures. Please refer table x for more production information:
Table 4: Magni's current product capacity and output (pcs/ per annum)
Production Capacity Production output Utilisation
Country pcs per annum pcs per annum Rate (%)
Malaysia 2.4 1.7 71%
Vietnam 27.6 20.5 74%
Total 30.0 22.2 Source: company
In 1996, SIG formed a joint venture agreement with Vietnamese partner, Viet Tien
Garment Import, Export Company (VTEC) to establish manufacturing operations in
Vietnam. Contract manufacturing facilities are owned and managed by VTEC while SIG
contributes necessary machinery and equipment and technical know-how and skills. Most
importantly, the contract manufacturing facilities in Vietnam solely and exclusively
undertake contract manufacturing for SIG.
9% 7% 10% 14%
0% -4%
9%
16% 18%
8% 6%
-50%
-40%
-30%
-20%
-10%
0%
10%
20%
30%
2.0
3.0
4.0
5.0
6.0
7.0
8.0
9.0
05 06 07 08 09 10 11 12 13 14 15 3mth16
Page 10 of 23
Magni-Tech Industries Bhd
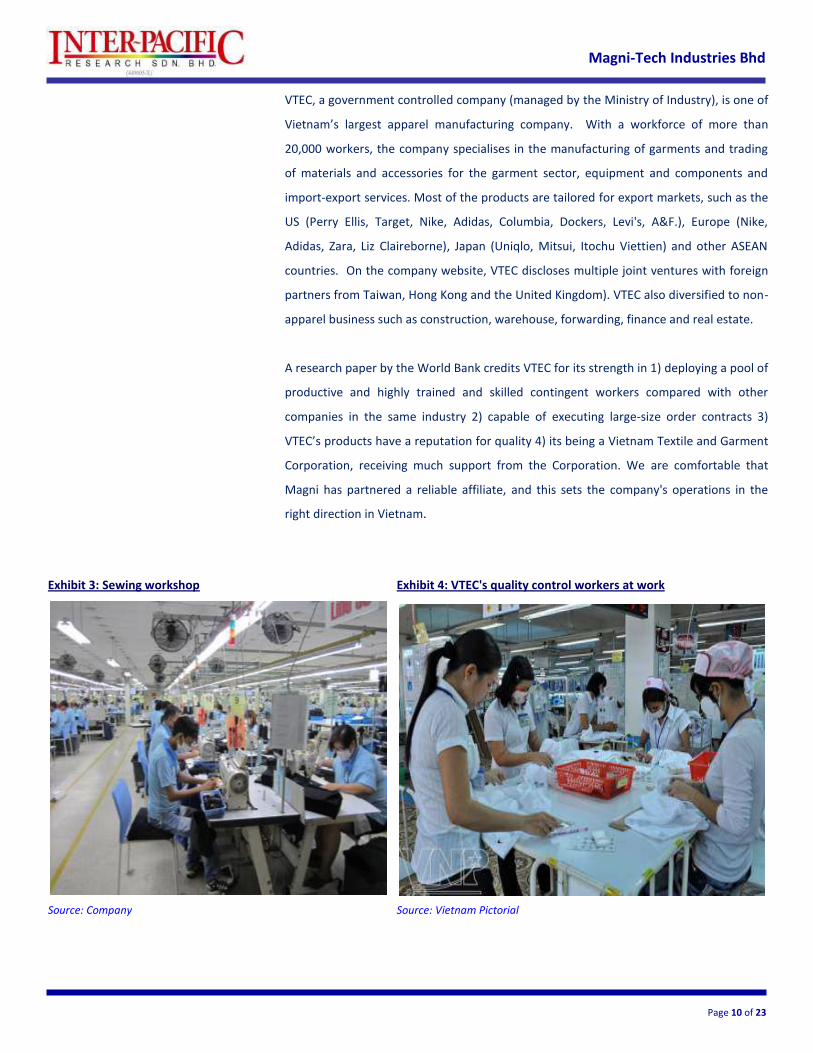
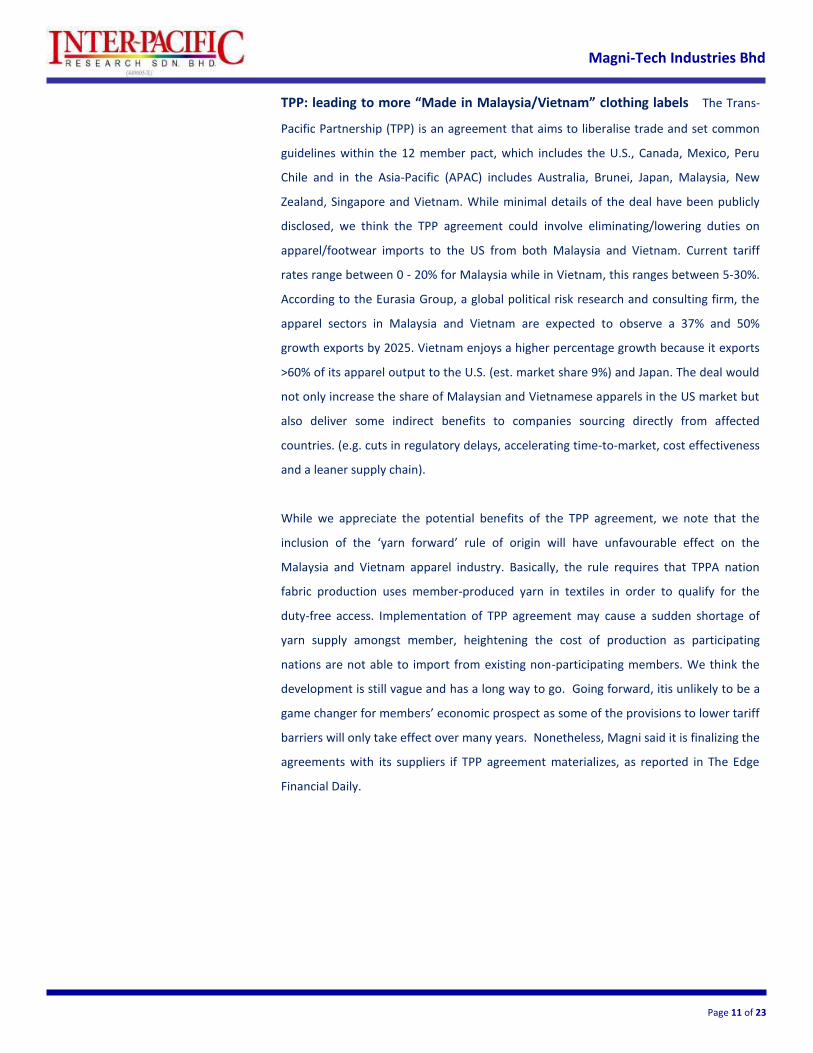
Exhibit 3: Sewing workshop Exhibit 4: VTEC's quality control workers at work
Source: Company Source: Vietnam Pictorial
VTEC, a government controlled company (managed by the Ministry of Industry), is one of
Vietnam’s largest apparel manufacturing company. With a workforce of more than
20,000 workers, the company specialises in the manufacturing of garments and trading
of materials and accessories for the garment sector, equipment and components and
import-export services. Most of the products are tailored for export markets, such as the
US (Perry Ellis, Target, Nike, Adidas, Columbia, Dockers, Levi's, A&F.), Europe (Nike,
Adidas, Zara, Liz Claireborne), Japan (Uniqlo, Mitsui, Itochu Viettien) and other ASEAN
countries. On the company website, VTEC discloses multiple joint ventures with foreign
partners from Taiwan, Hong Kong and the United Kingdom). VTEC also diversified to non-
apparel business such as construction, warehouse, forwarding, finance and real estate.
A research paper by the World Bank credits VTEC for its strength in 1) deploying a pool of
productive and highly trained and skilled contingent workers compared with other
companies in the same industry 2) capable of executing large-size order contracts 3)
VTEC’s products have a reputation for quality 4) its being a Vietnam Textile and Garment
Corporation, receiving much support from the Corporation. We are comfortable that
Magni has partnered a reliable affiliate, and this sets the company's operations in the
right direction in Vietnam.
Page 11 of 23
Magni-Tech Industries Bhd
TPP: leading to more “Made in Malaysia/Vietnam” clothing labels The Trans-
Pacific Partnership (TPP) is an agreement that aims to liberalise trade and set common
guidelines within the 12 member pact, which includes the U.S., Canada, Mexico, Peru
Chile and in the Asia-Pacific (APAC) includes Australia, Brunei, Japan, Malaysia, New
Zealand, Singapore and Vietnam. While minimal details of the deal have been publicly
disclosed, we think the TPP agreement could involve eliminating/lowering duties on
apparel/footwear imports to the US from both Malaysia and Vietnam. Current tariff
rates range between 0 - 20% for Malaysia while in Vietnam, this ranges between 5-30%.
According to the Eurasia Group, a global political risk research and consulting firm, the
apparel sectors in Malaysia and Vietnam are expected to observe a 37% and 50%
growth exports by 2025. Vietnam enjoys a higher percentage growth because it exports
>60% of its apparel output to the U.S. (est. market share 9%) and Japan. The deal would
not only increase the share of Malaysian and Vietnamese apparels in the US market but
also deliver some indirect benefits to companies sourcing directly from affected
countries. (e.g. cuts in regulatory delays, accelerating time-to-market, cost effectiveness
and a leaner supply chain).
While we appreciate the potential benefits of the TPP agreement, we note that the
inclusion of the ‘yarn forward’ rule of origin will have unfavourable effect on the
Malaysia and Vietnam apparel industry. Basically, the rule requires that TPPA nation
fabric production uses member-produced yarn in textiles in order to qualify for the
duty-free access. Implementation of TPP agreement may cause a sudden shortage of
yarn supply amongst member, heightening the cost of production as participating
nations are not able to import from existing non-participating members. We think the
development is still vague and has a long way to go. Going forward, itis unlikely to be a
game changer for members’ economic prospect as some of the provisions to lower tariff
barriers will only take effect over many years. Nonetheless, Magni said it is finalizing the
agreements with its suppliers if TPP agreement materializes, as reported in The Edge
Financial Daily.
Page 12 of 23
Magni-Tech Industries Bhd
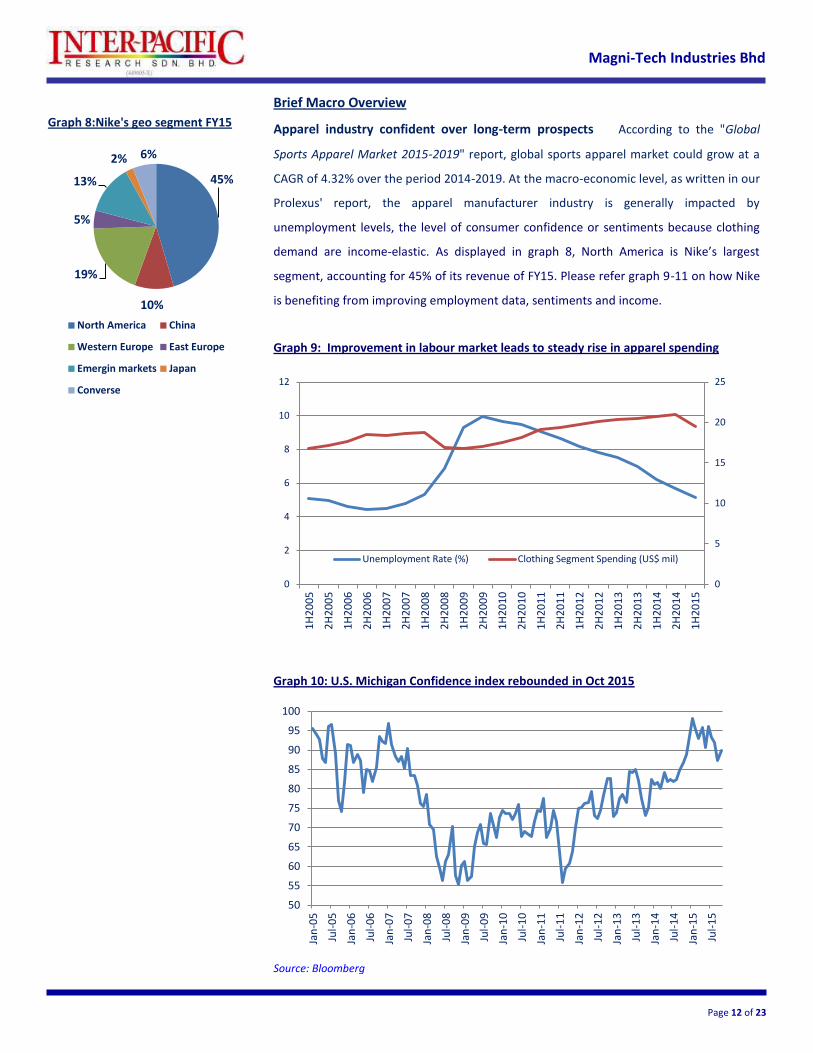
Graph 8:Nike's geo segment FY15
45%
10%
19%
5%
13%
2% 6%
North America China
Western Europe East Europe
Emergin markets Japan
Converse
Brief Macro Overview
Apparel industry confident over long-term prospects According to the "Global
Sports Apparel Market 2015-2019" report, global sports apparel market could grow at a
CAGR of 4.32% over the period 2014-2019. At the macro-economic level, as written in our
Prolexus' report, the apparel manufacturer industry is generally impacted by
unemployment levels, the level of consumer confidence or sentiments because clothing
demand are income-elastic. As displayed in graph 8, North America is Nike’s largest
segment, accounting for 45% of its revenue of FY15. Please refer graph 9-11 on how Nike
is benefiting from improving employment data, sentiments and income.
Graph 9: Improvement in labour market leads to steady rise in apparel spending
Graph 10: U.S. Michigan Confidence index rebounded in Oct 2015
Source: Bloomberg
0
5
10
15
20
25
0
2
4
6
8
10
12
1H
20
05
2H
20
05
1H
20
06
2H
20
06
1H
20
07
2H
20
07
1H
20
08
2H
20
08
1H
20
09
2H
20
09
1H
20
10
2H
20
10
1H
20
11
2H
20
11
1H
20
12
2H
20
12
1H
20
13
2H
20
13
1H
20
14
2H
20
14
1H
20
15
Unemployment Rate (%) Clothing Segment Spending (US$ mil)
50
55
60
65
70
75
80
85
90
95
100
Jan
-05
Jul-
05
Jan
-06
Jul-
06
Jan
-07
Jul-
07
Jan
-08
Jul-
08
Jan
-09
Jul-
09
Jan
-10
Jul-
10
Jan
-11
Jul-
11
Jan
-12
Jul-
12
Jan
-13
Jul-
13
Jan
-14
Jul-
14
Jan
-15
Jul-
15
Page 13 of 23
Magni-Tech Industries Bhd
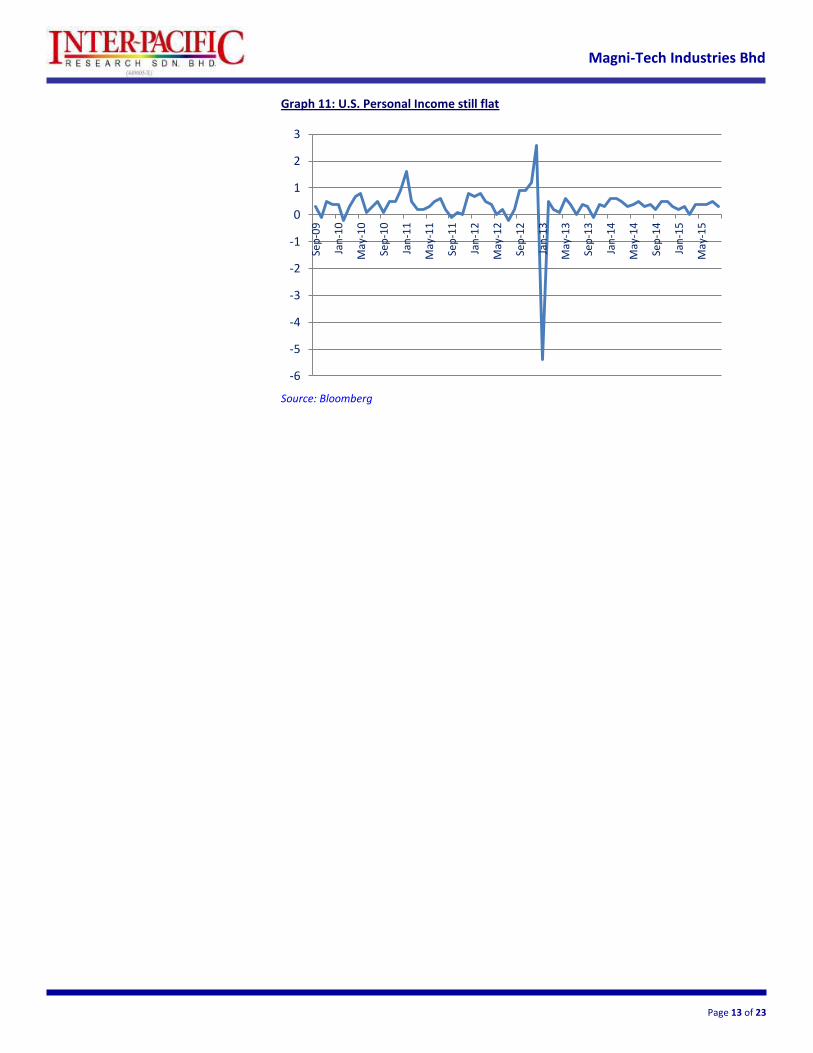
Graph 11: U.S. Personal Income still flat
Source: Bloomberg
-6
-5
-4
-3
-2
-1
0
1
2
3
Sep
-09
Jan
-10
May
-10
Sep
-10
Jan
-11
May
-11
Sep
-11
Jan
-12
May
-12
Sep
-12
Jan
-13
May
-13
Sep
-13
Jan
-14
May
-14
Sep
-14
Jan
-15
May
-15

Page 14 of 23
Magni-Tech Industries Bhd
Financials
Income Statement
Uptrending Revenues Magni has registered a track record of uninterrupted profits
since 2007, with its performance mainly tracking Nike’s sales performance. The company
delivered a 10-year revenue CAGR of 22.5% from 2005 to 2015, surviving many of the
crises that impacted the world economy. The figures starting 2009 in Chart 8 coincide
with the inclusion of full year contribution from the garment business rather than the
packaging business alone.
Graph 12: Revenue 8-year Actual & Forecast (2009-2017f RM' mil)
Source: Company, Inter-Pacific
Poised for stronger earnings growth Our forecasts are for Magni to achieve revenues
of RM792mil/RM850mil in FY16/FY17 respectively, climbing 10%/7.3% YoY, with net
income reaching RM63mil/RM71.7mil, up 20.7%/13.8% YoY respectively. This is based
on a 10% CAGR from 2010-2015 extrapolated into future years, as guided by
management’s minimum expectations moving forward. We assume a gradual ramp-up in
production capacity and expanding export sales in FY16. Revenues may continue to
increase post-2016, supported by the continued increase in orders from Nike, but we
have not imputed any pickup in the pace of increase in orders, to be conservative.
Balance Sheet
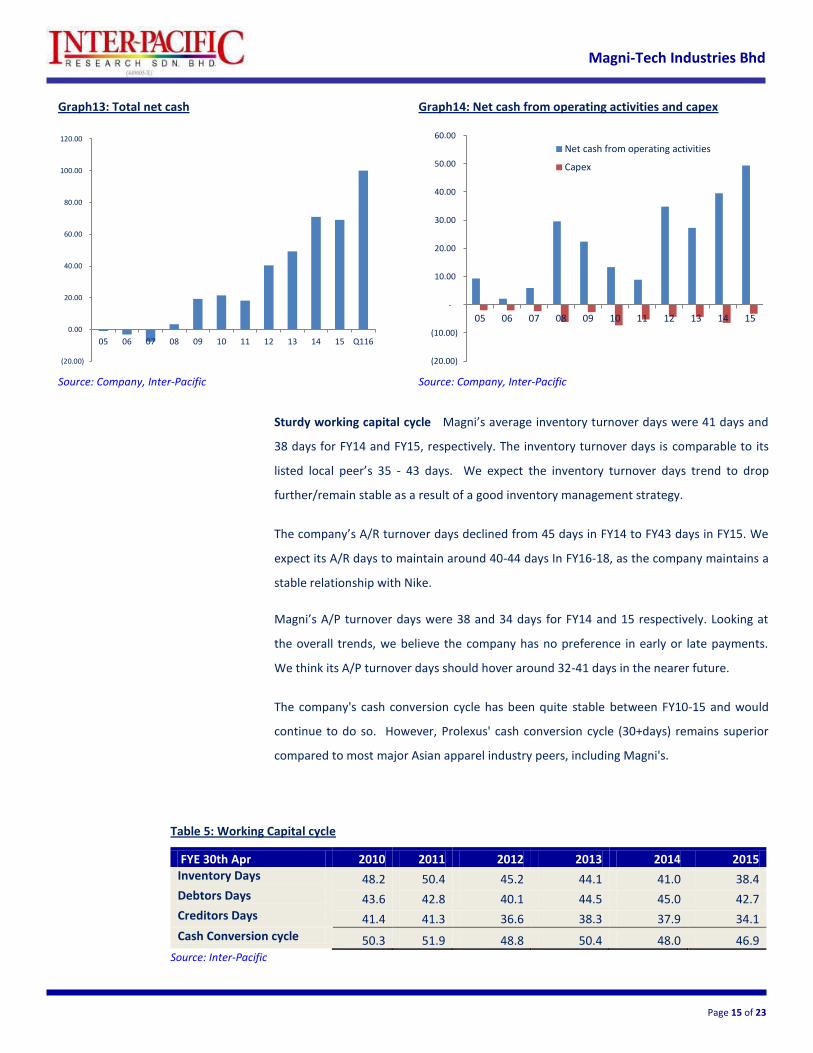
Cash-rich As at July 2015, Magni has a total net cash of RM100mil, a treasury cash pile
of RM0.92per share. The company has been generating healthy operating cash flows and
has been in a net cash position since 2008. With thislarge amount of cash in hand, Magni
has enough cash to fund capex for plant expansions or seek M&A opportunities.
-5
0
+5
+10
+15
+20
+25
300
400
500
600
700
800
900
09 10 11 12 13 14 15 16f 17f
Revenue % change YoY
Page 15 of 23
Magni-Tech Industries Bhd
Table 5: Working Capital cycle
FYE 30th Apr 2010 2011 2012 2013 2014 2015 Inventory Days 48.2 50.4 45.2 44.1 41.0 38.4 Debtors Days 43.6 42.8 40.1 44.5 45.0 42.7 Creditors Days 41.4 41.3 36.6 38.3 37.9 34.1
Cash Conversion cycle 50.3 51.9 48.8 50.4 48.0 46.9 Source: Inter-Pacific
Graph13: Total net cash
Source: Company, Inter-Pacific
(20.00)
0.00
20.00
40.00
60.00
80.00
100.00
120.00
05 06 07 08 09 10 11 12 13 14 15 Q116
Graph14: Net cash from operating activities and capex
Source: Company, Inter-Pacific
(20.00)
(10.00)
-
10.00
20.00
30.00
40.00
50.00
60.00
05 06 07 08 09 10 11 12 13 14 15
Net cash from operating activities
Capex
Sturdy working capital cycle Magni’s average inventory turnover days were 41 days and
38 days for FY14 and FY15, respectively. The inventory turnover days is comparable to its
listed local peer’s 35 - 43 days. We expect the inventory turnover days trend to drop
further/remain stable as a result of a good inventory management strategy.
The company’s A/R turnover days declined from 45 days in FY14 to FY43 days in FY15. We
expect its A/R days to maintain around 40-44 days In FY16-18, as the company maintains a
stable relationship with Nike.
Magni’s A/P turnover days were 38 and 34 days for FY14 and 15 respectively. Looking at
the overall trends, we believe the company has no preference in early or late payments.
We think its A/P turnover days should hover around 32-41 days in the nearer future.
The company's cash conversion cycle has been quite stable between FY10-15 and would
continue to do so. However, Prolexus' cash conversion cycle (30+days) remains superior
compared to most major Asian apparel industry peers, including Magni's.
Page 16 of 23
Magni-Tech Industries Bhd
Table 6: Overall margins comparison with listed peer
GP margin 2009 2010 2011 2012 2013 2014 2015 2016f 2017f
Magni 11.4% 14.3% 14.8% 14.5% 16.0% 14.8% 15.9% 16.5% 16.9%
Prolexus 12.5% 15.0% 13.1% 15.4% 16.8% 17.5% 19.7% 23.1% 23.4%
EBIT margin 2009 2010 2011 2012 2013 2014 2015 2016f 2017f
Magni 4.1% 5.9% 5.4% 7.7% 8.6% 8.6% 9.8% 10.7% 11.3%
Prolexus 2.6% 4.9% 3.2% 5.9% 8.3% 8.3% 8.3% 9.0% 9.5%
PATMI margins 2009 2010 2011 2012 2013 2014 2015 2016f 2017f
Magni 3.0% 4.4% 3.9% 5.7% 6.3% 6.4% 7.3% 8.0% 8.4%
Prolexus 0.2% 2.5% 2.8% 5.4% 7.3% 7.1% 7.3% 7.8% 8.3% Source: Inter-Pacific
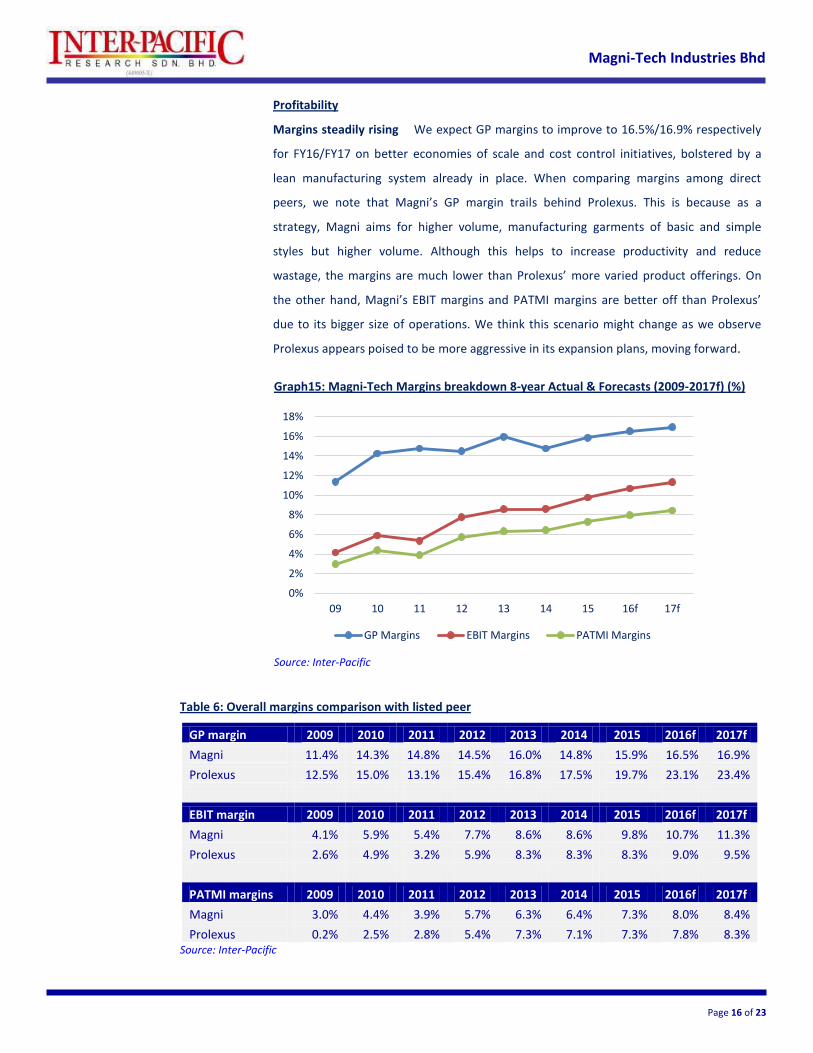
Graph15: Magni-Tech Margins breakdown 8-year Actual & Forecasts (2009-2017f) (%)
Source: Inter-Pacific
0%
2%
4%
6%
8%
10%
12%
14%
16%
18%
09 10 11 12 13 14 15 16f 17f
GP Margins EBIT Margins PATMI Margins
Profitability
Margins steadily rising We expect GP margins to improve to 16.5%/16.9% respectively
for FY16/FY17 on better economies of scale and cost control initiatives, bolstered by a
lean manufacturing system already in place. When comparing margins among direct
peers, we note that Magni’s GP margin trails behind Prolexus. This is because as a
strategy, Magni aims for higher volume, manufacturing garments of basic and simple
styles but higher volume. Although this helps to increase productivity and reduce
wastage, the margins are much lower than Prolexus’ more varied product offerings. On
the other hand, Magni’s EBIT margins and PATMI margins are better off than Prolexus’
due to its bigger size of operations. We think this scenario might change as we observe
Prolexus appears poised to be more aggressive in its expansion plans, moving forward.

Page 17 of 23
Magni-Tech Industries Bhd
Graph 16: ROE Trend Actual & Forecast (2005-2016f) (%)
Source: Inter-Pacific
Stable dividends Magni does not adopt an explicit dividend policy. The company has
been steadily increasing DPS since 2005, even though it does not have an explicit dividend
policy. Magni recently announced its final dividend of 3 per share ex-date to be set on 9th
Nov 2015. We note that its dividend payout ratio has been on a declining trend since
listing. With a higher earnings base going forward, we think there is still possibility the
company will declare stable/higher dividends. Assuming the company kept dividend
payouts above 25%, the expected dividend yield is about 2.5%.
Graph 17: Dividend Payout (RM sen) and Dividend Payout Ratio (%)
Source: Company, Inter-Pacific
-20%
-15%
-10%
-5%
0%
5%
10%
15%
20%
25%
30%
05 06 07 08 09 10 11 12 13 14 15 (a/f) 16f
Magni Prolexus
9
8
9
13 13
15 15
20%
25%
30%
35%
40%
45%
50%
-
2
4
6
8
10
12
14
16
10 11 12 13 14 15 16f
DPS (Sen)
Payout Ratio (%)
Page 18 of 23
Magni-Tech Industries Bhd
Risk
Dependent on a single customer Magni is heavily dependent on the success of Nike
which accounts for 95% of apparel revenues, representing an outsized customer risk.
Losing Nike will negatively affect the company's future earnings. We think the risk is low
because SIG has a working relationship of at least 30 years with Nike. Any strain in the
company’s relationship with Nike could disrupt its entire apparel segment business
model. Besides, SIG previously bagged Nike's tier-1 status for woven manufacturers
worldwide. This history of long relationship and track record provides us some
consolation that an abrupt cessation is not probable anytime soon. In view of SIG’s
capability to develop and produce a wide range of product types ranging from basic to
highly technical seam sealed garments, Magni is confident that it would be able to
switch its operations to serve other customers such as Adidas, Fila, Puma and Reebok
whom they had working relationships with.
Unfavourable currency fluctuation The company's sales and purchases are mainly
quoted in USD. A 10% weakening in USD would affect bottom-line earnings (~5% to 7%
changes to PBT). The company uses forward foreign currency contracts to hedge USD
denominated sales.
Competitive risks With Nike continuing its strong growth performance, we believe
competition in the garments industry will intensify in 2016; apparel players will rush to
fill orders up their capacities, competing for the same orders/clients. They will therefore
have to defend their margins with higher production efficiencies (improving
output/hour). Magni also faces competition from new entrants to the industry,
particularly from other low-cost producers in China, India, Sri Lanka, Vietnam and
Bangladesh.
Page 19 of 23
Magni-Tech Industries Bhd
Management - Board of Directors
Executive Chairman Tan Sri Dato’ Seri Tan Kok Ping
Managing Director Tan Poay Seng
Executive Director Tan Kok Aun
Non-Independent Non-Executive Directors H’ng Cheok Seng
Tan Thiam Chai
Independent Non-Executive Directors Mawan Noor Aini Binti Md. Ismail
Tan Poh Heng
Alternate Director Chang Chuen Hwa
(Alternate Director to Tan Poay Seng)
Tan Sri Dato’ Seri Tan Kok Ping has more than 40 years of experience in various business
sectors which include property development, manufacturing of consumer electronics,
garment, corrugated and plastic packaging products. He also sits on the Board of a
subsidiary of Berjaya Land Bhd as well as in several private limited companies. He was
previously Managing Director and Deputy Chairman of Berjaya Sports Toto Bhd, Non-
Executive Chairman of Berjaya Retail Bhd, Chairman of Penang Joint Chambers of
Commerce and Deputy President of The Associated Chinese Chambers of Commerce and
Industry of Malaysia. He is the Executive Adviser and former President of Penang Chinese
Chamber of Commerce.
Mr Tan Poay Seng is the son of Tan Sri Dato’ Seri Tan Kok Ping and has been the Managing
Director of Magni-Tech Industries Bhd since 2000. He was Managing Director of Fila Sports
Malaysia S/B (which markets and retails sportswear in Malaysia) and also South Island
Garment S/B before that. He holds a Diploma in Hotel Management from Hotel Consult in
Switzerland.
Mr Tan Kok Aun, a mechanical engineering graduate of Trinity College, Ireland. He is
brother to Tan Sri Dato’ Seri Tan Kok Ping and pioneered South Island Packaging (Penang)
S/B after it was set up in 1973. He has 40 years of experience and knowledge in the printing
and packaging industry.
Mr H’ng Cheok Seng holds a professional membership of the Association of Chartered
Certified Accountants and held positions in multinational electronics & electrical and
garment companies prior to assuming a position with the Berjaya Group since 1997.
Page 20 of 23
Magni-Tech Industries Bhd
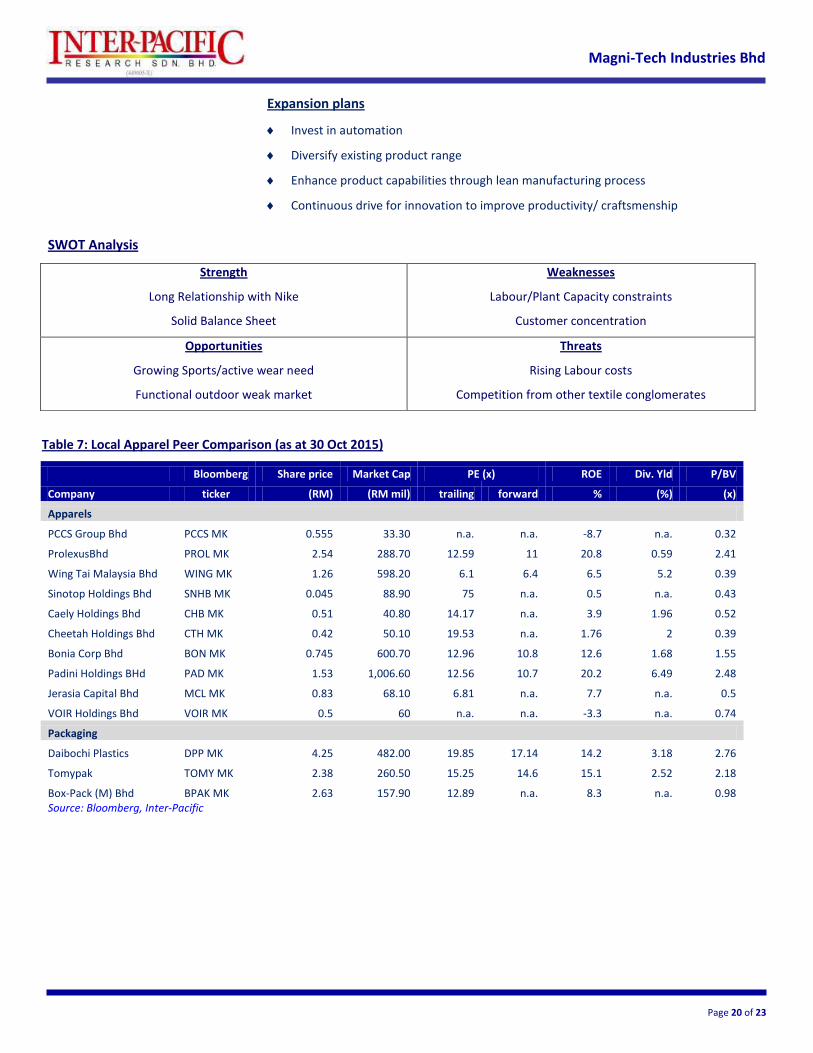
SWOT Analysis
Table 7: Local Apparel Peer Comparison (as at 30 Oct 2015)
Bloomberg Share price Market Cap PE (x) ROE Div. Yld P/BV
Company ticker (RM) (RM mil) trailing forward % (%) (x)
Apparels
PCCS Group Bhd PCCS MK 0.555 33.30 n.a. n.a. -8.7 n.a. 0.32
ProlexusBhd PROL MK 2.54 288.70 12.59 11 20.8 0.59 2.41
Wing Tai Malaysia Bhd WING MK 1.26 598.20 6.1 6.4 6.5 5.2 0.39
Sinotop Holdings Bhd SNHB MK 0.045 88.90 75 n.a. 0.5 n.a. 0.43
Caely Holdings Bhd CHB MK 0.51 40.80 14.17 n.a. 3.9 1.96 0.52
Cheetah Holdings Bhd CTH MK 0.42 50.10 19.53 n.a. 1.76 2 0.39
Bonia Corp Bhd BON MK 0.745 600.70 12.96 10.8 12.6 1.68 1.55
Padini Holdings BHd PAD MK 1.53 1,006.60 12.56 10.7 20.2 6.49 2.48
Jerasia Capital Bhd MCL MK 0.83 68.10 6.81 n.a. 7.7 n.a. 0.5
VOIR Holdings Bhd VOIR MK 0.5 60 n.a. n.a. -3.3 n.a. 0.74
Packaging
Daibochi Plastics DPP MK 4.25 482.00 19.85 17.14 14.2 3.18 2.76
Tomypak TOMY MK 2.38 260.50 15.25 14.6 15.1 2.52 2.18
Box-Pack (M) Bhd BPAK MK 2.63 157.90 12.89 n.a. 8.3 n.a. 0.98 Source: Bloomberg, Inter-Pacific
Strength
Long Relationship with Nike
Solid Balance Sheet
Weaknesses
Labour/Plant Capacity constraints
Customer concentration
Opportunities
Growing Sports/active wear need
Functional outdoor weak market
Threats
Rising Labour costs
Competition from other textile conglomerates
Expansion plans
Invest in automation
Diversify existing product range
Enhance product capabilities through lean manufacturing process
Continuous drive for innovation to improve productivity/ craftsmenship
Page 21 of 23
Magni-Tech Industries Bhd
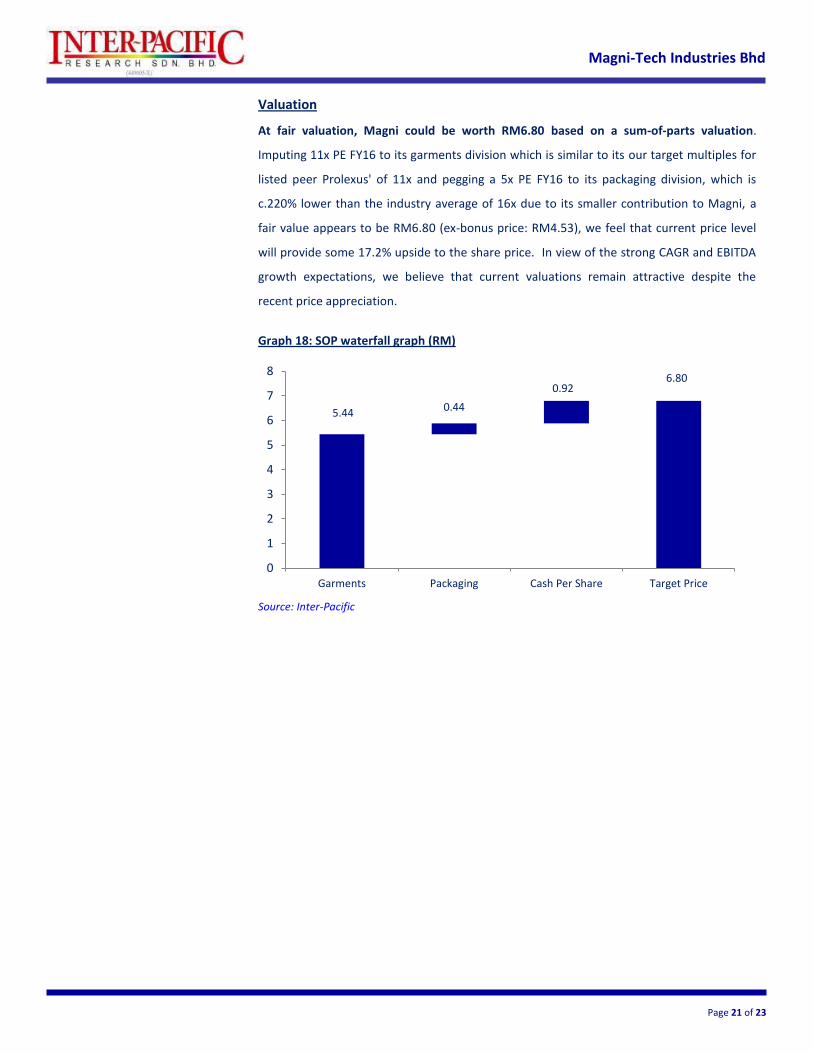
Valuation
At fair valuation, Magni could be worth RM6.80 based on a sum-of-parts valuation.
Imputing 11x PE FY16 to its garments division which is similar to its our target multiples for
listed peer Prolexus' of 11x and pegging a 5x PE FY16 to its packaging division, which is
c.220% lower than the industry average of 16x due to its smaller contribution to Magni, a
fair value appears to be RM6.80 (ex-bonus price: RM4.53), we feel that current price level
will provide some 17.2% upside to the share price. In view of the strong CAGR and EBITDA
growth expectations, we believe that current valuations remain attractive despite the
recent price appreciation.
Graph 18: SOP waterfall graph (RM)
Source: Inter-Pacific
5.44 0.44
0.92 6.80
0
1
2
3
4
5
6
7
8
Garments Packaging Cash Per Share Target Price
Page 22 of 23
Magni-Tech Industries Bhd
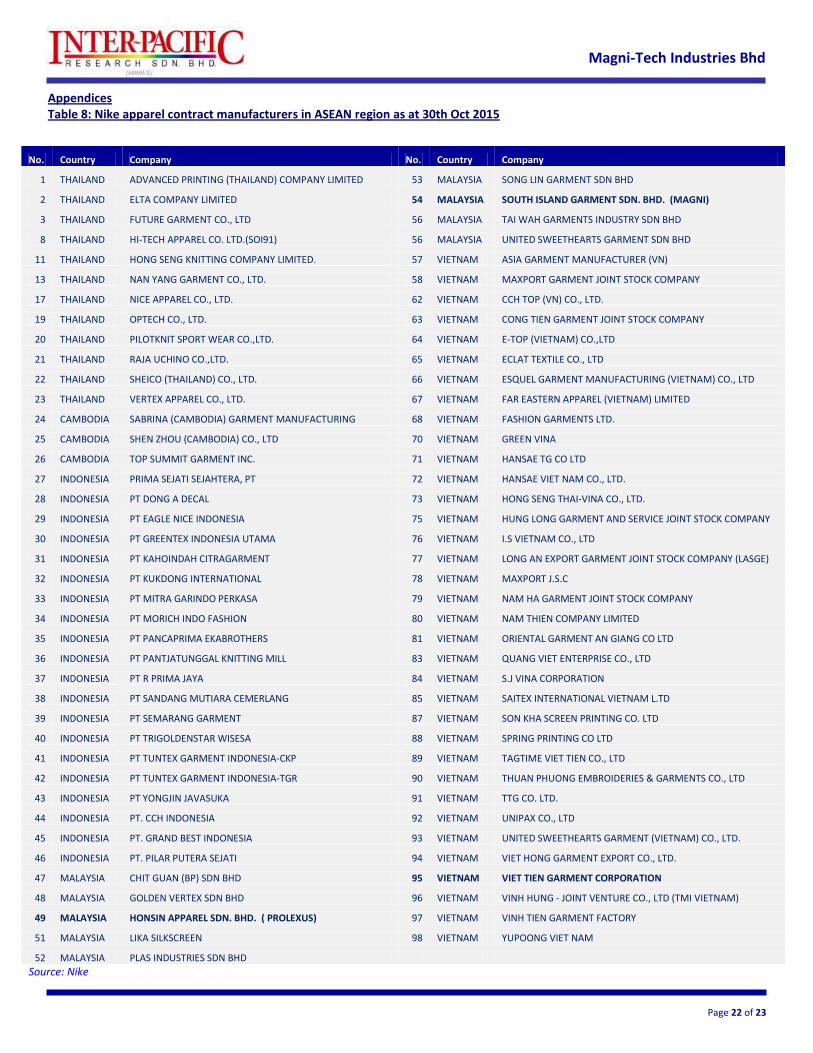
Appendices Table 8: Nike apparel contract manufacturers in ASEAN region as at 30th Oct 2015
No. Country Company No. Country Company
1 THAILAND ADVANCED PRINTING (THAILAND) COMPANY LIMITED 53 MALAYSIA SONG LIN GARMENT SDN BHD
2 THAILAND ELTA COMPANY LIMITED 54 MALAYSIA SOUTH ISLAND GARMENT SDN. BHD. (MAGNI)
3 THAILAND FUTURE GARMENT CO., LTD 56 MALAYSIA TAI WAH GARMENTS INDUSTRY SDN BHD
8 THAILAND HI-TECH APPAREL CO. LTD.(SOI91) 56 MALAYSIA UNITED SWEETHEARTS GARMENT SDN BHD
11 THAILAND HONG SENG KNITTING COMPANY LIMITED. 57 VIETNAM ASIA GARMENT MANUFACTURER (VN)
13 THAILAND NAN YANG GARMENT CO., LTD. 58 VIETNAM MAXPORT GARMENT JOINT STOCK COMPANY
17 THAILAND NICE APPAREL CO., LTD. 62 VIETNAM CCH TOP (VN) CO., LTD.
19 THAILAND OPTECH CO., LTD. 63 VIETNAM CONG TIEN GARMENT JOINT STOCK COMPANY
20 THAILAND PILOTKNIT SPORT WEAR CO.,LTD. 64 VIETNAM E-TOP (VIETNAM) CO.,LTD
21 THAILAND RAJA UCHINO CO.,LTD. 65 VIETNAM ECLAT TEXTILE CO., LTD
22 THAILAND SHEICO (THAILAND) CO., LTD. 66 VIETNAM ESQUEL GARMENT MANUFACTURING (VIETNAM) CO., LTD
23 THAILAND VERTEX APPAREL CO., LTD. 67 VIETNAM FAR EASTERN APPAREL (VIETNAM) LIMITED
24 CAMBODIA SABRINA (CAMBODIA) GARMENT MANUFACTURING 68 VIETNAM FASHION GARMENTS LTD.
25 CAMBODIA SHEN ZHOU (CAMBODIA) CO., LTD 70 VIETNAM GREEN VINA
26 CAMBODIA TOP SUMMIT GARMENT INC. 71 VIETNAM HANSAE TG CO LTD
27 INDONESIA PRIMA SEJATI SEJAHTERA, PT 72 VIETNAM HANSAE VIET NAM CO., LTD.
28 INDONESIA PT DONG A DECAL 73 VIETNAM HONG SENG THAI-VINA CO., LTD.
29 INDONESIA PT EAGLE NICE INDONESIA 75 VIETNAM HUNG LONG GARMENT AND SERVICE JOINT STOCK COMPANY
30 INDONESIA PT GREENTEX INDONESIA UTAMA 76 VIETNAM I.S VIETNAM CO., LTD
31 INDONESIA PT KAHOINDAH CITRAGARMENT 77 VIETNAM LONG AN EXPORT GARMENT JOINT STOCK COMPANY (LASGE)
32 INDONESIA PT KUKDONG INTERNATIONAL 78 VIETNAM MAXPORT J.S.C
33 INDONESIA PT MITRA GARINDO PERKASA 79 VIETNAM NAM HA GARMENT JOINT STOCK COMPANY
34 INDONESIA PT MORICH INDO FASHION 80 VIETNAM NAM THIEN COMPANY LIMITED
35 INDONESIA PT PANCAPRIMA EKABROTHERS 81 VIETNAM ORIENTAL GARMENT AN GIANG CO LTD
36 INDONESIA PT PANTJATUNGGAL KNITTING MILL 83 VIETNAM QUANG VIET ENTERPRISE CO., LTD
37 INDONESIA PT R PRIMA JAYA 84 VIETNAM S.J VINA CORPORATION
38 INDONESIA PT SANDANG MUTIARA CEMERLANG 85 VIETNAM SAITEX INTERNATIONAL VIETNAM L.TD
39 INDONESIA PT SEMARANG GARMENT 87 VIETNAM SON KHA SCREEN PRINTING CO. LTD
40 INDONESIA PT TRIGOLDENSTAR WISESA 88 VIETNAM SPRING PRINTING CO LTD
41 INDONESIA PT TUNTEX GARMENT INDONESIA-CKP 89 VIETNAM TAGTIME VIET TIEN CO., LTD
42 INDONESIA PT TUNTEX GARMENT INDONESIA-TGR 90 VIETNAM THUAN PHUONG EMBROIDERIES & GARMENTS CO., LTD
43 INDONESIA PT YONGJIN JAVASUKA 91 VIETNAM TTG CO. LTD.
44 INDONESIA PT. CCH INDONESIA 92 VIETNAM UNIPAX CO., LTD
45 INDONESIA PT. GRAND BEST INDONESIA 93 VIETNAM UNITED SWEETHEARTS GARMENT (VIETNAM) CO., LTD.
46 INDONESIA PT. PILAR PUTERA SEJATI 94 VIETNAM VIET HONG GARMENT EXPORT CO., LTD.
47 MALAYSIA CHIT GUAN (BP) SDN BHD 95 VIETNAM VIET TIEN GARMENT CORPORATION
48 MALAYSIA GOLDEN VERTEX SDN BHD 96 VIETNAM VINH HUNG - JOINT VENTURE CO., LTD (TMI VIETNAM)
49 MALAYSIA HONSIN APPAREL SDN. BHD. ( PROLEXUS) 97 VIETNAM VINH TIEN GARMENT FACTORY
51 MALAYSIA LIKA SILKSCREEN 98 VIETNAM YUPOONG VIET NAM
52 MALAYSIA PLAS INDUSTRIES SDN BHD
Source: Nike
Page 23 of 23
Magni-Tech Industries Bhd
IMPORTANT: This report has been prepared from sources that are believed to be reliable but we do not hold ourselves responsible for its completeness and accuracy. All opinions and estimates in this report are subject to change without notice. We do not accept any liability that may arise from the use of information in this report. Inter-Pacific Research SdnBhd and or its associates may from time to time have interest and/or underwriting commitments in the company being reported. This report is for internal circulation only and the contents or any part thereof cannot be reproduced in any manner whatsoever except with the prior written consent of Inter-Pacific Research Sdn Bhd.
Published and Printed by:
Inter-Pacific Research Sdn Bhd (449005-X)
West Wing, Level 13,
Berjaya Times Square,
No.1, Jalan Imbi,
55100 Kuala Lumpur
General Line : 03-2117 1888 Fax : 03-2142 7678
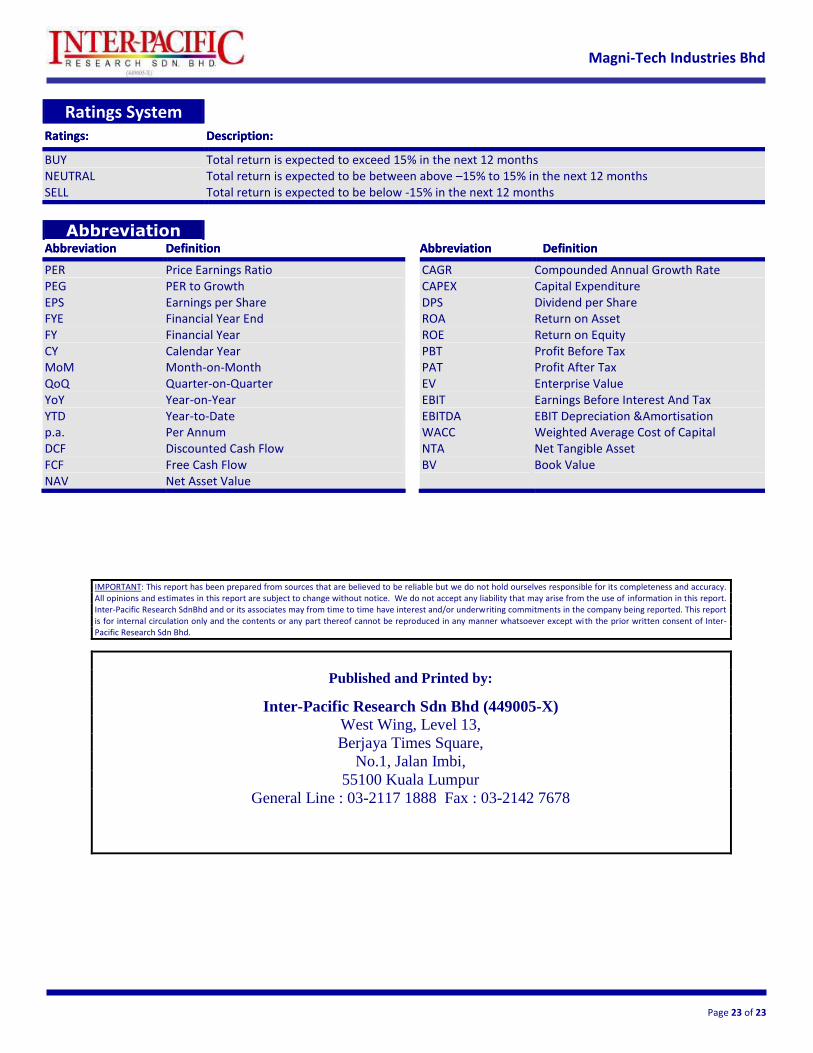
Ratings System
Ratings: Description:
BUY Total return is expected to exceed 15% in the next 12 months NEUTRAL Total return is expected to be between above –15% to 15% in the next 12 months SELL Total return is expected to be below -15% in the next 12 months
Abbreviation
Abbreviation Definition Abbreviation Definition
PER Price Earnings Ratio CAGR Compounded Annual Growth Rate PEG PER to Growth CAPEX Capital Expenditure EPS Earnings per Share DPS Dividend per Share FYE Financial Year End ROA Return on Asset FY Financial Year ROE Return on Equity CY Calendar Year PBT Profit Before Tax MoM Month-on-Month PAT Profit After Tax QoQ Quarter-on-Quarter EV Enterprise Value YoY Year-on-Year EBIT Earnings Before Interest And Tax YTD Year-to-Date EBITDA EBIT Depreciation &Amortisation p.a. Per Annum WACC Weighted Average Cost of Capital DCF Discounted Cash Flow NTA Net Tangible Asset FCF Free Cash Flow BV Book Value NAV Net Asset Value
Copyright © 2022 FDOKUMEN