A Survey of Collection Development Practices in Technical ...
Upload
khangminh22Category
view
0download
0
JR
5R
15-025
DATA COLLECTION SURVEYON
DISASTER RISK MANAGEMENTIN
CARICOM COUNTRIES
FINAL REPORT
SEPTEMBER 2015
JAPAN INTERNATIONAL COOPERATION AGENCY
NIPPON KOEI CO.,LTD.
DA
TA
CO
LL
EC
TIO
N SU
RV
EY
ON
DISA
STE
RR
ISK M
AN
AG
EM
EN
T IN
CA
RIC
OM
CO
UN
TR
IES
FINA
L R
EPO
RT
SEPT
EM
BE
R 2015
DATA COLLECTION SURVEY ON
DISASTER RISK MANAGEMENT IN
CARICOM COUNTRIES
FINAL REPORT
SEPTEMBER 2015
JAPAN INTERNATIONAL COOPERATION AGENCY
NIPPON KOEI CO., LTD. 5R
JR
15-025

Location M
ap (1/3)


S-1
Summary CHAPTER 1 OUTLINE OF THE SURVEY 1.1 Background of the Survey
The Caribbean is a vulnerable area for high-impact disasters such as big hurricanes and floods. According to a report by the Caribbean Disaster Emergency Management Agency (hereinafter referred to as “CDEMA”), the economic damage caused by natural disasters in the whole Caribbean area is about US$3 billion every year. There are many small countries in terms of economic magnitude in the Greater Antilles and the Lesser Antilles located on the eastern side of the Caribbean Sea. Therefore, the disasters that strike often affect the whole country. Thus, it is necessary that an indicator for assistance be studied from different viewpoints of income level as there is a particular vulnerability in small island countries. The phase 2 of the Disaster Prevention Project in the Caribbean area was carried out in Barbados, Saint Lucia, Dominica, Grenada, Guyana, and Belize between 2009 and 2012. It has been carried out as part of the efforts to reduce disaster risk by using the flood hazard map, early warning system, and community disaster prevention plan which have been prepared through the pilot project sites in each country. However, further assistance is necessary such that these efforts would be replicated in the whole country and disseminated to the whole Caribbean area. Under the above background, the Caribbean Community (hereinafter referred to as “CARICOM”) countries are expecting expanded assistance for an integrated disaster prevention related to non-structural and structural measures such as infrastructure, policy, and administration of disaster prevention.
1.2 Objectives of the Survey
(1) Pick up and analyze the present situation and problems of 12 target countries in CARICOM and to study the direction of international cooperation through data collection and analysis,
(2) Assist in the execution of the invitation program for target countries and seminar hosted by JICA because they are studying on how to apply Japanese technology in these target countries, and,
(3) Organize required information for formulation of future projects.
1.3 Type of Disaster
The grouping of disaster types in this study is shown in below;
Large Grouping Small Grouping Large Grouping Small Grouping
Flood Heavy Rainfall Sediment Disaster Slope failure Flash Flood Landslide Hurricane Debris flow Drainage Earthquake Earthquake
Tsunami Tsunami Storm and flood damage
Storm surge Drought Drought Wind disaster Source: JICA Study Team
1.4 Filed Work
The itinerary of the field work is shown in Table 1.4.1. The JICA Study Team was divided into two groups. And agencies visited by each team are shown in Section 1.4.2.

S-2
CHAPTER 2 PRESENT SITUATION OF SURVEY COUNTRIES 2.1 Antigua and Barbuda Basic Data
Antigua and Barbuda is located at the center of the Leeward Islands in the Lesser Antilles situated at the easternmost of the West Indies. The country consists of three major inhabited islands of Antigua, Barbuda, and Redonda, and several smaller islands. The total land area of the country is about 440 km2 (almost equivalent to that of Tanegashima Island of Japan). Most parts of the islands are lowlands. Total population and per capita of GDP of the Antigua and Barbuda is about 90,000 persons and about 13,000 US dollars, respectively, and the income level is a high income level. Monthly average temperature ranges between 26°C and 28°C. he average annual rainfall in Antigua Island is about 1,200 mm.
Disaster Situation
The most frequent disaster in Antigua and Barbuda during the period of 1990-2014 is due to heavy rain, while damages due to cyclones are the most serious in terms of economic loss.
Flood
The records of hurricanes since 1971 until 2012 are tabulated below. Name Day/Month/Year Dmage
Hugo 17 September 1989 2 death, 181 injuries, economic loss abou 80 million US dollars(about 21% of GDP)
Luis 05 - 06 Sep 1995 3 death, 165 injuries, economic loss abou 350 million US dollars(about 71% of GDP)
Georges 21 September 1998 2 death, economic loss abou 100 million US dollars(about 16% of GDP)
Jose 20-21 October 1999 1 death, ecomoic lossis no information Omar 16 October 2008 Economic loss 18 million US dollars (about 1% of
GDP) Earl 29-30 August 2010 Economic loss 12million USdollars (about 1% of
GDP) Source: JICA Study Team
Of these watersheds, the Body Ponds Watershed with an area of about 4,000 ha is located in the western and central areas of the island, which is so called Central Plain Zone. Precipitation water of heavy rain concentrates in the watershed so that inundation occurs in the Bendals area situated at the downstream part of the watershed.
Sediment Disaster
Sediment disaster records are not kept by any agency of Antigua and Barbuda and the records are also not available on the internet. According to hearing results in the survey, slope failures occurred, as a recent event, in October 1999 due to heavy rainfall by Hurricane Irene around Monks Hill area. The Body Ponds Watershed with an area of about 4,000 ha is located in the Central Plain Zone. Precipitation water of heavy rain is concentrated in the watershed thereby causing inundation disasters in the Bendals area in the downstream part of the watershed. Sediment discharge is an issue in the Body Ponds Watershed that is followed by the abovementioned surface water flow. As a countermeasure against the sediment discharge issue, planting activities were started by the Ministry of Health and Environment recently on the slopes where uncovering is ongoing. A slope failure occurred on the slope along the road around Monks Hill in the southwest part of the island when it rained heavily during the hurricane in 1999. It was observed during the survey that the slope was about 70 m high and small-scale collapses were found on the middle and top of the slope. Also, no damage expansion since then was found although no countermeasures were carried out.
Storm Surge

S-3
It is reported that storm surges during hurricane attacks have caused coastal erosion damages in Galley Bay in five island villages and beach in Landing Bay located in the western area of Saint John’s. Moreover, the storm surges have spread over the main roads running in the east-southeast area resulting in damages to houses. The damages have been restored already.
Earthquake
Records of disasters caused by past major earthquakes are shown below. Occurrence Magnitude Disaster Situation
November 29, 2007 M7.4 No remarkable damage in Antigua November 21, 2004 M6.3 -Damages in buildings
-Tsunami of 1 m high or less October 8, 1974 M7.5 4 injured, No death February 8, 1843 +/- M8 estimated Details unknown April 5, 1690 >M8 -Collapse of some buildings -Death toll
unknown Source: Prepared by the JICA Study Team based on Home Page of Seismic Research Center and others.
Tsunami
Records of past major tsunamis are shown below. Attacked Date Tsunami Height
(m) Description
November 1, 1755 3.6 m Tsunami caused by the earthquake in Lisbon, Portugal attacked Antigua and Barbuda.
March 19, 1802 Unknown
February 8, 1843 1.2 m
November 18, 1867 3.0 m Earthquake of M 7.5; Hypocenter is in Virgin Island
December 25, 1969 0.46 m
December 26, 1997* 3.0 m Due to the eruption of Mt. Montserrat
Source: Tablet: Preliminary List of Caribbean Tsunamis, (http://poseidon.uprm.edu/lander/tabla1a.htm)
* http://antiguaobserver.com/a-tsunami-could-cover-barbuda/
Drought
According to the “National Adaptation Strategy and Action Plan to Address Climate Change in the Water Sector in Antigua and Barbuda, November 2014” prepared by the Caribbean Community Climate Change Center and the Ministry of Health and Environment, Antigua and Barbuda experienced a probability of 54.5% for drought with a scale of once-a-year occurrence between 1928 and 2013. Severe drought was experienced in 1983 to 1984, and water was imported from Dominican Republic. Since then, the installation of desalination plants has progressed.
Disaster Managemet
The National Office of Disaster Services (NODS) is the supervising agency for disaster management in Antigua and Barbuda, which supervises disaster response as well as preparedness, countermeasures, mitigation, and restoration. The NODS Secretariat currently comprises 17 members and the shortage of personnel is covered by volunteer(s). Of the 17 members, seven are technical staffs. The members of the district committee and its subordinate community level agencies for emergency response are volunteers.
Meteorological and Hydrologic Services
Operation of the meteorological services has been conducted in the Vere Cornwall Bird International Airport since the early 1970s by a government agency. Presently, the
S-4
Meteorological Service Office is under the Ministry of Civil Aviation and Public Utilities Transport (MCAUPT). Meteorological service provided for the airport aviation is a main service, as well as, national meteorological service for Antigua and Barbuda and weather forecast for the Leeward Islands. Tide level observation is also conducted. Total number is 35 persons only against the target of 58 persons, which shows apparent shortage of staff. Required annual budget is said to be Bds$3 million, while actual approved amount is about 70% only of the requirement. Actual required personnel cost is about 50% of the said required annual budget. There are 12 existing automatic stations in Antigua and Barbuda including 11 in Antigua and one remaining in Barbuda, while there are two other stations, which have not been operational due to equipment/battery problem. No observation is conducted in Antigua and Barbuda. It is said that tide level observation is conducted in the National Defense Base.
Support of Donor Agencies
CIDA carries out the following projects.
Caribbean Disaster Risk Management Program-Knowledge Sharing
Community Disaster Risk Reduction Program
2.2 Guyana Basic Data
Guyana is a continental country, with an area of about 215,000 km2, bordered by Suriname to the east, Brazil to the southwest, and Venezuela to the west, and by the Atlantic Ocean to the north. The land is divided into four main regions based on topographical and geological features, which are the low coastal plain, the hilly sand and clay area, the interior savannahs and the forested highland region. Total population and per capita of GDP of the Guyana is about 800,000 persons and about 3,300 US dollars, respectively, and the income level is a low/middle income level. Monthly average temperature is about 26°C and the average annual rainfall is about 2,260 mm.
Disaster Situation
The major natural disasters are the flood, the storm surge and the hogh tidal water.
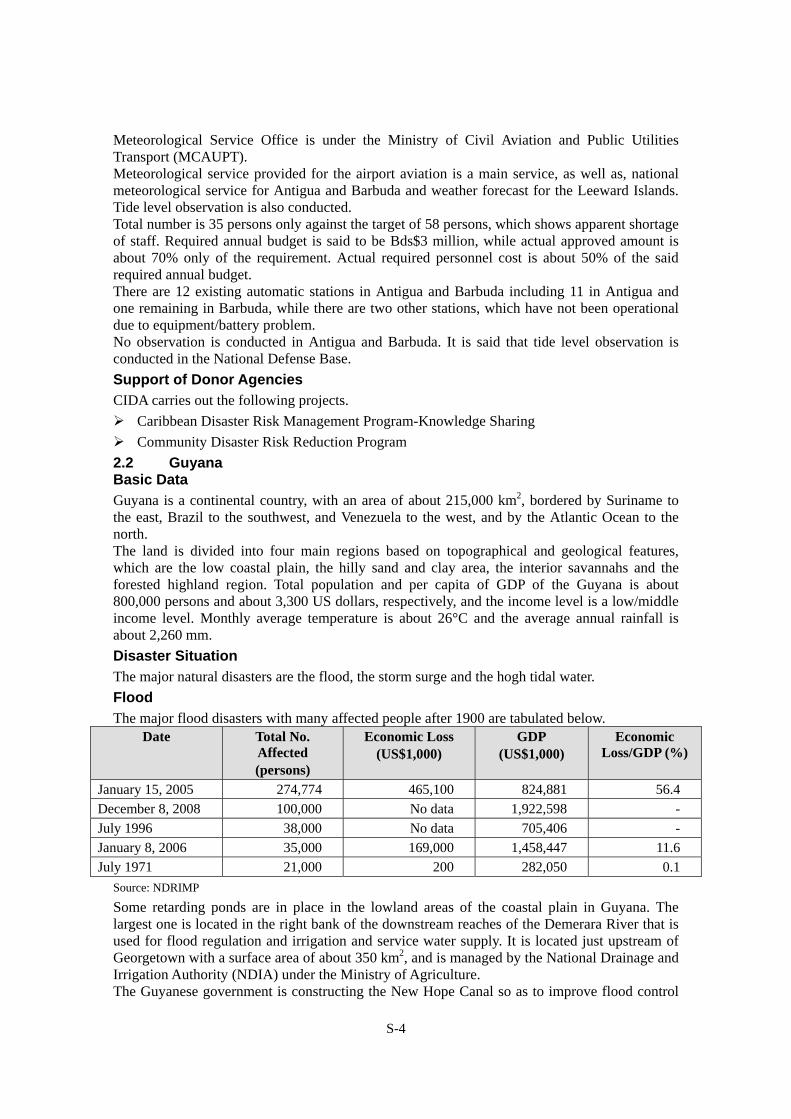
Flood The major flood disasters with many affected people after 1900 are tabulated below.
Date Total No. Affected (persons)
Economic Loss (US$1,000)
GDP (US$1,000)
Economic Loss/GDP (%)
January 15, 2005 274,774 465,100 824,881 56.4
December 8, 2008 100,000 No data 1,922,598 -
July 1996 38,000 No data 705,406 -
January 8, 2006 35,000 169,000 1,458,447 11.6
July 1971 21,000 200 282,050 0.1
Source: NDRIMP
Some retarding ponds are in place in the lowland areas of the coastal plain in Guyana. The largest one is located in the right bank of the downstream reaches of the Demerara River that is used for flood regulation and irrigation and service water supply. It is located just upstream of Georgetown with a surface area of about 350 km2, and is managed by the National Drainage and Irrigation Authority (NDIA) under the Ministry of Agriculture. The Guyanese government is constructing the New Hope Canal so as to improve flood control

S-5
capacity by discharging towards the Atlantic Ocean, which will be in service shortly. There are five pumping stations and ten locations of sluices along the Demerara River in Georgetown as well as two pumping stations with four pump units in the seaside area. Drainage channels in the urban area are classified as trunk line (primary), secondary, and tertiary, and these channels comprise the interconnected channel network system. Sediment deposit and wastes in the channel are identified as drainage issues.
Sediment Disasters
In Guyana, most of the sediment disasters occur in inland regions (Regions 8, 9, and 10) where few people live such that it is not recognized as a major problem by the government. Since inland areas where sediment disasters occur are almost inaccessible, site inspection was not carried out in this survey.
Storm Surge
Ground elevation in the coastal area is lower than the sea level during high tide time. Some places with lower level than the mean sea level frequently suffer high surge disaster and inundation due to insufficient drainage of such seawater. More frequent high surge disasters are caused than flooding by heavy rain and/or river overflow. Particularly, the coastal trunk road suffers inundation frequently due to high surge. Due to the spring tide in 2013, overtopping of seawater caused inundation in the coastal area and roads, and the dyke was raised by parapet wall by 1 m.
Earthquake
The country has not been subject to any other earthquake event in recorded history including inland area except for the earthquakes in 2008 (M4.0) and 2007 (M4.6) whose epicenter is offshore of Guyana.
Tsunami
Potential risk of tsunami disaster is conceivable when the eruption of Mt. Kick’em Jenny will take place, which is an undersea volcano located between Grenada and Saint Vincent. Tsunami was generated by a local earthquake on September 20, 1825, whose wave height is unknown.
Drought
Drought disasters occurred from 1997 to 1998 and in 2010. Due to the drought situation since July 1997, 607,200 people were affected and the economic loss amounted to US$29,000.
Bridges
Guyana is one of the few continental countries in the CARICOM countries. Feature of flood in Guyana is quite different from that of the other island countries in that no flash flood has occurred in the coastal lowlands. The JICA Study Team surveyed most of the trunk road which connects the capital Georgetown and Corriverton, which is the border town with neighbouring Suriname.
Disaster Management
The Civil Defence Commission (CDC) was established in 1982 to be in charge of planning and operation concerning all disasters. CDC Number of the CDC staffs is 24 in total, out of which CDC employes nine staffs directly. Remaining 15 staffs are temporary transfer from the army whose salaries are not shouldered by CDC. In CDC, proper planning is considered as an effective measure for disaster management. Principal plans and procedures applied in CDC are as follows:
i) Disaster Plans : Preparatory plan [Warning, Evacuation, Evacuation Center, Necessity, Search/Rescue] is to be prepared both for the presently known risks and conceivable risks

S-6
ii) Contingency Plans : Action plan for contingency situation
iii) Forward Planning : Definite development plan to prepare for impending crisis
iv) Standard Operating Procedures : For preparation of correspondence for expected situation by each organization
Meteorological and Hydrologic Services
Total number of HD-MA personnel is 79 persons, 65 of whom are engineers. Meteorological and hydrologic observations are conducted at nine locations of meteorological stations including the two at the airports and 202 rainfall stations, 16 of which are automatic rainfall stations. There are water level stations at 41 locations, 27 of which are automatic observation stations. The Doppler type meteorological radar system is equipped at the Cheedi Jegan International Airport, which is managed and maintained by two electrical engineers, two telecommunication engineers, and one information management engineer. Observed data are sent out every morning to the CDC, NDIA, and other related agencies and research institutes. Furthermore, the data are recorded in the HD-MA database developed in the 1990s, but these data are not open to public in principle.
Support of Donor Agencies Government of Japan
For the flood control in the low-lying wetland extending around the suburb of Georgetown as well as the rehabilitation of the East Demerara Conservancy which has retarding capacity, the Rehabilitation Plan of the East Demerara Conservancy was implemented under grant aid from 2010 to 2011. This composed of the grant of materials and equipment for dyke rehabilitation with a ceiling amount of ¥289 million followed by the improvement of drainage and water supply facilities. World Bank
The 30-year development plan of the drainage facilities was formulated through a local development study and the Conservancy Adaptation Study (supported by the Economic Commission for Latin America and the Caribbean, 2005), which requires a project cost of US$120 million. Out of the 50 stations, 14 pump stations are in progress under the Indian government fund, and ten stations are completed out of these 14 stations.
UNDP
The Project for Japan-Caribbean Climate Change Partnership targeting eight Caribbean countries including Guyana, Grenada, Jamaica, Suriname, Saint Vincent and Grenadines, Saint Lucia, Dominica, and Belize has completed the signing of the Exchange of Note in July 2014. Implementation is scheduled to commence in April 2015 under a partnership agreement with CDEMA after the current procurement stage.
2.3 Grenada Basic Data
Grenada, consisting of Grenada Island and neighbouring islands, is located in the southernmost end of the Windward Islands. The Grenada main island has undulating topography with less plain lands, having a land area of 310 km2. Total population and per capita of GDP of the Grenada is about 106,000 persons and about 7,500 US dollars, respectively, and the income level is a High/Medium income level. Monthly average temperature ranges from about 25°C and 26°C. The average annual rainfall in Grenada Island is about 1,900 mm.
Disaster Situation

S-7
The most frequent disaster in Grenada from 1990 to 2014 is due to heavy rains, while the disaster causing the most serious economic loss is due to cyclones.
Flood
The records of hurricanes since 1954 until 2010 are tabulated below. Name Day/Month/Year Dmage
Janet 23 September 1955 147 death, economic loss unknown
Flora 01 October 1963 6 death, 165 injuries, economic loss abou 25 thousands US dollar
Lenny 13 November 1999 economic loss abou 27% of GDP
Ivan 8 September 2004 139death, ecomoic lossis about 890million US dollars (about 148% of GDP)
Emily 14 July 2005 1 death, Economic loss unknown Source: JICA Study Team
In Grenada Island’s capital of St. George’s, Gouyave and Victoria are the areas prone to floods or inundation due to insufficient drainage capacities. It is planned to improve the drainage in St. George’s and Goyave by World Bank. On the other hand, Victoria was already rehabilitated by financial assistance of the Chinese Government. Sediment Disasters Sediment disaster records are not kept in order by any agency of Grenada and few records are also available on the internet. Information on the recent sediment disaster records are tabulated below.
Day/Month/Year Damaged Area Type of Disaster
Cause Damage
September 2014 Entrance of Sendall Tunnel, St. George’s Town
Slope collapse
Heavy rain Road blocked
12 April, 2011 Gouyave Town and Victoria Town
Debris flow
Heavy rain over 150 mm/day
Flood in Gouyave and Victoria Town
September 2004 Gouyave Town Debris flow
Heavy rain by Hurricane Ivan
Damage of Hubble Bridge
Source: JICA Study Team
A 15 m wide slope beside the entrance of the Sendall Tunnel constructed in 1895 in St. George’s collapsed due to heavy rains in September 2014. The upper area of the damaged slope is a historic place for tourism, having heavy traffic. The stability and protection works for the damaged slope will be carried out under the Regional Disaster Vulnerability Reduction Projects (RDVRP) financed by the World Bank. The West Coast Road running between St. George’s Town and Victoria is rolling with steep cut slopes. Protection works of the slopes are few, so that many damages are observed on the road shoulders and cut slopes including rock falls near Concord. In particular, slopes near Palmiste have cap rock structure composed of softer tuff overlaid by hard lava, and larger sized collapses are also observed. . Although the Island Crossing Road runs along rolling land form, few slope protection works have been carried out, and therefore many collapses of road shoulders and other portions have happened. The Little River basin located in the northwest of the island has the Florida area in the upstream, which is identified in the Grenada National Hazard Mitigation Plan 2006 as one of the high priority areas for improvement against sediment disaster. Storm Surge Roads alongside the coast have been damaged by storm surges caused by hurricane. In
S-8
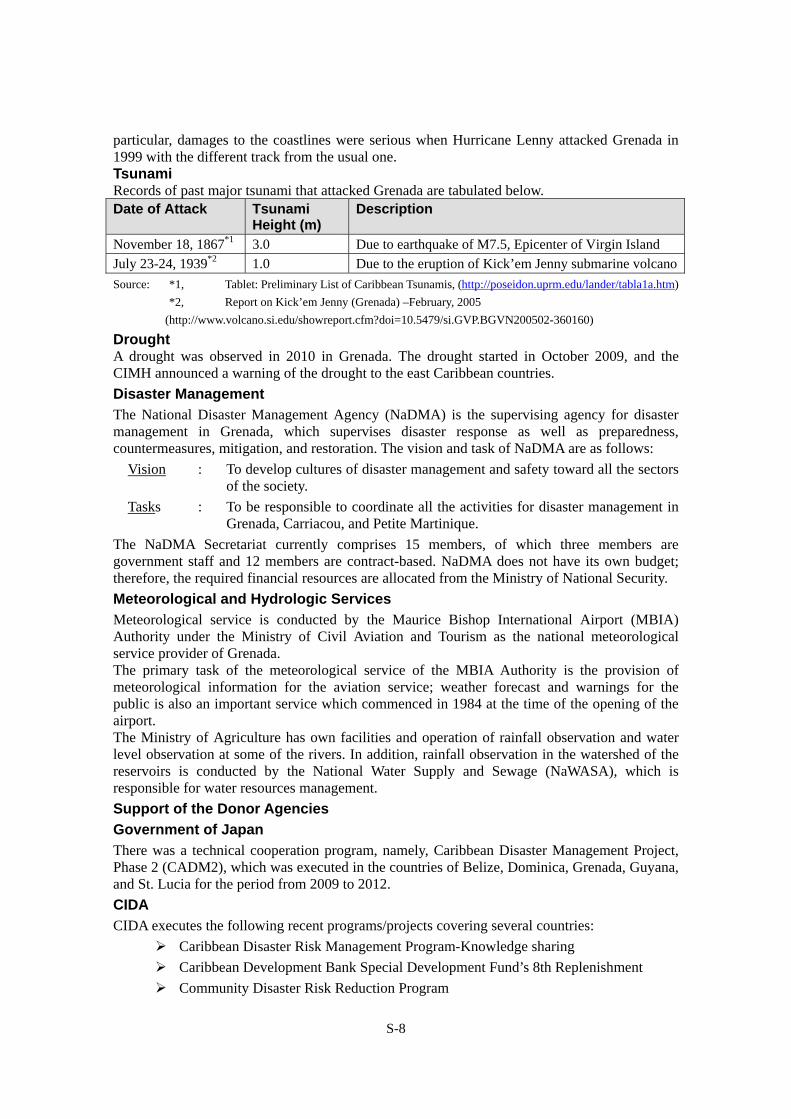
particular, damages to the coastlines were serious when Hurricane Lenny attacked Grenada in 1999 with the different track from the usual one. Tsunami Records of past major tsunami that attacked Grenada are tabulated below. Date of Attack Tsunami
Height (m) Description
November 18, 1867*1 3.0 Due to earthquake of M7.5, Epicenter of Virgin Island
July 23-24, 1939*2 1.0 Due to the eruption of Kick’em Jenny submarine volcano
Source: *1, Tablet: Preliminary List of Caribbean Tsunamis, (http://poseidon.uprm.edu/lander/tabla1a.htm)
*2, Report on Kick’em Jenny (Grenada) –February, 2005
(http://www.volcano.si.edu/showreport.cfm?doi=10.5479/si.GVP.BGVN200502-360160)
Drought A drought was observed in 2010 in Grenada. The drought started in October 2009, and the CIMH announced a warning of the drought to the east Caribbean countries.
Disaster Management
The National Disaster Management Agency (NaDMA) is the supervising agency for disaster management in Grenada, which supervises disaster response as well as preparedness, countermeasures, mitigation, and restoration. The vision and task of NaDMA are as follows:
Vision : To develop cultures of disaster management and safety toward all the sectors of the society.
Tasks : To be responsible to coordinate all the activities for disaster management in Grenada, Carriacou, and Petite Martinique.
The NaDMA Secretariat currently comprises 15 members, of which three members are government staff and 12 members are contract-based. NaDMA does not have its own budget; therefore, the required financial resources are allocated from the Ministry of National Security.
Meteorological and Hydrologic Services
Meteorological service is conducted by the Maurice Bishop International Airport (MBIA) Authority under the Ministry of Civil Aviation and Tourism as the national meteorological service provider of Grenada. The primary task of the meteorological service of the MBIA Authority is the provision of meteorological information for the aviation service; weather forecast and warnings for the public is also an important service which commenced in 1984 at the time of the opening of the airport. The Ministry of Agriculture has own facilities and operation of rainfall observation and water level observation at some of the rivers. In addition, rainfall observation in the watershed of the reservoirs is conducted by the National Water Supply and Sewage (NaWASA), which is responsible for water resources management.
Support of the Donor Agencies
Government of Japan
There was a technical cooperation program, namely, Caribbean Disaster Management Project, Phase 2 (CADM2), which was executed in the countries of Belize, Dominica, Grenada, Guyana, and St. Lucia for the period from 2009 to 2012.
CIDA
CIDA executes the following recent programs/projects covering several countries:
Caribbean Disaster Risk Management Program-Knowledge sharing
Caribbean Development Bank Special Development Fund’s 8th Replenishment
Community Disaster Risk Reduction Program

S-9
World Bank Regional Disaster Vulnerability Reduction Project
Caribbean Handbook on Risk Information Management Program
UNDP Enhancing Resilience to Reduce Vulnerability in the Caribbean
2.4 Jamaica
Basic Data
The island of Jamaica is one of the four islands in Greater Antilles located northwest of the Caribbean Sea and its area is 10,990 km2. Total population and per capita of GDP of theJamaica is about 2.7 million persons and about 15,300 US dollars, respectively, and the income level is a High/Middium income level. Monthly average temperature ranges from about 25°C and 35°C. The average annual rainfall in Jamaica is about 2,000 mm.
Disaster Situation
The most serious disaster in Jamaica from 1990 to 2014 is due to flood in terms of death toll and economic loss Flood
Flood
Recent disasters caused by flood in Jamaica are tabulated below. Date Hurricane
Name Damages
(million US$*)Economic
Loss (million US$*)
Deaths Source
May-June 1986 (Heavy rain) 76 N/A 54 EM-DAT
September 12, 1988 Gilbert 1 N/A 49 EM-DAT
October 28, 2001 Michelle 53.3 1.5 1 PIOJ Report
May 22, 2002 (Heavy rain) 45.8 5.4 0 PIOJ ReportSeptember 8, 2004 Ivan 358.5 221.0 15 PIOJ Report
July-August 2005 Dennis and Emily
85.2 11.6 0 PIOJ Report
October 13, 2005 Wilma N/A N/A 0 PIOJ ReportAugust 20, 2007 Dean 205.6 123.8 6 PIOJ Report
August 28, 2008 Gustav 200.2 13.9 10 PIOJ Report
September 28, 2010 Nicole 227.2 12.4 16 PIOJ Report
October 22, 2012 Sandy 103.4 4.1 1 PIOJ Report
Remarks *: Value at that time
Along the Rio Cobre River flowing down in the west of the metroplitan area, flood damages have frequently occured in road inundation as well as flat bridges on mountain streams. According to the National Works Agency (NWA), the countermeasure and improvement plan had been formulated previously but was cancelled due to the review of regional comprehensive traffic network. On the other hand, the early waning system was established in the river basin with Inter-American Development Bank (IDB) support and operated and managed by the Water Resource Agency (WRA). The Hope River, the Bully Bay River, and the Yallahs River in the southeast area are subflow rivers during the dry season. Bridges on the trunk road crossing these rivers were damaged or washed away previously by floods and sediment flows; replacement and/or rehabilitation of such bridges have been in progress. The Morant River, the Hector’s River, the Black River, and the Priestmans River in the eastern

S-10
area have surface flows even in the dry season. Bridges and coastal revetment of the coastal road crossing the Black River are maintained and protected.
Sediment Disaster
Landslides that occured in Jamaica are concentrated in the mountainous area where igneous and metamorphic rocks are distributed. The large-scale landslides were found in the northeast region (Portland), while more frequent but smaller ones were elsewhere, mostly in St. Andrew. Major landslides in Jamaica are those such as Judgment Cliff (1692), Preston (1986), and the White Hall (2005 and 2009). The steep mountainous section from Agulala Vale to Golden Spring (Junction Main Road) which is a part of A3 highway connecting Port Maria and Kingston. The said section, where traffic is heavy because it is the shortest route between Port Maria and Kingston, is running along the Wag Water River and suffering frequent falling rocks, slope failure, and landslide. Traffic stoppage due to sediment disaster has serious impact on logistics.
Storm Surge and Tsunami
Record of past disasters in Jamaica due to storm surge and tsunami is tabulated below. Date Height of Waves Areas Affected Effects
Year 1722 16 ft. Port Royal, Queenstown and Kingston
November 2, 1726 Kingston, Spanish Town, Port Royal
Many lives lost
October 3, 1780 St. James, Hanover, Westmoreland
1,000 deaths
October 18, 1815 Port Royal Several vessels destroyed
August 31, 1831 100 ft. East and Northeast Coast Houses damaged October 31, 1874 Palisades Year 1912 Surge recorded 1/2
miles from shore Western parishes – Savanna-La-Mar were worst hit
Lives lost
November 4, 1932 Mountaineous sea waves
Westmoreland, Hanover is the most affected
Many lives lost
August 5, 1980 40 ft. recorded at Galena Point
Entire island, north coast is the most affected
Roads and other coastal infrastructure destroyed
October 24, 1998 50 ft. (16 m) at West End-Negri
South Coast Coastal infrastructure destroyed
Source: ODPEM and Disaster Information Kit for the Media(ver 05/95CDMP/OAS)
N. Harris, Mines and Geology Division, Jamaica, the use of Nowcasting Technology for Natural Hazard Mitigation: The Jamaican Experience
Earthquake
The Jamaica Seismograph Network (JSN) recorded and processed over 200 earthquakes during the period from August 2010 to July 2011, but most of these events have M4.0 or less. The most active area was the Blue Mountain Block followed by the Montpelier-Newmarket Belt. The earthquake in 1962 destroyed Port Royal, parts of Kingston, and Vere Plains, and resulted in 3,000 deaths as well as destruction and damage to many buildings, liquefaction and land subsidence. Recently, two people were killed by the earthquake (M5.4) in 1993 which occurred around Kingston and St. Andrew.
Drought
Drought situation in 2014 caused severe water shortage, and the water level of the Mona Reservoir dropped that remaining storage would be depleted within two weeks. This drought

S-11
situation affected crops, particularly coffee production wherein the annual production dropped to 40% of the average coupled with a spread of disease.
Bridges
Restoration of bridges and rivers hit by disasters has been implemented with the support of donors. Among these, the World Bank Disaster Vulnerable Reduction Project (DVRP) in collaboration with the agencies concerned is promoting comprehensive disaster management measures including slope protections and early warning system as well as publicity, in addition to the rehabilitation of bridges and roads. The outline of present situation is tabulated below. No Bridge Name Road Problematic Situation Present Situation
1. Flat Bridge A-1 Overflowed Used as before
2. Bog Walk Br. A-1 Girder soaked Used as before 3. Cone Gully River A-3 Over flowed Used as before 4. Monetgo Bay River A-3 Girder soaked Used as before
5. Great River A-3 Over flowed Used as before
6. Queens River A-3 Girder soaked Used as before
7. Cabarita River A-2 Overflowed Used as before
8. Rio Minho River A-2 Not damaged Used as before
9. Spanish Town Bridge A-1 Not damaged Used as before
10. Harbour Bridge A-4 Broken in 2008 Newly built in 2011
25. Westmoreland Bridge A-3 Broken in 2006 Newly built in 2013
Source:JICA Study Team
Disaster Management
In Jamaica, the disaster management organizations are established in accordance with the Disaster Preparedness and Emergency Management Act (1993) including the National Disaster Committee and the Parish Disaster Committee as the responsible organizations as well as the Office of Disaster Preparedness and Emergency Management (ODPEM) for cordination. ODPEM is the organization for supervising disaster management in Jamaica, whose activities cover not only disaster correspondence but also preparadness, mitigation, and recovery. Activities of ODPEM are supervised by the Board of Management whose members are appointed by the Office of the Minister, while in terms of government organization it is under the Ministry of Local Government and Community.
Meteorological and Hydrologic Services
The meteorological service in Jamaica is undertaken under the Meteorological Service (MS-MWLEC) which is one of the divisions of the Ministry of Water, Land, Environment and Climate Change. MS-MWLEC is composed of the administrative department and meteorological department in the headquarters as well as the weather forecast department in two airports. Tasks of the Water Resource Authority (WRA) are water resources management, water resources permits and licenses, and observation and management of hydrologic data including water level observation and preparation of its guidelines. MS-MWLEC is composed of 52 technical persons, 23 administrative staffs, and volunteer site observers. Meanwhile, WRA consists of 62 staffs including 32 technical staffs. MS-MWLEC manages rainfall observation (visual) stations at about 200 locations in the whole country. Data observed by the volunteer site observers are collected by the collector at the end of every month. Other than these stations, about 50 self-recording rainfall stations exist. The radar rainfall observation system set up at the Norman Manley Airport requires replacement due to aging. This replacement is considered under the World Bank project. Required information
S-12
WRA carries out hydrologic observations including river water levels at 120 points and groundwater at about 300 locations as well as monitoring of water quality and intake water amount.
Support of the Donor Agencies
Government of Japan
The Data Collection Survey on Disaster Risk Management in Jamaica and Saint Lucia (JICA 2014) was conducted and the implementation of the preparatory survey for disaster response communication system improvement plan in Jamaica has been determined, which includes the dispatch of the JICA Expert, equipment grant for the renewal of the emergency radio communication system.
World Bank
World Bank carries out the project formulation to consider the development plan in Jamaica.
UNDP
To support the attainment of the Jamaica National Development Plan, Vision 2030 Jamaica, and Millennium Development Goals
IDB
Current support is made through the PPCR Project under implementation together with the World Bank; a portion of the project under IDB is regarded as the climate change aspect but not the disaster management aspect.
CIDA
To emphasize on community disaster management projects considering the increase of natural disasters have caused negative impact on the economic development of the Caribbean countries, particularly impact on the vulnerable communities in terms of disasters
2.5 Suriname
Basic Data
Suriname is a country situated on the northeastern Atlantic coast of South America. It is bordered by French Guiana to the east, Guyana to the west, and Brazil to the south. The land area of Suriname is about 165,000 km2. Total population and per capita of GDP of the Suriname is about 549 thousands persons and about 9,800 US dollars, respectively, and the income level is a High/Middium income level. Monthly average temperature ranges from about 25°C and 28°C. The average annual rainfall at Zanderij is about 2,350 mm.
Disaster Situation
It is observed that heavy rains cause the most frequent disaster in Suriname from 1990 to 2014, while cyclone disasters cause the most serious economic losses.
Flood
Recent disasters caused by flood in Suriname are tabulated below. Year/Month Damage August 1969 Unknown
May 2006 Affected people 32,000person, economic loss 400 thousandsUS dollars
June 2008 Death 2person, affected people about 6,500 persons, Economicloss unknown
Source:JICA Study Team
Sediment Disaster
Sediment disaster records are not kept by any agency of Suriname and few records are also available on the internet. According to information obtained from the road section of the

S-13
Ministry of Public Works, they have no experience on sediment disasters on roads. Almost all people of Suriname live in the plain land, where few damages occur due to sediment disasters.
Storm Surge
Coastlines have moved backward along the northern coast from Tottoness to western Paramaribo due to waves and storm surges. This is supposed to have happened because of the cutting of mangrove, which had covered the coastlines.
Disaster Management
The National Coordination Center for Disaster Relief (Nationaal Coördinatie Centrum voor Rampenbeheersing: NCCR) is the supervising agency for disaster management in Suriname, which supervises disaster response as well as preparedness, countermeasures, mitigation, and restoration. NCCR plays a role “to lead activities of disaster management corresponding to the necessity to control the disasters and risks in Suriname”. The NCCR Secretariat currently comprises eight members, including a director, five managers, and two office staffs. NCCR has an annual budget of SRD 1 million, and the separate disaster fund is available for emergency responses.
Meteorological and Hydrologic Services
Meteorological and hydrological services are undertaken respectively by the Meteorological Division and Hydraulic Research Division, both of which are under the Directorate of Water Engineering, Ministry of Public Works (MPW). The Meteorological Division carries out meteorological observation, provision of meteorological information and weather forecast, dissemination of meteorological warnings, provision of meteorological information for air traffic control as well as storage, analysis and provision of observed data. Meanwhile, the Hydraulic Research Division conducts the hydrologic observation works such as water level, discharge, and water quality, and laboratory works such as planning, water quality analysis, and studies on flood and erosion, among others. The number of personnel of the Meteorological Division is 70 in the whole country, 34 of whom belong to the headquarters including the national synoptic station at the Johan Adolf Pengel (JAP) International Airport. The number of personnel of the Hydraulic Research Division is 27 and the present issues are the lack of and aging personnel. There are 70 manned stations in the country where visual reading is made by the observer; there were about 200 stations in the 1970s. The 70 stations are composed of four synoptic stations and remaining rainfall observation stations. Of the 70 stations, more than 40 are located in the Coastal Area; most of the remaining 30 stations are primarily installed in small local airport inland provinces. These 20 sites are located within the tidal section of each river and the purposes of the observations are for flood, navigation, irrigation, and structure design. Discharge is estimated by incorporating the tide effect to the water level.
Support of the Donor Agencies UNDP
UNDP is preparing a plan, by using the Japan Fund, for the agriculture, energy, and flood control sectors in Paramaribo.
Chinese Government
The road rehabilitation project is ongoing for the inland east-west road between Zanderij and Pikin Saron through the loan aid from the Chinese government.
2.6 Saint Christopher and Nevis Basi Data
Saint Christopher and Nevis is a twin island country with a total landmass of 269 km2, lying to

S-14
the north of the Antilles Islands. Saint Christopher Island, the larger of the two, is about 176 km2 in size, and Nevis Island has a land area of 93 km2. Total population and per capita of GDP of the Saint Christopher and Nevis is about 54 thousands persons and about 14,000 US dollars, respectively, and the income level is a High/Middium income level. Monthly average temperature ranges from about 24°C and 27°C. The average annual rainfall in Saint Christopher is about 1,700 mm
Disaster Situation
The most frequent disaster in Saint Christopher and Nevis from 1990 to 2014 is that due to heavy rains, while the disaster causing the most serious economic losses is that due to cyclones.
Flood
The major hurricanes which affected Saint Christopher and Nevis from 1954 to 2010 are tabulated below.
Name Year/Month/Date (Category) 被害 Hugo 17-September, 1989 (h4) Death 1person, Affected people 1,300
persons, economic loss 46 million USdollars (about 32% of GDP)
Luis 5-September, 1995 (h4) Affected people 1,80persons, economic loss 200million US dollars (about 87% of GDP)
Georges 21-September, 1998 (h3) Death 5 persons, Affected people 10,000 persons, economic loss 400 million US dollars (about 138% of GDP)
Lenny 18-November, 1999 (h4) Affected people 1,180 persons, economic loss 4,100 US dollars (about 13% of GDP)
Source:JICA Study Team
Sediment Disaster
Sediment disaster records are not kept in order by any agency in Saint Christopher and Nevis and the records are not also available on the internet. Officers of the government agencies concerned explained during the survey that almost no damage due to sediment disasters were suffered in Saint Christopher and Nevis.
Storm Surge
Hurricane Omar of Category 4 damaged the coastal structures, when it passed at 150 km east of the Saint Christopher and Nevis Islands. Hurricane Lenny of Category 4 caused waves with height of 6.1 m, which hit the coastal area and extended inland by 180 m from the coastline. The wave resulted in damages to the commercial buildings/facilities and erosion of the coasts at several points.
Earthquake
Records of disasters caused by the past major earthquakes in Saint Christopher and Nevis are tabulated below.
Occurrence Disaster Area Magnitude Disaster Situation April 30, 2013 Saint Christopher and
Nevis, Antigua, St. Maarten
M5.3 No serious damage
November 29, 2007
Martinique Region M7.4 No serious damage in Saint Christopher and Nevis
October 8, 1974 Saint Christopher and Nevis, Antigua, Barbuda
M7.5 The roof of St. Thomas Church collapsed.

S-15
Occurrence Disaster Area Magnitude Disaster Situation April 5, 1690 Saint Christopher and
Nevis, Antigua, Montserrat
>M8 A massive earthquake and tsunami destroyed the city of Jamestown, then the capital of Nevis. Jesuit college and several wooden buildings were destroyed in St. Kitts.
Source: Prepared by the JICA Study Team based on the Home Page of Seismic Research Center and others.
Tsunami
Tsunami had been occurred near the Grenada in 18 November, 1867 due to earthquake at Virgin Island.
Disaster Management
The National Emergency Management Agency (NEMA) is a national organization which manages disaster prevention in Saint Christopher and Nevis. In addition, the Nevis Administration (Administrative Department) handles all administrative matters specific to Nevis Island including disaster prevention and infrastructure development as well. Eventually, two organizations are responsible for disaster prevention inter alia National Emergency Management Agency (NEMA) and Nevis Disaster Management Department (NDMD). NEMA is responsible for handling a national level disaster and a disaster in Saint Christopher Island. Meanwhile, NDMD is responsible for the prevention of disaster in Nevis Island. The following paragraphs outline the vision and mission of NEMA;
Vision : To provide appropriate preventive measures to mitigate the vulnerabilities against various hazards and effective responding measures to mitigate national level disasters through availing all the abilities of communities, governments and private sectors including NGOs.
Mission : To alleviate the impacts of a disaster to lives, properties and the happiness of the people and to minimize the vulnerability of the society against disaster. Along this line, NEMA coordinates and encourages the disaster management activities during disaster.
The number of the stationed staffs is seven in the secretarial office of NEMA for the time being. Amongst them, four are technical staffs. No information is available so far with regard to the budget allocated to NEMA. The number of staffs managing NDMD is eight persons. The alleged budget is EC$50,000.
Meteorological and Hydrologic Services
Two meteorological offices respectively in Saint Christopher and Nevis conduct meteorological observation and forecast exclusively for air aviation purpose; however, both offices provide meteorological information and forecast for domestic purpose based on the meteorological information provided by Antigua and Barbuda. Saint Christopher Meteorological Service is the meteorological office of Saint Christopher Air and Sea Port Authority (SCASPA), which conducts meteorological observation works as part of air traffic control service at the Robert L. Bradshaw International Airport, and provides meteorological information to the public. In Nevis, the meteorological service is similarly conducted by the Nevis Air and Sea Port Authority (NASPA) which is in charge of the Vance W. Amory Airport. Personnel of the Saint Christopher Meteorological Service office consist of seven technical staffs with no administrative staff. Nevis Meteorological Service office, there is only one concurrent staff who is an air control officer.

S-16
Support of the Donor Agencies CIDA
The notable examples of cooperation extended by other donors in the disaster management field are “Caribbean Disaster Risk Management Program-Knowledge Sharing” being conducted by CIDA.
UNCCD
Preparation of National Adaptation Plan relating to land use.
2.7 Saint Vincent and the Grenadines
Basic Data
Saint Vincent and the Grenadines is composed of Saint Vincent Island, the largest island of the country, and the Grenadines Islands. Saint Vincent Island is approximately 29 km north to south and 17.7 km wide on the east-west axis, and it covers some 344 km2. The Grenadines have seven main islands, namely: Bequia (18 km2), Mustique (7.5 km2), Union, Canouan (7.5 km2), Mayreau, Palm, and Petit Saint Vincent. Total population and per capita of GDP of the Saint Vincent and the Grenadines is about109 thousands persons and about 8,500 US dollars, respectively, and the income level is a High/Middium income level. Annual average temperature is 27.6°C. The average annual rainfall in Saint Vincent and the Grenadines is about 1,620 mm.
Disaster Situation
The most serious disaster in Saint Vincent and the Grenadines from 1990 to 2014 is due to flood in terms of death toll and economic loss.
Flood
Record of flood damages due to recent hurricanes and heavy rain is tabulated below..
Date Event Impact Death Cost in Million EC$
1955 Hurricane Janet
Most severe damage by a disaster. 122 -
2008 Hurricane Omar – Storm Surge
30 boats destroyed Damage along coastline
Nil 5
2010 Hurricane Tomas
The most affected area was NE and NW of the country by flooding and strong winds; 28% of the population was affected, including 5% severely, over 1,200 shelters; Forestry and agriculture were significantly affected, both crops and infrastructure; Infrastructure was also affected due to flooding and landslides
Nil 133 (10.5% GDP)
2011 April - Rainfall
Torrential rainfall affected the NE of the country (in and around Georgetown) resulting in severe flooding, landslides, damage to roads and bridges, disruption of water supply and displacement of 56 families
Nil 100
2013 December- Rainfall
12 deaths, 500 persons displaced, extensive damage to infrastructure
12 330
Source: Saint Vincent and the Grenadines Country Profile, 2014 (NEMO, EU, UNDP)
Sediment Disaster
Sediment disasters occur in almost the entire area of Saint Vincent Island, especially in the south to southwest regions as well as Owia-Fancy area in northernmost region of the island, where steep slopes continue to the coast. In the section from the new airport construction site of the Windward Highway to Georgetown, cliffs composed of volcanic ejection, having average relative height of 15 m, continues for a

S-17
long distance. The same section suffers significant coastal erosion due to northeast trade winds. Rockfalls from the cliffs and sediment runoff occurred constantly, and each time they occur, the road is temporarily closed and reopens only after removing the sediment. The landslide was caused by the heavy rain of Christmas trough in December 2013 and deposits of volcanic ash origin have run off toward the valley bottom. Large crack with width of 50-60 cm is running intermittently for nearly 50 m on the road. Road is still blocked so that cars have been forced to take detour in the residential area. World Bank has been considering reconstruction plan for this site. In Bequia Island, since many houses were destroyed by serious landslide damage caused by the heavy rains of Christmas trough in December 2013, the residents were forced to reconstruct, renovate, or transfer. The traces of landslides still remain everywhere such as collapsed house left as it was in Union Vale area.
Storm Surge
In Saint Vincent and the Grenadines, major cities are located in the coastal areas and residential houses and some public structures such as roads suffer damages from storm and coastal erosion. Particularly in the east coast, there are many high risk areas of coastal erosion caused by storm surge and high waves due to hurricanes and tropical storm. In Georgetown, for instance, it is said that, according to a meeting with the University of the West Indies, the coastal line has retreated for about 200 m since 1940. Erosions in the east coast have progressed and MPW is planning to take countermeasures.
Earthquake
Major earthquakes observed in Saint Vincent and the Grenadines between 1816 and 2000 are tabulated below.
Date Epicenter Magnitude (MMI*) Notes July 17, 1902 Detail unknown Detail unknown Buildings damaged
September 26, 1928 Barbados-Tobago 6.5 (VI - VII)
January 11, 1939 Martinique 7.0 (VII - VIII)
August 24, 1952 Distant earthquakes Detail unknown March 09, 1953 Distant earthquakes Detail unknown
March 19, 1953 175 km NW of St. Lucia Detail unknown Buildings damaged
April 02, 1997 NW of Tobago 5.6 (II: Saint
Vincent)
November 29, 2007 40km SSE of Roseau, Dominica
7.4
*: MMI ((Modified Mercalli Intensity)
Source: NEMO (2014), Bryan J. Boruff (2006), USAID/OAS Caribbean Disaster Mitigation Project (1997)
Tsunami
Small-scale tsunamis were observed in 1939 and 1955, which were caused by the volcanic activities of the submarine volcano Kick’em Jenny in the southern sea area of Saint Vincent and the Grenadines.
Drought
In recent years, drought situations occurred in 2010 and 2014. Especially during the dry season from 2009 to 2010, the most serious drought in the recent ten years occurred and drought warning was issued over the whole country. Meanwhile, the Grenadine Islands receive less rainfall than Saint Vincent Island and is a high risk area for drought because there are no surface water resources as well as they only rely on rainwater storage facilities.
Bridges
The JICA Study Team conducted the site inspections for almost all main trunk roads to

S-18
investigate damage situation and current progress of restoration works. The bridges and roads inspection results are tabulated below.
No Name Road Damage Situation Present Situation 1. Yarabaqua River Bridge (arch) WWH Overflowed Used as before
2. Colonarie River Bridge (wrecked) Abutments
WWH Broken; flew away
Still no bridge: There is new bridge very near the location
3. Colonarie River Bridge WWH Girder was broken Newly refurbished
4. Black Point River Bridge WWH Overflowed Used as before
5. Caratal River Bridge WWH Broken New bridge is under construction
6. Langley River Bridge WWH Damaged Refurbished
7. Rabacca River Bridge WWH Overflowed and partly buried
Used as before
8. Waribishi River Bridge WWH Overflowed Used as before
9. Leeward Highway Buccament River Bridge No.1
LWH Overflowed Used as before
10. Buccament River Bridge No.2 LWH Broken New bridge is under construction
11. Cumberland River Bridge No.1 LWH Overflowed Used as before
12. Cummberland River Bridge No.2
LWH Overflowed Used as before
13. Chateaubelair River Bridge LWH Broken New bridge is under construction
14. Sharpe’s River Sharp’s Bridge LWH Broken New bridge is under construction
15. Leeward Highway BRAGSA Borrow pit
LWH Landslide Debris are taken away
16. Richmand River Road Erosion LWH Road shoulders were eroded
Not yet refurbished
Note: WWH: Windward Highway, LWH: Leeward Highway
Source:JICA Study Team
Disaster Management
The National Emergency Management Organization (NEMO) is the main organization responsible for coordination of disaster management activities under the Ministry of National Security and Air and Sea Ports Development (MNSASPD). Total number of staffs in NEMO is 13 including four technical staffs; there were only two in the beginning comprising of director and secretary.
Meteorological and Hydrologic Services
The meteorological service office in Saint Vincent and the Grenadines is under MNSASPD and the meteorological observation is conducted by the Saint Vincent and the Grenadines Meteorological Office (MNSASPD-SVGMT Airport). The Central Water and Sewage Authority (CWSA) was established in 2008 with the main task of water resources management. Therefore, past data accumulation is not sufficient (data for four manned rainfall stations only). Observation has been made since 1979 but stored data from 1987 are only available. Personnel of MNSASPD-SVGMT Airport consist of eleven technical experts. Only six staffs are working in CWSA.

S-19
Both offices did not disclose their budget but have similar issues that proper operation and maintenance works for the observation equipment are hard to be conducted due to insufficient budget and insufficient number of staffs for the works. MNSASPD-SVGMT Airport conducts meteorological observations at E.T. Joshua Airport in Saint Vincent Island and local airports in the Bequia and Union Islands. CSWA operates, for the service of water resources management, rainfall stations at 28 locations and meteorological stations at five locations. The river water level observation is conducted by CWSA at seven locations for the purpose of water resources management. Observations are mainly made by the automatic stations; however, some stations do not function well due to lack of maintenance and insufficient O&M budget. Formally, automatic stations were installed at 14 locations; no restoration has been made after the damages due to Hurricane Tomas in 2010 and the Christmas heavy rain in 2013.
Support of the Donor WB
The Regional Disaster Vollanability Reduction Project (RDVRP) covers many and various components and involves many ministries and agencies such as the Ministry of Transport and Works (MTW), NEMO, and Ministry of Housing. The project is composed of many supporting components including bridges, roads, coastal erosion, and slope stabilization as hard component as well as training, education, and GIS support as soft component.
CIDA
Caribbean Disaster Risk Management Program-Knowledge sharing
2.8 Saint Lucia
Basic Data
The island of Saint Lucia is a small island situated in the Lesser Antilles. Saint Lucia is a volcanic island and characterized by mountainous and undulated topography, where the highest peak is Mt. Gimie (950 m). Active Soufriére Volcanic Centre in the southwest part of the island is alive. Total population and per capita of GDP of the Saint Lucia is about 182 thousands persons and about 7,300 US dollars, respectively, and the income level is a High/Middium income level. Annual average temperature is 28°C. The average annual rainfall in St. Lucia is about 1,265 mm in the rather flat coastal area and 3,420 mm in the high altitude area.
Disaster Situation
The most serious disaster in Saint Lucia from 1990 to 2014 is due to flood in terms of death toll and economic loss.
Flood
The recent flood disasters are tabulated below.
Disaster Occurence Date Death Toll Damage Amount(Referrence)(US$1,000 )
Storm 1988/09/11 45 1,000,000 Storm 1980/08/01 18 No data Storm 1963/09/25 10 3,465 Storm 2010/10/30 10 500 Storm 1980/07/31 9 87,990 Flood 2013/12/23 6 No data Storm 1994/09/10 4 No data Storm 2007/08/17 1 40,000
Source: Data Collection Survey on Disaster Risk Management in Jamaica and Saint Lucia (JICA 2014)
Sediment Disaster
Major sediment disasters that occurred in Saint Lucia Island are tabulated below.

S-20
Date Event Number
of Deaths
Number ofHomeless Comment
November 21/22, 1938
Ravine Poisson Landslide 100
July 10, 1960 Landslide 6 Hurricane Abby
1981 Landslide on West Coast Road between Castries and Soufriere
About 765 m3 of debris from the cut slope blocked the road.
September 17, 1988
Landslide
November 06, 1990
Landslide in Morne du Don
68
November 29, 1992
Landslide in Bocage 10 families affected (36 persons)
September 10, 1994
Mudslide 3 Tropical Storm Dabby
October 14, 1998 Landslide in Boguis 12 households (49 persons)
September 01, 1999
Black Mallet /Maynard Hill Landslip
102 families relocated
Approximately 80,000 m3 of colluvial material 'flowed' downslope toward the Marchand River
September 26, 2004
Landslide/Subsidence in Tapion
Approximately 1,800 m3 of colluvial material 'flowed' down slope
July 01, 2005 Landslide Windjammer Landing Beach Resort
Heavy rainfall prior to the failure
October 30/31, 2010
Many landslides in Colombette, Fond St Jacques, along the Barre De L'ile, Millet and on the hills east and south of Castries
Hurricane Tomas
December 24, 2013 Several landslides along the roads
Christmas Eve Trough
Source: NEMO (2011), CHARIM (2015)
Storm Surge
Design scale assessment against strong wind, storm surge, and high wave was made under the Caribbean Disaster Mitigation Project (CDMP) by the recurrence interval. High surge and high wave levels in and around Castries for the 100-year probable flood are estimated to be 0.6 m and 6.1 m, respectively.
Earthquake
In Saint Lucia Island, there have been at least ten earthquakes in the last 200 years including volcanic earthquake swarms and their aftershocks as tabulated below.
Date Event (Magnitude) Note
January 11, 1839 Earthquake (7.5)
Located east of Martinique - In Castries, all public buildings and masonry houses were severely damaged with partial collapse in some cases. In Soufriere, one person was killed.

S-21
Date Event (Magnitude) Note February 02, 1906 Earthquake (7.0) May 21, 1946 Earthquake Building damage
March 19, 1953 Earthquake (7.3)
In Castries, there was partial collapse of buildings previously damaged by the 1948 fire, and some damage to other buildings. New buildings designed to resist earthquakes were not damaged.
Early 1986 Series of Earthquakes12 earthquakes happened in a single day, of which four were reported to be widely felt in southern Saint Lucia.
1990 Series of Earthquakes(3.0 to 4.5)
From February to November, ranging in strength from M3.0 to 4.5. 29 earthquakes occurred in a single day on May 19, 1990.
April to June 1999 Series of Earthquakes105 volcanic earthquakes were recorded in southern Saint Lucia.
2000 Series of Earthquakes
The swarm began in July 2000 and culminated on November 24, 2000 with 27 earthquakes occurring in a single day. Activity was largely over by January 2001.
November 29, 2007
Earthquake (7.3)
December 11, 2007
Earthquake (5.3) Aftershock
Source:NEMO(2011), UWI-SRC
Tsunami
Tsunami disaster record is scarcely available in Saint Lucia. In 1755, the tsunami caused by the earthquake which occured near Lisbon, Portugal reached the Caribbean Sea area. The wave height observed in Saint Lucia is higher than 10 m, which shows that tsunami to be caused in the Atlantic Ocean might reach the east coastal area of the Caribbean Sea. .
Drought
Saint Lucia has sometimes suffered damage from drought and occurence frequency is estimated at once in less than five years according to the meteolological service.
Bridges
The disaster-stricken bridges are tabuled below. No Name Road Damage Situation Present Situation ① Canaries Bridge WCR Broken Rebuilt with Bailey Bridge
② Ravine Claire Bridge Flowed down Re-erected with Bailey Bridge
③ Mocha Bridge Broken Newly built
④ Piaye ValleyBridge WCR Broken Newly built
⑤ Wannier,- Micoud Culvert
ECR Culvert and road flushed away
Newly constructed with larger section box culvert
⑥ Cul de Sac Bridge ECR Overflowed Used in a critical condition
⑦ Ferrands Bridge ECR Overflowed Used in a critical condition
⑧ Ravine Poisson
Bridge
ECR Overflowed Used in a critical condition
⑨ Alba Bridge ECR Broken Newly built
Source:JICA Study Team

S-22
Disaster Management
The present main tasks and activities of the NEMO secretariat include disaster management training and enlightment activities during the preparatory stage as well as taking charge of the urgent operation center for urgent disaster corespondence. However, NEMO does not work proactively on other disaster management activities.
The NEMO secretariat comprises nine staffs and staff insufficiency is supplemented by the volunteers’ assistance. Members of the national committee in case of emergency correspondence are mostly volunteers. Meteorological and Hydrologic Services
The meteorological service office is under the Ministry of Infrastructure, Port Service and Transport (MIPST). MIPST-Saint Lucia Meteorological Service (SLMS), Hewanorra Airport Satellite Office conducts the meteorological observation in the airport.
Water level observation is conducted by the Water Resource Management Agency (WRMA) under the Ministry of Sustainable Development, Energy, Science and Technology (MSDES), while the Water and Sewerage Company (WASCO) carries out reservoir water level observation.
The numbers of personnel of MIPST and WRMA are about 30 and nine, respectively. Both offices did not disclose their budget but said that the operation and maintenance works cannot be executed good enough due to budget constraint.
Rainfall stations under WRMA exist at 35 locations nationwide; however, 12 stations are not functioning and without any restoration effort due to financial constraint. Support of Donor Agency
WB
The World Bank has commenced the DVRP as a new project in the disaster management field in FY2014 for about three to five years.
2.9 Dominica Basic Data
Dominica is a small island country included in the Lesser Antilles. The island is approximately 48 km north to south and 24 km wide on the east-west axis. Dominica is a mountainous volcanic island and the highest point on the island is Morne Diablotin at 1,447 m in the central part of the island. Morne Trois Piton, being registered as a UNESCO World Heritage Site, is the second highest at approximately 1,423 m located in the southern part of the island. Total population and per capita of GDP of the Dominica is about 72 thousands persons and about 7,200 US dollars, respectively, and the income level is a High/Middium income level. Annual mean temperature is about 26°C to 27°C in the coastal area. The average annual rainfall in Dominica is over 2,500 mm.
Disaster Situation
The most frequent disaster hitting Dominica is that due to flood.
Flood and Sediment Disaster
Major floods and sedimentdisasters are tabulated below. Date Event Impact Losses Classification
December 23-25, 2013 (Christmas Flood)
Trough, flash flood and landslides
Damage to housing and infrastructure
Heavy rain caused by cold front
April 2013 Heavy rains, 30+ landslides across the country
Damage to roads and agriculture
2 deaths
2011 -Storm Ophelia -Collapse of
-Damage to housing and infrastructure

S-23
Date Event Impact Losses Classification Matthieu Dam (natural dam formed during 1995 flood)
-4 deaths, Huge economic loss including agriculture and livestocks in Layou Valley on downstream reaches
July 2009 Flooding Damage to infrastructure 2008 Hurricane Omar Damage to coast and fishing
industry No death Sea surge, 20 to
30 feet 2007 Hurricane Dean
(Category 2) Damage to agriculture and housing
Flash flood
1999 Hurricane Lenny Coastal damage 1 death Sea surge, 30 to 40 feet
September 5, 1995 Hurricane Luis Damage to housing, agriculture and infrastructure
September 1995 Hurricane Dean (Category 2)
Damage to housing, agriculture and infrastructure
August 26, 1995 Hurricane Lenny Damage to housing, agriculture and infrastructure
September 17, 1989
Hurricane Hugo (Category 4)
September 10, 1988
Hurricane Gilbert (Tropical depression)
1984 Hurricane Klaus
1980 Hurricanes Frederick and Allen (Category 1)
Economy, Agriculture No deaths Disaster
August 29, 1979 Hurricane David (Category 5)
Total devastation 43 deaths, 60% homeless
Disaster
1920 Landslide and flooding in Roseau Valley
1 family died
Source:Disaster Risk Reduction Country Profile 2014
The Roseau River flows through the Roseau City area, which is like a mountain stream with rather high flow velocity. In the upper reaches of the urban area where there is no dyke system, flood disasters frequently occur due to flash floods by heavy rainfall every year. In the downstream reach in the urban area, no severe flood damage has occured since river improvement with bank protection works have been well undertaken through steel sheet pile revetment, concrete wall, and gabion piling. Currently, river protection works with concrete walls are in progress at the downstream right bank using the national budget. Furthermore, sediment runoff is so remarkable that periodical dredging works are carried out at the river mouth area and downstream reaches..
The Layou River is one of the biggest river in Dominica. The alluvial cone is formed around the river mouth. River flow is rather gentle than other rivers because of gentle river bed slope.
In the 2011 flood, villages at the right side of the river mouth were inundated due to flooding around the bridge on the trunk road, while no inundation occured in the 2013 flood. During the flooding in 2011, lots of sediment were deposited in the downstream reaches where dredging works are ongoing.
Nearly vertical cliffs continue on the mountain side along the western coastal road towards the southernmost Scotts Head from Loubiere. Although the cliffs with relative height of about 20 m

S-24
and consisting of pyroclastic debris covered with volcanic ash flow continue collapsing, fundamental countermeasures are not yet implemented. Only temporary countermeasures are taken such as temporary closure of road and sediment removal when sediment disasters occur. Road is reopened after the removal of sediments.
An avtive large-scale landslide is sliding on major primary road connecting capital and airport on Spring field area. Compared with the past satellite image with the current GPS coordinate, it appears that the ground has been pushed out to the downstream together with the road by about 20 m at the maximum.
Storm Surge
It is noted that some parts of residential houses and public infrastructure such as roads are damaged by storm surge and coastal erosion. Paricularly in 1999 and 2008, coastal erosion was severe and the coastal lines near the airport was damaged by erosion caused by Hurricane Omar in 2008.
Earthquake
The record of earthquakes including volcanic earthquakes observed in Dominica since the 18th century is summarized below.
Date Location Problem Center Comments February to June 1765
S. Dominica Southern centres 150 shocks felt
October 1841 N. Dominica Diablotins/Aux Diables Up to 20 earthquakes felt per day January to April
1849 S. Dominica
Plat Pays volcanic complex
24 earthquakes felt in one night in Soufrière area
February to March 1893
N. Dominica Diablotins/Aux Diables Frequent shocks felt in mid-March
October 1937 to April 1938
S. Dominica Southern centre(s) 13 shocks felt within a few hours on 1
April
September 1959 to May 1960
S. Dominica Southern centre(s) Not felt. Exact locations unknown,
but within 5 km of Roseau
June 1967 S. Dominica Southern centre(s) Lasted 2 days, June 19-20; 65 events
January to June 1969
Detail unknown
Detail unknown 126 events between January 1–5;
swarm until Jun.
January 1971 Detail
unknown Detail unknown 25 shocks felt on January 15
April to November 1974
S. Dominica Plat Pays volcanic
complex
Major belt of epicentres trending E-W through Boiling Lake and Wotten
Waven. >190 earthquakes recorded on April
19
February to June 1976
S. Dominica Southern centre(s) Epicentres in Roseau, extending
offshore to SW
November 1985 to June 1986
S. Dominica Plat Pays volcanic
complex Epicentres beneath Morne Plat Pays
December 1994 to January 1995
S. Dominica Plat Pays volcanic
complex Epicentres beneath Morne Plat Pays
November to December 1997
S. Dominica Plat Pays volcanic
complex Epicentres beneath Morne Plat Pays

S-25
Date Location Problem Center Comments October 1998
to July 2000 S. Dominica
Plat Pays volcanic complex and Anglais
More than180 earthquakes recorded on Oct. 23, 1998
January 20 to 25, 2000
N. Dominica Single station–no
locations possible
66 earthquakes recorded on January 20, 2000
February to June 2003
N. Dominica Aux Diables/Diablotins
More than 50 earthquakes recorded from February 15 to 26, 2003; More
than 500 times of earthquakes recorded from April 14 to 26, 2003
November 21, 2004
Leeward Islands
50 km NNW of Roseau, M6.3
Damage to churches and housing in the north; No deaths
November 29, 2007
Leeward Islands
40 km SSE of Roseau, M7.4
Damage to housing infrastructure; No deaths
Source:Prepared by the JICA Study Team based on the data from UWI-Seismic Research Centre
Tsunami
Volcanic belt exists in the central area of the island. Tsunami has been experienced in Dominica since 1955.
Drought
In recent years, drought disaster occurred in 2010. In this year, forest fires occurred frequently due to unusual dry climate.
Bridges
The present situation of the bridges that have been inspected is summarized below. No Bridge Name Road Damage Situation Present Situation 1. Checkhall River Bridge WCR Overflowed Used as before 2. Massacre River Bridge WCR Overflowed Concrete wall was built
and used as before
3. Mahault River Bridge WCR Overflowed Concrete wall was built and used as before
4. Belfast River Bridge
5. Layou River Mouth Bridge WCR Overflowed Used as before
6. Layou River, Midstream Bridge
Overflowed and one span broken
Repaired and used as before
7. Layou River, Upper branch stream Bridge
EOLH Overflowed and broken Refurbished
8. Channel River Bridge Overflowed Used as before
9. Geneva River DFSJ Overflowed Used as before
10. White River FJPS Overflowed, Deteriorated by sea breeze
Plan of renovation through EU Fund
11. Tabarie River DMR Overflowed Used as before
12. China Friendship Bridge HS No damage
13. Roseau Bridge GGS Overflowed Used as before
14. West Bridge IndPS Overflowed Used as before
15. Bath Road Bridge BR Overflowed Used as before 16. Bath Estate Bridge Vale R. Overflowed Used as before
17. Emshall Bridge Overflowed Used as before

S-26
No Bridge Name Road Damage Situation Present Situation 18. Pothal Bridge Overflowed Used as before
19. Trafalgar Bridge group Overflowed Used as before
Note: WCR: West Coast Road (Official Name: The Edward Oliver Leblanc Highway), EOLH: The Edward Oliver Leblanc Highway, DFSJ: Dubuc Fond St Jean Road, FJPS: Fond St Jean Petitte Savanne Main Road. DMR: Delices Main Road, HS: Hanover Street, GGS: Great George Street, IndPS: Independence Street, BR: Barth Road
Source:JICA Study Team
Disaster Management
The Office of Disaster Management’s (ODM’s) task is to protect the people and the national economy from the impact due to disasters through efforts in cooperation with ODM personnel, government, and regional and international agencies as well as prior and prompt correspondence. ODM keeps close cooperation with the National Emergency Planning Organization (NEPO), which is a government organization that undertakes plan formulation and organizational development concerning disaster correspondence at the central state level.
The main task of NEPO is to develop, operate, and maintain the National Emergency Operations Centre in accordance with the prescription in the National Disaster Plan. Detailed functions are stipulated in the National Disaster Plan 2001. ODM in cooperation with NEPO deals with every scope of disaster management including disaster protection, disaster mitigation, prior preparadness, and restoration.
Meteorological and Hydrologic Services
The meteorological service (MPWEP-MS) office under the Ministry of Water, Land, Environment and Climate Change exists at the Canefield Airport.
The Ministry of Agriculture, Fisheries and Forestry, Agriculture Division (MA-AD) has been conducting agro-meteorological observation since the 1970s aimed at crop management as well as flood and drought management.
MPWEP-MS personel consists of ten staffs of technical experts including two meteologists and two staffs for the operation and maintenance works. An annual budget amounts to about US$20,000 which amount is not enough for participating the outside training program. Annually allocated amount for the operation and maintenance works is in the range of US$2,000 to US$3,000.
MPWEP-MS conducts meteorological observation in the airports at two locations. MA-AD carries out agro-meteorological observation at ten agro-meteorological stations. River water level observation is carried out by DOWASCO.
Support of the Donor Agency WB
The World Bank has commenced the DVRP as a new project in the disaster management field in FY2014 for about three to five years.
2.10 Trinidad and Tobago Basic Data
The Republic of Trinidad and Tobago is a twin island country consisting of the Trinidad and Tobago islands, and covers a land area of about 5,100 km2. Trinidad Island is about 4,770 km2 in area, which occupies 93% of the country's total area. Tobago Island has an area of about 300 km2. Trinidad Island has three distinct mountain ranges, namely: northern range, central range, and southern range. The highest point in the country reaches 940 m above sea level in the northern range. Tobago Island is volcanic in origin, but there is no volcanic activity at present.
Total population and per capita of GDP of the Trinidad and Tobago is about 1.3 million persons and about 18,000 US dollars, respectively, and the income level is a High income level. Monthly average temperature ranges between about 25 ºC and 28 ºC. The average annual

S-27
rainfall in Trinidad Island is about 1,900 mm..
Disaster Situation
The most frequent disaster in Trinidad and Tobago from 1990 to 2014 is that due to heavy rains, while cyclones have resulted in the most serious economic losses.
Flood
The records of tropical storms and hurricanes which affected the Trinidad and Tobago islands are summarized beow.
Year/Month/Day Hurricane/Heavy Rain Damage 1-Ocotber, 1963 FLORA(H3) Death 20persons, economic loss 30 millions US
dollar 14-August, 1974 ALMA(TS) Death 1person, economic loss 5 million US dollarsYear 1985 Flood Economic loss 15 millions TT dollars Year 1993 Flood Death 5persons, economic loss unknown Year 2000 Flood Death 1person, economic loss unknown
Source:JICA Study Team
The lower Oropuche River basin is a lowland located in Naparima in the south of Trinidad Island. The basin is inundated every rainy season, and houses in the basin are damaged by the floods.
Sediment Disaster
Records of major sediment disasters that occurred recently in Trinidad and Tobago are summarized below.
Occurrence Disaster Area Type and Magnitude
Cause Disaster Situation
2012 Diego Martin Mudflow Rainfall 2 dead 2011 North Coast Road
to Maracas Landslide Rainfall Blockage of North Coast Road
(several hours), Damage to upstream area of La Seiva (Road Maraval)
2010 Western Main Road to Chaguaramas
Rockfall Rainfall Blockage of Western Main Road
November 12, 2004
Delaford on Tobago's west end
Landslide Rainfall of 208.7 mm (6 hours)
2 dead, 5 injured, 1,200 persons affected, Economic loss of US$9 million
Source: Base on the Disaster Risk Reduction Country Document, Trinidad and Tobago, 2014, ODPM, the JICA Study Team prepared the table above.
Roads located in the north of the capital of Port of Spain including Diego Martin Road, Morne Coco Road, and North Coast Road run through steep slope areas with weak weathered metamorphic rocks, so that they suffer from sediment disasters such as slope collapses every year.
Storm Surge
The eastern and southern coasts of Trinidad Island have been eroded seriously by storm surges. Although repair works for maintenance only have been made at the eroded portions at present, the countermeasures planned in the Coastal Zone Management Plan are about to be implemented.
Strong Wind
According to the “Disaster Risk Reduction Country Document, Trinidad and Tobago, 2014, ODPM”, the number of damages due to strong winds amounted to 277 from 2011 to 2014.

S-28
Earthquake
Records of disasters caused by past major earthquakes in Trinidad and Tobago are summarized below.
Occurrence Disaster Area Magnitude Disaster Situation 2010 Felt throughout Trinidad
from Carenage to Moruga and Matura
M4.7 No dead, no injured
2009 On land and felt in Sangre Grande and Penal
M4.8 No dead, no injured
2008 East coast and felt mainly in Galeota
M5.6 No dead, no injured
November 29, 2007
Felt throughout Eastern Caribbean from Puerto Rico to Guyana, St. Lucia, St. Vincent and Barbados
M7.3 -
September 29, 2006
Felt throughout Trinidad M5.8 3 injured in Point Lisas
April 22, 1997 South coast of Tobago M6.1 2 injured, 6 houses destroyed, estimated loss of US$25 million in Tobago Island
January 1, 1996 North of Trinidad M5.2 No dead, no injured 1988 East coast of Trinidad M6.3 No dead, no injured March 10, 1988 Throughout the Lesser
Antilles from Trinidad to St. Vincent
M7.5 -
March 1982 Near Tobago M5.2 - September 20, 1968
Port of Spain in Trinidad, Venezuela
M7.0 Damage of Hilton Hotel in Port of Spain, etc.
December 4, 1954
Northeast coast of Trinidad
M6.5 1 dead, several persons injured, stone masonry buildings destroyed in Port of Spain
February 24, 1918
Northwest of Trinidad M6.5 Stone masonry buildings destroyed in Port of Spain
1888 From Trinidad to St. Vincent
M7.5 -
October 21, 1766
Trinidad’s then capital San Jose
M7.9 Recorded maximum in Trinidad and Tobago, stone masonry buildings destroyed, 2 aftershocks
Source: The JICA Study Team prepared based on the Disaster Risk Reduction Country Document of Trinidad and Tobago (ODPM, 2014) and Country Disaster Risk Evaluation Report (IDB, 2013)
Tsunami
Tsunami in Trinidad and Tobago was recorded at December, 2012 due to earhquake.
Drought
Trinidad and Tobago suffered from drought in 2010, which started from October 2009.
Disaster Management
The Office of Disaster Preparedness and Management (ODPM) is the supervising agency for disaster management in Trinidad and Tobago, which supervises disaster response as well as preparedness, countermeasures, mitigation, and restoration. ODPM was organized in 2005 by transforming it from the National Disaster Management Agency (NDMA). ODPM is an organization under the Ministry of National Security.
The vision and tasks of ODPM are described as follows:

S-29
Vision : To become the premier regional Disaster Risk Management Organization.
Tasks : To build national disaster risk management and climate change adaptation capabilities with its partners and coordinate response and recovery operations in order to protect the people, environment and economy and ensure a disaster resilient nation.
On the other hand, the Tobago Emergency Management Agency (TEMA) is functioning under the Tobago House of Assembly in Tobago Island. TEMA’s tasks are almost the same as those of ODPM, although the tasks are limited within Tobago Island. ODPM executes supports to Tobago Island in case of disasters.
The ODPM Secretariat currently comprises 29 members, 14 of whom are technical staffs. The budget of ODPM for operation is US$10 million allocated from the national budget. The secretariat
Meteorological and Hydrologic Services
The meteorological service office of Trinidad and Tobago is one of the divisions of the Ministry of the Environment and Water Resources, whose main office exists in the complex of the Piarco International Airport. Provision of meteorological information for the traffic control of the airport is one of the main tasks of the services.
The main office in the airport, as the main synoptic station, conducts ground meteorological observation, upper air observation, forecasting, and data collection and analyses. The ground observation and meteorological information provision is made also at the ANR Robinson Airport in Tobago.
The meteorological service office in Trinidad and Tobago has 33 staffs in Trinidad and seven in Tobago. It has eight meteorologists/forecasters.
Total annual budget amounts to TT$25 million; however, technical-related budget such as for procurement of equipment and O&M costs is only TT$2.5 million. No government budget is appropriated for research, which has been covered by the donation of WMO or under joint research with university.
The Doppler type meteorological radar system is installed at Brasso Venado in central Trinidad which replaced the previous one in 2007-08.
Support of the Donor Agency
The scheme of “Disaster Risk Evaluation” was implemented with the financial assistance of IDB. The projects for drainage improvement of Port of Spain and erosion mitigation for the coasts are implemented, too. A drainage project financed by the Spanish government is also ongoing.
2.11 Barbados
Basic Data
Barbados is the easternmost island of the Lesser Antilles in the West Indies with a total land area of 430 km2. The island is relatively flat rising gently to the central highland region with the highest Mount Hillaby’s peak of 330 m above sea level.
The island is divided into two in terms of geology. The 85% of the island is covered by Pleistocene coral reef limestone cap, and the remaining 15% is an inlier of Tertiary sedimentary rocks of marine origin. The limestone forms terraces in the western part of the island. Erosion of the limestone has resulted in the formation of various caves and gullies. The sedimentary rocks crop out in a triangular region in the northeast Barbados called the Scotland District. Total population and per capita of GDP of the Barbados is about 285 thousands persons and about 15,000 US dollars, respectively, and the income level is a High income level. Annual mean temperature is about 25°C to 28°C in the coastal area. The average annual rainfall in Barbados is about 1,350 mm.

S-30
Disaster Management
The most frequent disaster in Barbados from 1990 to 2014 is that due to cyclones (wind), which also leads to the most serious economic losses. Floods also occur frequently; however, their economic losses are not so large.
Flood
The records of hurricanes which affected Barbados from 1954 to 2010 are summarized below. Year/Month/Date Hurricane/ Flood Damage
22-September, 1955 Janet Death 38persons, economic loss 5 million US dollars
1-October, 1970 Flood Death 1person, economic loss 500 thousands US dollars
4-August, 1980 Allen Affected people 5007persons, economic loss 860 million US dollars
Source:JICA Study Team
The flood damage occurs at Gardenland in Bridgetown, Speightstown and Holetown.
Sediment Disaster
Sediment disaster records are not kept in order by any agency in Barbados, and records or articles on sediment disasters are not also available on the internet. However, the Scotland District covered by sedimentary rocks is vulnerable to sediment disasters such as landslides and slope collapses.
Recent landslide areas are; Saint Joseph's Church Area of Scotland District White Hill Area of Scotland District
Earthquake
Records of disasters caused by past major earthquakes in Barbados are summarized below. Occurrence Disaster Area Magnitude Disaster Situation
February 18, 2014 Martinique M6.5 No major disaster
November 29, 2007 Martinique M7.4 2 injured, several houses destroyed in Barbados
March 19, 1953 Barbados, St. Lucia, St. Vincent
Unknown Houses damaged
August 30, 1844 St. Vincent, Barbados
Unknown Details unknown
Source: Prepared by the JICA Study Team based on home page of Seismic Research Center and others.
Tsunami
Records of past major tsunami in Barbados are tabulated below. Date of Attack Tsunami Height (m) Description March 31, 1761 Unknown Affected by the earthquake in Lisbon, Portugal
April 24, 1767 Unknown -
December 25, 1969 0.46 m -
Source: Preliminary List of Caribbean Tsunamis, (http://poseidon.uprm.edu/lander/tabla1a.htm)
Disaster Management
The Department of Emergency Management (DEM) is the supervising agency for disaster management in Barbados, which supervises disaster response as well as preparedness, countermeasures, mitigation, and restoration. DEM was established in 2007 in accordance with the Emergency Management Act 2006.
The vision and tasks of DEM are as follows:

S-31
Vision : To develop, promote, and maintain a comprehensive National Disaster Management Programme which will educate all citizens about the various elements of disaster management.
Task : To coordinate all emergency management activities in Barbados; evaluate and modify plans on disaster management and its education; and guide for effective restoration.
DEM comprises 14 members, five of whom are technical staffs. The annual budget for DEM is Bds$1.5 million.
Meteorological and Hydrologic Services
The meteorological service office is under the Ministry of Agriculture and has its main office at the Grantley Adams International Airport, whose service covers meteorological monitoring, research, and meteorological services including observation, forecasting, and warning.
Hydrological observation including water level and discharge measurement is said to be a task of the Drainage Division of the Ministry of the Environment and Drainage; however regular and continuous observation has not been conducted.
Tide level and surge observations are undertaken by the Coastal Zone Management Unit (CZMU) of the Ministry of the Environment and Drainage.
Meteorological service office has an annual budget of US$2 million on the average and personnel of 34 staffs including 30 technical persons.
The Doppler wave type meteorological radar donated by EU has been operated in Castle Grant since 2008.
There are 5 rainfall observation stations by Meteorological Service Office and about 25 manual stations are observed by plantation companies.
Support of the Donor Agency
The project of Road Rehabilitation and Improving Connectivity of Road Infrastructure is scheduled to be implemented, and the Coastal Risk Assessment and Management Program is in progress. Both of these projects are under IDB’s loan schemes.
2.12 Belize Basic Data
Belize is located in the Yucatan Peninsula of Central America, and covers 22,960 km2. About 95% of the whole area belongs to the mainland in the continent part and the remaining 5% is occupied by more than 1,060 islands in the Caribbean Sea.
Topographical feature of the Belizean landscape is classified into two main physiographic regions, i.e., south and north. The Maya Mountains (highest elevation is 1,120 m) with the studded basins and plateaus therein dominate the southern area, and the narrow coastal plain exists along the shore of the Caribbean Sea. Almost all regions in the north area comprise lowlands below 150 m above sea level. Especially, 18 major rivers and many perennial streams drain low-lying coastal areas in the northern and central parts of the country, which are flat and swampy, with many lagoons.
Total population and per capita of GDP of the Belize is about 332 thousands persons and about 4,900 US dollars, respectively, and the income level is a High/Middle income level. Annual maximum and minimum temperature are about 29.4°C to 21.1°C, respectively. The average annual rainfall in Belize is about3,800 mm.
Disaster Situation
Belize is a continental country with vast expanse of land whose natural environment varies between the inland and coastal areas. Most of the population lives in the low areas of the coastal plain. Natural disasters in Belize are caused mainly by flood, storm surge, and high waves.

S-32
Flood
The damages by the floods were as follows;
Belize City, which was formerly the capital of Belize, located in the peninsula which sticks out to the sea, has suffered devastating damages due to Hurricane Hatti in 1961 and the death toll reached 275.
In 2008, flood disasters occurred all over Belize and about 50,000 persons
The Crooked Tree Village was one of the target communities for community disaster management in the Caribbean Disaster Management Project, Phase II (CADM2 from January 2009 to June 2012), which is located at the downstream lagoon of the Belize River with a population of about 1,000. Inundation occurs in this community every year when the water level of the lagoon rises; in 2014, the situation where there is no other access than using boat lasted for about three to four months.
In the North Stann Creek River basin in the southeast area of Belize, flash flood occurred in 2008 around Middlesex Bridge of the Hummingbird Highway, which resulted in three dead residents at the downstream section of the bridge.
The Dagras Village is a flood prone area and has suffered inundation once every three years during the rainy season. It is located at the right bank of the Rio Hondo River flowing along the border with Mexico. The maximum depth of inundation reaches to 5 ft.
Storm Surge
More than 60% of the total population lives in the coastal area; therefore, once high tide period coincides with hurricane or long-term inundation type of flood, serious inundation disasters would be caused. In the past, storm surge due to hurricane caused inundation in the Corozal region, from the coastal line up to one to two miles inland from the coast.
Earthquake
An M7.3 earthquake that occurred off the coast of Honduras in 2009 hit Belize and many of the houses in Monkey River Town were damaged. Although details are unclear, shaking of the 1912 earthquake off the coast of Belize, the 1999 earthquake in Honduras, and the 2007 earthquake in Guatemala (M6.7) were observed in Belize.
Drought
When Belize City experienced serious drought situation in 1975, water intake from the source of water supply became impossible due to the lowering of the water level of the Belize River, which supplies 17% of the total water supply.
Bridges
Kendal Bridge : Destroyed by Tropical Storm Arthur in June 2008 and the new bridge was in service in 2012.
Mullin River Bridge : Destroyed at almost the same time as the Kendal Bridge, and a temporary bridge is in use at present.
Beaver Dam Bridge : Overflowed; the existing steel girder bridge was constructed in 2007.
Rancho Dolores Bridge : Broken at the time of earthquake with an epicenter in Guatemala.
More Tomorrow Bridge : - ditto - -
Disaaster Mnagement
The National Emergency Management Organization (NEMO) has been established as the disaster coordination agency to respond to any emergency situation including threat stage, to guard people’s lives and national properties, and to mitigate impact of emergency, in collaboration with each emergency management committee as well as public and private

S-33
agencies and organizations.
Present personnel of NEMO consist of 25 staffs including seven technical staff and 18 supporting staffs. As for the organizational aspect, it has three layers composed of the National Emergency Operation Center (NEOC) at the national level, the District Emergency Operation Center (DEOC) at the regional level, and the Village Emergency Operation Center (VEOC) at the community level. At the national level, there are 14 committees including nine in each district, two in Cayo Region, and three in Belize City. At the district level, the committees are similarly formed.
Meteorological and Hydrologic Services
The meteorological service is conducted by the National Meteorological Service (NMS) under the Ministry of Labor, Local Government, Rural Development, NEMO and Immigration and Nationality (MLLGRD-NEMO-NMS).
The Hydrological Unit under the Ministry of Natural Resources and Agriculture (MNRA-HD) is the agency to conduct hydrological observation and management of permits and licenses of water use. Before the reorganization of the government agencies in 2012, MNRA-HD was under same ministry as NMS.
NMS has 26 staffs including 21 technical staffs as well as annual budgets equivalent to US$424,000 (2012) and US$534,000 (2014). MNRA-HD has only four staffs at present.
MLLGRD-NEMO-NMS conducts meteorological service with the synoptic stations at 20 locations nationwide and automatic stations at eight locations.
Support of the Donor Agency
World Bank
On-going project
Climate Resilient Infrastructure Project
Caribbean Handbook on Risk Management
IDB
Flood Mitigation Infrastructure Program for Belize City
CHAPTER 3 ISSUES ON DISASTER MANAGEMENT OF SURVEY COUNTRIES 3.1 Antigua and Barbuda
The issues of the Antigua and Barbuda are shown below. Field No. Issue
General for Disaster
Management
AB-1 Improvement of insufficiency of NODS staff AB-2 Capacity improvement of NCCR staff (Community-based disaster
mitigation) AB-3 Improvement of budget insufficiency of NODS AB-4 Governance AB-5 Strengthening of cooperating system of NODS with domestic
organizations AB-6 Strengthening of community disaster mitigation
Flood AB-7 Elimination of submergence of the low lying flat plain AB-8 Mandate of the administrator of Rive AB-9 Rehabilitation of damages on the bridge
Storm Surge AB-10 Planned response to coastal erosion
Earthquake AB-11 Development of hazard map for earthquake AB-12 Development of disaster management plan for earthquake for the
capital Tsunami AB-13 Formulation of disaster management plan for tsunami

S-34
Field No. Issue Earthquake/Strong Wind AB-14 Development of design standard methods against seismic load and
wind load Drought AB-15 Solution of sedimentation in the reservoir of Potwork Dam
Meteorological
Observation
AB-16 Increase of forecasters and staffs for maintenance of equipment
AB-17 Improvement of insufficient capabilities of meteorological observer AB-18 Improvement of insufficiency of budget allocated to meteorological
observation
AB-19 Prompt fixing of damaged equipment to observe meteoro-hydrologyAB-20 Improvement of insufficient capability in maintenance of
meteoro-hydrologic observation System Source: JICA Study Team
3.2 Guyana
The issues of the Guyana are shown below. Field No. Issue
General for Disaster
Management
GY-1 Capability improvement of CDC staff GY-2 Improvement of budget insufficiency allocated to CDC
Flood GY-3 Mitigation of flood in the low lying Surrounding Areas of the Capital, Georgetown due to high tide and poor drainage
GY-4 Superannuation of Demerara Harbour bridge Storm Surge
GY-5 Mitigation of damage due to high tide and coastal erosion along coastal areas
GY-6 Subsidence in the coastal areas GY-7 Cultivation of the coastal engineering experts
Earthquake GY-8 Preparation of disaster mitigation plan against earthquake for the capital
Tsunami GY-9 Development of hazard map for tsunami GY-10 Preparation of evacuation plan against tsunami
Earthquake/Strong
Wind
GY-11 Development of standard design methods against seismic load and wind load
Drought GY-12 Mitigation of damage due to water shortage in inland in the southwestern area
Meteorological
Observation
GY-13 Improvement of insufficiency of maintenance staff
GY-14 Improvement of insufficiency of budget for maintenance GY-15 Improvement of meteoro-hydrologic data collection in the inland
areas Source: JICA Study Team
3.3 Grenada
The issues of the Grenada are shown below. Field No. Issue
General for Disaster
Management
GR-1 Improvement of insufficiency of staff for NaDMA GR-2 Improvement of coordination between NaDMA and the
communities Flood GR-3 Mitigation of inundation in Saint George’s due to the landside
water Sediment GR-4 Mitigation of disasters due to landslide in the upstream area of the
Little River and debris Flow GR-5 Mitigation of damages due to slope failure and rockfall along West

S-35
Field No. Issue Coast Road
GR-6 Improvement of insufficient capacity of the countermeasure on sediment disaster along the road
Storm Surge GR-7 Mitigation of coastal erosion in the north coast of Grenville
Earthquake GR-8 Development of hazard map related to earthquake is not available GR-9 Preparation of disaster mitigation plan against earthquake for the
capital Tsunami GR-10 Formulation of an evacuation plan for tsunami
Earthquake/Strong
Wind
GR-11 Development of standard design methods against the seismic load and wind load
Drought GR-12 Superannuation of the appurtenant facilities of the weir
Meteorological
Observation
GR-13 To Secure telecommunication facility GR-14 Clarification of responsible organization for the operation of
observation and warning system Source: JICA Study Team
3.4 Jamaica
The issues of the Jamaica are shown below. Field No. Issue
Flood JA-1 Improvement of the bridge in the middle reach of the Rio Cobre River to solve Traffic Interruption due to the flood
JA-2 Prevention of mudflow on the rivers in the southeast region Sediment JA-3 Prevention of slope failure between Agulala Vale and Golden
Spring JA-4 Development of detailed road hazard map is not available
Source: JICA Study Team
3.5 Suriname
The issues of the Suriname are shown below. Field No. Issue
General for Disaster
Management
SU-1 Improvement of insufficiency of NCCR staff SU-2 Improvement of insufficient capacity of NCCR staff SU-3 Provision of NCCR home office SU-4 Preparation of base map
Flood SU-5 Improvement of drainage in Paramaribo SU-6 Evacuation response to flooding in the middle reach of the Marowijine
River SU-7 Improvement of the Road to Prevent Annual Road Closure in the
Section between Apoera and Zanderij due to Flooding Storm Surge SU-8 Mitigation of coastal erosion
Tsunami SU-9 Monitoring and Collection of Tsunami Information in and around Suriname
Meteorological
Observation
SU-10 Improvement of Insufficiency of staff SU-11 Improvement of rainfall observation network SU-12 Execution of observation of the water level and discharge
measurement at no-tide affected section SU-13 Mitigation of Man-made flooding due to the discharge from
Brommestein Dam
Source:JICA Study Team

S-36
3.6 Saint Christopher and Nevis
The issues of the Saint Christopher and Nevis are shown below. Field No. Issue
General for
Disaster
Management
CN-1 Determination of National Disaster Management Strategy CN-2 Improvement of insufficiency of NEMA staff CN-3 Improvement of insufficient budget allocation to NEMA CN-4 Requirement to develop hazard map for disasters in Nevis Island
other than flood Flood CN-5 Improvement of drainage capacity in Basseterre
CN-6 Bridge improvement to prevent temporary closure of the Causeway Ring Road along the west coast due to flood
CN-7 Floodwater control from the northwestern areas of Basseterre Sediment CN-8 Risk of slope failure on the steep slopes along the road towards the
southern peninsula. Storm Surge CN-9 Countermeasure against high tide to Cause Road closure at the Old
Road Bay area Flood-Storm
Surge-Tsunami
CN-10 Provision system of information to the customers of the hotels in North Frigate Bay which is vulnerable to flood, high tide, and tsunami
Earthquake CN-11 Preparation of earthquake hazard map in Saint Christopher CN-12 Preparation of disaster mitigation plan for earthquake for the
capital Earthquake/Strong
Wind
CN-13 Development of standard design methods against seismic load and wind load
Meteorological
Observation
CN-14 Establishment of independent office instead of a section of the airport managing company to conduct the observation
CN-15 Own weather forecasting and meteorological information CN-16 Preparation of an observation system
Source: JICA Study Team
3.7 Saint Vincent and the Grenadines
The issues of the Saint Vincent and the Grenadines are shown below. Field No. Issue
General for Disaster
Management
SV-1 Improvement of insufficiency of NEMO staff SV-2 Capability improvement of NEMO staff SV-3 Improvement of Budget Insufficiency allocated to NEMO
Flood SV-4 Mitigation of damages due to the flood caused by the Cumberland River
Sediment SV-5 Mitigation of slope failure of the mountain side of the road along the east coast
Storm Surge SV-6 Mitigation of coastal erosion along the east coast
Earthquake SV-7 Development of hazard map regarding earthquake SV-8 Formulation of disaster mitigation plan for earthquake for the
capital Tsunami SV-9 Formulation of evacuation plan for tsunami
Earthquake/Strong
Wind
SV-10 Development of standard design methods against seismic load and wind load
Drought SV-11 Formulation of countermeasure for water shortage in the Grenadines

S-37
Field No. Issue
Meteorological
Observation
SV-12 Insufficient number of staffs for the observation SV-13 Insufficient capacity of the staffs SV-14 Insufficient budget SV-15 Deteriorated equipment are left unrepaired
Source: JICA Study Team
3.8 Saint Lucia
The issues of the Saint Lucia are shown below. Field No. Issue
General for Disaster
Management
SL-1 Improvement of insufficiency of NEMO staff SL-2 Capacity improvement of the NEMO staffs SL-3 Improvement of budget insufficiency allocated to NEMO SL-4 Improvement of communication among organizations
disaster-related organization Flood SL-5 Mitigation of damages in the bridges on the Trunk Ring Road in the
island Sediment SL-6 Mitigation of slope failure along on the mountain side slope of the
trunk ring road in the island Earthquake SL-7 No hazard map for earthquake is available
SL-8 Preparation of disaster mitigation plan for capital against earthquake Tsunami SL-9 Preparation of evacuation plan for tsunami
Earthquake/Strong
Wind
SL-10 Development of standard design methods against seismic load and wind load
Drought SL-11 Improvement of sediment siltation in John Compton Dam Reservoir
Meteorological
Observation
SL-12 Increasing staff for meteorological observation SL-13 Capacity improvement of the maintenance staffs SL-14 Improvement of the budget insufficiency allocated to the
observation SL-15 Repair of equipment for the meteoro-hydrologic observation
Source: JICA Study Team
3.9 Dominica
The issues of the Dominica are shown below. Field No. Issue
General for Disaster
Management
DM-1 Improvement of insufficiency of ODM staff DM-2 Improvement of budget insufficiency allocated to ODM DM-3 Rehabilitation of the damaged shelters and improvement of the
functions of evacuation facilities Flood DM-4 Improvement of Trafalgar Bridge to Secure Access Route during
Flooding from Trafalgar Village to the Capital DM-5 Re-installation of the Pipeline which was Washed Away by Flood
to Secure Conveying Water to the Capital Sediment DM-6 Mitigation of slope failure along the coastal road in the southwest
area DM-7 Mitigation of road damage caused by Antrim landslide
Coast DM-8 Mitigation of Damages due to Coastal Erosion
Earthquake DM-9 Formulation of disaster mitigation plan against earthquake for the capital
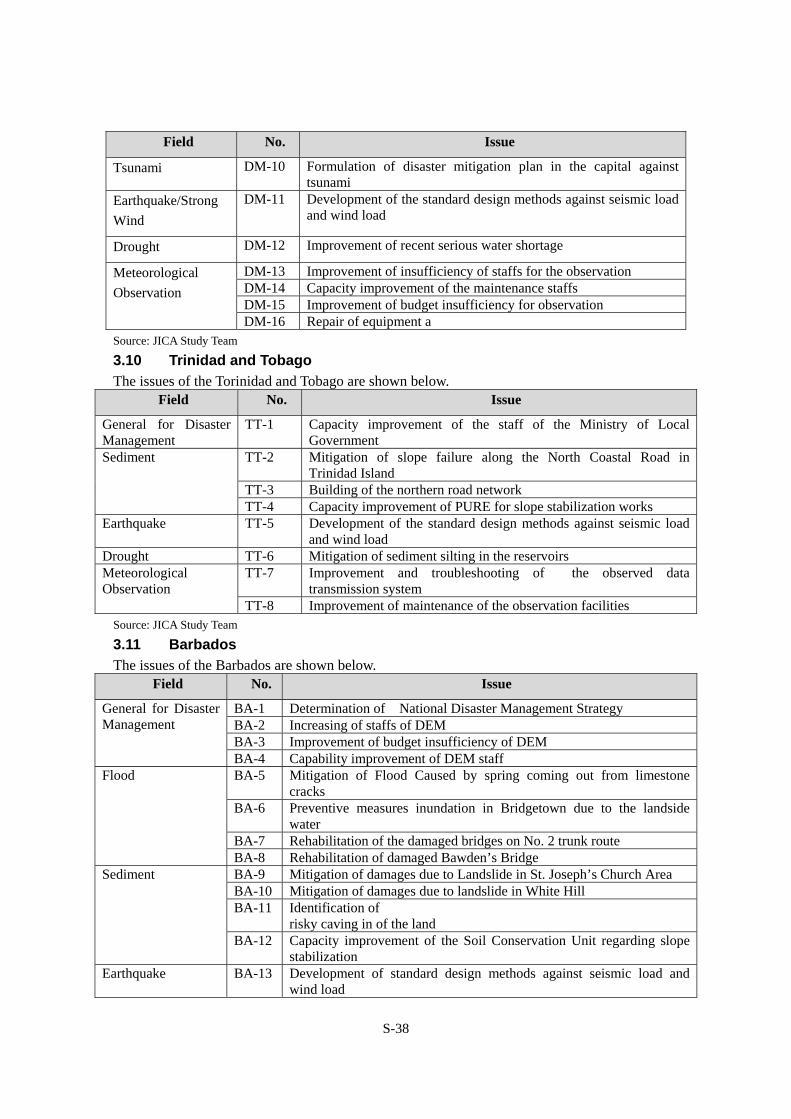
S-38
Field No. Issue
Tsunami DM-10 Formulation of disaster mitigation plan in the capital against tsunami
Earthquake/Strong
Wind
DM-11 Development of the standard design methods against seismic load and wind load
Drought DM-12 Improvement of recent serious water shortage
Meteorological
Observation
DM-13 Improvement of insufficiency of staffs for the observation DM-14 Capacity improvement of the maintenance staffs DM-15 Improvement of budget insufficiency for observation DM-16 Repair of equipment a
Source: JICA Study Team
3.10 Trinidad and Tobago
The issues of the Torinidad and Tobago are shown below. Field No. Issue
General for Disaster Management
TT-1 Capacity improvement of the staff of the Ministry of Local Government
Sediment TT-2 Mitigation of slope failure along the North Coastal Road in Trinidad Island
TT-3 Building of the northern road network TT-4 Capacity improvement of PURE for slope stabilization works
Earthquake TT-5 Development of the standard design methods against seismic load and wind load
Drought TT-6 Mitigation of sediment silting in the reservoirs Meteorological Observation
TT-7 Improvement and troubleshooting of the observed data transmission system
TT-8 Improvement of maintenance of the observation facilities Source: JICA Study Team
3.11 Barbados
The issues of the Barbados are shown below. Field No. Issue
General for Disaster Management
BA-1 Determination of National Disaster Management Strategy BA-2 Increasing of staffs of DEM BA-3 Improvement of budget insufficiency of DEM BA-4 Capability improvement of DEM staff
Flood BA-5 Mitigation of Flood Caused by spring coming out from limestone cracks
BA-6 Preventive measures inundation in Bridgetown due to the landside water
BA-7 Rehabilitation of the damaged bridges on No. 2 trunk route BA-8 Rehabilitation of damaged Bawden’s Bridge
Sediment BA-9 Mitigation of damages due to Landslide in St. Joseph’s Church Area BA-10 Mitigation of damages due to landslide in White Hill BA-11 Identification of
risky caving in of the land BA-12 Capacity improvement of the Soil Conservation Unit regarding slope
stabilization Earthquake BA-13 Development of standard design methods against seismic load and
wind load

S-39
Field No. Issue
BA-14 Formulation of disaster mitigation plan for earthquake in the capital Tsunami BA-15 Preparation of evacuation plan for tsunami Meteorological Observation
BA-16 Improvement of meteoro-rainfall observation network BA-17 Enhancement of a database system
Source: JICA Study Team
3.12 Belize
The issues of the Belize are shown below. Field No. Issue
General for Disaster Management
BZ-1 Improvement of insufficiency of staff of NEMO BZ-2 Prompt processing for addition and reallocation of NEMO budget
Flood BZ-3 Improvement of narrow bridge on the major trunk road(Hummingbird Highway) to secure traffic capacity
Sediment BZ-4 Mitigation of Vulnerability to Sediment Disaster in the surrounding areas of Maya Mountains
Storm Surge BZ-5 Mitigation of water surging and coastal erosion occurred in the coastal area
Earthquake BZ-6 Formulation of disaster mitigation plan for earthquake in Belize City Tsunami BZ-7 Preparation of Hazard map and evacuation plan for tsunami Earthquake/Strong Wind
BZ-8 Development of standard design methods against seismic load and wind load
Drought BZ-9 Solution of water shortage in the northern inland Meteorological Observation
BZ-10 Improvement of insufficiency of the maintenance staff BZ-11 Improvement of budget insufficiency for maintenance BZ-12 Capacity improvement of staffs of the meteorological service BZ-13 Database system used is developed in other country
Source: JICA Study Team
CHAPTER 4 PROPOSED MEASURES BY NATION 4.1 Antigua and Barbuda
The proposed projects of the Antigua and Barbuda are shown below. No Terms Project Title Component
AB-2 Short, Medium
Capacity building of NODs staff
1) Training for the formulation of disaster mitigation plan, monitoring and evaluation capability
AB-6 Medium, Long
Capacity building for disaster mitigation in the community
1) Training for disaster mitigation for community
AB-7 Short Formulation of Integrated Water Resources Management
1) Formulation of water utilization plan 2) Formulation of flood management plan 3) Formulation of watershed preservation plan
AB-9 Short, Medium
Rehabilitation Plan of Bendals Bridge
1) Study on natural conditions 2) Design of the bridge 3) Study and design of the river banks 4) Construction planning and cost estimates 5) Construction
AB-10 Short Formulation of Coastal Zone Management Plan
1) Diagnosis of the present conditions 2) Development of the hazard maps 3) Assessment of the priority of the sites and the
predictions of the measure 4) Study on maintenance
AB-11 Short, Formulation of Disaster 1) Confirmation study on the existing situations

S-40
No Terms Project Title Component AB-12 Medium Mitigation Plan for St.
John’s against Earthquake2) Update of the hazard map for earthquake 3) Study on evacuation route and evacuation shelter 4) Evaluation of risk and preparation of scenario 5) Plan formulation for disaster mitigation 6) Preparation of training materials like disaster
mitigation maps and evacuation training 7) Fostering of leader for disaster mitigation
facilitators AB-13 Short,
Medium Formulation of Tsunami Disaster Mitigation Plan for the Urbanized Areas along the Coast
1) Confirmation of the present conditions 2) Preparation of hazard maps for tsunami 3) Study on evacuation route and evacuation shelter 4) Study on warning system 5) Formulation of disaster mitigation plan 6) Study on evacuation route and evacuation shelter 7) Fostering of leader for disaster mitigation
facilitators and evacuation training AB-15 Short,
Medium Countermeasure for Sedimentation of Potwork Dam
1) Study on the existing sedimentation 2) Evaluation of countermeasures 3) Construction plan and cost estimates 4) Construction or provision of equipment
AB-17 Medium, Long
Capacity Building of Meteorological Observer
1) Training to enhance the capability of forecaster
AB-20 Short, Medium
Capacity Building of Maintenance Staffs for Meteorological Observation Facilities
1) Training for the maintenance of equipment for meteorological observation (Especially the communication system)
Source: JICA Study Team
4.2 Guyana
The proposed projects of theGuyana are shown below. No Term Project Title Component
GY-1 Short・ Medium
Capacity Building of the CDC staffs
1) Training for disaster mitigation planning and monitoring.
2) Training for preparation of hazard map GY-3 Short
Drainage Improvement for Georgetown
1) Diagnosis 2) Review of design conditions for the pump
stations 3) Review of the existing design 4) Design of the pump stations 5) Cost estimates 6) Construction
GY-5, -6
Short Disaster Mitigation of the Coastal Area Against Surging and Coastal Erosion
1) Diagnosis 2) Surveys for subsidence 3) Alternative study 4) Design for the selected optimum measure 5) Cost estimates 6) Construction
GY-7 Short Training of coastal erosion 1) Mechanism on coastal erosion 2) Advantage and disadvantage of countermeasures
for the coastal erosion 3) Plan formulation and design of the measures. 4) Monitoring of coastal erosion

S-41
No Term Project Title Component 5) Coastal conservation plan
GY-8 Short・ Medium
Disaster Mitigation Plan for Earthquake in Georgetown
1) Confirmation survey of the present condition 2) Revision of the hazard maps for earthquake 3) Study on evacuation route and evacuation
shelter 4) Assessment of risk and preparation of scenario 5) Formulation of disaster mitigation plan 6) Preparation of text such as disaster mitigation
map and evacuation training 7) Fostering of leaders for education in disaster
mitigation GY-9 GY-20
Short・ Medium
Disaster Mitigation Plan for Tsunami in the Coastal Areas
1) Diagnosis 2) Development of hazard map for tsunami 3) Study on evacuation route and evacuation shelter4) Study on warning system 5) Formulation of disaster mitigation plan 6) Preparation of text-like disaster mitigation map
and evacuation training 7) Fostering of leaders for education in disaster
mitigation GY-13 Medium
・Long Capacity Building of the Staff for Meteorological Works
1) Training for the maintenance of equipment
GY-15 Medium・Long
Improvement of Meteoro-hydrologic Data Collection in the Inland Areas
1) Confirmation of present situation 2) Plan formulation on development of
meteoro-hydrologic observation network 3) Provision of necessary equipment 4) Installation of observatories 5) Installation and test 6) Preparation of manuals
Source: JICA Study Team
4.3 Grenada
The proposed projects of theGrenada are shown below. No Term Title of the Project Component
GR-2 Short・ Medium
Capacity Building of NaDMA Staffs
1) Training for disaster mitigation plan, monitoring, and assessment
2) Method to train the community for disaster mitigation
GR-3 Short Mitigation of Landside Water Flooding in St. George
1) Diagnosis 2) Conditions for planning 3) Study on the optimal measure 4) Design of the optimum measure 5) Cost estimate 6) Construction
GR-4 Short・ Medium
Mitigation of Landslide and Debris Flow in the Little River basin
1) Diagnosis 2) Investigation and Monitoring 3) Study and design of landslide countermeasure 4) Study and design of slit dam 5) Construction plan and cost estimates 6) Construction
GR-5 Short・ Medium
Slope Stabilization along the West Coast Road
1) Diagnosis 2) Prioritization of the sites and survey

S-42
No Term Title of the Project Component 3) Study and design of the measures 4) Construction planning and cost estimates 5) Construction
GR-6 Short Training regarding Sediment Disaster
1) Lecture on institution (System, Organization, Regulation, Budgetary procedure)
2) Lecture on erosion phenomena, mechanism, survey, and stabilization menu (Delineation of the dangerous zone, hazard map, structures and warning and evacuation)
3) Site excursion on the stabilization measures in a slope failure dangerous zone
4) Practice on the risk assessment for slope failure : identification of issues and presentation thereof
5) Formulation of an action plan to improve disaster mitigation plan, system and study on the countermeasures
GR-7 Short Training for Mitigation of Coastal Erosion
1) Cause and the mechanism of coastal erosion2) Menu of countermeasures and the merit and
demerit 3) Forecasting method 4) Monitoring and measuring method 5) Coastal erosion and disaster 6) Design of protection against erosion 7) Preservation of coast and coastal
managementGR-8, GR-9
Short・ Medium
Formulation of Disaster Mitigation of Earthquake in St. George’s
1) Existing plan and confirmation of the conditions 2) Update of hazard map for earthquake 3) Study on evacuation route and shelter 4) Risk analysis and preparation of scenario 5) Formulation of disaster prevention 6) Preparation of training materials like disaster
mitigation map and evacuation training 7) Fostering of leader for training
GR-10 Short・ Medium
Formulation of Disaster Mitigation of Tsunami in Towns in the Coastal Area
1) Confirmation of the conditions 2) Preparation of hazard map for tsunami 3) Study on evacuation route and shelter 4) Study on warning 5) Formulation of disaster prevention 6) Preparation of training materials like disaster
mitigation map and evacuation training 7) Fostering of leader for training
Source: JICA Study Team
4.4 Jamaica
The proposed projects of the Jamaica are shown below. No Term Project Title Component
JA-1 Short Rehabilitation Plan of Flat Bridge
1) Diagnosis 2) Review of the future plan 3) Natural condition 4) Design of bridge 5) Design of bank protection

S-43
No Term Project Title Component 6) Cost estimates 7) Construction
JA-2 Shor・Medium
Comprehensive Basin-wide Soil Management Plan for the Rivers in the Southeast Area
1) Diagnosis 2) Study on the sediment productivities 3) Analysis for riverbed variability 4) Study on the control of the sediment productivity 5) Surveys of the sand mining 6) Soil management plan, monitoring plan
JA-3 Short Stabilization of the Slopes along the A3 Road
1) Diagnosis 2) Prioritization and survey 3) Study and design of the countermeasures 4) Cost estimates 5) Construction
JA-4 Short・Medium
Preparation of a Road Hazard Map
1) Diagnosis 2) Development of hazard map for erosion 3) Proposal for monitoring
Source: JICA Study Team
4.5 Suriname
The proposed projects of the Suriname are shown below. No Term Project Title Component
SU-2 Short・ Medium
Capacity Building of NCCR Staff
1) Training for disaster mitigation planning, monitoring, and evaluation
2) Training method for community disaster mitigation
SU-4 Short Development of Topographic Map of Suriname
1) Shooting of air photo 2) Establishment of standard datum 3) Development of digital map 4) Transfer of knowledge for map development
SU-5 Short・ Medium
Drainage Improvement Plan in the Paramaribo Area
1) Diagnosis 2) Study on future development 3) Study on the drainage network 4) Study on the storage 5) Study on the pump station 6) Cost estimates
SU-6 Short Community-based Disaster Mitigation in the Middle Reach Areas of the Marowijine River
1) Diagnosis 2) Development of hazard map 3) Study on shelter and stock yard 4) Study on the evacuation route 5) Training material for community-based disaster
management 6) Training for the leader on disaster mitigation
SU-7 Short・ Medium
Betterment of the Submerged Road in the Section between Apoera and Zanderij
1) Diagnosis 2) Basic conditions 3) Study on the longitudinal and sectional profiles
of the road 4) Study on the countermeasures 5) Design of the selected optimum option 6) Cost estimates 7) Construction
SU-8 Short Countermeasure for Coastal Erosion on the Northern Coast
1) Diagnosis 2) Comparative study 3) Design of the optimum option

S-44
No Term Project Title Component 4) Cost Estimates
SU-9 Short・ Medium
Strengthening of Disaster Mitigation against Tsunami
1) Planning of the observation 2) Installation of observation facility 3) Establishment of monitoring system 4) Establishment of the system for coordination
with other related agencies 5) Establishment of maintenance system
SU-11 SU-12
Medium・ Long
Enforcement of Meteoro-hydrologic Observation Facilities
1) Diagnosis 2) Allocation plan of the new rainfall and water
level gauging stations 3) Plan for maintenance 4) Installation of equipment (Observation and
communication) 5) Renovation of database system
Source: JICA Study Team
4.6 Saint Christopher and Nevis
The proposed projects of the Saint Christopher and Nevis are shown below. No Terms Project Title Component
CN-1 Medium・ Long
Preparation of National Strategy for Disaster Mitigation
1) Diagnosis of responsible organization for disaster mitigation and NEMA
2) Study on the policy of CDEMA 3) Study on the relationship of NEMA and Nevis
Disaster Management Department (NDMD) in Saint Christopher and Nevis
4) Confirmation of the disaster response policy in each island
5) Preparation of the strategy CN-2 Short・
Medium Capacity Building for the Staffs of NEMA/NDMD
1) Capacity building for general disaster mitigation 2) Capacity building for community disaster
mitigation CN-4 Short Development of Hazard
Map for Nevis Island 1) Diagnosis 2) Development of hazard map
CN-5 Short Improvement of Drainage Capacity in Basseterre
1) Diagnosis 2) Urban development plan 3) Study on drainage network, pump station, and
retarding basin 4) Comparative study 5) Design and implementation of the optimum plan
CN-6 Short Betterment of Causeway 1) Diagnosis 2) Design condition 3) Comparative study 4) Design of the optimum plan 5) Cost estimates 6) Construction
CN-9 Short Protection Works for High Tide at Old Road Bay
1) Diagnosis 2) Study on design condition 3) Alternative study 4) Comparative study 5) Cost estimation for the optimum plan 6) Construction
CN-10 Short Disaster Mitigation Focusing on Tourism
1) Diagnosis 2) Renovation of hazard map for North Frigate Bay

S-45
No Terms Project Title Component 3) Study on evacuation route and evacuation center 4) Preparation of evacuation map in multiple
languages 5) Training for evacuation
CN-11 Short Formulation of Disaster Mitigation Plan for Earthquake in Basseterre
1) Confirmation of the existing plans 2) Renovation of hazard map for earthquake 3) Study on evacuation route and evacuation center 4) Risk assessment and preparation of scenario 5) Formulation of disaster mitigation plan 6) Preparation of disaster mitigation materials like
disaster mitigation map and evacuation training 7) Fostering of leaders for disaster mitigation
training Source: JICA Study Team
4.7 Saint Vincent and the Grenadines
The proposed projects of the Saint Vincent and the Grenadines are shown below. No Term Title of the Project Component
SV-2 Short Capacity Building of NEMO Staffs
1) Training to understand disaster mitigation plan, to monitor and to assess
SV-4 Short
Restoration of the Damage Caused by the Flood of the Cumberland River
1) Diagnosis 2) Study on the basic condition 3) Study on the bridges and the appurtenant structures4) Design of the bridges and the appurtenant
structures 5) Construction plan and cost estimates 6) Construction
SV-5, SV-6
Short
Stabilization of the Slope Failure and Coastal Erosion along the Coastal Road in the Eastern Area
1) Diagnosis 2) Selection of the priority sites and survey 3) Study and design of the countermeasure 4) Construction plan and cost estimates 5) Construction
SV-7, SV-8
Short・ Medium
Formulation of Disaster Mitigation Plan for Earthquake in Kings Town
1) Diagnosis 2) Update of the hazard map for earthquake 3) Study on evacuation route and shelter 4) Risk assessment and preparation of scenario 5) Formulation of the plan 6) Preparation of training materials like disaster
mitigation map and evacuation training 7) Training of leaders for disaster mitigation
SV-9 Short・ Medium
Formulation of Disaster Mitigation Plan for Tsunami in Urbanized Areas along the Coast
1) Diagnosis 2) Development of hazard maps for tsunami 3) Study on evacuation route and shelter 4) Study on warning 5) Formulation of disaster management 6) Preparation of training materials like disaster
mitigation map and evacuation training 7) Training of leaders for disaster mitigation
SV-11 Short Water Resources Development Plan for the Grenadines
1) Diagnosis 2) Study on surface and groundwater potential 3) Study on water demand 4) Formulation of water resources development
SV-13 Short Capacity Building for the 1) Training for the maintenance of equipment

S-46
No Term Title of the Project Component Staff for operation and maintenance works
SV-15 Medium Rehabilitation of Equipment for Meteorological Observation
1) Repair of the damaged equipment
Source: JICA Study Team
4.8 Saint Lucia
The proposed projects of the Saint Lucia are shown below. No Term Title of Project Component
SL-2
Short・ Medium
Capacity Building of NEMO Staffs
1) Training to understand disaster mitigation plan, to monitor, and to assess
SL-4
Short・ Medium
Strengthening of Communication in Emergency
1) Dispatching of experts for the strengthening of communication system for disaster
SL-5 Short
Rehabilitation of Bridges on the Trunk Ring Road in the Island
1) Diagnosis 2) Study on bridges and appurtenant structures 3) Design of bridges and appurtenant structures 4) Construction plan and cost estimates 5) Rehabilitation works
SL-6 Short
Stabilization of Slopes Along the Trunk Ring Road in the Island
1) Diagnosis 2) Study on priority and survey 3) Study and design of the countermeasure 4) Construction plan and cost estimates 5) Construction
SL-7 SL-8
Short・ Medium
Disaster Mitigation Plan for Earthquake in Castries
1) Diagnosis 2) Update of the hazard map 3) Study on evacuation route and shelter 4) Risk assessment and preparation of scenario 5) Formulation of disaster mitigation plan 6) Preparation of training materials like disaster
mitigation map and evacuation training 7) Fostering of leader for training on disaster
management SL-9 Short・
Medium Formulation of Disaster Mitigation Plan for Tsunami in the Urbanized Areas along the Coast
1) Diagnosis 2) Development of hazard maps for tsunami 3) Study on evacuation route and shelter 4) Study on warning 5) Formulation of disaster management 6) Preparation of training materials like disaster
mitigation map and evacuation training 7) Training of leaders for disaster mitigation
SL-11 Short
Countermeasures for Sedimentation in the Reservoir of John Compton Dam
1) Review of the existing study 2) Study on the applicability of the technology
developed in Japan 3) Review on the watershed management 4) Implementation of the countermeasures for
sedimentation SL-13
Short
Capacity Building for the Staff of Meteorological Observation
1) Training for meteoro-hydrologic observation 2) Training for maintenance of equipment

S-47
No Term Title of Project Component SL-15 Medium Rehabilitation of the
Meteoro-hydrologic Observation System
1) Rehabilitation of the deteriorated system
Source: JICA Study Team
4.9 Dominica
The proposed projects of the Dominica are shown below. No Term Project Title Component
DM-3
Short・ Medium
Development and Rehabilitation of Evacuation Shelter
1) Diagnosis of the existing evacuation shelter 2) Establishment and evaluation of criteria for the
development and rehabilitation of evacuation shelter
3) Prioritization of the candidates for development and rehabilitation
4) Construction and rehabilitation DM-4 Short
Rehabilitation of the Bridges on the Ring Road in the Surrounding Areas of the Capital
1) Diagnosis 2) Study on the natural conditions 3) Design of bridge 4) Design of bank protection works 5) Construction plan and cost estimates 6) Construction
DM-5 Short
Rehabilitation of Pipeline to Supply Water to the Capital
1) Diagnosis 2) Study on the natural conditions 3) Design of pipeline and bridges 4) Design of the appurtenant structures 5) Construction plan and cost estimates 6) Construction
DM-6 Short
Stabilization of the Slopes Along the Road on the West Coast
1) Diagnosis 2) Prioritization of the sites and survey 3) Design of the stabilization measures 4) Construction plan and cost estimates 5) Construction
DM-7 Short Countermeasure Construction against Antrim Landslide
1) Diagnosis 2) Survey, geological investigation and monitoring 3) Design of the countermeasure 4) Construction plan and cost estimates 5) Construction
DM-8 Short・ Medium
Coastal Zone Disaster Management Plan
1) Diagnosis 2) Development of hazard map for coastal erosion 3) Prioritization of sites 4) Study on the countermeasures and projection
after the implementation of the measures 5) Study on the proposed institution for
maintenance DM-9 Short・
Medium Disaster Mitigation Plan against Earthquake in Roseau
1) Confirmation of the present condition including the existing plans
2) Update of the hazard map for earthquake 3) Study on evacuation route and shelter 4) Risk assessment and preparation of scenario 5) Preparation of disaster management plan 6) Preparation of training materials like disaster
management map and evacuation training 7) Fostering of leaders for training

S-48
No Term Project Title Component DM-10 Short・
Medium Formulation of Disaster Mitigation Plan for Tsunami in Urbanized Areas along the Coast
1) Diagnosis 2) Development of hazard maps for tsunami 3) Study on evacuation route and shelter 4) Study on warning 5) Formulation of disaster management plan 6) Preparation of training materials like disaster
mitigation map and evacuation training 7) Training of leaders for disaster mitigation
DM-11 Medium・Long
Study on the Design Standard for the Disaster Mitigation Structures for Earthquake and Strong Wind
1) Study on the design concepts adopted in other countries
2) Study on the applicability of the standards adopted in other countries
3) Preparation of the proposed standard DM-12 Medium
・Long Water Resources Management Plan
1) Diagnosis 2) Study on groundwater 3) Study on the potential 4) Formulation of water resources management
plan DM-13
Medium・Long
Capacity Building of Meteorological Observation Staff
1) Training for observation 2) Training for the maintenance of equipment
Source: JICA Study Team
4.10 Trinidad and Tobago
The proposed projects of the Trinidad and Tobago are shown below. No. Terms Project Title Component
TT-1 Short・ Medium
Capacity Building of the Ministry of Local Government Staff
1) Capacity enhancement for disaster mitigation
TT-2 Short・ Medium
Stabilization of Slopes Along the Northern Road
1) Diagnosis 2) Selection of the priority sites 3) Study on the countermeasure 4) Construction plan and cost estimates 5) Construction
TT-3 Medium Development of Linkage Road of North Coast Road and Paria Main Road
1) Diagnosis 2) Study on alignment 3) Environmental assessment 4) Design 5) Cost estimates 6) Construction
TT-4 Short Capacity Strengthening for the PURE Staffs for Slope Stabilization Works
1) Seminar on administration for disaster mitigation (system, organization, regulation and budget)
2) Lecture on mechanism, survey and monitoring, stabilization method for mass movement (zoning, hazard map and warning and evacuation)
3) Lecture on design of structural countermeasures
4) Reconnaissance at the site 5) Preparation of the action plan to improve the
existing mitigation plan, mitigation system

S-49
No. Terms Project Title Component and the countermeasure
TT-5 Medium・Long
Study on the Design Criteria for Earthquake
1) Study on the concept of design criteria in other country
2) Study on the applicability of the criteria adopted in other country
3) Proposal of criteria TT-6 Short Implementation of
Countermeasure for Sediment Silting in the Reservoir
1) Study on the siltation 2) Study on countermeasure 3) Cost estimates 4) Construction or provision of equipment
TT-7 Medium・ Long
Betterment of Meteorological Observation System (in case of additional relay station)
1) Diagnosis 2) Study on the location of the relay station 3) Wave propagation test 4) Design of the relay station 5) Estimation of equipment needed 6) Cost estimates 7) Installation and construction
Source: JICA Study Team
4.11 Barbados
The proposed projects of the Barbados are shown below. No Term Title of Project Component
BA-1 Short Formulation of a National Disaster Mitigation Strategy
1) Diagnosis of responsible organization for disaster mitigation and DEM
2) Study on the policy of CDEMA 3) Confirmation of the disaster response policy in
each island 4) Preparation of the strategy
BA-4 Short Capacity Building for the DEM Staff
1) Capacity building for general disaster mitigation 2) Capacity building for community disaster
mitigation BA-5 Medium・
Long Mitigation of Flood by Spring Coming Out from Limestone
1) Review on the existing study 2) Diagnosis (mechanism of spring out) 3) Estimation of flood discharge 4) Study on the countermeasures 5) Design 6) Cost estimates 7) Implementation
BA-6 Short・ Medium
Mitigation of Inundation by Landside Water in Bridgetown
1) Diagnosis of the inundation 2) Alternative study on drainage network and
retarding basin or storage 3) Formulation of drainage plan 4) Design 5) Cost estimates 6) Implementation
BA-9 Short・ Medium
Countermeasure Construction against Landslide in St. Joseph’s Church Area
1) Diagnosis 2) Topo survey and geological survey 3) Monitoring and analysis 4) Study and design of countermeasure 5) Cost estimates 6) Implementation of construction
BA-10 Short・ Countermeasure 1) Diagnosis

S-50
No Term Title of Project Component Medium Construction against
Landslide on road in White Hill
2) Topo survey and geological survey 3) Monitoring and analysis 4) Study and design of countermeasure 5) Cost estimates 6) Implementation of construction
BA-11 Short Disaster Mitigation of Caving in
1) Diagnosis (preparation of cave map) 2) Study on the countermeasure (prioritization) 3) Comparative study 4) Selection and design of pilot project 5) Implementation of the pilot project
BA-12 Short Capacity Strengthening of Soil Conservation Unit in Slope Stabilization
1) Lecture on the administration for disaster mitigation (system organization regulation and budget)
2) Lecture on mass movement (mechanism, method of survey and measure to mitigate disaster such as zoning, hazard map, and warning and evacuation)
3) Lecture on design of structural countermeasures
4) Site reconnaissance 5) Practice on risk analysis and identification
of issue and presentation 6) Practice on preparation of the action plan for
the improvement of disaster management plan, organization and countermeasures
BA-13 Medium・ Long
Study on Design Standard for Earthquake
1) Study on the design concept of other country 2) Applicability of the standard adopted in other
countries 3) Proposal of design standard
BA-14 Short・ Medium
Disaster Mitigation Plan for Earthquake in Bridgetown
1) Confirmation of the existing plans 2) Renovation of hazard map for earthquake 3) Study on evacuation route and evacuation center 4) Risk assessment and preparation of scenario 5) Formulation of disaster mitigation plan 6) Preparation of disaster mitigation materials like
disaster mitigation map and evacuation training 7) Fostering of leaders for disaster mitigation
training BA-15 Short・
Medium Formulation of Disaster Mitigation Plan for Tsunami in the Urbanized Areas along the Coast
1) Diagnosis 2) Development of hazard maps for tsunami 3) Study on evacuation route and shelter 4) Study on warning 5) Formulation of disaster management 6) Preparation of training materials like disaster
mitigation map and evacuation training 7) Training of leaders for disaster mitigation
BA-16 BA-17
Medium・ Long
Improvement of Meteorological Observation System
1) Improvement plan of rainfall gauging network 2) Installation of observatories and data gathering
system 3) Improvement of database system
Source: JICA Study Team

S-51
4.12 Belize
The proposed projects of the Belize are shown below. No Term Project Title Component
BZ-3 Short Road Widening Works of the Narrow Bridge Section in the Trunk Highway(Hummingbird Highway)
1) Diagnosis 2) Study on the existing plans 3) Comparative study on the widening plans 4) Design of the selected optimum plan 5) Construction planning and cost estimates 6) Construction
BZ-4 Short・Medium
Capacity Building for Erosion Management
1) Training on risk assessment, mapping, and plan formulation for the countermeasure of erosion
BZ-5 Short
Development of Countermeasures Against Water Surging and Coastal Erosion in the Coastal Zone
1) Diagnosis 2) Comparative study 3) Design for the selected optimum plan 4) Construction plan and cost estimates 5) Construction
BZ-6 Short・Medium
Disaster Mitigation Plan for Earthquake in Belize City
1) Study on the existing plans 2) Update of the hazard map for earthquake 3) Studies on evacuation route and shelter 4) Risk assessment and preparation of scenario 5) Formulation of disaster mitigation plan 6) Preparation of training materials like disaster
mitigation map and evacuation training 7) Fostering of leaders for training for disaster
mitigation BZ-7 Short・
Medium Formulation of Disaster Mitigation Plan Against Tsunami in the Coastal Zone
1) Study on the existing plans 2) Update of the hazard map for earthquake 3) Studies on evacuation route and shelter 4) Risk assessment and preparation of scenario 5) Formulation of disaster mitigation plan 6) Preparation of training materials like disaster
mitigation map and evacuation training 7) Fostering of leaders for training for disaster
mitigation BZ-8 Medium
・Long Study on the Design Standard for the Disaster Mitigation Structures for Earthquake and Strong Wind
1) Study on the design concepts adopted in other countries
2) Study on the applicability of the standards adopted in other countries
3) Preparation of the proposed standard BZ-9 Medium
Water Resources Management Plan for the Northern Inland
1) Diagnosis 2) Projection of the future water demand 3) Study on groundwater 5) Study on dams 6) Formulation of water resources management plan
BZ-12 Short Capacity Strengthening for Maintenance of Meteorological Observation System
1) Training for meteorological observation 2) Training for maintenance of meteorological
observation system
Source: JICA Study Team
CHAPTER 5 INVITATION PROGRAM AND SEMINOR IN JAPAN
5.1 Prepaeation of Invitation Program in Japan

S-52
Timing of Invitation program
The participants of the invitation program are the staff from disaster-related agencies. The rainy season in the Caribbean countries starts in June. Because it is difficult to invite the participants during the rainy season, the invitation program was scheduled from 21 May to 30 May. Participants
The JICA Study Team explained the purpose, period, and tentative schedule of the invitation program in Japan to the disaster management agency of each country during the field survey of the two representatives each from the disaster management agencies of the participating countries. Thedisaster-related agencies gave the information of the participants in the beginning of May. Ten countries gave the information of their participants except Barbados and Guyana. The disaster-related agency in Guyana sent the information of the participants, but they were not able to get approval from their government. On the other hand, the disaster-related agency in Barbados notified the difficulty of the arrangement of the participants. A total of 17 participants went to Japan. The participants of the invitation program in Japan consist of 16 persons from ten countries and one person from the Caribbean Disaster Emergency Management Agency (CDEMA).
Schedule The schedule of the invitation program in Japan is shown below.
Date Schedule 1 21 May Arrive at Japan
2 22 May Courtesy call to Japan International Cooperation Agency (JICA) Meeting for the preparation of seminar Courtesy call to Ministry of Foreign Affairs (MOFA) Courtesy call to Ministry of Land, Infrastructure, Transportation and Tourism
(MLIT) Courtesy call to World Bank Tokyo Office
3 23 May Site visit in Tokyo Visit Tokyo Rinkai Disaster Park Moving (Tokyo to Osaka)
4 24 May Site visit in Kyoto
5 25 May Visit Uji River (Flood mitigation)
6 26 May Visit Kamenose Landslide Prevention Project Visit Sayama Reservoir Moving (Osaka to Tokyo)
7 27 May Visit Tenku Park (Underground retarding basin) Preparation of the JICA seminar material
8 28 May Attend the JICA seminar Discussion between JICA and participants of each country
9 29 May Discussion between JICA and participants from Belize, Dominica, Saint Lucia, and Saint Vincent and the Grenadines
Site visit in Tokyo
10 30 May Leaving from Japan
Source: JICA Study Team
5.2 Execution of Invitation Program in Japan
Courtesy Call to related Ministries/Agencies The participants visited to JICA head office, Ministry of Foreign Affair, Ministry of Land, Infrastructure, Transportation and Tourism, and World Bank Tokyo Office.

S-53
Follow up Seminar of Japan-CARICOM Relations The JICA seminar titled “Follow up seminar of Japan-CARICOM Relations: Present Situation of Disaster Prevention Sector in CARICOM” was held at the Conference Room 8A, 8th Floor, Takebashi Godo Building on 28 May, 2015, 9:30 to 12:30 and 51 persons attended. It was mainly sponsored by JICA and co-organized by the Tokyo Disaster Risk Management in Tokyo Hub, World Bank, and MOFA. The schedule of the seminar is summarized below.
9:00-9:30 Registration
9:30-9:35 Opening Speech Vice President of JICA, KUROYANAGI Tosiyuki
9:35-9:55 Assistance to CARICOM countries from Japan
Ministry of Foreign Affairs, International Cooperation Bureau, Country Assistance Planning Division II Assistant Manager HISHIYAMA Satoru
9:55-10:10 Problems and Needs for disaster prevention sector in CARICOM Area
JICA Study Team for Data Collection Survey on Disaster Risk Management in CARICOM
Team Leader AZUMA Yasuhiro
10:10-10:25 Future prospects and activities for disaster prevention sector in JICA
JICA Global Environmental Division,Water Resources and Disaster Management Group Deputy Director AKIYAMA Shintaro
10-25-10:40 Future prospects and activities for disaster prevention sector in CARICOM area
World Bank, Global Lead for Resilience and Disaster Risk Management Niels Holm Nielsen
10:40-10:50 Break
(1st session) 10:50-11:40 2nd Session) 11:40-12:30
Panel Discussion Present Situation and Problems of the disaster prevention sector in CARICOM area and expectation for Japan 1st Session: Investment of Disaster Prevention under Public Works 2nd Session: Mainstreaming of Disaster Prevention beyond the Organizations
Moderator: JICA Global Environmental Division, Senior Advisor BABA Hitoshi Commentator: World Bank: Global Lead for Resilience and Disaster Risk Management Niels Holm Nielsen Panelist (1st session) Participants from Belize, Dominica, Saint Christopher and Nevis, Saint Vincent and the Grenadines, Suriname Panellist Participants from Antigua and Barbuda, Grenada, Jamaica, Saint Lucia, Trinidad and Tobago, and CDEMA
Source: JICA Study Team

S-54
Exchange of Opinion JICA explained the issues and countermeasures as results of the field investigation and JICA and the participants of each country also discussed after the seminar in Takebashi Godo Building on 28 May, 2015 and at JICA head office in the beforenoon of 29 May, 2015.

i
Data Collection Survey on
Disaster Risk Management in
CARICOM Countries
Final Report
Table of Contents
Location Map Summary Table of Contents Abbreviation
Page
CHAPTER 1 OUTLINE OF THE SURVEY ............................................................................ 1-1
1.1 Background of the Survey .............................................................................................. 1-1
1.2 Objectives of the Survey ................................................................................................ 1-1
1.3 Target Countries and Type of Disasters ......................................................................... 1-1
1.4 Field Work ...................................................................................................................... 1-3
1.4.1 Overall Survey Schedule................................................................................. 1-3
1.4.2 Agencies Visited for Meetings ........................................................................ 1-4
1.5 Composition of Report ................................................................................................... 1-7
CHAPTER 2 PRESENT SITUATION OF SURVEY COUNTRIES ........................................... 2-1
2.1 Antigua and Barbuda ..................................................................................................... 2-1
2.1.1 Profile ............................................................................................................. 2-1
2.1.2 Disaster Situation ............................................................................................ 2-5
2.1.3 Present Disaster Management ....................................................................... 2-11
2.1.4 Meteorological and Hydrologic Services ...................................................... 2-13
2.1.5 Support of the Japanese Government ........................................................... 2-15
2.1.6 Support of Other Donors ............................................................................... 2-15
2.2 Guyana ......................................................................................................................... 2-16
2.2.1 Profile ........................................................................................................... 2-16
2.2.2 Disaster Situation .......................................................................................... 2-19
2.2.3 Present Disaster Management ....................................................................... 2-30
2.2.4 Meteorological and Hydrologic Services ...................................................... 2-33
2.2.5 Support of the Japanese Government ........................................................... 2-34

ii
page
2.2.6 Support of Other Donors ............................................................................... 2-34
2.3 Grenada ........................................................................................................................ 2-35
2.3.1 Profile ........................................................................................................... 2-35
2.3.2 Disaster Situation .......................................................................................... 2-39
2.3.3 Present Disaster Management ....................................................................... 2-46
2.3.4 Meteorological and Hydrologic Services ...................................................... 2-47
2.3.5 Support of the Japanese Government ........................................................... 2-49
2.3.6 Support of Other Donors ............................................................................... 2-49
2.4 Jamaica ......................................................................................................................... 2-50
2.4.1 Profile ........................................................................................................... 2-50
2.4.2 Disaster Situation .......................................................................................... 2-53
2.4.3 Present Disaster Management ....................................................................... 2-65
2.4.4 Meteorological and Hydrologic Services ...................................................... 2-65
2.4.5 Support of the Japanese Government ........................................................... 2-66
2.4.6 Support of Other Donors ............................................................................... 2-67
2.5 Suriname ...................................................................................................................... 2-69
2.5.1 Profile ........................................................................................................... 2-69
2.5.2 Disaster Situation .......................................................................................... 2-73
2.5.3 Present Disaster Management ....................................................................... 2-75
2.5.4 Meteorological and Hydrologic Services ...................................................... 2-77
2.5.5 Support of the Japanese Government ........................................................... 2-79
2.5.6 Support of Other Donors ............................................................................... 2-79
2.6 Saint Christopher and Nevis ........................................................................................ 2-80
2.6.1 Profile ........................................................................................................... 2-80
2.6.2 Disaster Situation .......................................................................................... 2-85
2.6.3 Present Disaster Management ....................................................................... 2-88
2.6.4 Meteorological and Hydrologic Services ...................................................... 2-90
2.6.5 Support of the Japanese Government ........................................................... 2-92
2.6.6 Support of Other Donors ............................................................................... 2-92
2.7 Saint Vincent and the Grenadines ................................................................................ 2-93
2.7.1 Profile ........................................................................................................... 2-93
2.7.2 Disaster Situation .......................................................................................... 2-96
2.7.3 Present Disaster Management ..................................................................... 2-106
2.7.4 Meteorological and Hydrologic Services .................................................... 2-106
2.7.5 Support of Other Donors ............................................................................. 2-107

iii
page
2.8 Saint Lucia ................................................................................................................. 2-109
2.8.1 Profile ......................................................................................................... 2-109
2.8.2 Disaster Situation ........................................................................................ 2-113
2.8.3 Present Disaster Management ..................................................................... 2-123
2.8.4 Meteorological and Hydrologic Services .................................................... 2-124
2.8.5 Support of the Japanese Government ......................................................... 2-124
2.8.6 Support of Other Donors ............................................................................. 2-124
2.9 Dominica .................................................................................................................... 2-126
2.9.1 Profile ......................................................................................................... 2-126
2.9.2 Disaster Situation ........................................................................................ 2-131
2.9.3 Present Disaster Management ..................................................................... 2-143
2.9.4 Meteorological and Hydrologic Services .................................................... 2-143
2.9.5 Support of the Japanese Government ......................................................... 2-144
2.9.6 Support of Other Donors ............................................................................. 2-144
2.10 Trinidad and Tobago .................................................................................................. 2-146
2.10.1 Profile ......................................................................................................... 2-146
2.10.2 Disaster Situation ........................................................................................ 2-150
2.10.3 Present Disaster Management ..................................................................... 2-154
2.10.4 Meteorological and Hydrologic Services .................................................... 2-155
2.10.5 Support of the Japanese Government ......................................................... 2-157
2.10.6 Support of Other Donors ............................................................................. 2-157
2.11 Barbados .................................................................................................................... 2-158
2.11.1 Profile ......................................................................................................... 2-160
2.11.2 Disaster Situation ........................................................................................ 2-161
2.11.3 Present Disaster Management ..................................................................... 2-166
2.11.4 Meteorological and Hydrologic Services .................................................... 2-166
2.11.5 Support of the Japanese Government ......................................................... 2-168
2.11.6 Support of Other Donors ............................................................................. 2-168
2.12 Belize ......................................................................................................................... 2-169
2.12.1 Profile ......................................................................................................... 2-169
2.12.2 Disaster Situation ........................................................................................ 2-172
2.12.3 Present Disaster Management ..................................................................... 2-182
2.12.4 Meteorological and Hydrologic Services .................................................... 2-183
2.12.5 Support of the Japanese Government ......................................................... 2-184
2.12.6 Support of Other Donors ............................................................................. 2-184

iv
Page
2.13 Organization of CARICOM ....................................................................................... 2-185
2.13.1 Caribbean Disaster Emergency Management Agency (CDEMA) .............. 2-185
2.13.2 Caribbean Institute Meteorology and Hydrology (CIMH) ......................... 2-186
2.13.3 Seismic Research Center ............................................................................ 2-187
CHAPTER 3 ISSUES ON DISASTER MANAGEMENT OF SURVEY COUNTRIES ............ 3-1
3.1 Antigua and Barbuda ..................................................................................................... 3-1
3.1.1 Issues on Disaster Prevention Administration ................................................ 3-1
3.1.2 Issues on Structural Measures ......................................................................... 3-3
3.1.3 Issues on Non-structural Measures ................................................................. 3-5
3.1.4 Issues Related to Meteorological and Hydrologic Observations .................... 3-7
3.1.5 Related Issues on Disaster Prevention in Antigua and Barbuda ..................... 3-8
3.2 Guyana ........................................................................................................................... 3-9
3.2.1 Issues on Disaster Prevention Administration ................................................ 3-9
3.2.2 Issues on Structural Measures ......................................................................... 3-9
3.2.3 Issues on Non-structural Measures ............................................................... 3-12
3.2.4 Issues Related to Meteorological and Hydrologic Observations .................. 3-12
3.2.5 Related Issues on Disaster Prevention in Guyana ......................................... 3-13
3.3 Grenada ........................................................................................................................ 3-14
3.3.1 Issues on Disaster Prevention Administration .............................................. 3-14
3.3.2 Issues on Structural Measures ....................................................................... 3-14
3.3.3 Issues on Non-structural Measures ............................................................... 3-17
3.3.4 Issues Related to Meteorological and Hydrologic Observations .................. 3-18
3.3.5 Related Issues on Disaster Prevention in Grenada........................................ 3-18
3.4 Jamaica ......................................................................................................................... 3-20
3.4.1 Issues on Structural Measures ....................................................................... 3-20
3.4.2 Issues on Non-structural Measures ............................................................... 3-21
3.4.3 Related Issues on Disaster Prevention in Jamaica ........................................ 3-21
3.5 Suriname ...................................................................................................................... 3-22
3.5.1 Issues on Disaster Prevention Administration .............................................. 3-22
3.5.2 Issues on Structural Measures ....................................................................... 3-22
3.5.3 Issues on Non-structural Measures ............................................................. 3-22
3.5.4 Issues Related to Meteorological and Hydrologic Observations .................. 3-24
3.5.5 Related Issues on Disaster Prevention in Suriname ...................................... 3-25

v
Page
3.6 Saint Christopher and Nevis ........................................................................................ 3-26
3.6.1 Issues on Disaster Prevention Administration .............................................. 3-26
3.6.2 Issues on Structural Measures ....................................................................... 3-26
3.6.3 Issues on Non-structural Measures ............................................................... 3-28
3.6.4 Issues Related to Meteorological and Hydrologic Observations .................. 3-29
3.6.5 Related Issues on Disaster Prevention in Saint Christopher and Nevis ........ 3-29
3.7 Saint Vincent and the Grenadines ................................................................................ 3-31
3.7.1 Issues on Disaster Prevention Administration .............................................. 3-31
3.7.2 Issues on Structural Measures ....................................................................... 3-31
3.7.3 Issues on Non-structural Measures ............................................................... 3-32
3.7.4 Issues Related to Meteorological and Hydrologic Observations .................. 3-33
3.7.5 Related Issues on Disaster Prevention in Saint Vincent and the Grenadines .................................................................................................... 3-34
3.8 Saint Lucia ................................................................................................................... 3-35
3.8.1 Issues on Disaster Prevention Administration .............................................. 3-35
3.8.2 Issues on Structural Measures ....................................................................... 3-35
3.8.3 Issues on Non-structural Measures ............................................................... 3-36
3.8.4 Issues Related to Meteorological and Hydrologic Observations .................. 3-37
3.8.5 Related Issues on Disaster Prevention in Saint Lucia ................................... 3-39
3.9 Dominica ...................................................................................................................... 3-40
3.9.1 Issues on Disaster Prevention Administration .............................................. 3-40
3.9.2 Issues on Structural Measures ....................................................................... 3-40
3.9.3 Issues on Non-structural Measures ............................................................... 3-41
3.9.4 Issues Related to Meteorological and Hydrologic Observations .................. 3-43
3.9.5 Related Issues on Disaster Prevention in Dominica ..................................... 3-43
3.10 Trinidad and Tobago .................................................................................................... 3-44
3.10.1 Issues on Disaster Prevention Administration .............................................. 3-44
3.10.2 Issues on Structural Measures ....................................................................... 3-44
3.10.3 Issues on Non-structural Measures ............................................................... 3-45
3.10.4 Issues Related to Meteorological and Hydrologic Observations .................. 3-46
3.10.5 Related Issues on Disaster Prevention in Trinidad and Tobago .................... 3-47

vi
Page
3.11 Barbados ...................................................................................................................... 3-48
3.11.1 Issues on Disaster Prevention Administration .............................................. 3-48
3.11.2 Issues on Structural Measures ....................................................................... 3-48
3.11.3 Issues on Non-structural Measures ............................................................... 3-50
3.11.4 Issues Related to Meteorological and Hydrologic Observations .................. 3-50
3.11.5 Related Issues on Disaster Prevention in Barbados ...................................... 3-51
3.12 Belize ........................................................................................................................... 3-52
3.12.1 Issues on Disaster Prevention Administration .............................................. 3-52
3.12.2 Issues on Structural Measures ....................................................................... 3-52
3.12.3 Issues on Non-structural Measures ............................................................... 3-53
3.12.4 Issues Related to Meteorological and Hydrologic Observations .................. 3-55
3.12.5 Related Issues on Disaster Prevention in Belize ........................................... 3-56
CHAPTER 4 PROPOSED MEASURES BY NATION ............................................................... 4-1
4.1 Antigua and Barbuda ..................................................................................................... 4-1
4.1.1 General Matters for Disaster Management ..................................................... 4-1
4.1.2 Flood ............................................................................................................... 4-4
4.1.3 High Tide, Earthquake, Tsunami, Strong Wind, and Drought ........................ 4-5
4.1.4 Meteoro-hydrologic Observation .................................................................... 4-9
4.1.5 List of Conceivable Projects ......................................................................... 4-11
4.2 Guyana ......................................................................................................................... 4-12
4.2.1 General Matters for Disaster Management ................................................... 4-12
4.2.2 Flood ............................................................................................................. 4-13
4.2.3 High Tide, Earthquake, Tsunami, Strong Wind, and Water Shortage ........... 4-14
4.2.4 Meteoro-hydrologic Observation .................................................................. 4-18
4.2.5 List of Conceivable Projects ......................................................................... 4-19
4.3 Grenada ........................................................................................................................ 4-21
4.3.1 General Matters for Disaster Management ................................................... 4-21
4.3.2 Flood, Mass Movement, High Tide, Earthquake, Tsunami, and Drought ..... 4-22
4.3.3 Meteoro-hydrologic Observation .................................................................. 4-27
4.3.4 List of Conceivable Projects ......................................................................... 4-27
4.4 Jamaica ......................................................................................................................... 4-29
4.4.1 Flood ............................................................................................................. 4-29
4.4.2 Mass Movement ............................................................................................ 4-30
4.4.3 List of Conceivable Projects ......................................................................... 4-31

vii
Page
4.5 Suriname ...................................................................................................................... 4-32
4.5.1 General Matters for Disaster Management ................................................... 4-32
4.5.2 Flood, High Tide, and Tsunami ..................................................................... 4-33
4.5.3 Meteoro-hydrologic Observation .................................................................. 4-36
4.5.4 List of Conceivable Projects ......................................................................... 4-37
4.6 Saint Christopher and Nevis ........................................................................................ 4-39
4.6.1 General Matters for Disaster Management ................................................... 4-39
4.6.2 Flood ............................................................................................................. 4-40
4.6.3 Mass Movement, High Tide, Earthquake, Tsunami, and Strong Wind ......... 4-42
4.6.4 Meteoro-hydrologic Observation .................................................................. 4-44
4.6.5 List of Conceivable Projects ......................................................................... 4-45
4.7 Saint Vincent and the Grenadines ................................................................................ 4-47
4.7.1 General Matters for Disaster Management ................................................... 4-47
4.7.2 Flood, Mass Movement, High Tide, Earthquake, Tsunami, Strong Wind, and Water Shortage ....................................................................................... 4-48
4.7.3 Observation of Meteoro-Hydrology ............................................................. 4-51
4.7.4 List of Conceivable Projects ......................................................................... 4-52
4.8 Saint Lucia ................................................................................................................... 4-54
4.8.1 General Matters for Disaster Management ................................................... 4-54
4.8.2 Flood, Mass Movement, High Tide, Earthquake, and Tsunami .................... 4-55
4.8.3 Meteoro-Hydrologic Observation ................................................................. 4-58
4.8.4 List of Conceivable Projects ......................................................................... 4-60
4.9 Dominica ...................................................................................................................... 4-61
4.9.1 General Matters for Disaster Management ................................................... 4-61
4.9.2 Flood, Mass Movement, High Tide, Earthquake, and Tsunami .................... 4-62
4.9.3 Meteoro-Hydrologic Observation ................................................................. 4-66
4.9.4 List of Conceivable Projects ......................................................................... 4-67
4.10 Trinidad and Tobago .................................................................................................... 4-69
4.10.1 General Matters for Disaster Management ................................................... 4-69
4.10.2 List of Conceivable Projects ......................................................................... 4-73
4.11 Barbados ...................................................................................................................... 4-74
4.11.1 General Matters for Disaster Management ................................................... 4-74
4.11.2 Flood ............................................................................................................. 4-75
4.11.3 Mass Movement, Earthquake, and Tsunami ................................................. 4-77
4.11.4 Meteoro-Hydrologic Observation ................................................................. 4-80
4.11.5 List of Conceivable Projects ......................................................................... 4-81
viii
Page
4.12 Belize ........................................................................................................................... 4-83
4.12.1 General Matters for Disaster Management ................................................... 4-83
4.12.2 Flood, Mass Movement, High Tide, Earthquake, Tsunami, Strong Wind, and Water Shortage .................................................................................. .... 4-84
4.12.3 Meteoro-Hydrologic Observation ................................................................. 4-87
4.12.4 List of Conceivable Projects ......................................................................... 4-89
4.13 Common Problems and the Countermeasures for Several Countries .......................... 4-90
4.13.1 CDEMA ........................................................................................................ 4-90
4.13.2 Seismic Research Center .............................................................................. 4-90
CHAPTER 5 INVITATION PROGRAM AND SEMINAR IN JAPAN ...................................... 5-1
5.1 Preparation of Invitation Program in Japan ................................................................... 5-1
5.2 Execution of Invitation Program in Japan ...................................................................... 5-3
5.2.1 Courtesy Call to Related Ministries/Agencies ................................................ 5-3
5.2.2 Outline of Site Investigation ........................................................................... 5-4
5.2.3 Follow-up Seminar of Japan-CARICOM Relations ....................................... 5-5
5.2.4 Exchange of Opinion ...................................................................................... 5-8
5.3 Observation on the Invitation Program in Japan ............................................................ 5-8
5.3.1 Result of Questionnaire .................................................................................. 5-8
5.3.2 Observation of Invitation Program in Japan based on Questionnaire ........... 5-12

ix
List of Tables Page
Table 1.3.1 Disaster Situation in CARICOM ........................................................................... 1-2
Table 1.3.2 Grouping of the Disaster Types in the Survey ....................................................... 1-3
Table 1.4.1 Field Work ............................................................................................................. 1-3
Table 2.1.1 Basic Data of Antigua and Barbuda ...................................................................... 2-1
Table 2.1.2 Change in Population in Antigua and Barbuda...................................................... 2-4
Table 2.1.3 Nominal GNI and GDP per Capita in Antigua and Barbuda ................................. 2-4
Table 2.1.4 Central Government Agencies of Antigua and Barbuda ........................................ 2-4
Table 2.1.5 Parish and Dependency in Antigua and Barbuda .................................................. 2-5
Table 2.1.6 Major Hurricanes in Antigua and Barbuda ............................................................ 2-6
Table 2.1.7 Major Earthquakes in Antigua and Barbuda ........................................................ 2-10
Table 2.1.8 Past Tsunamis that Attacked Antigua and Barbuda ............................................. 2-10
Table 2.1.9 National Disaster Committee Members .............................................................. 2-12
Table 2.1.10 Staffing Position of NODS .................................................................................. 2-13
Table 2.2.1 Basic Data of Guyana .......................................................................................... 2-16
Table 2.2.2 Change in Population in Guyana ......................................................................... 2-18
Table 2.2.3 Nominal GNI and GDP per Capita in Guyana .................................................... 2-18
Table 2.2.4 Central Government Agencies of Guyana ........................................................... 2-18
Table 2.2.5 Administrative Regions in Guyana ...................................................................... 2-19
Table 2.2.6 Major Flood Disasters in Guyana (1900-2013) ................................................... 2-20
Table 2.2.7 Bridges Inspected and their Situation .................................................................. 2-26
Table 2.2.8 Recently Prepared Policies and Plans in Guyana Related to Disasters ............... 2-30
Table 2.3.1 Basic Data of Grenada ......................................................................................... 2-35
Table 2.3.2 Change in Population in Grenada ........................................................................ 2-38
Table 2.3.3 Nominal GNI and GDP per Capita in Grenada ................................................... 2-38
Table 2.3.4 Central Government Agencies of Grenada .......................................................... 2-39
Table 2.3.5 Parishes and Dependency in Grenada ................................................................. 2-39
Table 2.3.6 Major Hurricanes in Grenada .............................................................................. 2-40
Table 2.3.7 Major Sediment Disasters that Recently Occurred in Grenada ........................... 2-42
Table 2.3.8 Major Earthquakes in Grenada ............................................................................ 2-45
Table 2.3.9 Past Tsunami that Attacked Grenada ................................................................... 2-45
Table 2.3.10 Members of National Emergency Advisory Council ........................................... 2-47
Table 2.3.11 Existing Meteorological Stations in Grenada ...................................................... 2-48
Table 2.4.1 Basic Data of Jamaica ......................................................................................... 2-50
Table 2.4.2 Change in Population in Jamaica......................................................................... 2-52
Table 2.4.3 Nominal GNI and GDP per Capita in Jamaica .................................................... 2-52

x
Page
Table 2.4.4 Central Government Agencies of Jamaica ........................................................... 2-53
Table 2.4.5 Administrative Parishes in Jamaica ..................................................................... 2-53
Table 2.4.6 Major Hurricane and Downpour Disasters in Jamaica ........................................ 2-54
Table 2.4.7 Past Damages by Storm Surge and Tsunami in Jamaica ..................................... 2-59
Table 2.4.8 Past Major Earthquakes Which Caused Severe Damages in Jamaica / Summary of Typical Earthquake Damages in Jamaica ....................................... 2-61
Table 2.4.9 Locations and Situations of Bridges and Roads during Field Inspection ............ 2-62
Table 2.5.1 Basic Data of Suriname ....................................................................................... 2-69
Table 2.5.2 Change in Population in Suriname ...................................................................... 2-72
Table 2.5.3 Nominal GNI and GDP per Capita in Suriname .................................................. 2-72
Table 2.5.4 Central Government Agencies of Suriname ........................................................ 2-72
Table 2.5.5 Local Administrative Districts in Suriname ........................................................ 2-73
Table 2.6.1 Basic Data of Saint Christopher and Nevis ......................................................... 2-80
Table 2.6.2 Change in Population in Saint Christopher and Nevis ........................................ 2-83
Table 2.6.3 Nominal GNI and GDP per Capita in Saint Christopher and Nevis .................... 2-84
Table 2.6.4 Central Government Agencies of Saint Christopher and Nevis .......................... 2-84
Table 2.6.5 Parishes in Saint Christopher and Nevis .............................................................. 2-84
Table 2.6.6 Major Hurricanes in Saint Christopher and Nevis ............................................... 2-85
Table 2.6.7 Major Earthquakes in Saint Christopher and Nevis ............................................ 2-88
Table 2.6.8 Past Tsunami Attacked Saint Christopher and Nevis ........................................... 2-88
Table 2.6.9 Members of the National Disaster Committee .................................................... 2-89
Table 2.6.10 Existing Meteorological Observation Stations in Saint Christopher ................... 2-90
Table 2.7.1 Basic Data of Saint Vincent and the Grenadines ................................................. 2-93
Table 2.7.2 Change in Population in Saint Vincent and the Grenadines ................................ 2-95
Table 2.7.3 Nominal GNI and GDP per Capita in Saint Vincent and the Grenadines ............ 2-95
Table 2.7.4 Central Government Agencies of Saint Vincent and the Grenadines .................. 2-96
Table 2.7.5 Administrative Regions in Saint Vincent and the Grenadines ............................. 2-96
Table 2.7.6 Major Disasters and Damages from 1900 to 2013 in Saint Vincent and the Grenadines ........................................................................................................... 2-97
Table 2.7.7 Major Hurricane and Downpour Disasters and Damages ................................... 2-97
Table 2.7.8 Major Sediment Disasters in the Saint Vincent Island (19th Century to Date) .................................................................................................................... 2-99
Table 2.7.9 Major Earthquakes Observed in Saint Vincent and Grenadines ........................ 2-101
Table 2.7.10 Locations and Situations of Bridges and Roads during Field Inspection .......... 2-102
Table 2.8.1 Basic Data of Saint Lucia .................................................................................. 2-109
Table 2.8.2 Change in Population in Saint Lucia ................................................................. 2-112

xi
Page
Table 2.8.3 Nominal GNI and GDP per Capita in Saint Lucia ............................................. 2-112
Table 2.8.4 Central Government Agencies of Saint Lucia ................................................... 2-112
Table 2.8.5 Administrative Regions in Saint Lucia .............................................................. 2-113
Table 2.8.6 Severe Natural Disasters in Saint Lucia in the Past 100 Years .......................... 2-114
Table 2.8.7 Major Sediment Disasters in Saint Lucia .......................................................... 2-116
Table 2.8.8 Major Earthquakes Observed in Saint Lucia ..................................................... 2-118
Table 2.8.9 Situation of Disaster-Stricken Bridges .............................................................. 2-119
Table 2.8.10 Recent Donor’s Support in Disaster Management Field in Saint Lucia ............ 2-125
Table 2.9.1 Basic Data of Dominica ..................................................................................... 2-126
Table 2.9.2 Change in Population in Dominica .................................................................... 2-130
Table 2.9.3 Nominal GNI and GDP per Capita in Dominica ............................................... 2-130
Table 2.9.4 Central Government Agencies of Dominica ...................................................... 2-130
Table 2.9.5 Administrative Parishes in Dominica ................................................................ 2-131
Table 2.9.6 Major Flood and Sediment Disasters in Dominica ............................................ 2-132
Table 2.9.7 Major Sediment Disaster that Occurred in Dominica (1806–2014) .................. 2-135
Table 2.9.8 Major Earthquakes Observed in Dominica (18th Century to Date) .................. 2-137
Table 2.9.9 Inspected Bridges in Dominica.......................................................................... 2-139
Table 2.10.1 Basic Data of Trinidad and Tobago ................................................................... 2-146
Table 2.10.2 Change in Population in Trinidad and Tobago .................................................. 2-148
Table 2.10.3 Nominal GNI and GDP per Capita in Trinidad and Tobago .............................. 2-149
Table 2.10.4 Central Government Agencies of Trinidad and Tobago .................................... 2-149
Table 2.10.5 Local Administrative Districts in Trinidad and Tobago ..................................... 2-150
Table 2.10.6 Records of Tropical Storms and Hurricanes in Trinidad and Tobago ................ 2-151
Table 2.10.7 Recent Sediment Disasters in Trinidad and Tobago .......................................... 2-152
Table 2.10.8 Major Earthquakes in Trinidad and Tobago ...................................................... 2-153
Table 2.10.9 Past Tsunami that Attacked Trinidad and Tobago .............................................. 2-154
Table 2.11.1 Basic Data of Barbados ..................................................................................... 2-158
Table 2.11.2 Change in Population in Barbados .................................................................... 2-160
Table 2.11.3 Nominal GNI and GDP per Capita in Barbados ................................................ 2-161
Table 2.11.4 Central Government Agencies of Barbados ...................................................... 2-161
Table 2.11.5 Parishes in Barbados .......................................................................................... 2-161
Table 2.11.6 Major Hurricanes in Barbados ........................................................................... 2-162
Table 2.11.7 Major Earthquakes in Barbados ........................................................................ 2-165
Table 2.11.8 Past Tsunami that Attacked Barbados ................................................................ 2-165
Table 2.11.9 Surface Meteorological Observations in Barbados ........................................... 2-167
Table 2.11.10 Tide Level and Surge Observation Stations in Barbados .................................. 2-167

xii
Page
Table 2.12.1 Basic Data of Belize .......................................................................................... 2-169
Table 2.12.2 Change in Population in Belize ......................................................................... 2-171
Table 2.12.3 Nominal GNI and GDP per Capita in Belize ..................................................... 2-171
Table 2.12.4 Central Government Agencies of Belize ........................................................... 2-172
Table 2.12.5 Administrative Districts in Belize ..................................................................... 2-172
Table 2.12.6 Inspected Bridges in Belize ............................................................................... 2-177
Table 2.13.1 CDEMA’s Member Countries ........................................................................... 2-185
Table 2.13.2 Sub-Regional Focal Points and Countries/Area ................................................ 2-185
Table 2.13.3 Contributing Countries to the Seismic Research Centre ................................... 2-187
Table 2.13.4 Project Profiles of SRC Projects with Donors ................................................... 2-189
Table 3.1.1 Issues Related to Disaster Management in Antigua and Barbuda ......................... 3-8
Table 3.2 .1 Local Drainage Project in Georgetown ................................................................. 3-9
Table 3.2.2 Local Drainage Project in Georgetown (Proposed Project Expecting Japanese Support) ................................................................................................ 3-10
Table 3.2.3 Issues Related to Disaster Management in Guyana ............................................. 3-13
Table 3.3.1 Issues Related to Disaster Management in Grenada ............................................ 3-19
Table 3.4.1 Issues Related to Disaster Management in Jamaica ............................................ 3-21
Table 3.5.1 Issues Related to Disaster Management in Suriname .......................................... 3-25
Table 3.6.1 Issues Related to Disaster Management in Saint Christopher and Nevis ............ 3-30
Table 3.7.1 Issues Related to Disaster Management in Saint Vincent and the Grenadines ........................................................................................................... 3-34
Table 3.8.1 Issues Related to Disaster Management in Saint Lucia ....................................... 3-39
Table 3.9.1 Issues Related to Disaster Management in Dominica ......................................... 3-43
Table 3.10.1 Dams in Trinidad and Tobago.............................................................................. 3-44
Table 3.10.2 Issues Related to Disaster Management in Trinidad and Tobago ........................ 3-47
Table 3.11.1 Issues Related to Disaster Management in Barbados .......................................... 3-51
Table 3.12.1 Issues Related to Disaster Management in Belize ............................................... 3-56
Table 4.1.1 Issues, Countermeasures and Terms Regarding General Matters for Disaster Management in Antigua and Barbuda ..................................................... 4-3
Table 4.1.2 Issues, Countermeasures and Terms Regarding Flood Management in Antigua and Barbuda ............................................................................................. 4-5
Table 4.1.3 Issues, Countermeasures and Terms Regarding High Tide, Earthquake, Tsunami, Strong Wind, and Drought in Antigua and Barbuda .............................. 4-8
Table 4.1.4 Issues, Countermeasures and Terms Regarding Meteorological and Hydrologic Observation in Antigua and Barbuda ............................................... 4-10
Table 4.1.5 List of Conceivable Projects in Antigua and Barbuda ......................................... 4-11
xiii
Page
Table 4.2.1 Issues, Countermeasures and Terms Regarding General Matters for Disaster Management in Guyana ......................................................................... 4-13
Table 4.2.2 Issues, Countermeasures and Term Related to Flood in Guyana ........................ 4-14
Table 4.2.3 Issues, Countermeasures and Terms for Surge, Earthquake, Tsunami, Strong Wind and Water Shortage in Guyana ....................................................... 4-17
Table 4.2.4 Issues, Countermeasures and Terms for Meteoro-Hydrologic Observation in Guyana ............................................................................................................ 4-19
Table 4.2.5 List of Conceivable Projects in Guyana .............................................................. 4-19
Table 4.3.1 Issues, Countermeasures and Terms Regarding General Matters for Disaster Management in Grenada ........................................................................ 4-22
Table 4.3.2 Issues, Countermeasures and Terms for High Tide, Earthquake, Tsunami, Strong Wind, and Water Shortage in Grenada ..................................................... 4-26
Table 4.3.3 Issues, Countermeasures and Terms for Meteoro-Hydrologic Observation in Grenada ........................................................................................................... 4-27
Table 4.3.4 List of Conceivable Projects in Grenada ............................................................. 4-27
Table 4.4.1 Issues, Countermeasures and Terms Related to Flood in Jamaica....................... 4-29
Table 4.4.2 Issues, Countermeasures and Terms Rgarding Erosion in Jamaica ..................... 4-30
Table 4.4.3 List of Conceivable Projects in Jamaica .............................................................. 4-31
Table 4.5.1 Issues, Countermeasures and Terms Regarding General Matters for Disaster Management in Suriname ...................................................................... 4-33
Table 4.5.2 Issues, Countermeasures and Terms Regarding Flood, Surge and Tsunami in Suriname .......................................................................................................... 4-35
Table 4.5.3 Issues, Countermeasures and Terms for Meteoro-hydrologic Observation in Suriname .............................................................................................................. 4-37
Table 4.5.4 List of Conceivable Projects in Suriname ........................................................... 4-37
Table 4.6.1 Issues, Countermeasures, and Terms Regarding General Matters for Disaster Management in Saint Christopher and Nevis ........................................ 4-40
Table 4.6.2 Issues, Countermeasures and Terms Regarding Flood in Saint Christopher and Nevis ............................................................................................................. 4-41
Table 4.6.3 Issues, Countermeasures and Term Regarding Mass Movement, High Tide, Tsunami, Earthquake, and Strong Wind in Saint Christopher and Nevis ............ 4-44
Table 4.6.4 Issues, Countermeasures, and Terms Regarding Meteorological and Hydrologic Observation in Saint Christopher and Nevis .................................... 4-45
Table 4.6.5 Proposed Projects List for Saint Christopher and Nevis ..................................... 4-46
Table 4.7.1 Issues, Countermeasures and Terms Regarding General Disaster Management in Saint Vincent and the Grenadines .............................................. 4-48
Table 4.7.2 Issues, Countermeasures and Terms for Flood, Erosion, Surging, Earthquake, Tsunami, Strong Wind, and Water Shortage in Saint Vincent and the Grenadines .............................................................................................. 4-51

xiv
Page
Table 4.7.3 Issues, Countermeasures and Terms Regarding Meteoro-Hydrologic Observation in Saint Vincent and the Grenadines ............................................... 4-52
Table 4.7.4 List of Conceivable Projects in Saint Vincent and the Grenadines ..................... 4-53
Table 4.8.1 Issues, Countermeasures and Terms Regarding General Matters for Disaster Management in Saint Lucia ................................................................... 4-55
Table 4.8.2 Issues, Countermeasures and Terms for Flood, Erosion, Surge, Earthquake, and Tsunami in Saint Lucia ................................................................................. 4-58
Table 4.8.3 Issues, Countermeasures and Term for Meteoro-Hydrologic Observation in Saint Lucia ........................................................................................................... 4-59
Table 4.8.4 List of Conceivable Projects in Saint Lucia ........................................................ 4-60
Table 4.9.1 Issues, Countermeasures and Terms Regarding General Matters for Disaster Management in Dominica ..................................................................... 4-62
Table 4.9.2 Issues, Countermeasures and Terms for Flood, Mass Movement, High Tide, Earthquake, and Tsunami in Dominica ................................................................ 4-65
Table 4.9.3 Issues, Countermeasures and Terms for Meteoro-Hydrologic Observation in Dominica ......................................................................................................... 4-67
Table 4.9.4 List of Conceivable Projects in Dominica ........................................................... 4-67
Table 4.10.1 Issues, Countermeasures and Terms Regarding General Matters for Disaster Management in Trinidad and Tobago .................................................... 4-72
Table 4.10.2 List of Conceivable Projects in Trinidad and Tobago .......................................... 4-73
Table 4.11.1 Issues, Countermeasures and Terms Regarding General Matters for Disaster Management in Barbados ...................................................................... 4-75
Table 4.11.2 Issues, Countermeasures and Terms against Flood in Barbados ......................... 4-76
Table 4.11.3 Issues, Countermeasures and Terms for Erosion, Earthquake, and Tsunami in Barbados .......................................................................................................... 4-79
Table 4.11.4 Issues, Countermeasures, and Terms for Meteoro-Hydrologic Observation in Barbados .......................................................................................................... 4-80
Table 4.11.5 List of Conceivable Projects in Barbados ............................................................ 4-81
Table 4.12.1 Issues, Countermeasures and Terms Regarding General Disaster Management in Belize ......................................................................................... 4-84
Table 4.12.2 Issues, Countermeasures and Terms for Flood, Erosion, Surging, Earthquake, Tsunami, Strong Wind, and Water Shortage in Belize .................... 4-87
Table 4.12.3 Issues, Countermeasures and Terms Regarding Meteoro-Hydrologic Observation in Belize .......................................................................................... 4-88
Table 4.12.4 List of Conceivable Projects in Belize ................................................................ 4-89
Table 5.1.1 List of Participants for the Invitation Program ...................................................... 5-1
Table 5.1.2 Schedule for Invitation Program in Japan ............................................................. 5-3
Table 5.2.1 Schedule of Follow-up Seminar of Japan-CARICOM Relations .......................... 5-5
xv
List of Figures Page
Figure 1.3.1 Routes of Hurricanes and Tropical Cyclones (2000-2013) ................................... 1-2
Figure 1.3.2 Trenches around the Caribbean Sea ...................................................................... 1-2
Figure 1.3.3 Seismic Forecast around the Caribbean Sea .......................................................... 1-2
Figure 2.1.1 Topography of the Antigua Island ......................................................................... 2-2
Figure 2.1.2 Topography of the Barbuda Island ........................................................................ 2-2
Figure 2.1.3 Geological Map of the Antigua Island ................................................................... 2-3
Figure 2.1.4 Climate Feature in Saint John’s (Antigua) ............................................................ 2-3
Figure 2.1.5 Occurrence Rate by Disaster in Antigua and Barbuda .......................................... 2-5
Figure 2.1.6 Cause-specific Percentage of Economic Loss in Antigua and Barbuda ................ 2-5
Figure 2.1.7 Impact Frequency for Antigua and Barbuda in Each Category ............................. 2-6
Figure 2.1.8 Watershed Division Map in the Antigua Island ..................................................... 2-7
Figure 2.1.9 Upstream Area of Body Ponds Watershed ............................................................. 2-8
Figure 2.1.10 Roadside Slope around Monks Hill in the Southwest of the Antigua Island ......... 2-9
Figure 2.1.11 Damaged Area Caused by Storm Surge in the Antigua Island .............................. 2-9
Figure 2.1.12 Tsunami Occurrence Frequency and Height in the Caribbean Countries ............ 2-11
Figure 2.1.13 Organizational Structure of Government Agencies for Disaster Management in Antigua and Barbuda ................................................................. 2-12
Figure 2.2.1 Terrain and Geological Area Classification in Guyana ....................................... 2-17
Figure 2.2.2 Climate Feature in Georgetown (Guyana) ........................................................... 2-17
Figure 2.2.3 Occurrence Rate by Disaster and Cause-specific Percentage of Economic Loss by Disasters ................................................................................................. 2-19
Figure 2.2.4 Major Rivers in Guyana ...................................................................................... 2-20
Figure 2.2.5 Location of the East Demerara Reservoir ............................................................ 2-21
Figure 2.2.6 Improvement Works of the East Demerara Reservoir ......................................... 2-22
Figure 2.2.7 Drainage Pump Station and Drainage Diagram of Georgetown .......................... 2-22
Figure 2.2.8 Coastal Dyke in Georgetown ............................................................................... 2-23
Figure 2.2.9 Physiographic Region Map ................................................................................. 2-24
Figure 2.2.10 Geological Map of Guyana ................................................................................. 2-25
Figure 2.2.11 Locations of Field Inspection (Bridges) .............................................................. 2-27
Figure 2.2.12 Demerara Harbour Bridge ................................................................................... 2-28
Figure 2.2.13 Hope Canal Bridge .............................................................................................. 2-29
Figure 2.2.14 Berbice Bridge ..................................................................................................... 2-29
Figure 2.2.15 Bridges in Naivil Village ..................................................................................... 2-30
Figure 2.2.16 NIDRMP and Five Components of Disaster Management ................................. 2-32
Figure 2.2.17 National Organizational Structure for Disaster management in Guyana............. 2-33

xvi
Page
Figure 2.3.1 Topography of Grenada ....................................................................................... 2-36
Figure 2.3.2 Geology of Grenada ............................................................................................ 2-37
Figure 2.3.3 Climate Feature in St. George’s (Grenada) .......................................................... 2-38
Figure 2.3.4 Occurrence Rate by Disaster in Grenada ............................................................. 2-40
Figure 2.3.5 Cause-specific Percentage of Economic Loss in Grenada .................................. 2-40
Figure 2.3.6 Flood Prone Areas in Grenada ............................................................................. 2-41
Figure 2.3.7 Slope Collapse at the Entrance of Sendall Tunnel ............................................... 2-42
Figure 2.3.8 Slope Collapse along the West Coast Road ......................................................... 2-43
Figure 2.3.9 Slope Collapse of Shoulders along Island Crossing Road between St. George’s and Grenville ........................................................................................ 2-43
Figure 2.3.10 Damages in the Little River Basin Caused by Flood and Sediment Disasters .............................................................................................................. 2-44
Figure 2.3.11 Storm Surge during Hurricane Lenny.................................................................. 2-44
Figure 2.3.12 Affected Area by Coastal Erosion at the Northern Grenville .............................. 2-45
Figure 2.3.13 Affected Area by Strong Winds at the National Stadium .................................... 2-45
Figure 2.3.14 Organizational Structure of NaDMA in Grenada ................................................ 2-46
Figure 2.4.1 Topography of Jamaica ........................................................................................ 2-51
Figure 2.4.2 Geology of Jamaica ............................................................................................. 2-51
Figure 2.4.3 Monthly Mean Temperature in Jamaica (Kingston Manley Airport) .................. 2-52
Figure 2.4.4 Monthly Mean Rainfall in Jamaica (Kingston Manley Airport).......................... 2-52
Figure 2.4.5 Proportion of Disasters in terms of Death Toll and Cause-specific Percentage of Economic Loss by Disasters ......................................................... 2-54
Figure 2.4.6 Site Conditions during Field Inspection (Flood: Rio Cobre River, Flat Bridge) ................................................................................................................. 2-55
Figure 2.4.7 Site Situations during Field Inspection (Flood: Rivers in the Southeast Area) .................................................................................................................... 2-56
Figure 2.4.8 Locations of Field Inspections (Flood) ................................................................ 2-57
Figure 2.4.9 Landslide Inventory Map .................................................................................... 2-58
Figure 2.4.10 Overview of the Varying Landslide Sizes in Eastern Jamaica ............................. 2-58
Figure 2.4.11 Site Inspections (Sediment Disaster) ................................................................... 2-59
Figure 2.4.12 Distribution of Local Region Seismicity around Jamaica (1998 - 2010) ............ 2-60
Figure 2.4.13 Distribution of Regional Earthquake Epicentres ................................................. 2-60
Figure 2.4.14 Liquefaction caused by the 1692 Earthquake ...................................................... 2-61
Figure 2.4.15 Locations of Field Inspection (Bridges) .............................................................. 2-63
Figure 2.4.16 Rio Cobre River, Flat Bridge ............................................................................... 2-64
Figure 2.4.17 Harbour Bridge .................................................................................................... 2-64

xvii
Page
Figure 2.4.18 Westmoreland Bridge .......................................................................................... 2-65
Figure 2.5.1 Land Form of Suriname ....................................................................................... 2-70
Figure 2.5.2 Geological Map of Suriname ............................................................................... 2-71
Figure 2.5.3 Climate Features in Zanderij (Suriname) ............................................................ 2-71
Figure 2.5.4 Occurrence Rate by Disaster in Suriname ........................................................... 2-73
Figure 2.5.5 Cause-specific Percentage of Economic Loss in Suriname ................................. 2-73
Figure 2.5.6 Flood Area in May 2006 ...................................................................................... 2-74
Figure 2.5.7 Flood Inundation in May 2006 ............................................................................ 2-74
Figure 2.5.8 Current Erosion of Coast and its Countermeasures ............................................. 2-75
Figure 2.5.9 Organizational Structure of Government Agencies for Disaster Management in Suriname .................................................................................... 2-76
Figure 2.5.10 Organizational Structure of NCCR ...................................................................... 2-76
Figure 2.6.1 Topography of Saint Christopher and Nevis ....................................................... 2-81
Figure 2.6.2 Geology of the Saint Christopher Island ............................................................. 2-82
Figure 2.6.3 Geology of the Nevis Island ................................................................................ 2-82
Figure 2.6.4 Climate Feature in Basseterre (Saint Christopher) .............................................. 2-83
Figure 2.6.5 Occurrence Rate by Disaster in Saint Christopher and Nevis ............................. 2-85
Figure 2.6.6 Cause-specific Percentage of Economic Loss in Saint Christopher and Nevis .................................................................................................................... 2-85
Figure 2.6.7 Areas Affected by Floods in Saint Christopher and Nevis .................................. 2-87
Figure 2.6.8 Rockfall from Slope of Road to South Peninsula ................................................ 2-87
Figure 2.6.9 Relationship between NEMA and NDMD .......................................................... 2-89
Figure 2.7.1 Topography of Saint Vincent and the Grenadines ............................................... 2-94
Figure 2.7.2 Geology of the Saint Vincent Island .................................................................... 2-94
Figure 2.7.3 Monthly Mean Rainfall and Temperature in Saint Vincent (1990-2009) ............ 2-95
Figure 2.7.4 Proportion of Disasters in terms of Death Toll and Cause-specific Percentage of Economic Loss by Disaster .......................................................... 2-97
Figure 2.7.5 Area Affected by Hurricane Thomas ................................................................... 2-98
Figure 2.7.6 Locations of Field Inspection in the Saint Vincent Island ................................. 2-100
Figure 2.7.7 Locations of Field Inspection in the Bequia Island ........................................... 2-100
Figure 2.7.8 Site Inspection (Sediment Disaster) .................................................................. 2-100
Figure 2.7.9 Present Hazard Map for Storm Surge; Critical Points of Storm Surges and Erosion (USAID, 2007) ..................................................................................... 2-101
Figure 2.7.10 Locations of Field Inspection (Bridges) ............................................................ 2-104
Figure 2.7.11 Langley River Bridge ........................................................................................ 2-105
Figure 2.7.12 Rabacca River Bridge ........................................................................................ 2-105
xviii
Page
Figure 2.7.13 Cumberland Bridge ........................................................................................... 2-106
Figure 2.7.14 Organizational Structure for Disaster Management in Saint Vincent and the Grenadines ......................................................................................................... 2-106
Figure 2.8.1 Topography of Saint Lucia ................................................................................ 2-111
Figure 2.8.2 Geological Map of Saint Lucia .......................................................................... 2-111
Figure 2.8.3 Monthly Mean Rainfall and Temperature in Saint Lucia .................................. 2-111
Figure 2.8.4 Proportion of Disaster in terms of Death Toll and Cause-specific Percentage of Economic Loss by Disasters ....................................................... 2-114
Figure 2.8.5 Site Situations (Flood) ....................................................................................... 2-115
Figure 2.8.6 Flood Damage Situation at the Hewanorra Airport ........................................... 2-116
Figure 2.8.7 Site Inspection on the West Coast Road in Anse La Verdure Area (February 21, 2015) ............................................................................................................ 2-117
Figure 2.8.8 Numeric Simulation Result of Tsunami in the Atlantic Ocean .......................... 2-118
Figure 2.8.9 Locations of Field Inspection (Bridge) .............................................................. 2-120
Figure 2.8.10 Canaries Bridge ................................................................................................. 2-121
Figure 2.8.11 Cul de Sac Bridge .............................................................................................. 2-122
Figure 2.8.12 Ferrands Bridge ................................................................................................. 2-122
Figure 2.8.13 Ravine Poisson Bridge ...................................................................................... 2-122
Figure 2.8.14 Millennium Highway ......................................................................................... 2-123
Figure 2.9.1 Topography of Dominica ................................................................................... 2-128
Figure 2.9.2 Geology of Dominica ........................................................................................ 2-129
Figure 2.9.3 Monthly Mean Rainfall and Temperature in Dominica (Canefield, Melville Hall) ................................................................................................................... 2-129
Figure 2.9.4 Proportion of Disaster in terms of Death Toll and Cause-specific Percentage of Economic Loss by Disaster ........................................................ 2-131
Figure 2.9.5 Situation of Affected Area along the Roseau River ........................................... 2-133
Figure 2.9.6 River Mouth Area of the Layou River ............................................................... 2-134
Figure 2.9.7 River Mouth Area of the Massacre River .......................................................... 2-134
Figure 2.9.8 Locations of Field Inspection (Sediment Disaster) ........................................... 2-136
Figure 2.9.9 Steep Cut Slope between Pointe Michel and Soufriere ..................................... 2-136
Figure 2.9.10 Antrim Landslide in Springfield Estate ............................................................. 2-137
Figure 2.9.11 Locations of Field Inspection (Bridges) ............................................................ 2-140
Figure 2.9.12 Layou River Mouth Bridge................................................................................ 2-141
Figure 2.9.13 White River Bridge ............................................................................................ 2-141
Figure 2.9.14 Trafalgar Bridge ................................................................................................ 2-142
Figure 2.9.15 Wotten Waven-Trafalgar Link Bridge ............................................................... 2-142
Figure 2.10.1 Topography of Trinidad and Tobago ................................................................. 2-147

xix
Page
Figure 2.10.2 Geology of the Trinidad Island .......................................................................... 2-147
Figure 2.10.3 Climate Feature in Port of Spain (Trinidad Island) ........................................... 2-148
Figure 2.10.4 Occurrence Rate by Disaster in Trinidad and Tobago ....................................... 2-150
Figure 2.10.5 Cause-specific Percentage of Economic Loss in Trinidad and Tobago ............. 2-150
Figure 2.10.6 Flood Prone Area in the Trinidad Island ............................................................ 2-152
Figure 2.10.7 Slope Collapse in North Coast Road in the Trinidad Island .............................. 2-152
Figure 2.10.8 Damages of Road due to Landslides in San Feancique Road in the South of the Trinidad Island ............................................................................................. 2-153
Figure 2.10.9 Organizational Structure of ODPM and Relationship with TEMA ................... 2-155
Figure 2.11.1 Land Form of Barbados ..................................................................................... 2-159
Figure 2.11.2 Geological Map of Barbados ............................................................................. 2-159
Figure 2.11.3 Climate Feature in Bridgetown (Barbados) ....................................................... 2-160
Figure 2.11.4 Occurrence Rate by Disaster in Barbados ......................................................... 2-162
Figure 2.11.5 Cause-specific Percentage of Economic Loss in Barbados ............................... 2-162
Figure 2.11.6 Flood Prone Areas ............................................................................................. 2-163
Figure 2.11.7 Damages due to Landslide in Saint Joseph's Church Area ................................ 2-164
Figure 2.11.8 Damages to Roads due to Landslide in November 2014 (White Hill Area) ...... 2-165
Figure 2.12.1 Topography of Belize ........................................................................................ 2-170
Figure 2.12.2 Geology of Belize .............................................................................................. 2-170
Figure 2.12.3 Monthly Mean Temperature and Rainfall in Belize City (Belize) ..................... 2-171
Figure 2.12.4 Occurrence Rate by Disaster and Cause-specific Percentage of Economic Loss by Disasters ............................................................................................... 2-173
Figure 2.12.5 Flood-affected Area near Crooked Tree Point ................................................... 2-174
Figure 2.12.6 North Stann Creek River, Middlesex Bridges ................................................... 2-174
Figure 2.12.7 Slope Failure Site and Locations in Belize ........................................................ 2-175
Figure 2.12.8 Locations of Field Inspection in Belize (Bridges) ............................................. 2-178
Figure 2.12.9 Bridges in and around Hummingbird Highway (1/2 – 2/2) ............................... 2-179
Figure 2.12.10Sittee River, Kendal Bridge .............................................................................. 2-181
Figure 2.12.11 Location of Previous Mullin Bridge ................................................................ 2-181
Figure 2.12.12Temporary Mullin Bridge Site .......................................................................... 2-182
Figure 2.13.1 Recorded Earthquakes Greater than M5.0 that Occurred in Eastern Caribbean (1900-2005) ...................................................................................... 2-187
Figure 2.13.2 Network of Earthquake Monitoring in Eastern Caribbean ................................ 2-188
Figure 2.13.3 GPS Network of Seismic Research Centre ........................................................ 2-189
Figure 3.1.1 Potwork Dam Reservoir ........................................................................................ 3-3
Figure 3.1.2 Disaster Area in the Antigua Island ....................................................................... 3-4

xx
Page
Figure 3.1.3 Road Sign at the Banderz Bridge .......................................................................... 3-5
Figure 3.1.4 Disaster Risk Map in the Antigua Island ............................................................... 3-5
Figure 3.2.1 Disaster Area in Guyana ...................................................................................... 3-11
Figure 3.3.1 Disaster Vulnerable Sites in Grenada .................................................................. 3-17
Figure 3.4.1 Disaster Vulnerable Sites in Jamaica ................................................................... 3-21
Figure 3.5.1 Disaster Vulnerable Area in Suriname ................................................................. 3-23
Figure 3.6.1 Causeways along the West Coastal Road in the Saint Christopher Island .......... 3-27
Figure 3.6.2 Road Networks in the Saint Christopher and Nevis ............................................ 3-27
Figure 3.7.1 Disaster Area in the Saint Vincent Island ............................................................ 3-32
Figure 3.8.1 Disaster Area in the Saint Lucia Island ............................................................... 3-38
Figure 3.9.1 Disaster Area in Dominica ................................................................................... 3-41
Figure 3.10.1 Disaster Vulnerable Area in Trinidad and Tobago ............................................... 3-45
Figure 3.11.1 Disaster Vulnerable Area in Barbados ................................................................. 3-49
Figure 3.12.1 Disaster Vulnerable Area in Belize ...................................................................... 3-54

Abbreviation Abbreviation English 5Cs Caribbean Community Climate Change Center AASHTO American Association of State and Highway Transportation Officials BS British Standard CADM2 Caribbean Disaster Management Project Phase 2 CAMI Caribbean Agro-meteorological Initiate CARICOM Caribbean Community CDB Caribbean Development Bank CDEMA Caribbean Disaster Management Agency CDERA Caribbean Disaster Emergency Response Agency CDM Comprehensive Disaster Management CDMP Caribbean Disaster Mitigation Project CHARIM Caribbean Handbook on Risk Management CIA Central Intelligence Agency CIDA Canadian International Development Agency CIMH Caribbean Institute of Meteorology and Hydrology CMI Caribbean Meteorological Institute COHI Caribbean Operational Hydrological Institute CUBiC Caribbean Uniform Building Code DEM Digital Elevation Model DF/R Draft Final Report DFID Department for International Development DRM Disaster Risk Management EM-DAT Emergency Event Database EU European Union EWS Early Warning System F/S Feasibility Study F/R Final Report FAO Food and Agriculture Organization GAR Global Assessment Report GDP Gross Domestic Production GFCF Gross Fixed Capital Formation GFS Global Forecast System GGP Grass-roots Human Security Project GNI Gross National Income HDI Human Development Index HFA Hyogo Framework for Action HIV Human Immunodeficiency Virus IAEA International Atomic Energy Agency ICT Information and Communication Technology IC/R Inception Report IDB Inter-American Development Bank IT/R Interim Report JICA Japan International Cooperation Agency KOICA Korean International Cooperation Agency LiDAR Light Detection and Ranging or
Laser Imaging Detection and Ranging MOFA Ministry of Foreign Affair NEMO National Emergency Management Office NGO Non-Government Organization NOAA National Oceanic and Atmospheric Administration OECS Organization of Easter Caribbean States PAHO Pan American Health Organization
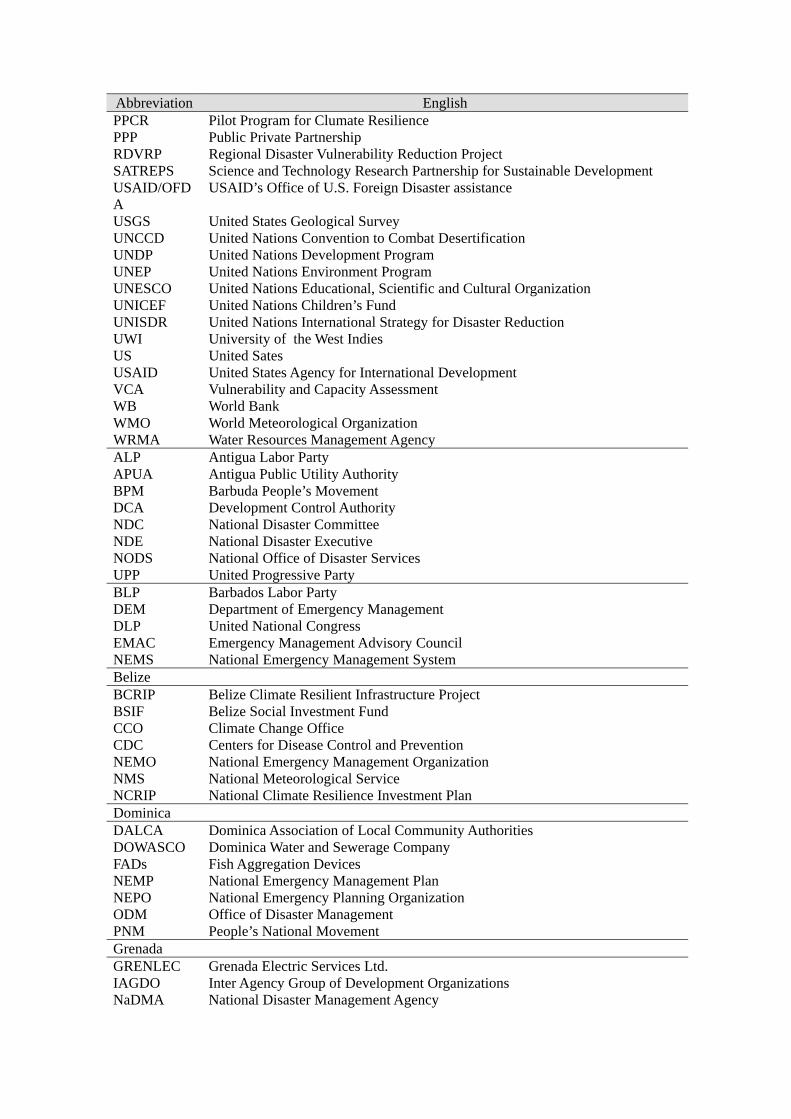
Abbreviation English PPCR Pilot Program for Clumate Resilience PPP Public Private Partnership RDVRP Regional Disaster Vulnerability Reduction Project SATREPS Science and Technology Research Partnership for Sustainable Development USAID/OFDA
USAID’s Office of U.S. Foreign Disaster assistance
USGS United States Geological Survey UNCCD United Nations Convention to Combat Desertification UNDP United Nations Development Program UNEP United Nations Environment Program UNESCO United Nations Educational, Scientific and Cultural Organization UNICEF United Nations Children’s Fund UNISDR United Nations International Strategy for Disaster Reduction UWI University of the West Indies US United Sates USAID United States Agency for International Development VCA Vulnerability and Capacity Assessment WB World Bank WMO World Meteorological Organization WRMA Water Resources Management Agency ALP Antigua Labor Party APUA Antigua Public Utility Authority BPM Barbuda People’s Movement DCA Development Control Authority NDC National Disaster Committee NDE National Disaster Executive NODS National Office of Disaster Services UPP United Progressive Party BLP Barbados Labor Party DEM Department of Emergency Management DLP United National Congress EMAC Emergency Management Advisory Council NEMS National Emergency Management System Belize BCRIP Belize Climate Resilient Infrastructure Project BSIF Belize Social Investment Fund CCO Climate Change Office CDC Centers for Disease Control and Prevention NEMO National Emergency Management Organization NMS National Meteorological Service NCRIP National Climate Resilience Investment Plan Dominica DALCA Dominica Association of Local Community Authorities DOWASCO Dominica Water and Sewerage Company FADs Fish Aggregation Devices NEMP National Emergency Management Plan NEPO National Emergency Planning Organization ODM Office of Disaster Management PNM People’s National Movement Grenada GRENLEC Grenada Electric Services Ltd. IAGDO Inter Agency Group of Development Organizations NaDMA National Disaster Management Agency

Abbreviation English NDC National Democratic Congress NERO National Emergency Recovery Organization NNP New National Party Guyana APUA Antigua Public Utility Authority CDC Civil Defense Commission DANA Damage Assessment and Needs Analysis EPA Environmental Protection Agency GNBS Guyana National Bureau of Standard GoG Government of Guyana NIDRMP National Integrated Disaster Risk Management Plan SOPs Standard Operating Procedures Jamaica JDIP Jamaica Development Infrastructure Project JIE Jamaica Institution of Engineers JLP Jamaica Labor Party NEPA National Environmental and Planning Agency NNBC New National Building Code NWA National Works Authority MoSSaiC Management of Slope Stability in Communities ODPEM Office of Disaster Preparedness and Emergency Management ODPRRC Office of Disaster and Emergency Relief Coordination OPPEN Office of Disaster Preparedness and Emergency Management PNP People’s National Party WRA Water Resource Agency CCM Concerned Citizens Movement NDMD Nevis Disaster Management Department NEMA National Emergency Management Agency NRP Nevis Reformation Party PAM People’s Action Movement SKNLP Saint Kitts and Nevis Labor Party St. Lucia DVRP Disaster Vulnerability Reduction Project ECR East Coast Road MISPT-SLMS
Ministry of Infrastructure, Port Service & Transport- St. Lucia Meteorological Services
MiSSaiC Management of Slope Stability in Community NEMO National Emergency Management Organization SLMS Saint Lucia Meteorological Service WRMA Water Resource Management Agency WASCO Water Service Cooperation UWP United Workers Party SLP Saint Lucia Labor Party BRAGSA Buildings Roads and General Services Authority CDRR Community Disaster Risk Reduction Team CWSA Central Water and Sewage Authority EEC Emergency Executive Committee MTWUDLG Ministry of Transport, Works, Urban Development and Local Government NEC National Emergency Council NEMO National Emergency Management Organization NDP New Democratic Party ULP Unity Labour Party Suriname

Abbreviation English NCCR Nationaal Coördinatie Centrum voor Rampenbeheersing (Dutch)
National Coordination Center for Disaster (English) SWM N.V. Surinaamsche Waterleiding Maatschappij (Dutch)
Suriname Water Company Ltd. (English). EOC Emergency Operation Center MOLG Ministry of Local Government NEMA National Disaster Management Agency ODPM Office of Disaster Preparedness and Management PNM People’s National Movement PURE Program for Upgrading Road Efficiency TEMA Tobago Emergency Management Agency UNC United National Congress WASA Water and Sewerage Authority of Trinidad and Tobago

1 - 1
CHAPTER 1 OUTLINE OF THE SURVEY
1.1 Background of the Survey
The Caribbean is a vulnerable area for high-impact disasters such as big hurricanes and floods. According to a report by the Caribbean Disaster Emergency Management Agency (hereinafter referred to as “CDEMA”), the economic damage caused by natural disasters in the whole Caribbean area is about US$3 billion every year.
There are many small countries in terms of economic magnitude in the Greater Antilles and the Lesser Antilles located on the eastern side of the Caribbean Sea. Therefore, the disasters that strike often affect the whole country. Thus, it is necessary that an indicator for assistance be studied from different viewpoints of income level as there is a particular vulnerability in small island countries.
The Disaster Prevention Project in the Caribbean area has been carried out under the Japan International Cooperation Agency (hereinafter referred to as “JICA”) in Barbados, Saint Vincent, and Trinidad and Tobago from 2002 to 2006. It has assisted in establishing the Caribbean Community Program Framework (2005 to 2015), which is a framework of integrated disaster prevention strategy for the Caribbean area under the Caribbean Disaster Emergency Response Agency (hereinafter referred to as “CDERA”). CDERA was changed to CDEMA in September 2009.
The phase 2 of the Disaster Prevention Project in the Caribbean area was carried out in Barbados, Saint Lucia, Dominica, Grenada, Guyana, and Belize between 2009 and 2012. It has been carried out as part of the efforts to reduce disaster risk by using the flood hazard map, early warning system, and community disaster prevention plan which have been prepared through the pilot project sites in each country. However, further assistance is necessary such that these efforts would be replicated in the whole country and disseminated to the whole Caribbean area.
Under the above background, the Caribbean Community (hereinafter referred to as “CARICOM”) countries are expecting expanded assistance for an integrated disaster prevention related to non-structural and structural measures such as infrastructure, policy, and administration of disaster prevention.
1.2 Objectives of the Survey
The objectives of the survey are to collect data and information and analyze them in order to:
(1) Pick up and analyze the present situation and problems of 12 target countries in CARICOM and to study the direction of international cooperation through data collection and analysis,
(2) Assist in the execution of the invitation program for target countries and seminar hosted by JICA because they are studying on how to apply Japanese technology in these target countries, and,
(3) Organize required information for formulation of future projects.
1.3 Target Countries and Type of Disasters
The frequency of disaster types in the 12 target countries from 1980, according to the disaster categories in the Emergency Event Database (EM-DAT), is shown in Table 1.3.1.

1 - 2
Table 1.3.1 Disaster Situation in CARICOM
Note: The above table is prepared based on the EM-DAT disaster list between 1980 and 2013.
Source: JICA Survey Team
It is expected that the disasters caused by the tropical cyclones mentioned in Table 1.3.1 occur from a combination of flood inundation due to rainfall, landslide, wind disaster, storm surge, and so on. As observed in Table 1.3.1, 10 countries suffer damages from hurricanes, except for 2 countries (i.e., Guyana and Suriname), which are located in South America.
Moreover, the routes of hurricanes and tropical cyclones from 2000 to 2013 are shown in Figure 1.3.1.
The seabed of the Caribbean Sea consists of five basins and each basin is divided by a seabed mountain. The Hispanola and Puerto Rico trenches, as shown in Figure 1.3.2, are earthquake nests. Large earthquakes with magnitudes of 7.5 or more have occurred more than ten times during the past 500 years and damages by tsunami have also occurred. The seismic forecast around the target countries is shown in Figure 1.3.3. As mentioned above, many disasters have occurred in CARICOM countries.
Source: Woods Hole Oceanographic Institution Source:Geology of Caribbean 1988 by Oceanographic Institution
Figure 1.3.2 Trenches around the Caribbean Sea
Figure 1.3.3 Seismic Forecast around the Caribbean Sea
Type of DisasterFlood Mass mov. Storm
General FlashStormsurge
unknown Dry WetTropicalCyclone
unknown
1 Guyana 3 0 0 2 0 1 0 0 0 32 Belize 1 0 0 2 0 0 9 0 0 03 Jamaica 3 1 0 3 0 0 15 1 0 24 St. Vincent 2 0 1 1 0 0 9 0 1 05 Dominica 0 0 0 0 0 0 9 0 0 06 St. Lucia 1 1 0 0 0 1 10 1 1 07 Grenada 0 0 0 0 0 0 5 0 0 18 Suriname 2 0 0 0 0 0 0 0 0 09 Antigua and Barbuda 0 0 0 0 0 0 8 0 0 1
10 St. Kitts and Nevis 0 0 0 1 0 0 6 0 0 011 Trinidad and Tobago 0 1 0 1 0 1 4 0 1 112 Barbados 0 0 0 1 0 0 6 0 1 1
DroughtCountry NameNo.
Earthquake
Note: Arrangement of NOAA data Source: JICA Survey Team
Figure 1.3.1 Routes of Hurricanes and Tropical Cyclones (2000-2013)
Hispanola Trench
Puerto Rico Trench

1 - 3
Drought is also one of the disasters experienced in the CARICOM countries. According to Table 1.3.1, six out of the 12 target countries have suffered from drought. Therefore, drought is also considered in this survey. In 2010, drought occurred in Saint Lucia, Barbados, Saint Vincent and the Grenadines, Grenada, Antigua Barbuda, Jamaica, Guyana, and Trinidad and Tobago.
Storm and flood damages include “flood”, “sediment disaster”, “storm surge”, and “wind disaster”. To avoid duplication of disaster types, “storm surge” and “wind disaster” are grouped under “storm and flood damage”. The grouping of disaster types in this study is shown in Table 1.3.2.
Table 1.3.2 Grouping of the Disaster Types in the Survey
Large Grouping Small Grouping Large Grouping Small Grouping Flood Heavy Rainfall Sediment Disaster Slope failure
Flash Flood Landslide Hurricane Debris flow Drainage Earthquake Earthquake
Tsunami Tsunami Storm and flood damage
Storm surge Drought Drought Wind disaster
Source: JICA Survey Team
1.4 Field Work
1.4.1 Overall Suvey Schedule
The itinerary of the field work is shown in Table 1.4.1. The JICA Survey Team was divided into two groups, Team A and Team B, to work in 12 target countries in two months.
Table 1.4.1 Field Work Team A Team B
Team Leader/Flood Management A
Yasuhiro AZUMA Co Team Leader/Flood Management B
Tadahiro FUKUDA
Sediment Disaster Specialist
Tomoyuki NISHIKAWA Geologist/ Disaster Risk Analyst
Ken KOIZUMI
Meteorology and Hydrology
Masaki ITO Bridge Engineer Kuniaki NISHIJIMA
2/15 Travel(Tokyo→Toronto) 2/16 Travel(Toronto→Barbados) 2/17-2/24 Courtesy visit to CDEMA,
meetings with the government agencies concerned in Barbados, field inspection
2/17 Courtesy visit to CDEMA, Travel (Barbados→Saint Lucia)
2/25 Travel (Barbados→Saint Christopher and Nevis)
2/18-2/25 Meetings with the government agencies concerned in Saint Lucia, field inspection
2/26-3/4 Meetings with the government agencies concerned in Saint Christopher and Nevis, Field inspection
2/26 Travel (Saint Lucia→Dominica)
3/5 Travel (Saint Christopher and Nevis→Grenada)
2/27-3/6 Meetings with the government agencies concerned in Dominica, field inspection
3/6-3/13 Meetings with the government agencies concerned in Grenada, field inspection
3/7 Travel (Dominica→Saint Vincentand theGrenadines)
3/14 Travel (Grenada→Antigua and Barbuda)
3/8-3/16 Meetings with the government agencies concerned in St. Vincent, Field inspection
3/15-3/20 Meetings with the 3/17 Travel (Saint Vincent and the
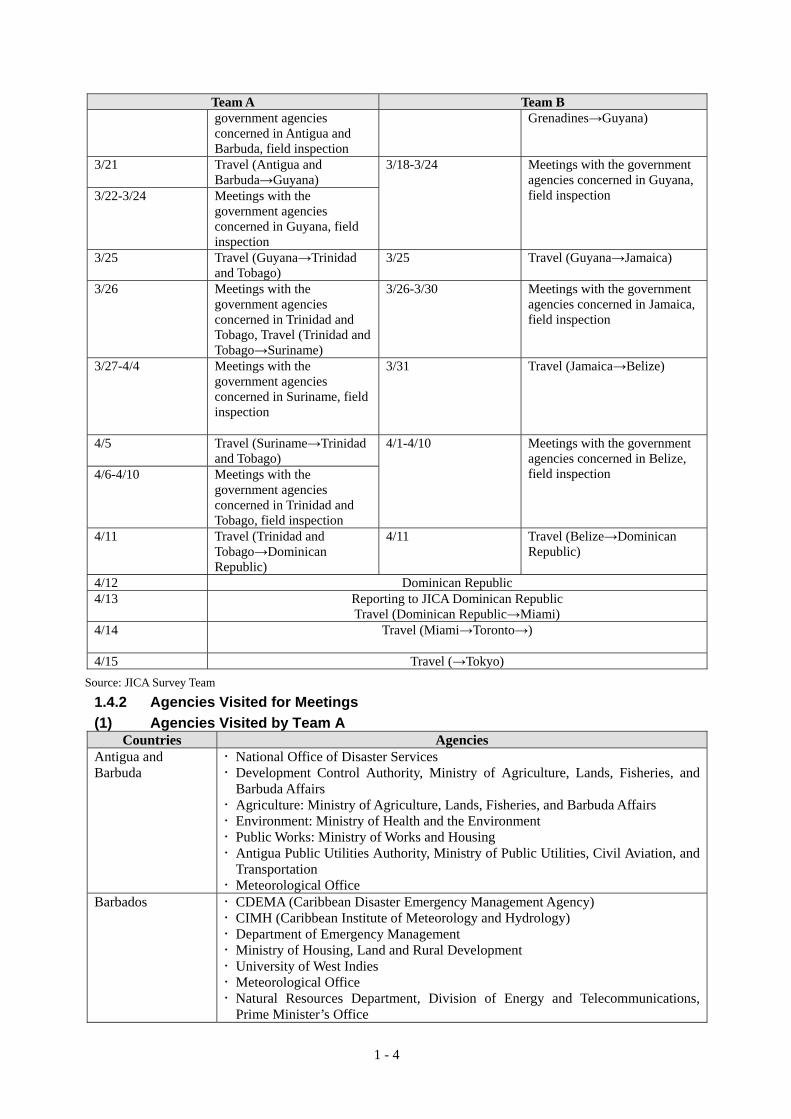
1 - 4
Team A Team B government agencies concerned in Antigua and Barbuda, field inspection
Grenadines→Guyana)
3/21 Travel (Antigua and Barbuda→Guyana)
3/18-3/24 Meetings with the government agencies concerned in Guyana, field inspection 3/22-3/24 Meetings with the
government agencies concerned in Guyana, field inspection
3/25 Travel (Guyana→Trinidad and Tobago)
3/25 Travel (Guyana→Jamaica)
3/26 Meetings with the government agencies concerned in Trinidad and Tobago, Travel (Trinidad and Tobago→Suriname)
3/26-3/30 Meetings with the government agencies concerned in Jamaica, field inspection
3/27-4/4 Meetings with the government agencies concerned in Suriname, field inspection
3/31 Travel (Jamaica→Belize)
4/5 Travel (Suriname→Trinidad and Tobago)
4/1-4/10 Meetings with the government agencies concerned in Belize, field inspection 4/6-4/10 Meetings with the
government agencies concerned in Trinidad and Tobago, field inspection
4/11 Travel (Trinidad and Tobago→Dominican Republic)
4/11 Travel (Belize→Dominican Republic)
4/12 Dominican Republic 4/13 Reporting to JICA Dominican Republic
Travel (Dominican Republic→Miami) 4/14 Travel (Miami→Toronto→)
4/15 Travel (→Tokyo)
Source: JICA Survey Team
1.4.2 Agencies Visited for Meetings
(1) Agencies Visited by Team A Countries Agencies
Antigua and Barbuda
National Office of Disaster Services Development Control Authority, Ministry of Agriculture, Lands, Fisheries, and
Barbuda Affairs Agriculture: Ministry of Agriculture, Lands, Fisheries, and Barbuda Affairs Environment: Ministry of Health and the Environment Public Works: Ministry of Works and Housing Antigua Public Utilities Authority, Ministry of Public Utilities, Civil Aviation, and
Transportation Meteorological Office
Barbados CDEMA (Caribbean Disaster Emergency Management Agency) CIMH (Caribbean Institute of Meteorology and Hydrology) Department of Emergency Management Ministry of Housing, Land and Rural Development University of West Indies Meteorological Office Natural Resources Department, Division of Energy and Telecommunications,
Prime Minister’s Office

1 - 5
Countries Agencies Welfare Department, Ministry of Social Care, Consituency Empowerment, and
Community Development Soil Conservation Unit, Ministry of Agriculture Ministry of Transportation and Works Coastal Zone Management Unit, Ministry of the Environment and Drainage Drainage Division, Ministry of the Environment and Drainage Barbados Water Authority
Grenada National Disaster Management Agency Ministry of Agriculture, Lands, Forestry, Fisheries, and the Environment Physical Planning Unit, Ministry of Communications, Works, Physical
Development, Public Utilities, ICT, & Community Development Road Unit, Ministry of Communications, Works, Physical Development, Public
Utilities, ICT & Community Development Meteorological Office Statistics Department, Ministry of Finance, Planning, Economic Development,
Trade, Energy & Cooperatives Fire Department National Water Supply and Sewage
Saint Christopher and Nevis
Department of Physical Planning and Environment, Ministry of Sustainable Development National Emergency Management Agency Department of Public Works Agricultural Resource Management Project Office, Department of Agriculture Saint Christopher Meteorological Services Office Nevis Disaster Management Department Department of Physical Planning (Nevis) Nevis Air and Sea Port Authority Department of Agriculture
Suriname NCCR (Nationaal Coördinatie Centrum voor Rampenbeheersing in Dutch, National Coordination Center for Disaster in English) Environment, Directorate for Environment, Ministry of Labour, Technological
Development, and Environment Planning, Ministry of Public Works River and Drainage, Ministry of Public Works Road, Ministry of Public Works Meteorological Office, Ministry of Public Works Hydrological Office, Ministry of Public Works Spatial Planning, Ministry of Spatial Planning, Land and Forest Management SWM (N.V. Surinaamsche Waterleding Maatschappij in Dutch, Suriname Water
Company Ltd. in English) United Nations Development Programme (UNDP)
Trinidad and Tobago
Office of Disaster Preparedness and Management (ODPM) Meteorological Office Drainage Unit, Ministry of Environment and Water Resources Highway Division, Ministry of Works Program for Upgrading Road Efficiency (PURE), Ministry of Works Coastal Zone Unit, Ministry of Works Seismic Research Center Water and Sewerage Authority of Trinidad and Tobago (WASA) Ministry of Local Government
Source: JICA Survey Team

1 - 6
(2) Agencies Visited by Team B Countries Agencies
Belize ・ Ministry of Forestry, Fisheries and Sustainable Development, Climate Change Office
・ JICA Belize Office ・ National Emergency Management Organization (NEMO) ・ Ministry of Works ・ Ministry of Labour, Local Government, Rural Development, National
Emergency Management and Immigration and Nationality, National Meteorological Service
・ Belize Coastal Zone Management Authority and Institute ・ Belize Red Cross Society ・ Inter-American Development Bank (IDB) ・ Ministry of Economic Development, Belize Social Investment Fund ・ Ministry of Natural Resources and Agriculture, Hydrology Unit ・ Belmopan City Council/Reconstruction and Development Coorporation ・ Caribbean Community Climate Change Centre (5C’s)
Dominica ・ Ministry of Environment, Natural Resources, Physical Planning and Fisheries, Environmental Coordinating Unit
・ Ministry of Public Works, Energy & Ports, Meteorological Service (MPWEP-MS)
・ Ministry of Agriculture, Fisheries and Forestry, Forestry Wildlife, and Parks Division
・ Ministry of Agriculture, Fisheries and Forestry, Agriculture Division ・ Dominica Red Cross Society ・ Ministry for National Security, Immigration and Labor, Office of Disaster
Management (ODM) ・ Ministry of Public Works, Energy and Ports, Technical Service Division ・ Dominica Water and Sewerage Company (DOWASCO) ・ World Bank, Disaster Vulnerability Reduction Project Office
Guyana ・ Civil Deffence Commission (CDC) ・ Ministry of Agriculture, Agriculture Sector Development Unit ・ JICA CARICOM Secretariat ・ Ministry of Natural Resources and Environment, Environmental Protection
Agency ・ Ministry of Agriculture, Hydrometeorological Department ・ Ministry of Agriculture, National Drainage, and Irrigation Authority ・ Guyana Red Cross Society ・ Ministry of Public Works, Works Service Group ・ Guyana United Nationas Development Programme (UNDP) ・ Guyana Water Inc. (GWI) ・ Georgetown City, City Engineer Office
Jamaica ・ Planning Institute of Jamaica ・ JICA Jamaica Office ・ Embassy of Japan in Jamaica ・ Office of Disaster Preparedness and Emergency Management (ODEPEN) ・ Ministry of Water, Land, Environment, and Climate Change, Meteorological
Service ・ Water Resource Authority (WRA) ・ Ministry of Water, Land, Environment and Climate Change, National
Environment and Planning Agency ・ National Work Authority (NWA) ・ Ministry of Science, Technology, Energy and Mining, Mines, and Geology
Division

1 - 7
Countries Agencies ・ National Road Operating and Constructing Company ・ Mona GeoInformatics Institute
Saint Lucia ・ Ministry of Infrastructure, Port Service and Transport, Department of Planning and Economic Affairs
・ Ministry of Sustainable Development, Energy, Science and Technology, Water Resource Management Agency
・ Office of the Prime Minister, National Emergency Management Organization (NEMO)
・ Ministry of Infrastructure, Port Service and Transport , Saint Lucia Meteorological Service
・ Water Service Cooperation (WASCO) ・ Ministry of Agriculture, Food Production, Fisheries, Cooperatives and Rural
Development, Department of Agriculture ・ JICA Saint Lucia Office ・ World Bank, Disaster Vulnerability Reduction Project (DVRP) Office ・ Ministry of Agriculture, Food Production, Fisheries, Cooperatives and Rural
Development, Department of Fisheries Saint Vincent and the Grenadines
・ Ministry of National Security, Air and Sea Port Development, National Emergency Management Organization
・ Ministry of Agriculture, Rural Transformation, Industry Forestry and Fisheries, Forestory Department
・ Ministry of National Security, Air and Sea Port Development, Saint Vincent and the Grenadines Meteorological Office
・ Saint Vincent and the Grenadines Red Cross Society ・ Ministry of Finance and Economic Planning, Central Planning Division ・ Ministry of Transport, Work, Urban Development, and Local Government ・ Central Water and Sewerage Authority (CWSA) ・ Buildings Roads and General Services Authority (BRAGSA) ・ Ministry of Agriculture, Rural Transformation, Industry Forestry and Fisheries,
Agriculture Department ・ World Bank, Disaster Vulnerability Reduction Project Office (DVRP)
Source: JICA Survey Team
1.5 Composition of Report
The separated volume in the report consists of;
Chapter 1 Outline of the Survey
Chapter 2 Present Situation of Survey Countries
Chapter 3 Issues on Disaster Management of Survey Countries
Chapter 4 Proposed Measures by Nation
Chapter 5 Invitation Program and Seminor in Japan

2 - 1
CHAPTER 2 PRESENT SITUATION OF SURVEY COUNTRIES
2.1 Antigua and Barbuda
2.1.1 Profile
(1) Basic Data
The basic data of Antigua and Barbuda are shown in Table 2.1.1.
Table 2.1.1 Basic Data of Antigua and Barbuda
Profile Population 89,990 persons (2013, World Bank) Land area 440 km2 (World Bank) Capital Saint Johnnk Largest city Saint Johnty GDP US$1.201 billion (2013, World Bank)
GDP per capita US$13,336 (2013, World Bank) GNI (Atlas method) US$1.174 billion (2013, World Bank)
GNI per capita US$13,050 (2013, World Bank) GDP growth rate -0.1% (2013, World Bank) GFCF (% GDP) 30.2 (2013, World Bank) Current account US$(-)180 million (2013, Balance of Payments Manual, IMF) Assistance received total US$2 million (2012, World Bank) Income level High Income Level Independence November 1, 1981 Currency Eastern Carib Dollar (EC$) Climate Tropical Forest Climate Administrative division 6 parishes and 2 dependencies Residents Black or Mulatto 87%, Mixed race 5%, Hispanic 3%, European
ancestry 2%, Others 3% (2011, CIA World Fact Book) Language Official Language: English Religion Christian 77%, etc. Principal industry Tourism, Construction industry, Light industry
Major Development Index HDI index 0.760 (2012, UNDP) Literacy rate (15-24 years old) -- Primary school enrollment rate 99.7% (2011, World Bank) Infant mortality rate (per 1,000 births) 13.29 persons (2014, CIA World Fact Book) Mortality rate of pregnant women and nursing mothers (per 1,000 cases)
--
HIV infection rate (15-49 years old) -- Improved water service rate 98% (2012, World Bank) Improved sanitation rate 91% (2011, World Bank) GINI index 0.0 (2009, UNISDR, GAR) Life expectancy at birth (years) 75.7 years (2012, World Bank)
Poverty gap at national poverty lines (%)
--
Social expenditure (% of GDP) 0.0 Governance Indicators
Rule of law 0.86 (2013, UNISDR, GAR) Government effectiveness 0.48 (2013, UNISDR, GAR) Voice and accountability 0.65 (2013, UNISDR, GAR)

2-2
Control of corruption 1.29 (2013, UNISDR, GAR) Environment
Ecological footprint 0.00 (UNISDR, GAR) Environmental performance index 48.9 (UNISDR, GAR) Forest change 0.00 % (2000-2012, UNISDR, GAR) Freshwater withdrawals (% of internal resource)
16.2% (UNISDR, GAR)
Climate Change Electricity production from renewable energy
1.00% (UNISDR, GAR)
CO2 emissions 5.89 metric ton/capita (UNISDR, GAR) Source: World Bank, UNDP, CIA World Fact Book, MOFA (Data Book by ODA target country), UNISDR
(2) Natural Overview
1) Topography and Geology
Antigua and Barbuda is located at the center of the Leeward Islands in the Lesser Antilles situated at the easternmost of the West Indies. The country consists of three major inhabited islands of Antigua, Barbuda, and Redonda, and several smaller islands. The total land area of the country is about 440 km2 (almost equivalent to that of Tanegashima Island of Japan), in which the areas of the Antigua and Barbuda islands are 282 km2 and 160 km2, respectively. Most parts of the islands are lowlands and the highest mountain is Mount Obama with a peak of 395 m.
Topographies of Antigua and Barbuda are respectively shown in Figures 2.1.1 and 2.1.2.
Source: Sustainable Island Resource Management Zoning Plan for Antigua and Barbuda (including Redonda), December 2011 GENIVAR Trinidad and Tobago
Figure 2.1.1 Topography of the Antigua Island
Figure 2.1.2 Topography of the Barbuda Island
The geology of Antigua Island is shown in Figure 2.1.3. Antigua is divided by the low central belt into three nearly equal parts. The southwestern part consisting of volcanic materials is hilly and rough with many peaks made of volcanic rocks. The central region is lower and flatter, and extends diagonally across the island and is underlain by thin-bedded mudstones, volcanic sandstones, and conglomerates. There are many freshwater ponds in the central and coastal parts of the island. The northeastern part is rolling, with low ridges and hills of limestone marl having the elevation of 15-30 m. Barbuda is relatively flat with lagoons and some low hills of 10 m high rising to just 38 m at the maximum in the highlands area. The island is mostly coral limestone.
2) Climate
Antigua and Barbuda is located at around 17ºN latitude and 62ºW longitude, and in the tropical maritime climate zone. Monthly average temperature ranges between 26°C and 28°C. December to March has the lowest temperature, while June to September has the highest. Rainy season is between July and December, and dry season is from January to June. The average annual rainfall in Antigua

2 - 3
Island is about 1,200 mm. The monthly mean maximum and minimum temperatures and monthly mean rainfall in Saint John’s are shown in Figure 2.1.4.
Source: Sustainable Island Resource Management Zoning Plan for Antigua and Barbuda, 2011, GENIVAR
Figure 2.1.3 Geological Map of the Antigua Island
Source: http://www2m.biglobe.ne.jp/ZenTech/world/kion/Antigua_and_Barbuda/St_Johns.htm
Figure 2.1.4 Climate Feature in Saint John’s (Antigua)
(3) Socioeconomic Condition
1) Political Situation
Antigua and Barbuda got autonomy from the United Kingdom in 1967. Although Barbuda Island wanted to remain under the British during secession, it became an independent British Commonwealth
Sandstone, conglomerate & shale
Limestone
Lava

2-4
member country on November 1, 1981. The present political parties are the Antigua Labour Party (ALP), the United Progressive Party (UPP), and the Barbuda People's Movement (BPM). ALP and UPP have replaced the regime alternately through democratic elections. Currently, ALP is the ruling party.
The parliament is bicameral consisting of the House of Representatives and Senate wherein the legislators of the former are elected through the direct national election and senators of the latter are appointed. The Prime Minister is appointed from the House of Representatives.
2) Population
According to the World Bank’s survey, the estimated total population was about 90,000 as of 2013, of which 25% are residing in the urban area. Residents in the urban area have been decreasing in number and moving to the suburbs since 2008. Table 2.1.2 shows the trend in the change of population.
Table 2.1.2 Change in Population in Antigua and Barbuda
Indicator 1988 1993 1998 2003 2008 2013Total population (person) 62,538 64,868 74,206 80,904 85,349 89,985Population growth rate (annual %) -1.50 2.24 2.70 1.09 1.12 1.02Urban population (person) 22,053 22,515 24,380 24,647 23,391 22,175Urban population (% of total) 35.26 34.71 32.86 30.47 27.41 24.64Rural population (person) 40,485 42,353 49,826 56,257 61,958 67,810Rural population (% of total) 64.74 65.29 67.14 69.53 72.59 75.36Source: World Bank, World Data Bank
3) GNI and GDP
The nominal gross national income (GNI) per capita and nominal gross domestic product (GDP) per capita of Antigua and Barbuda are about US$15,000 as shown in Table 2.1.3.
Table 2.1.3 Nominal GNI and GDP per Capita in Antigua and Barbuda
Indicator 2009 2010 2011 2012 2013 GNI per capita, Atlas method (US$) 13,420 12,620 12,370 12,850 13,050 GDP per capita (US$) 13,979 13,017 12,818 13,526 13,342 Source: World Bank, World Data Bank
4) Government Agencies and Administrative Division
The ministries of the Government of Antigua and Barbuda are enumerated in Table 2.1.4.
Table 2.1.4 Central Government Agencies of Antigua and Barbuda
Central Government Agencies Office of the Prime Minister Ministry of Finance and Corporate Governance Ministry of Legal Affairs, Public Safety, Immigration and Labour Ministry of Public Utilities, Civil Aviation and Transportation Ministry of Tourism, Economic Development, Investment and Energy Ministry of Health and the Environment Ministry of Works and Housing Ministry of Trade, Commerce, Industry, Sports, Culture and National Festival Ministry of Social Transformation and Human Resource Development Ministry of Foreign Affair and International Trade Ministry of Information, Broadcasting, Telecommunications and Information Technology Ministry of Agriculture, Lands, Fisheries and Barbuda Affairs Ministry of Education, Science and Technology
Source: http://www.ab.gov.ag/article_details.php?id=307&category=66
The local administrative districts are composed of six parishes and two dependencies as shown in Table 2.1.5.

2 - 5
Table 2.1.5 Parish and Dependency in Antigua and Barbuda
No. Parish/Dependency Area (km2) Population (head)*
1 Saint George 24 7,496 2 Saint John 74 49,225 3 Saint Mary 59 7,067 4 Saint Paul 48 7,979 5 Saint Peter 33 5,269 6 Saint Philip 44 3,125 7 Barbuda 161 1,638 8 Redonda 1.6 0
Source: For area and population except those in Redonda, Census data in 2011 (GeoHive.com: Antigua and Barbuda), For area and population in Redonda, http://thecommonwealth.org/our-member-countries/antigua-and-barbuda
2.1.2 Disaster Situation
(1) General
The outline of disasters in every survey country is described in the Global Assessment Report on Disaster Risk Reduction 2015 issued by the United Nations International Strategy for Disaster Reduction (UNISDR). The occurrence rate by disaster and the cause-specific percentage of the economic losses of Antigua and Barbuda are shown in Figures 2.1.5 and 2.1.6, respectively. As shown in the figures, the most frequent disaster in Antigua and Barbuda during the period of 1990-2014 is due to heavy rain, while damages due to cyclones are the most serious in terms of economic loss.
Source: Global Assessment Report on Disaster Risk Reduction Note: The term “Cyclone” is used as in the source.
Figure 2.1.5 Occurrence Rate by Disaster in Antigua and Barbuda
Figure 2.1.6 Cause-specific Percentage of Economic Loss in Antigua and Barbuda
(2) Flood
Record of Major Hurricanes
A hurricane causes not only flood disasters but also, in many cases, compound disasters due to strong wind and storm surge, so that disaster records due to hurricane will be described herein as under flood category although such disasters might be categorized into strong wind and/or storm surge.
The records of hurricanes which have affected Antigua and Barbuda since 1971 until 2012 are shown in Table 2.1.6. The impact frequency by tropical depression, tropical storm, and hurricanes (categories 1 to 4) is shown in Figure 2.1.7.
34%
27%
15%
11%
8%
4%1%
Rain
Cyclone
Windstorm
Coastal Erosion
Flood
95%
4% 1%
Cyclone
Earthquake
Fire

2-6
Table 2.1.6 Major Hurricanes in Antigua and Barbuda
Name Day/Month/Year Name Day/Month/Year Doria 23 August 1971 Bonnie 21 August 1998
Christine 03-04 September 1973 Georges 21 September 1998
Carmen 29-30 August 1974 Jose 20-21 October 1999 Eloise 14-15 September 1975 Lenny 18-20 November 1999
Claudette 17 July 1979 Chris 19 August 2000
David 29-30 August 1979 Debby 22 August 2000
Frederic 03 September 1979 Helene 17 September 2000
Floyd 03-04 September 1981 Jeanne 13-14 September 2004
Gert 08 September 1981 Chris 02 August 2006
Arthur 01-03 September 1984 Dean 17 August 2007
Chris 23-24 August 1988 Omar 16 October 2008
Dean 03 August1989 Ana 16-17 August 2009
Hugo 17 September 1989 Erika 02-03 September 2009 Klaus 04 - 07 Oct 1990 Earl 29-30 August 2010
Iris 27 - 28 Aug 1995 Fiona 01 September 2010
Luis 05 - 06 Sep 1995 Irene 21 August 2011
Marilyn 15-Sep 1995 Maria 10-11 September 2011
Sebastien 24-Oct 1995 Ophelia 25 and 27 September 2011
Bertha 08-Jul 1996 Isaac 22-23 August 2012
Hortense 07 - 08 Sep 1996 Rafael 13-14 October 2012
Note: Data from 1971 until 2012 (41 cyclones including 10 tropical depressions, 16 tropical storms, and 15 hurricanes)
Source: Vulnerability Impact and Adaptation Analysis in the Caribbean, National Vulnerability Analysis for Antigua and Barbuda, CARIBSAVE Partnership
Source: Antigua and Barbuda Meteorological Office, 2014
Figure 2.1.7 Impact Frequency for Antigua and Barbuda in Each Category
The hurricanes which caused rather severe damages among those shown in Table 2.1.6 are presented hereunder.
(a) Hurricane Hugo
Hurricane Hugo damaged Antigua and Barbuda on September 17, 1989. The damages comprised two deaths and 181 injuries, and 15% of the houses were damaged which resulted in 509 people losing

2 - 7
their houses. The economic loss amounted to about US$80 million, which was equivalent to about 21% of GDP of US$370 million in 1989.
(b) Hurricane Luis
Hurricane Luis seriously damaged Antigua and Barbuda on September 5-6, 1995. The hurricane was categorized as Category 4 having the maximum wind velocity of 135 mph (60 m/s) and accumulated rainfall of 10 in (250 mm) or more. Most of the houses were completely or partially destroyed in Barbuda Island, while 45% of the houses were completely destroyed in Antigua Island. Death toll was three; 165 persons were injured, and 32,000 people were affected by the hurricane. The amount of the damage was estimated to be US$350 million, which was equivalent to about 71% of GDP of US$490 million in 1995.
(c) Hurricane George
Hurricane George damaged Antigua and Barbuda on September 21, 1998. The hurricane was Category 3 having the maximum wind velocity of 115 mph (51 m/s) and recorded rainfall of 7.5 in (190 mm) in Saint John’s. Death toll was two and 2,025 people were affected. The amount of the damage was US$100 million, which was equivalent to about 16% of GDP of US$620 million in 1998.
(d) Hurricane Jose
Hurricane Jose damaged Antigua and Barbuda on October 20-21, 1999. The hurricane had strong winds, which caused inundation in major roads. Death toll was one and the number of the affected people reached to about 2,500. Records of the economic loss were not found.
(e) Hurricane Omar
Hurricane Omar caused damages to Antigua and Barbuda on October 16, 2008 due to heavy rainfall. The hurricane affected about 25,800 people and the amount of the damages was US$18 million. It also caused 1-day complete closure of the international airport and 2-day blackout and closure of schools. It caused serious damages to roads as well as to fisheries and agriculture in coastal areas. The amount of the damages was equivalent to about 1% of GDP of US$1.34 billion in 2008.
(f) Hurricane Earl
Hurricane Earl damaged Antigua and Barbuda on August 29-30, 2010. Floods and strong winds affected 1,000 families, and damaged agricultural and fishery sectors severely. The estimated economic loss was US$12 million, which was equivalent to about 1% of GDP of US$1.14 billion in 2010.
Field Inspection and Confirmation of Site Condition
Antigua Island is generally divided into watersheds as shown in Figure 2.1.8.
Of these watersheds, the Body Ponds Watershed with an area of about 4,000 ha is located in the western and central areas of the island, which is so called Central Plain Zone. Precipitation water of heavy rain concentrates in the watershed so that inundation occurs in the Bendals area situated at the downstream part of the watershed.
Particularly, the lowland that should have been a retarding basin has been developed because no serious hurricane disaster occurred for about 40 years since the 1950s. However, the number of hurricane increased in the recent 20 years, and these hurricanes caused disasters to the farmlands and houses.
Furthermore, the area near Saint John’s in the downstream part of the Body Ponds Watershed has been developed, in terms of housing development, in a similar
Figure 2.1.8 Watershed Division Map in the Antigua Island
Source: ESAL 2008

2-8
manner as that of the lowland, so that inundations sometimes occur.
(3) Sediment Disasters
Major Sediment Disaster Records
Sediment disaster records are not kept by any agency of Antigua and Barbuda and the records are also not available on the internet. According to hearing results in the survey, slope failures occurred, as a recent event, in October 1999 due to heavy rainfall by Hurricane Irene around Monks Hill area located in the southwest area of Antigua Island; neither death nor injury was reported.
Field Inspection and Confirmation of Site Condition
Sediment Outflow from Body Ponds Watershed in the Central Part of Island
The Body Ponds Watershed with an area of about 4,000 ha is located in the Central Plain Zone. Precipitation water of heavy rain is concentrated in the watershed thereby causing inundation disasters in the Bendals area in the downstream part of the watershed. Sediment discharge is an issue in the Body Ponds Watershed that is followed by the abovementioned surface water flow. As a countermeasure against the sediment discharge issue, planting activities were started by the Ministry of Health and Environment recently on the slopes where uncovering is ongoing. No observation has been made on the effect of the planting on sediment discharge control. There is no definite watershed management plan. Figure 2.1.9 shows the upstream area of the Body Ponds Watershed, where the sediment discharge is an issue, and planting activities in the watershed. Figure 2.1.9 shows the situation in the Body Ponds Watershed.
Upstream Area of Body Ponds Watershed (It looks like Cuesta Landform.)
Planting Activities by the Ministry of Health and Environment
Source: JICA Study Team
Figure 2.1.9 Upstream Area of Body Ponds Watershed
Roadside Slope around Monks Hill
A slope failure occurred on the slope along the road around Monks Hill in the southwest part of the island when it rained heavily during the hurricane in 1999. It was observed during the survey that the slope was about 70 m high and small-scale collapses were found on the middle and top of the slope. Also, no damage expansion since then was found although no countermeasures were carried out as shown in Figure 2.1.10.

2 - 9
Small-scale Collapses Found on the Middle and Top of the Slope
Area of Slope Failure that Occurred during Hurricane in 1999 (No expansion of the failure was seen.)
Source: JICA Study Team
Figure 2.1.10 Roadside Slope around Monks Hill in the Southwest of the Antigua Island
(4) Storm Surge
Disaster Records due to Storm Surge
Beaches and facilities along the coastline such as hotels, villas, and condominiums have been damaged by storm surges caused by the hurricane. It is said that damages on the coastline caused by erosion have been experienced but no specific record is available.
Field Inspection and Confirmation of Site Condition
It is reported that storm surges during hurricane attacks have caused coastal erosion damages in Galley Bay in five island villages and beach in Landing Bay located in the western area of Saint John’s. Moreover, the storm surges have spread over the main roads running in the east-southeast area resulting in damages to houses.
The damages have been restored already. As for the damaged beach, the restoration by artificial beach nourishment was only a temporary solution and high probability of future damage is foreseen due to storm surge that could be caused by hurricanes with severe gale.
Figure 2.1.11 shows the damaged areas, in which houses and cottages exist, caused by storm surges in Antigua Island.
Inundated Houses by storm surge due to Hurricanes Damaged Cottages in Coastal Line Source: JICA Study Team
Figure 2.1.11 Damaged Area Caused by Storm Surge in the Antigua Island

2-10
(5) Strong Wind
The disasters caused by the hurricane are explained in the previous Item (2): Flood. As mentioned in the item, large-scale destruction of houses is supposed to be due to strong winds. Higher influence of strong winds is seen in higher hurricane category.
(6) Earthquake
Records of disasters caused by past major earthquakes are shown in Table 2.1.7.
Table 2.1.7 Major Earthquakes in Antigua and Barbuda
Occurrence Disaster Area Magnitude Disaster Situation NoteNovember 29, 2007
Martinique Region M7.4 No remarkable damage in Antigua
-
November 21, 2004
Dominica, Guadeloupe, Montserrat, St. Maarten, Antigua, Nevis and St. Vincent
M6.3 -Damages in buildings -Tsunami of 1 m high or less
-
October 8, 1974
Antigua and Barbuda and Saint Christopher
M7.5 4 injured, No death -
February 8, 1843
Guadeloupe, Antigua, Barbuda, Nevis, Saint Christopher, Montserrat and Dominica
+/- M8 estimated
Details unknown -
April 5, 1690 Saint Christopher and Nevis, Antigua, Montserrat
>M8 -Collapse of some buildings -Death toll unknown
-
Source: Prepared by the JICA Study Team based on Home Page of Seismic Research Center and others.
(7) Tsunami
Records of past major tsunamis are shown in Table 2.1.8.
Table 2.1.8 Past Tsunamis that Attacked Antigua and Barbuda
Attacked Date Tsunami Height (m) Description
November 1, 1755 3.6 m Tsunami caused by the earthquake in Lisbon, Portugal attacked Antigua and Barbuda.
March 19, 1802 Unknown
February 8, 1843 1.2 m November 18, 1867 3.0 m Earthquake of M 7.5; Hypocenter is in Virgin Island
December 25, 1969 0.46 m
December 26, 1997* 3.0 m Due to the eruption of Mt. Montserrat
Source: Tablet: Preliminary List of Caribbean Tsunamis, (http://poseidon.uprm.edu/lander/tabla1a.htm)
* http://antiguaobserver.com/a-tsunami-could-cover-barbuda/
Figure 2.1.12 shows the records in Caribbean countries concerning tsunami in terms of attack frequency and height.
Figure 2.1.12 shows that higher tsunami was observed in Antigua and Barbuda, Dominica, Guadeloupe, Netherlands Antilles, and Saint Vincent and the Grenadines.

2 - 11
Source: Caribbean Training Course in Seismology and Tsunami Warnings St. Augustine, Trinidad and Tobago, June 25-30,
2007
Figure 2.1.12 Tsunami Occurrence Frequency and Height in the Caribbean Countries
(8) Drought
According to the “National Adaptation Strategy and Action Plan to Address Climate Change in the Water Sector in Antigua and Barbuda, November 2014” prepared by the Caribbean Community Climate Change Center and the Ministry of Health and Environment, Antigua and Barbuda experienced a probability of 54.5% for drought with a scale of once-a-year occurrence between 1928 and 2013. Severe drought was experienced in 1983 to 1984, and water was imported from Dominican Republic. Since then, the installation of desalination plants has progressed. According to EM-DAT, the people affected by the 1983-84 drought totaled to 75,000.
2.1.3 Present Disaster Management
(1) Framework of Disaster Management
The National Office of Disaster Services (NODS) is the supervising agency for disaster management in Antigua and Barbuda, which supervises disaster response as well as preparedness, countermeasures, mitigation, and restoration. NODS was established as an organization under the Ministry of Health and Interior in 1984. The present NODS is an organization under the Ministry of Social Transformation and Human Resource.
The vision and tasks of NODS are shown as follows:
Vision : To lower vulnerability to both natural and man-made disasters in Antigua and Barbuda through promotion of multi-sector and integrated disaster mitigation plan.
Task : To defend human life and property of Antigua and Barbuda as well as executing support of sustainable development through environmental protection, at anytime and in any situation.
The organizational structure of the government agencies related to disaster management is shown in Figure 2.1.13.
Cuba
Haiti
Dominican Republic
Venezuela
PuertoRico
Honduras
Panama
US Virgin Islands
NetherlandsAntilles
Barbados
Antigua and Barbuda
Martinique
Dominica
St Vincent and Grenadines
Guadeloupe

2-12
Source: National Disaster Management Plan-Basic Plan, Reviewed 7 January 2014
Figure 2.1.13 Organizational Structure of Government Agencies for Disaster Management in Antigua and Barbuda
The chairperson of the above organizational structure is the Prime Minister, and NODS works as the coordinating body. The chairperson of the National Disaster Committee is also the Prime Minister and the members of the committee are shown in Table 2.1.9. There are 17 district level committees including 16 committees in Antigua Island and one committee in Barbuda Island. All members of the district level committees are composed of volunteers, and the names of leaders and contact addresses are found in the NODS home page.
Table 2.1.9 National Disaster Committee Members
No. Member 1 Prime Minister (Chairperson)
2 Minister of the ministry responsible for management of the disasters that broke out (Vice chairperson)
3 Minister or the official who shall be acting chairperson when both chairperson and vice chairperson are absent, to be appointed by the Prime Minister
4 The following members appointed by the Prime Minister: (i) Police, (ii) Army, (iii) Fire,
5 Meteorological Agency
6 Antigua Public Utilities Authority 7 Minister responsible for finance
8 Minister responsible for public health
9 Minister responsible for local government
10 Minister responsible for environment
11 Minister responsible for public works
12 Ministries and bureaus designated by the Prime Minister as concerned agencies
13 Volunteers and organizations including NGOs to be considered necessary by the Prime Minister
Source: National Disaster Management Plan-Basic Plan, Reviewed 7 January 2014
Cabinet (POLICY DECISIONS)
Ministry HQ (ADMIN SUPPORT)
National Disaster Committee (POLICY RECOMMENDATIONS)
National Office for Disaster Services (NODS) (COORDINATING UNIT)
National Level Committees Sector Level Committees District Level Committees
Key Agencies Community Level Agencies Key Agencies

2 - 13
(2) Organization and Budget of NODS Secretariat
The NODS Secretariat currently comprises 17 members and the shortage of personnel is covered by volunteer(s). Of the 17 members, seven are technical staffs. As shown in Figure 2.1.13, members of the district committee and its subordinate community level agencies for emergency response are volunteers. There are 14 positions in NODS as shown in Table 2.1.10.
Table 2.1.10 Staffing Position of NODS
No. Position No. Position 1 Director 8 Communications Officer
2 Deputy Director 9 Switchboard Operator
3 Executive Officer 10 GIS Specialist 4 Junior Accounts Clerk 11 Database Manager
5 Secretary 12 Senior Clerk
6 Administrator 13 Junior Clerk
7 Public Relation Officer 14 Petty Officer
Source: http://nods.gov.ag/about-us/nods-staff/
It is important for NODS to secure competent persons in order that NODS fulfill its tasks as the coordinating agency of disaster risk management at every stage including pre-disaster, during disaster, and post-disaster.
NODS currently and mainly conducts activities of disaster management education and enlightenment during the prior/preparation stage as well as operation of the emergency operation center during the disaster response stage.
The SWOT analysis done in the National Disaster Management Plan-Basic Plan, Reviewed 7 indicated that:
Weaknesses of NODS : i) Governance, ii) Insufficient capable personnel, and iii) Budget deficit.
Threats to NODS : i) Vulnerability against hazard, ii) Climate change, iii) Impact on the economy, iv) Collaboration with domestic other sectors, and v) Impact on society.
2.1.4 Meteorological and Hydrologic Services
(1) Meteorological and Hydrologic Agencies and Duties
Operation of the meteorological services has been conducted in the Vere Cornwall Bird International Airport since the early 1970s by a government agency. Presently, the Meteorological Service Office is under the Ministry of Civil Aviation and Public Utilities Transport (MCAUPT).
Meteorological service provided for the airport aviation is a main service, as well as, national meteorological service for Antigua and Barbuda and weather forecast for the Leeward Islands. Tide level observation is also conducted.
(2) Outline of Meteorological and Hydrologic Agencies (Personnel and Budget)
Personnel is presently composed of one director/deputy director (target: 2), four meteorologists (target: 6), one forecaster I (target: 4), one forecaster II (target: 3), 5-6 IT engineers and climatologist as well as 14 meteorological officers/observers including five in the airport and nine for the site stations. Total number is 35 persons only against the target of 58 persons, which shows apparent shortage of staff.
Required annual budget is said to be Bds$3 million, while actual approved amount is about 70% only of the requirement. Actual required personnel cost is about 50% of the said required annual budget.
(3) Meteorological and Hydrologic Observations
1) Meteorological Observations (Surface and Altostratus)
There are 12 existing automatic stations in Antigua and Barbuda including 11 in Antigua and one remaining in Barbuda, while there are two other stations, which have not been operational due to equipment/battery problem. Out of the 12 stations, the synoptic stations exist at ten locations and

2-14
rainfall stations at two locations. These stations are rather evenly distributed in the island except in the east and northeast areas.
The meteorological observations in Antigua and Barbuda have commenced since 1970 at the Vere Cornwall Bird International Airport, at Light House (rainfall only in the central part of the island) since 1981, and in the agro-meteorological station at Green Castle (rainfall; automatic and manned) since 1957.
Observed data are originally designed to be sent through radio communication to the main office at the airport; however, some of those that functioned during observation have malfunctioned due to communication problem. Furthermore, automatic stations do not send observed data at present to the Caribbean Institute for Meteorology and Hydrology (CIMH) through satellite communication in spite of its true function.
Equipment and installation costs of the automatic stations were covered by the national budget for one station only and by funding from donors including European countries as well as the Organization of Eastern Caribbean States (OECS).
Operation and maintenance (O&M) cost is covered by the national budget, and there is some constraint in the replacement of aging equipment owing to the difficulty of securing spare parts especially expensive parts such as humidity sensor and solar panel.
2) Meteorological Radar Observation
Meteorological radar facility is not available and there is no schedule so far to introduce such system in Antigua and Barbuda in consideration of its O&M cost. Meteorological information is secured from the radar observation in Guadeloupe and weather forecasts are disseminated not only for Antigua and Barbuda but also the Leeward Islands including Guadeloupe.
3) Hydrologic Observation (River)
No observation is conducted in Antigua and Barbuda.
4) Tide and Surge Observations
It is said that tide level observation is conducted in the National Defense Base.
5) Observation Database System
In the computer server in the main office at the international airport, the following information are respectively but not systematically stored:
a) Data observed in the international airport,
b) Disseminated information including forecasts and hurricane warnings in text file, and
c) Other observation data.
(4) Dissemination of Weather Information, Forecast, and Warning
Regular dissemination such as weather forecast is carried out in text image in the following manner:
a) Website for the public,
b) Telephone and facsimile for domestic media including hurricane bulletin, and
c) E-mail for the Leeward Islands.
Observed data and forecasts are sent to CIMH. Drought information is provided in cooperation with CIMH only for domestic which incorporates domestic situation specifically.
As for the hurricane information, it is disseminated in text data in various forms such as “Hurricane Forecast Form”, “Extreme Weather Bulletin Form”, and “Tropical Cyclone Watch Statement”. The meteorological warnings are sent out through e-mails and telephone for the government agencies (NODS, disaster management-related agencies, MCAPUT) as well as media, and released on the website.

2 - 15
(5) Cooperation with Other Related Meteorological Agencies
The Antigua and Barbuda Meteorological Services provide weather forecasts and hurricane information based on the National Hurricane Center (NHC) and National Oceanic and Atmospheric Administration (NOAA) information for the Leeward Islands countries including Saint Christopher and Nevis as well as the British Montserrat, British Anguilla, and the British Virgin Island in accordance with the agreement with the Caribbean Meteorological Organisation CMO. Cost required for such service is paid by MCAPUT; however, it is more advantageous if training and equipment support are obtained from the membership of CMO and CIMH.
2.1.5 Support of the Japanese Government
Some supports on the fishery sector of Antigua and Barbuda have been provided by the Japanese government. However, no support was made for the disaster management sector.
2.1.6 Support of Other Donors
Antigua and Barbuda has not received direct support from other donors, but received some supports covering several Caribbean Community and Common Market (CARICOM) countries. The following Canadian International Development Agency (CIDA) programs/projects are ongoing:
Caribbean Disaster Risk Management Program-Knowledge Sharing
This program commenced in September 2013. The executing agency is the University of the West Indies. Countries included in the program are Anguilla, Antigua and Barbuda, Dominica, Grenada, Jamaica, Saint Christopher and Nevis, Saint Lucia, Montserrat, and Saint Vincent and the Grenadines. Key activities include: (1) developing case studies on successful disaster risk reduction practices; (2) establishing a database of disaster events in the Caribbean; (3) organizing staff and student exchanges; and (4) developing online courses on comprehensive disaster management for business and private sector.
Community Disaster Risk Reduction Program
This program commenced in March 2012. The executing agency is the Caribbean Development Bank. Countries included in the program are Anguilla, Antigua and Barbuda, Dominica, Dominican Republic, Grenada, Haiti, Jamaica, Saint Christopher and Nevis, Saint Lucia, Montserrat, and Saint Vincent and the Grenadines. The program supports community resilience in the face of natural disasters by undertaking demonstration projects that help determine which prevention or mitigation measures are most effective. The demonstration projects are implemented in 15 to 17 communities across the Caribbean, with a focus on high-risk, low-income communities.
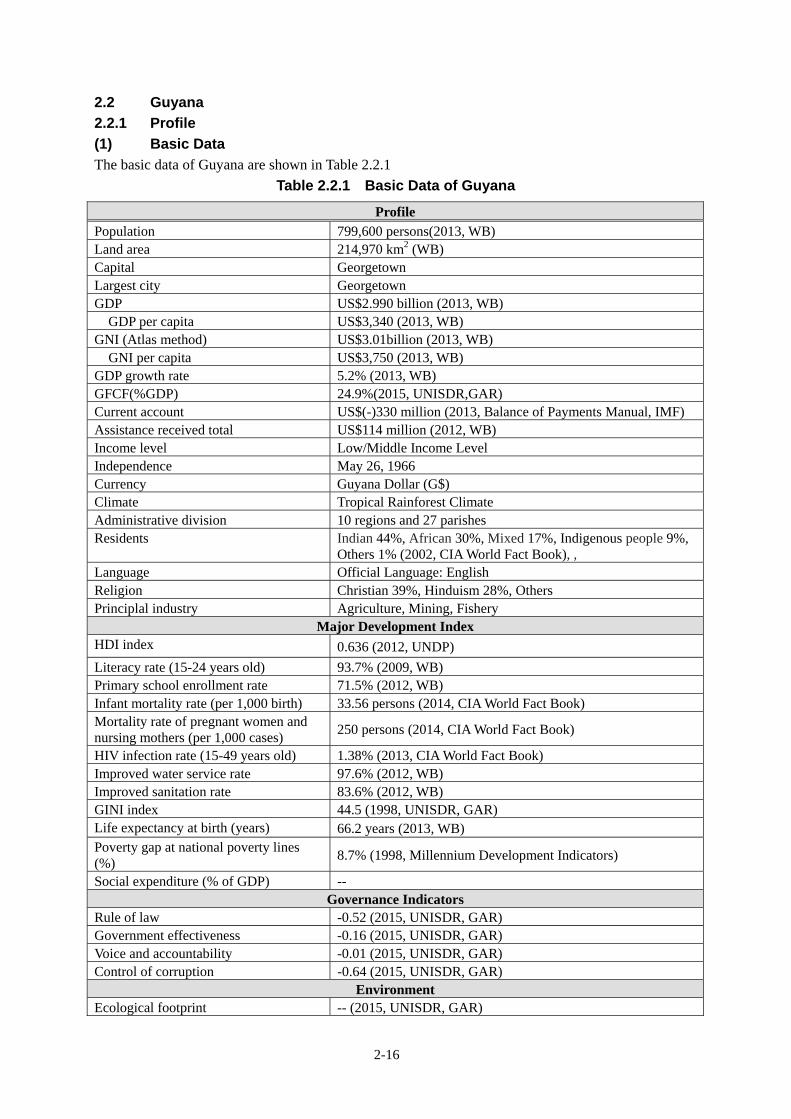
2-16
2.2 Guyana
2.2.1 Profile
(1) Basic Data
The basic data of Guyana are shown in Table 2.2.1
Table 2.2.1 Basic Data of Guyana
Profile Population 799,600 persons(2013, WB) Land area 214,970 km2 (WB) Capital Georgetown Largest city Georgetown GDP US$2.990 billion (2013, WB)
GDP per capita US$3,340 (2013, WB) GNI (Atlas method) US$3.01billion (2013, WB) GNI per capita US$3,750 (2013, WB) GDP growth rate 5.2% (2013, WB) GFCF(%GDP) 24.9%(2015, UNISDR,GAR) Current account US$(-)330 million (2013, Balance of Payments Manual, IMF) Assistance received total US$114 million (2012, WB) Income level Low/Middle Income Level Independence May 26, 1966 Currency Guyana Dollar (G$) Climate Tropical Rainforest Climate Administrative division 10 regions and 27 parishes Residents Indian 44%, African 30%, Mixed 17%, Indigenous people 9%,
Others 1% (2002, CIA World Fact Book), , Language Official Language: English Religion Christian 39%, Hinduism 28%, Others Principlal industry Agriculture, Mining, Fishery
Major Development Index HDI index 0.636 (2012, UNDP)
Literacy rate (15-24 years old) 93.7% (2009, WB) Primary school enrollment rate 71.5% (2012, WB) Infant mortality rate (per 1,000 birth) 33.56 persons (2014, CIA World Fact Book) Mortality rate of pregnant women and nursing mothers (per 1,000 cases)
250 persons (2014, CIA World Fact Book)
HIV infection rate (15-49 years old) 1.38% (2013, CIA World Fact Book) Improved water service rate 97.6% (2012, WB) Improved sanitation rate 83.6% (2012, WB) GINI index 44.5 (1998, UNISDR, GAR) Life expectancy at birth (years) 66.2 years (2013, WB) Poverty gap at national poverty lines (%)
8.7% (1998, Millennium Development Indicators)
Social expenditure (% of GDP) -- Governance Indicators
Rule of law -0.52 (2015, UNISDR, GAR) Government effectiveness -0.16 (2015, UNISDR, GAR) Voice and accountability -0.01 (2015, UNISDR, GAR) Control of corruption -0.64 (2015, UNISDR, GAR)
Environment Ecological footprint -- (2015, UNISDR, GAR)
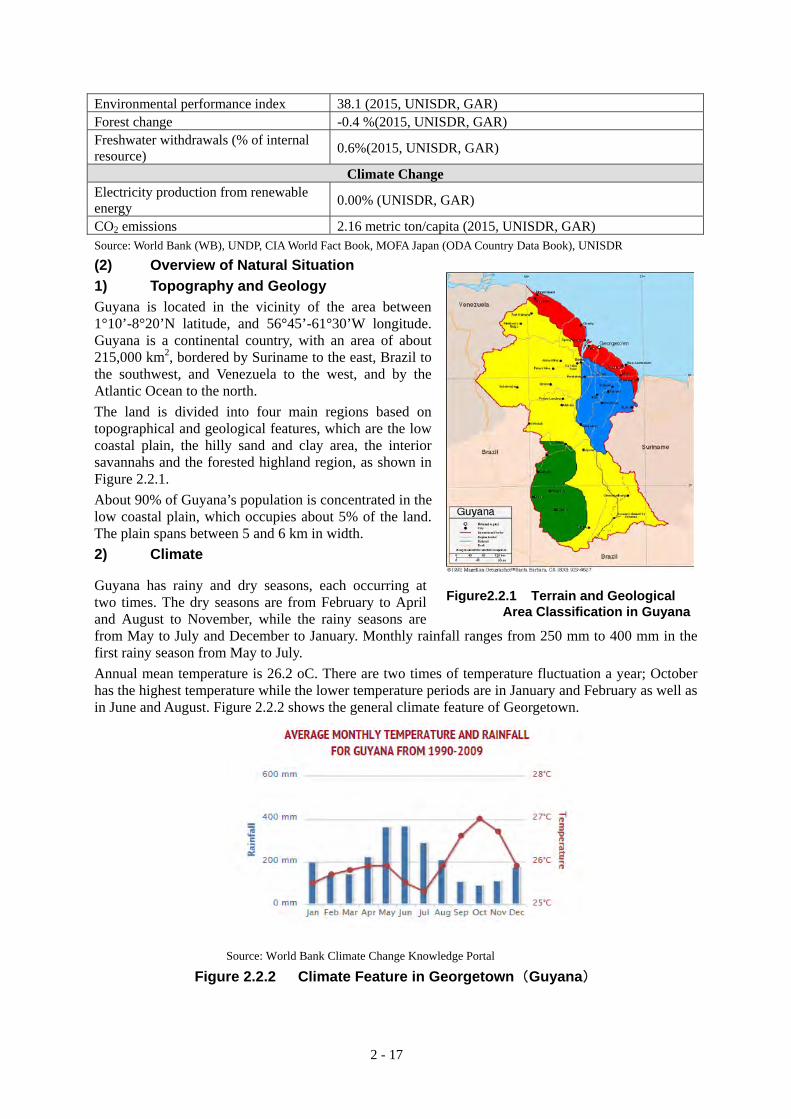
2 - 17
Environmental performance index 38.1 (2015, UNISDR, GAR) Forest change -0.4 %(2015, UNISDR, GAR) Freshwater withdrawals (% of internal resource)
0.6%(2015, UNISDR, GAR)
Climate Change Electricity production from renewable energy
0.00% (UNISDR, GAR)
CO2 emissions 2.16 metric ton/capita (2015, UNISDR, GAR) Source: World Bank (WB), UNDP, CIA World Fact Book, MOFA Japan (ODA Country Data Book), UNISDR
(2) Overview of Natural Situation
1) Topography and Geology
Guyana is located in the vicinity of the area between 1°10’-8°20’N latitude, and 56°45’-61°30’W longitude. Guyana is a continental country, with an area of about 215,000 km2, bordered by Suriname to the east, Brazil to the southwest, and Venezuela to the west, and by the Atlantic Ocean to the north.
The land is divided into four main regions based on topographical and geological features, which are the low coastal plain, the hilly sand and clay area, the interior savannahs and the forested highland region, as shown in Figure 2.2.1.
About 90% of Guyana’s population is concentrated in the low coastal plain, which occupies about 5% of the land. The plain spans between 5 and 6 km in width.
2) Climate
Guyana has rainy and dry seasons, each occurring at two times. The dry seasons are from February to April and August to November, while the rainy seasons are from May to July and December to January. Monthly rainfall ranges from 250 mm to 400 mm in the first rainy season from May to July.
Annual mean temperature is 26.2 oC. There are two times of temperature fluctuation a year; October has the highest temperature while the lower temperature periods are in January and February as well as in June and August. Figure 2.2.2 shows the general climate feature of Georgetown.
Source: World Bank Climate Change Knowledge Portal
Figure 2.2.2 Climate Feature in Georgetown(Guyana)
Figure2.2.1 Terrain and Geological Area Classification in Guyana

2-18
(3) Socioeconomic Condition
1) Political Situation
Guyana became independent from Britain in 1966. It has been a constitutional republic with single chamber. The ruling People's Progress and Civil Party, which won in the general elections of November 2011, were responsible for the administration since 1992. However, in the general elections of May 2015, A Pratnership for National Unity(APNU), which was the opposition party until the current election, has established of a coalition government with the Alliance for Change.
2) Population
According to the World Bank’s survey, it is estimated that the total population of Guyana was about 800,000 as of 2013, 30% or less of which are living in the urban area. Residents in the urban area have remained almost at the same level in terms of ratio to the whole population, but slightly decreasing in the long-term period. Table 2.2.2 shows the change of population in Guyana.
Table 2.2.2 Change in Population in Guyana
Indicator 1988 1993 1998 2003 2008 2013 Total population (person) 733,057 724,014 737,526 753,612 775,739 799,613
Population growth rate (annual %) -0.78 0.14 0.47 0.40 0.69 0.53
Urban population (person) 218,180 212,245 212,931 214,259 218,898 226,946
Urban population (% of total) 29.76 29.32 28.87 28.43 28.22 28.38
Rural population (person) 514,877 511,769 524,595 539,353 556,841 572,667
Rural population (% of total) 70.24 70.69 71.13 71.57 71.78 71.62
Source: World Bank, World Data Bank
3) GNI and GDP
Nominal GNI per capita and nominal GDP per capita of Guyana are around US$2,400 as shown in Table 2.2.3.
Table 2.2.3 Nominal GNI and GDP per Capita in Guyana
Indicator 2009 2010 2011 2012 2013 GNI per capita, Atlas method (US$) 480 500 880 900 2,330GDP per capita (US$) 564 611 973 984 2,478Source: World Bank, World Data Bank
4) Government Agencies and Administrative Division
The ministries of the Government of Guyana are enumerated in Table 2.2.4
Table 2.2.4 Central Government Agencies of Guyana
Central Government Agencies Ministry of Agriculture
Ministry of Amerindian Affairs
Ministry of Culture, Youth and Sports
Ministry of Fisheries, Crops and Livestock
Ministry of Foreign Affairs
Ministry of Foreign Trade and International Co-operation
Ministry of Home Affairs
Ministry of Housing and Water
Ministry of Human Services and Social Security
Ministry of Labour
Ministry of Legal Affairs
Ministry of Local Government and Regional Development
Ministry of Public Service
Ministry of Tourism, Industry and Commerce

2 - 19
Central Government Agencies Ministry of Transport, Communication and Hydraulics
Office of the Minister for Parliamentary Affairs
Source:http//www.commonwealth/nation.org/sectors-guyana/government/government-ministries
Guyana is composed of ten local administrative regions as shown in Table 2.2.5.
Table 2.2.5 Administrative Regions in Guyana
No. Region Area (km2) Population (Census 2012)1 Barima-Waini 20,339 26,941
2 Pomeroon-Supenaan 6,195 46,810
3 Essequibo Islands-West Demerara
3,755 107,416
4 Demerara-Mahaica 2,232 313,429
5 Mahaica-Berbice 4,190 49,723
6 East Berbice-Corentyne 36,234 109,431 7 Cuyuni-Mazaruni 47,213 20,280
8 Potaro-Siparuni 20,051 10,190
9 Upper Takutu-Upper Essequibo 57,750 24,212
10 Upper Demerara-Beribece 17,040 39,452
Source:Area - http://www.statoids.com/ugy.html; Population – 2012 Census data
2.2.2 Disaster Situation
(1) General
Guyana is a continental country with a vast extent of land, whose natural environment varies between the inland and coastal areas. Most of the population lives in low areas of the coastal plain. Natural disasters in Guyana are caused mainly by flood, storm surge, and high waves.
The “Global Assessment Report on Disaster Risk Reduction 2015” prepared by UNISDR reveals the general feature of disasters by country, which presents the occurrence rate by disaster and the cause-specific percentage of economic loss by disasters as shown in Figure 2.2.3.
Note: The term “Cyclone” is used as in the source.
Figure 2.2.3 Occurrence Rate by Disaster (left) and Cause-specific Percentage of Economic Loss by Disasters (right)
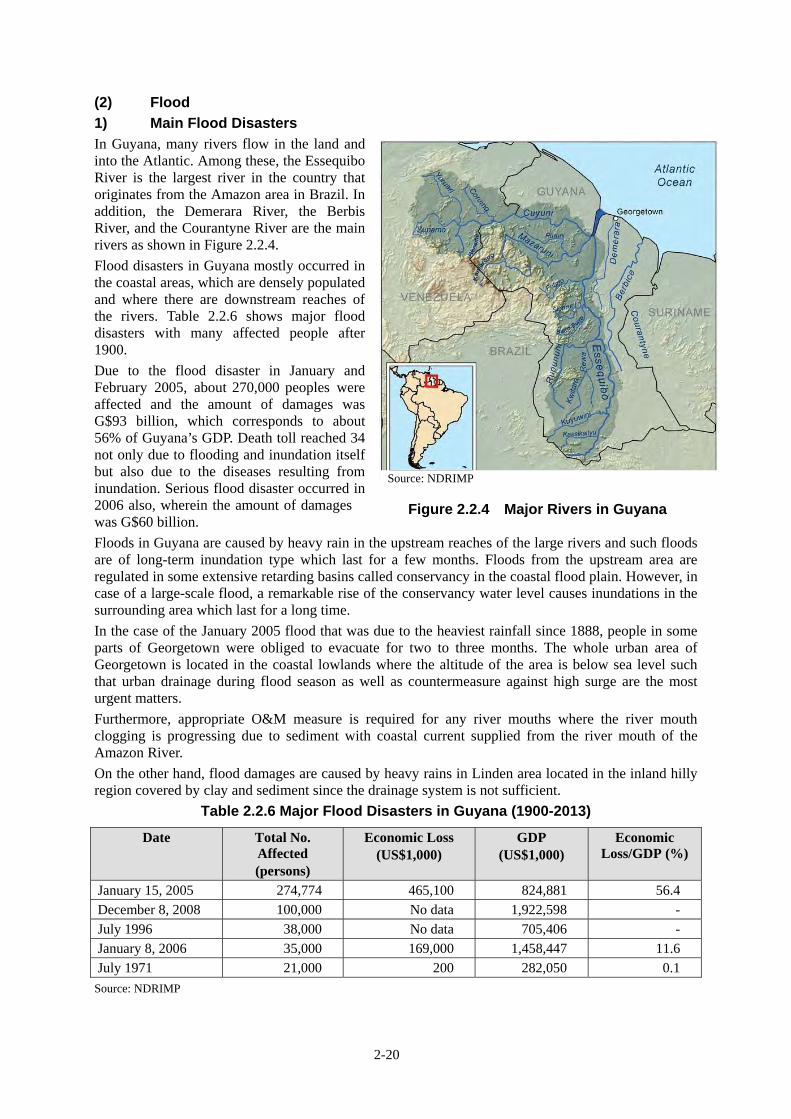
2-20
(2) Flood
1) Main Flood Disasters
In Guyana, many rivers flow in the land and into the Atlantic. Among these, the Essequibo River is the largest river in the country that originates from the Amazon area in Brazil. In addition, the Demerara River, the Berbis River, and the Courantyne River are the main rivers as shown in Figure 2.2.4.
Flood disasters in Guyana mostly occurred in the coastal areas, which are densely populated and where there are downstream reaches of the rivers. Table 2.2.6 shows major flood disasters with many affected people after 1900.
Due to the flood disaster in January and February 2005, about 270,000 peoples were affected and the amount of damages was G$93 billion, which corresponds to about 56% of Guyana’s GDP. Death toll reached 34 not only due to flooding and inundation itself but also due to the diseases resulting from inundation. Serious flood disaster occurred in 2006 also, wherein the amount of damages was G$60 billion.
Floods in Guyana are caused by heavy rain in the upstream reaches of the large rivers and such floods are of long-term inundation type which last for a few months. Floods from the upstream area are regulated in some extensive retarding basins called conservancy in the coastal flood plain. However, in case of a large-scale flood, a remarkable rise of the conservancy water level causes inundations in the surrounding area which last for a long time.
In the case of the January 2005 flood that was due to the heaviest rainfall since 1888, people in some parts of Georgetown were obliged to evacuate for two to three months. The whole urban area of Georgetown is located in the coastal lowlands where the altitude of the area is below sea level such that urban drainage during flood season as well as countermeasure against high surge are the most urgent matters.
Furthermore, appropriate O&M measure is required for any river mouths where the river mouth clogging is progressing due to sediment with coastal current supplied from the river mouth of the Amazon River.
On the other hand, flood damages are caused by heavy rains in Linden area located in the inland hilly region covered by clay and sediment since the drainage system is not sufficient.
Table 2.2.6 Major Flood Disasters in Guyana (1900-2013)
Date Total No. Affected (persons)
Economic Loss (US$1,000)
GDP (US$1,000)
Economic Loss/GDP (%)
January 15, 2005 274,774 465,100 824,881 56.4
December 8, 2008 100,000 No data 1,922,598 -
July 1996 38,000 No data 705,406 -
January 8, 2006 35,000 169,000 1,458,447 11.6
July 1971 21,000 200 282,050 0.1
Source: NDRIMP
Source: NDRIMP
Figure 2.2.4 Major Rivers in Guyana

2 - 21
2) Field Inspection and Confirmation of Site Condition
(a) Countermeasure for External Water Flooding by Conservancy
Some retarding ponds are in place in the lowland areas of the coastal plain in Guyana. The largest one is located in the right bank of the downstream reaches of the Demerara River that is used for flood regulation and irrigation and service water supply. It is located just upstream of Georgetown with a surface area of about 350 km2, and is managed by the National Drainage and Irrigation Authority (NDIA) under the Ministry of Agriculture.
The retarding pond is surrounded by dyke at the downstream side and several sluice gates are installed on the dyke. The sluice gates are operated according to the operation rule during the flood period. The Land of Canaan Gate facing the Demerara River at the west end of the dyke is closed to prevent countercurrent from the Demerara River when the river water level is higher than the pond level. The Maduni Gate at the east part connecting to the Mahaica River and drainage canal is used for the drainage from the pond as well as water supply for irrigation and service water around the retarding pond. Location of the East Demerara Reservoir is shown in Figure 2.2.5.
The Guyanese government is constructing the New Hope Canal so as to improve flood control capacity by discharging towards the Atlantic Ocean, which will be in service shortly.
Furthermore, reinforcement works and regular maintenance of the channels inside the pond as well as dykes have been carried out, and widening and reinforcement of the main dykes of the northern part, which partially collapsed during flood, is currently carried out, and the pond nearby the dyke is being excavated to maintain the pond capacity, while the excavated material is used as banking material. Fiigure 2.2.6 shows improvement works of the the East Demerara Reservoir.
Source: JICA CDMP-2
Figure 2.2.5 Location of the East Demerara Reservoir
Hope Canal

2-22
Widening and Reinforcement Works of Main Dyke in Southern Part of the East Demerara Reservoir
Regulator Inlet of Hope Canal
Source: JICA Study Team
Figure 2.2.6 Improvement Works of the East Demerara Reservoir
(b) Internal Drainage in Georgetown
There are five pumping stations and ten locations of sluices along the Demerara River in Georgetown as well as two pumping stations with four pump units in the seaside area. Existing drainage capacity is about 40 m3/s in total against the design drainage capacity of 150 m3/s. Drainage channels in the urban area are classified as trunk line (primary), secondary, and tertiary, and these channels comprise the interconnected channel network system. Sediment deposit and wastes in the channel are identified as drainage issues. Figure 2.2.7 shows the Drainage Pump Station and the Drainage Diagram of Georgetown.
Drainage Pump Station in Georgetown Drainage Diagram Exhibited in the City Hall Source: JICA Study Team
Figure 2.2.7 Drainage Pump Station and Drainage Diagram of Georgetown
(3) Sediment Disasters
Physiographic region map and geological map are respectively shown in Figures 2.2.9 and 2.2.10. In Guyana, most of the sediment disasters occur in inland regions (Regions 8, 9, and 10) where few people live such that it is not recognized as a major problem by the government. Since inland areas where sediment disasters occur are almost inaccessible, site inspection was not carried out in this survey.
(4) Storm Surge
Ground elevation in the coastal area is lower than the sea level during high tide time. Some places with lower level than the mean sea level frequently suffer high surge disaster and inundation due to insufficient drainage of such seawater. More frequent high surge disasters are caused than flooding by heavy rain and/or river overflow.

2 - 23
Particularly, the coastal trunk road suffers inundation frequently due to high surge. As a countermeasure against the high surge, the tide embankment of continuous concrete retaining wall was constructed along the coastal line and mangrove trees were planted. However, due to the spring tide in 2013, overtopping of seawater caused inundation in the coastal area and roads, and the dyke was raised by parapet wall by 1 m. Figure 2.2.8 shows general views of the Coastal Dyke in Georgetown.
Coastal Dyke Raised with Parapet Wall High Tide Situation in front of the Coastal Dyke Source: JICA Study Team
Figure 2.2.8 Coastal Dyke in Georgetown
(5) Strong Wind
In Guyana, disaster due to strong winds seldom occurs.
(6) Earthquake
The country has not been subject to any other earthquake event in recorded history including inland area except for the earthquakes in 2008 (M4.0) and 2007 (M4.6) whose epicenter is offshore of Guyana. However, shakings of the earthquakes that occurred in neighboring countries such as Venezuela and the Caribbean countries were observed in Guyana. Powerful tremors from a 7.4 magnitude earthquake in the Caribbean Sea near Martinique were felt across Guyana in November 2007.
(7) Tsunami
Potential risk of tsunami disaster is conceivable when the eruption of Mt. Kick’em Jenny will take place, which is an undersea volcano located between Grenada and Saint Vincent. Tsunami was generated by a local earthquake on September 20, 1825, whose wave height is unknown.
Officials concerned in disaster management, including officers of the Civil Defense Commission (CDC), have rather little concern about the said disaster management although they seem to recognize such potential risk of tsunami and earthquake disasters.
(8) Drought
Drought disasters occurred from 1997 to 1998 and in 2010. Due to the drought situation since July 1997, 607,200 people were affected and the economic loss amounted to US$29,000.
Southwestern area, where Regions 8 and 9 exist, is located in the savanna climate and is a high drought risk zone. Rainfall pattern of this area has the following characteristics:
i) The annual rainfall amount is similar to the country average,
ii) There is rainy season twice a year in the northern coastal area, and
iii) Rain is concentrated in the southern mountainous area during the rainy season (once a year) and there is a large seasonal difference of rainfall.
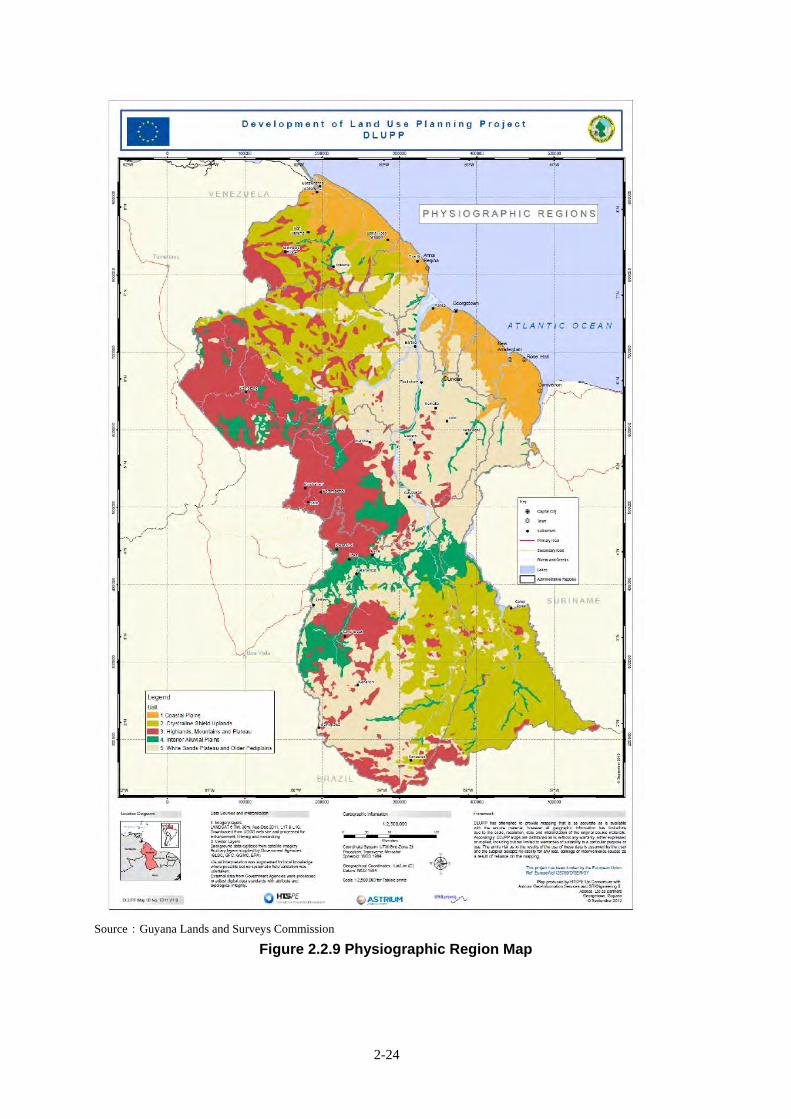
2-24
Source:Guyana Lands and Surveys Commission
Figure 2.2.9 Physiographic Region Map

2 - 25
Source:Guyana Lands and Surveys Commission
Figure 2.2.10 Geological Map of Guyana
It is reported that water levels of some of the lakes are abnormally lowered due to severe drought in the past, so that falling water volume was much decreased at the Kaieteur Waterfall.

2-26
(9) Bridges
Guyana is one of the few continental countries in the CARICOM countries. Feature of flood in Guyana is quite different from that of the other island countries in that no flash flood has occurred in the coastal lowlands.
The JICA Study Team surveyed most of the trunk road which connects the capital Georgetown and Corriverton, which is the border town with neighbouring Suriname. Table 2.2.7 enumerates the bridges along the said road as well as the locations ashown in Figure 2.2.11.
Table 2.2.7 Bridges Inspected and their Situation
No. Name Road Situation Present Situation 1. Demerara Harbour Bridge Not suffered but old Used as usual
2. Hope Canal Bridge Not suffered Newly built
3. Mahaica Bridge Not suffered Used as usual
4. Mahaicony Bridge Rather new Used as usual
5. Abary Bridge Not suffered Used as usual
6. Berbice Bridge Not suffered Used as a toll bridge. Opened in December 2008
8. Bush lack Bridge Not suffered but old Used as usual
9 Neville Bridge Not suffered but old Used as usual
10. Jopper Bridge Not suffered but old Used as usual
Source:JICA Study Team

2 - 27
Source:JICA Study Team
Figure 2.2.11 Locations of Field Inspection (Bridges)
1) Present Situation of Bridges
Rivers in Guyana are continental rivers and many have wide river mouth. Therefore, a long bridge is required for such downstream section. In fact, some existing bridges have a length longer than 1,500 m such as the Demerara Harbour Bridge and the Berbice River Bridge.
General feature of inspected bridges are described hereunder.
Demerara Harbour Bridge (①)
The bridge crossing the Demerara River at the river mouth section is the longest one in the world as a pontoon type. Thirty-five years have passed since its completion and traffic have been increasing recently (daily average of 15,000 units); therefore, it might be time to replace it with a new bridge considering its lifetime as well.
Pre-feasibility study on the replacement of the bridge has been conducted and the Ministry of Public Works (MPW) hopes to conduct a full-scale feasibility study. The present situation of the Demerara Bridge is shown in Figure 2.2.12. Main dimension of the bridge is as follows:
Length:1,851 m
Type:Pontoon bridge with 61 spans of Bailey bridge girder
Clearance: 7.9 m
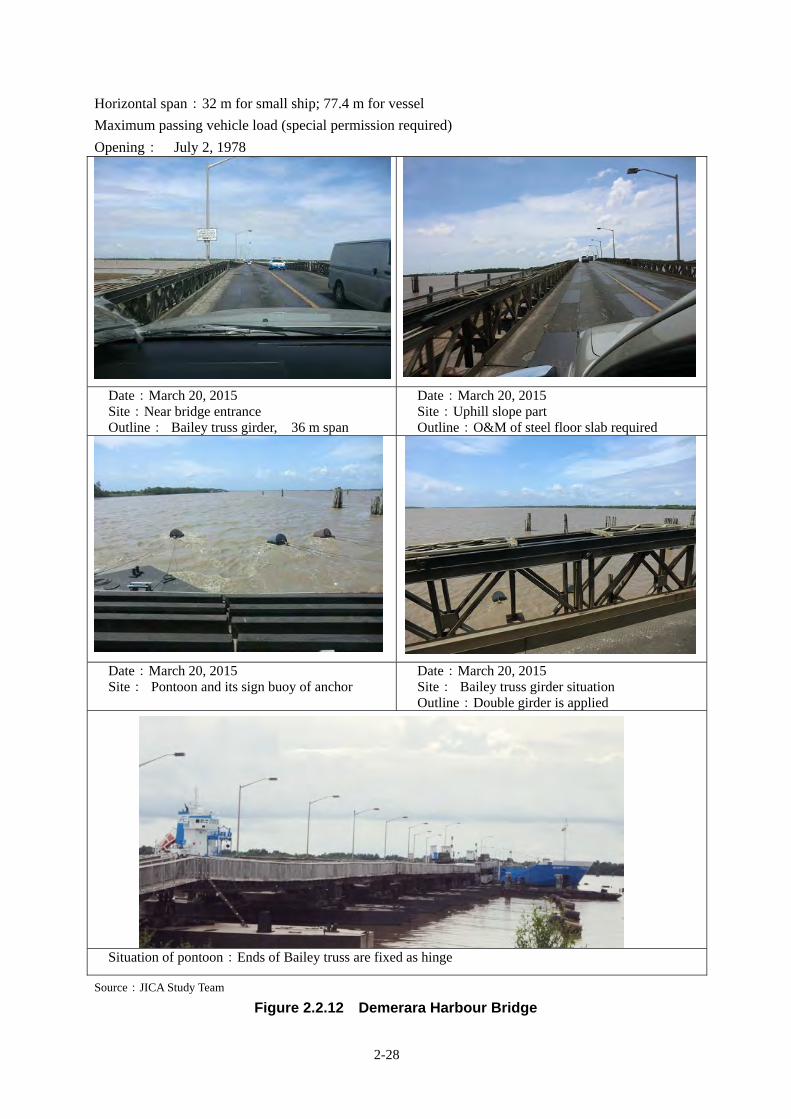
2-28
Horizontal span:32 m for small ship; 77.4 m for vessel
Maximum passing vehicle load (special permission required)
Opening: July 2, 1978
Date:March 20, 2015 Site:Near bridge entrance Outline: Bailey truss girder, 36 m span
Date:March 20, 2015 Site:Uphill slope part Outline:O&M of steel floor slab required
Date:March 20, 2015 Site: Pontoon and its sign buoy of anchor
Date:March 20, 2015 Site: Bailey truss girder situation Outline:Double girder is applied
Situation of pontoon:Ends of Bailey truss are fixed as hinge
Source:JICA Study Team
Figure 2.2.12 Demerara Harbour Bridge

2 - 29
Hope Canal Bridge(②)
The new bridge was completed in February 2014 across the new canal (Hope Canal) which was constructed to increase drainage capacity of the Demerara Conservancy. Present view of the Hope Canal Bridge is presented in Figure 2.2.13.
Date:March 21, 2015 Site: Substructure Outline: PCI girder bridge (5 beams)
Date:March 21, 2015 Site:Downstream side view from the right bankOutline: -
Source:JICA Study Team
Figure 2.2.13 Hope Canal Bridge
Berbice Bridge (⑥)
The Berbice Bridge is a similar pontoon type bridge to the Demerara Harbour Bridge across the Berbice River nearby New Amsterdam, whose construction was completed in December 2008. The length is 1,570 m, which is the sixth longest in the world as a pontoon type bridge. A 70 m wide span is secured for a large ship (vessel) with an electrically movable span, while a 35 m wide span and 11.9 m clearance is always secured for small ship. The bridge is owned by the Berbice Bridge Company at present and to be transferred to the Guyanese government in 2035. Present view of the Berbice Bridge is presented in Figure 2.2.14.
Date:March 21, 2015 Site:Direction to Georgetown Outline:Steel floor slab with cleat
Date:March 21, 2015 Site: Bound for Georgetown Outline:Position toward 75 m span section for vessel
Source:JICA Study Team
Figure 2.2.14 Berbice Bridge
Bridge in the Vicinity of Naivil Village (⑨)
There is a bridge with four spans of concrete slab with 20 m length attached to the control gates on the Corentyne Coast Road across an irrigation canal near Naivil Village (41 km far from New Amsterdam).

2-30
There are several bridges similar to this bridge. View of the bridges in Naivil Village is presented in Figure 2.2.13.
Date:March 21, 2015 Site:Bridge crossing a canal Outline:Bridge is attached to the control gate
Date:March 21, 2015 Site:Bridge crossing a canal (upstream view) Outline:Four gates attached
Source:JICA Study Team
Figure 2.2.15 Bridges in Naivil Village
2)Design Criteria (Earthquake Resistance Standard and Freeboard)
The American Association of State Highway and Transportation Officials (AASHTO) Standards or British Standards (BS) is applied as a design standard in which the design flood water level is based on the probable 100-year rainfall and clearance is determined locally according to the respective districts.
Scarce earthquake is experienced in Guyana among the CARICOM countries, and a regional seismic factor is defined from 0 to 0.25 in the Caribbean Uniform Building Code (CUBiC). This factor is not applicable for bridge design and it seems that few consideration for earthquake resistance is given for bridges.
2.2.3 Present Disaster Management
(1) Framework of Disaster Management
After the National Prevention, Preparedness and Relief Plan took effect in 1982, the Guyanese government has prepared and enforced several policies and plans aiming at the improvement of disaster management with several international donors. Out of the above, the principal policies and plans concerning disaster management are shown in Table 2.2.8. However, according to the National Integrated Disaster Risk Management Plan (NIDRMP) decided in 2013, it was pointed out that operation and enforcement of the national disaster management system or comprehensive disaster management program have not been satisfactorily secured.
Table 2.2.8 Recently Prepared Policies and Plans in Guyana Related to Disasters
Date Key Policies, Strategies and Plans Related to Disaster
Risk Management in Guyana
Description Linked to Disaster Management and Disaster Risk Management
1982 National Prevention, Preparedness and Relief Plan
Guyana’s efforts to manage emergencies and disasters date back from 1982 when the Civil Defense Commission (CDC) developed this Plan to cope with all types of disasters.
1985 National Disaster Preparedness and Response Plan
Outlines stakeholders involved in disaster management and their roles.
2001 National Development Strategy (2001-2010)
Provides a framework for national planning and captures a number of cross-spectral issues such as environment, forestry, agriculture, mining, tourism, and fisheries, among others. Makes some clear statements on measures to be taken to build capacity
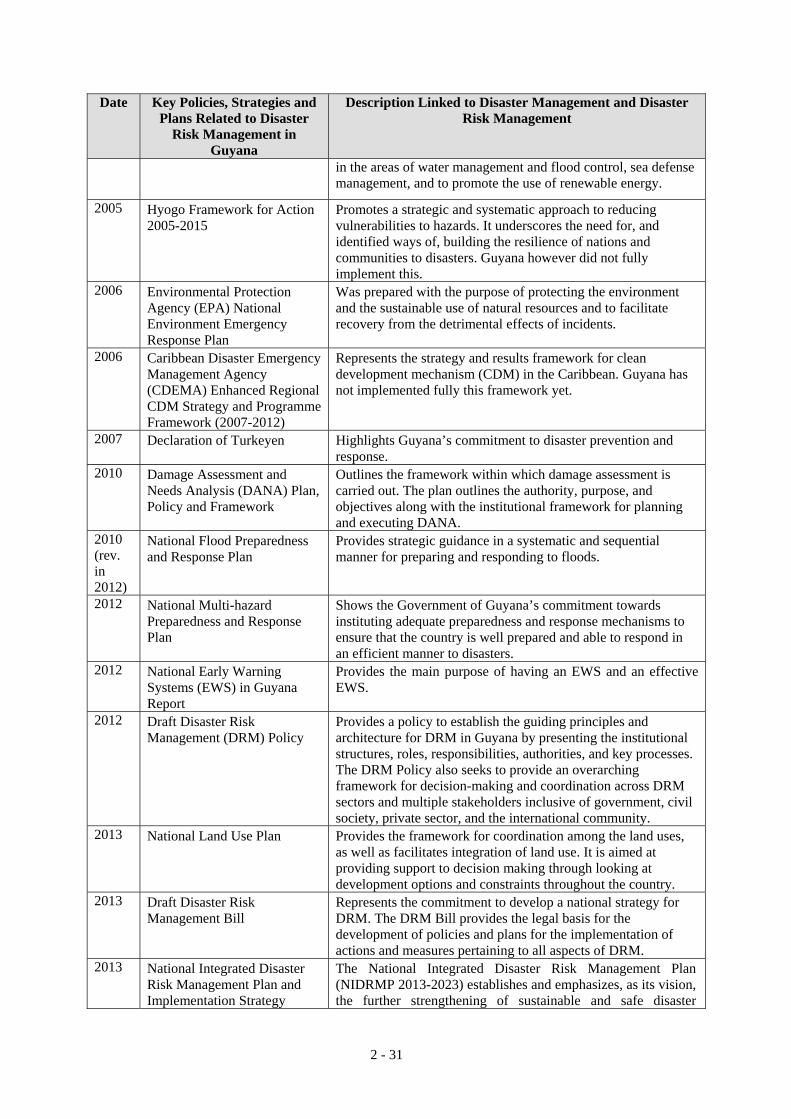
2 - 31
Date Key Policies, Strategies and Plans Related to Disaster
Risk Management in Guyana
Description Linked to Disaster Management and Disaster Risk Management
in the areas of water management and flood control, sea defense management, and to promote the use of renewable energy.
2005 Hyogo Framework for Action 2005-2015
Promotes a strategic and systematic approach to reducing vulnerabilities to hazards. It underscores the need for, and identified ways of, building the resilience of nations and communities to disasters. Guyana however did not fully implement this.
2006 Environmental Protection Agency (EPA) National Environment Emergency Response Plan
Was prepared with the purpose of protecting the environment and the sustainable use of natural resources and to facilitate recovery from the detrimental effects of incidents.
2006 Caribbean Disaster Emergency Management Agency (CDEMA) Enhanced Regional CDM Strategy and Programme Framework (2007-2012)
Represents the strategy and results framework for clean development mechanism (CDM) in the Caribbean. Guyana has not implemented fully this framework yet.
2007 Declaration of Turkeyen Highlights Guyana’s commitment to disaster prevention and response.
2010 Damage Assessment and Needs Analysis (DANA) Plan, Policy and Framework
Outlines the framework within which damage assessment is carried out. The plan outlines the authority, purpose, and objectives along with the institutional framework for planning and executing DANA.
2010 (rev. in 2012)
National Flood Preparedness and Response Plan
Provides strategic guidance in a systematic and sequential manner for preparing and responding to floods.
2012 National Multi-hazard Preparedness and Response Plan
Shows the Government of Guyana’s commitment towards instituting adequate preparedness and response mechanisms to ensure that the country is well prepared and able to respond in an efficient manner to disasters.
2012 National Early Warning Systems (EWS) in Guyana Report
Provides the main purpose of having an EWS and an effective EWS.
2012 Draft Disaster Risk Management (DRM) Policy
Provides a policy to establish the guiding principles and architecture for DRM in Guyana by presenting the institutional structures, roles, responsibilities, authorities, and key processes. The DRM Policy also seeks to provide an overarching framework for decision-making and coordination across DRM sectors and multiple stakeholders inclusive of government, civil society, private sector, and the international community.
2013 National Land Use Plan Provides the framework for coordination among the land uses, as well as facilitates integration of land use. It is aimed at providing support to decision making through looking at development options and constraints throughout the country.
2013 Draft Disaster Risk Management Bill
Represents the commitment to develop a national strategy for DRM. The DRM Bill provides the legal basis for the development of policies and plans for the implementation of actions and measures pertaining to all aspects of DRM.
2013 National Integrated Disaster Risk Management Plan and Implementation Strategy
The National Integrated Disaster Risk Management Plan (NIDRMP 2013-2023) establishes and emphasizes, as its vision, the further strengthening of sustainable and safe disaster

2-32
Date Key Policies, Strategies and Plans Related to Disaster
Risk Management in Guyana
Description Linked to Disaster Management and Disaster Risk Management
mitigation and disaster recovery force against major hazard, as well as the establishment and continuation of integrated disaster management as a goal.
Source: NIDRMP
The relation between NIDRMP and the five components of disaster management shown in NIDRMP is illustrated in Figure 2.2.16. Plan and policies that have been decided to date and those to be formulated are clearly classified and it is recommended to determine various plans in accordance with the classification and frameworks.
Source: NIDRMP
Figure 2.2.16 NIDRMP and Five Components of Disaster Management
(2) Civil Defence Commission
The Civil Defence Commission (CDC) was established in 1982 to be in charge of planning and operation concerning all disasters. The Comprehensive National Disaster Preparedness Plan was decided and enforced in 1985. CDC was supervised by the Office of the Minister at the early stage and then transferred under the Office of the President in 1992. In order to respond to the intensification of domestic and international disasters, the SOP of the National Emergency Operations Centre was revised in September 2001. CDC is a member of CDEMA and operated by 23 personnel who were mainly ex-professional soldiers.
Number of the CDC staffs is 24 in total, out of which CDC employes nine staffs directly. Remaining 15 staffs are temporary transfer from the army whose salaries are not shouldered by CDC.
In CDC, proper planning is considered as an effective measure for disaster management. Principal plans and procedures applied in CDC are as follows:

2 - 33
i) Disaster Plans : Preparatory plan [Warning, Evacuation, Evacuation Center, Necessity, Search/Rescue] is to be prepared both for the presently known risks and conceivable risks
ii) Contingency Plans : Action plan for contingency situation
iii) Forward Planning : Definite development plan to prepare for impending crisis
iv) Standard Operating Procedures : For preparation of correspondence for expected situation by each organization
Since the flood disaster in 2005, the disaster risk management direction of CDC has been shifting. The present policy where the government takes the responsibility for disasters is still unchanged; however, it is seeking that risk management shall be extended to the community base. The organizational structure for the disaster management is as shown in Figure 2.2.17.
Source : Disaster Risk Management in Guyana (Powerpoint picture prepared by CDC)
Figure 2.2.17 National Organizational Structure for Disaster management in Guyana
2.2.4 Meteorological and Hydrologic Services
(1) Meteorological and Hydrologic Agencies and Duties
Meteorological and hydrologic services have been carried out by the Hydro-meteorological Department under the Ministry of Agriculture (HD-MA) since 1992 in accordance with the Water Resource Act. Former organization of HD-MA was established under the Ministry of Public Works in 1965.
Observations of the tide level and reservoir water level are respectively conducted by the Marine Administration Department (MARAD) under the Ministry of Public Works and the National Drainage and Irrigation Authority (NDIA-MA) under the Ministry of Agriculture.
(2) Outline of Meteorological and Hydrologic Agencies (Personnel and Budget)
Total number of HD-MA personnel is 79 persons, 65 of whom are engineers.
(3) Meteorological and Hydrologic Observations
1) Meteorological Observations(Surface and Upper Air)
Meteorological and hydrologic observations are conducted at nine locations of meteorological stations including the two at the airports and 202 rainfall stations, 16 of which are automatic rainfall stations. The meteorological stations are located at two international airports (Cheedi Jegan Airport and Ogle Airport) as well as in the coastal and northeast areas.
2) Meteorological Radar Observation
The Doppler type meteorological radar system is equipped at the Cheedi Jegan International Airport, which is managed and maintained by two electrical engineers, two telecommunication engineers, and
Cabinet
Minister of State
CDC National Diasaster Risk Reduction Coordination Platform
National EmergencyOperation Center

2-34
one information management engineer.
3) Hydrologic Observation (River)
There are water level stations at 41 locations, 27 of which are automatic observation stations. However, automatic stations do not function well including four malfunctioning ones due to insufficient O&M budget and O&M staff.
4) Hydrologic Observation (River)
Tide level observation is conducted by MARAD.
5) Observation Database System
Observed data are sent out every morning to the CDC, NDIA, and other related agencies and research institutes. Furthermore, the data are recorded in the HD-MA database developed in the 1990s, but these data are not open to public in principle.
The existing database system is planned to be improved under the National Water Information System (NWIS) and/or Amazon Countries Treaty Organization (ACTO).
2.2.5 Support of the Japanese Government
The East Demerara Conservancy suffered serious damages from the record heavy rainfall in January 2005 and about 40% of the residents around the conservancy were affected.
For the flood control in the low-lying wetland extending around the suburb of Georgetown as well as the rehabilitation of the East Demerara Conservancy which has retarding capacity, the Rehabilitation Plan of the East Demerara Conservancy was implemented under grant aid from 2010 to 2011. This composed of the grant of materials and equipment for dyke rehabilitation with a ceiling amount of ¥289 million followed by the improvement of drainage and water supply facilities.
2.2.6 Support of Other Donors
(1) World Bank
The 30-year development plan of the drainage facilities was formulated through a local development study and the Conservancy Adaptation Study (supported by the Economic Commission for Latin America and the Caribbean, 2005), which requires a project cost of US$120 million. The project is supported by the World Bank and the European Union (EU) although further funding is still necessary. In the development plan, it is proposed to install the pumping stations at 50 locations. Out of the 50 stations, 14 pump stations are in progress under the Indian government fund, and ten stations are completed out of these 14 stations.
(2) United Nations Development Programme (UNDP)
The Project for Japan-Caribbean Climate Change Partnership targeting eight Caribbean countries including Guyana, Grenada, Jamaica, Suriname, Saint Vincent and Grenadines, Saint Lucia, Dominica, and Belize has completed the signing of the Exchange of Note in July 2014. Implementation is scheduled to commence in April 2015 under a partnership agreement with CDEMA after the current procurement stage.
The disaster-related project under UNDP efforts will be completed soon and it is considered important to sustain the supports for related disasters afterward. With the cooperation between UNDP and the Lands and Surveys Commission, preparation of a protocol for the early warning system against drought, which is a system to convey drought information from the government agency to community concerned, has been conducted since 2014 by procuring an Ugandan consultant.
As for the community disaster management services by UNDP, the construction works of the Regional Risk Management Center was carried out from 2013 to early 2014 in Lethem in Region 9 with a cost of US$25,000 including site selection of the center, procurement of material and equipment, and training of the personnel of the center in Cuba.
At present, the community development project is in progress targeting 187 villages, of which 27 villages have been completed as pilot project. However, they are having hard access to the target villages. This project is composed of 70% to 80% of agriculture-related components.
From now on, activities of UNDP concerning disaster management in Guyana will be those related to climate change adaption.

2 - 35
2.3 Grenada
2.3.1 Profile
(1) Basic Data
The basic data of Grenada are shown in Table 2.3.1.
Table 2.3.1 Basic Data of Grenada
Profile Population 105,897 persons (2013, World Bank) Land area 340 km2 (World Bank) Capital St. George’s Largest city St. George’s GDP US$0.8 billion (2013, World Bank)
GDP per capita US$7,490 (2013, World Bank) GNI (Atlas method) US$0.793 billion (2013, World Bank)
GNI per capita US$7,490 (2013, World Bank) GDP growth rate 2.4% (2013, World Bank) GFCF (% GDP) 17.3% (2013, GAR) Current account US$(-)221.04 million (2010, MOFA) Assistance received total US$33.84 million (2010, MOFA) Income level High/Medium Income Level Independence February 7, 1974 Currency Eastern Carib Dollar (EC$) Climate Temperate Humid Climate Administrative division 6 parishes and 1 dependency Residents African, Indian, European Language English (Official Language), French Patois Religion Christian, etc. Principal industry Agriculture, Tourism
Major Development Index HDI index 0.744 (2013, UNDP) Literacy rate (15-24 years old) -- Primary school enrollment rate 87.0% (2009, MOFA) Infant mortality rate (per 1,000 births) 10.3 persons (2011, MOFA) Mortality rate of pregnant women and nursing mothers (per 1,000 cases)
24 persons (2010, MOFA)
HIV infection rate (15-49 years old) -- Improved water service rate -- Improved sanitation rate 97.0% (2010, MOFA) GINI index -- Life expectancy at birth (years) 75.66 years (2010, MOFA) Poverty gap at national poverty lines (%)
--
Social expenditure (% of GDP) -- Governance Indicators
Rule of law 0.16 (2013, UNISDR, GAR) Government effectiveness 0.27 (2013, UNISDR, GAR) Voice and accountability 0.82 (2013, UNISDR, GAR) Control of corruption 0.41 (2013, UNISDR, GAR)

2-36
Environment Ecological footprint 0.00 (UNISDR, GAR) Environmental performance index 35.2 (UNISDR, GAR) Forest change 0.00% (2000-2012, UNISDR, GAR) Freshwater withdrawals (% of internal resource)
0.0% (UNISDR, GAR)
Climate Change Electricity production from renewable energy
1.00% (UNISDR, GAR)
CO2 emissions 2.49 metric ton/capita (UNISDR, GAR) Source: World Bank, UNDP, CIA World Fact Book, MOFA (Data Book by ODA target country), UNISDR
(2) Natural Overview
1) Topography and Geology
Grenada, consisting of Grenada Island and neighbouring islands, is located in the southernmost end of the Windward Islands. The Grenada main island has undulating topography with less plain lands, having a land area of 310 km2.
The interior of Grenada Island is dominated by mountain peaks, steep ridges, and deep narrow valleys. The highest peak is Mount St. Catherine with an elevation of about 840 m above sea level. Mount St. Catherine is a stratovolcano and has a horseshoe-shaped crater open to the east, with several lava domes within it. The pyroclastic flow materials are spread over the northwestern side of the mountain. There is no record of recent eruptions of the mountain.
The entire eastern coast of Grenada is composed of reworked volcanic deposits, which account for the gently rolling topography. The western coast displays a more rugged landscape, owing to the asymmetric eruption to the west Grenada. Figures 2.3.1 and 2.3.2 show the topography and geology of Grenada, respectively.
Source: http://www.lib.utexas.edu/maps/americas/grenada.gif
Figure 2.3.1 Topography of Grenada

2 - 37
Source: Land Use Division, Ministry of Agriculture
Figure 2.3.2 Geology of Grenada
2) Climate
Grenada is located at around 12°N latitude and 62°W longitude, and in the tropical climate zone. Monthly average temperature ranges from about 25°C and 26°C. It has little temperature variation throughout the year although December to March is the lowest temperature period, while June to September is the highest. Rainy season is from July to December, and the dry season is from January to June. The average annual rainfall in Grenada Island is about 1,900 mm. The monthly mean maximum and minimum temperatures and monthly mean rainfall in St. George’s are shown in Figure 2.3.3.

2-38
Source: http://www2m.biglobe.ne.jp/ZenTech/world/kion/Grenada/St_Georges.htm
Figure 2.3.3 Climate Feature in St. George’s (Grenada)
(3) Socioeconomic Condition
1) Political Situation
Grenada gained its independence from the United Kingdom in 1974. The military invasion of Grenada (Invasion of Grenada) by the United States of America (USA) and OECS during the disturbance after the coup d’etat in 1983 attracted the international community. Grenada is a constitutional monarchy as a member of the Commonwealth of Nations having the parliamentary cabinet system. Under the present two-party system, the liberal National Democratic Congress (NDC) and the conservative New National Party (NNP) have political influences.
2) Population
According to the World Bank’s survey, the estimated total population of Grenada is about 105,000 in 2013. Table 2.3.2 shows the trend of the population. It is observed in the table that although both of the urban and rural populations have an increasing trend, the ratio of the urban population to the total has a decreasing trend after 2003.
Table 2.3.2 Change in Population in Grenada
Indicator 1988 1993 1998 2003 2008 2013 Total population (person) 98,063 98,302 101,302 102,369 103,932 105,897
Population growth rate (annual %) -1.34 1.13 0.17 0.26 0.33 0.39
Urban population (person) 32,684 33,447 35,799 36,864 37,182 37,681
Urban population (% of total) 33.3 34.0 35.3 36.0 35.8 35.6
Rural population (person) 65,379 64,855 65,503 65,505 66,750 68,216
Rural population (% of total) 66.7 66.0 64.7 64.0 64.2 64.4 Source: World Bank, World Data Bank
3) GNI and GDP
The nominal GNI per capita and nominal GDP per capita are about US$7,500 in Grenada as shown in Table 2.3.3.
Table 2.3.3 Nominal GNI and GDP per Capita in Grenada
Indicator 2009 2010 2011 2012 2013 GNI per capita, Atlas method (US$) 6,810 7,050 7,180 7,160 7,490
GDP per capita (US$) 7,395 7,366 7,410 7,583 7,891
Source: World Bank, World Data Bank

2 - 39
4) Government Agencies and Administrative Division
The ministries of the Government of Grenada are enumerated in Table 2.3.4.
Table 2.3.4 Central Government Agencies of Grenada
Central Government Agencies Office of the Prime Minister
Ministry of Agriculture, Forestry and Fisheries Ministry of Carriacou and Petite Martinique Affairs
Ministry of Education and Human Resource Development
Ministry of Environment, Foreign Trade, Export
Ministry of Finance, Economic Development, Energy and Foreign Trade
Ministry of Health
Ministry of Housing, Lands and Community Development
Ministry of Labour, Social Security and Ecclesiastical Affairs
Ministry of Legal Affairs
Ministry of Social Development
Ministry of Tourism Ministry of Works, Physical Development and Public Utilities
Source: http://www.gov.gd/gov_ministries.html
The local administrative districts are composed of six parishes and one dependency as shown in Table 2.3.5.
Table 2.3.5 Parishes and Dependency in Grenada
No. Parish/Dependency Area (km2) Population (head) 1 Saint Andrew 99 24,749 2 Saint David 44 11,486 3 Saint George 65 37,057 4 Saint John 35 8,591 5 Saint Mark 25 3,994 6 Saint Patrick 42 10,674 7 Carriacou and Petite Martinique 34 6,981
Source: For area, http://www.geohive.com/cntry/grenada.aspx
For population, Census data in 2001 (Total population of Grenada: 102,632)
2.3.2 Disaster Situation
(1) General
The outline of disasters in every survey country is described in the Global Assessment Report on Disaster Risk Reduction 2015, which is issued by the UNISDR. The occurrence rate by disaster and the cause-specific percentage of the economic losses in Grenada are shown in Figures 2.3.4 and 2.3.5, respectively. According to the figures, the most frequent disaster in Grenada from 1990 to 2014 is due to heavy rains, while the disaster causing the most serious economic loss is due to cyclones.

2-40
Source: Global Assessment Report on Disaster Risk Reduction
Note: The term “Cyclone” is used as in the source.
Figure 2.3.4 Occurrence Rate by Disaster in Grenada
Figure 2.3.5 Cause-specific Percentage of Economic Loss in Grenada
(2) Flood
1) Record of Major Hurricanes
The record of major hurricanes that affected Grenada from 1954 to 2010 is shown in Table 2.3.6.
Table 2.3.6 Major Hurricanes in Grenada
Name Day/Month/Year Name Day/Month/Year Hazel 6 October 1954 Lenny 13 November 1999
Janet 23 September 1955 Joyce 1 October 2000
Anna 29 July 1961 Lili 24 September 2002
Flora 1 October 1963 Earl 15 August 2004
Cora 11 August 1978 Ivan 8 September 2004
Danielle 8 September 1986 Emily 14 July 2005
Joan 14 October 1988 Felex 1 September 2007 Arthur 25 July 1990
Source: http://stormcarib.com/climatology/TGPY_all_isl.htm
The hurricanes which caused rather severe damages among those shown in Table 2.3.6 are presented hereunder.
Hurricane Janet
Hurricane Janet of Category 3, which was accompanied by strong winds with maximum speed of 115 mph (51 m/s) and heavy rains, attacked Grenada on September 23, 1955 and damaged around half of the areas of its economic activities and residents. The death toll was 147 persons. Records of the economic loss were not found.
Hurricane Flora
Hurricane Flora damaged Grenada on October 1, 1963. It was categorized as Category 3 having a wind speed of 127 mph (57 m/s). The hurricane resulted in the death of six persons and economic losses of US$25,000. As no information on GDP in 1963 is available, the ratio of the economic loss to GDP is not calculated.
Hurricane Lenny
Hurricane Lenny damaged Grenada on November 13, 1999. The storm surge induced by the hurricane caused the damages to parts of the foundation for fishery facilities being constructed under the Japanese International Cooperation Agency (JICA) grant scheme. Roads running along the western coast were damaged and coasts were eroded too. The total economic losses amounted to an equivalent of 27% of the GDP, and the persons affected were 210.
23%
20%
18%
8%
6%
6%
6%
6%4%
1%1% 1% Cyclone
Storm
Flood
Coastal Erosion
Fire
Drought
Earthquake
Landslide
Electric Storm
Eruption
Forest Fire
Other hazards
77%
15%
4%3% 1%
Cyclone
Flood
Surge
Coastal Erosion
Landslide
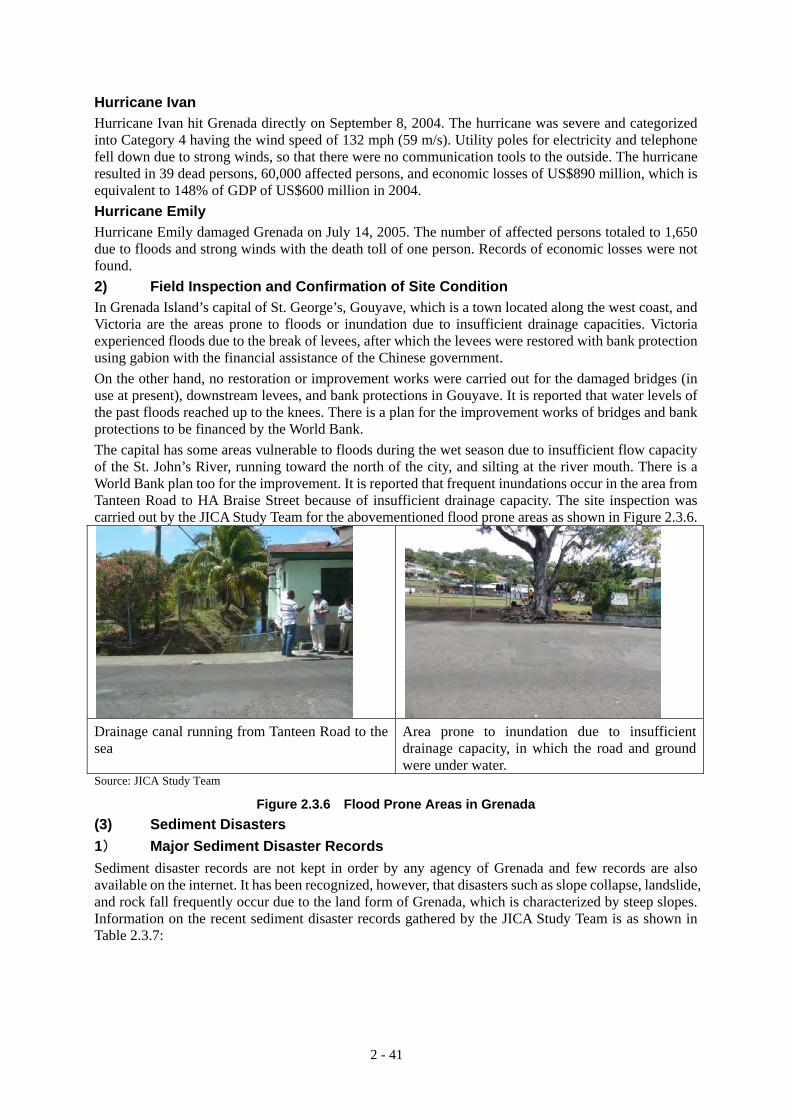
2 - 41
Hurricane Ivan
Hurricane Ivan hit Grenada directly on September 8, 2004. The hurricane was severe and categorized into Category 4 having the wind speed of 132 mph (59 m/s). Utility poles for electricity and telephone fell down due to strong winds, so that there were no communication tools to the outside. The hurricane resulted in 39 dead persons, 60,000 affected persons, and economic losses of US$890 million, which is equivalent to 148% of GDP of US$600 million in 2004.
Hurricane Emily
Hurricane Emily damaged Grenada on July 14, 2005. The number of affected persons totaled to 1,650 due to floods and strong winds with the death toll of one person. Records of economic losses were not found.
2) Field Inspection and Confirmation of Site Condition
In Grenada Island’s capital of St. George’s, Gouyave, which is a town located along the west coast, and Victoria are the areas prone to floods or inundation due to insufficient drainage capacities. Victoria experienced floods due to the break of levees, after which the levees were restored with bank protection using gabion with the financial assistance of the Chinese government.
On the other hand, no restoration or improvement works were carried out for the damaged bridges (in use at present), downstream levees, and bank protections in Gouyave. It is reported that water levels of the past floods reached up to the knees. There is a plan for the improvement works of bridges and bank protections to be financed by the World Bank.
The capital has some areas vulnerable to floods during the wet season due to insufficient flow capacity of the St. John’s River, running toward the north of the city, and silting at the river mouth. There is a World Bank plan too for the improvement. It is reported that frequent inundations occur in the area from Tanteen Road to HA Braise Street because of insufficient drainage capacity. The site inspection was carried out by the JICA Study Team for the abovementioned flood prone areas as shown in Figure 2.3.6.
Drainage canal running from Tanteen Road to the sea
Area prone to inundation due to insufficient drainage capacity, in which the road and ground were under water.
Source: JICA Study Team
Figure 2.3.6 Flood Prone Areas in Grenada
(3) Sediment Disasters
1) Major Sediment Disaster Records
Sediment disaster records are not kept in order by any agency of Grenada and few records are also available on the internet. It has been recognized, however, that disasters such as slope collapse, landslide, and rock fall frequently occur due to the land form of Grenada, which is characterized by steep slopes. Information on the recent sediment disaster records gathered by the JICA Study Team is as shown in Table 2.3.7:

2-42
Table 2.3.7 Major Sediment Disasters that Recently Occurred in Grenada
Day/Month/Year Damaged Area Type of Disaster Cause Damage Remarks
September 2014 Entrance of Sendall Tunnel, St. George’s Town
Slope collapse
Heavy rain Road blocked -
12 April, 2011 Gouyave Town and Victoria Town
Debris flow
Heavy rain over 150 mm/day
Flood in Gouyave and Victoria Town
-
September 2004 Gouyave Town Debris flow
Heavy rain by Hurricane Ivan
Damage of Hubble Bridge
-
Source: JICA Study Team
2) Field Inspection and Confirmation of Site Condition
Current conditions of the damaged sites inspected by the JICA Study Team are described hereunder.
(a) Slope Collapse at the Entrance of Sendall Tunnel
A 15 m wide slope beside the entrance of the Sendall Tunnel constructed in 1895 in St. George’s collapsed due to heavy rains in September 2014 as shown in Figure 2.3.7. The upper area of the damaged slope is a historic place for tourism, having heavy traffic. The stability and protection works for the damaged slope will be carried out under the Regional Disaster Vulnerability Reduction Projects (RDVRP), whose budget of EC$2 million (equivalent to about US$740,000) is financed by the World Bank. According to the Ministry of Communications, Works, Physical Development, Public Utilities, ICT and Community Development, the project is in the stage of procurement for construction, as of March 2015.
(The stability and protection works for the damaged slope will be carried out under the World Bank’s RDVRP.)
Source: http://www.weefmgrenada.com/newsimg/ Sendall-Tunnel-Slide-Day.jpg
Source: JICA Study Team
Slope Collapse at the Entrance of Sendall Tunnel in September 2014(View right after the collapse)
Condition of Slope at the Entrance of Sendall Tunnel as of March 2015
Figure 2.3.7 Slope Collapse at the Entrance of Sendall Tunnel
(b) Slope Collapse along West Coast Road between St. George’s and Victoria
The West Coast Road running between St. George’s Town and Victoria is rolling with steep cut slopes. Protection works of the slopes are few, so that many damages are observed on the road shoulders and cut slopes including rock falls near Concord. In particular, slopes near Palmiste have cap rock structure composed of softer tuff overlaid by hard lava, and larger sized collapses are also observed. The Concord

2 - 43
and Palmiste areas have been identified as vulnerable to disasters and are recognized as priority areas for improvement works in the Grenada National Hazard Mitigation Plan 2006. Figure 2.3.8 shows collapses of road shoulders and cut slopes in the Concord and Palmiste areas.
Collapse of Shoulders along West Coast Road (near Concord)
Collapse of Cut Slopes along West Coast Road Showing Cap Rock Structure(near Palmiste)
Source: JICA Study Team
Figure 2.3.8 Slope Collapse along the West Coast Road
(c) Slope Collapse along the Island Crossing Road between St. George’s and Grenville
Although the Island Crossing Road runs along rolling land form, few slope protection works have been carried out, and therefore many collapses of road shoulders and other portions have happened as shown in Figure 2.3.9. In particular, since the road runs along narrow ridges with deep valleys on both sides near the Constantine area, collapses occur toward the road shoulders which may need urgent countermeasures. The Constantine Road and the connecting River Road in St. George’s Town will have some slope improvement works under the World Bank’s RDVRP.
Collapse of Road Shoulders near Constantine Area(The slope stability work will be carried out
under the World Bank’s RDVRP.)
Collapse of Road Shoulders near Vandome Area (Countermeasures including the drainage work are necessary)
Source: JICA Study Team
Figure 2.3.9 Slope Collapse of Shoulders along Island Crossing Road between St. George’s and Grenville
(d) Sediment Disasters in the Little River Basin Including Damages to Bridge
The Little River basin located in the northwest of the island has the Florida area in the upstream, which is identified in the Grenada National Hazard Mitigation Plan 2006 as one of the high priority areas for improvement against sediment disaster, and Gouyave at the river mouth. Piers of the Hubble Bridge at the river mouth were washed away by floods with debris during the attack of Hurricane Ivan in 2004. The bridge is in use at present without restoration, which seems to be very dangerous. Furthermore,

2-44
Gouyave was flooded due to heavy rains accompanied by the debris flow in April 2011. Figure 2.3.10 shows the damages in the Little River basin.
After the disaster in April 2011, the Natural Disaster Management Rehabilitation and Reconstruction (Extreme Rainfall Event) Project was planned to be implemented from 2012 to 2014 by the Caribbean Development Bank (CDB) and the Government of Grenada. The project does not seem to be implemented. However, the restoration work of the Hubble Bridge will be carried out under the World Bank’s RDVRP.
Damages of Hubble Bridge at the river mouth of the Little River (whose piers were washed away when Hurricane Ivan attacked in 2004.)
Gouyave located at the river mouth of the Little River, where the flood with debris occurred in April 2011
Source: JICA Study Team
Figure 2.3.10 Damages in the Little River Basin Caused by Flood and Sediment Disasters
(4) Storm Surge
Disaster Records due to Storm Surge
Roads alongside the coast have been damaged by storm surges caused by hurricane. In particular, damages to the coastlines were serious when Hurricane Lenny attacked Grenada in 1999 with the different track from the usual one. Figure 2.3.11 shows the storm surge that occurred during Hurricane Lenny.
Source: Toa Corporation
Figure 2.3.11 Storm Surge during Hurricane Lenny
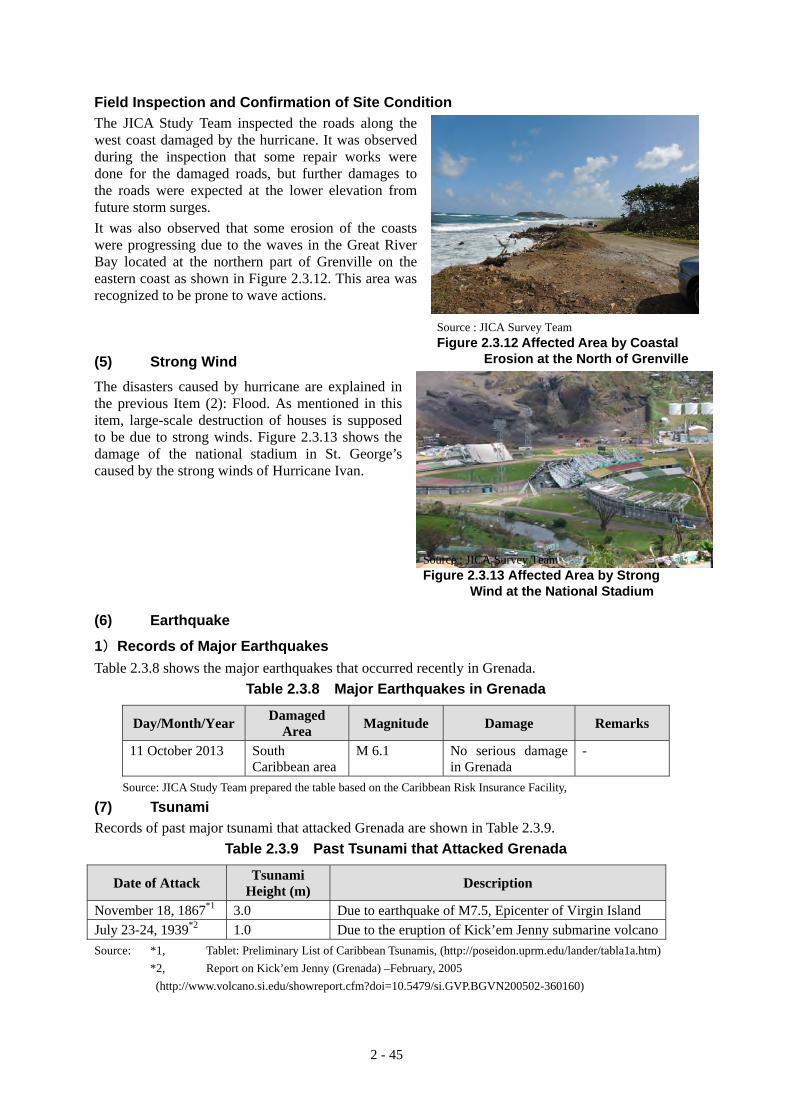
2 - 45
Field Inspection and Confirmation of Site Condition
The JICA Study Team inspected the roads along the west coast damaged by the hurricane. It was observed during the inspection that some repair works were done for the damaged roads, but further damages to the roads were expected at the lower elevation from future storm surges.
It was also observed that some erosion of the coasts were progressing due to the waves in the Great River Bay located at the northern part of Grenville on the eastern coast as shown in Figure 2.3.12. This area was recognized to be prone to wave actions.
(5) Strong Wind
The disasters caused by hurricane are explained in the previous Item (2): Flood. As mentioned in this item, large-scale destruction of houses is supposed to be due to strong winds. Figure 2.3.13 shows the damage of the national stadium in St. George’s caused by the strong winds of Hurricane Ivan.
(6) Earthquake
1)Records of Major Earthquakes
Table 2.3.8 shows the major earthquakes that occurred recently in Grenada.
Table 2.3.8 Major Earthquakes in Grenada
Day/Month/Year Damaged Area Magnitude Damage Remarks
11 October 2013 South Caribbean area
M 6.1 No serious damage in Grenada
-
Source: JICA Study Team prepared the table based on the Caribbean Risk Insurance Facility,
(7) Tsunami
Records of past major tsunami that attacked Grenada are shown in Table 2.3.9.
Table 2.3.9 Past Tsunami that Attacked Grenada
Date of Attack Tsunami Height (m) Description
November 18, 1867*1 3.0 Due to earthquake of M7.5, Epicenter of Virgin Island
July 23-24, 1939*2 1.0 Due to the eruption of Kick’em Jenny submarine volcano
Source: *1, Tablet: Preliminary List of Caribbean Tsunamis, (http://poseidon.uprm.edu/lander/tabla1a.htm)
*2, Report on Kick’em Jenny (Grenada) –February, 2005
(http://www.volcano.si.edu/showreport.cfm?doi=10.5479/si.GVP.BGVN200502-360160)
Source : JICA Survey Team Figure 2.3.12 Affected Area by Coastal
Erosion at the North of Grenville
Source : JICA Survey Team Figure 2.3.13 Affected Area by Strong
Wind at the National Stadium

2-46
(8) Drought
A drought was observed in 2010 in Grenada. The drought started in October 2009, and the CIMH announced a warning of the drought to the east Caribbean countries.
Grenada faces a problem of decrease in river water level due to increase in irrigation water demands and water taking. The government calls for water saving and planned water use to the water users.
2.3.3 Present Disaster Management
(1) Framework of Disaster Management
The National Disaster Management Agency (NaDMA) is the supervising agency for disaster management in Grenada, which supervises disaster response as well as preparedness, countermeasures, mitigation, and restoration. NaDMA was established in 1985 by re-organizing the predecessor of the National Emergency Recovery Organization (NERO) in the Pan Caribbean Disaster Preparedness Project. NaDMA is an organization under the Office of the Prime Minister.
The vision and task of NaDMA are as follows:
Vision : To develop cultures of disaster management and safety toward all the sectors of the society.
Tasks : To be responsible to coordinate all the activities for disaster management in Grenada, Carriacou, and Petite Martinique.
The organizational structure of NaDMA is shown in Figure 2.3.14.
Source: Grenada National Disaster Management Organisation in a State of Emergency, presented by Benedict Peters,
National Disaster Coordinator
Figure 2.3.14 Organizational Structure of NaDMA in Grenada
The chairperson of this organization is the Prime Minister, and NaDMA works as the coordinating body. The chairperson of the National Emergency Advisory Council shown above is also the Prime Minister. Table 2.3.10 shows the members of the National Emergency Advisory Council. The district level committee consists of 17 committees, whose members are volunteers.

2 - 47
Table 2.3.10 Members of National Emergency Advisory Council
No. Member 1 Honourable Prime Minister - Chairman
2 Permanent Secretary, Office of the Prime Minister – Deputy Chairman
3 Minister of National Security 4 National Security Advisor
5 Permanent Secretary, Ministry of Foreign Affairs
6 Permanent Secretary, Ministry of Finance
7 Permanent Secretary, Ministry of Tourism
8 Commissioner of Police
9 Chief Educational Officer, Ministry of Education
10 Chief Medical Officer, Ministry of Health
11 Chief Technical Officer, Ministry of Communication and Works
12 Chief Technical Officer, Ministry of Agriculture
13 Chief Meteorologist, Point Salines International Airport 14 Director of Information, GIS
15 Representative, Maurice Bishop International Airport
16 Representative, Grenada Ports Authority
17 Representative, GRENLEC
18 Representative, National Water and Sewage Authority
19 Representative, Cable and Wireless
20 Representative, Digicel
21 Director General, Grenada Red Cross Society
22 Representative, Customs and Excise Department
23 Representative, National Telecommunications Regulatory Commission 24 Representative, Grenada Solid Waste Management Authority
25 Representative, Grenada Private Sector Organisation
26 Representative, Grenada Hotel and Tourism Association
27 Representative, Texaco
28 Representative, Shell
29 Saint George’s University
30 Representative, Conference of Churches Grenada
31 Representative, Service Clubs - Rotary and Salvation Army
32 Representative, Marketing and National Importing Board 33 Representative, Trades Union Council
34 Representative, National Youth Council
35 Representative, IAGDO
Source: http://www.gov.gd/departments/nadma.html
(2) Organization and Budget of NaDMA Secretariat
The NaDMA Secretariat currently comprises 15 members, of which three members are government staff and 12 members are contract-based. NaDMA does not have its own budget; therefore, the required financial resources are allocated from the Ministry of National Security.
2.3.4 Meteorological and Hydrologic Services
(1) Meteorological and Hydrologic Agencies and Duties
Meteorological service is conducted by the Maurice Bishop International Airport (MBIA) Authority under the Ministry of Civil Aviation and Tourism as the national meteorological service provider of Grenada.

2-48
The primary task of the meteorological service of the MBIA Authority is the provision of meteorological information for the aviation service; weather forecast and warnings for the public is also an important service which commenced in 1984 at the time of the opening of the airport.
The Ministry of Agriculture has own facilities and operation of rainfall observation and water level observation at some of the rivers. In addition, rainfall observation in the watershed of the reservoirs is conducted by the National Water Supply and Sewage (NaWASA), which is responsible for water resources management.
(2) Outline of Meteorological and Hydrologic Agencies (Personnel and Budget)
Personnel of the meteorological service office are composed of a manager, four forecasters, and 16 technicians. Annual budget is covered by the authority’s cost, which amounts to about EC$3,650,000 as operation cost including personnel and equipment maintenance costs. Investment costs such as installation of equipment and new system introduction are part of government expenditure and/or donor’s funding.
(3) Meteorological and Hydrologic Observations
1) Meteorological Observations (Surface and Altostratus)
Meteorological stations in Grenada are shown in Table 2.3.11.
Daily precipitation is measured at manned rainfall stations at 27 locations around the island, which are managed by NaWASA. Observed data in text format are sent to the Ministry of Agriculture so as to be accumulated in the National Water Information System (NWIS). The Ministry of Agriculture conducts its own rainfall observation.
Table 2.3.11 Existing Meteorological Stations in Grenada
No(s). Location Notes Synoptic station 1 In MBIA (international
airport) All information to be reported to WMO
Automatic station(precipitation, wind, atmospheric pressure, temperature, humidity)
5 MBIA, Carriacou Island, Pearls Airport (north east coast of the island), northern end point of the island, Mirabeau (center of the island, latest)
Scheduled to transmit all data to the meteorological office through telecommunication, but manually collected at present due to telecommunication problem except from the airport station
Automatic rainfall station
4 Central and western part of the island (along the highway connecting Gouyave and Grenville)
Transmitted to the meteorological office of the UNDPERC Project(Note 1)
Automatic rainfall station
2 Great River basin Installed under the JICA-CADM II (Note 2)
but not sent to the meteorological officeSource: JICA Study Team
Note: 1- ERC Project (Enhancement Resilience to Reduce Vulnerability in the Caribbean Region)
2- Early Warning System composed of 1 automatic water level station and 2 automatic rainfall stations in the Great River basin under CADM II is not functional due to unclear O&M base.
2) Meteorological Radar Observation
Radar observation information in picture image is received from the CMO’s radar system, which is within the coverage of Barbados and Trinidad and Tobago systems.
3) Hydrologic Observation (River)
Water level observation is conducted by the Ministry of Agriculture at several rivers. NaWASA carried out discharge measurement at the upstream section of more than 17 water supply reservoirs to estimate the inflow to the reservoirs.
4) Tide and Surge Observations
No tide level and surge observation is conducted.
2 - 49
5) Observation Database System
All data collected by the meteorological service office are stored in the computer server of its main office, of which water data are sent to the NWIS for accumulation in the database system together with data from other related bodies. Data managed by the meteorological service office are individually available at the government agencies and related research institutes.
(4) Dissemination of Weather Information, Forecast and Warning
Information collected in the meteorological service is mainly informed to media through internet as well as weather forecast based on satellite data and hurricane information.
(5) Cooperation with Other Related Meteorological Agencies Information of its satellite observation is provided by NOAA and hurricane information is provided by NHC.
2.3.5 Support of the Japanese Government
There are some supports by the Japanese government to Grenada for the fishery sector recently; however, no support to the disaster management sector is made yet.
There was a technical cooperation program, namely, Caribbean Disaster Management Project, Phase 2 (CADM2), which was executed in the countries of Belize, Dominica, Grenada, Guyana, and St. Lucia for the period from 2009 to 2012.
2.3.6 Support of Other Donors
CIDA executes the following recent programs/projects covering several countries:
Caribbean Disaster Risk Management Program-Knowledge Sharing
For details, refer to Section 2.1.6 of this report.
Caribbean Development Bank Special Development Fund’s 8th Replenishment
This program covers the assistance for emergency supports, and roads, water, and agricultural sectors.
Community Disaster Risk Reduction Program
For details, refer to Section 2.1.6 of this report.
The World Bank executes the Regional Disaster Vulnerability Reduction Project for several countries. For Grenada, the World Bank decided to include in the project the restoration work of the Sendall Tunnel, and recently added the flood mitigation project for the St. Johns River basin. The World Bank plans to repair the Hubble Bridge and improve the lower reach of the Little River. A scheme of the Small Farmer Vulnerable Reduction Initiative is ongoing in the agricultural sector.
With the financial assistance of the World Bank, EC and the African, Caribbean and Pacific Group of States (ACP), the Caribbean Handbook on Risk Information Management Program (CHARIM) started in 2014 for the countries of Grenada, Belize, Dominica, Saint Lucia, and Saint Vincent and the Grenadines. The executing agencies of the program are five universities and research institutions. The program aims to prepare an online handbook in order to facilitate the generation of landslide/flood hazard and risk information and application for projects and programs of planning and infrastructure sectors, especially targeted to the small countries in the Caribbean region.
The Enhancing Resilience to Reduce Vulnerability in the Caribbean Project is undertaken by UNDP, and four units of automatic rain gauges have been installed in Grenada under the project. In addition, the Community Alerts Project was implemented by UNDP and was completed in 2014.

2-50
2.4 Jamaica
2.4.1 Profile
The data collection survey conducted in Jamaica emphasized the confirmation of the present situation and implementation progress of the components recommended by the Jamaica and St. Lucia Data Collection Survey in 2014 as well as on the current efforts and activities of the government and other donors which is inquired and confirmed from the Office of Disaster Preparedness and Emergency Management (ODPEM).
The basic information have been confirmed and updated by referring to the report of the said survey.
Basic Data
The basic data of Jamaica are shown in Table 2.4.1
Table 2.4.1 Basic Data of Jamaica
Profile Population 2,714,734 persons (2013,WB) Land area 10,990 km2 (WB) Capital Kingston Largest city Kingston GDP US$1.436 billion (2013, WB)
GDP per capita US$5,290 (2013, WB) GNI (Atlas method) US$1.371billion (2013, WB) GNI per capita US$15,290 (2013, WB) GDP growth rate 1.27% (2013, WB) GFCF (%GDP) 19.7(2015, UNISDR, GAR) Current account US$(-)1,927 million (2013, Balance of Payments Manual, IMF)Assistance received total US$21 million (2012, WB) Income level High/Middium Income level Independence August 6, 1962 Currency Jamaican Dollar (J$) Climate Tropical Rainforest Climate Administrative division 3 countries and 14 parishes Residents African 92.1%, Mixed 6.1%, Others (2011, CIA World Fact
Book) Language Official Language: English Religion Christian and others Principal industry Industry, Agriculture
Major Development Indices HDI index 0.730 (2012, UNDP) Literacy rate (15-24 years old) 95.9% (2012, WB) Primary school enrollment rate 85.2% (2013, WB) Infant mortality rate (per 1,000 births) 13.69 persons (2014, CIA World Fact Book) Mortality rate of pregnant women and nursing mothers (per 1,000 cases)
80 persons (2014, CIA World Fact Book)
HIV infection rate (15-49 years old) 1.8%(2012, WB) Improved water service rate 93.1% (2012, WB) Improved sanitation rate 80.2% (2012, WB) GINI index 45.5 (2015, UNISDR, GAR) Life expectancy at birth (years) 72.5 (2013, WB)
Poverty gap at national poverty lines (%)
0.2% (2004, Millennium Development Indicators)
Social expenditure (% of GDP) --

2 - 51
Governance Indicators Rule of law -0.39 (2015, UNISDR, GAR) Government effectiveness -0.02 (2015, UNISDR, GAR) Voice and accountability 0.50 (2015, UNISDR, GAR) Control of corruption -0.38 (2015, UNISDR, GAR)
Environment Ecological footprint 1.93 (2015, UNISDR, GAR) Environmental performance index 58.3 (2015, UNISDR, GAR) Forest change -3.4 (2015, UNISDR, GAR) Freshwater withdrawals (% of internal resource)
9.9 (2015, UNISDR, GAR)
Climate Change Electricity production from renewable energy
6.22% (2015, UNISDR, GAR)
CO2 emissions 2.66metric ton/capita (2015, UNISDR, GAR)
Source:World Bank (WB), UNDP, CIA World Fact Book, MOFA Japan (ODA Country Data Book), UNISDR
(2) Overview of Natural Situation
1) Topography and Geology
The island of Jamaica is one of the four islands in Greater Antilles located northwest of the Caribbean Sea and its area is 10,990 km2. The island is broadly divided into the east mountains area, the central valley and plateau area, and the coastal plain as shown in Fugure 2.4.1. There is a chain of mountains from southeast to north-westward and they are formed in the stratum which consists of eruptive rock and metamorphic rock.
The geological map of Jamaica is shown in Figure 2.4.2. The geology of Jamaica can be classified into three main types based on land forms: alluvial deposits which form the low-lying coastal plains and interior valleys, yellow and white limestone which form the karst hills in the Cockpit area, and igneous and metamorphic rocks which form the central mountain chain. In the northern part of the Blue Mountain, there is a plateau with an altitude of 1,000 m or more, which consists of folding limestone. And the plateau of karst composed of limestone occupies two thirds of the island.
Source: maps.com Source: Mines and Geology Division, Ministry of Science,
Technology Energy and Mining Figure 2.4.1 Topography of Jamaica Figure 2.4.2 Geology of Jamaica
2) Climate
Jamaica is located between 17°N and 18°N latitude and around 77°30’W longitude, and in the subtropical maritime climate zone. Annual temperature ranges from 25°C to 35°C; the lowest temperature is recorded between January and February, and the highest between July and August. The rainy season is from May to October, while the dry season is from February to March. Annual rainfall amount is about 2,000 mm; however, a regional bias in rainfall is remarkable with 1,000 mm/yr in the northern and southern coastal areas, while more than 7,500 mm in some areas of Blue Mountain; it is

2-52
probably due to effect of geomorphologic rainfall by mountain. Monthly mean temperature and rainfall Kingston Manley Airport are sindicated in Figures 2.4.3 and 2.4.4, respectively
Source: Data from Meteorological Service Jamaica
Figure 2.4.3 Monthly Mean Temperature in Jamaica
(Kingston Manley Airport)
Source: Data from Meteorological Service Jamaica
Figure 2.4.4 Monthly Mean Rainfall in Jamaica
(Kingston Manley Airport)
(3) Socioeconomic Condition
1) Political Situation
Jamaica got autonomy from the United Kingdom in 1959 and it was an independent British Commonwealth member country in 1962. The present political parties are the People’s National Party (PNP) having slogans of extension of autonomy as well as democratic socialism, Jamaica Labour Party (JLP) of conservative centrist, and some minor parties. The change of government is made through a democratic election with PNP and JLP.
2) Population
According to the World Bank’s survey, it is estimated that total population was about 2.7 million as of 2013. Ratio of urban population to the total population is rather decreasing, and the urban population started decreasing since the early 2000s as shown in Table 2.4.2.
Table 2.4.2 Change in Population in Jamaica
Indicator 1988 1993 1998 2003 2008 2013 Total population (person) 2,356,400 2,441,024 2,556,780 2,624,695 2,671,934 2,714,734
Population growth rate (annual %) 0.25 0.74 0.89 0.36 0.35 0.26
Urban population (person) 1,200,916 1,217,192 1,244,257 1,248,384 1,245,896 1,239,656
Urban population (% of total) 50.96 49.86 48.67 47.56 46.63 45.66 Rural population (person) 1,155,484 1,223,832 1,312,523 1,376,311 1,426,038 1,475,078
Rural population (% of total) 49.04 50.14 51.34 52.44 53.37 54.34
Source: World Bank, World Data Bank
3) GNI and GDP
Nominal GNI per capita and nominal GDP per capita of Jamaica are over US$5,000 as shown in Table 2.4.3.
Table 2.4.3 Nominal GNI and GDP per Capita in Jamaica
Indicator 2009 2010 2011 2012 2013 GNI per capita, Atlas method (US$) 4,510 4,580 4,800 5,190 5,220GDP per capita (US$) 4,522 4,917 5,346 5,464 5,290Source: World Bank, World Data Bank

2 - 53
4) Government Agencies and Administrative Division
The ministries of the Government of Grenada are enumerated in Table 2.4.4.
Table 2.4.4 Central Government Agencies of Jamaica
Central Government Agencies Office of the Prime Minister
Ministry of Defense, Development, Information and Sports
Ministry of Transport, Works and Housing
Ministry of Finance and Planning
Ministry of Water, Land, Environment and Climate Change
Ministry of National Security
Ministry of Foreign Affairs and Foreign Trade
Ministry of Science, Technology, Energy and Mining
Ministry of Labour and Social Security Ministry of Agriculture and Fisheries
Ministry of Industry, Investment and Commerce
Ministry of Health
Ministry of Local Government and Community Development
Ministry of Education
Ministry of Tourism and Entertainment
Ministry of Youth and Culture
Ministry of Justice
Source: http://www.cabinet.gov.jm/about/background_cabinet_office/
Local administrative districts are composed of three countries and 14 parishes as shown in Table 2.4.5.
Table 2.4.5 Administrative Parishes in Jamaica
No. Parish Area (km2) Population (2012) 1 Clarendon 1,196 246,322 2 Hanover 450 69,874 3 Kingston 22 666,041 4 St. Andrew 431 5 Manchester 830 190,812 6 Portland 814 82,183 7 St. Ann 1,213 173,232 8 St. Catherine 1,192 518,345 9 St. Elizabeth 1,212 150,993
10 St. James 595 184,662 11 St. Mary 611 114,227 12 St. Thomas 743 94,410 13 Trelawny 875 75,558 14 Westmoreland 807 144,817
Source: http://www.citypopulation.de/Jamaica.html
2.4.2 Disaster Situation
(1) General
According to the Global Assessment Report on Disaster Risk Reduction 2015 (UNISDR), the most serious disaster in Jamaica from 1990 to 2014 is due to flood in terms of death toll and economic loss as shown in Figure 2.4.5.
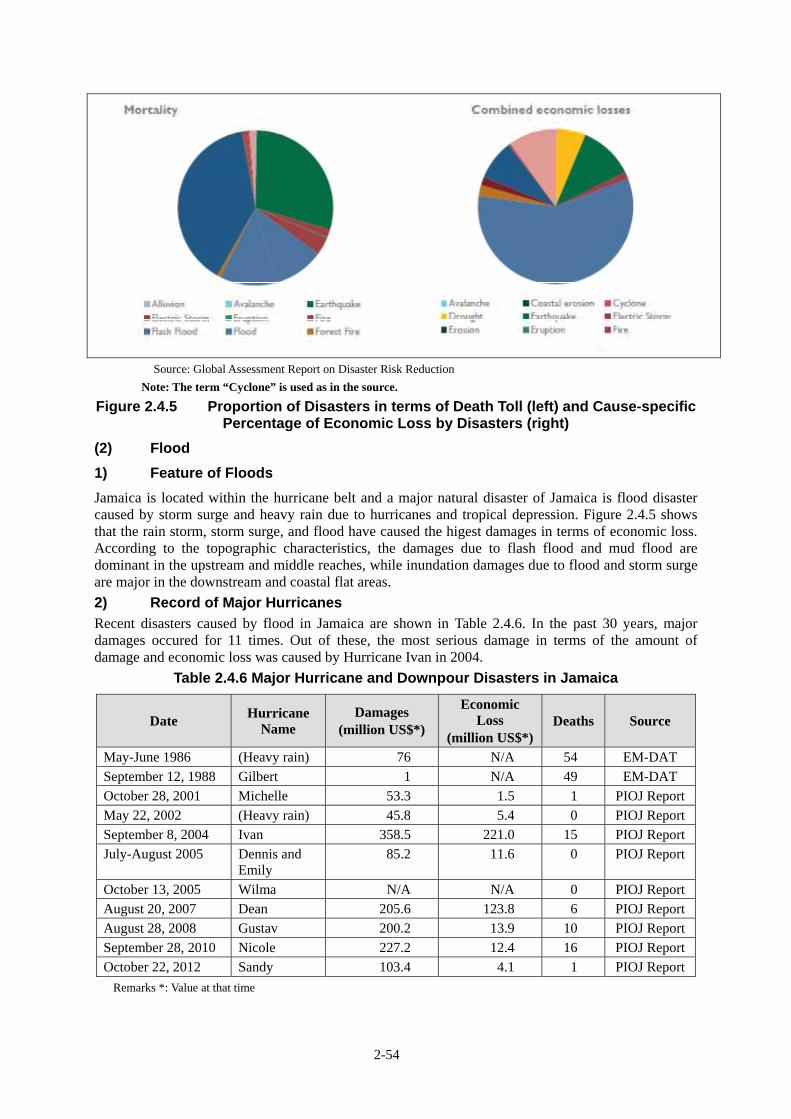
2-54
Source: Global Assessment Report on Disaster Risk Reduction
Note: The term “Cyclone” is used as in the source.
Figure 2.4.5 Proportion of Disasters in terms of Death Toll (left) and Cause-specific Percentage of Economic Loss by Disasters (right)
(2) Flood
1) Feature of Floods
Jamaica is located within the hurricane belt and a major natural disaster of Jamaica is flood disaster caused by storm surge and heavy rain due to hurricanes and tropical depression. Figure 2.4.5 shows that the rain storm, storm surge, and flood have caused the higest damages in terms of economic loss. According to the topographic characteristics, the damages due to flash flood and mud flood are dominant in the upstream and middle reaches, while inundation damages due to flood and storm surge are major in the downstream and coastal flat areas.
2) Record of Major Hurricanes
Recent disasters caused by flood in Jamaica are shown in Table 2.4.6. In the past 30 years, major damages occured for 11 times. Out of these, the most serious damage in terms of the amount of damage and economic loss was caused by Hurricane Ivan in 2004.
Table 2.4.6 Major Hurricane and Downpour Disasters in Jamaica
Date Hurricane Name
Damages (million US$*)
Economic Loss
(million US$*)Deaths Source
May-June 1986 (Heavy rain) 76 N/A 54 EM-DAT
September 12, 1988 Gilbert 1 N/A 49 EM-DAT
October 28, 2001 Michelle 53.3 1.5 1 PIOJ Report
May 22, 2002 (Heavy rain) 45.8 5.4 0 PIOJ ReportSeptember 8, 2004 Ivan 358.5 221.0 15 PIOJ Report
July-August 2005 Dennis and Emily
85.2 11.6 0 PIOJ Report
October 13, 2005 Wilma N/A N/A 0 PIOJ ReportAugust 20, 2007 Dean 205.6 123.8 6 PIOJ Report
August 28, 2008 Gustav 200.2 13.9 10 PIOJ Report
September 28, 2010 Nicole 227.2 12.4 16 PIOJ Report
October 22, 2012 Sandy 103.4 4.1 1 PIOJ Report
Remarks *: Value at that time

2 - 55
3) Field Inspection and Confirmation of Site Condition
The following Figures 2.4.6 and 2.4.7 show present situations of the flood damaged area inspected by the JICA Study Team as well as the inspected site locations as shown in Figure 2.4.8.
i) Rio Cobre River, Flat Bridges
Along the Rio Cobre River flowing down in the west of the metroplitan area, flood damages have frequently occured in road inundation as well as flat bridges on mountain streams. According to the National Works Agency (NWA), the countermeasure and improvement plan had been formulated previously but was cancelled due to the review of regional comprehensive traffic network. NWA is considering countermeasures against flood on flat bridge and riverside roads in view of disaster management of the tourism resources along the mountain streams.
On the other hand, the early waning system was established in the river basin with Inter-American Development Bank (IDB) support and operated and managed by the Water Resource Agency (WRA).
Date:March 29, 2015 Site: Rio Cobre River, Spanish Town Bridge Outline:It is wadi in dry season like rivers in the southeast area. The pipeline crossing the river functions as groundsill. (Source: JICA Study Team)
Date:March 29, 2015 Site:Rio Cobre River, Bog Walk Bridge Outline:A water level gauge and staff gauge are installed at the upstream of the right bank, which are managed by WRA.(Source:JICA Study Team)
Date:2008 Site:Rio Cobre River, Flat Bridge Outline: Flat Bridge damaged by the flood in August 2008. Restored every time when it is damaged. Source: http://go-jamaica.com/blog/2008/10/09/ bog-walk-gorge-before-and-after-gustav/gorgeb20080831ng/
Date:March 29, 2015 Site:Rio Cobre River, Flat Bridge Outline:Flat bridge located in upstream reach of the dam head. The bridge has a single lane with masonry abutment which is durable for overflowing. (Source: JICA Study Team)
Figure 2.4.6 Site Conditions during Field Inspection (Flood: Rio Cobre River, Flat Bridge)
Pipe line
WL Gaude with solar power
Staff Gauge

2-56
ii) Rivers in Southeast Area
The Hope River, the Bully Bay River, and the Yallahs River in the southeast area are subflow rivers during the dry season. Bridges on the trunk road crossing these rivers were damaged or washed away previously by floods and sediment flows; replacement and/or rehabilitation of such bridges have been in progress.
It is required to take sabo measures including sediment control facilities in the upstream reaches as well as river bank erosion control and groundsills for riverbed protection.
Site:Hope River at Harbor View Bridge Outline: Photo of the bridge that was washed away during Tropical Storm Gustav in October 2008. After a temporary bridge for three years, the new bridge was constructed in 2011 with IDB support. It is said that abutment and piers were unstable due to riverbed degradation caused by active riverbed mining. Source:http://sflcn.com
Date:March 28, 2015 Site:Hope River at Harbor View Bridge Outline:The Hope River is wadi in dry season. Riverbed material is composed of sand and gravel as well as boulder where large quantities of sediment have been transported. Gabion revetment was constructed on the riverbanks around the bridge when a new bridge was constructed.
Source:JICA Study Team
Date:- Site:Yallahs River at Yallahs Bridge Outline:Photo of the Yallahs Bridge damaged during flood in October 2002. A new bridge was constructed under IDB Jamaica Development Infrastructure Project (JDIP) supported by IDB in 2011. Source: http://www.mona.uwi.edu/
Date:March 28, 2015 Site:Bully Bay River at Bully Bay Bridge Outline:It is wadi in dry season and a large amount of sand and gravel is accumulated. River improvement by dredging was conducted by NWA without river banking. It is concerned that river bank would be severely eroded in the rainy season and dredged materials would flow into the channel. Source: JICA Study Team
Figure 2.4.7 Site Situations during Field Inspection (Flood: Rivers in the Southeast Area)
Riverbank Protection with Gabion

2 - 57
iii) Rivers in the East, Northeast, and Central-Northern Areas
The Morant River, the Hector’s River, the Black River, and the Priestmans River in the eastern area have surface flows even in the dry season. Bridges and coastal revetment of the coastal road crossing the Black River are maintained and protected.
Source:JICA Study Team
Figure 2.4.8 Locations of Field Inspections (Flood)
Hector’s River
Spanish Town BR.
Dam Head.
Flat Br.
Bog Walk Br
Cone Gully River Queens River
Monetgo Bay River
Great River
Abarite River
Rio Minho River
Hope River
Yallahs River
Bully Bay River
Morant River
Black River
Priestmans River
West Town River
Rio Grande River
Swift River
Spanish River Buff Bay River Dry River
Pancar River
Pancar River2
Wag Water River Westmoreland Br.
Wag Water River 」Grand Old Br.

2-58
(3) Sediment Disasters
1) Distribution Charasteristic of Sediment Disasters
Landslides that occured in Jamaica are concentrated in the mountainous area where igneous and metamorphic rocks are distributed. The landslide inventory including a total of 2,983 landslide sites that occured in several decades in the eastern area was prepared by the Mines and Geology Division (MGD). These landslides are compiled into a database with their sizes as well as present conditions as referred to in Figures 2.4.9 and 2.4.10. According to these maps, large-scale landslides were found in the northeast region (Portland), while more frequent but smaller ones were elsewhere, mostly in St. Andrew. Urban development at St. Andrew is supposed to increase the incidence of slope instability.
Major landslides in Jamaica are those such as Judgment Cliff (1692), Preston (1986), and the White Hall (2005 and 2009). The Portland landslide disaster, which occurred extensively due to record prolonged and heavy rainfall for two days with 200 to 300 mm, led to the death of four persons who were buried by the debris (Ahmad 2001b). The NWA indicates that the cost of recovery initiatives for landslides is increasing. Since 2001, the cost for clearing landslide debris and constructing retaining walls averaged between J$230 and J$400 million per year (Smith 2007).
Source:UWI-MONA (2013)
Figure 2.4.9 Landslide Inventory Map
Source:World Bank (2013)
Figure 2.4.10 Overview of the Varying Landslide Sizes in Eastern Jamaica

2 - 59
2) Field Inspection and Confirmation of Site Condition
The JICA Study Team conducted the field inspection around the steep mountainous section from Agulala Vale to Golden Spring (Junction Main Road) which is a part of A3 highway connecting Port Maria and Kingston.
The said section, where traffic is heavy because it is the shortest route between Port Maria and Kingston, is running along the Wag Water River and suffering frequent falling rocks, slope failure, and landslide. Traffic stoppage due to sediment disaster has serious impact on logistics. In case of such traffic closure, the road is temporarily closed and is reopened only after removing the sediment, e.g., through symptomatic treatment when sediment disasters occurred as shown in Figure 2.4.11. In addition to slope stabilizations, comprehensive countermeasures including road widening and bridge renovation are necessary because the road is narrow and the bridges are old.
Date: March 8, 2015
Location: Stop 3: Route A3
Description: Junction Main Road running along the Wag Water River has been constructed by cutting slopes along the river, but almost no slope stabilization works are performed.
Date: March 8, 2015
Location: Stop 3: Route A3
Description: There is no protective fence in steep cliff. Rock frequently falls and sediment outflows as well to the road. Traffic is heavy.
Source:JICA Study Team
Figure 2.4.11 Site Inspections (Sediment Disaster)
(4) Storm Surge and Tsunami
Record of past disasters in Jamaica due to storm surge and tsunami is shown in Table 2.4.7. When some records about the earthquakes and tsunami occurred nearby Trinidad and Tobago are compared each other, there some inconsistencies among those and it is not clear whether the high wave records are due to storm surge or tsunami based on the table.
Table 2.4.7 Past Damages by Storm Surge and Tsunami in Jamaica
Date Height of Waves Areas Affected Effects 1722 16 ft. Port Royal, Queenstown
and Kingston
November 2, 1726 Kingston, Spanish Town, Port Royal
Many lives lost
October 3, 1780 St. James, Hanover, Westmoreland
1,000 deaths
October 18, 1815 Port Royal Several vessels destroyed
August 31, 1831 100 ft. East and Northeast Coast Houses damaged October 31, 1874 Palisades 1912 Surge recorded 1/2
miles from shore Western parishes – Savanna-La-Mar were worst hit
Lives lost

2-60
Date Height of Waves Areas Affected Effects November 4, 1932 Mountaineous sea
waves Westmoreland, Hanover is the most affected
Many lives lost
August 5, 1980 40 ft. recorded at Galena Point
Entire island, north coast is the most affected
Roads and other coastal infrastructure destroyed
October 24, 1998 50 ft. (16 m) at West End-Negri
South Coast Coastal infrastructure destroyed
Source: ODPEM and Disaster Information Kit for the Media(ver 05/95CDMP/OAS)
N. Harris, Mines and Geology Division, Jamaica, the use of Nowcasting Technology for Natural Hazard Mitigation: The Jamaican Experience
(5) Strong Wind
Strong winds during hurricanes cause damages to crops and coastal road, and collapse of residential houses. According to the risk assessment survey on strong winds and earthquake for whole Jamaica conducted in 2009 supported by IDB, the annual amount of damage to crops, coastal road, and residential house collapse caused by strong winds during hurricanes is bigger than that due to earthquake.
(6) Earthquake
The Jamaica Seismograph Network (JSN) recorded and processed over 200 earthquakes during the period from August 2010 to July 2011, but most of these events have M4.0 or less. The most active area was the Blue Mountain Block followed by the Montpelier-Newmarket Belt as seen in Figures 2.4.12 and 2.4.13.
Typical earthquake damages in Jamaica are summarized in Table 2.4.8. The earthquake in 1962 destroyed Port Royal, parts of Kingston, and Vere Plains, and resulted in 3,000 deaths as well as destruction and damage to many buildings, liquefaction as seen in Figure 2.4.14, and land subsidence. Recently, two people were killed by the earthquake (M5.4) in 1993 which occurred around Kingston and St. Andrew.
Source:Earthquake Unit, WUI-MONA(2010) Source:Earthquake Unit, WUI-MONA (2007)
Figure 2.4.12 Distribution of Local Region Seismicity around Jamaica
(1998 - 2010)
Figure 2.4.13 Distribution of Regional Earthquake Epicentres

2 - 61
Source:Earthquake Unit, WUI-MONA(2010)
Figure 2.4.14 Liquefaction caused by the 1692 Earthquake
(7) Drought
Drought situation in 2014 caused severe water shortage, and the water level of the Mona Reservoir dropped that remaining storage would be depleted within two weeks. This drought situation affected crops, particularly coffee production wherein the annual production dropped to 40% of the average coupled with a spread of disease.
Table 2.4.8 Past Major Earthquakes Which Caused Severe Damages in Jamaica /
Summary of Typical Earthquake Damages in Jamaica
Year Date Max. Intensity Places Affected Observed Damage
1667 - VIII - Landslide 1688 1-Mar VII Port Royal Houses and ships damaged
1692 7-Jun X Port Royal, Kingston, Vere Plains. Also felt strongly island-wide
3,000 dead; buildings collapsed; liquefaction, subsidence, landslides and water ejected
1771 3-Sep VII Port Royal, Kingston Damage to structures; felt on boats in port
1812 11-Nov VIII Kingston Several people killed; walls fell, buildings damaged
1824 10-Apr VII Kingston; Spanish Town, St. Catherine; Old Harbour, Clarendon
Loud noise accompanied by shock; some houses fell
1839 5-Nov VII Montego Bay, St. James Government buildings declared unsafe due to damage
1907 14-Jan IX Kingston, Port Royal
1,000 dead; fire over 56 acres; most buildings collapsed; water mains broken; landslides and slumps; localized tsunami; statues rotated; near total destruction of damage - estimated 2 million pounds sterling in damage
1914 3-Aug VII Eastern Jamaica Buildings cracked, doors and windows out of plumb; clocks stopped; stocks in drug stores broken
1943 15-Jul VII St. Elizabeth Landslides; many were left homeless; breakages of merchandise in shops
1957 1-Mar VIII Montego Bay, St. James and felt island-wide
4 dead; landslides; bridges damaged; rotation of spires and monuments; springs

2-62
Year Date Max. Intensity Places Affected Observed Damage
increased flow and muddied; utility poles and lines broken; breakages of items off shelves
1993 13-Jan VII Kingston and St. Andrew. Also felt island-wide
2 dead; items thrown off shelves and broke; most were frightened; heavy furniture shifted; water splashed out of containers and pools; much non-structural damage; few cases of structural damage
2005 12-Jun VII
Central Jamaica - Felt strongest in Aenon Town and Top Alston in Clarendon; Silent Hill, Manchester; Wait-a-bit and Lemon Walk, Trelawny
Moderate to heavy structural damage on most vulnerable structures; some people had to be dug out of collapsed dwelling; minor injuries from falling objects
Source:Earthquake Unit, WUI-MONA (2007)
(8) Bridges
Restoration of bridges and rivers hit by disasters has been implemented with the support of donors. Among these, the World Bank Disaster Vulnerable Reduction Project (DVRP) in collaboration with the agencies concerned is promoting comprehensive disaster management measures including slope protections and early warning system as well as publicity, in addition to the rehabilitation of bridges and roads.
The JICA Study Team inspected the trunk roads in Trinidad and Tobago as shown in Figure 2.4.15 as well as the outline of present situation as shown in Table 2.4.9.
Table 2.4.9 Locations and Situations of Bridges and Roads during Field Inspection
No Bridge Name Road Problematic Situation Present Situation
1. Flat Bridge A-1 Overflowed Used as before
2. Bog Walk Br. A-1 Girder soaked Used as before
3. Cone Gully River A-3 Over flowed Used as before
4. Monetgo Bay River A-3 Girder soaked Used as before
5. Great River A-3 Over flowed Used as before 6. Queens River A-3 Girder soaked Used as before
7. Cabarita River A-2 Overflowed Used as before
8. Rio Minho River A-2 Not damaged Used as before
9. Spanish Town Bridge A-1 Not damaged Used as before
10. Harbour Bridge A-4 Broken in 2008 Newly built in 2011
25. Westmoreland Bridge A-3 Broken in 2006 Newly built in 2013
Source:JICA Study Team

2 - 63
Western Area
Eastern Area
Source:JICA Study Team
Figure 2.4.15 Locations of Field Inspection (Bridges)
1) Present Situation of Bridges
Rio Cobre River, Flat Bridge
This flat bridge is located on the National Road A-1 connecting Kingston and St. Ann’s Bat Rio via Moneague and crossing the Cobre River. The bridge is a submerged concrete slab type with two piers,

2-64
and is 25 m long and 3.5 m wide. Traffic on the road around this bridge is suspended due to inundation during every flood. The present situation of the Falt Bridge is shown in Figure 2.4.16.
Date:March 29, 2015 Site: Rio Cobre River, Flat Bridge
Outline:Submerged bridge with concrete slab with two piers; 25 m long and 3.5 m wide.
Date:March 29, 2015 Site: Rio Cobre River, Flat Bridge Outline:Alternate traffic with traffic signal at both sides.
Source:JICA Study Team
Figure 2.4.16 Rio Cobre River, Flat Bridge
Implementation of the new highway network project (Highway 2000) is ongoing, in which the North South Link across the island from north to south is partially in service for one-third of the total distance. The remaining two-thirds is already under construction. Upon completion of the section between Linstead– Angels Interchange-Mandela/Caymanas, it would be a bypass route for the Bog Walk Gauge passing the flat bridge, which is a narrow part of the National Road A-1.
Harbour Bridge
The Harbour bridge is on National Road A-4 crossing the Hope River. The bridge was totally washed away due to flood during Hurricane Gustav, and re-constructed and opened in November 2011 as shown in Fugure 2.4.17.
Date:March 28, 2015 Site:Harbor Bridge (A4) Outline: The previous bridge was washed
away entirely due to flood caused by Hurricane Gustav in 2008. The present bridge was completed in November 2011.
Date:March 28, 2015 Site:Harbor Bridge (A4) Outline:No water was found in the channel of the
Hope River. Upon flooding, water and much sediment flow down.
Source:JICA Study Team
Figure 2.4.17 Harbour Bridge

2 - 65
Westmoreland Bridge(A3)
The Westmoreland Bridge is a bridge across the Wag Water River. It had been destroyed during Hurricane Gustav and reconstructed under Jamaica Development Infrastructure Project (JDIP) supported by China in August 2008. The present situation of the Westmoreland Bridge is shown in Figure 2.4.18
Date:March 28, 2015 Site:Westmoreland Bridge Outline: Concrete Box Girder Bridge
Date:March 28, 2015 Site:Westmoreland Bridge Outline:Old bridge was left at downstream side.
Source:JICA Study Team
Figure 2.4.18 Westmoreland Bridge
2) Design Criteria (Earthquake Resistance Standard and Freeboard)
AASHTO is applied as the design standard wherein the design flood water level is based on the probable 100-year rainfall and clearance should be 1.0 m at the minimum.
There are provisions for earthquake resistance standards, by which new bridges are constructed, while no consideration was made for the old bridge and it is under review recently.
2.4.3 Present Disaster Management
(1) Framework of Disaster Management
In Jamaica, the disaster management organizations are established in accordance with the Disaster Preparedness and Emergency Management Act (1993) including the National Disaster Committee and the Parish Disaster Committee as the responsible organizations as well as the Office of Disaster Preparedness and Emergency Management (ODPEM) for cordination. Under the same act, the Disaster Management Basic Plan as well as the action plan is formulated.
Starting from 2009, various reviews concerning the disaster management acts and related acts as well as the disaster management organizations have been undertaken such as strengthening of ODPEM’s authority in executing its functions, and clear definition of roles of related agencies and parish.
(2) Office of Disaster Preparedness and Emergency Management (ODPEM)
ODPEM is the organization for supervising disaster management in Jamaica, whose activities cover not only disaster correspondence but also preparadness, mitigation, and recovery. It was established in 1993 as the Office of Disaster and Emergency Relief Coordination (ODPRRC) and then changed its name to ODPEM.
Activities of ODPEM are supervised by the Board of Management whose members are appointed by the Office of the Minister, while in terms of government organization it is under the Ministry of Local Government and Community.
2.4.4 Meteorological and Hydrologic Services
(1) Meteorological and Hydrologic Agencies and Duties
The meteorological service in Jamaica is undertaken under the Meteorological Service (MS-MWLEC) which is one of the divisions of the Ministry of Water, Land, Environment and Climate Change.

2-66
MS-MWLEC is composed of the administrative department and meteorological department in the headquarters as well as the weather forecast department in two airports.
Tasks of the Water Resource Authority (WRA) are water resources management, water resources permits and licenses, and observation and management of hydrologic data including water level observation and preparation of its guidelines. Based on such observed data, WRA provides the concerned agencies with technical advices, guidance, and water use control as well as preparation of the guidelines for water level observation.
(2) Outline of Meteorological and Hydrologic Agencies (Personnel and Budget)
MS-MWLEC is composed of 52 technical persons, 23 administrative staffs, and volunteer site observers. Meanwhile, WRA consists of 62 staffs including 32 technical staffs.
(3) Meteorological and Hydrologic Observations
1) Meteorological Observations(Surface and Upper Air)
MS-MWLEC manages rainfall observation (visual) stations at about 200 locations in the whole country. Data observed by the volunteer site observers are collected by the collector at the end of every month. Other than these stations, about 50 self-recording rainfall stations exist.
2) Meteorological Radar Observation
The radar rainfall observation system set up at the Norman Manley Airport requires replacement due to aging. This replacement is considered under the World Bank project. Required information regarding hurricane is acquired from NHC’s information, satellite information such as the Geostationary Operational Environmental Satellite Program (GOES) of the National Aeronautics and Space Administration (NASA), and radar observation under the CMO system.
3) Hydrologic Observation (River)
WRA carries out hydrologic observations including river water levels at 120 points and groundwater at about 300 locations as well as monitoring of water quality and intake water amount.
4) Observation Database System
MS-MWLEC provides the concerned agencies with the information of probable rainfall and rainfall intensity duration curves (IDF Curves) based on the observed rainfall data from 1992 to 2008 (data before 1992 were burned down).
(4) Dissemination of Weather Information, Forecast and Warning
WRA carries out real time measurement of rainfall and river water level in collaboration with MS-MWLEC in the Rio Cobre River basin so as to undertake flood forecasting under the assistance of the World Bank.
(5) Cooperation with Other Related Meteorological Agencies
MS-MWLEC keeps close coordination and sharing of information with WRA, and receives supports from IDB, the World Bank, United States Agency for International Development (USAID), EU, and UNDP through the concerned agencies. Furthermore, training of engineers and coordination meetings are undertaken every other year in coordination with CMO and CIMH.
2.4.5 Support of the Japanese Government
Supports by the Japanese government for the natural disaster field in Jamaica have been made on grant aid basis since the late 1970s to the late 1980s and in Yen loans from the late 1980s.
The supports in the disaster management sector have been made as follows:
1) Support in the strengthening of the national disaster database in ODPEM through a JICA Expert for CARICOM, from 2010 to 2011;
2) Support in the rehabilitation of roads and bridges damaged by hurricanes through the senior volunteers dispatched for NWA from 2009;
3) Support in the compilation of Jamaica Hazards Handy Manual (2015) to be issued by ODPEM through the senior volunteer dispatched for ODPEM from July 2013;

2 - 67
4) Grant assistance for the Grassroots Human Security Project for the rehabilitation of the Annotto Bay Public Hospital and Titchfield Public High School damaged by Hurricane Sandy that hit Jamaica in October 2012; and
5) Community disaster management and coastal risk assessment activities by the Japan Overseas Cooperation Volunteers.
Furthermore, the Data Collection Survey on Disaster Risk Management in Jamaica and Saint Lucia (JICA 2014) was conducted and the implementation of the preparatory survey for disaster response communication system improvement plan in Jamaica has been determined, which includes the dispatch of the JICA Expert, equipment grant for the renewal of the emergency radio communication system.
2.4.6 Support of Other Donors
The disaster management sector is supported by several international agencies including the World Bank, United Nations Children’s Fund (UNICEF), Food and Agriculture Organization (FAO), IDB, EU, CDB, and CDEMA, as well as some countries including Canada, USA, and UK.
(1) National Development Plan (UNDP), Jamaica Office
1) To support the attainment of the Jamaica National Development Plan, Vision 2030 Jamaica, and Millennium Development Goals;
2) To emphasize earthquake disaster management in terms of disaster management aspect; and
3) To held regular coordination meetings for effectively supporting activities by UN family organizations including FAO, International Atomic Energy Agency (IAEA), Pan American Health Organizations (PAHO), UNDP, United Nations Environment Programme (UNEP), and United Nations Educational, Scientific and Cultural Organization (UNESCO). As for coordination with the donor countries, irregular meetings are held.
(2) World Bank (WB)
1) Project formulation is made incorporating the Jamaica National Development Plan;
2) A policy for project implementation is to strengthen the coordination with the other donor agencies aiming at effective investment; and
3) Cooperative efforts with the other agencies are possible since project formulation is made gradually over more than one year.
(3) Inter-American Development Bank (IDB)
1) Future direction of supports to be provided for Jamaica:
To emphasize on water, energy, education, social security, transportation and public private partnership (PPP).
No support is currently made for disaster management sector. No schedule of support for the whole disaster management aspects but some possibility of business related to disaster mitigation.
2) Present movement of supports for the disaster management sector.
Current support is made through the PPCR Project under implementation together with the World Bank; a portion of the project under IDB is regarded as the climate change aspect but not the disaster management aspect.
(4) Canadian International Development Agency (CIDA)
1) CIDA supports the whole CARICOM;
2) Target is whole disaster management cycles as well as integrated disaster management;
3) Project implementation is made through coordination and cooperation with the other donor agencies as well as CDEMA; and
4) To emphasize on community disaster management projects considering the increase of natural disasters have caused negative impact on the economic development of the Caribbean countries, particularly impact on the vulnerable communities in terms of disasters.

2-68
(5) Coordination with UNISDR and Others and National Policy in Future International Conference
ODPEM maintains close coordination with UNISDR through active communication. UNISDR regularly reviews the disaster risk management plan (DRMP) of Jamaica and Jamaica’s national policy (Vision 2030 Jamaica, Disaster Management BasicPlan and Action Plan) is formulated in line with UNISDR.
(6) Coordination with CDEMA
ODPEM cooperates well with CDEMA by dispatching a director to attend the Technical Advisory Committee held by CDEMA for three to four times a year. As a focal point in CARICOM, Jamaica provides technical support to the four countries in the northwestern group including Bahamas, Belize, Turks and Caicos, and Haiti.

2 - 69
2.5 Suriname
2.5.1 Profile
(1) Basic Data
The basic data of Suriname are shown in Table 2.5.1.
Table 2.5.1 Basic Data of Suriname
Profile Population 539,300 people (2013, World Bank) Land area 163,820 km2 (World Bank) Capital Paramaribo Largest city Paramaribo GDP US$5.299 billion (2013, World Bank)
GDP per capita US$9,826 (2013, World Bank) GNI (Atlas method) US$5.053 billion (2013, World Bank)
GNI per capita US$9,370 (2013, World Bank) GDP growth rate 2.9% (2013, World Bank) GFCF (% GDP) -- (2013, World Bank) Current account US$653 million (2010, MOFA) Assistance received total US$400 million (2010, World Bank) Income level High/Middle Income Level Independence November 25, 1975 Currency Surinamese Dollar (SRD) Climate Tropical Climate Administrative division 10 districts Residents East Indian 27%, Afro-surinamese/Creole 17%, Maroon
15%, Javanese 15%, Mixed 12% Language Official Language: Dutch Religion Christian 40%, Hinduism 20%, Muslim 14%, etc. Principal industry Mining (Bauxite), Agriculture
Major Development Index HDI index 0.705 (2012, UNDP) Literacy rate (15-24 years old) -- Primary school enrollment rate 92.8% (2011, MOFA) Infant mortality rate (per 1,000 births) 20.3 persons (2013, World Bank) Mortality rate of pregnant women and nursing mothers (per 1,000 cases)
130 persons (2010, MOFA)
HIV infection rate (15-49 years old) 0.9% (2013, World Bank) Improved water service rate 67.10%(Coverage of water supply system, 2012, WHO)
Improved sanitation rate 80% (2012, World Bank) GINI index 52.9 (1999, UNISDR, GAR) Life expectancy at birth (years) 70.8 years (2012, UNISDR, GAR)
Poverty gap at national poverty lines (%) -- Social expenditure (% of GDP) 0.0
Governance Indicators Rule of law -0.09 (2013, UNISDR, GAR) Government effectiveness 0.00 (2013, UNISDR, GAR) Voice and accountability 0.31 (2013, UNISDR, GAR) Control of corruption -0.38 (2013, UNISDR, GAR)
Environment Ecological footprint 0.0 (UNISDR, GAR) Environmental performance index 53.6 (2014, UNISDR, GAR)
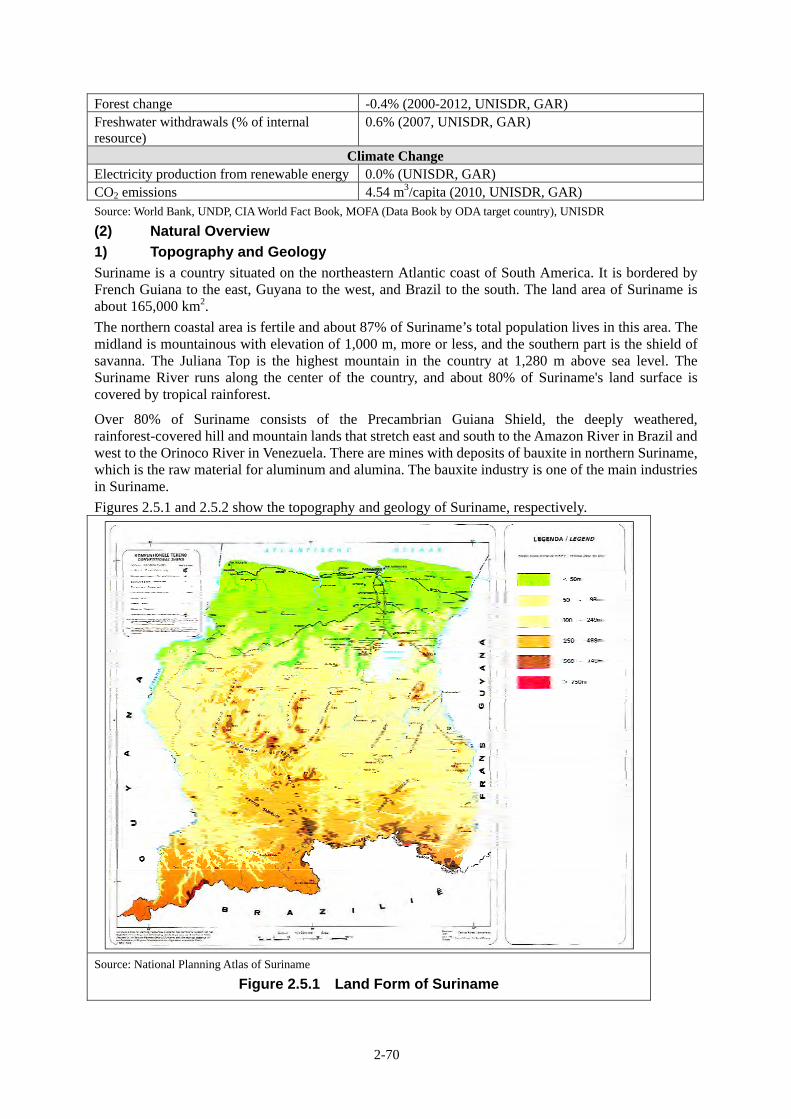
2-70
Forest change -0.4% (2000-2012, UNISDR, GAR) Freshwater withdrawals (% of internal resource)
0.6% (2007, UNISDR, GAR)
Climate Change Electricity production from renewable energy 0.0% (UNISDR, GAR) CO2 emissions 4.54 m3/capita (2010, UNISDR, GAR) Source: World Bank, UNDP, CIA World Fact Book, MOFA (Data Book by ODA target country), UNISDR
(2) Natural Overview
1) Topography and Geology
Suriname is a country situated on the northeastern Atlantic coast of South America. It is bordered by French Guiana to the east, Guyana to the west, and Brazil to the south. The land area of Suriname is about 165,000 km2.
The northern coastal area is fertile and about 87% of Suriname’s total population lives in this area. The midland is mountainous with elevation of 1,000 m, more or less, and the southern part is the shield of savanna. The Juliana Top is the highest mountain in the country at 1,280 m above sea level. The Suriname River runs along the center of the country, and about 80% of Suriname's land surface is covered by tropical rainforest.
Over 80% of Suriname consists of the Precambrian Guiana Shield, the deeply weathered, rainforest-covered hill and mountain lands that stretch east and south to the Amazon River in Brazil and west to the Orinoco River in Venezuela. There are mines with deposits of bauxite in northern Suriname, which is the raw material for aluminum and alumina. The bauxite industry is one of the main industries in Suriname.
Figures 2.5.1 and 2.5.2 show the topography and geology of Suriname, respectively.
Source: National Planning Atlas of Suriname
Figure 2.5.1 Land Form of Suriname

2 - 71
Source: http://www.staatsolie.com/pio/index.php?option=com_content&view=article&id=7&Itemid=30
Figure 2.5.2 Geological Map of Suriname
2) Climate
Suriname is located at 12°-16°N latitude and 54°-58°W longitude, and in the tropical climate zone. Monthly average temperature ranges between about 25°C and 28°C. January and February have the lowest temperature, while September to November is the highest temperature period. Rainy seasons are from April to August and from November to February, while the dry seasons are from February to April and from August to November. The average annual rainfall in Zanderij is about 2,350 mm. The monthly mean maximum and minimum temperatures and monthly mean rainfall in Zanderij are shown in Figure 2.5.3.
Source: http://www2m.biglobe.ne.jp/ZenTech/world/kion/Suriname/Suriame_Paramalibo.htm
Figure 2.5.3 Climate Features in Zanderij (Suriname)

2-72
(3) Socioeconomic Condition
1) Political Situation
Suriname got autonomy from the Kingdom of the Netherlands in 1954, and gained its independence in November 1975. A military coup overthrew the then government in 1980 and the military government advanced the socialization. The military rule collapsed in 1986 due to the breaking-out of the civil war and the government returned to the civil type in 1988.
The legislative body of the government is a unicameral National Assembly, and the legislators are re-elected every five years. The President of Suriname is elected for a five-year term through an affirmative vote of two-thirds of the members of the National Assembly.
2) Population
According to the World Bank’s survey, the estimated total population was about 540,000 in 2013, 66% of which live in the urban area. Although the number of the residents in the urban area has been increasing, the ratio of urban residents against the total population has remained at the same level. Table 2.5.2 shows the change in population in Suriname.
Table 2.5.2 Change in Population in Suriname
Indicator 1990 2000 2005 2010 2012 2013 Total population (person) 406,704 466,668 499,523 524,960 534,541 539,276Population growth rate (annual %) 1.6 1.4 1.2 0.9 0.9 0.9Urban population (person) 267,268 310,073 333,092 348,279 353,909 356,677Urban population (% of total) 65.7 66.4 66.7 66.3 66.2 66.1Rural population (person) 139,496 156,595 166,431 176,681 180,632 182,599Rural population (% of total) 34.3 33.6 33.3 33.7 33.8 33.9Source: World Bank, World Data Bank
GNI and GDP The nominal GNI per capita and nominal GDP per capita of Suriname are about US$9,500 as shown in Table 2.5.3.
Table 2.5.3 Nominal GNI and GDP per Capita in Suriname
Indicator 2008 2009 2010 2011 2012 2013 GNI per capita, Atlas method (US$) 6,330 7,000 7,800 8,320 8,920 9,370GDP per capita (US$) 6,855 7,450 8,321 8,349 9,378 9,826Source: World Bank, World Data Bank
4) Government Agencies and Administrative Division
The ministries of the Surinamese government are enumerated in Table 2.5.4.
Table 2.5.4 Central Government Agencies of Suriname
Central Government Agencies Cabinet of the President Cabinet of the Vice President Ministry of Foreign Affairs Ministry of Natural Resources Ministry of Transport, Communication, and Tourism Ministry of Sport and Youth Affairs Ministry of Trade and Industry Ministry of Defense Ministry of Education and Community Development Ministry of Public Works Ministry of Home Affairs Ministry of Public Health Ministry of Social Affairs and Housing Ministry of Finance

2 - 73
Central Government Agencies Ministry of Regional Development Ministry of Agriculture, Animal Husbandry and Fisheries Ministry of Justice and Police Ministry of Labour, Technological Development and Environment Ministry of Physical Planning, Land and Forestry Management
Source: http://consulaatsuriname.nl/
There are ten local administrative districts in Suriname as shown in Table 2.5.5.
Table 2.5.5 Local Administrative Districts in Suriname
No. Administrative Districts Area (km2) Population (head)*
1 Brokopondo 7,364 15,909 2 Commewijne 2,353 31,420 3 Coronie 3,902 3,391 4 Marowijne 4,627 18,294 5 Nickerie 5,353 34,323 6 Para 5,393 24,700 7 Paramaribo 182 240,924 8 Saramacca 3,636 17,480 9 Sipaliwini 130,567 37,065
10 Wanica 443 118,222 Note * Census data in 2012 (Total population in Suriname: 541,638)
Source: http://www.citypopulation.de/Suriname-Cities.html
2.5.2 Disaster Situation
(1) General
The outline of the disasters in every survey country is described in the Global Assessment Report on Disaster Risk Reduction 2015, which is issued by the UNISDR. The occurrence rate by disaster and the cause-specific percentage of economic losses by disaster in Suriname are shown in Figures 2.5.4 and 2.5.5, respectively. According to the figures, it is observed that heavy rains cause the most frequent disaster in Suriname from 1990 to 2014, while cyclone disasters cause the most serious economic losses.
Source: Global Assessment Report on Disaster Risk Reduction Note: The term “Cyclone” is used as in the source.
Figure 2.5.4 Occurrence Rate by Disaster in Suriname
Figure 2.5.5 Cause-specific Percentage of Economic Loss in Suriname
34%
27%
15%
11%
8%
4% 1%Rain
Cyclone
Windstorm
Coastal Erosion
Flood
95%
4% 1%
Cyclone
Earthquake
Fire

2-74
(2) Flood
Suriname is not located in the hurricane belt; hence, floods in Suriname are usually caused by heavy and/or long rains. According to EM-DAT, the floods causing damages are those that occurred in August 1969, May 2006, and June 2008. Less information is available for the flood in August 1969. The following are descriptions of the floods that occurred recently in May 2006 and June 2008.
Flood in May 2006
Suriname experienced continuous heavy rain from the last week of April to the first week of May, resulting in extraordinary water level rises in the major rivers in central and eastern Suriname.
The floods caused the severest damages in both Brokopondo and Sipaliwini districts, including about 32,000 affected residents, which is equivalent to 66% of the population of these districts, and economic loss of SRD 110 million (US$40 million) equivalent to about 2% of GDP. Figures 2.5.6 and 2.5.7 show the flood areas and flooding condition, respectively.
Source: PowerPoint by NCCR “Disaster Management in Suriname”
Figure 2.5.7 Flood Inundation in May 2006
Langa Tabiki
Figure 2.5.6 Flood Area in May 2006
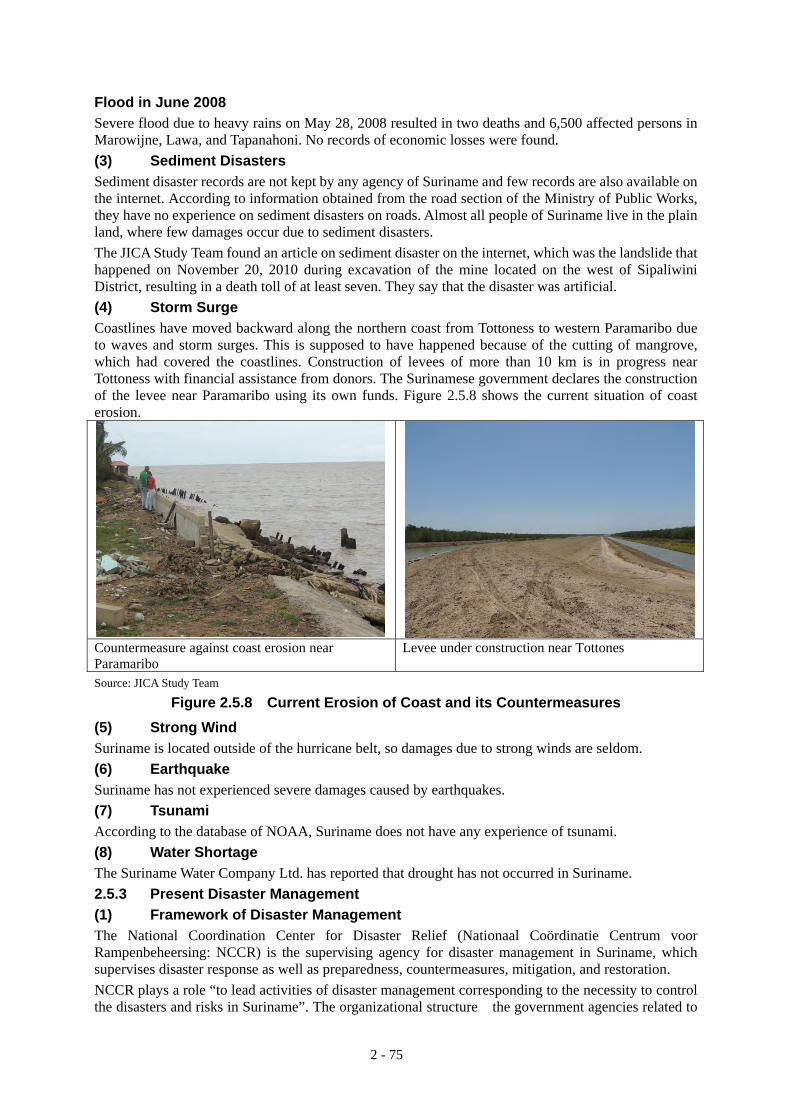
2 - 75
Flood in June 2008
Severe flood due to heavy rains on May 28, 2008 resulted in two deaths and 6,500 affected persons in Marowijne, Lawa, and Tapanahoni. No records of economic losses were found.
(3) Sediment Disasters
Sediment disaster records are not kept by any agency of Suriname and few records are also available on the internet. According to information obtained from the road section of the Ministry of Public Works, they have no experience on sediment disasters on roads. Almost all people of Suriname live in the plain land, where few damages occur due to sediment disasters.
The JICA Study Team found an article on sediment disaster on the internet, which was the landslide that happened on November 20, 2010 during excavation of the mine located on the west of Sipaliwini District, resulting in a death toll of at least seven. They say that the disaster was artificial.
(4) Storm Surge
Coastlines have moved backward along the northern coast from Tottoness to western Paramaribo due to waves and storm surges. This is supposed to have happened because of the cutting of mangrove, which had covered the coastlines. Construction of levees of more than 10 km is in progress near Tottoness with financial assistance from donors. The Surinamese government declares the construction of the levee near Paramaribo using its own funds. Figure 2.5.8 shows the current situation of coast erosion.
Countermeasure against coast erosion near Paramaribo
Levee under construction near Tottones
Source: JICA Study Team
Figure 2.5.8 Current Erosion of Coast and its Countermeasures
(5) Strong Wind
Suriname is located outside of the hurricane belt, so damages due to strong winds are seldom.
(6) Earthquake
Suriname has not experienced severe damages caused by earthquakes.
(7) Tsunami
According to the database of NOAA, Suriname does not have any experience of tsunami.
(8) Water Shortage
The Suriname Water Company Ltd. has reported that drought has not occurred in Suriname.
2.5.3 Present Disaster Management
(1) Framework of Disaster Management
The National Coordination Center for Disaster Relief (Nationaal Coördinatie Centrum voor Rampenbeheersing: NCCR) is the supervising agency for disaster management in Suriname, which supervises disaster response as well as preparedness, countermeasures, mitigation, and restoration.
NCCR plays a role “to lead activities of disaster management corresponding to the necessity to control the disasters and risks in Suriname”. The organizational structure the government agencies related to

2-76
related to disaster management is shown in Figure 2.5.9. The chairperson of the above organizational structure is the Prime Minister and NCCR works as the coordinating body.
Source: PowerPoint prepared by NCCR, “Disaster Management in Suriname”
Figure 2.5.9 Organizational Structure of Government Agencies for Disaster Management in Suriname
(2) Organization of NCCR
The NCCR Secretariat currently comprises eight members, including a director, five managers, and two office staffs. NCCR has an annual budget of SRD 1 million, and the separate disaster fund is available for emergency responses. The organizational structure of NCCR is shown in Figure 2.5.10.
Source: PowerPoint prepared by NCCR, “Disaster Management in Suriname”
Figure 2.5.10 Organizational Structure of NCCR

2 - 77
(3) NCCR and Local Level Disaster Management
As shown in Figure 2.5.9, disaster management consists of national and district level management. There is a district committee in each district, and the district commissioner is appointed by the head of the district, that is appointed by the president. The district committee is a committee under the Ministry of Rural Development, and works in collaboration with NCCR in case of emergency.
When a district committee is not able to manage the disaster, even if it occurred within the district, other district committees via NCCR and/or the central government will take the necessary actions and assistances for the disaster management.
2.5.4 Meteorological and Hydrologic Services
(1) Meteorological and Hydrologic Agencies and Duties
Meteorological and hydrological services are undertaken respectively by the Meteorological Division and Hydraulic Research Division, both of which are under the Directorate of Water Engineering, Ministry of Public Works (MPW).
MPW generally covers the services such as infrastructure facilities management in the area called “Coastal Zone” only. However, MPW is responsible for the meteorological and hydrologic services for the whole country.
The Meteorological Division carries out meteorological observation, provision of meteorological information and weather forecast, dissemination of meteorological warnings, provision of meteorological information for air traffic control as well as storage, analysis and provision of observed data. Meanwhile, the Hydraulic Research Division conducts the hydrologic observation works such as water level, discharge, and water quality, and laboratory works such as planning, water quality analysis, and studies on flood and erosion, among others.
(2) Outline of Meteorological and Hydrologic Agencies (Personnel and Budget)
1) Meteorological Division
The number of personnel of the Meteorological Division is 70 in the whole country, 34 of whom belong to the headquarters including the national synoptic station at the Johan Adolf Pengel (JAP) International Airport. The number of weather forecasters is five and all of them are working in the national synoptic station. Only two technical staffs are available who are responsible for O&M works of the observation instrument in the whole country such that regular maintenance of all stations in the country is made only once every year. The most important issue is to improve the present O&M capacity. In order to develop automatic observation system, staff training and personnel enhancement including IT-related engineers shall be targeted.
2) Hydraulic Research Division
The number of personnel of the Hydraulic Research Division is 27 and the present issues are the lack of and aging personnel. The present situation has been caused by the government policy of no recruitment of retired personnel so as to reduce the number of personnel considering that there were about 150 staffs in the 1980s.
Personnel (27 in total) consist of one bachelor (head of office), two college dropouts, and ten technicians. The present situation requires not only increasing the number of staff but also capacity improvement of personnel.
Annual budget for technical purposes is about SRD 1 million.
(3) Meteorological and Hydrologic Observations
1) Meteorological Observations (Surface and Altostratus)
There are 70 manned stations in the country where visual reading is made by the observer; there were about 200 stations in the 1970s. The 70 stations are composed of four synoptic stations and remaining rainfall observation stations. Of the 70 stations, more than 40 are located in the Coastal Area; most of the remaining 30 stations are primarily installed in small local airport inland provinces. In either case, data is sent to the headquarters through telephone or radio communication from the inland stations.
2-78
Automatic stations exist at seven locations in and around the capital Paramaribo as well as the western part of the Coastal Area, which were installed through the grant aid of the Caribbean Climate Change Center as well as EU and have been functioning since 2014.
It is targeted that observation situation would be improved in the remote area, particularly in the inland area by means of automation of the existing manned stations. In such future plan, data transmission would be through satellite and/or internet communications.
Observed data archives are mostly those in the 1970s and the present observation was restored after 1986.
2) Meteorological Radar Observation
No radar observation is conducted.
3) Hydrologic Observation (River)
Water level observations had been previously conducted at many places; however, most of these observations were discontinued in 1986. About 15%-20% (about 20 locations) of these observations in the Coastal Area were revived. These 20 sites are located within the tidal section of each river and the purposes of the observations are for flood, navigation, irrigation, and structure design. Discharge is estimated by incorporating the tide effect to the water level. Such observation records are stored in the data logger and downloaded data are collected regularly.
Among the 20 water level stations above, one station has been automated and another four stations will be automated with the national budget, for which necessary equipment has already been procured and ready for installation. It is planned that the water level stations in the inland area will be improved to automatic observation stations with automatic communication system.
Water level and discharge observation in the section where no tidal influence was observed was carried out once around 1986 in the upstream reach of the rivers.
4) Tide and Surge Observations
Tide level observation is carried out at the estuary of the Marowijine River, the Cauranntyne River, the Cattica River, and other rivers.
5) Other Observations
Water quality observation is regularly conducted in major rivers and in the northeast area of Suriname, while sediment sampling data have not been updated.
No river survey was conducted after around 1986 when surveys were carried out in major rivers nationwide; however, the Maritime Office sometimes conducts sounding survey in the downstream section for navigation purposes.
6) Observation Database System
All meteorological observed data are stored in the computer of the Meteorological Division. Both previous data and current daily data including the latest daily data and past records such as monthly summary are available on the website.
At present, the observed meteorological and hydrologic data collected are respectively stored in the respective computers of the Meteorological Division and Hydraulic Research Division. In the future, both divisions desire to establish a data storage system in the ministry’s computer to share all collected data.
(4) Dissemination of Weather Information, Forecast, and Warning
The meteorological and weather forecasts in Suriname are prepared and disseminated for domestic referring to the meteorological satellite information as well as result of numerical forecast provided by NOAA without considering meteorological radar information. These information and forecast are available on a daily basis. Warnings such as heavy rain warnings are issued as “Special Information” but on a daily basis.
Forecasts, warnings, and daily data are sent out to the media, air aviation, and public (on the website).

2 - 79
(5) Cooperation with Other Related Meteorological Agencies
Suriname is not a member of CMO and no radar information is received from the Caribbean radar system. However, Suriname receives various information from NOAA including meteorological satellite information, hurricane information, and numerical forecast outcome.
2.5.5 Support of the Japanese Government
Almost no assistance has been given to Suriname by the Japanese government.
2.5.6 Support of Other Donors
UNDP is preparing a plan, by using the Japan Fund, for the agriculture, energy, and flood control sectors in Paramaribo.
The road rehabilitation project is ongoing for the inland east-west road between Zanderij and Pikin Saron through the loan aid from the Chinese government.

2-80
2.6 Saint Christopher and Nevis
2.6.1 Profile
(1) Basic Data
The basic data of Saint Christopher and Nevis are shown in Table 2.6.1.
Table 2.6.1 Basic Data of Saint Christopher and Nevis
Profile Population 54,190 persons (2013, World Bank) Land area 260 km2 (2013, World Bank) Capital Basseterre Largest city Basseterre GDP US$0.765 billion (2013, World Bank)
GDP per capita US$14,130 (2013, World Bank) GNI (Atlas method) US$0.75 billion (2013, World Bank)
GNI per capita US$13,890 (2013, World Bank) GDP growth rate 4.2% (2013, World Bank) GFCF (% GDP) 28.9% (2013, GAR) Current account US$(-)129.16 million (2010, MOFA) Assistance received total US$11.42 million (2010, World Bank) Income level High-medium Income Level Independence September 19, 1983 Currency Eastern Carib Dollar (EC$) Climate Tropical Forest Climate Administrative division 14 parishes (9 parishes in Saint Christopher Island and 5
parishes in Nevis Island) Residents African, British, Portuguese, Lebanese, etc. Language Official Language: English Religion Christian, etc. Principal industry Agriculture, Tourism, etc.
Major Development Index HDI index 0.750 (2013, UNDP) Literacy rate (15-24 years old) -- Primary school enrollment rate 83.2% (2010, MOFA) Infant mortality rate (per 1,000 births) 6.1 persons (2011, MOFA) Mortality rate of pregnant women and nursing mothers (per 1,000 cases)
--
HIV infection rate (15-49 years old) 0.9% (2010, UNDP) Improved water service rate 99% (2010, MOFA) Improved sanitation rate 96% (2010, MOFA) GINI index -- Life expectancy at birth (years) 75.0 years (2012, WHO) Poverty gap at national poverty lines (%)
--
Social expenditure (% of GDP) -- Governance Indicators
Rule of law 0.73 (2013, UNISDR, GAR) Government effectiveness 0.90 (2013, UNISDR, GAR) Voice and accountability 1.14 (2013, UNISDR, GAR) Control of corruption 0.98 (2013, UNISDR, GAR)
Environment Ecological footprint 0.00 (UNISDR, GAR)

2 - 81
Environmental performance index 0.0 (UNISDR, GAR) Forest change 0.0% (2000-2012, UNISDR, GAR) Freshwater withdrawals (% of internal resource)
0.0% (UNISDR, GAR)
Climate Change Electricity production from renewable energy
1.00% (UNISDR, GAR)
CO2 emissions 4.76 metric ton/capita (UNISDR, GAR) Source: World Bank, UNDP, CIA World Fact Book, MOFA (Data Book by ODA target country), UNISDR
(2) Natural Overview
1) Topography and Geology
Saint Christopher and Nevis is a twin island country with a total landmass of 269 km2, lying to the north of the Antilles Islands. Saint Christopher Island, the larger of the two, is about 176 km2 in size, and Nevis Island has a land area of 93 km2.
Saint Christopher Island has a higher elevation at the center and northwest part, which is covered by deep tropical rainforest. The highest peak is Mount Liamuiga of about 1,155 m, located in the north of Saint Christopher Island. The Southern Peninsula is low to hilly area with elevation up to 319 m, which is covered by dry grass, shrub, and cactuses. The capital of Basseterre is located 12 km south of Mount Liamuiga. Nevis Island is round shaped, and the central peak rises to 984 m in altitude.
Saint Christopher Island is composed almost exclusively of volcanic rocks of andesite or dacite mineralogy. The surface geology comprises almost entirely undifferentiated lavas and volcanoclastic deposits. The geology of Nevis Island can be subdivided into four informal units, namely: volcanic of
Figure 2.6.1 Topography of Saint Christopher and Nevis
Source: The Saint Christopher Nevis National Disaster Plan

2-82
the eruptive centers, volcanogenic rocks - pyroclastic and lahar, fluviatile and lacustrine deposits, and raised beaches.
Figure 2.6.1 shows the topography of Saint Christopher and Nevis. Figures 2.6.2 and 2.6.3 show the geology of Saint Christopher Island and Nevis Island, respectively.
Source: http://www.caribbeanvolcanoes.com/stkitts/content/highres_stkitts.pdf
Figure 2.6.2 Geology of the Saint Christopher Island
Source: Seismic Research Center, UWI(http://www.uwiseismic.com/Downloads/nevis4website.pdf)
Figure 2.6.3 Geology of the Nevis Island

2 - 83
2) Climate
Saint Christopher and Nevis is located at around 17°N latitude and 63°W longitude, and in the tropical maritime climate zone. Monthly average temperature ranges between about 24°C and 27°C. January to February is the lowest temperature period, while June to October is the highest. It is rainy season from July to November, and dry season from January to June. The average annual rainfall at Basseterre is about 1,700 mm. The monthly mean maximum and minimum temperatures and monthly mean rainfall in Basseterre are shown in Figure 2.6.4.
Source: http://www2m.biglobe.ne.jp/ZenTech/world/kion/Saint_Kitts_and_Nevis/Basseterre.htm
Figure 2.6.4 Climate Feature in Basseterre (Saint Christopher)
(3) Socioeconomic Condition
1) Political Situation
Saint Christopher and Nevis gained its independence from the United Kingdom in 1983. It is a constitutional monarchy and a member of the Commonwealth of Nations having the parliamentary cabinet system. The cabinet has the administrative power, of which the Prime Minister is elected in the parliament and appointed by the Governor-General. Under the present two-party system, the centre-left Saint Kitts and Nevis Labour Party (SKNLP) and Peoples’ Action Movement (PAM) of the centrism wing have political influences. The autonomous government and its parliament are established in Nevis Island separately, and another two-party system consisting of Concerned Citizens Movement (CCM) and Nevis Reformation Party (NRP) is active.
2) Population
According to the World Bank’s survey, the estimated total population in 2013 was about 54,000. About 32% of the total population resides in the urban area. The urban population has an increasing trend. Table 2.6.2 shows the trend of population change.
Table 2.6.2 Change in Population in Saint Christopher and Nevis
Indicator 1988 1993 1998 2003 2008 2013 Total population (person) 41,045 41,836 44,391 47,679 51,110 54,191
Population growth rate (annual %) -0.75 1.14 1.15 1.57 1.24 1.13
Urban population (person) 14,309 14,263 14,716 15,391 16,276 17,283
Urban population (% of total) 34.9 34.1 33.2 32.3 31.8 31.9
Rural population (person) 26,736 27,573 29,675 32,288 34,834 36,908
Rural population (% of total) 65.1 65.9 66.8 67.7 68.2 68.1
Source: World Bank, World Data Bank

2-84
3) GNI and GDP
The nominal GNI per capita and nominal GDP per capita are about US$14,000 in Saint Christopher and Nevis as shown in Table 2.6.3.
Table 2.6.3 Nominal GNI and GDP per Capita in Saint Christopher and Nevis
Indicator 2009 2010 2011 2012 2013 GNI per capita, Atlas method (US$) 13,090 12,650 13,020 13,080 13,890
GDP per capita (US$) 13,703 13,227 13,744 13,659 14,133
Source: World Bank, World Data Bank
4) Government Agencies and Administrative Division
The ministries of the Government of Saint Christopher and Nevis are enumerated in Table 2.6.4.
Table 2.6.4 Central Government Agencies of Saint Christopher and Nevis
Central Government Agencies Ministry of Finance
Ministry of Sustainable Development
Ministry of National Security Ministry of People Empowerment and Constituency Empowerment
Ministry of Education, Youth, Sport and Culture
Ministry of Nevis Affairs
Ministry of Labour, Social Security and Ecclesiastical Affairs
Ministry of Foreign Affairs and Aviation
Ministry of Agriculture
Ministry of Health
Ministry of National Health Insurance
Ministry of Human Settlement
Ministry of Community Development Ministry of Gender Affairs
Ministry of Social Services, Co-operatives and Land
Ministry of Tourism, International Trade, Industry and Commerce
Ministry of Public Infrastructure, Post, Urban Development and Transport
Ministry of Justice, Legal Affairs and Communications
Source: http://sknis.info/about/
The local administrative districts are composed of 14 parishes as shown in Table 2.6.5.
Table 2.6.5 Parishes in Saint Christopher and Nevis
No. Parish Area (km2) Population (head)* 1 Christ Church Nichola Town 18.6 2,059
2 Saint Anne Sandy Point 12.8 3,140 3 Saint George Basseterre 28.7 13,220
4 Saint George Gingerland 18.5 2,568
5 Saint James Windward 31.1 1,836
6 Saint John Capesterre 24.8 3,181
7 Saint John Figtree 21.3 2,922
8 Saint Mary Cayon 15.1 3,374
9 Saint Paul Capesterre 13.8 2,460
10 Saint Paul Charlestown 3.5 1,820
11 Saint Peter Basseterre 20.7 3,472
12 Saint Thomas Lowland 18.1 2,035

2 - 85
No. Parish Area (km2) Population (head)* 13 Saint Thomas Middle Island 24.3 2,332
14 Trinity Palmett Point 15.4 1,692
Remark* Census data in 2001 (Total population of Saint Christopher and Nevis: 46,325)
Source: http://www.citypopulation.de/StKittsNevis.html
2.6.2 Disaster Situation
(1) General
The outline of disasters in every survey country is described in the Global Assessment Report on Disaster Risk Reduction 2015, which is issued by UNISDR. The occurrence rate by disaster and the cause-specific percentage of economic losses in Saint Christopher and Nevis are shown in Figures 2.6.5 and 2.6.6, respectively. As shown in the figures, the most frequent disaster in Saint Christopher and Nevis from 1990 to 2014 is that due to heavy rains, while the disaster causing the most serious economic losses is that due to cyclones.
Source: Global Assessment Report on Disaster Risk Reduction
Note: The term “Cyclone” is used as in the source.
Figure 2.6.5 Occurrence Rate by Disaster
in Saint Christopher and Nevis
Figure 2.6.6 Cause-specific Percentage of Economic Loss in Saint Christopher
and Nevis
(2) Flood
1) Record of Major Hurricanes
Table 2.6.6 shows the major hurricanes which affected Saint Christopher and Nevis from 1954 to 2010.
Table 2.6.6 Major Hurricanes in Saint Christopher and Nevis
Name Day/Month/Year Name Day/Month/Year Alice 3 January1954 Bertha 8 July 1996
Betsy 12 August 1956 Georges 21 September 1998 (h3)
Donna 5 September 1960 (h4) Jose 20 October 1999
Hugo 17September 1989 (h4) Lenny 18 November 1999 (h4)
Luis 5 September 1995 (h4) Debby 22 August 2000
Marilyn 15 September 1995 Earl 30 August 2010 (h2)
(Entries in parentheses (“h1~h4”) refer to the category of the hurricanes.)
Source: http://stormcarib.com/climatology/TKPK_all_isl.htm
The hurricanes which caused rather severe damages among those shown in Table 2.6.6 are presented hereunder.
(a) Hurricane Hugo
The attack of Hurricane Hugo on September 17, 1989, accompanied by strong winds and heavy rains, resulted in serious damage in particular to Nevis Island. The damages to Nevis Island included the following: 15% of houses completely destroyed, roofs of 40-50% of houses destroyed, eight hotels
28%
27%12%
11%
8%
7%7%
Cyclone
Rain
Windstorm
Coastal Erosion
Drought
Fire
Flood
89%
11%
Cyclone
Fire
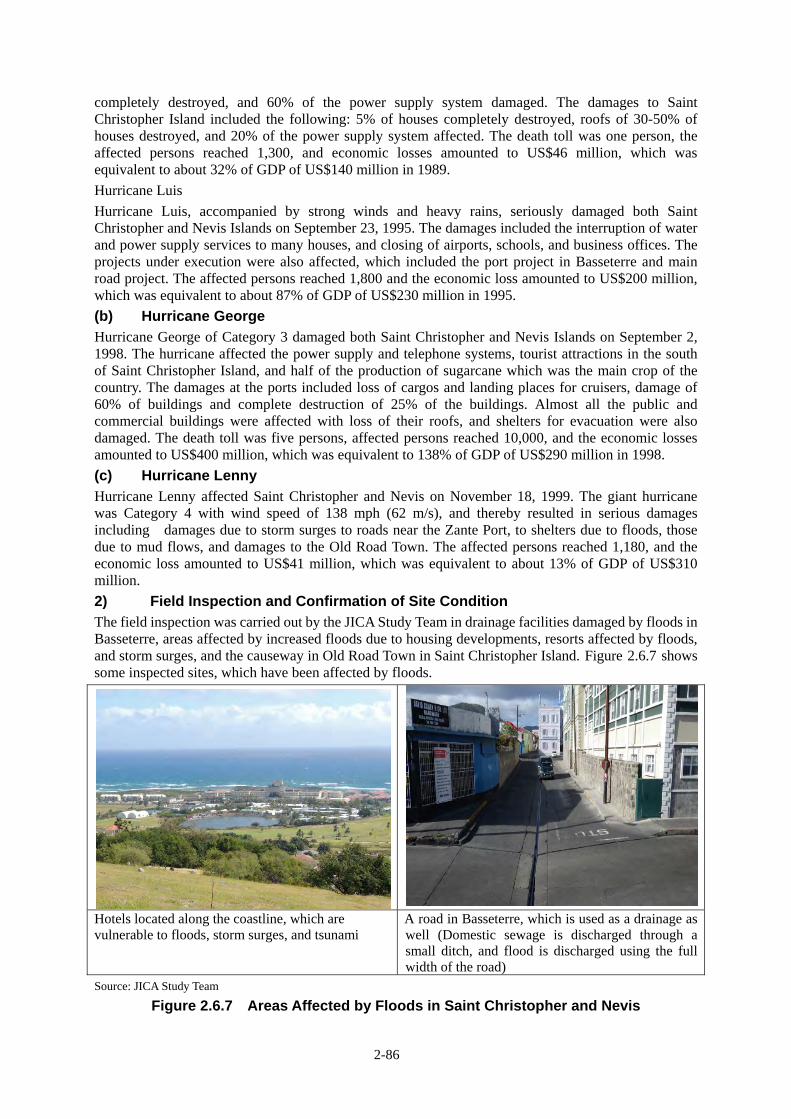
2-86
completely destroyed, and 60% of the power supply system damaged. The damages to Saint Christopher Island included the following: 5% of houses completely destroyed, roofs of 30-50% of houses destroyed, and 20% of the power supply system affected. The death toll was one person, the affected persons reached 1,300, and economic losses amounted to US$46 million, which was equivalent to about 32% of GDP of US$140 million in 1989.
Hurricane Luis
Hurricane Luis, accompanied by strong winds and heavy rains, seriously damaged both Saint Christopher and Nevis Islands on September 23, 1995. The damages included the interruption of water and power supply services to many houses, and closing of airports, schools, and business offices. The projects under execution were also affected, which included the port project in Basseterre and main road project. The affected persons reached 1,800 and the economic loss amounted to US$200 million, which was equivalent to about 87% of GDP of US$230 million in 1995.
(b) Hurricane George
Hurricane George of Category 3 damaged both Saint Christopher and Nevis Islands on September 2, 1998. The hurricane affected the power supply and telephone systems, tourist attractions in the south of Saint Christopher Island, and half of the production of sugarcane which was the main crop of the country. The damages at the ports included loss of cargos and landing places for cruisers, damage of 60% of buildings and complete destruction of 25% of the buildings. Almost all the public and commercial buildings were affected with loss of their roofs, and shelters for evacuation were also damaged. The death toll was five persons, affected persons reached 10,000, and the economic losses amounted to US$400 million, which was equivalent to 138% of GDP of US$290 million in 1998.
(c) Hurricane Lenny
Hurricane Lenny affected Saint Christopher and Nevis on November 18, 1999. The giant hurricane was Category 4 with wind speed of 138 mph (62 m/s), and thereby resulted in serious damages including damages due to storm surges to roads near the Zante Port, to shelters due to floods, those due to mud flows, and damages to the Old Road Town. The affected persons reached 1,180, and the economic loss amounted to US$41 million, which was equivalent to about 13% of GDP of US$310 million.
2) Field Inspection and Confirmation of Site Condition
The field inspection was carried out by the JICA Study Team in drainage facilities damaged by floods in Basseterre, areas affected by increased floods due to housing developments, resorts affected by floods, and storm surges, and the causeway in Old Road Town in Saint Christopher Island. Figure 2.6.7 shows some inspected sites, which have been affected by floods.
Hotels located along the coastline, which are vulnerable to floods, storm surges, and tsunami
A road in Basseterre, which is used as a drainage as well (Domestic sewage is discharged through a small ditch, and flood is discharged using the full width of the road)
Source: JICA Study Team
Figure 2.6.7 Areas Affected by Floods in Saint Christopher and Nevis

2 - 87
Source: JICA Survey Team
Figure 2.6.8 Rockfall from Slope of Road to South Peninsula
(3) Sediment Disasters
1) Major Sediment Disaster Records
Sediment disaster records are not kept in order by any agency in Saint Christopher and Nevis and the records are not also available on the internet. Officers of the government agencies concerned explained during the survey that almost no damage due to sediment disasters were suffered in Saint Christopher and Nevis.
2) Field Inspection and Confirmation of Site Condition
There is no major river in Saint Christopher and Nevis, but streams of 7-8 m wide run toward the coasts. The roads running around Saint Christopher Island pass over the plain land and no slope protection is made basically. The road section to the South Peninsula passes through steep sloped area, in which no slope protection is seen too. Some small-scale rockfall of weathered sand stones was observed in the section as shown in Figure 2.6.8.
(4) Storm Surge
Hurricane Omar of Category 4 damaged the coastal structures, when it passed at 150 km east of the Saint Christopher and Nevis Islands.
Hurricane Lenny of Category 4 caused waves with height of 6.1 m, which hit the coastal area and extended inland by 180 m from the coastline. The wave resulted in damages to the commercial buildings/facilities and erosion of the coasts at several points.
(5) Strong Wind
Hurricanes of Categories 3 or 4 have caused damages to roofs of houses.
(6) Earthquake
Records of disasters caused by the past major earthquakes in Saint Christopher and Nevis are shown in Table 2.6.7.
Table 2.6.7 Major Earthquakes in Saint Christopher and Nevis
Occurrence Disaster Area Magnitude Disaster Situation NoteApril 30, 2013 Saint Christopher and
Nevis, Antigua, St. Maarten
M5.3 No serious damage -
November 29, 2007
Martinique Region M7.4 No serious damage in Saint Christopher and Nevis
-
October 8, 1974 Saint Christopher and Nevis, Antigua, Barbuda
M7.5 The roof of St. Thomas Church collapsed.
April 5, 1690 Saint Christopher and Nevis, Antigua, Montserrat
>M8 A massive earthquake and tsunami destroyed the city of Jamestown, then the capital of Nevis. Jesuit college and several wooden buildings were destroyed in St. Kitts.
-
Source: Prepared by the JICA Study Team based on the Home Page of Seismic Research Center and others.
(7) Tsunami
Records of past major tsunami in Saint Christopher and Nevis are shown in Table 2.6.8.
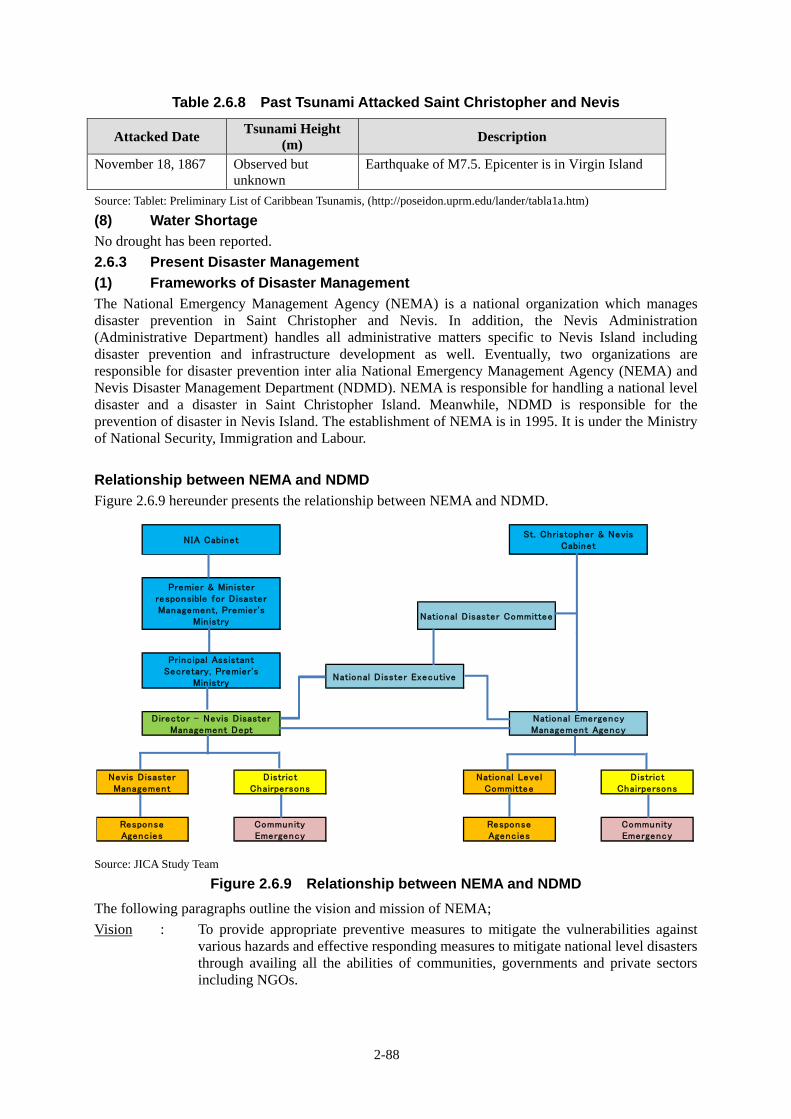
2-88
Table 2.6.8 Past Tsunami Attacked Saint Christopher and Nevis
Attacked Date Tsunami Height (m) Description
November 18, 1867 Observed but unknown
Earthquake of M7.5. Epicenter is in Virgin Island
Source: Tablet: Preliminary List of Caribbean Tsunamis, (http://poseidon.uprm.edu/lander/tabla1a.htm)
(8) Water Shortage
No drought has been reported.
2.6.3 Present Disaster Management
(1) Frameworks of Disaster Management
The National Emergency Management Agency (NEMA) is a national organization which manages disaster prevention in Saint Christopher and Nevis. In addition, the Nevis Administration (Administrative Department) handles all administrative matters specific to Nevis Island including disaster prevention and infrastructure development as well. Eventually, two organizations are responsible for disaster prevention inter alia National Emergency Management Agency (NEMA) and Nevis Disaster Management Department (NDMD). NEMA is responsible for handling a national level disaster and a disaster in Saint Christopher Island. Meanwhile, NDMD is responsible for the prevention of disaster in Nevis Island. The establishment of NEMA is in 1995. It is under the Ministry of National Security, Immigration and Labour.
Relationship between NEMA and NDMD
Figure 2.6.9 hereunder presents the relationship between NEMA and NDMD.
Source: JICA Study Team
Figure 2.6.9 Relationship between NEMA and NDMD
The following paragraphs outline the vision and mission of NEMA;
Vision : To provide appropriate preventive measures to mitigate the vulnerabilities against various hazards and effective responding measures to mitigate national level disasters through availing all the abilities of communities, governments and private sectors including NGOs.
National Disaster Committee
National LevelCommittee
ResponseAgencies
DistrictChairpersons
CommunityEmergency
DistrictChairpersons
CommunityEmergency
National EmergencyManagement Agency
National Disster Executive
St. Christopher & NevisCabinet
Director - Nevis DisasterManagement Dept
ResponseAgencies
Nevis DisasterManagement
NIA Cabinet
Premier & Min isterresponsible for DisasterManagement, Premier's
Min istry
Princ ipal AssistantSecretary, Premier's
Min istry

2 - 89
Mission : To alleviate the impacts of a disaster to lives, properties and the happiness of the people and to minimize the vulnerability of the society against disaster. Along this line, NEMA coordinates and encourages the disaster management activities during disaster.
The Prime Minister heads NEMA to secure an effective coordination among the various managing offices. On the other hand, the premier, who is the chief of Nevis Administration, governs NDMD which coordinates disaster management activities as well. The head of NEMA, who is the Prime Minister, chairs the National Disaster Committee, which appears in the above Figure 2.6.9. Table 2.6.9 lists the members of the National Disaster Committee.
Table 2.6.9 Members of the National Disaster Committee
No. Member 1 Prime Minister (Premier, Chairperson)
2 Cabinet Secretary (Vice Chairperson)
3 Member of Medical and Public Health Sub-committee
4 Member of Transportation Sub-committee
5 Member of Education, Communication and Warning Sub-committee
6 Member of Housing and Shelter Sub-committee
7 Member of Damage Assessment and Needs Analysis Sub-committee
8 Member of Environment Sub- Committee 9 Member of Foreigner Assistance Sub-committee
10 Member of Welfare, Relief Supplies and Shelter Management Sub-committee
11 Member of Utility Sub-committee
12 Member of Search, Rescue and Initial Clearance Sub-committee
13 All Permanent Secretaries
14 The Commander – St Kitts Defense Force
15 The Commissioner of Police
16 Technical Director – Ministry of Housing
17 The Chief Information Officer - Saint Kitts-Nevis Information Service (SKNGIS)
18 The President - St Kitts Nevis Red Cross Society 19 Chairman - Nevis Evangelical Council
20 Chairman - St Kitts Christian Council
21 Chairman - Nevis Christian Council
22 President – St Kitts Nevis Chamber of Industry and Commerce
23 General Manager - St Christopher Air and Sea Ports Authority
24 Chief Meteorologist - St Kitts Met Services
25 The National Disaster Coordinator – NEMA
26 The Director – Nevis Disaster Management Department
Source: The Saint Kitts-Nevis National Disaster Plan, Part 1 Basic Plan prepared by NEMA, 2013
A district level disaster committee handles district level subjects in relation to disaster management. There are eight district level disaster committees in Saint Christopher Island and five district level disaster committees in Nevis Island. All the members of the district level disaster committee are on voluntary bases.
Organization and Budget of NEMA and NDMD Secretarial Offices
The number of the stationed staffs is seven in the secretarial office of NEMA for the time being. Amongst them, four are technical staffs. No information is available so far with regard to the budget allocated to NEMA. The number of staffs managing NDMD is eight persons. The alleged budget is EC$50,000.

2-90
2.6.4 Meteorological and Hydrologic Services
(1) Meteorological and Hydrologic Agencies and Duties
Two meteorological offices respectively in Saint Christopher and Nevis conduct meteorological observation and forecast exclusively for air aviation purpose; however, both offices provide meteorological information and forecast for domestic purpose based on the meteorological information provided by Antigua and Barbuda.
Saint Christopher Meteorological Service is the meteorological office of Saint Christopher Air and Sea Port Authority (SCASPA), which conducts meteorological observation works as part of air traffic control service at the Robert L. Bradshaw International Airport, and provides meteorological information to the public. This is the sole system in the Caribbean countries where SCASPA, as a corporate body, undertakes meteorological service with authorization.
In Nevis, the meteorological service is similarly conducted by the Nevis Air and Sea Port Authority (NASPA) which is in charge of the Vance W. Amory Airport. In Saint Christopher and Nevis, both offices are almost similar organizations and both are air and sea ports management corporations. Meanwhile, the Saint Christopher Meteorological Office is an independent organization in the corporation (SCASPA) and serves as the meteorological office. On the other hand, meteorological service in Nevis is undertaken only as part of the air control service.
In terms of external relations, the meteorological service in Saint Christopher is representing the national meteorological service.
No hydrologic observation such as river water level is conducted in the country but tide level observation is being conducted by the Department of Physical Planning and Environment, Ministry of Sustainable Development.
(2) Outline of Meteorological and Hydrologic Agencies (Personnel and Budget)
Personnel of the Saint Christopher Meteorological Service office consists of seven technical staffs with no administrative staff; the seven technical staffs comprised one senior meteorologist/forecaster/climate change personnel, two personnel in charge of instrumentation and data processing who have received technical training on the instrument, and four observers. As for Nevis Meteorological Service office, there is only one concurrent staff who is an air control officer.
The Saint Christopher Meteorological Service Office has an annual budget of US$200,000 or less, which is a part of the SCASPA’s budget and there is no clear classification of budget for air traffic control and meteorological services. Procurement of small equipment and parts is covered by the said budget, while the procurement of rather large-scale instrument is made using the budget of the Department of Physical Planning and Environment or through CIMH funding.
(3) Meteorological and Hydrologic Observations
1) Meteorological Observations (Surface and Altostratus)
The meteorological observation stations in Saint Christopher are shown in Table 2.6.10.
Table 2.6.10 Existing Meteorological Observation Stations in Saint Christopher
Observation Site Observation Note Robert L. Bradshaw International Airport
All surface observation items
Observed data are sent to the Meteorological Office in the airport as well as SCASPA - Statistic Dept. and CIMH
Cayon Town (7 km north from Basseterre)
Automatic observation of precipitation, wind velocity and wind direction only
Observed data are directly sent to CIMH, while Saint Christopher Meteorological Service monitor those data in the CIMH data server
Brimstone Hill Fortress (12 km WNW from Basseterre)
General surface observation in calm condition
-ditto-
Sand Bank Bay (about 10 km Automatic observation of -ditto-

2 - 91
Observation Site Observation Note SE from Basseterre) precipitation, wind velocity
and wind direction only
Ottley's (2 km NW from Cayon Town)
(under installation of equipment)
Under the budget of the Department of Physical Planning and Environment
Source: JICA Study Team
Until the year 2005 when sugarcane plantation has been in operation, rainfall observation had been undertaken in the plantation wherein observed data was collected by SCASPA - Statistic Department.
Only the observed data in the airport are managed by the Saint Christopher Meteorological Office; however, the other data are directly sent to CIMH. The meteorological office receives and monitors these data in Saint Christopher through CIMH data server. Observed data in the airport have been recorded since 1971 and sent to CIMH.
Meteorological observation is conducted only in the airport where the synoptic station (manned observation every six hours) and automatic observation instrument (rainfall, wind direction, and speed) are equipped.
2) Meteorological Radar Observation
Radar images provided by Antigua and Barbuda are monitored together with the other meteorological information.
3) Hydrologic Observation (River)
No hydrologic observation such as river water level is conducted in Saint Christopher and Nevis.
4) Tide and Surge Observations
The tide level observation is conducted at the sea level station monitoring facility in the Basseterre Port which is observed and maintained by the Department of Physical Planning and Environment.

2-92
5) Observation Database System
No database system is available.
(4) Dissemination of Weather Information, Forecast, and Warning
Saint Christopher and Nevis meteorological services are provided with the following meteorological information and forecasts by Antigua and Barbuda, which are disseminated and provided for domestic purpose:
1) The meteorological service in Antigua and Barbuda provides the meteorological information including wind speed/direction, atmospheric pressure, temperature, and wave height, as well as general weather forecast and hurricane course prediction. Usually, “weather forecast” is received two times every day in the morning and evening, while more frequent information are received including the hurricane course prediction when a hurricane is approaching.
2) Information received in normal condition is in text data within one page size which is just the same content for Saint Christopher and Nevis that can be obtained from the website of the Antigua and Barbuda meteorological services.
3) Both meteorological offices in Saint Christopher and Nevis respectively receive the meteorological information from Antigua and Barbuda through e-mail and/or facsimile. The meteorological office in Saint Christopher provides weather forecast to media based on the information received incorporating observation in the airport. In case of Nevis, the information received is directly released to the media, and for the public the same information is provided through NEMA but no direct dissemination is made.
4) Similar information is sent to NEMA and NEMA sends out information to the media by adding warning and advices on rough weather condition. Saint Christopher Meteorological Office provides direct information to the public in Nevis for rough weather condition only.
(5) Cooperation with Other Related Meteorological Agencies
As mentioned above, the meteorological service in Saint Christopher and Nevis wholly rely on the information provided by Antigua and Barbuda.
As for the observation facilities except that in the airport, they were installed through CIMH support and funding; furthermore, all the observed data are directly sent to CIMH and kept in its data server. Saint Christopher meteorological services obtain such data by accessing to the same server, which shows that Saint Christopher’s operation fully depends on the support of other organizations rather than mutual cooperation.
Both meteorological offices in Saint Christopher and Nevis are a member of CMO as one body, i.e., “Saint Christopher and Nevis”, so as to receive support and cooperation. As for collaboration with CIMH, operation fund is contributed both by the meteorological service and the government.
2.6.5 Support of the Japanese Government
The Government of Japan has extended cooperation to Saint Christopher and Nevis substantially in the fisheries field. Cooperation to other fields has been conducted through the training programs.
2.6.6 Support of Other Donors
The notable examples of cooperation extended by other donors in the disaster management field are “Caribbean Disaster Risk Management Program-Knowledge Sharing” being conducted by CIDA and addressing the Caribbean countries (Refer to Section 2.1.6), Preparation of National Adaptation Plan relating to land use, which is assisted by the United Nations Convention to Combat Desertification (UNCCD), and Climate Change Program by EU.

2 - 93
2.7 Saint Vincent and the Grenadines
2.7.1 Profile
(1) Basic Data
The basic data of Saint Vincent and the Grenadines are shown in Table 2.7.1.
Table 2.7.1 Basic Data of Saint Vincent and the Grenadines
Profile Population 109,373 persons (2013, WB) Land area 390 km2 (WB) Capital Kingstown Largest city Kingstown GDP US$709 million (2013, WB)
GDP per capita US$8,486 (2013, WB) GNI (Atlas method) US$706 million (2013, WB) GNI per capita US$6,460 (2013, WB) GDP growth rate 1.7% (2013, WB) GFCF(%GDP) 0.0 (2015, UNISDR, GAR) Current account US$(-)193 million (2013, Balance of Payments Manual, IMF) Assistance received total US$9 million (2012, WB) Income level High/Middle Income Level Independence October 27, 1979 Currency East Caribbean Dollar (EC$) Climate Tropical Rainforest Climate Administrative division 6 districts Residents African 66%, Mixed 19%, East Indian 6%, European 4%,
Caribbean 2%, Others 3%(2011, CIA World Fact Book) Language Official Language: English Religion Christian 88%, Others Principal industry Tourism, Agriculture
Major Development Indices HDI index 0.733 (2012, UNDP) Literacy rate (15-24 years old) -- Primary school enrollment rate 91.6% (2013, WB) Infant mortality rate (per 1,000 births) 13.07 persons (2014, CIA World Fact Book) Mortality rate of pregnant women and nursing mothers (per 1,000 cases)
45 persons (2014, CIA World Fact Book)
HIV infection rate (15-49years old) -- Improved water service rate 95.1% (2012, WB) Improved sanitation rate 76.1% (2007, WB) GINI index 0.0 (2015, UNISDR, GAR) Life expectancy at birth (years) 72.5 years (2013, WB)
Poverty gap at national poverty lines (%)
--
Social expenditure (% of GDP) -- Governance Indicators
Rule of law 0.86 (2015, UNISDR, GAR) Government effectiveness 0.90 (2015, UNISDR, GAR) Voice and accountability 1.05 (2015, UNISDR, GAR) Control of corruption 0.98 (2015, UNISDR, GAR)
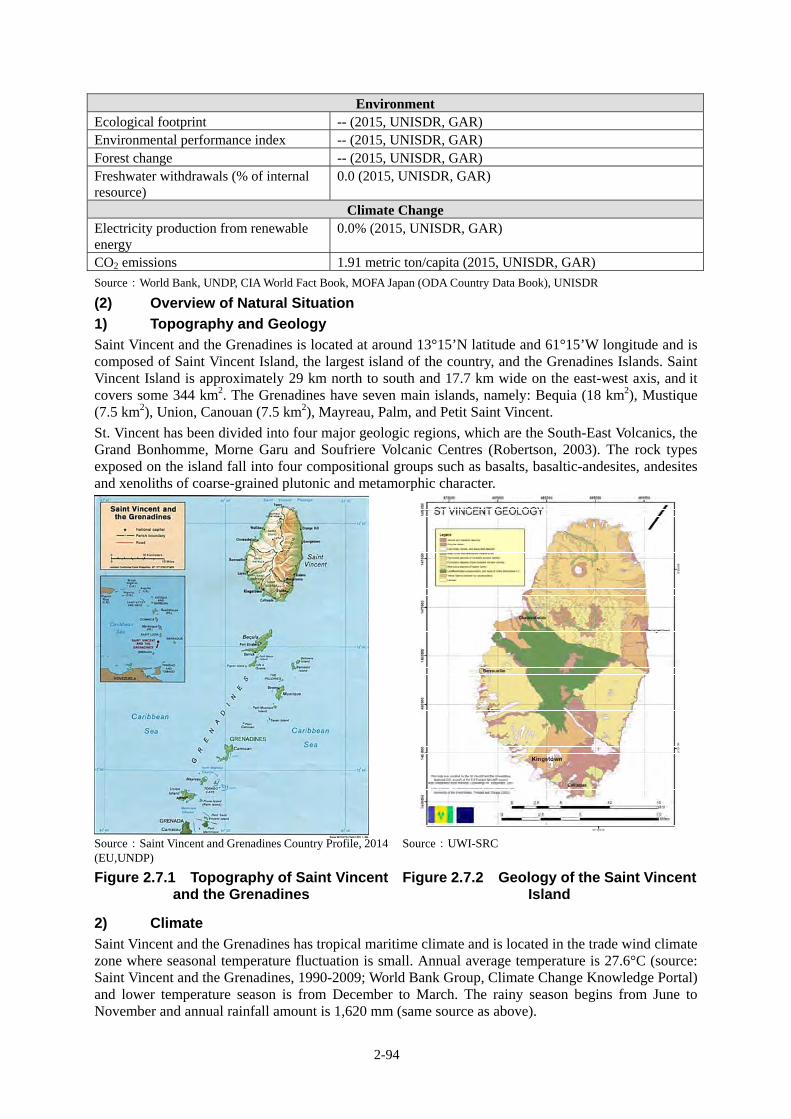
2-94
Environment Ecological footprint -- (2015, UNISDR, GAR) Environmental performance index -- (2015, UNISDR, GAR) Forest change -- (2015, UNISDR, GAR) Freshwater withdrawals (% of internal resource)
0.0 (2015, UNISDR, GAR)
Climate Change Electricity production from renewable energy
0.0% (2015, UNISDR, GAR)
CO2 emissions 1.91 metric ton/capita (2015, UNISDR, GAR)
Source:World Bank, UNDP, CIA World Fact Book, MOFA Japan (ODA Country Data Book), UNISDR
(2) Overview of Natural Situation
1) Topography and Geology
Saint Vincent and the Grenadines is located at around 13°15’N latitude and 61°15’W longitude and is composed of Saint Vincent Island, the largest island of the country, and the Grenadines Islands. Saint Vincent Island is approximately 29 km north to south and 17.7 km wide on the east-west axis, and it covers some 344 km2. The Grenadines have seven main islands, namely: Bequia (18 km2), Mustique (7.5 km2), Union, Canouan (7.5 km2), Mayreau, Palm, and Petit Saint Vincent.
St. Vincent has been divided into four major geologic regions, which are the South-East Volcanics, the Grand Bonhomme, Morne Garu and Soufriere Volcanic Centres (Robertson, 2003). The rock types exposed on the island fall into four compositional groups such as basalts, basaltic-andesites, andesites and xenoliths of coarse-grained plutonic and metamorphic character.
Source:Saint Vincent and Grenadines Country Profile, 2014 (EU,UNDP)
Source:UWI-SRC
Figure 2.7.1 Topography of Saint Vincent and the Grenadines
Figure 2.7.2 Geology of the Saint Vincent Island
2) Climate
Saint Vincent and the Grenadines has tropical maritime climate and is located in the trade wind climate zone where seasonal temperature fluctuation is small. Annual average temperature is 27.6°C (source: Saint Vincent and the Grenadines, 1990-2009; World Bank Group, Climate Change Knowledge Portal) and lower temperature season is from December to March. The rainy season begins from June to November and annual rainfall amount is 1,620 mm (same source as above).

2 - 95
The Grenadines Islands have less rainfall than Saint Vincent Island, and annual rainfall amount is about 1,250 mm on the average in Bequia Island, Union Island, and Canouan Island where meteorological observation is undertaken.
Source: World Bank Group, Climate Change Knowledge Portal
Figure 2.7.3 Monthly Mean Rainfall and Temperature in Saint Vincent(1990-2009)
(3) Socioeconomic Condition
1) Political Situation
Saint Vincent and the Grenadines became independent from Britain in 1979, and it has been a constitutional republic with single chamber. The Unity Labour Party (ULP) and the New Democratic Party (NDP), as the two major parties, have been responsible for the administration since the independence. Minister Ralph Gonsalves of ULP has been in power for three terms since the general election in December 2010.
2) Population
According to the 2013 census, the total population was about 109,000. The decrease of urban population over the past 15 years is remarkable.
Table 2.7.2 Change in Population in Saint Vincent and the Grenadines
Indicator 1988 1993 1998 2003 2008 2013 Total population (person) 106,533 108,097 107,923 108,353 109,158 109,373
Population growth rate (annual %) 0.60 0.09 -0.07 0.19 0.10 0.00
Urban population (person) 63,622 61,980 59,939 58,216 56,685 54,853
Urban population (% of total) 59.72 57.34 55.54 53.73 51.93 50.15
Rural population (person) 42,911 46,117 47,984 50,137 52,473 54,520
Rural population (% of total) 40.28 42.66 44.46 46.27 48.07 49.85
Source: World Bank, World Data Bank
3) GNI and GDP
Nominal GNI per capita and nominal GDP per capita of Saint Vincent and the Grenadines are around US$6,500 as shown in Table 2.7.3.
Table 2.7.3 Nominal GNI and GDP per Capita in Saint Vincent and the Grenadines
Indicator 2009 2010 2011 2012 2013 GNI per capita, Atlas method (US$) 6,270 6,030 6,070 6,340 6,460
GDP per capita (US$) 6,178 6,232 6,185 6,339 6,486
Source: World Bank, World Data Bank
4) Government Agencies and Administrative Division
The ministries of the Government of Saint Vincent and the Grenadines are enumerated in Table 2.7.4.

2-96
Table 2.7.4 Central Government Agencies of Saint Vincent and the Grenadines
Central Government Agencies Office of the Prime Minister
Ministry of Finance and Economic Planning
National Reconciliation, the Public Service, Labour, Information and Ecclesiastical Affairs
Ministry of National Mobilization, Social Development, Family, Gender Affairs, Persons with Disabilities and Youth
Ministry of Education
Ministry of National Security, Air and Sea Port Development
Ministry of Agriculture, Industry, Forestry, Fisheries and Rural Transformation
Ministry of Transport , Works , Urban Development and Local Government
Ministry of Health, Wellness and The Environment
Ministry of Housing, Informal Human Settlements, Land and Surveys and Physical Planning
Ministry of Legal Affairs
Ministry of Foreign Affairs, Foreign Trade, Commerce and Information Technology
Ministry of Tourism, Sports and Culture
Source: http://www.gov.vc/index.php/en/ministries (Official website of the Government of the Saint Vincent and the Grenadines)
Local administrative regions consist of 13 districts as shown in Table 2.7.5.
Table 2.7.5 Administrative Regions in Saint Vincent and the Grenadines
District Area (km2) Population (2012) Barrouallie 36.8 5,884
Bridgetown 18.6 6,568
Calliaqua 30.6 24,205
Chateraubelair 80.0 5,756
Colonarie 34.7 6,849 Georgetown 57.5 7,061
Kingstown 4.9 12,909
Layou 28.7 6,339
Marriaqua 24.3 7,798
Sandy Bay 13.7 2,576
Suburbs of Kingston 16.6 13,812
Northern Grenadines 23.3 6,184
Southern Grenadines 19.4 4,050 Source: http://www.citypopulation.de/StVincent.html
2.7.2 Disaster Situation
(1) General
According to the Global Assessment Report on Disaster Risk Reduction 2015 issued by UNISDR, the disaster frequency and economic losses in Saint Vincent and the Grenadines are shown in Figure 2.7.4. As shown in the figure, the major natural disasters are flood, strong winds, earthquake, volcanic eruption, and drought. The most serious disaster in Saint Vincent and the Grenadines from 1990 to 2014 is due to flood in terms of death toll and economic loss. Table 2.7.4 shows the past major disasters and related damages.
As a serious natural disaster in the Grenadine Islands, the slope failure in Baquia Island in 2005 with two deaths is a major disaster. Recently, drought frequently causes damages. In addition, volcanic disaster is conceivable because of the active volcano Soufrière (El. 1,234 m) located in the northern part of Saint Vincent Island which erupted in 1979.

2 - 97
Table 2.7.6 Major Disasters and Damages from 1900 to 2013 in Saint Vincentand the Grenadines
Type of Events Nos. of Events Loss of Lives
Earthquake 5 0
Flood 7 3 in 1992
Hurricanes and Storms 15 122 in 1955, 2 in 1967, 4 in 2002, 1 in 2008, 9 in 2010.
Volcanic Eruption 3 1600 in 1902
Drought 2 0
Source: Saint Vincent and the Grenadines Country Profile, 2014(NEMO, EU, UNDP)
Source: Global Assessment Report on Disaster Risk Reduction
Note: The term “Cyclone” is used as in the source.
Figure 2.7.4 Proportion of Disasters in terms of Death Toll (left) andCause-specific Percentage of Economic Loss by Disaster (right)
(2) Flood
1) Record of Major Hurricanes Record of flood damages due to recent hurricanes and heavy rain is shown in Table 2.7.7.
Table 2.7.7 Major Hurricane and Downpour Disasters and Damages
Date Event Impact Death Cost in Million EC$
1955 Hurricane Janet
Most severe damage by a disaster. 122 -
2008 Hurricane Omar – Storm Surge
30 boats destroyed Damage along coastline
Nil 5
2010 Hurricane Tomas
The most affected area was NE and NW of the country by flooding and strong winds; 28% of the population was affected, including 5% severely, over 1,200 shelters; Forestry and agriculture were significantly affected, both crops and infrastructure; Infrastructure was also affected due to flooding and landslides
Nil 133 (10.5% GDP)
2011 April - Rainfall
Torrential rainfall affected the NE of the country (in and around Georgetown) resulting in severe flooding, landslides, damage to roads and bridges, disruption of water supply and displacement of 56 families
Nil 100

2-98
Date Event Impact Death Cost in Million EC$
2013 December- Rainfall
12 deaths, 500 persons displaced, extensive damage to infrastructure
12 330
Source: Saint Vincent and the Grenadines Country Profile, 2014 (NEMO, EU, UNDP)
2) Hurricane Tomas
Hurricane Tomas, which was classified as Category 2 with a maximum wind velocity of 98 mph (44 m/s), caused serious damages in the northeast region of Saint Vincent Island including Park Hill, Chester Cottage, Sandy Bay and Byera, as well as Chateaubelair, Coulls Hill, Spring Village, and Fitz Hughes in the northwest region.
Figure 2.7.5 presents the locations of disaster area based on the disaster situation assessment report. Amount of damages and loss was estimated at US$48 million.
Damages include 9 deaths, 6,100 persons affected, and 1,200 damaged houses with 20 completely destroyed.
In the agriculture sector, about 98% of cultivated land was damaged. In terms of public infrastructure, serious damages were caused in water supply facility, telecommunication system, and power generation and transmission systems.
3) Christmas Downpour
Severe floods and sediment disasters were caused by the Christmas heavy rainfall in 2013 in the basins of the Colonarie River, the Cartal River, the Langley River, and the Waribishi River in the east coastal area as well as in the basins of the Bucomment River, the Cumberland River and streams in the Chateaubelai District.
Estimated damages and losses amounted to US$108 million, which corresponds to about 15% of GDP. All flood disasters were due to flash floods and damages include inundation in lowland along the river course at the peak time of floods, washed away bridges, damages in the hydropower stations, and collapse of houses.
According to the interview with the residents, flood inundation continued for several hours. The rehabilitation works including restoration of main bridges, repair of houses, and resettlement have been carried out with financial supports of the government and many donors, which amount to about EC$1 billion based on the budget document.
(3) Sediment Disasters
1) Characteristics of Occurrence Distribution of Sediment Disasters
Sediment disasters occur in almost the entire area of Saint Vincent Island, especially in the south to southwest regions as well as Owia-Fancy area in northernmost region of the island, where steep slopes continue to the coast. Focus should be given to these areas in terms of casualties and infrastructure damage. Major sediment disasters since the 19th century in Saint Vincent Island are summarized in Table 2.7.8.
Source:Macro Socio-Economic Assessment of the Damage and Losses Caused by Hurricane Tomas (2011)
Figure 2.7.5 Area Affected by Hurricane Thomas

2 - 99
Table 2.7.8 Major Sediment Disasters in the Saint Vincent Island (19th Century to Date)
Source:CHARIM (2015)
2) Field Inspection and Confirmation of Site Condition
Field inspection was conducted for Saint Vincent Island and Bequia Island, which is one of the isolated islands, as shown in Figures 2.7.6 and 2.7.7, respectively.
i) Outcrop along Windward Highway in Saint Vincent Island (Stop 1)
In the section from the new airport construction site of the Windward Highway to Georgetown, cliffs composed of volcanic ejection, having average relative height of 15 m, continues for a long distance. The same section suffers significant coastal erosion due to northeast trade winds. Rockfalls from the cliffs and sediment runoff occurred constantly, and each time they occur, the road is temporarily closed and reopens only after removing the sediment.
ii) Collapsed Site on Vigie Highway in Mesopotamia District of Saint Vincent Island (Stop 2)
The landslide was caused by the heavy rain of Christmas trough in December 2013 and deposits of volcanic ash origin have run off toward the valley bottom. Large crack with width of 50-60 cm is running intermittently for nearly 50 m on the road. Road is still blocked so that cars have been forced to take detour in the residential area. World Bank has been considering reconstruction plan for this site.
iii) Landslide Site in Bequia Island (Stop 3)
In Bequia Island, since many houses were destroyed by serious landslide damage caused by the heavy rains of Christmas trough in December 2013, the residents were forced to reconstruct, renovate, or transfer. The traces of landslides still remain everywhere such as collapsed house left as it was in Union Vale area as seen in the lower-right of Figure 2.7.8.
Date Events Notes Information availableSeptember 09, 1874 Tropical Storm Landslides and Flooding Heavy Rain
January 01, 1876 Tropical Storm Landslides and Flooding Heavy Rain for 2 daysAugust 16, 1884 Tropical Storm Landslides and FloodingSeptember 06, 1885 Tropical Storm Landslides and FloodingSeptember 15, 1895 Tropical Storm Landslides and FloodingMay 08, 1902 Earthquakes and volcanic activity LandslidesMay 30, 1957 LandslideSeptember 01, 1962 Heavy rain Landslide Heavy RainSeptember 17, 1967 Hurricane Behulah Landslides and Flooding 18'' of rain in 12 hoursMay 13, 1974 Heavy rains Landslides and Flooding heavy RainsOctober 02, 1974 Tropical Storm Landslides and Flooding Heavy RainsOctober 18, 1977 Heavy Rains Flooding Heavy RainsOctober 19, 1978 NI LandslideMay 01, 1981 Tropical Storm LandslidesSeptember 08, 1986 Tropical Storm Daniel Landslides and FloodingSeptember 21, 1987 Hurricane Emily Landslides and FloodingNobember, 1884 NI Landslides’August 22, 1988 Previous Heavy Rains Rockslides Heavy RainsOctober 22, 1988 Heavy Rains Landslides Heavy RainsSeptember 28, 1990 Heavy Rains Landslides and Flooding Heavy RainsOctober 24, 1991 Torrential Downpours LandslidesAugust 26, 1995 Tropical Storm Iris Landslides and floodingSeptember 08, 1996 Incessant Rain Flooding and LandslidesSeptember 24, 2002 Tropical Storm Landslides and floodingSeptember 08, 2004 Hurricane Ivan Landslides and FloodingApril 11, 2011 Tropical Storm Landslides
December 24, 2013 Christmas Eve trough Manay landslidesHeavy Rain 200 to 300mm in two hours

2-100
Source:JICA Study Team Source:JICA Study Team
Figure 2.7.6 Locations of Field Inspection in the Saint Vincent Island
Figure 2.7.7 Locations of Field Inspection in the Bequia Island
Date:March 8, 2015 Site:Stop 1: Windward Highway
Date:March 8, 2015 Site:Stop 2: Landslide site at Vigie Highway
Date:March 8, 2015 Site:Stop 2: Landslide site on Vigie Highway
Date:March 13, 2015 Site:Stop 3: Landslide site in the Bequia Island
Source:JICA Study Team
Figure 2.7.8 Site Inspection (Sediment Disaster)
(4) Storm Surge
In Saint Vincent and the Grenadines, major cities are located in the coastal areas and residential houses and some public structures such as roads suffer damages from storm and coastal erosion. Figure 2.7.9
Removed sediment

2 - 101
shows the existing hazard map for storm surge as well as the location map for hazard area and points of the storm surge and coastal erosion.
Particularly in the east coast, there are many high risk areas of coastal erosion caused by storm surge and high waves due to hurricanes and tropical storm. In Georgetown, for instance, it is said that, according to a meeting with the University of the West Indies, the coastal line has retreated for about 200 m since 1940. Erosions in the east coast have progressed and MPW is planning to take countermeasures.
A new airport is under construction in the southeast area of the island whose runway will be protected by seawall at the place with severe erosion.
Source:Country Profile
Figure 2.7.9 Present Hazard Map for Storm Surge (left); Critical Points of Storm Surges and Erosion (right: USAID, 2007)
(5) Strong Wind
Strong winds when hurricane approaches or hits the country cause various damages on crops, coastal road as well as residential houses. The damages on crops caused by Hurricane Thomas were mainly due to strong winds as aforementioned in Item (1) Flood.
(6) Earthquake
Major earthquakes observed in Saint Vincent and the Grenadines between 1816 and 2000 are shown in Table 2.7.9. Tremors of the 2007 earthquake were felt over a wide range from Puerto Rico to Guyana.
Table 2.7.9 Major Earthquakes Observed in Saint Vincent and Grenadines
Date Epicenter Magnitude (MMI*) Notes December 26, 1816 Detail unknown Detail unknown
July 17, 1902 Detail unknown Detail unknown Buildings damaged
September 17, 1906 Detail unknown Detail unknown
September 26, 1928 Barbados‐Tobago 6.5 (VI - VII)
January 11, 1939 Martinique 7.0 (VII - VIII)
May 21, 1946 Detail unknown Detail unknown
August 24, 1952 Distant earthquakes Detail unknown

2-102
Date Epicenter Magnitude (MMI*) Notes March 09, 1953 Distant earthquakes Detail unknown
March 19, 1953 175 km NW of St. Lucia Detail unknown Buildings damaged
April 02, 1997 NW of Tobago 5.6 (II: Saint
Vincent)
November 29, 2007 40km SSE of Roseau, Dominica
7.4
*: MMI ((Modified Mercalli Intensity)
Source: NEMO (2014), Bryan J. Boruff (2006), USAID/OAS Caribbean Disaster Mitigation Project (1997)
(7) Tsunami
Small-scale tsunami were observed in 1939 and 1955, which were caused by the volcanic activities of the submarine volcano Kick’em Jenny in the southern sea area of Saint Vincent and the Grenadines. It is estimated that tsunami were generated for ten times during the past 500 years in the East Caribbean Sea area where Saint Vincent and the Grenadines is located.
(8) Drought
In recent years, drought situations occurred in 2010 and 2014. Especially during the dry season from 2009 to 2010, the most serious drought in the recent ten years occurred and drought warning was issued over the whole country. Meanwhile, the Grenadine Islands receive less rainfall than Saint Vincent Island and is a high risk area for drought because there are no surface water resources as well as they only rely on rainwater storage facilities.
(9) Bridges
1) Present Situation of Bridges
The topography of Saint Vincent Island is characterized by mountain ridges and valleys that are radiating towards the coastal area from the mountain area in the central part of the island. Therefore, inland roads are composed of sections with steep slopes and curves of small radius. At present, improvement works of the Leeward Highways’ section between Kingstown and Layou, which is about one-third of the total distance, in the western part of the island are carried out under CDB funding.
The JICA Study Team conducted the site inspections for almost all main trunk roads to investigate damage situation and current progress of restoration works. Table 2.7.10 shows the bridges and roads inspected and their present condition.
Table 2.7.10 Locations and Situations of Bridges and Roads during Field Inspection
No Name Road Damage Situation Present Situation 1. Yarabaqua River
Bridge (arch) WWH Overflowed
Used as before
2. Colonarie River Bridge (wrecked) Abutments
WWH Broken; flew away
Still no bridge: There is new bridge very near the location
3. Colonarie River Bridge
WWH Girder was broken Newly refurbished
4. Black Point River Bridge
WWH Overflowed Used as before
5. Caratal River Bridge
WWH Broken New bridge is under construction
6. Langley River Bridge
WWH Damaged Refurbished
7. Rabacca River Bridge
WWH Overflowed and partly buried
Used as before
8. Waribishi River Bridge
WWH Overflowed Used as before

2 - 103
No Name Road Damage Situation Present Situation 9. Leeward Highway
Buccament River Bridge No.1
LWH Overflowed Used as before
10. Buccament River Bridge No.2
LWH Broken New bridge is under construction
11. Cumberland River Bridge No.1
LWH Overflowed Used as before
12. Cummberland River Bridge No.2
LWH Overflowed Used as before
13. Chateaubelair River Bridge
LWH Broken New bridge is under construction
14. Sharpe’s River Sharp’s Bridge
LWH Broken New bridge is under construction
15. Leeward Highway BRAGSA Borrow pit
LWH Landslide Debris are taken away
16. Richmand River Road Erosion
LWH Road shoulders were eroded
Not yet refurbished
Note: WWH: Windward Highway, LWH: Leeward Highway
Source:JICA Study Team
(a) Langley River Bridge
The 10 m long and 10 m wide bridge located at the river mouth of the Langley River was damaged due to the Christmas heavy rainfall. It has been repaired and river revetment with gabion was installed. Present condition of the Langley Bridge is presented in Figure 2.7.11.
Date: March 8, 2015 Site: View from left bank side Outline: Length: 12 m, Width: about 10 m, Concrete girder
Date: March 8, 2015 Site: View from downstream (left) Outline: Gabion jetty is installed on both sides of the downstream section of the bridge
Source:JICA Study Team
Figure 2.7.11 Langley River Bridge

2-104
Source:JICA Study Team
Figure 2.7.10 Locations of Field Inspection (Bridges)
(b) Rabacca River Bridge
The bridge at the Rabacca River mouth has three spans of concrete box culverts with length of 24 m and width of 7.8 m. Its handrail was damaged due to the Christmas heavy rainfall when flood overflowed on the bridge surface. Surrounding area is covered by sand layer with volcanic ash and underground flow was observed. Present condition of the Rabacca Bridge is presented in Figure 2.7.12.

2 - 105
Date:March 8, 2015 Site:View from upstream (left) Outline:Flood seems to overflow everywhere. About one-third of the downstream side was buried by sediment.
Date:March 8, 2015 Site: View from downstream (left) Outline:Channel is buried under volcanic sediment and water is submerged
Source:JICA Study Team
Figure 2.7.12 Rabacca River Bridge
(c) Cumberland River Bridge 1
The existing bridge is of the Bailey type across the Cumberland River. The previous one was washed away by the flood in the 1990s and the present bridge with length of 24 m and width of 3.7 m was affected by flood flow during the Christmas heavy rainfall in 2013 but there was no remarkable damage. Present condition of the Cumberland Bridge is presented in Figure 2.7.13.
Date:March 9, 2015 AM 10:15 Site:Bridge crossing the Cumberland River Outline: Collapsed due to flood in the 1990s and replaced by the existing Bailey bridge which was submerged during the flood in 2013.
Date:March 9, 2015 Site:Bridge crossing the Cumberland River Outline:Asphalt pavement on the floor slab is
rather damaged.
Source:JICA Study Team
Figure 2.7.13 Cumberland Bridge
2)Design Criteria (Earthquake Resistance Standard and Freeboard)
It is not sure whether present bridge design takes into account seismic resistance. Flood water level to be applied for the bridge design has been revised to a probable 100-year from 50-year taking recent flood damages experience into consideration. Clearance under the bridge to be applied is 30 cm.

2-106
2.7.3 Present Disaster Management
(1) Framework of Disaster Management
The organizational structure related to disaster management of Saint Vincent and the Grenadines is shown in Figure 2.7.14. The Prime Minister performs his duty as the chairman of the National Emergency Council (NEC) and assumes full responsibility for disaster management. Under NEC, the Emergency Executive Committee (EEC) is established, whose chairman is the director of NEMO, and comprises representatives of the ministries and agencies concerned as well as the principal stakeholders.
There are ten national sub-committees under the ECC, namely: i) Rehabilitation and reconstruction, ii) Shelter and shelter
management, iii) Public information and education, iv) Emergency supplies, v) Emergency communication, vi) Transport and road clearance, vii) Damage and needs assessment, viii) Health services, ix) Voluntary services, and x) Search and rescue.
Regional level disaster management is carried out by 13 regional disaster management committees and many community disaster management committees. EEC is responsible for the formulation of the policies and plans made by the national sub-committees and NEC.
The disaster management plan formulated in 2005 is composed of the hurricane plan, volcanic evacuation plan, and flood corresponding plan, and involves various styles and guidelines. The same plan prescribes duties and responsibilities for the concerned organizations including NEC, EEC, the national sub-committees, and the regional and community disaster related committees.
The disaster office and the emergency operation center were established in 2005 with the support of the World Bank.
National Emergency Management Organization (NEMO)
The National Emergency Management Organization (NEMO) is the main organization responsible for coordination of disaster management activities under the Ministry of National Security and Air and Sea Ports Development (MNSASPD). NEMO was established in 2002 to be the responsible agency for national disaster management, whose operation and services are stipulated in the National Emergency and Disaster Management Act 15, 2006 as well as in the Emergency Powers Act 45, 1970.
Total number of staffs in NEMO is 13 including four technical staffs; there were only two in the beginning comprising of director and secretary.
2.7.4 Meteorological and Hydrologic Services
(1) Meteorological and Hydrologic Agencies and Duties
The meteorological service office in Saint Vincent and the Grenadines is under MNSASPD and the meteorological observation is conducted by the Saint Vincent and the Grenadines Meteorological Office (MNSASPD-SVGMT Airport).
The Central Water and Sewage Authority (CWSA) was established in 2008 with the main task of water resources management. Therefore, past data accumulation is not sufficient (data for four manned rainfall stations only). Observation have been made since 1979 but stored data from 1987 are only available.
(2) Outline of Meteorologicalper and Hydrologic Agencies (Personnel and Budget)
Personnel of MNSASPD-SVGMT Airport consist of eleven technical experts. Only six staffs are working in CWSA.
Source:Country Profile
Figure 2.7.14 Organizational Structure for Disaster Management in Saint Vincent and
the Grenadines

2 - 107
Both offices did not disclose their budget but have similar issues that proper operation and maintenance works for the observation equipment are hard to be conducted due to insufficient budget and insufficient number of staffs for the works.
(3) Meteorological and Hydrologic Observations
1) Meteorological Observations(Surface and Upper Air)
MNSASPD-SVGMT Airport conducts meteorological observations at E.T. Joshua Airport in Saint Vincent Island and local airports in the Bequia and Union Islands.
CSWA operates, for the service of water resources management, rainfall stations at 28 locations and meteorological stations at five locations. Observations are made for temperature, humidity, wind speed and direction, amount of solar radiation, vapor-transpiration, atmospheric pressure, and underground moisture.
Automatically observed data are collected by downloading data from the datalogger once a month by the CWSA staff.
2) Meteorological Radar Observation
No meteorological radar system is installed in Saint Vincent and the Grenadines but the whole land is covered by the radar systems in Martinique Island, Trinidad and Tobago, and Barbados, whose radar information are available.
3) Hydrologic Observation (River)
The river water level observation is conducted by CWSA at seven locations for the purpose of water resources management. Observations are mainly made by the automatic stations; however, some stations do not function well due to lack of maintenance and insufficient O&M budget. Formally, automatic stations were installed at 14 locations; no restoration has been made after the damages due to Hurricane Tomas in 2010 and the Christmas heavy rain in 2013.
Water quality observation has been started recently, which shows that no particular problem in both turbidity and quality is found at the upstream sampling points within the permissible level.
4) Observation Database System
Observed data by MNSASPD-SVGMT Airport are not open to the public but monthly data bulletin is issued every month. Observed data by CWSA are being shared with SVGMT, Agricultural Department, Forest Department, NEMO, and other concerned agencies.
(4) Dissemination of Weather Information, Forecast, and Warning
Flood warning based on water level observation seems not effective because flood phenomena in Saint Vincent and the Grenadines is of the flash flood type and with short runoff time and warning lead time is not sufficiently long.
(5) Cooperation with Other Related Meteorological Agencies
Cooperation with the other meteorological agencies is made through CIMH to share the meteorological information in the Caribbean area.
2.7.5 Support of Other Donors
(1) World Bank
As a disaster management project, the World Bank is implementing the Regional Disaster Vulnerability Reduction Project (RDVRP). The project commenced in 2011 and the project scope has been extended after serious damages due to the Christmas heavy rain in 2013 were experienced. The scope of works was extended with the additional project budget of US$40.2 million, which is double of the original budget (US$20.92million), and the implementation period was extended until the end of December 2018. The main components of the project are scheduled to be completed by 2016 such as the improvement of the infrastructure.
The project covers many and various components and involves many ministries and agencies such as the Ministry of Transport and Works (MTW), NEMO, and Ministry of Housing. The project is composed of many supporting components including bridges, roads, coastal erosion, and slope stabilization as hard component as well as training, education, and GIS support as soft component.
The RDVRP project is composed of the following four components:
2-108
Component-1 : Prevention and Adaption of Public Buildings
1) Renovation and repair of the public buildings
2) Rehabilitation and risk mitigation of the transportation infrastructure
Component-2 : Regional Platform for Hazard and Risk Evaluation, and Applications for Improved Decision Making
1) Risk analysis on natural hazards and climate change as well as broader-based cooperation for disaster management
2) Broader-based cooperation for watershed management
3) Broader-based cooperation for coastal conservation
Component-3 : Natural Disaster Response Investments
1) Emergency correspondence upon the event of disaster
Component-4 : Project Management and Implementation
The other activities and supports related to disaster management are implemented and planned as follows:
1) Improvement of bridges at two locations in Kingstown is conducted first, and then the countermeasures are to be implemented by turns, such as in the Cumberland River basin where serious damages were caused by the Christmas heavy rain in December 2013, whose investigation and survey have been completed.
2) There are many needs for infrastructure improvement in Saint Vincent and the Grenadines, for which the World Bank and CDB are mainly providing financial support although there are still many other needs to be addressed. In case of the east coastal area of SaintVincent Island, the shoreline survey and the slope investigation of the mountain side are being conducted, respectively by CDB and the World Bank. The coastal conservation and slope protection works under the World Bank funding are scheduled to be executed, taking survey results and cost-effectiveness into account.
3) No plan is formulated so far in the World Bank project concerning rehabilitation and improvement of the hydro-meteorological observation facilities of MET and CWSA; however, it is possible to include such measures in Component-2 depending on the request of MET and/or CWSA.
4) As for community hazard map preparation, several pilot projects have been set up in Georgetown, Spring Village, Union Island, and three other communities in cooperation with the GIS Team and NEMO. The preparation of hazard maps has been completed and the trainings are being carried out. The target hazards are storm surge, tsunami, volcanic eruption, landslide, and others.
5) The World Bank is not involved in the road improvement project under CDB between Kingstown and Layou. The survey for the road in Mesopotamia which suffered damages due to slope failures has just been finished. The investigation and study of the coastal road located east of the airport in Bequia Island, where coastal erosion is severe, ,are in progress with a policy to change the route.
(2) Other Donors
CDB is undertaking plan formulation such as the Richmond Area River Basin Countermeasure Plan in cooperation with the World Bank and the Cumberland Area River Basin Countermeasure Plan with the other donors. Study teams composed of five teams led by the Dutch Twente University are conducting the Caribbean Handbook on Risk Information Management (CHARIM) funded by the World Bank and other teams are investigating the slopes along the trunk roads in Belize, Dominica, Grenada, St. Lucia, and Saint Vincent and the Grenadines.
Copyright © 2022 FDOKUMEN