
Data Collection Survey on the Availability of ICT ...
62
19 - 019 JR 1R Data Collection Survey on the Availability of ICT Communication Tools for Disaster Prevention in Vietnam Final Report March 2019 Japan International Cooperation Agency (JICA) Oriental Consultants Global Co., Ltd. Pacific Consultants Co., Ltd.
-
Upload
khangminh22 -
Category
Documents
-
view
0 -
download
0
Transcript of Data Collection Survey on the Availability of ICT ...

19-019
J R1 R
Data Collection Survey on the Availability of
ICT Communication Tools for Disaster Prevention in Vietnam
Final Report
March 2019
Japan International Cooperation Agency (JICA)
Oriental Consultants Global Co., Ltd. Pacific Consultants Co., Ltd.

Data Collection Survey on the Availability of
ICT Communication Tools for Disaster Prevention in Vietnam
Final Report
March 2019
Japan International Cooperation Agency (JICA)
Oriental Consultants Global Co., Ltd. Pacific Consultants Co., Ltd.

Contents
Abbreviation List of Figures and Tables
Page
1. Outline of the Survey ........................................................................................................................ 1 1.1 Objective ................................................................................................................................... 1 1.2 Target Site ................................................................................................................................. 1 1.3 Related Government Agencies .................................................................................................. 2 1.4 Duration of the Study ................................................................................................................ 2
2. Survey of Disasters ........................................................................................................................... 3 2.1 Basic Information Collection .................................................................................................... 3 2.2 Information Dissemination ........................................................................................................ 5 2.3 Evacuation and Disaster Prevention ........................................................................................ 11
3. Summary of Issues and Proposal for Improvement ........................................................................ 18 3.1 Summary of Issues .................................................................................................................. 18 3.2 Consideration of Improvement Measures ............................................................................... 21 3.3 Selection of ICT tools for experiment ..................................................................................... 24
4. Verification of the Effects of Alarm Notifications and Disaster Prevention Information Dissemination Utilizing ICT Tools ................................................................................................. 26
4.1 Outline of the Experiment ....................................................................................................... 26 4.2 Results of the Experiment ....................................................................................................... 40
5. Conclusion ...................................................................................................................................... 47 5.1 Analysis and Summary of Improvements and Issues to be Improved .................................... 47 5.2 Further System Expansion ...................................................................................................... 54 5.3 Lessons Learned on the Public-Private Partnership and Utilization of Public Funds
through the Project .................................................................................................................. 55

Abbreviations
Abbreviation English
AR Augmented Reality
CCCO Climate Change Coordination Office
CCNDPC/SR Commanding Committee for Natural Disaster Prevention and Control and Search and Rescue
CSCNDPC Central Steering Committee for Natural Disaster Prevention and Control
DARD Department of Agriculture and Rural Development
DRR Disaster Risk Reduction
ICT Information and Communication Technology
JICA Japan International Cooperation Agency
MLIT Ministry of Land, Infrastructure, Transport and Tourism
NCHMF National Center for Hydro-Meteorological Forecasting
RIMS River Information Management System
VNMHA Vietnam Meteorological and Hydrological Administration

List of Figures Page
Figure 1.2.1 Target site ........................................................................................................................ 1 Figure 2.1.1 Trend of number of casualties and economic loss from natural disasters in
Vietnam ........................................................................................................................... 4 Figure 2.1.2 Trend of number of casualties and economic loss caused by natural disasters in
each province (left: Hue, right: Binh Dinh) .................................................................... 4 Figure 2.1.3 The trend of frequencies of flood occurrence ................................................................. 5 Figure 2.2.1 The locations of rain gauges and water level stations in Hue Province .......................... 6 Figure 2.2.2 The locations of rain gauges and water level stations in Binh Dinh Province ............... 6 Figure 2.2.3 Time series actions in Hue Province during the flood in November 2017 ..................... 8 Figure 2.2.4 Information dissemination route during disaster ............................................................ 9 Figure 2.2.5 An example of setting flood warning levels (Kim Long Station in Huong River) ....... 11 Figure 2.3.1 Evacuation Places during Floods .................................................................................. 13 Figure 3.1.1 Summary of issues ........................................................................................................ 20 Figure 4.1.1 Content of operation covered by the experiment .......................................................... 27 Figure 4.1.2 System composition subject of the experiment ............................................................ 28 Figure 4.1.3 Smartphone application screen (select the observation method) .................................. 28 Figure 4.1.4 Smartphone application display (AR marker: Hue Province) ...................................... 29 Figure 4.1.5 Smartphone application display (Manual water level input: Binh Dinh Province) ...... 29 Figure 4.1.6 Web application display (up: Hue, down: Binh Dinh ................................................... 30 Figure 4.1.7 Smartphone application display (system notification) .................................................. 31 Figure 4.1.8 Smartphone application display (alert notification) ...................................................... 31 Figure 4.1.9 Schedule of the experiment .......................................................................................... 32 Figure 4.1.10 Map of the observation point in Hue ............................................................................ 35 Figure 4.1.11 Map of the observation sites in Binh Dinh (1: Nhon Binh, 2: Canh Vinh) ................... 35 Figure 4.1.12 Example of flood warning level (Kim Long Station in Huong River) ......................... 36 Figure 5.1.1 Example of flood warning level (Kim Long Station in Huong River) ......................... 48 Figure 5.1.2 Concept of designated flood warning level in Japan .................................................... 48 Figure 5.1.3 Flood warning levels and risk levels in Japan .............................................................. 51 Figure 5.1.4 Current Issues ............................................................................................................... 53 Figure 5.1.5 Improvements and Issues to be Improved .................................................................... 53
List of Tables Page
Table 2.1.1 Basic social condition ....................................................................................................... 3 Table 2.2.1 Number of each type of rain gauge in both provinces ...................................................... 5 Table 2.2.2 An example of flood warning dissemination by CCNDPCSR of Hue City ..................... 7 Table 2.2.3 Disaster risk levels and organizations in charge ............................................................. 10 Table 2.2.4 Disaster risk levels for floods ......................................................................................... 10 Table 2.3.1 Selected communes / wards for interview ...................................................................... 11 Table 2.3.2 The survey questionnaire ................................................................................................ 11 Table 3.2.1 Challenges, measures, and effective ICT tools ............................................................... 21 Table 3.2.2 Proposed effective ICT tools .......................................................................................... 22 Table 3.3.1 Evaluation Table of ICT tools for Experiment ................................................................ 25 Table 4.1.1 Issues and improvement measures by ICT tools ............................................................ 26 Table 4.1.2 Content of the experiment .............................................................................................. 26 Table 4.1.3 Outline of preparation meeting (Hue Province) ............................................................. 32 Table 4.1.4 Outline of preparation meeting (Binh Dinh Province) ................................................... 33 Table 4.1.5 The participant (Hue Province)....................................................................................... 33 Table 4.1.6 The participants (Binh Dinh Provence) .......................................................................... 33 Table 4.1.7 Observers and observation time ...................................................................................... 36 Table 4.1.8 Thresholds for the experiment (Hue Province) ............................................................... 37 Table 4.1.9 Thresholds for the experiment (Binh Dinh) .................................................................... 37 Table 4.1.10 Changed thresholds for the experiment (Hue) ................................................................ 38 Table 4.1.11 Changed thresholds for the experiment (Binh Dinh) ...................................................... 38 Table 4.1.12 The Participants and Their Roles (Binh Dinh) ............................................................... 39 Table 4.1.13 The Participants and Their Roles (Hue).......................................................................... 39 Table 4.1.14 Evaluation meeting (Binh Dinh) ..................................................................................... 40 Table 4.1.15 Evaluation meeting (Hue) ............................................................................................... 40 Table 4.2.1 Effectiveness verification method .................................................................................. 41 Table 4.2.2 The number of observed data in the experiment ............................................................. 41 Table 4.2.3 Results of observed water level, inundation situation, and system notification ............. 42 Table 4.2.4 Results of sending alert notifications .............................................................................. 44 Table 4.2.5 Results of the interview (Hue) ........................................................................................ 44 Table 4.2.6 Results of the interview (Binh Dinh) .............................................................................. 45 Table 4.2.7 Requests and considerations for future use ..................................................................... 46 Table 5.1.1 List of necessary data and considerations for designing water level .............................. 50 Table 5.1.2 Summary of Improvements and Issues to be Improved .................................................. 52 Table 5.2.1 Advantages and Disadvantages of Two Systems ............................................................ 54

1
1. Outline of the Survey
1.1 Objective
This project aims to summarize the current situation and challenges on disaster risk management and to propose appropriate ICT (Information and Communication Technology) tools for disaster risk management, then verify the effectiveness of the proposed ICT tools.
1.2 Target Site
Thua Thien Hue Province and Binh Dinh Province in Vietnam
Source: JICA Study Team
Figure 1.2.1 Target site

2
1.3 Related Government Agencies
Department of Agriculture and Rural Development of Hue (DARD)
Department of Agriculture and Rural Development of Binh Dinh (DARD)
1.4 Duration of the Study
August 2018 – March 2019

3
2. Survey of Disasters
JICA study team summarized the current situation about basic information, information dissemination, evacuation, and disaster prevention by conducting interviews to the related organizations (i.e., DARD of Hue and Binh Dinh) and local residents, field survey, and disaster record analysis.
2.1 Basic Information Collection
Table 2.1.1 shows the basic social condition of both Hue and Binh Dinh Provinces. There are no remarkable differences between the two provinces and the national average in terms of population, area, ratio of male and female, and poverty rate.
Table 2.1.1 Basic social condition
Item (unit) Year
Nationwide(63 provinces) Hue Province Binh Dinh Province
Value Value Rank (Nationwide) Value Rank
(Nationwide)Population(million) 2016 92.7 1.15 36 1.52 17
Population density(person / km2) 2016 280 235.0 36 251.0 33
Area(km2) 2016 331,230 5,033 30 6,051 22Ratio of male and
female (F / M) 2016 0.97 0.99 26 0.96 58
Poverty rate (%) 2015 7 4 47 9 31*All rankings are arranged in descending order of values. *The poverty rate is higher if the value is larger.
Source: GENERAL STATISTICS OFFICE of VIETNAM
The trend of the number of casualties and total damage cost due to the natural disasters in Hue Province and Binh Dinh Province are shown in Figure 2.1.1. In 1999, the number of casualties in both provinces increased due to the occurrence of the largest flood ever recorded at that time in both provinces. Thereafter, Binh Dinh Province had the relatively large number of casualties, specifically 40 recorded casualties from several years of natural disaster occurrences. As for the total economic loss, the amounts tend to get larger in recent years, and it is presumed that the vulnerability to natural disasters is increasing due to the development of cities.

4
Source: JICA Study Team based on EM-DAT Database
Figure 2.1.1 Trend of number of casualties and economic loss from natural disasters in Vietnam
Source: JICA Study Team
Figure 2.1.2 Trend of number of casualties and economic loss caused by natural disasters in each province (left: Hue, right: Binh Dinh)
Figure 2.1.3 shows the trend of frequencies of flood occurrence due to overflow of the Huong River, the main river of Hue Province, and the Kone River, the main river of Binh Dinh Province. JICA study team considered “flood occurrence” as flooding with Alert 3 (the flood warning level is described later in this report) or higher warning level. Both Hue and Binh Dinh Provinces have faced flooding almost once a year. Also, the number of casualties and missing people and total economic loss tend to be large during the years with flood occurrences, therefore it is assumed that damage caused by flood comprised the major part of all the natural disaster damage.
~ ~ 359

5
Source: JICA Study Team
Figure 2.1.3 The trend of frequencies of flood occurrence
2.2 Information Dissemination
The survey about what kinds of disaster information are disseminated to related organizations (province, district/city and commune/ward), communities, and local people was implemented.
(1) Observation Stations and Contents of Disaster Warning Information
The locations of rain gauges and water level stations in Hue and Binh Dinh Provinces are shown in Table 2.2.1.
Table 2.2.1 Number of each type of rain gauge in both provinces
Station Hue Binh Dinh Manual Rainfall 2 46 Auto Rainfall 4 34 Manual Water Level 3 0 Auto Water Level 4 6
Source: JICA Study Team

6
Source: JICA Study Team
Figure 2.2.1 The locations of rain gauges and water level stations in Hue Province
Source: JICA Study Team
Figure 2.2.2 The locations of rain gauges and water level stations in Binh Dinh Province
In Hue Province, installation of ten new hydrological observation stations will be planned with Japanese grant aid. In addition, further installation of new hydro-meteorological stations up to fifty sites is planned based on the Province Master Plan 2030.
7
In Binh Dinh Province, eight other water level stations are newly installed under the support of the United States and Germany (of which, four are not operating as of 2018 due to equipment failure). Meteorological radar observation facility by Finland and hydro-meteorological station by Italy are planned to be introduced as well. Regarding rainfall stations, about forty rainfall gauges of private companies of WATEC have been used.
Although the number of hydro-meteorological stations has been increasing yearly, DARD presumes that more installations are necessary for monitoring small and medium rivers and reservoirs within the provinces.
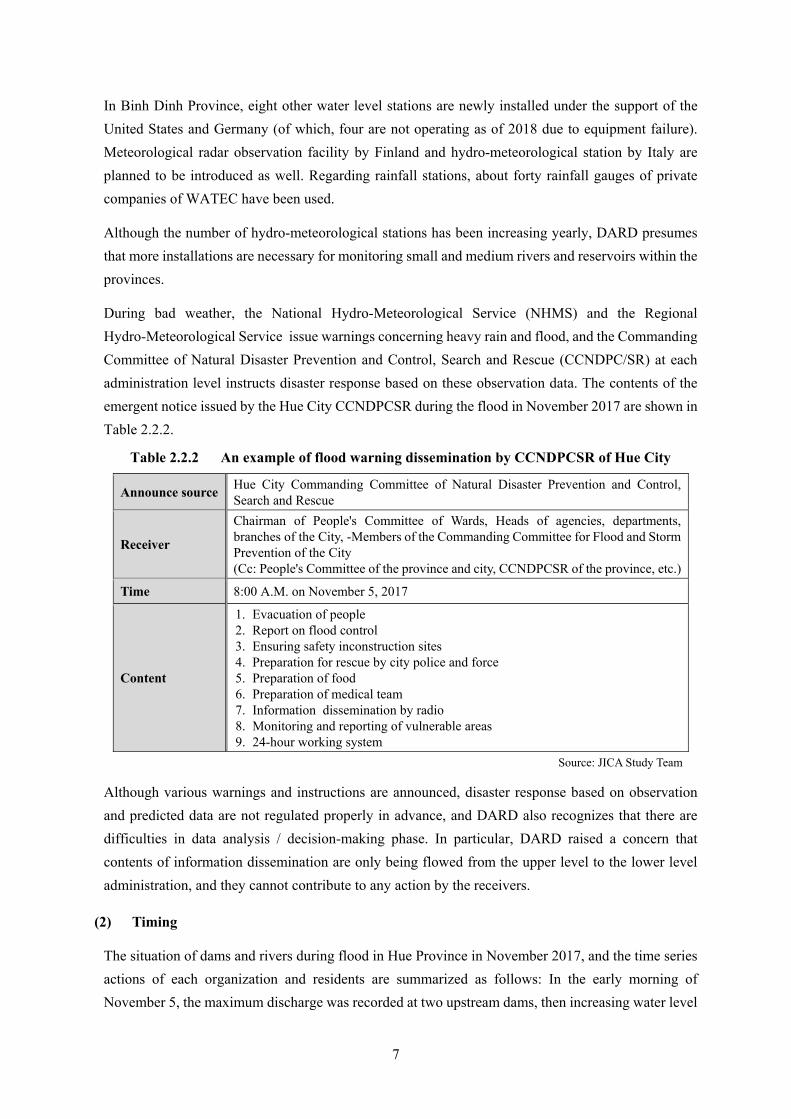
During bad weather, the National Hydro-Meteorological Service (NHMS) and the Regional Hydro-Meteorological Service issue warnings concerning heavy rain and flood, and the Commanding Committee of Natural Disaster Prevention and Control, Search and Rescue (CCNDPC/SR) at each administration level instructs disaster response based on these observation data. The contents of the emergent notice issued by the Hue City CCNDPCSR during the flood in November 2017 are shown in Table 2.2.2.
Table 2.2.2 An example of flood warning dissemination by CCNDPCSR of Hue City
Announce source Hue City Commanding Committee of Natural Disaster Prevention and Control, Search and Rescue
Receiver
Chairman of People's Committee of Wards, Heads of agencies, departments, branches of the City, -Members of the Commanding Committee for Flood and Storm Prevention of the City (Cc: People's Committee of the province and city, CCNDPCSR of the province, etc.)
Time 8:00 A.M. on November 5, 2017
Content
1. Evacuation of people 2. Report on flood control 3. Ensuring safety inconstruction sites 4. Preparation for rescue by city police and force 5. Preparation of food 6. Preparation of medical team 7. Information dissemination by radio 8. Monitoring and reporting of vulnerable areas 9. 24-hour working system
Source: JICA Study Team
Although various warnings and instructions are announced, disaster response based on observation and predicted data are not regulated properly in advance, and DARD also recognizes that there are difficulties in data analysis / decision-making phase. In particular, DARD raised a concern that contents of information dissemination are only being flowed from the upper level to the lower level administration, and they cannot contribute to any action by the receivers.
(2) Timing
The situation of dams and rivers during flood in Hue Province in November 2017, and the time series actions of each organization and residents are summarized as follows: In the early morning of November 5, the maximum discharge was recorded at two upstream dams, then increasing water level

8
at Kim Long Station, at the downstream of Huong River, was recorded. As Hue Province and City issued an emergency notice, some of the residents started to evacuate and it was recorded that the inundation reached house floor in the afternoon.
Source: JICA Study Team based on the report of Hue DARD
Figure 2.2.3 Time series actions in Hue Province during the flood in November 2017
Floods in Hue and Binh Dinh Provinces are often caused by heavy rains brought about by typhoons. The flood in November 2017 occurred during the typhoon, therefore government agencies could have prepared for the response 3-4 days before the flood occurred.
(3) Dissemination Route, Source, and Receiver
Regarding information dissemination, Government Decision No. 46/2014 (Disaster Warning and Dissemination) prescribes the forecast announcement and the dissemination route in as shown in Figure 2.2.4.
Dam OperationWater level at Kim LongStation (Huong River)
Hue Province GovernmentHue City
GovernmentCommune /
WardResidents
5:30 Typhoon alert update
6:00Start discharging from TaTrack Dam
7:00 Water level & rainfall report
9:00 0.85mOperation instructin for BinDien Dam
10:55 Heavy rain warning
14:00Start discharging fromBin Dien Dam
14:55 Tyhoon strike warning
16:00Operation instructin forTaTrack Dam
16:24 Heavy rain warning23:15 Flood warning
3:00Max discharge at TaTrack Dam
Alert II (2.0m) Increasing
3:10 Emergency notice
4:45Max discharge at BinDien Dam
8:00 Alert III (3.5m) IncreasingEmergencynotice
Start evacuation
9:30 Special flood warning11:00 Heavy rain warning
13:000.8m inundation(0.3m indoor)
16:00 Water level & rainfall report1.2m inundation(0.7m indoor)
18:36 Emergency flood warning19:00 Max water level (4.03m)21:00 Power outage5:00 Power recoverd5:30 Flood warning6:00 Alert III (3.5m) Decreasing
11:30 Heavy rain warning
4-Nov-17
5-Nov-17
6-Nov-17
Date
Info
rmat
ion
rece
ived
by
Fax,
SM
S,
tele
phon
e, m
aill
(afte
r 15
min
s)
Info
rmat
ion
rece
ived
by
loud
spea
ker (
afte
r 30
min
s)
*Sur
veye
d by
DAR
D
Info
rmat
ion
rece
ived
by
Fax,
SM
S,
tele
phon
e, m
aill
(afte
r 15
min
s)

9
Source: Present Situation of Legal and Institutional Arrangement and Activities on Natural Disaster Risk Reduction in Vietnam, Kenichiro TACHI, “KASEN (RIVER)”, November 2017
Figure 2.2.4 Information dissemination route during disaster
(4) Dissemination Method
Fax, SMS, mobile phone calls (smartphone), and e-mail by mobile phones are mainly used for information dissemination at the central, provincial and city/district levels. However, there are no Fax options at the district/city and commune/ward level in Binh Dinh Province, therefore, phone calls and e-mails are mainly used. In addition, DARD recognizes that they have failure in dissemination while there is power outage due to storm and flood.
Loudspeakers are mainly used for information dissemination to residents. However, according to DARD officials, the number of installed loudspeakers is not enough in both Hue and Binh Dinh Provinces, and more installations and alternative means of dissemination are needed.
Loudspeaker installed in a residential area Loudspeaker installed in a commune facility Source: JICA Study Team
Photo 1 Installed loudspeakers for information dissemination
Central CCNDPCSR
Provincial CCNDPCSR
City/District CCNDPCSR
Commune/Ward CCNDPCSR
National Hydro-Meteorological Service (National Center for Hydro-Meteorological Forecasting)
National Hydro-Meteorological Service (Regional Center for Hydro-Meteorological Forecasting)
Media (TV, Radio)
Internet
Residents
Disaster damage Emergency report
Disaster damage Emergency report
Disaster damage Emergency report
Disaster damage Emergency report
Hydro-Met information Emergency instruction
Hydro-Met information Emergency instruction
Hydro-Met information Emergency instruction
Hydro-Met information Emergency instruction
Hydro-Met information Emergency instruction
Hydro-Met information Emergency instruction

10
(5) Other Related Items
The Vietnamese government designed the disaster risk levels for floods as shown in Table 2.2.3. However, this matrix does not indicate the risk of disaster but only sets the level of the commanding committee which has the responsibility to respond, according to the report “Data Collection Survey on Strategy Development of Disaster Risk Reduction and Management in the Socialist Republic of Vietnam” (JICA, 2018).
Table 2.2.3 Disaster risk levels and organizations in charge
Source: Data Collection Survey on Strategy Development of Disaster Risk Reduction and Management in the Socialist
Republic of Vietnam (JICA, 2018)
Table 2.2.4 Disaster risk levels for floods
Source: Data Collection Survey on Strategy Development of Disaster Risk Reduction
and Management in the Socialist Republic of Vietnam (JICA, 2018)

11
As an example of designing flood warning levels, Figure 2.2.5 shows the threshold at the Kim Long Water Level Station in Huong River, Hue Province. Alert 3 in the station is set for the full level of the river (no dike).
Source: JICA Study Team
Figure 2.2.5 An example of setting flood warning levels (Kim Long Station in Huong River)
2.3 Evacuation and Disaster Prevention
JICA study team conducted interviews on how residents prepare for and respond to flood alerts. A total of 14 people from the government staff and residents of the communes / wards shown below were chosen for the interview based on past flood records and from recommendations by DARD staff.
Table 2.3.1 Selected communes / wards for interview
Hue Province Binh Dinh Province Huong Vinh Commune Quang Thanh Commune Quang An Commune Phu Mau Commune Huong Van Commune
Nhon Phu Ward Nhon Binh Ward
Source: JICA Study Team
The questionnaire for the interview is shown below.
Table 2.3.2 The survey questionnaire
Basic Information Sex, Age, Address
Past flood damage Experience of floods (If yes) the maxmum inundation depth, occurrence time, inundation duration, frequency, damage (death, injury, house that collapsed, furniture damage)
Evacuation
Experience of evacuation during flooding (If yes) how / where to evacuate, route / distance / time going to evacuation site, motive to evacuate, possible action when flood warning is received in advance (If no) reason not to evacuate
Information dissemination
Experience on receiving warning information from authorities (If yes) times / content, method of receiving, timing, from whom, helpful information
Source: JICA Study Team

12
Interview at Quang An Commune Interview with a local residentSource: JICA Study Team
Photo 2 Interview survey
The interview results are shown below.
(1) Content / Means / Timing to Get Information for Preparation
As mentioned above, heavy rain warning, flood warning, and evacuation instructions are shared from DARD through the commune / ward, occasionally using loudspeakers. Because the announcement through the loudspeaker may not reach some of the residents, the DARD and commune / ward officials do house-to-house visit to provide information.
According to DARD officials, it takes approximately one hour to disseminate information from provincial level to the residents.
(2) Evacuation Sites and Routes
According to interviews at the communes, residents evacuate to designated public facilities, such as schools, when floods occur. Evacuation centers were built with the support of JICA in Hue Province, and with the support of CCCO (Climate Change Coordination Office) in Binh Dinh Province. These evacuation centers are used not only during emergency but for community activities as well. In the interviews with residents, they identified nearby school facilities and pagodas as evacuation centers. Some of the residents evacuate onto the second floor of their houses or their relatives’ houses; however, securing food and daily necessities could be challenges in emergent situations.

13
Source: JICA Study Team
Figure 2.3.1 Evacuation Places during Floods
Evacuation center (JICA supported) Evacuation center (CCCO supported)
The second floor of the CCCO evacuation center (electric outlet is installed at the upper part of the wall in anticipation for flooding)
A toilet on the second floor of the CCCO evacuation center (available even during flood occurrence)
Source: JICA Study Team Photo 3 Evacuation centers
A comprehensive evacuation plan has not been formulated and the evacuation centers in each area, including evacuation routes, have not been designated. Therefore, evacuation of residents depends on individual initiatives during actual circumstances.

14
(3) Evacuation Method
Evacuation before flooding is done mainly on foot when the residents go to the nearest evacuation centers. After the area is inundated, boats are installed in several houses and commune offices for evacuation purposes. In this situation, the commune staff and residents may need more boats not only for evacuation but also for distribution of supplies. Notably, there is a case that a male household member opted to stay at his house even during flooding to protect household belongings.
Source: JICA Study Team
Photo 4 Emergency boats installed at a commune office
(4) Preparations such as Evacuation Drills
Residents have little opportunity for evacuation drills or DRR education, except from projects by donors as well as the Red Cross and by the province. However, some residents have the practice of transferring all household items to the upper floor at the beginning of the rainy season every year, minimizing property losses during flooding.
(5) Prioritization of Women, Elderly, and People with Disabilities (PWDs) During Evacuation
Quy Nhon City of Binh Dinh Province has a list of women, children, elderly, and people with disabilities (PWDs) in the city to be given top priority when evacuating. The list was prepared when a hazard map was created with German support in 2016, and it has been managed at the ward level (equal to commune level). During interviews with residents at the Nonh Phu Ward in Quy Nhon City, some residents confirmed that females and children are evacuated preferentially to neighboring evacuation centers.

15
Source: JICA Study Team
Location map of women, children, elderly, and PWDs living in the ward.
Photo 5 Hazard map of Binh Dinh Province created with the support of Germany
(6) Evacuation Rate / Duration
According to interviews with local residents, there were no cases of evacuation to designated evacuation centers before flooding. Furthermore, it was found that the evacuation sites were different according to the residents such as public evacuation centers, relatives’ houses, and upper floor or roof of their own houses etc. Since the government does not precisely keep records of the evacuation sites and number of evacuees, it is difficult to calculate the evacuation rate.
Also based on interviews, the duration of evacuation depends on the inundation duration in the area. It could be from 3 days to 2 weeks, depending on the condition of flooding .
(7) Hazard maps
According to interviews, inundation maps and flood hazard maps have no unified criteria and some of them were created through donors’ support, including JICA. Some of the evacuation maps for residents and at community level are also created by donors’ community support.

16
(8) Other Matters or Concerns
Because rivers in both Hue and Binh Dinh Provinces have few embankments, the characteristics of water level rise as well as flooding are different from Japan. According to the interview, residents start evacuation after the water level rises to their ankles; they do not evacuate in advance except elderly people. It is necessary to consider the river’s characteristics and the residents' awareness in designing threshold for issuing calls for evacuation.
Natural river course (upstream) Natural river course (upstream)
No-dike section (middle stream, urban area) No-dike section (middle stream, urban area)
Source: JICA Study Team
Photo 6 The river’s characteristics (Hue Province)

17
Natural river course (upstream) Natural river course (upstream)
No-dike section (middle part) Dike section (downstream)
Source: JICA Study Team
Photo 7 The river’s characteristics (Binh Dinh Province)

18
3. Summary of Issues and Proposal for Improvement
In this chapter, issues on disaster information utilized for evacuation and preparation are listed and corresponding measures to improve are proposed. Firstly, the issues are cited as follows based on the current situation presented in Chapter 2.
3.1 Summary of Issues
(1) Data Collection
Because the number of hydrological observation stations is insufficient (the number has been increasing but it is not enough yet), it is difficult to understand the hydrological characteristics of basins, including the water level of many reservoirs and ponds.
Once the observation equipment breaks down, it cannot be repaired. Then, observation data are missed.
There is insufficient budget for new installation and maintenance of equipment and systems. This situation can cause device breakdown and observation error.
Both rainfall and water level observations are operated manually, hence many observers are needed. Observed data are not telemetered at the manual observation station (the data can be acquired only through observers), so it is difficult to promptly carry out the activities for disaster warning.
Hydro-meteorological stations are introduced through donor support, however, government initiatives and donor efforts are not coordinated to each other.
(2) Information Analysis and Decision Making
Local government is unsure what to do with observed data much enough. This is the main reason why disaster information cannot be disseminated properly.
Since the relation between hydrological data like rainfall and water level, and the characteristics of floodings have not been analyzed, it is difficult to know and predict the current situation of flooding and, as a result, appropriate disaster prevention activities cannot be conducted.
(3) Dissemination
Information dissemination to residents may not be conducted promptly due to restrictions on means of communication and networks.
As mentioned in “(1) Data collection” above, information are not coordinated and this results to delays in information dissemination.

19
(4) Resident Evacuation
Residents choose different evacuation sites and evacuate at their own preferred time, therefore it is difficult for local governments to carry out emergency response.
Some residents do not evacuate to protect their household belongings.
Due to long inundation period, local government struggles to distribute goods and evacuation instructions after flood occurrence.
In proposing improvement measures, the above-mentioned issues can be summarized to the following four items.
Issue 1: [Data Collection] The number of hydrological observation data and stations are insufficient. It is difficult to promptly carry out activities, such as giving warning, because both rainfall and water level observations are done manually
Issue 2: [Information Analysis / Decision Making] Government cannot properly issue a call for warning and evacuation. The content of the warning are difficult to understand by the residents.
Issue 3: [Dissemination] It takes time to disseminate information and people cannot timely respond.
Issue 4: [Evacuation / Education] Even if residents receive instructions for evacuation, they cannot evacuate properly due to lack of awareness and knowledge.

20
Source: JICA Study Team
Figure 3.1.1 Summary of issues
• Insufficient budget for new station
• Difficulties in manual observation when floods occur
• Long time to gather data from each manual station
• Absence of the data integration system
• Unable to grab the real-time inundating
Data Collection Info Analysis
Decision Making Dissemination Evacuation
• Insufficient hydro-met data and stations
• Slow response due to manual observation
• Appropriate warning and evacuation order cannot be issued.
• Well-timed actions cannot be taken due to late information dissemination.
• Residents do not understand how and where to evacuate
• Insufficient awareness and knowledge of residents
• No criteria of warning
• Unspecific warning area
• Insufficient forecasting capability
• Insufficient data accumulation for hydrological analysis
• Sudden dissemination of evacuation information
• Unable to grab the real time inundating
• No disaster response plan
• Unstable communication line in bad weather
• Few tools for dissemination
• No evacuation plan (unspecified evacuation place)
• Insufficient disaster prevention maps
• Insufficient knowledge and tools of the government to provide disaster management education to residents
ReasonReason Reason Reason
Issue 1 Issue 2 Issue 3 Issue 4

21
3.2 Consideration of Improvement Measures
The issues on using ICT tools, including issues that cannot be solved by the tools, are summarized in Table 3.2.1 and shared with DARD.
Table 3.2.1 Challenges, measures, and effective ICT tools
Issue Measure Effective ICT tools [Data Collection] Insufficient number of hydrological stations Manual observation makes it difficult to carry out disaster response activities.
(Automatic) More hydro-meteorological observation stations need to be installed.
Water level observation using ICT tool and the application for reporting of inundation condition [1]
Water level gauge for risk management [2] Observation of water level and discharge with
camera photos (eye- BOX) [3] Operation and maintenance are easier and
with lower cost than conventional products.Monitoring of real-time inundation situation
Water level observation using ICT tool and the application for reporting of inundation condition [1]
Real-Time Flood Simulation [4] [Information Analysis / Decision Making] Government cannot properly issue calls for warning and evacuation. The residents find it difficult to understand content of warning
Improvement of flood prediction capability
Real-Time Flood Simulation [4]
Setting of criteria and target area for calling for warning and evacuation
(Another technical assistance on hydrological analysis is necessary, targeting DARD and HMS.)
Consideration of gradual dissemination for warning and evacuation for easy understanding
(Another technical assistance on evacuation decision making is necessary, targeting DARD, provinces, prefectures, and communes.)
Introduction of a system to judge the necessity of calling for warning and evacuation
Timeline support system [5]
[Dissemination] It takes time to disseminate information, hence timely response cannot be given.
Utilization of simultaneous dissemination services
Dissemination by fax, E-mail, and SMS [6] Push service for disaster notification [7] Wireless-activated disaster warning system
Building of a system and rule of reporting about damage and evacuation situations
Application for reporting and collecting the information of damage and evacuation situations [8]
Implementation of disaster drills regularly
(Another technical assistance on dissemination training is necessary, targeting DRR-related agencies.)
Development of sustainable telecommunication and power network available in bad weather
(Improvement of power and telecommunication infrastructure is necessary.)
[Resident evacuation / Education] Even if residents receive evacuation instructions, they cannot evacuate properly. Insufficient awareness and knowledge of residents
Formulation of evacuation plan (Another technical assistance on disaster drill at community level is necessary.)
Building of an evacuation center (Unable to solve with ICT tools) Preparation of a hazard map (evacuation map)
Real Time Flood Simulation [4] Display system for inundation probability map [9] Landslide alert information service [“Doshabul”
(Japanese product)] [10] Establishment of evacuation method and route
(Unable to solve with ICT tool)
Education of residents through community activity on DRR
Hazard visualization by AR [11] Application of evacuation guidance [12]
Common challenge Integrated system of data collection, data analysis / decision making, and dissemination
Disaster information sharing system [13]
* The figures in this table are common with the number of ICT tools used below.

22
ICT tools proposed above are summarized in the following table and introduced to DARD.
Table 3.2.2 Proposed effective ICT tools
Outline of proposed ICT tools
Measure 1: Installation of a hydrological station (automatic) & a rain gauge The following ICT tool is more affordable and easy maintainance
Measure 2: Monitoring of real-time inundation situations [1] Water level observation using ICT
tool and the application for reporting of inundation condition
[2] Water level gauge for Risk management
[3] Observation of water level and discharge with camera photos (eye- BOX)
Source: Fujitsu, Image of water level observation with AR technique
Source: Committee about Water level gauge for Risk management, Ministry of Land, Infrastructure,
Transport and Tourism
Source: Committee about Water level gauge for Risk management, PCKK
Water level can be measured in smartphones, recognizing QR code which is set on a river slope or bridge pier.
Low-cost water level gauge specialized in water level observation in flooding (300K to 1million JPY).
Water level gauge by camera image. It helps to measure water level and recognize risks by visualized image. (From 880K JPY)
Measure 3: Improvement of flood prediction capability Measure 4: Introduction of a system to judge the necessity of calling for warning and evacuation
[4] Real-time flood simulation system [5] Timeline support system
Source: Hitachi Power Solutions Co.,Ltd. Source: MLIT of Japan, PCKK
Time series change of inundated area can be confirmed by flood simulation contributing to flood control action planning.
Push service shows guidance of appropriate actions by each water level.Staff do not have to understand the whole DRR action process.

23
Outline of proposed ICT tools
Measure 5: Utilizing of simultaneous dissemination service Measure 6: Building of a system and reporting rules of flooding and evacuation situations
[6] Simultaneous dissemination system through fax, email, and SMS
[7] DRR information notification service [8] A system for data collection and reporting of flooding conditions and evacuation
Source: Hitachi Power Solutions Co.,Ltd Source: Safety tips , MLIT of Japan Source: Weathernews Inc., Twitter Inc.,
Simultaneous dissemination of registered disaster and meteorological information to media
Postnotification about disaster forecast to the device, warnings from meteorological agency, and emergency information from local governments.
System for reporting flooding conditions from affected residents and data collection about number of evacuees at each evacuation center.
Measure 7: Development of hazard maps (evacuation maps) Measure 8: Education of local residents through community DRR activities
[9] Display system for hazard maps using GIS ([11] Display of hazard maps using smart devices and AR technology)
[10] Push service for landslide risk (“Doshaburu”, a Japanese product)
[12] Application for evacuation guidance
Source: Pacific Consultants Co.,Ltd. Source: Pacific Consultants Co.,Ltd. Source: CAD CENTER CORPORATION
Confirmation of simulated inundation depth at current positions by GPS of smartphones using AR technology
Support for building and operation of a system for landslide risk management using rainfall data
Evacuation guidance to show locations of evacuation centers in smartphones using AR technology.

24
3.3 Selection of ICT tools for experiment
ICT tools to be targeted for experiment were evaluated and selected based on the following criteria.
(1) Applicability to site conditions
Based on the field survey, ICT tools were evaluated as to whether they would be applicable to natural and social conditions at the sites, and if there are enough studies and information necessary for the experiment. (A: they are evaluated as highly applicable to the site conditions, B: related studies, activities, information and data would be necessary, though the applicability would be expected, C: they are evaluated as low applicability or too early to install.)
(2) Necessary time for preparation of experiment
ICT tools were evaluated as to whether it would take time or not for the establishment of equipment / system, development of application etc. (A: experiment will be ready within 1 – 2 months, B: within 2 – 3 months, C: it will take more than 3 months)
(3) Intention of C/Ps
ICT tools were evaluated by C/Ps’ intention. (A: C/Ps have strong intention, B: C/Ps have positive intention, C: C/Ps have no interests.) This evaluation includes C/Ps’ intention to install and maintain the system at a low price after the experiment.
(4) Total evaluation
If the above all three criteria were evaluated as “A”, the total evaluation was evaluated as “A”. If there was “C” in even only one of three, the total evaluation was evaluated as “C”. Others were evaluated as “B”.

25
Table 3.3.1 Evaluation Table of ICT tools for Experiment
1) Applicability to site conditions 2) Necessary time
3) Intention of C/P
4) Total evaluation
[1] Water level observation using ICT tool and the application for reporting of inundation condition
A: Necessity of observation is high, and site conditions are ready, so that applicability is high. A A A
[2] Water level gauge for Risk Management
A: Necessity of observation is high, and site conditions are ready, so that applicability is high.
B B B
[3] Observation of water level and discharge with camera photos (eye- BOX)
A: Necessity of observation is high, and site conditions are ready, so that applicability is high. B A B
[4] Real-time flood simulation system
C: Effective simulation cannot be done at present due to not enough detailed topo map and hydrological data.
C C C
[5] Timeline support system C: “Timeline” cannot be prepared due to
no detailed role allocation and actions to be taken during disasters.
C C C
[6] Simultaneous dissemination system through fax, email, and SMS
A: Applicability is high from the point of “Dissemination”, though the contents of the message to be disseminated need to be carefully studied.
B B B
[7] DRR information notification service
A: Applicability is high from the point of “Dissemination”, though the contents of the message to be disseminated need to be carefully studied.
A A A
[8] A system for data collection and reporting of flooding conditions and evacuation
B: Rules to consolidate the conditions of affected people and evacuation are not standardized. Awareness for standardization is low.
B C C
[9][11] Display system for hazard maps using GIS (Display of hazard maps using smart devices and AR technology)
C: Effective display cannot be done due to not enough topo maps, hydrological data and hazard maps. C C C
[10] Push service for landslide risk (“Doshaburu”, a Japanese product)
C: Applicability is low, because the major disaster at the sites is flood. C C C
[12] Application for evacuation guidance
C: Application cannot be effectively utilized, because evacuation places are not designated properly and evacuation conditions are not properly reported.
C C C
[13] Disaster information sharing system
C: Applicability is low, because the study about what should be done by using the integrated information is not enough, though the necessity to integrate the related information is high.
C A C
Source: JICA Study Team
The JICA Study Team discussed with DARD in Hue and Binh Dinh and JICA based on the above table and decided the ICT tools for the experiment in this project as “[1] Water level observation using ICT tool and the application for reporting of inundation condition” and “[7] DRR information notification service”.

26
4. Verification of the Effects of Alarm Notifications and Disaster Prevention Information Dissemination Utilizing ICT Tools
4.1 Outline of the Experiment
(1) ICT Tools for the Experiment
Among the issues summarized in Chapter 3, the following table shows the issues that the officials of Hue and Binh Dinh Provinces have identified as particularly important and the corresponding improvement measures by ICT tools.
Table 4.1.1 Issues and improvement measures by ICT tools Issues Improvement measures by ICT tools
Issue 1 Insufficient hydro-meteorological stations. Delayed response due to manual observation.
Utilizing “[1] Application for water level observation by ICT tools” that collects and displays river water level.
Issue 3 Untimely response because dissemination takes a long time.
Utilizing “[7] Push disaster notification service” that disseminates information to many people immediately at the same time.
Common issue Solutions for above issues have to be affordable. Reasonable operation and maintenance cost by using widespread smartphone and cloud system.
Source: JICA Study Team
As is described in 3.3, “[1] Application for water level observation by ICT tools” and "[7] Application for DRR information notification service” were selected for the demonstration experiment through a series of discussions between JICA study team and DARD of Hue and Binh Dinh provinces. Those applications utilize smartphones and a cloud system
(2) Objectives of the Experiment
The demonstration experiment aims (1) quick, affordable and sustainable way of data collection, and (2) capacity building for DRR of related staff and community through the management of river information utilizing ICT for flood management work in Hue and Bin Dinh Provinces.
(3) Content of the Experiment
The target of the experiment is observation of river water level and inundation situation, display, decision making, and dissemination shown in the figure below.
Table 4.1.2 Content of the experiment Stage Content
1 Observation Observers monitor river water level and inundation situation by smartphone.
2 Display DRR office in DARD grasps the situation on the dashboard of the cloud system to display observed water level.
3 Decision making DRR office in DARD receives a system notification when water level gets over thethreshold, and makes a decision if it will disseminate an alert notification (**) of necessary information to the stakeholders
4 Dissemination DRR office in DARD disseminates an alert notification to the stakeholders by smartphones, and receivers take actions, if necessary.
Source: JICA Study Team

27
“System notification” in the decision-making process is automatically sent from the information system to the experiment participants when the water level exceeds the threshold. In contrast, “Alert Notification” is sent to the participants by smartphone application based on the decision made by DRR office in DARD.
Source: JICA Study Team
Figure 4.1.1 Content of operation covered by the experiment
Participants in the experiment undertook the roles shown below based on the above table and figure.
“Gauge Readers” observed the water level by smartphone. “Judgement” judged if he should disseminate the information or not based on the water level. “Notice Receivers” received the information by smartphone
(4) System Targeted in the Experiment
The system subject to this experiment conforms to the work flow in (3) above. The system, called the River Information Management System (RIMS), is composed of a smartphone application for observation and alert notification, and Web application on the cloud to display observed data and be accessed by the users from their PC. The Web application also has a management function of registering users and observation sites.
27
Measure and Report using designed smart phones in designated cycle
Displays water-level, and notice automatically to River administrators if exceeded determined level
Make overall judgement for releasing notice to stakeholders based on any other required information
Release Push Notice to disaster-related person’s Smart Phones with DARD’s messages for initial response
Collection Display/Analyze Judgement Notice
N earbyI nf orm at ion Cont act
User ABC
Wat er Level Measurement Sys tem
Viet nam Flood Not ice
N ew N ot ice Released!
Point
Wat er Level
N ot ice Level
M essage
Flood is likely t o occur by heavy rain
N orm al
23 cm
Point 1 - Upper
Gauge Readers Cloud System DARD Officials Notice Receivers
Release Push Notice to citizens to take actions for preventing severe damages
Public
N earbyI nf orm at ion Cont act
User ABC
Wat er Level Measurement Sys tem
Viet nam Flood Not ice
N ew N ot ice Released!
Point
Wat er Level
N ot ice Level
M essage
Flood is likely t o occur by heavy rain
N orm al
23 cm
Point 1 - Upper
CitizensReport Alert by System Release Notice
(Manually by DARD)Request to Measure / Report
Release Notice(Out of Scope)
Pilot Notice Operations are limited to Project Members

28
Source: JICA Study Team
Figure 4.1.2 System composition subject of the experiment
Observation Method 1)
Regarding the observation method using smartphone application in the experiment, automatic detection of water level using AR marker and photographing of river situation are applied in Hue Province. Manual inputting of water level and taking its photographs are applied in Binh Dinh province.
Users select auto detection (AR marker) or manual input of water level from top screen of the smartphone application for observation.
Source: Fujitsu, JICA Study Team
Figure 4.1.3 Smartphone application screen (select the observation method)
Observe & report water level and inundation situations
Display on the dashboard Disseminate to DRR related officials
Data Collection Display Dissemination
Auto detection of water level by
AR marker (Hue)
Manual input of water level (Binh
Dinh)
Tap “ Water Level” Move to observation screen

29
Source: Fujitsu, JICA Study Team
Figure 4.1.4 Smartphone application display (AR marker: Hue Province)
Source: Fujitsu, JICA Study Team
Figure 4.1.5 Smartphone application display (Manual water level input: Binh Dinh Province)
Set AR marker on screen *Adjust exposure angle
(Adjust Tilt and Size to 0%)
(1) Adjust water level gauge (green) to water surface (purple)
(2) Tap “DONE”
(1) Select observation point (2) Input message (3) Tap “SEND”
(1) Select observation point (2) Input message (3) Take a picture
Input water level Tap “OK”
Tap “SEND”

30
Display 2)
Data and pictures for each observation date and time at the observation points transmitted from the smartphone application are displayed in the Web application. Users can operate with various functions, such as displaying the observation points on the map, selecting the observed pictures to enlarge the display, switching the observation data with arrows ("<" or ">"), and seeing detailed screens for each observation point (time series, a graph, a table, etc.).
Source: Fujitsu, JICA Study Team
Figure 4.1.6 Web application display (up: Hue, down: Binh Dinh
System Notification 3)
When the observed water level exceeds the threshold which is designed in advance, system notification is automatically sent to the related officers through smartphone application.

31
Source: Fujitsu, JICA Study Team
Source: Fujitsu, JICA Study Team
Figure 4.1.7 Smartphone application display (system notification)
Alert Notification 4)
When the DARD official (administrator) decides to disseminate further alert to the experiment participants, alert notification is sent to specific participants.
Source: Fujitsu, JICA Study Team
Figure 4.1.8 Smartphone application display (alert notification)
Observed information (Auto discrimination in server) Observation site Water level data Level (Danger/Warning/Attention)
Message information
Open the map Tap
Tap “Notification” (1) Select receivers (2) Input message (3) Tap “SEND”

32
(5) Content of the Experiment
Schedule 1)
The data collection experiment was conducted in December 2018 after development of the application, workshop with DARD, and the preparation meeting as shown in Figure 4.1.9. Also, interview with DARD and evaluation of the effectiveness were carried out after the experiment.
Source: JICA Study Team
Figure 4.1.9 Schedule of the experiment
Preparation meeting 2)
Preparation meeting for the experiment outline and usage of the system were held in both Hue Province and Binh Dinh Province on November 28 and 30, 2018, respectively. The participants and agenda are shown in the table below.
Table 4.1.3 Outline of preparation meeting (Hue Province)
Time 9:00-12:30 on November 28, 2018 Participants 15 DARD staffs
Agenda 1.Project outline and system explanation 2.Observation site visit and smartphone application demonstration 3.Discussion on the threshold of water level for alert
Source: JICA Study Team

33
Table 4.1.4 Outline of preparation meeting (Binh Dinh Province)
Time 8:30-13:00 on November 30, 2018 Participants 8 DARD staff, including community staff
Agenda 1.Project outline and system explanation 2.Observation site visit and smartphone application demonstration 3.Discussion of the threshold of water level for alert
Source: JICA Study Team
Table 4.1.5 The participant (Hue Province)
No. Name Position 1 DANG VAN HOA Deputy Director of Bureau of Irrigation 2 LE DIEN MINH Bureau of Irrigation- Head of Disaster prevention unit 3 LE MAI MINH TAN Bureau of Irrigation - General affair manager 4 NGUYEN LUONG MINH Staff 5 LE VAN LAM Staff 6 LE VAN BINH Staff 7 NGUYEN XUAN DUYEN Staff 8 NGUYEN THANH QUANG Staff 9 TRAN TRUNG DUNG Staff
10 LE VAN KIM SANG Staff 11 NGUYEN THI THANH THAO Staff 12 LE VAN SONG Staff 13 TRAN DUY MINH HUY Staff 14 HO DANG PHUOC QUANG Staff 15 DUONG NGOC DIEM THU Staff
Source: JICA Study Team
Table 4.1.6 The participants (Binh Dinh Provence)
No. Name Position 1 NGUYEN XUAN PHU Deputy Director of Bureau of Irrigation 2 TRAN HUU KINH Bureau of Irrigation- Head of Disaster prevention unit 3 BUI PHI HUNG Staff 4 LE VAN TRUC Staff 5 VO TRUNG DUNG Staff 6 NGUYEN TUONG VI Staff 7 PHAM NGOC BAN Staff- NHON BINH Measurer 8 NGO VAN THU CANH VINH Measurer
Source: JICA Study Team

34
Source: JICA Study Team
Photo 8 Preparation meeting (left: Hue, right: Binh Dinh)
Twelve DARD staff in Hue installed the smartphone application, and six DARD staff in Binh Dinh installed it.
Target Observation Station 3)
One station in Hue and two stations in Binh Dinh were selected as the observation points for the experimental demonstration.
In Hue Province, AR marker was installed near the flood gate where the observation point of the water level (fixed to the wall at the bottom of the handrail along the water gate) can be found. In the experiment, the measurement values observed by smartphones were set to be the same as the scale (sea level) of the existing water level measurement water plate.
Source: JICA Study Team
Photo 9 The observation site in Hue (left: existing scale, right: smartphone display)

35
Source: Google map, JICA Study Team
Figure 4.1.10 Map of the observation point in Hue
In Binh Dinh province, the measurement values observed by smartphones in the experiment were inputted from the scale (sea level) of the existing water level measurement gauge.
Source: JICA Study Team
Photo 10 The observation sites in Binh Dinh (left: Nhon Binh, right: Canh Vinh)
Source: Google Map, JICA Study Team
Figure 4.1.11 Map of the observation sites in Binh Dinh (1: Nhon Binh, 2: Canh Vinh)

36
Observers and Time 4)
DARD staff visited the observation sites at the instruction meeting and confirmed the operation of the smartphone application and the data display on the web application. The observers and observation time were decided as shown in the table below.
Table 4.1.7 Observers and observation time
Site Observers Observation time 1 Hue 3 DARD staffs by turns 7:30-8:00、16:00-17:00。 2 Binh Dinh - Nhon Binh DARD staff 8:00/16:00 3 Binh Dinh - Canh Vinh Community staff 7:00/17:00
Source: JICA Study Team
Setting of Water Level Threshold 5)
The water level threshold for alert notification was designed during the discussion with DARD of both Hue and Binh Dinh Provinces, as shown in the table below, and set it to the system.
The water level threshold for the observation site in Hue Province refers to the one at Kim Long Station in Huong River (Alert 3 for bankful water level, Alert 2 for 2 m, and Alert 1 for 1.0 m as shown in Figure 4.1.12). Since the target site is close to the Kim Long Station, the same designed level was applied as Alert 3 for danger, Alert 2 for warning, and Alert 1 for attention as shown in Table 4.1.8.
If the designed water level is linked to the DRR actions by DARD staff, more practical experiment would be possible. However, water level threshold and DRR activities are not linked in Vietnam at present.
Since the highest water level at the observation point was 3.6 m in 2017, the AR marker may submerge and measurement may be impossible if same scale of flooding occurs. However, the experiment was done because of smaller amount of rain in 2018.
Source: JICA Study Team
Figure 4.1.12 Example of flood warning level (Kim Long Station in Huong River)

37
Table 4.1.8 Thresholds for the experiment (Hue Province)
Water level threshold RIMS display 3.5 m: Danger Purple when over the threshold 2.0 m: Caution Red when over the threshold 1.0 m: Attention Yellow when over the threshold Light blue when water level is less than 1.0 m.
Source: JICA Study Team
Source: JICA Study Team
Photo 11 Water level threshold in each observation site (Hue)
The water level threshold for the observation site in Binh Dinh Province was set as given in the table below based on the threshold at Kim Long Station and discussion with DARD. According to the observers in Binh Dinh Province, the water level had reached the highest in November 2017. The water level at Nhon Binh was 2.5 m and the level at Canh Vinh was 6 m in November 2017. However, the threshold for danger, equal to Alert 3, was set lower than the full river water level because of smaller amount of rain in 2018. Alerts 2 and 1 at Nhon Binh Station were set at 0.4 m to 0.5 m interval from the water level at Alert 3, which is smaller interval than that at Kim Long Station because of lower water depth. The interval at Canh Vinh Station is set at 1.0 m to 1.5 m from the water level at Alert 3 with reference to Kim Long Station.
Table 4.1.9 Thresholds for the experiment (Binh Dinh)
Threshold (Nhon Binh) Threshold (Canh Vinh) RIMS display 2.9m: Danger 6.5m: Danger Purple when over the threshold 2.5m: Warning 5.5m: Warning Red when over the threshold 2.0m: Attention 4.0m: Attention Yellow when over the threshold Light blue when the water level is less than the
attention level Source: JICA Study Team
3.5m
2.0m
1.0m

38
Below are the photographs showing the status of water level threshold at each observation site.
Canh Vinh Station (upstream) Nhon Binh Station (downstream)
Source: JICA Study Team
Photo 12 Water level threshold at the observation sites (Binh Dinh)
The water level during the experiment did not exceed the threshold due to small amount of rainfall, so the thresholds were lowered in both provinces on 24th December 2018 after meeting with them.
Table 4.1.10 Changed thresholds for the experiment (Hue)
Water level threshold RIMS display 3.5m: (Danger) Purple when over the threshold 2.0m⇒1.0m: (Caution) Red when over the threshold 1.0m⇒0.5m: Attention) Yellow when over the threshold Light blue when the level is less than attention level
Source: JICA Study Team
Table 4.1.11 Changed thresholds for the experiment (Binh Dinh)
Threshold (Nhon Binh) Threshold (Canh Vinh) RIMS display 2.9m: (Danger) 6.5m: (Danger) Purple when over the threshold 2.5m⇒2.0m: (Warning) 5.5m⇒3.0m: (Warning) Red when over the threshold 2.0m⇒0.8m: (Attention) 4.0m⇒2.0m: (Attention) Yellow when over the threshold Light blue when the level is less than attention
level Source: JICA Study Team
The Participants and Their Roles 6)
The participants in the experiment and their roles were set during the instruction meeting. The participants’ list and their respective roles are shown in the table below. As is explained in 4.1, “Gauge Readers” observed the water level by smartphone, “Judgement” judged if he should disseminate the information or not based on the water level, and “Receivers” received the information by smartphone.
6.5m
5.5m
3.0m
2.9m
2.5m

39
Table 4.1.12 The Participants and Their Roles (Binh Dinh)
No. Name Position Role 1 NGUYEN XUAN PHU Deputy Director of Bureau of Irrigation Receiver 2 TRAN HUU KINH Bureau of Irrigation- Head of Disaster
prevention unit Receiver
3 TRUONG VAN CHAU Specialist manager of agricultural project and clean water source
Guest of WS
4 LE VAN TRUC Official Judgement 5 VO TRUNG DUNG Official Receiver 6 NGUYEN TUONG VI Official Judgement 7 PHAM NGOC BAN Official- NHON BINH Measurer Gauge reader 8 NGO VAN THU CANH VINH Measurer Gauge reader
Source: JICA Study Team
Table 4.1.13 The Participants and Their Roles (Hue)
No. Name Position Role 1 DANG VAN HOA Deputy Director of Bureau of Irrigation Receiver 2 LE DIEN MINH Bureau of Irrigation- Head of Disaster
prevention unit Judgement
3 LE MAI MINH TAN Bureau of Irrigation - General affair manager
Receiver
4 NGUYEN LUONG MINH Official Receiver 5 LE VAN LAM Official Receiver 6 NGUYEN XUAN DUYEN Official Receiver 7 NGUYEN THANH
QUANG Official Gauge reader
8 TRAN TRUNG DUNG Official Gauge reader 9 LE VAN KIM SANG Official Gauge reader
10 LE VAN SONG Official Receiver 11 TRAN DUY MINH HUY Official Receiver 12 HO DANG PHUOC
QUANG Official Receiver
13 DUONG NGOC DIEM THU Official Receiver
Source: JICA Study Team
Although the experiment was designed to consider the issue of prompt information dissemination, not only to DARD officials but also to residents, the target for alert notification in the experiment was limited among DARD staff and observers based on the discussion with JICA and DARD because the kinds of information and the timing of alert need to be considered carefully for dissemination to residents, and there was no clear rules. The restriction also aimed to avoid confusion among residents because the thresholds in the experiment were tentative.

40
Evaluation Meeting for the Effectiveness of the Experiment 7)
Evaluation meeting was held in Binh Dinh and Hue Provinces on 11 and 14 January 2019 in order to get feedbacks from the participants and evaluate the system after the completion of the experimentation period. The participants and agenda are shown in the tables below.
Table 4.1.14 Evaluation meeting (Binh Dinh)
Time 13:30-15:30 on 11 January 2019 Participants Binh Dinh: 8 DARD staff, including community staff (all participants in the experiment)
Agenda 1.Review the experiment and explain the accumulated data in the RIMS 2.Q&A and discussion
Source: JICA Study Team
Table 4.1.15 Evaluation meeting (Hue)
Time 10:00-12:00 on 14 January 2019 Participants Hue: 13 DARD staff (all participants in the experiment)
Agenda 1.Review the experiment and explain the accumulated data in the RIMS 2.Q&A and discussion
Source: JICA Study Team
Source: JICA Study Team
Photo 13 Evaluation meeting (left: Binh Dinh, right: Hue)
4.2 Results of the Experiment
(1) Effectiveness Verification Method
The effectiveness of the experiment was verified by measuring the level of achievements on the two main objectives of the experiment through (1) evaluation based on data accumulated in RIMS, and (2) evaluation through interviews with participants in the experiment.

41
Table 4.2.1 Effectiveness verification method
Method Objective (1)
Quick, affordable and sustainable way of data collection
Objective (2) Capacity building of related staff and community for disaster risk
reduction and management
1 Evaluation on accumulated data in RIMS
The number of water level and inundation situation data
The Number of alert notifications Content of the alert notifications
2 Interview with participant
Easy Quick Effectiveness for disaster
prevention work Improvement for long term use
Ease of sending alert Any effect to change behavior and
notice Effectiveness for disaster
prevention work Improvement for long term use
Source: JICA Study Team
(2) Summary of the Results
Data Collected Through the Experiment 1)
Observation data of water level and inundation situation were collected almost as planned in both Hue and Binh Dinh Provinces. In Hue Province, the achievement was 87% as 54 times of actual observations out of 62 times observation plan (twice a day for 31 days from December 1st to 31st). In Binh Dinh Province, the achievement was 91% as 57 times of actual observations out of 62 times observation plan (twice a day for 31 days from December 1st to 31st) at both Nhon Binh and Canh Vinh observation sites. These were evaluated as very good results.
Table 4.2.2 The number of observed data in the experiment
Site Plan Result 1 Hue 62 54 (87%) 2 Binh Dinh - Nhon Binh 62 57 (91%) 3 Binh Dinh - Canh Vinh 62 57 (91%)
Source: JICA Study Team

42
Table 4.2.3 Results of observed water level, inundation situation, and system notification

43
Source: JICA Study Team
Automatic system notification from the RIMS to the smartphone application of the participants of the experiment was sent 3 times at Hue, 5 times at Nhon Binh, and 6 times at Canh Vinh with attention level (yellow hatch in the figure).
In addition, alert notification was issued based on the decision by DARD after the above system notification was not used even though the water level reached the attention level with low amount of rain in both Hue and Binh Dinh Provinces during the period.
However, the DARD staff (who had the authority to issue alert notifications) used the application for alert notification of the experiment to disseminate the information on hydraulic power plant discharge, and to ask the participants in Hue Province the conditions of the water level at other observation points (see the table below for details).

44
Table 4.2.4 Results of sending alert notifications
Source: JICA Study Team
Interview Results 2)
Based on the results of interview, the participants who were staff of both DARD Hue and Binh Dinh had an overall positive evaluation. They also pointed out the needs for consideration and improvement for the future.
Table 4.2.5 Results of the interview (Hue)
Objective Positive evaluation Improvement 1 Quick, affordable
and sustainable observation method
Operability and function of the application are very good.
Observer can check the data in the field. Checking water level with data and photos
isaccurate. Reflection and sharing of observed data to
the system are quick and easy
Measuring depends on the performance of the smartphone camera when it rains.
Difficulty of taking photos in backlight, rain, and nighttime situations.
2 Capacity building of related staff and community for DRR
It is effective to grasp the situation quickly by getting the notification.
Simultaneous dissemination is effective compared to the current system (SMS and telephone).
Understanding the site situation based on observation results (with pictures) and issuing instruction through alert notification contribute not only to daily work but also to the capability for DRR response
It will be better if they can choose the receivers of system notification depending on the threshold level (Attention, Caution, Danger)
There was no chance to disseminate messages by alert notification in this experiment
Source: JICA Study Team

45
Table 4.2.6 Results of the interview (Binh Dinh)
Objective Positive evaluation Improvement 1 Quick, affordable
and sustainable observation method
Operability of the application is good. Both data and photo observation
contributes to quick response Good to be able to send data in numerical
values even if they cannot take photos. Easy to use because observers can check in
the field if the data are reflected in the system.
Difficulty to access the site and observe during rain and flood occurrence
Unavailability of the application due to poor radio connection
2 Capacity building of related staff and community for DRRM
System notification is very effective, able to apply to other services
System notification triggered a discussion Alert notification was not used due to face
to face conversation in this experiment
It will be better if the participants can choose the receivers of system notification, depending on the threshold level.
Source: JICA Study Team
(3) Results of the Verification (Improvements and Remaining Problems)
In terms of “(1) quick, affordable and sustainable observation,” the accumulation of observation data was as planned and many positive opinions on quick data collection and sharing came out from the participants. As a result, this system can improve the issues on data collection and achieve the objective. Regarding “(2) capacity building of related staff and community for DRRM by system notification”, the system had achieved the objective that DARD staff take action by knowing the situation through the system notification of threshold level. This system can improve the issues on information dissemination. On the other hand, usage of alert notification function by DARD staff was not activated because the water level at the time of experimentation had remained less than the warning level due to small amount of rainfall.
In addition, as pointed out in the interviews conducted in the two provinces, the problems to be improved for actual use in disaster prevention operation are as follows: observation methods at nighttime and in bad weather, consideration of communication conditions as well as communication tool, customization of data input / output function, security in the technical aspects, and operation method at nighttime and in bad weather, safety of the observers, setting of operation rule for decision making, and alert notification in the operational aspects.

46
Table 4.2.7 Requests and considerations for future use
Item Problems to be improved 1 Observation method at nighttime
or bad weather To improve/install the tools applicable to observe data at night or
during bad weather To develop work schedule for staff who observe at night and on
holidays 2 Safety of the observers To secure the safety of the observers at night or during bad
weather; especially, it is dangerous to be close to a river during probable flood occurrence
3 Consideration for communication condition and communication tools
To use not only radio communication tools but SMS as an alternative application for emergency situations.
To apply the application to other OS other than Android smartphone
To implement market survey for penetration rate of smartphone and sharing of OS (Android/iOS) for future use.
4 Data editing and output function To add functions for editing, inputting, and outputting observed data
To integrate meteorological and other data for DRR work 5 Security To consider security against hacking 6 Decision making and operation
rule To develop a rule on when and how to disseminate an alert and the
target to be informed. It will not be DARD only that can decide to disseminate an alert to local people.
Source: JICA Study Team

47
5. Conclusion
5.1 Analysis and Summary of Improvements and Issues to be Improved
In Chapter 4, the system for information dissemination via smartphones based on water level observed with smartphones was built and verified. Also, items to be improved and issues were summarized.
In Chapter 5, improvements to be done as confirmed by the experimentation and issues to be improved were analyzed and summarized based on the overall challenges of the four stages presented in Chapter 3 (“Data collection”, “Information analysis / decision making”, “Dissemination”, and “Resident evacuation”).
(1) Data Collection
In response to the current issue that it is difficult to promptly carry out activities for disaster response, such as giving warning, because hydro-metrological data (station) are not sufficient and observation is done manually, a system demonstration experiment of water level observation using AR marker and smartphone was conducted. As a result, quick, affordable, and sustainable observations were carried out and the system worked appropriately and was verified.
Meanwhile, assuming that at the time of a disaster (heavy rain, strong wind, communication failure), it is difficult to observe the water level by this system, and problems like ensuring observers’ safety can arise, so it is necessary to consider other operation rules (such as reading the value of the water mark from a distance and sending it through smartphone or just sending photos to the server) during a high water level situation. Also, in the case of nighttime or backlighting, it is necessary to check the water level visually because it is difficult to get water level from photo.
Since the observer is always needed in this system, several missing observations have been confirmed during this demonstration experiment, and the above concern on the physical presence of the observer was raised. In order to make full use of this system for the purpose of disaster risk reduction that can save human lives, it is essential to solve problems on the physical system and to build a 24-hour operation system. If it is difficult, it should be positioned as a complementing system of another automatic observation system.
(2) Information Analysis and Decision Making
In response to the current issue that giving warning and evacuation are not properly conducted and understood, this water level observation system cannot be the improvement measure as shown in this demonstration experiment. The main reasons are as follows:
The water level criteria for issuing an alarm are not set. The target area for issuing an alarm is not clear. The plan for disaster risk reduction (i.e., relation between the water level for issuing an alarm
and the response) is not formulated.

48
To solve the issue, it is necessary to [1] set the water level criteria for issuing an alarm, [2] set the target area for issuing an alarm, and [3] formulate the plan for disaster risk reduction
For example, although the flood warning level (water level criteria) has been set in Vietnam as shown in Figure 5.1.1, its relationship with disaster response is not clear and well grounded.
Source: JICA Study Team
Figure 5.1.1 Example of flood warning level (Kim Long Station in Huong River)
In Japan, flood warning level (water level) and disaster response are properly related. For example, designated water level is related to the preparation of Suibodan (flood fighting corps) and warning water level is related to sending the Suibodan to grasp the situation.
Source: MLIT
Figure 5.1.2 Concept of designated flood warning level in Japan
Designated water level and warning water level are defined below.
Definition of Designated Water Level
Designated water level is set for the preparations of Suibodan (flood fighting corps) in relation to flood-control activities. In case of designing a new level, the actual situation of flood control has to be considered as described below:

49
1. Water level that can reach 20% of the designed high water discharge. 2. Water level in mid-large river that can be reached about once in a year. 3. Water level in small-mid river that can be reached about 5-10 times in a year. 4. Water level that is estimated to reach the warning water level among 1 - 3 above
Definition of Warning Water Level
The warning water level is set as the factor for dispatching the flood control team. That is, the water level to dispatch the team is based on the warning water level and the characteristics of each river and area.
The warning water level is designed in relation to the flood control activities and the conservation of river management facilities. In case of designing a new level, the actual situation of flood control has to be considered as described below:
1. Water level that can reach 50% of the designed high water discharge 2. 60% of lower level between the mean low water level and the designed high water level 3. Water level that can be reached about once in three years 4. 50% water level between the designed levee height and mean low water level at
unrepaired part. 5. Warning water level should be lower than 1 to 4 above in the river with snowmelt runoff
and steep stream.
Topographical data and considerations are necessary for setting the designated water level and warning water level in Japan.

50
Table 5.1.1 List of necessary data and considerations for designing water level
Item Data Objectives and notes
Designed high water level Warning water level Designated water level
Field survey: Water level observation
Water level observation at stations At least hourly water level data are needed in flooding
(twice a day data are insufficient to consider the criteria) Accumulate more than 10 years of observation data is
desirable Field survey: Water discharge observation
Observed water discharge data are desirable for evaluation of calculation of designed high water discharge
Observed water discharge data especially in flood time Observation point must be the same with water level observation
Field survey: River topographical survey
Cross and longitudinal section survey of the whole river 200 m interval longitudinally
Field survey: Flood mark survey
Flood mark data is desirable for evaluation of calculation of designed high water quantity
Hydrological analysis: Runoff analysis
Calculate designed high water level with designed high water discharge
Not only runoff analysis but observed water level and flood mark data should be compared
Warning water level Designated water level
Hydrological analysis: Runoff analysis
For calculating the water level that can reach 20 % (or 50 %) of designed high water discharge
For understanding longitudinal water level of the river
Warning water level
Observed data: Water level
Observed data summary as described below: Water level that can be reached once in 3 years Mean low water level (low water level: the water level that
does not go lower than this level for 275 days in a year) Designated water level
Observed data summary as described below: Water level in large river that can be reached once a year Water level in small mid-river that can be reached 5-10
times a year Source: JICA Study Team
In addition, flood warning levels regarding evacuation activity, such as the evacuation water level (indicative of the judgment of the evacuation recommendation by the municipal mayor's office and the water level that is a reference for the evacuation judgment of the residents) and the level of the dangerous water level (water level with possibility of causing serious disaster) are designed and linked with disaster response activities.

51
Source: MLIT
Figure 5.1.3 Flood warning levels and risk levels in Japan
As mentioned above, it is necessary to set the flood warning water level and to consider properly linking this water level with flood control and evacuation activities. Disaster prevention drills and education are also necessary.
In Vietnam, above countermeasures can contribute to improve the issues and make the system in the demonstration experiment more effective for the future.
(3) Information Dissemination
In response to the issue that dissemination takes time and timely action cannot be taken, the system (River Information Management System or RIMS and dissemination system by smartphone) can share information instantly (limited between DARD staff in the demonstration experiment).
Specifically, the water level observation result uploaded onto the RIMS is instantaneously displayed on the Web application. When the level exceeded threshold, the information is promptly disseminated among related staff. At this time, if a disaster response plan is formulated (regulation of actions for disaster prevention according to the water level is stipulated), timely disaster prevention activities can be carried out according to the plan. Also, simultaneous notification by using the smartphone dissemination system can be given to people involved, which leads to shortening the time spent on dissemination compared with using SMS and other means.
In the future, various types of observation data (rainfall amount, water level, water quality and quantity) and data from all the stations installed by various donors should be integrated in a system such as RIMS, and more timely and accurate disaster risk reduction activities will be required. In order to realize such system, it is important to consider the standardization of transmission rules of data (equivalent to telemeter transmission specifications of the Unified River Information System in Japan).
When it comes to the application of this system at the residents level, not all residents possess information-receiving device like smartphones, so there is a need for the government to continue to expand the existing information-spreading tools, such as loudspeakers. Furthermore, redundancy of

52
the information transmission system, assuming the time of power failure as well as communication failure, is also required since the operation of this system depends on the communication condition. 1
(4) Resident Evacuation
The issues, i.e., that the residents cannot evacuate properly even if they receive an instruction to evacuate, and that they are less conscious of disaster risk reduction, cannot be improved by the system. The main reasons are as follows:
Evacuation plan, including identification of designed shelter, is not fully formulated. Hazard map and disaster prevention map are not fully developed. Education for disaster risk reduction and the drill for residents are not enough.
In the future, it is necessary to consider solving the issues related to “(2) Information analysis / decision making” and to work on the above three issues.
(5) Conclusion
The following table and figure summarize the above results.
Table 5.1.2 Summary of Improvements and Issues to be Improved Issues Improvements Issues to be improved
[Data Collection] Insufficient number of hydrological stations Manual observation makes it difficult to carry out disaster response activities.
Prompt water level observation and data collection
Water level observation and observers’safety during flood
Photo shooting during nighttime and backlighting
Missing observation due to human errors Integration of various kinds of observed
data and data from various donors [Information Analysis / Decision Making] Government cannot properly issue calls for warning and evacuation. The residents find it difficult to understand content of warning.
(out of scope of experiment)
Set of water level criteria and target area for issuing alert
Formulation of disaster response plan (link between water level and response activity)
[Dissemination] It takes time to disseminate information, hence timely response cannot be given.
Prompt information sharing with DARD officials
Reliable information dissemination to related agencies and residents
Standardization of transmitting rules of data
Redundancy of the information transmission system, assuming the time of power failure as well as communication failure
[Resident evacuation] Even if residents receive evacuation instructions, they cannot evacuate properly. Insufficient awareness and knowledge of residents
(out of scope of experiment)
Formulation of evacuation plan (identification of evacuation shelter)
Preparation of hazard map and disaster prevention map
・Implementation of disaster risk reduction education and drills for residents
Source: JICA Study Team
1 According to the technical standard regarding SMS transmission formulated in 2014 in Vietnam, it is stipulated that "Sent
messages have to be received 92% or more within 20 seconds". However, this standard is applied during normal times and not applicable when disasters occur.
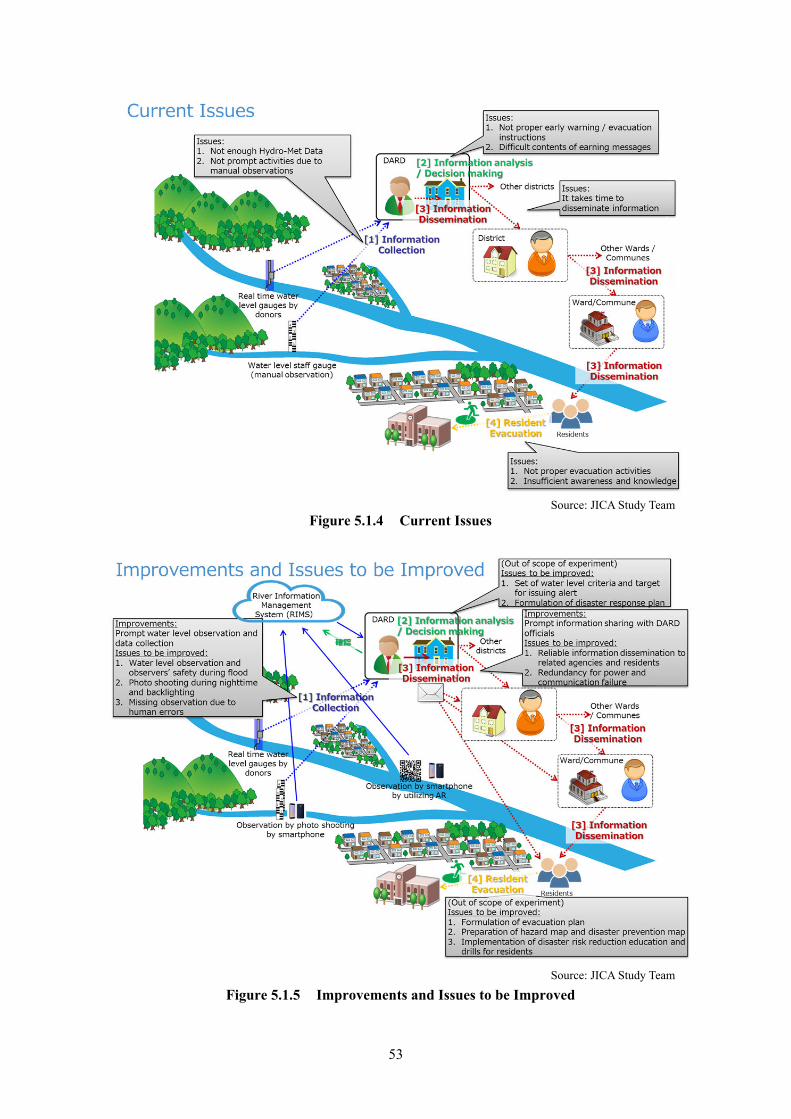
53
Source: JICA Study Team
Figure 5.1.4 Current Issues
Source: JICA Study Team
Figure 5.1.5 Improvements and Issues to be Improved

54
5.2 Further System Expansion
(1) Relation and Coordination with Conventional Technology
The following table summarizes the advantages and disadvantages of the introduced water level monitoring system by smartphone compared to the conventional real time system.
Table 5.2.1 Advantages and Disadvantages of Two Systems
System Advantages Disadvantages
Water level monitoring system by smartphone
It is easy to increase the number of observation stations at a low cost.
Operation and maintenance are easy and low cost.
It is necessary to secure the safety of observers during a flood.
It is difficult to observe during nighttime and backlighting.
There may be missing observations due to human errors.
Conventional real time water level monitoring system
Data can be collected without fail during nighttime and flooding.
It is costly to install, operate and maintain the equipment.
It is difficult to repair the malfunction of equipment and system.
Source: JICA Study Team
The water level monitoring system by smartphone is not recommended at this time for the purpose of disaster risk reduction and management related to human lives due to the physical and operational issues as listed in the above table. On the other hand, the conventional real time system is preferable for disaster risk reduction and management purposes from its certainty and reliability. However, due to its cost issue, installation of the stations takes time, and operation and maintenance are not easy. So that, the following points of cooperation and coordination by utilizing their advantages are recommended.
The conventional system should be used as the backbone observation system in order to know the present situation and to forecast the flood properly. On the other hand, the smartphone system will be utilized to back-up the system or to supplement the observation.
The smartphone system can be utilized as the immediate action for establishing the observation network, when the establishment of the conventional system takes time.
In addition, among the ICT tools introduced in Chapter 3, [2] Water level gauge for Risk management and [3] Observation of water level and discharge with camera photos (eye- BOX) have been developed in order to reduce the cost and to make their operation and maintenance easier, while keeping the accuracy and reliability of the conventional system. Therefore, we recommend the positive utilization of these equipment when the new observation system is installed in the future.
(2) Utilization of Water Level Observation Application by Smartphone
This system can be useful in the situations described below in addition to the case presented in the experiment.

55
Water level observation at reservoirs and ponds where expensive equipment cannot be installed
Water level observation in inundated urban area other than river (Useful for accumulation of inundation data. The safety of the observers is to be secured.)
5.3 Lessons Learned on the Public-Private Partnership and Utilization of Public Funds through the Project
Advantages of this system from the point of Public-Private Partnership are shown below.
As for the conventional system, all the equipment such as observation equipment, telemetry equipment, server and management software etc., are the property of government, and the government has a role to operate, maintain and update the system. Even though the system is donated by the donors, the government has to secure the budget and employ the engineers, etc., for its operation and maintenance. On the other hand, this system does not require the expensive monitoring equipment and is operated by man power. Also, by utilizing the Cloud Server, the government does not need to own the system and operate and maintain the system physically. In this case, the private sector will provide the services to government, and will receive the service charges from government, so that the cost will be less and early installation of the system will be possible.
As is shown in 5.1, challenges on the early warning and evacuation system can be divided into the challenges which can be solved by the installation of equipment and a system, and the challenges which will require the time to conduct the activities such as technical studies, enhancing public awareness, etc. The increase in speed to solve all the related issues is expected by promoting this kind of public-private partnership; the private sector will be in charge for the former challenges, and government will focus on the latter challenges which can be done only by the government.
In order to realize the above advantages of the system, it is necessary to secure the cost of operation and maintenance for initial installation, securing cloud environment, maintaining the cooperation of officers and residents, etc., even though the operation and maintenance cost is lower than the conventional system. Some ideas for the system expansion and promoting public-private partnership are shown below.
(1) Project Scheme for Sustainable System Operation
It is important to consider the project schemes and possibilities that can sustainably operate the system. For example, the following methods are conceivable:
As for the smartphone application, costs can be collected from revenues such as events of the government and advertisements of companies that sell goods related to disaster prevention.
56
In return for the operation and maintenance costs of RIMS, a private company can be given the right to use the data for services such as distribution of the accumulated data of rainfall, water level, images, and real-time data. 2
Systems to give recognizable incentives (coupon for shops, LINE sticker, etc.) to the residents who cooperate for water level monitoring etc., needs to be discussed in order to establish the cooperation framework with residents. 3
(2) Enhancement of Resident’ Awareness for Disaster Prevention
In this system, residents’ cooperation is indispensable for the water level monitoring and for information dissemination. In order to operate and utilize the system sustainably, enhancement of residents’ awareness for disaster prevention is necessary, such as “Self-help”, which means residents will protect themselves by themselves and “Mutual-help” which means residents will cooperate with each other in their areas. If such awareness would be enhanced through the government oriented community based disaster prevention activities, water level monitoring activity in this system could be conducted by residents or areas without compensation.
When the residents, who do not have enough knowledge on disaster prevention, conduct the water level monitoring, government officers have to train them in advance in order to prevent missing data or mistakes, and to confirm the monitored data. In addition, as is shown in 1) of 5.2, it is necessary to recognize the monitored data in this system as the complemental values for early warning and evacuation.
2 Insurance companies need meteorological data for agriculture insurance and weather derivatives, etc. Railway companies
and airline companies utilize the real time meteorological data for their operation. There is a business such that technical private companies collect, analyze, and prepare the data necessary for above companies.
3 For example, such systems can be established that LINE stickers can be given, if the residents conduct the water level monitoring / monitor flooding conditions several times.