survey and settlement in the Bronze Age Murghab Delta ...
333
- 1 - Illuminating the Black Sands: Survey and Settlement in the Bronze Age Murghab Delta, Turkmenistan Steven Brett Markofsky Thesis submitted for the degree of PhD Institute of Archaeology, University College London 2010
-
Upload
khangminh22 -
Category
Documents
-
view
0 -
download
0
Transcript of survey and settlement in the Bronze Age Murghab Delta ...

- 1 -
Illuminating the Black Sands:
Survey and Settlement in the Bronze Age Murghab Delta, Turkmenistan
Steven Brett Markofsky
Thesis submitted for the degree of PhD
Institute of Archaeology, University College London
2010

- 2 -
I, Steven Brett Markofsky, confirm that the work presented in this thesis is my own. Where
information has been derived from other sources, I confirm that this has been indicated in the
thesis.

- 3 -
Abstract
This thesis examines the Bronze Age settlement distribution in the Lower Murghab Delta,
Turkmenistan. The delta represents a visually obstructed landscape in which the reconstruction
of past archaeological patterns is extremely difficult. Drawing on concepts of distributional
archaeology and „siteless surveys‟, the research focuses on the distribution of surface pottery as
the primary dataset in an examination of local and regional settlement distributions and their
significance with respect to the proto-urban landscape of the delta. The survey data is assessed
within the context of past and present landscapes, examining issues of visibility and recovery
potential en route to a better understanding of the archaeological significance of the Bronze Age
settlement pattern.
While the central trajectory of the thesis is to address these issues, a secondary goal is to
examine the nature of survey itself in the region. The field results are therefore considered in
light of earlier Soviet/Russian and Italian research in the Murghab, assessing the effectiveness of
that work and the research potential of intensive survey in the region. In addressing these
questions, newer methodologies that incorporate spatial analysis and remote sensing data are
examined, both on their own merits and as adjunct methods to support field survey. Ultimately,
these questions are synthesised in order to examine the relationships between surface
distributions and the landscape, and ultimately to better understand settlement phenomena in the
northern Murghab.
- 4 -
Acknowledgements
First, I want to extend my heartfelt thanks to my supervisors, Tim Williams, Andrew Bevan and
Roger Matthews, for their constant support and encouragement. Their readiness to field
countless enquiries was incredible, and if I do pursue an academic career I can only hope to be
able to work with my students in the same way. Next, a singular „thanks for absolutely
everything‟ must go to Gaigysyz Joraev, who not only coordinated everything for everybody at
all times, but who has become a great friend. Sincere appreciation goes to Toby Wilkinson who
was an enormous help in turning this madcap desert idea into a reality; and to Lynne Paterson
for all the help in the field when the project almost collapsed. On the Merv front, thanks go first
to Basham Durdeyev, Parahat Chariyev and the whole field crew from Bayramaly for 3 seasons
of support and great fieldwork. Next come all the Merv regulars (and irregulars) who braved the
Karakum—Paul Wordsworth (who will one day accept the glory of the Bronze Age), Lucy
Denton, Jeremy Butler and Helena Franzen, and Dave Gilbert for fielding the endless pottery
questions. Much thanks to Luana Cenci, Owen Murray and Denitsa Nenova for illustration and
photography. Of the many scholars who offered support, I want to acknowledge Victor
Sarianidi for his gracious hospitality at Gonur, without whose monumental body of work none of
this would have been possible. There were countless people with whom I exchanged emails, but
I want to thank Berdy Udeumuradov for his extremely helpful insight on the region. On the
Italian front, I want to express my gratitude to everyone associated with the AMMD project who
shared their research and advice: Maurizio Tosi, Maurizio Cattani, Barbara Cerasetti, Mauro
Cremaschi, Andrea Ninfo, Paolo Mozzi and Alessandro Perego. Their contributions to research
in the delta have been enormous, and their guidance was invaluable. I also want to thank
Gabriele Rossi-Osmida and Anamyrat Orazov for sharing their knowledge of Adji Kui and for
their interest and encouragement in my own research. To the funding bodies that supported my
research—thanks go to the British Institue of Persian Studies, the UCL Graduate School and of
course the Institute of Archaeology. At UCL, countless people supported me and helped to
maintain my sanity. A special thank-you to Simon Groom for singlehandedly introducing me to
petrographic analysis and for continuing support throughout my work. Next, of course, are the
„regulars‟ in the GIS lab. Of this crew, Enrico Crema gets top mention for three years of
statistics help and navigation of the labyrinthine chaos that is the „R‟ programming language.
Thanks also to everyone who had the fortune (or misfortune) to see their colleague in the final
throes of the write-up stage: Yasemin Ozarslan, Giorgia Marchiori, Kristin Eklund, Eva Jobbova,
Shayna Meyers, Niki Kyriacou, Tendai Musindo, Daniela Arroyo Barrantes and Alessio
Palmisano. Of past GISers, thanks go to Michele Massa, Smiti Nathan, Christina Vona,
Michelle Weinhold, Andrea Kay, Amanda Erickson and Julie Malakie—for their moral support,
commiseration and friendship. There are a million others who could go on the list, but I want
to acknowledge a few who contributed enormously to this career path, all from different times in
my life: Robert Hines, Josh Wright and my Durham supervisors Graham Philip and Derek
Kennet. They fuelled my interest, kept it going, and continued to point me in the right direction.
My last, and equally important, round of thank-yous goes to friends and family. Cornelius
Mueller, Sabra and Rob Raven, Mrinalini Venkateswaran, Noam and Cilia Libeskind have been
there since Durham, an amazing group of people who helped make this chapter of my life
unforgettable. Also thanks to Mark Plaice, a great friend embarking on the same journey I‟m
about to finish. And closing with family—first, a million thank-yous to my second family, the
Geisingers, whose love and support go without saying! And in closing—Mom, Dad and
Lauren—I‟m finished. Thanks. For everything. I love you guys.
- 5 -
List of Contents
ABSTRACT ................................................................................................................................................. 3
ACKNOWLEDGEMENTS ........................................................................................................................ 5
LIST OF FIGURES .................................................................................................................................... 9
LIST OF TABLES .................................................................................................................................... 12
CHAPTER 1. INTRODUCTION ........................................................................................................ 13
1.1. OVERVIEW ................................................................................................................................ 13 1.2. BARRIERS TO ARCHAEOLOGICAL RESEARCH IN TURKMENISTAN ............................................. 15 1.3. OVERVIEW OF RESEARCH IN THE MURGHAB DELTA ................................................................. 16 1.4 THE NORTHERN MURGHAB AND THE EGRI BOGAZ SITES: INTRODUCING THE RESEARCH
AGENDA 20 1.5. RESEARCH QUESTIONS ............................................................................................................. 23 1.6 STRUCTURE OF THESIS .............................................................................................................. 24 1.7. LIMITATIONS............................................................................................................................. 24 1.8 GEOLOGY AND CLIMATE OF THE MURGHAB DELTA .................................................................. 25
1.8.1. Geological Setting ............................................................................................................... 25 1.8.2. Geomorphology and Hydrology .......................................................................................... 27 1.8.3. Climate and Soils ................................................................................................................ 29 1.8.4. Visibility and Archaeological Recovery Potential ............................................................... 33
Modern Agriculture ....................................................................................................................................... 33 Alluvial Sedimentation and Site Masking ...................................................................................................... 33 Dune Cover .................................................................................................................................................... 36
1.9. STUDY AREA ............................................................................................................................ 36 1.9.1. Description of Sites and Regional Environment .................................................................. 36 1.9.2. The Study Area Within the Context of the Northern Murghab ............................................ 39
CHAPTER 2. THEORETICAL FRAMEWORKS: CONCEPTS OF SURVEY AND
SETTLEMENT DEVELOPMENT IN THE MURGHAB DELTA ..................................................... 41
2.1. CENTRAL ASIAN ARCHAEOLOGY AND STATE FORMATION ........................................................ 41 2.1.1. Isolation of Central Asia in Archaeological Research ........................................................ 41 2.1.2. ‘Primary’ vs. ‘Secondary’: The Role of Central Asian Polities in the Broader Cultural Sphere
........................................................................................................................................................... 42 2.2. TRAJECTORIES OF URBANISM IN SOUTHERN TURKMENISTAN ................................................... 43
2.2.1. Growth of Urbanism: the Namazga IV and V periods......................................................... 43 2.2.2. Decline of the Urban Phase: The Namazga VI Period ........................................................ 44
2.3. MODELS OF DEVELOPMENT IN THE MURGHAB DELTA .............................................................. 45 2.3.1. Early Occupation in the Delta ............................................................................................. 45 2.3.2. A Question of Origins: Where did the Murghab Populations Come From? ....................... 46
The Elusive Case for an Indigenous Origin ................................................................................................... 46 External Origins for Murghab Settlement ...................................................................................................... 48
2.4. STRUCTURE OF THE MURGHAB SOCIETIES ................................................................................ 52 2.4.1. The Traditional Oasis Model............................................................................................... 53
The Oasis Model: Chronological Scheme and Settlement „Shift‟ .................................................................. 54 The Oasis Model: Problems and Refinements ............................................................................................... 56
2.4.2. Rethinking the Oasis Model: The AMMD model of a Continuous Alluvial Plain ............... 57 2.4.3. Interpretations of socio-political dynamics ......................................................................... 59 2.4.4. Critique of the AMMD Model.............................................................................................. 60
2.5. HYDROLOGY AND SETTLEMENT IN THE MURGHAB ................................................................... 61 2.6. THEORIES OF ARCHAEOLOGICAL SURVEY ................................................................................ 64
- 6 -
2.7. WHAT IS A „SITE‟? .................................................................................................................... 68 2.8. SPATIAL PATTERNING IN SURVEY INTERPRETATION ................................................................. 69 2.9. THE ROLE OF SCALE ................................................................................................................. 71 2.10. SURVEY DATA AS SPATIAL AND SCALAR PATTERN: GEOSTATISTICAL APPROACHES ............... 73
2.10.1. Integrating Space and Scale ........................................................................................... 74 2.10.2. Anisotropy and Directionality ........................................................................................ 75
2.11. SURVEY ON THE DESKTOP: REMOTE SENSING AND GIS ........................................................... 76 2.12. SUMMARY ................................................................................................................................. 78
CHAPTER 3. METHODOLOGIES .................................................................................................... 79
3.1. OVERVIEW ................................................................................................................................ 79 3.2. FIELD SURVEY .......................................................................................................................... 79
3.2.1. Initial Preparation ............................................................................................................... 79 3.2.2. Pilot Survey: Sampling Strategy and Selection of Initial Grids .......................................... 80 3.2.3. Fieldwalking Methodology .................................................................................................. 83
3.3. POTTERY ANALYSIS .................................................................................................................. 88 3.4. GIS AND SPATIAL ANALYSIS .................................................................................................... 89
3.4.1. Preparation of the GIS and Existing Data from the AMMD GIS ........................................ 89 3.4.2. NMDS Datasets ................................................................................................................... 90 3.4.3. Spatial Analysis ................................................................................................................... 90
3.5 REMOTE SENSING ..................................................................................................................... 91 3.5.1. IMAGERY SELECTION ...................................................................................................... 92
ASTER IMAGERY ....................................................................................................................................... 92 QUICKBIRD IMAGERY .............................................................................................................................. 93 AERIAL PHOTOGRAPHY .......................................................................................................................... 94 CORONA IMAGERY ................................................................................................................................... 94
3.5.2 Visibility and Landscape Analysis ....................................................................................... 95 3.5.3. Site Identification ................................................................................................................ 95
3.6. INTEGRATION WITH EXISTING DATA......................................................................................... 96 3.7. TEST PITS AND INVESTIGATION OF SUBSURFACE ...................................................................... 96 3.8. SUMMARY ................................................................................................................................. 97
CHAPTER 4. RESULTS: REMOTE SENSING IN THE NMDS LANDSCAPE ........................... 98
4.1. OVERVIEW ................................................................................................................................ 98 4.2. VISUAL ANALYSIS OF REMOTE SENSING DATA ...................................................................... 100
4.2.1. Aerial Photography ........................................................................................................... 100 4.2.2. CORONA Imagery ............................................................................................................. 102 4.2.3. QUICKBIRD Imagery ....................................................................................................... 104 4.2.4. ASTER Imagery ................................................................................................................. 106 4.2.5. ASTER/SRTM Digital Elevation Models ........................................................................... 107
4.3. MULTISPECTRAL ANALYSIS AND THE NORTHERN MURGHAB LANDSCAPE ............................. 113 4.3.1. Basic Image Manipulation in ASTER ................................................................................ 113 4.3.2. NDVI and Vegetation Cover .............................................................................................. 116 4.3.3. Principal Components Analysis ........................................................................................ 119
4.4. CLASSIFICATION AND VISIBILITY POTENTIAL ......................................................................... 123 4.4.1. Large-Scale Assessment of Land Type and Site Visibility ................................................. 123 4.4.2. Visibility in the Survey Area .............................................................................................. 125
Selection of Training Sites ........................................................................................................................... 125 4.5. REMOTE SENSING AND SITE IDENTIFICATION ......................................................................... 128
4.5.1. DEMS and Site Prospection .............................................................................................. 129 4.5.2. Multispectral Imagery and Site Prospection ..................................................................... 133 4.5.3. Multispectral Characteristics of AKF3, a New Site in the Central Delta ......................... 137
4.6. SUMMARY ............................................................................................................................... 139
- 7 -
CHAPTER 5. RESULTS OF FIELD SURVEY ............................................................................... 140
5.1. OVERVIEW .............................................................................................................................. 140 5.2. RECONNAISSANCE OF EGRI BOGAZ 1, 2 AND 3 ........................................................................ 140 5.3. GENERAL FIELD OBSERVATIONS IN THE NMDS SURVEY AREA ............................................. 141 5.4. OVERVIEW OF THE SURVEY DATA .......................................................................................... 143 5.5. VISIBILITY IN THE SURVEY AREA ........................................................................................... 155
5.5.1. The Effects of Land Cover on Sherd Density ..................................................................... 147 5.5.2. The Effects of Visibility on Sherd Density ......................................................................... 150
5.6. REGIONAL BREAKDOWN OF THE MATERIAL DISTRIBUTION ................................................... 155 5.6.1. Areas 1 and 1E .................................................................................................................. 155
The Nebulous Concept of Egri Bogaz 4 ...................................................................................................... 155 Other Previously Identified Sites in Area 1 ................................................................................................. 157 Material Distribution in the Central Portion of Area 1 ................................................................................. 159 Distribution of Surface Material Beyond the Area 1 Main Concentration ................................................... 160
5.6.2. The Western Settlement Region: Area 4 and the Takyr Zone ............................................ 163 5.6.3. The Intermediate Northern Zone—Areas 2 and 3 ............................................................. 166 5.6.4. The Western Survey Region: Areas 5-7 ............................................................................. 171 5.6.5. The Backcountry: Area 8 ................................................................................................... 177
5.7. SUBSURFACE ANALYSIS.......................................................................................................... 180 5.7.1. Area 4 Test Pits ................................................................................................................. 180 5.7.2. Area 1 Test Pits ................................................................................................................. 185
5.8. NMDS CULTURAL MATERIAL ................................................................................................ 187 5.8.1. General Characteristics of Diagnostic Material ............................................................... 187 5.8.2. Diagnostics by the Numbers .............................................................................................. 189 5.8.3. Abrasion and Size .............................................................................................................. 191
5.9. NMDS CHRONOLOGIES .......................................................................................................... 193 5.9.1. Early Bronze Age (Namazga IV) ....................................................................................... 193 5.9.2. Middle Bronze Age (Namazga V) ...................................................................................... 195 5.9.3. Late Bronze Age (Namazga VI) ......................................................................................... 198 5.9.4. Final Phase of the Bronze Age and Incised Coarseware .................................................. 199 5.9.5. Later Periods ..................................................................................................................... 200
5.10. PETROGRAPHIC ANALYSIS ...................................................................................................... 201 5.11. ADDITIONAL SURFACE FINDS AND MATERIALS ...................................................................... 205 5.12. SUMMARY ............................................................................................................................... 207
CHAPTER 6. RESULTS OF GIS AND SPATIAL ANALYSIS ..................................................... 209
6.1. OVERVIEW .............................................................................................................................. 209 6.2. THE BIG PICTURE: TRENDS FROM PREVIOUS MURGHAB SURVEYS ......................................... 209 6.3. GENERAL SPATIAL TRENDS IN THE NMDS DATA ................................................................... 211
6.3.1. Distributions of Material ................................................................................................... 214 6.4. „DOTS ON A MAP‟ REVISITED—SPATIAL STATISTICS IN THE SURVEY AREA .......................... 216
6.4.1. Global Statistics ................................................................................................................ 216 6.4.2. Multiscalar investigations ................................................................................................. 217 6.4.3. Local Indicators of Spatial Analysis (Getis-Ord and Local Moran’s) .............................. 222
Getis-Ord Gi* Statistic ................................................................................................................................. 222 Local Moran‟s 1 Statistic ............................................................................................................................. 225 Implications of Local Statistical Methods in Interpreting the NMDS Data ................................................. 227
6.5. DIRECTIONALITY IN THE MURGHAB LANDSCAPE ................................................................... 229 6.5.1. Visual Anisotropy .............................................................................................................. 229 6.5.2. Variography ...................................................................................................................... 233 6.5.3. Angular Wavelet Analysis ................................................................................................. 240
6.6. SUMMARY ............................................................................................................................... 244
CHAPTER 7. DISCUSSION: RE-EXAMINING SETTLEMENT IN THE NORTHERN
MURGHAB 246
7.1. OVERVIEW .............................................................................................................................. 246 7.2. SURFACE POTTERY IN A DYNAMIC LANDSCAPE...................................................................... 246

- 8 -
7.3 REVISITING THE OASIS MODEL ............................................................................................... 248 7.4 REVISITING CONTINUOUS SETTLEMENT ................................................................................. 251
7.4.1 Background Scatters.......................................................................................................... 252 7.4.2 Continuity and Settlement—Small Occupations ................................................................ 257 7.4.3. Continuity and Settlement—Larger Occupations .............................................................. 258 7.4.4. Settlement Complexes in the Murghab .............................................................................. 259
7.5 ISOLATION AND INTEGRATION ................................................................................................ 263 7.6 INTERPRETING THE SETTLEMENT PATTERN—SETTLEMENT HIERARCHIES ............................. 264 7.7 RIVER SYSTEMS AND LAND USE IN THE NORTHERN MURGHAB ............................................. 270
7.7.1 Watercourses and Occupation in the Egri Bogaz 4 Region .............................................. 271 7.7.2. Watercourses and Occupation in the Western Survey Area .............................................. 274 7.7.3 Water Accessibility ........................................................................................................... 276 7.7.4 Population and Land Use in the Study Area ..................................................................... 278
7.8. THE NORTHERN MURGHAB AS MARGINAL SETTLEMENT ENVIRONMENT ............................... 281 7.9 SURVEY IN CONTEXT: EXAMINING THE NMDS DATA IN LIGHT OF
CENTRAL ASIAN SETTLEMENT PATTERNS ................................................................................... 285 7.9.1. Comparative Intensity of Occupation ................................................................................ 285 7.9.2. Comparative Distribution of Settlement ............................................................................ 286 7.9.3. Re-Examining Settlement Trends in the Murghab ............................................................. 288
7.10 SUMMARY ............................................................................................................................... 292
CHAPTER 8. LESSONS FROM THE BLACK SANDS: METHODOLOGICAL ISSUES,
CONCLUSIONS AND NEW DIRECTIONS ...................................................................................... 293
8.1. LIMITATIONS OF RESEARCH METHODOLOGIES ....................................................................... 293 8.2. OUTCOMES IN SETTLEMENT INTERPRETATION IN THE NORTHERN MURGHAB ........................ 296
8.2.1. The NMDS Approach: Methodological Implications ........................................................ 296 8.2.2. An Interpretative Model: A Landscape of Clustered Directionality .................................. 299
Rivers and Directional Continuity ............................................................................................................... 299 The Wider Landscape and Directional Discontinuity .................................................................................. 300
8.2.3. Contributions of the NMDS survey to settlement analysis ................................................ 301 8.3. NEW DIRECTIONS: SUGGESTIONS FOR FURTHER RESEARCH ................................................... 303
REFERENCES ........................................................................................................................................ 305
APPENDICES ......................................................................................................................................... 323
Appendix A: Petrographic Analysis ................................................................................................. 323 Appendix B: Selected Small Finds ................................................................................................... 325
Appendix C: Surface Pottery Illustrations ....................................................................................... 328
- 9 -
List of Figures
Figure 1. Central Asia. .................................................................................................. 13
Figure 2. Namazga chronological horizons .................................................................... 16
Figure 3. Bronze Age Sites of the Murghab delta ........................................................... 17
Figure 4. Regions of the Murghab delta .......................................................................... 18
Figure 5. Regional Topographic Map of Central Asia .................................................... 26
Figure 6. Murghab Delta ................................................................................................. 27
Figure 7. Palaeochannels in the Murghab delta .............................................................. 29
Figure 8. Tugai-type vegetation along an irrigation canal. ............................................ 30
Figure 9. Landscape of rolling, semi-stable dunes. ......................................................... 31
Figure 10. Saxaul Vegetation in Autumn and Spring. .................................................... 31
Figure 11. Takyr surface. ................................................................................................ 32
Figure 12. Alluvial Cover. ............................................................................................. 34
Figure 13. Schematic diagram of the alluvial wedge on the Çarşamba Fan in Turkey and
its effect on site visibility ................................................................................................. 35
Figure 14. The NMDS study area in the regional context .............................................. 37
Figure 15: NMDS Study Area ......................................................................................... 38
Figure 16. Comparison of fortified architecture in the Murghab delta. ......................... 49
Figure 17. Namazga V figurines from Altyn Depe ........................................................ 50
Figure 18. Stratigraphy on Adji Kui 1 ............................................................................ 54
Figure 19. „Micro-Oases‟ in the Murghab delta. ........................................................... 56
Figure 20. Long-range transects conducted by AMMD researchers: 1995-2005 ........... 59
Figure 21. Schematic diagram of Murghab fluvial system. ........................................... 63
Figure 22. Location of Initial Grids ................................................................................ 82
Figure 23: NMDS Grid Format ....................................................................................... 84
Figure 24. Survey grid layout with superimposed analytical units. .............................. 85
Figure 25. NMDS Field Record Form ............................................................................ 87
Figure 26. Comparison of Spectral Bands for ASTER and Quickbird Imagery ............. 92
Figure 27. Satellite Imagery of the Murghab .................................................................. 94
Figure 28. Aerial Photographs of the Egri Bogaz region. ........................................... 101
Figure 29. Agricultural encroachment in the northern delta: 1964-2008.. ................... 103
Figure 30. Takyr Surface Comparison (Quickbird Panchromatic Image) .................... 105
Figure 31. Comparison of linear features in ASTER and Quickbird. .......................... 107
Figure 32. SRTM DEM of the Murghab delta. ............................................................ 109
Figure 33. Comparison of SRTM and ASTER DEMs for the study region. ............... 110
Figure 34. Slope map of NMDS survey area ................................................................ 112
Figure 35. ASTER Bands 1-9. .................................................................................... 114
Figure 36. Effects of Agricultural Masking on multiband ASTER image................... 115
Figure 37. Comparison of NDVIs from Quickbird and ASTER imagery. .................. 117
Figure 38. Relationship between sherd totals and estimated vegetation cover. .......... 119
Figure 39. PCA Bands 1, 2 and 4 ................................................................................. 120
Figure 40. Composite image of PCA bands 1-2-4. .................................................... 121
Figure 41. 5-Class Supervised Classification of ASTER/Quickbird Bands ................ 127
Figure 42. Fuzzy Peak Classification for Selected Sites ............................................... 132
Figure 43. Selected Results of Supervised Classification. ............................................ 135

- 10 -
Figure 44. Test Sites from Supervised Classification near Egri Bogaz 1 ..................... 136
Figure 45. Comparison of Image Enhancement Techniques for AKF3 ........................ 137
Figure 46. AKF3 facing southwest. .............................................................................. 138
Figure 47. Surface Pottery from AKF3 ......................................................................... 138
Figure 48. Riverine shells ............................................................................................. 143
Figure 49. Distribution of All Surface Pottery .............................................................. 144
Figure 50. Sand Cover Index for NMDS Survey Area ................................................. 151
Figure 51. Perspectives of the site of Egri Bogaz 4.. ................................................... 156
Figure 52. Topographic Map of Egri Bogaz 4 .............................................................. 157
Figure 53. NMDS material distribution in the Egri Bogaz 4 region ............................. 158
Figure 54. Namazga V type figurine recovered in Area 1 ............................................ 160
Figure 55. Area 1 and 1E Surface Distribution ............................................................. 161
Figure 56. CW 09 Surface scatter ................................................................................. 162
Figure 57. Probable Namazga V „Lug Handle‟............................................................. 162
Figure 58. Sherd distributions on the Area 4 takyr. ...................................................... 164
Figure 59. Area 2 Surface Distribution ......................................................................... 168
Figure 60. Northwestern Portion of Survey Area ......................................................... 171
Figure 61. The Western Survey Area—Areas 5-7 ........................................................ 172
Figure 62. Key Bronze Age Scatters in Western Survey Area .................................... 173
Figure 63. 'Kiln Site', facing west ................................................................................. 176
Figure 64. Brick from 'kiln site' .................................................................................... 176
Figure 65. Area 7 and Area 8 Surface Distribution ...................................................... 177
Figure 66. Surface sherds from Area 7 ......................................................................... 179
Figure 67. Area 4 Test Pits. . ........................................................................................ 181
Figure 68. Area 1 Test Pits ............................................................................................ 181
Figure 69. Test Pit 717-0 (facing north) ........................................................................ 183
Figure 70. Test Pit 717-2E (facing west) ...................................................................... 183
Figure 71. Schematic diagram of Area 4 test pits and topography ............................... 183
Figure 72. Comparative Size of Diagnostic Sherds ...................................................... 192
Figure 73. Comparative Degree of Abrasion of Diagnostic Sherds .............................. 192
Figure 74. Terracotta Anthropomorphic Figurines, Possible Namazga II-III Type. .... 194
Figure 75. Namazga V-type figurines from Area 1 and Area 5 .................................... 196
Figure 76. Distribution of MBA and LBA sherds in the Egri Bogaz 4 Region ............ 198
Figure 77. Copper or Bronze Axe head from M86 ....................................................... 206
Figure 78. Major areas of Bronze Age occupation in the survey region ...................... 212
Figure 79. Egri Bogaz area in context of other previously identified sites ................... 213
Figure 80: Comparative multiscalar analysis for Area 1 and full survey region. ........ 218
Figure 81. Ripley‟s K function (unweighted) for full NMDS survey area ................... 219
Figure 82. Local K function for NMDS survey area..................................................... 221
Figure 83: Autocorrelation over the NDMS Survey Region using the Gi* statistic. ... 223
Figure 84. Gi* surface for „offsite‟ regions .................................................................. 224
Figure 85. Relationship between diagnostics and „hotspots‟ for Area 5. .................... 225
Figure 86. Autocorrelation over the NDMS Survey Region: Local Moran‟s I............. 226
Figure 87. Comparison of Ripley‟s K and Getis Gi* for Area 5 .................................. 229
Figure 88. Synthetic model of Yaz III farm houses. .................................................... 230
Figure 89. Visible Anisotropy in the NMDS Sherd Distribution .................................. 231
Figure 90. Sherd recovery rates for walkers in Area 4. ................................................. 233
- 11 -
Figure 91. Directional Variograms of the ASTER Imagery ......................................... 235
Figure 92. Variograms of the NMDS Survey Area ...................................................... 237
Figure 93. Variogram Surface for Area 1 .................................................................... 238
Figure 94. Offsite Anisotropy ....................................................................................... 239
Figure 95. Analytical Regions for Angular Wavelet Analysis...................................... 240
Figure 96. Comparative Wavelet Analysis for Offsite Regions. ................................. 241
Figure 97. Distribution of Green Glazed Sherds in Area 2 ........................................... 243
Figure 98. Taip-Egri Bogaz 4 transect (1994)............................................................... 250
Figure 99. Comparative Settlement Complexes for Togolok and Egri Bogaz 4. ......... 262
Figure 100. Estimated site distances from Gonur ........................................................ 267
Figure 101. Settlement Density in the central delta ...................................................... 267
Figure 102. Togolok 21. ............................................................................................... 268
Figure 103. Proposed channel systems in the northern Murghab ................................ 270
Figure 104. Main Fluvial Features in Egri Bogaz 4 Region ........................................ 272
Figure 105. Schematic Diagram of Possible Land Clearance Area .............................. 273
Figure 106: Proposed channel systems in the Western Survey Area ............................ 275
- 12 -
List of Tables
Table 1. Pilot Survey Grids (2007).................................................................................. 82
Table 2. Comparison of Aerial Photography and Quickbird Imagery .......................... 105
Table 3. Comparison of ASTER and SRTM Digital Elevation Models ....................... 111
Table 4. PCA Discernibility of Selected Middle and Late Bronze Age Sites ............... 122
Table 5. Land Cover Percentage (Non-Agricultural) Based on ENVI Supervised
Classification .................................................................................................................. 124
Table 6. Description of Regions of Interest (ROIs) ..................................................... 126
Table 7. Endmember Separability of Bronze Age Training Sites (all bands) .............. 134
Table 8. Densities by Analytical Unit (sherds per 100m2) ........................................... 146
Table 9. Effects of Land Cover on Sherd Counts ......................................................... 147
Table 10. Effects of Land Cover on Sherd Counts by Analytical Unit ......................... 148
Table 11. Relationship between SCI and Sherd Totals ................................................. 152
Table 12. Relationship between SCI and Sherd Totals by sherd count categories ....... 153
Table 13. Regression Analysis--Generalised Linear Model.......................................... 154
Table 14: Area 4 Test Pits ............................................................................................. 184
Table 15: Area 1 Tes Pits .............................................................................................. 186
Table 16. Diagnostic Count by Analytical Unit ............................................................ 190
Table 17. Sample Results of Petrographic Analysis ..................................................... 204
Table 18. Sherd Counts on Takyr Surfaces ................................................................... 215
Table 19. Degree of Clustering (Clark-Evans Nearest Neighbour Test)....................... 217
Table 20. Observed Sherd Totals by Walker Line ........................................................ 232
Table 21. Population Estimates for Various Murghab Sites ......................................... 280

- 13 -
Chapter 1. Introduction
1.1. Overview
In November 2006, amid much national fanfare, a major international conference was held at the
major Bronze Age site of Gonur Depe in the former Soviet republic of Turkmenistan. The key
message of the conference, and ultimately its slogan, was that the Bronze Age region known
locally as „Margush‟ was at long last worthy of the appellation of a „New Centre of World
Civilisation‟ (State Information Agency of Turkmenistan 2006). This „Centre‟, it was
proclaimed, rivalled those of Mesopotamia, the valleys of the Nile and Indus, and China. The
festive and somewhat chaotic atmosphere accompanying this proclamation largely
overshadowed the theoretical and scientific goals of the conference—not least the significance of
what the discovery of a „previously unknown civilisation‟ might signify (G. Joraev, pers.
comm.). This symbolic certification of the ancient Murghab delta as a „Bronze Age
Civilisation‟, a full century after the first known prehistoric sites in the region were visited by
Raphael Pumpelly in the Kopet Dag foothills (Pumpelly 1908), is illustrative of the multiple
layers of inscrutability that have long veiled this important part of Turkmenistan‟s prehistory.
Figure 1. Central Asia. NASA Blue Marble Imagery
(http://earthobservatory.nasa.gov/Features/BlueMarble/)
- 14 -
To many people in Turkmenistan, Gonur Depe and Margush are synonymous concepts: the
culture is completely defined by the site. It is not difficult to see how such a notion may have
originated. Remotely situated in a relict part of the delta of the Murghab River, or Margiana in
its Hellenistic nomenclature (Rossi-Osmida 2007: 3), Gonur Depe is an anomaly (Figure 1).
Here, towards the end of the 3rd millennium BC and for reasons that are still not clear, a highly
distinctive cultural tradition appeared, apparent in many elements of its material culture.
Aspects of this unique identity included new ceramic forms, intricate stone and metalwork,
zoomorphic and geometric iconography and, perhaps most conspicuously, a new form of highly
stylised geometric architecture (Hiebert 1994a: 2). The depth of its material culture, reinforced
by the dominant scholarly opinion of Victor Sarianidi (e.g. 1990; 2002; 2005), the archaeologist
who discovered the site, has enshrined Gonur both in public and academic consciousness as the
type-site for an extraordinarily rich, intriguing, and elusive culture.
In reality, site and culture are rarely synonymous. While Gonur is certainly the largest known
Bronze Age settlement in the Murghab delta, and the richest in terms of the diversity and
craftsmanship of its material (Sarianidi 2005), it is only one of hundreds of sites in the region,
the vast majority of which remain unexplored. Several of the excavated sites, however, have
revealed material and architectural similarities, and based on the distinctiveness of the material
in the Murghab as well as the near-concurrent appearance of a similar material culture as far
away as the region known as Bactria, comprising southern Uzbekistan and northern Afghanistan,
Sarianidi has proposed a single complex for the entire region (Sarianidi 1990: 74). This cultural
entity, which he refers to as the Bactria Margiana Archaeological Complex (BMAC), has
become a pervasive concept in the archaeological literature. However, in the rush to interpret
the specific cultural phenomenon of the BMAC, with its perceived cultural uniformity, its rapid
rise to prominence and the extent of its influence, archaeologists have in many ways missed
opportunities for a fuller study of the Bronze Age in general, of which the BMAC represents
only one aspect.

- 15 -
1.2. Barriers to Archaeological Research in Turkmenistan
The path to a clear interpretation of the Bronze Age in the Murghab delta has been in many
respects even more labyrinthine than is usual in archaeological investigations. Perhaps the most
obvious complication is a political one. Turkmenistan is not an easily accessible country, and
bureaucratic issues may plague even well-established projects. Moreover, even two decades
after the fall of the Soviet Union, vestiges of the Iron Curtain still remain. Academia was not
immune to the tensions of the Cold War, and even when academic paths finally crossed in the
mid-1980s, aided by the new spirit of camaraderie during the perestroika era (Lamberg-
Karlovsky, foreward, Hiebert 1994a), the disconnect in methods and interpretations remained a
formidable impediment to collaborative research. Compounding this disconnect was a
significant linguistic barrier. Although Russian and Central Asian archaeologists published an
enormous body of research, the difficulty of the Russian language and the impediments to
obtaining the relevant sources relegated this work to the isolated sphere of Soviet scholarship
rather than fostering a fruitful academic discourse with archaeologists outside the USSR
(Lamberg-Karlovsky 2003). Even within collaborative projects today, vestiges of Soviet-
Western duality in both theory and method remain pervasive. Theoretical interpretations during
the Soviet era were drawn largely from Marxist ideologies, and the consequent focus on the
development of stratified class structures within prehistoric society largely informed theoretical
debate with respect to urbanism and complexity (Diakonoff et al. 1991; Kohl 2007; McGuire
1997). Methodologies, as well, varied widely between West and East, and different approaches
to C14
dating have resulted in substantial chronological differences, often spanning a half-
millennium, although reconciliation between Russian and Western calibrations has increased in
recent years (Kohl 2007: 19).
Political and academic barriers, however, have not been the only impediments to an
understanding of the Murghab Bronze Age. Poor site visibility is a major problem in the region
(see section 1.8.4), attributable to several factors. The explosion in urban and agricultural
development in the past several decades, largely precipitated by the construction of the Karakum
Canal in the 1950‟s and 1960‟s, has obliterated many archaeological sites and severely restricted
the recovery potential of others. Another problem is that the aggradation of the Murghab River
in antiquity has resulted in alluvial deposition which may be several metres deep in much of the
delta (Cremaschi 1998: also see section 1.8.4). Further north where the alluvium may be
expected to be less thick and agriculture less pervasive, sites may be easier to see, although these
- 16 -
are often severely deflated (Hiebert 1994a: 6). Moreover, heavy dunes cover much of the
landscape, presenting an additional barrier to site visibility (Cattani et al. 2008: 42).
1.3. Overview of Research in the Murghab delta
Research into the Bronze Age in the Murghab has largely proceeded at one of two conceptual
levels which may be considered macro-scale and micro-scale. At the macro-level, the grand
surveys conducted under the auspices of the Southern Turkmen Archaeological Expedition
(YuTake) in the 1940s and 1950s recalled S.P. Tolstov‟s highly influential work in Khoresmia
(Tolstov 1948), a prescient body of research that examined not only settlement but also its
significance in the context of complex fluvial landscapes (see also Adams‟ praise of this work
(Adams 1965)). As a result of the YuTake surveys, many new sites were discovered along the
foothills of the Kopet Dag mountains and as well as the Murghab delta, effectively placing the
Bronze Age civilisations of the region on the archaeological map (Masson 1988: 1).
Development of these societies was seen by many researchers to follow similar trajectories, and
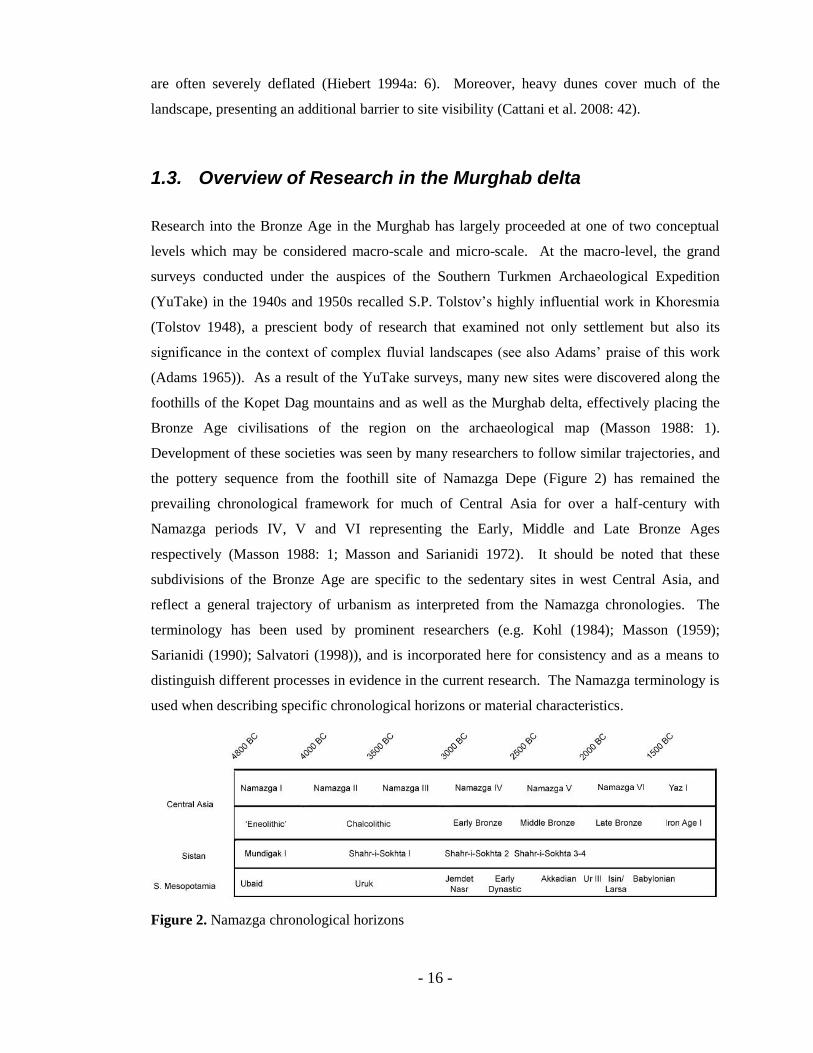
the pottery sequence from the foothill site of Namazga Depe (Figure 2) has remained the
prevailing chronological framework for much of Central Asia for over a half-century with
Namazga periods IV, V and VI representing the Early, Middle and Late Bronze Ages
respectively (Masson 1988: 1; Masson and Sarianidi 1972). It should be noted that these
subdivisions of the Bronze Age are specific to the sedentary sites in west Central Asia, and
reflect a general trajectory of urbanism as interpreted from the Namazga chronologies. The
terminology has been used by prominent researchers (e.g. Kohl (1984); Masson (1959);
Sarianidi (1990); Salvatori (1998)), and is incorporated here for consistency and as a means to
distinguish different processes in evidence in the current research. The Namazga terminology is
used when describing specific chronological horizons or material characteristics.
Figure 2. Namazga chronological horizons
- 17 -
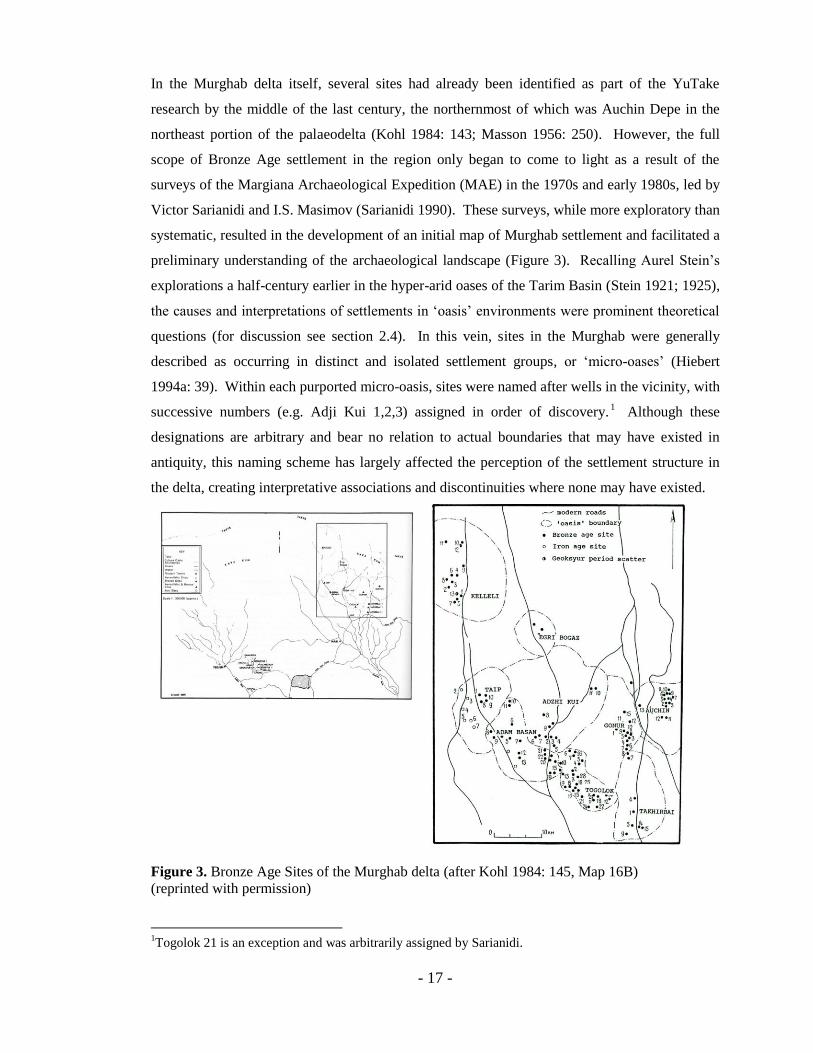
In the Murghab delta itself, several sites had already been identified as part of the YuTake
research by the middle of the last century, the northernmost of which was Auchin Depe in the
northeast portion of the palaeodelta (Kohl 1984: 143; Masson 1956: 250). However, the full
scope of Bronze Age settlement in the region only began to come to light as a result of the
surveys of the Margiana Archaeological Expedition (MAE) in the 1970s and early 1980s, led by
Victor Sarianidi and I.S. Masimov (Sarianidi 1990). These surveys, while more exploratory than
systematic, resulted in the development of an initial map of Murghab settlement and facilitated a
preliminary understanding of the archaeological landscape (Figure 3). Recalling Aurel Stein‟s
explorations a half-century earlier in the hyper-arid oases of the Tarim Basin (Stein 1921; 1925),
the causes and interpretations of settlements in „oasis‟ environments were prominent theoretical
questions (for discussion see section 2.4). In this vein, sites in the Murghab were generally
described as occurring in distinct and isolated settlement groups, or „micro-oases‟ (Hiebert
1994a: 39). Within each purported micro-oasis, sites were named after wells in the vicinity, with
successive numbers (e.g. Adji Kui 1,2,3) assigned in order of discovery.1 Although these
designations are arbitrary and bear no relation to actual boundaries that may have existed in
antiquity, this naming scheme has largely affected the perception of the settlement structure in
the delta, creating interpretative associations and discontinuities where none may have existed.
Figure 3. Bronze Age Sites of the Murghab delta (after Kohl 1984: 145, Map 16B)
(reprinted with permission)
1Togolok 21 is an exception and was arbitrarily assigned by Sarianidi.
- 18 -
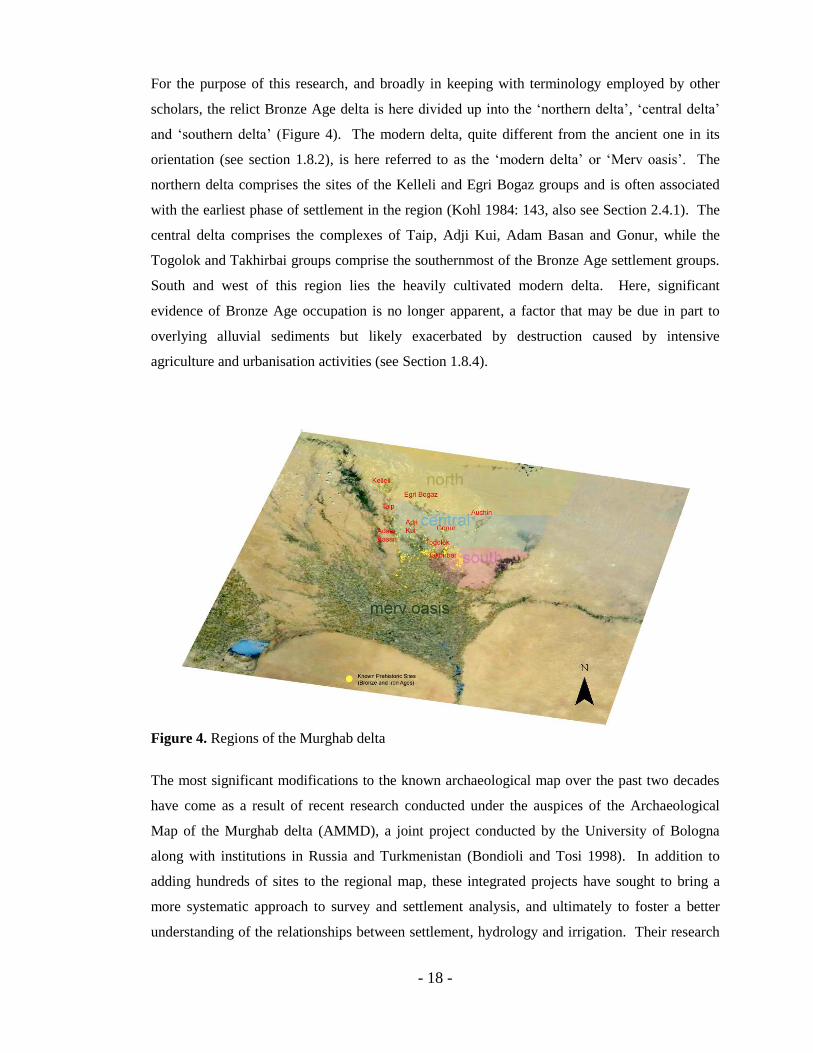
For the purpose of this research, and broadly in keeping with terminology employed by other
scholars, the relict Bronze Age delta is here divided up into the „northern delta‟, „central delta‟
and „southern delta‟ (Figure 4). The modern delta, quite different from the ancient one in its
orientation (see section 1.8.2), is here referred to as the „modern delta‟ or „Merv oasis‟. The
northern delta comprises the sites of the Kelleli and Egri Bogaz groups and is often associated
with the earliest phase of settlement in the region (Kohl 1984: 143, also see Section 2.4.1). The
central delta comprises the complexes of Taip, Adji Kui, Adam Basan and Gonur, while the
Togolok and Takhirbai groups comprise the southernmost of the Bronze Age settlement groups.
South and west of this region lies the heavily cultivated modern delta. Here, significant
evidence of Bronze Age occupation is no longer apparent, a factor that may be due in part to
overlying alluvial sediments but likely exacerbated by destruction caused by intensive
agriculture and urbanisation activities (see Section 1.8.4).
Figure 4. Regions of the Murghab delta
The most significant modifications to the known archaeological map over the past two decades
have come as a result of recent research conducted under the auspices of the Archaeological
Map of the Murghab delta (AMMD), a joint project conducted by the University of Bologna
along with institutions in Russia and Turkmenistan (Bondioli and Tosi 1998). In addition to
adding hundreds of sites to the regional map, these integrated projects have sought to bring a
more systematic approach to survey and settlement analysis, and ultimately to foster a better
understanding of the relationships between settlement, hydrology and irrigation. Their research

- 19 -
has culminated in a much clearer understanding of the geomorphology of the palaeodelta and
diachronic changes in settlement patterns from the Middle Bronze Age through the Islamic
period (Cattani and Salvatori 2008).
Punctuating these large-scale surveys has been a series of much more targeted investigations, the
micro-scale of Murghab research. These have generally focused on large sites with monumental
architecture although some investigations into finer aspects of local stratigraphy and domestic
contexts have been conducted (e.g. Hiebert 1994a: 29-38; Salvatori 2002; Cattani et al. 2008b).
Several of these investigations have developed into major, multi-year or even decades-long
excavations oriented towards the full horizontal exposure of monumental structures—and in
some cases entire cities (Sarianidi 1990; cf McGuire 1997: 59-62). While some of the more
recent projects have addressed more localised settlement landscapes and off-site pottery
distributions (see Cleuziou et al. 1998), these have been small-scale investigations, several of
which are only at a preliminary stage of analysis (B. Cerasetti, pers. comm.). The disconnect
between these two scales of research has resulted in a kind of interpolated understanding of the
Murghab Bronze Age, where concentrated pockets of incomplete site data have been draped
against a poorly understood regional backdrop. The results of such guesswork can be seen in the
myriad of conflicting theories surrounding the origin, development, and decline of complex
societies in the Murghab delta (see section 2.3.2., also P'yankova 1994).
This focus on a few archaeological places of interest within the vast landscape of the Murghab
delta highlights a lack of understanding at any number of regional levels. Largely absent from
research agendas has been the investigation of the smaller communities that might clarify the
nature not only of occupation, but also of settlement interaction. Indeed, sites beyond the
immediate boundaries of the larger centres have received scant attention in the literature, and
V.M. Masson treats these sites somewhat dismissively as small, non-urban entities that „do not
usually present traces of commercial activity‟ (Masson 1999: 342). When they do appear in the
literature, the descriptions are often limited to approximate measurements of the extent of
surface scatter, identification of occasional architectural or production features, and any small
finds that occur in the vicinity (e.g. Sarianidi 1990; Udeumuradov 1993). The extreme under-
emphasis on these smaller sites has yielded a lopsided interpretation of the Murghab drawn
largely from the excavation of a few substantial sites, Gonur Depe foremost among them.
- 20 -
1.4 The Northern Murghab and the Egri Bogaz Sites: Introducing the Research Agenda
If the Murghab as a whole is reluctant to yield its secrets, the northern delta is practically mute.
With the exception of two significant excavation programmes in the Kelleli region in the late
1970‟s and early 1980‟s (Udeumuradov 1993: 13-14; Masimov and Kohl 1981), research in the
north has been sporadic as archaeological interest has focused on the more accessible sites in the
central and southern regions of the ancient delta. Moreover, if the recent maps are any reflection
of archaeological reality, much of the region appears to be almost completely devoid of Bronze
Age occupation. While hundreds of new sites have been identified in the delta over the past two
decades, fewer than a dozen have been added to the known archaeological landscape in the north
(see appendices in Bondioli and Tosi 1998). This lack of knowledge, however, does not mean
that the northern Murghab has completely fallen below the radar of current research. The initial
plan of the AMMD investigations, in fact, had incorporated substantial work in the northern
delta. Unfortunately, while the region was recognised as potentially integral to the study of the
relationships between Murghab settlement and landscape, the visibility in the north was largely
written off as too obtrusive to offer a clear view of settlement factors in this region (Cattani and
Salvatori 2008). Nonetheless, a series of transects was conducted in the region that shed some
light on the extent of the distribution of material and occupation (see sections 2.4.2 and 7.4).
AMMD researchers returned to the north in 2009, this time conducting a small-scale but
intensive survey of the Auchin region (B. Cerasetti, pers. comm.). Unlike earlier investigations
in this region, this work has focused much more on spatial patterning and the distributions of
surface material. While analysis is preliminary and remains unpublished, it may substantially
improve the understanding of settlement in the northeastern portion of the delta.
Essentially, then, an enormous region of potential archaeological interest has been limited to a
few concentrated studies in the northwestern and northeastern portions of the palaeodelta,
pockets of investigation separated by nearly 50 km. Between these, with the exception of the
few additional sites discovered by the AMMD surveys noted above, the known archaeological
landscape is almost empty, with one conspicuous exception. About halfway between the Auchin
and Kelleli areas lie the few isolated sites of the Egri Bogaz group, anomalously located in what
appears to be, for all intents and purposes, the middle of nowhere. Very little is known about
these communities, and with the exception of their locations and a few isolated small finds
(Salvatori 2008a), almost nothing has been published. These sites have variously been
associated with the Middle or Late Bronze Age, and Udeumuradov has suggested that they may
- 21 -
represent a transitional phase between the earlier „Kelleli‟ phase, associated with the Middle
Bronze Age, and later occupations (Udeumuradov 1986, cited in Hiebert 1994a; Kohl 1984:
143). Evidence for such dating schemes is extremely limited, however, based on cursory
investigations of small-scale excavations and surface material, and discussions pertaining to
chronologies will be revisited in later chapters. The poor understanding of the archaeology in
the Egri Bogaz region is therefore unfortunate, since the presence of substantial archaeological
material in a pivotal location between Kelleli and the central delta suggests that this area may
reveal important information about regional settlement and its relationship with the better-known
sites further south. Equally important is what the apparent settlement gap may say about the
region, and whether it represents a true absence of occupation in the northern Murghab or is
instead due to issues of poor visibility or lack of investigation.
Such inquiries, in order to be successful, require a significant understanding of the complexities
of the landscape both ancient and modern, and this thesis builds upon a substantial foundation of
research devoted to understanding the nature of the geomorphology, land cover and soils in the
delta. In this vein, Suslov‟s seminal work (1961) provides a broad understanding of the
geomorphological character of the Karakum in the context of the diverse Central Asian
landscapes. Of particular interest to the current study is the character of the local
geomorphology, particularly the soil crusts known as takyrs (see description in section 1.8.3).
The genesis and development of these soils were the subject of several influential investigations
by N.I. Bazilivich (1956), and the refinement of subsurface profiles has recently been conducted
by Lebedeva-Verba and Gerasimova (2010). From an archaeological perspectibve, Lisitsina
(1973; 1976) and Lyapin (1991) have examined these features with respect to subsurface
archaeology, and each has provided comparative studies centred on the Murghab and Tedjen
deltas (also see sections 1.8.2 and 7.9). From the perspective of irrigation, the effects of
salinisation on agricultural potential have been explored by researchers such as Lavrov and
Kostyuchenko (1954). Anthropogenic effects of both pastoralism and agriculture (Fleskins et al.
2007) have been examined in the region, and these will be further addressed in Chapters 5 and 7.
More recently, researchers associated with the Institute for Desert Research in Ashgabat and the
Ben Gurion Institute in Israel have incorporated remote sensing technologies to examine these
landforms in the Karakum (e.g. Orlovsky et al. 2004). The current research seeks to deepen
these understandings and provide a closer look at the relationships between these features and
the surface distribution of Bronze Age material.
- 22 -
At issue, however, is the definition of both a scope of research and a starting point for analysis.
Egri Bogaz represents a largely unknown region in a largely unknown landscape, so it is
essential to assess not only the degree to which such a region may be expected to provide
answers to research questions, but how to ask such questions in the first place. If a more
conventional, „top-down‟ model were to be followed, one approach may be to systematically
survey an extensive region of the northern delta (see section 2.6). However, it is not clear that
such an approach would substantially broaden what the Russian and Italian surveys have already
contributed to our knowledge of the area. While the broad scope of settlement in the north is
certainly not yet known, there is much to be learned at narrower analytical scales—about local
and regional settlement interaction, material distribution, and survey potential that may only add
to the understanding of patterns of occupation in the north, but that lends itself well to the
limited scope and resources of doctoral research. Studies at these smaller scales are sorely
lacking in the Murghab, and are essential to understanding settlement integration, not just
settlement location.
With respect to a specific study location, it is essential to select an area where archaeological
information is likely to exist: a „stab in the dark‟ in this largely unexplored landscape is not a
viable option. The wealth of surface material recovered throughout the Egri Bogaz region
therefore implies a promising study area. While the research is not an investigation of a single
archaeological site per se, it centres on the landscape surrounding the northernmost and one of
the more recently discovered sites in the region, Egri Bogaz 4 (references in Bondioli and Tosi
1998: appendices, AMMD GIS system and Turkmen Ministry of Culture documents: see
Chapter 5). Unlike the other Egri Bogaz sites, Egri Bogaz 4 has not been affected by
agricultural development. Additionally, the varied landscape and presence of substantial scatters
of surface material over a large region, several of which have been designated as separate sites,
offer an excellent research context in which to explore variability both in landscape and
occupation. This research is thus not the study of a site but of a settlement landscape, intended
to chart a middle course between the macro- and micro- extremes in interpretive scale outlined
above. Through intensive field survey, the research focuses on settlement patterns at scales that
fall between site and region, in what may be considered an investigation of sub-regional
settlement patterning and interactions.

- 23 -
1.5. Research Questions
The research described in this thesis is hereafter referred to as the Northern Murghab Delta
Survey (NMDS), of which the central research question may be stated as follows:
How, in a highly obstructed archaeological landscape, can intensive survey be used to
investigate the archaeological and post-depositional processes that shaped the distribution
of surface material in the northern Murghab, and to what extent can such a survey
contribute to the broader understanding of settlement dynamics in the delta region?
In order to address this question more fully, the research may be further broken down into a set
of investigative goals that centre on the conjunction of spatial and scalar investigations within a
complex and variable landscape:
What is the relationship between settlement and the distribution of material in the
northern Murghab?
How may these relationships be used to explore the role of this region with respect to
broader settlement structure in the Murghab?
To what extent can intensive survey provide a better understanding of local and regional
interactions between settlements? Are settlements best treated as isolated entities or as
part of an integrated settlement hierarchy? Might a different model be more applicable?
To what extent can agricultural or economic strategies be inferred?
How can we better understand the concept of „site‟ with respect to surface scatters in the
northern Murghab?
To what extent can spatial analysis and remote sensing be used to supplement survey in
the Murghab, and perhaps elsewhere in Central Asia?
How effective have previous surveys been in exploring the nature of Murghab
settlement and how may they be improved?
In this reconciliation between the understanding of regional complexity in the northern Murghab
and field survey at the conceptual level, my research incorporates three distinct yet closely
related analytical frameworks: spatial distribution, scale and landscape. While any of these
alone could certainly serve as the subject of intensive study, the convergence of these concepts is
a powerful means to understand an almost entirely unknown archaeological landscape. In order
to bring these disparate approaches together, this study makes use of a range of technological
- 24 -
and statistical tools in addition to field survey, detailed in Chapter 3. Ultimately, it has become
possible to examine the concept of „site‟ itself as it pertains to Bronze Age occupation in the
Murghab, and to offer a much deeper perspective on the Bronze Age settlement landscape.
1.6 Structure of Thesis
In following this trajectory, the remainder of this chapter provides a general overview of the
study area. Chapter 2 then presents several of the theoretical questions that have guided both
past and present research in the region. The second part of the chapter entails a theoretical
assessment of the methodological approaches. These methodologies are described in detail in
Chapter 3. Chapters 4 through 6 comprise the bulk of the research results, and are structured to
develop an integrated theme of survey within a landscape: Chapter 4 presents the results of the
remote sensing analysis, and evaluates its implications in terms of visibility and site and
landscape interpretation. Following this exposition on the survey environment, Chapter 5 then
presents the results of the fieldwalking survey as well as a discussion on the material remains. A
spatial perspective is introduced in Chapter 6, which draws on statistical interpretation to further
explore the data from the previous two chapters. Analysis and discussion of the results comprise
Chapter 7, which endeavours to integrate the main themes of spatial patterning, scale and
landscape in a discussion of the archaeological significance of the settlement pattern. The final
chapter takes a step back, assessing the results of past and present survey work, the limitations of
these projects, and their ultimate implications for understanding settlement in the delta.
1.7. Limitations
This research is largely exploratory in nature, designed to gain insights into a portion of the
Murghab delta that continues to elude research agendas. Ultimately, this thesis is primarily
about settlement, and the degree to which intensive survey can address questions concerning
occupation and complexity of the settlement pattern. To this end, and keeping in mind the
difficult terrain with respect to archaeological visibility and overall accessibility, the research
employs several very different but interrelated techniques, outlined in detail in Chapter 3. Each
of these could alone constitute years of research. However, in an effort to address a major gap in
the knowledge of the region, the methods are employed as tools to supplement the primary
dataset provided by the survey itself, both in planning and analysis.
- 25 -
With respect to the choice of a survey location, Egri Bogaz 4 may seem at first to be an odd
selection. As noted above, very little is known about the site itself. Although classified as a
„site‟, Egri Bogaz 4 is defined only by surface scatters and the presence of a mound in the
vicinity although, as will be seen in later chapters, the relationship between scatter and
topography is far from clear. Clearly defined limits of occupation, architecture, production or
consumption areas—all are absent. Although inferences may be drawn from knowledge of other
sites in the Murghab, as well as the few surface artefacts already collected in the area, Egri
Bogaz 4 remains unexcavated, and great caution and scepticism must be used when attempting
to draw conclusions from surface distributions. However, these challenges bolster the choice of
this region for a study of a small-scale archaeological landscape. Without overwhelming
preconceived notions of what settlement patterning should look like in the northern Murghab,
the material distribution can more easily speak for itself, allowing patterns to be interpreted
rather than determined by known settlement entities. Moreover, the better-known settlement
areas of Kelleli and Auchin are further away from the central delta than Egri Bogaz, and less
suited to a more integrated assessment of how a small-scale settlement pattern may fit into a
larger deltaic one. Furthermore, the apparent isolation of the region on the known settlement
maps may offer clues not only to the settlement patterning, but to the nature of archaeological
recovery in a complex environment.
1.8 Geology and Climate of the Murghab delta
1.8.1. Geological Setting
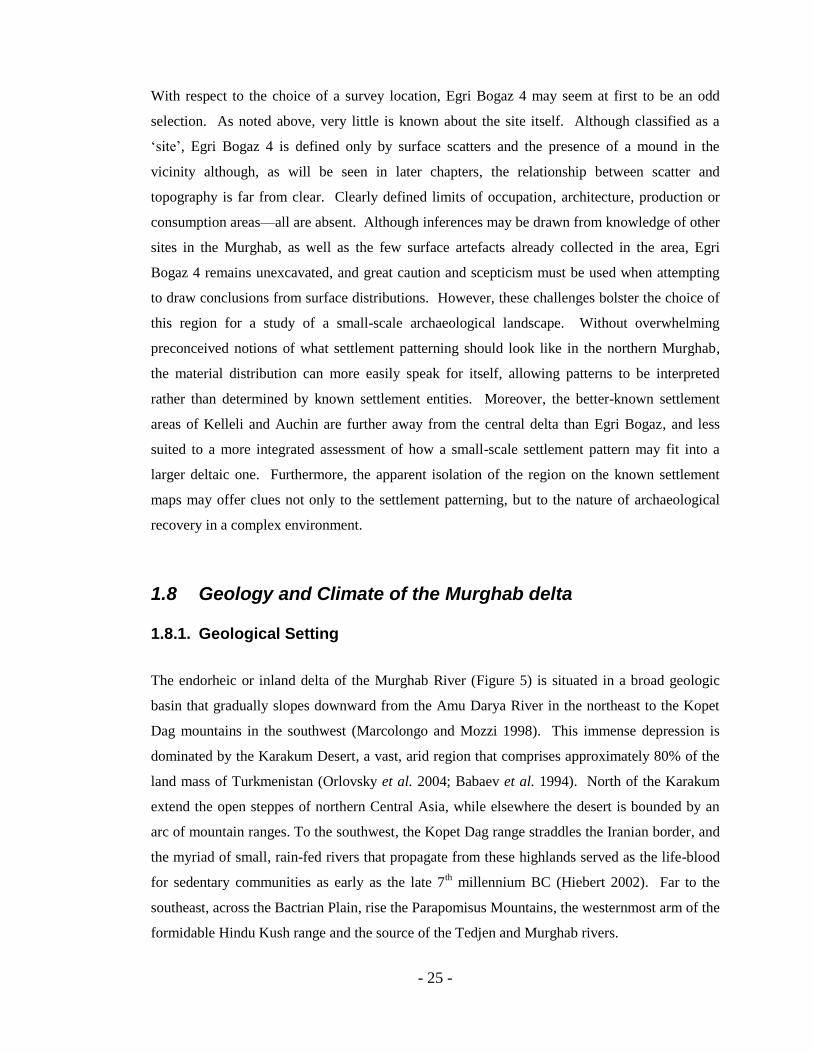
The endorheic or inland delta of the Murghab River (Figure 5) is situated in a broad geologic
basin that gradually slopes downward from the Amu Darya River in the northeast to the Kopet
Dag mountains in the southwest (Marcolongo and Mozzi 1998). This immense depression is
dominated by the Karakum Desert, a vast, arid region that comprises approximately 80% of the
land mass of Turkmenistan (Orlovsky et al. 2004; Babaev et al. 1994). North of the Karakum
extend the open steppes of northern Central Asia, while elsewhere the desert is bounded by an
arc of mountain ranges. To the southwest, the Kopet Dag range straddles the Iranian border, and
the myriad of small, rain-fed rivers that propagate from these highlands served as the life-blood
for sedentary communities as early as the late 7th millennium BC (Hiebert 2002). Far to the
southeast, across the Bactrian Plain, rise the Parapomisus Mountains, the westernmost arm of the
formidable Hindu Kush range and the source of the Tedjen and Murghab rivers.
- 26 -
Figure 5. Regional Topographic Map of Central Asia (NASA Blue Marble Imagery)
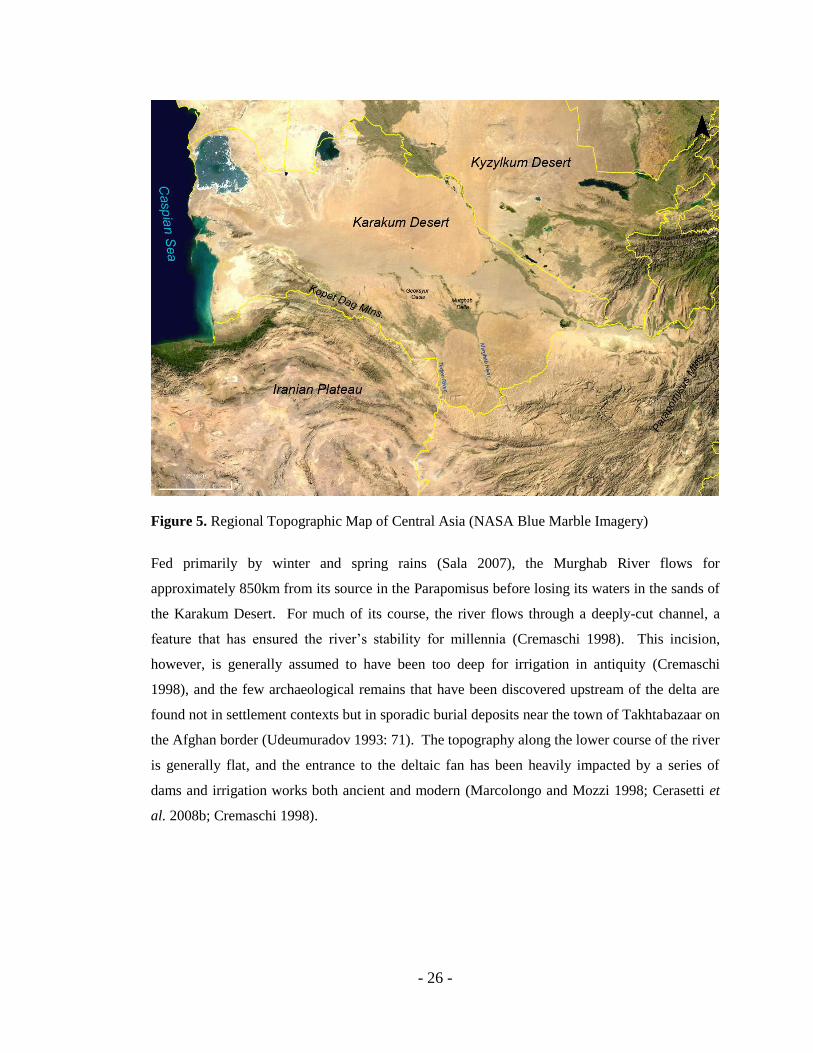
Fed primarily by winter and spring rains (Sala 2007), the Murghab River flows for
approximately 850km from its source in the Parapomisus before losing its waters in the sands of
the Karakum Desert. For much of its course, the river flows through a deeply-cut channel, a
feature that has ensured the river‟s stability for millennia (Cremaschi 1998). This incision,
however, is generally assumed to have been too deep for irrigation in antiquity (Cremaschi
1998), and the few archaeological remains that have been discovered upstream of the delta are
found not in settlement contexts but in sporadic burial deposits near the town of Takhtabazaar on
the Afghan border (Udeumuradov 1993: 71). The topography along the lower course of the river
is generally flat, and the entrance to the deltaic fan has been heavily impacted by a series of
dams and irrigation works both ancient and modern (Marcolongo and Mozzi 1998; Cerasetti et
al. 2008b; Cremaschi 1998).
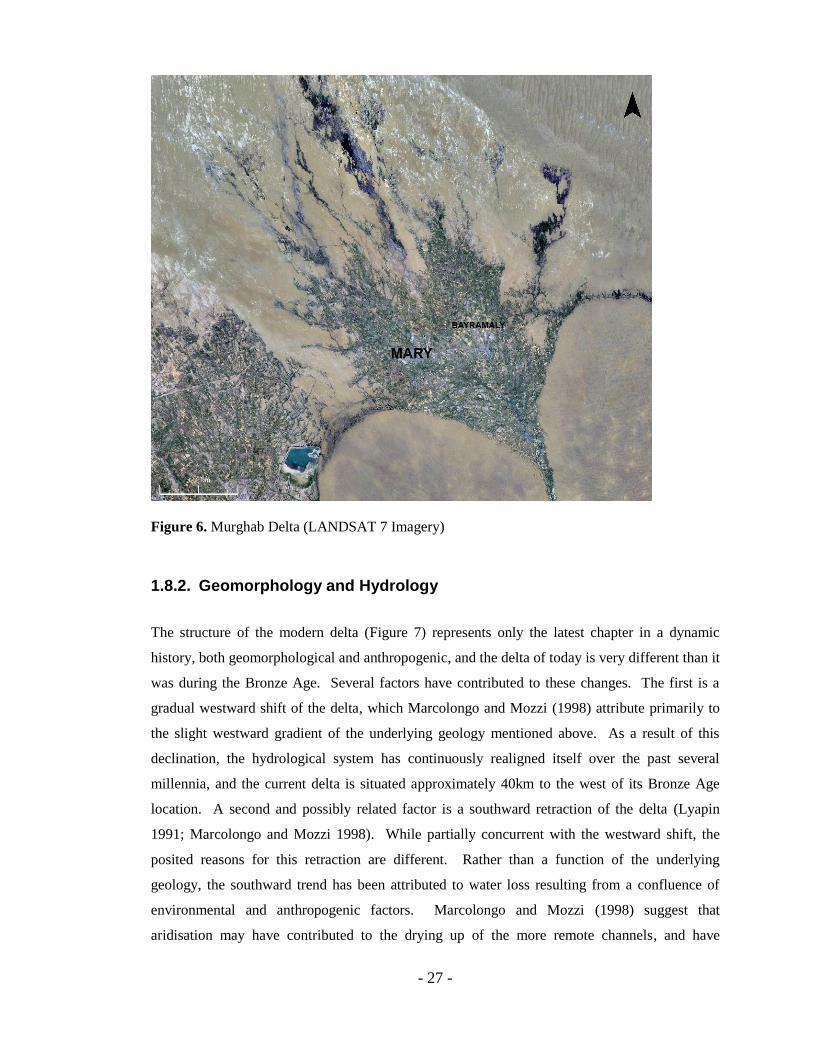
- 27 -
Figure 6. Murghab Delta (LANDSAT 7 Imagery)
1.8.2. Geomorphology and Hydrology
The structure of the modern delta (Figure 7) represents only the latest chapter in a dynamic
history, both geomorphological and anthropogenic, and the delta of today is very different than it
was during the Bronze Age. Several factors have contributed to these changes. The first is a
gradual westward shift of the delta, which Marcolongo and Mozzi (1998) attribute primarily to
the slight westward gradient of the underlying geology mentioned above. As a result of this
declination, the hydrological system has continuously realigned itself over the past several
millennia, and the current delta is situated approximately 40km to the west of its Bronze Age
location. A second and possibly related factor is a southward retraction of the delta (Lyapin
1991; Marcolongo and Mozzi 1998). While partially concurrent with the westward shift, the
posited reasons for this retraction are different. Rather than a function of the underlying
geology, the southward trend has been attributed to water loss resulting from a confluence of
environmental and anthropogenic factors. Marcolongo and Mozzi (1998) suggest that
aridisation may have contributed to the drying up of the more remote channels, and have
- 28 -
attributed both this process as well as a much earlier recession of the delta to similar climatic
variations. Based in part on Ehlers‟ assessment of water levels in the Caspian Sea (Ehlers 1971),
they see the first retraction as having ended by the early fourth millennium, after which a moist
period persisted until around 2000 BC, followed by a second period of desiccation and water
loss that, in tandem with anthropogenic modifications, has resulted in the delta of today. They
associate the Bronze Age occupations with the moist period, in general concurrence with
Lyapin‟s assessment that the extent of the late 3rd
millennium delta may be broadly inferred from
the Bronze Age settlement pattern (Lyapin 1991). From this period onwards, changes in water
management since the Iron Age and possibly earlier have played a role in altering the channel
network, a process that likely occurred concurrently with a process of rapidly encroaching
desertification towards the middle of the 2nd
millennium BC (Cremaschi 1998). This general
climatic deterioration, perhaps best documented archaeologically in southwest Asia (e.g. Weiss
1993) and the Levant (e.g. Rosen 2007), has been the subject of significant discussion and need
not be revisited here (also see Staubwasser et al. 2003 for discussion on oxygen isotope data in
south Asia). The implications of these changes for the northern Murghab delta will be further
addressed in sections 7.9-7.10.
The changing nature of the Murghab delta has hindered an accurate reconstruction of the ancient
hydrological regime, a problem that has been exacerbated by recent urbanism and agricultural
development. Fortunately, recent research has begun to address this problem. Employing a
combination of satellite imagery, aerial photography and field investigations, researchers
associated with the AMMD project have begun to reconstruct the palaeochannel network
(Cremaschi 1998; Cerasetti and Mauri 2002). With the assistance of satellite imagery, this
research has fostered a deeper understanding of the underlying topography and general
hydrological changes. While investigation of the overall infrastructure of the palaeodelta has
been extensive, investigation of the specific palaeochannels has been more targeted, and the only
published map of these watercourses covers a limited area extending from the limits of the
agricultural zone towards the northeastern part of the relict delta (Figure 7). South of this zone,
heavy agriculture has obliterated most traces of the pre-modern system of natural channels,
although significant research has been devoted to the anthropogenic development of the canal
systems (Cerasetti et al. 2008b). Largely absent from these hydrological investigations has been
any substantial investigation of the northern delta, a situation due both to the restrictive sand
cover in the region (see below) as well as the focus of archaeological research agendas
elsewhere (A. Ninfo, B. Cerasetti, pers. comm.). An unpublished northern extension to the
channel map exists in the AMMD GIS system, although these channels are based almost entirely
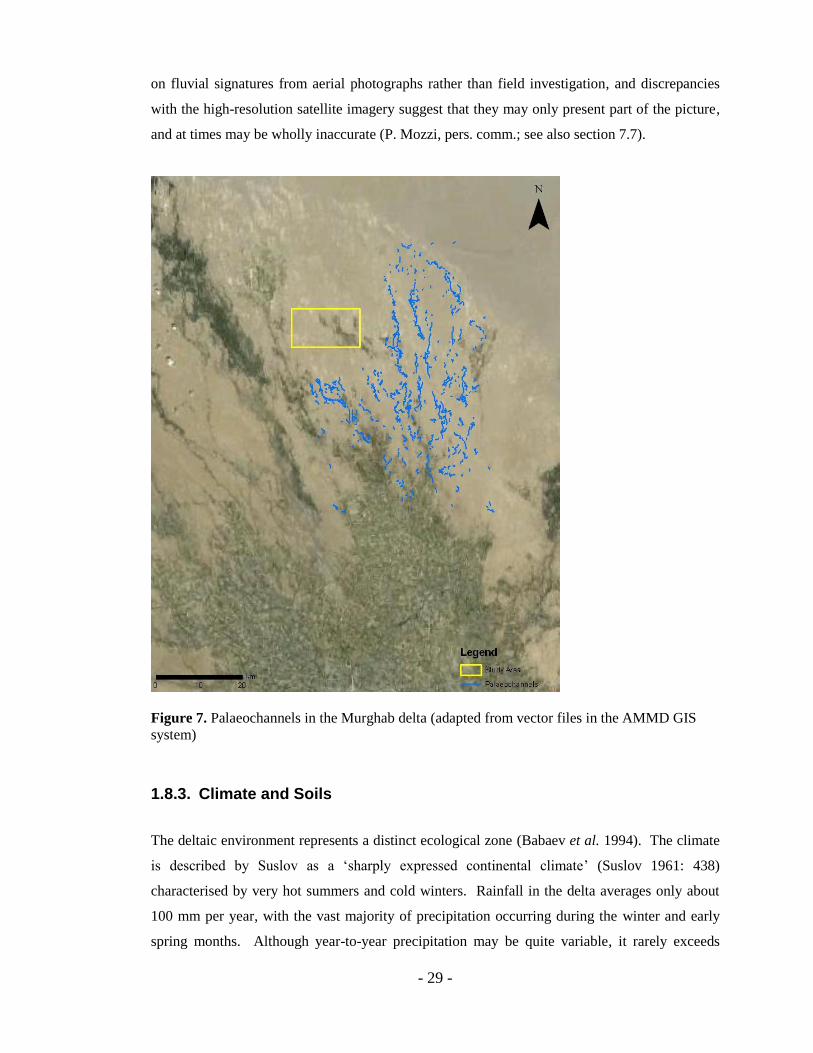
- 29 -
on fluvial signatures from aerial photographs rather than field investigation, and discrepancies
with the high-resolution satellite imagery suggest that they may only present part of the picture,
and at times may be wholly inaccurate (P. Mozzi, pers. comm.; see also section 7.7).
Figure 7. Palaeochannels in the Murghab delta (adapted from vector files in the AMMD GIS
system)
1.8.3. Climate and Soils
The deltaic environment represents a distinct ecological zone (Babaev et al. 1994). The climate
is described by Suslov as a „sharply expressed continental climate‟ (Suslov 1961: 438)
characterised by very hot summers and cold winters. Rainfall in the delta averages only about
100 mm per year, with the vast majority of precipitation occurring during the winter and early
spring months. Although year-to-year precipitation may be quite variable, it rarely exceeds
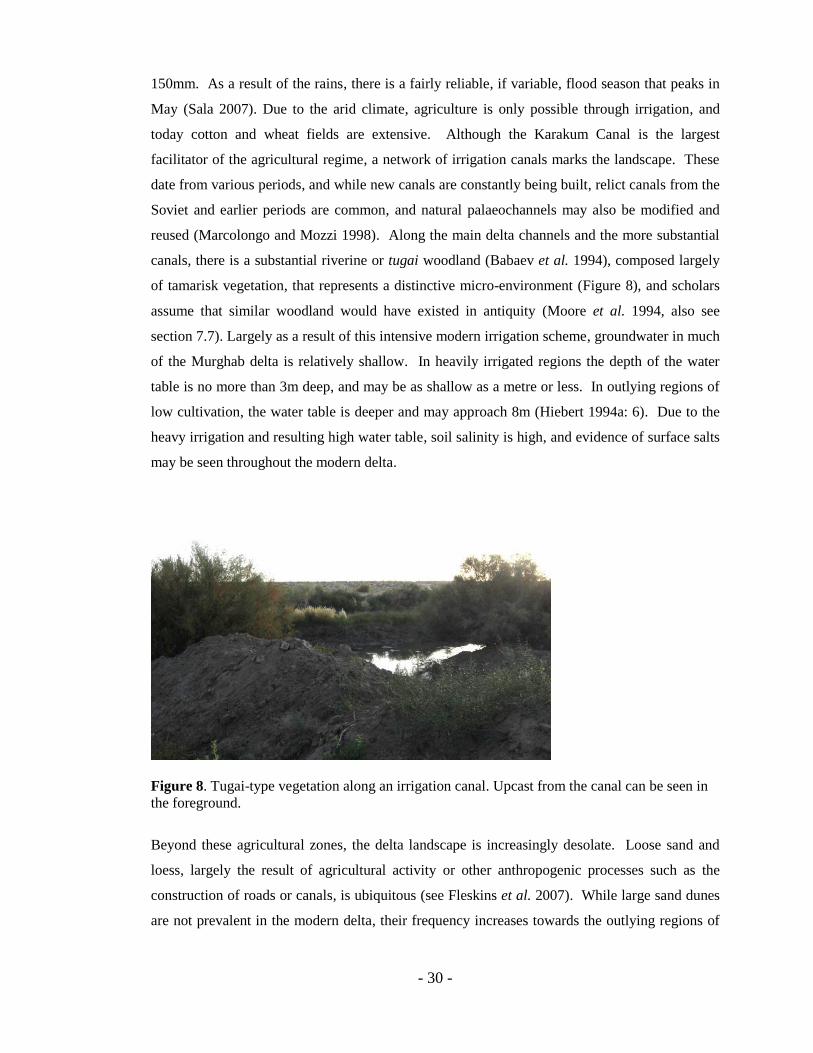
- 30 -
150mm. As a result of the rains, there is a fairly reliable, if variable, flood season that peaks in
May (Sala 2007). Due to the arid climate, agriculture is only possible through irrigation, and
today cotton and wheat fields are extensive. Although the Karakum Canal is the largest
facilitator of the agricultural regime, a network of irrigation canals marks the landscape. These
date from various periods, and while new canals are constantly being built, relict canals from the
Soviet and earlier periods are common, and natural palaeochannels may also be modified and
reused (Marcolongo and Mozzi 1998). Along the main delta channels and the more substantial
canals, there is a substantial riverine or tugai woodland (Babaev et al. 1994), composed largely
of tamarisk vegetation, that represents a distinctive micro-environment (Figure 8), and scholars
assume that similar woodland would have existed in antiquity (Moore et al. 1994, also see
section 7.7). Largely as a result of this intensive modern irrigation scheme, groundwater in much
of the Murghab delta is relatively shallow. In heavily irrigated regions the depth of the water
table is no more than 3m deep, and may be as shallow as a metre or less. In outlying regions of
low cultivation, the water table is deeper and may approach 8m (Hiebert 1994a: 6). Due to the
heavy irrigation and resulting high water table, soil salinity is high, and evidence of surface salts
may be seen throughout the modern delta.
Figure 8. Tugai-type vegetation along an irrigation canal. Upcast from the canal can be seen in
the foreground.
Beyond these agricultural zones, the delta landscape is increasingly desolate. Loose sand and
loess, largely the result of agricultural activity or other anthropogenic processes such as the
construction of roads or canals, is ubiquitous (see Fleskins et al. 2007). While large sand dunes
are not prevalent in the modern delta, their frequency increases towards the outlying regions of

- 31 -
the palaeodelta, foreshadowing the long, linear barkhan dunes that lay beyond the delta fan.
This large, intermediate region may thus be seen as a transitional zone, where sand dunes are
intermittent and variable in character. Stable and semi-stable dunes occur in the form of hillocks
or ridges and are generally oriented in an N-S or NNW-SSE direction. While not nearly as
regular or continuous as the extensive dunes further to the northeast, these features may at times
be several metres high and a few dozen metres in breadth. The complexity of the dune
landscape thus manifests itself in different forms, sometimes assuming a rolling, gently
undulating appearance (Figure 9), while at other times highly variable, punctuated by blow-outs.
Vegetation consists largely of haloxylon or black saxaul bushes, and some low grasses (Figure
10). The development of vegetation plays a significant role in the fixation and stabilisation of
dunes (Babaev 1973). Active, wind-blown dunes occur as well but these are intermittent,
resulting primarily from anthropogenic activity which may intensify soil erosion (Lioubimitseva
2003; Tsvetsinskaya et al. 2002).
Figure 9. Landscape of rolling, semi-stable dunes.
Figure 10. Saxaul Vegetation in Autumn and
Spring.
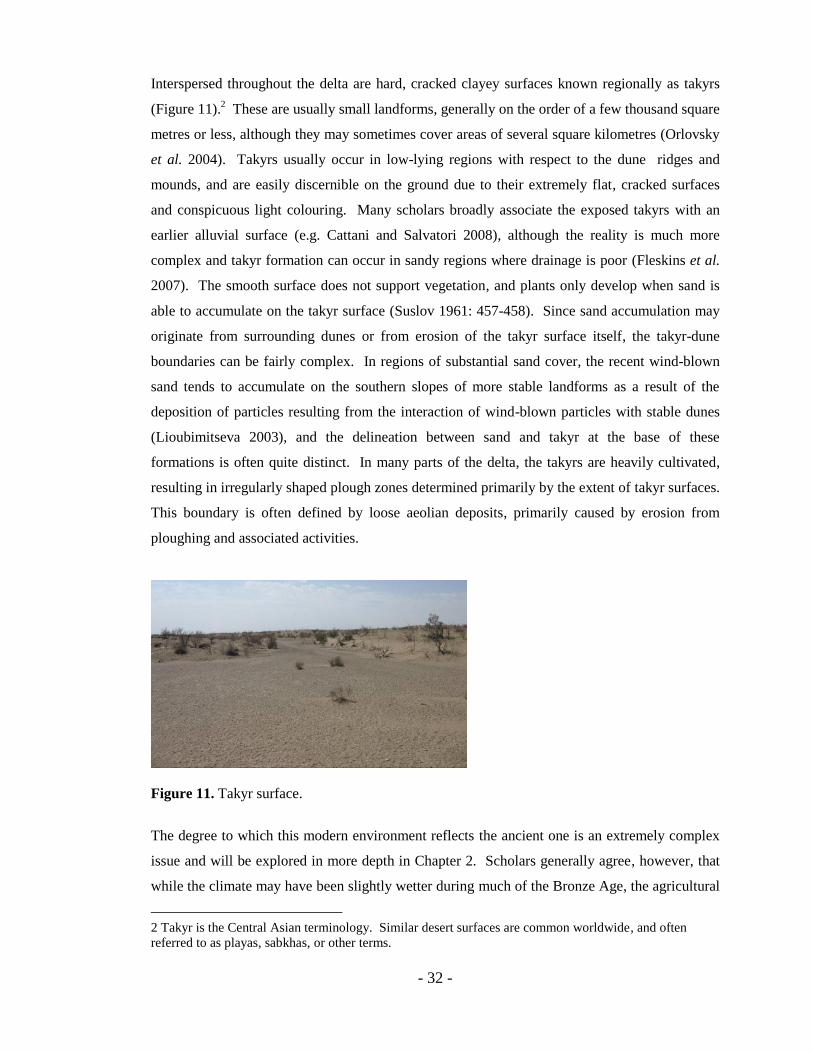
- 32 -
Interspersed throughout the delta are hard, cracked clayey surfaces known regionally as takyrs
(Figure 11).2 These are usually small landforms, generally on the order of a few thousand square
metres or less, although they may sometimes cover areas of several square kilometres (Orlovsky
et al. 2004). Takyrs usually occur in low-lying regions with respect to the dune ridges and
mounds, and are easily discernible on the ground due to their extremely flat, cracked surfaces
and conspicuous light colouring. Many scholars broadly associate the exposed takyrs with an
earlier alluvial surface (e.g. Cattani and Salvatori 2008), although the reality is much more
complex and takyr formation can occur in sandy regions where drainage is poor (Fleskins et al.
2007). The smooth surface does not support vegetation, and plants only develop when sand is
able to accumulate on the takyr surface (Suslov 1961: 457-458). Since sand accumulation may
originate from surrounding dunes or from erosion of the takyr surface itself, the takyr-dune
boundaries can be fairly complex. In regions of substantial sand cover, the recent wind-blown
sand tends to accumulate on the southern slopes of more stable landforms as a result of the
deposition of particles resulting from the interaction of wind-blown particles with stable dunes
(Lioubimitseva 2003), and the delineation between sand and takyr at the base of these
formations is often quite distinct. In many parts of the delta, the takyrs are heavily cultivated,
resulting in irregularly shaped plough zones determined primarily by the extent of takyr surfaces.
This boundary is often defined by loose aeolian deposits, primarily caused by erosion from
ploughing and associated activities.
Figure 11. Takyr surface.
The degree to which this modern environment reflects the ancient one is an extremely complex
issue and will be explored in more depth in Chapter 2. Scholars generally agree, however, that
while the climate may have been slightly wetter during much of the Bronze Age, the agricultural
2 Takyr is the Central Asian terminology. Similar desert surfaces are common worldwide, and often
referred to as playas, sabkhas, or other terms.
- 33 -
restrictions were likely still those expected in an arid or semi-arid environment (Hiebert 1994a).
The precipitation level below which dry-farming becomes unreliable is 200-300mm of rainfall
per year (also see Castel 2007; Wilkinson 1994), and Bronze Age rainfall is very unlikely to
have exceeded this threshold. As today, agriculture was only possible with irrigation, and the
presence of plump six-rowed barley (naked and hulled) and bread wheat attest to a robust
irrigation scheme in antiquity (Hiebert 1994a: 134; Miller 1999). Pastoralism was another
economic strategy that linked the Bronze Age societies with those of today, and domesticated
sheep and goat, and to a lesser extent cattle (Moore 1993; 1994), have long been attested in the
Murghab (see Chapter 7). Further opportunities for economic diversity both floral and faunal
may have been afforded by the tugai forest as well as the nearby desert environment, and the
presence of game including wild boar, tiger, gazelle and birds were available for hunting (see
Hiebert 1994a: 131-136 for a detailed discussion on the domestic economy).
1.8.4. Visibility and Archaeological Recovery Potential
Modern Agriculture
With respect to archaeological recovery, the diverse deltaic landscape presents some significant
difficulties. While archaeologists have long recognised that myriad factors may obscure or
destroy archaeological sites, the Murghab delta represents an amalgam of such obstructions.
Perhaps the most prominent factor contributing to the decreased archaeological visibility is the
Karakum Canal. The continued use and development of the canal has spurred an extensive
programme of agricultural development, and in conjunction with the urban expansion of the
cities of Mary and Bayramaly, many archaeological sites have been damaged or destroyed. One
excellent example is Kelleli 1, a large site of about 5 ha in the northern delta that has been
completely destroyed by agricultural activity (G. Bonora, pers. comm.).
Alluvial Sedimentation and Site Masking
A second issue is the degree of alluvial deposition. Because of its dynamic geomorphological
and hydrological history, alluvial sedimentation in the delta is complex. Researchers generally
agree that due to the stability of the Murghab main channel and consequent continuous silting,
alluvial deposits in much of the Merv oasis are several metres deep, and potentially an
impediment to archaeological recovery (Cattani and Salvatori 2008). In alluvial fans, sediments
decrease towards the margin, forming an „alluvial wedge‟ in which deposition thins out towards
the fringe of the fan. This depositional behaviour therefore leads to potentially higher levels of

- 34 -
archaeological recovery on or near the modern land surface towards the fringe of the delta,
although Brown has observed that the erosion from more active and braided streams may
sometimes destroy or damage small sites (Brown 1997: 38, 279). In the Murghab delta, a similar
inverse relationship between alluviation and archaeological visibility has been suggested
(Cremaschi 1998), and there are some indications that sites may be more easily detectable in the
northern fringe of the delta as a result of the reduced aggradation of alluvial sediments (see
below). South of the Takhirbai settlement group, evidence of Bronze Age settlement is almost
entirely absent, and only sites from the Iron Age and later are visible, with Salvatori (1998b)
suggesting that this may not be due to an actual lack of Bronze Age occupation but to alluvial
obstruction. He cites as evidence Cremaschi‟s (1998) investigations at two sites, AMMD 55 and
Garry Kishman, the latter of which is shown in Figure 12. While not located substantially south
of Takhirbai, the presence of Bronze Age materials at a depth of 1.5m suggests that the Bronze
Age occupational surface may be buried in some areas, although the Bronze Age material at the
Takhirbai sites suggests that the alluvial cover is not uniform (Salvatori 2007). Further evidence
of the burial of earlier surfaces may be found at the site of Togolok 1. Here, Middle Bronze
materials have been recovered from the basal levels of the site, although sherds from this period
do not occur on the surface (Hiebert 1994a: 22). While sporadic, there is enough evidence to
suggest that many Bronze Age sites may be buried.
Figure 12. Alluvial Cover. Left: Garry Kishman region (Cremaschi 1998: 23, Figure 5)
Right: Kelleli 1 Region (following Lyapin 1991)

- 35 -
Further north, the multitude of Bronze Age sites in the central delta indicates that alluvial
deposition is less of an issue. Lyapin (1991) suggests that the appearance of Bronze Age sites on
or above takyr surfaces indicates a shallow Bronze Age surface, and posits that a layer of dense
clay at a depth of 1.5m may represent the Chalcolithic surface. Moreover, the northern delta is
the only area where evidence of early materials prior to the Namazga V period have been
recorded. Kohl notes the discovery of Geoksyur-type (Namazga II or III) surface sherds in the
Kelleli region, not recorded elsewhere in the delta (Kohl 1984: 146). Moreover, in the basal
levels of the now-destroyed site of Kelleli 1, Masimov recorded evidence of carinated greywares
that he tentatively associated to the Namazga III-IV periods (Kohl 1984; Masimov 1979). The
Kelleli excavations are quite shallow and cultural deposits are usually less than 2m below the
raised depe surfaces (Masimov 1979) although Kohl (1984: 146) has cited a total cultural deposit
of 3m at Kelleli 1, which offers further evidence that alluvial cover this far north may be shallow
enough to reveal traces of pre-Namazga V occupation should it exist. A parallel situation may
be seen in the Çarşamba alluvial fan in southern Turkey (Boyer, Roberts & Baird 2006). Here,
near-complete site visibility was documented towards the margin of the alluvial cone, a situation
researchers attribute to the graduated cessation of alluvial deposition toward the margin of the
fan (Figure 13). Although the actual extent of the Bronze Age fluvial activity in the Murghab
delta remains unclear, a significant improvement in visibility may be expected in marginal
regions here as well.
Figure 13. Schematic diagram of the alluvial wedge on the Çarşamba Fan in Turkey and its
effect on site visibility (from Boyer et al. 2006: 692, Figure 7).

- 36 -
Dune Cover
An additional factor influencing site recovery only touched upon in this section as it is a central
theme of the overall research presented in following chapters is the prevalence of sand dunes.
While these may be expected to preserve sites, they pose a significant problem for recovery,
since their size completely impedes the detection of archaeological material. Sarianidi has
estimated that up to 30% of archaeological sites may simply be invisible due to the presence of
substantial dune cover (cited in Kohl 1984: 144). As discussed above, however, sand cover in
the delta is not uniform, and much of the prior AMMD research has made use of the windows of
opportunity afforded by isolated patches where dune cover is less of an issue. Cattani and
Salvatori see the region as a „privileged [archaeological] laboratory‟ based both on these
glimpses of the Bronze Age landscape as well as the high state of preservation of sites, largely
due to protection by dune cover (Salvatori 2008b: 60).
1.9. Study Area
1.9.1. Description of Sites and Regional Environment
The specific area of study (Figure 14, Figure 15) comprises a 140 km
2 zone in the northern
portion of the delta located approximately 100 km north of Bayramaly. While remote, the
region may be accessed via a paved road from Bayramaly that leads to a large gas compressor
station. A major canal parallels this road, leading to an extensive cultivated takyr near the
Kelleli site group, and some of the archaeological damage in this area has been noted above.
Just south of the gas utility is a smaller dirt road which extends ESE from the main artery. This
road parallels a gas pipeline, both of which skirt the site of Egri Bogaz 4 immediately to the
north. Despite the heavy agriculture in the Kelleli region, only a small portion of the study area
is cultivated and it is in this region that the sites of Egri Bogaz 1, 2 and 3, initially identified by
the Soviet expeditions of the 1970s and 1980s (Sarianidi 1990: 5), are located. All three sites
have been disturbed to some extent by ploughing, at least in the western sections, although the
sites have not been completely destroyed (also see section 5.2.). What is known about these
three sites is extremely limited. Udeumuradov conducted 2x2m soundings on the two larger
sites, Egri Bogaz 1 and 2, and some of this material has been collected but not analysed. He has
also attested the presence of „kiln remains‟ on these sites, and possible domestic architecture (B.
Udeumuradov, pers. comm.).
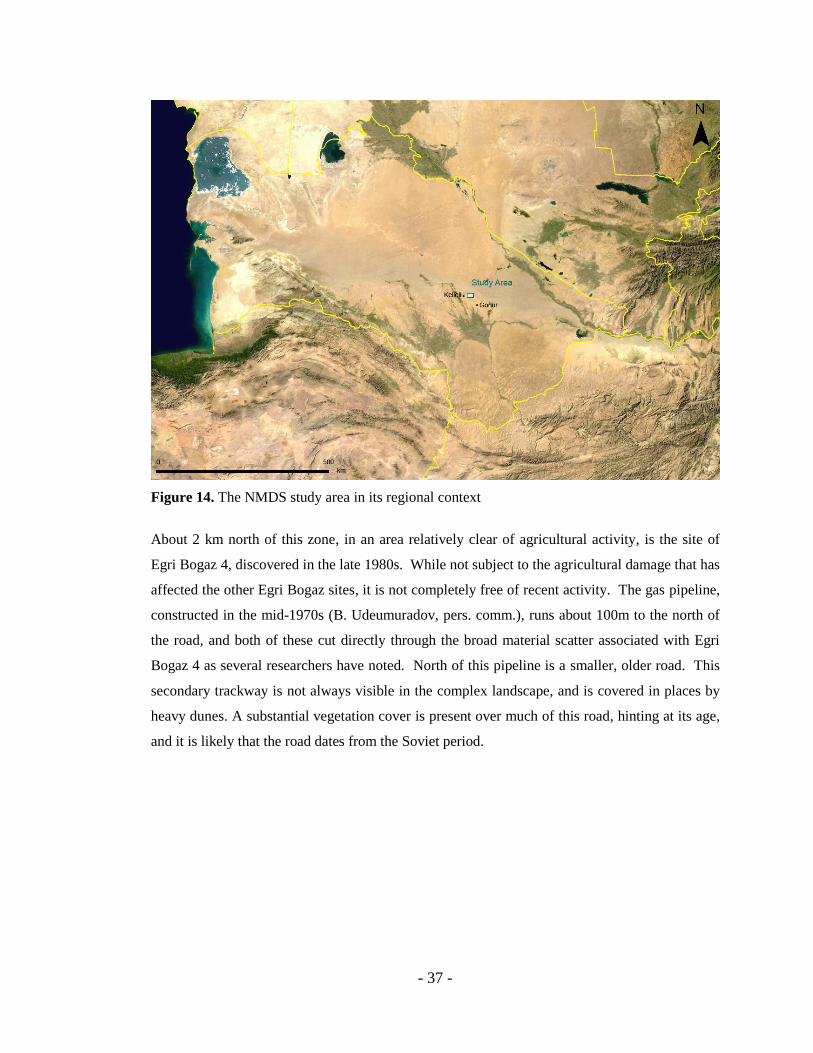
- 37 -
Figure 14. The NMDS study area in its regional context
About 2 km north of this zone, in an area relatively clear of agricultural activity, is the site of
Egri Bogaz 4, discovered in the late 1980s. While not subject to the agricultural damage that has
affected the other Egri Bogaz sites, it is not completely free of recent activity. The gas pipeline,
constructed in the mid-1970s (B. Udeumuradov, pers. comm.), runs about 100m to the north of
the road, and both of these cut directly through the broad material scatter associated with Egri
Bogaz 4 as several researchers have noted. North of this pipeline is a smaller, older road. This
secondary trackway is not always visible in the complex landscape, and is covered in places by
heavy dunes. A substantial vegetation cover is present over much of this road, hinting at its age,
and it is likely that the road dates from the Soviet period.

- 38 -
Figure 15: NMDS Study Area (ASTER 3-2-1 False Colour Imagery)
Beyond the presence of a significant surface scatter, almost nothing is known about Egri Bogaz
4. To date, it only appears twice in the published literature, both in publications by the AMMD
project, and then only as a site location with minimal supporting information (Bondioli and Tosi
1998: appendices; Cattani and Salvatori 2008: 18-19). Udeumuradov sees the site as yet another
small settlement area similar to the other Egri Bogaz settlements and claims to have found „kiln
remains‟ but no evidence of other architecture (B. Udeumuradov, pers. comm.). The substantial
surface scatter and the presence of a poorly defined mound have been sufficient to earn Egri
Bogaz 4 a designation by the Ministry of Culture as a protected site (see Section 5.5.1.), thereby
adding a fourth member to the posited Egri Bogaz settlement group. With the exception of a few
transects in the area (Cattani and Salvatori 2008: 18-19), and the collection of some surface
material, further research has not been conducted on the site.

- 39 -
1.9.2. The Study Area Within the Context of the Northern Murghab
Due to the lack of research on the Egri Bogaz sites, not a great deal can yet be said about them in
their own terms, and it is worthwhile briefly to situate them here in the context of other work
conducted in the northern Murghab before examining some of the more theoretical issues in the
following chapter. To date, the vast majority of archaeological research in the north has focused
on the sites of the Kelleli region (Masimov 1979; Masimov 1980; Masimov and Kohl 1981).
Located in the far northwestern portion of the Murghab delta, the settlement group consists of
approximately sixteen sites, twelve of which had already been identified by the early 1980s as a
result of Masimov‟s expeditions in the region. Although relatively remote, situated over 40 km
from Gonur, and over 10 km from the settlement groups of Taip and Egri Bogaz, the Kelleli
complex continues to play a pivotal role in the understanding not only of the northern fringe of
the Murghab delta, but of the delta-wide Bronze Age settlement distribution. The majority of
work conducted on the Kelleli sites in the 1970s and early 1980s centred on the sites of Kelleli 1,
3, 4 and 6 (Udeumuradov 1993: 13). The cultural horizon of these sites is primarily associated
with the Namazga V period (see section 2.4.1), although Udeumuradov has attested Namazga VI
materials on Kelleli 6, the only excavated Late Bronze context in the region (Udeumuradov
1993; Hiebert 1994a: 17). Architectural remains are attested on all four of these sites, of which
the most substantial is the fortified square structure on Kelleli 3, comprising over a hectare.
Probable domestic architecture has been attested on Kelleli 1, 4 and 6, and architecture within
the Kelleli 3 wall was considered by Masimov to be domestic in nature (Masimov 1980; Hiebert
1994a: 20)
Work at the Kelleli sites offered the firmest evidence then known of a substantial Namazga V
presence in the Murghab delta, and while this period is now known to be well-represented
throughout the delta (see section 2.3), its implications were extremely important. Previously,
Masson had associated Murghab settlement with the Namazga VI period, which he divided into
two phases, an earlier Auchin phase and a later Takhirbai phase (Masson 1988: 91). The Kelleli
findings added a layer of complexity to the chronology, and Masimov‟s findings of an almost
identical assemblage between the Kelleli assemblage and that of Altyn Depe in the Namazga V
period heavily influenced the chronological understanding of deltaic settlement (Masimov
1979). Unfortunately, while the evidence of Middle Bronze occupation was unquestionable,
evidence of prior occupation, well known in the foothills of southern Turkmenistan (Kircho

- 40 -
2004), was scant, represented only by a few painted surface sherds that Masimov has attributed
to the Namazga II or III period (Masimov 1980; Hiebert 1994a: 17), as well as occasional
„carinated greywares‟ in the basal levels of Kelleli 1 that he associates with Namazga IV
(Masimov 1980). With the exception of a second round of excavations on Kelleli 3 in the mid-
1980s, little additional work was conducted in this part of the delta until the surveys of the
AMMD in the mid-1990s, noted above. In addition to the identification of a few new sites, these
findings also broadened the chronology of both the Kelleli and Egri Bogaz region as Namazga
VI materials were identified in surface finds in both regions (Cattani and Salvatori 2008).
Having thus articulated the fledgling state of archaeology in the northern Murghab, the stage is
now set to connect some more dots, this time by way of the Egri Bogaz region. As the ninth and
most overlooked „micro-oasis‟—to invoke the conventional classification before deconstructing
its meaning—the full incorporation of Egri Bogaz in the known landscape of Murghab
occupation is not only warranted, but essential. Its potential to provide information not only on
the archaeology of all periods of the Bronze Age, but also on broader issues of survey and
interpretation in a different kind of archaeological landscape, offers an enticing environment for
research on several fronts. Ultimately, the central thesis is that, through a cautious unification of
spatial patterning, scale, and landscape, a much clearer understanding of the northern Murghab
settlement landscape has emerged.
- 41 -
Chapter 2. Theoretical Frameworks: Concepts of Survey and Settlement Development in the Murghab Delta
2.1. Central Asian archaeology and state formation
2.1.1. Isolation of Central Asia in Archaeological Research
In order to understand effectively concepts dealing with the surface manifestation of
archaeological phenomena and what they mean in relation to the organisation of Murghab
societies, it is necessary to gain some perspective by first establishing some theoretical
foundations of Central Asian archaeology in general. In a sense, Central Asian archaeology is
difficult to define, partially due to the fact that Central Asia itself is so difficult to pin down.
Nebulous concepts such as Inner Asia and Middle Asia—terms that may, but do not necessarily,
include Afghanistan or Mongolia, are tossed about alongside more historically formal but
inconvenient nomenclature such as „former Soviet Central Asia‟, denoting the five former Soviet
states in the region (Sinor 1990). Perhaps it seems odd that such geopolitical semantic games
should play a role in archaeology at all. But archaeologists, despite the growing appreciation for
the concept of continuum in so many aspects of the field, are still as hard-wired as anyone to
appreciate the convenience of distinct classifications and frames of reference.
Andre Gunder Frank, a vocal proponent of rethinking and ultimately elevating the role of
Central Asia in our understanding of prehistoric world systems, offers a bleak yet revealing
lamentation of the otherwise prevailing interpretation of the region as „a black hole in the centre
of the world‟ (Frank 1992: 1). Frank‟s meaning is not so much that the region has been
completely ignored—the depth of Central Asia‟s archaeological record had become fairly well
known by this time, at least in academic circles—but that it has lacked its own frame of
reference. Although archaeologists increasingly realise that the concept of a Greater
Mesopotamia is too simplistic and insufficient to account for the sheer complexity of the
archaeological record throughout Iran and Central Asia, the conceptual centres of gravity
continue to focus on southern Mesopotamia and the Indus Valley, and, to a lesser extent, Iran
(Kohl 2003).

- 42 -
2.1.2. ‘Primary’ vs. ‘Secondary’: The Role of Central Asian Polities in the Broader Cultural Sphere
The idea that the sedentary communities in southern Central Asia were a level below the
established civilisations in Mesopotamia and elsewhere in terms of urban complexity is hardly
far-fetched. There is a great deal of evidence to suggest that the urban centres in the later 3rd
and
early 2nd
millennium across much of the region did not reach the same stage of development and
complexity as did their larger counterparts in Mesopotamia or the Indus Valley. Most sites were
small, certainly by the standards of southern Mesopotamia: few sites exceeded 10ha during the
Bronze Age, of which the most prominent were Altyn Depe, Ulug Depe and Namazga Depe
(Kohl 1984: 107, 117). Another hallmark of many complex societies, a developed writing
system (Childe 1950), is also absent, although one need only look to the discussion of whether
or not the Indus script constituted a written language to see that the connections between writing
and urbanism may not be so clearly defined (Farmer et al. 2004; contra Parpola 1986). Drawing
in part on these limitations, Masson has suggested that these societies followed a developmental
process that he terms „Anatolian‟ rather than „Sumerian‟ in nature, a dichotomy that he attributes
in part to a lack of access to abundant irrigation sources more readily available along the Nile,
the Euphrates or the Indus (Masson and Sarianidi 1972: 112).
Inherent in many interpretations of secondary states is the idea that their development was
largely driven by external factors, a view that tends to restrict the agency of these communities
in charting their own course of development. In Central Asia, urbanism and complexity that
developed during the Namazga IV and V periods are treated largely as products of the vibrant
trade network spurred by primary centres to the south. Kohl, for example, sees the development
of the Central Asian sites as initially resulting from an interregional trade in luxury goods
focused on major population centres to the south and west. He attributes these „punctuated‟
developmental bursts to responses to external economic shifts rather than internal evolution
(Kohl 2003). Similarly, Masson, in further developing his Anatolian interpretation of
complexity, treats innovation and technological advance as imported knowledge rather than local
advancement (Masson and Sarianidi 1972).
Recent research, however, has criticised this relegation on the grounds that treating smaller
communities solely as products of a larger system tends to diminish the local role of these
communities (Stein 1999). In upper Mesopotamia, for example, Joan Oates has demonstrated

- 43 -
that urbanisation in the Khabur basin may not have been the direct result of Uruk expansion
from southern Mesopotamia, as has been thought. Rather, she attributes the pre-Uruk urban
phenomena such as monumental architecture and craft specialisation to local development,
possibly spurred in part by access to local obsidian sources (Oates et al. 2007; contra Algaze
1989). Gil Stein, in a critique of the core-periphery models that drive archaeological
interpretations of „World Systems‟ theory (Wallerstein 1974) has noted that „indigenous polities
are no longer seen as the passive victims of unequal exchange relationships in interregional
interaction‟ (Stein 2001: 367). This reassessment of the traditional role of polities not associated
with the „core‟ has become increasingly applicable to the agricultural societies of Central Asia.
2.2. Trajectories of Urbanism in Southern Turkmenistan
2.2.1. Growth of Urbanism: the Namazga IV and V periods
While these broad scale developmental questions remain outstanding, partially due to the poor
understanding of the Early Bronze Age in the region (Kohl 1984: 105), few scholars deny that
these societies attained a level of development that either reached or approached urbanism,
depending on the interpretation. Indeed, Kohl supports Masson‟s view of an urban revolution at
Altyn Depe, noting that nine of Childe‟s ten urban criteria, with the exception of writing, were
satisfied (Kohl 1984: 126). To the extent that legitimate urbanisation did occur, the current
understanding of the process has been drawn largely from developments in the well-studied sites
of Altyn Depe and Namazga Depe, seen by Masson as illustrative of the transitions from
Namazga IV to Namazga V (1988). Although social complexity is seen to have developed
rapidly through the Middle and Late Chalcolithic periods, as evidenced by significant population
growth and the development of long-distance trade, the hallmarks of urbanism began to appear
most prominently in the second half of the third millennium (Masson and Sarianidi 1972: 112-
120). Masson views the proto-urban settlement hierarchy of the Namazga IV period as two-
tiered, and distinguishes between small villages and the developing urban centres of Altyn,
Namazga and Khapuz Depe, amongst others (Masson and Sarianidi 1972: 118). Although there
is strong continuity from Namazga IV to Namazga V in the settlement pattern, several new
occupations occur during this period, which Masson (1981) attributes in part to poor agricultural
resources in the larger population centres. Evidence of a professional artisan class may be seen
in the development of more elaborate kilns and copper smelting furnaces (Masson and Sarianidi
1972: 112). The rapid decline of painted wares towards the end of the Namazga IV period and a
- 44 -
corresponding increase in plain, wheel-made materials may offer further evidence of a shift to
mass-produced materials that signify the burgeoning development of specialist classes during the
period (Masson and Sarianidi 1972: 112). A related, and possibly contemporary, development
may be seen at Ulug Depe, where recent research offers some evidence of the mass-production
of figurines of the type found throughout southern Turkmenistan as well as the Murghab
(Lecomte 2006). It is tempting to interpret such site-based diversification in production as
evidence of a developed, and stratified, administrative entity, although much more research is
needed before such a conclusion may be definitively reached.
The Namazga V period is usually associated with the height of urban development in the Kopet
Dag foothills, and a time of rapidly developing complexity (Masson and Sarianidi 1972).
Hiebert (1994a: 172) observes that, while the Namazga V period exhibits continuity from the
preceding period in terms of the settlement pattern, there is a significant shift eastwards towards
the Murghab (see discussions in sections 2.3.2. and 7.10). The period also evidences strong
signs of a deepening inter-regional outlook, not only in terms of the expansion of settlement, but
also in a growing network of trade. Masson suggests that the appearance of imported greywares
similar to those found at Hissar reflect increasing contacts with the Iranian plateau, and imported
ivory „gaming pieces‟ as well as the presence of at least one Harappan-type seal indicate contact
with the Indus Valley (Masson and Sarianidi 1972: 124).
2.2.2. Decline of the Urban Phase: The Namazga VI Period
The transition from Namazga V to Namazga VI remains poorly understood. Occurring towards
the beginning of the second millennium, it has been described as a collapse, or at least a decline,
of the urban centres in southern Turkmenistan (Masson 1999). Settlement sizes decreased
during this period, with the occupied area of Namazga Depe plummeting from 50ha to 2ha, and
the major centre of Altyn Depe was abandoned. Biscione (1977), however, suggests that
„collapse‟ is a misleading term. He disputes any population decline, citing an overall increase in
small villages. Perhaps most glaringly, these numbers do not incorporate the burgeoning
phenomenon in the Murghab delta—and indeed the development of the BMAC phenomenon has
been ascribed directly to this transitional period (see below), the significance of which will be
explored in sections 7.6 and 7.9. Salvatori (2008b) has suggested that, similarly, Namazga VI
sites in the Murghab were smaller than in the preceding period although more widely distributed.

- 45 -
He attributes the shift primarily to the changing nature of socio-political structures, rather than
more deterministic causes related to climate change and overpopulation.
2.3. Models of Development in the Murghab delta
2.3.1. Early Occupation in the Delta
With respect to the developing body of knowledge of sedentary societies in Bronze Age Central
Asia, the entire Murghab delta remains a grey area largely due to a poor understanding of the
origin of settlement in the region. The knowledge of the Central Asian Early Bronze Age is
generally poor, and while evidence of the period is firmly established in southern Turkmenistan,
it is heavily obstructed by later material (Kohl 1984: 105). In the Murghab delta, solid
archaeological evidence that predates the Namazga V period is rare, and with the exception of
the few sherds found in the Kelleli region mentioned above, evidence of Early Bronze Age or
earlier occupation in Margiana seldom occurs in the published literature. There are, however,
occasional hints of early material. Rossi-Osmida believes that an architectural horizon near Adji
Kui 1 may date to the late 4th or early 3
rd millennium BC, based on the recovery of geometric
painted wares as well as two features that he identifies as ovens (G. Rossi-Osmida, pers. comm.)
He proposes a similar date for the earliest phase of the neighbouring site of Adji Kui 9 based on
C14
evidence from the cultural horizon, and at least one sample has been confirmed by Salvatori
to date to the late fourth millennium (Rossi-Osmida 2007: 72). Salvatori, however, regards this
sample as an anomaly with respect to two others of a late third millennium date, which he
regards as „fully consistent‟ with the generally accepted dates for the Namazga V period
(Salvatori 2002: 119). Another piece of evidence for early occupation of the delta was the
presence of „an anthropic level‟ at a depth of 9m, consisting of extremely coarse sherds
recovered from a natural trench south of Merv in 2007 (Salvatori 2007). The C14
date on one
sample was identified as approximately 5840 BP, offering an indication of a possible
Chalcolithic presence in the delta (A. Ninfo, pers. comm.).

- 46 -
2.3.2. A Question of Origins: Where did the Murghab Populations Come From?
The Elusive Case for an Indigenous Origin
The lack of solid evidence of occupation prior to the late 3rd
millennium in the Murghab has
hindered a clear understanding of the origins of settlement in the area, and the result has been a
plethora of highly speculative theories regarding the beginnings of the Murghab occupation
(P'yankova 1994). In this vein, it is useful to begin with the possibility of an indigenous origin
to the Murghab occupation. In the face of an almost complete lack of evidence, support for local
origins tends to hinge less on specific theories than on a reluctance to discount completely the
possibility that early occupation may have existed in the delta. Considering the several
millennia of continuous development a short distance to the west, such a position is reasonable,
and two reasons for the lack of evidence are commonly cited. The first is simply a lack of
research, invoked by Kohl both in relation to the Murghab as well as the similar absence of the
absence of early (pre-Namazga VI) material in Bactria (Kohl, P. in response to Sarianidi and
Kohl 1979). He sees the fertile zones in both regions as likely areas for occupation, and
observes that the „lateness of [Bronze Age] discoveries only underscores the cardinal fact that
vast, important regions of Western Turkestan have yet to be adequately surveyed for
archaeological remains‟ (Kohl 1984: 143). Lamberg-Karlovsky, as well, cites the enormous
research gap from the Murghab through southern Bactria, suggesting that clues may not only be
found in the western regions, but possibly in the east towards Quetta and Baluchistan as well
(Lamberg-Karlovsky 2003). A second factor, touched upon in section 1.8.4, suggests that the
apparent absence of early material is attributable not to lack of settlement but to its
undetectability under alluvial deposits. Perhaps the strongest evidence that alluvial deposition is,
in fact, a factor is the extent of buried material from the Namazga V period on southern sites
such as Togolok 1 (Hiebert 1994a: 22). While this evidence in itself says nothing about earlier
(pre-Namazga V) material, the idea that evidence of Chalcolithic or Early Bronze Age material
may be more deeply buried further to the south is increasingly thought to be reasonable
(Salvatori 2007) and prevents an outright dismissal of the possibility of early settlement in the
region.
Each of these extenuating circumstances, however, presents difficulties in fully explaining the
lack of evidence of early occupation. The research argument, while certainly valid for regions
- 47 -
both west and east of the Murghab delta where very little work has been done, does not hold up
well to scrutiny in the delta itself. In terms of research agendas, the BMAC has been high on the
priority list for decades. The fact that substantial material evidence of Chalcolithic or Early
Bronze material has almost completely failed to appear in nearly 40 years of research since the
discovery of Gonur, not to mention the decades of earlier Soviet work, suggests that while early
settlement may have existed, it was likely very limited in comparison to other regions of
Turkmenistan, although it is certainly possible that a focus of early settlement may have
occurred much further south, fully undetectable beneath the alluvial deposits (section 1.8.4).
Indeed, the alluvial argument is somewhat more difficult to challenge since it deals with buried
evidence. While alluvial obstruction may serve as a valid explanation in the modern delta, and
especially along the main channel of the Murghab, the argument is much less tenable in the
north where the potential archaeological visibility is more promising, nearly 100 km from the
apex of the delta fan. As noted in section 1.9, the greywares found in situ on Kelleli 1, for
example were fairly shallow and the thickness of the cultural levels totals no more than 3m, most
of which are above ground-level (Kohl 1984: 146). The fact that the sporadic early material in
the northern delta is not deeply buried suggests that alluvial obstruction, at least in the north,
may not satisfactorily explain the apparent lack of early occupation. Moreover, the absence of
material from Namazga IV horizons after decades of excavation, with the notable exception at
Kelleli 1, is highly suspect (Masimov 1979). If the material evidence of Namazga V occupation
were the result of a continuous indigenous development from the Early Bronze period, it seems
logical that evidence for such continuity would at least be detectable in the central delta—even if
the alluvial sequence were the cause of obstructed visibility further south. The appearance of
Namazga V material immediately above bare soil in Gonur, Togolok, and Adji Kui 9 indicates
that such continuity was probably not the case in much of the delta (Salvatori 2002; Hiebert
1994a: 34). It is, of course, possible that much earlier occupations were succeeded by significant
periods of abandonment, but again evidence for such a conclusion remains elusive. If Rossi-
Osmida‟s findings were to be confirmed, they may suggest a more localised presence prior to the
Namazga V period in the earliest architectural sequences of Adji Kui 1, which would certainly
strengthen the case for similar finds elsewhere. If such a case were to be proven, it would
potentially place the origins of Murghab settlement in a completely different light, and here it is
worth reiterating the posited „first retraction‟ of the delta mentioned in section 1.8.2. This
scenario could suggest that Chalcolithic occupation was present, but confined to a more
constrained deltaic system which now eludes detection, buried under millennia of continuous
sedimentation. However, even if a Chalcolithic or Early Bronze presence were confirmed, the
case for a large-scale occupation prior to the Namazga V period remains tenuous.

- 48 -
External Origins for Murghab Settlement
Mesopotamia
In the absence of strong evidence for early occupation in the delta, most researchers have opted
to look elsewhere for its origins. One prominent theory, steadfastly adhered to by Sarianidi in
the face of strong recent criticism (see below), places the origins of major Murghab occupation
in northern Mesopotamia (Sarianidi 2002a; 2005). This occupation, which he directly links with
the BMAC phenomenon, he sees as the direct result of movement from northern Mesopotamia
or Iran. While he does not ignore the connections between the Kelleli materials and those found
in the Kopet Dag foothills, and has in a correspondence with Salvatori noted the presence of
possible Namazga III sherds on Gonur North (S. Salvatori, pers. comm.) he sees this occupation
primarily as a failed urban experiment from the west, supplanted with a longer-lived yet still
ultimately doomed Namazga VI occupation by way of northern Iran. He cites as evidence
certain architectural parallels, such as the „courtyards surrounded by corridors‟, and „complexes
of cells‟ that he links with sites like Mari and more indirectly to the Aegean, as well as
iconographic motifs (Sarianidi 2002b; 2005: 81-85). Indeed, he goes so far as to claim that the
architectural tradition is so unique that it „could not have had its roots in Central Asia‟ (Sarianidi
2002a: 86), although such a claim seems misplaced given the visual similarities between the
Gonur North architecture and that of the broadly contemporary site of Kelleli 3, particularly the
external bastions (Figure 16). Rossi-Osmida sees a direct Mesopotamian connection as well,
although in a somewhat modified form. Based largely on what he perceives as the military-type
character of the fortified architecture, as well as the evidence of a horse „bridles‟ he postulates an
Akkadian phase in the Murghab, possibly associated with a mercantile colony or military
expansion (see discussion in Rossi-Osmida 2007: 124-132). His assessment has been sharply
criticised by Salvatori, who finds no solid evidence to support Rossi-Osmida‟s interpretation,
although Salvatori does acknowledge that merchants from Mesopotamia could have been present
in the region (Salvatori 2007).
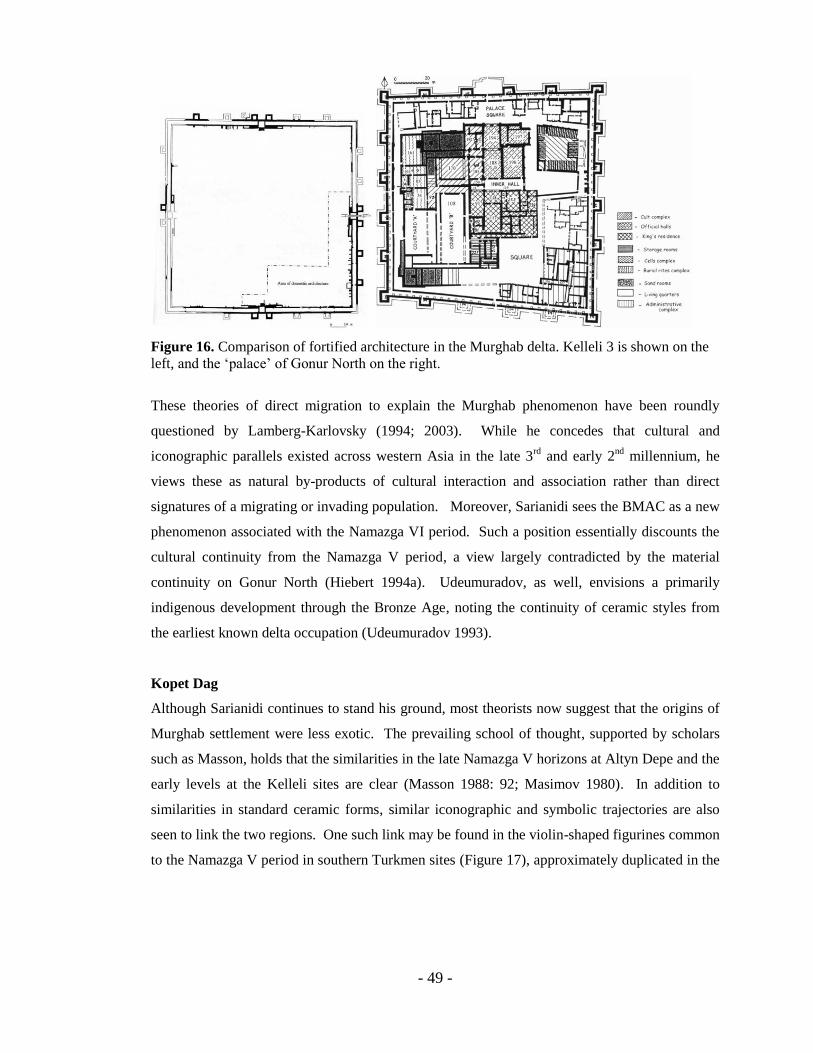
- 49 -
Figure 16. Comparison of fortified architecture in the Murghab delta. Kelleli 3 is shown on the
left, and the „palace‟ of Gonur North on the right.
These theories of direct migration to explain the Murghab phenomenon have been roundly
questioned by Lamberg-Karlovsky (1994; 2003). While he concedes that cultural and
iconographic parallels existed across western Asia in the late 3rd
and early 2nd
millennium, he
views these as natural by-products of cultural interaction and association rather than direct
signatures of a migrating or invading population. Moreover, Sarianidi sees the BMAC as a new
phenomenon associated with the Namazga VI period. Such a position essentially discounts the
cultural continuity from the Namazga V period, a view largely contradicted by the material
continuity on Gonur North (Hiebert 1994a). Udeumuradov, as well, envisions a primarily
indigenous development through the Bronze Age, noting the continuity of ceramic styles from
the earliest known delta occupation (Udeumuradov 1993).
Kopet Dag
Although Sarianidi continues to stand his ground, most theorists now suggest that the origins of
Murghab settlement were less exotic. The prevailing school of thought, supported by scholars
such as Masson, holds that the similarities in the late Namazga V horizons at Altyn Depe and the
early levels at the Kelleli sites are clear (Masson 1988: 92; Masimov 1980). In addition to
similarities in standard ceramic forms, similar iconographic and symbolic trajectories are also
seen to link the two regions. One such link may be found in the violin-shaped figurines common
to the Namazga V period in southern Turkmen sites (Figure 17), approximately duplicated in the

- 50 -
Murghab.3 Since this material is the earliest (with the exceptions noted above) to be found in
the delta, it suggests to these scholars an eastward shift of populations from the Kopet Dag to the
Murghab (Masson 1988; Hiebert 1994b). This view is supported by Biscione (1977), who sees
developments in the Murghab as broadly contemporaneous with a reorientation, rather than a
decline, of the settlement structure in the Kopet Dag. He suggests an eastward shift in
occupational focus from the piedmont of southern Turkmenistan to the Murghab delta, as
evidenced by the decline of the large sites of Altyn Depe and Namazga Depe and corresponding
increase in small village settlements. It must be stressed, however, that Biscione‟s assessment
came in the 1970s, towards the beginning of significant exploration of the Murghab when the
significant Namazga V occupation was not yet known, so contemporaneous occupation of both
regions may have been overlooked. Moreover, subsequent investigations in the 1980s and 1990s
revealed the broad expanse of Namazga V settlement in the Murghab, suggesting some degree of
contemporaneity with the urban phase in Southern Turkmenistan (Udeumuradov 1993). It is
also worth stressing that little work has been done in the regions between the Tedjen and
Murghab deltas, an area that, were settlement to be found, could certainly shed more light on the
Namazga V transition in both regions.
Figure 17. Namazga V figurines from Altyn Depe (Kohl 1984: plate 11c)
Additional Theories
While the predominant theories therefore involve movement from the west, a few other
possibilities have been put forward. Kohl has expressed scepticism that migration alone is the
sole explanatory factor for Murghab presence, and has suggested that the peopling of the
3Some stylistic differences occur—the common braided hairstyles found at Altyn Depe have not been
located in the Murghab sites, although impressions of such figurines have been located in Kelleli (Kohl
1984)
- 51 -
Murghab may have arisen in part from the sedentarisation and incorporation of „less developed‟
groups in the region‟ (Kohl 1984: 150; 2002). Kohl bases his argument in part on the
supposition that overall populations in the Murghab were much greater than in southern
Turkmenistan during this time, a possibility that, in his view, weakens the case for a primarily
migratory origin. However, the argument for the sedentarisation of steppe groups is
unconvincing for this period due to their late appearance in the Murghab, and the arrival of these
peoples only began in earnest towards the end of the Bronze Age (Cattani et al. 2008b; c).
However, it is interesting to note the results of several physical-anthropological investigations
conducted in the Gonur North cemetery that suggest that the Gonur population may not all
originate from the same region (Dubova 2006). While the subject is quite controversial and not
a part of the mainstream discourse in the region, it is interesting in light of Kohl‟s hypothesis.
However, given the fledgling state of research, such theories must remain largely speculative. A
second interpretation holds that the western regions may in fact not be the centre of origin at all,
and that Murghab societies may derive from the Baluchistan region (Lamberg-Karlovsky 2003).
This hypothesis is based on similarities in material culture over a wide region in the fourth and
third millennia, exhibited in part in the geometric motifs in Quetta ware during the Namazga II
period, as well as a vast trading network of lapis lazuli, stone vessels, and probably tin, to
indicate that cultural contacts were clearly in place across a vast expanse of territory by the early
3rd
millennium.
While the concept of migration as the sole cause of culture change or development is often seen
as antiquated and simplistic (Trigger 2006:310), and while Kohl may be correct in questioning
whether it is the only factor, it must be included as one of the plausible factors concerning
settlement development in the Murghab. There are obvious links between the Kopet Dag and
the Murghab delta during the late Namazga V period, and the contemporaneity of the changing
settlement pattern in the Kopet Dag and the rise of Murghab occupations is accepted by most
scholars, as discussed above. If evidence of late Chalcolithic and Early Bronze occupation
remains elusive, it would continue to weaken the case for indigenous occupation and further
support the possibility that the Murghab populations originated elsewhere. Further support may
be drawn from the comparatively late occupation of the Bactrian sites of the BMAC, associated
with Namazga VI occupation (Askarov 1973). New excavations at Tilla Bulak in southern
Uzbekistan confirm earlier research at Sapallitepa that place these sites at the earliest phase of
the Late Bronze Age (Kaniuth 2007b). The lack of a significant Namazga V presence in
northern Bactria, like that of Namazga IV in the Murghab, may indicate an eastward shift of the
focus of settlement from an initial occupation in the Kopet Dag (see discussion in section 7.10).
- 52 -
2.4. Structure of the Murghab Societies
In the absence of a well-established model for the Murghab delta, and amid conflicting
interpretations of the degree of „urbanism‟ or „statehood‟ that characterised the Bronze Age
societies in the region, archaeologists have often been forced to rely on borrowed interpretations
from better-established models elsewhere. We have already seen how both Masson and Kohl
have transferred Childe‟s interpretations to the complex settlement of Altyn Depe. The
reapplication of these in the Murghab, especially given the apparently similar level of
complexity of Gonur, is therefore unsurprising. As a result, established interpretations of
settlement hierarchies and structures drawn largely from Mesopotamian research have often
been applied rather arbitrarily. Masimov (1981), for example, envisions a three-tiered hierarchy
where the smallest sites are below 5ha, second-tier sites comprise 5-10ha and the largest
constitute regional centres and are larger than 10ha. Gonur is treated as a special case, and Kohl
(1984: 147) suggests it may represent the „principal political centre‟ of the entire region based on
its large size and the wealth of its material. P‟yankova and Masson propose a two-tiered model,
suggesting that the main distinction lies between fortified and unfortified settlements (P'yankova
1994; Masson and Sarianidi 1972: 112). The primacy of settlements within each region remains
unclear, and its interpretation tends to vary with the researcher. Sarianidi treats Gonur as the
„capital‟ of the entire „Margush‟ society (Sarianidi 2005: 74), and considers the other fortified
sites to be the capitals of their respective „micro-oasis‟ (see below). The definition of these
secondary centres, however, is not always clear and in some cases, as with Egri Bogaz 1 or
Kelleli 1, they seem to derive not from the presence of monumental architecture but from site
size. In other cases, more than one walled „citadel‟ occurs within each region. For example,
Sarianidi sees Adji Kui 8 as the pre-eminent settlement of the Adji Kui settlement group
(Sarianidi 1990: 7-8). While it may be the largest settlement in terms of the size of the mound,
substantial evidence of major occupations occur elsewhere in the area. On Adji Kui 9, a
fortified, parallelogram-shaped „citadel‟ comprises much of its associated settlement mound.
Only about 500m away is the site of Adji Kui 1, where architectural evidence is extensive.
Moreover, the recent discovery of what appears to be a multi-roomed ceramic production area
on Adji Kui 1, as evidenced by at least two large kilns as well as a significant quantity of fired
brick, clearly warrants a re-examination of the nature of centrality and administration in the
central Murghab (G. Rossi-Osmida, pers. comm.).
- 53 -
2.4.1. The Traditional Oasis Model
Traditional, yet still prevalent, interpretations of the Murghab have treated the late 3rd
and early
2nd
millennium occupation of the delta as an „oasis civilisation‟ (Hiebert 1994a; Sarianidi 1990).
While still invoked by many researchers, the term masks several shades of meaning at different
analytical levels. At the broadest level, the oasis concept pertains to the anomalous presence, in
the middle of a desert, of a fertile landscape within which human settlement and agriculture were
possible (Hiebert 1994a: 6). The potential for state development in regions of restricted water
access has been a lively theoretical discussion for decades. Early notions of a direct causal link
between irrigation and administrative complexity advocated by scholars such as Wittfogel
(1957) were, in a sense, inverted by Adams‟ more symbiotic model in which irrigation projects
developed as a function of increasing administrative complexity (1965). Newer interpretations
place more emphasis on the ways in which individuals and communities chose to respond to
adverse conditions such as flooding or changing fluvial patterns, as well as the ways in which
they may have perceived such potential dangers (Brown 1997).
While the nature of such „hydraulic societies‟ (Wittfogel 1957) is extremely important with
respect to large scale questions concerning the development of complexity in regions where
water is scarce, the oasis concept has been invoked at another level in the context of Murghab
settlement. At this level, most scholars see the settlement structure as comprised of a series of
distinct „micro-oases‟ (Hiebert 1994a: 39), that is, restricted micro-environments within which
settlement was possible. This model derives largely from a prevailing interpretation of the
Karakum Desert as an essentially timeless entity, a hostile environment of wind-deposited sands
that has existed throughout the Holocene (Gerasimov and Brice 1978). This static interpretation
of the landscape has fostered a fairly deterministic view of settlement potential from a
geomorphological perspective, one that restricts the Bronze Age communities to individual oases
with sufficient access to water and fertile land. „Each cluster of archaeological sites‟, according
to Cremaschi, „was thought to represent a single oasis fed by a branch of the Murghab river‟
(Cremaschi 1998: 15). In this view, settlements were ultimately bound to their micro-
environments within which small-scale irrigation would have been practised. The origin of these
hypothetical micro-environments has not been adequately addressed, and while they seem to be
taken for granted by Sarianidi (2005: 35) and Kohl (1984: 146), Moore stresses the human
component in developing such micro-environments. She posits a „human-modified micro-
climate‟ for Gonur, which may be similarly applied to other settlement groups throughout the
delta (Moore et al. 1994). In each of these interpretations, however, agricultural potential seems
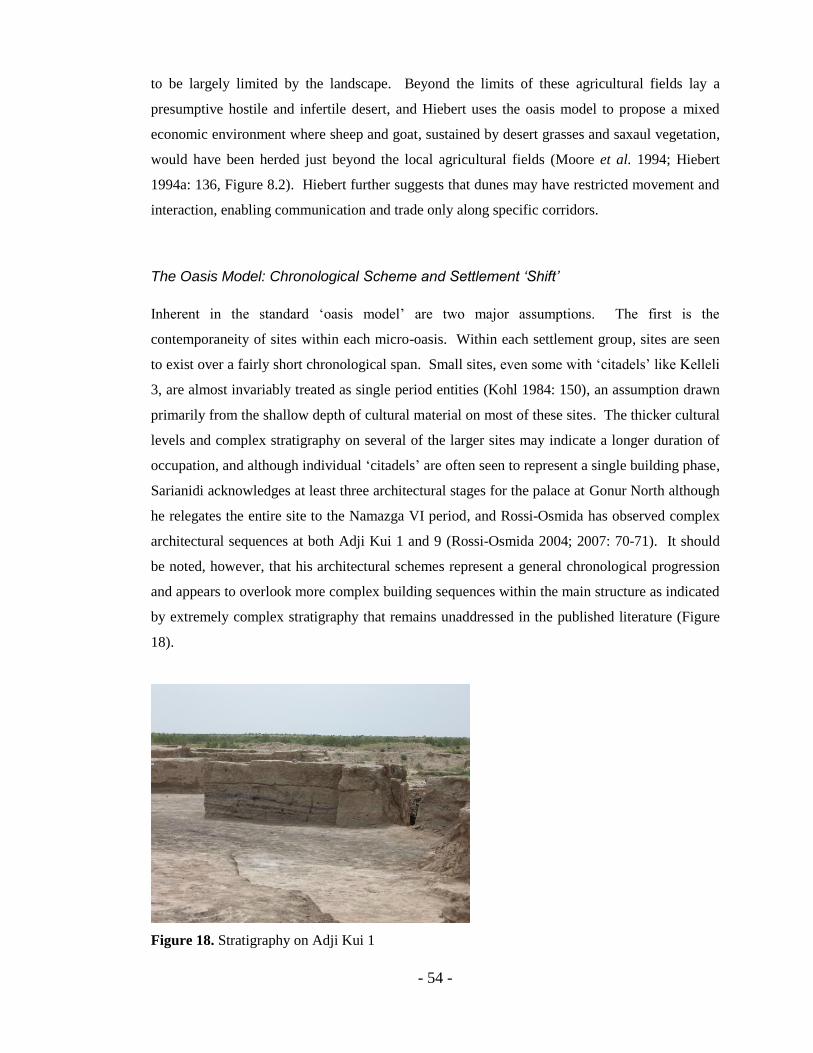
- 54 -
to be largely limited by the landscape. Beyond the limits of these agricultural fields lay a
presumptive hostile and infertile desert, and Hiebert uses the oasis model to propose a mixed
economic environment where sheep and goat, sustained by desert grasses and saxaul vegetation,
would have been herded just beyond the local agricultural fields (Moore et al. 1994; Hiebert
1994a: 136, Figure 8.2). Hiebert further suggests that dunes may have restricted movement and
interaction, enabling communication and trade only along specific corridors.
The Oasis Model: Chronological Scheme and Settlement ‘Shift’
Inherent in the standard „oasis model‟ are two major assumptions. The first is the
contemporaneity of sites within each micro-oasis. Within each settlement group, sites are seen
to exist over a fairly short chronological span. Small sites, even some with „citadels‟ like Kelleli
3, are almost invariably treated as single period entities (Kohl 1984: 150), an assumption drawn
primarily from the shallow depth of cultural material on most of these sites. The thicker cultural
levels and complex stratigraphy on several of the larger sites may indicate a longer duration of
occupation, and although individual „citadels‟ are often seen to represent a single building phase,
Sarianidi acknowledges at least three architectural stages for the palace at Gonur North although
he relegates the entire site to the Namazga VI period, and Rossi-Osmida has observed complex
architectural sequences at both Adji Kui 1 and 9 (Rossi-Osmida 2004; 2007: 70-71). It should
be noted, however, that his architectural schemes represent a general chronological progression
and appears to overlook more complex building sequences within the main structure as indicated
by extremely complex stratigraphy that remains unaddressed in the published literature (Figure
18).
Figure 18. Stratigraphy on Adji Kui 1

- 55 -
The second hallmark of the oasis model is a three-phase chronological scheme, associated with a
posited occupational shift to the south that most Soviet and Central Asian researchers attributed
to the drying up and retraction of the delta channels (e.g. Sarianidi and Kohl 1981). Originally,
this scheme was fairly straightforward due to the proposed simultaneous occupation within each
micro-oasis (Figure 19). The first phase, linked with the late Namazga V period, encompasses
the Kelleli sites and is restricted to the northern delta. The second phase is associated with the
development of the BMAC and linked with settlement groups in the central delta including
Gonur and Adji Kui. The final phase is located even further south, comprised primarily of the
sites in the Togolok and Takhirbai group (Kohl 1984: 143). It is this period that several
archaeologists have linked with the influx of the „Andronovo‟ groups from the northern steppes,
as evidenced by the presence of incised coarsewares in conjunction with several sites of the
period, primarily in domestic contexts (Hiebert et al. 2002; Cattani et al. 2008c). While the
three-phase scheme has largely been retained, the sites within each group have shifted with a
deepening understanding of the chronological complexity in the region. According to Hiebert, a
deep sounding conducted on the Gonur North mound revealed 2 distinct phases (Hiebert 1994a:
30-38). The lowest, Phase 1, he associates with Kelleli-type materials, while Phase 2, associated
with the BMAC, shows parallels with the southern mound of Gonur and the Togolok sites. The
third phase, found on the south but not the north mound of Gonur, is linked with the last period
of the Bronze Age and corresponds with the Takhirbai 3 assemblage. It is interesting to note that
Hiebert dates the monumental architecture of Gonur North to Phase 1, predating the BMAC
phase, and the implications of this chronology will be explored further in section 7.6.

- 56 -
Figure 19. „Micro-Oases‟ in the Murghab delta. Phase 1: Kelleli Phase (Namazga V) Phase 2:
Gonur Phase (Namazga VI) Phase 3: Togolok/Takhirbai Phase (late Namazga VI)
The Oasis Model: Problems and Refinements
Prior to the AMMD research, discussed in detail below, no significant challenges to the general
concept of an oasis civilisation had been made. There have been, however, more nuanced
interpretations, primarily with respect to the issues of chronology and settlement shift. As early
as 1984, Kohl voiced scepticism that „only the terminal waters of the Murghab in the Kelleli
oasis would have been occupied during the initial colonisation or settling of the Murghab‟ (Kohl
1984: 146). The implication was that additional material from the period probably existed but
had not been discovered—a situation that has since changed dramatically with the identification
of „Kelleli phase‟ materials in basal levels of Gonur North, Togolok 1, and Adji Kui 9 (Hiebert
1994a: 22; Salvatori 2002; also see chronological assessment of Rossi-Osmida 2007, noted
above). Just as Namazga V materials have now been found throughout the delta, Namazga VI
materials have been found to co-occur with early sites, even as far north as Kelleli (Hiebert
1994a: 17; Cattani and Salvatori 2008). Both circumstances greatly weaken the case for the
direct association between location and chronology.
- 57 -
As the chronological interpretation grows more complex, the related concept of a direct
settlement shift from northwest to southeast must be questioned as well. The chronological links
between Kelleli and Gonur North, as well as the deeply buried materials from the same period at
Togolok and perhaps further south (Cremaschi 1998) offer evidence that the both Middle and
Late Bronze Age occupation in the delta was widespread. While the majority of new settlements
during the Late Bronze Age appear to occur further south, as evidenced by the proliferation of
Namazga VI materials in this region in the early second millennium BC, it is not until the middle
of the 2nd millennium BC that a clearly discernible southward regression in settlement begins,
and this change becomes fully clear by the Iron Age. Such widespread, and apparently
concurrent, occupation throughout the Bronze Age has called into serious question the idea of a
simple three-phase settlement shift moving southwards in conjunction with the retraction of the
delta. While it is certainly the case that the scope of visible Middle Bronze settlement, as
observed from Namazga V surface materials, generally extends further north than Late Bronze
material, this is probably partially attributable to visibility issues. In terms of an actual
geographic shift, the lack of late-period sites in the north as well as the appearance of many Late
Bronze sites in the central delta and Takhirbai-period sites in the southern delta indicate a
retraction of the settlement pattern rather than an outright shift, with fewer new foundations
occurring in the north.
2.4.2. Rethinking the Oasis Model: The AMMD model of a Continuous Alluvial Plain
Few archaeologists, however, have questioned the basic idea of the „oasis civilisation‟ (for one
example see Renfrew 2006), although recently that has begun to change. Currently, and
somewhat quietly, the core underpinnings of the „oasis civilisation‟ are undergoing a significant
theoretical re-examination. While the notion of the „oasis civilisation‟ persists, the recent
AMMD research has begun to provide a very different picture of the landscape. According to
new interpretations, desertification began in earnest millennia later than previously thought. In a
direct challenge to Gerasimov‟s static interpretation of the Karakum (see above), Cremaschi
(1998) suggests that desertification may not have actually occurred until much later, and
proposes a mid-2nd
millennium date for the onset of the process. A detailed analysis of the
geomorphological data is beyond the scope of the current study (see Marcolongo and Mozzi
1998; Lyapin 1991; Cremaschi 1998), but two main pieces of evidence must be addressed. One
is the „exclusive‟ presence of aeolian sands in the „looters‟ pits‟ of the Gonur North cemetery
- 58 -
(1998: 18). Cremaschi asserts that the natural stratigraphy of these graves consists of alluvial
layers, so the presence of wind-deposited sand in the pits indicates a later onset of desert
encroachment that post-dates the digging of the graves. The second piece of evidence that
Cremaschi cites for late desertification are the results of a series of long-range transects
conducted in the mid 1990s which linked several major Bronze Age sites (Figure 20). The
purpose of these transects was to test the degree to which settlement was actually restricted to
the purported micro-oases, or whether the pattern was more complex. Contrary to the earlier
interpretations, the survey revealed evidence of pottery, and in some cases „sites‟, along all
transects surveyed (Cattani and Salvatori 2008). According to Cattani and Salvatori, the
findings indicate that material is continuous throughout the delta and not localised as per the
earlier models. The implication, they claim, is that the Murghab phenomenon should not be
viewed from the perspective of isolated, desert-enclosed micro-oases along a few available
channels, but in terms of an open well-watered floodplain where settlement and irrigation
agriculture were common. While either case would certainly have required access to reliable
water sources, especially in this arid region, this new model effectively removes the landscape of
desert dunes as an impediment to settlement and agriculture (Cattani & Salvatori 2008).
Moreover, the model allows for a more integrated settlement system where occupation and
agriculture could thus be much more widespread (see below). Although intensive studies of off-
site distributions have been limited, a number of suggestions have been put forth regarding the
interpretation of this continuous distribution of material. Drawing on Wilkinson's work in
northern Mesopotamia (Wilkinson 1982; 1994; Wilkinson and Tucker 1995), several researchers
associated with the AMMD project have attributed the broad distributions of low-density
material to manuring processes, although these possibilities have not been explored in detail (see
Section 7.4). A study of „off-site‟ material near the sites of Togolok and Site 55, conducted by
Serge Cleuziou demonstrated spikes in sherd densities several hundred metres away from the
extremely high-density areas (2000+ sherds/100m2) that he associates with the main settlement
areas (Cleuziou et al. 1998). The largest of these purported off-site distributions—peaks in an
otherwise low-density distribution—he attributes to farms or villages, although he notes the
tendency of material to gather in small over-sanded depressions as well, often resulting in
potential „false positives‟ caused by more recent geomorphological processes rather than
legitimate reflections of the ancient settlement pattern.
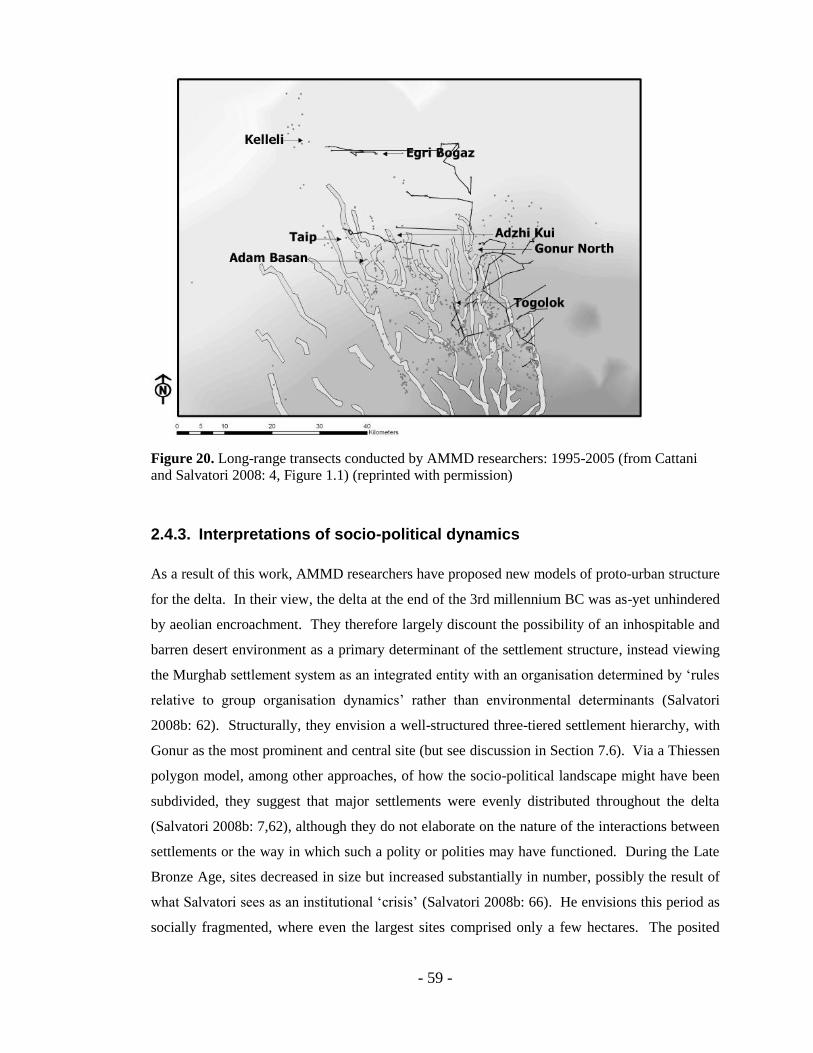
- 59 -
Figure 20. Long-range transects conducted by AMMD researchers: 1995-2005 (from Cattani
and Salvatori 2008: 4, Figure 1.1) (reprinted with permission)
2.4.3. Interpretations of socio-political dynamics
As a result of this work, AMMD researchers have proposed new models of proto-urban structure
for the delta. In their view, the delta at the end of the 3rd millennium BC was as-yet unhindered
by aeolian encroachment. They therefore largely discount the possibility of an inhospitable and
barren desert environment as a primary determinant of the settlement structure, instead viewing
the Murghab settlement system as an integrated entity with an organisation determined by „rules
relative to group organisation dynamics‟ rather than environmental determinants (Salvatori
2008b: 62). Structurally, they envision a well-structured three-tiered settlement hierarchy, with
Gonur as the most prominent and central site (but see discussion in Section 7.6). Via a Thiessen
polygon model, among other approaches, of how the socio-political landscape might have been
subdivided, they suggest that major settlements were evenly distributed throughout the delta
(Salvatori 2008b: 7,62), although they do not elaborate on the nature of the interactions between
settlements or the way in which such a polity or polities may have functioned. During the Late
Bronze Age, sites decreased in size but increased substantially in number, possibly the result of
what Salvatori sees as an institutional „crisis‟ (Salvatori 2008b: 66). He envisions this period as
socially fragmented, where even the largest sites comprised only a few hectares. The posited
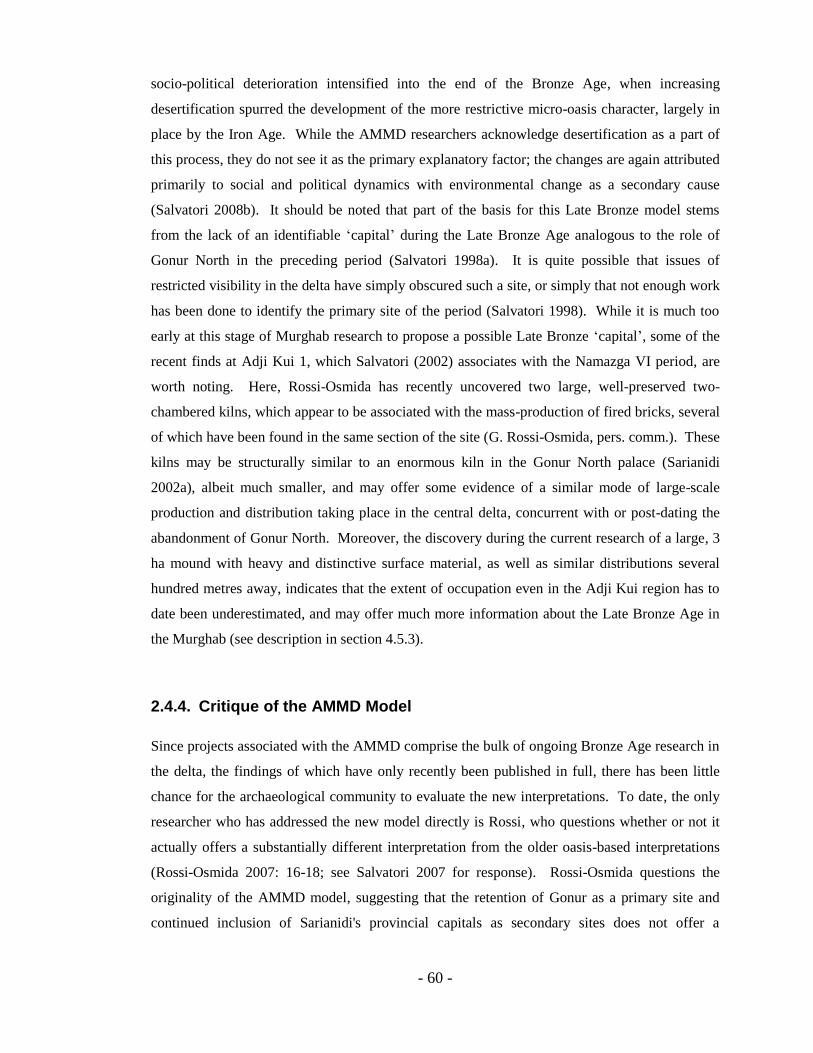
- 60 -
socio-political deterioration intensified into the end of the Bronze Age, when increasing
desertification spurred the development of the more restrictive micro-oasis character, largely in
place by the Iron Age. While the AMMD researchers acknowledge desertification as a part of
this process, they do not see it as the primary explanatory factor; the changes are again attributed
primarily to social and political dynamics with environmental change as a secondary cause
(Salvatori 2008b). It should be noted that part of the basis for this Late Bronze model stems
from the lack of an identifiable „capital‟ during the Late Bronze Age analogous to the role of
Gonur North in the preceding period (Salvatori 1998a). It is quite possible that issues of
restricted visibility in the delta have simply obscured such a site, or simply that not enough work
has been done to identify the primary site of the period (Salvatori 1998). While it is much too
early at this stage of Murghab research to propose a possible Late Bronze „capital‟, some of the
recent finds at Adji Kui 1, which Salvatori (2002) associates with the Namazga VI period, are
worth noting. Here, Rossi-Osmida has recently uncovered two large, well-preserved two-
chambered kilns, which appear to be associated with the mass-production of fired bricks, several
of which have been found in the same section of the site (G. Rossi-Osmida, pers. comm.). These
kilns may be structurally similar to an enormous kiln in the Gonur North palace (Sarianidi
2002a), albeit much smaller, and may offer some evidence of a similar mode of large-scale
production and distribution taking place in the central delta, concurrent with or post-dating the
abandonment of Gonur North. Moreover, the discovery during the current research of a large, 3
ha mound with heavy and distinctive surface material, as well as similar distributions several
hundred metres away, indicates that the extent of occupation even in the Adji Kui region has to
date been underestimated, and may offer much more information about the Late Bronze Age in
the Murghab (see description in section 4.5.3).
2.4.4. Critique of the AMMD Model
Since projects associated with the AMMD comprise the bulk of ongoing Bronze Age research in
the delta, the findings of which have only recently been published in full, there has been little
chance for the archaeological community to evaluate the new interpretations. To date, the only
researcher who has addressed the new model directly is Rossi, who questions whether or not it
actually offers a substantially different interpretation from the older oasis-based interpretations
(Rossi-Osmida 2007: 16-18; see Salvatori 2007 for response). Rossi-Osmida questions the
originality of the AMMD model, suggesting that the retention of Gonur as a primary site and
continued inclusion of Sarianidi's provincial capitals as secondary sites does not offer a
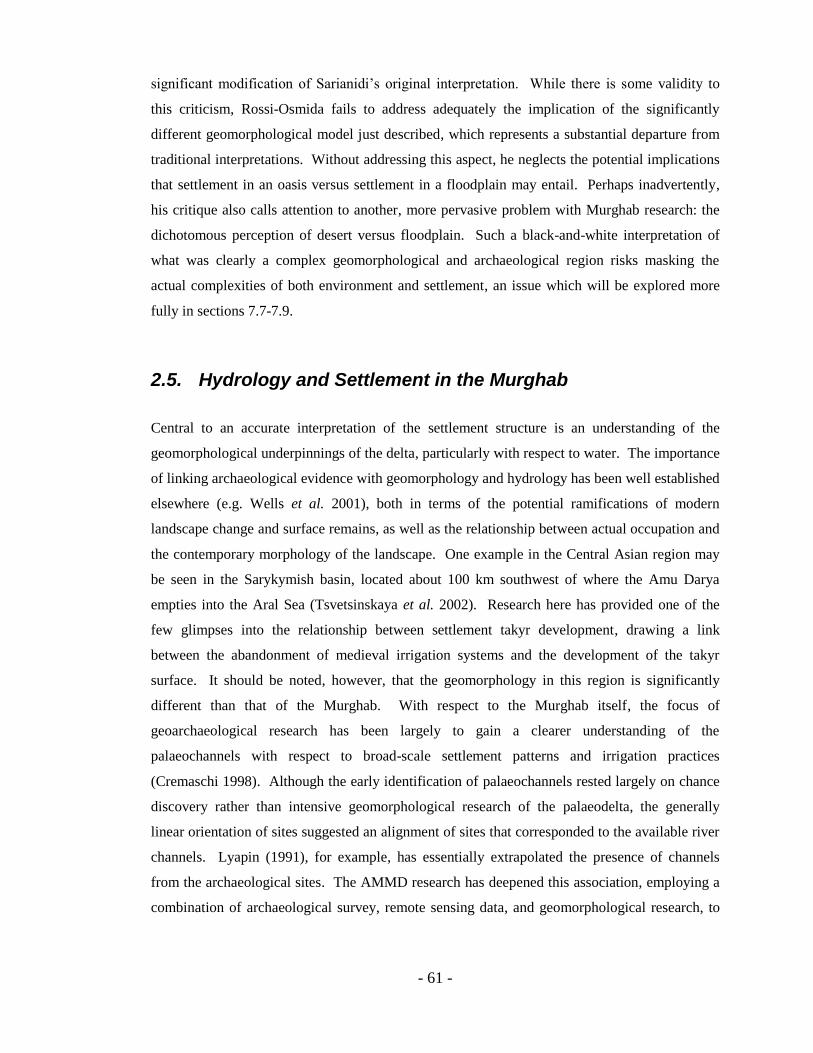
- 61 -
significant modification of Sarianidi‟s original interpretation. While there is some validity to
this criticism, Rossi-Osmida fails to address adequately the implication of the significantly
different geomorphological model just described, which represents a substantial departure from
traditional interpretations. Without addressing this aspect, he neglects the potential implications
that settlement in an oasis versus settlement in a floodplain may entail. Perhaps inadvertently,
his critique also calls attention to another, more pervasive problem with Murghab research: the
dichotomous perception of desert versus floodplain. Such a black-and-white interpretation of
what was clearly a complex geomorphological and archaeological region risks masking the
actual complexities of both environment and settlement, an issue which will be explored more
fully in sections 7.7-7.9.
2.5. Hydrology and Settlement in the Murghab
Central to an accurate interpretation of the settlement structure is an understanding of the
geomorphological underpinnings of the delta, particularly with respect to water. The importance
of linking archaeological evidence with geomorphology and hydrology has been well established
elsewhere (e.g. Wells et al. 2001), both in terms of the potential ramifications of modern
landscape change and surface remains, as well as the relationship between actual occupation and
the contemporary morphology of the landscape. One example in the Central Asian region may
be seen in the Sarykymish basin, located about 100 km southwest of where the Amu Darya
empties into the Aral Sea (Tsvetsinskaya et al. 2002). Research here has provided one of the
few glimpses into the relationship between settlement takyr development, drawing a link
between the abandonment of medieval irrigation systems and the development of the takyr
surface. It should be noted, however, that the geomorphology in this region is significantly
different than that of the Murghab. With respect to the Murghab itself, the focus of
geoarchaeological research has been largely to gain a clearer understanding of the
palaeochannels with respect to broad-scale settlement patterns and irrigation practices
(Cremaschi 1998). Although the early identification of palaeochannels rested largely on chance
discovery rather than intensive geomorphological research of the palaeodelta, the generally
linear orientation of sites suggested an alignment of sites that corresponded to the available river
channels. Lyapin (1991), for example, has essentially extrapolated the presence of channels
from the archaeological sites. The AMMD research has deepened this association, employing a
combination of archaeological survey, remote sensing data, and geomorphological research, to

- 62 -
gain a clearer understanding of the diachronic changes of the river system (Cerasetti et al.
2008b).
The basic trajectory of the hydrological changes, presented in Figure 21, has been discussed at
length by Cerasetti (2008b), of which a brief review is presented here. The work conducted by
the AMMD shows that, for the duration of the Bronze Age and into the early Iron Age, the delta
channels appear to have remained relatively stable, especially in the western part of the delta.
Changes in the hydrology during these periods are attributed primarily to the environmental and
geomorphological factors described in section 1.8 rather than human modification of the
channels (2008a). In subsequent periods, however, anthropogenic modification of the delta
probably played a much larger role from the mid-late Iron Age into the Achaemenid period.
Cerasetti (2008a) suggests that the significant transformation most likely began in the early Iron
Age, with the foundation of the large site of Yaz Depe. The growth of the Yaz population and
subsequent foundation of Erk Kala towards the end of the Iron Age represented growing,
centralised polities that required, in the face of declining water resources, a more centralised
management of large irrigation systems (Cerasetti et al. 2008a: 37). It is in this period that the
first dams were constructed just south of Merv. Ultimately, in this view, the retraction of the
delta channels resulted mainly from the large-scale management and diversion of water. While
Cerasetti thus attributes the late Iron Age transformation of the delta primarily to these large-
scale irrigation projects and dams, it is reasonable to assume that the increasingly adverse
climatic and geomorphological conditions that developed towards the end of the Bronze Age
would have continued. If this is the case, then it may make more sense to view the settlement
contraction during the Iron Age and Achaemenid periods as the result of a confluence of factors
both environmental and anthropogenic. In such a scenario, it may be that the decrease in
available riverine resources during the Bronze Age, largely driven by environmental
deterioration at first, accelerated towards the end of the second millennium and ultimately
spurred both the need for and the possibility of a centralised management of a dwindling primary
resource. While such a possibility may call to mind Wittfogel's deterministic models of
„oriental‟, „despotic‟ states driven by dwindling water access, we cannot discount the role of
increasing desertification in the development of the later settlement structure.
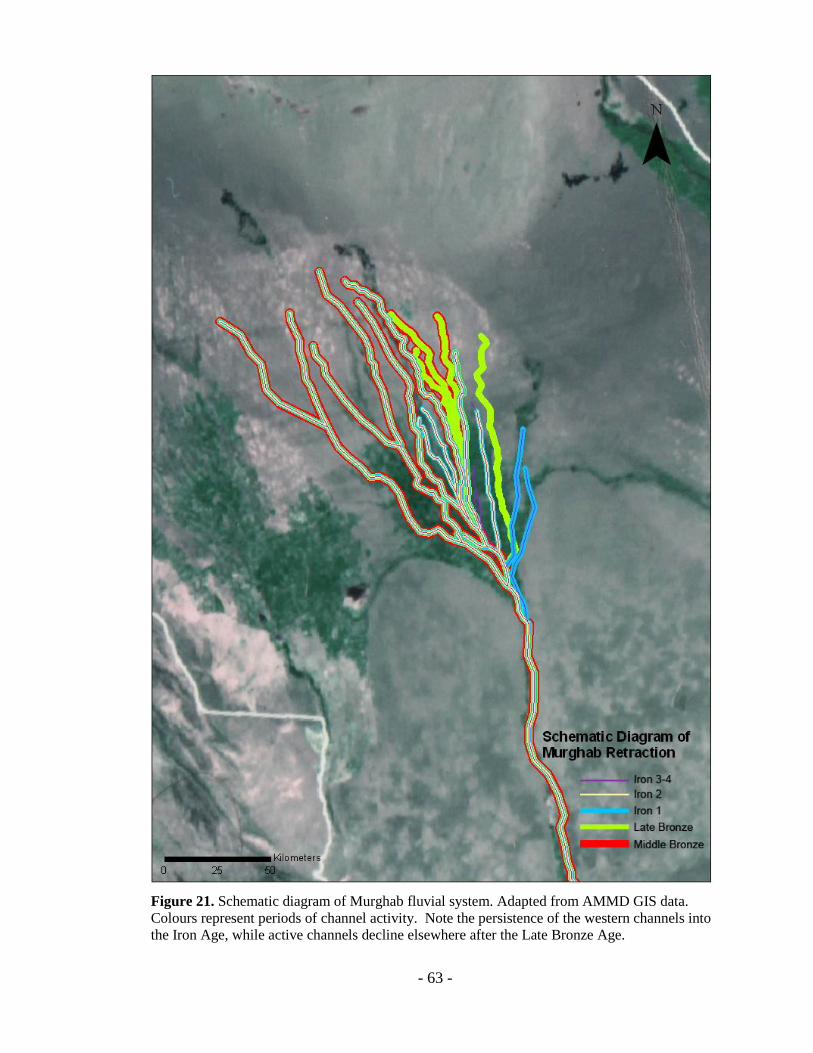
- 63 -
Figure 21. Schematic diagram of Murghab fluvial system. Adapted from AMMD GIS data.
Colours represent periods of channel activity. Note the persistence of the western channels into
the Iron Age, while active channels decline elsewhere after the Late Bronze Age.

- 64 -
2.6. Theories of Archaeological Survey
The importance of examining settlement patterns with respect to the landscapes in which they
occur has long been recognised in archaeology, and this priority is often addressed through
archaeological survey (Banning 2002). Contrary to the micro-scale of excavations—although
these too may offer a wealth of information about ancient landscapes through stratigraphic
analysis—the large land areas covered by surveys offer a glimpse into a region as a whole. The
manner in which such a large-scale tool has been employed, however, has changed greatly over
the decades. Initially, survey was largely seen as a precursor to the „main attraction‟ of
excavation (Ammerman 1981: 63). Although Braidwood, among others, recognised the
importance of understanding sites in their environmental context as early as the 1930s
(Wilkinson 2000), the primary function of surveys was to target sites for future research. The
development of archaeological survey as a study in itself began to come to the forefront in the
1960s, with a growing focus on settlement pattern analysis, pioneered by Willey a decade
earlier. „All-inclusive settlement pattern study,‟ Willey reflected, „was an attempt to prepare a
groundwork for an archaeological reconstruction that would approximate a total society, not just
the elite segment of that society‟ (Willey 1989: 170). Vogt (1956) outlined three thematic
constructs underlying this integrated study as follows:
„one which explores the relationships of living arrangements to geographical features,
such as topography, soils, vegetation types, or rainfall zones; a second which focuses upon
the social structural inferences that can be made about socio-political and ceremonial
organization; and a third which concentrates upon the study of change through time with a
view to providing materials for generalizing about cultural processes.‟ (Vogt 1956)
Such questions sought largely to understand settlement patterns within a wider anthropological
context (Holdaway and Fanning 2008), and methods inspired by work in Mesoamerica heavily
influenced survey in the Near East in the 1960s (Parsons 1972: 4). Adams‟ groundbreaking
work in the Diyala valley (1965), which investigated the relationships between diachronic
settlement change and shifting alluvial environments, employed settlement pattern analysis to
elucidate the relationships between settlement, hydrology and irrigation, an integrated approach
which remains highly influential today. Advances in geological and geomorphological research
have greatly informed many of these more recent projects, and Wells (2001) asserts that, without
properly integrating archaeological survey with these fields, a full comprehension of socio-

- 65 -
economic structures must remain elusive. In Central Asia, recent projects often employing
integrated teams of Russian, Central Asian and Western researchers have begun to focus more
heavily on understanding settlement landscapes, and in addition to the incorporation of more
developed geomorphological and hydrological studies, newer technologies such as GIS and
remote sensing have facilitated many of these projects (Mantellini et al. 2008; Cerasetti et al.
2008b).
An inherent assumption of archaeological survey is that the visible distribution of surface
material represents, to some extent, the original settlement landscape (Taylor et al. 2000). While
it is often tempting to assume a fairly faithful representation, and in formal terms an accurate
correlation of the manifestation of past archaeological landscapes with the present-day surface
distribution, such a logical leap is very problematic. One issue concerns the displacement of
surface material. Potsherds change their position in the ground over time, undergoing processes
of fragmentation and redeposition. Although recent studies (e.g. Taylor et al. 2000) have
suggested that certain processes such as ploughing may not significantly alter the general
distribution of surface scatters, factors such as erosion, fragmentation, human or animal
disturbance—all of these may significantly alter the original location of material in the
landscape. Another major issue is recovery bias, which encompasses several factors influencing
the ability to accurately record the actual distribution of sites in an archaeological landscape.
Van Leusen has identified three general categories of bias: conceptual, visual and observer (for
discussion see Van Leusen 2002: 4-6). To these we may introduce a fourth, accessibility bias,
which may reflect the primacy of certain potential survey areas at the expense of others based on
the difficulty in reaching parts of the landscape. Of these biases, observer bias is, perhaps, the
least pertinent to most Murghab research. Given the enormous geographical scope of the
previous Murghab surveys, any perceptual differences that may vary from archaeologist to
archaeologist are probably far less of a factor than the large-scale effects of limited visibility and
accessibility of large swathes of the landscape. Of greater significance are conceptual and
visibility biases which are addressed in some detail below.
Perhaps the best-known example of conceptual bias may be seen in what Wilkinson refers to as
the „tyranny of the tell‟, the tendency for archaeologists to focus on large sites either because of
their visual prominence or perceived archaeological potential (Wilkinson 2003a: 100). An
excellent example of such large-site dominance may be seen in recent work conducted in the
„Amuq Valley in southern Turkey, designed in part to revisit Braidwood‟s survey in the 1930s
which revealed a preponderance of large, nucleated Bronze Age tells (Yener et al. 2000;

- 66 -
Wilkinson et al. 2005; Casana 2003). The „Amuq Valley survey, as well as similar work in
northern Syria revealed hundreds of previously unrecorded sites, among them dispersed towns
and villages from the later periods that went undetected in the original survey. The new findings
offered a new interpretation of diachronic settlement change that had previously eluded
detection. Recent research in the Orontes valley, as well, has been designed to further the
understanding of flat or ploughed-out sites, often detectable through high resolution satellite
imagery or aerial photographs (Philip 2002). The under-representation of small sites is by no
means confined to the Near East, however. Glassow (1985) has criticised the secondary research
status of small sites in coastal California, noting that they offer new classes of archaeological
information that may not be available on more significant settlements, and Talmage and Chesler
(1977) have discussed the importance of small sites in understanding a broader range of issues
including resource procurement, socio-political structures, and questions of culture contact and
demographics. In the Murghab, the focus on large sites has been pervasive; the recording of
smaller occupations, especially during the Soviet surveys, was generally the by-product of
chance discovery. Fortunately, the importance of small sites has been increasingly recognised in
Central Asian survey, driven in part by a growing focus on sedentary-nomadic interactions in the
Murghab delta (e.g. Cattani et al. 2008b) as well as in recent projects in Samarkand (e.g. Stride
et al. 2009), and hundreds of small, flat sites have been recorded as a result (Bondioli and Tosi
1998). Unfortunately, the new focus on small nomadic sites in the Murghab continues to deflect
focus from smaller sedentary occupations which, passed over by the shifting focus of new
research agendas, remain poorly understood.
While these forms of conceptual bias tend to reflect the research aims and methodologies of the
archaeologists involved, visibility bias deals with the fact that not all archaeological sites can be
detected in various landscapes. Several factors, discussed extensively in the archaeological
literature, may be responsible for the masking of archaeological sites (Brown 1997; Wilkinson
and Tucker 1995: 17). Anthropogenic factors for example, such as urban development and
agricultural activity, may cover, alter, or destroy a site. Such factors are, of course, not limited
to modern human activity—large scale reoccupations of sites in antiquity may mask any
evidence of earlier activity—thus introducing a chronological skew to the original settlement
patterns. In addition to human activity, geomorphological factors play an enormous role in
determining whether or not sites are detectable. In alluvial environments, long known to be
prime locations for human settlement due to the fertility of soils and access to water for drinking
and irrigation, sites are often, paradoxically, more difficult to locate. Shifting river patterns and
the constant accumulation of alluvial sediments create a serious problem in terms of site masking
- 67 -
(Brown 1997: 38,42). While large sites are often prominent enough to be detected above the
alluvium, small settlements may be completely lost beneath dozens of metres of deposition. In
arid environments, shifting aeolian deposits may completely cover sites that were recently
visible—or in some cases reveal long-hidden sites from under the sands. In this context, it is
worth addressing these processes in the context of fluvial avulsion. Channel shifts are an issue
of particular significance in the examination of southern Mesopotamian settlement patterns and,
given the comparable arid environment and relatively flat alluvial environment in the Murghab,
Researchers such as Adams (1965, 1981) and Morozova (2005) have explored the aggradation of
fluvial sediments and irrigation soils in regions where channels rise above the flood plain. The
resulting development of natural levees (Adams 1965: 9-11), while fertile and favourable for
agricultural development, may also mask earlier deposits. Conversely, avulsion or desiccation
of river channels can facilitate the development of dunes that may completely obscure
archaeological sites (Morozova 2005).
Even in regions where archaeological material is visible, a plethora of post-depositional factors
may create a significant, and in some cases possibly an irreconcilable, mismatch between the
visible archaeological record and the actual nature of the settlement patterns in antiquity
(Suenson-Taylor 1999). Erosional and deflationary processes, while perhaps not completely
effacing the surface evidence of a settlement, may result in a host of post-depositional
complications. Aeolian deflation may strip a site of fine material and redeposit it elsewhere,
creating a skewed interpretation of the original surface distribution. Deflation, especially in arid
environments, may also result in the conflation of several distinct periods through the removal of
fine sediments, thus complicating accurate assessments of site size and chronologies (Rick
2002).
Although visibility bias is a well-recognised problem, and usually acknowledged in some form,
attempts to systematically measure its effects have been few, and the results somewhat
inconclusive. Shennan, through a regression analysis of various factors affecting visibility, has
found that while the primary land cover was the most significant contributor to site obstruction,
light bias was also a factor in the specific case of Romano-British pottery (Shennan 1985: 39,
Table 4.5). These factors may be expected to change in different landscapes however, so local
factors must be taken into account when considering potential effects of visibility on site
recovery. Unfortunately, systematic attempts to correct for visibility bias have been largely
unsuccessful, although a few attempts have been made (Bevan and Conolly 2004: 127;
Mattingly et al. 2000). Boeotian surveys have employed a simple visibility index—an
- 68 -
assessment of visibility on a 1-10 scale used to modify detected sherd counts (Bintliff and
Snodgrass 1988). A similar model has been tested by Bevan and Conolly (2004), although they
observe that the resulting corrected counts are highly suspect and likely not representative of the
original archaeological landscape. Ideal corrective models, if they are feasible at all, may
require more robust methods of standardising our assessment of differential visibility, although
little research has been done in this particular area. Some potential may be seen in the CARS
scale of standardised visibility, although this has not been effectively applied to archaeology
(Van Leusen 2002: 4-12).
2.7. What is a ‘Site’?
Given the magnitude of these biases, it is necessary to revisit a fundamental question of
archaeological survey: What can be learned from such an uncertainly founded reconstruction of
a settlement landscape? Surface distributions cannot simply be projected back in time as a
means of reconstructing the original distribution of communities. Present-day scatters of sherds
and other artefacts are the products of complex and dynamic processes, ancient as well as
modern. Even as early as the beginning of the last century, Stein (1921: 93) recognised the
complex nature of pottery distributions in the landscape around Khotan and elsewhere in the
Tarim Basin. While attributing many of the primary pottery distributions to tatis, „the wind-
eroded ground of ancient occupation‟, he also recognised the continuous distribution of material
throughout the landscape, which he associated with cultivation in antiquity. Because of the
complexity of depositional and post-depositional processes, the identification and interpretation
of spatial patterns of perceived settlements can offer only a shadowy representation of the
original landscape of habitation. This very loose correlation between present-day surface
distributions and actual occupation raises many interpretative questions. One is the pervasive
concept of „site‟ as the basic unit of analysis. In the vast majority of surveys, whether the goals
are to target future excavations, to understand settlement in relation to its surroundings, or some
other research focus, the basic analytical units are the archaeological sites—the atoms in a
molecular structure of discrete, yet somehow interlinked, archaeological entities. Depending on
the nature of the survey, as well as the previous knowledge of the archaeological environment,
this discrete unit may be a mound, a scatter of potsherds or lithics, or any other entity or
combination of entities. However, the actual nature of human occupation is complex, and by
reducing settlements to simple points on a map we risk overlooking important qualitative data
(Dunnell and Dancey 1983; Plog et al. 1978; Laurenza et al. 2005).

- 69 -
The question of what actually constitutes an archaeological site is a complex one for several
reasons. One theoretical issue addresses the fact that the activities and movements of
populations are not necessarily restricted by boundaries—either abstract or real. Activity
areas—whether social, agricultural or otherwise—commonly take place beyond a confined
habitation space. More central to the current research, however, is the identification of the site
with respect to collection and recovery methods—the ways in which „sites‟ are identified, or
perhaps passed over, in archaeological survey. Plog has provided a definition of site as a
„discrete and potentially interpretable locus of material…spatially bounded with those
boundaries marked by at least relative changes in artefact density.‟ (Plog et al. 1978: 390)
Gallant offers a somewhat modified definition that accounts for variations in visibility, defining
a site as an area of significant departure from the regional patterning where visibility is not an
attenuating factor (Gallant 1986). While such models are theoretically useful, the leap from
concept to methodology is notoriously difficult since the line between occupational scatter and
background distribution is typically a matter of gradual rather than substantial change. Site
identification, then, often depends on some kind of threshold above which material may be
classified as a site. In some cases, this may be determined simply by the presence or absence of
cultural material, sometimes in conjunction with a more qualitative perception of the nature of
the distribution. More often, sites are assessed based on sherd counts, or diagnostic totals,
although these may vary widely across surveys. Although such methods have been criticised as
simplistic and overly deterministic (Plog et al. 1978), they can offer a level of formality that may
be lacking in more qualitative or less systematic assessments (Gallant 1986).
2.8. Spatial Patterning in Survey Interpretation
The assignment of these definable locations within a survey area, typically sites but possibly
sampling areas, landscape features, or other entities, allows archaeologists to work with a set of
punctuated „known values‟, nodes through which some assessment of spatial relationships may
be derived. The ways in which the leap from discrete units to settlement patterns is conducted
are manifold, and Banning has identified several commonly-used conceptual models that
highlight the changing interpretations of settlement patterns (Banning 2002: 13-22). The
somewhat simplistic monument-based approach of many early surveys, as a result of an
increasing awareness of the complexity of not only sites but also distributions of material
throughout archaeological landscapes, has given way to a number of complex models that
- 70 -
attempt to address not only settlement location, but variability both on and off-site as well. The
manner in which these spatial relationships are conceptualised significantly influences the
interpretation of human settlement and interaction. For example, the development of catchment
analysis in the 1970s employed spatial relationships as a way of exploring the potential
economic influence of sites based on resource accessibility (e.g. Vita Finzi and Higgs 1970). By
contrast, the juxtaposition of survey and spatial relationships in the Americas focused largely on
political and social interactions (Holdaway and Fanning 2008). In many regions, the developing
processual school during the period fostered the incorporation of spatial models such as Thiessen
polygons to assess relative dominance of individual sites (e.g. Conrad 1978), although such
methods have come under criticism on the grounds that they are spatially deterministic and fail
to take into account „a myriad of other social and cultural factors‟ that may influence inter-site
dynamics (Conolly and Lake 2006: 212). Another commonly used method of understanding
settlement relationships is rank-size distribution, or Zipf's law (Laxton and Cavanagh 1995).
Several researchers have examined rank-size in relation to diachronic settlement shifts, often
with respect to settlement nucleation and dispersal, or processes of urbanisation or ruralisation
(e.g. Wilkinson and Tucker 1995). In the Murghab, both methods have been deployed in
conjunction with hydrological and geomorphological data to determine diachronic changes in
the settlement structure (Salvatori 1998a; 2008b). It is worth stressing, however, that the
effectiveness of such spatial approaches is largely contingent on broadly reliable and repeatable
measurements of site size or material distribution, a condition that, as will be shown in later
chapters, cannot always be satisfied in the Murghab delta.
Recent research has attempted to delve more deeply into the settlement landscape by focusing
more heavily on systemic interactions and off-site activities (Mattingly et al. 2000; Wilkinson
and Tucker 1995). Rather than simply examining points against a landscape, these studies have
focused heavily on the material distribution itself. Nonetheless, the concept of „site‟ is usually
retained, and can prove useful both conceptually and administratively (Bevan and Conolly 2004;
Dunnell and Dancey 1983: 272). This difficulty in identifying the actual location of occupation,
in conjunction with the growing understanding that settlement patterns are not just point-based
but act as continua at varying degrees, has led to a plethora of systematic approaches to
examining the settlement landscape as whole, beyond simply settlements in a landscape.
Building on Dunnell and Dancy‟s concept of the siteless survey, Ebert (1992) has explored the
concept of „distributional archaeology‟, designed to address the full distribution of artefacts in a
landscape. He invokes the concept of continuum in order to move away from the more common
- 71 -
site/non-site dichotomy, on the grounds that such a duality is too simplistic to understand the
intermediate level distributions that may not clearly fall into either category.
2.9. The Role of Scale
Another theoretical aspect of archaeological survey, and indeed of archaeological interpretation
more generally, is scale. Although many archaeological projects implicitly recognise this
concept to some extent, direct investigations of scale are often skirted in archaeological research.
This is perhaps not surprising given the nebulous and highly subjective character of scale as a
concept, referring as it does to a notion far more complex than simply a set of analytical
windows. The very act of determining the scale of a project establishes a spatial judgement, a
fixed aspect to what in reality was a continuous phenomenon (Atkinson 2000). Moreover, even
if we accept that it may not be possible to examine all pertinent scales at once, a further problem
exists in that the analytical scales chosen by archaeologists may not match the actual experience
of the people they study. It is beyond the scope of this work to explore in detail the theoretical
implications of such a disconnect—but it is worth noting that what archaeologists identify as a
town, or a community, or any other discrete locus of habitation may not have been perceived as
such by its inhabitants; and the implications for interpreting correctly the social, political or
economic aspects of a past society may be profound.
In the discourse on archaeological survey, discussion of scale usually focuses on the spatial
aspect. Sanders envisioned a two-tiered scale, differentiating between „community settlement
patterns‟ that dealt primarily with on-site distribution of local architecture, public works, and
community structure, and „zonal settlement patterns‟, which focused on the spatial and
„symbiotic relationships between communities‟ (Sanders 1956). This macro versus micro
interpretation of archaeological landscapes has remained highly pervasive and the merits of
„extensive‟ versus „intensive‟ survey remain a poignant theoretical topic (Caraher et al. 2006).
Although researchers recognised early on that effective surveys need not—and should not—
operate at only one scale of analysis (Adams 1965), such a dichotomy remains pervasive, and
the discourse among advocates of macro- and micro-scale survey remains contentious
(Wilkinson 2000; 2003b; Caraher et al. 2006). One of the primary issues is the degree to which
surveys conducted at one scale can address questions of another scale. Such a problem has been
articulated by Kowalewski (2008), who cautions that extremely intensive field surveys are often
inadequate to address broader-scale social, political and economic questions. While he does not
- 72 -
singularly dismiss the value of such projects, he suggests that they would be more effective as
„follow-up studies after regional coverage‟ (2008: 250). Such a conclusion is supported by
Matthews and Glatz (2009) who, in an assessment of the utility of intensive survey in refining
local data in the Paphlagonia region in Anatolia, do not see a substantial interpretative benefit of
intensive survey alone when applied to regional investigations. Similar concerns have been
voiced by Blanton (2001) who, in a critical review of the Mediterranean surveys that comprise
the POPULUS project, objects to the „myopic‟ attention paid to local settlement landscapes at
the expense of regional analysis; and cautions against regional level interpretations derived
solely from localised study. He goes so far as to suggest that these kinds of projects, due in part
to methodological differences as well as their tendency to disregard broader theoretical
interpretations, may actually hinder rather than foster comparative study.
This dichotomy of regional versus local in the archaeological discourse has resulted in a kind of
pitched battle in which it is not always easy to detect a middle ground. However, human
settlement and interaction are not confined to any single analytical scale, and it is in this respect
that intermediate scales of analysis must be addressed. To better understand such a concept it
may be useful to turn to Kantner who, in an excellent discussion of the hazy concept of regions
in archaeology, offers a definition of these as „spaces for which meaningful relationships can be
defined between past human behaviour, the material signatures people left behind, and/or the
varied and dynamic physical and social contexts in which human activity occurred‟ (Kantner
2008: 41). Although not speaking directly to archaeological survey, this definition is highly
applicable to the kinds of inter-site interactions that settlement pattern analysis seeks to address.
Moreover, his definition is useful in its suggestion that regional studies are, in essence, about
interaction. What it does not—and perhaps cannot—address are the actual dimensions of such
an analysis, and the exploration of this ambiguity is potentially extremely useful in the study of
archaeological survey.
How, then, can these intermediate scales be explored? A relatively new approach in archaeology
concerns multi-scalar analysis, essentially the investigation of more than one spatial scale at the
same time, or at least as part of an integrated strategy. Such analysis offers the ability to re-scale
data as well as the model used to represent that data, ultimately offering the chance to narrow or
broaden the scope of analysis and modify research questions accordingly (Atkinson 2000).
Ideally, however, a general understanding of the dataset is required in order to determine such
scales, and this inherent assumption is rarely satisfied in archaeology due to the paucity of
available data. For example, an archaeologist investigating a cluster of artefacts would be hard-
- 73 -
pressed to determine whether the size of the cluster represents the ideal analytical scale, or
whether to enlarge the window to consider broader processes, given that much of the original
material may be absent.
Recent research has begun to explore some of these methodological questions, investigating the
degree to which the investigation of different scales affects archaeological interpretation. Burger
and Todd, for example, have employed the „Modified-Whittaker multiscale sampling plot‟ in
order to measure the effect of scale on surface recovery, adjusting both the spatial extent as well
as the intensity (Burger and Todd 2006: 240). They found that by varying each of their three
scale metrics: the grain (sample unit size), the overall spatial extent, and the intensity of survey,
significant challenges to the conventional understanding of a survey landscape may be posed.
Other, more statistically rigorous approaches have been recently employed to investigate
archaeological landscapes, facilitated by the incorporation of GIS systems. Bevan and Connolly
have applied a statistical approach to multi-scalar analysis based on Ripley‟s K function to
survey data in Kythera, Greece (Bevan and Conolly 2006, also see section 6.4.2.). They point to
the extreme variability of both archaeological and geomorphological data to suggest that
multiscalar processes can offer a more critical assessment of archaeological landscapes (Bevan
and Conolly 2006: 229). Related explorations of multi-scalar phenomena have also incorporated
fractal-based methodologies which have been applied to explore multi-scale self-similarity in
urban development and settlement distributions, as well as in artefacts themselves, applying the
methods to processes of fragmentation and distribution of materials (Batty and Longley 1994;
Brown 2005).
2.10. Survey Data as Spatial and Scalar Pattern: Geostatistical Approaches
The previous sections have suggested that both spatial and scalar aspects of archaeological
survey deal with perceptions more than reality; the metrics by which we choose to measure
survey data largely determine the interpretation of that information. Since survey data,
particularly in the more distributional approaches discussed above, yield a more-or-less
continuous dataset, the question of how to break down this continuum and define the
interpretative units becomes even more pressing. A well-known interpretative problem in this
vein is what is known as the Modifiable Aerial Unit Problem, or MAUP (Openshaw and Taylor
1981). This statistical challenge arises from the demonstrated fact that, as either size or shape of
an analytical window changes, the statistical properties measured within that unit will be

- 74 -
affected. This can, to an extent, ultimately lead to wildly varying interpretation (especially for
the measurement of relationships as in regression analysis). One approach to mitigating this
problem is to minimise the potential heterogeneity of the interpretative units by defining units
that may be expected to have similar properties (Jelinski 1996). Unfortunately, while such an
approach is possible in some cases such as landscapes, where discrete land types can often be
articulated, such is typically not the case with archaeological data. Defining on-site versus off-
site, for example, or town versus city, involves the selection of heavily subjective parameters
that may not necessarily bear any resemblance to an original archaeological landscape.
2.10.1. Integrating Space and Scale
A second approach to providing spatially sensitive and scale-aware analysis that Jelinsky (1996)
recommends is the application of geostatistics, introduced here but explored in detail in Chapter
6. Lloyd defines geostatistics as a body of statistical concepts that explores „spatial variation,
spatial prediction, spatial simulation and spatial optimisation‟ (Lloyd 2004: 1). Geostatistics
offer potential in archaeology because of their ability to explore spatially heterogeneous
processes, in which spatial characteristics are not uniform over a given region. As noted above,
survey data may be affected not only by actual settlement patterns (themselves often quite
heterogeneous), but also post-depositional processes and other geomorphological factors. The
confluence of these suggests that archaeological distributions cannot be expected to exhibit
completely random behaviour in space, the Poisson process (complete spatial randomness or
CSR) against which most basic spatial statistical hypotheses have been tested (if they are tested
at all). Instead, the spatial distribution of archaeological data can be considered to be non-
stationary, where the mean and variance of the data change from location to location (Lloyd
2004). Pivotal to these analyses is a property referred to as spatial dependence, or what is
sometimes referred to as Tobler‟s „first law of geography‟ (Tobler 1970). The principle states
that similarities in observed geographic attributes vary inversely with the distance that separates
the observations: the further apart two measurements are, the more dissimilar they are likely to
be. Bevan and Connolly (2008) suggest that both „exogenous‟ factors and „endogenous‟ factors
may contribute to the spatial dependence of surface artefact distributions. They further
distinguish between induced and inherent spatial dependence where the former represents
dependence that may be coerced by some external factor such as the distribution of
environmental resources in a landscape, and the latter represents dependence inherent to the
attribute being assessed, such as sherd fragmentation. The Murghab surface distribution, as will

- 75 -
be shown in later chapters, offers an array of such processes; and as an extension of the
„exogenous‟ category we may add the visual restrictions of the prevailing geomorphology which
may falsely contribute to perceptions of spatial dependence by obscuring large swathes of the
landscape.
2.10.2. Anisotropy and Directionality
Another aspect of geostatistics, quite new to archaeology but potentially very useful in the
ridged landscape of the Murghab delta, is anisotropy, or directionality. Most archaeological
survey projects, although they may recognise directional influences, tend to be isotropic; that is,
they are assumed to exhibit the same behaviour in all directions. Longley and Batty (2003: 311)
explain isotropic space as a uniform Euclidean concept, where all directions and locations are
deemed equal. Survey data is often treated in such a manner, where sites or material scatters are
assumed to exist in a uniform spatial environment. Other data that may affect movement or
distribution of materials and sites in various directions may be recorded, but such information is
typically qualitative and treated as supplemental to the primary datasets. One advantage of this
directional uniformity is that its very simplicity facilitates the application of relatively
straightforward models to investigate spatial behaviour. A classic example may be seen in the
application of spatial models such as Central Place theory, often invoked to investigate
interactions between sites in a region of social, cultural and economic homogeneity.
Assumptions underlying the original model hold that societies within the regional space—and
the space itself—are essentially uniform (e.g. Conrad 1978). Although modifications, such as
weighting the relative prominence of particular centres, have been examined, the underlying
assumption of spatial homogeneity has remained fairly constant (Crumley 1979).
Anisotropic studies in archaeology, by contrast, are uncommon, and few quantitatively rigorous
analyses have been conducted outside of the more scientific aspects of the field such as
magnetometry (Hus et al. 2003). An exception is in the sometimes problematic but developing
study of cost-surface analysis, where slope is often cited as a potential anisotropic factor—it is
typically easier to travel downhill than uphill, a fact that may influence ways in which people
and animals may have moved through a landscape (e.g. Gonzales and Gergel 2007). However,
with the growing awareness of the relevance of geostatistics to archaeology, researchers have
begun to explore the importance of directionality in archaeological landscapes. Bevan and
Connolly (2008) have demonstrated that beyond certain distances, there is a strong tendency for
- 76 -
similar surface densities to be influenced by the underlying geology of the landscape, effectively
tracing a point at which directionality becomes a prime determinant of spatial dependence.
Other non-archaeological applications have included directional or anisotropic kriging in
creating predictive models, although Lloyd (2004) cautions that discontinuous data may best be
suited to exploratory rather than predictive applications.
2.11. Survey on the Desktop: Remote Sensing and GIS
These archaeological patterns do not occur in a vacuum, and it is essential to understand aspects
of the landscapes that contain them. Landscapes are, however, inherently qualitative, and it is
often difficult to treat them as empirical datasets as we can with other variables such as sherd
counts. Fortunately, the burgeoning field of remote sensing in archaeology offers a way around
this problem, albeit an imperfect one. Originally used primarily as a visual tool to supplement or
replace cartographic data, remote sensing data has evolved to a level where it can be included in
quantitative analysis and complex algorithms, and seamlessly integrated into wider GIS systems
(Parcak 2009). One of the more commonly used GIS data types, now increasingly derived via
aerial or satellite remote sensing methods (see Chapter 4), is the Digital Elevation Model
(DEM), which allows the encapsulation of topographical variation into discrete values not as
easily obtainable in other kinds of imagery. More recently, with the increasing availability of
multispectral data, various ground-truthed or wholly automated classification methods have been
used in the identification of sites, routes and trackways (e.g. Ur 2003).
As with other technological innovations in archaeology, however, remote sensing data has also
been the subject of significant theoretical debate (e.g. Atkinson 2004). Images of landscapes,
despite their apparent accuracy, are only models, and subject to similar constraints of space and
scale discussed above. What appears as a visual continuum is, in actuality, a series of discrete
pixels, each of which may mask highly localised variability in the landscape (Adams and
Gillespie 2006). Ideally, where possible, imagery should supplement rather than replace actual
fieldwork, and relying on imagery without proper ground truthing may well result in erroneous
interpretation of the data. A further problem may arise from image processing and interpretation
techniques. The ease of reducing satellite imagery to thematic maps, classified images and other
models hides a whole set of implicit assumptions and potentially significant parameters and, as
with GIS systems, it is easy for archaeologists to be lulled by a seemingly infinite array of data,
- 77 -
aimlessly looking for patterns, and too often finding them without having asked the appropriate
questions through which to properly interpret those patterns (Adams and Gillespie 2006).
In order to integrate the above concepts of space, scale and landscape, the role of Geographical
Information Systems (GIS) cannot be overstated. The theoretical discourse surrounding GIS is
peripheral to this research and has been discussed at length elsewhere (e.g. Conolly and Lake
2006: 1-10). However, two aspects are worth exploring here: its potential as an integrative tool
for the spatial and scalar problems posed above, and the degree to which its use in Central Asian
archaeology has realised that potential. Goodchild has defined spatial analysis as „a set of
techniques whose results are dependent on the locations of the objects of analysis‟, and such a
definition encapsulates perfectly why GIS offers so much potential (Goodchild 1992).
Moreover, the integration of categorical, numerical and even qualitative data within these
systems has allowed archaeological space to be interpreted in various contexts, integrating
archaeological and environmental variables with core spatial data. The incorporation of more
complex applications of spatial statistics in conjunction with these expanded datasets has, in a
sense, re-introduced a body of spatial and modelling research that had foundered, in part due to
technology‟s inability to keep up with intensive resource requirements. Even now, with GIS
firmly established in archaeological circles, software packages often offer only rudimentary
implementations and documentation of complex geoprocessing and/or statistical procedures, and
it is often all too easy to be lulled into a simplistic generation of a hydrological model or
interpolation surface without considering the effects of modifying various complex parameters.
As Connolly and Lake have cautioned, these tools therefore run the risk of reducing complex
human behaviours into simplistic, overly abstract patterns, and the same may be said for
archaeological landscapes as well. If these methodologies are not treated cautiously, they may
work against their stated goals by reverting to overly deterministic interpretations of human
settlement (Conolly and Lake 2006: 8).
With respect to the incorporation of GIS, remote sensing data and spatial analysis in Central
Asian projects, the region has lagged both in theory and methodology. While the importance of
these technologies is increasingly being realised in projects in Samarkand, the Tarim Basin, and
elsewhere (Mantellini et al. 2008; Padwa 2005), most investigations have remained largely
qualitative. Efforts have focused mainly on the data management and presentational facility of
such systems. While some settlement pattern analysis has been conducted, such research often
relies on traditional, visual approaches, and the extent of spatial analysis rarely goes beyond

- 78 -
basic metrics such as counts, areas and distances although methods such as Thiessen polygons
have been explored (see above). There are signs, however, of a shift to more intensive GIS-
based applications. Recent work conducted by the AMMD in the northeastern Murghab delta,
near the sites of Auchin, has begun to incorporate more distributional approaches to settlement
pattern analysis with the help of GIS (B. Cerasetti, pers. comm.). This work has employed
multi-level and gridded collection strategies that are uncommon in Central Asia, and may
indicate a growing awareness of the importance of spatial patterns in Central Asian archaeology.
2.12. Summary
This chapter has articulated a set of theoretical frameworks that will be used to guide the
investigation of the settlement patterns in this section of the northern Murghab. At once
disparate and integrated, these approaches are designed to provide as much context as possible
given the complex survey environment and the limitations on prior regional knowledge. By
interpreting aspects of spatial and scalar patterning of the material in the context of past and
present landscapes, a convergence facilitated by technological and statistical as well as more
traditional methods, a new perspective on the archaeological landscape will come forward. The
methodological parameters of this multifaceted investigation are outlined in the following
chapter.
- 79 -
Chapter 3. Methodologies
3.1. Overview
The research comprises a two-part project consisting of a desk-based component and a field
component, each of which incorporates several distinct yet integrated procedures orientated
towards a clearer understanding of the elusive, complex and largely hidden archaeological
landscape of the northern Murghab delta. The intensive survey component in particular was
designed to offer several original perspectives on the small and medium-scale distribution of
material culture and archaeological sites across the area. The research builds upon the survey
work that has been conducted in the delta since the 1950s, and narrows the analytical windows
in order to explore new perspectives pertaining not only to micro- and macro-settlement patterns,
but also key issues such as archaeological visibility and analytical scale.
3.2. Field Survey
3.2.1. Initial Preparation
During the week prior to the pilot survey in 2007 (see below), three days of field reconnaissance
were allotted in order to assess the on-site feasibility of the project as originally envisioned in
London. Pre-departure discussions with AMMD researchers familiar with the area suggested
that heavy dunes in the Egri Bogaz region could be logistically difficult for research, both in
terms of vehicle accessibility as well as survey implementation. Moreover, it was not known
whether the time taken to travel from the Merv project premises in Bayramaly would be
completely prohibitive.4
For the reconnaissance trips, a reference atlas was compiled from georeferenced raster and
vector data. The raster imagery included 1:100,000 scale Soviet military maps and
georeferenced ASTER images, to which aerial photographs were later added as they were
4The base of operations for the AMMD project is at a „Sovkhoz‟ about a half-hour‟s drive north of Merv.
This is a useful location for work to the east, such as at Takhirbai, but was found not to save any
significant time when working on sites in the Kelleli or Egri Bogaz area.

- 80 -
acquired and georeferenced. 5 The initial vector datasets consisted mainly of sites identified by
the AMMD survey as well as regions of interest identified during the desk-based portion of the
NMDS research. While these maps proved useful to have on hand, they were primarily used to
gain a general sense of direction or feel for the overall character of the landscape, as the
resolution was generally too low to provide any positive identification of specific features.
Moreover, the roads and tracks delineated on the Soviet maps are approximate and largely out-
of-date in a landscape subject to frequent and undocumented change. Since there are so many
new (albeit small) roads associated with agricultural development, pipeline construction and
maintenance and other reasons, the Soviet maps provided only a weak navigational aid for this
area.
3.2.2. Pilot Survey: Sampling Strategy and Selection of Initial Grids
The NMDS survey was designed to address a pressing need for a better understanding of inter-
settlement interactions at what may be considered a sub-regional scale. The sheer geographic
scope of the surveys to date offers very little perspective on occupational distribution at this
level, and the lack of sufficient data in this portion of the northern Murghab suggested that the
region would be ideal for this approach. There are, of course, well-established theoretical and
methodological precedents for intensive survey (Bevan and Conolly 2004; Bintliff and
Snodgrass 1988; Redman 1982; see discussion in Wilkinson 2000: 227). The survey rests
largely on the premise that, since the northern Murghab landscape is highly complex,
preconceived notions of site boundaries and subsequent extrapolations of settlement patterns
employed in previous research may be overstated or simplistic, and that a somewhat novel
approach to intensive survey in the region, designed to provide a full spatial continuum, may
offer better insight (Bevan and Conolly 2006). In this vein, the research seeks to avoid
preconceived notions of sites, and to proceed from a perspective of „distributional‟ archaeology
(Ebert 1992), where the primary dataset is the continuum of surface artefacts. The research is
not, however, intended to fully reject the theoretical notion of site, as is sometimes advocated in
the siteless or anti-site survey approach (Dunnell 1992). However, while site-based theoretical
5 In parts of Central Asia, higher resolution Soviet military maps of either 1:10000 or 1:25000 resolution
are available, and these have been used effectively in the Middle Zeravshan Valley (Stride et al 2009).
Unfortunately, due to more restricted accessibility in Turkmenistan as well as the highly sensitive nature
of the landscape due to oil and gas reserves, these could not be obtained for the project, and difficulties
have been reported in related projects as a result of attempts to procure higher resolution maps.

- 81 -
models are referenced in the research and analysis, these conceptual constraints are held to a
minimum.
The research was designed and conducted by the author, with the field assistance of about ten
people. These included workers from the nearby villages as well as several volunteers
associated with the Ancient Merv Project. The survey was conducted over two consecutive
autumn seasons in 2007 and 2008 and the first part of the spring season in 2009, comprising a
total of approximately eight weeks in the field. Autumn is the ideal time for field research in
southeastern Turkmenistan, due to the relatively mild conditions following the intense summer
heat (often over 40°C that may last through early or mid-September). Precipitation during this
period is extremely rare (although a few rainy days were experienced during the 2008 season),
so no wet-weather gear was required, rendering conditions quite amenable for archaeological
survey. The project was divided into two parts: a pilot survey in 2007, covering 4 km2, and the
main survey the following year designed to link all of the survey grids in a continuous two-
dimensional dataset. The pilot survey consisted of four discretely placed grids, each comprising
one square kilometre, and a fifth which was abandoned due to heavy agriculture (Figure 22).
These were selected to address perceived variability in topography and concentration of surface
material. The initial separation of the grids was a key factor in addressing potentially distinctive
patterns in different landscapes. While the initial sample of discrete, unconnected grids
precluded an investigation of the full spatial continuity of material in the initial phase of the
survey, this became possible with the completion of the full survey in 2008. Table 1 describes
the initial survey grids, the prevailing topography based on a visual assessment of satellite
imagery, and known Bronze Age sites identified in earlier surveys. Grids were aligned
according to the cardinal points and adjusted so that grid corners coincided with UTM
coordinates in multiples of 100m (e.g. 393500, 4250000), in order to facilitate the placement of
subsequent survey grids.
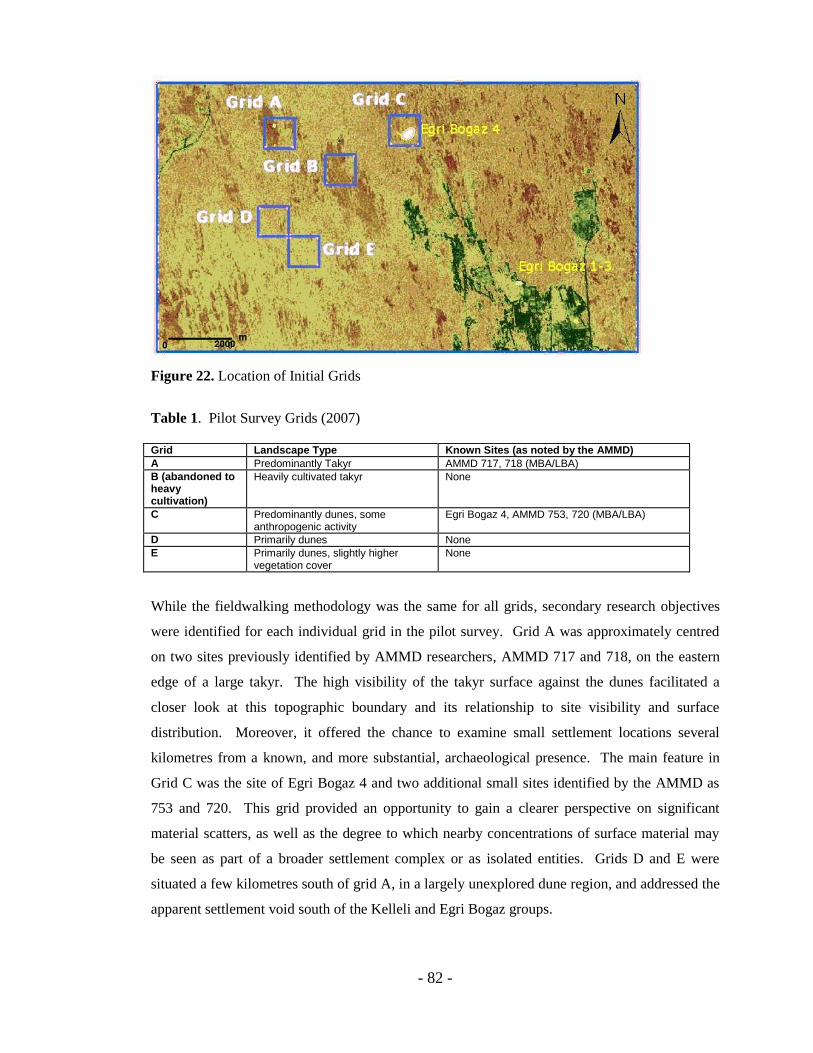
- 82 -
Figure 22. Location of Initial Grids
Table 1. Pilot Survey Grids (2007)
Grid Landscape Type Known Sites (as noted by the AMMD)
A Predominantly Takyr AMMD 717, 718 (MBA/LBA)
B (abandoned to heavy cultivation)
Heavily cultivated takyr None
C Predominantly dunes, some anthropogenic activity
Egri Bogaz 4, AMMD 753, 720 (MBA/LBA)
D Primarily dunes None
E Primarily dunes, slightly higher vegetation cover
None
While the fieldwalking methodology was the same for all grids, secondary research objectives
were identified for each individual grid in the pilot survey. Grid A was approximately centred
on two sites previously identified by AMMD researchers, AMMD 717 and 718, on the eastern
edge of a large takyr. The high visibility of the takyr surface against the dunes facilitated a
closer look at this topographic boundary and its relationship to site visibility and surface
distribution. Moreover, it offered the chance to examine small settlement locations several
kilometres from a known, and more substantial, archaeological presence. The main feature in
Grid C was the site of Egri Bogaz 4 and two additional small sites identified by the AMMD as
753 and 720. This grid provided an opportunity to gain a clearer perspective on significant
material scatters, as well as the degree to which nearby concentrations of surface material may
be seen as part of a broader settlement complex or as isolated entities. Grids D and E were
situated a few kilometres south of grid A, in a largely unexplored dune region, and addressed the
apparent settlement void south of the Kelleli and Egri Bogaz groups.

- 83 -
3.2.3. Fieldwalking Methodology
The full survey area consisted of 11 grids, sufficient to fully integrate the four grids in the pilot
study and a manageable number considering time constraints in the field. Each grid measured
one square kilometre, and designated by a letter from A-N. 6
Two exceptions were Grid M,
which was shortened by 100m and an additional 100m wide line between Grids H and C,
designated CW. These modifications were necessary based on the irregular placement of the
initial grids, but the changes were notational and had no effect on the research. With these
exceptions, each grid was divided into 100 single-hectare squares, numbered in columns from
00-99, representing the southwestern and northeastern corners respectively. These squares were,
in turn, subdivided into 20m x 20m collection units, or 25 collection units per hectare (Figure
23). This squares-within-squares hierarchy was designed primarily as a conceptual tool to
reference the two-dimensional surface distribution at multiple analytical scales. Additionally, it
offered a convenient system to reference perceived sites and materials visually. Throughout this
thesis, feature and artefact locations are therefore specified using the grid square rather than the
smaller collection unit for easier identification (i.e. M54).
6Two grids, I and J, were initially included to cover the regions north and south of Grid C, and an
additional grid, K, was placed in order to explore the increasing sherd scatter in the south of the survey
area, but these had to be abandoned due to time constraints and are not included in the NMDS survey map.

- 84 -
Figure 23: NMDS Grid Format
Field-walkers were spaced 20m apart, beginning at 10m along the baseline in order to prevent
overlap between adjacent tracts. Starting points were fixed via a Garmin Etrex GPS unit, with
an accuracy of 5m, and distances between walkers were measured by pacing. Each walker was
given a packet containing small bags for diagnostic collection (see below for a definition of
„diagnostic‟), labels, a pen and a compass. At a given signal, participants walked along
transects, reporting the total number of sherds observed on the ground, total number of „pakets‟
i.e. diagnostics), and a broad category of land cover or features (e.g. dune, takyr, shell) at 20m
intervals.
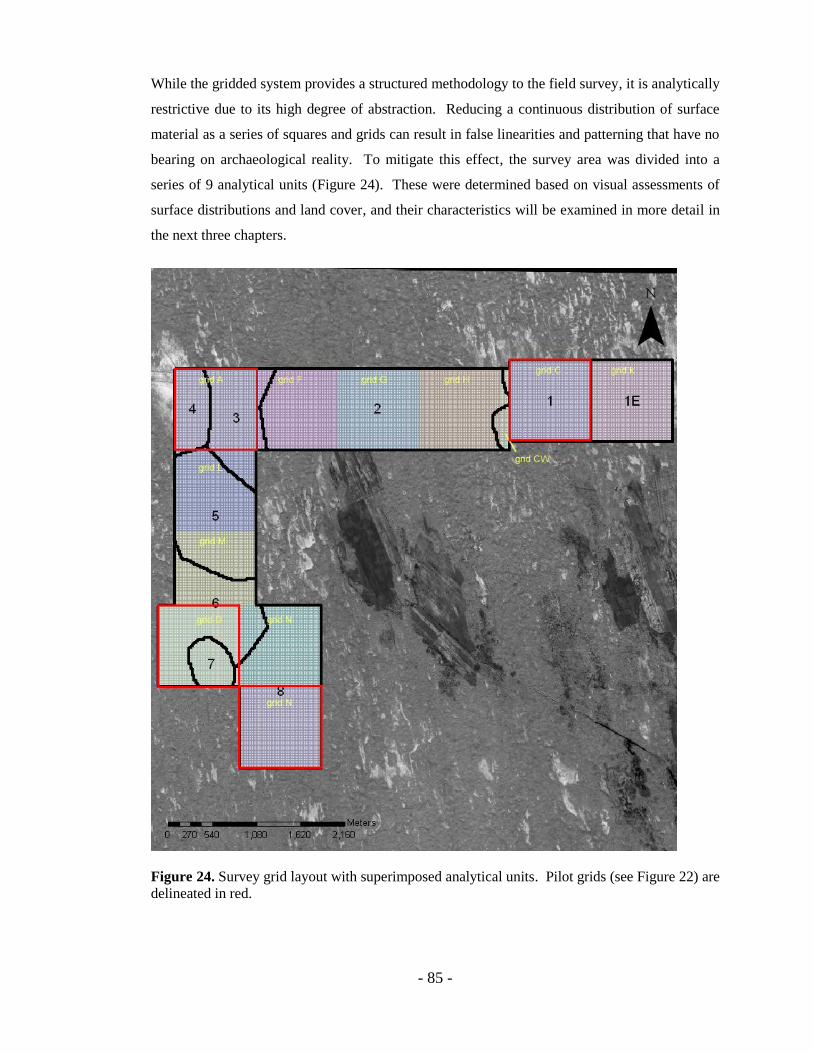
- 85 -
While the gridded system provides a structured methodology to the field survey, it is analytically
restrictive due to its high degree of abstraction. Reducing a continuous distribution of surface
material as a series of squares and grids can result in false linearities and patterning that have no
bearing on archaeological reality. To mitigate this effect, the survey area was divided into a
series of 9 analytical units (Figure 24). These were determined based on visual assessments of
surface distributions and land cover, and their characteristics will be examined in more detail in
the next three chapters.
Figure 24. Survey grid layout with superimposed analytical units. Pilot grids (see Figure 22) are
delineated in red.
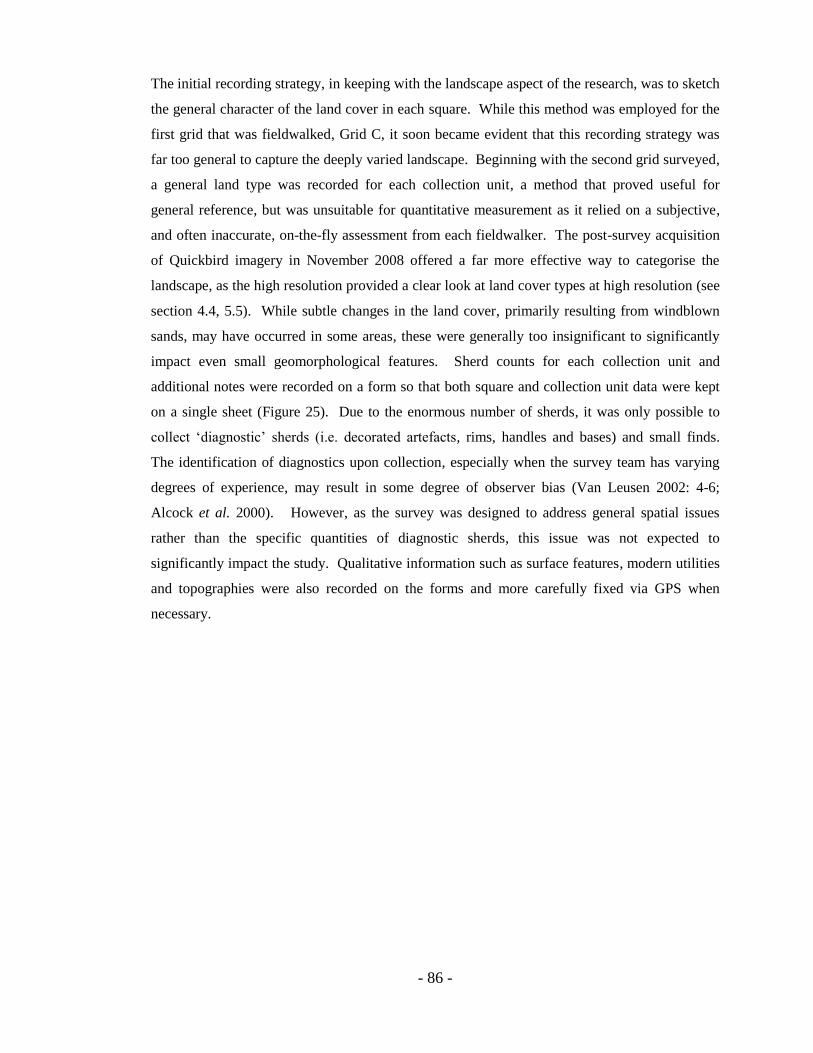
- 86 -
The initial recording strategy, in keeping with the landscape aspect of the research, was to sketch
the general character of the land cover in each square. While this method was employed for the
first grid that was fieldwalked, Grid C, it soon became evident that this recording strategy was
far too general to capture the deeply varied landscape. Beginning with the second grid surveyed,
a general land type was recorded for each collection unit, a method that proved useful for
general reference, but was unsuitable for quantitative measurement as it relied on a subjective,
and often inaccurate, on-the-fly assessment from each fieldwalker. The post-survey acquisition
of Quickbird imagery in November 2008 offered a far more effective way to categorise the
landscape, as the high resolution provided a clear look at land cover types at high resolution (see
section 4.4, 5.5). While subtle changes in the land cover, primarily resulting from windblown
sands, may have occurred in some areas, these were generally too insignificant to significantly
impact even small geomorphological features. Sherd counts for each collection unit and
additional notes were recorded on a form so that both square and collection unit data were kept
on a single sheet (Figure 25). Due to the enormous number of sherds, it was only possible to
collect „diagnostic‟ sherds (i.e. decorated artefacts, rims, handles and bases) and small finds.
The identification of diagnostics upon collection, especially when the survey team has varying
degrees of experience, may result in some degree of observer bias (Van Leusen 2002: 4-6;
Alcock et al. 2000). However, as the survey was designed to address general spatial issues
rather than the specific quantities of diagnostic sherds, this issue was not expected to
significantly impact the study. Qualitative information such as surface features, modern utilities
and topographies were also recorded on the forms and more carefully fixed via GPS when
necessary.
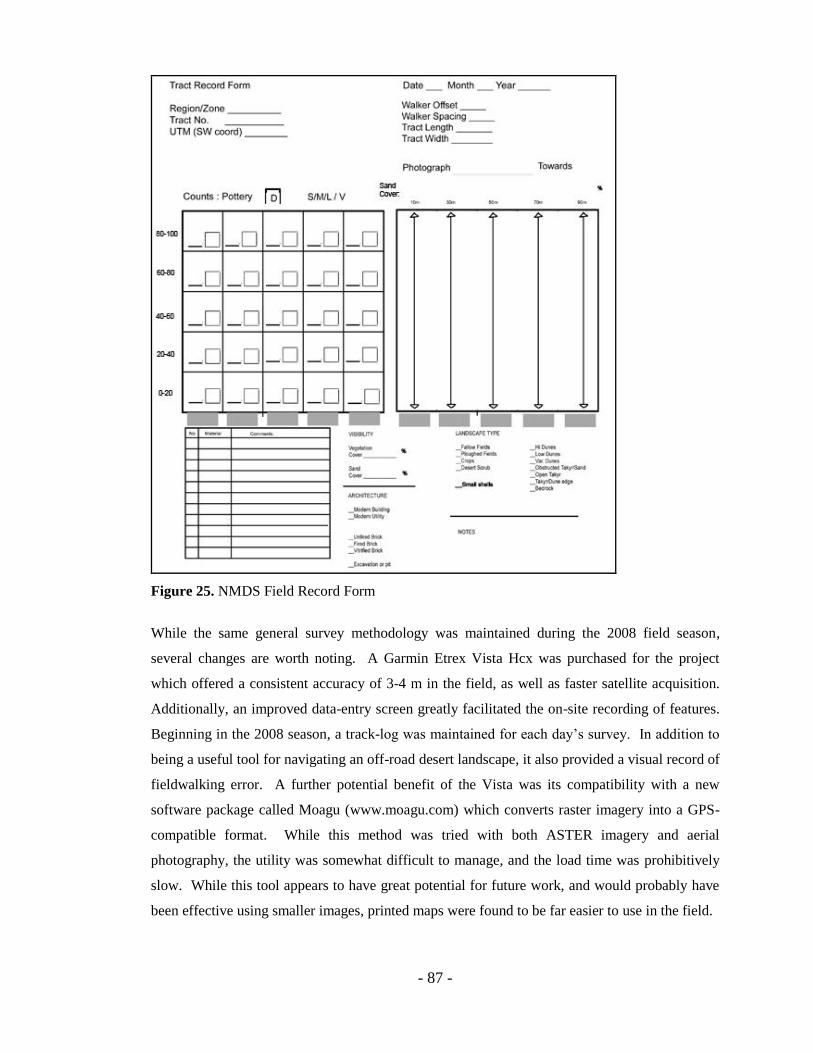
- 87 -
Figure 25. NMDS Field Record Form
While the same general survey methodology was maintained during the 2008 field season,
several changes are worth noting. A Garmin Etrex Vista Hcx was purchased for the project
which offered a consistent accuracy of 3-4 m in the field, as well as faster satellite acquisition.
Additionally, an improved data-entry screen greatly facilitated the on-site recording of features.
Beginning in the 2008 season, a track-log was maintained for each day‟s survey. In addition to
being a useful tool for navigating an off-road desert landscape, it also provided a visual record of
fieldwalking error. A further potential benefit of the Vista was its compatibility with a new
software package called Moagu (www.moagu.com) which converts raster imagery into a GPS-
compatible format. While this method was tried with both ASTER imagery and aerial
photography, the utility was somewhat difficult to manage, and the load time was prohibitively
slow. While this tool appears to have great potential for future work, and would probably have
been effective using smaller images, printed maps were found to be far easier to use in the field.
- 88 -
3.3. Pottery Analysis
Analysis of the diagnostic material was primarily orientated towards providing general
typological and chronological information that would be useful in examining the distribution of
Early, Middle and Late Bronze surface artefacts, although later material was also examined.
Before discussing the methodology, it is necessary to address a significant chronological
problem. The Bronze Age chronological horizon covered by the survey is small, spanning only
a few centuries. Moreover, the pottery forms in the region tend to be stylistically conservative,
and their composition from local alluvial clays changes little over time (Hiebert 1994a: 41, also
see petrographic discussion in section 5.11). As a further complication, the persistent Namazga
chronology is quite antiquated and geographically overextended, and regional variants of the
general Namazga typologies are only partially understood. The problems with distinguishing
pottery from subsequent chronological horizons are well known; examples include the
Middle/Late Bronze transition in Syria and the Iron Age/Achaemenid horizon in much of
western and Central Asia (Philip 2002; Casana 2003; Genito 1998: 151, footnote 5). Since
changes in material culture need not coincide with chronological windows developed by
archaeologists, the onset of a new chronological horizon may not always be discernible through
surface survey without the benefit of excavation. In many surveys, this problem is glossed over
with a broader diachronic approach—if a survey spans a few millennia, confusing a few
centuries is less of a problem. The NMDS survey, however, zeroes in on just such a horizon,
and this limitation must be taken into account in conducting the research.
Fortunately, there is a substantial body of literature that has focused on these specific problems,
and the Margiana variants of Namazga V and VI typologies have received significant treatment.
Most useful to this study has been Hiebert‟s chronology, derived from the 1989 deep sounding
on Gonur North, which offers not only an outstanding written and visual resource but also an
excellent analysis of perceived changes over a short period of time (Hiebert 1994a: 39-73).
Salvatori‟s excavations on Adji Kui 1 and 9 provide another outstanding resource, as well as his
reports on the ceramics from the Namazga V cemetery on Gonur North (Salvatori 2002; 1995).
P‟yankova (1993) and Udeumuradov (1993) have also provided in-depth analyses of Murghab
ceramics in broader regional context, although illustrations are often small and forms more
difficult to identify.
With the aid of these resources, and the professional assistance of Sandro Salvatori and Maurizio
Cattani at the University of Bologna, it was possible to assign a broad date to 620 of the 707
- 89 -
collected diagnostics of which 509 could be classified with reasonable certainty as Bronze Age
materials. Of these, 77 could be tentatively assigned to the Middle or Late Bronze Age, and
about 8 to the terminal or final Bronze Age (late Namazga VI, including 5 steppe coarsewares).
While the sample was often too small to comfortably sustain statistical evaluation, the number of
sherds was sufficient to examine general trends (see Chapters 5 and 7). Sherds were
photographed and entered into a database along with information on sherd size and abrasion.
This database could then be linked to the survey data through a GIS system (see below). Finally,
it is worth noting that further, more informal, chronological assessments were also conducted in
the field based on general shape typologies and fabrics.
As an adjunct to the pottery analysis, a small petrographic study was conducted (see section 5.9
for detailed methodology). The purpose of this investigation was to determine if any broad
classes could be identified that may offer additional insight into the chronology or provenance of
the surface material. A feasibility study of six sherds was conducted after the 2007 season, to
which an additional 12 sherds were added upon completion of the survey. Material was chosen
to reflect a range of types and fabrics based on visual observation, selected both from the Egri
Bogaz 4 region as well as more remote areas in the western part of the survey area in order to
evaluate any potential geographical variation.
3.4. GIS and Spatial Analysis
3.4.1. Preparation of the GIS and Existing Data from the AMMD GIS
The GIS used for this study manages both existing raster and vector data from the AMMD
project and new data obtained for the NMDS survey. The key raster datasets, explained in more
detail below, include multispectral ASTER imagery, CORONA imagery, Soviet aerial
photographs, and high resolution Quickbird imagery, the last of which was acquired in
November 2008. Some of the technical aspects of these satellites will be discussed in more
detail below, but it is worth mentioning that the Quickbird imagery was obtained during the
second field season, effectively providing a live image of the study area. Unfortunately, the
imagery was acquired too late to be of use in the initial survey design, although it played a
significant role in the post-processing and analysis of the data. In addition to these raster sets, a
large archive of vector data was generously provided by the University of Bologna, which
proved invaluable in the research. The primary spatial dataset from Bologna contained vector
- 90 -
data of all recorded sites in the Murghab. For the purposes of this research, a subset of this data
representing the Bronze Age sites was created. Sites dating from the Iron Age and later do not
comprise a significant component of this research, and are only occasionally included as a
general reference. Additional information about the AMMD sites including chronology and
comments was included in an accompanying Microsoft Access database that could be integrated
with the GIS data. Additional raw data from the AMMD GIS system (cited hereafter as AMMD
GIS) was available for further reference. Use of these datasets is noted in the text where
relevant.
3.4.2. NMDS Datasets
The area covered by the NMDS survey is represented by a single polygon shapefile containing
all 27,500 collection units. In order to facilitate integration with the existing AMMD data, the
NMDS dataset was projected into UTM coordinates, using the WGS 84 ellipsoid (Zone 41N).
Each collection unit was assigned a unique identifier containing the grid letter, square number
(00-99), and horizontal and vertical coordinates of its corresponding centroid [e.g. A233030].
Included within the shapefile are corresponding sherd and diagnostic totals as well as a comment
field. During the course of the research, many additional shapefiles and maps were created
based on the GIS analysis and evaluation of the remote sensing algorithms. These proved to be
very useful not only in analysis, but in visual presentation as well.
A companion database, built in Microsoft Access, comprises an inventory of all of the diagnostic
material and small finds collected during the course of the survey. In order to provide a spatial
reference for these diagnostics, each was assigned a random point within its corresponding
collection unit. This process allowed the diagnostic material to be integrated with the raw sherd
counts, facilitating both a visual and spatial examination of the material. In this way, broad
trends in material type and chronological shifts could be explored where possible.
3.4.3. Spatial Analysis
Whereas many other GIS-based projects in Central Asia have focused primarily on using GIS
applications for data management and presentation, the NMDS project placed much more
emphasis on spatial analysis functionality to make sense of a highly complex distribution of
- 91 -
surface materials and occupational areas. As in other projects, a substantial portion of these
investigations was initially visual: both material from the original AMMD research and the new
datasets were subjected to intensive visual examination. Foremost among these was the
detection of probable occupational areas as well as the relationships between these and the
landscape, as interpreted both from fieldwalking data and remote sensing imagery. A second,
and more complex, application of spatial analysis incorporated a suite of advanced statistical
methods. To apply these methods, the entire surface distribution was treated as a point pattern in
two-dimensional space, where either individual artefacts or collection units were represented by
discrete points in a spatially continuous pattern (for details see Chapter 6). While older global
statistics such as the Clark-Evans nearest neighbour test (Clark and Evans 1957) were employed
as a starting point, newer methods that focused on spatial autocorrelation and multiscalar
analysis, such as the Gi* statistic (Getis and Ord 1992) and K function (Ripley 1977)
respectively, were employed to deepen this understanding. Additional methods were borrowed
from geostatistics, designed to work with spatially heterogeneous and non-stationary
distributions. Of particular interest was the anisotropy, or directionality, of the landscape, and its
potential influence the material scatter from the perspective of settlement orientation,
geomorphology, and recovery bias. Two methods were employed for this exploration:
variography and angular wavelet analysis, each of which will be further explored in section 6.5.
3.5 Remote Sensing
The second aspect of the desk-based analysis was an evaluation of the utility of remote sensing
technologies for research in the Murghab. Using the ENVI image processing software, various
techniques including band combinations, classification algorithms and principal components
analysis (PCA) were explored to assess the potential for site identification and visibility analysis
as a supplement to field survey. Because of the complexity of many of the procedures, the
specific methods will be addressed in the corresponding sections in Chapter 4. Due to the
limitations of this research, discussion will focus primarily on the multispectral ASTER
imagery, the high resolution Quickbird Imagery and Digital Elevation Models (DEMs), and
aerial photography and CORONA imagery to a lesser extent. Other datasets, while useful for
the research, are not addressed in detail.
This section describes the general methodology of remote sensing analysis as applied to the
archaeological landscape of the northern Murghab, as well as some facets of the acquisition and
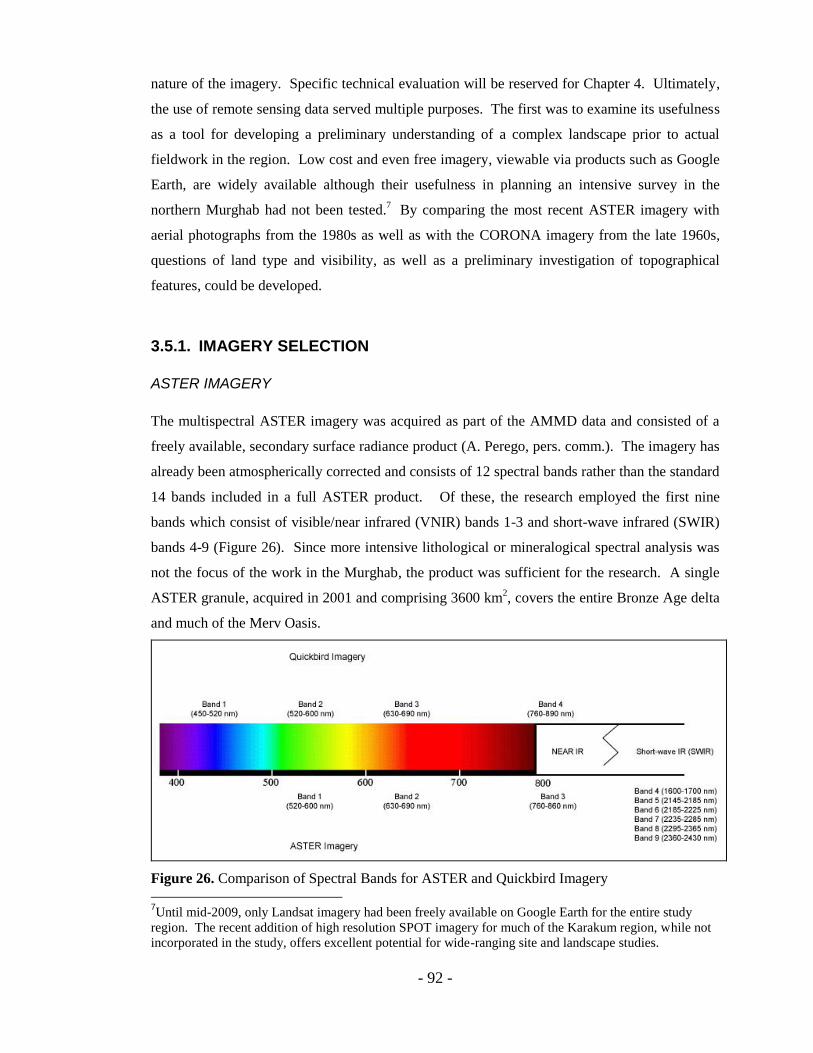
- 92 -
nature of the imagery. Specific technical evaluation will be reserved for Chapter 4. Ultimately,
the use of remote sensing data served multiple purposes. The first was to examine its usefulness
as a tool for developing a preliminary understanding of a complex landscape prior to actual
fieldwork in the region. Low cost and even free imagery, viewable via products such as Google
Earth, are widely available although their usefulness in planning an intensive survey in the
northern Murghab had not been tested.7 By comparing the most recent ASTER imagery with
aerial photographs from the 1980s as well as with the CORONA imagery from the late 1960s,
questions of land type and visibility, as well as a preliminary investigation of topographical
features, could be developed.
3.5.1. IMAGERY SELECTION
ASTER IMAGERY
The multispectral ASTER imagery was acquired as part of the AMMD data and consisted of a
freely available, secondary surface radiance product (A. Perego, pers. comm.). The imagery has
already been atmospherically corrected and consists of 12 spectral bands rather than the standard
14 bands included in a full ASTER product. Of these, the research employed the first nine
bands which consist of visible/near infrared (VNIR) bands 1-3 and short-wave infrared (SWIR)
bands 4-9 (Figure 26). Since more intensive lithological or mineralogical spectral analysis was
not the focus of the work in the Murghab, the product was sufficient for the research. A single
ASTER granule, acquired in 2001 and comprising 3600 km2, covers the entire Bronze Age delta
and much of the Merv Oasis.
Figure 26. Comparison of Spectral Bands for ASTER and Quickbird Imagery
7Until mid-2009, only Landsat imagery had been freely available on Google Earth for the entire study
region. The recent addition of high resolution SPOT imagery for much of the Karakum region, while not
incorporated in the study, offers excellent potential for wide-ranging site and landscape studies.
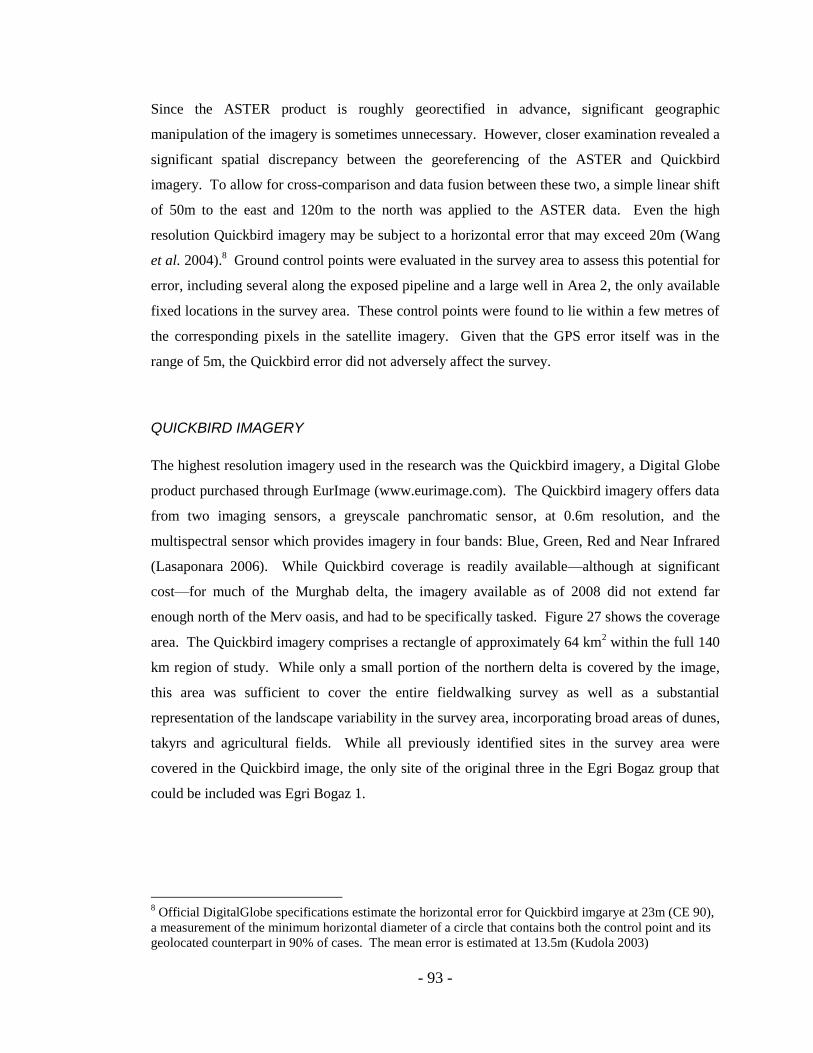
- 93 -
Since the ASTER product is roughly georectified in advance, significant geographic
manipulation of the imagery is sometimes unnecessary. However, closer examination revealed a
significant spatial discrepancy between the georeferencing of the ASTER and Quickbird
imagery. To allow for cross-comparison and data fusion between these two, a simple linear shift
of 50m to the east and 120m to the north was applied to the ASTER data. Even the high
resolution Quickbird imagery may be subject to a horizontal error that may exceed 20m (Wang
et al. 2004).8 Ground control points were evaluated in the survey area to assess this potential for
error, including several along the exposed pipeline and a large well in Area 2, the only available
fixed locations in the survey area. These control points were found to lie within a few metres of
the corresponding pixels in the satellite imagery. Given that the GPS error itself was in the
range of 5m, the Quickbird error did not adversely affect the survey.
QUICKBIRD IMAGERY
The highest resolution imagery used in the research was the Quickbird imagery, a Digital Globe
product purchased through EurImage (www.eurimage.com). The Quickbird imagery offers data
from two imaging sensors, a greyscale panchromatic sensor, at 0.6m resolution, and the
multispectral sensor which provides imagery in four bands: Blue, Green, Red and Near Infrared
(Lasaponara 2006). While Quickbird coverage is readily available—although at significant
cost—for much of the Murghab delta, the imagery available as of 2008 did not extend far
enough north of the Merv oasis, and had to be specifically tasked. Figure 27 shows the coverage
area. The Quickbird imagery comprises a rectangle of approximately 64 km2 within the full 140
km region of study. While only a small portion of the northern delta is covered by the image,
this area was sufficient to cover the entire fieldwalking survey as well as a substantial
representation of the landscape variability in the survey area, incorporating broad areas of dunes,
takyrs and agricultural fields. While all previously identified sites in the survey area were
covered in the Quickbird image, the only site of the original three in the Egri Bogaz group that
could be included was Egri Bogaz 1.
8 Official DigitalGlobe specifications estimate the horizontal error for Quickbird imgarye at 23m (CE 90),
a measurement of the minimum horizontal diameter of a circle that contains both the control point and its
geolocated counterpart in 90% of cases. The mean error is estimated at 13.5m (Kudola 2003)
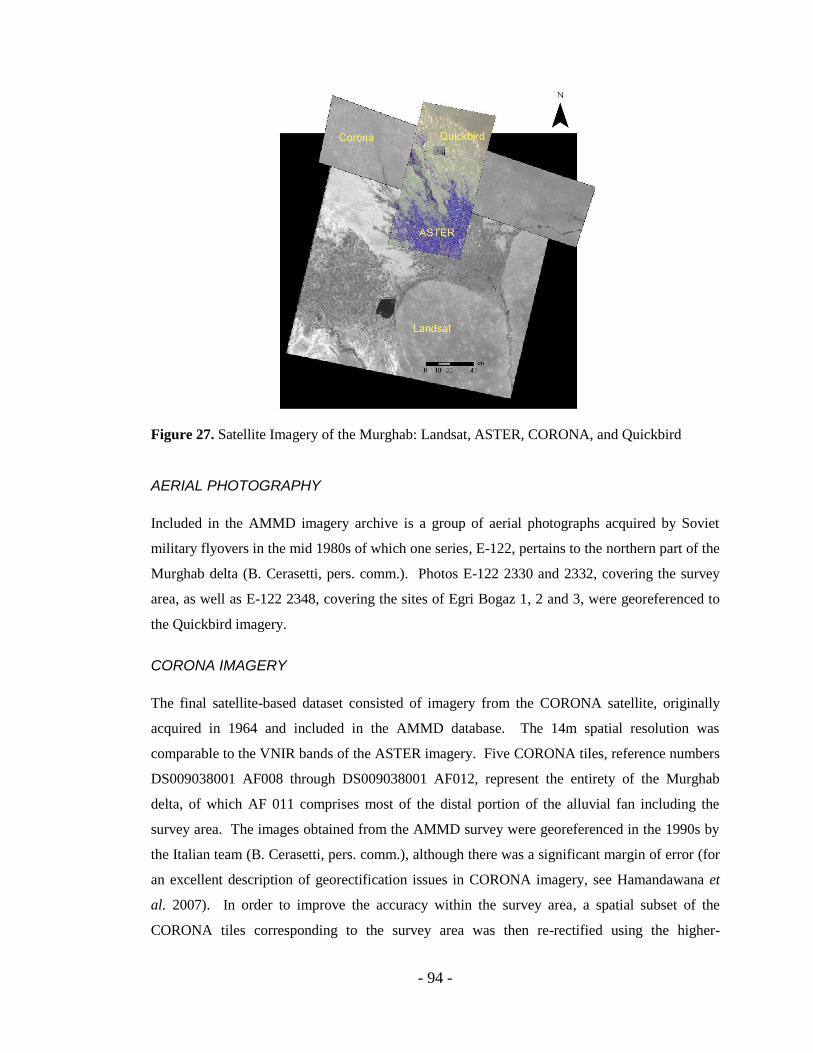
- 94 -
Figure 27. Satellite Imagery of the Murghab: Landsat, ASTER, CORONA, and Quickbird
AERIAL PHOTOGRAPHY
Included in the AMMD imagery archive is a group of aerial photographs acquired by Soviet
military flyovers in the mid 1980s of which one series, E-122, pertains to the northern part of the
Murghab delta (B. Cerasetti, pers. comm.). Photos E-122 2330 and 2332, covering the survey
area, as well as E-122 2348, covering the sites of Egri Bogaz 1, 2 and 3, were georeferenced to
the Quickbird imagery.
CORONA IMAGERY
The final satellite-based dataset consisted of imagery from the CORONA satellite, originally
acquired in 1964 and included in the AMMD database. The 14m spatial resolution was
comparable to the VNIR bands of the ASTER imagery. Five CORONA tiles, reference numbers
DS009038001 AF008 through DS009038001 AF012, represent the entirety of the Murghab
delta, of which AF 011 comprises most of the distal portion of the alluvial fan including the
survey area. The images obtained from the AMMD survey were georeferenced in the 1990s by
the Italian team (B. Cerasetti, pers. comm.), although there was a significant margin of error (for
an excellent description of georectification issues in CORONA imagery, see Hamandawana et
al. 2007). In order to improve the accuracy within the survey area, a spatial subset of the
CORONA tiles corresponding to the survey area was then re-rectified using the higher-
- 95 -
resolution Quickbird imagery. Unfortunately, the lack of clearly identifiable built features in the
CORONA imagery meant that topographical features, usually visually prominent takyrs, had to
be used for the georectification. While not ideal, the method offered an improved horizontal
accuracy at the regional level, which was adequate for a visual analysis.
3.5.2 Visibility and Landscape Analysis
Prior to the pilot survey conducted in 2007, an initial assessment of the ASTER imagery was
undertaken in order to gain a clearer understanding of the spectral characteristics of the northern
Murghab landscape, and to use this remotely acquired information to assist in the initial
placement of each isolated grid of the pilot survey. While the preliminary knowledge of a few
sites as well as a general character of the landscape could be ascertained from the existing
research, the finer detail of topographic and land-use variations—and their relationship to the
settlement pattern—remained unknown. Using broad classification algorithms described in detail
in Chapter 4, it became possible to gain a better sense of the variations in the landscape even
prior to ground truthing. With the completion of the pilot study, it then became possible to
examine the initial relationship between the landscape and the potential for archaeological
recovery in the designated survey grids. These questions concerning visibility and land cover
were explored more fully with the acquisition of the Quickbird imagery and concurrent
completion of the full survey in 2009.
3.5.3. Site Identification
A second goal was to examine the extent to which methods of remote site identification such as
those used in Anatolia and elsewhere could be applied to the Murghab, with particular focus on
the Egri Bogaz study area. This investigation, described in detail in Chapter 4, aimed to explore
both the visual potential of the imagery—both in terms of site identification using standard
image enhancement techniques, as well as the potential advantages of multispectral image
processing through the use of more advanced image processing techniques. These relied most
heavily on supervised and unsupervised classification techniques and Principal Components
Analysis. An addition examination employed ASTER and SRTM DEMs to evaluate the
potential to detect sites topographically (see Ur et al. 2006).

- 96 -
3.6. Integration with Existing Data
It is necessary to comment briefly on the procedures used for data integration in this project. In
recent years, there has been a growing awareness of the difficulties associated with comparative
research, given that few research projects adhere to exactly the same procedures and parameters.
Differences in research questions and methodologies—in the importance afforded to certain
artefacts, whether to collect material or merely study it in the field, what parameters to record,
etc.—all of these issues become even more problematic when an attempt is made to explore
many disparate datasets from different research projects. The advent of newer technologies, in
this regard, seems at times both a blessing and a curse. Researchers clamour at archaeological
conferences for the need for scalability, ontology development, standards for interoperability, so
that multiple and various projects can be incorporated (e.g. Isaksen et al. 2009). While some
progress has been made on these fronts, the solutions often tend to be as proprietary as the
original projects, and true scalable electronic resources are hard to come by.
For this reason, it is worth noting what the NMDS research can and cannot do with respect to
integration. Because the research is not focused on „sites‟ per se, it is not directly structured for
full integration with the existing AMMD database. Although AMMD site designations are used
as reference points throughout the study, the definition of site in the northern Murghab is
intended to be an outcome rather than a starting point of the research. In this sense, the „siteless
survey‟ (Dunnell and Dancey 1983) is a key methodological theme, albeit not ultimately a
mantra. Because of the vastly different methodologies and datasets, it is not envisioned that the
NMDS systems will become fully compatible with either the AMMD database or other Central
Asian archaeological databases. However, the structure does facilitate comparative assessment
of both datasets, as well as useful ground control against which to conduct investigations in other
areas, and ongoing research collaboration between these projects further facilitates qualitative
integration.
3.7. Test Pits and Investigation of Subsurface
The above methodologies focus entirely on surface observations. However, significant
geomorphological and post-depositional processes have unquestionably altered the distribution
of surface artefacts over the past four millennia, and it is necessary to gain some sense of the
relationship between surface distributions and subsurface archaeology. In order to explore this

- 97 -
relationship, a test-pit strategy was employed. This approach served a dual purpose. The first
objective was to investigate the presence or absence of cultural stratigraphy in areas that
displayed signs of occupation, either in terms of dense cultural material or surface features. A
secondary aim was to investigate the relationship between topographic variation and cultural
material, as well as the effect that erosion may have had on the subsurface cultural horizons. In
addition to gaining a better understanding of the archaeology, the subsurface investigation was
designed to gain further insight into both natural and cultural stratigraphy.
Since surface scatters are not necessarily a direct indicator of occupation, some care was
required in determining where to position the test pits (for detail see section 5.6). Furthermore,
with limited time and resources available to conduct these pits, a full systematic sampling
strategy could not be employed (but see Nance and Ball 1986 for discussion). Test pits were dug
as 1m x 1m x 1m units, oriented in the cardinal directions, and material was collected according
to broad stratigraphic context. Pits were to be taken to the top, rather than through, cultural
layers, as a fine-grained stratigraphic analysis was beyond the scope of the study. In a few
instances, augering was employed to further examine selected areas between test pits.
3.8. Summary
The methods employed thus offer an integrated approach to understanding the settlement
patterns in the northern Murghab delta. While the survey itself is the primary focus of this
research, it is supported throughout by further analyses of spatial distribution and landscape
through the technological approaches outlined in this chapter. The following three chapters will
present the results of these findings, beginning with an assessment of the remote sensing data in
its applicability to landscape interpretation, visibility and site detection.
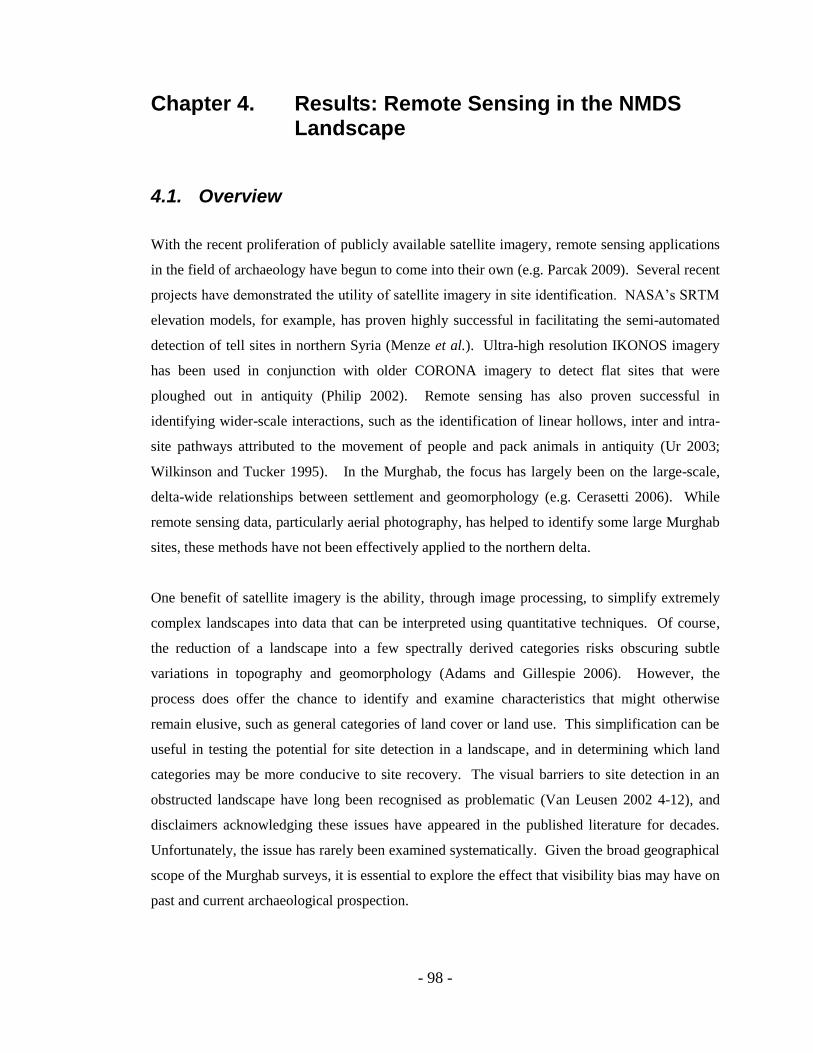
- 98 -
Chapter 4. Results: Remote Sensing in the NMDS Landscape
4.1. Overview
With the recent proliferation of publicly available satellite imagery, remote sensing applications
in the field of archaeology have begun to come into their own (e.g. Parcak 2009). Several recent
projects have demonstrated the utility of satellite imagery in site identification. NASA‟s SRTM
elevation models, for example, has proven highly successful in facilitating the semi-automated
detection of tell sites in northern Syria (Menze et al.). Ultra-high resolution IKONOS imagery
has been used in conjunction with older CORONA imagery to detect flat sites that were
ploughed out in antiquity (Philip 2002). Remote sensing has also proven successful in
identifying wider-scale interactions, such as the identification of linear hollows, inter and intra-
site pathways attributed to the movement of people and pack animals in antiquity (Ur 2003;
Wilkinson and Tucker 1995). In the Murghab, the focus has largely been on the large-scale,
delta-wide relationships between settlement and geomorphology (e.g. Cerasetti 2006). While
remote sensing data, particularly aerial photography, has helped to identify some large Murghab
sites, these methods have not been effectively applied to the northern delta.
One benefit of satellite imagery is the ability, through image processing, to simplify extremely
complex landscapes into data that can be interpreted using quantitative techniques. Of course,
the reduction of a landscape into a few spectrally derived categories risks obscuring subtle
variations in topography and geomorphology (Adams and Gillespie 2006). However, the
process does offer the chance to identify and examine characteristics that might otherwise
remain elusive, such as general categories of land cover or land use. This simplification can be
useful in testing the potential for site detection in a landscape, and in determining which land
categories may be more conducive to site recovery. The visual barriers to site detection in an
obstructed landscape have long been recognised as problematic (Van Leusen 2002 4-12), and
disclaimers acknowledging these issues have appeared in the published literature for decades.
Unfortunately, the issue has rarely been examined systematically. Given the broad geographical
scope of the Murghab surveys, it is essential to explore the effect that visibility bias may have on
past and current archaeological prospection.

- 99 -
In keeping with the overall direction of this study, and recognizing the need to explore the
survey area at different levels of analysis, visibility was addressed using scale as a prevailing
conceptual framework. At the broadest level, ASTER imagery was used to examine the Bronze
Age settlement landscape as a whole, in order to identify broad patterns that may affect the
potential for site recovery in the NMDS region as compared to elsewhere in the Murghab delta.
Narrowing the scope, a similar strategy was applied to the survey area itself, designed to identify
different local and regional factors that may affect recovery in various locations. This analysis
begins with a general assessment of the remote sensing data, and moves towards a more detailed
investigation of multispectral image analysis. Since the highest resolution Quickbird imagery
was obtained quite late into the course of the research, most of this work utilised the ASTER
imagery, and analyses where Quickbird imagery was included are clearly identified. The
chapter takes a top-down approach, beginning with an investigation of general characteristics of
the remote sensing data, then examining these more closely with respect to issues pertaining to
geomorphology, visibility and site-identification issues.
Prior to the analysis, a disclaimer is necessary. Remote sensing is a broad term, and it is
important to articulate what it means with respect to the current research. Essentially, remote
sensing reflects a method of data acquisition—not of interpretation. The ways in which such
data may ultimately be utilised are numerous, and range from simple thematic displays to sub-
pixel spectral analyses of various minerals (Adams and Gillespie 2006). In Central Asia,
satellite and aerial imagery have been used extensively to understand the geological
underpinnings of the Kopet Dag and Karakum—information heavily utilised both by the oil and
gas industries as well as in investigations of the desiccation and salinsation of the Aral Sea
region and Amu Darya rivers (e.g. Shi 2007; Orlovsky and Orlovsky 2002). With respect to
Murghab archaeology, the primary focus has been on the reconstruction of palaeo-hydrology.
Additionally, geophysical survey, also technically in the remote sensing category, has been
utilised in conjunction with high resolution IKONOS imagery at Merv (Herrmann 1994) .
With these limitations in mind, the use of remote sensing is here employed to address questions
of feasibility, and seeks to identify the extent to which this data can assist in making sense of the
distribution of archaeological materials in an obstructed landscape. In this respect, three lines of
enquiry are pursued. The first addresses archaeological visibility, and the degree to which it
may be quantified. A second avenue deals with the potential for identification of archaeological
sites in the Murghab, through both DEMs and multispectral imagery. Underlying each of these

- 100 -
is a third aim—the deeper understanding of the geomorphological landscape as detectable via
remote sensing, and its ultimate relationship to the distribution of settlement and material.
4.2. Visual Analysis of Remote Sensing Data
4.2.1. Aerial Photography
Two aerial photographs from the E122 series (see section 3.5.1), 2330 and 2332, were used in
the analysis, georeferenced to the high-resolution Quickbird imagery of the area. For
comparative purposes, two other photographs in the series, one covering the Kelleli sites, and
one covering a portion of the Adji Kui settlement region, were also georectified. An initial
investigation of these photographs revealed several problems with the imagery. The
photographs, while offering a high spatial resolution, are very grainy, and image artefacts are
common (Figure 28). These typically take the form of small brightness anomalies, although
broad horizontal striping tends to occur in some of the more uniform sanded areas. The edges of
the photographs are dark compared to the centres in each photograph, although features in these
areas may still be enhanced using simple histogram modifications. While it is possible to use
more advanced image enhancement techniques such as de-striping algorithms or Fourier-based
noise reduction techniques (Albani and Klinkenberg 2009), these were beyond the scope of
research and not deemed to be necessary in gaining an overall sense of the visual landscape.
- 101 -
Figure 28. Aerial Photographs of the Egri Bogaz region. Left: Full aerial photograph with Egri
Bogaz 4 in the centre. Note the striping on both the left and right of the image, and the
darkening towards the edges. Right: Close-up of same area. Takyrs are visible as light greys due
to their high reflectance. Agriculture is not evident here, although much of the takyr in the
southeastern quarter of the image is now under heavy cultivation.
An overall assessment of the aerial photographs reveals an adequate visual representation of the
key landforms within the survey area. The most clearly identifiable features, the unvegetated
takyrs, are easily discerned by their high reflectance (greyscale values of over 190). The general
trajectory of the dune ridges, typically orientated slightly to the west of due north, is clear,
enhanced by shadow. Specific geomorphological boundaries, however, are difficult to identify
in the photographs, and it was often difficult to assess where the specific boundary between, for
example, an oversanded takyr and an adjacent dune ridge actually occurred. Although the
AMMD researchers have highlighted the use of aerial photography in assisting the delta-wide
survey (Cremaschi 1998), site identification derived solely from the aerial photographs appeared
to be futile in the northern delta. Certain archaeological sites that occur within agricultural
zones, such as Kelleli 3 and 4 and Egri Bogaz 1 (not shown), could be seen against the
surrounding landscape, but this is due primarily to the fact that settlement mounds are often left
unploughed, perhaps due to the intensive resources necessary to fully clear the mounds rather
- 102 -
than any legitimate concern for the integrity of archaeological sites. On uncultivated takyrs,
known archaeological sites may be discernible when they occur in the middle of the feature as a
result of the clear delineation between the high-reflectance takyr surface and the mixed sandy
deposits that typify archaeological sites in the area. However, the visual signature of these
features is very similar to similar deposits that occur throughout the Murghab, and can easily be
confused with loose sands associated with anthropogenic activity or oversanding processes
associated with takyr erosion (Fleskins et al. 2007). While some of the concentrations of
material detected in the survey were associated with these soils, there was no obvious visual
signature in the survey area that can offer strong evidence of a site on its own merit. The poor
delineation of Egri Bogaz 4, comprising several hectares at the very least, offers a useful
illustration of this difficulty. While it is possible to discern individual mounds, it is difficult to
distinguish these from non-anthropogenic dune hillocks in the immediate vicinity. Better-
defined visual signatures such as those at Gonur North or Adji Kui 8 are absent in the northern
delta, and these larger sites may owe their detectability in part to their size, contiguity, and
relative lack of dune obstruction. Furthermore, it is probable that on some of the better-known
sites, decades of excavations have enhanced spectral distinctiveness.
4.2.2. CORONA Imagery
The available CORONA imagery offered a comparatively low 14m spatial resolution compared
to the CORONA imagery available in the Near East. It proved useful, however, in assessing
broad changes in landscape development, particularly with respect to agriculture. A comparison
of the CORONA imagery, acquired in 1964, to the recent ASTER and Quickbird imagery,
acquired in 2001 and 2008 respectively, reveals a landscape only partially affected by
anthropogenic activity, although the rapid agricultural development can easily be seen (Figure
29). Another useful application of the CORONA images was in the area of topographical
comparison. Although small depressions and takyrs could not be detected at this resolution,
comparisons between the CORONA imagery and other remote sensing imagery suggests that
substantial geomorphological features—particularly stable dunes and large takyrs—have
remained fairly stable. While such an observation may be obvious in terms of the underlying
geology, the accumulation and deflation of aeolian deposits can severely alter topography over
longer periods of time (Lioubimitseva 2003).

- 103 -
Figure 29. Agricultural encroachment in the northern delta: 1964-2008. Left: CORONA
Imagery, 1964. Centre: ASTER VNIR imagery, 2000. Right: Quickbird Multispectral imagery,
2008
In terms of the potential for site prospection, the CORONA imagery—at least at the resolution
available—did not prove to be an effective tool in the northern delta. Regions of moderate to
heavy surface scatter did not present a significant visual signature in the CORONA imagery, and
the complex surface environment of Egri Bogaz 4 offered little in the way of a distinctive
archaeological signature. Clearly, the lower resolution of this imagery compared to that
available in Syria and Anatolia, for example, was one reason for the poor detectability of sites.
However, given the significant success of CORONA imagery elsewhere in detecting sites
through crop-marks (e.g. Philip 2002), other factors must be considered. Beck (2007a) has
demonstrated that CORONA signatures can be affected by variations in on-site drainage levels,
an has been shown for several sites in the Homs region along the Orontes River in Syria. The
lack of similar characteristics in the northern Murghab, while possibly partially attributable to
the lower resolution, may also be explained by the obstruction of archaeological sites by sand.
Another possibility is that anthropogenic activity may not have been intensive enough in these
briefly occupied regions to leave an identifiable spectral signature on the landscape. Although
the CORONA imagery therefore seems to be of limited use in the northern Murghab, it should
be noted that imagery at 7-10m resolution has been used in conjunction with other remote
sensing data to assist in site identification in the central delta. Indeed, some large sites can be
seen in the CORONA imagery, although several of these, such as Gonur and Togolok, are easily
discernible in most imagery and are thus unlikely to have been missed with even a cursory scan
of the landscape.
- 104 -
4.2.3. QUICKBIRD Imagery
As noted above, the Quickbird imagery was obtained after the 2008 field season, so
unfortunately was not available for the initial stages of the survey. As an analytical tool,
however, its benefits were invaluable. Most apparent was the greatly improved spatial
resolution, which made it much easier to visually examine the landscape. Clear examples of the
improved resolution may be seen in the appearance of the main east-west road and gas pipeline
which are clearly visible as distinct horizontal features, as are dozens of smaller roads and
trackways throughout the survey area. Table 2 shows a comparison between the aerial
photography and the panchromatic Quickbird imagery, both high-resolution greyscale images.
In nearly all categories, the panchromatic imagery performed much more effectively in
identifying specific topographic and anthropogenic features in the landscape, facilitated by a
vastly superior image quality. A further advantage of the Quickbird imagery is its ability to
distinguish subtle differences within similar land types. Recent aeolian cover, for example,
tends to have a smooth, relatively uniform appearance, devoid of saxaul vegetation. Older,
stable dunes, by contrast, tend to appear as undulating features, often pockmarked by small
hillocks or depressions. On the takyrs, the panchromatic imagery was especially effective in
discerning subtle differences in moisture content. A recent study suggests that moisture and
associated development of vegetation on the surface of an enclosed takyr will lead to a decrease
in its surface reflectance (Orlovsky et al. 2004). The light grey shading on many of the takyrs
may therefore represent regions of slightly lower drainage, which may ultimately lead to an
increase in vegetation and ultimately to the oversanding of the takyr. Figure 30 shows a
comparative view of three takyrs, one of which (top centre) appears to be well maintained,
possibly in preparation for agricultural development. The association between the light grey
takyr surface and encroaching vegetation can be clearly seen, both in the pan-chromatic as well
as the lower resolution multispectral imagery (latter not shown).
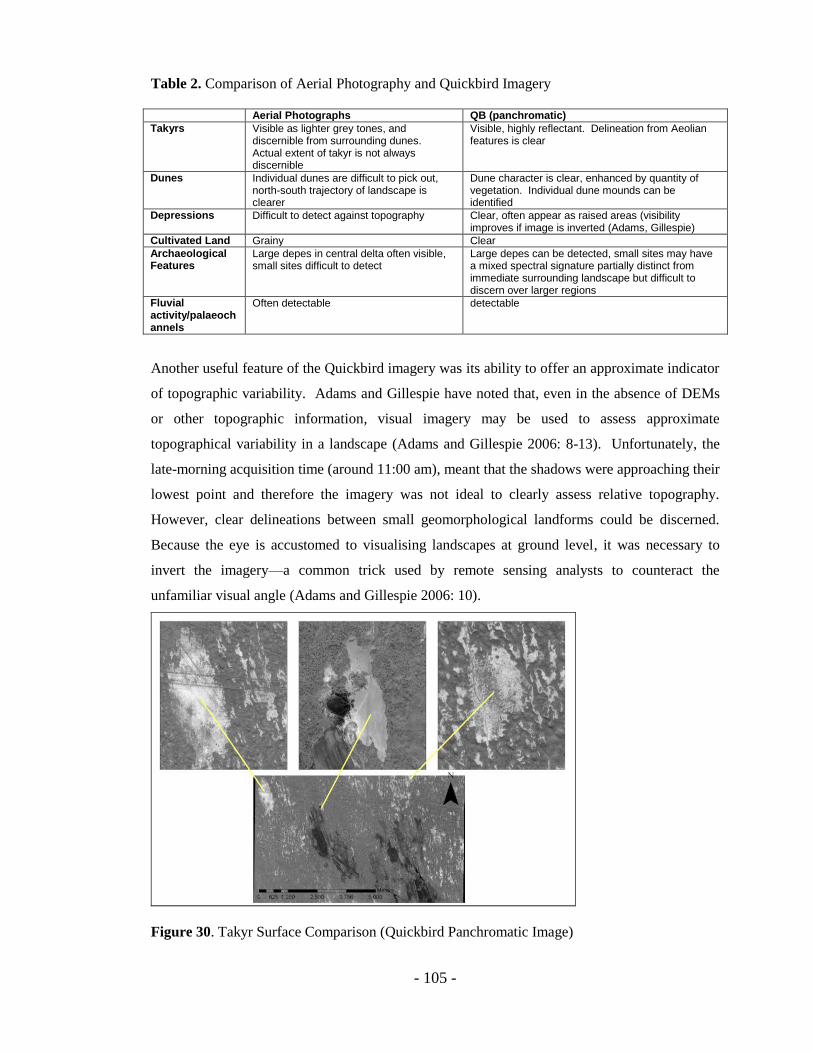
- 105 -
Table 2. Comparison of Aerial Photography and Quickbird Imagery
Aerial Photographs QB (panchromatic)
Takyrs Visible as lighter grey tones, and discernible from surrounding dunes. Actual extent of takyr is not always discernible
Visible, highly reflectant. Delineation from Aeolian features is clear
Dunes Individual dunes are difficult to pick out, north-south trajectory of landscape is clearer
Dune character is clear, enhanced by quantity of vegetation. Individual dune mounds can be identified
Depressions Difficult to detect against topography Clear, often appear as raised areas (visibility improves if image is inverted (Adams, Gillespie)
Cultivated Land Grainy Clear
Archaeological Features
Large depes in central delta often visible, small sites difficult to detect
Large depes can be detected, small sites may have a mixed spectral signature partially distinct from immediate surrounding landscape but difficult to discern over larger regions
Fluvial activity/palaeochannels
Often detectable detectable
Another useful feature of the Quickbird imagery was its ability to offer an approximate indicator
of topographic variability. Adams and Gillespie have noted that, even in the absence of DEMs
or other topographic information, visual imagery may be used to assess approximate
topographical variability in a landscape (Adams and Gillespie 2006: 8-13). Unfortunately, the
late-morning acquisition time (around 11:00 am), meant that the shadows were approaching their
lowest point and therefore the imagery was not ideal to clearly assess relative topography.
However, clear delineations between small geomorphological landforms could be discerned.
Because the eye is accustomed to visualising landscapes at ground level, it was necessary to
invert the imagery—a common trick used by remote sensing analysts to counteract the
unfamiliar visual angle (Adams and Gillespie 2006: 10).
Figure 30. Takyr Surface Comparison (Quickbird Panchromatic Image)
- 106 -
4.2.4. ASTER Imagery
The multispectral ASTER imagery, at 15m spatial resolution for the VNIR bands and 30m for
the SWIR bands (see section 3.5.1), was ideal for examining the general geomorphology of the
entire northern Murghab, as well as some of the larger archaeological sites in the central delta.
As with the other imagery, the most prominent geomorphological features were the larger
unvegetated takyrs, clearly visible in all bands. The high contrast of these features is due to their
high albedo—a unitless measurement of reflectivity—across the spectrum.9 (L. Orlovsky, pers.
comm.), While this identification was extremely useful for large takyr landforms, small ones
below a few hundred square metres tend to be too small to be clearly discerned even at the 15m
spatial resolution of the VNIR bands. Although some indicators of the underlying alluvial
geomorphology loosely associated with the takyrs could be discerned from the orientation of the
surrounding dunes, it proved difficult to distinguish takyrs from fluvial features at this
resolution, and linear features identifiable in the ASTER imagery were re-examined in the
Quickbird imagery to better understand the character of these landforms (see Marcolongo and
Mozzi 1998; Lyapin 1991 on possible alluvial characteristics to the dunes.).
One noteworthy feature of the ASTER imagery was its ability to distinguish north-south
linearity in the landscape. Although the resolution was too low to discern fine-scale
topographical variation that could be seen in the aerial photography and Quickbird imagery, the
ASTER imagery was the most effective in highlighting the dune topography in certain regions.
In order to determine if the high detail of the Quickbird imagery was interfering with the ability
to discern these broader patterns, the Quickbird image was resampled to 15m so that it could be
compared directly with the ASTER VNIR bands. The resampling process used a cubic
convolution method in order to provide a sharper rather than a smoother image (Reichenbach et
al. 1995), which was potentially useful for identifying linear features. The results, shown in
Figure 31, indicate that the linearity was still not detectable in the Quickbird imagery, and may
be related to the reduced shadowing due to the time of acquisition (see above). The aerial
photography showed the north-south patterning more clearly than the Quickbird imagery, so it is
plausible that differences in satellite acquisition may be the primary cause of the discrepancy.
9Albedo is defined as the ratio of reflected light to incident EM radiation. It is essentially a unitless
measurement of reflectivity between 0 and 1.
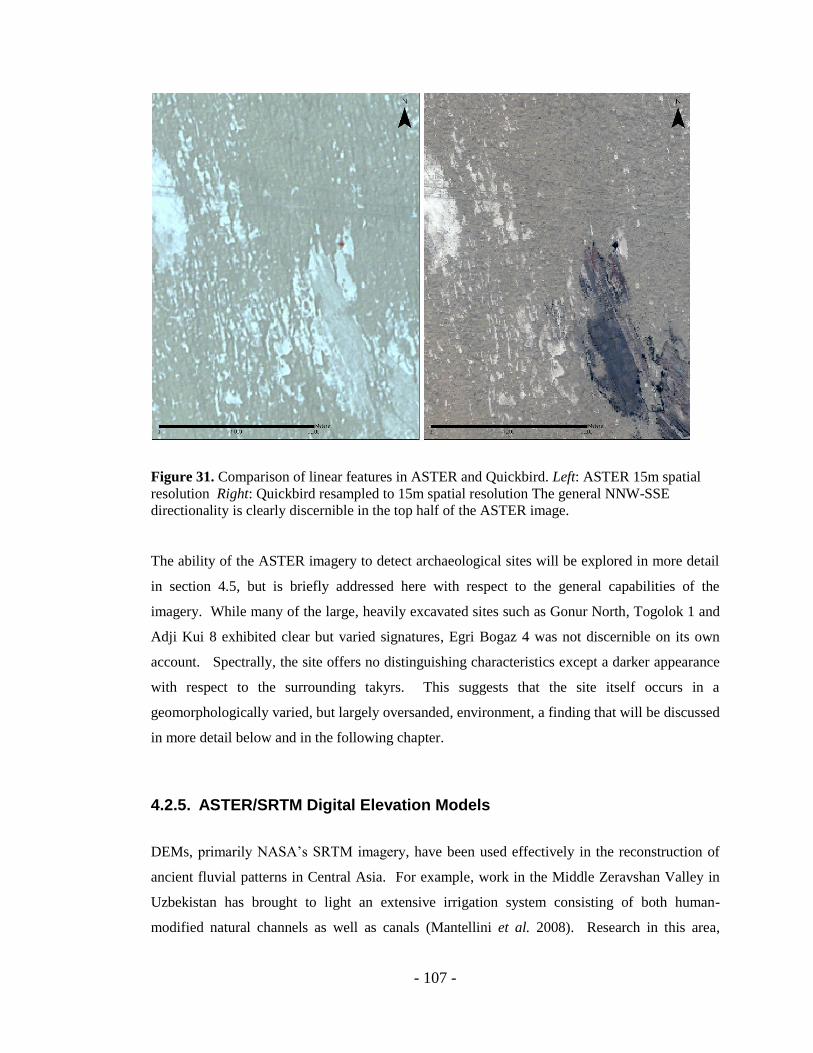
- 107 -
Figure 31. Comparison of linear features in ASTER and Quickbird. Left: ASTER 15m spatial
resolution Right: Quickbird resampled to 15m spatial resolution The general NNW-SSE
directionality is clearly discernible in the top half of the ASTER image.
The ability of the ASTER imagery to detect archaeological sites will be explored in more detail
in section 4.5, but is briefly addressed here with respect to the general capabilities of the
imagery. While many of the large, heavily excavated sites such as Gonur North, Togolok 1 and
Adji Kui 8 exhibited clear but varied signatures, Egri Bogaz 4 was not discernible on its own
account. Spectrally, the site offers no distinguishing characteristics except a darker appearance
with respect to the surrounding takyrs. This suggests that the site itself occurs in a
geomorphologically varied, but largely oversanded, environment, a finding that will be discussed
in more detail below and in the following chapter.
4.2.5. ASTER/SRTM Digital Elevation Models
DEMs, primarily NASA‟s SRTM imagery, have been used effectively in the reconstruction of
ancient fluvial patterns in Central Asia. For example, work in the Middle Zeravshan Valley in
Uzbekistan has brought to light an extensive irrigation system consisting of both human-
modified natural channels as well as canals (Mantellini et al. 2008). Research in this area,
- 108 -
however, has been facilitated by significant topographical variation as well as a comparatively
unobstructed landscape. Parallel research in the Murghab, begun slightly earlier, has employed
high resolution aerial photography, Soviet geological maps, and multispectral imagery to
significant effect in the southern and central palaeodelta, and this work has resulted in a deeper
understanding of channel use from antiquity (Cattani et al. 2008a; Cerasetti 2006). Considered
an integral part of the AMMD research, this hydrographic reconstruction has been testable to
some extent through the dating of materials along these channels, although the case in the north
remains poorly understood.
Since the SRTM imagery has been so effective elsewhere in the delta, its applicability in the
survey area was briefly assessed. As expected, the dendritic system of alluvial ridges could
easily be traced within the modern delta, and the extension of a few significant branches could
be traced slightly further (Figure 32). These branches are actually discernible by high rather
than low DEM values, thus identifying the ancient river system by the raised topography
associated with natural levees rather than any depressions associated with branches or channels.
These altimetric variations became increasingly difficult to discern towards the northern
Murghab, most likely due to the flatting of the topography towards the margin of the delta fan,
and possibly exacerbated by the increasing complexity of dune formations in the same region.
In the survey area itself, the main geomorphological features that could be discerned in the
SRTM imagery were broad, cleared takyrs associated with agricultural development, as well as a
few large, low lying basins, although the altitude difference is generally no more than a few
metres. Channels, either relict or associated with modern agriculture, were usually not
detectable in the SRTM.
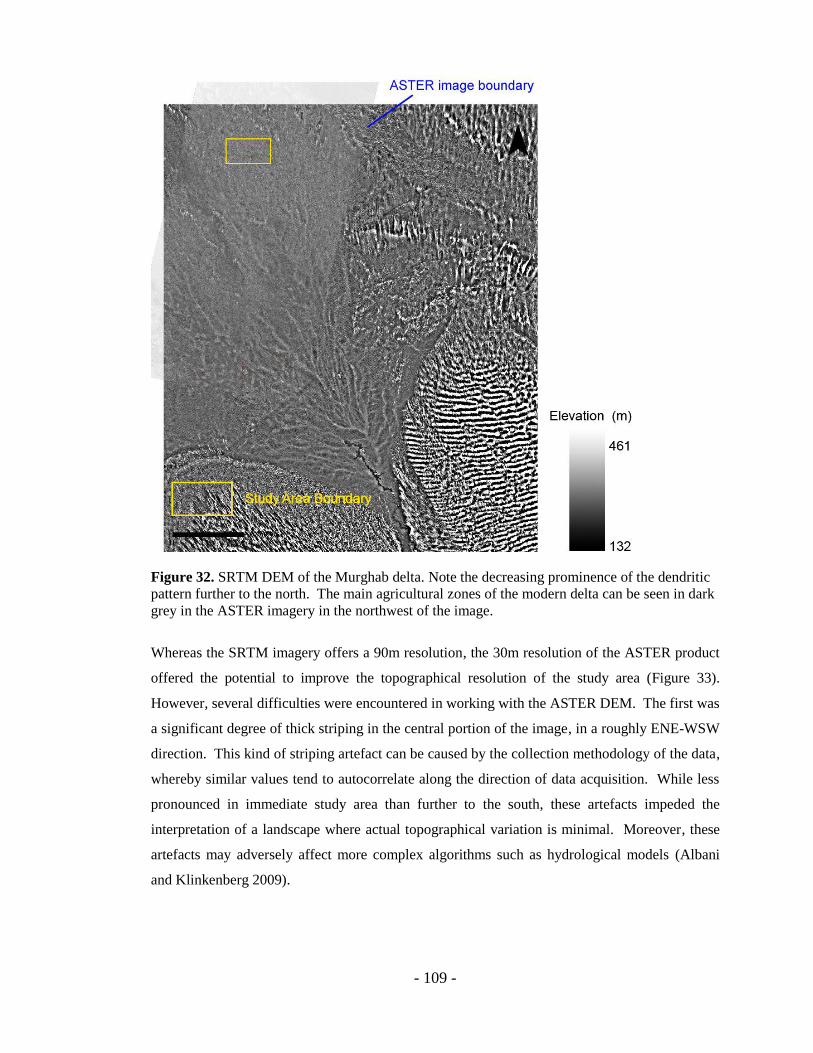
- 109 -
Figure 32. SRTM DEM of the Murghab delta. Note the decreasing prominence of the dendritic
pattern further to the north. The main agricultural zones of the modern delta can be seen in dark
grey in the ASTER imagery in the northwest of the image.
Whereas the SRTM imagery offers a 90m resolution, the 30m resolution of the ASTER product
offered the potential to improve the topographical resolution of the study area (Figure 33).
However, several difficulties were encountered in working with the ASTER DEM. The first was
a significant degree of thick striping in the central portion of the image, in a roughly ENE-WSW
direction. This kind of striping artefact can be caused by the collection methodology of the data,
whereby similar values tend to autocorrelate along the direction of data acquisition. While less
pronounced in immediate study area than further to the south, these artefacts impeded the
interpretation of a landscape where actual topographical variation is minimal. Moreover, these
artefacts may adversely affect more complex algorithms such as hydrological models (Albani
and Klinkenberg 2009).

- 110 -
Figure 33. Comparison of SRTM and ASTER DEMs for the study region. Top: SRTM DEM
(90m resolution) Bottom: ASTER DEM (30m resolution)
The ASTER DEM also proved difficult to interpret visually. The surface was highly variable,
with elevations constantly fluctuating even over small distances. In order to maximise the
potential for visual analysis, basic histogram stretches were applied, but these modifications
were of minimal effect due to the extreme local variability of the landscape. The only easily
identifiable features were related to modern agricultural practices. Large ploughed fields, often
reflective of cleared takyr surfaces, were often visible, and in some cases field delineations
themselves could be discerned, presumably as a result of upcast from small irrigation canals.
Major irrigation canals, in the same vein, were often easy to detect. The most prominent
agricultural zone identifiable on the DEM is the Kelleli region, which can be seen to open
outwards from the large irrigation canal that runs parallel to the main „Kompressor‟ road. The
smaller agricultural region just south of the survey area may also be seen. Most
geomorphological features such as dunes or takyrs did not respond well to the visual assessment
of the DEM. The failure of even large takyrs to be detected as flat topographical regions may
result from the lack of modern land clearance, and while variations in altitude as a result of sand

- 111 -
cover may only be a few dozen centimetres, such variations are significant in a region where the
topographical variation is rarely more than 5m.
In order to compare both DEMs directly, and in an attempt to reduce the extreme surface
roughness in the ASTER imagery, the ASTER DEM was resampled to 90m (as above) using a
bilinear interpolation. Basic statistics for each image, shown in Table 3, indicate that the mean
elevation was slightly higher for the ASTER imagery, although this appears to be partially
explained by the presence of a concentrated area of elevations around 200m in the Kelleli region,
an anomaly in the landscape. This feature does not appear to be solely an artefact of the DEM
since it corresponds to a large uncultivated area of about 9ha, although the altimetric variation is
far more subtle in the SRTM which indicates that the elevation values are probably not accurate.
Standard deviation in the original ASTER DEM is significantly higher than in the SRTM, which
indicates the higher sensitivity to spatial anomalies, although this discrepancy was reduced in the
resampled image. One noteworthy observation is that canals and field boundaries were often
clearly discernible in the ASTER DEM, but not the SRTM DEM. These differences between
DEMs at the same spatial resolution suggest that while the overall distribution of data may be
similar, there was a much greater surface sensitivity in the ASTER imagery associated with a
high resolution of data acquisition, but likely including significant surface artefacts and a much
higher potential for error.
Table 3. Comparison of ASTER and SRTM Digital Elevation Models
SRTM ASTER DEM
(30m) ASTER DEM (90m)
ASTER (3x3 Filter)
Max Elev (m) 189 147 151 155
Min Elev (m) 164 211 211 194
Mean Elev (m) 176.5 179 181 174
Std Dev 7.5 18.2 9.5 11.3
Both DEMs reveal that the topographical variation over the Bronze Age landscape is subtle, with
most of the variation within about 10m. Significant topographical variation, at least at these
analytical scales, occurs much further to the south. This uniformity can further be seen in a
slope map (Figure 34), a derivative raster dataset that measures the maximum rate of change in
elevation (by default, over a 3x3 cell neighbourhood). Slope measurements from the SRTM data
did not exceed 2 degrees over the study area, and 2.3 degrees over the entire region comprising
known Middle Bronze Age sites. By applying a stretched histogram, however, it became
possible to detect subtle patterns in the slope map. Low values, in particular, tend to occur in
regions of heavy agriculture. While this may seem obvious due to the levelling of fields for
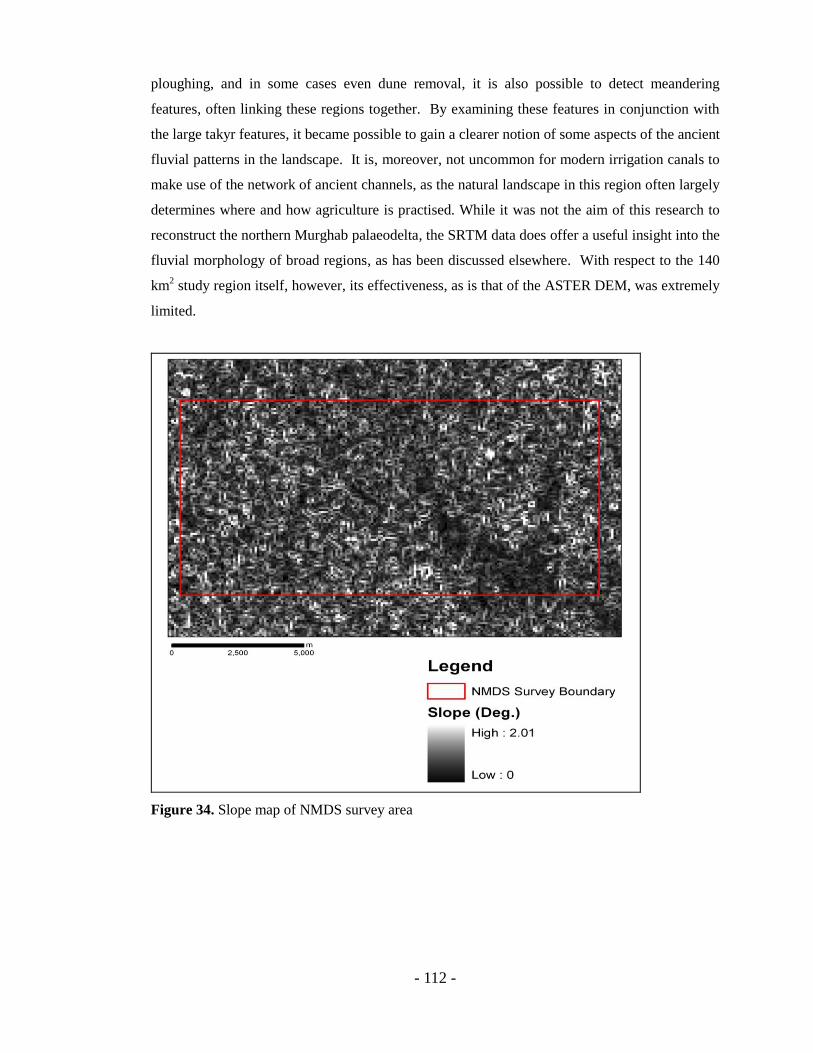
- 112 -
ploughing, and in some cases even dune removal, it is also possible to detect meandering
features, often linking these regions together. By examining these features in conjunction with
the large takyr features, it became possible to gain a clearer notion of some aspects of the ancient
fluvial patterns in the landscape. It is, moreover, not uncommon for modern irrigation canals to
make use of the network of ancient channels, as the natural landscape in this region often largely
determines where and how agriculture is practised. While it was not the aim of this research to
reconstruct the northern Murghab palaeodelta, the SRTM data does offer a useful insight into the
fluvial morphology of broad regions, as has been discussed elsewhere. With respect to the 140
km2 study region itself, however, its effectiveness, as is that of the ASTER DEM, was extremely
limited.
Figure 34. Slope map of NMDS survey area

- 113 -
4.3. Multispectral Analysis and the Northern Murghab Landscape
4.3.1. Basic Image Manipulation in ASTER
The original 3600 km2 ASTER image represents a spectrally varied landscape, encompassing
heavily mottled urban and agricultural features in the Mary and Bayramaly regions and a more
uniform desert landscape in the north. This variability is problematic in image interpretation,
since the colour table must account for all visible colours in the most optimal manner possible.
Spectrally diverse urban environments, for example, may take up the vast majority of available
colours (Adams and Gillespie 2006: 257-259). As a result, more uniform features in the desert
landscape—namely dunes and takyrs—yield very little visual differentiation. In order to
alleviate this problem and enhance contrast within the survey area, several modifications were
made. The first was simply to create a spatial subset of the study region. While simple, this
change removed nearly all of the urban and much of the agricultural landscape, resulting in a
much more diverse spectrum of the desert morphology in the northern delta. The resulting
image was further refined by masking out the remaining agricultural zones in the landscape,
resulting in an image that contained only sand dunes and takyr surfaces. With the full colour
spectrum thus available to represent these two land types to a viewer on-screen, spectral contrast
was greatly enhanced and subtle variations within seemingly uniform land types could be more
easily discerned by eye.
A comparison of the 9 ASTER bands used in the analysis (Figure 35) shows significant
distinctions between the VNIR bands (1-3) and the SWIR bands (4-9). The visible bands
effectively resolve different geomorphological features, particularly delineating the boundaries
between dunes and takyrs, and some differentiation within takyr morphology can be determined.
The region of oversanding on the takyr in the northwest of the survey area, for example, is
apparent in all three bands as a mottling of white and grey pixels due to a mixture of both
features. Subtle variations in the unobstructed takyr surfaces may also be identified, possibly
due to slight differences in drainage. The SWIR bands, however, were much more effective in
identifying changes in dune morphology. All SWIR bands, but especially bands 4 and 9, were
able to identify two broad geomorphological regions in the southwestern portion of the survey
area (areas 5-8). Lighter regions correspond to the low, rolling dunes that comprise much of the
western portion of the survey area, while a prominent region of dark pixels, predominantly in
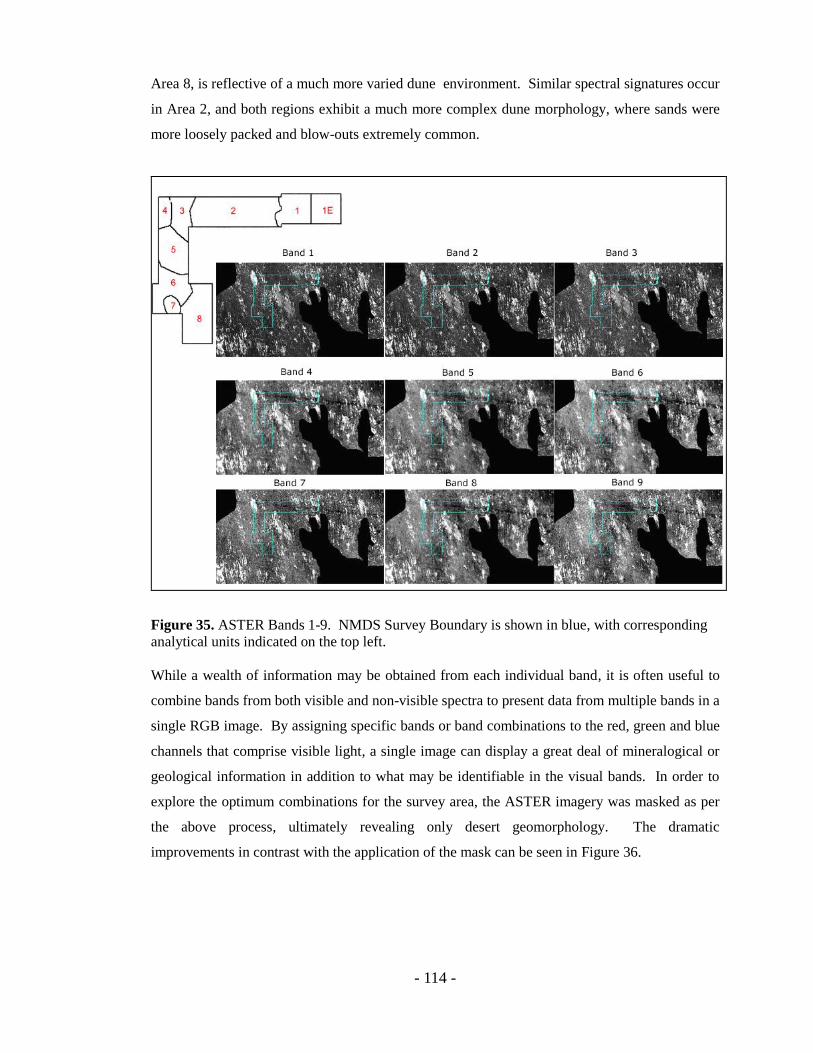
- 114 -
Area 8, is reflective of a much more varied dune environment. Similar spectral signatures occur
in Area 2, and both regions exhibit a much more complex dune morphology, where sands were
more loosely packed and blow-outs extremely common.
Figure 35. ASTER Bands 1-9. NMDS Survey Boundary is shown in blue, with corresponding
analytical units indicated on the top left.
While a wealth of information may be obtained from each individual band, it is often useful to
combine bands from both visible and non-visible spectra to present data from multiple bands in a
single RGB image. By assigning specific bands or band combinations to the red, green and blue
channels that comprise visible light, a single image can display a great deal of mineralogical or
geological information in addition to what may be identifiable in the visual bands. In order to
explore the optimum combinations for the survey area, the ASTER imagery was masked as per
the above process, ultimately revealing only desert geomorphology. The dramatic
improvements in contrast with the application of the mask can be seen in Figure 36.
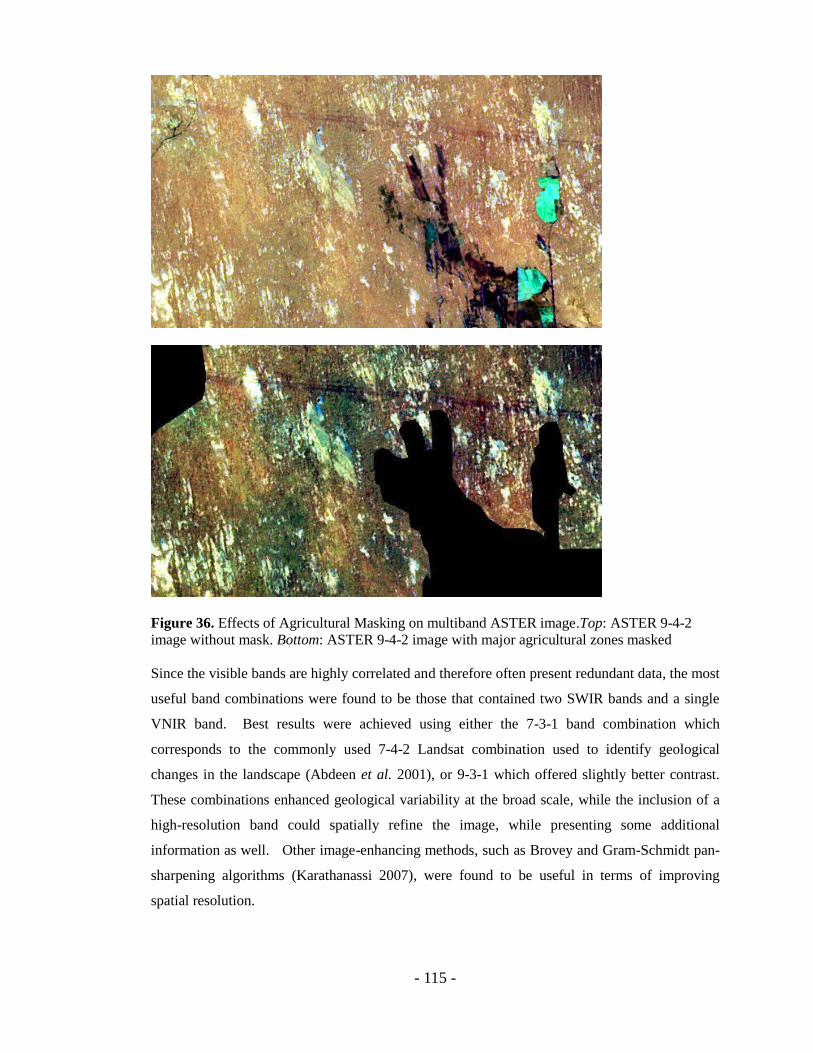
- 115 -
Figure 36. Effects of Agricultural Masking on multiband ASTER image.Top: ASTER 9-4-2
image without mask. Bottom: ASTER 9-4-2 image with major agricultural zones masked
Since the visible bands are highly correlated and therefore often present redundant data, the most
useful band combinations were found to be those that contained two SWIR bands and a single
VNIR band. Best results were achieved using either the 7-3-1 band combination which
corresponds to the commonly used 7-4-2 Landsat combination used to identify geological
changes in the landscape (Abdeen et al. 2001), or 9-3-1 which offered slightly better contrast.
These combinations enhanced geological variability at the broad scale, while the inclusion of a
high-resolution band could spatially refine the image, while presenting some additional
information as well. Other image-enhancing methods, such as Brovey and Gram-Schmidt pan-
sharpening algorithms (Karathanassi 2007), were found to be useful in terms of improving
spatial resolution.
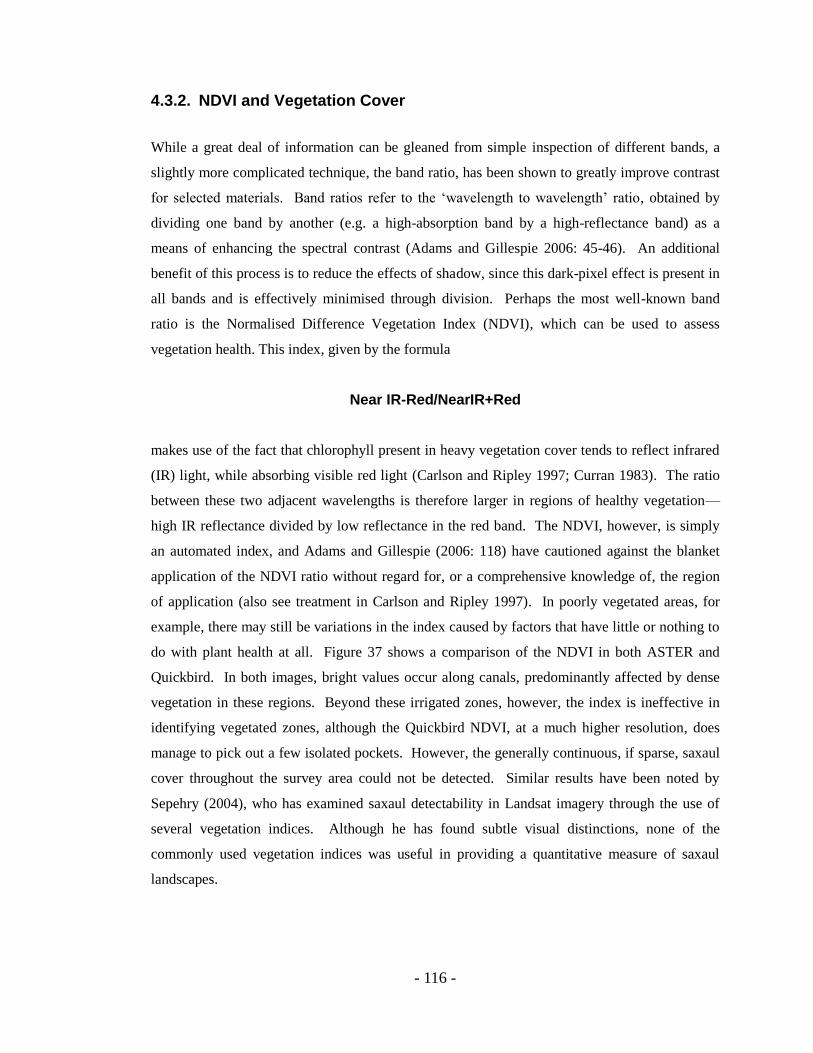
- 116 -
4.3.2. NDVI and Vegetation Cover
While a great deal of information can be gleaned from simple inspection of different bands, a
slightly more complicated technique, the band ratio, has been shown to greatly improve contrast
for selected materials. Band ratios refer to the „wavelength to wavelength‟ ratio, obtained by
dividing one band by another (e.g. a high-absorption band by a high-reflectance band) as a
means of enhancing the spectral contrast (Adams and Gillespie 2006: 45-46). An additional
benefit of this process is to reduce the effects of shadow, since this dark-pixel effect is present in
all bands and is effectively minimised through division. Perhaps the most well-known band
ratio is the Normalised Difference Vegetation Index (NDVI), which can be used to assess
vegetation health. This index, given by the formula
Near IR-Red/NearIR+Red
makes use of the fact that chlorophyll present in heavy vegetation cover tends to reflect infrared
(IR) light, while absorbing visible red light (Carlson and Ripley 1997; Curran 1983). The ratio
between these two adjacent wavelengths is therefore larger in regions of healthy vegetation—
high IR reflectance divided by low reflectance in the red band. The NDVI, however, is simply
an automated index, and Adams and Gillespie (2006: 118) have cautioned against the blanket
application of the NDVI ratio without regard for, or a comprehensive knowledge of, the region
of application (also see treatment in Carlson and Ripley 1997). In poorly vegetated areas, for
example, there may still be variations in the index caused by factors that have little or nothing to
do with plant health at all. Figure 37 shows a comparison of the NDVI in both ASTER and
Quickbird. In both images, bright values occur along canals, predominantly affected by dense
vegetation in these regions. Beyond these irrigated zones, however, the index is ineffective in
identifying vegetated zones, although the Quickbird NDVI, at a much higher resolution, does
manage to pick out a few isolated pockets. However, the generally continuous, if sparse, saxaul
cover throughout the survey area could not be detected. Similar results have been noted by
Sepehry (2004), who has examined saxaul detectability in Landsat imagery through the use of
several vegetation indices. Although he has found subtle visual distinctions, none of the
commonly used vegetation indices was useful in providing a quantitative measure of saxaul
landscapes.

- 117 -
Figure 37. Comparison of NDVIs from Quickbird (top) and ASTER (bottom) imagery. Note the
large area of healthy agriculture in the center of the Quickbird image. In the ASTER image, a
canal can already be seen cutting through this region, so it appears that the bulk of agricultural
development on this takyr was fairly recent.
Given the failure of the NDVI to produce a usable assessment of vegetation cover, a more direct
method was explored, one that employed the visual detectability of individual saxaul bushes in
the high-resolution Quickbird imagery. Individual saxaul shrubs are often visible in the
panchromatic imagery, and while these tend to run together in the multispectral imagery, saxaul
clumps can be easily detected. Standard classification algorithms are ineffective on a single-
channel panchromatic image, so in order to incorporate both the high resolution panchromatic
data and the multispectral data, the Gram-Schmidt pan-sharpening algorithm was selected. This
method was chosen over the Brovey pan-sharpening algorithm since its implementation in ENVI
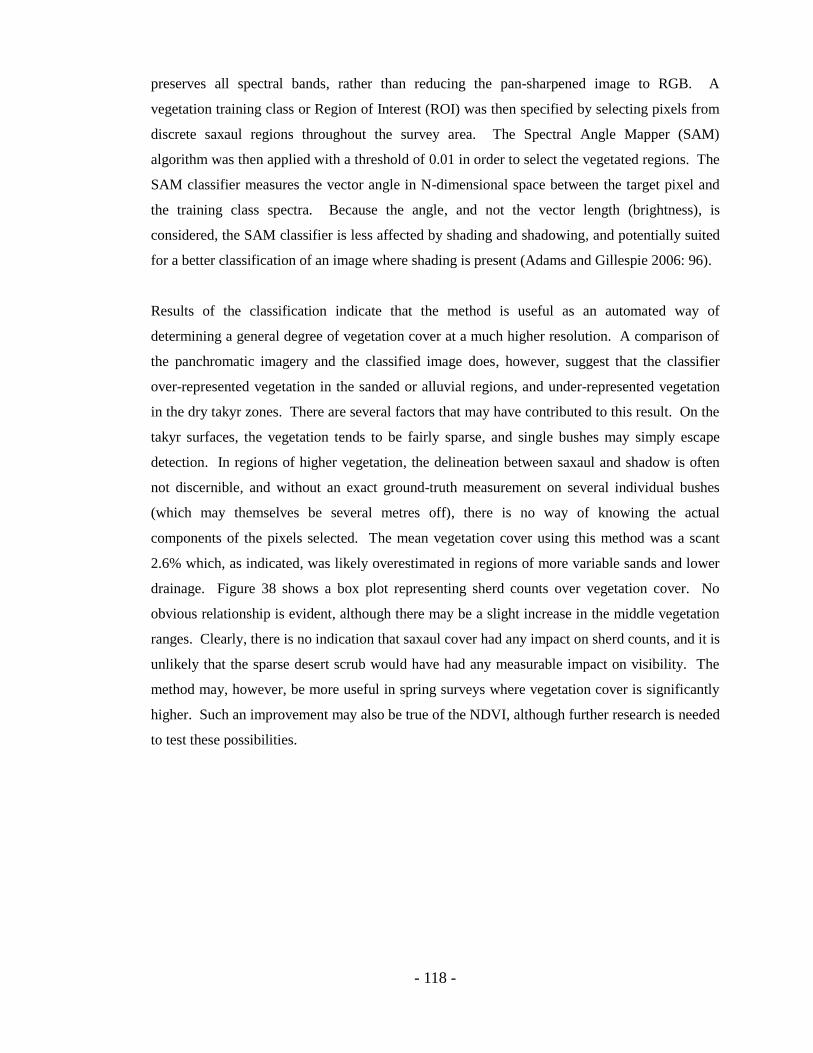
- 118 -
preserves all spectral bands, rather than reducing the pan-sharpened image to RGB. A
vegetation training class or Region of Interest (ROI) was then specified by selecting pixels from
discrete saxaul regions throughout the survey area. The Spectral Angle Mapper (SAM)
algorithm was then applied with a threshold of 0.01 in order to select the vegetated regions. The
SAM classifier measures the vector angle in N-dimensional space between the target pixel and
the training class spectra. Because the angle, and not the vector length (brightness), is
considered, the SAM classifier is less affected by shading and shadowing, and potentially suited
for a better classification of an image where shading is present (Adams and Gillespie 2006: 96).
Results of the classification indicate that the method is useful as an automated way of
determining a general degree of vegetation cover at a much higher resolution. A comparison of
the panchromatic imagery and the classified image does, however, suggest that the classifier
over-represented vegetation in the sanded or alluvial regions, and under-represented vegetation
in the dry takyr zones. There are several factors that may have contributed to this result. On the
takyr surfaces, the vegetation tends to be fairly sparse, and single bushes may simply escape
detection. In regions of higher vegetation, the delineation between saxaul and shadow is often
not discernible, and without an exact ground-truth measurement on several individual bushes
(which may themselves be several metres off), there is no way of knowing the actual
components of the pixels selected. The mean vegetation cover using this method was a scant
2.6% which, as indicated, was likely overestimated in regions of more variable sands and lower
drainage. Figure 38 shows a box plot representing sherd counts over vegetation cover. No
obvious relationship is evident, although there may be a slight increase in the middle vegetation
ranges. Clearly, there is no indication that saxaul cover had any impact on sherd counts, and it is
unlikely that the sparse desert scrub would have had any measurable impact on visibility. The
method may, however, be more useful in spring surveys where vegetation cover is significantly
higher. Such an improvement may also be true of the NDVI, although further research is needed
to test these possibilities.
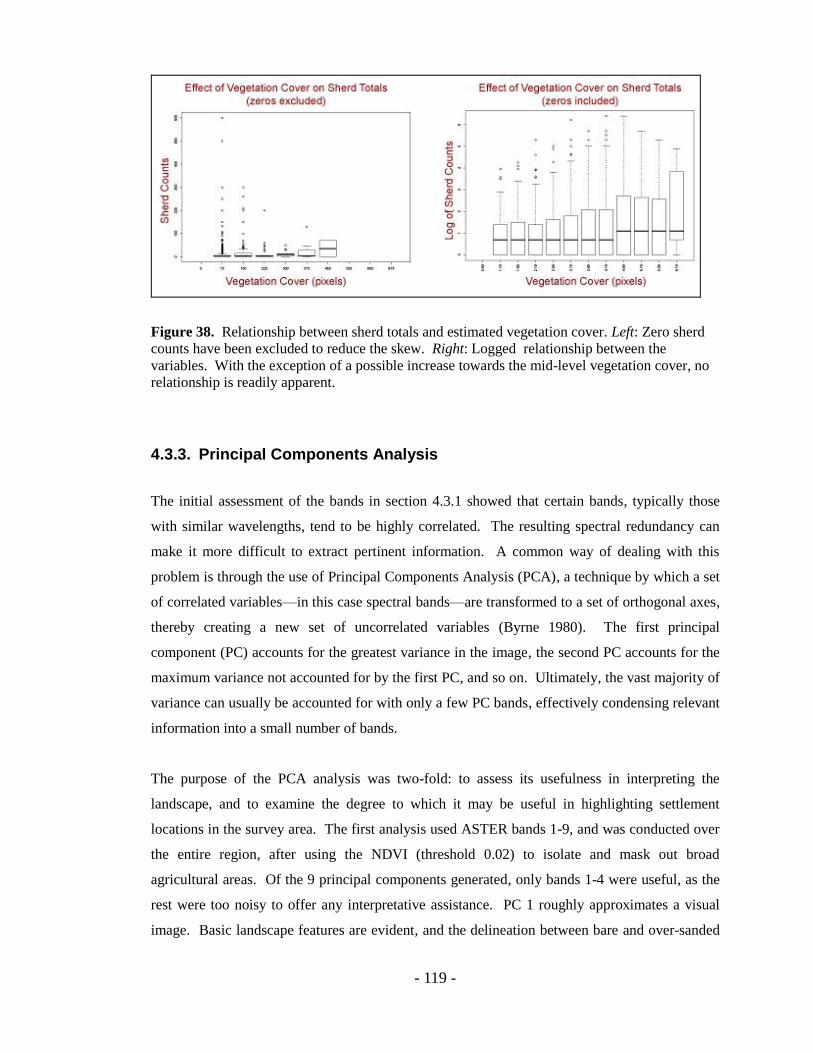
- 119 -
Figure 38. Relationship between sherd totals and estimated vegetation cover. Left: Zero sherd
counts have been excluded to reduce the skew. Right: Logged relationship between the
variables. With the exception of a possible increase towards the mid-level vegetation cover, no
relationship is readily apparent.
4.3.3. Principal Components Analysis
The initial assessment of the bands in section 4.3.1 showed that certain bands, typically those
with similar wavelengths, tend to be highly correlated. The resulting spectral redundancy can
make it more difficult to extract pertinent information. A common way of dealing with this
problem is through the use of Principal Components Analysis (PCA), a technique by which a set
of correlated variables—in this case spectral bands—are transformed to a set of orthogonal axes,
thereby creating a new set of uncorrelated variables (Byrne 1980). The first principal
component (PC) accounts for the greatest variance in the image, the second PC accounts for the
maximum variance not accounted for by the first PC, and so on. Ultimately, the vast majority of
variance can usually be accounted for with only a few PC bands, effectively condensing relevant
information into a small number of bands.
The purpose of the PCA analysis was two-fold: to assess its usefulness in interpreting the
landscape, and to examine the degree to which it may be useful in highlighting settlement
locations in the survey area. The first analysis used ASTER bands 1-9, and was conducted over
the entire region, after using the NDVI (threshold 0.02) to isolate and mask out broad
agricultural areas. Of the 9 principal components generated, only bands 1-4 were useful, as the
rest were too noisy to offer any interpretative assistance. PC 1 roughly approximates a visual
image. Basic landscape features are evident, and the delineation between bare and over-sanded
- 120 -
takyr is clear. Trackways appear to be enhanced in the image, as evidenced primarily by the
clarity of the road and pipeline. PCs 2 and 3 are not particularly useful in deconstructing the
general dune cover of the study area. Discrepancies in the takyr composition, however, are
much more clearly defined than in Band 1. Again, the large takyr in Area 4 offers a useful
analytical region. An RGB composite using PCA bands 4-3-2 clearly revealed the over-sanded
portion in the southwest, along with a bright area of red along the eastern perimeter of the takyr,
corresponding to Band 4. It is worth noting that high PCA 4 values are also associated with the
large, vegetated depression in Area 2, as well as the entire eastern edge of this takyr.
A second PCA evaluation incorporated both Quickbird and ASTER bands by creating a stacked
image, replacing the first three ASTER bands with the four corresponding Quickbird bands in
order to make use of Quickbird‟s higher resolution. The main agricultural zone was fully
masked, although the large, partially cultivated takyr extending south from Area 2 was included
in the analysis. PC 1, as in the ASTER PCA, effectively identified key geomorphological
features, distinguishing clearly between sanded and takyr regions, although discrepancy within
dune regions are not easily discernible (Figure 39). The dune ridges are much clearer in PC 2,
and these were further enhanced by employing PC band combinations of 1-2-4 or 4-2-1. These
linear features, represented by light green tones, can be seen on either side of Egri Bogaz.
Similar spectral features occur in conjunction with the major road and pipelines, and to a lesser
extent to the older road to the north. Interestingly, this degree of dune concentration does not
appear to feature prominently in the southern portion of the survey area. A boundary can be
traced southward from the eastern perimeter of the takyr in Area 4. The relationship between
high-density sherd scatters and the obstructed/eroded takyr surface, indicated by the purplish but
heavily mottled regions, is evident, most likely reflecting the eroded material onto the takyr
surface (discussed further in section 7.4).
Figure 39. PCA Bands 1, 2 and 4, respectively. Note the clarity of the dune topography in
PCA2 in the middle image (lighter N-S or NNW-SSE banding).

- 121 -
Figure 40. Composite image of PCA bands 1-2-4. Dune topography is very clear in light
blue/green, corresponding to Band 2.
In order to explore the possibility of detecting archaeological sites, an assessment of the
visibility of known Middle and Late Bronze Age settlement mounds was evaluated against the
first four PC bands from the ASTER imagery. The full results are shown in Table 4. Most of
the known archaeological sites are visible in PC1 as light grey regions, and typically appear
lighter than the surrounding landscape. Site discernibility is significantly reduced in PC2 and
PC3, although large sites are often still visible. The high factor loadings of VNIR bands in PC1
suggest that, for the most part, the discernibility of sites is determined primarily by the visible
spectrum. This does not, however, preclude some contribution from the SWIR channels, which
may be more likely to be enhanced by the spectral signatures of clays in decaying mud-brick. In
the northern delta, the PCA analysis did not sufficiently enhance site detection. While the larger
sites of Egri Bogaz 1 and 2 as well as Kelleli 3 and 4 could be detected, this was primarily due to
the high contrast against the ploughed fields which could be detected visually.
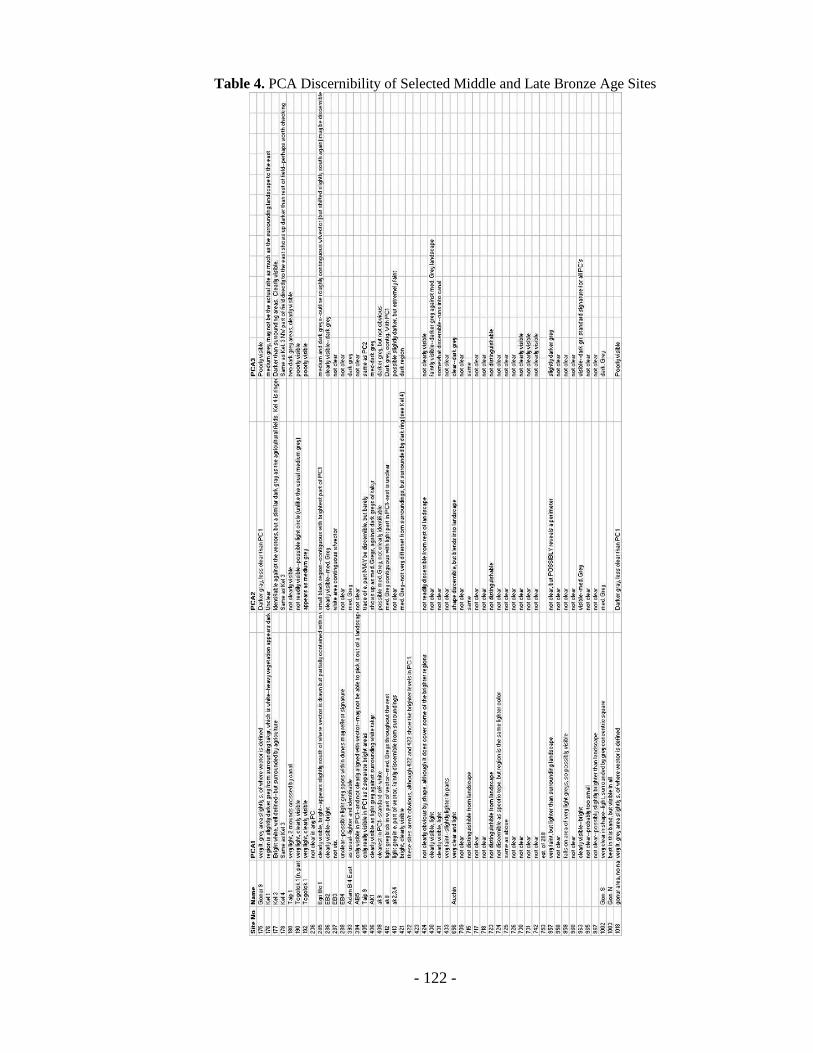
- 122 -
Table 4. PCA Discernibility of Selected Middle and Late Bronze Age Sites

- 123 -
4.4. Classification and Visibility Potential
The visibility problem in the Murghab delta, as noted in earlier chapters, is well recognised
(Cattani and Salvatori 2008). However, attempts to quantify the problem have been lacking (see
section 2.6). Instead, visibility in the Murghab is usually treated as binary, where sand cover is
seen to obscures material that would otherwise be visible on the exposed alluvial surface. The
lack of material in the north is therefore seen largely as the result of dune cover (e.g. Cattani et
al. 2008a: 42).
4.4.1. Large-Scale Assessment of Land Type and Site Visibility
To examine the effects of variable land cover on recovery potential, it was necessary to develop
a standard method of quantifying the land types over the survey area. In many surveys, this is
done visually, where an observer classifies a given area according to perceived land type,
vegetation cover, or some other determinant of visibility (Bintliff and Snodgrass 1985; Van
Leusen 2002: 4-12). While this was initially attempted for the NMDS survey it was found to be
ineffective due to the extreme variability of the landscape at small scales, and was therefore
subject to significant observer bias (see Chapter 3). Classification algorithms, commonly
employed in remote sensing technology, offered a way of statistically categorising large land
areas that effectively removed this bias, providing an alternative (and more systematic) bird‟s
eye model of a landscape not accessible to people in the field. Classification may be divided
into unsupervised and supervised algorithms. In unsupervised classifications, a set number of
classes is determined in advance, and image pixels are assigned to a particular class based on the
selected statistical algorithm. Supervised classifications, by contrast, allow the researcher to
specify particular training sites (Parcak 2009: 94-96). Ideally, these should be regions of limited
spectral variability that have been previously identified via ground truthing (Adams and
Gillespie 2006: 99-102). While this latter method does reintroduce an element of observer bias
in the selection of the training sites, it facilitates the inclusion of actual knowledge of a
landscape that would otherwise be missing, and can thus provide a more accurate interpretation
of the image.
In keeping with the concept of scale, the classification analysis was conducted using a top-down
approach to the categorisation of the landscape. The largest scale of analysis, covering the entire
survey area, sought to address the relative paucity of sites over a fairly large area, and the degree

- 124 -
to which the visibility restrictions of the northern Murghab may have contributed to this
perceived lack of occupation. As noted earlier (section 1.4), the low number of known sites in
this region stands in stark contrast to the relatively site-rich environment in the central delta.
While intensive geomorphological study has not focused specifically on the northern delta, a
simple test of landscape variability was used to compare the survey area to the larger region of
Middle Bronze settlement. First, a convex hull polygon was constructed that contained all
currently known Middle Bronze Age sites. Then, major agricultural zones identifiable in the
ASTER imagery were masked out. A supervised classification was run using easily identifiable
land types as training classes. The results, shown in Table 5, indicate that general distributions
within the uncultivated landscape in the 140 km2 study area were not significantly more
restrictive than in the Bronze Age delta in general. Furthermore, open and oversanded takyrs,
which researchers suggest show the clearest evidence of archaeological sites, are actually more
prevalent in the study area. This may be attributable to the increase in exposed clayey basins
towards the distal portion of the alluvial fan. Stable dune cover is slightly lower in the study
area, at 69.2% compared to 72.1% for the entire area. While this test is extremely general in
terms of the complex geomorphology in the region, it offers a general perspective on relative
visibility and prospects for site recovery. Since the survey area actually reveals less sand cover
than does the entire region, it is a reasonable assumption that visibility due to land cover
variation alone is probably not sufficient to explain the apparent lack of settlement in this region,
and other factors will be explored below.
Table 5. Land Cover Percentage (Non-Agricultural) Based on ENVI Supervised Classification
Land Type 140 km Study Area MB Region
(defined by Convex Hull polygon including all known MB sites)
Open Takyr (little or no oversanding or vegetation)
2.6 2.09
Oversanded/Obstructed Takyr 16.1 11.12
Stable Dunes 41.5 38.2
Variable Dunes (slightly higher vegetation density)
27.7 33.9
Active Dunes 11.1 13.4
Site+ 0.2 0.2
Cropland++ 0.4 0.6
+Based on the training site of AKF 3 (see below) selected because of its clear visual identification and
spectral contiguity
++Small percentage of cropland that was not masked by the algorithm. This category never rises above
1% and is insignificant to the analysis.

- 125 -
In order to broadly assess the relationship between land cover and Bronze Age settlement, a
similar test was conducted on all Bronze Age sites detected by previous Murghab surveys.
Using an unsupervised classification the Bronze Age region was divided into 8 land categories.
To prioritise the dominant land use features in this landscape and exclude single cell
identifications, a 3x3 low-pass majority filter was then used. Sites were designated as the
centroid of the corresponding AMMD polygon. A chi-squared test of sites in each land category
yielded a value of 33.2 at 7 degrees of freedom, suggesting a significant pattern in terms of the
kinds of landscapes in which sites appeared. Land categories that corresponded to vegetation
and open takyr had values that were too small to be significant. The highest chi square value for
a single category was for the sandy-takyr layer within an overall pattern that was very significant
(p<0.001). There are several potential reasons for this predominance of sites in the sandy-takyr
layer, pertaining to archaeological visibility rather than initial settlement pattern. The most
obvious is the fact that dune areas were less thoroughly surveyed, and probably obscured many
small sites. There is also a bias in the classification—the unsupervised 8-class classification is
only a rough approximation of the actual landscape, so the delineation between sand and takyr is
only representative. The significance of oversanded takyrs in terms of material distribution is
discussed in more detail below, as well as in section 7.2.
4.4.2. Visibility in the Survey Area
Selection of Training Sites
For the visibility analysis of the survey area itself, it was necessary to select a new group of
training sites that were more reflective of a localised area. The selection of these training areas,
or Regions of Interest (ROIs), was facilitated both by the excellent resolution of the Quickbird
panchromatic imagery, and the fact that all areas had been surveyed at the time of the analysis.
The familiarity with the landscape acquired from two years of survey afforded a much clearer
understanding of the relationship between the remote sensing data and actual land cover that was
the broader regional study could not provide. Furthermore, the fact that the imagery was
acquired at the time of the survey allowed image data to be directly associated with ground
observations. Based on field observations, eight training classes were initially selected for
analysis (Table 6). An image stack was then created, replacing the high resolution ASTER
bands 1-3 with Quickbird bands 1-4 (see section 4.3.3). This procedure allowed the high
resolution visible bands to be evaluated simultaneously with the lower resolution SWIR bands.
While this manipulation is not recommended for more advanced spectroscopic analysis due in
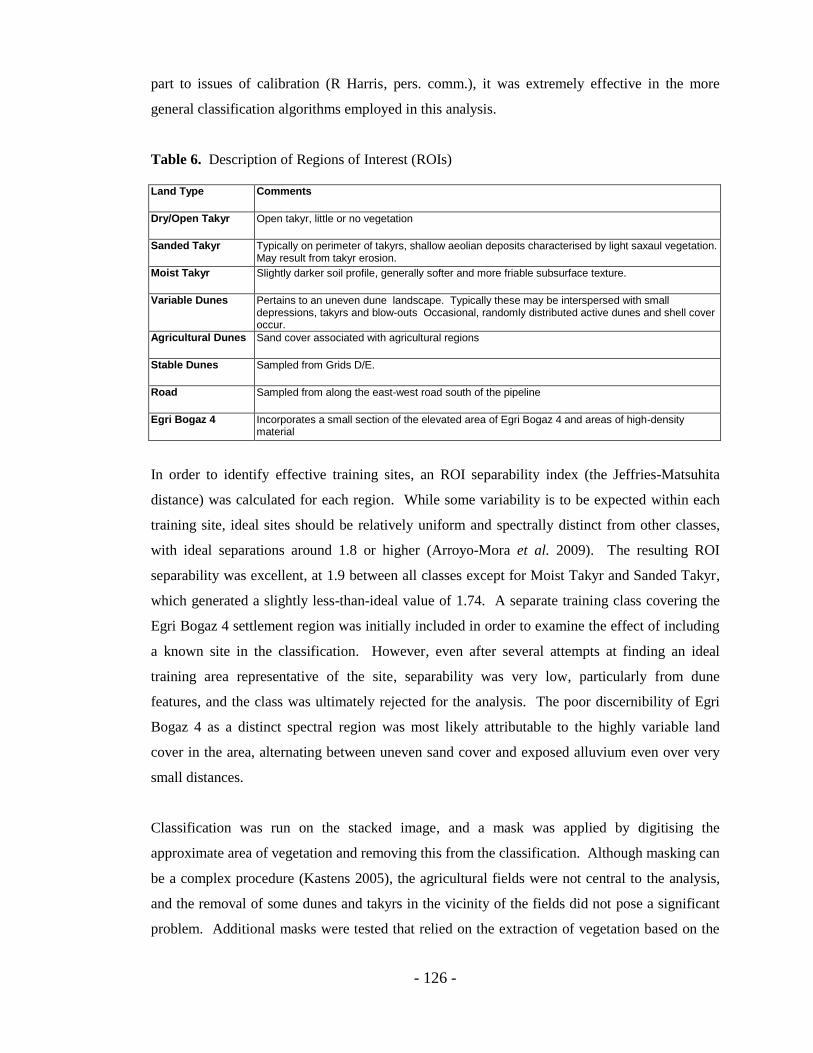
- 126 -
part to issues of calibration (R Harris, pers. comm.), it was extremely effective in the more
general classification algorithms employed in this analysis.
Table 6. Description of Regions of Interest (ROIs)
Land Type Comments
Dry/Open Takyr Open takyr, little or no vegetation
Sanded Takyr Typically on perimeter of takyrs, shallow aeolian deposits characterised by light saxaul vegetation. May result from takyr erosion.
Moist Takyr Slightly darker soil profile, generally softer and more friable subsurface texture.
Variable Dunes Pertains to an uneven dune landscape. Typically these may be interspersed with small depressions, takyrs and blow-outs Occasional, randomly distributed active dunes and shell cover occur.
Agricultural Dunes Sand cover associated with agricultural regions
Stable Dunes Sampled from Grids D/E.
Road Sampled from along the east-west road south of the pipeline
Egri Bogaz 4 Incorporates a small section of the elevated area of Egri Bogaz 4 and areas of high-density material
In order to identify effective training sites, an ROI separability index (the Jeffries-Matsuhita
distance) was calculated for each region. While some variability is to be expected within each
training site, ideal sites should be relatively uniform and spectrally distinct from other classes,
with ideal separations around 1.8 or higher (Arroyo-Mora et al. 2009). The resulting ROI
separability was excellent, at 1.9 between all classes except for Moist Takyr and Sanded Takyr,
which generated a slightly less-than-ideal value of 1.74. A separate training class covering the
Egri Bogaz 4 settlement region was initially included in order to examine the effect of including
a known site in the classification. However, even after several attempts at finding an ideal
training area representative of the site, separability was very low, particularly from dune
features, and the class was ultimately rejected for the analysis. The poor discernibility of Egri
Bogaz 4 as a distinct spectral region was most likely attributable to the highly variable land
cover in the area, alternating between uneven sand cover and exposed alluvium even over very
small distances.
Classification was run on the stacked image, and a mask was applied by digitising the
approximate area of vegetation and removing this from the classification. Although masking can
be a complex procedure (Kastens 2005), the agricultural fields were not central to the analysis,
and the removal of some dunes and takyrs in the vicinity of the fields did not pose a significant
problem. Additional masks were tested that relied on the extraction of vegetation based on the
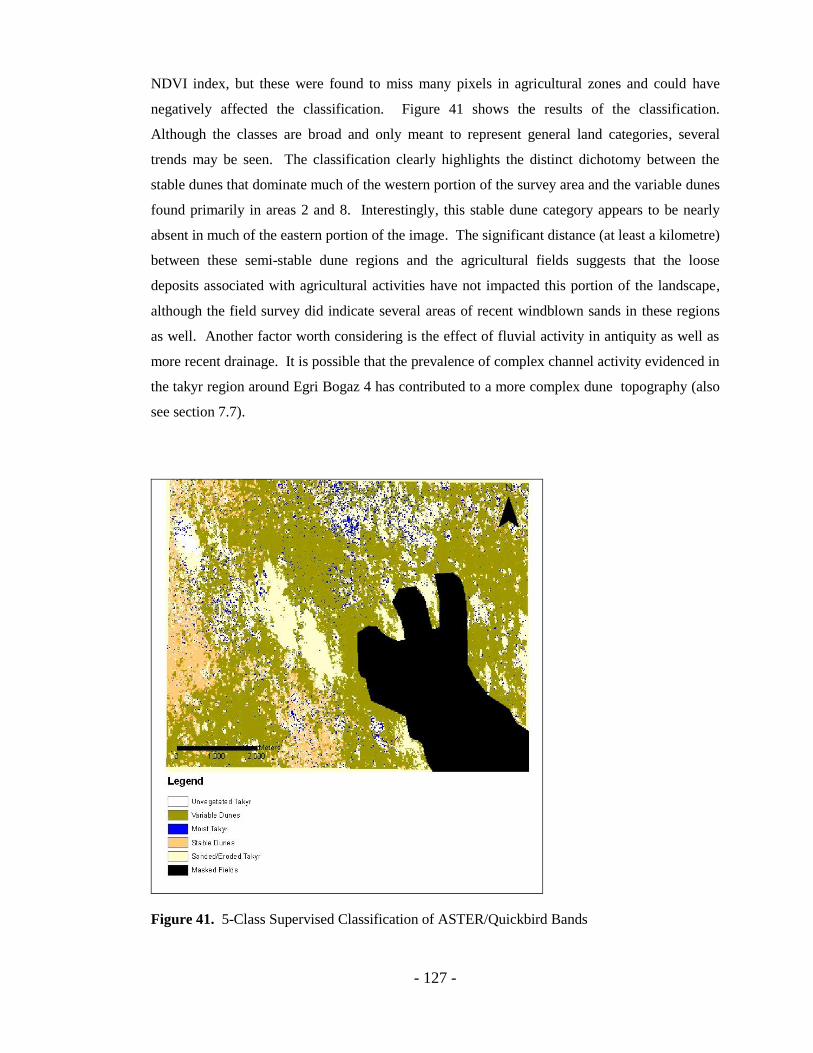
- 127 -
NDVI index, but these were found to miss many pixels in agricultural zones and could have
negatively affected the classification. Figure 41 shows the results of the classification.
Although the classes are broad and only meant to represent general land categories, several
trends may be seen. The classification clearly highlights the distinct dichotomy between the
stable dunes that dominate much of the western portion of the survey area and the variable dunes
found primarily in areas 2 and 8. Interestingly, this stable dune category appears to be nearly
absent in much of the eastern portion of the image. The significant distance (at least a kilometre)
between these semi-stable dune regions and the agricultural fields suggests that the loose
deposits associated with agricultural activities have not impacted this portion of the landscape,
although the field survey did indicate several areas of recent windblown sands in these regions
as well. Another factor worth considering is the effect of fluvial activity in antiquity as well as
more recent drainage. It is possible that the prevalence of complex channel activity evidenced in
the takyr region around Egri Bogaz 4 has contributed to a more complex dune topography (also
see section 7.7).
Figure 41. 5-Class Supervised Classification of ASTER/Quickbird Bands
- 128 -
A comparison of the stacked image with a supervised classification of only the Quickbird
imagery indicated that the latter was much less effective in discerning between the broad dune
categories. Although the small sandy depressions, typically barely covering the alluvium, were
more detectable using the high resolution imagery, the character of the dunescapes in the
southern portion of the survey area appear more uniform than in the ASTER imagery. This
suggests that much of the spectral variation is derived from the SWIR bands. Support for this
possibility may be seen by spectral signatures in ASTER Bands 4 and 9, which quite clearly
reveal this dichotomy in the dune regions (see section 4.3). The implications of such
classification algorithms will be examined at a much finer scale with respect to the specific
distribution of material in the following chapter.
4.5. Remote Sensing and Site Identification
Although remote sensing data has been employed since the mid-1990s as an aid to site
prospection in the Murghab (see above), its use in this endeavour has been largely unsystematic.
Elsewhere, more systematic approaches to site prospection have met with mixed results.
Topographical identification of large tells in the Khabur region in northern Syria has been
largely successful—but only in cases where the elevation differs significantly from the
background topography (Ur et al. 2006). Small sites, however, have typically eluded detection.
With respect to visual or multispectral imagery, high resolution CORONA and IKONOS
imagery have been fairly successful in western Syria, due in part to varied reflectances caused by
differential drainages (Beck et al. 2007a). Menze notes that well-drained, loessy soils and
decayed mud-brick that comprise the surface of tells can, in many cases, be easily identified.
The potential benefits of multispectral imagery in site identification, however, have only recently
been addressed. Some of the most promising results have been seen in the Khabur, where
multispectral classification of several coterminous ASTER granules correctly classified nearly
70% of training sites over a 5400 km2 test area (Menze and Ur 2007). Additionally, Lasaponara
and Masini (2006) have explored the multispectral capabilities of Quickbird, particularly with
respect to vegetation detection, finding that the Quickbird sensors were especially adept at
detecting cropmark variations in vegetated or agricultural zones.

- 129 -
4.5.1. DEMS and Site Prospection
The examination of remote sensing data for site prospection in the northern Murghab relied on a
general assessment both of DEM and multispectral data. The analysis was subject to several
initial limitations that must be noted here. First, the datasets were quite restrictive. The
Quickbird imagery only covered a small portion of the Bronze Age settlement region, where
known settlement mounds were scarce, so it could not be used effectively for comparison with
large known sites. Another significant problem was how to determine what constituted the
boundary of a site. This was less of an issue in the DEM assessment, where the mere knowledge
of the presence of a mound was sufficient for the analysis. In the multispectral imagery,
however, the selection of training regions where discrete spectral characteristics indicative of
anthropogenic mounds could be identified was a highly subjective process, and it proved
necessary to define entirely new boundaries rather than rely on the existing boundaries of the
sites defined in earlier surveys.
The complexity of the landscape, and the difficulty in identifying topographical variations even
in features that were visually prominent, such as takyrs, suggested that prospects for the
identification of settlement mounds in this landscape could be poor. While DEMs, primarily the
90m SRTM, have been used in the context of archaeological prospection in the Murghab, the
primary focus has been on geomorphology, with a secondary emphasis on visual modelling and
presentation. The systematic „tell-spotting‟ algorithms employed in northern Mesopotamia and
Anatolia (Menze et al. 2005) are so far absent in Central Asia, perhaps not surprising as the
research is quite new in archaeology. It is beyond the scope of this thesis to duplicate the Near
Eastern DEM analysis methods in the Murghab context, but a general assessment of feasibility
will be examined.
In order to investigate the utility of the ASTER DEM, the known large Bronze Age sites classed
as „Depe 1‟ in the AMMD designation (Bondioli and Tosi 1998: xvii), were overlaid on a
colour-stretched DEM. The first examination was purely visual and attempted to assess the
degree to which sites were discernible against the background topography. The results showed
that although major mounded sites such as Gonur North and Togolok 1 did exhibit variability in
elevation within their respective boundaries, none of the peak elevations within the site offered
any substantial deviation from the natural topographic variation. Perhaps the most obvious
reason for the lack of topographic prominence is that the Murghab landscape is heavily textured
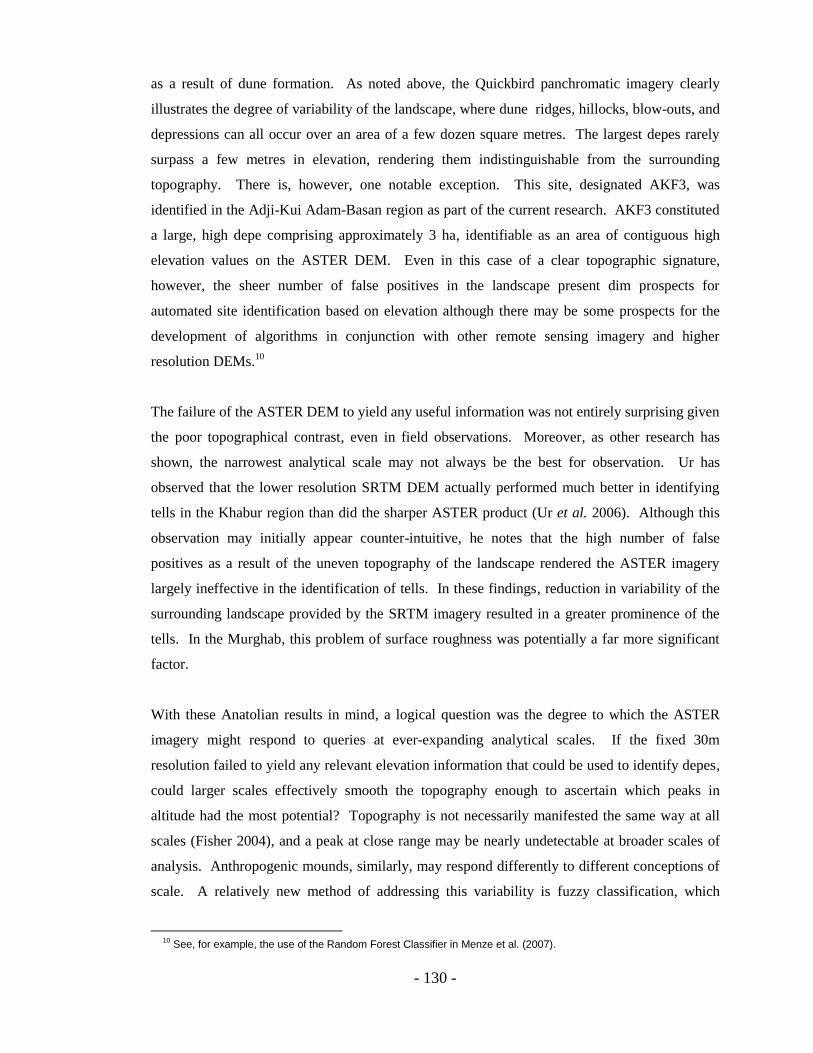
- 130 -
as a result of dune formation. As noted above, the Quickbird panchromatic imagery clearly
illustrates the degree of variability of the landscape, where dune ridges, hillocks, blow-outs, and
depressions can all occur over an area of a few dozen square metres. The largest depes rarely
surpass a few metres in elevation, rendering them indistinguishable from the surrounding
topography. There is, however, one notable exception. This site, designated AKF3, was
identified in the Adji-Kui Adam-Basan region as part of the current research. AKF3 constituted
a large, high depe comprising approximately 3 ha, identifiable as an area of contiguous high
elevation values on the ASTER DEM. Even in this case of a clear topographic signature,
however, the sheer number of false positives in the landscape present dim prospects for
automated site identification based on elevation although there may be some prospects for the
development of algorithms in conjunction with other remote sensing imagery and higher
resolution DEMs.10
The failure of the ASTER DEM to yield any useful information was not entirely surprising given
the poor topographical contrast, even in field observations. Moreover, as other research has
shown, the narrowest analytical scale may not always be the best for observation. Ur has
observed that the lower resolution SRTM DEM actually performed much better in identifying
tells in the Khabur region than did the sharper ASTER product (Ur et al. 2006). Although this
observation may initially appear counter-intuitive, he notes that the high number of false
positives as a result of the uneven topography of the landscape rendered the ASTER imagery
largely ineffective in the identification of tells. In these findings, reduction in variability of the
surrounding landscape provided by the SRTM imagery resulted in a greater prominence of the
tells. In the Murghab, this problem of surface roughness was potentially a far more significant
factor.
With these Anatolian results in mind, a logical question was the degree to which the ASTER
imagery might respond to queries at ever-expanding analytical scales. If the fixed 30m
resolution failed to yield any relevant elevation information that could be used to identify depes,
could larger scales effectively smooth the topography enough to ascertain which peaks in
altitude had the most potential? Topography is not necessarily manifested the same way at all
scales (Fisher 2004), and a peak at close range may be nearly undetectable at broader scales of
analysis. Anthropogenic mounds, similarly, may respond differently to different conceptions of
scale. A relatively new method of addressing this variability is fuzzy classification, which
10
See, for example, the use of the Random Forest Classifier in Menze et al. (2007).
- 131 -
employs a probabilistic method to determine whether a feature falls into a particular
topographical class. Membership is ranked on a 0-1 scale, where 1 indicates membership (i.e.,
peakedness) at all scales, and 0 represents no membership (see Fisher 2005; Fisher et al. 2007
for discussion). To conduct the analysis, the Landserf software package was used. First, a range
of analytical scales was defined, ranging from a 3x3 to an 11x11 window size (0.81ha to
10.9ha). The 11x11 window constitutes a 10.9 ha area of analysis, significantly larger than the
majority of sites in the delta with the exception of Gonur Depe. In terms of the topographical
background, all scales revealed the expected unevenness of the landscape. This was
unsurprising given the relative flatness over the DEM—the altitude ranges only 70m over 3,600
km2—so small changes in altitude were magnified. A fuzzy-peak classification was then run
over the same multiscalar rank. The results, shown in Figure 42, show the sites of Gonur Depe
and Egri Bogaz, against a raster of peak membership in both ASTER and SRTM. Each of these
sites has a recorded elevation of around 5m, compared to less than 3m for other sites in the delta
(but see discussion on elevation in section 5.5.1). The figures indicate that no apparent
relationship exists between sites and high-membership peaks. While peakedness does appear at
certain levels, the extensive area of the sites increases the likelihood that, against such an uneven
backdrop, some variation in the topography may occur, although the variation is too subtle and
the false positives too many for variation to be detected using this algorithm.

- 132 -
a: Gonur Depe
ASTER 30m Window size =
3m
b: Gonur Depe
ASTER 90m Window size =
5m
c: Gonur Depe
SRTM 90m Window size =
11m
d: Egri Bogaz 4
ASTER 30m Window size =
3m
e: Egri Bogaz 4
ASTER 90m Window size =
5m
f: Egri Bogaz 4
SRTM 90m Window size =
11m
Figure 42. Fuzzy Peak Classification for Selected Sites (ASTER and SRTM DEMs)
- 133 -
4.5.2. Multispectral Imagery and Site Prospection
The second application of remote sensing for site prospection concerned the feasibility of
identifying specific sites in the archaeological landscape through multispectral image
classification. Supervised classification has recently shown promise in the identification of small
tells in northern Syria using complex spatial, spectral and temporal classification algorithms
(Menze and Ur 2007). The methodology used for this study proceeds at a more general level,
assessing the degree to which it may be useful in conjunction with other techniques to
investigate the study area. Because large sites, with the exception of Egri Bogaz 4, did not occur
in the survey area, it was necessary to perform a delta-wide assessment first. The first step in the
classification involved the selection of training data. These training sites consisted of Bronze
Age sites identified as Depe 1 or 2 by the AMMD, as these tended to be visually prominent in
the ASTER imagery. Unfortunately, it became apparent that the site boundaries as defined by
the AMMD survey did not display any clear spectral contiguity, but were highly varied.
Attempts to use these as training sites, even at a highly restrictive classification threshold,
resulted in an enormous number of false positives—effectively including huge swathes of the
landscape. While the discrepancy between site boundary and spectral contiguity may be
partially due to the methodology used to measure the site, the actual complexity of the landscape
even within a small region probably plays a significant role as well. In order to obtain more
usable training data, regions of spectral contiguity were first manually selected from within the
AMMD site polygons. ENVI‟s „Grow‟ algorithm was then applied to digitally broaden the
training area to include contiguous pixels of similar value. The spectral variation between
training areas was then calculated using the Endmember Classification algorithm, the results of
which are shown in Table 7.
In order to examine the effects of spectral variability on the potential for site identification,
training sites were categorized into subgroups. Sites within a subgroup exhibited similar spectra,
while the variability was higher between subgroups. The results of this test indicated that
training sites within a specific subgroup were not able to effectively identify sites outside of that
subgroup. One particular example is worth mentioning. The subgroup containing Kelleli 3 and
4, as well as that containing Egri Bogaz 1 and 2, both fall in agricultural zones in the northern
delta. Because of this similarity, as well as the proximity of the Kelleli sites to the survey area, it
seemed plausible that the Kelleli subgroup might be more effective as a training class for sites in
the survey area than would central delta sites. When each group was used as a training group,
however, the other sites failed to respond as positive hits. These investigations suggested that,

- 134 -
rather than using a single group of training sites, several subgroups should be explored to
examine their effectiveness in isolating possible sites, as different sites may exhibit various
characteristics in different landscapes (Beck et al. 2007a). Menze (2007), in his multispectral
analysis of the Khabur basin, has come to a similar conclusion that landscape variability may
heavily affect classification algorithms beyond about a 100 km radius. This particular distance,
of course, pertains to the Khabur study and such distances should not be applied haphazardly
without prior knowledge of the specific landscape of study. The visual assessment of the
ASTER imagery indicates that, even over short distances, sites in different land categories may
exhibit very different spectral signatures.
Table 7. Endmember Separability of Bronze Age Training Sites (all bands)
Sites Internal Separability* External Separability
Kelleli 3,4 Internal separability <0.5 External separability 1.8 from Togolok
Gonur N., Adji Kui 1, Adji Kui 8 Internal separability approx. 0.5 Adji Kui 1 slightly higher reflectance than Gonur and Adji Kui 8
Togolok 1 - External separability 1.8 from Kelleli sites
Egri Bogaz 1, Egri Bogaz 2 Internal separability <0.5 External separability >1.75 from all site groupings
*N.B „Internal Separability‟ here refers to the endmember separability between sites in each row of the
table—i.e. those that show a similar spectral response. „External Separability‟ compares these classes to
each other. As indicated above, ideal separability indices should exceed 1.8, a figure also cited in the
ENVI documentation.
After running the supervised classifications against the training data, these were applied to the
full survey area. Classifications were run using a Maximum Likelihood algorithm at a threshold
of 98%, then processed using a Sieve procedure that filters out stray pixels, and a Clump
procedure that amalgamates the remaining data. Figure 43 clearly shows the enormous number
of positive hits in two selected classifications, far too many to offer a reliable method of
isolating individual sites. In certain cases, raising the detection threshold has been found to be
useful in restricting possible positives (D. Thompson, pers. comm.). However, none of the
previously identified sites within the survey area clearly correlated with the regions identified by
the classification except for a small area around Egri Bogaz 4, which may be expected in such a
varied landscape.

- 135 -
Figure 43. Selected Results of Supervised Classification. Blue areas: ASTER 7-3-1, Gonur/Adji
Kui subgroup. Purple areas: ASTER 4-6-8, Kelleli subgroup
The results of the above test suggest that, at least in the northern delta, broad-scale supervised
classifications were not an effective means to identify sites in the target area. There are several
reasons that may be account for this failure. One of these is simply the possibility that large,
easily identifiable sites were not present in the survey area. The notable absence of any features
that could clearly be considered depes, with the possible exception of the mounded areas in the
Egri Bogaz 4 region, suggests that sites of the scale of those in the central delta simply may not
exist in this particular area. A second reason, and one easily confirmed by field observations, is
that sand cover and takyr erosion may significantly alter site signatures. As will be shown in
Chapter 5, the site designated AMMD 717 is entirely obstructed by dune cover, and the pottery
distributed on the surface of the adjacent takyr is much too sparse to be detected in the ASTER
imagery (see study in Buck et al. 2003 on remote detection of surface pottery).
Given the inability to detect sites over a broad region, a more restrictive analysis was used to
assess the performance of the classifiers in one particular region. Since at least three sites were
visually detectable in the agricultural zone just south of Egri Bogaz 4 as opposed to none in the
sand/takyr landscape, a mask was created to isolate just the agricultural region. Egri Bogaz 1
and 2 were selected as training sites, since they were the only clearly identifiable sites in the
imagery. Again, the threshold was set to 98%. Unlike the previous tests, this classification

- 136 -
resulted in a very manageable set of nine possible site locations (Figure 44). Because of time
constraints and accessibility difficulties due to irrigation, only five of these were visited. All test
areas were found to be partially unploughed, often slightly raised and generally characterized by
loose sandy deposits. Of the five, four were almost completely devoid of archaeological
material, although the last site contained a few small ceramics at the edge of the loess,
continuing a few metres into the ploughed fields. At the moment, there is no clear basis for
labelling this a „site‟, although there may have been some occupation in the vicinity. However,
it appears that in the agricultural zone, the positive results of the supervised classification are
caused by the higher reflectance of unploughed areas rather than any specific spectral
characteristic of archaeological settlement.
Figure 44. Test Sites from Supervised Classification near Egri Bogaz 1
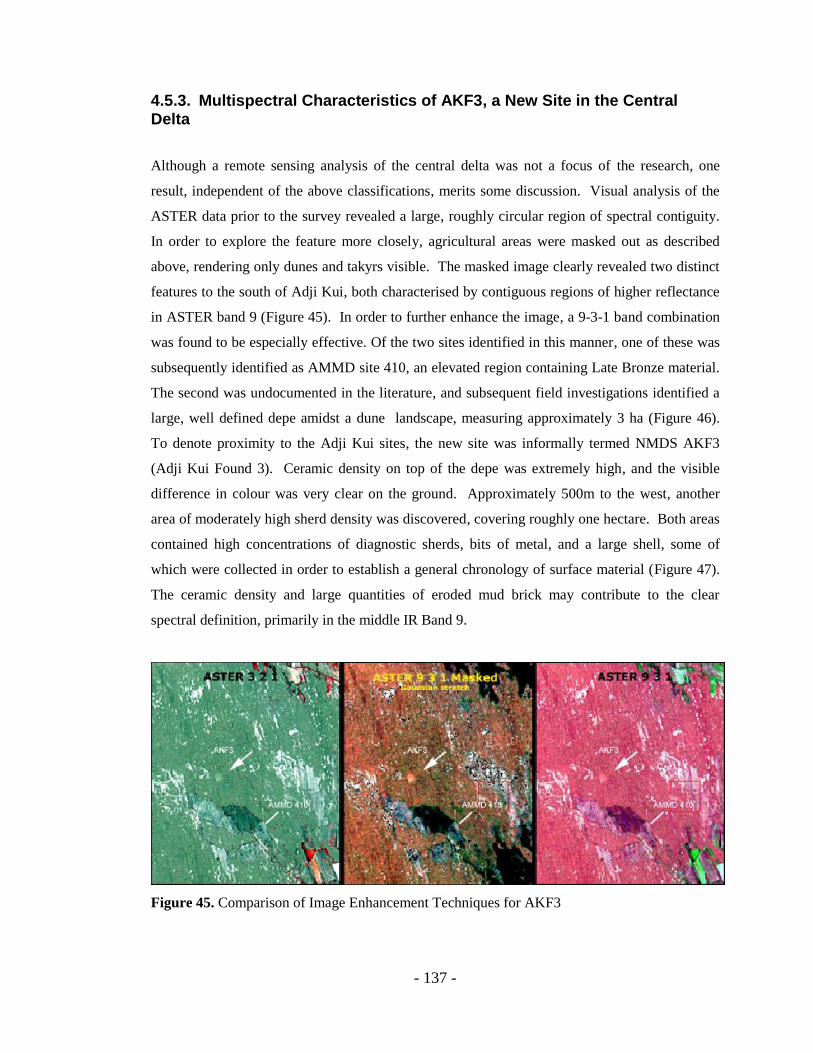
- 137 -
4.5.3. Multispectral Characteristics of AKF3, a New Site in the Central Delta
Although a remote sensing analysis of the central delta was not a focus of the research, one
result, independent of the above classifications, merits some discussion. Visual analysis of the
ASTER data prior to the survey revealed a large, roughly circular region of spectral contiguity.
In order to explore the feature more closely, agricultural areas were masked out as described
above, rendering only dunes and takyrs visible. The masked image clearly revealed two distinct
features to the south of Adji Kui, both characterised by contiguous regions of higher reflectance
in ASTER band 9 (Figure 45). In order to further enhance the image, a 9-3-1 band combination
was found to be especially effective. Of the two sites identified in this manner, one of these was
subsequently identified as AMMD site 410, an elevated region containing Late Bronze material.
The second was undocumented in the literature, and subsequent field investigations identified a
large, well defined depe amidst a dune landscape, measuring approximately 3 ha (Figure 46).
To denote proximity to the Adji Kui sites, the new site was informally termed NMDS AKF3
(Adji Kui Found 3). Ceramic density on top of the depe was extremely high, and the visible
difference in colour was very clear on the ground. Approximately 500m to the west, another
area of moderately high sherd density was discovered, covering roughly one hectare. Both areas
contained high concentrations of diagnostic sherds, bits of metal, and a large shell, some of
which were collected in order to establish a general chronology of surface material (Figure 47).
The ceramic density and large quantities of eroded mud brick may contribute to the clear
spectral definition, primarily in the middle IR Band 9.
Figure 45. Comparison of Image Enhancement Techniques for AKF3
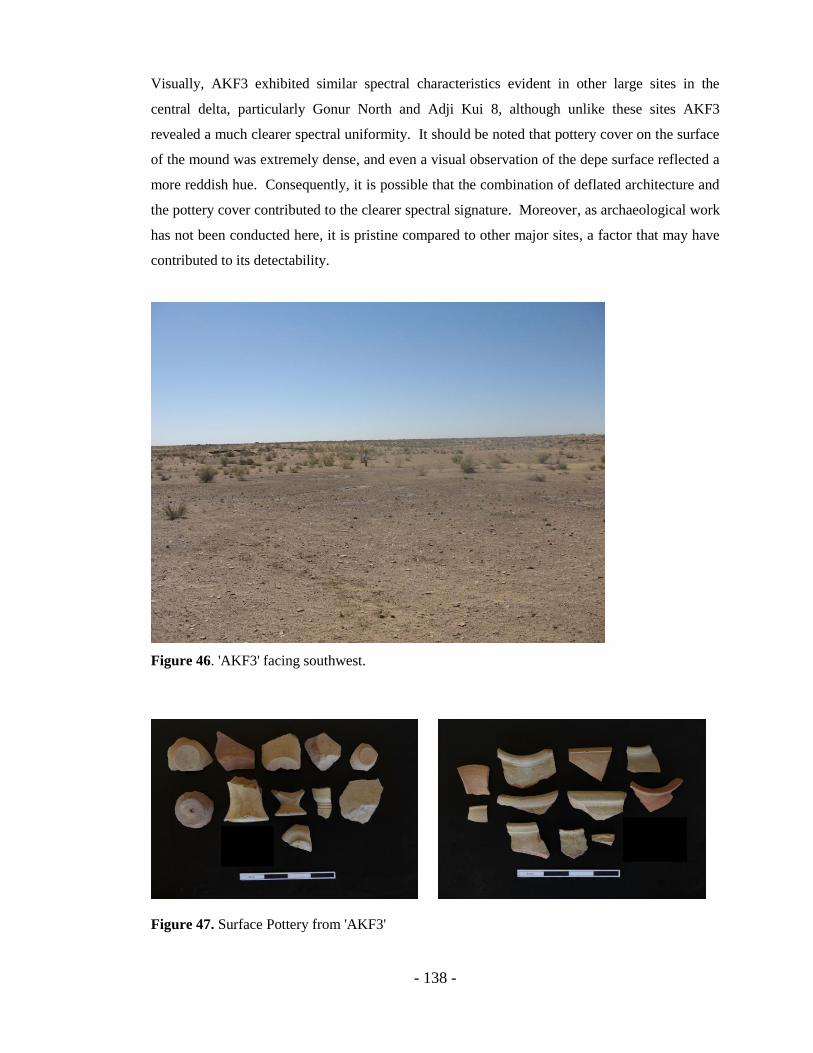
- 138 -
Visually, AKF3 exhibited similar spectral characteristics evident in other large sites in the
central delta, particularly Gonur North and Adji Kui 8, although unlike these sites AKF3
revealed a much clearer spectral uniformity. It should be noted that pottery cover on the surface
of the mound was extremely dense, and even a visual observation of the depe surface reflected a
more reddish hue. Consequently, it is possible that the combination of deflated architecture and
the pottery cover contributed to the clearer spectral signature. Moreover, as archaeological work
has not been conducted here, it is pristine compared to other major sites, a factor that may have
contributed to its detectability.
Figure 46. 'AKF3' facing southwest.
Figure 47. Surface Pottery from 'AKF3'
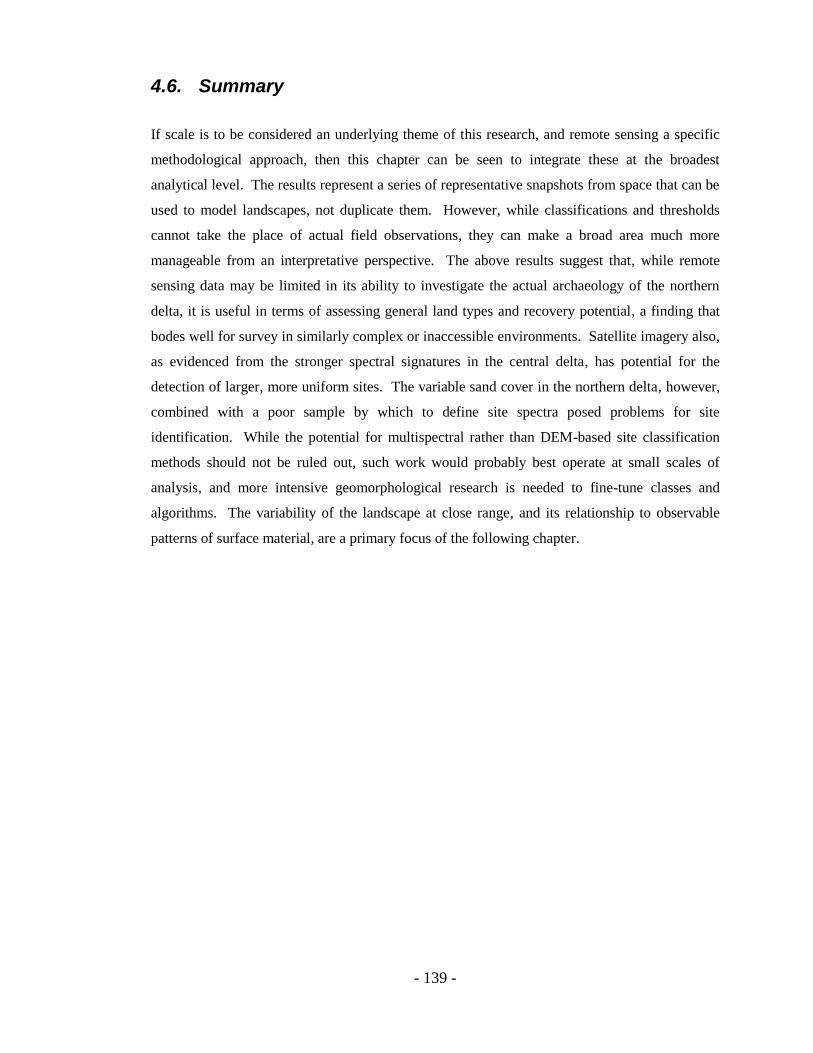
- 139 -
4.6. Summary
If scale is to be considered an underlying theme of this research, and remote sensing a specific
methodological approach, then this chapter can be seen to integrate these at the broadest
analytical level. The results represent a series of representative snapshots from space that can be
used to model landscapes, not duplicate them. However, while classifications and thresholds
cannot take the place of actual field observations, they can make a broad area much more
manageable from an interpretative perspective. The above results suggest that, while remote
sensing data may be limited in its ability to investigate the actual archaeology of the northern
delta, it is useful in terms of assessing general land types and recovery potential, a finding that
bodes well for survey in similarly complex or inaccessible environments. Satellite imagery also,
as evidenced from the stronger spectral signatures in the central delta, has potential for the
detection of larger, more uniform sites. The variable sand cover in the northern delta, however,
combined with a poor sample by which to define site spectra posed problems for site
identification. While the potential for multispectral rather than DEM-based site classification
methods should not be ruled out, such work would probably best operate at small scales of
analysis, and more intensive geomorphological research is needed to fine-tune classes and
algorithms. The variability of the landscape at close range, and its relationship to observable
patterns of surface material, are a primary focus of the following chapter.
- 140 -
Chapter 5. Results of Field Survey
5.1. Overview
The preceding chapter employed remote sensing data to describe and, where possible, quantify,
the NMDS survey landscape and to identify some of the biases that may potentially affect
recovery potential. This chapter returns to more traditional archaeological practices and
discusses the findings of the survey itself. In keeping with the overarching concept of scale, the
chapter begins with a brief discussion of the other Egri Bogaz sites before focusing the window
on the survey area from both a geomorphological and a material perspective. It then addresses
each region of the survey, categorised by analytical units as described in Chapter 3.
5.2. Reconnaissance of Egri Bogaz 1, 2 and 3
Immediately prior to the survey, the three southern sites of the Egri Bogaz complex, Egri Bogaz
1, 2 and 3, were visited in order to gain a clearer understanding of the local archaeological
environment. While no formal reports have been published, surface distributions and small
2x2m soundings have yielded diagnostic material and some kiln remains (B. Udeumuradov,
pers. comm.). Udeumuradov indicates that these three sites were largely damaged by
agricultural development, and subsequent AMMD investigations suggest that all three sites were
„partially under the plough‟ (see comments in AMMD GIS database). Although these sites have
been heavily affected by agricultural development, the damage was not as severe as might have
been expected. All three sites proved easily identifiable on the ground, although only Egri
Bogaz 1 and 2 are identifiable in the ASTER satellite imagery as bright areas clearly
distinguishable from the surrounding fields. The unploughed portions of all three sites are
characterised by loose sandy deposits with moderately dense surface scatters.
A cursory field investigation of Egri Bogaz 1 revealed a partially excavated kiln, surrounded by
a high density of pottery and brick debris. Beyond this region, surface materials decreased until
ending fairly abruptly at the edge of a large cotton field to the east, although a secondary
concentration continued to the north. Egri Bogaz 2, comparable in size to Egri Bogaz 1,
straddled a region of loose, windblown sand in the east and a large field extending
- 141 -
approximately 1 km to the west. The actual dimensions of either site were thus difficult to
determine, and portions of each were covered with dense vegetation. The density of material on
Egri Bogaz 2, while not systematically sampled, was higher and more widespread than in Egri
Bogaz 1, and brick debris, some of it vitrified, was found near the centre of the site. The surface
material on Egri Bogaz 2 continued into the fields, more so than at Egri Bogaz 1, although this
may be the result of previous ploughing rather than an actual reflection of the size of the site (see
Francovich 2000). The last of the three sites, Egri Bogaz 3, was a small, low mound located
about 500m north of Egri Bogaz 2. Surface materials were much less dense here, and did not
continue beyond the surface of the mound. Egri Bogaz 3 is the only site of the three that escaped
detection by the ASTER imagery. This was most likely due to its small size rather than any
unique spectral characteristics, since all three sites contained similar surface deposits.
Applications of higher resolution imagery such as IKONOS or Quickbird may be useful to
examine these sites more closely, given their effectiveness in detecting small ploughed-out
regions in Syria and Anatolia (Beck et al. 2007b), although with the exception of Egri Bogaz 1,
these were unavailable for the survey area.
5.3. General Field Observations in the NMDS Survey Area
Before providing a detailed examination of the survey data, it is necessary to look more closely
at the landscape as observed in the field. Although the survey area comprises only a small
region of the Murghab, the geomorphology may be seen as an approximate microcosm of the
northern delta as a whole. Takyrs comprise about 3.7 km2, or about 31% of the survey region.
Most of the exposed takyr surface is concentrated in two distinct areas: one in the northwestern
portion of the survey area, of which nearly half is comprised of a large, mostly unvegetated
takyr, and the other in the vicinity of Egri Bogaz 4. This latter takyr complex is discontinuous,
and broad areas of the eroded takyr surface are regularly interspersed with variable sand cover.
Several hundred metres to the south begins the northern fringe of a heavily cultivated region,
although these fields do not encroach on the survey area. A third takyr region, almost entirely
cultivated, comprises the region between these two takyr zones, and obstructs about 2 ha of the
survey area. The rest of the landscape is comprised primarily of variable dune cover.
Interspersed throughout this dune-takyr complex are numerous over-sanded depressions, and it
was primarily within these low-lying regions, either depressions or the over-sanded perimeters
of takyrs, where material tended to be most prevalent.
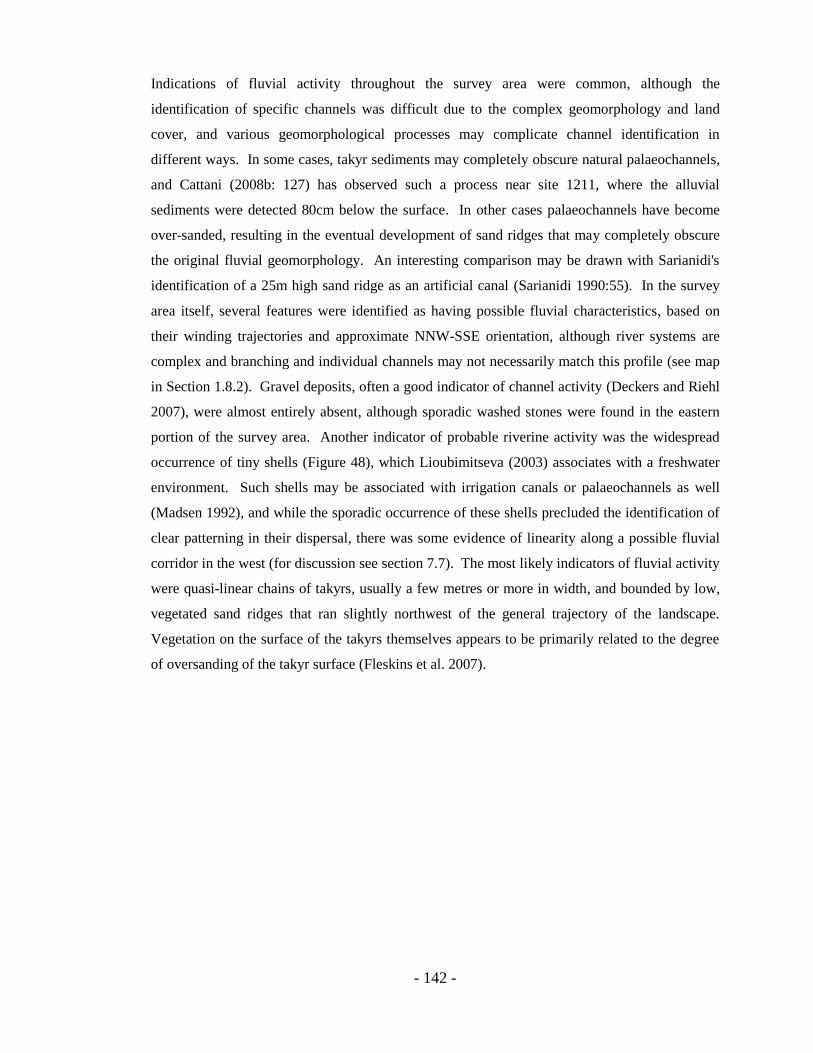
- 142 -
Indications of fluvial activity throughout the survey area were common, although the
identification of specific channels was difficult due to the complex geomorphology and land
cover, and various geomorphological processes may complicate channel identification in
different ways. In some cases, takyr sediments may completely obscure natural palaeochannels,
and Cattani (2008b: 127) has observed such a process near site 1211, where the alluvial
sediments were detected 80cm below the surface. In other cases palaeochannels have become
over-sanded, resulting in the eventual development of sand ridges that may completely obscure
the original fluvial geomorphology. An interesting comparison may be drawn with Sarianidi's
identification of a 25m high sand ridge as an artificial canal (Sarianidi 1990:55). In the survey
area itself, several features were identified as having possible fluvial characteristics, based on
their winding trajectories and approximate NNW-SSE orientation, although river systems are
complex and branching and individual channels may not necessarily match this profile (see map
in Section 1.8.2). Gravel deposits, often a good indicator of channel activity (Deckers and Riehl
2007), were almost entirely absent, although sporadic washed stones were found in the eastern
portion of the survey area. Another indicator of probable riverine activity was the widespread
occurrence of tiny shells (Figure 48), which Lioubimitseva (2003) associates with a freshwater
environment. Such shells may be associated with irrigation canals or palaeochannels as well
(Madsen 1992), and while the sporadic occurrence of these shells precluded the identification of
clear patterning in their dispersal, there was some evidence of linearity along a possible fluvial
corridor in the west (for discussion see section 7.7). The most likely indicators of fluvial activity
were quasi-linear chains of takyrs, usually a few metres or more in width, and bounded by low,
vegetated sand ridges that ran slightly northwest of the general trajectory of the landscape.
Vegetation on the surface of the takyrs themselves appears to be primarily related to the degree
of oversanding of the takyr surface (Fleskins et al. 2007).
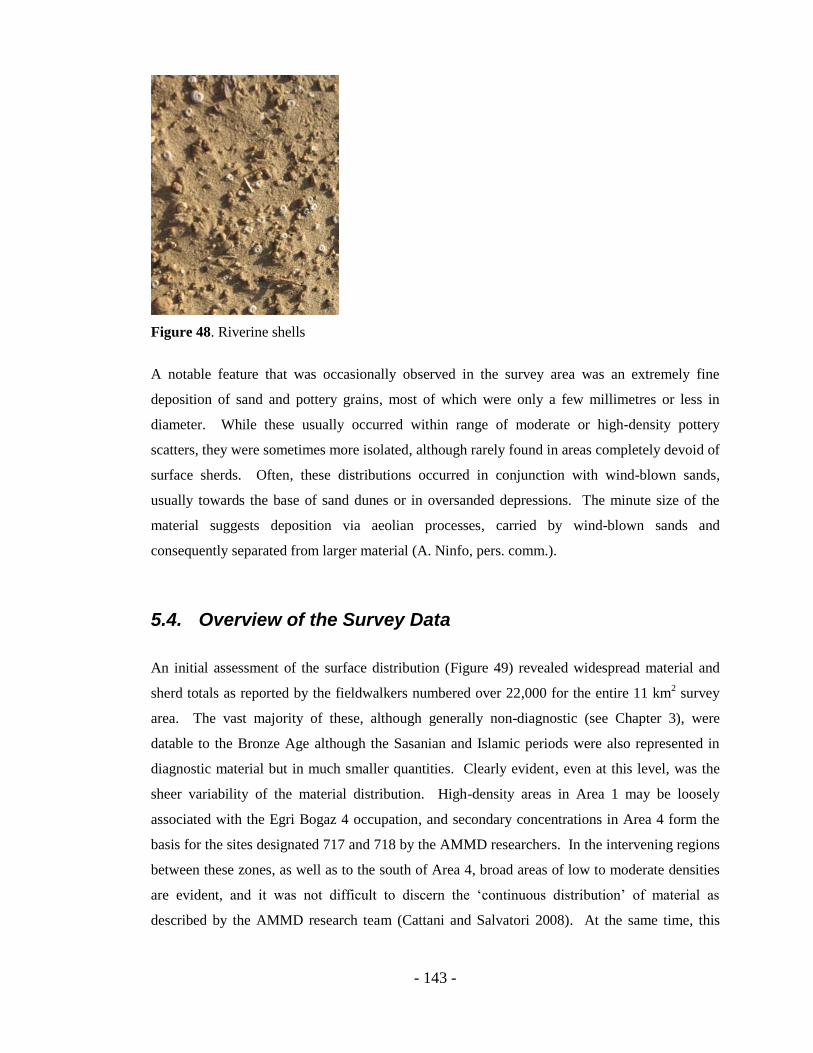
- 143 -
Figure 48. Riverine shells
A notable feature that was occasionally observed in the survey area was an extremely fine
deposition of sand and pottery grains, most of which were only a few millimetres or less in
diameter. While these usually occurred within range of moderate or high-density pottery
scatters, they were sometimes more isolated, although rarely found in areas completely devoid of
surface sherds. Often, these distributions occurred in conjunction with wind-blown sands,
usually towards the base of sand dunes or in oversanded depressions. The minute size of the
material suggests deposition via aeolian processes, carried by wind-blown sands and
consequently separated from larger material (A. Ninfo, pers. comm.).
5.4. Overview of the Survey Data
An initial assessment of the surface distribution (Figure 49) revealed widespread material and
sherd totals as reported by the fieldwalkers numbered over 22,000 for the entire 11 km2 survey
area. The vast majority of these, although generally non-diagnostic (see Chapter 3), were
datable to the Bronze Age although the Sasanian and Islamic periods were also represented in
diagnostic material but in much smaller quantities. Clearly evident, even at this level, was the
sheer variability of the material distribution. High-density areas in Area 1 may be loosely
associated with the Egri Bogaz 4 occupation, and secondary concentrations in Area 4 form the
basis for the sites designated 717 and 718 by the AMMD researchers. In the intervening regions
between these zones, as well as to the south of Area 4, broad areas of low to moderate densities
are evident, and it was not difficult to discern the „continuous distribution‟ of material as
described by the AMMD research team (Cattani and Salvatori 2008). At the same time, this
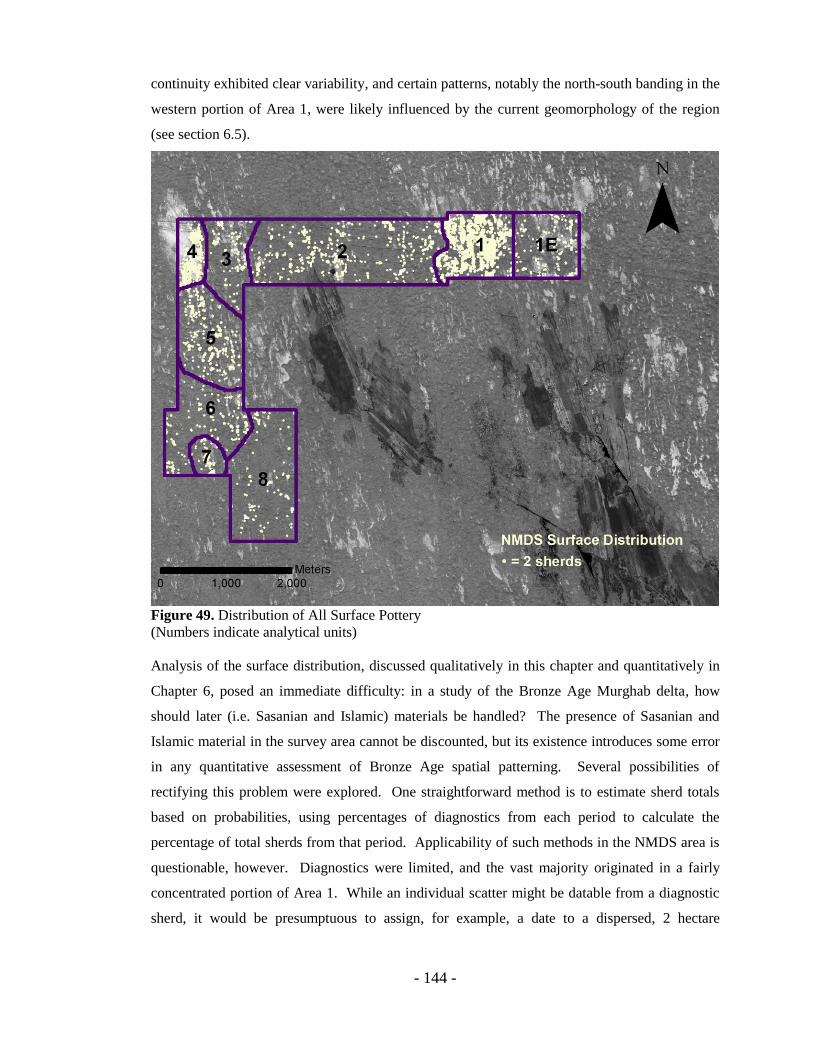
- 144 -
continuity exhibited clear variability, and certain patterns, notably the north-south banding in the
western portion of Area 1, were likely influenced by the current geomorphology of the region
(see section 6.5).
Figure 49. Distribution of All Surface Pottery
(Numbers indicate analytical units)
Analysis of the surface distribution, discussed qualitatively in this chapter and quantitatively in
Chapter 6, posed an immediate difficulty: in a study of the Bronze Age Murghab delta, how
should later (i.e. Sasanian and Islamic) materials be handled? The presence of Sasanian and
Islamic material in the survey area cannot be discounted, but its existence introduces some error
in any quantitative assessment of Bronze Age spatial patterning. Several possibilities of
rectifying this problem were explored. One straightforward method is to estimate sherd totals
based on probabilities, using percentages of diagnostics from each period to calculate the
percentage of total sherds from that period. Applicability of such methods in the NMDS area is
questionable, however. Diagnostics were limited, and the vast majority originated in a fairly
concentrated portion of Area 1. While an individual scatter might be datable from a diagnostic
sherd, it would be presumptuous to assign, for example, a date to a dispersed, 2 hectare

- 145 -
aggregation with one Bronze Age rim and two fragments from a Sasanian water jar. Moreover,
later materials were much less abraded, and fragments were often larger, suggesting that the
myriad small dispersed fragments, even if later diagnostics were more prevalent, are more
credibly associated with earlier material. One notable exception occurs in the central region of
Area 2, where several unglazed diagnostics were representative of mid-late Sasanian or Early
Islamic periods (D. Gilbert, G. Puschnigg, pers. comm.). However, such contexts responded
well to qualitative examination, and the analysis employs the full distribution of materials unless
otherwise indicated.
One of the more straightforward methods of interpreting distributional survey data, widely used
in the Aegean and elsewhere employs simple sherd counts (e.g. Bintliff and Snodgrass 1988).
Where „sites‟ tend to be the typical base units of large scale projects (see section 2.7), surveys
that look more at systems, continua, or offsite behaviour usually require some metric for
measuring the continuous distribution of material. Often, the core empirical data takes the form
of sherd counts or densities per unit area, which may be standardised as sherds per square metre
or some similar measurement (Mattingly et al. 2000). While some manner of measuring pottery
density is usually necessary if any quantitative or statistical data is to be performed (contra
Fentress et al. 2000), the process is often difficult or impossible to standardise, not only from
project to project, but even within a single survey. Despite these difficulties, much can be
learned by analysing basic sherd counts for the NMDS survey as a first step in understanding the
overall distribution of material.
Table 8 shows the average density of the surface material for all periods throughout the NMDS
survey region, in conjunction with the percentages of collection units containing artefactual
material. It should be noted that these figures represent sherd densities as recorded by the
walkers and, because of the unreliability of arbitrary scaling factors (cf Bevan and Conolly
2006), have not been scaled up to represent entire collection units (but see following discussion).
Over the entire survey area, mean recorded densities were extremely low, at 0.2 sherds/100m2.
Moreover, this number factors in the extremely high densities in the Egri Bogaz 4 region, and
the figure drops to 0.03 sherds/100m2 when this area is excluded. These low densities are a
little misleading, and the 20m spacing of the walkers may be expected to significantly reduce
sherd totals. Moreover, the speed at which each transect is walked further affects recovery rates.
The average time to traverse a 20m collection unit was approximately one minute, sufficient to
identify material within visible range for low to medium density regions although, as expected,
accuracy decreased with higher sherd totals (see also section 8.1). By applying an arbitrary scale
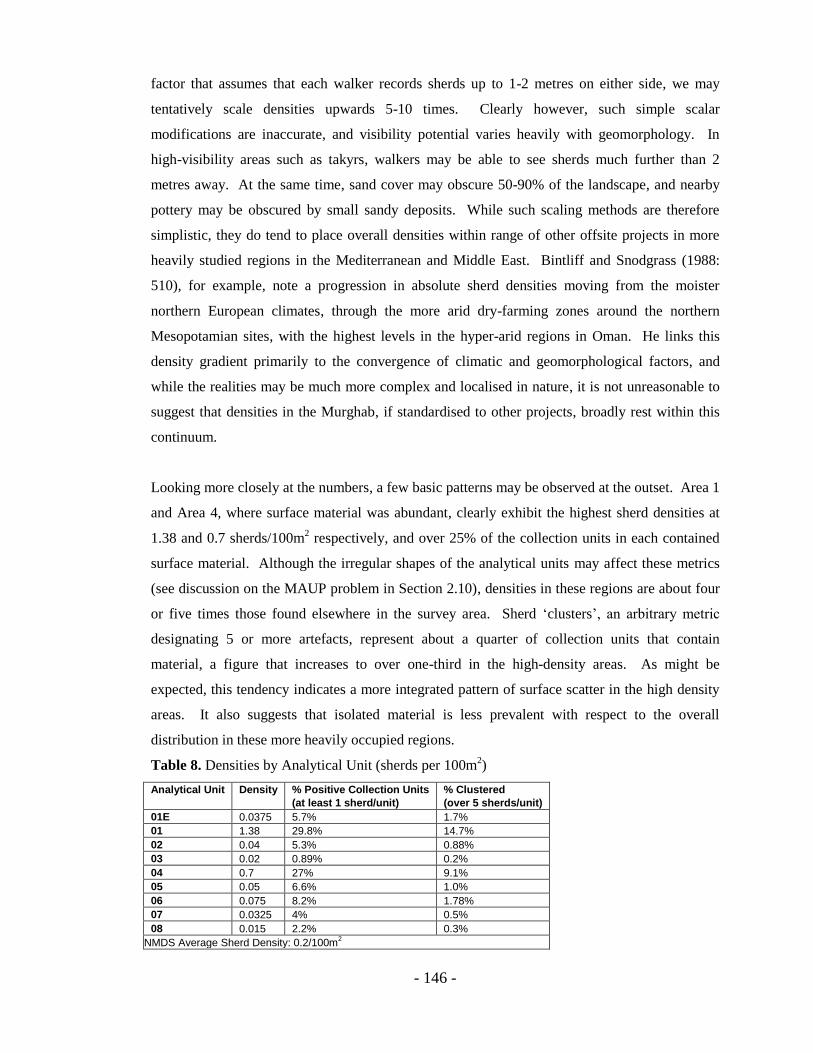
- 146 -
factor that assumes that each walker records sherds up to 1-2 metres on either side, we may
tentatively scale densities upwards 5-10 times. Clearly however, such simple scalar
modifications are inaccurate, and visibility potential varies heavily with geomorphology. In
high-visibility areas such as takyrs, walkers may be able to see sherds much further than 2
metres away. At the same time, sand cover may obscure 50-90% of the landscape, and nearby
pottery may be obscured by small sandy deposits. While such scaling methods are therefore
simplistic, they do tend to place overall densities within range of other offsite projects in more
heavily studied regions in the Mediterranean and Middle East. Bintliff and Snodgrass (1988:
510), for example, note a progression in absolute sherd densities moving from the moister
northern European climates, through the more arid dry-farming zones around the northern
Mesopotamian sites, with the highest levels in the hyper-arid regions in Oman. He links this
density gradient primarily to the convergence of climatic and geomorphological factors, and
while the realities may be much more complex and localised in nature, it is not unreasonable to
suggest that densities in the Murghab, if standardised to other projects, broadly rest within this
continuum.
Looking more closely at the numbers, a few basic patterns may be observed at the outset. Area 1
and Area 4, where surface material was abundant, clearly exhibit the highest sherd densities at
1.38 and 0.7 sherds/100m2 respectively, and over 25% of the collection units in each contained
surface material. Although the irregular shapes of the analytical units may affect these metrics
(see discussion on the MAUP problem in Section 2.10), densities in these regions are about four
or five times those found elsewhere in the survey area. Sherd „clusters‟, an arbitrary metric
designating 5 or more artefacts, represent about a quarter of collection units that contain
material, a figure that increases to over one-third in the high-density areas. As might be
expected, this tendency indicates a more integrated pattern of surface scatter in the high density
areas. It also suggests that isolated material is less prevalent with respect to the overall
distribution in these more heavily occupied regions.
Table 8. Densities by Analytical Unit (sherds per 100m2)
Analytical Unit Density % Positive Collection Units
(at least 1 sherd/unit)
% Clustered
(over 5 sherds/unit)
01E 0.0375 5.7% 1.7%
01 1.38 29.8% 14.7%
02 0.04 5.3% 0.88%
03 0.02 0.89% 0.2%
04 0.7 27% 9.1%
05 0.05 6.6% 1.0%
06 0.075 8.2% 1.78%
07 0.0325 4% 0.5%
08 0.015 2.2% 0.3%
NMDS Average Sherd Density: 0.2/100m2
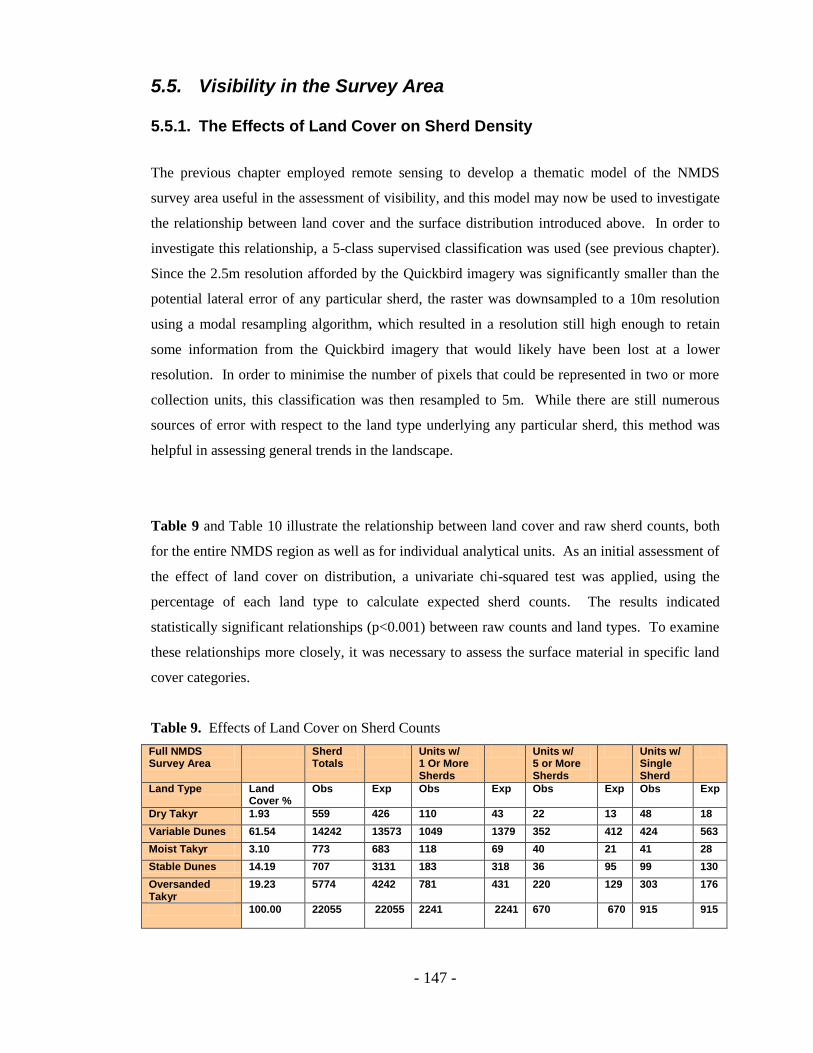
- 147 -
5.5. Visibility in the Survey Area
5.5.1. The Effects of Land Cover on Sherd Density
The previous chapter employed remote sensing to develop a thematic model of the NMDS
survey area useful in the assessment of visibility, and this model may now be used to investigate
the relationship between land cover and the surface distribution introduced above. In order to
investigate this relationship, a 5-class supervised classification was used (see previous chapter).
Since the 2.5m resolution afforded by the Quickbird imagery was significantly smaller than the
potential lateral error of any particular sherd, the raster was downsampled to a 10m resolution
using a modal resampling algorithm, which resulted in a resolution still high enough to retain
some information from the Quickbird imagery that would likely have been lost at a lower
resolution. In order to minimise the number of pixels that could be represented in two or more
collection units, this classification was then resampled to 5m. While there are still numerous
sources of error with respect to the land type underlying any particular sherd, this method was
helpful in assessing general trends in the landscape.
Table 9 and Table 10 illustrate the relationship between land cover and raw sherd counts, both
for the entire NMDS region as well as for individual analytical units. As an initial assessment of
the effect of land cover on distribution, a univariate chi-squared test was applied, using the
percentage of each land type to calculate expected sherd counts. The results indicated
statistically significant relationships (p<0.001) between raw counts and land types. To examine
these relationships more closely, it was necessary to assess the surface material in specific land
cover categories.
Table 9. Effects of Land Cover on Sherd Counts
Full NMDS Survey Area
Sherd Totals
Units w/ 1 Or More Sherds
Units w/ 5 or More Sherds
Units w/ Single Sherd
Land Type Land Cover %
Obs Exp Obs Exp Obs Exp Obs Exp
Dry Takyr 1.93 559 426 110 43 22 13 48 18
Variable Dunes 61.54 14242 13573 1049 1379 352 412 424 563
Moist Takyr 3.10 773 683 118 69 40 21 41 28
Stable Dunes 14.19 707 3131 183 318 36 95 99 130
Oversanded Takyr
19.23 5774 4242 781 431 220 129 303 176
100.00
22055 22055 2241 2241 670 670 915 915
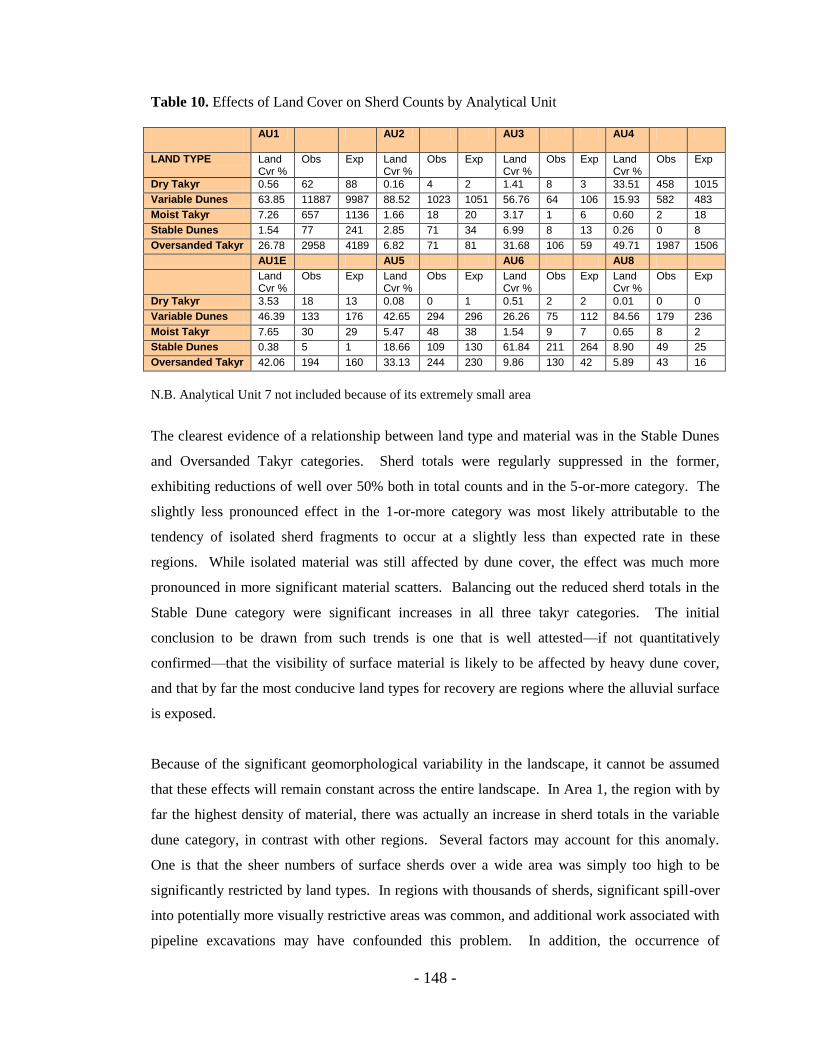
- 148 -
Table 10. Effects of Land Cover on Sherd Counts by Analytical Unit
AU1 AU2 AU3 AU4
LAND TYPE Land Cvr %
Obs Exp Land Cvr %
Obs Exp Land Cvr %
Obs Exp Land Cvr %
Obs Exp
Dry Takyr 0.56 62 88 0.16 4 2 1.41 8 3 33.51 458 1015
Variable Dunes 63.85 11887 9987 88.52 1023 1051 56.76 64 106 15.93 582 483
Moist Takyr 7.26 657 1136 1.66 18 20 3.17 1 6 0.60 2 18
Stable Dunes 1.54 77 241 2.85 71 34 6.99 8 13 0.26 0 8
Oversanded Takyr 26.78 2958 4189 6.82 71 81 31.68 106 59 49.71 1987 1506
AU1E AU5 AU6 AU8
Land Cvr %
Obs Exp Land Cvr %
Obs Exp Land Cvr %
Obs Exp Land Cvr %
Obs Exp
Dry Takyr 3.53 18 13 0.08 0 1 0.51 2 2 0.01 0 0
Variable Dunes 46.39 133 176 42.65 294 296 26.26 75 112 84.56 179 236
Moist Takyr 7.65 30 29 5.47 48 38 1.54 9 7 0.65 8 2
Stable Dunes 0.38 5 1 18.66 109 130 61.84 211 264 8.90 49 25
Oversanded Takyr 42.06 194 160 33.13 244 230 9.86 130 42 5.89 43 16
N.B. Analytical Unit 7 not included because of its extremely small area
The clearest evidence of a relationship between land type and material was in the Stable Dunes
and Oversanded Takyr categories. Sherd totals were regularly suppressed in the former,
exhibiting reductions of well over 50% both in total counts and in the 5-or-more category. The
slightly less pronounced effect in the 1-or-more category was most likely attributable to the
tendency of isolated sherd fragments to occur at a slightly less than expected rate in these
regions. While isolated material was still affected by dune cover, the effect was much more
pronounced in more significant material scatters. Balancing out the reduced sherd totals in the
Stable Dune category were significant increases in all three takyr categories. The initial
conclusion to be drawn from such trends is one that is well attested—if not quantitatively
confirmed—that the visibility of surface material is likely to be affected by heavy dune cover,
and that by far the most conducive land types for recovery are regions where the alluvial surface
is exposed.
Because of the significant geomorphological variability in the landscape, it cannot be assumed
that these effects will remain constant across the entire landscape. In Area 1, the region with by
far the highest density of material, there was actually an increase in sherd totals in the variable
dune category, in contrast with other regions. Several factors may account for this anomaly.
One is that the sheer numbers of surface sherds over a wide area was simply too high to be
significantly restricted by land types. In regions with thousands of sherds, significant spill-over
into potentially more visually restrictive areas was common, and additional work associated with
pipeline excavations may have confounded this problem. In addition, the occurrence of

- 149 -
significant sherd scatters on the surface of over-sanded mounds in several locations could be
expected to inflate the totals in sanded regions as well. Area 8, by contrast, actually indicated an
increase for counts in more stable environments, but a significant decrease for counts in variable
dune regions.
The distribution in sanded areas elsewhere is similarly complex. The effect of variable dunes on
visibility was not readily apparent in the offsite Area 2 and Area 5. One factor in both of these
regions may be the increased presence of late-period materials which may occur more readily
atop sanded regions that developed in the post-Bronze Age period (see Chapter 5). This is,
however, speculative, and the comparatively low numbers of Sasanian and Islamic surface
sherds combined with the fact that eroded material is more likely to derive from earlier periods
(section 5.8.3) suggests that this impact would be minimal. A clearer trend may be seen in the
western portion of the survey area, where the significant reduction of surface material in stable
dune environments may be explained by the presence of wide swathes of low, rolling dunes that
suggest a highly stable landscape. An additional factor may be the occasional presence of
broad, shallow fields of windblown sands in this particular region, which could be expected to
further restrict visibility.
In alluvial regions, perhaps the most surprising result was the consistent failure of the Dry Takyr
category to yield a comparatively high proportion of surface material, although it represents a
region of high visibility. This was particularly striking in Area 4, where the presence of
significant quantities of surface material scattered on the broad takyr suggested that this would
be a likely location for inflated counts on the takyr surface. Instead, observed counts were
actually about 50% lower than the expected total. A countervailing factor may again be seen in
the preponderance of material on the over-sanded takyr surface, corresponding to oversanded
and more eroded regions. It must be noted that this particular classification did tend to
underestimate the prevalence of the unvegetated takyr surface, which would certainly contribute
to lower sherd counts. However, the consistent high values in the sanded takyr zones—even in
area 1E, where broad regions of exposed takyr yielded no material at all, offers a clear indication
that the boundary areas between dune and takyr are highly significant in terms of recovery
potential.

- 150 -
5.5.2. The Effects of Visibility on Sherd Density
The above analysis has demonstrated that, as expected, sherd counts are likely to be suppressed
in general regions of high sand cover, and general increases tend to occur in eroded takyr
regions, which heavily contribute to oversanding. Land cover, however, cannot be treated as a
direct substitute for visibility, and it is useful to explore the concept in more detail. As noted
earlier, visibility tends to be treated in a simplistic manner in the Murghab, where sand cover is
directly linked with site obstruction. While the reality is much more complex, field observations
strongly supported the assumption that regions where heavy dunes were prevalent tended to
yield fewer surface sherds, while pottery was clearly visible on takyrs and in sandy depressions.
The quality of the dune cover also played a role. Stable dunes contributed the most to restricted
surface material, while sherds were often easily identifiable amid locally deposited sands
resulting from takyr erosion. Using the information derived from the supervised classification, it
was possible to propose a Sand Cover Index (SCI) that can be used to assess the potential visual
obstruction as a continuum, as follows:
SCI=(Sum of sand classes/Total)*100
where the sand classes comprised „Stable Dunes‟ and „Variable Dunes‟. By assessing sand
cover as a percentage of the collection unit, an allowance could be made for regions where
material may have aggregated in and around small depressions, a situation that was difficult to
trace in the above analysis. Fully obstructed regions, therefore, would be expected to yield low
material densities, while partially obstructed collection units would be more variable. The
resulting raster, shown in Figure 50, was first resampled from the original 2.5m resolution of the
Quickbird multispectral imagery to a finer 0.5m resolution in order to minimise the effect of
raster cells that lay on the border of two or more collection units. As expected, the large,
contiguous takyr regions show up as high visibility (low SCI) zones, while the broad regions of
heavy sand cover commonly found in the southern portion of the survey area exhibit high SCI
levels. The index in Area 2 shows a trend from obstructed visibility in the western part to highly
varied values in the east, corresponding to small, intermittent regions of exposed alluvium in an
otherwise heavily sand-covered region. Interestingly, the main road, where sherds tend to be
highly visible, is largely undetectable outside of Area 1. This is presumably a result of its
predominantly sandy composition, and the sherd visibility here most likely relates to recent
redeposition of material rather than to any archaeological or geomorphological factors.
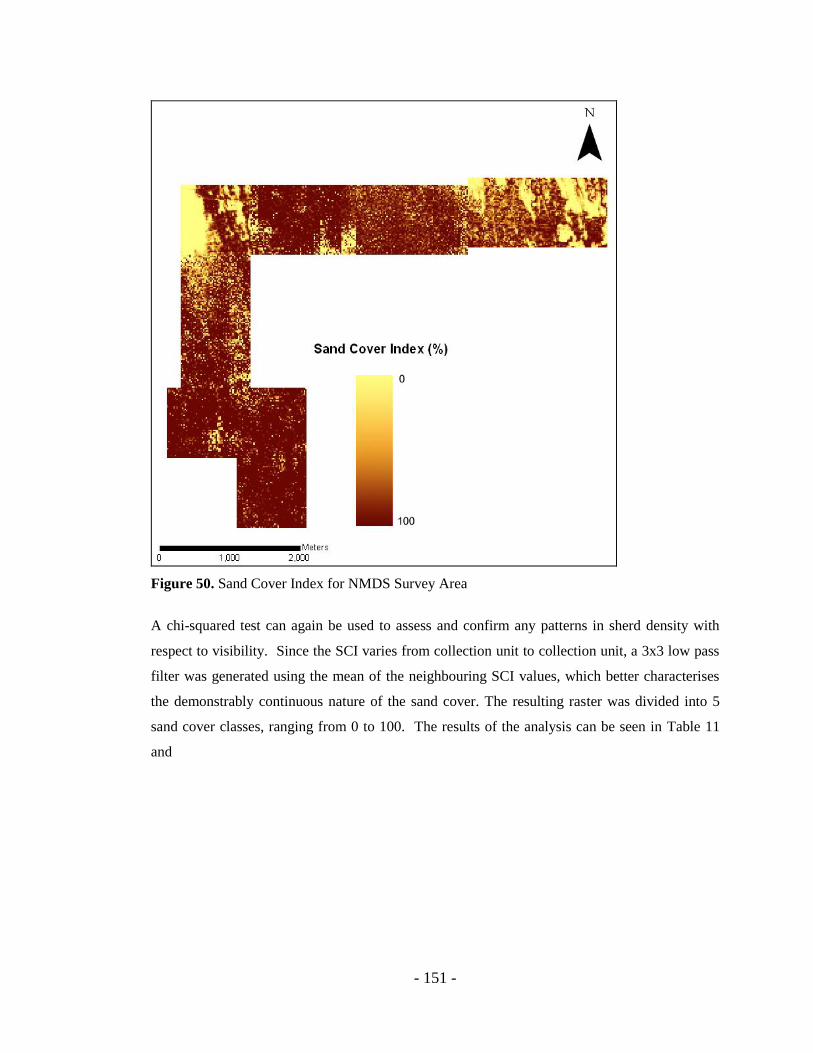
- 151 -
Figure 50. Sand Cover Index for NMDS Survey Area
A chi-squared test can again be used to assess and confirm any patterns in sherd density with
respect to visibility. Since the SCI varies from collection unit to collection unit, a 3x3 low pass
filter was generated using the mean of the neighbouring SCI values, which better characterises
the demonstrably continuous nature of the sand cover. The resulting raster was divided into 5
sand cover classes, ranging from 0 to 100. The results of the analysis can be seen in Table 11
and
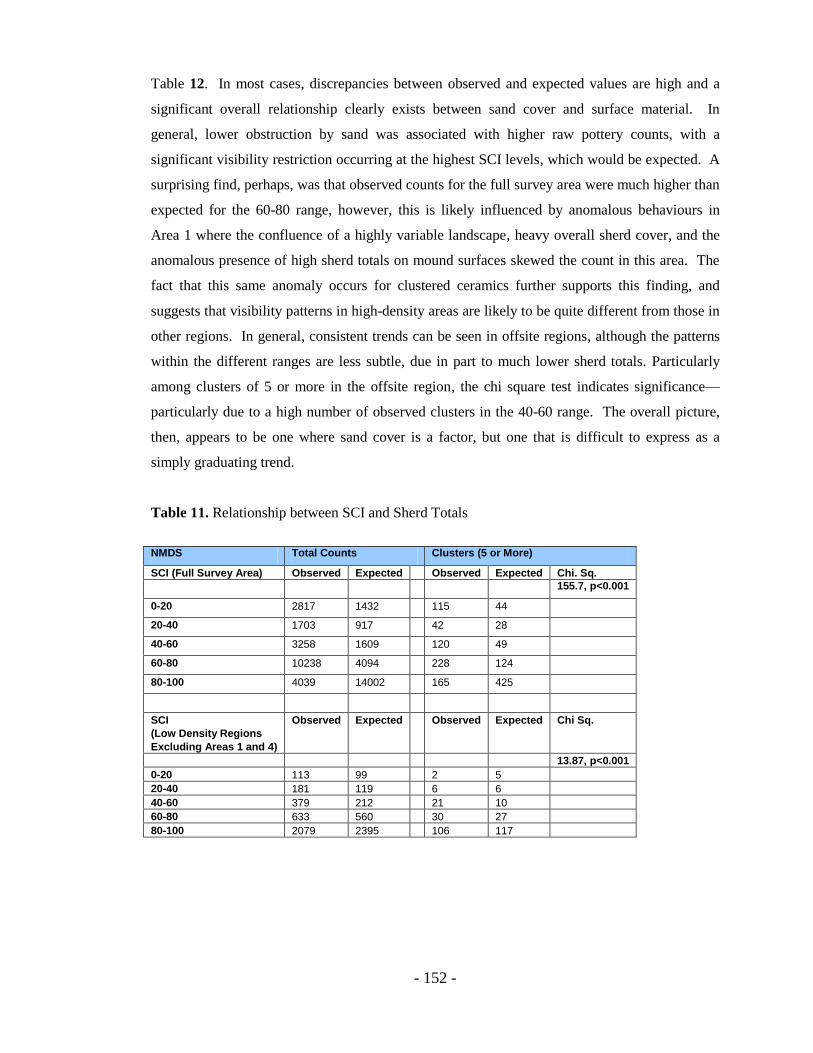
- 152 -
Table 12. In most cases, discrepancies between observed and expected values are high and a
significant overall relationship clearly exists between sand cover and surface material. In
general, lower obstruction by sand was associated with higher raw pottery counts, with a
significant visibility restriction occurring at the highest SCI levels, which would be expected. A
surprising find, perhaps, was that observed counts for the full survey area were much higher than
expected for the 60-80 range, however, this is likely influenced by anomalous behaviours in
Area 1 where the confluence of a highly variable landscape, heavy overall sherd cover, and the
anomalous presence of high sherd totals on mound surfaces skewed the count in this area. The
fact that this same anomaly occurs for clustered ceramics further supports this finding, and
suggests that visibility patterns in high-density areas are likely to be quite different from those in
other regions. In general, consistent trends can be seen in offsite regions, although the patterns
within the different ranges are less subtle, due in part to much lower sherd totals. Particularly
among clusters of 5 or more in the offsite region, the chi square test indicates significance—
particularly due to a high number of observed clusters in the 40-60 range. The overall picture,
then, appears to be one where sand cover is a factor, but one that is difficult to express as a
simply graduating trend.
Table 11. Relationship between SCI and Sherd Totals
NMDS Total Counts Clusters (5 or More)
SCI (Full Survey Area) Observed Expected Observed Expected Chi. Sq.
155.7, p<0.001
0-20 2817 1432 115 44
20-40 1703 917 42 28
40-60 3258 1609 120 49
60-80 10238 4094 228 124
80-100 4039 14002 165 425
SCI
(Low Density Regions
Excluding Areas 1 and 4)
Observed Expected Observed Expected Chi Sq.
13.87, p<0.001
0-20 113 99 2 5
20-40 181 119 6 6
40-60 379 212 21 10
60-80 633 560 30 27
80-100 2079 2395 106 117

- 153 -
Table 12. Relationship between SCI and Sherd Totals by sherd count categories
SCI (%) Sherd Count = 0 Sherd Count 1-5 Sherd Count 5-20 Sherd Count > 20
Obs Exp Obs Exp Obs Exp Obs Exp
0-20 2488 2827.6 442 187.9 105 42 37 21
20-40 1070 1128.3 114 75 26 16.8 18 8
40-60 1400 1486.3 147 98.8 42 22.1 29 11
60-80 2549 2632 206 174.9 64 39.1 47 20
80-100 17739 17171.9 769 1141.3 138 255 57 128
Chi-sq (df=4, p<0.0001)
56.5 557 203.5 146.83
In order to perform a more localised analysis, it was necessary to look more closely at the SCI
for individual analytical units. To do this, a generalised linear regression model (glm) was
employed to further explore potential correlations between the Sand Cover index and the
potential for surface recovery. The glm is similar to a standard linear regression, although it
offers much greater flexibility for different kinds of dependent variable and is better suited to
non-normal distributions (Venables and Ripley 2002: 183). The regression analysis was run on
the entire survey area as well as individual analytical units. Three separate regressions were run
using a quasi-Poisson model (for the use of this method, see Bevan and Conolly 2009: 960-3):
one using all sherds over all collection units (including zero-counts), the second on only positive
squares, and the third on collection units in which 5 or more sherds were present. The results,
shown in Table 13, indicate a significant negative correlation over the entire survey area when
zero-valued squares are considered, but not for the subsets of n>=1 or n>=5. categories showed
any significant correlation either over the full survey area or for individual analytical units. This
suggests that the inclusion of the zero-valued squares, which correlate strongly with low-
visibility units, have a significant effect on the overall regression. This relationship is even
clearer when we simply deal with presence versus absence of sherds and perform a logistic
regression, where the correlation between SCI and sherd total is negative in all cases at a
significance level of p<0.01. Ultimately, the analysis suggests that an increase in sand cover
implies a greater chance of zero sherd counts, but also implies that modelling any specific
decreasing trend in actual densities based solely on visibility would be unreliable (cf Bevan and
Conolly 2004).
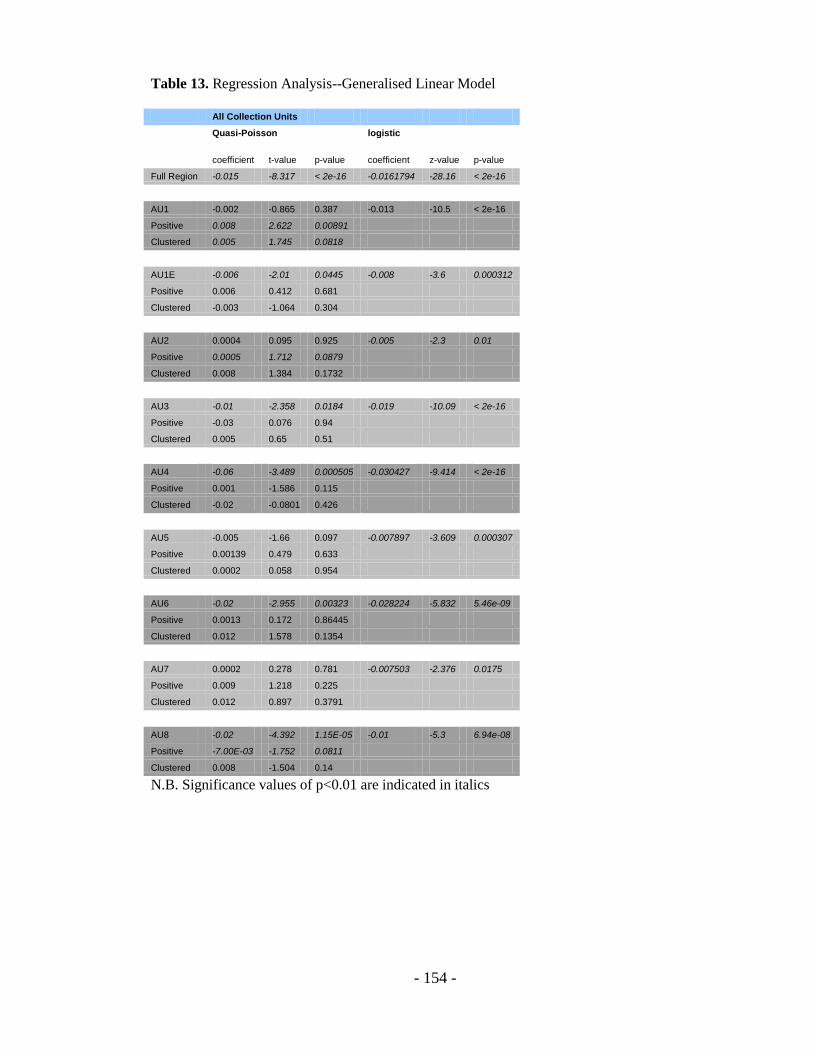
- 154 -
Table 13. Regression Analysis--Generalised Linear Model
All Collection Units
Quasi-Poisson logistic
coefficient t-value p-value coefficient z-value p-value
Full Region -0.015 -8.317 < 2e-16 -0.0161794 -28.16 < 2e-16
AU1 -0.002 -0.865 0.387 -0.013 -10.5 < 2e-16
Positive 0.008 2.622 0.00891
Clustered 0.005 1.745 0.0818
AU1E -0.006 -2.01 0.0445 -0.008 -3.6 0.000312
Positive 0.006 0.412 0.681
Clustered -0.003 -1.064 0.304
AU2 0.0004 0.095 0.925 -0.005 -2.3 0.01
Positive 0.0005 1.712 0.0879
Clustered 0.008 1.384 0.1732
AU3 -0.01 -2.358 0.0184 -0.019 -10.09 < 2e-16
Positive -0.03 0.076 0.94
Clustered 0.005 0.65 0.51
AU4 -0.06 -3.489 0.000505 -0.030427 -9.414 < 2e-16
Positive 0.001 -1.586 0.115
Clustered -0.02 -0.0801 0.426
AU5 -0.005 -1.66 0.097 -0.007897 -3.609 0.000307
Positive 0.00139 0.479 0.633
Clustered 0.0002 0.058 0.954
AU6 -0.02 -2.955 0.00323 -0.028224 -5.832 5.46e-09
Positive 0.0013 0.172 0.86445
Clustered 0.012 1.578 0.1354
AU7 0.0002 0.278 0.781 -0.007503 -2.376 0.0175
Positive 0.009 1.218 0.225
Clustered 0.012 0.897 0.3791
AU8 -0.02 -4.392 1.15E-05 -0.01 -5.3 6.94e-08
Positive -7.00E-03 -1.752 0.0811
Clustered 0.008 -1.504 0.14
N.B. Significance values of p<0.01 are indicated in italics

- 155 -
5.6. Regional Breakdown of the Material Distribution
5.6.1. Areas 1 and 1E
The Nebulous Concept of Egri Bogaz 4
The above investigation of visibility has provided a framework for understanding the limitations
of the landscape with respect to recovery, and an assessment of the biases that may influence the
sherd distribution. While the intent of the survey was to avoid preconceived notions of
archaeological sites, it is essential to first address the conventional interpretations of Egri Bogaz
4 before shifting back into a more distributional framework. According to the 2008 „Site
Passport‟ document compiled by the Ministry of Culture, the actual site comprises a 1-1.5m high
mound measuring approximately 0.1ha in area (Figure 51). A 50m protected zone around the
site extends the total protected area to 1.7ha. These dimensions are most likely based on
Udeumuradov‟s unpublished estimate of 1-2 ha, although he has said that the size of the site may
change significantly with the shifting sands (B. Udeumuradov, pers. comm.). The discrepancy
between the official estimate and Udeumuradov‟s assessment is likely due to the fact that the
official estimate pertains only to the small mounded area immediately south of the road, and
does not take into account the significant sherd scatters beyond this specific area. It is worth
noting that, contrary to the findings of both Udeumuradov and the AMMD researchers, no
mention is made in the government document of any threat posed by the gas pipeline, and no
utility work at all is indicated near the site. While it is possible that this omission may relate in
part to political sensitivities, failure to mention this significant feature may confirm that the
official designation of Egri Bogaz 4 pertains only to the mound. In either case, however,
Turkmen estimates indicate a small site on par with similar estimates for Egri Bogaz 1, 2 and 3
(B. Udeumuradov, pers. comm.; see also similar descriptions in corresponding site passports).
Compared with these findings, AMMD researchers have provided a very different assessment.
While not published in detail, records in both the AMMD GIS system and the 1998 AMMD
Preliminary Reports identify the site as a mound, approximately 5m in elevation, surrounded by
a large flat region (Bondioli and Tosi 1998: Appendix: Catalogue of Sites). The overall area,
according to an approximate estimation of the extent of the pottery scatter, comprises
approximately 13 ha, a region cut through both by the road and gas pipeline.
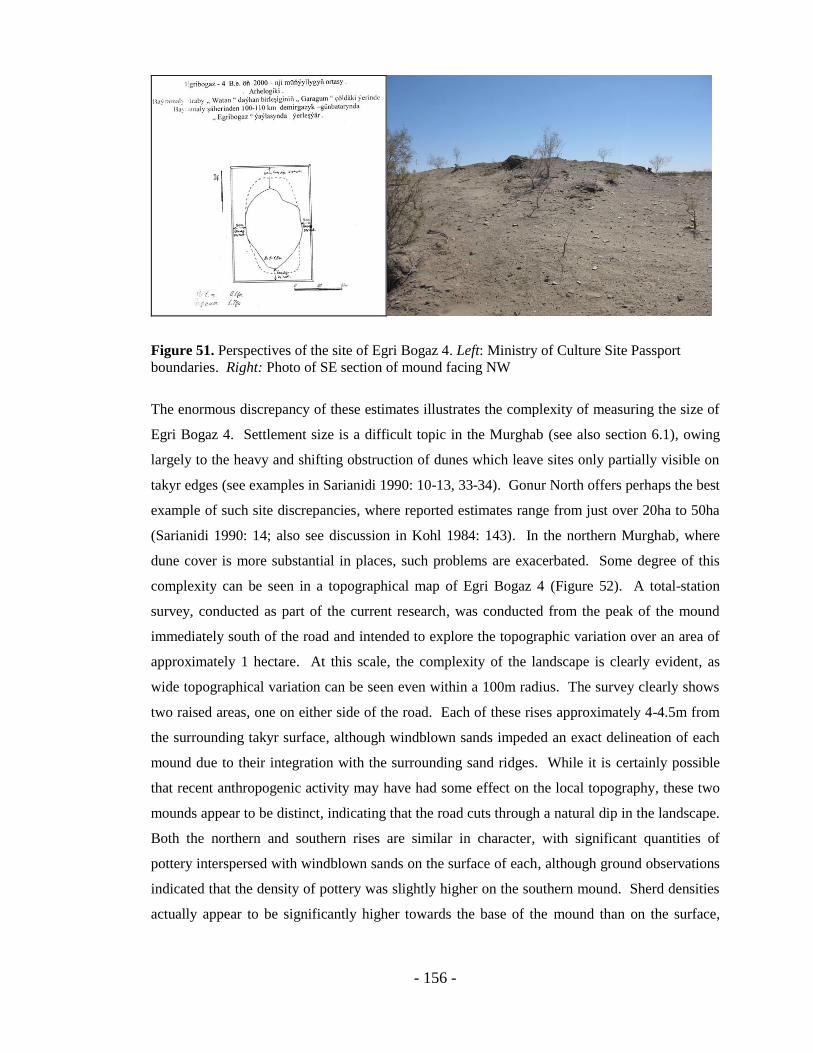
- 156 -
Figure 51. Perspectives of the site of Egri Bogaz 4. Left: Ministry of Culture Site Passport
boundaries. Right: Photo of SE section of mound facing NW
The enormous discrepancy of these estimates illustrates the complexity of measuring the size of
Egri Bogaz 4. Settlement size is a difficult topic in the Murghab (see also section 6.1), owing
largely to the heavy and shifting obstruction of dunes which leave sites only partially visible on
takyr edges (see examples in Sarianidi 1990: 10-13, 33-34). Gonur North offers perhaps the best
example of such site discrepancies, where reported estimates range from just over 20ha to 50ha
(Sarianidi 1990: 14; also see discussion in Kohl 1984: 143). In the northern Murghab, where
dune cover is more substantial in places, such problems are exacerbated. Some degree of this
complexity can be seen in a topographical map of Egri Bogaz 4 (Figure 52). A total-station
survey, conducted as part of the current research, was conducted from the peak of the mound
immediately south of the road and intended to explore the topographic variation over an area of
approximately 1 hectare. At this scale, the complexity of the landscape is clearly evident, as
wide topographical variation can be seen even within a 100m radius. The survey clearly shows
two raised areas, one on either side of the road. Each of these rises approximately 4-4.5m from
the surrounding takyr surface, although windblown sands impeded an exact delineation of each
mound due to their integration with the surrounding sand ridges. While it is certainly possible
that recent anthropogenic activity may have had some effect on the local topography, these two
mounds appear to be distinct, indicating that the road cuts through a natural dip in the landscape.
Both the northern and southern rises are similar in character, with significant quantities of
pottery interspersed with windblown sands on the surface of each, although ground observations
indicated that the density of pottery was slightly higher on the southern mound. Sherd densities
actually appear to be significantly higher towards the base of the mound than on the surface,
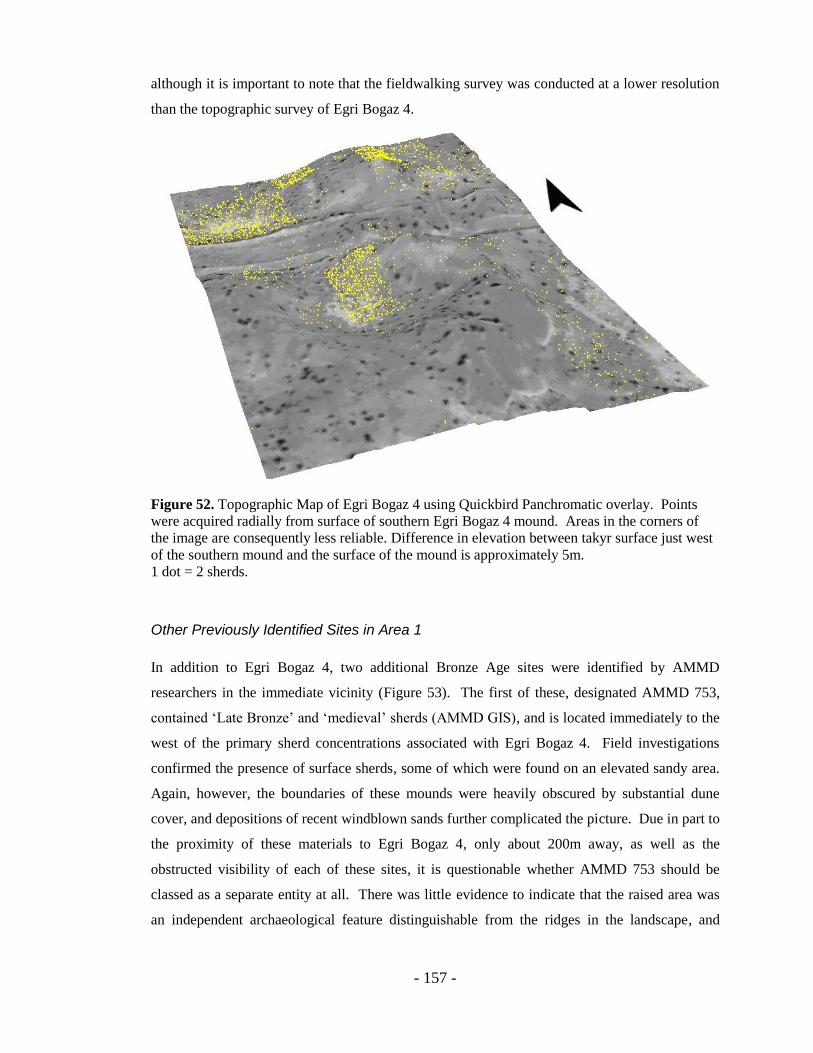
- 157 -
although it is important to note that the fieldwalking survey was conducted at a lower resolution
than the topographic survey of Egri Bogaz 4.
Figure 52. Topographic Map of Egri Bogaz 4 using Quickbird Panchromatic overlay. Points
were acquired radially from surface of southern Egri Bogaz 4 mound. Areas in the corners of
the image are consequently less reliable. Difference in elevation between takyr surface just west
of the southern mound and the surface of the mound is approximately 5m.
1 dot = 2 sherds.
Other Previously Identified Sites in Area 1
In addition to Egri Bogaz 4, two additional Bronze Age sites were identified by AMMD
researchers in the immediate vicinity (Figure 53). The first of these, designated AMMD 753,
contained „Late Bronze‟ and „medieval‟ sherds (AMMD GIS), and is located immediately to the
west of the primary sherd concentrations associated with Egri Bogaz 4. Field investigations
confirmed the presence of surface sherds, some of which were found on an elevated sandy area.
Again, however, the boundaries of these mounds were heavily obscured by substantial dune
cover, and depositions of recent windblown sands further complicated the picture. Due in part to
the proximity of these materials to Egri Bogaz 4, only about 200m away, as well as the
obstructed visibility of each of these sites, it is questionable whether AMMD 753 should be
classed as a separate entity at all. There was little evidence to indicate that the raised area was
an independent archaeological feature distinguishable from the ridges in the landscape, and
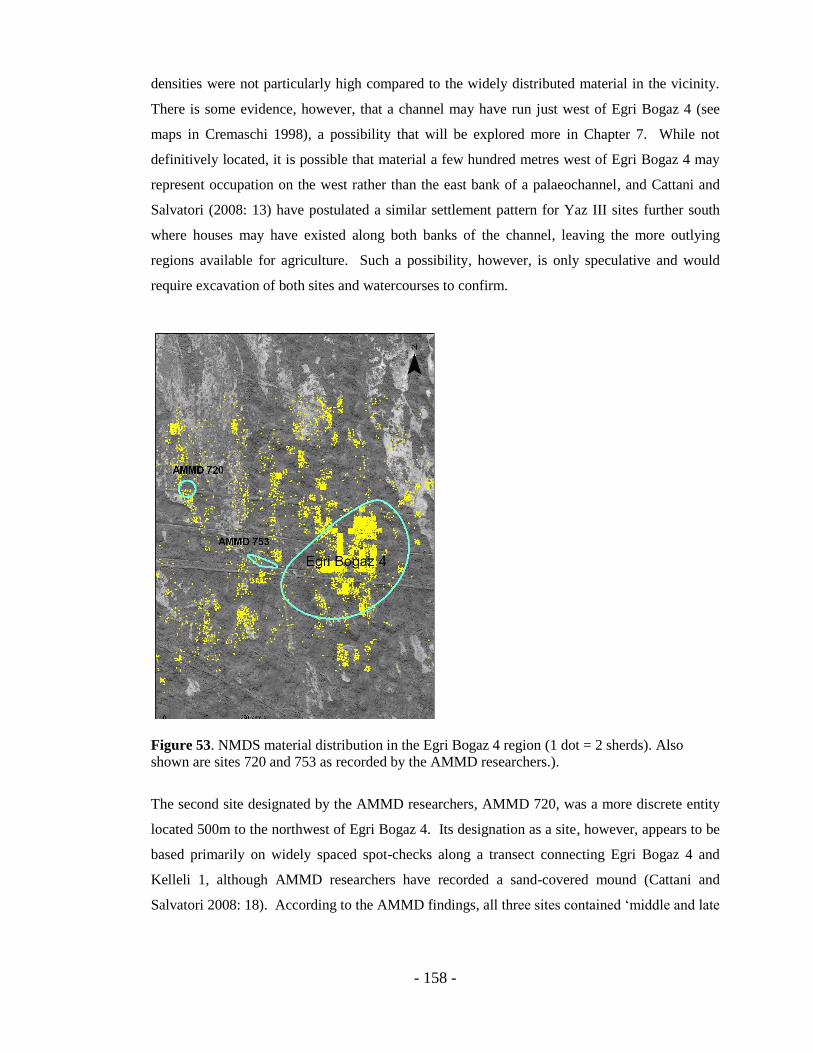
- 158 -
densities were not particularly high compared to the widely distributed material in the vicinity.
There is some evidence, however, that a channel may have run just west of Egri Bogaz 4 (see
maps in Cremaschi 1998), a possibility that will be explored more in Chapter 7. While not
definitively located, it is possible that material a few hundred metres west of Egri Bogaz 4 may
represent occupation on the west rather than the east bank of a palaeochannel, and Cattani and
Salvatori (2008: 13) have postulated a similar settlement pattern for Yaz III sites further south
where houses may have existed along both banks of the channel, leaving the more outlying
regions available for agriculture. Such a possibility, however, is only speculative and would
require excavation of both sites and watercourses to confirm.
Figure 53. NMDS material distribution in the Egri Bogaz 4 region (1 dot = 2 sherds). Also
shown are sites 720 and 753 as recorded by the AMMD researchers.).
The second site designated by the AMMD researchers, AMMD 720, was a more discrete entity
located 500m to the northwest of Egri Bogaz 4. Its designation as a site, however, appears to be
based primarily on widely spaced spot-checks along a transect connecting Egri Bogaz 4 and
Kelleli 1, although AMMD researchers have recorded a sand-covered mound (Cattani and
Salvatori 2008: 18). According to the AMMD findings, all three sites contained „middle and late
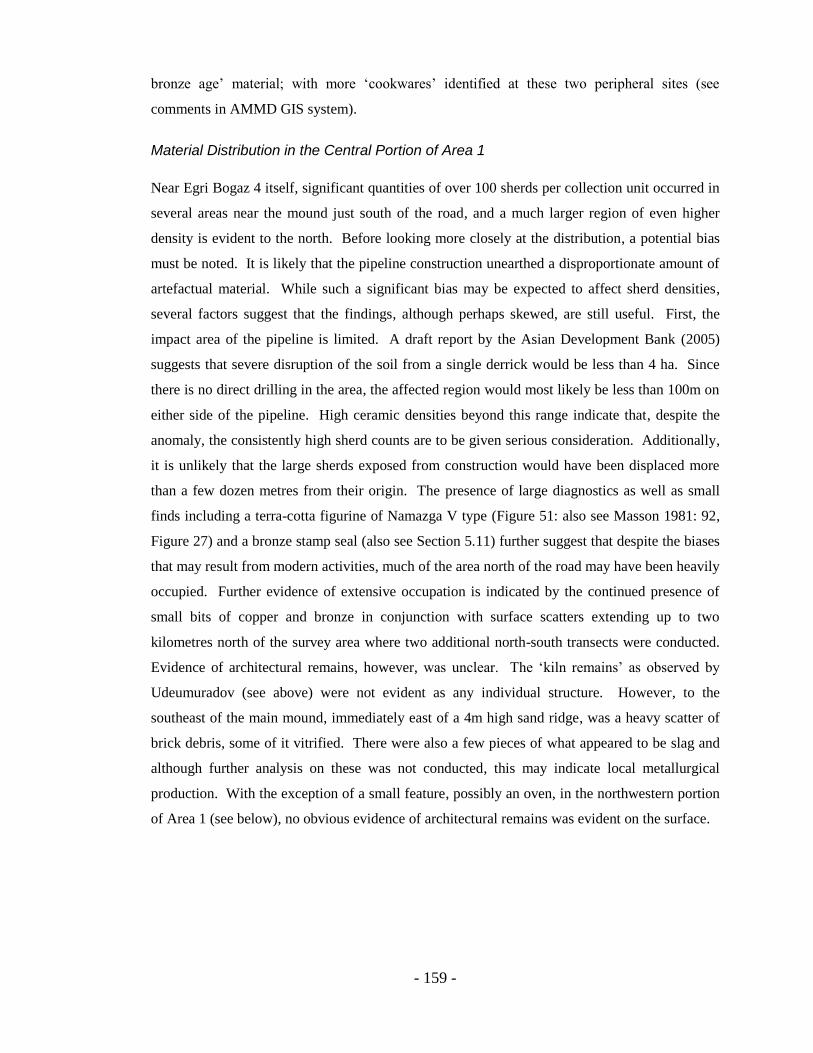
- 159 -
bronze age‟ material; with more „cookwares‟ identified at these two peripheral sites (see
comments in AMMD GIS system).
Material Distribution in the Central Portion of Area 1
Near Egri Bogaz 4 itself, significant quantities of over 100 sherds per collection unit occurred in
several areas near the mound just south of the road, and a much larger region of even higher
density is evident to the north. Before looking more closely at the distribution, a potential bias
must be noted. It is likely that the pipeline construction unearthed a disproportionate amount of
artefactual material. While such a significant bias may be expected to affect sherd densities,
several factors suggest that the findings, although perhaps skewed, are still useful. First, the
impact area of the pipeline is limited. A draft report by the Asian Development Bank (2005)
suggests that severe disruption of the soil from a single derrick would be less than 4 ha. Since
there is no direct drilling in the area, the affected region would most likely be less than 100m on
either side of the pipeline. High ceramic densities beyond this range indicate that, despite the
anomaly, the consistently high sherd counts are to be given serious consideration. Additionally,
it is unlikely that the large sherds exposed from construction would have been displaced more
than a few dozen metres from their origin. The presence of large diagnostics as well as small
finds including a terra-cotta figurine of Namazga V type (Figure 51: also see Masson 1981: 92,
Figure 27) and a bronze stamp seal (also see Section 5.11) further suggest that despite the biases
that may result from modern activities, much of the area north of the road may have been heavily
occupied. Further evidence of extensive occupation is indicated by the continued presence of
small bits of copper and bronze in conjunction with surface scatters extending up to two
kilometres north of the survey area where two additional north-south transects were conducted.
Evidence of architectural remains, however, was unclear. The „kiln remains‟ as observed by
Udeumuradov (see above) were not evident as any individual structure. However, to the
southeast of the main mound, immediately east of a 4m high sand ridge, was a heavy scatter of
brick debris, some of it vitrified. There were also a few pieces of what appeared to be slag and
although further analysis on these was not conducted, this may indicate local metallurgical
production. With the exception of a small feature, possibly an oven, in the northwestern portion
of Area 1 (see below), no obvious evidence of architectural remains was evident on the surface.

- 160 -
Figure 54. Namazga V type figurine recovered in Area 1
Distribution of Surface Material Beyond the Area 1 Main Concentration
Beyond these high-density regions, the surface material varied significantly over different parts
of the landscape. West of the main scatters, sherd counts declined considerably (Figure 55).
Approximately 100-200m beyond this low-density area, partially isolated patches of higher
density are oriented approximately SW-NE, approximately following the edge of a takyr. The
complex geomorphology in the area, however, may create false linearities that may not be
indicative of the original settlement pattern (see section 6.5.1). This effect can clearly be seen in
evenly spaced lines of higher ceramic densities oriented north-south, and are most likely
associated with interdunar depressions. If the dunes were the only factor, however, the highest
variation in sherd counts would be expected to be oriented perpendicularly to the dunes. It is
therefore likely that other factors have contributed to the patterning, a prospect that will be
examined more fully in the next chapter.

- 161 -
Figure 55. Area 1 and 1E Surface Distribution (1 dot=2 sherds)
In the northwest part of Area 1 (CW09), a large scatter of materials extended onto the surface of
a takyr (Figure 56). On the takyr itself, a slightly darker area proved to be an area of ash that
may be associated with the remains of an oven. Because of time constraints, the feature could
not be examined in detail, although a cursory investigation indicated the presence of bricks a few
centimetres below the surface, as well as charred remains of seeds. Although most of the pottery
occurred on the surface of the takyr, the presence of sherds on a low rise immediately to the
south of the takyr may indicate the existence of an anthropogenic mound. Pottery fragments in
this area included two small lug handles, seen by both Hiebert (1994a: 50) and P‟yankova
(P'yankova 1993) as Namazga V diagnostics (Figure 57). Only five of these were found in the
entire survey, four of which occurred several hundred metres to the northwest of Egri Bogaz 4.
Hiebert associates these lugs with hole-mouth pots, linked with Period 1 (Kelleli-phase) material
on Gonur as well as Kelleli 4 (P'yankova 1993; Hiebert 1994a: 50). Although any conclusion
must remain purely speculative at this point, the presence of these handles in conjunction with
the remains of an oven may offer some evidence for a Namazga V period domestic context
significantly northwest of Egri Bogaz 4. Further support for domestic activity areas beyond the
main depe may also be inferred from the higher density of blackened sherds in this periphery,
presumably the result of cooking.

- 162 -
Figure 56. CW 09 Surface scatter
Figure 57. Probable Namazga V „Lug Handle‟
The material found in Area 1 thus exhibited a significant degree of complexity, especially
towards the west. In order to see if the patterning to the east exhibited similar characteristics,
especially with respect to the secondary aggregations and linear patterning, an additional square
kilometre was surveyed in May of 2009, designated Area 1E. Vegetation cover in the spring
was much more substantial, covering nearly 20 percent of the surface in some areas compared to
5 percent or less in the autumn. Fully unvegetated takyr surfaces were rare, and vegetation
commonly occurred in takyr cracks where sand had accumulated (cf Fleskins et al. 2007;
Orlovsky et al. 2004). Nevertheless, visibility was generally high due to the large proportion of
exposed takyr surfaces, and while the vegetation could be expected to decrease sherd counts to
some extent, a visual assessment suggested that the obstructions were not significant. If
anything, vegetation cover would therefore be more likely to affect the recovery of individual
sherds rather than broader distributions of material.
The material distribution in Area 1E revealed a strikingly different character than in the western
portion of Area 1. Beyond about 200m east of Egri Bogaz 4, sherd counts declined
precipitously. Overall sherd densities in Area 1E were among the lowest in the survey area, and
counts of more than 10 sherds per collection unit were extremely rare throughout the area. From
a geomorphological perspective, the absence of material was surprising. Evidence of fluvial
activity was common, and at least one meandering takyr feature contained several rounded,
washed stones possibly indicative of a channel. Along this feature, partially obstructed by sand,
a small cluster of small and medium sized sherds was found, although these offered little
diagnostic evidence. These sherds were found within a small area of loose, fertile soils with bits
of eroded material, characteristic of many of the low lying occupational areas. Several small,
heavily abraded sherds occurred further north along this channel in K-21. While diagnostics in
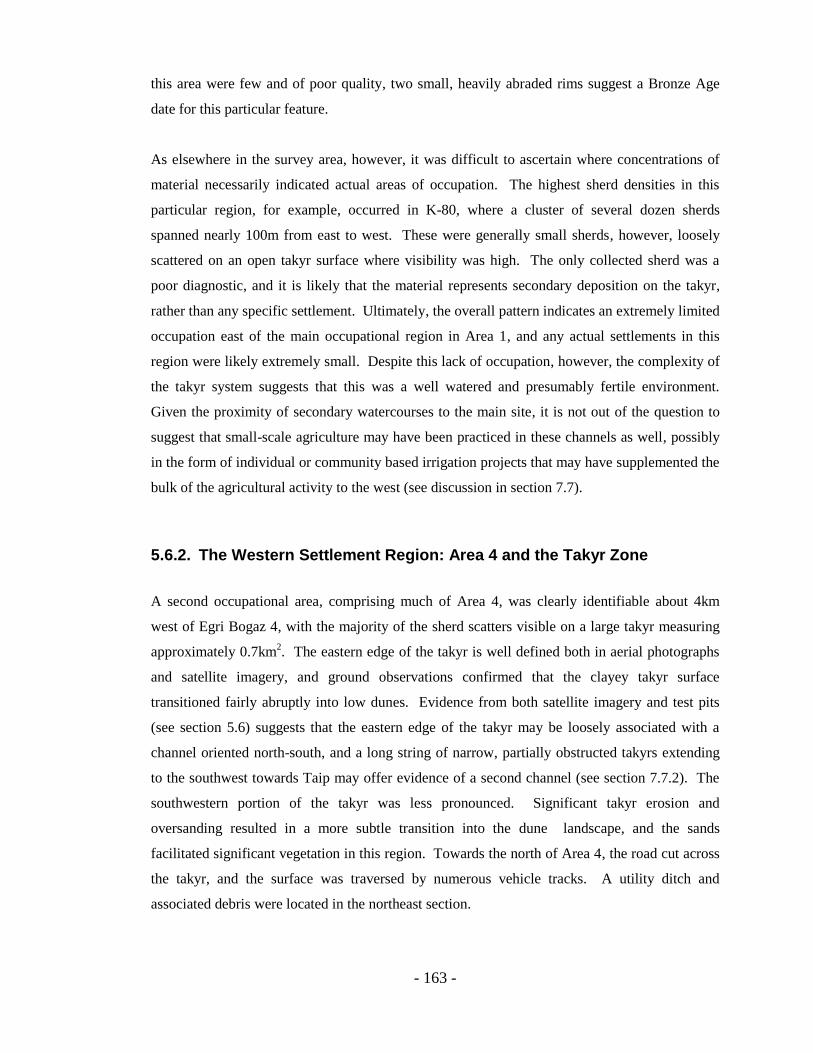
- 163 -
this area were few and of poor quality, two small, heavily abraded rims suggest a Bronze Age
date for this particular feature.
As elsewhere in the survey area, however, it was difficult to ascertain where concentrations of
material necessarily indicated actual areas of occupation. The highest sherd densities in this
particular region, for example, occurred in K-80, where a cluster of several dozen sherds
spanned nearly 100m from east to west. These were generally small sherds, however, loosely
scattered on an open takyr surface where visibility was high. The only collected sherd was a
poor diagnostic, and it is likely that the material represents secondary deposition on the takyr,
rather than any specific settlement. Ultimately, the overall pattern indicates an extremely limited
occupation east of the main occupational region in Area 1, and any actual settlements in this
region were likely extremely small. Despite this lack of occupation, however, the complexity of
the takyr system suggests that this was a well watered and presumably fertile environment.
Given the proximity of secondary watercourses to the main site, it is not out of the question to
suggest that small-scale agriculture may have been practiced in these channels as well, possibly
in the form of individual or community based irrigation projects that may have supplemented the
bulk of the agricultural activity to the west (see discussion in section 7.7).
5.6.2. The Western Settlement Region: Area 4 and the Takyr Zone
A second occupational area, comprising much of Area 4, was clearly identifiable about 4km
west of Egri Bogaz 4, with the majority of the sherd scatters visible on a large takyr measuring
approximately 0.7km2. The eastern edge of the takyr is well defined both in aerial photographs
and satellite imagery, and ground observations confirmed that the clayey takyr surface
transitioned fairly abruptly into low dunes. Evidence from both satellite imagery and test pits
(see section 5.6) suggests that the eastern edge of the takyr may be loosely associated with a
channel oriented north-south, and a long string of narrow, partially obstructed takyrs extending
to the southwest towards Taip may offer evidence of a second channel (see section 7.7.2). The
southwestern portion of the takyr was less pronounced. Significant takyr erosion and
oversanding resulted in a more subtle transition into the dune landscape, and the sands
facilitated significant vegetation in this region. Towards the north of Area 4, the road cut across
the takyr, and the surface was traversed by numerous vehicle tracks. A utility ditch and
associated debris were located in the northeast section.

- 164 -
Earlier research conducted in the mid-1990s revealed significant quantities of surface material in
the region (Bondioli and Tosi 1998: Site Catalogue; Cattani and Salvatori 2008). Along the
eastern edge of the takyr, the AMMD survey identified two previously unknown sites which
they designated AMMD 717 and AMMD 718, both broadly dated to the Bronze Age (Figure
58). Both of these are classified as type „Depe 2‟, denoting heavily eroded, shallow mounds of
low elevation (Cattani and Genito 1998), although researchers have acknowledged that, in both
cases, dunes may have heavily obstructed the main settlement area (Cattani and Salvatori 2008).
NMDS field investigations confirmed a large pottery scatter on the takyr surface which appears
to be the basis for the AMMD 717 site designation. However, while the surface elevation rose
slightly towards the edge of the takyr, this appeared to be due to the sand ridge rather than any
particular settlement mound, so the Depe 2 classification was questionable. High sherd densities
occurred in a concentrated area, spanning about 100m from the edge of the dune ridge westward
across the open takyr before abruptly ending. This pattern does not appear to be uniform
however. To the immediate northwest of the scatter there is an area almost completely devoid of
ceramic material. Southwards, material continuity was more evident, although densities were
comparatively low and only two diagnostics occurred in this intermediate zone, which spanned
about 400m from north to south.
Figure 58. Sherd distributions on the Area 4 takyr. Sites designated by AMMD researchers are
indicated in blue.

- 165 -
Confirmation of a specific location for the AMMD 718 site was difficult. This site is identified
in the AMMD reports as a small depe measuring approximately 50m x 100m. Field
observations, however, revealed a broad scatter of primarily eroded materials spanning several
hectares of slightly varied topography, although the elevation anomalies were largely the result
of takyr erosion and consequent oversanding. Surface material in the immediate vicinity of the
AMMD site designation consisted primarily of small, heavily abraded materials widely
dispersed across oversanded regions of the takyr and, as with the material just to the north,
continuing onto the base of the dune ridge. This scatter represented the eastern extremity of a
much larger area of material, including some traces of decayed brick further to the west that
covered much of the southwestern periphery of the takyr. In total, the scatter measured roughly
7 ha, compared with a much more confined area of 2.5-3 ha for the northern scatter, and the
heavy abrasion of much of the material in a region of widespread takyr erosion suggests that the
distribution may indicate an occupational area severely impacted by deflation and consequent
redeposition of surface material (see discussion of deflation in Rick 2002).
Another feature in this region that merits discussion is an area of green glazed sherds in the
northeast part of the takyr. These sherds most likely date to the late Abbasid or early Seljuk
periods (D. Gilbert, pers. comm.) and may reflect the small-scale reoccupation of the northern
delta in later periods (Wright 2008). While the Islamic occupation of the delta is beyond the
scope of this research, these finds are interesting in light of AMMD researchers‟ identification of
an early Islamic site, AMMD 215, located slightly west of the survey area. The presence of
green glazed sherds across the northern part of the survey area (see below) may indicate an east-
west movement, and this possibility will be explored in more detail in Section 6.5. Moreover,
green glazed sherds south of this region are interesting in light of Rossi-Osmida‟s discovery of
early Islamic material from a „burial‟ near Adji Kui 1 (G. Rossi-Osmida, pers. comm.). The
appearance of similar materials both in this portion of the central delta as well as in the survey
area may offer some evidence of a broad north-south trajectory to the distribution of such
material. While a detailed assessment of routes during the Islamic period is well beyond the
scope of this study, it is possible that the presence of these materials may be associated with
trade or communication routes extending northwards from Merv.
The absence of material in the far northwestern section of the survey area was striking, given the
extremely high visibility afforded by the open takyr surface and high density of material on the
southern and eastern takyr perimeter. Test pits, discussed in detail below, indicated an alluvial
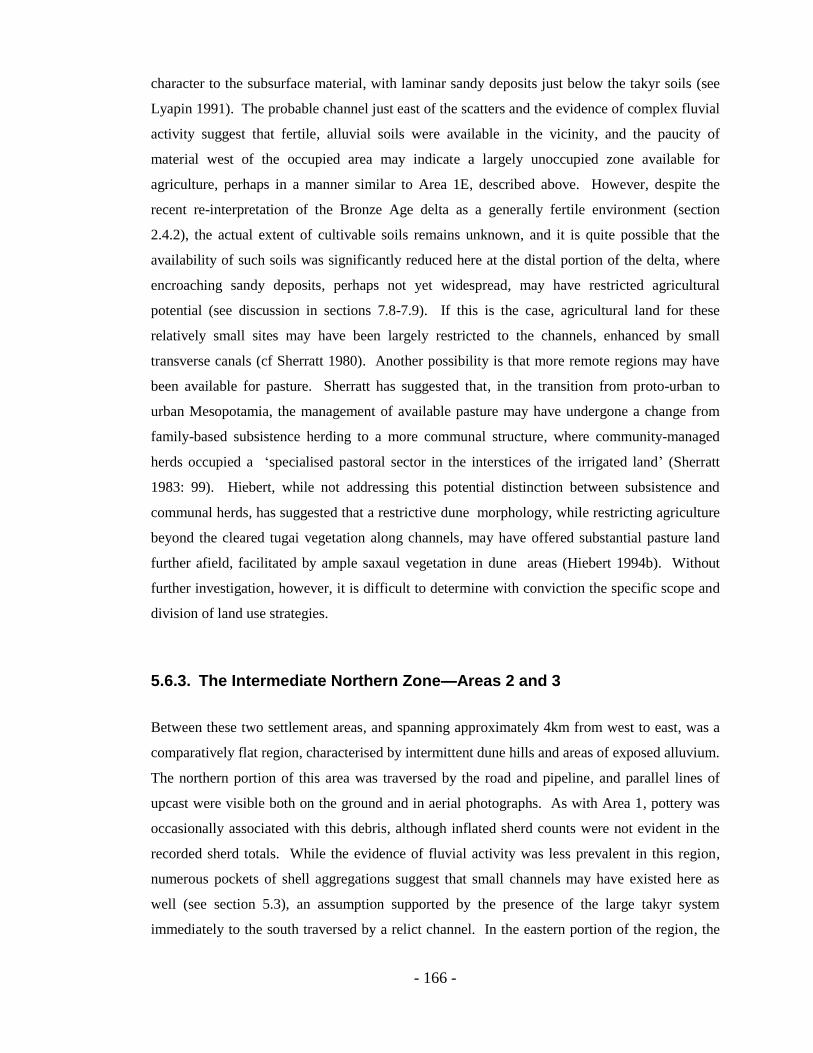
- 166 -
character to the subsurface material, with laminar sandy deposits just below the takyr soils (see
Lyapin 1991). The probable channel just east of the scatters and the evidence of complex fluvial
activity suggest that fertile, alluvial soils were available in the vicinity, and the paucity of
material west of the occupied area may indicate a largely unoccupied zone available for
agriculture, perhaps in a manner similar to Area 1E, described above. However, despite the
recent re-interpretation of the Bronze Age delta as a generally fertile environment (section
2.4.2), the actual extent of cultivable soils remains unknown, and it is quite possible that the
availability of such soils was significantly reduced here at the distal portion of the delta, where
encroaching sandy deposits, perhaps not yet widespread, may have restricted agricultural
potential (see discussion in sections 7.8-7.9). If this is the case, agricultural land for these
relatively small sites may have been largely restricted to the channels, enhanced by small
transverse canals (cf Sherratt 1980). Another possibility is that more remote regions may have
been available for pasture. Sherratt has suggested that, in the transition from proto-urban to
urban Mesopotamia, the management of available pasture may have undergone a change from
family-based subsistence herding to a more communal structure, where community-managed
herds occupied a „specialised pastoral sector in the interstices of the irrigated land‟ (Sherratt
1983: 99). Hiebert, while not addressing this potential distinction between subsistence and
communal herds, has suggested that a restrictive dune morphology, while restricting agriculture
beyond the cleared tugai vegetation along channels, may have offered substantial pasture land
further afield, facilitated by ample saxaul vegetation in dune areas (Hiebert 1994b). Without
further investigation, however, it is difficult to determine with conviction the specific scope and
division of land use strategies.
5.6.3. The Intermediate Northern Zone—Areas 2 and 3
Between these two settlement areas, and spanning approximately 4km from west to east, was a
comparatively flat region, characterised by intermittent dune hills and areas of exposed alluvium.
The northern portion of this area was traversed by the road and pipeline, and parallel lines of
upcast were visible both on the ground and in aerial photographs. As with Area 1, pottery was
occasionally associated with this debris, although inflated sherd counts were not evident in the
recorded sherd totals. While the evidence of fluvial activity was less prevalent in this region,
numerous pockets of shell aggregations suggest that small channels may have existed here as
well (see section 5.3), an assumption supported by the presence of the large takyr system
immediately to the south traversed by a relict channel. In the eastern portion of the region, the
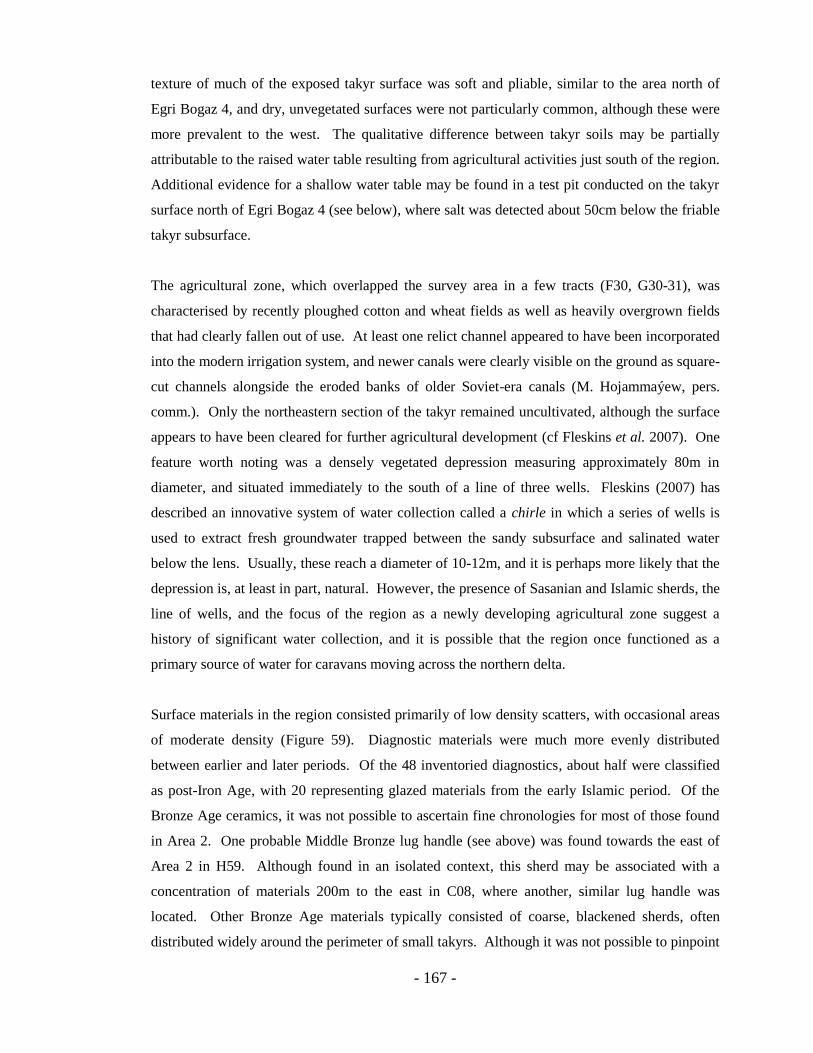
- 167 -
texture of much of the exposed takyr surface was soft and pliable, similar to the area north of
Egri Bogaz 4, and dry, unvegetated surfaces were not particularly common, although these were
more prevalent to the west. The qualitative difference between takyr soils may be partially
attributable to the raised water table resulting from agricultural activities just south of the region.
Additional evidence for a shallow water table may be found in a test pit conducted on the takyr
surface north of Egri Bogaz 4 (see below), where salt was detected about 50cm below the friable
takyr subsurface.
The agricultural zone, which overlapped the survey area in a few tracts (F30, G30-31), was
characterised by recently ploughed cotton and wheat fields as well as heavily overgrown fields
that had clearly fallen out of use. At least one relict channel appeared to have been incorporated
into the modern irrigation system, and newer canals were clearly visible on the ground as square-
cut channels alongside the eroded banks of older Soviet-era canals (M. Hojammaýew, pers.
comm.). Only the northeastern section of the takyr remained uncultivated, although the surface
appears to have been cleared for further agricultural development (cf Fleskins et al. 2007). One
feature worth noting was a densely vegetated depression measuring approximately 80m in
diameter, and situated immediately to the south of a line of three wells. Fleskins (2007) has
described an innovative system of water collection called a chirle in which a series of wells is
used to extract fresh groundwater trapped between the sandy subsurface and salinated water
below the lens. Usually, these reach a diameter of 10-12m, and it is perhaps more likely that the
depression is, at least in part, natural. However, the presence of Sasanian and Islamic sherds, the
line of wells, and the focus of the region as a newly developing agricultural zone suggest a
history of significant water collection, and it is possible that the region once functioned as a
primary source of water for caravans moving across the northern delta.
Surface materials in the region consisted primarily of low density scatters, with occasional areas
of moderate density (Figure 59). Diagnostic materials were much more evenly distributed
between earlier and later periods. Of the 48 inventoried diagnostics, about half were classified
as post-Iron Age, with 20 representing glazed materials from the early Islamic period. Of the
Bronze Age ceramics, it was not possible to ascertain fine chronologies for most of those found
in Area 2. One probable Middle Bronze lug handle (see above) was found towards the east of
Area 2 in H59. Although found in an isolated context, this sherd may be associated with a
concentration of materials 200m to the east in C08, where another, similar lug handle was
located. Other Bronze Age materials typically consisted of coarse, blackened sherds, often
distributed widely around the perimeter of small takyrs. Although it was not possible to pinpoint
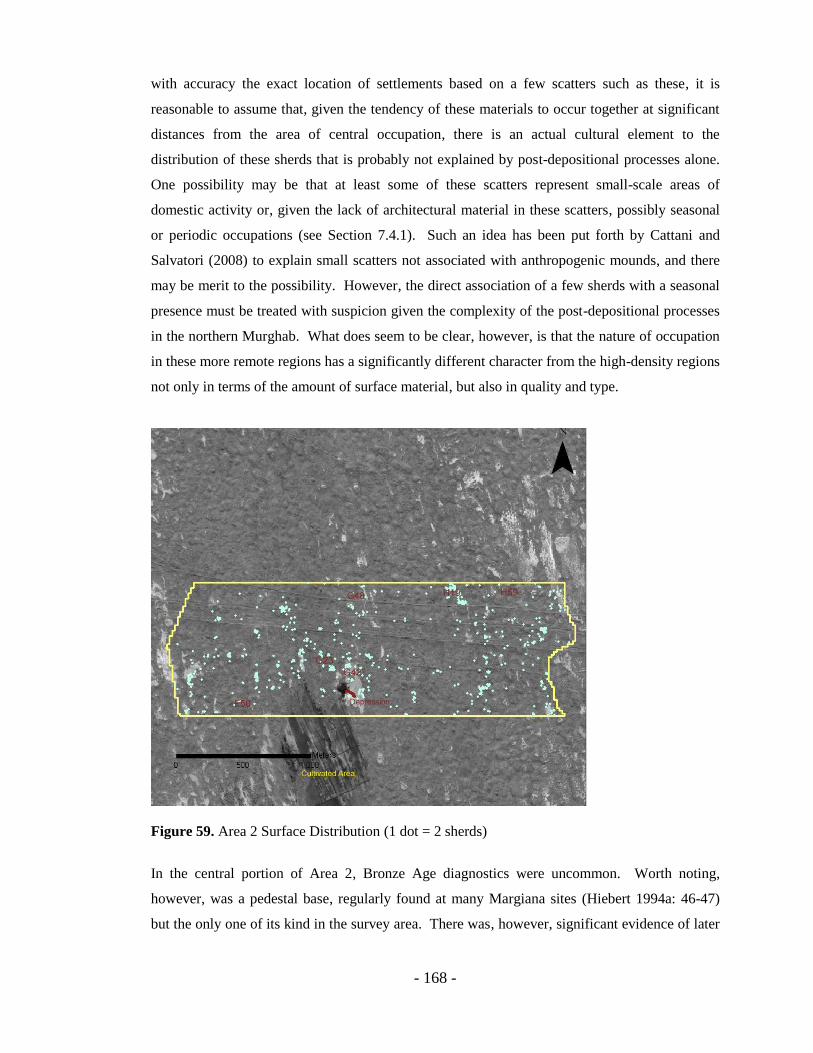
- 168 -
with accuracy the exact location of settlements based on a few scatters such as these, it is
reasonable to assume that, given the tendency of these materials to occur together at significant
distances from the area of central occupation, there is an actual cultural element to the
distribution of these sherds that is probably not explained by post-depositional processes alone.
One possibility may be that at least some of these scatters represent small-scale areas of
domestic activity or, given the lack of architectural material in these scatters, possibly seasonal
or periodic occupations (see Section 7.4.1). Such an idea has been put forth by Cattani and
Salvatori (2008) to explain small scatters not associated with anthropogenic mounds, and there
may be merit to the possibility. However, the direct association of a few sherds with a seasonal
presence must be treated with suspicion given the complexity of the post-depositional processes
in the northern Murghab. What does seem to be clear, however, is that the nature of occupation
in these more remote regions has a significantly different character from the high-density regions
not only in terms of the amount of surface material, but also in quality and type.
Figure 59. Area 2 Surface Distribution (1 dot = 2 sherds)
In the central portion of Area 2, Bronze Age diagnostics were uncommon. Worth noting,
however, was a pedestal base, regularly found at many Margiana sites (Hiebert 1994a: 46-47)
but the only one of its kind in the survey area. There was, however, significant evidence of later
- 169 -
occupation, evidenced by several glazed sherds as well as thick body fragments with a whitish-
yellow fabric of a type commonly found at Merv (author‟s personal observation). While non-
diagnostic with respect to finer chronologies, the fabrics are typical of Sasanian and Islamic
period ceramics throughout the Merv oasis (G. Puschnigg, pers. comm.). Several of these
materials occurred on or near an elevated sandy area in the centre of the takyr in G42. Although
no traces of architecture were found, the presence of a brick 50m to the northeast is worth
noting, as are several fired brick fragments associated with two significant sherd groups in tracts
G23 and G24, all of which appear datable to the Sasanian or Islamic periods. These sherd
clusters occurred in sandy depressions, and the presence of several small red sherds, heavily
weathered, should be noted. An additional find worth mentioning was a possible Middle Bronze
rim in F50, resembling Hiebert‟s „simple rim bowl‟ category, one of the few rim types that
occurs only in Period 1 in the Gonur North sounding (Hiebert 1994a: 47). Again, though, while
the recurrence of such materials may offer evidence of Middle Bronze occupation in the region,
it is not possible to definitively assign a chronology to this particular location based on a single
diagnostic.
An additional area with traces of later occupation occurred in the northern part of the survey area
in G48 and G49, partially comprising an elevated sandy region. One noteworthy find in this area
was a scatter of a dozen sherds with a yellow glazed interior, presumably from the same vessel
and assigned a single inventory number. Immediately to the south, the base of a large vessel
with a black interior glaze was recovered. Although similar green and black glazed pottery
occurred throughout the survey area, the presence of fragments of two large vessels in the same
general area may be indicative of a more substantial presence. As was the case with the Islamic
period finds, however, architectural evidence on the surface was absent, so it is difficult to say
with certainty whether these materials may be associated with small caravanserais or
waystations. The size of the vessels, however, suggests they may have been for stationary rather
than mobile use (D. Gilbert, pers. comm.), a possibility that may find support in the brick
evidence cited above. Moreover, the number of vessels of similar form, albeit usually unglazed,
may offer evidence of a similar trajectory of small-scale occupation, both short-term and mobile,
from at least as early as the Sasanian period well into the Islamic period. In addition to the
vessels described above, several Sasanian body sherds with a wavy, combed incision occurred in
this area. These also occurred in the western part of the survey area (see below), and the
appearance of this type of pottery is noteworthy in its similarity to two sherds of similar type
recovered from the surface of Adji Kui 8 during the first year of the NMDS project. The similar
distribution of Islamic materials has been noted above, and it may be that the presence of
- 170 -
Sasanian and Islamic materials both in the survey area and further south indicate a persistent
north-south trading corridor. However, as a large area south of Area 2 remained unsurveyed,
more research is necessary to determine actual broader-scale distributions of material.
In the western portion of the region, clearly identifiable Bronze Age material was sparse, and
almost completely absent in Area 3, where overall sherd densities measured a scant 0.02
sherds/100m2. The percentage of collection units containing material was extremely low, at only
0.89% in Area 3, and significant aggregations of over 5 sherds per collection unit were nearly
non-existent, although one cluster of green glazed sherds occurred along the road. Diagnostics
in the western portion of Area 2 and throughout Area 3 usually occurred singly, and were often
not clearly associated with any significant artefact clusters. The increased sand cover in this
region partially contributed to the absence of material, as suggested by the immediate cessation
of the takyr surface scatters in between Area 3 and Area 4 which coincided with a large dune
ridge. With the exception of this sand ridge, however, much of Area 3 exhibited high visibility,
as nearly a third of the area was comprised of open takyr. Aside from the glazed Islamic sherds,
diagnostics occurred singly and in low density regions, and consequently were difficult to
associate with specific settlement areas. The occasional green glazed sherds are probably
associated with broader, but highly dispersed, aggregations of similar materials on the large
takyr to the west. Ultimately, there is very little evidence for substantial Bronze Age occupation
in this area, although test pits revealing cultural material on the eastern boundary of Area 4
suggest that limited occupation may simply be obscured (see section 5.6.).
The character of surface scatters in the northwestern portion of this region (Figure 60) may offer
some insight into the nature of „background scatter‟ in the survey area (Bintliff and Snodgrass
1988). Raw sherd counts in Area 3 were 35 times lower than those just to the west in Area 4, a
figure that dropped only slightly when the proportion of positive collection units are considered,
and the number of collection units containing 5 or more sherds was 18 times fewer in Area 3
than in Area 4. The immediate and nearly complete cessation of material to the east of the takyr
is markedly different than the behaviour in occupied parts of the Egri Bogaz region, although
some parallel may be seen in the dune obstruction in both regions. While recovery bias was
certainly an issue, it is likely that the influence of the Area 4 sites on the surrounding landscape
was comparatively limited, although it is possible that small sites associated with the larger Area
4 occupations may have existed further to the east and have simply not been detected.
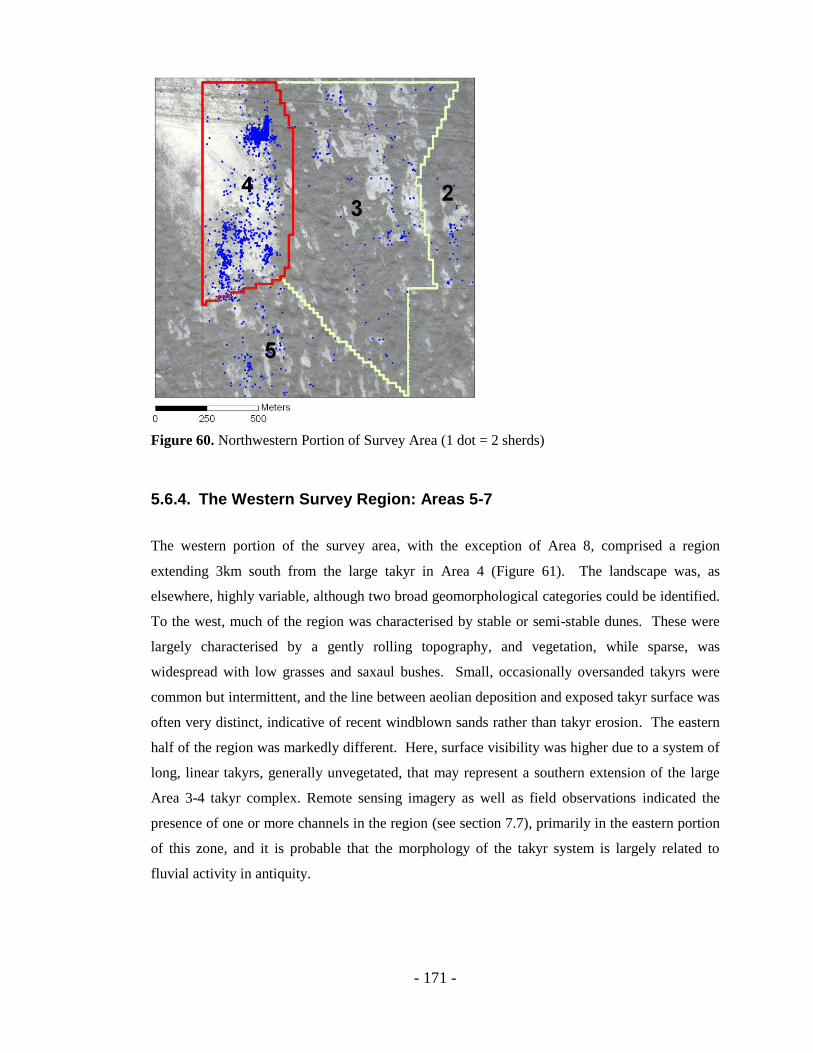
- 171 -
Figure 60. Northwestern Portion of Survey Area (1 dot = 2 sherds)
5.6.4. The Western Survey Region: Areas 5-7
The western portion of the survey area, with the exception of Area 8, comprised a region
extending 3km south from the large takyr in Area 4 (Figure 61). The landscape was, as
elsewhere, highly variable, although two broad geomorphological categories could be identified.
To the west, much of the region was characterised by stable or semi-stable dunes. These were
largely characterised by a gently rolling topography, and vegetation, while sparse, was
widespread with low grasses and saxaul bushes. Small, occasionally oversanded takyrs were
common but intermittent, and the line between aeolian deposition and exposed takyr surface was
often very distinct, indicative of recent windblown sands rather than takyr erosion. The eastern
half of the region was markedly different. Here, surface visibility was higher due to a system of
long, linear takyrs, generally unvegetated, that may represent a southern extension of the large
Area 3-4 takyr complex. Remote sensing imagery as well as field observations indicated the
presence of one or more channels in the region (see section 7.7), primarily in the eastern portion
of this zone, and it is probable that the morphology of the takyr system is largely related to
fluvial activity in antiquity.
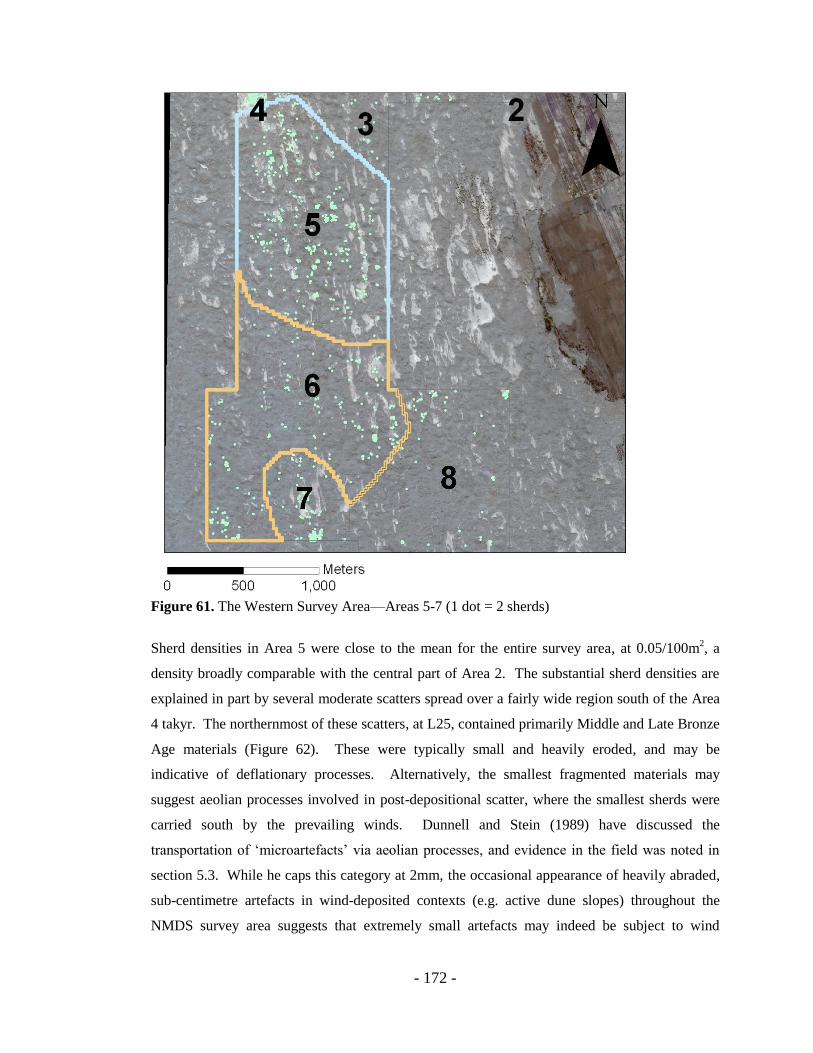
- 172 -
Figure 61. The Western Survey Area—Areas 5-7 (1 dot = 2 sherds)
Sherd densities in Area 5 were close to the mean for the entire survey area, at 0.05/100m2, a
density broadly comparable with the central part of Area 2. The substantial sherd densities are
explained in part by several moderate scatters spread over a fairly wide region south of the Area
4 takyr. The northernmost of these scatters, at L25, contained primarily Middle and Late Bronze
Age materials (Figure 62). These were typically small and heavily eroded, and may be
indicative of deflationary processes. Alternatively, the smallest fragmented materials may
suggest aeolian processes involved in post-depositional scatter, where the smallest sherds were
carried south by the prevailing winds. Dunnell and Stein (1989) have discussed the
transportation of „microartefacts‟ via aeolian processes, and evidence in the field was noted in
section 5.3. While he caps this category at 2mm, the occasional appearance of heavily abraded,
sub-centimetre artefacts in wind-deposited contexts (e.g. active dune slopes) throughout the
NMDS survey area suggests that extremely small artefacts may indeed be subject to wind
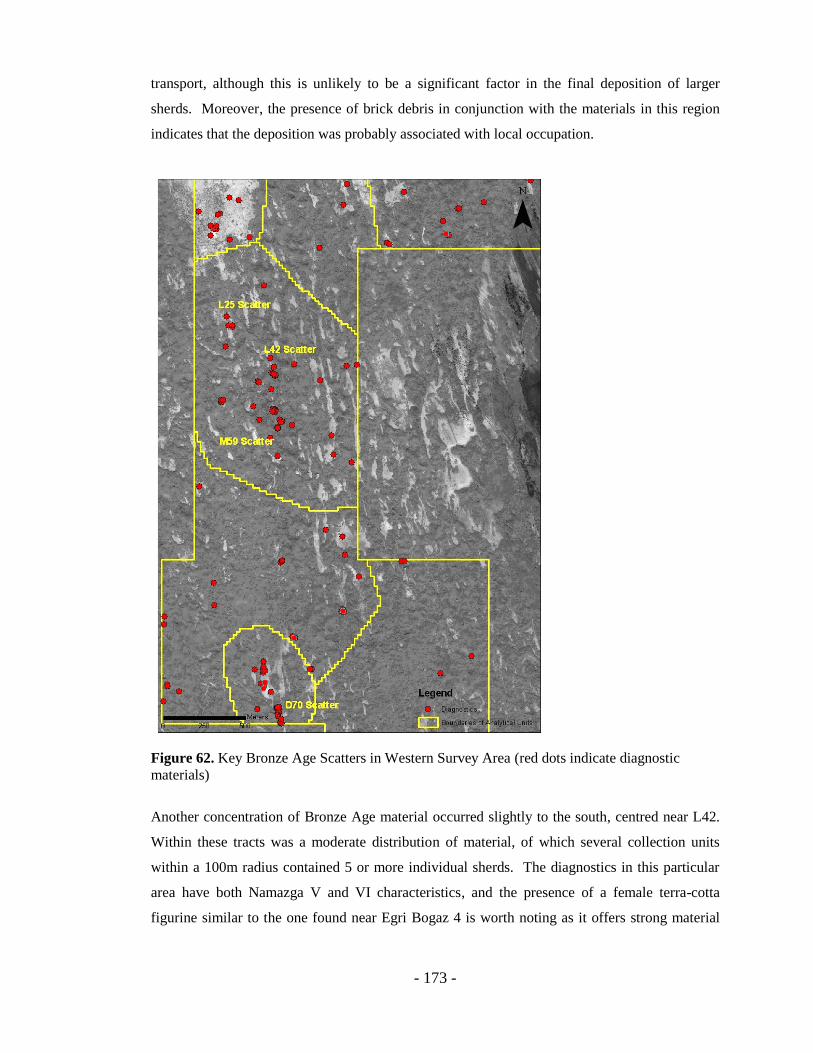
- 173 -
transport, although this is unlikely to be a significant factor in the final deposition of larger
sherds. Moreover, the presence of brick debris in conjunction with the materials in this region
indicates that the deposition was probably associated with local occupation.
Figure 62. Key Bronze Age Scatters in Western Survey Area (red dots indicate diagnostic
materials)
Another concentration of Bronze Age material occurred slightly to the south, centred near L42.
Within these tracts was a moderate distribution of material, of which several collection units
within a 100m radius contained 5 or more individual sherds. The diagnostics in this particular
area have both Namazga V and VI characteristics, and the presence of a female terra-cotta
figurine similar to the one found near Egri Bogaz 4 is worth noting as it offers strong material

- 174 -
evidence for the Namazga V period (see section 5.11). Compared with the broad scatter of
small, eroded fragments immediately to the north, these sherds are larger, and a few late-period
materials were found in the area as well. The Bronze Age materials were similar to those
throughout the survey area and may indicate a substantial occupation in the immediate vicinity.
If this is the case, establishing the boundary between this settlement area and the one to the north
is difficult, since small scale ceramic scatters continue almost uninterrupted in the intermediate
region. A third high-density area occurred about 300m further south, in M59. Here, again,
sherds could not easily be broken down into specific Middle or Late Bronze chronologies. This
broad assemblage comprised three separate aggregations each about 50-75m apart, each of
which was located in a depression where the takyr surface was partially exposed.
As in Area 2, Sasanian and early Islamic sherds were common, and several large base fragments
were found in this area. Architectural evidence directly associated with these distributions was
absent, with one major exception well to the south in D70 which will be addressed below.
While possible indications of mobility between Merv and the northern delta have been
addressed, it is also possible that these assemblages are reflective of a more permanent
occupation of the northern delta. Such a possibility may be supported by the possible discovery
of a tomb from the „Nestorian‟ period, loosely corresponding to the Late Sasanian/Early Islamic
period, near Adji Kui 1 (Casellato et al. 2007: Rossi-Osmida, pers. comm.). While such a find
may indicate a more permanent presence in the north-central delta at this time, these findings are
currently unpublished, and the lack of solid architectural evidence of waystations or
caravanserais renders such a possibility merely speculative.
Bordering Area 5 to the south, the landscape in Area 6 was similar, although the rolling dune
cover became more consistent and the takyr surface less obstructed. The overall sherd density
decreased towards the south and while surface material remained nominally continuous, it was
sparsely distributed, with densities measuring only 0.03 sherds/100m2. The landscape, while
remote and relatively undisturbed, was not completely free from anthropogenic activity, and
occasional flat sandy expanses appear to be used for grazing, as evidenced by large fields of
sheep dung that sometimes covered more than a hectare. Wind-blown sands were intermittent,
sometimes occurring on hill slopes. The „discontinuous bush‟ noted by Cremaschi (1998: 16),
clearly characterised the vegetation here, consisting primarily of low grasses and saxaul,
although areas of denser vegetation sometimes coincided with the edges of larger takyrs,
possibly resulting of higher moisture content along these lower-lying areas. Interspersed
amongst the dunes were takyrs ranging from two or three metres to over 100m across, and

- 175 -
artefactual material tended to cluster in small sandy depressions or over-sanded takyrs although
significant sherd concentrations were rare, with only 4% of collection units containing material.
Large, open takyrs were almost completely devoid of significant material concentrations,
although a few sherds were occasionally found at the takyr edges.
The southern part of this region designated Area 7, comprised a small area where both
geomorphology and surface distribution were distinctive with respect to the surrounding
landscape (Figure 65). It was dominated by a substantial takyr complex covering 5 or 6 ha and
evidence of nearby fluvial activity may be seen in the myriad of narrow, meandering takyr
features in the area as well as the resurgence of a widespread distribution of shells primarily to
the east of the takyr complex. The surface scatter here was substantially higher than in the
southern portion of Area 6, although the problem of modifiable aerial units (MAUP) discussed
in Chapter 2 certainly must be taken into account given the small size of Area 7. Two features
stand out and merit further discussion. The first consisted of two mounds at the northern edge of
the takyr complex. Each mound was roughly circular, less than 20m in diameter, and densely
covered with fired and vitrified brick debris (Figure 63). On the northeast mound four partially
buried bricks may indicate the remains of a kiln. One unbroken brick (Figure 64) had
dimensions of 31x31x6 cm, significantly different from the size range (approx. 40x20x12cm)
attested for most Bronze Age bricks (Rossi-Osmida 2004; Sarianidi 1990). The takyr in the
immediate vicinity was almost completely devoid of sherds, and no diagnostic material was
recovered. The presence of green and black glazed sherds a few hundred meters to the south, as
well as the brick size, may indicate a small presence in the area during the Abbasid or Seljuk
periods. In the centre of the takyr, several dozen metres to the south east of the brick deposit,
was a large, sandy mound, found in the satellite imagery to be spectrally similar to the larger
archaeological sites in the central delta. Investigations of this feature, however, yielded no
archaeological material except for a few late-period sherds around the base. The nature of the
brick scatter is puzzling, largely due to the lack of pottery, but a Bronze Age date for the site is
questionable on several counts. First, Bronze Age kiln sites tend to be associated with fairly
substantial ceramic scatters and debris, as observed in the partially excavated kilns on Egri
Bogaz 1 and 2 and possibly supported by the substantial brick scatters in Area 1. The extremely
low ceramic density casts doubt on the presence of pottery kilns on the site. Moreover, the size
of the few fired bricks was different from the standard Bronze Age bricks, as noted above. A
third issue, albeit a highly speculative one, concerns a striking linear feature that traversed the
western part of the takyr. While field examination indicated that the feature was a sand ridge,
Sarianidi‟s (1990: 55) contention that ridges may form atop raised canal banks may suggest that
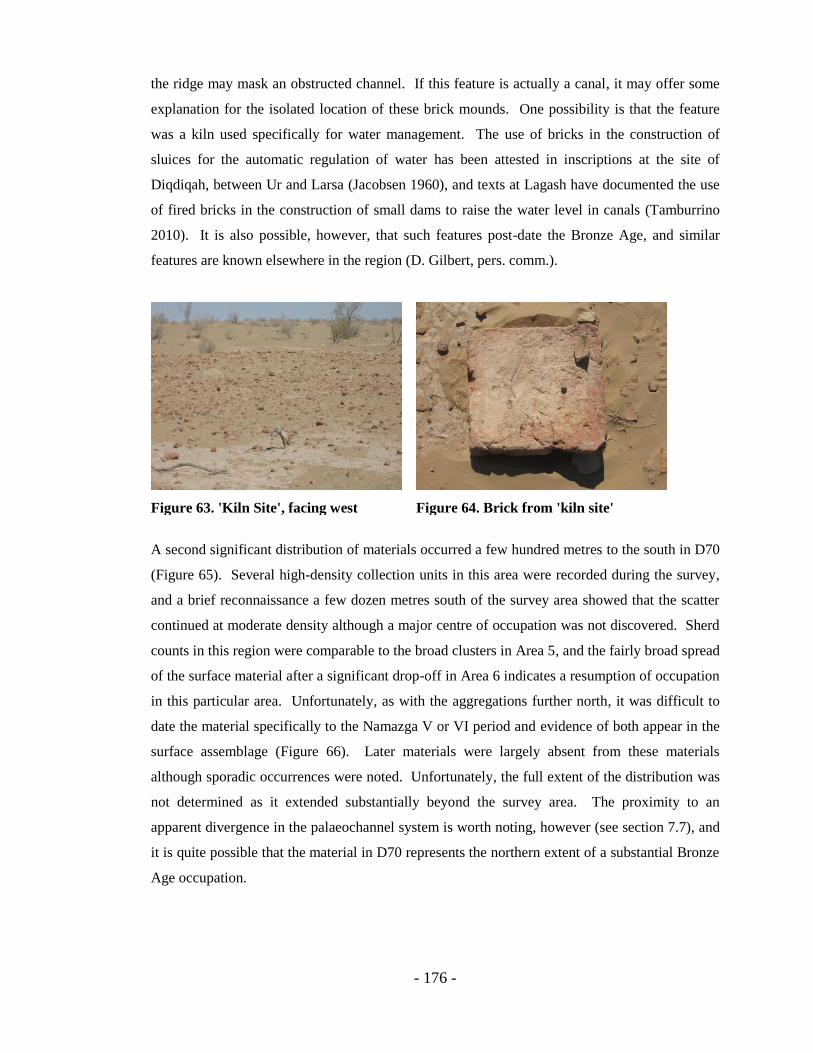
- 176 -
the ridge may mask an obstructed channel. If this feature is actually a canal, it may offer some
explanation for the isolated location of these brick mounds. One possibility is that the feature
was a kiln used specifically for water management. The use of bricks in the construction of
sluices for the automatic regulation of water has been attested in inscriptions at the site of
Diqdiqah, between Ur and Larsa (Jacobsen 1960), and texts at Lagash have documented the use
of fired bricks in the construction of small dams to raise the water level in canals (Tamburrino
2010). It is also possible, however, that such features post-date the Bronze Age, and similar
features are known elsewhere in the region (D. Gilbert, pers. comm.).
Figure 63. 'Kiln Site', facing west
Figure 64. Brick from 'kiln site'
A second significant distribution of materials occurred a few hundred metres to the south in D70
(Figure 65). Several high-density collection units in this area were recorded during the survey,
and a brief reconnaissance a few dozen metres south of the survey area showed that the scatter
continued at moderate density although a major centre of occupation was not discovered. Sherd
counts in this region were comparable to the broad clusters in Area 5, and the fairly broad spread
of the surface material after a significant drop-off in Area 6 indicates a resumption of occupation
in this particular area. Unfortunately, as with the aggregations further north, it was difficult to
date the material specifically to the Namazga V or VI period and evidence of both appear in the
surface assemblage (Figure 66). Later materials were largely absent from these materials
although sporadic occurrences were noted. Unfortunately, the full extent of the distribution was
not determined as it extended substantially beyond the survey area. The proximity to an
apparent divergence in the palaeochannel system is worth noting, however (see section 7.7), and
it is quite possible that the material in D70 represents the northern extent of a substantial Bronze
Age occupation.
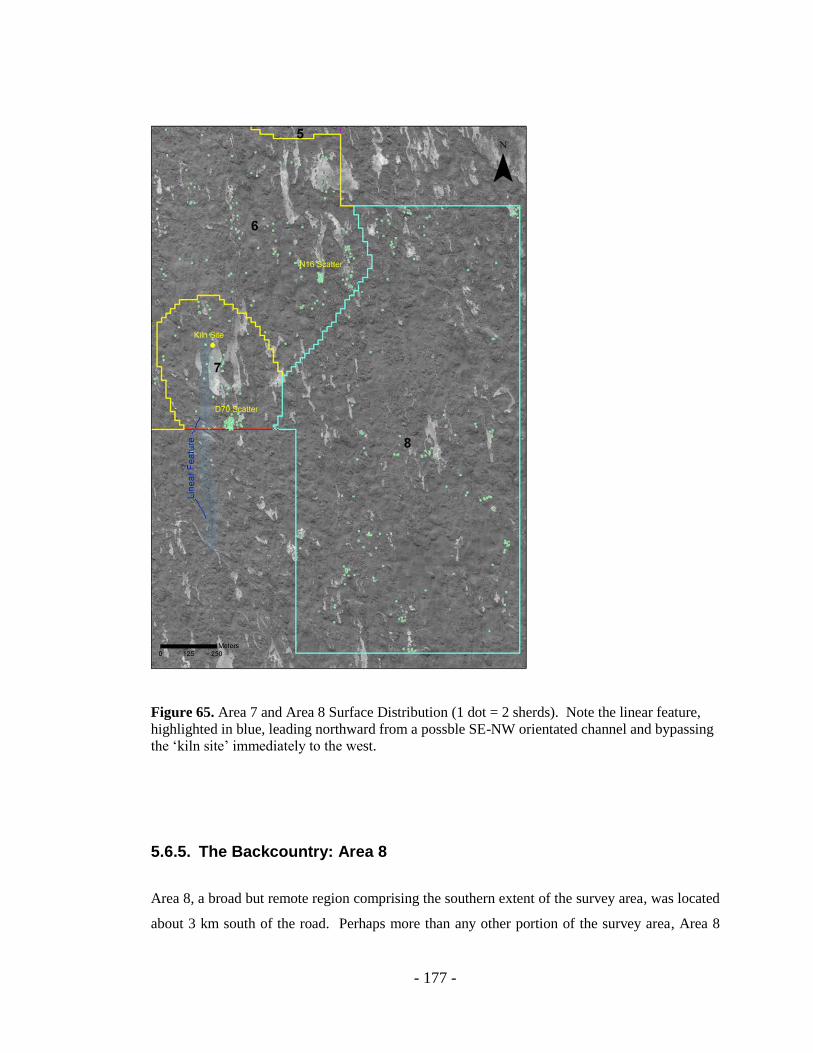
- 177 -
Figure 65. Area 7 and Area 8 Surface Distribution (1 dot = 2 sherds). Note the linear feature,
highlighted in blue, leading northward from a possble SE-NW orientated channel and bypassing
the „kiln site‟ immediately to the west.
5.6.5. The Backcountry: Area 8
Area 8, a broad but remote region comprising the southern extent of the survey area, was located
about 3 km south of the road. Perhaps more than any other portion of the survey area, Area 8
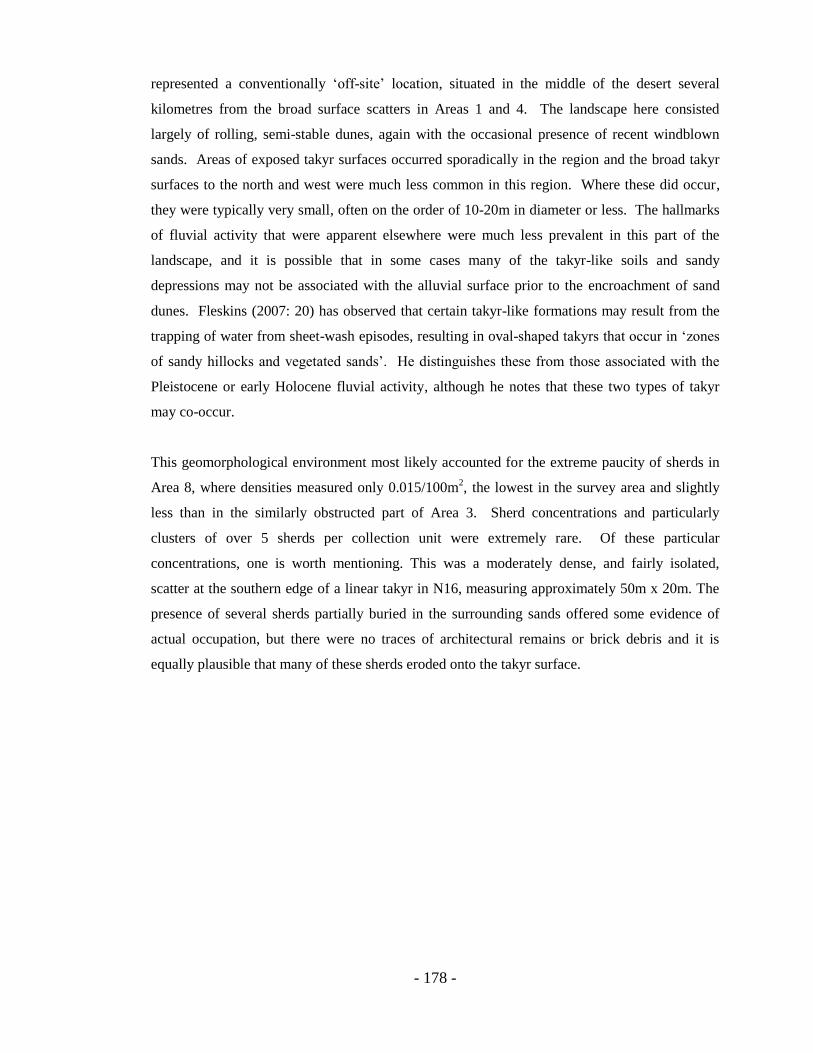
- 178 -
represented a conventionally „off-site‟ location, situated in the middle of the desert several
kilometres from the broad surface scatters in Areas 1 and 4. The landscape here consisted
largely of rolling, semi-stable dunes, again with the occasional presence of recent windblown
sands. Areas of exposed takyr surfaces occurred sporadically in the region and the broad takyr
surfaces to the north and west were much less common in this region. Where these did occur,
they were typically very small, often on the order of 10-20m in diameter or less. The hallmarks
of fluvial activity that were apparent elsewhere were much less prevalent in this part of the
landscape, and it is possible that in some cases many of the takyr-like soils and sandy
depressions may not be associated with the alluvial surface prior to the encroachment of sand
dunes. Fleskins (2007: 20) has observed that certain takyr-like formations may result from the
trapping of water from sheet-wash episodes, resulting in oval-shaped takyrs that occur in „zones
of sandy hillocks and vegetated sands‟. He distinguishes these from those associated with the
Pleistocene or early Holocene fluvial activity, although he notes that these two types of takyr
may co-occur.
This geomorphological environment most likely accounted for the extreme paucity of sherds in
Area 8, where densities measured only 0.015/100m2, the lowest in the survey area and slightly
less than in the similarly obstructed part of Area 3. Sherd concentrations and particularly
clusters of over 5 sherds per collection unit were extremely rare. Of these particular
concentrations, one is worth mentioning. This was a moderately dense, and fairly isolated,
scatter at the southern edge of a linear takyr in N16, measuring approximately 50m x 20m. The
presence of several sherds partially buried in the surrounding sands offered some evidence of
actual occupation, but there were no traces of architectural remains or brick debris and it is
equally plausible that many of these sherds eroded onto the takyr surface.
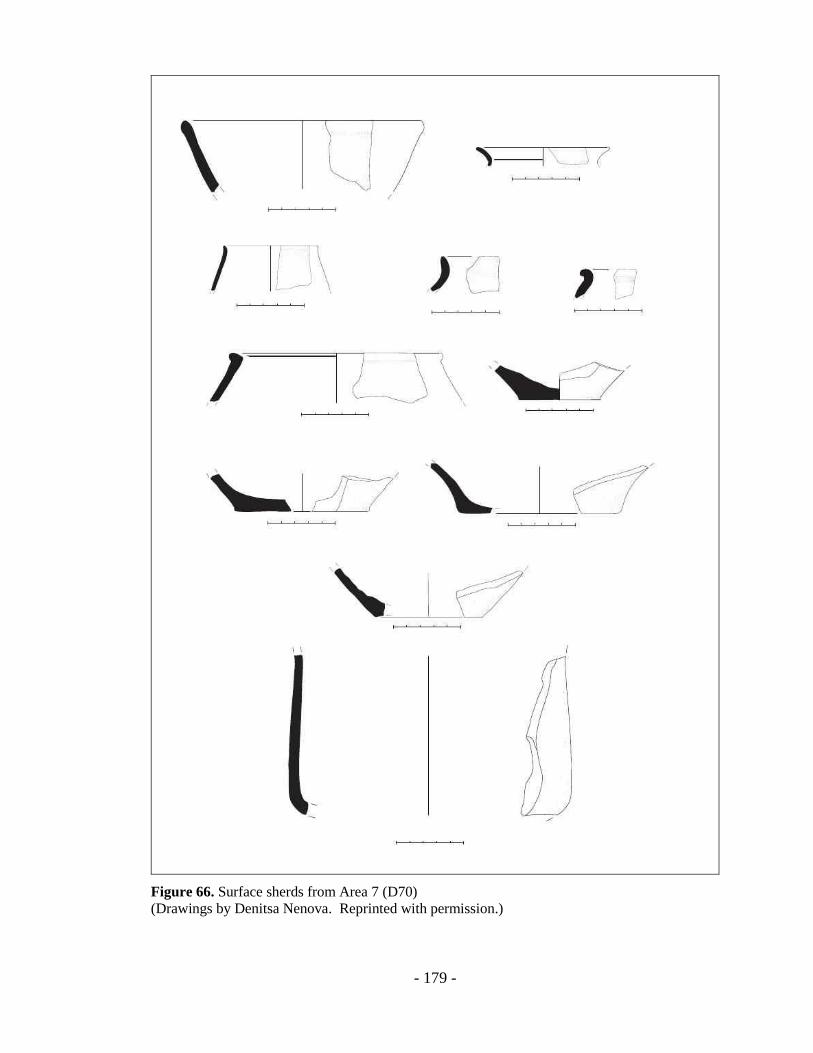
- 179 -
Figure 66. Surface sherds from Area 7 (D70)
(Drawings by Denitsa Nenova. Reprinted with permission.)

- 180 -
5.7. Subsurface Analysis
The above analysis has clearly shown the extent of variability in the NMDS survey area, and
suggests that the actual settlement landscape was far more complex than might be indicated
solely from the identification of a few sites over a broad region. However, four millennia is an
extremely long time, and it is unreasonable to assume that the archaeological landscape has
remained static. In order to test the degree to which the surface distribution accurately
represented actual occupation, several test pits were conducted in areas where, based on the
extent of material scatter, subsurface archaeology was deemed likely to have occurred. Due to
time and resources, these were limited, and only meant to represent a sample of the kind of
subsurface deposits that characterised the Egri Bogaz 4 region as well the more restricted surface
scatters in Area 4.
5.7.1. Area 4 Test Pits
The first series of test pits was centred just south of the road on the large takyr in Area 4 (Figure
67). The initial test pit, located within the AMMD 717 site boundary, was centred in an area of
high ceramic density on the takyr surface immediately west of a dune ridge of about 2m in
height. From here, additional pits, spaced 40m apart, extended both east and west to cover both
dunes and takyr. Measurements taken with a theodolite indicated that the topographic variation
on the takyr was minimal, although a 2 cm decrease in elevation towards the east may be
indicative of a slight west to east slope. The two test pits placed directly on the takyr surface
revealed natural stratigraphy, devoid of cultural material. Sediments associated with the takyr,
on the order of 10-20 cm deep, appeared to be predominantly friable clay. Fine, laminar sands
occurred below this layer, and below 50 or 60 cm a more compact, a sand/clay layer was
encountered. This secondary clay layer is interesting in light of Lyapin‟s findings in the Kelleli
1 area, in which he posits that a subsurface layer of dense clay immediately below a layer of
laminar sands may correspond to the Namazga II or III alluvial surface (Lyapin 1991). If this is
the case, it supports the possibility that Bronze Age alluvial deposits are not very thick in the
region, and that minimal subsurface investigation is sufficient to identify the extent of Bronze
Age deposition. Another noteworthy observation was that the appearance of the sandy layer in
TP 717-0 occurred nearly 20 cm below that of TP-717 1W, suggesting a downward grade to the
east (Figure 69). Such a slope is interesting in light of the presence of the extensive linear chain
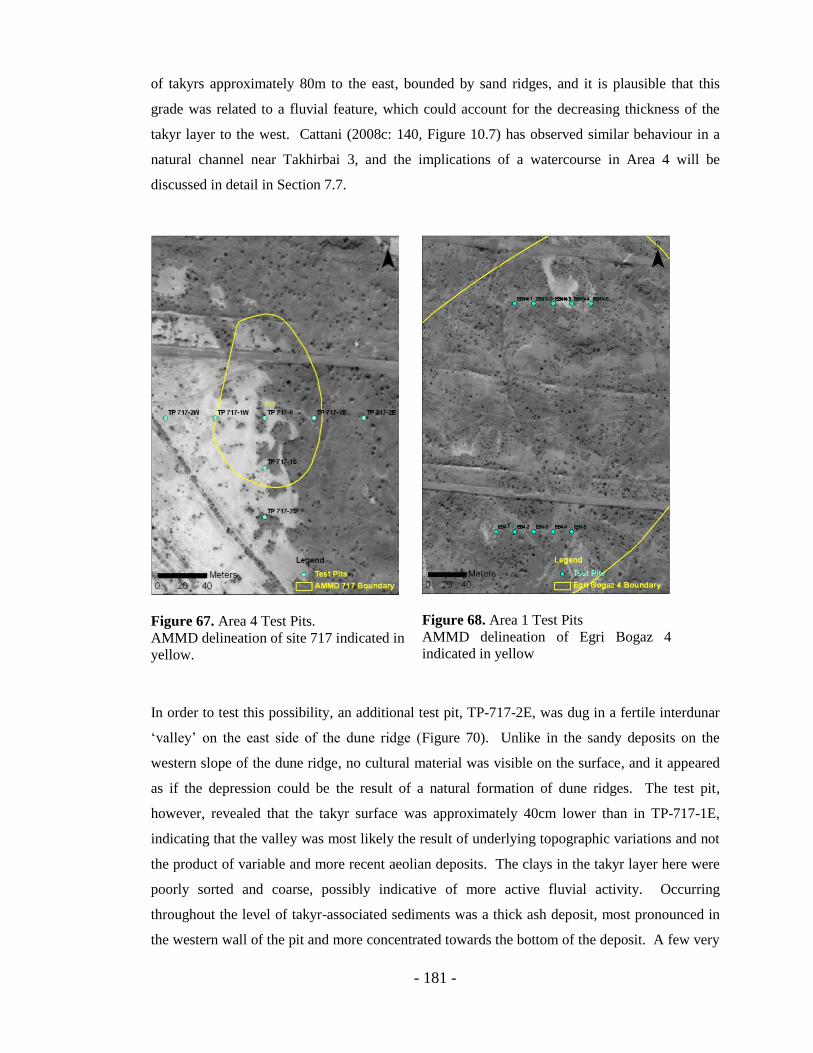
- 181 -
of takyrs approximately 80m to the east, bounded by sand ridges, and it is plausible that this
grade was related to a fluvial feature, which could account for the decreasing thickness of the
takyr layer to the west. Cattani (2008c: 140, Figure 10.7) has observed similar behaviour in a
natural channel near Takhirbai 3, and the implications of a watercourse in Area 4 will be
discussed in detail in Section 7.7.
Figure 67. Area 4 Test Pits.
AMMD delineation of site 717 indicated in
yellow.
Figure 68. Area 1 Test Pits
AMMD delineation of Egri Bogaz 4
indicated in yellow
In order to test this possibility, an additional test pit, TP-717-2E, was dug in a fertile interdunar
„valley‟ on the east side of the dune ridge (Figure 70). Unlike in the sandy deposits on the
western slope of the dune ridge, no cultural material was visible on the surface, and it appeared
as if the depression could be the result of a natural formation of dune ridges. The test pit,
however, revealed that the takyr surface was approximately 40cm lower than in TP-717-1E,
indicating that the valley was most likely the result of underlying topographic variations and not
the product of variable and more recent aeolian deposits. The clays in the takyr layer here were
poorly sorted and coarse, possibly indicative of more active fluvial activity. Occurring
throughout the level of takyr-associated sediments was a thick ash deposit, most pronounced in
the western wall of the pit and more concentrated towards the bottom of the deposit. A few very

- 182 -
small sherds and possible brick debris, less than 1cm in diameter, were found along with bits of
plaster, although no charcoal was recovered. Although the size of these sherds was similar to
abraded fragments found in test pits conducted to the south (TP 717-1S and TP-717-2S), the
sherds here were thicker and more intact which suggests that these were locally deposited sherds
rather than debris carried via aeolian processes. Unlike the windblown material on the surface
west of the ridge, it seems more likely that this material is directly associated with nearby
occupation although it is quite possible that this specific deposition was the result of more
confined erosional processes. A significant increase in the thickness of the ash deposit to the
west, as well as the west-to-east grade mentioned above, suggests that actual settlement may
have occurred on the alluvium quite close to the watercourse, although the occupational area is
now mostly covered by dunes (Figure 71). Two additional test pits excavated within 10m of TP-
717-2E failed to reveal a continuation of the deposit, although sparse evidence of plaster
occurred in these pits as well.
Test pits were then extended to the south, again at 40m spacing, where the open takyr gave way
to low, over-sanded regions with varying degrees of cultural material on the surface. While it
was unclear whether or not these slightly raised areas accounted for the „Depe 2‟ designation in
the AMMD reports, the concentrations of pottery initially appeared to offer a promising sample
although the surface sherds were heavily abraded. The situation in these test pits was
substantially different. The sandy surface layer was interspersed with large numbers of tiny,
heavily abraded and angular sherds, usually less than 1cm in diameter. The top layer of TP-717-
2S also contained charred seeds, although no evidence of scorching or ash was present, and the
seeds were similar to those found throughout the survey area and may indicate wind-carried
seeds from more recent fires. While the exact takyr horizon was not easily detectable below the
sand, possibly complicated by pedoturbation processes (see Leigh et al. 2001), the cultural
material was confined to the upper 10-20 cm, terminating around the sand-takyr horizon.
Successive strata, typically sandy but with progressively higher clay content, yielded no cultural
material in either of these two test pits.
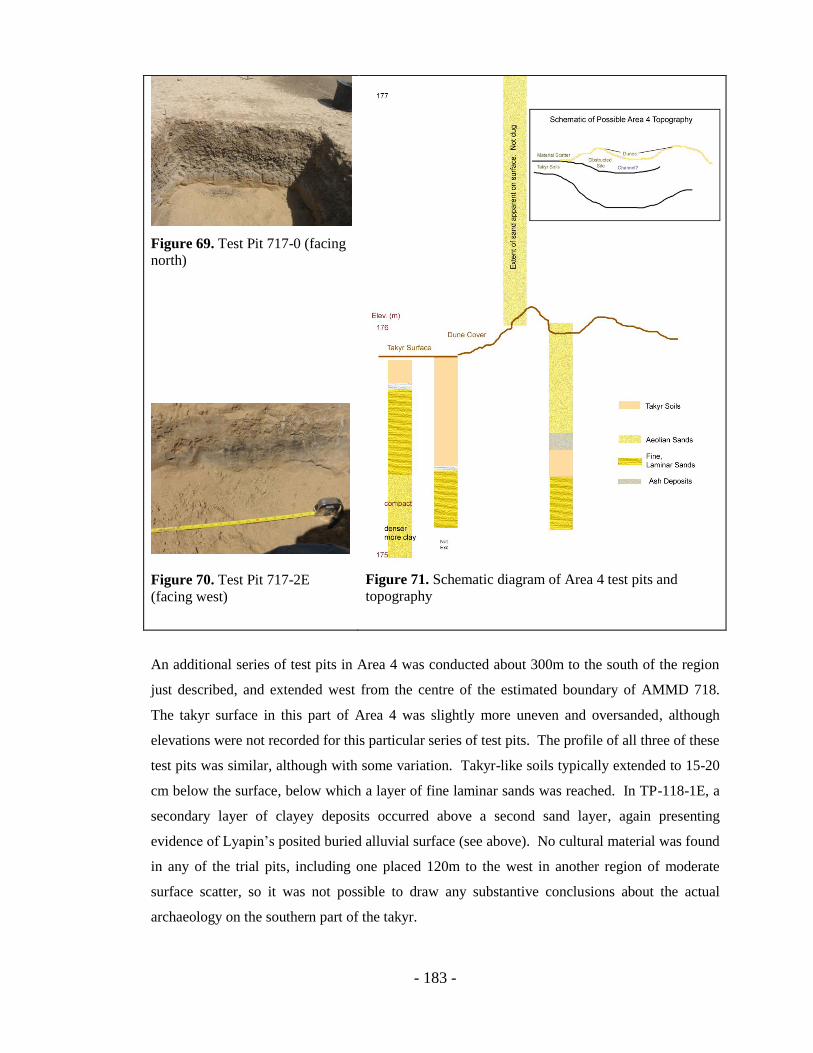
- 183 -
Figure 69. Test Pit 717-0 (facing
north)
Figure 70. Test Pit 717-2E
(facing west)
Figure 71. Schematic diagram of Area 4 test pits and
topography
An additional series of test pits in Area 4 was conducted about 300m to the south of the region
just described, and extended west from the centre of the estimated boundary of AMMD 718.
The takyr surface in this part of Area 4 was slightly more uneven and oversanded, although
elevations were not recorded for this particular series of test pits. The profile of all three of these
test pits was similar, although with some variation. Takyr-like soils typically extended to 15-20
cm below the surface, below which a layer of fine laminar sands was reached. In TP-118-1E, a
secondary layer of clayey deposits occurred above a second sand layer, again presenting
evidence of Lyapin‟s posited buried alluvial surface (see above). No cultural material was found
in any of the trial pits, including one placed 120m to the west in another region of moderate
surface scatter, so it was not possible to draw any substantive conclusions about the actual
archaeology on the southern part of the takyr.

- 184 -
Table 14: Area 4 Test Pits (vicinity of AMMD 717) Test Pit 717-2E
0-40 cm Generally fine dune sands. Clumpy quality to the soils
40-50cm Fine, ashy layer, gradually broadening towards the west edge of the pit. Occasional bits of plaster and small ceramic and brick fragments.
50-80cm Fine, laminar sands likely associated with alluvial
80-108cm (auger) continuation of fine, sandy sediments
108-120cm secondary, compacted clay layer
Test Pit 717-1E 0-35 cm Dug on a dune surface. Fine, loose sandy deposit. Too fine to auger
Test Pit 717-0
0-45 cm Takyr sediments. Blocky, crumbly material.
45-55cm Very fine greyish sands, indicative of alluvial deposits (Lyapin 1991)
50-75cm Fine, laminar sands. Yellowish-brown. Excavation abandoned at 75cm
Test Pit 717-1W 0-40 cm Takyr sediments. Blocky, crumbly material.
40-50cm Very fine greyish sands, indicative of alluvial deposits (Lyapin 1991)
50-100cm Fine, laminar sands. Yellowish-brown
Test Pit 717-1S
0-20 cm Windblown dune sands, very small, heavily abraded fragements (>45)
20-40cm Takyr sediments. Blocky, crumbly material. Cultural material continues with over 50 fragments. Similar quality as upper strat but slightly larger fragments
40cm-70cm Fine, laminar sands. Yellowish-brown
Test Pit 717-2S
0-20 cm Windblown dune sands, very small, heavily abraded fragements (>50)
20-40cm Takyr sediments. Blocky, crumbly material. Cultural material ends, but one vertical rim, probably MBA, appears at the boundary of this level and the sandy layer.
40cm-70cm Fine, laminar sands. Yellowish-brown

- 185 -
5.7.2. Area 1 Test Pits
A second region of subsurface analysis was conducted in Area 1, again traversing the
topography in an east-west direction. The first of these lines consisted of several test pits
spanning the conventional Egri Bogaz 4 mound (see section 5.6.1) as well as a large depression
to the immediate west. An additional line of excavations was situated 300m to the north in an
area of heavy and continuous material scatters. Each of these lines was situated at least 75m
from the pipeline in order to reduce the possibility of subsurface complexities from recent
activity. Given the proximity to the main site and the consequent potential for a clearer
understanding of the erosional processes acting on the depe itself, the spacing between these pits
was reduced to 20m, again on an east to west line, with two additional pits located in a region of
heavy brick concentration to the south east of the site. TP-EB4-3, the only excavation conducted
on the depe itself, yielded a single sandy layer to nearly 1.5m, almost devoid of cultural material
despite a rich presence of artefacts, including some diagnostic material, on the surface. Adjacent
test pits conducted on or just above the takyr surface immediately adjacent to the depe revealed
small, eroded fragments intermixed with the surface sands. One exception was TP-EB4-1,
which was dug directly into the surface of a vegetated and slightly eroded takyr and revealed
several small sherds within the takyr clays, although these were restricted to within 10cm of the
surface.
The northern line of test pits in Area 1 likewise comprised significant topographic variation,
rising approximately 2m in elevation from takyr to dune ridge. Of the four test pits conducted,
TP-EB4N-2, situated on the edge of the ridge, was by far the richest in cultural material, with a
substantial quantity of brick fragments and small pottery fragments. While some of the small,
abraded fragments appeared to have been deposited through aeolian processes as elsewhere in
the survey area, the mixed nature of the deposit and substantial size of several of the fragments
suggests that, while the final deposition may not directly reflect the original distribution, it is
quite likely reflective of significant nearby occupation. Of the two test pits conducted on the
takyr surface, a small amount of cultural material was present in the top layer of both of these
which may indicate deflationary activity. Additionally, the presence of a smooth, washed stone
in the top layer of TP-EB4N-4, situated on a low-lying, but uneven, takyr surface, may be
indicative of channel activity, and other, similar stones occurred along an apparent channel in
Area 1E.
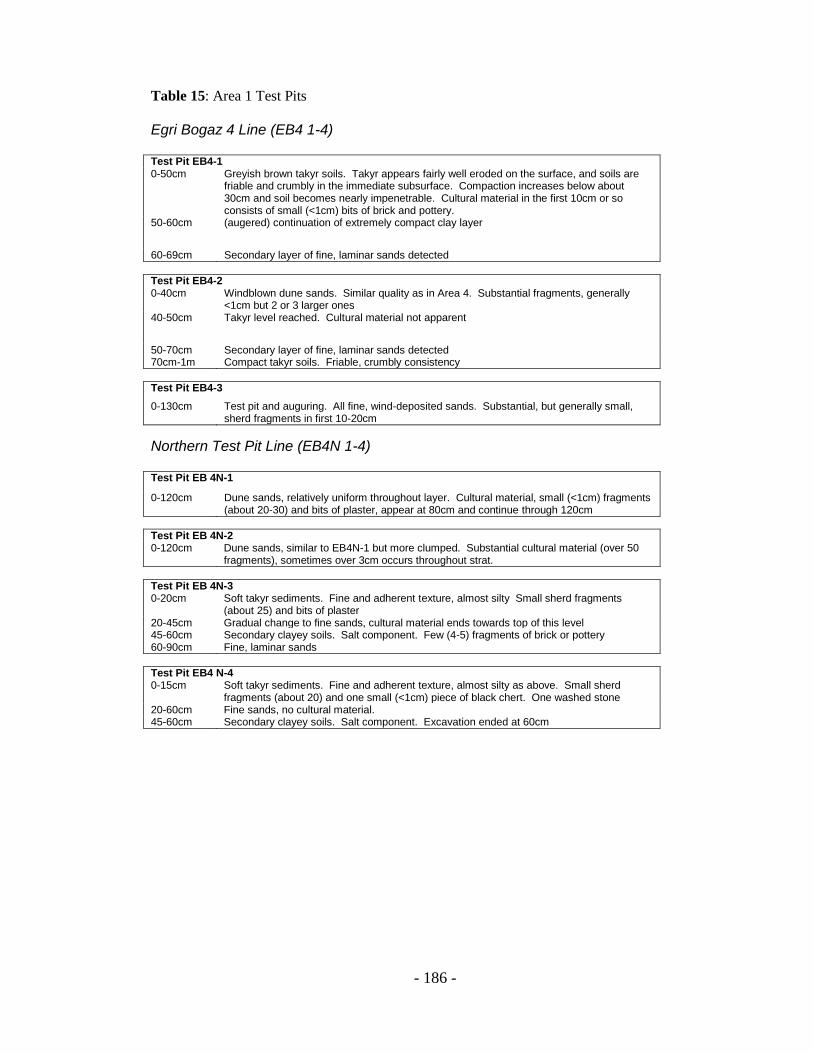
- 186 -
Table 15: Area 1 Test Pits
Egri Bogaz 4 Line (EB4 1-4) Test Pit EB4-1 0-50cm Greyish brown takyr soils. Takyr appears fairly well eroded on the surface, and soils are
friable and crumbly in the immediate subsurface. Compaction increases below about 30cm and soil becomes nearly impenetrable. Cultural material in the first 10cm or so consists of small (<1cm) bits of brick and pottery.
50-60cm (augered) continuation of extremely compact clay layer
60-69cm Secondary layer of fine, laminar sands detected
Test Pit EB4-2 0-40cm Windblown dune sands. Similar quality as in Area 4. Substantial fragments, generally
<1cm but 2 or 3 larger ones 40-50cm Takyr level reached. Cultural material not apparent
50-70cm Secondary layer of fine, laminar sands detected 70cm-1m Compact takyr soils. Friable, crumbly consistency
Test Pit EB4-3
0-130cm Test pit and auguring. All fine, wind-deposited sands. Substantial, but generally small, sherd fragments in first 10-20cm
Northern Test Pit Line (EB4N 1-4) Test Pit EB 4N-1
0-120cm Dune sands, relatively uniform throughout layer. Cultural material, small (<1cm) fragments (about 20-30) and bits of plaster, appear at 80cm and continue through 120cm
Test Pit EB 4N-2 0-120cm Dune sands, similar to EB4N-1 but more clumped. Substantial cultural material (over 50
fragments), sometimes over 3cm occurs throughout strat.
Test Pit EB 4N-3 0-20cm Soft takyr sediments. Fine and adherent texture, almost silty Small sherd fragments
(about 25) and bits of plaster 20-45cm Gradual change to fine sands, cultural material ends towards top of this level 45-60cm Secondary clayey soils. Salt component. Few (4-5) fragments of brick or pottery 60-90cm Fine, laminar sands
Test Pit EB4 N-4 0-15cm Soft takyr sediments. Fine and adherent texture, almost silty as above. Small sherd
fragments (about 20) and one small (<1cm) piece of black chert. One washed stone 20-60cm Fine sands, no cultural material. 45-60cm Secondary clayey soils. Salt component. Excavation ended at 60cm
- 187 -
Despite the lack of clear evidence for substantial occupation layers in Area 1, these small
excavations provided important information pertaining not only to the relationship between
surface and subsurface distributions, but also to the underlying topography of the landscape.
The locally variable but broadly uniform nature of the sediments below the takyr surfaces both
in Area 4 and Area 1 suggest substantial complexity in a long sequence of alluvial events. The
fairly shallow cultural material in the single positive test pit in Area 4 suggests that settlement
should be detectable quite close to the ancient alluvial surface, a finding that is consistent with
the shallow depth of material posited for the sites in both the Kelleli and Egri Bogaz regions
(Udeumuradov 1993; Masimov and Kohl 1981). Since the material recovered from the pit was
sparse and offered no diagnostic features, it cannot be said with absolute certainty that it reflects
a Bronze Age horizon, although this seems to be the most likely scenario based on the
surrounding material.
What the test pits ultimately offer is a set of both clues and restrictions on how to interpret the
survey data. Clearly, the estimation of specific site dimensions and locations based on material
scatter is extremely unreliable, a result of deflation and localised erosion, although fluvial
erosion may also have played a role in antiquity (cf Brown 1997: 279). Additionally, although
the evidence was very sporadic, artefacts beneath the sandy deposits exhibited a greater degree
of preservation which suggests that deflationary processes may be substantial on the exposed
takyr surfaces. At the same time, however, obvious cultural levels were largely absent with the
exception of the single case in Area 4. In Area 1, small sherds both on the surface and in the top
levels of the takyr clays offer weak evidence for definitive habitation. While deflation may well
be at work, the absence of large subsurface sherds again suggests that much of the surface
material is the result of secondary deposition, albeit most likely from a nearby origin. Of course,
a few pits on a takyr offer only a tiny window into the subsurface archaeology, and it is quite
possible that material has simply been missed, or that habitation was highly intermittent and the
assumption of uniform occupation, even in densely settled areas, may not be accurate.
5.8. NMDS Cultural Material
5.8.1. General Characteristics of Diagnostic Material
Having set out the scope of the surface distribution and its relationship with the subsurface
archaeology, the next phase of the analysis will assess the finds from a material and
chronological perspective. During the course of the 3-year survey, a total of 707 inventory

- 188 -
numbers were assigned to diagnostic material, 620 of which could be broadly dated. Of these,
509 were classed as Bronze Age materials, with the rest falling into post-Iron Age categories.
The Iron Age itself appears to be almost unrepresented, with the exception of a single painted
Yaz I sherd, and an additional find near Egri Bogaz 4 with a possible Yaz III-type rim (see
pottery descriptions in Bonora and Vidale 2008). These figures do not present the entire picture,
however. Since most of the diagnostics were found in a concentrated section of Area 1, the finds
in that particular region were heavily skewed towards Bronze Age materials. Diagnostics were
much more evenly distributed beyond this region, and of the 215 diagnostics recovered in areas
2 through 8, 84 were classed as Sasanian or Islamic, while 90 fell into the Bronze Age category.
These numbers are potentially misleading, however. Several dozen of these late-period sherds
were glazed sherds or large, high-fired vessels from the Sasanian or early Islamic periods. In
addition to their easy identification as diagnostics in the field, these fragments were far less
susceptible to abrasion. Indeed, it was not uncommon to find an isolated green-glazed fragment
among several non-diagnostic materials likely to date from the Bronze Age.
Although the finer details of the Middle and Late Bronze Age chronology are still not clearly
understood, some observations may be made about the types and distributions of the ceramics.
Materials found in the survey area were predominantly wheel-made, and represent a range of
clearly identifiable Namazga-type materials. Forms consisted primarily of undecorated, open
vessels. The near-total lack of decoration or other distinctive features suggests a primarily
domestic assemblage, although a single sherd with a herringbone pattern, found immediately
prior to the survey near Egri Bogaz 4, is worth noting (see Appendix 4). A number of fragments
showed signs of blackening, suggestive of their use for cooking. Storage vessels, while present,
were uncommon. Notably absent from the survey area were any indications of ceremonial
vessels, e.g. decorated or spouted containers, such as those found at Gonur. Pedestal bases,
which are common in the Namazga V necropolis at Gonur as well as in many of the Namazga VI
sites (Hiebert 1994a: 67-71; Udeumuradov and Rossi-Osmida 2002), were almost entirely
absent, and only a single base of this type was recovered in the entire survey area.
Most of the ceramics were comprised of a fine matrix with few if any apparent inclusions.
Bronze Age sherds were undecorated, and fabrics ranged from a reddish or rose colour to white,
often with a buff exterior. Darker red wares were less common and often heavily abraded.
Although Hiebert (1994a: 40) suggests that darker red and red-slipped wares at Gonur become
more prevalent from the Late Bronze Age into the Takhirbai period, the generally poor quality of
these materials in the NMDS survey suggests that they may simply represent more exposed
- 189 -
fabrics, and Puschnigg has observed that fabrics of this colour occur in most periods in the
Murghab (see Puschnigg 2006: 173, Fabric B3). Several sherds in Area 1 had a greenish hue,
commonly associated with the Namazga V period in excavated contexts (Hiebert 1994a: 67), but
discolouration from salts or other chemical processes is also possible in these exposed contexts
(B. Sillar, pers. comm.). Less common in the survey area were grey or brown wares which
P‟yankova and Hiebert have suggested originate during the Namazga VI or later periods
(Hiebert 1994a; P'yankova 1993). Preservation was varied, and abrasion resulting from wind-
blown sands resulted in a grainy exterior surface on most of the materials which made it
extremely difficult to identify external surface treatments such as slips or burnishing. Later
materials, often high-fired vessels from the Sasanian and early Islamic periods, were generally
less susceptible to erosion, and surface decoration, usually green or black internal or external
glaze, were often largely intact. Another category of material that occurred throughout the
survey area was coarseware. This material was generally handmade, although wheel-thrown
coarsewares are known in the Murghab (Hiebert 1994a: 61), and the poor quality of the materials
found on the surface often masked the production method. Hiebert cautions that a distinction
must be made between the incised coarsewares, associated with the steppe „Andronovo‟ groups
who inhabited the delta towards the end of the Bronze Age, and coarse domestic materials
associated with sedentary sites of the Namazga V and VI periods (Hiebert 1994a: 69). The
former, generally incised and comprising a coarse, greyish fabric, was rare in the survey area,
and only one context containing steppe materials was definitively identified in Area 2. The latter
group of coarsewares is represented in all periods of Murghab settlement (periods 1,2 and 3 in
the 1989 Gonur sounding), although Hiebert has noted an increase in reddish-purple, grog-
tempered fabrics in the Late Bronze Age (Hiebert 1994a: 61), a few of which were detected in
the southwestern portion of the survey area (e.g. E-32). Bonora and Vidale (2008) have noted
that coarsewares appear in the Yaz I period as well. However, these later materials are usually a
buff-brown to grey colour, and the almost complete absence of the highly diagnostic painted
wares that characterise the early Iron Age suggest that the coarsewares in the NMDS study area
were most likely products of the sedentary occupants of the northern Murghab.
5.8.2. Diagnostics by the Numbers
To gain a sense of the distribution of these materials throughout the survey area, it is useful to
assess briefly the quantity of diagnostic materials (Table 16). The use of diagnostics as a
scientific measurement is, of course, problematic since the identification and collection of such
materials in the field is extremely subjective (Mattingly et al. 2000). Nevertheless, the presence

- 190 -
of clearly identifiable rims or bases in one context compared to another may provide indirect
information on the character of the distribution with respect to primary or secondary depositional
contexts, and possibly even activity areas. In the survey area, Bronze Age diagnostics typically
represented between 2 and 5 percent of the aggregate sherd totals. Bevan has suggested that this
number is low compared to Aegean contexts, for example, where percentages of diagnostics (as
defined according to comparable criteria) are often 10+% (A. Bevan, pers. comm.). Although
different pottery traditions may partly explain these differences, it may also be that heavy
abrasion (see below) has contributed to the low numbers. Additionally, as noted in Chapter 1,
the desert climate is highly variable, and Taylor (2000) has suggested that severe freeze-thaw
cycles may further increase fragmentation. A combination of these processes may have resulted
in a much higher percentage of small, unidentifiable body fragments, ultimately reducing the
proportion of identifiable diagnostic materials. A striking example may be seen in Area 4,
where the diagnostic percentage was a minuscule 0.43%, the lowest in the survey area. Given
that these numbers were recorded in an area of high visibility, it is likely that poor ceramic
quality partially accounts for the lack of diagnostic material, and visual observation did reveal
that materials in much of Area 4 were small and heavily abraded. The Area 4 numbers contrast
significantly with those in the other zone of heavy occupation, Area 1, although the huge amount
of surface material in this latter region most likely contributed to unreliable diagnostic
percentages. While higher-quality, more clearly identifiable diagnostics may be more likely to
occur in more complex or „urban‟ areas, and while the pipeline excavations may have unearthed
larger fragments, any potential increase was probably counteracted by the overwhelming sherd
totals in the area. Ultimately the diagnostic counts in low to medium density areas are likely to
be much more reliable than those in Area 1.
Table 16. Diagnostic Count by Analytical Unit
Analytical
Unit
All
Sherds
Bronze
Age
Diags
Diag % Avg. Max.
Dim. (cm)
Abrasion
(1-10)
1E 380 3 0.79 5.64 2.66
1 15641 339 2.17 4.5 3.07
2 1187 37 3.12 6.04 3.03
3 187 2 1.07 5.33 2.36
4 3029 13 0.43 5 4.12
5 695 30 4.32 5.76 2.96
6 427 18 4.22 5.92 4.06
7 230 23 10 5.43 3.54
8 279 7 2.51 6.9 3.42

- 191 -
5.8.3. Abrasion and Size
Although diagnostics cannot be expected to offer an accurate representation of the full surface
assemblage, these materials contain several useful characteristics that can offer insight into the
nature of their deposition, of which size and abrasion will be briefly discussed here. It should be
cautioned that sherd size is a complex issue and, as Orton (1993: 214) admonishes,
fragmentation may vary widely amongst materials and contexts. In the NMDS survey, the
largest fragments were often late-period, high-fired sherds with a maximum dimension often
approaching 15cm for some of the thick bases, while green-glazed fragments tended to cluster
around 5 or 6cm. Bronze Age sherds fell broadly within the 4cm to 6cm range, with some of the
largest sherds occurring amid the dense surface scatters in Area 1. A visual assessment of the
size distribution is shown in Figure 72. Larger sherds tended to occur in the more significant
settlement areas, corresponding in part to the central Area 1 scatter as well as the probable
occupational areas in Areas 5 and 7. The surprising preponderance of small sherds in Area 4 has
been touched upon above, and may confirm that much of the Area 4 surface assemblage has
been exposed to deflation, especially in the southern part of the large takyr, or may be the result
of secondary deposition from the largely obstructed settlement area on the eastern edge of the
takyr. Intermediate regions exhibited substantial variation in size. Isolated large fragments in
the central portion of Area 2 may offer circumstantial evidence of local occupation, although it is
reasonable to assume that small sites existed in the region. Whether or not these mixed sherds
represent a larger individual settlement cannot be determined, although it should be mentioned
that several non-diagnostic sherds were found on the periphery of the agricultural region
immediately to the south, so a more significant occupation cannot be ruled out. In the more
remote regions of Area 1E and Area 8, aggregates of large sherds were generally absent. While
it is difficult to make any strong inferences about settlement from these diagnostics, the size data
clearly support the general impression of these latter regions as peripheral to main areas of
settlement activity.
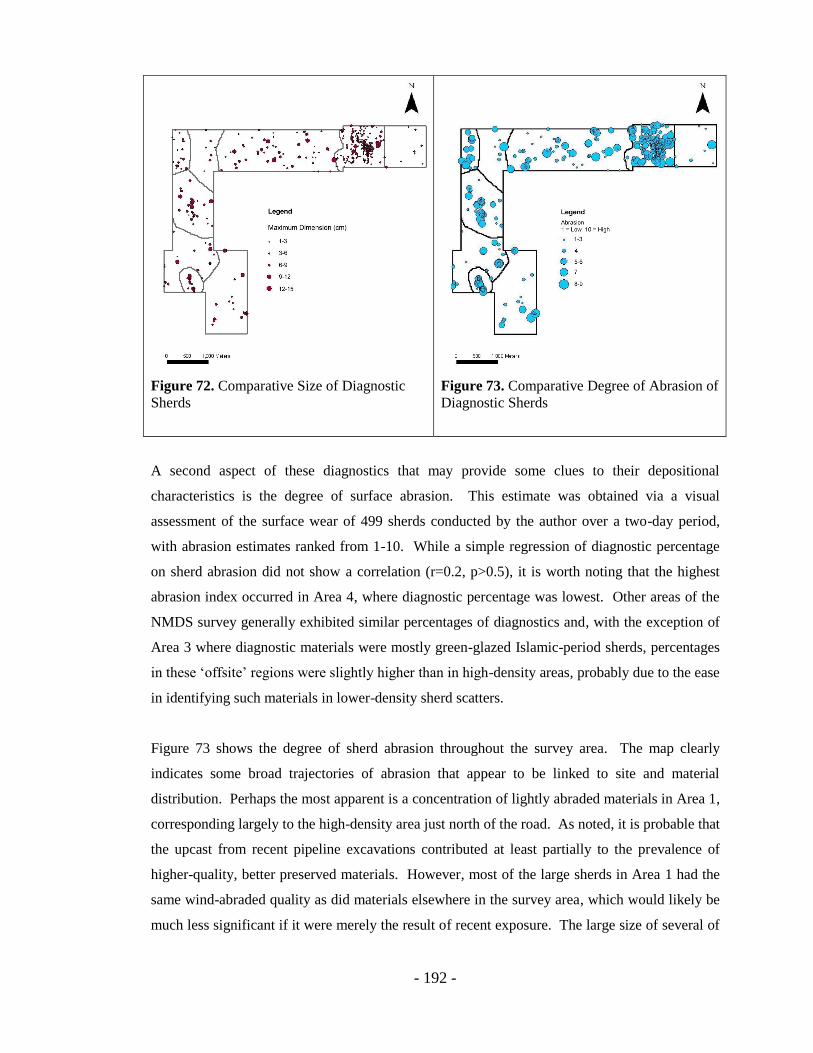
- 192 -
Figure 72. Comparative Size of Diagnostic
Sherds
Figure 73. Comparative Degree of Abrasion of
Diagnostic Sherds
A second aspect of these diagnostics that may provide some clues to their depositional
characteristics is the degree of surface abrasion. This estimate was obtained via a visual
assessment of the surface wear of 499 sherds conducted by the author over a two-day period,
with abrasion estimates ranked from 1-10. While a simple regression of diagnostic percentage
on sherd abrasion did not show a correlation (r=0.2, p>0.5), it is worth noting that the highest
abrasion index occurred in Area 4, where diagnostic percentage was lowest. Other areas of the
NMDS survey generally exhibited similar percentages of diagnostics and, with the exception of
Area 3 where diagnostic materials were mostly green-glazed Islamic-period sherds, percentages
in these „offsite‟ regions were slightly higher than in high-density areas, probably due to the ease
in identifying such materials in lower-density sherd scatters.
Figure 73 shows the degree of sherd abrasion throughout the survey area. The map clearly
indicates some broad trajectories of abrasion that appear to be linked to site and material
distribution. Perhaps the most apparent is a concentration of lightly abraded materials in Area 1,
corresponding largely to the high-density area just north of the road. As noted, it is probable that
the upcast from recent pipeline excavations contributed at least partially to the prevalence of
higher-quality, better preserved materials. However, most of the large sherds in Area 1 had the
same wind-abraded quality as did materials elsewhere in the survey area, which would likely be
much less significant if it were merely the result of recent exposure. The large size of several of
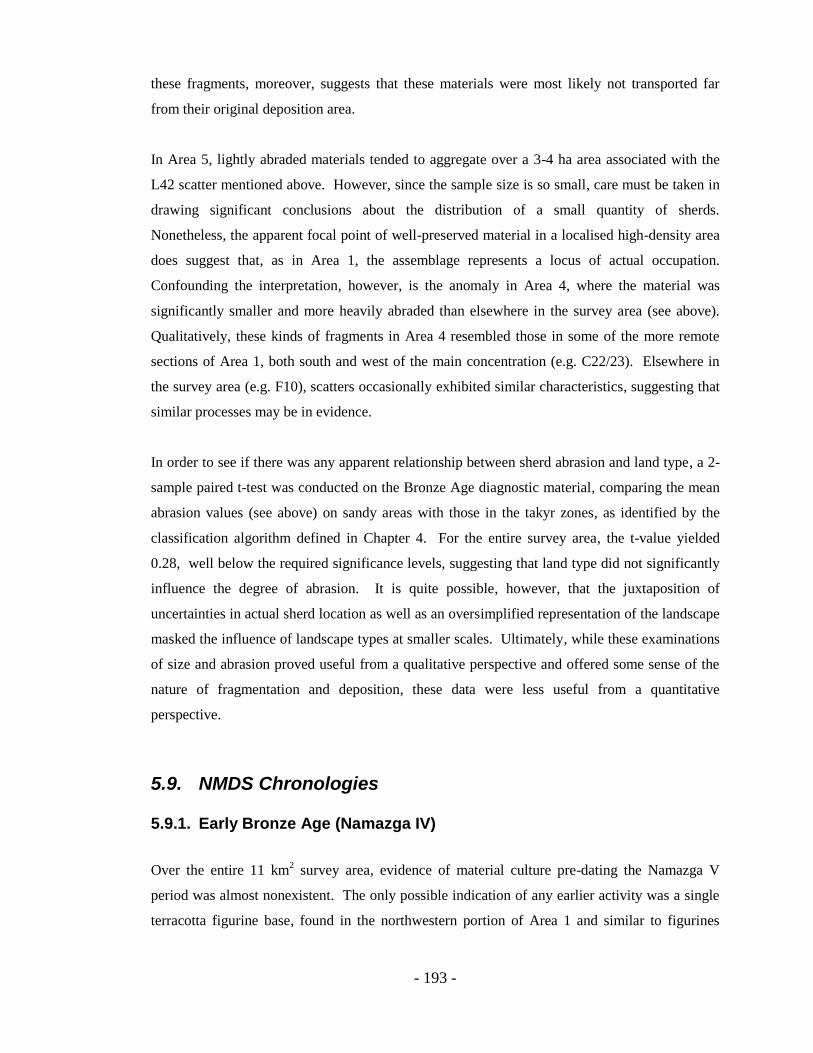
- 193 -
these fragments, moreover, suggests that these materials were most likely not transported far
from their original deposition area.
In Area 5, lightly abraded materials tended to aggregate over a 3-4 ha area associated with the
L42 scatter mentioned above. However, since the sample size is so small, care must be taken in
drawing significant conclusions about the distribution of a small quantity of sherds.
Nonetheless, the apparent focal point of well-preserved material in a localised high-density area
does suggest that, as in Area 1, the assemblage represents a locus of actual occupation.
Confounding the interpretation, however, is the anomaly in Area 4, where the material was
significantly smaller and more heavily abraded than elsewhere in the survey area (see above).
Qualitatively, these kinds of fragments in Area 4 resembled those in some of the more remote
sections of Area 1, both south and west of the main concentration (e.g. C22/23). Elsewhere in
the survey area (e.g. F10), scatters occasionally exhibited similar characteristics, suggesting that
similar processes may be in evidence.
In order to see if there was any apparent relationship between sherd abrasion and land type, a 2-
sample paired t-test was conducted on the Bronze Age diagnostic material, comparing the mean
abrasion values (see above) on sandy areas with those in the takyr zones, as identified by the
classification algorithm defined in Chapter 4. For the entire survey area, the t-value yielded
0.28, well below the required significance levels, suggesting that land type did not significantly
influence the degree of abrasion. It is quite possible, however, that the juxtaposition of
uncertainties in actual sherd location as well as an oversimplified representation of the landscape
masked the influence of landscape types at smaller scales. Ultimately, while these examinations
of size and abrasion proved useful from a qualitative perspective and offered some sense of the
nature of fragmentation and deposition, these data were less useful from a quantitative
perspective.
5.9. NMDS Chronologies
5.9.1. Early Bronze Age (Namazga IV)
Over the entire 11 km2 survey area, evidence of material culture pre-dating the Namazga V
period was almost nonexistent. The only possible indication of any earlier activity was a single
terracotta figurine base, found in the northwestern portion of Area 1 and similar to figurines
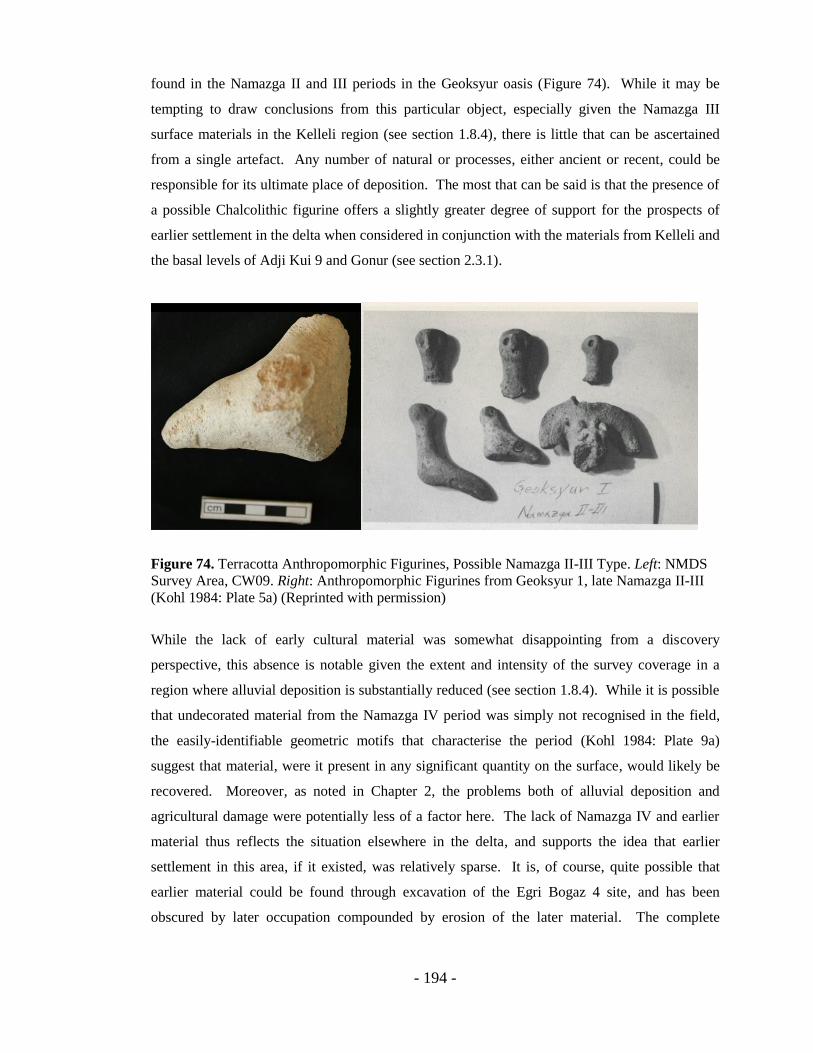
- 194 -
found in the Namazga II and III periods in the Geoksyur oasis (Figure 74). While it may be
tempting to draw conclusions from this particular object, especially given the Namazga III
surface materials in the Kelleli region (see section 1.8.4), there is little that can be ascertained
from a single artefact. Any number of natural or processes, either ancient or recent, could be
responsible for its ultimate place of deposition. The most that can be said is that the presence of
a possible Chalcolithic figurine offers a slightly greater degree of support for the prospects of
earlier settlement in the delta when considered in conjunction with the materials from Kelleli and
the basal levels of Adji Kui 9 and Gonur (see section 2.3.1).
Figure 74. Terracotta Anthropomorphic Figurines, Possible Namazga II-III Type. Left: NMDS
Survey Area, CW09. Right: Anthropomorphic Figurines from Geoksyur 1, late Namazga II-III
(Kohl 1984: Plate 5a) (Reprinted with permission)
While the lack of early cultural material was somewhat disappointing from a discovery
perspective, this absence is notable given the extent and intensity of the survey coverage in a
region where alluvial deposition is substantially reduced (see section 1.8.4). While it is possible
that undecorated material from the Namazga IV period was simply not recognised in the field,
the easily-identifiable geometric motifs that characterise the period (Kohl 1984: Plate 9a)
suggest that material, were it present in any significant quantity on the surface, would likely be
recovered. Moreover, as noted in Chapter 2, the problems both of alluvial deposition and
agricultural damage were potentially less of a factor here. The lack of Namazga IV and earlier
material thus reflects the situation elsewhere in the delta, and supports the idea that earlier
settlement in this area, if it existed, was relatively sparse. It is, of course, quite possible that
earlier material could be found through excavation of the Egri Bogaz 4 site, and has been
obscured by later occupation compounded by erosion of the later material. The complete
- 195 -
absence of such material, however, is suspect, especially considering that the depth of deposit is
very shallow in most Murghab sites (Hiebert 1994a: 17). Even if alluviation were a factor, it is
probable that a continuous occupation through the Namazga IV period into the Namazga V
would leave some traces of its existence. Again, however, there is the confounding situation of
the southern delta, where the complete lack of Middle Bronze surface material is almost
certainly the result of alluvial deposition. The Namazga V materials in burials in Taghta-
Bazaaar (Udeumuradov 1993), while not yet linked with any local settlement contexts, support
the case for undetected activity in the southern region, as does the identification of a coarse
sherd recovered from a natural cut south of Merv, addressed in section 2.3.1.
5.9.2. Middle Bronze Age (Namazga V)
As discussed elsewhere, the identification of purely Namazga V or Namazga VI materials,
especially in surface scatters, can be extremely difficult. Nevertheless, the excavations that have
been conducted in the central delta and at Kelleli, as well as the reference typologies in southern
Turkmenistan, offer some vital insights into the material culture of the Namazga V period in the
NMDS survey area. One of the clearest indicators of Middle Bronze presence in this area was a
flat violin-shaped female figurine (Figure 75). This object, and one quite similar to it found in
Area 5, are well-known forms both in the Murghab and Southern Turkmenistan during the
Namazga V period (Masson 1988:92, 27). Perhaps most prominently, these items have been
found in abundance in the Namazga V site of Adji Kui 9 (Rossi-Osmida 2007), as well as other
Middle Bronze contexts throughout the Murghab. Stylistically, there are distinct parallels
between these and the Namazga V statuettes in southern Turkmenistan sites such as Altyn Depe,
and a possible production centre for these objects has been attested during the same period at
Ulug Depe (Lecomte 2006). These figurines vanish abruptly at the beginning of the Namazga
VI horizon, and are absent in Late Bronze contexts in Bactria (Hiebert 1994a; Salvatori 2008a:
78). An additional small find that suggests a Namazga V presence was a copper or bronze seal,
found near a clearly disturbed context just north of the road in Area 1. These are usually found
in Namazga V contexts, and Salvatori posits a transition to stone seals during the Namazga VI
period (Salvatori 2008a). Hiebert has also noted the presence of seal impressions on ceramics
from the upper levels of Gonur North, although these were not recovered in the survey (Hiebert
1994a: 61).

- 196 -
Figure 75. Namazga V-type figurines from Area 1 and Area 5
The surface ceramics also provided distinctive evidence of Namazga V occupation. One of the
commonly cited hallmarks of Namazga V pottery, especially at Namazga Depe itself but also in
the Murghab, is a greenish exterior, although this feature can occasionally result from misfiring
of the vessels (Hiebert 1994a). Fragments with this colouration did occur in the NMDS survey,
primarily in the vicinity of Egri Bogaz 4. Of these, worth mentioning are bases with slightly
inward-sloping walls, possibly similar to finds in the basal levels of Adji Kui 9 (Salvatori 2002),
chronologically associated with the Kelleli phase. Also indicative of Namazga V occupation
were the lug handles noted above, which Hiebert (1994a: 50) associates with „hole-mouth pots‟.
In most of these fragments, only the handle remained, although one large sherd with the handle
and an undifferentiated vertical rim was located near Egri Bogaz 4 after the survey, offering
some confirmation of the vessel type, and similar vessels have been found at Kelleli 3 and 4 as
well as in the earliest levels at Gonur (P'yankova 1993; Hiebert 1994a: 50). With the exception
of this fragment and one handle in C-12, these handles were generally found in the far
northwestern part of Area 1 and were not found elsewhere in the survey area. Beyond area 1,
probable Namazga V pottery included plain-rim vessels, similar to the plain-rim bowls
associated primarily with Phase 1 of the Gonur North sounding (Hiebert 1994a: 47). Similar
rims with a slight eversion occurred throughout the survey area, although these rims are common
to multiple phases of the Murghab Bronze Age and could not be securely dated. Interestingly,
the vertical grooved rims, one of the signature Middle Bronze forms at both Gonur and Kelleli
and commonly found in the Gonur necropolis (S. Salvatori, pers. comm.), were almost entirely
absent in the survey area, and only one of these rim sherds was found immediately north of the
Egri Bogaz 4 mound.
- 197 -
Common to many Namazga V vessels are spiral-shaped, string-cut marks on bases (S. Salvatori,
pers. comm.) and these were prevalent throughout the survey area. This feature is widespread
throughout Turkmenistan and well-known at sites such as Altyn Depe during the Namazga V
period (Masson 1988). Although the process continues into the Late Bronze Age, the prevalence
of string-cut bases decreases during this period and knife cut, concentric incisions become more
common (S. Salvatori, pers. comm.). An additional feature of the Late Bronze bases is a slightly
more concave bottom, compared to the typically flat bases of the Namazga V period (S.
Salvatori, pers. comm.). Bases can be a difficult diagnostic, however, and their forms are often
less susceptible to change than rims. One example of this problem may be seen in the „tall-
necked bottles‟, characteristic of the Namazga V period in the southern Turkmen sites, but
spanning the Namazga VI period as well in the Murghab (Hiebert 1994a: 44, Figure 4.6). Bases
that fit this general profile were common throughout the survey area, and excavations at both
Adji Kui 1 and 9 have recovered similarly shaped bases from several contexts which support this
conservatism in form (Salvatori 2002).
Despite the difficulties in identification, there is enough material evidence to support a wide-
ranging occupation throughout the survey area in the Namazga V period, an assessment
consistent with the finds of the AMMD survey, which identified both Middle and Late Bronze
materials to the few sites recovered in the area (Cattani and Salvatori 2008). However, there are
some indications of a potentially significant pattern that may be present in Area 1. Clearly
identifiable Middle Bronze material is concentrated in the northern portion of the high density
surface scatter, but is much less common in the region of the Egri Bogaz 4 main mound, with the
exception of the single lug handle mentioned above. It is, of course, possible that the pipeline
excavation contributed to an over-representation of earlier materials that would not otherwise
have been exposed on the surface. However, the continuous presence of Namazga V material to
the north and northwest indicates that the Middle Bronze occupation in Area 1 is fairly
widespread. The lack of a comparable number of Namazga V diagnostics in the southern
portion of area 1 may, of course, be partially attributable to the difficulty in assigning
chronologies, and earlier ceramics may simply be obscured by the presence of later materials.
However, it is worth noting that Salvatori (2008b: 62, footnote 6) has recorded „settlements and
farms of the Middle Bronze Age‟ northeast of the Egri Bogaz sites compared with the mixed
Middle and Late Bronze deposits in the vicinity of the survey area. It is therefore possible that
the survey data reflect a broader pattern. The implications of these distributions will be
discussed more fully in Chapter 7.

- 198 -
Figure 76. Distribution of MBA and LBA sherds in the Egri Bogaz 4 Region
5.9.3. Late Bronze Age (Namazga VI)
As with the Middle Bronze materials, Late Bronze ceramics were also well-represented in the
survey area. Hiebert has noted that fabrics during the period tend to be darker shades of red, and
fine reddish wares with a buff exterior, tentatively associated with the period, were common in
the NMDS survey area. Also associated with the Late Bronze Age is the appearance of grey
wares, attested by Hiebert in the south mound of Gonur, and the appearance of imported
greywares has been noted by P‟yankova (1993; Hiebert 1994a). At least one grey sherd
contained the presence of flint inclusions, possibly indicative of an imported vessel (see
discussion on petrography in section 5.10). Several grey sherds were found in the western
sections of Area 1, although these were less prevalent in the high-density regions. Other grey
and black wares, often coarse and handmade, occurred in eastern parts of area 2, often with
evidence of blackening from cooking. Other features typical of late Namazga V and Namazga
VI materials were the distinctive trumpet-shaped bases that occurred sporadically throughout the
survey area. While these are well known in Gonur North, both in the necropolis as well as in
domestic contexts (Udeumuradov and Rossi-Osmida 2002; Salvatori 1995), their continuation
into the later phase as indicated by similar material at Togolok 1 and Gonur South complicates
any attempt to ascertain a definitive date.

- 199 -
The appearance of both Middle and Late Bronze material throughout the survey area is
interesting in light of Udeumuradov‟s interpretation of the region as a transitional zone between
Kelleli and the later phases of Gonur (see Udeumuradov, 1989, cited in Hiebert 1994a: 40).
However, it is worth noting that at least one significant Late Bronze site, Kelleli 6, has been
identified in the Kelleli region (Hiebert 1994a: 17), and recent AMMD data included in the
published database documents Late Bronze ceramics in association with Kelleli 3 and 4 as well.
Whether these dates reflect a cursory assessment of surface material or a re-examination of
excavated vessels is unclear, however, and most archaeologists maintain that both sites should
be placed within the Namazga V horizon (Masimov 1979; Hiebert 1994a).
5.9.4. Final Phase of the Bronze Age and Incised Coarseware
Evidence for the last stage of the Bronze Age, sometimes referred to as the Takhirbai period and
classed as the Final Bronze Age by AMMD researchers, has been noted occasionally in the
recent northern Murghab transects (Cattani and Salvatori 2008), but the main locus of
occupation by this period is in the southern portion of the delta, in the Takhirbai region. Indeed,
with the exception of the few greywares that could fall either in the Late Bronze or Final Bronze
period, and possibly some of the more coarse reddish wares, clearly identifiable forms from the
period were markedly absent from the survey area. One notable exception was a flat, everted
rim found in D-85, similar to Hiebert‟s ledge-rim bowl (Hiebert 1994a: 71, Figure 4-40). Poor
representation of the period may receive indirect support in the relative lack of the incised
coarsewares associated with the Andronovo cultures of the northern steppes. With the exception
of a few steppe materials between Kelleli and Egri Bogaz recently published by the AMMD
researchers, these materials are not common in the northern Murghab, although their presence is
well documented further south in sandy areas loosely associated with Late or Final Bronze Age
sites (Cattani et al. 2008b). In the NMDS region, only a single context (H45) yielded clearly
identifiable steppe materials, about 200m away from the western extent of significant Bronze
Age occupation in Area 1. While the occurrence of these coarsewares supports some degree of
interaction between the steppe and the sedentary societies in the northern Murghab, it seems
likely that the extent was quite limited. Elsewhere in the Murghab, the movement of Andronovo
peoples has generally been seen as occurring broadly in tandem with the encroachment of desert
sands, as attested by the common occurrence of incised steppe pottery on semi-stable sand dunes
rather than the alluvial surfaces typical of the sedentary Bronze Age settlements. The
- 200 -
significance of the increased interaction between sedentary and nomadic groups, and the
significance of this interplay with respect to the ultimate change in the socio-economic structure
towards the middle of the second millennium, is beyond the scope of this research and has been
discussed in detail elsewhere (Cattani et al. 2008b; c).
5.9.5. Later Periods
The Iron Age (Yaz I-III periods) was almost entirely unrepresented in the survey area. Painted
wares typical of the Early Iron Age were not found except in the instance of a single sherd with
painted, hatched lines in an isolated location in Area 2. The absence of any significant Iron Age
occupation this far north has been well-established elsewhere (Salvatori 2008b; 1998b), and the
northern extent of settlement from the period can be traced in a hypothetical east-west line
approximately 10 km south of the southern limit of the survey area. North of this line, Yaz III
material is extremely rare although AMMD reports have documented materials from the period
in a light scatter nearly 20 km northwest of the Kelleli Oasis (AMMD GIS). Additional
information about this information is not published, however, and its sheer isolation offers little
substantive evidence of legitimate occupation from this period. In conjunction with the poor
representation of materials from the end of the Bronze Age, it is reasonable to assume that, in
accordance with the results of earlier research, the early second millennium saw a significant
decrease in occupation in the northern fringe of the delta. This does not mean that no settlement
existed at all, however, and further research may certainly reveal more information about the end
of the Bronze Age in the region. Indeed, the interactions of incoming steppe groups with the
remnants of sedentary populations in the north may look quite different from similar interactions
in the more established central and southern sites, although significant research in this part of the
delta has not been conducted.
With the exception of these rare Iron Age materials, the diagnostics suggest a significant gap
until the middle Sasanian period, although several thick non-diagnostic sherds seen in
association with these materials in the field are reminiscent of many undecorated materials found
at Merv. While Sasanian materials have received significant recent study (e.g. Puschnigg 2006),
those of the Parthian period are less well understood (G. Puschnigg, pers. comm.) and it is
possible that some materials from the Parthian and early Sasanian period have been overlooked.
Most of the sherds from the late periods are thick with a uniform yellowish-white fabric, similar
to materials found in abundance in excavated contexts throughout Merv. These sherds often
- 201 -
occurred in sandy depressions, although field observations indicated that the sherd density for
these materials was very low compared with that of the Bronze Age scatters. The absence of
dense scatters from these periods, or any obvious architectural features, suggests that these
materials were most likely the result of either small-scale occupations or waystations, or perhaps
the result of mobile activities associated with long-distance trade.
Easier to identify were materials from the Islamic period, of which the most common were
similar whitish-yellow fabrics, often with a green or black glaze on either the internal or external
surface. Often, these sherds occurred singly, and several were found near the pipeline, so
evidence of specific sites could not be inferred from these particular artefacts. At least one large
base fragment contained a black interior glaze, which suggests a functional rather than a
decorative element. Castellato (2007) notes that glazes are often used for waterproofing and
support, so the identification of other glazed-interior sherds as fragments of water jars is quite
plausible.
5.10. Petrographic Analysis
In order to gain a better understanding of the variations in pottery fabrics in the northern delta, a
small petrographic analysis was conducted with the goal of identifying variability within the
material. Ultimately, this data may then be linked with known geologies to identify variations in
provenance. A successful petrographic analysis, integrated with other datasets, may reveal a
wealth of information regarding the origin and production of pottery. Petrographic analysis is
not unknown in the region. A major study has recently been conducted on materials from the
Kopet Dag foothills in Southern Turkmenistan (Coolidge 2005), and a large, systematic analysis
was recently conducted on the some of the early Islamic materials in the Merv oasis (Casellato et
al. 2007). Formal studies in the Bronze Age delta are rare, although Hiebert has cited results
from Gonur. To date, the story of pottery in the Murghab through the Bronze Age and later is
one of conservatism, and ware types are generally uniform, derived from local alluvial clays
(Hiebert 1994a).
The first part of the analysis consisted of a pilot study of six thin sections from Area 1. Five of
these, all from wheel-made vessels, were selected in order to provide a very small but
representative impression of the Bronze Age materials, and the sixth was an exotic sherd
consisting of a grey fabric with visible flint inclusions, which Salvatori has associated with Late
- 202 -
Bronze kitchenwares (S. Salvatori, pers. comm.). To this initial study were thereafter added an
additional twelve thin sections (see Appendix), including five samples from the western part of
the survey area. While most of the samples were selected from commonly occurring ware types
in order to examine general petrographic trends, a few outliers were included as well in order to
incorporate the full range of variability. In Area 1, these included a ribbed sherd from the 1st
millennium AD, recovered from the surface of the Egri Bogaz 4 mound, as well as a cream-
coloured sherd incised with a herringbone pattern, which Salvatori has suggested dates to the
Late Bronze Age (S. Salvatori, pers. comm.).
The first part of the study sought to determine whether or not broad categories could be
determined that might offer a clue to different processes or provenances. Isolating individual
fabric types, however, proved to be extremely difficult. While clear variations could be
identified in the matrix colour, this behaviour may often be caused by various firing conditions
(S. Groom, pers. comm.), and a closer examination of the mineral composition of the fabric did
not reveal a clear relationship between the colour of the matrix and the petrographic
composition. The matrices themselves are fine, and fairly uniform across the assemblage.
Quartz is the dominant inclusion, usually comprising 10-15% of the fabric. Common to all
material was a small percentage of biotite mica, typically around 1-2%, as well as plagioclase
feldspars in similar quantities. Aggregates of granite were occasionally found in similar
concentrations, and the volcanic origin of these inclusions may indicate that these materials
formed part of the transported alluvium.
While the material could not be easily classified, there was an apparent gradient to the quartz
distribution with the lowest percentages occurring in samples 2,8 and 14. Quartz distributions
tend to be unimodal and poorly sorted, with grains ranging from sub-rounded to sub-angular.
These characteristics suggest a fluvial rather than an aeolian derivation, although Bui (1990) has
shown that grain-size signatures in transitional zones are much more difficult to interpret, and
the complex fluvial-aeolian interplay in the northern Murghab epitomises such a region.
Evidence of deliberate additions of temper is difficult to detect. Hiebert (1994a: 65) posits a
slight increase in sand-tempered fabrics towards the Late Bronze Age at Gonur, and there is one
aspect of the material that is worth addressing in this regard. Sample 15, taken from the
moderate assemblage in D-70, shows very little fine quartz in the underlying matrix, but quartz
inclusions are very large and angular (Table 17). A similar fabric occurs in sample 3, and it is
possible that the lack of quartz in the matrix indicates a process of levigation, after which
alluvial sands may have been added as temper (S. Groom, pers. comm.).

- 203 -
Evidence of other inclusions was limited. Several sherds exhibited evidence of linear, parallel
voids, often in-filled with calcium carbonate agglomerations and possibly indicative of chaff
temper. There are two outliers worth mentioning, however. Sample 12 is a grey body sherd,
and contained sharply angular flint inclusions. Similar material was extremely rare in the survey
area, and the sample was clearly an outlier in the petrographic spectrum. In the resource-poor
northern Murghab, flint is not readily available (A. Ninfo, pers. comm.; P. Mozzi, pers. comm.).
The most likely origin for flint, on the basis of accessibility, is the Kopet Dag, although Mozzi
suggests that flint nodules in this region tend to be less angular than those found in the sample.
Ample flint quarries may also have been available in Bactria as well as northern Iran (Coolidge
2005). Moreover, the nature of the fabric, primarily in its extremely low quartz component,
appears to be quite different from the rest of the material, suggesting that the entire pot, rather
than just the temper, was probably imported. Such a possibility would be in line with the
increasing presence of greywares during the Late Bronze period (P'yankova 1993), and while a
single sherd is too small a sample, the presence of a few similar sherds in the survey area may
provide some evidence of the scope of exchange in the Late Bronze period. The only other clear
outlier in the assemblage was Sample 19, taken from a coarseware sherd in Area 8. While the
matrix was similar to the rest of the assemblage, large chunks of grog were clearly evident. The
fabric of the grog is almost identical to the background matrix, suggesting an entirely local
process of grinding and recycling local pottery as temper.
The results of the petrographic analysis primarily reveal the uniformity of the material, and
suggest that little information on provenance is directly accessible using this methodology on
such a local scale. Furthermore, no apparent distinction could be discerned between
geographical areas, indicating that any subtle variation between clays associated with different
channel system is either not discernible or requires a much more rigorous petrographic study
well out of the scope of this research. At the same time, there are conclusions that can be drawn.
The analysis indicates conservatism and provinciality in the procurement of clays for pottery.
While there was variability in the materials studied, this was primarily related to the richness of
the fabrics, rather than a substantive qualitative difference. While it is possible that the subtle
variability in temper may reflect active decisions in the production process, more research is
needed to determine if certain qualities may have been sought in local clays, or if production
processes that involved tempering were different, perhaps incorporating naturally levigated clays
(Hamer and Hamer 1975). While these possibilities are important to consider, variation may be
best explained by local variation in the alluvium.
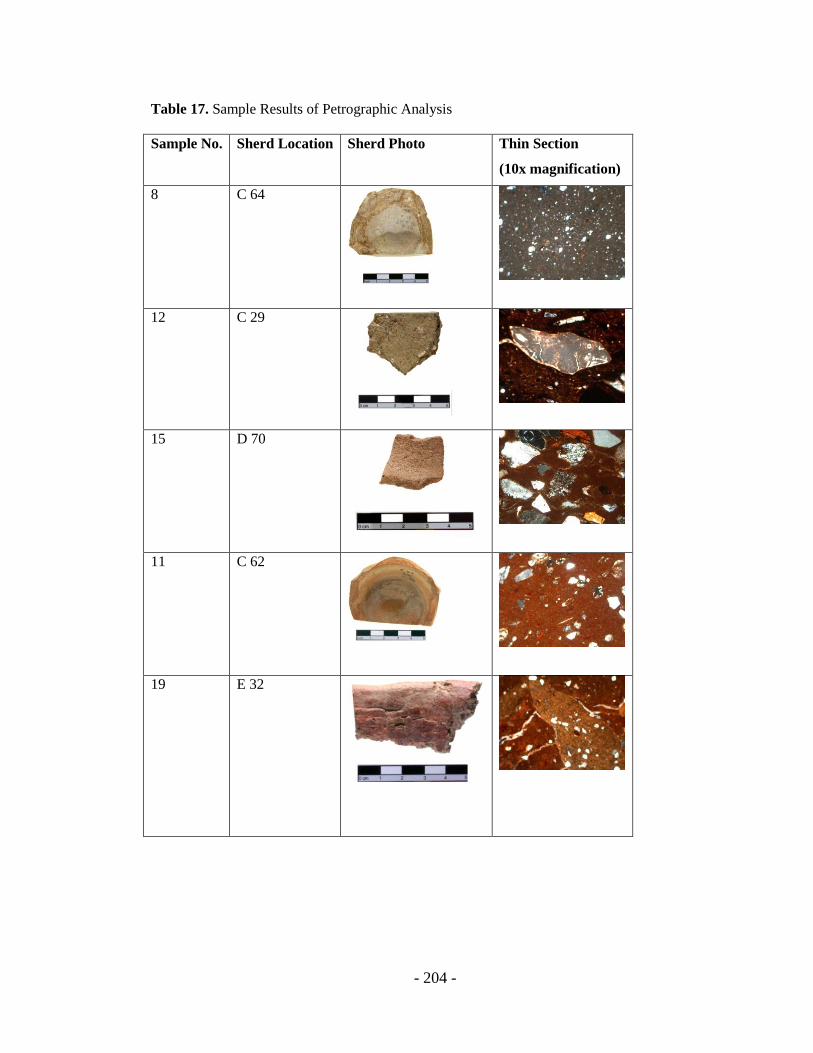
- 204 -
Table 17. Sample Results of Petrographic Analysis
Sample No. Sherd Location Sherd Photo Thin Section
(10x magnification)
8 C 64
12 C 29
15 D 70
11 C 62
19 E 32
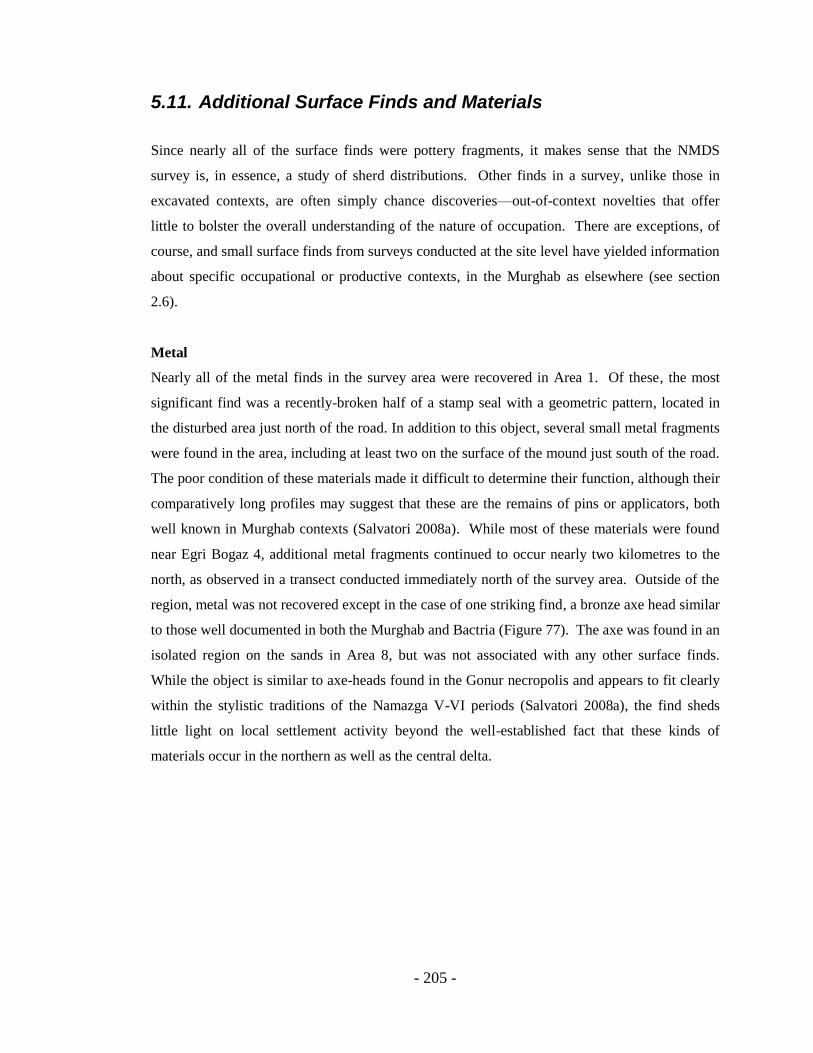
- 205 -
5.11. Additional Surface Finds and Materials
Since nearly all of the surface finds were pottery fragments, it makes sense that the NMDS
survey is, in essence, a study of sherd distributions. Other finds in a survey, unlike those in
excavated contexts, are often simply chance discoveries—out-of-context novelties that offer
little to bolster the overall understanding of the nature of occupation. There are exceptions, of
course, and small surface finds from surveys conducted at the site level have yielded information
about specific occupational or productive contexts, in the Murghab as elsewhere (see section
2.6).
Metal
Nearly all of the metal finds in the survey area were recovered in Area 1. Of these, the most
significant find was a recently-broken half of a stamp seal with a geometric pattern, located in
the disturbed area just north of the road. In addition to this object, several small metal fragments
were found in the area, including at least two on the surface of the mound just south of the road.
The poor condition of these materials made it difficult to determine their function, although their
comparatively long profiles may suggest that these are the remains of pins or applicators, both
well known in Murghab contexts (Salvatori 2008a). While most of these materials were found
near Egri Bogaz 4, additional metal fragments continued to occur nearly two kilometres to the
north, as observed in a transect conducted immediately north of the survey area. Outside of the
region, metal was not recovered except in the case of one striking find, a bronze axe head similar
to those well documented in both the Murghab and Bactria (Figure 77). The axe was found in an
isolated region on the sands in Area 8, but was not associated with any other surface finds.
While the object is similar to axe-heads found in the Gonur necropolis and appears to fit clearly
within the stylistic traditions of the Namazga V-VI periods (Salvatori 2008a), the find sheds
little light on local settlement activity beyond the well-established fact that these kinds of
materials occur in the northern as well as the central delta.
- 206 -
Figure 77. Copper or Bronze Axe head from M86
Stone
Evidence of worked stone, either implements or debitage, was extremely rare. Only a single
instance of black chert was found during the survey. A single sub-centimetre cube of black
chert, possibly debitage, was found in a test pit in Area 1 immediately below the takyr surface, in
an area of unusually high ceramic density. The cultural material located in this context was
extremely fragmented, and the shallowness of the deposit suggests that the material may have
resulted from erosion immediately to the west. It is somewhat surprising that worked stone did
not occur in larger quantities, since finished stone implements are known throughout the
Murghab (Salvatori 2008a). The absence of debitage can be partially explained by the lack of
stone quarries in the immediate area (P. Mozzi, pers. comm.). Stone implements elsewhere in
the Murghab in Namazga V and VI periods are seen as imported finished goods, and the
strongest evidence of local production from raw materials acquired elsewhere occurs in the
Takhirbai period, where a local bead-making industry has been inferred from the presence of
turquoise and lapis lazuli flakes on Takhirbai 1 (Vidale et al. 1998). The lack of finished stone
products elsewhere may simply reflect the masking of primary contexts, since stone is resistant
to the fragmentation properties that contribute to the redeposition of pottery. While stone tools
were not recovered, larger stone materials that appear to be linked to Bronze Age occupation did
occur in the survey area (see Appendix). Worth noting is a chunk of pinkish-white calcite of a
type found commonly at Gonur and other Murghab sites, as well as a small chunk of yellowish
onyx similar in appearance to some of the „mace-heads‟ or „bishops‟ staffs‟ found at Togolok 21
(Sarianidi 2005: 273, Fig. 126). These materials tended to occur singly, however, and did not
indicate any wider pattern of distribution.
- 207 -
Brick
Brick debris occurred throughout the survey area, although primarily in conjunction with the
more substantial surface distributions in Areas 1 and 4. The largest concentration of such
material occurred just southeast of the main Egri Bogaz 4 mound, in association with moderate
ceramic densities and a few pieces of slag, and a similar scatter occurred near the northern line
of test pits. Some of the debris was fired, and some signs of vitrification were reminiscent of the
kiln-associated scatter on Egri Bogaz 1 as well as similar materials on Egri Bogaz 2 (see Section
5.2). These concentrations may therefore represent production areas, which may see some
support in the specialised craft production areas at large sites such as Adji Kui 1 and Gonur, as
well as Altyn Depe and Ulug Depe in southern Turkmenistan (Masson 1988: 127, 150; Kohl
1984). Isolated brick fragments also occurred in Area 4 in association with moderate sherd
scatters (A11), although these were too few to draw any conclusions pertaining to production or
activity areas.
Terracotta
The three figurines, two of clear Namazga V type, and one that may be significantly earlier, have
already been discussed. In addition to these, the only other terracotta objects recovered were
two spindle whorls, one in the eastern section of Area 2 in an isolated context, and a second,
similar object associated with the large scatter near L42. The occurrence of this spindle whorl
with broad distribution of Namazga V and VI materials, as well as one of the Namazga V
figurines, may be seen to offer some support for a significant, if localised, occupation in the
western part of the survey area.
5.12. Summary
It is clear from the preceding data, even at this middle stage in the analysis, that there is an
unfolding story in this distribution of 22,000 potsherds. The qualitative data, set against the
restrictions of a dynamic and visually obstructed landscape, show clear signs of patterning, both
of material and of possible settlement areas. Even at this point, however, it is easy to see where
the old biases come into play. Perhaps the „tyranny of the tell‟ is less problematic, with no
significant mounded settlements to speak of, but it is easy to focus on the large aggregations
simply because there is potentially more information there, and consequently fall into precisely
the same trap the research seeks to avoid. This problem will be addressed to a significant extent
- 208 -
in the following chapter, which attempts to revisit the distributional pattern from fairly new and
more quantitative angles.
Before this voyage into the statistical abstract, it is worth assessing the potential benefit of the
survey data. There is clearly a relationship between the character of the material distribution and
aspects of actual occupation, although not every scatter can offer specific information. There
are also substantial indications, based on the tendency of materials to aggregate over large areas,
that even though visibility may be restrictive, it is only a limiting factor in interpreting this
particular archaeological landscape—not a catastrophic one. Indeed, both the geomorphology
and the distribution of materials are dynamic processes that, while altering the picture of the
original landscape, are able to offer substantial clues as well.
- 209 -
Chapter 6. Results of GIS and Spatial Analysis
6.1. Overview
The preceding chapter introduced the key observations and features of the fieldwalking survey,
broadly situated against the backdrop of current geomorphology and topography. Given the
extremely tenuous nature of the relationships between the surface material and the actual
subsurface archaeology, it falls now to other kinds of analysis to examine how such a skewed
picture can be put in perspective—and if, in fact, it is feasible to do so in such a complex
landscape. The following analysis of spatial patterning aims to keep the concept of scale at the
forefront of discussion, beginning with a broad overview of spatial concepts in the delta as a
whole, then narrowing the analytical lens throughout the course of the chapter, ultimately
focusing on particular regions within the survey area itself.
6.2. The Big Picture: Trends from Previous Murghab Surveys
As briefly discussed in Chapter 2, spatial analysis has played a significant role in the more recent
understanding of the Murghab settlement structure (Cleuziou et al. 1998; Cattani et al. 2008a).
It is useful, however, to briefly assess the NMDS findings against these observed spatial
patterns. As of 2008, the prehistoric (i.e. Bronze and Iron Age) archaeological map catalogued
over 900 sites, 11
of which 361 are classed as Middle or Late Bronze Age. Of these, only 8,
including the well-known settlements of Gonur North and Adji Kui 9, are classified as strictly
MBA, while 51 exhibit continuity into the LBA. New sites established during the LBA initially
appear to be much more prevalent, although these may be over-represented due to the masking
of earlier material. Furthermore, as addressed in Chapters 3 and 5, chronological attribution may
be further exacerbated by the close similarities between the MBA and LBA plainwares
throughout the delta.
Another complication, discussed in the previous chapter with specific reference to Egri Bogaz 4,
is the concept of size. The estimation of site size is a complex topic in the delta, due to the
tendency for material to aggregate on takyr edges or to be obstructed by dune encroachment, as
11
The updated inventory list as of 2008 only records 794 sites, although this appears to simply reflect that
sites with higher ID numbers simply have not been processed.
- 210 -
well as the complex processes of erosion and deflation (also see section 7.2). For many of the
larger sites in the delta, excellent topographic maps have been created using total station surveys,
although these usually represent the actual mounded regions of sites, so the boundary
delineations may be arbitrary and often not associated with the extent of material scatter (see
maps in Bondioli and Tosi 1998: 268-297). Small, surface scatters previously identified by the
Russian and Central Asian surveys are often measured by the length and width of the pottery
distribution (e.g. Sarianidi 1990: 11-13), and the AMMD database indicates that size estimates
of 101 of the 900 sites, including most of the named sites identified by earlier Soviet surveys,
remain unmodified from their initial observations. Newly identified small scatters with no
clearly discernible topographic anomalies are classified in the AMMD database as either „spot‟
or „potsherd scatter‟, a classification that accounts for 90 of the 361 Bronze Age sites in the
delta. These are described in terms of pottery density, which is nearly always low (Bondioli and
Tosi 1998: xviii), and reliable site dimensions are usually not recorded.
For larger sites, the method of identifying site size employed by AMMD researchers involved
„walking along its perimeter and marking all evident corner points along the breaking line of
artefacts‟ primary distribution or along the edges of overlapping [geomorphological]
elements…‟ (Bondioli and Tosi 1998: xvi). Exactly how this „breaking line‟ was determined,
however, is not clear. Although the complex topography of the entire Egri Bogaz 4 environment
was discussed in the previous chapter, it is difficult to ascertain exactly which parameters are
used in measuring dimensions. In addition to Egri Bogaz 4, the treatment of two particular sites
in the database offers two very different perspectives of size estimate. One of these is AMMD
412, a Bronze Age site estimated at 6.5 ha (AMMD GIS). The site is an amalgam of Adji Kui
2,3 and 4 as originally identified by Sarianidi (see discussion in Rossi-Osmida 2007: 21). This
site is conveniently located along the road to the survey area, and a chance observation revealed
a large scatter of material immediately to the south which spanned more than a hectare. In the
AMMD database, AMMD 412 is described as being surrounded by dunes, suggesting that the
extent of the occupied area may not have been accurately measured. A different picture,
however, emerges for the large post-Iron Age mounds much closer to Merv. Several of these
mounds are clearly identifiable from the road and, due to their location in the southern delta, are
unobstructed by sand. A cursory examination of the size discrepancy between one of these
depes, AMMD 448, and its associated sherd scatter was conducted by taking GPS measurements
every few metres or so around the mound. The surface material was generally confined to the
mound, and similar observations were made at a second site, AMMD 36, although this was not
measured. Is should be noted, however, that these depes are situated in agricultural regions
- 211 -
which probably hindered the detection of surface material, although the actual depes can easily
be discerned in the landscape. While these observations in no means represent a systematic
study, they clearly illustrate the confounding impact that geomorphological conditions may have
on the perception of site size, particularly in the sand-obstructed northern delta.
6.3. General Spatial Trends in the NMDS Data
In the NMDS study region, the results of the survey data discussed in Chapter 5 indicated the
presence of at least three or four large and fairly distinct settlement regions (Figure 78). The
first corresponds to the large occupied zone in Area 1. Based on the extent of the moderate to
heavy scatters, this general area of sherd coverage comprises approximately 60ha, although the
actual settled area is likely to be much lower. Although the limited scope of the survey could
not offer an estimate of the full spatial patterning of the settlement area, the continued presence
of sherd concentrations beyond the northern boundary of the survey area suggests that more
limited occupation may have extended several kilometres to the north of Egri Bogaz 4. This
finding is supported by the continued presence of brick and metal more than a kilometre north of
the main survey region, usually associated with light to moderate sherd concentrations.
In the east-west direction, significant occupation was much more constrained, with a distinct
fall-off in material concentration occurring approximately 800m to the west of the highest-
density region. To the east, the decline in material was even more dramatic, with a near
cessation of Bronze Age surface sherds occurring within about 300m. While this apparent
eastern extent of Bronze Age material may be partially attributable to sand cover, large patches
of visible alluvium and takyr surfaces in Area 1E suggest that visibility is less of an issue than an
actual cessation of heavy occupation. Moreover, the presence of dense surface scatters
throughout the varied landscape in Area 1 suggests that substantial occupation is unlikely to be
completely obscured by such geomorphological conditions.
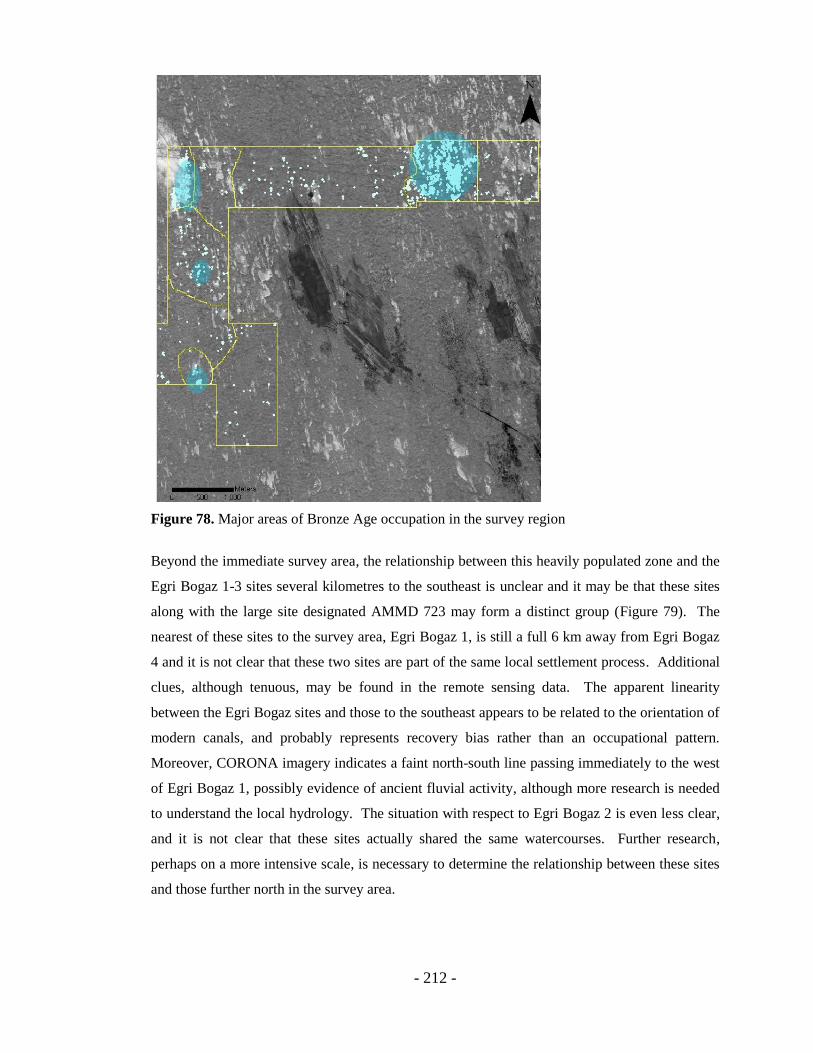
- 212 -
Figure 78. Major areas of Bronze Age occupation in the survey region
Beyond the immediate survey area, the relationship between this heavily populated zone and the
Egri Bogaz 1-3 sites several kilometres to the southeast is unclear and it may be that these sites
along with the large site designated AMMD 723 may form a distinct group (Figure 79). The
nearest of these sites to the survey area, Egri Bogaz 1, is still a full 6 km away from Egri Bogaz
4 and it is not clear that these two sites are part of the same local settlement process. Additional
clues, although tenuous, may be found in the remote sensing data. The apparent linearity
between the Egri Bogaz sites and those to the southeast appears to be related to the orientation of
modern canals, and probably represents recovery bias rather than an occupational pattern.
Moreover, CORONA imagery indicates a faint north-south line passing immediately to the west
of Egri Bogaz 1, possibly evidence of ancient fluvial activity, although more research is needed
to understand the local hydrology. The situation with respect to Egri Bogaz 2 is even less clear,
and it is not clear that these sites actually shared the same watercourses. Further research,
perhaps on a more intensive scale, is necessary to determine the relationship between these sites
and those further north in the survey area.
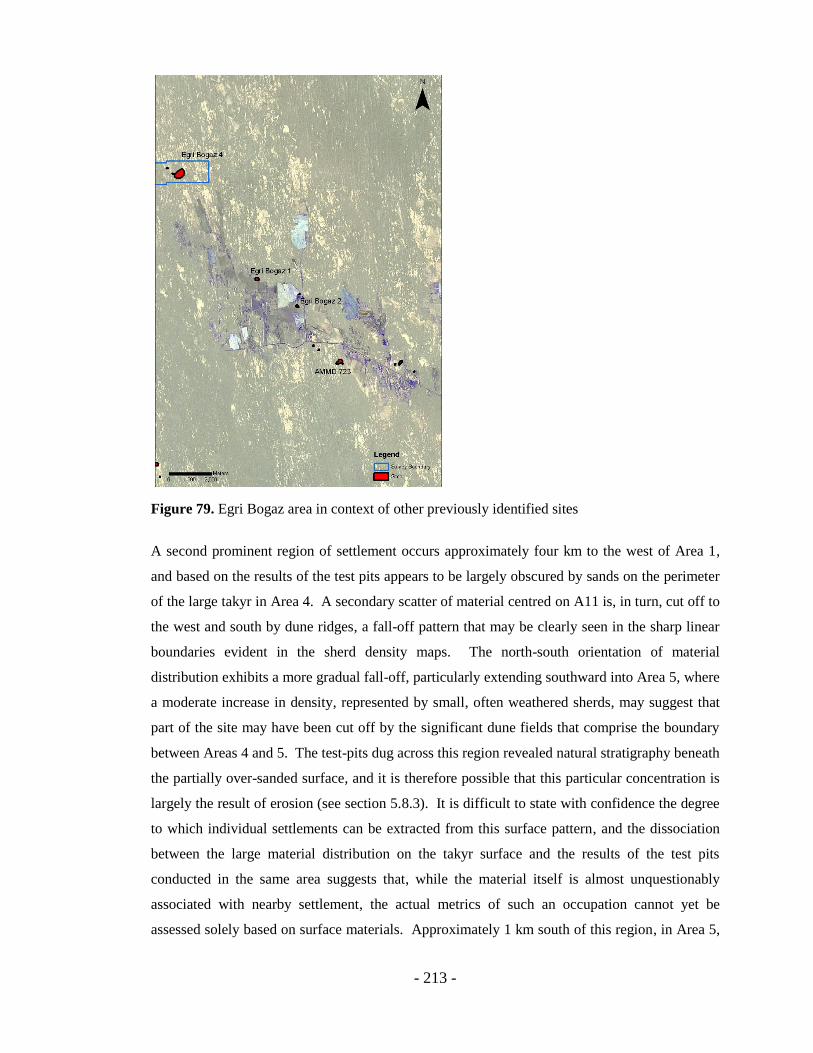
- 213 -
Figure 79. Egri Bogaz area in context of other previously identified sites
A second prominent region of settlement occurs approximately four km to the west of Area 1,
and based on the results of the test pits appears to be largely obscured by sands on the perimeter
of the large takyr in Area 4. A secondary scatter of material centred on A11 is, in turn, cut off to
the west and south by dune ridges, a fall-off pattern that may be clearly seen in the sharp linear
boundaries evident in the sherd density maps. The north-south orientation of material
distribution exhibits a more gradual fall-off, particularly extending southward into Area 5, where
a moderate increase in density, represented by small, often weathered sherds, may suggest that
part of the site may have been cut off by the significant dune fields that comprise the boundary
between Areas 4 and 5. The test-pits dug across this region revealed natural stratigraphy beneath
the partially over-sanded surface, and it is therefore possible that this particular concentration is
largely the result of erosion (see section 5.8.3). It is difficult to state with confidence the degree
to which individual settlements can be extracted from this surface pattern, and the dissociation
between the large material distribution on the takyr surface and the results of the test pits
conducted in the same area suggests that, while the material itself is almost unquestionably
associated with nearby settlement, the actual metrics of such an occupation cannot yet be
assessed solely based on surface materials. Approximately 1 km south of this region, in Area 5,
- 214 -
there is a significant concentration of material over several hectares that may constitute a
separate occupational area from those listed above. While the predominant material dates from
the Bronze Age, there is also a significant quantity of later sherds from the Sasanian and Early
Islamic periods. Small quantities of brick, as well as the figurine mentioned above, further
suggest that this region constitutes a legitimate settlement area rather than simply a southern
extension of the Area 4 occupation.
A final, and clearly distinct, occupational zone occurs yet another two kilometres to the south of
the concentrations in Areas 4 and 5. While the problems of dating the brick-covered mounds in
this area have been addressed (section 5.6.4), the significant scatter of Bronze Age material a
few hundred metres to the south, from which nearly a dozen diagnostic sherds were recovered, is
significant. The material occurs within a region of apparently complex fluvial activity that may
be associated with the relative linearity of the sherd distributions extending from this region
northwards towards the Area 4 sites. Without excavation, it is not possible to determine with
certainty if the sand ridge immediately west of the D-63 brick concentration is associated with a
canal, although the linearity of the feature, and its origin at an apparent palaeochannel to the
south suggest that this may be a possibility.
6.3.1. Distributions of Material
As noted above, the majority of recorded sites are sherd scatters that occur on the edges of
takyrs. Table 18 shows the relationship between ceramic concentrations and open takyr surface,
determined using the supervised image classification used in the visibility analysis (section
4.3.3). Two size categories of takyr, 400 m2 and 1000 m
2, were included in the investigation, in
order to examine the relationship between settlement and broader alluvial regions, and a buffer
zone was set at 20m to account for the potential error in locating any one particular sherd. Small
takyr regions, and depressions below the size of a single collection unit, were not included in the
analysis. The results show that for each size category, observed sherd counts were significantly
higher than expected sherd counts. The exception occurred when the highest density areas, 1
and 4, were removed. In these cases, sherd counts on the takyrs were actually lower than
expected—although this is most likely related to the preponderance of small and often
oversanded takyrs that may not have been detected by the analysis. When the 20m buffer zone
was included, however, sherd counts in all cases were significantly greater than expected. In
terms of total area, the buffer only increased the hypothetical takyr cover by a little over 1%,
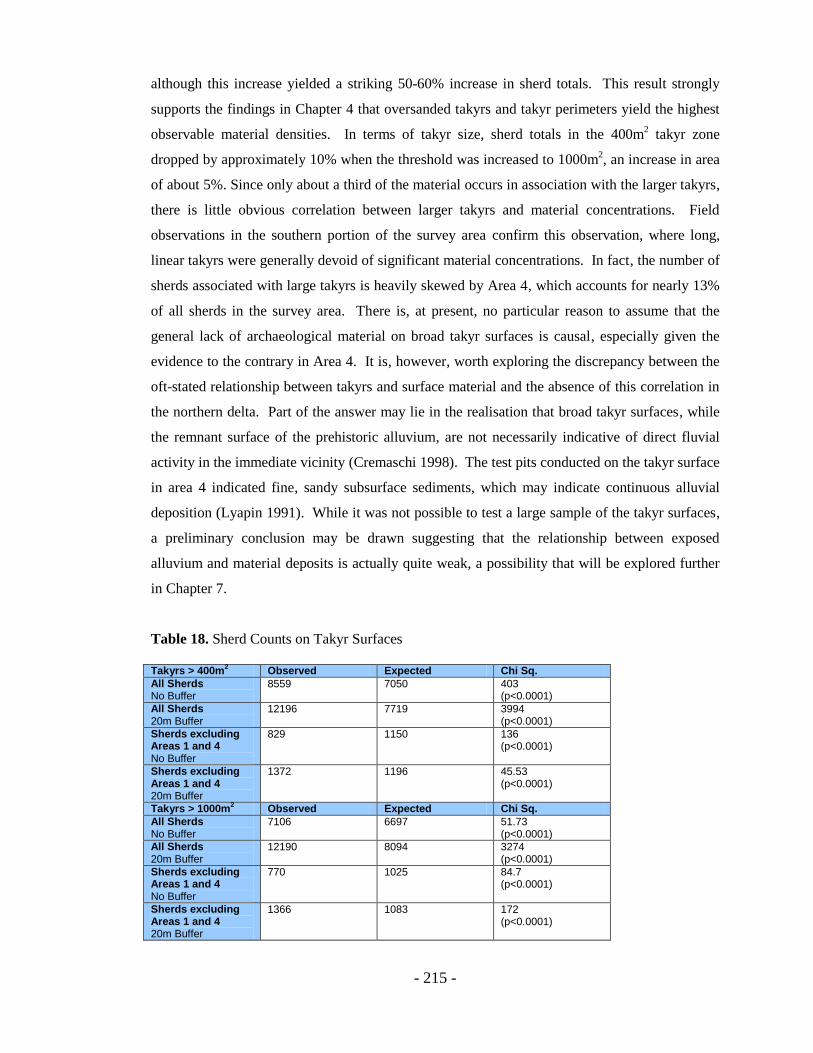
- 215 -
although this increase yielded a striking 50-60% increase in sherd totals. This result strongly
supports the findings in Chapter 4 that oversanded takyrs and takyr perimeters yield the highest
observable material densities. In terms of takyr size, sherd totals in the 400m2 takyr zone
dropped by approximately 10% when the threshold was increased to 1000m2, an increase in area
of about 5%. Since only about a third of the material occurs in association with the larger takyrs,
there is little obvious correlation between larger takyrs and material concentrations. Field
observations in the southern portion of the survey area confirm this observation, where long,
linear takyrs were generally devoid of significant material concentrations. In fact, the number of
sherds associated with large takyrs is heavily skewed by Area 4, which accounts for nearly 13%
of all sherds in the survey area. There is, at present, no particular reason to assume that the
general lack of archaeological material on broad takyr surfaces is causal, especially given the
evidence to the contrary in Area 4. It is, however, worth exploring the discrepancy between the
oft-stated relationship between takyrs and surface material and the absence of this correlation in
the northern delta. Part of the answer may lie in the realisation that broad takyr surfaces, while
the remnant surface of the prehistoric alluvium, are not necessarily indicative of direct fluvial
activity in the immediate vicinity (Cremaschi 1998). The test pits conducted on the takyr surface
in area 4 indicated fine, sandy subsurface sediments, which may indicate continuous alluvial
deposition (Lyapin 1991). While it was not possible to test a large sample of the takyr surfaces,
a preliminary conclusion may be drawn suggesting that the relationship between exposed
alluvium and material deposits is actually quite weak, a possibility that will be explored further
in Chapter 7.
Table 18. Sherd Counts on Takyr Surfaces
Takyrs > 400m
2 Observed Expected Chi Sq.
All Sherds No Buffer
8559 7050 403 (p<0.0001)
All Sherds 20m Buffer
12196 7719 3994 (p<0.0001)
Sherds excluding Areas 1 and 4 No Buffer
829 1150 136 (p<0.0001)
Sherds excluding Areas 1 and 4 20m Buffer
1372 1196 45.53 (p<0.0001)
Takyrs > 1000m2 Observed Expected Chi Sq.
All Sherds No Buffer
7106 6697 51.73 (p<0.0001)
All Sherds 20m Buffer
12190 8094 3274 (p<0.0001)
Sherds excluding Areas 1 and 4 No Buffer
770 1025 84.7 (p<0.0001)
Sherds excluding Areas 1 and 4 20m Buffer
1366 1083 172 (p<0.0001)
- 216 -
6.4. ‘Dots on a Map’ Revisited—Spatial Statistics in the Survey Area
6.4.1. Global Statistics
To this point, the spatial concepts discussed have emphasised intuitive, visual aspects of the
dataset to identify patterns in the material distribution, focusing primarily on the identification of
possible settled regions based on observable metrics. In the spirit of Ebert‟s distributional
archaeology (1992), the collection methodologies identified in Chapter 3 allow the NMDS
survey data to be treated as a quasi-continuous dataset. Actual continuity is, of course, purely
theoretical—and even within small sample units a significant degree of uncertainty and sampling
error must be acknowledged (Orton 2004; Shennan 1997). The NMDS survey area can be
thought of as a full population of interlinked units from which a spatial point pattern can be
extracted. For the purposes of the following analyses, two types of spatial point patterns were
created. The first of these represents the total number of sherds counted in the field, with these
sherds then assigned to random absolute locations within each respective collection unit. The
resulting point pattern is thus only a representation of the material distribution, where any
individual point represents a sherd that may in actuality be up to a maximum of 34m (the
hypotenuse of a collection unit, though usually likely to be much less) from the actual sherd
location barring other errors in counting or fieldwalking. A second point pattern represents the
locations of positive collection units—i.e. units with at least one sherd present—and was
generated using the centroid of each collection unit in the NMDS grid.
In order to assess the relevance of these spatial patterns to questions of settlement distribution,
an appropriate set of questions must be devised that centre on the identification of one or more
null hypotheses against which spatial patterning may be tested. In the case of the NMDS data,
the initial questions deal with global aspects of the distribution and aim to assess the general
character of the surface scatter throughout the survey area. Banning (2002: 51) has noted that
the Poisson distribution may be used as a general model to represent a completely random
distribution of sites or material in the field (Complete Spatial Randomness or CSR), although the
use of the Poisson model as a spatial null hypothesis has been criticised by Nance and Ball
(1989: 40) in environments where clustering is known to be present. These problems with the
distribution are exacerbated even further when recovery biases are factored in, and assumptions
of randomness in the underlying spatial pattern may become increasingly unreliable.

- 217 -
Nevertheless, as Banning (2002: 51) has noted, the Poisson distribution is still useful to assess
the general character of point patterns, before delving into secondary or more local factors that
may be affecting the distribution.
The following analysis steps through a suite of methods for considering point patterns, with
some ultimately proving more useful than others. The first approach addresses the extent of
clustering in the survey area, and begins with the simplest and most conventional test, using a
Clark-Evans nearest neighbour statistic (Clark and Evans 1957). This test measures the mean
distance between any two points in order to assess the overall degree of clustering with respect
to a Gaussian distribution. While still commonly employed, the statistic falls short in that it only
considers one analytical scale. Moreover, the metric offers only a global assessment of the
degree of clustering, while saying nothing of local or regional patterns. Thus, in a convoluted
and only partially visible landscape like the Murghab, such a statistic can only be used as a
starting point.
Table 19 presents the Clark-Evans statistics for the entire survey area, and offers confirmation
that complete spatial randomness (CSR) can be rejected over the survey area. The similarity in
the ratio of observed to expected distances is similar for pockets of 5 or 10 sherds, suggesting
that similar processes may be at work for small clusters, whereas the much higher ratio for all
positive collection units (sherd counts of 1 or more) indicates that sporadic occurrences of a
single artefact may have a significant impact on the overall pattern of clustering.
Table 19. Degree of Clustering (Clark-Evans Nearest Neighbour Test)
Full Survey Area
(sherd counts)
Avg/Expected
Nearest Neighbour
(m)
Z Significance (p) NN Ratio
>=1 30.2/58.9 -44 <0.01 0.51
>=2 34.5/76.6 -38 <0.01 0.45
>=5 38/106 -31 <0.01 0.35
>=10 48.5/ -24 <0.01 0.36
6.4.2. Multiscalar investigations
While the Clark-Evans test can be useful in providing an overall degree of clustering, it faces an
inherent drawback in that it only evaluates the distance to the nearest neighbour of a given point,
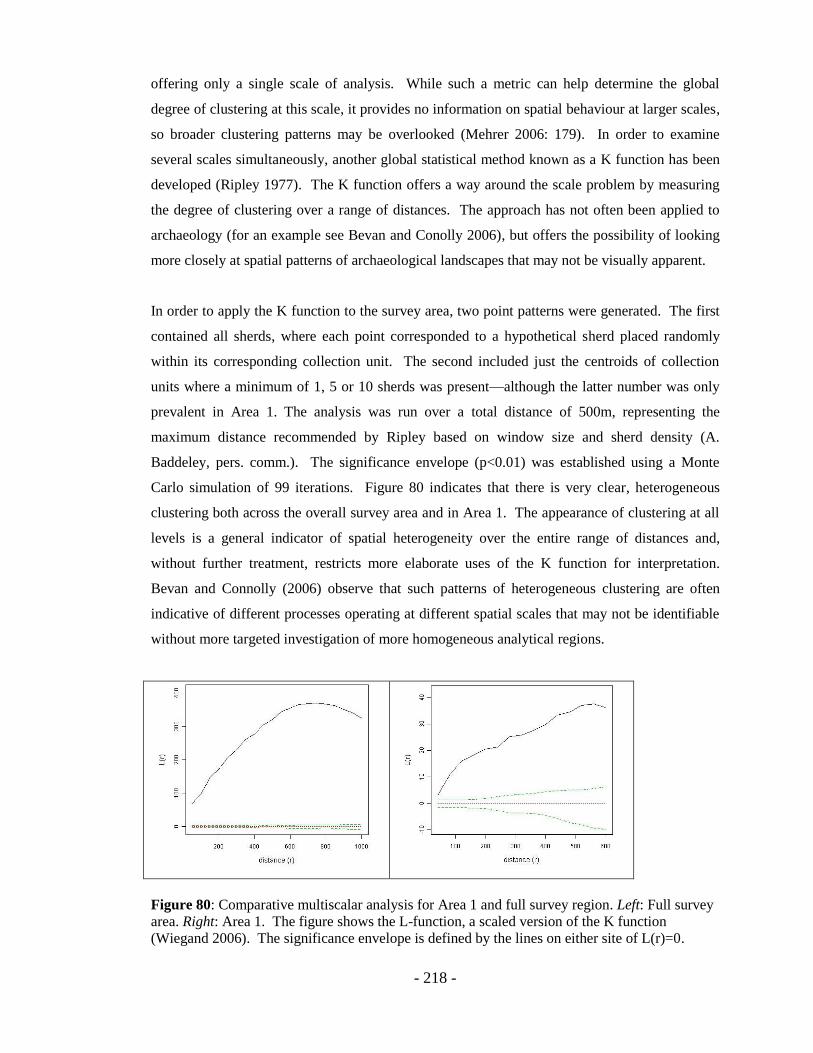
- 218 -
offering only a single scale of analysis. While such a metric can help determine the global
degree of clustering at this scale, it provides no information on spatial behaviour at larger scales,
so broader clustering patterns may be overlooked (Mehrer 2006: 179). In order to examine
several scales simultaneously, another global statistical method known as a K function has been
developed (Ripley 1977). The K function offers a way around the scale problem by measuring
the degree of clustering over a range of distances. The approach has not often been applied to
archaeology (for an example see Bevan and Conolly 2006), but offers the possibility of looking
more closely at spatial patterns of archaeological landscapes that may not be visually apparent.
In order to apply the K function to the survey area, two point patterns were generated. The first
contained all sherds, where each point corresponded to a hypothetical sherd placed randomly
within its corresponding collection unit. The second included just the centroids of collection
units where a minimum of 1, 5 or 10 sherds was present—although the latter number was only
prevalent in Area 1. The analysis was run over a total distance of 500m, representing the
maximum distance recommended by Ripley based on window size and sherd density (A.
Baddeley, pers. comm.). The significance envelope (p<0.01) was established using a Monte
Carlo simulation of 99 iterations. Figure 80 indicates that there is very clear, heterogeneous
clustering both across the overall survey area and in Area 1. The appearance of clustering at all
levels is a general indicator of spatial heterogeneity over the entire range of distances and,
without further treatment, restricts more elaborate uses of the K function for interpretation.
Bevan and Connolly (2006) observe that such patterns of heterogeneous clustering are often
indicative of different processes operating at different spatial scales that may not be identifiable
without more targeted investigation of more homogeneous analytical regions.
Figure 80: Comparative multiscalar analysis for Area 1 and full survey region. Left: Full survey
area. Right: Area 1. The figure shows the L-function, a scaled version of the K function
(Wiegand 2006). The significance envelope is defined by the lines on either site of L(r)=0.
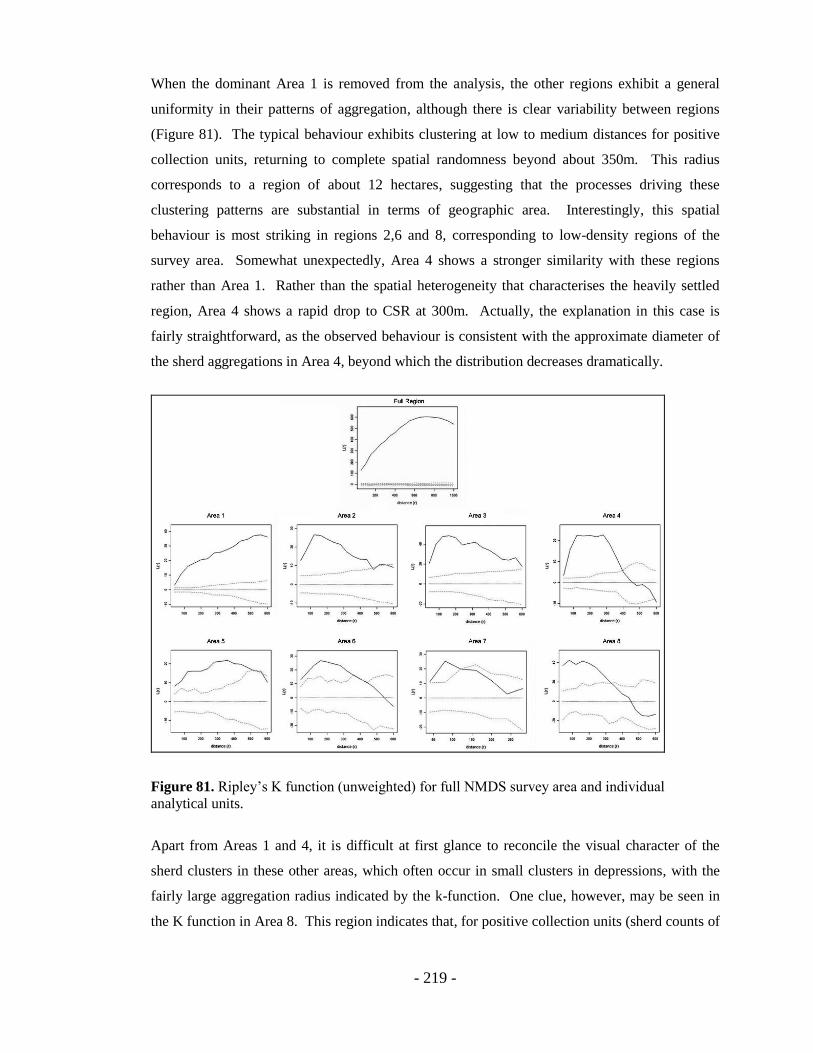
- 219 -
When the dominant Area 1 is removed from the analysis, the other regions exhibit a general
uniformity in their patterns of aggregation, although there is clear variability between regions
(Figure 81). The typical behaviour exhibits clustering at low to medium distances for positive
collection units, returning to complete spatial randomness beyond about 350m. This radius
corresponds to a region of about 12 hectares, suggesting that the processes driving these
clustering patterns are substantial in terms of geographic area. Interestingly, this spatial
behaviour is most striking in regions 2,6 and 8, corresponding to low-density regions of the
survey area. Somewhat unexpectedly, Area 4 shows a stronger similarity with these regions
rather than Area 1. Rather than the spatial heterogeneity that characterises the heavily settled
region, Area 4 shows a rapid drop to CSR at 300m. Actually, the explanation in this case is
fairly straightforward, as the observed behaviour is consistent with the approximate diameter of
the sherd aggregations in Area 4, beyond which the distribution decreases dramatically.
Figure 81. Ripley‟s K function (unweighted) for full NMDS survey area and individual
analytical units.
Apart from Areas 1 and 4, it is difficult at first glance to reconcile the visual character of the
sherd clusters in these other areas, which often occur in small clusters in depressions, with the
fairly large aggregation radius indicated by the k-function. One clue, however, may be seen in
the K function in Area 8. This region indicates that, for positive collection units (sherd counts of
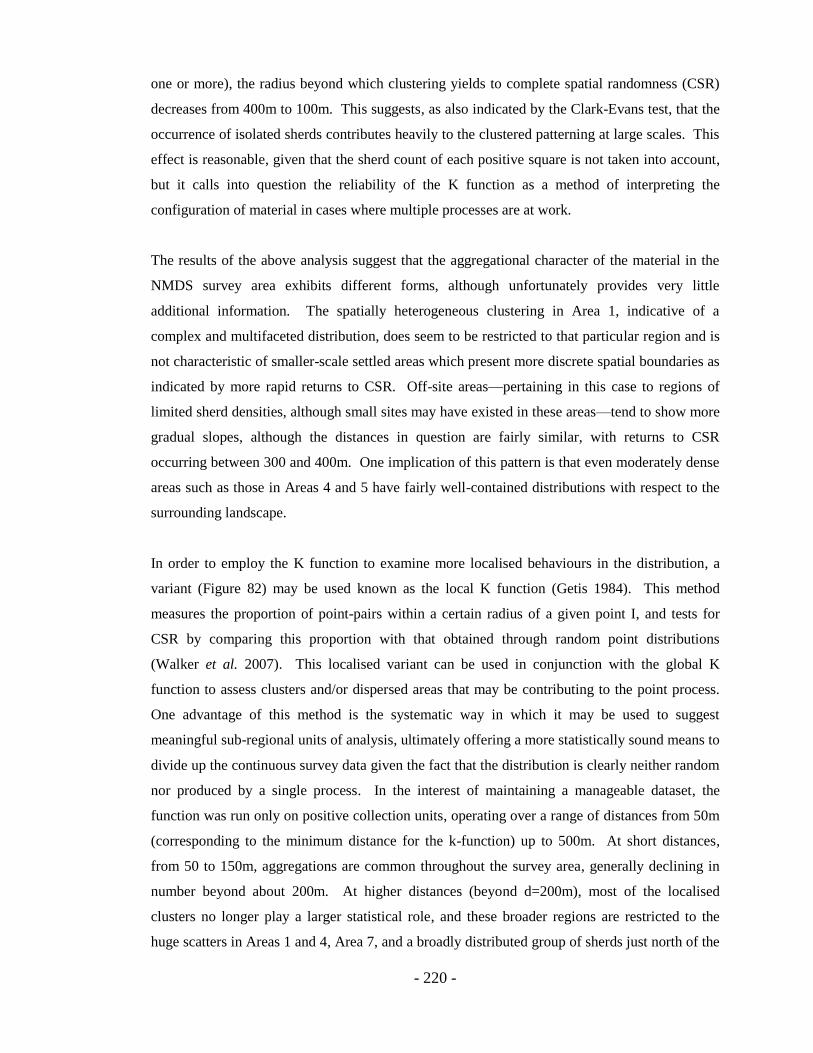
- 220 -
one or more), the radius beyond which clustering yields to complete spatial randomness (CSR)
decreases from 400m to 100m. This suggests, as also indicated by the Clark-Evans test, that the
occurrence of isolated sherds contributes heavily to the clustered patterning at large scales. This
effect is reasonable, given that the sherd count of each positive square is not taken into account,
but it calls into question the reliability of the K function as a method of interpreting the
configuration of material in cases where multiple processes are at work.
The results of the above analysis suggest that the aggregational character of the material in the
NMDS survey area exhibits different forms, although unfortunately provides very little
additional information. The spatially heterogeneous clustering in Area 1, indicative of a
complex and multifaceted distribution, does seem to be restricted to that particular region and is
not characteristic of smaller-scale settled areas which present more discrete spatial boundaries as
indicated by more rapid returns to CSR. Off-site areas—pertaining in this case to regions of
limited sherd densities, although small sites may have existed in these areas—tend to show more
gradual slopes, although the distances in question are fairly similar, with returns to CSR
occurring between 300 and 400m. One implication of this pattern is that even moderately dense
areas such as those in Areas 4 and 5 have fairly well-contained distributions with respect to the
surrounding landscape.
In order to employ the K function to examine more localised behaviours in the distribution, a
variant (Figure 82) may be used known as the local K function (Getis 1984). This method
measures the proportion of point-pairs within a certain radius of a given point I, and tests for
CSR by comparing this proportion with that obtained through random point distributions
(Walker et al. 2007). This localised variant can be used in conjunction with the global K
function to assess clusters and/or dispersed areas that may be contributing to the point process.
One advantage of this method is the systematic way in which it may be used to suggest
meaningful sub-regional units of analysis, ultimately offering a more statistically sound means to
divide up the continuous survey data given the fact that the distribution is clearly neither random
nor produced by a single process. In the interest of maintaining a manageable dataset, the
function was run only on positive collection units, operating over a range of distances from 50m
(corresponding to the minimum distance for the k-function) up to 500m. At short distances,
from 50 to 150m, aggregations are common throughout the survey area, generally declining in
number beyond about 200m. At higher distances (beyond d=200m), most of the localised
clusters no longer play a larger statistical role, and these broader regions are restricted to the
huge scatters in Areas 1 and 4, Area 7, and a broadly distributed group of sherds just north of the
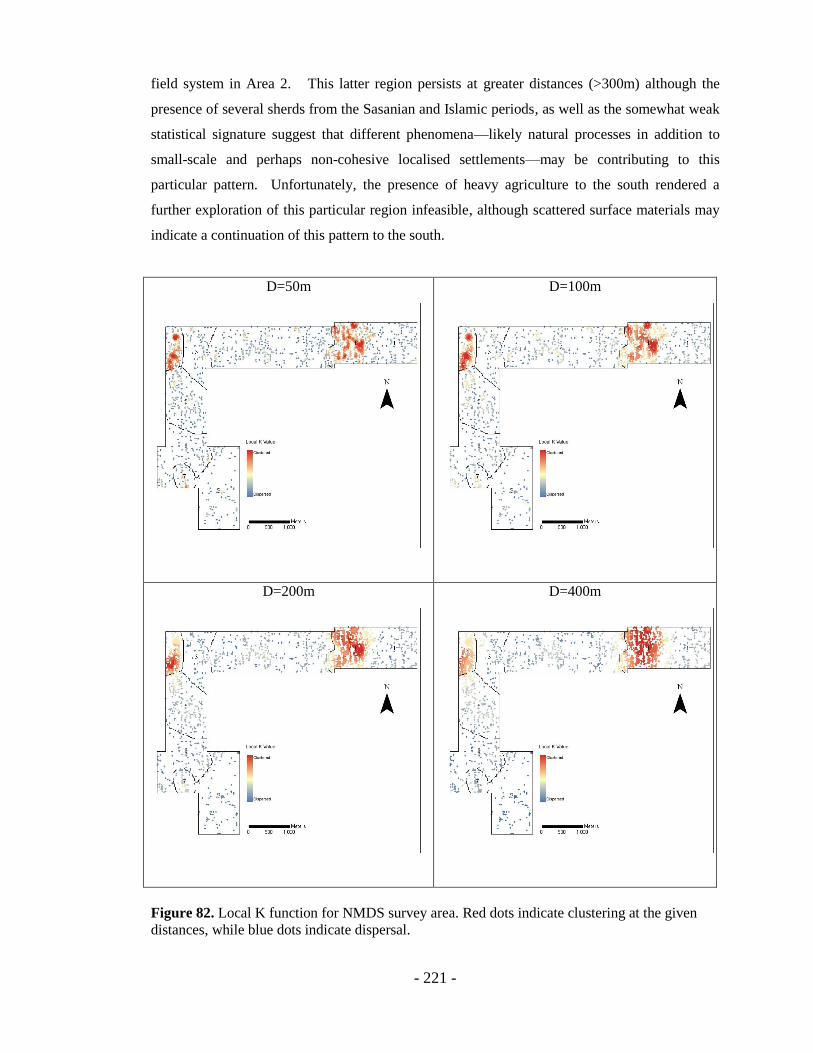
- 221 -
field system in Area 2. This latter region persists at greater distances (>300m) although the
presence of several sherds from the Sasanian and Islamic periods, as well as the somewhat weak
statistical signature suggest that different phenomena—likely natural processes in addition to
small-scale and perhaps non-cohesive localised settlements—may be contributing to this
particular pattern. Unfortunately, the presence of heavy agriculture to the south rendered a
further exploration of this particular region infeasible, although scattered surface materials may
indicate a continuation of this pattern to the south.
D=50m
D=100m
D=200m
D=400m
Figure 82. Local K function for NMDS survey area. Red dots indicate clustering at the given
distances, while blue dots indicate dispersal.

- 222 -
6.4.3. Local Indicators of Spatial Analysis (Getis-Ord and Local Moran’s)
The local Ripley‟s K represents an initial foray into local and regional processes that cannot be
detected at the global level, and, as indicated, suggests that the spatial distribution throughout the
survey area is highly varied. In order to explore these local patterns more fully, a host of other
methods are available under the category of Local Indicators of Spatial Analysis (LISA)
(Anselin 1995). Two of these, the Getis Ord Gi* statistic and the Local Morans statistic, address
patterns of spatial autocorrelation—the tendency for similar values (in this case counts of sherds
per square) to occur in close proximity to each other. While not yet heavily used in archaeology,
a few applications, particularly with respect to Mayan settlement patterns have shown such
spatial statistics to be useful (Premo 2004).
Getis-Ord Gi* Statistic
The Gi* statistic is a local variation of the Getis Ord General G statistic, a global measure of the
aggregation of high values—in this case sherd counts—in a spatial point pattern (Getis and Ord
1992). The advantage of the Gi* statistic is that it provides a value for each point within the
analysis, facilitating a visual and statistical representation of areas of higher concentration. For
this study, the original sherd counts were modified by taking the square root of the total for each
collection unit, in order to retain the zero values for empty collection units. The Gi* analysis
was applied to the full survey area, then to each individual analytical unit. Following Premo
(2004), a multi-scalar approach to the Gi* statistic was employed, where distances from 50m to
200m were evaluated. The 50m threshold was selected as a minimum distance in order to
account for the inherent error in sherd location as well as possible larger errors in fieldwalking
itself.
Figure 83 shows the results of the Gi* analysis over the entire survey region at 100m and 200m.
Immediately apparent is the degree to which the increasing analytical scale (distance) affects the
perception of the settlement pattern. At d=200m, only two regions show substantial „hotspots‟
of highly autocorrelated sherd counts. For the purpose of this discussion, these areas may be
considered statistical „regions of influence‟ and comprise 40.5 ha for the western ‟hotspot‟ and
108.6ha for the eastern one. While these figures provide a useful representation of the statistical
range of material distributions in the landscape, the numbers clearly cannot be taken at face
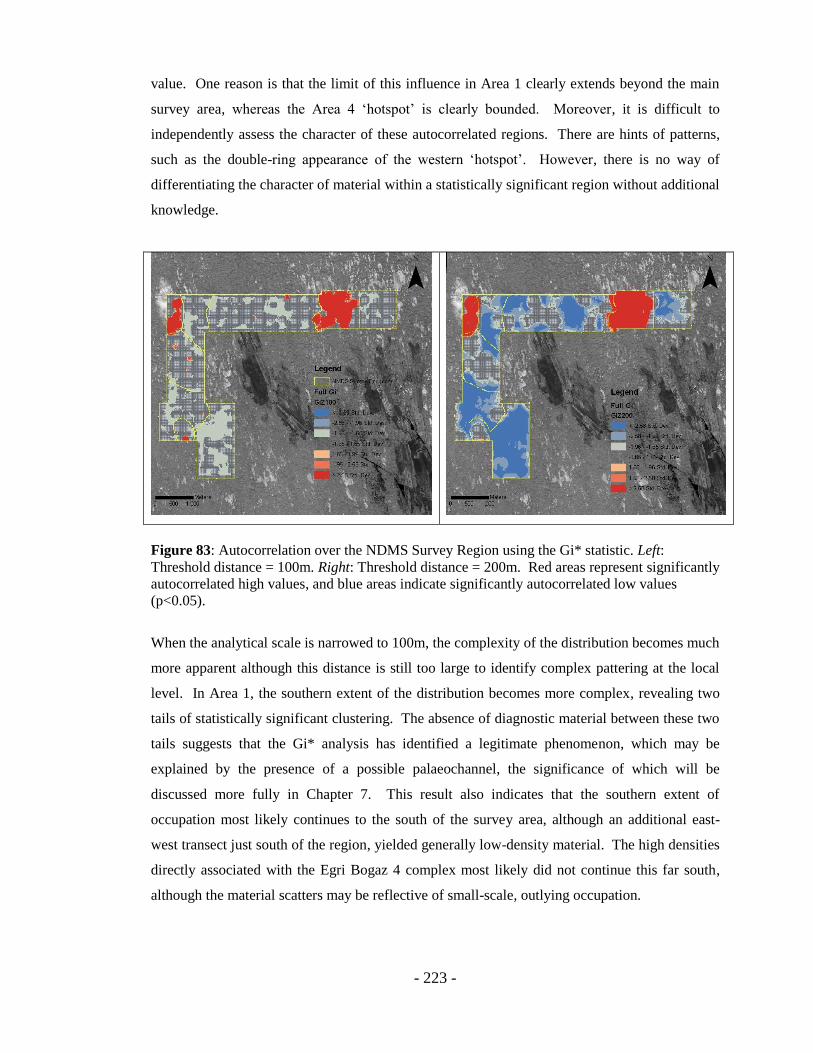
- 223 -
value. One reason is that the limit of this influence in Area 1 clearly extends beyond the main
survey area, whereas the Area 4 „hotspot‟ is clearly bounded. Moreover, it is difficult to
independently assess the character of these autocorrelated regions. There are hints of patterns,
such as the double-ring appearance of the western „hotspot‟. However, there is no way of
differentiating the character of material within a statistically significant region without additional
knowledge.
Figure 83: Autocorrelation over the NDMS Survey Region using the Gi* statistic. Left:
Threshold distance = 100m. Right: Threshold distance = 200m. Red areas represent significantly
autocorrelated high values, and blue areas indicate significantly autocorrelated low values
(p<0.05).
When the analytical scale is narrowed to 100m, the complexity of the distribution becomes much
more apparent although this distance is still too large to identify complex pattering at the local
level. In Area 1, the southern extent of the distribution becomes more complex, revealing two
tails of statistically significant clustering. The absence of diagnostic material between these two
tails suggests that the Gi* analysis has identified a legitimate phenomenon, which may be
explained by the presence of a possible palaeochannel, the significance of which will be
discussed more fully in Chapter 7. This result also indicates that the southern extent of
occupation most likely continues to the south of the survey area, although an additional east-
west transect just south of the region, yielded generally low-density material. The high densities
directly associated with the Egri Bogaz 4 complex most likely did not continue this far south,
although the material scatters may be reflective of small-scale, outlying occupation.
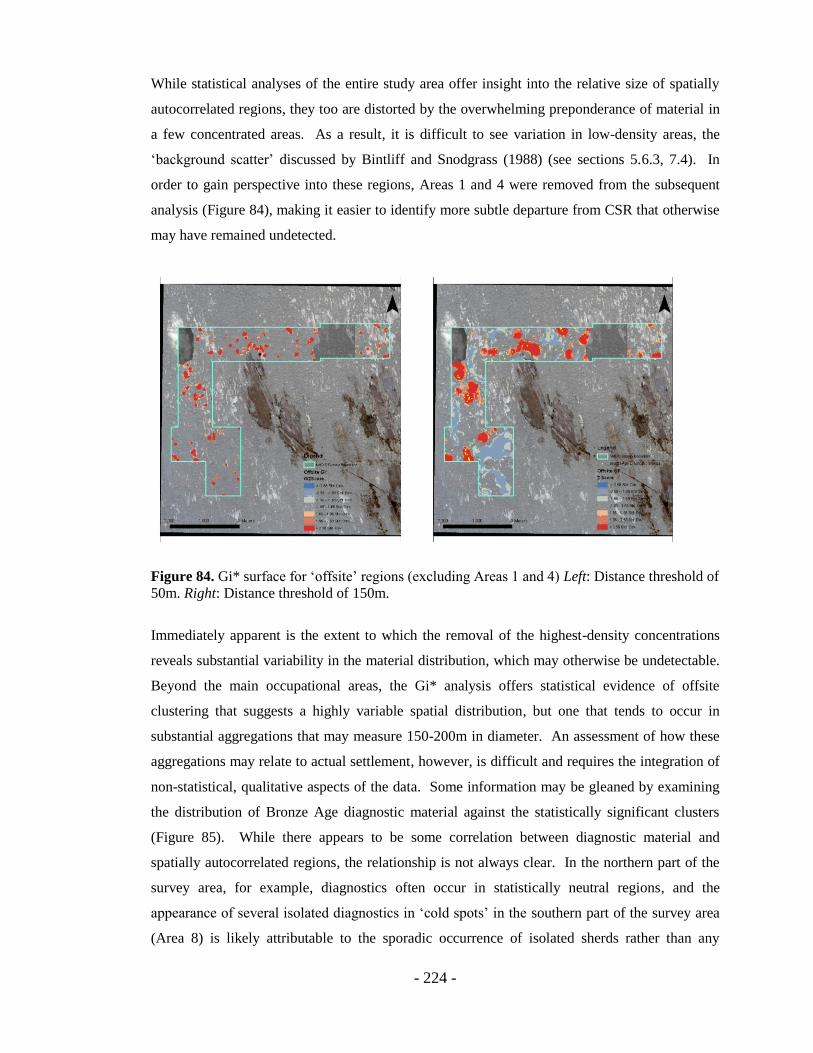
- 224 -
While statistical analyses of the entire study area offer insight into the relative size of spatially
autocorrelated regions, they too are distorted by the overwhelming preponderance of material in
a few concentrated areas. As a result, it is difficult to see variation in low-density areas, the
„background scatter‟ discussed by Bintliff and Snodgrass (1988) (see sections 5.6.3, 7.4). In
order to gain perspective into these regions, Areas 1 and 4 were removed from the subsequent
analysis (Figure 84), making it easier to identify more subtle departure from CSR that otherwise
may have remained undetected.
Figure 84. Gi* surface for „offsite‟ regions (excluding Areas 1 and 4) Left: Distance threshold of
50m. Right: Distance threshold of 150m.
Immediately apparent is the extent to which the removal of the highest-density concentrations
reveals substantial variability in the material distribution, which may otherwise be undetectable.
Beyond the main occupational areas, the Gi* analysis offers statistical evidence of offsite
clustering that suggests a highly variable spatial distribution, but one that tends to occur in
substantial aggregations that may measure 150-200m in diameter. An assessment of how these
aggregations may relate to actual settlement, however, is difficult and requires the integration of
non-statistical, qualitative aspects of the data. Some information may be gleaned by examining
the distribution of Bronze Age diagnostic material against the statistically significant clusters
(Figure 85). While there appears to be some correlation between diagnostic material and
spatially autocorrelated regions, the relationship is not always clear. In the northern part of the
survey area, for example, diagnostics often occur in statistically neutral regions, and the
appearance of several isolated diagnostics in „cold spots‟ in the southern part of the survey area
(Area 8) is likely attributable to the sporadic occurrence of isolated sherds rather than any
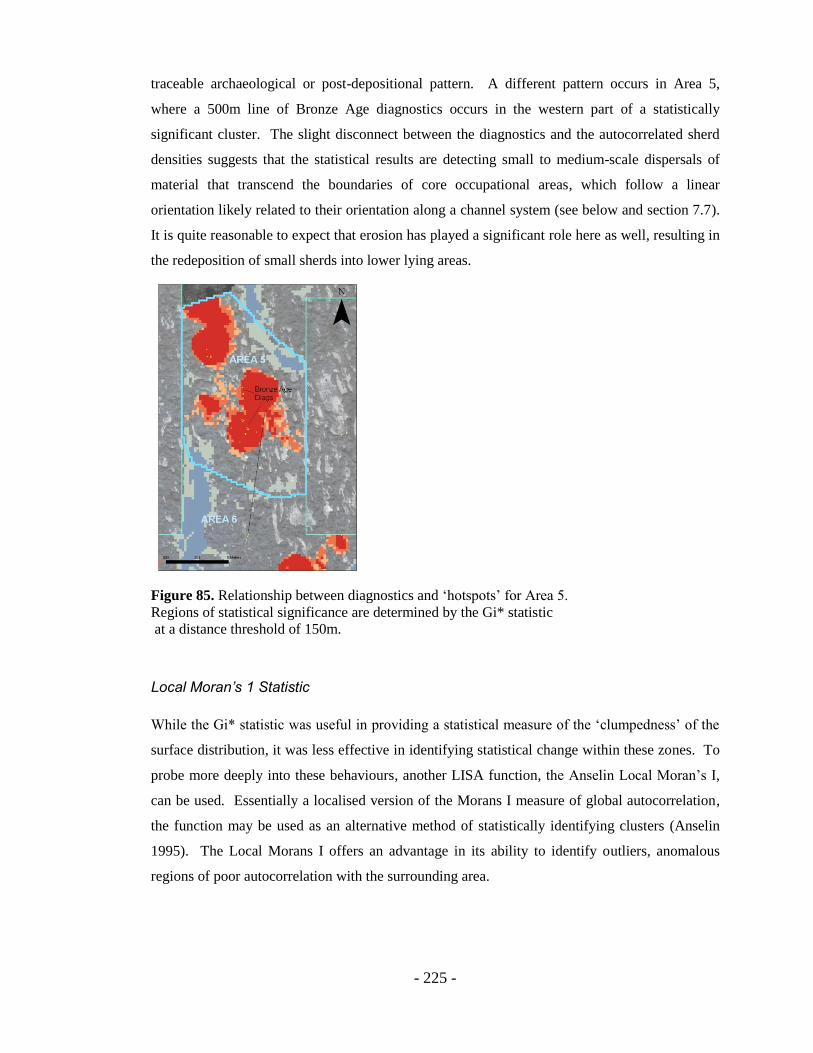
- 225 -
traceable archaeological or post-depositional pattern. A different pattern occurs in Area 5,
where a 500m line of Bronze Age diagnostics occurs in the western part of a statistically
significant cluster. The slight disconnect between the diagnostics and the autocorrelated sherd
densities suggests that the statistical results are detecting small to medium-scale dispersals of
material that transcend the boundaries of core occupational areas, which follow a linear
orientation likely related to their orientation along a channel system (see below and section 7.7).
It is quite reasonable to expect that erosion has played a significant role here as well, resulting in
the redeposition of small sherds into lower lying areas.
Figure 85. Relationship between diagnostics and „hotspots‟ for Area 5.
Regions of statistical significance are determined by the Gi* statistic
at a distance threshold of 150m.
Local Moran’s 1 Statistic
While the Gi* statistic was useful in providing a statistical measure of the „clumpedness‟ of the
surface distribution, it was less effective in identifying statistical change within these zones. To
probe more deeply into these behaviours, another LISA function, the Anselin Local Moran‟s I,
can be used. Essentially a localised version of the Morans I measure of global autocorrelation,
the function may be used as an alternative method of statistically identifying clusters (Anselin
1995). The Local Morans I offers an advantage in its ability to identify outliers, anomalous
regions of poor autocorrelation with the surrounding area.

- 226 -
Figure 86. Autocorrelation over the NDMS Survey Region: Local Moran‟s I statistic
As with the Gi* tests, the Moran‟s I was evaluated at distances from 50m to 200m (Figure 86).
While highly autocorrelated regions are similar in the two tests, the statistical landscape
provided by the Moran‟s I rendering is different in informative ways from the Gi* statistic. The
large clusters in Areas 1 and 4 offer some insight into the complexity of the boundaries of these
distributions that cannot be detected using the Gi* statistic. In both areas, statistical boundaries
are evident in the dark blue „halos‟ that can be seen surrounding the primary distributions. In the
Moran‟s I rendering, these rings represent regions of low spatial autocorrelation at a significance
level of p<0.01 indicating that the sherd totals exhibit a significant departure from the
surrounding distribution. In terms of raw sherd counts, these halos represent areas of extremely
low or zero density. The structure of these statistical haloes is interesting, in that, with the
exception of the western portion of Area 1, they do not adhere to a linear pattern as may be
expected if the only contributing factor were the restricted visibility caused by dune ridges.
This suggests that actual fall-off, rather than visual obstruction, is primarily accountable for the
radial patterning. In Area 4, there appear to be several localised post-depositional behaviours at
work. In the north, the region of high significance is confined, presumably representing a large
but relatively restricted area of large, loose sherds on the takyr surface. The lack of subsurface
material associated with this scatter, although cultural remains were found beneath the dunes
100m to the east (see section 5.6), may be indicative of a localised erosional process, possibly a
deflation event and subsequent redeposition of material a short distance from the actual
occupation area. The southern area, by contrast, is much more extensive and the fall-off in sherd
- 227 -
totals markedly more gradual. As noted in Chapter 5, diagnostics in this region were small and
heavily abraded, and the land cover comprised primarily eroded takyr surfaces. The confluence
of these factors suggests that, in the south, the lack of significant dune protection may have left
the region open to more serious deflation, resulting in a larger dispersal of heavily abraded
materials.
As with the Gi* statistic, the Local Moran‟s analysis shows the degree to which broader
analytical scales affect the statistical interpretation of highly autocorrelated areas. At the 50 and
100m levels, the Moran‟s I analysis identified 22 and 26 clusters respectively, with the large
scatters in Areas 1 and 4 identified as individual entities. A dramatic shift occurs at d=200m, at
which only 14 scatters could be statistically identified, several of which comprise only two or
three collection units. At this largest scale only a few scatters, H-19, L-62, L-26 and D-70 have
significant distributions greater than two or three collection units. For these four regions, the
area of greatest statistical significance ranges between 100m and 150m across, or approximately
1-2.5 ha. While such a metric must be interpreted with caution in attempting to derive the actual
dimensions not only of actual settlement areas but the current dimensions of the scatters, it does
offer a route to the interpretation of the potential influence that a site may have had on the
landscape.
Implications of Local Statistical Methods in Interpreting the NMDS Data
The preceding analyses suggest that, by applying these distinct yet related statistical analyses to
the NMDS survey data, a series of unifying themes can be drawn. Perhaps the clearest
implication is that the spatially heterogeneous distribution of surface sherds is extremely
complex, and that settlement cannot—and should not—be inferred from statistical processes
alone. Indeed, autocorrelated sherd densities may reflect processes of post-depositional
fragmentation or deflation rather than actual areas of settlement or other activity, and these
possibilities will be explored more fully in Chapter 7. However, there are some general
archaeological implications worth addressing more fully. All three analyses of local patterning
easily discerned the high density regions in Area 1 and Area 4, but indicated significant spatial
heterogeneity within the distributions, offering statistical evidence that the discrete concept of
„site‟ is overly simplistic and that complex local processes were at work (see discussion in
section 7.4). In other, lower-density regions, the data indicate spatial heterogeneity as well. In
these regions, statistically significant aggregations are typically restricted to 2 or 3 ha. These

- 228 -
dimensions have clearly been inflated by post-depositional processes, although actual settlement
is suggested by the presence of diagnostics in the vicinity of the largest concentrations. With
respect to the „background scatter‟ itself, the Gi* analysis suggests that there is some
relationship between regions of heavy dune cover and significant negative autocorrelation.
Conversely, broad regions of high clustering tend to align loosely with the large takyr systems in
the survey area or in moderately over-sanded regions north of cultivated takyr zones. Although
such observations can only be general, they offer statistical support for the association of broad
material scatters with fluvial systems. Interfluvial zones, by contrast, exhibit low density,
loosely autocorrelated surface scatters that may occasionally deviate from CSR at broad scales.
The results of these spatial investigations suggest that, beyond the main occupational zones,
there is a range of about 200-300m beyond which aggregation ceases to become statistically
significant. While clustering is often detectable at shorter ranges, localised settlement and post-
depositional processes affecting the material scatter may simply operate at too fine a scale to be
adequately investigated by the statistical methods. At the other extreme, beyond about 300m,
the effects of these processes fall below the detection thresholds. Clearly, this statistical
phenomenon does not indicate that such processes actually cease to have any influence beyond
the clusters, but it does offer the opportunity to propose theoretical limits for offsite behaviour.
However, these may vary according to region. In Area 5, for example, clustering occurs through
around 500m, although a look at the graphs for this area indicates that the spatial patterning is
less straightforward than initially apparent (Figure 87). High-density collection units show two
peaks, at both 200m and 400m. These findings may indicate aggregations of small communities,
perhaps loosely organised within larger units, and such possible modularity will be discussed in
section 7.6. Ultimately, however, while some archaeological insights are possible, and while the
above investigations clearly demonstrate the presence of different processes operating at
multiple scales, the role of these methods in explaining specific archaeological or post-
depositional processes is very limited.
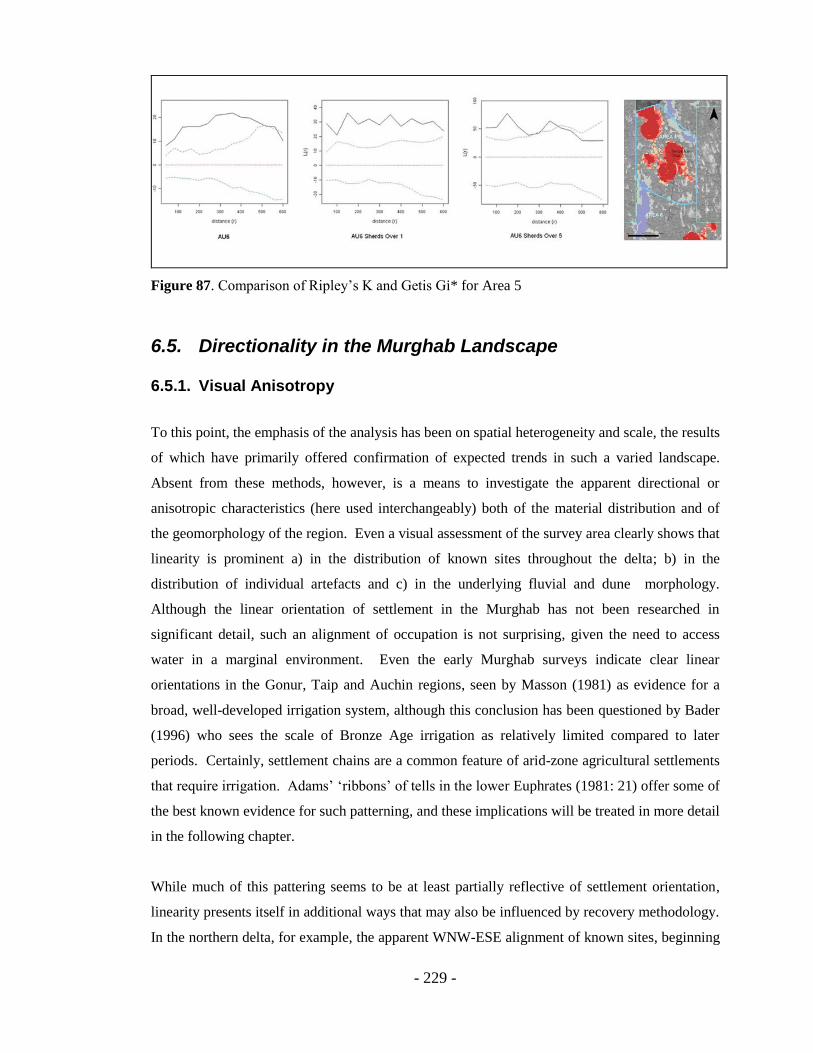
- 229 -
Figure 87. Comparison of Ripley‟s K and Getis Gi* for Area 5
6.5. Directionality in the Murghab Landscape
6.5.1. Visual Anisotropy
To this point, the emphasis of the analysis has been on spatial heterogeneity and scale, the results
of which have primarily offered confirmation of expected trends in such a varied landscape.
Absent from these methods, however, is a means to investigate the apparent directional or
anisotropic characteristics (here used interchangeably) both of the material distribution and of
the geomorphology of the region. Even a visual assessment of the survey area clearly shows that
linearity is prominent a) in the distribution of known sites throughout the delta; b) in the
distribution of individual artefacts and c) in the underlying fluvial and dune morphology.
Although the linear orientation of settlement in the Murghab has not been researched in
significant detail, such an alignment of occupation is not surprising, given the need to access
water in a marginal environment. Even the early Murghab surveys indicate clear linear
orientations in the Gonur, Taip and Auchin regions, seen by Masson (1981) as evidence for a
broad, well-developed irrigation system, although this conclusion has been questioned by Bader
(1996) who sees the scale of Bronze Age irrigation as relatively limited compared to later
periods. Certainly, settlement chains are a common feature of arid-zone agricultural settlements
that require irrigation. Adams‟ „ribbons‟ of tells in the lower Euphrates (1981: 21) offer some of
the best known evidence for such patterning, and these implications will be treated in more detail
in the following chapter.
While much of this pattering seems to be at least partially reflective of settlement orientation,
linearity presents itself in additional ways that may also be influenced by recovery methodology.
In the northern delta, for example, the apparent WNW-ESE alignment of known sites, beginning
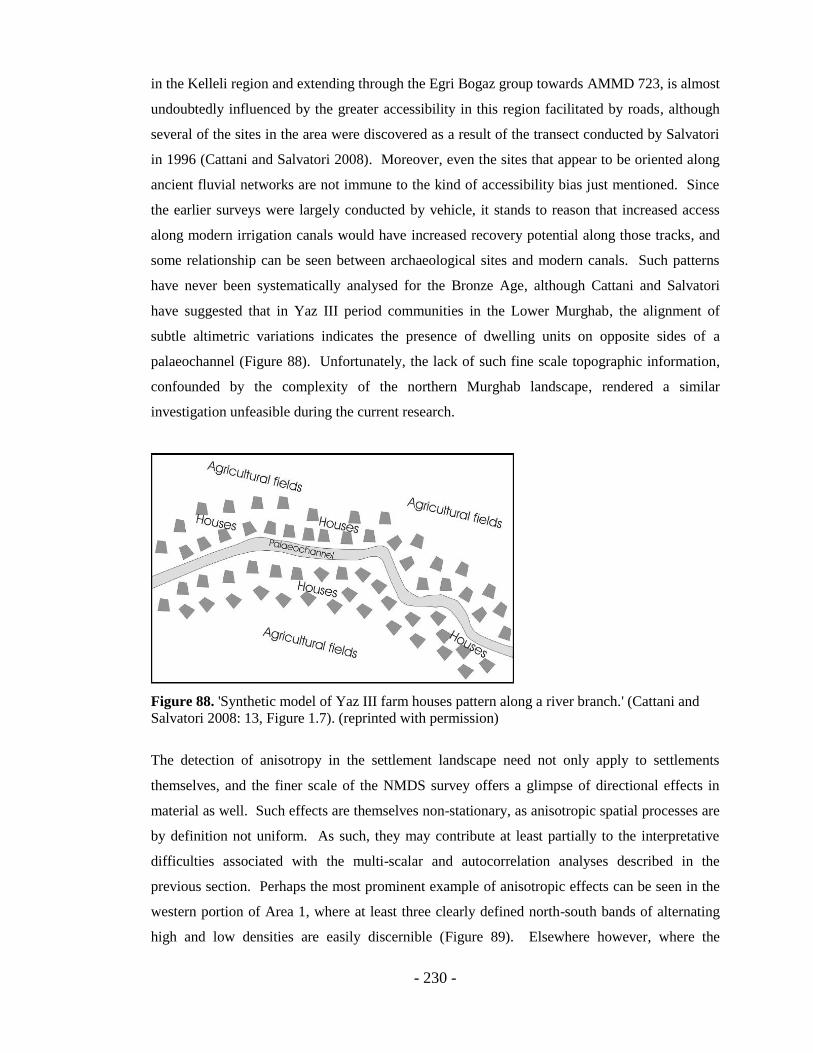
- 230 -
in the Kelleli region and extending through the Egri Bogaz group towards AMMD 723, is almost
undoubtedly influenced by the greater accessibility in this region facilitated by roads, although
several of the sites in the area were discovered as a result of the transect conducted by Salvatori
in 1996 (Cattani and Salvatori 2008). Moreover, even the sites that appear to be oriented along
ancient fluvial networks are not immune to the kind of accessibility bias just mentioned. Since
the earlier surveys were largely conducted by vehicle, it stands to reason that increased access
along modern irrigation canals would have increased recovery potential along those tracks, and
some relationship can be seen between archaeological sites and modern canals. Such patterns
have never been systematically analysed for the Bronze Age, although Cattani and Salvatori
have suggested that in Yaz III period communities in the Lower Murghab, the alignment of
subtle altimetric variations indicates the presence of dwelling units on opposite sides of a
palaeochannel (Figure 88). Unfortunately, the lack of such fine scale topographic information,
confounded by the complexity of the northern Murghab landscape, rendered a similar
investigation unfeasible during the current research.
Figure 88. 'Synthetic model of Yaz III farm houses pattern along a river branch.' (Cattani and
Salvatori 2008: 13, Figure 1.7). (reprinted with permission)
The detection of anisotropy in the settlement landscape need not only apply to settlements
themselves, and the finer scale of the NMDS survey offers a glimpse of directional effects in
material as well. Such effects are themselves non-stationary, as anisotropic spatial processes are
by definition not uniform. As such, they may contribute at least partially to the interpretative
difficulties associated with the multi-scalar and autocorrelation analyses described in the
previous section. Perhaps the most prominent example of anisotropic effects can be seen in the
western portion of Area 1, where at least three clearly defined north-south bands of alternating
high and low densities are easily discernible (Figure 89). Elsewhere however, where the
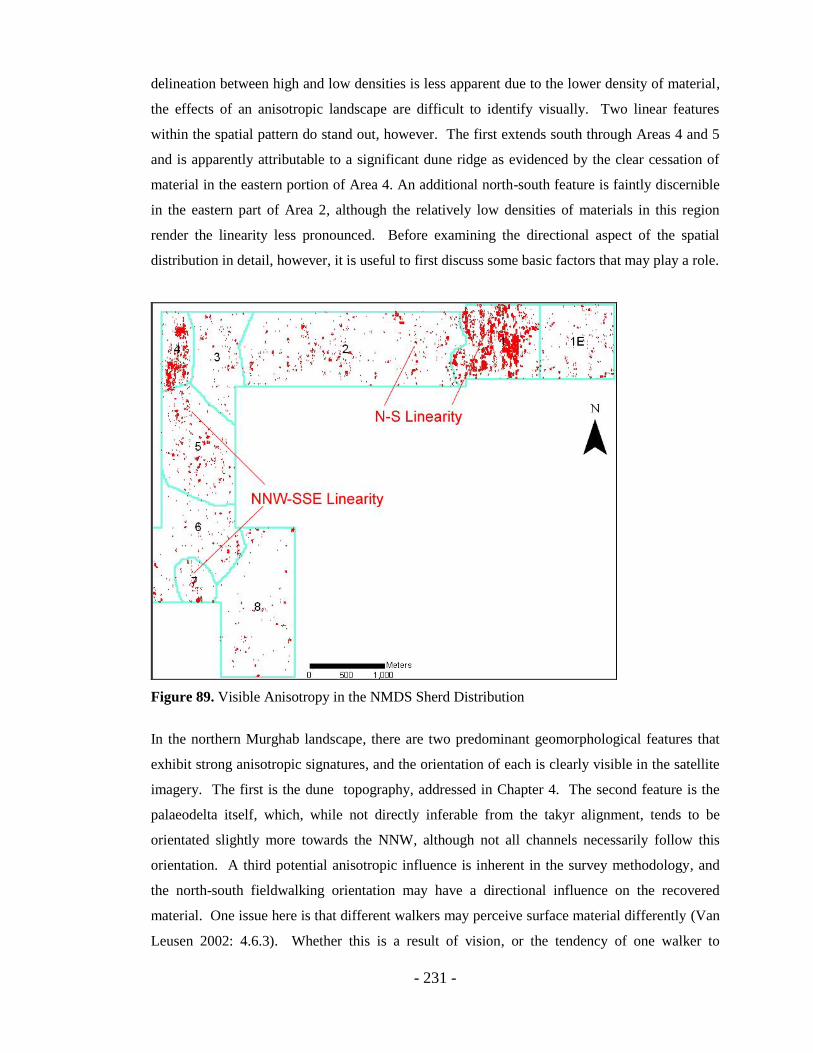
- 231 -
delineation between high and low densities is less apparent due to the lower density of material,
the effects of an anisotropic landscape are difficult to identify visually. Two linear features
within the spatial pattern do stand out, however. The first extends south through Areas 4 and 5
and is apparently attributable to a significant dune ridge as evidenced by the clear cessation of
material in the eastern portion of Area 4. An additional north-south feature is faintly discernible
in the eastern part of Area 2, although the relatively low densities of materials in this region
render the linearity less pronounced. Before examining the directional aspect of the spatial
distribution in detail, however, it is useful to first discuss some basic factors that may play a role.
Figure 89. Visible Anisotropy in the NMDS Sherd Distribution
In the northern Murghab landscape, there are two predominant geomorphological features that
exhibit strong anisotropic signatures, and the orientation of each is clearly visible in the satellite
imagery. The first is the dune topography, addressed in Chapter 4. The second feature is the
palaeodelta itself, which, while not directly inferable from the takyr alignment, tends to be
orientated slightly more towards the NNW, although not all channels necessarily follow this
orientation. A third potential anisotropic influence is inherent in the survey methodology, and
the north-south fieldwalking orientation may have a directional influence on the recovered
material. One issue here is that different walkers may perceive surface material differently (Van
Leusen 2002: 4.6.3). Whether this is a result of vision, or the tendency of one walker to
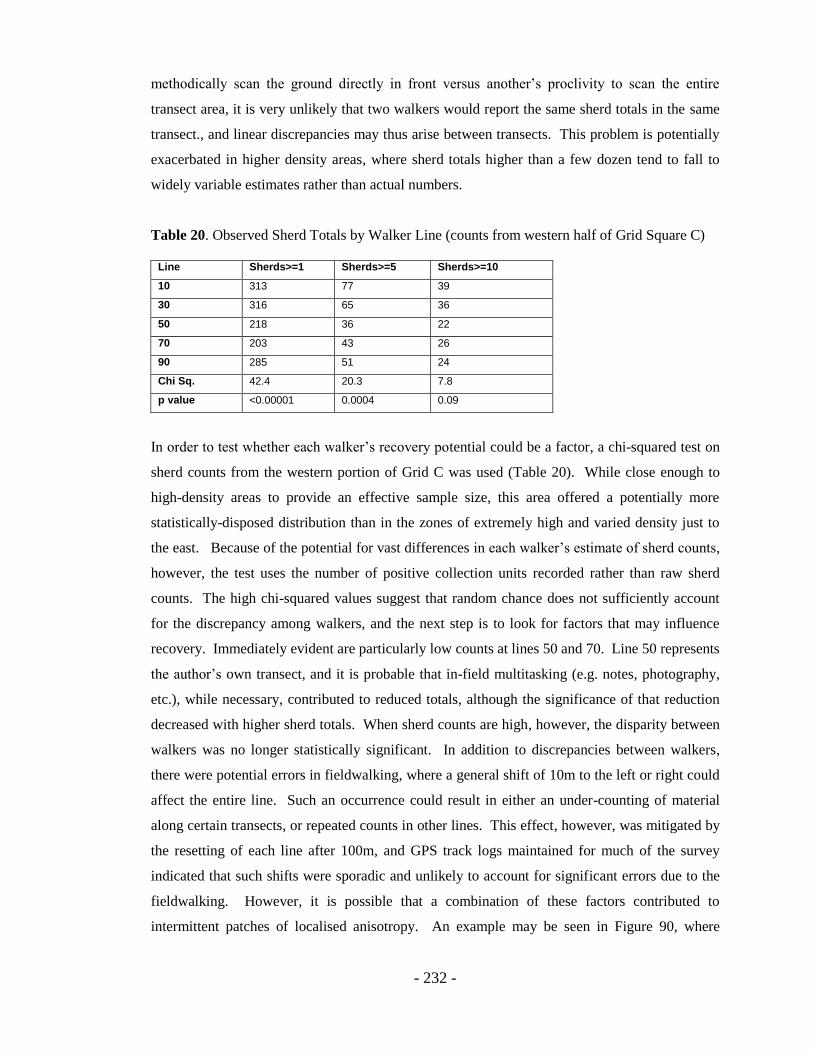
- 232 -
methodically scan the ground directly in front versus another‟s proclivity to scan the entire
transect area, it is very unlikely that two walkers would report the same sherd totals in the same
transect., and linear discrepancies may thus arise between transects. This problem is potentially
exacerbated in higher density areas, where sherd totals higher than a few dozen tend to fall to
widely variable estimates rather than actual numbers.
Table 20. Observed Sherd Totals by Walker Line (counts from western half of Grid Square C)
Line Sherds>=1 Sherds>=5 Sherds>=10
10 313 77 39
30 316 65 36
50 218 36 22
70 203 43 26
90 285 51 24
Chi Sq. 42.4 20.3 7.8
p value <0.00001 0.0004 0.09
In order to test whether each walker‟s recovery potential could be a factor, a chi-squared test on
sherd counts from the western portion of Grid C was used (Table 20). While close enough to
high-density areas to provide an effective sample size, this area offered a potentially more
statistically-disposed distribution than in the zones of extremely high and varied density just to
the east. Because of the potential for vast differences in each walker‟s estimate of sherd counts,
however, the test uses the number of positive collection units recorded rather than raw sherd
counts. The high chi-squared values suggest that random chance does not sufficiently account
for the discrepancy among walkers, and the next step is to look for factors that may influence
recovery. Immediately evident are particularly low counts at lines 50 and 70. Line 50 represents
the author‟s own transect, and it is probable that in-field multitasking (e.g. notes, photography,
etc.), while necessary, contributed to reduced totals, although the significance of that reduction
decreased with higher sherd totals. When sherd counts are high, however, the disparity between
walkers was no longer statistically significant. In addition to discrepancies between walkers,
there were potential errors in fieldwalking, where a general shift of 10m to the left or right could
affect the entire line. Such an occurrence could result in either an under-counting of material
along certain transects, or repeated counts in other lines. This effect, however, was mitigated by
the resetting of each line after 100m, and GPS track logs maintained for much of the survey
indicated that such shifts were sporadic and unlikely to account for significant errors due to the
fieldwalking. However, it is possible that a combination of these factors contributed to
intermittent patches of localised anisotropy. An example may be seen in Figure 90, where
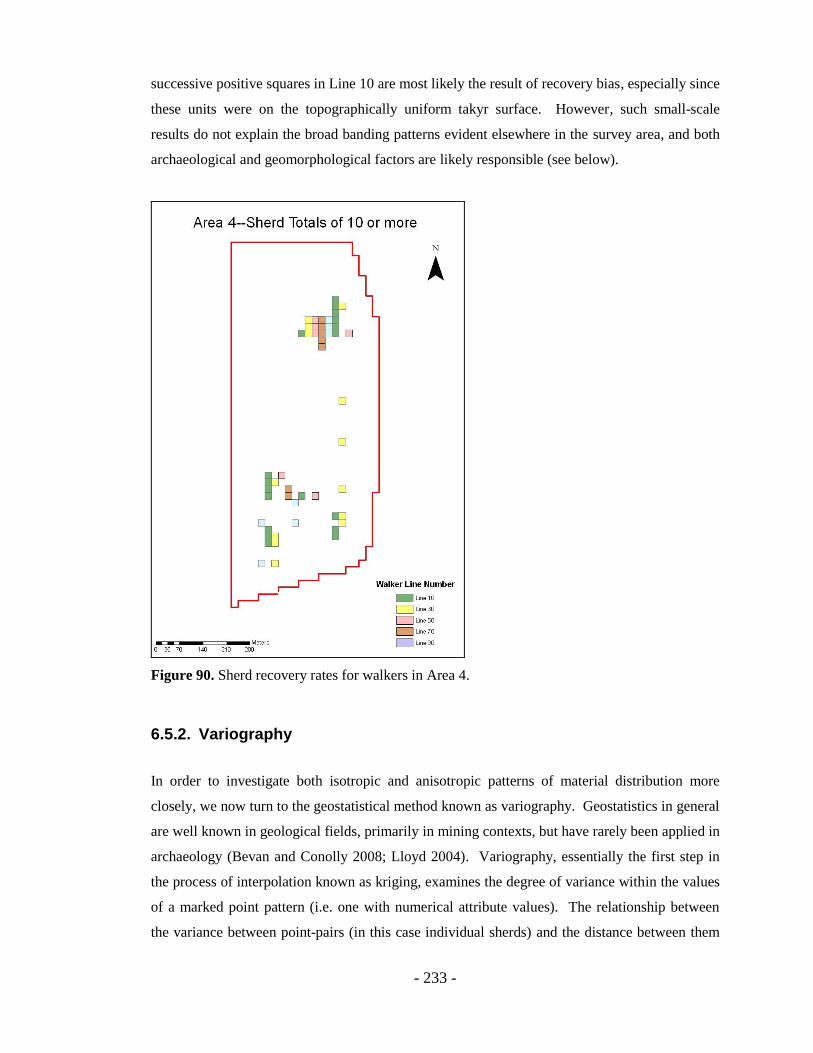
- 233 -
successive positive squares in Line 10 are most likely the result of recovery bias, especially since
these units were on the topographically uniform takyr surface. However, such small-scale
results do not explain the broad banding patterns evident elsewhere in the survey area, and both
archaeological and geomorphological factors are likely responsible (see below).
Figure 90. Sherd recovery rates for walkers in Area 4.
6.5.2. Variography
In order to investigate both isotropic and anisotropic patterns of material distribution more
closely, we now turn to the geostatistical method known as variography. Geostatistics in general
are well known in geological fields, primarily in mining contexts, but have rarely been applied in
archaeology (Bevan and Conolly 2008; Lloyd 2004). Variography, essentially the first step in
the process of interpolation known as kriging, examines the degree of variance within the values
of a marked point pattern (i.e. one with numerical attribute values). The relationship between
the variance between point-pairs (in this case individual sherds) and the distance between them

- 234 -
can be demonstrated using variograms (see below). These may be omni-directional, in which
the only consideration is the distance (or lag) between the point pairs (Gringarten 2001).
Alternatively, variograms may be targeted to explore anisotropic effects by selecting a specific
angle or angles for analysis. In a region such as the Murghab, where the predominant
directionality of the landscape is determined by the dune ridges, this kind of anisotropic
investigation can prove useful in examining the degree to which geomorphology, settlement, or
other factors may have influenced the ultimate distribution of surface pottery, either prior to or
after deposition.
In order to provide a statistical assessment of the anisotropy in the underlying geomorphology,
the semi-variance of the ASTER imagery was examined. The Quickbird imagery was not
included in the analysis due to the substantial computational demands of the imagery and the
fact that visual anisotropy was less evident than in the ASTER imagery (see Chapter 4). To
reduce the potential for redundancy in the data the imagery was reduced to its first and second
principal components, as higher PCs contained significant background noise. This process was
run twice: once on the full 9-band image and once using only the SWIR bands. The results of
these analyses are shown in Figure 91. The expected north-south anisotropy was not clearly
evident in the full ASTER image, but did tend to be fairly prominent in the first PC of the
infrared bands (red highlight). This finding supports the results of the PCA in Chapter 4 that
indicated that the SWIR bands were more effective at isolating underlying geomorphology.
There is also some evidence of correlation in the NNE direction (30°), although this was difficult
to account for visually and may be partially attributable to edge effects of the irregular boundary.
There were additional factors that detracted from a clear north-south anisotropy, and an
examination of the variogram for Area 2 showed clear anisotropic patterning in the direction of
the road and pipeline, indicating that modern activity can significantly affect the spectral
signatures used to identify anisotropy.
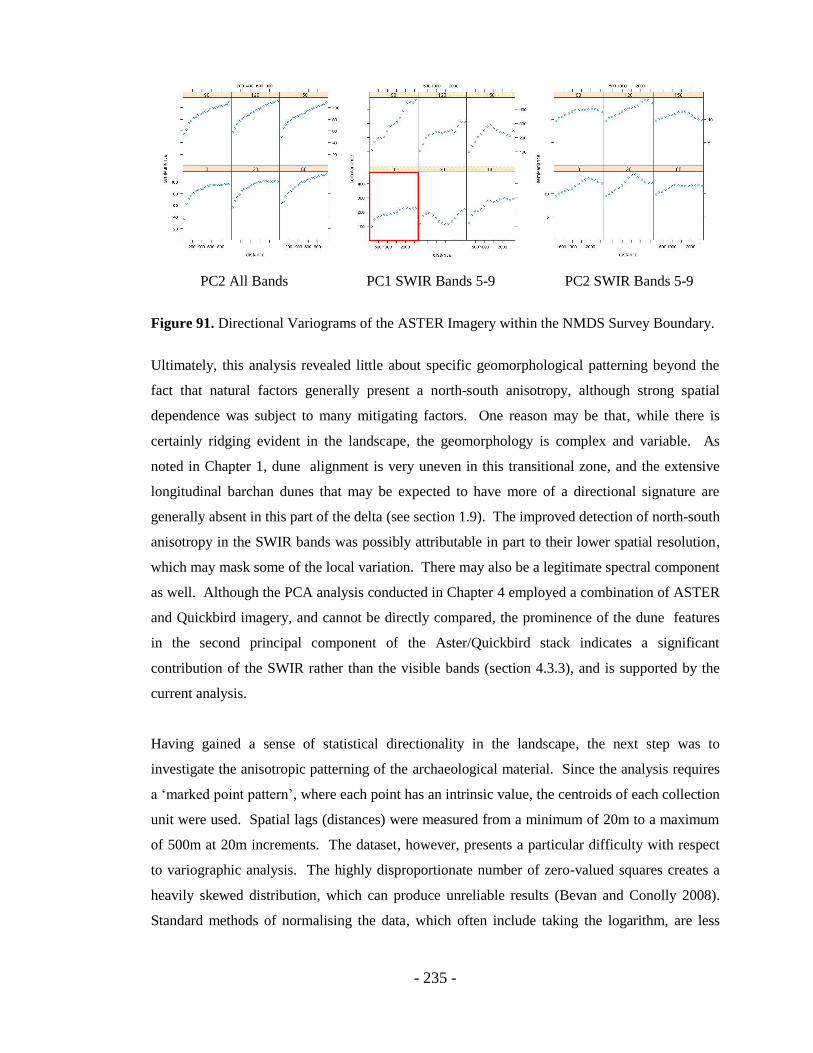
- 235 -
PC2 All Bands PC1 SWIR Bands 5-9 PC2 SWIR Bands 5-9
Figure 91. Directional Variograms of the ASTER Imagery within the NMDS Survey Boundary.
Ultimately, this analysis revealed little about specific geomorphological patterning beyond the
fact that natural factors generally present a north-south anisotropy, although strong spatial
dependence was subject to many mitigating factors. One reason may be that, while there is
certainly ridging evident in the landscape, the geomorphology is complex and variable. As
noted in Chapter 1, dune alignment is very uneven in this transitional zone, and the extensive
longitudinal barchan dunes that may be expected to have more of a directional signature are
generally absent in this part of the delta (see section 1.9). The improved detection of north-south
anisotropy in the SWIR bands was possibly attributable in part to their lower spatial resolution,
which may mask some of the local variation. There may also be a legitimate spectral component
as well. Although the PCA analysis conducted in Chapter 4 employed a combination of ASTER
and Quickbird imagery, and cannot be directly compared, the prominence of the dune features
in the second principal component of the Aster/Quickbird stack indicates a significant
contribution of the SWIR rather than the visible bands (section 4.3.3), and is supported by the
current analysis.
Having gained a sense of statistical directionality in the landscape, the next step was to
investigate the anisotropic patterning of the archaeological material. Since the analysis requires
a „marked point pattern‟, where each point has an intrinsic value, the centroids of each collection
unit were used. Spatial lags (distances) were measured from a minimum of 20m to a maximum
of 500m at 20m increments. The dataset, however, presents a particular difficulty with respect
to variographic analysis. The highly disproportionate number of zero-valued squares creates a
heavily skewed distribution, which can produce unreliable results (Bevan and Conolly 2008).
Standard methods of normalising the data, which often include taking the logarithm, are less
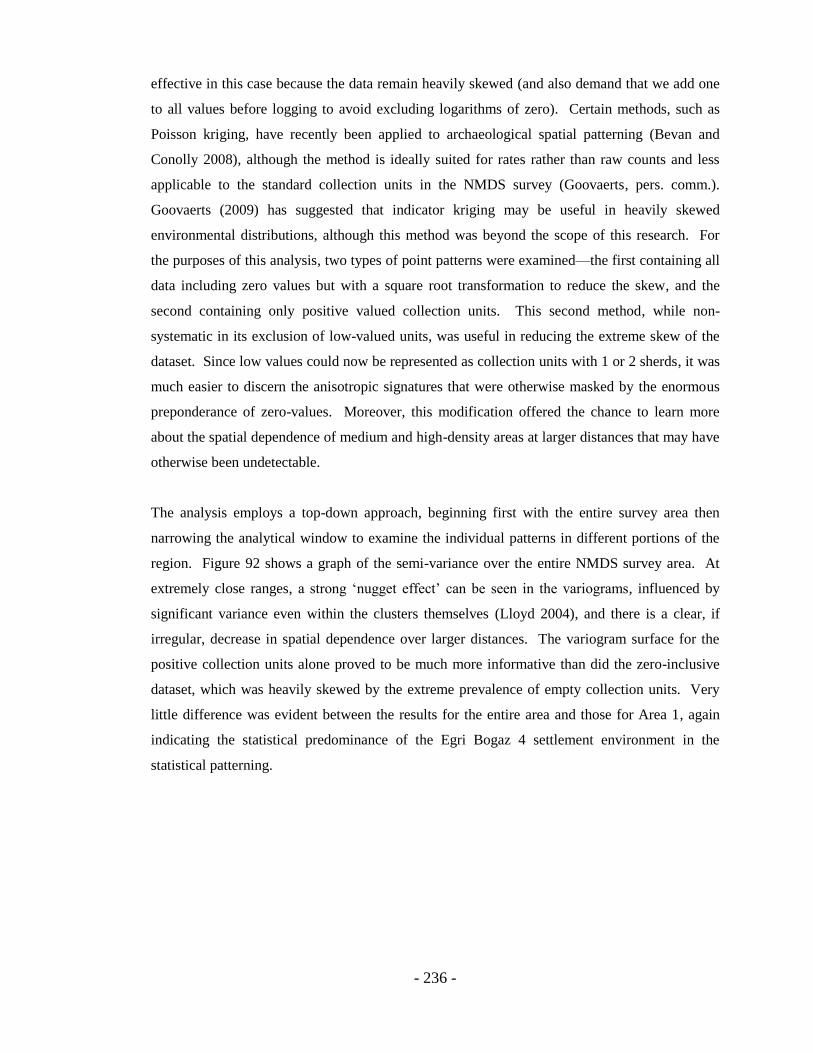
- 236 -
effective in this case because the data remain heavily skewed (and also demand that we add one
to all values before logging to avoid excluding logarithms of zero). Certain methods, such as
Poisson kriging, have recently been applied to archaeological spatial patterning (Bevan and
Conolly 2008), although the method is ideally suited for rates rather than raw counts and less
applicable to the standard collection units in the NMDS survey (Goovaerts, pers. comm.).
Goovaerts (2009) has suggested that indicator kriging may be useful in heavily skewed
environmental distributions, although this method was beyond the scope of this research. For
the purposes of this analysis, two types of point patterns were examined—the first containing all
data including zero values but with a square root transformation to reduce the skew, and the
second containing only positive valued collection units. This second method, while non-
systematic in its exclusion of low-valued units, was useful in reducing the extreme skew of the
dataset. Since low values could now be represented as collection units with 1 or 2 sherds, it was
much easier to discern the anisotropic signatures that were otherwise masked by the enormous
preponderance of zero-values. Moreover, this modification offered the chance to learn more
about the spatial dependence of medium and high-density areas at larger distances that may have
otherwise been undetectable.
The analysis employs a top-down approach, beginning first with the entire survey area then
narrowing the analytical window to examine the individual patterns in different portions of the
region. Figure 92 shows a graph of the semi-variance over the entire NMDS survey area. At
extremely close ranges, a strong „nugget effect‟ can be seen in the variograms, influenced by
significant variance even within the clusters themselves (Lloyd 2004), and there is a clear, if
irregular, decrease in spatial dependence over larger distances. The variogram surface for the
positive collection units alone proved to be much more informative than did the zero-inclusive
dataset, which was heavily skewed by the extreme prevalence of empty collection units. Very
little difference was evident between the results for the entire area and those for Area 1, again
indicating the statistical predominance of the Egri Bogaz 4 settlement environment in the
statistical patterning.
- 237 -
Figure 92. Variograms of the NMDS Survey Area (Positive Sherd Counts, Sqrt of Total)
Left: Omnidirectional variogram Right: Directional Variograms. 0° corresponds to north-south
and 90° corresponds to east-west.
In order to look more closely at the Area 1 anisotropy, a variogram surface may be used (Figure
93). While some slight banding is evident in the N-S direction, indicated by the light blues and
whites, the strongest directional influence appears to be to the NNE beyond about 150m.
Clearly, several concurrent anisotropic influences are at work in this area, although teasing them
apart is difficult. There is some indication of N-S anisotropy at extremely close ranges (the
small, darker pink band in centre of diagram) and it possible that recovery bias in the
fieldwalking is contributing to the spatial pattering at these extremely near distances, although
similar orientation in the geomorphology is potentially a more significant factor. At slightly
higher distances, anisotropy is extremely variable, probably reflective of the patchy but dense
sherd cover and varied geomorphology in Area 1. Beyond about 150m, however, there is a
pronounced shift to a SSW-NNE orientation. The prominence of this direction is striking, and is
supported by the general orientation of some of the moderate sherd aggregations west of Egri
Bogaz 4. In conjunction with the fact that these patterns run against the prevailing
geomorphology, there may be some indication of an actual occupational phenomenon, possibly
determined both by proximity to water as well as accessibility to the main settlement area (see
also section 7.4.4, Figure 100). Such a possibility is highly speculative based on discontinuous
surface scatters, however. Moreover, the hint of similar directionality in the ASTER imagery
noted above, albeit much less clear, suggests that some of this anisotropy may simply follow the
exposed takyr surface.
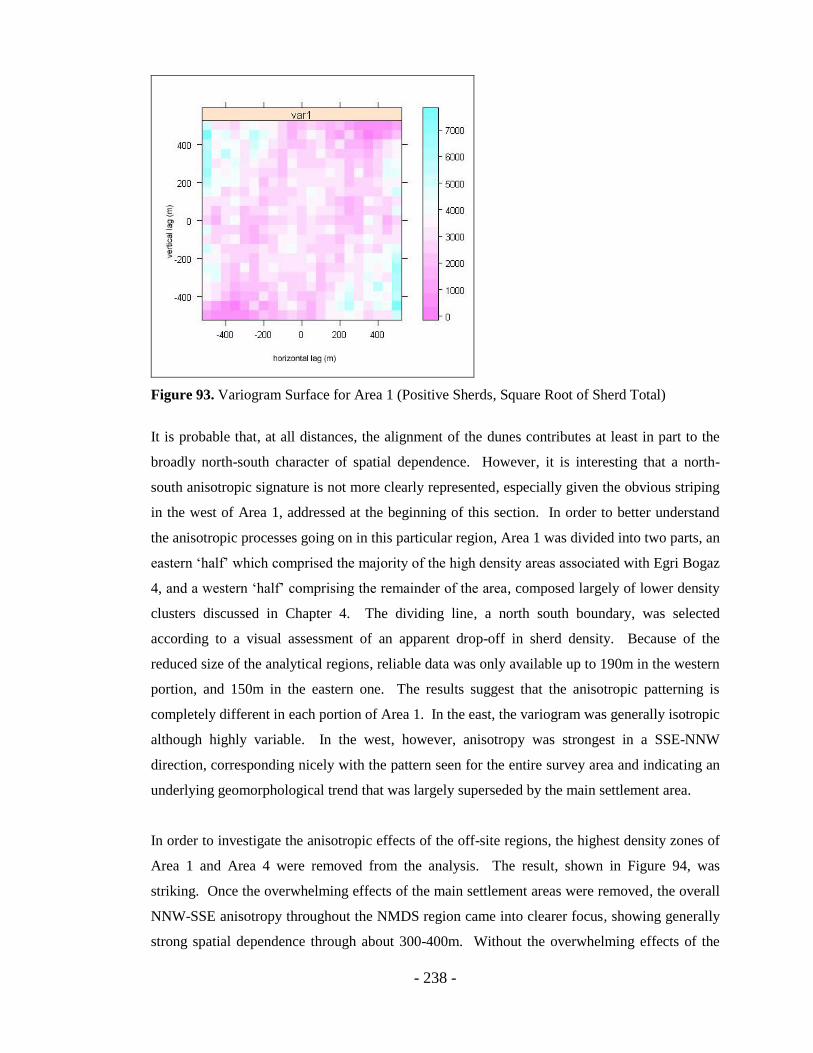
- 238 -
Figure 93. Variogram Surface for Area 1 (Positive Sherds, Square Root of Sherd Total)
It is probable that, at all distances, the alignment of the dunes contributes at least in part to the
broadly north-south character of spatial dependence. However, it is interesting that a north-
south anisotropic signature is not more clearly represented, especially given the obvious striping
in the west of Area 1, addressed at the beginning of this section. In order to better understand
the anisotropic processes going on in this particular region, Area 1 was divided into two parts, an
eastern „half‟ which comprised the majority of the high density areas associated with Egri Bogaz
4, and a western „half‟ comprising the remainder of the area, composed largely of lower density
clusters discussed in Chapter 4. The dividing line, a north south boundary, was selected
according to a visual assessment of an apparent drop-off in sherd density. Because of the
reduced size of the analytical regions, reliable data was only available up to 190m in the western
portion, and 150m in the eastern one. The results suggest that the anisotropic patterning is
completely different in each portion of Area 1. In the east, the variogram was generally isotropic
although highly variable. In the west, however, anisotropy was strongest in a SSE-NNW
direction, corresponding nicely with the pattern seen for the entire survey area and indicating an
underlying geomorphological trend that was largely superseded by the main settlement area.
In order to investigate the anisotropic effects of the off-site regions, the highest density zones of
Area 1 and Area 4 were removed from the analysis. The result, shown in Figure 94, was
striking. Once the overwhelming effects of the main settlement areas were removed, the overall
NNW-SSE anisotropy throughout the NMDS region came into clearer focus, showing generally
strong spatial dependence through about 300-400m. Without the overwhelming effects of the
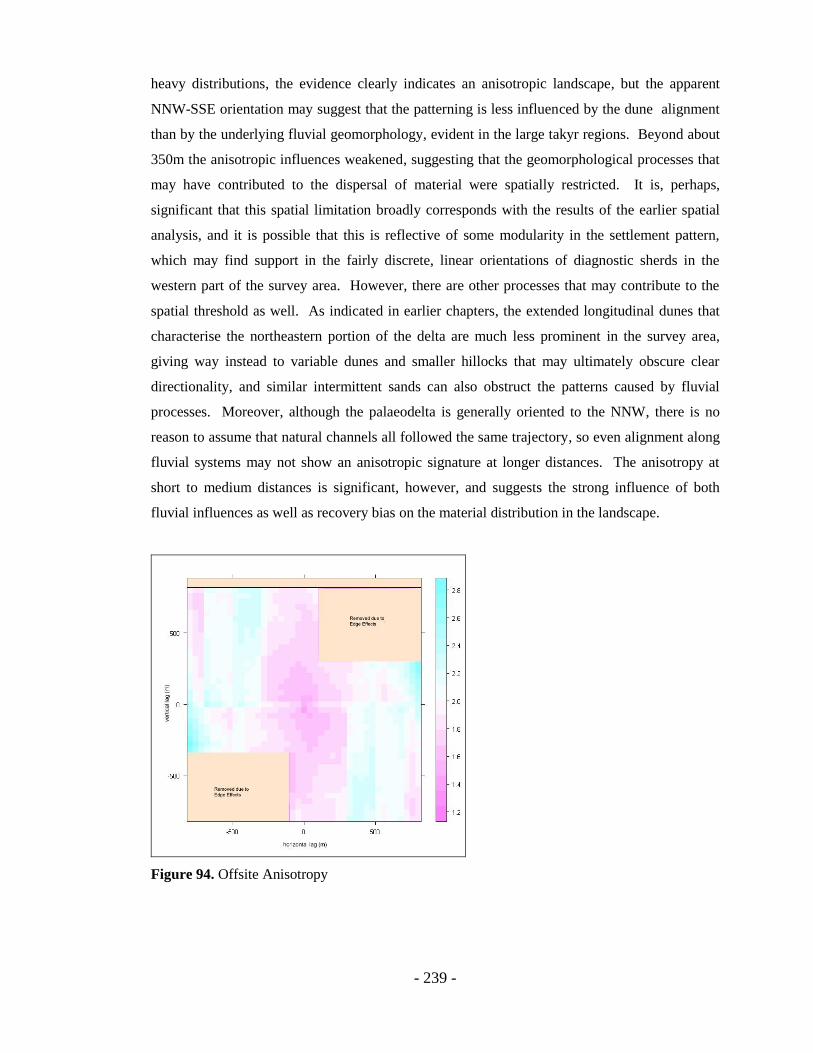
- 239 -
heavy distributions, the evidence clearly indicates an anisotropic landscape, but the apparent
NNW-SSE orientation may suggest that the patterning is less influenced by the dune alignment
than by the underlying fluvial geomorphology, evident in the large takyr regions. Beyond about
350m the anisotropic influences weakened, suggesting that the geomorphological processes that
may have contributed to the dispersal of material were spatially restricted. It is, perhaps,
significant that this spatial limitation broadly corresponds with the results of the earlier spatial
analysis, and it is possible that this is reflective of some modularity in the settlement pattern,
which may find support in the fairly discrete, linear orientations of diagnostic sherds in the
western part of the survey area. However, there are other processes that may contribute to the
spatial threshold as well. As indicated in earlier chapters, the extended longitudinal dunes that
characterise the northeastern portion of the delta are much less prominent in the survey area,
giving way instead to variable dunes and smaller hillocks that may ultimately obscure clear
directionality, and similar intermittent sands can also obstruct the patterns caused by fluvial
processes. Moreover, although the palaeodelta is generally oriented to the NNW, there is no
reason to assume that natural channels all followed the same trajectory, so even alignment along
fluvial systems may not show an anisotropic signature at longer distances. The anisotropy at
short to medium distances is significant, however, and suggests the strong influence of both
fluvial influences as well as recovery bias on the material distribution in the landscape.
Figure 94. Offsite Anisotropy
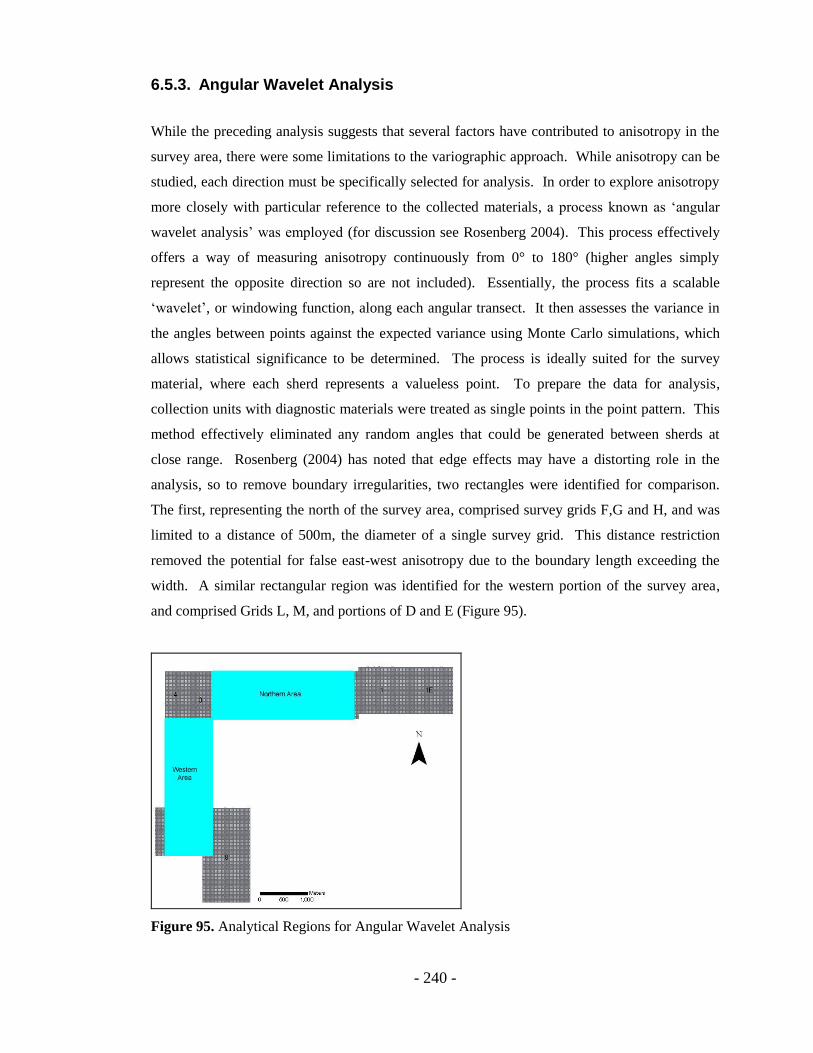
- 240 -
6.5.3. Angular Wavelet Analysis
While the preceding analysis suggests that several factors have contributed to anisotropy in the
survey area, there were some limitations to the variographic approach. While anisotropy can be
studied, each direction must be specifically selected for analysis. In order to explore anisotropy
more closely with particular reference to the collected materials, a process known as „angular
wavelet analysis‟ was employed (for discussion see Rosenberg 2004). This process effectively
offers a way of measuring anisotropy continuously from 0° to 180° (higher angles simply
represent the opposite direction so are not included). Essentially, the process fits a scalable
„wavelet‟, or windowing function, along each angular transect. It then assesses the variance in
the angles between points against the expected variance using Monte Carlo simulations, which
allows statistical significance to be determined. The process is ideally suited for the survey
material, where each sherd represents a valueless point. To prepare the data for analysis,
collection units with diagnostic materials were treated as single points in the point pattern. This
method effectively eliminated any random angles that could be generated between sherds at
close range. Rosenberg (2004) has noted that edge effects may have a distorting role in the
analysis, so to remove boundary irregularities, two rectangles were identified for comparison.
The first, representing the north of the survey area, comprised survey grids F,G and H, and was
limited to a distance of 500m, the diameter of a single survey grid. This distance restriction
removed the potential for false east-west anisotropy due to the boundary length exceeding the
width. A similar rectangular region was identified for the western portion of the survey area,
and comprised Grids L, M, and portions of D and E (Figure 95).
Figure 95. Analytical Regions for Angular Wavelet Analysis

- 241 -
Figure 96 shows a comparison between the wavelet analysis in the northern and western regions.
Immediately apparent is the significant anisotropic difference between the two areas. In the
west, spikes at 90 degrees (N-S) are prominent. Since the method does not offer the possibility
to examine the anisotropy in incremental distance bands, the maximum distance was lowered
incrementally to determine whether different distances had any effect on directionality.
Interestingly, below 200m, the preponderance of 90-degree angles in the western offsite region
nearly vanishes, with the closest spike occurring at about 110 degrees. There is some question
of reliability, however, as the distance reduction resulted in far fewer point-pairs, so the pattern
must be interpreted with caution. Moreover, similar spikes occur towards 180 degrees.
However, even if the spikes cannot be completely trusted, it does appear that there is a legitimate
case to be made for a shift from N-S to NNW-SSE as distance decreases, a finding that is
concurrent with the variographic evidence.
Figure 96. Comparative Wavelet Analysis for Offsite Regions. Top: Northern region. Note the
spikes at 170° (corresponding to the road) and 0°. Bottom: Western region. Note the range of
high values from 90°-100°, reflecting the underlying geomorphology.
The northern part of the survey area, however, exhibits a completely different anisotropic
character. Here, the directionality tends towards the horizontal rather than the vertical, with
peaks around 0 degrees. The apparent horizontal directionality described above certainly plays a
- 242 -
role, but in order to determine what processes are actually at work it is useful to try to
deconstruct the anisotropy by period. Unfortunately, there were not enough diagnostics in either
the Bronze Age or the later periods to offer a very clean depiction of angular variance, as
indicated by the substantial fluctuations in the graphs. However, there are some distinct trends
worth exploring. The first is that, for Bronze Age diagnostics, there is no statistically significant
anisotropy in this particular region, suggesting that neither fluvial processes nor significant
recovery biases from the dunes significantly impacted recovery. Of course, a few dozen
diagnostics is a very small sample, but when viewed in light of the variograms described above,
it is clear that the north-south directional variance is not nearly as strong a factor as in either the
western survey area or the western portion of Area 1.
If no strong anisotropic signature is evident for the Bronze Age diagnostics in the northern
portion of the survey area, the prospects improve for the late period materials. Here, a much
stronger east-west anisotropy could be detected, with a secondary spike around 165-170°. This
angle corresponds directly with the road and pipeline, and the occurrence of late period sherds
both at the edge of the road and in the pipeline fill certainly contributes to a recovery bias in this
direction. However, a closer look at the material distribution suggests that there are processes
that are not so easily explained by these recent projects. A map of the distribution of glazed
sherds, datable to the early Islamic period, shows that these fragments tend to follow a general
east-west trajectory. There is a clear correlation between several of these sherd fragments and a
long, winding track approximately 1 km south of the main road (Figure 97). Although the
diagnostic sherds along this road are sparse—less than ten were recovered—the pattern is
evident, and stretches for several kilometres. When viewed in association with the more general
east-west anisotropy, it is quite possible that this road represents the continued use of a much
older trackway, and other quasi-linear dispersals of Islamic period ceramics have been known to
occur elsewhere in the delta (T. Williams, pers. comm.). Also noteworthy is the occurrence of
this track just north of a later-period site on the takyr, briefly addressed in Chapter 5. Although
only a single glazed sherd was found in that particular concentration, the chronology of the
fragments suggests a Sasanian date for the foundation of the settlement, which most likely
continued into the Islamic period. The presence of the wells (section 5.6.3.), at least two of
which are clearly out of use, offers some evidence that this pattern of ceramics may signify a
fairly significant east-west trading corridor with at least one easily accessible waystation in the
area. If this is the case, it is interesting when viewed in conjunction with the more north-south
orientation of materials in the western portion of the survey area, and perhaps particularly with

- 243 -
the „kiln site‟ discussed earlier. It is possible that the survey area happens to coincide with a
crossing of Islamic period trading routes, quite possibly originating during the middle Sasanian
period or even earlier. However, further analysis of Islamic period trading routes falls beyond
the scope of this research; moreover, the narrow width of the western portion of the survey area
restricts a full examination of the material distribution in the east-west direction. The possibility,
then, of additional parallel routes cannot be ruled out, and there is no reason to assume that this
particular distribution of Islamic sherds necessarily represents a major east-west corridor.
Figure 97. Distribution of Green Glazed Sherds in Area 2
The predominant NNW-SSE orientation of the surface scatter suggests that anisotropic factors
play a significant role in the NMDS surface distribution. Assessing the contributing factors to
this directionality, however, is difficult. At short distances, anisotropic signatures are less
readable, suggesting that in areas of high density, phenomena associated with occupation, or
simply extreme local variability, may supersede either recovery or geomorphological factors that

- 244 -
become more prominent towards the periphery of these scatters. This possibility aligns with the
findings of Bevan and Conolly (2008), who have demonstrated that anisotropic factors
contributing to the material distribution on the Greek island of Antikythera were more
discernible at higher distances, largely influenced by the geology of the region.
The second consideration deals with recovery bias. As noted above, the observable banding
does not appear to be readily explainable by fieldwalking bias alone, although this may be a
contributing factor. A second, and more likely contributing factor is the dune landscape. While
generally oriented north-south, the interplay with the fluvial system suggests that the actual dune
geomorphology is much more complex, and it would be incautious to rule out the ridging as a
significant contributing factor. Unfortunately, it is difficult to separate the dune morphology
from the alluvial processes in this environment. As Lioubimitseva (2003) has noted, alluvial
geomorphology and the overlying dune ridges do not necessarily occur independently of each
other, as can be seen in the occasional aeolian accretions apparently associated with fluvial
features. It is therefore likely that a north-south component of both features may contribute to
the anisotropy.
A third, and distinctly related factor, may be related directly to occupation. Settlement along a
fluvial system, however, may be expected to exhibit similar anisotropy as the geomorphology
itself, so it is difficult to discern definitively. There is some indication that, at least in the larger
area of occupation in Area 1, such directionality may be less of a factor in the central area of
settlement than in the western periphery of occupation. While speculative, such a pattern may
indicate that on-site distributions, while clearly affected by post-depositional processes, offer
some vestigial patterning from activities related to community structure and organisation. The
increased anisotropy in peripheral areas may therefore reflect a greater responsiveness to
geomorphology, not only in terms of fluvial processes involved in post-deposition, but also in
the nature of actual occupation or land use.
6.6. Summary
A problem with statistical interpretations, and perhaps legitimate fodder for post-processual
criticism of such methods, is a tendency for non-statisticians to equate probability with
absolutes. It is all too easy for archaeologists, lulled and perhaps intimidated by these abstract
values, to unquestioningly accept and pass on these mathematical reductions of complex
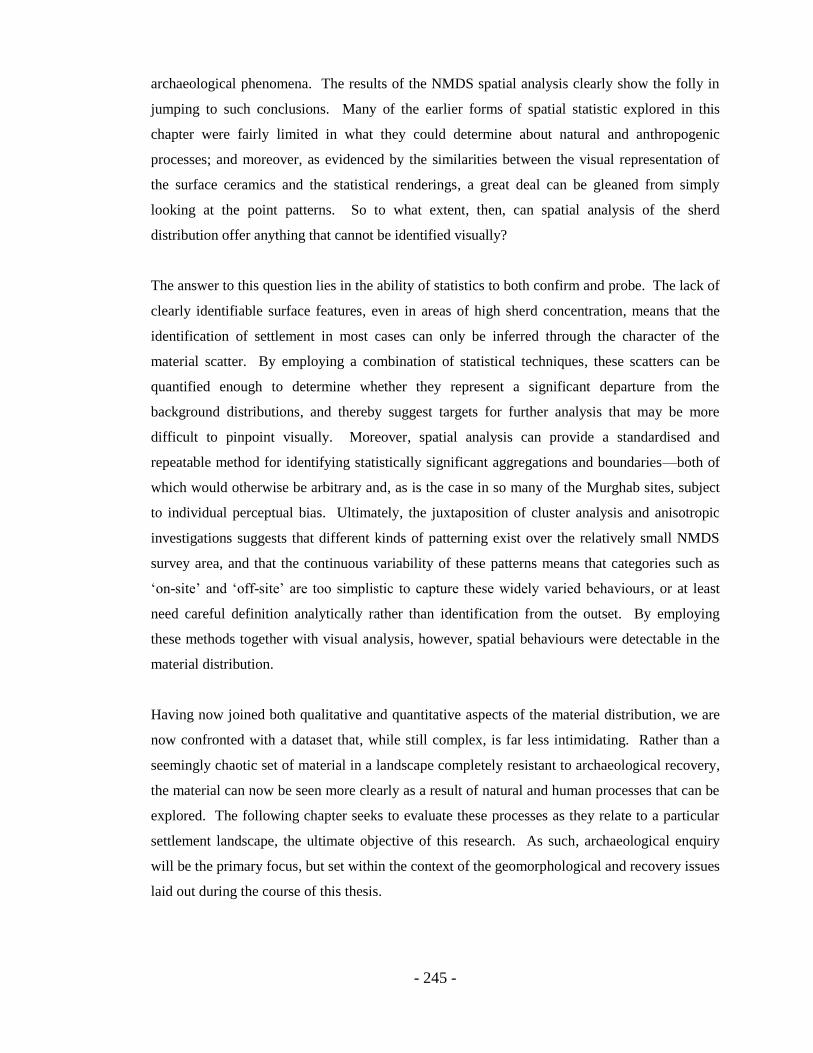
- 245 -
archaeological phenomena. The results of the NMDS spatial analysis clearly show the folly in
jumping to such conclusions. Many of the earlier forms of spatial statistic explored in this
chapter were fairly limited in what they could determine about natural and anthropogenic
processes; and moreover, as evidenced by the similarities between the visual representation of
the surface ceramics and the statistical renderings, a great deal can be gleaned from simply
looking at the point patterns. So to what extent, then, can spatial analysis of the sherd
distribution offer anything that cannot be identified visually?
The answer to this question lies in the ability of statistics to both confirm and probe. The lack of
clearly identifiable surface features, even in areas of high sherd concentration, means that the
identification of settlement in most cases can only be inferred through the character of the
material scatter. By employing a combination of statistical techniques, these scatters can be
quantified enough to determine whether they represent a significant departure from the
background distributions, and thereby suggest targets for further analysis that may be more
difficult to pinpoint visually. Moreover, spatial analysis can provide a standardised and
repeatable method for identifying statistically significant aggregations and boundaries—both of
which would otherwise be arbitrary and, as is the case in so many of the Murghab sites, subject
to individual perceptual bias. Ultimately, the juxtaposition of cluster analysis and anisotropic
investigations suggests that different kinds of patterning exist over the relatively small NMDS
survey area, and that the continuous variability of these patterns means that categories such as
„on-site‟ and „off-site‟ are too simplistic to capture these widely varied behaviours, or at least
need careful definition analytically rather than identification from the outset. By employing
these methods together with visual analysis, however, spatial behaviours were detectable in the
material distribution.
Having now joined both qualitative and quantitative aspects of the material distribution, we are
now confronted with a dataset that, while still complex, is far less intimidating. Rather than a
seemingly chaotic set of material in a landscape completely resistant to archaeological recovery,
the material can now be seen more clearly as a result of natural and human processes that can be
explored. The following chapter seeks to evaluate these processes as they relate to a particular
settlement landscape, the ultimate objective of this research. As such, archaeological enquiry
will be the primary focus, but set within the context of the geomorphological and recovery issues
laid out during the course of this thesis.
- 246 -
Chapter 7. Discussion: Re-examining Settlement in the Northern Murghab
7.1. Overview
The preceding chapters have examined the character of the material distribution in the Murghab
study area as comprehensively as possible while avoiding overly confining classifications. With
this restriction as an underlying theme, Chapter 4 offered an assessment of the current landscape
with respect both to the underlying geomorphology and visibility issues. It then drew on remote
sensing data to derive a series of partially abstract, quantifiable models against which to situate
the archaeological evidence. Chapter 5 presented the survey data, examining qualitative aspects
of the material distribution within the formidable interpretative barriers laid out in the previous
chapter. Chapter 6 then broadened the scope to an examination of the spatial characteristics of
the distribution, and attempted to present some measurable settlement entities and examine the
ways in which the conceptions of these may change at different analytical scales. The task at
hand is to shift from the observable data to a broader understanding of the actual nature of
Bronze Age settlement in the northern Murghab delta. The discussion below necessarily begins
by examining in detail the degree to which the NMDS data supports the models that have been
traditionally employed to explain the Murghab phenomenon.
7.2. Surface Pottery in a Dynamic Landscape
Before delving fully into the Bronze Age settlement landscape, however, it is necessary to first
review the archaeological landscape as it stands today, the end product of a complex and
changing sequence of geomorphological and other post-depositional processes. As shown in
Chapters 4 and 5, the relationship between the exposed takyr and settlement has been clearly
overstated in the existing literature. Even in Area 4, where material comprised much of the takyr
surface, the subsurface investigations indicated that surface scatters here were likely the result of
erosion of material from an obstructed site immediately to the east. Elsewhere, broad, open
takyrs bore little relationship to actual settlement, and occasional sherds in these areas were
detectable merely as a result of increased visibility. Despite the weak correlation between
unvegetated takyrs and occupation, however, the story is markedly different for eroded takyr
surfaces, which account for a significant portion of surface material. It is therefore instructive to
- 247 -
explore in more detail patterns of aggregation to see if something may be learned about both
post-depositional processes and, if possible, about the nature of the initial settlement patterns.
While the takyrs in the Murghab are often assumed to reflect alluvial surfaces associated with
the palaeodelta, it is simplistic to treat them as convenient windows of exposure onto a static
Bronze Age landscape. In reality, takyrs are highly dynamic geomorphological features
(Fleskins et al. 2007; Suslov 1961). A host of processes, both natural and anthropogenic, may
affect these features, and may ultimately impact the material deposition on their surfaces.
Fleskins (2007) notes that takyrs have been a central source of inexpensive and easily obtainable
fresh water for centuries, and scatters of Islamic pottery have been discovered in small takyr-like
depressions in other locations throughout the Karakum (P. Wordsworth, pers. comm.). It is
certainly reasonable, then, that movements of humans and livestock over fairly small,
concentrated areas have resulted in both redistribution and further fragmentation of surface
material (Taylor et al. 2000). Of even greater significance, perhaps, may be the natural
processes that characterise takyr surfaces. Of these factors, two are worth exploring in some
detail. The first is surface water run-off. The hard clayey takyr crust is the prime factor
contributing to a low-drainage environment. Fleskins has shown that, on unvegetated takyr
surfaces, as much as 71% of surface water remains on the takyr surface after drainage, enough to
be „harvested‟ for agro-pastoral purposes or for drinking water (Fleskins et al. 2007). Although
rainfall is uncommon in the northern Murghab, it is quite possible that heavier rainstorms,
particularly in the spring, may contribute to the displacement of material in the direction of the
surface runoff. Test pits in Area 4 indicated a gradual slope to the east, so material shifted by
water may have a tendency to drift in this direction. It must be stressed, though, that such a
hypothesis is based on data from a single takyr and cannot be treated as a definitive conclusion.
Moreover, the flat terrain suggests that drainage processes would be slow, so the actual potential
for run-off associated redeposition may be weak.
A related process, and one that may affect surface distributions more directly, is the erosion of
the takyr surface itself, well documented in the Karakum (Suslov 1961; Lioubitsemeva 2003)
and clearly observable in the field. Takyr surfaces are highly susceptible to wind-based erosion,
resulting in the deflation of the surface and consequent accumulation of local and wind-borne
deposits (Argaman 2006). Similar to the accretion of sands and vegetation discussed in Chapter
5, the resulting build up of material tends to capture water which results in the development of
vegetation. This process further traps wind-blown material, and a cycle of depositional
processes ensues. As surface run-off is also dramatically reduced by this process (see Fleskins et
- 248 -
al. 2007), some stabilisation of surface materials may result as well. Moreover, wind-blown
sand accretion may be more pronounced in boundary areas between takyr and dune ridges. This
may result in part from moisture becoming trapped in these slightly lower-lying, transitional
regions. Also, the proximity of these boundary zones to sand ridges themselves suggests that
aeolian deposits are more likely to be deposited in these regions as a result of the interaction
between wind and dunes. It is therefore reasonable to attribute the deposition of material on the
eroded takyr perimeter largely to relatively recent geomorphological processes.
In dune environments, material dispersion consisted primarily of isolated sherds. Occasional
diagnostics or small finds, in general, were not associated with significant assemblages, although
exceptions may be found in the more concentrated aggregations in sandy depressions, discussed
in more detail below. Given the extremely low densities in these areas, it is difficult to identify
any particular post-depositional processes that may account for these materials, and it seems
likely that a combination of wind or water-driven processes, or even sporadic collection and
discard, may account for their presence rather than any systematic settlement pattern or field
process. The paucity of occupational evidence on dune surfaces has been noted elsewhere
(Cattani and Salvatori 2008), although an exception may be found in the scatters of „Andronovo‟
type coarsewares, commonly found on sand dunes and attributed to later movements of steppe
nomadic groups after the processes of desertification were well underway during the Final
Bronze Age (Cattani et al. 2008b).
7.3 Revisiting the Oasis Model
The theoretical underpinnings of the oasis model have already been discussed in Chapter 2,
although it should be mentioned that, in a sense, the NMDS survey at just 11 km2 operates at the
wrong scale to adequately assess a model meant to interpret the entire delta. There are, however,
some key inferences that can be drawn from the data that suggest that the traditional oasis model
is far too simplistic to accurately describe the Bronze Age settlement pattern in the delta. The
first is the continuity of the surface material apparent in both the NMDS and AMMD projects,
the complexities of which will be discussed below. While the contention of several AMMD
researchers that the ongoing distribution of material represents continuous settlement (Cattani
and Salvatori 2008) or farmland (Cleuziou et al. 1998) is questionable (see section 2.4), the
results of this research strongly suggest that actual settlement processes were at work in the
intermediate zones between larger occupational areas (e.g. Area 2; see section .5.6.3).

- 249 -
A second feature that calls the oasis model into question is the long and at least partially
continuous distribution of material in the western portion of the survey area (see Chapters 5 and
6). The survey in this area represents one of the few substantial examinations of the „empty‟
region south of the Kelleli-Egri Bogaz line (Cattani and Salvatori 2008). The presence of
apparent, if small scale, settlement in Area 5 is interesting in light of several scatters (AMMD
961, 962, 966) discovered along a transect conducted in the mid-1990s between Egri Bogaz 4
and Taip (Cattani and Salvatori 2008), which bypassed the survey area a few kilometres to the
south (Figure 98). At least one region along this transect, although not designated as a specific
site, is described as containing dense Late Bronze material, and appears to extend the NMDS
pattern a few kilometres to the south. Perhaps even more significant is the line of sites (963,
964, 965, 1083, 1084), themselves spanning a distance of over 3 km and continuing into the
Adam Basan settlement area. With the exception of AMMD 963, designated as a „type 1‟ depe
with Middle and Late Bronze material, these sites are assigned to the Late Bronze Age, although
such designations based on small surface distributions are, as has been noted, questionable. This
clear evidence of linearity extending south from the survey area suggests that these scatters may
be part of the same channel system or systems that watered the sites in the western portion of the
NMDS survey area. The juxtaposition of findings of both surveys therefore indicates a
significant occupational continuity with respect to the Bronze Age fluvial system. While such
alignments of small settlements do not alone refute the micro-oasis interpretation, the lack of
clearly bounded and isolated regions suggests that the traditional model‟s emphasis on
ecological restrictiveness may indeed be overstated. Moreover, it may be expected that, if the
oasis model were accurate, evidence of it would be most prominent in the northern Murghab,
since the distal portion of the alluvial fan would presumably exhibit the earliest signs of aeolian
encroachment in the delta.
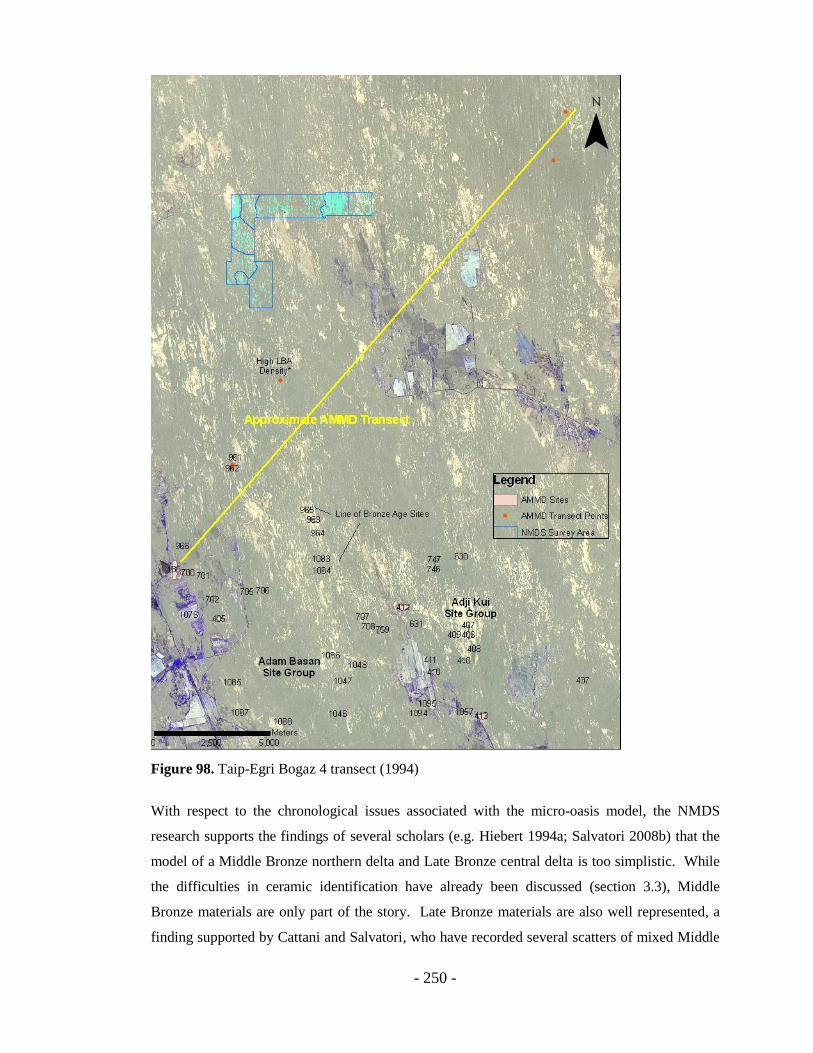
- 250 -
Figure 98. Taip-Egri Bogaz 4 transect (1994)
With respect to the chronological issues associated with the micro-oasis model, the NMDS
research supports the findings of several scholars (e.g. Hiebert 1994a; Salvatori 2008b) that the
model of a Middle Bronze northern delta and Late Bronze central delta is too simplistic. While
the difficulties in ceramic identification have already been discussed (section 3.3), Middle
Bronze materials are only part of the story. Late Bronze materials are also well represented, a
finding supported by Cattani and Salvatori, who have recorded several scatters of mixed Middle
- 251 -
and Late Bronze material along various transects in the northern delta as elsewhere (Cattani and
Salvatori 2008). Continuity into the final phase of the Bronze Age was less easy to identify, and
Takhirbai-type materials were not readily identifiable in the field (see Section 5.9). However,
the presence of at least one cluster of incised coarsewares as well as a single Yaz I sherd, both
found in similar locations in Area 2, offers some evidence that at least limited occupation
continued into the post-Namazga VI period. However, the presence of this material, while
generally associated with the decline of the sedentary communities due to its appearance in
contexts that date from the end of the Bronze Age (Hiebert et al. 2002), certainly does not in
itself guarantee the presence of an associated sedentary occupation, and the failure of such
material to occur in significant quantities within Area 1 raises questions regarding the extent to
which the steppe presence was directly associated with the main occupation in this region.
There is therefore sufficient evidence to roundly question the categorisation of the Egri Bogaz
settlements as a distinct and isolated micro-oasis. Indeed, their classification as such has
perpetuated the skewed perception of an almost unsettled northern delta, a perception that is not
substantiated by the data. However, as noted in Chapter 1, the rejection of an oasis-based
settlement pattern does not necessitate the other extreme of a continuously settled, integrated and
fertile alluvial plain, and between these broad conceptual frameworks lie any number of mid-
level approaches. Prior to investigating more nuanced models, it is worth examining in detail
some concepts of continuity, as manifested in the distribution of surface material.
7.4 Revisiting Continuous Settlement
The continuous model of Murghab settlement has already been discussed at length (see section
2.4.2.). To review briefly, the model posits a late 2nd
millennium date for the onset of
desertification, and ultimately diminishes the conventional interpretation of the Karakum sands
as a barrier to settlement and movement during the Bronze Age. The hypothesised absence of
this aeolian barrier allowed full exploitation of the deltaic alluvium, rich with fertile soils that
were therefore available for cultivation (Cremaschi 1998; Salvatori 1998b), and evidence of this
palaeo-landscape is indirectly detectable in the extensive material scatter evident in the long-
range transects conducted throughout the delta. Sites have generally been attested where
substantial surface material occurs, often in conjunction with topographical anomaly (Bondioli
and Tosi 1998). The occurrence of both random scatters and more prominent depes or elevated
- 252 -
regions suggests to the researchers that vast areas of the delta were heavily occupied or at least
open for significant agricultural activity (Cattani and Salvatori 2008).
Advocates of the continuous occupation model recognise that such patterns are not truly
uniform, and these researchers have certainly not dismissed the linear characteristics of the delta-
wide settlement pattern (e.g. Cattani and Salvatori 2008). However, the sheer geographical
scope of their particular avenue of inquiry has precluded the possibility of looking more deeply
at the nature of this continuity, with the exception of the few intensive surveys conducted as part
of the AMMD projects (see section 2.4.2). The following discussion will examine continuity on
several levels, beginning with an assessment of the material scatter, then shifting to more
familiar concepts of occupation and settlement. By gradually broadening the analytical window,
it will become possible to attain a better understanding of the intermediate scales of settlement
en route to a larger goal: a better understanding of the nature of occupation in the northern
Murghab.
7.4.1 Background Scatters
Perhaps it is best to begin by evaluating the NMDS material distribution through the lens of
background scatter, a concept that is often invoked to describe the broad distribution of low-
density ceramic material that may occur in off-site regions. Bintliff and Snodgrass (1988)
describe this phenomenon in Aegean contexts as a „sherd carpet‟ in which the distribution
exhibits little or no discernible variation in density, effectively ruling out the presence of actual
occupational areas or activity areas. This perceived uniformity of off-site material has been
questioned by Alcock and Cherry (1994), who suggest that varied processes may be expected to
affect such distributions in different ways. Kotsakis has observed some of this variability, noting
that certain areas where off-site scatters may be expected do not always yield surface material
(Kotsakis 1989, cited in Alcock et al. 1994). Moreover, the Boeotian data relied largely on basic
sherd densities, and subtleties that may have been detectable through more intensive types of
spatial analysis were not explored. In the NMDS survey, the surface scatter indicated broad
variations both in land cover and material density, with the clearest evidence of clustering
occurring in concentrated areas. Below a radius of about 50m, the minimum distance employed
in the statistical analyses, the identification of sherd clusters was purely visual, and the tendency
for these to occur in sandy depressions or eroded takyrs was evident from observation. Thus, at
the smallest analytical scales, both aggregation and absence of material may be seen primarily as

- 253 -
the result of a highly capricious landscape where even a small accumulation of a few centimetres
of wind-blown sand can obstruct a scatter of material that may otherwise be visible in an
exposed patch of alluvium. At larger scales, however, there is evidence of other processes at
work that cannot be explained simply by these localised occurrences, and these will be explored
in more detail below.
In order to better understand the nature of this highly discontinuous background scatter, it is
useful to explore some of the more traditional explanations for the presence of off-site material,
and to evaluate the degree to which the NMDS surface distribution may support or refute these
models. One of the more commonly cited rationales to account for background scatter is
manuring (Wilkinson 1982). The widespread application of manure as fertiliser is well-
established in antiquity (Bintliff and Snodgrass 1988), and Goldberg and Macphail (2006: 204-
206) have noted that ploughsoils may contain anomalous anthropogenic deposits. Citing the
rural late Roman site of Oakley in Suffolk, England, they observe charcoal, burnt flints, ash and
other indicators of refuse in ploughmarks, reflecting the mixing of anthropogenic refuse in the
manuring regimen. Wilkinson (1982), in turn, describes „night soils‟, aggregations of refuse
from cess-pits or other waste-removal activities often located on the outskirts of habitation
regions, that likely became mixed with other artefacts over time. The acquisition and
distribution of these materials as fertiliser therefore resulted in the widespread, if inadvertent,
dispersal of surface sherds, which were then subject to further fragmentation over the millennia.
The nearly continuous distribution of these materials observed by Wilkinson may extend from
three to six kilometers radially, a distance could be reached within two hours‟ haul (Wilkinson
1982: 326). Variability in the continuity of the scatter may be partially related in part to the
orientation of field systems or available irrigation, as well as erosional processes such as
gullying. While the manuring hypothesis has been widely invoked to account for broad
background scatters in diverse regions (Alcock et al. 1994; Bintliff and Snodgrass 1988), Alcock
has criticised such broad and often uncritical applications of the theory. Although she does
acknowledge that manuring may account for the deposition of at least some cultural material,
and praises Wilkinson‟s rigorous methodology, she cautions against invoking the hypothesis as a
catch-all explanation for background scatters in highly varied and often untested regions.
In the Murghab, researchers have similarly attributed what they view as a continuous
background scatter to manuring (e.g. Cleuziou 1998), although no specific test of the hypothesis
in this particular region has been conducted. It is therefore necessary to investigate the degree to
which the NMDS data substantiates such a theory. While the survey is not intended to be

- 254 -
directly comparable with Wilkinson‟s results, some broad assessments are possible that can shed
light on the degree to which the model explains the sherd scatters in the survey area. By far the
most apparent discrepancy between the NMDS survey and others in the Aegean and the Near
East is in the magnitude of the background scatter. Wilkinson (1982: 331) estimates that the
hinterland surrounding Tell Sweyhat, estimated at a 3km radius, may contain some 8-10 million
sherds as a result of Bronze Age manuring practices, or over 177,000/km2. Although
Wilkinson‟s methodology (1982: 327) employed a more intensive strategy in each individual
sampling unit, recording and collecting all material greater than 1cm, his estimates far exceed
the observed sherd totals in the NMDS survey. Even in Area 1, the density averaged just over
14,000 sherds/km2. If this estimate were scaled up by a factor of 5-10, representing the portion
of the landscape unseen by the walker, counts increase to 70,000-140,000 sherds/km2. While
this measurement is not too far from Wilkinson‟s estimates, it should be noted that Area 1
represents a heavily occupied region, of which the majority of sherds fall in a small number of
collection units. However, in the adjacent, less settled Areas 1E and 2, where counts are likely
to be much more reliable, densities fell to only a few hundred sherds/km2. Even taking the
restricted visibility into account, these numbers are several orders of magnitude less than those
described in the Near East. Moreover, in hyper-arid zones, such as coastal Oman, Wilkinson has
documented sherd counts on the order of 2.5-10 sherds per square metre, the result of lag
deposits that remain after the soils have been removed via deflation. The comparative absence
of material in the Murghab, a region of similar aridity and high deflation, is striking and suggests
that a continuous sherd scatter resulting from manuring may not be in evidence here. A further
problem lies in the distribution of these materials. Broad takyr surfaces, meant to reflect the
ancient alluvial surface, remain largely devoid of significant material scatter. It is difficult to
ascertain the degree to which these surfaces were cultivated, although the test pits dug into the
takyr surface, sometimes in regions of high sherd concentrations, did not provide any evidence
of organic material that may be expected in heavily manured zones (Goldberg and Macphail
2006: 204). Given the current level of analysis, it would be impossible to claim with any
convincing evidence that manuring processes were not occurring in the Murghab,12
but it is an
enormous logical leap to move from possibility to a primary explanation for spatial patterning.
Rather than a blanket transposition of Aegean and Mesopotamian models onto the Murghab, it is
more judicious to suggest that while manuring may have partially contributed to some surface
scatters, such a process was likely to have been intermittent rather than continuous, and perhaps
12
Alcock and Cherry (1994) acknowledge that manuring was quite likely a contributing factor to offsite
scatter in the Aegean, but they question Bintliff and Snodgrass‟ reliance on the theory as the primary
explanation for the surface scatters.
- 255 -
more intensive along channels or irrigation ditches. If this is the case, it may partially account
for some of the directionality in the material distribution.
A second factor that may contribute to the background scatter is the chance discard or lateral
displacement of materials by humans or animals. Although Bintliff and Snodgrass (1988)
discount such processes from having a significant effect on the material distribution in Boeotia,
the nomadic history of the Karakum demonstrates that the movement of humans and animals
was widespread, even in the absence of sedentary occupation. Several broad expanses of sheep
dung were found in the survey area, indicating that flocks may pass through regularly.
Moreover, the occurrence of several individual small finds in isolated contexts may support
chance discard of individual artefacts as part of pastoral and other mobile or semi-mobile
practices. While such processes would hardly account for the presence of major aggregations of
artefacts, they may have contributed to low-density scatters or isolated fragments offsite. The
fairly common occurrence of isolated regions where several sherds from a single vessel occurred
concurrently may offer further evidence of this process. While these „pot-smashes‟ occurred
primarily with late-period vessels, it is likely that similar processes affected Bronze Age pottery
as well, both in modern times and in antiquity.
A third factor is that these background distributions reflect actual small-scale settlement
processes or activities that may be expected to occur in the immediate vicinity of settlements,
such as production or burial. In both Areas 1 and 4, the occurrence of sherds in conjunction with
vitrified brick and slag suggest that some of the material is associated with kilns, and such a
possibility is supported by the extent of the scatters near the excavated kilns on Egri Bogaz 1 and
2. Sherds may also be associated with burials (Wilkinson 1982), and the presence of substantial
cemeteries at several Murghab sites suggests that similar activities may be in evidence in the
NMDS region as well. In terms of actual occupation, the lack of substantial architectural
material or small finds associated with these small scatters suggests that any occupation was
likely to have been intermittent; short-term or transient processes that may have contributed to
the material distribution. Perhaps the most common explanation for short-term habitation is
seasonal settlement, although Foxhall (2000) criticises such a label as a convenient yet simplistic
way to account for sparse assemblages of indeterminate origin. Although seasonality has been
invoked to account for the smaller scatters in the Murghab (Cattani et al. 2008a: 44), there are
problems with this explanation. Seasonal occupation is often linked with transhumance, where
high pastures are sought out in summer, and protected valleys in the winter (Harris and Gosden
1996). Such strategies, however, are not applicable in the northern Murghab, where terrain is
- 256 -
essentially flat and relatively uniform. One possibility may be that short-term occupations were
linked with local herding activities. Evidence at Gonur suggests that a substantial proportion of
the Bronze Age economy was devoted to livestock breeding—primarily sheep and goat, and to a
lesser extent cattle (Moore 1993; 1994). Although the actual location of pastureland cannot be
determined from the current data, the mixed economy suggests that herding was most likely
practiced within range of the urban centres, and it is possible that unused agricultural land may
have seen a dual function as local pasture (Wilkinson 1993: 558). If this is the case, small
scatters may not represent significant settlement at all, but vestiges of activities by local herders
or farmers. Even today, occasional ash deposits can be seen on remote takyrs, or sometimes
within walking distance of agricultural fields, the remains of fires built by local herders. In this
light, it is interesting to consider the presence of poor-quality, often blackened, sherds that
occurred intermittently in Areas 1 and 2. These were of Namazga V-VI type and consequently
associated with deltaic rather than steppe communities, although rare evidence of the latter does
begin to occur in the region towards the end of the period (Cattani et al. 2008b for discussion).
These scatters tended to occur in extremely low densities, suggesting that the association of
these sparse coarsewares with significant settlement—even small-scale seasonal or periodic
occupations—may be a stretch. More substantial aggregations, however, may be reflective of
small-scale sedentarism.
Lastly, this already complex and varied dispersal of material is likely to have been further
modified, perhaps substantially, by ongoing geomorphological processes. With respect to the
small offsite scatters, erosion and deflation have likely contributed significantly to the surface
distribution. Deflation is well documented in the Murghab (Rossi-Osmida 2007; Hiebert
1994a), and while it is often referenced in the literature in the context of deflated architecture, its
impact on site surfaces is well established (Rosen 1986). Hiebert (1994a: 35) notes that the top
30cm of the Gonur North deep sounding consisted primarily of a mix of abraded sherd
fragments amid yellowish-brown sandy deposits. While he attributes material on the surface
primarily to wind-blown deposition, he associates the shallow subsurface mix of sand and
cultural material primarily with deflation. In offsite depressions and takyr surfaces, complex
deflationary processes are also plausible. In these low-lying areas, wind may erode finer
materials, resulting in the dissolution of discrete stratigraphy. This process may result in the
formation of „lag deposits‟, aggregations of heavier material left behind by the removal of fine
particles via wind erosion (Rick 2002). The result may be an unstratified palimpsest of large
surface artefacts from different chronological periods, which may then be redeposited via further
erosional processes, effectively confounding the archaeological landscape. Such processes may
- 257 -
partially account for the perception of some of the northern deltaic sites as single-period
occupations, and it is quite possible that significant scatters removed from the major
occupational areas, such as the large takyr-edge concentration in N-16 (see section 5.6.4.), may
result in part from similar processes.
The above discussion illustrates that, rather than a passive „background‟, the sherd scatters
represent highly complex and varied processes, which in turn vary from region to region.
Clearly, small scale settlement and activities associated with such settlement account for at least
some of the material, and these distributions are more substantial in the immediate peripheral
zones beyond primary settlement areas. If practices of manuring and activities associated with
pastoral activities are to be included in these processes, the implication is that these scatters are
indicative of activities associated with mixed economic processes that decline at distances
beyond two or three kilometres. Beyond these distances, as in Areas 3 and 8, the paucity of
material suggests that activity is much more limited, and the occasional material in these regions
is more likely to have resulted from isolated activities (see above) or chance discard. In all
cases, however, these distributions have been heavily modified by complex geomorphological
processes. These, over the past four millennia, have acted as the primary agents in determining
the current character of the surface scatter.
7.4.2 Continuity and Settlement—Small Occupations
To this point, our examination of continuity has focused on the distribution of material directly
observable in the landscape, and while there is clearly a large amount of what may be thought of
as „offsite‟ material, the scatters are not so much „continuous‟ as variable and punctuated, and
this patterning will be revisited in section 7.7 with respect to the fluvial system. At the next
analytical level, and perhaps more difficult to conceptualise, is an analysis of continuity in
relation to actual sites or settlements, which are largely conceptual and often not directly
measurable (see discussion in section 2.7). Some information may be gleaned from the presence
of medium-density sherd scatters distributed over several collection units, especially when these
occur together with diagnostic material. The prevalence of such scatters suggests that small-
scale occupations may have been commonplace. The largest of these occurs in close proximity
to larger settlement areas, one example of which is the large scatter in H59. It is difficult,
however, to determine the nature of these occupations, and there is no reason to assume that the
scatters represent a uniform phenomenon even over a small area. Some possible explanations
- 258 -
for low-density scatters were addressed above, and in some cases, small scatters on the periphery
of more substantial distributions may represent domestic occupations. Such settlements may
account for the small aggregations that occur west of the predominant scatters in Area 1 and,
while speculative, the possibility finds support elsewhere in the delta. Small domestic structures
were discovered beyond the walls of the main buildings on Adji Kui 1 (Salvatori 2002). The
occurrence of domestic architecture has also been documented about 100m south of the
monumental structure on Gonur North, where a substantial quantity of Namazga V domestic
wares was discovered (Hiebert 1994a: 96-99). It is possible that the surface distribution in H59
represents a similar domestic context, whereas sparsely distributed, often coarser materials
further afield indicate more transient occupation. In the western part of the survey area, similar
Namazga V and VI materials along the survey corridor show no obvious evidence of
differentiation, and material types were similar in Areas 5, 6 and 7. A possible picture, then, is
one of relative cultural standardisation throughout the survey area, with the greatest
differentiation in status occurring in the immediate vicinity of Egri Bogaz 4, where the range of
material may reflect different levels of wealth and status, co-existing in close proximity. A
possibly similar situation may be seen in the site of Altyn Depe, where evidence of specialist
classes and social hierarchies is well-documented and seen as one of the hallmarks of the
urbanising Namazga V period (Masson 1988, also see section 2.2). Such a possibly is only
speculative, however, and it is very possible that differences in material relate to different
functional uses rather than clearly stratified social groups.
7.4.3. Continuity and Settlement—Larger Occupations
Shifting the focus from these small entities to more heavily occupied zones raises new
interpretative difficulties from the perspective of continuity. Because actual settlement
boundaries are highly ambiguous, it is difficult to determine when to employ on-site or off-site
interpretations, especially at the margins of high-density zones. Surveys that focus on individual
sites are often highly intensive, requiring full, intensive sampling of a mound in order to locate
specific areas of production, communal or other activity (see Cattani et al. 2008b; Vidale et al.
1998 for local examples). The NMDS survey, which relied on 20m collection units, employed
too broad a scale to assess adequately highly localised occupational trends and activity areas.
However, based on the convergence of surface and sub-surface observations, some initial
conclusions may be drawn with respect to the continuity of material in more densely occupied
regions. The first deals with topographical variation, and its relationship to the material
- 259 -
distribution. As may be expected, there was some relationship between occupation and
mounded areas, indicated by the moderate density of large sherds on the surface of several
mounds in Area 1. However, the significant depth of loose aeolian deposits devoid of cultural
material suggests that the elevations of these mounds may be overstated, and evidence from the
test pits (section 5.6) suggests that anthropogenic mounds may often be partially or wholly
obstructed by sand. Material on the takyr was difficult to attribute directly to settlement since
subsurface material was generally absent. While deflation may have played a role, the excellent
preservation of many exposed sites in the delta suggests that substantial occupation would be
detectable, although small settlements may have eroded away. There are several possibilities
that may account for such aggregations of sherds in low-lying areas. The first of these is erosion
from nearby settlement locations. However, there are other, anthropogenic processes that may
be considered as well. Allison (1999: 21) discusses the concept of „secondary deposition‟, by
which artefacts are redeposited from their primary contexts. While natural processes are
sometimes included in this terminology, Allison specifically notes the deposition of refuse in
areas beyond actual habitation. Such processes may, at least in part, account for the presence of
fairly large sherds in regions that do not appear to directly reflect habitation areas. Another
possible anthropogenic explanation for these low-lying areas of high surface density may be that
they were communal spaces or external courtyards. Such a feature has been identified at Altyn
Depe, where Masson has identified a central square of approximately one hectare (Masson
1981). While this is a possibility, there are some significant problems with such an
interpretation. Unlike the feature on Altyn Depe, the depressions in Area 1 appear to be natural,
indicated by both the lack of cultural stratigraphy in the test pits as well as the fact that there is
no significant topographic variation between these depressions and the surrounding takyrs. It is
possible that deflationary processes on the exposed takyr have erased evidence of occupation,
and the cyclical process of takyr deflation and resurfacing discussed by Suslov (1961: 457) may
have entrapped remnant cultural material in the immediate takyr subsurface. The presence of
tiny fragments of cultural material intermixed with the takyr soils could provide some evidence
for this process both in the areas north and west of Egri Bogaz 4. However, the lack of
substantial cultural strata suggests that significant occupation was minimal.
7.4.4. Settlement Complexes in the Murghab
The scope and apparent complexity of occupation in Area 1 warrants further investigation. Too
often, site characteristics are inferred simply from the size of the surface distribution and

- 260 -
location in the landscape. Essentially, the Egri Bogaz 4 concept requires a new interpretation.
While the true characteristics of a settlement are difficult to extract based solely on surface
scatter, there are clues that can be read from the pottery distribution. One concept that is
beginning to surface in newer Murghab research is the „settlement complex‟. This concept
remains loosely defined, largely due to the continuing lack of sufficient regional studies. The
original notion of the settlement complex in the Murghab is directly linked with the micro-oasis
model, and used to represent a semi-isolated cluster of occupational areas (e.g. Sarianidi 1990;
Udeumuradov 1993), usually separated by a few kilometres (see section 2.4). A modified use
of the term, however, denotes a region of distributed mounds or other settlement areas—often
associated with a central, and often fortified, occupation area. In a recent reassessment of the
Togolok 1 site, Cattani observes that „this series of discrete entities (low mounds) seems actually
to belong to a single large settlement, presumably no less than 60 hectares, which perhaps
reveals the presence of a real, large-sized central place in the Margiana of the Late Bronze Age‟
(Cattani et al. 2008a: 6). Hiebert, as well, notes the proximity between Togolok 1 and 24, and
suggests that the relatively short distance separating these two sites, at less than 600m, represents
just one section of a contiguous chain of occupation (Hiebert 1994a: 20). A similar phenomenon
may exist at Taip, although the estimate for this complex is somewhat smaller, at 25 ha (Cattani
et al. 2008a: 6). Although Adji Kui escapes mention in this context, the recent work conducted
by Rossi-Osmida suggests that settlement activity associated with Adji Kui 1 and Adji Kui 9,
themselves separated by only a few hundred metres, was much more intensive than previously
thought (Rossi-Osmida 2007: 33; but see criticism in Salvatori 2007). Although Salvatori
(2002) dates Adji Kui 1 to the Namazga VI period and Adji Kui 9 to Namazga V, recent finds
from the former may indicate an earlier date for the initial occupation of the former (G. Rossi-
Osmida, pers. comm.). If this is the case, then there may be a plausible argument for partially
contemporary occupation at both sites. Moreover, Rossi-Osmida's discovery of continuous
surface sherds linking these two sites may further support this possibility—although this
material has not been directly linked with occupation and may result primarily from erosion
(Rossi-Osmida 2007:33; also see criticism in Salvatori 2007). The possibility of settlement
complexes in the central delta is further supported by the tangential discovery of AKF3 during
the current research (section 4.5.3). Here, in addition to the significant aggregations of large
sherds on the depe, substantial diagnostic material was found on the surface of a takyr about
500m west of the site, in a scatter that comprised nearly a hectare. Further insight into the
behaviour of a potential settlement complex may be seen in the experimental transects conducted
between Togolok, Takhirbai and AMMD 55, which revealed significant fluctuations in ceramic
densities well beyond the primary site location. As noted above, Cleuziou has attributed the

- 261 -
more significant peaks to small settlements, possibly farms, although he does acknowledge the
complications associated with the overrepresentation of pottery on takyrs or sandy depressions
(Cleuziou et al. 1998).
Settlement aggregations such as these are not restricted to the Murghab. At Shahdad, for
example, a pattern of what Hakemi and Sajjedi view as horizontal rather than vertical
stratigraphy has been attributed to occupational shifts as a means of coping with a changing and
tenuous fluvial system (Hakemi and Sajjedi 1988). Another conceptual model may be seen in
Titrish Hoyuk in Anatolia where, beyond the main settlement mound, Wilkinson has
documented the presence of an outer town as well as outlying suburbs. Significantly, he notes
that sites with a shorter period of occupation may spread out substantially (Algaze et al. 1992).
Given that significant Bronze Age occupation in the northern Murghab most likely spanned no
more than a few centuries (see sections 2.3.2., 5.8), such a pattern may be in evidence here.
Additional parallels, albeit from an earlier period, may be found in the spatially expansive
Chalcolithic settlements in much of the Near East. These communities were largely dispersed
and may offer evidence of a shifting settlement pattern (Casana 2003; Parr 2003). Although
these settlements represent a much longer occupational duration than the Murghab occupations,
the similar dispersal of low-mounded settlement areas may offer some insight into early
processes of urbanisation (for further discussion see below).
In this frame of reference, occupation in Area 1 may be better represented as a settlement
process—a complex, quasi-linear chain of occupational areas that comprised a substantial area
of occupation. Clearly, the published description of Egri Bogaz 4 as a discrete unit flanked by
two small secondary sites is overly simplistic, and the focus on the site as a singular entity forces
the rest of the archaeological landscape into the conceptual background. But what might such a
complex look like? In this visually obstructed landscape, the actual scope of occupation is
difficult to determine, but a general model may be proposed. The intensity and diversity of
material in the centre of Area 1 indicates a primary settlement area comprising several hectares,
although it is unlikely that this entire area was occupied. Secondary concentrations or activity
areas are oriented approximately south to north, to the west of the main occupation area, likely
following a watercourse (see section 7.7). Although neither the northern nor the southern extent
of the Area 1 distribution is known, an additional transect just south of Area 1 confirmed the
absence of substantial surface material south of Egri Bogaz 4. Therefore, settlement appears to
have extended northwards rather than southwards, although it is possible that some of this
material was transported by fluvial erosion.
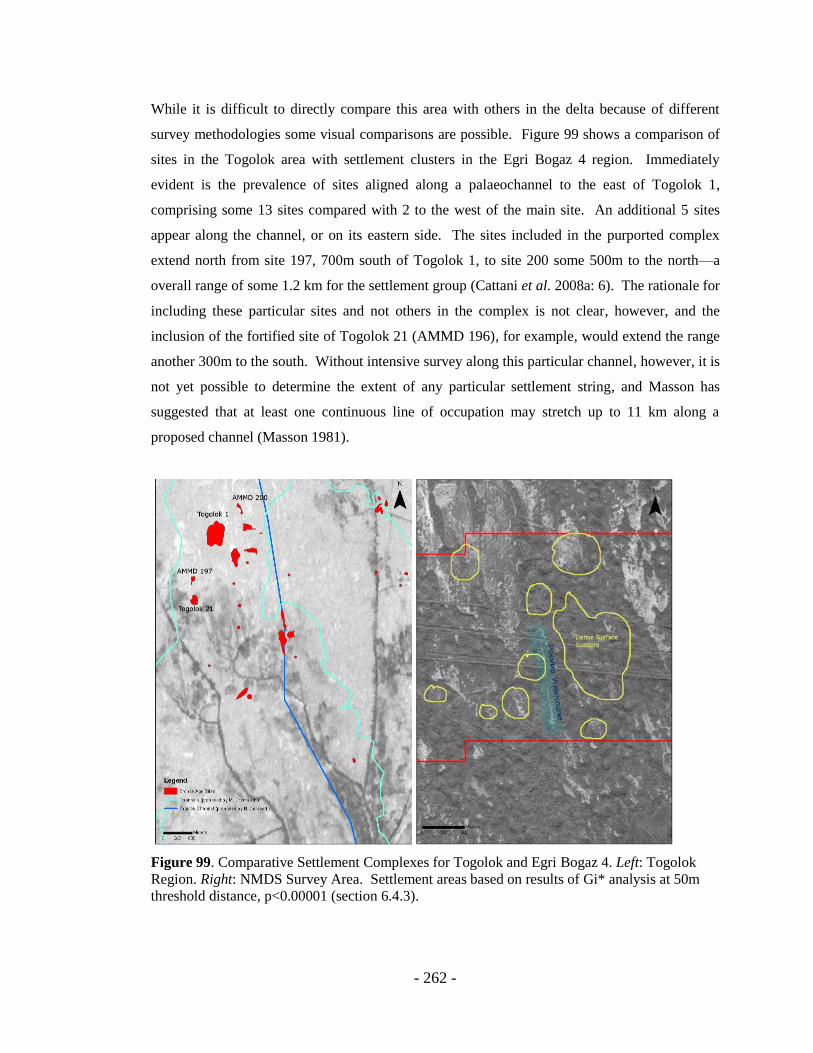
- 262 -
While it is difficult to directly compare this area with others in the delta because of different
survey methodologies some visual comparisons are possible. Figure 99 shows a comparison of
sites in the Togolok area with settlement clusters in the Egri Bogaz 4 region. Immediately
evident is the prevalence of sites aligned along a palaeochannel to the east of Togolok 1,
comprising some 13 sites compared with 2 to the west of the main site. An additional 5 sites
appear along the channel, or on its eastern side. The sites included in the purported complex
extend north from site 197, 700m south of Togolok 1, to site 200 some 500m to the north—a
overall range of some 1.2 km for the settlement group (Cattani et al. 2008a: 6). The rationale for
including these particular sites and not others in the complex is not clear, however, and the
inclusion of the fortified site of Togolok 21 (AMMD 196), for example, would extend the range
another 300m to the south. Without intensive survey along this particular channel, however, it is
not yet possible to determine the extent of any particular settlement string, and Masson has
suggested that at least one continuous line of occupation may stretch up to 11 km along a
proposed channel (Masson 1981).
Figure 99. Comparative Settlement Complexes for Togolok and Egri Bogaz 4. Left: Togolok
Region. Right: NMDS Survey Area. Settlement areas based on results of Gi* analysis at 50m
threshold distance, p<0.00001 (section 6.4.3).
- 263 -
7.5 Isolation and Integration
By treating the settlement pattern in Area 1 as a process, we can add several layers of complexity
to the overall settlement pattern analysis and thus gain a deeper understanding of the role that
this region may have played in the broader northern Murghab settlement pattern. It is difficult,
however, to determine where such an assessment might begin. The sheer intensity and breadth
of material in Area 1 denotes this area as a primary locus of regional occupation. Primacy itself,
however, is a loaded term. In Murghab research, the concepts of primacy and centrality have
been taken for granted—used either to denote provincial centres of isolated micro-oases (e.g.
Sarianidi 1990), or as nodes in an integrated settlement hierarchy. Implicit in these traditional
interpretations is a distinction between an urban centre, usually containing a large fortified
structure, and some number of external rural, town or village sites (P'yankova 1994). In a recent
interpretation of the Egri Bogaz site group based largely on Thiessen polygons, Egri Bogaz 1 has
been proposed as a key regional centre during the Middle Bronze Age, shifting to Egri Bogaz 4
during the Late Bronze Age (Salvatori 2008a: 62, 65). The substantial presence of Namazga V
materials in the survey area, however, calls this chronology into question. Furthermore, while
no systematic study was conducted on the pottery from previous excavations on Egri Bogaz 1-3,
a brief assessment by the author indicated several large Namazga VI-type fragments from Egri
Bogaz 3. While these observations do not refute the possibility that the southern Egri Bogaz
sites contained a substantial Middle Bronze occupation, the clear evidence for widespread
Namazga V materials throughout the survey area substantially weakens the case for a shift of the
occupational centre north from Egri Bogaz 1 to Egri Bogaz 4 in the Namazga VI period.
One useful framework that may be used to explore the relationship between the Area 1
occupation and the smaller settlement groups in the western survey area is that of rural-urban
interaction, although to treat these as strictly dichotomous concepts may be too simplistic. The
complex systemic nature of rural-urban interactions has become increasingly recognised not
only with respect to understanding rural sites as sustaining communities for urban centres
(Keatinge 1975), but as complex entities themselves (Schwartz and Falconer 1994). As
Matthews observes, „any study of [Mesopotamian] urbanism needs to look beyond the city walls
as well as inside them in order to fully understand the nature of the life of common people.‟
(Matthews 2003: 182) In the Murghab, questions concerning urban and rural settlement have
not been explored in depth, and, as noted in Chapter 1, the focus on large sites has tended to
ignore most sites that may fall into the rural category. A further difficulty lies in defining what
actually constitutes a „rural‟ settlement. Small occupations in the eastern portion of Area 2 may

- 264 -
have existed within the hinterland of the Egri Bogaz 4 complex (see section 7.7), and while these
may have contributed to the larger local economy of Egri Bogaz 4, the discontinuous nature of
settlement may suggest that rural settlements sustained themselves through small-scale
subsistence strategies. Similarly, the lack of material beyond the main concentrations in Area 4
may represent a sparsely populated region within the agricultural sphere of these smaller
settlements. The lack of clearly identifiable small occupations in this latter area may indicate
that substantial communities may have been more apt to develop within easy access to regional
centres. Further support for such a conclusion may be found in the sparse zone of Area 8 where,
in the absence of a significant centre of occupation, evidence for even small settlements—
representing either populations associated with the larger sites or small groups already in the
area—was significantly lower. However, the increased sherd densities suggest that there may
have been substantial occupation just south of the survey area (extending southward from D70),
although the extent of the sherd scatter could not be determined.
In the western portion of the survey area, detection of a rural-urban dichotomy is even more
problematic. Surface scatters in this region, and the prevalence of Namazga V/VI diagnostic
materials, indicate a line of small but probably permanent sedentary communities, well beyond
the immediate sustaining area of the Area 1 occupations (see section 7.7.1). The degree to
which urban or proto-urban complexity was manifested in these settlements cannot be
determined, although the fact that these sites are only a few kilometres away from the more
populated areas suggests that none of these occupations were extremely isolated. Furthermore,
the results of the anisotropic investigations, discussed in section 6.5, may suggest that influence
may have been transferred differently from community to community along the channel
networks than across them, the significance of which will be discussed in more detail in section
7.7.
7.6 Interpreting the Settlement Pattern—Settlement Hierarchies
The preceding analysis has sought to better understand the continuum of surface material vis-à-
vis actual patterns of occupation. The next step is to situate this discussion within the broader
regional context of Murghab settlement. As discussed in section 2.4, a common theme that tends
to appear in the Murghab, as elsewhere, is the three-tiered settlement hierarchy, drawn largely
from Mesopotamian models in the absence of a comparable model for the sedentary sites of
- 265 -
Central Asia. In the dry-farming zones of the northern Jazeira, for example, this hierarchy takes
the form of an evenly distributed, three-layered settlement system centred on the large, site of
Hawa (nearly 100ha). Second tier sites, usually over 10 ha, occur at fairly regular intervals of 9-
12 km, while the smallest sites, usually less than 5ha, may occur around 5km from the second-
tier sites (Wilkinson 2000; Wilkinson and Tucker 1995). A similar interpretation of the
settlement pattern has been applied to the foothill settlements in the Kopet Dag. Here,
Dolukhanov suggests that the largest sites, each corresponding to a particular oasis, were
separated by an average of 55km, with second and third tier sites occurring in each micro-oasis.
He attributes the persistence of this pattern in part to an efficient and stable agricultural regime,
and suggests that a similar organisational pattern may exist in the Murghab, based on the
primacy of Gonur and distributed smaller settlements (Dolukhanov 1981).
Neither of these models, however, provides a direct parallel to the situation in the Murghab.
While the Tedjen delta may offer the closest geomorphological parallel, settlement in that region
is thought to have ceased by the Late Chalcolithic period, with the possible exception of Chhong
Depe (Hiebert 2002). Although Lyapin (1991) has suggested that Bronze Age settlement may
have existed further north, this assumption remains speculative. The known Bronze Age
occupations occur instead along the foothill streams, a wetter climate where the presence of
einkorn wheat and salt-adapted weeds suggest that limited dry-farming may have been practised
in addition to irrigation agriculture (Hiebert 2002). A closer comparison for arid alluvial
environments may be found in southern Mesopotamia, where settlement structure has been much
more extensively researched. With respect to hierarchical structures in this region, Adams
cautions that assumptions of regularity intrinsically associated with settlement hierarchies may
not be applicable to the vagaries of alluvial settlement. Citing, for example, a major gap in
occupation between the cities of Nippur, Isin and Shuruppak not well explained by
geomorphology, he suggests that local variability in the settlement distribution may reflect
broader strategies of land and water management (Adams 1981: 21).
In the Murghab, the ascription of hierarchy to the proto-urban settlement pattern has been drawn
largely from the perception of Gonur as a large central capital (Figure 100), and even the most
conservative estimates of Gonur‟s size far surpass estimates of other individual sites in the delta.
Functionally, however, the actual nature of Gonur's influence over other delta settlements
remains unknown. At first glance, it is not difficult to envision the fortified Murghab
settlements as small-scale emulations of the primary site, but there are several indications that
the actual situation is far more complicated. One of these is the location of Gonur itself.

- 266 -
Although the site is treated as central, it is actually one of the easternmost of the Murghab
settlements, and the density of substantial sites (over 2 ha) beyond the main site is actually
significantly lower than in more central regions of the delta (Figure 101), although Sarianidi has
documented a total of 14 sites in the Gonur „complex‟ (Sarianidi 1990: 34). It could be argued,
however, that low densities of occupation in the surrounding area may actually strengthen the
argument for Gonur‟s primacy, and such a possibility finds support elsewhere. For example, the
beginning of the urbanising phase of Altyn Depe towards the end of the Namazga III period was
broadly contemporaneous with the abandonment of the smaller site of Ilgynly Depe, possibly
representing the absorption of its inhabitants into a growing urban centre (Masson 1988:14).
Much further west, late 3rd
millennium North Mesopotamian sites in the process of urbanisation
may have expanded at the expense of surrounding towns, as evidenced by settlement pattern
changes in the Khabur valley and North Jazeira (Wilkinson 1994: 490; Wilkinson and Tucker
1995). Unfortunately, a thorough investigation of the hinterland of Gonur Depe has not been
conducted, so it is not yet possible to examine such processes further. Moreover, Sarianidi has
linked the surrounding settlements in the vicinity of Gonur with the Late Bronze Age (Sarianidi
1990), although further research has not confirmed this chronology. If this dating is correct,
however, the contemporaneity of these sites with the establishment of the smaller southern
mound of Gonur may be indicative of Late Bronze processes of de-urbanisation, reflecting in the
settlement pattern populations that had previously been incorporated in the larger Gonur
settlement (Salvatori 2008b). However, the chronological scheme in the region is questionable,
and it is highly unlikely that the Gonur North mound represents the extent of Middle Bronze
settlement in that region, given the well-documented existence of mixed Middle and Late Bronze
occupations throughout the delta discussed in Chapter 2.
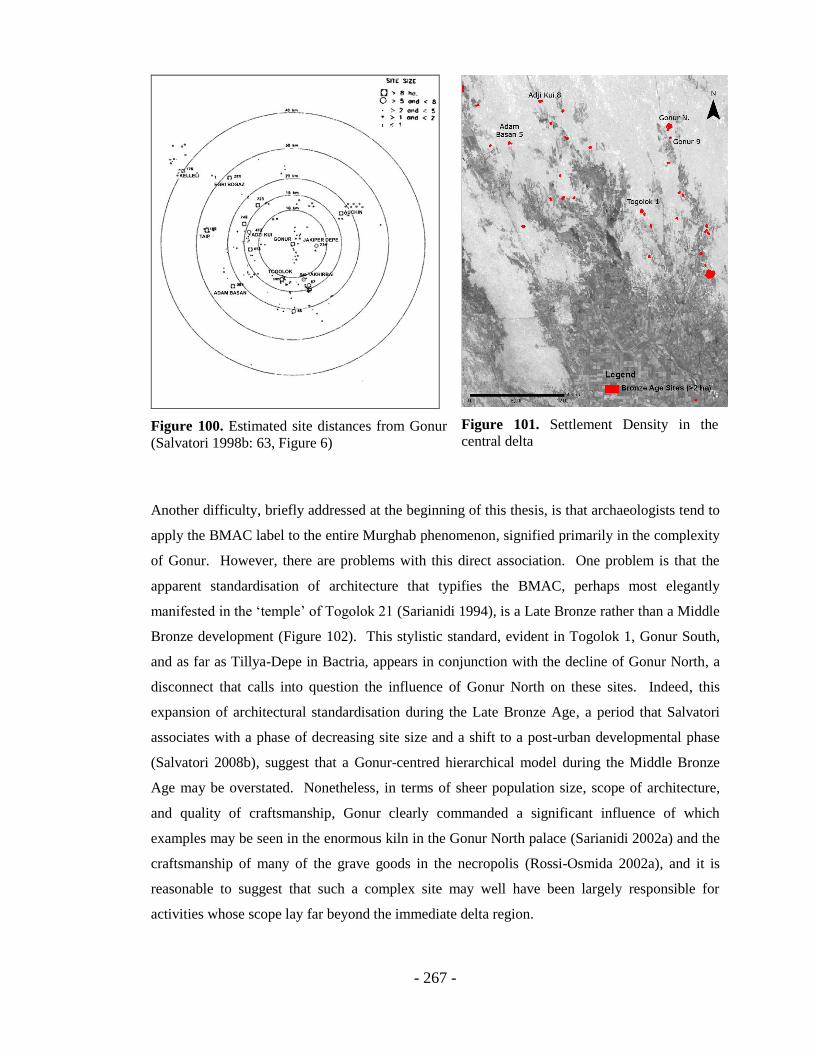
- 267 -
Figure 100. Estimated site distances from Gonur
(Salvatori 1998b: 63, Figure 6)
Figure 101. Settlement Density in the
central delta
Another difficulty, briefly addressed at the beginning of this thesis, is that archaeologists tend to
apply the BMAC label to the entire Murghab phenomenon, signified primarily in the complexity
of Gonur. However, there are problems with this direct association. One problem is that the
apparent standardisation of architecture that typifies the BMAC, perhaps most elegantly
manifested in the „temple‟ of Togolok 21 (Sarianidi 1994), is a Late Bronze rather than a Middle
Bronze development (Figure 102). This stylistic standard, evident in Togolok 1, Gonur South,
and as far as Tillya-Depe in Bactria, appears in conjunction with the decline of Gonur North, a
disconnect that calls into question the influence of Gonur North on these sites. Indeed, this
expansion of architectural standardisation during the Late Bronze Age, a period that Salvatori
associates with a phase of decreasing site size and a shift to a post-urban developmental phase
(Salvatori 2008b), suggest that a Gonur-centred hierarchical model during the Middle Bronze
Age may be overstated. Nonetheless, in terms of sheer population size, scope of architecture,
and quality of craftsmanship, Gonur clearly commanded a significant influence of which
examples may be seen in the enormous kiln in the Gonur North palace (Sarianidi 2002a) and the
craftsmanship of many of the grave goods in the necropolis (Rossi-Osmida 2002a), and it is
reasonable to suggest that such a complex site may well have been largely responsible for
activities whose scope lay far beyond the immediate delta region.
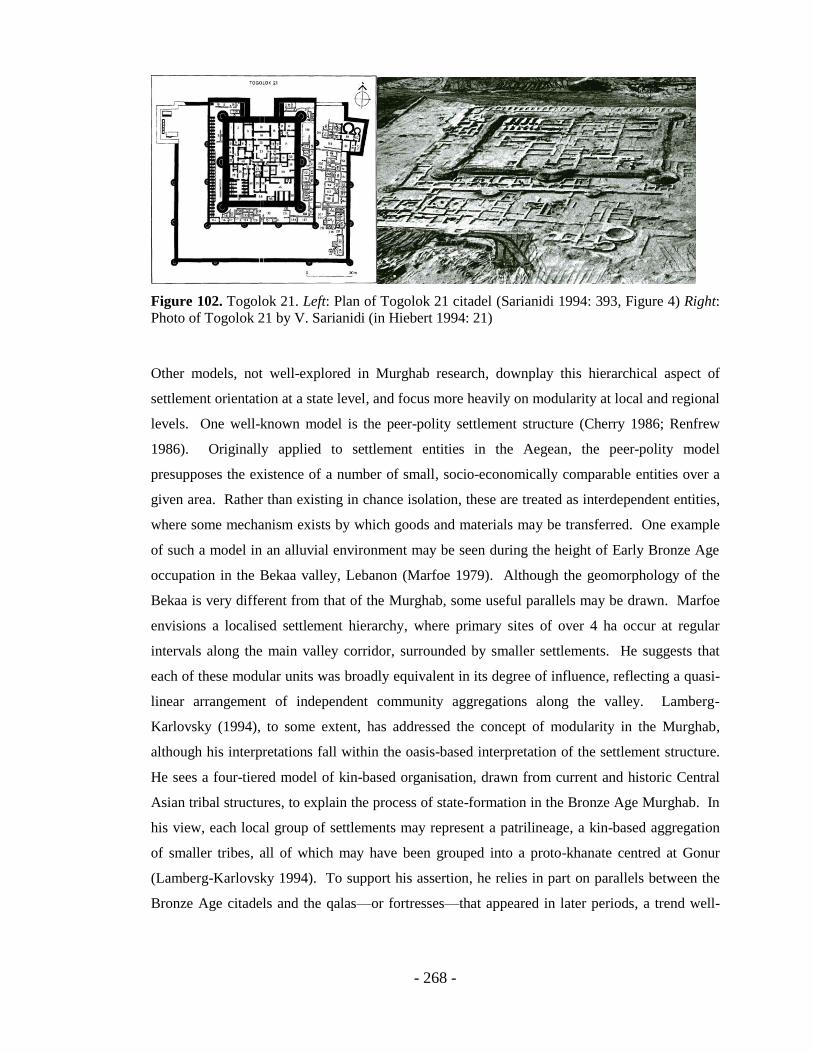
- 268 -
Figure 102. Togolok 21. Left: Plan of Togolok 21 citadel (Sarianidi 1994: 393, Figure 4) Right:
Photo of Togolok 21 by V. Sarianidi (in Hiebert 1994: 21)
Other models, not well-explored in Murghab research, downplay this hierarchical aspect of
settlement orientation at a state level, and focus more heavily on modularity at local and regional
levels. One well-known model is the peer-polity settlement structure (Cherry 1986; Renfrew
1986). Originally applied to settlement entities in the Aegean, the peer-polity model
presupposes the existence of a number of small, socio-economically comparable entities over a
given area. Rather than existing in chance isolation, these are treated as interdependent entities,
where some mechanism exists by which goods and materials may be transferred. One example
of such a model in an alluvial environment may be seen during the height of Early Bronze Age
occupation in the Bekaa valley, Lebanon (Marfoe 1979). Although the geomorphology of the
Bekaa is very different from that of the Murghab, some useful parallels may be drawn. Marfoe
envisions a localised settlement hierarchy, where primary sites of over 4 ha occur at regular
intervals along the main valley corridor, surrounded by smaller settlements. He suggests that
each of these modular units was broadly equivalent in its degree of influence, reflecting a quasi-
linear arrangement of independent community aggregations along the valley. Lamberg-
Karlovsky (1994), to some extent, has addressed the concept of modularity in the Murghab,
although his interpretations fall within the oasis-based interpretation of the settlement structure.
He sees a four-tiered model of kin-based organisation, drawn from current and historic Central
Asian tribal structures, to explain the process of state-formation in the Bronze Age Murghab. In
his view, each local group of settlements may represent a patrilineage, a kin-based aggregation
of smaller tribes, all of which may have been grouped into a proto-khanate centred at Gonur
(Lamberg-Karlovsky 1994). To support his assertion, he relies in part on parallels between the
Bronze Age citadels and the qalas—or fortresses—that appeared in later periods, a trend well-
- 269 -
represented through the fortified square citadels during the Yaz III periods and later (also see
architecture discussion in Mamedov 2003).
While the NMDS data alone cannot provide a definitive picture of the proto-urban structure in
the Murghab, the anisotropic patterning discussed earlier offers some clues. Clearly, the
orientation of channels was a major factor in the distribution of medium to large settlements, and
if the western portion of the survey area is any indication, there was a degree of modularity that
was at least partially related to the structure of the fluvial system. Lamberg-Karlovsky, in
further developing his notion of pre-Khanate tribal structures, envisions a scenario in which the
leaders of local kin-groups were responsible for managing local public-works projects,
particularly irrigation (Lamberg-Karlovsky 1994). In proposing this model, he follows other
researchers who have questioned Wittfogel‟s assumption that substantial irrigation projects
necessarily require a strong central authority (Farrington 1980). It may be that, at least along
individual channel networks, the settlement pattern reflects a level of community or kin-based
modularity. The extent to which these groups looked to the Egri Bogaz 4 region for
administration is a question that must remain unsolved, and the failure to detect any monumental
structures in Area 1 certainly does not mean that they did not exist, nor does it discount the
possibility that Egri Bogaz maintained a level of administrative control over the immediate
region. There are, however, indications that suggest that the interpretation of Egri Bogaz 4 as
one of a group of distributed secondary centres may not be the best interpretation of either this
settlement or others in the delta. In both Margiana and Bactria, planned, monumental buildings
sometimes occur not singly, but in pairs separated by short distances, usually within 2 or 3 km
and sometimes less. The examples of Adji Kui 1 and 9 as well as Kelleli 3 and 4 have already
been cited, and to these must be added Togolok 1 and 21, as well as the T-shaped „palace‟ and
round „temple‟ of the Bactrian site of Dashly 1 (Sarianidi 1977: 31). Although Sarianidi draws a
distinction between citadel and temple (Sarianidi 1994), and Lamberg-Karlovsky, in an
innovative turn, has suggested a conceptual replacement of „citadel‟ with „marketplace‟ and
„temple‟ with „caravanserai‟, sufficient evidence to determine the function of these buildings
remains lacking (Lamberg-Karlovsky et al. 1988: 20). This organisation may indicate that,
partly in line with Lamberg-Karlovsky‟s reasoning, modularity may exist on more than one
scale, reflecting aggregations of groups at various levels.
- 270 -
7.7 River Systems and Land Use in the Northern Murghab
Given the arid environment in the delta, an informed assessment of the nature of settlement
requires an understanding of its relationship to available water resources. Although a clear
picture of the hydrological network in the north is not yet available, a few investigations have
been conducted, although these have not incorporated significant field research (see section 2.4).
The most recently published hydrological model, generated as part of the AMMD research,
refers to an „Adji-Kui-Egri Bogaz drainage directrix‟ (Cerasetti et al. 2008b: 33, Figure 2.3).
While this system is largely schematic, its orientation broadly follows Kohl in proposing a
channel system that flows north via Adji Kui and continues just to the west of Egri Bogaz 4 (see
map in section 1.3). A much more detailed system of possible channels exists for the north
(Figure 103), although these remain unpublished. Furthermore, these were not subject to the
same rigorous field research as elsewhere in the delta, and significant discrepancies between
these channels and the satellite imagery suggest that they are much less reliable.
Figure 103. Proposed channel systems in the northern Murghab (from unpublished GIS data by
M. Cremaschi)
The results of the NMDS research suggest that, even as schematic representations of streams in
the northern Murghab, the current interpretations are problematic. Rather than a single fluvial
system joining the Adji Kui sites in the central delta with Egri Bogaz in the north, the hydrology
appears to be far more complex. Over the entire survey area, at least two distinct areas of fluvial
Figure removed pending formal publication of channel
data
- 271 -
activity, separated by several kilometres, may be inferred from the takyr system, and each of
these itself may have comprised a complex system of channels. The first of these extends NNW
through the immediate Egri Bogaz 4 settlement region. A second system extends broadly
northward and is related to the takyr system that dominates Area 4 and portions of Area 5.
Between these, the large, cultivated takyrs likely indicate a third system. To a degree, the
unpublished palaeochannel map described above distinguishes between systems in the western
and eastern portion of the survey area, but again there were major inconsistencies between this
data and the imagery. The following sections will address the implications of possible channel
systems in Areas 1 and 4 as they relate to human settlement in the region.
7.7.1 Watercourses and Occupation in the Egri Bogaz 4 Region
The actual watercourses that sustained communities in Area 1 are difficult to interpret based on
visual observation alone, and the complexity of the fluvial system in this region cannot be
underestimated. Based on an assessment of aerial photography in the immediate vicinity of Egri
Bogaz 4, Cremaschi has identified numerous indications of fluvial morphology (Figure 104), and
similar signatures were identifiable both east and west of the main settlement area. This
complexity is not depicted in the existing hydrological maps, however. Because of this lack of
solid data, it is difficult to determine definitively the location of the primary channel for these
settlements, although the fluvial signatures offer some clues. One candidate for a main
watercourse is a long, linear takyr about 250m west of the main occupation area, running SSE to
NNW and flanked by low ridges. Whether the feature is natural or anthropogenic could not be
determined, and Adams (1981: 19) has suggested that natural deflation and changes in the
channel flow often blur this distinction. The sherd density in this region was strikingly low
given the generally high visibility in the area, and merits some discussion. One possible
explanation for the lack of material may be its displacement by fluvial processes in antiquity,
when the channels were still active. Several scholars have discussed the significant role of
fluvial erosion in the destruction of archaeological sites (e.g. Peltenburg 2007; Brown 1997:
279), and such processes may have occurred in antiquity, ultimately contributing to the erosion
of settlement mounds and the displacement of material.
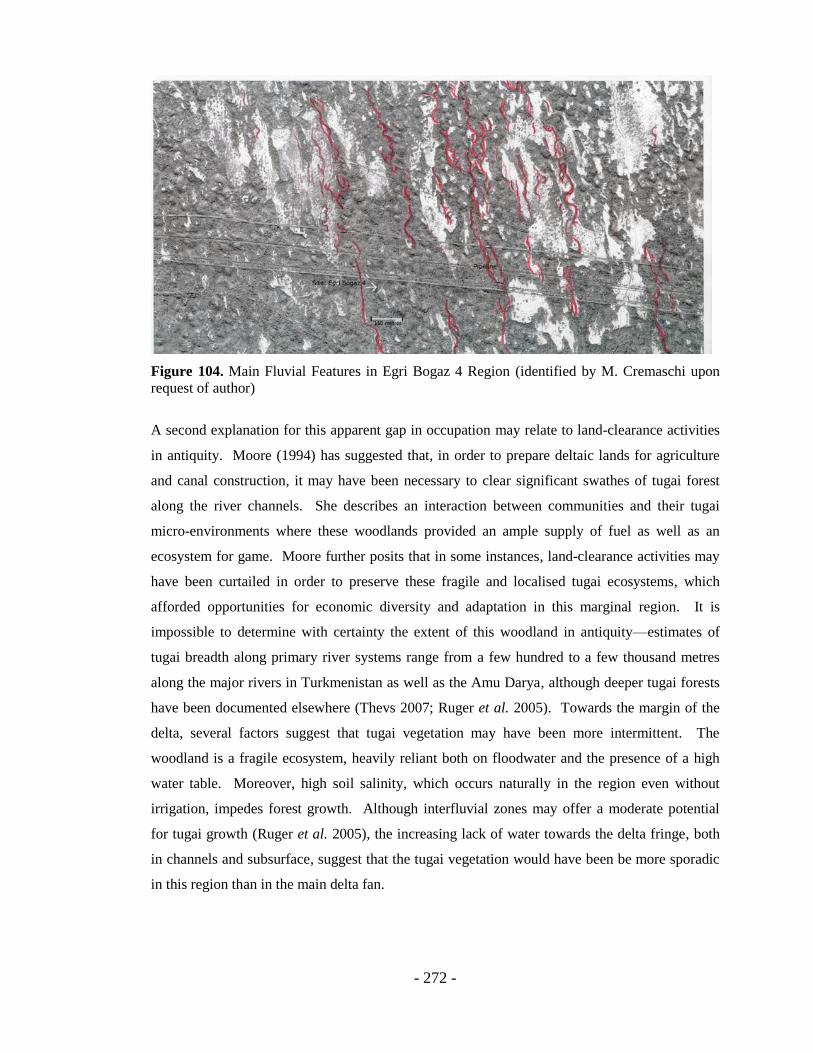
- 272 -
Figure 104. Main Fluvial Features in Egri Bogaz 4 Region (identified by M. Cremaschi upon
request of author)
A second explanation for this apparent gap in occupation may relate to land-clearance activities
in antiquity. Moore (1994) has suggested that, in order to prepare deltaic lands for agriculture
and canal construction, it may have been necessary to clear significant swathes of tugai forest
along the river channels. She describes an interaction between communities and their tugai
micro-environments where these woodlands provided an ample supply of fuel as well as an
ecosystem for game. Moore further posits that in some instances, land-clearance activities may
have been curtailed in order to preserve these fragile and localised tugai ecosystems, which
afforded opportunities for economic diversity and adaptation in this marginal region. It is
impossible to determine with certainty the extent of this woodland in antiquity—estimates of
tugai breadth along primary river systems range from a few hundred to a few thousand metres
along the major rivers in Turkmenistan as well as the Amu Darya, although deeper tugai forests
have been documented elsewhere (Thevs 2007; Ruger et al. 2005). Towards the margin of the
delta, several factors suggest that tugai vegetation may have been more intermittent. The
woodland is a fragile ecosystem, heavily reliant both on floodwater and the presence of a high
water table. Moreover, high soil salinity, which occurs naturally in the region even without
irrigation, impedes forest growth. Although interfluvial zones may offer a moderate potential
for tugai growth (Ruger et al. 2005), the increasing lack of water towards the delta fringe, both
in channels and subsurface, suggest that the tugai vegetation would have been be more sporadic
in this region than in the main delta fan.

- 273 -
A hypothetical land-clearance zone in the area of primary occupation is shown in Figure 105.
The possible tugai region in this area covers several dozen hectares, an area large enough for
some agriculture to have been practiced but too small to support a significant population (see
section 7.7.4). Broader cultivation areas may have been available in the sparsely populated, yet
apparently well-watered, area east of Egri Bogaz 4. Unfortunately, evidence of small transverse
canals could not be identified in the survey area, and it is quite possible that a network of small
canals existed not only in association with the main watercourse of Egri Bogaz 4, but also with
other, smaller channel systems beyond the site itself. Adams (1981) has described the potential
advantages of multiple water sources from the perspective of agriculture and settlement growth,
and such may be the case in the northern Murghab as well.
Figure 105. Schematic Diagram of Possible Land Clearance Area
- 274 -
7.7.2. Watercourses and Occupation in the Western Survey Area
In the western portion of the survey area, there is evidence of a secondary fluvial system entirely
unrelated to that in Area 1. Two possible palaeochannels, identifiable in the satellite imagery,
support this assumption. The first is a long, meandering feature that extends from southwest to
northeast and skirts the Area 4 takyr to the east (Figure 106). The trajectory of this feature was
difficult to trace in the visible imagery, and multispectral image enhancement was found to be
useful in its identification. Although more geomorphological work clearly needs to be
conducted, the imagery indicates that this possible channel may be associated in part with the
Taip settlement group, although the region immediately northeast of Taip has not been heavily
surveyed, so little can be definitively stated about occupation in this area. There are some
observations worth noting, however. Four Bronze Age diagnostics were found at the western
edge of the survey area, all within 150m of the channel. These were fairly isolated, located over
a half-kilometre from the heavier concentrations in the region (notably L42),, and therefore do
not appear to be directly associated with more significant occupational areas. The second
possible system extends from south to north, skirting the large takyr in Area 4 to the east, and is
likely associated with more significant occupations in L42 and D70. While the general
trajectory of this system may be inferred from the remote sensing data in places, it is not possible
to determine with certainty the hydrology of particular channels without further research.
However, indirect evidence of its continuation may be seen in the long chain of sites directly
east of Adam Basan 5 which broadly follow a similar trajectory (refer to section 7.3, figure 97).
The evidence may thus indicate a single fluvial system that flowed northwards from the central
delta, of which the sites in the western portion of the survey area represent the northern extent.
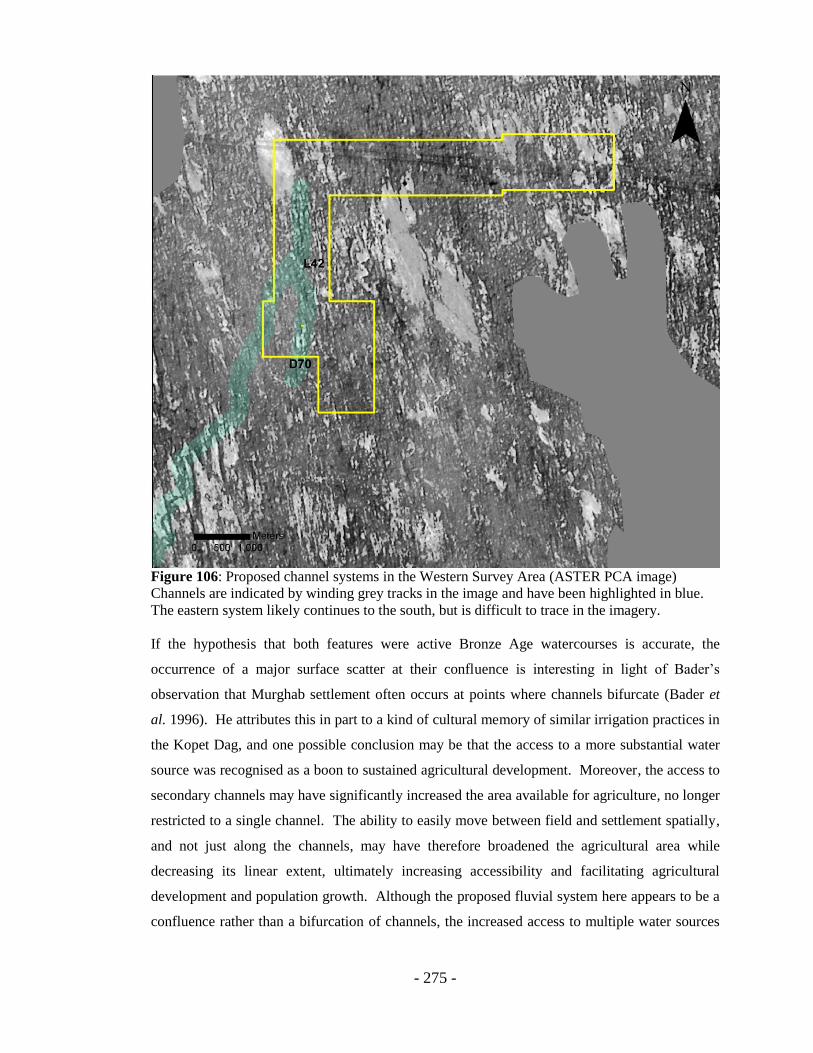
- 275 -
Figure 106: Proposed channel systems in the Western Survey Area (ASTER PCA image)
Channels are indicated by winding grey tracks in the image and have been highlighted in blue.
The eastern system likely continues to the south, but is difficult to trace in the imagery.
If the hypothesis that both features were active Bronze Age watercourses is accurate, the
occurrence of a major surface scatter at their confluence is interesting in light of Bader‟s
observation that Murghab settlement often occurs at points where channels bifurcate (Bader et
al. 1996). He attributes this in part to a kind of cultural memory of similar irrigation practices in
the Kopet Dag, and one possible conclusion may be that the access to a more substantial water
source was recognised as a boon to sustained agricultural development. Moreover, the access to
secondary channels may have significantly increased the area available for agriculture, no longer
restricted to a single channel. The ability to easily move between field and settlement spatially,
and not just along the channels, may have therefore broadened the agricultural area while
decreasing its linear extent, ultimately increasing accessibility and facilitating agricultural
development and population growth. Although the proposed fluvial system here appears to be a
confluence rather than a bifurcation of channels, the increased access to multiple water sources
- 276 -
may have held a similar attraction as a new settlement location. Even if this is the case, it does
not directly account for the occupations north or south of this confluence, and it is likely that
individual streams were sufficient for small, local agricultural communities to develop.
Unfortunately, it is not currently possible to obtain a fine chronology for settlement in this region
and both Middle and Late Bronze material occurred together. Consequently, it cannot be said
definitively whether these sites were fully contemporary, or whether, perhaps, there was a shift
upstream as the availability of water and fertile land decreased with accelerating processes of
desertification.
The picture that therefore begins to emerge for the western portion of the survey area is one of
small-scale but persistent occupation situated in close proximity to watercourses. The largest of
these were separated by approximately 1 km, with smaller communities intermittently
distributed. The small size of these communities and their distribution along the channel
networks suggests a degree of self-sufficiency at the local level, in which small communities,
rather than a larger regional centre, were responsible for their own activities with respect to land-
clearance, small-scale irrigation and farming. Clearly, a kilometre is not a significant distance to
travel between communities, so such projects would have been conducted within a broader
cultural milieu. The question of whether each settlement represented a kin-based community, or
whether settlements were linked via other cultural phenomenon, cannot be adequately assessed
at present, and the nature of the influence held by the larger communities in Area 1 over these
small settlements remains an outstanding question.
7.7.3 Water Accessibility
The above discussion highlights the importance of water in relation to settlement, and although
neither occupation nor watercourses can be precisely delimited from the surface survey, some
tentative conclusions may be drawn concerning the nature of occupation in the region. In Area
1, the main area of occupation was likely situated a few hundred metres away from the channel
system. Such a model finds support elsewhere in the delta where the main occupied regions of
major sites such as Gonur and Togolok 1 were situated a few hundred metres from their
respective channels (AMMD GIS system). Moore (1994) notes that sites may occur on naturally
elevated areas which offered a protected environment, safe from spring flooding, around which
agricultural fields would have been situated, and several sites in the Murghab occur on natural
rises. While flooding in this distal region of the delta may have been less predictable than in the

- 277 -
central delta,13
the awareness of flood potential may have warranted a careful balance between
accessibility to water sources and caution. It is difficult, however, to determine whether similar
factors applied in the study area. As discussed in section 4.5, analysis of the remote sensing
imagery did not detect significant variation in fluvial topography in the northern delta, and the
shallow stratigraphy of northern sites offers little evidence of clear topographical preference in
settlement location, and elevated regions may be entirely anthropogenic in nature. At the same
time, however, evidence from both Areas 1 and 4 indicates a weak but discernible relationship
between more significant surface scatters and dune ridges, and it is possible that this situation
reflects a chain of occupation in areas of slight topographic prominence, perhaps on natural
levees that over time have developed into dune ridges (cf Lioubimitseva 2003).
While conclusions regarding water and settlement are only tentative, the preceding analysis
suggests that at least some of the moderate scatters along this corridor pertain to small
settlements and cannot be written off solely as the result of post-depositional processes. If this is
the case, a possible relationship may be drawn between site size and proximity to channels.
Small occupations both in Area 1 and in the western part of the survey area may have been
located closer to watercourses, with larger settlements established slightly further away. While
speculative, such a settlement pattern may reflect the reduced capacity of smaller communities to
undertake agricultural projects on the scale of their larger counterparts. Another possibility is
that, over several centuries, settlement structures evolved organically, influenced by changing
watercourses and perhaps related shifts in zones of highest agricultural potential (also see
below).
Clearly, the fluvial system was integral to the settlement distribution, a situation that calls to
mind Adams‟ research in southern Mesopotamia, although on a much smaller scale. He
describes the settlement patterns of the lower Euphrates as a series of „ribbons‟ of occupation
along the channels, and partially attributes the resulting spatial irregularity to the demands of a
centralised authority in both administration and extraction of wealth and surplus that may have
been facilitated by the navigability of the channel system (Adams 1981: 21). Wilkinson (2000)
has also addressed the offsite regions between the irrigated zones, positing that settlement voids
during the Uruk and later periods may represent regions where irrigable land was less accessible,
resulting in less cultivable land and a consequent dearth of occupation. He qualifies this
possibility, however, by suggesting that gaps in settlement may also have resulted from
13
See McCarthy (2003) for related discussion of inland delta flooding of the Okavungo Delta, Botswana.
- 278 -
significant alluvial deposition, and both scholars recognise that the lower Mesopotamian
settlement pattern is far from complete. The Murghab distribution therefore exhibits some of the
hallmarks of the southern Mesopotamian settlement distribution, although the scale of the entire
system is much smaller. Settlement sizes and consequent populations are lower in the Murghab
delta, and there is no evidence that Adams‟ proposed level of state development and
administration for Mesopotamia was matched here. Channels in the northern Murghab, as in
Mesopotamia, likely acted as conduits not only for agriculture but for communication and
perhaps local administration.
7.7.4 Population and Land Use in the Study Area
While some general insights into the relationship between land, water and settlement are
possible, it is difficult to provide a clearer picture without understanding the nature of the
communities themselves. Unfortunately, many facets of actual occupation are not detectable
through surface survey. Two potentially measurable aspects, however, are settlement size and
population, although these metrics are difficult to estimate effectively, particularly in the
Murghab. While the problems with site size have been discussed throughout the thesis, the
population issue warrants some additional discussion. As noted by Alcock and others,
population estimates based on surface scatter alone are notoriously unreliable (Alcock et al.
2000; Wilkinson 2003b), and the NMDS survey data offers nothing in the way of discrete
architecture, measurable hinterlands, or even reliable estimates of settlement size from which to
begin an analysis. Nevertheless, there are methods through which relative population estimates
may be explored to examine possible ranges of occupation and to ultimately to derive a better
understanding of the ways in which people and resources may have been distributed (Wilkinson
2003b).
Population estimates for settled areas in both dry-farming and irrigated zones throughout the
Near East commonly range from 100-200 persons per hectare (Kramer 1982; Stein and
Wattenmaker 1990), although Stein and Wattenmaker suggest that urban densities may actually
be significantly lower than those of outlying villages due to the large proportion of public space
that may not have been available for domestic occupation. Furthermore, Kramer observes that
the degree of nucleation or dispersal within even a single community can heavily influence the
on-site population density. She cites significant population variability in settlements in parts of
modern-day Jordan and Khuzestan where densities may range from 20 persons/ha in dispersed

- 279 -
settlements to 200 persons/ha in villages (Kramer 1982: 159, Table 5-2). While a significant
degree of variation must be considered, population estimates can, however, offer useful
perspective regarding the agricultural capacity for these settlements.
Because of the extreme difficulty in determining the actual occupied area of NMDS settlements,
an estimate of population is perhaps even more confounding than usual. However, the apparent
dispersal of inhabited space and consistently shallow cultural levels suggest that the highest
population estimates are likely unwarranted. Moreover, the marginal climate of the entire delta,
the relatively brief period of occupation, and perhaps a reduced productive capacity in the deltaic
fringe all suggest that populations may have been even more restricted, particularly in the north.
It is difficult, however, to determine where a population estimate might start. The extent of
surface material associated with the Area 1 settlements approaches 100 ha, of which 60 ha or so
contained moderate to high densities of material. The lack of significant subsurface cultural
deposits, however, suggests that most of this material, especially in the low lying takyrs, resulted
from erosion. Significant populations were most likely concentrated on a number of small, low
mounds, some of which are partially or wholly obstructed. Since these are often
indistinguishable from dunes, they cannot be easily traced, but it is unlikely that actual occupied
area in this central region exceeded several hectares. An estimate as high as 10 ha, for example,
significantly larger than the estimates for nearly all Murghab sites, would yield a total on-site
population of about 1,000 persons in the main settlement area (assuming the lower end of the
range), and quite possibly far fewer. Immediately to the west, the partially continuous line of
occupation was most likely comprised of small individual settlements or areas of related activity.
Even if several of these occupied regions comprised up to two hectares, it is a stretch to envision
a maximum population of more than around 1,500 persons for the primary settled portions of
Area 1 and outlying occupational areas, although the extreme complexity of the surface scatter
renders any population estimate purely a conceptual starting point, rather than a definitive
estimate. While Areas 1E and 2 both exhibited evidence of small-scale occupation, the general
absence of architectural debris and the sparsely distributed, generally non-diagnostic material
point to scattered outlying occupations or intermittent pastoral or agricultural activity (see
section 7.4.1), some of which may have occurred within the hinterland of the Area 1 settlements.
A few kilometres to the west, the overall extent of material scatter in Area 4 covers
approximately 10 ha. The actual extent of primary occupation may have been small, however,
and clearly not conterminous with the sherd distribution on the takyr surface. While much of the
surface material consisted of small, heavily abraded sherds, evidence of some brick debris in the
southern part of this takyr may broaden the scope of occupation to include very small peripheral

- 280 -
settlements. As noted above, it is unlikely that most of these occupations spanned more than a
hectare or so, and the fairly even, if intermittent, distribution of these communities along the
channels, together with smaller outlying occupations, suggests that populations were unlikely to
have exceeded a few hundred persons over several kilometres.
To place this small portion of the northern Murghab in perspective, some population estimates
may be derived from architectural remains elsewhere in the delta. Several methods have been
employed to attempt to estimate populations based on domestic living space (Casselberry 1974;
Naroll 1962), and some comparative population estimates for the confirmed built environments
of known Murghab sites are shown in Table 21. For the typical walled „citadel‟ (with the
exception of Gonur North), the maximum population was likely no more than several hundred,
possibly as high as 1,000, although these numbers do not consider settlement beyond the known
built environment. Evidence from several sites (e.g. Kelleli 3, Gonur 1, Adji Kui 9), indicates
the presence of additional domestic architecture beyond the fortified centres (Salvatori 2002;
Masimov 1980; Hiebert 1994a), although these outlying areas may have been less densely
populated (Kramer 1982). The outlying case of Gonur Depe, both in terms of estimates based on
site size and architectural area, suggests a much higher population on the order of several
thousand, a number that is substantiated by the excavation of thousands of burials in the
Namazga V cemetery (Rossi-Osmida 2002b). In addition to the population of Gonur North, the
recovery of over a dozen sites in the vicinity of Gonur (Sarianidi 1990) suggest that regional
occupation may have been significantly higher, although not all of these settlements were
necessarily occupied at the same time.
Table 21. Population Estimates for Various Murghab Sites based on architectural evidence
Site Pop. Range
(main structure)*
Kelleli 3 1000-1080
Kelleli 4 90-101
Gonur N. 2100-2265
Adji Kui 9 490-535
Togolok 21 1,000-1080*
*Low population estimate uses Naroll‟s estimate of 10 m
2 of living space per person. The higher estimate
reflects Casselberry‟s calculation of 6 persons for the first 25 ft2, then 100 ft
2 of living space for each
additional person.
- 281 -
A significant body of research has explored the relationship between population and sustaining
areas necessary to support settlement (Stein and Wattenmaker 1990). Although analysis based
solely on such nebulous population estimates is difficult—and perhaps risky from an
interpretative perspective—a cautious examination can offer insight into land use strategies and
ultimately broader socio-economic practices. Near Eastern archaeologists have proposed
anywhere from 1 to 3 ha of cultivable land per inhabitant, with the more marginal dry-farming
zones in northern Mesopotamia falling in the higher range due to a decreased productive
capacity and reliability (Stein and Wattenmaker 1990; Wilkinson et al. 2007). Assuming a
conservative size range of 5-8 ha for densely settled zone in Area 1 and 1.5 ha per person, this
would result in a circular zone of cultivation with a radius between 1.2 and 2.2 km. There is no
reason, however, to assume that sustaining areas along a channel would have been equal in all
directions (Adams 1981; Peltenburg 2007). A better representation may be a linear or more
elliptical hinterland, or, given the probable complexity of the channel network, perhaps a highly
irregular and organic form. It is not possible to determine precisely the location of preferred
agricultural land based solely on surface scatters, however. The direction of fall-off in material
away from the main scatters, broadly perpendicular to the fluvial signatures, may indicate
hinterlands irrigated either from canal systems associated with primary watercourses, or from
more localised natural or modified watercourses east of the settlement. While there is no way of
knowing the extent to which cultivable land may have extended beyond the stream channels in
the northern delta, the lack of obvious large scale canalisation suggests that fields may have been
directly irrigated by the palaeochannels, perhaps subject to anthropogenic modification or the
construction of small supplementary canals. Water may have been carried to the fields by
networks of small feeder canals, a possibility that concurs with Bader‟s depiction of the
irrigation systems during the Bronze Age (Bader et al. 1996).
7.8. The Northern Murghab as Marginal Settlement Environment
A substantial body of recent research has focused on the adaptive strategies employed by
communities living in marginal, dryland environments (Wilkinson et al. 2004; Barker and
Gilbertson 2000). The concept of margin, defined in this context, may be envisioned as a zone
of relative adversity with respect to precipitation and, consequently, agricultural potential. Many
recent studies have focused on the resilience of agricultural communities in the face of
deteriorating conditions (Barker and Gilbertson 2000). One recently discovered example may be
- 282 -
seen in the well-planned, agricultural site of al-Rawda in western Syria. The presence of this site
in a stark, arid environment represents an anomalous flourishing of urban planning and
agricultural production during the last quarter of the 3rd millennium, a period and region usually
associated with urban decline and a concurrent transition to a more pastoral economy (Castel
2007). A related development may be evident in the Homs region, where the stability of the
settlement pattern during the EB IV period suggests that settlement may have intensified, rather
than declined, during the period (Philip 2010). Philip attributes this development largely to a
growing awareness of and adaptability to the more marginal steppe environment to the east.
While strategies in marginal environments may be both adaptive and innovative, It is often all
too easy to infer simple causative relationships between environmental change and human
adaptation (Rosen 2007: 1-3). It is not necessary to revisit the well-known controversies
surrounding environmental determinism, but it is important to be aware of the distorted vision of
hindsight. Brown cautions that what we may interpret as innovative strategies of adaptation may
not have been construed as such by those who developed them (Brown 1997: 279). In many
cases, to be sure, strategic decisions at both local and administrative levels anticipated and dealt
with major events, including not only immediate events such as floods, but also longer term
changes to the fluvial system. Texts from early second millennium Isin and Larsa, for example,
demonstrate both administrative awareness and directives in response to water management,
although local officials rather than the state may have been responsible for the direct
implementation of such policies (Rowton 1967). More subtle environmental or
geomorphological changes, however, such as deforestation, salinisation (Adams 1981) or
productivity loss in soils, were likely less detectable, and when a tipping point may have been
reached, it is likely that adaptive strategies—whether these included physical movement,
changes in water management, or agro-economic strategies, were often slow to develop.
The myriad small settlements and channel systems distributed over a small region of the
northern Murghab suggests that its occupational history, although comparatively short-lived, was
complex. As discussed in Chapter 5, there is a strong case to be made for relatively widespread
Middle Bronze Age occupation and directly related activity such as agricultural processing,
livestock management and small-scale crafting within the bounds of the survey area, and based
on the subtle yet perceptible shift in the distribution of identifiable Middle and Late Bronze
materials in Area 1 (see Chapter 5), there are signs that the more restricted Late Bronze
occupations that Salvatori (2008b) observes elsewhere in the delta may have occurred here as
well. The abandonment of the region into the Iron Age, while perhaps not total, is strongly
- 283 -
supported by the survey data, and clearly aligns with other findings in the delta. Although the
specific chronologies cannot easily be fine-tuned without further research and excavation, there
is enough of a diachronic trend from the survey data to be able to propose some theories linking
settlement change with geomorphological change in the region. As noted in Chapter 4, the
SRTM imagery suggests that the clear topographic signature of the palaeodelta apparent in the
Merv oasis are no longer easily traceable this far to the north, although an exception may be
found in the westernmost channel system connecting Taip with the Kelleli sites. The tenuous yet
identifiable association between these natural levees and the known palaeochannels in the central
delta suggests that the topography towards the distal portion of the delta, beginning in a region
approximately north of the Adji Kui region, is much gentler than further to the south. While this
gradual flattening of the topography may be expected towards the fringe of the delta fan, it may
offer some different perspectives on the nature of settlement in this particular region.
In order to better understand the settlement characteristics in this distal portion of the Murghab
delta, it is useful to briefly examine possible behaviours of the river system that may have
influenced the distribution of settlement. Marangenli (2004) has described two general fluvial
types that occur in arid and semi-arid zones. The first of these are perennial streams, often on
the order of a few dozen to a few hundred kilometres in length. These regimes are often
characterised by sporadic yet intensive flood cycles. While the stream channels of these systems
may initially be well-defined, channel definition decreases towards the fringes of the delta fans.
Eventually, individual watercourses effectively become undetectable, opening into a landscape
of mud flats often typified by sebkha (takyr) environments. At the other end of the spectrum
are extensive, typically rain-fed, exotic rivers, often on the order of hundreds or thousands of
kilometres in length. These tend to lose water along their course, and may weaken enough to
form inland deltas characterised by braided stream channels. The endorheic deltas of the
Murghab and Tedjen are perhaps anomalous in that they exhibit characteristics of both classes,
although the dendritic patterns of their respective deltas tends to resemble the former perennial
streams. A comparable fluvial regime may be found in the Okavungo River in Botswana, where
water loss results in a dendritic fan in the sands of the Kalahari, irrigating an extensive 15,000
km2 (Stanistreet 1993; McCarthy 2003).
In such an environment, it may be that while channel accessibility largely determined the
possibility of settlement, there may have been other options as well. Sherratt (1980) has
suggested that as early as the late Neolithic, small transverse canals were constructed off of
braided streams in Choga Mama, as well as in several Kopet Dag sites. He further notes that in
- 284 -
some cases, the sheet flow associated with shallow canals may have been enough to facilitate
non-canalized small-scale irrigation. Moreover, small pockets of more fertile soil, even in
interfluvial regions, could have been exploited by small farming groups, although these may
have been less reliable. With respect to the northern Murghab, it is quite possible that several of
these strategies may have been employed concurrently. The prevalence of small pockets of
occupation far from major settlement areas may offer some evidence of at least a small degree of
local self-sufficiency with respect to water acquisition and management. While these sites are
probably best viewed as short-term occupations or activity areas due to the paucity of material
and complete lack of architectural remains (see section 7.4.1), there may have been enough
available water for localised subsistence agriculture. A kilometre is not any great walking
distance, however, no more than 15 minutes or so, and it may be more reasonable to assume that
the bulk of foodstuffs were obtained from more significant agricultural fields closer to the
centre. At present, however, there is not enough information to definitively assess the degree of
economic and agricultural centralisation in the region.
While speculative, we may now put forth a picture of a northern Murghab settlement
environment where water sources, while perhaps plentiful and easily accessible, may have been
rather unreliable even as early as the Middle Bronze Age—and increasingly so as encroaching
aeolian deposits and continuing processes of aridisation and consequent water loss (see section
1.8; also Weiss 1993; Cremaschi 1998) began to interfere with the natural drainage network.
The complexity of the takyr system may reflect shifting stream channels, particularly in Area 1.
While such complexity may have offered some advantages in terms of access to varied water
sources, it may also have been symptomatic of an increasingly unreliable hydrological system.
An interesting comparison may be made with some of the wadi-based settlements in Syria and
elsewhere in northern Mesopotamia. Wilkinson has noted that, in many cases, settlement tended
to occur towards the termini of the wadis, where water may be more manageable and closer to
the surface (Wilkinson and Tucker 1995: 29-30). Soils in these regions are often highly fertile,
and in several instances initial settlement tends to occur in such areas. Over time, settlement
became possible further upstream, facilitated by an increasing population and larger labour force
better able to manage a potentially more productive, but complex, irrigation system. One
example of this pattern may be seen in the southern portion of the Homs Survey in the Orontes
Valley, Syria. In this region, survey data reveal the existence of sporadic Chalcolithic
settlements (e.g. sites 251 and 478) at the downstream end of the wadis, with an increase in
upstream occupation into the Middle and Late Bronze Age (e.g. site 254) before eventually
shifting away from these localised water sources with the development of larger, state-
- 285 -
administered irrigation projects (based on GIS data from the Survey of the Homs Region
evaluated by the author in 2005 in the course of MA research).
Clearly, the northern Murghab cannot be assumed to foster the same kinds of settlement patterns
that would be found along wadi systems, although the arid climate in these regions would have
necessitated irrigation agriculture and restricted primary settlement to regions along the channels
themselves. Unfortunately, the narrow chronological window in the Murghab restricts the
ability to investigate the development of settlement with respect to irrigation agriculture.
However, it is a reasonable assumption that, if the Middle Bronze occupation in the Murghab
originated in part from the Kopet Dag (see Section 7.10), requisite water-management and
irrigation strategies would have been familiar territory. Knowledge, however, still required the
necessary labour to implement it, and more research is necessary to investigate the manner in
which such projects may have been structured, and the level of administration driving them.
7.9 Survey in Context: Examining the NMDS Data in Light of Central Asian Settlement Patterns
7.9.1. Comparative Intensity of Occupation
The results of the NMDS survey, when situated in the context of the rest of the work that has
been conducted in the northern fringe of the Murghab, thus demonstrate highly complex and
variable settlement patterns within what had been previously viewed as an almost empty
settlement landscape. Moreover, as illustrated above, the overall orientation of settlement with
respect to the fluvial system reflects a consistent character that occurs throughout the delta,
although at a smaller scale both in terms of the intensity as well as the distribution of settlement.
The apparent absence of large settlement mounds, supported both by the remote sensing analysis
and in-field observations, suggests that these are substantially less prevalent in the region. While
raised occupational areas were detectable in Area 1, their actual elevations were difficult to
estimate due to the substantial sand cover, and evidence from the southern Egri Bogaz sites, as
well as those in the Kelleli region, suggests that while deflation has almost certainly contributed
to reducing site elevations, even fortified sites (e.g. Kelleli 3) did not attain any significant
elevation even in antiquity. The shallow cultural levels of these northern sites may be compared
with evidence from elsewhere in the delta in further support of a reduced occupational intensity.
While the depth of cultural material in this region tends to coincide broadly with the uppermost
takyr layers, recent research suggests that this is not the case everywhere in the delta.
- 286 -
Unpublished excavations at Adji Kui 1, which rises approximately 3.5m above the takyr surface,
have unearthed cultural layers up to 1.8m below the takyr (G. Rossi-Osmida, pers. comm.), and
Hiebert notes that, while Gonur North appears to have been constructed on a raised section of
the alluvial plain, the southern mound of Gonur was dug into the takyr surface (Hiebert 1994a).
Conversely, the few excavated northern sites are usually shallow mounds seldom surpassing a
metre or two in elevation, and significant deposits below the takyr level have not been recorded.
This profile is reflected in the NMDS survey area as well. The ash deposits noted in the Area 4
test pit, for example, occurred on or slightly below the takyr surface beneath the dunes, and the
possible oven in the northwest portion of Area 1 may similarly indicate a feature constructed on
or just below the Bronze Age alluvial surface. While the more deeply buried cultural levels in
the central delta (e.g. Adji Kui 1, Togolok 1) may be related to heavier alluvial deposition
further upstream (see section 1.9), the increased thickness of the cultural deposits towards the
south and the larger number of clearly identifiable settlement areas suggests that populations
there were substantially larger and the area more intensively occupied.
7.9.2. Comparative Distribution of Settlement
In order to gain some perspective on the significance of such a settlement distribution, it is
useful to consider the region in light of comparative developments elsewhere, particularly in the
Kopet Dag foothills. In terms of both intensity and breadth of settlement, the Murghab
phenomenon represents a different occupational structure than that which occurred in southern
Turkmenistan. The thickness of the Namazga V and VI levels in the Murghab, even on the
largest sites, rarely surpass a metre, while cultural levels on the order of 10 or 12m occur at sites
such as Altyn Depe and Ulug Depe (Masson 1981). While it is possible that deflation of the
drier, sandier soils of the Murghab may have reduced the thickness of cultural levels more
rapidly than in the moister soils of the foothill range (and it is worth noting that Aurel Stein
(1925) suggested that deflation may have lowered the exposed desert surface by as much as a
foot per century in parts of the Tarim Basin), it is likely that the thin cultural levels reflect less
intensive settlement in the Murghab. However, the tenuous chronological understanding of
Murghab pottery means that direct comparisons with southern Turkmen sites are difficult, so
there may be chronological overlap that has not yet been clearly identified.
In addition to the intensity of occupation, the overall settlement patterns are significantly
different as well. In the Murghab, occupation is broadly distributed throughout the river system

- 287 -
forming the broadly linear trajectories discussed in Chapter 6, and similar settlement patterns are
identifiable in the Bactrian sites (Hiebert 1994a: 28) (Sarianidi 1977). Masson (1981) attributes
the broader geographic scope of occupation in Bactria and Margiana to what he sees as a more
highly developed irrigation system, where the linearity of settlement orientation represents a
highly organised network of irrigation canals, although, as noted above, such an extensive
system is disputed by Bader (1996). Similarly, Lisitsina (1981) has questioned the extent of the
irrigation system in this area, and the lack of clearly identifiable canals in the survey area may
indicate that irrigation in the region was actually less developed than in the Kopet Dag—perhaps
the result of the focus on local water management strategies and the lack of a substantial and
centrally mobilised labour force. In this context, it is worth revisiting the linear feature in Area
7, discussed in Chapter 5. While speculative, if the feature is indeed anthropogenic in nature,
and if the „brick kiln‟ was in fact used for a sluice or dam (see section 5.6.5.), it may suggest a
more substantial mechanism of water control, perhaps attributable to the burgeoning
administrative capacity evident in the Adji Kui region. Such a possibility is interesting in light
of other linear features in the Gonur region that have been identified by Marcolongo and Mozzi
(1998), and may be anthropogenic in origin, although their function has not been determined.
Given the distinctive nature of Murghab occupation, it is clear that the Murghab delta does not
reflect a simple reorientation of the foothill settlement pattern, but has its own distinct character.
In the foothill zone, the settlement pattern is broadly nucleated, and depes may reach 25-30m in
height. The nucleation of Bronze Age sites, particularly in the Near East, has been the subject of
a great deal of recent research in recent years (Wilkinson 2003a), and attributed in part to the
centralised administration and systems of land-tenure that persisted through the Iron Age
(Wilkinson et al. 2004). Similarities between many of the Kopet Dag sites and those in northern
Mesopotamia and Anatolia suggest that similar processes were in evidence during the urban
phase here as well. In the Murghab, some nucleation of settlement occurred, but to a very
limited degree. The fortified settlements clearly indicate centralised areas of occupation, at least
on a local level, and evidence of production in the survey area both in terms of the
concentrations of vitrified brick as well as the evidence of metal and possible slag suggest that
mechanisms of local production were in place (cf Hiebert 1994b). However, the overall
trajectories of occupation were quite fluid and complex, as the complex distribution of material
in the NMDS survey clearly illustrates. Primarily in Area 1, but also along the channel systems
in the western part of the survey area, continuous but clustered aggregations of material offer a
picture of highly dynamic local activity and interaction within the settlement pattern that is not

- 288 -
reflected in the large nucleated settlements in southern Turkmenistan, only a few hundred
kilometres to the west.
7.9.3. Re-Examining Settlement Trends in the Murghab
Given the still-hazy picture of the development and decline of Bronze Age society in the
northern Murghab, it is important to assess how the local settlement patterns of the NMDS
survey fit into the broader inter-regional picture. Via its „BMAC‟ guise, settlement in the
Murghab is often treated as a specific development that arose out of a broadly west-to-east
cultural shift. Whatever the reasons for this movement eastward, the development is described
by several researchers (e.g. Hiebert 1994; Kohl 1981), in terms of colonisation from southern
Turkmenistan, a response to deteriorating climatic and environmental conditions, touched upon
in Chapter 2 and revisited below. Dolukhanov (1981) suggests that the shift may have resulted
from population pressure resulting from intensive cultivation by communities in the Kopet Dag
foothills. In this view, movement east was driven largely by the decrease in available farmland
and the consequent search for untapped agricultural resources that were certainly available in the
Murghab. Masson (1981) broadly agrees, tracing the eastward shift largely to deterioration in
the foothill micro-environment in southern Turkmenistan, owing in part to deforestation and
ultimate desiccation of the environment (see Chapter 2).
While the similarity in material culture between the Murghab and southern Turkmenistan
suggests that migratory processes contributed to the late Namazga V peopling of the Murghab, it
is worth exploring how such processes may have transpired, and if the NMDS data can offer
some perspective. If such movement occurred on a grand scale, it is possible that the process
may have been driven in part by a central authority in southern Turkmenistan, of which Altyn
Depe, based on its size and its precipitous decline in the Namazga VI period, may be the most
likely candidate. If this is the case, the late Namazga V period in the Kopet Dag may be seen as
a kind of 'last gasp‟ of urbanised society in the face of an already weakening inter-regional
economic system (cf Weiss 1993). It may therefore have made sense for ruling or administrative
groups to look eastwards for easier access to commodities such as tin (Kaniuth 2007a), or luxury
goods such as lapis lazuli. Indeed, the substantial settlement of an area largely lacking in natural
resources apart from fertile land and alluvial clays may further support the possibility that
settlement here offered some promise in its increased proximity to raw materials, a trajectory of
movement that eventually incorporated the richer Bactrian region a short time later. It is
difficult, however, to determine just how much, if any, of the initial settlement of the Murghab
- 289 -
delta may have been determined by direct colonial aspirations. Indeed, the Namazga VI
evidence at Altyn Depe is almost absent (Masson 1988), and while some of the initial movement
towards the Murghab at the apex of the urban period may have been driven by a central
authority, it is doubtful that such an authority would have directly controlled the continuing
settlement of the Murghab.
A more likely possibility, then, and one that may see some traces, albeit speculative, in the
clustered continuity of the survey data, is that groups independently moved east in the face of a
weakening urban centre increasingly restricted in its ability to support its inhabitants. Although
tracking such movement is difficult due to the poor understanding of the region between the
Murghab and Tedjen, the proliferation of small sites in the Kopet Dag foothills during the Late
Bronze Age (Biscione 1977; Kohl 1981) suggests that settlement remains dynamic during the
period, and Biscione cites the persistence of small sites during this period to suggest that
populations remained fairly stable, if more difficult to trace. One model, then, is an uneven
ripple effect from the west rather than a direct, centralised colonisation process. Anthony
(1990), in discussing migratory patterns of nomadic cultures, identifies several patterns of
increasing breadth and intensity by which people may move from one place to another, and
although his theories are largely applied to mobile groups there is no reason to discount similar
behaviours in sedentary communities. At the largest scale are significant kin-based movements,
where entire groups may, either together or over long periods of time, move to regions where the
perceived benefit is greater. It is likely that communities in the Kopet Dag region were aware of
the agricultural potential in the Murghab delta, particularly if communities were already extant
in the lower delta prior to the large-scale occupation that took place towards the end of the
Namazga V period. The area between the easternmost sites of the Kopet Dag and the Murghab
delta is less than 150 km, not close enough for constant transit but well within range of longer-
distance exchange, and the Kopet Dag offered substantial resources (e.g. flint, turquoise; see also
Coolidge 2006) to encourage continued movement to and from the Murghab even in the wake of
a broader shift to the east.
Returning to the survey data, the clustered, quasi-linear patterning evident at several concurrent
levels of analysis indicates substantial variability in the peopling of the delta, and suggests that
small settlements likely appeared unevenly in fertile areas along river channels. Larger
communities, as evidenced from the chains of high-density areas in both Areas 1 and 5,
aggregated in similar fashions, their higher populations facilitated by greater access to cultivable
land (see above). The similarity of the distribution of the larger aggregations in the NMDS
- 290 -
region to those found elsewhere in the delta suggest that such processes occurred on a fairly
large scale towards the end of the Namazga V period, and the clear directionality in the
orientation of these settlements, in accordance with the channels evident in the satellite imagery,
demonstrates the enormous significance of the fluvial system in shaping the initial settlement
patterns. The anisotropic propagation of material highlights the role of the natural channel
system, and demonstrates that rather than extensive, artificial irrigation networks, served as the
primary conduits for agricultural development among larger communities. In this regard, there
are signs of more intensive cultivation in the more populated Area 1 where, as indicated in
section 5.6, some evidence of cultural material occurred in the upper levels of the test pits.
Lisitsina (1973) has suggested that cultural material may occur in the top 30 or 40 cm of takyr
soils in cultivated areas, and it is possible that, although manuring is likely not the primary
explanation for the larger sherd scatters on takyr surfaces (see above), that such processes may
have contributed to the subsurface material in Area 1 not clearly associated with direct
occupation.
While agricultural activity and significant occupation propagated along the channel systems, the
complexity of the sherd distribution even in low density areas not directly associated with the
fluvial system suggests that these regions were active as well, but that the nature of such activity
was very different. Sherd aggregations in these regions are far more variable, and anisotropic
signatures much more difficult to identify. Moreover, the current geomorphology of the
landscape takes on a more prominent role in the archaeological recovery of these regions.
However, as discussed earlier in this chapter, the continued presence of archaeological material
suggests that scatters resulted both from local mobility associated with the pastoral activities of a
mixed economy (see discussion in section 7.4), as well as from small-scale but opportunistic
occupation facilitated by intermittent and shifting fertile zones. Cazancli (2002) has modelled
the behaviour of floodwaters in alluvial fans, finding that lateral erosion and channel shifts
upstream may result in the constant reshaping of the distal regions. It is likely that the
interfluvial environment thus offered both promise and risk for smaller-scale occupation and
cultivation while the primary channels remained, at least for a time, more stable and suitable for
larger scale settlement.
It is worthwhile to briefly address these complexities of the sherd distribution in the context of
the purported geomorphological and climatic changes that occurred towards the beginning of the
second millennium, outlined in Chapter 2. Much of the recent examination of the relationship
between climate and culture change has shifted away from grand-scale explanations (see Rosen
- 291 -
2007), focusing instead on local and regional responses to climatic variation. Possehl, for
example, has questioned the view proposed by Weiss (1993) that precipitous climatic changes in
northern Mesopotamia, by weakening demand for resources in southern Mesopotamia,
ultimately contributed to economic decline on the Indian subcontinent (Weiss 1993). While
acknowledging that socio-economic and climatic factors likely played a role in the Indus decline,
Possehl prefers to examine these on more local and regional levels. He focuses on the
disappearance of the Saraswati River, a currently dry riverbed along which a substantial number
of Indus settlements were discovered (Possehl 1997), as a more likely culprit in the dissolution
of societies in that region. Elsewhere in the broader region, Stein (1925) has documented the
presence of settlements far beyond the current oases in the Lop Nor region, and the desiccated
environments of sites such as Shahdad (see above) offer further testament to regional desiccation
and water loss that ultimately contributed to societal decline. Unfortunately, the NMDS survey
data do not offer enough chronological resolution to adequately trace changes towards the end of
the Bronze Age, but the apparent southward shift in Namazga VI material in Area 1 (see section
5.8) may indicate a reorientation of the settlement pattern. Viewed in conjunction with the
apparently burgeoning development of the Adji Kui region during this period, this patterning
may reflect larger scale change, not only locally, in response to an increasingly unreliable fluvial
system (see Section 5.8, but also in response to a deepening centre of influence just to the south.
It is tempting, in this light, to envision a slow movement of northern groups and new settlements
into the central delta towards the end of the Bronze Age, a shift that would have been similarly
constrained by the availability of water, and manifested ultimately in the continued clustered
directionality of the settlement pattern.
- 292 -
7.10 Summary
This chapter has offered some interpretations of the settlement landscape through an integrated
examination of the data presented in the previous three chapters. While surface material cannot
act as a direct substitute for subsurface archaeology, there is a wealth of information available to
provide informed speculation not only about settlement areas, but interactions and peripheral
activities as well. Furthermore, the analysis has highlighted the need to consider the landscape
in detail and at several scales of analysis, both in terms of material distribution and recovery
potential. Through this approach, clear patterns have emerged that highlight the integrated
nature of the various processes shaping the surface distribution. Furthermore, these patterns
demonstrate the necessity in examining not only settlement processes, but post-depositional
factors, concurrently. In this manner, it has become to not only understand the nature of
settlement, but to understand the archaeological landscape as a coalescence of dynamic and
continuous processes. These findings will now assessed as a whole, drawn together in the final
chapter of this thesis.

- 293 -
Chapter 8. Lessons from the Black Sands: Methodological Issues, Conclusions and New Directions
From its inception this research has relied upon a fundamental assumption: that even in the
adverse, obstructed archaeological landscape of the northern Murghab, a region that has for
decades eluded substantial archaeological enquiry, innovative approaches to surface survey can
shed new light on a little-known settlement landscape. To arrive at these realisations, the
research embarked on several exploratory yet closely linked trajectories, joining more traditional
aspects of transect-based survey with newer statistical and technological approaches to data
acquisition and analysis. From a theoretical perspective, the research sought to unify concepts of
spatial patterning, scale and landscape as a means to ultimately draw conclusions about a society
from a heterogeneous patchwork of surface pottery.
8.1. Limitations of Research Methodologies
Before detailing the outcomes of the NMDS research, a critical assessment of the methodologies
is necessary. Most of the approaches used in this research are new to the Murghab, and in some
cases, as with the investigations of anisotropy (section 6.5) and visibility (section 4.3.3), they
have rarely been applied in any archaeological investigations. Moreover, the complex nature of
the northern Murghab landscape requires an evaluation of the methods not only in terms of
general effectiveness, but also with respect to their applicability in this unique archaeological
environment. The first consideration is the use of intensive survey as a tool for settlement
pattern investigation. General problems associated with collection and counting of surface
materials are well established (Mattingly et al. 2000) and the quantitative errors that may result
from differences in skill, vision and perception among fieldwalkers were evident in the NMDS
survey (section 6.5.1). Additionally, the pace at which transects were walked contributed to
potential inaccuracies, and sherd counts became less reliable as material densities increased. As
evidenced by the highly varied sherd counts in Area 1 (section 5.6.1), recorded totals in high-
density collection units were subject to significant variation, a problem which was substantially
reduced in lower density regions.
- 294 -
While such errors may complicate any survey, several factors were peculiar to the northern
Murghab landscape, and resulted in an even greater potential for error than might be expected in
other surveys. The prevailing north-south topography of the dune ridges often resulted in
unintentional shifts of the walker lines. Although locations were repeatedly corrected, these may
have at times affected the recorded sherd totals. There was also a general tendency for the eye to
be drawn towards takyrs or depressions, where sherds were expected and potentially easier to
spot. A related problem was the variation in sherd scatters. Tiny, abraded materials associated
with sandy deposits at the edge of a depression could be practically ignored by one observer but
seen as dozens of sherds by another. Attempts to work with the team to identify different kinds
of scatters as they occurred were helpful, but often difficult because of communication
difficulties due both to the different first languages of the surveyors and the 20m distance
between them in the field.
A second issue concerned the chronology of the material. While the project was designed as a
spatial investigation rather than a chronological one, the fact that Middle and Late Bronze
materials did not exhibit substantially different spatial patterning meant that settlement change
could only be indirectly inferred, not directly identified. While anticipated from the beginning
of this research, the problem was initially expected to be one of chronological identification
rather than ambiguous spatial patterning. With the exception of a possible shift in distribution
from the Middle to the Late Bronze Age in Area 1 (see section 5.8.2), the coterminous
occurrence of material from both periods in most of the major scatters indicated that fine
chronological resolution could not easily be linked with the settlement pattern. Furthermore, this
observation suggests that the predominance of Late Bronze material in small sites and transects
observed by the AMMD researchers (Cattani and Salvatori 2008) may reflect the poor diagnostic
character of material in the field rather than actual chronology. Ultimately, the strengths of the
NMDS survey lay in spatial, not chronological, investigation.
Another set of limitations concerned the integration of remote sensing data in the survey. Since
the initial survey design relied heavily on this data, certain initial assumptions about the northern
Murghab landscape were necessary to launch the project, but these had to be modified during the
course of the research. The first issue was a tendency to underestimate, prior to the actual
fieldwork, the extreme complexity of the landscape. While this theme has been articulated
repeatedly throughout the thesis (especially Chapter 4) and was recognised in principle from the
beginning of the research, the planning of an intensive survey based in part on a visual
interpretation of medium-resolution satellite imagery and abstract delimitations of
- 295 -
archaeological sites (section 3.2.2) carried some risk. Because ground-truthing could not be
employed until the second year of the research, the placement of survey grids effectively relied
on desk-based models of the archaeological landscape rather than a full understanding of the
actual environment (refer to Adams and Gillespie 2006 for in depth discussion on these
limitations). These problems were, however, effectively countered by the design of the pilot
survey which facilitated modification of the overall survey design should it have been required.
Moreover, the simplistic but easily identifiable dichotomy between sand and takyr was readily
apparent in the preliminary visual and multispectral analysis so that initial questions of material
distribution in these regions could be addressed and subsequently refined.
Another issue pertained to scale, a concept that proved just as relevant to image analysis (see
Atkinson 2004) as to the spatial patterning of material. While the ASTER imagery effectively
identified general characteristics of geomorphology and land-use (section 4.2.4), and was useful
in assessing the properties of the material distribution over broad land categories, its
applicability at small scales was limited and the imagery could not be effectively employed to
draw sound conclusions regarding isolated sherd scatters. Moreover, since the ASTER infrared
bands offered only 30m spatial resolution, this information could not be extracted at the
collection unit level. Conversely, the 0.6m-2.5m resolution of the Quickbird imagery, while
offering a wealth of information about localised land cover, was often unnecessarily high for the
raw survey data since landscape variations often occurred below the error threshold for
individual sherd location. The apparent association of particular sherd distributions with small
depressions, for example, was therefore potentially unreliable. By employing a multiscalar
approach to the remote sensing data, however, a useful compromise was attained through which
to conduct an integrated study of material and landscape.
In terms of site identification, the applicability of remote sensing was limited due to two primary
factors. First, the sheer number of „false positives‟ hindered the systematic examination of these
regions (section 4.5.2). Even when thresholds were extremely restrictive, there was no clear
correlation between positive spectral hits and sites or sherd concentrations in the survey area. It
was particularly noteworthy, in light of the intensive surface distribution in Area 1, that this
region did not exhibit distinctive spectral characteristics as did the larger sites in the central
delta. This suggests that a shifting, extensive rather than intensive occupation had less of an
impact on the landscape. Furthermore, in the survey area, sites could not be identified based on
spectral contiguity, a likely effect of the extreme variability over small areas. While problematic
- 296 -
in this particular area of the delta, the weaknesses of these particular remote sensing approaches
were likely due to the absence of exposed and unmodified archaeological surfaces.
Spatial analysis, while useful in discerning broad statistical tendencies, was similarly limited by
the extreme variability of the landscape. Significant topographical and material variation not
only within the analytical units, but even within smaller statistically significant regions indicated
strong spatial heterogeneity throughout the survey area which hindered sound statistical
evaluation of truly homogeneous regions (section 6.4.2). Furthermore, the variations in sherd
counts described above, while reduced via normalisation of the data, added additional error to
the statistical evaluations. The anisotropic analysis (section 6.5) was subject to similar
complications, and while general directional trends were clearly identifiable, the identification of
individual localised processes was best suited to visual rather than statistical evaluation.
In a region where most of the methodological approaches are untested, these limitations become
even more important when drawing final conclusions. Indeed, a perennial problem with
Murghab research has been the failure to recognise such limits, and to draw overly large-scale
conclusions often not substantiated by the few available points of analysis. The final sections of
this thesis therefore provide a reflexive view of the methodology in order to develop a new
understanding of the settlement pattern, and to provide a new set of interpretations and
perspectives on the Bronze Age occupation of the northern Murghab.
8.2. Outcomes in Settlement Interpretation in the Northern Murghab
8.2.1. The NMDS Approach: Methodological Implications
As discussed throughout this thesis, the NMDS survey was conducted in response to some
strongly entrenched and sometimes overly constraining theoretical frameworks with respect to
the character of both the river delta and the associated distributions of cultural material. The
current study navigated these constraints by taking an exploratory and innovative approach to
the survey data, loosening the prevailing frameworks enough to allow the surface scatters to
offer new perspectives on the northern Murghab settlement pattern and ultimately present the
sedentary societies of the delta in a new light. The following discussion articulates the key
- 297 -
methodological outcomes as a precursor to broader conclusions concerning the nature of
settlement and material distributions in the northern Murghab.
Firstly, the results of the survey clearly highlight the wealth of information that may be obtained
from intensive survey, data largely unobtainable from more extensive approaches. The NMDS
research provides clear evidence that the distribution of settlement and material in the northern
Murghab is much more complex and varied than these older models suggest (sections 5.6, 6.4-
6.5), and demonstrates the dangers of inferring settlement patterns from grand-scale, site-based
surveys alone. Particularly in the Murghab, where visibility is extremely restrictive and sites not
topographically prominent, cursory assessments of site sizes and numbers may be highly
misleading (see section 6.1). Moreover, the variability of the sherd scatters in both high and low
density areas illustrates the complex interplay of settlement, geomorphology and recovery bias,
valuable information that had previously remained elusive. Indeed, if the aim of the current
research had been simply to find archaeological sites, then the scepticism of archaeologists who
question intensive and more quantitative approaches (e.g. Fentress 2000; but see discussion in
Caraher et al. 2006; also see section 2.7) may have been more apt. Even the cursory coverage of
this region by the AMMD researchers was sufficient to locate the largest scatters, and were the
same resources applied here as elsewhere in the Murghab, many smaller aggregations would
have been identified. These findings concur with Redman‟s (1982) observation that the
intensification of a survey may not necessarily improve the recovery potential for large sites.
However, Redman suggests that „under ideal conditions one could probably identify a large
mound site from 0.5km or more away...and within 50m to detect...a scatter of artefacts and no
topographic anomaly‟ (Redman 1982). In the northern Murghab, a region riddled with such
topographic anomalies, these qualifying words are profoundly relevant and strategies that
address these issues are therefore essential. By narrowing the scope of survey it has become
possible to detect not only scatters, but, even more importantly, patterns of distribution hitherto
undetected in extensive surveys.
Secondly, the NMDS survey demonstrates the importance of a multi-scalar approach that in
conjunction with the wealth of data provided by the earlier Italian and Russian projects (see
treatment in sections 5.6.1, 6.2, 7.8), facilitated the interpretation of local and regional settlement
patterns. While the concerns regarding the applicability of small-scale surveys to regional
questions (see section 2.7) are well-intentioned and, in many contexts, fully valid, there is a great
deal to be learned about both settlement and post-depositional processes at small scales that, if
properly integrated with broader regional knowledge, can offer a wealth of information that may
- 298 -
not otherwise be attainable. Furthermore, the multiscalar approach has allowed the NMDS data
to serve as a kind of methodological anchor against which to assess spatial patterning elsewhere
in the delta. The methods used in this research are definable, repeatable and transferable, and
may therefore be used to explore local processes in different areas that can ultimately strengthen
the multi-scalar understanding of the entire region.
Thirdly, the broadening of traditional survey methodologies to include both remote sensing and
spatial analysis has facilitated a series of new interpretations often not discernible through field
methods alone. By offering full and quantifiable depictions of both the sherd distribution and
the land cover, it was possible to obtain a much deeper understanding of visibility (section 4.3.3)
and topography. Furthermore, inferences could be drawn concerning the relationship between
complex sherd scatters and the dynamic geomorphological processes that contributed to the
surface distribution (sections 6.5, 7.4.2). The further integration of spatial dependence and
anisotropic analysis clearly demonstrated that while recovery biases and post-depositional
processes were substantial (section 6.5), important archaeological conclusions could be drawn
about settlement in the Murghab, explored in detail in Chapter 7 and revisited below. These
findings partially counter Cattani‟s contention that, due to the visibility problems „there was no
possibility of developing any reliable reconstruction of the agricultural landscape or of drawing a
population estimate from the settlement data‟ (Cattani et al. 2008a: 43), while continuing to
agree with the general point that these extrapolations are difficult. In fact, the outlook for such
interpretation is made brighter if we examine the data at several concurrent scales of analysis, as
this allows us to address more comprehensively the multiple facets of material distribution from
settlement process to final deposition (cf Bevan and Conolly 2006).
The investigation of both anisotropic and aggregational variability in the surface distribution is
therefore an essential aspect in the identification of processes that have influenced the final
deposition. Equally important, however, is an understanding of the lenses through which the
surface material is interpreted, as they profoundly influence the way the surface scatters appear
to the observer and must be deconstructed accordingly. In this regard, the use of remote sensing
to identify both the inherent anisotropy of the landscape and the character of land cover, each at
multiple analytical scales, was pivotal. The biases that result from directional landscapes, as
well as their interpretative potential, are too influential to be overlooked, and it is important to
assess these factors prior to undertaking many field projects. Moreover sampling strategies may
benefit by taking directionality into account, and it is important to recognise where sampling
- 299 -
may inadvertently be affected by directional continuity or discontinuity, discussed in more detail
below.
The fourth methodological outcome is a reassessment of the concept of „site‟ in the context of
the northern Murghab archaeological landscape. If by site we mean a discrete aggregation of
surface material that broadly represents an actual settlement location, then the notion is not
particularly useful in the context of intensive survey in this region (also see discussion in section
2.7). Post-depositional processes have shifted or obstructed material, and the discrepancy
between surface scatters and subsurface archaeology indicates that the delineation of discrete
occupational areas is unreliable (section 5.6). Moreover, there is no reason to assume that actual
settlements in antiquity were strictly delimited. Broad surface scatters may reflect outlying
occupations, for example, while anisotropic patterning may indicate activities associated with
agriculture or irrigation along watercourses. Moreover, occupation may have slowly shifted,
with individuals, families or groups relocating either in tandem with shifting watercourses or
possibly further upstream as agricultural potential on the northern fringe of the delta slowly
deteriorated. Such behaviours are only very imperfectly captured by the conventional notion of
an archaeological site. Thus, while the concept may still be useful at larger analytical scales, its
value progressively weakens as the complexity of the material distribution comes into greater
focus. Nevertheless, some choices still have to be made concerning those regions that warrant
further study and those that do not. In this regard, the best candidates for „sites‟ were generally
broader regions of high spatial clustering (section 6.4.3), often comprising sandy depressions or
eroded takyr surfaces, and characterised by sherds of varied sizes, the presence of diagnostic
material and occasionally by topographical variation (cf „tepe 1‟, „tepe 2‟ and „elevated density
areas‟ in Bondioli and Tosi 1998).
8.2.2. An Interpretative Model: A Landscape of Clustered Directionality
Rivers and Directional Continuity
Having articulated the methodological advances of the NMDS survey, some conclusions may
now be drawn about the nature of the surface distribution itself. To provide a framework for this
discussion, a re-assessment of the „continuous landscape‟, described in section 7.4, is necessary.
As discussed in sections 2.4 and 7.4, the AMMD model of a continuous settlement landscape
provides a much more appropriate model of Murghab occupation than does the prevailing „oasis‟
model, particularly in demonstrating that much more of the landscape was potentially available
- 300 -
for settlement and land-use than had previously been described. However, the NMDS work has
highlighted some major constraints to this continuity. Of paramount significance is the
demonstration that the distribution of neither settlement nor material is uniform. As discussed in
the previous chapter and in section 6.4, surface distributions behave very differently in different
directions. The primary determinant in this regard is the channel system (section 7.7), and the
constraining influence of channel availability directly influenced the linearity of the settlement
pattern. Surface distributions along these fluvial corridors exhibit clear signs of clustering, with
a degree of regularity that suggests that the small occupations along river channels were broadly
similar in size and influence. Larger communities existed, as evident in Area 1, but the overall
appearance of the settlement pattern reflects common structural characteristics in high and low
density areas along the watercourses. Communities aggregated in some regions more so than
others, for reasons primarily associated with the availability of water and fertile land,
particularly in the marginal and tenuous agricultural environment of the northern Murghab
(sections 7.8-7.9). Post-depositional processes in these regions have a directional component as
well, and the apparent conveyance of material in similar directions as the chains of high density
clusters highlights a fluvial component to the redeposition of materials, both from actual channel
flow in antiquity as well as more recent rainfall events that continue to transport material along
exposed areas of relict channels. Additionally the cultivation of soils, broadly but not entirely
constrained to the channels, likely followed a similar trajectory (sections. 7.6-7.7) and, in
conjunction with erosional processes, may have contributed to the continuous distribution of
small fragments in these regions.
The Wider Landscape and Directional Discontinuity
If the watercourses influenced settlement, agriculture and post-depositional processes along the
main channels, a completely different story has emerged in regions more removed from these
channels. In these low-density areas, settlement continuity is much more irregular and the
anisotropic patterning harder to read. Here, the initial deposition of material was partially
attributable to transient occupation and mobility associated with pastoral activities (see
discussion in section 7.4). Additionally, opportunistic agricultural activity played a role, and
may reflect the cultivation of areas that may not have been directly channelled but still fertile,
the result of unpredictable fluvial processes in the delta fringe (section 7.8). In this vein, we
must also consider the possibility that small scatters may also be associated with small transverse
irrigation channels, undetectable in the deflated landscape, which may extend substantially
beyond the primary channels. Wilkinson (2003a: 71) suggests that, through direct processes of
- 301 -
canal construction and land-clearance as well as indirect effects caused by erosion and silting,
even small-scale, localised irrigation strategies may shape distributions. It is likely that many, if
not all, of these factors were in play in the NMDS landscape. Ultimately, however, these
processes only account for the presence of material—they do not fully predict which processes
caused each individual sherd scatter. While the larger aggregations likely represent heavily
modified archaeological processes, the actual location of material, and particularly the small,
clustered sherd scatters, are more likely attributable to immediate and localised
geomorphological processes. In these cases, sherds, affected both by wind deflation and water
erosion, tend to aggregate in low-lying areas and may not directly reflect settlement at all (cf
Cleuziou 1998).
8.2.3. Contributions of the NMDS survey to settlement analysis
On a broader scale, the anisotropic landscape of the NMDS survey clearly reveals that while
structured continuity is an important characteristic of the settlement pattern, this does not imply
that the entire landscape was fully accessible, or utilised in a uniform manner. The extreme
variability in the surface distribution shows that the dichotomy between the oasis model (section
2.4.1) and the AMMD model of a fertile alluvial plain (section 2.4.2) is overly simplistic, and
neither interpretation fully captures the development of settlement in what was likely a region of
significant environmental and geomorphological transition. The already marginal environment
towards the distal portion of the delta (see section 7.8), offered comparatively restricted
opportunities for settlement establishment and development when compared with the central
delta, and the decrease in later material suggests that the situation became even more tenuous
into the second millennium. Moreover, while water was readily available even in the northern
fringe of the delta, its exploitation did not match the scale of major hydraulic societies such as
southern Mesopotamia, and large artificial canals that may signify transportation and state-
sponsored water management (Adams 1965) were not in evidence in the northern Murghab.
Nonetheless, there were still ample opportunities for communities to exploit a landscape that was
at once adverse and productive, as reflected in a complex occupational landscape that clearly
adds a great deal to the previous interpretations of the Egri Bogaz region.
By exploring the non-uniformity of the material distribution, the NMDS research has provided
an analytical framework that addresses local and regional variability, and can now offer
interpretations as to how communities may have developed and functioned. Initial settlement
locations, often representing the appearance of kin or kin-based groups in the delta, were largely
- 302 -
influenced by resource availability, although, as Anthony (2000) notes, other factors such as the
presence (or absence) of other groups in the area may also have influenced where people chose
to settle. These settlements provided the initial clustered anisotropy that continues to define the
settlement landscape. Development of these communities comprised a series of processes,
vestiges of which can be seen in the complexity of the sherd distribution. Economic strategies
likely involved individual, kin or community-based control of various aspects of a mixed
economy, including the management of fields and herds as well as irrigation canals, and the
vestiges of these practices, albeit heavily modified by post-depositional processes, may be seen
in the sherd distribution. The primacy of the local economy may also be seen in the sporadic but
identifiable evidence of production, evident in the substantial quantities of vitrified brick and
metal, particularly in Area 1 (section 5.6.1). This distribution recalls concentrated production
areas at sites such as Gonur (Sarianidi 2002a), Adji Kui (G. Rossi-Osmida, pers. comm.) and
Taip (Kohl 1984: 150) as well as sites in Bactria (Kohl 1984: 150), and strengthens the argument
for production at the local level.
The complexity of the material distribution beyond the clustered large scatters is thus a testament
to the dynamism of local development in the northern Murghab. Neither fully restricted to oasis-
based micro-environments, nor completely unconstrained, the surface distributions indicate a
complex and predominantly local exploitation of an often unreliable landscape, one that
ultimately yielded to a conjunction of increasingly adverse environmental and socio-economic
circumstances, most significantly an increasingly unreliable fluvial regime and consequent
decrease in productivity. Dispersed scatters and, occasionally, low settlement mounds reflect an
organic, unstructured approach to settlement and agriculture, perhaps indicating the need of
families or communities to locate more fertile land or stable sources of water, fairly rapid
changes that took place over years rather than generations.
For all that may be inferred about settlement development, distribution and land use, the surface
distribution of today ultimately represents nearly four millennia of change that has drastically
reshaped the initial settlement distribution, both smoothing and punctuating it into a continuum
of sherds that represent a highly stylised picture of the original settlement pattern. While
settlement-derived activities offered early modifications to the initial distribution, these were
further shaped over time by erosion and deflation, modified by wind, water and the chance
interference of people and animals. This research thus speaks to the extreme dynamism inherent
in what was once thought to be an extremely sparse archaeological landscape, and offers new
insight into how such processes may be interpreted.
- 303 -
8.3. New Directions: Suggestions for Further Research
This research has sought to illuminate a shadowed landscape and provide a step forward in our
understanding of broader settlement processes in the northern Murghab. Each aspect of the
settlement pattern that has come into greater focus has suggested new avenues of potential
research, both in theory and method. From the perspective of survey, there is an entire delta that
remains to be explored in greater depth, and the NMDS research has suggested new methods and
interpretative frameworks for that exploration. Clearly, the integration of the northern delta into
broader Murghab investigations must continue. Reliance on the Kelleli region is not sufficient
to unravel the mysteries of the north, and the success in investigating the settlement complexity
of the Egri Bogaz region demonstrates that even in this obstructed landscape, a great deal of
archaeological information is accessible. Certainly, further excavation is necessary, and an
intensive programme of subsurface investigation would be useful in establishing a much-needed
chronology for this region. From a geomorphological perspective, a targeted investigation of the
hydrological system in the north would greatly enhance the understanding of the relationship
between water and settlement at the local and regional levels. Beyond the limits of the known
occupational sphere of the delta, there is clearly a role for both spatial analysis and remote
sensing, and perhaps these may be effective at larger scales to identify more elusive evidence of
occupation beyond the known delta fringe. To this end, investigations of the far north and east
of the Murghab delta, as well as the largely unstudied region between the Murghab and Tedjen,
are greatly needed.
In a region so heavily defined by unknowns, every contribution to archaeological knowledge
runs the risk of becoming overemphasised, a research beacon that exerts undue influence in the
absence of substantive background data. As suggested in the opening chapter, this is a problem
that plagues the Murghab, where a few sites are too often seen to represent the entire delta. In
reality, every scale of analysis offers new and different information and the integration of these
is fundamental to understanding not only the main areas of occupation, but the delta as a whole.
Whether or not the Murghab Bronze Age really does represent a „New Centre of World
Civilisation‟, it certainly needs a better sense of perspective. This outlook was the underlying
theoretical motivation behind this research, and its realisation in the field via the deliberately
integrated assessment of settlement patterning, scale and wider landscape represents the main
contribution of this research.

- 304 -
- 305 -
References
ABDEE N, M. M., THURMOND, A. K. & ABDELSALAM, M. G. (2001). Application of
ASTER band ratio images for geological mapping in arid regions: the Neoproterozoic
Allaqi Suture. Abstract with Program, Geological Society of America, 2001, 289.
ADAMS, J. B. & GILLESPIE, A. R. (2006) Remote Sensing of Landscapes with Spectral
Images: A Physical Modelling Approach, Cambridge, Cambridge University Press.
ADAMS, R. M. (1965) Land Behind Baghdad: a History of Settlement on the Diyala Plains,
Chicago, University of Chicago Press.
ADAMS, R. M. (1981) Heartland of Cities: Surveys of Ancient Settlement and Land use on the
Central Floodplain of the Euphrates, Chicago, University of Chicago Press.
ALBANI, M. & KLINKENBERG, B. (2009) A spatial filter for the removal of striping artifacts
in digital elevation models. Photogrammetric Engineering and Remote Sensing, 755-
765.
ALCOCK, S., CHERRY, J. & DAVIS, J. (1994) Intensive survey, agricultural practice and the
classical landscape of Greece. IN MORRIS, I. (Ed.) Classical Greece: Ancient Histories
and Modern Archaeologies. Cambridge, Cambridge University Press 137-170.
ALCOCK, S., FRANCOVICH, R. & PATTERSON, H. (2000) Extracting meaning from
ploughsoil assemblages: assessments of the past, strategies for the future. Extracting
Meaning from Ploughsoil Assemblages. Oxford, Oxbow Books 1-4.
ALGAZE, G. (1989) The Uruk expansion: cross-cultural exchange in early Mesopotamian
civilization. Current Anthropology, 30, 571-608.
ALGAZE, G., MISIR, A. & WILKINSON, T. J. (1992) Sanliurfa Museum/University of
California excavations and surveys at Titris Höyük, 1991: A preliminary report.
Anatolica, 18, 33-60.
ALLISON, P. (1999) Formation processes of house floor assemblages. IN ALLISON, P. (Ed.)
The Archaeology of Household Activities. London, Routledge.
AMMERMAN, A. J. (1981) Surveys and archaeological research. Annual Review of
Anthropology, 10, 63-88.
ANSELIN, L. (1995) Local indicators of spatial association-LISA. Geographical Analysis, 27,
93-115.
ANTHONY, D. (1990) Migration in archeology: the baby and the bathwater. American
Anthropologist, 92, 895-914.
ARGAMAN, E. (2006) Erodibility of some crust forming soils/sediments from the Southern
Aral Sea Basin as determined in a wind tunnel. Earth Surface Processes and Landforms,
31, 47-63.
- 306 -
ARROYO-MORA, J. P., KALACSKA, M. & CHAZDON, R. (2009). Anais XIV Simpósio
Brasileiro de Sensoriamento Remoto, Natal, Brasil, 25-30 abril 2009, INPE, p. 2539-
2546. Anais XIV Simpósio Brasileiro de Sensoriamento Remoto, Natal, Brasil, 25-30
abril 2009, INPE, p. 2539-2546, Natal, Brazil.
ASKAROV, A. A. (1973) Sapallitepa, Tashkent.
ATKINSON, P. M. (2000) Spatial scale problems and geostatistical solutions: a review. The
Professional Geographer, 52, 607-623.
ATKINSON, P. M. (2004) Spatial variation in land cover and choice of spatial resolution for
remote sensing. International Journal of Remote Sensing, 25, 3687-3702.
BABAEV (1973) Oazisnye peski Turkmenistana i puti ikh osvoeniia, Ylym.
BABAEV, A. G., FET, V. & ATAMURADOV, K. I. (1994) Landscapes of Turkmenistan.
Biogeography and Ecology of Turkmenistan. London, Kluwer Academic Publishers.
BADER, A., GAIBOV, V., GUBAEV, A. & KOSHELENKO, G. (1996) The oasis of Merv: the
dynamics of its settling and irrigation. Ancient civilizations from Scythia to Siberia, 3,
49-60.
BANNING, C. B. (2002) Archaeological Survey, New York, Kluwer Academic Publishers.
BARKER, G. & GILBERTSON, D. (2000) Archaeology of Drylands: Living at the Margins,
New York, Routledge.
BATTY, M. & LONGLEY, P. (1994) Fractal Cities, San Diego, Academic Press Professional.
BAZILEVITCH, N. I. (1956) On the role of vegetation on the formation and evolution of takyric
plains on the Meshed-Messariansk deltaic alluvial plain. Takyrs of Southwestern
Turkmenia. Moscow, Nauk 222-277.
BECK, A., PHILIP, G., ABDULKARIM, M. & DONOGHUE, D. (2007a) Evaluation of Corona
and Ikonos high resolution satellite imagery for archaeological prospection in western
Syria. Antiquity, 81, 161-175.
BECK, A., WILKINSON, K. & PHILIP, G. (2007b). Some techniques for improving the
detection of archaeological features from satellite imagery. Remote Sensing for
Environmental Monitoring, GIS Applications, and Geology VII., Florence, Italy, 674903.
BEVAN, A. & CONOLLY, J. (2004) GIS, archaeological survey, and landscape archaeology on
the island of Kythera, Greece. Journal of Field Archaeology, 29, 123-138.
BEVAN, A. & CONOLLY, J. (2006) Multi-scalar approaches to settlement pattern analysis.
Confronting Scale in Archaeology: Issues of Theory and Practice. 217-234.
BEVAN, A. & CONOLLY, J. (2008) Modelling Spatial Heterogeneity and Nonstationarity in
Artifact-Rich Landscapes. Journal of Archaeological Science, 956-964.
BINTLIFF, J. L. & SNODGRASS, A. M. (1985) The Cambridge/Bradford Boeotian Expedition:
the first four years. Journal of Field Archaeology, 12, 123-161.
- 307 -
BINTLIFF, J. L. & SNODGRASS, A. M. (1988) Off-site pottery distributions: A regional and
interregional perspective. Current Anthropology, 29, 506-513.
BISCIONE, R. (1977) The crisis of Central Asia Urbanization in II Millennium BC and Villages
as an alternative system. Le Plateau Iranien et l'Asie Centrale des origines a la conquete
islamique. Paris, CNRS 113-128.
BLANTON, R. (2001) Mediterranean myopia. Antiquity, 75, 267-269.
BONDIOLI, L. & TOSI, M. (1998) Introduction. IN GUBAEV, A., KOSHELENKO, G. &
TOSI, M. (Eds.) The Archaeological Map of the Murghab Delta: Preliminary Reports
1990-1995. Rome, IsIAO 97.
BONORA, G. L. & VIDALE, M. (2008) An aspect of the early Iron Age (Yaz I) period in
Margiana: ceramic production at Site No. 999. IN SALVATORI, S. & TOSI, M. (Eds.)
The Bronze Age and Early Iron Age in the Margiana Lowlands: Facts and
Methodological Proposals for a Redefinition of the Research Strategies. 153-194.
BROWN, A. G. (1997) Alluvial Geoarchaeology: Floodplain Archaeology and Environmental
Change, Cambridge, Cambridge University Press.
BROWN, C. T. (2005) The broken past: Fractals in archaeology. Journal of Archaeological
Method and Theory, 12, 37-78.
BUCK, P., SABOL, D. & GILLESPIE, A. (2003) Sub-pixel artifact detection using remote
sensing. Journal of Archaeological Science, 30, 973-989.
BUI, C. N. (1990) Using quartz grain size and shape analysis to distinguish between aeolian and
fluvial deposits in the Dallol Bosso of Niger (West Africa). Earth Surface Processes and
Landforms, 14, 157-166.
BURGER, O. & TODD, L. (2006) Grain, extent, and intensity: the components of scale in
archaeological survey. Confronting Scale in Archaeology. Oxford, Archaeopress 235-
255.
BYRNE, G. F. (1980) Monitoring land-cover change by principal component analysis of
multitemporal Landsat data. Remote Sensing of Environment, 10, 175-184.
CACILM (2005) Central Asian Countries Initiative for Land Management, Asian Development
Bank.
CARAHER, W. R., NAKASSIS, D. & PETTIGREW, D. (2006) Siteless survey and intensive
data collection in an artifact-rich environment: case studies from the Eastern Corinthia,
Greece. Journal of Mediterranean Archaeology, 19, 7-43.
CARLSON, T. N. & RIPLEY, D. A. (1997) On the relation between NDVI, fractional
vegetation cover, and leaf area index. Remote Sensing of Environment, 62, 241-252.
CASANA, J. (2003) From Alalakh to Antioch. Oriental Institute. Chicago, University of
Chicago.
- 308 -
CASELLATO, U., FENZI, F., RICCARDI, M., ROSSI-OSMIDA, G. & VIGATO, P. (2007)
Physico-chemical and mineralogical study of ceramic findings from Mary City,
Turkmenistan. Journal of Cultural Heritage, 8, 412-422.
CASSELBERRY, S. E. (1974) Further refinement of formulae for determining population from
floor area. World Archaeology, 6, 117-122.
CASTEL, C. (2007) Urbanism on the margins: A third millennium BC Al-Rawda in the arid
zone of Syria. Antiquity, 81, 601-616.
CATTANI, M. & GENITO, B. (1998) The pottery chronological seriation of the Murghab Delta
from the end of the Bronze Age to the Achaemenid Period: a preliminary note. IN
GUBAEV, A., KOSHELENKO, G. & TOSI, M. (Eds.) The Archaeological Map of the
Murghab Delta: Preliminary Reports 1990-1995. Rome, IsIAO 75-88.
CATTANI, M. & SALVATORI, S. (2008) Transects and other techniques for systematic
sampling. IN CATTANI, M. & SALVATORI, S. (Eds.) The Bronze Age and Early Iron
Age in the Margiana Lowlands: Facts and Methodological Proposals for a Redefinition
of the Research Strategies. Oxford, Archaeopress 1-29.
CATTANI, M., CERASETTI, B., SALVATORI, S. & TOSI, M. (2008a) The Murghab Delta in
Central Asia 1990-2001: the GIS from research resource to reasoning tool for the study
of settlement change in long-term fluctuations. IN CATTANI, M. & SALVATORI, S.
(Eds.) The Bronze Age and Early Iron Age in the Margiana Lowlands: Facts and
Methodological Proposals for a Redefinition of the Research Strategies. Oxford,
Archaeopress 41-48.
CATTANI, M., SALVATORI, S. & TOSI, M. (2008b) Excavations at sites no. 1211 and no.
1219 (Final Bronze Age). IN SALVATORI, S. & TOSI, M. (Eds.) The Bronze Age and
Early Iron Age in the Margiana Lowlands: Facts and Methodological Proposals for a
Redefinition of the Research Strategies. Oxford, Archaeopress 119-133.
CATTANI, M., SALVATORI, S. & TOSI, M. (2008c) The final phase of the Bronze Age and
the "Andronovo Question" in Margiana. IN SALVATORI, S. & TOSI, M. (Eds.) The
Bronze Age and Early Iron Age in the Margiana Lowlands: Facts and Methodological
Proposals for a Redefinition of the Research Strategies. Oxford, Archaeopress 133-148.
CAZANACLI, D., PAOLA, C. & PARKER, G. (2002) Experimental steep, braided flow:
application to flooding risk on fans. Journal of hydraulic engineering (New York, N. Y.
Online), 128, 322-330.
CERASETTI, B. (2006) A 5000-Years history of settlement and irrigation in the Murghab Delta
(Turkmenistan): an attempt of reconstruction of ancient deltaic system. BAR
International Series, 1016, 21-28.
CERASETTI, B. & MAURI, M. (2002) The Murghab Delta palaeochannel reconstruction on the
basis of remote sensing from space. Space Applications for Heritage Conservation.
Strasbourg, France.
CERASETTI, B., SALVATORI, S. & TOSI, M. (2008a) Archaeological Map of the Murghab
Delta GIS System.
- 309 -
CERASETTI, B., SALVATORI, S. & TOSI, M. (2008b) A GIS for the archaeology of the
Murghab Delta. IN SALVATORI, S. & TOSI, M. (Eds.) The Bronze Age and Early Iron
Age in the Margiana Lowlands: Facts and Methodological Proposals for a Redefinition
of the Research Strategies. Oxford, Archaeopress 29-34.
CHERRY, J. (1986) Polities and Palaces: some problems in Minoan state formation. IN
RENFREW, C. & CHERRY, J. (Eds.) Peer polity interaction and socio-political change
(New Directions in Archaeology). Cambridge, Cambridge University Press 19-46.
CHILDE, V. G. (1950) The urban revolution. The Town Planning Review, 21, 3-17.
CLARK, P. J. & EVANS, F. C. (1957) Distance to nearest neighbor as a measure of spatial
relationships in populations. Ecology, 35, 445-453.
CLEUZIOU, S., GAIBOV, V. & ANNAEV, T. (1998) Off-site archaeological transects in N.
Margiana. IN GUBAEV, A., KOSHELENKO, G. & TOSI, M. (Eds.) The
Archaeological Map of the Murghab Delta: Preliminary Reports 1990-1995. Rome,
IsIAO 26-34.
CONOLLY, J. & LAKE, M. (2006) Geographical Information Systems in Archaeology,
Cambridge, UK, Cambridge University Press.
CONRAD, G. W. (1978) Models of compromise in settlement pattern studies: an example from
coastal Peru. World Archaeology, 9, 281-298.
COOLIDGE, J. W. (2005) Southern Turkmenistan in the Neolithic: a Petrographic Case Study,
Oxford, Oxford University Press.
CREMASCHI, M. (1998) Palaeohydrography and Middle Holocene desertification in the
northern fringe of the Murghab delta. IN GUBAEV, A., KOSHELENKO, G. & TOSI,
M. (Eds.) The Archaeological Map of the Murghab Delta: Preliminary Reports 1990-
1995. Rome, IsIAO 15-25.
CRUMLEY, C. (1979) Three locational models: an epistemological assessment for anthropology
and archaeology. Advances in Archaeological Method and Theory 2, 141-173
CURRAN, P. J. (1983) Multispectral remote sensing for the estimation of green leaf area index.
Philosophical transactions - Royal Society. Biological Sciences, 309, 257-270.
DECKERS, K. & RIEHL, S. (2007) Fluvial environmental contexts for archaeological sites in
the Upper Khabur basin (northeastern Syria) Quaternary Research, 67, 337-348.
DIAKONOFF, I. M., ILYIN, G. F., DIAKONOFF, I. M. & KOHL, P. (1991) The First States in
India, and the Pre-Urban Cultures of Central Asia and Iran. Early Antiquity. Chicago,
University of Chicago Press.
DOLUKHANOV, P. M. (1981) The ecological prerequisites for early farming in Southern
Turkmenia. The Bronze Age Civilization of Central Asia. Armonk, NY, M.E. Sharpe.
DUBOVA, M. A. (2006) Qui vivait … Gonur Depe? Dossiers d'Archeologie. 40-45.
- 310 -
DUNNELL, R. C. (1992) The notion site. IN ROSSIGNOL, J. & WANDSNIDER, L. (Eds.)
Space, Time and Archaeological Landscapes. New York, Plenum Press.
DUNNELL, R. C. & DANCEY, W. S. (1983) The siteless survey: a regional scale data
collection strategy. Advances in Archaeological Method and Theory, 6, 267-287.
DUNNELL, R. C. & STEIN, J. K. (1989) Theoretical issues in the interpretation of
microartifacts. Geoarchaeology, 4, 31-42.
EBERT, J. I. (1992) Distributional Archaeology, University of New Mexico Press.
EHLERS, E. (1971) Klimageschichte und Siedlungsgang in vorund frühgeschichtlicher Zeit in
der Turkmenensteppe Nordpersiens. Archäologische Mitteilungen aus Iran, 4, 7-19.
FARMER, S., SPROAT, R. & WITZEL, M. (2004) The collapse of the Indus-script thesis: the
myth of a literate Harappan civilisation. Electronic Journal of Vedic Studies. 19-57.
FARRINGTON, I. S. (1980) The archaeology of irrigation canals, with special reference to Peru.
World Archaeology, 11, 287-305.
FENTRESS, E., FRANCOVICH, R. & PATTERSON, H. (2000) What are we counting for?
Extracting Meaning from Ploughsoil Assemblages. Oxford, Oxbow Books 44-52.
FISHER, P. (2004) Where is Helvellyn? Fuzziness of multi-scale landscape morphometry.
Transactions of the Institute of British Geographers, 29, 106-128.
FISHER, P. (2005) Fuzziness and ambiguity in multi-scale analysis of landscape morphometry
Fuzzy Modeling with Spatial Information for Geographic Problems. 209-232.
FISHER, P., CHENG, T. & WOOD, J. (2007) Higher order vagueness in geographical
information: Empirical geographical population of Type n fuzzy sets. GeoInformatica,
11, 311-330.
FLESKINS, L., ATAEV, A., MAMEDOV, B. & SPAAN, W. P. (2007) Desert water harvesting
from takyr surfaces: assessing the potential of traditional and experimental technologies
in the Karakum. Land Degradation & Development, 18, 17-39.
FOXHALL, L. (2000) The running sands of time: archaeology and the short-term. World
Archaeology, 31, 484-498.
FRANCOVICH, R. (2000) Extracting Meaning from Ploughsoil Assemblages, Oxford, Oxbow
Books.
FRANK, A. G. (1992) The centrality of Central Asia. Studies in History, 8, 43.
GALLANT, T. W. (1986) "Background noise" and site definition: a contribution to survey
methodology Journal of Field Archaeology, 13, 403-418.
GENITO, B. (1998) The Achaemenids in the history of Central Asia. IN GUBAEV, A.,
KOSHELENKO, G. & TOSI, M. (Eds.) The Archaeological Map of the Murghab Delta:
Preliminary Reports 1990-1995. Rome, IsIAO 149-158.
- 311 -
GERASIMOV, I. P. & BRICE, W. C. (1978) Ancient rivers in the deserts of Soviet Central
Asia. The Environmental History of the Near and Middle East Since the Last Ice Age.
New York, Academic Press 319-334.
GETIS, A. (1984) Interaction modeling using second-order analysis. Environment and Planning,
16, 173-183.
GETIS, A. & ORD, J. (1992) The analysis of spatial association by use of distance statistics.
Geographical Analysis, 24, 189-206.
GLASSOW, M. (1985) The significance of small sites to California archaeology. Journal of
California and Great Basin Anthropology, 7, 58-66.
GOLDBERG, P. & MACPHAIL, R. (2006) Practical and Theoretical Geoarchaeology,
Malden, Massachusetts, Blackwell.
GONZALES, C. K. & GERGEL, S. (2007) Testing assumptions of cost surface analysis--a tool
for invasive species management. Landscape Ecology, 22, 1155-1168.
GOODCHILD, M. (1992) Integrating GIS and spatial data analysis: problems and possibilities.
International Journal of Geographical Information Science, 6, 407-423.
GOOVAERTS, P. (2009) AUTO-IK: A 2D indicator kriging program for the automated non-
parametric modeling of local uncertainty in earth sciences. sComputers and
Geosciences, 35, 1255-1270.
GRINGARTEN, E. (2001) Teacher's aide variogram interpretation and modeling. Mathematical
Geology, 33, 507-534.
HAKEMI, A. & SAJJEDI, M. (1988) Shahdad excavations in the context of the oasis
civilisation. IN LIGABUE, G. & SALVATORI, S. (Eds.) Bactria: An Ancient Oasis
Civilisation From the Sands of Afghanistan. Rome, Centro di Studi Ligabue 141-152.
HAMANDAWANA, H., ECKARDT, F. & RINGROSE, S. (2007) Proposed methodology for
georeferencing and mosaicking Corona photographs. International Journal of Remote
Sensing, 28, 5-22.
HAMER, F. & HAMER, J. (1975) The Potter's Dictionary of Materials and Techniques,
London, A.C. Black.
HARRIS, D. & GOSDEN, C. (1996) The Origins and Spread of Agriculture and Pastoralism in
Eurasia, Oxon, UCL Press.
HERRMANN, G. (1994) The International Merv Project Preliminary Report on the Second
Season (1993). Iran, 32, 53-75.
HIEBERT, F. (2002) The Kopet Dag sequence of early villages in Central Asia. Paléorient, 28,
25-41.
HIEBERT, F. T. (1994a) Origins of the Bronze Age Oasis Civilization in Central Asia,
Cambridge, Massachusetts, Peabody Museum of Archaeology and Anthropology.

- 312 -
HIEBERT, F. T. (1994b) Production evidence for the origins of the Oxus Civilization. Antiquity,
68, 372-387.
HIEBERT, F. T., BOYLE, K., RENFREW, C. & LEVINE, M. (2002) Bronze Age interaction
between the Eurasian Steppe and Central Asia. Ancient Interactions: East and West in
Eurasia. Cambridge, Cambridge University Press 237-248.
HOLDAWAY, S. & FANNING, P. (2008) Developing a landscape history as part of a survey
strategy: a critique of current settlement system approaches based on case studies from
western New South Wales, Australia. Journal of Archaeological Method and Theory,
15, 167-189.
HUS, J., ECH-CHAKROUNI, S., JORDANOVA, D. & GEERAERTS1, R. (2003)
Archaeomagnetic investigation of two mediaeval brick constructions in north Belgium
and the magnetic anisotropy of bricks. Geoarchaeology, 18, 225-253.
ISAKSEN, L., MARTINEZ, K., GIBBINS, N., EARL, G. & KEAY, S. (2009) Linking
archaeological data. Computer Applications and Quantitative Methods in Archaeology
conference. March 2009. Williamsburg, Va.
JACOBSEN, T. (1960) The waters of Ur. Iraq, 22, 174-185.
JELINSKI, C. E. (1996) The modifiable areal unit problem and implications for landscape
ecology. Landscape Ecology, 11, 129-140.
KANIUTH, K. (2007a) The metallurgy of the Late Bronze Age Sapalli culture (Southern
Uzbekistan) and its implications for the 'tin question'. Iranica Antiqua, XLII, 23-40.
KANIUTH, K. (2007b) Preliminary report on the first campaign. Archäologische Mitteilungen
aus Iran, 39, 31-47.
KANTNER, C. J. (2008) The archaeology of regions: from discrete analytical toolkit to
ubiquitous spatial perspective. Journal of Archaeological Research, 16, 37-81.
KARATHANASSI, V. (2007) A comparison study on fusion methods using evaluation
indicators. International Journal of Remote Sensing, 28, 2309-2341.
KASTENS, C. H. (2005) Image masking for crop yield forecasting using AVHRR NDVI time
series imagery. Remote Sensing of Environment, 99, 341-356.
KEATINGE, R. W. (1975) Urban settlement systems and rural sustaining communities: an
example from Chan Chan's hinterland. Journal of Field Archaeology, 2, 215-227.
KIRCHO, L. (2004). Middle Bronze softstone from Altyn-Depe in southwest Central Asia.
Softstone in Arabia and Iran, 2009.
KOHL, P. (1984) Central Asia Palaeolithic Beginnings to the Iron Age: L'Asie Centrale Des
Origines l'Age Du Fer.
KOHL, P. (2002) Archaeological transformations: crossing the pastoral/agricultural bridge.
Iranica Antiqua, 37, 151-190.
- 313 -
KOHL, P. (2003) Afghanistan and the Bronze Age: limning an image dimly perceived. IN
BOPEARACHCHI, O. & BOUSSAC, M.-F. (Eds.) Afghanistan Ancien Carrefour entre
l'est et l'ouest. Brepols: Turnhout: Brussels, Belgium 65-80.
KOHL, P. (2007) The Making of Bronze Age Eurasia, Cambridge, Cambridge University Press.
KOSTYUCHENKO, V. P. & LISITSINA, G. N. (1973) Nekotorye osobennosti razvitiya
irrigatsionnogo zemledeliya v aridnoi zone. Zhurnal Problemy Osvoeniya Pustyn, 4.
KRAMER, C. (1982) Village Ethnoarchaeology: Rural Iran in Archaeological Perspective,
New York, Academic Press.
LAMBERG-KARLOVSKY, C. C. (1994) The Bronze Age khanates of Central Asia. Antiquity,
68, 398-405.
LAMBERG-KARLOVSKY, C. C. (2003) Civilization, state or tribes? Bactria and Margiana in
the Bronze Age. The Review of Archaeology, 24, 11-19.
LAMBERG-KARLOVSKY, C. C., LIGABUE, G. & SALVATORI, S. (1988) Bronze Age of
Bactria. Bactria: an ancient oasis civilization from the sands of Afghanistan.
LASAPONARA, R. (2006) On the potential of QuickBird data for archaeological prospection.
International Journal of Remote Sensing, 27, 3607-3614.
LASAPONARA, R. & MASINI, N. (2006) Identification of archaeological buried remains
based on the normalized difference vegetation index (NDVI) from Quickbird satellite
data. Geoscience and Remote Sensing Letters, IEEE, 3, 325-328.
LAURENZA, S., PUTZOLU, C., FARINETTI, E. & FORTE, M. (2005) Re-thinking landscape
archaeology and GIS analyses: a different way of dealing with archaeological
landscapes within GIS. The Reconstruction of Archaeological Landscapes through
Digital Technologies. Proceedings of the 2nd Italy-United States Workshop, Rome,
Italy, November 3-5, 2003, Berkeley, USA, May 2005. Oxford, Archaeopress.
LAVROV, A. P. & KOSTYUCHENKO, V. P. (1954) O genezise glinistykh prikustovykh bugrov
v Prialkhanskom raione, Isvestiya Akademii Nauk.
LAXTON, R. R. & CAVANAGH, W. G. (1995) The rank-size distribution and the history of
site structure from survey data. Journal of Quantitative Anthropology, 5, 327-258.
LEBEDEVA-VERBA, M. P. & GERASIMOVA, M. I. (2010) Micromorphology of takyrs and
the desert “papyrus” of Southwestern Turkmenia. Eurasian Soil Science, 43, 1220-1229.
LECOMTE, O. (2006) Ulug Depe: 4000 ans d'évolution entre plaine et désert. Dossiers
d'Archeologie, 317, 16-23.
LEIGH, D. S., GOLDBERG, P., HOLLIDAY, V. & FERRING, C. R. (2001) Buried artifacts in
sandy soils: techniques for evaluating pedoturbation versus sedimentation. Earth
Sciences and Archaeology. New York, Kluwer Academic/Plenum Press 269-295.
LIOUBIMITSEVA, E. (2003) Arid environments. IN SHAHGEDANOVA, M. (Ed.) The
Physical Geography of Northern Eurasia. Oxford, Oxford University Press.
- 314 -
LISITSINA, G. N. (1976) Arid soils—The source of archaeological information. Journal of
Archaeological Science, 3, 55-60.
LLOYD, C. D. (2004) Archaeology and geostatistics. Journal of Archaeological Science, 31,
151-165.
LONGLEY, P. & BATTY, M. (2003) Advanced spatial analysis:the CASA book of GIS,
Redlands, CA, ESRI.
LYAPIN, A. A. (1991) Paleogeographic features of the Murgab and Tedzhen deltas (eneolithic
period, stone age). Problemy Osvoeniya Pustyn (Problems in Desert Development), 2,
63-70.
MADSEN, H. (1992) Food selection by freshwater snails in the Gezira irrigation canals, Sudan.
Hydrobiologia, 228, 203-217.
MAMEDOV, M. (2003) Drevnii Arkhitektura Baktrii i Margiani, Ashkhabad.
MANTELLINI, S., RONDELLI, B. & STRIDE, S. (2008) Analytical approach for representing
the water landscape evolution in Samarkand Oasis (Uzbekistan). Computer Applications
in Archaeology. Budapest, CAA.
MARCOLONGO, B. & MOZZI, P. (1998) Outline of recent geological history of the Kopet-
Dagh mountains and the southern Kara-Kum. IN GUBAEV, A., KOSHELENKO, G. &
TOSI, M. (Eds.) The Archaeological Map of the Murghab Delta: Preliminary Reports
1990-1995. Rome, IsIAO 1-14.
MARFOE, L. (1979) The integrative transformation: Patterns of sociopolitical organization in
southern Syria. Bulletin of the American Schools of Oriental Research, 1-42.
MARINANGELI, L., ORI, G., ROSSI, A. & DI ACHILLE, G. (2004). Reconstruction of the
paleohydrology in desert areas using SAR and digital topography data. Envisat and ERS
Symposium, Salzburg, Austria.
MASIMOV, I. S. (1979) Izuchenie pamatnikov epokhi bronzi nizovii Murgaba. Sovetskaya
Arkheologiya, 111-131.
MASIMOV, I. S. (1980) Kelleli—novie oazis Epokhy Bronzy Nizovii Murgaba.
Arkheologicheskie Otkritya.
MASIMOV, I. S. & KOHL, P. (1981) The study of Bronze Age sites in the Lower Murghab.
The Bronze Age Civilization of Central Asia. New York, Sharpe 194-220.
MASSON, V. M. (1956) Pervobytno-obshenie stroi na territorii Turkmenii. Trudi Yutake, VII,
233-259.
MASSON, V. M. (1981) Urban centers of early class society. The Bronze Age Civilization of
Central Asia. New York, Sharpe 96-106.
MASSON, V. M. (1988) Altyn Depe. Hoboken, NJ, John Wiley and Sons.
- 315 -
MASSON, V. M. (1999) The decline of the Bronze Age civilization and movements of the
tribes. IN DANI, H. (Ed.) History of civilizations of Central Asia. 337-356.
MASSON, V. M. & SARIANIDI, V. S. (1972) Central Asia: Turkmenia before the
Achaemenids, Thames & Hudson.
MATTHEWS, R. (2003) The Archaeology of Mesopotamia: Theories and Approaches, London,
Routledge.
MATTHEWS, R. & GLATZ, C. (2009) At Empire's Edge: Project Paphlagonia Regional
Survey in North-Central Turkey, Oxford, Oxbow Books.
MATTINGLY, D., FRANCOVICH, R. & PATTERSON, H. (2000) Methods of collection,
recording and quantification. Extracting Meaning from Ploughsoil Assemblages.
Oxford, Oxbow Books 5-15.
MCCARTHY, C. M. (2003) Flooding patterns of the okavango wetland in Botswana between
1972 and 2000. Ambio, 32, 453-467.
MCGUIRE, C. H. (1997) A Marxist Archaeology, Clinton Corners, New York, Percheron Press.
MEHRER, M. W. (2006) GIS And Archaeological Site Location Modeling, Boca Raton, Taylor
& Francis.
MENZE, B. H., SHERRATT, A. & UR, J. (2005). Tell spotting-surveying Near Eastern
settlement mounds from space. CIPA 2005 XX International Symposium, Torino, Italy,
2005, CIPA 2005 XX International Symposium.
MENZE, B. H. & UR, J. (2007) Classification of multispectral ASTER imagery in
archaeological settlement survey in the Near East. International Archives of
Photogrammetry, Remote Sensing and Spatial Information Sciences, XXXVI, 244-249.
MILLER, N. F. (1999) Agricultural development in western Central Asia in the Chalcolithic and
Bronze Ages. Vegetation History and Archaeobotany, 8, 13-19.
MOORE, K. M. (1993) Animal use at Bronze Age Gonur Depe. IASCCA Information Bulletin,
19.
MOORE, K. M., MILLER, N., HIEBERT, F. & MEADOW, R. (1994) Agriculture and herding
in the early oasis settlements of the Oxus civilization. Antiquity, 68, 418-427.
MOROZOVA, G. (2005) A review of Holocene avulsions of the Tigris and Euphrates rivers and
possible effects on the evolution of civilizations in lower Mesopotamia.
Geoarchaeology, 20, 401-423.
NANCE, J. D. & BALL, B. F. (1986) No surprises? The reliability and validity of test pit
sampling. American Aantiquity, 51, 457-483.
NAROLL, R. (1962) Floor area and settlement population. American Antiquity, 27, 587-589.
OATES, J., MCMAHON, A., KARSGAARD, P., AL QUNTAR, S. & UR, J. (2007) Early
Mesopotamian urbanism: a new view from the north. Antiquity, 81, 585-600.
- 316 -
OPENSHAW, S. & TAYLOR, P. J. (1981) The modifiable aerial unit problem. IN WRIGLEY,
N. & BENNETT, R. J. (Eds.) Quantitative Geography: A British View. London,
Routledge 60-70.
ORLOVSKY, L., DOURIKOV, M. & BABAEV, A. G. (2004) Temporal dynamics and
productivity of biogenic soil crusts in the central Karakum Desert, Turkmenistan.
Journal of Arid Environments, 56, 579-601.
ORLOVSKY, L. & ORLOVSKY, N. (2002) Dust in the wind. OE Magazine.
ORTON, C. (2004) Point pattern analysis revisited. Archeologia e Calcolatori, XV, 299-315.
ORTON, C., TYERS, P. & VINCE, A. G. (1993) Pottery in Archaeology, Cambridge,
Cambridge University Press.
P'YANKOVA, L. (1993) Pottery of Bactria and Margiana in the Bronze Age. IASCCA
Information Bulletin, 19, 109-127.
P'YANKOVA, L. (1994) Central Asia in the Bronze Age: sedentary and nomadic cultures.
Antiquity, 68, 355-372.
PADWA, M. (2005) Archaeological GIS and oasis geography in the Tarim Basin. Silk Road
Foundation Newsletter.
PARCAK, S. H. (2009) Satellite Remote Sensing for Archaeology, New York, Routledge.
PARPOLA, A. (1986) The Indus script: a challenging puzzle. World Archaeology, 17, 399-419.
PARR, P. J. (2003) Synopsis. IN P.J., P. (Ed.) Excavations at Arjoune, Syria. BAR International
1-3.
PARSONS, C. R. (1972) Archaeological settlement patterns. Annual Review of Anthropology, 1,
127-150.
PELTENBURG, E. (2007). Diverse settlement pattern changes in the Middle Euphrates Valley
in the later third millennium B.C.: the contribution of Jarablus Tahtani. Sociétés
Humaines et Changement Climatique â la fin du Troisième Millénaire: une Crise a-t-
elle eu lieu en Haute Mésopotamie?, Actes de colloques du Lyon, 5-8 décembre 2005,
Varia Anatolica 19, 247-266.
PHILIP, G. (2002) CORONA satellite photography: an archaeological application from the
Middle East. Antiquity, 76, 109-118.
PHILIP, G. (2010) Settlement intensity and attenuation in the Bronze Age Northern Levant.
Unpublished conference paper. ICAANE. London.
PLOG, S., PLOG, F. & WAIT, W. (1978) Decision making in modern surveys. Advances in
Archaeological Method and Theory, 1, 383-421.
POSSEHL, G. L. (1997) The transformation of the Indus civilization. Journal of World
Prehistory, 11, 425-472.

- 317 -
PREMO, L. S. (2004) Local spatial autocorrelation statistics quantify multi-scale patterns in
distributional data: an example from the Maya Lowlands. Journal of Archaeological
Science, 31, 855-866.
PUMPELLY, R. (1908) Explorations in Turkestan, Expedition of 1904, Washington, DC,
Carnegie Institution of Washington.
PUSCHNIGG, G. (2006) Ceramics of the Merv Oasis: Recycling the City, Walnut Creek,
California, Left Coast Press.
REDMAN, C. L. (1982) Archaeological survey and the study of Mesopotamian urban systems.
Journal of Field Archaeology, 9, 375-382.
REICHENBACH, S. E., KOEHLER, D. & STRELOW, D. (1995) Restoration and
reconstruction of AVHRR images. IEEE Transactions on Geoscience and Remote
Sensing, 33, 997-1007.
RENFREW, C. (1986) Introduction: Peer polity interaction and socio-political change. IN
RENFREW, C. & CHERRY, J. (Eds.) Peer polity interaction and socio-political change
(New Directions in Archaeology). Cambridge, Cambridge University Press 1-18.
RENFREW, C. (2006). Margiana and beyond. Ancient Margiana - New Center of World
Civilization, Mary, Turkmenistan, 2006, 129-131.
RICK, T. C. (2002) Eolian processes, ground cover, and the archaeology of coastal dunes: a
taphonomic case study from San Miguel Island, California, U.S.A. Geoarchaeology, 17,
811-833.
RIPLEY, B. D. (1977) Modelling spatial patterns. Journal of the Royal Statistical Society, 39,
172-212.
ROSEN, A. (1986) Cities of Clay: the Geoarchaeology of Tells, Chicago, University of Chicago
Press.
ROSEN, A. M. (2007) Civilizing Climate: Social Responses to Climate Change in the Ancient
Near East, Lanham, AltaMira Press.
ROSENBERG, M. (2004) Wavelet analysis for detecting anisotropy in point patterns. Journal of
Vegetation Science, 15, 277-284.
ROSSI-OSMIDA, G. (2002a) Considerations on the Necropolis at Gonur-Depe. Margiana
Gonur-depe Necropolis. Padova, Ligabue Study and Research Centre 69-117.
ROSSI-OSMIDA, G. (2002b) The palace and necropolis of Gonur. Margiana Gonur-depe
Necropolis. Padova, Ligabue Study and Research Centre 17-49.
ROSSI-OSMIDA, G. (2004) Preliminary report on research carried out in the Oasis of Adji Kui
2004. Central Asia Cultural Values, 3, 17-30.
ROSSI-OSMIDA, G. (2007) Citadella de la Statuette, Richere de la Etudi Ligabue.

- 318 -
ROWTON (1967) Watercourses and water rights in the official correspondence from Larsa and
Isin Journal of Cuneiform Studies, 21, 267-274.
RUGER, N., SCHLUTER, M. & MATTHIES, M. (2005) A fuzzy habitat suitability index for
Populus euphratica in the Northern Amudarya delta (Uzbekistan). Ecological Modelling,
184, 313-328.
SALA, R. (2007) Historical survey of irrigation practices in West Central Asia. Almaty
Academy of Geoarchaeology.
SALVATORI, S. (1995) Gonur-depe 1 (Margiana, Turkmenistan): the Middle Bronze Age
graveyard. Preliminary Report on the 1994 excavation campaign. Rivista di
Archaeologia, 19, 5-37.
SALVATORI, S. (1998a) The Bronze Age in Margiana. IN GUBAEV, A., KOSHELENKO, G.
& TOSI, M. (Eds.) The Archaeological Map of the Murghab Delta: Preliminary Reports
1990-1995. Rome, IsIAO 47-56.
SALVATORI, S. (1998b) Margiana Archaeological Map: The Bronze Age settlement pattern.
IN GUBAEV, A., KOSHELENKO, G. & TOSI, M. (Eds.) The Archaeological Map of
the Murghab Delta: Preliminary Reports 1990-1995. Rome, IsIAO 57-66.
SALVATORI, S. (2002) The project for the Archaeological Map of the Murghab Delta
(Turkmenistan): Stratigraphic trial trenches at Adzhi Kui 1 and 9. Ancient Civilizations
from Scythia to Siberia, 8, 107-178.
SALVATORI, S. (2007) About excavations at a Bronze Age site in Margiana (Turkmenistan).
Rivista di Archaeologia, 31, 10-28.
SALVATORI, S. (2008a) Cultural variability in the Bronze Age Oxus Civilisation and its
relations with the surrounding regions of Central Asia and Iran. IN SALVATORI, S. &
TOSI, M. (Eds.) The Bronze Age and Early Iron Age in the Margiana Lowlands: Facts
and Methodological Proposals for a Redefinition of the Research Strategies. Oxford,
Archaeopress 75-98.
SALVATORI, S. (2008b) The Margiana settlement pattern from the Middle Bronze Age to the
Parthian-Sasanian: a contribution to the study of complexity. IN SALVATORI, S. &
TOSI, M. (Eds.) The Bronze Age and Early Iron Age in the Margiana Lowlands: Facts
and Methodological Proposals for a Redefinition of the Research Strategies. Oxford,
Archaeopress 57-74.
SARIANIDI, V. (1977) Drevnie Zemledel'tsi Afghanistana, Moscow, Nauk.
SARIANIDI, V. (1990) Drevnosti Strani Margush, Ashkhabad.
SARIANIDI, V. (1994) Temples of Bronze Age Margiana: traditions of ritual architecture
Antiquity, 68, 388-397.
SARIANIDI, V. (2002a) The fortification and palace of northern Gonur. Iran, 40, 75-87.
SARIANIDI, V. (2002b) Margus, Ashgabat, Turkmendowlethabarlary.

- 319 -
SARIANIDI, V. (2005) Gonurdepe, Ashgabat, MIRAS.
SARIANIDI, V. & KOHL, P. (1979) On early trade. Current anthropology, 20, 165-167.
SARIANIDI, V. S. & KOHL, P. (1981) Margiana in the Bronze Age. The Bronze Age
Civilization of Central Asia. New York, Sharpe 165-193.
SCHWARTZ, G. & FALCONER, S. (1994) Rural approaches to social complexity.
Archaeological Views From the Countryside. Washington and London, Smithsonian
Institution Press 1-9.
SEPEHRY, A. (2004). Application limit of Landsat ETM images to detect Saxaul plant
community in desert ecosystems Proceedings of SPIE, 2004, 268.
SHENNAN, S. (1985) Experiments in the Collection and Analysis of Archaeological Survey
Data: The East Hampshire Survey.
SHENNAN, S. (1997) Quantifying Archaeology, Edinburgh, Edinburgh University Press.
SHERRATT, A. (1980) Water, soil and seasonality in early cereal cultivation. World
Archaeology, 11, 313-330.
SHERRATT, A. (1983) The secondary exploitation of animals in the Old World. World
Archaeology, 15, 90-104.
SHI, Z. (2007) Modeling of cotton yields in the Amu Darya river floodplains of Uzbekistan
integrating multitemporal remote sensing and minimum field data. American Society of
Agronomy, 99, 1317-1326.
SINOR, D. (1990) The Cambridge History of Early Inner Asia, Cambridge, Cambridge
University Press.
STANISTREET, J. G. (1993) The Okavango fan and the classification of subaerial fan systems.
Sedimentary Geology, 85, 115-133.
STAUBWASSER, M., SIROCKO, F., GROOTES, P. M. & SEGL, M. (2003) Geophysical
Research Letters, 30, 7.1-7.4.
STEIN, A. (1921) Serindia: Detailed Report of Explorations in Central Asia and Westernmost
China, Oxford, Clarendon Press.
STEIN, A. (1925) Innermost Asia: its geography as a factor in history. The Geographical
Journal, 65, 377-403.
STEIN, G. (1999) Rethinking World-Systems: Diasporas, Colonies, and Interaction in Uruk
Mesopotamia, Tucson, University of Arizona Press.
STEIN, G. (2001) Understanding state societies in the Old World. IN FEINMAN, G. M. &
PRICE, T. D. (Eds.) Archaeology at the Millennium--a Sourcebook. New York, Klewer.
- 320 -
STEIN, G. & WATTENMAKER, P. (1990) The 1987 Tell Leilan regional survey: preliminary
report. IN MILLER, N. (Ed.) Economy and Settlement in the Near East: Analyses of
Ancient Sites and Materials. Warminister, PA, Neibauer Press 9-18.
STRIDE, S., RONDELLI, B. & MANTELLINI, S. (2009) Canals versus horses: political power
in the oasis of Samarkand. World Archaeology, 41, 73-87.
SUENSON-TAYLOR, K. (1999) Data in conservation: The missing link in the process. Studies
in Conservation, 44, 184-194.
SUSLOV, S. P. (1961) Physical Geograpy of Asiatic Russia, San Francisco and London, W.H.
Freeman and Company.
TALMAGE, V. & CHESLER, O. (1977) The Importance of Small, Surface and Disturbed Sites
as Sources of Significant Archaeological Data, Office of Archaeology and Historic
Preservation, National Park Service.
TAMBURRINO, A. (2010) Water technology in ancient Mesopotamia. IN MAYS, W. (Ed.)
Ancient Water Technologies. New York, Springer 28-49.
TAYLOR, J., FRANCOVICH, R. & PATTERSON, H. (2000) Cultural depositional processes
and post-depositional problems. Extracting Meaning from Ploughsoil Assemblages.
Oxford, Oxbow Books 16-28.
THEVS, N. (2007) Ecology, Spatial Structure, Distribution and Utilization of the Tugai
Vegetation at the Middle Reaches of the Tarim River, Xinjiang, China, Göttingen,
Cuvellier.
TOBLER, C. R. (1970) A computer movie simulating urban growth in the Detroit region.
Economic Geography, 46, 234-240.
TOLSTOV, S. P. (1948) Drevnii Khorezma. Opyt Istoriko-Arkheologicheskogo Issledovaniya,
Moscow.
TRIGGER, B. G. (2006) A History of Archaeological Thought, Cambridge, Cambridge
University Press.
TSVETSINSKAYA, E., VAINBERG, B. & GLUSHKO, E. (2002) An integrated assessment of
landscape evolution, long-term climate variability, and land use in the Amudarya
Prisarykamysh delta. Journal of Arid Environments, 51, 363-381.
UDEUMURADOV, B. (1993) Altyn-Depe i Margiana, Ashgabat, Ylym.
UDEUMURADOV, B. & ROSSI-OSMIDA, G. (2002) Ceramic material from Gonur-Depe
necropolis. Margiana Gonur-depe Necropolis. Padova, Ligabue Study and Research
Centre 133-144.
UR, J. (2003) CORONA Satellite photography and ancient road networks: a northern
Mesopotamian case study. Antiquity, 77, 102-115.

- 321 -
UR, J., MENZE, B. H. & SHERRATT, A. (2006) Detection of ancient settlement mounds -
archaeological survey based on the SRTM terrain model. Photogrammetric Engineering
and Remote Sensing, 72, 321-327.
VAN LEUSEN, P. M. (2002) Pattern to process: methodological investigations into the
formation and interpretation of spatial patterns in archaeological landscapes. University
of Groningen, PhD Thesis, Groningen.
VENABLES, W. N. & RIPLEY, B. D. (2002) Modern Applied Statistics with S, New York,
Springer.
VIDALE, M., BIANCHETTI, P. & CATTANI, M. (1998) A semi-precious stone-working area
dating to the Late Iron Age on the surface of Takhirbai-depe. IN GUBAEV, A.,
KOSHELENKO, G. & TOSI, M. (Eds.) The Archaeological Map of the Murghab Delta:
Preliminary Reports 1990-1995. Rome, IsIAO 105-114.
VITA FINZI, C. & HIGGS, E. S. (1970) Prehistoric economy in the Mount Carmel area of
Palestine: Site catchment analysis. Proceedings of the Prehistoric Society, 1-37.
VOGT (1956) An appraisal of prehistoric settlement patterns in the New World.
WALKER, R. S., NOVARO, A. J. & BRANCH, L. C. (2007) Functional connectivity defined
through cost-distance and genetic analyses: a case study for the rock-dwelling mountain
vizcacha (Lagidium viscacia) in Patagonia, Argentina. Landscape Ecology, 22, 1303-
1314.
WALLERSTEIN, I. (1974) Origins of the Modern World System, New York, Academic Press.
WANG, L., SOUSA, W. P., GONG, P. & BIGING, G. (2004) Comparison of IKONOS and
QuickBird images for mapping mangrove species on the Caribbean coast of Panama.
Remote Sensing of Environment, 91, 432-440.
WEISS, H. (1993) The genesis and collapse of third millennium north Mesopotamian
civilization. Science, 261, 995-1004.
WELLS, L., GOLDBERG, P., HOLLIDAY, V. & FERRING, C. R. (2001) A geomorphological
approach to reconstructing archaeological settlement patterns based on surficial artifact
distribution: Replacing humans on the landscape. Earth Sciences and Archaeology. New
York, Kluwer Academic/Plenum Publishers 107-141.
WIEGAND, T. (2006) Extending point pattern analysis for objects of finite size and irregular
shape. Journal of Ecology, 94, 825-837.
WILKINSON, T. J. (1982) The definition of ancient manured zones by means of extensive
sherd-sampling techniques. Journal of Field Archaeology, 9, 323-333.
WILKINSON, T. J. (1993) Linear hollows in the Jazira: Upper Mesopotamia. Antiquity, 67,
548-562.
WILKINSON, T. J. (1994) The structure and dynamics of dry-farming states in Upper
Mesopotamia [and comments and reply]. Current Anthropology, 35, 483-520.
- 322 -
WILKINSON, T. J. (2000) Regional approaches to Mesopotamian archaeology: the contribution
of archaeological surveys. Journal of Archaeological Research, 8, 219-267.
WILKINSON, T. J. (2003a) Archaeological Landscapes of the Near East, Tucson, University of
Arizona Press.
WILKINSON, T. J. (2003b) Archaeological survey and long-term population trends in Upper
Mesopotamia and Iran. IN MILLER, N. & ABDI, K. (Eds.) Yeki Bud, Yeki Nabud:
Essays on the Archaeology of Iran in honor of William M. Sumner. Los Angeles, Cotsen
Institute of Archaeology in association with the American Institute of Iranian Studies
and the Unversity of Pennsylvania Museum of Archaeology and Anthropology 39-52.
WILKINSON, T. J., CASANA, J. & K.A.YENER (2005) Settlement and landscapes in the
Amuq region. The Amuq Valley Regional Survey Projects, Vol. 1: Surveys in the Plain
of Antioch and Orontes Delta, Turkey, 1995-2002.
WILKINSON, T. J., CHRISTIAN, J., UR, J., ALTAWEEL, M. & WIDELL, M. (2007)
Urbanization within a Dynamic Environment: Modeling Bronze Age Communities in
Upper Mesopotamia. American anthropologist, 109, 52-68.
WILKINSON, T. J., MILLER, N., REICHEL, C. & WHITCOMB, D. (2004) On the Margin of
the Euphrates: Settlement and Land Use at Tell Es-Sweyhat and in the Upper Lake
Assad Area, Syria, Chicago, Oriental Institute, University of Chicago.
WILKINSON, T. J. & TUCKER, D. J. (1995) Settlement Development in the North Jazira, Iraq.
A study of the Archaeological Landscape, Warminster, Aris Phillips.
WILLEY, G. (1989) Settlement pattern studies and evidence for intensive agriculture in the
Maya lowlands. IN LAMBERG-KARLOVSKY, C. C. (Ed.) Archaeological Thought in
America. Cambridge, Cambridge University Press 167-182.
WITTFOGEL, K. A. (1957) Oriental Despotism, New Haven, Yale University Press.
WRIGHT, J. (2008) Non-graphic information systems and diachronic transformations in
Margiana. IN SALVATORI, S. & TOSI, M. (Eds.) The Bronze Age and Early Iron Age
in the Margiana Lowlands: Facts and Methodological Proposals for a Redefinition of
the Research Strategies. Oxford, Archaeopress.
YENER, A., EDENS, C., HARRISON, T., VERSTRAETE, V. & WILKINSON, T. J. (2000)
The Amuq Valley Regional Project, 1995-1998. American Journal of Archaeology, 204,
163-220.
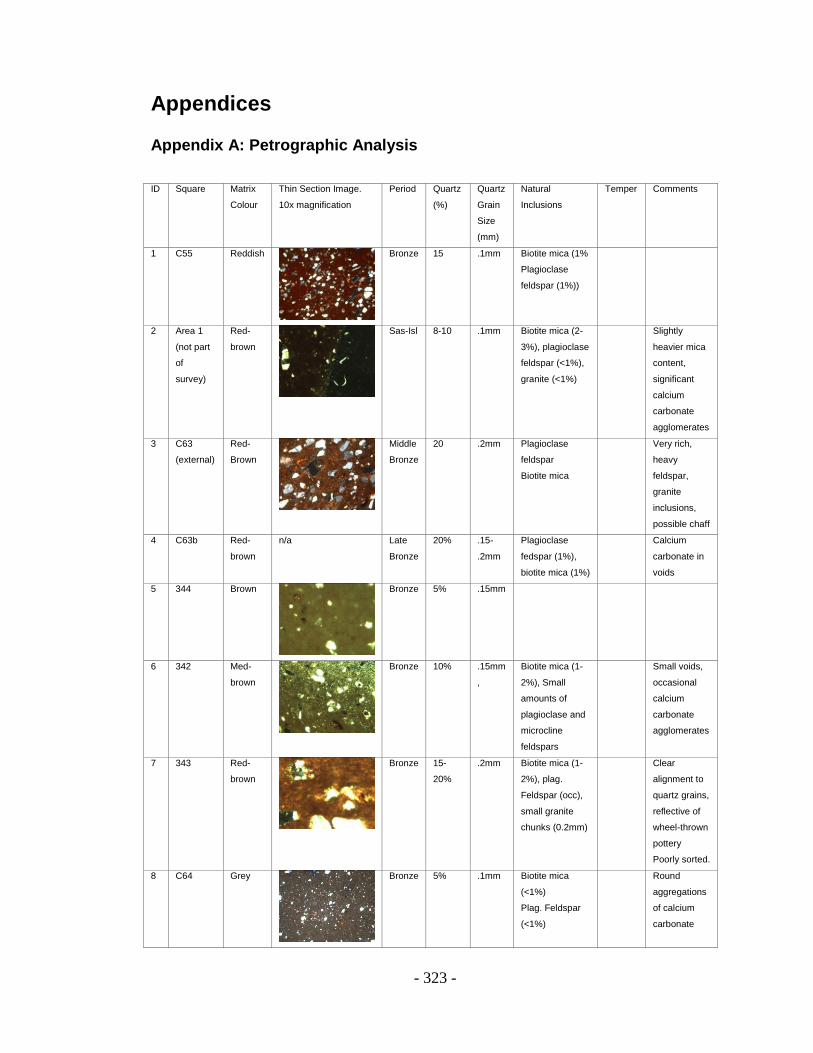
- 323 -
Appendices
Appendix A: Petrographic Analysis
ID Square Matrix
Colour
Thin Section Image.
10x magnification
Period Quartz
(%)
Quartz
Grain
Size
(mm)
Natural
Inclusions
Temper Comments
1 C55 Reddish
Bronze 15 .1mm Biotite mica (1%
Plagioclase
feldspar (1%))
2 Area 1
(not part
of
survey)
Red-
brown
Sas-Isl 8-10 .1mm Biotite mica (2-
3%), plagioclase
feldspar (<1%),
granite (<1%)
Slightly
heavier mica
content,
significant
calcium
carbonate
agglomerates
3 C63
(external)
Red-
Brown
Middle
Bronze
20 .2mm Plagioclase
feldspar
Biotite mica
Very rich,
heavy
feldspar,
granite
inclusions,
possible chaff
4 C63b Red-
brown
n/a Late
Bronze
20% .15-
.2mm
Plagioclase
fedspar (1%),
biotite mica (1%)
Calcium
carbonate in
voids
5 344 Brown
Bronze 5% .15mm
6 342 Med-
brown
Bronze 10% .15mm
,
Biotite mica (1-
2%), Small
amounts of
plagioclase and
microcline
feldspars
Small voids,
occasional
calcium
carbonate
agglomerates
7 343 Red-
brown
Bronze 15-
20%
.2mm Biotite mica (1-
2%), plag.
Feldspar (occ),
small granite
chunks (0.2mm)
Clear
alignment to
quartz grains,
reflective of
wheel-thrown
pottery
Poorly sorted.
8 C64 Grey
Bronze 5% .1mm Biotite mica
(<1%)
Plag. Feldspar
(<1%)
Round
aggregations
of calcium
carbonate
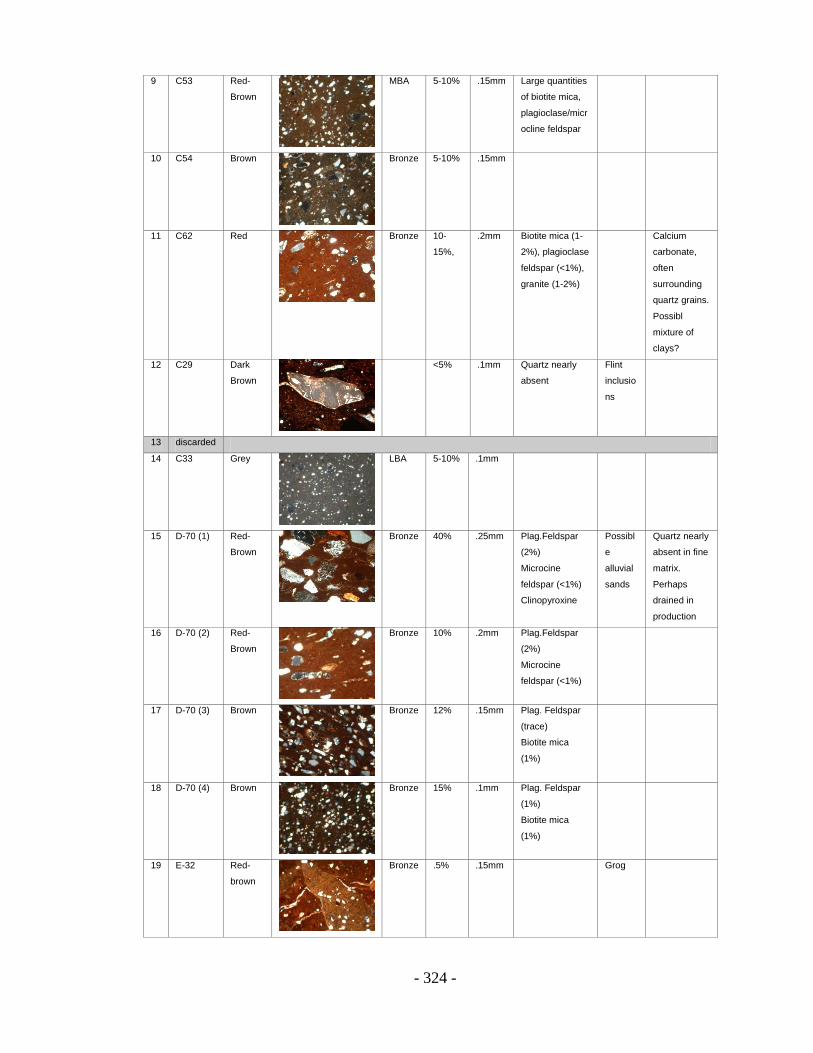
- 324 -
9 C53 Red-
Brown
MBA 5-10% .15mm Large quantities
of biotite mica,
plagioclase/micr
ocline feldspar
10 C54 Brown
Bronze 5-10% .15mm
11 C62 Red
Bronze 10-
15%,
.2mm Biotite mica (1-
2%), plagioclase
feldspar (<1%),
granite (1-2%)
Calcium
carbonate,
often
surrounding
quartz grains.
Possibl
mixture of
clays?
12 C29 Dark
Brown
<5% .1mm Quartz nearly
absent
Flint
inclusio
ns
13 discarded
14 C33 Grey
LBA 5-10% .1mm
15 D-70 (1) Red-
Brown
Bronze 40% .25mm Plag.Feldspar
(2%)
Microcine
feldspar (<1%)
Clinopyroxine
Possibl
e
alluvial
sands
Quartz nearly
absent in fine
matrix.
Perhaps
drained in
production
16 D-70 (2) Red-
Brown
Bronze 10% .2mm Plag.Feldspar
(2%)
Microcine
feldspar (<1%)
17 D-70 (3) Brown
Bronze 12% .15mm Plag. Feldspar
(trace)
Biotite mica
(1%)
18 D-70 (4) Brown
Bronze 15% .1mm Plag. Feldspar
(1%)
Biotite mica
(1%)
19 E-32 Red-
brown
Bronze .5% .15mm Grog
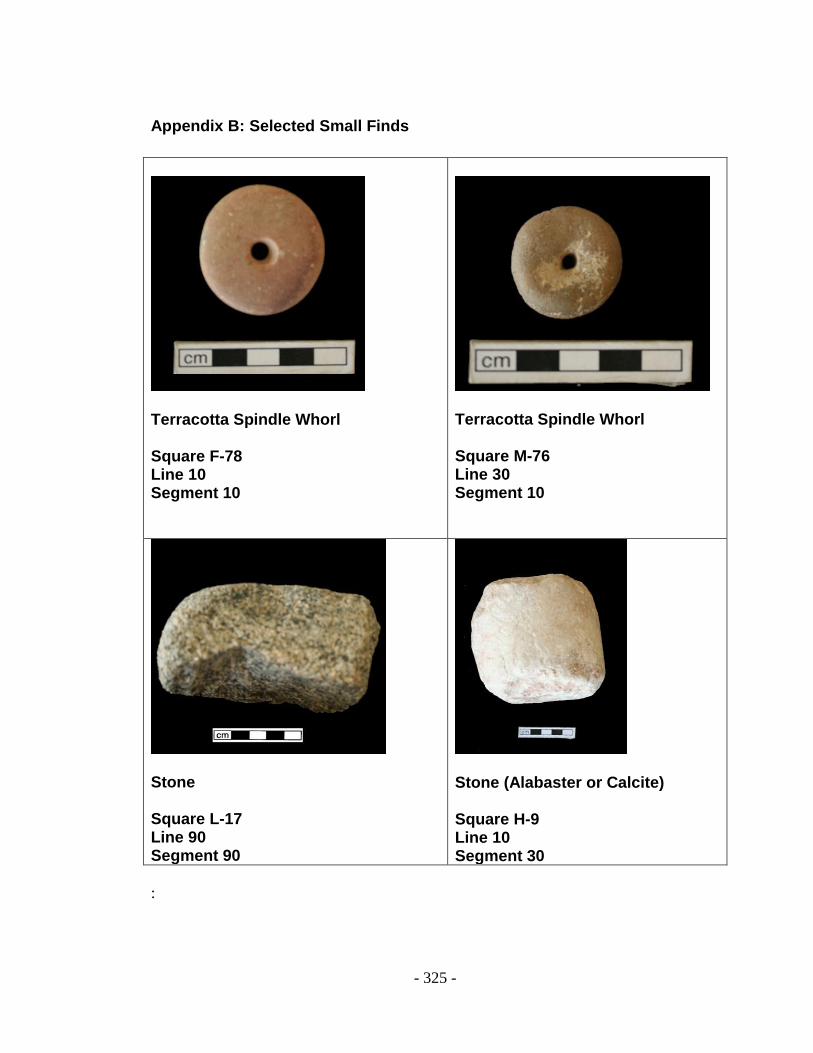
- 325 -
Appendix B: Selected Small Finds
Terracotta Spindle Whorl Square F-78 Line 10 Segment 10
Terracotta Spindle Whorl Square M-76 Line 30 Segment 10
Stone Square L-17 Line 90 Segment 90
Stone (Alabaster or Calcite) Square H-9 Line 10 Segment 30
:
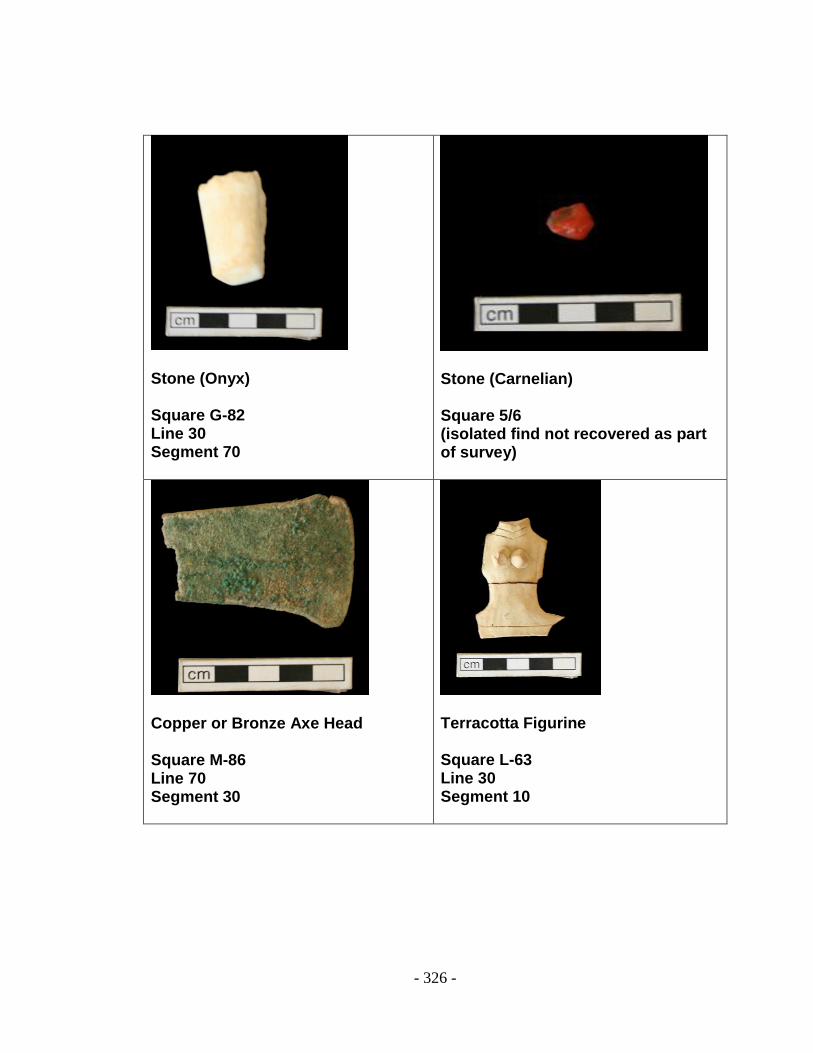
- 326 -
Stone (Onyx) Square G-82 Line 30 Segment 70
Stone (Carnelian) Square 5/6 (isolated find not recovered as part of survey)
Copper or Bronze Axe Head Square M-86 Line 70 Segment 30
Terracotta Figurine Square L-63 Line 30 Segment 10
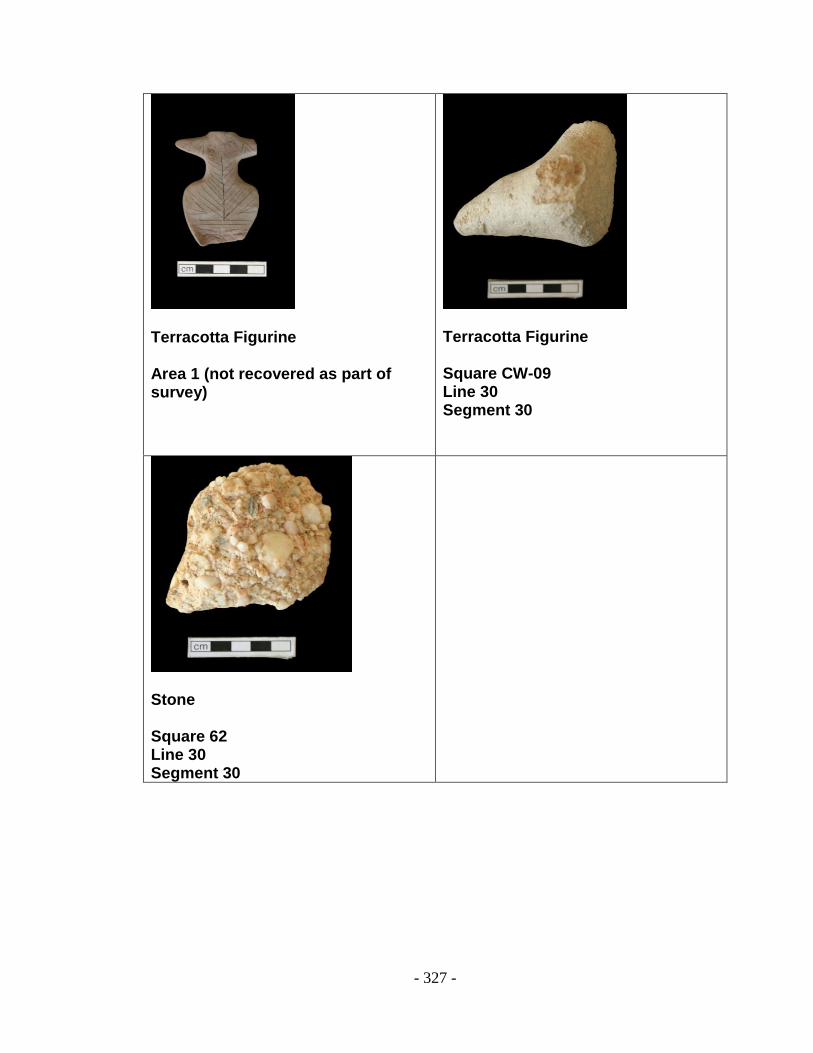
- 327 -
Terracotta Figurine
Area 1 (not recovered as part of survey)
Terracotta Figurine Square CW-09 Line 30 Segment 30
Stone Square 62 Line 30 Segment 30
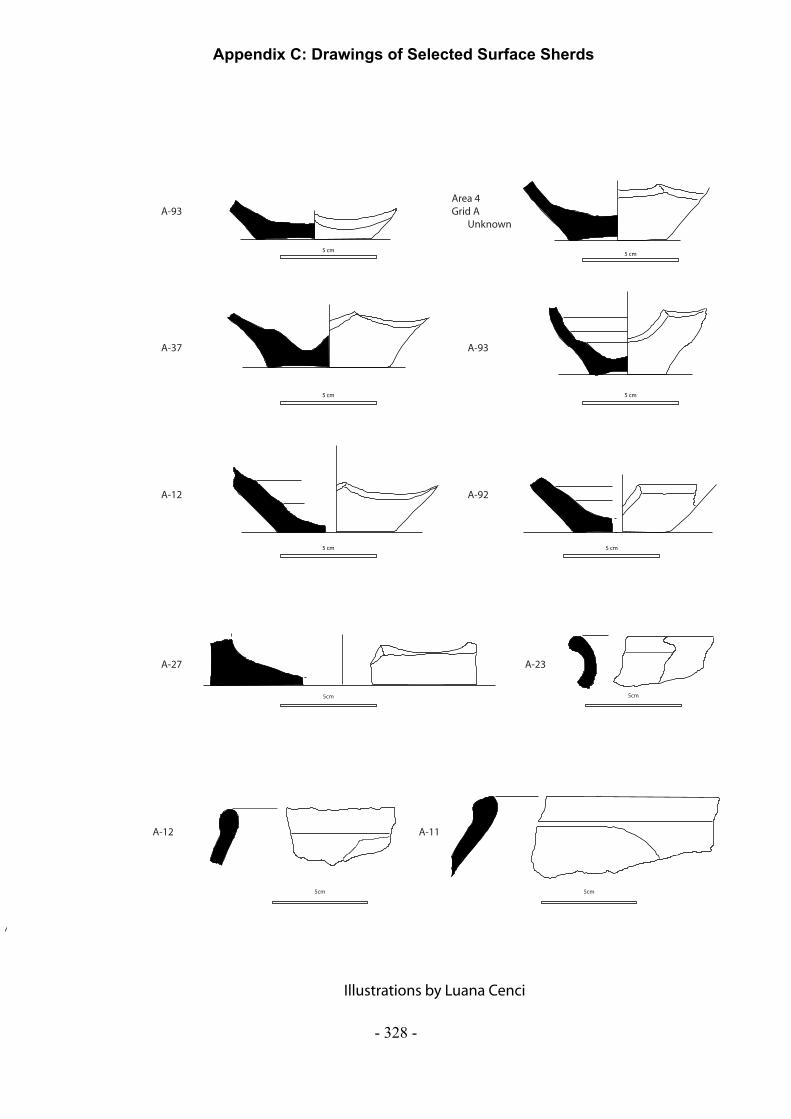
5 cm
5 cm
5 cm
5 cm
5 cm
5 cm
A-93
A-37
A-12
Area 4Grid A Unknown
A-93
A-92
Appendix C: Drawings of Selected Surface Sherds
5cm 5cm
5cm 5cm
A-27
A-12
A-23
A-11
Illustrations by Luana Cenci
- 328 -

5 cm
5 cm
5 cm
C-11
C-12
C-11
C-22
C-36
C-38
C-36
5 cm
5 cm
5 cm
5 cm
Illustrations by Toby Wilkinson
- 329 -

5 cm
5 cm
C-22
C-22
C-23
C-28
C-28
5 cm
5 cm
5 cm
Illustrations by Toby Wilkinson
- 330 -
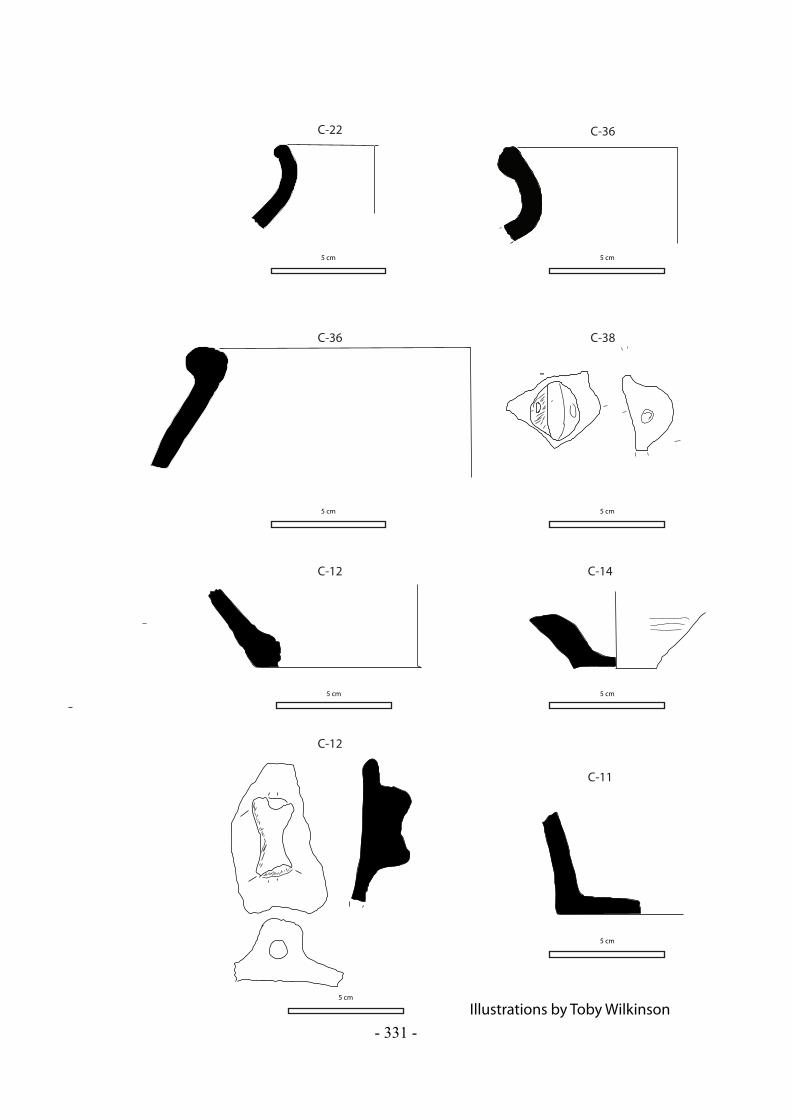
C-36
5 cm 5 cm
C-22
C-36 C-38
5 cm 5 cm
5 cm
5 cm
5 cm
5 cm
C-12 C-14
C-11
C-12
Illustrations by Toby Wilkinson
- 331 -
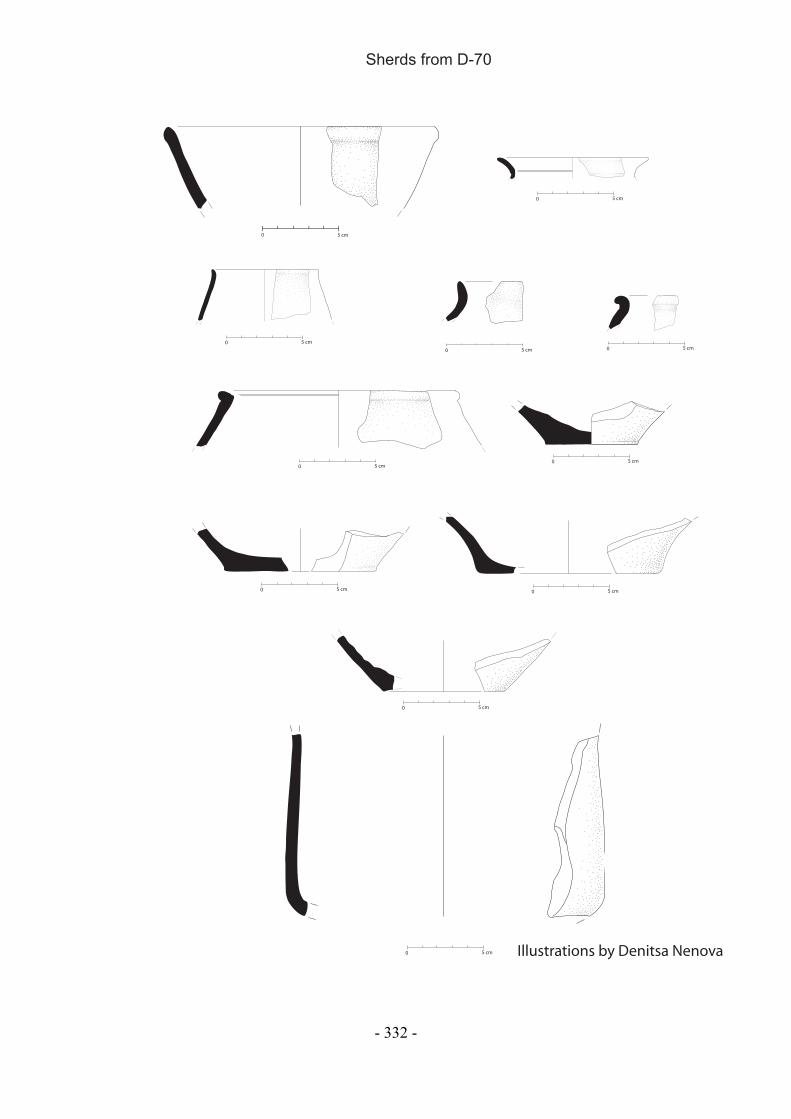
0 5 cm
Illustrations by Denitsa Nenova
0 5 cm
0 5 cm
0 5 cm 0 5 cm
0 5 cm0 5 cm
0 5 cm 0 5 cm
0 5 cm
0 5 cm
Sherds from D-70
- 332 -
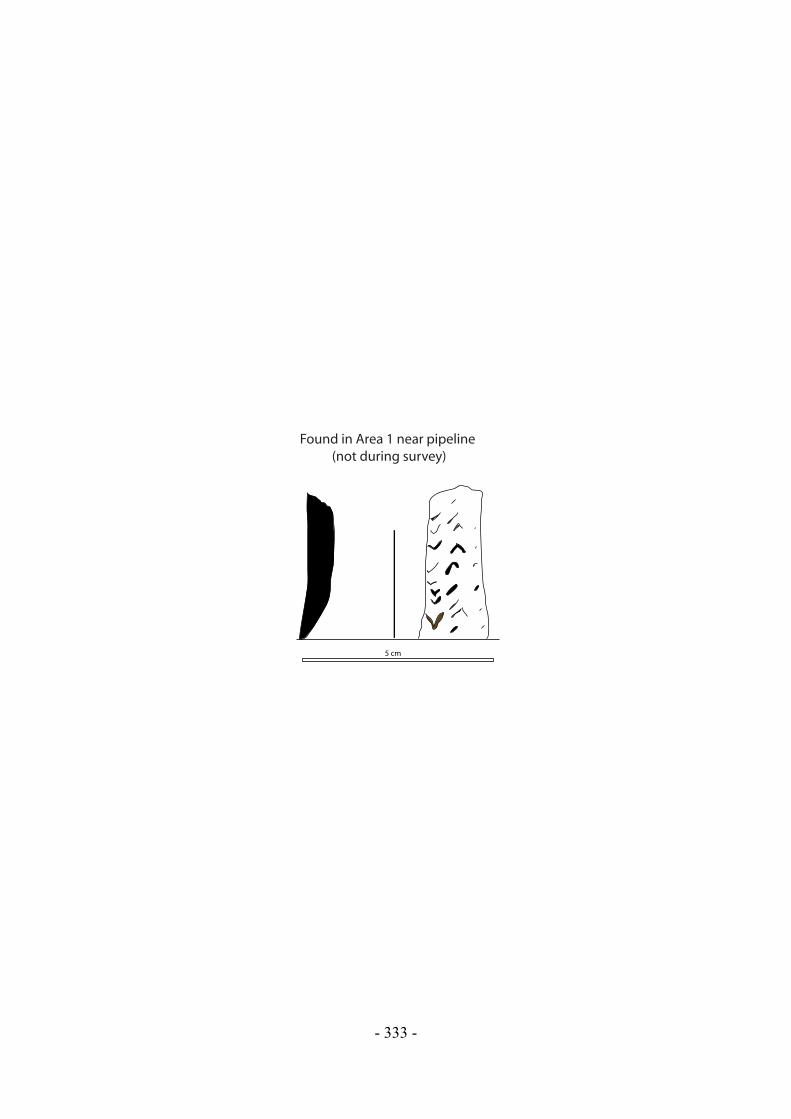
5 cm
Found in Area 1 near pipeline (not during survey)
- 333 -