Surface temperature measurements of active lava flows on Kilauea volcano, Hawai′i
33
1 SURFACE TEMPERATURE MEASUREMENTS OF ACTIVE LAVA FLOWS ON KILAUEA VOLCANO, HAWAI'I Harry Pinkerton a , Mike James a and Alun Jones b a Department of Environmental Science, Institute of Environmental and Natural Sciences, Lancaster University, Lancaster. LA1 4YQ U.K. b The GeoInformation Group, 307 Cambridge Science Park, Milton Road, Cambridge CB4 0ZD Reprint requests to: Prof. H. Pinkerton Tel. 01524 593912 Fax. 01524 593985 Email addresses: [email protected], [email protected]
-
Upload
johnshopkins -
Category
Documents
-
view
0 -
download
0
Transcript of Surface temperature measurements of active lava flows on Kilauea volcano, Hawai′i
1
SURFACE TEMPERATURE MEASUREMENTS OF ACTIVE LAVA FLOWS ON
KILAUEA VOLCANO, HAWAI'I
Harry Pinkertona, Mike Jamesa and Alun Jonesb
a Department of Environmental Science, Institute of Environmental and Natural Sciences,
Lancaster University, Lancaster. LA1 4YQ U.K.
b The GeoInformation Group, 307 Cambridge Science Park, Milton Road, Cambridge CB4 0ZD
Reprint requests to: Prof. H. Pinkerton
Tel. 01524 593912
Fax. 01524 593985
Email addresses: [email protected], [email protected]
2
Abstract
Systematic hand-held radiometer measurements of lava surface temperatures in active
flows and tubes on Kilauea volcano, Hawai'i reveal complexities that cannot be resolved in
remotely sensed data from aircraft or satellites. Using portable infrared Minolta/Land Cyclops
radiometers, we measured surface temperatures of flows at various distances from their sources
and investigated cooling rates and the development of crust. Our measurements suggest that the
upper surface of these lava flows can be split into a minimum of four thermal components; core
(>1050 ˚C), visco-elastic skin (750 to 900 ˚C), rigid solid crust (<750 ˚C), and flow margins
(<175 ˚C). For the 'a'a flows investigated, a cool rigid crust characteristically developed in the
central part of channels within 30 m of the source vent and incandescent lava was exposed in the
marginal shear zones of channels. This affects the heat loss and morphology of lava in active
channels. Our investigations of temperature distributions on pahoehoe flow fields reveal
temperature anomalies of up to 150 ˚C above active tubes and tumuli.
Key words: lava; temperature; radiometer; Kilauea; flow; remote sensing
3
1. Introduction
Thermal data from active lava flows are required to test and help refine cooling models
of lava and related fluid dynamic models (see review by Griffiths, 2000). While remote sensing
methods have considerable potential for regular monitoring of thermal budgets of active lava
flows (e.g. Wooster et al., 1997), the resolution of current satellite imagery means that they
cannot yet generate the temperature data required to help refine the next generation of lava flow
models. In this paper we review some of the limitations of satellite imagery and assess the
usefulness of alternative methods of collecting temperature data. We then describe a series of
measurements made on active lava flows on Kilauea using hand-held infrared radiometers and
use these measurements to determine the minimum number of thermal components required to
analyse satellite thermal data from active lava flows. We report surface and internal temperature
measurements of lava tubes, together with surface temperature measurements of tumuli and other
features that characterise different components of active flow fields.
2. Temperature measurements of active lava flows
The temperatures of active lava flows and lakes can be measured from the ground, from
the air and from space. The techniques involved are varied when carrying out measurements on
the ground, but restricted to the detection of infrared radiation on airborne and satellite
platforms. Using different techniques and platforms offers the opportunity of collecting data over
a wide range of temporal and spatial scales.
2.1. Air and space borne measurements
Surface temperatures of active flows and lava lakes have been determined from satellites
and from aircraft (e.g. Bonneville et al., 1985; Oppenheimer and Rothery, 1989, 1991; Rothery
et al., 1988; Oppenheimer, 1991; Flynn and Mouginis-Mark, 1992; Realmuto et al., 1992;
4
Mouginis-Mark et al., 1994; Flynn et al., 1994; Harris et al., 1995, 1999). Satellite images have
the advantage over aircraft-based systems of regularity of cover (a return period of 16 days for
Landsat, 6 hours for NOAA AVHRR, 16 days for Terra ASTER and 2 days for Terra MODIS).
Although the spatial resolution of commonly used ~8 to 14 µm thermal infrared data from
satellites (ranging from 90 m for ASTER to 1 km for AVHRR) is too poor to be of value for
certain aspects of lava flow modelling, satellite remote sensing methods will undoubtedly be of
immense value in hazard assessment during future eruptions (Francis and Rothery, 2000). This is
particularly apparent as the newest satellites (Ikonos, and Hyperion on EO-1) now offer metre
scale resolution and hyperspectral data.
Airborne surveys generally have a better spatial resolution than satellite data, and they
have been used successfully to map lava tubes, tumuli and other thermal and morphological units
on active flow fields (Realmuto et al., 1992; Rothery and Pieri, 1993). However, surveys using
thermal imaging systems are too expensive to be used routinely, and the resolution (typically
approximately 6 m) is, in most cases, too coarse to measure accurately the temperatures of the
core, crust or any other part of an active lava flow.
One of the main complications with the interpretation of remotely sensed thermal data is
the presence of different surface temperatures within the areas imaged by individual pixels. Each
data number corresponds to the integrated radiance from the area of the pixel rather than the
actual temperature of any one component within it. For pixels including two thermal components
(of estimated relative areal proportions), temperatures can be determined by the use of the dual
band technique (e.g. Dozier, 1981; Matson and Dozier, 1981; Rothery et al., 1988; Pieri et al.,
1990; Oppenheimer, 1991; Oppenheimer et al., 1993). However, a common scenario in images
obtained for volcanic monitoring is the presence of at least three thermal components within a
pixel (a ‘cold’ background and a lava lake or flow comprising cooled crust and hotter surface
cracks), necessitating a three component model (Harris et al., 1997; Wooster and Rothery, 1997;
Wooster et al., 1997; Harris et al., 1999). This increases the number of unknown parameters
5
which must be estimated for a unique solution (Harris et al., 1999). For eruption monitoring
using low resolution images, temperatures are normally assumed in order to obtain the areal
extent of thermal anomalies (Harris et al., 1997, 1998), and thus alternative thermal data could
be of great value for increasing the accuracy of this technique.
2.2. Ground-based measurements
The temperature of lava flows is commonly measured using thermocouples (e.g.
Archambault and Tanguy, 1976; Lipman and Banks, 1987; Wolfe et al., 1988; Mangan et al.,
1993; Pinkerton, 1993; Neal et al., 1988) and, when appropriate precautions are taken, a
precision of ±1 ˚C is possible. However, the slow response times of thermocouples (Lipman and
Banks, 1987; Pinkerton, 1993) limit the number of accurate measurements that can be made at
any locality. Thermocouples are also very difficult to use in many situations (e.g. rapidly moving
lava in large channels or tubes). Consequently, few systematic studies of temporal and spatial
changes in the temperatures of lava flows have been made, an exception being the
comprehensive study by Lipman and Banks (1987).
Optical pyrometers (Ault et al., 1961; Swanson, 1973) have been used during the past 40
years to measure temperatures during eruptions. More accurate temperatures, and improved
spatial resolution, have been obtained using infrared ‘Hotshot’ pyrometers (e.g. Lipman and
Banks, 1987). On lava flows, they can be used to measure the temperature of the crust or, if it is
exposed, the incandescent interior. When rapid convection or vigorous degassing are taking
place, for example on active lava lakes and in fire fountains (e.g. Lipman and Banks, 1987),
instruments of this type can measure temperatures of the hottest parts of the lava. The main
limitations of these instruments are their slow response time (30 seconds for one reading) and
that they are sensitive only to temperatures above 500 ˚C.
The above problems can be reduced by collecting quenched samples and determining
the pre-quench temperature using geothermometry (Helz and Thornber, 1987; Mangan et al.,
6
1993; Cashman et al., 1999). This method permits internal temperatures of lava flows to be
determined if quenched samples from the highest temperature zones within the flow can be
collected. However, due to the difficulties of collecting samples from different zones within
flows, geothermometry permits measurements to be made for only a small proportion of any
flow. In addition, the errors can be significant (±8 to 10 ˚C), even for lavas for which accurate
geothermometric calibration data exist. There is, therefore, a need for ground-based remote
sensing methods for the collection of temperature data from active lava flows.
A Geophysical and Environmental Research (GER) multispectral dual beam
spectroradiometer has been used by Flynn and Mouginis-Mark (1992, 1994) and Flynn et al.
(1993) to measure temperatures of a lava lake and of lava flows. This instrument permits the use
of multiple bands and hence can provide very useful thermal data which can be solved for 2 or 3
thermal components. However, it has a scan time of 30 s and rapid temperature fluctuations can
saturate the instrument, potentially resulting in data loss during important periods of channel
development (Flynn and Mouginis-Mark, 1994).
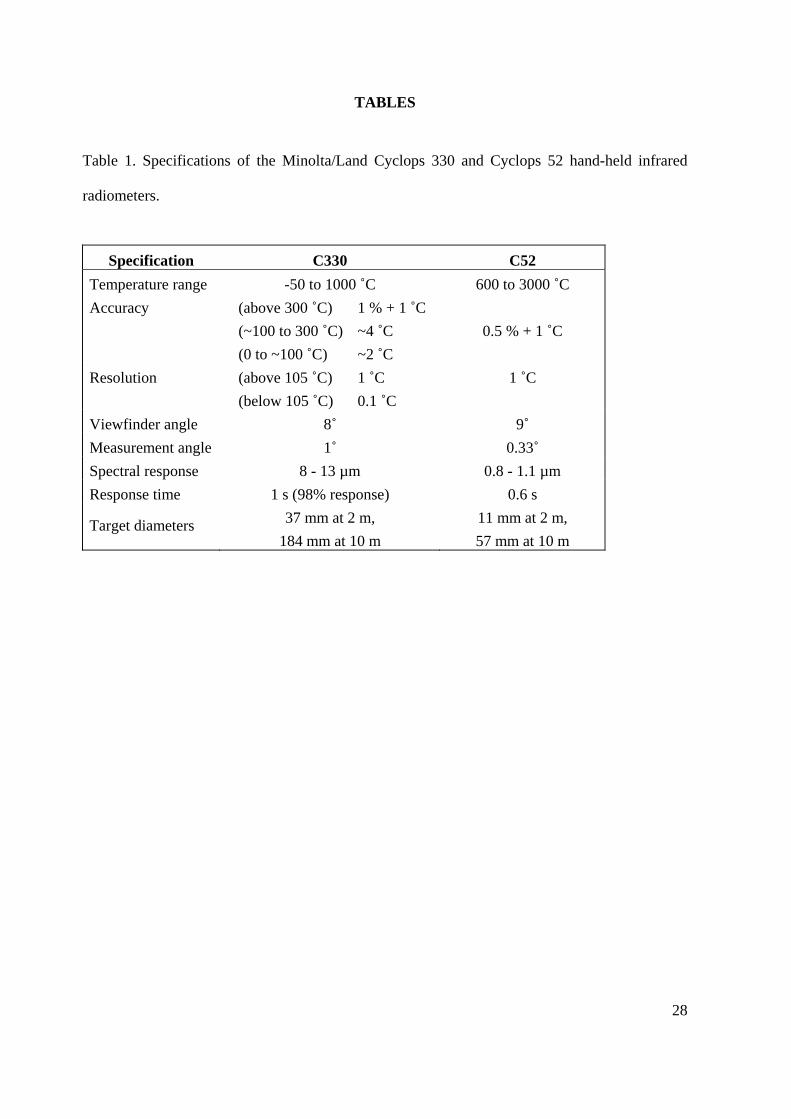
The instruments we used were Cyclops C330 and C52 infrared radiometers, developed by
Minolta/Land (Table 1). They are well suited for work on active lava flows because they are
compact, light (800 g), robust and easy to operate in adverse conditions. They can be hand held
or tripod mounted and rapid measurements (~1 s-1) can be made. They have a single lens reflex
viewfinder with an ~10˚ field of view and a smaller measuring field of view (1˚ for the C330;
0.33˚ for the C52). Both instruments can readily be connected to a dedicated controller and data
logger. Their operational wavelengths are within windows of high atmospheric transmittance and
only two instruments are required to cover the entire range of temperatures encountered on
volcanoes. Precisions of order 6 ˚C (Table 1) are claimed if the correct emissivities are used. The
instruments have previously been used to estimate temperatures in Strombolian vents, lava lakes,
fumaroles and lava flows (Oppenheimer and Rothery, 1989, 1991; Oppenheimer, 1991;
Oppenheimer et al., 1993; Rothery et al., 1995; Harris, 1998). Hon et al. (1994) used a C330
7
radiometer in conjunction with a number of thermocouples at different depths within a pahoehoe
flow on Kilauea, Hawai'i to investigate cooling and crustal thickening rates. However, there have
been no detailed, systematic measurements using these instruments of the temporal and spatial
changes in the surface temperatures of active lava flows.
In this paper, we present the results of a study of surface temperature variations of lava
flowing in channels and through tubes on the South East Rift Zone, Kilauea (Figure 1). We also
present surface temperature measurements of different components of lava flows on this flow
field made during two different periods (January to February 1990, and September 1994). The
area was particularly suitable because of easy access to different parts of the flow field and
minimal degassing of fumes during both measuring periods.
3. Sources of error in radiometer surveys
Accurate temperature measurements using radiometers can be made only if appropriate
emissivities are used for each type of surface being measured and for each instrument (Salisbury
and D'Aria, 1992; Flynn et al., 1993). Precautions must also be taken to minimise absorption by
volcanic gas and scattering by particulate matter (Oppenheimer and Rothery, 1989). Additional
potential sources of error include variations in solar radiation contributions (Flynn et al., 1993),
fields of view that include more than one thermal component, and inappropriate viewing angles.
To assess the importance of these errors, a series of measurements was carried out on active
flows in the South East Rift Zone between September 12 and 24, 1994. These measurements
complement laboratory measurements of the emissivity of crustal material from the 1990
eruption.
3.1. Emissivity of lava
A range of emissivities are currently used for basalt. At wavelengths corresponding to the C52
radiometer (0.8 to 1.1 µm) these include 0.5 to 0.9 (Rothery et al., 1988), 0.95 to 0.97 (Crisp et
8
al., 1990), >0.995 (Flynn et al., 1993) and 1.0 (Pieri et al., 1990). In view of the large uncertainty
in basalt emissivity between 0.8 and 1.1 µm, and because this was the instrument used for all
high temperature (>600 ˚C) measurements, we carried out laboratory measurements of the
emissivity of Hawaiian lava by heating a sample of Hawaiian pahoehoe in a horizontal tube
furnace. The surface temperature of the sample was measured using the C52 radiometer and a
previously calibrated Comark Cr-Al thermocouple (Jones, 1992). The furnace construction,
coupled with a small diameter tube (2.5 cm) and large sample size (1.5 cm diameter) minimised
reflection from the furnace walls. Temperatures were recorded at 50 ˚C intervals between 600 ˚C
and 990 ˚C. The best agreement between the thermocouple and the C52 data was obtained when
the emissivity selector was set at 1.00 (Figure 2). This was the emissivity we used for all C52
measurements. For the C330 we used an emissivity of 0.95 as also employed by Harris et al.
(1998).
3.2. Effects of sunlight
The radiance contribution from reflected sunlight can be seen as a peak at 0.554 µm in multi-
spectral radiometers (Flynn et al., 1993) and it can influence apparent temperatures measured
using the C52 which measures radiance in the range 0.8 to 1.1 µm. The effect was seen clearly
during a series of measurements on a small active vent on September 23, 1994 where
temperatures measured in diffuse sunlight were between 8 and 36 ˚C higher than the stable
temperature of 1087 ˚C measured when the sun was obscured by cloud. These observations
confirm the need to ensure that measurements using this instrument are not made in sunlight and,
ideally, they should be carried out at night. All C52 measurements reported here were carried out
either under overcast conditions, or at dusk.
3.3. Effects of viewing distance
In common with other remote sensing methods used on lava flows, the area being viewed by a
9
radiometer may include more than one thermal component. This can be reduced by minimising
the viewing distance to the target. The relationship between viewing area, distance and viewing
angle (the angle between the line of site and the normal of the surface being viewed) are shown
for both Cyclops radiometers in Figure 3. During one set of measurements carried out in
September 1994 with the C52 radiometer, the surface temperature of lava emerging from a small
vent on Kilauea was measured at different viewing distances (Figure 4). The data show a clear
reduction in apparent temperatures with increased viewing distance (-1.9 ˚C m-1), a result of the
hottest parts of the flow becoming smaller fractions of the measured area at larger viewing
distances (increased effective target diameters). This effect is a function of the cooling and
surface deformation history of the flow before and during eruption from the vent. It is also
dependent on the surface roughness of the flow; thus the value of -1.9 ˚C m-1 can only be used
for other flows with similar surface textures and pre-eruption histories to the measured flow. For
all measurements on active flows presented here, the viewing distance was less than 8 m, and for
many measurements it was less than 2 m. The viewing angle did not exceed 40˚ from the
perpendicular and was, in most cases, between 0˚ and 20˚.
3.4. Comparison between thermocouple and radiometer measurements
The high thermal gradients in most lava flows dictate that surface temperatures measured
using radiometers are considerably lower than the maximum internal temperatures that can be
measured using thermocouples unless the flow is thermally well mixed. When measurements
were made of high effusion rate flows close to a tube exit on Kilauea (September 20, 1994),
surface temperatures measured using the C52 radiometer were up to 20 ˚C lower than maximum
stable internal temperatures recorded using a previously calibrated Cr/CrAl thermocouple.
We conclude that if appropriate emissivities are used, the viewing distance minimised,
and the measurements carried out in the absence of sunlight and fumes, then temperatures
obtained with the C52 radiometer are within ±10 ˚C of the maximum surface temperatures of the

10
measured area. Errors will be greater for the C330 (see Table 1); however this was used only
during traverses over the surface of cooled crust (mostly <200 ˚C ) above lava tubes and tumuli.
4. Measurements from the South East Rift Zone, Kilauea
When the first set of measurements were made (January 1990), lava flowed out of
Kupaianaha lava lake through a single tube and into the sea near Kupapua Point (Figure 1). This
was typical of activity during Episode 48 on the South East Rift Zone of Kilauea. On January 13,
a surface 'a'a flow broke out of the tube and headed southeast (Figure 1, localities 1a and b).
After a pause in the eruption at the beginning of February, extrusion resumed and a new
breakout, approximately 2 km from Kupaianaha, also flowed southeast before splitting into a
number of smaller flows, 3.5 km downflow (Figure 1, localities 4, 5, 6, and 7). The proximal
parts of the new primary channel rapidly tubed over, as did the upper parts of some of the
subsidiary branching flows. The development of the 1990 Kalapana flow field is described in
detail by Mattox et al. (1993). During 1990, temperatures were measured using the C52 and
C330 radiometers at Kupaianaha lava lake and on a number of active flows in channels and
tubes. In addition, two traverses were carried out across part of the January 1990 flowfield.
After a brief period of eruptive activity up-rift from Kupaianaha in November 1991,
Episode 48 ended in February 1992. In March 1992, new lavas emerged from the western flank
of Pu'u 'O'o. A small shield was constructed and this was the source of lavas that reached the sea
6 – 10 km SW of Kalapana (Heliker et al., 1998; Kauahikaua et al., 1998). Temperature
measurements were made using the same instruments on a number of small lava flows in
September 1994, both above and below Pali Uli.
4.1. Temperature of lava in Kupaianaha lava lake
Vigorous convection and mild fountaining within Kupaianaha lava lake occasionally
brought the hottest fraction of lava to the surface, allowing temperatures to be measured using
11
the C52 radiometer. A maximum temperature of 1153 ˚C was recorded (January 19, 1990),
which is thought to be a reasonable reflection of the internal lava temperature. This can be
compared with temperatures obtained from glass geothermometry (Helz and Thornber, 1987).
Using this technique, Helz et al. (1991) calculated an eruption temperature of between 1155 ±8
˚C and 1157 ±8 ˚C for lava in Kupaianaha from May 1989 to January 1990.
4.2. Temperatures within tubes
The opportunity to study and monitor flowing lava within tubes is often limited by the
sporadic nature of ‘skylights’ in the tube roof and by the potential hazards when making
measurements or collecting samples through skylights. Using an optical pyrometer and
thermocouples, Swanson (1973) and Tilling et al. (1987) recorded temperatures in lava tubes in
the range 1130 to 1165 ˚C from the 1971 to 1972 eruption of Mauna Ulu. However, Kauahikaua
et al. (1998) recorded temperatures of only ~1080 ˚C in tubes from Pu'u 'O'o in 1994. These
temperatures, obtained by optical pyrometer, were considerably lower than those of 1154 ±3˚C
determined by geothermometry for the core of these flows (Heliker et al., 1998).
Skylights were present within the established tube system on Kilauea’s South East Rift
Zone during January and February 1990 at varying distances from the Kupaianaha vent. Using
the C52 radiometer, temperatures of lava flowing within tubes were measured through two of
these skylights (localities 3 and 6, Figure 1). Figure 5 shows data collected at locality 3, a
skylight with a diameter of ~1.5 m, 8 km from Kupaianaha, over a period of 4 minutes, on
February 21. The radiometer was mounted on a tripod in order to monitor the same spatial point
as the lava flowed through the measurement field of view. It was oriented to record surface
temperatures as far up the tube as possible (a measurement distance of ~2.5 m, giving an
effective target diameter of ~1.8 cm), where cooling due to radiant heat loss through the skylight
would be minimised.
The data show fluctuations of surface temperature between 1114 and 1138 ˚C over the
12
monitoring period, reflecting either real temperature differences or changes in the amount of
thermal radiation absorbed by volcanic gases. Real temperature differences could indicate the
periodic disruption or thinning of a semi-continuous, cooled skin on the surface of the lava. This
interpretation is supported by observations of sheared bubbles on the surface whose interiors
were a visibly brighter orange (and thus hotter) than the surrounding lava. This observation was
made in all the tubes monitored.
The maximum surface temperature within any part of the tube system (1138 ˚C) was
recorded on a number of occasions, but is 15 ˚C lower than our estimate of maximum
temperatures in the lava pond. However, there is no evidence of complete thermal mixing within
the observed tubes. The core temperatures of lava within the tubes would therefore be higher
than the measured surface values. Higher core temperatures are also indicated by a minimum
recorded temperature for lava flowing into the ocean during this period of 1145 ˚C (Heltz et al.,
1991).
The surface temperature distribution across an active lava channel contained within a
tube was recorded through another skylight at a distance of 10 km from Kupaianaha (locality 6).
The data collected (Figure 6) show that the pasty, slower moving lava adjacent to the margins of
the tube was cooler than the central part of the flow surface, in agreement with similar data
collected by Flynn and Mouginis-Mark (1994).
A lava surface temperature of 1020 ˚C was measured at a tube exit, at Kupapau Point
(Figure 1), in January 1990. This low temperature in the distal parts of the tube results from the
reduced flow velocities in the tube with increasing distance from Kupaianaha and the consequent
increased thermal boundary layer thickness on top of the lava. The temperature difference
between the core and the surface therefore increased from ~3 ˚C at Kupaianaha to ~125 ˚C at the
tube mouth, 12 km from Kupaianaha.
13
4.3. Axial surface temperature measurements along the main channel
The behaviour of lava as it flows from a tube mouth to a flow front has been studied
extensively in the field, particularly on Kilauea, Hawai'i (Macdonald, 1953; Greeley, 1971,
1987; Swanson, 1973; Peterson and Tilling, 1980; Fink and Zimbelman, 1986; Lipman and
Banks, 1987; Rowland and Walker, 1990) and Mt. Etna, Sicily (Pinkerton and Sparks, 1976;
Chester et al., 1985; Pinkerton, 1987; Kilburn and Lopes, 1988). However, apart from the study
by Lipman and Banks (1987), these do not provide any data on the temperatures of the different
areas within flows (e.g. exposed core and cooled crust) as a channel advances. By collecting
surface temperature data along the axis of a channel we have been able to investigate the
temperatures of different types of flow surface and also calculate down-flow cooling rates.
Surface temperatures were recorded along the axis of a stable, tube-fed, channelled 'a'a
lava flow, 9 km from Kupaianaha (locality 4, Figure 1). The flow contained a well developed
channel ~2.5 m wide, with a central surface velocity of 0.4 m s-1, confined between stable rubbly
levees (Figure 7a) similar to those described by Greeley (1971, 1972) and Lipman and Banks
(1987). Temperatures were measured using the C52 radiometer at 2 m intervals over a 46 m
distance along the central portion of the flow (Figure 7b), and the highest temperatures measured
over monitoring periods of 20 s recorded. The distance between the radiometer and the centre of
the channel was 2 ±,0.5 m in all cases, and the effective diameter of the target area measured by
the C52 was <1.4 cm. The time taken to complete the profile was approximately 20 minutes,
during which there was no significant change in the condition of the flow surface along the
measured length of the channel. The data can therefore be considered to represent an
instantaneous thermal profile of this section of the flow.
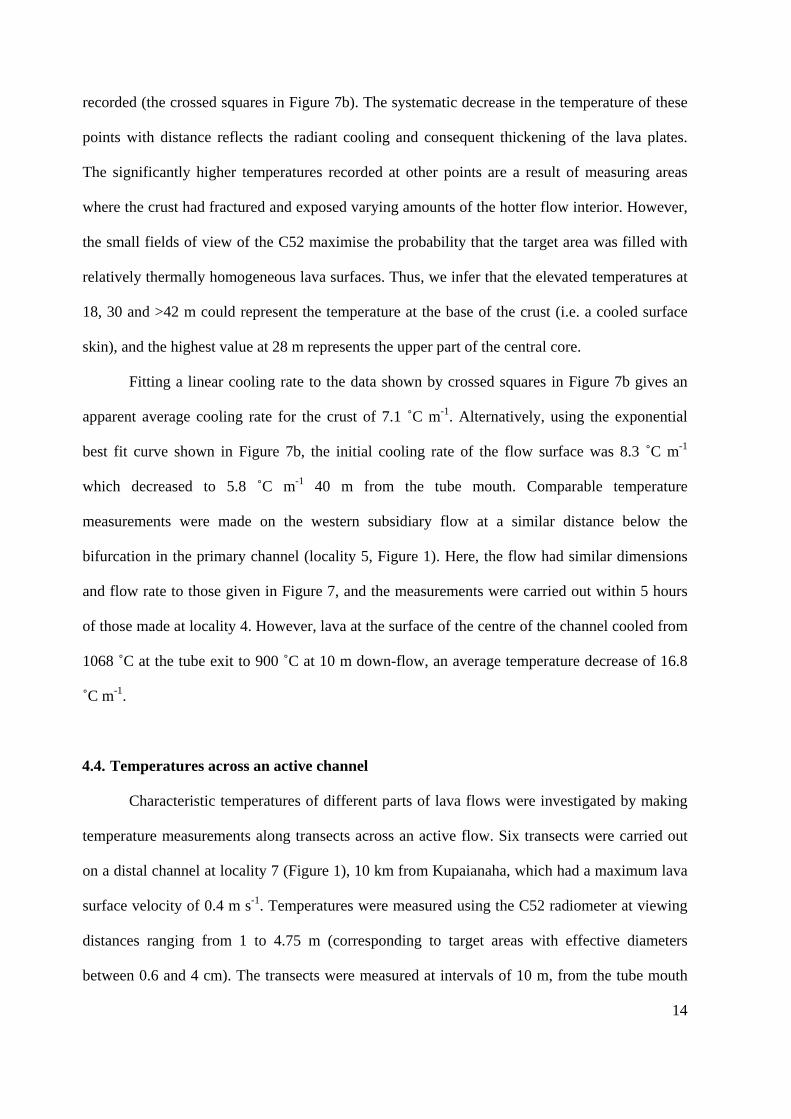
Three distinct thermal components were observed in the channel. On the surface of the
flow, large plates of lava cooled and thickened with distance from the tube mouth, forming a
medial crust. Between the plates, regions of incandescent skin were locally sheared to reveal the
top of the flow's central core. The temperature of the top of the crust is the lower temperature
14
recorded (the crossed squares in Figure 7b). The systematic decrease in the temperature of these
points with distance reflects the radiant cooling and consequent thickening of the lava plates.
The significantly higher temperatures recorded at other points are a result of measuring areas
where the crust had fractured and exposed varying amounts of the hotter flow interior. However,
the small fields of view of the C52 maximise the probability that the target area was filled with
relatively thermally homogeneous lava surfaces. Thus, we infer that the elevated temperatures at
18, 30 and >42 m could represent the temperature at the base of the crust (i.e. a cooled surface
skin), and the highest value at 28 m represents the upper part of the central core.
Fitting a linear cooling rate to the data shown by crossed squares in Figure 7b gives an
apparent average cooling rate for the crust of 7.1 ˚C m-1. Alternatively, using the exponential
best fit curve shown in Figure 7b, the initial cooling rate of the flow surface was 8.3 ˚C m-1
which decreased to 5.8 ˚C m-1 40 m from the tube mouth. Comparable temperature
measurements were made on the western subsidiary flow at a similar distance below the
bifurcation in the primary channel (locality 5, Figure 1). Here, the flow had similar dimensions
and flow rate to those given in Figure 7, and the measurements were carried out within 5 hours
of those made at locality 4. However, lava at the surface of the centre of the channel cooled from
1068 ˚C at the tube exit to 900 ˚C at 10 m down-flow, an average temperature decrease of 16.8
˚C m-1.
4.4. Temperatures across an active channel
Characteristic temperatures of different parts of lava flows were investigated by making
temperature measurements along transects across an active flow. Six transects were carried out
on a distal channel at locality 7 (Figure 1), 10 km from Kupaianaha, which had a maximum lava
surface velocity of 0.4 m s-1. Temperatures were measured using the C52 radiometer at viewing
distances ranging from 1 to 4.75 m (corresponding to target areas with effective diameters
between 0.6 and 4 cm). The transects were measured at intervals of 10 m, from the tube mouth
15
(at 0 m, approximately 200 m from the active flow front, Figure 8a) to 50 m down-flow (Figure
8f).
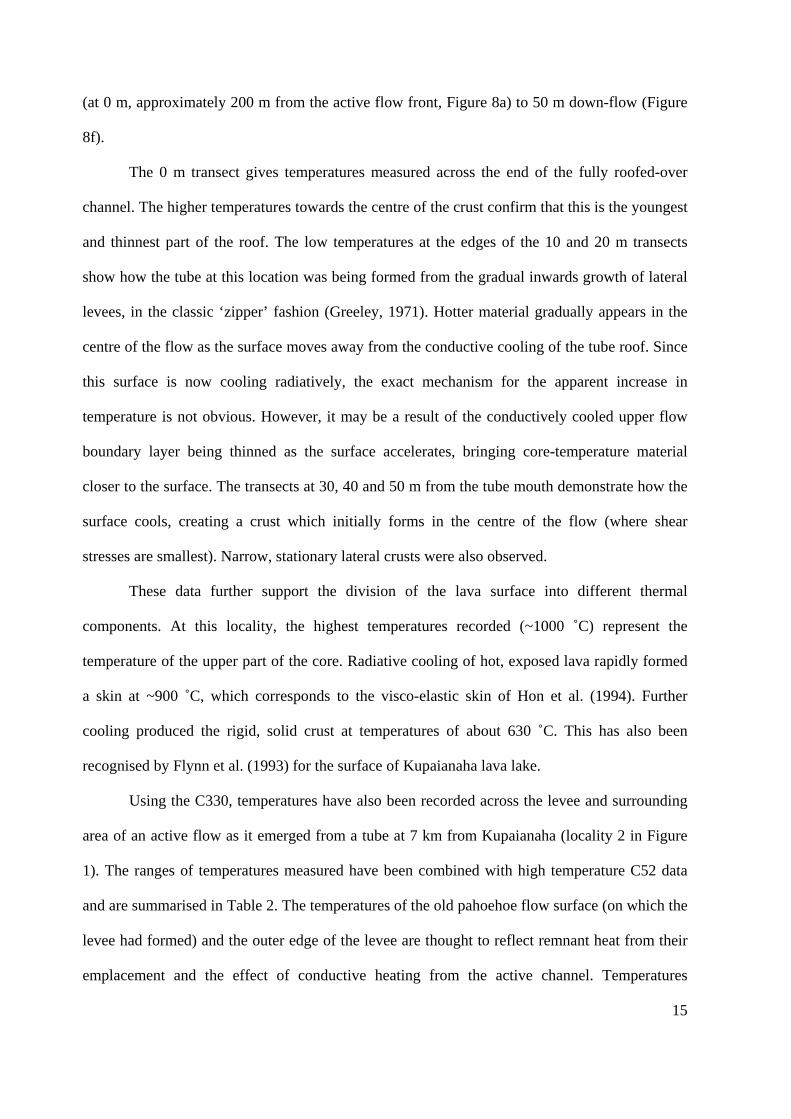
The 0 m transect gives temperatures measured across the end of the fully roofed-over
channel. The higher temperatures towards the centre of the crust confirm that this is the youngest
and thinnest part of the roof. The low temperatures at the edges of the 10 and 20 m transects
show how the tube at this location was being formed from the gradual inwards growth of lateral
levees, in the classic ‘zipper’ fashion (Greeley, 1971). Hotter material gradually appears in the
centre of the flow as the surface moves away from the conductive cooling of the tube roof. Since
this surface is now cooling radiatively, the exact mechanism for the apparent increase in
temperature is not obvious. However, it may be a result of the conductively cooled upper flow
boundary layer being thinned as the surface accelerates, bringing core-temperature material
closer to the surface. The transects at 30, 40 and 50 m from the tube mouth demonstrate how the
surface cools, creating a crust which initially forms in the centre of the flow (where shear
stresses are smallest). Narrow, stationary lateral crusts were also observed.
These data further support the division of the lava surface into different thermal
components. At this locality, the highest temperatures recorded (~1000 ˚C) represent the
temperature of the upper part of the core. Radiative cooling of hot, exposed lava rapidly formed
a skin at ~900 ˚C, which corresponds to the visco-elastic skin of Hon et al. (1994). Further
cooling produced the rigid, solid crust at temperatures of about 630 ˚C. This has also been
recognised by Flynn et al. (1993) for the surface of Kupaianaha lava lake.
Using the C330, temperatures have also been recorded across the levee and surrounding
area of an active flow as it emerged from a tube at 7 km from Kupaianaha (locality 2 in Figure
1). The ranges of temperatures measured have been combined with high temperature C52 data
and are summarised in Table 2. The temperatures of the old pahoehoe flow surface (on which the
levee had formed) and the outer edge of the levee are thought to reflect remnant heat from their
emplacement and the effect of conductive heating from the active channel. Temperatures
16
recorded from the inner levee edge, adjacent to the active channel, are more likely to be
dominated by the absorption and reflection of radiant heat from the channel. Thus, measured
temperatures of inner levee walls will be a strong function of the size and surface state of the
channel.
4.5. Temperatures across lava flow fields
Surface temperatures over lava flow fields range from background temperatures (<50 ˚C)
to those of molten lava (>1000 ˚C). Detection of thermal anomalies can help to locate the
position of active lava tubes, which play a major role in the development of many pahoehoe (e.g.
Peterson and Tilliing 1980) and 'a'a (e.g. Calvari and Pinkerton, 1998, 1999) lava flow fields.
Lava tube monitoring is critical to understanding and predicting the growth of these flow fields.
Recent studies have successfully utilised several geophysical techniques, e.g. very low frequency
electromagnetic induction and magnetometry (Zablocki, 1978; Jackson et al., 1987; Kauahikaua
et al., 1990; Hon et al., 1994) to detect lava tubes. Thermal anomalies of up to 24 ˚C greater than
the temperature of the surrounding lavas were measured during an overflight with a thermal
infrared multispectral scanner (TIMS) by Realmuto et al. (1992). To complement the TIMS
study, Realmuto et al. (1992) also carried out transects with a hand-held radiation thermometer
over the Kapa'ahu lava tube on 22 May 1989. The average of these measurements was 42 °C,
which was in agreement with the TIMS derived temperatures of 38 to 44 °C. Thermal anomolies
due to lava tubes were also detected in thematic mapper (TM) scenes by Flynn et al. (1994), but
they were of lower magnitude (~4 °C) than those shown in the TIMS data (Realmuto et al.,
1992). Here we describe similar traverses taken across pahoehoe flow fields during 1990 and
1994.
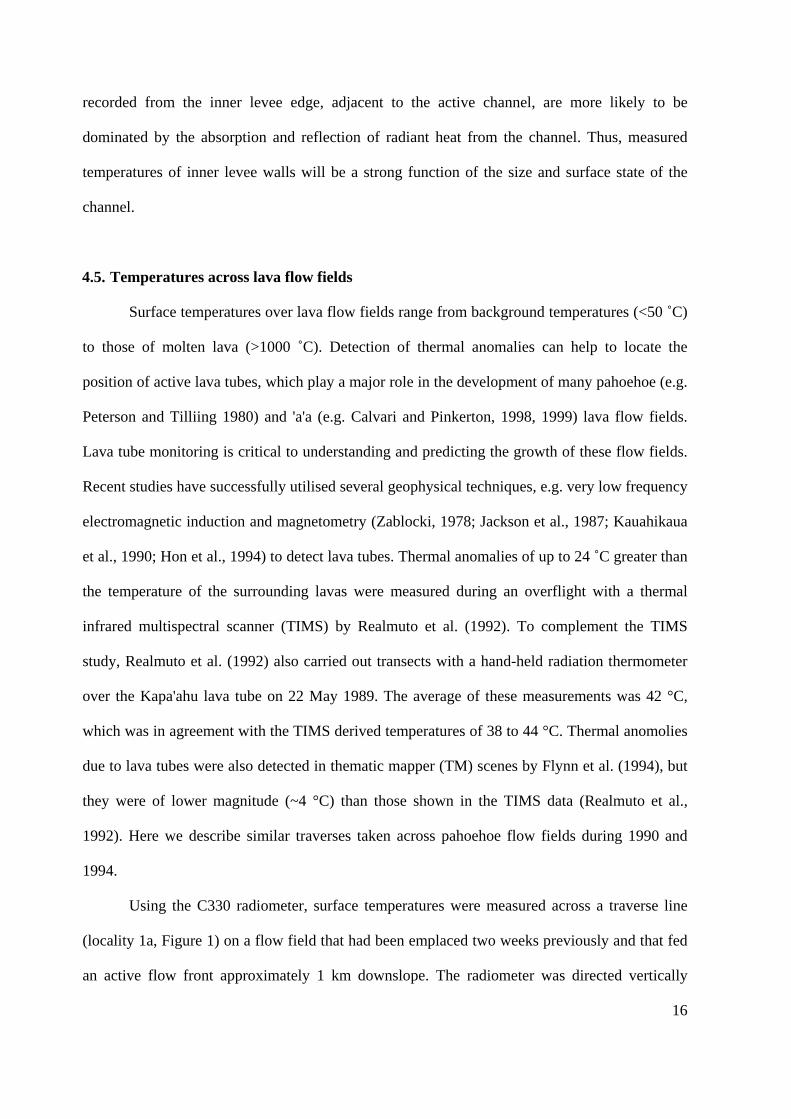
Using the C330 radiometer, surface temperatures were measured across a traverse line
(locality 1a, Figure 1) on a flow field that had been emplaced two weeks previously and that fed
an active flow front approximately 1 km downslope. The radiometer was directed vertically
17
downwards from ~60 cm above the surface, producing an effective target diameter of ~1 cm as
the operator walked across the traverse. A thermal anomaly at approximately 250 ˚C (a distance
of 120 m from the beginning of the traverse line, Figure 9a) coincided with independently
measured resistivity anomalies and is interpreted to indicate the presence of a tube. The elevated
‘background’ temperatures are due to the area being dominantly recent flows and still relatively
hot.
A second line was established over the same flow field 1 km upslope of the previous line
(locality 1b). The main part of this flow field had been emplaced more than 2 weeks prior to the
survey. This traverse identified no marked thermal anomaly along the tube and flow field
transect (Figure 9b). Resistivity surveys identified an anomaly at 130 m, where the measured
surface temperature was 95 ˚C. This is considered to be the position of a partially drained lava
tube. The high temperature (130 ˚C) at 80 m was caused by a viscous pahoehoe breakout in its
final stages of cooling. A close examination of the flows in both traverses showed that the field
was composed of multiple compound pahoehoe units, some of which had clearly been erupted
less than two weeks previously.
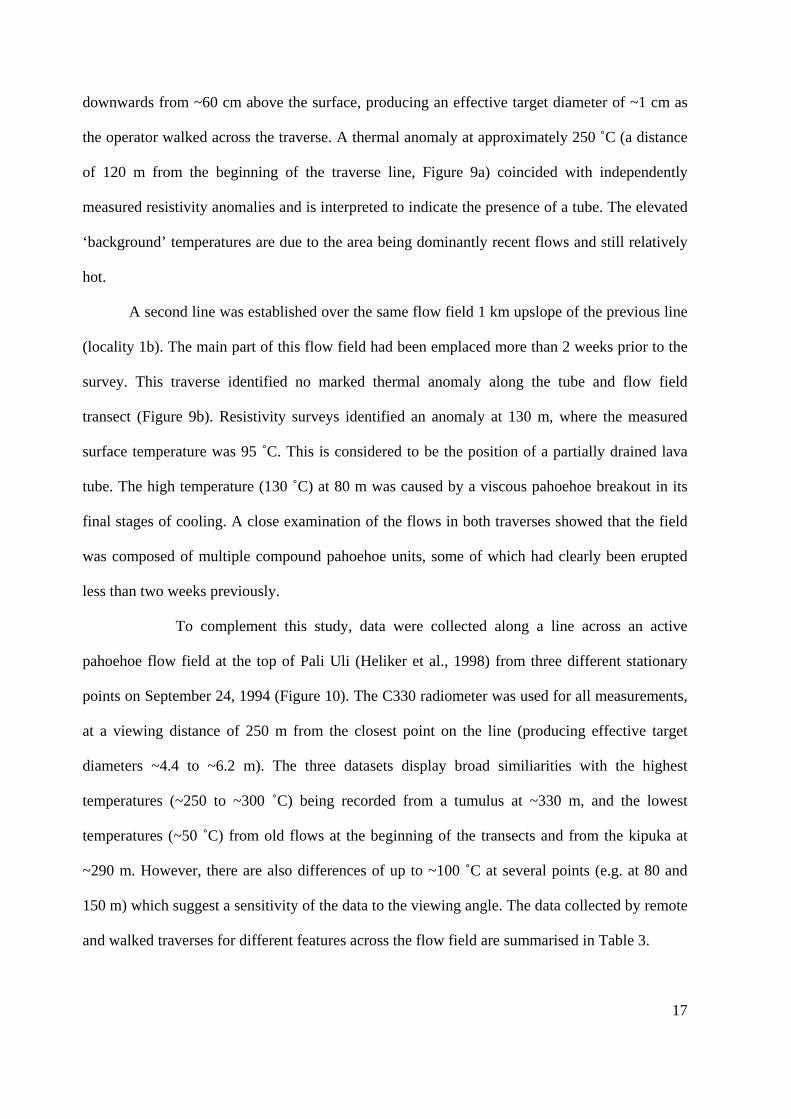
To complement this study, data were collected along a line across an active
pahoehoe flow field at the top of Pali Uli (Heliker et al., 1998) from three different stationary
points on September 24, 1994 (Figure 10). The C330 radiometer was used for all measurements,
at a viewing distance of 250 m from the closest point on the line (producing effective target
diameters ~4.4 to ~6.2 m). The three datasets display broad similiarities with the highest
temperatures (~250 to ~300 ˚C) being recorded from a tumulus at ~330 m, and the lowest
temperatures (~50 ˚C) from old flows at the beginning of the transects and from the kipuka at
~290 m. However, there are also differences of up to ~100 ˚C at several points (e.g. at 80 and
150 m) which suggest a sensitivity of the data to the viewing angle. The data collected by remote
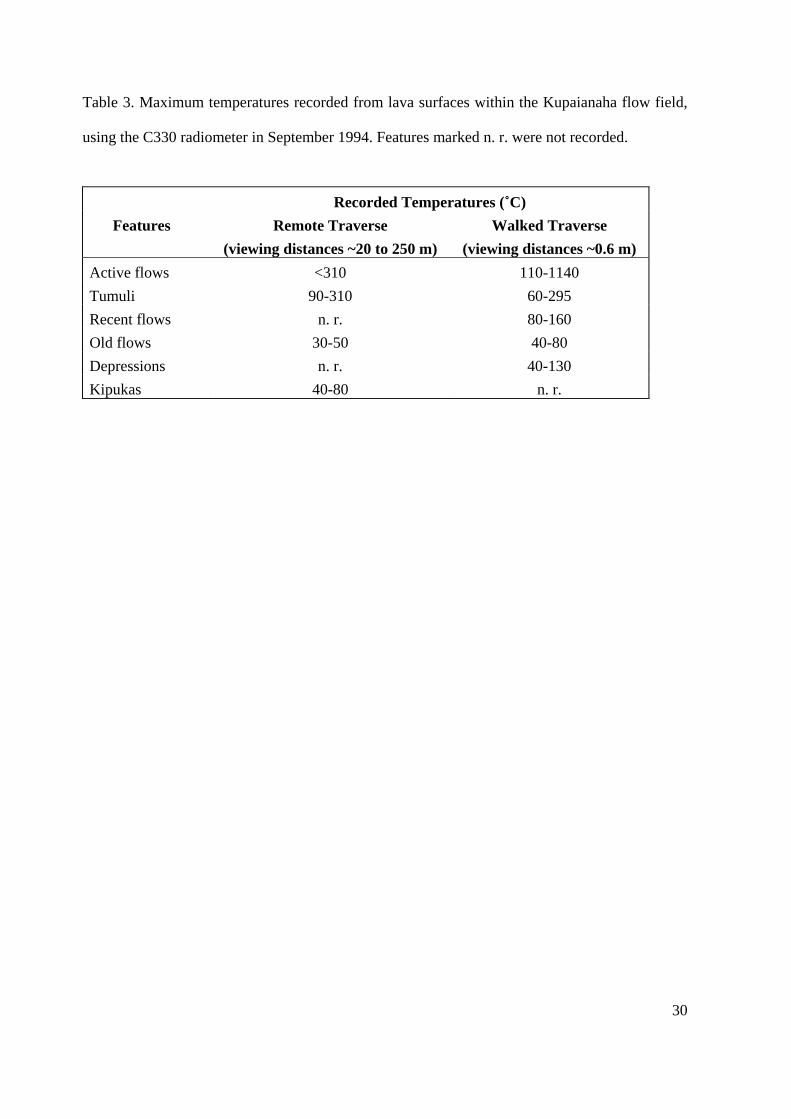
and walked traverses for different features across the flow field are summarised in Table 3.
18
5. Discussion
Our measurements emphasise the difficulties in determining the thermal structure of lava
flows. Although satellite images can provide simultaneously recorded measurements across an
entire lava flow or field, their relatively low spatial resolution usually necessitates the
incorporation of at least two thermal components into the interpretation of each pixel digital
number. Thus, unless useful data are obtained at two wavelengths, temperature or spatial
coverage parameters must be estimated or ranges of results given. At the expense of not
allowing simultaneous data collection from geographically separated areas, careful
measurements using hand-held radiometers permit temperatures of individual thermal
components to be obtained. Thus, our temperature data can be used to improve the interpretation
of satellite images by providing further control on the temperature ranges of different parts of
lava flows.
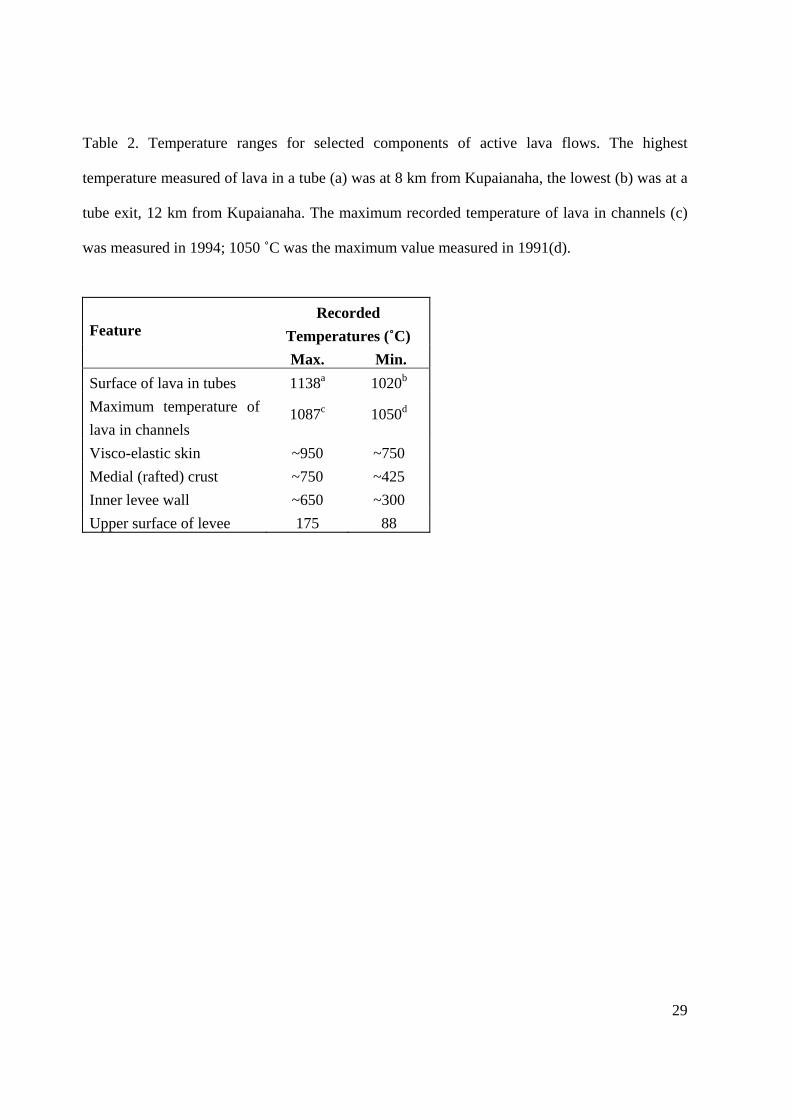
Our measurements of active flows can be summarised by dividing a typical flow surface
into four thermal components, each of which covers a range of temperature values; core (>1050
°C), visco-elastic skin (~750 to ~900 °C), rigid solid crust (<750 °C) and flow margins (<175
°C). Unfortunately, the relative spatial coverage of each component cannot be inferred from our
point measurements and will vary with parameters such as distance from the tube mouth, local
gradient and the flow history of the lava.
Our thermal anomalies for lava tubes and tumuli (of order 100 °C) are considerably
greater than those reported by Realmuto et al. (1992) in TIMS data from the Kupaianaha
flowfield in 1988 (anomalies of up to 15 °C, with the exception of those from skylights). This is
likely to be an effect of effective target area which, for the TIMS instrument, was several tens of
square metres (Realmuto et al., 1992) and for our surveys, approximately one square metre. A
small area of elevated temperature in our survey would thus represent a much larger proportion
of the target area than in a TIMS image, producing a greater apparent temperature.
19
The efficiency of lava tubes in transporting lava long distances and generating extensive
flowfields confirms that they are of great importance not only for hazard management but also
for understanding effusive volcanic processes on other planets (Keszthelyi, 1995; Sakimoto et
al., 1997). The cooling rate of lava within tubes is commonly considered to be approximately 1
°C km-1 (Keszthelyi, 1995) although field measurements have suggested that down-tube cooling
is not necessarily linear (Cashman et al., 1994). Our measurements of the surface temperature of
lava within tubes were taken at two localities and are not sufficient to confirm a definitive
cooling trend. However, assuming a lava pond temperature of 1158 °C, the data suggest an
approximately linear cooling rate of the exposed core of ~2 °C km-1.
Sakimoto and Zuber (1998) argue that heat loss within lava tubes is rate limited. They
thus assume that the upper flow surface in partly full tubes is at the same temperature as the
other flow boundaries, implying a similar thickness thermal boundary layer. However, cooling
of the flow surface will be accelerated under skylights and, although this is not thought to be
significant for the flow as a whole (Keszthelyi, 1995), it may be sufficient to generate or help
maintain a surface skin.
Our measurements through skylights also suggest that, perpendicular to the flow
direction, tubed flows have a different surface thermal profile compared with active channels in
subaerial flows. The higher temperatures measured at the margins of channels compared to their
centres is a consequence of hotter material being exposed to the surface as the crust is disrupted
by shear. Thus, we infer that higher temperatures are measured in areas of the flow where the
surface is highly disrupted, for example by a rapid increase in gradient. Tubed flows have cooler
margins than centres; this reflects the increased importance of conductive heat loss through the
tube walls compared with radiant heat loss from the surface.
Our surveys across flowfields highlight the potential problems of using remote sensing
without supplementary ground truth data. The surface temperatures we recorded across flows in
the latter stages of cooling were indistinguishable from those recorded over the surfaces of
20
active tubes. This implies that, in airborne or satellite images, features cannot be interpreted
using the anomaly magnitude alone and the spatial distribution of elevated temperature pixels
must be taken into account. The traverses also demonstrate the sensitivity of measured
temperatures (particularly the higher values) to the angle of observation. This is because
elevated temperatures in some regions are the result of small areas of much higher temperature
material within the target area. It is likely that these are located in relatively deep cracks and
thus visibile only from a viewing angle parallel to the cracks. This could have implications for
any correlation between satellite images taken at different angles, for example on and off nadir.
Within a satellite image, the area covered by a pixel may include all of these components
and a background. However, in some cases, certain thermal components may be safely neglected
if they are not sufficiently hot to contribute to the radiance at the observed frequency (Rothery et
al., 1988). Harris et al. (1998) provide a further example of ways of decreasing the number of
unknown parameters for image interpretation. The authors recognised that the high temperature
component of the lava flow they imaged (within the cracks in the crust) was itself composed of
two thermal components, corresponding to the uncooled molten lava and visco-elastic skin in
Table 2. Citing unpublished 1.1 µm video data, Harris et al. (1998) described these components
as a mesh of cooler filaments through which incandescent material was exposed. Assigning the
measurements of Flynn and Mouginis-Mark (1992) to this surface (the filaments, comprising
~96% of the area, at ~770 °C and the remaining 4% of the surface at ~1150 °C) allowed the
authors to calculate an effective integrated high temperature to use as a single component within
their model.
This study demonstrates the value of data acquired from modern hand-held infrared
digital video cameras which represent the next generation of technology in the thermal
investigation of lava flows (Pinkerton et al., 2000). Images captured by these systems combine
some of the advantages of space-borne systems (multiple, discrete, simultaneous measurements
distributed over a wide area and a rapid data capture rate) with those of the infrared radiometers
21
(individual pixel targets which can be sufficiently small to cover only one thermal component).
As an example, the Inframetrics ThermaCAM PM190 system has a viewing angle of ~16° and
an image size of 252 × 239 pixels. For a viewing range of 2 m this produces an image
representing ~0.56 × 0.56 m with an individual pixel size of <5 mm2. Such images can be used
to determine the range of surface temperatures and their spatial distribution, data which are
important for numerical models of lava flows as well as for satellite image interpretation. The
combination of small pixel size and relatively large spatial coverage increases the possibility of
measuring the maximum lava temperature (the core temperature, an essential parameter in
numerical models) during overturning or breakout events.
The increasing availability of portable instruments with high spatial resolution (infrared
video cameras) and high spectral resolution (spectroradiometers) promotes rapid advances in
field measurements of the thermal properties of lava flows. In combination with similar
advances in satellite technology (decreasing pixel size, hyperspectral instruments), this should
increase accuracy in the interpretation of remotely sensed data and consequently improve hazard
assessment and predictive models.
Acknowledgements
The authors wish to thank all staff of the Hawaiian Volcano Observatory for their assistance and
constructive comments. ACJ was funded by a NERC studentship GT4 GS 51 88. The work was
completed with the assistance of a grant from the commission of the European Communities
under the Fourth Framework Programme, Environment and Climate, Contract ENV4-CT97-
0713. The authors wish to thank Ken Hon, Tim Druitt, Luke Flynn and an anonymous reviewer
for their very useful comments on an embryonic version of this paper and Ricky Herd and Sonia
Calvari for their assistance in the field.
22
REFERENCES
Archambault, C., Tanguy, J.C., 1976. Comparative temperature measurement techniques on
Mount Etna lavas: problems and techniques. J. Volcanol. Geotherm. Res., 1: 113-125.
Ault, W.U., Eaton, J.P., Richter, D.H., 1961. Lava temperatures in the 1959 Kilauea eruption
and cooling lake. Geol. Soc. Amer. Bull., 72: 791-794.
Bonneville, A., Vasseur, G., Kerr, Y., 1985. Satellite thermal infrared observations of Mount
Etna after the 17th March 1981 eruption. J. Volcanol. Geotherm. Res., 24: 293-313.
Calvari. S., Pinkerton, H., 1998. Formation of lava tubes and extensive flow field during the
1991 - 93 eruption of Mount Etna. J. Geophys. Res., 103: 27,291-27,301.
Calvari S., Pinkerton, H., 1999. Lava tube morphology on Etna and evidence for lava flow
emplacement mechanisms. J. Volcanol. Geotherm. Res., 90: 263-280.
Cashman, K.V., Mangan, M.T., Newman, S., 1994. Surface degassing and modifications to
vesicle size distributions in active basalt flows. J. Volcanol. Geotherm. Res., 61: 45-68.
Cashman, K.V., Thornber, C., Kauahikaua, J.P. 1999. Cooling and crystallization of lava in open
channels, and the transition of Pahoehoe Lava to 'A'a. Bull. Volcanol., 61: 306-323.
Chester, D.K., Duncan, A.M., Guest, J.E., Kilburn, C.R.J., 1985. Mount Etna. The Anatomy of a
Volcano. Chapman Hall, London.
Dozier, J.A., 1981. A method for satellite identification of surface temperature fields of subpixel
resolution. Remote Sensing Environ., 11: 221-229.
Fink. J.H., Zimbelmann, J.R., 1986. Rheology of the 1983 Royal Gardens basalt flows, Kilauea
Volcano, Hawaii. Bull. Volcanol., 48: 87-96.
Flynn, L.P., Mouginis-Mark, P.J., 1994. Temperature of an active lava channel from spectral
measurements, Kilauea Volcano, Hawaii. Bull. Volcanol., 56: 297-301.
Flynn, L.P., Mouginis-Mark, PJ., 1992. Cooling rate of an active Hawaiian lava flow from night-
time spectroradiometer measurements. Geophys. Res. Lett., 19: 1783-1786.
23
Flynn, L.P., Mouginis-Mark, P.J., Horton, K.A., 1994. Distribution of thermal areas on an active
lava flow-field - Landsat observations of Kilauea, Hawaii, July 1991. Bull. Volcanol. 56: 284-
296.
Flynn, L.P., Mouginis-Mark, P.J., Gradie, J.C., Lucey, P.G., 1993. Radiative temperature
measurements at Kupaianaha Lava Lake, Kilauea Volcano, Hawaii. J. Geophys. Res., 98:
6461-6476.
Francis, P., Rothery, D., 2000. Remote sensing of active volcanoes. Ann. Rev. Earth. Planet.
Sci., 28: 81-106.
Greeley, R., 1971. Observations of actively forming lava tubes and associated structures,
Hawaii. Mod. Geol., 2: 207-223.
Greeley, R., 1972. Additional observations of actively forming lava tubes and associated
structures Hawaii. Mod. Geol., 3: 157-160.
Greeley. R, 1987. The role of lava tubes in Hawaiian volcanoes. In: Decker RW Wright TL
Stauffer PH (Editors). Volcanism in Hawaii. U.S. Geol. Survey Prof. Paper 1350: 1589-1602.
Griffiths, R.W., 2000. The dynamics of lava flows. Annu. Rev Fluid Mech., 32: 477-518.
Harris, A.J.L., Flynn, L.P., Keszthelyi, L., Mouginis-Mark, P.J., Rowland, S.K., Resing, J.A.,
1998. Calculation of lava effusion rates from Landsat TM data. Bull. Volcanol., 60: 52-71.
Harris, A.J.L., Vaughan, R.A., Rothery, D.A., 1995. Volcano detecion and monitoring using
AVHRR data: the Krafla eruption, 1984. Int. J. Remote Sensing, 16: 1001-1020.
Harris, A.J.L., Blake, S., Rothery, D.A., 1997. A chronology of the 1991 to 1993 Mount Etna
eruption using advanced very high resolution radiometer data: Implications for real-time
thermal volcano monitoring. J. Geophys. Res., 102: 7985-8003.
Harris, A.J.L., Flynn, L.P., Rothery, D.A., Oppenheimer, C., Sherman, S.B., 1999. Mass flux
measurements at active lava lakes: Implications for magma recycling. J. Geophys. Res., 104:
7117-7136.
24
Heliker, C.C., Mangan, M.T., Mattox, T.N., Kauahikaua, J.P., Helz, R.T., 1998. The character of
long-term eruptions: inferences from episodes 50-53 of the Pu'u 'O'o-Kupaianaha eruption of
Kilauea Volcano. Bull. Volcanol., 59: 381-393.
Helz, R.T., Thornber, C.R., 1987. Geothermometry of Kilauea Iki lava lake, Hawaii. Bull.
Volcanol., 49: 651-668
Helz, R.T., Heliker, C., Mangan, M., Hon, K., Neal, C.A., Simmons, L., 1991. Thermal history
of the current Kilauean East Rift eruption. A.G.U. Fall Meeting Abstracts San Francisco: 557
– 558.
Hon, K., Kauakikaua, J., Denlinger, R., MacKay, K., 1994. Emplacement and inflation of
pahoehoe sheet flows: observations and measurements of active lava flows on Kilauea
volcano, Hawaii. Geol. Soc. Amer. Bull., 106: 351-370.
Jackson, D.B., Hort, M.K.G., Hon, K., Kauahikaua, J. 1987. Detection and mapping of active
lava tubes using the VLF induction technique, Kilauea volcano, Hawaii. EOS Trans. A.G.U.,
68: 1543.
Jones, A.C., 1992. Remote sensing and thermal monitoring of active lava flows, Kilauea
Volcano, Hawaii. Ph.D. Thesis, Lancaster University, Lancaster, U.K.
Kauahikaua, J., Cashman, K.V., Mattox, T.N., Heliker, C.C., Hon, K.A., Mangan, M.T.,
Thornber, C.R., 1998. Observations on basaltic lava streams in tubes from Kilauea Volcano,
island of Hawaii. J. Geophys. Res., 103: 27,303-27,323.
Kauahikaua, J., Moulds, T., Hon, K., 1990. Observations of lava tube formation in Kupianaha,
Hawai'i. EOS Trans. A.G.U., 71: 1711.
Keszthelyi, L., 1995. A preliminary thermal budget for lava tubes on the Earth and planets. J.
Geophys. Res., 100: 20,411-20,420.
Kilburn, C.R.J., Lopes, R.M.C., 1988. The growth of a lava flow fields on Mount Etna, Sicily. J.
Geophys. Res., 93: 14,759-14,772.
Lipman, P.W., Banks, N.G., 1987. Aa flow dynamics, Mauna Loa 1984. In: Decker RW Wright
25
TL Stauffer PH (Editors), Volcanism in Hawaii . U.S. Geol. Survey. Prof. Paper 1350: 1527-
1567.
Macdonald, G.A., 1953. Pahoehoe, aa and block lava. Am. J. Sci., 251: 169-191.
Mangan, M.T., Cashman, K.V., Newman, S., 1993. Vesiculation of basaltic magma during
eruption. Geology, 21: 157-160.
Matson, M., Dozier, J.A., 1981. Identification of subresolution high temperature sources using a
thermal IR sensor. Photogramm. Eng. Remote Sens., 47: 1311-1318.
Mattox, T.N., Heliker, C., Kauahikaua, J., Hon, K., 1993. Development of the 1990 Kalapana
flow-field, Kilauea Volcano, Hawaii. Bull. Volcanol., 55: 407-413.
Mouginis-Mark, P., Garbeil, H., Flament, P., 1994. Effects of viewing geometry on AVHRR
observations of volcanic thermal anomalies. Remote Sens. Environ., 48: 51-60.
Neal, C.A., Duggan, T.J., Wolfe, E.W., Brandt, E.L., 1988. Lava samples, temperatures, and
compositions. In: Wolfe E.W. (Editor) The Pu'u O'o eruption of Kilauea Volcano, Hawaii;
episodes 1 through 20, January 3, 1983, through June 8, 1984. U.S. Geol. Survey Prof. Paper
1463: 99-127.
Oppenheimer, C., 1991, Lava flow cooling estimated from Landsat Thematic Mapper infrared
data: the Lonqumay eruption (Chile, 1989). J. Geophys. Res., 96: 21,865-21,878.
Oppenheimer, C., Rothery, D.A., 1989. Infrared remote sensing of hot volcanoes assessed by
field observations. Remote Sensing for Operational Applications. Proc. 15th Annual Conf. of
the Remote Sensing Society, University of Bristol: 317-322.
Oppenheimer, C., Rothery, D.A., 1991. Infrared monitoring of volcanoes by satellite. J. Geol.
Soc. London, 148: 563-569.
Oppenheimer, C., Francis, P.W., Rothery, D.A., Carlton, R.W.T., Glaze, L.S., 1993. Infrared
image-analysis of volcanic thermal features - Lascar Volcano, Chile, 1984-1992. J. Geophys.
Res., 98: 4269-4286.
Peterson, D.W., Tilling, R.I., 1980. Transition of basaltic lava from pahoehoe to aa, Kilauea
26
Volcano, Hawaii: Field observations and key factors. J. Volcanol. Geotherm. Res., 7: 271-
293.
Pieri, D.S., Glaze, L.S., Abrams, M.J., 1990. Thermal radiance observations of an active lava
flow during the June 1984 eruption of Mount Etna, Geology, 18: 1018-1022.
Pinkerton, H., 1987. Factors affecting the morphology of lava flows. Endeavour, 11: 73-79.
Pinkerton, H., 1993. Measurements of the properties of flowing lavas. In: Luongo, G., Kilburn,
C.R.J. (Editors), Handbook for the monitoring of active lava flows. University College Press,
London, 169-185.
Pinkerton, H., Sparks, R.S.J., 1976. The 1975 sub-terminal lavas, Mount Etna: a case history of
the formation of a compound lava field. J. Volcanol. Geotherm. Res., 1: 167-182.
Pinkerton, H., Kent, R., Calvari, S. (2000) Thermal imaging of Etna volcano, Sicily during
March to October, 1999. Geoscience 2000 abstract.
Realmuto, V.J., Hon, K., Kahle, A.B., Abbott, E.A., Pieri, D.C., 1992. Multispectral thermal
infrared mapping of the 1 October 1988 Kupaianaha flow field, Kilauea volcano, Hawaii.
Bull. Volcanol., 55: 33-44.
Rothery, D.A., Francis, P.W, Wood, C.A., 1988. Volcano monitoring using short wavelength
infrared data from satellites. J. Geophys Res., 93 : 7993-8008.
Rothery, D.A., Pieri, D.C., 1993. Remote sensing of active lavas. In: Luongo, G., Kilburn, C.R.J.
(Editors), Handbook for the monitoring of active lava flows. University College Press,
London, 203-232.
Rothery, D.A., Oppenheimer, C., Bonneville, A., 1995. Infrared thermal monitoring. In:
McGuire, W.J., Kilburn, C.R.J., Murray, J.B. (Editors), Monitoring Active Volcanoes.
University College Press, London, 184-216.
Rowland. S.K., Walker, G.P.L., 1990. Pahoehoe and aa in Hawaii: volumetric flow rate controls
the lava structure. Bull. Volcanol., 52: 615-628.
27
Sakimoto, S.E.H., Crisp, J., Baloga, S.M., 1997 Eruption constraints on tube-fed planetary lava
flows. J. Geophys. Res., 102: 6597-6613.
Sakimoto, S.E.H., Zuber, M.T., 1998. Flow and convective cooling in lava tubes. J. Geophys.
Res., 103: 27,465-27,487.
Salisbury, J.W., D’Aria, D.M., 1992. Emissivity of terrestrial materials in the 8-14mm
atmospheric window. Remote Sens. Environ., 42: 83-106.
Swanson, D.A. 1973. Pahoehoe flows from the 1969-1971 Mauna Ulu eruption, Kilauea
Volcano, Hawaii. Geol. Soc. Amer. Bull., 84: 615-626.
Tilling, R.I., Christiansen, R.L., Duffield, W.A., Endo, E.T., Holcomb, R.T., Koyanagi, R.Y.,
Peterson, D.W., Unger, J.D., 1987. The 1972-1974 Mauna-Ulu eruption, Kilauea Volcano: an
example of quasi-steady-state magma transfer. In: Decker, R.W., Wright, T.L., Staufer, P.H.
(Editors), Volcanism in Hawaii, Volume 1. U.S. Geol. Survey. Prof. Paper 1350: 405-469.
Wolfe, E.W., Neal, C.A., Banks, N.G., Duggan, T.J., 1988. Geological observations and
chronology of eruptive events during the first 20 episodes of the Pu'u 'O'o eruption, January 3,
1983 through June 8, 1984. In: Wolfe E.W. (Editor) The Pu'u O'o eruption of Kilauea
Volcano, Hawaii; episodes 1 through 20, January 3, 1983, through June 8, 1984. U.S. Geol.
Survey Prof. Paper 1463: 1-98.
Wooster, M.J., Rothery, D.A., 1997. Time-series analysis of effusive volcanic activity using the
ERS Along Track Scanning Radiometer: The 1995 Eruption of Fernandina volcano,
Galápagos Islands. Remote Sens. Environ., 62: 109-117.
Wooster, M.J., Wright, R., Blake, S., Rothery, D.A., 1997. Cooling mechanisms and an
approximate thermal budget for the 1991-1993 Mount Etna lava flow. Geophys. Res. Lett.,
24: 3277-3280.
Zablocki, C.J., 1978. Applications of the VLF induction method for studying some volcanic
processes of Kilauea volcano, Hawaii. J. Volcanol. Geotherm. Res., 3: 155-195.
28
TABLES
Table 1. Specifications of the Minolta/Land Cyclops 330 and Cyclops 52 hand-held infrared
radiometers.
Specification C330 C52
Temperature range -50 to 1000 ˚C 600 to 3000 ˚C Accuracy (above 300 ˚C) 1 % + 1 ˚C
(~100 to 300 ˚C) ~4 ˚C (0 to ~100 ˚C) ~2 ˚C
0.5 % + 1 ˚C
Resolution (above 105 ˚C) 1 ˚C (below 105 ˚C) 0.1 ˚C
1 ˚C
Viewfinder angle 8˚ 9˚ Measurement angle 1˚ 0.33˚ Spectral response 8 - 13 µm 0.8 - 1.1 µm Response time 1 s (98% response) 0.6 s
Target diameters 37 mm at 2 m, 184 mm at 10 m
11 mm at 2 m, 57 mm at 10 m
29
Table 2. Temperature ranges for selected components of active lava flows. The highest
temperature measured of lava in a tube (a) was at 8 km from Kupaianaha, the lowest (b) was at a
tube exit, 12 km from Kupaianaha. The maximum recorded temperature of lava in channels (c)
was measured in 1994; 1050 ˚C was the maximum value measured in 1991(d).
Feature Recorded
Temperatures (˚C) Max. Min. Surface of lava in tubes 1138a 1020b
Maximum temperature of lava in channels
1087c 1050d
Visco-elastic skin ~950 ~750 Medial (rafted) crust ~750 ~425 Inner levee wall ~650 ~300 Upper surface of levee 175 88
30
Table 3. Maximum temperatures recorded from lava surfaces within the Kupaianaha flow field,
using the C330 radiometer in September 1994. Features marked n. r. were not recorded.
Recorded Temperatures (˚C)
Features Remote Traverse (viewing distances ~20 to 250 m)
Walked Traverse (viewing distances ~0.6 m)
Active flows <310 110-1140 Tumuli 90-310 60-295 Recent flows n. r. 80-160 Old flows 30-50 40-80 Depressions n. r. 40-130 Kipukas 40-80 n. r.
31
FIGURE CAPTIONS
Figure 1. Map of Kilauea’s south east rift zone showing the two active vents, Pu'u 'O'o and
Kupaianaha, and the active flows studied in 1990. Field localities are indicated by the numbers
in boxes. The inset shows the area of study with relation to Hawai'i, Kilauea volcano, the
southwest rift zone (SWRZ) and the east rift zone (ERZ). The map has been compiled from field
mapping carried out by staff from the USGS Hawaiian Volcano Observatory (used with
permission).
Figure 2. The effect of emissivity selection on C52 radiometer measurements. Ratios are given
of temperatures measured by the C52 and a Comark Cr-Al thermocouple of a Hawaiian
pahoehoe sample heated in a horizontal tube furnace. The different symbols represent C52
measurements taken using different emissivity settings, as shown in the key. Results closest to
those of the thermocouple (i.e. a ratio of 1.00) were obtained using an emissivity of 1.00.
Figure 3. The effect of viewing distance and angle on the effective target area diameter for the
C330 and C52 radiometers. Angles are from the normal of the surface being viewed.
Figure 4. Temperatures recorded at different distances from an active vent at the eastern end of
Pali Uli on September 23, 1994 using the C52 radiometer. The extrapolated temperature of the
lava surface at the vent is 1095 °C.
Figure 5. Temperature measurements of the surface of a tubed lava flow carried out through a
skylight (locality 13), with the C52 radiometer. The radiometer was tripod-mounted and
recorded temperatures from an area located at the centre of the flow. The temperature variations
are due to hotter and colder portions of the lava flowing through the measuring area.
32
Figure 6. Transverse surface temperature profile across a tube lava flow carried out with the C52
at locality 14. The data points can be described as taken of (a) lava adjacent to the tube wall, (b)
surface skin shear zone, (c) outer edge of central skin and (d) the centre of the flow surface.
Temperatures given represent the maximum recorded over a 20 s interval.
Figure 7. Along-flow temperature measurements carried out at locality 4 using the C52
radiometer. (a) Sketch showing the channelised flow investigated. Note how shearing of the
central crustal plates exposed some areas of the upper layer of the flow interior. (b) Down-flow
cooling profile taken along the centre of the flow from the main branch. The data can be
interpreted as evidence for the three separate thermal components observed on most lava flows;
crust, visco-elastic skin, and exposed core. A least squares exponential fit (the dotted line) has
been calculated for the lowest temperature data points (those given as crossed squares) which are
thought to represent radiative surface cooling and thickening of the crust. Data points above the
line are measurements that include visco-elastic skin or, for the peak at 28 m, the upper part of
the core.
Figure 8. Transverse temperature profiles carried out with the C52 radiometer at locality 10,
demonstrating the development of a tube from an open channel by the growth of lateral stable
crust. Transect (a) is at the apex of the roof closure; Transect (f) is 50 m downstream. In (g), the
data are presented as a contour map. The hatched areas represent the sides of the channel where
the channel width was less than 2.8 m.
Figure 9. (a) Temperature profile using the C330 Radiometer across a two week old flow field at
locality 12a. The thermal anomaly at 120 m indicated the surface position of an active tube. (b)
Temperature profile across a flow field emplaced more than two weeks prior to the survey at

33
locality 12b. The thermal anomaly at 80 m is a recent surface flow; the active tube is situated at
130 m.
Figure 10. Traverses across the eastern end of the active flow field above Pali Uli, September 24,
1994 carried out with the C330 radiometer. The data were collected along a 500 m transect
across the active flow field from three different viewing positions (shown by the different
symbols). All positions were ~250 m from the closest point on the line of the traverse. Arrowed
features are (o) old flows, (t) tumuli and (k) kipukas.