Surface Finish Control in Machining Processes Using Haralick Descriptors and Neuronal Networks
11
Surface Finish Control in Machining Processes Using Haralick Descriptors and Neuronal Networks Enrique Alegre , Roc´ ıo Alaiz-Rodr´ ıguez, Joaqu´ ın Barreiro, Eduardo Fidalgo, and Laura Fern´ andez Dept. of Electrical, Automatic and Systems Engineering, University of Le´on, 24071 Le´on, Spain Phone: 0034 987 291989, Fax: 0034 987 291970 [email protected] Abstract. This paper presents a method to perform a surface finish control using a computer vision system. The goal pursued was to de- sign an acceptance criterion for the control of surface roughness of steel parts, dividing them in those with low roughness acceptable class and those with high roughness defective class. We have used 143 images ob- tained from AISI 303 stainless steel machining. Images were described using three different methods texture local filters, the first four Haralick descriptors from the gray-level co-occurrence matrix and a 20 features vector obtained from the first subband of a wavelet transform of the original image and also the gray-level original image. Classification was conducted using K-nn and Neuronal Networks. The best error rate - 4.0% - with k-nn was achieved using texture descriptors. With the neuronal network, an eight node hidden layer network using Haralick descriptors leads to the optimal configuration - 0.0% error rate. Keywords: roughness control, textural descriptors, gray level co-occurrence matrix, k-nn, neuronal network, classification. 1 Introduction Surface measurement has been an important topic in the research during the last decades. The reason is that it constitutes an important property of parts and products with high significance in their functionality. In many situations, it is required to qualify and quantify diverse aspects of the surfaces: geometry, topography, texture, roughness and defects [18]. When the quality control point of view is considered, the necessity of evaluate the surface roughness is obvious, since it represents an important requirement in many engineering applications [1,2,19]. The measurement of surface roughness started a few decades ago with the advent of tactile profilometers. These drag a stylus along a line segment and Corresponding author. R.P. Barneva et al. (Eds.): CompIMAGE 2010, LNCS 6026, pp. 231–241, 2010. c Springer-Verlag Berlin Heidelberg 2010
-
Upload
universidaddeleon -
Category
Documents
-
view
0 -
download
0
Transcript of Surface Finish Control in Machining Processes Using Haralick Descriptors and Neuronal Networks

Surface Finish Control in Machining Processes
Using Haralick Descriptors and NeuronalNetworks
Enrique Alegre�, Rocıo Alaiz-Rodrıguez, Joaquın Barreiro,Eduardo Fidalgo, and Laura Fernandez
Dept. of Electrical, Automatic and Systems Engineering,University of Leon, 24071 Leon, Spain
Phone: 0034 987 291989,Fax: 0034 987 291970
Abstract. This paper presents a method to perform a surface finishcontrol using a computer vision system. The goal pursued was to de-sign an acceptance criterion for the control of surface roughness of steelparts, dividing them in those with low roughness acceptable class andthose with high roughness defective class. We have used 143 images ob-tained from AISI 303 stainless steel machining. Images were describedusing three different methods texture local filters, the first four Haralickdescriptors from the gray-level co-occurrence matrix and a 20 featuresvector obtained from the first subband of a wavelet transform of theoriginal image and also the gray-level original image. Classification wasconducted using K-nn and Neuronal Networks. The best error rate - 4.0%- with k-nn was achieved using texture descriptors. With the neuronalnetwork, an eight node hidden layer network using Haralick descriptorsleads to the optimal configuration - 0.0% error rate.
Keywords: roughness control, textural descriptors, gray levelco-occurrence matrix, k-nn, neuronal network, classification.
1 Introduction
Surface measurement has been an important topic in the research during thelast decades. The reason is that it constitutes an important property of partsand products with high significance in their functionality. In many situations,it is required to qualify and quantify diverse aspects of the surfaces: geometry,topography, texture, roughness and defects [18]. When the quality control pointof view is considered, the necessity of evaluate the surface roughness is obvious,since it represents an important requirement in many engineering applications[1,2,19].
The measurement of surface roughness started a few decades ago with theadvent of tactile profilometers. These drag a stylus along a line segment and� Corresponding author.
R.P. Barneva et al. (Eds.): CompIMAGE 2010, LNCS 6026, pp. 231–241, 2010.c© Springer-Verlag Berlin Heidelberg 2010

232 E. Alegre et al.
record the vertical deflection of the stylus as it moves over the surface, thusrecording the height of the surface at the sampling points. Using this traditionaltechnology, the surface finish can be estimated by means of some roughness pa-rameters defined in international standards [6]. Development of these standardsis basically oriented to tactile measuring devices that provide twodimensionalrecords of part profile.
However, even though the stylus instrument is still considered to be the ac-cepted standard for measurement of surface roughness, the method has severaldisadvantages [15,18]: a) the stylus has to stay in permanent contact with thesurface and is therefore easily damaged or soiled; b) the single profile line coversonly a small part of the surface, possibly missing important areas; c) surfacedamage in some instances by the stylus force; d) low efficiency due to scanning.More disadvantages of stylus-based method can be found in [19].
These numerous disadvantages of contact methods have forced to surfacemeasurement technologies to evolve significantly during last years [1] towardsnon-contact methods. A large research has been done in order to characterize3D measurements of surface without contact at once. Among the common tech-niques are white-light interferometry, fringe projection, microscopy, speckle, lightscattering and others.
Among these modern techniques, those based on computer vision can be re-marked in terms of speed and accuracy. The advantages this technology pro-vides are diverse. Whereas tactile techniques characterize a linear track over thepart surface, computer vision techniques allow characterizing wide areas of thepart surface providing more information [3,11,15,16]. Also, computer vision tech-niques take measures faster, since images are captured in a very short time, andthey can be in-machine implemented. In addition, the application of exhaustivevalidity checking to each part is also possible. This aspect would be very difficultto achieve with traditional tactile porfilometers, which are slow and delicate.
Continuous advances have been made in sensor technologies. Particularly,vision sensors have been greatly enhanced in capabilities and cost reduction.Additionally, advances in image processing technology provide more reliable con-clusions than before.
In all, computer vision is a very interesting technology for industrial environ-ment. The use of these systems for the monitoring of machining operations hasproved [4,12] an important reduction in the cycle time and the required resources.In particular, the modeling and prediction of surface roughness by computer vi-sion have received a great deal of attention [2,3,4,5,6,8,9,10,11,12,15,16,17,19].
As far as the traditional contact techniques are concerned, computer vision tech-niques use other parameters to measure the surface finish. In the view of this con-sideration, the current standards developed for tactile devices do not reflect thecurrent state of technology. New procedures are necessary to correlate the resultsobtained with tactile instruments with those obtained using other devices, as thosebased on computer vision. In this context, two lines should be remarked: the studyon the spatial domain and the study in the frequency domain. This work tacklesthe measurement of surface quality from the point of view of the spatial domain.

Surface Finish Control in Machining Processes 233
Tarng and Lee [9] and Lee et al. [13] analyze the use of artificial vision andimage analysis to quantify the roughness in different turning operations. Methodsbased on image analysis capture an image of the surface and analyze its pixelsto obtain a diffuse light pattern. Later on, roughness parameters are calculatedby means of statistical descriptors. One of the most used parameters is thestandard deviation of gray levels. Kumar et al. [8] focus on milling, turningand molding processes. They make zoom over original images to obtain the Gaparameter (the image gray level average), finding a high correlation amongstthe Ga parameter and the surface roughness. Kiran et al. [7] used a measurecalled texture unit, calculated from the gray scale values of the image, in orderto describe the local texture of a pixel. Al-Kindi et al. [3] proposed a methodnamed intensitytopography compatibility (ITC), characterizing the image databy three components: lightning, reflectance and surface characteristics. Theycalculate the value of conventional roughness parameters combining statisticalsuch as mean value and standard deviation. Ramana and Ramamoothy [14]proposed a method based on the gray-level difference matrix for texture analysis.Tasan et al. [17] proposed a method for the comparison of local heights from theimage data using successive surface images. Lee et al. [12] developed a computervision system that measures the roughness in turning processes automatically.
In this work we propose a new method that can be used as an acceptancecriterion in a quality control process. We have classified the roughness of carbonsteel parts into two classes without error using texture descriptors.
The rest of the paper is organized as follows: Section 2 describes the imageacquisition process. A description of the features used is included in Section 3and the classification stage in Section 4. Finally, conclusions are summarized inSection 5.
2 Samples and Image Acquisition
2.1 Test Parts and Machining Characteristics
Test parts were made of AISI 303 X8CrNiS189 stainless steel. This material waschosen due to its common use in the small part mass-manufacturing industry.A MUPEM CNC multiturret parallel lathe ICIAR/1/42 model was used for themachining of parts.
Figure 1 shows the test part used. Several part operations were carried out,all of them representative of massive precision machining. However, only thecylindrical shape was used for surface finish measurement. Cutting tools werecoated carbide inserts from Sandvik. The machining parameters used for thetests were fixed at the following values: cutting speed 250 m/min, feed rate0.27 mm/rev and cutting depth 2 mm, considered as reference values. A surfacefinish control was performed on a HOMMELWELKE class 1 perfilometer. Itwas evident that the evolution of surface finish Ra values was far worse whenincreasing the machining time.

234 E. Alegre et al.
Fig. 1. Test parts used to measure the surface roughness
2.2 Image Acquisition
Images of the parts were captured using a specific location fixture which hadattached a camera and a diffuse lighting system (Figure 2). The part was po-sitioned onto a V shape bracket. The lighting system comprised a FOSTECregulated light source DCR RIII. A NER SCDI-25-F0 diffuse illumination SCDIsystem was used to avoid shines. The system provided diffuse illumination in thecamera axis.
The images were obtained using a Pulnix PE2015 B/W camera with 1/3 CCD.A Matrox Meteor II frame grabber card was used to digitize the images.
The optic assembly was composed of an OPTEM industrial zoom 70XL, withan extension tube of 1X and 0.5X/0,75X/1.5X/2.0X OPTEM lens. We used themaximum magnification of the system.
2.3 Experimental Image Set
Using such system, 143 images were captured (see Figure 3) with the same zscale. Each of the images was labeled with its Ra roughness parameter, obtainedusing the median of three repeated Ra measuring. The roughness values were inthe range 2.40 to 4.33 m.
Several experiments were carried out and the images were divided in two sets:the first class corresponds to low roughness (satisfactory) and the second classto high roughness (unacceptable). Images of both classes are shown in Figure 3.
Three different cases were considered. In the first case, the first thirty images(ordered by Ra values) were separated from the last thirty and labeled as class 1and class 2 respectively. In the second case, one class was composed by the firstfifty images and the second one by the last fifty. In the third case, seventy ofthem were assigned to class 1 while the other seventy to class 2. Images of bothclasses will be included in train and test subgroups as explained in Section 4.

Surface Finish Control in Machining Processes 235
Fig. 2. Camera and lighting system used in the image acquisition
(a) (b) (c)
(d) (e) (f)
Fig. 3. Images of both classes 1 and 2. a, b and c with low roughness (Ra of 2.66, 2.77and 2.82 µm respectively) and d, e and f with high roughness (Ra of 3.65, 4.03 and4.03 µm).
236 E. Alegre et al.
3 Image Processing and Feature Extraction Methods
3.1 Image Preprocessing
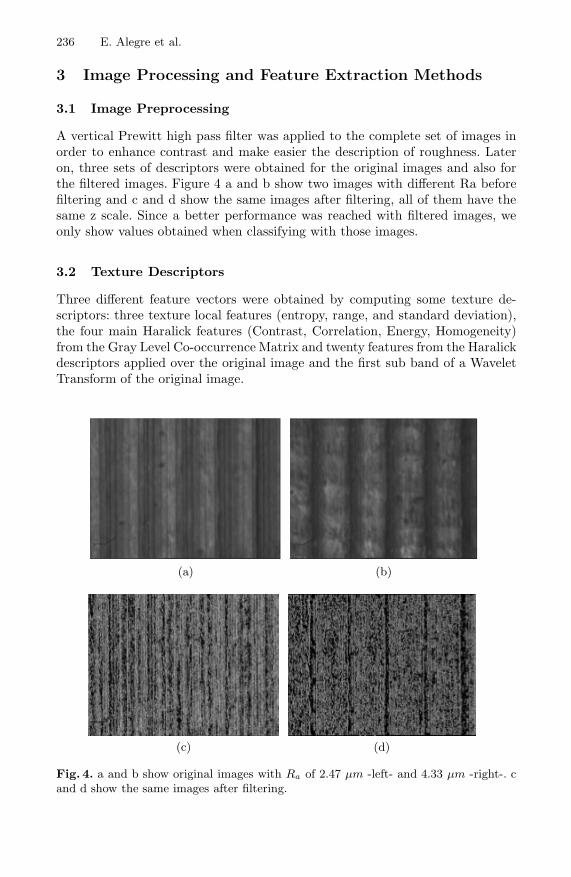
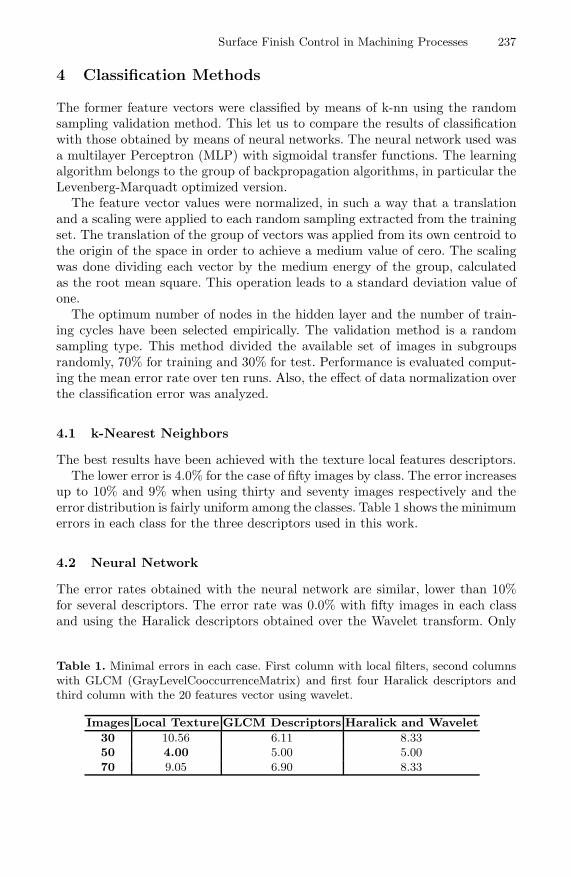
A vertical Prewitt high pass filter was applied to the complete set of images inorder to enhance contrast and make easier the description of roughness. Lateron, three sets of descriptors were obtained for the original images and also forthe filtered images. Figure 4 a and b show two images with different Ra beforefiltering and c and d show the same images after filtering, all of them have thesame z scale. Since a better performance was reached with filtered images, weonly show values obtained when classifying with those images.
3.2 Texture Descriptors
Three different feature vectors were obtained by computing some texture de-scriptors: three texture local features (entropy, range, and standard deviation),the four main Haralick features (Contrast, Correlation, Energy, Homogeneity)from the Gray Level Co-occurrence Matrix and twenty features from the Haralickdescriptors applied over the original image and the first sub band of a WaveletTransform of the original image.
(a) (b)
(c) (d)
Fig. 4. a and b show original images with Ra of 2.47 µm -left- and 4.33 µm -right-. cand d show the same images after filtering.
Surface Finish Control in Machining Processes 237
4 Classification Methods
The former feature vectors were classified by means of k-nn using the randomsampling validation method. This let us to compare the results of classificationwith those obtained by means of neural networks. The neural network used wasa multilayer Perceptron (MLP) with sigmoidal transfer functions. The learningalgorithm belongs to the group of backpropagation algorithms, in particular theLevenberg-Marquadt optimized version.
The feature vector values were normalized, in such a way that a translationand a scaling were applied to each random sampling extracted from the trainingset. The translation of the group of vectors was applied from its own centroid tothe origin of the space in order to achieve a medium value of cero. The scalingwas done dividing each vector by the medium energy of the group, calculatedas the root mean square. This operation leads to a standard deviation value ofone.
The optimum number of nodes in the hidden layer and the number of train-ing cycles have been selected empirically. The validation method is a randomsampling type. This method divided the available set of images in subgroupsrandomly, 70% for training and 30% for test. Performance is evaluated comput-ing the mean error rate over ten runs. Also, the effect of data normalization overthe classification error was analyzed.
4.1 k-Nearest Neighbors
The best results have been achieved with the texture local features descriptors.The lower error is 4.0% for the case of fifty images by class. The error increases
up to 10% and 9% when using thirty and seventy images respectively and theerror distribution is fairly uniform among the classes. Table 1 shows the minimumerrors in each class for the three descriptors used in this work.
4.2 Neural Network
The error rates obtained with the neural network are similar, lower than 10%for several descriptors. The error rate was 0.0% with fifty images in each classand using the Haralick descriptors obtained over the Wavelet transform. Only
Table 1. Minimal errors in each case. First column with local filters, second columnswith GLCM (GrayLevelCooccurrenceMatrix) and first four Haralick descriptors andthird column with the 20 features vector using wavelet.
Images Local Texture GLCM Descriptors Haralick and Wavelet
30 10.56 6.11 8.3350 4.00 5.00 5.0070 9.05 6.90 8.33

238 E. Alegre et al.
the Haralick descriptors enhance their results when using the vertical Prewittfiltering, the rest of them achieve significant better results when the filter is notapplied.
All descriptors were used for this test, and the results obtained from them areacceptable, in most of the cases with error rates below 10.0%.
Table 2 shows the global error rate for the case of thirty images in each class,used filtered images in Haralick descriptors, and non filtered images with theother two descriptors. Minimum error rate equals 0,69%. The values in the firstrow and first column are the number of cycles and the number of nodes in thehidden layer, respectively.
Table 3 and 4 show the global error rate for the other cases, that is, fifty andseventy images in each class. It is observed that the lower error rates correspondto the fifty image case, even better than those obtained with thirty images. Thebest error rate obtained reaches the 0.0%.
The reason of this behavior may be that, in the case of thirty images, the train-ing set is not large enough for optimum network learning and a reliable classifica-tion. In the case of seventy images the error rates increase up to 5,65% as expected,since values near to the decision border in both classes are very close, but even inthis case, the Haralick descriptors achieve acceptable error rates.
Table 2. Error rates in %. Classes with 30 images filtered with Prewitt in case ofLocal Texture and GLCM Descriptors. Number of cycles is shown in rows and numberof nodes in the hidden layer in columns.
Local Texture GLCM Descriptors Haralick Wavelet
25 100 200 1000 25 100 200 1000 25 100 200 1000
2 11.11 10.42 9.03 9.03 7.64 6.94 10.42 11.11 3.47 2.78 3.47 3.474 9.03 9.03 15.28 18.06 8.33 10.42 7.64 7.64 3.47 5.56 2.78 5.566 10.42 11.11 8.33 9.03 11.11 9.03 7.64 8.33 6.94 1.39 1.39 2.788 9.03 7.64 9.72 8.33 9.03 9.72 9.03 7.64 9.03 0.69 2.78 2.7810 12.5 9.03 6.25 6.94 11.81 8.33 8.33 9.03 1.39 1.39 0.69 1.3914 10.42 8.33 9.72 6.94 10.42 8.33 7.64 7.64 1.39 1.39 1.39 2.08
Table 3. Error rates in %. Classes with 50 images filtered with Prewitt in case ofLocal Texture and GLCM Descriptors. Number of cycles is shown in rows and numberof nodes in the hidden layer in columns.
Local Texture GLCM Descriptors Haralick Wavelet
25 100 200 1000 25 100 200 1000 25 100 200 1000
2 6.67 7.5 7.5 6.67 7.5 8.75 7.5 7.5 0.42 0.42 0.83 1.674 13.33 6.25 7.08 7.92 7.92 10.83 10.42 8.75 0.83 0.83 6.67 2.086 9.17 7.5 7.08 5.83 10.83 10.83 7.5 8.33 1.25 0.42 0.42 0.008 8.33 7.92 17.08 7.92 10.42 7.92 9.17 9.58 0.83 0.42 6.67 2.0810 7.5 6.25 7.5 10.83 8.33 7.5 16.67 8.75 1.25 0.42 0.42 2.0814 5.83 7.08 5 5.42 10 9.58 7.5 9.17 0.83 2.92 0.42 0.00

Surface Finish Control in Machining Processes 239
Table 4. Error rates in %. Classes with 70 images filtered with Prewitt in case ofLocal Texture and GLCM Descriptors. Number of cycles is shown in rows and numberof nodes in the hidden layer in columns.
Local Texture GLCM Descriptors Haralick Wavelet
25 100 200 1000 25 100 200 1000 25 100 200 1000
2 11.31 11.01 10.12 9.82 8.33 8.63 8.93 10.42 5.95 8.04 9.52 9.234 16.96 10.42 16.37 11.9 10.42 8.63 9.52 9.52 5.65 7.44 7.74 6.556 10.71 11.01 10.71 12.2 10.71 16.96 11.31 10.71 6.25 7.44 6.85 7.148 10.12 11.01 10.71 9.82 10.71 11.31 13.69 9.82 7.44 8.04 6.85 7.1410 9.52 16.07 11.01 13.69 12.2 12.8 11.31 11.31 9.82 6.25 7.74 7.7414 16.07 12.5 15.77 10.42 10.42 10.71 12.5 12.5 7.74 6.55 6.55 7.44
4.3 Minimum Errors
Table 5 shows the minimum errors obtained with each descriptor and with bothclassification methods. The n parameter indicates that feature vectors are nor-malized. It can be observed that the MLP classifier gives better results in mostof the cases, reaching its best result in the case of 50 images.
Table 5. Minimum errors with Local Texture Descriptors, Gray Level Co-occurrenceMatrix Descriptors and Haralick Descriptors
30 images 50 images 70 images
Class LText GLCM Har.W LText GLCM Har.W LText GLCM Har.W
KNN 8.33 6.65 8.33 5.00 5.00 5.00 7.86 7.86 8.57KNN n. 11.11 6.11 8.33 4.00 5.00 5.00 9.29 6.90 8.33MLP 16.67 1.39 7.41 10.00 3.33 4.44 8.33 7.14 7.14
MLP n. 6.25 6.25 0.69 5.00 7.08 0.00 9.23 8.04 5.65
5 Conclusions
This paper proposes a method based on computer vision to measure the surfacefinish quality of machined metallic parts. The performance of three differentsets of descriptors was analyzed, applied on both filtered and unfiltered images.With k-nn classification filtered images showed a better performance, but withthe neuronal network the non filtered images lead to lower error rates in the caseof Haralick with wavelet descriptors.
The best results were achieved using neuronal network classification, withHaralick descriptors applied to the first subband of the wavelet transform andto the original image. This configuration leads to a classification accuracy of100% when the first 50 and last 50 images were used. The results show thatthe use of texture descriptors is a feasible method to evaluate the roughness ofmetallic parts in the context of product quality and future research will focuson this line.

240 E. Alegre et al.
Acknowledgments. This work has been partially supported by the researchprojects DPI2006-02550 supported by the Spanish Ministry of Education andScience, ULE2005-01 by the University of Leon and LE018B06 by the Junta deCastilla y Leon.
References
1. Al-Kindi, G.A., Shirinzadeh, B.: An evaluation of surface roughness parame-ters measurement using vision-based data. Intl. J. of Mach. Tools & Manuf. 47,697–708 (2007)
2. Al-Kindi, G.A., Shirinzadeh, B.: Feasibility assessment of vision-based surfaceroughness parameters acquisition for different types of machined specimens. Imageand Vision Computing 27, 444–458 (2009)
3. Al-Kindi, G.A., Baul, R., Gill, K.: An application of machine vision in the auto-mated inspection of engineering surfaces. Intl. J. of Production Research 30(2),241–253 (1992)
4. Castejon, M., Alegre, E., Barreiro, J., Hernandez, L.K.: On-line tool wear moni-toring using geometric descriptors from digital images. Intl. J. of Machine Tools &Manufacture 47, 1847–1853 (2007)
5. Gadelmawla, E.: A vision system for surface roughness characterization using thegray level co-occurrence matrix. NDT& E Int. 37, 577–588 (2004)
6. ISO4288:1996. Geometrical product specification (GPS) Surface texture: Profilemethod
7. Kiran, M., Ramamoorthy, B., Radhakrishan, V.: Evaluation of surface roughnessby vision system. Intl. J. of Machine Tools and Manufacture 38, 685–690 (1998)
8. Kumar, R., Kulashekar, P., Dhansekar, B., Ramamoorthy, B.: Application of digitalimage magnification for surface roughness evaluation using machine vision. Intl. J.of Machine Tools and Manufacture 45, 228–234 (2005)
9. Lee, B., Tarng, Y.: Surface roughness inspection by computer vision in turningoperations. Intl. J. of Machine Tools and Manufacture 41, 1251–1263 (2001)
10. Lee, B., Hoa, S., Hob, S.: Accurate estimation of surface roughness from texturefeatures of the surface image using an adaptative neuro-fuzzy inference system.Precision Engineering 29, 95–100 (2005)
11. Lee, B., Yu, S., Juan, H.: The model of surface roughness inspection by visionsystem in turning. Mechatronics 14(1), 129–141 (2004)
12. Lee, B., Juan, H., Yu, S.: A study of computer vision for measuring surface rough-ness in the turning process. Intl. J. of Advanced Manufacturing Technology 19,295–301 (2002)
13. Lee, S., Chen, C.: On-line surface roughness recognition system using artificial neu-ral networks system in turning operations. The International Journal of AdvancedManufacturing Technology 22(7-8), 498–509 (2003)
14. Ramana, K., Ramamoorthy, B.: Statistical methods to compare texture featuresof machined surfaces. Pattern Recognition 29, 1447–1459 (1996)
15. Schmahling, F.A., Hamprecht, F.A., Hoffmann, D.M.P.: A three-dimensional mea-sure of surface roughness based on mathematical morphology. Intl. J. of MachineTools and Manufacture 46, 1764–1769 (2006)

Surface Finish Control in Machining Processes 241
16. Senin, N., Ziliotti, M., Groppetti, R.: Three-dimensional surface topography seg-mentation through clustering. Wear 262, 395–410 (2007)
17. Tasan, Y., De Rooij, M., Schipper, D.: Measurement of wear on asperity level usingimage-processing techniques. Wear 258, 83–91 (2005)
18. Tian, G.Y., Lu, R.S., Gledhill, D.: Surface measurement using active vision andlight scattering. Optics and Lasers in Engineering 45, 131–139 (2007)
19. Whitehouse, D.J.: Handbook of Surface and Nanometrology. Institute of PhysicsPublishing (IOP) (2003)