
Surface Finish Control in Machining Processes Using Haralick Descriptors and Neuronal Networks
Upload
independentCategory
view
1download
0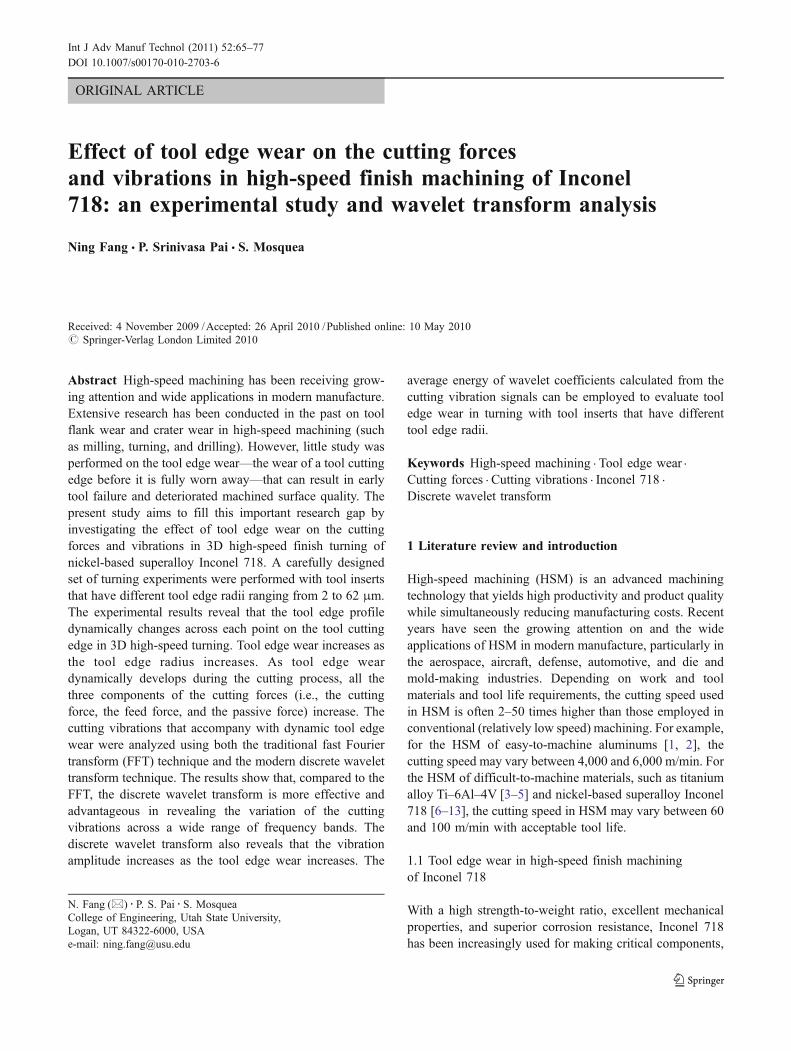
ORIGINAL ARTICLE
Effect of tool edge wear on the cutting forcesand vibrations in high-speed finish machining of Inconel718: an experimental study and wavelet transform analysis
Ning Fang & P. Srinivasa Pai & S. Mosquea
Received: 4 November 2009 /Accepted: 26 April 2010 /Published online: 10 May 2010# Springer-Verlag London Limited 2010
Abstract High-speed machining has been receiving grow-ing attention and wide applications in modern manufacture.Extensive research has been conducted in the past on toolflank wear and crater wear in high-speed machining (suchas milling, turning, and drilling). However, little study wasperformed on the tool edge wear—the wear of a tool cuttingedge before it is fully worn away—that can result in earlytool failure and deteriorated machined surface quality. Thepresent study aims to fill this important research gap byinvestigating the effect of tool edge wear on the cuttingforces and vibrations in 3D high-speed finish turning ofnickel-based superalloy Inconel 718. A carefully designedset of turning experiments were performed with tool insertsthat have different tool edge radii ranging from 2 to 62 μm.The experimental results reveal that the tool edge profiledynamically changes across each point on the tool cuttingedge in 3D high-speed turning. Tool edge wear increases asthe tool edge radius increases. As tool edge weardynamically develops during the cutting process, all thethree components of the cutting forces (i.e., the cuttingforce, the feed force, and the passive force) increase. Thecutting vibrations that accompany with dynamic tool edgewear were analyzed using both the traditional fast Fouriertransform (FFT) technique and the modern discrete wavelettransform technique. The results show that, compared to theFFT, the discrete wavelet transform is more effective andadvantageous in revealing the variation of the cuttingvibrations across a wide range of frequency bands. Thediscrete wavelet transform also reveals that the vibrationamplitude increases as the tool edge wear increases. The
average energy of wavelet coefficients calculated from thecutting vibration signals can be employed to evaluate tooledge wear in turning with tool inserts that have differenttool edge radii.
Keywords High-speed machining . Tool edge wear .
Cutting forces . Cutting vibrations . Inconel 718 .
Discrete wavelet transform
1 Literature review and introduction
High-speed machining (HSM) is an advanced machiningtechnology that yields high productivity and product qualitywhile simultaneously reducing manufacturing costs. Recentyears have seen the growing attention on and the wideapplications of HSM in modern manufacture, particularly inthe aerospace, aircraft, defense, automotive, and die andmold-making industries. Depending on work and toolmaterials and tool life requirements, the cutting speed usedin HSM is often 2–50 times higher than those employed inconventional (relatively low speed) machining. For example,for the HSM of easy-to-machine aluminums [1, 2], thecutting speed may vary between 4,000 and 6,000 m/min. Forthe HSM of difficult-to-machine materials, such as titaniumalloy Ti–6Al–4V [3–5] and nickel-based superalloy Inconel718 [6–13], the cutting speed in HSM may vary between 60and 100 m/min with acceptable tool life.
1.1 Tool edge wear in high-speed finish machiningof Inconel 718
With a high strength-to-weight ratio, excellent mechanicalproperties, and superior corrosion resistance, Inconel 718has been increasingly used for making critical components,
N. Fang (*) : P. S. Pai : S. MosqueaCollege of Engineering, Utah State University,Logan, UT 84322-6000, USAe-mail: [email protected]
Int J Adv Manuf Technol (2011) 52:65–77DOI 10.1007/s00170-010-2703-6
parts, and structures in the aerospace and aircraft industries.For example, it has been used as a structural material for avariety of components in jet engines, and it accounts formore than half of the total weight of the jet engine. Inconel718 has also received wide application in rocket motors andthrust reversers, pump bodies and parts, nuclear fuelelement spacers, hot extrusion tooling, and so on.
However, due to its high strength and low thermalconductivity, the machining of Inconel 718 often generatesnumerous concerns or problems, such as high cutting forcesand temperature, significant tool wear, short tool life, strongvibrations, and poor integrity of the machined surface [6–13]. Particularly, in high-speed finish machining—wherethe feed rate is low and in the same order of magnitude asthe tool edge dimension—tool edge wear typically domi-nates the tool wear patterns before a round tool cutting edgeis fully worn away. This is because the cutting action isundertaken by the round tool cutting edge, and a significantamount of tool wear occurs on the tool cutting edge itselfother than on the tool rake and flank surfaces. Only afterthe round tool cutting edge is worn away do tool flank andcrater wear begin to dominate the tool wear patterns.
Wu and Fang [14] defined tool edge wear as “the wear of atool cutting edge before it is fully worn away.” Theirexperimental results showed the dynamic development oftool edge wear before a round tool cutting edgewas fully wornaway. To more clearly illustrate tool edge wear, Fig. 1 showsthe location of tool edge wear on a cutting tool, including a3D view and a 2D cross-sectional view of the tool cuttingedge. As seen from Fig. 1, the location of tool edge wear isdifferent from those of crater wear and flank wear. Tool edgewear is also different from tool notch wear (also called toolnose radius wear or depth-of-cut notching in some literature).Tool notch wear occurs in the tool nose radius area and istypically measured on the tool rake face. Tool edge wear can
occur not only in the tool nose radius area but can also at anyother locations along the tool cutting edge.
Tool edge wear can be measured at a selected point onthe tool cutting edge by using a fine contour measuringinstrument [14]. The change in the area of the cross-sectionof the tool cutting edge at the selected point (as shown inFig. 1b) before and after cutting can be taken as the amountof tool edge wear (in mm2) at that selected point.
During machining, the tool cutting edge is subjected toextremely high mechanical and thermal loads, and theeffect of tool edge geometry has been proven to besignificant in a variety of finish machining operations[15–21]. The failure of the tool cutting edge, due to severeplastic deformation, severe wear, and even catastrophicbreakage, is often a direct contributor to early tool failure.The experimental results of 2D orthogonal HSM haveshown that tool edge wear constantly changes the tool edgegeometry and dimensions before the tool edge is fully wornaway [14]. A solid understanding of tool edge wear helpsbetter understand various machining phenomena that lead toearly tool failure and deteriorated machined surface quality.
1.2 Discrete wavelet transform
A brief introduction to wavelet transform is provided to betterunderstand the discrete wavelet transform (DWT) algorithmthat is employed in vibration analysis as involved in thepresent study. Wavelet transform is capable of compressing orde-noising a signal without appreciable degradation [22]. It isgenerally a mathematical function that multiplies the signalduring all its length, with elongated and compressed versionsof a mother wavelet that satisfies
Z þ1
�1y ðtÞdt ¼ 0 ð1Þ
Broken lines: worn tool
Solid lines: fresh tool
Tool flank wear
Tool
-chi
pco
ntac
t len
gth
Tool-edgewear
Rak
efa
ce
Flank face
Cuttingedge
ba
Fig. 1 Location of tool edge wear on a cutting tool: a 3D view and b 2D cross-sectional view
66 Int J Adv Manuf Technol (2011) 52:65–77

The translation and scaling operations on ψ(t) creates afamily of functions as
y a;bðtÞ ¼1ffiffiffia
p yt� b
a
� �ð2Þ
where the parameter a is a scaling factor and stretches (orcompresses) the mother wavelet. The parameter b istranslation along the time axis and simply shifts a waveletand so delays or advances the time at which it is activated.The factor 1=
ffiffiffia
pis used to ensure that the energy of the
scaled and translated versions, respectively, is the same asthe mother wavelet. The stretched and compressed waveletsthrough translation and scaling operation are used tocapture the different frequency components of the functionbeing analyzed. The translation operation involves shiftingof the mother wavelet along the time axis to capture thetime information of the function to be analyzed at adifferent position. A family of scaled and translated wave-lets can be created using scaling and translation parametersa and b. This allows signals occurring at different times andhaving different frequencies to be analyzed [22].
The discrete wavelet transform is based on the conceptof multi-resolution [23]. A signal is recursively decom-posed into a sum of details and approximations at differentlevels of resolution. The approximations are the high-scale,low-frequency components of the signals, whereas thedetails are the low-scale, high-frequency components. Thediscrete wavelet transform can be implemented by usinghierarchical filter banks. At any scale, level, or resolution, apair of high- and low-pass filters is used to process anincoming signal. The output from the low-pass filterrepresents the “approximations” of the signal, and theoutput from the high-pass filter provides the “details” lostthrough low-pass filtering. The approximations can befurther processed by another pair of high- and low-passfilters, with half of the previous cutoff frequency togenerate further “approximations” and “details.”
The discrete wavelet transform uses scale and positionvalues based on powers of two (so called dyadic scales andpositions) and makes the analysis much more efficient,whilst remaining accurate [24]. To do this, the scale andtime parameters are discretized as follows
a ¼ am0 ð3Þ
b ¼ nb0an0 ð4Þ
where m and n are two integers. The family of wavelets isgiven by
ym;nðtÞ ¼ a�m=20 y a�m
0 t� nb0� � ð5Þ
resulting in a discrete wavelet transform of the form[22]
DWTf m; nð Þ ¼ f ; ym;n
� �
¼ a�m=20
Rþ1�1 f ðtÞy a�m
0 t� nb0� � ð6Þ
1.3 Goal and significance of the present study
The goal of the present study is to investigate the effectof tool edge wear on the cutting forces and vibrations inhigh-speed finish turning of Inconel 718. This goal isachieved by conducting a carefully designed set ofturning experiments with tool inserts that have differentinitial tool edge radii ranging from 2 to 62 μm. Thescope of the present study does not include the effect oftool edge wear on the machined surface integrity (suchas surface roughness and residual stresses). To ensurethat tool edge wear (other than tool flank or crater wear)dominates the tool wear patterns, the cutting time wascontrolled in all the cutting experiments. The cuttingexperiments stopped if measurements showed that theround tool cutting edge was fully worn away andsignificant tool flank or crater wear occurred.
The scientific significance of the present study lies intwo aspects. First, the vast majority of literature on toolwear in HSM has focused on tool flank wear and/orcrater wear [such as 25, 26]. Little published literaturedeals with tool edge wear in HSM. The only exception isthe work that focused on tool edge wear in 2D HSM [14].To the best of the authors’ knowledge and based on theextensive literature review that used common literaturedatabase such as the Web of Science and EI, the presentpaper is the first to study tool edge wear in 3D HSM ofany known work materials. In particular, this paper dealswith the profiles of worn tool cutting edges and thevariations of the cutting forces and vibrations thataccompany dynamic tool edge wear.
Secondly, the present study is also the first study thatapplies the wavelet transform technique to analyze thedynamic nature of the cutting vibration signals thataccompany dynamic tool edge wear. Dealing with non-stationary sensor signals, wavelet transform involvesrepresenting time varying function or signal in terms ofsimple, fixed building blocks termed wavelets [27].Wavelet transform provides good resolution in both timeand frequency domains synchronously and can extract moreinformation in time domain at different frequency bands. Ithas been successfully applied in signal processing, imagecompression and enhancement, pattern recognition, commu-nication systems, control systems, biomedical imaging, airacoustic, radar, theoretical mathematics, etc. [23, 27–29]. It
Int J Adv Manuf Technol (2011) 52:65–77 67

has also been applied to monitor tool flank wear inmachining [30–33]. However, no literature is found onapplying wavelet transform to study tool edge wear basedon vibration signals. The vast majority of study onmachining dynamics (such as the cutting vibrations andchatter) focused on cutting with a fresh cutting tool or witha cutting tool having flank wear [34–38]. No publishedliterature is found that links tool edge wear and the cuttingvibrations. As will be shown later in this paper, wavelettransform can provide much useful information for moni-toring and investigating tool edge wear in HSM.
1.4 Logic structure of this paper
This paper starts with a description of the experimentalsetup (including work material, tool inserts, and thecutting conditions) and the methods of measuring thetool edge profile, the cutting forces, and the cuttingvibrations. Then, the experimental results and observa-tions of dynamic tool edge wear are presented. Theeffects of tool edge wear on the cutting forces andvibrations are studied. Next, both the traditional fastFourier transform (FFT) technique and the moderndiscrete wavelet transform technique are applied toprocess the collected vibration signals. The performanceof these two techniques is compared. The results fromthe discrete wavelet transform analysis are presented.Finally, the major scientific contributions and new researchfindings are summarized at the end of this paper.
2 Experimental setup and measurements
The experimental setup and the methods of measuring thetool edge profile (including fresh and worn tool edgeprofiles), the cutting forces, and the cutting vibrations aredescribed in detail in the following five sub-sections.
2.1 Work material
A CNC turning center (HAAS SL10) was employed toperform high-speed finish turning experiments on commer-cially available, nickel-based superalloy Inconel 718. Thework material has the following chemical compositions inpercentage of weight: Ni (+Co), 50–55%; Cr, 17–21%; Nb(+Ta), 4.75–5.5%; Mo, 2.8–3.3%; Ti, 0.65–1.15%; Co,1.0%; Mg, 0.35%; Cu, 0.3%; Si, 0.35%; Al, 0.2–0.8%; C,0.08%; Fe, balance. The work material has shear strength of860 MPa and hardness of 36 HRC. Its heat treatmentconditions were as follows: 1 h at 954°C to 982°C, air cool,8 h at 718°C, cool 56°C/h to 621°C, hold 8 h, and finallyair cool. Before cutting, the work material was made into asolid cylindrical bar with a diameter of 45 mm.
2.2 Tool inserts and the measurement of the tool edge profile
Three round-edge tools with different tool edge radii anda sharp tool were selected for use in the cuttingexperiments. The round-edge tools were triangular, flat-faced TPGN 220408 carbide inserts (KC 8050) made byKennametal Inc. The sharp tool was a triangular, flat-faced TPGN 220408 carbide insert (KC 313, also madeby Kennametal Inc.). Both the round-edge tools and thesharp tool had a tool (working) rake angle of 5o, a tool(working) flank angle of 6o, a tool (working) side cuttingangle of 0o, and tool nose radius of 0.8 mm. The tool noseradius and the tool edge radius are two different concepts,and they are measured in different geometrical planes in3D space.
The profile of fresh or worn tool cutting edges wasmeasured offline using a Mitutoyo type-SV600 finecontour measuring instrument, which was equipped witha diamond stylus with a tip radius of 5 μm. Each toolinsert was used only once for cutting. The tip radius ofthe diamond stylus was taken into account whenmeasuring the tool edge profile. Considering the actualarea of tool edge engagement with the work materialduring cutting, the tool edge profile was measured at fivepoints along the tool cutting edge, as shown in Fig. 2.For fresh tools, it was found that the tool edge radius wasnot uniform along the tool cutting edge due to manufac-turing errors. More than 20 commercially available toolinserts were initially measured, and those four inserts withthe most uniform distribution of the tool edge radius alongthe tool cutting edge were finally selected for use in thecutting experiments.
The four selected tool inserts are listed in Table 1,where the average tool edge radius was calculated usingthe individual tool edge radius at those five points. Forround-edge tools #1, #2, and #3 and the sharp tool, thetool edge radius was 38, 48, 62, and 2 μm, respectively.After cutting, the profile of worn tool edges was measuredagain at each of these five measurement points on eachtool insert.
Side
cut
ting
edg
e Tool no
se ra
dius
Tool rake face
Depth of cut
End cutting edge
1
5
4
23
Feed direction
Fig. 2 Measurement of the tool edge radius at five points along thetool cutting edge
68 Int J Adv Manuf Technol (2011) 52:65–77

2.3 Cutting conditions
The cutting conditions were as follows: cutting speed,225 m/min; feed rate, 0.10 mm/rev; and depth of cut,0.8 mm. In practical machining, the cutting speed formachining Inconel 718 is typically below 30 m/min. Thecutting speed used in the present study was more thanseven times higher than the typical, practical cutting speedto satisfy high-speed machining conditions and also tointentionally speed up the tool edge wear process. The feedrate was almost at the same magnitude as the tool edgeradius of the round-edge tools in order to magnify the tooledge effect. The depth of cut was the same as the tool noseradius. No coolants were employed in the cutting experi-ments to facilitate the collection of the cutting force andvibration signals.
Each cutting experiment was repeated two times, withthe variation of measurements generally within 5%range. The average value of the cutting force and theroot mean square (RMS) of the cutting vibrationmeasurements were taken as experimental data and werereported in this paper.
2.4 Measurement and processing of the cutting forcesignals
The cutting force measurement system consisted of aKistler 9257B, quartz three-component dynamometer, aKistler 5010 B multi-channel dual-mode charge amplifier,and a computer data acquisition system (Labview). Themeasurement system frequency was far more than twotimes the frequency of the cutting forces. An analog anti-alias filter was used.
The cutting force signals were acquired at a samplingrate of 10,000 Hz. After the force signals were collectedusing the dynamometer, MATLAB was employed to filterthe high-frequency noise from the signal. The digital filteremployed in MATLAB was Butterworth (1, 0.015). AMATLAB code was written to determine the average of thethree components of the cutting forces, namely, the cuttingforce Fc, the feed force Ff, and the passive force Fp. Thesethree forces are in the tangential (x or the cutting speed),axial (y or the feed rate), and radial (z or the depth of cut)direction, respectively.
2.5 Measurement and processing of the cutting vibrationsignals
While the cutting forces were measured using the Kistler9257B dynamometer, the cutting vibration signals weresimultaneously measured via a 356A63 Triaxial ICPaccelerometer that was fixed onto the tool holder throughan insulation screw hole. The tool overhang length was50 mm. The sensitivity of the accelerometer was 10 mV/g(±15%), and its measurement range was ±5 g (peak). Theaccelerometer sensed the vibration signals in the x, y, and zdirections, that is, the cutting speed, feed rate, and depth ofcut directions, respectively. The signal along the cuttingspeed direction (x direction) was taken into account foranalysis because it was found to be highly sensitive to thephenomena accompanying tool wear.
The sensed vibration signals, at the sampling frequencyof 10 kHz, were sent to a PCB 482A22 low noise signalconditioner and a NI SCXI-1530/1531 ICP accelerometerconditioning module. This amplified the conditioned signal,which was finally sent to the computer with LABVIEWsoftware for further processing and signal display.
The collected vibration signals were subjected to post-processing in both time and frequency domains. In the timedomain, the RMS value of vibration signal for eachexperiment was calculated. The RMS value of a vibrationsignal is the square root of the average of the squaredvalues of the vibration amplitude. It gives positive valuesthat can be used for vibration analysis. Traditional FFT wasperformed in the frequency domain analysis. The waveletanalysis [23, 27–29] that covers both time and frequencydomains was performed and is described in detail in asubsequent section of this paper.
3 Dynamic tool edge wear
As stated, the tool edge profile was measured at five pointsalong the tool cutting edge (see Fig. 2). The undeformed chipthickness increases from point 1 to point 5 due to the effect oftool nose radius. During cutting, the tool edge profiledynamically changes across each point on the tool cutting edge.
Figure 3 shows the representative profiles of tool cuttingedge before and after cutting at points 2 and 5 for each of
Tool edge radius (μm)
Point 1 Point 2 Point 3 Point 4 Point 5 Average
Round-edge tool #1 39 38.5 35.1 40 39.2 38
Round-edge tool #2 47.5 47.8 45.6 46.9 51 48
Round-edge tool #3 59.8 61.3 60.8 61.8 66.6 62
Sharp tool 2.8 0.1 3.0 2.3 3.7 2
Table 1 Variation of the tooledge radius along the tool cut-ting edge before cutting
Int J Adv Manuf Technol (2011) 52:65–77 69

the four tools. The tool edge profile shown in the figureincludes the tool rake face on the left side and the tool flankface on the right side of the profile.
As seen from Fig. 3, as a result of cutting, the initiallyround cutting edges of tools were all worn out to variousextents. Some observations of tool edge wear in 3Dmachining in the present study are similar to what wereobserved in 2D orthogonal cutting of Inconel 718. Forexample, it was reported that, in 2D orthogonal cutting ofInconel 718 with a round-edge tool, the initially round tooledge was gradually worn away and eventually became a“chamfered” tool edge under certain cutting conditions[14]. This reported phenomenon [14] was similar to whathappened at point 5 for round-edge tool #2. However, asclearly shown in Fig. 3, the tool edge wear in 3D machiningis more complex than that in 2D orthogonal cutting. Tooledge wear at each point along the tool cutting edge followsdifferent patterns of variation because the cutting conditionsand the initial tool edge profile are different at each point.At point 5, the tool cutting edge became “sharp” for round-edge tools #1 and 3 but became “chamfered” for round-edge tool #2.
Tool edge wear increases along the tool cutting edgefrom the tool tip (point 1) to point 5. For example, asshown in Fig. 3, tool edge wear at point 5 is more than thatat point 2 due to the larger undeformed chip thickness atpoint 5. More plastic deformation of work material occursin the shear zone adjacent to point 5.
4 Effect on the cutting forces
A direct consequence of the dynamic variation of tool edgewear is the dynamic variations of the cutting forces andvibrations in machining. Figure 4 shows two representativeexamples of the dynamic variation of the cutting forceswith dynamic tool wear for round-edge tool #1 (rn=38 μm)and the sharp tool (rn=2 μm). The cutting forces weremeasured throughout the entire cutting period. In Fig. 4, the
cutting force data are presented for only 2 s for clarityreasons. As seen clearly from Fig. 4, all the threecomponents of the cutting forces (i.e., cutting force Fc,feed force Ff, and passive force Fp) increase as tool weardevelops during cutting. The increase is more visible forthe sharp tool.
Figure 5 further shows the relationship between theaverage cutting forces and the initial tool edge radius forall the four tools. As seen from Fig. 5, all the threecomponents of the cutting forces increase as the initialtool edge radius increases. Compared to the other twoforce components, the feed force Ff has the largestgradient of increase.
In a previous theoretical study on 2D cutting with around-edge tool [20], it was concluded that the tool edgeradius affects the thrust force more than the cutting force. In2D cutting experiments [21], a similar observation was alsoreported wherein the effect of tool edge radius was visiblylarger on the thrust force than on the cutting force. The
0 0.5 1 1.5 2
0.5 1 1.5 2
0
50
100
150
200
Time, sec
Time, sec
Cut
ting
forc
es, N
Cut
ting
forc
es, N
Fc- cutting force
Ff- feed force
Fp- passive force
0
50
100
150
200
Fc-cutting force
Ff- feed force
Fp- passive force
a
b
Fig. 4 Representative examples of the dynamic variation of thecutting forces with dynamic tool wear: a round-edge tool #1, rn=38 μm and b the sharp tool
Point 2 Fresh
Point 2 Worn
Point 5 Fresh
Point 5 Worn
Round edge tool #1
Round edge tool #2
Round edge tool #3
Sharp tool
Fig. 3 Representative profiles of the tool cutting edge before and aftercutting
70 Int J Adv Manuf Technol (2011) 52:65–77
experimental evidence in 3D cutting presented in this papersupports the previous theoretical conclusion.
5 Effect on the cutting vibrations
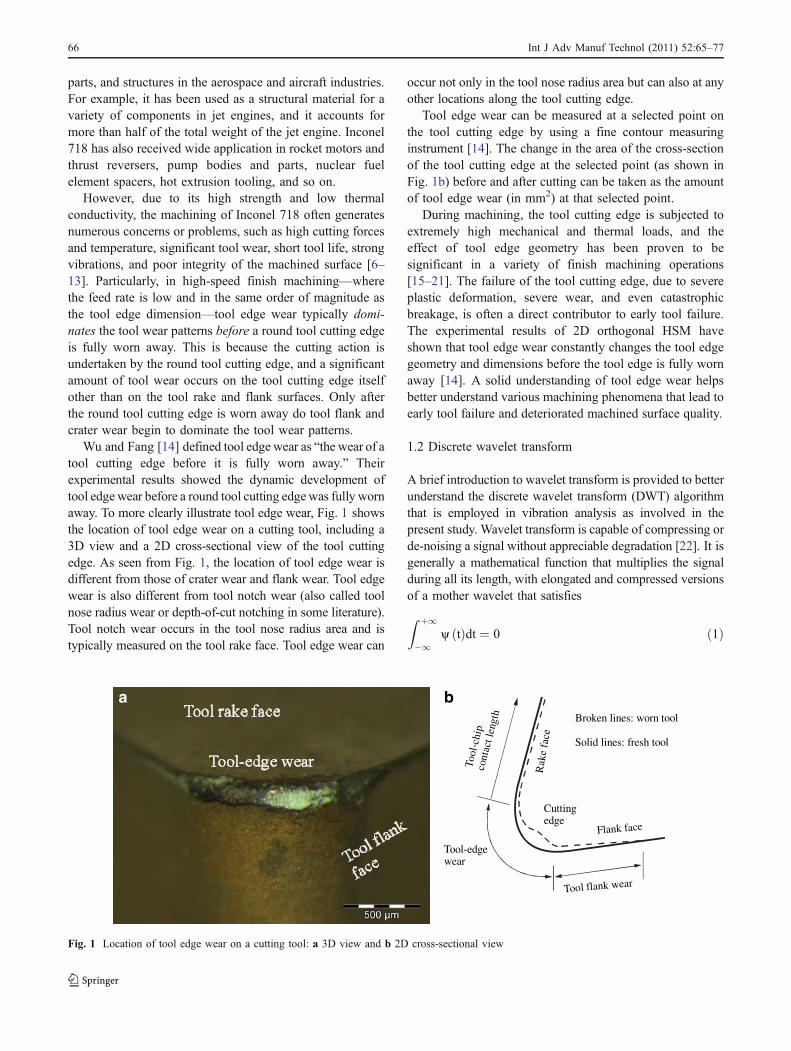
As shown in Fig. 3, the initial tool edge radius affectsdynamic tool edge wear, the latter of which is one of the mostsignificant contributors to the cutting vibrations and thequality of machined parts. Figure 6 further shows that all thethree components of the cutting vibrations (vx, vy, and vz)increase as the initial tool edge radius increases. Theincreasing trend is particularly obvious for round-edge tool#3, which has the largest initial tool edge radius (62 μm)among the three round-edge tools tested. In addition,compared to the cutting vibration in the radial (z or the depthof cut) direction, the cutting vibrations in the tangential (x orthe cutting speed) and axial (y or the feed rate) directionsincrease more rapidly.
6 FFT and wavelet analysis of the cutting vibrationsignals
A detailed comparison of all the cutting force and vibrationsignals measured in the present study shows that the cuttingvibrations are more sensitive than the cutting forces indetecting tool edge wear. The fluctuations of the cuttingforce components in machining are reflected in the vibrationspectra of the cutting tools and machine components. Asensitive accelerometer is able to easily sense the cuttingvibration signals, which are in a frequency range, to offerexcellent possibilities for in-process diagnosis of manyimportant machining phenomena including tool edge wear.
6.1 Fast Fourier transform analysis
The FFT of the cutting vibration signals collected from allthe four tool inserts was performed using Matlab [24].Figure 7 shows two representative examples of FFTanalysis for the round-edge tool #1 (rn=38 μm) and thesharp tool (rn=2 μm). Note that the vibration magnitudeshown in Fig. 7 is in the very small order of 10−4, which isnot easy to be detected from the vibration spectrum forpractical use in tool condition monitoring. In addition, thevariation of vibration signals in low (<1,000 Hz) and high(>4,000 Hz) frequency ranges are nearly all missing in theFFT results, as clearly shown in Fig. 7.
The above results confirm that the traditional FFTtechnique is not suitable for the analysis of non-linear,transient, and non-stationary cutting vibration signalswhose frequency characteristics are time varying. Thesignal patterns cannot be isolated and represented by justa number of natural frequencies that are not time-localized.Therefore, the FFT technique cannot reveal the variation ofvibration signals in a wide range of frequencies as tool edgewear develops.
6.2 Advantages of discrete wavelet transform over FFT
Depending on the properties of the signal and the objectiveof signal analysis, an optimal decomposition of a signalrequires desirable resolutions in both time and frequencydomains. In the present study, the frequency bands ofinterest for evaluation are 156.25–312.5 and 312.5–625 Hz.These bands could not be identified using FFT but could beidentified using DWT. DWT provides good resolution inboth time and frequency domains and makes use of multi-resolution analysis that recursively decomposes a signal
0 15 30 45 60 750.0
0.2
0.4
0.6
0.8
1.0
RM
S vi
brat
ion
ampl
itude
(g)
Initial tool edge radius (µm)
Vibration Vx
Vibration Vy
Vibration Vz
Fig. 6 RMS vibration amplitude vs. initial tool edge radius
0 15 30 45 60 750
40
80
120
160
200
240A
vera
ge c
uttin
g fo
rces
(N
)
Initial tool edge radius (µm)
Cutting force Fc
Feed force Ff
Passive force Fp
Fig. 5 Average cutting forces vs. initial tool edge radius
Int J Adv Manuf Technol (2011) 52:65–77 71

into low- and high-frequency components. This decompo-sition helps to better understand the behavior of thevibration signals in both high and low frequency domains.
Therefore, the present study chose the DWT technique toevaluate vibration signals. The choice was based oninherent differences between DWT and FFT techniques,not based on the tool edge wear process.
6.3 Results and discussions
Daubechies wavelet of order eight was employed toconstruct the high- and low-pass filters. The multi-resolution that included the “db8” wavelet base wasemployed in the discrete wavelet transform. The five-leveldecomposition of the original signal results in the followingfrequency bands: 0–156.25 Hz, 156.25–312.5 Hz, 312.5–625 Hz, 625–1250 Hz, 1.25–2.5 kHz, and 2.5–5 kHz. Thisdecomposition helps one understand the variation of
vibration signals in these bands as tool edge wear developsduring cutting.
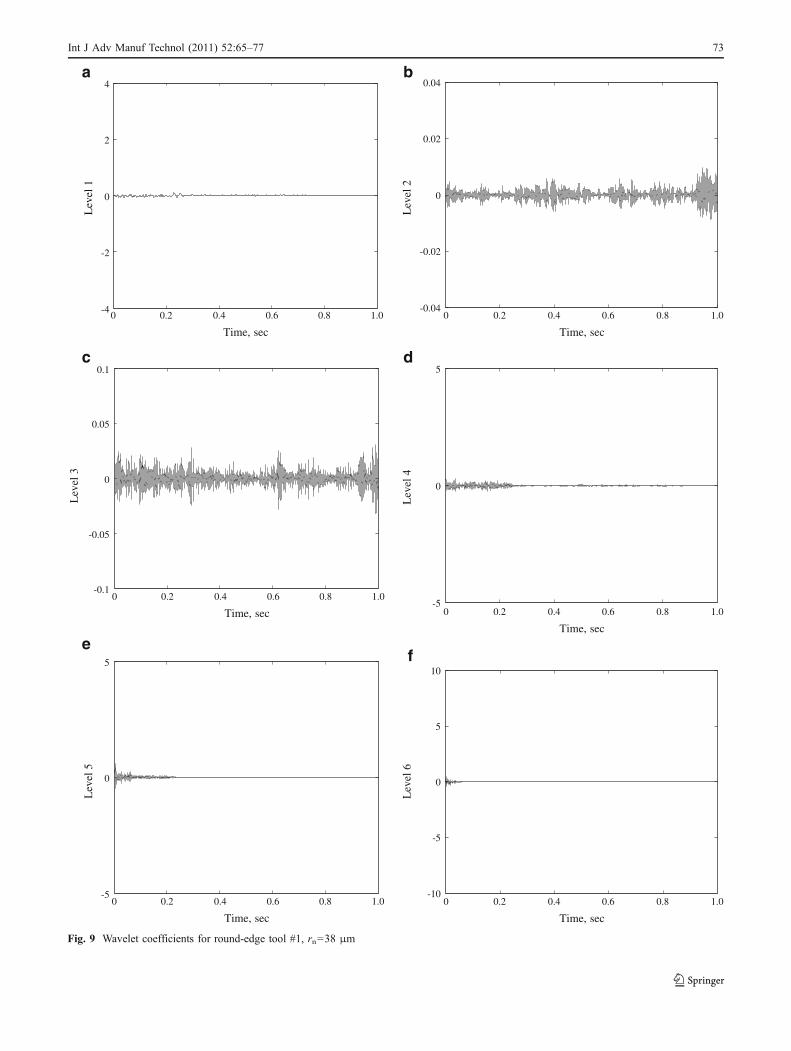
Figure 8 shows two representative examples of multi-resolution decomposition for round-edge tool #1 (rn=38 μm) and the sharp tool. Figures 9 and 10 show theapproximation and details at different levels resulting frommulti-resolution decomposition for round-edge tool #1 (rn=38 μm) and the sharp tool, respectively. In sub-panels a, d, e,and f in Figs. 9 and 10, the numerical scales of the verticalaxes at different levels were determined based on the largestnumerical value of vibration signals of all the four toolinserts for comparison purposes. No intention was made tomake the numerical scales of the vertical axes the same anduniform. The following observations and analysis are madefrom the experimental results:
1. Compared to the FFT analysis shown in Fig. 7, thediscrete wavelet transform (based on multi-resolutiondecomposition of the vibration signals) shown in Fig. 8is more effective and advantageous in revealing thevariation of the cutting vibrations across a wide rangeof frequency bands.
2. The wavelet decomposition of the vibration signalsshows high activity at levels 2 and 3 for all the signals,as clearly shown in Figs. 8 and 9. The frequency bandsof interest for analyzing tool edge wear from thisevaluation are 156.25–312.5 and 312.5–625 Hz. Thedynamic process of tool edge wear causes the cuttingforces to increase, thereby exciting different frequen-cies of vibrations of the tool holder and the machine
0 1000 2000 3000 4000 5000-0.04
-0.02
0
0.02
0.04
Mag
nitu
de, g
0 1000 2000 3000 4000 5000-0.04
-0.02
0
0.02
0.04
Frequency, Hz
Frequency, Hz
Mag
nitu
de, g
a
b
Fig. 8 Representative examples of multi-resolution decomposition: around-edge tool #1, rn=38 μm and b the sharp tool
0 1000 2000 3000 4000 50000
2
4
0
2
4
6
8
x 10-4
x 10-4
Frequency, Hz
0 1000 2000 3000 4000 5000
Frequency, Hz
Mag
nitu
de, g
Mag
nitu
de, g
a
b
Fig. 7 Representative examples of FFT analysis for the cuttingvibrations: a round-edge tool #1, rn=38 μm and b the sharp tool
72 Int J Adv Manuf Technol (2011) 52:65–77
-4
-2
0
2
4L
evel
1L
evel
5L
evel
3
Lev
el 2
Lev
el 4
Lev
el 6
0 0.2 0.4 0.6 0.8 1.0-0.04
-0.02
0
0.02
0.04
Time, sec
0 0.2 0.4 0.6 0.8 1.0
Time, sec
0 0.2 0.4 0.6 0.8 1.0
Time, sec
0 0.2 0.4 0.6 0.8 1.0
Time, sec
0 0.2 0.4 0.6 0.8 1.0
Time, sec
0 0.2 0.4 0.6 0.8 1.0
Time, sec
-0.1
-0.05
0
0.05
0.1
-5
0
5
-5
0
5
-10
-5
0
5
10
a b
c d
ef
Fig. 9 Wavelet coefficients for round-edge tool #1, rn=38 μm
Int J Adv Manuf Technol (2011) 52:65–77 73

Lev
el 2
Lev
el 4
Lev
el 6
-0.04
-0.02
0
0.02
0.04
-4
-2
0
2
4L
evel
1L
evel
5L
evel
3
-0.1
-0.05
0
0.05
0.1
-5
0
5
-5
0
5
-10
-5
0
5
10
0 0.2 0.4 0.6 0.8 1.0
Time, sec
0 0.2 0.4 0.6 0.8 1.0
Time, sec
0 0.2 0.4 0.6 0.8 1.0
Time, sec
0 0.2 0.4 0.6 0.8 1.0
Time, sec
0 0.2 0.4 0.6 0.8 1.0
Time, sec
0 0.2 0.4 0.6 0.8 1.0
Time, sec
a b
c d
e f
Fig. 10 Wavelet coefficients for the sharp tool
74 Int J Adv Manuf Technol (2011) 52:65–77

tool. It is evident that the low-frequency componentswere excited for the entire duration of the cut, and thehigher frequency components were active for only asmall duration of the entire cut.
3. The discrete wavelet transform also reveals that thevibration amplitude increases as the tool edge radiusincreases. It is effective to use wavelet analysis to identifytool edge wear based on the cutting vibration signals.
To further evaluate the use of wavelets for tool edgewear detection, the average energy of the wavelet coef-ficients are extracted from the vibration signal. A series ofcoefficient vectors, characteristic of the time-varying signal,was generated. Let the coefficient vectors be denoted asdj(k), where j (=1,2,3,...) is the number of levels or the scaleof decomposition of the signal and k represents theindividual coefficient values. The average energy ofwavelet coefficients are calculated as
Ej ¼ 1
Tj
XTj
k¼ d2j ðkÞ ð7Þ
where Tj is the number of coefficients in each scale. Thevalue of Tj is different for different scales because thetime spacing of wavelet coefficients varies with the resolutionj [13].
Figure 11 shows the variation of average energy ofwavelet coefficients for all the four tools at different scalesor levels. From Fig. 11, it is clear that for round-edge tool#3, which had the maximum tool edge radius, the amplitudeis the highest, and the increase of the amplitude is clearlyvisible at all levels with the maximum being at the firstlevel. The results shown in Fig. 11 demonstrate theeffectiveness of using the energy of the wavelet coefficients
to study tool edge wear in machining with tool inserts thathave different tool edge radii. These energy-related featurescan be employed as the inputs for pattern recognitiontechniques, such as artificial neural networks, in a toolcondition monitoring system. A detailed discussion on theapplication of these energy-related features is beyond thescope of this paper.
7 Conclusions
In the present study, a carefully designed set of experimentsin high-speed finish turning of Inconel 718 has been carriedout using four tool inserts with different tool edge radiiranging from 2 to 62 μm. The effect of tool edge radius ontool edge wear as well as the corresponding effects of tooledge wear on the cutting forces and the cutting vibrationshave been investigated using both the traditional fastFourier transform technique and the modern discretewavelet transform technique. The following paragraphssummarize the major scientific contributions and newresearch findings made from the present study:
1. In high-speed turning, the tool edge profile dynamicallychanges across each point on the tool cutting edge. Dueto different cutting conditions and different initial tooledge profile at each point, tool edge wear at each pointfollows different patterns of variation. Tool edge wearin 3D machining is more complex than in simple 2Dorthogonal cutting.
2. Tool edge wear increases as the tool edge radiusincreases. For the same tool insert, tool edge wearincreases along the tool cutting edge from point 1 (atthe tool tip) to point 5 (at the position close to theoutside diameter of the workpiece) due to the largerundeformed chip thickness at point 5 and more plasticdeformation of work material that occurs in the shearzone adjacent to point 5.
3. As tool edge wear develops during the cutting process, allthe three components of the cutting forces (i.e., cuttingforce Fc, feed force Ff, and passive force Fp) increase.
4. As the initial tool edge radius increases, all the threecomponents of the cutting forces increase. Compared tothe other two force components, the feed force Ff
increases more rapidly.5. The traditional FFT technique fails to reveal the
variation of vibration signals at a wide range offrequencies as tool edge wear develops. Therefore, itis not best suited to analyze the cutting vibrations thataccompany with dynamics of tool edge wear.
6. Compared to the FFT, the discrete wavelet transform ismore effective and advantageous in revealing thevariation of the cutting vibrations across a wide range
0 1 2 3 4 5 6 7
0
1
2
3
4
5
6
7
Am
plitu
de
Level
Round-edge tool #1
Round-edge tool #2
Round-edge tool #3
Sharp tool
Fig. 11 Average energy of wavelet coefficients for all the four tools
Int J Adv Manuf Technol (2011) 52:65–77 75

of frequency bands. The wavelet decomposition of thevibration signals shows high activity at levels 2 and 3 forall the collected signals. The frequency bands of interestfor analyzing tool edge wear from this evaluation are156.25–312.5 and 312.5–625 Hz. The low-frequencycomponents were excited for the entire duration of thecut, and the higher-frequency components were activefor only a small duration of the entire cut.
7. The discrete wavelet transform also reveals that thevibration amplitude increases as the tool edge radiusincreases. The average energy of wavelet coefficientscalculated from the cutting vibration signals can beemployed to evaluate tool edge wear in turning withtool inserts that have different tool edge radii.
References
1. Davim JP, Maranhao C, Jackson MJ, Cabral G, Gracio J (2008)FEM analysis in high speed machining of aluminum alloy (AI7075-0) using polycrystalline diamond (PCD) and cemented carbide(K10) cutting tools. Int J Adv Manuf Technol 39:1093–1100
2. Calatoru VD, Balazinski M, Mayer JRR, Paris H, L’Esperance G(2008) Diffusion wear mechanism during high-speed machiningof 7475-T351 aluminum alloy with carbide end mills. Wear265:1793–1800
3. Zhang S, Li JF, Deng JX, Li YS (2009) Investigation on diffusionwear during high-speed machining Ti–6Al–4V alloy with straighttungsten carbide tools. Int J Adv Manuf Technol 44:17–25
4. Molinari A, Musquar C, Sutter G (2002) Adiabatic shear bandingin high speed machining of Ti–6Al–4V: experiments andmodeling. Int J Plast 18:443–459
5. Barry J, Byrne G, Lennon D (2001) Observations on chipformation and acoustic emission in machining Ti–6Al–4V alloy.Int J Mach Tools Manuf 41:1055–1070
6. Fang N, Wu Q (2009) A comparative study of the cutting forces inhigh speed machining of Ti–6Al–4Vand Inconel 718 with a roundedge tool. J Mater Process Technol 209:4385–4438
7. Pawade RS, Joshi SS, Brahmankar PK (2008) Effect ofmachining parameters and cutting edge geometry on surfaceintegrity of high-speed turned Inconel 718. Int J Mach ToolsManuf 48:15–28
8. Nalbant M, Altm A, Gokkaya H (2007) The effect of cuttingspeed and cutting tool geometry on machinability properties ofnickel-base Inconel 718 super alloys. Mate Des 28:1334–1338
9. Ezugwu EO, Fadare DA, Bonney J, Da Silva RB, Sales WF(2005) Modelling the correlation between cutting and processparameters in high-speed machining of Inconel 718 alloy usingan artificial neural network. Int J Mach Tools Manuf 45:1375–1385
10. Coelho RT, Silva LR, Braghini A, Bezerra AA (2004) Someeffects of cutting edge preparation and geometric modificationswhen turning INCONEL 718 (TM) at high cutting speeds. J MaterProcess Technol 148:147–153
11. Dudzinski D, Devillez A (2004) A review of developmentstowards dry and high speed machining of Inconel 718 alloy. Int JMach Tools Manuf 44:439–456
12. Elwardany TI, Mohammed E, Elbestawi MA (1996) Cuttingtemperature of ceramic tools in high speed machining of difficult-to-cut materials. Int J Mach Tools Manuf 36:611–634
13. Narutaki N, Yamane Y (1993) High speed machining of Inconel718 with ceramic tools. CIRP Annals 42:103–106
14. Wu Q, Fang N (2006) Effect of tool-edge wear in high-speedmachining of superalloy Inconel 718. Trans NAMRI/SME34:397–402
15. Al-Zkeri I, Rech J, Altan T, Hamdi H, Valiorgue F (2009)Optimization of the cutting edge geometry of coated carbide toolsin dry turning of steels using a finite element analysis. Mach SciTechnol 13:36–51
16. Nasr MNA, Ng E-G, Elbestawi MA (2007) Modeling the effectsof tool-edge radius on residual stresses when orthogonal cuttingAISI 316L. Int J Mach Tools Manuf 47:401–411
17. Fang N, Wu Q (2005) The effects of chamfered and honed tooledge geometry in machining of three aluminum alloys. Int J MachTools Manuf 45:1178–1187
18. Klocke F, Kratz H (2005) Advanced tool edge geometry for highprecision hard turning. CIRP Annals 54:47–50
19. Yen YC, Jain A, Altan T (2004) A finite element analysis oforthogonal machining using different tool edge geometries. JMater Process Technol 146:72–81
20. Fang N (2003) Slip-line modeling of machining with a rounded-edge tool. Part I: new model and theory. J Mech Phys Solids51:715–742
21. Schimmel RJ, Endres WJ, Stevenson R (2002) Application of aninternally consistent material model to determine the effect of tooledge geometry in orthogonal machining. Trans ASME J ManufSci Engng 124:536–543
22. Chen BH, Wang XZ, Yang SH, McGreavy C (1999) Applicationof wavelets and neural networks to diagnostic system develop-ment, 1, feature extraction. Comp Chem Engng 23:899–906
23. Mallat S (1989) A theory of multiresolution signal decomposition:the wavelet representation. IEEE Trans Patt Analy Mach Intelli11:674–693
24. The MathWorks (2008) MATLAB Toolbox version 7.5 users’guide. The MathWorks, Natick, MA
25. Haber RE, Jimenez JE, Peres CR, Alique JR (2004) Aninvestigation of tool-wear monitoring in a high-speed machiningprocess. Sens Actua A - Phys 116:539–545
26. Dolinsek S, Sustarsic B, Kopac J (2001) Wear mechanisms ofcutting tools in high-speed cutting processes. Wear 250:349–356
27. Tang YY, Yang LH, Liu J, Ma H (2000) Wavelet theory andits application to pattern recognition, series in machineperception and artificial intelligence, vol 36. World Scientific,Singapore
28. Li T, Li Q, Zhu S, Ogihara M (2002) A survey on waveletapplications in data mining. ACM SIGKDD Explor Newslet4:49–68
29. Daubechies I (1990) The wavelet ransform, time-frequencylocalization and signal analysis. IEEE Trans Inform Theo36:961–1005
30. Kwak JS (2006) Application of wavelet transform technique todetect tool failure in turning operations. Int J Adv Manuf Technol28:1078–1083
31. Dimla DE (2002) The correlation of vibration signal features tocutting tool wear in a metal turning operation. Int J Adv ManufTechnol 19:705–713
32. Choi Y, Arayanaswami R, Chandra A (2004) Tool wearmonitoring in ramp cuts in end milling using the wavelettransform. Int J Adv Manuf Technol 23:419–428
33. Kunpeng Z, San WY, Soon HG (2009) Wavelet analysis of sensorsignals for tool condition monitoring: a review and some newresults. Int J Mach Tools Manuf 49:537–553
34. Movahhedy MR, Mosaddegh P (2006) Prediction of chatter inhigh speed milling including gyroscopic effects. Int J Mach ToolsManuf 46:996–1001
76 Int J Adv Manuf Technol (2011) 52:65–77

35. Solis E, Peres CR, Jimenez JE, Alique JR, Monje JC (2004) A newanalytical–experimental method for the identification of stabilitylobes in high-speed milling. Int J Mach Tools Manuf 44:1591–1597
36. Schmitz T, Davies M, Medicus K, Snyder J (2001) Improvinghigh-speed machining material removal rates by rapid dynamicanalysis. CIRP Annals 50:263–268
37. Altintas Y (2000) Manufacturing automation: metal cuttingmechanics, machine tool vibrations, and CNC design. CambridgeUniversity Press, Cambridge
38. Lee M, Thomas CE, Wildes DG (1987) Prospects for in-processdiagnosis of metal cutting by monitoring vibration signals. JMater Sci 22:3821–3830
Int J Adv Manuf Technol (2011) 52:65–77 77
Copyright © 2022 FDOKUMEN