Computer Vision and Classification Techniques on the Surface Finish Control in Machining Processes
10
Computer Vision and Classification Techniques on the Surface Finish Control in Machining Processes* Enrique Alegre, Joaquin Barreiro, Manuel Castej6n, and Sir Suarez Unive$idad de Le6n. E.I. Industrial e Inform6tica. 24071. Le6n. Spain enrique.alegre@uni1eoa. es Abstract, This work presents a method to perform a surface finish con- trol using a computer vision system. Test parts used were made of AISI 303 stainless steel and were machined with a MUPEM CNC multi-turret parallel lathe. Using a Pulnix PE2015 B/W camera, a difiuse illumina- tion and a industrial zoom, 140 images were acquired. We have applied a vertical Prewitt filter to all the images obtaining two sets, the original one and the filtered. We have described the images using three difierent methods. The first features vector was composed by the mean, standard deviation, skewness and kurtosis of the image histogram. The second features vectol was made up by four Haralick descriptors - contrast, cor- relation, ener8y and homogeneity. The last one was composed by 9 Laws descriptors. Using &-nn we have obtained a hit rate around 90 % with filtered images and, the best one, using Laws features vector of 92.14To with unfiltered images. These results show that it is feasible to use tex- ture descriptom to evaluate the rugosity of metallic pads in the context of product quality inspection. Introduction Diverse properties play an important role in the surface finish of the metallic parts, €.g. the mechanical strength, the wear resistance of the surfaces or the geometrical and dimensional quality of the characteristics of the parts. These properties are directly related to the surface finish level, which is determined by the manufacturing processes and the materials used. Thus, the measurement of the surface finish has been a research matter of special interest during the last fifty years in the machining sector- The surface finish degree can be objectively estimated by the measures of diverse rugosity parameters established in the international standards [1]. The development of these standards is basically oriented to tactile measuring devices that provide two dimensional records of the part profile. * This work has been partially supported by the research project DPI2006-02550 ftom the Spanish Ministry of Education and Science a,rld the ULE2005-01 from the Uni- versity of Le6n. A. Campilho and M- Kamel (Eds.): ICIAR 2008. LNCS5112. pp. 11011110, 2008. @ Springer-Verlas Berlin Heidelbcrs 2008
-
Upload
universidaddeleon -
Category
Documents
-
view
0 -
download
0
Transcript of Computer Vision and Classification Techniques on the Surface Finish Control in Machining Processes

Computer Vision and Classification Techniqueson the Surface Finish Control in Machining
Processes*
Enrique Alegre, Joaquin Barreiro, Manuel Castej6n, and Sir Suarez
Unive$idad de Le6n. E.I. Industrial e Inform6tica. 24071. Le6n. Spainenrique. alegre@uni1eoa. es
Abstract, This work presents a method to perform a surface finish con-
trol using a computer vision system. Test parts used were made of AISI303 stainless steel and were machined with a MUPEM CNC multi-turretparallel lathe. Using a Pulnix PE2015 B/W camera, a difiuse illumina-tion and a industrial zoom, 140 images were acquired. We have applieda vertical Prewitt filter to all the images obtaining two sets, the original
one and the filtered. We have described the images using three difierentmethods. The first features vector was composed by the mean, standarddeviation, skewness and kurtosis of the image histogram. The secondfeatures vectol was made up by four Haralick descriptors - contrast, cor-relation, ener8y and homogeneity. The last one was composed by 9 Laws
descriptors. Using &-nn we have obtained a hit rate around 90 % withfiltered images and, the best one, using Laws features vector of 92.14To
with unfiltered images. These results show that it is feasible to use tex-ture descriptom to evaluate the rugosity of metallic pads in the contextof product quality inspection.
Introduction
Diverse properties play an important role in the surface finish of the metallicparts, €.g. the mechanical strength, the wear resistance of the surfaces or thegeometrical and dimensional quality of the characteristics of the parts. Theseproperties are directly related to the surface finish level, which is determined bythe manufacturing processes and the materials used. Thus, the measurement ofthe surface finish has been a research matter of special interest during the lastfifty years in the machining sector-
The surface finish degree can be objectively estimated by the measures ofdiverse rugosity parameters established in the international standards [1]. Thedevelopment of these standards is basically oriented to tactile measuring devicesthat provide two dimensional records of the part profile.
* This work has been partially supported by the research project DPI2006-02550 ftomthe Spanish Ministry of Education and Science a,rld the ULE2005-01 from the Uni-versity of Le6n.
A. Campilho and M- Kamel (Eds.): ICIAR 2008. LNCS 5112. pp. 1101 1110, 2008.@ Springer-Verlas Berlin Heidelbcrs 2008

1102 E. Alegre et al.
Nevertheless, during the last decades the sudace measurement technologieshave significantly evolved, from the first analogical contact measuring devices tothe current digital techniques such as the optical, capacitive or laser devices I2].Amid the modern techniques, those based on computer vision can be remarked.
The advantages that this technology brings are many. While tactile techniquescharacterize a linear track over the surface of the part, the computer vision tech-niques allow to characterize whole areas of the surface of the part, providing moreinformation [3,4,5]. Besides, computer vision techniques take measures faster, asimages are captured in almost no time and so they can be implemented in themachine. According to this, it is possible to apply these techniques in the controlproccsses in real time on an autonomous manner. Besides, with them it is pos-sible to apply an exhaustive validity check to every single part produced, whichwould be very difficult to apply with traditioral tactile rugosimeters, slow anddelicate as they are.
Continuous advances have been made in sensing technologies and, particu-larly, in the vision sensors that have been specially enhanced in capabilities andwhose price has decreased. The advances made in the image processing tech-nology provide more reliable conclusions than before. In all, computer vision isa very interesting technology for the industrlal environment. The use of thesesystems ilr other monitoring operations in machining processes has proved 16,7]an important reduction in the cycle time and the needed resources.
As lar as the traditional contact techniques are concerned) computer visiontechniques use other parameters to determine the surface finish level. In thelight of this perspective, the current standards, developed for tactile devices, donot completely reflect the cuuent state of the technology. It is necessary to findprocedures that allow to correlate the results obtained by tactile instrumentswith those obtained with other kind of devices, as those based o! computervision.
In this field, two guidelines should be remarked: the study on the spatialdomain and the study in the frequency domain [8,9]. Our work tackles the mea-surement of the surface quality from the point of view of the spatial domain.Tarng and Lee [10] and Lee et al. [11] analyze the artiflcial vision and imageanalysis systems so as to quantify the rugosity in diffcrent turling operations.Those methods based on image analysis capture an image of the surface andanalyze the pixels so as to obtain a pattern of the diffuse light of the image.Later on, rugosity parameters are calculated by means of statistical descriptors.One of the more frequently used parameters is the standard deviation of thegray levels. Kumar et al. [12] focus on the milling, turning and molding pro-cesses zooming the original images and obtaining the Ga parameter (the imagegray Ievel average), finding a high correlation amongst the Ga parameter andthe rugosity of the surface.
AI-Kindi et al. 13] propose a method named intensity topography compatibil-ity (ITC), characterizing the image data by three componerts, namely lightningn(J,y), reflectance r(r,9) and surface characteristics F'(r,y) and they calcu-late the value of the traditional rugosity parameters combining statistics such as

Computer Vision and Classification Techniques 1103
mean and standard deviatiol. Juan et al. [13] develop a computer vision systemthat automatically measures the value of the rugosity in turning processes intro-ducing the theory ofpolynomial networks. Gadelmawla [14] uses the coocurrencematrix and introduces a new parameter, the maximum width of the matrix forcalculating the rugosity of the surface. Other authors, [16,15,17] also use thecoocurrence matrix and the texture energy. Ikonen and Toivanen [18] proposean algorithm that priorizes a pixel in the tail so as to calculate the minimumdistance in a curved space so that it helps in calculating the rugosity in a fasterand more eficieut manner, Kassim ct al. 119] use a column projection system, aconnectivity algorithm oriented by the Hough transform and run Iength statis-tics for the analysis of machined surfaces. Ngan [20] proposes a technique toquantifu the polish degree on moulds and matrices surfaces. Other techniques
[21] are based on the lightning of the surface by changing the lightning angleso as to correlate two patterns and use them as rugosity parameters. So as toestimate the rugosity of the surface, another important aspect in the cuttingpalameter is the combination of image analysis with neural network techniques
[22,23], support vector machines 124), fuzzy \ogic [25] and genetic algorithms [26].This work combines the use of digital image descriptors along with classifi-
cation techniques to estimate the surface finish of metallic parts obtained by aturn process. The initial goal pursued in this work was to design an acceptanceconirol strategy, that is to say, to define two classes related with two rugosityintervals. Class 1 would contain those parts with low rugosity -acceptable-
and class 2 would contain those with high rugosity defective
2 Design of the Experiment and Image Acquisition
2.1 Set of Samples Used
Test parts were made of AISI 303 / EN10088 X8CrNiS18 9 stainless steelcomposition shown in Table 1. This material was chosen due to its extelsive usein the industry ofsmall part mass manufacturing. A MUPEM CNC multi turretparallel lathe ICIAR/1/42 model was used for the machining of palts.
The test part is showed in frgure 1. Several part operations were carried out, allof them typical of massive precision mechanization, although only the cylindricalshape was used for surface finish measurcment-
The cutting tools were coated carbide inserts from Sandvik with the followingtechnical specifications: tliargular, tip angle 600, tip radius 0.8 mm, edge length11 mm, incidence angle 7', rake angle 6", position angle 93", edge radius 0.030.05 mm. The machining parameters used for the tests were fixed at the following
c< 0.10
S i< 0.75
Mn1.50. . .2 .00
P0.040
S0 . 2 8 . . . 0 . 3 5
Clr1 7 . 0 0 . . . 1 9 . 0 0
Ni8 . 5 0 . . . 9 . 5 0
Mo< 0.60
Table 1. ComDosition of AISI 303 stainless steel
1104 E. Alegre et al.
Fig. 1. Test part
values: cutting speed 250 m/min, feed IaIe 0.27 mm/rev and cutting dcpth 2mm, considered as reference values. A surface finish control was performed on aHOI\'I\,IEL WELKE class 1 perfilometer. It was evident that the surface finishRa value was far worse as the machinine time went bv.
2.2 lrr:age Acquisition
The images of the parts were captured using a specific positioning platformwhich had a camera and a diffuse lighting system attached. The part was fixedto a'V' shape bracket. The lighting system comprised a FOSTEC regulated lightsource DCR@III that provided an intense cold light. A NER SCDI-25-F0 difiuseillumination SCDI system was used to avoid shines. The system providcd diffuscillumination in the camera axis. It had been specially designed for applicationswith irregular mirrored surfaces that required uniform light. The positioning ofthe lighting was carried out by means of a FOSTEC dual bundle. Divcrsc tcstswere done changing the intensity of the light. The best results were obtained atthe 70 percent level.
The images were obtained using a Pulnix PE2015 B/W camera with 1/3"CCD. A Matrox Meteor II frame grabbcr card was used to digitize the images.The optic assembly was composed of an OPTEM industrial zoom 70XL, withan extension tube of 1X and 0.5X/0,75X/1.5X/2.0X OPTEM lens. Wc uscd themaximum magnification of the system.
Using such system, 140 images were captured; seventy of them belongingto class 1 while the other seventy belonging to class 2- The median of threerepeated measures of the Ra rugosity was used to label the rugosity of eachimage. The rugosity values of the parts considered were in the range from 2.40to 4.33 microns. Those images with a rugosity value lower than 2.76 were assignedto class 1 -acceptable rugosity-, while those with higher valuer were assignedto cla$s 2 unacceptable rugosity
2.3 Image Processing
So as to enhance contrast and easc the dcscription of the rugosity a verticalPrewitt high pass filter was applied to the whole set of images. Later on, thr€esets of descriptors were obtained both from the original images and from thefiltered ones. Figure 2 shows a set images both before and after being filtered.

Computer Vision and Classification Techniques 1105
Fig.2. Images with rugosity values of 2.40 microns (left) and 4-24 microns(right),before (upper row) and a.fter (lower row) applying the filter
The first set of descriptor was obtained combining four first order statisticsof the image histogram: mean, standard deviation, skewness and kurtosis. Thesecond set of descriptors was obtained calculating four Haralick descriptors ofthe normalized coocurrence matrix of each image. The third set contained nineLaws descriptors, as detailed in the next section.
3 Feature Extraction Methods
The following descriptors were obtained from each image.
3.1 First Order Statistics
Once the histogram ofeach image was obtained, the following first order statistics(FOS) were calculated. They provide information on the shape of the histogramof the image 127].
Mean255 255D LMItAI
i - 0 j - 0
2562( 1 )
IJ
Fi(r i - i )2
Standard deviation
(2)
E. Alegre et al.
where: n:pixels in the image, oi:gray level, 4:pixel frequency for a given c;gray level.
SkewnessLD Q;-m)sp(z;)
i , :oSlcewness :
( t . - 1\d3
where Z is a random va.riable expressing the gray level, and let p(Z;), wilhi, : O,2,. , , , , - 1, the corresponding value of the histogram, where -L is thenumber of difierent gray levels.
KurtosisL| (Za - m)ap(Z;)
i : oKwtosis :
(L - r)oa
As already mentioned, the first order statistics features vector compdses thesefour values for each image - mean, standard deviation, skewness and kurtosis.
3.2 Coocurrence Matrices
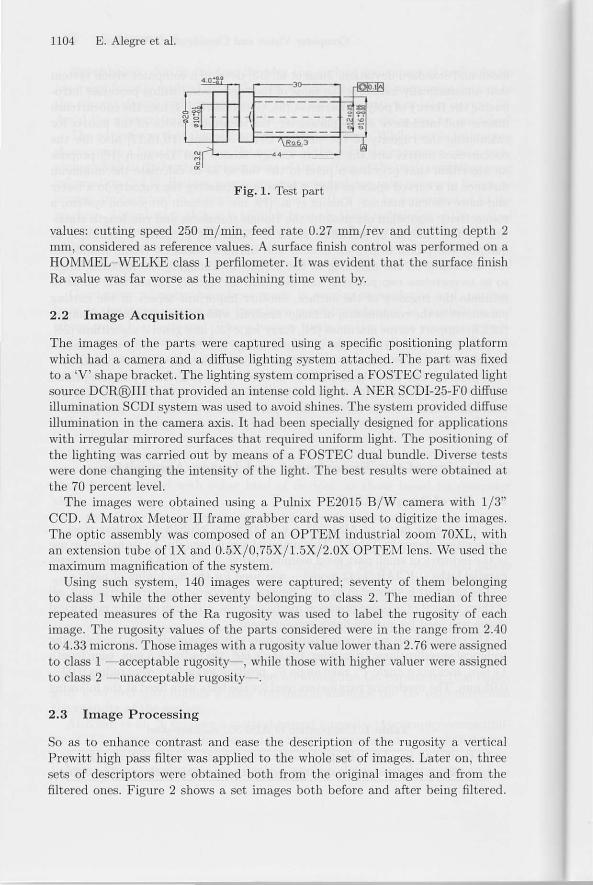
This method [28,29] obtains quantifiable information of an image using the fol-lowing normalized coocurrence matrix:
(3)
(4)- 3
Nd(i,i):r#er
Enersy:DDJ,i j
H onogeneity : )- )- , , ,1i+ L 1 + ( i _ i ) 2
(5)
where C4 is a coocurrence matrix.This matrix depends on the pixel distribution across the image, the neigh-
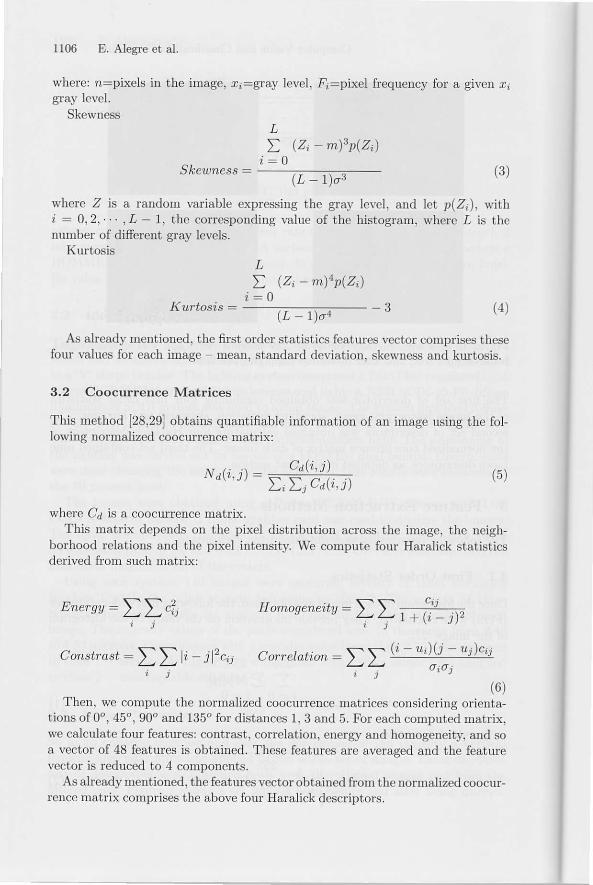
borhood relations and the pixel intensity. We compute four Ha:ralick statisticsderived ftom such matrix:
constrast : lllt - il" "ni
correlation - ;- 5- (i - u;Xr - zi)qi
N r
"7
o io i
(6)Then, we compute the normalized coocurrence matrices considering orienta-
tions of0o,45o,90o a.nd 135" for distances 1,3 and 5. For each computed matrix,we calculate four features: contrast, correlation, enerry and homogeneiQr, and soa vector of 48 features is obtained. These features are averaged and the featurevector is reduced to 4 components.
As already mentioned, the features vector obtained from the normalized coocur-rence matrix comprises the above four Haralick descriptors.
Computer Vision and Classification Techniques 1107
3.3 Laws Method
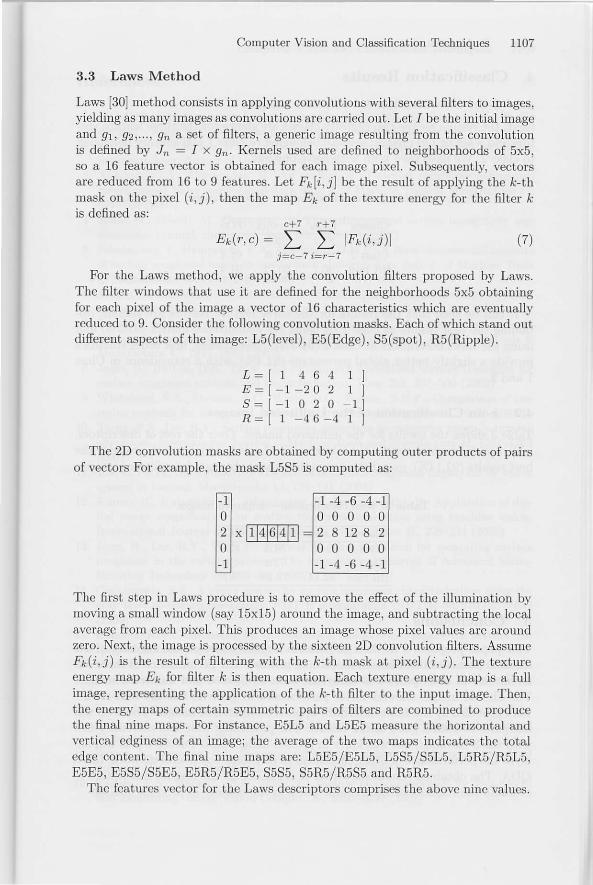
Laws [30] method consists in applying convolutions with several filters to images,yielding as rnany images as convolutions arc carried out. Lct 1 be the initial imageand g, 92,...,9n a set of filters, a generic image resulting from the convolutionis defined by J,, : I x g,- Kernels used are defined to neighborhoods of 5x5,so a 16 feature vector is obtained for each image pixel. Subsequently, vectorsare reduced from 16 to 9 features. Let F1[i,j] be the result of applying the k-thmask on the pixcl (i,j), then the map .E[ of the texture energy for the filter kis defined as:
c+7 r+zEx( r ,c ) : t t lF f r ( r , j ) l (z )
For the Laws method, we apply the convolution filters proposed by Laws.The filter windows that use it are defined for the neighborhoods 5x5 obtainingfor each pixel of the image a vector of 16 characteristics which are eventuallyreduced to 9. Consider the following convolution masks. Each of which stand outdifferent aspects of the image: L5(level), E5(Edge), S5(spot), R5(Ripple).
T _
q -
1 4 6 4 1 ,- 1 - 2 0 2 1- 1 0 2 0 - 11 4 6 - 4 1
The 2D convolution masks are obtained by computing outer products of pairsof vectors For example, the mask L5S5 is computed as:
Fl F -4 -6 -4rill 0 l l 0 0 0 0 0 llz lx iilZfdlafil )z a n a zlio l
- lo o o o ol
t ! l -1 -4 -6 -4 -11
The first step in Laws procedure is to rcmove the efiect of the illumination bymoving a small window (say 15x15) around the image, and subtracting the localaverage from each pixel. This produces an image whose pixel values are aroundzero. Next, the image is processed by the sixteen 2D convolution fllters. AssumeF;(i, j) is the result of f i l tering with the &-th mask at pixel (i, j). The textureenergy map .81 for filter k is then equation. Each texture energy map is a fullimage, representing the application of the &-th filter to the input image. Then,the energy maps of certain symmetric pairs of filters are combined to producethe final ninc maps. For instance, E5L5 and L5E5 measure the horizontal andvertical edginess of an image; the average of the two maps indicates the totaledge contcrt. The final nine maps arc: L5E5/E5L5, L5S5/S5L5, L5RS/R5L5,E5E5, E555/S5E5, E5R5/R5E5, S5S5, S5R5/R535 and R5R5.
The features vector for the Laws descriptors comprises the above nine values.

1108 E. Alegre et al.
4 Classification Results
4.L k-nn Classification for Filtered Irnages
Next. thc results for thc two rugositv classcs are shorvn for.the three fcature vcc-tors and a set of 140 images: scventy belonging to class 1 and scventl bclolgingto class 2. We have used k-nn with lcave-one-out.
Table 2. ,t-nn classificatiol filtered images
Clas*r Il*" H"*li.* TdSTlas. I 87r 92.9 9r iClass 2 9,1.3 88.6 91.4Hit rate 90.7 90.71 91.4
It can be seen that the results for the three feature vectors are sirnilar. ob-taining thc best results at class 1 by using the coocurrencc matr.ix (92.9%) andusing the Laws dcscriptors at class 2 (94.3%). Neverthelcss. first order statisticsprovide a sllghtly bettcr global per.centage (91.4%). with a coincidence in Class1 and 2.
4.2 k-nrr Classification of the Unfiltered Images
Table 3 shows the results for the unfiltered images. Over the rest of descriptors,which provide worse results than before, the Laws descriptors set provides thcbest results (92,14%), cven better ones than those obtained liom filtered imaees.
Table 3. A-nn classification unfiltered images
( lassps Laws Haralick FOSCiir re43 81-4 8t7Class 2 90 77.1 80Hit rate 92.14 79.28 87
5 Conclusions
This paper proposes a methocl to perform a quality test on the rugosity of themetallic parts obtained from a machining process. The pcrformance of three clif-fercnt sets of descriptors was analyzed, both on filtered and unfiltered images.The filtered imagcs showed better performance in general, but the best resnltswerc provided by the Laws descriptor applicd on unfiltered imagcs. Thc [-nn rvasadequate to obtain good initial results. Thc processing time was extrcnely fastwith the 3 methods. brrt was lower in filtered imagcs case. Future works will an-alyze the pcrformance of other classification methods, e.g. neural netrvork. LDA.QDA. The obtairred results show that it is feasiblc to us€ texture descrrplors roevaluate the rugosity of the netallic parts ir the context of product quality.

Computer Vision and Classification Techniques 1109
References
1, ISO 4288:1996. Geometrica.l product specification (GPS) - Surface texturei Profilemethod - Rules and procedures lor the assessment of surface texture
2. Jiang, X., Whitehouse, D-: Miniaturized optical measurement methods for surfacenanometrolos/. Annals of the CIRP 55 (2006)
3. Al-Kindi, G.A., Shirinzadeh, B.: An evaluation of surface roughness parametersmeasurement usi[g vision-based data. Intl. J. of Machine Tools & Manufacture 47,697 708 (2007)
4. Senin, N., Ziliotti, M., Groppetti, R.: Three-dimensional sudace topogaphy seg-mentation through clustering. Wea. 262, 395-410 (2007)
5. Schmahling, J., Hamprecht, F.A., Hoffmann, D.M.P.: A three-dimensional measureof surface roughness based on mathematical morphology. Intl. J. of Machine Tools& Manufacture 46, 1764 1769 (2006)
6. Alegre, E., Barreiro, J., Fernrindez, R.A., Castej6n, M.: Design ofacomputer visionsystem to estimate tool wearing. Material Science Forum 526, 61 66 (2006)
7. Castej6n, M., Alegre, E., Barreiro, J., Hern6ndez, L.K.: On-line tool wear moni-toring using geometric descriptors from digital images. Intl. J. of Machine Tools &Manufacture 47, 1847 1853 (2007)
8. Josso, B., Burton, D.R., Lalor, M.J.: Frequency normalised wavelet transform forsurface roughness analysis and characterisation. Wear 252,491 500 (2002)
9. Whitehead, S.A., Shearer, A.C., Watts, D.C., Wilson, N.H.F.: Comparison of twostylus methods for measuring surface texturc. Dental Materials 15, 79 86 (1999)
10. Tarng, Y.S., Lee, B.Y.: Surface roughness inspection by computer vision in turningoperations. International Journa.l of I{achine Tools and Manufacture 41, 1251, 1263(2001)
11. Lee, B.Y., Yu, S.F., Juan, H.: The model of surface roughness inspection by visionsystem in turning. Mechatronics 14, I29 L41 (2004)
12. Kumar, R., Kulashekar, P., Dhanasekar, B., Ramamoorthy, B.r Application of dig-ital image magnification for surface roughness eva,luation using machine vision.International Journal of Machine Tools and Manufa.ture 45, 228-234 (2005)
13. Juan, H., Lee, B.Y., Yu, S.F.: A study of computer vision for measuring surfaceroughness in the turning process. The International Journal of Advanced Manu-facturing Technology f9, 295 301 (2002)
14. Gadelmawla, E.S.: A vision system for surface roughness characterization using thegray level co-occulrence matri-'<. NDT E international (NDT E int.) 37,577 582(2004)
15. Ramana, K.V., Ramamoorthy, B.: Statistical methods to compare the texture fea-tures of machined surfaces 29, 1447 1459 (1996)
16. Krewet, B., Zhang, C., Kuhlenktter, X.: Automatic classification of defects on theproduct surface in grinding and polishing. Intemational Journal of Machine Toolsand Manufacture 46, 59 69 (2006)
17. Singh, V., Mishra, R.: Developing a machine vision system for spangle classifica-tion using image processilg a.nd artificial [eural network. Surface and CoatingsTechnolory 201, 2813 2817 (2006)
18. Ikonen, L., Toivanen, P.J.: Distance and nearest neighbor transforms on gray-levelsurfares. Pattern Recognition Letters 28, 604 612 (2007\
19. Kassim, A.A., Mannan, Ivl.A., Mian, Z.: Texture analysis methods for tool condi-tion monito ng. Image Vision Comput. 25, 1080-1090 (2007)

1110 E. Alegre et al.
20, Ngan, C.C., Tam, H.Y.: A non-contact technique fo! the on-site inspection of moldsand die6 polishiug. Journal of Matelials Processing Technologr 15t156, 1184-1188(2004)
21. Persson, U.: Surface roughuess rneasurement on mr^hined surfeces using 8,trgu-lar speck.le correlation. Journal of Materials Processing Techuologr 180, 233-238(2006)
22. Pernia.Espinoza, A.V., Ordieres-Mer6, J.8., Martinez-De-Pison, F.J., Gonzfilez-Marcos, A,: TAO-robust backpropogation lea,rning algorithm. Neura,l Net-works 18(2), 191-204 (2005)
23. Gonzd.lsz Marcos, A., Peruia Espinoza, A.V., Alba Elias, F., Garcia Forcada, A.: Aneural network-based spproach for optimising rubber extrusioD lines. IDterDationalJournal of C,omputer Integrated Marufacturing 20(8), 828-837 (2007)
24. Martinez-de-Pis6n, F,J., Barreto, C., Pernia, A.V., Alba, F.: Modelling of au elas-tomer profile extrusion process using support vector machines (SVM). Journal ofMateria.ls Processing Tecbnology 197(1-3), 161-169 (2008)
25. Halpern, J.Y.: Reasoning about uncedainty. MIT Press, Cambridge (2003)26. Le, K.C-, Ho, S.J., Ho, S.Y.: Accurate estimation of surface roughness from tex-
ture features of the surface image using an adaptive neuro-fuzzy inference system.Precision Engineering 29, 95-100 (2005)
27, Materka, A., Strz€lecki, M.: Texture aDalysis methods a review. Technical report,Technical University of Lodz, Institute of Electronics, COST B11 report (1998)
28. Davis L. S.: Image texture a,nalysis techniques - a survey. Technical Report CS-TR,pp. 80-139, I (1980)
29. Davis, L.S., Clearma.n, M., Aggarwal, J.K.: A compara,tive texture classicatrioustudy based on generalized co-occurrence matrices. In: Conference (1979)
30. La$s, K.: Texture enerry measures, In: Image Understanding Workshop, DARPA(1e79)