Surface charge heterogeneity of kaolinite in aqueous suspension in comparison with montmorillonite
20
Surface charge heterogeneity of kaolinite in aqueous suspension in comparison with montmorillonite Etelka Tombácz ⁎ , Márta Szekeres University of Szeged, Department of Colloid Chemistry, H-6720 Szeged, Aradi Vt. 1, Hungary Received 16 September 2005; accepted 25 May 2006 Available online 1 September 2006 Abstract An analogous study to 2:1 type montmorillonite [Tombácz, E., Szekeres, M., 2004. Colloidal behavior of aqueous montmorillonite suspensions: the specific role of pH in the presence of indifferent electrolytes. Appl. Clay Sci. 27, 75–94.] was performed on 1:1 type kaolinite obtained from Zettlitz kaolin. Clay minerals are built up from silica tetrahedral (T) and alumina octahedral (O) layers. These lamellar particles have patch-wise surface heterogeneity, since different sites are localized on definite parts of particle surface. pH-dependent charges develop on the surface hydroxyls mainly at edges besides the permanent negative charges on silica basal plane due to isomorphic substitutions. Electric double layers (edl) with either constant charge density on T faces (silica basal planes) or constant potential at constant pH on edges and O faces (hydroxyl-terminated planes) form on patches. The local electrostatic field is determined by the crystal structure of clay particles, and influenced by the pH and dissolved electrolytes. The acid–base titration of Na-kaolinite suspensions showed analogous feature to montmorillonite. The initial pH of suspensions and the net proton surface excess vs. pH functions shifted to the lower pH with increasing ionic strength indicating the presence of permanent charges in both cases, but these shifts were smaller for kaolinite in accordance with its much lower layer charge density. The pH-dependent charge formation was similar, positive charges in the protonation reaction of (Si–O) Al–OH sites formed only at pHs below ∼ 6–6.5, considered as point of zero net proton charge (PZNPC) of kaolinite particles. So, oppositely charged surface parts on both clay particles are only below this pH, therefore patch-wise charge heterogeneity exists under acidic conditions. Electrophoretic mobility measurements, however, showed negative values for both clays over the whole range of pH showing the dominance of permanent charges, and only certain decrease in absolute values, much larger for kaolinite was observed with decreasing pH below pH ∼ 6. The charge heterogeneity was supported by the pH-dependent properties of dilute and dense clay suspensions with different NaCl concentrations. Huge aggregates were able to form only below pH ∼ 7 in kaolinite suspensions. Coagulation kinetics measurements at different pHs provided undisputable proofs for heterocoagulation of kaolinite particles. Similarly to montmorillonite, heterocoagulation at pH ∼ 4 occurs only above a threshold electrolyte concentration, which was much smaller, only ∼ 1 mmol l − 1 NaCl for kaolinite, than that for montmorillonite due to the substantial difference in particle geometry. The electrolyte tolerance of both clay suspensions increased with increasing pH, pH ∼ 6–6.5 range was sensitive, and even a sudden change occurred above pH ∼ 6 in kaolinite. There was practically no difference in the critical coagulation concentration of kaolinite and montmorillonite (c.c.c.∼ 100 mmol l − 1 NaCl) measured in alkaline region, where homocoagulation of negatively charged lamellae takes place. Rheological measurements showed shear thinning flow character and small thixotropy of suspensions at and above pH ∼ 6.7 proving the existence of repulsive interaction between uniformly charged particles in 0.01 M NaCl for both Applied Clay Science 34 (2006) 105 – 124 www.elsevier.com/locate/clay ⁎ Corresponding author. Tel.: +36 62 544212; fax: +36 62 544042. E-mail address: [email protected] (E. Tombácz). 0169-1317/$ - see front matter © 2006 Elsevier B.V. All rights reserved. doi:10.1016/j.clay.2006.05.009
-
Upload
independent -
Category
Documents
-
view
3 -
download
0
Transcript of Surface charge heterogeneity of kaolinite in aqueous suspension in comparison with montmorillonite
(2006) 105–124www.elsevier.com/locate/clay
Applied Clay Science 34
Surface charge heterogeneity of kaolinite in aqueous suspensionin comparison with montmorillonite
Etelka Tombácz ⁎, Márta Szekeres
University of Szeged, Department of Colloid Chemistry, H-6720 Szeged, Aradi Vt. 1, Hungary
Received 16 September 2005; accepted 25 May 2006Available online 1 September 2006
Abstract
An analogous study to 2:1 type montmorillonite [Tombácz, E., Szekeres, M., 2004. Colloidal behavior of aqueousmontmorillonite suspensions: the specific role of pH in the presence of indifferent electrolytes. Appl. Clay Sci. 27, 75–94.] wasperformed on 1:1 type kaolinite obtained from Zettlitz kaolin. Clay minerals are built up from silica tetrahedral (T) and aluminaoctahedral (O) layers. These lamellar particles have patch-wise surface heterogeneity, since different sites are localized on definiteparts of particle surface. pH-dependent charges develop on the surface hydroxyls mainly at edges besides the permanent negativecharges on silica basal plane due to isomorphic substitutions. Electric double layers (edl) with either constant charge density on Tfaces (silica basal planes) or constant potential at constant pH on edges and O faces (hydroxyl-terminated planes) form on patches.The local electrostatic field is determined by the crystal structure of clay particles, and influenced by the pH and dissolvedelectrolytes. The acid–base titration of Na-kaolinite suspensions showed analogous feature to montmorillonite. The initial pH ofsuspensions and the net proton surface excess vs. pH functions shifted to the lower pH with increasing ionic strength indicating thepresence of permanent charges in both cases, but these shifts were smaller for kaolinite in accordance with its much lower layercharge density. The pH-dependent charge formation was similar, positive charges in the protonation reaction of (Si–O)Al–OH sitesformed only at pHs below ∼6–6.5, considered as point of zero net proton charge (PZNPC) of kaolinite particles. So, oppositelycharged surface parts on both clay particles are only below this pH, therefore patch-wise charge heterogeneity exists under acidicconditions. Electrophoretic mobility measurements, however, showed negative values for both clays over the whole range of pHshowing the dominance of permanent charges, and only certain decrease in absolute values, much larger for kaolinite was observedwith decreasing pH below pH∼6. The charge heterogeneity was supported by the pH-dependent properties of dilute and dense claysuspensions with different NaCl concentrations. Huge aggregates were able to form only below pH∼7 in kaolinite suspensions.Coagulation kinetics measurements at different pHs provided undisputable proofs for heterocoagulation of kaolinite particles.Similarly to montmorillonite, heterocoagulation at pH∼4 occurs only above a threshold electrolyte concentration, which was muchsmaller, only ∼1 mmol l−1 NaCl for kaolinite, than that for montmorillonite due to the substantial difference in particle geometry.The electrolyte tolerance of both clay suspensions increased with increasing pH, pH ∼6–6.5 range was sensitive, and even asudden change occurred above pH∼6 in kaolinite. There was practically no difference in the critical coagulation concentration ofkaolinite and montmorillonite (c.c.c.∼100 mmol l−1 NaCl) measured in alkaline region, where homocoagulation of negativelycharged lamellae takes place. Rheological measurements showed shear thinning flow character and small thixotropy of suspensionsat and above pH∼6.7 proving the existence of repulsive interaction between uniformly charged particles in 0.01 M NaCl for both
⁎ Corresponding author. Tel.: +36 62 544212; fax: +36 62 544042.E-mail address: [email protected] (E. Tombácz).
0169-1317/$ - see front matter © 2006 Elsevier B.V. All rights reserved.doi:10.1016/j.clay.2006.05.009
106 E. Tombácz, M. Szekeres / Applied Clay Science 34 (2006) 105–124
clays. The appearance of antithixotropy, the sudden increase in yield values, and also the formation of viscoelastic systems only atand below pH∼6 verify the network formation due to attraction between oppositely charged parts of kaolinite particles. Undersimilar conditions the montmorillonite gels were thixotropic with significant elastic response.© 2006 Elsevier B.V. All rights reserved.
Keywords: Kaolinite; pH-dependent charges; Aggregation; Coagulation kinetics; Dynamic light scattering; Rheology
1. Introduction
Clays are finely divided crystalline aluminosilicates.The principal building elements of the clay minerals aretwo-dimensional arrays of silicon–oxygen tetrahedra(tetrahedral silica sheet) and that of aluminum- or mag-nesium-oxygen-hydroxyl octahedra (octahedral, aluminaor magnesia sheet). Sharing of oxygen atoms betweensilica and alumina sheets results in two- or three-layerminerals, such as 1:1 type kaolinite built up from onesilica and one alumina sheet (TO), or 2:1 type mont-morillonite, in which an octahedral sheet shares oxygenatoms with two silica sheets (TOT) (Van Olphen, 1963;Schulze, 2002). Clay lamellae have negative charge siteson the basal planes owning to the substitution of thecentral Si- and Al-ions in the crystal lattice for lowerpositive valence ions. The degree of isomorphic substi-tution is different, therefore the layer charge density ofclay minerals shows high variety. This excess of negativelattice charge is compensated by the exchangeable cat-ions. Additional polar sites, mainly octahedral Al–OHand tetrahedral Si–OH groups, are situated at the brokenedges and exposed hydroxyl-terminated planes of claylamellae (Johnston and Tombácz, 2002). The amphotericsites are conditionally charged, and so either positive ornegative charges, depending on the pH, can develop onthe O faces and at the edges by direct H+/OH− transferfrom aqueous phase. This surface charge heterogeneity ofclay minerals presented originally by Van Olphen (1963),then supported and elaborated further inmany subsequentand recent investigations (e.g. Zhao et al., 1991; Zhou andGunter, 1992; Keren and Sparks, 1995; Schroth andSposito, 1997; Tombácz, 2002; Tombácz, 2003) governsthe particle interactions in clay mineral suspensions. Al-though the overall particle charge is negative in general,both negatively and positively charged parts on the sur-face of clay mineral particles exist simultaneously underacidic conditions.
The pH-dependent colloidal behavior and the uniquesurface charge heterogeneity of montmorillonite plateletswere the subject of our recent paper in Applied ClayScience (Tombácz and Szekeres, 2004). The simultaneouseffect of pH and indifferent electrolytes on the colloidal
behavior of montmorillonite suspensions was analyzed.The development of patch-wise surface charge heteroge-neity on montmorillonite particles dispersed in aqueoussolutions due to crystal lattice imperfections and surfaceprotolytic reactions of edge OH groups was explained.The local electrostatic field formed around the highlyasymmetric montmorillonite platelets (in respect of boththe aspect ratio and surface charging of edges and faces)was modeled introducing the dominant electric doublelayer (edl) with constant charge density (σ0) on the face oflamella and the hidden edl with constant potential atconstant pH (ψ0,H) at the edges, which are formed andneutralized by the clouds of counter ions (charge densitiesof diffuse layers, σd,f and σd,e, for faces and edges, re-spectively). As stated the pH of aqueous medium has twokinds of specific role, one is the high affinity of H+ ions toneutralize the permanent negative charges of dominantelectric double layer on faces, and the other is providingchemical species (H+ and OH−) to the surface protolyticreactions on edge sites, inwhich the pH-dependent hiddenelectric double layer forms. Besides the specific role ofpH, the effect of indifferent electrolytes on particle chargeheterogeneity was also analyzed, since the extremegeometry of montmorillonite lamellae allows that dom-inant edl extending from the particle faces spills over atlow salt concentration, when the thickness of edl (Debyelength, e.g.∼3 nm at 10mM) is larger than that of the thinlamella (∼1 nm). Therefore the hidden edl at the edgeregion can emerge only above a threshold of electrolyteconcentration estimated between 10 and 100 mM. Wecould state that the surface charge heterogeneity is not ageneral feature of montmorillonite particles, it exists onlyin aqueous medium at pHs below the point of zero charge(PZC) of edge site (∼6.5) and becomes perceptible abovea threshold of electrolyte concentration (20–30 mMNaCl), when the dominant edl remains localized on basalplane.
An analogous study on kaolinite was performed. Theobjective of present work is to show the essential dif-ferences originating from the crystal structure (TOT andTO) in the geometry and the layer charge density bet-ween montmorillonite and kaolinite, and to explain thesimultaneous effect of pH and indifferent electrolyte on

107E. Tombácz, M. Szekeres / Applied Clay Science 34 (2006) 105–124
the formation and neutralization of surface charges onkaolinite particles dispersed in aqueous solutions usingdilute and concentrated suspensions under controlledpH and ionic strength conditions.
The differences in surface charge heterogeneity bet-ween different clay particles manifested remarkably in arecent paper (Wan and Tokunaga, 2002). The partitioningof clay colloids at air–water interface was studied. Ref-erence samples of Clay Mineral Society was used to testparticle accumulation. Kaolinite (KGa1), illite (IMt-2)and montmorillonite (SWy-2) were measured in NaClsolutions under varying pH and ionic strength conditions.Montmorillonite lamellae were excluded from the air–water interface at any pH in 0.001MNaCl and up to 0.1Mat pH∼5.5, while kaolinite particles exhibited extremelyhigh affinity to the negatively charged air–water interfacebelow pH∼7, if NaCl concentration was at least 0.001M.These clay particles were definitely different in respect ofgeometry and surface charge properties. It is worth re-calling the data of Wan and Tokunaga (2002) relevant tothe subject of present paper (Table 1). The aspect ratio(diameter/thickness) 2 to 10 was measured for kaoliniteparticles, which is extremely different from that of mont-morillonite lamellae estimated as ∼500 or even larger.Much pronounced role of edge area in surface chargeproperties can be predicted for kaolinite as for montmo-rillonite, especially, if the difference in the structuralcharge densities being responsible for permanent charges isalso taken into consideration.
High-resolution transmission electron microscopy(HRTEM) examinations (Ma and Eggleton, 1999b)have indicated that three types of surface layers mayexist in natural kaolinite crystals. Type 1 has the expected0.7 nm TO surface layer as terminations. Type 2 has one1 nm pyrophyllite-like (TOT) layer as the surface layer onone side of a kaolinite particle, the spacing between theTOTand the adjacent TO layer is not expandable. Type 3kaolinite has one or several TOT collapsed smectite-likelayers at one or both sides of a stack forming a special kindof kaolinite–smectite interstratification, which has onlybeen recognized in some poorly-ordered kaolinites. Thesurface smectite layer(s) contribute to higher cation ex-change capacity (CEC) values. The same authors (Ma and
Table 1Size, shape, and charge properties of kaoliniteKGa-1 andmontmorilloniteSWy-2 (data from Wan and Tokunaga, 2002)
Claymineral
Sizenm
Structuralchargesites/nm2
Estimatedthicknessnm
Edge area% of total
Kaolinite b∼500 ∼0.3 40 to 70 20 to 30Montmorillonite N∼500 ∼14.9 1 b1
Eggleton, 1999a) determined the CEC of several kaolinitesamples and compared them to theoretical calculations ofCEC. This comparison revealed that the exchangeablecations occur mostly on the edges and on the basal (OH)surfaces of kaolinite. It was also shown that permanentnegative charge from isomorphic substitution of Al3+ forSi4+ is insignificant, and that the CEC of kaolinitestrongly depends on the particle size (both thickness anddiameter in the 00l plane) and the pH value. This studyrevealed that the hydroxyls on the exposed basal surfacesmay be ionizable in aqueous solutions, and the amount ofnegative charge on the edges and the exposed basal hy-droxyls depends on pH and other ion concentrations.
The development of pH-dependent surface chargeson kaolinite was explained by proton donor–acceptorreactions taking place simultaneously on basal planesand edges (Brady et al., 1996). Based on the measuredproton adsorption isotherms and molecular modeling ofproton-relaxed kaolinite structure, authors proved thesubstantial contribution of edge Al sites to the pH-de-pendent charge development due to thicker particles.
The acid–base chemistry of clay minerals with per-manent and variable charges was described by usingsurface complexation model, and its applications tomontmorillonite and kaolinite were presented (Kraepielet al., 1998). Protonation–deprotonation reactions weresupposed to take place both on the edges (≡Al–OHgroups) and on the gibbsite basal planes (Al–O–Algroups). Authors noted that kaolinite does not correspondexactly to the model solid, the distribution of permanentand variable charges is not uniform on the surface ofparticles.
Although the substantial difference in the pH-depen-dent behavior of clay minerals is known from sixties(Van Olphen, 1963), a unified triple layer model of clayminerals was still proposed and applied for smectite(2:1 type) and kaolinite (1:1 type) recently (Leroy andRevil, 2004). Authors emphasized that both chemicaland electrical characters of clay particles were consid-ered referring to the similar work of Avena and De Pauli(1998) published previously, meanwhile the significantdifferences in geometry and electric double layers ofclay particles with patch-wise charge heterogeneitywere ignored. Probably this also contributed to thechemical nonsense in surface site speciation calculatedfor kaolinite edges (Leroy and Revil, 2004). It has to bementioned, only the montmorillonite was investigatedin the referred paper (Avena and De Pauli, 1998), andauthors assumed the presence of smear-out charges andpotentials for 2:1 type clay particles in their surfacespeciation model as an acceptable approximation. Theproton binding at clay–water interfaces for both 2:1 and

Fig. 1. Development of patch-wise surface charge heterogeneity on 1:1 type kaolinite (atom arrangement in silica tetrahedral (T) and aluminaoctahedral (O) layers inserted) particles dispersed in aqueous solutions due to crystal lattice imperfections (permanent negative charges on T faces)and surface protolytic reactions of edge and O face OH groups (pH-dependent charges on edges). An electric double layer (edl) with constant chargedensity (σ0) on the T face of particle, while another edl with constant potential at constant pH (ψ0,H) on its edges and O face are formed, and both areneutralized by the clouds of counter ions (charge densities of diffuse layers, σd,f and σd,e, for T face and edges, respectively).
108 E. Tombácz, M. Szekeres / Applied Clay Science 34 (2006) 105–124
1:1 type clay particles is discussed in one of their recentwork (Avena et al., 2003). The proton affinity of dif-ferent surface sites located on basal plane and at brokenedges was analyzed on the basis of MUSIC model.They concluded that siloxane and gibbsite-like groupson the basal surface of 2:1 and 1:1 clays are notreactive, however, the protonation–deprotanation reac-tions take place on the Al–OH sites, while Si–OH sitesare unreactive at the broken edges under normal pHconditions. Additionally, the reactivity of edge groups isalso influenced by the presence of structural charges,and the electric field originating from the permanentcharges affects on both the basal and the edge surfacereactions.
The pH-dependent electro-osmotic flows observed inNaCl-water saturated kaolinite system were modeledsuccessfully in a recent paper (Dangla et al., 2004) usingsimilar approach to ours introduced for montmorillonite(Tombácz and Szekeres, 2004; Tombácz et al., 2004). Inthe case of kaolinite the low level of isomorphic subs-
titution (1–8 meq/100 g), i.e. the low permanent chargedensity (−0.064 to −0.5 C/m2) and the significance ofAl–OH sites in the formation of pH-dependent chargeswere underlined. We should note that this range ofcharge density is not low at all, especially comparing itwith the permanent charge density of montmorilloniteup to about −0.1 C/m2 (Van Olphen, 1963; Tombáczet al., 1990; Kraepiel et al., 1998).
As explained for montmorillonite before (Tombáczand Szekeres, 2004) and supported for clay colloids(Wan and Tokunaga, 2002), the effect of pH and indif-ferent electrolytes is mutual; none of them can be inter-preted alone. Now we attempt to outline schematicallyhow the material characteristics of kaolinite govern theformation of local electrostatic field around the rela-tively robust, less asymmetric clay particle than mont-morillonite lamella in respect of both the aspect ratio andsurface charge density in aqueous medium containingindifferent electrolytes besides the autoprotolytic pro-ducts of water in Figs. 1 and 2.
109E. Tombácz, M. Szekeres / Applied Clay Science 34 (2006) 105–124
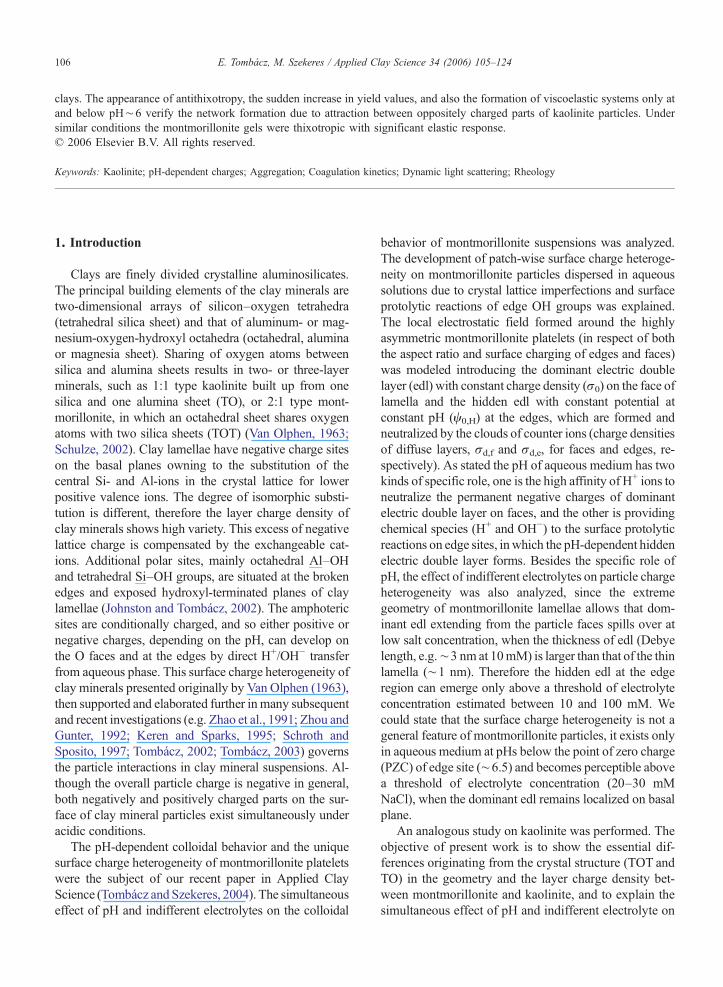
Unlike the 2:1 montmorillonite having two planarsiloxane surfaces per TOT layer, the 1:1 layers of kaolinite(crystal structure showed in Fig. 1) are bound together inthe c direction by hydrogen bonds between hydroxylgroups of octahedral (O) sheet and the highly electroneg-ative oxygens of the silicon tetrahedral (T) sheet. There-fore a kaolinite particle has one siloxane and one hydroxylsurface, T and O faces, respectively. This corresponds tothe Type 1 surface layer as terminations (Ma andEggleton, 1999b). Minor isomorphic substitution in thetetrahedral sheet results in a few permanent negativecharges on the T face. This excess of negative latticecharge is compensated by the exchangeable cations in thediffuse part of the electric double layer (edl) on T faces(Fig. 2). Two types of inorganic surface hydroxyl groups(ISOH) occur in the solid phase of different minerals(Johnston and Tombácz, 2002) as illustrated for kaolinitein Fig. 1. The first type is charge neutral ISOH groups,which are the part of the crystal structure. They arecoordinated to metal atoms whose coordination environ-ment is complete. The second ISOH, silanol and aluminolgroups that occur on broken edges and gibbsite planes, arebound to undercoordinated metal atoms, they are morereactive. The O face hydroxyl groups are probably lessreactive than edge aluminols and silanols (Brady et al.,1996; Avena et al., 2003), but not all papers distinguishbetween them (Coppin et al., 2002; Dangla et al., 2004).The pH-dependent charges, either positive or negative asshown in Fig. 1, can develop on these amphoteric sites at
Fig. 2. Schematic representation of the electric double layers forming aroundindifferent electrolytes on particle charge heterogeneity besides the specific
the edges and O faces by direct H+ or OH− transfer fromaqueous phase. The variable edge charges are compen-sated by a cloud of counter ions in the electric doublelayers at edges and O faces presented schematically atdifferent electrolyte concentrations in Fig. 2. The patch-wise charge heterogeneity can develop on the differentparts of kaolinite particle, if the pH of aqueous solution islower than the point of zero charge (PZC) of amphoteric(mainly edge) sites, which is about 3 to 4 (Appel et al.,2003), 3.8 (Brady et al., 1996), 5.5 (Dangla et al., 2004),4–5.5 (Coppin et al., 2002), 5.9 (Kretzschmar et al., 1998)or ranging frompH5 to 9 depending on the kaolinite used,the clay pretreatment, and the method used for itsdetermination as stated in the paper of Kretzschmar etal. (1998). However, at very low electrolyte concentration(b∼0.001 M), where the thickness of edl (Debye length,e.g. ∼10 nm at 0.001 M) is comparable with the thick-ness of kaolinite particle (10–120 nm (Brady et al., 1996),40–70 nm (Wan and Tokunaga, 2002)), the oppositelycharged parts cannot see each other (top of Fig. 2). Theseemerged at higher, only above a heterocoagulation thresh-old of electrolyte concentration (bottom of Fig. 2) asintroduced for the interaction of oppositely charged mag-netite and montmorillonite particles before (Tombáczet al., 2001), and the attraction between the oppositelycharged parts results in heterocoagulated aggregates. Theedge(+)/face(−) interactions in kaolinite suspensions aremore important than that for montmorillonite, because theparticles are thicker (Penner and Lagaly, 2001).
the kaolinite particles under different solution conditions. The effect ofrole of pH.
110 E. Tombácz, M. Szekeres / Applied Clay Science 34 (2006) 105–124
2. Experimental
2.1. Preparation of kaolinite suspensions
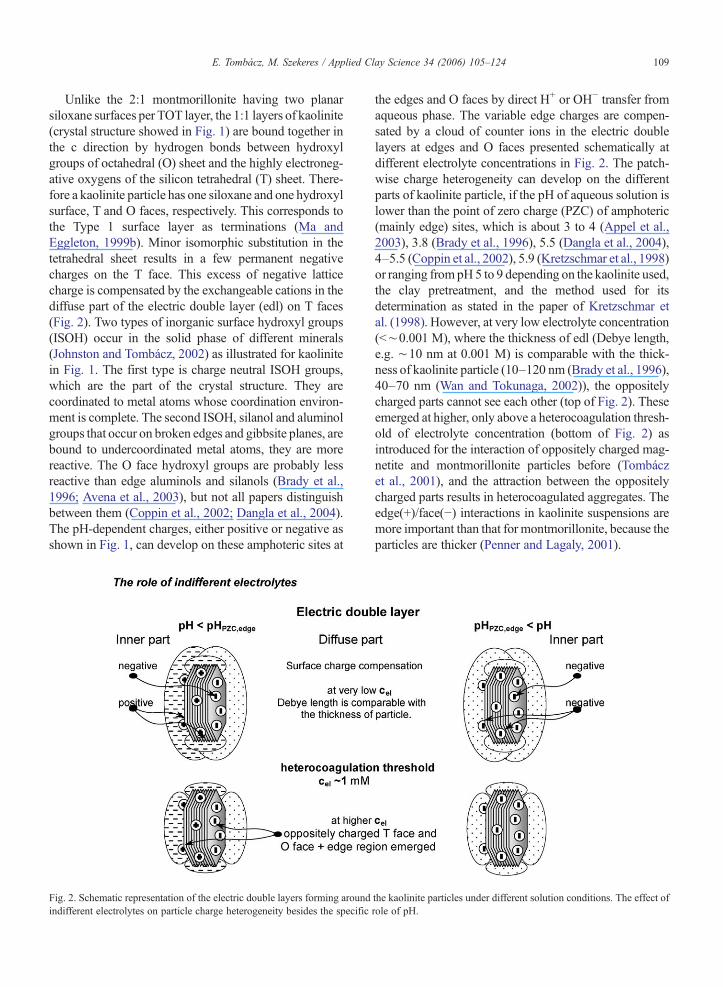
Kaolinite was obtained from Zettlitz kaolin (Germany). Anaqueous slurry of kaolin was treated with Na2CO3 at about80 °C for 2 days then diluted by Millipore water up to 4 g clayin 100 ml suspension. Kaolinite fraction smaller than 2 μmwasprepared by allowing the larger particles to settle down in theclay suspensions and then decanting. The excess carbonatewas eliminated by HCl addition. To obtain the monocationicNa-kaolinite, the suspension was treated with 1 M NaCl. Aftercentrifugation of the suspensions at 3600 RPM, the superna-tant solution was discarded and replaced with fresh solution.The procedure was repeated three times. The ionic strength ofsuspension was progressively lowered, first by washing withMillipore water and then by dialysis against 0.01 M NaCl, tothat used in the experiments. The progress of dialysis wascontrolled by measuring conductivities of inner and outerphases daily. Na-kaolinite suspension (∼200 g/l) in dialysistubes reached equilibrium state within 2 weeks. This procedureprovides a definite initial state with constant ionic strength atself-pH of suspensions for further work. The stock suspensionswere stored in refrigerator at 4–5 °C. The smaller electrolyteconcentration of medium was reached by dilution. Freeze-dried sample was prepared to measure cation exchange capac-ity (CEC) and specific surface area. CEC value was 9 meq/100 g. Specific surface area determined by nitrogen adsorption(BET) was 83 m2/g. X-ray diffraction pattern of air-dried andethylene glycol saturated kaolinite samples on glass plates wasdetermined to check the presence of smectite impurity. Mea-surement was performed over the scanning range 2°b2Θb40°at room temperature by using a Philips PW 1830 X-raygenerator with CuKα (λ=0.154 nm) radiation and a PhilipsPW 1820 goniometer operating in the reflection mode. Thecharacteristic reflections (d001 0.72 nm and d002 0.36 nm) ofkaolinite (Van Olphen and Fripiat, 1979) in both states can beshown in Fig. 3. For the sake of comparison the XRD patternof Na-montmorillonite taken before (Tombácz and Szekeres,
Fig. 3. XRD patterns of air-dried and ethylene glycol saturated kaolinite sa(Wyoming, Swy-1 sample).
2004) is also shown. The presence of swelling clays inkaolinite cannot be revealed, since no any reflection at∼7° 2Θappeared in the kaolinite sample swelled in ethylene glycol. Itshould be noted that the surface smectite layer(s) contribute tohigher CEC values cannot be detected by XRD (Ma andEggleton, 1999b). The water was obtained directly from aMillipore apparatus. All the used chemicals were analyticalreagent grade product (Reanal, Hungary).
2.2. Potentiometric acid–base titration
The pH-dependent surface charge was determined bypotentiometric acid–base titration under a CO2-free atmosphereusing electrolyte NaCl tomaintain a constant ionic strength 0.01,0.1 and 1 M, respectively. Before titration the suspensions con-taining ∼1 g kaolinite were stirred and bubbled with purifiednitrogen for an hour. Equilibrium titration was performed bymeans of a self-developed titration system (GIMET1) with 665Dosimat (Metrohm) burettes, nitrogen bubbling, magneticstirrer, and high performance potentiometer at 25±1 °C. Thewhole system (mV-measure, stirring, bubbling, amount andfrequency of titrant) was controlled by IBMPS/1 computer usingAUTOTITR software. A Radelkis OP-0808P (Hungary) com-bination pH electrode was calibrated for three buffer solutions tocheck the Nernstian response. The hydrogen ion activity vs.concentration relationship was determined from referenceelectrolyte solution titration, so that the electrode output couldbe converted directly to hydrogen ion concentration instead ofactivity. In the first cycle, suspensions were titrated with standardHCl solution down to pH 3.5 then with standard base solution(NaOH) up to pH 9.5, then again with acid solution in the thirdcycle. The titration was not reversible within the reproducibilityof thismethod, the curvesmeasured in the direction of decreasingand increasing pH (backward and forward curves, respectively)showed small hysteresis at each ionic strength, although theacid–base titrations were performed in the range of pH probablyfree of dissolution ([Al3+]∼10−3.5 M at pH∼3.5 and [Al(OH)4
−]∼10−5 M at pH∼9.5 in Bolt and Bruggenwert (1978); thedissolved Al concentration in the equilibrium aqueous phase of
mples on glass plates in comparison with that of Na-montmorillonite
111E. Tombácz, M. Szekeres / Applied Clay Science 34 (2006) 105–124
kaolinite suspensions after 3 days remained below 10−4 M overthe range of pH from 3 to 9 in Coppin et al., 2002).
The net proton surface excess amount (ΔnσH/OH, mol/g) isdefined as a difference of H+ and OH− surface excess amounts(nσH+ and nσOH−, respectively) related to unit mass of solid,ΔnσH/OH=n
σH+−nσOH−. The surface excess amount of any
solute, like H+ and OH− here, can be determined directly fromthe initial and equilibrium concentration of solute foradsorption from dilute solution (Everett, 1986). The valuesnσH+ and n
σOH− were calculated at each point of titration from
the electrode output using the actual activity coefficient fromthe slope of H+/OH− activity vs. concentration straight lines forbackground electrolyte titration.
2.3. Electrophoretic mobility measurement
Electrophoretic mobility of kaolinite, montmorillonite andaluminum oxide particles was measured at 25+0.1 °C in acapillary cell (ZET 5104) with ZetaSizer 4 (MALVERN, U.K.)apparatus. Stock dispersions were diluted to ∼0.05 g/l solidcontent and the salt concentration of dilute systems was ad-justed to a constant concentration of NaCl (0.01 M). The pH ofdilute dispersions were adjusted between ∼3 and ∼10 byadding either HCl or NaOH solutions, and measured directlybefore introducing sample in to the capillary cell.
2.4. Dynamic light scattering measurements
Dynamic light scattering (DLS) measurements were per-formed using a ZetaSizer 4 (MALVERN, U.K.) apparatus oper-ating at λ=633 nm produced by an He–Ne laser at scatteringangle 90° at 25±0.1 °C to determine average particle size indilute suspensions. The stock suspension of kaolinite was dilutedten times byMillipore water (suspension concentration∼20 g/l,ionic strength 0.001 M), and centrifuged at 6000 RPM for halfan hour to obtain the fine (b∼0.5 μm) kaolinite particles in thesupernatant. The fine fraction was diluted by Millipore watersolution to reach a constant solid content (∼0.1 g/l). Coagulationkinetics measurements were performed at pH ∼4, ∼6 and ∼8with the series of kaolinite suspensions containing different(from 0.0001 to 0.2M) final concentrations ofNaCl. The desiredpH values in the suspensions and in the double concentratedNaCl solutions were preadjusted by HCl and NaOH solutions,respectively, and they were stored in a thermostat at 25±0.1 °C.1 ml of suspension was placed in the measuring cell and 1 ml ofelectrolyte solution with the same pH was mixed with it, thensize measurement was started after 5 s and continued till 270 s(data collection time: 10 s, time between each sizing: 20 s). Sizeevolution of aggregateswas followed in time. The pH-dependentaggregation of montmorillonite and kaolinite particles wascompared at constant ionic strength (0.01 M NaCl). The pH ofdilute systems were adjusted in the range from 4 to 10, andmeasured directly before a sample was placed in the quartz cell.The size measurement was started after 5 min. The correlationfunctions were evaluated by cumulant analysis (Brown, 1993).Supposing a monomodal distribution a third-order cumulant
fitting was used, and the Z-average hydrodynamic size wascalculated.
2.5. Rheological measurements
The rheological measurements were performed with arheometer HAAKE RS 150 and a cone-plate sensor (DC60/2°Ti) at temperature 25±0.1 °C controlled by a HAAKEDC 30/K20 thermostat. Two types of measurements were performed:
— The flow curve (upward) was measured with a shear rateramp over 1 min from 0 to 100 1/s, then the ramp wasreversed to measure downward flow curve. The areabetween the upward and downward curve was calculatedas measure for thixotropy using data analysis option ofRheoWin software.
— The creep test was performed to determine the viscoelas-tic behavior under static condition. A constant stressbetween 0.01 and 10 Pa was applied for 1 min and theresulting strain was measured (creep), then stress wasreleased and strain was measured for 1 min (recovery).The shear creep compliance (J, 1/Pa) was calculateddividing the measured shear strain (γ) values by theapplied stress (τ, Pa).
The dynamic test of viscoelasticity was also attempted inforced oscillation measurements in the range of frequencyfrom 0.01 to 10 Hz, then of stress from 0 to 40 Pa.
15 g/100 g kaolinite suspensions containing 0.01 M NaClweremeasured at different pHs from∼5 to∼8. The pHs of densesuspensions were adjusted with adding estimated amounts of 1MNaOH or HCl solutions. The pHs of well-homogenized sus-pensionsweremeasured, then allwere stored in sealed vials undernitrogen for a day. The portions of suspensions were carefullyplaced on the measuring plate of rheometer, and the measuringposition was reached at low speed. The equilibrium pH values ofsuspensions were measured after rheological measurements. ThepH shift during 1-day-standing was less than 0.2 pH unit.
3. Results and discussion
3.1. Simultaneous pH-dependent charge developmenton edge and basal OH sites, and H+/Na+ ion exchangeon permanent negative charge sites
Potentiometric acid–base titration over the range of pHbetween 3.5 and 9.5 was used to characterize the pH-dependent charge development on the amphoteric surfacesites of kaolinite. Protolytic reactions at edges andprobably on basal OH faces take place in parallel withthe H+/Na+ ion exchange on permanent negative chargesites of T faces, and the separation of the individualcontribution to the measurable H+ and OH− consumptionis not possible experimentally. A prudent preparation ofkaolinite suspension provided a well-defined initial state
112 E. Tombácz, M. Szekeres / Applied Clay Science 34 (2006) 105–124
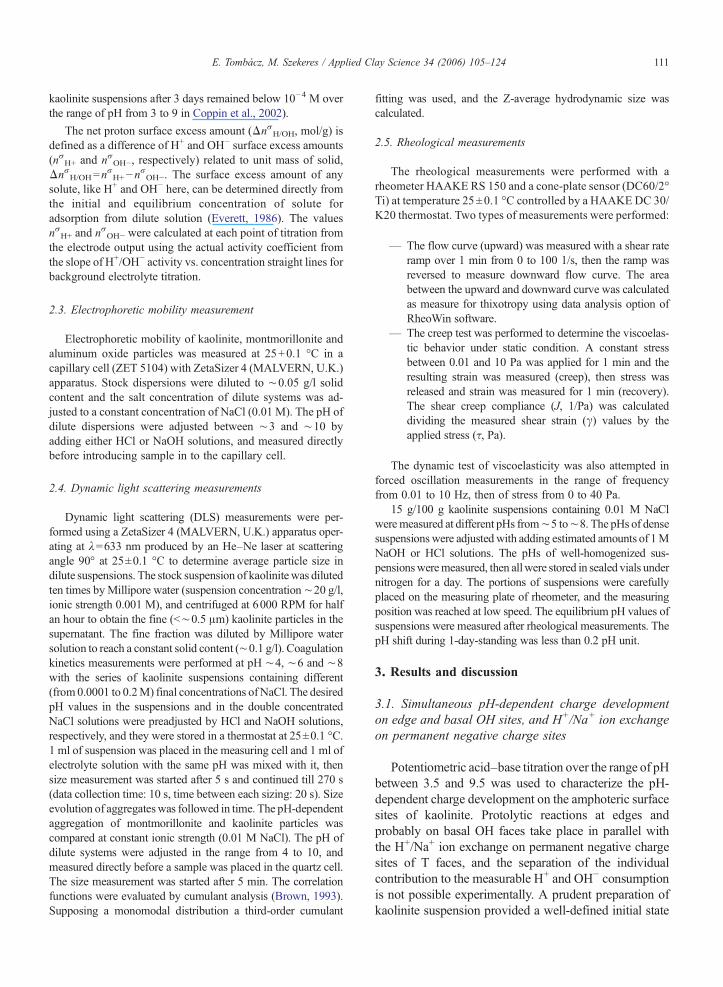
of titration and allowed us to use an evaluation methoddeveloped before for oxides (Tombácz and Szekeres,2001), which assumes only the mass conservation law forH+/OH− ions during titration. A constant NaCl concen-tration in liquid phase and a sufficient Na-saturation of ionexchange sites on faces was reached in an equilibriumdialysis of kaolinite suspension against 0.01MNaCl. Theacid–base titration cycles measured at 0.1 M NaClconcentration are shown in Fig. 4. The net proton con-sumption curves for Na-kaolinite show a small hysteresis,the backward and forward titration curves in the directionof decreasing and increasing pH, respectively, do notcoincide, which is different from that observed in the caseof montmorillonite samples (Tombácz and Szekeres,2004). The net proton consumption curves determined atdifferent salt concentrations showed similar characteras seen in Fig. 5. While the acid–base processes inmontmorillonite suspensions over the pH range free ofdissolution were considered as reversible equilibriumapart from the first downward curves, the analogoustitration of kaolinite suspensions did not result inreversible cycles satisfactorily within the experimentalerror of this method. Therefore the evaluation of kaolinitedata would not be correct, if we use the same equilibriummodel, which was applied to calculate the pH-dependentcharging of montmorillonite (Tombácz et al., 2004).
Similarly to montmorillonite, a decrease in the initialpH of suspensions with increasing salt concentration wasobserved in kaolinite suspensions, too. However, the ex-tent of pH shift (ΔpH=pHi,0.01−pHi,1) being almost thesame (ΔpH∼0.8) for the montmorillonite samples, wasmuch smaller (ΔpH=0.44) in kaolinite suspensions (the
Fig. 4. Experimental net proton surface excess curves for Na-kaolinite in 0.1the data of equilibrium titration cycles to test the reversibility of acid–base proforward (gray symbols) with 0.1 M NaOH solution, finally a backward titra
initial pH values given in Fig. 4). Since this pH shift isindicative of the permanent negative charges on solid inquestion according to the basic principles of acid–basesurface chemistry of soils (Sposito, 1984), it can be statedthat permanent charges are present in kaolinite particles,and the edl developed probably on T faces influences theion distribution of electrolytes, but the effect of layercharges is much less dominant, than that in montmoril-lonite suspensions.
The 2:1 layer-type montmorillonite has high perma-nent layer charge and negligible variable charge (Sposito,1984; Tombácz et al., 1990; Keren and Sparks, 1995;Mohan and Fogler, 1997; Tombácz et al., 1999), whilekaolinite has much lower apparent values, and its am-photeric character is obvious. Comparing the net protonsurface excess vs. pH functions of montmorillonite andkaolinite at three different ionic strengths (Fig. 6), whichnever intersect in contrast with oxides (James and Parks,1982), it can be seen that their overall H+/OH− consump-tion is similar, although the difference between montmo-rillonite and kaolinite, besides their crystal structure andlayer charge, in specific surface area is about one order ofmagnitude. Both sets of curves shifted in the direction oflower pH with increasing NaCl concentration, which alsoindicates the presence of permanent charges. The extent ofparallel shift, however, is smaller for the 1:1 type kaolinitethan that for 2:1 type montmorillonite in accordance withthe about one order of magnitude difference in cationexchange capacity (CEC) value of these samples (9 and105 meq/100 g for Zettlitz kaolin and Swy-2 montmo-rillonite, respectively (Tombácz, 2003; Tombácz andSzekeres, 2004)). This significant difference also supports
MNaCl solution at room temperature. The points were calculated fromcesses: first a backward (open symbols) with 0.1 MHCl solution, then ation (black symbols) again.

Fig. 5. Experimental net proton surface excess curves for Na-kaolinite dialyzed against 0.01 M NaCl solution, then diluted with NaCl solutions toadjust salt concentrations 0.01, 0.1 and 1 M, respectively, at room temperature. The points were calculated from the data of an equilibrium titrationcycles to test the reversibility of acid–base processes: first a backward (open symbols) with 0.1 M HCl, then a forward (gray symbols) with 0.1 MNaOH solution, finally a backward (black symbols) titration again.
113E. Tombácz, M. Szekeres / Applied Clay Science 34 (2006) 105–124
our statement above on the influence of layer charge. Themuch less proton excess amounts in the positive regionaccords well with the low layer charge density of kaolinite(Bolland et al., 1980; Zhou andGunter, 1992; Schroth andSposito, 1997), and the comparable values in the negativeregion show themore pronounced role of amphoteric siteson kaolinite particle in comparison with montmorillonite.
In the course of the acid–base titration of kaolinite thecontribution of amphoteric edge and basal OH (O face)sites to develop variable charges is significant. Besides thelimited ion-exchange process for H+ and Na+ ions onpermanent negative charges (NaX+H+⇔HX+Na+), the
Fig. 6. Comparison of the effect of electrolytes on the pH-dependent surmontmorillonite and kaolinite.
protonation and deprotonation of aluminol groups in thereactions Al–OH+H+⇔Al–OH2
+ and Al–OH⇔Al–O−+H+ takes place in the acidic and alkaline regions,respectively. The protonation of silanol groups at edges isnot probable above pH∼3.5, since silica surfaces areanionic down to pH∼3 (Brady et al., 1996). However, thecontribution of silanol groups to the base consumptionand negative charge formation in a deprotonation reaction(Si–OH⇔Si–O−+H+), especially above pH∼8 may bedominant.
The contribution of amphoteric sites to the acid–baseproperties of kaolinite seems to be significant, but their
face accumulation of protons determined by acid–base titration for

114 E. Tombácz, M. Szekeres / Applied Clay Science 34 (2006) 105–124
effect on charge-potential curves, i.e. opening with in-creasing electrolyte concentration due to charge screen-ing, which is typical for all amphoteric oxides, does notappear. The pH of zero net proton charge (PZNPC) ofkaolinite may be identified at pH∼6–6.5. This value ishigher than most reported value for specimen kaolinite(Zhou and Gunter, 1992; Schroth and Sposito, 1997),but is close to the published PZNC (point of zero netcharge) at pH 7.3–6.6 (Herrington et al., 1992), and thePZC of edge sites at pH 7.5 calculated from the poten-tiometric titration data corrected with the amount ofpermanent charges (Blockhaus et al., 1997).
It is worth comparing the results of kaolinite with theionic strength dependent surface charging of aluminumand silicon oxides in Fig. 7, which are relevant to the edgesites of kaolinite in chemical point of view. Both oxidesexhibit the common feature of net proton surface excessvs. pH curves at different ionic strengths. The main dif-ference between the acid–base properties of these oxidesis the pHs of their PZC, since it is above pH 8 for aluminaand below pH 4 for silica (Tombácz et al., 1995). In thecase of kaolinite, however, the reversible net protonsurface excess curves at different ionic strengths (Fig. 5)never intersect, no any common intersection point such asPZC or PZSE (point of zero salt effect) can be identified.The extent of proton accumulation on the surface ofkaolinite particles is always greater at lower ionic strengthsimilarly to those of the clays in literature (Kraepiel et al.,1998, 1999). Comparing the net proton surface excess vs.pH function measured for kaolinite with that of thealumina and silica samples in Fig. 7, we can conclude thatthe acid–base properties of amphoteric sites of kaolinite
Fig. 7. The pH-dependence of net proton surface excess amounts for differentfor Al2O3 (Aluminum Oxide C, Degussa) and SiO2 (Aerosil 200, Degussa),
are just between the surface OH bound to the pure Al2O3
and SiO2 solid matrix, similarly to our conclusion basedon the SCM modeling for montmorillonite, where westated that the OHgroups at edges having PZC at pH∼6.5as less basic than the Al–OH and less acidic than the Si–OH groups.
Positive charges can develop only on the Al–OH sitesof edges and basal OH surfaces at pHs below ∼6,however, these are not necessarily emerged at very lowelectrolyte concentration (b∼1 mM), when the Debyelength is comparable with the thickness of kaoliniteparticles as shown in Fig. 2. The unique surface chargeheterogeneity of kaolinite particles disappears, if the pHof suspensions is above the pHPZC, edge∼6–6.5, since thedeprotonation of Si–OH then that of the Al–OH sitestakes place with increasing pH of solution resulting innegative charges at edges and O faces similarly to that onT faces.
3.2. pH-dependent charge state of clay particles in elec-trolyte solutions
Electrophoretic mobility and zeta potential data holdinformation on the electric double layer of charged par-ticles. The sign of these measurable electric data is thesame as that of the excess charge of particle movingtogether with the adhered layer of counterions, and itsmagnitude is somewhat proportional to the particle charge(Hunter, 1981).
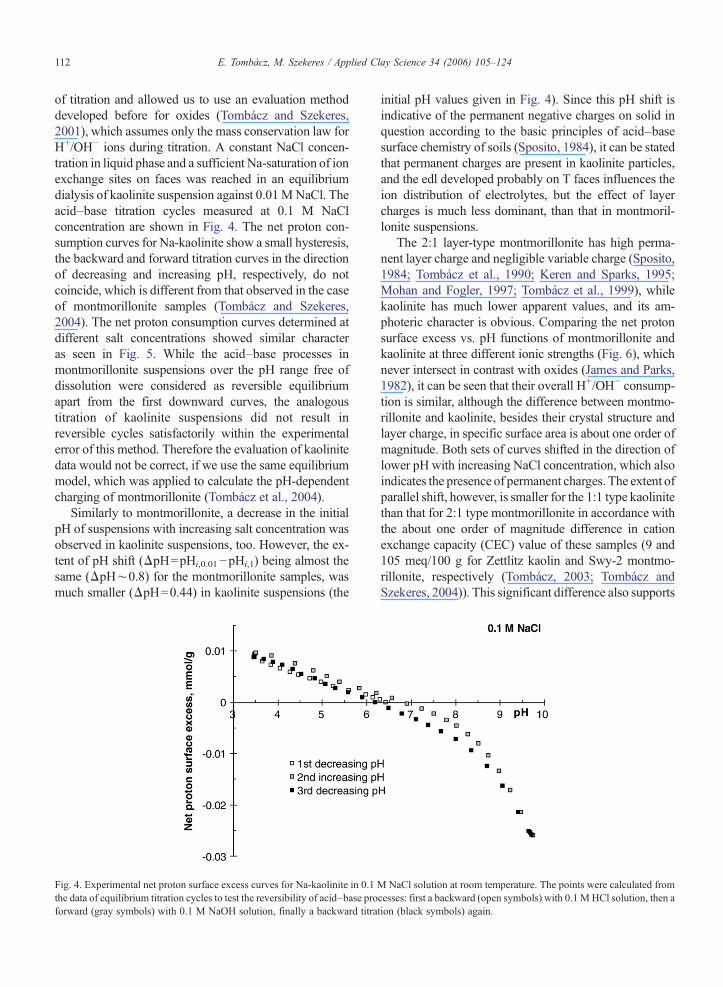
The pH-dependent electrophoretic mobility of solidparticles holding permanent and/or variable charges ischaracteristically different as shown for kaolinite,
solid materials. Experimental data measured at different ionic strengthsand for kaolinite at 0.01 M NaCl.
115E. Tombácz, M. Szekeres / Applied Clay Science 34 (2006) 105–124
montmorillonite and aluminum oxide particles in Fig. 8.The sign of the mobility measured in the aluminum oxidedispersions reverses at a characteristic pH identified as thepH of isoelectric point (IEP), if this is the intersectionpoint of pH-dependent curves measured at different ionicstrengths. The symmetric shape of the mobility–pH plotnear the IEP indicates the significance of H+/OH− ions indetermining surface charging. The pH of sign reversal ofelectrophoretic mobility (∼ IEP) in present example is atpH∼8 showing clearly that alumina particles are pos-itively charged below and negatively above this charac-teristic pH, which is close to the pH∼8 of PZCdetermined from the surface charge titration curves ofaluminum oxide (Fig. 7). The dominance of permanentnegative charges on montmorillonite and even kaoliniteparticles is obvious from the negative mobility valuesobserved over the whole range of pH. The contribution ofpositive charges, which develop on the Al–OH sites atexposed hydroxyl-terminated planes of kaolinite and atthe edges of both clays at pHs below∼7, is not significantas compared to the excess charge of clay particles. Adefinite bend of the mobility vs. pH curve for kaolinitebelow pH∼6 from that of montmorillonite shows a slightdecrease in the net negative particle charge of kaolinite,since the probable amount of protonated Al–OH sites(∼0.01 mmol/g at pH∼4 in Fig. 5), i.e., positive chargesbelow pH∼6, becomes comparable with the relativesmall amount of permanent negative charges on kaolinitesurface (CEC ∼0.09 meq/g). The negative value of elec-trophoretic mobility and zeta potential measured in mont-morillonite suspensions at even acidic pHs in generalrelates to the dominance of permanent charges, such as
Fig. 8. pH-dependent charge state of clay particles in comparison with aluminat 25±0.1 °C.
here 1.05 meq/g for Swy-2, which is much larger than theamount of edge Al–OH sites 0.03–0.04 mmol/g esti-mated in our previous model calculation (Tombácz et al.,2004). However, in the case of kaolinite small, butpositive values below the pH of isoelectric point (IEP) areoften published, such as zeta potential below pH∼4.3(Hu et al., 2003), electrophoretic mobility at pHb4.8(Kretzschmar et al., 1998), electroacoustic mobility belowpH 3.8–4.1, meanwhile large negative zeta potentialvalues (−26, −28 mV) are also given at pH∼4.4 forkaolinite in this paper (Appel et al., 2003) similarly to thatof −15 mV at pH∼4 (Akbour et al., 2002). This highvariety in the overall particle charge in acidic suspensionsalso supports that the negative layer charge of kaolinite iscomparable with the pH-dependent variable chargesdeveloping positive charges on edge and O face sites asdepicted in Fig. 1 in general, and so the appearance ofcharge reversal and IEP definitely depends on the kao-linite used, the clay pretreatment, and probably the meth-od used to determine these data.
3.3. Edge-to-face and face-to-face aggregation in dilutesuspensions
3.3.1. pH-dependent aggregation of clay particlesThe pure clay particles in aqueous medium are elec-
trostatically stabilized from colloidal stability point ofview. Particles either aggregate or disperse dependingon the structure of electric double layer formed on theparticle surface as depicted for kaolinite in Fig. 2 and formontmorillonite before (Tombácz and Szekeres, 2004).Aggregation processes in dilute suspensions can be
um oxide; laser Doppler electrophoresis measured in dilute suspensions
116 E. Tombácz, M. Szekeres / Applied Clay Science 34 (2006) 105–124
followed by particle size determination. Dynamic lightscattering (DLS) provides reliable size data even whenthe system is undergoing coagulation (Holthoff et al.,1996; James et al., 1992).
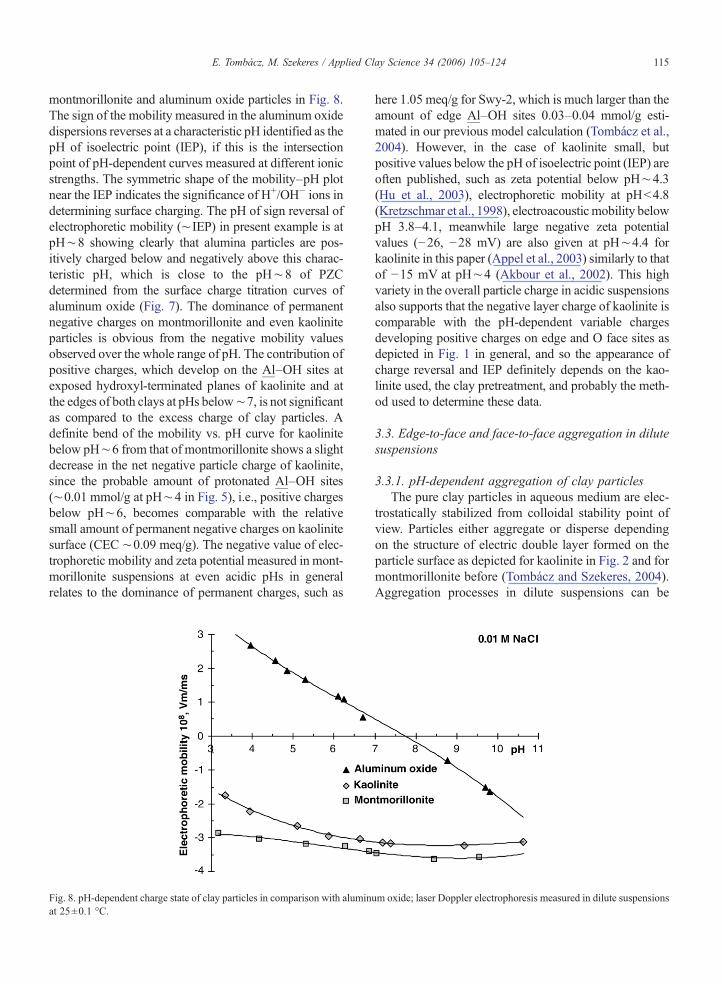
The pH-dependent hydrodynamic sizes calculatedfrom the cumulant analysis of first order correlation func-tions are shown in Fig. 9. Comparing themeasured data ofkaolinite and montmorillonite, the characteristic differ-ence in pH-induced particle aggregation in dilute sus-pensions containing only 0.01 M NaCl is obvious. Thehighly charged montmorillonite particles form stable sus-pension; apart from a slight increase below pH∼7, theaverage particle size is almost constant over the wholerange of pH as explained elsewhere (Keren and Sparks,1995; Tombácz et al., 1999, 2001). In principle the posi-tively charged edges can interact with the negative basalplates below pH∼6.5, however, edge-to-face heterocoa-gulation does not take place at such a low ionic strengthbecause the oppositely charged edge surfaces remainhidden due to the spillover of the dominant electric doublelayer on the face of montmorillonite plates (Tombácz andSzekeres, 2004). On the contrary, kaolinite particles,which have commensurable amounts of permanent andpH-dependent charges, strongly aggregate below thepH∼7, since the positively charged Al–OH sites es-pecially at edges can interactwith the negative basal platesforming edge-to-face aggregates (Van Olphen, 1963;Bartoli and Philippy, 1987; Zhao et al., 1991; Penner andLagaly, 2001). In the destabilized suspensions, the mea-sured particle size increased in time showing the progressof coagulation. Therefore, the measured larger sizesbelow the PZNPCof kaolinite in Fig. 9 are suitable only tocompare a given kinetic state of coagulating systems.
Fig. 9. Comparison of pH-dependent particle aggregation in kaolinite and mosuspensions at 25±0.1 °C. Clay samples: kaolinite from Zettlitz kaolin and
3.3.2. Coagulation kinetics of kaolinite at different pHsCoagulation kinetics measurements were performed
to obtain exact data for the pH-dependent colloidalstability of fine kaolinite particles dispersed in indiffer-ent electrolyte solution. Size evolution of aggregates intime was followed by dynamic light scattering. Theinitial slopes of hydrodynamic size vs. time curves werecalculated at different electrolyte concentrations. Theelectrolyte concentration in each series was increasedabove the limit of fast coagulation (diffusion limitedaggregation), where the initial slope of kinetic curvesbecomes independent of the electrolyte concentration.The stability ratio (w) was calculated from the initialslopes belonging to the slow and fast coagulation assuggested in literature (Holthoff et al., 1996; Kretzsch-mar et al., 1998).
The kinetic curves measured at pH∼4 were chosen asexamples in Fig. 10 to show the existence of stablecolloidal system, although it contains kaolinite particleswith oppositely charged surface parts as explained above(Fig. 2). The size data measured at the lowest salt con-centration (0.1 mmol l−1) do not change in time, kaoliniteparticles can remain single for long time proving that noheterocoagulation takes place below a threshold ofelectrolyte concentration ∼1 mmol l−1. Above it, how-ever, the extent of size increase in time becomes largeeven with a small increase in salt concentration, and thefast coagulation regime is reached at∼3 mmol l−1 NaCl.In a similar coagulation kinetics study of Kretzschmar etal. (1998), one (KGa-2) of the reference kaolinite of ClayMineral Society was measured at pH∼4 and ∼6. Thiskaolinite coagulated rapidly independent of electrolyteconcentration from 1 to 100 mmol l−1 at both pH values
ntmorillonite suspensions; dynamic light scattering measured in diluteWyoming montmorillonite (Swy-2).

Fig. 10. Coagulation kinetics measured by dynamic light scattering: the size evolution of aggregates in kaolinite suspensions containing differentNaCl concentrations at pH∼4, at 25±0.1 °C. Sample: fine fraction of kaolinite.
117E. Tombácz, M. Szekeres / Applied Clay Science 34 (2006) 105–124
contrarily to our finding in part, probably due to thesignificant difference between the kaolinite samples. TheKGa-2 kaolinite is a poorly crystallized sample with lowlayer charges, its CEC is 3.3 meq/100 g (Van Olphen andFripiat, 1979), while our sample from well-crystallizedZettlitz kaolin has about three times larger permanentcharge (CEC ∼9 meq/100 g).
The stability ratio values determined for the fine frac-tion of kaolinite at different pHs are plotted as a functionof salt concentration in Fig. 11. The series of points showthe typical curves with a slope of the slow coagulationregime and a plateau of the fast coagulation regime(w∼1). The critical coagulation concentration (c.c.c.)
Fig. 11. pH-dependent sensitivity of fine fraction
separates the fast from the slow coagulation regime. Theestimated c.c.c. values are 3, 20 and 100mmol l−1 NaCl atpH∼4, ∼6 and above ∼6.5, respectively. This colloidalstability results provide an indisputable proof for the pH-dependent stability of kaolinite, since the resistance ofsuspensions to electrolyte increases significantly with in-creasing pH of aqueous medium.
The enhanced stability is obvious especially at highpH∼8, where the amphoteric edge and O face sites ofkaolinite particles have become negatively charged simi-larly to the sign of the permanent charges on T faces(Fig. 2). Although the probability of edge-to-face collisionsis larger from hydrodynamic point of view, even in the
of kaolinite sols to indifferent electrolyte.
118 E. Tombácz, M. Szekeres / Applied Clay Science 34 (2006) 105–124
dispersion of the uniform negatively charged particlesabove the pH of PZNPC at pH∼6–6.5, the overlapping ofthe compressed edl on faces probably results in face-to-faceoriented aggregates. The c.c.c. value ∼100 mmol l−1 ofkaolinite similar to that of montmorillonite (97–102 mmoll−1 at pH∼8.5) in our previous paper (Tombácz andSzekeres, 2004) shows that no significant difference in thecolloidal stability of these clay minerals under slightlyalkaline conditions. And so, we may conclude that theuniform edl charged negatively above the pHof pHPZC,edge,used this unified term for both clays, does not differ fromeach other as depicted in Fig. 2 for kaolinite (bottom right)and montmorillonite (Tombácz and Szekeres, 2004). Sincethe charge density on particle surface has a determining rolein the edl development, the robust kaolinite particles andthe thin montmorillonite lamellae should have very similarsurface charge density in the alkaline region. This seems tobe supported by the enhanced deprotonation processresulting in negatively charged sites on kaolinite abovepH∼7 as shown in Fig. 6 in comparison with montmo-rillonite. A c.c.c. value 85±5 mmol l−1 measured atpH∼9.5 for the finest fraction of KGa-2 kaolinite waspublished recently in a delicate work (Berka and Rice,2004), then the structure of aggregates formed in differentregimes of coagulationwas also identified (Berka andRice,2005). This c.c.c. smaller than ours involves less resistanceagainst salt, so weaker colloidal stability of KGa-2 sample,which accords well with the above explanation, if we takeinto consideration that the permanent charge density ofKGa-2 is about third that of Zettlitz kaolin.
The onset of edge-to-face coagulation at pH∼4 startsonly above a threshold (∼1mmol l−1 NaCl) of electrolyteconcentration, where the positively charged edge regionof lamellae has emerged (Fig. 2) probably due to thechange in the thickness of edl (Debye length ∼10 nm in1 mmol l−1 1:1 electrolyte solution), since it becomescomparable with the thickness of kaolinite lamella (10–120 nm (Brady et al., 1996), 40–70 nm (Wan andTokunaga, 2002)). Kaolinite forms stable suspension atvery low ionic strengths, where Debye length is larger,and so the edls belonging to edges and faces may spillover. Under this condition (e.g. 0.1 mmol l−1 NaCl), theaverage particle sizes are constant (200–250 nm inFig. 10) in time independently of the existence of op-positely charged parts on particles. In principle, the posi-tively charged parts (edges and O faces) can interact withthe negative T faces below pH∼6–6.5, however, edge-to-face heterocoagulation does not take place at very lowionic strength similarly to the case of oppositely chargedmagnetite and montmorillonite particles published previ-ously (Tombácz et al., 2001). These coagulation kineticsstudies showed that diffusion limited aggregation is in-
duced by 1:1 electrolyte (NaCl) concentration larger than∼3 mmol l−1 at pH∼4, which is much lower, than 25–26 mmol l−1 determined for Swy-1 and -2 montmoril-lonite samples showing the different mechanisms due tosubstantial difference between the 1:1 type kaolinite and2:1 type montmorillonite particles. While the spillover ofthe dominant double layer on the faces of thin lamellaeseemed to be an acceptable mechanism for montmoril-lonite (Tombácz and Szekeres, 2004), it is not applied forthe robust kaolinite particles at all.
The pH region near to pHPZC, edge∼6–6.5, whereedges and O faces are probably uncharged, is very inter-esting in colloidal stability point of view. The kaolinitesuspensions are highly sensitive to even a small change inpH in this region. Based on the pH-dependent partitioningstudy (Wan and Tokunaga, 2002), exactly the same wasstated for KGa-1 sample, since kaolinite particles wereable to accumulate at air–water interface only at pH∼6.3,which was enhanced below (pH∼5.7), but did not occurat all above (pH∼7.5) this pH. Our coagulation kineticsresults at pH∼6 are shown in Fig. 11. The estimated c.c.c.value was about 20 mmol l−1 NaCl. However, a smallincrease in the pH of suspensions resulted in a suddenincrease in the resistance against salt reaching the stabilityin alkaline region, e.g. the limit of fast coagulation wasabout at∼100mmol l−1 NaCl, if the pHwas increased bysome tenths, to pH∼6.5. The probability of edge-to-facerandom collisions is larger than that of the face-to-facecollisions in this pH region, too.However, the existence ofdifferent structure of aggregates, i.e. either edge-to-face orface-to-face arrangement of lamellae, in equilibrium statemay be questionable. It seems no any driving force existsunder these solution conditions to rearrange the in situformed edge-to-face aggregates.
3.4. pH-dependent particle network formation inaqueous kaolinite suspensions
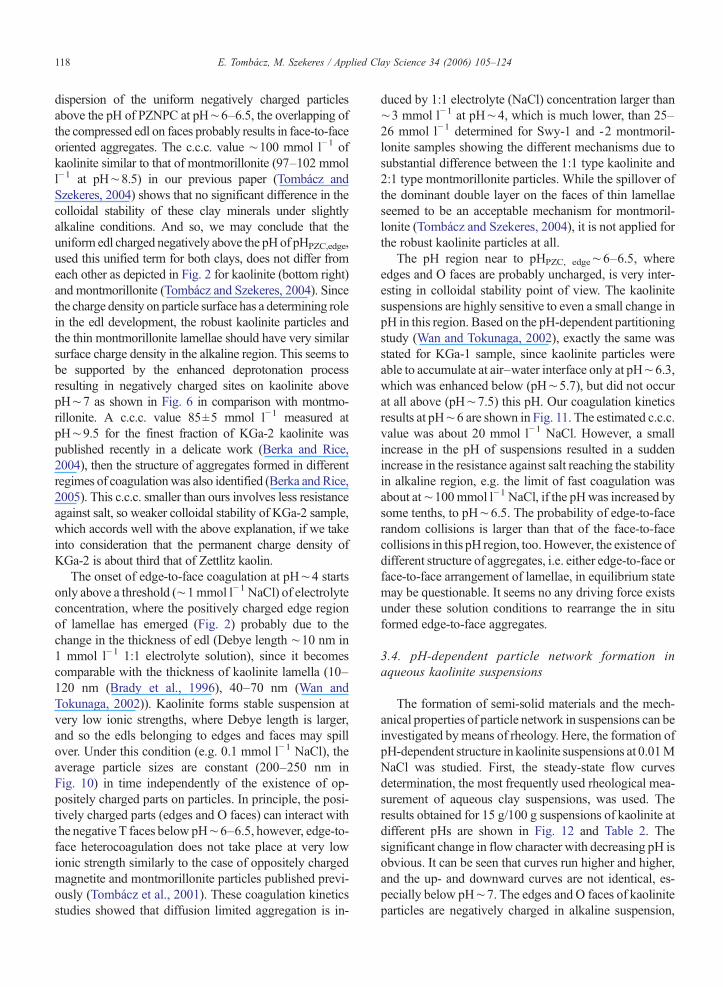
The formation of semi-solid materials and the mech-anical properties of particle network in suspensions can beinvestigated by means of rheology. Here, the formation ofpH-dependent structure in kaolinite suspensions at 0.01MNaCl was studied. First, the steady-state flow curvesdetermination, the most frequently used rheological mea-surement of aqueous clay suspensions, was used. Theresults obtained for 15 g/100 g suspensions of kaolinite atdifferent pHs are shown in Fig. 12 and Table 2. Thesignificant change in flow character with decreasing pH isobvious. It can be seen that curves run higher and higher,and the up- and downward curves are not identical, es-pecially below pH∼7. The edges and O faces of kaoliniteparticles are negatively charged in alkaline suspension,
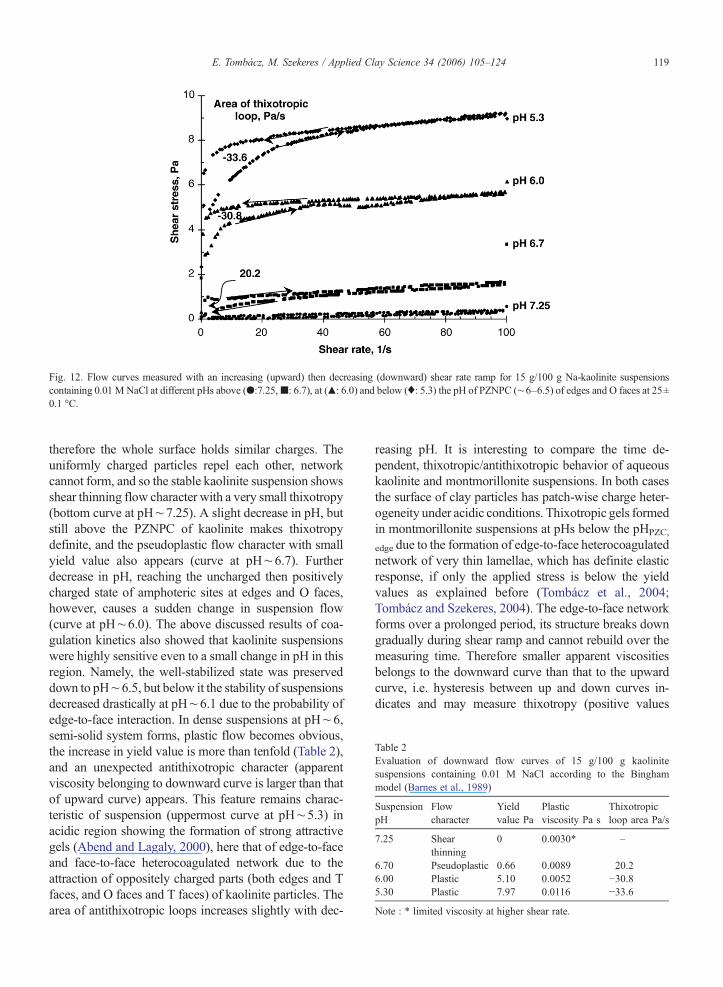
Fig. 12. Flow curves measured with an increasing (upward) then decreasing (downward) shear rate ramp for 15 g/100 g Na-kaolinite suspensionscontaining 0.01 M NaCl at different pHs above (●:7.25,■: 6.7), at (▴: 6.0) and below (♦: 5.3) the pH of PZNPC (∼6–6.5) of edges and O faces at 25±0.1 °C.
Table 2Evaluation of downward flow curves of 15 g/100 g kaolinitesuspensions containing 0.01 M NaCl according to the Binghammodel (Barnes et al., 1989)
SuspensionpH
Flowcharacter
Yieldvalue Pa
Plasticviscosity Pa s
Thixotropicloop area Pa/s
7.25 Shearthinning
0 0.0030* –
6.70 Pseudoplastic 0.66 0.0089 20.26.00 Plastic 5.10 0.0052 −30.85.30 Plastic 7.97 0.0116 −33.6
Note : * limited viscosity at higher shear rate.
119E. Tombácz, M. Szekeres / Applied Clay Science 34 (2006) 105–124
therefore the whole surface holds similar charges. Theuniformly charged particles repel each other, networkcannot form, and so the stable kaolinite suspension showsshear thinning flow character with a very small thixotropy(bottom curve at pH∼7.25). A slight decrease in pH, butstill above the PZNPC of kaolinite makes thixotropydefinite, and the pseudoplastic flow character with smallyield value also appears (curve at pH∼6.7). Furtherdecrease in pH, reaching the uncharged then positivelycharged state of amphoteric sites at edges and O faces,however, causes a sudden change in suspension flow(curve at pH∼6.0). The above discussed results of coa-gulation kinetics also showed that kaolinite suspensionswere highly sensitive even to a small change in pH in thisregion. Namely, the well-stabilized state was preserveddown to pH∼6.5, but below it the stability of suspensionsdecreased drastically at pH∼6.1 due to the probability ofedge-to-face interaction. In dense suspensions at pH∼6,semi-solid system forms, plastic flow becomes obvious,the increase in yield value is more than tenfold (Table 2),and an unexpected antithixotropic character (apparentviscosity belonging to downward curve is larger than thatof upward curve) appears. This feature remains charac-teristic of suspension (uppermost curve at pH∼5.3) inacidic region showing the formation of strong attractivegels (Abend and Lagaly, 2000), here that of edge-to-faceand face-to-face heterocoagulated network due to theattraction of oppositely charged parts (both edges and Tfaces, and O faces and T faces) of kaolinite particles. Thearea of antithixotropic loops increases slightly with dec-
reasing pH. It is interesting to compare the time de-pendent, thixotropic/antithixotropic behavior of aqueouskaolinite and montmorillonite suspensions. In both casesthe surface of clay particles has patch-wise charge heter-ogeneity under acidic conditions. Thixotropic gels formedin montmorillonite suspensions at pHs below the pHPZC,
edge due to the formation of edge-to-face heterocoagulatednetwork of very thin lamellae, which has definite elasticresponse, if only the applied stress is below the yieldvalues as explained before (Tombácz et al., 2004;Tombácz and Szekeres, 2004). The edge-to-face networkforms over a prolonged period, its structure breaks downgradually during shear ramp and cannot rebuild over themeasuring time. Therefore smaller apparent viscositiesbelongs to the downward curve than that to the upwardcurve, i.e. hysteresis between up and down curves in-dicates and may measure thixotropy (positive values
120 E. Tombácz, M. Szekeres / Applied Clay Science 34 (2006) 105–124
assigned to the hysteresis area). On the contrary, theapparent viscosity increases slightly during shear ramp inthe antithixotropic (negative values for loop area) kao-linite suspensions at and below pH∼6, where both theedges and the O faces hold certainly positive charges.Antithixotropy does not occur in montmorillonite suspen-sions, in which only the edges are negatively chargedbelow pH∼6.5. To interpret the antithixotropic behaviorof kaolinite suspensions, besides the formation of edge-to-face aggregates, we suppose a weaker attraction betweenthe oppositely charged O and T faces of particles, becausethe positive charge formation due to the protonation ofAl–OH sites on O faces is probably retarded as related tothat on edges (Avena et al., 2003). Both types of heter-ocoagulated aggregates form in a random collision duringsuspension preparation, and no driving force is present torearrange this particle network for even a long standstill.However, the weaker points of network, probably theadhered O and T faces, break first in the shear field, whenshear rate is increased (upward curve), and edge-to-faceaggregates can in situ form providing a slight increase inthe shear tolerance of kaolinite suspension in the down-ward shear ramp.
The yield values calculated for kaolinite suspensionsrise significantly with decreasing pH (Table 2), similarlyto that measured in montmorillonite suspensions. Theyield value is proportional to the mechanical strength ofphysical network and depends on the number and thestrength of bondages between particles in unit volume ofsuspensions (Barnes et al., 1989). The lower the pH thelarger the amount of positive charges on the edges and Ofaces of kaolinite plates, therefore the attraction betweenthe positively charged edges and negative basal platesbecomes stronger with decreasing pH.
We attempted to study on the viscoelastic properties ofkaolinite suspensions in parallel to the montmorillonite aspublished previously (Tombácz et al., 2004). While bothcreep tests and forced oscillation measurements weresuccessful in the case of montmorillonite proving theelastic behavior of thixotropicmontmorillonite gels belowthe pH of edge PZC, the measurements do not show aclear viscoelastic feature for kaolinite suspensions belowpH∼6. The elastic response of particle network wasmeasurable only under static conditions. Some series ofcreep and recovery curves measured at different pHs andstresses are shown in Fig. 13. The pH-dependent behaviorof kaolinite (Fig. 13 a) shows that alkaline suspension isessentially different from that of acidic ones in goodharmony with the feature of flow curves (Fig. 12). Analmost ideal Newtonian (liquid-like) behavior was de-tected for suspension containing uniformly charged par-ticles at pH∼7.25, since deformation continually
increased in a linear manner as long as the stress wasapplied, and there was no any restoration at all in theabsence of attraction between particles. However, suspen-sions at pH∼6 and 5.3, where particle network can buildin dense suspensions due to attractive forces between theoppositely charged parts of kaolinite plates, an elasticresponse in the jelly-like suspensions definitely appears.The contribution of elastic component to the viscoelasticdeformation of sample is obvious, since the applied stressresults in an instantaneous strain jump, which restoresafter releasing, but a significant non-recoverable defor-mation remains due to the presence of viscous component.Creep tests were used to analyze the recovery of structureinmontmorillonite suspensions over the range of pH from∼3 to 9 (Durán et al., 2000), and as a function of ionicstrength (Abend and Lagaly, 2000). Similar work was notfound for kaolinite. Our creep tests proved that attractiveparticle network forms in acidic suspensions due to theelectrostatic attraction between the oppositely chargedparts of kaolinite plates, which has elasticity besidesviscous properties. However, the shear stress tolerance ofviscoelastic particle network is limited, and it has closerelation with the yield values as shown for two sus-pensions having significantly different, low and high yieldvalues in the b and c parts of Fig. 13. On the one hand,even a very weak particle network formed in dense kao-linite suspension at pH∼6.7 can exhibit some elasticity(more than 50% recovery showed on curve in Fig. 13 b), ifit is deformed by smaller stress (0.1 Pa) than its yield value(0.66 Pa in Table 2), however, a liquid-like flow occurs atstronger effect (e.g. 1 Pa in Fig. 13 b). On the other hand, astrong particle network with dominant elastic response(about 90% recovery exhibited on curve belonging topH∼5.3 and 1 Pa in Fig. 13 c) can liquefy, if the appliedstress is larger than its tolerance, i.e. yield value ∼8 Pa(creep curve measured at 10 Pa in Fig. 13 c). In accor-dance with the facts for thixotropic montmorillonite gels(Tombácz et al., 2004; Tombácz and Szekeres, 2004), itcan be stated that an elastic response of particle network isexpected in kaolinite suspensions, if only the appliedstress is below the yield values. This last assumption wasnot emphasized in the previous papers (Durán et al., 2000;Abend and Lagaly, 2000), but creep tests were done atlow constant stresses in both works (0.2 and 0.4 Pa,respectively).
The creep tests proved attractive gel formation inacidic suspensions, which has measurable elasticitybesides viscous properties. However, the measurementsunder dynamic conditions failed, we could not find anappropriate region of linear viscoelasticity in the forcedoscillation studies for the same suspensions. It seems thatheterocoagulated network of robust kaolinite particles is
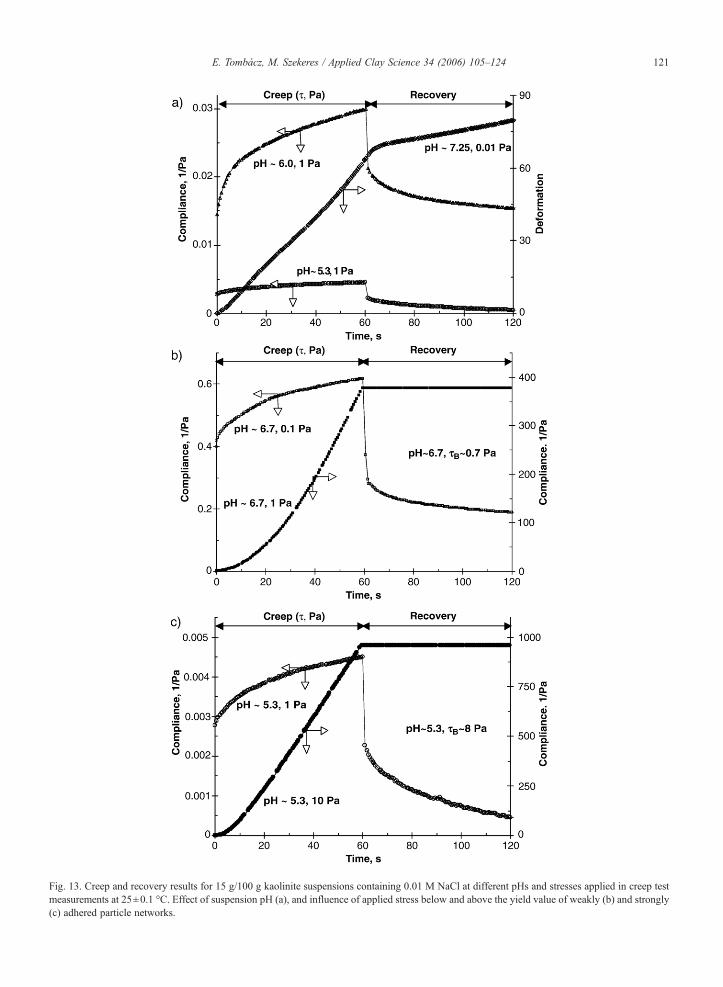
Fig. 13. Creep and recovery results for 15 g/100 g kaolinite suspensions containing 0.01 M NaCl at different pHs and stresses applied in creep testmeasurements at 25±0.1 °C. Effect of suspension pH (a), and influence of applied stress below and above the yield value of weakly (b) and strongly(c) adhered particle networks.
121E. Tombácz, M. Szekeres / Applied Clay Science 34 (2006) 105–124
122 E. Tombácz, M. Szekeres / Applied Clay Science 34 (2006) 105–124
fragile and rigid, and so it is substantially different fromthat of thin montmorillonite lamellae.
4. Conclusions
Clay mineral particles hold both permanent negativecharges on faces and pH-dependent either negative orpositive charges developing mainly on Al–OH activesites at the broken edges and exposed hydroxyl-termi-nated planes in general. Since these two types of sites aresituated on the given parts of particle surface, differentpatches exist on the basal planes and edges of claylamellae, and so the clay particles are the typical cases ofpatch-wise surface heterogeneity (Koopal, 1996; Tom-bácz, 2002). The size of patches and the lateralinteractions of surface sites are important to developpatch-wise charge heterogeneity in aqueous medium,where hydration and ion adsorption smear out theelectrostatic potential. With non-interacting patches eachpatch develops its own (smeared out) electrostatic poten-tial (Koopal, 1996).We have stated that the surface chargeheterogeneity is not a general feature of montmorilloniteparticles (Tombácz and Szekeres, 2004), now we attemptto summarize the facts for clay minerals in general, on thebasis of the study on 2:1 type montmorillonite and 1:1type kaolinite, which have essential differences originat-ing from the crystal structure (TOT and TO) in the geo-metry and the layer charge density.
The patch-wise surface heterogeneity is inherent pro-perty of clay mineral particles owing to their crystalstructure, the basal planes and edges of clay lamellaehold different surface sites in patches. The differentpatches of particle surface become charged in aqueoussuspensions due to the hydration of clay surface itselfand rather that of exchangeable cations (Johnston andTombácz, 2002), and the interfacial acid–base reactions(Tombácz, 2002). Thus surface charge heterogeneity ofclay particles may exist in aqueous suspensions. Surfacecharges are neutralized by a diffuse cloud of ions fromelectrolyte solutions. Electric double layers (edl) form oneach patches; one type with constant charge density onthe faces bearing permanent charges, and the other typewith constant potential at constant pH on the parts ofsurface, where pH-dependent charges develop, mainly atthe edges. Therefore the local electrostatic field formedaround particles with different asymmetry in respect ofboth the aspect ratio and the surface charging of edgesand faces is definitely determined by the crystal structureof clay particles. The electric fields on the differentpatches have mutual influence on processes. The electricfield on faces due to charge defects in crystal latticeaffects not only on ion distribution on basal planes, but
also on surface charge formation at edges as statedpreviously (Avena et al., 2003).
The effect of pH and indifferent electrolytes on thedevelopment of surface charge heterogeneity on clayparticle is simultaneous, none of them can be interpretedalone. The pH of aqueous medium has two kinds ofspecific role, one is the high affinity of H+ ions to neu-tralize the permanent negative charges on faces, and theother is providing chemical species (H+ and OH−) to thesurface protolytic reactions on broken edges and exposedhydroxyl-terminated planes, in which the pH-dependentedl forms. The fact that ion exchange reaction with H+-ions always takes place with changing pH, but its extent issignificantly influenced by the electrolyte concentration,results in a characteristic shift in the pH-dependent netproton surface excess curves measured with increasingionic strength. The effect of electrolytes is also doubled,since cations are always involved in the ionexchangeprocess, while both ions of electrolytes obey electrostaticconstraints, i.e. take part in formation of diffuse (outer)part of electric double layers on each patch. With in-creasing electrolyte concentration, on the one hand theionexchange equilibrium shifts, and on the other handsurface charge neutralization becomes more effectiveenhancing the charge formation on pH-dependent sites,besides the narrowing of all electric double layers. Weshould note that effect of decreasing salt content is op-posite, and for example the exhausted or even a longdialysis of clay suspensions against pure water results in afairly undefined state mainly in cationexchange, but indiffuse part of edls, too. A definite initial state of mono-cationic clay in aqueous suspension can be reached inequilibrium dialysis against dilute electrolyte solution, forexample 0.01 M NaCl in the case of Na-montmorilloniteand Na-kaolinite.
The existence of oppositely charged surface parts onparticles is the most interesting question of the surfacecharge heterogeneity of clays in both theoretical andpractical points of view. In general, it exists only in aqueousmedium under acidic conditions, where Al–OH sites areprotonated as proved at pHs below the point of zero charge(PZC) of edge sites (∼6.5) for montmorillonite (Tombáczand Szekeres, 2004), and as showed at pHs belowPZNPC∼6–6.5 involved both edge and O face sites forkaolinite in the present paper. Although the oppositelycharged patches on clay particles are present in acidicsuspensions, the positive and negative patchesmay not see,and so do not necessarily attract each other. Heterocoagula-tion becomes perceptible only above a threshold ofelectrolyte concentration, when electric double layersbelonging to different patches remain localized on thefaces and edges. This heterocoagulation threshold is

123E. Tombácz, M. Szekeres / Applied Clay Science 34 (2006) 105–124
definitely influenced by the geometry and layer chargedensity of clay particles. The extreme geometry ofmontmorillonite lamellae (Table 1) allows that dominantedl extending from the particle faces spills over at low saltconcentration, when the thickness of edl (Debye length,e.g. ∼3 nm at 10 mmol l−1) is larger than that of the thinlamella (∼1 nm) and it remains localized on basal planeonly at and above 20–30 mmol l−1 NaCl (Fig. 2 inTombácz andSzekeres, 2004). This threshold for the robustkaolinite particles is very low, only ∼1 mmol l−1 NaCl,where the positively charged edge region of lamellae hasemerged (Fig. 2), and the onset of heterocoagulation startsprobably due to the change in the thickness of edl (Debyelength ∼10 nm in 1 mmol l−1), where it becomescomparable with the thickness of kaolinite lamella (10–120 nm (Brady et al., 1996). This heterocoagulation,mainly interaction between faces with constant chargedensity and edges with constant potential (at constant pH)as depicted in Fig. 1 seems to be a fairly unusual case incolloid stability point of view (Gregory, 1975).
The crystal structure of clay minerals governs the sur-face charge heterogeneity of particles dispersed inaqueous medium. The existence of oppositely chargedpatches depends characteristically on the pH, but its ap-pearance in suspension properties depends on theelectrolyte concentration of solution, too. The behaviorof aqueous clay suspensions in the presence of indifferentelectrolytes, even the accumulation of clay particles at air–water interface, and the film formation, the dispersion oraggregation of particles, the unique time dependent flowproperties, especially thixotropy and viscoelastic gel for-mation, all these excellent properties can be tunedoptionally in the knowledge of specific surface chargeproperties of clay particles.
Acknowledgements
This work was supported by the grant GOCE-CT-2003-505450. The authors are grateful to FLORIN Rt.Szeged, Hungary for providing Rheometer HAAKERS150 at our services. We thank Clifford Johnston verymuch for drawing the atom arrangement in a two-layermineral inserted in Fig. 1, and for the remarkable dis-cussion on clays before.
References
Abend, S., Lagaly, G., 2000. Sol-gel transition of sodium montmo-rillonite dispersions. Appl. Clay Sci. 16, 201–227.
Akbour, R.A., Douch, J., Hamdani, M., Schmitz, P., 2002. Transport ofkaolinite colloids through quartz sand: influence of humic acid,Ca2+, and trace metals. J. Colloid Interface Sci. 253, 1–8.
Appel, C., Ma, L.Q., Dean Rhue, R., Kennelley, E., 2003. Point of zerocharge determination in soils via traditional methods and detectionof electroacoustic mobility. Geoderma 113, 77–93.
Avena, M.J., De Pauli, C.P., 1998. Proton adsorption and electroki-netics of an Argentinean montmorillonite. J. Colloid Interface Sci.202, 195–204.
Avena, M.J., Mariscal, M.M., De Pauli, C.P., 2003. Proton binding atclay surfaces in water. Appl. Clay Sci. 24, 3–9.
Barnes, H.A., Hutton, J.F., Walters, K., 1989. An Introduction toRheology. Elsevier, Amsterdam.
Bartoli, F., Philippy, R., 1987. The colloidal stability of variable-charge mineral suspensions. Clay Miner. 22, 93–107.
Berka, M., Rice, J.A., 2004. Absolute aggregation rate constants inaggregation of Kaolinite measured by simultaneous static anddynamic light scattering. Langmuir 20, 6152–6157.
Berka, M., Rice, J.A., 2005. Relation between aggregation kinetics andthe structure of kaolinite aggregates. Langmuir 21, 1223–1229.
Blockhaus, F., Séquaris, J.-M., Narres, H.D., Schwuger, M.J., 1997.Adsorption–desorption of acrylic-maleic acid copolymer at clayminerals. J. Colloid Interface Sci. 186, 234–247.
Bolland, M.D.A., Posner, A.M., Quirk, J.P., 1980. pH-independent andpH-dependent surface charges on kaolinite. Clays Clay Miner. 28,412–418.
Bolt, G.H., Bruggenwert, M.G.M. (Eds.), 1978. Soil Chemistry A.Basic Elements. Elsevier, Amsterdam.
Brady, P.V., Cygan, R.T., Nagy, K.L., 1996. Molecular controls onkaolinite surface charge. J. Colloid Interface Sci. 183, 356–364.
Brown, W. (Ed.), 1993. Dynamic Light Scattering. Oxford UniversityPress, New York.
Coppin, F., Berger, G., Bauer, A., Castet, S., Loubet, M., 2002. Sorptionof lanthanides on smectite and kaolinite. Chem. Geol. 182, 57–68.
Dangla, P., Fen-Chong, T., Gaulard, F., 2004. Modelling of pH-dependent electro-osmotic flows. C.R. Mecanique 332, 915–920.
Durán, J.D.G., Ramos-Tejada, M.M., Arroyo, F.J., Gonzáles-Caballero,F., 2000. Rheological and electrokinetic properties of sodium mont-morillonite suspensions - I. Rheological properties and interparticleenergy of interaction. J. Colloid Interface Sci. 229, 107–117.
Everett, D.H., 1986. Reporting data on adsorption from solution at thesolid/solution interface. Pure Appl. Chem. 58, 967–984.
Gregory, J., 1975. Interaction of unequal double layers at constantcharge. J. Colloid Interface Sci. 51, 44–51.
Herrington, T.M., Clarke, A.Q., Watts, J.C., 1992. The surface chargeof kaolin. Colloids Surf. 68, 161–169.
Holthoff, H., Egelhaaf, S.U., Borkovec, M., Schurtenberger, P., Sticher,H., 1996. Coagulation rate measurements of colloidal particles bysimultaneous static and dynamic light scattering. Langmuir 12,5541–5548.
Hu, Y., Jiang, H., Wang, D., 2003. Electrokinetic behavior and flotationof kaolinite in CTAB solution. Miner. Eng. 16, 1221–1223.
Hunter, R.J., 1981. Zeta Potential in Colloid Science, Principles andApplications. Academic Press, London.
James, R.O., Parks, G.A., 1982. Characterization of aqueous colloidsby their electrical double-layer and intrinsic surface chemicalproperties. In: Matijevic, E. (Ed.), Surface and Colloid Science,vol. 12. Plenum, New York, pp. 119–216.
James, M., Hunter, R.J., O'Brien, R.W., 1992. Effect of particle sizedistribution and aggregation on electroacoustic measurements ofzeta-potential. Langmuir 8, 420–423.
Johnston, C.T., Tombácz, E., 2002. Surface chemistry of soil minerals.In: Dixon, J.B., Schulze, D.G. (Eds.), Soil Mineralogy withEnvironmental Applications. Soil Science Society of America,Madison, Wisconsin, USA, pp. 37–67.
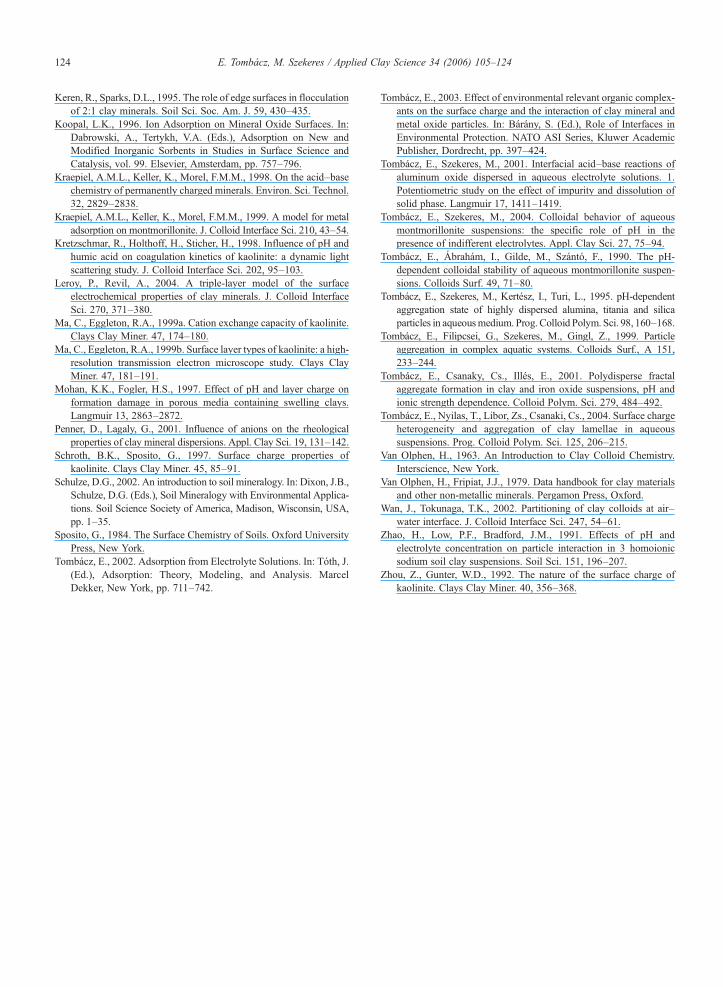
124 E. Tombácz, M. Szekeres / Applied Clay Science 34 (2006) 105–124
Keren, R., Sparks, D.L., 1995. The role of edge surfaces in flocculationof 2:1 clay minerals. Soil Sci. Soc. Am. J. 59, 430–435.
Koopal, L.K., 1996. Ion Adsorption on Mineral Oxide Surfaces. In:Dabrowski, A., Tertykh, V.A. (Eds.), Adsorption on New andModified Inorganic Sorbents in Studies in Surface Science andCatalysis, vol. 99. Elsevier, Amsterdam, pp. 757–796.
Kraepiel, A.M.L., Keller, K., Morel, F.M.M., 1998. On the acid–basechemistry of permanently charged minerals. Environ. Sci. Technol.32, 2829–2838.
Kraepiel, A.M.L., Keller, K., Morel, F.M.M., 1999. A model for metaladsorption on montmorillonite. J. Colloid Interface Sci. 210, 43–54.
Kretzschmar, R., Holthoff, H., Sticher, H., 1998. Influence of pH andhumic acid on coagulation kinetics of kaolinite: a dynamic lightscattering study. J. Colloid Interface Sci. 202, 95–103.
Leroy, P., Revil, A., 2004. A triple-layer model of the surfaceelectrochemical properties of clay minerals. J. Colloid InterfaceSci. 270, 371–380.
Ma, C., Eggleton, R.A., 1999a. Cation exchange capacity of kaolinite.Clays Clay Miner. 47, 174–180.
Ma, C., Eggleton, R.A., 1999b. Surface layer types of kaolinite: a high-resolution transmission electron microscope study. Clays ClayMiner. 47, 181–191.
Mohan, K.K., Fogler, H.S., 1997. Effect of pH and layer charge onformation damage in porous media containing swelling clays.Langmuir 13, 2863–2872.
Penner, D., Lagaly, G., 2001. Influence of anions on the rheologicalproperties of clay mineral dispersions. Appl. Clay Sci. 19, 131–142.
Schroth, B.K., Sposito, G., 1997. Surface charge properties ofkaolinite. Clays Clay Miner. 45, 85–91.
Schulze, D.G., 2002. An introduction to soil mineralogy. In: Dixon, J.B.,Schulze, D.G. (Eds.), Soil Mineralogy with Environmental Applica-tions. Soil Science Society of America, Madison, Wisconsin, USA,pp. 1–35.
Sposito, G., 1984. The Surface Chemistry of Soils. Oxford UniversityPress, New York.
Tombácz, E., 2002. Adsorption from Electrolyte Solutions. In: Tóth, J.(Ed.), Adsorption: Theory, Modeling, and Analysis. MarcelDekker, New York, pp. 711–742.
Tombácz, E., 2003. Effect of environmental relevant organic complex-ants on the surface charge and the interaction of clay mineral andmetal oxide particles. In: Bárány, S. (Ed.), Role of Interfaces inEnvironmental Protection. NATO ASI Series, Kluwer AcademicPublisher, Dordrecht, pp. 397–424.
Tombácz, E., Szekeres, M., 2001. Interfacial acid–base reactions ofaluminum oxide dispersed in aqueous electrolyte solutions. 1.Potentiometric study on the effect of impurity and dissolution ofsolid phase. Langmuir 17, 1411–1419.
Tombácz, E., Szekeres, M., 2004. Colloidal behavior of aqueousmontmorillonite suspensions: the specific role of pH in thepresence of indifferent electrolytes. Appl. Clay Sci. 27, 75–94.
Tombácz, E., Ábrahám, I., Gilde, M., Szántó, F., 1990. The pH-dependent colloidal stability of aqueous montmorillonite suspen-sions. Colloids Surf. 49, 71–80.
Tombácz, E., Szekeres, M., Kertész, I., Turi, L., 1995. pH-dependentaggregation state of highly dispersed alumina, titania and silicaparticles in aqueousmedium. Prog. Colloid Polym. Sci. 98, 160–168.
Tombácz, E., Filipcsei, G., Szekeres, M., Gingl, Z., 1999. Particleaggregation in complex aquatic systems. Colloids Surf., A 151,233–244.
Tombácz, E., Csanaky, Cs., Illés, E., 2001. Polydisperse fractalaggregate formation in clay and iron oxide suspensions, pH andionic strength dependence. Colloid Polym. Sci. 279, 484–492.
Tombácz, E., Nyilas, T., Libor, Zs., Csanaki, Cs., 2004. Surface chargeheterogeneity and aggregation of clay lamellae in aqueoussuspensions. Prog. Colloid Polym. Sci. 125, 206–215.
Van Olphen, H., 1963. An Introduction to Clay Colloid Chemistry.Interscience, New York.
Van Olphen, H., Fripiat, J.J., 1979. Data handbook for clay materialsand other non-metallic minerals. Pergamon Press, Oxford.
Wan, J., Tokunaga, T.K., 2002. Partitioning of clay colloids at air–water interface. J. Colloid Interface Sci. 247, 54–61.
Zhao, H., Low, P.F., Bradford, J.M., 1991. Effects of pH andelectrolyte concentration on particle interaction in 3 homoionicsodium soil clay suspensions. Soil Sci. 151, 196–207.
Zhou, Z., Gunter, W.D., 1992. The nature of the surface charge ofkaolinite. Clays Clay Miner. 40, 356–368.