Suppression of noise in the ECG signal using digital IIR filter
9
Suppression of Noise in the ECG Signal using Digital IIR Filter MAHESH S. CHAVAN, * RA.AGARWALA, ** M.D.UPLANE Department of Electronics engineering, PVPIT Budhagaon Sangli (MS), INDIA * Department of Electronics, NSIT New Delhi, INDIA ** Department of Electronics, Shivaji University Kolhapur (MS), INDIA [email protected] Abstract:-The electrocardiogram has considerable diagnostic significance, and application of ECG monitoring are diverse and in wide use. For diagnostic- quality ECG recordings, signal acquisition must be noise free. The signal acquisition is susceptible to the interference from other biological and environmental sources. This article presents the application of the digital IIR filter on the raw ECG signal. The filters utilized are Butterworth and elliptic notch and high pass filter. Complete design of the filters is depicted in the paper. At the end both the filter types are compared. It is found that the elliptic filter find suitable as compared to the Butterwoth with some limitations. Keywords: ECG, Digital Butterworth and Elliptic filter, Real time application, Noise reduction. 1. Introduction A medical topic that attracted the early interest of engineers is that of the electrocardiography. It is one of the most useful noninvasive medical diagnostic tests and is in very wide use (an estimated 200 million ECGs taken each year). Its technological challenge is to improve performance by increasing number of simultaneously recorded signals, raising the signal to noise ratio, and accomplishing these goals, possibly, with the subject under going physical activity. Therefore the electrocardiogram (ECG) signal is one of the most important vital signs monitored from cardiac patients. Cardiologist readily interprets the ECG waveforms and classifies them into normal and abnormal patterns. While acquisition of the ECG it gets corrupted due to different types of artifacts and interferences such as Power line interference, Electrode contact noise, Motion artifacts, Muscle contraction, Base line drift, Instrumentation noise generated by electronic devices and Electrosurgical noise. Different researchers have worked on the reduction of noise in the ECG signal. Power-line interference (either 50 Hz or 60 Hz) is a significant source of noise in biomedical recording. Elimination of power-line interference in the Electrocardiogram (ECG) signal by various methods has been proposed in the past. Mitov IP has investigated the method for removing the power line interference. Figure 1.a shows the typical power spectrum of the ECG signal. Figure 1.a: Typical power spectrum of the ECG signal. Many researchers are working on noise reduction in the ECG signal specifically powerline interference and baseline wander. While removing line interference, Mitov IP has used the sampling rate integer multiple of the nominal power line frequency [1], his method is suitable for off line use than that of the real time because of the computational complexity. Power-line interference 8th WSEAS Int. Conf. on MULTIMEDIA SYSTEMS and SIGNAL PROCESSING (MUSP '08), Hangzhou, China, April 6-8, 2008 ISBN: 978-960-6766-52-7 335 ISSN: 1790-5117
Transcript of Suppression of noise in the ECG signal using digital IIR filter
Suppression of Noise in the ECG Signal using Digital IIR Filter
MAHESH S. CHAVAN, * RA.AGARWALA, ** M.D.UPLANE Department of Electronics engineering, PVPIT Budhagaon Sangli (MS), INDIA
* Department of Electronics, NSIT New Delhi, INDIA ** Department of Electronics, Shivaji University Kolhapur (MS), INDIA
Abstract:-The electrocardiogram has considerable diagnostic significance, and application of ECG monitoring are diverse and in wide use. For diagnostic- quality ECG recordings, signal acquisition must be noise free. The signal acquisition is susceptible to the interference from other biological and environmental sources. This article presents the application of the digital IIR filter on the raw ECG signal. The filters utilized are Butterworth and elliptic notch and high pass filter. Complete design of the filters is depicted in the paper. At the end both the filter types are compared. It is found that the elliptic filter find suitable as compared to the Butterwoth with some limitations. Keywords: ECG, Digital Butterworth and Elliptic filter, Real time application, Noise reduction. 1. Introduction A medical topic that attracted the early interest of engineers is that of the electrocardiography. It is one of the most useful noninvasive medical diagnostic tests and is in very wide use (an estimated 200 million ECGs taken each year). Its technological challenge is to improve performance by increasing number of simultaneously recorded signals, raising the signal to noise ratio, and accomplishing these goals, possibly, with the subject under going physical activity. Therefore the electrocardiogram (ECG) signal is one of the most important vital signs monitored from cardiac patients. Cardiologist readily interprets the ECG waveforms and classifies them into normal and abnormal patterns. While acquisition of the ECG it gets corrupted due to different types of artifacts and interferences such as Power line interference, Electrode contact noise, Motion artifacts, Muscle contraction, Base line drift, Instrumentation noise generated by electronic devices and Electrosurgical noise. Different researchers have worked on the reduction of noise in the ECG signal. Power-line interference (either 50 Hz or 60 Hz) is a significant source of noise in biomedical
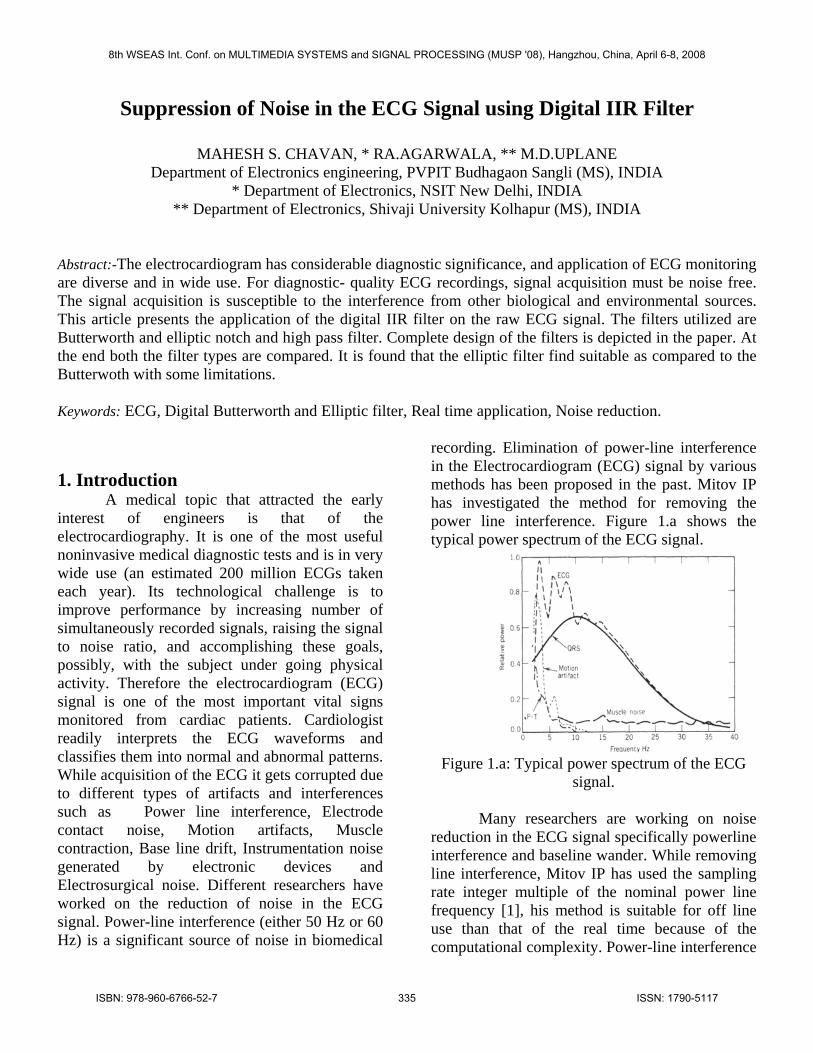
recording. Elimination of power-line interference in the Electrocardiogram (ECG) signal by various methods has been proposed in the past. Mitov IP has investigated the method for removing the power line interference. Figure 1.a shows the typical power spectrum of the ECG signal.
Figure 1.a: Typical power spectrum of the ECG
signal.
Many researchers are working on noise reduction in the ECG signal specifically powerline interference and baseline wander. While removing line interference, Mitov IP has used the sampling rate integer multiple of the nominal power line frequency [1], his method is suitable for off line use than that of the real time because of the computational complexity. Power-line interference
8th WSEAS Int. Conf. on MULTIMEDIA SYSTEMS and SIGNAL PROCESSING (MUSP '08), Hangzhou, China, April 6-8, 2008
ISBN: 978-960-6766-52-7 335 ISSN: 1790-5117
(either 50 Hz or 60 Hz) is a significant source of noise in biomedical recording. Elimination of power-line interference in the Electrocardiogram (ECG) signal by various methods has been proposed in the past. Despite the high common mode rejection ratio of the input amplifiers of the Electrocardiographs, recordings are often contaminated by power-line (mains) frequency interference [2]. The efficiency of notch filters and a subtraction procedure for power-line interference cancellation in electrocardiogram (ECG) signals is assessed by the Dotsinsky I, Stoyanov T [3]. Kumaravel N et.al demonstrated a novel method of integrating rule-based system approach with linear FIR filter and also with Wave digital filter has investigated [4]. Hamilton PS in his article compared adaptive and non-adaptive filters for reduction of power line interference in the ECG [5]. Ider YZ, Saki MC, Gcer HA have developed a method for line interference reduction to be used in signal-averaged electrocardiography[6]. Cramer E, McManus CD, Neubert D has introduced a global filtering approach. In this method two types of the digital filters are used. One is using lest square method and other is using special summation method [7]. Different scientists have tried for removing the power line interference and base line wonder specifically from the ECG signal [8-19]. In the present paper conventional filters are used. The filters selected are Butterworth and elliptic and there combination has been used.
2. Design of Digital Filter
The Butterworth type filter was first described by the British engineer Stephen Butterworth. Butterworth filters are causal in nature and of various orders, the lowest order being the best (shortest) in the time domain, and the higher orders being better in the frequency domain. Butterworth or maximally flat filters have a monotonic amplitude frequency response which is maximally flat at zero frequency response and the amplitude frequency response decreases logarithmically with increasing frequency.
The butterworth low pass filter has a magnitude response given by
5.02)(1
)(
⎥⎦
⎤⎢⎣
⎡ΩΩ
+
=ΩN
c
AjH
Where A is the filter gain and is the 3 db cut-off frequency and N is the order of the filter. The elliptic filter is also known as Cauer filter. This filter has equiripple pas band and stop band. Among the filter types discussed so far, for the given filter order, pass band and stop deviations, elliptic filter have the minimum transition band width. This signifies that it minimizes the maximum error in both the bands; as opposed to the Chebyshev type I filter which exhibits equiripple behavior in the pass band or the inverse Chebyshev of (Type II) filter which has ripple in the stop band.
cΩ
( )⎟⎟⎠
⎞⎜⎜⎝
⎛ΩΩ
+
=Ω
cNU
jH2
2
1
1
ε
Where ( )xU N is the Jacobian function of the order and N ε is a constant related to the pass band
ripple. Generally both Butterworth and elliptic filters are designed in the analog domain first and the converted in to digital filter using either bilinear transformation or impulse invariance method. Thereafter required type of filter can be achieved using frequency transformation. In the present work these filters are designed with the help of Mathlab FDA toolbox. It is also using bilinear transformation for the design. The basic block utilized in the proposed system is shown in figure. The both Butterworth and elliptic notch filter of the frequency 50 Hz and sampling frequency 1000Hz has been designed. Also low pass filter of 100 Hz and high filter of 0.5Hz has been designed for both the Butterworth and elliptic filters. Cascade combination of the filters has been implemented on the ECG signal. Basic Matlab model used for the real time filtering is shown in figure 1.b.
8th WSEAS Int. Conf. on MULTIMEDIA SYSTEMS and SIGNAL PROCESSING (MUSP '08), Hangzhou, China, April 6-8, 2008
ISBN: 978-960-6766-52-7 336 ISSN: 1790-5117
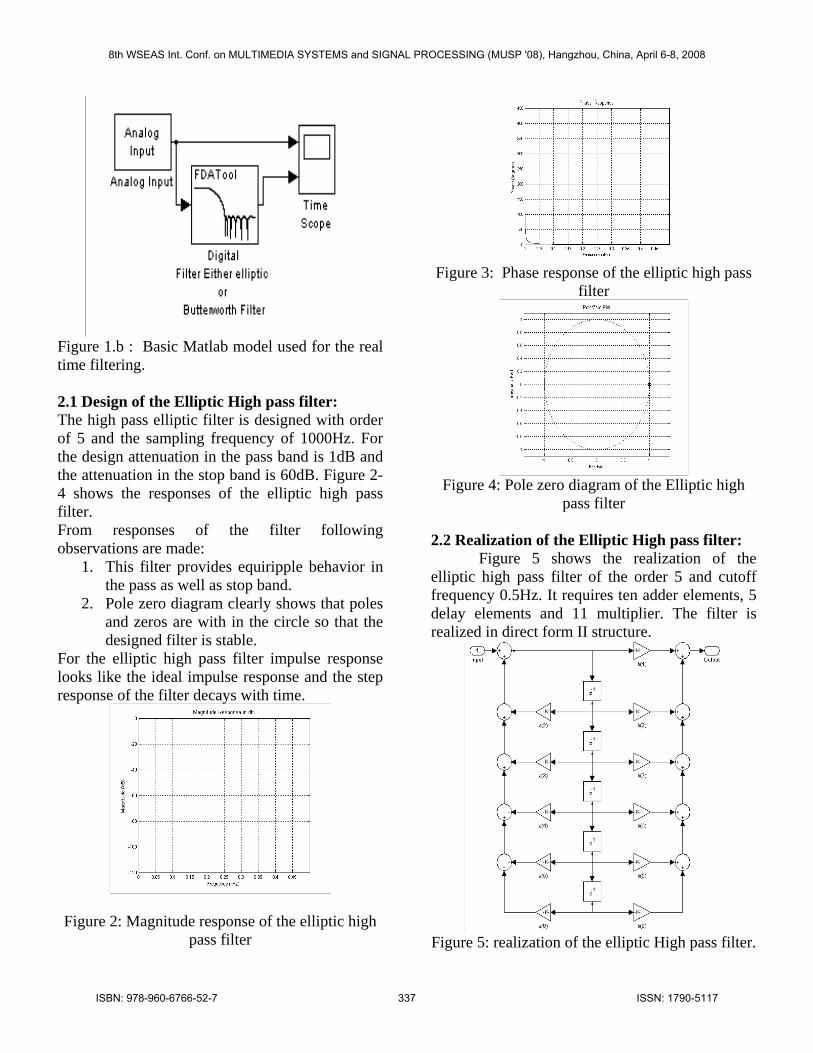
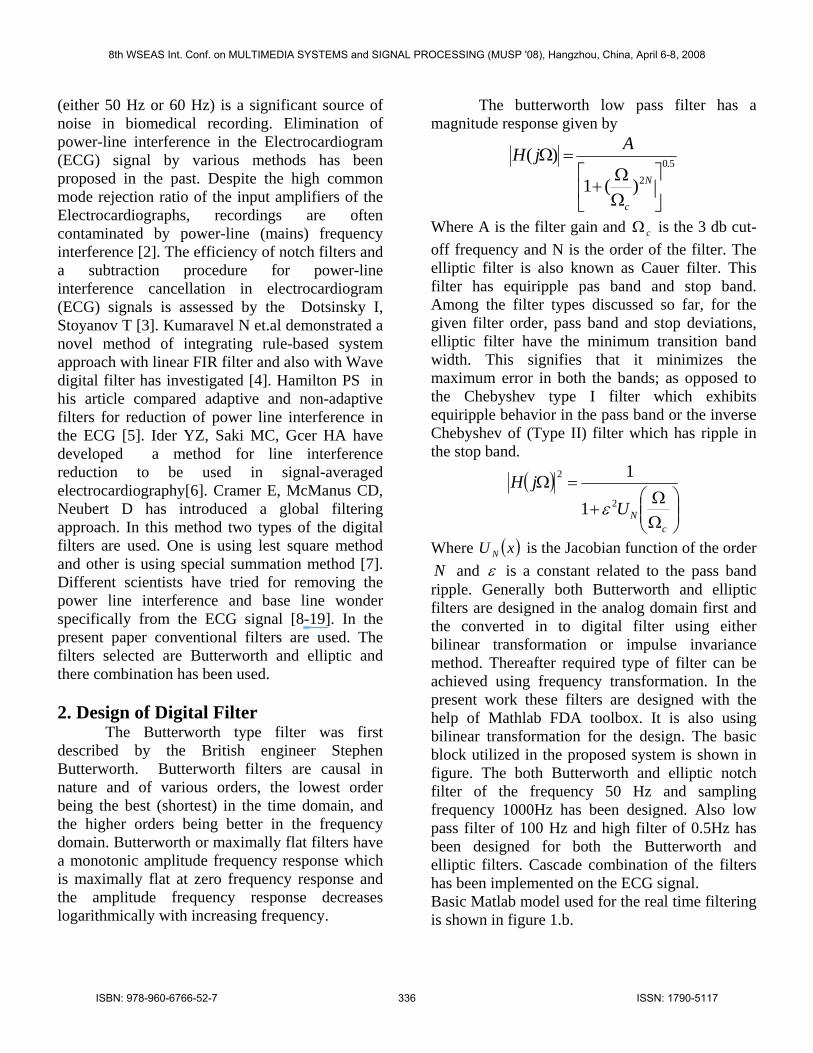
Figure 1.b : Basic Matlab model used for the real time filtering. 2.1 Design of the Elliptic High pass filter: The high pass elliptic filter is designed with order of 5 and the sampling frequency of 1000Hz. For the design attenuation in the pass band is 1dB and the attenuation in the stop band is 60dB. Figure 2-4 shows the responses of the elliptic high pass filter. From responses of the filter following observations are made:
1. This filter provides equiripple behavior in the pass as well as stop band.
2. Pole zero diagram clearly shows that poles and zeros are with in the circle so that the designed filter is stable.
For the elliptic high pass filter impulse response looks like the ideal impulse response and the step response of the filter decays with time.
Figure 2: Magnitude response of the elliptic high pass filter
Figure 3: Phase response of the elliptic high pass
filter
Figure 4: Pole zero diagram of the Elliptic high
pass filter
2.2 Realization of the Elliptic High pass filter: Figure 5 shows the realization of the elliptic high pass filter of the order 5 and cutoff frequency 0.5Hz. It requires ten adder elements, 5 delay elements and 11 multiplier. The filter is realized in direct form II structure.
Figure 5: realization of the elliptic High pass filter.
8th WSEAS Int. Conf. on MULTIMEDIA SYSTEMS and SIGNAL PROCESSING (MUSP '08), Hangzhou, China, April 6-8, 2008
ISBN: 978-960-6766-52-7 337 ISSN: 1790-5117
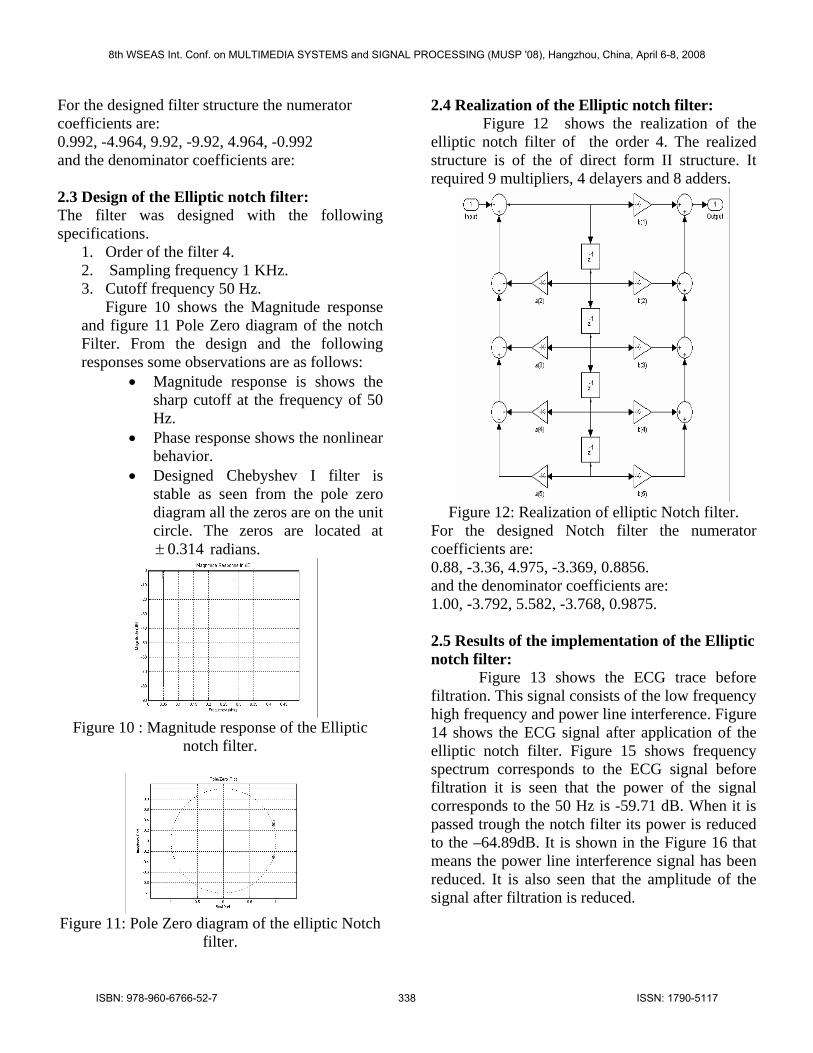
For the designed filter structure the numerator coefficients are: 0.992, -4.964, 9.92, -9.92, 4.964, -0.992 and the denominator coefficients are: 2.3 Design of the Elliptic notch filter: The filter was designed with the following specifications.
1. Order of the filter 4. 2. Sampling frequency 1 KHz. 3. Cutoff frequency 50 Hz.
Figure 10 shows the Magnitude response and figure 11 Pole Zero diagram of the notch Filter. From the design and the following responses some observations are as follows:
• Magnitude response is shows the sharp cutoff at the frequency of 50 Hz.
• Phase response shows the nonlinear behavior.
• Designed Chebyshev I filter is stable as seen from the pole zero diagram all the zeros are on the unit circle. The zeros are located at
radians. 314.0±
Figure 10 : Magnitude response of the Elliptic
notch filter.
Figure 11: Pole Zero diagram of the elliptic Notch
filter.
2.4 Realization of the Elliptic notch filter: Figure 12 shows the realization of the elliptic notch filter of the order 4. The realized structure is of the of direct form II structure. It required 9 multipliers, 4 delayers and 8 adders.
Figure 12: Realization of elliptic Notch filter.
For the designed Notch filter the numerator coefficients are: 0.88, -3.36, 4.975, -3.369, 0.8856. and the denominator coefficients are: 1.00, -3.792, 5.582, -3.768, 0.9875. 2.5 Results of the implementation of the Elliptic notch filter: Figure 13 shows the ECG trace before filtration. This signal consists of the low frequency high frequency and power line interference. Figure 14 shows the ECG signal after application of the elliptic notch filter. Figure 15 shows frequency spectrum corresponds to the ECG signal before filtration it is seen that the power of the signal corresponds to the 50 Hz is -59.71 dB. When it is passed trough the notch filter its power is reduced to the –64.89dB. It is shown in the Figure 16 that means the power line interference signal has been reduced. It is also seen that the amplitude of the signal after filtration is reduced.
8th WSEAS Int. Conf. on MULTIMEDIA SYSTEMS and SIGNAL PROCESSING (MUSP '08), Hangzhou, China, April 6-8, 2008
ISBN: 978-960-6766-52-7 338 ISSN: 1790-5117
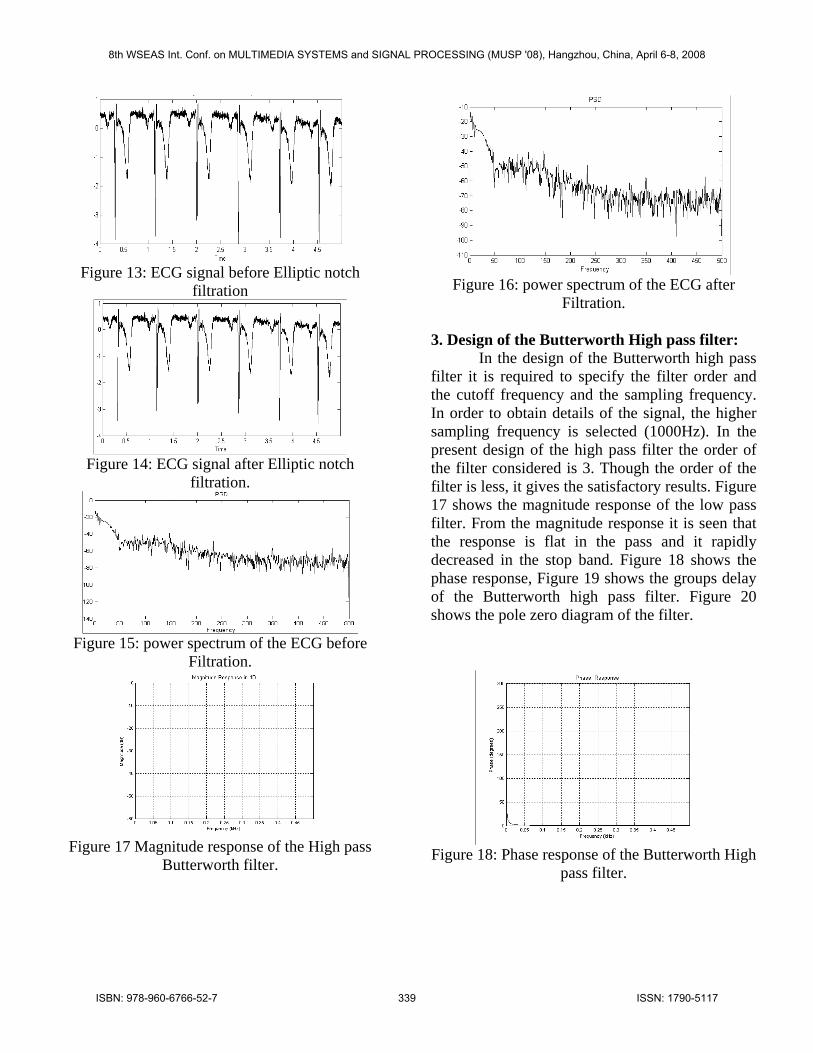
Figure 13: ECG signal before Elliptic notch
filtration
Figure 14: ECG signal after Elliptic notch
filtration.
Figure 15: power spectrum of the ECG before
Filtration.
Figure 16: power spectrum of the ECG after
Filtration.
3. Design of the Butterworth High pass filter: In the design of the Butterworth high pass
filter it is required to specify the filter order and the cutoff frequency and the sampling frequency. In order to obtain details of the signal, the higher sampling frequency is selected (1000Hz). In the present design of the high pass filter the order of the filter considered is 3. Though the order of the filter is less, it gives the satisfactory results. Figure 17 shows the magnitude response of the low pass filter. From the magnitude response it is seen that the response is flat in the pass and it rapidly decreased in the stop band. Figure 18 shows the phase response, Figure 19 shows the groups delay of the Butterworth high pass filter. Figure 20 shows the pole zero diagram of the filter.
Figure 17 Magnitude response of the High pass
Butterworth filter.
Figure 18: Phase response of the Butterworth High pass filter.
8th WSEAS Int. Conf. on MULTIMEDIA SYSTEMS and SIGNAL PROCESSING (MUSP '08), Hangzhou, China, April 6-8, 2008
ISBN: 978-960-6766-52-7 339 ISSN: 1790-5117
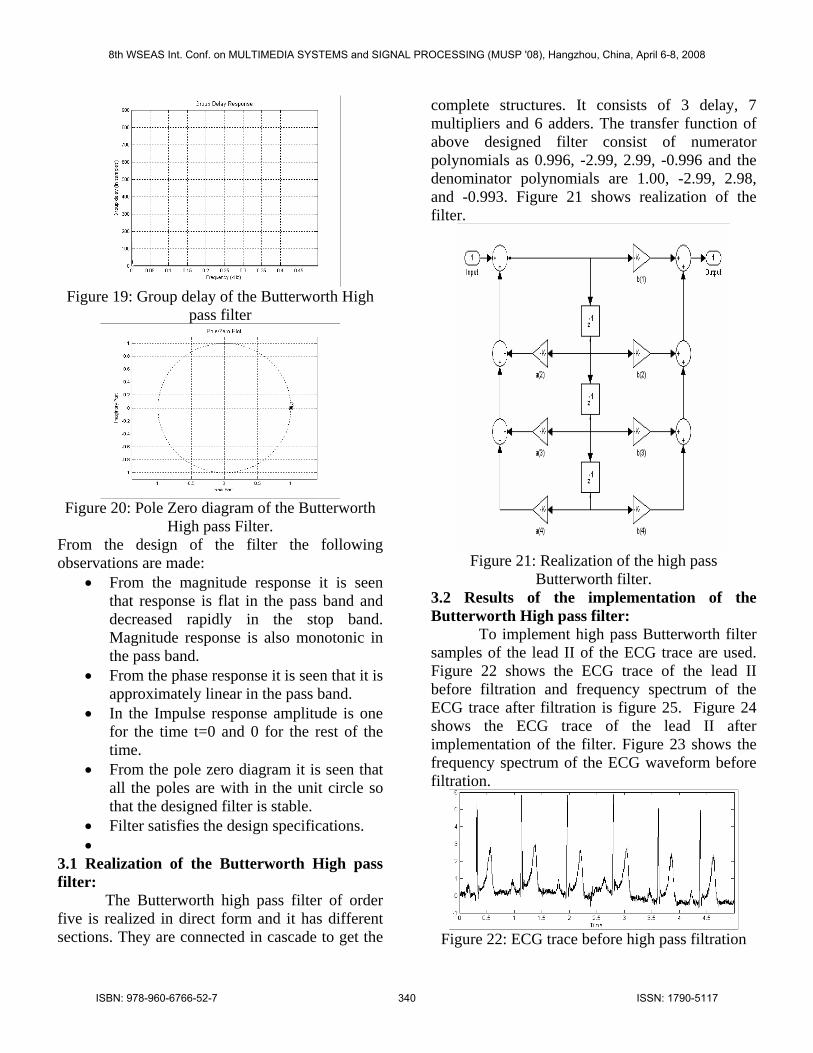
Figure 19: Group delay of the Butterworth High
pass filter
Figure 20: Pole Zero diagram of the Butterworth
High pass Filter. From the design of the filter the following observations are made:
• From the magnitude response it is seen that response is flat in the pass band and decreased rapidly in the stop band. Magnitude response is also monotonic in the pass band.
• From the phase response it is seen that it is approximately linear in the pass band.
• In the Impulse response amplitude is one for the time t=0 and 0 for the rest of the time.
• From the pole zero diagram it is seen that all the poles are with in the unit circle so that the designed filter is stable.
• Filter satisfies the design specifications. •
3.1 Realization of the Butterworth High pass filter:
The Butterworth high pass filter of order five is realized in direct form and it has different sections. They are connected in cascade to get the
complete structures. It consists of 3 delay, 7 multipliers and 6 adders. The transfer function of above designed filter consist of numerator polynomials as 0.996, -2.99, 2.99, -0.996 and the denominator polynomials are 1.00, -2.99, 2.98, and -0.993. Figure 21 shows realization of the filter.
Figure 21: Realization of the high pass
Butterworth filter. 3.2 Results of the implementation of the Butterworth High pass filter: To implement high pass Butterworth filter samples of the lead II of the ECG trace are used. Figure 22 shows the ECG trace of the lead II before filtration and frequency spectrum of the ECG trace after filtration is figure 25. Figure 24 shows the ECG trace of the lead II after implementation of the filter. Figure 23 shows the frequency spectrum of the ECG waveform before filtration.
Figure 22: ECG trace before high pass filtration
8th WSEAS Int. Conf. on MULTIMEDIA SYSTEMS and SIGNAL PROCESSING (MUSP '08), Hangzhou, China, April 6-8, 2008
ISBN: 978-960-6766-52-7 340 ISSN: 1790-5117
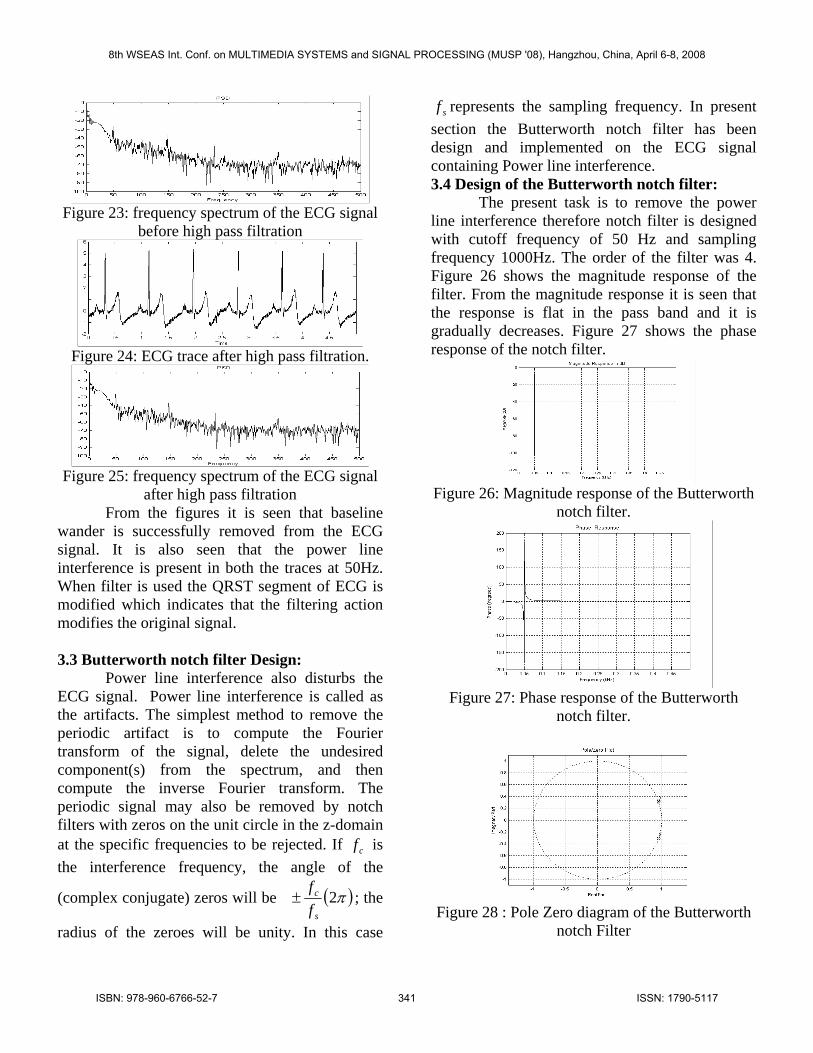
Figure 23: frequency spectrum of the ECG signal
before high pass filtration
Figure 24: ECG trace after high pass filtration.
Figure 25: frequency spectrum of the ECG signal
after high pass filtration From the figures it is seen that baseline wander is successfully removed from the ECG signal. It is also seen that the power line interference is present in both the traces at 50Hz. When filter is used the QRST segment of ECG is modified which indicates that the filtering action modifies the original signal. 3.3 Butterworth notch filter Design:
Power line interference also disturbs the ECG signal. Power line interference is called as the artifacts. The simplest method to remove the periodic artifact is to compute the Fourier transform of the signal, delete the undesired component(s) from the spectrum, and then compute the inverse Fourier transform. The periodic signal may also be removed by notch filters with zeros on the unit circle in the z-domain at the specific frequencies to be rejected. If is the interference frequency, the angle of the
(complex conjugate) zeros will be
cf
( π2s
c
ff
± ) ; the
radius of the zeroes will be unity. In this case
represents the sampling frequency. In present section the Butterworth notch filter has been design and implemented on the ECG signal containing Power line interference.
sf
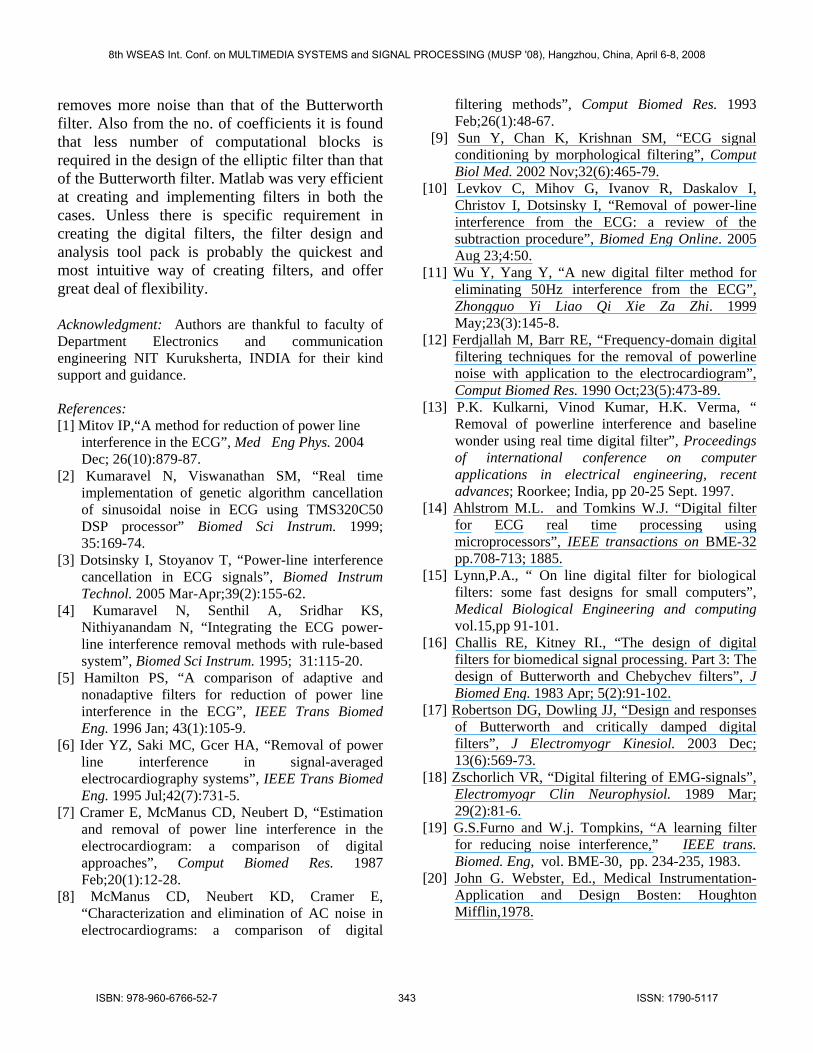
3.4 Design of the Butterworth notch filter: The present task is to remove the power
line interference therefore notch filter is designed with cutoff frequency of 50 Hz and sampling frequency 1000Hz. The order of the filter was 4. Figure 26 shows the magnitude response of the filter. From the magnitude response it is seen that the response is flat in the pass band and it is gradually decreases. Figure 27 shows the phase response of the notch filter.
Figure 26: Magnitude response of the Butterworth
notch filter.
Figure 27: Phase response of the Butterworth
notch filter.
Figure 28 : Pole Zero diagram of the Butterworth
notch Filter
8th WSEAS Int. Conf. on MULTIMEDIA SYSTEMS and SIGNAL PROCESSING (MUSP '08), Hangzhou, China, April 6-8, 2008
ISBN: 978-960-6766-52-7 341 ISSN: 1790-5117
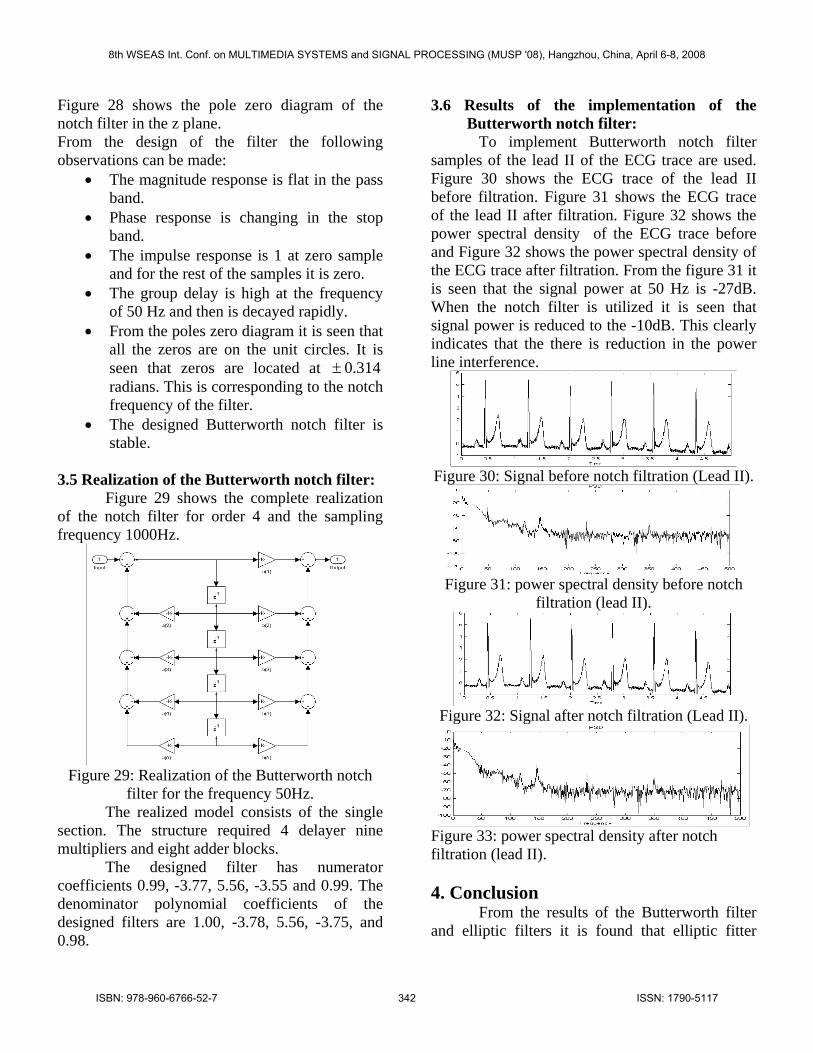
Figure 28 shows the pole zero diagram of the notch filter in the z plane. From the design of the filter the following observations can be made:
• The magnitude response is flat in the pass band.
• Phase response is changing in the stop band.
• The impulse response is 1 at zero sample and for the rest of the samples it is zero.
• The group delay is high at the frequency of 50 Hz and then is decayed rapidly.
• From the poles zero diagram it is seen that all the zeros are on the unit circles. It is seen that zeros are located at 314.0± radians. This is corresponding to the notch frequency of the filter.
• The designed Butterworth notch filter is stable.
3.5 Realization of the Butterworth notch filter: Figure 29 shows the complete realization of the notch filter for order 4 and the sampling frequency 1000Hz.
Figure 29: Realization of the Butterworth notch
filter for the frequency 50Hz. The realized model consists of the single section. The structure required 4 delayer nine multipliers and eight adder blocks. The designed filter has numerator coefficients 0.99, -3.77, 5.56, -3.55 and 0.99. The denominator polynomial coefficients of the designed filters are 1.00, -3.78, 5.56, -3.75, and 0.98.
3.6 Results of the implementation of the Butterworth notch filter:
To implement Butterworth notch filter samples of the lead II of the ECG trace are used. Figure 30 shows the ECG trace of the lead II before filtration. Figure 31 shows the ECG trace of the lead II after filtration. Figure 32 shows the power spectral density of the ECG trace before and Figure 32 shows the power spectral density of the ECG trace after filtration. From the figure 31 it is seen that the signal power at 50 Hz is -27dB. When the notch filter is utilized it is seen that signal power is reduced to the -10dB. This clearly indicates that the there is reduction in the power line interference.
Figure 30: Signal before notch filtration (Lead II).
Figure 31: power spectral density before notch
filtration (lead II).
Figure 32: Signal after notch filtration (Lead II).
Figure 33: power spectral density after notch filtration (lead II). 4. Conclusion From the results of the Butterworth filter and elliptic filters it is found that elliptic fitter
8th WSEAS Int. Conf. on MULTIMEDIA SYSTEMS and SIGNAL PROCESSING (MUSP '08), Hangzhou, China, April 6-8, 2008
ISBN: 978-960-6766-52-7 342 ISSN: 1790-5117
removes more noise than that of the Butterworth filter. Also from the no. of coefficients it is found that less number of computational blocks is required in the design of the elliptic filter than that of the Butterworth filter. Matlab was very efficient at creating and implementing filters in both the cases. Unless there is specific requirement in creating the digital filters, the filter design and analysis tool pack is probably the quickest and most intuitive way of creating filters, and offer great deal of flexibility. Acknowledgment: Authors are thankful to faculty of Department Electronics and communication engineering NIT Kuruksherta, INDIA for their kind support and guidance. References: [1] Mitov IP,“A method for reduction of power line
interference in the ECG”, Med Eng Phys. 2004 Dec; 26(10):879-87.
[2] Kumaravel N, Viswanathan SM, “Real time implementation of genetic algorithm cancellation of sinusoidal noise in ECG using TMS320C50 DSP processor” Biomed Sci Instrum. 1999; 35:169-74.
[3] Dotsinsky I, Stoyanov T, “Power-line interference cancellation in ECG signals”, Biomed Instrum Technol. 2005 Mar-Apr;39(2):155-62.
[4] Kumaravel N, Senthil A, Sridhar KS, Nithiyanandam N, “Integrating the ECG power-line interference removal methods with rule-based system”, Biomed Sci Instrum. 1995; 31:115-20.
[5] Hamilton PS, “A comparison of adaptive and nonadaptive filters for reduction of power line interference in the ECG”, IEEE Trans Biomed Eng. 1996 Jan; 43(1):105-9.
[6] Ider YZ, Saki MC, Gcer HA, “Removal of power line interference in signal-averaged electrocardiography systems”, IEEE Trans Biomed Eng. 1995 Jul;42(7):731-5.
[7] Cramer E, McManus CD, Neubert D, “Estimation and removal of power line interference in the electrocardiogram: a comparison of digital approaches”, Comput Biomed Res. 1987 Feb;20(1):12-28.
[8] McManus CD, Neubert KD, Cramer E, “Characterization and elimination of AC noise in electrocardiograms: a comparison of digital
filtering methods”, Comput Biomed Res. 1993 Feb;26(1):48-67.
[9] Sun Y, Chan K, Krishnan SM, “ECG signal conditioning by morphological filtering”, Comput Biol Med. 2002 Nov;32(6):465-79.
[10] Levkov C, Mihov G, Ivanov R, Daskalov I, Christov I, Dotsinsky I, “Removal of power-line interference from the ECG: a review of the subtraction procedure”, Biomed Eng Online. 2005 Aug 23;4:50.
[11] Wu Y, Yang Y, “A new digital filter method for eliminating 50Hz interference from the ECG”, Zhongguo Yi Liao Qi Xie Za Zhi. 1999 May;23(3):145-8.
[12] Ferdjallah M, Barr RE, “Frequency-domain digital filtering techniques for the removal of powerline noise with application to the electrocardiogram”, Comput Biomed Res. 1990 Oct;23(5):473-89.
[13] P.K. Kulkarni, Vinod Kumar, H.K. Verma, “ Removal of powerline interference and baseline wonder using real time digital filter”, Proceedings of international conference on computer applications in electrical engineering, recent advances; Roorkee; India, pp 20-25 Sept. 1997.
[14] Ahlstrom M.L. and Tomkins W.J. “Digital filter for ECG real time processing using microprocessors”, IEEE transactions on BME-32 pp.708-713; 1885.
[15] Lynn,P.A., “ On line digital filter for biological filters: some fast designs for small computers”, Medical Biological Engineering and computing vol.15,pp 91-101.
[16] Challis RE, Kitney RI., “The design of digital filters for biomedical signal processing. Part 3: The design of Butterworth and Chebychev filters”, J Biomed Eng. 1983 Apr; 5(2):91-102.
[17] Robertson DG, Dowling JJ, “Design and responses of Butterworth and critically damped digital filters”, J Electromyogr Kinesiol. 2003 Dec; 13(6):569-73.
[18] Zschorlich VR, “Digital filtering of EMG-signals”, Electromyogr Clin Neurophysiol. 1989 Mar; 29(2):81-6.
[19] G.S.Furno and W.j. Tompkins, “A learning filter for reducing noise interference,” IEEE trans. Biomed. Eng, vol. BME-30, pp. 234-235, 1983.
[20] John G. Webster, Ed., Medical Instrumentation-Application and Design Bosten: Houghton Mifflin,1978.
8th WSEAS Int. Conf. on MULTIMEDIA SYSTEMS and SIGNAL PROCESSING (MUSP '08), Hangzhou, China, April 6-8, 2008
ISBN: 978-960-6766-52-7 343 ISSN: 1790-5117